Dengue risk assessment using multicriteria decision analysis

IOSR Journal of Agriculture and Veterinary Science (IOSR-JAVS)
e-ISSN: 2319-2380, p-ISSN: 2319-2372. Volume 7, Issue 9 Ver. IV (Sep. 2014), PP 25-37 www.iosrjournals.org
www.iosrjournals.org 25 | Page
Land Suitability for Sorghum Using Multicriteria Evaluation
(MCE) and Analytical Hierarchy Process (AHP) in Bunkure Kano
State, Nigeria
1M. Ahmed and
2D. N. Jeb
1Department of Geography Bayero University, Kano 2National Center for Remote Sensing, Jos
Abstract: Among many factors limiting agricultural development in Nigeria is the lack of sufficient information on
soils and their characteristics. An attempt has been made by this study in generating soil database and mapping out
the physicochemical parameters and the suitable areas for sorghum cultivation. The aim of this research is to
analyse suitable areas for the cultivation of Sorghum (Sorghum bicolour (L.)) Bunkure Local Government Area of
Kano State. Fuzzy model, Multi Criteria Evaluation (MCE) and GIS were integrated in this study for land
evaluation. Data sourced (parameters) for this study includes; 51 soil samples from a gridded map of the area to the
depth of 30 cm. Satellite image (Spot-5) of 5 meter resolutions, Digital Elevation Model (DEM) and Soil characteristics map of the area. The parameters were subsequently integrated in Arc GIS 10.1 to generate the land
suitability map for the selected crop. The result of the analysis shows that the area has been dominated with
agricultural activities and the distribution of physicochemical parameters shows that pH ranging from 2.90 - 9.66,
while Mg with moderate value of 0.04-0.93.The area is generally affected with low OC, Na, Ca, and OM with < 2,
0.01-0.23, 1.05-9.12ppm, and 0.02-1.6% respectively. The medium are N, CEC and K with 0.02-0.96%, 2.09-
7.75meq/100g and 0.01 - 1.00 (cmol/kg) while salinity with 0.05-50.92. The results for suitability analysis indicated
that about 860.91 ha (8.6%) of land is highly suitable (S1) and 1712.15 ha (17.27%) of the area are moderately
suitable (S2). 2407.61 ha (24.29%) the area is found to be marginally suitable (S3) while, 3568.67 ha (36.01%) of
the land to be moderately suitable and 1361.88 ha (13.74%) to be not suitable (N). The study concluded that the soil
of the area is affected with salinity and low soil nutrients which can be control by proper management, it
recommend for proper use of fertilizer (organic and inorganic).
Keywords: Analytical Hierarchy Process (AHP), GIS, Multi Criteria Evaluation MCE, Sorghum, Suitability
I. Introduction Nigeria, having the largest population of any African country, rapid population growth, a high degree of
dependence on agriculture at the household level and large area of low potential (sub humid and sub arid) rainfed
farm land, is experiencing predominantly in nutrient depletion scenarios (Mortimore and Harris, 2003).
Land resource is gradually becoming scarce as increase in population places pressure on natural resources.
As world population grows: an increase of food supply is urgently needed to meet those demands. According to
FAO (2012) on the three decades of agriculture in the sub Saharan region, besides losing export market failed to
increase the production of food calories par capital above 2100/day. However, all other major regions in the
developing world improved, significantly (Alexandratos, 1995). It was projected that the region could not generate
growth on the scale necessary for feeding its growing population and catch up with the predicted average for
developing countries of 2730/day (Mortimore and Harris, 2003). Nevertheless, soil productivity depletion is often placed at the center of a nexus of population growth and agricultural decline (Cleaver and Schreiber, 1994; Breman
1998; White and Killick, 2001).
Furthermore, estimates were made by Stoorvogel, Smaling and Janssen (1993) in 38 sub Saharan countries.
The result shows that most of the important soil nutrients were lost in the area and the loses were projected to
increase the annual nutrient depletion. Also, the study of Henao and Banaante (1999) claimed that 86% of the sub
Saharan African countries are losing not less than 60-100 kg/ha/year (World Bank, 2003). Furthermore, a direct link
between soil nutrient depletion and food insecurity has been suggested by noting improvements for some major food
crops (Gruhn, Goletti and Yudelman 2000).
Lack of soil information has affected most of farming system and management. Ofor, Ibeawuchi and
Oparaeke (2009) opined that sorghum has a high demand for nutrients compared to cereals like rice, millet and
wheat. This crop require both the major nutrients (N, P and K) and the secondary nutrients (S, Mg, Ca, B, Fe, Cl, Cu

Land Suitability for Sorghum Using Multicriteria Evaluation (MCE) and Analytical Hierarchy Process
www.iosrjournals.org 26 | Page
etc.) in adequate amount to ensure good root establishment, vigorous and healthy growth and increased yields.
Agbede et al (2009) affirmed that lower soil organic matter, total N and available P attributed to the yield of
sorghum in some soils of Nigeria. Among many factors limiting agricultural development in Nigeria is the lack of
sufficient information on soils and their characteristics (Adamu, 2012).
Dugje, Kamara and. Ajeigbe (2009) found out that majority of the farmers in Bunkure (study area) cultivate
sorghum and millet. Sorghum cultivation was ranked highest in some part of the area, villages like Zangon- Buhari
and Kalalawa in Bunkure have the highest record compared with other crops. This shows the need for soil evaluation in the area with a view to knowing the most suitable area for sorghum cultivation. However, for the
purpose of this study Multi Criteria Evaluation (MCE) technique was applied for the land evaluation in the area.
Land suitability evaluation is classification of lands in terms of their suitability for a specific land use.
According to Food and Agricultural Organization (FAO, 1976), suitability is a function of crop requirements and
land characteristics. Suitability is a measure of how well the qualities of land unit match the requirements of a
particular form of land use. The objective of land suitability and evaluation is the prediction of inherent capacity of
the land units without deterioration (Elaalem, Comber and Fisher, 2001). Physical land evaluation is a prerequisite
for land-use planning, because it guides decisions on optimal use of land resources (Van Ranst, Tang, Groenemans,
and Sinthurahat, 1996). In multi-criteria decision making which is utilized for determination of optimum land use
type for an area, unequal importance of different land criteria is taken into consideration.
Multi Criteria Decision Making (MCDM) or Multi Criteria Evaluation (MCE) has been developed to improve spatial decision making when a set of alternatives need to be evaluated on the basis of conflicting and
incommensurate criteria. MCE is an effective tool for multiple criteria decision-making issues (Malczewski, 2006)
and aims to investigate a number of choice possibilities in light of not only multiple criteria but also multiple
objectives (Carver, 1991). Many of GIS-based land suitability analysis approaches are recently developed such as
Boolean overlay and modeling for land suitability analysis which could possibly be useful when making analysis
that has to do with a decision making.
Nevertheless, the use of modern technology has added more advantage in gathering information through
hardware and software which is more efficient. Many systems have been developed including Geographic
Information System (GIS). This is capable of systemically storing and analyzing both spatial data and non-spatial
data. GIS is used in creating models of a situation by using different criteria. Therefore, applying GIS in land
evaluation to provide fundamental information to support in decision making on land use plan seems to be able to
reduce problems caused by improper land use. In recent years, there has been increasing interest in integrating GIS capability with multi-criterion decision analysis techniques for spatial planning and management (Sekitani, and
Yamaki, (1999); Coulter, Sessions, and Michael (2003); Chakhar and Mousseau, (2008); Chen, Shahbaz and Xevi
(2009).
Most of the studies carried out in the area concentrated on the soil fertility or salinity without mapping the
distribution of the elements also the past studies used of soil unit and average values for the soil parameters which
give a false data for the area concerned (John, Antonio and Randy, 2004) and Poor soil sampling procedures account
for more than 90 percent error (Mahler and Tindall, 1990).
Furthermore, an attempt has been made by the Kano State Government in 2009 to produce a suitability map
for the cultivation of rice and some few crops in Tomas, Watari and Magaga dam sites (MARDITECH, 2011). The
study was limited to some specific areas and also the soil parameters were not mapped.
Tanko (2011) concentrated on the effect of salinity, the study shows that poor drainage arising from the application of irrigated water in the area there by increasing the effect of salinity. While, Baffa (2012) studied the
water requirement on crops such as Sugar cane, Garden egg, Rice, Onion, Tomato, and Hot pepper using irrigation
farming in the area. The result shows that the cultivation of these crops keep the people of the area busy for both dry
and rainy seasons thus, they generate more income than other crops. The study also shows that yield (output) is low,
even though, farmers use other means of managing the soil by choosing a fertilizer for a particular crop and it
concluded that salinity and other forms of land degradation are the major factor that resulted to low yield. The study
did not highlight the distribution and the concentration level of the salinity in the area.
Foli (2012) revealed low fertility of soils of Bunkure is well below critical levels of P and K. Low clay
content of 11% on average translated into low availability of the important plant nutrients N, P, and K. This study
targeted only the leguminous plants to see the effect of Nitrogen. The study refused to analyse the distribution of the
soil elements in the area.
Land Suitability for Sorghum Using Multicriteria Evaluation (MCE) and Analytical Hierarchy Process
www.iosrjournals.org 27 | Page
The ground truthing (field visit) information in Bunkure LGA (study area) shows that the selected crop
(Sorghum) was intensively cultivated before but today, farmers in the area now apply more fertilizer, compare with
the past when only animal dung were used on their farmlands and that form the basis for crop selection.
The main aim of this research is to map out the suitable areas for cultivation of Sorghum in Bunkure Kano
State, Nigeria.
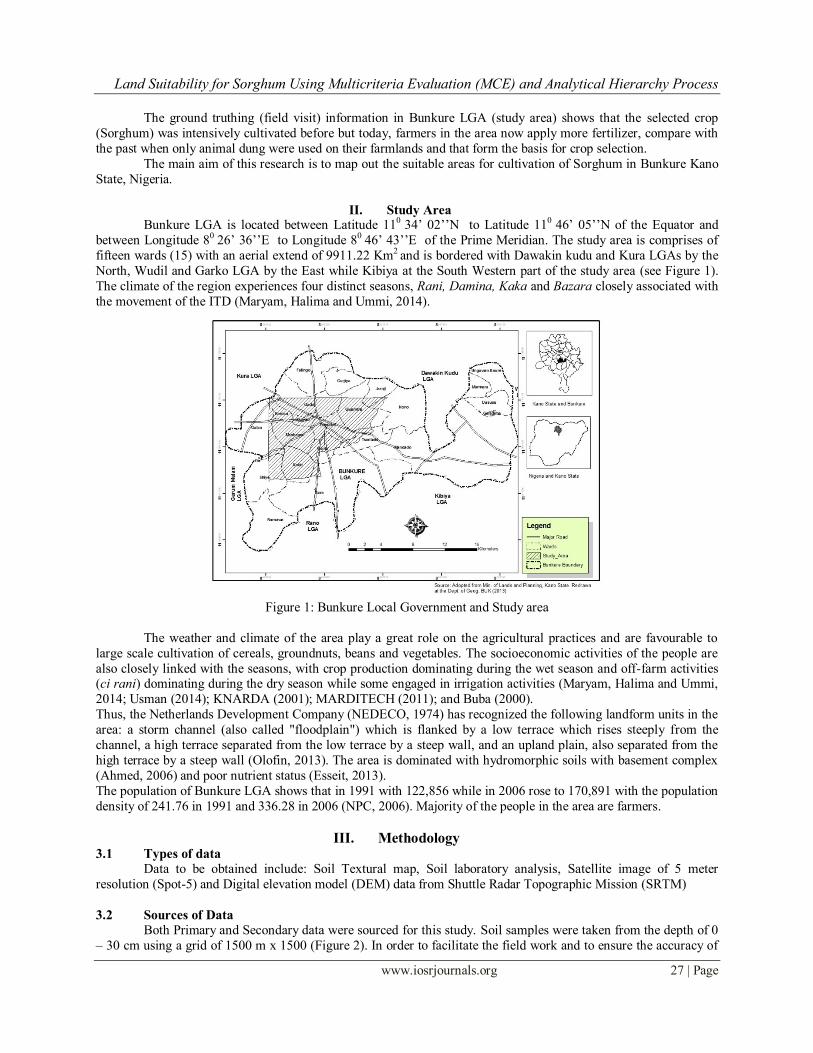
II. Study Area Bunkure LGA is located between Latitude 110 34‟ 02‟‟N to Latitude 110 46‟ 05‟‟N of the Equator and
between Longitude 80 26‟ 36‟‟E to Longitude 80 46‟ 43‟‟E of the Prime Meridian. The study area is comprises of
fifteen wards (15) with an aerial extend of 9911.22 Km2 and is bordered with Dawakin kudu and Kura LGAs by the
North, Wudil and Garko LGA by the East while Kibiya at the South Western part of the study area (see Figure 1).
The climate of the region experiences four distinct seasons, Rani, Damina, Kaka and Bazara closely associated with
the movement of the ITD (Maryam, Halima and Ummi, 2014).
Figure 1: Bunkure Local Government and Study area
The weather and climate of the area play a great role on the agricultural practices and are favourable to
large scale cultivation of cereals, groundnuts, beans and vegetables. The socioeconomic activities of the people are
also closely linked with the seasons, with crop production dominating during the wet season and off-farm activities (ci rani) dominating during the dry season while some engaged in irrigation activities (Maryam, Halima and Ummi,
2014; Usman (2014); KNARDA (2001); MARDITECH (2011); and Buba (2000).
Thus, the Netherlands Development Company (NEDECO, 1974) has recognized the following landform units in the
area: a storm channel (also called "floodplain") which is flanked by a low terrace which rises steeply from the
channel, a high terrace separated from the low terrace by a steep wall, and an upland plain, also separated from the
high terrace by a steep wall (Olofin, 2013). The area is dominated with hydromorphic soils with basement complex
(Ahmed, 2006) and poor nutrient status (Esseit, 2013).
The population of Bunkure LGA shows that in 1991 with 122,856 while in 2006 rose to 170,891 with the population
density of 241.76 in 1991 and 336.28 in 2006 (NPC, 2006). Majority of the people in the area are farmers.
III. Methodology 3.1 Types of data
Data to be obtained include: Soil Textural map, Soil laboratory analysis, Satellite image of 5 meter
resolution (Spot-5) and Digital elevation model (DEM) data from Shuttle Radar Topographic Mission (SRTM)
3.2 Sources of Data
Both Primary and Secondary data were sourced for this study. Soil samples were taken from the depth of 0
– 30 cm using a grid of 1500 m x 1500 (Figure 2). In order to facilitate the field work and to ensure the accuracy of

Land Suitability for Sorghum Using Multicriteria Evaluation (MCE) and Analytical Hierarchy Process
www.iosrjournals.org 28 | Page
the examination/sampling points, the points were uploaded on Global Positioning Systems (GPS) Garmin 76csx
model and the soil examined and sampled according to MARDITECH (2011) Wollenhaupt et al., (1994); Rehm et
al., (2001) and Umar (2011).
Figure 2: Sampling Points
Shuttle Radar Topographic Mission (SRTM) with the resolution of 90 meters were sourced (downloaded)
from www.ftp//glcf/landsat. This was used in the creation and extraction of the Digital Elevation Model (DEM)
which were used for developing the slope map of the area.
The soil texture map of the area with the scale of 1:25,000 published in 1976 produced by Netherlands
Development Company (NEDECO) was sourced from the Kano State Ministry of Agriculture. This was used in the
extraction of the soil boundaries, soil drainage and soil units jn the area.
Spot-5 satellite imagery with a 5 meter resolution for 2012 was sourced from the Archive of the National
Remote Sensing Center (NRSC), Kano. This was already rectified and corrected and was used for land unit
identification and landuse classification of the area. Also, data and related information for the suitability of the
selected crops were sourced from literatures.
3.3 Methods and Procedure for Data Collection
A preliminary survey was carried out in the area. The purpose of the survey was for the researcher to be
acquainted with the environment, and to help in the soil unit‟s identification using the soil characteristics map (base
map), and to re-establish the research and the selection of the crops for this study.
3.4 Field survey and data collection
A grid cells were prepared on the base map for sampling. Fifty one (51) soil samples were identified to the
distance of 1500 x 1500 meters and were collected in the field (Figure 2) using the USDA Soil Survey Manual (Soil
Survey Staff, 1981). At each soil site, a GPS (Global Position Systems, Garmin 76x model) reading was used in
taking the coordinates. The field equipments and tools that were used in collecting the soil samples includes the soil
auger, digital camera, Munsell color chart (USDA, 1994), 30 meters measuring tape and pH and EC kits. Figure 3. summarized the methodology.
IV. Data Analysis The data analyses were divided into two parts: these are the laboratory and GIS based analysis.
4.1 Laboratory Analysis
The samples were taken to the Standard laboratory (Department of Geography Bayero University Kano) air
dried and gently crushed with porcelain pestle and mortar; and then passed through a 2mm sieve to remove coarse
fragments. The fine earth samples (<2mm soil portion) collected were analysed. Particle size distribution was
determined using hydrometer method (Gee and Bauder, 1986). Sand, silt and clay was determined by dispersing the soil samples in 5% calgon (sodium hexametaphosphate) solution. The dispersed samples were shaken on a
Land Suitability for Sorghum Using Multicriteria Evaluation (MCE) and Analytical Hierarchy Process
www.iosrjournals.org 29 | Page
reciprocating shaker after which particle size distribution was determined with the aid of Bouyoucous hydrometer at
progressive time intervals. The textural classes were determined with the aid of USDA textural triangle.
The soil pH was determined both in water and 0.01M CaCl2 solution, using a soil to solution ratio of 1:2.5 (IITA,
1979). On equilibration, pH was reading with a glass electrode on a Pye- Unicam model 290mk pH meter. Delta pH
(dpH) values were determined. The Walkley – Black (1934) wet digestion method were used to determine the
organic carbon content of the soil samples. Total nitrogen was determined using the macro – kjedhal method. Soil
available phosphorus was determined using the Bray I method calorimetrically. Electrical Conductivity was determined using Bower and Wilcox (1965).
Exchangeable Ca, mg, Na and K were extracted with 1m ammonium acetate (1M NH4OAc) solution
buffered at pH 7.0 as described by Anderson and Ingram (1998). Potassium and Salinity in the extract were read on
a GallenKamp flame Analyzer. The extracts were diluted two times with the addition of 2ml of 6.5% lanthanuv cm
chloride solution to prevent ionic interference before Ca and Mg was read. The Ca and Mg were read on a pye
unicam model SP 192 atomic absorption spectrophotometer (AAS) at 423 and 285nm wavelength respectively. The
sum of Ca, Mg, Na, and K gave total exchangeable bases.
The soils were leached with 1m KCl solution. Exchange acidity (Al+H) in the 1m KCl extract was
determined by titration with 0.1m sodium hydroxide solution as described by Anderson and Ingram (1998). Cation
Exchange Capacity (CEC) of the soil were determine with 1m NH4OAc (1m ammonium acetate), buffered at pH 7.0
(Chapman 1965, Rhodes, 1982). The excess acetate was removed by repeated washing with alcohol. The absorbed ammonium ions were displace with 10% sodium chloride (pH 2.5) and determined by the Kjeldahl procedure (Soil
Survey Staff, 1972).
4.2 GIS Analysis
For the identification of the agricultural landuse, Spot-5 satellite images were digitized using “on-screen” in
the Arc GIS 10.1 environment. Different land classes were identified in the area which includes agricultural land,
built up areas, vegetation, water body and wetland. This analysis was performed according to Nuhu and Ahmed
(2013) where each land unit was coded for easy classification and identification.
The soil textural map were scanned and imported into Arc GIS10.1, then geo-referenced by using four (4)
Ground Control Points (GCP) that were read from UTM. For registration process (image geo-referencing), some
modifications were made during the geo-referencing for the selected control points in order to minimize the error
during digitization. The map was projected to WGS 1984 using Minna datum, UTM zone 32. The soil drainage was extracted from the map using “on screen digitization” query and overlay from the scanned map were performed. The
shape files of the soil drainage and soil units were converted to raster format using 5 meters resolution; in this case
the resolution of the satellite was adopted. The soil unit was also extracted from the map with the combination of the
satellite image (Spot-5). The slope of the area were analysed using Digital Elevation Model (DEM) which were
extracted from Shuttle Rader Topographic Mission (SRTM) data. The slope was reclassified by converting the
values (slope angles) into percentage and also adopting the satellite image resolution (5 meters).
4.3 Suitability Criteria for Sorghum
The weighted factor was estimated by pair wise comparison matrix (Saaty 1980) based on land
characteristics. After structuring the problem as a hierarchy using the Eigenvector. The criteria weight for
physicochemical parameters were performed together with the other factors like the slope, soil drainage, land units, soil depth, soil texture and land uses (see Table 1).
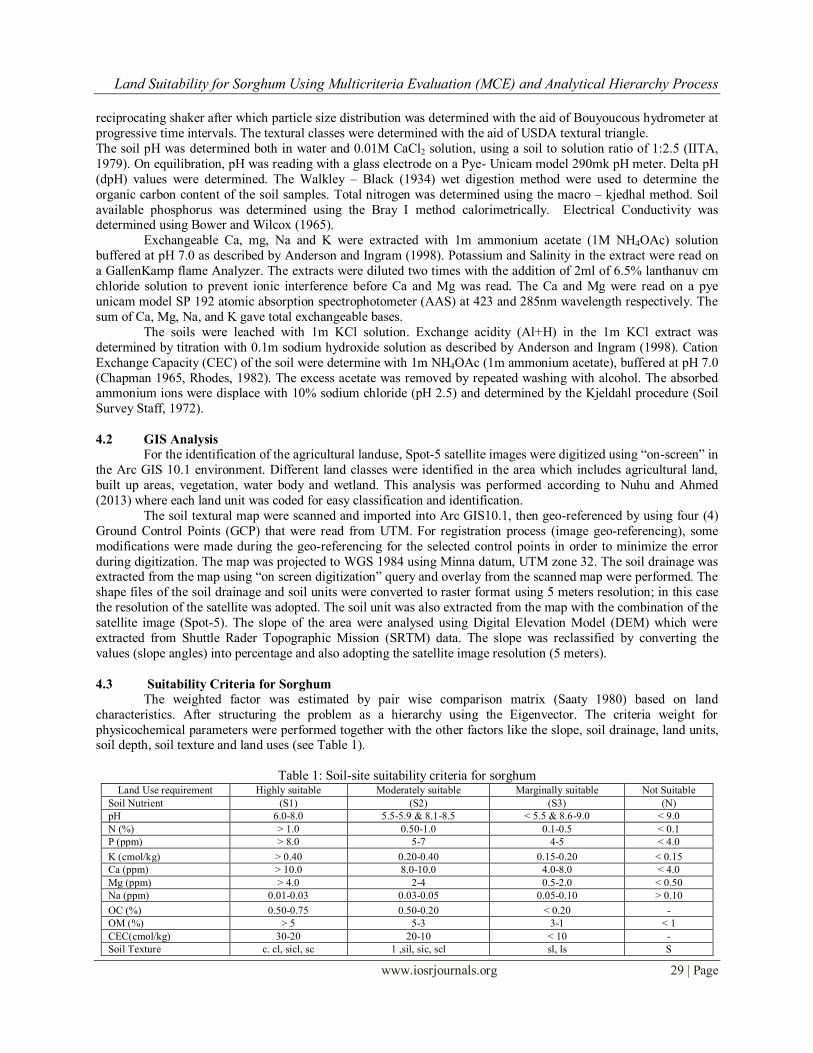
Table 1: Soil-site suitability criteria for sorghum Land Use requirement Highly suitable Moderately suitable Marginally suitable Not Suitable
Soil Nutrient (S1) (S2) (S3) (N)
pH 6.0-8.0 5.5-5.9 & 8.1-8.5 < 5.5 & 8.6-9.0 < 9.0
N (%) > 1.0 0.50-1.0 0.1-0.5 < 0.1
P (ppm) > 8.0 5-7 4-5 < 4.0
K (cmol/kg) > 0.40 0.20-0.40 0.15-0.20 < 0.15
Ca (ppm) > 10.0 8.0-10.0 4.0-8.0 < 4.0
Mg (ppm) > 4.0 2-4 0.5-2.0 < 0.50
Na (ppm) 0.01-0.03 0.03-0.05 0.05-0.10 > 0.10
OC (%) 0.50-0.75 0.50-0.20 < 0.20 -
OM (%) > 5 5-3 3-1 < 1
CEC(cmol/kg) 30-20 20-10 < 10 -
Soil Texture c. cl, sicl, sc 1 ,sil, sic, scl sl, ls S
Land Suitability for Sorghum Using Multicriteria Evaluation (MCE) and Analytical Hierarchy Process
www.iosrjournals.org 30 | Page
Land Quality
Slope (%) 0-4 3-8 8-16 > 16
Soil condition Deep soil Deep soil Moderately deep Shallow soil
Soil drainage Well drained Well Drained Moderately drained Poorly drained
Soil toxicity
EC(ds/m) 2-4 4-8 8-10 > 10
Note: clay-c, clay loam-cl, silt clay loam-sicl, silt clay-sc, loam-l, silt loam-sl, silt clay-sic, silt loam-sl,
Loam sand-ls, sand-s.
Source: FAO (1979), Metson (1961), USDA (1993), Bungham, (1962), MAFF (1967) and Van Diepen,
Van Keulen, Wolf and Berkhout, (1991).
Geo-processing model were used to execute the sequence of command to generate physical suitability maps
which were developed in the Fuzzy and AHP model for all the parameters or factors, while the Model Builder was
used in combining all the layers to generate the final suitability map. The suitability for each chemical and physical parameters were generated individually and classified using Analytical Hierarchy Process (AHP)
The analysis for pH showing in Figure 3C that the most suitable area is (S1) 5236.26 ha (52.83%). While
the moderately suitable (S2) 2604.86 ha (26.28%), marginally suitable (S3) 2001.00 ha (20.20%) and not suitable
(N) with 68.40 ha (0.69%). More than 50% is within the suitable class for sorghum, however pH value is strongly
related to BS-% within a soil testing class, and can be used as an indicator or index of certain chemical reactions
occurring in the soil. At very low pH, solubility of Al, Mn and Zn increase, and can become toxic to sensitive plants.
At high pH values, the solubility of Mn, and to a lesser extent Zn and Cu, can become so low that sorghum are
unable to obtain adequate supplies from the soil. The acceptable pH range varies for each soil class.
The analysis for Organic Matter (OM) in Figure 3E shows that the area for moderately suitable (S2) having
19.61 ha (0.20%), marginally suitable (S3) with 3309.08 ha (33.39%) and area not suitable (N) for sorghum shows
that 6582.53 (66.41%). Soil organic matter (OM) according to London (1988) is distinguished by its high moisture
retention, low plasticity, low cohesion, and the dark color it imparts to the soil. These in turn lead to the favorable physical properties such as high water holding capacity, more stable structure, improved tilth, and more rapid water
infiltration associated with mineral soils having significant organic matter content.
The electrical conductivity (EC) is an indicator for determination of saline soils, the analysis in Figure 3I
shows that the suitability (S1) for sorghum having 1506.34 ha (15.20%), moderately suitable (S2) 4259.10 ha
(42.97%), while the marginally suitable with (S3) 1597.48 (16.12%) and areas that are not suitable with (N) 2548.30
ha (25.71%).
The CEC affects the way a soil should be managed for sorghum cultivation. For example, a soil with a low
CEC (less than 5 meq/100g) generally has a low clay and organic matter content, has a low water holding capacity,
requires more frequent lime and fertilizer additions, and is subject to leaching and such soils will have lower yield
potential than soils with higher CEC under the same level of management, but high productivity can be maintained
by intensive management (Steven, 1998). The CEC values ranging within the marginally suitable (S3) with 9911.22 ha (100%) (Figure 3B) this indicated that the soil of area contained CEC that is marginally suitable for sorghum.
Nitrogen (N) is the element most frequently lacking for optimum sorghum production. Nitrogen
recommendations will vary with expected yield, soil texture, and cropping sequence (Grain Sorghum Production,
1998). The analysis for total Nitrogen (N) in Figure 3H shows that the suitable area with (S1) 67.12 ha (0.68%),
moderately suitable (S2) 1339.35 ha (13.51%), marginally suitable (S3) 8483.68 ha (85.60%) and not suitable (N)
with total area of 21.07 ha (0.21%).
The suitability for magnesium (Mg) for sorghum requirement shows that the area is generally affected by
deficiency in Mg. In cereal crops, Mg deficiency symptoms include interveinal chlorosis on the lower leaves. Leaf
edges may also show a thin hint of red or purple (London 1988). On broad-leaved crops, the lower leaves of Mg
deficient plants may initially show interveinal chlorosis and become purplish-red with green veins. Because, the
result indicated that marginally suitable (S3) with 1158.96 ha (11.69%) and not suitable (N) with 8752.26 ha
(88.31%) (Figure 3J). Potassium (K) is also relatively weak in the area the analysis indicated that the suitable area (S1) for
sorghum in Figure 3K is occupying 520 ha (5.25%) of the area while moderately suitable (S2) 3416.47 (34.47%),
marginally suitable (S3) 3560.97 ha (35.93%) and not suitable (N) 2413.76 ha (24.35%).
Calcium (Ca) deficiency results in poorly developed root systems and relatively little fruit of poor quality.
Foliage symptoms are extremely variable. Since Ca is immobile in the plant, affected plants may display malformed
young leaves and abnormal terminal growth. Calcium is not readily leached from the soil, although levels may be

Land Suitability for Sorghum Using Multicriteria Evaluation (MCE) and Analytical Hierarchy Process
www.iosrjournals.org 31 | Page
quite low in sandy surface soils. Deficiencies rarely occur in crops other than peanuts, potatoes and vegetables
subject to blossom end rot (London, 1988). In this study Ca shows that the area is dominated by low to very low
values particularly for sorghum cultivation. The suitable area shows that (Figure 3A) (S1) 0.86 ha (0.01%),
marginally suitable (S3) with 1536.74 ha (15.51%) and not suitable within (N) 8373.62 ha (84.49%).
The analysis of total sodium (Na) shows that suitable area (S1) with 35.28 ha (0.36%), moderately suitable
(S2) with 647.89 ha (6.54%) while marginally suitable (S3) having the area of 4405.46 ha (44.45%) and the area that
is not suitable with 4822.59 ha (48.66%) (Figure 3G). The suitability Phosphorus (P) in the area having more of the land that is within the threshold for sorghum
cultivation. This is an indication of having the suitable land (S1) with 8630.16 ha (87.07%) and the moderately
suitable (S2) with 1128.53 ha (11.39%) while marginally suitable with 150.89 ha (1.52%) and areas with not
suitable (N) within 1.64 ha (0.02%). Therefore, the area contained high amount of Phosphorus (Figure 3D). This is
unique among the anions, it has low mobility and availability in soils. It is difficult to manage because it reacts so
strongly with both solution and solid phases of the soil. As a result, mobility through the soil is extremely limited in
all but organic soils or white bleached sands with extremely low CEC's. Concentrations in soil solution range from
less than 0.1 to around 5 ppm. Most crops respond to P additions when soil solution levels are less than 0.1 to 0.2
ppm (London, 1988).
The landuses in the area were also analysed as a criteria for sorghum suitability classes and the result shows
(Figure 3P) that the agricultural land is the most suitable area for the cultivation. The result indicated that the suitable (S1) area from the land use category is within 7919.47 ha (79.90%) followed by moderately suitable (S2)
with 1526.95 ha (15.41%), marginally suitable (S3) 24.76 ha (0.25%) and not suitable within 440.04 ha (4.44%).
Soil texture is one of the determinants of the potentiality of a soil to hold nutrients and most of the physical
characteristics of the soil depend upon it. In this study the suitability for Sorghum was determined and about four
different classes of soil texture were identified in the area, this includes sandy clay loam, sandy loam, clay loam and
complex soils (the combination of two different soils) and all were tested for suitability, the result shows that (Figure
3L) areas with suitable texture with (S1) 30.26 (0.31%) while moderately suitable (S2) 7162.99 ha (72.27%) and the
area occupied by marginally suitable (S3) within 1910.16 ha (19.27%) the area that is not suitable (N) with 807.81
ha (8.15%). The result of the soil drainage in the area shows that three classes of soil drainage were identified and analyzed these
includes well drained, moderately and poorly drained soils, the suitable areas (S1) for sorghum is within 8455.91 ha (85.32%) while moderately suitable (S2) with 1112.19 ha (11.22%) and not suitable (N) with 343.12 ha (3.46%) (Figure 3M).
Table 2: Suitability classes for Sorghum in the study area Suitability classes Na OC EC K
Area (ha) (%) Area (ha) (%) Area (ha) (%) Area (ha) (%)
Suitable (S1) 35.28 0.36 1934.66 19.52 1506.34 15.2 520.02 5.25
Moderately suitable (S2) 647.889 6.54 1666.28 16.81 4259.10 42.97 3416.47 34.47
Marginally suitable (S3) 4405.46 44.45 6127.23 61.82 1597.48 16.12 3560.97 35.93
Not suitable (N) 4822.59 48.66 183.05 1.85 2548.30 25.71 2413.76 24.35
Total 9911.22 100 9911.22 100 9911.22 100 9911.22 100
pH N OM Ca
Suitability classes Area (ha) (%) Area (ha) (%) Area (ha) (%) Area (ha) (%)
Suitable (S1) 5236.26 52.83 67.1193 0.68 0 0.00 0 0.00
Moderately suitable (S2) 2604.86 26.28 1339.35 13.51 19.61 0.20 0.86 0.01
Marginally suitable (S3) 2001.70 20.20 8483.68 85.60 3309.08 33.39 1536.74 15.51
Not suitable (N) 68.396 0.69 21.0698 0.21 6582.53 66.41 8373.62 84.49
Total 9911.22 100 9911.22 100 9911.22 100 9911.22 100
P Mg CEC Soil Texture
Suitability classes Area (ha) (%) Area (ha) (%) Area (ha) (%) Area (ha) (%)
Suitable (S1) 8630.16 87.07 0 0 0.00 0.00 30.26 0.31
Moderately suitable (S2) 1128.53 11.39 0 0 0.00 0.00 7162.99 72.27
Marginally suitable (S3) 150.89 1.52 1158.96 11.69 9911.00 100.00 1910.16 19.27
Not suitable (N) 1.64 0.02 8752.26 88.31 0.00 0.00 807.813 8.15
Total 9911.22 100 9911.22 100 9911.22 100 9911.22 100
Land Use
Slope
Soil Drainage
Soil Depth
Suitability classes Area (ha) (%) Area (ha) (%) Area (ha) (%) Area (ha) (%)
Suitable (S1) 7919.469 79.90 4128.27 41.65 8455.91 85.32 5344.37 53.92
Moderatly suitable (S2) 1526.954 15.41 2498.63 25.21 1112.19 11.22 3492.40 35.24
Marginally suitable (S3) 24.75948 0.25 2360.83 23.82 0.00 0.00 0.00 0.00

Land Suitability for Sorghum Using Multicriteria Evaluation (MCE) and Analytical Hierarchy Process
www.iosrjournals.org 32 | Page
Not suitable (N) 440.0379 4.44 923.49 9.32 343.123 3.46 1074.45 10.84
Total 9911.22 100 9911.22 100 9911.22 100 9911.22 100
Soil Units
Suitability classes Area (ha) (%)
Suitable (S1) 9537.45 96.23
Moderatly suitable (S2) 373.77 3.77
Marginally suitable (S3) 0.00 0.00
Not suitable (N) 0.00 0.00 Total 9911.22 100
Sources: Data analysis (2014) Slope of an area determines the rate of erosion and is one of the factors used in this study for determination of
suitable areas for sorghum. Classification has been determined from Digital Elevation Model (DEM) for the
suitability classes. Four classes were identified ranging between 0 – 4%, 4 – 8%, 8 – 10% and greater than 10%. The
result shows that suitable area (S1) with 4128.27 ha (41.65%), while moderately suitable (S2) within 2498.63 ha
(25%), marginally suitable (S3) 2360.83 ha (23.82%) and area that is not suitable (N) with 923.49 ha (9.32%). The
result of this analysis in Figure 3N indicated that the southern part of the area is affected by badland topography and
erosion.
Soil depth is another important factors used for suitability analysis for cultivation of a particular crop. In
this study the soil depth were classified and weighted into deep, moderately deep and shallow soils and the result
indicated that the suitable area (S1) for sorghum with 5344.37 ha (53.92%) while for moderately suitable (S2) with
3492.37 ha (35.24%) and the area for not suitable (N) to be 1074.45 ha (10.84%). The soil unit were categorized as
upper and lower terrace which were tested for the suitability for sorghum and found out that the suitable area (S1) with 9537.45 ha (96.23%) while for moderately suitable (S2) with 373.77 ha (3.71%).

Land Suitability for Sorghum Using Multicriteria Evaluation (MCE) and Analytical Hierarchy Process
www.iosrjournals.org 33 | Page

Land Suitability for Sorghum Using Multicriteria Evaluation (MCE) and Analytical Hierarchy Process
www.iosrjournals.org 34 | Page
Note: A= Calcium (Ca), B = Cation Exchange Capacity (CEC), C = pH, D = Phosphorus (P), E = Organic Matter
(OM), F = Organic Carbon (OC), G = Sodium (Na), H = Nitrogen (N), I = Electrical Conductivity (EC), J =
Magnesium (Mg), K = Potassium (K), L = Soil texture, M = Soil drainage, N = slope (%) and O = Soil depth and P
= Landuse.
4.4 Combined layers (themes) for Sorghum suitability
The pairwise comparison matrix for all the criteria of sorghum cultivation, were weighted of the alternatives, the final rate were calculated the final suitability map. Model Builder as shown in Figure 4 was used in
combining the thematic layers produced in Figure 3 from the AHP and Fuzzy analysis was performed in the
weighted overlay operations.
Figure 4: Model Builder
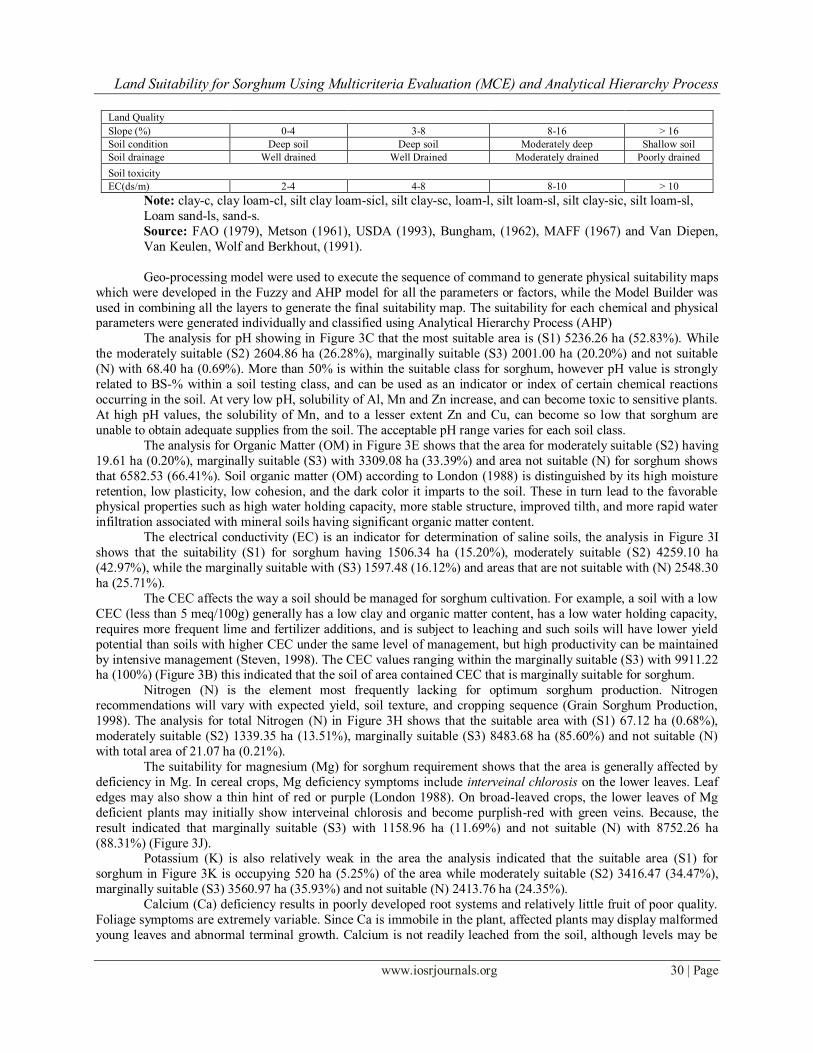
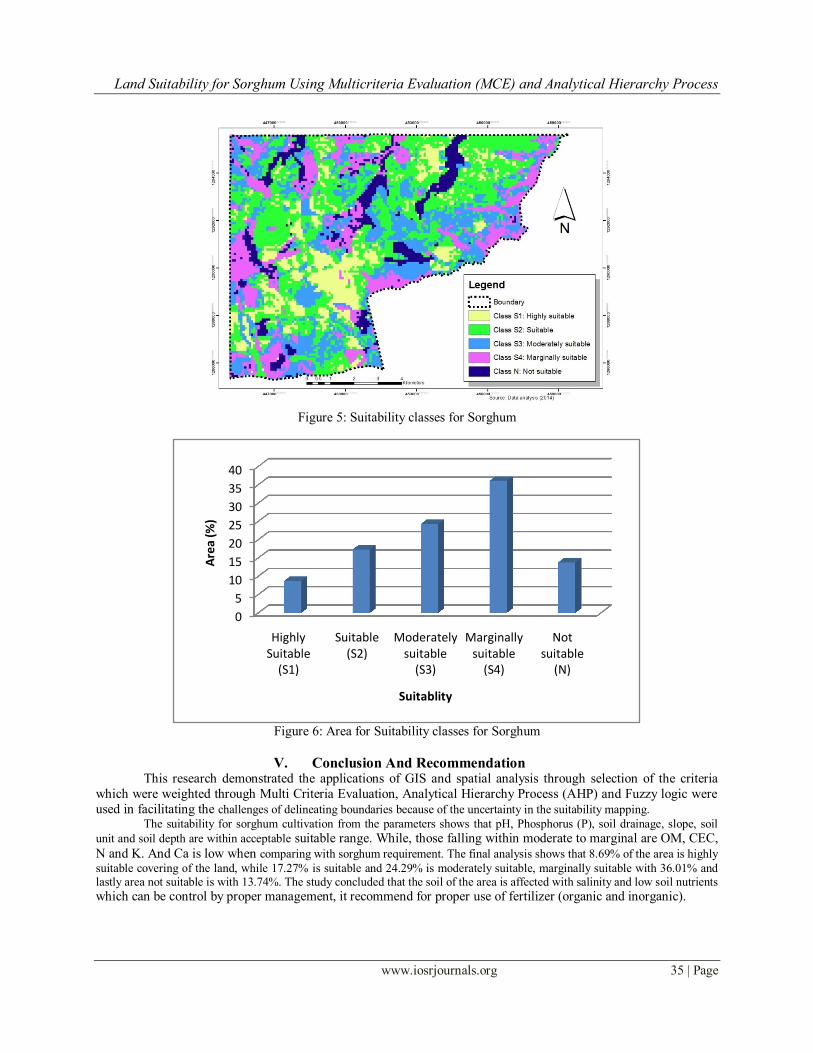
The result of the analysis (Figure 3) shows that the highly suitable area that meet up with all the
requirement is within (S1) 860.91 ha (8.69%). This area has all the quality that is requires (most suitable) to
cultivate sorghum. According to NEDECO (1976) is Hydromorphic in nature it mostly consist of silt and some
combination of loamy soils, clayey and sand that developed within the terraces which is good for cereal crops.
While, the suitable area (S2) with 1712.15 ha (17.27%). This land has constraints which can be overcome by little
investment. The area is affected by low levels of plant nutrients especially low organic matter (OM), high electrical
conductivity (EC) and little erosion. Perennial crops are thus more suitable for this area (USDA, 2009). Moderately
shallow soil depth, making agriculture possible only with little management, minimum tillage and careful erosion
control. The limitations will reduce productivity or benefits, and increase required inputs to the extent that the overall advantage to be gained from the use, although still attractive, will be appreciatable inferior to that expected
on (S1) class I land.
The moderately suitable (S3) with 2407.61 ha (24.29%) this area is falling within the irrigated field in the
study area which is affected by salinity, poorly drained and low nutrients. However, the land is having limitations
which, in aggregate are severe for sustained application of given use and will so reduce productivity or benefit or
increase required input, that this expenditure will be only moderately justified.
Marginally suitable (S4) having the area with 3568.67 ha (36.01%), but the area is affected by severely
erosion, shallow soils, very low organic matter and slopping topography. It is dominated by an undifferentiated
texture there by making the soil to be sandy. However, the land having limitations which may be surmountable in
time, but which cannot be corrected with existing knowledge at currently acceptable cost; the limitation are too
severe as to preclude successful sustained use of the land in the given manner. The area not suitable (N) for sorghum cultivation is 1361.88 ha (13.74%), this area is generally affected by
badland topography, rocky outcrops, complex texture and very poor nutrient; others include water bodies and poorly
drained soils which are generally not suitable for cultivation. Land having limitations which appear as severe to
preclude any possibilities of successful sustained use of the land to the given manner.
Land Suitability for Sorghum Using Multicriteria Evaluation (MCE) and Analytical Hierarchy Process
www.iosrjournals.org 35 | Page
Figure 5: Suitability classes for Sorghum
Figure 6: Area for Suitability classes for Sorghum
V. Conclusion And Recommendation This research demonstrated the applications of GIS and spatial analysis through selection of the criteria
which were weighted through Multi Criteria Evaluation, Analytical Hierarchy Process (AHP) and Fuzzy logic were
used in facilitating the challenges of delineating boundaries because of the uncertainty in the suitability mapping.
The suitability for sorghum cultivation from the parameters shows that pH, Phosphorus (P), soil drainage, slope, soil
unit and soil depth are within acceptable suitable range. While, those falling within moderate to marginal are OM, CEC,
N and K. And Ca is low when comparing with sorghum requirement. The final analysis shows that 8.69% of the area is highly
suitable covering of the land, while 17.27% is suitable and 24.29% is moderately suitable, marginally suitable with 36.01% and lastly area not suitable is with 13.74%. The study concluded that the soil of the area is affected with salinity and low soil nutrients
which can be control by proper management, it recommend for proper use of fertilizer (organic and inorganic).
0
5
10
15
20
25
30
35
40
Highly Suitable
(S1)
Suitable (S2)
Moderately suitable
(S3)
Marginally suitable
(S4)
Not suitable
(N)
Are
a (%
)
Suitablity

Land Suitability for Sorghum Using Multicriteria Evaluation (MCE) and Analytical Hierarchy Process
www.iosrjournals.org 36 | Page
References [1]. Adamu G. K. (2014). An Assessment of The Surface Characteristics and Potentials of Fadama Soils in The Reaches of Two Major
Streams in Kano State, Nigeria. Unpublished PhD. Theses submitted to the Department of Geography Bayero University Kano.
[2]. Agbede, T.M., Ojeniyi S.O. and Adekayode, F.O. 2009: Effect of Tillage on Soil Properties and Yield of Sorghum in Southwest Nigeria.
Nigerian Journal of Soil Science 19(2), 1 – 10.
[3]. Ahmed, K. (2006) The Physical Environment of Kano State, www.kanostate.net/physicalenvironment.html.
[4]. Alexandratos, N. (Ed), (1995). World Agriculture: Towards 2010. An FAO study. FAO/Wiley, Rome/Chichester.
[5]. Anderson, J.M. and Ingram, J.S.I. (1998): A hand book of methods. 2nd edn., CAB International, Wallingford U.K. p. 37.
[6]. Baffa M. A. (2012) Problems of Crop Water Requirement on Irrigation Plots at Bunkure LGA. Kano State. An Unpulished Bsc. Theses
submitted to the Department of Geography Bayero University Kano, Nigeria
[7]. Breman H., (1998) Amelioration de la fatilite des sols en Afrique de I‟Ouest: contraintes es perspectives. In Renard, G., Neef, A.,
Becker, K., Von Oppen, M. (Eds.), Soil Fertility Management in West African Land Use Systems. Margraf Verlag, Weikersheim, pp. 7-
20.
[8]. Buba, L. F (2010) Spatio Temporal rainfall and temperature variation in Northern Nigeria. An Unpublished PhD thesis Submitted to the
Geography Department Bayero University Kano, Nigeria
[9]. Bungham A (1962) Chemical Test for Available Phosphorus. Soil Science 94, 87-95.
[10]. Carver, S.J., 1991. Integrating multi-criteria evaluation with geographical information systems. International Journal of Geographical
Information System, 5: 321-339.
[11]. Chakhar S and V. Mousseau (2008), „GIS-based Multicriteria spatial modeling generic framework‟. International Journal of
Geographical Information Science, vol. 22, pp. 1159–1196
[12]. Chapman H.D. (1965) Cation Exchange Capacity. In :Black C.A (ed). Methods of Soil Analysis. Part 2. American Society of Agronomy,
Madison. Pp. 1149-1178
[13]. Chen Y. J. Yu., K. Shahbaz, and E. Xevi (2009), “A GIS-Based Sensitivity Analysis of Multi-Criteria Weights”, presented at the 18th
World IMACS / MODSIM Congress, Cairns, Australia, July 13-17.
[14]. Cleaver K.M., and Schreiber, G. A., (1994) Reversing the spiral: the Population Agriculture and Environment Nexus in sub-Saharan
Africa. The World Bank Washington DC
[15]. Coulter E. D., J. Sessions, and W.G Michael, W.G (2003). “Scheduling Forest Road Maintenance Using the Analytic Hierarchy Process
and Heuristics”, Silva Fennica, vol .40, pp. 143–160.
[16]. Dugje, I. Y. Kamara A. Y and. Ajeigbe H (2009) Biophysical Characterisation of Crop Fields in Sudan Savanna Zone of North Western
Nigeria: Kano-Katsina-Maradi Pilot Learning Site Sudan Savanna Agro-Ecological Zone Innovation Platform. Sub Saharan Challenge
Programme for Integrated Agricultural Research for Development. International Institute of Tropical Agriculture (IITA, Research to
Nourish Africa)
[17]. Elaalem E, A. Comber, and P. Fisher, (2001) “A Comparison of Fuzzy AHP and Ideal Point Methods for Evaluating Land Suitability”,
Transactions in GIS, vol.15, pp. 329- 346.
[18]. Elaalem M. (2012) Land Suitability Evaluation for Sorghum Based on Boolean and Fuzzy Multi-Criteria Decision Analysis Methods
International Journal of Environmental Science and Development, Vol. 3, No. 4.
[19]. Esseit U. E. (2013) Soils. Geography of Kano region. Tanko and Mumale S, B. (Eds) Kano Environment, Society and Development.
London and Abuja, Adonis and Abbey Publishers
[20]. FAO (1979) Soil Survey Investigation for Irrigation. Soil Bull No. 42 FAO Rome
[21]. FAO, (1976). A framework for land evaluation. Food and Agriculture Organization of the United Nations, Soils Bulletin 32. FAO,
Rome.
[22]. FAOSTAT (Food and Agriculture Organization/Statistics (2012). Trade data base, Production data base http://faostat.fao.org/
[23]. Foli (2012) Qualitative and quantitative diagnosis of macro and micronutrient deficiencies in soils across three agro-ecological
environments of northern Nigeria using the double-pot technique MSc internship report Plant Production Systems group Course
code: PPS-70424 Wageningen University. From http://www.n2africa.org
[24]. Gee G. W. and J. W. Bauder. (1986): Particle size analysis. In „Methods of soil analysis, Part 1‟.Vol. 9.(Ed. A. Klute) pp. 91–
100.American Society of Agronomy: Madison,WI.
[25]. Gruhn, P., Goletti, F., and Yudelman, M., (2000). Integrated Nutrient Management, Soil Fertility, and Sustainable Agriculture:
Current Issues and Future Challenges, Agriculture and the Environment Discussion Paper 32. International Food Policy Research
Institute, Washington.
[26]. Henao, J. and Banaante, C., (1999) Estimating Rates of Nutrient Depletion in Soils of Agricultural Lands of Africa, International
Fertilizer Development Center, Mussel Shoals, AL.
[27]. IITA. (1979). Selected methods for soil and plant analysis. International Institute of Tropical Agriculture. Manual series No. 1 pp 70.
[28]. John S., Antonia M., and Randy K. (2004) Take Good Soil Sample to help make good decision. Iowa State Univ. File code Agronomy 8-
5
[29]. KNARDA (Kano Agricultural and Rural Development Authority) (2001). Development Area Statistics.
[30]. London J.R. (1988). Toward a standard field assessment of soil texture for mineral soils. Soil survey and land Evaluation 8 (3) 161-165
[31]. Mahler, R.L. and T.A. Tindall (1990) Soil sampling. . Univ. Idaho Coop. Ext. Bull. 704 (revised)
[32]. Malczewski, J. (2006). GIS-based multicriteria analysis: a survey of the literature. International Journal of Geographic Information
Science, 20: 703–726.
[33]. MARDITECH (2011), Development of a GIS-Based Soil Suitability Classification for Rice Production in Kano State, Nigeria,
Unpublished Interim Report submitted to the Kano State Government, MARDITECH, Kualar Lumpur, Malaysia
[34]. Maryam L, Halima A. Idris and Ummi K. Mohammed (2014) Weather and Climate. In A.I Tanko and S.B. Mumale (Eds.) Kano
Environment, Society and Development. London and Abuja, Adonis and Abbey Publishers
[35]. Metson A.J (1961) Method of Chemical analysis for soil survey samples. New Zealand DSIR. Soil Bur Bull Govt. Printer, Wellington
New Zealand.
[36]. Mortimore M. and Harris F. (2003) Do small farmers‟ achieve contradict the nutrient depletion scenarios for Africa? Land use policy 22
43-56 Elsevier

Land Suitability for Sorghum Using Multicriteria Evaluation (MCE) and Analytical Hierarchy Process
www.iosrjournals.org 37 | Page
[37]. NEDECO, (Netherlands Dev. Company) (1976). Kano River Irrigation Project (KRIP) Main Report. Part VIII. Ministry ofAgriculture
and Natural Resources, Kano, Nigeria.
[38]. NPC (2006) National Population Commission
[39]. Nuhu Z and Ahmed M (2013) Agricultural Landuse in Sub-urban Lafia of Nasarawa State, Nigeria. Part-ii: Social Sciences and
Humanities ISSN-l: 2223-9553, ISSN: 2223-9944 Vol. 4 no. 4 avap international www.savap.org.pk www.journals.savap.org.pk
[40]. Ofor, M.O I.I Ibeawuchi and A.M.Oparaeke (2009) Crop Protection Problems in Production of Maize and Guinea Corn in Northern
Guinea Savanna of Nigeria and Control Measures Nature and Science;7(11)
[41]. Olofin E. A. (1985). Human Responses to the Natural environment in the Kano Region. In: Barkindo, A. A. (ed). Kano and its
Neighbours. ABU Press, Zaria.
[42]. Rehm, G.W., A.P. Mallarino, K. Reid, D. Franzen, and J. Lamb. (2001). Soil sampling for variable-rate fertilizer and lime application.
North Central Multistate Report 348 - NCR- 13 Committee. Minnesota Agricultural Experiment Station Bull. 608-2001. Univ. of
Minnesota, St. Paul., MN.
[43]. Rhoades, J.D. (1982). Cation exchange capacity. In Page, A.L., Miller, R.H. and Keeney, D.R. (eds). Methods of Soil Analysis. Part 2
Agron 9. Madison WI. PP 149-157.
[44]. Saaty, T.L. (1980). The analytic hierarchy process: McGraw Hill International., New York.
[45]. Sekitani,K. and N. Yamaki (1999),”A logical interpretation for the eigenvalues method in AHP”. Journal of the Operations Research
Society of Japan, vol. 42, pp. 219-232, 1999.
[46]. Soil Survey Staff. (1972). Soil Taxonomy. U.S. Dept. Agric. Handbook 436. U.S. Govt. Printing Office, Washington D.C
[47]. Soil Survey Staff. (1981). Keys to Soil Taxonomy, 8th edition. USDA Natural Resource Conservation Service, U.S. Government
Printing Office, Washington DC.
[48]. Steven C., (1998) Managers/Management of soil erosion. In: Management Practices for Maintaining soil Productivity in the douglas-
firregion (Ed) Sam D. Angima and Thomas A. Terry. In Best. Oregon State University. Extension service
[49]. Stoorvogel, J., Smaling, E., and Janssen, B., (1993). Calculating soil nutrient balances in Africa at different scales: I. Supra-national
scale, Fertile. Res., 35, 227 – 235
[50]. Tanko A.I. (2001), Some Physical and Chemical Changes in Soils, and their Agricultural Implications under large-scale Irrigation in
Kano Region, Northern Nigeria, Proceedings of Faculty Seminar Series Vol 1, Faculty of Social and Management Sciences,
BayeroUniversity Kano pp 247-269.
[51]. Umar, G. (2011) Assessment of the Fertility Status of some Irrigated Fluvisols in Northern Guinea Savannah of Nigeria. Volume 6 (1);
Savannah Journal of Agriculture ISSN 1597 9377 Faculty of Agriculture, Bayero University
[52]. USDA (1993), U.S Dept. of Agriculture. Soil Survey Manual
[53]. USDA (2009), Natural Resources Conservation Service. Planting And managing switch grass as a biomass energy crop. Plant
Materials Program. (http://plant materials.nrcs.usda.gov/pubs/NPMtechnotes/npmptn3-13079.pdf). Accessed 12/08/ 2014
[54]. Usman A (2014) Rainfall variability in Kano region. Unpublished Msc. Theses submitted to the Geography Department Bayero
University Kano, Nigeria
[55]. Van Diepen C.A, Van Keulen H., Wolf J., and Berkhout J.A.A (1991) Land Evaluation from Intuition to Quantification. In BA. Stewart
(ed) Advance in Social Science Springer New York 139-204 pp.
[56]. Van Ranst E., H.Tang, S. Groenemans, and S. Sinthurahat (1996), “Application of fuzzy logic to land suitability for rubber production in
peninsular Thailand”. Geoderma, vol.1, pp. 1-19
[57]. Walkley, A. and Black, A. (1934). An examination of Degtjareff Method of Determining Soil Organic Matter and a proposed
modification of the chromic acid titration method. Soil Science 37: 29-38.
[58]. www.ftp//glcf/landsat
[59]. White, H. and Killick, T., (2001) African Poverty at the Millennium. The World Bank,Washington DC.
[60]. Wollenhaupt, N.C., R.P. Wolkowski, and M.K. Clayton. (1994) Mapping soil test phosphorusand potassium for variable-rate fertilizer
application. J. Prod. Agric. 7:441-448.
Copyright © 2022 FDOKUMEN