Lamination microstructure in shear deformed copper single crystals
11
Lamination microstructure in shear deformed copper single crystals Olga Dmitrieva a , Patrick W. Dondl b, * , Stefan Mu ¨ ller b , Dierk Raabe a a Max-Planck-Institut fu ¨ r Eisenforschung GmbH, Max-Planck-Straße 1, D-40237 Du ¨ sseldorf, Germany b Hausdorff Center for Mathematics and Institute for Applied Mathematics, University Bonn, Endenicher Allee 60, D-53115 Bonn, Germany Received 10 November 2008; received in revised form 14 March 2009; accepted 19 March 2009 Available online 8 May 2009 Abstract We investigate the formation of microscopic patterns in a copper single crystal deformed in a shear experiment. Using high-resolution electron backscatter diffraction imaging, we find a band-like microstructure consisting of confined areas in the sample with rotated lat- tice. Digital image correlation allows us to exactly determine the macroscopic state of deformation of the sample. This data can be used as a side condition to calculate the lamination parameters from the theory of kinematically compatible lamination of separate material regions, each deforming in single slip. The parameters given by the theory agree with the measured properties, i.e. a lattice rotation of 3° and a lamination normal rotated 7° counterclockwise from a h111i direction. Ó 2009 Acta Materialia Inc. Published by Elsevier Ltd. All rights reserved. Keywords: Plasticity; Microstructure; Laminates; Single crystals; Digital image correlation 1. Introduction Many studies on the behavior of metals under stress aim at understanding the evolution of plastic deformation. Since plastic behavior of materials is the result of the inter- action of lattice defects at several length scales, the overall macroscopic properties are strongly influenced by the for- mation of internal microstructures. The main concern of this work is to obtain a better understanding of deforma- tion patterning phenomena in plasticity, particularly regarding the formation of laminates. These internal struc- tures generally arise when the energy density of the body becomes non-convex. This leads to a frustration of the homogeneous state, which makes it energetically favorable for the material to develop a microstructure. In plasticity such a loss of convexity in the energy can, for example, stem from the phenomenon of cross- (or latent-) hardening [1–3], when activity in one slip-plane suppresses activity in the others. The well-known example of geometric softening, where the lattice in a crystal locally rotates until one slip system is oriented such that it can accommodate the applied load [4–7] can also be explained by a loss of convexity in the energy [8]. In fatigue experi- ments, as well as in experiments involving only a single- pass deformation, the formation of laminate-like micro- structures has been observed [9–11]. This lamination behavior was explored by Ortiz and Repetto [8], who gen- erally considered it a phenomenon stemming from cross- hardening. In this work, we study the formation of lamination microstructure in plastically deformed copper single crys- tals under well-defined single-pass loading conditions. We measure the macroscopic deformation by the digital image correlation method and characterize the microstructure using electron backscatter diffraction. This allows us to quantitatively compare the predictions from the theory of laminates to the actually observed microstructure. To our knowledge, this is the first such quantitative analysis of the microstructure formed during plastic deformation. In simple shear experiments, nearly uniform macro- scopic strain can be achieved with the use of a sample 1359-6454/$36.00 Ó 2009 Acta Materialia Inc. Published by Elsevier Ltd. All rights reserved. doi:10.1016/j.actamat.2009.03.035 * Corresponding author. Tel.: +49 341 9959 601; fax: +49 341 9959 658. E-mail addresses: [email protected] (O. Dmitrieva), pwd@hcm. uni-bonn.de (P.W. Dondl), [email protected] (S. Mu ¨ ller), [email protected] (D. Raabe). www.elsevier.com/locate/actamat Available online at www.sciencedirect.com Acta Materialia 57 (2009) 3439–3449
Transcript of Lamination microstructure in shear deformed copper single crystals

Available online at www.sciencedirect.com
www.elsevier.com/locate/actamat
Acta Materialia 57 (2009) 3439–3449
Lamination microstructure in shear deformed copper single crystals
Olga Dmitrieva a, Patrick W. Dondl b,*, Stefan Muller b, Dierk Raabe a
a Max-Planck-Institut fur Eisenforschung GmbH, Max-Planck-Straße 1, D-40237 Dusseldorf, Germanyb Hausdorff Center for Mathematics and Institute for Applied Mathematics, University Bonn, Endenicher Allee 60, D-53115 Bonn, Germany
Received 10 November 2008; received in revised form 14 March 2009; accepted 19 March 2009Available online 8 May 2009
Abstract
We investigate the formation of microscopic patterns in a copper single crystal deformed in a shear experiment. Using high-resolutionelectron backscatter diffraction imaging, we find a band-like microstructure consisting of confined areas in the sample with rotated lat-tice. Digital image correlation allows us to exactly determine the macroscopic state of deformation of the sample. This data can be usedas a side condition to calculate the lamination parameters from the theory of kinematically compatible lamination of separate materialregions, each deforming in single slip. The parameters given by the theory agree with the measured properties, i.e. a lattice rotation of 3�and a lamination normal rotated 7� counterclockwise from a h111i direction.� 2009 Acta Materialia Inc. Published by Elsevier Ltd. All rights reserved.
Keywords: Plasticity; Microstructure; Laminates; Single crystals; Digital image correlation
1. Introduction
Many studies on the behavior of metals under stress aimat understanding the evolution of plastic deformation.Since plastic behavior of materials is the result of the inter-action of lattice defects at several length scales, the overallmacroscopic properties are strongly influenced by the for-mation of internal microstructures. The main concern ofthis work is to obtain a better understanding of deforma-tion patterning phenomena in plasticity, particularlyregarding the formation of laminates. These internal struc-tures generally arise when the energy density of the bodybecomes non-convex. This leads to a frustration of thehomogeneous state, which makes it energetically favorablefor the material to develop a microstructure.
In plasticity such a loss of convexity in the energy can,for example, stem from the phenomenon of cross- (orlatent-) hardening [1–3], when activity in one slip-plane
1359-6454/$36.00 � 2009 Acta Materialia Inc. Published by Elsevier Ltd. All
doi:10.1016/j.actamat.2009.03.035
* Corresponding author. Tel.: +49 341 9959 601; fax: +49 341 9959 658.E-mail addresses: [email protected] (O. Dmitrieva), pwd@hcm.
uni-bonn.de (P.W. Dondl), [email protected] (S. Muller),[email protected] (D. Raabe).
suppresses activity in the others. The well-known exampleof geometric softening, where the lattice in a crystal locallyrotates until one slip system is oriented such that it canaccommodate the applied load [4–7] can also be explainedby a loss of convexity in the energy [8]. In fatigue experi-ments, as well as in experiments involving only a single-pass deformation, the formation of laminate-like micro-structures has been observed [9–11]. This laminationbehavior was explored by Ortiz and Repetto [8], who gen-erally considered it a phenomenon stemming from cross-hardening.
In this work, we study the formation of laminationmicrostructure in plastically deformed copper single crys-tals under well-defined single-pass loading conditions. Wemeasure the macroscopic deformation by the digital imagecorrelation method and characterize the microstructureusing electron backscatter diffraction. This allows us toquantitatively compare the predictions from the theory oflaminates to the actually observed microstructure. To ourknowledge, this is the first such quantitative analysis ofthe microstructure formed during plastic deformation.
In simple shear experiments, nearly uniform macro-scopic strain can be achieved with the use of a sample
rights reserved.

3440 O. Dmitrieva et al. / Acta Materialia 57 (2009) 3439–3449
geometry in which friction effects are negligible in theregion of interest [12,13]. The use of single crystals as spec-imens allows defined macroscopic activation of a subset ofthe 12 face-centered cubic (fcc) slip systems h110i {111}(see Table 1) during deformation. The external plasticdeformation is accommodated by mobile dislocationswhich cause the slip. The interactions between mobileand immobile dislocations and subsequent dislocationtrapping lead to the hardening of the material. Regardingto the hardening effects, the plastic part of the stress–straincurve of single crystals is divided into several stages [14,15].Stage I (easy glide) occurs only during single slip, and thehardening rate is small compared to the other regions.Stage II (linear hardening) is characterized by a relativelyhigh constant work hardening rate due to the dislocationinteractions. Stage III corresponds to a decrease in workhardening rate due to the dynamic recovery which is sensi-tive to temperature and strain rate.
The load–displacement dependence during the sheardeformation is measured by a mechanical loading device.The evolution and spatial distribution of the deformationis traced on the surface of the sample using digital imagecorrelation (DIC). This allows the macroscopic propertiesof the deformation to be determined. The microstructureof the sheared material was then characterized using orien-tation microscopy based on the analysis of the electronbackscatter diffraction pattern (EBSD). In addition, a phe-nomenological crystal-plasticity finite-element method (CP-FEM) simulation was conducted, the macroscopic results ofwhich qualitatively agree with the DIC measurement.
In the present experiments we chose the orientation ofcopper single crystals considering the direction of theapplied load such that two slip systems in a single slip planehave highest (and equal) Schmid factors. The DIC analysisof the resulting strain shows a large region of almost homo-
Table 1Schmid and Boas’ fcc slip system nomenclature used in the text. For example
System B2 B4 B5 A3 A2
Slip systems in an fcc crystalffiffiffi2p
s �½0�11� �½10�1� �½�110� ±[101] �½01ffiffiffi3p
m (111) (111) (111) ð�111Þ ð�111
Fig. 1. (a) Schematic drawing of the specimen holder with the specimen usedcrystal sample positioned in the sample holder as shown in (a). (c) Positions of tindividual slip directions are indicated by the arrows. The nomenclature is giv
geneous, affine deformation. The sample in this region is insimple shear, with the shear normal, however, slightlyrotated with respect to the originally chosen slip plane.Therefore, a second set of slip systems must be activatedto accommodate this macroscopic deformation. An analy-sis, assuming infinite cross-hardening (the material is in sin-gle slip at each material point) predicts a laminationmicrostructure—similar to the ones found in shape mem-ory alloys—that corresponds almost exactly to the orienta-tion patterning observed in the EBSD measurement.
2. Experiments
2.1. Sample preparation and shear experiments
The single-crystal samples were cut from copper singlecrystal (99.98%) produced by the melt-grow method. Thespecimens were cut by spark erosion, polished mechanicallyand then electrolytically. The dimensions of the single-crys-tal samples are 3 mm � 2 mm with a height of 10–15 mm.The shear tests were performed on a special miniaturizedtesting device by Kammrath & Weiss GmbH (44141 Dort-mund, Germany), as described in Refs. [16,17]. The com-puterized device features two moveable cross-headsallowing the sample to remain in a stable centered positionduring testing. The load was controlled by the load cell withmaximal load value of 1 kN. The displacement with thedeformation rate 5 lm s�1 was measured by the machineextensometer. The position of the specimen in the sampleholder of the testing device is schematically shown inFig. 1a. The distance between the sample holders, i.e. thelength of the freestanding part of the specimen, is 2.4 mm.
Fig. 1b shows the initial orientation of the undeformedsingle crystal ð10 1Þ½12�1�. The deviation of the crystal lat-tice from the given orientation does not exceed 0.5�. The
, -B4 indicates a shear in the direction of �½10�1� � ½111�. From [8].
A6 C1 C3 C5 D4 D1 D6
�1� �½�1�10� ±[011] �½�10�1� �½1�10� �½�101� �½0�1�1� ±[110]Þ ð�111Þ ð�1�11Þ ð�1�11Þ ð�1�11Þ ð1�11Þ ð1�11Þ ð1�11Þ
for the shear experiments. (b) Crystallographic orientation of the single-he active slip planes according to the given crystallographic orientation; theen in Table 1.
1 For interpretation of color in Figs. 3–6 and 9, the reader is referred tothe web version of this article.
O. Dmitrieva et al. / Acta Materialia 57 (2009) 3439–3449 3441
shear load is applied along the ½12�1� direction shown inFig. 1b. Under these loading conditions, two coplanar slipsystems of the single crystal in the aforementioned crystal-lographic orientation have Schmid factors of magnitudeapproximately equal 0.63 (A2 and A6 in Table 1). Thesetwo slip systems are shown schematically in Fig. 1c; the slipdirections A2 and A6 are indicated by the arrows. The graytriangle corresponds to their common ð�1 11Þ plane and isoriented parallel to the load direction ½12�1�. Since the pri-mary active systems are coplanar (and thus their deforma-tions are compatible), one can consider their sum as asingle system for which the activation direction is the direc-tion of the applied load. Other slip systems with the non-zero Schmid factors are also shown in Fig. 1c in accordancewith the nomenclature in Table 1.
2.2. Digital image correlation method
In order to measure the strain on the surface of the spec-imen in situ, we used the DIC method [18,19]. The DICmethod is based on the recognition of geometrical changesin the grayscale distribution of surface patterns after strain-ing. In order to obtain a stochastic optical pattern, whiteacrylic spray was used for the background and graphitespray for optical decoration. For DIC we used an AramisSystem (version 6.0.0-3) by GOM Inc. equipped with twodigital cameras (CCD-1300, maximal resolution1280 � 1024 pixels) placed behind of the testing device.The recording time for each frame was set to 1 s.
2.3. Structural characterization using high-resolution EBSD
The structural characterization of the surface of thesamples and the orientation microscopy were performedby scanning electron microscopy (SEM) using a JEOLJSM 6500F microscope with a field emission gun operatedat 15 kV. The microscope is equipped with a detector forthe imaging of backscattered electrons (BSE imaging).The EBSD patterns were recorded and evaluated by anEDAX/TSL EBSD System equipped with a Digiview cam-era. In the high-resolution EBSD measurements the expo-sure time for each frame was set to about 0.5 s at thesmallest binning size, and for the calculation of the Houghtransformation a binned pattern size 240 � 240 and anangular spacing control of 0.5� were chosen.
2.4. FEM
The CP-FEM has been applied for the simulation of themetal deformation [20]. A phenomenological crystal-plas-ticity model based on the work of Kalidindi et al. [21]and Asaro [22] was used in this study for the time integra-tion of the constitutive equations. The elastoviscoplasticmodel was implemented in the finite-element code MARCusing the user-defined subroutine HYPELA2. We used athree-dimensional finite-element mesh with 2400 eight-node brick elements for the discretization of the sample.
3. Experimental and FEM results
3.1. Deformation of the single-crystal sample
The single-crystal specimens were deformed in simpleshear. The shear strain of the plastic deformation as mea-sured in the machine extensometer amounts to c = 0.23(technical shear strain). The load–displacement dependencewas recorded during the shear deformation with the stepsize of 5 lm. Fig. 2a (blue1 curve) presents the dependencebetween the applied shear stress s and shear strain c as cal-culated from the load–displacement data for the given sam-ple geometry.
Above s = 15 MPa the deformation of the specimen ispredominantly plastic and the slope (the hardening rateds/dc) of the approximately linear stress–strain dependenceis nearly constant (inset in Fig. 2a). The constant value ofds/dc corresponds to stage II of the plastic deformation(linear hardening). In order to quantify the hardening rateduring plastic deformation, we estimate the shear modulusG from the slope of the unloading branch of the blackcurve to G � 15 GPa. This value is somewhat lower thanthe more exact shear modulus obtained by measuring theultrasonic velocities (depending on the crystal direction,the values of the shear modulus obtained in this way arebetween 20 and 80 GPa [23]), but is of the same order ofmagnitude. We calculate the mean value of the hardeningrate hds/dci = 130 MPa � G/120. This value correlates tohardening rates in stage II (linear hardening) given in theliterature for the deformation of single crystals (G/200)[24,25]. No occurrence of the stage I (easy glide), which ischaracterized by a single glide with a low hardening rateof about G/5000, was observed here.
In the applied DIC approach, digital images of the spec-imen surface decorated with the optical pattern wererecorded during the experiment. Fig. 2b shows the digitalimages of the sample before (upper image) and after thedeformation (lower image). The presented images wereoverlaid with the obtained strain fields and reveal the distri-bution of the shear angles on the specimen surface in accor-dance to the color scale (right-hand side in Fig. 2b).
As seen in Fig. 3, the DIC measurement on the surfaceof the sheared copper single-crystal sample reveals an inho-mogeneous deformation with some concentration of strainnear the clamps. There is also a larger region of fairlyhomogeneous deformation in the central area of thesample.
The values of the shear angles of the homogeneouslydeformed central region were averaged, and in Fig. 2c thetime-resolved change of the mean shear angle is shown.From this curve it follows that the residual plastic deforma-tion amounts to a = 11.6� (c = 0.20). Since the DIC imageswere recorded simultaneously with the load–displacement

Fig. 2. (a) Shear stress s–shear strain c dependence obtained from the load–displacement measurement (blue curve) and using the DIC method (blackcurve), respectively. Inset: the hardening rate ds/dc calculated for the plastic deformation part of the stress–strain curve estimated from DIC. (b) Digitalimages of the sample surface decorated for the DIC method before (upper image) and after the deformation (lower image) overlaid with the obtaineddistribution of the shear angles according to the color scale. (c) Time-resolved change of the shear angle during the deformation experiment estimated bythe DIC method. The value of the shear angle was averaged over the central region of the investigated area as indicated in (b). (For interpretation of thereferences to color in this figure legend, the reader is referred to the web version of this paper.)
Fig. 3. The three- and two-dimensional strain components from DIC measurement: (a) U11, (b) U12, and (c) U22.
3442 O. Dmitrieva et al. / Acta Materialia 57 (2009) 3439–3449
measurement, we obtain the dependence between the shearstress and shear strain estimated using DIC (black curve inFig. 2b). This curve gives the effective deformation behav-ior of the sample after excluding the contributions of thesample holder or test device.
The DIC strain measurement also reveals the distribu-tion of macroscopic strain and of the deformation gradienton the surface of the deformed crystal. In order to analyzethe deformation in more detail, we compare the observeddeformation gradient F to a simple shear situation G(c,u)with only two parameters: the magnitude c and the orien-tation of the shear normal with respect to the vertical(expressed by the angle u). The comparison is done by min-imizing an energy E(F,G) that measures the differencebetween a given strain G and the observed deformationgradient F. The energy used is akin to a frame indifferentelastic energy assuming that F = FelG, i.e. the deformationnot covered by G has to be accommodated by an elasticdeformation Fel. We choose:
EðF ;GÞ ¼ffiffiffiffiffiffiffiffiffiffiffiffiffiffiffiffiffiffiffiffiffiffiffiffiffiffiffiffiffiffiðFG�1ÞT ðFG�1Þ
q� Id
��������
2
: ð1Þ
Here, the double bars in Ak k2 ¼P
i;jA2ij denote the Hilbert–
Schmidt norm of a matrix A. This Hilbert–Schmidt norm ofa symmetric strain tensor is equivalent to linear elastic energy.The square root T ¼
ffiffiffiAp
of a positive semidefinite matrix isthe unique positive semidefinite matrix such that T2 = A.
As one can see in Fig. 4, the strain in the homogeneousregion is very well approximated by a simple shear G with anormal slightly rotated—about 4–5�—clockwise from thevertical, since E(F,G) is very small compared to E(F, Id).Averaging the deformation gradient in the homogeneousregion (rows 4–12 and columns 3–19 of the nodes in theDIC figures, counting from the top-left) yields:
EðF avg;GÞ ¼ 6:1� 10�6 with
G ¼ 0:1991
�0:0156
� �� 0:0779
0:9970
� �þ Id: ð2Þ

Fig. 4. (a) Magnitude c of simple shear for the final deformation at t = 136 s. (b) Angle u of the shear normal, clockwise with respect to x2 direction for thefinal deformation at t = 136 s. (c) Logarithm of the measure of difference between the strain F and a simple shear G, ln (E(F,G)) for the final deformation att = 136 s. (d) Angle u of the shear normal at t = 30 s.
O. Dmitrieva et al. / Acta Materialia 57 (2009) 3439–3449 3443
One can see that G corresponds to a simple shear of mag-nitude c = 0.1997, and normal n rotated clockwise byu = 4.47� from the vertical.2
To assess the overall deformation of the sample, theaverage deformation gradient over the whole sample asmeasured by DIC was calculated. Unfortunately, theDIC-matching software does not always recognize enoughpoints in the deformed sample, especially in highly strainedregions. Because of this, assuming symmetry, only the tophalf of the sample—up to measurement row 9—could beused. This calculation reveals that the averaged total defor-mation Ftot corresponds almost exactly to the intendedboundary condition of a simple shear with vertical normal,so that:
EðF tot;GÞ ¼ 1:5� 10�4 with G ¼1 0:21
0 1
� �: ð3Þ
Given the imperfect pattern matching in DIC, which didnot allow the particularly highly strained regions near theclamps to be considered, this shear of magnitude c � 0.21is in agreement with the value given by the machine exten-someter. Fig. 4d also shows that for an early stage of thedeformation, at t = 30 s, the bulk part of the samplealready shows a variation in the shear normal away fromthe glide plane of the primary slip system. This explainswhy we experience stage II plasticity starting early in thedeformation process, since more than one glide plane hasto be active to accommodate this deformation.
2 The shear parameters were obtained using a gradient-flow method tofind the minimizers of E(F, �). This method was implemented in MATLAB.
3.2. Structural characterization of the deformed sample
3.2.1. BSE overview imaging
Fig. 5a shows the BSE micrograph of the single crystalafter shear deformation. The direction of the applied shearload is indicated by white arrows. From the geometry ofthe deformed sample one can estimate that the freestandingside plane of the crystal is tilted after the shear deformationto about 12� as marked with the green lines. The blue lineson the right-hand side again mark the position of the sideface and its normal direction. In this micrograph, the for-mation of glide bands can be observed in the deformed partof the crystal. In the inset of Fig. 5a we present a BSEmicrograph of higher resolution which provides moredetails and a higher BSE contrast. The direction of thebands is then indicated by the red line. The angle betweenthe observed bands and the side plane of the deformed partamounts to about 12�. Taking into account that the tilt ofthe side plane was also 12�, it can be concluded that themicrobands of the deformed single crystal are oriented par-allel to the initial position of the crystallographic plane ofthe primary slip, i.e. are aligned along the direction ofthe applied shear load. The areas with the observed glidebands were characterized using EBSD analysis.
3.2.2. EBSD characterization
Fig. 5b shows an EBSD map of the deformed part of thecrystal. The measurement was done with a scanning stepsize of 5 lm. The EBSD map shows the relative variationsof the orientation of the crystal lattice within 3� accordingto the color scale. The reference orientation relates to theblue areas. The formation of the microbands with a differ-ent orientation (red) compared to the material in between

Fig. 5. (a) BSE overview micrograph of the copper single crystal after shear deformation. The direction of the applied load is shown by the white arrows.The position of the side plane and its normal are drawn in blue. Inset: BSE micrograph of higher resolution placed adjusted to the scale. The angle betweenthe microbands and the side plane of the deformed crystal amounts to 12�. (b) EBSD map of the area in the deformed part of the specimen which showsthe relative crystallographic orientation changes within 3� according to the color scale. The plane traces of the slip planes are presented as black lines andlabeled according to the nomenclature given in Table 1. The direction of the microbands which are tilted to 7� with respect to the primary slip plane A isshown by the red line. (For interpretation of the references to color in this figure legend, the reader is referred to the web version of this paper.)
3444 O. Dmitrieva et al. / Acta Materialia 57 (2009) 3439–3449
(green/blue) can be observed from this map. Using theevaluation software from TSL, the plane traces of the{11 1} slip planes are displayed according to the averagedlattice orientation of the investigated area as shown inFig. 5b. As shown previously in Fig. 1c, the common slipplane of the primary active slip systems is initially orientedparallel to the shear load (along h112i). This plane trace isdrawn in Fig. 5b by the thick black line and marked as A.When comparing the direction of this {111} plane with thedirection of the microbands (displayed as a red line), adeviation of about 7 degrees can be determined. Thus,the direction of the microbands is not crystallographic.Furthermore, since the development of the microbandsoccurs along the direction of the applied load and parallelto the initial position of the primary slip plane, a macro-scopic tilt of the crystal lattice out of the initial state toabout 7� can be determined in the final state of thedeformation.
Fig. 6a shows an EBSD map of part of the deformedarea containing some microbands. The measurement wasdone using a scanning step size of 2 lm. From this micro-graph, a further feature of the bands can be observed,namely the additional patterning inside the ‘‘red” micro-bands which are subdivided into parts by orthogonal inter-sections (ladder-like substructure).
3.2.3. High-resolution EBSD
Fig. 6b shows the high-resolution EBSD measurementof the area that includes the microband and the surround-ing material. The step size of the scanning measurement
was 0.1 lm. The EBSD map presents the orientation distri-bution relative to a reference point (initial orientation)according to the color scale within 3�. The red zones inFig. 6b show the area on the edge of the microband. Thegreen/blue areas correspond to the material outside ofthe microband. The orientation difference indicates thatthe crystal lattice inside of the band is titled 3� relative tothe material outside of the band.
In order to understand in which way the materialrotates, we used an alternative representation of the EBSDresults (Fig. 6c). In Fig. 6c the variation in the crystal ori-entation out of the normal direction is displayed in thesame orientation deviation range as in Fig. 6b. Fig. 6creveals no significant rotation of the lattice out of the frontface. This observation shows that the lattice rotation ofapproximately 3� occurs within the plane. In Fig. 6b thepositions of the plane traces for measurement points insideand outside of the band are displayed. As schematicallyshown on the right-hand side in Fig. 6b, the rotation ofthe lattice inside of the band occurs counterclockwise com-pared to the outside region.
3.2.4. BSE imaging of the microbands
The microstructure of the deformed single crystal wasinvestigated using BSE imaging. The BSE image in Fig. 7presents an area of the deformed part of the crystal whichcontains a single microband. The position of the micro-band is indicated by braces.
We discuss what information can be extracted from theBSE contrasts observed for the deformed specimen (Fig. 7).

Fig. 6. (a) EBSD map of the part of the deformed area with several microbands. The map shows the relative crystallographic orientation changes within 3�according to the color scale. The plane traces of the slip planes are presented in the right corner. (b) High-resolution EBSD map on the edge of amicroband (lower part). The colors indicate the distribution of the crystal orientation relative to the reference point (initial orientation) within 3�. Theplane traces of the slip planes are presented for the areas inside (red) and outside (green/blue) of the microband. A graphical illustration of the observedlocal lattice rotation is presented on the right-hand side. (c) High-resolution EBSD map on the same area shows variation in the crystal orientation out ofthe normal direction according to the color scale. (For interpretation of the references to color in this figure legend, the reader is referred to the web versionof this paper.)
Fig. 7. SEM micrograph produced by the BSE imaging, showing a singlemicroband (marked with braces). The positions of the slip-plane traces incomparison to the direction of the microband (red line) are shown withwhite lines. (For interpretation of the references to color in this figurelegend, the reader is referred to the web version of this paper.)
O. Dmitrieva et al. / Acta Materialia 57 (2009) 3439–3449 3445
The electrolytic polishing applied additionally after thedeformation leads to a negligible topographic roughnessof the crystal surface. Therefore, the topographic contrastand also the material contrast can be neglected here. Onecan assume that the structures observed in the BSE imagescorrespond to pure electron channeling contrast. The elec-tron channeling contrast arises due to the dependence ofthe intensity of the backscattered electrons on the fulfill-ment of the Bragg condition, i.e. the intensity depends onthe tilt angle of the lattice with respect to the incident
beam. For a small local tilt of the lattice, the contrast isinduced predominantly by the superposition of strain fieldsfrom dislocations in the body [26,27]. As already shown, nosignificant tilt of the lattice with respect to the incidentbeam (i.e. no tilt out of the plane of the investigated sur-face), either in the microband and in the surrounding mate-rial, is observed. Therefore, we assume that the observedcontrast in the BSE images arises predominantly fromstrain fields of trapped dislocations in the deformed singlecrystal. Inside the microband in Fig. 7, bright lines alignedwith the trace of the slip plane A can be observed. Thus,some strain fields produced by the lattice distortion dueto the storage of dislocations can be assumed along the slipplane A. This could be associated with the trapping of themobile dislocation inside of the slip plane due to interac-tions between the dislocations of the slip systems A2 andA6 inside the slip plane A or due to the intersection of thismobile dislocations with some forest dislocations. Theenhanced mobility of the dislocations in the slip plane Asuggests activation of the corresponding slip systems A2and A6 inside the microbands.
3.3. Crystal plasticity finite-element simulation of the shear
experiment
The deformation found in the crystal-plasticity simula-tion described in Section 2.4 qualitatively agrees with theDIC measurement. We see a large inhomogeneous defor-mation near the fixed boundary on the top and the bottomof the sample. In particular, the deformation is high nearthe corners. There is also a large, homogeneously deformedregion in the center of the sample.
In this central region, the deformation amounts to asimple shear, with a shearing normal rotated slightly clock-wise with respect to the [111] crystal axis of the sample.

3446 O. Dmitrieva et al. / Acta Materialia 57 (2009) 3439–3449
The rotation is only approximately 1�, as opposed to the4.5� rotation found in the DIC measurement. Nevertheless,qualitatively, this would result in the same kind of micro-structure as calculated in the following section.
4. Energy minimizing microstructure
In the following we introduce the theoretical frameworkthat we use to analyze the experimentally observed disloca-tion microstructure described above. We rely on a contin-uum finite plasticity model, assuming strong cross-hardening, as described by Ortiz and Repetto [8].
4.1. Loss of convexity and formation of microstructure
Consider, using the framework of continuum mechan-ics, a body in a reference configuration X R3 and asmooth enough deformation y : X! R3, as illustrated inFig. 8. The deformation gradient is denoted by $y = F.To illustrate the key ideas we now consider the extremecase of an ideally plastic, elastically rigid solid with infinitecross-hardening. This corresponds to an energy functionalfor the crystal of the form:
EðF Þ ¼0 if QF ¼ csi � mi þ Id
for i 2 f1; . . . ; 12g and Q 2 SOð3Þ1 otherwise:
8><>: ð4Þ
In other words, the energy density is zero, as long as onecan find a slip system si � mi accommodating the deforma-tion gradient up to a rigid rotation Q. In between these raysof single-slip deformation the energy is large (in fact, it isinfinite), which renders the function non-convex. As we willsee in the next section, this leads to the phenomenon thatthrough the formation of a fine structure, e.g. by alternat-ing layers of material, respectively, deformed in differentsingle slips, one can accommodate, in an average sense, alarger variety of deformation gradients besides the obviousmacroscopic single slip. The important restriction, how-ever, is that the whole deformation has to be kinematicallycompatible, i.e. F has to be the gradient of a continuousfunction.
Fig. 8. Reference and deformed configuration. A piecewise affine defor-mation is sketched, where $y(x) equals one constant tensor for x 2 X1 Xand a different constant tensor for x 2 X2 X.
4.2. Piecewise affine deformations
A frequently observed type of kinematically compatiblemicrostructure consists of so-called rank-one laminates.Assume that the deformation is piecewise affine and thatthere are only two affine components, i.e. $y = F1 inX1 X and $y = F2 in X2 = XnX1, F1 and F2 constant(as illustrated in Fig. 8). This means that the deformationgradient is a certain constant F1 in a subset of the referenceconfiguration denoted by X1, and a different constant F2 inthe rest of the body denoted by X2 = XnX1 (X without X1).
Under this condition, the requirement of kinematiccompatibility is equivalent to the existence of an invariantplane, i.e. a plane that is stretched equally by both F1 andF2. The two differently deformed material domains canthen be ‘‘glued together” on this invariant plane, as illus-trated in Fig. 8. This relationship can be expressed byrequiring that:
QF 1 � F 2 ¼ b� n; ð5Þ
where Q is a rotation matrix, n is a normal vector and b is avector. This is also known as the Hadamard jump condi-tion. The two deformation gradients are then compatiblealong an invariant plane with normal n. One can show that,in general, this equation either has no solution or it has twosolutions [28].
This structure is very important in the theory of the mar-tensitic phase transformation, where Eq. (5) is known asthe twinning equation. For more information, see Ref.[29]. We will use the twinning equation to connect tworegions with activity in different slip systems to form anenergy-minimizing microstructure, assuming strong cross-hardening.
4.3. A lamination microstructure accommodating the
measured macroscopic boundary values
We consider the orientation of the sample during theshear experiment as illustrated in Fig. 1. It is clear that acompletely homogeneous shear of this type can be accom-modated by an activity in the A2 and A6 slip systems, sincec � ½12�1� � ½�111� ¼ c � ð½01�1� � ½�111� � ½�1�10� � ½�111�Þ. Theseslip systems are naturally compatible along the ½�111� direc-tion. Due to the free boundary conditions, there is thereforea variety of possibilities to construct this deformation as akinematically compatible plastic deformation.
The DIC measurement, however, reveals that the actualdeformation differs somewhat from this simplified assump-tion. Instead, there is a large, fairly homogeneous region(taken as above in Section 3.1) with average strain:
U ¼0:9555 �0:0198 0:0445
1:1036 0:0198
0:9555
0B@
1CA ð6Þ
in the final deformation state. In calculating this averagestrain by changing the basis from the one in the DIC mea-

O. Dmitrieva et al. / Acta Materialia 57 (2009) 3439–3449 3447
surement to the crystal directions, we assume that thedeformation normal to the crystal surface is the identity.
A MATLAB program was employed to find a deforma-tion, satisfying Eq. (5), with the two deformation gradientsbeing simple shear in fcc slip systems, which—on average—yields the macroscopic strain, Eq. (6), from the measure-ment. The program uses a gradient flow method for themagnitudes of slip in the involved slip systems with respectto the energy
E ¼ffiffiffiffiffiffiffiffiffiffiffiffiffiffiffiffiffiffiffiffiffiffiffiffiffiffiffiffiffiffiffiffiffiffiffiðUP�1ÞT � ðUP�1Þ
q� Id
��������
2
; ð7Þ
where P = (1 � k)Q(c1P1 + Id) + k(c2P2 + Id). Here, k isthe volume fraction of one part of the laminate, P1 andP2 are the two displacement gradients occurring in the lam-inate, and Q is the lattice rotation from the twinning Eq.(5) under which they are compatible. Eq. (7) is thereforea relaxation of the energy in Eq. (4) that allows for a smallelastic deformation.
The major plastic deformation component is an equal(opposite sign) activity in the aforementioned A2 and A6slip systems, which are naturally kinematically compatibleamong each other without a rotation Q. One can thereforeconsider this slip as one part of the laminate.
For the secondary component of plastic deformation,there are of course several different choices that would becompatible with this deformation. Two of those choicesare particularly natural, since they are compatible regard-less of the magnitude of slip: (i) an equal mixture of C1and C5 (opposite sign); and (ii) an equal mixture of B4and D4 (same sign). Geometrically, the three slip systemcombinations A2 � A6, C1 � C5 and B4 + D4 (nomen-clature from Table 1) form a closed loop on the tetrahe-dron in Fig. 1c.
One also has the choice as to which volume fraction isattributed to which slip. Using the histogram of the distri-bution of lattice rotations on the whole homogeneouslydeformed part of the face of the crystal, it can be deter-mined that the ‘‘green” parts of Fig. 5 occupy approxi-mately two-thirds of the total area in the picture. Thisarea can now either be the primary component in the plas-tic deformation or the secondary component.
The results of the MATLAB gradient-flow program aredisplayed in Table 2. It can be clearly seen that the
Table 2Results for matching the strain U from Eq. (6) with a lamination of slip systemvalues ci signify the magnitude and direction of slip in the i slip-component, a isand the lamination normal, measured clockwise. The value b is the angle of laremaining energy from the gradient flow. All rotations are exactly in the [101] pthe A2 slip system with positive sign from Table 1 and the A6 system with nenormal closer to the ½�111�-direction was picked, since the other solution woul
Choice of slip systems k cP1
P2 = B4 + D4 2/3 0.35? P2 = B4 + D4 1/3 0.18? P2 = C1 � C5 2/3 0.28
P2 = C1 � C5 1/3 0.14
A2 � A6 and C1 � C5 combination as well as theA2 � A6 and B4 + D4 combination yield laminationparameters almost exactly as observed in the experiment(marked by an arrow in Table 2), with the large volumefraction attributed to secondary and primary slip, respec-tively. The resulting deformations are illustrated in Fig. 9.
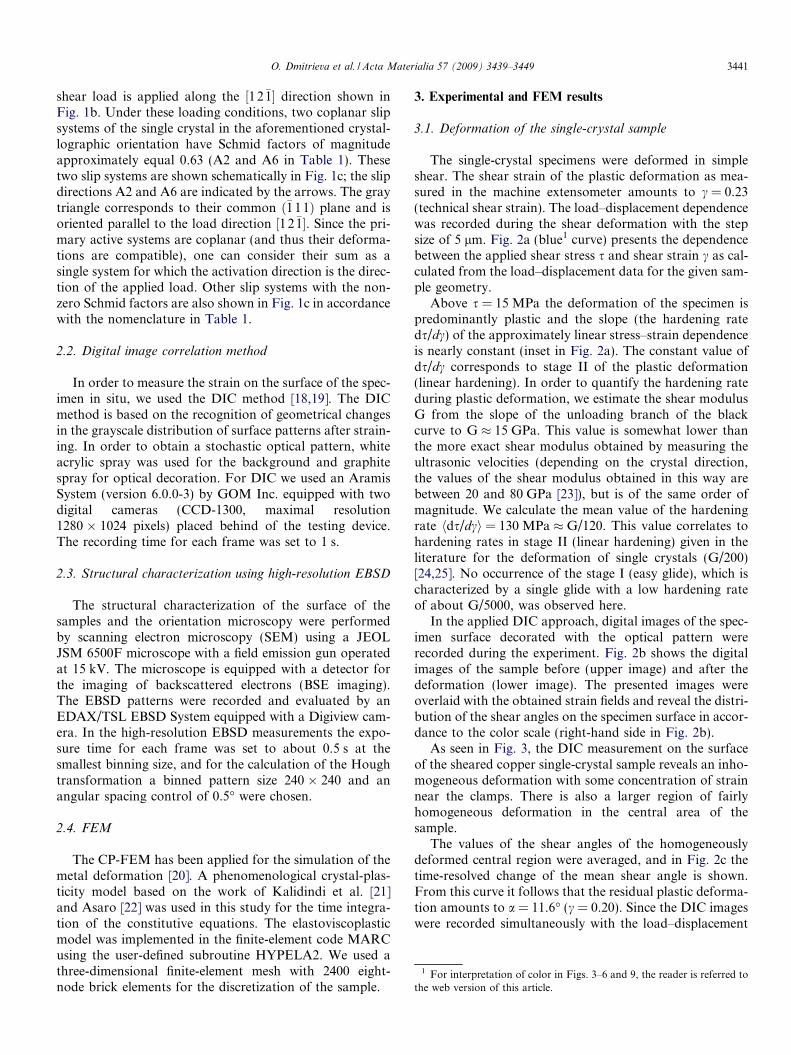
This means, firstly, that the calculated lamination direc-tion is rotated approximately 7� counterclockwise withrespect to the ½�111� direction in the region with larger vol-ume fraction. Secondly, the lattice in the area of smallervolume fraction (red regions in Figs. 5c and 6a) is rotatedcounterclockwise by approximately 3� in comparison to theneighboring area.
The BSE imaging discussed in Section 3.2.4 leads to theassumption that inside of the ‘‘red” microbands the shearactivity of A2 and A6 slip systems dominates. This wouldimply the choice of the combination A2 � A6 for primaryslip inside the microbands and C1 � C5 as the secondaryactive slip in the areas outside the microbands.
It should also be noted that the assumption of infinitecross-hardening leads to slightly larger values for boththe lamination angle and the lattice rotation in the calcula-tion. The difference between the measurement and the cal-culation could therefore be explained by a small amount ofmixing of the two slip systems.
Furthermore, the appearance of the substructure in themicrobands which is observed in the orientation map inFig. 6a can be attributed to the presence of a small amountof different slip systems activated inside the microbands.Their interaction can lead to the observed inhomogeneitiesin the slip distribution.
Of course, it is important that this microstructure isaccessible though the dynamic process of the shear experi-ment, i.e. that there is a continuous path from an unde-formed body to the final microstructure. For this, it isnecessary that the lamination angle (denoted a in Table2) does not change significantly during the deformation.Because the DIC data is available for the intermediatetime-steps during the deformation, this angle can be calcu-lated for the whole process of the deformation using Eq. (5)in the same way as it was done for Table 2. Fig. 10 showsthe evolution of this angle a. It can be seen that, after aninitial phase, where the deformation is in any case verysmall, a is nearly constant. The calculation of this angle
s. The value k is the volume fraction of the area deformed in slip P2. Thethe angle between the ½�111�-direction in the area of larger volume fraction
ttice rotation (clockwise) of the region of smaller volume fraction. E is thelane. In all cases, P1 = A2 � A6 (this denotes an equally large activity ofgative sign). Also, of the two solutions of Eq. (5), the one with twinningd give an entirely different picture.
cP2 a b E
0.042 �0.19� �1.9� 5.0 � 10�6
0.082 �7.5� 3.8� 5.0 � 10�6
�0.040 �6.3� 3.3� 5.0 � 10�6
�0.074 �14.3� �5.6� 5.0 � 10�6
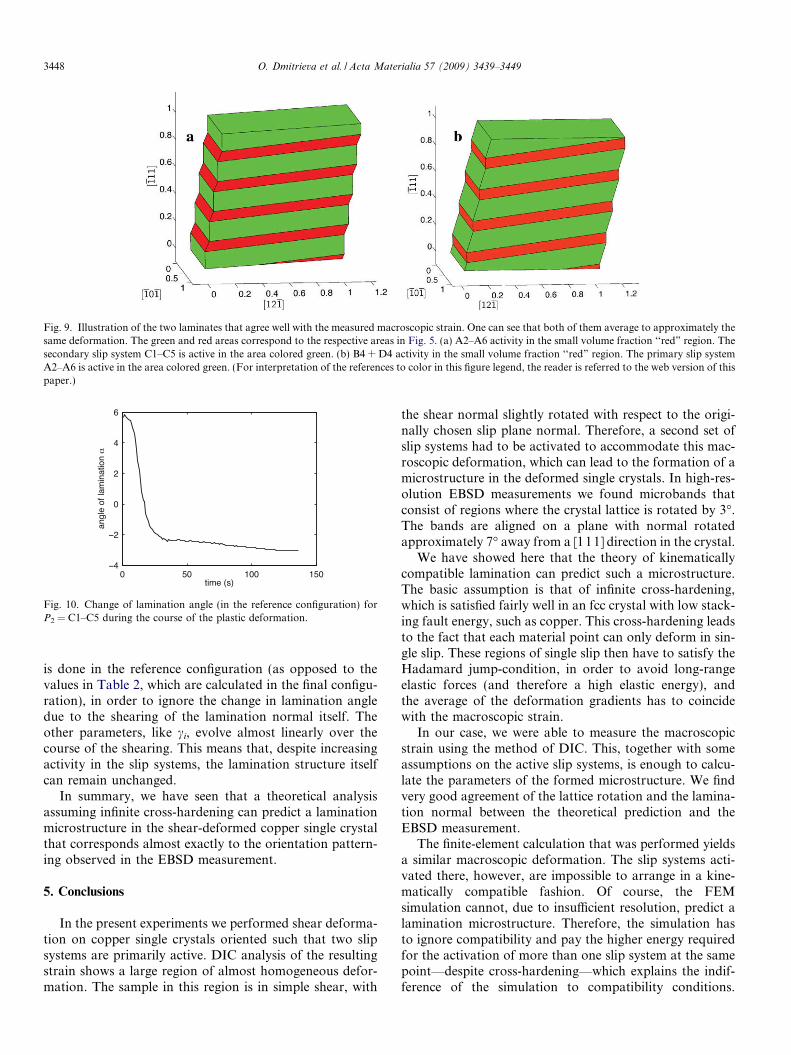
Fig. 9. Illustration of the two laminates that agree well with the measured macroscopic strain. One can see that both of them average to approximately thesame deformation. The green and red areas correspond to the respective areas in Fig. 5. (a) A2–A6 activity in the small volume fraction ‘‘red” region. Thesecondary slip system C1–C5 is active in the area colored green. (b) B4 + D4 activity in the small volume fraction ‘‘red” region. The primary slip systemA2–A6 is active in the area colored green. (For interpretation of the references to color in this figure legend, the reader is referred to the web version of thispaper.)
Fig. 10. Change of lamination angle (in the reference configuration) forP2 = C1–C5 during the course of the plastic deformation.
3448 O. Dmitrieva et al. / Acta Materialia 57 (2009) 3439–3449
is done in the reference configuration (as opposed to thevalues in Table 2, which are calculated in the final configu-ration), in order to ignore the change in lamination angledue to the shearing of the lamination normal itself. Theother parameters, like ci, evolve almost linearly over thecourse of the shearing. This means that, despite increasingactivity in the slip systems, the lamination structure itselfcan remain unchanged.
In summary, we have seen that a theoretical analysisassuming infinite cross-hardening can predict a laminationmicrostructure in the shear-deformed copper single crystalthat corresponds almost exactly to the orientation pattern-ing observed in the EBSD measurement.
5. Conclusions
In the present experiments we performed shear deforma-tion on copper single crystals oriented such that two slipsystems are primarily active. DIC analysis of the resultingstrain shows a large region of almost homogeneous defor-mation. The sample in this region is in simple shear, with
the shear normal slightly rotated with respect to the origi-nally chosen slip plane normal. Therefore, a second set ofslip systems had to be activated to accommodate this mac-roscopic deformation, which can lead to the formation of amicrostructure in the deformed single crystals. In high-res-olution EBSD measurements we found microbands thatconsist of regions where the crystal lattice is rotated by 3�.The bands are aligned on a plane with normal rotatedapproximately 7� away from a [111] direction in the crystal.
We have showed here that the theory of kinematicallycompatible lamination can predict such a microstructure.The basic assumption is that of infinite cross-hardening,which is satisfied fairly well in an fcc crystal with low stack-ing fault energy, such as copper. This cross-hardening leadsto the fact that each material point can only deform in sin-gle slip. These regions of single slip then have to satisfy theHadamard jump-condition, in order to avoid long-rangeelastic forces (and therefore a high elastic energy), andthe average of the deformation gradients has to coincidewith the macroscopic strain.
In our case, we were able to measure the macroscopicstrain using the method of DIC. This, together with someassumptions on the active slip systems, is enough to calcu-late the parameters of the formed microstructure. We findvery good agreement of the lattice rotation and the lamina-tion normal between the theoretical prediction and theEBSD measurement.
The finite-element calculation that was performed yieldsa similar macroscopic deformation. The slip systems acti-vated there, however, are impossible to arrange in a kine-matically compatible fashion. Of course, the FEMsimulation cannot, due to insufficient resolution, predict alamination microstructure. Therefore, the simulation hasto ignore compatibility and pay the higher energy requiredfor the activation of more than one slip system at the samepoint—despite cross-hardening—which explains the indif-ference of the simulation to compatibility conditions.

O. Dmitrieva et al. / Acta Materialia 57 (2009) 3439–3449 3449
Including certain kinds of lamination could be a way toimprove FEM simulations of crystal plasticity.
We conclude that in this experiment, a lamination-typemicrostructure was observed. The question whether sucha microstructure can be found under general loading con-ditions in finite plasticity is an open mathematical problem.For linearized crystal plasticity, this problem has beensolved with a positive answer [30]. A further open questionis that regarding the dynamics of such deformation, i.e.whether or not a certain microstructure can be formedgiven the whole time-dependent process of deformation.We assume that the lamination normal cannot change sig-nificantly over time, since this would automatically contra-dict the assumption of strong cross-hardening. The generalproblem of the dynamics of pattern formation in single-crystal plasticity is currently being investigated.
Acknowledgements
We are grateful to Dr. E. Hieckmann from TechnischeUniversitat Dresden for the helpful discussions concerningBSE analysis and to Dr. F. Roters from Max-Planck-Insti-tute for Iron Research for help with the FEM simulations.This work was supported by Deutsche Forschungsgemeins-chaft (DFG Forschergruppe 797) and by the Triple M pro-ject of the Max Planck Society. Most of this work wascarried out while SM and PWD were at the Max-Planck-Institute for Mathematics in the Sciences in Leipzig,Germany.
References
[1] Wu TY, Bassani JL, Laird C. Proc Roy Soc London, Ser A (MathPhys Sci) 1991;435:1.
[2] Kocks UF. Trans Metall Soc AIME 1964;230:1160.[3] Franciosi P, Zaoui A. Acta Metall 1982;30:1627.[4] Barrett CS, Levenson LH. Trans Am Ins Mining Metall Eng
1940;137:112.
[5] Dillamore IL, Katoh H. Metal Sci 1974;8:73.[6] Beaudoin AJ, Mecking H, Kocks UF. Philos Mag A – Phys Cond
Matter Struct Defects Mech Prop 1996;73:1503.[7] Han JH, Kim DK, Jee KK, Oh KH. 13th International conference on
strength of materials (ICSMA 13), Budapest, 2003. Mater Sci Eng A –Struct Mater Prop Microstruct Process 2004;387:60.
[8] Ortiz M, Repetto EA. J Mech Phys Solids 1999;47:397.[9] Rasmussen K, Pedersen O. Acta Metall 1980;28:1467.
[10] Jin N, Winter T. Acta Metall 1984;32:989.[11] Bay B, Hansen N, Hughes DA, Kuhlmann-Wilsdorf D. Acta Metall
Mater 1992;40:205.[12] Horstemeyer MF, Baskes MI, Plimpton SJ. Acta Mater 2001;49:
4363.[13] Tugcu P, Wu PD, Neale KW. Int J Plasticity 2002;18:PII S0749.[14] Seeger A. In: Fisher J, editor. Dislocations and mechanical properties
of crystals. New York: John Wiley; 1957. p. 243–329.[15] Diehl J. Z Metall 1956;47:331.[16] Sachs C, Fabritius H, Raabe D. J Struct Biol 2006;155:409.[17] Sachs C, Fabritius H, Raabe D. J Struct Biol 2008;161:120.[18] Raabe D, Sachtleber M, Zhao Z, Roters F, Zaefferer S. Acta Mater
2001;49:3433.[19] Sachtleber M, Zhao Z, Raabe D. Mater Sci Eng A – Struct Mater
Prop Microstruct Proces 2002;336:PII S0921.[20] Roters F. 13th International workshop on computational mechanics
of materials September 22–23, University of Magdeburg, 2003.Comput Mater Sci 2005;32:509.
[21] Kalidindi SR, Bronkhorst CA, Anand L. J Mech Phys Solids1992;40:537.
[22] Asaro RJ. Adv Appl Mech 1983;23:1.[23] Overton WC, Gaffney J. Phys Rev 1955;98:969.[24] Rollett AD, Kocks UF. Disclocations ’93. Microstructures and
physical properties, aussois. Diffus Defect Data Part B (Solid StatePhenomena) 1994;35–36:1.
[25] Nabarro FRN, Holt DB, Basinski ZS. Adv Phys 1964;13:193.[26] Crimp MA. Microsc Res Tech 2006;69:374.[27] Wilkinson AJ, Anstis GR, Czernuszka JT, Long NJ, Hirsch PB.
Philoso Mag A – Phys Con Matter Struct Defect Mech Prop1993;68:59.
[28] Ball JM, James RD. Arch Rat Mech Anal 1987;100:13.[29] Bhattacharya K. Microstructure of martensite: why it forms and how
it gives rise to the shape-memory effect. Oxford: Oxford UniversityPress; 2003.
[30] Conti S, Ortiz M. Arch Rat Mech Anal 2005;176:103.