
Optimising The Lamination Properties Of Textile Composites
181
Optimising The Lamination Properties Of Textile Composites A thesis submitted to The University of Manchester For the degree of Doctor of Philosophy in the Faculty of Engineering and Physical Sciences By Ali Hasan Mahmood Textiles Science & Technology School of Materials The University of Manchester 2011
-
Upload
khangminh22 -
Category
Documents
-
view
7 -
download
0
Transcript of Optimising The Lamination Properties Of Textile Composites

Optimising The Lamination Properties Of Textile Composites
A thesis submitted to
The University of Manchester
For the degree of Doctor of Philosophy
in the Faculty of
Engineering and Physical Sciences
By
Ali Hasan Mahmood
Textiles Science & Technology
School of Materials The University of Manchester
2011

2
Table of Contents Table of Contents .............................................................................................................. 2
Table of Figures ................................................................................................................ 5
List of Tables ..................................................................................................................... 8
List of Equations ............................................................................................................... 8
Abstract ............................................................................................................................. 9
Declaration .......................................................................................................................10
Copyright Statement ........................................................................................................11
Acknowledgements ...........................................................................................................13
CHAPTER 1 INTRODUCTION ....................................................................................14
1.1. RESEARCH BACKGROUND ..................................................................................14 1.2. PROJECT AIM AND OBJECTIVES ..........................................................................15 1.3. BRIEF CONTENT OF REMAINING CHAPTERS .........................................................16
CHAPTER 2 LITERATURE REVIEW .........................................................................17
2.1. INTRODUCTION ..................................................................................................17 2.2. COMPOSITES ......................................................................................................17
2.2.1. Matrix ...........................................................................................................17 2.2.1.1. Thermoplastic resins .............................................................................18 2.2.1.2. Thermoset resins ...................................................................................18
2.2.2. Reinforcement fibres .....................................................................................19 2.2.2.1. Glass fibre ............................................................................................19
2.3. FIBRE REINFORCED COMPOSITES ........................................................................22 2.4. MANUFACTURING OF COMPOSITES ....................................................................22 2.5. COMPOSITE FAILURE .........................................................................................24
2.5.1. Delamination .................................................................................................25 2.5.2. Importance of filling yarn ..............................................................................26 2.5.3. Effect of thickness and number of laminated layers .......................................28 2.5.4. Effect of thermal conditioning on glass composite failure ..............................29 2.5.5. Effect of hygro-thermal exposure on glass composites ...................................29 2.5.6. Effect of water absorption .............................................................................30
2.6. THROUGH-THE-THICKNESS REINFORCEMENT .....................................................30 2.6.1. Through-the-thickness stitching .....................................................................31 2.6.2. Z-Fibre Pinning .............................................................................................33
2.7. YARN TEXTURING FOR INCREASING THE BONDING STRENGTH ............................35 2.7.1. Air-jet texturing ............................................................................................36
2.7.1.1. Types of operations in air-jet texturing process......................................37 2.7.1.2. Texturing nozzles..................................................................................38
2.7.2. Key considerations for the air-jet texturing process ........................................46 2.7.2.1. Wetting of the yarn before entering the jet .............................................46 2.7.2.2. Primary flow length ..............................................................................47 2.7.2.3. Filament fineness ..................................................................................48 2.7.2.4. Reduction in strength of textured yarn ...................................................48 2.7.2.5. Overfeeding ..........................................................................................48 2.7.2.6. Filament cross-section...........................................................................49
2.8. COMMINGLING PROCESS ....................................................................................49 2.8.1. Jet design for the commingling process .........................................................50 2.8.2. Commingled yarns for composites .................................................................51 2.8.3. Glass filament commingling process .............................................................52

3
2.9. SELECTION CRITERIA FOR THE AIR-JET TEXTURING PROCESS ..............................53 2.10. SUMMARY .........................................................................................................54
CHAPTER 3 GLASS YARN TEXTURING, WEAVING AND COMPOSITE MANUFACTURING PROCESS .....................................................................................56
3.1. INTRODUCTION ..................................................................................................56 3.2. AIR-JET TEXTURING MACHINE ...........................................................................56
3.2.1. Texturing machine components .....................................................................56 3.2.2. Feeder yarn creel ...........................................................................................56 3.2.3. Rollers arrangement ......................................................................................57 3.2.4. The jet box ....................................................................................................58 3.2.5. Oil application device ....................................................................................59 3.2.6. Winding unit .................................................................................................59 3.2.7. Suction gun ...................................................................................................60 3.2.8. Gearing arrangement .....................................................................................61 3.2.9. Texturing machine set up for glass yarn .........................................................62 3.2.10. Alteration in the drawing zone...................................................................62 3.2.11. Alteration in the winding zone...................................................................63 3.2.12. Type of jet used ........................................................................................63 3.2.13. Selection of the overfeed value ..................................................................64 3.2.14. Selection of the air pressure value .............................................................65
3.3. WARPING PROCESS ............................................................................................67 3.4. GLASS FABRIC PRODUCTION ..............................................................................68
3.4.1. Problems during weaving process ..................................................................71 3.5. COMPOSITE MANUFACTURING ...........................................................................73
3.5.1. Vacuum bagging technique ...........................................................................73
CHAPTER 4 CHARACTERISATION, EQUIPMENT AND PROCEDURES ............77
4.1. INTRODUCTION ..................................................................................................77 4.2. BREAKING STRENGTH (TENACITY) TESTING OF GLASS YARNS ............................77 4.3. DENSITY, FIBRE VOLUME FRACTION AND VOID CONTENT .................................78 4.4. TENSILE TESTING ...............................................................................................80 4.5. FLEXURE TESTING (THREE POINT BENDING) .......................................................82 4.6. INTER-LAMINAR SHEAR STRENGTH (ILSS) .........................................................85 4.7. INTER-LAMINAR FRACTURE TOUGHNESS ............................................................86
4.7.1. Mode I Inter-laminar fracture toughness ........................................................87 4.8. SCANNING ELECTRON MICROSCOPE (SEM) ........................................................90
CHAPTER 5 EFFECT OF THE TEXTURING PROCESS ON GLASS YARN TENACITY ......................................................................................................................92
5.1. INTRODUCTION ..................................................................................................92 5.2. TENACITY OF THE FEED YARNS ..........................................................................92 5.3. TENACITY OF THE 300 TEX CATEGORY ...............................................................93 5.4. TENACITY OF THE 600 TEX CATEGORY ...............................................................97 5.5. TENACITY OF COMBINED CORE-AND-EFFECT FEED YARNS ................................ 100 5.6. BROKEN FILAMENTS AND LOSS IN LINEAR DENSITY ......................................... 101 5.7. SUMMARY ....................................................................................................... 103
CHAPTER 6 COMPOSITES MADE WITH TEXTURED YARNS: MECHANICAL TESTING, RESULTS AND DISCUSSION .................................................................. 104
6.1. INTRODUCTION ................................................................................................ 104 6.2. COMPOSITES NOMENCLATURE ......................................................................... 104 6.3. FIBRE VOLUME CONTENT ................................................................................. 105 6.4. TENSILE TESTING OF COMPOSITES .................................................................... 106
6.4.1. Tensile properties of 300 tex plain weave composites .................................. 107

4
6.4.2. Tensile properties of 300 tex twill weave composites ................................... 108 6.4.3. Tensile properties of 600 tex plain and twill composites .............................. 109
6.5. FLEXURE TESTING OF COMPOSITES .................................................................. 113 6.5.1. Flexure properties of 300 tex plain weave composites .................................. 114 6.5.2. Flexure properties of 300 tex twill weave composites .................................. 115 6.5.3. Flexure properties of 600 tex composites ..................................................... 116
6.6. INTER-LAMINAR SHEAR STRENGTH (ILSS) TESTING ......................................... 118 6.6.1. ILSS of 300 tex plain and twill weave composites ....................................... 118 6.6.2. ILSS of 600 tex plain and twill composites .................................................. 120 6.6.3. Microscope and SEM Analysis .................................................................... 121
6.7. FRACTURE TOUGHNESS (MODE I) TESTING ...................................................... 125 6.8. SUMMARY ....................................................................................................... 131
CHAPTER 7 COMPOSITES WITH TEXTURED AND NON-TEXTURED CORE YARNS ........................................................................................................................... 133
7.1. INTRODUCTION ................................................................................................ 133 7.2. CORE TEXTURED YARN COMPOSITES ................................................................ 133
7.2.1. Fibre volume content of CT composites ....................................................... 133 7.3. MECHANICAL PROPERTIES OF CT COMPOSITES ................................................ 134
7.3.1. Tensile properties of 600 tex CT composites ............................................... 134 7.3.2. Flexure properties of 600 tex CT composites ............................................... 136 7.3.3. ILSS of 600 tex CT plain and twill composites ............................................ 137
7.4. MIXED YARN COMPOSITES ............................................................................... 138 7.4.1. Fibre volume content of WfW composites ................................................... 138
7.5. MECHANICAL PROPERTIES OF WFW COMPOSITES ............................................ 138 7.5.1. Tensile properties of 600 tex WfW composites ............................................ 138 7.5.2. Flexure properties of 600 tex WfW composites ........................................... 140 7.5.3. ILSS of 600 tex WfW composites................................................................ 141
7.6. COMPARISON OF MECHANICAL PROPERTIES ..................................................... 142 7.7. PRODUCTION OF MIXED YARN FABRIC ON A POWER LOOM................................ 145 7.8. SUMMARY ....................................................................................................... 147
CHAPTER 8 CONCLUSIONS AND RECOMMENDATIONS FOR FUTURE WORK ................................................................................................................................ 148
8.1. CONCLUSIONS ................................................................................................. 148 8.1.1. Tenacity of yarn after texturing ................................................................... 148 8.1.2. Tensile properties of composites .................................................................. 149 8.1.3. Flexure properties of composites ................................................................. 149 8.1.4. Inter-laminar shear strength and fracture toughness of composites ............... 149 8.1.5. Weave structure .......................................................................................... 150 8.1.6. Composites with combination of textured and non-textured yarns ................ 150
8.2. RECOMMENDATIONS FOR FUTURE WORK ......................................................... 150
REFERENCES............................................................................................................... 152
APPENDIX A: CALCULATIONS FOR DRAW RATIO AND OVERFEED ............. 162
APPENDIX B: MECHANICAL PROPERTIES .......................................................... 166
Word count: 38232 words

5
Table of Figures Figure 2.1 Schematic diagram of the filament winding process [Mazumdar 2002] ..23 Figure 2.2 Schematic diagram of the sequence of delamination crack propagation between the layer in a woven-fabric laminate as viewed from the top [Kim and Sham 2000] ......................................................................................................................26 Figure 2.3 Resin rich areas in woven fabric composite ............................................27 Figure 2.4 Schematic diagram of the stitched preform [Nie et al 2008] ....................31 Figure 2.5 Schematic diagram of Z-pinning process Mouritz [2007] .......................34 Figure 2.6 Mechanism of air-jet texturing [Acar et al 2006] ....................................37 Figure 2.7 First Air-Jet Process “Taslan” by Du Pont ..............................................39 Figure 2.8 Taslan jets (a) Type 7 (b) Type 8 (c) Type 9 (d) Type 10 (e) Type 11 (f) Type 14...................................................................................................................41 Figure 2.9 Taslan Type 20.......................................................................................42 Figure 2.10 Standard-core Hemajet [Heberlein guide 1991] ....................................43 Figure 2.11 (Hemajet LB-02 Universal Housing with T-Series Jet Core) [Heberlein guide 1991] .............................................................................................................43 Figure 2.12 Heberlein Hemajet EO-52 [Oerlikon 2010] ..........................................44 Figure 2.13 Hemajet jet cores (a) A and T series, (b) A-2, S-2 and T-2 series [Oerlikon 2004a, 2007b] .........................................................................................45 Figure 2.14 Heberlein Jet Housing (a) Hemajet LB-04, (b) Hemajet LB-24 [Oerlikon 2007a, 2009b] .........................................................................................................46 Figure 2.15 Commingling process [Alagirusamy et al 2005] ...................................50 Figure 2.16 Air Inlet Configurations for Commingling Process [R. Alagirusamy et al 2005] ......................................................................................................................51 Figure 3.1 Creel Section ..........................................................................................57 Figure 3.2 Rollers Section .......................................................................................58 Figure 3.3 Jet box and components .........................................................................59 Figure 3.4 Oil application roller ..............................................................................59 Figure 3.5 Winding unit ..........................................................................................60 Figure 3.6 Suction gun ............................................................................................60 Figure 3.7 Gearing arrangement ..............................................................................61 Figure 3.8 Modified thread line diagram of Stähle RMT-D air-jet texturing machine for glass yarn ..........................................................................................................62 Figure 3.9 Jet housing (Heberlein hemajet LB-13) ..................................................63 Figure 3.10 Jet core (T-370) ....................................................................................63 Figure 3.11 Core-and-effect textured glass yarns .....................................................66 Figure 3.12 Single end warping machine (made by the Shirley Institute) .................67 Figure 3.13 Glass yarn warping in process ..............................................................68 Figure 3.14 Hand loom ...........................................................................................69 Figure 3.15 Dead weight for warp yarn tensioning ..................................................70 Figure 3.16 (1/1) Plain weave fabrics ......................................................................71 Figure 3.17 (1/3) Twill weave fabrics......................................................................71 Figure 3.18 Entanglements during the shedding process ..........................................72

6
Figure 3.19 Entanglements in 300 + 34 tex 3 bars pressure textured warp yarns ......73 Figure 3.20 Configuration diagram of the vacuum bagging process .........................74 Figure 3.21 Vacuum bag .........................................................................................74 Figure 4.1 Glass yarn specimen undergoing breaking strength testing .....................78 Figure 4.2 Composite specimen undergoing tensile testing ......................................81 Figure 4.3 Flexure testing assembly (a) three point bending (b) four point testing [Hodgkinson 2000] .................................................................................................83 Figure 4.4 Potential failure modes for flexure testing [BSI 14125 1998]..................83 Figure 4.5 Composite specimen undergoing Inter-laminar shear strength (ILSS) testing .....................................................................................................................86 Figure 4.6 Schematic diagrams of the basic modes of fracture, mode I (opening), mode II (shear), mode III (tearing) [Robinson and Hodgkinson 2000] .....................87 Figure 4.7 Double cantilever beam (DCB) specimen geometry, (a) end-blocks, (b) piano hinges [Robinson and Hodgkinson 2000] ......................................................88 Figure 4.8 DCB test specimen undergoing fracture toughness testing ......................89 Figure 4.9 Section of DCB with piano hinges indicating “t” ....................................90 Figure 4.10 Prepared samples for scanning electron microscopy (SEM) ..................91 Figure 5.1 Tenacity of the feed yarns ......................................................................93 Figure 5.2 Tenacity of textured and non-textured glass yarns of 300 tex category ...94 Figure 5.3 photomicrographs of 300 + 34 tex 5 bars textured yarn structure ............95 Figure 5.4 Photomicrographs of 300 + 68 tex 5 bars textured yarn structure ............95 Figure 5.5 Tenacity of textured and non-textured glass yarns of 600 tex category ...97 Figure 5.6 Comparison of tenacity of 300 and 600 tex textured yarns ......................98 Figure 5.7 Photomicrographs images of 600 + 34 tex 5 bars textured yarn structure 99 Figure 5.8 Photomicrographs of 600 + 68 tex 5 bars textured yarn structure ............99 Figure 5.9 Comparison of tenacity of non-textured feed yarns ............................... 100 Figure 5.10 Linear density (tex) of textured glass yarns (a) 300 tex (b) 600 tex category ................................................................................................................ 102 Figure 6.1 Tensile strength of 300 tex plain weave composites.............................. 107 Figure 6.2 Tensile modulus of 300 tex plain weave composites ............................. 107 Figure 6.3 Tensile strength of 300 tex twill weave composites .............................. 108 Figure 6.4 Tensile modulus of 300 tex twill weave composites ............................. 109 Figure 6.5 Tensile strength of 600 tex plain & twill weave composites.................. 110 Figure 6.6 Tensile modulus of 600 tex plain & twill weave composites ................. 110 Figure 6.7 Tensile tested samples of 600 tex non-textured plain weave composites ............................................................................................................................. 112 Figure 6.8 Tensile tested samples of 600 + 68 tex 5 bars textured plain weave composites ............................................................................................................ 113 Figure 6.9 Flexure strength of 300 tex plain weave composites ............................. 114 Figure 6.10 Flexure modulus of 300 tex plain weave composites .......................... 114 Figure 6.11 Flexure strength of 300 tex twill weave composites ............................ 115 Figure 6.12 Flexure modulus of 300 tex twill weave composites ........................... 116 Figure 6.13 Flexure strength of 600 tex plain & twill weave composites ............... 117 Figure 6.14 Flexure modulus of 600 tex plain & twill weave composites .............. 117

7
Figure 6.15 ILSS of 300 tex plain weave composites ............................................ 118 Figure 6.16 ILSS of 300 tex twill weave composites ............................................. 119 Figure 6.17 ILSS of 600 tex plain & twill weave composites ................................ 120 Figure 6.18 600 tex non-textured twill weave composite ....................................... 122 Figure 6.19 600 + 34 tex 5 bars twill weave composite ......................................... 123 Figure 6.20 SEM images 600 + 34 tex 5 bars twill weave composite ..................... 124 Figure 6.21 SEM image 600 + 34 tex 5 bars plain weave composites .................... 125 Figure 6.22 SEM image 600 without textured plain weave composite ................... 125 Figure 6.23 Typical load versus crosshead displacement curves for mode I specimens of the 600 non-textured twill weave and the 600 + 68 tex 5 bars twill weave composites ............................................................................................................ 127 Figure 6.24 Initiation and propagation values for mode I testing of 600 + 68 tex 5 bars textured and 600 non-textured twill weave composites .................................. 128 Figure 6.25 Comparison of the mean values of G1c (visual, 5 % offset and propagation) for mode I DCB testing of 600 + 68 tex 5 bars textured and 600 non-textured twill weave composites............................................................................ 129 Figure 6.26 SEM micrographs of fracture surfaces of 600 tex twill weave non-textured composite ................................................................................................ 130 Figure 6.27 SEM micrographs of fracture surfaces of 600 + 68 tex 5 bars twill weave textured composite ................................................................................................ 131 Figure 7.1 Tensile strength of 600 tex CT plain & twill weave composites ............ 135 Figure 7.2 Tensile modulus of 600 tex CT plain & twill weave composites ........... 135 Figure 7.3 Flexure strength of 600 tex CT plain & twill weave composites ........... 136 Figure 7.4 Flexure modulus of 600 tex CT plain & twill weave composites .......... 136 Figure 7.5 ILSS of 600 tex CT plain & twill weave composites ............................ 137 Figure 7.6 Tensile strength of 600 tex plain & twill weave WfW composites ........ 139 Figure 7.7 Tensile modulus of 600 tex plain & twill weave WfW composites ....... 139 Figure 7.8 Flexure strength of 600 tex plain & twill weave WfW composites ........ 140 Figure 7.9 Flexure modulus of 600 tex plain & twill weave WfW composites ....... 140 Figure 7.10 ILSS of 600 tex plain & twill weave WfW composites ....................... 141 Figure 7.11 Tensile strength of 600 tex plain & twill weave composites ................ 142 Figure 7.12 Tensile modulus of 600 tex plain & twill weave composites ............... 143 Figure 7.13 Flexure strength of 600 tex plain & twill weave composites ............... 143 Figure 7.14 Flexure modulus of 600 tex plain & twill weave composites .............. 144 Figure 7.15 Inter-laminar shear strength of 600 tex plain & twill weave composites ............................................................................................................................. 145 Figure 7.16 Production of mixed yarn fabric on a power loom .............................. 146

8
List of Tables Table 2.1 Available glass types and their properties [Vaughan 1998] ......................20 Table 2.2 Fibre glass filament designations [Vaughan 1998] ...................................21 Table 3.1 Fabric specifications ................................................................................71 Table 3.2 Consumable materials required for the vacuum bagging [Cripps 2000] ....75 Table 5.1 Number of filaments in glass yarns ..........................................................96 Table 6.1 Fibre volume content of glass composites .............................................. 105 Table 7.1 Fibre volume content of CT composites................................................. 134 Table 7.2 Fibre volume content of WfW composites ............................................. 138
List of Equations
Density of specimen = ρS (g/cm3) = LSAS
WAS
mmm
,,
,
(4.1) [BS ISO 1183-1, 2004]
79
f
Cff WV
(4.2) [Khan 2010]
.......................................................................79
10012
13
MMMMW f
(4.3) [BS ISO 1172, 1999] ........................................80
R
Cf
f
Cfo WWV
100100
(4.4) [Khan 2010].......................80
bhF
(4.5) [BS 2782-10: Method 1003 1977] ..............................................81
2
2
2 36123
Lsh
LS
bhFL
f (4.6) [BSI 14125 1998] ......................84
sF
bhLE f 3
3
4 (4.7) [BSI 14125 1998] .....................................................84
bhF
ILSSmax
43
(4.8) [BS ISO 14130 1998] ....................................86
FPG c
a 2b3
1
(4.9) [ASTM D 5528-01 2007]
............................................89
22
31031
2
at
aF
(4.10) [ASTM D 5528-01 2007]
.........................90

9
Abstract Woven glass composites have been used for many years in commercial applications
due to their light weight, competitive price and good engineering properties.
Absorption of energy by laminated composite material results in damage in various
forms, the most common of which is delamination. Inter-laminar fracture causes the
layers of composite to separate, resulting in a reduction in stiffness and strength of
the composite structure, matrix cracking and in some cases fibre breakage takes
place. The aim of this project was to improve the inter-laminar bond strength
between woven glass fabric and resin. Air jet texturing was selected to provide a
small amount of bulk to the glass yarn. The purpose was to provide more surface
contact between the fibres and resin and also to increase the adhesion between the
neighbouring layers. These were expected to enhance the resistance to delamination
in the woven glass composites.
Glass yarns were textured by a Stähle air jet texturing machine. Core-and-effect yarn
was produced instead of a simple air textured yarn. Hand loom and vacuum bagging
techniques were used for making the fabric and composite panels from both textured
and non-textured yarns. Density and fibre volume content were established for
physical characterisation. Breaking strength (tenacity) of the yarns and tensile,
flexure, inter-laminar shear strength (ILSS) and fracture toughness (mode 1)
properties of the composites were determined. Projection microscopy and SEM
imaging techniques were used to assess the fractured surfaces of the composite
specimens. The yarn tenacity and the tensile properties of the composites were
significantly reduced after the texturing process, whereas flexure properties were
unchanged. However, significant improvement was observed in the ILSS and
fracture toughness of the composites after the texturing process. It was also observed
that the composites made from the fabrics with textured yarns in only the weft
direction are the most advantageous as they maintained the tensile and flexure
properties but have significantly higher inter-laminar shear strength.

10
Declaration
No portion of the work referred to in the thesis has been submitted in support of an
application for another degree or qualification of this or any other university or other
institute of learning.
Ali Hasan Mahmood

11
Copyright Statement
I. The author of this thesis (including any appendices and/or schedules to this
thesis) owns certain copyright or related rights in it (the “Copyright”) and he
has given The University of Manchester certain rights to use such Copyright,
including for administrative purposes.
II. Copies of this thesis, either in full or in extracts and whether in hard or
electronic copy, may be made only in accordance with the Copyright,
Designs and Patents Act 1988 (as amended) and regulations issued under it
or, where appropriate, in accordance with licensing agreements which the
University has from time to time. This page must form part of any such
copies made.
III. The ownership of certain Copyright, patents, designs, trade marks and other
intellectual property (the “Intellectual Property”) and any reproductions of
copyright works in the thesis, for example graphs and tables
(“Reproductions”), which may be described in this thesis, may not be owned
by the author and may be owned by third parties. Such Intellectual Property
and Reproductions cannot and must not be made available for use without the
prior written permission of the owner(s) of the relevant Intellectual Property
and/or Reproductions.
IV. Further information on the conditions under which disclosure, publication
and commercialisation of this thesis, the Copyright and any Intellectual
Property and/or Reproductions described in it may take place is available in
the University IP Policy (see
http://www.campus.manchester.ac.uk/medialibrary/policies/intellectual-
property.pdf), in any relevant Thesis restriction declarations deposited in the
University Library, The University Library’s regulations (see
http://www.manchester.ac.uk/library/aboutus/regulations) and in The
University’s policy on presentation of Theses.

12
This thesis is dedicated to my (late) father (Mr. Jafar Mahmood), mother (Mrs.
Shahina Mahmood), my wife (Mrs. Sana Ali), my son (Master Saami Ali), my
brothers (Mr. Faiq Ali, Mr. Ammar Hasan, Mr. Hani Hasan), my sister (Mrs.
Aisha Faiq) and my nephew and niece (Master Hadi and Miss Manal).

13
Acknowledgements First and foremost, praises and thanks to Allah S.W.T who bestowed upon us all the
blessings and the faculties of thinking, learning and searching.
This study would not have been possible without the financial support of my
employer and sponsor, NED University of Engineering & Technology funded
through the Higher Education Commission (HEC) of Pakistan.
I would like to express my deepest gratitude for my supervisors, Prof. Porat and Dr.
Gong, whose encouragement, guidance and most importantly support from the initial
to the final level enabled me to think independently and to develop an understanding
of the subject.
I would also like to thank my parents, my brothers and sister, and my wife for
keeping up with me and my demands and their moral encouragement. They boosted
my ego, when it was needed and supported me in various ways but, all through their
unconditional love.
I would also like to sincerely thank Prof. Peter Foster, Dr. Sheraz Hussain Yousfani,
Dr. Laraib Alam Khan, Dr. Syed Naveed Rizvi, Dr. Alan Nesbitt, Dr. Chris Wilkins,
Dr. Chi Zhang, Mr. Steve Butt, Mr. Adrian Handley and Mr. Tom Kerr for their
valuable help, advice and technical assistance.
Many thanks go to PPG Industries for providing the glass filaments and Mr. Keith
Wilson for providing the best advices and support for texturing glass yarn.
Last but not least, I am indebted to any of my colleagues and staff members, and in
fact anyone else who has supported and assisted me in conducting this work.

14
Chapter 1 Introduction
1.1. Research background
Composite materials have gained substantial popularity for a wide range of
applications in structural components because of their high strength-to-weight and
stiffness-to-weight ratios. However, failure due to delamination (the separation of
laminate layers) is of great concern. Delamination, as indicated by various
researchers, is the most common cause of damage in glass composites. This happens
under the impact of load and results in fibre-matrix de-bonding. The purpose of this
research is to improve the bond strength between the glass and the matrix by using
textured yarns developed through the air jet texturing process. The concept was to
produce bulk in the yarn through texturing in order to provide more surface contact
between the fibre and resin, and between the neighbouring layers. The technique of
air jet texturing was utilised by Ma et al [2003] to improve the coated ratio and the
bond strength of glass/PVC fabrics. Koc et al [2008] found improvement in adhesion
of PET yarns to rubber by incorporating a very small amount of texturing. Langston
[2003] also found improvement in inter-laminar shear strength of composites by
texturing Aramid yarns and the reason was the anchoring and entanglement between
the layers due to the bulkier yarn structure.
One potential disadvantage of using textured yarns is the reduction in in-plane
mechanical strength due to the disorientation of filaments introduced in the texturing
process. Therefore, this study was based on the production of core-and-effect
textured reinforcement (glass) yarns. The intention was to keep the disorientation of
filaments as small as possible to minimise strength reduction while producing
sufficient texture to enhance the inter-laminar bonding strength. With the core-and-
effect yarn, the core yarn was processed with a minimum overfeed ratio to maintain
the strength of the final yarn. The effect yarn, however, was subjected to moderate
overfeed for the development of loops and bulk.

15
The yarns produced were then woven and a number of weave structures were
investigated and optimised, these fabrics were then used to produce composites
which were subjected to various tests.
1.2. Project aim and objectives
The aim of this project was to minimise the problem of delamination in composites
by increasing the bond strength between the reinforcement glass yarn fabric and the
resin and between the neighbouring layers.
In order to achieve the aim, the following tasks were planned:
review the literature in the fields of textile composites, delamination
behaviour of composites and the causes of delamination, other means for
improving the lamination strength, air jet texturing and commingling
processes;
manufacture the core-and-effect textured glass yarn through air jet texturing
and investigates the optimum texturing parameters;
investigate the effect of texturing parameters on the tenacity of glass yarns;
manufacture woven glass fabrics on a hand loom from both the textured and
non-textured glass yarns;
producing multi-layered thermoset composites by using a suitable technique
of composite manufacturing;
investigate the effect of texturing on the physical and mechanical properties
of these composites.

16
1.3. Brief content of remaining chapters
Chapter 2 covers the literature review including a short introduction to composites, a
literature survey of delamination and the preventive measures that are commonly
used and the air jet texturing and commingling processes.
Chapter 3 describes the equipment and techniques employed for the production of
samples used in this study together with their merits and constraints. This includes
the study of air jet texturing machine, texturing of glass yarns, fabric development
and finally the fabrication of composite panels.
The physical and mechanical test methods and equipment used to characterise the
textured and non-textured glass composites and the scientific principles involved in
the techniques are described in detail in Chapter 4.
Chapters 5, 6 and 7 cover the experimental work, results and discussion parts of this
study. The comparison of the tenacities of textured and non-textured glass yarns and
the effect of texturing on their tenacity are investigated in Chapter 5.
Chapter 6 includes the results and discussion regarding the effect of texturing on the
mechanical properties of the fabric composites made from core-and-effect textured
glass yarns.
Chapter 7 concerns the effect of texturing on the mechanical properties of
composites made from textured and non-textured core yarns. These composites were
developed by changing the composition of fabrics on the basis of their constituent
yarns.
Chapter 8 presents the conclusions of this work and suggests future work.

17
2. Chapter 2 Literature review
2.1. Introduction
This project is concerned with improving the lamination strength of glass reinforced
composites by modifying the fabric surface using air-jet textured yarn. The work is
based on a combination of textiles and composites technologies and relevant topics
to this work are reviewed below. This chapter includes a short introduction to
composites followed by a literature survey of delamination and the preventive
measures that are commonly used. It includes studies regarding the air-jet texturing
process, the commingling process and their importance for composites.
2.2. Composites
Composite materials are engineered, heterogeneous materials comprising two or
more constituent materials with a discrete and recognisable interface separating
them. These are macroscopic combinations and the most common naturally
occurring composite is wood. The two constituent materials are the matrix and the
reinforcement. Reinforcement fibres are usually of high strength/stiffness and are
generally orthotropic (having different properties in different directions depending
upon the direction of the applied load). The matrix material is ordinarily of a high
performance type. Moreover, both fibres and matrix may be organic or inorganic in
nature [Reinhart 1998, Peters 1998].
2.2.1. Matrix
The matrix acts as a binder for the fibres because it has adhesion and cohesion
characteristics. It helps in transferring of load to the fibres and between the fibres
and also guards them from environmental impacts. Orientation and location of the
fibres in the composite structure are maintained by the matrix. By distributing the
load evenly among the fibres, it resists damage and crack propagation. The matrix
contributes to the electrical and chemical properties of the composite [Reinhart 1998,
Peters 1998].
Most commercially produced composites use a polymer matrix material often called
a resin which is classified into two types, namely thermoplastic and thermoset resins.

18
2.2.1.1. Thermoplastic resins Thermoplastic resins are usually cheaper for fabrication. They can be stored safely
for long periods of time before moulding. They have the ability to be re-moulded by
application of temperature and pressure as the molecules are generally not cross-
linked. They are characterised by toughness and high impact strength. However, they
suffer thermal degradation with repetitive temperature cycling [Reinhart 1998].
The examples include Polyether ether ketone (PEEK), Polyphenylene sulfide (PPS),
Polyether ketone ketone (PEKK), Polyamide (PA or Nylon), Polybutylene
terephthalate (PBT), Polyethylene terephthalate (PET), Polyethylene (PE),
Polypropylene (PP), Polyvinyl chloride (PVC).
2.2.1.2. Thermoset resins Thermoset resins are generally available in liquid form and after mixing with other
ingredients they solidify. They form cross-linkages between the molecules during the
curing process and thus once cured, they cannot be remoulded. Thermosets are
relatively easy to process and usually do not require pressure or high temperature to
form. They normally possess a short workable shelf life [Peters 1998, Varma and
Gupta 2000].
Examples of thermosets resins include Epoxy, Polyester, Vinylester, Polyurethane,
Polyimide, Cyanate ester, Phenolic triazine.
Epoxy resins are relatively lower molecular weight polymers and are used as a
matrix for fibre composites in structural applications. They have a number of
advantages over the other types of polymers. They are inherently polar in nature
which provides excellent adhesion to a wide range of fibres. They have relatively
lower curing shrinkage and no volatile by-products which prevent undesirable void
formation. After curing, the epoxy resins possess high chemical and corrosion
resistance and good mechanical, thermal and electrical properties. However, they
have higher viscosity, are higher in cost and their major limitations are a longer

19
curing time and poor performance in hot-wet environments [Penn and Wang 1998,
Varma and Gupta 2000].
2.2.2. Reinforcement fibres
The purpose of fibre as reinforcement is to provide integrity and strength to the
structure by carrying the majority of the applied structural loads. Fibres are stronger
because while having smaller diameter, they have fewer defects and have the
possibility to align the crystal or molecular structure. Flaws or defect propagation
usually cause failure of the material. However, due to the presence of many fibres in
the composite structure, sudden damage does not usually occur. Most of the fibres
have to rupture before the complete failure of the composite and hence usually
warning signs are there before the collapse.
Fibre reinforcement, which is the discontinuous phase, is responsible for the primary
engineering properties of composites. The mechanical properties of composites
increase by increasing the fibre volume content up to a level where enough matrix
material is available to support the fibres and transfer the load within the composite
[Reinhart 1998].
Some examples of the reinforcement fibres are: glass, carbon, Kevlar (Aramid),
boron, polyethylene, silicon carbide, silicon nitrite, silica, etc.
Glass yarn was chosen for this project because it has a very wide appeal for
structured composites due to its low cost, easier handling and it is relatively easier to
process in the university research environment. Glass yarns possess a wide range of
properties and tailored performance for specific purposes which suited them for
many applications from small electrical products such as printed circuit boards to
boats and larger ships [Sims and Broughton 2000]. The next section describes the
types and properties of glass fibre.
2.2.2.1. Glass fibre Glass fibre is most widely used as a reinforcement for structural composites. Glass is
described as an amorphous material. It is made up of elements such as silicon, boron
and phosphorus which are transformed into glass by mixing with oxygen, sulphur,

20
tellurium and selenium. There are several glass compositions available (Table 2.1)
depending upon the desired properties for end use [Vaughan 1998]: Table 2.1 Available glass types and their properties [Vaughan 1998] Glass type Key features
A-glass High alkali or soda glass for good chemical resistance
E-glass Low alkali glass (aluminium borosilicate) for excellent electrical
insulation properties
C-glass Composed of soda borosilicate for excellent chemical resistance
S-2 glass Composed of magnesium, aluminium silicate and offers higher
physical strength (40% higher tensile strength than E-glass)
D-glass Superior dielectric constant than E-glass
R-glass Resistant to alkali and is used in reinforcing concrete
Low K An experimental fibre similar in properties to D-glass
Hollow
fibre
Tube-like or hollow fibre glass specific applications in light weight
reinforced aircraft parts
The properties of glass fibre depend on the composition of the original glass melt.
Some of the properties which glass fibre usually exhibits are:
High tensile strength In some applications the strength to weight ratio
exceeds steel wire.
Heat and fire resistance Due to its inorganic nature, glass fibre does not
support combustion.
Chemical resistance Not susceptible to fungal, bacterial or insect attack.
Moisture resistance Due to non-absorbency of water, glass fibre never
swells, rots, stretches or disintegrates in a moist atmosphere.
Thermal properties With having a low coefficient of thermal linear
expansion and a high coefficient of thermal conductivity, it performs well in
thermal functions.
Electrical properties As it has a non-conductive nature, it is efficiently used
for electrical insulation.

21
Glass yarns are created in many varieties so a particular system for yarn
classification is essential. Therefore, glass yarn nomenclature has been developed
based on both alphabetical and numerical designations.
For example ECG 150 4/2 s:
Where;
E Identifies the glass composition (E-glass).
C Recognizes filament type (C = continuous).
G Filament designation indicates filament diameter (from Table 2.2, G = 9
micron).
150 Stands for 1/100th of the single strand yield i.e. (15000 yards/pound).
4 Indicates the number of single strands twisted together i.e. Four strands of
150 1/0 are twisted together.
2 Shows the number of twisted yarns plied together. By multiplying the two
figures (4 x 2), the total number of basic strands in a plied yarn is obtained.
Moreover, by dividing the basic strand yield with total number of strands in
the yarn, yarn yield can be obtained.
S Designation of twist. Either 'S' or 'Z'.
Table 2.2 Fibre glass filament designations [Vaughan 1998]
Filament
designation
Filament diameter
in × 10-4 µm
B 1.5 3.8
C 1.8 4.5
D 2.1 5
DE 2.5 6
E 2.9 7
G 3.6 9
H 4.2 10
K 5.1 13
Therefore, the above yarn comprises type E-glass, having continuous filaments of 9
micron diameter. The yarn contains 8 (4 x 2) basic 150 strands, having a glass yield
of 1875 (15 000/8) yards/pound and using 'S' twist to create balance [Vaughan 1998].

22
2.3. Fibre reinforced composites
Fibre reinforced composites can be classified according to the form in which the
reinforcement fibre material is used. These are short discontinuous, long
discontinuous and continuous fibre reinforced composites. It can be further classified
according to the structure of the reinforcement such as woven, non-woven, braided,
knitted etc.
The parameters of fibres i.e. length, orientation and volume content dominate the
engineering properties of the composite. Among them, the length of the fibre is very
important and continuous and long discontinuous fibre composites are better in terms
of engineering properties [Reinhart 1998].
2.4. Manufacturing of composites
There are a number of processes used for manufacturing composites depending upon
the type of the end product and the performance required. A brief description of
some of the general composite manufacturing techniques is provided below:
The hand lay-up process is one of the oldest composite manufacturing techniques
and is still widely used for prototype part manufacturing and in the marine industry.
It is a labour intensive process in which the liquid resin is applied to the mould
followed by the placement of the reinforcement. The process of application of resin
and reinforcement layer continued until a suitable thickness is achieved. After fibre
wet-out, the laminate is allowed to cure. The spray-up process is also used as an
alternative to hand lay-up process in which the chopped fibres and resin are
deposited on to the mould by means of a spray gun [Mazumdar 2002, Khan 2010].
The filament winding process is used for making tubular parts and specialised
structures like pressure vessels. The process involves winding the resin impregnated
fibres at the desired angle over a rotating mandrel. Figure 2.1 shows the fibres’
passage moving through the resin bath and after impregnation they move back and
forth by means of the guide while the mandrel rotates at a specified speed. The
desired angle is achieved by controlling the motion of the guide and the mandrel
[Mazumdar 2002].

23
Figure 2.1 Schematic diagram of the filament winding process [Mazumdar 2002]
Pultrusion is a low-cost and a high volume manufacturing process in which the fibre
reinforcement after impregnation with resin is pulled through a heated die to make
the part. Pultrusion is used for the fabrication of composite parts with constant cross-
section profile e.g. rods, beams, channels, tubes, walkways and bridges, handrails,
light poles, etc [Mazumdar 2002].
Resin transfer moulding (RTM) is a closed mould operation in which the
reinforcement material is placed and clamped between two matching mould surfaces.
The resin is injected into the mould cavity through a port or series of ports under
moderate pressure. After curing the part is removed from the mould. Sometimes, for
assisting the resin flow and to remove the air bubbles, a vacuum is also created inside
the mould. The advantages associated with the RTM process are: lower investment
and operating cost, dimensional accuracy, manufacturing of complex parts, good
surface finish, low volatile emission due to closed moulding process. However, the
limitations are complex tooling design and also substantial trial-and-error
experimentation or flow simulation modelling is required for manufacturing the
complex parts [Mazumdar 2002].
The resin infusion process is an alteration to RTM in which only vacuum is used to
drive the resin flow and the laminates are enclosed in a one sided mould covered
with a bag. The resin is introduced inside the bag by means of one set of pipe work

24
while the second set allows the vacuum to be drawn from the bag. This technique is
commonly known as vacuum bagging and is utilised for this project as described in
Section 3.5.1 [Mazumdar 2002, Khan 2010].
The resin infusion technique has several names. Some of them are Vacuum Infusion
(Crystic VI), Co-injection RTM (CIRTM), Liquid resin infusion (LRI), Modified
vacuum infusion (MVI), Vacuum assisted Injection moulding (VAIM), Vacuum
assisted resin injection moulding (VARIM), Vacuum assisted resin transfer moulding
(VARTM), Vacuum infusion moulding process (VIMP) [Summerscales 2010].
2.5. Composite failure
Composite materials have a wide range of applications in structural components
because of their high strength-to-weight and stiffness-to-weight ratios. However, the
problem of delamination is of great concern. Failure caused in laminated composites
is usually by the separation of two laminate layers. Normally impact, shock and
cyclic stresses are responsible for failure. The problem of delamination is due to the
weakness of the composite in the through-the-thickness direction and the reason is
the inherent low adhesion inter-laminar strength [Pekbey and Sayman 2006].
Damage of any composite as a reaction to impact usually appears in the form of one
or more combined failure mechanisms which are matrix cracking, fibre fracture,
fibre-matrix de-bonding and delamination. The most crucial and common life-
restricting crack growth mode in laminated composites is delamination. Apart from
load application, various material properties and geometric parameters also influence
the failure mechanisms. However, whatever the mechanism is, the damage always
causes reduction in the stiffness and strength of the composite structure [Jang et al.
1989, Gweon and Bascom 1992, Pavier and Clarke 1995, Zhou and Davies 1995,
Adanur and Onal 2001, Ray 2005].
Baucom et al [2005a, 2006b] tested the S2-glass and E-glass composites with various
fabric architectures under repeated drop load impact in order to find out the damage
effect. The 4-ply specimens were observed under reflected light photography and
Scanning Electron Microscopy for visualisation of internal damage. It was found that

25
the damage mechanism was dominated by matrix cracking, matrix de-bonding,
delamination of layers and tensile fracture of fibres.
Pekbey and Sayman [2006] indicated that delamination causes serious degradation to
the composite structure. They found experimentally that the compressive strength of
composite materials was reduced with the presence of delamination as it always
weakened the structure.
Kumar et al [2007] investigated the relationship between post-impact compression
strength and the delamination area by performing impact tests on woven E-
glass/epoxy composite laminates. They found an increase in the delamination area
with increasing impact energy levels, which resulted in a decrease of compression
strength after impact. The decrease in load carrying capacity was assumed to be a
response to the degraded cross-sectional area of the sample under the action of
impact damage.
2.5.1. Delamination
Ebeling et al [1997] and Kim and Sham [2000] studied the failure mechanism of
delamination during the double cantilever beam test by the examination of crack
front movement across the width of the woven fabric laminated composite. Figure
2.2 illustrates multiple crack fronts, one for each warp yarn and the progress of crack
propagation between the layers when viewed from the top. Figure 2.2(a) shows
stable crack propagation where the crack front was most advanced in the direction
parallel to the exposed yarn (i.e. warp). However, the crack front lagged where the
yarns were perpendicular to it (i.e. weft) and the overall crack front seemed
discontinuous. Figure 2.2(b) shows unstable crack growth with a sudden load drop.
The entire crack front jumped forward but arrested instantaneously at the next
undulation resulting in a continuous crack front. Figure 2.2(c) shows recurrence of
Figure 2.2(a) for the adjacent cell. The repetition of approximately the same
procedure happened with crack propagation before complete delamination of the
composite laminate. The orientation of the yarn at the crack tip during the stress state
resulted in the change of discontinuous and continuous crack fronts periodically and
hence is responsible for the inter-laminar fracture toughness.

26
Figure 2.2 Schematic diagram of the sequence of delamination crack propagation between the
layer in a woven-fabric laminate as viewed from the top [Kim and Sham 2000]
2.5.2. Importance of filling yarn
Woven fabric laminated composites have an advantage over the unidirectional
layered composites with having a non-planar interply structure which provides
resistance to the growth of the crack. This is because of the interaction of a
delamination crack with the matrix regions and the weave structure during its
propagation. Some other advantages of woven fabrics are easy handling for
automation and conformability for complex shapes [Kotaki and Hamada 1997, Kim
and Sham 2000, Suppakul and Bandyopadhyay 2002].
Sample Width
Direction of delamination propagation

27
The toughness of the matrix is very important in preventing delamination and the
resin-rich areas play a very vital role. Ebeling et al [1997] highlighted two types of
resin-rich areas in glass woven fabric composites and their importance in
delamination. According to them, the first one was a yarn undulation area, where two
yarns intersected each other. The depth of this resin-rich area was half the ply
thickness. The second area was called the interstitial area and was situated at the
junction of four intersecting yarns, having the depth of resin equal to the thickness of
ply as shown in Figure 2.3.
Figure 2.3 Resin rich areas in woven fabric composite
Ebeling et al [1997] experimentally proved that for a brittle matrix, these areas and
especially the interstitial areas, promoted cracking and fracture of composites by
fracturing ahead of the main matrix. However, for stiffer matrices, they acted as
points of increased toughness and momentarily arrested the growth of the crack. The
undulation of the fibres which were perpendicular to the crack direction usually
restricted the crack jump. According to Ebeling et al [1997], delamination started
from the fibre/matrix de-bonding which is the easier path to follow. However, the
presence of filling yarns in the woven fabric forced the crack path to follow the inter-
laminar path and the changing of the crack path caused an increase in the
delamination toughness. They further concluded that composite toughness definitely
increased by increasing the matrix toughness.
Kotaki and Hamada [1997] investigated the fracture toughness of laminated
composites of differently placed satin weave structures. Their experimental results
also showed the highest fracture toughness with the sample which had more
transverse fibre strands.

28
2.5.3. Effect of thickness and number of laminated layers
The thickness of the composite is an essential factor for estimating the structural
damage, absorption of energy and resistance to penetration. Delamination behaviour
was examined by Xiao et al [2007] by making composites of a varying number of
layers. Plain woven S2 glass/SC-15 epoxy composites were manufactured and tested
under quasi-static punch shear apparatus. It was observed that thin laminated
structures had linear failure behaviour, while the thick laminated structures had bi-
linear failure characteristics. The damage sequence reported under action of load was
based on the following steps:
Delamination initiation
Delamination propagation
Fibre compression and shear failure
Fibre tension and shear failure
While examining the bi-linear behaviour, it was observed that the commencement of
delamination took place as a result of transverse shear loading under the application
of punch load. During delamination propagation, a gentler slope of the load-
displacement curve was observed and the flexure and shear stiffness were dropped.
However, the composite continued to carry the load until complete delamination and
the initiation of fibre failure.
Improvement in the load bearing capability and decrease in the amount of deflection
during impact loading was also indicated by Adanur and Onal [2001] for the thick
composite laminates. Aslan et al [2002] performed impact testing on E-glass/epoxy
woven laminated composites to investigate the significance of thickness and
dimensional effects. It was concluded that the peak impact force and the duration of
contact of load were vital factors. Thick composite laminates proved to be stiffer and
possessed high peak forces and smaller contact durations as compared to the thinner
composite laminates. The reason suggested was the increase in flexure and contact
stiffness with the increase in thickness. Therefore, thickness was found to be a
significant and governing factor for dynamic response and damage mechanism under
impact loading.

29
Sutherland and Soares [2004] indicated the difference of delamination damage
modes for thinner and thicker composite laminates of E-glass Polyester/epoxy
composites when subjected to high incident energies. According to them, the thinner
laminates suffered bending and fibre damage whereas indentation damage was found
for the thicker laminates followed by the internal delamination. They also found that
the energy at which the delamination starts increased with the increase in laminate
thickness.
2.5.4. Effect of thermal conditioning on glass composite failure
The exposure to severe thermal conditions of the environment and the effect of
thermal shock on the damage behaviour of glass composites were characterised by
Ray [2005]. The glass-polyester and glass-epoxy woven composites were treated by
varying the holding durations and by altering the number of cycles of high and low
temperatures. It was found that in comparison to glass-polyester, glass-epoxy
composites showed more resistance to thermal shocks because of more cross-linking
and greater adhesion properties. Moreover, improvement was found in inter-laminar
shear strength values with exposure to short holding times and fewer thermal fatigue
cycles. The reason suggested was an improvement in adhesion at the fibre-matrix
interface as an outcome of the surface chemistry mechanism and the post-curing
effect. However, interfacial de-bonding, crack initiation, and reduction in shear
strength values were observed with increasing exposure time to higher and lower
temperature extreme conditions and also with increasing number of cycles. This was
because of the increased residual stresses generated as a result of the difference in
thermal coefficients between the fibre and resin. This was a consequence of the
weakening of the interface and the delamination.
2.5.5. Effect of hygro-thermal exposure on glass composites
Jana and Bhunia [2008] examined the influence of environmental conditions such as
humidity and elevated temperature on the properties of glass composites. S2
Glass/SC-15 epoxy composite was exposed to hygro-thermal ageing conditions and
it was found that the matrix was affected and deteriorated. Inter-laminar shear stress
(ILSS) and delamination damage tolerance (DDT) were used as the tools for
evaluation and DDT was taken as the measure of stress on the onset of delamination.
It was observed that both ILSS and DDT reduced with the increasing exposure cycles

30
of humidity and temperature. It was suggested that hygro-thermal ageing caused
leaching of soluble degradation products which was also indicated by Gu and
Hongxia [2008] and there was a loss of weight. The matrix degradation weakened
the bond between the fibre and matrix and ultimately the failure occurred. The modes
of failure after the hygro-thermal ageing which resulted in delamination were matrix
cracking, fibre breakage to a certain extent and fibre matrix de-bonding.
Studies by Haque and Hossain [2003] also revealed that moisture absorption caused
hydrolysis and leaching effects resulting in diffusion of water into the matrix
materials. They observed micro-structural damage like fibre de-bonding and matrix
cracking due to swelling of the polymer matrix. They also observed that mechanical
properties deteriorated at elevated temperature beyond the glass transition
temperature which was probably due to the increased visco-elastic nature of the
resin. Their study showed that the degradation in strength at elevated temperatures
was more severe than that resulting from moisture absorption.
2.5.6. Effect of water absorption
The effect of water absorption on glass/polyester composites was investigated by Gu
and Hongxia [2008]. They combined two layers of E-glass plain woven fabric with
unsaturated polyester by using the vacuum resin infusion technique. Deterioration of
the composite matrix, reinforcing material, and interface was observed after
prolonged exposure to water (over 21 days) and the peeling strength was decreased.
The reason suggested by the researchers was the dissolution of some matrix elements
with water which percolate out and resulted in weight loss. However, peeling
strength seemed to increase with the exposure to water for 1-14 days. It was assumed
that during a short exposure, water molecules covered the voids of the matrix and
acted as a plasticiser and hence, an increase in weight was also observed. Moreover,
the hydroxyl group developed between the fibres and the matrix provided resistance
to the peeling action.
2.6. Through-the-thickness reinforcement
This project is concerned with improving the lamination strength between the fabric
and resin by modifying the individual fabric surface with the help of the air-jet
texturing process. However, to increase the delamination resistance of composite

31
structures, a common approach is through-the-thickness reinforcement. Growth of
delamination is restricted by bridging the cracks through stitching the laminate layers
in the thickness direction. The Z-fibre pinning process is also an attempt in which
transverse reinforcement is achieved, in the form of small diameter pins. A brief
account of these techniques with their merits and demerits is stated below.
2.6.1. Through-the-thickness stitching
The stitching process consists of sewing a high strength yarn, usually made of
carbon, aramid or glass, through the fabric composite preforms as shown in Figure
2.4. This process, in spite of having a number of advantages in terms of increasing
the laminate strength and resistance to delamination, also causes degradation of the
in-plane mechanical performance. Some of the critical factors are as follows:
Figure 2.4 Schematic diagram of the stitched preform [Nie et al 2008]
Improvement in impact damage resistance through stitching is sensitive to the type of
yarn used for stitching and also to the type and density of the stitching. According to
Kang and Lee [1994], chain stitching caused reduction of in-plane tensile strength
and modulus of S-2 glass/polyester composites with increasing stitching density of
Kevlar fibre. The reason suggested was the damage of some of the reinforcement
fibres during the penetration of the sewing needles.
Velmurugan and Solaimurugan [2007] introduced a number of modifications to the
stitching process of glass/polyester composites stitched with Kevlar. They used
manual plain stitching in place of chain or lock stitch in order to reduce fibre damage
Stitching Yarn

32
during the stitching process. The selection of plain stitch was also to avoid the
formation of thread cross and resin-rich pockets as in the case with lock stitch.
Moreover, instead of using twisted yarns, they utilised untwisted fibre roving and the
reason suggested was the uniform distribution of fibres in the stitches which
consequently increased the absorption of energy. The twisted fibre yarns in contrast,
acted as a whole and resulted in single step de-bonding. With the above
modifications, improved tensile, shear and impact strengths were achieved.
An examination of E-glass plain woven preforms and composites stitched with
Kevlar, using scanning electron microscopy, was carried out by Mouritz [2004] to
identify micro structural damage. Breakage of fibres by the stroke of the sewing
needle and distortion of woven fibres due to the sliding action of the sewing thread
was observed. It was also found that the surface of the preforms suffered from
crimping of the woven fibres as a result of pressing against the stitches which
became a source of distortion. Mouritz [2004] concluded that stitching caused
degradation of tensile fatigue properties in the form of early initiation and growth of
cracks, which happened as a result of crimping and distortion of load bearing fibres.
According to Nie et al [2008] the in-plane tensile strength of stitched composites is
sensitive to the stitch spacing. Small stitch spacing with a higher number of stitches
would effectively suppress the delamination and enhance the load bearing capability
of the composite. However, a higher number of stitches caused more fibre damage
and ultimately reduced the in-plane tensile strength. Nie et al [2008] found 5 mm to
be the optimum stitch spacing for composites of plain weave T300 1 K carbon fibres
with improved inter-laminar in-plane and tensile strengths.
Stitching is more helpful for providing resistance to the crack propagation through
fibre bridging rather than the crack initiation. According to Parlapalli et al [2007],
stitching is effective when the delamination length goes beyond 0.5L where, L is the
length of the specimen of glass/epoxy laminate composite stitched with Kevlar and
Twaron threads. The reason suggested was the possible reduction of composite
stiffness due to stitching. Above the 0.5L delamination length, the stitching started to
become effective.

33
Mouritz [2003] also indicated that improvement in delamination resistance occurred
when crack length grew above 15mm. According to Mouritz [2003], the stitch
bridging zone is not fully developed before the 15mm crack length. Moreover,
because of having very few stitches in a 15 mm length, an insignificant suppression
of the crack growth took place.
According to Yoshimura et al [2008], reinforcement of laminated composites by
using the through-the-thickness stitching technique seemed more promising with
larger impact energy. Yoshimura et al [2008] suggested that with a larger impact
energy level and a larger delamination area, there was an increase in the number of
stitched threads to be strained. The applied energy was then spent more for
increasing the strain energy of threads than spent on crack extensions. However, with
smaller delamination under the impact of low energy, because of the lower number
of available strained threads, the applied work was largely spent on crack growth.
It can be summarised that the in-plane properties of composites may be improved,
degraded or unaffected by the stitching process depending on a large number of
interacting factors. These include the type of laminate, the lamination technique,
stitching conditions i.e. stitch type, density, yarn diameter, orientation and also the
type of loading (Mouritz et al 1997). The major advantage of the stitching process is
that it improves the inter-laminar fracture resistance by resisting the crack growth as
it moves from stitch to stitch [Mouritz et al 1997, Yoshimura 2008, Velmurugan and
Solaimurugan 2007]. However, the drawback of localised damage zones around the
stitches due to needle action, misalignment of fibres by the stitches, formation of
resin rich areas due to spreading of fibres around the stitches and also weak interface
between the stitched yarns and matrix are reported as the major detrimental concerns
[Kang and Lee 1994, Mouritz et al (1996a, 1997b), Beier 2008].
2.6.2. Z-Fibre Pinning
Z-fibre pinning is an alternative technique to the stitching of composite laminates in
the Z-direction. Z-fibres are small diameter rods made up of carbon, titanium,
aluminium, stainless steel, glass etc embedded in resin. The diameter ranges from
0.15 to 1 mm. Insertion of the pins takes place through a specialised ultrasonic

34
insertion gun from a collapsible foam sandwich in which the Z-pins are held as
shown in Figure 2.5. Usually Z-pins are inserted into the prepregs before the resin
curing process [Cartie et al 2004, Partridge and Cartie 2005].
Figure 2.5 Schematic diagram of Z-pinning process Mouritz [2007]
Z-pinning is advantageous in improving the damage tolerance of the laminated
composites by offering resistance to delamination but it has limitations as well.
Zhang et al [2006] demonstrated that Z-pinning was quite effective for delaying the
delamination propagation rather than the damage initiation. The reason suggested
was the weak bond between the pins and the base laminate due to the presence of
resin pockets around the pins. Moreover, the pins were initially placed vertically to
the mode II crack plane and resist less the damage initiation. The pin traction force
increased with the change of angle of the pins during the crack growth and hence
reduction of the delamination area was achieved during the crack growth.
According to Zhang et al [2006], Z-pinning is more effective for thicker laminates
due to the difference in failure mode. For thinner laminates, the dominant failure
mode during transverse impact load is bending which causes matrix cracking.
However, delamination due to inter-laminar shear stresses took place in the thicker
laminates and the Z-pins were found to be helpful in arresting the delamination
cracks for propagation.

35
Allegri and Zhang [2007] stated that Z-fibres were beneficial for improving the
resistance to de-bonding and provided hindrance in delamination growth but the
diameter of the inserted pins was critical. According to them, increasing the pin
diameter would be helpful in increasing the frictional sliding shear and was
advantageous for the joint strength. However, at the same time, it had a detrimental
effect on the in-plane mechanical properties because of the local misalignment of the
in-plane laminates which increased by using the larger diameter pins. Mouritz [2007]
also indicated that the development of resin zones was associated with the amount
and the diameter of Z-pins. Isolation of resin zones from each other took place when
the pins were spaced wide apart. However, with closely spaced or large Z-pins,
continuous resin channels extending in the fibre direction would form which resulted
in decreasing the mechanical properties.
Another problem which is more prominent in Z-pinning is that Z-pinning causes
swelling of laminates. Chang et al [2006] as cited by Mouritz [2007] explained that
the problem of swelling was due to the spreading out of laminates to provide room
for the pins and also by the resistance of Z-pins against the compaction of prepreg
during curing. Swelling causes reduction of the fibre volume content and ultimately
deteriorates the mechanical properties. Stitching, however, raises the fibre volume
content by compacting the laminate preforms [Mouritz 2004a, 2007b].
2.7. Yarn texturing for increasing the bonding strength
The aim of this project is to increase the inter-laminar bond strength between woven
fabric of glass and resin, and between the neighbouring layers. Texturing increases
the bulk of glass yarns and this is expected to improve the adhesion between the
glass yarn and the resin and the resistance to delamination. Although a number of
techniques for producing textured filament yarns have been developed such as gear-
crimping, edge-crimping, stuffer-box, knit-de-knit, false twist and air-jet texturing,
the main techniques used are false twist, stuffer-box and air jet texturing processes.
The stuffer-box method caused buckling of the yarn in a wave form followed by the
heat setting in the crimped state. False twist is the process of twisting, setting and de-

36
twisting thermoplastic filament yarns. Due to the setting, the deformation is
permanently set in the yarn [Hearle et al 2001].
However, for texturing of glass yarn, the false twist and stuffer-box processes are not
practically possible because of the stiff nature of the yarn. In addition, yarns textured
through these processes are very stretchy and only show the texture in the relaxed
state. Therefore, a purely mechanical texturing process by means of an air-jet was
considered the only option for texturing the glass yarn for composite reinforcements.
2.7.1. Air-jet texturing
Air-jet texturing does not require thermoplastic yarn as it works on a purely
mechanical basis. Textured yarns, having an appearance just like spun yarns, can be
produced from thermoplastic, cellulosic or nonorganic filament yarns by the action
of a highly turbulent, non-uniform, supersonic jet of air. Formation of loops takes
place on the surface of the filament yarn, giving it a voluminous character. The
feeding of the yarn leads the delivery or take-up process. A pressurised air jet causes
the filaments of the constituent yarn to texture and blend together as shown in Figure
2.6. The supply yarn is usually wetted by a wetting unit just before feeding into the
texturing nozzle. A wide range of filament yarns can be textured by the air-jet
process [Demir and Behery 1997].

37
Where, L1 = The starting points of the separation of filaments inside the nozzle.
L2 = The starting points of the loop formation process.
L3 = The furthest point of the loops reached outside the nozzle.
Figure 2.6 Mechanism of air-jet texturing [Acar et al 2006] 2.7.1.1. Types of operations in air-jet texturing process There are three types of operations for producing a wide variety of textured yarns
namely
Single-end texturing
Parallel texturing
Core-and-effect texturing
In the single-end process, as the name suggests, a single end of yarn is introduced to
a nozzle with overfeed to produce the resultant yarn. In the parallel texturing process,
two or more yarns are usually fed to the nozzle for blending but have the same
amount of overfeed. The supply yarn may differ in terms of raw material, linear
densities, number of constituent filaments, etc. However, the versatility and
uniqueness of the air-jet process is found in the core-and-effect texturing process. In

38
this process, one or more yarns are supplied to the nozzle with relatively lower
overfeed to form the core and the other group is fed at the same time to the nozzle at
a higher overfeed percentage to create the desired bulk and where relevant a
voluminous effect. For example, a wide variety of fancy yarns is produced through
the core-and-effect process [Demir and Behery 1997].
2.7.1.2. Texturing nozzles The nozzle is the most important component in the line of air-jet texturing and is the
heart of the process. Since the 1950’s, lots of research work has been done to develop
an efficient air texturing nozzle and a number of different designs and shapes have
come into being. However, the purpose of the jet is always to create a supersonic,
turbulent and non-uniform flow to entangle filaments for creating loops and
producing textured yarn [Acar 1989].
Among the number of jets available in the market for producing a variety of textured
yarns, Taslan jets by Du Pont and Hemajet jets by Heberlein have made the most
significant commercial contribution to the field.
The first British patent [Du Pont 1952] and US patent [Du Pont 1957] was believed
to be the first process of air-jet texturing and was licensed under the brand name
“Taslan” by Du Pont as shown in Figure 2.7. A turbulent region was produced by
passing compressed air through a narrow space. The yarn was fed through the
turbulent zone and the formation of loops took place.

39
Figure 2.7 First Air-Jet Process “Taslan” by Du Pont
According to Demir and Wray [1989], the early jets were developed and modified on
a trial and error basis and there was no understanding of using wet yarn. In the next
modification, as per Figure 2.8a, a venturi, (a short tube with a tapered construction
in the middle that causes an increase in the velocity of flow of a fluid) was used to
speed up the compressed air.
Moreover, the jet was modified by adding a baffle plate and by introducing a screw-
type air channel to produce a spin in the air (shown in Figure 2.8b).
In 1954, Du Pont introduced Taslan Type 9 (Figure 2.8c) as a further amendment of
the texturing nozzle and which stayed longer in the industry. A longitudinal airflow
channel with a venturi was used as a modification and a pre-twisted supplied yarn
was fed at an angle of 45˚ through a stepped, tubular needle [Du Pont 1954, Du Pont
1960].
The major drawback of this jet was the crucial setting of the needle which had to be
done by specially trained operators for a reasonable texturing effect through the
nozzle [Demir and Wray 1989]. Further developments by Du Pont in the field of jet
design came in the form of the Taslan 10 Jet (Figure 2.8d) patented in 1960 [Du Pont

40
1960]. The design concept was altered by using the straight (axial) path for yarn flow
and the air entered at a right angle to the yarn channel. The negative aspect of this
design was the uncontrollable acceleration of the air stream due to the straight exit
tube. The Taslan Type 11 nozzle [Du Pont 1970, Du Pont 1972] (Figure 2.8e) was
the modified version through which this defect was overcome by using a venturi type
channel configuration.
Several versions of the Taslan 11 Jet were also designed by modifying the
compressed air inlet into the turbulence chamber. An advanced development
appeared as Taslan 14 Jet [Du Pont 1976] with a baffle element as shown in Figure
2.8f to deflect the air-jet at the exit of the nozzle. Initially, flat plate-type impact
elements were used but cylindrical bars, conical elements and spherical bodies were
utilised later on [Wickramasinghe 2003].

41
Figure 2.8 Taslan jets (a) Type 7 (b) Type 8 (c) Type 9 (d) Type 10 (e) Type 11 (f) Type 14
With all the previous Taslan Jets, the problem found was the difficulties of setting up
and also inconsistency of product variation among nozzles. This was claimed to be
overcome with the introduction of Taslan 20 Jet as shown in Figure 2.9 [Du Pont
1981].

42
Figure 2.9 Taslan Type 20
The attractive features of Taslan 20 Jets were the shorter channel length and enlarged
yarn inlet at the side of the needle. The nozzle in this type of jet consisted of
cylindrical venturi which could be moved and the position could be adjusted by a
rotating thumb wheel. The venturi could be stimulated from a string-up position to an
operating position by means of a cam, located on a rotatable cylindrical baffle. In
this way, self-stringing of the feed yarn was claimed to be made possible.
With the Taslan 20, the Du Pont nozzle designers had done several modifications by
utilising their experience for achieving maximum output. However, the problem of
pollution of surrounding areas of the texturing nozzle with spin finish and water mist
was still there. The contamination of the venturi resulted in an obstacle for smooth
operation and thus again become the source of jet-to-jet inconsistency [Acar 1989,
Wickramasinghe 2003].
Apart from Taslan jets made by Du Pont, Courtaulds Ltd and Enterprise Machine
and Development (EMAD) Corporation also provided the texturing jets in the market
by filing their patents [Courtaulds ltd 1979, EMAD corp. (1974a, 1976b, 1980c),
Demir and Wray 1989].
In 1978, a new design of air-jet was presented in the texturing market by Heberlein
Maschinenfabrik AG of Switzerland. The name given to this jet was the “Standard-

43
core Hemajet” (Figure 2.10). Heberlein introduced a radial type hemajet core with a
flow of air in the yarn channel by means of three inclined inlet holes. The core had a
wide trumpet shape at the exit side and an adjustable spherical impact baffle element
[Demir and Wray 1989].
Figure 2.10 Standard-core Hemajet [Heberlein guide 1991]
The universal housing Hemajet LB-02 with “T series” jet cores (Figure 2.11) with
one or more aisles for air to flow in the channel of the yarn were begun to be
developed from 1982 [Wickramasinghe 2003, Heberlein guide 1991].
Figure 2.11 (Hemajet LB-02 Universal Housing with T-Series Jet Core) [Heberlein guide 1991]
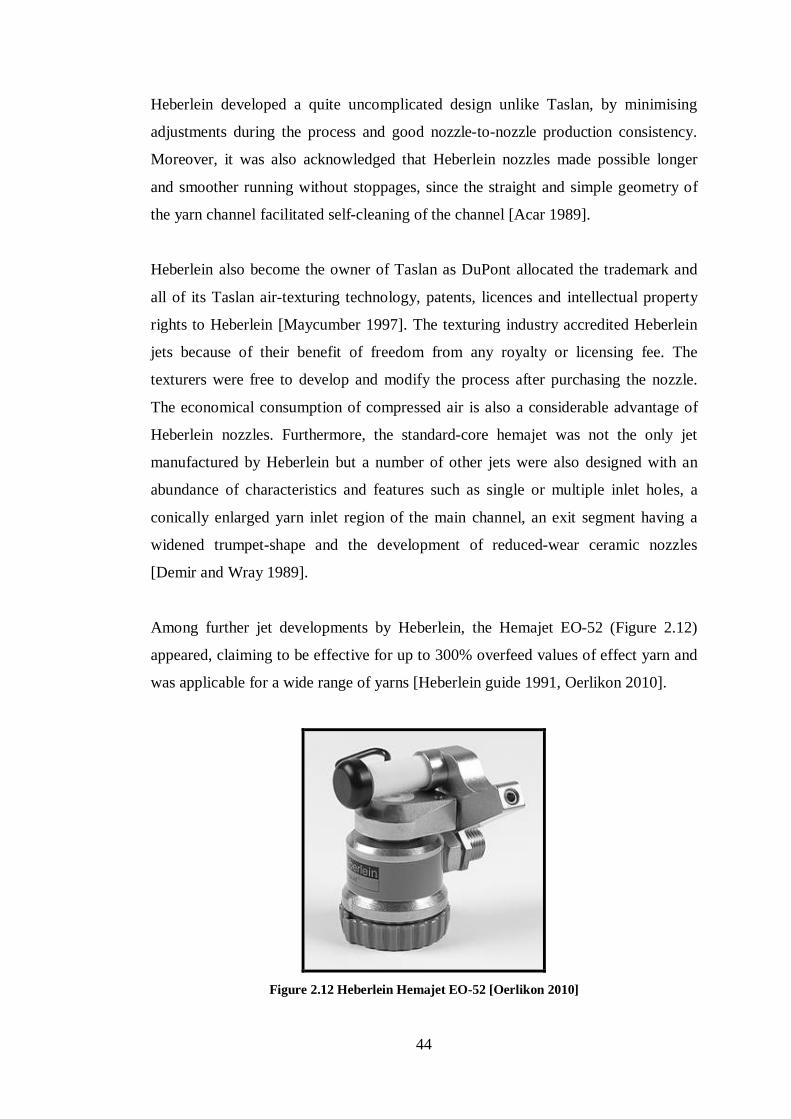
44
Heberlein developed a quite uncomplicated design unlike Taslan, by minimising
adjustments during the process and good nozzle-to-nozzle production consistency.
Moreover, it was also acknowledged that Heberlein nozzles made possible longer
and smoother running without stoppages, since the straight and simple geometry of
the yarn channel facilitated self-cleaning of the channel [Acar 1989].
Heberlein also become the owner of Taslan as DuPont allocated the trademark and
all of its Taslan air-texturing technology, patents, licences and intellectual property
rights to Heberlein [Maycumber 1997]. The texturing industry accredited Heberlein
jets because of their benefit of freedom from any royalty or licensing fee. The
texturers were free to develop and modify the process after purchasing the nozzle.
The economical consumption of compressed air is also a considerable advantage of
Heberlein nozzles. Furthermore, the standard-core hemajet was not the only jet
manufactured by Heberlein but a number of other jets were also designed with an
abundance of characteristics and features such as single or multiple inlet holes, a
conically enlarged yarn inlet region of the main channel, an exit segment having a
widened trumpet-shape and the development of reduced-wear ceramic nozzles
[Demir and Wray 1989].
Among further jet developments by Heberlein, the Hemajet EO-52 (Figure 2.12)
appeared, claiming to be effective for up to 300% overfeed values of effect yarn and
was applicable for a wide range of yarns [Heberlein guide 1991, Oerlikon 2010].
Figure 2.12 Heberlein Hemajet EO-52 [Oerlikon 2010]

45
After the T-series jet cores, more jet cores were developed including the S-series, A-
Series and then as a further modification T-2, S-2 and A-2 jet cores were introduced
(Figure 2.13). Considering the strength and durability factors, A, S and T jet core
series were made completely of ceramics. The T-2, S-2 and A-2 cores were made
with an additional advantage of a metal outer sleeve which protects the ceramic jet
and makes it almost unbreakable. Coloured rings are present for identification and
avoids the possibility of mixing up the jet cores [Oerlikon 2004a, 2007b].
(a) (b)
Figure 2.13 Hemajet jet cores (a) A and T series, (b) A-2, S-2 and T-2 series [Oerlikon 2004a, 2007b]
Jet housings for texturing were developed in the form of the Hemajet LB-04 and the
Hemajet LB-24 (Figure 2.14). Both jet core series i.e. T, S and A series and T-2, S-2
and A-2 series, can be fitted in these housings. The Hemajet LB-04 has a plastic
body and can be fitted to all types of air texturing machines, having an easy process
for exchanging jet cores, threading the yarn and having higher chemical resistance.
The Hemajet LB-24 is provided with an additional mechanism of rotating jet cores
which enhance cleaning inside the jet and result in increased process efficiency
[Oerlikon 2007a, 2009b].
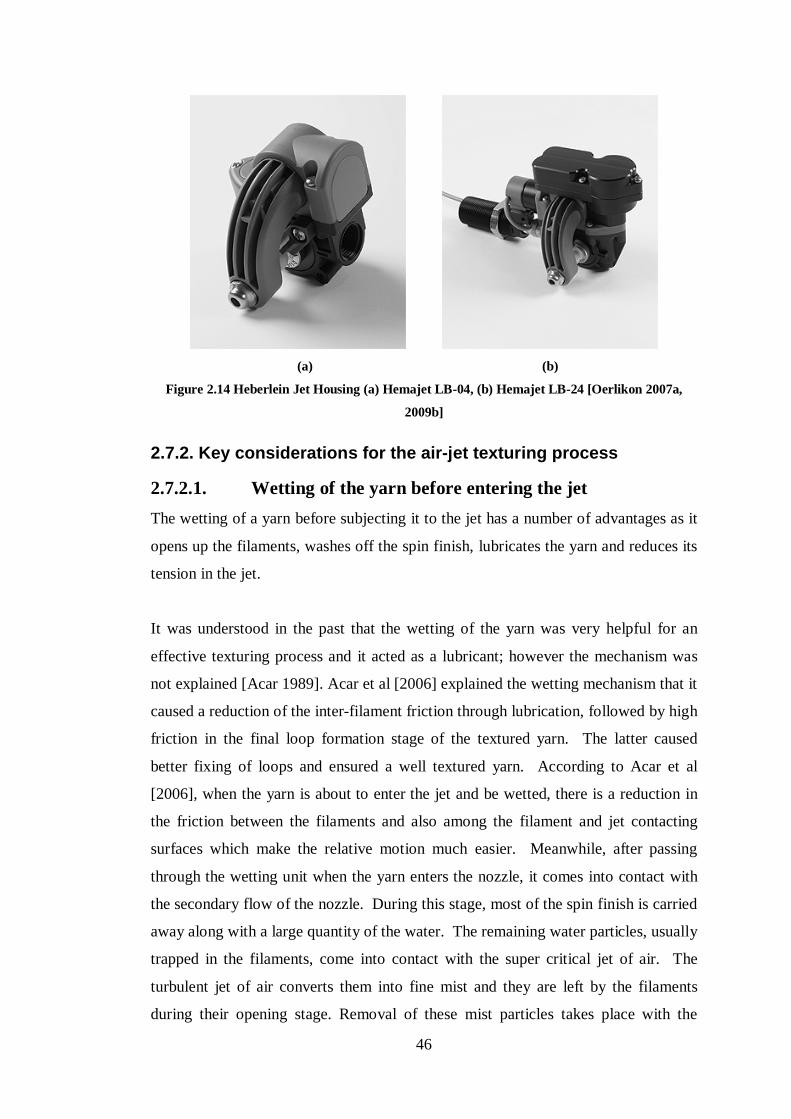
46
(a) (b)
Figure 2.14 Heberlein Jet Housing (a) Hemajet LB-04, (b) Hemajet LB-24 [Oerlikon 2007a,
2009b]
2.7.2. Key considerations for the air-jet texturing process
2.7.2.1. Wetting of the yarn before entering the jet The wetting of a yarn before subjecting it to the jet has a number of advantages as it
opens up the filaments, washes off the spin finish, lubricates the yarn and reduces its
tension in the jet.
It was understood in the past that the wetting of the yarn was very helpful for an
effective texturing process and it acted as a lubricant; however the mechanism was
not explained [Acar 1989]. Acar et al [2006] explained the wetting mechanism that it
caused a reduction of the inter-filament friction through lubrication, followed by high
friction in the final loop formation stage of the textured yarn. The latter caused
better fixing of loops and ensured a well textured yarn. According to Acar et al
[2006], when the yarn is about to enter the jet and be wetted, there is a reduction in
the friction between the filaments and also among the filament and jet contacting
surfaces which make the relative motion much easier. Meanwhile, after passing
through the wetting unit when the yarn enters the nozzle, it comes into contact with
the secondary flow of the nozzle. During this stage, most of the spin finish is carried
away along with a large quantity of the water. The remaining water particles, usually
trapped in the filaments, come into contact with the super critical jet of air. The
turbulent jet of air converts them into fine mist and they are left by the filaments
during their opening stage. Removal of these mist particles takes place with the
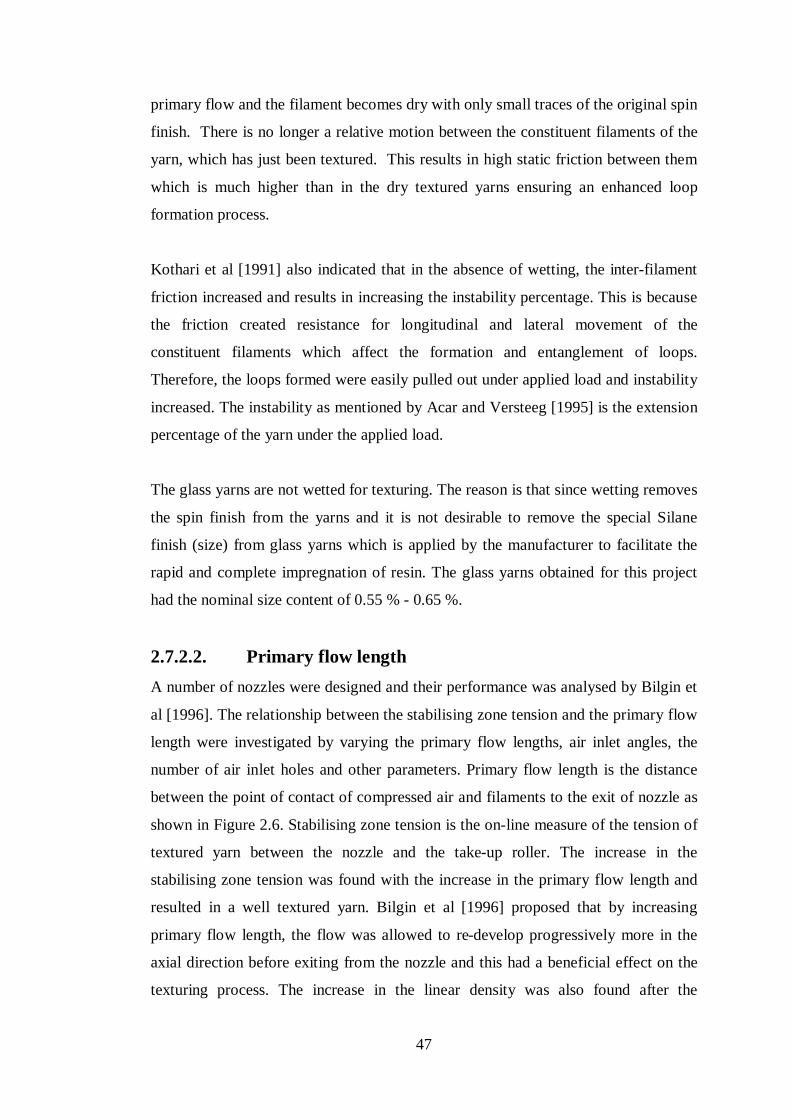
47
primary flow and the filament becomes dry with only small traces of the original spin
finish. There is no longer a relative motion between the constituent filaments of the
yarn, which has just been textured. This results in high static friction between them
which is much higher than in the dry textured yarns ensuring an enhanced loop
formation process.
Kothari et al [1991] also indicated that in the absence of wetting, the inter-filament
friction increased and results in increasing the instability percentage. This is because
the friction created resistance for longitudinal and lateral movement of the
constituent filaments which affect the formation and entanglement of loops.
Therefore, the loops formed were easily pulled out under applied load and instability
increased. The instability as mentioned by Acar and Versteeg [1995] is the extension
percentage of the yarn under the applied load.
The glass yarns are not wetted for texturing. The reason is that since wetting removes
the spin finish from the yarns and it is not desirable to remove the special Silane
finish (size) from glass yarns which is applied by the manufacturer to facilitate the
rapid and complete impregnation of resin. The glass yarns obtained for this project
had the nominal size content of 0.55 % - 0.65 %.
2.7.2.2. Primary flow length A number of nozzles were designed and their performance was analysed by Bilgin et
al [1996]. The relationship between the stabilising zone tension and the primary flow
length were investigated by varying the primary flow lengths, air inlet angles, the
number of air inlet holes and other parameters. Primary flow length is the distance
between the point of contact of compressed air and filaments to the exit of nozzle as
shown in Figure 2.6. Stabilising zone tension is the on-line measure of the tension of
textured yarn between the nozzle and the take-up roller. The increase in the
stabilising zone tension was found with the increase in the primary flow length and
resulted in a well textured yarn. Bilgin et al [1996] proposed that by increasing
primary flow length, the flow was allowed to re-develop progressively more in the
axial direction before exiting from the nozzle and this had a beneficial effect on the
texturing process. The increase in the linear density was also found after the

48
texturing process which indicated good utilisation of overfeed. Scanning electron
microscopy results confirmed that by increasing the primary flow length, the yarn
produced had a greater number of smaller loops which were firmly anchored in the
yarn core.
2.7.2.3. Filament fineness Acar [1989] reported the suitability of finer filaments for the air-jet texturing process
because of their lower bending and torsional stiffness. Formation of loops would be
easier as they deformed easily with lower drag forces. Sengupta et al [1996] stated
that finer filaments produced high bulk and volume as they bent easily under the
action of the jets. However, formation of more neps took place at the same time, as
there were more chances of non-opening due to the lower surface area of the
filaments. Rengasamy et al [2004] indicated that textured yarns made up of finer
filaments have lower instability because the finer filaments bent without difficulty
and formed a larger number of small loops and entanglements.
2.7.2.4. Reduction in strength of textured yarn Rengasamy et al [2004] investigated the effect of the texturing process on the
strength of textured yarn and found that the strength decreased after the texturing
process. This was because after the formation of loops, the parallel arrangement
vanished and hence all the filaments did not contribute to bearing the load stresses.
It was also indicated that tenacity was decreased with increasing the air pressure
since the turbulence by increasing the pressure caused the formation of more loops
and resulted in an enhanced texturing effect. High loop formation decreased the
number of straight filaments responsible for bearing loads and as a result the yarn
suffered loss of tenacity.
2.7.2.5. Overfeeding Overfeed is the positive difference between the input speed of the yarn entering the
jet and the withdrawing speed of the yarn coming out of the jet. According to
Alagirusamy and Ogale [2004] and Sengupta et al [1991], overfeed is one of the
essential requirements of air-jet texturing as it provides additional length of filaments
to facilitate loop formation and the bulk of the yarn. They suggested that the

49
texturing efficiency and the linear density increased with increasing overfeed but the
loop stability reduced. According to Chimeh et al [2005], overfeeding plays a key
role in developing loop size and loop density for air-jet textured yarns and increasing
overfeed up to an optimum level would cause an increase in the linear density.
Moreover, the results of Rengasamy et al [2004] revealed that increasing the
overfeed difference between the core and the effect components resulted in
decreasing tenacity. This is because during loading, the effect filaments having
higher overfeed were less strained and the yarn breaking extension was largely
influenced by the rupture of the core filaments.
2.7.2.6. Filament cross-section Acar [1989] reported that non-circular filament structures are appropriate for the air-
jet process because they have lower torsional and twisting stiffness and therefore,
less drag force required for carrying them. Alagirusamy and Ogale [2004] indicated
that the cross-section of filaments contributed to air texturing performance.
According to their studies, filaments with elliptical, hollow circular and non-circular
cross-sections with a greater surface area are more suitable for air-jet texturing as
compared to solid circular ones of equal linear density.
2.8. Commingling process
Commingling is a common use of air jet technology in composite manufacturing.
Commingling is a process of producing entanglements between the filaments of two
or more constituent yarns by the help of an air jet, usually acting perpendicular to the
yarn flow. The principle of commingling as shown in Figure 2.15 is actually the
formation of the opened sections followed by the nips. Nips are entangled points
between opened sections. The strong jet of air causes the opening of the filaments
and results in an open section whereas, the nips forms on either side [Alagirusamy
and Ogale 2004, Alagirusamy et al 2006].

50
Figure 2.15 Commingling process [Alagirusamy et al 2005]
Miao and Soong [1995] investigated the properties of commingled yarn and found
that they were highly dependent on the process parameters i.e. air pressure, overfeed
ratio and throughput speed. They used Nylon multifilament yarns and their results
illustrated that air pressure is a very important factor and the increase in air pressure
caused enhancement in interlacing. Versteeg et al [1999] also found an increase in
the nip frequency with the increase of supplied air pressure. An increase in overfeed
resulted in a reduction of the nip frequency but the degree of interlacing increased.
Alagirusamy and Ogale [2004] indicated that the requirement of overfeed for the
commingling process is zero or very low, as overfeed reduces yarn tension and hence
affects the nip frequency.
Moreover, the increase in yarn throughput speed decreases both the nip frequency
and the degree of interlacing. Tenacity of the yarn was found to be reduced after
commingling because in flat yarns, filaments were aligned parallel and were
subjected to load together. However after the commingling process, due to varying
angles, the filaments shared the applied stresses unequally, resulting in a reduction of
tenacity [Miao and Soong 1995].
2.8.1. Jet design for the commingling process
Alagirusamy et al [2005] performed a number of experiments to investigate the
consequences of jet design on the process of commingling by changing the number

51
of air inlets, their angles and positions in the jet. Among the three configurations
(shown in Figure 2.16), Configuration 3 with an inclined air jet at a 45° angle
followed by two perpendicular jets on the other side, gave acceptable commingling
results.
Configuration 1 Configuration 2 Configuration 3
Figure 2.16 Air Inlet Configurations for Commingling Process [R. Alagirusamy et al 2005] The design of texturing and commingling jets is differentiated by Alagirusamy and
his co-workers [2004a, 2005b, 2005c] on the basis of the angle and direction of air
flow in the jet. They suggested that air flow in the texturing jet is usually angular in
the direction of the yarn flow. It helps in forwarding the yarn along with inserting
loops in it. Formation of loops takes place due to the impact of shock waves which
cause the opening up of the filaments. Moreover, overfeed of the yarn facilitates
bending of the filaments in reaction to the shock waves. The enhancement of the
texturing process with oblique air inlets at angles of 45 and 60 degrees in the
direction of the yarn flow was also reported by Rwei and Pai [2002]. However, in the
commingling process, blending and homogenous distribution of matrix and
reinforcing filaments is the requirement. Therefore, they suggested that angular jets
against the yarn flow direction (backward commingling jets) are better for the
commingling process as shown in Figure 2.16 (Configuration 3).
2.8.2. Commingled yarns for composites
Composites, having textile-based reinforcement, are usually developed through
impregnating the reinforcement fibres with liquid resin. However, due to the
drawback of higher viscosity of thermoplastic resins, it is difficult to obtain a
homogenous composite structure. Another option for processing thermoplastic
composites is to add the polymer in solid form to the fibres in such a way that
Yarn entry

52
uniform mixing of the two parts of the composite is achieved. Development of
commingled yarns for thermoplastic composites was introduced to overcome the
problem of higher viscosity of thermoplastics and the difficulty in having a
homogenous composite structure. The commingling process is used for mixing the
high performance reinforcement filaments and the thermoplastic resin forming
filaments. Fabrics or other textile forms are developed from these commingled yarns
(hybrid yarns) and impregnation is achieved by application of sufficient heat and
pressure to have small flow paths for the thermoplastic matrix around the fibres
[Alagirusamy and Ogale 2005, Zaixia 2006, Alagirusamy et al 2006, Golzar et al
2007].
The performance of commingled yarns and their effect on the mechanical properties
of composites were reported in the literature. It was indicated that improvement in
the quality of consolidation, mechanical properties and reduction in void content of
thermoplastic composites can be achieved by controlling the parameters i.e. holding
time, tool temperature and pressure [McDonnell 2001, Bernhardsson and Shishoo
2000, Alagirusamy et al 2006].
2.8.3. Glass filament commingling process
A combination of high performance reinforcing filaments with matrix-forming
thermoplastic filaments (glass/polypropylene (GF-PP), glass/polyester (GF-PET),
and glass/nylon (GF-NY)) were developed through the commingling process and
characterised. The effect of air pressure and the volume content of matrix-forming
filaments on the nip frequency and degree of interlacing were investigated
[Alagirusamy and Ogale 2005] and their effects on the tensile properties of yarns
were also studied [Ogale and Alagirusamy 2007]. The nozzle design used for the
above studies was Configuration 3 shown in Figure 2.16.
It was observed that the nip frequency and the degree of interlacement increase with
an increase in the air pressure because of the increase of air flow velocity and yarn
rotation inside the jet. The variation in nip frequency with the change of the volume
content of the matrix forming filaments depends on the number of filaments, nature
and the linear density of filaments [Alagirusamy and Ogale 2005].

53
Moreover, it was observed that tenacity is the property of thermoplastic yarns
whereas the modulus is the property of the high performance yarns. The results
showed that tenacity is unaffected by increasing pressure for all three combinations
but the modulus of GF-PET and GF-NY seems to decrease with increasing pressure.
This was possibly because during high movement of filaments with increasing
pressure, the alignment of glass filaments was effected. GF-PP had no effect on the
modulus because the polypropylene filaments by nature have a higher diameter and
lower density. Therefore, even if the glass filaments moved with increasing air
pressure, in the subsequent winding process they again adjust the structure with the
winding tension.
Reduction in the modulus of commingled yarn was observed with an increase in the
volume content of the matrix forming filaments. This was because of the decrease in
the proportion of glass filaments. Moreover, increase in tenacity of GF-PET and GF-
NY and decrease in tenacity of GF-PP was observed with the increase of the matrix
volume content. The reason suggested was that according to their results, the glass
had lower tenacity than PET and NY but higher than PP. Therefore, increasing the
volume content of the PET and NY resulted in the increase in tenacity of the
commingled yarn. However, an increase in volume content of the polypropylene
resulted in a decrease in the tenacity of the commingled yarn [Ogale and
Alagirusamy 2007].
The commingling process has the ability of distributing the constituent filaments
efficiently over the cross-section. Through microscopic investigation, it was found
that even distribution of filaments over the hybrid yarn cross-section not only
depends on the air pressure but also on the diameter of the reinforcement and matrix
filaments. For uniform distribution of filaments, the diameters should be
approximately equal. Moreover, higher air pressure is not desirable since in addition
to damaging the filaments, it restricts the distribution of filaments by making the
structure more compact [Kang et al 2007, Herath et al 2007].
2.9. Selection criteria for the air-jet texturing process
This project is concerned with producing bulk and loops in the glass yarn to improve
fabric layers adhesion between the glass and the resin. The improvement in bonding

54
by the air-jet texturing process is explained to some extent by Ma et al [2003] in the
context of thermoplastics-based composites. They textured a single glass filament
yarn by varying the overfeed and the air pressure and the coated ratio of yarns was
measured. The coated ratio is the percentage increase in the weight of the yarn due to
the absorption of resin. It was found that the coated ratio increased by increasing the
air pressure and overfeed values. Moreover, an increment was also observed in the
bond tenacity of two layers of the woven fabrics made by using the textured glass
yarns which were impregnated with PVC resin and joined together by means of a
welding torch. The suggested reason was the increase in bulk of the yarn with the
application of air pressure and overfeed. However, the effect of texturing on the yarn
strength was not considered in their study which is likely to be decreased with the
application of excessive pressure and overfeed. This is because the number of the
filaments contributing to the strength of the yarn would decrease with increasing the
bulk content of the yarn.
This project is focused on the utilisation of lower values of overfeed and pressure so
as not to disturb the filament orientation within the textured yarns too greatly and
avoid excessive loss of strength. This approach was shown to have potential by Koc
et al [2008] who found improvement in adhesion of PET yarns to rubber by
incorporating a very small amount of texturing. Although they found a reduction in
yarn strength even with the lower texturing parameters, their results showed
improvement in adhesion between rubber and the PET yarns.
2.10. Summary
The purpose of this research is to improve the bond strength between glass and the
matrix by using air-jet textured yarn. The constituents of composites, delamination
failure, and the preventive measures for increasing the delamination resistance in the
form of through-the-thickness reinforcement were reviewed. Commingling and air-
jet texturing processes were also reviewed. The commingling process is also used for
producing reinforcement yarns but has a different approach as compared to the air-jet
texturing process. Commingling is used for uniformly mixing the thermoplastic yarns
with the reinforcement yarns and thus overcoming the problem of higher flow
viscosity of the thermoplastic resins during manufacturing of composites.

55
To realise the aims of this project, the core-and-effect is the most promising
technique because the core yarn can be potentially processed with minimum overfeed
to maintain the strength while the effect yarn can be subjected to moderate overfeed
for developing the loops and bulk in the resultant textured yarn as will be described
in the following chapters.

56
3. Chapter 3 Glass yarn texturing, weaving and composite
manufacturing process
3.1. Introduction
This chapter describes the equipment and techniques employed for the production of
samples used in this study. The chapter includes the introduction of the air-jet
texturing machine, the texturing process of glass yarns, the development of fabrics
and then finally the fabrication of composite panels. A brief account of each
experimental stage in this research work is provided together with some discussions
of their merits and constraints.
3.2. Air-jet texturing machine
The single head Stähle RMT-D air-jet texturing machine used for this study was
originally for texturing filament yarn (Polyester, Polypropylene, Polyamide, Nylon,
Acetate etc) and can operate at speeds of up to 500 m/min.
3.2.1. Texturing machine components
The Stähle RMT-D air-jet texturing machine mainly comprises a pre-texturing zone
including the drawing and heat setting arrangement followed by the texturing unit
and then finally the winding zone. A brief description of each component is
provided.
3.2.2. Feeder yarn creel
The creel is situated at the back of the machine as shown in Figure 3.1 for holding
the feeder yarn packages. There are 12 slots available to hold the core and effect
supply yarns. After passing from the yarn guides, the feeder yarns were presented to
the feed rollers from the bottom of the machine.

57
Figure 3.1 Creel Section
3.2.3. Rollers arrangement
The machine has two separate sets of rollers for both the core and the effect yarns
before the jet box and one set for the resultant textured yarn after the jet as shown in
Figure 3.2. A range of overfeed and draw ratios can be achieved for both the core
and effect yarns [RMT-D manual 2001].

58
Figure 3.2 Rollers Section
The machine has the ability to heat set the feed yarns before subjecting them to the
jet and also after the texturing process in the form of the heated pins and the godet
rollers. The heat setting process is essential for the synthetic partially-oriented yarns
(POY) however no heat setting was required for texturing the glass yarns so the heat
setting devices were bypassed.
3.2.4. The jet box
The jet box usually consists of two yarn inlets for the core and the effect yarns, a
wetting unit (water applicator), an air-jet with housing, an eyelet for textured yarn
exit and an opening for the water to drain. The water is applied in a controlled
manner to any one of the feeder yarns (usually the effect yarn) to improve the
efficiency of the process. The jet box can be opened by unfastening the two side
screws in order to access especially when threading the machine. Control of the noise
Delivery roller
Core yarn path
Effect yarn path
Godet roller

59
level during operation is also one of the functions of the jet box. Figure 3.3 shows the
jet box on the left and the yarn inlets, jet and water applicator on the right.
Figure 3.3 Jet box and components
3.2.5. Oil application device
The different finishes can be applied to the textured yarn by means of a roller (shown
in Figure 3.4) moving slowly in a fluid reservoir. The textured yarn comes in contact
with the roller just before the package winding process.
Figure 3.4 Oil application roller
3.2.6. Winding unit
The textured yarn after passing through the delivery roller and the yarn guide reaches
the winding unit. The package is negatively driven by means of a rotating cylinder
from underneath. The traverse motion is controlled by the reciprocating yarn guide
moving in a to-and-fro direction as shown in Figure 3.5.

60
Figure 3.5 Winding unit
3.2.7. Suction gun
The machine is equipped with a suction gun (shown in Figure 3.6) which helps in
threading the yarn through the machine. The use of the suction gun for threading the
yarn is always recommended, rather than the use of hands, for operator safety.
Figure 3.6 Suction gun

61
3.2.8. Gearing arrangement
The driving mechanism of the machine depends on the gearing arrangement present
at the back of the machine which receives the drive from an AC motor. Transfer of
the motion from the motor to the gears and among the gears takes place by means of
driving belts and each gear change position is equipped with a belt tensioner as
shown in Figure 3.7. By using different gear ratios, various rollers speeds and a range
of draw ratios and overfeeds can be achieved.
Figure 3.7 Gearing arrangement
Belt tensioners

62
Figure 3.8 Modified thread line diagram of Stähle RMT-D air-jet texturing machine for glass
yarn
3.2.9. Texturing machine set up for glass yarn
The machine was modified for processing the glass yarn because of the difference in
the nature of the yarn. The modifications were performed in the drawing zone,
winding zone and in the jet box.
3.2.10. Alteration in the drawing zone
There was no requirement for pre- or post-drawing or for heat setting for glass yarns
on the machine. Therefore, the draw ratios were kept to zero by running the input
roller and the feed roller at the same speed. The passage between them was utilised
as a pre-tension zone for stable feeding of the core and the effect yarn to the air jet.

63
The line diagram illustrating the production process of the core-and-effect glass yarn
on the air-jet texturing machine is shown in Figure 3.8 above.
3.2.11. Alteration in the winding zone
A variable speed winding unit was also introduced to the machine by replacing the
original one. The reason was to take up the yarn at a slightly higher speed (5%) than
the delivery roller which helped in tightening up the loops and proper winding of the
resultant textured yarn on the cone for the warping and weaving process.
3.2.12. Type of jet used
The jet and the housing used for texturing the glass yarn in this project had the
following specifications:
Jet housing = Heberlein Hemajet (R) LB-13 (Figure 3.9);
Jet core = T 370 (Figure 3.10).
Figure 3.9 Jet housing (Heberlein hemajet LB-13)
Figure 3.10 Jet core (T-370)

64
The wetting assembly was removed from the jet box as it was not required for
texturing the glass yarn.
After setting up the machine, the next task performed was the selection of two
important process parameters i.e. overfeed and the air pressure for the production of
the core-and-effect yarn.
3.2.13. Selection of the overfeed value
It was considered that a smaller amount of overfeed would be enough for the core
yarn to provide sufficient texture in the structure so as to lose as little as possible
yarn strength. For determining the optimum value of the core yarn overfeed, the core
yarns were textured by varying the overfeed value starting from the smallest value of
2.9%. It was observed that by increasing the overfeed from 2.9% to 5.5%, the loss in
the breaking strength increased from 15% to 40% at 4 bars air pressure. The breaking
strength was tested according to BS ISO 3341 [2000]. Based on the observation
above, 2.9% was taken as the overfeed value of the core yarn for further processing.
For the effect yarn overfeed, a number of trials were conducted. The first trial was
performed with 38% overfeed as that was the minimum value of overfeed which
could be set for the effect yarn in the machine according to the gearing arrangement.
However, it was observed that the yarn was not able to run properly and it became
loose and failed to move forward on the rollers before the jet. The reason for this was
the stiff nature of glass filaments which caused difficulty in the formation of loops
and failed in converting overfeed into loops. The mechanism of loop formation is to
utilise the extra length of yarn fed through overfeed and to convert it into loops with
the action of the air jet. Moreover, the appearance of the loops in the resultant glass
yarn was different to that of the polyester yarn after the texturing process in terms of
tightness of the loops. Before starting to work on glass yarn in this project, the
machine was operated with polyester yarn and it was observed that at 38% effect
yarn overfeed, the loops formed quite easily and were firmly held by the core.
Further trials were conducted by gradually decreasing the overfeed value of the
effect yarn. During these trials, the basic gearing diagram was also altered by
changing some fixed gears along with the normal variable gears. However, an

65
unstable texturing process was observed because the stiffer nature of glass filaments
did not allow the full utilisation of the extra length fed through overfeeding.
Promising results were achieved for the effect yarn at 9.2% overfeed as the yarn ran
properly and the process was found to be stable without any breakage and loosening
of the yarn on the feed rollers before entering the jet.
3.2.14. Selection of the air pressure value
Heberlein, the manufacturer of the air-jet, recommended a moderate range of 3 to 6
bars air pressure for texturing the glass yarn so this range was selected for producing
the core-and-effect yarn. Higher air pressure is also not desirable because, despite the
advantage of development of more loops in the yarn structure, it causes broken
filaments and a reduction in strength of the yarn. Since maintaining the strength of
glass yarn is one of the objectives of this project, it was decided to use lower air
pressures.
During the texturing process, the core-and-effect yarn was produced with visible
loops at pressures of 3, 4, and 5 bars. Smaller and tighter loops were found more in
the structure of the yarns made at 5 bars air pressure followed by 4 bars and then 3
bars as shown in Figure 3.11. The increase in the air pressure from 3 bars to 5 bars
resulted in the formation of small loops which were held firmly in the structure of the
core yarn. Higher pressure helped in opening the core yarn and more rearrangement
of the filaments providing more locking of the loops. The formation of more loops
with increased air pressure was also indicated by Rengasamy et al. [2004].

66
Figure 3.11 Core-and-effect textured glass yarns
Further trials were made by producing the textured yarn at 6 bars air pressure but
deterioration was observed in the structure of the resulting yarn. Although the yarn
possessed smaller loops, at the same time too many broken filaments were observed
in the structure. Also the process was not stable and the effect yarn was out of control
on the rollers on several occasions.
Therefore, the core-and-effect yarn produced for this research work had the
following parameters;
Core yarn linear density = 300 and 600 tex,
Effect yarn linear density = 34 and 68 tex,
Core yarn overfeed % = 2.9 %,
Effect yarn overfeed % = 9.2 %,
Air pressure = 3 to 5 bars.
Refer to Table 5.1 on page 96 for further details of the yarn structure.

67
3.3. Warping process
Warping is an essential preparation process for weaving. The traditional method
involves the use of a considerable number of cones which impose a practical limit on
the number of trials in a research environment due to the preparation time required.
To alleviate this problem, a single-end warping machine, which requires only one
cone, was used in this project. The warping machine, made by Shirley Institute, is
shown in Figure 3.12. This machine was purposely manufactured for making short
length warping beams of maximum 8 metres especially for educational and research
work. The yarn was withdrawn from one side of the machine (shown in Figure 3.13)
and after passing through the tensioning device and the guiding rollers, it was tied on
one edge of the warping wheel.
Figure 3.12 Single end warping machine (made by the Shirley Institute)
The machine was equipped with clutch and breaking devices to control the motion of
the warping wheel. Each rotation of the wheel made up one warp yarn ‘end’ and after
having the desired number of ends, the warp sheet was transferred to the weaving
beam on the beaming unit. The transfer of warp yarns on the weaving beam took
place by slowly rotating the wheel to maintain an even tension with the help of the
brakes. The diameter of the wheel was changeable for adjusting the circumference of

68
the wheel according to the required length of the warp sheet. The gearing
arrangement helped in placing the yarns evenly one after another at an appropriate
distance without overlapping each other and the selection of suitable gears depends
on the linear density of the yarn and the number of ends/cm required in the finished
fabric.
Figure 3.13 Glass yarn warping in process
3.4. Glass fabric production
It was recognised that many types of fabric would have to be produced to achieve the
aims of the project and after initial trials on commercial looms, it was decided to use
a hand loom for this purpose. The advantage of a small hand loom is reduced time of
preparation between production of different samples and greater handling flexibility,
especially as some yarns proved to be difficult to prepare and weave as discussed
later in this thesis. It was recognised, however, that uniformity of weaving
parameters could be potentially more difficult for a hand loom and great care was
taken to minimise this. The hand loom used is shown in Figure 3.14.
Both the glass textured and the non-textured yarns were utilised in fabrics based on
plain (1/1) weave and twill (1/3) weave for comparative purposes. Four harness

69
frames were utilised for lifting and lowering the warp yarns in both types of weave
pattern. The warp beam was prepared by utilising the maximum available
circumference of the single-end warping machine (i.e. 8 metres) and the beam was
installed at the back of the hand loom. The drawing-in process of warp yarns through
the heald wires and the reed was performed carefully to avoid entanglement and
damage to the yarns. The warp yarns were kept in tension by means of the rope and
dead weights as shown in Figure 3.15.
Figure 3.14 Hand loom

70
Figure 3.15 Dead weight for warp yarn tensioning
Apart from the fabrics manufactured using the core-&-effect yarns and the fabrics
made from the non-textured glass yarns, two other categories of textured fabrics were
also produced. The composition of fabrics was changed on the bases of the
constituent yarns. The first one was the core textured fabrics produced by using core
textured yarns and termed “CT fabrics”. The yarn used in warp and weft of the CT
fabrics was the single textured yarn with the absence of the effect yarn. The second
variant was in the form of mixed yarn fabrics termed as “WfW fabrics” having non-
textured glass yarn in the warp and the core-and-effect textured glass yarn in the
weft. The details of both these modified textured fabrics and the properties of their
composites are explained in Chapter 7.
The specifications of the fabrics produced are listed in Table 3.1.

71
Table 3.1 Fabric specifications Fabric types
Fabric specifications 300 plain 300 twill 600 plain 600 twill
No. of ends/cm 6 6 4 4
No. of picks/cm 5.5 6 - 6.5 4 4 – 4.5
Air pressure (bars) 3 – 5 3 - 5 5 5
Core yarn tex 300 300 600 600
Effect yarn tex 34 and 68 34 and 68 34 and 68 34 and 68
The surface structure of the fabrics made by using the textured yarns was different to
the fabrics of the non-textured yarns as shown in Figures 3.16 and 3.17. The textured
yarn fabrics showed a hairy surface with small loops and more bulk in the structure.
Also they were not found to be as shiny as the surfaces of the non-textured fabrics
because of less oriented filaments in the yarn structure. 300 tex non-textured (300+34) tex textured at 5 bars
Figure 3.16 (1/1) Plain weave fabrics
300 tex non-textured (300+34) tex textured at 5 bars
Figure 3.17 (1/3) Twill weave fabrics
3.4.1. Problems during weaving process
There were difficulties in weaving with the yarns textured at 3 bars air pressure
because the loops did not firmly hold in the yarn structure. During the weaving
process, the entanglement of loops among the warp yarns started with the change of

72
the shed and the entanglement clusters formed before and after the heald wires on
several occasions as shown in Figure 3.18. These entanglement clusters caused
resistance in the opening of the shed and created problems for the weft insertion
process.
Figure 3.18 Entanglements during the shedding process
The yarns produced at 4 bars pressure also suffered a few entanglement problems
during the weaving process but the problem was greater with the textured yarns of 3
bars pressure (Figure 3.19), since the loops were more susceptible to being separated
from the core yarn and getting entangled. It was also observed that the problem of
entanglements was lower in the (1/3) twill weave fabric as compared to the plain
weave. This was because only 25% warp yarns were involved in the opening of the
shed and due to the low abrasive action, the formation of entangled clusters was
reduced. The weaving process was therefore carefully handled and the warp yarns
were let off before the fabric take-up process. This helped in reducing the tension in
the yarns when they were pulled through the heald wires and also it helped in
minimising the sliding contact between the yarns. This preventative measure can be
applied to power looms as well for handling the delicate warp yarns by setting up the
let off a little ahead of the fabric take up.

73
Figure 3.19 Entanglements in 300 + 34 tex 3 bars pressure textured warp yarns
Good results for weaving the fabric were obtained with the yarns textured at 5 bars
pressure since the higher texturing air pressure helped in opening the core yarn
structure and caused more rearrangement of the filaments which eventually provided
more locking of the loops. As the loops were small and firmly held in the yarn
structure, there was no entanglement problems like those observed with the textured
yarns at 5 bars air pressure. The fabric production process was smooth in both the
300 and 600 tex yarn categories textured at 5 bars air pressure and both the plain and
twill weave fabrics were produced without any entanglement problems.
3.5. Composite manufacturing
Manufacturing of the glass fabric laminated composites was carried out by infusing
the epoxy resin using the vacuum bagging technique in which 4 layers of the glass
fabrics were laid over one another. A range of composites were produced from the
textured and the non-textured glass fabrics and the classification is based on the
linear density (tex) of the core-and-effect yarns, texturing air pressure and the type of
weave pattern.
3.5.1. Vacuum bagging technique
The vacuum bagging technique is actually an extension of the wet lay-up process in
which the excess resin and entrapped air are extracted to improve the consolidation
of the laminates. The technique employed in this study was by sandwiching the hand
laid laminates with peel-ply, perforated release film and resin infusion mesh and then

74
covered by vacuum bagging film which was sealed to the edges of the tool by means
of tacky tape. Four layers of glass fabrics were taken in each case and were placed
over one another in an identical orientation. The sequence of the vacuum bagging
assembly is shown in Figure 3.20 and the actual vacuum bag with the glass fabric
laminate is shown in Figure 3.21.
Figure 3.20 Configuration diagram of the vacuum bagging process
Spiral cut tube
Tacky tape
Fabric laminate
Resin infusion pipe
Metal tool
Breather cloth
Resin trap
Figure 3.21 Vacuum bag

75
A vacuum pump was used to extract the air from the bag for consolidating the
laminate and the vacuum was maintained by applying pressure up to 1 atmosphere.
The function and importance of each component of the vacuum bagging assembly is
described in Table 3.2. Table 3.2 Consumable materials required for the vacuum bagging [Cripps 2000]
Metal tool To provide a smooth flat base
Peel ply Perforated heat-set nylon ply to provide the clean surface and easy
removal of laminate from the bag.
Perforated
release film
To provide uniform distribution of the resin and also help in
avoiding the adhesion of infusion mesh with the peel ply
Resin infusion
mesh
To provide a path for the resin flow
Release film A PTFE film used to prevent the adhesion of any resin to the metal
tool
Breather cloth A nonwoven porous material used to provide the air flow path over
the laminate for allowing the escape of air and moisture and for
ensuring uniform vacuum pressure across the component. It also
absorbs the excess resin from the laminate.
Breach unit A connector between the bagging film and the suction pipe
Bagging film Membrane which allows a vacuum to be drawn within the bag
Spiral cut tube To flow the resin evenly along the whole width of the laminate
Resin infusion
pipe
To infuse the resin solution into the vacuum bag.
Resin trap The passage made in the vacuum line to collect any excess resin
before it reaches the pump in order to prevent damage to the
vacuum pump
Tacky tape Adhesive strip used for sealing the bag to the tool without any
leakage.
Suction pipe Connector to the vacuum pump
The resin (Araldite LY5052) and hardener (Aradur HY5052) used for making
composites were obtained from Aeropia Ltd. The mixture of resin and hardener was
prepared with a ratio of 100:38. After combining the two components, the vessel was
gently stirred for 4 - 5 minutes for complete mixing. The stirring was performed

76
carefully to avoid the formation of air bubbles. Resin was introduced into the bag
through the infusion pipe already fitted in the assembly as shown in Figure 3.21.
After complete impregnation, the resin supply was cut off although the suction pump
was allowed to maintain the vacuum overnight. The composite panels, after having
cured at room temperature for 24 hours, were then further cured in the oven at 100°C
for 4 hours.

77
4. Chapter 4 Characterisation, equipment and procedures
4.1. Introduction
This chapter describes physical and mechanical test methods and equipment used to
characterise the textured and non-textured glass composites. The composite panels
were developed utilising the vacuum bagging technique and after the curing process
the specimens were cut using a diamond blade cutter according to the respective
standard dimensions for physical and mechanical characterisation. The mechanical
performance was measured using tensile testing, a three point bending test, inter-
laminar shear strength (ILSS) test and mode 1 fracture toughness tests. Before testing
the composites, the breaking strength (tenacity) of glass yarns was also determined.
For physical characterisation, the density was measured by the immersion method
and then the fibre volume and void content of the composites were determined by
calcination or the resin burn out process. Finally the post-fracture analysis was done
using a projection microscope and by using scanning electron microscopy (SEM).
4.2. Breaking strength (tenacity) testing of glass yarns
The tenacity of glass yarns was determined for all the textured yarns produced at
different air pressures and also for the non-textured glass yarns in order to find out
the effects of the texturing process. The standard followed for this test is BS ISO
3341 [2000]. The principle of the test is to determine the breaking force by
elongating the specimen by an appropriate mechanical means until rupture. The
breaking strength or tenacity (cN/tex) was calculated by dividing the value of
breaking force obtained from the test by the density (tex) of the particular glass yarn.
Ten specimens of each type of yarn were tested on an Instron 4411 machine by
gripping them between the pair of clamps as shown in Figure 4.1. The specimen
gauge length was set at 250 mm, a 5 kN load cell was used and the test crosshead
speed was 200 mm/min. The yarns were conditioned before the test according to the
standard BS EN ISO 291 [2008] at (23 ± 2 °C, 50 ± 5 % RH) for 6 hours.

78
Figure 4.1 Glass yarn specimen undergoing breaking strength testing
4.3. Density, Fibre Volume fraction and Void Content
The density of composites made from textured and non-textured glass fabrics was
measured according to the standard BS EN ISO 1183-1 [2004] by using the
immersion method. Five specimens were cut from each panel from different places
and their weight was determined. A fine wire of maximum 0.5 mm diameter was
used for hanging the composite pieces and its weight in air and water was measured.
The weight in air of the specimens was measured by hanging them through a balance
hook by means of a wire. Also the weight of the specimens in water was determined
by immersing them in water in a 100 ml beaker while they were suspended stationary
by the wire. Care was taken to avoid any air bubbles adhering to the specimen or
found in the beaker otherwise the bubbles were removed by means of a fine wire.
The weighing balance used for the measurement of weights had an accuracy of 0.1
mg.
The density of the specimen was calculated using the following formula:
Weight of the specimen in air = mS,A (g) = m3 – m1
Glass yarn specimen clamped in the jaws

79
Weight of the specimen in water = mS,L (g) = m4 – m2
Density of specimen = ρS (g/cm3) = LSAS
WAS
mmm
,,
,
(4.1) [BS ISO 1183-1, 2004]
Where,
m1 is the weight of wire in air;
m2 is the weight of wire in water;
m3 is the weight of (wire + specimen) in air;
m4 is the weight of (wire + specimen) in water;
ρw is the density of water which was taken to be 0.998 g/cm3.
The fibre volume content and void content were determined by using calcination or
the resin burn out process according to standard BS EN ISO 1172 [1999]. After
calculating the density, the specimens were dried in the oven at 100 °C for 2 hours
and then cooled in a dessicator. As a preparation step, the glass crucibles were
cleaned, dried, weighed and then placed in the furnace at 625 °C (the temperature
required for the calcination process) for 10 minutes. After cooling down in the
dessicator, they were verified for any change of weight and if found, the process was
repeated until constant mass for the crucible was reached. For the calcination
process, the weight of the empty crucibles and the weight of the crucibles with the
specimen in them were recorded. The crucibles were then placed in the furnace,
preheated to a temperature of 625 °C and heated to constant mass. Subsequently the
crucibles, together with the residue, were taken out of the furnace and cooled in the
dessicator to ambient temperature and then weighed again.
The fibre volume content (%) was determined by the following equation;
f
Cff WV
(4.2) [Khan 2010]
Where,
Vf is the fibre content as a percentage of the initial volume;
Wf is the fibre content as a percentage of the initial mass;
ρc is the density of composite specimen;
ρf is the density of fibre.

80
Wf was calculated by the following equation:
10012
13
MMMMW f
(4.3) [BS ISO 1172, 1999]
Where,
M1 is the initial mass in grams of the empty crucible;
M2 is the initial mass in grams of the crucible plus specimen;
M3 is the final mass in grams of the crucible plus residue after calcination.
The void content as a percentage of initial volume was determined from the
following equation:
R
Cf
f
Cfo WWV
100100
(4.4) [Khan 2010] Where,
ρR is the density of the resin.
4.4. Tensile testing
The basic purpose of tensile testing is to determine the tensile strength and modulus
of the material. However closer observation provides more information about its
behaviour under the applied load. A composite may split or delaminate, the nature of
the failure may be brittle with no warning, or it may start with visible or audible
signs. All this information is useful and knowledge of the failure mode is vital to
establish the end use of the material [Godwin 2000].
There are varieties of specimen sizes, test piece specifications, and testing procedures
described in a number of published standards. The standard followed for the
determination of tensile properties in this study is BS 2782-10: Method 1003 [1977].
The dimensions of the samples were: overall length = 250 mm, width = 25 mm and
the gauge length = 100 mm. The tests were conducted on an Instron universal testing
machine model 1331 with a 50 kN load cell at an extension rate of 2.0 mm/min. Five
specimens of each type were cut in both the warp and weft directions using a
diamond blade cutter and the dimensions of all the specimens were measured before
the test. Extensometer was attached to the composite specimens as shown in Figure

81
4.2 during testing to acquire data for establishing the values of the Modulus of
Elasticity in megapascals.
Extensometer
Figure 4.2 Composite specimen undergoing tensile testing
Tensile strength at maximum force was determined by using the following equation;
bhF
(4.5) [BS 2782-10: Method 1003 1977]
Where, = Strength at maximum force, in megapascals;
F =Maximum tensile force, in Newtons;
b = Mean initial width of the test specimen, in millimetres;
h = Mean initial thickness of the test specimen, in millimetres.

82
4.5. Flexure testing (Three point bending)
The flexure test is used in industry to determine the mechanical properties of resins
and laminated fibre composites because of the ease of the test method,
instrumentation and the equipment required. This test is also used to determine the
inter-laminar shear strength of a laminate (using a short beam). The process is almost
the same for both the tests (i.e. inter-laminar shear strength (ILSS) and flexure
testing) except for the size of the test specimen. ILSS is usually performed with the
smaller span length/thickness ratio in order to avoid bending and to increase the level
of shear stress [Hodgkinson 2000].
The methods used for determination of flexure properties were three point and four
point bending. Three point bending is the method in which a bars of rectangular
cross-section was loaded from the top while resting on the two supports whereas in
four point bending two loads are symmetrically placed between the two supports as
shown in Figure 4.3 (a and b). The geometry of four point loading provides a
constant bending moment between the central loading members and this causes a
reduction in contact stresses in the beams. Whereas in three point loading
arrangement the stress concentrations exist at the loading point so, four point bending
method is more attractive if the state of stress is of concern but it is easier to perform
the three point bending test [Hodgkinson 2000].
(a)

83
(b)
Figure 4.3 Flexure testing assembly (a) three point bending (b) four point testing [Hodgkinson 2000]
The flexure testing resulted in a wide range of failure modes depending on the
chosen method, type and layup of the materials being tested. The potential failure
modes are tensile fracture, compressive fracture, tensile and compressive fracture
accompanied by inter-laminar shear and inter-laminar shear fracture as shown in
Figure 4.4. All failure modes are not acceptable especially those initiated by inter-
laminar shear. To avoid inter-laminar shear failure, the specimen with large span-to
thickness ratio should be used. The standard for flexure testing BSI 14125 [1998]
recommends a minimum span-to-thickness ratio of 16:1.
Figure 4.4 Potential failure modes for flexure testing [BSI 14125 1998]

84
This test method is not appropriate for the determination of design parameters, but
used as a quality-control test. This is because the specimen is subjected to a
combined stress state and the flexure strength and modulus are combinations of the
subsequent tensile and compressive properties of the material. [BSI 14125 1998 and
Hodgkinson 2000]. During the testing of flexure properties, flexure strength and modulus were
determined for both the textured and non-textured composite samples in the warp
and weft directions according to British standard BS EN ISO 14125 [1998]. Five
specimens of each type were cut in both the warp and weft directions using a
diamond blade cutter. The dimensions of the samples were: specimen length = L =
40 mm, span length = S = 32 mm and width = b = 15 mm. The testing was conducted
on an Instron universal testing machine model 4411 with 5 kN load cell at a constant
crosshead speed of 1.0 mm/min. The radii of loading nose and supports were selected
as 5.0 mm and 2.0 mm respectively.
The flexure strength (σf) including the large displacement correction factor was
calculated using the following equation:
2
2
2 36123
Lsh
LS
bhFL
f (4.6) [BSI 14125 1998]
Where,
σf is the flexure stress, in megapascals (MPa);
F is the load in Newtons (N);
L is the span, in millimetres (mm);
h is the thickness of the specimen, in millimetres (mm);
b is the width of the specimen, in millimetres (mm);
s is the beam mid-point deflection, in millimetres (mm).
Flexure modulus (Ef) was calculated using the following equation:
sF
bhLE f 3
3
4 (4.7) [BSI 14125 1998]
Where (ΔF/Δs) is the slope of the load displacement curve.

85
4.6. Inter-laminar shear strength (ILSS)
The ILSS is measured using the short beam method as it is the simplest test to be
performed and is widely used. The measured strength is called the apparent inter-
laminar shear strength and the method is suitable for use with fibre-reinforced plastic
composites with a thermoset or a thermoplastic matrix. The result obtained for ILSS
is not an absolute value and therefore not used for the determination of design
parameters but can be used for quality control purposes. Due to this fact, the term
‘apparent’ is used for describing the measured quantity. Since the test results are
achieved from different-sized specimens or from specimens tested under dissimilar
conditions, they are not directly comparable. The nature of the test method is similar
to the three-point loading method used to determine the flexure properties but a
smaller span-to-thickness ratio is adopted to increase the level of shear stresses and
to avoid flexure or bending failure [Broughton 2000 and BS ISO 14130 1998].
The development of shear stresses and strain concentrations in the matrix region
between the fibres is generally the cause of shear failure which results in interfacial
failure. The literature [Tanoglu et al. 2001; Paiva et al. 2005; Khan 2010] confirms
that ILSS is a matrix dependent property of any material and is used for
characterising and comparing the bonding strength between fibre and matrix.
Composite samples were tested for ILSS (Figure 4.5) in both the warp and weft
directions. All test dimensions and crosshead speeds were selected and the
calculations were done according to the standard BS EN ISO 14130 [1998] i.e.
specimen length = L = 20 mm, span length = S = 10 mm and width = b =10 mm.
Five specimens of each type were cut in both warp and weft directions using a
diamond blade cutter. The test was conducted on the same Instron universal testing
machine model 4411 used for flexure testing with 5 kN load cell at a constant
crosshead speed of 1.0 mm/min.

86
Figure 4.5 Composite specimen undergoing Inter-laminar shear strength (ILSS) testing
Like flexure testing, a range of failure modes is possible including inter-laminar
shear failure, mixed mode failure of shear + tension or shear + compression, and
non-shear failure mode like tension and compression. However, only inter-laminar
shear failure in the form of single or multiple shears is the acceptable mode.
The ILSS in megapascals (MPa) can be determined by the following equation;
bhF
ILSSmax
43
(4.8) [BS ISO 14130 1998]
Where,
Fmax is the failure or maximum load, in Newton;
b is the width, in millimetres, of the test specimen;
h is the thickness, in millimetres, of the test specimen.
4.7. Inter-laminar fracture toughness
Laminated fibre-reinforced composites made of high strength fibres like glass,
carbon, Kevlar etc in a relatively weak matrix material like polyester, epoxy, PEEK
etc are prone to de-lamination which is in the form of separation of the layers. De-
Specimen for ILSS

87
lamination is a common damage form of laminated fibre-reinforced composites
which can be principally detrimental for structural behaviour. Apart from the
external loading conditions, the de-lamination failure also depends on the inherent
properties of the fibre and resin, processing conditions and inter-laminar stresses
induced by temperature and moisture conditions [Khan 2010].
Significant efforts have been made to recognise and improve the de-lamination
resistance of composite materials. The successful methods used to enumerate the de-
lamination resistance of fibre reinforced composites are mode I, mode II and mode
III of inter-laminar fracture toughness tests as shown in Figure 4.6. The critical strain
energy release rate was used to express the inter-laminar fracture toughness of
laminated composites which is the energy consumed by the material as the de-
lamination front proceeds through a unit area and is usually represented by the
symbol Gc. The units commonly used for Gc are Joules per square metre [Robinson
and Hodgkinson 2000].
Figure 4.6 Schematic diagrams of the basic modes of fracture, mode I (opening), mode II
(shear), mode III (tearing) [Robinson and Hodgkinson 2000]
4.7.1. Mode I Inter-laminar fracture toughness
Mode I was selected to measure the Inter-laminar fracture toughness which is the
most commonly used method and is also known as the double cantilever beam
(DCB) test.

88
Figure 4.7 Double cantilever beam (DCB) specimen geometry, (a) end-blocks, (b) piano hinges
[Robinson and Hodgkinson 2000]
Figure 4.7 illustrates two possible types of loading attachments, namely loading
blocks or piano hinges. The parameters are L = total length, b = width and h =
thickness of the beam type specimen. ao is the implanted de-lamination length from
the centre of the hinge and it is produced in the specimen by inserting PTFE film or
other non-adhesives during the processing of the laminated composites.
The piano hinge-type loading attachment was used (as shown in Figure 4.8) for
determining the Mode I fracture toughness of textured and non-textured glass
composites and five specimens were tested for each type. The dimensions of the
samples were: specimen length = L = 140 mm, implanted de-lamination length = ao =
50 mm and width = b = 25 mm. The hinges were bonded using resin containing glass
beads which define the thickness of the layer. The Instron 4411 machine was used
and fracture toughness was measured according to standard ASTM D 5528-01
[2007] at a crosshead speed of 1 mm/min and load cell of 500 N. A 15 μm thick

89
PTFE film was inserted between the centre layers of the laminate prior to the resin
infusion process to produce an initial de-lamination crack.
Figure 4.8 DCB test specimen undergoing fracture toughness testing
Modified beam theory (MBT) was utilised as a data reduction method for the
determination of GIC. The other methods available are the compliance calibration
method (CC) and the modified compliance calibration method (MCC) [ASTM D
5528-01 2007]. The beam theory expression used in this study, for the strain energy
release rate with the correction factors for DCB is as follows;
FPG c
a 2b3
1
(4.9) [ASTM D 5528-01 2007]
Where,
P is the applied load;
is the load point displacement;
b is the specimen width;
a is the de-lamination length;
is the crack-tip rotation correction factor;
DCB specimen in the jaws

90
F is the large displacement effect correction factor.
can be calculated by generating a least squares plot of the cube root of compliance
C1/3 as a function of de-lamination length where compliance is the ratio of the load
point displacement to the applied load. The large displacement effects should be
corrected by the addition of a factor F which can be calculated from the following
equation.
22
31031
2
at
aF
(4.10) [ASTM D 5528-01 2007]
Where, “t” (shown in Figure 4.9) is for piano hinges. This correction factor F
accounts for both the shortening of the moment arm as well as tilting of the end
blocks.
Figure 4.9 Section of DCB with piano hinges indicating “t”
4.8. Scanning electron microscope (SEM)
Observation of composite samples using a scanning electron microscope is very
common since it is capable of generating high resolution images. SEM is a very
significant instrument for analysing the post-fracture surfaces of the fibre reinforced
composites. In this work, SEM was used to examine the fracture surfaces of textured
and non-textured composite samples after subjecting them to ILSS and mode I inter-
laminar fracture toughness testing. The composite samples were inspected using a
Philips model XL30 field emission gun (FEG) SEM microscope. For Mode 1 testing,
small sections of tested samples were cut from the test samples and were stuck to the
metal stubs using double-sided carbon tabs. The whole assembly was then coated
with a very thin layer of carbon using an Edwards S150B sputter coater in order to
improve the conductivity of the surface. For ILSS tested samples, the cross-section

91
of the delaminated surfaces was viewed through a SEM as shown in Figure 4.10. So
the samples were prepared by placing them vertically in a circular plastic cast and the
mixture of polyester resin and hardener was poured in it. The samples were left for a
day to allow the solution to be set and then they were taken out of the cast for
grinding and polishing. The cleaned polished surfaces were presented for viewing to
obtain very fine images.
ILSS Sample Metal Stub
Figure 4.10 Prepared samples for scanning electron microscopy (SEM)
Along with SEM, the textured glass yarn samples and some polished ILSS tested
samples were also examined by using the Projectina Micro Macro Projection
Microscope (MMP-1000) with PIA 4000 software. The variation in arrangement of
loops in different classes of textured yarns and their presence in the textured yarns
structure was verified using the projection microscope.

92
5. Chapter 5 Effect of the texturing process on glass yarn
tenacity
5.1. Introduction
The reason for texturing glass yarn was to produce bulk and loops in the structure but
at the same time the texturing process was expected to reduce the breaking strength
of the yarns due to the disorientation of filaments. The tenacity of the textured and
non-textured yarns was compared in this chapter and the effect of the texturing
process on the breaking strength of the glass yarns was examined. The textured glass
yarns were divided into two categories depending upon the linear density of the core
yarns (i.e. 300 tex and 600 tex).
5.2. Tenacity of the feed yarns
Before analysing the variation in tenacity of the yarns after the texturing process, the
tenacity of the core and effect feed yarns was determined. The testing was performed
on an Instron 4411 according to standard BS ISO 3341 [2000] by taking ten
specimens of glass yarns randomly from the cone. The specimen gauge length was
250 mm, the load cell used was of 5 kN and the test cross head speed was 200
mm/min. The results are shown in Figure 5.1 below.

93
Tenacity of feed yarns
01020304050607080
300 core
600 core
34 effect
68 effect
Feed yarn type
Tena
city
(cN
/tex)
Figure 5.1 Tenacity of the feed yarns
5.3. Tenacity of the 300 tex category
The glass yarns are symbolised on the basis of the thickness of the core and effect
yarns (tex value) and the air pressures used for texturing. For example 300 + 34 5B
means:
Core yarn tex = 300
Effect yarn tex = 34
Air pressure = 5 bars
Tenacity (cN/tex) of the textured and non-textured glass yarns was determined on an
Instron 4411 according to standard BS ISO 3341 [2000]. The yarns were textured by
varying the air pressure from 3 to 5 bars as explained in Section 3.2.14. The results
obtained are shown in Figure 5.2:

94
Tenacity of 300 tex glass yarns after texturing process
0
10
20
30
40
50
60
300 NT
300+34 3B
300+34 4B
300+34 5B
300+68 3B
300+68 4B
300+68 5B
Yarn type
Tena
city
(cN
/tex)
Figure 5.2 Tenacity of textured and non-textured glass yarns of 300 tex category
A significant loss in tenacity was found after texturing the 300 tex core-and-effect
yarns. This loss ranges from 41 % to 47 % in the 300 + 34 tex yarns and from 54 %
to 62% in the 300 + 68 tex yarns respectively. Since the texturing process resulted in
the formation of loops and bulk in the glass yarn, the parallel arrangement of
filaments in the structure was disturbed. However, Figure 5.2 shows that the
texturing air pressure had a statistically insignificant effect on the variation in
tenacity for both the 300 + 34 and 300 + 68 tex yarns. It was found that the loss in
tenacity was higher in the 300 + 68 tex yarns than in 300 + 34 tex textured yarns.
The reason for the lower tenacity of the 300 + 68 tex yarns is the greater proportion
of the effect filaments which contribute less to the strength than the core since the
tenacity is calculated by dividing the breaking force by the total linear density of the
yarn. Yarns textured at 5 bars pressure were also examined under a projection
microscope at 20x magnification to find out if there were any structural differences
between them and the following results were obtained:

95
Figure 5.3 photomicrographs of 300 + 34 tex 5 bars textured yarn structure
Figure 5.4 Photomicrographs of 300 + 68 tex 5 bars textured yarn structure

96
The photomicrographs in Figures 5.3 and 5.4 showed a difference in structure in the
two types of textured yarns. The structure of the 300 + 68 tex textured yarn
possessed more loops and cross filaments which caused more disturbance in the
structure of yarn. The number of filaments in the structure of the feed yarns were
also determined and listed in the following table:
Table 5.1 Number of filaments in glass yarns
Yarn linear
density (tex) No. of filaments
Filament
diameter (μm)
34 211 9
68 341 10
300 767 14
600 1780 13
The filament diameters mentioned in Table 5.1 show that the filaments have different
diameters and hence the doubling of linear density is not just the doubling of yarns. It
can be observed from the above table that the 300 + 68 tex yarn had more filaments
i.e. (767+341=1108) in the structure than the 300 + 34 tex yarn i.e. (767+211=978).
The higher number of filaments usually enhanced the texturing effect. It caused more
mutual entanglement of filaments within the yarn at the same air pressure and hence
decreased the tenacity. Alagirusamy and Ogale [2004] also indicated that
improvement in texturing and an increase in the mutual entanglement of filaments
took place if a higher number of filaments were available in the yarn structure. This
improvement in the texturing process resulted in a decrease in tenacity of the
resultant textured yarn.
Therefore the higher effect yarn linear density and the higher number of filaments in
the structure of the 300 + 68 tex textured yarns were the two possible reasons for the
greater percentage loss in tenacity after the texturing process as compared to the 300
+ 34 tex textured yarns.

97
5.4. Tenacity of the 600 tex category
Textured glass yarns of the 600 tex core category were also examined for change in
tenacity and the following results were obtained:
Tenacity of 600 tex glass yarns after texturing process
05
101520253035404550
600 NT
600+34 5B
600+68 5B
Yarn type
Tena
city
(cN
/tex)
Figure 5.5 Tenacity of textured and non-textured glass yarns of 600 tex category
The same loss in tenacity after the texturing process was found in the 600 tex
category (Figure 5.5) although the percentage loss is smaller than for the 300 tex
yarns i.e. (21% and 24%) in the 600 + 68 and 600 + 34 tex yarns respectively.
However, no significant difference in tenacity was found between the 600 + 34 and
600 + 68 tex yarns textured at 5 bars air pressure. This is likely to be due to the
smaller linear density difference between the 600 + 68 tex yarn and the 600 + 34 tex
yarn. Therefore, the disturbance in the yarn structure after the texturing process was
not very different between the two yarns. This is in contrast to the 300 tex yarn
category where the tenacity of the 300 + 68 tex yarns was significantly lower as
compared to the 300 + 34 tex yarns at 5 bars texturing air pressure (Figure 5.6).

98
Comparison of 300 and 600 tex categories at 5 bar pressure
05
10152025303540
300+34
300+68
600+34
600+68
Yarn type
Tena
city
(cN
/tex)
Figure 5.6 Comparison of tenacity of 300 and 600 tex textured yarns
Moreover, the disturbance during the texturing process is more on the surface.
Therefore, the 600 tex yarns with more core filaments in the structure have a reduced
number of disturbed fibres. This helped in maintaining the tenacity after the texturing
process.
The textured core-and-effect yarns of 600 + 34 and 600 + 68 tex were also observed
under a projection microscope and the following images were obtained:

99
Figure 5.7 Photomicrographs images of 600 + 34 tex 5 bars textured yarn structure
Figure 5.8 Photomicrographs of 600 + 68 tex 5 bars textured yarn structure
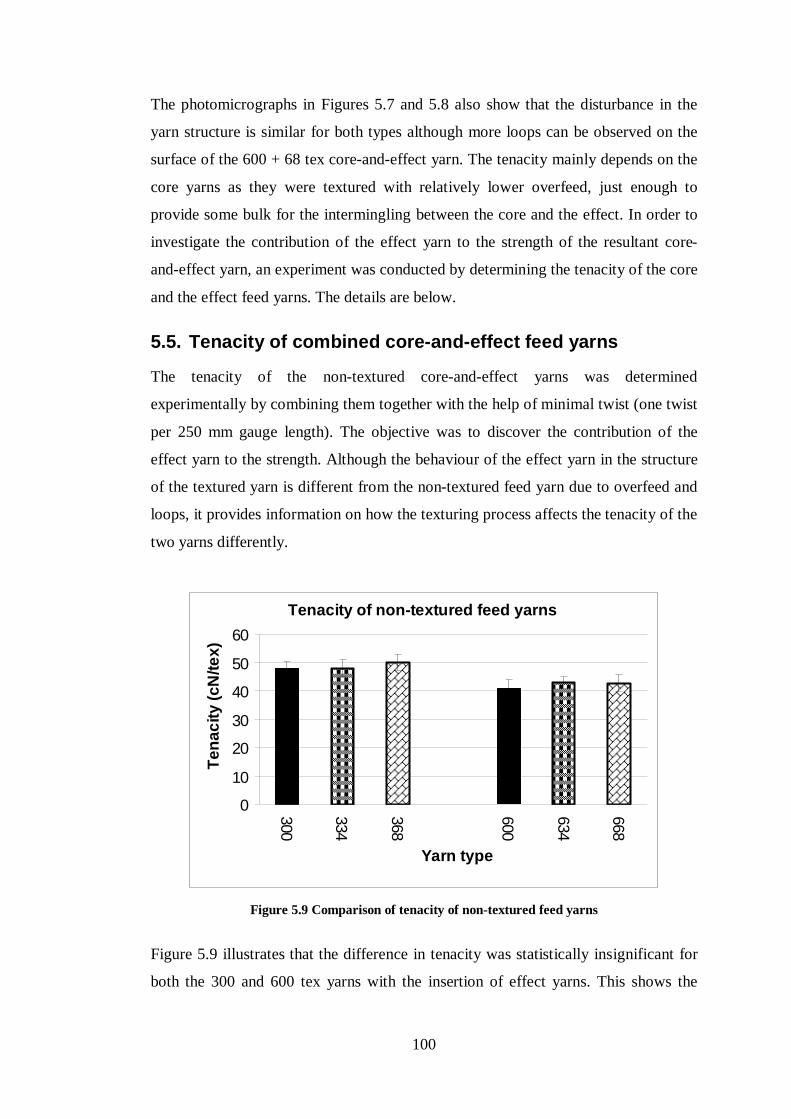
100
The photomicrographs in Figures 5.7 and 5.8 also show that the disturbance in the
yarn structure is similar for both types although more loops can be observed on the
surface of the 600 + 68 tex core-and-effect yarn. The tenacity mainly depends on the
core yarns as they were textured with relatively lower overfeed, just enough to
provide some bulk for the intermingling between the core and the effect. In order to
investigate the contribution of the effect yarn to the strength of the resultant core-
and-effect yarn, an experiment was conducted by determining the tenacity of the core
and the effect feed yarns. The details are below.
5.5. Tenacity of combined core-and-effect feed yarns
The tenacity of the non-textured core-and-effect yarns was determined
experimentally by combining them together with the help of minimal twist (one twist
per 250 mm gauge length). The objective was to discover the contribution of the
effect yarn to the strength. Although the behaviour of the effect yarn in the structure
of the textured yarn is different from the non-textured feed yarn due to overfeed and
loops, it provides information on how the texturing process affects the tenacity of the
two yarns differently.
Tenacity of non-textured feed yarns
0
10
20
30
40
50
60
300
334
368
600
634
668
Yarn type
Tena
city
(cN
/tex)
Figure 5.9 Comparison of tenacity of non-textured feed yarns
Figure 5.9 illustrates that the difference in tenacity was statistically insignificant for
both the 300 and 600 tex yarns with the insertion of effect yarns. This shows the

101
contribution of effect yarn in maintaining the overall tenacity of the non-textured
yarns otherwise the tenacity (cN/tex) would be lower.
However, the case is different for the textured core-and-effect yarn and the effect
yarns contributing less in the overall tenacity. The reason is their more disoriented
structure because they were overfed. The effect yarn usually enhances the texturing
effect by the formation of loops and causing disturbance in the yarn structure. This in
turn resulted in a decrease in tenacity of the resultant textured yarn.
5.6. Broken filaments and loss in linear density
The linear density (tex) of the resultant yarn was found to be slightly reduced after
the texturing process as shown in Figure 5.10 although theoretically it was expected
to be increased because of the overfeeding. The reduction in linear density was
calculated against the nominal linear density of the particular yarn which was
determined by incorporating overfeed percentages of the constituent yarns. The
major reason for the reduction in linear density was the modified winding process
which was carried out at a slightly higher speed (5 %) than the speed of the delivery
roller of the machine. This helped in tightening up the loops and proper winding of
the resultant textured yarn on a cone for the subsequent warping and weaving
processes. The other possible reason for this reduction was the broken filaments and
fibre fly generated during the texturing process which settled on different parts of the
machine. A hand blower was used to blow the fibre fly away from the machine
processing line in order to avoid any contamination of the resultant yarn. Choi [1999]
as cited by Alagirusamy and Ogale [2004a, 2006b] reported the effect of different
types of commingling and air texturing nozzles on carbon filaments. They stated that
increase in the air pressure resulted in increasing filament damage and loss of broken
filaments which adversely affected the yarn strength and linear density. Their
experimental results showed that the linear density was decreased in all the cases
with an increase in the texturing air pressure. It was also observed from the results of
this study (Figure 5.10a) that the linear density of the textured yarns decreased with
an increase in the air pressure from 3 bars to 5 bars in the 300 tex category.

102
Variation in linear density of glass yarns (300 tex)
280300320340360380400
Nom
inal lineardensity
300+34 (3 Bar)
300+34 (4 Bar)
300+34 (5 Bar)
Nom
inal lineardensity
300+68 (3 Bar)
300+68 (4 Bar)
300+68 (5 Bar)
Yarn type
Line
ar d
ensi
ty (t
ex)
(a)
Variation in linear density of glass yarns (600 tex)
580600620640660680700
Nom
inal lineardensity
600+34 (5 Bar)
Nom
inal lineardensity
600+68 (5 Bar)
Yarn type
Line
ar d
ensi
ty (t
ex)
(b)
Figure 5.10 Linear density (tex) of textured glass yarns (a) 300 tex (b) 600 tex category

103
5.7. Summary
Significant loss in tenacity was observed after the texturing process in both the 300
tex and 600 tex glass yarn categories. However, the variation in tenacity of the 300
tex textured yarns with the change in texturing air pressure from 3 to 5 bars was
insignificant.
In the 300 tex category, the loss was found to be higher in the 300 + 68 tex yarns as
compared to the 300 + 34 tex yarns. The reason for this is the greater proportion of
the effect filaments which contribute less to the strength than the core since the
tenacity is calculated by dividing the breaking force by the total linear density of the
yarn.
The difference in tenacity of the 600 + 34 and 600 + 68 tex core-and-effect yarns was
found to be statistically insignificant. This is likely due to the smaller linear density
difference between the 600 + 68 tex yarn and the 600 + 34 tex yarn. The disturbance
in the yarn structure after the texturing process was not very different between the
two yarns.
The contribution of the effect yarn in the tenacity of the resultant yarn was
investigated and it was observed that it behaved differently in textured and non-
textured yarn. The effect yarn contributed to the total tenacity in non-textured yarn
but in the textured yarn they contributed less because of more disorientation and
overfeed than expected. However, it enhances the texturing effect by the formation
of loops and causes disturbance in the yarn structure.
It was also observed that the linear density was decreased after the texturing process.
The reason was the installation of a modified winding unit which accounted for the
tightening up of loops by winding the yarn under tension. Moreover, filament
damage during the texturing process which caused a loss of broken filaments in the
form of fibre fly was the other possible reason for the reduction in linear density after
the texturing process.

104
6. Chapter 6 Composites made with textured yarns: mechanical
testing, results and discussion
6.1. Introduction
A common mode of damage in high performance composites is delamination. This
mode of failure depends on the intrinsic properties of the fibre along with the
external loading conditions. The aim of this project is to optimise the lamination
properties of glass composites by using the air-jet texturing process. Composites
were prepared using fabrics made from both textured and non-textured yarns and
their mechanical properties were determined and compared in this chapter to
investigate the effect of the texturing process on these properties.
6.2. Composites nomenclature
The composites are divided into categories based on the linear density of the core
and effect yarns (tex value), the air pressures used for texturing, sample directions
(warp and weft) and the weave structure. For example 300 + 34 tex 5B Pl means:
Core yarn = 300 tex.
Effect yarn = 34 tex.
Air pressure = 5 bars.
Weave type = Plain weave.
The samples were tested in both the warp and weft directions because of the slightly
unbalanced weave structure. Apart from the composites made from the core-and-
effect textured yarns in the warp and weft directions, some other composites were
also produced and these are discussed in detail in the next chapter.

105
6.3. Fibre volume content
The density and fibre volume content are important physical properties of the
composites and are dependent on the amount of reinforcement present in the
structure. The density and fibre volume content were determined using the
immersion and calcination methods respectively for the textured and non-textured
composites. The procedures were explained in detail in Section 4.3 of this thesis. The
following results were obtained: Table 6.1 Fibre volume content of glass composites
Weave Type Composite type Density
(g/cm3) CV% Fibre
Volume Content
CV% Void content
Plain
300 non-textured 1.8628 0.74 52.18 1.85 1.49 300 + 34 3 bars 1.6441 1.42 36.15 3.06 1.28 300 + 34 4 bars 1.6293 1.61 37.69 3.50 4.30 300 + 34 5 bars 1.6278 1.05 38.78 1.71 5.10 300 + 68 4 bars 1.6653 1.39 37.94 1.97 1.57 300 + 68 5 bars 1.5579 0.45 36.56 2.37 7.9
Twill
300 non-textured 1.8361 0.43 48.64 0.2 0.10 300 + 34 3 bars 1.6662 0.25 37.13 0.66 0.53 300 + 34 4 bars 1.6688 0.96 37.84 1.81 1.15 300 + 34 5 bars 1.6928 0.63 38.85 1.27 0.29 300 + 68 3 bars 1.6622 0.19 37.77 1.62 1.65 300 + 68 4 bars 1.6597 1.00 37.59 2.18 1.64 300 + 68 5 bars 1.6314 0.62 38.08 0.88 4.05
Plain 600 non-textured 1.8621 0.75 52.25 1.11 1.63 600 + 34 5 bars 1.6996 1.13 39.10 1.19 0.10 600 + 68 5 bars 1.6665 0.47 38.19 0.85 1.76
Twill 600 non-textured 1.9104 0.35 54.39 0.71 0.01 600 + 34 5 bars 1.7255 0.52 43.96 1.73 3.50 600 + 68 5 bars 1.6510 0.62 36.41 2.01 1.13
The results in Table 6.1 illustrate reductions in the density and fibre volume content
in all the categories of the textured composites as compared to the non-textured
composites. The number of fabric layers and the weave structures are same for the

106
two types of composites (i.e. textured and non-textured) however, because of the
bulkier structure of the constituent textured yarn, the textured composites were found
to be thicker and with lower fibre volume content. Table 6.1 also shows the void
content of composites below 5 % which is an acceptable level for the majority of
applications [Liu et al 2006]. The only exception is the 300 + 68 5 bars plain
composites with approx. 8% void content which might be because of the
experimental error.
6.4. Tensile testing of composites
The basic purpose of tensile testing is to determine the tensile strength and modulus
of the material and to analyse the change in the property due to the texturing process.
The tensile strength and tensile modulus were obtained for both the textured and non-
textured composite samples in the warp and weft directions.
The composites are divided into two groups based on the two weave structures, plain
and twill. In the case of 300 + 68 tex yarns textured at 3 bars pressure, the weaving
process became almost impossible because of the excessive warp yarn entanglement
and resulted in the failure to produce enough fabric to conduct tensile testing. The
same problem happened in the case of the twill fabric of 300 + 34 tex yarns textured
at 4 bars air pressure.
The standard followed for the determination of tensile properties is BS 2782-10
[1977]. Five specimens of each type were cut in both the warp and weft directions
using a diamond blade cutter. Extensometer was applied to the composite specimens
to acquire modulus data. The tests were conducted on an Instron universal testing
machine model 1331 with 50 kN load cell at an extension rate of 2.0 mm/min. The
following results were obtained for tensile properties of the 300 tex composites.

107
6.4.1. Tensile properties of 300 tex plain weave composites
Tensile strength 300 plain
050
100150200250300350400
300 NT
300+34 3B
300+34 4B
300+34 5B
300+68 4B
300+68 5B
300 NT
300+34 3B
300+34 4B
300+34 5B
300+68 4B
300+68 5B
Composite type
Tens
ile s
treng
th (M
Pa)
Figure 6.1 Tensile strength of 300 tex plain weave composites
Tensile modulus 300 plain
0
5000
10000
15000
20000
25000
30000
300 NT
300+34 3B
300+34 4B
300+34 5B
300+68 4B
300+68 5B
300 NT
300+34 3B
300+34 4B
300+34 5B
300+68 4B
300+68 5B
Composite type
Ten
sile
mod
ulus
(MPa
)
Figure 6.2 Tensile modulus of 300 tex plain weave composites
It can be seen from the results of 300 tex plain weave samples (Figures 6.1 and 6.2)
that there was a statistically significant reduction in tensile strength after texturing.
Plain Warp Plain Weft
Plain Warp Plain Weft

108
This is mainly due to the reduction in the breaking strength of the constituent yarns
after the texturing process (as discussed in Chapter 5). There is no obvious trend in
the effects of air pressure on tensile strength and the difference is statistically
insignificant. This is because the tenacity of the constituent yarns was also not
changed considerabily by varying the texturing air pressure as explained in Chapter
5. It can also be seen that the reduction in tensile properties of the textured
composites were smaller when compared to the reduction in the breaking strength of
the contituent yarns after texturing. The reduction in tensile strength ranges from 20
to 32 % after the texturing process whereas the reduction in tenacity of the textured
yarns was in the range of 41 to 62 %. This is due to the contribution of the matrix
which held the filaments together and distributed the load more evenly among the
filaments once they were embedded in the composites. This was also observed by
Langston [2003] in his work on textured Aramid yarns.
The tensile strength values in the weft direction were mostly found to be less than the
warp direction for plain weave because there were slightly fewer yarns (less yarn
density) in the weft direction as shown in Table 3.1.
6.4.2. Tensile properties of 300 tex twill weave composites
The tensile properties of the 300 tex twill weave fabric composites are shown in
Figures 6.3 and 6.4.
Tensile strength 300 twill
050
100150200250300350400
300 NT
300+34 3B
300+34 5B
300+68 4B
300+68 5B
300 NT
300+34 3B
300+34 5B
300+68 4B
300+68 5B
Composite type
Tens
ile s
treng
th (M
Pa)
Figure 6.3 Tensile strength of 300 tex twill weave composites
Twill Warp Twill Weft

109
Tensile modulus 300 twill
0
5000
10000
15000
20000
25000
300 NT
300+34 3B
300+34 5B
300+68 4B
300+68 5B
300 NT
300+34 3B
300+34 5B
300+68 4B
300+68 5B
Composite type
Tens
ile m
odul
us (M
Pa)
Figure 6.4 Tensile modulus of 300 tex twill weave composites
Similarly to the plain weave composites, a statistically significant reduction in tensile
properties was observed in the twill weave composites. It can be seen that the
variation in the tensile properties was statistically insignificant with the change in
texturing air pressure for both 300 + 34 and 300 + 68 tex twill weave composites.
Moreover, the tensile strength in the weft direction of 300 + 34 tex category was
higher than in the warp direction because of the slightly unbalanced weave (having
higher fibre density in the weft direction). This is because of the structure of 1/3 twill
weave which contained less interlacing in the warp and weft directions.
6.4.3. Tensile properties of 600 tex plain and twill composites
600 tex textured composites were made by texturing the glass yarn at 5 bars pressure
only. This was because it was found that for the 300 tex category, the yarn made at 5
bars pressure had the least entanglement problems in weaving. The tensile properties
of 600 tex composites are shown in Figures 6.5 and 6.6.
Twill Warp Twill Weft
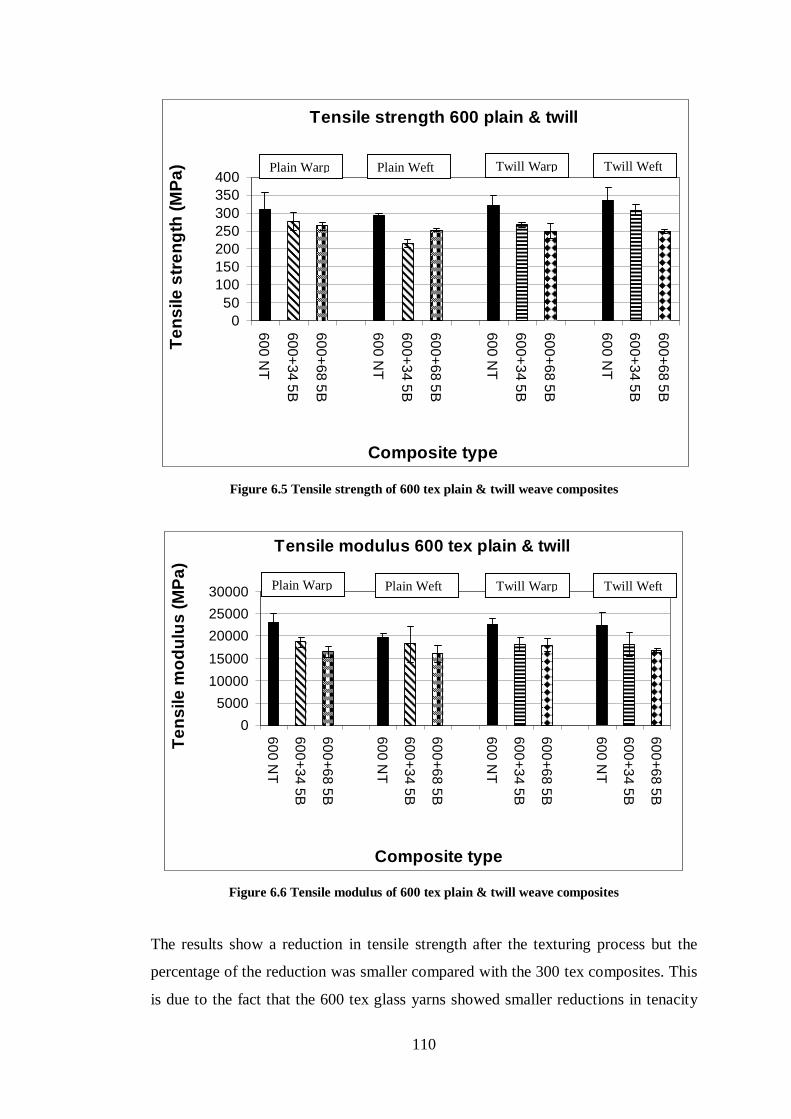
110
Tensile strength 600 plain & twill
050
100150200250300350400
600 NT
600+34 5B
600+68 5B
600 NT
600+34 5B
600+68 5B
600 NT
600+34 5B
600+68 5B
600 NT
600+34 5B
600+68 5B
Composite type
Ten
sile
stre
ngth
(MPa
)
Figure 6.5 Tensile strength of 600 tex plain & twill weave composites
Tensile modulus 600 tex plain & twill
05000
1000015000200002500030000
600 NT
600+34 5B
600+68 5B
600 NT
600+34 5B
600+68 5B
600 NT
600+34 5B
600+68 5B
600 NT
600+34 5B
600+68 5B
Composite type
Tens
ile m
odul
us (M
Pa)
Figure 6.6 Tensile modulus of 600 tex plain & twill weave composites
The results show a reduction in tensile strength after the texturing process but the
percentage of the reduction was smaller compared with the 300 tex composites. This
is due to the fact that the 600 tex glass yarns showed smaller reductions in tenacity
Plain Warp Plain Weft Twill Warp Twill Weft
Plain Warp Plain Weft Twill Warp Twill Weft

111
than the 300 tex yarns after texturing. The decrease in tensile properties was found to
be statistically significant in most of the plain and twill weave composites of the 600
+ 34 and 600 + 68 tex categories. It was observed that the tensile properties of the
twill weave composites in the weft direction were higher than or similar to the warp
direction for both the textured and non-textured composites. This is because of the
slightly unbalanced weave and higher fibre density in the weft direction as shown in
Table 3.1.
The failure mechanism of textured and non-textured composites was also observed to
be different. Delamination in the testing area of the specimen accompanied by an
audible cracking sound was observed before failure in the non-textured composite
samples whereas the textured composites failed without excessive delamination. It
can be observed through the images (Figures 6.7 and 6.8) taken after the tensile
testing that de-lamination surrounding the area of failure was higher in the non-
textured 600 tex plain composites followed by delamination marks in the whole
testing area. However, the textured composites of 600+ 68 tex 5 bars plain weave did
not show any major sign of delamination in the testing area. Moreover, the
delamination at the point of failure was also found to be small for textured
composites. This illustrated the difference in the laminate bonding between the two
types of composites. The textured composites showed better results as the loopy and
bulkier yarn structure promoted bonding between the laminate layers.

112
Figure 6.7 Tensile tested samples of 600 tex non-textured plain weave composites
Delamination surrounding the area of failure
Delamination marks in the testing area

113
Figure 6.8 Tensile tested samples of 600 + 68 tex 5 bars textured plain weave composites
6.5. Flexure testing of composites
The flexure test is used in the industry to determine the resistance of laminated
reinforced fibre composites when they are subjected to bending loads. The flexure
test is also used to determine the inter-laminar shear strength (ILSS) of a laminate by
using a short beam [Hodgkinson (2000)]. The process is almost the same for the two
tests except for the size of the test specimen (explained in Section 4.5).
Delamination surrounding the area of failure

114
The flexure properties were determined according to British Standard BS EN ISO
14125 [1998] and the following results were obtained for the 300 tex plain weave
category.
6.5.1. Flexure properties of 300 tex plain weave composites
Flexure strength 300 plain
0
100
200
300
400
500
300 NT
300+34 3B
300+34 4B
300+34 5B
300+68 4B
300+68 5B
300 NT
300+34 3B
300+34 4B
300+34 5B
300+68 4B
300+68 5B
Composite type
Flex
ure
stre
ngth
(MPa
)
Figure 6.9 Flexure strength of 300 tex plain weave composites
Flexure modulus 300 plain
0
4000
8000
12000
16000
300 NT
300+34 3B
300+34 4B
300+34 5B
300+68 4B
300+68 5B
300 NT
300+34 3B
300+34 4B
300+34 5B
300+68 4B
300+68 5B
Composite type
Flex
ure
mod
ulus
(M
Pa)
Figure 6.10 Flexure modulus of 300 tex plain weave composites
Plain Warp Plain Weft
Plain Warp Plain Weft

115
It can be seen from Figures 6.9 and 6.10 that the flexure strength of the 300 tex plain
weave composites decreased significantly after the texturing process with both 34
and 68 tex effect yarns. The only exception is for the plain woven composite of 300
+ 34 tex yarn textured at 5 bars pressure which showed a flexure strength equal to the
300 tex non-textured composite. The flexure modulus showed a significant reduction
after the texturing process in the weft direction of all the 300 tex composites.
However, the reduction in the warp direction was small and statistically insignificant.
No particular trend can be seen for the textured composites with the change of
texturing air pressure from 3 to 5 bars. In the 300 + 68 tex composites, no significant
variation in the flexure properties is observed with the change of texturing air
pressure.
Sudarisman [2008] reported that the flexure properties also depend on the fibre
volume content of the composite structure along with the other parameters.
Therefore, it can be assumed that the decrease in flexure properties of the textured
composites is because of their lower fibre volume content.
6.5.2. Flexure properties of 300 tex twill weave composites
The flexure properties of the twill weave composites from the 300 tex category are
shown in Figures 6.11 and 6.12:
Flexure strength 300 twill
0
100
200
300
400
500
300 NT
300+34 3B
300+34 4B
300+34 5B
300+68 3B
300+68 4B
300+68 5B
300 NT
300+34 3B
300+34 4B
300+34 5B
300+68 3B
300+68 4B
300+68 5B
Composite type
Flex
ure
stre
ngth
(MPa
)
Figure 6.11 Flexure strength of 300 tex twill weave composites
Twill Warp Twill Weft

116
Flexure modulus 300 twill
0
4000
8000
12000
16000
300 NT
300+34 3B
300+34 4B
300+34 5B
300+68 3B
300+68 4B
300+68 5B
300 NT
300+34 3B
300+34 4B
300+34 5B
300+68 3B
300+68 4B
300+68 5B
Composite type
Flex
ure
mod
ulus
(MP
a)
Figure 6.12 Flexure modulus of 300 tex twill weave composites
The twill weave composites of the 300 tex textured yarns showed slightly better
results as compared to the plain weave composites of the same yarns. This is because
twill weave has less interlacing and more float yarns in the fabric structure as
compared to the plain weave which provided more contact surface between the
layers and therefore improve bonding.
It can be seen that although the flexure strength was reduced significantly in most
cases of textured composites, the modulus showed statistically insignificant
differences after texturing. Moreover, no significant variation was observed in the
flexure properties of the 300 + 34 and 300 + 68 tex categories with the change of
texturing air pressure in both the warp and weft directions.
6.5.3. Flexure properties of 600 tex composites
Flexure properties of the 600 tex textured composites are shown in Figures 6.13 and
6.14:
Twill Warp Twill Weft

117
Flexure strength 600 tex plain and twill
0
100
200
300
400
500
600 NT
600+34 5B
600+68 5B
600 NT
600+34 5B
600+68 5B
600 NT
600+34 5B
600+68 5B
600 NT
600+34 5B
600+68 5B
Composite type
Flex
ure
stre
ngth
(MPa
)
Figure 6.13 Flexure strength of 600 tex plain & twill weave composites
Flexure modulus 600 tex plain and twill
0
4000
8000
12000
16000
600 NT
600+34 5B
600+68 5B
600 NT
600+34 5B
600+68 5B
600 NT
600+34 5B
600+68 5B
600 NT
600+34 5B
600+68 5B
Composite type
Flex
ure
mod
ulus
(MPa
)
Figure 6.14 Flexure modulus of 600 tex plain & twill weave composites
It was observed using the t-test (Figures 6.13 and 6.14) that the flexure strength and
modulus of the 600 tex composites in both plain and twill weave structures were not
affected by the texturing process. Although the fibre volume content of the
Plain Warp Plain Weft Twill Warp Twill Weft
Plain Warp Plain Weft Twill Warp Twill Weft

118
composites was found to be lower after the texturing process, the introduction of
loops and bulk in the yarn helped in improving the fibre-matrix bonding and hence
enhanced the transfer of load between the laminates. Moreover, the lower
deterioration of 600 tex yarn after the texturing process also assisted in maintaining
the flexure properties. Therefore, it is concluded that the 600 tex composites were
better than the 300 tex composites in maintaining flexure properties after the
texturing process.
6.6. Inter-laminar shear strength (ILSS) testing
The ILSS was tested according to the BS EN ISO 14130 [1998] by using the three
point bending short beam method. The testing procedure was the same as the one
used for determining the flexure properties but the difference was the size of the
sample. ILSS is usually performed with a smaller span length/thickness ratio in order
to avoid bending and to increase the level of shear stress as discussed in Section 4.6.
The test was conducted on an Instron universal testing machine model 4411 with a 5
kN load cell at a constant crosshead speed of 1.0 mm/min.
6.6.1. ILSS of 300 tex plain and twill weave composites
The results of plain weave composites in the 300 tex category are as follows:
Inter-laminar shear strength 300 tex plain
0
5
10
15
20
25
30
35
40
45
300 NT
300+34 3B
300+34 4B
300+34 5B
300+68 4B
300+68 5B
300 NT
300+34 3B
300+34 4B
300+34 5B
300+68 4B
300+68 5B
Composite type
ILS
S (M
Pa)
Figure 6.15 ILSS of 300 tex plain weave composites
Plain Warp Plain Weft

119
After the texturing process, the ILSS of the 300 tex plain composites (Figure 6.15)
increased in both the warp and weft directions. The loops and bulky structure of the
textured yarns provided more contact area for the resin and increased the laminate
bonding strength. The increase in ILSS after the texturing process was statistically
significant in most cases. However, the effect of air pressure on the ILSS shows no
particular trend.
The inter-laminar shear strength in the twill weave 300 tex textured and non-textured
composites is shown in Figure 6.16.
Inter-laminar shear strength 300 tex twill
0
5
10
15
20
25
30
35
40
45
300 NT
300+34 3B
300+34 4B
300+34 5B
300+68 3B
300+68 4B
300+68 5B
300 NT
300+34 3B
300+34 4B
300+34 5B
300+68 3B
300+68 4B
300+68 5B
Composite type
ILS
S (M
Pa)
Figure 6.16 ILSS of 300 tex twill weave composites
The t-test confirms that the ILSS of the twill weave composites increased after the
texturing process (Figure 6.16). It can also be observed that the ILSS in the twill
weave composites was slightly higher than the plain weave composites in both the
warp and weft directions. The reason is the difference in structure of the two types of
weaves as explained in Section 6.4.2. The highest ILSS of 40 MPa was found in the
warp direction of the composite of 300 + 34 tex yarn textured at 5 bars pressure
followed by 39 MPa in both the warp and weft directions of the composite of 300 +
68 yarns textured at 5 bars pressure. The textured structures with bulk and loops
Twill Warp Twill Weft
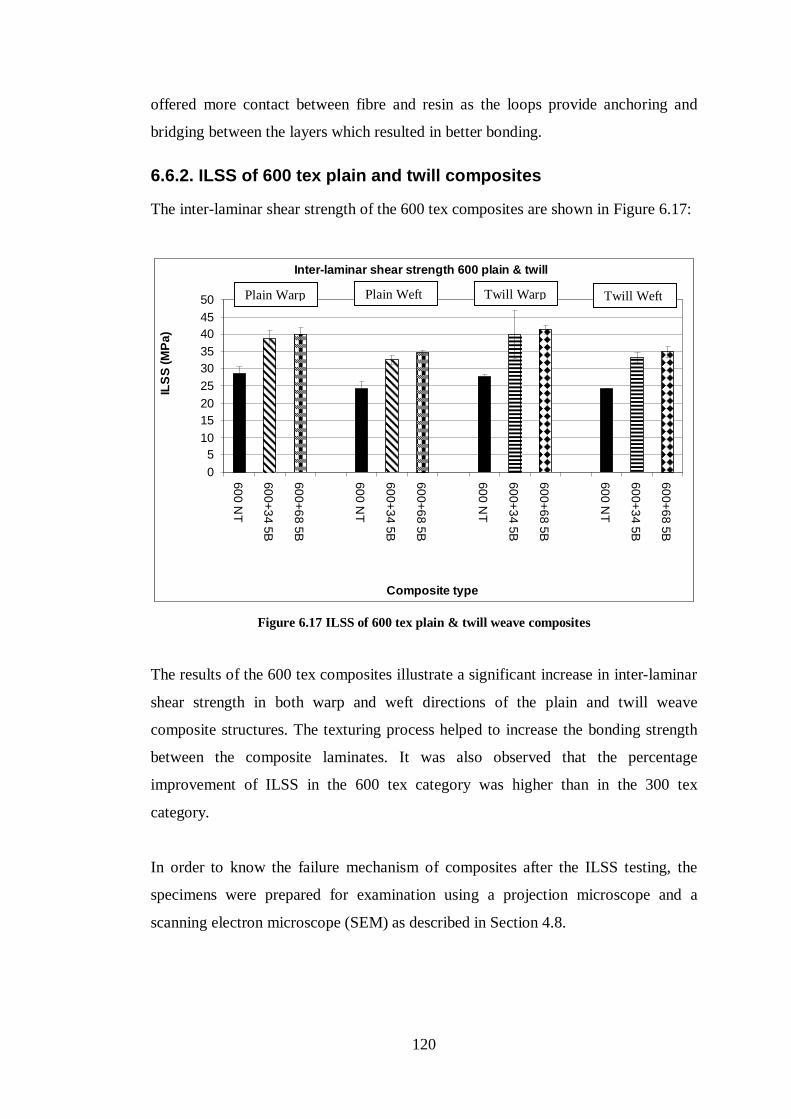
120
offered more contact between fibre and resin as the loops provide anchoring and
bridging between the layers which resulted in better bonding.
6.6.2. ILSS of 600 tex plain and twill composites
The inter-laminar shear strength of the 600 tex composites are shown in Figure 6.17:
Inter-laminar shear strength 600 plain & twill
05
101520253035404550
600 NT
600+34 5B
600+68 5B
600 NT
600+34 5B
600+68 5B
600 NT
600+34 5B
600+68 5B
600 NT
600+34 5B
600+68 5B
Composite type
ILS
S (M
Pa)
Figure 6.17 ILSS of 600 tex plain & twill weave composites
The results of the 600 tex composites illustrate a significant increase in inter-laminar
shear strength in both warp and weft directions of the plain and twill weave
composite structures. The texturing process helped to increase the bonding strength
between the composite laminates. It was also observed that the percentage
improvement of ILSS in the 600 tex category was higher than in the 300 tex
category.
In order to know the failure mechanism of composites after the ILSS testing, the
specimens were prepared for examination using a projection microscope and a
scanning electron microscope (SEM) as described in Section 4.8.
Plain Warp Plain Weft Twill Warp Twill Weft

121
6.6.3. Microscope and SEM Analysis
The microscope images of the samples after the inter-laminar shear strength test are
shown in Figures 6.18 to 6.22. The pictures show a bulkier structure of the yarns
with a greater yarn diameter in the textured fabric providing more contact area for
the resin. The decrease in fibre volume content and increase in thickness also
provided evidence of this bulkier structure. Figure 6.18 demonstrates a clear, smooth
delamination in non-textured samples whereas Figure 6.19 of the textured samples
shows the crack growth was in a zigzag fashion. This was possibly because of the
improved laminate bonding and the resistance provided by the loops through fibre
bridging between the laminate layers.

122
Figure 6.18 600 tex non-textured twill weave composite
Smooth Delamination

123
Figure 6.19 600 + 34 tex 5 bars twill weave composite
In Figure 6.20 some weft filaments of the upper layer can be seen below the crack
after delamination. This is an evidence of improvement in bonding between the
layers which force some filaments to remain attached with the lower layer after
delamination.
Delamination in a zigzag manner

124
Figure 6.20 SEM images 600 + 34 tex 5 bars twill weave composite
The improvement in bonding strength between the fibres and the resin helped in
transferring the load from the matrix to the fibres, which resulted in an increase in
ILSS up to 40 % (300 + 34 tex and 600 + 34 tex, 5 bars twill weave composites). In
contrast, fibre matrix debonding can be clearly observed without any significant fibre
damage in the composite specimen of the 600 tex without textured glass filaments
(Figure 6.18).
Figure 6.21 shows that there were no clear separation lines between the layers of the
composite made by using textured glass fabrics. The loops and bulkier structure of
the textured yarn caused the mixing of filaments from adjacent layers. However,
Figure 6.22 shows that for composites from the non-textured yarns, the separation
line can be easily seen due to a relatively straight filament structure.
Crack

125
Figure 6.21 SEM image 600 + 34 tex 5 bars plain weave composites
Figure 6.22 SEM image 600 without textured plain weave composite
6.7. Fracture toughness (Mode I) testing
This test method is usually used to find quantitatively the effect of fibre surface
treatment, local variations in fibre volume, processing conditions and environmental
variables on G1c (Strain energy release rate) of a composite material. It can also be
utilised to compare quantitatively the relative G1c values of differently constituted
composite materials. In addition, the method can help in determining the
Separation lines are not noticeable
Clear separation lines

126
delamination failure criteria for composite damage tolerance and durability analyses
[ASTM D 5528-01, 2007].
The Mode I fracture toughness of the textured and non-textured glass composites
was tested on an Instron 4411 machine according to standard ASTM D 5528-01
[2007]. The procedures, the equations used to determine the critical strain energy
release rate (G1c) and the testing jigs employed for the measurement of delamination
resistance are explained in detail in Section 4.7.1. The yarn used for fabricating twill
weave textured samples was 600 + 68, textured at 5 bars air pressure and the non-
textured twill samples were developed using the 600 tex non-textured yarn. Twill
weave fabrics were selected for determining the effect of texturing on fracture
toughness properties because Suppakul and Bandyopadhyay [2002] reported higher
fracture energies for these structures. They investigated the effect of different weave
patterns of E-glass fabric composites on the inter-laminar fracture toughness property
and found the highest energy values were from the twill weave composites.
Figure 6.23 (a & b) shows typical load versus crosshead displacement curves for the
double cantilever beam (DCB) tests performed on specimens made of textured and
non-textured glass fabrics. Initially, the applied load increased linearly with
extension due to the implanted delamination (developed by introducing the PTFE
film between the middle layers as stated earlier in Section 4.7.1) for both types until
the commencement of the crack propagation. With the growth of the crack, several
load drops were experienced until the desired delamination of the DCB specimen
was reached. The critical load (N) and the crack length (mm) were recorded at the
onset of the crack propagation and at intervals during crack propagation.

127
Figure 6.23 Typical load versus crosshead displacement curves for mode I specimens of the 600
non-textured twill weave and the 600 + 68 tex 5 bars twill weave composites The resistance curve (R-curve) in Figure 6.24 shows mode I crack initiation and
propagation energies of the textured and non-textured glass composite samples. The
initiation values of G1c can be evaluated in three forms as stated below by using the
load displacement value.
At the point of deviation from linearity in the load-displacement curve and
symbolised as NL and is usually the lowest of all the three G1c initiation
values.
By visually observing the point on the edge at which the delamination starts
with the help of a magnification device symbolized as VIS.
The 5% offset which is measured at the point at which the compliance has
increased by 5%.
All three G1c initiation values were calculated for both the textured and non-textured
samples. It was found from the R-curve that the textured composite samples have
higher initiation and propagation G1c values than the non-textured samples. The
improvement in G1c values in the textured composites was due to enhanced bonding
between the layers since the bulkier loopy structure of textured yarns offered more
contact area for resin to adhere. Deng and Ye [1999] reported that the values of G1c
relied on the mechanisms of delamination growth and were affected by several
factors such as the inter-laminar bonding strength, fibre/matrix adhesion and the

128
degree of fibre bridging. Therefore, the higher G1c value of the textured composites
provided more evidence of improvement in laminate bonding strength after the
texturing process. Figure 6.25 shows mean values of the initiation and propagation
data along with the error bars and it was found that the increase in G1c of textured
composites was statistically significant.
0
0.5
1
1.5
2
2.5
50 55 60 65 70 75 80 85 90 95 100
Delamination length, a (mm)
GIc
(kJ/
m2)
600+68 textured Prop600 Non-textured PropNL texturedNL non-textured5% offset textured5% offset non-textured
Figure 6.24 Initiation and propagation values for mode I testing of 600 + 68 tex 5 bars textured
and 600 non-textured twill weave composites
Visual Initiation values

129
0.0
0.5
1.0
1.5
2.0
NL N
ontextured
NL Textured
5% offset
Non textured
5% offset
Textured
VIS
Non
textured
VIS
Textured
Non texturedP
rop.GIC
TexturedP
rop.GIC
GIc
(kJ/
m2)
Figure 6.25 Comparison of the mean values of G1c (visual, 5 % offset and propagation) for mode
I DCB testing of 600 + 68 tex 5 bars textured and 600 non-textured twill weave composites
It can be observed from Figure 6.24 that the value of G1c was increased with
propagation of cracking in both the textured and non-textured samples. This fact was
also evident from the mean data shown in Figure 6.25 where the mean G1c values of
crack propagation for both textured and non-textured samples were higher than the
crack initiation values. It was reported that since the G1c value depends on the
delamination crack length and laminate thickness, the initiation values of G1c are
usually much lower than the values measured during stable propagation. Also the
fracture toughness properties depend on a number of factors such as the complex
interaction of fibres, fibre geometry, resin type and properties but fibre bridging is
the dominant factor in contributing to fracture toughness of composites [ASTM D
5528-01, 2007].
The SEM micrographs for the DCB fracture surfaces of the textured and non-
textured samples are presented in Figures 6.26 and 6.27. It can be observed that in
the non-textured composites, the fracture occurred predominantly at the fibre/matrix
interface as reflected by the barse filaments and filament imprints or impressions left
by them on the fracture surfaces indicating poor interfacial bonding. Although some
Crack Initiation
Crack Propagation

130
broken filaments can be observed on the surfaces, the common phenomenon of
fractured de-bonded fibres or fibre bridging was not commonly found. However, the
examination of fractured surfaces of textured samples (Figure 6.27) show debonded
and fractured filaments and evidence of fibre bridging which results in higher
fracture toughness. It was reported that pull-out and breakage of bridged fibres are
dissipative processes that require input of work and thus result in high fracture
resistance [Suppakul and Bandyopadhyay 2002]. It can be seen from the images of
the textured samples that the filaments have lower alignment than the non-textured
samples and cross filaments can be observed which demonstrate the loopy and
bulkier yarn structure.
Figure 6.26 SEM micrographs of fracture surfaces of 600 tex twill weave non-textured
composite

131
Figure 6.27 SEM micrographs of fracture surfaces of 600 + 68 tex 5 bars twill weave textured
composite
6.8. Summary
This chapter presents the effect of the texturing process on the mechanical properties
of glass fabric composites. The composites were divided into two categories
depending upon the linear density of the constituent yarn i.e. the 300 tex and 600 tex
category. The mechanical properties were tested for both the textured and non-
textured samples and the results were compared.
The tensile properties were significantly reduced after the texturing process in both
the composites of the 300 tex (14% to 32%) and the 600 tex (10% to 25%)
categories. However, the composites of the 600 tex category showed a lower
reduction in tensile properties after texturing than the 300 tex category. This is due to
the fact that the deterioration in breaking strength of the 600 tex glass yarn after
texturing is smaller than that of the yarns of 300 tex category. The flexure properties
of the 300 tex composites were reduced (i.e. 14% to 30%) after texturing but
remained unchanged for 600 tex composites.

132
Improvement was observed in the inter-laminar shear strength (i.e. 15% to 33% in
the 300 tex and 35% to 45% in the 600 tex category) and also in the fracture
toughness Mode-1 (50%) of the composites after texturing. This is due to the fact
that the loops and bulkier structure of the textured fabric offered more contact
between the fibre and resin and enhanced fibre-matrix adhesion. The fibre bridging
due to the textured loops also resulted in higher fracture toughness for the textured
composites.
The effect of texturing air pressure on the mechanical properties was unclear. The
performance of composites was also compared on the bases of the fabric weave
structure. Twill weave has less interlacing and more float yarns in the fabric structure
as compared to the plain weave, which provided more contact surface and therefore
improved bonding between the layers.

133
7. Chapter 7 Composites with textured and non-textured core
yarns
7.1. Introduction
This chapter is concerned with some of the other types of textured composites which
can be produced in addition to those made from the core-&-effect textured yarns in
both the warp and weft directions as described in Chapter 6. The composition of
fabrics was changed by using the core textured yarns or using the non-textured core
yarn in the warp and core-&-effect yarn in the weft. These composites are
represented by “CT” and “WfW” respectively as mentioned in Section 3.4. The aim
of developing these composites especially the WfW composites was to improve
weaving performance and the tensile properties without losing too much of the
advantage of the improved inter-laminar shear strength. This chapter explains in
detail these modified composites and the effect of texturing on their mechanical
properties.
7.2. Core textured yarn composites
The core textured (CT) composites were developed using single core textured yarn.
The yarn for these composites was made by texturing only the 600 tex yarn at 5 bars
pressure. The resulting yarn had a bulkier structure but did not possess any loops
because of the absence of finer effect yarn. This was found to be a relatively simpler
texturing process in terms of yarn handling and the overfeed percentage for the yarn
was kept the same as for the other textured yarns, i.e. 2.9 %. The yarn is coded as
“CT yarn” which means core textured yarn.
Two different types of composites were prepared using the CT yarn by varying the
weft. In Type 1, the plain and twill weave fabrics were made using 600 tex CT yarn
for both the warp and weft. In Type 2, 600 tex CT yarn was used in the warp and the
core-&-effect yarn of 600 + 68 tex was used in the weft.
7.2.1. Fibre volume content of CT composites
Table 7.1 shows the density and fibre volume content of the CT composites
determined by using the immersion and calcination methods respectively. The

134
procedures were explained in detail in Section 4.3 and the following results were
obtained.
Table 7.1 Fibre volume content of CT composites
Weave Type Composite type Density
(g/cm3) CV%
Fibre Volume Content
CV%
Void content
Plain
600 non textured 1.8621 0.75 52.25 1.11 1.63 600 CT 5 bars (Type 1) 1.6960 0.56 39.91 4.75 1.27 600 CT 668 5 bars (Type 2)
1.6550 0.80 38.83 1.32 0.80
Twill
600 non textured 1.9104 0.35 54.39 0.71 0.01 600 CT 5 bars (Type 1) 1.6870 0.14 36.16 2.52 0.86 600 CT 668 5 bars (Type 2)
1.6640 0.62 36.61 1.71 1.02
Table 7.1 shows reductions in the density and fibre volume content of the CT
textured composites after texturing similar to the composites of the core-&-effect
textured yarns (Section 6.3). The number of fabric layers and the weave structure is
the same for the textured and non-textured composites. However, the bulkier
structure of the constituent textured yarn resulted in thicker textured composites with
lower fibre volume content. Table 7.1 also shows the void content of composites
below 2 % which is well within the acceptable level for critical applications [Liu et al
2006].
7.3. Mechanical properties of CT composites
The mechanical properties of these composites were determined and compared with
the properties of the non-textured composites, similar to the work done with core-&-
effect textured yarn based composites.
7.3.1. Tensile properties of 600 tex CT composites
The tensile properties of the 600 tex CT composites are shown in Figures 7.1 and
7.2.

135
Tensile strength 600 tex core textured plain & twill
050
100150200250300350400
600 NT
600 CT 5B
600 CT 668 5B
600 NT
600 CT 5B
600 CT 668 5B
600 NT
600 CT 5B
600 CT 668 5B
600 NT
600 CT 5B
600 CT 668 5B
Composite type
Ten
sile
stre
ngth
(MP
a)
Figure 7.1 Tensile strength of 600 tex CT plain & twill weave composites
Tensile modulus 600 tex core textured plain & twill
0
5000
10000
15000
20000
25000
30000
600 NT
600 CT 5B
600 CT 668 5B
600 NT
600 CT 5B
600 CT 668 5B
600 NT
600 CT 5B
600 CT 668 5B
600 NT
600 CT 5B
600 CT 668 5B
Composite type
Tens
ile m
odul
us (M
Pa)
Figure 7.2 Tensile modulus of 600 tex CT plain & twill weave composites
Similarly to the case of core-&-effect textured yarn composites, a reduction in tensile
properties was observed after the texturing process in both types of CT composites.
Tensile strength and modulus were significantly reduced in both the warp and weft
directions of the plain and twill weave structures. This is due to the fact that the
tenacity of CT yarns also decreased significantly (31.2 %) after the texturing process.
Plain Warp Plain Weft Twill Warp Twill Weft
Plain Warp Plain Weft Twill Warp Twill Weft

136
It can also be observed that there was no considerable difference in the tensile
properties of the two types of CT composites with the change of weft yarn.
7.3.2. Flexure properties of 600 tex CT composites
The flexure properties of the 600 tex CT composites are shown in Figure 7.3 and 7.4.
Flexure strength 600 tex core textured plain and twill
0
100
200
300
400
500
600 NT
600 CT 5B
600 CT 668 5B
600 NT
600 CT 5B
600 CT 668 5B
600 NT
600 CT 5B
600 CT 668 5B
600 NT
600 CT 5B
600 CT 668 5B
Composite type
Flex
ure
stre
ngth
(MPa
)
Figure 7.3 Flexure strength of 600 tex CT plain & twill weave composites
Flexure modulus 600 tex core textured plain and twill
0
4000
8000
12000
16000
20000
600 NT
600 CT 5B
600 CT 668 5B
600 NT
600 CT 5B
600 CT 668 5B
600 NT
600 CT 5B
600 CT 668 5B
600 NT
600 CT 5B
600 CT 668 5B
Composite type
Flex
ure
mod
ulus
(MPa
)
Figure 7.4 Flexure modulus of 600 tex CT plain & twill weave composites
Plain Warp Plain Weft Twill Warp Twill Weft
Plain Warp Plain Weft Twill Warp Twill Weft

137
Figures 7.3 and 7.4 show that the flexure properties of CT composites were either
similar or increased after the texturing process. It can also be observed that the
flexure properties of the twill weave composites were slightly higher than the plain
weave composites in both types of CT composites.The reason is probably due to the
fact that the twill weave has less interlacing and more float yarns which provided
more contact surface for the resin and improved the bonding between the layers.
7.3.3. ILSS of 600 tex CT plain and twill composites
The inter-laminar shear strength (ILSS) of the CT composites are shown in Figure
7.5.
Inter-laminar shear strength 600 plain & twill
05
1015202530354045
600 NT
600 5 bar CT
600 CT+668 5B
600 NT
600 5 bar CT
600 CT+668 5B
600 NT
600 5 bar CT
600 CT+668 5B
600 NT
600 5 bar CT
600 CT+668 5B
Composite type
ILSS
(MP
a)
Figure 7.5 ILSS of 600 tex CT plain & twill weave composites
It can be seen that the ILSS increased significantly after texturing in both types of the
600 tex CT composites similar to the ILSS of the core-and-effect textured yarn
composites. The bulkier structure of the CT composites provided more contact
surfaces between the fibre and resin and helped in improving the bonding between
the layers of laminated composites. However, the differences in ILSS between the
two types of CT composites were statistically insignificant.
Plain Warp Plain Weft Twill Warp Twill Weft

138
7.4. Mixed yarn composites
Mixed yarn composites were made by using the fabric which had 600 tex non-
textured yarn in the warp direction and the 600 tex based core-&-effect textured yarn
in the weft direction (WfW).
7.4.1. Fibre volume content of WfW composites
Table 7.2 shows the density and fibre volume content of the WfW composites
determined by using the immersion and calcination methods respectively.
Table 7.2 Fibre volume content of WfW composites
Weave Type Composite type Density
(g/cm3) CV%
Fibre Volume Content
CV%
Void content
Plain 600 non textured 1.8621 0.75 52.25 1.11 1.63 600 + 34 5 bars WfW 1.7356 0.42 42.82 2.13 1.32 600 + 68 5 bars WfW 1.7676 1.05 43.62 2.28 0.65
Twill 600 non textured 1.9104 0.35 54.39 0.71 0.01 600 + 34 5 bars WfW 1.7621 1.00 44.46 2.31 0.99 600 + 68 5 bars WfW 1.7987 0.08 45.79 0.46 0.21
A decrease in the density and fibre volume content of the WfW composites was
found as compared to the non-textured composites but the decrease is smaller than
between the core-and-effect textured and the CT composites. This is due to the fact
that the bulkier textured yarn was only used in the weft direction. The void content of
the WfW composites was found to be low and below the 2% level.
7.5. Mechanical properties of WfW composites
7.5.1. Tensile properties of 600 tex WfW composites
The tensile properties of the 600 tex WfW composites are shown in Figures 7.6 and
7.7.

139
Tensile Strength 600 (mixed yarn composites) plain & twill
050
100150200250300350400
600 NT
600+34 5B (W
fW)
600+68 5B (W
fW)
600 NT
600+34 5B (W
fW)
600+68 5B (W
fW)
600 NT
600+34 5B (W
fW)
600+68 5B (W
fW)
600 NT
600+34 5B (W
fW)
600+68 5B (W
fW)
Composite type
Ten
sile
stre
ngth
(MPa
)
Figure 7.6 Tensile strength of 600 tex plain & twill weave WfW composites
Tensile Modulus 600 (mixed yarn composites) plain & twill
05000
1000015000200002500030000
600 NT
600+34 5B (W
fW)
600+68 5B (W
fW)
600 NT
600+34 5B (W
fW)
600+68 5B (W
fW)
600 NT
600+34 5B (W
fW)
600+68 5B (W
fW)
600 NT
600+34 5B (W
fW)
600+68 5B (W
fW)
Composite Type
Tens
ile M
odul
us (M
Pa)
Figure 7.7 Tensile modulus of 600 tex plain & twill weave WfW composites
It can be seen that the tensile strength of the WfW composites was unchanged after
texturing especially in the warp direction. The reason for this is the presence of non-
textured glass yarn in the warp. Although the cross-sectional area of the samples was
slightly different because of the increase in thickness, it does not affect the tensile
strength. Moreover, the difference in tensile modulus was also mostly insignificant.
Plain Warp Plain Weft Twill Warp Twill Weft
Plain Warp Plain Weft Twill Warp Twill Weft

140
7.5.2. Flexure properties of 600 tex WfW composites
The flexure properties of the 600 tex WfW composites are shown in Figures 7.8 and
7.9.
Flexure Strength 600 (mixed yarn composites) Plain and Twill
0100200300400500600
600 NT
600+34 5B W
fW
600+68 5B W
fW
600 NT
600+34 5B W
fW
600+68 5B W
fW
600 NT
600+34 5B W
fW
600+68 5B W
fW
600 NT
600+34 5B W
fW
600+68 5B W
fW
Composite type
Flex
ure
Stre
ngth
(MPa
)
Figure 7.8 Flexure strength of 600 tex plain & twill weave WfW composites
Flexure Modulus 600 (mixed yarn composites) Plain and Twill
0
4000
8000
12000
16000
20000
600 NT
600+34 5B W
fW
600+68 5B W
fW
600 NT
600+34 5B W
fW
600+68 5B W
fW
600 NT
600+34 5B W
fW
600+68 5B W
fW
600 NT
600+34 5B W
fW
600+68 5B W
fW
Composite type
Flex
ure
Mod
ulus
(MPa
)
Figure 7.9 Flexure modulus of 600 tex plain & twill weave WfW composites
It can be observed from Figure 7.8 and 7.9 that the flexure properties of the WfW
composites were either similar or increased considerably. The reason is that the fibre
volume content did not decrease as much as for the core-and-effect textured
Plain Warp Plain Weft Twill Warp Twill Weft
Plain Warp Plain Weft Twill Warp Twill Weft

141
composites. It was reported that the flexure properties depend on the fibre volume
content of the composite structure along with the other parameters [Sudarisman
2008]. Moreover, the textured yarns in the weft with loops and bulk enhanced the
fibre-matrix bonding and resulted in improved flexure properties of the WfW
composites.
7.5.3. ILSS of 600 tex WfW composites
The inter-laminar shear strength (ILSS) of 600 tex WfW composites are shown in Figure 7.10.
Inter-laminar shear strength 600 (mixed yarn composites) Plain & Twill Composite
01020304050
600 NT
600+34 5B W
fW
600+68 5B W
fW
600 NT
600+34 5B W
fW
600+68 5B W
fW
600 NT
600+34 5B W
fW
600+68 5B W
fW
600 NT
600+34 5B W
fW
600+68 5B W
fW
Composite type
ILS
S (M
Pa)
Figure 7.10 ILSS of 600 tex plain & twill weave WfW composites
Figure 7.10 illustrates a significant increase in the inter-laminar shear strength (ILSS)
of the WfW composites after texturing in the warp and weft of both weave structures.
The presence of textured yarn in the weft helped in improving the bonding between
the laminates and resulted in increasing the ILSS.
The mixed yarn composites have the advantage of a relatively simpler weaving
process because the non-textured warp yarns prevent entanglements during the
change of shed. Moreover, the deterioration in the tensile properties after texuring is
less significant than the core-and-effect textured composites and the CT composites.
Plain Warp Plain Weft Twill Warp Twill Weft
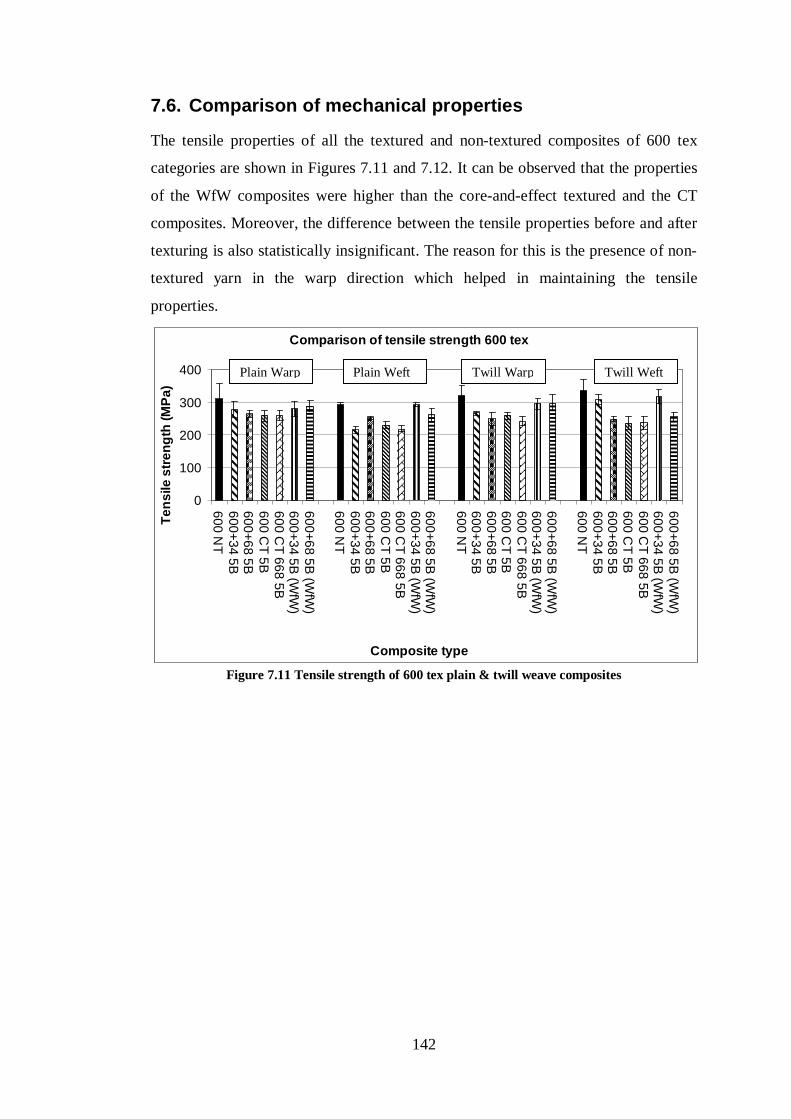
142
7.6. Comparison of mechanical properties
The tensile properties of all the textured and non-textured composites of 600 tex
categories are shown in Figures 7.11 and 7.12. It can be observed that the properties
of the WfW composites were higher than the core-and-effect textured and the CT
composites. Moreover, the difference between the tensile properties before and after
texturing is also statistically insignificant. The reason for this is the presence of non-
textured yarn in the warp direction which helped in maintaining the tensile
properties.
Comparison of tensile strength 600 tex
0
100
200
300
400
600 NT
600+34 5B600+68 5B600 C
T 5B600 C
T 668 5B600+34 5B
(WfW
)600+68 5B
(WfW
)
600 NT
600+34 5B600+68 5B600 C
T 5B600 C
T 668 5B600+34 5B
(WfW
)600+68 5B
(WfW
)
600 NT
600+34 5B600+68 5B600 C
T 5B600 C
T 668 5B600+34 5B
(WfW
)600+68 5B
(WfW
)
600 NT
600+34 5B600+68 5B600 C
T 5B600 C
T 668 5B600+34 5B
(WfW
)600+68 5B
(WfW
)
Composite type
Ten
sile
stre
ngth
(MPa
)
Figure 7.11 Tensile strength of 600 tex plain & twill weave composites
Plain Warp Plain Weft Twill Warp Twill Weft

143
Comparison of tensile modulus 600 tex
0
5000
10000
15000
20000
25000
30000
600 NT
600+34 5B600+68 5B600 C
T 5B600 C
T 668 5B600+34 5B (W
fW)
600+68 5B (WfW
)
600 NT
600+34 5B600+68 5B600 C
T 5B600 C
T 668 5B600+34 5B (W
fW)
600+68 5B (WfW
)
600 NT
600+34 5B600+68 5B600 C
T 5B600 C
T 668 5B600+34 5B (W
fW)
600+68 5B (WfW
)
600 NT
600+34 5B600+68 5B600 C
T 5B600 C
T 668 5B600+34 5B (W
fW)
600+68 5B (WfW
)
Composite type
Tens
ile m
odul
us (M
Pa)
Figure 7.12 Tensile modulus of 600 tex plain & twill weave composites
Figures 7.13 and 7.14 show the flexure properties of all the textured and non-textured
composites of the 600 tex categories. It can be seen that the flexure properties of all
the textured composites are mostly similar to each other; however, slightly higher
values are observed for the WfW composites. A possible reason for this is the
relatively smaller decrease in the fibre volume content of the WfW composites after
texturing. Although the texturing process reduces the fibre volume content, the
bulkier structure of the textured yarns enhanced the fibre-matrix bonding and
maintained the flexure properties.
Comparison of flexure strength 600 tex
0
100
200
300
400
500
600
600 NT
600+34 5B600+68 5B600 C
T 5B600 C
T 668 5B600+34 5B
WfW
600+68 5B W
fW
600 NT
600+34 5B600+68 5B600 C
T 5B600 C
T 668 5B600+34 5B
WfW
600+68 5B W
fW
600 NT
600+34 5B600+68 5B600 C
T 5B600 C
T 668 5B600+34 5B
WfW
600+68 5B W
fW
600 NT
600+34 5B600+68 5B600 C
T 5B600 C
T 668 5B600+34 5B
WfW
600+68 5B W
fW
Composite type
Flex
ure
stre
ngth
(MPa
)
`
Figure 7.13 Flexure strength of 600 tex plain & twill weave composites
Plain Warp Plain Weft Twill Warp Twill Weft
Plain Warp Plain Weft Twill Warp Twill Weft
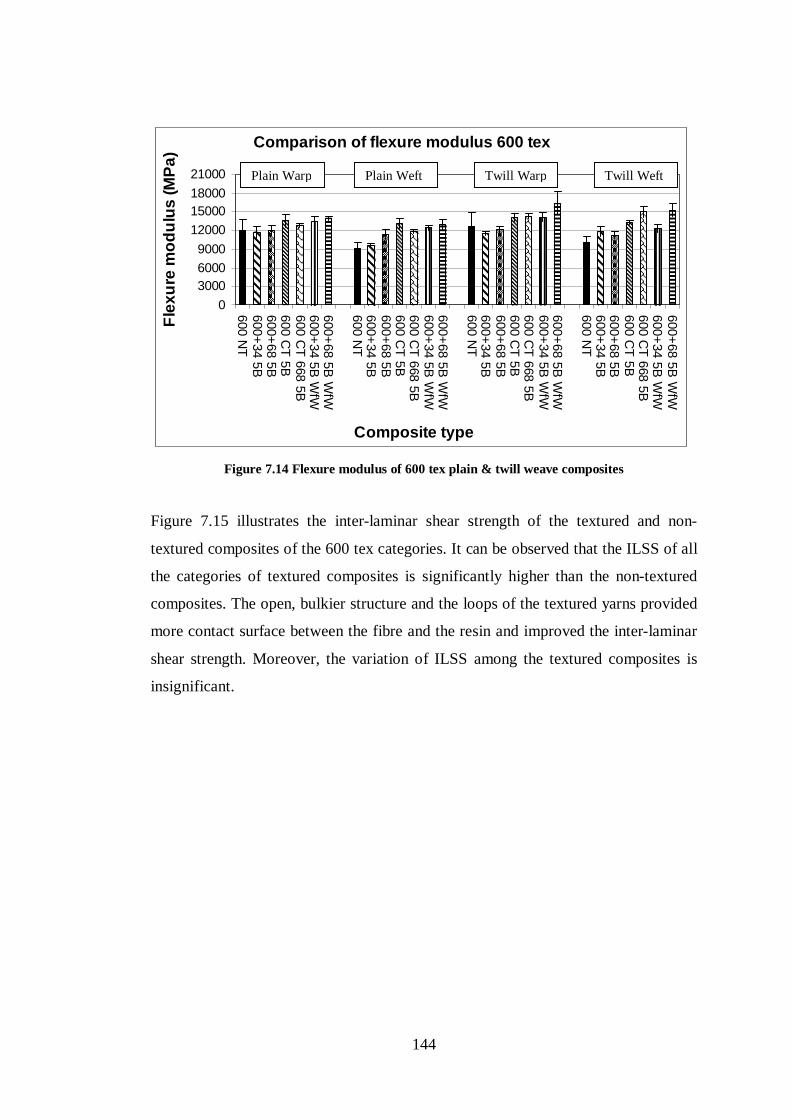
144
Comparison of flexure modulus 600 tex
0300060009000
12000150001800021000
600 NT
600+34 5B600+68 5B600 C
T 5B600 C
T 668 5B600+34 5B
WfW
600+68 5B W
fW
600 NT
600+34 5B600+68 5B600 C
T 5B600 C
T 668 5B600+34 5B
WfW
600+68 5B W
fW
600 NT
600+34 5B600+68 5B600 C
T 5B600 C
T 668 5B600+34 5B
WfW
600+68 5B W
fW
600 NT
600+34 5B600+68 5B600 C
T 5B600 C
T 668 5B600+34 5B
WfW
600+68 5B W
fW
Composite type
Flex
ure
mod
ulus
(MPa
)
Figure 7.14 Flexure modulus of 600 tex plain & twill weave composites
Figure 7.15 illustrates the inter-laminar shear strength of the textured and non-
textured composites of the 600 tex categories. It can be observed that the ILSS of all
the categories of textured composites is significantly higher than the non-textured
composites. The open, bulkier structure and the loops of the textured yarns provided
more contact surface between the fibre and the resin and improved the inter-laminar
shear strength. Moreover, the variation of ILSS among the textured composites is
insignificant.
Plain Warp Plain Weft Twill Warp Twill Weft

145
Comparison of inter-laminar shear strength 600 tex
05
101520253035404550
600 NT
600+34 5B600+68 5B600 5 bar C
T600 C
T+668 5B600+34 5B
WfW
600+68 5B W
fW
600 NT
600+34 5B600+68 5B600 5 bar C
T600 C
T+668 5B600+34 5B
WfW
600+68 5B W
fW
600 NT
600+34 5B600+68 5B600 5 bar C
T600 C
T+668 5B600+34 5B
WfW
600+68 5B W
fW
600 NT
600+34 5B600+68 5B600 5 bar C
T600 C
T+668 5B600+34 5B
WfW
600+68 5B W
fW
Composite type
ILS
S (M
Pa)
Figure 7.15 Inter-laminar shear strength of 600 tex plain & twill weave composites
The above comparison of mechanical properties reveals the advantage of the WfW
composites; They maintain the tensile and flexure properties of the composites from
non-textured yarns but have significantly higher inter-laminar shear strength than the
non-textured specimens. Moreover, the weaving of the WfW fabrics was found to be
easier without any entanglements.
The next task was to explore the possibility of the development of textured yarn
fabrics on a power loom so as to confirm that they can be produced using industrial
practice in the future. The following experiment was conducted in this respect.
7.7. Production of mixed yarn fabric on a power loom
A trial was performed to weave WfW fabric on a rapier loom. The following are the
details of the experiment.
The loom was a dornier rapier loom model PTVH4/J operated with the Staubli’s
Jacquard shedding mechanism. It had 700 tex warp yarns already installed. The 600
+ 68 tex 5 bars core-and-effect textured yarn was used in the weft and was supplied
from a cone as shown in Figure 7.16. The warp yarns also come directly from the
cones. A creel was placed behind the loom to hold the warp cones and the yarn
Plain Warp Plain Weft Twill Warp Twill Weft

146
tension was maintained by means of the roller arrangement. The loom operated at 82
picks/min and had the warp and weft density of 15 ends/cm and 12 picks/cm
respectively. The loom ran smoothly without any breakages and approximately one
metre of fabric was successfully produced.
Figure 7.16 Production of mixed yarn fabric on a power loom
Cone carrying textured yarn

147
7.8. Summary
This chapter covers the effect of texturing on the mechanical properties of 600 tex
mixed yarns (WfW) and core textured (CT) composites. The WfW composites were
made using the non-textured yarn in the warp and the core-and-effect textured yarn
in the weft. The CT composites were composed of a single textured glass yarn
without any effect yarn. The CT composites were further divided into two types:
Type 1 consisted of core textured yarns in both the warp and weft whereas Type 2
had core textured yarns in the warp and core-and-effect textured yarns in the weft.
The tensile properties of CT composites were significantly reduced after the
texturing process (16% to 30%); however the WfW composites had similar tensile
properties to the non-textured composites. The reason for this is that the textured
yarn is only used in the weft direction in the WfW composites. The flexure properties
were not changed considerably for both the CT and WfW composites. Although the
textured composites had proportionally lower fibre volume content than the non-
textured composites, the bulkier yarn structure provided better fibre-matrix bonding
and hence enhanced the transfer of load between the laminates. Improvement was
observed in the inter-laminar shear strength of both the CT (32 % to 46 %) and the
WfW composites (35 % to 49 %).
It can be concluded from the comparison of the mechanical properties of the 600 tex
composites that the WfW composites are the most advantageous; they maintained the
tensile and flexure properties but have significantly higher inter-laminar shear
strength (35 % to 49 %). Moreover, the weaving of WfW composites is also easier
without entanglements as demonstrated by weaving it successfully on a commercial
rapier loom.

148
8. Chapter 8 Conclusions and Recommendations for future
work
8.1. Conclusions
The aim of this project was to optimise the lamination properties of glass composites
by using the air jet texturing process and to minimise the problem of delamination.
Core-and-effect textured glass yarns were developed in this respect and the optimum
texturing parameters were investigated. The glass yarns were divided into two
categories depending on the core yarn linear density. These were 300 tex and 600 tex
yarns. It was found that the textured yarns in the 300 tex category with visible loops
could be produced at 3 to 5 bars air pressure, 2.9 % core yarn overfeed and 9.2 %
effect yarn overfeed. However, the weaving process became very difficult for the
yarns textured at 3 and 4 bars air pressure because of the excessive warp yarn
entanglement during the change of shed. Therefore, the yarns for the 600 tex
category were textured at 5 bars pressure only. Following are the main conclusions
of this project.
8.1.1. Tenacity of yarn after texturing
Before the development of the fabrics and composites, the effect of texturing on the
yarn tenacity was investigated. The tenacity of the core-and-effect glass yarn
decreased significantly after the texturing process in both the 300 tex and 600 tex
glass yarn categories. In 300 tex yarns the decrease in tenacity was 40 % to 60 %
whereas, the decrease in tenacity of 600 tex yarns ranged from 21 % to 24 %.
However, the air pressure did not show a significant effect on the yarn tenacity. A
higher proportion of effect filaments produced final yarns with lower tenacity as the
more textured effect-filaments contributed less to the strength than the core.
Similarly, higher core yarn linear density resulted in higher final yarn tenacity. Some
decrease in linear density after texturing was also observed. The post-texturing
stretching and to a lesser extent loss of broken filaments in the form of fibre fly
during texturing were the possible reasons for this reduction in linear density.

149
8.1.2. Tensile properties of composites
The effect of texturing on the mechanical properties of the composites was
investigated and it was observed that the tensile properties were significantly reduced
after texturing. The reduction was observed to be 14% to 32% in the 300 tex
category and 10% to 25% in the 600 tex category. The percentage decrease was
smaller for the 600 tex yarn composites due to the fact that the deterioration in
tenacity of the 600 tex glass yarns after texturing was also smaller than the 300 tex
yarns.
8.1.3. Flexure properties of composites
The flexure properties were mostly found to be unaffected by the texturing process.
Although the fibre volume content of the composites was found to be lower after the
texturing process, the introduction of loops and bulk in the yarn helped to improve
the fibre-matrix bonding and hence enhanced the transfer of load between the
laminates. It was also observed that the 600 tex yarn composites were better than the
300 tex yarn composites in maintaining the flexure properties after texturing and the
reason is the lower deterioration of 600 tex yarn after the texturing process.
8.1.4. Inter-laminar shear strength and fracture toughness of composites
The inter-laminar shear strength and the fracture toughness Mode-1 increased
significantly after the texturing process. The increase in inter-laminar shear strength
was found to be 15 % to 33 % in the 300 tex category and 35 % to 45 % in the 600
tex category. The fracture toughness (mode-1) was observed to be increased by 50 %
after texturing. This was because the loops and bulkier structure of the textured
fabric offered more contact between the fibre and resin and enhanced the fibre-
matrix adhesion. Although the textured composites had proportionally lower fibre
volume content than the non-textured composites, the bulkier yarn structure provided
better fibre-matrix bonding and hence enhanced the transfer of load between the
laminates. The data in this project did not show any clear trend for the effect of
texturing air pressure on the mechanical properties.

150
8.1.5. Weave structure
Among the plain and twill weave structures, the twill weave provided more surface
contact and therefore possessed better mechanical properties. This is because in twill
weave, there is less interlacing and more float yarns.
8.1.6. Composites with combination of textured and non-textured yarns
Composites with textured and non-textured core yarns were also produced and the
effect of texturing on their mechanical properties was determined. The fabrics were
made by using the core textured yarns in the warp and weft, or by using non-textured
core yarn in the warp and core-&-effect textured yarn in the weft. It was observed
that the composites made from fabrics having the non-textured yarn in the warp and
core-&-effect textured yarn in the weft had the best combination of mechanical
properties among all the textured composites. They maintained the tensile and
flexure properties after texturing and had significantly higher inter-laminar shear
strength, ranging from 35 % to 49 %, similar to the other textured composites.
Moreover, weaving of these fabrics was also relatively easier and was successfully
done on a Rapier Loom without any loop entanglement and yarn breakage.
Based on the results found in this project, the bonding strength of the laminated
composite structures could be improved by using air jet textured yarns. The bulkier
and loopy structure of textured reinforcement yarn can be utilised to provide more
surface contact between the fibre and resin and the problem of delamination can be
reduced provided the production parameters of both yarn and fabrics are optimised.
The best combination of mechanical properties can be achieved by using the twill
weave fabrics of mixed 600 tex textured and non-textured yarns having textured
yarns in the weft and non-textured yarns in the warp. However, the panel thickness
will be increased by about 5 % and the fibre volume content will reduced by a
similar figure.
8.2. Recommendations for future work
The glass yarns used to develop the core-and-effect textured yarns in this project
have the linear densities of 300 tex and 600 tex for core yarns and 34 tex and 68 tex
for effect yarns. Other yarn configurations i.e. linear densities, core-effect ratios and

151
their interaction with the texturing parameters could be further analysed. Moreover,
glass yarns are used in this project because of the convenience but the possibility of
texturing other high performance fibres like Carbon, Kevlar, etc and the effect of
texturing on their properties could be part of future work.
Further development of textured yarn fabric on a power loom could be carried out to
optimise parameters so as to achieve practical industrial production. Further
attention could be made to produce yarns which improve weaving efficiency.
Only composites of plain and twill weave structures have been analysed in this
research work. However, other important weave structures, especially satin weave,
could also be utilised in future and the effect of texturing on their mechanical
properties could be investigated.
The polymer matrix composites may be exposed to environments involving elevated
temperatures and humidity in certain applications. The absorption of moisture and
thermal fatigue cycles strongly affects the physical and mechanical properties of
composites [Ray 2005, Jana and Bhunia 2008]. Therefore, determination of the
effects of hygro-thermal conditioning on the mechanical performance of textured
composites could be part of future work.
Moreover, the effect of water absorption on the mechanical performance of textured
composites could also be analysed in future. This is because glass composites are
extensively employed in a wide variety of marine applications and degradation of
mechanical properties, especially in the through-the-thickness direction, which
usually happens with prolonged exposure to water [Gu and Hongxia 2008].

152
References
1. Acar, M and Versteeg, H. K. (1995) Reply to "Comments on 'Effects of
Geometry on the Flow Characteristics and Texturing Performance of Air-Jet
Texturing Nozzles'". Textile Research Journal, 65(9), pp. 556.
2. Acar, M et al. (2006) The Mechanism of the Air-Jet Texturing: The Role of
Wetting, Spin Finish and Friction in Forming and Fixing Loops. Textile
Research Journal, 76(2), pp. 116-125.
3. Acar, M. (1989) Basic principles of Air-jet Texturing and Mingling/Interlacing
Processes. In: Air-jet texturing and Mingling/Interlacing; Proceedings of the
International Conference. September 1989. Loughborough University of
Technology, pp. 01-17.
4. Acar, M. (1989) Trends in Air-jet Texturing. In: Air-jet texturing and
Mingling/Interlacing; Proceedings of the International Conference. September
1989. Loughborough University of Technology, pp. 217-226.
5. Adanur, S and Onal, L. (2001) Factors Affecting the Mechanical Properties of
Laminated Glass/Graphite-Epoxy Hybrid Composites. Journal of Industrial
Textiles, 31(2), pp. 123-133.
6. Alagirusamy, R. and Ogale, V. (2004) Commingled and Air Jet-textured
Hybrid Yarns for Thermoplastic Composites. Journal of Industrial Textiles,
33(4), pp. 223-243.
7. Alagirusamy, R. and Ogale, V. (2005) Development and Characterisation of
GF/PET, GF/Nylon, and GF/PP Commingled Yarns for Thermoplastic
Composites. Journal of Thermoplastic Composite Materials, 18, pp. 269-285.
8. Alagirusamy, R. et al. (2005) Effect of Jet Design on Commingling of
Glass/Nylon Filaments. Journal of Thermoplastic Composite Materials, 18, pp.
255-268.
9. Alagirusamy, R. et al. (2006) Hybrid Yarns and Textile Preforming for
Thermoplastic Composites. Textile Progress, 38(4), pp. 1-71.
10. Allegri, G. and Zhang, X. (2007) On the delamination and debond suppression
in structural joints by Z-fibre pinning. Composites: Part A, 38, pp. 1107–1115.
11. Arbelaiz, A. et al. (2005) Mechanical properties of flax fibre/polypropylene
composites. Influence of fibre/matrix modification and glass fibre

153
hybridization. Composites: Part A (Applied science and manufacturing), 36,
pp. 1637–1644.
12. Aslan, Z., Karakuzu, R. and Sayman, O. (2002) Dynamic Characteristics of
Laminated Woven E-Glass–Epoxy Composite Plates Subjected to Lowvelocity
Heavy Mass Impact. Journal of Composite Materials, 36(21), pp. 2421-2442.
13. ASTM (2007) D 5528-01, Standard test method for Mode I Inter-laminar
fracture toughness of unidirectional fibre-reinforced polymer matrix
composites. West Conshohocken, United States: ASTM International.
14. Baucom, J. N. and Zikry, M. A. (2005) Low-velocity impact damage
progression in woven E-glass composite systems. Composites: Part A, 36, pp.
658-664.
15. Baucom, J. N., Zikry, M. A. and Rajendran, A. M. (2006) Low-velocity impact
damage accumulation in woven S2-glass composite systems. Composites
Science and Technology, 66, pp. 1229-1238.
16. Beier, U. et al. (2008) Evaluation of preforms stitched with a low melting-
temperature thermoplastic yarn in carbon fibre-reinforced composites.
Composite Part A, 39, pp. 705-711.
17. Bernhardsson, J. and Shishoo, R. (2000) Effect of Processing Parameters on
Consolidation Quality of GF/PP Commingled Yarn Based Composites. Journal
of Thermoplastic Composite Materials, 13, pp. 292-313.
18. Bilgin, S., Versteeg, H. K. and Acar, M. (1996) Effect of Nozzle Geometry on
Air-Jet Texturing Performance. Textile Research Journal, 66(2), pp. 83-90.
19. British Standards Institute (1977) 2782-10: Methods of testing Plastics —Part
10: Glass reinforced plastics — Method 1003: Determination of tensile
properties. London: British Standards Institute.
20. British Standards Institute (1998) 14125: Fibre-reinforced plastic composites
—Determination of flexural properties. London: British Standards Institute.
21. British Standards Institute (1998) 14130: Fibre-reinforced plastic composites
— Determination of apparent inter-laminar shear strength by short-beam
method. London: British Standards Institute.
22. British Standards Institute (1999) 1172: Textile-glass-reinforced plastics —
Prepregs, moulding compounds and laminates — Determination of the textile-
glass and mineral-filler content — Calcination methods. London: British
Standards Institute.

154
23. British Standards Institute (2000) 3341: Textile glass—Yarns—Determination
of breaking force and breaking elongation. London: British Standards Institute.
24. British Standards Institute (2004) 1183-1: Plastics - Methods for determining
the density of non-cellular plastics - Part 1: Immersion method, liquid
pyknometer method and titration method. London: British Standards Institute.
25. British Standards Institute (2008) 291: Plastics — Standard atmospheres for
conditioning and testing. London: British Standards Institute.
26. Broughton, W.R. (2000) Through-thickness testing. In: Hodgkinson, J.M. (ed.)
Mechanical testing of advanced fibre composites. Cambridge, England:
Woodhead Publishing Limited.
27. Cartie, D. D. R., Cox, B. N. and Fleck, N. A. (2004) Mechanisms of crack
bridging by composite and metallic rods. Composites: Part A, 35, pp. 1325–
1336.
28. Chimeh, M. Y. et al. (2005) Characterizing bulkiness and hairiness of air-jet
textured yarn using imaging techniques. Journal of the Textile Institute, 96(4),
pp. 251-255.
29. Courtaulds Ltd., Yarn Processing, Patent BP1554572, 24th October 1979.
30. Cripps, D., Searle, T. J. and Summerscales, J. (2000) Open Mold Techniques
for Thermoset Composites. In: Kelly, A. and Zweben, C. (eds.) Comprehensive
Composite Materials. Vol 2. Elsevier Science Ltd.
31. Demir, A. and Behery, H. M. (1997) Synthetic filament yarn: texturing
technology. Upper Saddle River, NJ : Prentice Hall.
32. Demir, A. and Wray, G. R. (1989) Evaluation of Air-jet Texturing Process – A
Historical Review. In: Air-jet texturing and Mingling/Interlacing; Proceedings
of the International Conference. September 1989. Loughborough University of
Technology, pp. 19-37.
33. Deng, S. and Ye, L. (1999) Influence of fibre-Matrix Adhesion on Mechanical
Properties of Graphite/Epoxy Composites: II. Inter-laminar fracture and In-
plane shear behaviour. Journal of Reinforced Plastics and Composites, 18 (11),
pp. 1041-1057.
34. Du Pont de Nemours & Co. Inc, Bulky Continuous Filament Yarn, Patent
US2783609, 5th March 1957.

155
35. Du Pont de Nemours & Co. Inc, Bulky Yarns and Methods and Apparatus for
the Production Thereof, Patent GB732929, 15th December 1952.
36. Du Pont de Nemours & Co. Inc, Improvement in Apparatus for Production of
Voluminous Yarns and Products Produced Thereby, Patent GB893020, 20th
May 1960.
37. Du Pont de Nemours & Co. Inc, Method and Apparatus for Texturing Yarn,
Patent GB1448100, 2nd September 1976.
38. Du Pont de Nemours & Co. Inc, New Devices for Texturing Yarn, Patent
GB1282148, 19th July 1972.
39. Du Pont de Nemours & Co. Inc, Yarn Texturing Jet, Patent US4259768, 7th
April 1981.
40. Du Pont de Nemours & Co. Inc, Yarn Treating Apparatus, Patent GB762630,
19th July 1954.
41. Du Pont de Nemours & Co. Inc, Yarn Treating Apparatus, Patent US2958112,
1st November 1960.
42. Du Pont de Nemours & Co. Inc, Yarn Treating Apparatus, Patent US3545057,
8th December 1970.
43. Ebeling, T. et al (1997) Delamination Failure of a Woven Glass Fibre
Composite. Journal of Composite Materials, 31(13), pp. 1318-1333.
44. Enterprises Machine and Development Corporation, Resiliently supported
Baffle for Yarn Texturing Air-jet, Patent US3979805, 14th September 1976.
45. Enterprises Machine and Development Corporation, Resonant Baffle for Yarn
Texturing Air-jet, Patent US3881232, 6th May 1975.
46. Enterprises Machine and Development Corporation, Yarn Texturing Air-jet
with Cylindrical and Planar Baffles, Patent US4187593, 12th February 1980.
47. Godwin, E.W. (2000) Tension. In: Hodgkinson, J.M. (ed.) Mechanical testing
of advanced fibre composites. Cambridge, England: Woodhead Publishing
Limited.
48. Golzar, M., Brunig, H. and Mader, E. (2007) Commingled Hybrid Yarn
Diameter Ratio in Continuous Fibre-reinforced Thermoplastic Composites.
Journal of Thermoplastic Composite Materials, 20, pp. 17-26.
49. Gu, H. and Hongxia, S. (2008) Delamination behaviour of glass/polyester
composites after water absorption. Materials and Design, 29, pp. 262-264.

156
50. Gweon, S. Y. and Bascom, W. D. (1992) Damage in carbon fibre composites
due to repetitive low-velocity impact loads. Journal of Materials Science 27,
pp. 2035-2047.
51. Haque, A. and Hossain, M. K. (2003) Effects of Moisture and Temperature on
High Strain Rate Behavior of S2-Glass–Vinyl Ester Woven Composites.
Journal of Composite Materials, 37, pp. 627-647.
52. Hearle, J. W. S., Hollick, L and Wilson, D. K. (2001) Yarn Texturing
Technology. Woodhead publishing limited in association with The Textile
Institute.
53. Heberlein Guide (1991) “Air Texturing”. Position within the Production
Process of Textiles. 327/01. pp. 4.1-4.3.
54. Herath, C. N. et al. (2007) An Analysis on the Tensile Strength of Hybridized
Reinforcement Filament Yarns by Commingling Process. Materials Science
Forum, 539-543, pp. 974-978.
55. Hodgkinson, J.M. (2000) Flexure. In: Hodgkinson, J.M. (ed.) Mechanical
testing of advanced fibre composites. Cambridge, England: Woodhead
Publishing Limited.
56. Jana, R. N. and Bhunia, H. (2008) Hygrothermal Degradation of the Composite
Laminates From Woven Carbon/SC-15 Epoxy Resin and Woven Glass/SC-15
Epoxy Resin. Polymer Composites, pp. 664-669.
57. Jang, B. Z. et al. (1989) Impact Resistance and Energy Absorption Mechanisms
in Hybrid Composites. Composites Science and Technology, 34, pp. 305-335.
58. Kang, B. C. et al. (2007) Microscopic Evaluation of Commingling-Hybrid
Yarns. Materials Science Forum, 539-543, pp. 992-996.
59. Kang, T. J. and Lee, S. H. (1994) Effect of Stitching on the Mechanical and
Impact Properties of Woven Laminate Composite. Journal of Composite
Materials, 28(16), pp. 1574-1587.
60. Khan, L.A. (2010) Cure Optimization of 977-2A Carbon/epoxy Composites for
Quickstep Processing. Thesis (PhD), University of Manchester.
61. Kim, J. K. and Sham, M. L. (2000) Impact and delamination failure of woven-
fabric composites. Composites Science and Technology, 60, pp. 745-761.
62. Koc, S. K., Hockenberger, A. S. and Wei, Q. (2008) Effect of air-jet texturing
on adhesion behaviour of polyester yarns to rubber. Applied Surface Science,
254, pp. 7049-7055.

157
63. Kotaki, M. and Hamada, H (1997) Effect of interfacial properties and weave
structure on mode I interlaminar fracture behaviour of glass satin woven fabric
composites. Composites: Part A, 28A, pp. 257-266.
64. Kothari, V. K., Sengupta, A. K. and Rengasamy, R. S. (1991) Role of Water in
Air-Jet Texturing: Part I: Polyester Filament Feeder Yarns with Different
Frictional Characteristics. Textile Research Journal, 61(9), pp. 495-502.
65. Kumar, R. L. V. et al (2007) Post Impact Compression Strength (PICS)
Evaluation of Glass/Epoxy Composite Using a Novel Approach. Effect of
Delamination Area. Journal of Reinforced Plastics and Composites, 26(11),
pp. 1101-1109.
66. Langston, T. B, (2003). The mechanical behaviour of air textured aramid yarns
in thermoset. Thesis (MSc), NCSU.
67. Liu, L. et al (2006) Effects of cure cycles on void content and mechanical
properties of composite laminates. Composite Structures, 73, pp. 303-309.
68. Ma, H. Y., Sui, Q. X. and Chou, T. W. (2003) Absorption and Permeability of
Air-Jet Textured Glass Fiber Yarn and its Fabric for Resin. Journal of Donghua
University, 20(2), pp. 122-124.
69. Maycumber, S. G. (1997) DuPont Taslan technology, trademark assigned to
Heberlein In Daily News Record, HighBeam Research Available from:
www.highbeam.com.
70. Mazumdar, S. K. (2002) Composites Manufacturing. Materials, Product, and
Process Engineering. CRC Press.
71. Mcdonnell, P. et al. (2001) Processing and mechanical properties evaluation of
a commingled carbon-fibre PA-12 composites. Composites: Part A, 32, pp.
925-932.
72. Miao, M. and Soong, M. C. C. (1995) Air Interlaced Yarn Structure and
Properties. Textile Research Journal, 65(8), pp. 433-440.
73. Mouritz, A. P. (2003) Comment on the impact damage tolerance of stitched
composites. Journal of Materials Science Letters, 22, pp. 519-521.
74. Mouritz, A. P. (2004) Fracture and tensile fatigue properties of stitched
fibreglass composites. Proc. Instn Mech. Engrs Part L: J. Materials: Design
and Applications (Special Issue Paper), 218, pp. 87-93.
75. Mouritz, A. P. (2007) Review of z-pinned composite laminates. Composites:
Part A, 2007. 38, pp. 2383–2397.

158
76. Mouritz, A. P., Gallagher, J. and Goodwin, A. A. (1996) Flexural strength and
interlaminar shear strength of stitched GRP laminates following repeated
impacts. Composite Science and technology, 57, pp. 509-522.
77. Mouritz, A. P., Leong, K. H, and Herszberg, I. (1997) A review of the effect of
stitching on the in-plane mechanical properties of fibre-reinforced polymer
composites. Composite Part A, 28A, pp. 979-991.
78. Naganuma, T. et al. (2009) Influence of prepreg conditions on the void
occurrence and tensile properties of woven glass fiber-reinforced polyimide
composites. Composites Science and Technology, 69, pp. 2428–2433.
79. Nei, J. et al. (2008) Effect of stitch spacing on mechanical properties of
carbon/silicon carbide composites. Composites Science and Technology, 68, pp.
2425–2432.
80. Oerlikon textile components (2004) Heberlein HemaJet-Jet Cores, Heberlein,
Available from: www.components.oerlikontextile.com.
81. Oerlikon textile components (2007) Leaflet - HemaJet Jet Cores Series 2,
Heberlein, www.components.oerlikontextile.com.
82. Oerlikon textile components (2007) Leaflet - HemaJet-LB24, Heberlein,
www.components.oerlikontextile.com.
83. Oerlikon textile components (2009) Leaflet - HemaJet-LB04, Heberlein,
www.components.oerlikontextile.com.
84. Oerlikon textile components (2010) Leaflet - HemaJet-EO52, Heberlein,
www.components.oerlikontextile.com.
85. Ogale, V. and Alagirusamy, R. (2007) Tensile properties of GF-polyester, GF-
nylon, and GF-polypropylene commingled yarns. Journal of the Textile
Institute, 98(1), pp. 37-45.
86. Operating Manual (2001) Edition, Operating Manual for Air-Jet Texturing
Machine RMT-D. Stähle SSM Switzerland.
87. Paiva, J.M.F.d., Mayer, S and Rezende, M.C. (2005) Evaluation of mechanical
properties of four different carbon/epoxy composites used in aeronautical field.
Materials Research, 8 (1), pp. 91-97.
88. Parlapalli, M. R. et al. (2007) Experimental investigation of delamination
buckling of stitched composite laminates. Composites: Part A, 38, pp. 2024–
2033.

159
89. Partridge, I. K. and Cartie, D. D. R. (2005) Delamination resistant laminates by
Z-Fiber pinning: Part I manufacture and fracture performance. Composites:
Part A, 36, pp. 55–64.
90. Pavier, M. J. and Clarke, M. P. (1995) Experimental techniques for the
investigation of the effects of impact damage on carbon fibre composites.
Composites Science and Technology, 55, pp. 157-169.
91. Pekbey, Y. and Sayman, O. (2006) A Numerical and Experimental
Investigation of Critical Buckling Load of Rectangular Laminated Composite
Plates with Strip Delamination. Journal of Reinforced Plastics and Composites,
25, pp. 685-697.
92. Penn, L. S. and Wang, H. (1998) Epoxy resins. In: Peters, S.T. (ed.) Handbook
of Composites, second edition. London, England: Chapman & Hall.
93. Peters, S. T. (1998) Introduction, Composite basics and Roadmap. In: Peters,
S.T. (ed.) Handbook of Composites, second edition. London, England:
Chapman & Hall.
94. Ray, B. C. (2005) Thermal Shock and Thermal Fatigue on Delamination of
Glass-fiber-reinforced Polymeric Composites. Journal of Reinforced Plastics
and Composites, 24(01), pp. 111-116.
95. Reinhart, T. J. (1998) Overview of Composite. In: Peters, S.T. (ed.) Handbook
of Composites, second edition. London, England: Chapman & Hall.
96. Rengasamy, R. S., Kothari, V. K. and Patnaik, A. (2004) Effect of Process
Variables and Feeder Yarn Properties on the Properties of Core-and-Effect and
Normal Air-Jet Textured Yarns. Textile Research Journal, 74(3), pp. 259-264.
97. Robinson, P. and Hodgkinson, J.M. (2000) Interlaminar fracture toughness. In:
Hodgkinson, J.M. (ed.) Mechanical testing of advanced fibre composites.
Cambridge, England: Woodhead Publishing Limited.
98. Rwei, S. P. and Pai, H. I. (2002) Fluid Simulation of the Airflow in Texturing
Jets. Textile Research Journal, 72, pp. 520-525.
99. Sengupta, A. K., Kothari, V. K. and Jsensarma, J. K. (1996) Effects of Filament
Modulus and Linear Density on the Properties of Air-Jet Textured Yarns.
Textile Research Journal, 66(7), pp. 452-455.
100. Sengupta, A. K., Kothari, V. K and Srinivasan, J. (1991) Effect of Process
Variables in Air-Jet Texturing on the Properties of Spun Yarns with Different
Structures. Textile Research Journal, 61(12), p. 729-735.

160
101. Sims, G. D. and Broughton, W. R. (2000) Glass Fibre Reinforced Plastics—
Properties In: Kelly, A. and Zweben, C. (eds.) Comprehensive Composite
Materials. Elsevier Ltd.
102. Sudarisman and Davies, I. J. (2008) The effect of processing parameters on
the flexural properties of unidirectional carbon fibre-reinforced polymer
(CFRP) composites. Materials Science and Engineering A, 498, pp. 65-68.
103. Summerscales, J. (2010) A taxonomy for resin infusion processes, Marine
and Offshore Composites, The Royal Institution of Naval Architects.
104. Suppakul, P. and Bandyopadhyay, S. (2002) The effect of weave pattern on
the mode-I inter-laminar fracture energy of E-glass/vinyl easter composites.
Composite Science and Technology, 62 (5), pp. 709-717.
105. Sutherland, L. S. and Soares, C. G. (2004) Effect of laminate thickness and of
matrix resin on the impact of low fibre-volume, woven roving E-glass
composites. Composites Science and Technology, 64, pp. 1691–1700.
106. Tanoglu, M. et al. (2001) Effects of thermoplastic preforming binder on the
properties of S2-glass fabric reinforced epoxy composites. International
Journal of Adhesion and Adhesives, 21 (3), pp. 187-195.
107. Varma, I. K. and Gupta, V. B. (2000) thermosetting resin - properties. In:
Kelly, A. and Zweben, C. (eds.) Comprehensive composite materials. Vol 2.
Elsevier Science Ltd.
108. Vaughan, D. J. (1998) Fiberglass reinforcements. In: Peters, S.T. (ed.)
Handbook of Composites, second edition. London, England: Chapman & Hall.
109. Velmurugan, R. and Solaimurugan, S. (2007) Improvements in Mode I
interlaminar fracture toughness and in-plane mechanical properties of stitched
glass/polyester composites. Composites Science and Technology, 67, pp. 61-69.
110. Versteeg, H. K., Acar, M. and Bilgin, S. (1999) Effect of Geometry on the
Performance of Intermingling Nozzles. Textile Research Journal, 69(8), pp.
545-551.
111. Wickramasinghe, G. L. D. (2003) Steam-jet Intermingled Sewing Threads.
Thesis (PhD), UMIST.
112. Xiao, J. R., Gama, B. A. and Gillespie Jr., J. W. (2007) Progressive damage
and delamination in plain weave S-2 glass/SC-15 composites under quasi-static
punch-shear loading. Composite Structures, 78, pp. 182-196.

161
113. Yoshimura, A. et al. (2008) Improvement on out-of-plane impact resistance
of CFRP laminates due to through-the-thickness stitching. Composites: Part A,
39, pp. 1370–1379.
114. Zaixia, F. et al. (2006) Investigation on the Tensile Properties of Knitted
Fabric Reinforced Composites made from GF–PP Commingled Yarn Preforms
with Different Loop Densities. Journal of Thermoplastic Composite Materials,
19, pp. 113 – 126.
115. Zhang, X., Hounslow, L. and Grassi, M. (2006) Improvement of low-velocity
impact and compression-after-impact performance by z-fibre pinning.
Composites Science and Technology, 66, pp. 2785–2794.
116. Zhou, G. and Davies, G. A. O. (1995) Characterisation of thick glass woven
roving/polyester laminates: 1. Tension, compression and shear. Composites,
26(8), pp. 579-586.

162
Appendix A: Calculations for draw ratio and overfeed
The parameters i.e. draw ratios and the overfeed percentage of both the core and
effect yarns; can be calculated with the help of the diameters of the rollers and the
gear teeth ratios. The calculations shown in Appendix A were based on Figure A.1
which illustrates the system of gears of the air-jet texturing machine.
Figure A.1 Gearing diagram of Stähle RMT-D air-jet texturing machine
Where,
Z1 to Z16 are gears,
Z7 is the changeable gear for the core yarn draw ratio,
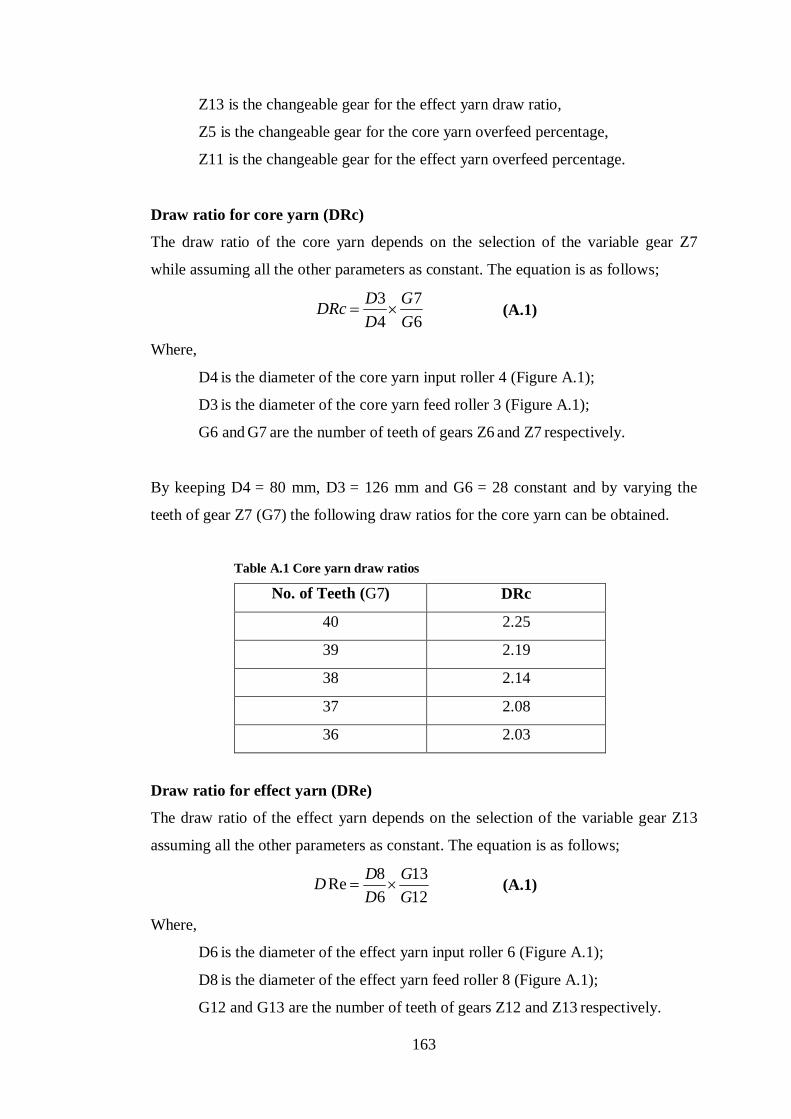
163
Z13 is the changeable gear for the effect yarn draw ratio,
Z5 is the changeable gear for the core yarn overfeed percentage,
Z11 is the changeable gear for the effect yarn overfeed percentage.
Draw ratio for core yarn (DRc)
The draw ratio of the core yarn depends on the selection of the variable gear Z7
while assuming all the other parameters as constant. The equation is as follows;
67
43
GG
DDDRc (A.1)
Where,
D4 is the diameter of the core yarn input roller 4 (Figure A.1);
D3 is the diameter of the core yarn feed roller 3 (Figure A.1);
G6 and G7 are the number of teeth of gears Z6 and Z7 respectively.
By keeping D4 = 80 mm, D3 = 126 mm and G6 = 28 constant and by varying the
teeth of gear Z7 (G7) the following draw ratios for the core yarn can be obtained.
Table A.1 Core yarn draw ratios
No. of Teeth (G7) DRc
40 2.25
39 2.19
38 2.14
37 2.08
36 2.03
Draw ratio for effect yarn (DRe)
The draw ratio of the effect yarn depends on the selection of the variable gear Z13
assuming all the other parameters as constant. The equation is as follows;
1213
68Re
GG
DDD (A.1)
Where,
D6 is the diameter of the effect yarn input roller 6 (Figure A.1);
D8 is the diameter of the effect yarn feed roller 8 (Figure A.1);
G12 and G13 are the number of teeth of gears Z12 and Z13 respectively.

164
By keeping D6 = 80 mm, D8 = 126 mm and G12 = 33 constant and by varying the
teeth of gear Z13 (G13), the following draw ratios for the effect yarn can be
obtained.
Table A.2 Effect yarn draw ratios
No. of Teeth (G13) DRe
40 1.91
39 1.86
38 1.81
37 1.76
36 1.72
Overfeed percentage for core yarn (OFc)
Core yarn overfeed is the positive difference in the speed between the core yarn
entering the jet and the textured yarn coming out of the jet. The core yarn overfeed
percentage derived from the gearing arrangement is as follows;
100154
31
1416
125
GG
GG
GG
DDOFc (A.3)
Where,
D5 is the diameter of the core yarn feed roller 5 (Figure A.3);
D12 is the diameter of the textured yarn delivery roller 12 (Figure A.3);
G1, G3, G4, G5, G14 and G16 are the number of teeth of gears Z1, Z3, Z4,
Z5, Z14 and Z16 respectively.
The parameters taken as constant for the above equation were D5 = 124.5 mm, D12
= 126 mm, G16 = 40, G14 = 40, G1 = 40, G4 = 100 and G5 = 96 and the number of
teeth (G3) of the variable gear Z3 can be changed to achieve following values of the
core yarn overfeed.

165
Table A.3 Core yarn overfeed percentage
No. of Teeth (G3) OFc
40 2.9
39 5.5
38 8.3
37 11.3
36 14.4
Overfeed percentage for effect yarn (OFe)
Effect yarn overfeed is also calculated through the gearing arrangement as per the
calculation of overfeed for the core yarn and following equation was established.
10011110
21
1416
128
GG
GG
GG
DDOFe (A.4)
Where,
D8 is the diameter of the effect yarn feed roller 8 (Figure A.1);
D12 is the diameter of the textured yarn delivery roller 12 (Figure A.1);
G1, G2, G10, G11, G14 and G16 are the number of teeth of gears Z1, Z2,
Z10, Z11, Z14 and Z16 respectively.
The parameters taken as constant for the above equation were D8 = 126 mm, D12 =
126 mm, G16 = 40, G14 = 40, G1 = 40, G10 = 40 and G11 = 29 and the number of
teeth (G2) of the variable gear Z2 can be changed to achieve the following values of
effect yarn overfeed.
Table A.4 Effect yarn overfeed percentage
No. of Teeth (G2) OFe
40 37.9
39 41.5
38 45.2
37 49.1
36 53.2

166
Appendix B: Mechanical properties Note: (S) means statistically significant and (NS) means not significant Table B.1 Tenacity of textured and non-textured glass yarns of 300 tex category
Yarn type Tenacity
(cN/tex) S.D C.V %
confidence
95%
%
Reduction
Significance
300 NT 47.76 3.82 8.00 2.36
300+34 3B 25.33 3.99 15.73 2.47 46.96 < 0.05 (S)
300+34 4B 27.67 1.90 6.88 1.18 42.06 < 0.05 (S)
300+34 5B 28.13 4.74 16.84 2.94 41.10 < 0.05 (S)
300+68 3B 21.73 3.52 16.20 2.18 54.50 < 0.05 (S)
300+68 4B 18.11 4.00 22.10 2.48 62.08 < 0.05 (S)
300+68 5B 20.98 5.29 25.24 3.28 56.07 < 0.05 (S)
Table B.2 Tenacity of textured and non-textured glass yarns of 600 tex category
Yarn type Tenacity
(cN/tex) S.D C.V %
confidence
95%
%
Reduction
Significance
600 NT 40.81 4.80 11.76 2.97
600+34 5B 31.14 4.05 13.01 2.51 23.70 < 0.05 (S)
600+68 5B 32.30 5.97 18.49 3.70 20.85 < 0.05 (S)
Table B.3 Tenacity of non-textured feed yarns
Yarn type Tenacity
(cN/tex) S.D C.V %
confidence
95%
%
change
Significance
300 core 47.76 3.82 8.00 2.36
334 47.82 4.95 10.34 3.07 0.13 0.49 (NS)
368 49.82 4.34 8.71 2.69 4.13 0.14 (NS)
600 core 40.81 4.80 11.76 2.97
634 42.88 3.27 7.62 2.03 4.83 0.14 (NS)
668 42.54 4.75 11.16 2.94 4.07 0.21 (NS)
34 effect 55.02 5.15 9.36 3.20
68 effect 65.68 6.42 9.77 3.98

167
Table B.4 Variation in linear density (tex) of textured glass yarns
Yarn type Linear Density (Tex) S.D. CV
%
Confidence
95 %
%
reduction
346 nominal L.D
300+34 (3 Bar) 331.6 1.14 0.34 1.00 4.11
300+34 (4 Bar) 330.2 2.49 0.75 2.18 4.52
300+34 (5 Bar) 326.8 3.90 1.19 3.42 5.50
383 nominal L.D
300+68 (3 Bar) 364.8 5.59 1.53 4.90 4.74
300+68 (4 Bar) 364.4 1.95 0.53 1.71 4.85
300+68 (5 Bar) 362.6 3.44 0.95 3.01 5.32
655 nominal L.D
600+34 (5 Bar) 621.4 3.29 0.53 2.88 5.06
692 nominal L.D
600+68 (5 Bar) 661 2.46 0.37 2.16 4.45
Table B.5 Tensile strength of 300 tex Plain weave composites
Weave/
direction
Composite
type
Tensile
strength
(MPa)
Std-
dev
C.V
%
95% Conf.
Interval
%
change Signif.
Plain
Warp
300 NT 360.70 21.34 5.90 18.70
300+34 3B 243.30 25.35 10.42 22.22 -32.55 <0.05
(S)
300+34 4B 253.30 20.77 8.20 18.21 -29.77 <0.05
(S)
300+34 5B 288.91 13.13 4.54 11.51 -19.90 <0.05
(S)
300+68 4B 266.94 12.82 4.80 11.23 -25.99 <0.05
(S)
300+68 5B 251.61 20.80 8.26 18.22 -30.24 <0.05
(S)
Plain
Weft
300 NT 279.00 17.54 6.29 15.37
300+34 3B 264.34 18.73 7.09 16.42 -5.26 0.12

168
(NS)
300+34 4B 207.51 14.19 6.84 12.44 -25.62 <0.05
(S)
300+34 5B 240.82 10.39 4.32 9.11 -13.68 <0.05
(S)
300+68 4B 208.01 11.44 5.50 11.21 -25.44 <0.05
(S)
300+68 5B 200.01 22.66 11.33 22.21 -28.31 <0.05
(S)
Table B.6 Tensile modulus of 300 tex Plain weave composites
Weave/
direction Comp. type
Tensile
modulus
(MPa)
Std-dev C.V %
95%
Conf.
Interval
% change Signif.
Plain
Warp
300 NT 21470.00 3684.00 17.16 3229.40
300+34 3B 17140.00 1320.23 7.70 1157.21 -20.17 <0.05
(S)
300+34 4B 19800.00 738.24 3.73 647.09 -7.78 0.19
(NS)
300+34 5B 18311.00 1314.00 7.18 1151.72 -14.71 0.065
(NS)
300+68 4B 16100.00 4984.70 30.96 4369.19 -25.01 0.07
(NS)
300+68 5B 16680.00 1042.59 6.25 913.85 -22.31 <0.05
(S)
Plain
Weft
300 NT 19585.00 1839.40 9.39 1612.30
300+34 3B 18520.00 813.63 4.39 713.17 -5.44 0.14
(NS)
300+34 4B 18980.00 4727.26 24.91 4143.55 -3.09 0.4
(NS)
300+34 5B 15665.20 1154.93 7.37 1012.32 -20.01 <0.05
(S)

169
300+68 4B 14845.00 656.03 4.42 642.90 -24.20 <0.05
(S)
300+68 5B 17575.00 3287.73 18.70 3221.92 -10.26 0.17
(NS)
Table B.7 Tensile strength of 300 tex Twill weave composites
Weave/
direction Comp. type
Tensile
strength
(MPa)
Std-
dev
C.V
%
95%
Conf.
Interval
%
change Signif.
Twill
Warp
300 NT 341.53 40.87 11.96 35.83
300+34 3B 240.67 8.54 3.55 7.49 -29.53 <0.05 (S)
300+34 5B 255.98 19.04 7.44 16.69 -25.05 <0.05 (S)
300+68 4B 268.50 23.80 8.86 20.86 -21.38 <0.05 (S)
300+68 5B 258.52 9.84 3.80 8.62 -24.31 <0.05 (S)
Twill
Weft
300 NT 318.98 23.86 7.48 20.92
300+34 3B 272.54 22.21 8.15 19.46 -14.56 <0.05 (S)
300+34 5B 265.40 16.45 6.20 14.42 -16.80 <0.05 (S)
300+68 4B 248.57 11.52 4.63 10.10 -22.07 <0.05 (S)
300+68 5B 242.68 12.87 5.31 11.29 -23.92 <0.05 (S)
Table B.8 Tensile modulus of 300 tex Twill weave composites
Weave/
direction Comp. Type
Tensile
modulus
(MPa)
Std-dev C.V
%
95%
Conf.
Interval
%
change Signif.
Twill
Warp
300 NT 21987.80 1169.92 5.32 1025.46
300+34 3B 14928.20 818.48 5.48 717.42 -32.11 <0.05 (S)
300+34 5B 16020.75 400.54 2.50 392.52 -27.14 <0.05 (S)
300+68 4B 17242.00 917.95 5.32 899.57 -21.58 <0.05 (S)

170
300+68 5B 16340.00 716.24 4.38 627.80 -25.69 <0.05 (S)
Twill
Weft
300 NT 20314.80 509.27 2.51 446.39
300+34 3B 16576.20 922.24 5.56 808.36 -18.40 <0.05 (S)
300+34 5B 16388.40 997.68 6.08 874.50 -19.33 <0.05 (S)
300+68 4B 15522.00 766.80 4.94 672.12 -23.59 <0.05 (S)
300+68 5B 17020.00 630.07 3.70 552.28 -16.22 <0.05 (S)
Table B.9 Flexure strength of 300 tex plain weave composites
Weave/
direction Composite type
Flex str
(MPa)
Std-
dev C.V %
95%
Conf.
Interval
%
change Signif.
Plain
Warp
300 NT 419.78 37.49 8.93 32.86
300+34 3B 305.68 18.43 6.03 16.15 -27.18 <0.05 (S)
300+34 4B 307.16 31.72 10.33 27.80 -26.83 <0.05 (S)
300+34 5B 431.80 6.72 1.56 5.89 2.86 0.26
(NS)
300+68 4B 348.63 52.15 14.96 45.72 -16.95 <0.05 (S)
300+68 5B 268.00 18.90 7.05 16.56 -36.16 <0.05 (S)
Plain
Weft
300 NT 388.34 11.91 3.07 10.44
300+34 3B 277.27 44.75 16.14 39.22 -28.60 <0.05 (S)
300+34 4B 247.00 33.54 13.57 29.39 -36.40 <0.05 (S)
300+34 5B 337.00 26.26 7.80 23.02 -13.22 <0.05 (S)
300+68 4B 301.57 43.09 14.29 37.76 -22.34 <0.05 (S)
300+68 5B 255.00 33.04 12.96 29.00 -34.34 <0.05 (S)

171
Table B.10 Flexure modulus of 300 tex plain weave composites
Weave/
direction
Composite
type
Flexure
Modulus
(Mpa)
Std-dev C.V %
95%
Conf.
Interval
%
change Signif.
Plain
Warp
300 NT 11883.12 2309.51 19.44 2024.33
300+34 3B 7859.14 768.53 9.78 673.63 -33.86 <0.05
(S)
300+34 4B 9728.62 1034.12 10.63 906.43 -18.13 0.05
(NS)
300+34 5B 11318.60 1654.90 14.62 1450.54 -4.75 0.34
(NS)
300+68 4B 10517.62 1372.13 13.05 1202.70 -11.49 0.15
(NS)
300+68 5B 9803.55 1059.16 10.80 928.38 -17.50 0.06
(NS)
Plain
Weft
300 NT 11184.33 474.03 4.24 415.50
300+34 3B 7896.82 1800.48 22.80 1578.16 -29.39 <0.05
(S)
300+34 4B 8430.30 765.38 9.10 670.87 -24.62 <0.05
(S)
300+34 5B 7697.96 417.10 5.42 365.60 -31.17 <0.05
(S)
300+68 4B 9015.93 1411.83 15.66 1237.50 -19.39 <0.05
(S)
300+68 5B 8324.44 1057.01 12.70 926.50 -25.57 <0.05
(S)
Table B.11 Flexure strength of 300 tex twill weave composites
Weave/
direction
Composite
type
Flex str
(MPa)
Std-
dev C.V %
95%
Conf.
Interval
%
change Signif.
Twill
Warp
300 NT 428.37 24.48 5.72 21.46
300+34 3B 358.14 27.01 7.54 23.67 -16.39 <0.05 (S)

172
300+34 4B 407.50 38.20 9.37 33.49 -4.87 0.17 (NS)
300+34 5B 353.83 25.44 7.19 22.30 -17.40 <0.05 (S)
300+68 3B 337.74 17.41 5.16 15.26 -21.16 <0.05 (S)
300+68 4B 375.12 18.47 4.92 16.19 -12.43 <0.05 (S)
300+68 5B 365.36 24.18 6.62 21.20 -14.71 <0.05 (S)
Twill
Weft
300 NT 412.65 36.83 8.93 32.28
300+34 3B 385.03 28.12 7.30 24.65 -6.69 0.11 (NS)
300+34 4B 381.13 58.88 15.45 51.61 -7.64 0.17 (NS)
300+34 5B 369.79 21.82 5.90 19.13 -10.39 <0.05 (S)
300+68 3B 365.92 25.06 6.85 21.97 -11.32 <0.05 (S)
300+68 4B 373.52 33.60 8.99 29.45 -9.48 0.06 (NS)
300+68 5B 350.90 17.15 4.89 15.03 -14.96 <0.05 (S)
Table B.12 Flexure modulus of 300 tex twill weave composites
Weave/
direction
Composite
type
Flexure
Modulus
(MPa)
Std-dev C.V %
95%
Conf.
Interval
%
change Signif.
Twill
Warp
300 NT 11262.20 1137.9 10.10 997.40
300+34 3B 11537.03 985.57 8.54 863.87 2.44 0.35
(NS)
300+34 4B 10967.55 1546.6 14.10 1355.6
6 -2.62
0.37
(NS)
300+34 5B 12151.40 789.20 6.50 691.72 7.90 0.1 (NS)
300+68 3B 11459.64 415.43 3.63 364.13 1.75 0.37
(NS)
300+68 4B 11988.10 1061.1 8.85 930.14 6.45 0.16
(NS)
300+68 5B 11857.09 825.10 6.96 723.21 5.28 0.19

173
(NS)
Twill
Weft
300 NT 12445.70 1657.9 13.32 1453.2
300+34 3B 10993.80 735.94 6.70 645.07 -11.67 0.06
(NS)
300+34 4B 11425.32 1589.4 13.91 1393.2 -8.20 0.17
(NS)
300+34 5B 11939.48 604.52 5.06 529.90 -4.07 0.27
(NS)
300+68 3B 10568.72 1072.2 10.14 939.87 -15.08 <0.05 (S)
300+68 4B 10874.12 876.96 8.06 768.67 -12.63 0.06
(NS)
300+68 5B 10487.89 574.68 5.48 503.72 -15.73 <0.05 (S)
Table B.13 ILSS of 300 tex plain weave composites
Weave/
direction
Comp.
type
ILSS
(MPa)
Std-
dev C.V %
95%
Conf.
Interval
%
increase
ILSS
Signif.
Plain
Warp
300 NT 31.556 2 6.34 1.753
300+34 3B 35.206 1.76 5.00 1.543 11.57 <0.05 (S)
300+34 4B 35.204 4.38 12.44 3.839 11.56 0.07 (NS)
300+34 5B 39.159 3.04 7.76 2.665 24.09 <0.05 (S)
300+68 4B 36.16 4.11 11.36 3.601 14.59 <0.05 (S)
300+68 5B 34.35 1.5 4.35 1.310 8.85 <0.05 (S)
Plain
Weft
300 NT 26.433 2.27 8.59 1.990
300+34 3B 30.77 2.71 8.81 2.375 16.41 <0.05 (S)
300+34 4B 27.978 2.62 9.36 2.296 5.84 0.17 (NS)
300+34 5B 31.044 2.58 8.32 2.260 17.44 <0.05 (S)
300+68 4B 28.52 3.46 12.13 3.033 7.90 0.15 (NS)
300+68 5B 29.63 5.08 17.17 4.460 12.09 0.12 (NS)
Table B.14 ILSS of 300 tex twill weave composites
Weave/
direction
Composite
type
ILSS
(MPa)
Std-
dev C.V %
95%
Conf.
%
increase Signif.

174
Interval ILSS
Twill
Warp
300 NT 30.11 2.08 6.91 1.823
300+34 3B 35.66 2.96 8.30 2.595 18.43 <0.05 (S)
300+34 4B 33.88 1.58 4.66 1.385 12.52 <0.05 (S)
300+34 5B 40.12 1.11 2.77 0.973 33.24 <0.05 (S)
300+68 3B 34.97 4.51 12.90 3.953 16.14 <0.05 (S)
300+68 4B 37.25 1.51 4.05 1.324 23.71 <0.05 (S)
300+68 5B 38.77 1.79 4.62 1.569 28.76 <0.05 (S)
Twill
Weft
300 NT 27.85 3.42 12.28 2.998
300+34 3B 33.57 3.26 9.71 2.857 20.54 <0.05 (S)
300+34 4B 34.27 2.24 6.54 1.963 23.05 <0.05 (S)
300+34 5B 36.97 5.12 13.86 4.490 32.75 <0.05 (S)
300+68 3B 34.35 4.32 12.58 3.787 23.34 <0.05 (S)
300+68 4B 35.2 2.063 5.86 1.808 26.39 <0.05 (S)
300+68 5B 38.65 4.61 11.91 4.040 38.78 <0.05 (S)
Table B.15 Tensile strength of 600 tex plain and twill weave composites
Dir. Type Tensile
strength (MPa)
Std-dev
C.V % 95%
Conf. Interval
% change
Signif.
Plain
Warp
600 NT 310.80 54.20 17.44 47.51
600+34 5B 278.28 28.28 10.16 24.79 -10.46 0.139 (NS)
600+68 5B 264.21 13.60 5.15 10.88 -14.99 0.07 (NS)
600 CT 5B 259.26 19.34 7.46 16.95 -16.58 0.051 (NS)
600 CT 668
5B 260.10 16.64 6.40 14.59 -16.31 0.052 (NS)
600+34 5B
(WfW) 280.00 25.89 9.25 22.70 -9.91 0.147 (NS)
600+68 5B
(WfW) 288.30 17.65 6.12 15.48 -7.24 0.21 (NS)
Plain 600 NT 292.24 8.64 2.96 7.57

175
Weft 600+34 5B 214.42 11.52 5.37 10.10 -26.63 <0.05 (S)
600+68 5B 252.28 6.42 2.55 5.63 -13.67 <0.05 (S)
600 CT 5B 229.80 10.73 4.67 9.40 -21.37 <0.05 (S)
600 CT 668
5B 218.50 9.04 4.14 7.93 -25.23 <0.05 (S)
600+34 5B
(WfW) 292.78 6.88 2.35 6.03 0.18 0.458 (NS)
600+68 5B
(WfW) 261.70 20.67 7.89 18.12 -10.45 <0.05 (S)
Twill
Warp
600 NT 320.68 32.63 10.17 28.60
600+34 5B 266.89 7.36 2.76 6.45 -16.77 <0.05 (S)
600+68 5B 250.74 22.55 8.99 19.76 -21.81 <0.05 (S)
600 CT 5B 259.17 12.97 5.00 11.37 -19.18 <0.05 (S)
600 CT 668
5B 243.30 14.58 5.99 12.80 -24.13 <0.05 (S)
600+34 5B
(WfW) 294.16 18.39 6.25 16.12 -8.27 0.08 (NS)
600+68 5B
(WfW) 298.67 28.34 9.49 24.84 -6.86 0.14 (NS)
Twill
Weft
600 NT 335.70 38.71 11.53 33.93
600+34 5B 308.22 15.29 4.96 14.98 -8.19 0.103 (NS)
600+68 5B 248.30 6.62 2.67 5.80 -26.04 <0.05 (S)
600 CT 5B 235.50 23.12 9.82 20.27 -29.85 <0.05 (S)
600 CT 668
5B 236.30 25.25 10.70 22.13 -29.61 <0.05 (S)
600+34 5B
(WfW) 317.92 23.05 7.25 20.20 -5.30 0.203 (NS)
600+68 5B
(WfW) 254.55 14.05 5.52 12.30 -24.17 <0.05 (S)

176
Table B.16 Tensile modulus of 600 tex plain and twill weave composites
Dir. Type Modulus (MPa) Std-dev C.V %
95% Conf.
Interval %
change Signif.
Plain Warp
600 NT 23080.80 2171.76 9.41 1903.60 600+34
5B 18627.40 1231.92 6.61 1079.80 -19.29 <0.05 (S)
600+68
5B 16511.33 1570.60 9.51 1256.74 -28.46 <0.05 (S)
600 CT
5B 15198.60 386.10 2.54 338.40 -34.15 <0.05 (S)
600 CT
668 5B 16431.00 1867.00 11.36 1636.00 -28.81 <0.05 (S)
600+34
5B
(WfW) 20200.00 821.58 4.07 720.14 -12.48 <0.05 (S)
600+68
5B
(WfW) 19260.00 3007.52 15.62 2636.16 -16.55 <0.05 (S)
Plain Weft
600 NT 19751.20 1073.56 5.44 941.00 600+34
5B 18237.20 4671.64 25.62 4094.80 -7.67 0.259 (NS)
600+68
5B 16008.00 2089.00 13.04 1831.00 -18.95 <0.05 (S)
600 CT
5B 16081.80 2362.10 14.69 2070.50 -18.58 <0.05 (S)
600 CT
668 5B 14546.00 1509.00 10.38 1323.00 -26.35 <0.05 (S)
600+34
5B
(WfW) 19800.00 1505.00 7.60 1319.16 0.25 0.477
(NS)
600+68
5B 19309.00 2775.95 14.38 2433.18 -2.24 0.37 (NS)

177
(WfW)
Twill Warp
600 NT 22679.00 1530.35 6.75 1341.14 600+34
5B 17998.40 1802.75 10.02 1580.15 -20.64 <0.05 (S)
600+68
5B 17912.00 1693.70 9.46 1484.60 -21.02 <0.05 (S)
600 CT
5B 15542.00 1137.00 7.32 997.00 -31.47 <0.05 (S)
600 CT
668 5B 16236.00 2689.00 16.56 2357.00 -28.41 <0.05 (S)
600+34
5B
(WfW) 17520.00 939.15 5.36 823.18 -22.75 <0.05 (S)
600+68
5B
(WfW) 17777.00 2218.80 12.48 1944.82 -21.61 <0.05 (S)
Twill Weft
600 NT 22526.80 3149.15 13.98 2760.30 600+34
5B 18173.25 2663.35 14.66 2610.04 -19.33 <0.05 (S)
600+68
5B 16749.80 566.97 3.38 496.96 -25.65 <0.05 (S)
600 CT
5B 17321.00 2197.30 12.69 1926.00 -23.11 <0.05 (S)
600 CT
668 5B 16278.00 1341.00 8.24 1176.00 -27.74 <0.05 (S)
600+34
5B
(WfW) 20520.00 1416.69 6.90 1241.76 -8.91 0.121
(NS)
600+68
5B
(WfW) 18385.00 2077.20 11.30 1820.70 -18.39 <0.05 (S)

178
Table B.17 Flexure strength of 600 tex plain and twill weave composites
Dir. Type Flex str (MPa) Std-dev C.V %
95% Conf.
Interval
% change Signif.
Plain Warp
600 NT 381.11 26.15 6.86 22.92
600+34 5B 370.20 28.98 7.83 25.40 -2.86 0.27 (NS)
600+68 5B 354.21 11.11 3.14 9.74 -7.06 <0.05 (S)
600 CT 5B 372.22 25.08 6.74 21.98 -2.33 0.3 (NS)
600 CT 668 5B 390.68 14.93 3.82 13.09 2.51 0.25 (NS)
600+34 5B WfW 365.51 10.13 2.77 8.88 -4.09 0.13 (NS)
600+68 5B WfW 386.65 20.89 5.40 18.31 1.45 0.36 (NS)
Plain Weft
600 NT 331.56 33.30 10.04 29.19
600+34 5B 337.32 14.36 4.26 12.59 1.74 0.37 (NS)
600+68 5B 337.86 22.85 6.76 20.03 1.90 0.37 (NS)
600 CT 5B 359.55 15.73 4.38 13.79 8.44 0.07 (NS)
600 CT 668 5B 358.03 24.84 6.94 21.77 7.98 0.1 (NS)
600+34 5B WfW 346.52 27.84 8.04 24.41 4.51 0.23 (NS)
600+68 5B WfW 387.99 39.18 10.10 34.34 17.02 <0.05 (S)
Twill Warp
600 NT 351.53 46.33 13.18 40.61
600+34 5B 320.15 15.30 4.78 13.41 -8.93 0.104 (NS)
600+68 5B 394.80 5.32 1.35 4.70 12.31 0.053 (NS)
600 CT 5B 409.18 13.73 3.35 12.03 16.40 <0.05 (S)
600 CT 668 5B 420.20 14.69 3.50 12.88 19.53 <0.05 (S)
600+34 5B WfW 453.21 29.26 6.46 25.65 28.92 <0.05 (S)
600+68 5B WfW 440.95 48.48 10.99 42.50 25.44 <0.05 (S)
Twill Weft 600 NT 379.21 19.52 5.15 17.11

179
600+34 5B 355.82 31.15 8.76 27.31 -6.17 0.1 (NS)
600+68 5B 386.36 39.98 10.35 35.05 1.89 0.36 (NS)
600 CT 5B 396.52 49.05 12.37 42.99 4.57 0.24 (NS)
600 CT 668 5B 423.76 45.07 10.64 39.50 11.75 0.05 (NS)
600+34 5B WfW 408.15 26.17 6.41 22.93 7.63 <0.05 (S)
600+68 5B WfW 400.00 41.80 10.45 36.65 5.48 0.18 (NS)
Table B.18 Flexure modulus of 600 tex plain and twill weave composites
Dir. Type Flexure modulus
(Mpa)
Std-dev
C.V %
95% Conf. Interval
% change Signif.
Plain Warp
600 NT 11995.37 2040.7 17.0 1788.79
600+34 5B 11644.72 1093.9 9.39 958.89 -2.9 0.37 (NS)
600+68 5B 12072.49 846.67 7.01 742.12 0.6 0.47 (NS)
600 CT 5B 13611.00 1173.4 8.62 1028.6 13.4 0.088 (NS)
600 CT 668 5B 12861.00 344.50 2.68 301.9 7.2 0.2
(NS) 600+34 5B
WfW 13529.63 915.07 6.76 802.08 12.7 0.088 (NS)
600+68 5B WfW 13938.40 310.60 2.23 272.24 16.1 0.051
(NS)
Plain Weft
600 NT 9071.25 1101.7 12.1 965.66
600+34 5B 9634.94 389.10 4.04 341.06 6.2 0.16 (NS)
600+68 5B 11390.12 961.66 8.44 842.91 25.5 <0.05 (S)
600 CT 5B 13157.00 924.00 7.02 809.7 45.0 <0.05 (S)
600 CT 668 5B 11817.00 359.00 3.03 314.34 30.2 <0.05
(S) 600+34 5B
WfW 12471.31 479.76 3.85 420.52 37.4 <0.05 (S)
600+68 5B WfW 12914.44 1045.1 8.09 916.06 42.3 <0.05
(S) Twill Warp 600 NT 12679.67 2479.7 19.5 2173.53

180
600+34 5B 11500.75 406.57 3.54 356.37 -9.1 0.18 (NS)
600+68 5B 12153.26 610.86 5.03 535.43 -4.15 0.33 (NS)
600 CT 5B 14098.10 733.70 5.2 643.1 11.1 0.14 (NS)
600 CT 668 5B 14296.00 458.32 3.21 401.73 12.7 0.11
(NS) 600+34 5B
WfW 14172.02 762.42 5.38 668.28 11.7 0.127 (NS)
600+68 5B WfW 16385.40 2072.1 12.6 1816.31 29.2 <0.05
(S)
Twill Weft
600 NT 10176.13 1021.0 10.0 895.00
600+34 5B 11829.66 900.93 7.62 789.69 16.2 <0.05 (S)
600+68 5B 11282.74 663.91 5.88 581.93 10.8 <0.05 (S)
600 CT 5B 13320.00 367.00 2.75 321.56 30.8 <0.05 (S)
600 CT 668 5B 15003.00 952.00 6.34 834.25 47.4 <0.05
(S) 600+34 5B
WfW 12297.01 707.66 5.75 620.28 20.8 <0.05 (S)
600+68 5B WfW 15308.46 1268.9 8.29 1112.23 50.4 <0.05
(S)
Table B.19 ILSS of 600 tex plain and twill weave composites
Dir. Type ILSS (MPa)
Std-dev C.V % 95% Conf.
Interval
% increase
ILSS Signif
Plain Warp
600 NT 28.45 2.49 8.75 2.18
600+34 5B 38.77 2.64 6.81 2.31 36.25 <0.05 (S)
600+68 5B 39.99 2.04 5.10 1.79 40.55 <0.05 (S)
600 5 bar CT 38 1.93 5.07 1.69 33.53 <0.05 (S)
600 CT+668 5B 39.53 2.53 6.40 2.22 38.91 <0.05
(S) 600+34 5B
WfW 38.28 3.29 8.59 2.88 34.53 <0.05 S
600+68 5B WfW 37.33 2.38 6.38 2.08 31.18 <0.05
S
Plain 600 NT 24.16 2.45 10.16 2.15

181
Weft 600+34 5B 32.57 1.58 4.85 1.38 34.80 <0.05 (S)
600+68 5B 34.68 0.65 1.86 0.57 43.55 <0.05 (S)
600 5 bar CT 33.24 3.22 9.68 2.82 37.57 <0.05 (S)
600 CT+668 5B 34.28 3.15 9.19 2.76 41.88 <0.05
(S) 600+34 5B
WfW 35.87 3.6 10.04 2.23 48.47 <0.05 S
600+68 5B WfW 35.95 1.02 2.85 0.89 48.79 <0.05
S
Twill Warp
600 NT 27.63 0.76 2.77 0.67
600+34 5B 39.90 7.92 19.85 6.94 44.39 <0.05 (S)
600+68 5B 41.35 1.39 3.36 1.22 49.62 <0.05 (S)
600 5 bar CT 36.47 3.21 8.8 2.81 31.97 <0.05 (S)
600 CT+668 5B 40.06 1.06 2.63 0.93 44.96 <0.05
(S) 600+34 5B
WfW 39.47 6.73 17.04 4.17 42.84 <0.05 S
600+68 5B WfW 39.27 1.28 3.25 0.79 42.10 <0.05
S
Twill Weft
600 NT 24.09 0.24 0.99 0.21
600+34 5B 33.27 1.68 5.05 1.47 38.06 <0.05 (S)
600+68 5B 34.886 1.89 5.42 1.66 44.76 <0.05 (S)
600 5 bar CT 33.994 3.13 9.2 2.74 41.06 <0.05 (S)
600 CT+668 5B 35.76 2.91 8.14 2.55 48.39 <0.05
(S) 600+34 5B
WfW 35.867 3.93 10.95 2.43 48.83 <0.05 S
600+68 5B WfW 36.466 3.45 9.47 2.14 51.32 <0.05
S