Labour Force Survey 2020 - Agjencia e Statistikave të Kosovës |
42
Republika e Kosovës Republika Kosova-Republic of Kosovo Qeveria - Vlada – Government Ministria e Financave, Punës dhe Transfereve – Ministarstvo za Financije, Rada i Transfera – Ministry of Finance, Labor end Transfers Agjencia e Statistikave të Kosovës - Agencija za Statistike Kosova – Kosovo Agency of Statistics Series 5: Social Statistics Labour Force Survey 2020
-
Upload
khangminh22 -
Category
Documents
-
view
2 -
download
0
Transcript of Labour Force Survey 2020 - Agjencia e Statistikave të Kosovës |
Republika e Kosovës
Republika Kosova-Republic of Kosovo Qeveria - Vlada – Government
Ministria e Financave, Punës dhe Transfereve – Ministarstvo za Financije, Rada i Transfera –Ministry of Finance, Labor end Transfers
Agjencia e Statistikave të Kosovës - Agencija za Statistike Kosova – Kosovo Agency of Statistics
Series 5: Social Statistics
Labour Force Survey 2020
Publisher: Kosovo Agency of Statistics (KAS)
Publication date: July, 2021© - Kosovo Agency of Statistics
Reproduction is authorized when source is indicated
More information is available on Internet
http://ask.rks-gov.net/
Foreword
The purpose of the Labour Force Survey (LFS) in Kosovo is to provide statistical data on
statistical indicators of the labor market and to enable their comparison with previous years and
quarters.
Report of LFS in the year of 2020 contains information on employment and unemployment
according to age, gender, employment status, economic activity, occupation and other areas of
the labour market.
In 2020, the employment rate is 28.4%, the unemployment rate is 25.9% while the inactivity
rate is 61.7%.
LFS data indicate that the percentage of people employed part -time in 2020 is 7.5%. Self-
employment (as a percentage of employees) in 2020 was 21.1%. Percentage of employees in
unstable jobs (persons who are self-employed and have no employees and those who work
without pay in a family business) is 17.0%. Trade, manufacturing, construction and education
continue to employ almost half of employed persons.
Regarding the participation in the workforce which was 38.3% in this period, the number of
females belonging to the labour force is 20.8% and 56.0% is for males.
The unemployment rate among young people is 49.1%.
Long-term unemployment of young people (age 15-19) who have been unemployed for more
than 12 months for this quarter is 51.9%.
The percentage of young people who are not employed nor in education or training - NEET
(respondents aged 15-24) is 33.6%.
KAS thank the participants and other stakeholders, especially its staff in the implementation of
LFS 2019. At the same time, KAS informs all users of official statistics that KAS, within budget
opportunities, is continuously making capacity building efforts to publish stable and more quality
statistics.
According to the Law on Official Statistics, No. 04/L-034, the Kosovo Agency of Statistics is
responsible for the production of official statistics in the Republic of Kosovo, therefore, when
using this data, the source shall be cited.
Comments, remarks, suggestions and proposals regarding this publication are welcome and
can be sent to email address: [email protected]
Avni Kastrati - Director of the Department of Social Statistics
Naime Rexhepi - Head of the Division of Social Statistics
Publication was prepared by:
Bujar Hajrizi - Head of Sector
Bedrije Demaj - Senior Officer
Besarta Thaçi - Officer
July, 2021 Acting Chief Executive Officer, KAS Ilir.T.Berisha
Labour Force Survey, 2020
2
Introduction
Kosovo Agency of Statistics (KAS) has started the implementation of the Labour Force Survey
(LFS) in 2001, and has continued as an annual survey until 2009. Due to the preparation of the
Population Census, the Labour Force Survey (LFS) was not conducted in 2010 and 2011.
Since 2012, Labour Force Survey (LFS) is developed according to Eurostat methodology as the
continued survey (52 calendar weeks – reference weeks), as well as:
• Revised questionnaire (following the Eurostat guidelines)
• New sampling frame (based on the Population, Households and Dwellings Census in
Kosovo 2011).
• Sample rotation means that the proportion of the sample is replaced in
each round of survey according to a predefined rotation model. The
sample consists of a number of sub-samples or groups of rotations. In
each round of survey, a new rotation set is inserted into the sample to
replace the rotation group from the previous round of the survey. The
sample share that is common for the two rounds of the survey allows
the estimation of gross changes and enables reliable estimates of net
changes. Also, from a practical point of view, the independent
interviewing and improved controls during data analysis is enabled
• Interview of the households are conducted via laptop, through the CAPI method – Computer
Assisted Personal Interviewing, which enables faster generation of data than through the
PAPI method, respectively through the traditional method of data collection through interview
by paper and pencil, which are entered to the computer.
The main objectives of LFS are collection of information mainly on the supply side of the labour
market, i.e. information on those who are working or actively looking for a job.
.

Labour Force Survey, 2020
3
Acknowledgements
Since 2014, the LFS is realized with KAS budget. We express our gratitude to the hard work of
the heads of regional offices of KAS, who supervised the field work, and to the families who
have shared their time and provided data by helping in this way the collection of such detailed
information.
Labour Force Survey, 2020
4
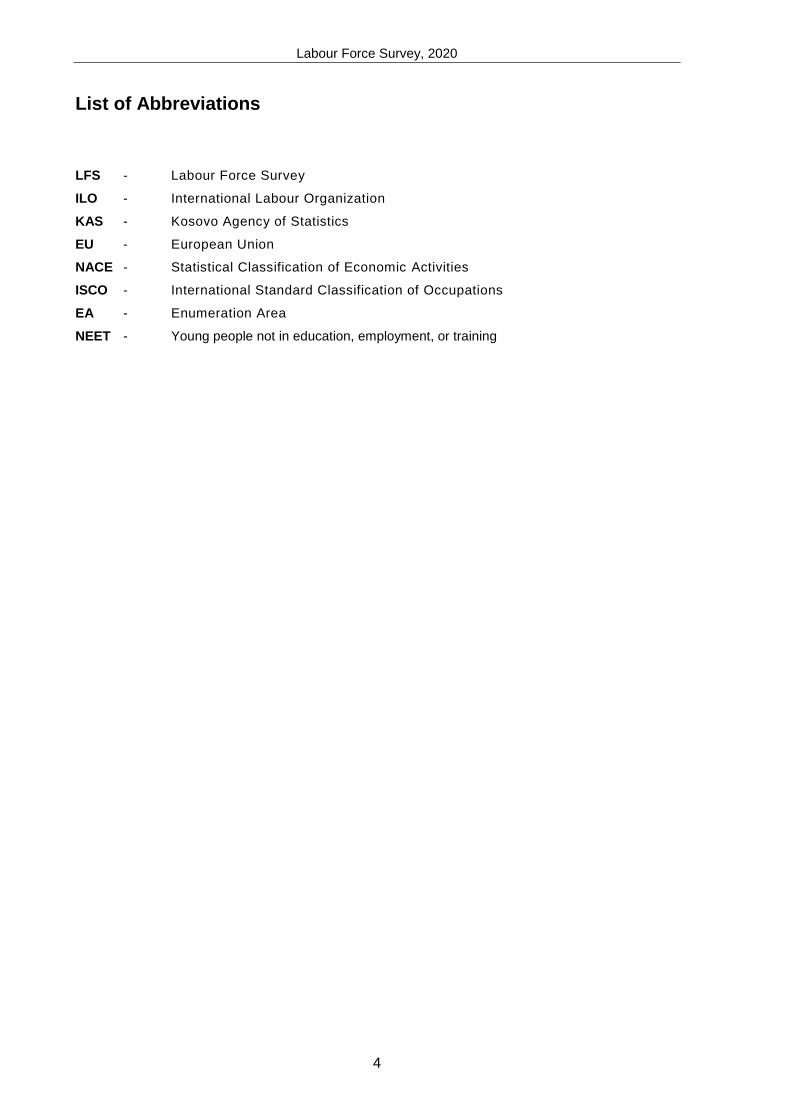
List of Abbreviations
LFS - Labour Force Survey
ILO - International Labour Organization
KAS - Kosovo Agency of Statistics
EU - European Union
NACE - Statistical Classification of Economic Activities
ISCO - International Standard Classification of Occupations
EA - Enumeration Area
NEET - Young people not in education, employment, or training
Labour Force Survey, 2020
5
List of Contents
Page
Foreword ............................................................................................................................... 1 Introduction ............................................................................................................................ 2 Acknowledgements ................................................................................................................ 3 List of Abbreviations .............................................................................................................. 4 Definitions .............................................................................................................................. 7
......................... 10 Key indicators ...................................................................................................................... 11 Tab. 1: Key indicators of the labour market .......................................................................... 13 1. Employment ..................................................................................................................... 14 1.1: Employment by gender ................................................................................................. 14 1.2: Employment by age group and educational level .......................................................... 14 Tab.1.1: Number of employees and employment rate by gender and age group ................ 15 Tab. 1.2: Employment by educational level ......................................................................... 15 Tab. 1.3: Higher level of education by type of employer (15-64) .......................................... 16 1.3: Employment status ....................................................................................................... 16 Tab. 1.4: Employment status by gender (%) ........................................................................ 16 1.4: Vulnerable employment ................................................................................................ 16 Tab. 1.5: Vulnerable employment by gender ........................................................................ 17 Tab. 1.6: Vulnerable employment by occupation and gender ............................................... 17 Tab. 1.7: Vulnerable employment by educational level and gender ...................................... 18 1.5: Types of contracts ......................................................................................................... 18 1.6: Employment by activity ................................................................................................. 19 Tab. 1.8: Employment by activity and gender (in thousand) ................................................. 19 Tab. 1.9: Employment by activity and gender (in %) ............................................................ 20 1.7: Employment by occupation ........................................................................................... 21 Tab. 1.10: Employment by occupation and gender (in %) .................................................... 21 1.8: Employment models ..................................................................................................... 22 Tab. 1.11: Reasons for working part-time by gender (%) ..................................................... 22 Tab. 1.12: Employment by hours of work per week and by gender ...................................... 23 Tab. 1.13: Average number of hours worked per week by type of employer and gender ..... 23 Tab. 1.14: Employment models by gender ........................................................................... 24 1.9: Net monthly wages ....................................................................................................... 25 2. Unemployment ................................................................................................................. 26 2.1: Unemployment by gender ............................................................................................. 26 Tab. 2.1: Number of unemployed and unemployment rate by gender .................................. 26 2.2: Unemployment by age group and educational level ...................................................... 27 Tab. 2.2. Number of unemployed and unemployment rate by gender and age group .......... 27 Table 2.3. Number of unemployed and the unemployment rate by educational level and gender ................................................................................................................................. 27 2.3: Youth unemployment .................................................................................................... 28 Tab.2.4: Percentage of unemployed youth in total unemployment and unemployment rate among young people by gender .................................................................................... 28 Tab. 2.5: Unemployment rate of young people to adults, by gender ..................................... 28 2.4: Duration of unemployment ............................................................................................ 29 Table 2.6: Duration of unemployment for more than a year by age group and ender (%) ... 29 Graph. 2.2. Duration of unemployment for more than a year by age group and gender (%) ........................................................................................................................... 29 3. Participation in the workforce ........................................................................................... 30 Graph. 3.1: Participation rate in the labour force by gender ................................................. 30 Tab. 3.1: Labour force and the participation rate in the labour force by gender and age group ................................................................................................................................... 31

Labour Force Survey, 2020
6
Page
4. Inactive persons ............................................................................................................... 32 Graph 4.1: Inactivity participation rate by gender ................................................................. 32 4.1: Inactive young people not in education, employment, or training (NEET) ...................... 33 Tab 4.1: Young people who are not employed, do not attend school or training (NEET) by gender ................................................................................................................ 33 5. Demographic and economic dependency ratios ............................................................... 34 Tab 5.1: Demographic dependency ratios ............................................................................ 34 Tab 5.2: Economic dependency ratios ................................................................................. 34 6. Data accuracy .................................................................................................................. 35 Tab. 6: Accuracy of LFS-based estimates in 2019 at country level ...................................... 35 7. The key indicators in the countries of Southwest Europe ................................................. 36 Tab. 7.1: The rate of participation in the labour force ........................................................... 36 Tab. 7.2: The rate of employment ........................................................................................ 36 Tab. 7.3: The rate of unemployment .................................................................................... 36 Tab. 7.4: The rate of inactivity .............................................................................................. 36
Labour Force Survey, 2020
7
Definitions
The working age population includes people aged 15 to 64 years. This measure is used
to give an estimate of the total number of potential workers within the economy.
The workforce consists of employed and unemployed persons, according to precise
definitions given below. Inactive persons are not considered part of the workforce.
1. Employed: persons who during the reference week did any work for pay, profit
or family gain, in cash or in kind, or who were temporarily absent in their work.
2. Unemployed: persons who during the reference week:
• Were without work, i.e. they were not in paid employment or self -
employed;
• Were currently available for work, i.e. they were willing to start paying job or self -
employment within two weeks; and
• Seeking work, i.e. they had taken specific steps during the past four
weeks in search of paid employment or self-employment.
3. Inactive persons: persons who during the reference period were
neither employed nor unemployed.
Classification of the population in these three above categories depends on
the application of the principle of activity - what did the person do during the reference
week - and a set of priority rules on activities that give priority to employment over
unemployment and unemployment over economic inactivity. Classification also
depends on a clear understanding of which activities are considered as "employment".
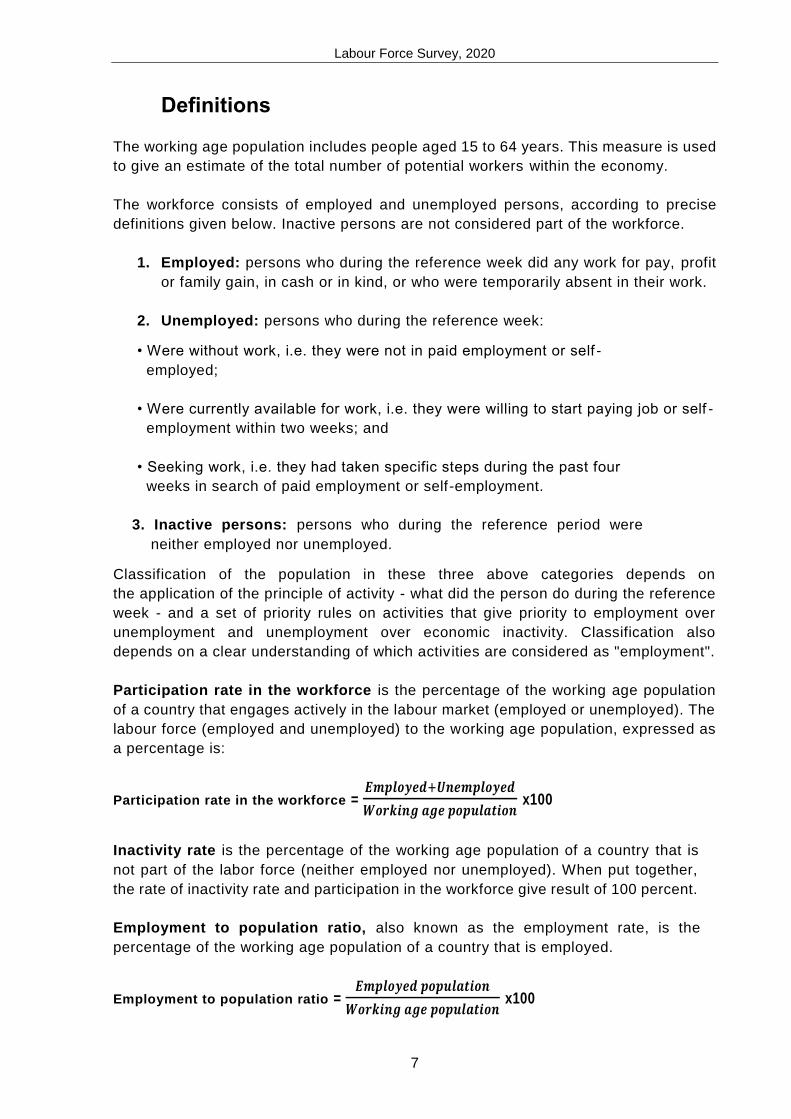
Participation rate in the workforce is the percentage of the working age population
of a country that engages actively in the labour market (employed or unemployed). The
labour force (employed and unemployed) to the working age population, expressed as
a percentage is:
Participation rate in the workforce = 𝑬𝒎𝒑𝒍𝒐𝒚𝒆𝒅+𝑼𝒏𝒆𝒎𝒑𝒍𝒐𝒚𝒆𝒅
𝑾𝒐𝒓𝒌𝒊𝒏𝒈 𝒂𝒈𝒆 𝒑𝒐𝒑𝒖𝒍𝒂𝒕𝒊𝒐𝒏x100
Inactivity rate is the percentage of the working age population of a country that is
not part of the labor force (neither employed nor unemployed). When put together,
the rate of inactivity rate and participation in the workforce give result of 100 percent.
Employment to population ratio, also known as the employment rate, is the
percentage of the working age population of a country that is employed.
Employment to population ratio = 𝑬𝒎𝒑𝒍𝒐𝒚𝒆𝒅 𝒑𝒐𝒑𝒖𝒍𝒂𝒕𝒊𝒐𝒏
𝑾𝒐𝒓𝒌𝒊𝒏𝒈 𝒂𝒈𝒆 𝒑𝒐𝒑𝒖𝒍𝒂𝒕𝒊𝒐𝒏x100
Labour Force Survey, 2020
8
The unemployment rate is the percentage of the labour force that is unemployed.
Workforce is defined as the basis for this indicator and not the working age
population.
Unemployment rate = 𝑼𝒏𝒆𝒎𝒑𝒍𝒐𝒚𝒆𝒅
𝑳𝒂𝒃𝒐𝒖𝒓 𝑭𝒐𝒓𝒄𝒆x100
Discouraged workers are persons who do not have jobs, who are currently available for
work but have given up looking for work because they believe that they can not find work. This
category of discouraged persons is included in the inactive population category.
Youth unemployment refers to the unemployment rate of persons aged 15-24 years.
NEET form part of young people (age 15-24) who are neither employed nor attending
school nor not even training.
Vulnerable employment refers to self-employed persons (own-account workers) who
have no employed persons or unpaid family workers. These kind of employees are less
likely to have formal work arrangements and more likely for lacking appropriate working
conditions.
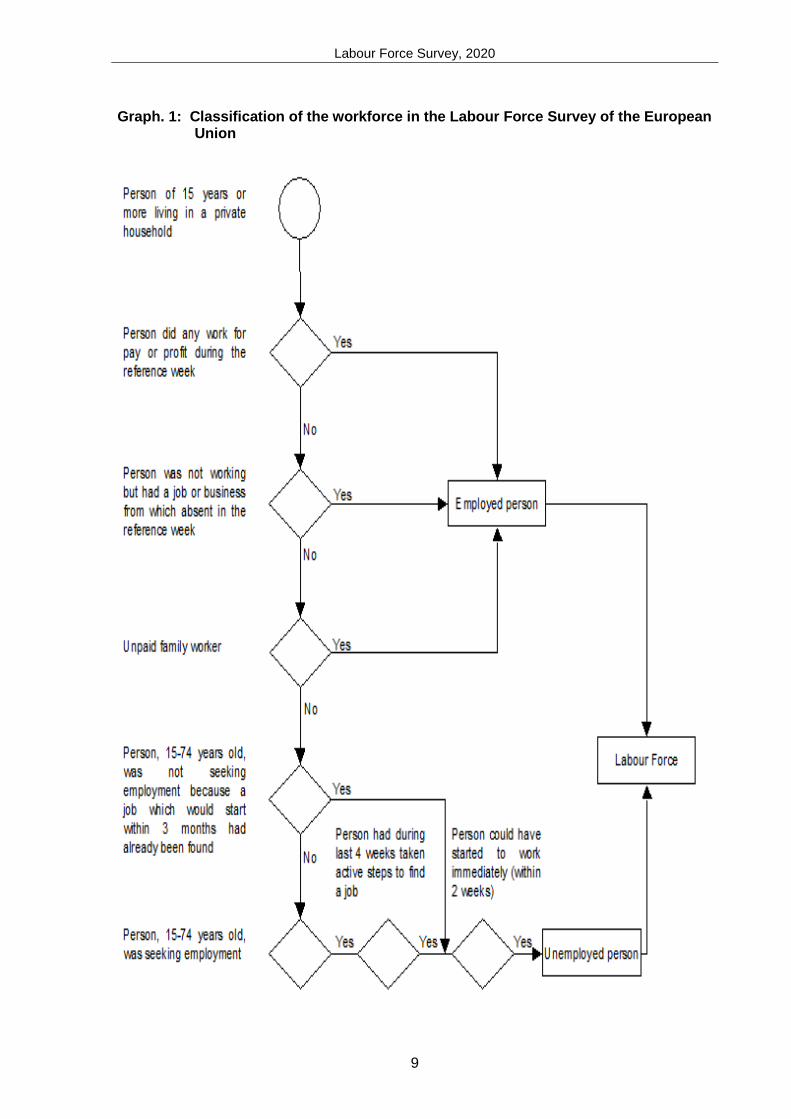
The diagram below illustrates the criteria used for classification of the population in
working age as employed, unemployed or inactive.
Labour Force Survey, 2020
9
Graph. 1: Classification of the workforce in the Labour Force Survey of the European Union
Labour Force Survey, 2020
10
Data collection during the COVID-19 Pandemic
Due to the COVID-19 Pandemic that gripped the Republic of Kosovo (mid-March 2020), the
results of the Labour Force Survey for Q1 2020 were not published according to the planned
date, as KAS could not continue collecting field data after March 16, 2020 to complete the
timely data collection for the first quarter of 2020. After facilitating the measures by the
competent institutions of the Republic of Kosovo, KAS took all steps to facilitate these
measures to continue its regular surveys, among others to continue the field work for the
collection of LFS data in housing units / households.
Delays in data collection as a result of the COVID-19 Pandemic have also affected the LFS
Results for Q2, Q3 and Q4 to be published late.
Methodology and collection of LFS data in 2020.
Kosovo Agency of Statistics (KAS), publishes employment / unemployment data from the
Labour Force Survey (LFS) which are collected from the field by surveyors according to the
sampling selected in housing units / households. LFS quarters (4 quarters) are divided into 13
reference weeks while this year the fourth quarter (Q4) had 14 reference weeks, and include
sampling rotation with surveys and re-surveys (for more on sample rotation see page 2 of the
publication).
Collection of the data in the field:
Due to the delays in the collection of data in the field, for 2020, respondents of housing units / households were asked about their situation according to the reference weeks of 2020.
Due to the situation created by the COVID-19 Pandemic, the housing units / households that refused to respond by physical contact, were also contacted by phone for information, thus all foreseen surveys and re-surveys were completed.

Labour Force Survey, 2020
11
Key indicators
Graph 1 indicates a summary of the state of the labour market of Kosovo's population based on
the Labour Force Survey in 2020. Among the main results of the LFS in 2020, as indicated in
Graph 1 and elaborated further in this report, are:
• Almost two thirds of Kosovo's population is of working age (age 15 -64). It is expected that the
working age population to increase rapidly over the next decade as Kosovo is among the
countries with the youngest population in Europe.
• Of the working age population, 61.7% are not economically active, which means that they are
not employed and have not been active in search of employment during the past four weeks
and / or are not ready to start working within two weeks.
• From 38.3% (468,451 persons) of the population that is economically active, 25.9% (121,379
persons) are unemployed.
• The ratio of employment to the population (employment rate), 28.4% (347,071 persons) are
employed.
• 61.7% of the working age population is inactive.
• There are significant gender differences in all labour market.
• One in five (20.8%)) females of working age are active in the labour market, compared with
about three-fifths (56.0%) of working-age males
• Among persons in the labour force, unemployment is higher for females than for males
(32.3% compared to 23.5 %).
• The employment rate among working age females is only 14.1%, compared with 42.8% for
males.
• The employment rate among working age females is only 13.9 %, compared with 46.2 % for
males.
• This very low degree of unemployment among females stems from the combination of very
low participation in the labour force and high unemployment.
• Females were mainly employed in the education, trade and health sectors (52.7% of
employed females). Males were mainly employed in the sectors of trade, construction, and
manufacture (employing 44.1% of employed males).
• Youth unemployment is very high in Kosovo.
• In 2020, young people in Kosovo had two times more likely to be unemployed than adults.
Among persons aged 15-24 in the labour force, 49.1% were unemployed.
Unemployment is higher among young females (57.2 %) than young males (45.2%).
• One-third (33.6%) of those aged 15 to 24 years in Kosovo were not in education,
employment or training (NEET). This figure is 33.2% for young females compared with 34.0%
for young males.
Labour Force Survey, 2020
12
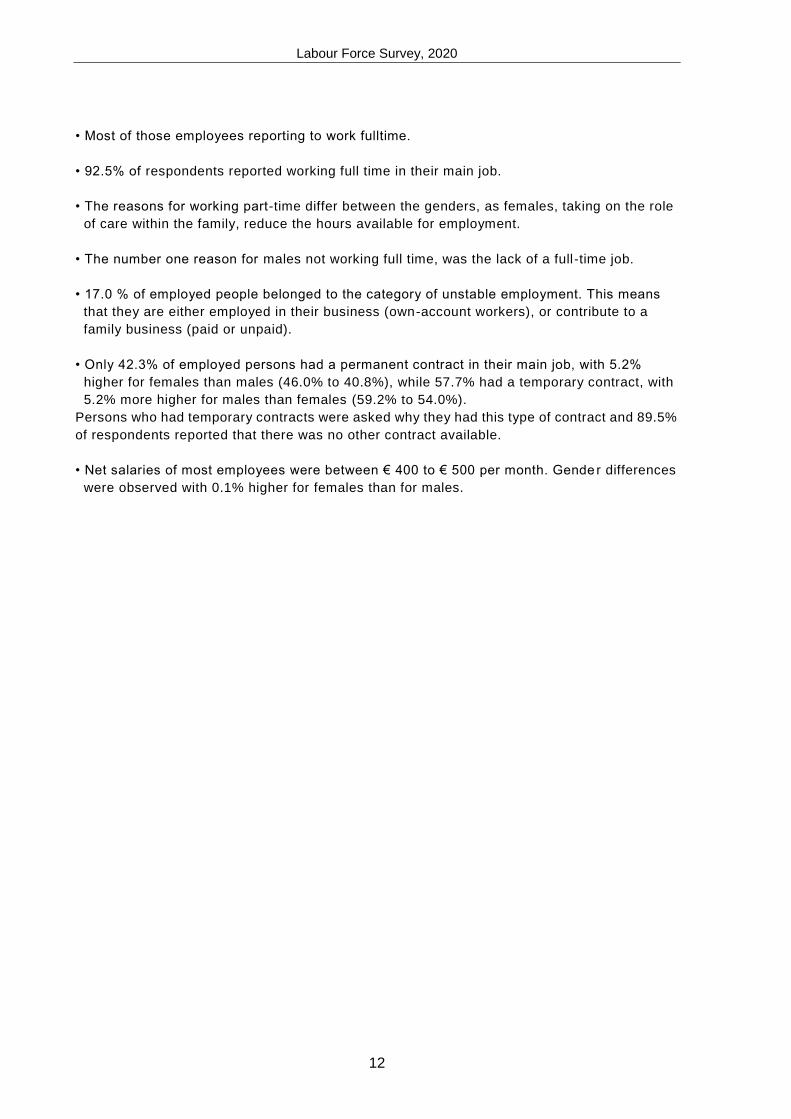
• Most of those employees reporting to work fulltime.
• 92.5% of respondents reported working full time in their main job.
• The reasons for working part-time differ between the genders, as females, taking on the role
of care within the family, reduce the hours available for employment.
• The number one reason for males not working full time, was the lack of a full -time job.
• 17.0 % of employed people belonged to the category of unstable employment. This means
that they are either employed in their business (own-account workers), or contribute to a
family business (paid or unpaid).
• Only 42.3% of employed persons had a permanent contract in their main job, with 5.2%
higher for females than males (46.0% to 40.8%), while 57.7% had a temporary contract, with
5.2% more higher for males than females (59.2% to 54.0%).
Persons who had temporary contracts were asked why they had this type of contract and 89.5%
of respondents reported that there was no other contract available.
• Net salaries of most employees were between € 400 to € 500 per month. Gende r differences
were observed with 0.1% higher for females than for males.
Labour Force Survey, 2020
13
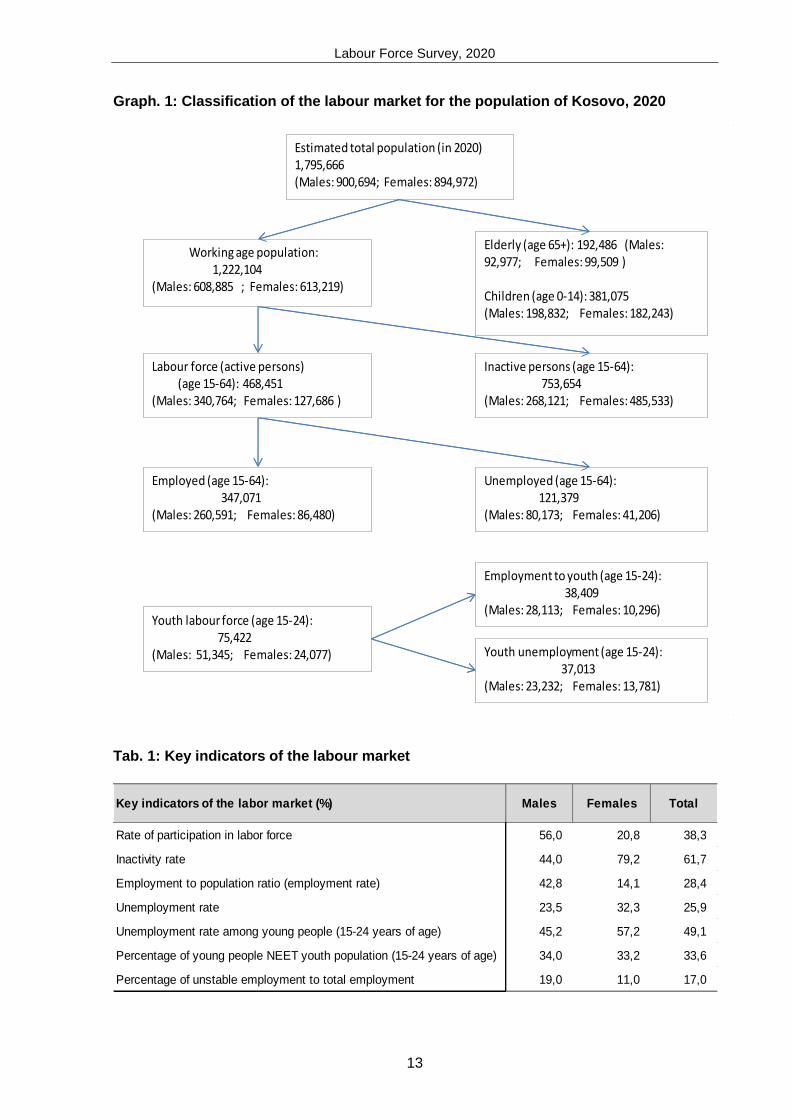
Graph. 1: Classification of the labour market for the population of Kosovo, 2020
Popullsia e përgjithshme e vlerësuar (1 Korrik 2014) 1,811,521(Meshkuj 911,131, Femra: 900,390)
Popullsia në moshë pune:1,202,489
(Meshkuj: 600,481 Femra: 602,008)
Të moshuar (mosha 65+): 149,797(Meshkuj: 72,217, Femra: 77,570)
Fëmijë (mosha 0-14): 459,244(Meshkuj: 238,433, Femra 220,811)
Fuqia punëtore (persona aktivë) (15-64 vjeç): 500,251
(Meshkuj: 371,276, Femra: 128,975
Të punësuar (15-64 vjeç):323,508
(Meshkuj: 248,224, Femra: 75,284)
Fuqia punëtore tek të rinjtë (15-24 vjeç):82,619
(Meshkuj: 57,230, Femra: 25,389)
Persona joaktivë (15-64 vjeç):702,238
(Meshkuj: 229,205, Femra: 473,033)
Të papunë(15-64 vjeç):176,743
(Meshkuj: 123,052, Femra: 53,691)
Të rinj të punësuar (15-24 vjeç):32,222
(Meshkuj: 25,046 , Femra: 7,176)
Të rinj të papunë (15-24 vjeç):50,396
(Meshkuj: 32,183, Femra: 18,213)
Estimated total population (in 2020) 1,795,666(Males: 900,694; Females: 894,972)
Working age population: 1,222,104
(Males: 608,885 ; Females: 613,219)
Elderly (age 65+): 192,486 (Males: 92,977; Females: 99,509 )
Children (age 0-14): 381,075(Males: 198,832; Females: 182,243)
Labour force (active persons) (age 15-64): 468,451
(Males: 340,764; Females: 127,686 )
Employed (age 15-64):347,071
(Males: 260,591; Females: 86,480)
Youth labour force (age 15-24):75,422
(Males: 51,345; Females: 24,077)
Inactive persons (age 15-64):753,654
(Males: 268,121; Females: 485,533)
Unemployed (age 15-64):121,379
(Males: 80,173; Females: 41,206)
Employment to youth (age 15-24):38,409
(Males: 28,113; Females: 10,296)
Youth unemployment (age 15-24):37,013
(Males: 23,232; Females: 13,781)
Tab. 1: Key indicators of the labour market
Key indicators of the labor market (%) Males Females Total
Rate of participation in labor force 56,0 20,8 38,3
Inactivity rate 44,0 79,2 61,7
Employment to population ratio (employment rate) 42,8 14,1 28,4
Unemployment rate 23,5 32,3 25,9
Unemployment rate among young people (15-24 years of age) 45,2 57,2 49,1
Percentage of young people NEET youth population (15-24 years of age) 34,0 33,2 33,6
Percentage of unstable employment to total employment 19,0 11,0 17,0
Labour Force Survey, 2020
14
1. Employment
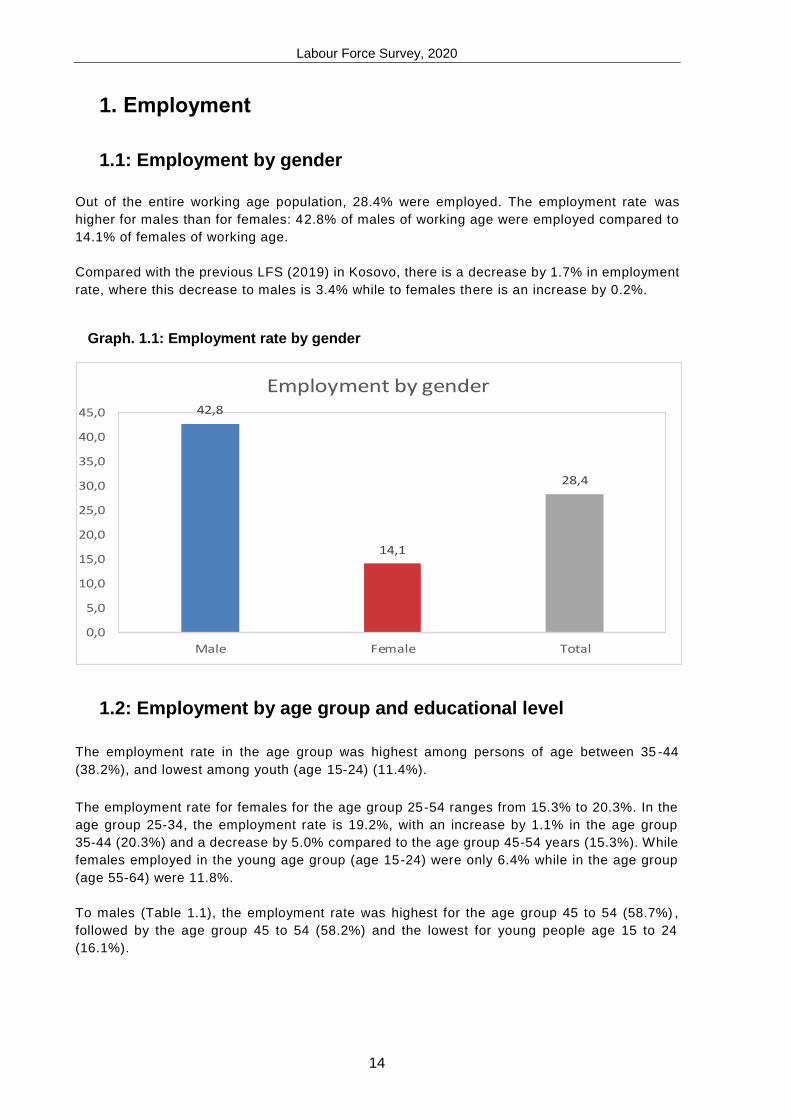
1.1: Employment by gender
Out of the entire working age population, 28.4% were employed. The employment rate was
higher for males than for females: 42.8% of males of working age were employed compared to
14.1% of females of working age.
Compared with the previous LFS (2019) in Kosovo, there is a decrease by 1.7% in employment
rate, where this decrease to males is 3.4% while to females there is an increase by 0.2%.
Graph. 1.1: Employment rate by gender
42,8
14,1
28,4
0,0
5,0
10,0
15,0
20,0
25,0
30,0
35,0
40,0
45,0
Male Female Total
Employment by gender
1.2: Employment by age group and educational level
The employment rate in the age group was highest among persons of age between 35 -44
(38.2%), and lowest among youth (age 15-24) (11.4%).
The employment rate for females for the age group 25-54 ranges from 15.3% to 20.3%. In the
age group 25-34, the employment rate is 19.2%, with an increase by 1.1% in the age group
35-44 (20.3%) and a decrease by 5.0% compared to the age group 45-54 years (15.3%). While
females employed in the young age group (age 15-24) were only 6.4% while in the age group
(age 55-64) were 11.8%.
To males (Table 1.1), the employment rate was highest for the age group 45 to 54 (58.7%) ,
followed by the age group 45 to 54 (58.2%) and the lowest for young people age 15 to 24
(16.1%).
Labour Force Survey, 2020
15
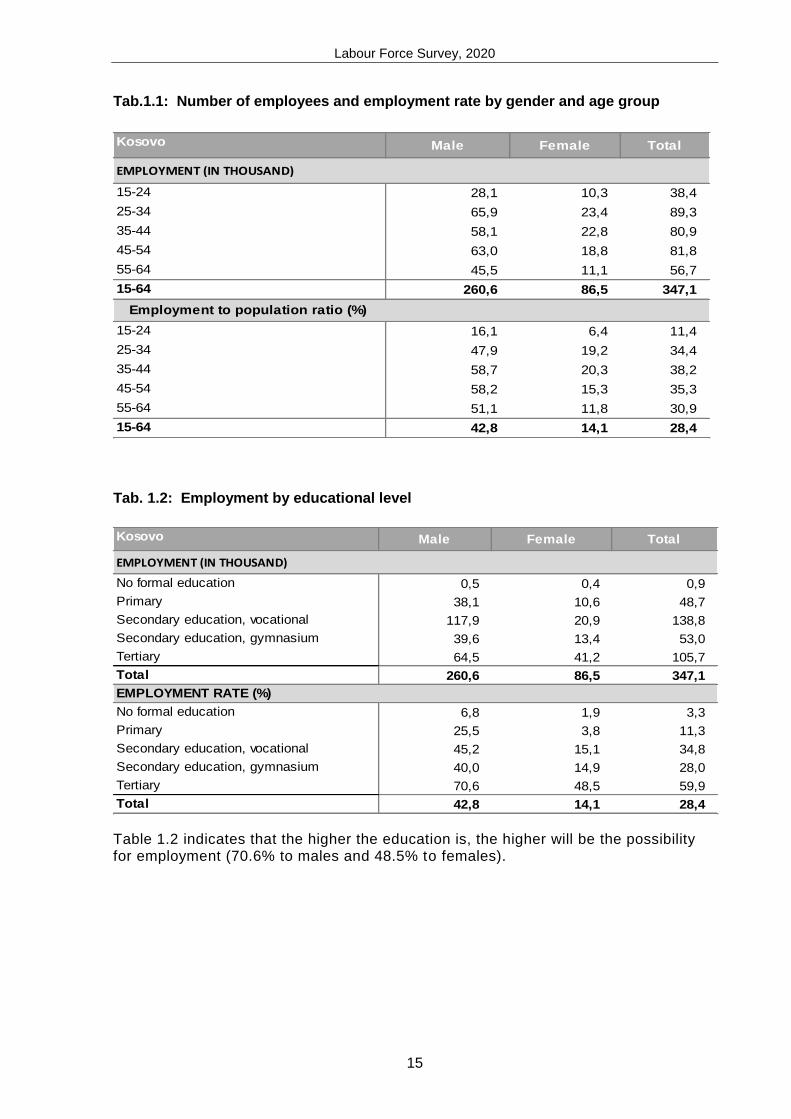
Tab.1.1: Number of employees and employment rate by gender and age group
Kosovo Male Female Total
15-24 28,1 10,3 38,4
25-34 65,9 23,4 89,3
35-44 58,1 22,8 80,9
45-54 63,0 18,8 81,8
55-64 45,5 11,1 56,7
15-64 260,6 86,5 347,1
15-24 16,1 6,4 11,4
25-34 47,9 19,2 34,4
35-44 58,7 20,3 38,2
45-54 58,2 15,3 35,3
55-64 51,1 11,8 30,9
15-64 42,8 14,1 28,4
EMPLOYMENT (IN THOUSAND)
Employment to population ratio (%)
Tab. 1.2: Employment by educational level
Kosovo Male Female Total
No formal education 0,5 0,4 0,9
Primary 38,1 10,6 48,7
Secondary education, vocational 117,9 20,9 138,8
Secondary education, gymnasium 39,6 13,4 53,0
Tertiary 64,5 41,2 105,7
Total 260,6 86,5 347,1
No formal education 6,8 1,9 3,3
Primary 25,5 3,8 11,3
Secondary education, vocational 45,2 15,1 34,8
Secondary education, gymnasium 40,0 14,9 28,0
Tertiary 70,6 48,5 59,9
Total 42,8 14,1 28,4
EMPLOYMENT (IN THOUSAND)
EMPLOYMENT RATE (%)
Table 1.2 indicates that the higher the education is, the higher will be the possibility for employment (70.6% to males and 48.5% to females).
Labour Force Survey, 2020
16
Tab. 1.3: Higher level of education by type of employer (15-64)
KosovoPublic sector,
government
State-owned
enterprise
Private
company
Individual,
private
No formal education 0,2 0,1 0,1 2,1
Primary 3,9 7,8 14,3 43,2
Secondary education,
vocational25,1 39,7 45,1 30,6
Secondary education,
gymnasium8,2 5,5 19,1 20,9
Tertiary 62,7 46,9 21,3 3,2
Total 100,0 100,0 100,0 100,0
HIGHEST EDUCATIONAL LEVEL (%)
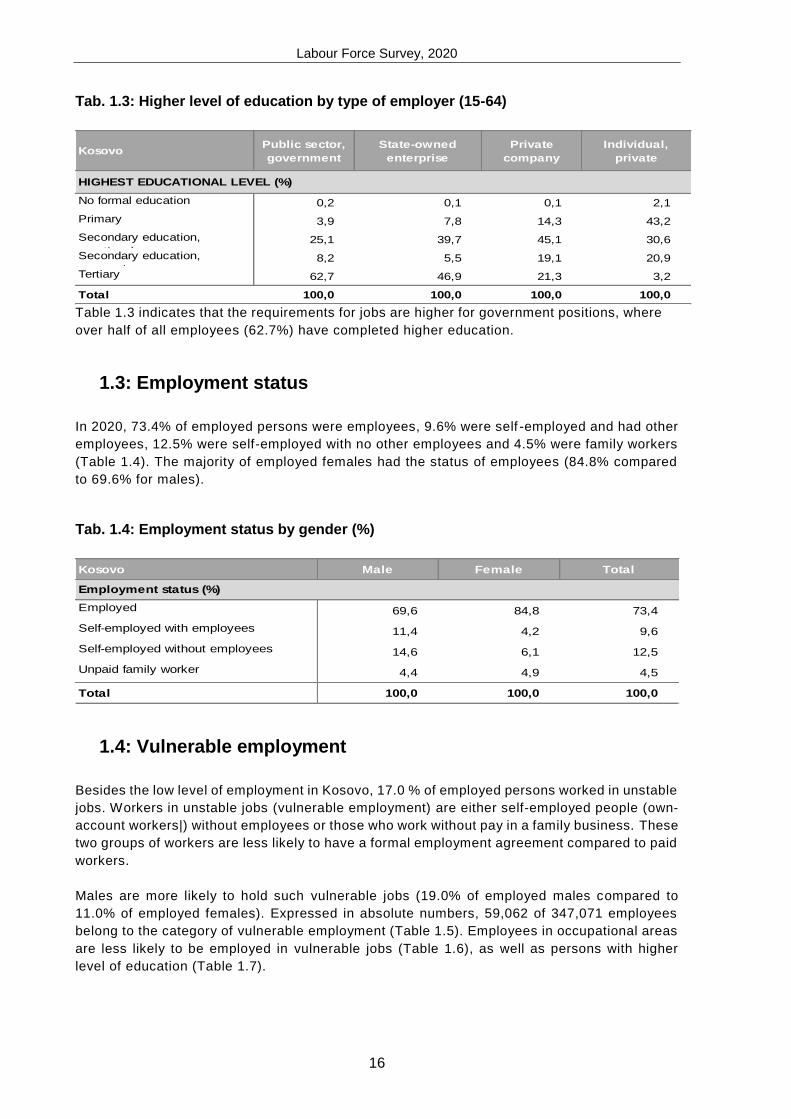
Table 1.3 indicates that the requirements for jobs are higher for government positions, where
over half of all employees (62.7%) have completed higher education.
1.3: Employment status
In 2020, 73.4% of employed persons were employees, 9.6% were self -employed and had other
employees, 12.5% were self-employed with no other employees and 4.5% were family workers
(Table 1.4). The majority of employed females had the status of employees (84.8% compared
to 69.6% for males).
Tab. 1.4: Employment status by gender (%)
Kosovo Male Female Total
Employed 69,6 84,8 73,4
Self-employed with employees 11,4 4,2 9,6
Self-employed without employees 14,6 6,1 12,5
Unpaid family worker 4,4 4,9 4,5
Total 100,0 100,0 100,0
Employment status (%)
1.4: Vulnerable employment
Besides the low level of employment in Kosovo, 17.0 % of employed persons worked in unstable
jobs. Workers in unstable jobs (vulnerable employment) are either self-employed people (own-
account workers|) without employees or those who work without pay in a family business. These
two groups of workers are less likely to have a formal employment agreement compared to paid
workers.
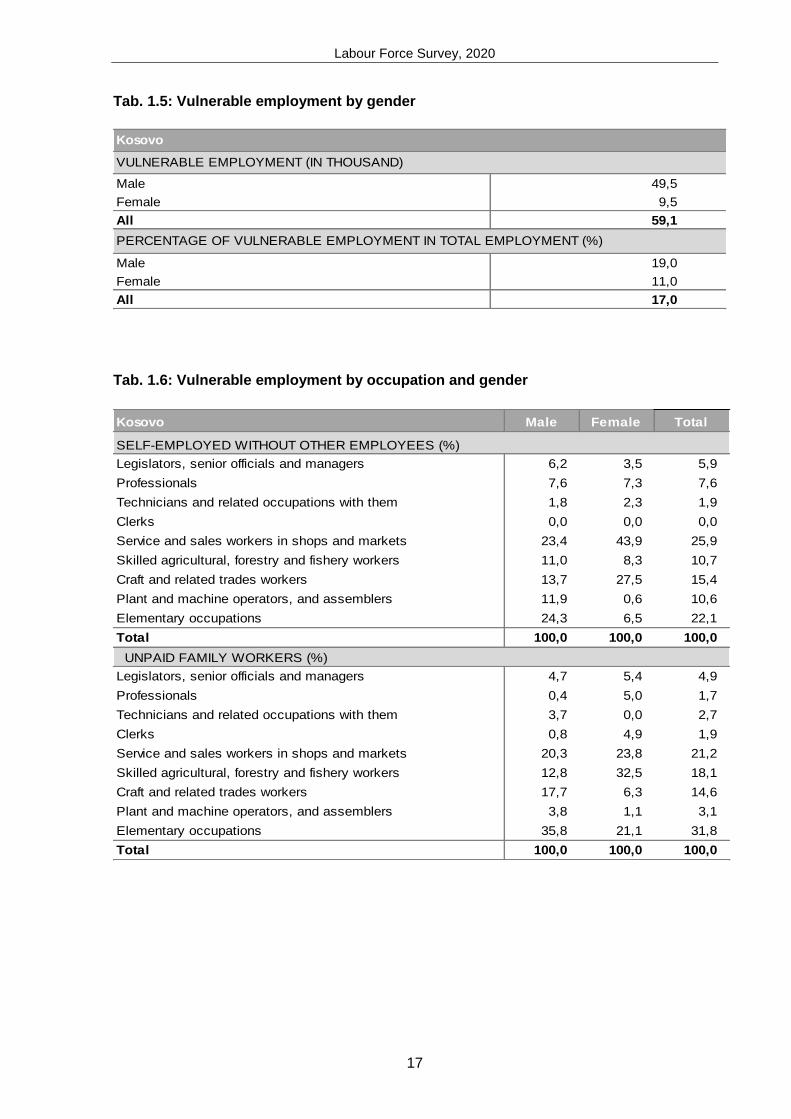
Males are more likely to hold such vulnerable jobs (19.0% of employed males compared to
11.0% of employed females). Expressed in absolute numbers, 59,062 of 347,071 employees
belong to the category of vulnerable employment (Table 1.5). Employees in occupational areas
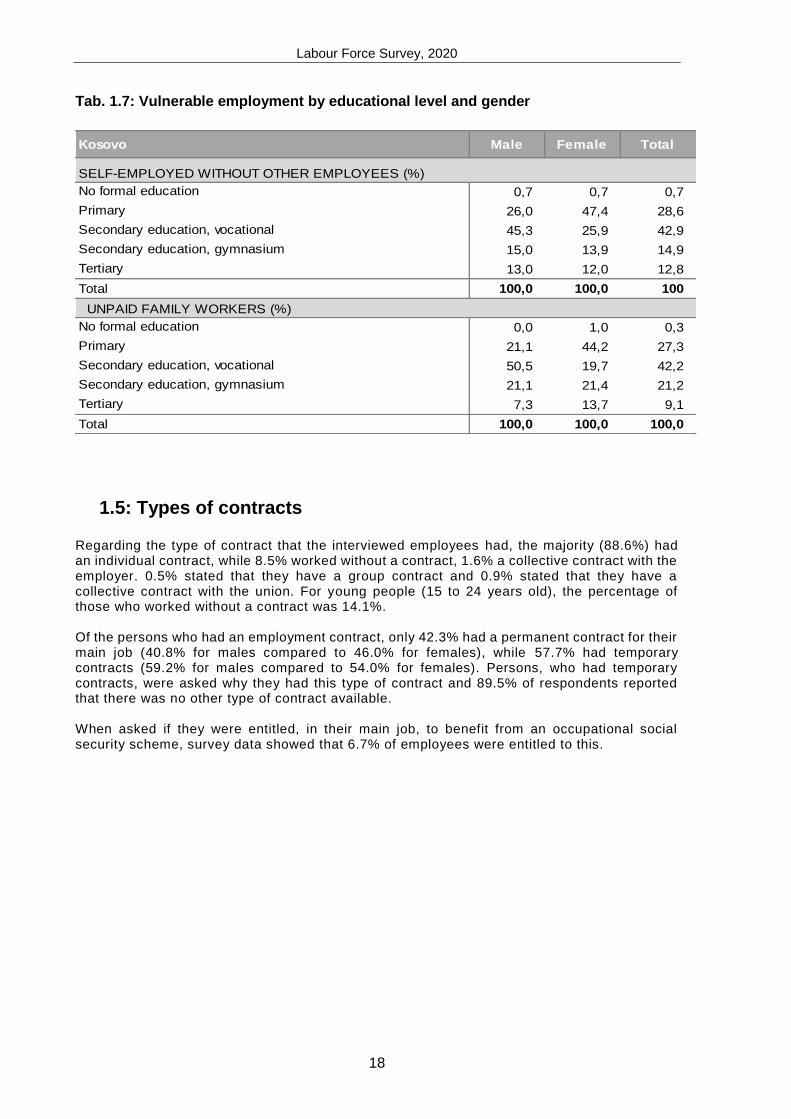
are less likely to be employed in vulnerable jobs (Table 1.6), as well as persons with higher
level of education (Table 1.7).
Labour Force Survey, 2020
17
Tab. 1.5: Vulnerable employment by gender
Male 49,5
Female 9,5
All 59,1
Male 19,0
Female 11,0
All 17,0
Kosovo
VULNERABLE EMPLOYMENT (IN THOUSAND)
PERCENTAGE OF VULNERABLE EMPLOYMENT IN TOTAL EMPLOYMENT (%)
Tab. 1.6: Vulnerable employment by occupation and gender
Kosovo Male Female Total
Legislators, senior officials and managers 6,2 3,5 5,9
Professionals 7,6 7,3 7,6
Technicians and related occupations with them 1,8 2,3 1,9
Clerks 0,0 0,0 0,0
Service and sales workers in shops and markets 23,4 43,9 25,9
Skilled agricultural, forestry and fishery workers 11,0 8,3 10,7
Craft and related trades workers 13,7 27,5 15,4
Plant and machine operators, and assemblers 11,9 0,6 10,6
Elementary occupations 24,3 6,5 22,1
Total 100,0 100,0 100,0
Legislators, senior officials and managers 4,7 5,4 4,9
Professionals 0,4 5,0 1,7
Technicians and related occupations with them 3,7 0,0 2,7
Clerks 0,8 4,9 1,9
Service and sales workers in shops and markets 20,3 23,8 21,2
Skilled agricultural, forestry and fishery workers 12,8 32,5 18,1
Craft and related trades workers 17,7 6,3 14,6
Plant and machine operators, and assemblers 3,8 1,1 3,1
Elementary occupations 35,8 21,1 31,8
Total 100,0 100,0 100,0
SELF-EMPLOYED WITHOUT OTHER EMPLOYEES (%)
UNPAID FAMILY WORKERS (%)
Labour Force Survey, 2020
18
Tab. 1.7: Vulnerable employment by educational level and gender
Kosovo Male Female Total
No formal education 0,7 0,7 0,7
Primary 26,0 47,4 28,6
Secondary education, vocational 45,3 25,9 42,9
Secondary education, gymnasium 15,0 13,9 14,9
Tertiary 13,0 12,0 12,8
Total 100,0 100,0 100
No formal education 0,0 1,0 0,3
Primary 21,1 44,2 27,3
Secondary education, vocational 50,5 19,7 42,2
Secondary education, gymnasium 21,1 21,4 21,2
Tertiary 7,3 13,7 9,1
Total 100,0 100,0 100,0
SELF-EMPLOYED WITHOUT OTHER EMPLOYEES (%)
UNPAID FAMILY WORKERS (%)
1.5: Types of contracts Regarding the type of contract that the interviewed employees had, the majority (88.6%) had an individual contract, while 8.5% worked without a contract, 1.6% a collective contract with the employer. 0.5% stated that they have a group contract and 0.9% stated that they have a collective contract with the union. For young people (15 to 24 years old), the percentage of those who worked without a contract was 14.1%. Of the persons who had an employment contract, only 42.3% had a permanent contract for their main job (40.8% for males compared to 46.0% for females), while 57.7% had temporary contracts (59.2% for males compared to 54.0% for females). Persons, who had temporary contracts, were asked why they had this type of contract and 89.5% of respondents reported that there was no other type of contract available. When asked if they were entitled, in their main job, to benefit from an occupational social security scheme, survey data showed that 6.7% of employees were entitled to this.

Labour Force Survey, 2020
19
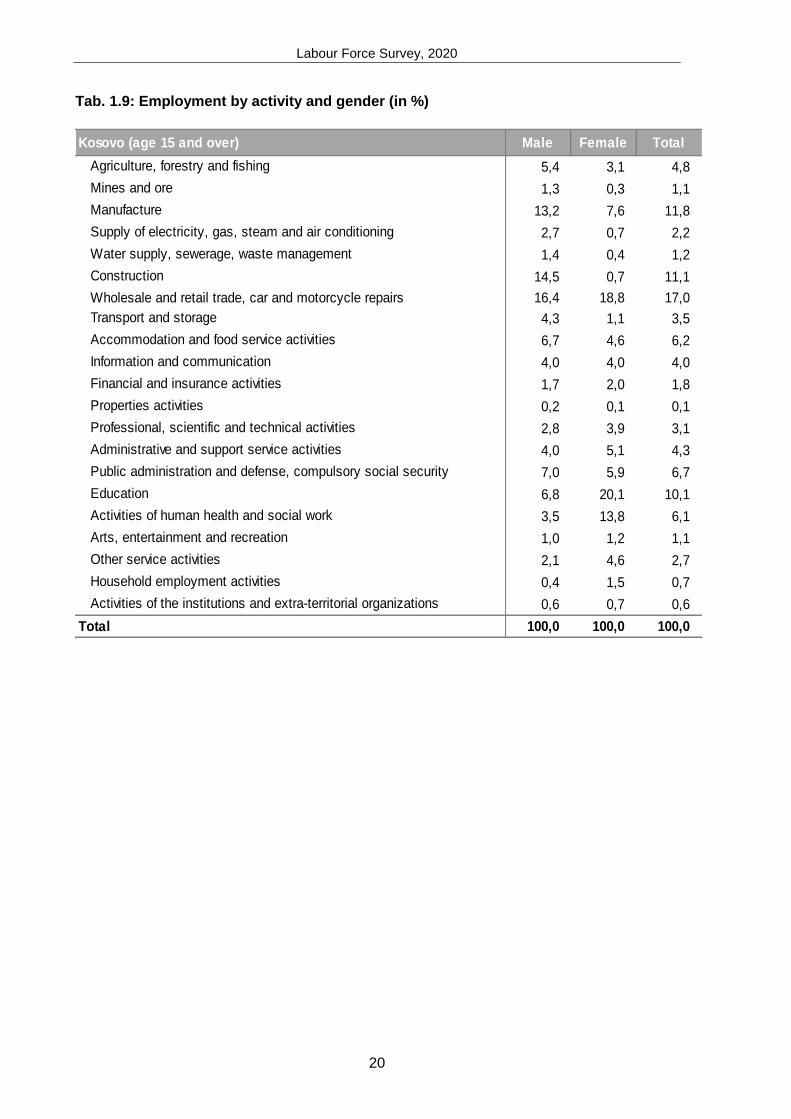
1.6: Employment by activity
Trade, construction, manufacturing and education employ more than half of employed
persons in 2020 (see tables 1.8 and 1.9). Trade employ 17.0%, continuing with
manufacturing with 11.8%, construction with 11.1% and education with 10.1 %, of employed
persons in Kosovo.
Education, trade, and health care were the three leading female employers (employing 52.7%
of employed females). Trade, construction and manufacturing are the most common sectors
of employment for males (employing 44.1% of employed males).
Tab. 1.8: Employment by activity and gender (in thousand)
Kosovo (age 15 and over) Male Female Total
Agriculture, forestry and fishing 14,2 2,7 16,9
Mining and ore 3,5 0,2 3,8
Manufacture 34,9 6,6 41,5
Supply of electricity, gas, steam and air conditioning 7,2 0,7 7,8
Water supply, sewerage, waste management 3,7 0,4 4,1
Construction 38,2 0,6 38,8
Wholesale and retail trade, car and motorcycle repairs 43,2 16,4 59,6
Transport and storage 11,2 0,9 12,2
Accommodation and food service activities 17,8 4,0 21,7
Information and communication 10,4 3,5 13,9
Financial and insurance activities 4,5 1,7 6,2
Properties activities 0,4 0,0 0,5
Professional, scientific and technical activities 7,3 3,4 10,7
Administrative and support service activities 10,6 4,4 15,0
Public administration and defense, compulsory social security 18,3 5,2 23,5
Education 18,0 17,5 35,5
Activities of human health and social work 9,3 12,0 21,3
Arts, entertainment and recreation 2,8 1,1 3,8
Other service activities 5,5 4,0 9,5
Household employment activity 1,2 1,3 2,4
Activities of the institutions and extra-territorial organizations 1,6 0,6 2,2
Total 263,8 87,1 350,9
Labour Force Survey, 2020
20
Tab. 1.9: Employment by activity and gender (in %)
Kosovo (age 15 and over) Male Female Total
Agriculture, forestry and fishing 5,4 3,1 4,8
Mines and ore 1,3 0,3 1,1
Manufacture 13,2 7,6 11,8
Supply of electricity, gas, steam and air conditioning 2,7 0,7 2,2
Water supply, sewerage, waste management 1,4 0,4 1,2
Construction 14,5 0,7 11,1
Wholesale and retail trade, car and motorcycle repairs 16,4 18,8 17,0
Transport and storage 4,3 1,1 3,5
Accommodation and food service activities 6,7 4,6 6,2
Information and communication 4,0 4,0 4,0
Financial and insurance activities 1,7 2,0 1,8
Properties activities 0,2 0,1 0,1
Professional, scientific and technical activities 2,8 3,9 3,1
Administrative and support service activities 4,0 5,1 4,3
Public administration and defense, compulsory social security 7,0 5,9 6,7
Education 6,8 20,1 10,1
Activities of human health and social work 3,5 13,8 6,1
Arts, entertainment and recreation 1,0 1,2 1,1
Other service activities 2,1 4,6 2,7
Household employment activities 0,4 1,5 0,7
Activities of the institutions and extra-territorial organizations 0,6 0,7 0,6
Total 100,0 100,0 100,0
Labour Force Survey, 2020
21
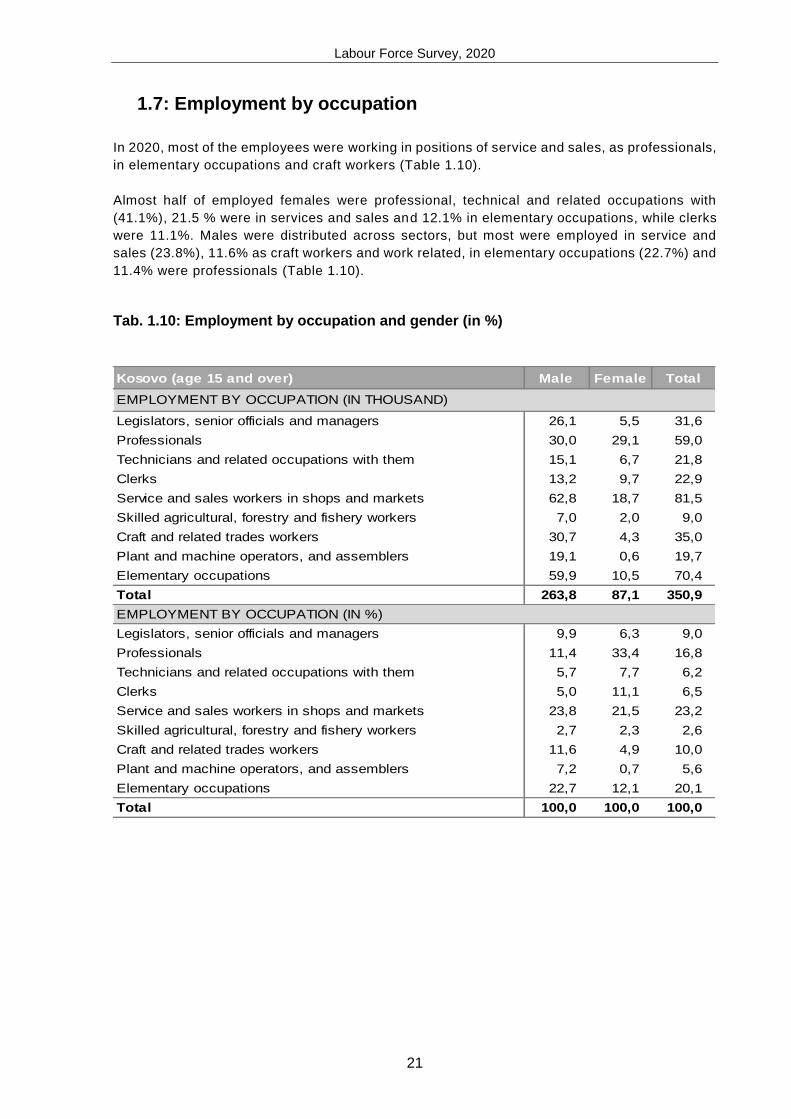
1.7: Employment by occupation
In 2020, most of the employees were working in positions of service and sales, as professionals,
in elementary occupations and craft workers (Table 1.10).
Almost half of employed females were professional, technical and related occupations with
(41.1%), 21.5 % were in services and sales and 12.1% in elementary occupations, while clerks
were 11.1%. Males were distributed across sectors, but most were employed in service and
sales (23.8%), 11.6% as craft workers and work related, in elementary occupations (22.7%) and
11.4% were professionals (Table 1.10).
Tab. 1.10: Employment by occupation and gender (in %)
Kosovo (age 15 and over) Male Female Total
Legislators, senior officials and managers 26,1 5,5 31,6
Professionals 30,0 29,1 59,0
Technicians and related occupations with them 15,1 6,7 21,8
Clerks 13,2 9,7 22,9
Service and sales workers in shops and markets 62,8 18,7 81,5
Skilled agricultural, forestry and fishery workers 7,0 2,0 9,0
Craft and related trades workers 30,7 4,3 35,0
Plant and machine operators, and assemblers 19,1 0,6 19,7
Elementary occupations 59,9 10,5 70,4
Total 263,8 87,1 350,9
Legislators, senior officials and managers 9,9 6,3 9,0
Professionals 11,4 33,4 16,8
Technicians and related occupations with them 5,7 7,7 6,2
Clerks 5,0 11,1 6,5
Service and sales workers in shops and markets 23,8 21,5 23,2
Skilled agricultural, forestry and fishery workers 2,7 2,3 2,6
Craft and related trades workers 11,6 4,9 10,0
Plant and machine operators, and assemblers 7,2 0,7 5,6
Elementary occupations 22,7 12,1 20,1
Total 100,0 100,0 100,0
EMPLOYMENT BY OCCUPATION (IN THOUSAND)
EMPLOYMENT BY OCCUPATION (IN %)
Labour Force Survey, 2020
22
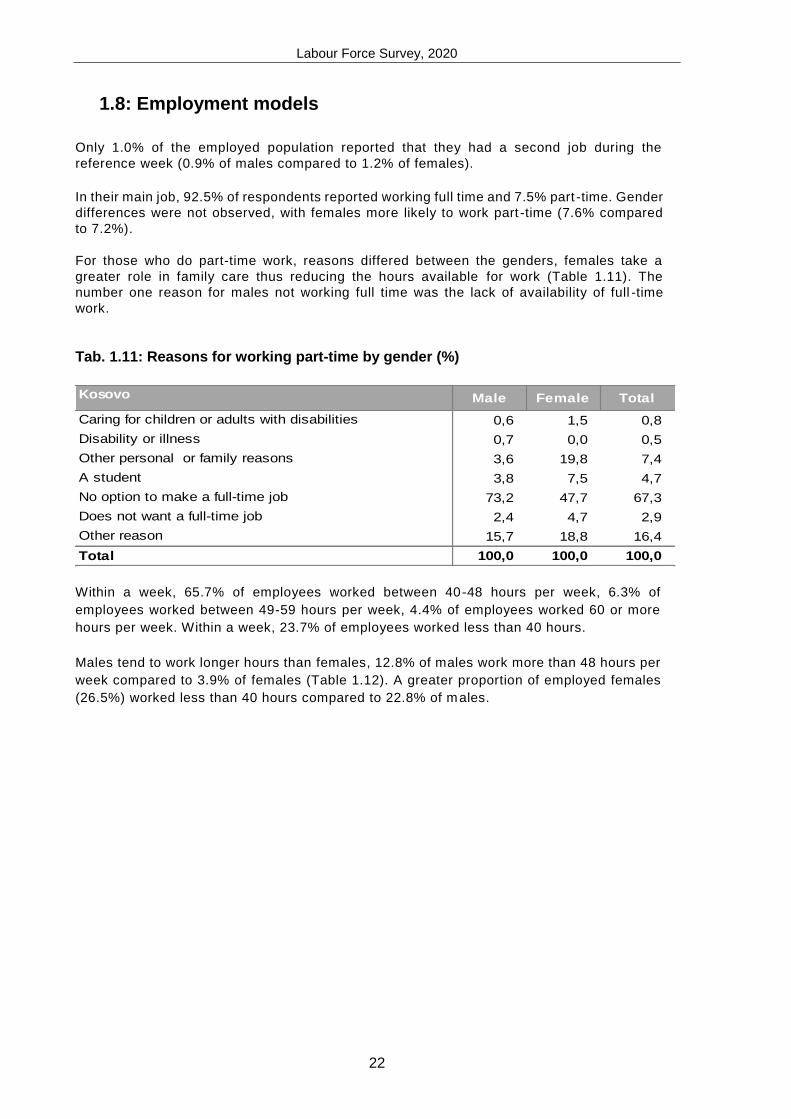
1.8: Employment models
Only 1.0% of the employed population reported that they had a second job during the
reference week (0.9% of males compared to 1.2% of females).
In their main job, 92.5% of respondents reported working full time and 7.5% part -time. Gender
differences were not observed, with females more likely to work part -time (7.6% compared
to 7.2%).
For those who do part-time work, reasons differed between the genders, females take a
greater role in family care thus reducing the hours available for work (Table 1.11). The
number one reason for males not working full time was the lack of availability of full -time
work.
Tab. 1.11: Reasons for working part-time by gender (%)
Kosovo Male Female Total
Caring for children or adults with disabilities 0,6 1,5 0,8
Disability or illness 0,7 0,0 0,5
Other personal or family reasons 3,6 19,8 7,4
A student 3,8 7,5 4,7
No option to make a full-time job 73,2 47,7 67,3
Does not want a full-time job 2,4 4,7 2,9
Other reason 15,7 18,8 16,4
Total 100,0 100,0 100,0
Within a week, 65.7% of employees worked between 40-48 hours per week, 6.3% of
employees worked between 49-59 hours per week, 4.4% of employees worked 60 or more
hours per week. Within a week, 23.7% of employees worked less than 40 hours.
Males tend to work longer hours than females, 12.8% of males work more than 48 hours per
week compared to 3.9% of females (Table 1.12). A greater proportion of employed females
(26.5%) worked less than 40 hours compared to 22.8% of males.

Labour Force Survey, 2020
23
Tab. 1.12: Employment by hours of work per week and by gender
Kosovo Male Female Total
Less than 25 45,1 17,4 62,5
25-34 12,1 5,0 17,0
35-39 2,2 0,6 2,8
40-48 167,7 60,2 227,9
49-59 19,6 2,1 21,7
60 and more 13,9 1,2 15,1
Total 260,6 86,5 347,1
Les than 25 17,3 20,1 18,0
25-34 4,6 5,8 4,9
35-39 0,9 0,7 0,8
40-48 64,3 69,6 65,7
49-59 7,5 2,5 6,3
60 and more 5,3 1,4 4,4
Total 100,0 100,0 100,0
EMPLOYMENT BY THE NUMBER OF HOURS (IN THOUSAND)
EMPLOYMENT BY THE NUMBER OF HOURS (IN %)
Respondents working in the public sector have reported shorter hours than those working in
the private sector (Table 1.13). Males and females working in private companies have worked
longer hours compared to all types of employment.
Tab. 1.13: Average number of hours worked per week by type of employer and gender Kosovo Public sector,
Government
State-owned
enterprise
Private
company
Individual,
private
Male 34,6 36,4 41,9 38,0
Female 32,1 33,4 39,3 23,3
Total 33,6 35,7 41,3 34,2
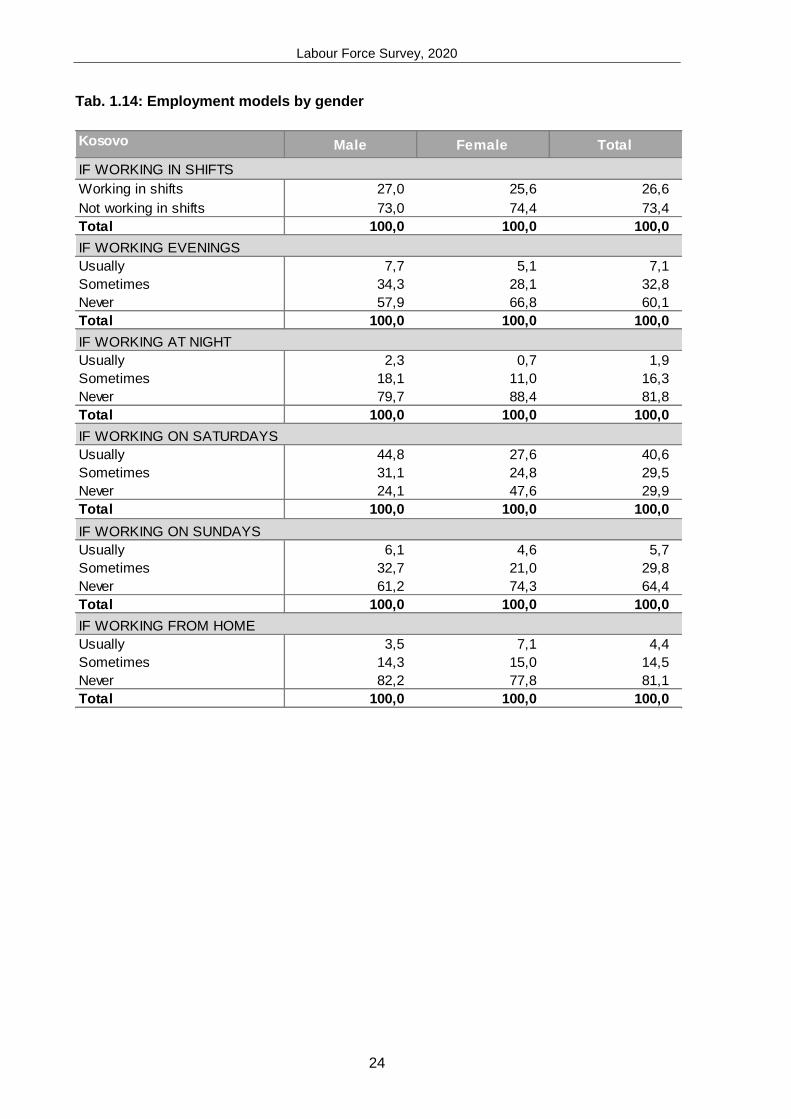
The chances are lower for females to work in shifts during night shifts, evenings and
weekends but slightly larger to work from home (Table 1.14).
Labour Force Survey, 2020
24
Tab. 1.14: Employment models by gender
Kosovo Male Female Total
Working in shifts 27,0 25,6 26,6
Not working in shifts 73,0 74,4 73,4
Total 100,0 100,0 100,0
Usually 7,7 5,1 7,1
Sometimes 34,3 28,1 32,8
Never 57,9 66,8 60,1
Total 100,0 100,0 100,0
Usually 2,3 0,7 1,9
Sometimes 18,1 11,0 16,3
Never 79,7 88,4 81,8
Total 100,0 100,0 100,0
Usually 44,8 27,6 40,6
Sometimes 31,1 24,8 29,5
Never 24,1 47,6 29,9
Total 100,0 100,0 100,0
Usually 6,1 4,6 5,7
Sometimes 32,7 21,0 29,8
Never 61,2 74,3 64,4
Total 100,0 100,0 100,0
Usually 3,5 7,1 4,4
Sometimes 14,3 15,0 14,5
Never 82,2 77,8 81,1
Total 100,0 100,0 100,0
IF WORKING IN SHIFTS
IF WORKING ON SUNDAYS
IF WORKING FROM HOME
IF WORKING EVENINGS
IF WORKING AT NIGHT
IF WORKING ON SATURDAYS
Labour Force Survey, 2020
25
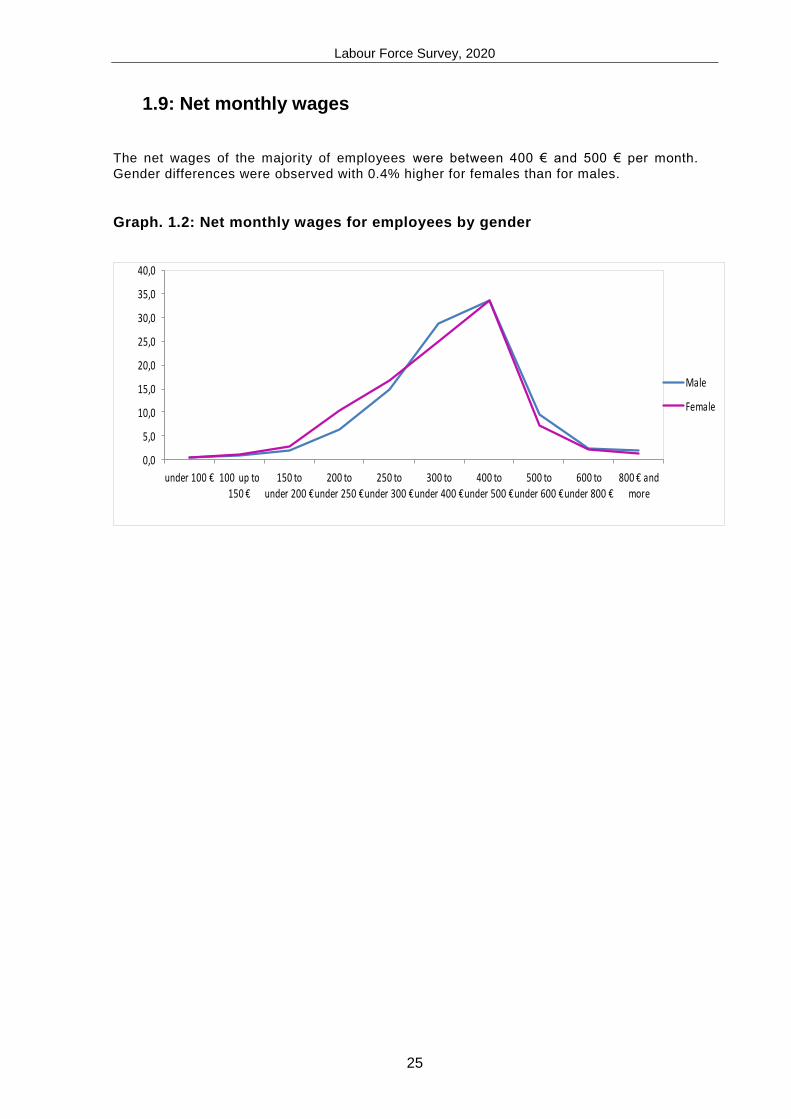
1.9: Net monthly wages
The net wages of the majority of employees were between 400 € and 500 € per month.
Gender differences were observed with 0.4% higher for females than for males.
Graph. 1.2: Net monthly wages for employees by gender
0,0
5,0
10,0
15,0
20,0
25,0
30,0
35,0
40,0
under 100 € 100 up to 150 €
150 to under 200 €
200 to under 250 €
250 to under 300 €
300 to under 400 €
400 to under 500 €
500 to under 600 €
600 to under 800 €
800 € and more
Male
Female
Labour Force Survey, 2020
26
2. Unemployment
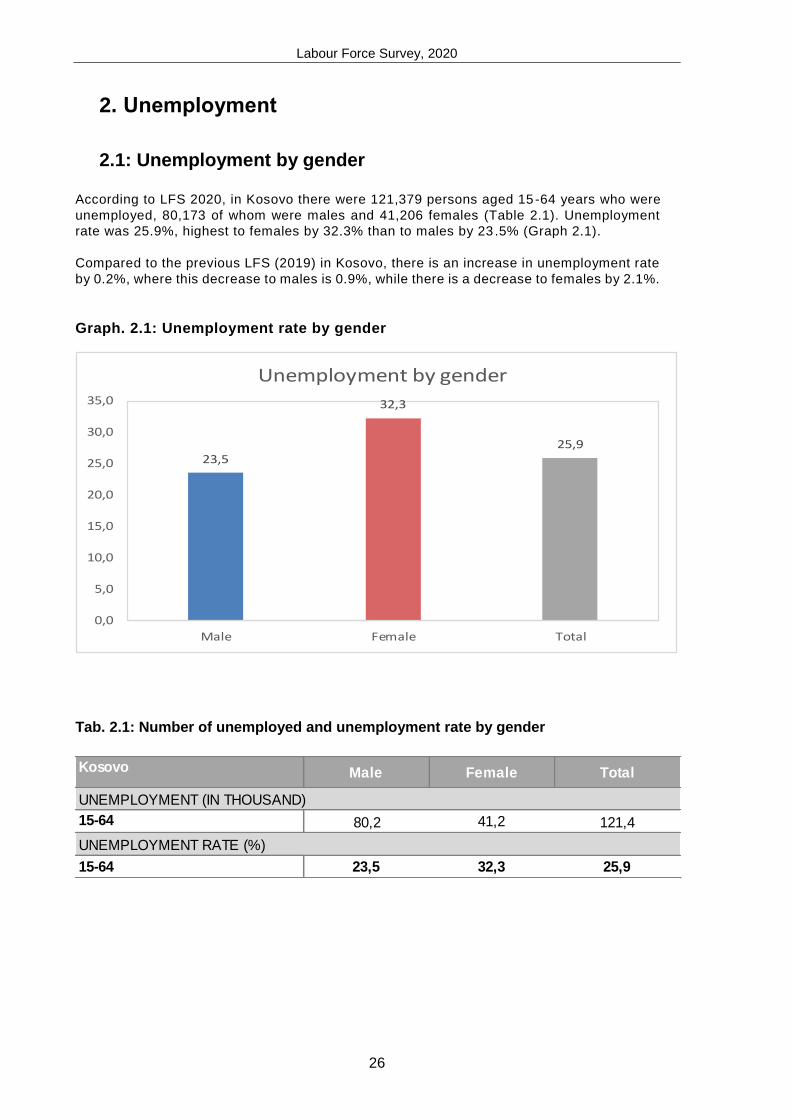
2.1: Unemployment by gender According to LFS 2020, in Kosovo there were 121,379 persons aged 15-64 years who were
unemployed, 80,173 of whom were males and 41,206 females (Table 2.1). Unemployment
rate was 25.9%, highest to females by 32.3% than to males by 23 .5% (Graph 2.1).
Compared to the previous LFS (2019) in Kosovo, there is an increase in unemployment rate
by 0.2%, where this decrease to males is 0.9%, while there is a decrease to females by 2.1%.
Graph. 2.1: Unemployment rate by gender
23,5
32,3
25,9
0,0
5,0
10,0
15,0
20,0
25,0
30,0
35,0
Male Female Total
Unemployment by gender
Tab. 2.1: Number of unemployed and unemployment rate by gender
Kosovo Male Female Total
15-64 80,2 41,2 121,4
15-64 23,5 32,3 25,9
UNEMPLOYMENT (IN THOUSAND)
UNEMPLOYMENT RATE (%)
Labour Force Survey, 2020
27
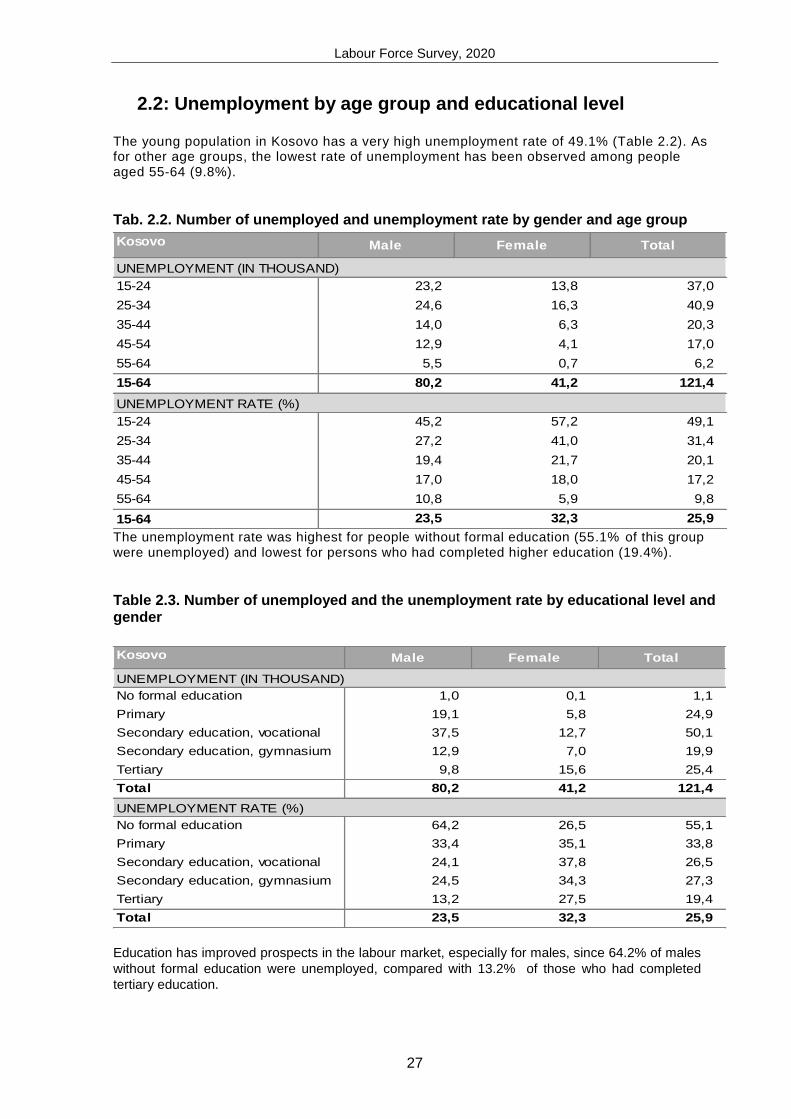
2.2: Unemployment by age group and educational level The young population in Kosovo has a very high unemployment rate of 49.1% (Table 2.2). As for other age groups, the lowest rate of unemployment has been observed among people aged 55-64 (9.8%).
Tab. 2.2. Number of unemployed and unemployment rate by gender and age group
Kosovo Male Female Total
15-24 23,2 13,8 37,0
25-34 24,6 16,3 40,9
35-44 14,0 6,3 20,3
45-54 12,9 4,1 17,0
55-64 5,5 0,7 6,2
15-64 80,2 41,2 121,4
15-24 45,2 57,2 49,1
25-34 27,2 41,0 31,4
35-44 19,4 21,7 20,1
45-54 17,0 18,0 17,2
55-64 10,8 5,9 9,8
15-64 23,5 32,3 25,9
UNEMPLOYMENT (IN THOUSAND)
UNEMPLOYMENT RATE (%)
The unemployment rate was highest for people without formal education (55.1% of this group were unemployed) and lowest for persons who had completed higher education (19.4%).
Table 2.3. Number of unemployed and the unemployment rate by educational level and gender Kosovo Male Female Total
No formal education 1,0 0,1 1,1
Primary 19,1 5,8 24,9
Secondary education, vocational 37,5 12,7 50,1
Secondary education, gymnasium 12,9 7,0 19,9
Tertiary 9,8 15,6 25,4
Total 80,2 41,2 121,4
No formal education 64,2 26,5 55,1
Primary 33,4 35,1 33,8
Secondary education, vocational 24,1 37,8 26,5
Secondary education, gymnasium 24,5 34,3 27,3
Tertiary 13,2 27,5 19,4
Total 23,5 32,3 25,9
UNEMPLOYMENT RATE (%)
UNEMPLOYMENT (IN THOUSAND)
Education has improved prospects in the labour market, especially for males, since 64.2% of males
without formal education were unemployed, compared with 13.2% of those who had completed
tertiary education.
Labour Force Survey, 2020
28
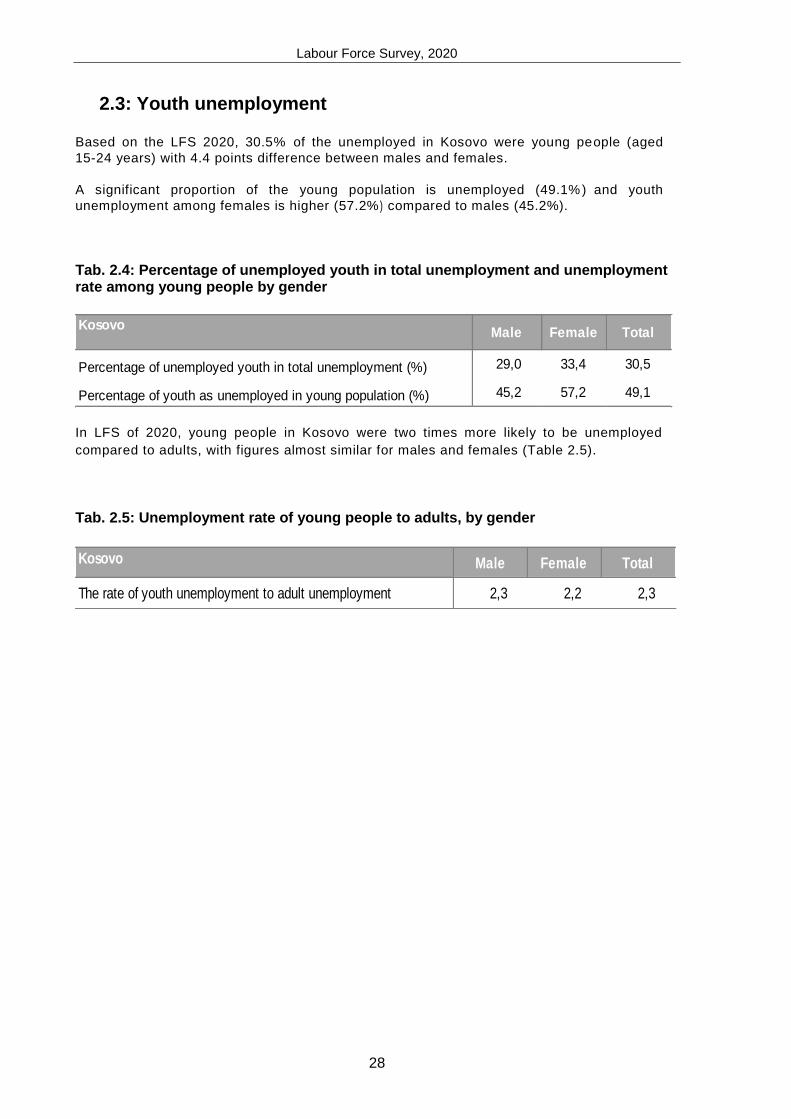
2.3: Youth unemployment
Based on the LFS 2020, 30.5% of the unemployed in Kosovo were young people (aged
15-24 years) with 4.4 points difference between males and females.
A significant proportion of the young population is unemployed (49.1%) and youth
unemployment among females is higher (57.2%) compared to males (45.2%).
Tab. 2.4: Percentage of unemployed youth in total unemployment and unemployment rate among young people by gender
KosovoMale Female Total
Percentage of unemployed youth in total unemployment (%) 29,0 33,4 30,5
Percentage of youth as unemployed in young population (%) 45,2 57,2 49,1
In LFS of 2020, young people in Kosovo were two times more likely to be unemployed
compared to adults, with figures almost similar for males and females (Table 2.5).
Tab. 2.5: Unemployment rate of young people to adults, by gender
Kosovo Male Female Total
The rate of youth unemployment to adult unemployment 2,3 2,2 2,3
Labour Force Survey, 2020
29
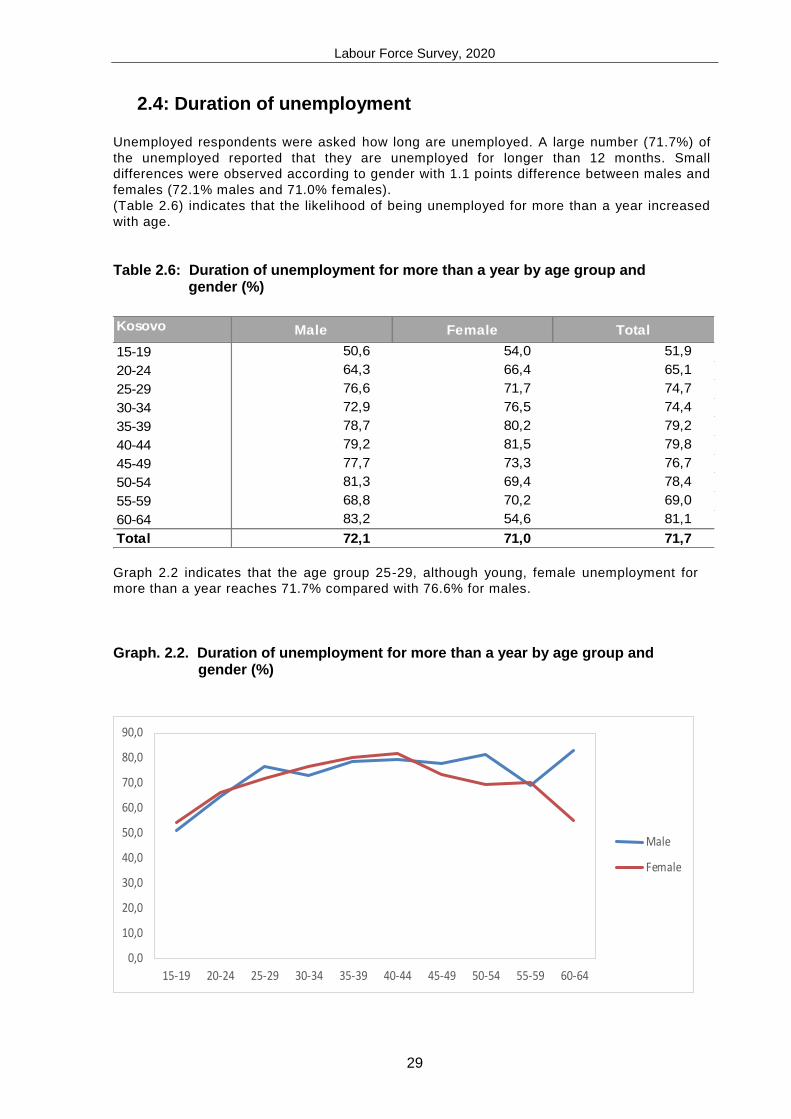
2.4: Duration of unemployment
Unemployed respondents were asked how long are unemployed. A large number (71.7%) of
the unemployed reported that they are unemployed for longer than 12 months. Small
differences were observed according to gender with 1.1 points difference between males and
females (72.1% males and 71.0% females).
(Table 2.6) indicates that the likelihood of being unemployed for more than a year increased
with age.
Table 2.6: Duration of unemployment for more than a year by age group and gender (%)
Kosovo Male Female Total
15-19 50,6 54,0 51,9
20-24 64,3 66,4 65,1
25-29 76,6 71,7 74,7
30-34 72,9 76,5 74,4
35-39 78,7 80,2 79,2
40-44 79,2 81,5 79,8
45-49 77,7 73,3 76,7
50-54 81,3 69,4 78,4
55-59 68,8 70,2 69,0
60-64 83,2 54,6 81,1
Total 72,1 71,0 71,7
Graph 2.2 indicates that the age group 25-29, although young, female unemployment for
more than a year reaches 71.7% compared with 76.6% for males.
Graph. 2.2. Duration of unemployment for more than a year by age group and gender (%)
0,0
10,0
20,0
30,0
40,0
50,0
60,0
70,0
80,0
90,0
15-19 20-24 25-29 30-34 35-39 40-44 45-49 50-54 55-59 60-64
Male
Female
Labour Force Survey, 2020
30
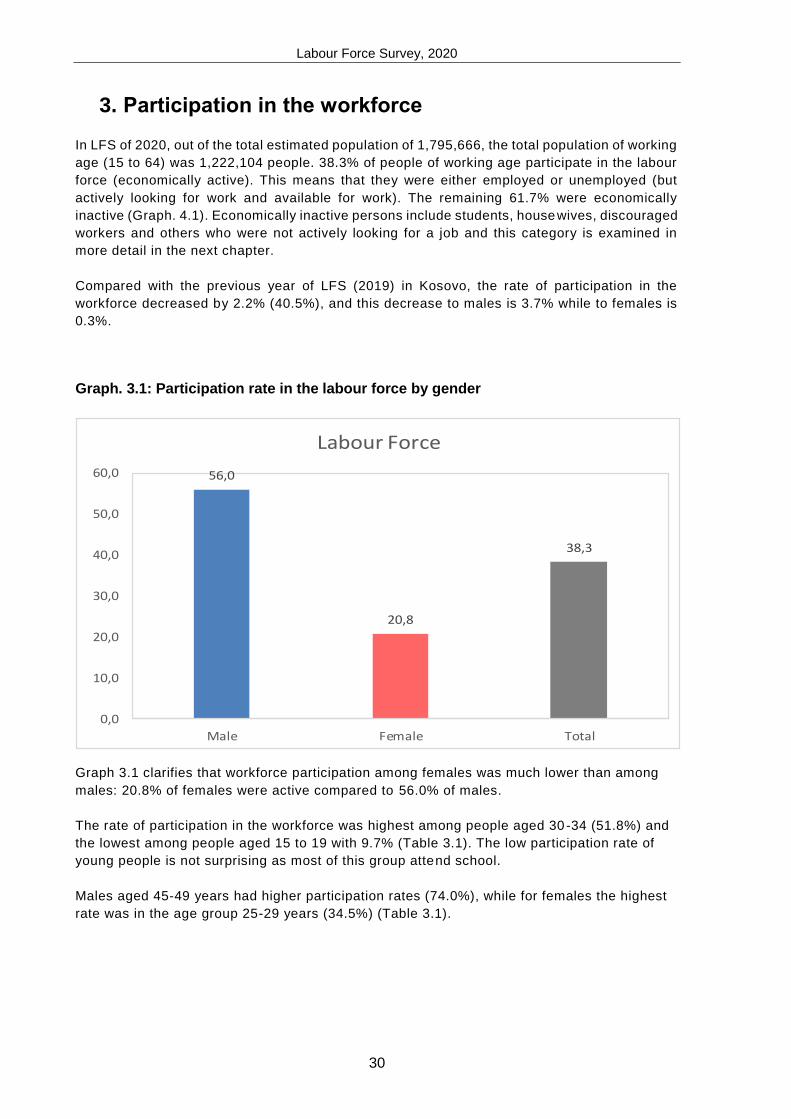
3. Participation in the workforce
In LFS of 2020, out of the total estimated population of 1,795,666, the total population of working
age (15 to 64) was 1,222,104 people. 38.3% of people of working age participate in the labour
force (economically active). This means that they were either employed or unemployed (but
actively looking for work and available for work). The remaining 61.7% were economically
inactive (Graph. 4.1). Economically inactive persons include students, housewives, discouraged
workers and others who were not actively looking for a job and this category is examined in
more detail in the next chapter.
Compared with the previous year of LFS (2019) in Kosovo, the rate of participation in the
workforce decreased by 2.2% (40.5%), and this decrease to males is 3.7% while to females is
0.3%.
Graph. 3.1: Participation rate in the labour force by gender
56,0
20,8
38,3
0,0
10,0
20,0
30,0
40,0
50,0
60,0
Male Female Total
Labour Force
Graph 3.1 clarifies that workforce participation among females was much lower than among
males: 20.8% of females were active compared to 56.0% of males.
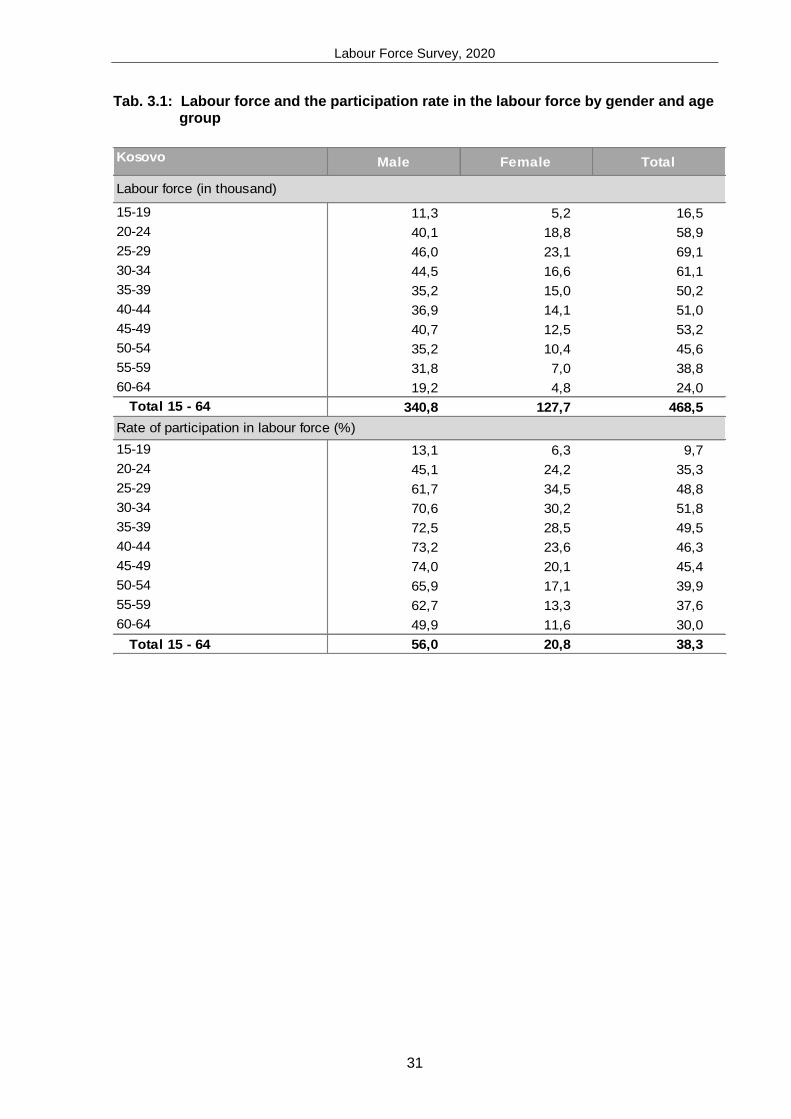
The rate of participation in the workforce was highest among people aged 30 -34 (51.8%) and
the lowest among people aged 15 to 19 with 9.7% (Table 3.1). The low participation rate of
young people is not surprising as most of this group attend school.
Males aged 45-49 years had higher participation rates (74.0%), while for females the highest
rate was in the age group 25-29 years (34.5%) (Table 3.1).
Labour Force Survey, 2020
31
Tab. 3.1: Labour force and the participation rate in the labour force by gender and age group
Kosovo Male Female Total
15-19 11,3 5,2 16,5
20-24 40,1 18,8 58,9
25-29 46,0 23,1 69,1
30-34 44,5 16,6 61,1
35-39 35,2 15,0 50,2
40-44 36,9 14,1 51,0
45-49 40,7 12,5 53,2
50-54 35,2 10,4 45,6
55-59 31,8 7,0 38,8
60-64 19,2 4,8 24,0
Total 15 - 64 340,8 127,7 468,5
15-19 13,1 6,3 9,7
20-24 45,1 24,2 35,3
25-29 61,7 34,5 48,8
30-34 70,6 30,2 51,8
35-39 72,5 28,5 49,5
40-44 73,2 23,6 46,3
45-49 74,0 20,1 45,4
50-54 65,9 17,1 39,9
55-59 62,7 13,3 37,6
60-64 49,9 11,6 30,0
Total 15 - 64 56,0 20,8 38,3
Rate of participation in labour force (%)
Labour force (in thousand)
Labour Force Survey, 2020
32
4. Inactive persons
Special attention is paid to the description and estimation of the employed population and the
unemployed, which together comprise the Labour Force (or economically active persons).
However, the category of "inactive" is equally important. Changes in activ ity rates are an
important part of labour supply impact on potential economic growth. This is due to the large
number of potential workers among those currently inactive.
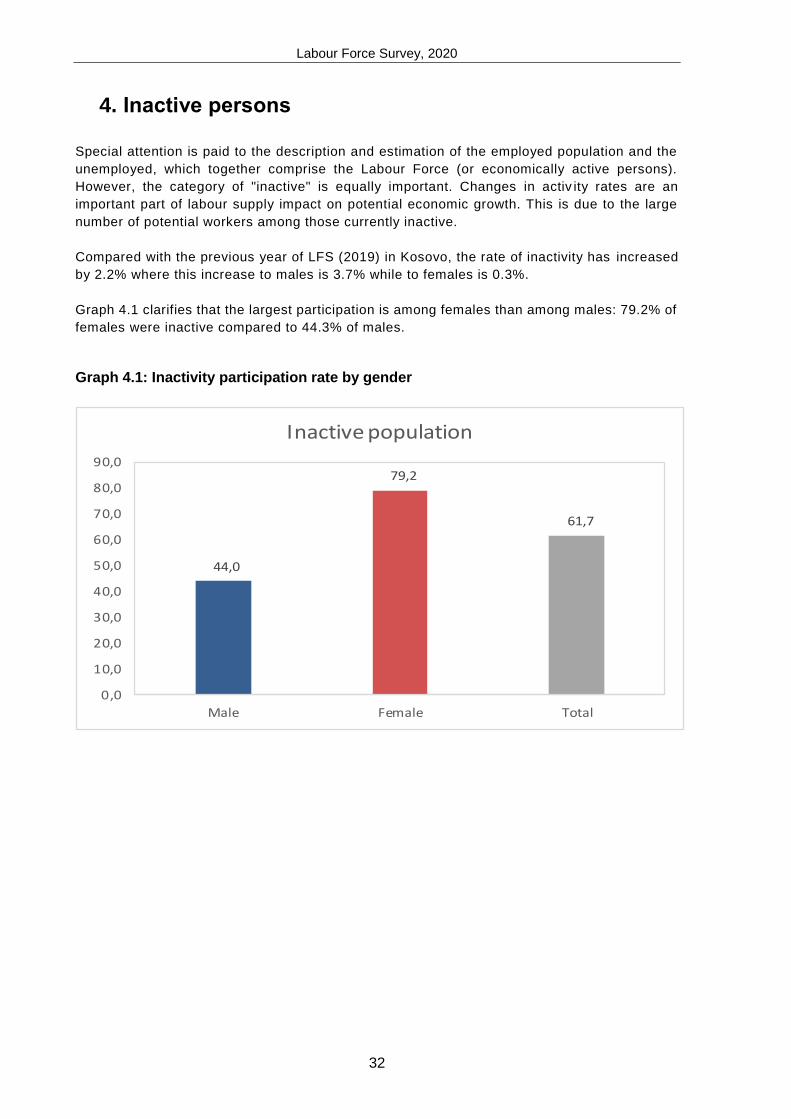
Compared with the previous year of LFS (2019) in Kosovo, the rate of inactivity has increased
by 2.2% where this increase to males is 3.7% while to females is 0.3%.
Graph 4.1 clarifies that the largest participation is among females than among males: 79.2% of
females were inactive compared to 44.3% of males.
Graph 4.1: Inactivity participation rate by gender
44,0
79,2
61,7
0,0
10,0
20,0
30,0
40,0
50,0
60,0
70,0
80,0
90,0
Male Female Total
Inactive population
Labour Force Survey, 2020
33
4.1: Inactive young people not in education, employment, or training (NEET)
The youth of this group (NEET) involves young people who are unemployed, not in school,
nor trained, i.e. they are completely detached from the labour market and does not participate
neither in the education system. High rates of this group in the population of young people
raise concerns about youth employment in the future as it indicates detachment from the
labour market. In addition, a large number of young people not engaged in cou ntries with
high unemployment of young people, such as Kosovo, can cause reduced profits due to
increased competition, and has the opportunity to contribute to social problems.
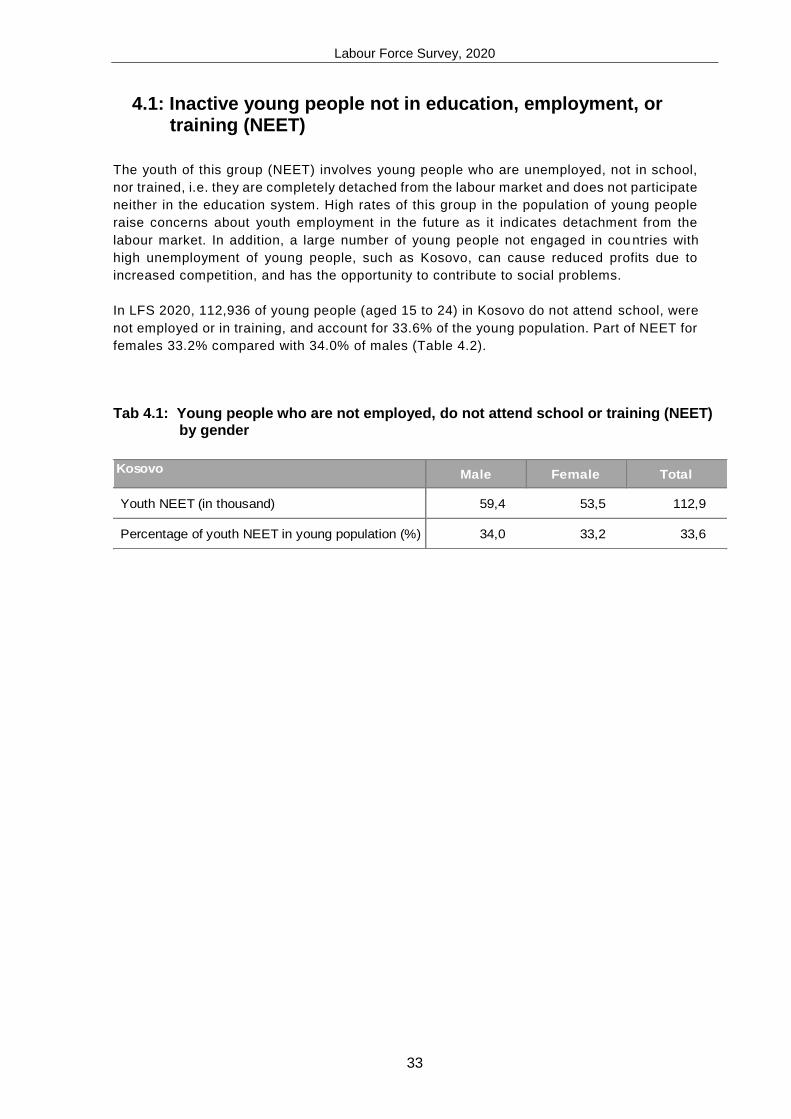
In LFS 2020, 112,936 of young people (aged 15 to 24) in Kosovo do not attend school, were
not employed or in training, and account for 33.6% of the young population. Part of NEET for
females 33.2% compared with 34.0% of males (Table 4.2).
Tab 4.1: Young people who are not employed, do not attend school or training (NEET) by gender
Kosovo Male Female Total
Youth NEET (in thousand) 59,4 53,5 112,9
Percentage of youth NEET in young population (%) 34,0 33,2 33,6
Labour Force Survey, 2020
34
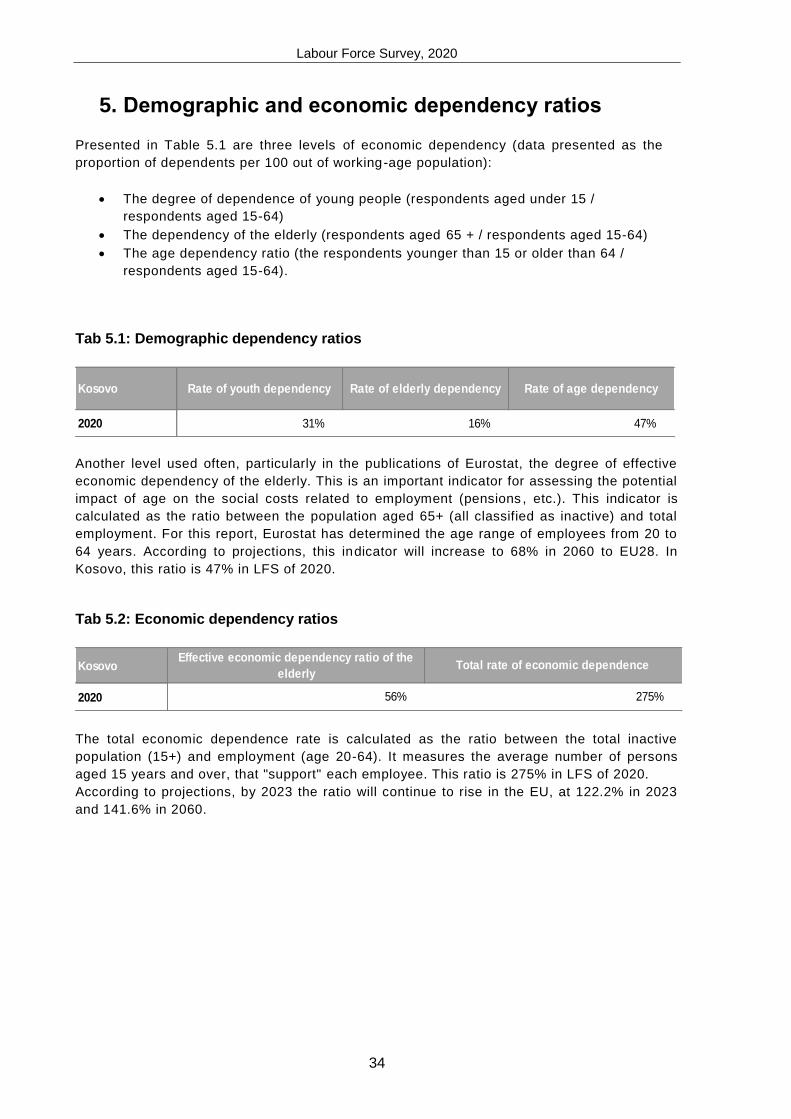
5. Demographic and economic dependency ratios
Presented in Table 5.1 are three levels of economic dependency (data presented as the
proportion of dependents per 100 out of working-age population):
The degree of dependence of young people (respondents aged under 15 /
respondents aged 15-64)
The dependency of the elderly (respondents aged 65 + / respondents aged 15-64)
The age dependency ratio (the respondents younger than 15 or older than 64 /
respondents aged 15-64).
Tab 5.1: Demographic dependency ratios
Kosovo
2020
Rate of youth dependency Rate of elderly dependency Rate of age dependency
31% 16% 47%
Another level used often, particularly in the publications of Eurostat, the degree of effective
economic dependency of the elderly. This is an important indicator for assessing the potential
impact of age on the social costs related to employment (pensions , etc.). This indicator is
calculated as the ratio between the population aged 65+ (all classified as inactive) and total
employment. For this report, Eurostat has determined the age range of employees from 20 to
64 years. According to projections, this indicator will increase to 68% in 2060 to EU28. In
Kosovo, this ratio is 47% in LFS of 2020.
Tab 5.2: Economic dependency ratios
Kosovo
2020
Effective economic dependency ratio of the
elderly
56%
Total rate of economic dependence
275%
The total economic dependence rate is calculated as the ratio between the total inactive
population (15+) and employment (age 20-64). It measures the average number of persons
aged 15 years and over, that "support" each employee. This ratio is 275% in LFS of 2020.
According to projections, by 2023 the ratio will continue to rise in the EU, at 122.2% in 2023
and 141.6% in 2060.
Labour Force Survey, 2020
35
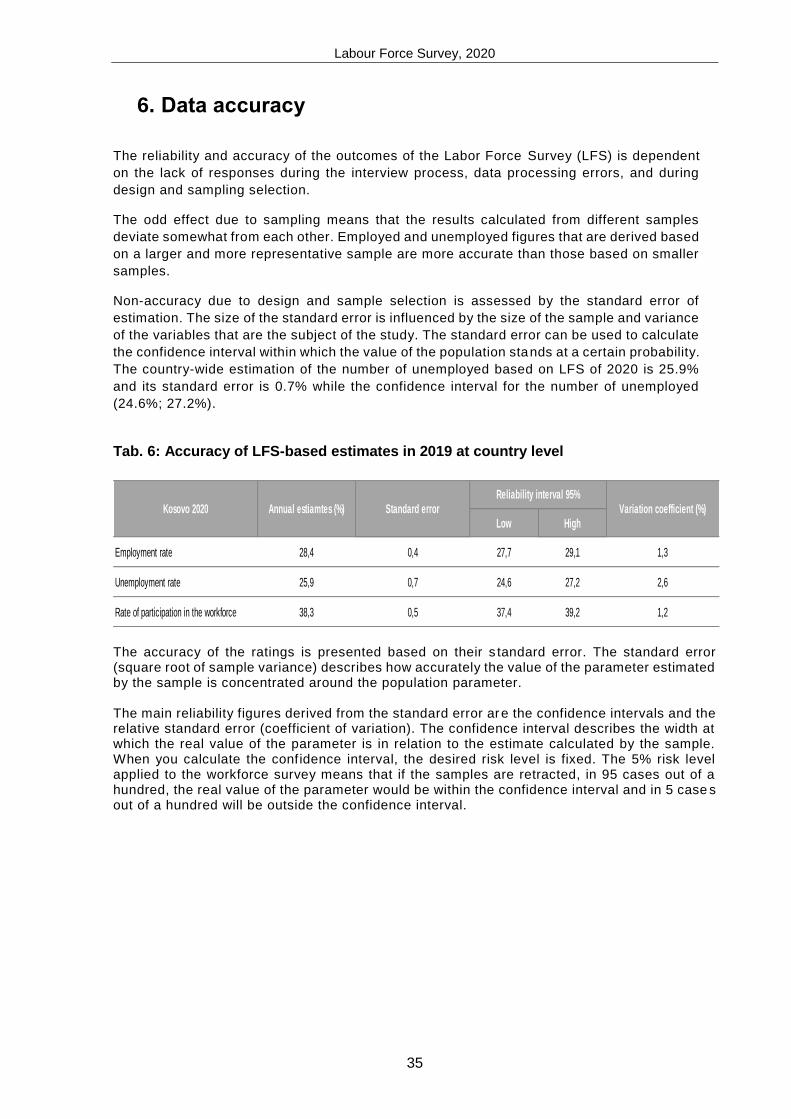
6. Data accuracy
The reliability and accuracy of the outcomes of the Labor Force Survey (LFS) is dependent
on the lack of responses during the interview process, data processing errors, and during
design and sampling selection.
The odd effect due to sampling means that the results calculated from different samples
deviate somewhat from each other. Employed and unemployed figures that are derived based
on a larger and more representative sample are more accurate than those based on smaller
samples.
Non-accuracy due to design and sample selection is assessed by the standard error of
estimation. The size of the standard error is influenced by the size of the sample and variance
of the variables that are the subject of the study. The standard error can be used to calculate
the confidence interval within which the value of the population stands at a certain probability.
The country-wide estimation of the number of unemployed based on LFS of 2020 is 25.9%
and its standard error is 0.7% while the confidence interval for the number of unemployed
(24.6%; 27.2%).
Tab. 6: Accuracy of LFS-based estimates in 2019 at country level
Low High
Employment rate 28,4 0,4 27,7 29,1 1,3
Unemployment rate 25,9 0,7 24,6 27,2 2,6
Rate of participation in the workforce 38,3 0,5 37,4 39,2 1,2
Standard errorReliability interval 95%
Annual estiamtes (%)Kosovo 2020 Variation coefficient (%)
The accuracy of the ratings is presented based on their s tandard error. The standard error (square root of sample variance) describes how accurately the value of the parameter estimated by the sample is concentrated around the population parameter. The main reliability figures derived from the standard error are the confidence intervals and the relative standard error (coefficient of variation). The confidence interval describes the width at which the real value of the parameter is in relation to the estimate calculated by the sample. When you calculate the confidence interval, the desired risk level is fixed. The 5% risk level applied to the workforce survey means that if the samples are retracted, in 95 cases out of a hundred, the real value of the parameter would be within the confidence interval and in 5 case s out of a hundred will be outside the confidence interval.

Labour Force Survey, 2020
36
7. The key indicators in the countries of Southwest Europe
In the tables: 7.1; 7.2; 7.3 and 7.4 are presented the key indicators in the countries of Southeast Europe.
Tab. 7.1: The rate of participation in the labour force
Total Male Female
Kosovo 38,3 56,0 20,8
Albania 69,1 77,1 61,2
North Macedonia 65,5 76,7 54,0
Montenegro 61,5 68,3 54,7
Serbia 67,8 75,1 60,6
Bosnia and Herzegovina 58,2 70,4 46,1
Rate of participation in the workforceSoutheast European countries
(age group 15-64) 2020
Tab. 7.2: The rate of employment
Total Male Female
Kosovo 28,4 42,8 14,1
Albania 60,6 67,8 53,6
North Macedonia 54,7 63,7 45,3
Montenegro 50,3 56,1 44,4
Serbia 58,8 65,6 52,0
Bosnia and Herzegovina 48,8 60,2 37,3
Employment rateSoutheast European countries
(age group 15-64)2020
Tab. 7.3: The rate of unemployment
Total Male Female
Kosovo 25,9 23,5 32,3
Albania 12,2 12,0 12,4
North Macedonia 16,6 16,9 15,6
Montenegro 18,3 17,8 18,8
Serbia 13,3 12,5 14,2
Bosnia and Herzegovina 16,2 14,4 19,0
Unemployment rateSoutheast European countries
(age group 15-64)2020
Tab. 7.4: The rate of inactivity
Total Male Female
Kosovo 61,7 44,0 79,2
Albania 30,9 22,9 38,8
North Macedonia 34,5 23,3 46,0
Montenegro 38,5 31,7 45,3
Serbia 32,2 24,9 39,4
Bosnia and Herzegovina 41,8 29,6 53,9
Inactivity rateSoutheast European countries
(age group 15-64)2020
Katalogimi në botim – (CIP)Biblioteka Kombëtare e Kosovës “Pjetër Bogdani”
331.51:311(496.51)“2020”
Labour Force Survey 2020 / publication was prepared by Bujar Hajrizi ... [et al.]. - Pristina : Kosovo Agency of Statistiks, 2021. - 39 f. : ilustr. ; 28 cm. - (Social Statistics ; Series 5)
1. Hajrizi, Bujar 2. Demaj, Bedrije 3. Rama, Rrahman 4. Thaçi,Besarta
ISBN 978-9951-22-738-4
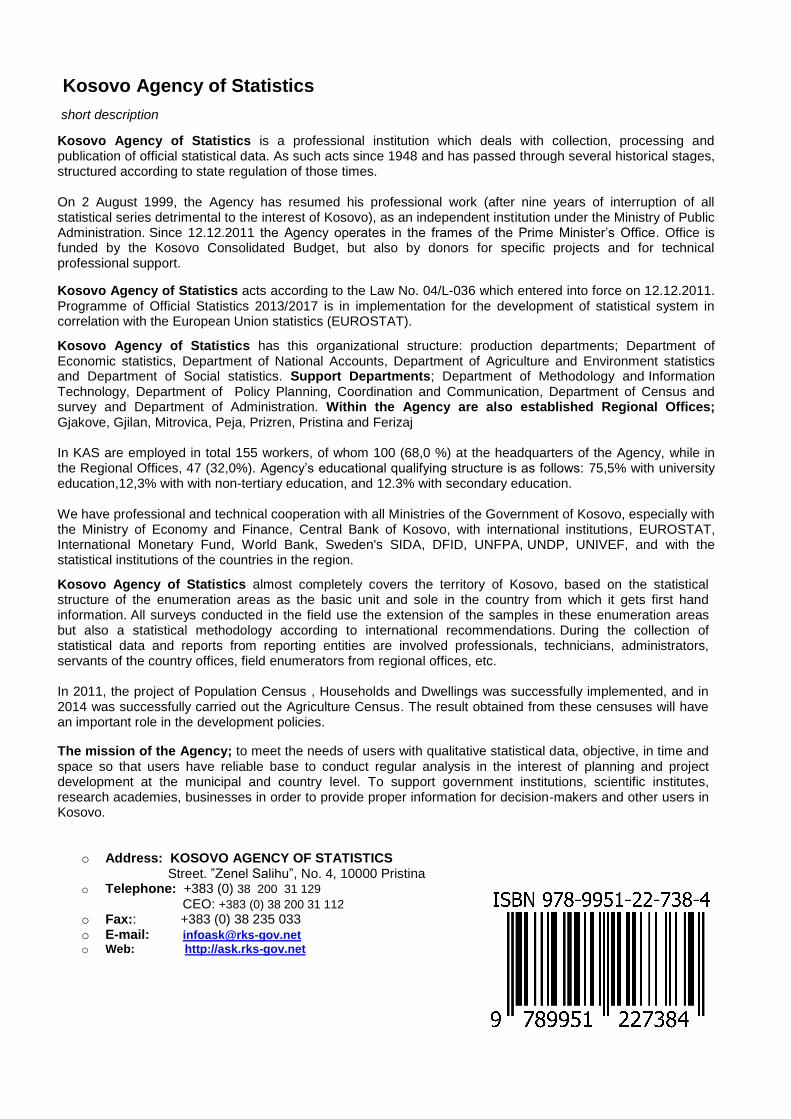
Kosovo Agency of Statistics
short description
Kosovo Agency of Statistics is a professional institution which deals with collection, processing and publication of official statistical data. As such acts since 1948 and has passed through several historical stages, structured according to state regulation of those times.
On 2 August 1999, the Agency has resumed his professional work (after nine years of interruption of all statistical series detrimental to the interest of Kosovo), as an independent institution under the Ministry of Public Administration. Since 12.12.2011 the Agency operates in the frames of the Prime Minister’s Office. Office is funded by the Kosovo Consolidated Budget, but also by donors for specific projects and for technical professional support.
Kosovo Agency of Statistics acts according to the Law No. 04/L-036 which entered into force on 12.12.2011. Programme of Official Statistics 2013/2017 is in implementation for the development of statistical system in correlation with the European Union statistics (EUROSTAT).
Kosovo Agency of Statistics has this organizational structure: production departments; Department of Economic statistics, Department of National Accounts, Department of Agriculture and Environment statistics and Department of Social statistics. Support Departments; Department of Methodology and Information Technology, Department of Policy Planning, Coordination and Communication, Department of Census and survey and Department of Administration. Within the Agency are also established Regional Offices; Gjakove, Gjilan, Mitrovica, Peja, Prizren, Pristina and Ferizaj
In KAS are employed in total 155 workers, of whom 100 (68,0 %) at the headquarters of the Agency, while in the Regional Offices, 47 (32,0%). Agency’s educational qualifying structure is as follows: 75,5% with university education,12,3% with with non-tertiary education, and 12.3% with secondary education.
We have professional and technical cooperation with all Ministries of the Government of Kosovo, especially with the Ministry of Economy and Finance, Central Bank of Kosovo, with international institutions, EUROSTAT, International Monetary Fund, World Bank, Sweden's SIDA, DFID, UNFPA, UNDP, UNIVEF, and with the statistical institutions of the countries in the region.
Kosovo Agency of Statistics almost completely covers the territory of Kosovo, based on the statistical structure of the enumeration areas as the basic unit and sole in the country from which it gets first hand information. All surveys conducted in the field use the extension of the samples in these enumeration areas but also a statistical methodology according to international recommendations. During the collection of statistical data and reports from reporting entities are involved professionals, technicians, administrators, servants of the country offices, field enumerators from regional offices, etc.
In 2011, the project of Population Census , Households and Dwellings was successfully implemented, and in 2014 was successfully carried out the Agriculture Census. The result obtained from these censuses will have an important role in the development policies.
The mission of the Agency; to meet the needs of users with qualitative statistical data, objective, in time and space so that users have reliable base to conduct regular analysis in the interest of planning and project development at the municipal and country level. To support government institutions, scientific institutes, research academies, businesses in order to provide proper information for decision-makers and other users in Kosovo.
o Address: KOSOVO AGENCY OF STATISTICS Street. ”Zenel Salihu”, No. 4, 10000 Pristina
o Telephone: +383 (0) 38 200 31 129
CEO: +383 (0) 38 200 31 112
o Fax:: +383 (0) 38 235 033o E-mail: [email protected]
o Web: http://ask.rks-gov.net