Comportamentos associados ao sono em estudantes do ensino médio: análises transversal e prospectiva
Upload
khangminh22Category
view
2download
0

1
La vita e i sogni sono fogli di uno stesso libro.
Leggerli in ordine è vivere, sfogliarli a caso è sognare
A. Schopenhauer
Dedicato a
tutti coloro ai quali basta uno sguardo per capirmi

2
Index
1. Introduction .................................................................................................................. 7
1.1 The gut microbiota: structure and function .................................................................. 7
1.2 The microbiota composition along the gastrointestinal tract ....................................... 8
1.3 The gut microbiota: from the birth to adulthood ........................................................ 10
1.4 Host-microbes coevolution, gut homeostasis and dysbiosis ...................................... 11
1.5 The impact of the diet on gut microbiota ................................................................... 14
1.6 The metabolome ......................................................................................................... 16
1.7 The gut microbiota and host immune system ............................................................ 17
1.8 The gut microbiota and human diseases .................................................................... 20
1.9 The gut microbiota and metabolic diseases ............................................................... 20
1.9.1 Obesity ................................................................................................................. 20
1.9.2 Type 2 diabetes .................................................................................................... 22
1.9.3 Cardiovascular disease ........................................................................................ 22
1.9.4 Liver diseases ...................................................................................................... 22
1.10 Gut-Brain axis and neurological diseases ................................................................ 24
1.11 The gut microbiota and immune-mediated inflammatory diseases ......................... 25
1.11.1 Inflammatory Bowel Disease ............................................................................ 25
1.11.2 Pharmacological treatment of IBD .................................................................... 28
1.11.3 Microbiota-base interventions in IBD ............................................................... 30
1.11.4 Rheumatic disease and arthritis ......................................................................... 30
1.12 The fungal communities in the gut: the mycobiota .................................................. 32
1.12.1 Mycobiota and IBD ........................................................................................... 33
1.13 Metagenomics in studying the human gut microbiota ............................................. 35
1.13.1 Statistical analysis of taxonomic and functional profiles .................................. 37
1.13.2 Metatranscriptomics and metagenomic inference ............................................. 38
1.13.3 Limitation of metagenomic analysis ................................................................. 40
2. Aim of the PhD research project .................................................................................. 42
3. Effect of diet and environment on gut microbiota in healthy populations living in
different environments. Comparative study in children living in rural and urban
Africa and in Europe ......................................................................................................... 43
3.1 Scientific Background ................................................................................................ 43
3.2 Materials and Methods ............................................................................................... 44
3.2.1 Enrollment of children populations and fecal sample collection ........................ 44
3.2.2 Bacterial genomic DNA extraction from fecal samples ...................................... 45

3
3.2.3 Pyrosequencing .................................................................................................... 45
3.2.4 Data analysis ........................................................................................................ 46
3.2.5 Determination of Short-Chain Fatty Acids (SCFAs) in Fecal Samples .............. 48
3.3 Results and discussion................................................................................................ 48
3.3.1. Transition from a rural to an urban environment changes dietary habits of
Burkina Faso populations ............................................................................................. 48
3.3.2 Microbiota characterization of Burkina Faso and European populations:
taxonomic changes as an effect of diet and migration from rural to urban environments
...................................................................................................................................... 55
3.3.3 Prediction of functional metabolic profiles of gut microbiota from African and
European population ..................................................................................................... 62
3.3.4 Carbohydrate metabolism, glycan biosynthesis and energy metabolism ............ 63
3.3.5 Functions related to aminoacid metabolism ........................................................ 64
3.3.6 Vitamin and cofactor metabolism ....................................................................... 66
3.3.7 Lipid metabolism ................................................................................................. 67
3.3.8 Metabolism of terpenoids and polyketides, secondary metabolism, and antibiotic
biosynthesis and resistance ........................................................................................... 68
3.3.9 Xenobiotics metabolism ...................................................................................... 69
3.4 Conclusions ................................................................................................................ 70
4. Phenotype and disease course of early-onset pediatric inflammatory bowel
disease ................................................................................................................................. 72
4.1. Scientific Background ............................................................................................... 72
4.2 Materials and Methods ............................................................................................... 73
4.2.1 Patients and clinical features ............................................................................... 73
4.2.2 Statistical methods ............................................................................................... 75
4.3 Results ........................................................................................................................ 75
4.3.1 IBD subjects ........................................................................................................ 75
4.3.2 Initial classification and location of the disease .................................................. 76
4.3.3 Classification and Disease Extent at Follow-up .................................................. 78
4.3.4 Clinical Presentation ............................................................................................ 78
4.3.5 Medical and Surgical Treatment ......................................................................... 78
4.3.6 Subgroup Analysis of VEO-IBD ......................................................................... 80
4.4 Discussion .................................................................................................................. 80
5. Alteration of fecal microbiota profiles in juvenile idiopathic arthritis. Associations
with HLA-B27 allele and disease status ........................................................................... 84
5.1 Scientific background ................................................................................................. 84
5.2 Materials and Methods ............................................................................................... 85

4
5.2.1 Sampling of subjects ............................................................................................ 85
5.2.2 DNA extraction ................................................................................................... 86
5.2.3 Pyrosequencing .................................................................................................... 86
5.2.4 Data analysis ........................................................................................................ 86
5.3 Results ........................................................................................................................ 88
5.3.1 Clinical features of JIA patients .......................................................................... 88
5.3.2 Microbiota characterization by 16S rDNA sequencing in the JIA groups and
healthy controls ............................................................................................................ 88
5.3.3 Fecal microbiota comparison between acute disease and remission in JIA
categories ...................................................................................................................... 94
5.3.4 Metabolic function prediction ............................................................................. 96
5.4 Discussion .................................................................................................................. 98
6. Age and gender affect the composition of fungal population of the human
gastrointestinal tract ........................................................................................................ 102
6.1 Scientific Background .............................................................................................. 102
6.2 Materials and Methods ............................................................................................. 103
6.2.1 Study participants .............................................................................................. 103
6.2.2 Isolation and identification of cultivable fungal species from feces ................. 103
6.2.3 Phenotypical characterization of fungal isolates ............................................... 104
6.2.4 Antifungal susceptibility testing ........................................................................ 104
6.2.5 DNA extraction and PCR amplification of fungal ITS1 rDNA region ............. 105
6.2.6 Library construction and pyrosequencing ......................................................... 105
6.2.7 Data analysis ...................................................................................................... 105
6.3 Results ...................................................................................................................... 106
6.3.1 Cultivable Gut Mycobiota ................................................................................. 106
6.3.2 Fungal Gut Metagenomics ................................................................................ 109
6.3.3 Phenotyping the gut mycobiota ......................................................................... 112
6.4 Discussion ................................................................................................................ 115
7. Genotyping and immunophenotyping of cultivable fungal isolates from pediatric
patients affected by Inflammatory Bowel Disease and their interaction with bacterial
communities ...................................................................................................................... 119
7.1 Scientific background ............................................................................................... 119
7.2 Materials and Methods ............................................................................................. 121
7.2.1 Enrolment of patients and healthy subjects ....................................................... 121
7.2.2 Isolation and identification of yeast species from fecal samples ...................... 121
7.2.3. Statistical correlation between clinical parameters, phenotypes and fungal
isolates ........................................................................................................................ 122

5
7.2.4 Phenotypical characterization of fungal isolates ............................................... 122
7.2.5 Biofilm formation assay of C. albicans strains and thickness measurement .... 123
7.2.6 Candida cell morphology studies ...................................................................... 124
7.2.7 In vitro phagocytosis assay ................................................................................ 124
7.2.8 Intracellular survival assay ................................................................................ 125
7.2.9 Phagolysosome acidification assay ................................................................... 125
7.2.10 In vitro adhesion assay and secretory activity of human epithelial cell line
Caco-2 ......................................................................................................................... 125
7.2.11 Epifluorescence microscopy ............................................................................ 126
7.2.12 S. cerevisiae population genetic analysis ........................................................ 126
7.2.13 Whole genome analysis of two C. albicans isolates ....................................... 127
7.2.14 Illumina quality control and SNP calling ........................................................ 127
7.2.15 Variant imposition, gene loss prediction and Gene Ontology enrichment of lost,
duplicate, truncated genes .......................................................................................... 128
7.2.16 Cell wall extraction and quantification of sugars by HPAEC-PAD ................ 128
7.2.17 Human Peripheral Blood Mononuclear Cells and Dendritic Cells preparation,
fungal challenge and cytokine assays ......................................................................... 129
7.2.18 Statistical analysis of human immune response data ...................................... 129
7.2.19 Bacterial DNA extraction from fecal samples and pyrosequencing ............... 129
7.2.20 Metagenomic data analysis .............................................................................. 130
7.3 Result and discussion ............................................................................................... 130
7.3.1 The mycobiota of Crohn’s disease patients is enriched for S. cerevisiae strains
.................................................................................................................................... 131
7.3.2 S. cerevisiae population structure from human gut ........................................... 134
7.3.3 Phenotypic characterization of S. cerevisiae isolates. Sporulation ability correlate
with ASCA serum level of CD patients ..................................................................... 136
7.3.4 Genetic variation analysis of C. albicans isolates ............................................. 139
7.3.5 Phenotypic analysis of C. albicans isolates ....................................................... 143
7.3.6 Adhesion of C. albicans isolates to human epithelial cells ............................... 147
7.3.7 Susceptibility of the C. albicans isolates to microglial cell-mediated antifungal
activity ........................................................................................................................ 148
7.3.8 Cell wall composition of gut isolates suggests selection by intestinal
environment ................................................................................................................ 150
7.3.9 Immunomodulatory properties of cultivable fungal isolates ............................. 151
7.3.10 Cell wall components correlated with PBMCs cytokine release ..................... 157
7.3.11 Fungal interaction with gut bacterial communities ......................................... 158
7.4 Conclusions .............................................................................................................. 163

6
8. Summary ....................................................................................................................... 167
9. References ..................................................................................................................... 170
10. Publications ................................................................................................................ 220

7
1. Introduction
1.1 The gut microbiota: structure and function
The gut microbiota is the complex of microbial communities inhabiting the human
gastrointestinal (GI) tract. The GI symbiontic communities include archaea, bacteria, fungi,
and viruses. The most abundance microorganisms residing in the GI tract are bacteria, with
a density of approximately 1013-1014 cells/g of fecal matter (Weinstock 2012).
The human gut microbiota is defined a “superorganism” (Fig. 1.1). Our body made up of
10% of our cells and the rest 90% comprises microbial cells (Zhao 2013), with a biomass
amount of microbiota approximately of 2 kg (Qin, Li et al. 2010). It is known that microbes
resident in the gut belong to more than 1000 different species encoding more than 3 million
bacterial genes (microbiome), and comprising about 150 times more genes than the human
genome (Qin, Li et al. 2010).
Fig. 1.1 General information about human gut microbiota (from www.gutmicrobiotawatch.org “Gut
Microbiota for Health”).
Under normal physiological conditions, the gut microbiota plays an important role in
structural functions (Fig. 1.2), in protecting the host against pathogenic microbes (Endt,
Stecher et al. 2010;Fukuda, Toh et al. 2011;Fukuda, Toh et al. 2012), in modulating
immunity (Maynard, Elson et al. 2012), and in regulating metabolic processes (Tremaroli
and Backhed 2012;Cani 2014), such as fermentation of indigestible dietary polysaccharides,
synthesis of essential amino acids and vitamins, and metabolism of xenobiotics (Gill, Pop et
al. 2006;Qin, Li et al. 2010;Yatsunenko, Rey et al. 2012;Cabreiro, Au et al. 2013).

8
Fig. 1.2 Functional contributions of the gut microbiota (O’Hara A.M. & Shanahan F., EMBO Report
2006).
The cross talk between the host and gut microbiota in particular thorough metabolic, immune
and nervous system have become the topics of study over the past decade. The symbiontic
and mututalistic interaction between host and microbes is explained in the “hologenome
theory of evolution” (Margulis, 1993; Rohwer et al.,2002), in which the term “hologenome”
describes the sum of genetic information of the host and its symbiotic microorganisms
(Zilber-Rosenberg and Rosenberg 2008). In this context, the holobiont (the host and its
symbiotic microbiota) with its hologenome (genetic information of either host or
microbiota), acting in consortium, should be considered as a unique unit of selection in
evolution. Changes may occur either in the host genome or in the associated microbial
genomes, and variation in the diverse microbial symbionts can have an important role in the
adaptation and evolution of the holobiont. The association between host and symbionts
affects the fitness of the holobiont within its environment, and under environmental stress,
the symbiotic microbial community can change rapidly.
1.2 The microbiota composition along the gastrointestinal tract
Microbial communities are spatially distributed within the GI tract, with differential
abundance from the stomach to the colon (Fig. 1.3). A variety of bacterial species passes
through the GI tract strating from mouth. Few data have been collected about the stable
microbial populations in the proximal esophagus. Distal esophagus is relatively limited in
microbial diversity and dominated by Streptococcus species. Other genera such as
Prevotella, Actinomyces, Lactobacillus, and Staphylococcus have been found (Pei, Bini et
al. 2004). In contrast to other body sites, where greater microbial diversity is associated with
human health, increased microbial diversity in the distal esophagus has been associated with
chronic inflammation and dysplasia (Yang, Lu et al. 2009). The microbial diversity of the
human stomach is strongly influenced by low pH of the gastric lumen that selects acid-
resistant bacteria, and by presence or absence of the gastric pathogen Helicobacter pylori.
When H. pylori infection occurs, the microbial diversity of the stomach is limited (Bik,
Eckburg et al. 2006). The most prevalent genera in the gastric microbiota comprises a total

9
of 10 genera including Prevotella, Streptococcus, Veillonella, and Rothia (Andersson,
Lindberg et al. 2008).
The human small intestine remains a frontier for exploration of healthy human microbiology.
It is observed that diversity and complexity of bacterial communities increase in the
proximal–distal direction, from the duodenum through the jejunum and ileum. Streptococcus
seems to be a dominant genus in the duodenum and jejunum (Justesen, Nielsen et al. 1984).
The 70% of the total GI microbes inhabits the colon (Ley, Turnbaugh et al. 2006). The
number of bacteria in the healthy human gut likely exceed 1000 species. At the terminal
ileum the prevalent species change from aerobes to anaerobes (Mondot, de Wouters et al.
2013). Significant differences in microbial composition on mucosal surfaces compared to
within the lumen were observed (Li, Yang et al. 2015). At the mucosal surface microbes are
in closer proximity to the intestinal epithelium and may have a greater influence on the
immune system, whereas luminal/fecal microbes might be more important for energy and
metabolic functions. The healthy human gut is dominated by the presence of four bacterial
phyla: Bacteroidetes, Firmicutes, Actinobacteria, Proteobacteria, and Verrucomicrobia.
Bacteroidetes and Firmicutes account for a large majority of microbiota (Tap, Mondot et al.
2009;Forbes, Van Domselaar et al. 2016). Although some evidences suggest that the ratio of
Firmicutes:Bacteroidetes is related to metabolic syndromes (Turnbaugh, Ley et al. 2006),
this ratio varies significantly among healthy individuals in association with different dietary
habits and geographic areas (De Filippo, Cavalieri et al. 2010;Yatsunenko, Rey et al. 2012).
The phylum Proteobacteria accounts for only a small proportion of GI communities in
healthy individuals, but often a higher proportion of Proteobacteria was observed in patients
with GI diseases, in particular with regards to E. coli.
In healthy condition, considerable diversity of bacterial species exists, as well as an inter-
individual microbial diversity. Several studies have recognized common core subsets within
the microbiota that are relatively stable throughout large populations and that can even
persist in adult age (Faith, Guruge et al. 2013). However, the human microbiota is shaped
by multiple factors, such as genetics, immune system and environmental factors, including
diet, life style, and the aging process.
Studies on GI colonization across the age showed that gut microbiome changes with
development and maturation of its host (Cebra 1999;Hooper, Midtvedt et al. 2002;Backhed,
Ley et al. 2005;Hansen, Nielsen et al. 2012). The reciprocal co-evolution between mammals
and their gut microbes has lasted for hundreds of millions of years (Ley, Hamady et al. 2008).
An important scientific goal is to understand the relationships between the complex gut
ecosystem and its role in health and disease.

10
Fig. 1.3 Overview of microbial component in the different districts of GI tract (Aron-Wisnewsky J,
Doré J & Clement K. Nat Rev Gastroenterol Hepatol 2012).
1.3 The gut microbiota: from the birth to adulthood
It was long believed that humans were sterile before birth, but recent studies have shown
that the first meconium of full-term, healthy neonates contains a simple community,
dominated by genera such as Escherichia-Shigella, Enterococcus, Leuconostoc,
Lactococcus, and/or Streptococcus (Jimenez, Marin et al. 2008;Gosalbes, Llop et al. 2013).
Furthermore, the mode of birth (vaginal delivery or caesarean section) may affect the
composition of the early microbiota. Infants who are delivered vaginally have initial
microbiota resembling those of the mothers’ vaginal tracts, dominated by Lactobacilli,
whereas those delivered by Caesarean section have initial microbiota populated by
Staphylococcus, Corynebacterium, and Propionibacterium, largely resembling the
microbiota of their mothers’ skin (Palmer, Bik et al. 2007;Human Microbiome Project 2012).
After the birth, the human intestine is rapidly colonized by a set of microbes. First colonizers
are facultative anaerobes, which create an environment suited to colonization of strict
anaerobes, such as Bacteroides, Clostridium, and Bifidobacterium spp. It has been observed
that the gut microbiota of infants is characterized by low diversity and a relative dominance
of the phyla Actinobacteria and Proteobacteria. Subsequently, the microbiota become more
diverse with enrichment in Firmicutes and Bacteroidetes (Eckburg, Bik et al. 2005;Qin, Li
et al. 2010;Backhed 2011). Factors known to influence colonization include genetics,
gestational age, mode of birth, diet (breast milk or formula), environmental factors, such as
sanitation, and antibiotic treatment (Adlerberth and Wold 2009;Marques, Wall et al. 2010)
(Fig. 1.4).
As dietary richness and environmental exposures increase during the first year of life, the
richness and complexity of the GI microbiota also increase (Koenig, Spor et al.
2011;Yatsunenko, Rey et al. 2012). Infancy is a distinctive stage for the microbiota also in
terms of functional acquisition. The infant microbiota appears to be specialized for the
acquisition of nutrients (e.g. vitamin B and amino acids) compared to that of adults
(Yatsunenko, Rey et al. 2012). The first 3 years of life represent the most critical period for

11
child growth and development. In this period, diet changes and gut microbiota alteration has
the potential to profoundly affect host health and development (Palmer, Bik et al.
2007;Agans, Rigsbee et al. 2011;Ringel-Kulka, Cheng et al. 2013). It has been observed that
the GI microbiota of a 3-years-child is 40%–60% similar to that of a healthy adult, reaching
an adult-like state (Palmer, Bik et al. 2007). Although the GI microbiota of children and
teenagers contain many of the same taxa as adults, significant differences in proportions of
Bacteroides and Bifidobacterium spp., as well as members of the class Clostridia have been
reported.
It has been proposed that the adult GI microbiome remains stable from the third through
seventh decades of life (Biagi, Nylund et al. 2010). The specific microbial diversity in
healthy adult subjects plays an important role in maintaining immune homeostasis. During
this relatively stable period of microbiota development, important taxa and their functions
could be altered. It is known that the loss of immune gut homeostasis and leaky gut syndrome
are linked with microbiota alterations and predispose to disease (Kayama and Takeda 2012).
Aging and inflammation are correlated processes, and key hallmarks include decreases in GI
function, host immune response and the development of chronic or low-grade inflammation.
Much of these variations appear to be diet-driven, and correlate strongly with indicators of
relative health, including markers of frailty and inflammation (Claesson, Jeffery et al. 2012).
Fig. 1.4 Factors affecting the stability and complexity of the gut microbiota over time from infancy
to adulthood and elderly include genetics, mode of birth, diet, geography, hygiene, stress, medication.
Some of these factors can introduce perturbations affecting the complexity, resilience and stability
of the microbiota, potentially introducing microbial dysbiosis. Features of an imbalanced
microbiome include an increase in gram-negative bacteria linked to an environment of oxidative
stress and inflammation and metabolite production. In the healthy gut, diversity, resilience and
stability contribute to important physiological processes such as protection against pathogens,
training of the immune system, and digestion of food to supply energy and nutrients including
vitamins and SCFAs (Kostic AD, et al. Gastroenterology 2014).
1.4 Host-microbes coevolution, gut homeostasis and dysbiosis
Humans represent a scaffold on which diverse microbial ecosystems are established (e.g.
skin, vagina and gut). During evolution, changes in the length and compartmentalization of

12
the digestive tract have enabled vertebrates to occupy diverse habitats and exploit different
feeding strategies. Many of these innovations in gut physiology were driven by the need to
optimize basic physiological and biologic functions, such as nutrient absorption (Ley,
Hamady et al. 2008). Animal and human host and their microbiota have co-evolved over the
millennia into a homeostatic, symbiotic relationship. Normal functioning of the digestive
and immune systems depend on the presence of nonpathogenic “beneficial” bacteria.
Homeostasis of the gut microbiota is characterized by the co-existence of various microbial
species. Healthy status is represented by high level of gut microbial richness, while disease
condition is characterized by depletion of gut microbial species (Cotillard, Kennedy et al.
2013;Le Chatelier, Nielsen et al. 2013). In an ecologic context, the biodiversity creates an
ecosystem able to resist the perturbation from outside environment (Turnbaugh, Hamady et
al. 2009). In fact, competitive interactions among microbial species may help in maintaining
the gut microbiota stability (Coyte, Schluter et al. 2015). This phenomenon includes the
concept of “resilience” that is referred to the amount perturbation that a microbial system
can tolerate and the ability to restore the equilibrium state (Lozupone, Stombaugh et al.
2012). Understanding how the health microbiota forms a stable and resilient state would
allow strategies able to increase the resilience in disease conditions (Fig. 1.4).
Disruption of microbial equilibrium can result in dysbiosis. Gut dysbiosis refers to an altered
composition of intestinal microbial populations and it is thought to provide continuous
immunological stimulation leading to immune response anomalies and increase risk of
disease. Altered composition of gut microbiota has been observed in a number of GI
diseases, such as Inflammatory Bowel Disease (IBD), celiac disease, irritable bowel
syndrome (IBS), antibiotic-associated diarrhea, tropical enteropathy, and others (Brown,
Wlodarska et al. 2015;Keely, Walker et al. 2015;D'Argenio, Casaburi et al. 2016;Distrutti,
Monaldi et al. 2016;Larcombe, Hutton et al. 2016). Several evidences propose that dysbiosis
of gut microbiota is not limited to gastrointestinal diseases; thereby suggesting that gut
bacteria can affect the systemic immunological response. A number of studies have
investigated gut dysbiosis in relation to metabolic syndromes (obesity, diabetes), chronic
periodontitis, vaginosis, atopic diseases, rheumatic disease, Alzheimer’s disease, autism and
others (Daulatzai 2014;Blasco-Baque, Garidou et al. 2016;Johnson and Ownby 2016).
However, while a breakdown in the equilibrium of the intestinal milieu may be widely
recognized, it is unclear whether dysbiosis represents a cause or consequence of disease.
Several studies showed differential factors contributing to dysbiosis, including host genetics
(mutations in genes involved in intracellular recognition of microbes- NOD2, or related to
immune regulatory or pro-inflammatory responses), lifestyle (diet, stress), exposure to
microorganisms and medical practices (antibiotics, hygiene). Mutations in genes involved
in immune regulatory mechanisms or pro-inflammatory pathways could lead to uncontrolled
inflammation in the intestine. In conditions of dysbiosis, there is an abnormal shift in the
microbiota composition, which results in either a reduction in the numbers of symbionts
and/or an increase in the numbers of pathobionts (Fig. 1.5). The result is a non-specific
inflammation, which may predispose genetically susceptible individual to inflammatory
disease. It is also hypothesized that inflammation alone influences the composition of the
microbiota in favor of pathobionts (Round and Mazmanian 2009).

13
Moreover, sanitation and overuse of drugs and antibiotics, which do not distinguish between
pathogenic or symbiotic microorganisms, could adversely alter the microbiota (Round and
Mazmanian 2009).
Fig 1.5 A healthy microbiota contains a balanced composition of bacteria, such as symbionts that are
organisms with known health promoting functions, commensals that are permanent residents provide
no benefit or detriment to the host, and pathobionts that are also permanent residents of the
microbiota and have the potential to induce pathology. During dysbiosis the numbers of symbionts
is decreased and the numbers of pathobionts is increased. Recent societal advances contribute to
immunological dysregulation associated with dysbiosis of the microbiota (Round JL, et al. Nat Rev
Immunol. 2009).
In this context, the "old friends hypothesis" proposed in 2003 by Rook et coworkers (Rook,
Martinelli et al. 2003), and the “hygiene hypothesis” (Strachan 2000) may offer an
explanation for the link between microbial exposure and development of diseases. The “old
friends hypothesis” referred to the microbes evolved together with the host immune system,
in hunter-gatherer era, and thus having been present during the evolution of the human
immune system. They are thought to have been strictly involved with the human immune
defense development. (Rook, Lowry et al. 2013). The “hygiene hypothesis” (also called the
“biome depletion theory” and the “lost friends theory”) states that reduction of important
microbial pattern necessary to educate the host immune system results in decreased gut
microbial diversity and altered host-microbe interactions that can promote disease in
susceptible host. Thus, a sterile environment or excessive hygiene, typical of westernized
countries, allow to protect from exposure to dangerous pathogens, but also avoid the
exposure to “old friends” health-promoting bacteria, making immature immune system,
especially in childhood, and favoring development of allergies and autoimmune diseases
(Fig. 1.6).

14
Fig. 1.6 Causes of microbial dysbiosis include genetics, lifestyle, early colonization and medical
practices. The composition of gut microbiota can shape a healthy immune response
(immunoregulation by production of Treg cells) or predispose to disease (inflammatory responses by
T helper -Th1-Th2-Th17 cells) (Round JL, et al. Nat Rev Immunol. 2009).
1.5 The impact of the diet on gut microbiota
Several studies demonstrated that the mutual relationship between the gut microbiota and its
host is strongly influenced by diet. Consumption of various nutrients affects the composition
and structure of the microbial communities and provides substrates for microbial
metabolism.
Starting from the childhood, the greatest change in the microbiota composition occurred with
the introduction of solid foods. In this period of life a shift toward a more stable, adult-like
microbiota occur with weaning (Koenig, Spor et al. 2011). This event introduces the
potential association between diet, commensal bacteria, and health. Multiple studies have
established differences in gut microbiota composition in breastfed or formula fed infants
(Stark and Lee 1982;Yoshioka, Iseki et al. 1983;Penders, Thijs et al. 2006). In human milk,
there are important bioactive compounds, especially indigestible glycan that contribute to
absorption and digestion of nutrients, immune protection, and selectively promoting growth
of Bifidobacterium genus (Stark and Lee 1982;Yoshioka, Iseki et al. 1983;Balmer and
Wharton 1989;Le Huerou-Luron, Blat et al. 2010;Hernell 2011). Bifidobacteria are linked
to fortification of the gut mucosal barrier, to protection against pathogens and to modulation
of the gut immune system (Lievin, Peiffer et al. 2000;Ouwehand, Isolauri et al. 2002;Fukuda,
Toh et al. 2011). Another difference is that aerobic organisms seem to be more prevalent in
the feces of breastfed infants, whereas anaerobic and facultative anaerobic organisms, which
preferentially use anaerobic glycolysis, are more commonly found in the feces of formula-
fed infants (Koenig, Spor et al. 2011).
Food sources have guided the evolution of humans, and the co-evolution with symbiontic
microbes leading to mutualistic relationships. A comparison of the gut microbiota between
different primates and mammals found that humans clustered more closely with omnivorous
primates than non-primates species (Ley, Hamady et al. 2008). Thus, variety of foods in an
omnivorous diet is the most important factor of microbiota evolution.

15
Significant variations in microbiota composition have been associated with consumption of
dietary fiber from fruits, vegetables, and other plants, compared to a diet rich in animal
protein, simple sugar and lipid. In controlled dietary experiments in humans, variations in
intake of resistant starch or non-starch polysaccharide altered levels of specific bacterial
taxa, such as Ruminococcus bromii and Eubacterium rectale (Walker, Ince et al. 2011).
These taxa were shown to selectively metabolize specific insoluble carbohydrate substrates
based on in vitro analyses of human fecal samples (Leitch, Walker et al. 2007). Model
systems have shown that an important function of the gut mcrobiota is its ability to ferment
complex carbohydrates and polysaccharides which leads to production of short-chain fatty
acids (SCFAs) (Koropatkin, Cameron et al. 2012). Sources of glycans for intestinal
microbiota metabolism are derived not only from diet but also from mucus produced by the
host.
In the last years, the study of different populations worldwide, in uncontrolled environments,
help to understanding of how diet shape the microbiota composition. Several studies have
showed systematic comparation of fecal microbiota from traditional populations living in
non-industrialized societies to those with a westernized lifestyle (De Filippo, Cavalieri et al.
2010;Yatsunenko, Rey et al. 2012;Schnorr, Candela et al. 2014;Martinez, Stegen et al.
2015;Gomez, Petrzelkova et al. 2016). Our study (De Filippo, Cavalieri et al. 2010) showed
for the first time that the gut microbiota from children living in rural African village of
Burkina Faso is completely different from the microbiota of children living in the Western
world, such as Italy. We demonstrated that the different dietary habits (fiber-rich diet of rural
African populations versus typical western diet, high in fat, animal-protein and simple sugar)
shape the gut microbiota composition. The gut microbiota of rural African children was
enriched in specific bacterial genera (Prevotella, Xylanibacter, Butyrivibrio and Treponema)
able to degrade fiber and to maximize the energy extraction from indigestible dietary
polysaccharides, producing higher levels of SCFAs, compared to the microbiota of European
children. We demonstrated that properly the diet is responsible of microbiota composition.
In fact, children of 1-2 years old, belonging to both the populations, that were breast-fed,
showed the same microbiota composition with predominace in Bifidobacteria.
More recently, the study of impact diet on gut microbiota was observed in geographically
isolated populations, such as Amazonas from Venezuela, or rural populations from Malawi
(Yatsunenko, Rey et al. 2012), Bangladeshi children (Lin, Bik et al. 2013), Papua New
Guinea populations (Martinez, Stegen et al. 2015) versus U.S.A. residents. Moreover,
evaluation of the gut microbial structures between the rural Hadza hunter-gatherers in
Tanzania and urban Italians contributed to understand the differential metabolic acquisition
of gut microbiota (Schnorr, Candela et al. 2014).
The MetaHIT Consortium has proposed to categorize the gut microbiota in “enterotypes”
(Arumugam, Raes et al. 2011). People can be classified as having a predominance of
Prevotella, Bacteroides, or Ruminococcus in the gut microbiota. These enterotypes was
correlated with the diet rich in animal-protein and fat (Bacteroides) and diet rich in
carbohydrates and simple sugars (Prevotella) (Wu, Chen et al. 2011). There has been
considerable discussion about the enterotypes; some data sets support the existence of these
categories, whereas others do not (Lozupone, Stombaugh et al. 2012), suggesting that
detection of enterotypes depends on the computational approach used to analyze data sets

16
(Koren, Knights et al. 2013). It is suggested that a better term might be “enterogradient”,
based on predominace of Bacteroides or Prevotella. It appears that these two genera largely
do not exist in equal proportions in the human intestine (Faust, Sathirapongsasuti et al. 2012).
A greater proportion of Prevotella in the human gut microbiota could be considered a marker
of rural or traditional culture, whereas a greater proportion of Bacteroides is associated with
industrialized countries (Arumugam, Raes et al. 2011).
Altogether, these studies demonstrated co-evolution between diet and microbiota in rural
areas and urban societies, showing the effect of westernization on loss of traditional
microbes (De Filippo, Cavalieri et al. 2010;Wu, Chen et al. 2011;David, Maurice et al.
2014;Sonnenburg and Backhed 2016), supporting the hypothesis of consequent bacterial
richness depletion in relation with metabolic (obesity, insulin resistance, dyslipidemia), and
inflammatory disorders.
However, diet has also been associated with other types of gut microbes, such as archaea
and fungi (Dollive, Peterfreund et al. 2012;Hoffmann, Dollive et al. 2013). For example,
carbohydrate consumption is associated with abundance in archeon Methanobrevibacter in
the gut (Hoffmann, Dollive et al. 2013). Methanobrevibacter can increase the production of
gas and SCFAs by metabolizing hydrogen, deriving by carbohydrate fermentation, and thus
playing an anti-inflammatory role (Samuel and Gordon 2006). Similarly, diet might also
affect intestinal fungal communities, which have been associated with the pathogenesis of
IBD. Evidences showed that alteration of immune response to fungi could contribute to
chronic inflammation, as occurs in Crohn’s disease (Sendid, Quinton et al. 1998;Iliev, Funari
et al. 2012;Sokol, Leducq et al. 2016).
1.6 The metabolome
The gut microbiome represent an extended reservoir of metabolic capabilities able to affect
significantly the host metabolism with a wide range of otherwise inaccessible metabolic
capacities.
The metabolome is the set of small-molecule chemicals found within a biological sample
that may include endogenous metabolites that are naturally produced by an organism (such
as amino acids, nucleic acids, fatty acids, amines, sugars, vitamins, co-factors, antibiotics,
etc.), as well as exogenous chemicals (such as drugs, environmental contaminants, food
additives, toxins and other xenobiotics; Fig. 1.7).
In experimental animal model, Turnbaugh and collaborators defined a core gut of
microbiome, representing a consistent set of functional profile (Turnbaugh, Hamady et al.
2009). Identifying biologically important variations against this core remains a challenge.
Metabolomic studies analyze complex systems, including the repertoire of the gut
metabolites, using high-throughput analytical methods. Mass spectrometry (MS) and nuclear
magnetic resonance (NMR) spectroscopy allow robust and sensitive identification of
metabolites produced by microbes and host cells in different samples (such as feces, urine,
and tissue). These tools allow for reconstructing the metabolic profile of gut microbiome by
analyzing the presence and quantity of thousands of metabolites simultaneously, in
comparison with metabolic outcomes in the host, determining the effect of a specific
treatment or perturbations.

17
The dietary components that escape digestion in the upper gastrointestinal tract provide most
of the substrates for the gut microbiota. Fermentation of carbohydrates by bacteria leads to
the production of SCFAs, such as butyrate, propionate, and acetate, promoting health and
provide resistance to infection. Studies have shown that ulcerative colitis patients have fewer
butyrate-producing bacteria (eg, Roseburia hominis and Faecalibacterium prausnitzii),
resulting in lower levels of butyrate (Machiels, Joossens et al. 2014;Wang, Chen et al. 2014).
In addition, butyrate and propionate can potentiate de novo generation of T regulatory (Treg)
cells in the peripheral immune system (Furusawa, Obata et al. 2013). It has been suggested
that modulation of butyrate- and propionate-producing microbes might therefore be used to
treat IBD (Ursell, Haiser et al. 2014).
GI microbes can catabolize protein to amino acids and participate in the luminal conversion
of amino acids to biogenic amines, immunomodulatory compounds, and other signaling
molecules. Proteins from the diet may be catabolized by microbial proteinases and
peptidases, together with human proteinases. The generation of free amino acids in the
stomach and small intestine provide substrates for luminal conversion of amino acids. Amino
acids can be converted by decarboxylation reactions
and catalyzed by GI bacteria to form different signaling molecules. L-histidine can be
converted to the biogenic amine, histamine, by histidine decarboxylases produced by GI
bacteria. Histamine can suppress production of inflammatory cytokines by signaling through
the histamine type 2 receptor, which is present on intestinal epithelial cells (Sander, Lorentz
et al. 2006;Thomas, Hong et al. 2012). In addition, bacteria can produce antimicrobial
peptides or bacteriocins that promote resilience or resistance to infection by enteric
pathogens (O'Shea, Cotter et al. 2012). The production of antimicrobial compounds by
commensals might prevent expansion of enteric pathogens or indigenous pathobionts
(Kamada, Seo et al. 2013).
Fig. 1.7 Dietary components escaping the digestion in the GI tract provide most of the substrates for
the gut microbiota (Modified from Basson A, et al. Front Immunol. 2016).
1.7 The gut microbiota and host immune system
Several studies indicated a mutualistic relationship between gut microbiota and host innate

18
and adaptive immune system. The immune system is responsible for recognizing, responding
and adapting to foreign and self molecules and therefore it is important during conditions of
both health and disease (Round and Mazmanian 2009).
Unlike opportunistic pathogens, which elicit immune responses resulting in tissue damage
during infection, some symbiotic bacteria have been observed to prevent inflammatory
disease during colonization. However, the “normal” microbiota also contains
microorganisms capable to induce inflammation under particular conditions (pathobionts).
Therefore, the microbiota has the potential to exert both pro- and anti-inflammatory
responses, and the composition of gut bacterial communities may be intimately linked to the
functioning of the immune system.
The role of the microbiota in the development of the immune system has been studied for
more than a century, and major information derive by germ-free (GF) and gnotobiotic animal
models. GF animals show impaired development of gut-associated lymphoid tissues
(GALTs), such as Peyer’s patches (PPs) and isolated lymphoid follicles (Gordon, Bruckner-
Kardoss et al. 1966;Hamada, Hiroi et al. 2002;Bouskra, Brezillon et al. 2008). Notably, a
greater number of IgE+ B cells and a lower number of IgA+ B cells were found in the PPs
of GF mice, compared with conventionally raised mice (Durkin, Bazin et al. 1981).
Colonization of GF mice by commensal microorganisms induces immune reactions in
lymphoid cell called “germinal centers” and IgA development (Shroff, Meslin et al.
1995;Talham, Jiang et al. 1999).
The microbiota also have an important role in balancing effector T-cell immune responses
in the GI tract (Kamada and Nunez 2013). GF mice have reduced numbers of T-helper (Th)1
and Th17 cells. Therefore, the intestinal T-cell immune response in GF animals is controlled
primarily by Th2 cells (Mazmanian, Liu et al. 2005;Chung, Pamp et al. 2012). The imbalance
in Th cell responses in GF mice can be reversed by reconstitution with conventional
microbiota, indicating that microorganisms shape intestinal Th-cell–mediated immunity
(Chung, Pamp et al. 2012).
The balance between pro-and anti-inflammatory mechanisms, important for gut immune
homeostasis, is directly affected by the commensal microbes. For example, H. pylori
infection induces Interleukin (IL)-17 responses in the GI tract. In mice, segmented
filamentous bacteria (SFB) promote the accumulation of pro-inflammatory Th1 and Th17
cells in the small intestine (Gaboriau-Routhiau, Rakotobe et al. 2009). Th17 cells are a
lineage of CD4+ Th cells, which defend against extracellular microorganisms and also are
involved in autoimmune disease development (Littman and Rudensky 2010) (Fig. 1.8). In
GF mice or mice treated with antibiotics, the numbers of Th17 cells in the small intestine is
greatly reduced (Hall, Bouladoux et al. 2008;Ivanov, Frutos Rde et al. 2008). Other members
of the human gut microbiota and certain bacterial pathogens are strong inducers of Th17 cell
development. For example, enteric pathogens can induce a Th17-mediated response, even
in the absence of commensal microbes, as observed by monocolonization of GF mice with
the enteric pathogen Citrobacter rodentium (Kamada, Kim et al. 2012).
Anti-inflammatory responses are promoted by the generation of regulatory T cells (Treg).
Several studies showed that retinoic acid (Mucida, Park et al. 2007), bacteria belonging to
the Clostridium cluster IV and XIVa (Atarashi, Tanoue et al. 2013), Faecalibacterium
prausnitzii (Qiu, Zhang et al. 2013) and SCFAs production (Arpaia, Campbell et al. 2013)

19
promote accumulation of Treg cells, as well as polysaccharide A of Bacteroides fragilis, a
human commensal, facilitate the differentiation of CD4+ Th in Treg cells and IL-10
production (Round and Mazmanian 2010) (Fig. 1.8). Hence, microbes and metabolites in the
gut are essential in maintaining immunological equilibrium.
Furthermore, the gut bacteria is essential for the development and function of Foxp3+ Treg
cells in the intestine (Fig. 1.8). In the absence of the microbiota, the number of inducible
Foxp3+ Treg (iTreg) cells is reduced significantly in the colonic lamina propria (Atarashi,
Tanoue et al. 2011;Geuking, Cahenzli et al. 2011). Reduced development of iTreg cells in
GF mice can be restored by recolonization with the intestinal microbiota, indicating that
commensals are involved in the generation of colonic Treg cells.
Fig 1.8 Commensal bacteria induce CD4+T cell differentiation. The differentiation of naïve CD4+T
cells in Th1, Th2, Th17 lineages and Tregs. Each differentiated lineage secretes specific cytokines.
Bacteria species are also able induce a particular T cell differentiation pathway. Th1 cells play an
important role in eliminating intracellular pathogens, while Th2 function to control parasitic
infection. The primary role of Th17 is to control infection while Tregs is to regulate immune response
(Wu HJ & Wu E Gut Microbes 2012).
The commensal microbiota regulates the development of intestine-specific B-cell receptors,
and influences immunoglobulin response within the intestinal mucosa. Within the GI tract,
most IgA-producing B cells mature in PPs upon stimulation by commensal microorganisms
(Macpherson, Geuking et al. 2012). Early stages of B-cell development occur not only in
fetal liver and bone marrow, but also in the intestinal mucosa (Wesemann, Portuguese et al.
2013). In GF mice, the lack of microbiota-derived signals results in immature formation of
germinal centers in the PPs and reduced generation of IgA-producing B cells (Fagarasan,
Kawamoto et al. 2010).
Although commensal bacteria are important for the development of intestinal immune
responses, excessive immune stimulation by commensals can lead to inappropriate
activation of immune cells and harmful intestinal inflammation. In the colon, the epithelial
surface is covered by an inner mucus layer that shields the immune system from excessive

20
stimulation by resident microbes and by mechanical stress, whereas large numbers of
commensal bacteria colonize the outer mucus layer (Kamada and Nunez 2014). Thus,
perturbations of the gut microbiota disrupt this balance primarily affecting the gut mucosa
and the systemic immune response. A ‘leaky gut’ characterized by increased gut
permeability, microbial imbalance, and impaired mucosal immunity has been identified to
promote the development of immune mediated-inflammatory diseases (Forbes, Van
Domselaar et al. 2016).
1.8 The gut microbiota and human diseases
The world is experiencing a progressive increase of metabolic and immune mediated
diseases, with a dramatically increase in pediatric populations. It has been hypothesized that
a reduced diversity of gut microbial communities may have generated an abnormal immune
maturation in early childhood (Renz, Brandtzaeg et al. 2011;McDade 2012). Several
immune-mediated diseases such as IBD, obesity, allergies, type I diabetes, multiple
sclerosis, autism, rheumatic disease and arthritis show rising incidences in economically
developed countries. In this context, a theory of “microbial deprivation syndromes of
affluence” has been proposed (Renz, Brandtzaeg et al. 2011;McDade 2012;Kondrashova,
Seiskari et al. 2013;West, Jenmalm et al. 2015). There is growing concern that recent
lifestyle innovations, most notably the high-fat/high-sugar “Western” diet, processed and
refining food, pollution, hygiene, sanitation and antibiotic treatment have altered the
composition and metabolic functions of gut microbiota (Turnbaugh, Ridaura et al.
2009;David, Maurice et al. 2014).
Recent research in animal models has demonstrated an essential contribution of the gut
microbiota in non-communicable diseases that have higher prevalence in westernized
societies (Wen, Ley et al. 2008;Berer, Mues et al. 2011;Devkota, Wang et al. 2012;Koeth,
Wang et al. 2013). These observations have led scientists to hypothesize that aberrant
(dysbiotic) microbiomes and/or the loss of specific symbionts predispose westerners to non-
communicable diseases (Blaser and Falkow 2009;Martinez, Stegen et al. 2015). On the other
hand, non-industrialized societies are charged by a high incidence of infectious diseases,
such as malaria, HIV, HBV infections, including life-threatening diarrhea (Pop, Walker et
al. 2014). The importance of the gut microbiota for non-communicable diseases in
westernized societies and the prevalence of infectious diseases in non-industrialized
communities warrant studies that compare the microbiome in both settings.
1.9 The gut microbiota and metabolic diseases
1.9.1 Obesity
Obesity is caused by a dysregulation of energy balance where the amount of energy intake
from the food exceeds the needs of the body (Turnbaugh, Ley et al. 2006). Several studies
have demonstrated that altered composition of gut microbiota is correlated with obesity (Ley,
Backhed et al. 2005;Ley, Turnbaugh et al. 2006;Turnbaugh, Backhed et al. 2008). One of
the first studies in animal model showed that fecal microbiota of obese ob/ob mice was

21
enriched in Firmicutes and depleted in Bacteroidetes when compared to lean mice (Ley,
Backhed et al. 2005). Similar results were confirmed in the high fat diet (HFD)-induced
obese mice, in which abundance of Firmicutes was observed, together with an enrichment
in Mollicutes, able to ferment simple sugars and complex carbohydrates (Turnbaugh,
Backhed et al. 2008). However, the relevance of Firmicutes/Bacteroidetes ratio in human
obesity did not reported in all studies (Duncan, Lobley et al. 2008;Schwiertz, Taras et al.
2010;Le Chatelier, Nielsen et al. 2013). It has been supposed that the gut microbiota may
affect host metabolism by extraction of energy and nutrients from foods or by affecting the
host gene expression involved in energy metabolism. Metagenomic analysis showed that the
gut microbiome of obese ob/ ob mice was enriched in the degradation of dietary
polysaccharides such as starch, sucrose and galactose, indicating that gut microbiota of ob/ob
mice had increased capacity of food energy harvest compared with that of lean mice
(Turnbaugh, Ley et al. 2006). Furthermore, GF mice with gut microbial colonization
exhibited a significant increase in body fat content (Backhed, Ding et al. 2004). Fat
accumulation could be promote by inhibition of AMPK-dependent fatty acid oxidation
(Backhed, Manchester et al. 2007), or via suppressing the production of functional beige fat
in white adipose tissue by microbiota (Suarez-Zamorano, Fabbiano et al. 2015).
Another important factor responsible for the early onset of obesity is low-grade systemic
inflammation. Continuous subcutaneous infusion of lipopolysaccharide (LPS), a cell wall
component of Gram-negative bacteria, showed an increased body weight and adipose tissue
depots, as well as the upregulation of several inflammatory cytokines (Cani, Neyrinck et al.
2007;Cani, Bibiloni et al. 2008). Interstingly, antibiotic treatment markedly reduced body
weight and plasma LPS levels in both HFD-fed and ob/ob mice.
The endocannabinoid (eCB) system has been identified as another crucial modulator in the
development of gut microbiota-mediated obesity. Gut microbiota alteration resulted in the
change of cannabinoid 1 (CB1) receptor expression in the colon. Consequently, activation
of the eCB system increased the gut permeability by decreasing the expression of two tight
junction proteins. In the adipose tissues, eCB system activation also promoted adipogenesis
via increasing the expression of genes involved in the adipocyte differentiation and
lipogenesis (Muccioli, Naslain et al. 2010).
Several studies have demonstrated that SCFA signaling pathways are involved in the gut
microbiota-mediated host metabolism (Tazoe, Otomo et al. 2008;Breton, Tennoune et al.
2016). SCFAs are the main fermentation products of dietary fibers metabolized by intestinal
bacteria. G protein-coupled receptor 41 (GPR41) and 43 (GPR43) are two important SCFA
receptors located in the enteroendocrine cells of intestinal epithelium. Activation of these
receptors by SCFAs promoted the release of 5-hydroxytryptamine (5-HT) and peptide YY
(PYY), thereby influencing the colonic mobility (Tazoe, Otomo et al. 2008). Production of
circulating hormone PYY was also required for increasing gut microbiota-induced efficiency
for energy harvest from the diet (Samuel, Shaito et al. 2008). Intestinal gluconeogenesis has
a beneficial effect on the regulation of glucose and energy homeostasis. Butyrate directly
induced gluconeogenesis by promoting the activity of glucose-6-phosphatase and the
expression of phosphoenolpyruvate carboxykinase 1. In contrast, propionate-mediated
induction of gluconeogenesis was dependent on a gut-brain communication axis (De Vadder,
Kovatcheva-Datchary et al. 2014).
22
1.9.2 Type 2 diabetes
Type 2 diabetes is a metabolic disorder characterized by insulin resistance. Obesity is
considered to be linked with the onset of type 2 diabetes. Recently, alteration of gut
microbiota was associated with the development of diabetes (Larsen, Vogensen et al.
2010;Qin, Li et al. 2012;Karlsson, Tremaroli et al. 2013) (Fig. 1.9). Metagenomic analysis
showed that the ratio of Bacteroidetes/Firmicutes and the abundance of Proteobacteria were
higher in diabetic subjects, whereas Clostridia was significantly lower, compared with
healthy controls (Larsen, Vogensen et al. 2010). In addition, in pre-diabetic subjects
significantly lower abundance of Verrucomicrobia was observed suggesting that this phylum
could be a potential diagnostic biomarker for the progression of diabetes (Zhang, Shen et al.
2013). In a Chinese diabetic cohort, several butyrate-producing bacteria, such as
Faecalibacterium prausnitzii, Roseburia intestinalis and R. inulinivorans were significantly
reduced, whereas opportunistic pathogens including Clostridium symbiosum, Eggerthella
lenta and Escherichia coli were enriched compared with healthy controls (Qin, Li et al.
2012). Functional analysis indicated that pathways, related to oxidative stress resistance,
methane metabolism and sulphate reduction were enriched in the gut microbiome of diabetic
patients (Qin, Li et al. 2012). In another study, increased abundance of Lactobacillus spp.
and decrease in Clostridium spp. were observed in the gut microbiota of European diabetic
women. In general, functional pathway enriched in diabetic populations were related to
starch and glucose metabolism, fructose and mannose metabolism, as well as ABC
transporters and glutathione synthesis (Karlsson, Tremaroli et al. 2013).
1.9.3 Cardiovascular disease
In an animal model study, dietary supplementation with three dietary lipid
phosphatidylcholine metabolites, such as choline, trimethylamine N-oxide (TMAO) and
betaine resulted in the enhancement of atherosclerosis in Apoe−/− mice. In these mice,
suppression of gut microbiota by broad-spectrum antibiotics completely repressed the
dietary choline-mediated progression of atherosclerosis (Wang, Klipfell et al. 2011). Study
in humans further confirmed that the gut microbiota played a key role in the production of
plasma TMAO, significantly associated with an increased risk of major adverse
cardiovascular adverse events (Tang, Wang et al. 2013) (Fig. 1.9). Zhu and collaborators
demonstrated that TMAO could directly promote the platelet hyperreactivity by increasing
the intracellular calcium release and thereby enhancing the potential of thrombosis risk (Zhu,
Gregory et al. 2016). Targeted inhibition of microbial TMA production by a structural analog
of choline, 3,3-dimethyl-1-butanol (DMB), has recently been shown to attenuate the
development of atherosclerosis in Apoe−/− mice (Wang, Roberts et al. 2015).
1.9.4 Liver diseases
Altered gut microbial composition has also been demonstrated to be related with several
liver diseases, such as nonalcoholic fatty liver disease (NAFLD) (Jiang, Wu et al. 2015),

23
hepatic encephalopathy (Bajaj, Ridlon et al. 2012) and cirrhosis (Qin, Yang et al. 2014) (Fig.
1.9).
Specific bacterial families, such as Alcaligenaceae, Porphyromonadaceae and
Enterobacteriaceae, were significantly associated with cognitive impairment and
inflammation in hepatic encephalopathy patients (Bajaj, Ridlon et al. 2012). The gut
microbiota of patients with hepatitis B liver cirrhosis had depletion in bacteria important for
colonic bile acid metabolism (Wei, Yan et al. 2013).
At the functional level, microbial functions of liver cirrhosis patients were enriched in
ammonia production, phosphotransferase systems and membrane transport, whereas
functions including carbohydrate and amino acid metabolism were enriched in healthy
controls (Qin, Yang et al. 2014).
High prevalence of small intestinal bacterial overgrowth was observed in patients with
cirrhosis (Gupta, Dhiman et al. 2010).
Immune responses may be involved in the etiology of microbe-associated liver diseases. In
patients with hepatitis by C virus infection, the ability of anti-bacterial antibodies in
regulating complement-mediated killing of gut bacteria was impaired (Lamontagne, Long et
al. 2013).
Enterohepatic circulation is another key mechanism linking the gut microbiota and the liver.
In the enterohepatic circulation, bile salts synthesized in the liver are secreted into the
intestinal tract, where they could be metabolized by intestinal bacteria in primary and
secondary bile acids (Ridlon, Kang et al. 2006). These findings suggest that bile acid may
play an essential role in the regulation of gut microbiota composition, but gut microbiota can
also have an active effect on the physical functions of the liver (Islam, Fukiya et al.
2011;Kakiyama, Pandak et al. 2013).
Gut microbiota-mediated metabolism of dietary choline might contribute to the development
of NAFLD (Dumas et al., 2006). Moreover, inflammasome deficiency-associated dysbiosis
of gut microbiota might also be a determinant factor in the progression of NAFLD (Henao-
Mejia, Elinav et al. 2012).
Fig. 1.9 The gut microbiota and metabolic diseases. Three major pathways through which gut
microbiota can alter human cardiovascular system and metabolism (Vinjé S, et al. Eur Heart J. 2014).

24
1.10 Gut-Brain axis and neurological diseases
The “gut-brain axis” is a bi-directional communication system comprised of neural
pathways, such as the enteric nervous system, vagus, sympathetic and spinal nerves, and
humoral pathways, which include cytokines, hormones, and neuropeptides as signaling
molecules. Recent evidences, arising from animal models, support a role of gut microbes as
signaling components in the gut-brain axis (Bercik, Collins et al. 2012) (Fig. 1.10). Of
increasing interest is the relationship between the GI tract and brain function and
development, and their mutualistic influence. It has been reported that, on the one hand, gut
microbiota is involved in activation of neuronal pathways to the brain, in activation of
mucosal immune response and production of metabolites that directly affect the nervous
central system. On the other hand, the stress, anxiety induced changes in GI ecosystem
(Grenham, Clarke et al. 2011).
Fig. 1.10 The gut-brain axis: communication and reciprocal influence. Gut microbiota contributes to
appropriate signaling along the gut–brain axis. Intestinal dysbiosis can adversely influence gut
physiology, leading to inappropriate gut–brain axis signaling and consequences for central nervous
system (CNS) functions, resulting in disease states. Conversely, stress and diseases can affect gut
function and lead to perturbations of the microbiota (Cryan JF & Dinan TG. Nat Rev Neurosci. 2012).
Key experiments have shown that mice display altered and anxiety-like behavior during the
early phase of acute infection with Campylobacter jejuni (Lyte, Varcoe et al. 1998).
Evidences indicated that blood-brain barrier (BBB) play an important role in controlling the
exchange of molecules and nutrients between the brain and GI ecosystem. For example, GF
mice had increased permeability of BBB compared with specific-pathogen-free (SPF) mice
(Braniste, Al-Asmakh et al. 2014). Fecal transplantation from mice with normal gut
microbiota into GF mice or treatment of GF mice with bacteria that produce SCFAs
decreased the permeability of BBB (Braniste, Al-Asmakh et al. 2014). The gut microbiota

25
was also found to be crucial for the maturation and function of microglia in the brain (Erny,
Hrabe de Angelis et al. 2015).
GF mice displayed increased motor activity and reduced anxiety-like behaviors when
compared with the SPF mice (Diaz Heijtz, Wang et al. 2011). GF mice also had significant
social impairments and were more susceptible to the restraint stress than SPF mice (Sudo,
Chida et al. 2004;Desbonnet, Clarke et al. 2014). In SPF mice antibiotic treatment increased
exploratory behavior and the expression of brain-derived neurotropic factor (BDNF) in the
hippocampus (Bercik, Park et al. 2011).
Exposure to the social disruption stressor and early life stress could also lead to an altered
gut microbial composition (O'Mahony, Marchesi et al. 2009;Park, Collins et al. 2013;De
Palma, Blennerhassett et al. 2015).
These findings provide strong evidence for the existence of a “microbiota-gut-brain axis”
and underscore the essential role of gut microbiota in the regulation of its homeostasis
(Gareau, Wine et al. 2011;Clarke, Grenham et al. 2013).
Several neurodevelopmental disorders are associated with gut microbiota dysbiosis.
Children with autism often have frequent gastrointestinal complications, and abnormal
composition of gut microbiota has been reported (Bolte 1998;Song, Liu et al. 2004;Finegold,
Dowd et al. 2010). In the autistic children, high levels of Bacteroidetes were found, while
Firmicutes were abundant in the control subjects (Finegold, Dowd et al. 2010). Abundance
of toxin-producing bacterial group of Clostridium, as well as lower abundance of the
carbohydrate-degrading bacteria, such as Prevotella, Coprococcus and Veillonellaceae,
were found in autistic children compare with healthy controls (Parracho, Bingham et al.
2005;Kang, Park et al. 2013). Moreover, high abundance of Sutterella species was found in
the gut of children with autism affected from gastrointestinal dysfunction (Williams, Hornig
et al. 2012).
Multiple sclerosis is immune-mediated central nervous system inflammatory disorder in
which the role of gut microbiota is investigating. Mice in experimental autoimmune
encephalomyelitis (EAE) model produced many features of multiple sclerosis and in GF
condition showed attenuated symptoms of EAE, compared with SPF mice (Lee, Menezes et
al. 2011). Bacteria-mediated signals from the gut to the brain might be transduced directly
via peripheral vagal afferent nerves (Gaykema, Goehler et al. 2004;Goehler, Gaykema et al.
2005;Goehler, Park et al. 2008). Therefore, intestinal microbiota might be an important
regulator in the initiation of spontaneous demyelinating autoimmune disease (Berer, Mues
et al. 2011).
1.11 The gut microbiota and immune-mediated inflammatory diseases
1.11.1 Inflammatory Bowel Disease
Alteration in the commensal bacteria equilibrium was investigated principally in
Inflammatory Bowel Disease (IBD). IBD comprises Crohn’s disease (CD) and ulcerative
colitis (UC), two chronic inflammatory disorders with multifactorial etiology (Aujnarain,
Mack et al. 2013;Fiocchi 2013). Those pathologies are characterize by interplay between

26
genetic, environmental and immunological factors leading to a dysregulated host immune
response to the intestinal microbial communities (Fig. 1.11A).
Fig. 1.11 (A) Factors involved in the etiology of IBD. (B) Different disease extension and
histological characteristics between Ulcerative colitis and Crohn’s disease. Ulcerative colitis
typically begins in the rectum and may extend in the entire colon. UC affects only the inner layer of
the bowel wall. Crohn’s disease generally involved the end of the small intestine and the beginning
of the colon, and may affect any part of the GI tract in a patchy pattern. CD may affect all layers of
the bowel wall.
Recent evidences showed an increased incidence of IBD in children (up to 25%). Early
onset-IBD is characterized by disease severity and a greater impact of genetic predisposition
compared to older age of onset (Gupta, Bostrom et al. 2008;Sauer and Kugathasan 2010).
Deficiency of IL-10, a well-known anti-inflammatory cytokine and its receptor genes were
associated with very early-onset IBD (Glocker, Kotlarz et al. 2009;Kotlarz, Beier et al.
2012;Shah, Kammermeier et al. 2012).
CD is characterized by focal and transmural lesions, with deep ulcerations that can result in
development of fistulas, abscesses, and strictures (Fig. 1.11B). In contrast, UC is
characterized by mucosal inflammation in colon, beginning in the rectum and extending
proximally (Fig. 1.11B). Both types of IBD often involve chronic relapsing that can be
medically managed but may require surgical intervention in severe cases (Kaplan 2015).
A role of gut microbiota in IBD has been suspected since the early descriptions of potential
infectious agents (Kirsner 1988), but no single agent has been proven to cause IBD. The
intestinal bacterial communities in IBD has been thoroughly investigated, and several groups
worldwide observed dysbiosis. In general, in the gut microbiota of CD patients a
significantly lower bacterial diversity compared with that of healthy subjects was observed
(Manichanh, Rigottier-Gois et al. 2006). Moreover, many IBD genetic risk variants
identified by genome-wide association studies are involved in mediating host responses to
gut microbiota. From the over 200 single-nucleotide polymorphisms (SNPs) associated with
increased risk for IBD (Liu, van Sommeren et al. 2015), several pathways and genes have
been identified that may either affect the way gut microbes are assembled or how the host is
impacted by alterations in the gut microbiome. Nucleotide-binding oligomerization domain
containing protein 2 (NOD2, also known as CARD15) was the first gene of the IBD

27
susceptibility to be identified. NOD2 encodes an intracellular receptor for the bacterial
peptidoglycan muramyl dipeptide (Hugot, Chamaillard et al. 2001;Ogura, Bonen et al.
2001). The discovery of NOD2 and other IBD susceptibility genes (e.g. ATG16L1, IRGM,
CARD9, and IL23R) underscores the importance of innate and adaptive host immune
responses to gut microbiota. Furthermore, mutations that potentially alter the function or
expression of these genes can affect the gut microbiota in ways that disrupt host-microbe
interactions to set the stage for the onset of disease (Cadwell, Liu et al. 2008;Kaser and
Blumberg 2011). Nod2-deficient mice exhibit significantly increase in Bacteroides,
Firmicutes, and Bacilli and decreased ability to clear the pathogenic bacteria, Helicobacter
hepaticus (Petnicki-Ocwieja, Hrncir et al. 2009). In addition, CD and UC patients with
NOD2 risk alleles (Leu1007fs, R702W, or G908R) often have decreased Clostridium groups
XIVa and IV and increased Actinobacteria and Proteobacteria (Frank, Robertson et al.
2011).
In the majority of cases, however, genetic susceptibility is insufficient to cause IBD. Even
among monozygotic twins, where the concordance for CD between is between 35% and 58%
and for UC between 16% to 18.5% (Orholm, Binder et al. 2000;Halfvarson, Bodin et al.
2003;Spehlmann, Begun et al. 2008), the penetrance is not 100%. Thus, non-genetic factors,
such as environment and gut microbiota, are important contributors to the pathogenesis of
IBD.
The remarkable increase in incidence and prevalence of IBD especially in industrialized
countries where changes in hygienic conditions, diet, environment, and lifestyle have taken
place (Molodecky, Soon et al. 2012) suggests that the increase of IBD is more likely caused
by environmental and societal factors. In this context, the increasing and promiscuous use
of antibiotics may contribute to alter the gut microbiota. Changes in diet and dietary habits
are among the largest modifications that occur with increased industrialization and
westernization. In addition to increased daily caloric consumption, diets are higher in fat and
refined sugars, and lower in complex carbohydrates and fiber. A controlled-feeding study
showed that the gut microbiota composition is dramatically changed by a high fat/low-fiber
compared with a low-fat/high-fiber diet (Wu, Chen et al. 2011). A study in IL-10-deficient
mice showed that different types of dietary fat had different effects on gut microbiota. A diet
rich in saturated milk fat, for instance, caused enrichment in Proteobacteria, particularly
Bilophila wadsworthia, in the gut microbiota compared with isocaloric, isonitrogenous diets
high in polyunsaturated fat. Furthermore, the presence of B. wadworthia increased the
incidence and severity of spontaneous colitis in genetically susceptible IL10-deficient mice
(Devkota, Wang et al. 2012). In addition, David and co-workers (David, Maurice et al. 2014)
demonstrated that an animal-based diet rapidly changed the gut microbiota composition in
humans and lead to increase in levels of bile-tolerant bacteria (Alistipes, Bilophila, and
Bacteroides), including B. wadworthia and decrease in metabolizing plant polysaccharides
bacteria, such as Roseburia, Eubacterium rectale, and Ruminococcus bromii.
Improvements in hygienic practices and environment conditions over the past century have
also been implicated in contributing to the increase incidence and prevalence of IBD. A
study in India showed that CD was positively associated with urban living and safe drinking
water and negatively with the presence of cattle in the home (Pugazhendhi, Sahu et al. 2011).

28
Many changes in both structure and function of gut microbiota are associated with active
IBD. In general, abundance of Actinobacteria and Proteobacteria and decreased abundance
of Bacteroidetes and Lachnospiraceae (group IV and XIVa Clostridia) were detected in IBD
patients compared with that of non-IBD controls (Seksik, Rigottier-Gois et al. 2003;Gophna,
Sommerfeld et al. 2006;Frank, St Amand et al. 2007). Other studies showed alterations of
gut microbiota in CD patients with increase in Enterobacteriaceae and Ruminococcus
gnavus, and decrease in Dialister invisus, Bifidobacterium adolescentis, Roseburia, and
Faecalibacterium prausnitzii (Willing, Dicksved et al. 2010;Joossens, Huys et al. 2011). In
addition, low proportion of Faecalibacterium prausnitzii, a well-known anti-inflammatory
commensal bacterium, was associated with a high risk of endoscopic recurrence following
surgical resection in CD patients (Sokol, Pigneur et al. 2008).
The composition and abundance of both luminal and mucosa-associated microbiota vary
along the GI tract (Peterson, Frank et al. 2008;Gu, Chen et al. 2013), and can be significantly
impacted by intestinal inflammation in a number of different ways. Mucosal-associated
microbiota can differ significantly from their luminal counterparts, the latter most likely
being the major contributors to fecal microbiota.
1.11.2 Pharmacological treatment of IBD
Due to continuous efforts to unravel the pathogenesis of IBD and develop molecular targeted
drugs, new IBD therapies are now available alongside conventional immunosuppressive
treatments (Hirata, Ihara et al. 2016). The goal of pharmacological treatments is to prevent
recurrence of active disease (relapses/flares), to achieve mucosal healing and to mantain
remission (Aloi, Nuti et al. 2014). Treatments may depend on the part of the intestinal tract
that is affected, as certain medications are formulated to release the active drug in different
parts of the bowel.
Conventional therapies for IBD include the aminosalicylates, corticosteroids, and
immunosuppressive drugs (Fig. 1.12). An increasing number of novel and alternative
therapeutic approaches are in progress. New biologic therapies include the targeting of
proinflammatory cytokines, enhancement or infusion of anti-inflammatory cytokines,
blocking intravascular adhesion molecules, and modifying T-cell functions.
The current treatment of IBD follows a “step-up” approach (Fig. 1.12). Therapy of mild-to-
moderate IBD may include induction treatment with mesalazine (5-ASA), antibiotic, or
corticosteroids. Patients who respond to corticosteroids should be tapered and then switched
to an immunomodulatory, such as azathioprine/6-mercaptopurine. Patients who do not
respond to induction with 5-ASA might be switched to budesonide, when disease is mildly
active, or to oral prednisone or anti-TNF-α /azathioprine, when disease is moderately active.
The conventional therapeutic strategies could be represented by a pyramid (Fig. 1.12). When
disease becomes more severe, we move up the pyramid to use "stronger" treatments.
Although this pyramid gives a general framework of current therapeutic strategies by
moving from "milder" treatment to "stronger" treatments, newer studies have suggested that
"stronger" treatments given earlier in the disease course may lead to less bowel damage in
particular for CD disease. Thus, a top-down approach is proposed (Fig. 1.12).

29
The first, and still most effective, molecular treatment is anti-TNFα anti-body therapy, which
became available in the early 2000s. TNFα is an important cytokine in systemic
inflammation, and its neutralization has been tested experimentally and clinically (Brenner,
Blaser et al. 2015). Currently, anti-TNFα therapy has been approved for rheumatoid arthritis,
psoriasis, ankylosing spondylitis, and both types of IBD.
In treating IBD, anti- TNFα agents successfully suppress inflammation, reverse epithelial
injury and promote mucosal healing, while in CD they are often effective against fistulizing
forms, which usually represent a more severe and advanced disease state. Infliximab,
adalimumab, certolizumab pegol, and golimumab are the TNFα -targeting drugs currently
approved for clinical use, and other drugs are also under-going clinical trials. Biologic agents
are generally administered in patients who are refractory to conventional therapies.
However, there is growing evidences that such agents could be used in the initial phases of
the disease, typically in pediatric patients, to interrupt the inflammatory process (top-down
approach; Fig. 1.12).
The successful results achieved by anti- TNFα therapy have led to the exploration of other
cytokine-targeting therapies (Amiot and Peyrin-Biroulet 2015). Some of these molecules
were shown to be upregulated in the serum and tissues of IBD patients, and their role was
examined using gene-specific KO mouse models. However, identification of the appropriate
timing and patients with the right genetic, phenotypic, and risk factors, together with more
information on the safety, could favour the long-term benefits of pharmacological
treatments.
Fig 1.12 Step-up and Top-down approaches for IBD treatment. Pyramid represent different
therapeutic approaches from mild to stronger and more toxic therapies (Step-up), and early
aggressive treatment with immunomodulators and biologic agents (Top-down). Abbreviations: 5-
ASA, 5-aminosalicylate; 6-MP, 6-mercaptopurine; AZA, azathioprine; MTX, methotrexate (Aloi M,
et al. Nat Rev Gastroenterol Hepatol. 2014).
In pediatric patient management guideline, enteral nutrition (EN) has been proposed as
support of nutritional therapy. EN is based on polymeric formula, and showed to induce
clinical remission, promoting mucosal healing, improving nutritional status, decreasing pro-
inflammatory cytokine levels and reducing serum inflammatory markers, especially in CD
patients (Beattie, Schiffrin et al. 1994;Royall, Greenberg et al. 1995;Bannerjee, Camacho-

30
Hubner et al. 2004;Fell 2005). The hypothesis regarding the mechanism of action of EN
include modification of gut microbiota. Several studies demonstrated the success of this
therapy in induction of remission (Lionetti, Callegari et al. 2005;Leach, Mitchell et al.
2008;Shiga, Kajiura et al. 2012;Tjellstrom, Hogberg et al. 2012;D'Argenio, Precone et al.
2013).
1.11.3 Microbiota-base interventions in IBD
Regarding autoimmune and inflammatory diseases, there is a strong rationale for restoring
the healthy state to gut microbiota. Several interventions on gut microbiota, including
prebiotics and probiotics, have been studied especially in IBD.
Prebiotics are nondigestible constituents of food that selectively stimulate the growth or
activity of one or a limited number of bacterial species already resident in the colon. Some
examples of prebiotics are dietary fiber and some types of oligosaccharides (e.g.
fructooligosaccharides and galactooligosaccharides).
Probiotics are live microorganisms administered to alter the gut microbiota and confer a
beneficial effect on health. Potential mechanisms of probiotic action include competitive
interactions, production of antimicrobial metabolites, influences on the epithelium, and
immune modulation.
Few of these microbiota-based intervention have shown promise or efficacy (Shen, Zuo et
al. 2014). The lack of success of these therapies is given the fact that many of these
preparations contain microbial strains that may not be indigenous to the gut and cannot
survive in a hostile inflammatory environment. Moreover, strong is the heterogeneity
microbiota of the patients.
Recently, fecal microbiota transplantation (FMT) has been proposed as an alternative
treatment for IBD. The rationale for FMT is based on the notion that transplant a microbiota
from healthy subject to a host recipient (patient) would replace the functions of the diseased
microbial organ, avoid inflammation, and thus restoring intestinal and immune homeostasis.
FMT showed high effective for the treatment of Clostridium difficile colitis, but its efficacy
in IBD host remains controversial (Angelberger, Reinisch et al. 2013;Rossen, Fuentes et al.
2015).
Many factors may therefore have to be taken into consideration to increase the success of
FMT in IBD, such as the genetic background of donor and recipient, environmental factors,
disease states, and the predisposition of gut microbiota to responde at perturbations
(resilience). The recipient’s microbiota seems difficult to replace because these
microrganisms have been already selected for their ability to survive in an inflammatory
condition (Miyoshi and Chang 2016). In this context, it is plausible to assume that the auto-
FMT, using a fecal sample collected during remission, is the most successful.
1.11.4 Rheumatic disease and arthritis
In the last decade, alteration of gut microbiota was observed in other autoimmune diseases,
such as rheumatic disease and arthritis, most notably rheumatoid arthritis (RA), psoriasis,
and the related spondyloarthritides (SpA), including ankylosing spondylitis (AS) and

31
reactive arthritis (ReA), similarly to IBD. Studies unravelling the microbiota composition in
RA has gained importance.
Studies in GF animal models reveal relationships between microorganisms, mucosal
immunity, and joint inflammation (Taurog, Richardson et al. 1994;Rath, Herfarth et al.
1996;Longman and Littman 2015). In fact, multiple animal models have established a
biologic connection between the presence of microbiota and development of synovitis.
Recent studies in humans suggest that alteration of oral and gut microbiota and an increase
in leaky gut could trigger systemic joint inflammation in the context of pre-existent
autoimmunity (Fig. 1.13) (Scher, Sczesnak et al. 2013;Brusca, Abramson et al.
2014;Costello, Ciccia et al. 2014;Taneja 2014;Longman and Littman 2015;Scher, Ubeda et
al. 2015;Zhang, Zhang et al. 2015).
Fig. 1.13 Proposed mechanisms of pathophysiology of rheumatoid arthritis (RA) modulated by
microbial dysbiosis. Microbial dysbiosis in oral cavity, lung and gut could act in concert with
environmental and host genetic factors to initiate RA disease. Especially in the gut, microbial
dysbiosis tilts the balance in favor of pro-inflammatory cytokine production. Infection in gut also
breaks down the immune barrier, leading to release of bacterial cell wall components into the
circulation. These bacterial cell wall components have been shown to elicit an immune response in
the joints (Sandhya P et al. International Journal of Rheumatic Diseases 2016).
Unlike the case with RA, the existence of SpA has been documented for centuries, its
prevalence is significantly higher in Caucasian populations, its clinical manifestations are
much more heterogeneous, and genes (particularly HLA–B27) have a relatively larger effect
in disease incidence. A prominent role of pro-inflammatory Th17 cells and their cytokine,
IL-17 is observed. The epidemiologic relationship between intestinal microorganisms, gut
inflammation, and rheumatic disease is supported by observation of infectious diarrhea in
the pathogenesis of ReA, and the association between IBD and AS and PsA. A recent study
32
showed that HLA–B27–transgenic rats had an increase in Prevotella species and a decrease
in Rikenellaceae and Akkermansia compared with wild type rat (Lin, Bach et al. 2014).
Therefore, it is supposed that, as in RA-like disease, microbiota alterations are a consequence
of host genetic predisposition or perhaps a superimposed requirement for activation of
downstream immunologic events in susceptible animals.
AS patients had a higher prevalence of several bacteria, such as Lachnospiraceae and
Prevotellaceae and a concomitant decrease in Ruminococcaceae and Rikenellaceae families.
Scher and co-workers (Scher, Ubeda et al. 2015) defined the intestinal microbiota of PsA
patients compared to that of psoriasis patients and healthy controls. While psoriasis patients
and PsA patients both showed decreased levels of Coprococcus, PsA patients were further
characterized by significantly lower levels of Akkermansia and Ruminococcus, suggesting a
chronological loss of diversity that may correlate with the natural history of disease.
Interestingly, studies in IBD revealed similar reductions of the Ruminococcaceae family and
Akkermansia genus.
In children with enthesitis-related arthritis (ERA), a Juvenile Idiopathic Arthritis (JIA),
resembling the spondyloarthropathy of the adult, the abundance of Faecalibacterium
prausnitzii was significantly lower than that in healthy controls (Stoll, Kumar et al. 2014).
Effect of dysbiosis has been demonstrated in multiple animal models of autoimmune
diseases. When the homeostatic balance in the microbial communities’ composition is
perturbed, a state of dysbiosis occurs and a downstream local and systemic proinflammatory
response is elicited. Several evidences in humans suggest that a similar perturbation can be
associated with multiple rheumatic and autoimmune disorders, which could potentially
explain the source of various cytokine-induced systemic inflammatory responses. A key role
is also played by epithelial cells and mucus layer, producing a protective barrier against
pathobionts, and innate/adaptive immune cells residing in the lamina propria. Their
fundamental role is to communicate with the microbiota to promote a state of physiologic
inflammation in order to actively tolerate a constant antigenic load that promotes nutritional,
metabolic, and immune benefits.
1.12 The fungal communities in the gut: the mycobiota
Despite the well-recognized role of bacteria communities in inflammatory and autoimmune
diseases, eukaryotes microorganisms inhabiting the GI tract, such as fungi, could play also
an important role in the stability of microbial communities in human health and disease.
Yeasts were detected in human stool samples in 1917, and by the mid-20th century, their
presence in the human intestine was proposed to have a saprotrophic role (Gumbo, Isada et
al. 1999). The role of fungal communities in the gut, the mycobiota, has been initially studied
in animals, ranging from ruminants to insects, such as wasps (Stefanini, Dapporto et al.
2012).
Fungi represent a rich and diverse microbial community in the normal human intestine.
Based on cultivation studies, the total number of fungal microorganisms is estimated to be
100-102 colony forming units (CFUs)/ml in the oral cavity and increases to up 106 CFU/ml
in the feces (Simon and Gorbach 1984;Bernhardt 1996;Bernhardt and Knoke 1997). The

33
available data suggest that fungal communities are stable across time (Scupham, Presley et
al. 2006;Ott, Kuhbacher et al. 2008;Sokol, Leducq et al. 2016).
Recently, Next Generation Sequencing technologies allow deepening the composition of
mycobiota in various district of human body (Rizzetto, De Filippo et al. 2014). The first
culture-independent analysis of the mycobiota populating the mammalian intestine indicated
that fungi belonging to four major fungal phyla, Ascomycota, Basidiomycota,
Chytridiomycota, and Zygomycota, reavling diversity and abundance of fungal species in
the murine gastrointestinal tract (Scupham, Presley et al. 2006). The 18S rDNA sequence is
a widely used molecular target for genetic studies of fungal diversity (van Elsas, Duarte et
al. 2000;Scanlan and Marchesi 2008). Similarly to bacterial 16S rDNA, 18S rDNA belongs
to the gene cluster encoding for ribosomal RNA, which consists of three rRNA subunit
genes, internally transcribed spacers (ITS), and intergenic sequences. The evolutionary
conserved and variable regions, and the different length of ITS regions, make the 18S rRNA
an ideal target for molecular phylogeny studies (van Elsas, Duarte et al. 2000;Swidsinski,
Loening-Baucke et al. 2009).
Fungi are isolated from different body sites, especially Candida albicans, is a commensal of
the normal enteric microbiota starting from birth (Ott, Kuhbacher et al. 2008).
It has been hypothesized that fungi reach the GI tract through food. Fermented foods and
beverages containing eukaryotic species, such as bread, beer, and wine, are fungal sources
for the host (Scanlan and Marchesi 2008). Diet is a constant and dynamic factor shaping the
composition of resident microbial populations in the gut, and in turn the mucosal immunity.
It is possible that differences in fungal colonization are related to differences in the host
genetic makeup or differences in gut permeability.
1.12.1 Mycobiota and IBD
The different interactions between fungi, bacteria, and immune responses can significantly
affect gut health and likely contribute to the pathobiology of GI disorders, especially IBD.
When mucosal homeostasis breaks down in a genetically predisposed individual, the
resulting immune response may lead to chronic inflammation (Zhang and Li 2014) (Fig.
1.14). Despite the well-recognized role of intestinal bacterial communities, recent evidences
showed a contribution of mycobiota as the causative agents of diseases, such as IBS, IBD,
and “leaky gut” syndrome (Sendid, Quinton et al. 1998;Boorom, Smith et al. 2008;Ott,
Kuhbacher et al. 2008;Schulze and Sonnenborn 2009;Iliev, Funari et al. 2012;Sokol, Leducq
et al. 2016).
Several years ago, antibodies against S. cerevisiae (ASCA) were shown to be associated with
CD (Standaert-Vitse, Jouault et al. 2006), possibly indicating that fungi could play a role in
the aberrant immune responses.
The immune response to the gut mycobiota is a balance between tolerance and antimicrobial
defense (Mukherjee, Sendid et al. 2015). Fungi are recognized through interactions between
their pathogen-associated molecular patterns (PAMPs, such as β-glucan) and host immune
cells with specific pattern recognition receptors (PRRs), such as C-type lectins (for example,
dectin-1, dectin-2, etc.) and Toll-like receptors (TLRs). Subsequently, antigen-presenting
cells present fungal antigens, as MHC class II conjugates, which interact with T‑cell

34
receptors on naive T cells (Romani 2011). These interactions lead to differentiation of naive
T cells to different types of inflammatory T helper cells (Th1, Th2 or Th17) and regulatory
T (Treg) cells in the presence of specific cytokines (Fig. 1.14). Th17 cells have been shown
to interact with fungi and differentiate in the presence of IL‑17A/F, IL‑21, IL‑22 and TNF.
T‑cell activation can trigger an inflammatory response, which results in the recruitment of
humoral and cellular factors of innate immunity, promoting specific antibody production by
B cells (Dominguez-Villar and Hafler 2011;Zelante and Ricciardi-Castagnoli
2012;Hernandez-Santos, Huppler et al. 2013).
Immune homeostasis is maintained in healthy tissues by interdependent control exerted by
Th1 and Th2 cytokines and by Treg cells (Fig. 1.14). Perturbations that cause dysbiosis in
the gut microbiome can disrupt immune homeostasis, resulting in unregulated immune
defense and intestinal inflammation, as occurs in IBD (Mukherjee, Sendid et al. 2015).
The mechanisms by which fungi influence gastrointestinal diseases are beginning to be
investigated. Some studies suggest that fungal-associated mucosal inflammation (by Th17
or Th2 cells) or tolerance (by Th1 or Treg cells) is dependent on the intracellular pathways
activated by the interaction of fungal-derived molecules and PRRs.
Activation of plasma cells, via Th2 cells, to detect fungal cell wall antigens results in
production of antiglycan antibodies (for example ASCA), which are released into the blood.
The Th1 or Th17 pathways become unregulated (for example, by absence or insufficient
levels of Treg cells), triggering recruitment of monocytes, monocyte-derived macrophages
and neutrophils and promoting production of proinflammatory molecules. This step causes
tissue damage mediated by reactive oxygen species, proteolytic peptides and enzymes,
eventually manifesting as gastrointestinal diseases (Fig. 1.14).
The mechanism by which fungi aggravate the inflammatory response in gastrointestinal
disease probably involves multiple steps. Aggravation can be dependent or independent of
dectin and can be disease-specific. Moreover, during colonization or infection it is possible
that Candida or other yeast, such as Saccharmoyces cerevisiae, release cell wall mannan,
glucan and chitin, inducing the production of antiglycan antibodies (ASCA) (Sendid,
Quinton et al. 1998;Standaert-Vitse, Jouault et al. 2006). Thus, the fungal and host immune
system interactions could worsen the inflammatory process in gastrointestinal disease.
The ability of fungi to modulate immune cells can also be species dependent. Some studies
have investigated the response of macrophages to different Candida spp. (C. albicans or C.
parapsilosis) (Monk, Hutvagner et al. 2010;Nemeth, Toth et al. 2014). Such species-
dependent induction of host immune pathways might be of particular relevance in the setting
of IBD, as it is possible that the changes in immune status of affected tissues could be
triggered by genus-level, as well as species‑level changes in the mycobiota.
In mice, it is observed that gut inflammation promotes fungi proliferation (Jawhara, Thuru
et al. 2008). Conversely, some fungi can modulate susceptibility to inflammation triggering
(Candida albicans) or reducing it (Saccharomyces boulardii) (Jawhara and Poulain 2007).
Mice lacking major genes involved in fungi sensing, such as Dectin-1 or Card9, have an
increased fungal microbiota load with a marked abundance in C. tropicalis mainly observed
during active colitis (Iliev, Funari et al. 2012;Sokol, Conway et al. 2013).
In CD patients, fungal diversity is higher than that observed in healthy subjects (Ott,
Kuhbacher et al. 2008). Candida albicans, Aspergillus clavatus, and C. neoformans were

35
observed increased in CD patients (Li, Wang et al. 2014). In pediatric subjects, fungal taxa,
such as S. cerevisiae, Clavispora lusitaniae, Cyberlindnera jadinii, C. albicans, and
Kluyveromyces marxianus were positively associated with CD (Chehoud, Albenberg et al.
2015). Finally, Sokol and co-workers characterized the fungal microbiota in both healthy
subjects and IBD patients, observing a clear fungal dysbiosis in patients (Sokol, Leducq et
al. 2016). Altogether, these findings suggest a link between fungal microbiota and IBD
pathogenesis.
Fig. 1.14 Normal and abnormal interactions between fungi and the host immune system in the GI
tract. APCs present fungal antigens as MHC class II conjugates to T‑cell receptors on naive T cells.
T cells then differentiate into T helper cells (TH1 or TH17), which secrete different proinflammatory
and anti-inflammatory cytokines leading to recruitment of humoral and cellular factors of innate
immunity. (A) In healthy tissues, immune homeostasis is maintained by interdependent control
exerted by Th1 cytokines and Treg cells. (B) In IBD patients, dysfunctional regulation of Th1 or
Th17 pathways triggers an unregulated inflammatory response and recruitment of innate immune
cells. Activation of the Th2 pathway can lead to plasma cells detecting fungal cell wall antigens and
producing antiglycan antibodies (ASCA, ALCA and ACCA). Abbreviations: ACCA, anti-
chitobioside carbohydrate IgA antibodies; ALCA, anti‑laminaribioside carbohydrate IgG antibodies;
APC, antigen presenting cell; ASCA, anti‑S. cerevisiae antibodies; mac, macrophage; NK, natural
killer cell (Mukherjee P.K. et al Nat. Rev. Gastroenterol. Hepatol 2015).
1.13 Metagenomics in studying the human gut microbiota
Studies on microbial communities have been largely dependent on classical cultivation
techniques. Culture of microrganisms has long provided, and still provides, one of the most
detailed methods of study in microbiology. However, most intestinal microbes are anaerobic

36
and traditional culture methods only cultivate 10%-30% of gut microbiota (Suau, Bonnet et
al. 1999;Tannock 2001;Sokol and Seksik 2010). In the mid-1970s, the discovery that
portions of the gene encoding the small subunit 16S ribosomal RNA (rRNA) were highly
conserved among bacteria (Woese, Fox et al. 1975), while other internal regions of the gene
are highly variable, having almost entirely unique sequences in most bacteria species (Fig.
1.16), allowed the use of this gene as molecular marker discriminating bacteria at different
taxa levels (Sunagawa, Mende et al. 2013).
Fig 1.15 Variable regions of the 16S ribosomal RNA. Secondary structure of the 16S rRNA of E.
coli, as generated using the xrna program. In red, fragment R1 includes regions V1 and V2; in orange,
fragment R2 including region V3; in yellow, fragment R3 including region V4; in green, fragment
R4 including regions V5 and V6; in blue, fragment R5 including regions V7 and V8; and in purple,
fragment R6 including region V9 (Yarza P, et al. Nat Rev Microbiol. 2014).
Polymerase chain reaction (PCR) amplification, with universal primers, of genomic DNA
from a community of microbes, followed by cloning and sequencing, provides marker genes
that can be used to quantify bacterial taxa present within a sample. With the rapid
development of molecular technologies such as PCR-denaturing gradient gel electrophoresis
(DGGE), it has been shown that the gut microbial ecosystem is far more complex than
previously thought (Eckburg, Bik et al. 2005).
In recent years, Next Generation Sequencing (NGS) technologies have been developed
(Shendure and Ji 2008;Fuller, Middendorf et al. 2009), enabling the analysis of a large
number of microorganisms in different environments and matrices, including the human gut
(Human Microbiome Project 2012).

37
The Sanger sequencing method has advanced through 454 technologies (Margulies, Egholm
et al. 2005;Sogin, Morrison et al. 2006) to Illumina (San Diego, CA) sequencing (Bentley,
Balasubramanian et al. 2008;Lazarevic, Whiteson et al. 2009).
Analysis of 16S rDNA sequence and metagenomics have been used to study uncultivated
gut microbial communities. These approaches allow for qualitatively defining of a given
microbial community. Shotgun metagenomic sequencing can be used to understand structure
and functions of microbiome (Woese and Fox 1977;Handelsman 2004;Lepage, Leclerc et
al. 2013).
Metagenomics was first described in 1998 by Handelsman and Rodon (Handelsman, Rondon
et al. 1998;Rondon, Raffel et al. 1999), and became another DNA sequencing approach to
study the complex gut microbial community (Gill, Pop et al. 2006;Turnbaugh, Hamady et
al. 2009;Qin, Li et al. 2010). Firstly, the total DNA of all microorganisms is extracted from
fecal samples. Before being sequenced, total DNA samples are randomly trimmed by a
“shotgun” approach. The comprehensive sequences are then analyzed to obtain either
species profiles based on phylogenetic markers (16S rDNA) or genomic profiles based on
whole genomes (Tringe, von Mering et al. 2005). The shotgun sequence reads are filtered to
obtain the high-quality sequences for the whole genomic profile by metagenomics. Based
on sequence overlaps, the filtered sequences are then assembled to form longer genomic
sequence contigs. Computational methods are needed to code sequences in the contigs. Data
mining and database searches applying different powerful algorithms are then used to
annotate genes (Thomas, Gilbert et al. 2012). The information obtained from the sequence-
based and functional metagenomics enables a more comprehensive understanding of the
structure and function of microbial communities.
The use of “omic” technologies (metagenomics, transcriptomics, metabolomics, and
proteomics) has revealed the complexity of gut microbial communities, providing sufficient
information on: i) detection of microbial composition and diversity, ii) novel genes, iii)
microbial pathways, iv) functional dysbiosis, v) antibiotic resistance genes (resistome), vi)
determination of interactions and co-evolution between microbiota and host, and vii)
understand the gut microbiota composition and function in health, and in diseases.
1.13.1 Statistical analysis of taxonomic and functional profiles
Metagenomic studies of the gut microbiota produce an amount of data providing the relative
abundance of taxa or functional units for each sample. For interpretation of data, tools occur
able to summarize and visualize the results in order to find which taxa or functional
acquisitions differ significantly between metadata groups. There are many software
packages that allow for visualization, exploration, and analysis of such data, using 454 or
Illumina data as inputs, such as Mothur (Schloss, Westcott et al. 2009), QIIME (Caporaso,
Kuczynski et al. 2010), MICCA (Albanese, Fontana et al. 2015), MEGAN (Huson, Auch et
al. 2007), Galaxy (Blankenberg, Von Kuster et al. 2010). In addition, analyses of microbial
communities have focused on descriptive ecologic metrics, such as alpha and beta diversity
(Lozupone and Knight 2008;Morgan and Huttenhower 2012). Alpha diversity, a measure of
species richness within a sample. Alpha diversity is quantified in terms of number of
observed Operational Taxonomic Units (OTUs), or through richness estimators, such as

38
Abundance-based Coverage Estimator, Chao index, Shannon index. Beta diversity allow us
to understand variability beteween samples and the microbial structure among groups, by
using visualizations, such as principal coordinates analysis (PCoA) (Manton, Stallard et al.
1982), calculated on UniFrac distances (weighted –quantitative and unweighted -qualitative
variants)(Lozupone, Lladser et al. 2011) or Bray-Curtis dissimilarities, based on
phylogenetic distances (McMurdie and Holmes 2014). This type of visualization, known as
an ordination, provides a qualitative overview of the principal factors associated with
variance in the data.
Moreover, useful information are obtained by biomarker discovery evaluating which
metadata are associated significantly with increases or decreases in specific taxa or
functions. Tools, such as LEfSe (Segata, Izard et al. 2011), MaAsLin (Morgan, Tickle et al.
2012), MetaStats (White, Nagarajan et al. 2009), STAMP (Parks and Beiko 2010), and
metagenomeSeq (Paulson, Stine et al. 2013) have been designed for this type of 16S
sequence and metagenomic data analysis. These methods might detect differences in clades
or activities of specific pathways in patients vs healthy controls based on different variables,
such as genetic or environmental factors. By using metagenomic functional data, it is often
possible to find significant shifts in the microbial community that are not visible in
comparisons of strains or species. Because of the high level of variation in the gut microbiota
of each individual, when the microbiomes of patients and controls are compared, many
species will be present only in a few individuals, in highly varying amounts. Thus, there will
be insufficient statistical power to discern whether these variations in species differ
significantly between populations, and the number of species found to do so will be low. In
contrast, an environmental factor that provides selective pressure can perturb many members
of the community to a small but consistent degree, such that specific functional pathways
differ significantly, even when no individual strain has changed sufficiently in abundance to
pass the statistical threshold. These types of studies can identify changes in the balance of a
community in which no single microbe dominates.
1.13.2 Metatranscriptomics and metagenomic inference
Metatranscriptomics complements metagenomic studies allowing a more dynamic view of
the microbial community and its response to environmental factors.
Metagenomic data sequences provide information about microbial DNA content, and
thereby the composition and potential genetic features of different microbial communities.
Although metagenomes show which taxa are most abundant in communities, and differences
between the functional capacities of cohorts, the metatranscriptomes determine whether the
most abundant microbes are the most metabolically active, and the consequences of the
observed functional differences. For example, metagenomic analysis of fecal samples from
patients and healthy controls might show a large change in measured abundance of genes
involved in tryptophan biosynthesis, associated with disease. Metatranscriptome analyses
might show that these genes also were expressed differentially between patients and controls,
supporting the association between this functional acquisition and the disease. Otherwise,
metatranscriptome analyses might show that the genes were expressed in neither patients nor

39
controls, concluding that tryptophan biosynthesis to be discharged as a component of
disease-associated changes in microbial community structure.
Metagenomic inference was developed to partially obtain Whole Genome Sequencing
information based on 16S sequence data. In order to predict how taxonomic differences
between microbiota of different groups affects their microbial metabolic potential, we can
apply PICRUSt (Phylogenetic Investigation of Communities by Reconstruction of
Unobserved States) (Langille, Zaneveld et al. 2013), a computational approach useful to
infer the functional contribution of microbial communities on 16S rDNA sequencing data
set. PICRUSt implements an extended ancestral-state reconstruction algorithm to predict
which gene families are present, and then combines gene families to estimate the significant
differences in the main functional classes (KEGG categories) of the composite metagenome.
From a OTUs table derived by metataxonomic anlysis of 16S dataset PICRUSt first
calculates the functional capacity of the genome corresponding to each OTU, producing a
list of KEGG Ortholog gene identifiers by default. Functional capacity is calculated directly
from corresponding reference genomes when available, and otherwise probabilistically
inferred from available reference genomes based on the degree of within-clade conservation
of each function (for example, is this OTU derived from an Prevotellaceae, and most
Prevotellaceae have this function, so the genome corresponding to this OTU likely has this
function). Finally, each function’s abundance results in an inferred metagenome, or rather a
set of samples with corresponding predicted functional abundances.
Fig 1.16 Workflow for meta’omic study of the gut microbiome proposed by Morgan X.C. and
Huttenhower C. (2014). Two-stage experimental design can incorporate a large number of cost-
effective 16S sequenced samples coupled with a smaller number of metagenomes or
metatranscriptomes; microPITA guides the targeted selection of such samples. 16S sequencing and
metagenomic data each can yield taxonomic abundance tables, the former using environments such
as Quantitative Insights Into Microbial Ecology (QIIME) or MOTHUR, and the latter systems such

40
as MetaPhlAn. Metagenome and metatranscriptome analyses similarly can yield the abundances of
gene families or pathways in the microbial community of the gut using systems such as HUMAnN
or a 16S data set can be used to determine a predictive metagenome through PICRUSt. Finally,
taxonomic and functional profiles can be assessed using downstream statistical tests for significant
associations with clinical metadata in either a univariate (LEfSe) or multivariate (MaAsLin) manner.
OTU, operational taxonomic unit; NCBI, National Center for Biotechnology Information; CAZy,
Carbohydrate Active enZyme database (Morgan X.C. & Huttenhower C. Gastroenterology 2014).
1.13.3 Limitation of metagenomic analysis
Although metagenomics have been shown to be an exceptional and powerful technology in
studying the human gut microbiome, there are still some limitations in the use of
metagenomics. Firstly, it is not possible to identify microbial expression. Secondly, as
metagenomics require much higher sequence coverage than 16S rDNA sequence analysis,
the costs and time involved in DNA sequencing projects for gut metagenomics are far greater
than those of 16S rDNA sequence analysis. Thirdly, to obtain high coverage required for
metagenomics, a sufficient quantity and high quality of DNA samples are essential.
Although preventive steps are performed, human contaminants are found in 50%-90% of
sequences (Human Microbiome Project 2012). Different DNA extraction kits and
laboratories also affect the assessment of human gut microbiota (Kennedy, Walker et al.
2014). Comparing data across studies that use different bacterial DNA extraction methods
is difficult (Wesolowska-Andersen, Bahl et al. 2014). Moreover, the significant differences
in microbial composition observed on mucosal surfaces compared to luminal/fecal material
may not adequately reflect the totality of viable microbes within the gut, and it makes the
studies can not be compared. Fourthly, the quality of the underlying functional annotations
of metagenomic sequence fragments is very important. However, a significant proportion of
data cannot be assigned a function due to a lack of close matches in reference databases (Qin,
Li et al. 2010). Millions of sequences in each sample are required for functional gene analysis
of a complex microbial community. It is difficult to identify and improve the accuracy of
information derived from the relatively short gene fragments generated by NGS, due to the
many bioinformatics challenges proposed by the vast metagenomic shotgun sequencing. It
is also difficult to assign function unambiguously based on sequence similarity alone, which
may cause misannotation (Schnoes, Brown et al. 2009). Moreover, when there are less
abundant members of the microbiome or a community containing many closely related
species, it may be difficult to assemble genomes (Albertsen, Hugenholtz et al. 2013). This
can lead to a situation where, even if a function can be identified, it may be a challenge to
assign it to specific species within the microbial community. In addition, DNA is the material
used in metagenomic sequencing, and the expression of each functional gene in a sample in
a given environment is very difficult to determine.

41
Fig 1.17 Different gut microbiome study approaches. Characteristics, limitations, and applications
of different gut microbiome approaches from cultivation to metabolomics are presented (Wang W.L.
et al. World J Gastroenterol. 2015).

42
2. Aim of the PhD research project
Autoimmune and inflammatory diseases are increasing in western populations of
industrialized countries with a shift of disease onset to the pediatric populations. Several
evidences indicate that diet globalization, processing of food, urbanization and other
environmental factors, such as sanitation and antibiotic treatment are involved in
modifications of gut microbiota/mycobiota composition. Alteration of gut microbial profiles
could induce inflammation and immune responses, and thus promote inflammatory and
autoimmune disorders, such as Inflammatory Bowel Disease (IBD) or rheumatic diseases.
This PhD project aims at: 1- dissecting the role of diet and environment on gut microbiota
of healthy children from rural and urbanized environments; 2- investigating the association
of bacterial and fungal microbiome alterations in pediatric patients affected by inflammatory
and autoimmune disorders, dramatically increased in the western world; 3-studying the
immunomodulatory potential of fungal isolates in health and disease, and their interaction
with bacterial gut communities.
In particular, in order to understand the impact of diet and urbanization in shaping the gut
microbiota, we investigated the microbiome of healthy children populations having different
dietary habits and living in a rural African village and in urban areas (a small town and the
capital city of Burkina Faso), comparing with that of children living in Italy. These pediatric
populations were selected as representative populations in which the incidence of
autoimmune and inflammatory diseases is very low, and as representative of the western and
industrialized populations respectively.
In order to deepen the knowledge of the pathogenesis of IBD at early onset (EO), we
evaluated the phenotype and course of EO-IBD (0–5 years) compared with pediatric later-
onset disease (6–11 and 12–18 years). Understanding the factors that contribute to early age
of onset of IBD could potentially facilitate intervention strategy development.
Then, we characterized the gut microbiota composition of children affected by Juvenile
Idiopathic Arthritis (JIA), a typical immune-mediated condition that is largely increasing in
western pediatric populations in order to define specific microbial "pro-arthritogenic"
profiles, in association with HLA-B27 status.
Furthermore, we investigated the gut mycobiota composition in the healthy population at
different age range, characterizing phenotypically the fungal isolates for traits related to
adaptation in the gut environment and for potential pathogenic traits. Finally, we
characterized phenotypically and immunologically fungal isolates from pediatric IBD
patients in order to understand the potential role of fungal strains in etiology of IBD, and
their interaction with microbiota.

43
3. Effect of diet and environment on gut microbiota in healthy populations
living in different environments. Comparative study in children living in
rural and urban Africa and in Europe
This chapter will be shortly submitted for publication as an original research article:
De Filippo C., Di Paola M., Ramazzotti M., Albanese D., Pieraccini G., Banci E.,
Miglietta F., Cavalieri D. and Lionetti P.
Transitional hologenomes: how diet, urbanization, and environment shape the bacterial
and fungal gut communities in children.
3.1 Scientific Background
Nutritional evolution in humans is a hundred-thousands year process in which genetic
changes reflected environmental challenges. Animal and human hosts and their microbiota
have co-evolved together over the millennia into a homeostatic, symbiotic relationship.
Thus, normal functioning of the digestive and immune systems depend on the presence of
non-pathogenic ‘beneficial’ microrganisms inhabiting our gastrointestinal tract.
Unraveling the ecology and evolutionary history of human gut microbiota has recently
become possible through the advent of metagenomics. Initially, large-scale projects, such as
the European Metagenomics of the Human Intestinal Tract (MetaHIT) (Qin, Li et al. 2010)
and the US Human Microbiome Project (Human Microbiome Project 2012) were focused
on analysis of the microbiota of volunteers from western industrialized countries, in order to
discovermicrobial communities linked to the rise of new diseases such as obesity, allergies,
autoimmune diseases and Inflammatory Bowel Disease (IBD). More recently studies looked
beyond the Western world, relative to human population still living in rural environments
and having a life-style completely different from that of western countries, are being rapidly
enriched from metagenomic datasets obtained worldwide in different populations, showing
that both host and environmental factors can affect gut microbial ecology over a lifetime
(Borenstein, Kupiec et al. 2008;Freilich, Goldovsky et al. 2009). Dietary habits are
considered one of the main factors contributing to the diversity of human gut microbiota (De
Filippo, Cavalieri et al. 2010;David, Maurice et al. 2014). Our previous study showed for
the first time that the gut microbiota from children living in rural African village in Burkina
Faso, in an environment that still resembles that of Neolithic subsistence farmers, is
completely different from the microbiota of children living in urban area of the Western
world (De Filippo, Cavalieri et al. 2010), demonstrating that the different dietary habits
(fiber-rich diet of rural populations versus typical western diet rich in fat, animal proteins
and simple sugars) affect the gut microbiota. Since then the impact of diet on gut microbiota
was observed in geographically isolated populations, such as Amazonas from Venezuela,
rural populations from Malawi (Yatsunenko, Rey et al. 2012) and from Papua New Guinea
(Martinez, Stegen et al. 2015).
In addition, dietary switch from carnivorous to vegetarian diets across the human evolution
was associated to drastic and rapid changes in gut microbiota (David, Maurice et al.
44
2014;Gomez, Petrzelkova et al. 2016). The study of gut microbiota in ancestral populations,
such as Hazda hunter-gatherers from Tanzania, one of the last few remaining population
with diet and life-style resembling that of the Paleolithic era (Schnorr, Candela et al. 2014),
showed significant differences in microbiota due to dietary fluctuations linked to seasonal
and annual changes. Microbiota characterization of BaAka hunter-gatherers and Bantu
agriculturalists reflect microbial gradients linked to traditional subsistence strategies
(Gomez, Petrzelkova et al. 2016).
Altogether, these studies demonstrated that microbiota evolution reflects the degree of
traditional lifestyle and showing the effect of westernization on loss of traditional
commensal microrganisms. Attempts to understanding what benefits make both vegetarian
and omnivorous diet on host’s health is controversial (Wu, Chen et al. 2011). Different
profiles in gut microbiota are associated with dietary pattern. A fiber and plant-derived
polysaccharide-rich diet is associated with an enrichment in Bacteroidetes phylum with
respect to Firmicutes (De Filippo, Cavalieri et al. 2010;Yatsunenko, Rey et al. 2012;David,
Maurice et al. 2014).
It is evident that traditional microbiota are potentially a goldmine of metabolic and microbial
diversity to be understood, preserved and harnessed to drive improved human health through
directed dietary microbiota modulation. The multiple metabolic functions of the gut
microbiota on host physiology include carbohydrate fermentation, vitamin and energy
production, amino acid metabolism, xenobiotic degradation, and biotransformation of bile
acids by enzymes that have important implications for the metabolism of cholesterol and
glucose (Tremaroli and Backhed 2012). The fermentation of non-digestible carbohydrates
stimulates the growth of bacteria producing short-chain fatty acids (SCFAs), among which
the more important are the acetate, butyrate and propionate that are differentially associated
to disease and health status.
Aim of the present study was assess the impact of transition from a rural village, with
marginal contacts with globalized world, to a suburban small town and urban area, on dietary
habits and on the gut microbiota in populations of the same African ethnic group, living in
the same country. In these populations, such event is in parallel with increased wealth and
greater food availability. In this study, we integrated the gut microbiota characterization of
our previous study on African children population living in the rural villages of Boulpon
(district of Nanoro) in Burkina Faso (De Filippo, Cavalieri et al. 2010), with microbiota of
children of the same Mossi ethnicity, living in the small town of Nanoro and of children
from wealth families living in Ouagadougou, the capital city. Then, we compared the gut
microbiota composition of these three African populations corresponding to different levels
of urbanitazion with that of a previously known Italian population, as representative of a
typical western and urbanized population.
3.2 Materials and Methods
3.2.1 Enrollment of children populations and fecal sample collection
In this study, we enrolled 11 healthy children living in the rural village of Boulpon
(Boulkiemde province, Burkina Faso, BR), 8 healthy children living in the small urbanized
town of Nanoro (Boulkiemde province, Burkina Faso, BT), 5 children living in the capital

45
city of Burkina Faso, and 13 healthy children living in the urban area of Florence, Italy (EU).
All children aged 2 to 6 years, had not taken antibiotics or probiotics in the 6 months prior
to the sampling dates and had not been hospitalized in the previous 6 months. A detailed
medical and lifestyle report was obtained from EU children’s parents as well as a 4-day
dietary questionnaire and an in-depth interview on African children’s diet was obtained
directly from their mothers.
Despite the high incidence of infectious disease, including malaria and malnutrition in the
area, all children were healthy at the time of sample collection. Children living in the capital
city (BC) were healthy and belonging to wealthy families. For BR and BT children, upper
mid-arm measurement excluded both severe and moderate malnutrition. As representative
of a healthy Western population (EU) we selected children of the same age who are generally
concordant for growth, socially homogeneous and eating the diet and living in an
environment typical of the developed and urbanized world. All individuals were made aware
of the nature of the experiment and gave written informed consent in accordance with the
sampling protocol approved by the Ethical Committee of Meyer Children Hospital, Florence,
Italy. Fecal samples were collected by physicians and preserved in RNAlater (Qiagen) at
−80 °C until extraction of genomic DNA.
3.2.2 Bacterial genomic DNA extraction from fecal samples
The bacterial genomic DNA extraction procedure is based on a modified protocol proposed
by Zoetendal et al. (Zoetendal, Heilig et al. 2006). In brief, after dissolving about 500 mg of
each fecal sample in physiological solution and homogenization by vigorous hand shaking,
600 µl of the suspension was centrifuged (10,000 g, for 10 minutes at 4°C) to obtain pellets.
The pellets were dissolved in 1 ml ice-cold 1x-PBS and centrifuged at 700 g at 4°C for 1
minute. The supernatants were transferred into a 15 ml tube and were centrifuged at 9000 g
at 4°C for 5 minutes. Subsequently, the pellets were suspended in 2.8 ml TE buffer by
repeated pipetting. Then, 180 μl of SDS 10% (w/v) and 18 μl of proteinase K (20 mg/ml)
were added. The samples were incubated for 1 hour at 37°C. Afterward, 20 μl RNase (40
μg/ml) were added and incubated at room temperature (RT) for 5 minutes. An equal volume
of phenol/chloroform (50:50) was added and the samples were shaken well until the phases
were completely mixed. The mixtures were centrifuged at 4500 g for 2 minutes. The upper
layers were transferred into a new tube. This step was repeated again so that the interface of
the two layers was clean. Then, 1/10 volume of 3 M sodium acetate pH 5.2 and two volumes
of 96% ethanol were added and mixed gently. The mixtures were stored overnight at -20°C
to precipitate the genomic DNA, then the samples were centrifuged at 4°C at 9000 g for 10
minutes. The genomic DNA was washed twice into 1 ml of 70% ethanol. Finally, dried
samples were suspended in 300 μl of nuclease-free water (Ambion). DNA quality was
assessed by gel electrophoresis and spectrophotometry measuring OD 260/280. Only
samples with good DNA quality were processed.
3.2.3 Pyrosequencing
For each sample, we amplified the 16S rRNA gene using the special fusion primer set

46
specific for V5-V6 hypervariable regions and corresponding to primers 784F and 1061R
described by Andersson et al. (Andersson, Lindberg et al. 2008), and using the FastStart
High Fidelity PCR system (Roche Life Science, Milano, Italy). The 454 pyrosequencing was
carried out on the GS FLX+ system using the XL+chemistry following the manufacturer
recommendations.
For each sample, a PCR mix of 100 µl was prepared containing 1X PCR buffer, 5U of
FastStart High Fidelity polymerase blend and dNTPs from the FastStart High Fidelity PCR
system (Roche), 200 nM of primers (Eurogentec) and 100 ng of gDNA. Thermal cycling
consisted of initial denaturation at 95°C for 5 minutes followed by 30 cycles of denaturation
at 95°C for 40 seconds, annealing at 55°C for 40 seconds, and extension at 72°C for 1 minute,
with a final extension of 7 minutes at 72°C. Amplicons were visualized on 1.0% agarose
gels using SYBR Safe DNA gel stain in 0.5X TBE (Invitrogen) and were cleaned using the
HighPure Cleanup kit (Roche) according to the manufacturer’s instructions.
Amplicon DNA concentrations were determined using the Quant-iT PicoGreen dsDNA
reagent and kit (Invitrogen) following the manufacturer’s instructions. Assays were carried
out using 10 µl of cleaned PCR product in a total reaction volume of 200 µl in black, 96-
well microtiter plates. Fluorescence was measured on Perkin Elmer Victor Plate reader using
the 485/530 nm excitation/emission filter pair with measurement time 0.1 second. Following
quantitation, cleaned amplicons were combined in equimolar ratios into a single tube. The
final pool of DNA was precipitated on ice for 45 minutes following the addition of 5 M NaCl
(0.2 M final concentration) and two volumes of ice-cold 100% ethanol. The precipitated
DNA was centrifuged at 7,800 g for 40 minutes at 4°C, and the resulting pellet was washed
with an equal volume of ice-cold 70% ethanol and centrifuged again at 7,800 g for 20
minutes at 4°C. The supernatant was removed and the pellet was air dried for 10 minutes at
room temperature and then resuspended in 100 µl of nuclease-free water (Ambion). The final
concentration of the pooled DNA was determined using a NanoDrop spectrophotometer
(Thermo Fisher).
3.2.4 Data analysis
Pyrosequencing resulted in 194`202 filtered reads for BT (Number of reads for each BT
sample, mean 24`275.25; Read length, mean 244.64), and 89`888 filtered reads for BC
(Number of reads for each BC sample, mean 17`977.6; Read length, mean 291). Raw 454
files were demultiplexed using Roche's .sff file software. Data anlysis was performed
together with previous data obtained for BR and EU populations (De Filippo, Cavalieri et
al. 2010), and available at http://www.ebi.ac.uk/ena/data/view/ERP000133. The previous
data for BR and EU showed 256`308 filtered reads for BR (Number of reads for each sample,
mean 23`300.73; Read length, mean 235.73) and 303`972 filtered reads for EU Samples
(Number of reads for each sample, mean 23`382.46; Read length, mean 235.95).
Reads of all data sets were pre-processed using the MICCA pipeline (version 0.1,
http://compmetagen.github.io/micca/) (Albanese, Fontana et al. 2015). Forward and reverse
primer trimming and quality filtering were performed using micca-preproc truncating reads
shorter than 280nt (quality threshold=18). Denovo sequence clustering, chimera filtering and
taxonomy assignment were performed by micca-otu-denovo (parameters -s 0.97 -c).

47
Operational Taxonomic Units (OTUs) were assigned by clustering the sequences with a
threshold of 97% pair-wise identity, and their representative sequences were classified using
the RDP software version 2.7 (Wang, Garrity et al. 2007). Template-guided multiple
sequence alignment was performed using PyNAST57 (version 0.1) (Caporaso, Bittinger et
al. 2010) against the multiple alignment of the Greengenes 16S rRNA gene database
(DeSantis, Hugenholtz et al. 2006) filtered at 97% similarity. Finally, a phylogenetic tree
was inferred using FastTree (Price, Dehal et al. 2010) and micca-phylogeny (parameters: -a
template-template-min-perc 50). Sampling heterogeneity was reduced by rarefaction,
obtaining 12`964 sequences per sample.
Chao1 index and Shannon entropy (indicators of alpha diversity) and UniFrac (Lozupone,
Lladser et al. 2011) and Bray-Curtis dissimilarities (indicators of beta diversity) were
calculated using the phyloseq package (McMurdie and Holmes 2014) of the R software suite.
Exploratory analysis was performed by Principal coordinates analysis (PCoA) using the
phyloseq package of the R software suite. Multiple-rarefaction PCoA plots (“jackknifed”
PCoA plots) (Lozupone, Lladser et al. 2011) were computed to assess the robustness of the
beta-diversity analyses.
The significance of between-groups differentiation on the UniFrac distances and Bray-Curtis
dissimilarity was assessed by PERMANOVA using the adonis() function of the R package
vegan with 999 permutations.
To compare the relative abundances of OTUs among the four groups, the two-sided,
unpaired Wilcoxon test was computed, removing taxa not having a relative abundance of at
least 0.1%, in at least 20% of the samples, and using the function mt() in the phyloseq library
and the p-values were adjusted for multiple comparison controlling the family-wise Type I
error rate (minP procedure).
Based on sequence abundances in each population, heatmap plots of percentage abundances,
at different taxa, were obtained by using STAMP (Parks, Tyson et al. 2014), and supported
by dendogram, obtained with Average Neighbour and Unweighted Pair Group Method with
Arithmetic Mean (UPGMA), useful to cluster fecal samples of the children populations
based on taxa abundances.
On the basis of the relative abundances, the metagenomic biomarker discovery and related
statistical significance were assessed using the linear discriminant analysis (LDA) effect size
(LEfSe) method (Segata, Izard et al. 2011). LEfSe uses the Kruskal–Wallis rank-sum test to
identify features with significantly different abundances between assigned taxa compared to
the groups, and LDA to estimate the size effect of each feature. An alpha significance level
of 0.05, either for the factorial Kruskal-Wallis test among classes or for the pairwise
Wilcoxon test between subclasses, was used. A size-effect threshold of 2.0 on the
logarithmic LDA score was used for discriminative microbial biomarkers.
To infer the functional contribution of microbial communities on 16S rDNA sequencing data
set, we applied PICRUSt (Phylogenetic Investigation of Communities by Reconstruction of
Unobserved States) (Langille, Zaneveld et al. 2013), that implements an extended ancestral-
state reconstruction algorithm to predict which gene families are present, and then combines
gene families to estimate the significant differences in the main functional classes (KEGG
categories) of the composite metagenome. From a OTUs table with associated Greengenes
identifiers, we obtained the final output from metagenome prediction as an annotated table

48
of predicted gene family counts for each sample, where the encoded functions of each gene
family are orthologous groups or other identifiers such as KEGG orthologs (KOs). The
functional pathways discovery and related statistical significance were assessed by LEfSe.
In general, PICRUSt map the subset of 16S sequences to their nearest sequenced reference
genome. To evaluate accuracy of PICRUSt, we used the Nearest Sequenced Taxon Index
(NSTI), developed to quantify the availability of nearby genome representatives for each
microbiome sample. NSTI is the sum of phylogenetic distances for each organism in the
OTU table to its nearest sequenced reference genome, and, in general, the accuracy of
PICRUSt decreased with increasing NSTI across all samples. NSTI values calculated from
16S data set of Burkina Faso and European children showed low values for BR and BT
populations, and higher values for BC and EU populations, confirming that reference
genome coverage is not sufficient to allow accurate PICRUSt prediction for these
populations. Therefore, inference of functional profiles must be applied with caution to the
most novel and diverse communities, as those of gut microbiota of Burkina Faso populations.
3.2.5 Determination of Short-Chain Fatty Acids (SCFAs) in Fecal Samples
Concentrations of fecal SCFAs were determined from 250 mg frozen fecal samples,
according to the previous protocol (De Filippo, Cavalieri et al. 2010), by SPME-GC-MS
using a Varian Saturn 2000 GC-MS instrument with 8200 CX SPME autosampler. Briefly,
fecal samples were homogenized after addition of 1 ml of 10% perchloric acid and
centrifuged at 15,000 g for 5 minutes at 4°C. Concentrations of SCFASs were determined in
a 1:25 dilution of 500 µl supernatant. We used 5 µl of a mixture of deuterated acids
containing 50 ng D3-propionic, 50 ng D7-butyric and 500 ng D4-acetic acids as internal
standard. A calibration curve was prepared, adding the mixture of internal standards (5 µl)
to scalar amounts of the acids. The Varian MS workstation software (version 6.6) was used
for data acquisition and processing. The SCFAS concentration in fecal sample was expressed
in µmol/g of feces. To determine statistical significance of differences observed among the
four populations we used unpaired Student’s t test (one tailed).
3.3 Results and discussion
3.3.1. Transition from a rural to an urban environment changes dietary habits of
Burkina Faso populations
In order to investigate the effect of transition from different environments, corresponding to
a different socio-economic status and food availability, on gut microbial communities, we
studied fecal microbiota composition of three populations of healthy children belonging to
the Mossi ethnic group (representing the largest ethnic group of Burkina Faso, accounting
for the 74.9% of Burkinabè population), but living in different areas of Burkina Faso. In
particular, we compared a previously analyzed population of 11 children (BR) living in
Boulpon, a typical rural village of Burkina Faso (Boulkiemdé province, Nanoro department;
Geographic coordinates 12°39′N 2°4′W; (De Filippo, Cavalieri et al. 2010), with 8 children
(BT) belonging to families living in Nanoro, a small African town (Geographic coordinates
12°41′N 2°12′W) surrounded by rural villages, therefore corresponding to an initial

49
urbanization status, and 5 children (BC) from wealthy families, living in the capital city of
Burkina Faso, Ouagadougou (Geographic coordinates 12°21′26″N 1°32′7″W; Fig. 3.1),
about 90 km distance from Nanoro. Boulpon village consists of a cluster of huts built using
wood and straw (Fig. 3.1A), in which the population live in communities based on
subsistance agricolture. Nanoro is a small town with about 5`200 inhabitants, consisting in
urban agglomerates of of small brick houses (Fig. 3.1B). Ouagadougou is the capital city of
Burkina Faso, with a population of 1`475`223 inhabitants, and is the administrative, cultural,
economic and industrial center of the nation. The industry of Ouagadougou is sector that
fuels urban growth, as people move to the city from the countryside to find employment in
industries of processing plants and factories. As far as concern level of economic status and
health conditions, all selected children were healthy at time of the investigation. However,
BR children were poor, at high risk of infectious diseases and malnutrition, BT children were
of average economic conditions for Burkina Faso standard living in a dirty environment (Fig
1b), at risk of infectious disease and at low risk of malnutrition. Finally, BC children were
from wealthy families living in clean modern houses, at no risk of malnutrition and at lower
risk of infectious diseases when compared to the other groups of African children but
certainly at higher risk of infections when compared to Italian children.
In addition, it is worth of mentioning that the capital city of Ouagadougou is very polluted
by vehicles exhaust gas, especially during the dry season.
Fig. 3.1 Rural and urban environments in Burkina Faso. (A) Rural village in Boulpon, (B) urban
village in Nanoro town, (C) Ouagadougou, the capital city of Burkina Faso, and (D) map of Burkina
Faso.
Dietary habits of these three African populations was compared with a population of our
previous study composed by 13 European children (EU) living in Florence (Italy) and
characterized by a typical western diet (De Filippo et al. 2010). The age range of all groups

50
of children was 2-6 years, with an average of 4.6 ± 1.5 years (mean±s.e.) and the sex ratio
(F:M) was 14:23 (Table 3.1). This age range was chosen in order to evaluate the acquisition
of microbial biodiversity and microbiota evolution in first years of life. In fact, during human
life cycle, colonization of the infant gastrointestinal tract by microbial communities is
essential for microbiota–host interactions and influences health and disease status
(Rodriguez, Murphy et al. 2015).
Initially, we performed an analysis of dietary habits and daily food intake for all children
populations, based on dietary questionnaires and interviews to mothers, estimating average
values for quantity of food ingested per day, food energy (Kcal/day), grams of protein, fat,
carbohydrate, including simple sugar, and fiber (Table 3.2).
As showed in our previous study (De Filippo, Cavalieri et al. 2010), the diet of BR rural
children is predominantly vegetarian, rich in fibers and plant-polysaccharides and low in fat,
animal protein and simple sugar (Table 3.2A). The sources of fibers are also quite unique,
as derived from locally cultivated indigenous cereals (Petit millet, Panicum miliaceum and
Sorghum, Sorghum vulgare), legumes (Niebè, Vigna unguiculata), vegetables (Néré, Parkia
biglobosa and Baobab leaves), fruits (especially Mango, Papaya and Bananas), and
fermented products (Soumbalà from Nerè seeds). Millet and sorghum, typical cereals of
Burkinabè diet, are usually still ground into flour on a grinding stone, similarly to what man
began to do during the agriculture revolution in the Neolithic era, to produce a thick porridge
called Tô, that is the principal dish-component of Burkinabè meals.
The BT children living in Nanoro town still eat cereals and legumes similarly to BR
population, but, depending on socio-economic status, they add in their diet also rice, corn,
peanuts, peanut oil, and on average once a week mutton or chicken meat from animals that
are bred in the village or alternatively dried fish. Differently from BR population, in Nanoro
town, cereal flour, legumes, fruit and dried fish are bought in the local market, in which
products from neighboring countries can be also found (Table 3.2B).
The BC children, living in the capital city, Ouagadogou, together with a typical African diet
based on cereals (millet, sorghum, rice, soja) and legumes (Niebè), eat bread, milk and dairy
products as cheese and yoghurt, eggs, fruit juices, snacks, sweet bakery products and no
more than 3 times per week different kinds of meat and fish, including frozen fish. Their diet
therefore is very similar to that of children living in industrialized and globalized world.
Many of these products are bought at supermarket (Table 3.2C).
The EU diet is a typical western diet, high in starch, simple sugar, animal protein, and fat
and low in fiber, as previously described (De Filippo et al, 2010) (Table 3.2D).

51
Table 3.1 Characteristics of the four studied populations
Sample ID Group Nation Environment Sex Age
2BR BR Burkina Faso Rural village M 5
6BR BR Burkina Faso Rural village F 6
7BR BR Burkina Faso Rural village M 6
8BR BR Burkina Faso Rural village M 6
9BR BR Burkina Faso Rural village M 6
10BR BR Burkina Faso Rural village F 6
11BR BR Burkina Faso Rural village M 5
12BR BR Burkina Faso Rural village M 6
13BR BR Burkina Faso Rural village M 6
15BR BR Burkina Faso Rural village M 6
17BR BR Burkina Faso Rural village F 5
ratio (F:M) 3:8 age (average ±SD) 5.7 ±0.46
1BT BT Burkina Faso Small Town M 2
2BT BT Burkina Faso Small Town F 3
3BT BT Burkina Faso Small Town F 8
4BT BT Burkina Faso Small Town M 4
5BT BT Burkina Faso Small Town M 5
6BT BT Burkina Faso Small Town M 4
7BT BT Burkina Faso Small Town M 7
8BT BT Burkina Faso Small Town F 2
ratio (F:M) 3:5 age (average ±SD) 4.4±2.19
1BC BC Burkina Faso Capital city M 4
2BC BC Burkina Faso Capital city F 3
3BC BC Burkina Faso Capital city F 2
4BC BC Burkina Faso Capital city F 3
5BC BC Burkina Faso Capital city F 2
ratio (F:M) 4:1 age (average ±SD) 2.8±0.83
1EU EU Italy European city M 2
5EU EU Italy European city M 5
6EU EU Italy European city M 6
8EU EU Italy European city M 5
10EU EU Italy European city M 5
11EU EU Italy European city M 5
12EU EU Italy European city M 6
13EU EU Italy European city M 5
17EU EU Italy European city M 5
18EU EU Italy European city F 3
19EU EU Italy European city F 4
20EU EU Italy European city F 5
21EU EU Italy European city F 3
ratio (F:M) 4:9 age (average ±SD) 4.5±1.19
Total groups ratio (F:M)14:23 age (average ±SD) 4.6±1.55

52
Table 3.2 Total daily food intake in terms of protein, fat, carbohydrate and fiber in relation to the
average of maximum quantity ingested per day relative to Burkina Faso and European children
(A) BR Composition of Edible Portion
Dish component Daily Q
(grams)*
Percentage on total daily Q
Food Energy (Kcal)
Moisture (%)
Protein (g)
Fat (g)
Carbohydrate, total (incl. fiber) (g)
Fiber (g)
Cereals and starchy component (Millet,Sorghum)
170 38% 495.4 46.38 10.1 4.06 105.53 1.09
Legumes (Niebè, Black-Eyed Peas) 70 16% 267.4 6.02 25.795 8.47 26.285 6.16
Vegetables (Nerè) 60 13% 55.2 47.1 3.36 3.84 4.26 0.612
Fruit (mango, papaya) 130 29% 48.75 115.7 0.91 0.195 12.48 6.37
Milk (cow's milk)
Milk derivates
Meats, meat derivates, fish
Egg
Oil and fats (karitè) 15 3% 129.3 0.21 0 14.67 0.09 0
Peanuts
Sugar and honey
Total daily food intake 445 996.1 40.2 31.2 148.6 14.2
* Average of max Quantity ingested per child per day
(B) BT Composition of Edible Portion
Dish component Daily Q
(grams)*
Percentage on total daily Q
Food Energy (Kcal)
Moisture (%)
Protein (g)
Fat (g)
Carbohydrate, total (incl. fiber) (g)
Fiber (g)
Cereals and starchy component (Millet,Sorghum, Rice, Corn)
195 42.4% 470 78 10.4 4.0 100.4 1.6
Legumes (Niebè, Black-Eyed Peas)
70 15.2% 222.6 4.9 21.2 7.0 21.8 4.9
Vegetables (Nerè and Baobab leaves)
50 10.9% 136 21.6 8.8 9 8 1
Fruit (mango, papaya) 100 21.7% 37.5 89.2 0.6 0.1 9.6 4.8
Milk and Milk derivatives
Meats, meat derivatives, fish (mutton**; lake fish**)
20 4.3% 32.9 11.3 3.71 0.58 0.02 0
Egg
Oil 15 3.3% 135 0 0 15 0 0
Peanuts 10 2.2% 60.5 0.5 1.7 5.5 2.2 0.2
Sugar and honey
Total daily food intake 460.0 1094.5 46.5 41.2 142 12.5
* Average of max Quantity ingested per child per day
**once a week

53
(C)
BC Composition of Edible Portion
Dish component Daily Q
(grams)*
percentage on total daily Q
Food Energy
(Kcal/die)
Moisture (%)
Protein (g)
Fat (g) Carbohydrate,
total (incl. fiber) (g)
Fiber (g)
Cereals and starchy component (bread, millet, sorghum, corn)
160 17.1% 384 40 8.5 3.2 82.4 1.4
Legumes 30 3.2% 95.4 26.25 9.2 15 9.4 2.1
Vegetables (Nerè, Tomatoes, carrots, zucchini, aubergine)
120 12.8% 10.8 49.39 1.49 0.17 2.52 1.1
Fruit ( mango, bananas, papaya) 100 10.7% 37.5 89.2 0.6 0.1 9.6 4.8
Fruit juice 110 11.8% 53.9 40.66 0.55 0.09 13.9 0
Milk and Milk derivatives (cow’s milk, yoghurt, cheese)
250 26.7% 246.7 218.5 12 16.65 13.2 0
Meats, meat derivates, fish 60 6.4% 98.8 34.14 11.13 1.75 0.06 0
Egg 30 3.2% 38.4 77.1 3.72 2.61 0 0
Oil 20 2.1% 180 0 0 20 0 0
Peanuts 15 1.6% 90.7 7.5 2.55 8.25 3.3 0.3
Sugar and honey 10 1.1% 38.7 0 0 0 10 0
Snacks 30 3.2% 179.55 18.8 2.2 8.7 34.9 0
Total daily food intake 935 1454.27 51.92 76.5 179.26 9.7
* Average of max Quantity ingested per child per day
(D)
EU Composition of Edible Portion
Dish component Daily Q
(grams)*
percentage on total daily Q
Food Energy ( Kcal/die)
Moisture (%)
Protein (g)
Fat (g)
Carbohydrate, total (incl.
fiber) (g)
Fiber (g)
Cereals and starchy component 160 17.3% 375 68.02 9.7 4.89 152.38 3.46
Legumes (Beans, String beans, Peas)
20 2.2% 10.9 15.4 1.2 0.1 3.7 0.9
Vegetables (carrot,potatoes, fennel, tomato, zucchini)
100 10.8% 50.9 82.3 2.3 1.1 18.4 1.6
Fruit (apple, pear, peach, grapes, bananas, mandarin)
140 15.1% 83.5 114.9 1.1 0.3 43.0 2.4
Milk and milk derivatives (cow's milk, mozzarella, parmesan, cheese)
290 31.4% 314.7 232.06 21.23 22.15 20.78 0.0
Meats, meat derivatives, fish 120 13% 157.7 83.9 26.0 4.6 6.2 0.0
Egg and derivates 30 3.2% 91.1 16.9 2.9 8.7 0.4 0.0
Oil and fats (Extra virgin olive oil and butter)
25 2.7% 210.65 1.4 0.1 23.3 0.2 0.0
Peanuts
Sugar and Honey 10 1.1% 38.7 0.0 0.0 0.0 10.0 0.0
Snacks 30 3.2% 179.55 18.8 2.2 8.7 34.9 0.0
Total daily food intake 925 1512.7 66.7 73.9 290.0 8.4
* Average of max Quantity ingested per child per day
Considering nutritional analysis of the 4 populations we observed that, moving from rural
(BR) to urban population (BT, BC and EU), the variety of food consumption was increased
(Fig.3.2), and the fiber intake was progressively reduced, passing from rural to urban African
populations, and finally to EU children, as well as the daily intake of fat, protein and simple
sugar, and consequently the daily caloric intake (Table 3.2). The average amount of fiber in
BR diet is 14.2 g/d (3.19% of total grams of daily food intake) compared with 12.5 g/d

54
(2.72%) in BT, 9.7 g/d (1.04%) in BC and 8.4 g/d (0.9%) in EU. The fiber intake presented
an opposite trend when compared with the average daily calorie amounts (BR: 996 kcal/day;
BT: 1094.5 kcal/day; BC: 1454.3 kcal/day; EU: 1512.7 kcal/day; Table 3.2).
Fig. 3.2 Variety of food consumption in the four children populations. Pie charts indicate the
percentages of daily foods assumed by the African and European populations. BR: children form
rural village; BT: children from Nanoro town; BC: children from BF capital city; EU: children from
Europe (Florence, Italy)
In our previous study (De Filippo, Cavalieri et al. 2010), comparing dietary habits of BR and
EU populations, we observed a correlation between fiber intake and levels of fecal short
chain fatty acids (SCFAs). Thus, considering the differences in food consumption, especially
in fiber intake in BT and BC populations compared with BR, we performed metabolomics
analysis by Solid-phase microextraction- Gas Chromatography- Mass spectrometry (SPME-
GC-MS), measuring SCFAs levels in fecal sample of BT and BC children. The SPME-GC-
MS analysis showed a significant reduction of total fecal SCFAs moving from BR to urban
populations (Fig. 3.3; p-values by one-tailed Student t test) indicating a clear trend,
especially for propanoic and pentanoic acids (Fig. 3.3; p-values by one-tailed Student t-test).
Interestingly, EU presented significantly low levels of SCFAs, especially butyric acid,
compared to the three African groups (Fig. 3.3; p-values by one-tailed Student t test). Fecal
samples of BC showed a significant increase in total SCFAs levels, especially for acetic and
butyric acids compared to BT and EU, but a decrease compared to BR (Fig. 3.3; p-values by
one-tailed Student t test).

55
Fig. 3.3 Quantification of SCFAs levels in fecal samples from BR, BT, BC, and EU populations by
SPME-GC-MS. Mean values (±SEM) are plotted. Comparison among groups by one-tailed Student
t test. *p< 0.05; **p≤ 0.01; ***p≤ 0.001.
3.3.2 Microbiota characterization of Burkina Faso and European populations:
taxonomic changes as an effect of diet and migration from rural to urban environments
In order to understand the correlation among SCFAs reduction observed from rural to urban
populations with respect to diversity of microbial profiles, we studied the taxonomic
distribution of gut microbiota of BT and BC populations through pyrosequencing, using 454
FLX sequencing of the V5-V6 hypervariable regions of 16S rRNA gene. We compared the
meta-taxonomics data with the previous results obtained for BR and EU populations (De
Filippo, Cavalieri et al. 2010).
The taxonomic distribution in the four populations showed a countertrend abundance of
Bacteroidetes and Firmicutes, the two dominant phyla of gut microbiota, moving from BR
to BT, to BC, and EU populations (Fig. 3.4A-B), with a gradual decrease of
Bacteroidetes/Firmicutes ratio. Bacteroidetes were enriched especially in BR and BT (mean
relative abundance 68.6% and 47.7% respectively, versus 32.6% in BC and 25.9% in EU),
with a significantly higher abundance when comparing BR with BC and EU (Figure 3.4A;
Wilcoxon rank-sum test). Conversely, Firmicutes were more abundant in BC and EU (57.5%
and 60.2% mean relative abundance, respectively) than in BT, and significantly enriched
compared with BR (Figure 3.4A; Wilcoxon rank-sum test), in according with our previous
observations. Actinobacteria were more abundant in BC compared to the other African and
European populations (6.74% in BC vs 3.6% in EU, 0.17% in BR, and 1.11% in BT), and
significantly reduced in BR compared to the other groups (Figure 3.4A; Wilcoxon rank-sum
test). An abundance in Proteobacteria was observed in BT and EU (3.8% in BT and 4.94%
EU vs 2.73% in BR and 1.26% in BC), compared with other populations, although not
statistically significant. Among the minor phyla of gut microbiota, Spirochaetes was

56
significantly increased in BR compared with BC and EU, as well as in BT compared to EU
(Figure 3.4A; Wilcoxon rank-sum test). As reported in Fig. 3.4A, BR and especially BT
populations showed a greater variability with respect to the relative abundance of phyla
compared with BC and EU children, suggesting an inter-variability in microbiota
composition. A possible explanation of such observation could be the higher exposure to an
external dirty environment, lower level sanitation in both BR and BT groups of children, in
addition to the higher variability of the dietary habits of the BT group.
Based on sequence abundances at phylum level in each population, the dendogram obtained
with Average Neighbour and Unweighted Pair Group Method with Arithmetic Mean
(UPGMA), showed a clear separation between BR and EU populations, (Fig. 3.4B)
especially due to the different ratio Bacteroidetes/Firmicutes, as previousy observed (De
Filippo, Cavalieri et al. 2010). In contrast, BT and BC children showed a progressive shift
towards phyla distribution observed in EU children in accordance to different dietary habits
and environments. Interestingly, whereas the majority of BC samples clustered together with
EU, also two BT samples clustered closely to EU group, due to the Firmicutes relative
abundance. In our opinion this is due to the fact that as observed by questionnaires dietary
habits of BT children living in the community of Nanoro town were not uniform and some
of them had a diet more similar to that of western population, whereas others still had a diet
resembling that of rural areas. Thus, the majority of BT samples fell within the BR cluster,
or in a subcluster interposed between BR and EU population, due to the abundance in
Bacteroidetes in their microbiota (Fig. 3.4B). These results suggest that Burkina Faso
populations belonging to the same Mossi ethnicity and living in the same geographic area
differ in microbiota composition according to the modifications of dietary habits and kind
of environment where they live.
The observed distribution of the four populations based on taxonomic assignment at phylum
level was confirmed by analysis of microbial community structure (beta diversity).
Considering Unweighted and Weighted UniFrac distances, and Bray-Curtis dissimilarities,
Principal Coordinates (PCoA) analysis (Fig. 3.4C) showed a clear separation between BR
(green dots) and EU (red dots) samples, confirming different gut microbiota composition
between African and European populations (uUnifrac ADONIS and ANOSIM, p-val=
0.0001; wUnifrac ADONIS and ANOSIM p-val= 0.0001; bray-curtis ADONIS and
ANOSIM p-val= 0.0001). BT samples (blue dots) result close to the BR population, while
BC (orange dots) approaches the EU (Fig. 3.4C), suggesting changes of gut microbial
communities in African populations, as an effect of moving from the rural to the urban
condition.

57
Fig. 3.4 (A) Box plot of relative abundances of the major statistically significant different phyla in
African and European populations (Wilcoxon rank sum test; * p-value <0.05, **p-value <0.01; ***
p-value<0.001). (B) Heatmap plot indicating the proportion (%) of sequences assigned at each
phylum. Each sample, belonging to respective group, is represented by a different color: green=BR,
blue=BT, orange=BC and red=EU. The blue squares indicate abundance percentage of each phylum
in each sample. Dendrograms, obtained with Average Neighbour UPGMA method, are used to
cluster both phyla (vertical) and fecal samples of the children populations (horizontal) based on phyla
abundances. (C) Beta diversity: Principal coordinate analysis (PCoA) derived from unweighted and
weighted UniFrac and Bray-Curtis distances among samples of the four populations (P=0.0001 by
PERMANOVA). Colored dots representative of the four populations are as in (A) and (B). For each
axis, in square brackets, the percent of variation explained was reported.
Next, we evaluated different microbial richness (alpha diversity) among populations. By
observed OTUs and Chao1 index, we found a downward trend in species richness from rural
BR to urban BC and to EU, whereas BT children showed a high alpha diversity index.
Shannon index, estimating entropy, indicated a reduced alpha diversity in BR compared to
the other populations. No statistically significant differences (PERMANOVA analysis) were
obtained with the three estimators of alpha diversity, probably due to the variability observed
within the African and European groups (Fig. 3.5A-C). Furthermore, measuring intra-group
dissimilarities among the populations (Fig. 3.5D-E), by unweighted UniFrac distance
comparison, we observed more intra-variation of gut microbiota profiles in BT and BC,

58
compared to BR and EU populations, even if no statistically significant. However,
considering inter-group distances among African populations with respect to EU, we
confirmed that microbiota composition of BR population differs significantly from EU,
while distances between BT and EU, as well as between BC and EU were significantly lower
than BR to EU (Fig. 3.5D-E; Pairwise comparisons using Wilcoxon rank sum test, FDR
adjustment p<0.001), suggesting a transition of gut microbiote profiles of urban Africa
populations towards profiles characteristic of western population.
Fig. 3.5 Box plots of alpha diversity in the three African populations compared to EU, based on (A)
number of observed OTUs, (B) Chao 1 index and (C) Shannon index. P=0.096 BU vs EU pairwise
comparisons using Wilcoxon rank sum test. (D-E) Unweighted UniFrac distances based on observed
phylogenetic differences, (D) between samples from the same population (intra-group distances) and
(E) between samples from African vs EU population (inter-group distances). Pairwise comparisons
using Wilcoxon rank sum test; FDR p-value adjustment method, ***p<0.0001.
Following the taxonomic assignment at family level, we observed that Prevotellaceae,
representing the most abundant family in BR and BT populations (66.8% and 41.14% mean
relative abundance in BR and BT respectively), were significantly enriched in rural BR
compared with BC and EU with a clear reduction in BC (10.4%), and almost absence in EU
(0.44%) (Fig. 3.6A; Wilcoxon rank-sum test). Conversely, several families were less
abundant in BR population and progressively more abundant in urban African children (BT
and BC) and in EU. Among these, Bacteroidaceae, Bifidobacteriaceae,
Porphyromonadaceae and Rikenellaceae were significantly decreased in BR compared with
BC and EU, and in BT compared with EU, as well as Lachnospiraceae and
Ruminococcaceae, were significantly reduced in BR compared with BC and EU (Fig. 3.6A;
Wilcoxon rank-sum test). Furthermore, we observed a significant increase in
Enterobacteriaceae in BT population compared with EU, and in EU compared to BR (Fig.
3.6A; Wilcoxon rank-sum test).
Among the minor component of gut microbiota (relative abundance <0.05), we observed
that Coriobacteriaceae was significantly enriched in BT compared to EU, and

59
Erysipelotrichaceae in BC compared with BR and EU (Fig. 3.6A; Wilcoxon rank-sum test).
Leuconostocaceae was significantly more abundant in BR compared with EU (Fig. 3.6;
Wilcoxon rank-sum test). Spirochaetaceae was more variables within the BT population and
more abundant in BR population compared to BC and EU (Fig. 3.6A; Wilcoxon rank-sum
test). Desulfovibrionaceae and Sutterellaceae were progressively and significantly enriched
in urban BT, BC and EU, and almost absent in rural BR population (Fig. 3.6A; Wilcoxon
rank-sum test).
Differential abundances of these families allow a clear discrimination of the microbiota
profiles in the four populations, as highlighted by PCoA analysis based on UniFrac distances
and Bray-Curtis dissimilarities (Fig. 3.6B). In particular, on one hand, the observed
abundances of Prevotellaceae in BR and BT, and on other hand Bacteroidaceae,
Lachnospiraceae, Rikenellaceae and Porphyromonadaceae in EU, explain the distances
between African and European samples. The abundances in Lachnospiraceae and
Ruminococcaceae explain the sample distribution of BC populations towards EU samples.
Fig. 3.6 Box plot of relative abundances of the statistically significant different families in African
and European populations (Wilcoxon pairwise test; * p-value <0.05, **p-value <0.01; *** p-
value<0.001). (B) Beta diversity and correlation with the principal abundant bacterial families. PCoA
derived from unweighted and weighted UniFrac and Bray-Curtis distances among fecal samples of
the four populations in relation with abundances of the principal bacterial families, represented by
colored rectangles, in each population (P=0.0001 by PERMANOVA). Different sizes of rectangles
indicate different order of relative family abundance. For each axis, in square brackets, the percent
of variation explained was reported.
At genus level, as reported in our previous study, gut microbiota of BR was almost entirely
populated by Prevotella (64.4% average out of total sequence amount), as confirmed by
observed Prevotellaceae family at higher taxonomic level. BT and BC populations presented
a progressive decrease in Prevotella abundance compared to BR (38.8% in BT and 10.3%
in BC; Wilcoxon rank-sum test; BR vs BC p=0.01; BR vs EU p=0.0002; BT vs EU p=0.002;

60
Fig. 3.7), reflecting both the effect of transition from rural to urban environment and the
reduction of dietary fiber intake. Moreover, this genus resulted absent in EU, as previously
reported in our study.
By BLAST alignment, we observed that Prevotella sequences were attributable with 99%
of identity to P. copri, P. melaninogenica and P. stercorea, over uncultured Prevotella spp.
In our previous study, we found a set of sequences classified as Xylanibacter. Recently,
Xylanibacter 16S rDNA was re-classified within the larger Prevotella genus (Sakamoto and
Ohkuma 2012). Interestingly, an increase in Treponema, Succinivibrio and Weissella
discriminated both BR and BT from BC and EU (Wilcoxon rank-sum test; p-value are
respectively reported in Fig. 3.7). By BLAST alignment, we observed that Treponema spp.
sequences were mainly attributable with 99% of identity to T. succinifaciens, a known
carbohydrate metabolizer isolated from gut of termites and swine, and observed in other
traditional human populations (Obregon-Tito, Tito et al. 2015). Interestingly, rural African
population occasionally eat cooked termites. Other Treponema sequences were attributable
to uncultured batceria and with minor percentage of identity to T. porciunum.
Succinivibrio, is generally associated with the bovine rumen (Bryant 1970), and was also
found in higher frequency in the Hadza hunter gatherers and traditional Peruvian populations
(Schnorr, Candela et al. 2014;Obregon-Tito, Tito et al. 2015) and might be involved in
starch, hemicellulose, and xylan degradation, similarly to Prevotella and Treponema.
Thus, these observations confirm that the enrichment in bacteria metabolizers of plant-
polysaccharides, hemicellulose, and xylan, as previous observed (De Filippo, Cavalieri et al.
2010), derived by a high-fiber diet resultant essentially by consumption of fiber rich
vegetables, cereals and legumes locally cultivated, and similarly to wht reported in children
and adults from Malawi and Venezuela whose diet was dominated by plant-derived
polysaccharide foods (Yatsunenko, Rey et al. 2012). Passing from rural to urban microbiota,
these genera decreased dramatically, until to be depleted in EU children. Interestingly, the
progressive loss of these bacteria reflect the gradual reduction in fecal SCFA levels from BR
to BT, BC and EU populations.
Thus, in BC the urbanization and the westernization led to loss of ancient microbial profiles
typical of traditional and rural populations, such as Prevotella, and to the gain of bacterial
species associated with a western-like diet, such as Lachnospiraceae incertae sedis,
Roseburia and Dorea that were increased in urban BC and EU (Wilcoxon rank-sum test; p-
value are respectively reported in Fig. 3.7). Morevoer, Bacteroides and Bifidobacterium,
generally associated to milk and milk-derives food consumption and to childhood
microbiota, were more abundant in BC and in EU compared with BR and BT, probably in
relation to consumption of milk and milk-derived product in these populatons.
The majority of sequences belonging to Bacteroides genus, and consistently found in BC
and EU metagenome, was attributable to B. uniformis, and in minor abundance to B.
acidifaciens, B. caccae, B. coprophilus, B. ovatus, and B. plebeius. In BR and BT
populations, although Bacteroides was poorly represented, we found Bacteroides sequences
attributable with 95% of identity to B. vulgatus. Interestingly, a study on gnotobiotic
interleukin-2-deficient mice showed that B. vulgatus has a possible protective role against
E. coli induced-colitis (Waidmann, Bechtold et al. 2003), suggesting that the probable
unique Bacteroides species found in rural BR microbiota could have a protective role against

61
potential pathogenic bacteria. Notably, in our previous study (De Filippo, Cavalieri et al.
2010), we showed that potential pathogenic bacteria, such as Shigella and Escherichia and
other Enterobacteriaceae, were underrepresented in BR microbiota compared to EU,
suggesting that, in accordance with the “old friend hypothesis”, microbial diversity and the
enrichment in SCFA-producing bacteria, in rural microbiota is able to protect against
pathogenic microbes and gastrointestinal disease.
Regarding Bifidobacterium genus, we observed that BC and EU populations were mainly
enriched in B. longum, and in minor part in B. adolescentis, B. bifidum and B. breve. We did
not observe any association with age range and increase of Bifidobacterium spp, in
accordance with the observation in other children belonging to Tunapuco traditional
population (Obregon-Tito, Tito et al. 2015). BC and EU children in our study are those who
consume milk and dairy products.
Finally, Alistipes, Odoribacter and Barnesiella discriminated Europeans from African
populations, as representative genera of Western population, in accordance with Martinez
and collaborators (Martinez, Stegen et al. 2015).
Among the minor representative genera, we observed an increase in Odoribacter, Sutterella,
Parasutterella, Bilophila and Clostridium XIVa, that includes Clostridium spp., Roseburia
and Ruminococcus obeum, in both BC and EU population (Fig. 3.7), suggesting that diet rich
in protein and fat and poor in fiber influences the gut microbiota, independently from
geographic origin. In fact, Alistipes and Bilophila has been previously linked to animal-based
diet. It has been reported that high-fat diet induces an increase in abundance of Biophila
wadsworthia, a member of the Desulfovibrionaceae family, which generates hydrogen
sulfide via taurine metabolism, associated to inflammation, as recently observed in mice
(Devkota, Wang et al. 2012).

62
Fig. 3.7 Box plot of relative abundances of the statistically significant different genera in African
and European populations (p-value by Wilcoxon pairwise test).
3.3.3 Prediction of functional metabolic profiles of gut microbiota from African and
European population
In order to evaluate how the observed taxonomic differences between the gut microbiota of
African and European children affect their metabolic potential, we applied PICRUSt
(Phylogenetic Investigation of Communities by Reconstruction of Unobserved States), a
computational approach useful to infer the functional contribution of microbial communities
on 16S rDNA sequencing data set. We decide to use this approach although we are aware of
PICRUSt imits since the accuracy of PICRUSt varies based on the availability of reference
genomes for microorganisms in each environment/sample, and probably several microbial
functions related to metagenome of isolated and traditional populations are still unknown,
which are not yet present in the current database. PICRUSt prediction performed on samples
from Burkina Faso and European children revealed significant differences in the main

63
functional classes (KEGG categories at level 2), deriving from acquisitions related to the
different environments and to different dietary habits (Fig. 3.8). LEfSe analysis performed
on PICRUSt output showed several KEGG categories differentially enriched in the African
and European populations (Fig. 3.8). In particular, in BR metagenome, we observed
enrichment in several functions, such as glycan biosynthesis and metabolism, energy
metabolism, metabolism of terpenoids and polyketides, a source of plant phenolics, and
metabolism of cofactors and vitamins, probably related to consumption of cereals, legumes,
fiber and plant-polysaccharides rich food. In BC, we found enrichment in carbohydrate
metabolism, mainly related to starch and sucrose rich diet, as well as biosynthesis of
secondary metabolites, and function related to bacterial cell motility. In EU, we observed
enrichment in function related to consumption of animal-protein and fat rich diet, such as
aminoacids and lipid metabolism, and functions related to bacterial membrane transport and
signal transduction. LEfSe did not show significant functional enrichment in BT
metagenome, when compared to the other groups, considering KEGG categories at level 2,
but at level 3 we observed enrichment of KEGG functions related to antibiotic biosynthesis
(novobiocin biosynthesis) and terpenes degradation (geraniol degradation), an organic
compound derived from plants.
Fig. 3.8 Differences in bacterial functional classes (KEGG categories level 2). Functional pathways
significantly enriched in African and European populations based on PICRUSt prediction. LEfSe
results indicate a sequentially significant ranking among populations (Alpha value=0.05 for the
factorial Kruskal-Wallis test among classes). The threshold for the logarithmic LDA score was 2.0.
3.3.4 Carbohydrate metabolism, glycan biosynthesis and energy metabolism
Considering KEGG categories at level 3 (Fig. 3.9), we observed that BR metagenome was
enriched in functions related to glycan biosynthesis, glycosil transferases and TCA cycle,
involved in complex carbohydrate metabolism, deriving from fiber and polysaccharides rich
food, as well as functions related to lipopolysaccharide biosynthesis proteins and

64
glycosphingolipides biosynthesis, involved in building of bacterial membrane and in
membrane-protein modulation contributing to cell–cell communication (D'Angelo, Capasso
et al. 2013) (Fig. 3.9A). Interestingly, we found enrichment in carbon fixation pathways and
oxidative phosphorylation, metabolic functions that are both related to carbohydrate
metabolism and involved in releasing energy, associated with the TCA cycle pathway (Fig.
3.9B).
In BC metagenome, we observed enrichment in starch and sucrose metabolism, as well as
the penthose phosphate metabolism, a metabolic pathway parallel to glycolysis that
generates NADPH and 5-carbon sugars, such as ribose 5-phosphate, a precursor for the
synthesis of nucleotides, and erythrose 4-phosphate (E4P), used in the synthesis of aromatic
amino acids. Moreover, we found enrichment in pathways related to glycosphingolipid
synthesis-lacto e neolacto series, involved in ceramide production, that plays an important
role in bacterial infections (Grassme and Becker 2013) (Fig. 3.9A). Interestingly, BC
metagenome was also enriched in methane metabolism (Fig. 3.9B). Fermentation of
polysaccharides by colonic microorganisms can produce a number of by-products, gases,
such as H2 and CH4 (methane) (Danielsson, Werner-Omazic et al. 2014). We could
hypothesize that the presence of Ruminococcaceae, Lachnospiraceae, and Clostridiaceae,
as observed in BC microbiota, can promote functional acquisition related to methane
metabolism.
In EU metagenome, over the general pathway related to carbohydrate metabolism, pentose,
glucoronate interconversion pathways and C5-branched dibasic acid metabolism, deriving
from a simple sugar rich diet, we found enrichment in galactose metabolism, involved in
conversion of galactose into glucose (Fig. 3.9B). Although legumes, grains, tubers and
vegetables are galactose sources, galactose derives mainly from hydrolysis of lactose, the
milk sugar. Therefore, acquisition of related function in EU metagenome arise from dairy
milk derived-products. Other functions enriched in EU were the glyoxylate and
dicarboxylate metabolism, related to glyoxylate cycle, involved in biosynthesis of
carbohydrates from fatty acids, and butanoate metabolism. This metabolic pathwayconverge
in glycolysis, aminoacid metabolism and fatty acid degradation with synthesis and
degradation of ketone bodies.
Moreover, regarding energy metabolism, sulfur and nitrogen metabolism were enriched in
EU metagenome. We suppose that Bilophila, found abundantly in EU microbiota, a well-
known sulphite-reducing bacterium, could be responsible of this functional contribution.
Regarding nitrogen metabolism, several enteric bacteria produce reduced nitrogen by dietary
amino acids and animal-protein.
3.3.5 Functions related to aminoacid metabolism
The majority of pathways involved in amino acid metabolism were enriched in BR
metagenome compared to the other populations (Fig. 3.9D), such as metabolism of glycine,
serine, threonine, cysteine, methionine, D-glutamine and D-glutamate, beta and D-alanine
and tyrosine, as well as the tripeptide gluthatione, derived from cysteine, glutamate and
glycine, an important antioxidant molecule derived by biosynthetisis of the host but also of
bacteria. These findings suggest the potential ability of BR microbiota to contribute in host

65
metabolic functions in conditions of poor aminoacid food intake.
The high intake of cereals and legumes in BR diet represents a source of aminoacids,
especially glutamate, alanine and cysteine. An exceptionally source of glycine, alanine, and
glutamic acid could be the Baobab, whose leaves are added in the principal Burkinabè dishes
(Table 3.2). Similar findings were observed in Hazda, one of the last hunter-gatherer
population, having Baobab leaves as part of diet (Schnorr, Candela et al. 2014). In general,
plant proteins are deficient in lysine, methionine, and tryptophan, and are much less
concentrated and less digestible than animal proteins. The absence of lysine and other
essential aminoacids in cereals, which represent the basis of the African diet, leads to an
inability to synthesize protein and ultimately could predispose to malnutrition, especially a
syndrome known as Kwashiorkor, common among children in these countries
(http://www.fao.org/docrep/t0395e/T0395E0c.htm).
Commensal bacteria can provide amino acids to the host from both dietary and endogenous
proteins. Peptides and amino acids are used as carbon, nitrogen and energy sources by both
saccharolytic and non-saccharolytic bacteria. Some saccharolytic species, such as
Prevotella, the predominant genus in BR group, are able to derive amounts of energy from
the carbon skeletons of peptides and amino acids, while others, including Enterococci and
Enterobacteria, are able to ferment both carbohydrates and amino acids.
Glutammate is the principal source of nitrogen for the host. Bacteria can make the carbon
skeletons of all amino acids and transaminate those carbon skeletons with nitrogen from
glutamine or glutamate to complete the amino acid structures. Interestingly, the observed
enrichment in beta and D-alanine metabolism represents a way to produce glucose,
especially in condition of fasting. In fact, alanine can be converted to pyruvate in the liver
by the glucose-alanine cycle, as a source of carbon for gluconeogenesis, in order to form
glucose that can be used as energy for the muscle.
Another metabolic function found in BR population is the selenocompound metabolism,
deriving from consumption of cereal grains, legumes and soybeans (Whanger 2002) (Fig.
3.9D). Selenocompounds are organometallic molecules composed by selenium, an essential
element playing critical roles for the host, such as reproduction, thyroid hormone
metabolism, DNA synthesis, and protection from oxidative damage and infection (Sunde
and Thompson 2009).
Surprisingly, metabolism of taurine and hypotaurine was enriched in BR metagenome (Fig.
3.9D). Generally, taurine is a major constituent of bile acid, important to emulsify fat.
However, taurine is also derived from cysteine, thus enrichment in cysteine metabolism
found in BR could explain this functional acquisition.
In BC metagenome, we found enrichment in aromatic aminoacid (phenylalanine, tyrosine
and tryprophan; Fig. 3.9D) that could derived from E4P (see carbohydrate metabolism),
potentially produced by the observed pentose phosphate biosynthesis (Fig. 3.9A). Such
observation is in accordance with a previous study on microbiota transplantation of obese
twin in mice (Ridaura, Faith et al. 2013). In BC we also found enrichment in cyanoaminoacid
and phosphonate and phosphinate metabolism (Fig. 3.9D), related to carbon-phosphorous
bonds contained in several natural products (C-P compounds). Among microorganisms able
to biosynthetize C-P compounds there are Actinobacteria, found abundant in BC microbiota.
In EU metagenome, we observed enrichment in metabolism of aminoacids, such as arginine,

66
proline, valine, leucine, isoleucine, histidine and tryptophan, and lysine biosynthesis and
degradation (Fig. 3.9D). These aminoacid can originate from the animal-protein rich food,
typical of western population. Good sources of lysine are high-protein foods such as eggs,
meat (specifically red meat), and beans. Regarding essential branched-chain aminoacid
(BCAAs, such as valine, leucine, and isoleucine) our results are in agreement with recently
analyzed metagenome of an Italian population (Rampelli, Schnorr et al. 2015). It is
noteworthy that, metabolic function related to BCAAs and aromatic aminoacid are enriched
in obese compared to lean individuals (Newgard, An et al. 2009), and increased level in
BCCA is associated with the risk of developing future type 2 diabetes (Wang, Larson et al.
2011). These findings suggest that microbiome of EU population could contribute to
acquisition of metabolic conditions predisposing to metabolic syndrome, typical of western
countries. Moreover, the breakdown of basic amino acids by commensal bacteria is a source
of SCFAs, as demonstrated by Smith and Macfarlane (Smith and Macfarlane 1997). In
general, alanine, glycine and cysteine are fermented by bacteria to acetate, propionate and
butyrate. Serine is fermented to acetate and butyrate, while threonine is mainly metabolised
to propionate. The main products of methionine metabolism are propionate and butyrate.
Interestingly, metabolism of these aminoacids was found enriched in BR, and, together with
fiber and polysaccharide fermentation, could contribute the abundance in SCFAs observed
in fecal samples of BR. Regarding aminoacid metabolism enriched in EU group, lysine and
arginine, and deamination of histidine produce butyrate and acetate, while BCCAs are
slowly fermented by colonic bacteria. Thus, diet and the functional acquisitions of bacteria
metagenome to metabolize aminoacids or fermented fiber and polysaccharides rich foods
could explain the different levels of SCFAs observed in our studied populations.
3.3.6 Vitamin and cofactor metabolism
Evidences showed that commensal colonic bacteria are a significant source of a range of
vitamins to the host (Hill 1997). Unlike dietary vitamins, which are mainly absorbed in the
proximal part of the small intestine, the uptake of microbial vitamins predominantly occurs
in the colon (Said and Mohammed 2006). Among this, the B vitamins, including thiamin,
riboflavin, niacin, folate, vitamin B6, vitamin B12, biotin and pantothenic acid, cooperate
collectively and individually to perform many different processes, such as the release of
energy deriving from carbohydrates, proteins and fats, or regulation of immune cells
(Brestoff and Artis 2013).
Regarding KEGG categories related to cofactors and vitamin metabolism, in BR
metagenome we found pholate biosynthesis, riboflavin metabolism, vitamin B6 and retinol
metabolism, nicotinate and nicotinamide metabolism, ubiquinone and terpenoid
biosynthesis. Altogether, these functional acquisitions are related to cofactors and coenzyme
involved in oxidative reactions, energy, and carbohydrate and aminoacids metabolism.
Functional acquisition in folate metabolism in BR metagenome is essential for DNA, RNA
building and for metabolizing of amino acids which are required for cell division.
Riboflavin is involved in enzymatic reactions, including oxidation of pyruvate, α-
ketoglutarate, and branched-chain amino acids.
Vitamin B6 is as a coenzyme involved in amino acid, glucose, and lipid metabolism.

67
Nicotinate, also known as niacin, and nicotinamide are precursors for generation of
coenzymes, NAD+ and NADP+, which are essential for redox reactions. Ubiquinone and
other terpenoid-quinone are electron carriers in oxidative phosphorylation, important to
energy metabolism.
Retinol is the active form of vitamin A, a fat-soluble vitamin involved in promoting vision,
strong bones and healthy skin. The body can also convert retinal and retinoic acids,
compounds found in carotene, into retinol. Mango and papaya, normally present in the diet
of BR population, are sources of carotenoids. A recent study showed that the bioavailability
of β-carotene from papayas was approximately three times higher than that from carrots and
tomatoes, generally assumed from European children (Schweiggert, Kopec et al. 2014).
Thus, this finding could explain the enriched functional acquisition retinol metabolism of
commensal bacteria in BR.
In BC metagenome, lipoic acid and biotin metabolism were enriched. Lipoic acid is
covalently bound to specific proteins, which function as cofactors for several important
mitochondrial enzyme complexes in antioxidant reactions. Biotin is a coenzyme for
carboxylase enzymes, involved in the synthesis of fatty acids, isoleucine, and valine, and in
gluconeogenesis.
In EU, functions related to porphyrin and chlorophyll metabolism, panthotenate and CoA
metabolism, and thiamine metabolism were enriched. Porphyrins are essential cofactors of
many proteins including cytochrome, haemoglobin and myoglobin. Porphyrin biosynthesis
is known in proteobacteria and requires the formation of δ-aminolevulinic acid by the
reaction of glycine with succinyl-CoA from the citric acid cycle.
Regarding thiamine, the best characterized form is thiamine pyrophosphate (TPP), a
coenzyme involved in the catabolism of sugars and amino acids. Interestingly, thiamine
metabolism is related to sulfur metabolism observed enriched in EU metagenome.
3.3.7 Lipid metabolism
Studies on animal models showed that commensal bacterial can regulate and maintain the
lipid homeostasis. In gnotobiotic mice, bacterial species associated with a high-fat, high-
sugar diet promote obesity (Turnbaugh, Ridaura et al. 2009). In mice living in a germ-free
environment showed that they have lower fat mass compared to their conventionally reared
counterparts, a phenotype that is associated with a diminished capacity for harvesting energy
from ingested food and a broadly altered lipid profiles (Backhed, Ding et al.
2004;Turnbaugh, Ley et al. 2006). Moreover, alteration in lipid homeostasis in germfree
mice can be partially rescued by colonization with human fecal content (Martin, Dumas et
al. 2007).
Commensal bacteria might also regulate immune cell function through the fatty acidy sensor
proteins in the peroxisome proliferator activated receptor (PPAR) family of nuclear receptors
that recognize endogenous and exogenous lipid moieties (Odegaard, Ricardo-Gonzalez et al.
2007;Hong, Kidani et al. 2012).
Our analysis reveal differential functional acquisition related to lipid metabolism
characterized the metagenome of the four studied popolations. In BR we found enrichment
in arachidonic acid, fatty acid biosynthesis and lipid biosynthesis proteins (Fig. 3.9C). In

68
particular, bacterial biosynthesis of arachidonic acid could be involved either for
phospholipids of cell membranes building or as key inflammatory intermediate.
In BC we observed enrichment in primary and secondary bile acid biosynthesis, and linoleic
metabolism, an essential polyunsaturated fatty acid involved in the biosynthesis of
arachidonic acid (Fig. 3.9C). Interestingly, commensal bacteria deconjugate bile acids,
synthesized in the liver from cholesterol-derived precursor molecules, and convert primary
into secondary bile acids (Brestoff and Artis 2013). Synthesis of bile acids is one of the
predominant mechanisms for the excretion of excess cholesterol, and is involved in intestinal
absorption of fat-soluble vitamins. In addition, bile acids act as signaling molecules that
regulate metabolic and immune cell homeostasis.
In EU we found an enrichment in glycerophospholipid and fatty acid metabolism and
synthesis and degradation of ketone bodies (Fig. 3.9C), clearly derived from lipid rich diet.
In particular, synthesis and degradation of ketone bodies could be derived from glucose
production from non-carbohydrate sources, and it could explain the observed enrichment in
butanoate metabolism.
3.3.8 Metabolism of terpenoids and polyketides, secondary metabolism, and antibiotic
biosynthesis and resistance
A wide range of natural compounds are produced by human-associated bacteria (Donia and
Fischbach 2015). These molecules cover the entire spectrum of chemical classes that have
been isolated from terrestrial and aquatic bacterial species and include well-characterized
mediators of microbe-host and microbe-microbe interactions.
Terpenoids are a subclass of the prenyllipids (terpenes, prenylquinones, and sterols). The
major microbiota-derived terpenoids are not synthesized de novo by the microbiota, but they
are derivatives of the host-derived primary bile acids cholic acid (CA) and chenodeoxycholic
acid (CDCA). CA and CDCA are biosynthesized in the human liver, conjugated to taurine
or glycine, and then excreted in bile. Numerous biochemical transformations of CA and
CDCA are performed by gut bacteria, including deconjugation from taurine and glycine,
oxidation, epimerization and esterification.
Alkaloids are biosynthetized principally by aminoacids, while polyphenols are formed by
malonate/acetate pathway. Polyketides are large classes of natural organic compounds
produced by living organisms (soil and aquatic bacteria) in order to give survival advantage.
The biosyntheses of polyketides share striking similarities with fatty acid biosynthesis, and
many of the commonly used antibiotics, such as tetracycline and macrolides, are produced
by polyketide synthases.
In BR microbiome we observed enriched functions related to isoquinoline alkaloid
biosynthesis, tropane, piperidine and pyridine alkaloid biosynthesis, prenyl transferases,
zeatin and siderophore biosynthesis. These functions are certainly related to a high
consumption of plant derived foods. In BC, we found enrichment in phenylpropanoid and
carotenoid biosynthesis. On the contrary, in EU we found an enrichment in flavone and
flavonol biosynthesis, stilbenoid diarylheptanoil and gingerol biosynthesis, polyketides
sugar unit biosynthesis.
Then, we focused on functional acquisitions related to antibiotic biosynthesis and resistance.

69
In the four populations, we observed differential and progressively increased antibiotic
biosynthesis functions, passing from rural to urban populations. In particular we found
acquired streptomycins biosynthesis function in BR metagenome, novobiocin biosynthesis
in BT, butirosine, neomycin and ansamycin biosynthesis in BC, and beta-lactamase
resistance, penicillin and cephalosporin biosynthesis, and tetracyclin biosynthesis in EU
(Fig. 3.9E-F). In natural environment, antibiotics production is a mechanism of competition
among bacteria that provide a selective benefit for the producing strain. The most of the
antibiotics derived from biomolecules and secondary metabolites produced by soil-dwelling
microorganisms (Davies and Davies 2010), and microbiota of rural populations could
acquired this potential for the unique scope of survival and competition among bacteria. The
observed beta-lactamase resistance and the cephalosporin biosynthesis acquisitions in EU
metagenome confirmed that the use of antibiotics in agriculture, in livestock and medical
practice could induce functional acquisitions related to antibiotic resistance, an emerging
and dramatic problem in industrialized and globalized populations.
3.3.9 Xenobiotics metabolism
In BR metagenome, we found enrichment in toluene, naftalene and ethylbenzene
degradation (Fig. 3.9H). This pathway referred to aromatic organic compounds metabolism
that include several compounds containing benzene ring, including phenolic compounds. As
observed in a recent study (Barelli, Albanese et al. 2015) on functional acquisitions related
to xenobiotic degradation by microbiota of red colobus monkeys eating several plant species
in the forest of Tanzania, we could hypothesize that the presence of widespread plants and
vegetables rich in tannins and phenolic compounds in rural village of Burkina Faso, require
metabolic acquisition to digest xenobiotics by commensal bacteria, rather than acquired
functions related to environmental contaminant degradation.
In urbanized BC and EU metagenomes, chloralkene, bisphenol, dioxin and xylene
degradation and benzoate and 1,1,1-Trichloro-2,2,bis-4-chlorophenyl-ethane-DDT
degradation were enriched functions, respectively (Fig. 3.9H). The degradation of these
xenobiotics by microbiota of these urban populations can be considered a functional
response of bacterial to exposure of toxic compounds derived by pollution (especially
chloroalkene and dioxin) of industrialized and urban environment. Among benzoate
compounds, sodium benzoate, a food additive with preserving role, known as E211, is most
widely used in acidic foods, carbonated drinks, jams and fruit juices. Furthermore, several
chlorinated organic insecticide are persistent contaminant in the environment and potentially
in cultivated foods.

70
Fig. 3.9 Differences in bacterial functional classes (KEGG categories level 3). Functional pathways
significantly enriched in African and European populations based on PICRUSt prediction. LEfSe
results indicate a sequentially significant ranking among populations (Alpha value=0.05 for the
factorial Kruskal-Wallis test among classes). The threshold for the logarithmic LDA score was 2.0.
3.4 Conclusions
Studies on traditional and culturally diverse populations living in isolation from the
globalized world, and characterization of gut microbiota across geography allowed to
observe relationships between environmental factors, lifestyle and intestinal microbial
profiles, and to evaluate the effect of variables that correlate with microbiota diversity, such
as diet, environmental exposures, and sanitation. The modification of microbiota
composition that occurs in children of the same African ethnic group that moves from rural

71
villages to small town and then to the capital city of Burkina Faso provide useful insights on
the role of the change of dietary habits and environment taking place with improvement of
socio-economic resources of the family. These observations may be considered as a model
of the changes that occur in human societies with the urbanization, until to reach modern
societies.
Across the history, from Paleolithic to Neolithic era, humans change their lifestyle from
nomadic hunter-gatherer to sedentary populations dedicated to agriculture and to food
production enough to feed themselves and their families. This life-style emerged during the
Neolithic revolution and continues in large parts of rural Africa, Asia and Latin America,
whereas had largely disappeared in Europa and North America. Subsequently, adjacent to
rural villages, humans developed small towns, where economic activity consisted primarily
of trade at markets and manufacturers on a small scale. Boulpon, Nanoro and Ouagadogu
represent three steps of human transition to urban environment, and the consequent dietary
differentiation.
The transition from rural to urban area of populations from the same ethnic group and the
same geographic region represent another piece of a puzzle, useful to complete the frame of
co-evolution among diet, gut microbiota and host. Studying in deep the modification of
dietary habits of an African ethnic group moving from a rural to an urban environment, we
observed a gradual enrichment in food variety, with increase in animal-derived products
(meat, fish and milk-derived food), processed and refined foods, and consequent increase in
fat and animal protein and reduction in fiber intake. By using a metagenomics approach, we
discovered key microbial markers that have remained relatively unaltered over hundreds of
generations, and are reliable indicators of ancient migratory patterns, as well as microbial
profiles loss in the course of urbanization, industrialization and westernization.
Interestingly, microbial profiles found enriched in microbiota of westernized populations
were found associated to IBD and other autoimmune diseases, or metabolic disorders. These
findings could explain the association between microbial profiles and the developing of
health disorders typical of the western world, especially with early-onset. Westernization
has been consistently associated with lower alpha diversity (microbial richness) and higher
beta diversity (intra-individual diversity). Microbial dispersal due to environmental
exposition and transmission in rural populations play a fundamental role in structuring the
gut microbiome. Urbanization and westernization promote limitation in microbial dispersal
due to sanitation (hygiene), medication (antibiotics overuse), together with a diet poor in
fiber and rich in fat and animal-protein based products, leading to the loss of bacterial
lineages able to ferment complex carbohydrates and produce the well-known anti-
inflammatories SCFAs. However, we should not forget that rural children either for loss of
sanitation and scarcity of food are at high risk of infectious diseases and malnutrition.
On the other hand, the importance to preserve an ancient microbiome and maintain
biodiversity has considerable repercussions for human health, especially in industrialized
and westernized populations, in which noncomunicable diseases are spread. Our study
showed properly the gradual disappear of ancient microbes during the transition from rural
to urban environment, and suggest the importance to develop strategies to preserve microbial
functional acquisitions that have been destroyed in the course of urbanization of human
populations.

72
4. Phenotype and disease course of early-onset pediatric inflammatory
bowel disease
This chapter has been reprinted* from:
Aloi M, Lionetti P, Barabino A, Guariso G, Costa S, Fontana M, Romano C, Lombardi G,
Miele E, Alvisi P, Diaferia P, Baldi M, Romagnoli V, Gasparetto M, Di Paola M, Muraca
M, Pellegrino S, Cucchiara S, Martelossi S; SIGENP IBD Group.
Phenotype and disease course of early-onset pediatric inflammatory bowel disease.
Inflamm Bowel Dis. 2014 Apr; 20(4):597-605. doi:10.1097/01.MIB.0000442921.77945.09.
*Copyright © 2014 Crohn’s & Colitis Foundation of America, Inc.
4.1. Scientific Background
The inflammatory bowel diseases (IBD), Crohn’s disease (CD) and ulcerative colitis (UC),
are complex polygenic disorders, resulting of an interplay between genetic, environmental,
and immunological factors leading to a dysregulated immune response of the host to the
intestinal microbiota (Aujnarain, Mack et al. 2013;Fiocchi 2013). Up to 25% of patients first
present during childhood or adolescence, with early-onset (EO) (0–5 yr) and very early-onset
(VEO) diseases (0–2 yr) increasingly reported (Marx, Seidman et al. 2002;Gupta, Bostrom
et al. 2008;Nieuwenhuis and Escher 2008;Maisawa, Sasaki et al. 2013). Although data on
EO forms are scattered, they seem to be characterized by a unique phenotype, extensive and
aggressive, which affect the management of this age group (Gupta, Bostrom et al. 2008).
Moreover, prior reports suggest that EO-IBD differ epidemiologically and are distinguished
by a predominant colonic involvement and a greater impact of genetic predisposition,
compared with older age of onset (Ravikumara and Sandhu 2006;Sauer and Kugathasan
2010). From this point of view, EO disease represents an exceptional model to study the
initial host immune response to characterize genotype–phenotype relations and identify
environmental factors influencing disease development, as well as to evaluate the natural
history of the disease(Oliva-Hemker and Fiocchi 2002;Heyman, Kirschner et al.
2005;Scherr, Essers et al. 2009). Understanding the factors that contribute to early age of
onset could potentially facilitate intervention strategy development, thereby influencing
disease outcome and risk of long-term sequelae. Recently, an increased interest for early
forms of disease came from the discovery of Crohn’s-like colitis, very severe and not
responding to conventional therapies, associated with a defect of the receptor of interleukin
10 (IL-10R) or IL-10 itself, in a subset of patients developing the disease within the first
months of life (Glocker, Kotlarz et al. 2009;Begue, Verdier et al. 2011). Such severity and
EO point to probable monogenetic diseases as opposed to the multigenetic trait observed in

73
the known forms of IBD. This discovery opens new horizons in the knowledge of the
pathogenesis of the disease; hence, a better clinical definition of early and very early forms
of disease may lay the foundation for further studies of genotype–phenotype correlation.
Thus, primary aim of this study was to evaluate the phenotype and course of EO-IBD (0–5
yr) compared with pediatric later-onset disease (6–11 and 12–18 yr). Moreover, as a
secondary outcome, within the 0- to 5-year group, we evaluated potential differences in
presentation and behavior of VEO forms of the disease (0–2 yr) than those presenting
between 3 and 5 years.
4.2 Materials and Methods
4.2.1 Patients and clinical features
Italian pediatric IBD centers belonging to the Pediatric Gastroenterology, Hepatology and
Nutrition Italian Society in 2008 established a prospective registry to collect demographic,
clinical, and epidemiologic data from pediatric patients with IBD. The registry started at
January 1, 2009 and included patients less than 18 years with a new diagnosis of IBD. Data
of all children enrolled and stored in the registry from January 1, 2009 to April 22, 2013 (the
data retrieval date) were used for this study. Fourteen Italian sites of Gastronterology Unit
participated to this study, including the Gastroenterology unit of Meyer Children Hospital.
Institutional review board approval for the registry protocol and the informed consent and
assent forms were obtained at each site before subject enrollment and data collection. Signed
parental and patient informed consent and signed youth assent, when appropriate, were
required from all patients enrolled. Trained investigators at each center obtained information
from the medical records (electronic and paper charts). Standardized information was
entered into the registry. Data were submitted quarterly to the central repository at Pediatric
Gastroenterology and Liver Unit, Sapienza University of Rome for scrutiny of data quality,
maintenance of data integrity, data storage, and subsequent data analysis. The study end date
was defined as the date of the most recent clinic visit before April 22, 2013.
Eligible subjects included all patients with any form of IBD (UC, CD, and inflammatory
bowel disease unclassified [IBDU]) who were diagnosed before 18 years of age and followed
in the pediatric gastroenterology centers at the participating sites. Only new IBD cases,
diagnosed after January 1, 2009 were prospectively enrolled. Diagnosis of IBD was based
on clinical history, physical examination, endoscopic appearance, histologic findings, and
radiologic studies, according to Porto criteria (North American Society for Pediatric
Gastroenterology, Nutrition et al. 2007). The latter implied that ileocolonoscopy and upper
gastrointestinal endoscopy were assumed to be performed in all patients, as well as imaging
of the small bowel (except in patients with a definitive diagnosis of UC). Participating
centers were also expected to take at least 2 biopsies from each segment of the
gastrointestinal tract (esophagus, stomach, duodenum, terminal ileum, and all segments of
the colon) and to record the endoscopic and histologic findings from each segment
separately.
Allergic disorders (immunoglobulin E, skin prick, and patch tests) and infectious enteritis or
colitis (Salmonella, Shigella, Escherichia coli, Yersinia, Clostridium difficile toxins,
Entamoeba histolytica stool samples) were excluded during the initial work-up.

74
Immunological defects were also ruled out in all patients with suspected EO-IBD by
routinely testing immunoglobulin levels, autoantibodies, lymphocyte phenotyping,
granulocytes function, and oxidative burst. Mutations in the IL-10R and IL-10 genes were
also evaluated in all children with VEO forms of IBD (<2 yr). Only patients with a final
diagnosis of IBD with no other immunological (including those with confirmed IL-10R or
IL-10 axis mutations), allergic, or infectious diseases were included in the registry. If the
length of follow-up was less than 6 months, the data were excluded from the analysis. The
information retrieved for the purpose of this study included demographic features (age, sex),
family history of IBD, IBD type (CD, UC, IBDU), and disease distribution. A family history
for IBD was defined by the presence of CD or UC in first-degree relatives only.
EO-IBD was defined as a diagnosis made in patients of 0 to 5 years of age. Within this group,
VEO-IBD was defined as a diagnosis of IBD made between 0 and 2 years of age.
The disease location at the diagnosis and at follow-up was established by endoscopic and
imaging evaluations in all patients according to the availability of individual methods for
each center and reported in the registry. Disease location was described according to Paris
classification (Levine, Griffiths et al. 2011). For CD, L1 was defined as an involvement of
the terminal ileum and limited cecal disease, L2 an isolated colitis, L3 an ileocolonic disease,
L4a an upper disease proximal to Ligament of Treitz, whereas L4b distal to ligament of
Treitz and proximal to distal 1/3 ileum. For UC, proctitis (E1) was defined as an involvement
limited to the rectum (i.e., proximal extent of inflammation distal to the rectosigmoid
junction). Left sided UC (E2) was defined as an involvement limited to the portion of the
colorectum distal to the splenic flexure. Extensive UC (E3) was defined as a disease
extending proximally to the splenic flexure but distally to the hepatic flexure, whereas
pancolitis (E4) included a colitis extended proximally to the hepatic flexure.
Symptoms at onset of disease included abdominal pain, diarrhea, rectal bleeding, perianal
disease, and growth failure.
Disease activity at the diagnosis was scored by the Pediatric Crohn’s Disease Activity Index
(PCDAI)(Hyams, Ferry et al. 1991) or the Pediatric Ulcerative Colitis Activity Index
(PUCAI)(Turner, Otley et al. 2007) for CD and UC, respectively. Laboratory tests included
full blood count, C-reactive protein, erythrocyte sedimentation rate, perinuclear anti-
neutrophil cytoplasmic antibodies (p-ANCA), anti-Saccharomyces cerevisiae antibodies
(ASCA), nutritional, renal and liver function parameters. Endoscopic and imaging
examinations carried out at the diagnosis and follow-up included ileocolonoscopy,
esophagogastroduodenoscopy, enteroscopy, capsule endoscopy ultrasound with or without
oral contrast, and magnetic resonance imaging.
Medications comprised 6-mercaptopurine (6-MP)/azathioprine, methotrexate, thalidomide,
cyclosporine, biological therapy (infliximab or adalimumab), nutritional therapy, and
corticosteroids (oral [budesonide, prednisone, prednisolone] and intravenous
[methylprednisolone]). Surgical procedures included all intestinal resections.
Extraintestinal manifestations (EIMs) included skin, joint, and ocular manifestations;
pancreatitis; osteopenia; primary sclerosing cholangitis; and growth failure.
Patient data were updated every 6 months, by entering in the registry every evaluation made
by patients. Every 6 months, clinical data, PUCAI/PCDAI, medical and surgical therapy,

75
laboratory tests (those performed at diagnosis), imaging and/or endoscopic evaluation, and
complications of the disease, were reported.
For the purpose of this study, all previous information were analyzed and compared in all
patient populations. As a primary outcome of the study, recorded data of patients 0 to 5 years
(EO) were compared with those with a later onset, divided in 2 groups (6–11 and 12–18 yr).
As a secondary outcome, we evaluated within the population with EO-IBD the phenotype
and natural history of VEO (0–2 yr) forms compared with those diagnosed in children aged
3 to 5 years.
4.2.2 Statistical methods
All data were summarized and displayed as the mean 6 SD for the continuous variables.
Categorical data were expressed as frequencies and percentages. Comparison of groups was
performed using Student’s t test for unpaired data in two-group comparison and one-way
analysis of variance with Bonferroni’s test for multiple group comparison. Chi-square test
with Fisher’s correction was used to evaluate the differences for categorical variables
wherever needed. A p-value of 0.05 or less was considered significant. Odds ratios from
univariate logistic regression models were used to assess differences by age group in the
prevalence of symptoms at disease onset and laboratory values at diagnosis. The Kaplan–
Meier survival method was used to estimate the interval free from surgery during follow-up.
Differences between curves were tested using the Log-Rank test. The GraphPad statistical
package was used to perform all statistical evaluations (GraphPad Software, Inc., San Diego,
CA).
4.3 Results
4.3.1 IBD subjects
From 2009 to 2013, we identified 688 patients with a diagnosis of IBD, 182 had a length of
follow-up less than 6 months and were excluded from the analysis. Five hundred six children
met the inclusion criteria and were enrolled in the study. Fifty-four percent were males and
mean age at the diagnosis was 10.2 years (range, 0.8–18.3). Mean follow-up was 40 months
(range, 6–50). Eleven percent (n=54) of patients were in the range 0 to 5 years of age, 39%
(n=197) in 6 to 11 years, and 50% (n=255) in 12 to 18 years (Fig. 4.1). Table 4.1 highlights
the main clinical characteristics of 506 enrolled patients.

76
Fig. 4.1 Frequency of CD, UC and IBDU considering the different age range (0-5 years; 6-11 years;
12-18 years).
Table 4.1 Clinical Characteristics of 506 Children with IBD
4.3.2 Initial classification and location of the disease
All patients had a complete ileocolonoscopy under general anesthesia or deep sedation at the
diagnosis. Fifty-five percent had an esophago-gastroduodenoscopy and 48% also had an
evaluation of the small-bowel (78% CD, 21% UC): of them, 52% underwent ultrasound,
43% magnetic resonance imaging, 17% capsule endoscopy, and 6% enteroscopy. Thirty-
seven percent of patients had 2 or more methods for imaging the small bowel. At the
diagnosis, 224 were classified as CD (44%), 245 as UC (48%), and 37 as IBDU (7%). UC
was the most frequent diagnosis in EO-IBD (59%) and in 6- to 11-year-old group (53%),
compared with children of 12 to 18 years of age (42.5%) (p=0.03 versus 0- to 5-yr group),
whereas CD was predominant in the latter (p=0.0001 versus 0- to 5-yr group). A
classification as IBDU was more common in the range 0 to 5 years (22%) compared with
the other groups (7% in 6- to 11-yr and 3.5% in 12- to 18-yr group; p=0.002 and p=0.0001,

77
respectively; Fig. 5.1). Fifty percent of children with EO-CD presented an isolated colonic
disease (L2) compared with 14% in 6- to 11-year and 16% in 12- to 18-year group (P=0.005).
No significant differences were found for the other CD locations among the 3 groups,
although an isolated ileal disease (L1) was rare in 0- to 5-year group (10% versus 23% in 6–
11 yr and 52% in 12–18 yr), and an upper gastrointestinal involvement was more frequent
in younger children (30% versus 18% in 6–11 yr and 16% in 12–18 yr). Figure 4.2 shows
the CD location in all groups. Among patients with UC, 62% of patients in the 0- to 5-year
range had a pancolitis, compared with 38% of 6- to 11-year (p=0.02) and 28% of 12- to 18-
year range (p=0.002). No other significant differences were found for the other UC location
among the three groups (Fig. 4.3).
Fig. 4.2 Disease location at the diagnosis according to Paris classification in EO-CD (0–5 yr) and
later-onset CD (6–11 and 12–18 yr). L1: ileum, L2: colon; L3: ileocolon; L4: upper gastrointestinal;
p: perianal disease.
Fig. 4.3 Disease location at the diagnosis according to Paris classification in EO-UC (0–5 yr) and
later-onset UC (6–11 and 12–18 yr). E1: proctitis; E2: left-sided colitis; E3: extensive colitis; E4:
pancolitis.

78
4.3.3 Classification and Disease Extent at Follow-up
At follow-up, a change in diagnosis was reported in 2% of all patients: 40% of children in
0- to 5-year group received a change of the initial diagnosis during the follow-up, 50% of 6
to 11 years, and 10% of 12–18 years (p=0.003, 0–5 versus 12–18 yr). Among children with
EO disease initially classified as IBDU, 3 (25%) were finally diagnosed as UC, 1 (8%) as
CD, whereas 67% continued to be classified as IBDU. No significant differences were found
for disease extent at 40-month follow-up, although a higher proportion of children with EO-
CD presented an extension of the disease involving ileum and colon (L3) at the last
evaluation compared with the diagnosis (60% versus 40%; p=0.65). We did not find
significant changes in the CD and UC location at follow-up in older age groups.
4.3.4 Clinical Presentation
Table 5.2 shows the clinical presentation in the three age groups. EIMs were detected in 28%
of patients at the diagnosis: skin involvement (n=45), axial arthropathies (n=10), peripheral
arthritis/arthralgia (n=50), pancreatic involvement (n=5), and osteopenia (n=4). Growth
failure at diagnosis was reported in 22% of children. No significant differences were found
for the prevalence of EIMs among the three age groups. Other clinical variables at the
diagnosis, such as PCDAI or PUCAI, hemoglobin, white blood cell count, erythrocyte
sedimentation rate, C-reactive protein, hypoalbuminemia, positive perinuclear
antineutrophil cytoplasmic antibodies, and anti-S. cerevisiae antibodies did not differ by age
group.
4.3.5 Medical and Surgical Treatment
Fifty-seven percent of patients started corticosteroids, 35% azathioprine, 4% methotrexate,
16% nutritional therapy, 5% biologics, 2% thalidomide, and 2% cyclosporine. At the
diagnosis, no significant differences were found among the three groups in the corticosteroid
need, although at the latest follow-up, a significantly higher proportion of patients with EO-
IBD were under steroids compared with 12- to 18-year group (p<0.05). The use of other
therapies at diagnosis and follow-up (i.e., nutritional therapy, immunomodulators, and
biologics) did not significantly differ among the three groups.
Table 4.2 Prevalence of Clinical Symptoms at Presentation

79
Figures 4.4 and 4.5 show the different therapies underwent by patients. Sixty patients
underwent surgery at least once between diagnosis and last follow-up, resulting in a crude
surgical rate of 12%.
No significant differences for surgical risk were reported among the three age groups (Fig.
4.6).
Fig. 4.4 Immunomodulator and steroid therapy at diagnosis and follow-up in 0- to 5-year, 6- to 11-
year, and 12- to 18-year group. *p<0.05, 0- to 5-year versus 12- to 18-year group.
Fig. 4.5 Nutritional and biological therapy at diagnosis and follow-up in 0- to 5-year, 6- to 11-year,
and 12- to 18-year group.
Fig 4.6 Cumulative risk of surgery in 506 children with IBD according to the age at diagnosis.

80
4.3.6 Subgroup Analysis of VEO-IBD
Finally, among children with EO-IBD, we made a subgroup analysis evaluating potential
peculiarities in presentation and disease course of very early forms (0–2 yr) compared with
diseases presenting in children of 3 to 5 years of age. The diagnosis of UC was the most
common in both groups, although numerically higher in 3 to 5 years (68% versus 40%). Both
groups were characterized by an extensive disease at the diagnosis, pancolonic involvement
in UC, and an isolated colitis for CD. Upper gastrointestinal involvement was more common
in children of 3 to 5 years than the very younger, although the difference was not significant.
Other variables at the diagnosis and at follow-up, i.e., sex, family history for IBD, delay of
the diagnosis (>6 months), EIMs, mean PUCAI and PCDAI at the diagnosis, C-reactive
protein, and perinuclear antineutrophil cytoplasmic antibodies at the diagnosis and changes
of the diagnosis at follow-up did not differ between the 2 groups (Table 4.3).
Table 4.3 Clinical Characteristics of EO- and VEO-IBD
4.4 Discussion
Reports of pediatric IBD have been published for several years (Sawczenko and Sandhu
2003;Griffiths 2004;Paul, Birnbaum et al. 2006). Recently, evidence for increased incidence
of IBD in young children and the identification of early forms of severe disease have
represented a significant step forward the understanding of the pathogenesis underlying IBD,
determining renewed interest in the younger age group (Cannioto, Berti et al. 2009;Glocker,
Kotlarz et al. 2009;Begue, Verdier et al. 2011;Shah, Kammermeier et al. 2012). The most
relevant discovery in this field has been the recognition of forms of Crohn’s-like colitis with
perianal involvement and onset in the first months of life, associated with a defect of IL-10R

81
or IL-10 itself (Glocker, Kotlarz et al. 2009;Begue, Verdier et al. 2011). These diseases
present a Mendelian pattern of heritability, differently to the multigenetic trait observed in
the known forms of IBD, adding them to the group of primary immunodeficiencies resulting
in severe dysregulation of the intestinal immune system (Shah, Kammermeier et al. 2012).
For this reason, we did not included these forms in the registry and in this study. Our study
not only adds new data on the peculiarities of EO-IBD, in terms of phenotype and disease
course, but also represents a full application of the Paris classification of IBD in a large
population of children. Detailed follow-up of 506 pediatric patients followed in the main
tertiary referral centers for IBD in Italy has allowed us to evaluate these findings, particularly
the initial clinical presentation and the disease progression. Data were collected by a
structured prospective registry, including all newly diagnosed pediatric IBD patients in Italy
from January 1, 2009. Our results confirm that the phenotype of pediatric IBD patients
differs according to age, and that the EO disease is extensive and severe already at the
presentation. Clinical data on the EO-IBD are scarce because this age group represents only
a small portion of the pediatric population. Griffiths (Griffiths 2004) in a cohort of children
with IBD (n=503) found 4% to be less than 5 years at diagnosis. More recently, Gupta et al
(5) presented their results in 600 children with CD: 9% of them were 0 to 5 years old at the
time of diagnosis. In our cohort, 11% (n=54) were less than 5 years at the time of diagnosis
and 4% less than 2 years. Among the younger children, the diagnosis of UC was the most
common, although a significant number of patients received a diagnosis of IBDU (22%).
These data are similar to those reported in 2002 by Mamula et al. (Mamula, Telega et al.
2002) showing an indeterminate colitis in 23% of 82 children with EO-IBD. Strikingly,
many of our children with IBDU maintained this diagnosis during the follow-up, suggesting
the strain of making a definitive diagnosis in younger children. During the course of the
disease, diagnosis changes occurred more frequently in younger than older children,
although the difference was not significant. We cannot exclude that the small number of
younger children has influenced the statistical significance of this result. Overall, our
population of childhood-onset IBD was characterized by a widespread anatomical
involvement in all age groups. CD presented with an extensive phenotype, regardless of the
age at the diagnosis. EO-CD was characterized by significantly higher rates of isolated
colonic CD, compared with older children. These data are consistent with that reported by
Heyman et al (Heyman, Kirschner et al. 2005) from the North American Pediatric IBD
Consortium Registry. In 1370 children, the prevalence of isolated colonic disease was
significantly higher in younger (less than 8 yr of age) compared with older children. Paul et
al (Paul, Birnbaum et al. 2006) reported data from 413 children with IBD and compared
children presenting before and after the age of 5 years. In the EO group, 76% had an isolated
colonic disease, 34% ileocolonic, whereas 0% had ileal involvement only. Conversely, older
children mainly presented with ileocolonic involvement (48%). Also in our cohort, the
proportion of patients with an ileocolonic involvement at the diagnosis was higher in older
children. We also found that one-third of younger patients presented an upper
gastrointestinal involvement already at the diagnosis. This result is remarkable because, to
our knowledge, there are no previous studies on EO-IBD indicating the involvement of the
upper gastrointestinal tract in this age group. Our study, by using the Paris classification,
allowed us to accurately define this finding. Overall, 6% of our pediatric population

82
presented lesions of the upper gastrointestinal segment. This figure is close to prior reports
in children (Vernier-Massouille, Balde et al. 2008;de Bie, Paerregaard et al. 2013). More
than half of our patients underwent an upper and lower endoscopy at the diagnosis, and
almost half also small-bowel imaging. The wide range of investigation may explain the high
prevalence of upper gastrointestinal involvement. Nevertheless, our analysis based on the
Paris classification, seem to confirm the significant differences between CD location in
pediatric-onset, notably EO disease and adult onset CD (Gower-Rousseau, Vasseur et al.
2013). Overall, an extensive disease location was also demonstrated for pediatric UC,
although the proportion of patients having a pancolitis already at the diagnosis was
significantly higher in younger than older children. Our study not only is consistent with
previous data indicating a widespread extension of pediatric UC (Van Limbergen, Russell
et al. 2008;Aloi, D'Arcangelo et al. 2013;Levine, de Bie et al. 2013), but directly compares
early- with later-onset cohort in the same population of pediatric patients (62% of younger
children presented a pancolitis at the diagnosis compared with 38% in older group). We did
not find a high overall rate of disease extension at follow-up; thus at the end of the study,
the disease extent was similar to that at the diagnosis. These data are, somewhat at variance
with other pediatric studies, suggesting a high rate of disease extension in pediatric UC and
CD (Van Limbergen, Russell et al. 2008). One explanation could be the short follow-up of
our study (40 mo). Longer, prospective studies on the disease course of EO-IBD may
confirm these data. In terms of clinical presentation, rectal bleeding was the most common
symptom in younger children, whereas the older age group presented with more varied
symptoms. This figure can be explained by the homogeneous colonic involvement in the EO
disease, while multiple locations with more variable clinical pictures were found in later-
onset forms. Several data suggest that the EO-IBD present a stronger genetic impact than the
later-onset disease (de Ridder, Weersma et al. 2007;Ruemmele 2010;Bianco, Zanin et al.
2013). Differently from these reports, we did not find significant differences for family
history between the EO and the later-onset groups. One explanation may lie in the fact that
we have only considered the first-degree relatives, not extending to the rest of the family.
This could have reduced the number of patients with a family history in our cohort.
Subsequent studies in this population to investigate the impact of genetic background and
potential combinations of genetic and environmental influences in disease onset are therefore
needed. Some data suggest a higher “severity” in terms of behavior and disease course of
EO-IBD (Van Limbergen, Russell et al. 2008). We evaluated the need of corticosteroids,
immunomodulators, biologics, and surgery in an attempt to identify differences in severity
according to age. We did not find significant differences in medical therapeutic strategy at
the diagnosis among the 3 groups, indirectly suggesting a similar response to treatment
regardless of age. Although, at the maximum follow-up, a significant number of children in
the 0- to 5-year age group needed steroids. This might suggest a more aggressive disease
than in older children, although the use of other drugs was not different. Moreover, our data
suggest a similar. However, evaluation of these results as a surrogate for severity is difficult,
and confounded by various factors, particularly the variability among individual physicians
in the use of these agents. Sixty patients underwent surgery at least once between diagnosis
and maximal follow-up, resulting in a crude surgical rate of 12%. This figure is close to
previous French and North American studies (Romberg-Camps, Dagnelie et al.

83
2009;Schaefer, Machan et al. 2010). We did not find differences according to age, probably
the short time of follow-up influenced this result. This study has some limitations. Our
registry is based on patient data from large regional referral centers, which may not allow
extrapolation to the real Italian pediatric population with IBD. However, children with
chronic disease tend to be referred to tertiary referral centers such as these, and unlike adults
with IBD, they are rarely treated exclusively by a primary care pediatrician. In summary,
our data suggest not only that the number of EO-IBD is steadily increasing, but also that the
phenotype is extensive and aggressive already at the onset of the disease. The widespread
location of CD and UC, notably younger patients, may suggest the use of
immunomodulatory and biologic agents early in the course of the disease. Nevertheless,
those therapies should be ideally targeted on those patients with a more “severe” disease,
thus future studies on genetic, clinical, and serologic risk factors for a disabling course in
EO-IBD are warranted. Genetic impact does not seem significant in our population,
suggesting that environmental triggers play a crucial role in the pathogenesis of EO disease.
Several arguments indicate that a change of the intestinal microbiota, probably secondary to
changes in alimentary habits, along with particularly sterile living conditions make
individuals prone to developing IBD, and this could probably be important also in younger
children (Schirbel and Fiocchi 2011;Cucchiara, Stronati et al. 2012). The identification of
different clinical forms of EO disease, through the analysis of genotype–phenotype
correlations, the identification of specific genotypes, and particularly combinations of
genetic and environmental influences in disease onset, could consent in the near future to
typify the disease already at onset, allowing specific therapies for the individual patient.

84
5. Alteration of fecal microbiota profiles in juvenile idiopathic arthritis.
Associations with HLA-B27 allele and disease status
This chapter has been reprinted* from:
Di Paola M, Cavalieri D, Albanese D, Sordo M, Pindo M, Donati C, Pagnini I, Giani T,
Simonini G, Paladini A, Lionetti P, De Filippo C, Cimaz R.
Alteration of Fecal Microbiota Profiles in Juvenile Idiopathic Arthritis. Associations with
HLA-B27 Allele and Disease Status.
Frontiers in Microbiology 2016 Oct 26;7:1703. doi: 10.3389/fmicb.2016.01703
* Copyright© 2016 Di Paola M, Cavalieri D, Albanese D, Sordo M, Pindo M, Donati C,
Pagnini I, Giani T, Simonini G, Paladini A, Lionetti P, De Filippo C, Cimaz R.
This is an open-access article distributed under the terms of the Creative Commons
Attribution License (CCBY).
5.1 Scientific background
Characterization of bacterial commensal communities in autoimmune and inflammatory
diseases is a topic of great interest for understanding the role and interaction of intestinal
microbiota with the host immune system. It is known that the gut microbiota is shaped by
several environmental factors, including dietary habits, antibiotics, infectious agents, and air
pollution (De Filippo, Cavalieri et al. 2010;David, Materna et al. 2014;Salim, Kaplan et al.
2014), and in turn, that microbiota shapes the immune system, modulating homeostasis in
healthy status individuals or promoting inflammation when dysbiosis occurs. Recent
findings demonstrate that alteration in the equilibrium among commensal bacteria is
associated not only with Inflammatory bowel disease (IBD), allergy, diabetes and celiac
disease (Cheng, Palva et al. 2013), but also with rheumatoid arthritis (Vaahtovuo, Munukka
et al. 2008;Sandhya, Danda et al. 2016;Scher, Littman et al. 2016). Juvenile idiopathic
arthritis (JIA) is the most common chronic rheumatic disease in children, and comprises a
clinically heterogeneous group of conditions characterized by chronic arthritis, synovial
inflammation and erosion of bone and cartilage (Ravelli and Martini 2007). According to
several factors, including the number of affected joints, JIA is divided in psoriatic,
oligoarticular (up to four affected joints), polyarticular (five or more affected joints) (Oberle,
Harris et al. 2014), and enthesitis-related arthritis (ERA), in which entheses (attachments of
tendons and ligaments to bone) are affected. ERA accounts for 10%–20% of JIA and is
considered the equivalent of spondyloarthropathy, a disease frequently characterized by
clinical and subclinical intestinal involvement (Bryan and Rabinovich 2014;Oberle, Harris
et al. 2014;Aggarwal and Misra 2015).

85
Immunological, genetic and environmental factors are involved in the pathogenesis of ERA
(Stoll, Kumar et al. 2014;Gmuca and Weiss 2015). Gene variants in the Major
Histocompatibility Complex, especially the HLA-B27 alleles, have been identified as
predisposing factors (Gmuca and Weiss 2015).
Alterations of gut microbiota (dysbiosis) and a decrease in gut microbiota richness (Li, Wang
et al. 2014;Collado, Rautava et al. 2015;Rogers 2015) are emerging as factors associated
with the development of inflammatory and systemic autoimmune diseases (Yeoh, Burton et
al. 2013;Longman and Littman 2015). Of great interest is the understanding of dysbiosis as
a trigger or a reflection of autoimmune and inflammatory disorders (Chung and Kasper
2010;Stoll, Kumar et al. 2014), in fact, also autoimmunity can drive instability of the gut
microbial ecosystem.
Studies in germ-free animal models reveal relationships between microorganisms, mucosal
immunity, and joint inflammation (Taurog, Richardson et al. 1994;Rath, Herfarth et al.
1996;Longman and Littman 2015). Recent studies in humans suggest that alteration of oral
and gut microbiota and an increase in leaky gut could trigger systemic joint inflammation in
the context of pre-existent autoimmunity (Scher, Sczesnak et al. 2013;Brusca, Abramson et
al. 2014;Costello, Ciccia et al. 2014;Taneja 2014;Longman and Littman 2015;Scher, Ubeda
et al. 2015;Zhang, Zhang et al. 2015). However, although arthritis susceptibility has been
linked to the gut microbiome, and it has proposed that in synovial fluids the presence of pro-
arthritogenic bacterial DNA, deriving by circulating intestinal bacterial products, may
promote synovial inflammation ((Kempsell, Cox et al. 2000;Gerard, Wang et al. 2001;Moen,
Brun et al. 2006;Oberle, Harris et al. 2014), a causal relationship between bacterial infection
and onset of rheumatological diseases has not yet been firmly demonstrated. Further studies
on leaky gut syndrome could clarify the presence of bacterial products circulating and
influencing the systemic immune response, also in light of the presence of bacteria in non-
rheumatoid arthritis controls (Kempsell, Cox et al. 2000), and of potential microbial
contamination found in amplification technique of 16S rDNA, as previous observed (Grahn,
Olofsson et al. 2003). A targeted-metagenomics approach can provide an in-depth
characterization of microbial communities, allowing investigation of correlations between
microbiota composition and human pathologies (Lozupone, Stombaugh et al. 2012).
In this study, we characterized and compared the gut microbiota of JIA patients, affected by
enthesitis-related arthritis (JIA-ERA) and polyarticular JIA (non-enthesitis-related arthritis,
n-ERA), with healthy subjects (HS), in order to define specific microbial "pro-arthritogenic"
profiles.
5.2 Materials and Methods
5.2.1 Sampling of subjects
We enrolled 29 JIA patients (13 males and 16 females, age range 2-18 years), 19 of whom
were affected by enthesitis-related arthritis (ERA) and 10 by polyarticular JIA (n-ERA).
Exclusion criteria were: acute diarrhea, infectious gastroenteritis, antibiotic treatment in the
previous 3 months, and diagnosis of chronic gastrointestinal disease. A total of 29 healthy
children and adolescents (11 males and 18 females; age range 2-18 years) not affected by
autoimmune and inflammatory conditions, infectious gastroenteritis, or chronic
gastrointestinal disease, were enrolled as controls.

86
We collected a fecal sample from each subject, and a second one from 17 ERA patients three
months later, in order to evaluate microbiota variability. We also gathered clinical
information, including: enthesitis and arthritis localization, age of onset, HLA-B27 status,
family history of ankylosing spondylitis or other HLA-B27-related diseases, comorbidities,
laboratory parameters (C Reactive Protein, Erythrocyte Sedimentation Rate, ANA and
pANCA autoantibody positivity), and pharmacological treatments (Table 5.1). None of the
patients underwent treatment with proton pump inhibitors (PPIs). Active disease was defined
by the presence of active arthritis and/or enthesitis at the time of stool sampling. As reported
in Table 5.1, a total of 4 JIA-ERA and 4 JIA-nERA patients had clinically active disease.
Fecal calprotectin (Aomatsu, Yoden et al. 2011) was also assessed by ELISA assay for
subclinical intestinal inflammation (Eurospital, Trieste, Italy). Parents or guardians gave
written informed consent for fecal samples and clinical data collection of their children. The
study protocol was approved by the Ethics Committee of the Meyer Children’s Hospital,
Florence, Italy (Protocol ref. Nov 12th, 2013), and carried out in accordance with the
approved guidelines.
5.2.2 DNA extraction
Fecal samples were preserved in RNAlater (Qiagen) at 4°C for the first 48 h, and kept at
−80°C until DNA extraction. Bacterial genomic DNA extraction and quality control were
carried out following our previous protocol (De Filippo, Cavalieri et al. 2010).
5.2.3 Pyrosequencing
For each sample, we amplified the 16S rRNA gene using the special fusion primer set
specific for V5-V6 hypervariable regions and corresponding to primers 784F and 1061R
described by Andersson et al. (Andersson, Lindberg et al. 2008), and using the FastStart
High Fidelity PCR system (Roche Life Science, Milano, Italy). The 454 pyrosequencing was
carried out on the GS FLX+ system using the XL+chemistry following the manufacturer
recommendations (see materials and methods in chapter 3).
5.2.4 Data analysis
Pyrosequencing resulted in a total of 2`180`826 16S rDNA reads with a mean of 29`078
sequences per sample. Average sequence lengths were 290 nt (±SD 45) and 286 nt (±SD 50)
for the first and second run, respectively. Raw 454 files were demultiplexed using Roche's
.sff file software, and available at the European Nucleotide Archive
(http://www.ebi.ac.uk/ena/data/view/PRJEB11846) under the accession study ERP013262.
Reads were pre-processed using the MICCA pipeline (version 0.1,
http://compmetagen.github.io/micca/) (Albanese, Fontana et al. 2015). Forward and reverse
primer trimming and quality filtering were performed using micca-preproc truncating reads
shorter than 280nt (quality threshold=18). Denovo sequence clustering, chimera filtering and
taxonomy assignment were performed by micca-otu-denovo (parameters -s 0.97 -c).
Operational Taxonomic Units (OTUs) were assigned by clustering the sequences with a
threshold of 97% pair-wise identity, and their representative sequences were classified using
the RDP software version 2.7 (Wang, Garrity et al. 2007). Template-guided multiple

87
sequence alignment was performed using PyNAST57 (version 0.1) (Caporaso, Bittinger et
al. 2010) against the multiple alignment of the Greengenes 16S rRNA gene database
(DeSantis, Hugenholtz et al. 2006) filtered at 97% similarity. Finally, a phylogenetic tree
was inferred using FastTree (Price, Dehal et al. 2010) and micca-phylogeny (parameters: -a
template-template-min-perc 50). Sampling heterogeneity was reduced by rarefaction,
obtaining 12,964 sequences per sample.
Chao1 index and Shannon entropy (indicators of alpha diversity) and UniFrac (Lozupone
and Knight 2005) and Bray-Curtis dissimilarities (indicators of beta diversity) were
calculated using the phyloseq package (McMurdie and Holmes 2014) of the R software suite.
Exploratory analysis was performed by Principal coordinates analysis (PCoA) using the
phyloseq package of the R software suite. Multiple-rarefaction PCoA plots (“jackknifed”
PCoA plots) (Lozupone, Lladser et al. 2011) were computed to assess the robustness of the
beta-diversity analyses.
The significance of between-groups differentiation on the UniFrac distances and Bray-Curtis
dissimilarity was assessed by PERMANOVA using the adonis() function of the R package
vegan with 999 permutations.
To compare the relative abundances of OTUs among the three groups of subjects, the two-
sided, unpaired Wilcoxon test was computed, removing taxa not having a relative abundance
of at least 0.1%, in at least 20% of the samples, and using the function mt() in the phyloseq
library and the p-values were adjusted for multiple comparison controlling the family-wise
Type I error rate (minP procedure). Further significant differences in bacterial taxa were
supported by non-parametric White’s test and Welch’s test by using STAMP (Parks, Tyson
et al. 2014), and p-values were adjusted for multiple comparisons by Storey FDR, as
proposed in STAMP.
On the basis of the relative abundances, the metagenomic biomarker discovery and related
statistical significance were assessed using the linear discriminant analysis (LDA) effect size
(LEfSe) method (Segata, Izard et al. 2011). LEfSe uses the Kruskal–Wallis rank-sum test to
identify features with significantly different abundances between assigned taxa compared to
the groups, and LDA to estimate the size effect of each feature. An alpha significance level
of 0.05, either for the factorial Kruskal-Wallis test among classes or for the pairwise
Wilcoxon test between subclasses, was used. A size-effect threshold of 2.0 on the
logarithmic LDA score was used for discriminative microbial biomarkers.
In order to predict how taxonomic differences between fecal microbiota of the three groups
impact their microbial metabolic potential, we applied PICRUSt (Phylogenetic Investigation
of Communities by Reconstruction of Unobserved States) (Langille, Zaneveld et al. 2013),
a computational approach useful to infer the functional contribution of microbial
communities on 16S rDNA sequencing data set. PICRUSt implements an extended
ancestral-state reconstruction algorithm to predict which gene families are present, and then
combines gene families to estimate the significant differences in the main functional classes
(KEGG categories) of the composite metagenome. From a OTUs table with associated
Greengenes identifiers, we obtained the final output from metagenome prediction as an
annotated table of predicted gene family counts for each sample, where the encoded
functions of each gene family are orthologous groups or other identifiers such as KEGG

88
orthologs (KOs). The functional pathways discovery and related statistical significance were
assessed by LEfSe.
5.3 Results
5.3.1 Clinical features of JIA patients
We collected clinical features, as well as comorbidities and therapies, for each enrolled
patient at the time of fecal sampling (Table 7.1). As known, due to the two different subsets
of JIA, females are affected from polyarticular JIA two to four times more often than males
(Oberle, Harris et al. 2014). In our cohort, most of the enrolled JIA-ERA patients were males
(13/19), while all JIA-nERA patients were females (10/10). Thus, we evaluated the
sex/gender as a potential variable influencing the gut microbiota composition in both JIA
categories. Regarding HLA-B27 status, 47% (9/19) of JIA-ERA patients resulted HLA-B27
positive, while all JIA-nERA patients were HLA-B27 negative. Calprotectin level, a
measurement of intestinal inflammation, was positive (>100 µg/g) in 10.5% (2/19) of JIA-
ERA and in 20% (2/10) of JIA-nERA patients (see Methods section).
5.3.2 Microbiota characterization by 16S rDNA sequencing in the JIA groups and
healthy controls
We sequenced the V5-V6 hypervariable region of 16S rRNA gene for the meta-taxonomic
study of microbiota in a total of 75 fecal samples from 19 JIA-ERA patients, 10 JIA-nERA
and 29 healthy subjects (HS). From 17 JIA-ERA patients a second fecal sample was
collected 3 months later, to evaluate microbiota variability over time.
The taxonomic distribution in the three groups showed variations in gut microbiota
composition (Fig. 5.1). Firmicutes, the dominant phylum of gut microbiota, was the most
abundant in all samples (over 50% of total reads; Fig. 5.1).
Considering the 20 most abundant families, we found statistically significant differences
between groups in Ruminococcaceae, Peptostreptococcaceae, Clostridiaceae I and
Veillonellaceae (Fig. 5.2A). Ruminococcaceae was more abundant in children in both JIA
categories, compared with HS (21.6% in JIA-ERA and 27.2% in JIA-nERA vs 12.0% in HS;
Wilcoxon rank-sum test, JIA-ERA vs HS p=0.0004; JIA-nERA vs HS p=0.0006; Fig. 5.2A).
Although there was a reduction of Peptostreptococcaceae and Clostridiaceae I in all JIA
patients (ERA and nERA) compared with HS (0.3% in JIA-ERA, 0.4% in JIA-nERA and
1.1% in HS; 0.1% in JIA vs 0.5% in HS respectively), we found statistically significant
differences only between JIA-ERA vs HS (Wilcoxon rank-sum test, p=0.033 for
Peptostreptococcaceae, p=0.017 for Clostridiaceae I respectively, Fig. 5.2A). We observed
a statistically significant predominance of Veillonellaceae in JIA-nERA compared with HS
(1.4% in JIA-nERA vs 0.4% in HS; Wilcoxon rank-sum test, p=0.012; Fig. 5.2A).

89
Table 5.1 Clinical features of JIA patients and age/sex information of healthy subjects
ERA n-ERA HS
Number 19 10 29
Age (years) median, range 14.3; 9 to 18 10.5; 2 to 17 13; 2 to 18
Male: Female, number 13:6 0:10 11:18
Disease duration (months) median, range 55; 2 to 93 97; 3 to 150 -
Acute disease, number (%) 4 (21%) 4 (40%) -
Calprotectin positive, number (%) 2 (10.5%) 2 (20%) -
High Erythrocyte sedimentation rate, number
(%) 3 (15.7%) 0 (0%) -
HLA-B27+ 9 (47%) 0 (0%) -
ANA+ 4 (21%) 9 (90%) -
Complications or comorbidities, number (%)
No 10 (52.6%) 3 (30%) -
Uveitis 1 (5.2%) 7 (70%) -
β- thalassemia 1 (5.2%) 0 (0%) -
Pectum escavatum 2 (10.5%) 0 (0%) -
Asthma 2 (10.5%) 0 (0%) -
Osteoporosis 1 (5.2%) 0 (0%) -
Obesity 1 (5.2%) 0 (0%) -
Hypothyroidism 1 (5.2%) 0 (0%) -
Epigastric hernia 1 (5.2%) 0 (0%) -
Cataract 1 (5.2%) 0 (0%) -
Breast fibroadenoma 1 (5.2%) 0 (0%) -
Treatment, number of patients (%)
NSAIDs 18 (95%) 1 (10%) -
Sulfasalazine 8 (42%) 0 (0%) -
Steroids 4 (21%) 0 (0%) -
Methotrexate 4 (21%) 0 (0%) -
Etanercept 3 (15.7%) 4 (40%) -
Abatacept 1 (5.2%) 5 (50%) -
Adalimumab 2 (10.5%) 0 (0%) -

90
Fig. 5.1 Overview of fecal microbiota profiles in JIA and healthy subjects. Percentage of reads (A)
of the main four phyla in JIA patients (ERA and n-ERA) and healthy subjects (HS) and (B)
percentage of reads of the top 20 families in JIA patients and HS.
Figure 5.2 Relative abundances of fecal bacterial components in JIA and HS groups. Box plot of
statistically significant different bacterial (A) families and (B) genera in JIA patients compared to
HS (Pairwise comparisons using Wilcoxon rank sum test; *** p<0.001; ** p<0.01; * p<0.05 FDR

91
adjusted). For Faecalibacterium genus, statistical significance of the comparison JIA-ERA vs JIA-
nERA was obtained by Welch’s test without multiple testing correction.
Considering gender as potential variable influencing the gut microbiota composition, we
confirmed that among the enrolled female subjects (6 JIA-ERA, 10 JIA-nERA and 18 HS),
Firmicutes were more abundant in the JIA-nERA group compared with HS (Fig. 5.3;
Wilcoxon rank-sum test p<0.05). Among the minor constituents of fecal microbiota, we
observed an increase in Sutterellaceae and Enterobacteriaceae in JIA-ERA female patients
compared with female HS (2.5% in JIA-ERA vs 1.2% in HS and 0.5% in JIA-ERA vs 0.3%
in HS, respectively; Wilcoxon rank-sum test, p<0.05; Supplementary Figure 2B), and
Streptococcaceae in JIA-nERA compared with HS (1% in JIA-nERA vs 0.3% in HS;
Wilcoxon rank-sum test, p<0.05; Fig. 5.3).
Fig. 5.3 Box plot of relative abundances of the statistically significant different bacterial (A) phylum
and (B) families in JIA female patients compared with female HS (p-value by Wilcoxon rank-sum
test, p<0.05).
At genus level, we found an abundance of Clostridium cluster XIVb in JIA-ERA patients
compared with HS (0.23% in JIA-ERA vs 0.1% in HS; Wilcoxon rank-sum test, p=0.007;
Fig. 5.2B). Moreover, we observed a decrease in the relative abundance in Faecalibacterium
in JIA-nERA compared with either JIA-ERA or HS, even if not statistically significant
(0.18% in JIA-nERA vs 0.35% in HS; 0.18% in JIA-nERA vs 0.41% in JIA-ERA; Fig.
5.2B).
By Linear discriminant analysis Effect Size (LEfSe), we evaluated significant differences in
abundance between assigned taxa with respect to JIA patient groups. We observed
differentially abundant taxa discriminating for HLA-B27 status. At family level, increased

92
Lactobacillaceae in HLA-B27 positive-JIA patients, and Pasturellaceae in HLA-B27
negative-JIA patients were found (Fig. 5.4). Of the increased genera in HLA-B27 positive
JIA patients, we observed Bilophila, Parvimonas and Oscillibacter, while Haemophilus and
Eggerthella, were differentially enriched in HLA-B27 negative patients (Fig. 5.4B). When
considering only the JIA-ERA group, in addition to the five genera reported in Fig. 5.4B,
Lactobacillus, Clostridium cluster XI and Dialister were enriched in HLA-B27 positive
patients, while only Haemophilus discriminated for HLA-B27 negative status (Fig. 5.4C).
Figure 5.4 Differences in bacterial taxa per HLA-B27 status. LEfSe analysis shows a statistically
significant enrichment of (A) families, and (B-C) genera, in (A-B) all JIA patients and in (C) JIA-
ERA patients, considering the HLA-B27 status. LEfSe results indicate a sequentially significant
ranking among groups (Alpha value=0.05 for the factorial Kruskal-Wallis test among classes). The
threshold for the logarithmic LDA score was 2.0.
Further, we evaluated correlations between microbiota profiles of JIA patients and fecal
calprotectin, as well as with respect to different medical treatments. We did not find any
significant correlation between fecal calprotectin levels and microbiota profiles, probably
due to the low number of patients with concomitant intestinal inflammation at the time of
sampling. Regarding the effect of pharmacological therapies on gut microbiota of JIA
patients, in our cohorts, JIA-ERA patients were treated with NSAIDs, alone or associated
with sulfasalazine/methotrexate/biologics in different combinations, as reported in Table
5.1. JIA-nERA patients were mainly treated with biologic drugs, such as Abatacept and
Etanercept. Despite the low number of patients stratified by pharmacological treatment,
LEfSe analysis showed indications of association among different bacterial profiles and
therapies (Fig. 5.5A-C), among which we observed enrichment in Collinsella, associated
with exacerbation of joint disease (Chen, Wright et al. 2016), in JIA-ERA patients treated
with combined NSAIDs and sulfasalazine therapy. However, a larger cohort of patients
would be needed to strengthen our preliminary results and to understand the causality
between therapies, gut microbiota profiles and clinical status.

93
Fig. 5.5 Microbiota profile enrichment related to different therapies in JIA patients. LEfSe analysis
performed in (A) all JIA patients, in (B) JIA-ERA, and in (C) JIA-nERA patients shows a statistically
significant enrichment of bacterial genera correlated with different therapies. LEfSe results indicate
a sequentially significant ranking among groups (Alpha value=0.05 for the factorial Kruskal-Wallis
test among classes). The threshold for the logarithmic LDA score was 2.0.
In order to evaluate differences in the microbial biodiversity (alpha-diversity) among groups,
we calculated the observed number of OTUs (a measurement of the total number of species
present in a microbial community) and the Chao1 index (an indicator of species richness
based on number of rare species), observing a significant reduction in alpha diversity in the
JIA samples compared to HS (Fig. 5.6A, B; p-value<0.005 JIA-ERA vs HS and JIA-nERA
vs HS). This suggests that microbiota of JIA patients is associated with biodiversity
depletion, as observed in IBD patients. However, we did not find significant differences
among the three groups using measures of biodiversity that take the evenness of the species
distributions into account, like the Shannon entropy (Fig. 5.6C), the Dominance (1-Simpson
index) and Equitability (Pielou index).
To estimate the variability of microbial communities between-sample (beta-diversity), we
calculated the Bray-Curtis and unweighted UniFrac dissimilarities. Principal Coordinates
analysis (PCoA) on unweighted UniFrac dissimilarities showed that both JIA samples (ERA
and nERA) were more similar to each other than to HS samples (Fig. 5.6D). Bray Curtis
dissimilarity confirmed the differences among samples in the three populations
(PERMANOVA, p<0.001; Fig. 7.6E). Considering HLA-B27 status, PCoA, calculated on
unweighted UniFrac and Bray-Curtis dissimilarity, showed that HLA-B27 positive JIA-ERA
patients form subgroups with respect to other JIA-ERA samples (Fig. 5.6F-G), confirmed
also by neighbor joining clustering based on Bray-Curtis dissimilarities (Fig. 5.6). However,
the sample distribution of patients and healthy subjects was more marked based on disease
and health status (Fig. 5.6D-E).

94
Figure 5.6 Alpha and beta diversity measures. (A-C) Box plots of (A) number of observed OTUs,
(B) Chao 1, and (C) Shannon indexes in the three studied populations. Pairwise comparisons using
the Wilcoxon rank sum test., **p-value <0.005, false discovery rate adjustment. (D-E) PCoA of (D)
unweighted UniFrac and (E) Bray Curtis dissimilarities. (F-G) PCoA of unweighted UniFrac and
Bray Curtis dissimilarities considering HLAB27 status (red asterisks). Colored dots: red=JIA-ERA,
orange=JIA-nERA, and green=HS samples.
5.3.3 Fecal microbiota comparison between acute disease and remission in JIA
categories
At the moment of fecal sampling, 21% of JIA-ERA patients (4/19) and 40% of JIA-nERA
patients (4/10) had clinically active disease. Despite the reduced number of samples, LEfSe
analysis showed significant differences in abundances of bacterial genera in samples
collected during clinically active disease and during remission. In particular, Sutterella was
increased in samples collected during active disease, while Clostridium cluster IV and XVIII,
Parasutterella and Odoribacter were enriched in samples collected from patients in
remission (Fig. 5.7A).
Furthermore, we calculated intra-group distances by unweighted UniFrac, comparing all JIA
samples collected from patients with active disease and those in remission, versus the HS

95
samples. Although differences were not statistically significantly, we observed a trend
indicating higher intra-group distances between JIA-ERA samples collected during active
disease with respect to intra-group distances between JIA-nERA during active disease (Fig.
5.7B; intra-active JIA-ERA vs intra-active JIA-nERA). Within the JIA-ERA group, we
found more variation in microbiota profile in samples collected during active disease
compared to remission (Fig. 5.7B; intra-active JIA-ERA vs intra-remission JIA-ERA). On
the contrary, although not statistically significantly different, the intra-distance of active
disease samples in the JIA-nERA group was lower than in remission samples (Fig. 5.7B;
intra-active JIA-nERA vs intra-remission JIA-nERA), indicating different microbial
heterogeneity in active disease and remission in the two different JIA subsets. Comparing
the samples collected from patients in remission, we observed that distances within the JIA-
nERA group were greater than within the JIA-ERA group (Fig. 5.7B; intra-remission JIA-
nERA vs intra-remission JIA-ERA).
Interestingly, when we compared JIA groups with HS, the intra-group distance in the HS
group was lower than within both JIA groups (Fig. 5.7B) and significantly correlated with
intra-distances observed in JIA-ERA patients, either active or in remission, and with intra-
distance observed in JIA-nERA patients in remission (Wilcoxon rank-sum test; intra-HS vs
intra-active JIA-ERA p=0.02; intra-HS vs intra-remission JIA-ERA p=0.0004; intra-HS vs
intra-remission JIA-nERA p=0.03), indicating that the microbiota composition within the
healthy group was significantly more homogeneous than those within the JIA groups.
Figure 5.7 Fecal microbiota comparison in patients during acute disease and in remission. (A) LEfSe
analysis shows a statistically significant enrichment of bacterial genera in JIA patients, in active
disease (black) and in remission (white). LEfSe results indicate significant ranking among groups
(Alpha value=0.05 for the factorial Kruskal-Wallis test among classes). The threshold for the
logarithmic LDA score was 2.0. (B) Intra-group distances calculated by Unweighted UniFrac
between samples collected during active disease and in remission from JIA-ERA and JIA-nERA

96
patients. P-values displayed are the results of Wilcoxon rank-sum tests. (C) Box plots of relative
distances, calculated by Unweighted UniFrac, among different JIA samples and HS samples and
distances of different the two samples of the same JIA-ERA patient. P-values displayed are the results
of Wilcoxon rank sum test; * p-value <0.05, **p-value <0.01; *** p-value<0.001.
Next, we evaluated microbiota variations over time in patients of the JIA-ERA group,
considering pairwise UniFrac distances between samples A and B (collected three months
apart). The matrices obtained by principal coordinate analysis (PCoA), derived from
pairwise unweighted and weighted UniFrac distances between samples A vs B, allowed us
to explore inter- and intra-individual similarities or dissimilarities among samples, showing
in most part of the cases lower distances between samples of the same patient than from
different patients (Fig. 5.8). Comparing the distributions among all JIA and HS samples vs
the JIA-ERA samples at two different times by Unweighted UniFrac mean distances, we
confirmed that samples from the same patient are more similar than samples from different
patients, as well as samples from HS, as expected (Fig. 5.7).
Fig. 5.8 Principal coordinate analysis (PCoA) derived from pairwise un-weighted and weighted
UniFrac, and Bray-Curtis distances among JIA-ERA samples (A and B samples of the same JIA-
ERA patient are represented as dot and triangle with same color, respectively). For each axis, in
square brackets, the percent of variation explained was reported.
5.3.4 Metabolic function prediction
The microbiota is able to affect host physiology and metabolic functions, contributing to
normal development and homeostasis of the immune system in the gut, modulating epithelial
cell proliferation and protecting against pathogenic bacteria (Tremaroli and Backhed
2012;Sommer and Backhed 2013). Bacterial species are known to carry and transfer operons
containing genes for different metabolic functions. Different bacterial species are enriched
for certain functions and these correlations have been categorized in well-organized
databases (Kanehisa, Goto et al. 2014). Therefore, in order to clarify how phylogenetic
differences between the fecal microbiota of JIA patients impact their metabolic potential, we
applied PICRUSt (Phylogenetic Investigation of Communities by Reconstruction of
Unobserved States), a computational approach used to predict the functional composition of
a metagenome (Langille, Zaneveld et al. 2013). LEfSe analysis performed on PICRUSt
output showed differentially enriched functional classes (KEGG categories) among JIA

97
subgroups compared with HS (Fig. 5.9). Within the main KEGG categories, we observed
significant enrichment of functions related to cell motility (Flagellar assembly, Ko:02040,
Bacterial chemotaxis and Bacterial motility proteins, Ko:02030) in JIA-ERA compared with
JIA-nERA and HS (Fig. 5.9A-B). Pathways related to Membrane transport (Secretion
system, Ko:03070) and unclassified Cellular Processes and Signaling (Sporulation) were
significantly enriched, respectively, in JIA-ERA and JIA-nERA compared with HS group
(Fig. 5.9B-C). A remarkable enrichment in metabolic functions regarding carbohydrate
metabolism, lipid metabolism, aminoacid metabolism, and other aminoacid metabolism
identified a core of metabolic capabilities, especially in JIA-nERA metagenome compared
to JIA-ERA (Fig. 5.9A) and HS (Fig. 5.9C). On the other hand, metabolism of cofactors and
vitamins (folate biosynthesis and nicotinate and nicotinamide metabolism) and metabolism
of other aminoacids (Glycine, Serine Threonine) significantly characterized HS metagenome
compared to JIA-ERA (Fig. 5.9B).

98
Figure 5.9 Metabolic function prediction associated to the microbiota profiles. LEfSe analysis,
performed on metabolic functions inferred by PICRUSt analysis shows statistically significant
enrichment of KEGG categories in (A) JIA-ERA vs JIA-nERA, (B) JIA-ERA vs HS, and (C) in JIA-
nERA vs HS. LEfSe results indicate significant ranking among groups (Alpha value=0.05 for the
factorial Kruskal-Wallis test among classes). The threshold for the logarithmic LDA score was 2.0.
5.4 Discussion
There are many lines of evidence that link the microbiota to rheumatic diseases. Animal
models have been used to establish this possible correlation, such as the use of germ-free
and gnotobiotic mice, in which animals were colonized with a specific microbial population,
or through the use of antibiotics to understand the effect of microbiota modulation on
rheumatic diseases. Principal limits of animal studies are the sample size and the difficulty
to mimic the complex multifactorial pathogenesis of these pathologies.
In our study, we tried to define the role of microbiota in patients affected by Juvenile
Idiopathic Arthritis. Alterations and decrease of microbiota richness were recently found in
JIA compared with healthy controls (Stoll, Kumar et al. 2014), as well as in rheumatoid
arthritis, ankylosing spondylitis and psoriatic arthritis, the latter two conditions related to
spondyloarthropathies (Stebbings, Munro et al. 2002;Scher, Sczesnak et al. 2013;Costello,
Ciccia et al. 2014;Gill, Asquith et al. 2015;Scher, Ubeda et al. 2015). We also observed
variations in fecal microbiota composition and a reduction of microbial richness among JIA
patients, affected by enthesitis-related arthritis (ERA) and polyarticular JIA (nERA), in
comparison with healthy subjects. When compared to HS, in both JIA categories, we found
statistically significant abundance in Ruminococcaceae, reduction in Clostridiaceae and
Peptostreptococcaceae in JIA-ERA, and increase in Veillonellaceae in JIA-nERA. Of note,
abundance in Veillonellaceae was recently found associated to ankylosing spondylitis
(Costello, Ciccia et al. 2014). Conversely to our results, previous studies on ankylosing
spondylitis (Costello, Ciccia et al. 2014;Scher, Ubeda et al. 2015) and on oligoarticular and

99
polyarticular JIA (Tejesvi, Arvonen et al. 2015) showed depletion of either
Ruminococcaceae or Veillonellaceae.
The enrichment of anaerobic Gram-positive Clostridium cluster XIVb in JIA-ERA patients
suggests a causal relation with inflammation. In fact, members of cluster XIVb, C.
propionicum and C. colinum, (Collins, Lawson et al. 1994) were previously observed in
poultry ulcerative enteritis (Berkhoff 1985). Also, studies in animal models have indicated
that cell wall peptidoglycans of Clostridium and other anaerobic Gram-positive species can
induce either chronic and erosive or transient arthritis (Severijnen, van Kleef et al.
1989;Simelyte, Rimpilainen et al. 2003). The observed decreasing trend in Faecalibacterium
in JIA-nERA, considered an anti-inflammatory microorganism and a marker of health, has
also been consistently reported in Crohn’s disease patients (Sokol, Pigneur et al. 2008).
Conversely to our results, a recent study showed reduction of Faecalibacterium prasnutzii
in JIA-ERA patients (Stoll, Kumar et al. 2014).
The partial agreement of our findings with results obtained in other studies could be due to
several factors, including variabilities and size of cohorts (different JIA categories, disease
status, untreated or treated patients), as well as geography, environment or dietary habits of
the patients, as shown by David and co-workers (David, Maurice et al. 2014).
Despite the limited possibility to generalize our results, due to the reduced number of patients
in the cohorts, our results on JIA show intriguing links in terms of fecal microbiota profiles,
with IBD and other autoimmune diseases associated to gastrointestinal disorders.
We are well aware that the known predominance of females in JIA-nERA introduces a
potential gender effect, yet Enterobacteriaceae and Streptococcaceae, enriched in JIA-ERA
and in JIA-nERA female patients, were also found to be correlated with intestinal
inflammation as observed in biopsy samples of Crohn’s disease patients (Gevers,
Kugathasan et al. 2014) and the increase in Sutterellaceae observed in JIA-ERA female
patients, as well as in samples collected in active disease, is also in line with increase in
Sutterella previously found in children with autism suffering from gastrointestinal disorder
(Williams, Hornig et al. 2012). Moreover, in samples collected in remission, we found
abundance in Clostridium spp. cluster IV that have been reported to be inducers of colonic
T regulatory cell (Atarashi, Tanoue et al. 2011), as well as in Odoribacter, known producer
of Short Chain Fatty Acids (SCFAs), anti-inflammatory metabolites, and previously found
reduced in IBD (Morgan, Tickle et al. 2012). However, in remission we also found enriched
bacteria involved in intestinal inflammation and metabolic disorders, such as Parasutterella,
found in a mice model of chemically induced colitis (Zhang, Wu et al. 2016), Clostridium
cluster XVIII, encompassing C. ramosum, involved in diet-induced obesity (Woting, Pfeiffer
et al. 2014) and C. spiroforme, a toxin-associated disease producer, involved in rabbit colitis
(Carman and Borriello 1984).
Differentially abundant taxa, previously found in relation to rheumatoid arthritis, oral
infection, intestinal inflammation or colitis, or to intestinal barrier permeability, discriminate
for positivity of HLA-B27 allele, a genetic marker strongly associated with
spondyloarthropathies. Among these, in HLA-B27 positive ERA patients we found
Bilophila, a sulphite-reducing bacterium known to be involved in murine colitis (Devkota,
Wang et al. 2012) and in intestinal inflammatory disorders in humans (Loubinoux,
Bronowicki et al. 2002;Rowan, Docherty et al. 2009), via H2S production promoting

100
intestinal inflammation. Parvimonas was commonly observed in periodontitis and
appendicitis (Zhong, Brower-Sinning et al. 2014), and Oscillibacter was shown to be
involved in gut barrier integrity in mice (Lam, Ha et al. 2012). In HLA-B27 negative-ERA
patients, we found Haemophilus and Eggerthella, recently associated with rheumatoid
arthritis (Zhang, Zhang et al. 2015;Chen, Wright et al. 2016). Moreover, when considering
only the ERA group, in HLA-B27 positive patients we also showed enrichment of
Lactobacillus, observed as potential arthritogenic agent via its cell wall pepetidoglycan
(Severijnen, van Kleef et al. 1989), Clostridium cluster XI, that includes C. difficile, a well-
known proinflammatory and colitis inducing-bacterium, and Dialister, frequently found in
periodontitis and other infections (Morio, Jean-Pierre et al. 2007).
Recent studies on animal models showed association between HLA-B27 allele and other
different bacterial species, including B. vulgatus and Prevotella spp. (Lin, Bach et al. 2014)
and Akkermansia muciniphila (Asquith, Stauffer et al. 2016). In particular, Akkermansia spp.
was suggested as potential pro-arthritogenic bacterial genus. However, the study of Stoll and
collaborators (Stoll, Kumar et al. 2014) showed abundance of Akkermansia in a low
percentage of ERA patients, but no significant association with HLA-B27 status. In our
study, we did not find Akkermansia spp. as part of the core gut microbiota of our patients,
yet we found other species correlated with HLA-B27 allele. Little is known on the
geographic distribution of Akkermansia spp., that could be less represented in our cohorts.
Overall this could suggest that other bacterial species, in absence of Akkermansia spp. can
discriminate HLA-B27 status, and that disease biomarkers should be based on patterns of
taxonomic units or biological functions, rather than on single species.
Regarding the functional contribution of microbiota profiles, by PICRUSt prediction
analysis we observed distinctive functional acquisitions among JIA subgroups and HS. A
core of metabolic capabilities, regarding carbohydrate, lipid, aminoacid, cofactors and
vitamins metabolism, were enriched in JIA-nERA and HS metagenomes. It is worth noting
that microbiota of JIA-ERA patients is significantly enriched in functions related to cell
motility, including flagellar assembly, bacterial chemotaxis and motility proteins,
representing possible traits of virulence that could be associated to gut inflammation. These
indications of enrichment in potentially pathogenic invasiveness-related traits in JIA-ERA
metagenome could suggest a potential improved ability of microbial components to pass
through the gastrointestinal barrier and migrate in other districts, also responding to nutrient
gradients. Moreover, given that in mice models immunogenicity of flagellin CBir1 was
observed, with consequent induction of colitis, and antibodies anti-CBir1 were found in CD
patients with complicated disease (Targan, Landers et al. 2005), we cannot exclude the
potential effect of flagellar-assembly proteins of some components of microbiota on host
immune system of JIA.
Despite the relatively small cohort of patients in our study, the microbial profile differences
in active disease and remission are corroborated by the observed intra- and inter-group
distances of microbiota samples in active, remission and healthy status. As expected, our
results suggest that during active disease the microbiota is strongly perturbed (major intra-
group distance compared with remission). Healthy status allows a more stable microbiota
ecosystem compared to disease status, as previously observed (Coyte, Schluter et al. 2015).
Remission is characterized by an intermediate microbial pattern, different from both active

101
disease and healthy controls, likely resulting from a different trajectory to stable state and in
which autoimmune reactivity and the microbial ecosystem are mutually shaped.
Although microbial profiles may differ in an individual-specific manner, the observed fecal
microbiota dissimilarities in the same subject at different collection times, and among JIA
categories and healthy controls suggest that continued perturbation and instability of the
microbial ecosystem may contribute to inflammation.
Another aspect that should be more thoroughly investigated is the association between
microbial profiles and pharmacologic therapies in autoimmune diseases. Recent studies, as
previously observed in IBD patients, highlighted the effect of different therapies on
microbiota, such as the rapid effect of enteral nutrition in the shaping of microbiota (Lionetti,
Callegari et al. 2005) and the dysbiosis associated with antibiotic treatment (Lewis, Chen et
al. 2015), as well as the effect of protonic pomp inhibitors on reduction of bacterial richness
and selection of “unhealthy” microbiota (Imhann, Bonder et al. 2016). Moreover, the recent
considerations suggest that the use of sulfasalazine could protect the intestinal epithelium
from injury, reducing the bacterial product circulation (Rosenbaum and Asquith 2016).
Despite the reduced number of patients on single or combined therapies in the cohort, our
results showed indications of different microbial profiles associated to pharmacological
therapies, such as NSAIDs, immunosuppressants and biologics, providing interesting clues
on effect of such treatments on gut microbiota selection. For example, the enrichment of
Collinsella, involved in exacerbation of joint disease (Chen, Wright et al. 2016), observed
in JIA-ERA patients treated with NSAIDs in combination with sulfasalazine, results in
contrast with hypothesis of Rosenbaum and Asquith (Rosenbaum and Asquith 2016). Our
results prompt future studies on larger cohorts, including untreated newly-onset patients,
addressing the effect of different pharmacological therapies on patients in active disease and
remission, investigating how inflammation can indirectly modify microbiota, selecting
differential microbial components, via mechanisms involved in epithelial barrier function
and immune response and how pharmacological treatment contribute to perturb the gut
microbial equilibrium compared to healthy status.
Finally, given the extreme inter-individual variability of microbiota in inflammatory and
autoimmune diseases, further investigations on microbiota dynamics in different phases of
disease should address the causes of perturbation and the restoration of microbial
equilibrium, in order to adopt therapeutic strategies able to maintain microbial diversity and
a stable state, essential for immune homeostasis and the host’s health. Research in this
direction should include therapeutic strategies able to modulate the microbiota, not only with
diet and probiotics, but also evaluating new therapeutic approaches, such as fecal
transplantation, recently adopted in other diseases and that have shown some effectiveness,
especially during active disease. Furthermore, the understanding of the microbial functional
acquisition and the relationships with epithelial barrier function and host immune response
could help to identify the pro-arthtritogenic contribution of the microbiota.

102
6. Age and gender affect the composition of fungal population of the
human gastrointestinal tract
This chapter has been reprinted* from:
Strati F., Di Paola M., Stefanini I., Albanese D., Rizzetto L., Lionetti P., Calabrò A.,
Jousson O., Donati C., Cavalieri D., De Filippo C.
Age and Gender Affect the Composition of Fungal Population of the Human
Gastrointestinal Tract. Frontiers in Microbiology. 2016 Aug 3;7:1227. doi:
10.3389/fmicb.2016.01227.
* Copyright© 2016 Strati, Di Paola, Stefanini, Albanese, Rizzetto, Lionetti, Calabrò,
Jousson, Donati, Cavalieri and De Filippo. This is an open-access article distributed under
the terms of the Creative Commons Attribution License (CCBY).
6.1 Scientific Background
The human gut is a complex ecological niche in which archaea, bacteria, protozoa, fungi,
and viruses co-exist in close association with the host (Reyes, Haynes et al.
2010;Arumugam, Raes et al. 2011)(Reyes et al., 2010; Arumugam et al., 2011; Human
Microbiome Project Consortium, 2012). Even if it has been estimated that the number of
bacteria hugely outreaches the number of fungi in the gastrointestinal (GI) tract (Huffnagle
and Noverr 2013), fungi play a relevant role in the physiology of the human host (Oever and
Netea 2014;Underhill and Iliev 2014). Recent studies showed that, while the composition of
the bacterial community is relatively stable over time, the fungal population inhabiting the
murine gut undergoes significant changes during the animal’s lifetime (Dollive, Chen et al.
2013). This brought to the conclusion that gut fungal populations are more variable than
bacterial ones and that their composition may be influenced by environmental fungi
(Underhill and Iliev 2014). Despite evidence that fungi inhabit the mammalian GI tract and
interact with the host immune system (Romani 2011;Rizzetto, De Filippo et al.
2014;Underhill and Iliev 2014), the composition and characteristics of the mycobiota in
healthy hosts have been poorly explored. The prevalent interest in describing pathogenic
fungi, their phenotypes and the process by which they establish the infection is one of the
major cause that brought to neglect the harmless part of the commensal fungal population.
Despite this topic has been only marginally explored to date, it has been shown that mucosal
fungi are able to modulate both the innate and adaptive immune responses (Romani
2011;Rizzetto, De Filippo et al. 2014;Underhill and Iliev 2014) thus supporting the need to
further study the whole gut mycobiota. Furthermore, alterations of the gut mycobiota have
been associated to different pathologies ranging from metabolic disorders (obesity) to

103
colorectal adenomas and Inflammatory Bowel Diseases (IBDs) (Luan, Xie et al. 2015;Mar
Rodriguez, Perez et al. 2015;Sokol, Leducq et al. 2016). A recent study showed the
association of IBDs to alteration of the gut mycobiota. In particular Sokol and colleagues
showed that IBD patients bear a smaller proportion of Saccharomyces cerevisiae and higher
of Candida albicans compared to healthy subjects. In addition, they highlighted the
existence in Crohn’s disease of interconnected alterations between bacterial and fungal
communities (Sokol, Leducq et al. 2016). However, the role of the gut mycobiota in the
maintenance of health it is still far from being well-understood because the studies carried
out so far focused on disease-causing taxa. Nevertheless, some yeasts have been clinically
prescribed for a long time because of their potential probiotic properties, suggesting a
beneficial role of some fungi for host health. A great example of “beneficial” fungus is
represented by S. cerevisiae var. boulardii, used for the relief of gastro enteritis (Hatoum,
Labrie et al. 2012). In order to reduce the gap of knowledge concerning the gut mycobiota
and its interplay with the host, we characterized the gut mycobiota composition of a cohort
of healthy subjects by means of metagenomics, fungal cultivation, and phenotypic assays.
6.2 Materials and Methods
6.2.1 Study participants
Fecal samples were collected from 111 Italian healthy volunteers (49 male and 62 female,
average age, 10±8.2) (Table 6.1) and analyzed within 24 hours. Written informed consent
has been obtained from all the enrolled subjects or tutors in accordance with the guidelines
and regulations approved by the Research Ethical Committees of the Meyer Children’s
Hospital and the Azienda Ospedaliera Careggi, Florence. All the subjects enrolled were non-
smokers, followed a Mediterranean-based diet and they did not take antibiotics, antifungals
or probiotics in the 6 months prior to sample collection. None of the participants had any
history of gastrointestinal abnormalities.
6.2.2 Isolation and identification of cultivable fungal species from feces
Stool samples were diluted in sterile Ringer's solution and plated on solid YPD medium (1%
Yeast extract, 2% Bacto-peptone, 2% D-glucose, 2% agar) supplemented with 25U/ml of
penicillin, 25µg/ml of streptomycin (Sigma-Aldrich) and incubated aerobically at 27°C for
3-5 days. All fungal isolates grown on the selective medium were further isolated to obtain
single-cell pure colonies. Genomic DNA was extracted from pure cultures of isolated
colonies as previously described (Hoffman and Winston 1987). Strains were identified by
amplification and sequencing of the ribosomal Internal Transcribed Spacer (ITS) region,
using ITS1 (5’-GTTTCCGTAGGTGAACTTGC-3’) and ITS4 (5’-
TCCTCCGCTTATTGATATGC-3’) primers, as previously described (Sebastiani, Barberio
et al. 2002). Fungal isolates were identified by using the BLAST algorithm in the NCBI
database (minimum 97% sequence similarity and 95% coverage with a described species).

104
6.2.3 Phenotypical characterization of fungal isolates
Fungal isolates were tested for phenotypical features that could be related to the ability of
colonization and persistence in the human gut. Cell growth in liquid media was monitored
by optical density measurement at 630nm with a microplate reader (Synergy2, BioTek,
USA) after 48h of incubation under tested conditions. Three independent replicates were
performed for each test.
Growth at supra optimal temperatures. Fungal isolates (~105 cells/ml) were grown at supra
optimal temperatures in liquid YPD medium (40°C, 42°C, 44°C and 46°C).
pH impact on growth. Fungal isolates (~105 cells/ml) were grown at 37°C in liquid YPD
medium at pH 2.0 and pH 3.0 adding hydrochloric acid/potassium chloride and citrate
buffers respectively to test their ability to resist to the acidic environments encountered
during GI tract passage.
Tolerance to bile acids. Fungal isolates (~105 cells/ml) were grown in liquid YPD medium
at 37°C in the presence of three different concentrations of bile [Ox-bile, Sigma-Aldrich;
0.5%, 1% and 2% (w/v)] mimicking the physiological intestinal settings (Noriega,
Gueimonde et al. 2004).
Resistance to oxidative stress. Fungal resistance to oxidative stress was evaluated by
measuring the inhibition halo induced by the treatment of fungal strains (~107 cells/ml)
grown on YPD solid medium with 0.5mM hydrogen peroxide (H2O2). The percentage of
sensitivity to oxidative stress was calculated as the deviation of the inhibition halo diameter
(Ø) from that of the environmental, oxidative stress sensitive M28-4D Saccharomyces
cerevisiae strain (Cavalieri, Townsend et al. 2000) according to the following formula: [(Ø
sample – Ø M28-4D)/Ø M284D]*100.
Invasive growth. The ability of fungal strains to penetrate the YPD solid medium was tested
as previously described (Vopalenska, Hulkova et al. 2005). M28-4D and BY4742 S.
cerevisiae strains, known to be invasive and non-invasive respectively, have been used as
controls. The strain invasiveness was assigned with scores from 3 (highly invasive) to 0
(non-invasive).
Hyphal formation. Fungal cells (~105 cells/ml) were grown for 7 days in liquid YPD and
YNB media (0.67% Yeast Nitrogen Base w/o aminoacids and (NH4)2SO4 (Sigma-Aldrich),
2% glucose), both at 27°C and 37°C in order to evaluate hyphae or pseudohyphae formation.
Formation of hyphae was inspected by optical microscope observation with a Leica DM1000
led instrument (magnification 40x and 100x).
6.2.4 Antifungal susceptibility testing
All fungal isolates were tested for susceptibility to fluconazole, itraconazole and 5-
flucytosine (Sigma-Aldrich) by Minimum Inibitory Concentration (MIC) assays according
to the European Committee on Antimicrobial Susceptibility Testing (EUCAST)
recommendations (Rodriguez-Tudela, Arendrup et al. 2008;Subcommittee on Antifungal
Susceptibility Testing of the 2008). Clinical and Laboratory Standards Institute (CLSI)
clinical breakpoints (CBPs) were used to evaluate the antifungal resistance (Pfaller and
Diekema 2012;Castanheira, Messer et al. 2014). CBPs have not been established for non-
Candida yeasts and non-Aspergillus moulds, however have been used as a proxy for the
evaluation of antifungals susceptibility in such isolates.

105
6.2.5 DNA extraction and PCR amplification of fungal ITS1 rDNA region
DNA extraction from fecal samples (250 mg) was performed using the FastDNA™ SPIN
Kit for Feces (MP-Biomedicals, USA) following manufacturer's instructions. DNA quality
was checked on 1% agarose gel TAE 1X and quantified with a NanoDrop®
spectrophotometer. For each sample, fungal ITS1 rDNA region was amplified using a
specific fusion primer set coupled with forward primer 18SF (5’-
GTAAAAGTCGTAACAAGGTTTC-3’) and reverse primer 5.8S1R (5’-
GTTCAAAGAYTCGATGATTCAC-3’) (Findley, Oh et al. 2013) containing adaptors, key
sequence and barcode (Multiple IDentifier) sequences as described by the 454 Sequencing
System Guidelines for Amplicon Experimental Design (Roche, Switzerland). The PCR
reaction mix contained 1X FastStart High Fidelity PCR buffer, 2mM MgCl2, 200µM of
dNTPs, 0.4µM of each primer (PRIMM, Italy), 2.5U of FastStart High Fidelity Polymerase
Blend and 100ng of gDNA as template. Thermal cycling conditions used were 5min at 95°C,
35 cycles of 45sec at 95°C, 45sec at 56°C and 1.30min at 72°C followed by a final extension
of 10min at 72°C. All PCR experiments were carried out in triplicates using a Veriti®
Thermal Cycler (Applied Biosystems, USA).
6.2.6 Library construction and pyrosequencing
The PCR products obtained were analyzed by gel electrophoresis and cleaned using the
AMPure XP beads kit (Beckman Coulter, USA) following the manufacturer’s instructions,
quantified via quantitative PCR using the Library quantification kit – Roche 454 titanium
(KAPA Biosystems, USA) and pooled in equimolar way in a final amplicon library. The 454
pyrosequencing was carried out on the GS FLX+ system using the XL+ chemistry following
the manufacturer's recommendations (Roche, Switzerland).
6.2.7 Data analysis
Pyrosequencing resulted in a total of 1.337.184 reads with a mean of 19.379±13.334
sequences per sample. Raw 454 files were demultiplexed using the Roche's sff file software
and submitted to the European Nucleotide Archive with accession number PRJEB11827
(http://www.ebi.ac.uk/ena/data/view/PRJEB11827). Sample accessions and metadata are
available in Supplementary Table S1. Reads were pre-processed using the MICCA pipeline
(Albanese, Fontana et al. 2015). Forward and reverse primers trimming and quality filtering
were performed using micca-preproc. De-novo sequence clustering, chimera filtering and
taxonomy assignment were performed by micca-otu-denovo: Operational Taxonomic Units
(OTUs) were assigned by clustering the sequences with a threshold of 97% pairwise identity
and their representative sequences were classified using the RDP classifier version 2.8
(Wang, Garrity et al. 2007) against the UNITE fungal ITS database (Koljalg, Nilsson et al.
2013). Denovo multiple sequence alignment was performed using T-Coffee (Notredame,
Higgins et al. 2000). Fungal taxonomy assignments were then manually curated using
BLASTn against the GenBank’s database for accuracy. High quality fungal sequences were

106
detected in all samples. Furthermore the sequences belonging to Agaricomycetes [unlikely
to be residents of the human gut due to their ecology (Hibbett 2006)] were manually filtered
out.
The phylogenetic tree was inferred by using micca-phylogeny (Price, Dehal et al. 2010).
Rarefaction analysis resulted in a sequencing depth adequate to capture the ecological
diversity of the samples up to saturation. Sampling heterogeneity was reduced by rarefaction.
Alpha and beta-diversity estimates were computed using the phyloseq R package (McMurdie
and Holmes 2013). PERMANOVA (Permutational multivariate analysis of variance) was
performed using the adonis() function of the vegan R package with 999 permutations.
Permutations have been constrained within age groups (corresponding to 0-2 y/o, 3-10 y/o,
11-17 y/o and >18 y/o) or gender to reduce possible biases related to the unequal age and
gender distributions among subjects using the “strata” argument within the adonis() function.
Two-sided, unpaired Welch t-statistics were computed using the function mt() in the
phyloseq library and the p-values were adjusted for multiple comparison controlling the
family-wise Type I error rate (minP procedure) (Westfall and Young 1993). Wilcoxon rank-
sum tests and Spearman’s correlations were performed using the R software (Team 2014)
through the stats R package (version 3.1.2) and the psych R package (Revelle 2013)
respectively. p-values have been corrected for multiple comparison by using the false
discovery rate correction (Benjamini and Hochberg 1995).
6.3 Results
6.3.1 Cultivable Gut Mycobiota
The cultivable gut mycobiota of 111 healthy volunteers (Table 6.1) was investigated through
isolation in selective media. Fungi were detected in more than 80% of subjects leading to
the identification of 349 different isolate. Thirty-four different fungal species were detected
at different frequencies of isolation (Table 6.2) among which Aspergillus glaucus, Candida
albicans, Candida deformans, Candida fermentati, Candida glabrata, Candida intermedia,
Candida lusitaniae, Candida metapsilosis, Candida parapsilosis, Candida pararugosa,
Candida tropicalis, Candida zelanoydes, Cryptococcus saitoi, Lichtheimia ramosa, Mucor
circinelloides, Pleurostomophora richardsiae, Rhodotorula mucilaginosa, Trichosporon
asahii, Yarrowia lipolytica. These species were previously found in different human body
sites, including the GI tract as commensal or opportunistic pathogens (Araujo, Pina-Vaz et
al. 2007;Alastruey-Izquierdo, Hoffmann et al. 2010;Levenstadt, Poutanen et al. 2012;Gouba,
Raoult et al. 2014;Lee, Billmyre et al. 2014;Rizzetto, De Filippo et al. 2014).

107
Table 6.1 Characteristics of the study participants
We also isolated the environmental fungi Aspergillus pseudoglaucus, Eurotium
amstelodami, Eurotium rubrum, Penicillium brevicompactum, Penicillium paneum,
Penicillium crustosum, Pichia caribbica, Pichia fermentans, Pichia kluyveri, Pichia
manshurica, Rhodosporidium kratochvilovae, Saccharomyces cerevisiae, Starmerella
bacillaris and Torulaspora delbrueckii. Such species were previously found in
fermentations, oenological samples (Chitarra, Abee et al. 2004;Butinar, Zalar et al.
2005;Scanlan and Marchesi 2008;Barata, Malfeito-Ferreira et al. 2012;Bezerra-Bussoli,
Baffi et al. 2013;Tristezza, Vetrano et al. 2013;Vardjan, Mohar Lorbeg et al. 2013;de Melo
Pereira, Soccol et al. 2014;Wang, Esteve-Zarzoso et al. 2014;Belda, Navascues et al. 2015)
and rarely found in clinical samples (de la Camara, Pinilla et al. 1996;Kaygusuz,
Mulazimoglu et al. 2003;Butinar, Zalar et al. 2005;Rizzetto, De Filippo et al. 2014). The
39.8% of subjects showed at least one Candida albicans isolate, which resulted in the most
common yeast species found in our samples, in line with previous reports on the gut
mycobiota of healthy subjects (Khatib, Riederer et al. 2001;Bougnoux, Diogo et al. 2006).

108
Table 6.2 Fungal isolates and frequencies of isolation
Population level analysis of the cultivable gut mycobiota revealed significant gender-related
differences, with female subjects showing a higher number of fungal isolates (p<0.005,
Wilcoxon rank-sum test; Fig. 6.1A) and fungal species (p<0.05, Wilcoxon rank-sum test;
Fig. 6.1B) compared to male subjects (not related to individual’s age) while we did not
observed significant differences in the fungal population among the investigated age groups
(Fig. 6.1C, D). Finally, no species per se was responsible for these differences, as indicated
by the fact that we did not find significant differences between individual species abundances
in male and female subjects for any investigated age group.
Fig. 6.1 Gender-related and age-related differences in the gut mycobiota of 111 healthy volunteers.
Histogram of the mean of (A) abundances and (B) richness ± standard error of fungal isolates in
female and male subjects. Box-plot representation of the (C) abundance and (D) richness of fungal
isolates in different age groups i.e. infants (0–2 years old), children (3–10 years old), adolescents
(11–17 years old) and adults (≥ 18 years old). **p < 0.005,*p < 0.05,Wilcoxon rank-sum test.

109
6.3.2 Fungal Gut Metagenomics
To better characterize the intestinal fungal community structure associated to our cohort of
healthy subjects we further analyzed a subset of these subjects (57 subjects, 29 females and
28 males, average age 12±9.5) by means of amplicon-based ITS1 targeted metagenomics,
looking at gender and age groups differences. The analysis led to the identification of 68
fully classified (to the genus level) fungal taxa and 26 taxa only partially classified (of which
2 classified to the phylum level, 5 classified to the order level, 9 classified to the class level
and 9 classified to the family level). Measurements of the fungal richness within each sample
i.e. the alpha-diversity (see Materials and Methods), revealed no significant differences
among male and female subjects (Fig. 6.2A), differently from the above finding based on
the culture-based analysis in which we observed an increased number of intestinal fungal
species in females compared to males (Fig. 6.2B). Furthermore we observed that infants and
children harbor a higher fungal richness compared to adults as indicated by the number of
the observed OTUs (p<0.05, Wilcoxon rank-sum test, Fig. 6.2B). The analysis of beta-
diversity identified significant differences in the composition of the gut mycobiota among
gender and age groups. PCoA (Principal Coordinates Analysis) revealed that samples cluster
by gender, based on the unweighted UniFrac distance and the Bray-Curtis dissimilarity
(p<0.05, PERMANOVA; Fig. 6.2C, D) and by age groups, based on the unweighted UniFrac
distance (p<0.05, PERMANOVA; Fig. 6.2C).
Fig. 6.2 Box-plot of fungal alpha-diversity measures using the number of observed OTUs between
(A) genders or (B) age groups, and measures of fungal beta-diversity by PCoA of the between
samples distances measured using (C) the unweighted UniFrac distance and (D) the Bray-Curtis
dissimilarity. *p < 0.05, Wilcoxon rank-sum test.
We calculated PERMANOVAs constraining permutations within levels (gender or age
groups) to avoid biases related to the unequal distribution of genders among age groups and

110
vice-versa. Genus level analysis showed Penicillium, Aspergillus and Candida as the most
abundant genera in this subset of subjects (22.3%, 22.2% and 16.9% respectively) (Fig. 6.3).
We further observed that Aspergillus and Tremellomycetes_unidentified_1 were
significantly more abundant in male than female subjects (p<0.05, Welch t-test) and in
children than adults (p<0.05, Welch t-test). To note, the latter result could be biased by the
unbalanced distribution of male and female subjects in children and adults groups (14/22
male children and 3/17 male adults). Furthermore the genus Penicillium was significantly
more abundant in infants than adults (p<0.05, Welch t-test). Interestingly, we identified
sequences belonging to the single-cell protozoa Blastocystis, eukaryotes abundant in the
human gut microbiota (Scanlan and Marchesi 2008), only in adolescent and adult females
(Fig. 6.3), that could potentially be due to exposure to pets.

111
Fig. 6.3 Stacked bar-plot representation of the relative abundances at the genus level of the fecal
mycobiota of healthy subjects from metagenomics analysis distributed according to individuals’ life
stage and gender.

112
6.3.3 Phenotyping the gut mycobiota
The characterization of phenotypic features of the isolates related to the ability to survive
and colonize the human gut was performed to estimate if such isolates were commensals
adapted to this ecological niche or passengers introduced through the diet and delivered with
the feces.
We therefore investigated the isolates’ resistance by a series of assays mimicking the
conditions that fungal isolates face during passage through the human GI tract. In addition
to the fact that the human body temperature (37°C) is higher than the optimum for most
fungal species, in the GI tract fungi are also exposed to acidic and oxidative environments
and to bile salts, produced by the liver and secreted into the duodenum, exposing the
microorganisms to oxidative stress and DNA damage (Kandell and Bernstein 1991).
The majority of the isolates were found to tolerate acidic conditions (58.9% and 94.8% of
isolates were able to grow at pH 2 and pH 3, respectively) and oxidative stress (85.7% of the
isolates showed higher tolerance compared to environmental M28 S. cerevisiae strain), both
conditions are characteristic of the gut environment. Tolerance to physiological
concentrations of bile acids was also observed (89.8%, 87.5% and 85.7% of fungal isolates
were able to grow in presence of ox-bile 0.5%, 1% and 2% respectively) as well as the ability
to grow at supra optimal temperatures with almost all the isolates (99.4%) being able to grow
at 37°C . The comparison of the growth ability of such isolates at pH 3 and at growing
concentrations of ox-bile (i.e. 0.5%, 1.0% and 2.0% ox-bile) with respect to the control
growth condition (37°C, no bile, pH 6.5) revealed that these stressful conditions do not
significantly affect the growth ability of the fungal isolates (Fig. 6.4). By contrast, a
significant growth reduction was observed when comparing the isolated grown at pH 2 with
respect to the control growth condition (p<0.0001, Wilcoxon rank-sum test; Fig. 6.4). As
expected, a progressive reduction of growth ability was observed in correspondence of
incubation temperature increase (i.e. from 40°C to 46°C) for all the tested isolates (p<0.0005,
Wilcoxon rank-sum test; Fig. 6.4).
Fig. 6.4 Box-plot of the comparison of fungal isolates growth ability at 37°C (control condition) vs.
different stressful conditions mimicking the gastrointestinal tract challenges. **p<0.0005, ***p<
0.0001,Wilcoxon rank-sum test.

113
In addition to the ability of fungal isolates to tolerate the intestinal environmental stresses,
we also explored their ability to undergo phenotypic changes favoring their persistence
within the human gut. Among these, we assessed the formation of hyphae and the ability to
penetrate the solid growth medium, thus to adhere to host tissues. The 56.9% of fungal
isolates was able to form hyphae or pseudohyphae. In addition, the morphotype switch to
hyphae and pseudo-hyphae was related to the isolates’ invasiveness, with hyphae and
pseudohyphae-forming isolates being the most invasive (Fig. 6.5A), suggesting that such
isolates may be able to adhere to or invade the host tissues. Furthermore, we observed that
hyphae-forming isolates are significantly more resistant to itraconazole than pseudohyphae-
forming isolates and isolates unable to form hyphae (p<0.05, Wilcoxon rank-sum test; Fig.
6.5B). These phenotypic traits in conditions of altered immune system or in association with
intestinal dysbiosis, could represent a pathogenic potential for the host.
Fig. 6.5 Box-plot of fungal isolates able (or not) to produce hyphae or pseudohyphae in relationship
with (A) their ability to be invasive on YPD solid medium, (B) their resistance to itraconazole. *p<
0.05, **p< 0.005,***p< 0.001,Wilcoxon rank-sum test.
It is now recognized that inappropriate antifungal use contributes to the increase in microbial
antifungal resistance, complicating therapeutic intervention and the eventual eradication of
pathogens (Chen, Playford et al. 2010;Arendrup, Sulim et al. 2011). Due to the relevance of
such aspect and its impact on clinical studies, we tested all fungal isolates for their
susceptibility to the widely therapeutically used azoles, fluconazole and itraconazole (Martin
2000) as well as the non-azole antifungal 5-flucytosine (Vermes, Guchelaar et al. 2000). A
total of 31.5% of the isolates were resistant to fluconazole and, as expected, similar levels of
itraconazole resistance were found (for 39.2% of the isolates the MIC was ≥ 1μg/ml).
Previous studies have indeed suggested that cross-resistance may occur between fluconazole
and other azole compounds (i.e. itraconazole) (Pfaller, Diekema et al. 2006) and we further
confirmed such observations with the finding of a significant positive correlation between
the isolates resistance to these two antifungals (Spearman’s r=0.43, p<0.05; Fig. 6.6). Most
of the isolates (99.34%) showed high susceptibility to 5-flucytosine with most MIC values
≤ 0.125μg/ml. Among the 9 most abundant species (at least 6 isolates per species), C.

114
albicans, Pichia spp. and Rhodotorula mucillaginosa showed the highest resistance to
fluconazole, with MIC 90> 64μg/ml (Table 6.3).
Table 6.3 Antifungal activity against the most abundant fungal species
Furthermore, it is worth to note that resistance to tested antifungals is positively correlated
with the ability of strains to grow under stressful conditions, such as supra optimal
temperature, acidic conditions, and bile salts exposure (p<0.05, Spearman’s r correlation;
Fig. 6.6).
Fig. 6.6 Spearman’s r correlation analysis between antifungals susceptibility and growth ability of
the tested fungal isolates under different stress conditions. Solid squares represent the degree of
correlation among the variables taken into account. Crossed squares indicate non-significant
correlations; significant results with p < 0.05.

115
6.4 Discussion
The vast majority of fungal species inhabiting our body are commensals and opportunistic
pathogens that could turn into potential threats depending on strain virulence traits and on
the status of the host’s immune system. In this perspective to discover a pathogenic infection
it seems crucial to define exactly which species are normally present in a given body district.
The human GI tract is known to contain variable communities of bacteria but also fungi have
an important role in this ecological niche (Underhill and Iliev 2014). Nevertheless, the
phylogenetic characterization of fungal microorganisms and their specific role as part of the
GI niche have not yet been studied extensively.
The advent of sanitation and food globalization has reduced the possibility for humans to
come across with the richness of fungal species present in traditional fermented foods.
Fungal infections are an ever increasing problem either as side effects of antibiotics use, high
dose chemotherapy and of the spread of immunosuppressive diseases. Estimates of global
mortality rates suggest that fungi are responsible for more deaths than either tuberculosis or
malaria (Brown, Denning et al. 2012). Most of this mortality is caused by species belonging
to four fungal genera: Aspergillus, Candida, Cryptococcus, and Pneumocystis that are
rapidly becoming resistant to most antifungal drugs (Brown, Denning et al. 2012;Denning
and Bromley 2015). The information on these fungi so far derives from the study of lung
infections, while little is known on the gut mycobiota composition and its role in health and
disease. The knowledge on the gut mycobiota is currently limited to few studies making it
difficult to assess the significance of differences found in the intestinal fungal populations
of diseases such as Inflammatory Bowel Diseases due to the lack of information on what the
healthy mycobiota is. Here we aimed at defining the “healthy” gut mycobiota, showing that
the intestinal fungal community of a cohort of Italian healthy volunteers is a variegate
ecosystem that differs in function of individuals’ life stage in a gender-dependent manner.
We identified 34 fungal species of different ecological origins. While the majority of our
fungal isolates has been previously described as inhabitants of the mammalian
gastrointestinal tract (Rizzetto, De Filippo et al. 2014), some of the isolates belong to species
so far identified in environmental samples only. Environmental fungi, in particular putative
food-borne fungi, have been previously observed to be able to survive the transition through
the GI tract possibly being metabolically active in the gut (David, Maurice et al. 2014). The
phenotypic properties of fungi isolated in this study suggested that these isolates are able to
survive in the human GI tract, prompting the hypothesis of an ecological selection and
potential ability to colonize this niche (David, Maurice et al. 2014). Indeed the phenotypic
features of the fungal isolates identified endow such isolates with an excellent ecological
fitness in the human gastrointestinal tract. We observed that approximately half of the
isolates form hyphae or pseudohyphae, which are known to be involved in the adhesion to
or penetration within the GI mucosa (Staab, Datta et al. 2013), consolidation of the colony,
nutrient intake and formation of 3-dimensional matrices (Brand 2012). Indeed a key factor
of C. albicans commensalism/pathogenicity is its ability to switch between different
morphologies, comprising cellular, pseudohyphae and hyphae forms. As reported for C.
albicans, the reversible transition to filamentous growth as a response to environmental cues
(Sudbery 2011) and phenotypic switching is essential for mucosal fungal colonization
(Vautier, Drummond et al. 2015).

116
Previous studies have shown that C. albicans over-expresses a wide range of genes involved
in resistance to high temperature and pH, oxidative stress and hyphae formation during ileum
and colon commensal colonization of BALB/c mice (Pierce, Dignard et al. 2013). Similarly,
the fungal isolates of this study, showing resistance to oxidative, high temperature, bile acids
and pH stresses may hold the potential to colonize the human gut. It is plausible that fecal
fungal isolates with specific characteristics (such as high resistance to acidic pH and bile
salts) survived to the gut environment, and that these traits make them able to colonize the
gut. Thus, we can hypothesize a long process of evolution, selection or adaptation of
environmental and food-borne strains to the human host, suggesting that pathogenic strains
of commensal species can evolve through a repeated process of evolution and selection,
depending on the immune status of the host. These findings encourage for in-depth, strain-
level extensive studies on human gut mycobiota and the integration of such data with
immunology to further establish the relevance of fungi in host physiology and host-microbe
interaction. Furthermore fungi may train host’s immune system simply when passengers,
rather than necessarily persisting only as continuous colonizers (Rizzetto, Ifrim et al. 2016).
We discovered that several fungal isolates displayed different levels of antifungal resistance.
About 20 years ago, azole-sensitive C. albicans dominated infections, with other Candida
species rarely observed. Actually C. glabrata is the second most-commonly isolated
Candida species in the European Union and United States and has high rates of antifungal
resistance (Slavin, van Hal et al. 2015). Inappropriate antifungal use has contributed to the
increase in antifungal resistance, causing objective complications for the treatment of
invasive fungal infections that nowadays represent a severe cause of morbidity and mortality
among immunocompromised individuals, neonates and elderly (Brown, Denning et al.
2012). Recent studies indicated that fungal infections may originate from individual’s own
commensal strains suggesting that the ability of a commensal microorganism to promote
disease is not merely a consequence of impaired host immunity (Odds, Davidson et al. 2006),
suggesting that rural and other commercial uses of azole could be the culprit for the
emergence of these resistant strains (Snelders, Camps et al. 2012). This underlines the risk
that the increase of antifungal usage outside of the clinic could also lead to increased
resistance to antifungals of individual’s own commensal strains representing an important
epidemiological problem in the future and remarking the importance to increase the
investment in antifungal research.
It should be noted that all the samples analyzed by metagenomics resulted in high quality
fungal sequences, indicating that all the fecal samples studied had fungal DNA. So far, the
estimated ratio fungi/bacteria of 1:10000 (Huffnagle and Noverr 2013), discourages an
approach based on whole metagenome shotgun sequencing (Underhill and Iliev 2014). We
thus performed amplicon-based ITS1 metagenomics on a subset of healthy donors
identifying more than 90 different fungal taxa. The first striking evidence was that
metagenomics detected also sequences belonging to Agaricomycetes, among which several
edible fungi, thus suggesting that dietary fungal intake is a potential confounding effect when
studying the gut mycobiota. On the contrary, 34 different fungal species were isolated using
the culture-based approach. Both methods detected in any case differences in the diverse
groups of study. The discrepancies observed between culture-dependent and culture-
independent approaches on the description of fungal populations could be attributed to the

117
methodological differences of the two procedures applied suggesting that several of the
fungal taxa identified by the metagenomics approach are not cultivable, either because we
lack the proper culture conditions or because these belong to DNA from dead cells,
environmental or food-borne fungi that cannot survive the passage through the GI tract, but
whose DNA is still detectable. Furthermore, the DNA extraction method used could not be
suited to extract all the fungal DNA from the stool samples since the rare taxa Yarrowia,
Starmerella, Rhodosporidium and Pleurostomophora have been found only by the culture-
based approach. On the other hand, the culture condition that we used might be responsible
for some of the discrepancies observed between the two methods. In our experience, the vast
majority of human commensal fungi grows in YPD, yet other environmental derived fungi
that we were not able to cultivate, might need different culture conditions from those we
used in this work. Although, for example, Saccharomyces cerevisiae is often found in
fermented food, it has been shown that it can survive GI tract challenges being a commensal
of the human GI tract (Rizzetto, De Filippo et al. 2014) educating also adaptive immunity
(Rizzetto, Ifrim et al. 2016). S. cerevisiae has been introduced in the human intestine through
diet and fermented beverages and has accompanied human evolution for at least the past
5150 years (Cavalieri, McGovern et al. 2003). Our evidence, together with previous results,
including a recent description of S. cerevisiae in IBS patients gut (Sokol, Leducq et al. 2016)
shows that this microorganism is a potential commensal of the human intestine. The overall
reduction of the amount and diversity of fungi introduced through consumption of fermented
beverages suggests that the human gut mycobiota could be in dynamic change and certain
potentially beneficial species could be lost as a result of modern food processing procedures,
cultural changes and food globalization. Ongoing studies on microbial anthropology in
human populations consuming traditional fermented foods hold the promise to shed light on
the evolution of the fungal mycobiome as associated to the evolution of diet. On the contrary,
the edible fungi belonging to Agaricomycetes cannot settle in the human gut due to their
ecology (Hibbett 2006) so we filtered-out these sequences for downstream analyses to
reduce statistical noises on ecological measures, improving our results on the
characterization of intestinal fungal communities. We are aware that other taxa identified by
our analyses having environmental and food-borne origin may not be able to settle in the
human gut, however little is known about these taxa while the Agaricomycetes sequences
that we retrieved had a very low prevalence in the dataset and mostly belonged to edible
fungi such as Boletus, Suillus or Agrocybe.
We further observed that amplicon-based ITS1 metagenomics cannot confidently describe
fungal populations at a deeper level than genus overlooking species level information
provided by the fungal cultivation approach. On the other hand, metagenomics analysis
detected community structure differences that fungal cultivation did not identified. However,
the analysis of alpha-diversity from cultivation data on the subset of subjects used for the
metagenomics analysis revealed no significant differences among genders remarking that
the different sample sizes used in this work are an additional factor in the discrepancies
observed between the two methods. Although the major limitation of culture-based methods
for the study of microbial communities is the loss of ecological information due to the
inability to cultivate most microorganisms by standard culturing techniques, fungi included,

118
culture-based analysis of the human gut mycobiota is fundamental to discern fungal
phenotypes that would be otherwise lost by metagenomics.
In addition, population level analyses with both approaches revealed interesting cues. As
occurs for the bacterial microbiota, the intestinal mycobiota is shaped by host’s age, gender,
diet and geographical environment (Yatsunenko, Rey et al. 2012;Hoffmann, Dollive et al.
2013;David, Maurice et al. 2014). Previous studies have shown that the development of the
gut bacterial microbiota starts at birth with colonization by a low number of species from
the vaginal and fecal microbiota of the mother and is characterized by many shifts in
composition during infancy (Yatsunenko, Rey et al. 2012). Similarly, the mycobiota may
show the same fate, but we observed an inverted trend in which the richness of the gut
mycobiota of infants (0-2 years old) and children (3-10 years old) was higher than adults
(≥18 years old). It has been shown that suppression of the bacterial microbiota upon
treatment with antibiotics results in the outgrowth of the gut mycobiota (Dollive, Chen et al.
2013) probably as a consequence of reduced ecological competition. Similarly, a weak
bacterial competition, in particular during infancy when the bacterial microbiota is less stable
(Koenig, Spor et al. 2011;Lozupone, Faust et al. 2012), could be the reason why we observed
an increased fungal alpha-diversity during the early stages of life or this could be due to the
different interactions between intestinal fungi and diet (Hoffmann, Dollive et al. 2013;David,
Maurice et al. 2014) which is peculiar during infancy. We also found that female subjects
had a higher number of fungal isolates and different fungal species compared to male
subjects and that female mycobiota cluster apart from male mycobiota. This may be ascribed
to the role of sex hormones in modulating microbiota composition (Markle, Frank et al.
2013) and of diet in shifting the microbiota composition in a gender-dependent manner
(Bolnick, Snowberg et al. 2014). Furthermore the higher relative abundance of Candida in
the fecal samples from female than male subjects could be also attributed to the prevalence
of Candida species in the vaginal mycobiota (Drell, Lillsaar et al. 2013) due to the anatomical
proximity of the two districts. To the best of our knowledge, this is the first time that gender-
related differences are described in the human gut mycobiota.
In conclusion, we can state that culture-independent approaches are very promising for
future investigation of the mycobiota, but require significant improvements in the selection
of markers for amplicon-based metagenomics and the reference databases. Additionally
development of markers targeting pathogenicity traits, including the genes involved in host
invasion or evasion of immune defenses, or markers detecting resistance to azoles or other
antifungals, is required to thoughtfully apply metagenomics to fungal infections,
discriminating the healthy mycobiota from an altered one. Such improvement can be
achieved only through systematic sequencing efforts of the cultivable mycobiota, paralleling
what happened for the prokaryotic microbiota. In our experience, currently, the combination
of the two methods compensated the methodological limits intrinsic in both approaches
avoiding to overlook significant differences present in the gut mycobiota of healthy subjects.

119
7. Genotyping and immunophenotyping of cultivable fungal isolates from
pediatric patients affected by Inflammatory Bowel Disease and their
interaction with bacterial communities
This chapter will be shortly submitted for publication as original research articles:
Di Paola M., De Filippo C., Stefanini I., Rizzetto L., Rivero D., Ramazzotti M., Tocci N.,
Lenucci M.S., Lionetti P., Cavalieri D.
Genotyping and immunophenotyping of the Crohn’s disease mycobiome reveals its
interactions with the bacterial communities of the gut
Di Paola M., Rizzetto L., Colombari B., Bernà L., De Filippo C., Ardizzoni A., Tocci N.,
Paulone S., Lionetti P., Gut I. G., Blasi E., Cavalieri D., Peppoloni S.
Candida albicans isolates with different genomic backgrounds show diverse host adaptation
and differential susceptibility to phagocytosis
7.1 Scientific background
Several studied investigated the contribution of bacterial communities in the etiology of
Inflammatory Bowel Disease (IBD) (Seksik, Rigottier-Gois et al. 2003;Gophna,
Sommerfeld et al. 2006;Frank, St Amand et al. 2007;Ott, Kuhbacher et al. 2008;Sokol, Lay
et al. 2008;Gevers, Kugathasan et al. 2014;Machiels, Joossens et al. 2014). Despite the large
amount of metagenomics and clinical information, the studies on gut microbiota did not lead
to discovery of the causative agents of IBD, nor allowed novel intervention strategies.
Few studies investigating the mycobiota in chronic inflammation described a more
heterogeneous community, especially in patients affected by Crohn’s disease (CD)
compared with healthy subjects, and suggesting a contribution of altered mycobiota as the
causative agents of diseases, such as Irritable Bowel Syndorme, IBD, and “leaky gut”
syndrome (Sendid, Quinton et al. 1998;Boorom, Smith et al. 2008;Ott, Kuhbacher et al.
2008;Schulze and Sonnenborn 2009;Li, Wang et al. 2014;Sokol, Leducq et al. 2016). In fecal
samples from IBD patients, Chehoud et al. (Chehoud, Albenberg et al. 2015) found a
simplification of fungal microbiota, mainly enriched in Candida spp.. A study on pediatric
subjects showed that fungal taxa such as S. cerevisiae, Clavispora lusitaniae, Cyberlindnera
jadinii, C. albicans, and Kluyveromyces marxianus were positively associated with CD
(Lewis, Chen et al. 2015). Finally, Sokol and co-workers (Sokol, Leducq et al. 2016)
observed a clear fungal dysbiosis in CD patients, with enrichment in Candida spp. and
reduction of S. cerevisiae in disease versus remission.
Studies on the mice model showed that gut inflammation promotes fungal proliferation
(Jawhara and Poulain 2007). In a mice model of chemically-induced colitis, an association

120
between gut inflammation and an increase in Candida was observed (Iliev, Funari et al.
2012).
Interestingly, amongst IBDs one of the markers proposed to discriminate CD from UC was
the positivity for anti-Saccharomyces cerevisiae antibodies (ASCA) (McKenzie, Main et al.
1990;Quinton, Sendid et al. 1998). This could be a result of colonization with S. cerevisiae
and increase in permeability on conditions associated to a leaky gut, but previous studies
showed that ASCA is produced also in response to Candida or other yeast. In fact, the
production of ASCA appear to be induced by several types of mannans present in the fungal
cell wall of different Ascomycetes (Sendid, Quinton et al. 1998;Standaert-Vitse, Jouault et
al. 2006). Thus, the fungal and host immune system interactions could worsen the
inflammatory process in gastrointestinal disease, especially in IBD, as a result of the
composition of the fungal cell wall.
Candida albicans is a commensal for approximatively in 80% of our body, inhabiting our
skin, GI and urogenital tracts (Rizzetto, Ifrim et al. 2016). Genome-wide surveys of the
microorganisms (Costello, Stagaman et al. 2012) have suggested the presence of strong
selective control on microbial communities that colonize and persist in particular
environments. Adaptation to a new environment is of fundamental importance in ecology.
Infectious agents adapt to escape detection by the immune system, as well as damage by
safer target specifically drugs. Although C. albicans isolates tend to show clonal origin,
recombination and cross-chromosomal rearrangements may occur and result more common
under stressful environmental conditions, such as prolonged drug treatments or exposure to
host immune defences, playing a significant role in promoting microevolution of this
opportunistic pathogen.
Different fungal isolates differ in adhesion, filamentous growth, and virulence (Ford, Funt
et al. 2015), revealing host adaptation and suggesting immune evasion strategies. Hyphal
growth and biofilm formation are key factors promoting fungal escape from phagocytes
(Marcil, Harcus et al. 2002;Ghosh, Navarathna et al. 2009;Orsi, Borghi et al. 2014) by
impairing phagosome maturation, a key process in the control of infection and pivotal to
both innate and adaptive immunity.
The scarcity of S. cerevisiae in the gut of healthy controls (chapter 6) found in our study
(Strati, Di Paola et al. 2016) and its presence in IBD patient’s gut is particularly striking.
Foods are thought to be the principal fungal sources for the host (Scanlan and Marchesi
2008). Fermented foods and beverages, such as bread, beer, and wine, are containing
eukaryotes species, especially S. cerevisiae. The long lasting association of S. cerevisiae
with human activities (3150 B.C.) (Cavalieri, McGovern et al. 2003) has led to the idea that
its population biology and evolution (Aa, Townsend et al. 2006;Ezov, Boger-Nadjar et al.
2006;Ruderfer, Pratt et al. 2006;Legras, Merdinoglu et al. 2007;Liti, Carter et al. 2009;Dunn,
Richter et al. 2012) are mainly shaped by the role of this microorganism in industrial
fermentations, rather than from commensalism. Recent discovery of the role of wasp’s gut
as a winter reservoir and potential evolutionary niche for S. cerevisiae indicated how the
ecological cycle of this microorganism is just beginning to be understood (Stefanini,
Dapporto et al. 2012;Stefanini, Albanese et al. 2016). The possible evolution of S. cerevisiae
in the animal GI tract is not limited to wasps or fruit-flies (Goddard and Greig 2015), but
probably extends to vertebrates and finally to mammals.

121
The recent studies have begun to note that the mycobiota is a significant player in host-
microbe interactions, and is able to shape both innate and adaptive immunity (Xu, Boyd et
al. 1999;Hardison and Brown 2012;Sancho and Reis e Sousa 2012;Angebault, Djossou et al.
2013;Rizzetto, De Filippo et al. 2014;Nguyen, Viscogliosi et al. 2015;Romani, Zelante et al.
2015). It is hypothesized that differences in fungal colonization are related to differences in
the host genetic makeup or in gut permeability. Furthermore, an unpaired immune response
to fungi could result in altered fungal colonization/infection (Strope, Skelly et al. 2015).
In this work, we investigated the immunomodulatory features of fungal isolates from IBD
patients, especially S. cerevisiae and C. albicans isolates, characterizing phenotypically and
genotypically for traits related to adaptation to gut environment in order to understand the
strategies related to interplay or evasion of host immune system, and the relationships
between fungal and bacterial gut communities.
7.2 Materials and Methods
7.2.1 Enrolment of patients and healthy subjects
A total of 93 pediatric subjects were enrolled at the Meyer Children’s Hospital (Florence,
Italy). All individuals were Caucasian and the age ranged from 4-19 years (Table 7.1). For
CD patients, disease activity was scored using the Pediatric Crohn's Disease Activity Index
(PCDAI). For UC patients, a similar index was used to measure disease activity, the Pediatric
Ulcerative Colitis Activity Index (PUCAI), as reported in materials and methods of chapter
4. Inflammatory activity was assessed in all IBD patients through clinical parameters, such
as erythrocyte sedimentation rate (ESR), C Reactive Protein (CRP) and fecal calprotectin, a
useful marker of mucosal inflammation (Aomatsu, Yoden et al. 2011). Anti-Saccharomyces
cerevisiae Antibodies (ASCA), IgA and IgG levels were evaluated for each IBD patient
(Table 7.1).
By calprotectin measure, mucosal inflammation of IBD patients was evaluated routinary
together with endoscopy. To induce disease remission, different therapeutic regimens were
adopted, such as enteral nutrition with a polymeric formula, surgery, immunosuppressant
and immunomodulating therapies (such as 6-mercaptopurine and azathioprine), Infliximab
(anti-TNFα Antibody), steroids (budesonide, prednisone, beclomethasone) and 5-
aminosalycilates (sulfasalazine, mesalamine).
All enrolled individuals were made aware of the nature of the experiment, and all gave
written informed consent in accordance with the sampling protocol approved by the Ethical
Committees of the Meyer Children’s Hospital and the Azienda Ospedaliera Universitaria
Careggi, Florence, Italy (Ref. n. 87/10).
7.2.2 Isolation and identification of yeast species from fecal samples
Feces were collected from all pediatric subjects. A 1 ml feces aliquot was plated on Yeast
Extract-Peptone-Dextrose (YPD) agar medium supplemented with chloramphenicol
(1mg/ml) and incubated at 28° C. After 2-3 days, fungal colonies were observed. Yeast
genomic DNA was extracted as previously described by Sebastiani and collaborators
(Sebastiani, Barberio et al. 2002). Fungal isolates were identified by sequencing of the

122
ribosomal Internal Transcribed Spacer (ITS) region, using ITS1 (5’-
GTTTCCGTAGGTGAACTTGC-3’) and ITS4 (5’-TCCTCCGCTTATTGATATGC -3’)
primers, using megaBLAST algorithm in the NCBI database. Long-term storage of the
isolates was carried out in 20% glycerol at –80°C.
For host-fungal interaction studies, isolates were cultured overnight at 37°C in Sabouraud
dextrose agar (SDA, Oxoid, Hampshire, UK). Then, yeast cells were washed twice with
sterile Phosphate Buffered Saline (PBS, EuroClone, Wetherby, UK), counted and suspended
in Roswell Park Memorial Institute (RPMI) 1640 medium at the desired concentration.
7.2.3. Statistical correlation between clinical parameters, phenotypes and fungal
isolates
To evaluate variables that might influence the presence of yeast in fecal samples, such as
clinical parameters, sex, age and location of the inflammation and treatment, we performed
logistic regression using automated model selection. To observe correlations between yeast
isolates from IBD, clinical features and ASCA, we used the Wald test. Chi Square statistics
were applied to associate significant correlations with the variables mentioned above. Yates
correction was applied in the case of expected frequencies less than 5. G test was applied in
order to evaluate significant correlation fungal isolates between mucosal indeces. Species
richness and biodiversity in yeast populations from the three groups were estimated using
the Species Prediction and Diversity Estimation (SPADE) program
(http://chao.stat.nthu.edu.tw). Biodiversity was estimated by comparing the Shannon and
Simpson indices. Fisher Exact Test was performed in order to evaluate significant
correlations between different virulence-related traits.
7.2.4 Phenotypical characterization of fungal isolates
S. cerevisiae and C. albicans isolates were tested for virulence related traits. We evaluated
the ability of strains to rapidly adapt to environmental changes and acquire different
phenotypic conformations (e.g. pseudohyphae, spores) in order to assess the potential ability
of yeast cells to invade human tissues. The phenotypic characteristics of S. cerevisiae were
compared to M28-4D and BY4742 S. cerevisiae laboratory strains, while for C. albicans
strains the reference strain was SC5314 (ATCC® MYA-2876™).
Invasive growth. The ability of fungal isolates to penetrate solid rich medium (YPD, Yeast
Peptone Dextrose, 1% Yeast Extract, 2% Peptone, 2% Glucose, 2% agar) was tested in order
to assess the potential ability of yeast cells to invade human tissues. Yeast cells (104 and 102
cells/ml) were spotted on solid YPD plates and incubated at 28°C and 37°C. After 5 days of
growth, cultures were stained with Coomassie blue as previously described (Palkova 2004).
As a result, the invading cells are colored blue. M28-4D and BY4742 S. cerevisiae strains,
known to be highly invasive and non-invasive respectively, were used as controls. SC5314
C. albicans strain, showing invasivity, were used as controls.
Resistance to oxidative stress. Yeast resistance to oxidative stress was evaluated by
measuring the inhibition halo, treating S. cerevisiae strains (107 cell/ml) with tert-Butyl-
hydroperoxide (tBut-OOH). After 5 days of incubation at 28° C, the inhibition halo on YPD+
1 M tButOOH was measured. The percentage of sensitivity to oxidative stress was calculated
as the deviation of the inhibition halo diameter (Ø) from that of the M28-4D S. cerevisiae

123
strain, showing the highest resistance to oxidative stress (0% sensitivity), according to the
following formula: (Ø sample – Ø M284D strain) / Ø M284D strain *100.
Growth at supra optimal temperatures. S. cerevisiae and C. albicans strains were grown at
supra optimal temperatures, to test a typical feature of clinically isolated and pathogen
strains. Yeast cells (106 cell/ml) were spotted on solid YPD medium and incubated at 4° C,
40° C, 42° C, and 44° C for 3 days.
Pseudohyphal and Hyphal formation. Yeast cells (106 cells/ml) were grown in liquid YPD
and YNB media (0.67% Yeast Nitrogen Base w/o amino acids and (NH4)2SO4 and 2%
glucose), both at 28°C and 37°C. After 7 days of incubation, pseudohyphae formation was
scored for S. cerevisiae strains and hyphae for C. albicans strains. Every S. cerevisiae strain
isolated from IBD patients and HS was tested and compared with the S. cerevisiae laboratory
strain BY4742, known to be incapable of assuming pseudohyphal conformation. The C.
albicans reference strain was SC5314 (ATCC® MYA-2876™).
Sporulation rate. A large amount of pre-aged S. cerevisiae cells, grown on YPD, was
transferred onto Spo IV (sporulation medium: 2% Potassium acetate, 0.25% Yeast Extract,
0.1% glucose) and incubated at 4°C, 28°C and 37°C. After 5 and 10 days, spore formation
was assessed. The SK1 S. cerevisiae strain was used as a positive control (100% sporulation
efficiency). The sporulation percentage was calculated as a ratio of the number of asci
observed and the total number of cells and asci.
pH impact on growth. S. cerevisiae strains were grown on YPD medium at pH 3.0, 4.8 and
7.4, adding citrate, acetate, and phosphate buffers respectively.
Growth on different carbon sources. C. albicans yeast cells (106 cells/ml) were grown in
solid YP added with the following carbon sources (2%): glucose, galactose, glycerol,
ethanol, sucrose, oleate, and evaluating the survival after 3 days.
Antifungal agent resistance. Antifungal drugs susceptibility was performed evaluating the
growth of C.albicans yeast cells (106 cells/ml) in solid YPD added with different
concentration of fluconazole and ketoconazole (0.01 mM, 0.1 mM, 0.5 mM, 1 mM and 5
mM for each drug). SC5314 was used as control. Colony formation was evaluated after 24
h, 48 h and 72 h of growth at 28°C.
7.2.5 Biofilm formation assay of C. albicans strains and thickness measurement
Candida strains were grown overnight in SDA plates at 37°C. Cells were washed with PBS
and standardized to 1×10⁵ or 1×10⁶ yeast cells/ml in complete RPMI. Then, 100 µl aliquots
of each yeast cell suspension were placed in 96-well polystyrene microplates and incubated
at 37°C for 24 and 48 h. After incubation, the biofilm grown in each well was quantified by
means of the crystal violet (CV) assay, according to previously described protocols (Orsi,
Borghi et al. 2014). To evaluate the number of both yeasts and budding yeast cells released
in the biofilm supernatants, biofilms were grown for 48 h as described above. One-hundred
microliters of culture supernatants were then removed from each wells and the number of
both yeasts and budding yeast cells counted using the chamber Burker.
To measure the biofilm thickness, 106 cells/ml C. albicans strains were seeded in 6 wells
plates (Nalge Nunc International, Naperville, IL, USA), in complete RPMI and incubated
for 24 h and 48 h in presence of CO2. The cells were washed with PBS at room temperature,
124
fixed with 4% PFA for 30 min at 4°C and delicately washed with cold PBS to remove PFA.
The plates were then placed upside down and were allowed to dry for 1 hour. The samples
were finally visualized using an optical microscope equipped with Nomarski DIC optics
(Nikon Instruments Inc. USA), in order to measure the biofilm thickness. The samples were
moved (2 μm steps) along their vertical axis starting from the biofilm bottom to the hyphae
top. Microphotographs were taken at each focal plan by means of a DS-2Mv Nikon digital
camera, and the resulting photographs were analyzed [Nikon NIS ELEMENTS (version
D3.1) software]. By taking into account the analyzed μm, and by putting together the
acquired optical sections in a sequence, such software allowed to visualize each biofilm
sample in a movie format.
7.2.6 Candida cell morphology studies
To examine cell morphology, 1x10⁶/ml Candida cells were seeded in 24-well polystyrene
plates with plastic cover slips for 24 h at 37°C under 5% CO2. Then the cells were washed
three times with PBS and each strain was fixed with 2.5% glutaraldehyde (Electron
Microscopy Sciences, Hatfield, PA, USA) in 0.1 M phosphate buffer (pH 7.2) for 18 h at
4°C. The samples were then carefully washed with 0.1 M phosphate buffer (pH 7.2). Post-
fixation was carried out for 1 h at room temperature with 1% osmium tetroxide (Electron
Microscopy Sciences). Initial dehydration was accomplished by placing specimens in the
following series of ethanol gradients: 30% (one time for 3 min), 50% (one time for 6 min),
70% (one time for 10 min), 90% (two times for 8 min) and 100% (three times for 8 min).
The samples were critical point dried (Critical Point Dryer, CPD0-10, Balzers, Lichtenstein)
before being gold coated (Sputter coater K550, Emitech Ltd, Ashford, UK) and examined
with a Scanning Electron Microscope (SEM, Nova-NanoSEM 450, FEI Company, OR,
USA).
7.2.7 In vitro phagocytosis assay
The following experiments are conducted in collaboration with laboratory of Prof. Peppoloni
from University of Modena and Reggio, Italy. The previously established murine microglial
cell line BV2 (50) was maintained in RPMI 1640 medium supplemented with 10% heat-
inactivated fetal bovine serum (FBS) (Defined Hyclone, Logan, UT, USA), gentamicin (50
mg/ml; Bio Whittaker, Verviers, Belgium) and L-glutamine (2 mM; EuroClone, Milan,
Italy), hereafter referred to as “complete medium”. Cells were detached biweekly by
vigorous shaking and fresh cultures were started at a concentration of 5 x10⁵/ml on the day
before each experiment. BV2 cells were cultivated at 37°C under 5% CO2.
To strengthen attachment of BV2 cells to the wells, Lab-Tek II chamber slides (Nalge Nunc
International, Naperville, IL, USA) were pretreated with poly-L-lysine (Sigma Aldrich; 10
mg/well) for 30 min, and washed twice with PBS. BV2 cells (2x10⁶/ml, 100 µl/well) were
incubated for 15 min and then infected with a suspension of C. albicans cells (4x10⁶/ml, 100
µl/well) in complete RPMI [effector to target (E:T) ratio of 1:2]. The BV2 cells were
incubated for 1.5 or 3 h at 37 °C under 5% CO2. Fifteen minutes before the end of incubation,
the C. albicans cells were treated with Uvitex 2B (40 µl/well, Polisciences, Inc, PA, USA),
a fluorescent dye that bind the chitin in the fungal cell wall. The BV2 cells were then washed

125
three times with PBS to remove extracellular yeasts and fixed for 30 min with 4%
paraformaldehyde (PFA) (Sigma Aldrich) in PBS. BV2 cells were washed with PBS and
then treated with ProLong Gold Antifade Reagent (PLGAR, Molecular Probes, Invitrogen,
St. Louis, Mo, USA) in order to suppress the photobleaching effect and preserve the signals
of fluorescently labeled target molecules. The remaining blue fluorescence of Candida
bound to BV2 cells, as well as the unlabeled internalized fungi, was visualized by
epifluorescence microscopy (Nikon Instruments). At least 200 microglial cells from each
sample were examined and the percentage of cells with intracellular yeasts was defined as
the ratio of the number of BV2 cells containing one or more unlabeled Candida to the total
number of cells examined.
7.2.8 Intracellular survival assay
BV2 cells (2x10⁶/ml, 5x10⁶/2.5 ml) were incubated in 25-cm2 tissue-culture flasks (Nalge
Nunc International, Naperville, IL, USA) for 1.5 h with the Candida strains (4x10⁶/ml,
107/2.5 ml) in complete RPMI medium at an E:T ratio of 1:2. Cells were washed twice with
PBS to remove the extracellular yeasts, suspended in complete RPMI (time 0) and seeded in
twenty-four-well polystyrene plates (Nalge Nunc International, Naperville, IL, USA). At 0,
3, 6 and 20 h post-infection, the BV2 cells were lysed with 0.2% (v/v) Triton X-100 for 15
sec to release intracellular Candida. Serial dilutions of the lysates were then plated onto SAB
plates and incubated for 24 h. The results were expressed as Survival Index (SI) at different
time points. The SI was calculated as the number of CFU detected at 3, 6 and 20 h divided
by the CFU number obtained at the time 0. Control experiments were carried out to verify
that the treatment with Triton X-100 was not toxic for the Candida (data not shown).
7.2.9 Phagolysosome acidification assay
Visualization of the acidic Candida-containing phagosomes was performed as described
previously (Orsi, Colombari et al. 2009), using the acidotropic dye LysoTracker Red DND-
99 (Molecular Probes, Invitrogen) at a final concentration of 5 mM. The blue fluorescence
(Uvitek 2B labelling) of bound C. albicans and the unlabeled internalized Candida (no
fluorescence) were visualized by epifluorescence microscopy. Successful acidification of
phagosomes containing unlabeled Candida was indicated by the simultaneous appearance
of LysoTracker Red DND-99 (red fluorescence) and Candida cells within the phagosomes,
resulting in red fluorescence when merging the images. For quantitative analysis, the
percentage of acidic phagosomes per image was calculated as the number of red phagosomes
within the phagocytic cells divided by the total number of Candida internalized (unlabeled
yeasts).
7.2.10 In vitro adhesion assay and secretory activity of human epithelial cell line
Caco-2
The human epithelial colorectal adenocarcinoma cell line Caco-2 was grown in 75-cm2
tissue-culture flasks (Nalge Nunc International, Naperville, IL, USA). Just before they reach
the confluence, Caco-2 cell cultures were split 1:3 by standard methods. For the culture of

126
the Caco-2 cells Dulbecco’s Modified Eagle’s Medium (DMEM; EuroClone, Milan, Italy)
supplemented with 10% heat-inactivated FBS, 2 mM L-glutamine and 50 mg/ml gentamycin
was used. The cells were cultivated at 37 °C under 5% CO2. The Caco-2 fresh cultures were
started at a concentration of 6.5 x10⁵/ml for the adhesion experiments and at a concentration
of 8 x10⁵/ml for the secretion assay.
Caco-2 cells (1.3 x 10⁵/200μl, 6.5 x 10⁵/ml, 200 µl/well) were seeded in Lab-Tek II chamber
slides, grown at 37°C to confluence (24 h) and then infected with a suspension of Candida
(5.2 x 10⁵/200 µl, 2.6 x10⁶/ml, 200 µl/well) in complete RPMI (E:T ratio of 1:2). Caco-2
cells were incubated for 1.5 or 3 h at 37°C under 5% CO2. Fifteen min before the end of
incubation, C. albicans cells were treated with 40 µl/well of 1% Uvitex 2B, washed three
times with PBS to remove unbound yeast cells and fixed for 30 min with PBS-buffered 4%
PFA. The Caco-2 cells were washed twice with PBS and then treated with PLGAR. The blue
fluorescence of bound C. albicans was visualized by epifluorescence microscopy. At least
200 epithelial cells from each sample were examined and the percentage of Caco-2 cells with
adherent yeasts was defined as the ratio of the number of Caco-2 cells with one or more C.
albicans to the total number of Caco-2 cells examined.
Caco-2 cells were seeded in 24 well-plates and were allowed to reach the confluence for 24
h. Candida strains (E:T ratio of 1:100) were then added and incubated for 6 h and 24 h. The
presence of β-2 defensin in the culture supernatants was assessed by means of enzyme
immunoassay [β-2-Defensin (Human), Phoenix Pharmaceuticals Inc., Karlsruhe, Germany].
7.2.11 Epifluorescence microscopy
Prior to visualization, Lab-Tek II chamber slides were washed with PBS and then treated
with PLGAR. Epifluorescence and differential interference contrast (DIC) microscopy were
performed using a Nikon Eclipse 90i imaging system equipped with Nomarski DIC optics
(Nikon Instruments Inc. USA). At each time point, samples were photographed with a DS-
2Mv Nikon digital camera, and the resulting microphotographs were analyzed by using the
Nikon NIS ELEMENTS version D3.1 software.
7.2.12 S. cerevisiae population genetic analysis
A set of 129 strains was characterized in terms of allelic variation at 12 microsatellites loci
(Legras, Merdinoglu et al. 2007). The chord distance Dc matrix was calculated for each
strain with a laboratory-made program. The phylogenetic tree was obtained with the
Neighbor-joining method from the distance matrices with the Phylip Neighbor 3.67 package
and drawn up using MEGA4.0 (Tamura 2011). The tree was rooted using the midpoint
method.
Sequences of analyzed samples submitted to GenBank (ID: KF261601-KF261724), were
compared with S. cerevisiae pre-edited sequences downloaded from the Sanger institute
website. The collection included strains isolated from a wide variety of sources, such as
grapes, vineyards, wasps, and different types of fermentation, as well as other clinical strains
(isolated in concomitance with other fungal infections). SNPs identified by alignment
against the reference S288C genome were concatenated to give a unique sequence. The
aligned/concatenated SNPs sequences were used to compute distances with the Kimura two

127
parameter model (Felsenstein 1989) using Phylip dnadist and then clustered with the
Neighbor-joining method (Saitou and Nei 1987), using Phylip Neighbour.
Population ancestries were estimated by using the model-based program Structure (Pritchard
et al. 2000). K=5 and K=6 were chosen as the most representative of the population
structures for the three genome-mimicking gene sequences. The results of 10 independent
Structure chains were combined with CLUMPP. Population structure was also evaluated
using principal component analysis (PCA) and Differential Analysis of Principal
Components (DAPC) using the R adegenet package. The groups’ inter- and intra- genetic
distances, calculated with the Kimura two parameter model, were statistically tested using
the Mann-Whitney U test and Levene test.
7.2.13 Whole genome analysis of two C. albicans isolates
Whole genome sequencing was performed using the Illumina GAIIx and HiSeq2000
sequencing instruments. The standard Illumina protocol with minor modifications was
followed for the creation of short-insert paired-end libraries (Illumina Inc.). In brief, 2.0 μg
of genomic DNA was sheared on a Covaris™ E220 in order to reach the fragment size of
~500bp. The fragmented DNA was end-repaired, adenylated and ligated to Illumina specific
paired-end adaptors. To obtain a library of very precise insert size (500bp) with the size
deviation of +/- 25bp, the DNA with adaptor-modified ends was size selected and purified
using the E-gel agarose electrophoresis system (Invitrogen). After size selection, the library
was PCR amplified using 10 PCR cycles. Each library was run in a fraction of a GAIIx
flowcell lane in paired end mode of 2x151bp or on HiSeq2000 in 2x101bp read length, both
according to standard Illumina operation procedures. Primary data analysis was carried out
with the standard Illumina pipeline. The purity of the signal from each cluster was examined
over the first 25 cycles and chastity = Highest_Intensity/(Highest_Intensity +
Next_Highest_Intensity) was calculated for each cycle. To remove the least reliable data
from the analysis, reads were filtered according to chastity > 0.6, for all but one of the first
25 bases. If there were two bases, the read was subsequently removed.
7.2.14 Illumina quality control and SNP calling
Illumina reads were subjected to quality control (filtering and trimming) using QC Toolkit
(Patel and Jain 2012). Paired reads were filtered with parameters: -l 70,
(cutOffReadLen4HQ) and -s 20 (cutOffQualScore). As a result, reads with a PHRED quality
score of less than 20 for more than 30% of their length were discarded. Moreover, reads were
trimmed at the 3' end for bases with a PHRED quality score of less than 30. Paired reads
were mapped to the reference genomes [C. albicans SC5314, REfSeq
NZ_AACQ00000000.1, (Stanford University), and WO-1, RefSeq AAFO00000000.1
(Broad Institute)], using Burrows Wheeler Aligner (BWA http://bio-bwa.sourceforge.net/).
The Genome Analysis Toolkit (GATK) was used for base quality score recalibration, Indel
realignment, duplicate removal, and to perform SNP and Indel (insertion or deletion)
discovery (McKenna, Hanna et al. 2010).

128
7.2.15 Variant imposition, gene loss prediction and Gene Ontology enrichment of
lost, duplicate, truncated genes
The coding sequences of C. albicans strains were created using variant imposition (a.k.a.
consensus calling) in order to create uniform sets of genes for further analysis. Briefly, this
technique inserted variants (SNPs and Indels) produced by GATK and specific for each
strain into the coding sequences of the reference strains (SC5314 and WO-1) to create
accurate CDS useful for phylogenetic comparison across strains. For each strain, the
alignments (BWA, then optimized by GATK) of reads versus the reference genome were
analyzed and CDSs (taken from the genomic coordinates of SC5314 reference strain and
reassembled in case of multiple exons) evidencing a zero coverage in at least one position
were called as “lost”. In fact, these genes were apparently non-functional, broken, or lacked
evident similarity with the reference. We considered that only a minority of genes (around
10%) had some positions (<5) with a coverage equal to 0. Although possibly affected by
technical errors, especially in genes belonging to regions with low complexity or repetitive
sequences that could be difficult to align, we considered this approach a valuable source of
information and that false positive genes should appear in the majority of the strains analyzed
and could be either false positives or acquisitions of the reference genome. Gene Ontology
Term Finder tool on Candida Genome Database (CGD; http://www.candidagenome.org/)
were used for Functional Enrichment Analysis, using default parameters (therefore
considering as valid results with a p-value<0.05).
7.2.16 Cell wall extraction and quantification of sugars by HPAEC-PAD
The sugar composition of S. cerevisiae and C. albicans cell walls was analysed in
collaboration with Dr. M. S. Lenucci of Dep. di Scienze e Tecnologie Biologiche ed
Ambientali (Di.S.Te.B.A.), Università del Salento (Italy), as previously described (Dallies,
Francois et al. 1998) applying the following modifications. Briefly, about 200 mg of
stationary phase cells were harvested and washed with deionized water. Cells were
resuspended in 1ml of Tris-HCl 10mM (pH 8.5) and subsequently disrupted by three rounds
of vortexing at maximum speed (30 s) and chilling on ice (1 min) using glass beads (0.45-
0.55mm). Cell pellets were subjected to extraction with 100 μl of H2SO4 72% (w/w) for 1 hr
at room temperature. The resulting slurry was diluted with MilliQ water, to a final volume
of 1ml and heated for four hours at 100°C. The hydrolysate was then diluted to 9 ml with
MilliQ water, neutralized with saturated Ba(OH)2 and left overnight at 4°C to allow the
precipitation of sulfate ions. After centrifugation at 3800g for 5 min. The supernatant was
subjected to monosaccharide analysis with High-Performance Anion-Exchange
Chromatography coupled with Pulsed Amperometric Detector (HPAEC-PAD). All samples
were filtered through a 0.2mm Spartan 13 filter (Schleicher & Schuell Microscience, Dassel,
Germany) prior to analysis on a Dionex HPAEC equipped with a CarboPac PA10 (4 x 50
mm) guard column and a CarboPac PA10 (4 x 250 mm) analytical column. Separation was
performed as previously showed (Dallies et al., 1998). Sugars were quantified with a pulsed
amperometric detector (PAD) with gold electrode. Glucosammine, galactose, glucose and
mannose (for chitin, glucan and mannan content determination, respectively) were identified
by comparison with reference compounds and quantified according to calibration curves
obtained for each sugar.

129
7.2.17 Human Peripheral Blood Mononuclear Cells and Dendritic Cells
preparation, fungal challenge and cytokine assays
Peripheral Blood Mononuclear Cells (PBMCs) were isolated from fresh blood obtained from
5 pediatric CD patients and 6 healthy donors, as a control, (from Meyer children Hospital
and the Transfusion Unit of the Careggi Hospital, Florence, Italy, respectively) by Ficoll-
Hypaque density gradient centrifugation (Biochrom AG). The experimental plan was
approved by the local Ethical Committee of the Meyer and Careggi hospitals, and informed
consent was obtained from all CD patients and healthy donors. Monocytes were isolated
from low density PBMCs by magnetic enrichment with anti-CD14 beads (Miltenyi Biotec).
Cells were cultured in the presence of GM-CSF (800 U/ml) and recombinant IL-4 (1000
U/ml) for 6 days to allow Dendritic Cells (DC) differentiation (Netea, Ferwerda et al. 2006).
DC activation was induced by fungal strains in the different life stages. Depending on the
experiments, moDCs were added at different concentrations. Serial dilution of live/UV-
treated yeast preparations was added to the moDCs at different stimuli:DC ratios.
For confirmation experiments, PBMCs from the same healthy subjects were used;
stimulation was performed as in DC challenge experiments. All stimulations were carried
out by challenging PBMCs with live fungi at 106 cells/ml concentration. After 24 hr or 7
days of incubation, supernatants were collected and stored at -20°C until assayed by mean
of cytokine detection. Human Milliplex® assay for TNF-α, IFN-γ, IL-1β, IL-6, IL-10, IL-
23, IL-12p70 and IL-17A production was performed according to the manufacturer’s
instructions using Luminex technology.
7.2.18 Statistical analysis of human immune response data
Principal Component Analysis (PCA) was carried out by using the dudi.mix function of the
ade4 R package in order to find possible correlations between a specific immune response
and the ancestral lineage of the strains and the ability to sporulate. Strains were used as cases,
and the variables were represented by cytokine release from human PBMCs upon
stimulation with the normalized strains (as compared to the relative cytokine amount
expressed by un-stimulated PBMCs) and the strain’s sporulation ability, using the
percentage of sporulation after 5 days in SPOIV medium as a factor (categorized into “high
sporulation”->25%, “low sporulation”-<25% and “any sporulation”-0%). Spearman’s
correlations among sugar cell wall and cytokine release upon fungal stimulation were
performed using the R software through the stats R package (version 3.1.2). P-values have
been corrected for multiple comparison by using the false discovery rate correction.
7.2.19 Bacterial DNA extraction from fecal samples and pyrosequencing
Fecal samples were preserved in RNAlater (Qiagen) at 4°C for the first 48 h, and kept at
−80°C until DNA extraction. Bacterial genomic DNA extraction and quality control were
carried out following our previous protocol (De Filippo, Cavalieri et al. 2010). For each
sample, we amplified the 16S rRNA gene using the special fusion primer set specific for V5-
V6 hypervariable regions and corresponding to primers 784F and 1061R described by
Andersson et al. (Andersson, Lindberg et al. 2008), and using the FastStart High Fidelity

130
PCR system (Roche Life Science, Milano, Italy). The 454 pyrosequencing was carried out
on the GS FLX+ system using the XL+chemistry following the manufacturer
recommendations (see materials and methods in chapter 3).
7.2.20 Metagenomic data analysis
Raw 454 files were demultiplexed using Roche's .sff file software. Reads were pre-processed
using the MICCA pipeline (version 0.1, http://compmetagen.github.io/micca/) (Albanese,
Fontana et al. 2015). Forward and reverse primer trimming and quality filtering were
performed using micca-preproc truncating reads shorter than 250nt (quality threshold=18).
Denovo sequence clustering, chimera filtering and taxonomy assignment were performed by
micca-otu-denovo (parameters -s 0.97 -c). Operational Taxonomic Units (OTUs) were
assigned by clustering the sequences with a threshold of 97% pair-wise identity, and their
representative sequences were classified using the RDP software version 2.7 (Wang, Garrity
et al. 2007). Template-guided multiple sequence alignment was performed using PyNAST57
(version 0.1) (Caporaso, Bittinger et al. 2010) against the multiple alignment of the
Greengenes 16S rRNA gene database (DeSantis, Hugenholtz et al. 2006) filtered at 97%
similarity. Finally, a phylogenetic tree was inferred using FastTree (Price, Dehal et al. 2010)
and micca-phylogeny (parameters: -a template-template-min-perc 50).
Alpha diversity was measured using richness of observed OTUs and Shannon index.
Exploratory analysis was performed by Non-metric MultiDimensional Scaling (NMDS) and
beta dispersion with PCoA ordination based on Bray-Curtis dissimilarities (indicators of beta
diversity) by phyloseq package (McMurdie and Holmes 2014) of the R software suite. The
significance of between-groups differentiation was assessed by PERMANOVA using the
adonis() function of the R package vegan with 999 permutations.
To compare the relative abundances of OTUs among the three groups of subjects, the two-
sided, unpaired Wilcoxon test was computed, removing taxa not having a relative abundance
of at least 0.1%, in at least 20% of the samples, and using the function mt() in the phyloseq
library and the p-values were adjusted for multiple comparison controlling the family-wise
Type I error rate (minP procedure).
On the basis of the relative abundances, the metagenomic biomarker discovery and related
statistical significance were assessed using the linear discriminant analysis (LDA) effect size
(LEfSe) method (Segata, Izard et al. 2011). LEfSe uses the Kruskal–Wallis rank-sum test to
identify features with significantly different abundances between assigned taxa compared to
the groups, and LDA to estimate the size effect of each feature. An alpha significance level
of 0.05, either for the factorial Kruskal-Wallis test among classes or for the pairwise
Wilcoxon test between subclasses, was used. A size-effect threshold of 2.0 on the
logarithmic LDA score was used for discriminative microbial biomarkers.
7.3 Result and discussion

131
7.3.1 The mycobiota of Crohn’s disease patients is enriched for S. cerevisiae
strains
We used selective media to characterize the cultivable gut mycobiota from feces from 34
pediatric Crohn’s disease patients (CD), 27 ulcerative colitis patients (UC), and 32 healthy
children (HC) (Table 7.1). Sequencing of rDNA ITS1-5.8S-ITS4 region allowed us to
classify a total of 112 yeast isolates belonging to 20 different species (Fig. 7.1; Table 7.2).
The CD group showed the highest number of isolates (N=78) belonging to 12 different
species, compared to UC and HC (N=12 and N=22 isolates, respectively; Table 7.2). S.
cerevisiae, C. albicans and C. parapsilosis composed the largest part of the CD mycobiota
(27, 22 and 16 isolates belonging to the three species respectively; Fig. 7.1; Table 7.2),
resulting in a significantly higher richness in CD (p<0.0001 Kruskal-Wallis test; Fig. 7.2).
Fig. 7.1 Cultivable fecal mycobiota in IBD patients and healthy children. Distribution of yeast
isolates (n =112) from fecal samples of Crohn’s Disease (CD), Ulcerative Colitis (UC) patients and
healthy children (HC; total subjects enrolled n=93). The number of subjects bearing at least one
isolate per yeast species is reported on the bars.
A B
Fig. 7.2 Richness and biodiversity of cultivable mycobiota. (A-B) Differences in species richness
and biodiversity of IBD and HC fecal mycobiota for the most abundant species. (A) Box plots related
to species richness and (B) to the number of isolates in the three groups studied. CD= Crohn’s Disease
patients; UC= Ulcerative Colitis patients; HC= healthy children. Kruskal-Wallis test: Species
richness, p= 0.004; number of isolates p= 9.267x10⁻⁸.

132
Table 7.1 Clinical data of IBD patients investigated in this study
CD UC
Number of patients 34 27
Gender: M/F ratio 20\14 13\14
Age average (range) 15.01 (10.5-18.9) 12.4 (3.25-18.9)
LOCALIZATION (number of patients)
ileum 13 0
colon 3 17
ileum-colon 15 0
sigma-rectum 0 8
DISEASE ACTIVITY (number of patients)
PCDAI <10 20 PCDAI >10 14 PUCAI <10 23
PUCAI >10 4
Anti S. cerevisiae Antibody (number of patients)
ASCA + 27 3
ASCA - 7 24
INFLAMMATION INDECES (number of patients)
Calprotectin >100 18 17
Calprotectin <100 16 10
ESR>31 12 6
ESR <31 19 19
CRP>0,5mg/L 16 6
CRP<0,5mg/L 15 19
TREATMENTS (number of patients)
enteral nutrition 12 0
infliximab 4 0
thalidomide 4 0
azathioprine 3 5
aminosalicylates 8 23
steroids 0 5
metotrexate 2 1
ciclosporine 2 0
6- mercaptopurine 6 5

133
Table 7.2 Yeast species isolated and identified by sequencing of the ITS region. For each yeast
species, number of isolates and number of subjects with each yeast species isolates are indicated, as
well as total species and average and standard deviation of strains for species are indicated
N° of yeast isolates N° of subjects with
yeast isolates
Phylum Yeast Species CD UC HC Total CD UC HC
Ascomycetes
Saccharomyces cerevisiae 27 2 2 31 9 2 2
S. delbrueckii 2 0 0 2 1 0 0
Candida albicans 22 7 10 39 5 6 10
C. ernobii 0 1 0 1 0 1 0
C. glabrata 0 1 0 1 0 1 0
C. pararugosa 1 0 0 1 1 0 0
C. parapsilosis 16 1 1 18 6 1 1
C. tropicalis 0 0 1 1 0 0 1
C.zeylanoides 0 0 1 1 0 0 1
Clavispora lusitaniae 2 0 2 4 2 0 2
Issatchenkia orientalis 1 0 0 1 1 0 0
Pichia carribica 0 0 1 1 0 0 1
P. kluyveri 0 0 1 1 0 0 1
P. membranifaciens 1 0 0 1 1 0 0
Yarrowia lipolitica 0 0 1 1 0 0 1
Basidiomycetes
Criptococcus adeliensis 1 0 0 1 1 0 0
C. liquefaciens 1 0 0 1 1 0 0
C. saitoi 0 0 1 1 0 0 1
Rhodotorula mucilaginosa 3 0 1 4 3 0 1
Trichosporon faecale 1 0 0 1 1 0 0
Total isolates 78 12 22 112 Total species 12 5 11 20 Average of strains per species 7 2 2 6 Standard deviation of strains per species 8 2 2 11
Stratifying CD patients according to clinical markers useful for monitoring mucosal disease
activity, such as fecal calprotectin dosage, we observed that 52.9% (18/34) of the patients
presented high mucosal inflammation indexes. We found yeasts in 61% (11 out of 18) of CD
patients with mucosal inflammation, from which 45% (5 out of 11) we isolated S. cerevisiae.
For UC, in 44.4% (12/27) patients we found yeasts, and in only 7.4% (2/27) of the UC with
no mucosal inflammation we isolated S. cerevisiae.
We observed that in CD the presence of yeasts significantly correlated with mucosal
inflammation indexes (G test, G adj. 6.280; p=0.012), in agreement with recent observations
(Li, Wang et al. 2014).
It is well known that in CD a loss of tolerance towards commensal yeasts is expressed by
ASCA marker. The clinical status and ASCA levels of the IBD patients correlate with the
presence/absence of yeast isolated in feces (p=1.42x10⁻⁶, χ2 test). Nevertheless, no
significant correlation between ASCA positive (ASCA+) CD patients and the most abundant
fungal species per se has been found, indicating that ASCA production is not promoted by
a specific yeast species, but rather by strain-specific antigenic properties, as previously
observed (McKenzie, Main et al. 1990).

134
7.3.2 S. cerevisiae population structure from human gut
While the identification of Candida spp. from fecal samples has been described in previous
studies (Ott, Kuhbacher et al. 2008;Iliev, Funari et al. 2012), the isolation of a large amount
of S. cerevisiae isolates is an intriguing finding. We thus focused on the 31 S. cerevisiae
isolates: 27 from CD, 2 from UC patients and 2 from HC (Table 7.2).
In order to investigate the origin of these strains, we performed phylogenetic analysis based
on 12 microsatellite loci (Legras, Merdinoglu et al. 2007). Neighbor-Joining clustering based
on chord distances (see materials and methods) was used to assess the similarity of fecal
isolates as compared to others 123 strains from a wide variety of sources (soil, insect gut,
grape, wine fermentation, bakery and clinical environment) (Legras, Merdinoglu et al.
2007;Stefanini, Dapporto et al. 2012). Interestingly, we observed that the strains clustered
based on the patients from which they were isolated (Fig. 7.3A). Secondly a significant
fraction of gut isolates (17 out of 31), grouped in a separated cluster (Fig. 7.3A) with respect
to all the other known strains. This cluster encompasses isolates (YB, YD and YE series)
from three CD patients (B, D and E respectively), suggesting the existence of a population
of human gut strains with common specific genomic characteristics. We defined these
isolates as “human gut”-HG1 (Fig. 7.3A). We identified other 2 sub-clusters of HG strains.
A second group (namely HG2; from 3 IBD patients and 2 from HC) clustered closely to
strains used in bakery or isolated from the gut of wasps caught in the same geographical area
of both patients and healthy subjects (Tuscany-Italy; Fig. 7.3A), suggesting an
environmental/food-borne origin of these strains. A third group of four HG strains (namely
HG3), encompassing only isolates from a single CD patient (YH1-YH4), co-clustered with
the SK1 laboratory strain (Fig. 7.3A). This was no exception since strains isolated from the
same patient resulted more genetically similar than other strains belonging to the same
cluster according to subclustering, strains of the YB, YD and YE series of HG1 cluster and
the YH strains of HG3 cluster (Fig. 7.3A), and to the comparison of intra-series and intra-
cluster chord distances (Fig. 7.4). Both these indications suggested that the strains isolated
from feces of the same patient arose from clonal expansion within the gut of each patient.

135
Fig. 7.3 S. cerevisiae population phylogeny. (A) S. cerevisiae strain clustering based on the genetic
distances calculated with microsatellite analysis (21 selected loci). Blue shadows indicates the human
gut (HG) clusters. Color code of strains: purple-wine, green-grapes, dark yellow-natural sources,
yellow-bakery (bread and beer), light blue-other fermentations, pink-clinical, red-insect gut, black-
laboratory, blue-fecal isolates. (B) The Strains’ most probable ancestry, inferred by Structure
analysis and combined with CLUMPP, performed on SNP profiles. The proportion of the most
probable inferred ancestors for each strain is indicated by the colors of the horizontal bars. Vertical
colored bars indicate previously identified ancestries: red-west African (WA); light blue- Sake; dark
yellow- north America (NA); black-laboratory; light blue-sake; purple-wine European (WE).
Fig. 7.4 Comparison of genetic distances (base on chord distances) among strains isolated from the
same CD patient with respect to the relative clade. Wilcoxon rank sum test p-val<0.05.Note: B, D,
E, P, H are different CD patients. HG= Human gut clade, W/E= wine European clade.

136
Notably, we observed that the HG isolates from fecal samples did not cluster with clinical
strains previously sequenced (Liti, Carter et al. 2009;Strope, Skelly et al. 2015). This could
be ascribed to the fact that the latter were isolated, either in the presence of infections caused
by fungal pathogens or from different human body sites, constituting different environmental
niche compared to gut environment. These results are in line with the previous observation
(Koren, Knights et al. 2013) of a different gut microbial community with respect to different
communities of other body districts. The ancestral analysis, performed on microsatellite
SNPs, shows that the gut strains genome originates from different ancestors (Fig. 7.3B).
7.3.3 Phenotypic characterization of S. cerevisiae isolates. Sporulation ability
correlate with ASCA serum level of CD patients
We studied HG strains for phenotypic differences in traits relevant for growth in the gut
environment, such as invasivity, resistance to supra-optimal temperatures, oxidative stress,
and sporulation (McCusker, Clemons et al. 1994;Diezmann and Dietrich 2009) (Fig. 7.5).
Fig. 7.5 Phenotypic characterization of S. cerevisiae isolates. (A) Comparison of substrate invasivity
of selected strains. As a result, the invading cells are colored blue, after staining with Coomassie
blue. (B) Survival to oxidative stress evaluating the inhibition halo after 5 days of incubation with
tert-Butyl-hydroperoxide. (C) Pseudohyphal formation, growth assessment at high temperatures and
sporulation ability.
We found significant associations between fecal strain invasivity and sporulation (P=0.001,
Fisher’s exact test, FET), invasivity and resistance to oxidative stress (P=0.01, FET) and
sporulation rate and pseudohyphal formation (P=0.022, FET).

137
Table 7.3 Summary of virulence–related traits tested on S. cerevisiae strains isolated from fecal samples of IBD patients and HC
ID PATIENT Mucosal
Inflammation ID Strain pseudohyphae Invasivity
Oxidative
stress
(Inhibition)
4°C 40°C 42°C 44°C pH 3.0 pH 4.8 pH 7.4
Sporulation (%) in
SPO IV
4°C 28°C 37°C
CD
A (ASCA+) yes YA5 - + --- + +++ +++ - +++ +++ +++ 5% 20% 10%
B (ASCA-) yes
YB7 - ++ -- + +++ ++ - +++ +++ +++ - 10% -
YB8 - + -- + +++ +++ - +++ +++ +++ - 10% -
YB9 - - -- + +++ ++ - +++ +++ +++ - - -
YB10 - - -- + +++ ++ - +++ +++ +++ - - -
YB11 - + +++ + +++ ++ - +++ +++ +++ - - -
YB12 - + +++ - +++ ++ - +++ +++ +++ - - 15%
YB13 - - --- + +++ ++ - +++ +++ +++ - - -
P (ASCA+) yes
YP1 - + --- + +++ ++ - +++ +++ +++ - 26% 20%
YP2 - + - + +++ ++ - +++ +++ +++ 5% 18% 13%
YP3 - + + + +++ ++ - +++ +++ +++ - 33% -
YP4 - + + + +++ ++ - +++ +++ +++ 5% 20% -
D (ASCA-) yes
YD1 - - +++ + +++ +++ - +++ +++ +++ - - -
YD2 - - +++ + +++ +++ - +++ +++ +++ - - -
YD3 - - +++ + +++ +++ - +++ +++ +++ - - -
YD4 - - +++ + +++ +++ - +++ +++ +++ - - -
YD5 - - +++ + +++ +++ - +++ +++ +++ - - -
YD6 - - +++ + +++ +++ - +++ +++ +++ - - -
E (ASCA-) no
YE1 - - +++ + +++ ++ - +++ +++ +++ - - -
YE2 - - +++ + +++ ++ - +++ +++ +++ - - -
YE3 - - +++ + +++ ++ - +++ +++ +++ - - -
YE4 - - +++ + +++ ++ - +++ +++ +++ - - -
YE5 - - ++ + +++ ++ - +++ +++ +++ - - -
H (ASCA+) yes
YH1 +++ +++ ++ ++ +++ +++ - +++ +++ +++ - 30% 30%
YH2 ++ ++ --- ++ +++ +++ - +++ +++ +++ - 35% 40%
YH3 ++ - --- ++ +++ +++ - +++ +++ +++ - 20% 30%
YH4 ++ - --- ++ +++ +++ - +++ +++ +++ 18% 40% 5%
UC 5UC (ASCA-) no YUC5 - - +++ - +++ +++ - +++ +++ +++ - 10% -
22UC (ASCA-) no YUC22 - - --- ++ +++ ++ - +++ +++ +++ - 10% -
HC 19N - YN19 - - +++ ++ +++ ++ - +++ +++ +++ - 15% 5%
13N - 13EU - - +++ + +++ ++ - +++ +++ +++ - - -

138
Only the YH strains (HG3 group) are able to form pseudohyphae, to resist to oxidative stress
and showed the highest sporulation rate (>30% asci/cell at 37°C). HG1 strains (especially
YD, YE and some YB) were not invasive, sensitive to oxidative stress and unable to
sporulate (Table 7.3).
Interestingly, microsatellite-based clustering and ancestral lineages (Fig. 7.3) reflected the
gut strains ability to sporulate. Indeed, HG1 group showed low sporulation rate (none or
ranging from 0% to 10%). HG2 group showed medium/low sporulation rate (ranging from
15% to 25%). Moreover, HG3 strains showed the highest percentage of sporulation (>30%).
To investigate the genetic determinants of this phenotype, we sequenced the RME1 gene, the
master regulator of sporulation that is known to have polymorphisms discriminating strains
from different sources (Deutschbauer and Davis 2005;Gerke, Lorenz et al. 2009). The
phylogenetic analysis based on the SNPs in RME1 showed that strains from the same patient
clustered together, supporting clonal expansion within the patient, as observed in
microsatellites and ancestry analyses (Fig. 7.6). The S. cerevisiae isolates with medium/high
sporulation capability were isolated from ASCA+ CD patients, while strains unable to
sporulate were isolated from ASCA- CD patients (P<0.0001, FET). In general, sporulation
ability seems to be correlated with the ASCA levels measured in CD patients.

139
Fig. 7.6 Phylogenetic tree obtained by calculating the yeast strain genetic distances based on the SNP
sequences of the RME1 gene. For each HG strain, the percentage of sporification and the SNP
position, including the adenine insertion (at -308 position), were reported in opposite file. Color code
of strains: dark blue-fecal isolates from IBD patients and HC, purple- wine/European, green-Tuscan,
dark yellow-natural sources, yellow-bakery (bread and beer), light blue-other fermentations, pink-
clinical, red-insect gut, grey- west African.
7.3.4 Genetic variation analysis of C. albicans isolates
In order to evaluate the ability of C. albicans clinical strains to adapt to environmental
conditions, we selected two isolates, YL1 and YQ2, from fecal samples of pediatric Crohn’s
disease (CD) patients. Initially we performed analysis of genome-wide variation,
discovering a total of 178`336 SNPs/Indels and 168`981 SNPs/Indels for YL1 and YQ2
isolates, respectively, with nucleotide polymorphisms in coding DNA sequence (CDS) of
43%-44%, as compared to the Candida albicans SC5314 reference genome. Heterozygous
variants ranged from 55% to 65%, with respect to the SC5314 and WO-1 C. albicans
references genomes (Table 7.4). Specific homozygous regions for both YL1 and YQ2 were
identified in chromosome 7 and in chromosome 2 and 4, respectively.

140
Table 7.4 Alignment statistics of YL1 and YQ2 sequenced isolates against the reference genomes of
C. albicans SC5314 and WO-1. For each strain, the table provides the amount of reads obtained after
filtering and trimming process, the mapping and coverage information, the total number of
SNPs/indels with respect to the references, and the fraction of homozygous and heterozygous
polymorphisms
Gene Ontologies (GO) enrichment analysis showed that highly polymorphic genes in YL1
were those related to response to nutrients, external stimuli, starvation and genes, involved
to filamentous growth, while highly mutated genes, common to both YL1 and YQ2 isolates,
include those codifying for cell wall, adhesion and hyphal cell wall categories (Fig. 7.7).
For each sequenced genome, we identified genetic losses by comparison with the reference
genome SC5314 (Table 7.5 and Materials and Methods). We found 20 lost Open Reading
Frame -ORFs (7 of which were shared by YL1 and YQ2 and 6 were specific for YL1 and 7
for YQ2), that encoded for retro-transposable elements and factors involved in biofilm
formation (among these, HLA21 in both YL1 and YQ2, whereas the ADH3 was present only
in YQ2).
By comparing sequenced reads across the chromosomes, we found genomic regions with
copy number variations. We identified duplication sites located especially in chromosome 2
and 6. Among the 11 duplicated ORFs present in both isolates, several were retro-elements;
one of them, the FGR24 gene, being a filamentous growth regulator. Other two members of
FGR family (FGR13 and FGR14) resulted duplicated in the YL1 genome, as well as a gene

141
regulated by three iron-responsive transcriptional factors (Sef1p- Sfu1p- and Hap43p),
known to be involved in C. albicans commensalism and pathogenesis (Chen, Pande et al.
2011). The YQ2 genome showed duplication of a member of telomere-associate (TLO) gene
family, known for its variability in number and position in C. albicans (Hirakawa, Martinez
et al. 2015)(Table 7.6). Furthermore, we searched for variants resulting in loss-of-function
mutations, as SNPs producing internal stop and out-frame insertions or deletions (Indels).
Across the YL1 and YQ2 genomes, we found 130 and 110 truncated ORFs, respectively,
while Indels resulted in out-of-frame mutations that disrupted 22 and 16 genes, respectively
in the two strains. In the YL1 genome, we found prematurely stopped protein-coding genes
involved in filamentous growth, cellular growth and response to stimuli. We detected as
disrupted genes related to biofilm induction, such as GPR1, a G-protein-coupled receptor
involved in filamentous growth and responsive to starvation, and EFG1, a key regulator of
either the white/opaque switching or filamentous growth and virulence of Candida, whose
loss of function has been related to increased commensal fitness (Hirakawa, Martinez et al.
2015). The following genes, associated with known functions (Huang 2012), were found as
truncated in YL1 and YQ2 isolates. In particular, the PHR1 (pH responsive), CYR1
(starvation and CO2 responsive), SSK2 (responsive to osmotic stress), RFG1 (Repressor of
Filamentous Growth), FLO8 (transcription factor required for hyphal formation and CO2
induced white-opaque switching), ALS3 (cell wall adhesion induced and required for spider
biofilm), VRG4 (a GDP-mannose transporter), SNT1 (a transposon mutation affecting
filamentous growth) and PDX1 (a spider biofilm-repressed gene).

142
Fig. 7.7 GO enrichment analysis of the most polymorphic genes in the two C. albicans isolates.
Gene Ontology Term Finder tool on Candida Genome Database were used for Functional Enrichment
Analysis, using default parameters. Valid results were considered with a p< 0.05.

143
Table 7.5 Summary of lost genes in the whole genome sequenced isolates. Gene Ontology of lost
genes for each isolate by Gene Ontology Term Finder tool on Candida Genome Database (CGD).
Significant at p<0.05
Table 7.6 Summary of duplicated genes in the whole genome sequenced isolates. Gene Ontology of
duplicated genes for each isolate by Gene Ontology Term Finder tool on Candida Genome Database
(CGD). Significant at p<0.05
7.3.5 Phenotypic analysis of C. albicans isolates
The ability of the two isolates to form hyphae was evaluated under standard culture
conditions (i.e. YPD and YNB without amino acids and supplemented with ammonium
sulphate) at 28°C and 37°C. Unlike YL1, YQ2 showed hyphal formation after 3 and 7 days,
at 37°C, both in YPD and YNB media (Fig. 7.8A). Then, we evaluated the fungal growth in
the presence of different carbon sources. We found that both isolates showed a significant
lower growth rate in the presence of non-fermentable carbon sources, namely, 2% of

144
glycerol, ethanol or oleate (Fig. 7.8B). Furthermore, we exposed YL1 and YQ2 to the
oxidative stress induced by 1M tert-butyl hydroperoxide. We found that the YL1 was more
susceptible to the oxidative stress than YQ2 and SC5314 strain (Fig. 7.8C).
Moreover, we investigated the susceptibility to Ketoconazole and Fluconazole (0.01 mM,
0.1 mM, 0.5 mM, 1 mM and 5 mM for each drug), two fungicidal agents known to interfere
with the synthesis of fungal cell membrane. We observed that both isolates showed
resistance to Fluconazole, while only the YQ2 was resistant to Ketoconazole (Fig. 7.9).
We also tested the ability of the strains to form biofilm in RPMI, in presence or absence of
FBS and CO2. Both YL1 and YQ2 isolates were able to produce biofilm after 48 h of
incubation, irrespectively of the presence of FBS; nevertheless, the thickness of YL1 biofilm
was significantly higher than that produced by YQ2 (Table 7.7). Noteworthy, YQ2 did not
produce biofilm at 24 hr in the absence of FBS (Table 7.8); also CO2 markedly influenced
the biofilm formed by YQ2 since in its absence biofilm production was delayed.
Furthermore, by investigating the morphological characteristics of the biofilms grown for 48
hr under standard culture condition, we found marked differences in thickness mirrored by
different cellular structures. As shown in Table 7.8, the number of both yeasts and budding
yeast cells released by YL1 biofilm in the medium was significantly higher compared to
YQ2. Kinetic studies showed that after 3 h both isolates form long hyphae; however, only
the YL1 strain produced several budding yeast cells. At 24 hr, the YL1 biofilm showed a
more dense hyphal structure with interspersed germinating yeast cells that were not present
in YQ2 biofilm (Fig. 7.10).

145
Fig. 7.8 Phenotype analysis of C. albicans strains in standard laboratory condition. (A) Morphotype
switching of YL1, YQ2 and SC5314 was observed in standard laboratory liquid culture condition,
as YPD and YNB (without amino acids and with Ammonia sulfate) at 28°C and 37°C. (B) Ability
of growing in different carbon sources has been assessed by plating 104 cells on solid medium added
by 2% of Glucose, Galactose, Glycerol, Ethanol or Oleate. Colony formation has been obsewrved
after 3 days of growth at 28°C. (C) Survival to oxidative stress evaluating the inhibition halo after 5
days of incubation with tert-Butyl-hydroperoxide (1 mM).

146
Fig. 7.9 Resistance to ketoconazole and fluconazole antifungal treatment. Antifungal drugs
susceptibility was performed evaluating the growth of yeast cells (106 cells/ml) in solid YPD added
with different concentration of fluconazole and ketoconazole (0.01 mM, 0.1 mM, 0.5 mM, 1 mM
and 5 mM for each drug). SC5314 was used as control. Colony formation was evaluated after 24 h,
48 h and 72 h of growth at 28°C.
Table 7.7 Biofilm thickness of C. albicans isolates grown in RPMI in presence or absence of FBS
24 h 48 h
RPMI +10% FBS RPMI RPMI +10% FBS RPMI
C. albicans YL1 134 133.5* 182.6* 136.5
C. albicans YQ2 110 14 127 104.5
The asterisks indicate statistically significant differences (*p < 0.05)
Table 7.8 Biofilm structure and characteristics of C. albicans isolates grown for 48 h in RPMI with
FBS
Thickness
(µm)
# yeast cells released in the
biofilm supernatants (x 104)
# budding yeast cells released in the biofilm supernatants (x 104)
C. albicans YL1 168* 19* 6.2*
C. albicans YQ2 96.6 5 1.3
The asterisks indicate statistically significant differences (*p < 0.05)
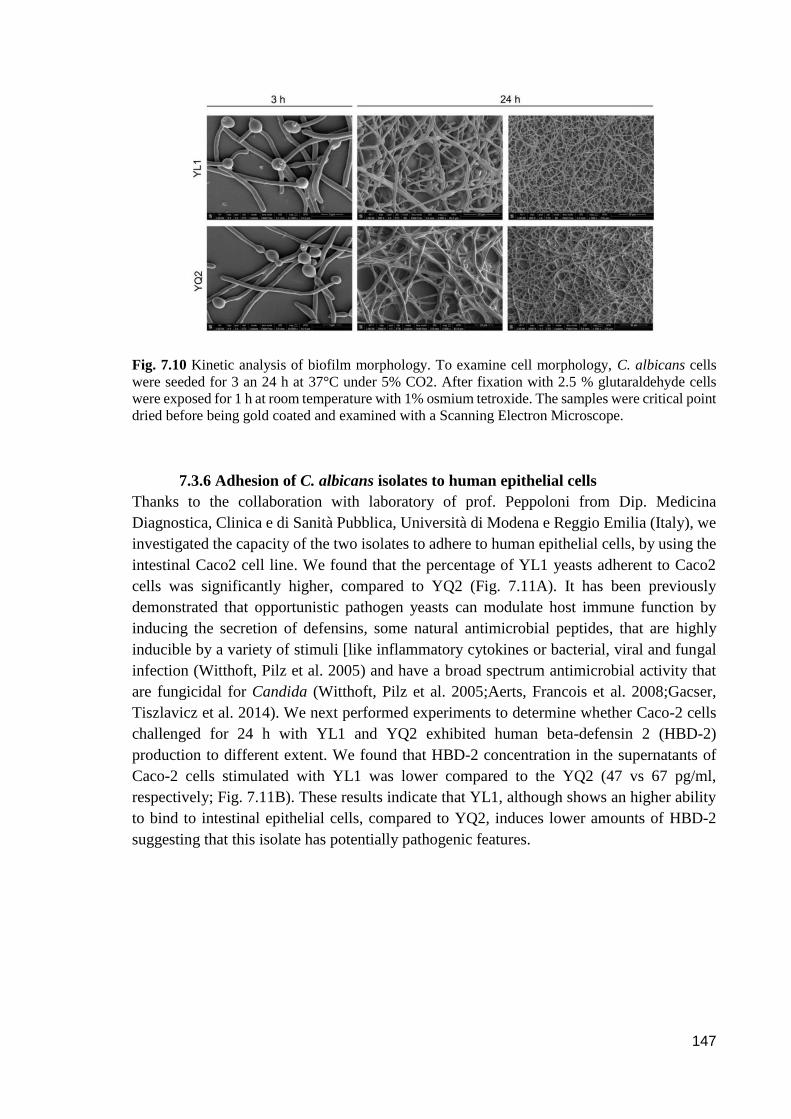
147
Fig. 7.10 Kinetic analysis of biofilm morphology. To examine cell morphology, C. albicans cells
were seeded for 3 an 24 h at 37°C under 5% CO2. After fixation with 2.5 % glutaraldehyde cells
were exposed for 1 h at room temperature with 1% osmium tetroxide. The samples were critical point
dried before being gold coated and examined with a Scanning Electron Microscope.
7.3.6 Adhesion of C. albicans isolates to human epithelial cells
Thanks to the collaboration with laboratory of prof. Peppoloni from Dip. Medicina
Diagnostica, Clinica e di Sanità Pubblica, Università di Modena e Reggio Emilia (Italy), we
investigated the capacity of the two isolates to adhere to human epithelial cells, by using the
intestinal Caco2 cell line. We found that the percentage of YL1 yeasts adherent to Caco2
cells was significantly higher, compared to YQ2 (Fig. 7.11A). It has been previously
demonstrated that opportunistic pathogen yeasts can modulate host immune function by
inducing the secretion of defensins, some natural antimicrobial peptides, that are highly
inducible by a variety of stimuli [like inflammatory cytokines or bacterial, viral and fungal
infection (Witthoft, Pilz et al. 2005) and have a broad spectrum antimicrobial activity that
are fungicidal for Candida (Witthoft, Pilz et al. 2005;Aerts, Francois et al. 2008;Gacser,
Tiszlavicz et al. 2014). We next performed experiments to determine whether Caco-2 cells
challenged for 24 h with YL1 and YQ2 exhibited human beta-defensin 2 (HBD-2)
production to different extent. We found that HBD-2 concentration in the supernatants of
Caco-2 cells stimulated with YL1 was lower compared to the YQ2 (47 vs 67 pg/ml,
respectively; Fig. 7.11B). These results indicate that YL1, although shows an higher ability
to bind to intestinal epithelial cells, compared to YQ2, induces lower amounts of HBD-2
suggesting that this isolate has potentially pathogenic features.

148
Fig. 7.11 YL1 and YQ2 showed different ability to adhere to epithelium, and produce HBD-2. (A)
Caco-2 cells were seeded in Lab-Tek II chamber slides, grown at 37°C to confluence (24 h) and then
infected with a suspension of Candida in complete RPMI for 1.5 or 3 h at 37°C under 5% CO2.
Uvitex 2B fluorescence of bound C. albicans was visualized by epifluorescence microscopy. At least
200 epithelial cells from each sample were examined and the percentage of Caco-2 cells with
adherent yeasts was defined as the ratio of the number of Caco-2 cells with one or more C. albicans
to the total number of Caco-2 cells examined. Data are represented as mean ± SD (N=3). *p<0.05.
(B) Caco-2 cells are incubate with Candida strains (reference strain SC5314 and YL1 and YQ2
isolates) or LPS (10μg/ml) for 24 hr (ratio 1:100). Levels of β-defensin-2 are measured by ELISA
assay.
7.3.7 Susceptibility of the C. albicans isolates to microglial cell-mediated
antifungal activity
We performed studies to characterize the interaction of clinical isolates with microglial cells
(in collaboration with laboratory of prof. Peppoloni-Università di Modena e Reggio Emilia).
Microglial cells (BV2 cells) play a crucial role in preventing the outcome of experimental
infection by C. albicans (Blasi, Mazzolla et al. 1991). In particular, such cells exert anti-
candida phagocytic and killing activity and express a restricted pattern of secretory response
(Blasi, Pitzurra et al. 1990;Blasi, Mazzolla et al. 1991;Blasi, Puliti et al. 1994). Using a
previously established fluorescence-based assay (Peppoloni, Colombari et al. 2013), we
measured the number of phagocytic cells at 1.5 and 3 hr post-infection. As shown in Fig.
7.12A, the phagocytic uptake of the two strains followed a similar pattern with time, since
the percentages of microglial BV2 cells which internalized YL1 or YQ2 were not
significantly different. These results indicate that the both strains were phagocytosed
efficiently by microglia and to a similar extent. To examine the ability of the two isolates to
survive within microglia, BV2 cells were challenged with YL1 or YQ2 strain for 1.5 h, and
then fungal load was determined 0, 3, 6 and 20 h later. Initially and up to 6 h, the number of
CFU recovered from microglial cells remained constant and was similar in the two groups.
In contrast, at 24 h, the intracellular levels of YL1 were more than threefold higher than
those observed with YQ2 (p<0.05) (Fig. 7.12B).
It is known that intracellular killing of microorganisms involves the fusion of lysosomes,
containing microbicidal factors, with phagosomes in an acidic environment [a process
known as “phagosome maturation”] (Vieira, Botelho et al. 2002) and that some pathogens
are able to survive or even multiply inside of the phagocytes by inhibiting this process
(Urban, Lourido et al. 2006). To investigate the events occurring after Candida ingestion by
microglia, acidification of fungal cell-containing phagosomes was assessed (Kinchen and
Ravichandran 2008). YL1 and YQ2 yeast cells were incubated for 1 and 3 hr with microglia

149
in the presence of LysoTracker, a marker of phagosome acidification (see Materials and
Methods). Overlapping pictures obtained with different fluorescence channels were used to
evaluate the successful acidification of Candida-containing phagosomes [simultaneous
appearance of LysoTracker (red fluorescence) and unlabeled yeasts within the phagosomes]
(Fig. 7.12C). To quantify the phenomenon, we determined the percentage of acidic
phagosomes by counting the Candida-containing phagosomes within each microglial cell.
As shown in Fig. 7.12D, at 1.5 h after infection, the percentage of YQ2-harbouring
phagosomes was higher than that of YL1-containing phagosomes. Indeed, about 18% of the
YQ2 were associated with acidic phagolysosomes, while this percentage dropped to 9% in
the case of the YL1 strain. Similar results were also observed after 3 h and in both cases the
differences between YQ2 and YL1 were statistically significant (p<0.05). Taken together,
this evidence suggests that the YL1 resists to microglia-mediated intracellular killing by
inhibiting phagosome maturation within these cells, indicating the pathogenic traits of fungal
isolates from human gut.
Fig. 7.12 C. albicans strains differently resist to phagocytic antifungal activity. (A) Susceptibility of
the YL1 and YQ2 strains to phagocytosis by microglia was assessed by epifluorescence microscopy
on microglia infected with the different strains. Oregon green 488 prelabelled yeast cells were
exposed to BV2 cells (E : T=1 : 5) for 1.5 and 3 h. At each end point, Uvitex 2B was added for 15
min; the cultures were then washed, fixed and analysed by epifluorescence microscopy. Data are
shown as mean±SD (N=3). (B) Susceptibility of the YL1 and YQ2 strains to antifungal activity by
microglia. Yeast cells were exposed to BV2 cells at E : T=10 : 1. After 3, 6 and 20 h, the percent of
antifungal activity was determined. Data are shown as mean±SD (N=43). *p<0.05, YL1 vs YQ2. (C)
Acidification of phagolysosomes containing YL1 and YQ2 cells. Oregon green 488 prelabelled yeast
cells were exposed to BV2 cells (E : T=1 : 5); then LysoTraker dye was added. After counterstaining
with Uvitex 2B, samples were fixed and then visualized by epifluorescence microscopy.
Representative images of acidification of phagolysosomes by means of epifluorescence. (D)
Acidification of phagolysosomes containing YL1 and YQ2 cells. The results, expressed as percent
of acid phagolysosomes, were calculated by evaluating the number of red-stained vacuoles among
200 yeast-containing vacuoles. Data are shown as mean±SD (N=3). *p<0.05, YL1 vs YQ2.

150
7.3.8 Cell wall composition of gut isolates suggests selection by intestinal
environment
The sugar moieties of cell wall are the principal antigens sensed by the host immune system
during host-fungal interaction (Lewis, Bain et al. 2012;O'Meara, Veri et al. 2015). We
compared the cell wall sugar composition of a selection of 13 gut isolates (10 from CD, 2
from UC and 1 from HS), with a set of 10 S. cerevisiae strains isolated from other sources
(laboratory, natural environment, wasps’gut and wine), and other 4 gut isolates, belonging
to Candida spp. from CD patient and the SC5314 C. albicans reference strain (Fig. 7.13A-
B).
High-Performance Anion-Exchange Chromatography (HPAEC) analyses revealed that,
when grown in presence of glucose (YPD culture medium), S. cerevisiae gut isolates show
inverse ratio mannose: galactose, with a significantly lower percentage of mannose
compared to all the other strains (Kruskal-Wallis p<0.05, fdr corrected; Fig. 7.13C). All gut
isolates, both from human and wasps, bear a significant higher galactose content (Fig.
7.13A). When compared with gut Candida spp. isolates, we observed a higher amount of
galactose in S. cerevisiae gut isolates (Fig. 7.13B). The peculiar cell wall composition of HG
S. cerevisiae strains appears to be a “gut” specific feature and could represent a selective
advantage to survive and colonize the host gut.
Noteworthy, when lactose was used as sole carbon source, levels of cell wall components
remain almost completely unchanged in the HG isolates, while some of the natural and wine
strains showed an enrichment of the galactose and a reduction in mannose (Kruskal-Wallis
test; Fig. 7.13C). This suggests an inducible induction of the genes responsible for galactose
metabolism being it constitutive in gut isolates for adapting to the gut environment.

151
Fig. 7.13 Cell wall sugar components of HG isolates grown in presence of glucose (YPD culture
medium) as carbon sources. (A-B) Percentage of mannose, glucose, galactose and glucosamine
amounts in (A) S. cerevisiae isolates from gut and compared with strains from other sources
(laboratory, natural environment, wine, and wasp’s gut), compared with (B) cell wall sugar
components of Candida spp. isolates from CD patients. Ca= C. albcans and Cp= C. parapsilosis.
(C) Percentage of galactose, glucosamine, glucose and mannose amounts detected in cell wall of S.
cerevisiae isolates grown in presence of glucose and lactate as carbon sources (YPD and YPL culture
medium, respectively), and categorized based on the different origins: gut, laboratory, natural
sources, wasp’ gut and wine. The graphs provide average for each category and the p-values obtained
by Wilcoxon rank sum test. Statistically significant differences among groups are indicated by
different letters (“a”= human gut, “b”=laboratory, “c”=natural sources, “d”=wasp’ gut and “e”=
wine); single letter for p<0.05, double letter for p<0.01.
7.3.9 Immunomodulatory properties of cultivable fungal isolates
While responding to pathogenic organisms is a main function of the immune system,
recognition and tolerance of commensal bacteria are equally important for host health
(Kosiewicz, Zirnheld et al. 2011). Commensal microbes calibrate innate and adaptive
immune responses and influence the activation threshold for pathogenic stimulations, in

152
large part by producing molecules that mediate host-microbial interactions (Donia and
Fischbach 2015). A recent paper showed how differences in composition and function of gut
microbial communities might contribute to inter-individual variation in cytokine responses
to microbial stimulations in healthy humans. Host-microbial interactions reveal that TNF-α
and IFN-γ production are associated with specific microbial metabolic pathways (Schirmer
M. et al 2016). Yeast cell wall ratio between chitin and mannans has also been shown to be
associated to differential production of IL-17, TNF-α and IFN-γ (Rizzetto, Kuka et al.
2010;Rizzetto, De Filippo et al. 2014;Rizzetto, Ifrim et al. 2016). To link the observed strain-
specific genetic and phenotypic differences, with inflammatory cytokine production capacity
of the host, we evaluated the immunoreactivity of a set of the cultivable fungal isolates
belonging to S. cerevisiae and Candida spp., measuring the cytokine profiles in vitro on
dendritic cells (DC) and on human peripheral blood mononucleated cells (PBMCs) from
healthy donors and CD patients, upon challenges with IBD and HC yeasts. A first screening
was performed on S. cerevisiae and Candida spp. isolates, using monocyte derived DCs from
6 healthy donors. TNF-α IL-10, IL-1β, IL-6, IL-12p70 and IL-23 cytokines levels were
measured (Fig. 7.14). We probed immune reactivity to a set of S. cerevisiae isolates from
IBD and HC, comparing with isolates from other sources, such as 2 laboratory strains (SK1
and BY4741), 3 wild strains from Portugal, 9 isolates from human gut (2 from HC, 6 from
CD and 1 from UC), 4 grape isolates from Tuscan wineyards (Fig. 7.14A). In parallel, we
tested DC immune reactivity to a set of Candida spp isolates from IBD and healthy subjects
comprising 13 C. albicans isolates, 4 C. parapsilosis isolates and 1 C. glabrata isolate, and
comparing with the SC5314 C. albicans reference strain (Fig. 7.14B).
This investigation showed greater strains-specific rather than species-specific differences in
the cytokine profiles. At the species level, a few generalizations were possible (Fig. 7.14C).
We observed higher levels of IL-6 and IL-10 upon stimulation with S. cerevisiae isolates,
compared to Candida spp. (Fig. 7.14C, Student’s t test p=0.0021 S. cerevisiae vs C. albicans
and p=0.011 S. cerevisiae vs C. parapsilosis for IL-6; p=0.005 S. cerevisiae vs C. albicans
for IL-10). IL-1 was higher upon stimulation with Candida spp. compared with S.
cerevisiae strains (Fig. 7.14C, Student’s t test p=7.76x10⁻⁶ S. cerevisiae vs C. albicans and
p=0.004 S. cerevisiae vs C. parapsilosis). The TNF-α production was quite uniform in
response to the different investigated isolates, belonging either to S. cerevisiae or Candida
spp. with the exception of two S. cerevisiae gut isolates – one derived from a HC (Y13EU),
one from a CD patient (YA5) - which showed a markedly low induction of this cytokine
(Fig. 7.14A-B).
S. cerevisiae isolates from IBD patients showed a lower induction of IL-6, IL-1β, IL-12p70
and IL-23 with respect to the gut isolates from HC (Fig. 7.14A). Immune responses to natural
strains are more variable (Fig. 7.14A). In general, the different strains isolated from diverse
ecological niches showed an immune-based diversity which seems to correlate with their
origin as shown by clustering the 6 cytokine profiles. The same results could be obtained by
clustering only three of them, IL-10, IL-12p70 and IL-23, indicating that these cytokines
mainly distinguish the immune response to the different strains (Fig. 7.14A).

153
Fig. 7.14 DC immune response to S. cerevisiae and Candida spp. isolates. (A-B) Strain-specific
cytokine profiles. Ability of DC from healthy donors (n=6) to discriminate among different isolates
of (A) S. cerevisiae and (B) Candida spp. was tested as differential cytokine production. DCs were
stimulated with cells for 24 hours and cultures supernatants used for TNF-α, IL-10, IL-1β, IL-6, IL-
12p70 and IL-23 measurements. For S. cerevisiae isolates, different sources of isolates are indicated,
such as laboratory, natural environment, gut, and grape. For both S. cerevisiae and Candida spp.
from the human gut were indicated whether isolated from CD, UC patients or healthy children (HC).
Ca= C. albicans; Cp= C. parapsilosis; Cg= C. glabrata. (C) Species-specific cytokine profiles.

154
Average of cytokine levels for each tested fungal species. *p<0.05; **p<0.001; ***p<0.0001 by
Student’s t Test.
The interesting cytokine profiles observed was confirmed by PBMCs cytokines release (Fig.
7.15). Selected strains, belonging to S. cerevisiae and Candida spp., were tested for the
ability to induce inflammatory (IL-1β, IL-6, TNF-α, IFN-γ, IL-17A) and anti-inflammatory
(IL-10) responses (Fig. 7.15A-C). The different S. cerevisiae isolates showed diverse ability
to promote IL-6, TNF-α, IL-17 and IFN, whose inflammatory role was counterbalanced by
IL-10 induction with different extent (Fig. 7.15A-C). The results highlight the ability of S.
cerevisiae to promote either inflammation, resistance or tolerance upon immune cell
recognition.
Upon stimulation with different Candida spp. strains, IFN and TNF-α showed variations
tending to parallel IL-10 profiles and to oppose IL-17 profiles (Fig. 7.15A-C). The levels of
these cytokines displayed a strain-specific pattern. These screening allowed to categorize the
different isolates of Candida spp as INF+ or INF- strains. While the IFN-mediated
inflammatory response induced by the healthy isolate (YN1) seems to be well
counterbalanced by IL-10 production, other responses are not (i.e YB1-induced response),
as indicated by the low IL-10 production and the presence of both IFN and IL-17.
Fig. 7.15 PBMCs-primed adaptive immune response to different fungal isolates. (A-B) Selected
strains S. cerevisiae (light grey) and Candida spp. (gray scales) were tested for the ability to induce
inflammatory responses and specifically cytokines deriving by Th1 (IFN-γ), Th17 (IL-17) and Treg
(IL-10). Healthy PBMCs from n=6 donors were stimulated with live cells for 24h or 5 days, and
cytokine levels were measured. (C) Average of cytokine levels for each tested fungal species.
**p<0.001; ***p<0.0001 by Student’s t Test.
By comparison of healthy donors and CD patients PBMCs cytokine release (Fig. 7.16), we
observed a general wide variability in immune reactivity, especially for PBMCs of patients.
Generalizing, healthy subjects (HS) immune responses showed lower inter-patient
variability, higher levels of IFN-γ and a trend of lower levels of IL-6 compared to CD

155
patients. While IL-1β, IL-17A, TNF-α and IL-10 release reflected a strain-specific pattern
both in CD and HS (Fig. 7.16), ranging from high IL-17A and low IFN-γ and IL-10 (YB8
and YD1) to a pure Th1-driving response (high IFN-γ and low IL-17A and IL-10, as YE5)
or high IL-10 (YH1). Therefore, unlike the healthy subjects, these results suggested that the
inflammatory and clinical status of the patient strongly influence the immune response
against strains. Interestingly, in some cases, CD patients (with different clinical status and
mucosal inflammation; Table 7.9) response differently to own isolates compared to S.
cerevisiae from other patients (Fig. 7.16, red triangles). PBMCs of CD patient, from which
YE5 strain was isolated, the only CD patient that showed both clinical remission and lack of
mucosal inflammation (Table 7.9), induced release high IFN-γ and TNF-α and low IL-17A
compared to other patients in response to the same isolate (Fig. 7.16, red triangle). While,
PBMCs of CD patient (H) in clinical remission, but active mucosal inflammation (Table
7.9), upon own YH1 isolate challenge, release low IL-17A and high IL-10 compared to other
patients in response to the same isolate (Fig. 7.16, red triangle). Strains isolated from CD
patients (B and D) in active disease and mucosal inflammation, YB8 and YD1 show high
levels of IL17A and TNF-α and low level of IFN-γ and IL10 (Fig. 7.16, red triangles).
Table 7.9 Relation among and clinical features of the IBD and healthy children
S.
cerevisiae
strain
Subject ASCA
Inflammation indexes Intestinal
mucosa
status (by
calprotectin
dosage)
Clinical
status
PCDAI PUCAI calprotectin
<10
CD
remission
<10
UC
remission
<100
no
inflammation
YA5 A CD
patient + 12.5
1100 Inflammation Active
YB8 B CD
patient - 15 1300 Inflammation Active
YP1 P CD patient + 0 280 Inflammation Remission
YD1 D CD
patient - 12.5 2600 Inflammation Active
YE5 E CD
patient - 0 80 no inflammation Remission
YH1 H CD
patient + 5 600 Inflammation Remission
YUC22 22 UC
patient - 0 27 no inflammation Remission
Y13EU 13 healthy
child ND Healthy
Note: ASCA= anti-S. cerevisiae antibody; PCDAI and PUCAI are clinical indexes of active CD and
UC disease, respectively.

156
Fig. 7.16 Individual cytokine patterns for S. cerevisiae isolates from IBD patients (n=7) and healthy
donors (n=6). PBMC T-polarizing (A) and pro-inflammatory (B) cytokine release from HC (white
circles) and CD patients (black squares), upon stimulation with 9 S. cerevisiae selected strains
(indicated in horizontal axis). In each scatter-plot, red triangles represent CD patient PBMC cytokine
release after stimulation with his own isolate.
The in vitro assay revealed IL-17A, IFN-γ (both known to afford colonization resistance),
and IL-10 (the cytokine involved in immune tolerance) as the main factors discriminating S.
cerevisiae isolates (Fig. 7.17 A-B).
Sporulation rate allows to stratify the S. cerevisiae isolates for the differential cytokines
induction (Fig. 7.17B). Not sporulating HG1 strains showed a tendency towards the
induction of IFN-γ-mediated responses (Fig. 7.17B). HG2 strains with low sporulation
efficiency induced high IL-17A production (Wilcox rank sum test p<0.05; Fig. 7.17B). The
opposite trend was observed for the high sporulator (HG3), in which the high IFN-γ
mediated-inflammatory response was counterbalanced by high levels of the
immunosuppressive cytokine IL-10 (Fig. 7.17).

157
Fig. 7.17 Relationship between pro-inflammatory cytokine (TNF-α, IL-6 and IL-1β) and T-
polarizing cytokine (IFN-γ, IL-17 and IL-10) release to S. cerevisiae strains and sporulation ability.
(A) Duality diagram for the first two components obtained by analyzing correspondence between
healthy human PBMCs immune reactivity to S. cerevisiae isolates and the ability of yeast to
sporulate. The cases for analysis were the S. cerevisiae isolates from fecal samples of IBD patients
and HC. Black labels: HG1-isolates not able to sporulate; blue labels: HG2-isolates with low
sporulation frequency; red labels: HG3-isolates with high sporulation frequency. The variables are
the ability to sporulate at low and high frequency and cytokines (grey rectangles). (B) Box plot of
cytokine release (pg/ml) upon stimulation with yeast strains, grouped by sporulation ability. (C-E)
PBMC cytokine release from healthy volunteers, upon stimulation with selected S. cerevisiae strains
(C) not able to sporulate-HG1 (D) able to sporulate at low frequency- HG2 and (E) able to sporulate
at high frequency-HG3. The means of cytokine measurements for six healthy volunteers, error bars
and SD are reported.
7.3.10 Cell wall components correlated with PBMCs cytokine release
We than investigated correlations among the cell wall sugar composition of each gut strain
and among the levels of cytokines produced by donors’ PBMCs upon strain’s challenge
(Spearman r; Fig. 7.18). The analysis revealed that galactose amount positively correlated
with glucosamine, and confirmed that mannose amount negatively correlated with galactose
and glucosamine (Spearman r; Fig. 7.18). The pro-inflammatory IL-17 and IL-1β cytokines
positively correlated among them (Spearman r; Fig. 7.18). Interestingly, the amount of
glucose in the cell wall was positively correlated with the levels of IL-17A, and negatively
with IFN-γ produced by challenged donor PBMCs, in concordance with the knowledge that
b-glucans promote Th17 differentiation (Gagliardi, Teloni et al. 2010;Kashem, Igyarto et al.
2015).

158
Fig. 7.18 Spearman correlation among amount of cell wall components of S. cerevisiae gut isolates
and IL-17A, IFN-γ and IL-10 release (the intensity of colors red or blue in each rectangle indicate
different rate of negative and positive correlation respectively, among the variables reported in the
two coordinates, as indicated by colored scale bar; the “X” indicate no-correlation).
7.3.11 Fungal interaction with gut bacterial communities
Fungi and bacteria coexist within the gut environment and may directly interact either in
mutualistic or competitive relations. The observed different strain-specific immune
responses, upon stimulation with different S. cerevisiae and Candida spp. isolates, suggest
that the presence/absence of yeasts could result in different bacterial community structures.
We thus performed metagenomics analysis on a selection of 19 fecal samples from CD
patients (Table 7.10), from which we isolated S. cerevisiae (n=7) or Candida spp. (n=5), and
we compared them with fecal samples from which we did not isolated any yeasts (n=7). We
sequenced the V5-V6 hypervariable region of 16S rRNA gene for the meta-taxonomic study
of microbiota composition.
In order to evaluate differences in the microbial biodiversity (alpha-diversity) in presence or
absence of cultivable fungi and considering the disease status, we calculated the bacterial
species richness (by observed number of OTUs), finding a higher bacterial richness, when
fungal isolates were absent than when we isolated Candida spp. or S. cerevisiae (Fig. 7.19A).
This result could be related to the competition between fungal and bacterial communities in
the gut environment. However, Shannon index, accounting evenness of the species
distributions based on entropy, did not show these differences. Considering disease status,
we observed an increase in bacterial species richness in samples collected in remission,
considering either the number of OTUs or Shannon index, this latter resulting statistically
significant (Fig. 7.19B; Wilcokon rank sum test; p value=0.003). This result is in accordance
with the well-known reduction of bacterial richness in IBD gut microbiota, especially in
active disease.

159
Table 7.10 Description of disease status and presence of yeast for each fecal sample used to
metagenomic analysis
ID fecal
sample Disease status
Presence of yeast
in fecal sample Yeast species
1CHT26 active Y+ S. cerevisiae (YA5)
2CHT4 active Y+ S. cerevisiae (YB8)
2CHT5 active Y+ S. cerevisiae (YB10)
3CHT13 remission Y+ S. cerevisiae (YP)
6CHT1 active Y+ S. cerevisiae (YD)
12CHT0 remission Y+ S. cerevisiae (YE)
17CHT0 active Y+ S. cerevisiae (YH)
1CHT14 active Y+ C. albicans
1CHT34 active Y+ C. albicans
23CHT13 remission Y+ C. albicans
4CHT0 active Y+ C. parapsilosis
24CHT8 remission Y+ C. parapsilosis
23CHT0 active Y- -
24CHT0 active Y- -
2CHT0 active Y- -
3CHT0 active Y- -
3CHT3 remission Y- -
4CHT5 active Y- -
4CHT6 active Y- -
Note: Y+= presence of yeast isolates; Y-= absence of yeast isolates. In yeast species colomn,
in brackets the isolates of S. cerevisiae tested for immunologic and phenotypic features are
reported.
Fig. 7.19 Alpha diversity of gut microbiota in presence/absence of fungal isolates. Box plots of
species richness measured by number of observed OTUs and Shannon index at genus level,

160
considering (A) presence/absence of fungal isolates in fecal samples (Other Y= Candida spp.; Sc=
S. cerevisiae; Y- = absence of fungi), or (B) disease status of the patients (active and remission).
Pairwise comparisons using the Wilcoxon rank sum test, **p<0.005.
To estimate the variability of microbial community between-sample (beta-diversity), we
performed PCoA calculated on Bray-Curtis dissimilarities (Betadispersion). Although we
found no statistically significant differences, we observed higher variability of bacterial
communities in absence of cultivable fungi and progressively lower biodiversity in presence
of other fungi, especially with S. cerevisiae (Fig. 7.20A), confirming the microbial
competition in gut environment. However, we found a statistically significant increase in
beta diversity in samples collected in active disease compared to remission (Fig. 7.20;
Wilcokon rank sum test; p=0.03).
Fig. 7.20 Betadispersion analysis. Principal Coordinate analysis (PCoA) calculated on Bray-Curtis
distances considering (A) presence/absence of fungal isolates in fecal samples (Other Y= Candida
spp.; Sc= S. cerevisiae; Y- = absence of fungi), and (B) disease status of the patients (active and
remission). The colored networks represent distances of each point from centroid. The calculated
distances from centroids are reported in the boxplot on the right, respectively. Pairwise comparisons
using the Wilcoxon rank sum test, *p<0.01.
The taxonomic distribution in the three groups showed variations in gut microbiota
composition.

161
At phylum level (Fig. 7.21A), we observed that Bacteroidetes was more abundant when S.
cerevisiae was isolated, compared to fecal samples in which we isolated other fungi (i.e.
Candida spp.) or when we did not find any fungal isolate (Wilcoxon rank sum test, p=0.04,
fdr correction). An opposed trend was observed regarding Proteobacteria that were more
abundant in samples in which we did not find fungal isolates, and reduced when S. cerevisiae
was isolated. Firmicutes were more abundant when Candida spp. were isolated. Considering
disease status, we did not find differences at phylum level.
At family level (Fig. 7.21B), we observed abundance of Bacteroidaceae in fecal samples
collected in remission and in which we isolated S. cerevisiae. While Lachnospiraceae and
Prevotellaceae were found in presence of Candida spp., and Enterobacteriaceae,
Aeromonadaceae and Pasturellaceae in fecal samples, collected in active disease and in
which we did not find fungi.
These results suggest that presence of fungal isolates and disease status could contribute to
the shaping of bacterial microbiota composition. In fact, we found an association in
remission among presence of S. cerevisiae and prevalence in Bacteroidaceae. Active disease
is associated with absence of fungal isolates and prevalence of potential bacterial
pathobionts, such as Enterobacteriaceae.
At genus level (Fig. 7.21C), we confirmed the results obtained at highest taxonomic levels.
For example, abundance in Bacteroides were observed in fecal samples in which we isolated
S. cerevisiae. While an increase in Clostridium, Prevotella and a decrease in
Faecalibacterium were found in samples, in which we isolated Candida spp.
Interestingly, LEfSe analysis (identifying statistically different features among groups and
estimating the effect size of each differentially abundant feature; see materials and methods)
confirmed the abundance in Bacteroidetes phylum (Fig. 7.22A), and in particular abundance
in Bacteroides genus, associated with presence of S. cerevisiae, together with Pseudomonas
and Phascolarctobacterium, belonging to Veillonellaceae family, and involved in succinate
fermentation (Fig. 7.21C). In fecal samples, in which we did not isolated any fungi, we
confirmed an enrichment in Proteobacteria (Fig. 7.21A), especially Enterobacteriaceae
families and Plesiomonas genus (Fig. 7.22C), known as Aeromonas shigelloides (name
"shigelloides" is derived from the fact that many strains cross-react antigenically with
Shigella) (Chida, Okamura et al. 2000), found responsible of diarrhea and gastroenteritis in
humans (Brenden, Miller et al. 1988).
Comparing fecal samples in which we isolated S. cerevisiae with respect to samples in which
we isolated Candida spp., associated with S. cerevisiae isolates, we observed enrichment in
Porphyromonadaceae family, and the well-known anti-inflammatory Faecalibacterium
genus (Fig. 7.22B-C). In presence of Candida spp., we found enrichment of Aeromonadales,
Clostridiaceae, Plesiomonas, Erwinia and Clostridium (Fig. 7.22B-C). Comparing fecal
samples in which we isolated Candida spp., with respect to samples in absence of fungi, we
observed enrichment in Clostridium genus, and Mogibacteriaceae family, that include
genera such as Mogibacterium that was previously isolated from subgingival biofilm of
periodontitis (Casarin, Saito et al. 2012) respectively (Fig. 7.22B-C).

162
Fig. 7.21 Stacked bar-plot representation of the relative abundances at (A) phylum, (B) family and
(C) genus level of the fecal microbiota of CD patients from metagenomics analysis distributed
according to presence/absence of fungal isolates (Sc+= S. cerevisiae; Other Y= Candida spp.
isolates; Y-= no fungal isolates) in fecal samples and disease status (active vs remission) at
collection’s time.
Considering disease status, we observed that Bacteroidaceae family and Coprococcus,
Paraprevotella, Lactococcus and Roseburia genera were significantly enriched in remission
status (Fig. 7.22D). However, LEfSe analysis did not find any bacterial taxa significantly
enriched in active disease.
These results suggest that the presence of S. cerevisiae and its immunomodulatory
properties, could promote a favorable gut environment for beneficial genera, such as
Faecalibacterium. This could be the result both of production of specific metabolites or
mediated by trained immunity, an innate immune mechanism through which yeasts could
alter the bacterial communities composition by targeting the immune system against specific
harmful bacteria (Rizzetto, Ifrim et al. 2016). On the contrary, the presence of Candida spp.
promote enrichment in potential pathogenic bacteria, such as Proteobacteria and in particular
Enterobacteriaceae.

163
However, independently by fungal isolates, significant differences in gut microbiota profiles
could be found in relation to disease status. Many of these taxa have been reported in
previous studies (Sokol, Cosnes et al. 2008;Willing, Dicksved et al. 2010;Morgan, Tickle et
al. 2012;Gevers, Kugathasan et al. 2014;Sokol, Leducq et al. 2016), including
Lachnospiraceae, Enterobacteriaceae, and Pasteurellaceae. Notably in IBD flare,
Coprococcus were decreased as well as Roseburia, and Faecalibacterium (Sokol, Leducq et
al. 2016).
Fig. 7.22 Differences in bacterial taxa in relation with presence/absence of cultivable fungi and
disease status. LEfSe analysis shows a statistically significant enrichment of (A) phylum, (B) family
and (C) genera, in CD patients’ fecal samples in relation with (A-C) presence/absence of fungi
(CD_Y-), and specifically in presence of S. cerevisiae (CD_Sc+) or other fungi (CD_Other_Y), and
(D) in association with active disease and remission. LEfSe results indicate a sequentially significant
ranking among groups (Alpha value=0.05 for the factorial Kruskal-Wallis test among classes). The
threshold for the logarithmic LDA score was 2.0.
7.4 Conclusions
Analysis of cultivable gut mycobiota showed that S. cerevisiae is enriched in CD patients
compared to UC and healthy children. Microsatellite genotyping of S. cerevisiae human gut
isolates, allowed identification of clusters with common specific genomic characteristics,

164
together with strains with an environmental/food-borne origin. The clonal expansion
observed in gut environment of each CD patient suggests that a CD-specific gut environment
may favor colonization and clonal expansion of fungi, such as S. cerevisiae, that normally
are passengers, and occasionally can become colonizers. Moreover, the human gut could be
considered amongst the different ecological niches of S. cerevisiae, so far represented by
natural environments (e.g. grape, soil).
Studies on the mice model showed that gut inflammation promotes fungal proliferation
(Jawhara and Poulain 2007). Our observation on clonal expansion could be a result of
increase in permeability on conditions associated to a leaky gut that may favor colonization
with S. cerevisiae.
The phenotypic characterization of S. cerevisiae strains showed different traits potentially
associated with gut adaptation and colonization. Analysis of cell wall sugar composition
showed that cell wall of HG strains is uniquely composed by high levels of galactose and
glucosamine and low levels of glucose and mannose, a feature that discriminates gut-derived
strains from isolates from other origins. Particularly interesting is the finding that galactose
is a discriminating component of gut strains. Galactose has been reported to be crucial in
cell adhesion, biofilm formation and flocculation. The ability to grow in biofilm and floc
represents an advantage in response to stress condition or in immune response recognition
(Smukalla, Caldara et al. 2008). Strains from environmental origin, when grown in lactate,
also show enrichment in galactose, thus indicating that the genetic makeup is similar but that
the expression of genes for galactose metabolism is constitutive in gut strains only, thus
suggesting an “environmental imprinting” on the strains.
Regarding C. albicans, it is well-known its role as opportunistic pathogen. C. albicans
morphogenetic plasticity is considered to be its most important virulence attribute
(Kumamoto and Vinces 2005;Lu, Su et al. 2011). We showed that two distinct C. albicans
isolates (YL1 and YQ2) from CD patients elaborate differential response to phagocytes and
this phenomenon is dependent upon the genomic background and their ability to adapt to
host environment. The whole genome sequencing of the two C. albicans isolates revealed
that these strains present a great number of highly polymorphic genes, compared to the
reference strain, involved external structure, cell wall composition, fungal-type cell wall,
cell adhesion and hyphal cell wall determinants. By assessing their ability to undergo
morphological switch from yeasts to hyphae, we found that the YL1 strain form biofilm
(characterized by a higher density of hyphae with several interspersed germinating yeasts)
more rapidly than the YQ2.
Adherence to epithelia is one of the prerequisite essential to accomplish pathogenesis of C.
albicans in the mammalian host. Our results showed that YL1 has a higher ability, compared
to YQ2, to adhere to human intestinal cells in vitro. Furthermore, phagocytes plays a critical
role in balancing colonization/infection caused by this opportunistic yeast. Interestingly,
albeit similarly internalized, the YL1 isolate, in contrast to YQ2, was able to resist to
intracellular killing, and even replicate inside the microglia by inhibiting phagosome
maturation in these cells.
The studies on the cell wall sugar composition have demonstrated marked differences
between the two isolates in terms of mannan and glucan content. Indeed, the YQ2 strain

165
exhibited higher mannan concentrations in its cell wall, while YL1 had more glucan,
accounting for the diversity in the yeast cell:hyphae ratio observed in the biofilm structures.
The different composition of cell wall in human gut isolates in S. cerevisiae is associated
with strain-specific differences in the cytokine pattern induced in healthy donors, thus
reflecting the yeast strains ability to induce different inflammatory responses.
The discovery that cell wall glucose amount in S. cerevisiae strains is positively correlated
with the level of IL-17A induced in challenged PBMCs is in concordance with the
knowledge that the sugar portions of cell wall are the principal antigens recognized by the
host immune system during host-fungal interplay, and that β-glucans promote Th17
differentiation. As a consequence, we can hypothesize that galactose helps yeasts to hide
from immune functions and reduce inflammatory responses, that in the end would lead to
strain clearance.
Increase of the intestinal permeability, dysbiosis (Koh 2013), or even impairment of the
immune system are all conditions whose complicate the fungal-host interplay (Underhill and
Iliev 2014). We observed that in CD the presence of yeasts significantly correlated with
mucosal inflammation, in agreement with recent observations (Li, Wang et al. 2014), and
that ASCA levels correlate with the presence of fecal fungi. However, it is known that ASCA
production is not promoted by a specific yeast species, but rather by strain-specific antigenic
properties (McKenzie, Main et al. 1990). Thus, the comparison with immunomodulatory
properties of S. cerevisiae and Candida spp. isolates allowed the differentiation of pro-
inflammatory response between these two fungal genera. In general, we observed differential
immune response upon stimulation with both S. cerevisiae and Candida spp., but the large
diversity in the immunomodulatory profiles, considering the different isolates, suggests a
strain-specific pattern of cytokines. Moreover, the different strains isolated from diverse
ecological niches showed an immune-based diversity which seem to correlate with their
origin.
The immunological screening allowed the categorization of different isolates either
belonging to Candida spp or S. cerevisiae. The different S. cerevisiae isolates showed
diverse ability to promote proinflammtory response, via IL-6, IL-17 and IFN-γ,
counterbalanced by IL-10 induction, suggesting the ability of S. cerevisiae to promote either
inflammation, resistance or tolerance upon immune cell recognition. C. albicans isolates
could be categorize as INF+ or INF- strains or inducers of IL-1 β and low inducer of IL-10.
By comparison of healthy donors and CD patients PBMCs cytokine release, upon S.
cerevisiae challenge, we observed a general wide variability in immune reactivity, especially
for PBMCs of patients, probably derived from clinical status of the patient and alteration
status of immune system against fungal strains. The in vitro assay revealed IL-17A, IFN-γ
(both known to afford colonization resistance), and IL-10 (the cytokine involved in immune
tolerance) as the main factors discriminating S. cerevisiae isolates. Interestingly, in some
cases, CD patients’ response differently to own isolates compared to S. cerevisiae from other
patients, as a result of altered immune response and of induction of trained immunity by
fungal strain. PBMCs of CD patient with both clinical remission and lack of mucosal
inflammation, upon stimulation with own S. cerevisiae isolate, induced high IFN-γ and TNF-
α and low IL-17 compared to other patients in response to the same isolate. While, strains
166
isolated from patients in active disease and mucosal inflammation show high levels of IL17
and TNF-α and low level of IFN-γ and IL10.
In addition, the observed immune responses induced by gut S. cerevisiae strains seem to be
strongly correlated with sporulation ability, and the sporulation correlated with the ASCA
levels measured in CD patients. Sporulating isolates show opposite immunomodulatory
ability with respect to non-sporulating strains (HG1), inducing IFN-γ-mediated responses.
Strains (HG2) with medium ability to sporulate elicit IL-17-mediated inflammatory response
(Th-17) and this is associated with glucose-rich cell wall. Only HG3 strains, the highest
sporulators, induced tolerogenic response (high level of IFN-γ counterbalanced by IL-10
induction), showing to be able to escape immunosurveilance.
The results herein presented indicate how, from an evolutionary perspective, gut
environment could serve as reservoirs and evolutionary niches for S. cerevisiae, in which
genetic makeup could ultimately influence its immunogenicity, highlighting the need to
consider the interplay between fungal cell wall and gut immune function in determining
mycobiota composition.
Clonal expansion of strains with peculiar genetic characteristics and cell wall composition,
derived probably by a single colonization event, could be the result of selection and
adaptation to a peculiar leaky gut environment. This could be particularly relevant in
understanding the role of these strains in health and disease, since the molecular mechanisms
used by yeast to colonize the host, as a harmless commensal appear as a continuum with the
strategies used for evading immune surveillance and can thus potentially turn a friend into a
foe.
In the gut environment, yeast survival is difficult and competition is intense, if we considered
coexistence with bacteria. We also evaluated the gut microbiota profiles in presence/absence
of cultivable fungi. Our results showed that the presence of S. cerevisiae and its
immunomodulatory properties promote a favorable gut environment for beneficial genera,
such as Bacteroides and Faecalibacterium. While gut microbiota of CD patients enriched in
Candida spp. or other species favor enrichment in potential pathogenic bacteria, especially
Proteobacteria and Enterobacteriaceae.
Our in vitro results showed that exposure to commensal fungi can affect the immune
response. The ability of these commensal to survive in different host niches suggests the
acquisition of functional specializations for commensalism and disease, acting mainly on
modification of the cell wall structure and composition. Such differences occur both in
commensals such as S. cerevisiae, and opportunistic pathogens, such as Candida albicans.
Thus, indeed, understanding of the impact of fungi on host's immune system, in health and
disease, depends on strain specific phenotypic and genomic characteristics, modulating their
mechanism of interaction with the host immune system. The frontiers of metagenomics and
immunology studies thus should move from species level generalizations, to the profound
understanding of the strain level networks of interactions both in the fungal and in the
bacterial communities.

167
8. Summary
The comparative characterization of microbial communities (bacteria and fungi) in healthy
children populations and in pediatric patients affected by autoimmune and inflammatory
diseases provided insights on involvement of microbial profiles and the developing of
pathologies typical of the western world.
Taking as a reference traditional pediatric populations living in rural village, we monitored
the metagenomic scale of microbial changes upon transition to suburban and urban areas and
shift to a globalized diet. We discovered key microbial patterns that are lost in the course of
urbanization, industrialization and westernization, and a marked shift to bacterial patterns
that in the microbiota of western populations appear associated to IBD and other
autoimmune diseases. Analysis of the microbial functions, changed upon the transition from
rural to urban life, revealed loss of functions related to dietary changes, in particular loss of
functions related to fiber and polysaccharides degradation, due to the poor intake of dietary
fiber and the high content in animal protein and fat, and gain of genes for antibiotic
resistance, such as beta-lactamase resistance derived by antibiotics usage in livestock
practice and in the medicine. Also, degradation of xenobiotics represent a functional
response of symbiontic bacteria to exposure of toxic compounds derived by pollution,
industrialized and urban environment, and organic insecticide potentially used in agriculture,
as well as to food additive widely used to preserve foods. The importance to preserve an
ancient microbiome and maintain biodiversity has considerable repercussions for human
health, especially in industrialized and westernized populations, in which non-
communicable diseases are spread. Our study showed the gradual disappearance of ancient
microbes during the transition from rural to urban environment, and the importance to
develop strategies either to support symbiont dispersion, reducing the diffusion of pathogens,
or to reintroduce ancient bacteria with important functional acquisitions that have been
destroyed in the course of urbanization of human populations.
Inflammatory bowel disease represent one of the major pathologies of the western world,
with a growing increase in the pediatric population. In order to deepen the knowledge of the
pathogenesis of IBD at early onset (EO), we evaluated the phenotype and course of EO-IBD
(0–5 years) compared with pediatric later-onset disease (6–11 and 12–18 years), observing
potential differences in presentation and behavior of EO forms of the disease. Understanding
the factors that contribute to early age of onset of IBD could potentially facilitate intervention
strategy development.
Another typical immune-mediated condition that is largely increasing in western pediatric
populations is Juvenile Idiopathic Arthritis (JIA). JIA comprises a clinically heterogeneous
group of conditions characterized by chronic arthritis and synovial inflammation. Among
these, enthesitis related arthritis (ERA) is frequently characterized by clinical and subclinical
intestinal involvement. In this PhD thesis, we observed association between alterations of
gut microbial profiles in ERA samples and either HLA-B27 status or pharmacological
therapies, such as anti-inflammatories, corticosteroids and anti-TNF drugs. Our results on
JIA show intriguing links in terms of fecal microbiota profiles with IBD and other
autoimmune diseases associated to gastrointestinal disorders. Dysbiosis could have a pro-
arthritogenic role together with enriched microbial functions related to cell motility and
chemotaxis, representing possible traits of virulence that could be associated to gut

168
inflammation. Our results suggest a potential improved ability of microbial components to
pass through the gastrointestinal barrier and migrate in other districts, such as synovial fluid
and joints, inducing inflammation.
However, the observed extreme inter-individual variability of microbiota in inflammatory
and autoimmune diseases suggest that no a single microorganism is involved in pathogenesis
of these disorders. Further investigations should address the causes of perturbation and the
restoration of microbial equilibrium, in order to adopt therapeutic strategies able to maintain
microbial diversity, essential for immune homeostasis and the host’s health. Research in this
direction should include therapeutic strategies able to modulate the microbiota, with not only
diet and probiotics, but also evaluating new therapeutic approaches, such as fecal
transplantation, recently adopted in other diseases, especially in C. difficile inducing-
diarrhea, and that have shown some effectiveness during chronic inflammation.
Furthermore, the understanding of the microbial functional acquisition and the relationships
with epithelial barrier function and host immune response could help to understand the
contribution of microbiota in chronic inflammation.
Another aspect deepen in the present PhD thesis is the characterization of fungal
communities in health and disease. We try to define a “healthy” gut mycobiota, showing that
the intestinal fungal communities of healthy volunteers is a variegate ecosystem that differs
in function of individuals’ life stage in a gender-dependent manner. As occurs for the
bacterial microbiota, the intestinal mycobiota is shaped by host’s age, gender, diet and
geographical environment. Previous studies have shown that the development of the gut
bacterial microbiota starts at birth with colonization by a low number of species from the
mothers’s vaginal and fecal microbiota and it is characterized by many shifts in composition
during infancy. Similarly, the mycobiota may show the same fate. However, we observed an
inverted trend in which the richness of the gut mycobiota of infants and children was higher
than in adults, suggesting that, because during infancy the bacterial microbiota is less stable,
a weak bacterial competition occurs, leading to an increase of fungi during the early stages
of life. Suppression of the bacterial microbiota upon treatment with antibiotics or diet could
be further factors involved in the shaping of gut mycobiota.
The majority of fungal isolates living in our gut has been previously described as inhabitants
of the mammalian gastrointestinal tract, some of the isolates belong to species so far
identified only in environmental samples. The fungal isolates of this study, showing
resistance to oxidative, high temperature, bile acids and pH stresses, may hold the potential
to colonize the human gut. It is plausible that fecal fungal isolates with specific
characteristics survived to the gut environment, and that these traits make them able to
colonize the gut. Thus, we can hypothesize a long process of evolution, selection or
adaptation of environmental and food-borne strains to the human host, suggesting that
pathogenic strains of commensal species can evolve through a repeated process of evolution
and selection, depending on the immune status of the host.
To assess the potential role of fungal strains in etiology of IBD, we investigated the
immunomodulatory features of fungal isolates from IBD patients. We characterized
phenotypically and genotypically S. cerevisiae and C. albicans isolates, for traits related to
adaptation to gut environment, in order to understand the strategies related to interplay or

169
evasion of host immune system, and the relationships between fungal and bacterial gut
communities.
Analysis of cultivable gut mycobiota showed that S. cerevisiae is enriched in CD patients
compared to UC and healthy children. The clonal expansion observed in gut environment of
CD patients suggests that a CD-specific gut environment and leaky gut, may promote
patients colonization and clonal expansion of fungi, such as S. cerevisiae, that normally are
passengers, and occasionally can become colonizers.
Interestingly, we observed that in CD the presence of yeasts significantly correlated with
mucosal inflammation, and that ASCA levels correlate with the presence of fecal fungi.
However, it is known that ASCA production is not promoted by a specific yeast species, but
rather by strain-specific antigenic properties. The comparison with immunomodulatory
properties of S. cerevisiae isolates and Candida spp. allowed to differentiate pro-
inflammatory response between S. cerevisiae and Candida spp.. Our in vitro results showed
that exposure to commensal fungi can affect the immune response. The ability of these
commensal to survive in different host niches suggests the acquisition of functional
specializations for commensalism and disease, acting mainly on modification of the cell wall
structure and composition. Such differences occur both in commensals such as S. cerevisiae,
and opportunistic pathogens, such as C. albicans.
We also evaluated the gut microbiota profiles in presence/absence of cultivable fungi, in
order to understand the bacterial-fungal interaction in the gut environment. Our findings
showed that the presence of S. cerevisiae and its immunomodulatory properties promote a
favorable gut environment for beneficial bacteria. On the contrary, gut microbiota of CD
patients enriched in Candida spp. or other species promote enrichment in potential
pathogenic bacteria belonging to Proteobacteria phylum. However, bacterial profiles
resulted specific for disease status and in particular for remission, as observed in previous
studies on IBD.
Altogether, these results encourage for in-depth, strain-level extensive studies on human gut
mycobiota and the integration of metagenomic data with immunology to further establish
the relevance of fungi in host physiology and host-microbe interaction, as well as the
interaction with microbial communities.

170
9. References
Aa, E., J. P. Townsend, R. I. Adams, K. M. Nielsen and J. W. Taylor (2006). Population
structure and gene evolution in Saccharomyces cerevisiae. FEMS Yeast Res 6(5): 702-715.
Adlerberth, I. and A. E. Wold (2009). Establishment of the gut microbiota in Western
infants. Acta Paediatr 98(2): 229-238.
Aerts, A. M., I. E. Francois, B. P. Cammue and K. Thevissen (2008). The mode of
antifungal action of plant, insect and human defensins. Cell Mol Life Sci 65(13): 2069-
2079.
Agans, R., L. Rigsbee, H. Kenche, S. Michail, H. J. Khamis and O. Paliy (2011). Distal gut
microbiota of adolescent children is different from that of adults. FEMS Microbiol Ecol
77(2): 404-412.
Aggarwal, A. and D. P. Misra (2015). Enthesitis-related arthritis. Clin Rheumatol.
Alastruey-Izquierdo, A., K. Hoffmann, G. S. de Hoog, J. L. Rodriguez-Tudela, K. Voigt,
E. Bibashi and G. Walther (2010). Species recognition and clinical relevance of the
zygomycetous genus Lichtheimia (syn. Absidia pro parte, Mycocladus). J Clin Microbiol
48(6): 2154-2170.
Albanese, D., P. Fontana, C. De Filippo, D. Cavalieri and C. Donati (2015). MICCA: a
complete and accurate software for taxonomic profiling of metagenomic data. Sci Rep 5:
9743.
Albertsen, M., P. Hugenholtz, A. Skarshewski, K. L. Nielsen, G. W. Tyson and P. H.
Nielsen (2013). Genome sequences of rare, uncultured bacteria obtained by differential
coverage binning of multiple metagenomes. Nat Biotechnol 31(6): 533-538.
Aloi, M., G. D'Arcangelo, F. Pofi, F. Vassallo, V. Rizzo, F. Nuti, G. Di Nardo, M.
Pierdomenico, F. Viola and S. Cucchiara (2013). Presenting features and disease course of
pediatric ulcerative colitis. J Crohns Colitis 7(11): e509-515.
Aloi, M., F. Nuti, L. Stronati and S. Cucchiara (2014). Advances in the medical
management of paediatric IBD. Nat Rev Gastroenterol Hepatol 11(2): 99-108.
Amiot, A. and L. Peyrin-Biroulet (2015). Current, new and future biological agents on the
horizon for the treatment of inflammatory bowel diseases. Therap Adv Gastroenterol 8(2):
66-82.
Andersson, A. F., M. Lindberg, H. Jakobsson, F. Backhed, P. Nyren and L. Engstrand
(2008). Comparative analysis of human gut microbiota by barcoded pyrosequencing. PLoS
One 3(7): e2836.

171
Angebault, C., F. Djossou, S. Abelanet, E. Permal, M. Ben Soltana, L. Diancourt, C.
Bouchier, P. L. Woerther, F. Catzeflis, A. Andremont, C. d'Enfert and M. E. Bougnoux
(2013). Candida albicans is not always the preferential yeast colonizing humans: a study in
Wayampi Amerindians. J Infect Dis 208(10): 1705-1716.
Angelberger, S., W. Reinisch, A. Makristathis, C. Lichtenberger, C. Dejaco, P. Papay, G.
Novacek, M. Trauner, A. Loy and D. Berry (2013). Temporal bacterial community
dynamics vary among ulcerative colitis patients after fecal microbiota transplantation. Am
J Gastroenterol 108(10): 1620-1630.
Aomatsu, T., A. Yoden, K. Matsumoto, E. Kimura, K. Inoue, A. Andoh and H. Tamai
(2011). Fecal calprotectin is a useful marker for disease activity in pediatric patients with
inflammatory bowel disease. Dig Dis Sci 56(8): 2372-2377.
Araujo, R., C. Pina-Vaz and A. G. Rodrigues (2007). Susceptibility of environmental
versus clinical strains of pathogenic Aspergillus. Int J Antimicrob Agents 29(1): 108-111.
Arendrup, M. C., S. Sulim, A. Holm, L. Nielsen, S. D. Nielsen, J. D. Knudsen, N. E.
Drenck, J. J. Christensen and H. K. Johansen (2011). Diagnostic issues, clinical
characteristics, and outcomes for patients with fungemia. J Clin Microbiol 49(9): 3300-
3308.
Arpaia, N., C. Campbell, X. Fan, S. Dikiy, J. van der Veeken, P. deRoos, H. Liu, J. R.
Cross, K. Pfeffer, P. J. Coffer and A. Y. Rudensky (2013). Metabolites produced by
commensal bacteria promote peripheral regulatory T-cell generation. Nature 504(7480):
451-455.
Arumugam, M., J. Raes, E. Pelletier, D. Le Paslier, T. Yamada, D. R. Mende, G. R.
Fernandes, J. Tap, T. Bruls, J. M. Batto, M. Bertalan, N. Borruel, F. Casellas, L.
Fernandez, L. Gautier, T. et al. (2011). Enterotypes of the human gut microbiome. Nature
473(7346): 174-180.
Asquith, M. J., P. Stauffer, S. Davin, C. Mitchell, P. Lin and J. T. Rosenbaum (2016).
Perturbed Mucosal Immunity and Dysbiosis Accompany Clinical Disease in a Rat Model
of Spondyloarthritis. Arthritis Rheumatol 68(9): 2151-2162.
Atarashi, K., T. Tanoue, K. Oshima, W. Suda, Y. Nagano, H. Nishikawa, S. Fukuda, T.
Saito, S. Narushima, K. Hase, S. Kim, J. V. Fritz, P. Wilmes, S. Ueha, K. Matsushima, H.
Ohno, B. Olle, S. Sakaguchi, T. Taniguchi, H. Morita, M. Hattori and K. Honda (2013).
Treg induction by a rationally selected mixture of Clostridia strains from the human
microbiota. Nature 500(7461): 232-236.
Atarashi, K., T. Tanoue, T. Shima, A. Imaoka, T. Kuwahara, Y. Momose, G. Cheng, S.
Yamasaki, T. Saito, Y. Ohba, T. Taniguchi, K. Takeda, S. Hori, Ivanov, II, Y. Umesaki, K.
Itoh and K. Honda (2011). Induction of colonic regulatory T cells by indigenous
Clostridium species. Science 331(6015): 337-341.
172
Aujnarain, A., D. R. Mack and E. I. Benchimol (2013). The role of the environment in the
development of pediatric inflammatory bowel disease. Curr Gastroenterol Rep 15(6): 326.
Backhed, F. (2011). Programming of host metabolism by the gut microbiota. Ann Nutr
Metab 58 Suppl 2: 44-52.
Backhed, F., H. Ding, T. Wang, L. V. Hooper, G. Y. Koh, A. Nagy, C. F. Semenkovich
and J. I. Gordon (2004). The gut microbiota as an environmental factor that regulates fat
storage. Proc Natl Acad Sci U S A 101(44): 15718-15723.
Backhed, F., R. E. Ley, J. L. Sonnenburg, D. A. Peterson and J. I. Gordon (2005). Host-
bacterial mutualism in the human intestine. Science 307(5717): 1915-1920.
Backhed, F., J. K. Manchester, C. F. Semenkovich and J. I. Gordon (2007). Mechanisms
underlying the resistance to diet-induced obesity in germ-free mice. Proc Natl Acad Sci U
S A 104(3): 979-984.
Bajaj, J. S., J. M. Ridlon, P. B. Hylemon, L. R. Thacker, D. M. Heuman, S. Smith, M.
Sikaroodi and P. M. Gillevet (2012). Linkage of gut microbiome with cognition in hepatic
encephalopathy. Am J Physiol Gastrointest Liver Physiol 302(1): G168-175.
Balmer, S. E. and B. A. Wharton (1989). Diet and faecal flora in the newborn: breast milk
and infant formula. Arch Dis Child 64(12): 1672-1677.
Bannerjee, K., C. Camacho-Hubner, K. Babinska, K. M. Dryhurst, R. Edwards, M. O.
Savage, I. R. Sanderson and N. M. Croft (2004). Anti-inflammatory and growth-
stimulating effects precede nutritional restitution during enteral feeding in Crohn disease. J
Pediatr Gastroenterol Nutr 38(3): 270-275.
Barata, A., M. Malfeito-Ferreira and V. Loureiro (2012). The microbial ecology of wine
grape berries. Int J Food Microbiol 153(3): 243-259.
Barelli, C., D. Albanese, C. Donati, M. Pindo, C. Dallago, F. Rovero, D. Cavalieri, K. M.
Tuohy, H. C. Hauffe and C. De Filippo (2015). Habitat fragmentation is associated to gut
microbiota diversity of an endangered primate: implications for conservation. Sci Rep 5:
14862.
Beattie, R. M., E. J. Schiffrin, A. Donnet-Hughes, A. C. Huggett, P. Domizio, T. T.
MacDonald and J. A. Walker-Smith (1994). Polymeric nutrition as the primary therapy in
children with small bowel Crohn's disease. Aliment Pharmacol Ther 8(6): 609-615.
Begue, B., J. Verdier, F. Rieux-Laucat, O. Goulet, A. Morali, D. Canioni, J. P. Hugot, C.
Daussy, V. Verkarre, B. Pigneur, A. Fischer, C. Klein, N. Cerf-Bensussan and F. M.
Ruemmele (2011). Defective IL10 signaling defining a subgroup of patients with
inflammatory bowel disease. Am J Gastroenterol 106(8): 1544-1555.

173
Belda, I., E. Navascues, D. Marquina, A. Santos, F. Calderon and S. Benito (2015).
Dynamic analysis of physiological properties of Torulaspora delbrueckii in wine
fermentations and its incidence on wine quality. Appl Microbiol Biotechnol 99(4): 1911-
1922.
Benjamini, Y. and Y. Hochberg (1995). Controlling the false discovery rate: a practical
and powerful approach to multiple testing. Journal of the Royal Statistical Society. Series
B (Methodological): 289-300.
Bentley, D. R., S. Balasubramanian, H. P. Swerdlow, G. P. Smith, J. Milton, C. G. Brown,
K. P. Hall, D. J. Evers, C. L. Barnes, H. R. Bignell, J. M. Boutell, J. Bryant, R. J. et al.
(2008). Accurate whole human genome sequencing using reversible terminator chemistry.
Nature 456(7218): 53-59.
Bercik, P., S. M. Collins and E. F. Verdu (2012). Microbes and the gut-brain axis.
Neurogastroenterol Motil 24(5): 405-413.
Bercik, P., A. J. Park, D. Sinclair, A. Khoshdel, J. Lu, X. Huang, Y. Deng, P. A.
Blennerhassett, M. Fahnestock, D. Moine, B. Berger, J. D. Huizinga, W. Kunze, P. G.
McLean, G. E. Bergonzelli, S. M. Collins and E. F. Verdu (2011). The anxiolytic effect of
Bifidobacterium longum NCC3001 involves vagal pathways for gut-brain communication.
Neurogastroenterol Motil 23(12): 1132-1139.
Berer, K., M. Mues, M. Koutrolos, Z. A. Rasbi, M. Boziki, C. Johner, H. Wekerle and G.
Krishnamoorthy (2011). Commensal microbiota and myelin autoantigen cooperate to
trigger autoimmune demyelination. Nature 479(7374): 538-541.
Berkhoff, H. A. (1985). Clostridium-Colinum Sp-Nov, Nom Rev, the Causative Agent of
Ulcerative Enteritis (Quail Disease) in Quail, Chickens, and Pheasants. International
Journal of Systematic Bacteriology 35(2): 155-159.
Bernhardt, H. (1996). [Candida in the ecological system of the orointestinal tract]. Mycoses
39 Suppl 1: 44-47.
Bernhardt, H. and M. Knoke (1997). Mycological aspects of gastrointestinal microflora.
Scand J Gastroenterol Suppl 222: 102-106.
Bezerra-Bussoli, C., M. A. Baffi, E. Gomes and R. Da-Silva (2013). Yeast diversity
isolated from grape musts during spontaneous fermentation from a Brazilian winery. Curr
Microbiol 67(3): 356-361.
Biagi, E., L. Nylund, M. Candela, R. Ostan, L. Bucci, E. Pini, J. Nikkila, D. Monti, R.
Satokari, C. Franceschi, P. Brigidi and W. De Vos (2010). Through ageing, and beyond:
gut microbiota and inflammatory status in seniors and centenarians. PLoS One 5(5):
e10667.

174
Bianco, A. M., V. Zanin, L. Monasta, S. Martelossi, A. Marcuzzi and S. Crovella (2013).
Family history in early-onset inflammatory bowel disease. J Gastroenterol 48(1): 144.
Bik, E. M., P. B. Eckburg, S. R. Gill, K. E. Nelson, E. A. Purdom, F. Francois, G. Perez-
Perez, M. J. Blaser and D. A. Relman (2006). Molecular analysis of the bacterial
microbiota in the human stomach. Proc Natl Acad Sci U S A 103(3): 732-737.
Blankenberg, D., G. Von Kuster, N. Coraor, G. Ananda, R. Lazarus, M. Mangan, A.
Nekrutenko and J. Taylor (2010). Galaxy: a web-based genome analysis tool for
experimentalists. Curr Protoc Mol Biol Chapter 19: Unit 19 10 11-21.
Blasco-Baque, V., L. Garidou, C. Pomie, Q. Escoula, P. Loubieres, S. Le Gall-David, M.
Lemaitre, S. Nicolas, P. Klopp, A. Waget, V. Azalbert, A. Colom, M. Bonnaure-Mallet, P.
Kemoun, M. Serino and R. Burcelin (2016). Periodontitis induced by Porphyromonas
gingivalis drives periodontal microbiota dysbiosis and insulin resistance via an impaired
adaptive immune response. Gut.
Blaser, M. J. and S. Falkow (2009). What are the consequences of the disappearing human
microbiota? Nat Rev Microbiol 7(12): 887-894.
Blasi, E., R. Mazzolla, R. Barluzzi, P. Mosci, A. Bartoli and F. Bistoni (1991).
Intracerebral transfer of an in vitro established microglial cell line: local induction of a
protective state against lethal challenge with Candida albicans. J Neuroimmunol 32(3):
249-257.
Blasi, E., L. Pitzurra, A. M. Burhan Fuad, P. Marconi and F. Bistoni (1990). Gamma
interferon-induced specific binding of tetanus toxin on the GG2EE macrophage cell line.
Scand J Immunol 32(3): 289-292.
Blasi, E., M. Puliti, L. Pitzurra, A. Bartoli and F. Bistoni (1994). Heterogeneous secretory
response of phagocytes from different anatomical districts to the dimorphic fungus
Candida albicans. Cell Immunol 153(1): 239-247.
Bolnick, D. I., L. K. Snowberg, P. E. Hirsch, C. L. Lauber, E. Org, B. Parks, A. J. Lusis, R.
Knight, J. G. Caporaso and R. Svanback (2014). Individual diet has sex-dependent effects
on vertebrate gut microbiota. Nat Commun 5: 4500.
Bolte, E. R. (1998). Autism and Clostridium tetani. Med Hypotheses 51(2): 133-144.
Boorom, K. F., H. Smith, L. Nimri, E. Viscogliosi, G. Spanakos, U. Parkar, L. H. Li, X. N.
Zhou, U. Z. Ok, S. Leelayoova and M. S. Jones (2008). Oh my aching gut: irritable bowel
syndrome, Blastocystis, and asymptomatic infection. Parasit Vectors 1(1): 40.
Borenstein, E., M. Kupiec, M. W. Feldman and E. Ruppin (2008). Large-scale
reconstruction and phylogenetic analysis of metabolic environments. Proc Natl Acad Sci U
S A 105(38): 14482-14487.

175
Bougnoux, M. E., D. Diogo, N. Francois, B. Sendid, S. Veirmeire, J. F. Colombel, C.
Bouchier, H. Van Kruiningen, C. d'Enfert and D. Poulain (2006). Multilocus sequence
typing reveals intrafamilial transmission and microevolutions of Candida albicans isolates
from the human digestive tract. J Clin Microbiol 44(5): 1810-1820.
Bouskra, D., C. Brezillon, M. Berard, C. Werts, R. Varona, I. G. Boneca and G. Eberl
(2008). Lymphoid tissue genesis induced by commensals through NOD1 regulates
intestinal homeostasis. Nature 456(7221): 507-510.
Brand, A. (2012). Hyphal growth in human fungal pathogens and its role in virulence. Int J
Microbiol 2012: 517529.
Braniste, V., M. Al-Asmakh, C. Kowal, F. Anuar, A. Abbaspour, M. Toth, A. Korecka, N.
Bakocevic, L. G. Ng, P. Kundu, B. Gulyas, C. Halldin, K. Hultenby, H. Nilsson, H.
Hebert, B. T. Volpe, B. Diamond and S. Pettersson (2014). The gut microbiota influences
blood-brain barrier permeability in mice. Sci Transl Med 6(263): 263ra158.
Brenden, R. A., M. A. Miller and J. M. Janda (1988). Clinical disease spectrum and
pathogenic factors associated with Plesiomonas shigelloides infections in humans. Rev
Infect Dis 10(2): 303-316.
Brenner, D., H. Blaser and T. W. Mak (2015). Regulation of tumour necrosis factor
signalling: live or let die. Nat Rev Immunol 15(6): 362-374.
Brestoff, J. R. and D. Artis (2013). Commensal bacteria at the interface of host metabolism
and the immune system. Nat Immunol 14(7): 676-684.
Breton, J., N. Tennoune, N. Lucas, M. Francois, R. Legrand, J. Jacquemot, A. Goichon, C.
Guerin, J. Peltier, M. Pestel-Caron, P. Chan, D. Vaudry, J. C. do Rego, F. Lienard, L.
Penicaud, X. Fioramonti, I. S. Ebenezer, T. Hokfelt, P. Dechelotte and S. O. Fetissov
(2016). Gut Commensal E. coli Proteins Activate Host Satiety Pathways following
Nutrient-Induced Bacterial Growth. Cell Metab 23(2): 324-334.
Brown, E. M., M. Wlodarska, B. P. Willing, P. Vonaesch, J. Han, L. A. Reynolds, M. C.
Arrieta, M. Uhrig, R. Scholz, O. Partida, C. H. Borchers, P. J. Sansonetti and B. B. Finlay
(2015). Diet and specific microbial exposure trigger features of environmental enteropathy
in a novel murine model. Nat Commun 6: 7806.
Brown, G. D., D. W. Denning, N. A. Gow, S. M. Levitz, M. G. Netea and T. C. White
(2012). Hidden killers: human fungal infections. Sci Transl Med 4(165): 165rv113.
Brusca, S. B., S. B. Abramson and J. U. Scher (2014). Microbiome and mucosal
inflammation as extra-articular triggers for rheumatoid arthritis and autoimmunity. Curr
Opin Rheumatol 26(1): 101-107.

176
Bryan, A. R. and C. E. Rabinovich (2014). Enthesitis-related arthritis: time to re-define?
Curr Rheumatol Rep 16(12): 466.
Bryant, M. P. (1970). Normal flora--rumen bacteria. Am J Clin Nutr 23(11): 1440-1450.
Butinar, L., P. Zalar, J. C. Frisvad and N. Gunde-Cimerman (2005). The genus Eurotium -
members of indigenous fungal community in hypersaline waters of salterns. FEMS
Microbiol Ecol 51(2): 155-166.
Cabreiro, F., C. Au, K. Y. Leung, N. Vergara-Irigaray, H. M. Cocheme, T. Noori, D.
Weinkove, E. Schuster, N. D. Greene and D. Gems (2013). Metformin retards aging in C.
elegans by altering microbial folate and methionine metabolism. Cell 153(1): 228-239.
Cadwell, K., J. Y. Liu, S. L. Brown, H. Miyoshi, J. Loh, J. K. Lennerz, C. Kishi, W. Kc, J.
A. Carrero, S. Hunt, C. D. Stone, E. M. Brunt, R. J. Xavier, B. P. Sleckman, E. Li, N.
Mizushima, T. S. Stappenbeck and H. W. t. Virgin (2008). A key role for autophagy and
the autophagy gene Atg16l1 in mouse and human intestinal Paneth cells. Nature
456(7219): 259-263.
Cani, P. D. (2014). Metabolism in 2013: The gut microbiota manages host metabolism. Nat
Rev Endocrinol 10(2): 74-76.
Cani, P. D., R. Bibiloni, C. Knauf, A. Waget, A. M. Neyrinck, N. M. Delzenne and R.
Burcelin (2008). Changes in gut microbiota control metabolic endotoxemia-induced
inflammation in high-fat diet-induced obesity and diabetes in mice. Diabetes 57(6): 1470-
1481.
Cani, P. D., A. M. Neyrinck, F. Fava, C. Knauf, R. G. Burcelin, K. M. Tuohy, G. R.
Gibson and N. M. Delzenne (2007). Selective increases of bifidobacteria in gut microflora
improve high-fat-diet-induced diabetes in mice through a mechanism associated with
endotoxaemia. Diabetologia 50(11): 2374-2383.
Cannioto, Z., I. Berti, S. Martelossi, I. Bruno, N. Giurici, S. Crovella and A. Ventura
(2009). IBD and IBD mimicking enterocolitis in children younger than 2 years of age. Eur
J Pediatr 168(2): 149-155.
Caporaso, J. G., K. Bittinger, F. D. Bushman, T. Z. DeSantis, G. L. Andersen and R.
Knight (2010). PyNAST: a flexible tool for aligning sequences to a template alignment.
Bioinformatics 26(2): 266-267.
Caporaso, J. G., J. Kuczynski, J. Stombaugh, K. Bittinger, F. D. Bushman, E. K. Costello,
N. Fierer, A. G. Pena, J. K. Goodrich, J. I. Gordon, G. A. Huttley, S. T. Kelley, D. Knights,
J. E. Koenig, et al. (2010). QIIME allows analysis of high-throughput community
sequencing data. Nat Methods 7(5): 335-336.

177
Carman, R. J. and S. P. Borriello (1984). Infectious nature of Clostridium spiroforme-
mediated rabbit enterotoxaemia. Vet Microbiol 9(5): 497-502.
Casarin, R. C., D. Saito, V. R. Santos, S. P. Pimentel, P. M. Duarte, M. Z. Casati and R. B.
Goncalves (2012). Detection of Mogibacterium timidum in subgingival biofilm of
aggressive and non-diabetic and diabetic chronic periodontitis patients. Braz J Microbiol
43(3): 931-937.
Castanheira, M., S. A. Messer, R. N. Jones, D. J. Farrell and M. A. Pfaller (2014). Activity
of echinocandins and triazoles against a contemporary (2012) worldwide collection of
yeast and moulds collected from invasive infections. Int J Antimicrob Agents 44(4): 320-
326.
Cavalieri, D., P. E. McGovern, D. L. Hartl, R. Mortimer and M. Polsinelli (2003).
Evidence for S. cerevisiae fermentation in ancient wine. J Mol Evol 57 Suppl 1: S226-232.
Cavalieri, D., J. P. Townsend and D. L. Hartl (2000). Manifold anomalies in gene
expression in a vineyard isolate of Saccharomyces cerevisiae revealed by DNA microarray
analysis. Proc Natl Acad Sci U S A 97(22): 12369-12374.
Cebra, J. J. (1999). Influences of microbiota on intestinal immune system development.
Am J Clin Nutr 69(5): 1046S-1051S.
Chehoud, C., L. G. Albenberg, C. Judge, C. Hoffmann, S. Grunberg, K. Bittinger, R. N.
Baldassano, J. D. Lewis, F. D. Bushman and G. D. Wu (2015). Fungal Signature in the Gut
Microbiota of Pediatric Patients With Inflammatory Bowel Disease. Inflamm Bowel Dis
21(8): 1948-1956.
Chen, C., K. Pande, S. D. French, B. B. Tuch and S. M. Noble (2011). An iron homeostasis
regulatory circuit with reciprocal roles in Candida albicans commensalism and
pathogenesis. Cell Host Microbe 10(2): 118-135.
Chen, J., K. Wright, J. M. Davis, P. Jeraldo, E. V. Marietta, J. Murray, H. Nelson, E. L.
Matteson and V. Taneja (2016). An expansion of rare lineage intestinal microbes
characterizes rheumatoid arthritis. Genome Med 8(1): 43.
Chen, S. C., E. G. Playford and T. C. Sorrell (2010). Antifungal therapy in invasive fungal
infections. Curr Opin Pharmacol 10(5): 522-530.
Cheng, J., A. M. Palva, W. M. de Vos and R. Satokari (2013). Contribution of the
intestinal microbiota to human health: from birth to 100 years of age. Curr Top Microbiol
Immunol 358: 323-346.
Chida, T., N. Okamura, K. Ohtani, Y. Yoshida, E. Arakawa and H. Watanabe (2000). The
complete DNA sequence of the O antigen gene region of Plesiomonas shigelloides

178
serotype O17 which is identical to Shigella sonnei form I antigen. Microbiol Immunol
44(3): 161-172.
Chitarra, G. S., T. Abee, F. M. Rombouts, M. A. Posthumus and J. Dijksterhuis (2004).
Germination of penicillium paneum Conidia is regulated by 1-octen-3-ol, a volatile self-
inhibitor. Appl Environ Microbiol 70(5): 2823-2829.
Chung, H. and D. L. Kasper (2010). Microbiota-stimulated immune mechanisms to
maintain gut homeostasis. Curr Opin Immunol 22(4): 455-460.
Chung, H., S. J. Pamp, J. A. Hill, N. K. Surana, S. M. Edelman, E. B. Troy, N. C. Reading,
E. J. Villablanca, S. Wang, J. R. Mora, Y. Umesaki, D. Mathis, C. Benoist, D. A. Relman
and D. L. Kasper (2012). Gut immune maturation depends on colonization with a host-
specific microbiota. Cell 149(7): 1578-1593.
Claesson, M. J., I. B. Jeffery, S. Conde, S. E. Power, E. M. O'Connor, S. Cusack, H. M.
Harris, M. Coakley, B. Lakshminarayanan, O. O'Sullivan, G. F. Fitzgerald, J. Deane, M.
O'Connor, N. Harnedy, K. O'Connor, D. O'Mahony, D. van Sinderen, M. Wallace, L.
Brennan, C. Stanton, J. R. Marchesi, A. P. Fitzgerald, F. Shanahan, C. Hill, R. P. Ross and
P. W. O'Toole (2012). Gut microbiota composition correlates with diet and health in the
elderly. Nature 488(7410): 178-184.
Clarke, G., S. Grenham, P. Scully, P. Fitzgerald, R. D. Moloney, F. Shanahan, T. G. Dinan
and J. F. Cryan (2013). The microbiome-gut-brain axis during early life regulates the
hippocampal serotonergic system in a sex-dependent manner. Mol Psychiatry 18(6): 666-
673.
Collado, M. C., S. Rautava, E. Isolauri and S. Salminen (2015). Gut microbiota: a source
of novel tools to reduce the risk of human disease? Pediatr Res 77(1-2): 182-188.
Collins, M. D., P. A. Lawson, A. Willems, J. J. Cordoba, J. Fernandez-Garayzabal, P.
Garcia, J. Cai, H. Hippe and J. A. Farrow (1994). The phylogeny of the genus Clostridium:
proposal of five new genera and eleven new species combinations. Int J Syst Bacteriol
44(4): 812-826.
Costello, E. K., K. Stagaman, L. Dethlefsen, B. J. Bohannan and D. A. Relman (2012). The
application of ecological theory toward an understanding of the human microbiome.
Science 336(6086): 1255-1262.
Costello, M. E., F. Ciccia, D. Willner, N. Warrington, P. C. Robinson, B. Gardiner, M.
Marshall, T. J. Kenna, G. Triolo and M. A. Brown (2014). Intestinal dysbiosis in
ankylosing spondylitis. Arthritis Rheumatol.
Cotillard, A., S. P. Kennedy, L. C. Kong, E. Prifti, N. Pons, E. Le Chatelier, M. Almeida,
B. Quinquis, F. Levenez, N. Galleron, S. Gougis, S. Rizkalla, J. M. Batto, P. Renault, A.

179
N. R. M. consortium, J. Dore, J. D. Zucker, K. Clement and S. D. Ehrlich (2013). Dietary
intervention impact on gut microbial gene richness. Nature 500(7464): 585-588.
Coyte, K. Z., J. Schluter and K. R. Foster (2015). The ecology of the microbiome:
Networks, competition, and stability. Science 350(6261): 663-666.
Cucchiara, S., L. Stronati and M. Aloi (2012). Interactions between intestinal microbiota
and innate immune system in pediatric inflammatory bowel disease. J Clin Gastroenterol
46 Suppl: S64-66.
D'Angelo, G., S. Capasso, L. Sticco and D. Russo (2013). Glycosphingolipids: synthesis
and functions. FEBS J 280(24): 6338-6353.
D'Argenio, V., G. Casaburi, V. Precone, C. Pagliuca, R. Colicchio, D. Sarnataro, V.
Discepolo, S. M. Kim, I. Russo, G. Del Vecchio Blanco, D. S. Horner, M. Chiara, G.
Pesole, P. Salvatore, G. Monteleone, C. Ciacci, G. J. Caporaso, B. Jabri, F. Salvatore and
L. Sacchetti (2016). Metagenomics Reveals Dysbiosis and a Potentially Pathogenic N.
flavescens Strain in Duodenum of Adult Celiac Patients. Am J Gastroenterol 111(6): 879-
890.
D'Argenio, V., V. Precone, G. Casaburi, E. Miele, M. Martinelli, A. Staiano, F. Salvatore
and L. Sacchetti (2013). An altered gut microbiome profile in a child affected by Crohn's
disease normalized after nutritional therapy. Am J Gastroenterol 108(5): 851-852.
Dallies, N., J. Francois and V. Paquet (1998). A new method for quantitative determination
of polysaccharides in the yeast cell wall. Application to the cell wall defective mutants of
Saccharomyces cerevisiae. Yeast 14(14): 1297-1306.
Danielsson, R., A. Werner-Omazic, M. Ramin, A. Schnurer, M. Griinari, J. Dicksved and
J. Bertilsson (2014). Effects on enteric methane production and bacterial and archaeal
communities by the addition of cashew nut shell extract or glycerol-an in vitro evaluation.
J Dairy Sci 97(9): 5729-5741.
Daulatzai, M. A. (2014). Chronic functional bowel syndrome enhances gut-brain axis
dysfunction, neuroinflammation, cognitive impairment, and vulnerability to dementia.
Neurochem Res 39(4): 624-644.
David, L. A., A. C. Materna, J. Friedman, M. I. Campos-Baptista, M. C. Blackburn, A.
Perrotta, S. E. Erdman and E. J. Alm (2014). Host lifestyle affects human microbiota on
daily timescales. Genome Biol 15(7): R89.
David, L. A., C. F. Maurice, R. N. Carmody, D. B. Gootenberg, J. E. Button, B. E. Wolfe,
A. V. Ling, A. S. Devlin, Y. Varma, M. A. Fischbach, S. B. Biddinger, R. J. Dutton and P.
J. Turnbaugh (2014). Diet rapidly and reproducibly alters the human gut microbiome.
Nature 505(7484): 559-563.
180
Davies, J. and D. Davies (2010). Origins and evolution of antibiotic resistance. Microbiol
Mol Biol Rev 74(3): 417-433.
de Bie, C. I., A. Paerregaard, S. Kolacek, F. M. Ruemmele, S. Koletzko, J. M. Fell, J. C.
Escher and E. P. I. W. G. o. ESPGHAN (2013). Disease phenotype at diagnosis in
pediatric Crohn's disease: 5-year analyses of the EUROKIDS Registry. Inflamm Bowel Dis
19(2): 378-385.
De Filippo, C., D. Cavalieri, M. Di Paola, M. Ramazzotti, J. B. Poullet, S. Massart, S.
Collini, G. Pieraccini and P. Lionetti (2010). Impact of diet in shaping gut microbiota
revealed by a comparative study in children from Europe and rural Africa. Proc Natl Acad
Sci U S A 107(33): 14691-14696.
de la Camara, R., I. Pinilla, E. Munoz, B. Buendia, J. L. Steegmann and J. M. Fernandez-
Ranada (1996). Penicillium brevicompactum as the cause of a necrotic lung ball in an
allogeneic bone marrow transplant recipient. Bone Marrow Transplant 18(6): 1189-1193.
de Melo Pereira, G. V., V. T. Soccol, A. Pandey, A. B. Medeiros, J. M. Andrade Lara, A.
L. Gollo and C. R. Soccol (2014). Isolation, selection and evaluation of yeasts for use in
fermentation of coffee beans by the wet process. Int J Food Microbiol 188: 60-66.
De Palma, G., P. Blennerhassett, J. Lu, Y. Deng, A. J. Park, W. Green, E. Denou, M. A.
Silva, A. Santacruz, Y. Sanz, M. G. Surette, E. F. Verdu, S. M. Collins and P. Bercik
(2015). Microbiota and host determinants of behavioural phenotype in maternally
separated mice. Nat Commun 6: 7735.
de Ridder, L., R. K. Weersma, G. Dijkstra, G. van der Steege, M. A. Benninga, I. M.
Nolte, J. A. Taminiau, D. W. Hommes and P. C. Stokkers (2007). Genetic susceptibility
has a more important role in pediatric-onset Crohn's disease than in adult-onset Crohn's
disease. Inflamm Bowel Dis 13(9): 1083-1092.
De Vadder, F., P. Kovatcheva-Datchary, D. Goncalves, J. Vinera, C. Zitoun, A. Duchampt,
F. Backhed and G. Mithieux (2014). Microbiota-generated metabolites promote metabolic
benefits via gut-brain neural circuits. Cell 156(1-2): 84-96.
Denning, D. W. and M. J. Bromley (2015). Infectious Disease. How to bolster the
antifungal pipeline. Science 347(6229): 1414-1416.
DeSantis, T. Z., P. Hugenholtz, N. Larsen, M. Rojas, E. L. Brodie, K. Keller, T. Huber, D.
Dalevi, P. Hu and G. L. Andersen (2006). Greengenes, a chimera-checked 16S rRNA gene
database and workbench compatible with ARB. Appl Environ Microbiol 72(7): 5069-5072.
Desbonnet, L., G. Clarke, F. Shanahan, T. G. Dinan and J. F. Cryan (2014). Microbiota is
essential for social development in the mouse. Mol Psychiatry 19(2): 146-148.

181
Deutschbauer, A. M. and R. W. Davis (2005). Quantitative trait loci mapped to single-
nucleotide resolution in yeast. Nat Genet 37(12): 1333-1340.
Devkota, S., Y. Wang, M. W. Musch, V. Leone, H. Fehlner-Peach, A. Nadimpalli, D. A.
Antonopoulos, B. Jabri and E. B. Chang (2012). Dietary-fat-induced taurocholic acid
promotes pathobiont expansion and colitis in Il10-/- mice. Nature 487(7405): 104-108.
Diaz Heijtz, R., S. Wang, F. Anuar, Y. Qian, B. Bjorkholm, A. Samuelsson, M. L.
Hibberd, H. Forssberg and S. Pettersson (2011). Normal gut microbiota modulates brain
development and behavior. Proc Natl Acad Sci U S A 108(7): 3047-3052.
Diezmann, S. and F. S. Dietrich (2009). Saccharomyces cerevisiae: population divergence
and resistance to oxidative stress in clinical, domesticated and wild isolates. PLoS One
4(4): e5317.
Distrutti, E., L. Monaldi, P. Ricci and S. Fiorucci (2016). Gut microbiota role in irritable
bowel syndrome: New therapeutic strategies. World J Gastroenterol 22(7): 2219-2241.
Dollive, S., Y. Y. Chen, S. Grunberg, K. Bittinger, C. Hoffmann, L. Vandivier, C. Cuff, J.
D. Lewis, G. D. Wu and F. D. Bushman (2013). Fungi of the murine gut: episodic
variation and proliferation during antibiotic treatment. PLoS One 8(8): e71806.
Dollive, S., G. L. Peterfreund, S. Sherrill-Mix, K. Bittinger, R. Sinha, C. Hoffmann, C. S.
Nabel, D. A. Hill, D. Artis, M. A. Bachman, R. Custers-Allen, S. Grunberg, G. D. Wu, J.
D. Lewis and F. D. Bushman (2012). A tool kit for quantifying eukaryotic rRNA gene
sequences from human microbiome samples. Genome Biol 13(7): R60.
Dominguez-Villar, M. and D. A. Hafler (2011). Immunology. An innate role for IL-17.
Science 332(6025): 47-48.
Donia, M. S. and M. A. Fischbach (2015). HUMAN MICROBIOTA. Small molecules
from the human microbiota. Science 349(6246): 1254766.
Drell, T., T. Lillsaar, L. Tummeleht, J. Simm, A. Aaspollu, E. Vain, I. Saarma, A.
Salumets, G. G. Donders and M. Metsis (2013). Characterization of the vaginal micro- and
mycobiome in asymptomatic reproductive-age Estonian women. PLoS One 8(1): e54379.
Duncan, S. H., G. E. Lobley, G. Holtrop, J. Ince, A. M. Johnstone, P. Louis and H. J. Flint
(2008). Human colonic microbiota associated with diet, obesity and weight loss. Int J Obes
(Lond) 32(11): 1720-1724.
Dunn, B., C. Richter, D. J. Kvitek, T. Pugh and G. Sherlock (2012). Analysis of the
Saccharomyces cerevisiae pan-genome reveals a pool of copy number variants distributed
in diverse yeast strains from differing industrial environments. Genome Res 22(5): 908-
924.

182
Durkin, H. G., H. Bazin and B. H. Waksman (1981). Origin and fate of IgE-bearing
lymphocytes. I. Peyer's patches as differentiation site of cells. Simultaneously bearing IgA
and IgE. J Exp Med 154(3): 640-648.
Eckburg, P. B., E. M. Bik, C. N. Bernstein, E. Purdom, L. Dethlefsen, M. Sargent, S. R.
Gill, K. E. Nelson and D. A. Relman (2005). Diversity of the human intestinal microbial
flora. Science 308(5728): 1635-1638.
Endt, K., B. Stecher, S. Chaffron, E. Slack, N. Tchitchek, A. Benecke, L. Van Maele, J. C.
Sirard, A. J. Mueller, M. Heikenwalder, A. J. Macpherson, R. Strugnell, C. von Mering
and W. D. Hardt (2010). The microbiota mediates pathogen clearance from the gut lumen
after non-typhoidal Salmonella diarrhea. PLoS Pathog 6(9): e1001097.
Erny, D., A. L. Hrabe de Angelis, D. Jaitin, P. Wieghofer, O. Staszewski, E. David, H.
Keren-Shaul, T. Mahlakoiv, K. Jakobshagen, T. Buch, V. Schwierzeck, O. Utermohlen, E.
Chun, W. S. Garrett, K. D. McCoy, A. Diefenbach, P. Staeheli, B. Stecher, I. Amit and M.
Prinz (2015). Host microbiota constantly control maturation and function of microglia in
the CNS. Nat Neurosci 18(7): 965-977.
Ezov, T. K., E. Boger-Nadjar, Z. Frenkel, I. Katsperovski, S. Kemeny, E. Nevo, A. Korol
and Y. Kashi (2006). Molecular-genetic biodiversity in a natural population of the yeast
Saccharomyces cerevisiae from "Evolution Canyon": microsatellite polymorphism, ploidy
and controversial sexual status. Genetics 174(3): 1455-1468.
Fagarasan, S., S. Kawamoto, O. Kanagawa and K. Suzuki (2010). Adaptive immune
regulation in the gut: T cell-dependent and T cell-independent IgA synthesis. Annu Rev
Immunol 28: 243-273.
Faith, J. J., J. L. Guruge, M. Charbonneau, S. Subramanian, H. Seedorf, A. L. Goodman, J.
C. Clemente, R. Knight, A. C. Heath, R. L. Leibel, M. Rosenbaum and J. I. Gordon (2013).
The long-term stability of the human gut microbiota. Science 341(6141): 1237439.
Faust, K., J. F. Sathirapongsasuti, J. Izard, N. Segata, D. Gevers, J. Raes and C.
Huttenhower (2012). Microbial co-occurrence relationships in the human microbiome.
PLoS Comput Biol 8(7): e1002606.
Fell, J. M. (2005). Control of systemic and local inflammation with transforming growth
factor beta containing formulas. JPEN J Parenter Enteral Nutr 29(4 Suppl): S126-128;
discussion S129-133, S184-128.
Felsenstein, J. (1989). Mathematics vs. Evolution: Mathematical Evolutionary Theory.
Science 246(4932): 941-942.
Findley, K., J. Oh, J. Yang, S. Conlan, C. Deming, J. A. Meyer, D. Schoenfeld, E.
Nomicos, M. Park, N. I. H. I. S. C. C. S. Program, H. H. Kong and J. A. Segre (2013).

183
Topographic diversity of fungal and bacterial communities in human skin. Nature
498(7454): 367-370.
Finegold, S. M., S. E. Dowd, V. Gontcharova, C. Liu, K. E. Henley, R. D. Wolcott, E.
Youn, P. H. Summanen, D. Granpeesheh, D. Dixon, M. Liu, D. R. Molitoris and J. A.
Green, 3rd (2010). Pyrosequencing study of fecal microflora of autistic and control
children. Anaerobe 16(4): 444-453.
Fiocchi, C. (2013). Inflammatory bowel disease: evolutionary concepts in biology,
epidemiology, mechanisms and therapy. Curr Opin Gastroenterol 29(4): 347-349.
Forbes, J. D., G. Van Domselaar and C. N. Bernstein (2016). The Gut Microbiota in
Immune-Mediated Inflammatory Diseases. Front Microbiol 7: 1081.
Ford, C. B., J. M. Funt, D. Abbey, L. Issi, C. Guiducci, D. A. Martinez, T. Delorey, B. Y.
Li, T. C. White, C. Cuomo, R. P. Rao, J. Berman, D. A. Thompson and A. Regev (2015).
The evolution of drug resistance in clinical isolates of Candida albicans. Elife 4: e00662.
Frank, D. N., C. E. Robertson, C. M. Hamm, Z. Kpadeh, T. Zhang, H. Chen, W. Zhu, R. B.
Sartor, E. C. Boedeker, N. Harpaz, N. R. Pace and E. Li (2011). Disease phenotype and
genotype are associated with shifts in intestinal-associated microbiota in inflammatory
bowel diseases. Inflamm Bowel Dis 17(1): 179-184.
Frank, D. N., A. L. St Amand, R. A. Feldman, E. C. Boedeker, N. Harpaz and N. R. Pace
(2007). Molecular-phylogenetic characterization of microbial community imbalances in
human inflammatory bowel diseases. Proc Natl Acad Sci U S A 104(34): 13780-13785.
Freilich, S., L. Goldovsky, A. Gottlieb, E. Blanc, S. Tsoka and C. A. Ouzounis (2009).
Stratification of co-evolving genomic groups using ranked phylogenetic profiles. BMC
Bioinformatics 10: 355.
Fukuda, S., H. Toh, K. Hase, K. Oshima, Y. Nakanishi, K. Yoshimura, T. Tobe, J. M.
Clarke, D. L. Topping, T. Suzuki, T. D. Taylor, K. Itoh, J. Kikuchi, H. Morita, M. Hattori
and H. Ohno (2011). Bifidobacteria can protect from enteropathogenic infection through
production of acetate. Nature 469(7331): 543-547.
Fukuda, S., H. Toh, T. D. Taylor, H. Ohno and M. Hattori (2012). Acetate-producing
bifidobacteria protect the host from enteropathogenic infection via carbohydrate
transporters. Gut Microbes 3(5): 449-454.
Fuller, C. W., L. R. Middendorf, S. A. Benner, G. M. Church, T. Harris, X. Huang, S. B.
Jovanovich, J. R. Nelson, J. A. Schloss, D. C. Schwartz and D. V. Vezenov (2009). The
challenges of sequencing by synthesis. Nat Biotechnol 27(11): 1013-1023.
Furusawa, Y., Y. Obata, S. Fukuda, T. A. Endo, G. Nakato, D. Takahashi, Y. Nakanishi, C.
Uetake, K. Kato, T. Kato, M. Takahashi, N. N. Fukuda, S. Murakami, E. Miyauchi, S.

184
Hino, K. Atarashi, S. Onawa, Y. Fujimura, T. Lockett, J. M. Clarke, D. L. Topping, M.
Tomita, S. Hori, O. Ohara, T. Morita, H. Koseki, J. Kikuchi, K. Honda, K. Hase and H.
Ohno (2013). Commensal microbe-derived butyrate induces the differentiation of colonic
regulatory T cells. Nature 504(7480): 446-450.
Gaboriau-Routhiau, V., S. Rakotobe, E. Lecuyer, I. Mulder, A. Lan, C. Bridonneau, V.
Rochet, A. Pisi, M. De Paepe, G. Brandi, G. Eberl, J. Snel, D. Kelly and N. Cerf-
Bensussan (2009). The key role of segmented filamentous bacteria in the coordinated
maturation of gut helper T cell responses. Immunity 31(4): 677-689.
Gacser, A., Z. Tiszlavicz, T. Nemeth, G. Seprenyi and Y. Mandi (2014). Induction of
human defensins by intestinal Caco-2 cells after interactions with opportunistic Candida
species. Microbes Infect 16(1): 80-85.
Gagliardi, M. C., R. Teloni, S. Mariotti, C. Bromuro, P. Chiani, G. Romagnoli, F.
Giannoni, A. Torosantucci and R. Nisini (2010). Endogenous PGE2 promotes the
induction of human Th17 responses by fungal ss-glucan. J Leukoc Biol 88(5): 947-954.
Gareau, M. G., E. Wine, D. M. Rodrigues, J. H. Cho, M. T. Whary, D. J. Philpott, G.
Macqueen and P. M. Sherman (2011). Bacterial infection causes stress-induced memory
dysfunction in mice. Gut 60(3): 307-317.
Gaykema, R. P., L. E. Goehler and M. Lyte (2004). Brain response to cecal infection with
Campylobacter jejuni: analysis with Fos immunohistochemistry. Brain Behav Immun
18(3): 238-245.
Gerard, H. C., Z. Wang, G. F. Wang, H. El-Gabalawy, R. Goldbach-Mansky, Y. Li, W.
Majeed, H. Zhang, N. Ngai, A. P. Hudson and H. R. Schumacher (2001). Chromosomal
DNA from a variety of bacterial species is present in synovial tissue from patients with
various forms of arthritis. Arthritis Rheum 44(7): 1689-1697.
Gerke, J., K. Lorenz and B. Cohen (2009). Genetic interactions between transcription
factors cause natural variation in yeast. Science 323(5913): 498-501.
Geuking, M. B., J. Cahenzli, M. A. Lawson, D. C. Ng, E. Slack, S. Hapfelmeier, K. D.
McCoy and A. J. Macpherson (2011). Intestinal bacterial colonization induces mutualistic
regulatory T cell responses. Immunity 34(5): 794-806.
Gevers, D., S. Kugathasan, L. A. Denson, Y. Vazquez-Baeza, W. Van Treuren, B. Ren, E.
Schwager, D. Knights, S. J. Song, M. Yassour, X. C. Morgan, A. D. Kostic, C. Luo, A.
Gonzalez, D. McDonald, Y. Haberman, T. Walters, S. Baker, J. Rosh, M. Stephens, M.
Heyman, J. Markowitz, R. Baldassano, A. Griffiths, F. Sylvester, D. Mack, S. Kim, W.
Crandall, J. Hyams, C. Huttenhower, R. Knight and R. J. Xavier (2014). The treatment-
naive microbiome in new-onset Crohn's disease. Cell Host Microbe 15(3): 382-392.

185
Ghosh, S., D. H. Navarathna, D. D. Roberts, J. T. Cooper, A. L. Atkin, T. M. Petro and K.
W. Nickerson (2009). Arginine-induced germ tube formation in Candida albicans is
essential for escape from murine macrophage line RAW 264.7. Infect Immun 77(4): 1596-
1605.
Gill, S. R., M. Pop, R. T. Deboy, P. B. Eckburg, P. J. Turnbaugh, B. S. Samuel, J. I.
Gordon, D. A. Relman, C. M. Fraser-Liggett and K. E. Nelson (2006). Metagenomic
analysis of the human distal gut microbiome. Science 312(5778): 1355-1359.
Gill, T., M. Asquith, J. T. Rosenbaum and R. A. Colbert (2015). The intestinal microbiome
in spondyloarthritis. Curr Opin Rheumatol 27(4): 319-325.
Glocker, E. O., D. Kotlarz, K. Boztug, E. M. Gertz, A. A. Schaffer, F. Noyan, M. Perro, J.
Diestelhorst, A. Allroth, D. Murugan, N. Hatscher, D. Pfeifer, K. W. Sykora, M. Sauer, H.
Kreipe, M. Lacher, R. Nustede, C. Woellner, U. Baumann, U. Salzer, S. Koletzko, N.
Shah, A. W. Segal, A. Sauerbrey, S. Buderus, S. B. Snapper, B. Grimbacher and C. Klein
(2009). Inflammatory bowel disease and mutations affecting the interleukin-10 receptor. N
Engl J Med 361(21): 2033-2045.
Gmuca, S. and P. F. Weiss (2015). Juvenile spondyloarthritis. Curr Opin Rheumatol 27(4):
364-372.
Goddard, M. R. and D. Greig (2015). Saccharomyces cerevisiae: a nomadic yeast with no
niche? FEMS Yeast Res 15(3).
Goehler, L. E., R. P. Gaykema, N. Opitz, R. Reddaway, N. Badr and M. Lyte (2005).
Activation in vagal afferents and central autonomic pathways: early responses to intestinal
infection with Campylobacter jejuni. Brain Behav Immun 19(4): 334-344.
Goehler, L. E., S. M. Park, N. Opitz, M. Lyte and R. P. Gaykema (2008). Campylobacter
jejuni infection increases anxiety-like behavior in the holeboard: possible anatomical
substrates for viscerosensory modulation of exploratory behavior. Brain Behav Immun
22(3): 354-366.
Gomez, A., K. J. Petrzelkova, M. B. Burns, C. J. Yeoman, K. R. Amato, K. Vlckova, D.
Modry, A. Todd, C. A. Jost Robinson, M. J. Remis, M. G. Torralba, E. Morton, J. D.
Umana, F. Carbonero, H. R. Gaskins, K. E. Nelson, B. A. Wilson, R. M. Stumpf, B. A.
White, S. R. Leigh and R. Blekhman (2016). Gut Microbiome of Coexisting BaAka
Pygmies and Bantu Reflects Gradients of Traditional Subsistence Patterns. Cell Rep 14(9):
2142-2153.
Gophna, U., K. Sommerfeld, S. Gophna, W. F. Doolittle and S. J. Veldhuyzen van Zanten
(2006). Differences between tissue-associated intestinal microfloras of patients with
Crohn's disease and ulcerative colitis. J Clin Microbiol 44(11): 4136-4141.

186
Gordon, H. A., E. Bruckner-Kardoss and B. S. Wostmann (1966). Aging in germ-free
mice: life tables and lesions observed at natural death. J Gerontol 21(3): 380-387.
Gosalbes, M. J., S. Llop, Y. Valles, A. Moya, F. Ballester and M. P. Francino (2013).
Meconium microbiota types dominated by lactic acid or enteric bacteria are differentially
associated with maternal eczema and respiratory problems in infants. Clin Exp Allergy
43(2): 198-211.
Gouba, N., D. Raoult and M. Drancourt (2014). Eukaryote culturomics of the gut reveals
new species. PLoS One 9(9): e106994.
Gower-Rousseau, C., F. Vasseur, M. Fumery, G. Savoye, J. Salleron, L. Dauchet, D.
Turck, A. Cortot, L. Peyrin-Biroulet and J. F. Colombel (2013). Epidemiology of
inflammatory bowel diseases: new insights from a French population-based registry
(EPIMAD). Dig Liver Dis 45(2): 89-94.
Grahn, N., M. Olofsson, K. Ellnebo-Svedlund, H. J. Monstein and J. Jonasson (2003).
Identification of mixed bacterial DNA contamination in broad-range PCR amplification of
16S rDNA V1 and V3 variable regions by pyrosequencing of cloned amplicons. FEMS
Microbiol Lett 219(1): 87-91.
Grassme, H. and K. A. Becker (2013). Bacterial infections and ceramide. Handb Exp
Pharmacol(216): 305-320.
Grenham, S., G. Clarke, J. F. Cryan and T. G. Dinan (2011). Brain-gut-microbe
communication in health and disease. Front Physiol 2: 94.
Griffiths, A. M. (2004). Specificities of inflammatory bowel disease in childhood. Best
Pract Res Clin Gastroenterol 18(3): 509-523.
Gu, S., D. Chen, J. N. Zhang, X. Lv, K. Wang, L. P. Duan, Y. Nie and X. L. Wu (2013).
Bacterial community mapping of the mouse gastrointestinal tract. PLoS One 8(10):
e74957.
Gumbo, T., C. M. Isada, G. Hall, M. T. Karafa and S. M. Gordon (1999). Candida glabrata
Fungemia. Clinical features of 139 patients. Medicine (Baltimore) 78(4): 220-227.
Gupta, A., R. K. Dhiman, S. Kumari, S. Rana, R. Agarwal, A. Duseja and Y. Chawla
(2010). Role of small intestinal bacterial overgrowth and delayed gastrointestinal transit
time in cirrhotic patients with minimal hepatic encephalopathy. J Hepatol 53(5): 849-855.
Gupta, N., A. G. Bostrom, B. S. Kirschner, S. A. Cohen, O. Abramson, G. D. Ferry, B. D.
Gold, H. S. Winter, R. N. Baldassano, T. Smith and M. B. Heyman (2008). Presentation
and disease course in early- compared to later-onset pediatric Crohn's disease. Am J
Gastroenterol 103(8): 2092-2098.

187
Halfvarson, J., L. Bodin, C. Tysk, E. Lindberg and G. Jarnerot (2003). Inflammatory bowel
disease in a Swedish twin cohort: a long-term follow-up of concordance and clinical
characteristics. Gastroenterology 124(7): 1767-1773.
Hall, J. A., N. Bouladoux, C. M. Sun, E. A. Wohlfert, R. B. Blank, Q. Zhu, M. E. Grigg, J.
A. Berzofsky and Y. Belkaid (2008). Commensal DNA limits regulatory T cell conversion
and is a natural adjuvant of intestinal immune responses. Immunity 29(4): 637-649.
Hamada, H., T. Hiroi, Y. Nishiyama, H. Takahashi, Y. Masunaga, S. Hachimura, S.
Kaminogawa, H. Takahashi-Iwanaga, T. Iwanaga, H. Kiyono, H. Yamamoto and H.
Ishikawa (2002). Identification of multiple isolated lymphoid follicles on the
antimesenteric wall of the mouse small intestine. J Immunol 168(1): 57-64.
Handelsman, J. (2004). Metagenomics: application of genomics to uncultured
microorganisms. Microbiol Mol Biol Rev 68(4): 669-685.
Handelsman, J., M. R. Rondon, S. F. Brady, J. Clardy and R. M. Goodman (1998).
Molecular biological access to the chemistry of unknown soil microbes: a new frontier for
natural products. Chem Biol 5(10): R245-249.
Hansen, C. H., D. S. Nielsen, M. Kverka, Z. Zakostelska, K. Klimesova, T. Hudcovic, H.
Tlaskalova-Hogenova and A. K. Hansen (2012). Patterns of early gut colonization shape
future immune responses of the host. PLoS One 7(3): e34043.
Hardison, S. E. and G. D. Brown (2012). C-type lectin receptors orchestrate antifungal
immunity. Nat Immunol 13(9): 817-822.
Hatoum, R., S. Labrie and I. Fliss (2012). Antimicrobial and probiotic properties of yeasts:
from fundamental to novel applications. Front Microbiol 3: 421.
Henao-Mejia, J., E. Elinav, C. Jin, L. Hao, W. Z. Mehal, T. Strowig, C. A. Thaiss, A. L.
Kau, S. C. Eisenbarth, M. J. Jurczak, J. P. Camporez, G. I. Shulman, J. I. Gordon, H. M.
Hoffman and R. A. Flavell (2012). Inflammasome-mediated dysbiosis regulates
progression of NAFLD and obesity. Nature 482(7384): 179-185.
Hernandez-Santos, N., A. R. Huppler, A. C. Peterson, S. A. Khader, K. C. McKenna and S.
L. Gaffen (2013). Th17 cells confer long-term adaptive immunity to oral mucosal Candida
albicans infections. Mucosal Immunol 6(5): 900-910.
Hernell, O. (2011). Human milk vs. cow's milk and the evolution of infant formulas. Nestle
Nutr Workshop Ser Pediatr Program 67: 17-28.
Heyman, M. B., B. S. Kirschner, B. D. Gold, G. Ferry, R. Baldassano, S. A. Cohen, H. S.
Winter, P. Fain, C. King, T. Smith and H. B. El-Serag (2005). Children with early-onset
inflammatory bowel disease (IBD): analysis of a pediatric IBD consortium registry. J
Pediatr 146(1): 35-40.

188
Hibbett, D. S. (2006). A phylogenetic overview of the Agaricomycotina. Mycologia 98(6):
917-925.
Hibbett, D. S. (2006). A phylogenetic overview of the Agaricomycotina. Mycologia 98(6):
917-925.
Hill, M. J. (1997). Intestinal flora and endogenous vitamin synthesis. Eur J Cancer Prev 6
Suppl 1: S43-45.
Hirakawa, M. P., D. A. Martinez, S. Sakthikumar, M. Z. Anderson, A. Berlin, S. Gujja, Q.
Zeng, E. Zisson, J. M. Wang, J. M. Greenberg, J. Berman, R. J. Bennett and C. A. Cuomo
(2015). Genetic and phenotypic intra-species variation in Candida albicans. Genome Res
25(3): 413-425.
Hirata, Y., S. Ihara and K. Koike (2016). Targeting the complex interactions between
microbiota, host epithelial and immune cells in inflammatory bowel disease. Pharmacol
Res 113(Pt A): 574-584.
Hoffman, C. S. and F. Winston (1987). A 10-Minute DNA Preparation from Yeast
Efficiently Releases Autonomous Plasmids for Transformation of Escherichia-Coli. Gene
57(2-3): 267-272.
Hoffmann, C., S. Dollive, S. Grunberg, J. Chen, H. Li, G. D. Wu, J. D. Lewis and F. D.
Bushman (2013). Archaea and fungi of the human gut microbiome: correlations with diet
and bacterial residents. PLoS One 8(6): e66019.
Hong, C., Y. Kidani, A. G. N, T. Phung, A. Ito, X. Rong, K. Ericson, H. Mikkola, S. W.
Beaven, L. S. Miller, W. H. Shao, P. L. Cohen, A. Castrillo, P. Tontonoz and S. J.
Bensinger (2012). Coordinate regulation of neutrophil homeostasis by liver X receptors in
mice. J Clin Invest 122(1): 337-347.
Hooper, L. V., T. Midtvedt and J. I. Gordon (2002). How host-microbial interactions shape
the nutrient environment of the mammalian intestine. Annu Rev Nutr 22: 283-307.
Huang, G. (2012). Regulation of phenotypic transitions in the fungal pathogen Candida
albicans. Virulence 3(3): 251-261.
Huffnagle, G. B. and M. C. Noverr (2013). The emerging world of the fungal microbiome.
Trends Microbiol 21(7): 334-341.
Hugot, J. P., M. Chamaillard, H. Zouali, S. Lesage, J. P. Cezard, J. Belaiche, S. Almer, C.
Tysk, C. A. O'Morain, M. Gassull, V. Binder, Y. Finkel, A. Cortot, R. Modigliani, P.
Laurent-Puig, C. Gower-Rousseau, J. Macry, J. F. Colombel, M. Sahbatou and G. Thomas
(2001). Association of NOD2 leucine-rich repeat variants with susceptibility to Crohn's
disease. Nature 411(6837): 599-603.

189
Human Microbiome Project, C. (2012). A framework for human microbiome research.
Nature 486(7402): 215-221.
Human Microbiome Project, C. (2012). Structure, function and diversity of the healthy
human microbiome. Nature 486(7402): 207-214.
Huson, D. H., A. F. Auch, J. Qi and S. C. Schuster (2007). MEGAN analysis of
metagenomic data. Genome Res 17(3): 377-386.
Hyams, J. S., G. D. Ferry, F. S. Mandel, J. D. Gryboski, P. M. Kibort, B. S. Kirschner, A.
M. Griffiths, A. J. Katz, R. J. Grand, J. T. Boyle and et al. (1991). Development and
validation of a pediatric Crohn's disease activity index. J Pediatr Gastroenterol Nutr 12(4):
439-447.
Iliev, I. D., V. A. Funari, K. D. Taylor, Q. Nguyen, C. N. Reyes, S. P. Strom, J. Brown, C.
A. Becker, P. R. Fleshner, M. Dubinsky, J. I. Rotter, H. L. Wang, D. P. McGovern, G. D.
Brown and D. M. Underhill (2012). Interactions between commensal fungi and the C-type
lectin receptor Dectin-1 influence colitis. Science 336(6086): 1314-1317.
Imhann, F., M. J. Bonder, A. Vich Vila, J. Fu, Z. Mujagic, L. Vork, E. F. Tigchelaar, S. A.
Jankipersadsing, M. C. Cenit, H. J. Harmsen, G. Dijkstra, L. Franke, R. J. Xavier, D.
Jonkers, C. Wijmenga, R. K. Weersma and A. Zhernakova (2016). Proton pump inhibitors
affect the gut microbiome. Gut 65(5): 740-748.
Islam, K. B., S. Fukiya, M. Hagio, N. Fujii, S. Ishizuka, T. Ooka, Y. Ogura, T. Hayashi
and A. Yokota (2011). Bile acid is a host factor that regulates the composition of the cecal
microbiota in rats. Gastroenterology 141(5): 1773-1781.
Ivanov, II, L. Frutos Rde, N. Manel, K. Yoshinaga, D. B. Rifkin, R. B. Sartor, B. B. Finlay
and D. R. Littman (2008). Specific microbiota direct the differentiation of IL-17-producing
T-helper cells in the mucosa of the small intestine. Cell Host Microbe 4(4): 337-349.
Jawhara, S. and D. Poulain (2007). Saccharomyces boulardii decreases inflammation and
intestinal colonization by Candida albicans in a mouse model of chemically-induced
colitis. Med Mycol 45(8): 691-700.
Jawhara, S., X. Thuru, A. Standaert-Vitse, T. Jouault, S. Mordon, B. Sendid, P.
Desreumaux and D. Poulain (2008). Colonization of mice by Candida albicans is promoted
by chemically induced colitis and augments inflammatory responses through galectin-3. J
Infect Dis 197(7): 972-980.
Jiang, W., N. Wu, X. Wang, Y. Chi, Y. Zhang, X. Qiu, Y. Hu, J. Li and Y. Liu (2015).
Dysbiosis gut microbiota associated with inflammation and impaired mucosal immune
function in intestine of humans with non-alcoholic fatty liver disease. Sci Rep 5: 8096.

190
Jimenez, E., M. L. Marin, R. Martin, J. M. Odriozola, M. Olivares, J. Xaus, L. Fernandez
and J. M. Rodriguez (2008). Is meconium from healthy newborns actually sterile? Res
Microbiol 159(3): 187-193.
Johnson, C. C. and D. R. Ownby (2016). Allergies and Asthma: Do Atopic Disorders
Result from Inadequate Immune Homeostasis arising from Infant Gut Dysbiosis? Expert
Rev Clin Immunol 12(4): 379-388.
Joossens, M., G. Huys, M. Cnockaert, V. De Preter, K. Verbeke, P. Rutgeerts, P.
Vandamme and S. Vermeire (2011). Dysbiosis of the faecal microbiota in patients with
Crohn's disease and their unaffected relatives. Gut 60(5): 631-637.
Justesen, T., O. H. Nielsen, I. E. Jacobsen, J. Lave and S. N. Rasmussen (1984). The
normal cultivable microflora in upper jejunal fluid in healthy adults. Scand J Gastroenterol
19(2): 279-282.
Kakiyama, G., W. M. Pandak, P. M. Gillevet, P. B. Hylemon, D. M. Heuman, K. Daita, H.
Takei, A. Muto, H. Nittono, J. M. Ridlon, M. B. White, N. A. Noble, P. Monteith, M.
Fuchs, L. R. Thacker, M. Sikaroodi and J. S. Bajaj (2013). Modulation of the fecal bile
acid profile by gut microbiota in cirrhosis. J Hepatol 58(5): 949-955.
Kamada, N., Y. G. Kim, H. P. Sham, B. A. Vallance, J. L. Puente, E. C. Martens and G.
Nunez (2012). Regulated virulence controls the ability of a pathogen to compete with the
gut microbiota. Science 336(6086): 1325-1329.
Kamada, N. and G. Nunez (2013). Role of the gut microbiota in the development and
function of lymphoid cells. J Immunol 190(4): 1389-1395.
Kamada, N. and G. Nunez (2014). Regulation of the immune system by the resident
intestinal bacteria. Gastroenterology 146(6): 1477-1488.
Kamada, N., S. U. Seo, G. Y. Chen and G. Nunez (2013). Role of the gut microbiota in
immunity and inflammatory disease. Nat Rev Immunol 13(5): 321-335.
Kandell, R. L. and C. Bernstein (1991). Bile salt/acid induction of DNA damage in
bacterial and mammalian cells: implications for colon cancer. Nutr Cancer 16(3-4): 227-
238.
Kanehisa, M., S. Goto, Y. Sato, M. Kawashima, M. Furumichi and M. Tanabe (2014).
Data, information, knowledge and principle: back to metabolism in KEGG. Nucleic Acids
Res 42(Database issue): D199-205.
Kang, D. W., J. G. Park, Z. E. Ilhan, G. Wallstrom, J. Labaer, J. B. Adams and R.
Krajmalnik-Brown (2013). Reduced incidence of Prevotella and other fermenters in
intestinal microflora of autistic children. PLoS One 8(7): e68322.

191
Kaplan, G. G. (2015). The global burden of IBD: from 2015 to 2025. Nat Rev
Gastroenterol Hepatol 12(12): 720-727.
Karlsson, F. H., V. Tremaroli, I. Nookaew, G. Bergstrom, C. J. Behre, B. Fagerberg, J.
Nielsen and F. Backhed (2013). Gut metagenome in European women with normal,
impaired and diabetic glucose control. Nature 498(7452): 99-103.
Kaser, A. and R. S. Blumberg (2011). Autophagy, microbial sensing, endoplasmic
reticulum stress, and epithelial function in inflammatory bowel disease. Gastroenterology
140(6): 1738-1747.
Kashem, S. W., B. Z. Igyarto, M. Gerami-Nejad, Y. Kumamoto, J. Mohammed, E. Jarrett,
R. A. Drummond, S. M. Zurawski, G. Zurawski, J. Berman, A. Iwasaki, G. D. Brown and
D. H. Kaplan (2015). Candida albicans morphology and dendritic cell subsets determine T
helper cell differentiation. Immunity 42(2): 356-366.
Kayama, H. and K. Takeda (2012). Regulation of intestinal homeostasis by innate and
adaptive immunity. Int Immunol 24(11): 673-680.
Kaygusuz, I., L. Mulazimoglu, N. Cerikcioglu, A. Toprak, A. Oktay and V. Korten (2003).
An unusual native tricuspid valve endocarditis caused by Candida colliculosa. Clin
Microbiol Infect 9(4): 319-322.
Keely, S., M. M. Walker, E. Marks and N. J. Talley (2015). Immune dysregulation in the
functional gastrointestinal disorders. Eur J Clin Invest 45(12): 1350-1359.
Kempsell, K. E., C. J. Cox, M. Hurle, A. Wong, S. Wilkie, E. D. Zanders, J. S. Gaston and
J. S. Crowe (2000). Reverse transcriptase-PCR analysis of bacterial rRNA for detection
and characterization of bacterial species in arthritis synovial tissue. Infect Immun 68(10):
6012-6026.
Kennedy, N. A., A. W. Walker, S. H. Berry, S. H. Duncan, F. M. Farquarson, P. Louis, J.
M. Thomson, U. I. G. Consortium, J. Satsangi, H. J. Flint, J. Parkhill, C. W. Lees and G. L.
Hold (2014). The impact of different DNA extraction kits and laboratories upon the
assessment of human gut microbiota composition by 16S rRNA gene sequencing. PLoS
One 9(2): e88982.
Khatib, R., K. M. Riederer, J. Ramanathan and J. Baran, Jr. (2001). Faecal fungal flora in
healthy volunteers and inpatients. Mycoses 44(5): 151-156.
Kinchen, J. M. and K. S. Ravichandran (2008). Phagosome maturation: going through the
acid test. Nat Rev Mol Cell Biol 9(10): 781-795.
Kirsner, J. B. (1988). Historical aspects of inflammatory bowel disease. J Clin
Gastroenterol 10(3): 286-297.

192
Koenig, J. E., A. Spor, N. Scalfone, A. D. Fricker, J. Stombaugh, R. Knight, L. T.
Angenent and R. E. Ley (2011). Succession of microbial consortia in the developing infant
gut microbiome. Proc Natl Acad Sci U S A 108 Suppl 1: 4578-4585.
Koeth, R. A., Z. Wang, B. S. Levison, J. A. Buffa, E. Org, B. T. Sheehy, E. B. Britt, X. Fu,
Y. Wu, L. Li, J. D. Smith, J. A. DiDonato, J. Chen, H. Li, G. D. Wu, J. D. Lewis, M.
Warrier, J. M. Brown, R. M. Krauss, W. H. Tang, F. D. Bushman, A. J. Lusis and S. L.
Hazen (2013). Intestinal microbiota metabolism of L-carnitine, a nutrient in red meat,
promotes atherosclerosis. Nat Med 19(5): 576-585.
Koh, A. Y. (2013). Murine models of Candida gastrointestinal colonization and
dissemination. Eukaryot Cell 12(11): 1416-1422.
Koljalg, U., R. H. Nilsson, K. Abarenkov, L. Tedersoo, A. F. Taylor, M. Bahram, S. T.
Bates, T. D. Bruns, J. Bengtsson-Palme, T. M. Callaghan, B. Douglas, T. Drenkhan, U.
Eberhardt, M. Duenas, et al. (2013). Towards a unified paradigm for sequence-based
identification of fungi. Mol Ecol 22(21): 5271-5277.
Kondrashova, A., T. Seiskari, J. Ilonen, M. Knip and H. Hyoty (2013). The 'Hygiene
hypothesis' and the sharp gradient in the incidence of autoimmune and allergic diseases
between Russian Karelia and Finland. APMIS 121(6): 478-493.
Koren, O., D. Knights, A. Gonzalez, L. Waldron, N. Segata, R. Knight, C. Huttenhower
and R. E. Ley (2013). A guide to enterotypes across the human body: meta-analysis of
microbial community structures in human microbiome datasets. PLoS Comput Biol 9(1):
e1002863.
Koropatkin, N. M., E. A. Cameron and E. C. Martens (2012). How glycan metabolism
shapes the human gut microbiota. Nat Rev Microbiol 10(5): 323-335.
Kosiewicz, M. M., A. L. Zirnheld and P. Alard (2011). Gut microbiota, immunity, and
disease: a complex relationship. Front Microbiol 2: 180.
Kotlarz, D., R. Beier, D. Murugan, J. Diestelhorst, O. Jensen, K. Boztug, D. Pfeifer, H.
Kreipe, E. D. Pfister, U. Baumann, J. Puchalka, J. Bohne, O. Egritas, B. Dalgic, K. L.
Kolho, A. Sauerbrey, S. et al. (2012). Loss of interleukin-10 signaling and infantile
inflammatory bowel disease: implications for diagnosis and therapy. Gastroenterology
143(2): 347-355.
Kumamoto, C. A. and M. D. Vinces (2005). Contributions of hyphae and hypha-co-
regulated genes to Candida albicans virulence. Cell Microbiol 7(11): 1546-1554.
Lam, Y. Y., C. W. Ha, C. R. Campbell, A. J. Mitchell, A. Dinudom, J. Oscarsson, D. I.
Cook, N. H. Hunt, I. D. Caterson, A. J. Holmes and L. H. Storlien (2012). Increased gut
permeability and microbiota change associate with mesenteric fat inflammation and
metabolic dysfunction in diet-induced obese mice. PLoS One 7(3): e34233.

193
Lamontagne, A., R. E. Long, M. A. Comunale, J. Hafner, L. Rodemich-Betesh, M. Wang,
J. Marrero, A. M. Di Bisceglie, T. Block and A. Mehta (2013). Altered functionality of
anti-bacterial antibodies in patients with chronic hepatitis C virus infection. PLoS One
8(6): e64992.
Langille, M. G., J. Zaneveld, J. G. Caporaso, D. McDonald, D. Knights, J. A. Reyes, J. C.
Clemente, D. E. Burkepile, R. L. Vega Thurber, R. Knight, R. G. Beiko and C.
Huttenhower (2013). Predictive functional profiling of microbial communities using 16S
rRNA marker gene sequences. Nat Biotechnol 31(9): 814-821.
Larcombe, S., M. L. Hutton and D. Lyras (2016). Involvement of Bacteria Other Than
Clostridium difficile in Antibiotic-Associated Diarrhoea. Trends Microbiol 24(6): 463-476.
Larsen, N., F. K. Vogensen, F. W. van den Berg, D. S. Nielsen, A. S. Andreasen, B. K.
Pedersen, W. A. Al-Soud, S. J. Sorensen, L. H. Hansen and M. Jakobsen (2010). Gut
microbiota in human adults with type 2 diabetes differs from non-diabetic adults. PLoS
One 5(2): e9085.
Lazarevic, V., K. Whiteson, S. Huse, D. Hernandez, L. Farinelli, M. Osteras, J. Schrenzel
and P. Francois (2009). Metagenomic study of the oral microbiota by Illumina high-
throughput sequencing. J Microbiol Methods 79(3): 266-271.
Le Chatelier, E., T. Nielsen, J. Qin, E. Prifti, F. Hildebrand, G. Falony, M. Almeida, M.
Arumugam, J. M. Batto, S. Kennedy, P. Leonard, J. Li, K. Burgdorf, N. Grarup, T.
Jorgensen, I. Brandslund, H. et al. (2013). Richness of human gut microbiome correlates
with metabolic markers. Nature 500(7464): 541-546.
Le Huerou-Luron, I., S. Blat and G. Boudry (2010). Breast- v. formula-feeding: impacts on
the digestive tract and immediate and long-term health effects. Nutr Res Rev 23(1): 23-36.
Leach, S. T., H. M. Mitchell, W. R. Eng, L. Zhang and A. S. Day (2008). Sustained
modulation of intestinal bacteria by exclusive enteral nutrition used to treat children with
Crohn's disease. Aliment Pharmacol Ther 28(6): 724-733.
Lee, S. C., R. B. Billmyre, A. Li, S. Carson, S. M. Sykes, E. Y. Huh, P. Mieczkowski, D.
C. Ko, C. A. Cuomo and J. Heitman (2014). Analysis of a food-borne fungal pathogen
outbreak: virulence and genome of a Mucor circinelloides isolate from yogurt. MBio 5(4):
e01390-01314.
Lee, Y. K., J. S. Menezes, Y. Umesaki and S. K. Mazmanian (2011). Proinflammatory T-
cell responses to gut microbiota promote experimental autoimmune encephalomyelitis.
Proc Natl Acad Sci U S A 108 Suppl 1: 4615-4622.
Legras, J. L., D. Merdinoglu, J. M. Cornuet and F. Karst (2007). Bread, beer and wine:
Saccharomyces cerevisiae diversity reflects human history. Mol Ecol 16(10): 2091-2102.

194
Leitch, E. C., A. W. Walker, S. H. Duncan, G. Holtrop and H. J. Flint (2007). Selective
colonization of insoluble substrates by human faecal bacteria. Environ Microbiol 9(3):
667-679.
Lepage, P., M. C. Leclerc, M. Joossens, S. Mondot, H. M. Blottiere, J. Raes, D. Ehrlich
and J. Dore (2013). A metagenomic insight into our gut's microbiome. Gut 62(1): 146-158.
Levenstadt, J. S., S. M. Poutanen, S. Mohan, S. Zhang and M. Silverman (2012).
Pleurostomophora richardsiae - an insidious fungus presenting in a man 44 years after
initial inoculation: A case report and review of the literature. Can J Infect Dis Med
Microbiol 23(3): 110-113.
Levine, A., C. I. de Bie, D. Turner, S. Cucchiara, M. Sladek, M. S. Murphy, J. C. Escher
and E. P. I. W. G. o. ESPGHAN (2013). Atypical disease phenotypes in pediatric
ulcerative colitis: 5-year analyses of the EUROKIDS Registry. Inflamm Bowel Dis 19(2):
370-377.
Levine, A., A. Griffiths, J. Markowitz, D. C. Wilson, D. Turner, R. K. Russell, J. Fell, F.
M. Ruemmele, T. Walters, M. Sherlock, M. Dubinsky and J. S. Hyams (2011). Pediatric
modification of the Montreal classification for inflammatory bowel disease: the Paris
classification. Inflamm Bowel Dis 17(6): 1314-1321.
Lewis, J. D., E. Z. Chen, R. N. Baldassano, A. R. Otley, A. M. Griffiths, D. Lee, K.
Bittinger, A. Bailey, E. S. Friedman, C. Hoffmann, L. Albenberg, R. Sinha, C. Compher,
E. Gilroy, L. Nessel, A. Grant, C. Chehoud, H. Li, G. D. Wu and F. D. Bushman (2015).
Inflammation, Antibiotics, and Diet as Environmental Stressors of the Gut Microbiome in
Pediatric Crohn's Disease. Cell Host Microbe 18(4): 489-500.
Lewis, L. E., J. M. Bain, C. Lowes, C. Gillespie, F. M. Rudkin, N. A. Gow and L. P. Erwig
(2012). Stage specific assessment of Candida albicans phagocytosis by macrophages
identifies cell wall composition and morphogenesis as key determinants. PLoS Pathog
8(3): e1002578.
Ley, R. E., F. Backhed, P. Turnbaugh, C. A. Lozupone, R. D. Knight and J. I. Gordon
(2005). Obesity alters gut microbial ecology. Proc Natl Acad Sci U S A 102(31): 11070-
11075.
Ley, R. E., M. Hamady, C. Lozupone, P. J. Turnbaugh, R. R. Ramey, J. S. Bircher, M. L.
Schlegel, T. A. Tucker, M. D. Schrenzel, R. Knight and J. I. Gordon (2008). Evolution of
mammals and their gut microbes. Science 320(5883): 1647-1651.
Ley, R. E., P. J. Turnbaugh, S. Klein and J. I. Gordon (2006). Microbial ecology: human
gut microbes associated with obesity. Nature 444(7122): 1022-1023.

195
Li, G., M. Yang, K. Zhou, L. Zhang, L. Tian, S. Lv, Y. Jin, W. Qian, H. Xiong, R. Lin, Y.
Fu and X. Hou (2015). Diversity of Duodenal and Rectal Microbiota in Biopsy Tissues and
Luminal Contents in Healthy Volunteers. J Microbiol Biotechnol 25(7): 1136-1145.
Li, M., M. Wang and S. M. Donovan (2014). Early development of the gut microbiome
and immune-mediated childhood disorders. Semin Reprod Med 32(1): 74-86.
Li, Q., C. Wang, C. Tang, Q. He, N. Li and J. Li (2014). Dysbiosis of gut fungal
microbiota is associated with mucosal inflammation in Crohn's disease. J Clin
Gastroenterol 48(6): 513-523.
Lievin, V., I. Peiffer, S. Hudault, F. Rochat, D. Brassart, J. R. Neeser and A. L. Servin
(2000). Bifidobacterium strains from resident infant human gastrointestinal microflora
exert antimicrobial activity. Gut 47(5): 646-652.
Lin, A., E. M. Bik, E. K. Costello, L. Dethlefsen, R. Haque, D. A. Relman and U. Singh
(2013). Distinct distal gut microbiome diversity and composition in healthy children from
Bangladesh and the United States. PLoS One 8(1): e53838.
Lin, P., M. Bach, M. Asquith, A. Y. Lee, L. Akileswaran, P. Stauffer, S. Davin, Y. Pan, E.
D. Cambronne, M. Dorris, J. W. Debelius, C. L. Lauber, G. Ackermann, Y. V. Baeza, T.
Gill, R. Knight, R. A. Colbert, J. D. Taurog, R. N. Van Gelder and J. T. Rosenbaum
(2014). HLA-B27 and human beta2-microglobulin affect the gut microbiota of transgenic
rats. PLoS One 9(8): e105684.
Lionetti, P., M. L. Callegari, S. Ferrari, M. C. Cavicchi, E. Pozzi, M. de Martino and L.
Morelli (2005). Enteral nutrition and microflora in pediatric Crohn's disease. JPEN J
Parenter Enteral Nutr 29(4 Suppl): S173-175; discussion S175-178, S184-178.
Liti, G., D. M. Carter, A. M. Moses, J. Warringer, L. Parts, S. A. James, R. P. Davey, I. N.
Roberts, A. Burt, V. Koufopanou, I. J. Tsai, C. M. Bergman, D. Bensasson, M. J. O'Kelly,
A. van Oudenaarden, D. B. Barton, E. Bailes, A. N. Nguyen, M. Jones, M. A. Quail, I.
Goodhead, S. Sims, F. Smith, A. Blomberg, R. Durbin and E. J. Louis (2009). Population
genomics of domestic and wild yeasts. Nature 458(7236): 337-341.
Littman, D. R. and A. Y. Rudensky (2010). Th17 and regulatory T cells in mediating and
restraining inflammation. Cell 140(6): 845-858.
Liu, J. Z., S. van Sommeren, H. Huang, S. C. Ng, R. Alberts, A. Takahashi, S. Ripke, J. C.
Lee, L. Jostins, T. Shah, S. Abedian, J. H. Cheon, J. Cho, N. E. Daryani, L. Franke, Y.
Fuyuno, A. Hart, R. et al. (2015). Association analyses identify 38 susceptibility loci for
inflammatory bowel disease and highlight shared genetic risk across populations. Nat
Genet 47(9): 979-986.

196
Longman, R. S. and D. R. Littman (2015). The functional impact of the intestinal
microbiome on mucosal immunity and systemic autoimmunity. Curr Opin Rheumatol
27(4): 381-387.
Loubinoux, J., J. P. Bronowicki, I. A. Pereira, J. L. Mougenel and A. E. Faou (2002).
Sulfate-reducing bacteria in human feces and their association with inflammatory bowel
diseases. FEMS Microbiol Ecol 40(2): 107-112.
Lozupone, C., K. Faust, J. Raes, J. J. Faith, D. N. Frank, J. Zaneveld, J. I. Gordon and R.
Knight (2012). Identifying genomic and metabolic features that can underlie early
successional and opportunistic lifestyles of human gut symbionts. Genome Res 22(10):
1974-1984.
Lozupone, C. and R. Knight (2005). UniFrac: a new phylogenetic method for comparing
microbial communities. Appl Environ Microbiol 71(12): 8228-8235.
Lozupone, C., M. E. Lladser, D. Knights, J. Stombaugh and R. Knight (2011). UniFrac: an
effective distance metric for microbial community comparison. ISME J 5(2): 169-172.
Lozupone, C., M. E. Lladser, D. Knights, J. Stombaugh and R. Knight (2011). UniFrac: an
effective distance metric for microbial community comparison. Isme Journal 5(2): 169-
172.
Lozupone, C. A. and R. Knight (2008). Species divergence and the measurement of
microbial diversity. FEMS Microbiol Rev 32(4): 557-578.
Lozupone, C. A., J. I. Stombaugh, J. I. Gordon, J. K. Jansson and R. Knight (2012).
Diversity, stability and resilience of the human gut microbiota. Nature 489(7415): 220-
230.
Lu, Y., C. Su, A. Wang and H. Liu (2011). Hyphal development in Candida albicans
requires two temporally linked changes in promoter chromatin for initiation and
maintenance. PLoS Biol 9(7): e1001105.
Luan, C., L. Xie, X. Yang, H. Miao, N. Lv, R. Zhang, X. Xiao, Y. Hu, Y. Liu, N. Wu, Y.
Zhu and B. Zhu (2015). Dysbiosis of fungal microbiota in the intestinal mucosa of patients
with colorectal adenomas. Sci Rep 5: 7980.
Lyte, M., J. J. Varcoe and M. T. Bailey (1998). Anxiogenic effect of subclinical bacterial
infection in mice in the absence of overt immune activation. Physiol Behav 65(1): 63-68.
Machiels, K., M. Joossens, J. Sabino, V. De Preter, I. Arijs, V. Eeckhaut, V. Ballet, K.
Claes, F. Van Immerseel, K. Verbeke, M. Ferrante, J. Verhaegen, P. Rutgeerts and S.
Vermeire (2014). A decrease of the butyrate-producing species Roseburia hominis and
Faecalibacterium prausnitzii defines dysbiosis in patients with ulcerative colitis. Gut 63(8):
1275-1283.

197
Macpherson, A. J., M. B. Geuking and K. D. McCoy (2012). Homeland security: IgA
immunity at the frontiers of the body. Trends Immunol 33(4): 160-167.
Maisawa, S., M. Sasaki, S. Ida, K. Uchida, S. Kagimoto, T. Shimizu and A. Yoden (2013).
Characteristics of inflammatory bowel disease with an onset before eight years of age: a
multicenter epidemiological survey in Japan. J Gastroenterol Hepatol 28(3): 499-504.
Mamula, P., G. W. Telega, J. E. Markowitz, K. A. Brown, P. A. Russo, D. A. Piccoli and
R. N. Baldassano (2002). Inflammatory bowel disease in children 5 years of age and
younger. Am J Gastroenterol 97(8): 2005-2010.
Manichanh, C., L. Rigottier-Gois, E. Bonnaud, K. Gloux, E. Pelletier, L. Frangeul, R.
Nalin, C. Jarrin, P. Chardon, P. Marteau, J. Roca and J. Dore (2006). Reduced diversity of
faecal microbiota in Crohn's disease revealed by a metagenomic approach. Gut 55(2): 205-
211.
Manton, K. G., E. Stallard and W. Riggan (1982). Strategies for analysing ecological
health data: models of the biological risk of individuals. Stat Med 1(2): 163-181.
Mar Rodriguez, M., D. Perez, F. Javier Chaves, E. Esteve, P. Marin-Garcia, G. Xifra, J.
Vendrell, M. Jove, R. Pamplona, W. Ricart, M. Portero-Otin, M. R. Chacon and J. M.
Fernandez Real (2015). Obesity changes the human gut mycobiome. Sci Rep 5: 14600.
Marcil, A., D. Harcus, D. Y. Thomas and M. Whiteway (2002). Candida albicans killing
by RAW 264.7 mouse macrophage cells: effects of Candida genotype, infection ratios, and
gamma interferon treatment. Infect Immun 70(11): 6319-6329.
Margulies, M., M. Egholm, W. E. Altman, S. Attiya, J. S. Bader, L. A. Bemben, J. Berka,
M. S. Braverman, Y. J. Chen, Z. Chen, S. B. Dewell, L. Du, J. M. Fierro, X. V. Gomes, B.
C. Godwin, W. et al. (2005). Genome sequencing in microfabricated high-density picolitre
reactors. Nature 437(7057): 376-380.
Markle, J. G., D. N. Frank, S. Mortin-Toth, C. E. Robertson, L. M. Feazel, U. Rolle-
Kampczyk, M. von Bergen, K. D. McCoy, A. J. Macpherson and J. S. Danska (2013). Sex
differences in the gut microbiome drive hormone-dependent regulation of autoimmunity.
Science 339(6123): 1084-1088.
Marques, T. M., R. Wall, R. P. Ross, G. F. Fitzgerald, C. A. Ryan and C. Stanton (2010).
Programming infant gut microbiota: influence of dietary and environmental factors. Curr
Opin Biotechnol 21(2): 149-156.
Martin, F. P., M. E. Dumas, Y. Wang, C. Legido-Quigley, I. K. Yap, H. Tang, S. Zirah, G.
M. Murphy, O. Cloarec, J. C. Lindon, N. Sprenger, L. B. Fay, S. Kochhar, P. van Bladeren,
E. Holmes and J. K. Nicholson (2007). A top-down systems biology view of microbiome-
mammalian metabolic interactions in a mouse model. Mol Syst Biol 3: 112.

198
Martin, M. V. (2000). The use of fluconazole and itraconazole in the treatment of candida
albicans infections: a review. J Antimicrob Chemother 45(4): 555.
Martinez, I., J. C. Stegen, M. X. Maldonado-Gomez, A. M. Eren, P. M. Siba, A. R.
Greenhill and J. Walter (2015). The gut microbiota of rural papua new guineans:
composition, diversity patterns, and ecological processes. Cell Rep 11(4): 527-538.
Marx, G., E. G. Seidman, S. R. Martin and C. Deslandres (2002). Outcome of Crohn's
disease diagnosed before two years of age. J Pediatr 140(4): 470-473.
Maynard, C. L., C. O. Elson, R. D. Hatton and C. T. Weaver (2012). Reciprocal
interactions of the intestinal microbiota and immune system. Nature 489(7415): 231-241.
Mazmanian, S. K., C. H. Liu, A. O. Tzianabos and D. L. Kasper (2005). An
immunomodulatory molecule of symbiotic bacteria directs maturation of the host immune
system. Cell 122(1): 107-118.
McCusker, J. H., K. V. Clemons, D. A. Stevens and R. W. Davis (1994). Saccharomyces
cerevisiae virulence phenotype as determined with CD-1 mice is associated with the ability
to grow at 42 degrees C and form pseudohyphae. Infect Immun 62(12): 5447-5455.
McDade, T. W. (2012). Early environments and the ecology of inflammation. Proc Natl
Acad Sci U S A 109 Suppl 2: 17281-17288.
McKenna, A., M. Hanna, E. Banks, A. Sivachenko, K. Cibulskis, A. Kernytsky, K.
Garimella, D. Altshuler, S. Gabriel, M. Daly and M. A. DePristo (2010). The Genome
Analysis Toolkit: a MapReduce framework for analyzing next-generation DNA
sequencing data. Genome Res 20(9): 1297-1303.
McKenzie, H., J. Main, C. R. Pennington and D. Parratt (1990). Antibody to selected
strains of Saccharomyces cerevisiae (baker's and brewer's yeast) and Candida albicans in
Crohn's disease. Gut 31(5): 536-538.
McMurdie, P. J. and S. Holmes (2013). phyloseq: an R package for reproducible
interactive analysis and graphics of microbiome census data. PLoS One 8(4): e61217.
McMurdie, P. J. and S. Holmes (2014). Waste not, want not: why rarefying microbiome
data is inadmissible. PLoS Comput Biol 10(4): e1003531.
Miyoshi, J. and E. B. Chang (2016). The gut microbiota and inflammatory bowel diseases.
Transl Res.
Moen, K., J. G. Brun, M. Valen, L. Skartveit, E. K. Eribe, I. Olsen and R. Jonsson (2006).
Synovial inflammation in active rheumatoid arthritis and psoriatic arthritis facilitates
trapping of a variety of oral bacterial DNAs. Clin Exp Rheumatol 24(6): 656-663.

199
Molodecky, N. A., I. S. Soon, D. M. Rabi, W. A. Ghali, M. Ferris, G. Chernoff, E. I.
Benchimol, R. Panaccione, S. Ghosh, H. W. Barkema and G. G. Kaplan (2012). Increasing
incidence and prevalence of the inflammatory bowel diseases with time, based on
systematic review. Gastroenterology 142(1): 46-54 e42; quiz e30.
Mondot, S., T. de Wouters, J. Dore and P. Lepage (2013). The human gut microbiome and
its dysfunctions. Dig Dis 31(3-4): 278-285.
Monk, C. E., G. Hutvagner and J. S. Arthur (2010). Regulation of miRNA transcription in
macrophages in response to Candida albicans. PLoS One 5(10): e13669.
Morgan, X. C. and C. Huttenhower (2012). Chapter 12: Human microbiome analysis.
PLoS Comput Biol 8(12): e1002808.
Morgan, X. C., T. L. Tickle, H. Sokol, D. Gevers, K. L. Devaney, D. V. Ward, J. A. Reyes,
S. A. Shah, N. LeLeiko, S. B. Snapper, A. Bousvaros, J. Korzenik, B. E. Sands, R. J.
Xavier and C. Huttenhower (2012). Dysfunction of the intestinal microbiome in
inflammatory bowel disease and treatment. Genome Biol 13(9): R79.
Morio, F., H. Jean-Pierre, L. Dubreuil, E. Jumas-Bilak, L. Calvet, G. Mercier, R. Devine
and H. Marchandin (2007). Antimicrobial susceptibilities and clinical sources of Dialister
species. Antimicrob Agents Chemother 51(12): 4498-4501.
Muccioli, G. G., D. Naslain, F. Backhed, C. S. Reigstad, D. M. Lambert, N. M. Delzenne
and P. D. Cani (2010). The endocannabinoid system links gut microbiota to adipogenesis.
Mol Syst Biol 6: 392.
Mucida, D., Y. Park, G. Kim, O. Turovskaya, I. Scott, M. Kronenberg and H. Cheroutre
(2007). Reciprocal TH17 and regulatory T cell differentiation mediated by retinoic acid.
Science 317(5835): 256-260.
Mukherjee, P. K., B. Sendid, G. Hoarau, J. F. Colombel, D. Poulain and M. A. Ghannoum
(2015). Mycobiota in gastrointestinal diseases. Nat Rev Gastroenterol Hepatol 12(2): 77-
87.
Nemeth, T., A. Toth, Z. Hamari, A. Falus, K. Eder, C. Vagvolgyi, A. J. Guimaraes, J. D.
Nosanchuk and A. Gacser (2014). Transcriptome profile of the murine macrophage cell
response to Candida parapsilosis. Fungal Genet Biol 65: 48-56.
Netea, M. G., G. Ferwerda, C. A. van der Graaf, J. W. Van der Meer and B. J. Kullberg
(2006). Recognition of fungal pathogens by toll-like receptors. Curr Pharm Des 12(32):
4195-4201.
Newgard, C. B., J. An, J. R. Bain, M. J. Muehlbauer, R. D. Stevens, L. F. Lien, A. M.
Haqq, S. H. Shah, M. Arlotto, C. A. Slentz, J. Rochon, D. Gallup, O. Ilkayeva, B. R.
Wenner, W. S. Yancy, Jr., H. Eisenson, G. Musante, R. S. Surwit, D. S. Millington, M. D.

200
Butler and L. P. Svetkey (2009). A branched-chain amino acid-related metabolic signature
that differentiates obese and lean humans and contributes to insulin resistance. Cell Metab
9(4): 311-326.
Nguyen, L. D., E. Viscogliosi and L. Delhaes (2015). The lung mycobiome: an emerging
field of the human respiratory microbiome. Front Microbiol 6: 89.
Nieuwenhuis, E. E. and J. C. Escher (2008). Early onset IBD: what's the difference? Dig
Liver Dis 40(1): 12-15.
Noriega, L., M. Gueimonde, B. Sanchez, A. Margolles and C. G. de los Reyes-Gavilan
(2004). Effect of the adaptation to high bile salts concentrations on glycosidic activity,
survival at low PH and cross-resistance to bile salts in Bifidobacterium. Int J Food
Microbiol 94(1): 79-86.
North American Society for Pediatric Gastroenterology, H., Nutrition, A. Colitis
Foundation of, A. Bousvaros, D. A. Antonioli, R. B. Colletti, M. C. Dubinsky, J. N.
Glickman, B. D. Gold, A. M. Griffiths, G. P. Jevon, L. M. Higuchi, J. S. Hyams, B. S.
Kirschner, S. Kugathasan, R. N. Baldassano and P. A. Russo (2007). Differentiating
ulcerative colitis from Crohn disease in children and young adults: report of a working
group of the North American Society for Pediatric Gastroenterology, Hepatology, and
Nutrition and the Crohn's and Colitis Foundation of America. J Pediatr Gastroenterol Nutr
44(5): 653-674.
Notredame, C., D. G. Higgins and J. Heringa (2000). T-Coffee: A novel method for fast
and accurate multiple sequence alignment. Journal of molecular biology 302(1): 205-217.
O'Mahony, S. M., J. R. Marchesi, P. Scully, C. Codling, A. M. Ceolho, E. M. Quigley, J.
F. Cryan and T. G. Dinan (2009). Early life stress alters behavior, immunity, and
microbiota in rats: implications for irritable bowel syndrome and psychiatric illnesses. Biol
Psychiatry 65(3): 263-267.
O'Meara, T. R., A. O. Veri, T. Ketela, B. Jiang, T. Roemer and L. E. Cowen (2015).
Global analysis of fungal morphology exposes mechanisms of host cell escape. Nat
Commun 6: 6741.
O'Shea, E. F., P. D. Cotter, C. Stanton, R. P. Ross and C. Hill (2012). Production of
bioactive substances by intestinal bacteria as a basis for explaining probiotic mechanisms:
bacteriocins and conjugated linoleic acid. Int J Food Microbiol 152(3): 189-205.
Oberle, E. J., J. G. Harris and J. W. Verbsky (2014). Polyarticular juvenile idiopathic
arthritis - epidemiology and management approaches. Clin Epidemiol 6: 379-393.
Obregon-Tito, A. J., R. Y. Tito, J. Metcalf, K. Sankaranarayanan, J. C. Clemente, L. K.
Ursell, Z. Zech Xu, W. Van Treuren, R. Knight, P. M. Gaffney, P. Spicer, P. Lawson, L.
Marin-Reyes, O. Trujillo-Villarroel, M. Foster, E. Guija-Poma, L. Troncoso-Corzo, C.

201
Warinner, A. T. Ozga and C. M. Lewis (2015). Subsistence strategies in traditional
societies distinguish gut microbiomes. Nat Commun 6: 6505.
Odds, F. C., A. D. Davidson, M. D. Jacobsen, A. Tavanti, J. A. Whyte, C. C. Kibbler, D.
H. Ellis, M. C. Maiden, D. J. Shaw and N. A. Gow (2006). Candida albicans strain
maintenance, replacement, and microvariation demonstrated by multilocus sequence
typing. J Clin Microbiol 44(10): 3647-3658.
Odegaard, J. I., R. R. Ricardo-Gonzalez, M. H. Goforth, C. R. Morel, V. Subramanian, L.
Mukundan, A. Red Eagle, D. Vats, F. Brombacher, A. W. Ferrante and A. Chawla (2007).
Macrophage-specific PPARgamma controls alternative activation and improves insulin
resistance. Nature 447(7148): 1116-1120.
Oever, J. T. and M. G. Netea (2014). The bacteriome-mycobiome interaction and
antifungal host defense. Eur J Immunol 44(11): 3182-3191.
Ogura, Y., D. K. Bonen, N. Inohara, D. L. Nicolae, F. F. Chen, R. Ramos, H. Britton, T.
Moran, R. Karaliuskas, R. H. Duerr, J. P. Achkar, S. R. Brant, T. M. Bayless, B. S.
Kirschner, S. B. Hanauer, G. Nunez and J. H. Cho (2001). A frameshift mutation in NOD2
associated with susceptibility to Crohn's disease. Nature 411(6837): 603-606.
Oliva-Hemker, M. and C. Fiocchi (2002). Etiopathogenesis of inflammatory bowel
disease: the importance of the pediatric perspective. Inflamm Bowel Dis 8(2): 112-128.
Orholm, M., V. Binder, T. I. Sorensen, L. P. Rasmussen and K. O. Kyvik (2000).
Concordance of inflammatory bowel disease among Danish twins. Results of a nationwide
study. Scand J Gastroenterol 35(10): 1075-1081.
Orsi, C. F., E. Borghi, B. Colombari, R. G. Neglia, D. Quaglino, A. Ardizzoni, G. Morace
and E. Blasi (2014). Impact of Candida albicans hyphal wall protein 1 (HWP1) genotype
on biofilm production and fungal susceptibility to microglial cells. Microb Pathog 69-70:
20-27.
Orsi, C. F., B. Colombari, A. Ardizzoni, S. Peppoloni, R. Neglia, B. Posteraro, G. Morace,
G. Fadda and E. Blasi (2009). The ABC transporter-encoding gene AFR1 affects the
resistance of Cryptococcus neoformans to microglia-mediated antifungal activity by
delaying phagosomal maturation. FEMS Yeast Res 9(2): 301-310.
Ott, S. J., T. Kuhbacher, M. Musfeldt, P. Rosenstiel, S. Hellmig, A. Rehman, O. Drews, W.
Weichert, K. N. Timmis and S. Schreiber (2008). Fungi and inflammatory bowel diseases:
Alterations of composition and diversity. Scand J Gastroenterol 43(7): 831-841.
Ouwehand, A., E. Isolauri and S. Salminen (2002). The role of the intestinal microflora for
the development of the immune system in early childhood. Eur J Nutr 41 Suppl 1: I32-37.
202
Palkova, Z. (2004). Multicellular microorganisms: laboratory versus nature. EMBO Rep
5(5): 470-476.
Palmer, C., E. M. Bik, D. B. DiGiulio, D. A. Relman and P. O. Brown (2007).
Development of the human infant intestinal microbiota. PLoS Biol 5(7): e177.
Park, A. J., J. Collins, P. A. Blennerhassett, J. E. Ghia, E. F. Verdu, P. Bercik and S. M.
Collins (2013). Altered colonic function and microbiota profile in a mouse model of
chronic depression. Neurogastroenterol Motil 25(9): 733-e575.
Parks, D. H. and R. G. Beiko (2010). Identifying biologically relevant differences between
metagenomic communities. Bioinformatics 26(6): 715-721.
Parks, D. H., G. W. Tyson, P. Hugenholtz and R. G. Beiko (2014). STAMP: statistical
analysis of taxonomic and functional profiles. Bioinformatics 30(21): 3123-3124.
Parracho, H. M., M. O. Bingham, G. R. Gibson and A. L. McCartney (2005). Differences
between the gut microflora of children with autistic spectrum disorders and that of healthy
children. J Med Microbiol 54(Pt 10): 987-991.
Patel, R. K. and M. Jain (2012). NGS QC Toolkit: a toolkit for quality control of next
generation sequencing data. PLoS One 7(2): e30619.
Paul, T., A. Birnbaum, D. K. Pal, N. Pittman, C. Ceballos, N. S. LeLeiko and K. Benkov
(2006). Distinct phenotype of early childhood inflammatory bowel disease. J Clin
Gastroenterol 40(7): 583-586.
Paulson, J. N., O. C. Stine, H. C. Bravo and M. Pop (2013). Differential abundance
analysis for microbial marker-gene surveys. Nat Methods 10(12): 1200-1202.
Pei, Z., E. J. Bini, L. Yang, M. Zhou, F. Francois and M. J. Blaser (2004). Bacterial biota
in the human distal esophagus. Proc Natl Acad Sci U S A 101(12): 4250-4255.
Penders, J., C. Thijs, C. Vink, F. F. Stelma, B. Snijders, I. Kummeling, P. A. van den
Brandt and E. E. Stobberingh (2006). Factors influencing the composition of the intestinal
microbiota in early infancy. Pediatrics 118(2): 511-521.
Peppoloni, S., B. Colombari, C. Beninati, F. Felici, G. Teti, P. Speziale, S. Ricci, A.
Ardizzoni, L. Manca and E. Blasi (2013). The Spr1875 protein confers resistance to the
microglia-mediated killing of Streptococcus pneumoniae. Microb Pathog 59-60: 42-47.
Peterson, D. A., D. N. Frank, N. R. Pace and J. I. Gordon (2008). Metagenomic approaches
for defining the pathogenesis of inflammatory bowel diseases. Cell Host Microbe 3(6):
417-427.

203
Petnicki-Ocwieja, T., T. Hrncir, Y. J. Liu, A. Biswas, T. Hudcovic, H. Tlaskalova-
Hogenova and K. S. Kobayashi (2009). Nod2 is required for the regulation of commensal
microbiota in the intestine. Proc Natl Acad Sci U S A 106(37): 15813-15818.
Pfaller, M. A. and D. J. Diekema (2012). Progress in antifungal susceptibility testing of
Candida spp. by use of Clinical and Laboratory Standards Institute broth microdilution
methods, 2010 to 2012. J Clin Microbiol 50(9): 2846-2856.
Pfaller, M. A., D. J. Diekema and D. J. Sheehan (2006). Interpretive breakpoints for
fluconazole and Candida revisited: a blueprint for the future of antifungal susceptibility
testing. Clin Microbiol Rev 19(2): 435-447.
Pierce, J. V., D. Dignard, M. Whiteway and C. A. Kumamoto (2013). Normal adaptation
of Candida albicans to the murine gastrointestinal tract requires Efg1p-dependent
regulation of metabolic and host defense genes. Eukaryot Cell 12(1): 37-49.
Pop, M., A. W. Walker, J. Paulson, B. Lindsay, M. Antonio, M. A. Hossain, J. Oundo, B.
Tamboura, V. Mai, I. Astrovskaya, H. Corrada Bravo, R. Rance, M. Stares, M. M. Levine,
S. et al. (2014). Diarrhea in young children from low-income countries leads to large-scale
alterations in intestinal microbiota composition. Genome Biol 15(6): R76.
Price, M. N., P. S. Dehal and A. P. Arkin (2010). FastTree 2--approximately maximum-
likelihood trees for large alignments. PLoS One 5(3): e9490.
Pugazhendhi, S., M. K. Sahu, V. Subramanian, A. Pulimood and B. S. Ramakrishna
(2011). Environmental factors associated with Crohn's disease in India. Indian J
Gastroenterol 30(6): 264-269.
Qin, J., R. Li, J. Raes, M. Arumugam, K. S. Burgdorf, C. Manichanh, T. Nielsen, N. Pons,
F. Levenez, T. Yamada, D. R. Mende, J. Li, J. Xu, S. Li, D. Li, J. Cao, B. Wang, H. Liang,
H. Zheng, et al. (2010). A human gut microbial gene catalogue established by
metagenomic sequencing. Nature 464(7285): 59-65.
Qin, J., Y. Li, Z. Cai, S. Li, J. Zhu, F. Zhang, S. Liang, W. Zhang, Y. Guan, D. Shen, Y.
Peng, D. Zhang, Z. Jie, W. Wu, Y. Qin, W. Xue, J. Li, L. Han, D. Lu, P. Wu, Y. Dai, X.
Sun, Z. Li, A. Tang, et al. (2012). A metagenome-wide association study of gut microbiota
in type 2 diabetes. Nature 490(7418): 55-60.
Qin, N., F. Yang, A. Li, E. Prifti, Y. Chen, L. Shao, J. Guo, E. Le Chatelier, J. Yao, L. Wu,
J. Zhou, S. Ni, L. Liu, N. Pons, J. M. Batto, S. P. Kennedy, P. Leonard, C. Yuan, W. Ding,
Y. Chen, X. Hu, B. Zheng, G. Qian, W. Xu, S. D. Ehrlich, S. Zheng and L. Li (2014).
Alterations of the human gut microbiome in liver cirrhosis. Nature 513(7516): 59-64.
Qiu, X., M. Zhang, X. Yang, N. Hong and C. Yu (2013). Faecalibacterium prausnitzii
upregulates regulatory T cells and anti-inflammatory cytokines in treating TNBS-induced
colitis. J Crohns Colitis 7(11): e558-568.

204
Quinton, J. F., B. Sendid, D. Reumaux, P. Duthilleul, A. Cortot, B. Grandbastien, G.
Charrier, S. R. Targan, J. F. Colombel and D. Poulain (1998). Anti-Saccharomyces
cerevisiae mannan antibodies combined with antineutrophil cytoplasmic autoantibodies in
inflammatory bowel disease: prevalence and diagnostic role. Gut 42(6): 788-791.
Rampelli, S., S. L. Schnorr, C. Consolandi, S. Turroni, M. Severgnini, C. Peano, P. Brigidi,
A. N. Crittenden, A. G. Henry and M. Candela (2015). Metagenome Sequencing of the
Hadza Hunter-Gatherer Gut Microbiota. Curr Biol 25(13): 1682-1693.
Rath, H. C., H. H. Herfarth, J. S. Ikeda, W. B. Grenther, T. E. Hamm, Jr., E. Balish, J. D.
Taurog, R. E. Hammer, K. H. Wilson and R. B. Sartor (1996). Normal luminal bacteria,
especially Bacteroides species, mediate chronic colitis, gastritis, and arthritis in HLA-
B27/human beta2 microglobulin transgenic rats. J Clin Invest 98(4): 945-953.
Ravelli, A. and A. Martini (2007). Juvenile idiopathic arthritis. Lancet 369(9563): 767-
778.
Ravikumara, M. and B. K. Sandhu (2006). Epidemiology of inflammatory bowel diseases
in childhood. Indian J Pediatr 73(8): 717-721.
Renz, H., P. Brandtzaeg and M. Hornef (2011). The impact of perinatal immune
development on mucosal homeostasis and chronic inflammation. Nat Rev Immunol 12(1):
9-23.
Revelle, W. (2013). psych: procedures for psychological, psychometric, and personality
research. R package version 1.3. 10. Northwestern University, Evanston, IL.
Reyes, A., M. Haynes, N. Hanson, F. E. Angly, A. C. Heath, F. Rohwer and J. I. Gordon
(2010). Viruses in the faecal microbiota of monozygotic twins and their mothers. Nature
466(7304): 334-338.
Ridaura, V. K., J. J. Faith, F. E. Rey, J. Cheng, A. E. Duncan, A. L. Kau, N. W. Griffin, V.
Lombard, B. Henrissat, J. R. Bain, M. J. Muehlbauer, O. Ilkayeva, C. F. Semenkovich, K.
Funai, D. et al. (2013). Gut microbiota from twins discordant for obesity modulate
metabolism in mice. Science 341(6150): 1241214.
Ridlon, J. M., D. J. Kang and P. B. Hylemon (2006). Bile salt biotransformations by
human intestinal bacteria. J Lipid Res 47(2): 241-259.
Ringel-Kulka, T., J. Cheng, Y. Ringel, J. Salojarvi, I. Carroll, A. Palva, W. M. de Vos and
R. Satokari (2013). Intestinal microbiota in healthy U.S. young children and adults--a high
throughput microarray analysis. PLoS One 8(5): e64315.
Rizzetto, L., C. De Filippo and D. Cavalieri (2014). Richness and diversity of mammalian
fungal communities shape innate and adaptive immunity in health and disease. Eur J
Immunol 44(11): 3166-3181.

205
Rizzetto, L., D. C. Ifrim, S. Moretti, N. Tocci, S. C. Cheng, J. Quintin, G. Renga, V.
Oikonomou, C. De Filippo, T. Weil, B. A. Blok, M. S. Lenucci, M. A. Santos, L. Romani,
M. G. Netea and D. Cavalieri (2016). Fungal Chitin Induces Trained Immunity in Human
Monocytes during Cross-talk of the Host with Saccharomyces cerevisiae. J Biol Chem
291(15): 7961-7972.
Rizzetto, L., M. Kuka, C. De Filippo, A. Cambi, M. G. Netea, L. Beltrame, G. Napolitani,
M. G. Torcia, U. D'Oro and D. Cavalieri (2010). Differential IL-17 production and mannan
recognition contribute to fungal pathogenicity and commensalism. J Immunol 184(8):
4258-4268.
Rodriguez-Tudela, J., M. Arendrup, F. Barchiesi, J. Bille, E. Chryssanthou, M. Cuenca-
Estrella, E. Dannaoui, D. Denning, J. Donnelly and F. Dromer (2008). EUCAST Definitive
Document EDef 7.1: method for the determination of broth dilution MICs of antifungal
agents for fermentative yeasts: Subcommittee on Antifungal Susceptibility Testing (AFST)
of the ESCMID European Committee for Antimicrobial Susceptibility Testing
(EUCAST)∗. Clinical Microbiology and Infection 14(4): 398-405.
Rodriguez, J. M., K. Murphy, C. Stanton, R. P. Ross, O. I. Kober, N. Juge, E. Avershina,
K. Rudi, A. Narbad, M. C. Jenmalm, J. R. Marchesi and M. C. Collado (2015). The
composition of the gut microbiota throughout life, with an emphasis on early life. Microb
Ecol Health Dis 26: 26050.
Rogers, G. B. (2015). Germs and joints: the contribution of the human microbiome to
rheumatoid arthritis. Nat Med 21(8): 839-841.
Romani, L. (2011). Immunity to fungal infections. Nat Rev Immunol 11(4): 275-288.
Romani, L., T. Zelante, M. Palmieri, V. Napolioni, M. Picciolini, A. Velardi, F. Aversa
and P. Puccetti (2015). The cross-talk between opportunistic fungi and the mammalian host
via microbiota's metabolism. Semin Immunopathol 37(2): 163-171.
Romberg-Camps, M. J., P. C. Dagnelie, A. D. Kester, M. A. Hesselink-van de Kruijs, M.
Cilissen, L. G. Engels, C. Van Deursen, W. H. Hameeteman, F. L. Wolters, M. G. Russel
and R. W. Stockbrugger (2009). Influence of phenotype at diagnosis and of other potential
prognostic factors on the course of inflammatory bowel disease. Am J Gastroenterol
104(2): 371-383.
Rondon, M. R., S. J. Raffel, R. M. Goodman and J. Handelsman (1999). Toward functional
genomics in bacteria: analysis of gene expression in Escherichia coli from a bacterial
artificial chromosome library of Bacillus cereus. Proc Natl Acad Sci U S A 96(11): 6451-
6455.
Rook, G. A., C. A. Lowry and C. L. Raison (2013). Microbial 'Old Friends',
immunoregulation and stress resilience. Evol Med Public Health 2013(1): 46-64.

206
Rook, G. A., R. Martinelli and L. R. Brunet (2003). Innate immune responses to
mycobacteria and the downregulation of atopic responses. Curr Opin Allergy Clin
Immunol 3(5): 337-342.
Rosenbaum, J. T. and M. J. Asquith (2016). The Microbiome: a Revolution in Treatment
for Rheumatic Diseases? Curr Rheumatol Rep 18(10): 62.
Rossen, N. G., S. Fuentes, M. J. van der Spek, J. G. Tijssen, J. H. Hartman, A. Duflou, M.
Lowenberg, G. R. van den Brink, E. M. Mathus-Vliegen, W. M. de Vos, E. G. Zoetendal,
G. R. D'Haens and C. Y. Ponsioen (2015). Findings From a Randomized Controlled Trial
of Fecal Transplantation for Patients With Ulcerative Colitis. Gastroenterology 149(1):
110-118 e114.
Round, J. L. and S. K. Mazmanian (2009). The gut microbiota shapes intestinal immune
responses during health and disease. Nat Rev Immunol 9(5): 313-323.
Round, J. L. and S. K. Mazmanian (2010). Inducible Foxp3+ regulatory T-cell
development by a commensal bacterium of the intestinal microbiota. Proc Natl Acad Sci U
S A 107(27): 12204-12209.
Rowan, F. E., N. G. Docherty, J. C. Coffey and P. R. O'Connell (2009). Sulphate-reducing
bacteria and hydrogen sulphide in the aetiology of ulcerative colitis. Br J Surg 96(2): 151-
158.
Royall, D., G. R. Greenberg, J. P. Allard, J. P. Baker and K. N. Jeejeebhoy (1995). Total
enteral nutrition support improves body composition of patients with active Crohn's
disease. JPEN J Parenter Enteral Nutr 19(2): 95-99.
Ruderfer, D. M., S. C. Pratt, H. S. Seidel and L. Kruglyak (2006). Population genomic
analysis of outcrossing and recombination in yeast. Nat Genet 38(9): 1077-1081.
Ruemmele, F. M. (2010). Pediatric inflammatory bowel diseases: coming of age. Curr
Opin Gastroenterol 26(4): 332-336.
Said, H. M. and Z. M. Mohammed (2006). Intestinal absorption of water-soluble vitamins:
an update. Curr Opin Gastroenterol 22(2): 140-146.
Saitou, N. and M. Nei (1987). The neighbor-joining method: a new method for
reconstructing phylogenetic trees. Mol Biol Evol 4(4): 406-425.
Sakamoto, M. and M. Ohkuma (2012). Reclassification of Xylanibacter oryzae Ueki et al.
2006 as Prevotella oryzae comb. nov., with an emended description of the genus
Prevotella. Int J Syst Evol Microbiol 62(Pt 11): 2637-2642.
Salim, S. Y., G. G. Kaplan and K. L. Madsen (2014). Air pollution effects on the gut
microbiota: a link between exposure and inflammatory disease. Gut Microbes 5(2): 215-
219.

207
Samuel, B. S. and J. I. Gordon (2006). A humanized gnotobiotic mouse model of host-
archaeal-bacterial mutualism. Proc Natl Acad Sci U S A 103(26): 10011-10016.
Samuel, B. S., A. Shaito, T. Motoike, F. E. Rey, F. Backhed, J. K. Manchester, R. E.
Hammer, S. C. Williams, J. Crowley, M. Yanagisawa and J. I. Gordon (2008). Effects of
the gut microbiota on host adiposity are modulated by the short-chain fatty-acid binding G
protein-coupled receptor, Gpr41. Proc Natl Acad Sci U S A 105(43): 16767-16772.
Sancho, D. and C. Reis e Sousa (2012). Signaling by myeloid C-type lectin receptors in
immunity and homeostasis. Annu Rev Immunol 30: 491-529.
Sander, L. E., A. Lorentz, G. Sellge, M. Coeffier, M. Neipp, T. Veres, T. Frieling, P. N.
Meier, M. P. Manns and S. C. Bischoff (2006). Selective expression of histamine receptors
H1R, H2R, and H4R, but not H3R, in the human intestinal tract. Gut 55(4): 498-504.
Sandhya, P., D. Danda, D. Sharma and V. Scaria (2016). Does the buck stop with the
bugs?: an overview of microbial dysbiosis in rheumatoid arthritis. Int J Rheum Dis 19(1):
8-20.
Sauer, C. G. and S. Kugathasan (2010). Pediatric inflammatory bowel disease: highlighting
pediatric differences in IBD. Med Clin North Am 94(1): 35-52.
Sawczenko, A. and B. K. Sandhu (2003). Presenting features of inflammatory bowel
disease in Great Britain and Ireland. Arch Dis Child 88(11): 995-1000.
Scanlan, P. D. and J. R. Marchesi (2008). Micro-eukaryotic diversity of the human distal
gut microbiota: qualitative assessment using culture-dependent and -independent analysis
of faeces. ISME J 2(12): 1183-1193.
Schaefer, M. E., J. T. Machan, D. Kawatu, C. R. Langton, J. Markowitz, W. Crandall, D.
R. Mack, J. S. Evans, M. D. Pfefferkorn, A. M. Griffiths, A. R. Otley, A. Bousvaros, S.
Kugathasan, J. R. et al. (2010). Factors that determine risk for surgery in pediatric patients
with Crohn's disease. Clin Gastroenterol Hepatol 8(9): 789-794.
Scher, J. U., D. R. Littman and S. B. Abramson (2016). Review: Microbiome in
Inflammatory Arthritis and Human Rheumatic Diseases. Arthritis Rheumatol 68(1): 35-45.
Scher, J. U., A. Sczesnak, R. S. Longman, N. Segata, C. Ubeda, C. Bielski, T. Rostron, V.
Cerundolo, E. G. Pamer, S. B. Abramson, C. Huttenhower and D. R. Littman (2013).
Expansion of intestinal Prevotella copri correlates with enhanced susceptibility to arthritis.
Elife 2: e01202.
Scher, J. U., C. Ubeda, A. Artacho, M. Attur, S. Isaac, S. M. Reddy, S. Marmon, A.
Neimann, S. Brusca, T. Patel, J. Manasson, E. G. Pamer, D. R. Littman and S. B.
Abramson (2015). Decreased bacterial diversity characterizes the altered gut microbiota in

208
patients with psoriatic arthritis, resembling dysbiosis in inflammatory bowel disease.
Arthritis Rheumatol 67(1): 128-139.
Scherr, R., J. Essers, H. Hakonarson and S. Kugathasan (2009). Genetic determinants of
pediatric inflammatory bowel disease: is age of onset genetically determined? Dig Dis
27(3): 236-239.
Schirbel, A. and C. Fiocchi (2011). Targeting the innate immune system in pediatric
inflammatory bowel disease. Expert Rev Gastroenterol Hepatol 5(1): 33-41.
Schloss, P. D., S. L. Westcott, T. Ryabin, J. R. Hall, M. Hartmann, E. B. Hollister, R. A.
Lesniewski, B. B. Oakley, D. H. Parks, C. J. Robinson, J. W. Sahl, B. Stres, G. G.
Thallinger, D. J. Van Horn and C. F. Weber (2009). Introducing mothur: open-source,
platform-independent, community-supported software for describing and comparing
microbial communities. Appl Environ Microbiol 75(23): 7537-7541.
Schnoes, A. M., S. D. Brown, I. Dodevski and P. C. Babbitt (2009). Annotation error in
public databases: misannotation of molecular function in enzyme superfamilies. PLoS
Comput Biol 5(12): e1000605.
Schnorr, S. L., M. Candela, S. Rampelli, M. Centanni, C. Consolandi, G. Basaglia, S.
Turroni, E. Biagi, C. Peano, M. Severgnini, J. Fiori, R. Gotti, G. De Bellis, D. Luiselli, P.
Brigidi, A. Mabulla, F. Marlowe, A. G. Henry and A. N. Crittenden (2014). Gut
microbiome of the Hadza hunter-gatherers. Nat Commun 5: 3654.
Schulze, J. and U. Sonnenborn (2009). Yeasts in the gut: from commensals to infectious
agents. Dtsch Arztebl Int 106(51-52): 837-842.
Schweiggert, R. M., R. E. Kopec, M. G. Villalobos-Gutierrez, J. Hogel, S. Quesada, P.
Esquivel, S. J. Schwartz and R. Carle (2014). Carotenoids are more bioavailable from
papaya than from tomato and carrot in humans: a randomised cross-over study. Br J Nutr
111(3): 490-498.
Schwiertz, A., D. Taras, K. Schafer, S. Beijer, N. A. Bos, C. Donus and P. D. Hardt
(2010). Microbiota and SCFA in lean and overweight healthy subjects. Obesity (Silver
Spring) 18(1): 190-195.
Scupham, A. J., L. L. Presley, B. Wei, E. Bent, N. Griffith, M. McPherson, F. Zhu, O.
Oluwadara, N. Rao, J. Braun and J. Borneman (2006). Abundant and diverse fungal
microbiota in the murine intestine. Appl Environ Microbiol 72(1): 793-801.
Sebastiani, F., C. Barberio, E. Casalone, D. Cavalieri and M. Polsinelli (2002). Crosses
between Saccharomyces cerevisiae and Saccharomyces bayanus generate fertile hybrids.
Res Microbiol 153(1): 53-58.

209
Segata, N., J. Izard, L. Waldron, D. Gevers, L. Miropolsky, W. S. Garrett and C.
Huttenhower (2011). Metagenomic biomarker discovery and explanation. Genome Biol
12(6): R60.
Seksik, P., L. Rigottier-Gois, G. Gramet, M. Sutren, P. Pochart, P. Marteau, R. Jian and J.
Dore (2003). Alterations of the dominant faecal bacterial groups in patients with Crohn's
disease of the colon. Gut 52(2): 237-242.
Sendid, B., J. F. Quinton, G. Charrier, O. Goulet, A. Cortot, B. Grandbastien, D. Poulain
and J. F. Colombel (1998). Anti-Saccharomyces cerevisiae mannan antibodies in familial
Crohn's disease. Am J Gastroenterol 93(8): 1306-1310.
Severijnen, A. J., R. van Kleef, M. P. Hazenberg and J. P. van de Merwe (1989). Cell wall
fragments from major residents of the human intestinal flora induce chronic arthritis in
rats. J Rheumatol 16(8): 1061-1068.
Shah, N., J. Kammermeier, M. Elawad and E. O. Glocker (2012). Interleukin-10 and
interleukin-10-receptor defects in inflammatory bowel disease. Curr Allergy Asthma Rep
12(5): 373-379.
Shen, J., Z. X. Zuo and A. P. Mao (2014). Effect of probiotics on inducing remission and
maintaining therapy in ulcerative colitis, Crohn's disease, and pouchitis: meta-analysis of
randomized controlled trials. Inflamm Bowel Dis 20(1): 21-35.
Shendure, J. and H. Ji (2008). Next-generation DNA sequencing. Nat Biotechnol 26(10):
1135-1145.
Shiga, H., T. Kajiura, J. Shinozaki, S. Takagi, Y. Kinouchi, S. Takahashi, K. Negoro, K.
Endo, Y. Kakuta, M. Suzuki and T. Shimosegawa (2012). Changes of faecal microbiota in
patients with Crohn's disease treated with an elemental diet and total parenteral nutrition.
Dig Liver Dis 44(9): 736-742.
Shroff, K. E., K. Meslin and J. J. Cebra (1995). Commensal enteric bacteria engender a
self-limiting humoral mucosal immune response while permanently colonizing the gut.
Infect Immun 63(10): 3904-3913.
Simelyte, E., M. Rimpilainen, X. Zhang and P. Toivanen (2003). Role of peptidoglycan
subtypes in the pathogenesis of bacterial cell wall arthritis. Ann Rheum Dis 62(10): 976-
982.
Simon, G. L. and S. L. Gorbach (1984). Intestinal flora in health and disease.
Gastroenterology 86(1): 174-193.
Slavin, M., S. van Hal, T. C. Sorrell, A. Lee, D. J. Marriott, K. Daveson, K. Kennedy, K.
Hajkowicz, C. Halliday, E. Athan, N. Bak, E. Cheong, C. H. Heath, C. Orla Morrissey, S.

210
Kidd, R. et al. (2015). Invasive infections due to filamentous fungi other than Aspergillus:
epidemiology and determinants of mortality. Clin Microbiol Infect 21(5): 490 e491-410.
Smith, E. A. and G. T. Macfarlane (1997). Dissimilatory amino Acid metabolism in human
colonic bacteria. Anaerobe 3(5): 327-337.
Smukalla, S., M. Caldara, N. Pochet, A. Beauvais, S. Guadagnini, C. Yan, M. D. Vinces,
A. Jansen, M. C. Prevost, J. P. Latge, G. R. Fink, K. R. Foster and K. J. Verstrepen (2008).
FLO1 is a variable green beard gene that drives biofilm-like cooperation in budding yeast.
Cell 135(4): 726-737.
Snelders, E., S. M. Camps, A. Karawajczyk, G. Schaftenaar, G. H. Kema, H. A. van der
Lee, C. H. Klaassen, W. J. Melchers and P. E. Verweij (2012). Triazole fungicides can
induce cross-resistance to medical triazoles in Aspergillus fumigatus. PLoS One 7(3):
e31801.
Sogin, M. L., H. G. Morrison, J. A. Huber, D. Mark Welch, S. M. Huse, P. R. Neal, J. M.
Arrieta and G. J. Herndl (2006). Microbial diversity in the deep sea and the underexplored
"rare biosphere". Proc Natl Acad Sci U S A 103(32): 12115-12120.
Sokol, H., K. L. Conway, M. Zhang, M. Choi, B. Morin, Z. Cao, E. J. Villablanca, C. Li,
C. Wijmenga, S. H. Yun, H. N. Shi and R. J. Xavier (2013). Card9 mediates intestinal
epithelial cell restitution, T-helper 17 responses, and control of bacterial infection in mice.
Gastroenterology 145(3): 591-601 e593.
Sokol, H., J. Cosnes, O. Chazouilleres, L. Beaugerie, E. Tiret, R. Poupon and P. Seksik
(2008). Disease activity and cancer risk in inflammatory bowel disease associated with
primary sclerosing cholangitis. World J Gastroenterol 14(22): 3497-3503.
Sokol, H., C. Lay, P. Seksik and G. W. Tannock (2008). Analysis of bacterial bowel
communities of IBD patients: what has it revealed? Inflamm Bowel Dis 14(6): 858-867.
Sokol, H., V. Leducq, H. Aschard, H. P. Pham, S. Jegou, C. Landman, D. Cohen, G.
Liguori, A. Bourrier, I. Nion-Larmurier, J. Cosnes, P. Seksik, P. Langella, D. Skurnik, M.
L. Richard and L. Beaugerie (2016). Fungal microbiota dysbiosis in IBD. Gut.
Sokol, H., B. Pigneur, L. Watterlot, O. Lakhdari, L. G. Bermudez-Humaran, J. J.
Gratadoux, S. Blugeon, C. Bridonneau, J. P. Furet, G. Corthier, C. Grangette, N. Vasquez,
P. Pochart, G. Trugnan, G. Thomas, H. M. Blottiere, J. Dore, P. Marteau, P. Seksik and P.
Langella (2008). Faecalibacterium prausnitzii is an anti-inflammatory commensal
bacterium identified by gut microbiota analysis of Crohn disease patients. Proc Natl Acad
Sci U S A 105(43): 16731-16736.
Sokol, H. and P. Seksik (2010). The intestinal microbiota in inflammatory bowel diseases:
time to connect with the host. Curr Opin Gastroenterol 26(4): 327-331.

211
Sommer, F. and F. Backhed (2013). The gut microbiota--masters of host development and
physiology. Nat Rev Microbiol 11(4): 227-238.
Song, Y., C. Liu and S. M. Finegold (2004). Real-time PCR quantitation of clostridia in
feces of autistic children. Appl Environ Microbiol 70(11): 6459-6465.
Sonnenburg, J. L. and F. Backhed (2016). Diet-microbiota interactions as moderators of
human metabolism. Nature 535(7610): 56-64.
Spehlmann, M. E., A. Z. Begun, J. Burghardt, P. Lepage, A. Raedler and S. Schreiber
(2008). Epidemiology of inflammatory bowel disease in a German twin cohort: results of a
nationwide study. Inflamm Bowel Dis 14(7): 968-976.
Staab, J. F., K. Datta and P. Rhee (2013). Niche-specific requirement for hyphal wall
protein 1 in virulence of Candida albicans. PLoS One 8(11): e80842.
Standaert-Vitse, A., T. Jouault, P. Vandewalle, C. Mille, M. Seddik, B. Sendid, J. M.
Mallet, J. F. Colombel and D. Poulain (2006). Candida albicans is an immunogen for anti-
Saccharomyces cerevisiae antibody markers of Crohn's disease. Gastroenterology 130(6):
1764-1775.
Stark, P. L. and A. Lee (1982). The microbial ecology of the large bowel of breast-fed and
formula-fed infants during the first year of life. J Med Microbiol 15(2): 189-203.
Stebbings, S., K. Munro, M. A. Simon, G. Tannock, J. Highton, H. Harmsen, G. Welling,
P. Seksik, J. Dore, G. Grame and A. Tilsala-Timisjarvi (2002). Comparison of the faecal
microflora of patients with ankylosing spondylitis and controls using molecular methods of
analysis. Rheumatology (Oxford) 41(12): 1395-1401.
Stefanini, I., D. Albanese, A. Cavazza, E. Franciosi, C. De Filippo, C. Donati and D.
Cavalieri (2016). Dynamic changes in microbiota and mycobiota during spontaneous 'Vino
Santo Trentino' fermentation. Microb Biotechnol 9(2): 195-208.
Stefanini, I., L. Dapporto, J. L. Legras, A. Calabretta, M. Di Paola, C. De Filippo, R. Viola,
P. Capretti, M. Polsinelli, S. Turillazzi and D. Cavalieri (2012). Role of social wasps in
Saccharomyces cerevisiae ecology and evolution. Proc Natl Acad Sci U S A 109(33):
13398-13403.
Stoll, M. L., R. Kumar, C. D. Morrow, E. J. Lefkowitz, X. Cui, A. Genin, R. Q. Cron and
C. O. Elson (2014). Altered microbiota associated with abnormal humoral immune
responses to commensal organisms in enthesitis-related arthritis. Arthritis Res Ther 16(6):
486.
Strachan, D. P. (2000). Family size, infection and atopy: the first decade of the "hygiene
hypothesis". Thorax 55 Suppl 1: S2-10.

212
Strati, F., M. Di Paola, I. Stefanini, D. Albanese, L. Rizzetto, P. Lionetti, A. Calabro, O.
Jousson, C. Donati, D. Cavalieri and C. De Filippo (2016). Age and Gender Affect the
Composition of Fungal Population of the Human Gastrointestinal Tract. Front Microbiol 7:
1227.
Strope, P. K., D. A. Skelly, S. G. Kozmin, G. Mahadevan, E. A. Stone, P. M. Magwene, F.
S. Dietrich and J. H. McCusker (2015). The 100-genomes strains, an S. cerevisiae resource
that illuminates its natural phenotypic and genotypic variation and emergence as an
opportunistic pathogen. Genome Res 25(5): 762-774.
Suarez-Zamorano, N., S. Fabbiano, C. Chevalier, O. Stojanovic, D. J. Colin, A.
Stevanovic, C. Veyrat-Durebex, V. Tarallo, D. Rigo, S. Germain, M. Ilievska, X. Montet,
Y. Seimbille, S. Hapfelmeier and M. Trajkovski (2015). Microbiota depletion promotes
browning of white adipose tissue and reduces obesity. Nat Med 21(12): 1497-1501.
Suau, A., R. Bonnet, M. Sutren, J. J. Godon, G. R. Gibson, M. D. Collins and J. Dore
(1999). Direct analysis of genes encoding 16S rRNA from complex communities reveals
many novel molecular species within the human gut. Appl Environ Microbiol 65(11):
4799-4807.
Subcommittee on Antifungal Susceptibility Testing of the, E. E. C. f. A. S. T. (2008).
EUCAST definitive document EDef 7.1: method for the determination of broth dilution
MICs of antifungal agents for fermentative yeasts. Clin Microbiol Infect 14(4): 398-405.
Sudbery, P. E. (2011). Growth of Candida albicans hyphae. Nat Rev Microbiol 9(10): 737-
748.
Sudo, N., Y. Chida, Y. Aiba, J. Sonoda, N. Oyama, X. N. Yu, C. Kubo and Y. Koga
(2004). Postnatal microbial colonization programs the hypothalamic-pituitary-adrenal
system for stress response in mice. J Physiol 558(Pt 1): 263-275.
Sunagawa, S., D. R. Mende, G. Zeller, F. Izquierdo-Carrasco, S. A. Berger, J. R. Kultima,
L. P. Coelho, M. Arumugam, J. Tap, H. B. Nielsen, S. Rasmussen, S. Brunak, O. Pedersen,
F. Guarner, W. M. de Vos, J. Wang, J. Li, J. Dore, S. D. Ehrlich, A. Stamatakis and P.
Bork (2013). Metagenomic species profiling using universal phylogenetic marker genes.
Nat Methods 10(12): 1196-1199.
Sunde, R. A. and K. M. Thompson (2009). Dietary selenium requirements based on tissue
selenium concentration and glutathione peroxidase activities in old female rats. J Trace
Elem Med Biol 23(2): 132-137.
Swidsinski, A., V. Loening-Baucke and A. Herber (2009). Mucosal flora in Crohn's
disease and ulcerative colitis - an overview. J Physiol Pharmacol 60 Suppl 6: 61-71.

213
Talham, G. L., H. Q. Jiang, N. A. Bos and J. J. Cebra (1999). Segmented filamentous
bacteria are potent stimuli of a physiologically normal state of the murine gut mucosal
immune system. Infect Immun 67(4): 1992-2000.
Tamura, K. (2011). Ribosome evolution: emergence of peptide synthesis machinery. J
Biosci 36(5): 921-928.
Taneja, V. (2014). Arthritis susceptibility and the gut microbiome. FEBS Lett 588(22):
4244-4249.
Tang, W. H., Z. Wang, B. S. Levison, R. A. Koeth, E. B. Britt, X. Fu, Y. Wu and S. L.
Hazen (2013). Intestinal microbial metabolism of phosphatidylcholine and cardiovascular
risk. N Engl J Med 368(17): 1575-1584.
Tannock, G. W. (2001). Molecular assessment of intestinal microflora. Am J Clin Nutr
73(2 Suppl): 410S-414S.
Tap, J., S. Mondot, F. Levenez, E. Pelletier, C. Caron, J. P. Furet, E. Ugarte, R. Munoz-
Tamayo, D. L. Paslier, R. Nalin, J. Dore and M. Leclerc (2009). Towards the human
intestinal microbiota phylogenetic core. Environ Microbiol 11(10): 2574-2584.
Targan, S. R., C. J. Landers, H. Yang, M. J. Lodes, Y. Cong, K. A. Papadakis, E.
Vasiliauskas, C. O. Elson and R. M. Hershberg (2005). Antibodies to CBir1 flagellin
define a unique response that is associated independently with complicated Crohn's
disease. Gastroenterology 128(7): 2020-2028.
Taurog, J. D., J. A. Richardson, J. T. Croft, W. A. Simmons, M. Zhou, J. L. Fernandez-
Sueiro, E. Balish and R. E. Hammer (1994). The germfree state prevents development of
gut and joint inflammatory disease in HLA-B27 transgenic rats. J Exp Med 180(6): 2359-
2364.
Tazoe, H., Y. Otomo, I. Kaji, R. Tanaka, S. I. Karaki and A. Kuwahara (2008). Roles of
short-chain fatty acids receptors, GPR41 and GPR43 on colonic functions. J Physiol
Pharmacol 59 Suppl 2: 251-262.
Team, R. C. (2014). R: A language and environment for statistical computing. R
Foundation for Statistical Computing, Vienna, Austria, 2012, ISBN 3-900051-07-0.
Tejesvi, M. V., M. Arvonen, S. M. Kangas, P. L. Keskitalo, A. M. Pirttila, T. J. Karttunen
and P. Vahasalo (2015). Faecal microbiome in new-onset juvenile idiopathic arthritis. Eur
J Clin Microbiol Infect Dis.
Thomas, C. M., T. Hong, J. P. van Pijkeren, P. Hemarajata, D. V. Trinh, W. Hu, R. A.
Britton, M. Kalkum and J. Versalovic (2012). Histamine derived from probiotic
Lactobacillus reuteri suppresses TNF via modulation of PKA and ERK signaling. PLoS
One 7(2): e31951.

214
Thomas, T., J. Gilbert and F. Meyer (2012). Metagenomics - a guide from sampling to data
analysis. Microb Inform Exp 2(1): 3.
Tjellstrom, B., L. Hogberg, L. Stenhammar, K. E. Magnusson, T. Midtvedt, E. Norin and
T. Sundqvist (2012). Effect of exclusive enteral nutrition on gut microflora function in
children with Crohn's disease. Scand J Gastroenterol 47(12): 1454-1459.
Tremaroli, V. and F. Backhed (2012). Functional interactions between the gut microbiota
and host metabolism. Nature 489(7415): 242-249.
Tringe, S. G., C. von Mering, A. Kobayashi, A. A. Salamov, K. Chen, H. W. Chang, M.
Podar, J. M. Short, E. J. Mathur, J. C. Detter, P. Bork, P. Hugenholtz and E. M. Rubin
(2005). Comparative metagenomics of microbial communities. Science 308(5721): 554-
557.
Tristezza, M., C. Vetrano, G. Bleve, G. Spano, V. Capozzi, A. Logrieco, G. Mita and F.
Grieco (2013). Biodiversity and safety aspects of yeast strains characterized from
vineyards and spontaneous fermentations in the Apulia Region, Italy. Food Microbiol
36(2): 335-342.
Turnbaugh, P. J., F. Backhed, L. Fulton and J. I. Gordon (2008). Diet-induced obesity is
linked to marked but reversible alterations in the mouse distal gut microbiome. Cell Host
Microbe 3(4): 213-223.
Turnbaugh, P. J., M. Hamady, T. Yatsunenko, B. L. Cantarel, A. Duncan, R. E. Ley, M. L.
Sogin, W. J. Jones, B. A. Roe, J. P. Affourtit, M. Egholm, B. Henrissat, A. C. Heath, R.
Knight and J. I. Gordon (2009). A core gut microbiome in obese and lean twins. Nature
457(7228): 480-484.
Turnbaugh, P. J., R. E. Ley, M. A. Mahowald, V. Magrini, E. R. Mardis and J. I. Gordon
(2006). An obesity-associated gut microbiome with increased capacity for energy harvest.
Nature 444(7122): 1027-1031.
Turnbaugh, P. J., V. K. Ridaura, J. J. Faith, F. E. Rey, R. Knight and J. I. Gordon (2009).
The effect of diet on the human gut microbiome: a metagenomic analysis in humanized
gnotobiotic mice. Sci Transl Med 1(6): 6ra14.
Turner, D., A. R. Otley, D. Mack, J. Hyams, J. de Bruijne, K. Uusoue, T. D. Walters, M.
Zachos, P. Mamula, D. E. Beaton, A. H. Steinhart and A. M. Griffiths (2007).
Development, validation, and evaluation of a pediatric ulcerative colitis activity index: a
prospective multicenter study. Gastroenterology 133(2): 423-432.
Underhill, D. M. and I. D. Iliev (2014). The mycobiota: interactions between commensal
fungi and the host immune system. Nat Rev Immunol 14(6): 405-416.

215
Urban, C. F., S. Lourido and A. Zychlinsky (2006). How do microbes evade neutrophil
killing? Cell Microbiol 8(11): 1687-1696.
Ursell, L. K., H. J. Haiser, W. Van Treuren, N. Garg, L. Reddivari, J. Vanamala, P. C.
Dorrestein, P. J. Turnbaugh and R. Knight (2014). The intestinal metabolome: an
intersection between microbiota and host. Gastroenterology 146(6): 1470-1476.
Vaahtovuo, J., E. Munukka, M. Korkeamaki, R. Luukkainen and P. Toivanen (2008). Fecal
microbiota in early rheumatoid arthritis. J Rheumatol 35(8): 1500-1505.
van Elsas, J. D., G. F. Duarte, A. Keijzer-Wolters and E. Smit (2000). Analysis of the
dynamics of fungal communities in soil via fungal-specific PCR of soil DNA followed by
denaturing gradient gel electrophoresis. J Microbiol Methods 43(2): 133-151.
Van Limbergen, J., R. K. Russell, H. E. Drummond, M. C. Aldhous, N. K. Round, E. R.
Nimmo, L. Smith, P. M. Gillett, P. McGrogan, L. T. Weaver, W. M. Bisset, G. Mahdi, I.
D. Arnott, J. Satsangi and D. C. Wilson (2008). Definition of phenotypic characteristics of
childhood-onset inflammatory bowel disease. Gastroenterology 135(4): 1114-1122.
Vardjan, T., P. Mohar Lorbeg, I. Rogelj and A. Canzek Majhenic (2013). Characterization
and stability of lactobacilli and yeast microbiota in kefir grains. J Dairy Sci 96(5): 2729-
2736.
Vautier, S., R. A. Drummond, K. Chen, G. I. Murray, D. Kadosh, A. J. Brown, N. A. Gow,
D. M. MacCallum, J. K. Kolls and G. D. Brown (2015). Candida albicans colonization and
dissemination from the murine gastrointestinal tract: the influence of morphology and
Th17 immunity. Cell Microbiol 17(4): 445-450.
Vermes, A., H. J. Guchelaar and J. Dankert (2000). Flucytosine: a review of its
pharmacology, clinical indications, pharmacokinetics, toxicity and drug interactions. J
Antimicrob Chemother 46(2): 171-179.
Vernier-Massouille, G., M. Balde, J. Salleron, D. Turck, J. L. Dupas, O. Mouterde, V.
Merle, J. L. Salomez, J. Branche, R. Marti, E. Lerebours, A. Cortot, C. Gower-Rousseau
and J. F. Colombel (2008). Natural history of pediatric Crohn's disease: a population-based
cohort study. Gastroenterology 135(4): 1106-1113.
Vieira, O. V., R. J. Botelho and S. Grinstein (2002). Phagosome maturation: aging
gracefully. Biochem J 366(Pt 3): 689-704.
Vopalenska, I., M. Hulkova, B. Janderova and Z. Palkova (2005). The morphology of
Saccharomyces cerevisiae colonies is affected by cell adhesion and the budding pattern.
Res Microbiol 156(9): 921-931.
Waidmann, M., O. Bechtold, J. S. Frick, H. A. Lehr, S. Schubert, U. Dobrindt, J. Loeffler,
E. Bohn and I. B. Autenrieth (2003). Bacteroides vulgatus protects against Escherichia

216
coli-induced colitis in gnotobiotic interleukin-2-deficient mice. Gastroenterology 125(1):
162-177.
Walker, A. W., J. Ince, S. H. Duncan, L. M. Webster, G. Holtrop, X. Ze, D. Brown, M. D.
Stares, P. Scott, A. Bergerat, P. Louis, F. McIntosh, A. M. Johnstone, G. E. Lobley, J.
Parkhill and H. J. Flint (2011). Dominant and diet-responsive groups of bacteria within the
human colonic microbiota. ISME J 5(2): 220-230.
Wang, C., B. Esteve-Zarzoso and A. Mas (2014). Monitoring of Saccharomyces cerevisiae,
Hanseniaspora uvarum, and Starmerella bacillaris (synonym Candida zemplinina)
populations during alcoholic fermentation by fluorescence in situ hybridization. Int J Food
Microbiol 191: 1-9.
Wang, Q., G. M. Garrity, J. M. Tiedje and J. R. Cole (2007). Naive Bayesian classifier for
rapid assignment of rRNA sequences into the new bacterial taxonomy. Appl Environ
Microbiol 73(16): 5261-5267.
Wang, T. J., M. G. Larson, R. S. Vasan, S. Cheng, E. P. Rhee, E. McCabe, G. D. Lewis, C.
S. Fox, P. F. Jacques, C. Fernandez, C. J. O'Donnell, S. A. Carr, V. K. Mootha, J. C.
Florez, A. Souza, O. Melander, C. B. Clish and R. E. Gerszten (2011). Metabolite profiles
and the risk of developing diabetes. Nat Med 17(4): 448-453.
Wang, W., L. Chen, R. Zhou, X. Wang, L. Song, S. Huang, G. Wang and B. Xia (2014).
Increased proportions of Bifidobacterium and the Lactobacillus group and loss of butyrate-
producing bacteria in inflammatory bowel disease. J Clin Microbiol 52(2): 398-406.
Wang, Z., E. Klipfell, B. J. Bennett, R. Koeth, B. S. Levison, B. Dugar, A. E. Feldstein, E.
B. Britt, X. Fu, Y. M. Chung, Y. Wu, P. Schauer, J. D. Smith, H. Allayee, W. H. Tang, J.
A. DiDonato, A. J. Lusis and S. L. Hazen (2011). Gut flora metabolism of
phosphatidylcholine promotes cardiovascular disease. Nature 472(7341): 57-63.
Wang, Z., A. B. Roberts, J. A. Buffa, B. S. Levison, W. Zhu, E. Org, X. Gu, Y. Huang, M.
Zamanian-Daryoush, M. K. Culley, A. J. DiDonato, X. Fu, J. E. Hazen, D. Krajcik, J. A.
DiDonato, A. J. Lusis and S. L. Hazen (2015). Non-lethal Inhibition of Gut Microbial
Trimethylamine Production for the Treatment of Atherosclerosis. Cell 163(7): 1585-1595.
Wei, X., X. Yan, D. Zou, Z. Yang, X. Wang, W. Liu, S. Wang, X. Li, J. Han, L. Huang
and J. Yuan (2013). Abnormal fecal microbiota community and functions in patients with
hepatitis B liver cirrhosis as revealed by a metagenomic approach. BMC Gastroenterol 13:
175.
Weinstock, G. M. (2012). Genomic approaches to studying the human microbiota. Nature
489(7415): 250-256.
Wen, L., R. E. Ley, P. Y. Volchkov, P. B. Stranges, L. Avanesyan, A. C. Stonebraker, C.
Hu, F. S. Wong, G. L. Szot, J. A. Bluestone, J. I. Gordon and A. V. Chervonsky (2008).

217
Innate immunity and intestinal microbiota in the development of Type 1 diabetes. Nature
455(7216): 1109-1113.
Wesemann, D. R., A. J. Portuguese, R. M. Meyers, M. P. Gallagher, K. Cluff-Jones, J. M.
Magee, R. A. Panchakshari, S. J. Rodig, T. B. Kepler and F. W. Alt (2013). Microbial
colonization influences early B-lineage development in the gut lamina propria. Nature
501(7465): 112-115.
Wesolowska-Andersen, A., M. I. Bahl, V. Carvalho, K. Kristiansen, T. Sicheritz-Ponten,
R. Gupta and T. R. Licht (2014). Choice of bacterial DNA extraction method from fecal
material influences community structure as evaluated by metagenomic analysis.
Microbiome 2: 19.
West, C. E., M. C. Jenmalm and S. L. Prescott (2015). The gut microbiota and its role in
the development of allergic disease: a wider perspective. Clin Exp Allergy 45(1): 43-53.
Westfall, P. H. and S. S. Young (1993). Resampling-based multiple testing: Examples and
methods for p-value adjustment, John Wiley & Sons.
Whanger, P. D. (2002). Selenocompounds in plants and animals and their biological
significance. J Am Coll Nutr 21(3): 223-232.
White, J. R., N. Nagarajan and M. Pop (2009). Statistical methods for detecting
differentially abundant features in clinical metagenomic samples. PLoS Comput Biol 5(4):
e1000352.
Williams, B. L., M. Hornig, T. Parekh and W. I. Lipkin (2012). Application of novel PCR-
based methods for detection, quantitation, and phylogenetic characterization of Sutterella
species in intestinal biopsy samples from children with autism and gastrointestinal
disturbances. MBio 3(1).
Willing, B. P., J. Dicksved, J. Halfvarson, A. F. Andersson, M. Lucio, Z. Zheng, G.
Jarnerot, C. Tysk, J. K. Jansson and L. Engstrand (2010). A pyrosequencing study in twins
shows that gastrointestinal microbial profiles vary with inflammatory bowel disease
phenotypes. Gastroenterology 139(6): 1844-1854 e1841.
Witthoft, T., C. S. Pilz, K. Fellermann, M. Nitschke, E. F. Stange and D. Ludwig (2005).
Enhanced human beta-defensin-2 (hBD-2) expression by corticosteroids is independent of
NF-kappaB in colonic epithelial cells (CaCo2). Dig Dis Sci 50(7): 1252-1259.
Woese, C. R. and G. E. Fox (1977). Phylogenetic structure of the prokaryotic domain: the
primary kingdoms. Proc Natl Acad Sci U S A 74(11): 5088-5090.
Woese, C. R., G. E. Fox, L. Zablen, T. Uchida, L. Bonen, K. Pechman, B. J. Lewis and D.
Stahl (1975). Conservation of primary structure in 16S ribosomal RNA. Nature 254(5495):
83-86.

218
Woting, A., N. Pfeiffer, G. Loh, S. Klaus and M. Blaut (2014). Clostridium ramosum
promotes high-fat diet-induced obesity in gnotobiotic mouse models. MBio 5(5): e01530-
01514.
Wu, G. D., J. Chen, C. Hoffmann, K. Bittinger, Y. Y. Chen, S. A. Keilbaugh, M. Bewtra,
D. Knights, W. A. Walters, R. Knight, R. Sinha, E. Gilroy, K. Gupta, R. Baldassano, L.
Nessel, H. Li, F. D. Bushman and J. D. Lewis (2011). Linking long-term dietary patterns
with gut microbial enterotypes. Science 334(6052): 105-108.
Xu, J., C. M. Boyd, E. Livingston, W. Meyer, J. F. Madden and T. G. Mitchell (1999).
Species and genotypic diversities and similarities of pathogenic yeasts colonizing women.
J Clin Microbiol 37(12): 3835-3843.
Yang, L., X. Lu, C. W. Nossa, F. Francois, R. M. Peek and Z. Pei (2009). Inflammation
and intestinal metaplasia of the distal esophagus are associated with alterations in the
microbiome. Gastroenterology 137(2): 588-597.
Yatsunenko, T., F. E. Rey, M. J. Manary, I. Trehan, M. G. Dominguez-Bello, M.
Contreras, M. Magris, G. Hidalgo, R. N. Baldassano, A. P. Anokhin, A. C. Heath, B.
Warner, J. Reeder, J. Kuczynski, J. G. Caporaso, C. A. Lozupone, C. Lauber, J. C.
Clemente, D. Knights, R. Knight and J. I. Gordon (2012). Human gut microbiome viewed
across age and geography. Nature 486(7402): 222-227.
Yeoh, N., J. P. Burton, P. Suppiah, G. Reid and S. Stebbings (2013). The role of the
microbiome in rheumatic diseases. Curr Rheumatol Rep 15(3): 314.
Yoshioka, H., K. Iseki and K. Fujita (1983). Development and differences of intestinal
flora in the neonatal period in breast-fed and bottle-fed infants. Pediatrics 72(3): 317-321.
Zelante, T. and P. Ricciardi-Castagnoli (2012). The yin-yang nature of CSF1R-binding
cytokines. Nat Immunol 13(8): 717-719.
Zhang, Q., Y. Wu, J. Wang, G. Wu, W. Long, Z. Xue, L. Wang, X. Zhang, X. Pang, Y.
Zhao, L. Zhao and C. Zhang (2016). Accelerated dysbiosis of gut microbiota during
aggravation of DSS-induced colitis by a butyrate-producing bacterium. Sci Rep 6: 27572.
Zhang, X., D. Shen, Z. Fang, Z. Jie, X. Qiu, C. Zhang, Y. Chen and L. Ji (2013). Human
gut microbiota changes reveal the progression of glucose intolerance. PLoS One 8(8):
e71108.
Zhang, X., D. Zhang, H. Jia, Q. Feng, D. Wang, D. Liang, X. Wu, J. Li, L. Tang, Y. Li, Z.
Lan, B. Chen, Y. Li, H. Zhong, H. Xie, Z. Jie, W. Chen, S. Tang, X. Xu, X. Wang, X. Cai,
S. Liu, Y. Xia, J. et al. (2015). The oral and gut microbiomes are perturbed in rheumatoid
arthritis and partly normalized after treatment. Nat Med 21(8): 895-905.

219
Zhang, Y. Z. and Y. Y. Li (2014). Inflammatory bowel disease: pathogenesis. World J
Gastroenterol 20(1): 91-99.
Zhao, L. (2013). The gut microbiota and obesity: from correlation to causality. Nat Rev
Microbiol 11(9): 639-647.
Zhong, D., R. Brower-Sinning, B. Firek and M. J. Morowitz (2014). Acute appendicitis in
children is associated with an abundance of bacteria from the phylum Fusobacteria. J
Pediatr Surg 49(3): 441-446.
Zhu, W., J. C. Gregory, E. Org, J. A. Buffa, N. Gupta, Z. Wang, L. Li, X. Fu, Y. Wu, M.
Mehrabian, R. B. Sartor, T. M. McIntyre, R. L. Silverstein, W. H. Tang, J. A. DiDonato, J.
M. Brown, A. J. Lusis and S. L. Hazen (2016). Gut Microbial Metabolite TMAO Enhances
Platelet Hyperreactivity and Thrombosis Risk. Cell 165(1): 111-124.
Zilber-Rosenberg, I. and E. Rosenberg (2008). Role of microorganisms in the evolution of
animals and plants: the hologenome theory of evolution. FEMS Microbiol Rev 32(5): 723-
735.
Zoetendal, E. G., H. G. Heilig, E. S. Klaassens, C. C. Booijink, M. Kleerebezem, H. Smidt
and W. M. de Vos (2006). Isolation of DNA from bacterial samples of the human
gastrointestinal tract. Nat Protoc 1(2): 870-873.

220
10. Publications

ORIGINAL ARTICLE
Phenotype and Disease Course of Early-onset PediatricInflammatory Bowel DiseaseMarina Aloi, MD, PhD,1 Paolo Lionetti, MD, PhD,2 Arrigo Barabino, MD,3 Graziella Guariso, MD,4
Stefano Costa, MD,5 Massimo Fontana, MD,6 Claudio Romano, MD,7 Giuliano Lombardi, MD,8
Erasmo Miele, MD,9 Patrizia Alvisi, MD,10 Paolo Diaferia, MD,11 Maurizio Baldi, MD,12
Vittorio Romagnoli, MD,13 Marco Gasparetto, MD,4 Monica Di Paola, PhD,2 Monica Muraca, MD,3
Salvatore Pellegrino, MD,5 Salvatore Cucchiara, MD, PhD,1 and Stefano Martelossi, MD,14 on behalf ofSIGENP IBD Group
Background: Early-onset (EO) pediatric inflammatory bowel diseases (IBD) seem to be more extensive than those with a later onset. To test this hypothesis,we examined the phenotype and disease course of patients with IBD diagnosis at 0 to 5 years, compared with the ranges 6 to 11 and 12 to 18 years.
Methods: Anatomic locations and behaviors were assessed according to Paris classification in 506 consecutive patients: 224 Crohn’s disease, 245ulcerative colitis, and 37 IBD-unclassified.
Results: Eleven percent of patients were in the range 0 to 5 years, 39% in 6 to 11 years, and 50% in 12 to 18 years. Ulcerative colitis was the mostfrequent diagnosis in EO-IBD and in 6- to 11-year-old group, whereas Crohn’s disease was predominant in older children. A classification as IBD-unclassified was more common in the range 0 to 5 years compared with the other groups (P , 0.005). EO Crohn’s disease showed a more frequentisolated colonic (P , 0.005) and upper gastrointestinal involvement than later-onset disease. Sixty-two percent of the patients in the 0 to 5 years range hadpancolonic ulcerative colitis, compared with 38% of 6 to 11 years (P ¼ 0.02) and 31% of 12–18 years (P ¼ 0.002) range. No statistical difference for familyhistory for IBD was found in the 3-year age groups. Therapies at the diagnosis were similar for all children. However, at latest follow-up, a significantly higherproportion of younger children were under steroids compared with older groups (P , 0.05). Surgical risk did not differ according to age.
Conclusions: EO-IBD exhibits an extensive phenotype and benefit from aggressive treatment strategies, although surgical risk is similar to later-onsetdisease. A family history for IBD is not common in EO disease.
(Inflamm Bowel Dis 2014;20:597–605)
Key Words: children, inflammatory bowel disease, early onset
T he inflammatory bowel diseases (IBD), Crohn’s disease (CD)and ulcerative colitis (UC), are complex polygenic disorders,
resulting of an interplay between genetic, environmental, andimmunological factors leading to a dysregulated immune responseof the host to the intestinal microbiota.1,2 Up to 25% of patientsfirst present during childhood or adolescence,3 with early-onset(EO) (0–5 yr) and very early-onset (VEO) diseases (0–2 yr)increasingly reported.4–7 Although data on EO forms are scat-tered, they seem to be characterized by a unique phenotype,extensive and aggressive, which affect the management of thisage group.5 Moreover, prior reports suggest that EO-IBD differepidemiologically and are distinguished by a predominant colonicinvolvement and a greater impact of genetic predisposition, com-pared with older age of onset.8,9 From this point of view,EO disease represents an exceptional model to study the initialhost immune response to characterize genotype–phenotype rela-tions and identify environmental factors influencing diseasedevelopment, as well as to evaluate the natural history of thedisease.10–12 Understanding the factors that contribute to earlyage of onset could potentially facilitate intervention strategydevelopment, thereby influencing disease outcome and risk oflong-term sequelae. Recently, an increased interest for early formsof disease came from the discovery of Crohn’s-like colitis, very
Received for publication December 19, 2013; Accepted January 6, 2014.
From the 1Pediatric Gastroenterology and Liver Unit, Sapienza University ofRome, Rome, Italy; 2Gastroenterology and Nutrition Unit, Meyer Pediatric Hos-pital, Florence, Italy; 3Gastroenterology and Endoscopy Unit, G. Gaslini Institutefor Children, Genoa, Italy; 4Department of Pediatric Gastroenterology, Univer-sity of Padua, Padua, Italy; 5Pediatric Gastroenterology, University of Messina,Messina, Italy; 6Pediatric Department, Buzzi Children’s Hospital of Milan,Milan, Italy; 7Pediatric Gastroenterology and Endoscopy, University of Messina,Messina, Italy; 8Pediatric Gastroenterology and Endoscopy Unit, Spirito SantoHospital, Pescara, Italy; 9Department of Pediatrics, University of Naples Feder-ico II, Naples, Italy; 10Pediatric Department, Maggiore Hospital, Bologna, Italy;11Pediatric Department, Giovanni XXIII Hospital, Bari, Italy; 12Pediatric Gastroen-terology Unit, University of Turin, Turin, Italy; 13Department of Pediatrics, UniversitàPolitecnica delle Marche, Ancona, Italy; and 14Department of Pediatrics, Institute ofChild Health, IRCSS Burlo Garofalo, Trieste, Italy.
The authors have no conflicts of interest to disclose.
Reprints: Stefano Martelossi, MD, Department of Pediatrics, Institute of ChildHealth, IRCSS Burlo Garofalo, Via dell’Istria, 65, Trieste 34137, Italy (e-mail:[email protected]).
Copyright © 2014 Crohn’s & Colitis Foundation of America, Inc.
DOI 10.1097/01.MIB.0000442921.77945.09
Published online 24 February 2014.
Inflamm Bowel Dis � Volume 20, Number 4, April 2014 www.ibdjournal.org | 597

severe and not responding to conventional therapies, associatedwith a defect of the receptor of interleukin 10 (IL-10R) or IL-10itself, in a subset of patients developing the disease within the firstmonths of life.13,14 Such severity and EO point to probable mono-genetic diseases as opposed to the multigenetic trait observed inthe known forms of IBD. This discovery opens new horizons inthe knowledge of the pathogenesis of the disease; hence, a betterclinical definition of early and very early forms of disease maylay the foundation for further studies of genotype–phenotypecorrelation. Thus, primary aim of this study was to evaluatethe phenotype and course of EO-IBD (0–5 yr) compared withpediatric later-onset disease (6–11 and 12–18 yr). Moreover, asa secondary outcome, within the 0- to 5-year group, we evalu-ated potential differences in presentation and behavior of VEOforms of the disease (0–2 yr) than those presenting between3 and 5 years.
PATIENTS AND METHODSPediatric gastroenterologists from all the Italian pediatric
IBD centers belonging to the Pediatric Gastroenterology, Hepatol-ogy and Nutrition Italian Society in 2008 established a prospectiveregistry to collect demographic, clinical, and epidemiologic datafrom pediatric patients with IBD. The registry started at January 1,2009 and included patients less than 18 years with a new diagnosisof IBD. Data of all children enrolled and stored in the registry fromJanuary 1, 2009 to April 22, 2013 (the data retrieval date) wereused for this study. Fourteen sites participated to this study:Pediatric Gastroenterology and Liver Unit, Sapienza Universityof Rome, Rome, Italy; Gastroenterology and Nutrition Unit, MeyerPediatric Hospital, Florence, Italy; Gastroenterology and Endos-copy Unit, G. Gaslini Institute for Children, Genoa, Italy; PediatricGastroenterology, University of Padua, Padua, Italy; PediatricGastroenterology, University of Messina; Department of Pediatrics,University of Milan, Milan, Italy; Pediatric Gastroenterology andEndoscopy, University of Messina; Pediatric Gastroenterology andEndoscopy Unit, Spirito Santo Hospital, Pescara, Pescara, Italy;Department of Pediatrics, University of Naples Federico II, Naples;Pediatric Department, Maggiore Hospital, Bologna, Italy; PediatricDepartment, Giovanni XXIII Hospital, Bari, Italy; PediatricGastroenterology Unit, University of Turin. Turin, Italy;Department of Pediatrics, Università Politecnica delle Marche,Ancona, Italy; Department of Pediatrics, Institute of ChildHealth, IRCSS Burlo Garofalo, Trieste, Italy. Institutionalreview board approval for the registry protocol and the informedconsent and assent forms were obtained at each site before sub-ject enrollment and data collection. Signed parental and patientinformed consent and signed youth assent, when appropriate,were required from all patients enrolled. Trained investigatorsat each center obtained information from the medical records(electronic and paper charts). Standardized information wasentered into the registry. Data were submitted quarterly to thecentral repository at Pediatric Gastroenterology and Liver Unit,Sapienza University of Rome for scrutiny of data quality,
maintenance of data integrity, data storage, and subsequent dataanalysis. The study end date was defined as the date of the mostrecent clinic visit before April 22, 2013.
Eligible subjects included all patients with any form of IBD(UC, CD, and inflammatory bowel disease unclassified [IBDU])who were diagnosed before 18 years of age and followed in thepediatric gastroenterology centers at the participating sites. Onlynew IBD cases, diagnosed after January 1, 2009 were pro-spectively enrolled. Diagnosis of IBD was based on clinicalhistory, physical examination, endoscopic appearance, histologicfindings, and radiologic studies, according to Porto criteria.15 Thelatter implied that ileocolonoscopy and upper gastrointestinalendoscopy were assumed to be performed in all patients, as wellas imaging of the small bowel (except in patients with a definitivediagnosis of UC). Participating centers were also expected to takeat least 2 biopsies from each segment of the gastrointestinal tract(esophagus, stomach, duodenum, terminal ileum, and all seg-ments of the colon) and to record the endoscopic and histologicfindings from each segment separately. Allergic disorders (immu-noglobulin E, skin prick, and patch tests) and infectious enteritisor colitis (Salmonella, Shigella, Escherichia coli, Yersinia, Clos-tridium difficile toxins, Entamoeba histolytica stool samples) wereexcluded during the initial work-up. Immunological defects werealso ruled out in all patients with suspected EO-IBD by routinelytesting immunoglobulin levels, autoantibodies, lymphocyte phe-notyping, granulocytes function, and oxidative burst. Mutations inthe IL-10R and IL-10 genes were also evaluated in all childrenwith VEO forms of IBD (,2 yr). Only patients with a final diag-nosis of IBD with no other immunological (including those withconfirmed IL-10R or IL-10 axis mutations), allergic, or infectiousdiseases were included in the registry.
If the length of follow-up was less than 6 months, the datawere excluded from the analysis. The information retrieved for thepurpose of this study included demographic features (age, sex),family history of IBD, IBD type (CD, UC, IBDU), and diseasedistribution. A family history for IBD was defined by the presenceof CD or UC in first-degree relatives only. EO-IBD was defined asa diagnosis made in patients of 0 to 5 years of age. Within thisgroup, VEO-IBD was defined as a diagnosis of IBD madebetween 0 and 2 years of age. The disease location at thediagnosis and at follow-up was established by endoscopic andimaging evaluations in all patients according to the availability ofindividual methods for each center and reported in the registry.For the purpose of this article, disease location was describedaccording to Paris classification.16 For CD, L1 was defined as aninvolvement of the terminal ileum and limited cecal disease, L2 anisolated colitis, L3 an ileocolonic disease, L4a an upper diseaseproximal to Ligament of Treitz, whereas L4b distal to ligament ofTreitz and proximal to distal 1/3 ileum. For UC, proctitis (E1) wasdefined as an involvement limited to the rectum (i.e., proximalextent of inflammation distal to the rectosigmoid junction). Left-sided UC (E2) was defined as an involvement limited to theportion of the colorectum distal to the splenic flexure. ExtensiveUC (E3) was defined as a disease extending proximally to the
Aloi et al Inflamm Bowel Dis � Volume 20, Number 4, April 2014
598 | www.ibdjournal.org

splenic flexure but distally to the hepatic flexure, whereas panco-litis (E4) included a colitis extended proximally to the hepaticflexure.
Symptoms at onset of disease included abdominal pain,diarrhea, rectal bleeding, perianal disease, and growth failure.Disease activity at the diagnosis was scored by the PediatricCrohn’s Disease Activity Index (PCDAI)17 or the PediatricUlcerative Colitis Activity Index (PUCAI)18 for CD and UC,respectively. Laboratory tests included full blood count, C-reactiveprotein, erythrocyte sedimentation rate, perinuclear anti-neutrophilcytoplasmic antibodies (p-ANCA), anti-Saccharomyces cerevi-siae antibodies (ASCA), nutritional, renal and liver functionparameters. Endoscopic and imaging examinations carried outat the diagnosis and follow-up included ileocolonoscopy, esoph-agogastroduodenoscopy, enteroscopy, capsule endoscopy ultra-sound with or without oral contrast, and magnetic resonanceimaging.
Medications comprised 6-mercaptopurine (6-MP)/azathio-prine, methotrexate, thalidomide, cyclosporine, biological therapy(infliximab or adalimumab), nutritional therapy, and cortico-steroids (oral [budesonide, prednisone, prednisolone] and intra-venous [methylprednisolone]). Surgical procedures included allintestinal resections.
Extraintestinal manifestations (EIMs) included skin, joint,and ocular manifestations; pancreatitis; osteopenia; primary scle-rosing cholangitis; and growth failure. Patient data were updatedevery 6 months, by entering in the registry every evaluation madeby patients. Every 6 months, clinical data, PUCAI/PCDAI, medicaland surgical therapy, laboratory tests (those performed at diagno-sis), imaging and/or endoscopic evaluation, and complications ofthe disease, were reported.
For the purpose of this study, all previous information wereanalyzed and compared in all patient populations. As a primaryoutcome of the study, recorded data of patients 0 to 5 years (EO)were compared with those with a later onset, divided in 2 groups(6–11 and 12–18 yr). As a secondary outcome, we evaluatedwithin the population with EO-IBD the phenotype and naturalhistory of VEO (0–2 yr) forms compared with those diagnosedin children aged 3 to 5 years.
Statistical MethodsAll data were summarized and displayed as the mean 6 SD
for the continuous variables. Categorical data were expressed asfrequencies and percentages. Comparison of groups was per-formed using Student’s t test for unpaired data in two-group com-parison and one-way analysis of variance with Bonferroni’s testfor multiple group comparison. Chi-square test with Fisher’s cor-rection was used to evaluate the differences for categorical vari-ables wherever needed. A P value of 0.05 or less was consideredsignificant. Odds ratios from univariate logistic regression modelswere used to assess differences by age group in the prevalence ofsymptoms at disease onset and laboratory values at diagnosis. TheKaplan–Meier survival method was used to estimate the intervalfree from surgery during follow-up. Differences between curves
were tested using the Log-Rank test. The GraphPad statisticalpackage was used to perform all statistical evaluations (GraphPadSoftware, Inc., San Diego, CA).
RESULTS
PopulationFrom 2009 to 2013, we identified 688 patients with
a diagnosis of IBD, 182 had a length of follow-up less than6 months and were excluded from the analysis. Five hundred sixchildren met the inclusion criteria and were enrolled in the study.Fifty-four percent were males and mean age at the diagnosis was10.2 years (range, 0.8–18.3). Mean follow-up was 40 months(range, 6–50). Eleven percent (n ¼ 54) of patients were in therange 0 to 5 years of age, 39% (n ¼ 197) in 6 to 11 years, and50% (n ¼ 255) in 12 to 18 years. Table 1 highlights the mainclinical characteristics of 506 enrolled patients. Table 2 shows theprevalence of EO-IBD reported in previous studies compared withour cohort.
Initial Classification and Location ofthe Disease
All patients had a complete ileocolonoscopy under generalanesthesia or deep sedation at the diagnosis. Fifty-five percent hadan esophagogastroduodenoscopy and 48% also had an evaluationof the small-bowel (78% CD, 21% UC): of them, 52% underwentultrasound, 43% magnetic resonance imaging, 17% capsuleendoscopy, and 6% enteroscopy. Thirty-seven percent of patientshad 2 or more methods for imaging the small bowel. At thediagnosis, 224 were classified as CD (44%), 245 as UC (48%),and 37 as IBDU (7%). UC was the most frequent diagnosis inEO-IBD (59%) and in 6- to 11-year-old group (53%), comparedwith children of 12 to 18 years of age (42.5%) (P ¼ 0.03 versus0- to 5-yr group), whereas CD was predominant in the latter (P ,0.0001 versus 0- to 5-yr group). A classification as IBDU wasmore common in the range 0 to 5 years (22%) compared with theother groups (7% in 6- to 11-yr and 3.5% in 12- to 18-yr group;P ¼ 0.002 and P , 0.0001, respectively). Table 3 shows theinitial classification of EO-IBD in our cohort compared with pub-lished data. Fifty percent of children with EO-CD presented anisolated colonic disease (L2) compared with 14% in 6- to 11-yearand 16% in 12- to 18-year group (P, 0.005). No significant differ-ences were found for the other CD locations among the 3 groups,although an isolated ileal disease (L1) was rare in 0- to 5-year group(10% versus 23% in 6–11 yr and 52% in 12–18 yr), and an uppergastrointestinal involvement was more frequent in younger children(30% versus 18% in 6–11 yr and 16% in 12–18 yr). Figure 1 showsthe CD location in all groups.
Among patients with UC, 62% of patients in the 0- to5-year range had a pancolitis, compared with 38% of 6- to 11-year(P ¼ 0.02) and 28% of 12- to 18-year range (P ¼ 0.002). No othersignificant differences were found for the other UC locationamong the 3 groups (Fig. 2).
Inflamm Bowel Dis � Volume 20, Number 4, April 2014 Phenotype and Disease Course of EO Pediatric IBD
www.ibdjournal.org | 599

Classification and Disease Extent at Follow-upAt follow-up, a change in diagnosis was reported in 2% of
all patients: 40% of children in 0- to 5-year group receiveda change of the initial diagnosis during the follow-up, 50% of 6 to11 years, and 10% of 12–18 years (P¼ 0.003, 0–5 versus 12–18 yr).Among children with EO disease initially classified as IBDU,3 (25%) were finally diagnosed as UC, 1 (8%) as CD, whereas67% continued to be classified as IBDU. No significant differenceswere found for disease extent at 40-month follow-up, althougha higher proportion of children with EO-CD presented an extensionof the disease involving ileum and colon (L3) at the last evaluationcompared with the diagnosis (60% versus 40%; P ¼ 0.65). We didnot find significant changes in the CD and UC location at follow-upin older age groups.
Clinical PresentationTable 4 shows the clinical presentation in the 3 age groups.
EIMs were detected in 28% of patients at the diagnosis: skininvolvement (n ¼ 45), axial arthropathies (n ¼ 10), peripheralarthritis/arthralgia (n ¼ 50), pancreatic involvement (n ¼ 5), and
osteopenia (n¼ 4). Growth failure at diagnosis was reported in 22%of children. No significant differences were found for the prevalenceof EIMs among the 3 age groups. Other clinical variables at thediagnosis, such as PCDAI or PUCAI, hemoglobin, white blood cellcount, erythrocyte sedimentation rate, C-reactive protein, hypoalbu-minemia, positive perinuclear antineutrophil cytoplasmic antibod-ies, and anti-S. cerevisiae antibodies did not differ by age group.
Medical and Surgical TreatmentFifty-seven percent of patients started corticosteroids, 35%
azathioprine, 4% methotrexate, 16% nutritional therapy, 5%biologics, 2% thalidomide, and 2% cyclosporine.
At the diagnosis, no significant differences were foundamong the 3 groups in the corticosteroid need, although at thelatest follow-up, a significantly higher proportion of patients withEO-IBD were under steroids compared with 12- to 18-year group(P , 0.05). The use of other therapies at diagnosis and follow-up(i.e., nutritional therapy, immunomodulators, and biologics) didnot significantly differ among the 3 groups. Figures 3 and 4 showthe different therapies underwent by patients.
Sixty patients underwent surgery at least once betweendiagnosis and last follow-up, resulting in a crude surgical rate of
TABLE 1. Clinical Characteristics of 506 Children with IBD
Age 0–5 yr, n ¼ 54 (11%) Age 6–11 yr, n ¼ 197 (39%) Age 12–18 yr, n ¼ 255 (50%) P
Sex (males) 23 (42%) 82 (41%) 170 (67%) 0.94a; ,0.001b
Follow-up (range), mo 44 (11–50) 40 (6–48) 36 (6–46) 0.26a; 0.08b
Diagnostic delay (.6 mo) 16 (29%) 52 (26%) 72 (28%) 0.72a; 0.86b
Diagnosis
CD 10 (18%) 78 (40%) 137 (54%) 0.006a; ,0.0001b
UC 32 (59%) 105 (53%) 108 (42.5%) 0.56a; 0.03b
IBDU 12 (22%) 14 (7%) 9 (3.5%) 0.002a; ,0.0001b
Family history for IBD 6 (11%) 30 (15%) 29 (11%) 0.58a; 0.94b
Disease activity (at the diagnosis)
PUCAI (mean 6 SD) 30.7 6 17.2 33.8 6 19.5 36.4 6 18.1 0.54a; 0.52b
PCDAI (mean 6 SD) 25 6 6.3 21.6 6 13.4 21.3 6 14.3 0.53a; 0.23b
a0 to 5 versus 6 to 11 years.b0 to 5 versus 12 to 18 years.
TABLE 2. Prevalence of EO-IBD in Our CohortCompared with Previous Studies
Population EO-IBD, %
Aloi et al19 506 11Griffiths20 503 4
Gupta et al5 600 9
Paul et al21 413 12
Sawczenko and Sandhu22 739 4
Heyman et al10 1370 15
TABLE 3. IBD Type at the Diagnosis in Our Cohort ofEO-IBD Compared with Published Data
CD, % UC, % IBDU, %
Aloi et al19 18 59 22
Paul et al21 34 66 0
Sawczenko and Sandhu22 31 38 24
Heyman et al10 35 40 27
Mamula et al23 33 44 23
Aloi et al Inflamm Bowel Dis � Volume 20, Number 4, April 2014
600 | www.ibdjournal.org

12%. No significant differences for surgical risk were reportedamong the 3 age groups (Fig. 5).
Subgroup Analysis of VEO-IBDFinally, among children with EO-IBD, we made a subgroup
analysis evaluating potential peculiarities in presentation anddisease course of very early forms (0–2 yr) compared with dis-eases presenting in children of 3 to 5 years of age. The diagnosisof UC was the most common in both groups, although numeri-cally higher in 3 to 5 years (68% versus 40%). Both groups werecharacterized by an extensive disease at the diagnosis, pancolonicinvolvement in UC, and an isolated colitis for CD. Upper gastro-intestinal involvement was more common in children of 3 to5 years than the very younger, although the difference was notsignificant. Other variables at the diagnosis and at follow-up, i.e.,
sex, family history for IBD, delay of the diagnosis (.6 mo),EIMs, mean PUCAI and PCDAI at the diagnosis, C-reactive pro-tein, and perinuclear antineutrophil cytoplasmic antibodies at thediagnosis and changes of the diagnosis at follow-up did not differbetween the 2 groups (Table 5).
DISCUSSIONReports of pediatric IBD have been published for several
years.20–23 Recently, evidence for increased incidence of IBD inyoung children and the identification of early forms of severe dis-ease have represented a significant step forward the understandingof the pathogenesis underlying IBD, determining renewed interestin the younger age group.13,14,24,25 The most relevant discovery inthis field has been the recognition of forms of Crohn’s-like colitis
FIGURE 1. Disease location at the diagnosis according to Paris classification in EO-CD (0–5 yr) and later-onset CD (6–11 and 12–18 yr). L1: ileum, L2:colon; L3: ileocolon; L4: upper gastrointestinal; p: perianal disease.
FIGURE 2. Disease location at the diagnosis according to Paris classification in EO-UC (0–5 yr) and later-onset UC (6–11 and 12–18 yr). E1: proctitis;E2: left-sided colitis; E3: extensive colitis; E4: pancolitis.
Inflamm Bowel Dis � Volume 20, Number 4, April 2014 Phenotype and Disease Course of EO Pediatric IBD
www.ibdjournal.org | 601

with perianal involvement and onset in the first months of life,associated with a defect of IL-10R or IL-10 itself.13,14 These dis-eases present a Mendelian pattern of heritability, differently to themultigenetic trait observed in the known forms of IBD, addingthem to the group of primary immunodeficiencies resulting insevere dysregulation of the intestinal immune system.25 For thisreason, we did not included these forms in the registry and in thisstudy.
Our study not only adds new data on the peculiarities ofEO-IBD, in terms of phenotype and disease course, but alsorepresents a full application of the Paris classification of IBD ina large population of children. Detailed follow-up of 506 pediatricpatients followed in the main tertiary referral centers for IBD inItaly has allowed us to evaluate these findings, particularly theinitial clinical presentation and the disease progression.
Data were collected by a structured prospective registry,including all newly diagnosed pediatric IBD patients in Italy fromJanuary 1, 2009. Our results confirm that the phenotype ofpediatric IBD patients differs according to age, and that the EOdisease is extensive and severe already at the presentation.Clinical data on the EO-IBD are scarce because this age grouprepresents only a small portion of the pediatric population.Griffiths20 in a cohort of children with IBD (n ¼ 503) found
4% to be less than 5 years at diagnosis. More recently, Guptaet al5 presented their results in 600 children with CD: 9% of themwere 0 to 5 years old at the time of diagnosis. In our cohort, 11%(n ¼ 54) were less than 5 years at the time of diagnosis and 4%less than 2 years. Among the younger children, the diagnosis ofUC was the most common, although a significant number ofpatients received a diagnosis of IBDU (22%). These data aresimilar to those reported in 2002 by Mamula et al,23 showingan indeterminate colitis in 23% of 82 children with EO-IBD.Strikingly, many of our children with IBDU maintained this diag-nosis during the follow-up, suggesting the strain of makinga definitive diagnosis in younger children. During the course ofthe disease, diagnosis changes occurred more frequently in youn-ger than older children, although the difference was not signifi-cant. We cannot exclude that the small number of youngerchildren has influenced the statistical significance of this result.
Overall, our population of childhood-onset IBD wascharacterized by a widespread anatomical involvement in allage groups. CD presented with an extensive phenotype, regardlessof the age at the diagnosis. EO-CD was characterized bysignificantly higher rates of isolated colonic CD, compared witholder children. These data are consistent with that reported byHeyman et al10 from the North American Pediatric IBD
TABLE 4. Prevalence of Clinical Symptoms at Presentation
0–5 yr, n ¼ 54 (%) 6–11 yr, n ¼ 197 (%) Odds Ratio,a (95% CI) P 12–18 yr, n ¼ 254 (%)
Odds Ratio,a
(95% CI) P
Abdominal pain 27 (50) 139 (70) 0.41 (0.22–0.77) 0.005 147 (58) 0.72 (0.40–1.3) 0.29Rectal bleeding 39 (72) 109 (55) 2.09 (1.0–4.0) 0.02 127 (50) 2.09 (1.3–4.9) 0.004
Diarrhea 33 (61) 108 (56) 1.2 (0.7–2.3) 0.44 139 (55) 1.3 (0.7–2.3) 0.45
Growth failure 9 (17) 49 (24) 0.60 (0.2–1.3) 0.27 62 (24) 0.61 (0.28–1.3) 0.28
Perianal disease 6 (11) 26 (13) 0.80 (0.3–2.0) 0.81 39 (15) 0.67 (0.27–1.6) 0.52
aThe 0- to 5-year group is the reference group.
FIGURE 3. Immunomodulator and steroid therapy at diagnosis and follow-up in 0- to 5-year, 6- to 11-year, and 12- to 18-year group. *P , 0.05,0- to 5-year versus 12- to 18-year group.
Aloi et al Inflamm Bowel Dis � Volume 20, Number 4, April 2014
602 | www.ibdjournal.org

Consortium Registry. In 1370 children, the prevalence of isolatedcolonic disease was significantly higher in younger (less than 8 yrof age) compared with older children. Paul et al21 reported datafrom 413 children with IBD and compared children presentingbefore and after the age of 5 years. In the EO group, 76% had anisolated colonic disease, 34% ileocolonic, whereas 0% had ilealinvolvement only. Conversely, older children mainly presentedwith ileocolonic involvement (48%). Also in our cohort, the pro-portion of patients with an ileocolonic involvement at the diag-nosis was higher in older children. We also found that one-third ofyounger patients presented an upper gastrointestinal involvementalready at the diagnosis. This result is remarkable because, to ourknowledge, there are no previous studies on EO-IBD indicatingthe involvement of the upper gastrointestinal tract in this agegroup. Our study, by using the Paris classification, allowed usto accurately define this finding. Overall, 6% of our pediatricpopulation presented lesions of the upper gastrointestinal seg-ment. This figure is close to prior reports in children.3,26 Morethan half of our patients underwent an upper and lower endoscopyat the diagnosis, and almost half also small-bowel imaging. Thewide range of investigation may explain the high prevalence ofupper gastrointestinal involvement. Nevertheless, our analysisbased on the Paris classification, seem to confirm the significantdifferences between CD location in pediatric-onset, notably EOdisease and adult onset CD.27
Overall, an extensive disease location was also demon-strated for pediatric UC, although the proportion of patientshaving a pancolitis already at the diagnosis was significantlyhigher in younger than older children. Our study not only isconsistent with previous data indicating a widespread extension ofpediatric UC,19,28,29 but directly compares early- with later-onsetcohort in the same population of pediatric patients (62% of youn-ger children presented a pancolitis at the diagnosis compared with38% in older group). We did not find a high overall rate of diseaseextension at follow-up; thus at the end of the study, the diseaseextent was similar to that at the diagnosis. These data are, some-what at variance with other pediatric studies, suggesting a highrate of disease extension in pediatric UC and CD.28 One expla-nation could be the short follow-up of our study (40 mo). Longer,prospective studies on the disease course of EO-IBD may confirmthese data.
In terms of clinical presentation, rectal bleeding was themost common symptom in younger children, whereas the olderage group presented with more varied symptoms. This figure canbe explained by the homogeneous colonic involvement in the EOdisease, while multiple locations with more variable clinicalpictures were found in later-onset forms. Several data suggest thatthe EO-IBD present a stronger genetic impact than the later-onsetdisease.30–32 Differently from these reports, we did not find sig-nificant differences for family history between the EO and thelater-onset groups. One explanation may lie in the fact that wehave only considered the first-degree relatives, not extending tothe rest of the family. This could have reduced the number ofpatients with a family history in our cohort. Subsequent studies inthis population to investigate the impact of genetic backgroundand potential combinations of genetic and environmental influen-ces in disease onset are therefore needed.
Some data suggest a higher “severity” in terms of behaviorand disease course of EO-IBD.28 We evaluated the need of cor-ticosteroids, immunomodulators, biologics, and surgery in anattempt to identify differences in severity according to age.We did not find significant differences in medical therapeutic
FIGURE 4. Nutritional and biological therapy at diagnosis and follow-up in 0- to 5-year, 6- to 11-year, and 12- to 18-year group.
FIGURE 5. Cumulative risk of surgery in 506 children with IBDaccording to the age at diagnosis.
Inflamm Bowel Dis � Volume 20, Number 4, April 2014 Phenotype and Disease Course of EO Pediatric IBD
www.ibdjournal.org | 603

strategy at the diagnosis among the 3 groups, indirectly suggest-ing a similar response to treatment regardless of age. Although,at the maximum follow-up, a significant number of children inthe 0- to 5-year age group needed steroids. This might suggesta more aggressive disease than in older children, although theuse of other drugs was not different. Moreover, our data suggesta similar. However, evaluation of these results as a surrogate forseverity is difficult, and confounded by various factors, particu-larly the variability among individual physicians in the use ofthese agents.
Sixty patients underwent surgery at least once betweendiagnosis and maximal follow-up, resulting in a crude surgicalrate of 12%. This figure is close to previous French and NorthAmerican studies.33,34 We did not find differences according toage, probably the short time of follow-up influenced this result.
This study has some limitations. Our registry is based onpatient data from large regional referral centers, which may notallow extrapolation to the real Italian pediatric population withIBD. However, children with chronic disease tend to be referredto tertiary referral centers such as these, and unlike adults withIBD, they are rarely treated exclusively by a primary carepediatrician.
In summary, our data suggest not only that the number ofEO-IBD is steadily increasing, but also that the phenotype isextensive and aggressive already at the onset of the disease. Thewidespread location of CD and UC, notably younger patients,may suggest the use of immunomodulatory and biologic agentsearly in the course of the disease. Nevertheless, those therapiesshould be ideally targeted on those patients with a more “severe”disease, thus future studies on genetic, clinical, and serologic riskfactors for a disabling course in EO-IBD are warranted. Geneticimpact does not seem significant in our population, suggestingthat environmental triggers play a crucial role in the pathogenesisof EO disease. Several arguments indicate that a change of theintestinal microbiota, probably secondary to changes in alimen-tary habits, along with particularly sterile living conditions makeindividuals prone to developing IBD, and this could probablybe important also in younger children.35,36 The identification ofdifferent clinical forms of EO disease, through the analysis ofgenotype–phenotype correlations, the identification of specificgenotypes, and particularly combinations of genetic and environ-mental influences in disease onset, could consent in the nearfuture to typify the disease already at onset, allowing specifictherapies for the individual patient.
TABLE 5. Clinical Characteristics of EO- and VEO-IBD
0–2 yr, n ¼ 20 3–5 yr, n ¼ 34 P
Sex (M) 12 (60%) 18 (53%) 0.77
Family history for IBD (first-degree relatives) 2 (10%) 4 (12%) 0.89Delay of the diagnosis (.6 mo) 10 (50%) 11 (32%) 0.25
Diagnosis
IBDU 6 (30%) 4 (12%) 0.14
UC 8 (40%) 23 (68%) 0.08
CD 6 (30%) 7 (20%) 0.51
Location of UC at diagnosis (Paris classification)
E1 1 (12%) 0 0.25
E2 0 4 (17%) 0.54E3 1 (12%) 3 (13%) 0.98
E4 6 (75%) 16 (70%) 0.95
Location of CD at diagnosis (Paris classification)
L1 1 (17%) 0 1.0
L2 3 (50%) 1 (17%) 0.54
L3 2 (33%) 4 (66%) 0.56
L4 1 (17%) 3 (50%) 0.54
Changes of the diagnosis at follow-up 2 (10%) 2 (6%) 0.67PUCAI (mean 6 SD) 35.5 6 12.4 38.4 6 12.4 0.72
PCDAI (mean 6 SD) 32.4 6 14.9 34.7 6 11.25 0.76
CRP (mean 6 SD) 4.8 6 4.7 5.7 6 9.1 0.74
EIMs at diagnosis 1 (5%) 3 (9%) 1.0
p-ANCA 4 (13%) 7 (20%) 0.46
Surgery at follow-up 2 (10%) 3 (9%) 1.0
CRP, C-reactive protein; pANCA, perinuclear antineutrophil cytoplasmic antibodies.
Aloi et al Inflamm Bowel Dis � Volume 20, Number 4, April 2014
604 | www.ibdjournal.org

REFERENCES1. Fiocchi C. Inflammatory bowel disease: evolutionary concepts in biology,
epidemiology, mechanisms and therapy. Curr Opin Gastroenterol. 2013;29:347–349.
2. Aujnarain A, Mack DR, Benchimol EI. The role of the environment in thedevelopment of pediatric inflammatory bowel disease. Curr GastroenterolRep. 2013;15:326.
3. Vernier-Massouille G, Balde M, Salleron J, et al. Natural history of pedi-atric Crohn’s disease: a population-based cohort study. Gastroenterology.2008;135:1106–1113.
4. Maisawa S, Sasaki M, Ida S, et al. Characteristics of inflammatory boweldisease with an onset before eight years of age: a multicenter epidemio-logical survey in Japan. J Gastroenterol Hepatol. 2013;28:499–504.
5. Gupta N, Bostrom AG, Kirschner BS, et al. Presentation and diseasecourse in early- compared to later-onset pediatric Crohn’s disease. Am JGastroenterol. 2008;103:2092–2098.
6. Nieuwenhuis EE, Escher JC. Early onset IBD: what’s the difference? DigLiver Dis. 2008;40:12–15.
7. Marx G, Seidman EG, Martin SR, et al. Outcome of Crohn’s diseasediagnosed before two years of age. J Pediatr. 2002;140:470–473.
8. Sauer CG, Kugathasan S. Pediatric inflammatory bowel disease: high-lighting pediatric differences in IBD.Med Clin North Am. 2010;94:35–52.
9. Ravikumara M, Sandhu BK. Epidemiology of inflammatory bowel dis-eases in childhood. Indian J Pediatr. 2006;73:717–721.
10. Heyman MB, Kirschner BS, Gold BD, et al. Children with early-onsetinflammatory bowel disease (IBD): analysis of a pediatric IBD consortiumregistry. J Pediatr. 2005;146:35–40.
11. Oliva-Hemker M, Fiocchi C. Etiopathogenesis of inflammatory boweldisease: the importance of the pediatric perspective. Inflamm Bowel Dis.2002;8:112–128.
12. Scherr R, Essers J, Hakonarson H, et al. Genetic determinants of pediatricinflammatory bowel disease: is age of onset genetically determined? DigDis. 2009;27:236–239.
13. Glocker E, Kotlarz D, Boztug K, et al. Inflammatory bowel disease andmutations affecting the interleukin-10 receptor. N Engl J Med. 2009;361:2033–2045.
14. Begue B, Verdier J, Rieux-Laucat F, et al. Defective IL10 signalingdefining a subgroup of patients with inflammatory bowel disease. Am JGastroenterol. 2011;106:1544–1555.
15. Bousvaros A, Antonioli DA, Colletti RB, et al. Differentiating ulcerativecolitis from Crohn’s disease in children and young adults: report ofa working group of the North American Society for Pediatric Gastroen-terology, Hepatology, and Nutrition and the Crohn’s and Colitis Founda-tion of America. J Pediatr Gastroenterol Nutr. 2007;44:653–674.
16. Levine A, Griffiths A, Markowitz J, et al. Pediatric modification of theMontreal classification for inflammatory bowel disease: the Paris classifi-cation. Inflamm Bowel Dis. 2011;17:1314–1321.
17. Hyams JS, Ferry GD, Mandel FS, et al. Development and validation ofa pediatric Crohn’s disease activity index. J Pediatr Gastroenterol Nutr.1991;12:439–447.
18. Turner D, Otley AR, Mack D, et al. Development, validation, and eval-uation of a pediatric ulcerative colitis activity index: a prospective multi-center study. Gastroenterology. 2007;133:423–432.
19. Aloi M, D’Arcangelo G, Pofi F, et al. Presenting features and diseasecourse of pediatric ulcerative colitis. J Crohns Colitis. 2013;11:509–515.
20. Griffiths AM. Specificities of inflammatory bowel disease in childhood.Best Pract Res Clin Gastroenterol. 2004;18:509–523.
21. Paul T, Birnbaum A, Pal DK, et al. Distinct phenotype of early childhoodinflammatory bowel disease. J Clin Gastroenterol. 2006;40:583–586.
22. Sawczenko A, Sandhu B. Presenting features of inflammatory bowel dis-ease in Great Britain and Ireland. Arch Dis Child. 2003;88:995–1000.
23. Mamula P, Telega GW, Markowitz JE, et al. Inflammatory bowel diseasein children 5 years of age and younger. Am J Gastroenterol. 2002;97:2005–2010.
24. Cannioto Z, Berti I, Martellossi S, et al. IBD and IBD mimicking entero-colitis in children younger than two years of age. Eur J Pediatr. 2009;168:149–155.
25. Shah N, Kammermeier J, Elawad M, et al. Interleukin-10 and interleukin-10–receptor defects in inflammatory bowel disease. Curr Allergy AsthmaRep. 2012;12:373–379.
26. de Bie CI, Paerregaard A, Kolacek S, et al. Disease phenotype at diagnosisin pediatric Crohn’s disease: 5-year analyses of the EUROKIDS Registry.Inflamm Bowel Dis. 2013;19:378–385.
27. Gower-Rousseau C, Vasseur F, Fumery M, et al. Epidemiology of inflam-matory bowel diseases: new insights from a French population-basedregistry (EPIMAD). Dig Liver Dis. 2013;45:89–94.
28. Van Limbergen J, Russell RK, Drummond HE, et al. Definition of phe-notypic characteristics of childhood-onset inflammatory bowel disease.Gastroenterology. 2008;135:1114–1122.
29. Levine A, de Bie CI, Turner D, et al. Atypical disease phenotypes inpediatric ulcerative colitis: 5-year analyses of the EUROKIDS Registry.Inflamm Bowel Dis. 2013;19:370–377.
30. Ruemmele FM. Pediatric inflammatory bowel diseases: coming of age.Curr Opin Gastroenterol. 2010;26:332–336.
31. de Ridder L, Weersma RK, Dijkstra G, et al. Genetic susceptibility hasa more important role in pediatric-onset Crohn’s disease than in adult-onset Crohn’s disease. Inflamm Bowel Dis. 2007;13:1083–1092.
32. Bianco AM, Zanin V, Monasta L, et al. Family history in early onsetinflammatory bowel disease. J Gastroenterol. 2013;48:144.
33. Romberg-Camps MJ, Dagnelie PC, Kester AD, et al. Influence of pheno-type at diagnosis and of other potential prognostic factors on the course ofinflammatory bowel disease. Am J Gastroenterol. 2009;104:371–383.
34. Schaefer ME, Machan JT, Kawatu D, et al. Factors that determine risk forsurgery in pediatric patients with Crohn’s disease. Clin GastroenterolHepatol. 2010;8:789–794.
35. Cucchiara S, Stronati L, Aloi M. Interactions between intestinal micro-biota and innate immune system in pediatric inflammatory bowel disease.J Clin Gastroenterol. 2012;46:S64–S66.
36. Schirbel A, Fiocchi C. Targeting the innate immune system in pediatricinflammatory bowel disease. Expert Rev Gastroenterol Hepatol. 2011;5:33–41.
Inflamm Bowel Dis � Volume 20, Number 4, April 2014 Phenotype and Disease Course of EO Pediatric IBD
www.ibdjournal.org | 605

fmicb-07-01703 October 24, 2016 Time: 14:59 # 1
ORIGINAL RESEARCHpublished: 26 October 2016
doi: 10.3389/fmicb.2016.01703
Edited by:Omry Koren,
Bar-Ilan University, Israel
Reviewed by:Benoit Chassaing,
Georgia State University, USAUri Gophna,
Tel Aviv University, IsraelMiika Kaleva Arvonen,
Kuopio University Hospital & MedicalResearch Center Oulu, Finland
*Correspondence:Rolando Cimaz
[email protected] De Filippo
Specialty section:This article was submitted to
Microbial Symbioses,a section of the journal
Frontiers in Microbiology
Received: 15 July 2016Accepted: 12 October 2016Published: 26 October 2016
Citation:Di Paola M, Cavalieri D, Albanese D,
Sordo M, Pindo M, Donati C,Pagnini I, Giani T, Simonini G,
Paladini A, Lionetti P, De Filippo Cand Cimaz R (2016) Alteration
of Fecal Microbiota Profiles in JuvenileIdiopathic Arthritis. Associations withHLA-B27 Allele and Disease Status.
Front. Microbiol. 7:1703.doi: 10.3389/fmicb.2016.01703
Alteration of Fecal MicrobiotaProfiles in Juvenile IdiopathicArthritis. Associations with HLA-B27Allele and Disease StatusMonica Di Paola1, Duccio Cavalieri2, Davide Albanese3, Maddalena Sordo3,Massimo Pindo3, Claudio Donati3, Ilaria Pagnini4, Teresa Giani4, Gabriele Simonini1,4,Alessia Paladini4, Paolo Lionetti1, Carlotta De Filippo5* and Rolando Cimaz1,4*
1 Department of Neuroscience, Psychology, Drug Research and Child Health, Meyer Children’s Hospital, University ofFlorence, Florence, Italy, 2 Department of Biology, University of Florence, Florence, Italy, 3 Fondazione E. Mach, Researchand Innovation Center, Trento, Italy, 4 Rheumatology Unit, Anna Meyer Children’s Hospital, University of Florence, Florence,Italy, 5 Institute of Biometeorology, National Research Council, Florence, Italy
Alteration of gut microbiota is involved in several chronic inflammatory andautoimmune diseases, including rheumatoid arthritis, and gut microbial “pro-arthritogenic” profiles have been hypothesized. Intestinal inflammation may be involvedin spondyloarthropathies and in a subset of patients affected by Juvenile IdiopathicArthritis (JIA), the most common chronic rheumatic disease of childhood. Wecompared the fecal microbiota composition of JIA patients with healthy subjects(HS), evaluating differences in microbial profiles between sub-categories of JIA, suchas enthesitis-related arthritis (JIA-ERA), in which inflammation of entheses occurs,and polyarticular JIA, non-enthesitis related arthritis (JIA-nERA). Through taxon-levelanalysis, we discovered alteration of fecal microbiota components that could be involvedin subclinical gut inflammation, and promotion of joint inflammation. We observedabundance in Ruminococcaceae in both JIA categories, reduction in Clostridiaceaeand Peptostreptococcaceae in JIA-ERA, and increase in Veillonellaceae in JIA-nERA,respectively, compared with HS. Among the more relevant genera, we found an increasein Clostridium cluster XIVb, involved in colitis and arthritis, in JIA-ERA patients comparedwith HS, and a trend of decrease in Faecalibacterium, known for anti-inflammatoryproperties, in JIA-nERA compared with JIA-ERA and HS. Differential abundant taxaidentified JIA patients for the HLA-B27 allele, including Bilophila, Clostridium clusterXIVb, Oscillibacter, and Parvimonas. Prediction analysis of metabolic functions showedthat JIA-ERA metagenome was differentially enriched in bacterial functions relatedto cell motility and chemotaxis, suggesting selection of potential virulence traits. Wealso discovered differential microbial profiles and intra-group variability among activedisease and remission, suggesting instability of microbial ecosystem in autoimmunediseases with respect to healthy status. Similarly to other chronic autoimmune andinflammatory diseases, different microbial profiles, as observed among different JIAsubgroups compared to HS, and potential functional acquisition related to migration,could promote inflammation and contribute to the disease pathogenesis.
Keywords: juvenile idiopathic arthritis, enthesitis-related arthritis, gut microbiota, HLA-B27 allele, metagenomics
Frontiers in Microbiology | www.frontiersin.org 1 October 2016 | Volume 7 | Article 1703

fmicb-07-01703 October 24, 2016 Time: 14:59 # 2
Di Paola et al. Microbiota Characterization in JIA
INTRODUCTION
Characterization of bacterial commensal communities inautoimmune and inflammatory diseases is a topic of greatinterest for understanding the role and interaction of intestinalmicrobiota with the host immune system.
It is known that the gut microbiota is shaped by severalenvironmental factors, including dietary habits, antibiotics,infectious agents, and air pollution (De Filippo et al., 2010;David et al., 2014a; Salim et al., 2014), and in turn, thatmicrobiota shapes the immune system, modulating homeostasisin healthy status individuals or promoting inflammation whendysbiosis occurs. Recent findings demonstrate that alteration inthe equilibrium among commensal bacteria is associated notonly with Inflammatory bowel disease (IBD), allergy, diabetesand celiac disease (Cheng et al., 2013), but also with rheumatoidarthritis (Vaahtovuo et al., 2008; Sandhya et al., 2016; Scher et al.,2016).
Juvenile idiopathic arthritis (JIA) is the most commonchronic rheumatic disease in children, and comprises a clinicallyheterogeneous group of conditions characterized by chronicarthritis, synovial inflammation and erosion of bone andcartilage (Ravelli and Martini, 2007). According to several factors,including the number of affected joints, JIA is divided in psoriatic,oligoarticular (up to four affected joints), polyarticular (five ormore affected joints) (Oberle et al., 2014), and enthesitis-relatedarthritis (ERA), in which entheses (attachments of tendons andligaments to bone) are affected. ERA accounts for 10–20% ofJIA and is considered the equivalent of spondyloarthropathy,a disease frequently characterized by clinical and subclinicalintestinal involvement (Bryan and Rabinovich, 2014; Oberle et al.,2014; Aggarwal and Misra, 2015).
Immunological, genetic, and environmental factors areinvolved in the pathogenesis of ERA (Stoll et al., 2014; Gmucaand Weiss, 2015). Gene variants in the Major HistocompatibilityComplex, especially the HLA-B27 alleles, have been identified aspredisposing factors (Gmuca and Weiss, 2015).
Alterations of gut microbiota (dysbiosis) and a decreasein gut microbiota richness (Li et al., 2014; Collado et al.,2015; Rogers, 2015) are emerging as factors associated with thedevelopment of inflammatory and systemic autoimmune diseases(Yeoh et al., 2013; Longman and Littman, 2015). Of great interestis the understanding of dysbiosis as a trigger or a reflection ofautoimmune and inflammatory disorders (Chung and Kasper,2010; Stoll et al., 2014), in fact, also autoimmunity can driveinstability of the gut microbial ecosystem.
Studies in germ-free animal models reveal relationshipsbetween microorganisms, mucosal immunity, and jointinflammation (Taurog et al., 1994; Rath et al., 1996; Longmanand Littman, 2015). Recent studies in humans suggest thatalteration of oral and gut microbiota and an increase in leakygut could trigger systemic joint inflammation in the context ofpre-existent autoimmunity (Scher et al., 2013, 2015; Brusca et al.,2014; Costello et al., 2014; Taneja, 2014; Longman and Littman,2015; Zhang et al., 2015).
However, although arthritis susceptibility has been linked tothe gut microbiome, and it has proposed that in synovial fluids
the presence of pro-arthritogenic bacterial DNA, deriving bycirculating intestinal bacterial products, may promote synovialinflammation (Kempsell et al., 2000; Gerard et al., 2001; Moenet al., 2006; Oberle et al., 2014), a causal relationship betweenbacterial infection and onset of rheumatological diseases hasnot yet been firmly demonstrated. Further studies on leakygut syndrome could clarify the presence of bacterial productscirculating and influencing the systemic immune response, alsoin light of the presence of bacteria in non-rheumatoid arthritiscontrols (Kempsell et al., 2000), and of potential microbialcontamination found in amplification technique of 16S rDNA, asprevious observed (Grahn et al., 2003).
A targeted-metagenomics approach can provide an in-depth characterization of microbial communities, allowinginvestigation of correlations between microbiota compositionand human pathologies (Lozupone et al., 2012).
In this study, we characterized and compared the gutmicrobiota of JIA patients, affected by enthesitis-related arthritis(JIA-ERA) and polyarticular JIA (non-enthesitis-related arthritis,nERA), with healthy subjects (HS), in order to define specificmicrobial “pro-arthritogenic” profiles.
MATERIALS AND METHODS
Sampling of SubjectsWe enrolled 29 JIA patients (13 males and 16 females, agerange 2–18 years), 19 of whom were affected by ERA and 10 bypolyarticular JIA (nERA). Exclusion criteria were: acute diarrhea,infectious gastroenteritis, antibiotic treatment in the previous3 months, and diagnosis of chronic gastrointestinal disease.A total of 29 healthy children and adolescents (11 males and 18females; age range 2–18 years) not affected by autoimmune andinflammatory conditions, infectious gastroenteritis, or chronicgastrointestinal disease, were enrolled as controls.
We collected a fecal sample from each subject, and asecond one from 17 ERA patients three months later, in orderto evaluate microbiota variability. We also gathered clinicalinformation, including: enthesitis and arthritis localization, ageof onset, HLA-B27 status, family history of ankylosing spondylitisor other HLA-B27-related diseases, comorbidities, laboratoryparameters (C Reactive Protein, Erythrocyte Sedimentation Rate,ANA and pANCA autoantibody positivity), and pharmacologicaltreatments (Table 1; Supplementary Tables S1 and S2). None ofthe patients underwent treatment with proton pump inhibitors(PPIs). Active disease was defined by the presence of activearthritis and/or enthesitis at the time of stool sampling. Asreported in Table 1, a total of four JIA-ERA and four JIA-nERApatients had clinically active disease. Fecal calprotectin (Aomatsuet al., 2011) was also assessed by ELISA assay for subclinicalintestinal inflammation (Eurospital, Trieste, Italy). Parents orguardians gave written informed consent for fecal samples andclinical data collection of their children. The study protocolwas approved by the Ethics Committee of the Meyer Children’sHospital, Florence, Italy (Protocol ref. Nov 12th, 2013), andcarried out in accordance with the approved guidelines.
Frontiers in Microbiology | www.frontiersin.org 2 October 2016 | Volume 7 | Article 1703

fmicb-07-01703 October 24, 2016 Time: 14:59 # 3
Di Paola et al. Microbiota Characterization in JIA
TABLE 1 | Clinical features of JIA patients and age/gender information of healthy subjects (HS).
ERA nERA HS
Number 19 10 29
Age (years) median, range 14.3; 9 to 18 10.5; 2 to 17 13; 2 to 18
Male: Female, number 13:6 0:10 11:18
Disease duration (months) median, range 55; 2 to 93 97; 3 to 150 –
Acute disease, number (%) 4 (21%) 4 (40%) –
Calprotectin positive, number (%) 2 (10.5%) 2 (20%) –
High Erythrocyte sedimentation rate, number (%) 3 (15.7%) 0 (0%) –
HLA-B27+ 9 (47%) 0 (0%) –
ANA+ 4 (21%) 9 (90%) –
Complications or comorbidities, number (%)
No 10 (52.6%) 3 (30%) –
Uveitis 1 (5.2%) 7 (70%) –
β- thalassemia 1 (5.2%) 0 (0%) –
Pectum escavatum 2 (10.5%) 0 (0%) –
Asthma 2 (10.5%) 0 (0%) –
Osteoporosis 1 (5.2%) 0 (0%) –
Obesity 1 (5.2%) 0 (0%) –
Hypothyroidism 1 (5.2%) 0 (0%) –
Epigastric hernia 1 (5.2%) 0 (0%) –
Cataract 1 (5.2%) 0 (0%) –
Breast fibroadenoma 1 (5.2%) 0 (0%) –
Treatment, number of patients (%)
NSAIDs 18 (95%) 1 (10%) –
Sulfasalazine 8 (42%) 0 (0%) –
Steroids 4 (21%) 0 (0%) –
Methotrexate 4 (21%) 0 (0%) –
Etanercept 3 (15.7%) 4 (40%) –
Abatacept 1 (5.2%) 5 (50%) –
Adalimumab 2 (10.5%) 0 (0%) –
HLA, Human leukocyte antigen; ANA, Anti-nuclear antibody; NSAIDs, Non-steroidal anti-inflammatory drugs.
DNA ExtractionFecal samples were preserved in RNAlater (Qiagen) at 4◦C forthe first 48 h, and kept at −80◦C until DNA extraction. Bacterialgenomic DNA extraction and quality control were carried outfollowing our previous protocol (De Filippo et al., 2010).
PyrosequencingFor each sample, we amplified the 16S rRNA gene using thespecial fusion primer set specific for V5-V6 hypervariable regionsand corresponding to primers 784F and 1061R described byAndersson et al. (2008), and using the FastStart High FidelityPCR system (Roche Life Science, Milano, Italy). The 454pyrosequencing was carried out on the GS FLX+ system usingthe XL+chemistry following the manufacturer recommendations(details in Supplementary Materials).
Data AnalysisPyrosequencing resulted in a total of 2,180,826 16S rDNAreads with a mean of 29,078 sequences per sample. Averagesequence lengths were 290 nt (±SD 45) and 286 nt (±SD 50)
for the first and second run, respectively. Raw 454 files weredemultiplexed using Roche’s.sff file software, and available atthe European Nucleotide Archive1 under the accession studyERP013262. Reads were pre-processed using the MICCA pipeline(version 0.1)2 (Albanese et al., 2015). Forward and reverseprimer trimming and quality filtering were performed usingmicca-preproc truncating reads shorter than 280nt (qualitythreshold = 18). De novo sequence clustering, chimera filteringand taxonomy assignment were performed by micca-otu-denovo(parameters -s 0.97 -c). Operational Taxonomic Units (OTUs)were assigned by clustering the sequences with a threshold of97% pair-wise identity, and their representative sequences wereclassified using the RDP software version 2.7 (Wang et al., 2007).Template-guided multiple sequence alignment was performedusing PyNAST57 (version 0.1) (Caporaso et al., 2010) against themultiple alignment of the Greengenes 16S rRNA gene database(DeSantis et al., 2006) filtered at 97% similarity. Finally, aphylogenetic tree was inferred using FastTree (Price et al., 2010)
1http://www.ebi.ac.uk/ena/data/view/PRJEB118462http://compmetagen.github.io/micca/
Frontiers in Microbiology | www.frontiersin.org 3 October 2016 | Volume 7 | Article 1703

fmicb-07-01703 October 24, 2016 Time: 14:59 # 4
Di Paola et al. Microbiota Characterization in JIA
and micca-phylogeny (parameters: -a template-template-min-perc 50). Sampling heterogeneity was reduced by rarefaction,obtaining 12,964 sequences per sample.
Chao1 index and Shannon entropy (indicators of alphadiversity) and UniFrac (Lozupone and Knight, 2005) and Bray–Curtis dissimilarities (indicators of beta diversity) were calculatedusing the phyloseq package (McMurdie and Holmes, 2014) of theR software suite. Exploratory analysis was performed by Principalcoordinates analysis (PCoA) using the phyloseq package of theR software suite. Multiple-rarefaction PCoA plots (“jackknifed”PCoA plots) (Lozupone et al., 2011) were computed to assess therobustness of the beta-diversity analyses.
The significance of between-groups differentiation on theUniFrac distances and Bray–Curtis dissimilarity was assessed byPERMANOVA using the adonis() function of the R packagevegan with 999 permutations.
As a measure of species evenness, we calculated Dominance(1-Simpson index) and Equitability (Shannon diversity indexdivided by the logarithm of taxa number) by using PAST v 3.12(Hammer et al., 2001).
To compare the relative abundances of OTUs among the threegroups of subjects, the two-sided, unpaired Wilcoxon test wascomputed, removing taxa not having a relative abundance of atleast 0.1%, in at least 20% of the samples, and using the functionmt() in the phyloseq library and the p-values were adjusted formultiple comparison controlling the family wise Type I error rate(minP procedure). Further significant differences in bacterial taxawere supported by non-parametric White’s test and Welch’s testby using STAMP (Parks et al., 2014), and p-values were adjustedfor multiple comparisons by Storey FDR, as proposed in STAMP.
On the basis of the relative abundances, the metagenomicbiomarker discovery and related statistical significance wereassessed using the linear discriminant analysis (LDA) effect size(LEfSe) method (Segata et al., 2011). LEfSe uses the Kruskal–Wallis rank-sum test to identify features with significantlydifferent abundances between assigned taxa compared to thegroups, and LDA to estimate the size effect of each feature. Analpha significance level of 0.05, either for the factorial Kruskal–Wallis test among classes or for the pairwise Wilcoxon testbetween subclasses, was used. A size-effect threshold of 2.0 onthe logarithmic LDA score was used for discriminative microbialbiomarkers.
In order to predict how taxonomic differences between fecalmicrobiota of the three groups impact their microbial metabolicpotential, we applied PICRUSt (Phylogenetic Investigation ofCommunities by Reconstruction of Unobserved States) (Langilleet al., 2013), a computational approach useful to infer thefunctional contribution of microbial communities on 16S rDNAsequencing data set. PICRUSt implements an extended ancestral-state reconstruction algorithm to predict which gene familiesare present, and then combines gene families to estimate thesignificant differences in the main functional classes (KEGGcategories) of the composite metagenome. From a OTUs tablewith associated Greengenes identifiers, we obtained the finaloutput from metagenome prediction as an annotated tableof predicted gene family counts for each sample, where theencoded functions of each gene family are orthologous groups or
other identifiers such as KEGG orthologs (KOs). The functionalpathways discovery and related statistical significance wereassessed by LEfSe.
RESULTS
Clinical Features of JIA PatientsWe collected clinical features, as well as comorbidities andtherapies, for each enrolled patient at the time of fecal sampling(Table 1; more details in Supplementary Tables S1 and S2). Asknown, due to the two different subsets of JIA, females areaffected from polyarticular JIA two to four times more oftenthan males (Oberle et al., 2014). In our cohort, most of theenrolled JIA-ERA patients were males (13/19), while all JIA-nERA patients were females (10/10). Thus, we evaluated thesex/gender as a potential variable influencing the fecal microbiotacomposition in both JIA categories. Regarding HLA-B27 status,47% (9/19) of JIA-ERA patients resulted HLA-B27 positive, whileall JIA-nERA patients were HLA-B27 negative. Calprotectinlevel, a measurement of intestinal inflammation, was positive(>100 µg/g) in 10.5% (2/19) of JIA-ERA and in 20% (2/10) ofJIA-nERA patients (see Materials and Methods).
Microbiota Characterization by 16SrDNA Sequencing in the JIA Groups andHealthy ControlsWe sequenced the V5–V6 hypervariable region of 16S rRNA genefor the meta-taxonomic study of microbiota in a total of 75 fecalsamples from 19 JIA-ERA patients, 10 JIA-nERA, and 29 HS.From 17 JIA-ERA patients a second fecal sample was collected3 months later, to evaluate microbiota variability over time (seeMaterials and Methods).
The taxonomic distribution in the three groups showedvariations in gut microbiota composition (Figure 1;Supplementary Figure S1). Firmicutes, the dominant phylumof gut microbiota, was the most abundant in all samples (over50% of total reads; Supplementary Figure S1A). Consideringthe 20 most abundant families (Supplementary Figure S1B),we found statistically significant differences between groupsin Ruminococcaceae, Peptostreptococcaceae, Clostridiaceae Iand Veillonellaceae (Figure 1A). Ruminococcaceae was moreabundant in children in both JIA categories, compared with HS(21.6% in JIA-ERA and 27.2% in JIA-nERA vs. 12.0% in HS;Wilcoxon rank-sum test, JIA-ERA vs. HS p = 0.0004; JIA-nERAvs. HS p = 0.0006; Figure 1A). Although there was a reductionof Peptostreptococcaceae and Clostridiaceae I in all JIA patients(ERA and nERA) compared with HS (0.3% in JIA-ERA, 0.4%in JIA-nERA and 1.1% in HS; 0.1% in JIA vs. 0.5% in HS,respectively), we found statistically significant differences onlybetween JIA-ERA vs. HS (Wilcoxon rank-sum test, p = 0.033 forPeptostreptococcaceae, p= 0.017 for Clostridiaceae I, respectively,Figure 1A). We observed a statistically significant predominanceof Veillonellaceae in JIA-nERA compared with HS (1.4% inJIA-nERA vs. 0.4% in HS; Wilcoxon rank-sum test, p = 0.012;Figure 1A).
Frontiers in Microbiology | www.frontiersin.org 4 October 2016 | Volume 7 | Article 1703

fmicb-07-01703 October 24, 2016 Time: 14:59 # 5
Di Paola et al. Microbiota Characterization in JIA
FIGURE 1 | Relative abundances of fecal bacterial components in JIA and HS groups. Box plot of statistically significant different bacterial (A) families and(B) genera in JIA patients compared to HS (Pairwise comparisons using Wilcoxon rank sum test; ∗∗∗p < 0.001; ∗∗p < 0.01; ∗p < 0.05 FDR adjusted). ForFaecalibacterium genus, statistical significance of the comparison JIA-ERA vs. JIA-nERA was obtained by Welch’s test without multiple testing correction.
Considering gender as potential variable influencing the gutmicrobiota composition, we confirmed that among the enrolledfemale subjects (6 JIA-ERA, 10 JIA-nERA, and 18 HS), Firmicuteswere more abundant in the JIA-nERA group compared with HS(Supplementary Figure S2A; Wilcoxon rank-sum test p < 0.05).Among the minor constituents of fecal microbiota, we observedan increase in Sutterellaceae and Enterobacteriaceae in JIA-ERAfemale patients compared with female HS (2.5% in JIA-ERA vs.1.2% in HS and 0.5% in JIA-ERA vs. 0.3% in HS, respectively;Wilcoxon rank-sum test, p < 0.05; Supplementary Figure S2B),and Streptococcaceae in JIA-nERA compared with HS (1% inJIA-nERA vs. 0.3% in HS; Wilcoxon rank-sum test, p < 0.05;Supplementary Figure S2B).
At genus level, we found an abundance of Clostridium clusterXIVb in JIA-ERA patients compared with HS (0.23% in JIA-ERAvs. 0.1% in HS; Wilcoxon rank-sum test, p = 0.007; Figure 1B).Moreover, we observed a decrease in the relative abundance inFaecalibacterium in JIA-nERA compared with either JIA-ERAor HS, even if not statistically significant (0.18% in JIA-nERAvs. 0.35% in HS; 0.18% in JIA-nERA vs. 0.41% in JIA-ERA;Figure 1B).
By LDA Effect Size (LEfSe; see Materials and Methods), weevaluated significant differences in abundance between assigned
taxa with respect to JIA patient groups. We observed differentiallyabundant taxa discriminating for HLA-B27 status. At family level,increased Lactobacillaceae in HLA-B27 positive-JIA patients, andPasturellaceae in HLA-B27 negative-JIA patients were found(Figure 2A). Of the increased genera in HLA-B27 positive JIApatients, we observed Bilophila, Parvimonas, and Oscillibacter,while Haemophilus and Eggerthella, were differentially enrichedin HLA-B27 negative patients (Figure 2B). When consideringonly the JIA-ERA group, in addition to the five generareported in Figure 2B, Lactobacillus, Clostridium cluster XI,and Dialister were enriched in HLA-B27 positive patients, whileonly Haemophilus discriminated for HLA-B27 negative status(Figure 2C).
Further, we evaluated correlations between microbiota profilesof JIA patients and fecal calprotectin, as well as with respectto different medical treatments. We did not find any significantcorrelation between fecal calprotectin levels and microbiotaprofiles (Supplementary Tables S1 and S2), probably due to thelow number of patients with concomitant intestinal inflammationat the time of sampling. Regarding the effect of pharmacologicaltherapies on gut microbiota of JIA patients, in our cohorts, JIA-ERA patients were treated with NSAIDs, alone or associated withsulfasalazine/methotrexate/biologics in different combinations,
Frontiers in Microbiology | www.frontiersin.org 5 October 2016 | Volume 7 | Article 1703

fmicb-07-01703 October 24, 2016 Time: 14:59 # 6
Di Paola et al. Microbiota Characterization in JIA
FIGURE 2 | Differences in bacterial taxa related to HLA-B27 status. LEfSe analysis shows a statistically significant enrichment of (A) families, and (B,C)genera, in (A,B) all JIA patients and in (C) JIA-ERA patients, considering the HLA-B27 status. LEfSe results indicate a sequentially significant ranking among groups(Alpha value = 0.05 for the factorial Kruskal–Wallis test among classes). The threshold for the logarithmic LDA score was 2.0.
as reported in Table 1 and Supplementary Table S1. JIA-nERA patients were mainly treated with biologic drugs, such asAbatacept and Etanercept (Table 1; Supplementary Table S2).Despite the low number of patients stratified by pharmacologicaltreatment, LEfSe analysis showed indications of associationamong different bacterial profiles and therapies (as reportedin Supplementary data and Supplementary Figures S3A–C),among which we observed enrichment in Collinsella, associatedwith exacerbation of joint disease (Chen et al., 2016), in JIA-ERA patients treated with combined NSAIDs and sulfasalazinetherapy.
However, a larger cohort of patients would be neededto strengthen our preliminary results and to understand thecausality between therapies, gut microbiota profiles and clinicalstatus.
In order to evaluate differences in the microbial biodiversity(alpha-diversity) among groups, we calculated the observednumber of OTUs (a measurement of the total number of speciespresent in a microbial community) and the Chao1 index (anindicator of species richness based on number of rare species),observing a significant reduction in alpha diversity in the JIAsamples compared to HS (Figures 3A,B; p-value < 0.005 JIA-ERA vs. HS and JIA-nERA vs. HS; Supplementary Table S3).This suggests that microbiota of JIA patients is associated withbiodiversity depletion, as observed in IBD patients. However,we did not find significant differences among the three groupsusing measures of biodiversity that take the evenness of thespecies distributions into account, like the Shannon entropy(Figure 3C), the Dominance (1-Simpson index) and Equitability(Pielou index; Materials and Methods; Supplementary Figure S4).
To estimate the variability of microbial communities between-sample (beta-diversity), we calculated the Bray-Curtis and
unweighted UniFrac dissimilarities (see Materials and Methods).PCoA on unweighted UniFrac dissimilarities showed thatboth JIA samples (ERA and nERA) were more similar toeach other than to HS samples (Figure 3D). Bray Curtisdissimilarity confirmed the differences among samples in thethree populations (PERMANOVA, p < 0.001; Figure 3E).Considering HLA-B27 status, PCoA, calculated on unweightedUniFrac and Bray–Curtis dissimilarity, showed that HLA-B27positive JIA-ERA patients form subgroups with respect toother JIA-ERA samples (Figures 3F,G), confirmed also byneighbor joining clustering based on Bray–Curtis dissimilarities(Supplementary Figure S5). However, the sample distribution ofpatients and HS was more marked based on disease and healthstatus (Figures 3D,E).
Fecal Microbiota Comparison betweenAcute Disease and Remission in JIACategoriesAt the moment of fecal sampling, 21% of JIA-ERA patients(4/19) and 40% of JIA-nERA patients (4/10) had clinically activedisease. Despite the reduced number of samples, LEfSe analysisshowed significant differences in abundances of bacterial generain samples collected during clinically active disease and duringremission. In particular, Sutterella was increased in samplescollected during active disease, while Clostridium cluster IV andXVIII, Parasutterella and Odoribacter were enriched in samplescollected from patients in remission (Figure 4A).
Furthermore, we calculated intra-group distances byunweighted UniFrac, comparing all JIA samples collected frompatients with active disease and those in remission, versusthe HS samples. Although differences were not statistically
Frontiers in Microbiology | www.frontiersin.org 6 October 2016 | Volume 7 | Article 1703

fmicb-07-01703 October 24, 2016 Time: 14:59 # 7
Di Paola et al. Microbiota Characterization in JIA
FIGURE 3 | Alpha and beta diversity measures. (A–C) Box plots of (A) number of observed OTUs, (B) Chao 1, and (C) Shannon indexes in the three studiedpopulations. Pairwise comparisons using the Wilcoxon rank sum test., ∗∗p-value < 0.005, false discovery rate adjustment. (D,E) PCoA of (D) unweighted UniFracand (E) Bray–Curtis dissimilarities. (F,G) PCoA of unweighted UniFrac and Bray–Curtis dissimilarities considering HLAB27 status (red asterisks). Colored dots:red = JIA-ERA, orange = JIA-nERA, and green = HS samples.
significantly, we observed a trend indicating higher intra-groupdistances between JIA-ERA samples collected during activedisease with respect to intra-group distances between JIA-nERA during active disease (Figure 4B; intra-active JIA-ERAvs. intra-active JIA-nERA; Supplementary Table S4). Withinthe JIA-ERA group, we found more variation in microbiotaprofile in samples collected during active disease compared toremission (Figure 4B; intra-active JIA-ERA vs. intra-remissionJIA-ERA; Supplementary Table S4). On the contrary, althoughnot statistically significantly different, the intra-distance ofactive disease samples in the JIA-nERA group was lower thanin remission samples (Figure 4B; intra-active JIA-nERA vs.intra-remission JIA-nERA; Supplementary Table S4), indicating
different microbial heterogeneity in active disease and remissionin the two different JIA subsets. Comparing the samples collectedfrom patients in remission, we observed that distances withinthe JIA-nERA group were greater than within the JIA-ERAgroup (Figure 4B; intra-remission JIA-nERA vs. intra-remissionJIA-ERA; Supplementary Table S4).
Interestingly, when we compared JIA groups with HS, theintra-group distance in the HS group was lower than withinboth JIA groups (Figure 4B) and significantly correlated withintra-distances observed in JIA-ERA patients, either active orin remission, and with intra-distance observed in JIA-nERApatients in remission (Wilcoxon rank-sum test; intra-HS vs.intra-active JIA-ERA p = 0.02; intra-HS vs. intra-remission
Frontiers in Microbiology | www.frontiersin.org 7 October 2016 | Volume 7 | Article 1703

fmicb-07-01703 October 24, 2016 Time: 14:59 # 8
Di Paola et al. Microbiota Characterization in JIA
FIGURE 4 | Fecal microbiota comparison in patients during acute disease and in remission. (A) LEfSe analysis shows a statistically significant enrichment ofbacterial genera in JIA patients, in active disease (black) and in remission (white). LEfSe results indicate significant ranking among groups (Alpha value = 0.05 for thefactorial Kruskal-Wallis test among classes). The threshold for the logarithmic LDA score was 2.0. (B) Intra-group distances calculated by Unweighted UniFracbetween samples collected during active disease and in remission from JIA-ERA and JIA-nERA patients. P-values displayed are the results of Wilcoxon rank-sumtests. (C) Box plots of relative distances, calculated by Unweighted UniFrac, among different JIA samples and HS samples and distances of different the twosamples of the same JIA-ERA patient. P-values displayed are the results of Wilcoxon rank sum test; ∗p-value < 0.05, ∗∗p-value < 0.01; ∗∗∗p-value < 0.001.
JIA-ERA p = 0.0004; intra-HS vs. intra-remission JIA-nERAp= 0.03; Supplementary Table S4), indicating that the microbiotacomposition within the healthy group was significantly morehomogeneous than those within the JIA groups.
Next, we evaluated microbiota variations over time in patientsof the JIA-ERA group, considering pairwise UniFrac distancesbetween samples A and B (collected three months apart; seeMaterials and Methods). The matrices obtained by PCoA, derivedfrom pairwise unweighted and weighted UniFrac distancesbetween samples A vs. B, allowed us to explore inter- and intra-individual similarities or dissimilarities among samples, showingin most part of the cases lower distances between samples of thesame patient than from different patients (Supplementary FigureS6). Comparing the distributions among all JIA and HS samplesvs. the JIA-ERA samples at two different times by UnweightedUniFrac mean distances, we confirmed that samples from thesame patient are more similar than samples from differentpatients, as well as samples from HS, as expected (Figure 4C).
Metabolic Function PredictionThe microbiota is able to affect host physiology and metabolicfunctions, contributing to normal development, and homeostasis
of the immune system in the gut, modulating epithelial cellproliferation, and protecting against pathogenic bacteria(Tremaroli and Backhed, 2012; Sommer and Backhed, 2013).Bacterial species are known to carry and transfer operonscontaining genes for different metabolic functions. Differentbacterial species are enriched for certain functions and thesecorrelations have been categorized in well-organized databases(Kanehisa et al., 2014). Therefore, in order to clarify howphylogenetic differences between the fecal microbiota of JIApatients impact their metabolic potential, we applied PICRUSt(Phylogenetic Investigation of Communities by Reconstructionof Unobserved States), a computational approach used topredict the functional composition of a metagenome (Langilleet al., 2013). LEfSe analysis performed on PICRUSt output(Supplementary Table S5) showed differentially enrichedfunctional classes (KEGG categories) among JIA subgroupscompared with HS (Figure 5). Within the main KEGGcategories, we observed significant enrichment of functionsrelated to cell motility (Flagellar assembly, Ko:02040, Bacterialchemotaxis and Bacterial motility proteins, Ko:02030) in JIA-ERA compared with JIA-nERA and HS (Figures 5A,B). Pathwaysrelated to Membrane transport (Secretion system, Ko:03070)
Frontiers in Microbiology | www.frontiersin.org 8 October 2016 | Volume 7 | Article 1703

fmicb-07-01703 October 24, 2016 Time: 14:59 # 9
Di Paola et al. Microbiota Characterization in JIA
FIGURE 5 | Metabolic function prediction associated to the microbiota profiles. LEfSe analysis, performed on metabolic functions inferred by PICRUStanalysis shows statistically significant enrichment of KEGG categories in (A) JIA-ERA vs. JIA-nERA, (B) JIA-ERA vs. HS, and (C) in JIA-nERA vs. HS. LEfSe resultsindicate significant ranking among groups (Alpha value = 0.05 for the factorial Kruskal–Wallis test among classes). The threshold for the logarithmic LDA scorewas 2.0.
and unclassified Cellular Processes and Signaling (Sporulation)were significantly enriched, respectively, in JIA-ERA and JIA-nERA compared with HS group (Figures 5B,C). A remarkableenrichment in metabolic functions regarding carbohydratemetabolism, lipid metabolism, aminoacid metabolism, and otheraminoacid metabolism identified a core of metabolic capabilities,especially in JIA-nERA metagenome compared to JIA-ERA(Figure 5A) and HS (Figure 5C). On the other hand, metabolismof cofactors and vitamins (folate biosynthesis and nicotinate andnicotinamide metabolism) and metabolism of other aminoacids(Glycine, Serine, Threonine) significantly characterized HSmetagenome compared to JIA-ERA (Figure 5B).
DISCUSSION
There are many lines of evidence that link the microbiota torheumatic diseases. Animal models have been used to establishthis possible correlation, such as the use of germ-free andgnotobiotic mice, in which animals were colonized with aspecific microbial population, or through the use of antibioticsto understand the effect of microbiota modulation on rheumaticdiseases. Principal limits of animal studies are the sample size andthe difficulty to mimic the complex multifactorial pathogenesis ofthese pathologies.
In our study, we tried to define the role of microbiota inpatients affected by JIA. Alterations and decrease of microbiotarichness were recently found in JIA compared with healthycontrols (Stoll et al., 2014), as well as in rheumatoid arthritis,ankylosing spondylitis and psoriatic arthritis, the latter twoconditions related to spondyloarthropathies (Stebbings et al.,2002; Scher et al., 2013, 2015; Costello et al., 2014; Gill
et al., 2015). We also observed variations in fecal microbiotacomposition and a reduction of microbial richness among JIApatients, affected by ERA and polyarticular JIA (nERA), incomparison with HS.
When compared to HS, in both JIA categories, we foundstatistically significant abundance in Ruminococcaceae, reductionin Clostridiaceae and Peptostreptococcaceae in JIA-ERA, andincrease in Veillonellaceae in JIA-nERA. Of note, abundancein Veillonellaceae was recently found associated to ankylosingspondylitis (Costello et al., 2014). Conversely to our results,previous studies on ankylosing spondylitis (Costello et al., 2014;Scher et al., 2015) and on oligoarticular and polyarticular JIA(Tejesvi et al., 2016) showed depletion of either Ruminococcaceaeor Veillonellaceae.
The enrichment of anaerobic Gram-positive Clostridiumcluster XIVb in JIA-ERA patients suggests a causal relation withinflammation. In fact, members of cluster XIVb, C. propionicum,and C. colinum (Collins et al., 1994) were previously observedin poultry ulcerative enteritis (Berkhoff, 1985). Also, studiesin animal models have indicated that cell wall peptidoglycansof Clostridium and other anaerobic Gram-positive speciescan induce either chronic and erosive or transient arthritis(Severijnen et al., 1989; Simelyte et al., 2003). The observeddecreasing trend in Faecalibacterium in JIA-nERA, considered tobe an anti-inflammatory microorganism and a marker of health,has also been consistently reported in Crohn’s disease patients(Sokol et al., 2008). Conversely to our results, a recent studyshowed reduction of Faecalibacterium prasnutzii in JIA-ERApatients (Stoll et al., 2014).
The partial agreement of our findings with results obtainedin other studies could be due to several factors, includingvariabilities and size of cohorts (different JIA categories, disease
Frontiers in Microbiology | www.frontiersin.org 9 October 2016 | Volume 7 | Article 1703

fmicb-07-01703 October 24, 2016 Time: 14:59 # 10
Di Paola et al. Microbiota Characterization in JIA
status, untreated, or treated patients), as well as geography,environment or dietary habits of the patients, as shown by Davidand co-workers (David et al., 2014b).
Despite the limited possibility to generalize our results, dueto the reduced number of patients in the cohorts, our resultson JIA show intriguing links in terms of fecal microbiotaprofiles, with IBD and other autoimmune diseases associated togastrointestinal disorders.
We are well aware that the known predominance offemales in JIA-nERA introduces a potential gender effect, yetEnterobacteriaceae and Streptococcaceae, enriched in JIA-ERAand in JIA-nERA female patients, were also found to be correlatedwith intestinal inflammation as observed in biopsy samples ofCrohn’s disease patients (Gevers et al., 2014) and the increasein Sutterellaceae observed in JIA-ERA female patients, as wellas in samples collected in active disease, is also in line withincrease in Sutterella previously found in children with autismsuffering from gastrointestinal disorder (Williams et al., 2012).Moreover, in samples collected in remission, we found abundancein Clostridium spp. cluster IV that have been reported to beinducers of colonic T regulatory cell (Atarashi et al., 2011), as wellas in Odoribacter, known producer of Short Chain Fatty Acids(SCFAs), anti-inflammatory metabolites, and previously foundreduced in IBD (Morgan et al., 2012). However, in remission wealso found enriched bacteria involved in intestinal inflammationand metabolic disorders, such as Parasutterella, found in amice model of chemically induced colitis (Zhang et al., 2016),Clostridium cluster XVIII, encompassing C. ramosum, involvedin diet-induced obesity (Woting et al., 2014) and C. spiroforme,a toxin-associated disease producer, involved in rabbit colitis(Carman and Borriello, 1984).
Differentially abundant taxa, previously found in relationto rheumatoid arthritis, oral infection, intestinal inflammationor colitis, or to intestinal barrier permeability, discriminatefor positivity of HLA-B27 allele, a genetic marker stronglyassociated with spondyloarthropathies. Among these, in HLA-B27 positive ERA patients we found Bilophila, a sulphite-reducing bacterium known to be involved in murine colitis(Devkota et al., 2012) and in intestinal inflammatory disordersin humans (Loubinoux et al., 2002; Rowan et al., 2009), via H2Sproduction promoting intestinal inflammation. Parvimonas wascommonly observed in periodontitis and appendicitis (Zhonget al., 2014), and Oscillibacter was shown to be involved in gutbarrier integrity in mice (Lam et al., 2012). In HLA-B27 negative-ERA patients, we found Haemophilus and Eggerthella, recentlyassociated with rheumatoid arthritis (Zhang et al., 2015; Chenet al., 2016). Moreover, when considering only the ERA group,in HLA-B27 positive patients we also showed enrichment ofLactobacillus, observed as potential arthritogenic agent via its cellwall pepetidoglycan (Severijnen et al., 1989), Clostridium clusterXI, that includes C. difficile, a well-known proinflammatory andcolitis inducing-bacterium, and Dialister, frequently found inperiodontitis and other infections (Morio et al., 2007).
Recent studies on animal models showed association betweenHLA-B27 allele and other different bacterial species, includingB. vulgatus and Prevotella spp. (Lin et al., 2014) and Akkermansiamuciniphila (Asquith et al., 2016). In particular, Akkermansia
spp. was suggested as potential pro-arthritogenic bacterial genus.However, the study of Stoll and collaborators (Stoll et al., 2014)showed abundance of Akkermansia in a low percentage of ERApatients, but no significant association with HLA-B27 status.In our study, we did not find Akkermansia spp. as part of thecore gut microbiota of our patients, yet we found other speciescorrelated with HLA-B27 allele. Little is known on the geographicdistribution of Akkermansia spp. that could be less representedin our cohorts. Overall this could suggest that other bacterialspecies, in absence of Akkermansia spp. can discriminate HLA-B27 status, and that disease biomarkers should be based onpatterns of taxonomic units or biological functions, rather thanon single species.
Regarding the functional contribution of microbiota profiles,by PICRUSt prediction analysis we observed distinctivefunctional acquisitions among JIA subgroups and HS. A core ofmetabolic capabilities, regarding carbohydrate, lipid, aminoacid,cofactors, and vitamins metabolism, were enriched in JIA-nERAand HS metagenomes. It is worth noting that microbiota ofJIA-ERA patients is significantly enriched in functions related tocell motility, including flagellar assembly, bacterial chemotaxisand motility proteins, representing possible traits of virulencethat could be associated to gut inflammation. These indicationsof enrichment in potentially pathogenic invasiveness-relatedtraits in JIA-ERA metagenome could suggest a potentialimproved ability of microbial components to pass throughthe gastrointestinal barrier and migrate in other districts, alsoresponding to nutrient gradients. Moreover, given that in micemodels immunogenicity of flagellin CBir1 was observed, withconsequent induction of colitis, and antibodies anti-CBir1 werefound in CD patients with complicated disease (Targan et al.,2005), we cannot exclude the potential effect of flagellar-assemblyproteins of some components of microbiota on host immunesystem of JIA.
Despite the relatively small cohort of patients in our study, themicrobial profile differences in active disease and remission arecorroborated by the observed intra- and inter-group distancesof microbiota samples in active, remission and healthy status.As expected, our results suggest that during active disease themicrobiota is strongly perturbed (major intra-group distancecompared with remission). Healthy status allows a more stablemicrobiota ecosystem compared to disease status, as previouslyobserved (Coyte et al., 2015). Remission is characterized by anintermediate microbial pattern, different from both active diseaseand healthy controls, likely resulting from a different trajectoryto stable state and in which autoimmune reactivity and themicrobial ecosystem are mutually shaped.
Although microbial profiles may differ in an individual-specific manner, the observed fecal microbiota dissimilaritiesin the same subject at different collection times, and amongJIA categories and healthy controls suggest that continuedperturbation and instability of the microbial ecosystem maycontribute to inflammation.
Another aspect that should be more thoroughly investigatedis the association between microbial profiles and pharmacologictherapies in autoimmune diseases. Recent studies, as previouslyobserved in IBD patients, highlighted the effect of different
Frontiers in Microbiology | www.frontiersin.org 10 October 2016 | Volume 7 | Article 1703

fmicb-07-01703 October 24, 2016 Time: 14:59 # 11
Di Paola et al. Microbiota Characterization in JIA
therapies on microbiota, such as the rapid effect of enteralnutrition in the shaping of microbiota (Lionetti et al.,2005) and the dysbiosis associated with antibiotic treatment(Lewis et al., 2015), as well as the effect of protonic pompinhibitors on reduction of bacterial richness and selectionof “unhealthy” microbiota (Imhann et al., 2016). Moreover,the recent considerations suggest that the use of sulfasalazinecould protect the intestinal epithelium from injury, reducingthe bacterial product circulation (Rosenbaum and Asquith,2016). Despite the reduced number of patients on single orcombined therapies in the cohort, our results showed indicationsof different microbial profiles associated to pharmacologicaltherapies, such as NSAIDs, immunosuppressants, and biologics,providing interesting clues on effect of such treatments ongut microbiota selection. For example, the enrichment ofCollinsella, involved in exacerbation of joint disease (Chenet al., 2016), observed in JIA-ERA patients treated with NSAIDsin combination with sulfasalazine, results in contrast withhypothesis of Rosenbaum and Asquith (Rosenbaum and Asquith,2016). Our results prompt future studies on larger cohorts,including untreated newly onset patients, addressing the effectof different pharmacological therapies on patients in activedisease and remission, investigating how inflammation canindirectly modify microbiota, selecting differential microbialcomponents, via mechanisms involved in epithelial barrierfunction and immune response and how pharmacologicaltreatment contribute to perturb the gut microbial equilibriumcompared to healthy status.
Finally, given the extreme inter-individual variability ofmicrobiota in inflammatory and autoimmune diseases, furtherinvestigations on microbiota dynamics in different phasesof disease should address the causes of perturbation andthe restoration of microbial equilibrium, in order to adopttherapeutic strategies able to maintain microbial diversity and
a stable state, essential for immune homeostasis and the host’shealth. Research in this direction should include therapeuticstrategies able to modulate the microbiota, not only with dietand probiotics, but also evaluating new therapeutic approaches,such as fecal transplantation, recently adopted in other diseasesand that have shown some effectiveness, especially duringactive disease. Furthermore, the understanding of the microbialfunctional acquisition and the relationships with epithelialbarrier function and host immune response could help to identifythe pro-arthtritogenic contribution of the microbiota.
ADDITIONAL INFORMATION
Accession codes: Raw 454 files (.sff files) are available at theEuropean Nucleotide Archive (http://www.ebi.ac.uk/ena/data/view/PRJEB11846) under the accession study ERP013262.
AUTHOR CONTRIBUTIONS
All authors were involved in drafting the article or revisingit critically for important intellectual content, and all authorsapproved the final version to be published. Study conception anddesign: RC, CDF, PL, DC, MDP. Data analysis: DA, CD, MDP,MP, MS. Interpretation of data: MDP, CDF, RC, DC, PL, IP, TG,GS, AP.
SUPPLEMENTARY MATERIAL
The Supplementary Material for this article can be foundonline at: http://journal.frontiersin.org/article/10.3389/fmicb.2016.01703/full#supplementary-material
REFERENCESAggarwal, A., and Misra, D. P. (2015). Enthesitis-related arthritis. Clin. Rheumatol.
34, 1839–1846. doi: 10.1007/s10067-015-3029-4Albanese, D., Fontana, P., De Filippo, C., Cavalieri, D., and Donati, C. (2015).
MICCA: a complete and accurate software for taxonomic profiling ofmetagenomic data. Sci. Rep. 5:9743. doi: 10.1038/srep09743
Andersson, A. F., Lindberg, M., Jakobsson, H., Backhed, F., Nyren, P.,and Engstrand, L. (2008). Comparative analysis of human gutmicrobiota by barcoded pyrosequencing. PLoS ONE 3:e2836. doi:10.1371/journal.pone.0002836
Aomatsu, T., Yoden, A., Matsumoto, K., Kimura, E., Inoue, K., Andoh, A., et al.(2011). Fecal calprotectin is a useful marker for disease activity in pediatricpatients with inflammatory bowel disease. Dig. Dis. Sci. 56, 2372–2377. doi:10.1007/s10620-011-1633-y
Asquith, M. J., Stauffer, P., Davin, S., Mitchell, C., Lin, P., and Rosenbaum, J. T.(2016). Perturbed mucosal immunity and dysbiosis accompany clinical diseasein a rat model of spondyloarthritis. Arthritis Rheumatol. 68, 2151–2162. doi:10.1002/art.39681
Atarashi, K., Tanoue, T., Shima, T., Imaoka, A., Kuwahara, T., Momose, Y., et al.(2011). Induction of colonic regulatory T cells by indigenous Clostridiumspecies. Science 331, 337–341. doi: 10.1126/science.1198469
Berkhoff, H. A. (1985). Clostridium-colinum sp-nov, nom rev, the causative agentof ulcerative enteritis (quail disease) in quail, chickens, and pheasants. Int. J.Syst. Bacteriol. 35, 155–159. doi: 10.1099/00207713-35-2-155
Brusca, S. B., Abramson, S. B., and Scher, J. U. (2014). Microbiomeand mucosal inflammation as extra-articular triggers for rheumatoidarthritis and autoimmunity. Curr. Opin. Rheumatol. 26, 101–107. doi:10.1097/BOR.0000000000000008
Bryan, A. R., and Rabinovich, C. E. (2014). Enthesitis-related arthritis: time tore-define? Curr. Rheumatol. Rep. 16:466. doi: 10.1007/s11926-014-0466-z
Caporaso, J. G., Bittinger, K., Bushman, F. D., DeSantis, T. Z., Andersen, G. L.,and Knight, R. (2010). PyNAST: a flexible tool for aligning sequences to atemplate alignment. Bioinformatics 26, 266–267. doi: 10.1093/bioinformatics/btp636
Carman, R. J., and Borriello, S. P. (1984). Infectious nature of Clostridiumspiroforme-mediated rabbit enterotoxaemia. Vet. Microbiol. 9, 497–502. doi:10.1016/0378-1135(84)90070-1
Chen, J., Wright, K., Davis, J. M., Jeraldo, P., Marietta, E. V., Murray, J., et al. (2016).An expansion of rare lineage intestinal microbes characterizes rheumatoidarthritis. Genome Med. 8:43. doi: 10.1186/s13073-016-0299-7
Cheng, J., Palva, A. M., de Vos, W. M., and Satokari, R. (2013). Contribution ofthe intestinal microbiota to human health: from birth to 100 years of age. Curr.Top. Microbiol. Immunol. 358, 323–346. doi: 10.1007/82_2011_189
Chung, H., and Kasper, D. L. (2010). Microbiota-stimulated immune mechanismsto maintain gut homeostasis. Curr. Opin. Immunol. 22, 455–460. doi:10.1016/j.coi.2010.06.008
Collado, M. C., Rautava, S., Isolauri, E., and Salminen, S. (2015). Gut microbiota:a source of novel tools to reduce the risk of human disease? Pediatr. Res. 77,182–188. doi: 10.1038/pr.2014.173
Frontiers in Microbiology | www.frontiersin.org 11 October 2016 | Volume 7 | Article 1703

fmicb-07-01703 October 24, 2016 Time: 14:59 # 12
Di Paola et al. Microbiota Characterization in JIA
Collins, M. D., Lawson, P. A., Willems, A., Cordoba, J. J., Fernandez-Garayzabal, J.,Garcia, P., et al. (1994). The phylogeny of the genus Clostridium: proposal offive new genera and eleven new species combinations. Int. J. Syst. Bacteriol. 44,812–826. doi: 10.1099/00207713-44-4-812
Costello, M. E., Ciccia, F., Willner, D., Warrington, N., Robinson, P. C.,Gardiner, B., et al. (2014). Intestinal dysbiosis in ankylosing spondylitis.Arthritis Rheumatol. doi: 10.1002/art.38967 [Epub ahead of print].
Coyte, K. Z., Schluter, J., and Foster, K. R. (2015). The ecology of themicrobiome: networks, competition, and stability. Science 350, 663–666. doi:10.1126/science.aad2602
David, L. A., Materna, A. C., Friedman, J., Campos-Baptista, M. I., Blackburn,M. C., Perrotta, A., et al. (2014a). Host lifestyle affects human microbiota ondaily timescales. Genome Biol. 15:R89. doi: 10.1186/gb-2014-15-7-r89
David, L. A., Maurice, C. F., Carmody, R. N., Gootenberg, D. B., Button, J. E.,Wolfe, B. E., et al. (2014b). Diet rapidly and reproducibly alters the human gutmicrobiome. Nature 505, 559–563. doi: 10.1038/nature12820
De Filippo, C., Cavalieri, D., Di Paola, M., Ramazzotti, M., Poullet, J. B., Massart, S.,et al. (2010). Impact of diet in shaping gut microbiota revealed by a comparativestudy in children from Europe and rural Africa. Proc. Natl. Acad. Sci. U.S.A. 107,14691–14696. doi: 10.1073/pnas.1005963107
DeSantis, T. Z., Hugenholtz, P., Larsen, N., Rojas, M., Brodie, E. L., Keller, K.,et al. (2006). Greengenes, a chimera-checked 16S rRNA gene database andworkbench compatible with ARB. Appl. Environ. Microbiol. 72, 5069–5072. doi:10.1128/AEM.03006-05
Devkota, S., Wang, Y., Musch, M. W., Leone, V., Fehlner-Peach, H.,Nadimpalli, A., et al. (2012). Dietary-fat-induced taurocholic acid promotespathobiont expansion and colitis in Il10-/- mice. Nature 487, 104–108. doi:10.1038/nature11225
Gerard, H. C., Wang, Z., Wang, G. F., El-Gabalawy, H., Goldbach-Mansky, R.,Li, Y., et al. (2001). Chromosomal DNA from a variety of bacterial species ispresent in synovial tissue from patients with various forms of arthritis. ArthritisRheum. 44, 1689–1697. doi: 10.1002/1529-0131(200107)44:7<1689::AID-ART293>3.0.CO;2-K
Gevers, D., Kugathasan, S., Denson, L. A., Vazquez-Baeza, Y., Van Treuren, W.,Ren, B., et al. (2014). The treatment-naive microbiome in new-onset Crohn’sdisease. Cell Host Microbe 15, 382–392. doi: 10.1016/j.chom.2014.02.005
Gill, T., Asquith, M., Rosenbaum, J. T., and Colbert, R. A. (2015). The intestinalmicrobiome in spondyloarthritis. Curr. Opin. Rheumatol. 27, 319–325. doi:10.1097/BOR.0000000000000187
Gmuca, S., and Weiss, P. F. (2015). Juvenile spondyloarthritis. Curr. Opin.Rheumatol. 27, 364–372. doi: 10.1097/BOR.0000000000000185
Grahn, N., Olofsson, M., Ellnebo-Svedlund, K., Monstein, H. J., and Jonasson, J.(2003). Identification of mixed bacterial DNA contamination in broad-rangePCR amplification of 16S rDNA V1 and V3 variable regions by pyrosequencingof cloned amplicons. FEMS Microbiol. Lett. 219, 87–91. doi: 10.1016/S0378-1097(02)01190-4
Hammer, Ø., Harper, D. A. T., and Ryan, P. D. (2001). PAST: paleontologicalstatistics software package for education and data analysis. Palaeontol. Electron.4:9.
Imhann, F., Bonder, M. J., Vich Vila, A., Fu, J., Mujagic, Z., Vork, L., et al.(2016). Proton pump inhibitors affect the gut microbiome. Gut 65, 740–748.doi: 10.1136/gutjnl-2015-310376
Kanehisa, M., Goto, S., Sato, Y., Kawashima, M., Furumichi, M., and Tanabe, M.(2014). Data, information, knowledge and principle: back to metabolism inKEGG. Nucleic Acids Res. 42, D199–D205. doi: 10.1093/nar/gkt1076
Kempsell, K. E., Cox, C. J., Hurle, M., Wong, A., Wilkie, S., Zanders, E. D., et al.(2000). Reverse transcriptase-PCR analysis of bacterial rRNA for detection andcharacterization of bacterial species in arthritis synovial tissue. Infect. Immun.68, 6012–6026. doi: 10.1128/IAI.68.10.6012-6026.2000
Lam, Y. Y., Ha, C. W., Campbell, C. R., Mitchell, A. J., Dinudom, A., Oscarsson, J.,et al. (2012). Increased gut permeability and microbiota change associate withmesenteric fat inflammation and metabolic dysfunction in diet-induced obesemice. PLoS ONE 7:e34233. doi: 10.1371/journal.pone.0034233
Langille, M. G., Zaneveld, J., Caporaso, J. G., McDonald, D., Knights, D., Reyes,J. A., et al. (2013). Predictive functional profiling of microbial communitiesusing 16S rRNA marker gene sequences. Nat. Biotechnol. 31, 814–821. doi:10.1038/nbt.2676
Lewis, J. D., Chen, E. Z., Baldassano, R. N., Otley, A. R., Griffiths, A. M., Lee, D.,et al. (2015). Inflammation, antibiotics, and diet as environmental stressors ofthe gut microbiome in pediatric crohn’s disease. Cell Host Microbe 18, 489–500.doi: 10.1016/j.chom.2015.09.008
Li, M., Wang, M., and Donovan, S. M. (2014). Early development of the gutmicrobiome and immune-mediated childhood disorders. Semin. Reprod. Med.32, 74–86. doi: 10.1055/s-0033-1361825
Lin, P., Bach, M., Asquith, M., Lee, A. Y., Akileswaran, L., Stauffer, P., et al.(2014). HLA-B27 and human beta2-microglobulin affect the gut microbiota oftransgenic rats. PLoS ONE 9:e105684. doi: 10.1371/journal.pone.0105684
Lionetti, P., Callegari, M. L., Ferrari, S., Cavicchi, M. C., Pozzi, E., de Martino, M.,et al. (2005). Enteral nutrition and microflora in pediatric Crohn’s disease.JPEN J. Parenter. Enteral Nutr. 29(4 Suppl.), S173–S175; discussion S175–S178,S184–S188. doi: 10.1177/01486071050290S4S173
Longman, R. S., and Littman, D. R. (2015). The functional impact of the intestinalmicrobiome on mucosal immunity and systemic autoimmunity. Curr. Opin.Rheumatol. 27, 381–387. doi: 10.1097/BOR.0000000000000190
Loubinoux, J., Bronowicki, J. P., Pereira, I. A., Mougenel, J. L., and Faou,A. E. (2002). Sulfate-reducing bacteria in human feces and their associationwith inflammatory bowel diseases. FEMS Microbiol. Ecol. 40, 107–112. doi:10.1111/j.1574-6941.2002.tb00942.x
Lozupone, C., and Knight, R. (2005). UniFrac: a new phylogenetic method forcomparing microbial communities. Appl. Environ. Microbiol. 71, 8228–8235.doi: 10.1128/AEM.71.12.8228-8235.2005
Lozupone, C., Lladser, M. E., Knights, D., Stombaugh, J., and Knight, R. (2011).UniFrac: an effective distance metric for microbial community comparison.ISME J. 5, 169–172. doi: 10.1038/ismej.2010.133
Lozupone, C. A., Stombaugh, J. I., Gordon, J. I., Jansson, J. K., and Knight, R.(2012). Diversity, stability and resilience of the human gut microbiota. Nature489, 220–230. doi: 10.1038/nature11550
McMurdie, P. J., and Holmes, S. (2014). Waste not, want not: why rarefyingmicrobiome data is inadmissible. PLoS Comput. Biol. 10:e1003531. doi:10.1371/journal.pcbi.1003531
Moen, K., Brun, J. G., Valen, M., Skartveit, L., Eribe, E. K., Olsen, I., et al. (2006).Synovial inflammation in active rheumatoid arthritis and psoriatic arthritisfacilitates trapping of a variety of oral bacterial DNAs. Clin. Exp. Rheumatol.24, 656–663.
Morgan, X. C., Tickle, T. L., Sokol, H., Gevers, D., Devaney, K. L., Ward,D. V., et al. (2012). Dysfunction of the intestinal microbiome in inflammatorybowel disease and treatment. Genome Biol. 13:R79. doi: 10.1186/gb-2012-13-9-r79
Morio, F., Jean-Pierre, H., Dubreuil, L., Jumas-Bilak, E., Calvet, L., Mercier, G., et al.(2007). Antimicrobial susceptibilities and clinical sources of Dialister species.Antimicrob. Agents Chemother. 51, 4498–4501. doi: 10.1128/AAC.00538-07
Oberle, E. J., Harris, J. G., and Verbsky, J. W. (2014). Polyarticular juvenileidiopathic arthritis – epidemiology and management approaches. Clin.Epidemiol. 6, 379–393. doi: 10.2147/CLEP.S53168
Parks, D. H., Tyson, G. W., Hugenholtz, P., and Beiko, R. G. (2014). STAMP:statistical analysis of taxonomic and functional profiles. Bioinformatics 30,3123–3124. doi: 10.1093/bioinformatics/btu494
Price, M. N., Dehal, P. S., and Arkin, A. P. (2010). FastTree 2–approximatelymaximum-likelihood trees for large alignments. PLoS ONE 5:e9490. doi:10.1371/journal.pone.0009490
Rath, H. C., Herfarth, H. H., Ikeda, J. S., Grenther, W. B., Hamm, T. E. Jr., Balish, E.,et al. (1996). Normal luminal bacteria, especially Bacteroides species, mediatechronic colitis, gastritis, and arthritis in HLA-B27/human beta2 microglobulintransgenic rats. J. Clin. Invest. 98, 945–953. doi: 10.1172/JCI118878
Ravelli, A., and Martini, A. (2007). Juvenile idiopathic arthritis. Lancet 369,767–778. doi: 10.1016/S0140-6736(07)60363-8
Rogers, G. B. (2015). Germs and joints: the contribution of the human microbiometo rheumatoid arthritis. Nat. Med. 21, 839–841. doi: 10.1038/nm.3916
Rosenbaum, J. T., and Asquith, M. J. (2016). The microbiome: a revolutionin treatment for rheumatic diseases? Curr. Rheumatol. Rep. 18:62. doi:10.1007/s11926-016-0614-8
Rowan, F. E., Docherty, N. G., Coffey, J. C., and O’Connell, P. R. (2009). Sulphate-reducing bacteria and hydrogen sulphide in the aetiology of ulcerative colitis.Br. J. Surg. 96, 151–158. doi: 10.1002/bjs.6454
Frontiers in Microbiology | www.frontiersin.org 12 October 2016 | Volume 7 | Article 1703

fmicb-07-01703 October 24, 2016 Time: 14:59 # 13
Di Paola et al. Microbiota Characterization in JIA
Salim, S. Y., Kaplan, G. G., and Madsen, K. L. (2014). Air pollution effects on the gutmicrobiota: a link between exposure and inflammatory disease. Gut Microbes 5,215–219. doi: 10.4161/gmic.27251
Sandhya, P., Danda, D., Sharma, D., and Scaria, V. (2016). Does the buck stop withthe bugs?: an overview of microbial dysbiosis in rheumatoid arthritis. Int. J.Rheum. Dis. 19, 8–20. doi: 10.1111/1756-185X.12728
Scher, J. U., Littman, D. R., and Abramson, S. B. (2016). Review: microbiome ininflammatory arthritis and human rheumatic diseases. Arthritis Rheumatol. 68,35–45. doi: 10.1002/art.39259
Scher, J. U., Sczesnak, A., Longman, R. S., Segata, N., Ubeda, C., Bielski, C.,et al. (2013). Expansion of intestinal Prevotella copri correlates with enhancedsusceptibility to arthritis. Elife 2:e01202. doi: 10.7554/eLife.01202
Scher, J. U., Ubeda, C., Artacho, A., Attur, M., Isaac, S., Reddy, S. M., et al. (2015).Decreased bacterial diversity characterizes the altered gut microbiota in patientswith psoriatic arthritis, resembling dysbiosis in inflammatory bowel disease.Arthritis Rheumatol. 67, 128–139. doi: 10.1002/art.38892
Segata, N., Izard, J., Waldron, L., Gevers, D., Miropolsky, L., Garrett, W. S.,et al. (2011). Metagenomic biomarker discovery and explanation. Genome Biol.12:R60. doi: 10.1186/gb-2011-12-6-r60
Severijnen, A. J., van Kleef, R., Hazenberg, M. P., and van de Merwe, J. P. (1989).Cell wall fragments from major residents of the human intestinal flora inducechronic arthritis in rats. J. Rheumatol. 16, 1061–1068.
Simelyte, E., Rimpilainen, M., Zhang, X., and Toivanen, P. (2003). Role ofpeptidoglycan subtypes in the pathogenesis of bacterial cell wall arthritis. Ann.Rheum. Dis. 62, 976–982. doi: 10.1136/ard.62.10.976
Sokol, H., Pigneur, B., Watterlot, L., Lakhdari, O., Bermudez-Humaran, L. G.,Gratadoux, J. J., et al. (2008). Faecalibacterium prausnitzii is an anti-inflammatory commensal bacterium identified by gut microbiota analysis ofCrohn disease patients. Proc. Natl. Acad. Sci. U.S.A. 105, 16731–16736. doi:10.1073/pnas.0804812105
Sommer, F., and Backhed, F. (2013). The gut microbiota–masters of hostdevelopment and physiology. Nat. Rev. Microbiol. 11, 227–238. doi:10.1038/nrmicro2974
Stebbings, S., Munro, K., Simon, M. A., Tannock, G., Highton, J., Harmsen, H.,et al. (2002). Comparison of the faecal microflora of patients withankylosing spondylitis and controls using molecular methods of analysis.Rheumatology (Oxford) 41, 1395–1401. doi: 10.1093/rheumatology/41.12.1395
Stoll, M. L., Kumar, R., Morrow, C. D., Lefkowitz, E. J., Cui, X., Genin, A.,et al. (2014). Altered microbiota associated with abnormal humoral immuneresponses to commensal organisms in enthesitis-related arthritis. Arthritis Res.Ther. 16:486. doi: 10.1186/s13075-014-0486-0
Taneja, V. (2014). Arthritis susceptibility and the gut microbiome. FEBS Lett. 588,4244–4249. doi: 10.1016/j.febslet.2014.05.034
Targan, S. R., Landers, C. J., Yang, H., Lodes, M. J., Cong, Y., Papadakis, K. A.,et al. (2005). Antibodies to CBir1 flagellin define a unique response that isassociated independently with complicated Crohn’s disease. Gastroenterology128, 2020–2028. doi: 10.1053/j.gastro.2005.03.046
Taurog, J. D., Richardson, J. A., Croft, J. T., Simmons, W. A., Zhou, M., Fernandez,J. L., et al. (1994). The germfree state prevents development of gut and joint
inflammatory disease in HLA-B27 transgenic rats. J. Exp. Med. 180, 2359–2364.doi: 10.1084/jem.180.6.2359
Tejesvi, M. V., Arvonen, M., Kangas, S. M., Keskitalo, P. L., Pirttila, A. M.,Karttunen, T. J., et al. (2016). Faecal microbiome in new-onset juvenileidiopathic arthritis. Eur. J. Clin. Microbiol. Infect. Dis. 35, 363–370. doi:10.1007/s10096-015-2548-x
Tremaroli, V., and Backhed, F. (2012). Functional interactions betweenthe gut microbiota and host metabolism. Nature 489, 242–249. doi:10.1038/nature11552
Vaahtovuo, J., Munukka, E., Korkeamaki, M., Luukkainen, R., and Toivanen, P.(2008). Fecal microbiota in early rheumatoid arthritis. J. Rheumatol. 35, 1500–1505.
Wang, Q., Garrity, G. M., Tiedje, J. M., and Cole, J. R. (2007). Naive Bayesianclassifier for rapid assignment of rRNA sequences into the new bacterialtaxonomy. Appl. Environ. Microbiol. 73, 5261–5267. doi: 10.1128/AEM.00062-07
Williams, B. L., Hornig, M., Parekh, T., and Lipkin, W. I (2012). Applicationof novel PCR-based methods for detection, quantitation, and phylogeneticcharacterization of Sutterella species in intestinal biopsy samples fromchildren with autism and gastrointestinal disturbances. MBio 3:e261-11. doi:10.1128/mBio.00261-11
Woting, A., Pfeiffer, N., Loh, G., Klaus, S., and Blaut, M. (2014). Clostridiumramosum promotes high-fat diet-induced obesity in gnotobiotic mouse models.MBio 5:e1530-14. doi: 10.1128/mBio.01530-14
Yeoh, N., Burton, J. P., Suppiah, P., Reid, G., and Stebbings, S. (2013). The roleof the microbiome in rheumatic diseases. Curr. Rheumatol. Rep. 15:314. doi:10.1007/s11926-012-0314-y
Zhang, Q., Wu, Y., Wang, J., Wu, G., Long, W., Xue, Z., et al. (2016). Accelerateddysbiosis of gut microbiota during aggravation of DSS-induced colitis by abutyrate-producing bacterium. Sci. Rep. 6:27572. doi: 10.1038/srep27572
Zhang, X., Zhang, D., Jia, H., Feng, Q., Wang, D., Liang, D., et al. (2015).The oral and gut microbiomes are perturbed in rheumatoid arthritis andpartly normalized after treatment. Nat. Med. 21, 895–905. doi: 10.1038/nm.3914
Zhong, D., Brower-Sinning, R., Firek, B., and Morowitz, M. J. (2014).Acute appendicitis in children is associated with an abundance ofbacteria from the phylum Fusobacteria. J. Pediatr. Surg. 49, 441–446. doi:10.1016/j.jpedsurg.2013.06.026
Conflict of Interest Statement: The authors declare that the research wasconducted in the absence of any commercial or financial relationships that couldbe construed as a potential conflict of interest.
Copyright © 2016 Di Paola, Cavalieri, Albanese, Sordo, Pindo, Donati, Pagnini,Giani, Simonini, Paladini, Lionetti, De Filippo and Cimaz. This is an open-accessarticle distributed under the terms of the Creative Commons Attribution License(CC BY). The use, distribution or reproduction in other forums is permitted, providedthe original author(s) or licensor are credited and that the original publication in thisjournal is cited, in accordance with accepted academic practice. No use, distributionor reproduction is permitted which does not comply with these terms.
Frontiers in Microbiology | www.frontiersin.org 13 October 2016 | Volume 7 | Article 1703

ORIGINAL RESEARCHpublished: 03 August 2016
doi: 10.3389/fmicb.2016.01227
Frontiers in Microbiology | www.frontiersin.org 1 August 2016 | Volume 7 | Article 1227
Edited by:
Agostinho Carvalho,
University of Minho, Portugal
Reviewed by:
Norman Pavelka,
Singapore Immunology Network
(A*STAR), Singapore
Teresa Rinaldi,
Sapienza University of Rome, Italy
*Correspondence:
Duccio Cavalieri
Carlotta De Filippo
Specialty section:
This article was submitted to
Fungi and Their Interactions,
a section of the journal
Frontiers in Microbiology
Received: 25 May 2016
Accepted: 22 July 2016
Published: 03 August 2016
Citation:
Strati F, Di Paola M, Stefanini I,
Albanese D, Rizzetto L, Lionetti P,
Calabrò A, Jousson O, Donati C,
Cavalieri D and De Filippo C (2016)
Age and Gender Affect the
Composition of Fungal Population of
the Human Gastrointestinal Tract.
Front. Microbiol. 7:1227.
doi: 10.3389/fmicb.2016.01227
Age and Gender Affect theComposition of Fungal Population ofthe Human Gastrointestinal TractFrancesco Strati 1, 2, Monica Di Paola 3, Irene Stefanini 1, Davide Albanese 1, Lisa Rizzetto 1,
Paolo Lionetti 3, Antonio Calabrò 4, Olivier Jousson 2, Claudio Donati 1, Duccio Cavalieri 1, 5*
and Carlotta De Filippo 6*
1Department of Computational Biology, Research and Innovation Centre, Fondazione Edmund Mach, San Michele all’ Adige,
Italy, 2Centre for Integrative Biology, University of Trento, Trento, Italy, 3Department of Neuroscience, Psychology, Drug
Research and Child Health, Meyer Children’s Hospital, University of Florence, Florence, Italy, 4Gastroenterology Unit,
Department of Experimental and Clinical Biomedical Sciences, University of Florence, Florence, Italy, 5Department of Biology,
University of Florence, Sesto Fiorentino, Florence, Italy, 6 Institute of Biometeorology, National Research Council, Florence,
Italy
The fungal component of the human gut microbiota has been neglected for long time
due to the low relative abundance of fungi with respect to bacteria, and only recently few
reports have explored its composition and dynamics in health or disease. The application
of metagenomics methods to the full understanding of fungal communities is currently
limited by the under representation of fungal DNA with respect to the bacterial one,
as well as by the limited ability to discriminate passengers from colonizers. Here, we
investigated the gut mycobiota of a cohort of healthy subjects in order to reduce the
gap of knowledge concerning fungal intestinal communities in the healthy status further
screening for phenotypical traits that could reflect fungi adaptation to the host. We
studied the fecal fungal populations of 111 healthy subjects by means of cultivation
on fungal selective media and by amplicon-based ITS1 metagenomics analysis on a
subset of 57 individuals. We then characterized the isolated fungi for their tolerance to
gastrointestinal (GI) tract-like challenges and their susceptibility to antifungals. A total
of 34 different fungal species were isolated showing several phenotypic characteristics
associated with intestinal environment such as tolerance to body temperature (37◦C),
to acidic and oxidative stress, and to bile salts exposure. We found a high frequency of
azoles resistance in fungal isolates, with potential and significant clinical impact. Analyses
of fungal communities revealed that the human gut mycobiota differs in function of
individuals’ life stage in a gender-related fashion. The combination of metagenomics and
fungal cultivation allowed an in-depth understanding of the fungal intestinal community
structure associated to the healthy status and the commensalism-related traits of isolated
fungi. We further discussed comparatively the results of sequencing and cultivation
to critically evaluate the application of metagenomics-based approaches to fungal gut
populations.
Keywords: commensal fungi, human gut mycobiota, antifungal resistance, fungal metagenomics, fungi-host
interactions

Strati et al. Healthy Gut Mycobiota
INTRODUCTION
The human gut is a complex ecological niche in whicharchaea, bacteria, protozoa, fungi, and viruses co-exist in closeassociation with the host (Reyes et al., 2010; Arumugam et al.,2011; Human Microbiome Project Consortium, 2012). Evenif it has been estimated that the number of bacteria hugelyoutreaches the number of fungi in the gastrointestinal (GI)tract (Huffnagle and Noverr, 2013), fungi play a relevantrole in the physiology of the human host (Oever and Netea,2014; Underhill and Iliev, 2014). Recent studies showed that,while the composition of the bacterial community is relativelystable over time, the fungal population inhabiting the murinegut undergoes significant changes during the animal’s lifetime(Dollive et al., 2013). This brought to the conclusion that gutfungal populations are more variable than bacterial ones andthat their compositionmay be influenced by environmental fungi(Underhill and Iliev, 2014). Despite evidence that fungi inhabitthe mammalian GI tract and interact with the host immunesystem (Romani, 2011; Rizzetto et al., 2014; Underhill and Iliev,2014), the composition and characteristics of the mycobiotain healthy hosts have been poorly explored. The prevalentinterest in describing pathogenic fungi, their phenotypes andthe process by which they establish the infection is one ofthe major cause that brought to neglect the harmless partof the commensal fungal population. Despite this topic hasbeen only marginally explored to date, it has been shown thatmucosal fungi are able to modulate both the innate and adaptiveimmune responses (Romani, 2011; Rizzetto et al., 2014; Underhilland Iliev, 2014) thus supporting the need to further studythe whole gut mycobiota. Furthermore, alterations of the gutmycobiota have been associated to different pathologies rangingfrom metabolic disorders (obesity) to colorectal adenomas andInflammatory Bowel Diseases (IBDs) (Luan et al., 2015; MarRodriguez et al., 2015; Sokol et al., 2016). A recent study showedthe association of IBDs to alteration of the gut mycobiota.In particular Sokol and colleagues showed that IBD patientsbear a smaller proportion of Saccharomyces cerevisiae andhigher of Candida albicans compared to healthy subjects. Inaddition, they highlighted the existence in Crohn’s diseaseof interconnected alterations between bacterial and fungalcommunities (Sokol et al., 2016). However, the role of the gutmycobiota in the maintenance of health it is still far frombeing well-understood because the studies carried out so farfocused on disease-causing taxa. Nevertheless, some yeasts havebeen clinically prescribed for a long time because of theirpotential probiotic properties, suggesting a beneficial role ofsome fungi for host health. A great example of “beneficial”fungus is represented by S. cerevisiae var. boulardii, used forthe relief of gastroenteritis (Hatoum et al., 2012). In order toreduce the gap of knowledge concerning the gut mycobiotaand its interplay with the host, we characterized the gutmycobiota composition of a cohort of healthy subjects bymeans of metagenomics, fungal cultivation, and phenotypicassays.
MATERIALS AND METHODS
Study ParticipantsFecal samples were collected from 111 Italian healthy volunteers(49 male and 62 female, average age, 10 ± 8.2; Table 1)and analyzed within 24 h. Written informed consent hasbeen obtained from all the enrolled subjects or tutors inaccordance with the guidelines and regulations approved bythe Research Ethical Committees of the Meyer Children’sHospital and the Azienda Ospedaliera Careggi, Florence.All the subjects enrolled were non-smokers, followed aMediterranean-based diet and they did not take antibiotics,antifungals or probiotics in the 6 months prior to samplecollection. None of the participants had any history of GIabnormalities.
Isolation and Identification of CultivableFungal Species from FecesStool samples were diluted in sterile Ringer’s solution andplated on solid YPD medium (1% Yeast extract, 2% Bacto-peptone, 2% D-glucose, 2% agar) supplemented with 25 U/mlof penicillin, 25µg/ml of streptomycin (Sigma-Aldrich) andincubated aerobically at 27◦C for 3–5 days. All fungal isolatesgrown on the selective medium were further isolated to obtainsingle-cell pure colonies. Genomic DNA was extracted from purecultures of isolated colonies as previously described (Hoffmanand Winston, 1987). Strains were identified by amplificationand sequencing of the ribosomal Internal Transcribed Spacer(ITS) region, using ITS1 (5′-GTTTCCGTAGGTGAACTTGC-3′) and ITS4 (5′-TCCTCCGCTTATTGATATGC-3′) primers, aspreviously described (Sebastiani et al., 2002). Fungal isolates wereidentified by using the BLAST algorithm in the NCBI database(minimum 97% sequence similarity and 95% coverage with adescribed species).
Phenotypical Characterization of FungalIsolatesFungal isolates were tested for phenotypical features that couldbe related to the ability of colonization and persistence in thehuman gut. Cell growth in liquid media was monitored byoptical density measurement at 630 nm with a microplate reader(Synergy2, BioTek, USA) after 48 h of incubation under testedconditions. Three independent replicates were performed foreach test.
Growth at Supra Optimal TemperaturesFungal isolates (∼105 cells/ml) were grown at supra optimaltemperatures in liquid YPD medium (40, 42, 44, and 46◦C).
pH Impact on GrowthFungal isolates (∼105 cells/ml) were grown at 37◦C in liquidYPD medium at pH 2.0 and pH 3.0 adding hydrochloricacid/potassium chloride and citrate buffers, respectively, to testtheir ability to resist to the acidic environments encounteredduring GI tract passage.
Frontiers in Microbiology | www.frontiersin.org 2 August 2016 | Volume 7 | Article 1227

Strati et al. Healthy Gut Mycobiota
TABLE 1 | Characteristics of the study participants.
Age group (year) Infants (0–2) Children (3–10) Adolescents (11–17) Adults (≥18) All subjects
Number of subjects 18 48 24 21 111
% with fungi 88.9 83.3 70.8 76.2 80.2
Subject ID Gender Age (year) Subject ID Gender Age (year) Subject ID Gender Age (year)
HS1 M 5 HS38* F 25 HS75 F 1
HS2 M 5 HS39* F 27 HS76* M 1
HS3 M 14 HS40* M 27 HS77 F 4
HS4 M 1 HS41* F 24 HS78* M 12
HS5 F 20 HS42* F 24 HS79* M 0.1
HS6 F 20 HS43* M 26 HS80 F 0.1
HS7 F 20 HS44* F 24 HS81 F 7
HS8 M 5 HS45* F 6 HS82* M 10
HS9 M 14 HS46* F 6 HS83* M 12
HS10* F 2 HS47* F 10 HS84 F 6
HS11 M 16 HS48* F 2.5 HS85 F 10
HS12 M 15 HS49* M 2.5 HS86* M 7
HS13* F 18 HS50* F 1.5 HS87* M 9
HS14 F 0.3 HS51* F 8 HS88* M 7
HS15* F 11 HS52* F 23 HS89* M 12
HS16 M 14 HS53* F 23 HS90 F 8
HS17 M 15 HS54 M 2 HS91 F 2
HS18 M 11 HS55* M 2 HS92 F 12
HS19 F 3 HS56* M 2 HS93 F 4
HS20* F 4 HS57 F 12 HS94 F 4
HS21* F 5 HS58 F 3 HS95 F 10
HS22* F 15 HS59* M 5 HS96 F 12
HS23* F 11 HS60 F 3 HS97* M 6
HS24 M 15 HS61* M 2 HS98 F 16
HS25 M 7 HS62 F 4 HS99 F 3
HS26 M 3 HS63* M 5 HS100* M 0.1
HS27* F 9 HS64 F 3 HS101* M 4
HS28 M 5 HS65* M 5 HS102 F 13
HS29* F 16 HS66* M 0.1 HS103* M 7
HS30* F 12 HS67 F 1 HS104* M 4
HS31* F 24 HS68 F 4 HS105 F 8
HS32* F 32 HS69* M 6 HS106 F 5
HS33* F 32 HS70 F 11 HS107 M 13
HS34* F 25 HS71* M 1 HS108 M 4.5
HS35* F 26 HS72 F 10 HS109 M 1
HS36* M 20 HS73 F 4 HS110 M 12
HS37* F 28 HS74* M 6 HS111 M 18
*Samples analyzed also by mean of amplicon-based ITS1metagenomics.
Tolerance to Bile AcidsFungal isolates (∼105 cells/ml) were grown in liquid YPDmedium at 37◦C in the presence of three different concentrationsof bile [Ox-bile, Sigma-Aldrich; 0.5, 1, and 2% (w/v)]mimicking the physiological intestinal settings (Noriegaet al., 2004).
Resistance to Oxidative StressFungal resistance to oxidative stress was evaluated by measuringthe inhibition halo induced by the treatment of fungal strains(∼107 cells/ml) grown on YPD solid medium with 0.5mMhydrogen peroxide (H2O2). The percentage of sensitivity tooxidative stress was calculated as the deviation of the inhibition
Frontiers in Microbiology | www.frontiersin.org 3 August 2016 | Volume 7 | Article 1227

Strati et al. Healthy Gut Mycobiota
halo diameter (Ø) from that of the environmental, oxidativestress sensitive M28-4D S. cerevisiae strain (Cavalieri et al., 2000)according to the following formula: [(Ø sample—Ø M28-4D)/ØM284D]*100.
Invasive GrowthThe ability of fungal strains to penetrate the YPD solid mediumwas tested as previously described (Vopalenska et al., 2005).M28-4D and BY4742 S. cerevisiae strains, known to be invasive andnon-invasive, respectively, have been used as controls. The straininvasiveness was assigned with scores from 3 (highly invasive) to0 (non-invasive).
Hyphal FormationFungal cells (∼105 cells/ml) were grown for 7 days in liquid YPDand YNBmedia [0.67% Yeast Nitrogen Base w/o aminoacids and(NH4)2SO4 (Sigma-Aldrich), 2% glucose], both at 27 and 37◦C inorder to evaluate hyphae or pseudohyphae formation. Formationof hyphae was inspected by optical microscope observation witha Leica DM1000 led instrument (magnification 40x and 100x).
Antifungal Susceptibility TestingAll fungal isolates were tested for susceptibility to fluconazole,itraconazole, and 5-flucytosine (Sigma-Aldrich) by MinimumInibitory Concentration (MIC) assays according to the EuropeanCommittee on Antimicrobial Susceptibility Testing (EUCAST)recommendations (Rodriguez-Tudela et al., 2008a,b). Clinicaland Laboratory Standards Institute (CLSI) clinical breakpoints(CBPs) were used to evaluate the antifungal resistance (Pfallerand Diekema, 2012; Castanheira et al., 2014). CBPs have notbeen established for non-Candida yeasts and non-Aspergillusmolds, however have been used as a proxy for the evaluation ofantifungals susceptibility in such isolates.
DNA Extraction and PCR Amplification ofFungal ITS1 rDNA RegionDNA extraction from fecal samples (250 mg) was performedusing the FastDNATM SPIN Kit for Feces (MP-Biomedicals,USA) following manufacturer’s instructions. DNA qualitywas checked on 1% agarose gel TAE 1X and quantifiedwith a NanoDrop R© spectrophotometer. For each sample,fungal ITS1 rDNA region was amplified using a specificfusion primer set coupled with forward primer 18SF (5′-GTAAAAGTCGTAACAAGGTTTC-3′) and reverse primer5.8S1R (5′-GTTCAAAGAYTCGATGATTCAC-3′; Findley et al.,2013) containing adaptors, key sequence and barcode (MultipleIDentifier) sequences as described by the 454 SequencingSystem Guidelines for Amplicon Experimental Design (Roche,Switzerland). The PCR reaction mix contained 1X FastStart HighFidelity PCR buffer, 2mM MgCl2, 200µM of dNTPs, 0.4µMof each primer (PRIMM, Italy), 2.5 U of FastStart High FidelityPolymerase Blend, and 100 ng of gDNA as template. Thermalcycling conditions used were 5min at 95◦C, 35 cycles of 45 sat 95◦C, 45 s at 56◦C, and 1.30min at 72◦C followed by a finalextension of 10min at 72◦C. All PCR experiments were carriedout in triplicates using a Veriti R© Thermal Cycler (AppliedBiosystems, USA).
Library Construction and PyrosequencingThe PCR products obtained were analyzed by gel electrophoresisand cleaned using the AMPure XP beads kit (Beckman Coulter,USA) following the manufacturer’s instructions, quantified viaquantitative PCR using the Library quantification kit—Roche 454titanium (KAPA Biosystems, USA) and pooled in equimolar wayin a final amplicon library. The 454 pyrosequencing was carriedout on the GS FLX+ system using the XL+ chemistry followingthe manufacturer’s recommendations (Roche, Switzerland).
Data AnalysisPyrosequencing resulted in a total of 1.337.184 reads with amean of 19.379 ± 13.334 sequences per sample. Raw 454files were demultiplexed using the Roche’s sff file softwareand submitted to the European Nucleotide Archive withaccession number PRJEB11827 (http://www.ebi.ac.uk/ena/data/view/PRJEB11827). Sample accessions andmetadata are availablein Supplementary Table S1. Reads were pre-processed using theMICCA pipeline (Albanese et al., 2015) (http://www.micca.org).Forward and reverse primers trimming and quality filtering wereperformed using micca-preproc. De-novo sequence clustering,chimera filtering, and taxonomy assignment were performedby micca-otu-denovo: Operational Taxonomic Units (OTUs)were assigned by clustering the sequences with a threshold of97% pairwise identity and their representative sequences wereclassified using the RDP classifier version 2.8 (Wang et al., 2007)against the UNITE fungal ITS database (Koljalg et al., 2013). Denovomultiple sequence alignment was performed using T-Coffee(Notredame et al., 2000). Fungal taxonomy assignments werethen manually curated using BLASTn against the GenBank’sdatabase for accuracy. High quality fungal sequences weredetected in all samples. Furthermore, the sequences belonging toAgaricomycetes [unlikely to be residents of the human gut due totheir ecology Hibbett, 2006] were manually filtered out.
The phylogenetic tree was inferred by using micca-phylogeny(Price et al., 2010). Rarefaction analysis resulted in a sequencingdepth adequate to capture the ecological diversity of thesamples up to saturation. Sampling heterogeneity was reducedby rarefaction.Alpha and beta-diversity estimates were computedusing the phyloseq R package (McMurdie and Holmes, 2013).PERMANOVA (Permutational multivariate analysis of variance)was performed using the adonis() function of the veganR packagewith 999 permutations. Permutations have been constrainedwithin age groups (corresponding to 0–2, 3–10, 11–17, and >18y/o) or gender to reduce possible biases related to the unequalage and gender distributions among subjects using the “strata”argument within the adonis() function. Two-sided, unpairedWelch t-statistics were computed using the function mt() in thephyloseq library and the p-values were adjusted for multiplecomparison controlling the family-wise Type I error rate (minPprocedure; Westfall and Young, 1993). Wilcoxon rank-sum testsand Spearman’s correlations were performed using the R software(Team, 2014) through the stats R package (version 3.1.2) and thepsych R package (Revelle, 2013), respectively. p-values have beencorrected for multiple comparison by using the false discoveryrate correction (Benjamini and Hochberg, 1995).
Frontiers in Microbiology | www.frontiersin.org 4 August 2016 | Volume 7 | Article 1227

Strati et al. Healthy Gut Mycobiota
RESULTS
Cultivable Gut MycobiotaThe cultivable gut mycobiota of 111 healthy volunteers wasinvestigated through isolation in selective media. Fungiwere detected in more than 80% of subjects leading to theidentification of 349 different isolates (Supplementary Table S2).Thirty-four different fungal species were detected at differentfrequencies of isolation (Table 2) among which Aspergillusglaucus, Candida albicans, Candida deformans, Candidafermentati, Candida glabrata, Candida intermedia, Candidalusitaniae, Candida metapsilosis, Candida parapsilosis,Candida pararugosa, Candida tropicalis, Candida zelanoydes,Cryptococcus saitoi, Lichtheimia ramosa, Mucor circinelloides,Pleurostomophora richardsiae, Rhodotorula mucilaginosa,Trichosporon asahii, Yarrowia lipolytica. These species werepreviously found in different human body sites, including the GItract as commensal or opportunistic pathogens (Araujo et al.,2007; Johnson, 2009; Alastruey-Izquierdo et al., 2010; Kurtzmanet al., 2011; Levenstadt et al., 2012; Gouba et al., 2014; Lee et al.,2014; Rizzetto et al., 2014). We also isolated the environmentalfungi Aspergillus pseudoglaucus, Eurotium amstelodami,Eurotium rubrum, Penicillium brevicompactum, Penicilliumpaneum, Penicillium crustosum, Pichia caribbica, Pichiafermentans, Pichia kluyveri, Pichia manshurica, Rhodosporidiumkratochvilovae, Saccharomyces cerevisiae, Starmerella bacillaris,and Torulaspora delbrueckii. Such species were previously foundin fermentations, oenological samples (Chitarra et al., 2004;Butinar et al., 2005; Kurtzman et al., 2011; Barata et al., 2012;Bezerra-Bussoli et al., 2013; Tristezza et al., 2013; Vardjan et al.,2013; Belda et al., 2015; de Melo Pereira et al., 2014; Santini et al.,2014; Wang et al., 2014) and rarely found in clinical samples (dela Camara et al., 1996; Kaygusuz et al., 2003; Butinar et al., 2005;Rizzetto et al., 2014). The 39.8% of subjects showed at least oneC. albicans isolate, which resulted in the most common yeastspecies found in our samples, in line with previous reports on thegut mycobiota of healthy subjects (Khatib et al., 2001; Bougnouxet al., 2006).
Population level analysis of the cultivable gut mycobiotarevealed significant gender-related differences, with femalesubjects showing a higher number of fungal isolates (p <
0.005, Wilcoxon rank-sum test; Figure 1A) and fungal species(p < 0.05, Wilcoxon rank-sum test; Figure 1B) compared tomale subjects (not related to individual’s age) while we did notobserved significant differences in the fungal population amongthe investigated age groups (Figures 1C,D). Finally, no speciesper se was responsible for these differences, as indicated bythe fact that we did not find significant differences betweenindividual species abundances inmale and female subjects for anyinvestigated age group.
Fungal Gut MetagenomicsTo better characterize the intestinal fungal community structureassociated to our cohort of healthy subjects we further analyzeda subset of these subjects (57 subjects, 29 females, and 28males, average age 12 ± 9.5) by means of amplicon-basedITS1 targeted metagenomics, looking at gender and age groups
TABLE 2 | Fungal isolates and frequencies of isolation.
Species % Species %
Candida albicans 39.8 Rhodosporidium kratochvilovae 0.57
Rhodotorula mucilaginosa 12.6 Trichosporon asahii 0.57
Candida parapsilosis 12.3 Yarrowia lipolytica 0.57
Torulaspora delbrueckii 6.59 Aspergillus cristatus 0.28
Pichia fermentans 4.29 Candida deformans 0.28
Penicillium brevicompactum 3.72 Candida fermentati 0.28
Pichia manshurica 3.43 Candida glabrata 0.28
Pichia kluyveri 2.86 Candida intermedia 0.28
Candida lusitaniae 2.58 Candida metapsilosis 0.28
Pennicillium crustosum 1.43 Candida tropicalis 0.28
Saccharomyces cerevisiae 1.14 Candida zelanoydes 0.28
Penicillium paneum 0.58 Eurotium amstelodami 0.28
Aspergillus glaucus 0.57 Eurotium rubrum 0.28
Aspergillus pseudoglaucus 0.57 Lichtheimia ramose 0.28
Candida pararugosa 0.57 Pichia carribica 0.28
Cryptococcus saitoi 0.57 Pleurostomophora richardsiae 0.28
Mucor circinelloides 0.57 Starmerella bacillaris 0.28
differences. The analysis led to the identification of 68 fullyclassified (to the genus level) fungal taxa and 26 taxa onlypartially classified (of which 2 classified to the phylum level,5 classified to the order level, 9 classified to the class level,and 9 classified to the family level). Measurements of thefungal richness within each sample i.e., the alpha-diversity(see Materials and Methods), revealed no significant differencesamong male and female subjects (Figure 2A), differently fromthe above finding based on the culture-based analysis in whichwe observed an increased number of intestinal fungal speciesin females compared to males (Figure 1B). Furthermore, weobserved that infants and children harbor a higher fungalrichness compared to adults as indicated by the number ofthe observed OTUs (p < 0.05, Wilcoxon rank-sum test,Figure 2B). The analysis of beta-diversity identified significantdifferences in the composition of the gut mycobiota amonggender and age groups. PCoA (Principal Coordinates Analysis)revealed that samples cluster by gender, based on the unweightedUniFrac distance and the Bray-Curtis dissimilarity (p < 0.05,PERMANOVA; Figures 2C,D, Supplementary Table S3) and byage groups, based on the unweighted UniFrac distance (p <
0.05, PERMANOVA; Figure 2C, Supplementary Table S3). Wecalculated PERMANOVAs constraining permutations withinlevels (gender or age groups) to avoid biases related to theunequal distribution of genders among age groups and vice-versa. Genus level analysis showed Penicillium, Aspergillus,and Candida as the most abundant genera in this subsetof subjects (22.3, 22.2, and 16.9%, respectively; Figure 3,Supplementary Table S4). We further observed that Aspergillusand Tremellomycetes_unidentified_1 were significantly moreabundant in male than female subjects (p < 0.05, Welch t-test) and in children than adults (p < 0.05, Welch t-test).To note, the latter result could be biased by the unbalanceddistribution of male and female subjects in children and adults
Frontiers in Microbiology | www.frontiersin.org 5 August 2016 | Volume 7 | Article 1227

Strati et al. Healthy Gut Mycobiota
A C
B D
FIGURE 1 | Gender-related and age-related differences in the gut mycobiota of 111 healthy volunteers. Histogram of the mean of (A) abundances and (B)
the richness ± standard error of fungal isolates in female and male subjects; box-plot representation of the (C) abundance and (D) richness of fungal isolates in
different age groups i.e., infants (0–2 years old), children (3–10 years old), adolescents (11–17 years old) and adults (≥18 years old). **p < 0.005, *p < 0.05, Wilcoxon
rank-sum test.
groups (14/22 male children and 3/17 male adults). Furthermore,the genus Penicillium was significantly more abundant in infantsthan adults (p < 0.05, Welch t-test). Interestingly, we identifiedsequences belonging to the single-cell protozoa Blastocystis,eukaryotes abundant in the human gut microbiota (Scanlanand Marchesi, 2008), only in adolescent and adult females(Figure 3, Supplementary Table S4) that could potentially bedue to exposure to animals (Scanlan et al., 2014).
Phenotyping the Gut MycobiotaThe characterization of phenotypic features of the isolates relatedto the ability to survive and colonize the human gut wasperformed to estimate if such isolates were commensals adapted
to this ecological niche or passengers introduced through the dietand delivered with the feces.
We therefore investigated the isolates’ resistance by a series ofassays mimicking the conditions that fungal isolates face duringpassage through the human GI tract. In addition to the fact thatthe human body temperature (37◦C) is higher than the optimumfor most fungal species, in the GI tract fungi are also exposedto acidic and oxidative environments and to bile salts, producedby the liver and secreted into the duodenum, exposing themicroorganisms to oxidative stress and DNA damage (Kandelland Bernstein, 1991).
The majority of the isolates were found to tolerate acidicconditions (58.9 and 94.8% of isolates were able to grow at pH
Frontiers in Microbiology | www.frontiersin.org 6 August 2016 | Volume 7 | Article 1227

Strati et al. Healthy Gut Mycobiota
A B
C D
FIGURE 2 | Box-plot representation of fungal alpha-diversity measures using the number of observed OTUs between (A) genders or (B) age groups
and measures of fungal beta-diversity by PCoA of the between samples distances measured using (C) the unweighted UniFrac distance and (D) the
Bray-Curtis dissimilarity. *p < 0.05, Wilcoxon rank-sum test.
2 and pH 3, respectively) and oxidative stress (85.7% of theisolates showed higher tolerance compared to environmentalM28 S. cerevisiae strain), both conditions are characteristic ofthe gut environment. Tolerance to physiological concentrationsof bile acids was also observed (89.8, 87.5, and 85.7% of fungalisolates were able to grow in presence of ox-bile 0.5, 1, and2%, respectively) as well as the ability to grow at supra optimaltemperatures with almost all the isolates (99.4%) being ableto grow at 37◦C (Supplementary Table S2). The comparisonof the growth ability of such isolates at pH 3 and at growingconcentrations of ox-bile (i.e., 0.5, 1.0, and 2.0% ox-bile) withrespect to the control growth condition (37◦C, no bile, pH 6.5)revealed that these stressful conditions do not significantly affectthe growth ability of the fungal isolates (Figure 4). By contrast,a significant growth reduction was observed when comparingthe isolated grown at pH 2 with respect to the control growth
condition (p < 0.0001, Wilcoxon rank-sum test; Figure 4). Asexpected, a progressive reduction of growth ability was observedin correspondence of incubation temperature increase (i.e., from40 to 46◦C) for all the tested isolates (p < 0.0005, Wilcoxonrank-sum test; Figure 4).
In addition to the ability of fungal isolates to tolerate theintestinal environmental stresses, we also explored their ability toundergo phenotypic changes favoring their persistence within thehuman gut. Among these, we assessed the formation of hyphaeand the ability to penetrate the solid growth medium, thus toadhere to host tissues. The 56.9% of fungal isolates was ableto form hyphae or pseudohyphae (Supplementary Table S2).In addition, the morphotype switch to hyphae and pseudo-hyphae was related to the isolates’ invasiveness, with hyphaeand pseudohyphae-forming isolates being the most invasive(Figure 5A), suggesting that such isolates may be able to
Frontiers in Microbiology | www.frontiersin.org 7 August 2016 | Volume 7 | Article 1227

Strati et al. Healthy Gut Mycobiota
FIGURE 3 | Stacked bar-plot representation of the relative abundances at the genus level of the fecal mycobiota of healthy subjects from
metagenomics analysis distributed according to individuals’ life stage and gender.
Frontiers in Microbiology | www.frontiersin.org 8 August 2016 | Volume 7 | Article 1227

Strati et al. Healthy Gut Mycobiota
FIGURE 4 | Box-plot representation of the comparison of fungal isolates growth ability at 37◦C (control condition) vs. different stressful conditions
mimicking the gastrointestinal tract challenges. **p < 0.0005, ***p < 0.0001, Wilcoxon rank-sum test.
adhere to or invade the host tissues. Furthermore, we observedthat hyphae-forming isolates are significantly more resistant toitraconazole than pseudohyphae-forming isolates and isolatesunable to form hyphae (p < 0.05, Wilcoxon rank-sum test;Figure 5B). These phenotypic traits in conditions of altered
immune system or in association with intestinal dysbiosis, couldrepresent a pathogenic potential for the host.
It is now recognized that inappropriate antifungal usecontributes to the increase in microbial antifungal resistance,complicating therapeutic intervention, and the eventual
Frontiers in Microbiology | www.frontiersin.org 9 August 2016 | Volume 7 | Article 1227

Strati et al. Healthy Gut Mycobiota
A B
FIGURE 5 | Box-plot representation of fungal isolates able (or not) to produce hyphae or pseudohyphae in relationship with (A) their ability to be
invasive on YPD solid medium, (B) their resistance to itraconazole. *p < 0.05, **p < 0.005, ***p < 0.001, Wilcoxon rank-sum test.
eradication of pathogens (Chen et al., 2010; Arendrup et al.,2011). Due to the relevance of such aspect and its impact onclinical studies, we tested all fungal isolates for their susceptibilityto the widely therapeutically used azoles, fluconazole, anditraconazole (Martin, 2000) as well as the non-azole antifungal5-flucytosine (Vermes et al., 2000). A total of 31.5% of the isolateswere resistant to fluconazole and, as expected, similar levels ofitraconazole resistance were found (for 39.2% of the isolates theMIC was ≥1µg/ml; Supplementary Table S2). Previous studieshave indeed suggested that cross-resistance may occur betweenfluconazole and other azole compounds (i.e., itraconazole)(Pfaller et al., 2006) and we further confirmed such observationswith the finding of a significant positive correlation betweenthe isolates resistance to these two antifungals (Spearman’sr = 0.43, p < 0.05; Figure 6). Most of the isolates (99.34%)showed high susceptibility to 5-flucytosine with most MICvalues ≤0.125µg/ml (Supplementary Table S2). Among the9 most abundant species (at least 6 isolates per species),C. albicans, Pichia spp. and Rhodotorula mucillaginosa showedthe highest resistance to fluconazole, with MIC90 > 64µg/ml(Table 3). Furthermore, it is worth to note that resistance totested antifungals is positively correlated with the ability ofstrains to grow under stressful conditions, such as supra optimaltemperature, acidic conditions, and bile salts exposure (p < 0.05,Spearman’s r correlation; Figure 6).
DISCUSSION
The vast majority of fungal species inhabiting our body arecommensals and opportunistic pathogens that could turn into
potential threats depending on strain virulence traits and on thestatus of the host’s immune system. In this perspective to discovera pathogenic infection it seems crucial to define exactly whichspecies are normally present in a given body district.
The humanGI tract is known to contain variable communitiesof bacteria but also fungi have an important role in thisecological niche (Underhill and Iliev, 2014). Nevertheless, thephylogenetic characterization of fungal microorganisms andtheir specific role as part of the GI niche have not yet been studiedextensively.
The advent of sanitation and food globalization has reducedthe possibility for humans to come across with the richness offungal species present in traditional fermented foods. Fungalinfections are an ever increasing problem either as side effectsof antibiotics use, high dose chemotherapy, and of the spreadof immunosuppressive diseases. Estimates of global mortalityrates suggest that fungi are responsible for more deaths thaneither tuberculosis or malaria (Brown et al., 2012). Most of thismortality is caused by species belonging to four fungal genera:Aspergillus, Candida, Cryptococcus, and Pneumocystis that arerapidly becoming resistant tomost antifungal drugs (Brown et al.,2012; Denning and Bromley, 2015). The information on thesefungi so far derives from the study of lung infections, while littleis known on the gut mycobiota composition and its role in healthand disease. The knowledge on the gut mycobiota is currentlylimited to few studies making it difficult to assess the significanceof differences found in the intestinal fungal populations ofdiseases such as IBDs due to the lack of information on what thehealthy mycobiota is. Here we aimed at defining the “healthy”gut mycobiota, showing that the intestinal fungal community ofa cohort of Italian healthy volunteers is a variegate ecosystem
Frontiers in Microbiology | www.frontiersin.org 10 August 2016 | Volume 7 | Article 1227

Strati et al. Healthy Gut Mycobiota
FIGURE 6 | Spearman’s r correlation analysis between antifungals susceptibility and growth ability of the tested fungal isolates under different stress
conditions. Solid squares represent the degree of correlation among the variables taken into account. Crossed squares indicate non-significant correlations;
significant results with p < 0.05.
that differs in function of individuals’ life stage in a gender-dependent manner. We identified 34 fungal species of differentecological origins. While the majority of our fungal isolates hasbeen previously described as inhabitants of the mammalian GItract (Kurtzman et al., 2011; Rizzetto et al., 2014), some ofthe isolates belong to species so far identified in environmentalsamples only. Environmental fungi, in particular putative food-borne fungi, have been previously observed to be able to survivethe transition through the GI tract possibly being metabolicallyactive in the gut (David et al., 2014). The phenotypic propertiesof fungi isolated in this study suggested that these isolates are ableto survive in the human GI tract, prompting the hypothesis ofan ecological selection and potential ability to colonize this niche(David et al., 2014). Indeed the phenotypic features of the fungalisolates identified endow such isolates with an excellent ecologicalfitness in the human GI tract. We observed that approximatelyhalf of the isolates form hyphae or pseudohyphae, which areknown to be involved in the adhesion to or penetration withinthe GI mucosa (Staab et al., 2013), consolidation of the colony,nutrient intake and formation of 3-dimensional matrices (Brand,2011). A key factor of C. albicans commensalism/pathogenicity isits ability to switch between different morphologies, comprisingcellular, pseudohyphae, and hyphae forms. As reported forC. albicans, the reversible transition to filamentous growth as aresponse to environmental cues (Sudbery, 2011) and phenotypicswitching is essential for mucosal fungal colonization (Vautieret al., 2015).
Previous studies have also shown that C. albicans over-expresses a wide range of genes involved in resistance to hightemperature and pH, oxidative stress, and hyphae formationduring ileum and colon commensal colonization of BALB/c mice(Pierce et al., 2013). Similarly, the fungal isolates of this study,showing resistance to oxidative, high temperature, bile acids, andpH stresses may hold the potential to colonize the human gut. Itis plausible that fecal fungal isolates with specific characteristics(such as high resistance to acidic pH and bile salts) survived to
the gut environment, and that these traits make them able tocolonize the gut. Thus, we can hypothesize a long process ofevolution, selection or adaptation of environmental and food-borne strains to the human host, suggesting that pathogenicstrains of commensal species can evolve through a repeatedprocess of evolution and selection, depending on the immunestatus of the host (De Filippo et al., 2014). These findingsencourage for in-depth, strain-level extensive studies on humangut mycobiota and the integration of such data with immunologyto further establish the relevance of fungi in host physiology andhost-microbe interaction. Furthermore, fungi may train host’simmune system simply when passengers, rather than necessarilypersisting only as continuous colonizers (Rizzetto et al., 2016).
We discovered that several fungal isolates displayed differentlevels of antifungal resistance. About 20 years ago, azole-sensitive C. albicans dominated infections, with other Candidaspecies rarely observed. Actually C. glabrata is the second most-commonly isolated Candida species in the European Union andUnited States and has high rates of antifungal resistance (Slavinet al., 2015). Inappropriate antifungal use has contributed to theincrease in antifungal resistance, causing objective complicationsfor the treatment of invasive fungal infections that nowadaysrepresent a severe cause of morbidity and mortality amongimmunocompromised individuals, neonates and elderly (Brownet al., 2012). Recent studies indicated that fungal infections mayoriginate from individual’s own commensal strains suggestingthat the ability of a commensal microorganism to promotedisease is not merely a consequence of impaired host immunity(Odds et al., 2006), suggesting that rural and other commercialuses of azole could be the culprit for the emergence of theseresistant strains (Snelders et al., 2012). This underlines the riskthat the increase of antifungal usage outside of the clinic couldalso lead to increased resistance to antifungals of individual’s owncommensal strains representing an important epidemiologicalproblem in the future and remarking the importance to increasethe investment in antifungal research.
Frontiers in Microbiology | www.frontiersin.org 11 August 2016 | Volume 7 | Article 1227

Strati et al. Healthy Gut Mycobiota
TABLE 3 | Antifungal activity against the most abundant fungal species.
#Species (Number of tested) Antifungal MIC (µg/ml) *CBPs
MIC50 MIC90 %S %SDD %R
Candida albicans (123) Fluconazole 0.5 >64 65.6 0.8 33.4
Itraconazole 2 >8 29.3 5.7 65
5-Flucytosine 0.125 0.5 98.4 0.8 0.8
Candida lusitaniae (6) Fluconazole 0.125 0.5 100 0 0
Itraconazole 0.0156 0.125 100 0 0
5-Flucytosine 0.125 0.125 100 0 0
Candida parapsilosis (40) Fluconazole 0.5 2 92.5 0 7.5
Itraconazole 0.031 >8 75 5 20
5-Flucytosine 0.125 0.125 100 0 0
Penicillium brevicompactum* (13) Fluconazole 0.125 0.125 100 0 0
Itraconazole 0.0156 0.0156 92.5 0 7.5
5-Flucytosine 0.125 0.125 100 0 0
Pichia fermentans* (15) Fluconazole 32 >64 15.4 0 84.6
Itraconazole 0.25 4 44.7 20 33.3
5-Flucytosine 0.5 2 92.3 7.7 0
Pichia kluyveri* (9) Fluconazole 32 32 11.1 0 88.9
Itraconazole 0.125 0.125 88.9 11.1 0
5-Flucytosine 0.5 0.5 100 0 0
Pichia manshurica* (9) Fluconazole 0.25 >64 77.8 0 22.2
Itraconazole 0.0156 >8 77.8 0 22.2
5-Flucytosine 0.125 8 77.8 11.1 11.1
Rhodotorula mucilaginosa* (41) Fluconazole 0.5 >64 63.4 0 36.6
Itraconazole 0.0156 2 75.6 2.4 22
5-Flucytosine 0.125 0.125 100 0 0
Torulaspora delbrueckii* (23) Fluconazole 0.125 8 87 0 13
Itraconazole 0.0156 2 69.6 4.3 26.1
5-Flucytosine 0.125 0.125 100 0 0
*species-specific CBPs are available only for Candida and Aspergillus spp.; for those non-Candida and non-Asperigillus isolates Candida and Asperigillus’ CBPs have been used as a
proxy; #MIC50, MIC90, and CBPs have been calculated only for those species with number of isolates >5; S, sensible; SDD, Sensibility Dose-Dependent or Intermediate; R, resistant.
MIC ranges: Fluconazole 0.125–64µg/ml; Itraconazole 0.0156–8µg/ml; 5-Flucytosine 0.125–64µg/ml.
It should be noted that all the samples analyzed bymetagenomics resulted in high quality fungal sequences,indicating that all the fecal samples studied had fungal DNA.So far, the estimated ratio fungi/bacteria of 1:10000 (Huffnagleand Noverr, 2013), discourages an approach based on wholemetagenome shotgun sequencing (Underhill and Iliev, 2014).We thus performed amplicon-based ITS1 metagenomics on asubset of healthy donors identifying more than 90 differentfungal taxa. The first striking evidence was that metagenomicsdetected also sequences belonging to Agaricomycetes, amongwhich several edible fungi, thus suggesting that dietary fungalintake is a potential confounding effect when studying thegut mycobiota. On the contrary 34 different fungal specieswere isolated using the culture-based approach. Both methodsdetected in any case differences in the diverse groups ofstudy (Supplementary Figure S1). The discrepancies observedbetween culture-dependent and culture-independent approacheson the description of fungal populations could be attributed tothe methodological differences of the two procedures applied
suggesting that several of the fungal taxa identified by themetagenomics approach are not cultivable, either because welack the proper culture conditions or because these belong toDNA from dead cells, environmental or food-borne fungi thatcannot survive the passage through the GI tract, but whoseDNA is still detectable. Furthermore, the DNA extractionmethodused in this study could not be suited to extract all the fungalDNA from the stool samples since the rare taxa Yarrowia,Starmerella, Rhodosporidium, and Pleurostomophora have beenfound only by the culture-based approach. On the other handthe culture condition that we used might be responsible for someof the discrepancies observed between the two methods. In ourexperience most of the commensal fungi commonly found in thehuman gut can be cultivated in YPD, yet other fungi that we werenot able to cultivate might need different culture conditions fromthose we used in this work.
Although, for example, S. cerevisiae is often found infermented food, it has been shown that it can survive GI tractchallenges being a commensal of the human GI tract (Rizzetto
Frontiers in Microbiology | www.frontiersin.org 12 August 2016 | Volume 7 | Article 1227
Strati et al. Healthy Gut Mycobiota
et al., 2014) educating also adaptive immunity (Rizzetto et al.,2016). S. cerevisiae has been introduced in the human intestinethrough diet and fermented beverages and it has accompaniedhuman evolution for at least the past 5150 years (Cavalieri et al.,2003). Our evidence, together with previous results, includinga recent description of S. cerevisiae in IBDs (Sokol et al., 2016)showed that this microorganism is a potential commensal ofthe human intestine. The overall reduction of the amount anddiversity of fungi introduced through consumption of fermentedbeverages suggests that the human gut mycobiota could bein dynamic change and certain potentially beneficial speciescould be lost as a result of modern food processing procedures,cultural changes, and food globalization. Ongoing studieson microbial anthropology in human populations consumingtraditional fermented foods, hold the promise to shed lighton the evolution of the fungal microbiota as associated to theevolution of diet. On the contrary the edible fungi belongingto Agaricomycetes cannot settle in the human gut due to theirecology (Hibbett, 2006) so we filtered-out these sequences fordownstream analyses to reduce statistical noises on ecologicalmeasures, improving our results on the characterization ofintestinal fungal communities. We are aware that other taxaidentified by our analyses having environmental and food-borneorigin may not be able to settle in the human gut, however littleis known about these taxa while the Agaricomycetes sequencesthat we retrieved had a very low prevalence in the datasetand mostly belonged to edible fungi such as Boletus, Suillus orAgrocybe.
We further observed that amplicon-based ITS1metagenomicscannot confidently describe fungal populations at a deeperlevel than genus overlooking species level information providedby the fungal cultivation approach (see Figures 1B, 2A). Onthe other hand, metagenomics analysis detected communitystructure differences that fungal cultivation did not identified(see Figures 2B–D). Nevertheless, the analysis of alpha-diversityfrom cultivation data on the subset of subjects used for themetagenomics analysis revealed no significant differences amonggenders remarking that the different sample sizes used in thiswork are an additional factor in the discrepancies observedbetween the two methods. Although the major limitation ofculture-based methods for the study of microbial communities isthe loss of ecological information due to the inability to cultivatemost microorganisms by standard culturing techniques, fungiincluded, culture-based analysis of the human gut mycobiotais fundamental to discern fungal phenotypes that would beotherwise lost by metagenomics.
However, population level analyses with both approachesrevealed interesting cues. As occurs for the bacterial microbiota,the intestinal mycobiota is shaped by host’s age, gender, diet, andgeographical environment (Yatsunenko et al., 2012; Hoffmannet al., 2013; David et al., 2014). Previous studies have shownthat the development of the gut bacterial microbiota starts atbirth with colonization by a low number of species from thevaginal and fecal microbiota of the mother and is characterizedby many shifts in composition during infancy (Yatsunenko et al.,2012). Similarly, the mycobiota may show the same fate, butwe observed an inverted trend in which the richness of the gut
mycobiota of infants (0–2 years old) and children (3–10 yearsold) was higher than adults (≥18 years old). It has been shownthat suppression of the bacterial microbiota upon treatmentwith antibiotics results in the outgrowth of the gut mycobiota(Dollive et al., 2013) probably as a consequence of reducedecological competition. Similarly, a weak bacterial competition,in particular during infancy when the bacterial microbiota isless stable (Koenig et al., 2011; Lozupone et al., 2012), could bethe reason why we observed an increased fungal alpha-diversityduring the early stages of life or this could be due to the differentinteractions between intestinal fungi and diet (Hoffmann et al.,2013; David et al., 2014) which is peculiar during infancy.We alsofound that female subjects had a higher number of fungal isolatesand different fungal species compared to male subjects and thatfemale mycobiota cluster apart from male mycobiota. This maybe ascribed to the role of sex hormones in modulating microbiotacomposition (Markle et al., 2013) and of diet in shifting themicrobiota composition in a gender-dependent manner (Bolnicket al., 2014). Furthermore, the higher relative abundance ofCandida in the fecal samples from female than male subjectscould be also attributed to the prevalence of Candida species inthe vaginal mycobiota (Drell et al., 2013) due to the anatomicalproximity of the two districts. To the best of our knowledge, thisis the first time that gender-related differences are described inthe human gut mycobiota.
In conclusion we can state that culture-independentapproaches are very promising for future investigation of themycobiota, but yet require significant improvements in theselection of markers for amplicon-based metagenomics andthe reference databases. Additionally development of markerstargeting pathogenicity traits, including the genes involvedin host invasion or evasion of immune defenses, or markersdetecting resistance to azoles or other antifungals, is requiredto thoughtfully apply metagenomics to fungal infections,discriminating the healthy mycobiota from an altered one.Such improvement can be achieved only through systematicsequencing efforts of the cultivable mycobiota, paralleling whathappened for the prokaryotic microbiota. In our experience,currently, the combination of the two methods compensated themethodological limits intrinsic in both approaches avoiding tooverlook significant differences present in the gut mycobiota ofhealthy subjects.
AVAILABILITY OF SUPPORTING DATA
Raw sequences are available in the European Nucleotide Archive(ENA) with accession number PRJEB11827 (http://www.ebi.ac.uk/ena/data/view/PRJEB11827).
AUTHOR CONTRIBUTIONS
FS designed and performed the experiments, analyzed thedata, and wrote the manuscript. IS and MD performed theexperiments. IS, DA, and CD supervised and contributed to dataanalysis. PL and AC recruited subjects and collected specimens.
Frontiers in Microbiology | www.frontiersin.org 13 August 2016 | Volume 7 | Article 1227
Strati et al. Healthy Gut Mycobiota
IS, MD, LR, OJ, and CD critically reviewed the manuscript. DCand CDF conceived the study and approved the manuscript.
FUNDING
This work was supported by the Accordo di ProgrammaIntegrato “MetaFoodLabs” funded by the research officeof the Provincia Autonoma di Trento (Italy; PAT Prot.S216/2012/537723).
ACKNOWLEDGMENTS
The authors would like to thank Daniela Renzi, MaddalenaSordo, Massimo Pindo, and the lab staff of the SequencingPlatform Daniela Nicolini, Erika Stefani, and Simone Larger fortechnical support. Furthermore, a special thanks to UnifarmS.p.A. for supporting FS.
SUPPLEMENTARY MATERIAL
The Supplementary Material for this article can be foundonline at: http://journal.frontiersin.org/article/10.3389/fmicb.2016.01227
Supplementary Table S1 | Correspondences between deposited
metagenomics data and samples.
Supplementary Table S2 | Phenotypic characteristics and antifungals
susceptibility of fungal isolates. ∗calculated as the deviation of the
inhibition halo diameter (Ø) from that of the M28-4D S. cerevisiae strain,
according to the following formula: (Ø sample—Ø M284D strain)/Ø M284D
strain *100. #0, non-invasive; 1, poor invasive; 2, invasive; 3, very
invasive. −, no growth as measured by OD630 ≤ 0.2 or cfu/ml ≤ 105; +,
poor growth as measured by 0.2 < OD630 ≤ 0.7 or 105 < cfu/ml ≤
106; ++ good growth as measured by 0.7 < OD630 ≤ 1.2 or 106 <
cfu/ml ≤ 107; +++, very good growth as measured by OD630 > 1.2 or
cfu/ml > 107. na, not applicable; nd, not detected.
Supplementary Table S3 | Permutational multivariate analysis of variance
(PERMANOVA) tests on unweighted and weighted UniFrac distances and
Bray-Curtis dissimilarity.
Supplementary Table S4 | Mean relative abundance (%) of OTUs at the
genus level of fungal gut microbiota of healthy subjects from
metagenomics analysis.
Supplementary Figure S1 | Mean relative abundances of the gut
mycobiota in the different groups of study measured according to
(A) the culture-based approach (at species level) and (B) the
amplicon-based ITS1 metagenomics approach (at genus level). In
panel (B) are shown the most abundant genera (with relative abundances
>0.1%) while all the other less abundant genera were grouped together
and labeled as “others”.
REFERENCES
Alastruey-Izquierdo, A., Hoffmann, K., De Hoog, G. S., Rodriguez-Tudela, J. L.,Voigt, K., Bibashi, E., et al. (2010). Species recognition and clinical relevance ofthe zygomycetous genus Lichtheimia (syn. Absidia pro parte, Mycocladus). J.Clin. Microbiol. 48, 2154–2170. doi: 10.1128/JCM.01744-09
Albanese, D., Fontana, P., De Filippo, C., Cavalieri, D., and Donati, C. (2015).MICCA: a complete and accurate software for taxonomic profiling ofmetagenomic data. Sci. Rep. 5:9743. doi: 10.1038/srep09743
Araujo, R., Pina-Vaz, C., and Rodrigues, A. G. (2007). Susceptibility ofenvironmental versus clinical strains of pathogenic Aspergillus. Int. J.
Antimicrob. Agents 29, 108–111. doi: 10.1016/j.ijantimicag.2006.09.019Arendrup, M. C., Sulim, S., Holm, A., Nielsen, L., Nielsen, S. D., Knudsen, J.
D., et al. (2011). Diagnostic issues, clinical characteristics, and outcomesfor patients with fungemia. J. Clin. Microbiol. 49, 3300–3308. doi:10.1128/JCM.00179-11
Arumugam, M., Raes, J., Pelletier, E., Le Paslier, D., Yamada, T., Mende, D. R., et al.(2011). Enterotypes of the human gut microbiome. Nature 473, 174–180. doi:10.1038/nature09944
Barata, A., Malfeito-Ferreira, M., and Loureiro, V. (2012). The microbialecology of wine grape berries. Int. J. Food Microbiol. 153, 243–259. doi:10.1016/j.ijfoodmicro.2011.11.025
Belda, I., Navascues, E., Marquina, D., Santos, A., Calderon, F., and Benito, S.(2015). Dynamic analysis of physiological properties of Torulaspora delbrueckiiin wine fermentations and its incidence on wine quality. Appl. Microbiol.
Biotechnol. 99, 1911–1922. doi: 10.1007/s00253-014-6197-2Benjamini, Y., and Hochberg, Y. (1995). Controlling the false discovery rate: a
practical and powerful approach to multiple testing. J. Roy. Stat. Soc. Ser. B 57,289–300.
Bezerra-Bussoli, C., Baffi,M. A., Gomes, E., and Da-Silva, R. (2013). Yeast diversityisolated from grape musts during spontaneous fermentation from a Brazilianwinery. Curr. Microbiol. 67, 356–361. doi: 10.1007/s00284-013-0375-9
Bolnick, D. I., Snowberg, L. K., Hirsch, P. E., Lauber, C. L., Org, E., Parks, B., et al.(2014). Individual diet has sex-dependent effects on vertebrate gut microbiota.Nat. Commun. 5, 4500. doi: 10.1038/ncomms5500
Bougnoux, M. E., Diogo, D., Francois, N., Sendid, B., Veirmeire, S., Colombel, J. F.,et al. (2006). Multilocus sequence typing reveals intrafamilial transmission and
microevolutions of Candida albicans isolates from the human digestive tract.J. Clin. Microbiol. 44, 1810–1820. doi: 10.1128/JCM.44.5.1810-1820.2006
Brand, A. (2011). Hyphal growth in human fungal pathogens and its role invirulence. Int. J. Microbiol. 2012:517529. doi: 10.1155/2012/517529
Brown, G. D., Denning, D. W., Gow, N. A., Levitz, S. M., Netea, M. G., andWhite, T. C. (2012). Hidden killers: human fungal infections. Sci. Transl. Med.
4, 165rv113. doi: 10.1126/scitranslmed.3004404Butinar, L., Zalar, P., Frisvad, J. C., and Gunde-Cimerman, N. (2005). The
genus Eurotium - members of indigenous fungal community in hypersalinewaters of salterns. FEMS Microbiol. Ecol. 51, 155–166. doi: 10.1016/j.femsec.2004.08.002
Castanheira, M., Messer, S. A., Jones, R. N., Farrell, D. J., and Pfaller, M. A.(2014). Activity of echinocandins and triazoles against a contemporary (2012)worldwide collection of yeast and moulds collected from invasive infections.Int. J. Antimicrob. Agents 44, 320–326. doi: 10.1016/j.ijantimicag.2014.06.007
Cavalieri, D., McGovern, P. E., Hartl, D. L., Mortimer, R., and Polsinelli, M.(2003). Evidence for S. cerevisiae fermentation in ancient wine. J. Mol. Evol.
57(Suppl. 1), S226–S232. doi: 10.1007/s00239-003-0031-2Cavalieri, D., Townsend, J. P., and Hartl, D. L. (2000). Manifold anomalies in
gene expression in a vineyard isolate of Saccharomyces cerevisiae revealed byDNA microarray analysis. Proc. Natl. Acad. Sci. U.S.A. 97, 12369–12374. doi:10.1073/pnas.210395297
Chen, S. C., Playford, E. G., and Sorrell, T. C. (2010). Antifungal therapyin invasive fungal infections. Curr. Opin. Pharmacol. 10, 522–530. doi:10.1016/j.coph.2010.06.002
Chitarra, G. S., Abee, T., Rombouts, F. M., Posthumus, M. A., and Dijksterhuis, J.(2004). Germination of Penicillium paneum Conidia is regulated by 1-octen-3-ol, a volatile self-inhibitor. Appl. Environ. Microbiol. 70, 2823–2829. doi:10.1128/AEM.70.5.2823-2829.2004
David, L. A., Maurice, C. F., Carmody, R. N., Gootenberg, D. B., Button, J. E.,Wolfe, B. E., et al. (2014). Diet rapidly and reproducibly alters the human gutmicrobiome. Nature 505, 559–563. doi: 10.1038/nature12820
De Filippo, C., Di Paola, M., Stefanini, I., Rizzetto, L., Berná, L., Ramazzotti, M.,et al. (2014). Population genomics of Saccharomyces cerevisiae human isolates:passengers, colonizers, invaders. bioRxiv. doi: 10.1101/001891
de la Camara, R., Pinilla, I., Munoz, E., Buendia, B., Steegmann, J. L., andFernandez-Ranada, J. M. (1996). Penicillium brevicompactum as the cause of
Frontiers in Microbiology | www.frontiersin.org 14 August 2016 | Volume 7 | Article 1227

Strati et al. Healthy Gut Mycobiota
a necrotic lung ball in an allogeneic bone marrow transplant recipient. BoneMarrow Transplant. 18, 1189–1193.
de Melo Pereira, G. V., Soccol, V. T., Pandey, A., Medeiros, A. B., Andrade Lara,J. M., Gollo, A. L., et al. (2014). Isolation, selection and evaluation of yeasts foruse in fermentation of coffee beans by the wet process. Int. J. Food Microbiol.
188, 60–66. doi: 10.1016/j.ijfoodmicro.2014.07.008Denning, D. W., and Bromley, M. J. (2015). Infectious Disease. How to bolster the
antifungal pipeline. Science 347, 1414–1416. doi: 10.1126/science.aaa6097Dollive, S., Chen, Y. Y., Grunberg, S., Bittinger, K., Hoffmann, C., Vandivier,
L., et al. (2013). Fungi of the murine gut: episodic variation andproliferation during antibiotic treatment. PLoS ONE 8:e71806. doi:10.1371/journal.pone.0071806
Drell, T., Lillsaar, T., Tummeleht, L., Simm, J., Aaspollu, A., Vain, E.,et al. (2013). Characterization of the vaginal micro- and mycobiome inasymptomatic reproductive-age Estonian women. PLoS ONE 8:e54379. doi:10.1371/journal.pone.0054379
Findley, K., Oh, J., Yang, J., Conlan, S., Deming, C., Meyer, J. A., et al. (2013).Topographic diversity of fungal and bacterial communities in human skin.Nature 498, 367–370. doi: 10.1038/nature12171
Gouba, N., Raoult, D., and Drancourt, M. (2014). Eukaryote culturomics of the gutreveals new species. PLoS ONE 9:e106994. doi: 10.1371/journal.pone.0106994
Hatoum, R., Labrie, S., and Fliss, I. (2012). Antimicrobial and probiotic propertiesof yeasts: from fundamental to novel applications. Front. Microbiol. 3:421. doi:10.3389/fmicb.2012.00421
Hibbett, D. S. (2006). A phylogenetic overview of the Agaricomycotina.Mycologia
98, 917–925. doi: 10.3852/mycologia.98.6.917Hoffman, C. S., andWinston, F. (1987). A 10-Minute DNA preparation from yeast
efficiently releases autonomous plasmids for transformation of Escherichia Coli.Gene 57, 267–272. doi: 10.1016/0378-1119(87)90131-4
Hoffmann, C., Dollive, S., Grunberg, S., Chen, J., Li, H., Wu, G. D., et al. (2013).Archaea and fungi of the human gut microbiome: correlations with diet andbacterial residents. PLoS ONE 8:e66019. doi: 10.1371/journal.pone.0066019
Huffnagle, G. B., and Noverr, M. C. (2013). The emerging world of the fungalmicrobiome. Trends Microbiol. 21, 334–341. doi: 10.1016/j.tim.2013.04.002
Human Microbiome Project Consortium (2012). Structure, function anddiversity of the healthy human microbiome. Nature 486, 207–214. doi:10.1038/nature11234
Johnson, E. (2009). Rare and emerging Candida species. Curr. Fungal Infect. Rep.3, 152–159. doi: 10.1007/s12281-009-0020-z
Kandell, R. L., and Bernstein, C. (1991). Bile salt/acid induction of DNA damage inbacterial and mammalian cells: implications for colon cancer. Nutr. Cancer 16,227–238. doi: 10.1080/01635589109514161
Kaygusuz, I., Mulazimoglu, L., Cerikcioglu, N., Toprak, A., Oktay, A., andKorten, V. (2003). An unusual native tricuspid valve endocarditis caused byCandida colliculosa. Clin. Microbiol. Infect. 9, 319–322. doi: 10.1046/j.1469-0691.2003.00511.x
Khatib, R., Riederer, K. M., Ramanathan, J., and Baran, J. Jr. (2001). Faecalfungal flora in healthy volunteers and inpatients. Mycoses 44, 151–156. doi:10.1046/j.1439-0507.2001.00639.x
Koenig, J. E., Spor, A., Scalfone, N., Fricker, A. D., Stombaugh, J., Knight, R.,et al. (2011). Succession of microbial consortia in the developing infant gutmicrobiome. Proc. Natl. Acad. Sci. U.S.A. 108(Suppl. 1), 4578–4585. doi:10.1073/pnas.1000081107
Koljalg, U., Nilsson, R. H., Abarenkov, K., Tedersoo, L., Taylor, A. F., Bahram, M.,et al. (2013). Towards a unified paradigm for sequence-based identification offungi.Mol. Ecol. 22, 5271–5277. doi: 10.1111/mec.12481
Kurtzman, C. P., Fell, J. W., and Boekhout, T., (eds.). (2011). “The yeasts, ataxonomic study volume 1 fifth edition preface,” in Yeasts: A Taxonomic Study,
Vol. 1–3, 5th Edn (Elsevier Science), 13.Lee, S. C., Billmyre, R. B., Li, A., Carson, S., Sykes, S. M., Huh, E. Y., et al. (2014).
Analysis of a food-borne fungal pathogen outbreak: virulence and genomeof a Mucor circinelloides isolate from yogurt. Mbio 5, e01390–e01314. doi:10.1128/mBio.01390-14
Levenstadt, J. S., Poutanen, S. M., Mohan, S., Zhang, S., and Silverman, M. (2012).Pleurostomophora richardsiae - an insidious fungus presenting in a man 44years after initial inoculation: a case report and review of the literature. Can.J. Infect. Dis. Med. Microbiol. 23, 110–113. doi: 10.1155/2012/406982
Lozupone, C. A., Stombaugh, J. I., Gordon, J. I., Jansson, J. K., and Knight, R.(2012). Diversity, stability and resilience of the human gut microbiota. Nature489, 220–230. doi: 10.1038/nature11550
Luan, C., Xie, L., Yang, X., Miao, H., Lv, N., Zhang, R., et al. (2015). Dysbiosisof fungal microbiota in the intestinal mucosa of patients with colorectaladenomas. Sci. Rep. 5:7980. doi: 10.1038/srep07980
Markle, J. G., Frank, D. N., Mortin-Toth, S., Robertson, C. E., Feazel, L. M.,Rolle-Kampczyk, U., et al. (2013). Sex differences in the gut microbiome drivehormone-dependent regulation of autoimmunity. Science 339, 1084–1088. doi:10.1126/science.1233521
Mar Rodriguez, M., Perez, D., Javier Chaves, F., Esteve, E., Marin-Garcia, P., Xifra,G., et al. (2015). Obesity changes the human gut mycobiome. Sci. Rep. 5:14600.doi: 10.1038/srep14600
Martin, M. V. (2000). The use of fluconazole and itraconazole in the treatment ofCandida albicans infections: a review. J. Antimicrob. Chemother. 45, 555. doi:10.1093/oxfordjournals.jac.a020880
McMurdie, P. J., and Holmes, S. (2013). phyloseq: an R package for reproducibleinteractive analysis and graphics of microbiome census data. PLoS ONE
8:e61217. doi: 10.1371/journal.pone.0061217Noriega, L., Gueimonde, M., Sanchez, B., Margolles, A., and De Los
Reyes-Gavilan, C. G. (2004). Effect of the adaptation to high bile saltsconcentrations on glycosidic activity, survival at low PH and cross-resistanceto bile salts in Bifidobacterium. Int. J. Food Microbiol. 94, 79–86. doi:10.1016/j.ijfoodmicro.2004.01.003
Notredame, C., Higgins, D. G., and Heringa, J. (2000). T-Coffee: a novel methodfor fast and accurate multiple sequence alignment. J. Mol. Biol. 302, 205–217.doi: 10.1006/jmbi.2000.4042
Odds, F. C., Davidson, A. D., Jacobsen, M. D., Tavanti, A., Whyte, J. A., Kibbler,C. C., et al. (2006). Candida albicans strain maintenance, replacement, andmicrovariation demonstrated by multilocus sequence typing. J. Clin. Microbiol.
44, 3647–3658. doi: 10.1128/JCM.00934-06Oever, J. T., and Netea, M. G. (2014). The bacteriome-mycobiome interaction
and antifungal host defense. Eur. J. Immunol. 44, 3182–3191. doi:10.1002/eji.201344405
Pfaller, M. A., and Diekema, D. J. (2012). Progress in antifungal susceptibilitytesting of Candida spp. by use of Clinical and Laboratory Standards Institutebroth microdilution methods, 2010 to 2012. J. Clin. Microbiol. 50, 2846–2856.doi: 10.1128/JCM.00937-12
Pfaller, M. A., Diekema, D. J., and Sheehan, D. J. (2006). Interpretivebreakpoints for fluconazole and Candida revisited: a blueprint for the futureof antifungal susceptibility testing. Clin. Microbiol. Rev. 19, 435–447. doi:10.1128/CMR.19.2.435-447.2006
Pierce, J. V., Dignard, D., Whiteway, M., and Kumamoto, C. A. (2013). Normaladaptation of Candida albicans to the murine gastrointestinal tract requiresEfg1p-dependent regulation ofmetabolic and host defense genes. Eukaryot. Cell12, 37–49. doi: 10.1128/EC.00236-12
Price, M. N., Dehal, P. S., and Arkin, A. P. (2010). FastTree 2–approximatelymaximum-likelihood trees for large alignments. PLoS ONE 5:e9490. doi:10.1371/journal.pone.0009490
Revelle, W. (2013). Psych: Procedures for Psychological, Psychometric, and
Personality Research. R Package Version 1.3.10. Evanston, IL: NorthwesternUniversity.
Reyes, A., Haynes, M., Hanson, N., Angly, F. E., Heath, A. C., Rohwer, F.,et al. (2010). Viruses in the faecal microbiota of monozygotic twins and theirmothers. Nature 466, 334–338. doi: 10.1038/nature09199
Rizzetto, L., De Filippo, C., and Cavalieri, D. (2014). Richness and diversity ofmammalian fungal communities shape innate and adaptive immunity in healthand disease. Eur. J. Immunol. 44, 3166–3181. doi: 10.1002/eji.201344403
Rizzetto, L., Ifrim, D. C., Moretti, S., Tocci, N., Cheng, S. C., Quintin, J.,et al. (2016). Fungal chitin induces trained immunity in human monocytesduring cross-talk of the host with Saccharomyces cerevisiae. J. Biol. Chem. 291,7961–7972. doi: 10.1074/jbc.M115.699645
Rodriguez-Tudela, J., Arendrup, M., Arikan, S., Barchiesi, F., Bille, J.,Chryssanthou, E., et al. (2008a). EUCAST DEFINITIVE DOCUMENT E. DEF9.1: Method for the determination of broth dilution minimum inhibitoryconcentrations of antifungal agents for conidia forming moulds. Clin.
Microbiol. Infect. 14, 982–984.
Frontiers in Microbiology | www.frontiersin.org 15 August 2016 | Volume 7 | Article 1227

Strati et al. Healthy Gut Mycobiota
Rodriguez-Tudela, J., Arendrup, M., Barchiesi, F., Bille, J., Chryssanthou, E.,Cuenca-Estrella, M., et al. (2008b). EUCAST Definitive Document EDef 7.1:method for the determination of broth dilution MICs of antifungal agentsfor fermentative yeasts: subcommittee on Antifungal Susceptibility Testing(AFST) of the ESCMID European Committee for Antimicrobial SusceptibilityTesting (EUCAST)∗. Clin. Microbiol. Infect. 14, 398–405. doi: 10.1111/j.1469-0691.2007.01935.x
Romani, L. (2011). Immunity to fungal infections.Nat. Rev. Immunol. 11, 275–288.doi: 10.1038/nri2939
Santini, A., Mikušová, P., Sulyok, M., Krska, R., Labuda, R., and Šrobárová,A. (2014). Penicillium strains isolated from Slovak grape berries taxonomyassessment by secondary metabolite profile. Mycotoxin Res. 30, 213–220. doi:10.1007/s12550-014-0205-3
Scanlan, P. D., and Marchesi, J. R. (2008). Micro-eukaryotic diversity ofthe human distal gut microbiota: qualitative assessment using culture-dependent and -independent analysis of faeces. ISME J. 2, 1183–1193. doi:10.1038/ismej.2008.76
Scanlan, P. D., Stensvold, C. R., Rajilic-Stojanovic, M., Heilig, H. G., DeVos, W. M., O’toole, P. W., et al. (2014). The microbial eukaryoteBlastocystis is a prevalent and diverse member of the healthy human gutmicrobiota. FEMS Microbiol. Ecol. 90, 326–330. doi: 10.1111/1574-6941.12396
Sebastiani, F., Barberio, C., Casalone, E., Cavalieri, D., and Polsinelli, M.(2002). Crosses between Saccharomyces cerevisiae and Saccharomyces bayanusgenerate fertile hybrids. Res. Microbiol. 153, 53–58. doi: 10.1016/S0923-2508(01)01286-4
Slavin, M., Van Hal, S., Sorrell, T. C., Lee, A., Marriott, D. J., Daveson, K., et al.(2015). Invasive infections due to filamentous fungi other than Aspergillus:epidemiology and determinants of mortality. Clin. Microbiol. Infect. 21,e491–490. doi: 10.1016/j.cmi.2014.12.021
Snelders, E., Camps, S. M., Karawajczyk, A., Schaftenaar, G., Kema, G. H.,Van Der Lee, H. A., et al. (2012). Triazole fungicides can induce cross-resistance to medical triazoles in Aspergillus fumigatus. PLoS ONE 7:e31801.doi: 10.1371/journal.pone.0031801
Sokol, H., Leducq, V., Aschard, H., Pham, H. P., Jegou, S., Landman, C., et al.(2016). Fungal microbiota dysbiosis in IBD. Gut. doi: 10.1136/gutjnl-2015-310746. [Epub ahead of print].
Staab, J. F., Datta, K., and Rhee, P. (2013). Niche-specific requirement for hyphalwall protein 1 in virulence of Candida albicans. PLoS ONE 8:e80842. doi:10.1371/journal.pone.0080842
Sudbery, P. E. (2011). Growth of Candida albicans hyphae. Nat. Rev. Microbiol. 9,737–748. doi: 10.1038/nrmicro2636
Team, R. C. (2014). R: A Language and Environment for Statistical Computing.
R Foundation for Statistical Computing. Vienna: Austria. 2012. ISBN 3-900051-07-0.
Tristezza, M., Vetrano, C., Bleve, G., Spano, G., Capozzi, V., Logrieco, A., et al.(2013). Biodiversity and safety aspects of yeast strains characterized from
vineyards and spontaneous fermentations in the Apulia Region, Italy. FoodMicrobiol. 36, 335–342. doi: 10.1016/j.fm.2013.07.001
Underhill, D. M., and Iliev, I. D. (2014). The mycobiota: interactions betweencommensal fungi and the host immune system. Nat. Rev. Immunol. 14,405–416. doi: 10.1038/nri3684
Vardjan, T., Mohar Lorbeg, P., Rogelj, I., and Canzek Majhenic, A. (2013).Characterization and stability of lactobacilli and yeast microbiota in kefirgrains. J. Dairy Sci. 96, 2729–2736. doi: 10.3168/jds.2012-5829
Vautier, S., Drummond, R. A., Chen, K., Murray, G. I., Kadosh, D., Brown, A. J.,et al. (2015). Candida albicans colonization and dissemination from the murinegastrointestinal tract: the influence of morphology and Th17 immunity. Cell.Microbiol. 17, 445–450. doi: 10.1111/cmi.12388
Vermes, A., Guchelaar, H. J., and Dankert, J. (2000). Flucytosine: a review ofits pharmacology, clinical indications, pharmacokinetics, toxicity and druginteractions. J. Antimicrob. Chemother. 46, 171–179. doi: 10.1093/jac/46.2.171
Vopalenska, I., Hulkova, M., Janderova, B., and Palkova, Z. (2005). Themorphology of Saccharomyces cerevisiae colonies is affected by celladhesion and the budding pattern. Res. Microbiol. 156, 921–931. doi:10.1016/j.resmic.2005.05.012
Wang, C., Esteve-Zarzoso, B., and Mas, A. (2014). Monitoring of Saccharomyces
cerevisiae, Hanseniaspora uvarum, and Starmerella bacillaris (synonymCandida zemplinina) populations during alcoholic fermentation byfluorescence in situ hybridization. Int. J. Food Microbiol. 191, 1–9. doi:10.1016/j.ijfoodmicro.2014.08.014
Wang, Q., Garrity, G. M., Tiedje, J. M., and Cole, J. R. (2007). Naive Bayesianclassifier for rapid assignment of rRNA sequences into the new bacterialtaxonomy. Appl. Environ. Microbiol. 73, 5261–5267. doi: 10.1128/AEM.00062-07
Westfall, P. H., and Young, S. S. (1993). Resampling-Based Multiple Testing:
Examples and Methods for p-value Adjustment. Vol. 279. New York, NY: JohnWiley & Sons.
Yatsunenko, T., Rey, F. E., Manary, M. J., Trehan, I., Dominguez-Bello, M. G.,Contreras, M., et al. (2012). Human gut microbiome viewed across age andgeography. Nature 486, 222–227. doi: 10.1038/nature11053
Conflict of Interest Statement: The authors declare that the research wasconducted in the absence of any commercial or financial relationships that couldbe construed as a potential conflict of interest.
Copyright © 2016 Strati, Di Paola, Stefanini, Albanese, Rizzetto, Lionetti, Calabrò,
Jousson, Donati, Cavalieri and De Filippo. This is an open-access article distributed
under the terms of the Creative Commons Attribution License (CC BY). The use,
distribution or reproduction in other forums is permitted, provided the original
author(s) or licensor are credited and that the original publication in this journal
is cited, in accordance with accepted academic practice. No use, distribution or
reproduction is permitted which does not comply with these terms.
Frontiers in Microbiology | www.frontiersin.org 16 August 2016 | Volume 7 | Article 1227

221
Ringrazio tutti coloro che mi hanno supportata e incoraggiata in questo percorso e nella
vita
Andrea, i miei genitori, Antonio e Gabriele
Carlotta De Filippo, Prof. Paolo Lionetti e tutti i professori che mi hanno guidata e
consigliata
i miei vecchi e nuovi compagni: Damariz, Sara, Lisa, Irene, Matteo, Luisa, Valentina,
Monica, Silvia, Elena e Francesco V.
Copyright © 2022 FDOKUMEN