La télévision dans 36 Etats européens - Coe
274
2009 Television in 36 European States La télévision dans 36 Etats européens Fernsehen in 36 europäischen Staaten 1 VOLUME BAND YEARBOOK • ANNUAIRE • JAHRBUCH PDF VERSION
-
Upload
khangminh22 -
Category
Documents
-
view
1 -
download
0
Transcript of La télévision dans 36 Etats européens - Coe

1
2009
Television in 36 European States
La télévision dans 36 Etats européens
Fernsehen in 36 europäischen Staaten
1V o l u m eB a n D
Film, television and video in EuropeYEARBOOK 2009
The three-volume European Audiovisual Observatory Year-book offers a comprehensive
overview of the audiovisual sector in the Observatory’s 36 member states.
Data from more than 1,000 different sources are collected and analysed, and information is presented in over 500 graphs and tables. The result is a unique overview of Europe’s audio-visual markets in film, television and video.
The impartiality of the data presented is guaranteed by the Observatory’s sta-tus as a pan-European public body.
The three volumes of the Yearbook constitute an outstanding source for all those involved in the audiovisual sector, whether policy makers, profes-sionals or academics.
Film, télévision et vidéo en EuropeANNUAIRE 2009
L’Annuaire de l’Observatoire euro-péen de l’audiovisuel présente en trois volumes une analyse
complète du secteur audiovisuel (cinéma, télévision et vidéo) dans ses 36 Etats membres.
La préparation et l’exploitation de données issues de plus de mille sour-ces différentes et la présentation des résultats en plus de cinq cents gra-phiques et tableaux donnent une vue d’ensemble unique du marché en Europe.
Le statut d'organisme de service pu-blic paneuropéen garantit l'impartia-lité de ces données.
Le présent Annuaire en trois volumes constitue de ce fait une remarquable source d’information pour les profes-sionnels, les décideurs et les scienti-fiques.
Film, Fernsehen und Video in EuropaJAHRBUCH 2009
Das Jahrbuch der Europäischen Audiovisuellen Informati-onsstelle gibt für ihre 36 Mit-
gliedstaaten in drei Bänden einen umfassenden Überblick über die Ent-wicklung des audiovisuellen Sektors in den Bereichen Film, Fernsehen und Video.
Die Aufbereitung und Auswertung von mehr als 1000 Einzelquellen und die Darstellung der Ergebnisse in über 500 Graphiken und Tabellen verschaffen in Europa einen einmali-gen Marktüberblick.
Die Neutralität der Darstellung wird durch den öffentlich-rechtlichen Sta-tus der Europäischen Audiovisuellen Informationsstelle garantiert.
Damit bietet das vorliegende Jahr-buch mit seinen drei Bänden eine hervorragende Informationsquelle für alle Zielgruppen in der Politik, in der Industrie und in der Wissenschaft.
The content of the Yearbook is also available online:Le contenu de cet annuaire est également disponible en ligne : Die Inhalte des Jahrbuchs stehen auch online zur Verfügung: http://www.obs.coe.int/yb_premium/ Eu
rope
an A
udio
visu
al O
bser
vato
ry –
Obs
erva
toire
eur
opée
n de
l’au
diov
isue
l – E
urop
äisc
he A
udio
visu
elle
Info
rmat
ions
stel
le20
09> 6 <
YEARBOOK • ANNUAIRE • JAHRBUCH
Television in 36 European States
La télévision dans 36 Etats européens
Fernsehen in 36 europäischen Staaten
195e272 pages | Seiten
ISBN 978-92-871-6812-2PDF VERSION
Trends in European television
Les tendances de la télévision européenne
Trends im europäischen Fernsehen
195 e224 pages | Seiten
ISBN 978-92-871-6813-9PDF VERSION
Film and home video
Cinéma et vidéo
Film und Video
142,50 e128 pages | Seiten
ISBN 978-92-871-6814-6PDF VERSION
V o l u m eB a n D
V o l u m eB a n D
V o l u m eB a n D1 2 3
PDF VERSION
EUROPEAN AUDIOVISUAL OBSERVATORY, Yearbook 2009. Film, Television and Video in Europe, 2009 Edition, Vol. 1, “Television in 36 European States”, European Audiovisual Observatory, Strasbourg, 2009.
OBSERVATOIRE EUROPÉEN DE L’AUDIOVISUEL, Annuaire 2009. Cinéma, télévision et vidéo en Europe, Edition 2009, Vol. 1, "La télévision dans 36 Etats européens", Observatoire européen de l’audiovisuel, Strasbourg, 2009.
EUROPÄISCHE AUDIOVISUELLE INFORMATIONSSTELLE, Jahrbuch 2009. Film, Fernsehen und Video in Europa, 2009, Bd 1, Fernsehen in 36 europäischen Staaten, Europäische Audiovisuelle Informationsstelle, Straßburg, 2009.
Director of publication Directeur de la publication Verlagsleitung
Wolfgang Closs
Editor Coordination scientifique Unter der wissenschaftlichen Leitung vonDr. André Lange ([email protected])Head of the Department "Information on Markets and Financing" Responsable du département "Information sur les marchés et les financements" Leiter der Abteilung „Informationen über Märkte und Finanzierungen“
Special thanks to the following Remerciements particuliers à Besonderen Dank an MAVISE Project of the DG Communication of the European Commission (Florence Hartmann, Deirdre Kevin, European Audiovisual Observatory).
BUREAU VAN DIJK ELECTRONIC PUBLISHING (Vincent Leray, Idris Roty), EBU (Alexander Shulzyki, Lisa Benjamin, Anna-Sara Stalvik), EPRA (Emmanuelle Machet), EURODATA-TV ( Jacques Braun, Alexandre Callay, Alexandra Brenkman), LYNGSAT (Christian Lyngemark and his network), SCREEN DIGEST (Allan Hardy, Guy Bisson, Ben Keen).
Pedro Brauman (RTP, PT), Miguel Angel Fontan (SOFRES A.M., ES), Ragnar Karlsson (Statistics Iceland), Eva Harrie (NORDICOM, SE), Constantinos Papavasilopoulos (IOM, GR) and all our correspondents within television companies.
Department for Legal Information of the European Audiovisual Observatory (Dr. Susanne Nikoltchev, Francisco Cabrera) and their network of correspondents.
Editorial Assistant and Yearbook Premium Service Assistante éditoriale et Service premium de l’Annuaire Verlagsassistentin und Jahrbuch Premium ServiceValérie Haessig ([email protected], Tel. : +33 (0)3 90 21 60 11)
Translation and proofreading Traduction et relecture Übersetzung und KorrekturVéronique Campillo, France Courrèges, Michael Finn, Paul Green, Bernard Ludewig, Ralf Pfleger, Sonja Schmidt.
Documentation - Public Relations Documentation - Relations publiques Dokumentation - ÖffentlichkeitsarbeitAlison Hindhaugh ([email protected], Tel. : +33 (0)3 90 21 60 10)
Marketing Promotion MarketingMarkus Booms ([email protected], Tel. : +33 (0)3 90 21 60 06)
Publisher Editeur VerlagEuropean Audiovisual Observatory Observatoire européen de l’audiovisuel Europäische Audiovisuelle Informationsstelle 76, allée de la Robertsau F-67000 STRASBOURGhttp://www.obs.coe.intTél. : +33 (0)3 90 21 60 00 Fax : +33 (0)3 90 21 60 19 [email protected]
Exclusive distribution for Distribution exclusive pour Exklusiver Vertrieb für
Germany, Austria Allemagne, Autriche Deutschland, Österreich
NOMOS VERLAGSGESELLSCHAFT D - 76 520 BADEN-BADEN DEUTSCHLAND Fax: +49 (0) 7221 21 04 27 http://www.nomos.de
Spain, Latin America Espagne, Amérique latine Spanien, Lateinamerika
CINEinforme y TELEinforme Ediciones Exportfilm, S.L. Gran Vía 64 E-28013 MADRID - ESPAÑA Tel. +34 (9)1 541 21 29 / (9)1 541 27 14 Fax +34 (9)1 559 81 10 http://www.cineytele.com
Layout Maquette Gestaltung
Acom Europe, Paris
© 2009 European Audiovisual Observatory Observatoire européen de l’audiovisuel Europäische Audiovisuelle Informationsstelle, Strasbourg
Printed in France Imprimé en France Gedruckt in Frankreich
ISBN : 978-92-871-6812-2 (PDF VERSION)
AL Albania Albanie AlbanienAT Austria Autriche ÖsterreichBE Belgium Belgique BelgienBG Bulgaria Bulgarie BulgarienCH Switzerland Suisse SchweizCY Cyprus Chypre ZypernCZ Czech Republic République tchèque Tschechische RepublikDE Germany Allemagne DeutschlandDK Denmark Danemark DänemarkEE Estonia Estonie EstlandES Spain Espagne SpanienFI Finland Finlande FinnlandFR France France FrankreichGB United Kingdom Royaume-Uni Vereinigtes KönigreichGR Greece Grèce GriechenlandHR Croatia Croatie KroatienHU Hungary Hongrie UngarnIE Ireland Irlande IrlandIS Iceland Islande IslandIT Italy Italie ItalienLI Liechtenstein Principauté du Liechtenstein Fürstentum LiechtensteinLT Lithuania Lituanie LitauenLU Luxembourg Luxembourg LuxemburgLV Latvia Lettonie Lettland
MK “The former Yugoslav Republic of Macedonia“
“Ex-République yougoslave de Macédoine”
“ Ehemalige jugoslawische Republik Mazedonien“
MT Malta Malte MaltaNL Netherlands Pays-Bas NiederlandeNO Norway Norvège NorwegenPL Poland Pologne PolenPT Portugal Portugal PortugalRO Romania Roumanie RumänienRU Russian Federation Fédération de Russie Russische FöderationSE Sweden Suède SchwedenSI Slovenia Slovénie SlowenienSK Slovak Republic République slovaque Slowakische RepublikTR Turkey Turquie Türkei
EUR 15 European Community prior to 1 May 2004
Communauté européenne avant le 1er mai 2004
Europäische Gemeinschaft vor dem 1. Mai 2004
DZ Algeria Algérie AlgerienEG Egypt Egypte ÄgyptenIL Israel Israël IsraelJO Jordan Jordanie JordanienJP Japan Japon JapanLB Lebanon Liban LibanonMA Morocco Maroc MarokkoSA Saudi Arabia Arabie Saoudite Saudi-ArabienSY Syrian Arabic Republic République arabe de Syrie Arabische Republik SyrienTN Tunisia Tunisie TunesienUS United States of America Etats-Unis d'Amérique Vereinigte Staaten von Amerika
BA Bosnia and Herzegovina Bosnie-Herzégovine Bosnien-HerzegowinaBY Belarus Bielorussie WeißrusslandMD Moldova Moldavie MoldawienUA Ukraine Ukraine Ukraine
If you wish to reproduce tables or graphs contained in this publication please contact the European Audiovisual Observatory for prior approval. Please note that the European Audiovisual Observatory can only authorise reproduction of tables or graphs sourced as “European Audiovisual Observatory” or “OBS“. All other entries may only be reproduced with the consent of the original source.
Si vous souhaitez reproduire des tableaux ou graphiques de cette publication, veuillez contacter l’Observatoire européen de l’audiovisuel pour une autorisation préalable. Merci de noter que l’Observatoire européen de l’audiovisuel ne peut autoriser que la reproduction des tableaux et graphiques sourcés avec la mention “Source: European Audiovisual Observatory” ou “OBS”. La reproduction des autres tableaux et graphiques ne peut être effectuée sans l’autorisation préalable des sources originales.
Vor einer eventuellen Reproduktion von in dieser Publikation enthaltenen Tabellen oder Graphiken holen Sie bitte das Einverständnis der Europäischen Audiovisuellen Informationsstelle ein. Bitte beachten Sie, dass die Europäische Audiovisuelle Informationsstelle nur die Reproduktion der Tabellen oder Graphiken, die mit „Source: European Audiovisual Observatory” oder „OBS” gekennzeichnet sind, gestatten kann. Alle anderen Einträge können nur im Einverständnis mit der Originalquelle reproduziert werden.
Members of the European Audiovisual Observatory
Non-European States
European States non- members of the European Audiovisual Observatory
Membres de l’Observatoire européen de l’audiovisuel
Etats non-européens
Etats européens non-membres de l’Observatoire européen de l’audiovisuel
Mitglieder der Europäischen Audiovisuellen Informationsstelle
Außereuropäische Staaten
Europäische Staaten, die nicht Mitglied der Informationsstelle sind

32 0 0 9 | V o l u m e 1 | B a n d 1
Introduction Introduction Einführung
The first volume of this 15th edition of the Yearbook of the European Audio-
visual Observatory is being published at the end of a year which has seen the audio-visual sector faced with a major global eco-nomic crisis. It is clearly too early to sketch a full statistical picture of the impact of this crisis on television, cinema, the video mar-ket and the emerging field of on-demand audiovisual services.
Four strong trends appear to be emerging across Europe:• a troubled advertising market, which has
considerably weakened television com-panies financed by advertising, with an inevitable impact on production com-panies;
• steady consumer spending levels: even though free video via the internet has grown significantly thanks to the suc-cess of video-sharing sites and persistent piracy, cinema ticket sales are holding up and are even higher than in 2008; expenditure on subscriptions to pay-TV packages rose substantially in 2008 and appears to be at the same level in 2009, and even higher in some countries. The video market is fluctuating, depending on the country, but, supported by the growth of Blu-ray, is not collapsing;
• the takeoff, at varying speeds from one country to another, but palpable in most, of new distribution platforms for audio-visual services (digital terrestrial televi-sion, IPTV, mobile television), which is stimulating competition in a market previously dominated by cable operators and distributors of satellite packages;
• the rapid multiplication of the number of on-demand audiovisual services and the gradual adoption of this type of service by consumers.
In order to explain these developments more clearly, we have made a few changes to the content of volume 1 of the Yearbook.
Le premier volume de cette 15ème édition de l’Annuaire de l’Obser-
vatoire européen de l’audiovisuel paraît au terme d’une année qui aura vu le secteur audiovisuel confronté à une crise économi-que mondiale majeure. Il est évidemment trop tôt pour tracer un portrait statistique complet de l’impact de cette crise sur la télévision, le cinéma, le marché vidéo et sur le domaine émergent des services audiovisuels à la demande.
Quatre tendances fortes paraissent émer-ger dans l’ensemble de l’Europe :• la crise du marché publicitaire, qui a
affaibli considérablement les entreprises de télévision financées par la publicité, avec une conséquence inévitable sur les entreprises de production ;
• la bonne tenue des dépenses des consom-mateurs : malgré le fait que la vidéo gratuite sur internet se soit fortement développée, grâce au succès des sites de partage vidéo et au piratage persistant, la fréquentation des salles de cinéma se maintient et même augmente par rap-port à 2008 ; les dépenses en abonne-ment aux bouquets de chaînes à péage ont augmenté significativement en 2008 et paraissent se maintenir en 2009, voire renforcées dans certains pays. Le marché de la vidéo fluctue suivant les pays, mais, soutenu par la croissance du Blu-ray, ne s’effondre pas ;
• le décollage, à des rythmes divers suivant les pays, mais palpable dans la plupart d’entre eux, des nouvelles plates-formes de distribution des services audiovisuels (télévision numérique terrestre, IPTV, télévision vers les téléphones mobiles), qui vient stimuler la concurrence sur un marché que dominaient jusqu’ici les câblo-opérateurs et les distributeurs de bouquets satellitaires ;
• la multiplication rapide du nombre de services audiovisuels à la demande et l’adoption progressive de ce type de ser-vices par les consommateurs.
Pour mieux rendre compte de ces évo-lutions, nous avons procédé à quelques modifications dans le contenu du volume 1 de l’Annuaire. Nous proposons de nouveaux tableaux et graphiques permettant de mieux percevoir l’organisation des marchés nationaux :• l’évolution des équipements des ména-
ges en matière de réception (câble, satel-lite, numérique terrestre, IPTV) et des dépenses des ménages en matière de télé-vision à péage font l’objet de graphiques nouveaux, établis avec la collaboration de Screen Digest et, le cas échéant, des sources nationales disponibles ;
Der erste Band dieser 15. Ausgabe des Jahrbuchs der Europäischen Audio-
visuellen Informationsstelle erscheint zum Ende eines Jahres, in dem auch der audio-visuelle Sektor mit einer weltweiten Wirt-schaftskrise zu kämpfen hatte. Natürlich ist es noch zu früh, um ein vollständiges statistisches Bild der Auswirkungen die-ser Krise auf das Fernsehen, das Kino, den Videomarkt und den noch jungen Bereich der audiovisuellen On-Demand-Dienste zu zeichnen.
Aber es gibt vier deutliche Trends, die sich in ganz Europa abzeichnen:• die Krise des Werbemarkts hat zu einer
deutlichen Schwächung der werbe-finanzierten Fernsehsender geführt und belastet somit unweigerlich auch die Produktionsfirmen;
• die Verbraucher zeigen sich nach wie vor ausgabenfreudig: Trotz der rasanten Ent-wicklung von kostenlosen Videoange-boten im Internet, die im Wesentlichen auf den Erfolg von Videoportalen und anhaltende Piraterie zurückzuführen ist, ist die Zahl der Kinobesucher im Vergleich zu 2008 konstant geblieben und mitunter auch gestiegen; die Aus-gaben für Abonnements von Pay-TV-Paketen sind 2008 deutlich gestiegen und scheinen 2009 diesen Stand halten und in einigen Ländern sogar ausbauen zu können. Der Videomarkt entwickelt sich uneinheitlich, bricht aber dank des Wachstums der Blu-Ray-Disc nir-gendwo ein;
• die je nach Land mehr oder weniger dynamische, aber dennoch fast überall deutlich feststellbare Entwicklung der neuen Plattformen für audiovisuelle Dienste (DVB-T, IPTV, Handy-TV) führt zu einer Belebung des Wettbe-werbs auf einem Markt, der bislang von Kabelnetzbetreibern und Satelliten-TV-Anbietern beherrscht wurde;
• die Anzahl der audiovisuellen On-Demand-Dienste steigt rapide an und sie werden zunehmend vom Verbraucher angenommen.
Um diese Entwicklungen besser dar stellen zu können, haben wir an Band 1 des Jahrbuchs einige inhaltliche Änderungen vor-genommen. Es gibt neue Tabellen und Grafiken, die einen besseren Überblick über die Struk-tur der nationalen Märkte vermitteln:• Die Entwicklung der Haushaltsaus-
stattung mit Empfangsgeräten (Kabel, Satellit, DVB-T, IPTV) und der Haus-haltsausgaben für Pay-TV-Angebote ist Gegenstand neuer Grafiken, die in Zusammenarbeit mit Screen Digest und

4 2 0 0 9 | V o l u m e 1 | B a n d 1
Introduction Introduction Einführung
We have provided new tables and graphs which show the organisation of national markets more clearly:• the development of consumer reception
equipment (cable, satellite, digital ter-restrial, IPTV) and household expen-diture on pay-TV is represented in new graphs, prepared with the collaboration of Screen Digest and, where relevant, available national sources;
• distribution platforms are presented more systematically: number of chan-nels available per genre, number of sub-scribers, operating income;
• the main sources of funding of the national broadcasting system (public funding, advertising investment for television and radio, expenditure on pay-TV) are presented, illustrating the enormous diversity of national situa-tions.
On the other hand, the summaries of the financial situation of television companies and the pages describing the main chan-nels’ programming by genre have been omitted.
We hope that readers will appreciate these changes. We should point out the degree to which the new statistical series that we are publishing are estimated. In most of our member states, national statistics are not yet fully adapted to recent market developments: European harmonisation of collection indicators is not yet complete and a major problem is posed by the fact that companies in the sector do not all, to put it mildly, share the same percep-tion – or obligations – regarding trans-parency. For some companies, income is not broken down into activity segments: there is no distinction between produc-tion income and distribution income, or no identification of income linked to the distribution of audiovisual services for operators of «triple play» or «qua-druple play» services. To make matters worse, some distributors remain reluctant to reveal how many subscribers they have or how these are broken down between different platforms.
When data is not officially recorded, mod-elling often remains the only way of pre-senting data that makes sense in order to understand a national market. In this field, we decided to step up our collaboration with Screen Digest, which appears to pro-vide significant guarantees of reliability in its attempt to prepare harmonised data.I would like to thank our various suppliers of data at pan-European level (Bureau van Dijk Electronic Publishing, Médiamétrie/Eurodata-TV Worldwide, Screen Digest,
• les plates-formes de distribution sont présentées de manière plus systémati-que : nombre de chaînes offertes par genre, nombre d’abonné, produit opé-rationnel ;
• les principales sources de financement du système national de radio-télévision (financement public, investissements publicitaires télévision et radio, dépen-ses en télévision à péage) sont présentées, illustrant la grande diversité des situa-tions nationales ;
En revanche, les synthèses sur la situation financière des entreprises de télévision et les pages présentant la programmation par genre des principales chaînes ont été supprimées.
Nous espérons que les lecteurs apprécie-ront ces évolutions. Il nous faut signaler la part d’approximation que contiennent les nouvelles séries statistiques que nous publions. Dans la plupart de nos Etats membres, les collectes statistiques natio-nales ne sont pas encore complètement adaptées aux développements récents du marché : l’harmonisation européenne des indicateurs de collecte n’est généralement pas assurée et, difficulté principale, les entreprises du secteur n’ont pas toutes, c’est le moins que l’on puisse dire, la même perception – ni les mêmes obligations – en matière de transparence. Pour un certain nombre d’entreprises, on ne dispose pas d’une ventilation des recettes par segment d’activité : absence de distinction entre recettes d’édition de chaînes et recettes de distribution ; absence d’identification des recettes liées à la distribution de ser-vices audiovisuels pour les opérateurs de services « triple play », voire « quadruple play ». Qui plus est, un certain nombre de distributeurs restent réticents à commu-niquer sur leur nombre d’abonnés ou sur la ventilation de leurs abonnés par plate-forme.
La modélisation reste souvent la seule possibilité de présenter des données qui, à défaut d’être enregistrées, font sens pour comprendre un marché national. Dans ce domaine, nous avons choisi de renforcer notre collaboration avec Screen Digest, qui nous paraît fournir d’importantes garanties de sérieux dans la tentative de procéder à l’élaboration de données har-monisées.
Je voudrais remercier ici nos différents fournisseurs de données au niveau pan-européen (Bureau van Dijk Electronic Publishing, Médiamétrie/Eurodata-TV Worldwide, Screen Digest, le S.I.S. de l’UER-EBU, WARC) et les nombreux
den ggf. verfügbaren nationalen Quellen erstellt wurden;
• die Distributionsplattformen werden in einer systematischeren Weise dar gestellt: Anzahl Kanäle pro Genre, Anzahl Abon-nenten, Betriebsergebnis;
• zur Veranschaulichung der breiten Viel-falt auf nationaler Ebene werden die Hauptfinanzierungsquellen der natio-nalen Rundfunksysteme (öffentliche Finanzierung, Investitionen in Radio- und Fernsehwerbung, Ausgaben für Pay-TV) dargestellt;
Dagegen wurden die Übersichten der finanziellen Lage der Fernsehunternehmen sowie die Übersichten der Programm-gestaltung pro Genre der wichtigsten Sender abgeschafft.
Wir hoffen, dass die Leser diese Ver-änderungen begrüßen werden. Wir müs-sen darauf hinweisen, dass die neuen von uns veröffentlichten Zahlen zum Teil auf Schätzungen beruhen. In den meisten unserer Mitgliedstaaten wurden die stati-stischen Erhebungsverfahren noch nicht vollständig an die jüngsten Entwicklungen des Marktes angepasst. So ist die europa-weite Harmonisierung der statistischen Indikatoren in der Regel noch nicht gegeben. Zudem – und das ist die Haupt-schwierigkeit – haben die Unternehmen in diesem Sektor weder alle die gleiche Vorstellung von Transparenz, um es vor-sichtig auszudrücken, noch unterliegen sie diesbezüglich den gleichen Vorschriften. Für eine Reihe von Unternehmen gibt es keine Aufschlüsselung der Einnahmen nach Geschäftsbereich: keine Unterschei-dung zwischen Sonderbetriebs einnahmen und Distributionseinnahmen; keine Aus-weisung der Einnahmen aus der Verbrei-tung von audiovisuellen Diensten für Triple- oder Quadruple-Play-Anbieter. Darüber hinaus zeigen einige Betreiber wenig Bereitschaft zur Offenlegung ihrer Abonnentenzahlen oder Aufschlüsselung ihrer Abonnenten nach Plattform.
So ist Modellierung nicht selten die einzige Möglichkeit für eine sinnvolle Darstellung von Daten, die nicht separat aufgezeichnet werden, aber dennoch zum Verständnis eines nationalen Marktes beitragen kön-nen. Wir haben uns in dieser Frage ent-schlossen, unsere Zusammenarbeit mit der Firma Screen Digest zu verstärken, die in der Entwicklung vernünftiger harmoni-sierter Daten offenbar ein hohes Maß an Sorgfalt beweist.
Mein Dank gilt an dieser Stelle unseren verschiedenen Partnern, die uns Daten aus ganz Europa liefern (Bureau van Dijk

52 0 0 9 | V o l u m e 1 | B a n d 1
Introduction Introduction Einführung
the EBU SIS, WARC) and the numerous correspondents within national public bodies or companies who have helped us to prepare the first volume of this Yearbook.
Finally, in order to make it possible to display this new data on the pages of the Yearbook, we decided, with the agreement of the Observatory’s Executive Council, to present the tables and graphs in Eng-lish only. French- and German-speaking readers will find translations of the main indicators used at the end of the volume.
André LangeHead of the Department for Information on Markets and Financing
European Audiovisual Observatory
November 2009.
correspondants au sein des organismes publics nationaux ou au sein des entrepri-ses qui nous ont aidés dans la réalisation du premier volume de cet Annuaire.
Enfin, en vue de rendre possible le déploie-ment sur les pages de l’Annuaire de ces nouvelles données, nous avons décidé, avec l’accord du Conseil exécutif de l’Obser-vatoire, de ne plus présenter les tableaux et graphiques qu’en anglais. Les lecteurs francophones et germanophones trouve-ront en fin de volume la traduction des principaux indicateurs utilisés.
André Lange
Responsable du département « Information sur les marchés et les financements »
Observatoire européen de l’audiovisuel
Novembre 2009.
Electronic Publishing , Médiamétrie/Eurodata-TV Worldwide, Screen Digest, der SIS der UER/EBU, WARC) sowie den zahllosen Korrespondenten in nationalen öffentlichen Einrichtungen oder auch in Unternehmen, die uns bei der Erstellung des ersten Bandes dieses Jahrbuchs unter-stützt haben.
Um diese neuen Daten überhaupt im Jahrbuch unterbringen zu können, haben wir uns mit dem Einverständnis des Exekutiv-rates der Informationsstelle entschlossen, die Tabelle und Grafiken nur noch in eng-lischer Sprache zu veröffentlichen. Für die französisch- und deutschsprachigen Leser gibt es am Ende des Bandes eine Überset-zung der wichtigsten Indikatoren.
André Lange
Leiter der Abteilung „Markt- und Finanzierungsinformationen“
Europäische Audiovisuelle Informationsstelle.
November 2009.

Ready, Set … Go?The Audiovisual Media Services Directive
Published by the European Audiovisual Observatory Strasbourg 2009, 131 pages - ISBN 978-92-871-6665-4 – 89 EUR
Available in English, French and German
For further information, consult http://www.obs.coe.int/avmsd
Order online at http://www.coe.int/about/order or by Email: [email protected], by fax: +33 3 90 21 60 19
n The promotion of cultural diversityn Protection against hate speech and other unacceptable contentn Protection for underage users in particularn The limits to advertisingn Product placementn The right to short reporting
A discussion of the aims of the Audiovisual Media Services Directive and the interests involved, taking as examples:
The challenges of transposing the Directive into national law:
n Intelligibility, acceptance, manageability of the solutions chosenn Incorporation into existing media law of the concepts set out n Drawing a distinction between linear and non-linear services
n Definition of editorial responsibilityn Co-regulation – for what areas and how is it organised?n Rights of citizens and the industry to be heard
or have a say in mattersn Monitoring of compliance with the lawn The roles of the regulatory authoritiesn Responsibility for ensuring the implementation of,
and compliance with, the rules in individual cases
This IRIS Special focuses on issues relating to the transposition of the Audiovisual Media Services Directive into national law. In particular, it discusses the importance of this task for general concepts and key definitions contained in the Directive. On the basis of these concepts, it looks at practical issues and possible solutions that are emerging in the transposition arrangements of the various EU member states. Finally, it examines a number of subsidiary regulatory and monitoring issues.
In this discussion, it becomes clear on the one hand how big the differences in the transposition of the Directive from one state to another are and to what extent the different legal traditions of individual states have an impact. Numerous examples make it clear that the, in some cases, broadly defined concepts and targets of the Directive leave room for different national solutions, especially in the case of non-linear services. On the other hand, attention is also drawn to the fact that the current regulatory culture in some EU member states will change since a number of the Directive’s provisions will result in the lasting adaptation and simplification of their legislation.
Ready, Set … Go?The Audiovisual Media Services Directive

1Chapter Chapitre
Kapitel
Country by country
reports
Les paysages télévisuels,
pays par pays
Länderberichte
72 0 0 9 | V o l u m e 1 | B a n d 1
AL
AT
BE
BG
CH
CY
CZ
DE
DK
EE
ES
FI
FR
GB
GR
HR
HU
IE
IS
IT
LT
LU
LV
MK
MT
NL
NO
PL
PT
RO
RU
SE
SI
SK
TR
Country Pays Land
Albania Albanie Albanien 9
Austria Autriche Österreich 11
Belgium Belgique Belgien 18
Bulgaria Bulgarie Bulgarien 29
Switzerland Suisse Schweiz 34
Cyprus Chypre Zypern 43
Czech Republic République tchèque Tschechische Republik 47
Germany Allemagne Deutschland 54
Denmark Danemark Dänemark 67
Estonia Estonie Estland 75
Spain Espagne Spanien 81
Finland Finlande Finnland 91
France France Frankreich 99
United Kingdom Royaume-Uni Vereinigtes Königreich 114
Greece Grèce Griechenland 129
Croatia Croatie Kroatien 136
Hungary Hongrie Ungarn 142
Ireland Irlande Irland 149
Iceland Islande Island 156
Italy Italie Italien 162
Lithuania Lituanie Litauen 173
Luxembourg Luxembourg Luxemburg 178
Latvia Lettonie Lettland 185
“The former Yugoslav Republic of Macedonia“
“Ex-République yougoslave de Macédoine”
“ Ehemalige jugoslawische Republik Mazedonien“ 190
Malta Malte Malta 192
Netherlands Pays-Bas Niederlande 196
Norway Norvège Norwegen 203
Poland Pologne Polen 210
Portugal Portugal Portugal 218
Romania Roumanie Rumänien 225
Russian Federation Fédération de Russie Russische Föderation 232
Sweden Suède Schweden 238
Slovenia Slovénie Slowenien 245
Slovak Republic République slovaque Slowakische Republik 251
Turkey Turquie Türkei 256


10 2 0 0 9 | V o l u m e 1 | B a n d 1
AL
AT
BE
BG
CH
CY
CZ
DE
DK
EE
ES
FI
FR
GB
GR
HR
HU
IE
IS
IT
LT
LU
LV
MK
MT
NL
NO
PL
PT
RO
RU
SE
SI
SK
TR
AL
Albania Albanie Albanien AL
Number of TV channels by kind of licence 10.09 Public Private TotalTerrestrial analogue (national) 1 3 4DTT/Cable/Satellite/IPTV/Mobile 1 54 55Regional/local 0 73 73Regional/local windows 3 0 3Channels targeting foreign markets 1 0 1Total 6 130 136Foreign channels targeting the country 0 1 1
TV channels distributors 10.09 CompaniesCable operators 50
Satellite packagers 2 DigitAlb (subsidiary of Top Media), Albanian Satellite Communications (Tring package)
IPTV packagers 0DTT packagers 1 DigitAlb (subsidiary of Top Media)Mobile broadcast TV packagers 1 DigitAlb Mobile (subsidiary of Top Media)
Source: European Audiovisual Observatory
Supply of TV channels by genre and by platform (including foreign channels) 10.09
Analogue Terrestrial
Tirana
Digital Terrestrial
DigitAlbSatellite DigitAlb
Satellite Tring
Generalist - national (incl.dedicated) 4 4 7 3Generalist - foreign 5 3Adult 2 5 1Children 3 4 2Culture/ education/ documentary 3 6 2Minority interest groupsEntertainment/ TV fiction/ games 2 5Film 7 10 2Home shoppingInternational linguistic and culturalLifestyle/ specific leisure/ travel 1 1Music 2 4 2News/ business 6 4 2Parliament/ government/ administrationRegional/ local 1ReligionSports 5 7 1Various 1 2 1Total 4 39 56 21
Population and equipment 31.12.07Penetration
(in % HH) In thousand SourcesPopulation (inhabitants) – 3 170 INSTAT
Households – 742 –
TV households 94,5% 701 Albanian Media Monitoring Center
Cable TV households 5,4% 40 –
Digital cable TV households ~ ~ –
DTH/SMATV households 12,1% 90 SES Astra
DTH/SMATVdigital households ~ ~ –
IPTV subscriptions 0,0% 0 –
Installed DVB-T receivers 13,5% 100 –
Total digital TV households 25,0% 186 –
Households with PC 4,8% 35 –
Basic figures

112 0 0 9 | V o l u m e 1 | B a n d 1
AL
AT
BE
BG
CH
CY
CZ
DE
DK
EE
ES
FI
FR
GB
GR
HR
HU
IE
IS
IT
LT
LU
LV
MK
MT
NL
NO
PL
PT
RO
RU
SE
SI
SK
TR
AT
Austria Autriche Österreich AT
The Austrian television landscape is still dominated by the public service
broadcaster ORF. It has gradually been losing market share since the introduction of private television and competition from other channels. However, its two channels, ORF1 and ORF2, achieved a combined average market share of 40.9% in 2008 (down 6% since 2006), with ORF2 still the most watched channel, attracting 24.1% of viewers on average (down 2.1% since 2006). German channels have always played an important role in the Austrian market. The main German private channels have Austrian versions, and German private channels have a combined audience share of 27.9% (the most important of these being RTL Austria, Sat.1 Österreich and ProSieben Austria). Almost 10% audience share goes to German public service chan-nels. Partly due to this variety in the mar-ket, Austria was late in launching private television with the channel ATV in 2003. It currently has an audience share of 3%. Two more private channels have recently been launched: Austria 9 TV, (Burda Ver-lag) in 2007; and Puls 4 (ProSiebenSat.1 Media AG) in 2008. According to the 2008 Communica-tions Report published by the regulatory authority, KommAustria, the number of households receiving digital television by the end of 2008 was 54%. Digital satel-lite reception has played an important role with 43% of all TV households receiving digital satellite services (satellite is received in approximately 50% of households). Cable customers make up about 36% of households and 6% of Austrian house-holds have digital cable services. Over 5% of households rely on DTT for TV reception and many other households use it for additional television sets (over half a million DTT reception devices have been sold to date). Just 3% of houses relied on analogue terrestrial reception at the end of 2008. The first digital terrestrial platform was launched in October 2006. There are two national multiplexes (A and B) with six channels: ORF1, ORF2, ATV, Puls 4, ORF Sport Plus and 3Sat. A third mul-tiplex has been launched for regional and local channels (MUX C is operated by different companies in each region), and a 4th for the DVB-H platform. A total of six multiplexes are planned. Most of the regional capitals and many regions have already completed the transition from analogue to digital. All analogue signals are due to be switched off in Austria in 2010.As noted above, satellite is the most important mode of television reception in Austria, followed by cable. The public service broadcaster ORF provides a digital satellite package. The main operator is the
Le paysage télévisuel autrichien reste dominé par le radiodiffuseur public
ORF qui perd toutefois des parts de marché avec l’introduction de la télévision privée et la concurrence des autres chaî-nes. Les deux chaînes publiques ORF1 et ORF2 ont néanmoins réalisé une part de marché combinée de 40,9 % en 2008 (-6 % depuis 2006). ORF2 reste la chaîne la plus regardée avec une moyenne de 24,1 % des téléspectateurs (-2,1 % depuis 2006).Les chaînes allemandes ont toujours joué un rôle important sur le marché autrichien. Les principales chaînes commerciales allemandes diffusent des versions autrichiennes, se taillant une part d’audience combinée de 27,9 % (essentiellement RTL Autri-che, Sat.1 Österreich et ProSieben Austria). Les chaînes publiques alle mandes atteignent pratiquement 10 % de parts de marché. La variété des chaînes déjà dispo-nibles explique en partie que l’Autriche ait pris un certain retard dans le lancement de la télévision privée : la chaîne ATV a été lancée en 2003 seulement. Celle-ci dispose actuellement d’une part d’audience de 3 %. Deux nouvelles chaînes privées viennent d’être lancées : Austria9 TV (Burda Verlag) en 2007, et Puls 4 (Pro-SiebenSat.1 Media AG) en 2008.D’après le rapport de 2008 sur les commu-nications, publié par l’autorité de régula-tion KommAustria, le nombre de foyers recevant la télévision numérique était de 54 % à la fin 2008. Le satellite joue un rôle important: 43 % des foyers reçoivent des services numériques satellitaires (le satel-lite est reçu par environ 50 % des foyers). Les abonnés au câble représentent environ 36 %, dont 6 % des foyers qui réception-nent des services numériques par le câble. Plus de 5 % reçoivent des signaux télévisés par le biais de la TNT et un grand nombre de foyers y ont recours pour leurs télévi-seurs supplémentaires (plus d’un demi-million de décodeurs TNT ont été vendus à ce jour). À la fin 2008, seulement 3 % des foyers recevaient des signaux analogiques terrestres.La première plate-forme numérique terres-tre a été lancée en octobre 2006. Il existe deux multiplex nationaux (A et B), avec six chaînes : ORF1, ORF2, ATV, Puls 4, ORF Sport Plus et 3Sat. Un troisième multiplex a été lancé pour les chaînes régionales et locales (MUX C, exploité par les diffé-rentes firmes régionales). Un quatrième multiplex a été lancé pour la plate-forme DVB-H. Au total, six multi plex devraient voir le jour. La plupart des capitales régio-nales et de nombreuses régions ont déjà basculé de l’analogique au numérique. La transition de l’ensemble des signaux devrait avoir lieu en 2010.À l’évidence, le satellite est le plus impor-tant mode de réception des signaux télé-visés en Autriche, avant le câble. Le radio-
Die Fernsehlandschaft in Österreich wird nach wie vor vom öffentlich-
rechtlichen Sender ORF geprägt. Der ORF hat zwar seit der Einführung des Privatfernsehens und auch durch die Konkurrenz anderer Sender kontinuier-lich Zuschauer verloren, aber seine bei-den Sender ORF1 und ORF2 erreichten 2008 zusammen einen Marktanteil von 40,9 % (minus 6 % gegenüber 2006), wobei ORF2 mit einer durchschnitt-lichen Einschaltquote von 24,1 % (minus 2,1 % gegenüber 2006) immer noch der beliebteste Sender ist. Deutsche Sender haben schon immer eine wichtige Rolle auf dem österreichischen Markt gespielt. Die größten deutschen Pri-vatsender gibt es in österreichischen Ver-sionen und zusammen erreichen sie einen Marktanteil von 27,9 % (darunter an der Spitze RTL Austria, Sat.1 Österreich und ProSieben Austria). Fast 10 % entfallen auf die deutschen öffentlich-rechtlichen Sender. Nicht zuletzt wegen dieser Vielfalt erfolgte der Start des Privatfernsehens erst sehr spät (ATV im Jahr 2003). ATV hat derzeit einen Marktanteil von 3 %. Zwei weitere Privatsender sind unlängst auf Sendung gegangen: Austria 9 TV (Burda Verlag) 2007; und Puls 4 (ProSiebenSat.1 Media AG) 2008. Laut Kommunikationsbericht 2008 der Regulierungsbehörde KommAustria konnten Ende 2008 54 % der Haushalte digitales Fernsehen empfangen. Eine wich-tige Rolle spielt der digitale Empfang über Satellit: 43 % aller Fernsehhaushalte emp-fangen digitale Satellitenprogramme (rund 50 % der Haushalte haben Satellitenfern-sehen). Kabelkunden machen ca. 36 % der Haushalte aus und 6 % der österrei-chischen Haushalte nutzen digitale Kabel-dienste. Über 5 % der Haushalte sind für den Empfang des Fernsehprogramms auf DVB-T angewiesen, sehr viele Haushalte nutzen DVB-T für Zweitgeräte (bislang wurden über eine halbe Million DVB-T-Empfangsgeräte verkauft). Das analoge Antennenfernsehen nutzten Ende 2008 nur noch 3 % der Haushalte. Die erste DVB-T-Plattform wurde im Oktober 2006 in Betrieb genommen. Es gibt zwei nationale Multiplexe (A und B) mit sechs Sendern: ORF1, ORF2, ATV, Puls 4, ORF Sport Plus und 3Sat). Ein dritter Multiplex wurde für regionale und lokale Sender (MUX C wird in jeder Region von einem anderen Unternehmen betrieben) und ein vierter für die DVB-H- Plattform gestartet. Geplant sind ins-gesamt sechs Multiplexe. Die meisten Landeshauptstädte und viele Regionen haben die Umstellung von analog auf digital bereits abgeschlossen. Die endgül-tige Abschaltung der analogen Signale in Österreich soll 2010 erfolgen.Wie bereits erwähnt, erfolgt der Fernseh-empfang in Österreich in erster Linie über

92 0 0 9 | V o l u m e 1 | B a n d 1
AL
AT
BE
BG
CH
CY
CZ
DE
DK
EE
ES
FI
FR
GB
GR
HR
HU
IE
IS
IT
LT
LU
LV
MK
MT
NL
NO
PL
PT
RO
RU
SE
SI
SK
TR
AL
Albania Albanie Albanien AL
T hree players share the national audio-visual market: the Albanian public
service broadcaster RTSH, which oper-ates two channels, TVSH (Shqiptar TV1) and TVSH Sat (the international service of RTSH), and two private televi-sion operators, TV Klan and Top Channel (which is operated by the Albanian group Top Media).The activity of private electronic media began without a legal framework in 1995, with the launch of the unlicensed channel Shijak TV. After the creation of Keshilli Kombetar i Radiove dhe Televizioneve (National Council of Radio and Tele-vision - NCRT) in 1999, commercial radio and television stations started oper-ating under licences. Ten years after it was set up, NCRT issued licences to three national private terrestrial channels (TV Klan, TVA, the new name of TV Arbëria, and Top Channel), 69 local terrestrial channels and two channels for satellite distribution (Alsat and Vizion+).The financial structure of the general entertainment family channel Vizion+ was modified in the summer of 2008 when the German group WAZ Mediengruppe acquired a minority equity stake in it.There are around fifty cable operators in the Albanian market and two satellite platforms are now competing with one ano ther. The package offered by DigitAlb, which is controlled by the Top Media group, was launched in 2004 and offers around sixty channels. Its competitor, a new package called Tring, was launched by Albanian Satellite Communications in September 2008 and comprises over twenty free-to-air channels. Finally, since 2007 Albania has had a personal (DVB-H) mobile television service, DigitAlb Mobile, which is operated by the Top Media group.Top Media also controls the digital terres-trial television platform DigitAlb, which was launched in 2004 and offers 39 chan-nels. However, the package is transmitted via four multiplexes without a licence. In 2007, the Albanian parliament passed the Digital Broadcasting Act, which pro-vides for seven digital terrestrial multi-plexes: two for the public service broad-caster and five for the private operators, with one multiplex per operator. DigitAlb will therefore have to bring its service into compliance with the new law.
Trois acteurs se partagent le marché audiovisuel national : d’un côté,
la Radio-Télévision publique albanaise (RTSH) qui comprend deux chaînes, TVSH (Shqiptar TV1) et TVSH Sat (le service international du radiodiffu-seur public), et, d’un autre côté, deux opérateurs de télévision privés, TV Klan et Top Channel (opérée par le groupe albanais Top Media).Les activités des médias électroniques privés ont débuté sans cadre légal en 1995 avec le lancement de Shijak TV, une chaîne ne bénéficiant d’aucune licence. Après la création du Keshilli Kombetar i Radiove dhe Televizioneve (Conseil natio-nal de la radio et de la télévision - CNRT) en 1999, les radios et télévisions privées ont commencé à diffuser sous licence. Dix ans après sa création, le CNRT a délivré des licences à 3 chaînes privées terrestres nationales (TV Klan, TVA, nouveau nom de TV Arbëria, et Top Channel), 69 chaînes terrestres locales et 2 chaînes destinées à la diffusion par satellite (Alsat et Vizion+).La structure financière de la chaîne géné-raliste à public familial Vizion+ a été modifiée lors de l’été 2008 lorsque le groupe allemand WAZ Medien Gruppe a acquis une participation minoritaire dans son capital.Une cinquantaine de câblo-opérateurs opèrent sur le marché albanais et deux plates-formes satellitaires sont désormais en concurrence. Le bouquet DigitAlb, contrôlé par le groupe Top Media, a été lancé en 2004 et propose une soixantaine de chaînes. Face à lui, un nouveau bouquet, Tring, a été lancé par Albanian Satellite Communications en septembre 2008. Ce service comprend une vingtaine de chaînes en clair. Il existe enfin en Albanie depuis 2006 un service de télévision mobile personnelle (DVB-H), DigitAlb Mobile, dépendant du groupe Top Media.Top Media contrôle aussi la plate- forme de télévision numérique terrestre DigitAlb, qui a été lancée dès 2004 et propose 39 chaînes. Seulement, le bouquet est transmis via 4 multiplex, sans licence. Le Parlement albanais a adopté en 2007 la loi relative à la radiodiffusion numé-rique. Le texte prévoit sept multiplex numériques terrestres : 2 pour la radio-télévision publique et 5 pour les opéra-teurs privés, à raison d’un multiplex par opérateur. DigitAlb devra donc mettre son offre en conformité avec la nouvelle loi.
D rei Akteure teilen sich den audio-visuellen Markt in Albanien: auf der
einen Seite die öffentlich-rechtliche Rund-funkanstalt (RTSH) mit den beiden Sen-dern TVSH (Shqiptar TV1) und TVSH Sat (der internationale Kanal von RTSH) und auf der anderen Seite die beiden Pri-vatsender TV Klan und Top Channel (eine Tochter des albanischen Konzerns Top Media).Die Aktivitäten privater elektronischer Medien begannen 1995 in einem rechts-freien Raum mit dem Start des nicht lizenzierten Kanals „Shijak TV“. Nach der Einrichtung des Nationalen Radio- und Fernsehrates Keshilli Kombetar i Radiove dhe Televizioneve im Jahr 1999 mussten private Radio- und Fernsehsender eine Sendelizenz erwerben. Zehn Jahre nach seiner Gründung hat der Radio- und Fern-sehrat an drei landesweite terrestrische Pri-vatsender (TV Klan, TVA (ehemals TV Arbëria) und Top Channel), 69 lokale ter-restrische Sender sowie zwei über Satellit ausgestrahlte Sender (Alsat und Vizion+) Sendelizenzen vergeben.Die Finanzstruktur des auf Familien ausge-richteten Vollprogrammanbieters Vizion+ hat sich im Sommer 2008 geändert, als die deutsche WAZ Medien Gruppe mit einer Minderheitsbeteiligung bei dem Sender eingestiegen ist.Auf dem albanischen Markt gibt es rund 50 Kabelnetzbetreiber und inzwischen auch zwei konkurrierende Sat-T V-Plattformen. Das Bouquet DigitAlb des Konzerns Top Media ist bereits seit 2004 am Markt und umfasst rund 60 Kanäle. Dazu kommt seit September 2008 ein neues Angebot (Tring ) des Betreibers Albanian Satellite Communications mit ca. 20 unverschlüsselten Kanälen. Seit 2006 gibt es in Albanien mit DigitAlb Mobile (einer Tochter des Top Media- Konzerns) auch einen Anbieter für Handy- Fernsehen (DVB-H).Top Media kontrolliert auch die DVB-T- Plattform DigitAlb, die bereits 2004 gestartet wurde und 39 Kanäle anbietet. Allerdings wird das Bouquet ohne Lizenz über 4 Multiplexe ausgestrahlt. Das alba-nische Parlament hat 2007 das Gesetz über den digitalen Rundfunk verabschie-det. Darin sind sieben DVB-T-Multiplexe vorgesehen: zwei für den öffentlich-recht-lichen Rundfunk und jeweils ein Multi-plex für die fünf privaten Betreiber. Dies bedeutet, dass die Plattform DigitAlb ihr Angebot entsprechend dem neuen Gesetz wird anpassen müssen.
Sources: Conseil national de la radio et de la télévision : http://www.kkrt.gov.al Legal aspects: IRIS Merlin, http://merlin.obs.coe.int

12 2 0 0 9 | V o l u m e 1 | B a n d 1
AL
AT
BE
BG
CH
CY
CZ
DE
DK
EE
ES
FI
FR
GB
GR
HR
HU
IE
IS
IT
LT
LU
LV
MK
MT
NL
NO
PL
PT
RO
RU
SE
SI
SK
TR
AT
Austria Autriche Österreich AT
platform Premiere Österreich, a subsidiary of Germany’s Premiere Fernsehen. Since News Corporation’s takeover of Premiere AG, there has also (in July 2009) been a rebranding of Premiere Österreich, now known as “Sky”, with the Premiere chan-nels rebranded as Sky channels. The for-mer co-operation (whereby subscribers to each had access to a selection of channels from the other package) between ORF Digital and Premiere Österreich ended in July 2009 with the re-branding of the package. There are many cable operators in Austria, the most important of these being UPC. In March 2009, UPC Telekabel, had a total of 555,000 subscribers. In 2006, Telekom Austria launched the IPTV platform AONtv (Aon Digital) in Vienna. The service announced that it had reached 75 000 subscribers in May 2009.Following legislation in 2007, mobile terrestrial television was launched in Aus-tria in time for the Euro 2008 football championship. Media Broadcast GmbH, a subsidiary of the TDF group, has a license to operate a multiplex platform for mobile terrestrial broadcasting for 10 years. Broad-casting services are offered by ONE and H3G Austria. Figures for DVB-H users are not available but H3G Austria announced in February 2009 that it had 90 000 sub-scribers of its TV services (received either on the mobile phone or on the DVB-H receiver).Following complaints submitted to the European Commission by the Aus-trian Commercial Broadcasters Asso-ciation – VÖP (in 2005), the European Commission requested that Austria, pur-suant to Article 88.2 of the EC Treaty, explain the financing of the public broad-caster ORF. In January 2008, the European Commission requested, among others, a clearer definition of the remit, in particu-lar with regard to online services.
diffuseur public ORF propose un bouquet numérique par satellite. L’opérateur prin-cipal est Premiere Österreich, une filiale de la plate-forme allemande Premiere Fernsehen. Depuis la prise de contrôle de Premiere AG par News Corporation, Premiere Österreich a été rebaptisée Sky et les chaînes Premiere ont été renommées sous label Sky. La coopération entre ORF Digital et Premiere Österreich, qui per-mettait aux abonnés de chaque partenaire d’accéder à une sélection de chaînes de l’autre bouquet, a pris fin en juillet 2009 avec le changement de nom du bouquet.En Autriche, il existe de nombreux câblo-opérateurs ; UPC est le plus important d’entre eux. En mars 2009, UPC Telekabel comptait un total de 555 000 abonnés. En 2006, Telekom Austria a lancé la plate- forme AONtv IPTV (Aon Digital) à Vienne. En mai 2009, le service annonçait 75 000 abonnés.Suite à la loi de 2007, la télévision mobile terrestre a été lancée en Autriche, à temps pour l’Euro 2008. Media Broadcast GmbH, une filiale du groupe TDF, pos-sède une licence d’exploitation de 10 ans pour la plate-forme multiplex de radio-diffusion mobile terrestre. Les services de radiodiffusion sont proposés par ONE et H3G Austria. Le nombre d’utilisa-teurs de la télévison mobile personnelle (DVB-H) n’est pas connu avec précision, mais H3G Austria annonçait, en février 2009, 90 000 abonnés à ses services télé-visés (soit sur téléphone mobile soit sur récepteur DVB-H).Suite à une plainte déposée en 2005 par l’association des radiodiffuseurs privés autrichiens (VÖP), la Commission euro-péenne a demandé à l’Autriche, en vertu de l’article 88.2 du Traité CE, de s’expliquer sur le financement du diffuseur public ORF. En janvier 2008, la Commission a sollicité, entre autres, une définition plus claire de sa mission, notamment à l’égard des services en ligne.
Satellit und in zweiter Linie über Kabel. Der ORF bietet ein Paket für digitales Satellitenfernsehen an. Wichtigster Betrei-ber ist die Plattform Premiere Österreich, eine Tochter der deutschen Firma Premi-ere Fernsehen. Seit der Übernahme der Premiere AG durch die News Corporation wurde auch (im Juli 2009) Premiere Öster-reich in „Sky“ und die Premiere-Kanäle in Sky-Kanäle unbenannt. Die bis dahin bestehende Kooperation zwischen ORF Digital und Premiere Österreich (wonach die Abonnenten Zugang zu einigen Kanälen des jeweils anderen Pakets hatten) wurde im Juli 2009 mit der Umbenennung des Pakets beendet. In Österreich gibt es viele Kabelnetz-betreiber, von denen UPC der wichtigste ist. Im März 2009 hatte UPC Telekabel insgesamt 555 000 Abonnenten. 2006 hat Telekom Austria in Wien die IPT V-Plattform AONtv (Aon Digital) in Betrieb genommen. Nach eigenen Angaben hatte der Dienst im Mai 75 000 Abonnenten.Mit der Gesetzgebung von 2007 wurde der Weg für das mobile terres trische Fernsehen in Österreich geebnet. Der Startschuss erfolgte anlässlich der Fuß-balleuropameisterschaft 2008. Die Media Broadcast GmbH, eine Tochter der fran-zösischen TDF, hat eine 10-Jahres-Lizenz für den Betrieb einer Multiplex-Plattform für das mobile terrestrische Fernsehen erworben. Rundfunkdienste werden von ONE und H3G Austria angeboten. Zahlen über DVB-H-Nutzer liegen zwar keine vor, aber H3G Austria hatte im Februar 2009 nach eigenen Angaben 90 000 Abonnenten für seine Fernseh-dienste (Empfang auf dem Handy oder einem DVB-H-Endgerät).Nach mehrfachen Beschwerden des Verbands Österreichischer Privatsen-der (VÖP) bei der Europäischen Kom-mission (im Jahr 2005) hat die Kommis-sion von Österreich verlangt, nach Artikel 88.2 EG-Vertrag die Finanzierung des ORF zu erläutern. Im Januar 2008 hat die Europäische Kommission unter anderem eine präzisere Formulierung des öffent-lich-rechtlichen Auftrags, insbesondere in Verbindung mit Onlinediensten, verlangt.
Sources: KommAustria/ Rundfunk und Telekom Regulierungs-GmbH (RTR-GmbH): http://www.rtr.at Digital Developments: Digitaler Rundfunk: http://www.digitaler-rundfunk.at ORF Markt & Medienforschung: http://mediaresearch.orf.at Legal aspects: IRIS Merlin: http://merlin.obs.coe.int

132 0 0 9 | V o l u m e 1 | B a n d 1
AL
AT
BE
BG
CH
CY
CZ
DE
DK
EE
ES
FI
FR
GB
GR
HR
HU
IE
IS
IT
LT
LU
LV
MK
MT
NL
NO
PL
PT
RO
RU
SE
SI
SK
TR
AT
Austria Autriche Österreich AT
Population and equipment 31.12.08Penetration
(in % HH) In thousand SourcesPopulation (inhabitants) – 8 355 Eurostat
Households – 3 566 Eurostat
TV households 95,3% 3 398 European Audiovisual Observatory
Cable TV households 37,7% 1 343 Screen Digest / European Audiovisual Observatory
Digital cable TV households 12,3% 440 Screen Digest / European Audiovisual Observatory
DTH / SMATV households 50,2% 1 705 Screen Digest / European Audiovisual Observatory
Dig. DTH / SMATV households 39,0% 1 325 RTR
IPTV subscriptions 1,8% 64 Screen Digest / European Audiovisual Observatory
Installed DVB-T receivers 28,0% 1 000 Screen Digest / European Audiovisual Observatory
Total digital TV households 54,0% 1 926 Austrian Communications Authority - KommAustria
Households with PC 74,5% 2 657 Statistik Austria / European Audiovisual Observatory
Households with broadband connections 54,5% 1 943 Statistik Austria / European Audiovisual Observatory
Mobile phone TV subscriptions – 114 Screen Digest
Broadcast mobile TV receivers – 54 Screen Digest
TV channels distributors 11.09 CompaniesCable operators >250 UPC Telekabel, Kabelsignal,...Satellite packagers 2 ORF, Sky ÖsterreichProviders of IPTV services 3 Infotech EDV-System, Pitztalnet, Telekom AustriaDTT multiplex operators 14 1 national (ORS) and 13 operators for 16 regional areasTV telephone packagers 2 Hutchinson 3G Austria, OnePersonal mobile TV packagers 2 Hutchinson 3G Austria, One
Number of TV channels by kind of licence 10.09 Public Private TotalTerrestrial (national) 3 4 7Cable/Satellite/IPTV/Mobile 1 60 61Regional/Local 3 59 62Regional/local windows 10 10Channels targeting foreign markets 1 7 8Total 18 130 148Foreign channels targeting the country 5 5
Supply of TV channels by genre and by platform (including foreign channels) 11.09
Cable UPC Telekabel
Satellite ORF Satelit
Satellite Sky Österreich
IPTV Aon Digital
Generalist - national 7 3 7Generalist - foreign 24 15Adult 1 3 1Children 5 8 5Culture/ education/ documentary 15 5 11Minority interest groupsEntertainment/ TV fiction/ games 14 11 9Film 6 11 3Home shopping 2International linguistic and cultural 5 1 1Lifestyle/ specific leisure/ travel 6 2 2Music 12 3 6News/ business 11 9Parliament/ government/ administrationRegional/ local 5ReligionSports 11 1 9 7Various 1Total 124 5 53 76
Source: European Audiovisual Observatory
Basic figures

14 2 0 0 9 | V o l u m e 1 | B a n d 1
AL
AT
BE
BG
CH
CY
CZ
DE
DK
EE
ES
FI
FR
GB
GR
HR
HU
IE
IS
IT
LT
LU
LV
MK
MT
NL
NO
PL
PT
RO
RU
SE
SI
SK
TR
AT
Austria Autriche Österreich AT
Source: European Audiovisual Observatory on the basis of data from Screen Digest, WARC, ORF
Source: European Audiovisual Observatory
Source: Screen DigestSource: Screen Digest
Households TV equipment 2004-2008
Number of households accessing multichannel platforms as at 31.12.2008
Consumers pay-TV gross spend 2004-2008
Gross revenues of radio-television 2004-2008
In thousands.
In thousands.
EUR thousand.
EUR million.
2004 2005 2006 2007 2008
0
2 000
1 500
1 000
500
Satellite households
Cable households
DTT households
IPTV households
1 6031 650 1 675 1 700 1 705
1 284 1 303 1 322
3800
375
1 000
1 325 1 343
0 0 4
2164
ORF Digita
l Sat
ORS (DTT) e
st.
UPC Austria
Sky Öste
rreich
est.
Aon Digita
l TV
Liwest
est.
0
500
1 000
1 500
2 0001 900
1 000
545
204
7520
DTT
IPTV
Sat
PC
Cable
2004 2005 2006 2007 2008
0
350 000
300 000
250 000
200 000
150 000
100 000
50 000
Cable TV
IPTVSatellite
318 210
244 270 247 594
267 671
288 377
2 31612 824
0 0 4 21 64
2004 2005 2006 2007 2008
0
600
400
200
TV adspend
Radio-TV licence fee
Consumerspay-TV spend
Radio adspend
State grants
573
473
301
166
1
595
504
331
166
2
477
445
244
164
3
488
451
248
168
3
524
463
270
163
1
Market trends

152 0 0 9 | V o l u m e 1 | B a n d 1
AL
AT
BE
BG
CH
CY
CZ
DE
DK
EE
ES
FI
FR
GB
GR
HR
HU
IE
IS
IT
LT
LU
LV
MK
MT
NL
NO
PL
PT
RO
RU
SE
SI
SK
TR
AT
Austria Autriche Österreich AT
1 Also active as satellite packager (ORF-Digital-Sat).2 Includes telecommunication activities.
Main broadcasters Channels 2005 2006 2007 2008 2008/07
ORF 1 sptv, sprad ORF-1, ORF-2, ORF Sat, TW1 990 010 917 642 969 067 943 038 -2,7%
ATV Privat TV GmbH & Co KG adtv ATV – – 38 580 ~ ~p.m. ATV Privat-TV Services AG adtv ATV 42 569 53 457 46 095 – –Tourismusfernsehen GmbH thtv TW1 ~ ~ ~ ~ ~LT 1 Privatfernsehen rtv LT 1 ~ 803 ~ ~ ~
Main distributors Services Packages 2005 2006 2007 2008 2008/07Orange GmbH (formerly One GmbH) 2 3G TV Orange Handy TV 650 836 593 587 602 883 ~ ~
UPC Austria est. 2 3Play UPC Austria 278 883 318 906 341 757 386 578 13,1%T-Mobile Austria GmbH 2 3G TV Mobile TV 214 775 ~ 344 829 ~ ~Telekom Austria AG (Internet Access & Media) 2 3Play AonTV ~ ~ 280 700 235 300 -16,2%
Hutchinson 3G Austria GmbH 2 3G TV 3 161 455 164 876 184 570 ~ ~Liwest Kabelmedien GmbH 2 3Play Liwest ~ ~ 40 400 ~ ~Kabelsignal AG 2 3Play kabelTV 24 046 27 134 29 590 ~ ~B.Net Burgenland Telekom 2 3Play B.NEt kabel TV – 13 000 16 006 17 366 8,5%
Premiere Fernsehen GmbH Sat-TV Premiere Österreich ~ 2 316 12 824 ~ ~
Source: European Audiovisual Observatory
EUR thousand.
2004 2005 2006 2007 2008
0
800 000
600 000
400 000
200 000
1 000 000
ATV Privat-TV Services AG
ORF
Operating revenues of main television companies in Austria 2005-2008 EUR thousand.
T.1.AT.1G.1.AT.1

16 2 0 0 9 | V o l u m e 1 | B a n d 1
AL
AT
BE
BG
CH
CY
CZ
DE
DK
EE
ES
FI
FR
GB
GR
HR
HU
IE
IS
IT
LT
LU
LV
MK
MT
NL
NO
PL
PT
RO
RU
SE
SI
SK
TR
AT
Austria Autriche Österreich AT
Source: ORF / European Audiovisual Observatory
Income 2005 2006 2007 2008 2005 2006 2007 2008 2008/07Total public income 453,3 463,7 474,1 505,3 45,8% 48,2% 48,1% 52,1% 6,6% - Aid/Grants 2,5 0,9 1,3 1,5 0,3% 0,1% 0,1% 0,2% 15,4% - Licence fee 450,8 462,8 472,7 503,9 45,5% 48,1% 48,0% 52,0% 6,6%Total commercial income 300,8 302,0 300,2 263,3 30,4% 31,4% 30,5% 27,2% -12,3% - Advertising 300,8 302,0 300,2 263,3 30,4% 31,4% 30,5% 27,2% -12,3%Other income 235,9 196,9 211,2 200,7 23,8% 20,5% 21,4% 20,7% -5,0%
Total 990,0 962,6 985,5 969,4 100,0% 100,0% 100,0% 100,0% -1,6%
Expenditure 2005 2006 2007 2008 2005 2006 2007 2008 2008/07Purchase of goods and services 389,7 410,3 435,7 467,3 38,6% 43,7% 42,9% 51,1% 7,2%
Cost of personnel 431,1 393,0 406,4 404,7 42,7% 41,9% 40,1% 44,3% -0,4%Depreciation 56,1 52,9 54,2 41,9 5,6% 5,6% 5,3% 4,6% -22,7%Operating expenditure 1 008,8 938,6 1 014,7 913,9 100,0% 100,0% 100,0% 100,0% -9,9%
Net result 5,7 9,0 -12,2 -104,4 755,7%Operating margin (%) -1,9 -2,3 -5,1 -13,1
EUR million.
In %.
2004 2005 2006 2007 2008
0
1 000
600
800
400
200
Other income
Advertising
Licence fee
Aids/Grants
2004 2005 2006 2007 2008
-60
0
10
-10
-20
-30
-40
-50
Pro�t marginReturn on total assetsOperating margin
Return on shareholders’ funds
ORF financial situation 2005-2008 EUR million.
T.1.AT.2G.1.AT.2

172 0 0 9 | V o l u m e 1 | B a n d 1
AL
AT
BE
BG
CH
CY
CZ
DE
DK
EE
ES
FI
FR
GB
GR
HR
HU
IE
IS
IT
LT
LU
LV
MK
MT
NL
NO
PL
PT
RO
RU
SE
SI
SK
TR
AT
Austria Autriche Österreich AT
Daily share Prime time (18:00-23:00)Channels 2004 2005 2006 2007 2008 2004 2005 2006 2007 2008ORF2 28,3 26,9 26,2 24,4 24,1 32,6 31,3 30,6 29,1 29,1ORF1 21,8 20,3 20,5 17,8 16,8 22,4 20,9 21,1 17,9 17,03sat 1,2 1,3 1,3 1,5 1,6 1,1 1,3 1,3 1,5 1,5Austrian public channels 51,3 48,4 48,1 43,7 42,5 56,1 53,4 52,9 48,4 47,6SAT.1 Österreich 5,6 6,2 6,0 6,6 7,2 4,2 5,0 5,0 4,9 4,8ProSieben Österreich 4,7 4,5 4,4 4,6 4,8 4,3 4,0 4,0 4,3 4,5ATV 1,9 2,4 2,4 2,6 3,0 2,1 2,6 2,8 3,0 3,4Kabel Eins Austria 2,6 2,6 2,4 2,5 2,5 2,2 2,1 2,2 2,4 2,4Austrian private channels 14,9 15,6 15,3 16,3 17,4 12,7 13,7 14,0 14,6 15,1ARD 3,3 3,6 3,7 3,7 3,7 3,6 3,9 3,9 4,0 3,8ARD 3 3,7 4,1 4,6 4,9 4,9 3,7 4,1 4,5 4,8 4,7ZDF 3,4 3,9 3,8 3,9 4,2 3,7 3,9 3,8 4,0 4,4Arte – – – 0,8 0,8 – – – 0,9 0,9Foreign public channels 10,5 11,7 12,2 13,3 13,5 11,1 11,9 12,2 13,7 13,8RTL 5,4 5,6 5,5 5,6 5,5 4,8 4,7 4,5 5,1 5,3RTL 2 3,1 2,7 2,5 2,6 2,5 2,7 2,4 2,1 2,3 2,1Super RTL 3,1 3,1 2,8 3,0 2,7 2,7 3,0 2,7 2,6 2,5Vox 3,0 3,2 3,3 3,9 3,9 2,8 3,1 3,2 4,2 3,8Eurosport 0,9 1,0 0,9 0,9 0,8 0,6 0,6 0,6 0,6 0,5DSF – – 0,6 0,6 0,5 – – 0,6 0,6 0,5Foreign private channels 15,5 15,6 15,5 16,6 15,7 13,6 13,9 13,7 15,4 14,6Others 7,8 8,7 8,9 10,1 10,8 6,4 7,2 7,1 7,9 8,8
Source: Eurodata TV Worldwide / AGTT / GfK Teletest
Daily share. In %, 3 years +.
Prime time (18:00-23:00). In %, 12 years +.
2004 2005 2006 2007 2008
0
10
20
30
ORF2
ORF1
ZDF
ATVVoxRTL
RTL 2 SAT.1Österreich
ProSiebenÖsterreich
3sat
Kabel EinsAustria
ARDARD 3Super RTL
2008
ProSieben Österreich 4,5%
ORF229,1%
ORF117,0%
3sat: 1,5%
Others8,8%
DSF0,5%
Super RTL2,5%
RTL5,3%
Arte0,9% ZDF
4,4%ARD 3 4,7%
ARD3,8%
Kabel Eins Austria2,4%
ATV3,4%
Eurosport0,5%
Vox3,8%
RTL 22,1%
SAT.1 Österreich: 4,8%
TV audience market share in Austria 2004-2008 In %, 3 years +.
T.1.AT.3G.1.AT.3

18 2 0 0 9 | V o l u m e 1 | B a n d 1
AL
AT
BE
BG
CH
CY
CZ
DE
DK
EE
ES
FI
FR
GB
GR
HR
HU
IE
IS
IT
LT
LU
LV
MK
MT
NL
NO
PL
PT
RO
RU
SE
SI
SK
TR
BE
Belgium Belgique Belgien BE
The three Communities (Flemish, French and German-speaking) each
have responsibility for audiovisual com-munication and constitute separate mar-kets, the common feature of which is the fact that all three markets have been extensively cabled for three decades and are thus able to receive the channels of neigh bouring countries. They have their own systems of regulating the audiovisual media and their own public-service broad-casting authorities, namely VRT, RTBF and BRF respectively.In the German-speaking Community, the majority of the population (about 74 000 inhabitants) choose to watch the German television channels. In the French Community, the French channels also have a significant penetration. Despite the existence of a growing range of local programmes, these channels still have a one third share of the audience. This phe-nomenon is found to a lesser extent in the Flemish Community, where people prefer the Flemish channels although the Dutch and British channels also have a sizeable market share.In the French and Flemish Communities, there is very fierce competition between the public broadcasters VRT and RTBF and their private sector rivals.• In the Flemish-speaking Community, the
main channel Eén (VRT) increased its dai-ly audience market share to 31.7% in 2008 (compared with 30.1% in 2007). Its imme-diate competitor, the channel VTM (pro-duced by Belgium’s VMMa group), also recorded a rise in its daily audience (21.4%, up from 20.7% in 2007). The concentration of the dominant players has thus increased, in contrast to most other European mar-kets, where it is tending to decline. In third place is the second public channel Ketnet/Canvas, whose daily audience has gone down to 8.6%. Finally, the market shares of VT4 (Group Pro SiebenSat.1 Media AG) and 2BE (VMMa) have remained stable at 6.5% and 5.8% respec-tively.
• The audience share of the French Com-munity channels is still remarkably stable. RTL-TVI continues to dominate the market with a 19.2% daily audi-ence (and a prime time market share of 27.5%), ahead of TF1 with 17% and La Une (RTBF) with 15%. The market share of the French channels is unchanged at 33%, while that of the RTL channels has risen slightly to 26%. Belgium’s public channels have more than 20% (with La Deux rising above 5% for the first time). The country’s private channels share 7.7 of the market (recording a rise thanks to the arrival of MTV Wallonie).
The cable operators dominate the dis-tribution of multi-channel packages by
Les trois Communautés (flamande, française et germanophone), sont
compétentes en matière de communi-cation audiovisuelle et constituent des marchés distincts, dont la caractéristique commune est d’être fortement câblés, depuis trois décennies, et donc récep-tifs aux chaînes des pays voisins. Elles disposent de leurs propres systèmes de régulation des médias audiovisuels ainsi que de leurs propres organismes de radio - télé vision de service public, respective-ment la VRT, la RTBF et la BRF.En Communauté germanophone, la population (environ 74 000 habitants) se tourne majoritairement vers les chaînes de télévision allemandes. En Communauté française, la pénétration des chaînes fran-çaises reste aussi très importante. Malgré l’existence d’une offre locale de plus en plus fournie, ces dernières représentent encore plus d’un tiers des parts de marché d’audience. Ce phénomène se retrouve dans une moindre mesure en Commu-nauté flamande, dont les habitants sont davantage tournés vers les chaînes flaman-des, mais où la part de marché des chaînes néerlandaises et britanniques n’est pas négligeable.Dans les Communautés française et flamande, il règne une concurrence très vive entre les chaînes des radiodiffuseurs publics, VRT et RTBF, et leurs rivales privées :• En Communauté flamande, la première
chaîne Eén (VRT) voit encore augmen-ter sa part de marché d’audience quoti-dienne à 31,7 % en 2008 (contre 30,1 % en 2007), tout comme sa concurrente, la chaîne VTM (éditée par le groupe belge VMMa), qui progresse en 2008 à 21,4 % d’audience quotidienne (contre 20,7 % en 2007). La concentration autour des acteurs dominants s’est donc renforcée, au contraire de la plupart des autres marchés européens où celle-ci tend plutôt à s’éroder. En troisième posi-tion se trouve la seconde chaîne publi-que Ketnet/Canvas, qui recule à 8,6 % d’audience quotidienne ; enfin VT4 (groupe ProsiebenSat.1 Media AG) et 2BE (VMMa) demeurent stables à res-pectivement 6,5 % et 5,8 % de parts de marché.
• L’audience des chaînes en Communauté française est toujours marquée par une étonnante stabilité. RTL-TVI continue de dominer le marché avec 19,2 % de l’audience quotidienne (et une part de marché de 27,5 % aux heures de grande écoute), devant TF1 avec 17 % et La Une (RTBF) à 15 %. La part des chaînes fran-çaises reste stable autour de 33 %, celle des chaînes RTL progresse légèrement à 26 %, les chaînes publiques belges s’éta-blissent à plus de 20 % (La Deux pas-sant pour la première fois au-dessus de la barre des 5 %), et les chaînes privées
In Belgien sind die drei Gemeinschaften, die flämische, die französische und die
deutschsprachige, für den audiovisuellen Bereich zuständig. Sie bilden jeweils einen eigenen Markt, jedoch mit der Gemein-samkeit, dass sie seit drei Jahrzehnten in großem Umfang verkabelt sind und daher den Empfang der Sender aus den Nachbar-ländern ermöglichen. Jede Gemeinschaft verfügt über ein eigenes Regulierungs-system für die audiovisuellen Medien sowie über eigene öffentlich-rechtliche Rundfunkanstalten: VRT, RTBF bzw. BRF.In der Deutschsprachigen Gemeinschaft wendet sich die Bevölkerung (etwa 74 000 Einwohner) in der Mehrzahl dem deutschen Fernsehen zu. In der Fran-zösischen Gemeinschaft ist die Durch-dringungsrate der französischen Fernseh-sender ebenfalls sehr hoch. Obwohl sich das belgische Angebot zunehmend verbessert, entfällt auf die ausländischen Fernsehsender immer noch über ein Drit-tel der Marktanteile. Dasselbe Phänomen findet sich abgeschwächt auch in der Flä-mischen Gemeinschaft, deren Einwohner eher flämische Sender einschalten, wo aber der Marktanteil der niederländischen und britischen Sender nicht zu vernach-lässigen ist.In der Flämischen und der Französischen Gemeinschaft herrscht eine starke Kon-kurrenz zwischen den öffentlich-recht-lichen Sendern VRT und RTBF und ihren privaten Mitbewerbern:• In der Flämischen Gemeinschaft stieg
die tägliche Einschaltquote des ersten Programms Eén (VRT) weiter an, das 2008 einen Marktanteil von 31,7 % erzielte (gegenüber 30,1 % 2007). Der Ver folger VTM (von der belgischen VMMa-Gruppe) legte 2008 ebenfalls zu und kam auf eine tägliche Einschaltquo-te von 21,4 % (gegenüber 20,7 % 2007). Die beiden Hauptakteure konnten ihre Führungsposition also weiter ausbauen, während in den meisten anderen euro-päischen Märkten eher der gegenläufige Trend zu beobachten ist. An dritter Stel-le folgt das zweite öffentlich-rechtliche Programm Ketnet/Canvas, das auf eine tägliche Einschaltquote von 8,6 % sank. VT4 (Pro SiebenSat.1 Media AG) und 2BE (VMMa) lagen stabil bei einem Marktanteil von 6,5 bzw. 5,8 %.
• Die Einschaltquoten in der Franzö-sischen Gemeinschaft sind weiterhin erstaunlich stabil. RTL-TVI hatte den Markt fest im Griff mit einer täglichen Einschaltquote von 19,2 % (und 27,5 % Marktanteil in der Hauptsendezeit), vor TF1 mit 17 % und La Une (RTBF) mit 15 %. Der Anteil der Sender aus Frankreich blieb bei rund 33 % kon-stant, derjenige von RTL legte leicht zu auf 26 %, die belgischen öffentlich-rechtlichen Sender kamen auf über

192 0 0 9 | V o l u m e 1 | B a n d 1
AL
AT
BE
BG
CH
CY
CZ
DE
DK
EE
ES
FI
FR
GB
GR
HR
HU
IE
IS
IT
LT
LU
LV
MK
MT
NL
NO
PL
PT
RO
RU
SE
SI
SK
TR
BE
Belgium Belgique Belgien BE
a wide margin but their supremacy is being challenged. Belgacom TV claimed to have 589,000 subscribers to its IPTV service in June 2009, and the numbers are steadily rising. Parallel to the rapid rise of IPTV in Belgium, two satellite packages have been launched by the Airfield Media Group (already linked to the Dutch sat-ellite package Canal Digitaal): following the introduction of the TV Vlaanderen package for the Flemish Community, which had over 70 000 subscribers at the end of 2008, the Télésat package target-ing the French Community was launched in January 2009. Mobile television is also available via the services provided by Belgacom Proximus and Mobistar.This increased competition has resulted in major trends towards consolidation, first of all on the cable market, with the take-over of UPC Belgium in 2007, followed in 2008 by the purchase of the Interkabel television activities (Interlectra, Integan, WVEM and PBE) by Telenet. Telenet is the country’s largest operator and had more than 2.3 million subscribers in June 2009. Tecteo, the French Commu-nity’s main cable operator, took control of the cable operator ACM and the provider of the BeTV premium channels in 2008. Consolidation is also taking place on the internet access market. For example, Belgacom has bought the internet access provider Scarlet, which claimed to have 180,000 subscribers in December 2008.The switch to digital terrestrial TV is taking more time in one Community than in the other:• The Flemish Community is fully
covered by the DTT network, the ana-logue switch off having taken place on November 3rd 2008. VRT, which operates the first DTT multiplex, sold its terres-trial broadcasting facilities to Norkring België in December 2008. VRT owns 51% of this company, and Norkring SA, a subsidiary of Norway’s Telenor group, which has an option to increase its stake in the capital of Norkring België to 75%, owns 49%. In June 2009, Norkring België was awarded a licence to oper-ate six future DVB-T (digital terrestrial television) multiplexes and one DVB-H (mobile television) multiplex.
• Meanwhile, the French Community plans to switch off analogue signals on November 30th 2011. RTBF launched its first digital terrestrial services in November 2007 with a package com-prising La Une, La Deux, La Trois (a new channel essentially comprising programmes from the RTBF Sat chan-nel), Euronews and BRF (channel of the German-speaking Community’s public service broadcaster).
The other multiplex will be launched when the analogue switchoff takes place in 2011.
belges se partagent donc 7,7 % des parts de marché (en progression grâce à l’arri-vée de MTV Wallonie).
La distribution des offres multi-chaînes de télévision est largement dominée par les câblo-opérateurs qui voient toutefois leur suprématie contestée. Belgacom TV revendique en effet 589 000 abonnés en juin 2009 à son service de télévision par protocole IP, un chiffre en constante aug-mentation. Parallèlement à l’essor de l’IP-TV en Belgique, deux bouquets satellites ont été lancés par Airfield Media Group (déjà lié au bouquet satellite néerlandais Canal Digitaal): après le bouquet TV Vlaanderen destiné à la Communauté fla-mande et affichant plus de 70 000 abon-nés à la fin de l’année 2008, le bouquet Télésat ciblant la Communauté française a été lancé en janvier 2009. La télévision sur téléphone mobile est aussi présente à travers les offres de Belgacom Proximus et de Mobistar.Cette concurrence accrue a mené à d’im-portants mouvements de consolidation. D’abord sur le marché du câble avec le rachat en 2007 d’UPC Belgium, puis en 2008 la reprise des activités télévisuelles d’Interkabel (Interlectra, Integan, WVEM et PBE) par Telenet, le plus grand opéra-teur du pays avec 2,3 millions d’abonnés en juin 2009. Tecteo, principal câblo- opérateur en Communauté française, a pour sa part pris le contrôle du câblo-opérateur ACM et de l’éditeur de chaînes premium BETV en 2008. Les consolida-tions sont aussi à l’œuvre sur le marché de l’accès à Internet, ainsi Belgacom a racheté le fournisseur d’accès à Internet Scarlet, qui revendiquait 180 000 abonnés, en décembre 2008.La transition vers le numérique terrestre ne s’effectue pas au même rythme dans les deux Communautés :• La Communauté flamande est totale-
ment couverte par le réseau TNT et l’ar-rêt de la diffusion analogique a été opéré le 3 novembre 2008. La VRT, qui opérait le premier multiplex de la TNT, a reven-du en décembre 2008 ses infrastructures de diffusion terrestre à Norkring België. Cette firme est possédée à 51 % par la VRT et à 49 % par Norkring SA, une filiale du groupe norvégien Telenor, qui bénéficie d’une option pour monter jusqu’à 75 % dans le capital de Norkring België. Norkring België s’est vu attribuer en juin 2009 la licence d’exploitation des six futurs multiplex DVB-T (télévision numérique terrestre) ainsi que d’un multi plex DVB-H (télévision mobile).
• La Communauté française a planifié quant à elle l’extinction de l’ana logique au 30 novembre 2011. La RTBF a inau-guré en novembre 2007 ses services en numérique terrestre avec le lance-ment d’un bouquet composé de La Une,
20 % (wobei La Deux zum ersten Mal die 5 %-Schwelle überschritt), und die belgischen Privatsender erzielten zusam-men einen Marktanteil von 7,7 % (ein Plus gegenüber dem Vorjahr, was dem Sendestart von MTV Wallonie zu ver-danken ist).
Die Verbreitung der TV-Multikanal-angebote wird weitgehend von den Kabel-netzbetreibern dominiert, aber deren Vor-machtstellung bröckelt. Der IPTV-Dienst von Belgacom hatte im Juni 2009 nach eigenen Angaben 589 000 Abonnenten, eine Zahl die ständig weiter wächst. Parallel zum IPTV-Boom in Belgien wur-den zwei Satellitenbouquets von der Air-field Media Group gestartet (die bereits am niederländischen Satellitenbouquet Canal Digitaal beteiligt ist): Nach TV Vlaande-ren für die Flämische Gemeinschaft mit über 70 000 Abonnenten Ende 2008 ging das Bouquet Télésat für die Französische Gemeinschaft im Januar 2009 auf Sen-dung. Fernsehempfang auf dem Handy ist über die Angebote von Belgacom Pro-ximus und Mobistar ebenfalls möglich.Diese zunehmende Konkurrenz führte zu umfangreichen Konsolidierungs-bewegungen. Zunächst auf dem Kabel-markt, wo Telenet – der mit 2,3 Mio. Abonnen ten ( Juni 2009) größte Betrei-ber des Landes – 2007 UPC Belgium und 2008 den Fernsehbereich von Inter-kabel (Interlectra, Integan, WVEM und PBE) übernahm. Tecteo, der wichtigste Kabelnetzbetreiber in der Französischen Gemeinschaft hat 2008 die Kontrolle über seinen Mitbewerber ACM und den Betreiber von Premium-Fernsehkanälen BETV übernommen. Auch im Markt für Internetanbieter findet eine Kon-solidierung statt. So hat Belgacom den Anbieter Scarlet übernommen, der im Dezember 2008 nach eigenen Angaben 180 000 Abonnenten hatte.Die Umstellung auf die digitale terres-trische Rundfunkverbreitung erfolgt in den beiden Gemeinschaften in unter-schiedlichem Tempo:• In der gesamten Flämischen Gemein-
schaft ist digitales terrestrisches Fern-sehen empfangbar, und die analogen Signale wurden am 3. November 2008 abgeschaltet. VRT, Betreiber des ersten DVB-T-Multiplex, hat im Dezember 2008 seine Sendeanlagen für die terre-strische Ausstrahlung an Norkring België verkauft. Dieses Unternehmen gehört zu 51 % VRT und zu 49 % Norkring SA, einer Tochter der norwegischen Telenor-Gruppe, die über eine Option verfügt, den eigenen Anteil bis auf 75 % des Kapitals an Norkring België zu erhöhen. Norkring België erhielt im Juni 2009 den Zuschlag für die Lizenz zum Betrieb der sechs künftigen DVB-T-Multiplexe sowie eines DVB-H-Multiplex (mobiles Fernsehen).

20 2 0 0 9 | V o l u m e 1 | B a n d 1
AL
AT
BE
BG
CH
CY
CZ
DE
DK
EE
ES
FI
FR
GB
GR
HR
HU
IE
IS
IT
LT
LU
LV
MK
MT
NL
NO
PL
PT
RO
RU
SE
SI
SK
TR
BE
Belgium Belgique Belgien BE
In July 2009, the French Com munity’s regulator, the CSA, published the results of a consultation on the follow-up to its strategic plan for the digital transition, with a view to its re-evaluation.In January 2009, the Council of State reversed the CSA’s decision of 29 Novem-ber 2006 stating that the company TVI SA had broadcast the RTL-TVI and Club RTL services without permission. In its judgment, it pointed out that the CSA could not disclaim the authorisation granted by the Luxembourg authorities. The channels RTL-TVI, Club RTL and Plug TV are accordingly no longer subject to Belgian jurisdiction but are covered by the Luxembourg licence granted to the company CLT-UFA.Decrees transposing the Audiovisual Media Services Directive (2007/65/EC) were published in the French and the Flemish Communities in March 2009. The two texts adopt the main elements of the directive but with certain specific features of their own. For example, in the French Community the decree introduces a distinction between an open and a closed distribution platform and replaces the sys-tem for authorising television service pro-viders by one involving a requirement to make a declaration to the CSA (except in the case of services that make use of rare resources).Finally, the Flemish Community regulator Vlaamse Regulator voor de Media pub-lished a report on media concentration in December 2008. In September 2009, the French Community regulator CSA launched a website on media services and pluralism in the French Community.
La Deux, La Trois (un nouveau canal essentiellement alimenté par les pro-grammes de la chaîne RTBF Sat), de Euronews et de BRF (la chaîne du radio-diffuseur de service public de la Com-munauté germanophone). Les autres multiplex seront lancés au moment de l’extinction des diffusions analogiques en 2011. Le CSA Belge a publié en juillet 2009 les résultats d’une consul tation sur le suivi de son plan stratégique de tran-sition numérique, dans l’optique de sa réévaluation.
En janvier 2009, le Conseil d’Etat a infir-mé la décision du CSA du 29 novembre 2006 stipulant que la société TVI SA avait retransmis les services RTL-TVI et Club RTL sans autorisation. Dans son arrêt le Conseil d’Etat précise que le CSA ne pouvait nier l’autorisation octroyée par les autorités luxembourgeoises. Les chaînes RTL-TVI, Club RTL et Plug TV ne dépendent donc plus de la juridiction belge mais sont couvertes par la licence luxembourgeoise octroyée à la société CLT-UFA.Dans la Communauté française et dans la Communauté flamande ont été publiés en mars 2009 les décrets transposant la directive services de médias audiovisuels (2007/65/CE). Les deux textes repren-nent les principaux éléments de la direc-tive, avec toutefois certaines spécificités. Ainsi, dans la Communauté française, le décret introduit une distinction entre plate-forme de distribution ouverte et fermée ou encore il remplace le régime d’autorisation des éditeurs de service télé-visuels par un régime déclaratif (sauf pour les services utilisant des ressources rares).Enfin, le Vlaamse Regulator voor de Media (régulateur dans la Communauté flamande) a publié en décembre 2008 un rapport sur la concentration des médias. Le CSA (régulateur dans la Communauté française) a quant à lui lancé un site sur l’offre de médias et le pluralisme en Com-munauté française en septembre 2009.
• Die Französische Gemeinschaft hat ihrerseits die Analogabschaltung für den 30. November 2011 geplant. Die RTBF hat im November 2007 ein Bouquet aus La Une, La Deux, La Trois (einem neuen Kanal, der ausschließlich mit Programmen von RTBF Sat gespeist wird), Euronews und BRF (dem Kanal des öffentlich-rechtlichen Rundfunk-veranstalters der Deutschsprachigen Gemeinschaft) gestartet und damit ihr digitales terrestrisches Angebot ein-geweiht.
Die anderen Multiplexe nehmen ihren Betrieb auf, sobald die Analogausstrah-lung 2011 eingestellt wird. Die belgische Aufsichtsbehörde CSA hat im Juli 2009 die Ergebnisse einer Befragung zur Umset-zung des Strategieplans für die Umstellung auf Digitaltechnik veröffentlicht, der über-arbeitet werden soll.Im Januar 2009 hat der Staatsrat (Conseil d’Etat) die Entscheidung des CSA vom 29. November 2006 für ungültig erklärt, wonach das Unternehmen TVI SA die Sender RTL-TVI und Club RTL ohne Genehmigung ausstrahlte. In seinem Urteil machte der Conseil d’Etat deutlich, dass der CSA die von den luxembur-gischen Behörden ausgestellte Sendege-nehmigung nicht ignorieren könne. Die Sender RTL-TVI, Club RTL und Plug TV unterstünden nicht mehr der bel-gischen Rechtsprechung und fielen unter die luxemburgische Lizenz für das Unter-nehmen CLT-UFA.In der Flämischen und der Französischen Gemeinschaft wurden im März 2009 Rechtsverordnungen zur Umsetzung der Richtlinie über audiovisuelle Medien-dienste (2007/65/EG) veröffentlicht. Beide Verordnungen greifen die wesent-lichen Elemente der Richtlinie auf, führen allerdings auch gewisse Besonderheiten ein. So macht die Verordnung der Fran-zösischen Gemeinschaft einen Unter-schied zwischen einer offenen und einer geschlossenen Verbreitungsplattform und ersetzt das System der Genehmigung für Betreiber von Fernsehdiensten durch eine formlose Anmeldung (außer für Dienste, die knappe Ressourcen nutzen).Die flämische Regulierungsbehörde Vlaamse Regulator voor de Media hat im Dezember 2008 einen Bericht über die Medienkonzentration veröffentlicht. Die Regulierungsbehörde der Französischen Gemeinschaft, CSA, hat im September 2009 einen Internetauftritt zum Thema Medienangebot und Pluralismus in der Französischen Gemeinschaft in Betrieb genommen.
Sources: Conseil supérieur de l’audiovisuel (Communauté française) : http:/ :www.csa.be Vlaamse Regulator voor de Media (Communauté flamande) : http://www.vlaamseregulatormedia.be Medienrat (Communauté germanophone): http://www.medienrat.be Annuaire de la l’audiovisuel de la Communauté française de Belgique, 2009. Legal aspects: IRIS Merlin, http://merlin.obs.coe.int

212 0 0 9 | V o l u m e 1 | B a n d 1
AL
AT
BE
BG
CH
CY
CZ
DE
DK
EE
ES
FI
FR
GB
GR
HR
HU
IE
IS
IT
LT
LU
LV
MK
MT
NL
NO
PL
PT
RO
RU
SE
SI
SK
TR
BE
Belgium Belgique Belgien BE
Source: European Audiovisual Observatory2 The 7 news channels distributed via DTT in the French community of Belgium are 7 linguistic versions of Euronews.
Population and equipment 31.12.08Penetration
(in % HH) In thousand SourcesPopulation (inhabitants) – 10 750 Eurostat
Households – 4 570 Statbel (as at 1.1.2008)
TV households 98,6% 4 506 European Audiovisual Observatory
Cable TV households 80,8% 3 692 Screen Digest / European Audiovisual Observatory
Digital cable TV households 19,6% 898 Screen Digest / European Audiovisual Observatory
DTH/SMATV households 9,6% 440 Screen Digest / European Audiovisual Observatory
Pay DTH households 1,6% 73 Screen Digest / European Audiovisual Observatory
IPTV subscriptions 9,6% 441 Screen Digest / European Audiovisual Observatory
Installed DVB-T receivers 1,4% 64 Screen Digest / European Audiovisual Observatory
Total digital TV households 32,8% 1 476 European Audiovisual Observatory
Households with PC 71,2% 3 253 Screen Digest / European Audiovisual Observatory
Households with broadband connections 57,1% 2 609 Screen Digest / European Audiovisual Observatory
Mobile phone TV subscriptions – 9,6 Screen Digest
Number of TV channels French Community Flemish Community German speaking Communityby kind of licence 10.09 Public Private Total Public Private Total TotalTerrestrial (national) 3 – 3 3 0 3 1Cable/Satellite/IPTV/Mobile 0 27 27 – 52 52 1Regional/Local 12 – 12 – 10 10 –Regional/Local windows 1 – 1 – – 0 –Channels targeting foreign markets 1 – 1 – – 0 –Total 17 27 44 3 62 65 2Foreign channels targeting the country 0 4 4 0 0 0 –
1 Since February 2009, the cable-operator Tecteo is the only owner of the the cable TV services packager BETV.
TV channels distributors 11.09 Companies
Cable operators 9 Aiesh, Brutélé (Voo), Integan, Interelectra, Newico (Voo), Numericable, Tecteo (Voo) 1 , Telenet, Wolu TV.
Satellite packagers 1 Airfield Media Group, which distributes two packages : TV Vlaanderen and Télésat.
IPTV packagers 2 Belgacom, Scarlet.DTT multiplex operators 2 Norkring Belgie (51% owned by the VRT), RTBF.Mobile phone TV packagers 2 Belgacom Mobile (Proximus), Mobistar.
Supply of TV channels by genre and by platform (including foreign channels) 10.09
Digital terrestrial
CFB
Digital terrestrial
VLGCable
TelenetCable
Voo
Satellite TV Vlaan-
derenSatellite
Télésat
IPTV Belgacom
TVGeneralist - national (incl.dedicated) 4 1 6 6 2 4 5Generalist - foreign – – 24 17 32 11 16Adult – – 7 3 12 5 4Children – – 21 17 15 7 22Culture/Education/Documentary – 2 21 14 16 7 19Minority interest groups – – – – 1 – –Entertainment/TV fiction/Games – – 25 15 15 5 14Film – – 15 8 2 5 5Home shopping – – – 1 12 1 –International linguistic and cultural – – 5 4 16 3 2Lifestyle/Specific leisure/Travel – – 14 11 9 7 11Music – – 16 12 19 9 14News/Business 7 – 14 13 31 8 9Parliament/Government/Administration – – – – 2 – –Regional/Local – – 11 15 7 – 18Religion – – – – 7 – –Sports – – 16 10 13 2 15Various – – 3 1 2 – 12Total 11 3 198 147 213 74 166
2
Basic figures
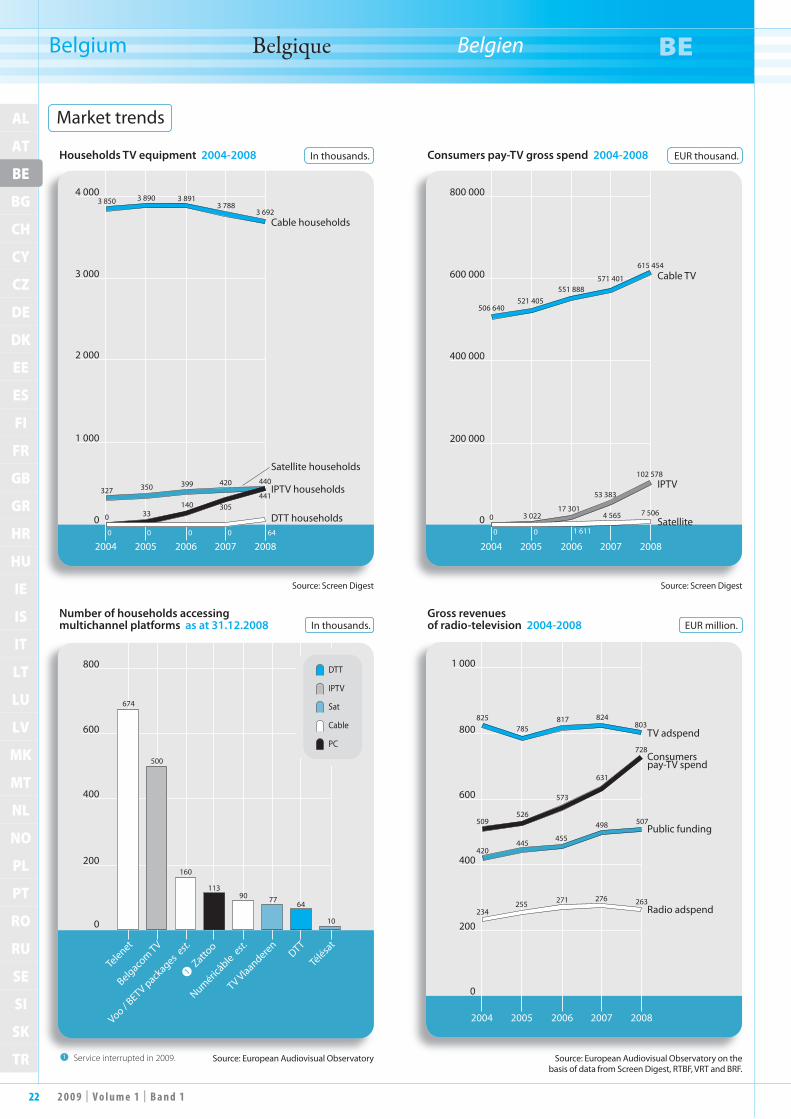
22 2 0 0 9 | V o l u m e 1 | B a n d 1
AL
AT
BE
BG
CH
CY
CZ
DE
DK
EE
ES
FI
FR
GB
GR
HR
HU
IE
IS
IT
LT
LU
LV
MK
MT
NL
NO
PL
PT
RO
RU
SE
SI
SK
TR
BE
Belgium Belgique Belgien BE
Source: European Audiovisual Observatory on the basis of data from Screen Digest, RTBF, VRT and BRF.
Source: European Audiovisual Observatory
Source: Screen DigestSource: Screen Digest
1 Service interrupted in 2009.
Households TV equipment 2004-2008
Number of households accessing multichannel platforms as at 31.12.2008
Consumers pay-TV gross spend 2004-2008
Gross revenues of radio-television 2004-2008
In thousands.
In thousands.
EUR thousand.
EUR million.
2004 2005 2006 2007 2008
0
4 000
3 000
2 000
1 000
Cable households
Satellite households
DTT households
IPTV households
3 6923 850
327
0
0 0 0 0 64
350
33
399
140
420
305
440
441
3 890 3 8913 788
Telenet
Belgacom TV
Voo / BETV pack
ages est.
Numéricâble e
st.
TV Vlaanderen
Zattoo
DTT
Télésa
t
0
200
400
600
800
1
500
160
7790113
64
10
674
DTT
IPTV
Sat
PC
Cable
2004 2005 2006 2007 2008
0
800 000
600 000
400 000
200 000
Cable TV
IPTV
Satellite
506 640
0
0 0 1 611
4 565 7 5063 02217 301
53 383
102 578
521 405551 888
571 401
615 454
2004 2005 2006 2007 2008
0
1 000
800
600
400
200
TV adspend
Consumerspay-TV spend
Public funding
Radio adspend
825
509
420
234255 271 276 263
785
526
445455
498 507
573
631
728
817 824803
Market trends
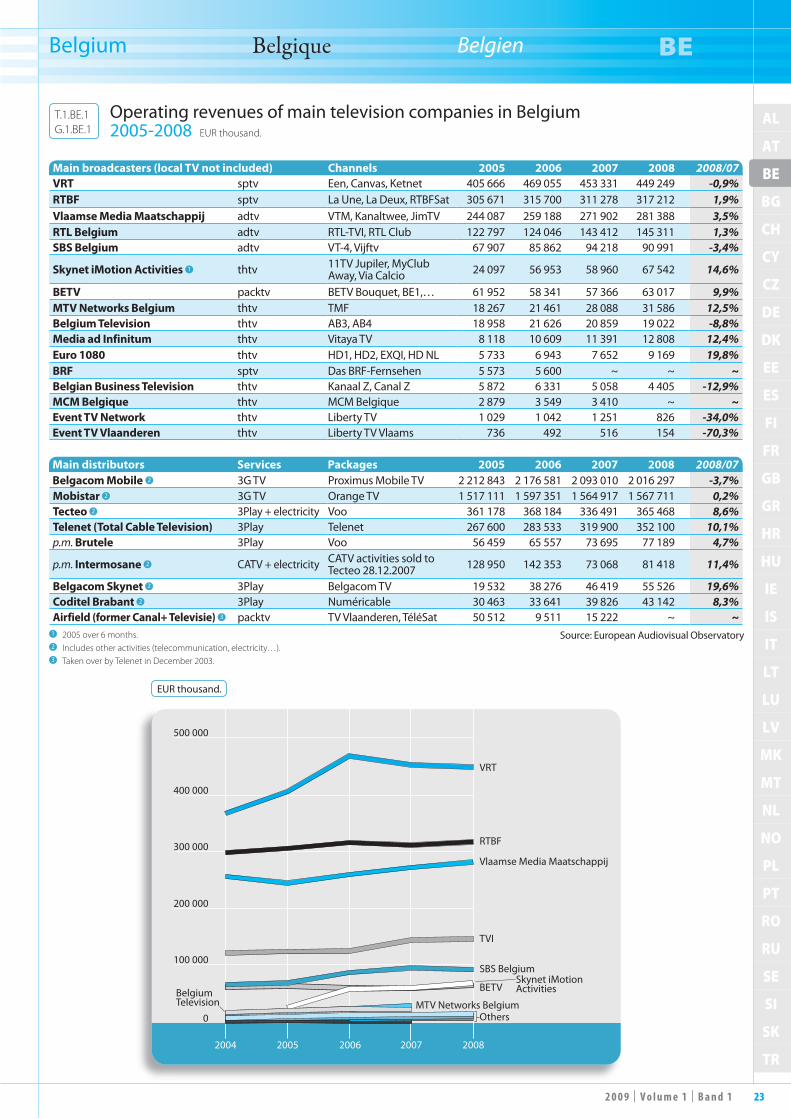
232 0 0 9 | V o l u m e 1 | B a n d 1
AL
AT
BE
BG
CH
CY
CZ
DE
DK
EE
ES
FI
FR
GB
GR
HR
HU
IE
IS
IT
LT
LU
LV
MK
MT
NL
NO
PL
PT
RO
RU
SE
SI
SK
TR
BE
Belgium Belgique Belgien BE
Main broadcasters (local TV not included) Channels 2005 2006 2007 2008 2008/07VRT sptv Een, Canvas, Ketnet 405 666 469 055 453 331 449 249 -0,9%RTBF sptv La Une, La Deux, RTBFSat 305 671 315 700 311 278 317 212 1,9%Vlaamse Media Maatschappij adtv VTM, Kanaltwee, JimTV 244 087 259 188 271 902 281 388 3,5%RTL Belgium adtv RTL-TVI, RTL Club 122 797 124 046 143 412 145 311 1,3%SBS Belgium adtv VT-4, Vijftv 67 907 85 862 94 218 90 991 -3,4%
Skynet iMotion Activities 1 thtv 11TV Jupiler, MyClub Away, Via Calcio 24 097 56 953 58 960 67 542 14,6%
BETV packtv BETV Bouquet, BE1,… 61 952 58 341 57 366 63 017 9,9%MTV Networks Belgium thtv TMF 18 267 21 461 28 088 31 586 12,5%Belgium Television thtv AB3, AB4 18 958 21 626 20 859 19 022 -8,8%Media ad Infinitum thtv Vitaya TV 8 118 10 609 11 391 12 808 12,4%Euro 1080 thtv HD1, HD2, EXQI, HD NL 5 733 6 943 7 652 9 169 19,8%BRF sptv Das BRF-Fernsehen 5 573 5 600 ~ ~ ~Belgian Business Television thtv Kanaal Z, Canal Z 5 872 6 331 5 058 4 405 -12,9%MCM Belgique thtv MCM Belgique 2 879 3 549 3 410 ~ ~Event TV Network thtv Liberty TV 1 029 1 042 1 251 826 -34,0%Event TV Vlaanderen thtv Liberty TV Vlaams 736 492 516 154 -70,3%
Main distributors Services Packages 2005 2006 2007 2008 2008/07Belgacom Mobile 2 3G TV Proximus Mobile TV 2 212 843 2 176 581 2 093 010 2 016 297 -3,7%Mobistar 2 3G TV Orange TV 1 517 111 1 597 351 1 564 917 1 567 711 0,2%Tecteo 2 3Play + electricity Voo 361 178 368 184 336 491 365 468 8,6%Telenet (Total Cable Television) 3Play Telenet 267 600 283 533 319 900 352 100 10,1%p.m. Brutele 3Play Voo 56 459 65 557 73 695 77 189 4,7%
p.m. Intermosane 2 CATV + electricity CATV activities sold to Tecteo 28.12.2007 128 950 142 353 73 068 81 418 11,4%
Belgacom Skynet 2 3Play Belgacom TV 19 532 38 276 46 419 55 526 19,6%Coditel Brabant 2 3Play Numéricable 30 463 33 641 39 826 43 142 8,3%Airfield (former Canal+ Televisie) 3 packtv TV Vlaanderen, TéléSat 50 512 9 511 15 222 ~ ~
Source: European Audiovisual Observatory1 2005 over 6 months.2 Includes other activities (telecommunication, electricity…).3 Taken over by Telenet in December 2003.
EUR thousand.
2004 2005 2006 2007 2008
0
500 000
400 000
300 000
200 000
100 000
VRT
RTBF
Vlaamse Media Maatschappij
TVI
SBS Belgium
BETVBelgiumTelevision
OthersMTV Networks Belgium
Skynet iMotionActivities
Operating revenues of main television companies in Belgium 2005-2008 EUR thousand.
T.1.BE.1G.1.BE.1

24 2 0 0 9 | V o l u m e 1 | B a n d 1
AL
AT
BE
BG
CH
CY
CZ
DE
DK
EE
ES
FI
FR
GB
GR
HR
HU
IE
IS
IT
LT
LU
LV
MK
MT
NL
NO
PL
PT
RO
RU
SE
SI
SK
TR
BE
Belgium Belgique Belgien BE
Source: RTBF / European Audiovisual Observatory
Income 2005 2006 2007 2008 2005 2006 2007 2008 2008/07Total public income 187 026 192 217 201 625 208 052 72,7% 72,1% 73,9% 73,3% 3,1% - Aid/Grants 181 896 186 594 193 182 203 379 70,8% 70,0% 70,8% 71,6% 5,0% - Other public income 5 130 5 623 8 443 4 673 2,0% 2,1% 3,1% 1,6% -80,7%Total commercial income 69 560 73 916 69 213 73 358 27,1% 27,7% 25,4% 25,8% 5,6% - Advertising 52 988 56 191 56 679 59 336 20,6% 21,1% 20,8% 20,9% 4,5% - Facilities 4 054 4 989 4 320 4 532 1,6% 1,9% 1,6% 1,6% 4,7% - Other commercial income 12 517 12 736 8 214 9 489 4,9% 4,8% 3,0% 3,3% 13,4%Other income 496 481 2 114 2 589 0,2% 0,2% 0,8% 0,9% 18,3%TOTAL 257 081 266 614 272 952 283 998 100% 100% 100% 100% 3,9%
Expenditure 2005 2006 2007 2008 2005 2006 2007 2008 2008/07 Purchase of goods and services 88 148 96 823 147 696 145 099 33,9% 35,8% 47,4% 46,1% -1,8%
Cost of personnel 158 402 159 374 149 717 156 254 60,8% 58,9% 48,1% 49,6% 4,4%Depreciation 13 818 14 568 13 911 13 597 5,3% 5,4% 4,5% 4,3% -2,3%Operating expenditure 260 368 270 765 311 324 314 950 100% 100% 100% 100% 1,2%
Net result -3 959 -1 058 11 816 -636 -105,4%Operating margin (%) -1,45 -1,68 -0,01 0,71
EUR thousand.
In %.
2004 2005 2006 20082007
0
300 000
200 000
100 000 Aid/Grants
Other commercialincome
Other public income
Advertising
FacilitiesOther income
2004 2005 2006 2007 2008
-6
0
1
-1
-2
-3
-4
-5
Operating margin
Pro�t marginReturn on total assets
RTBF financial situation 2005-2008 EUR thousand.
T.1.BE.2G.1.BE.2

252 0 0 9 | V o l u m e 1 | B a n d 1
AL
AT
BE
BG
CH
CY
CZ
DE
DK
EE
ES
FI
FR
GB
GR
HR
HU
IE
IS
IT
LT
LU
LV
MK
MT
NL
NO
PL
PT
RO
RU
SE
SI
SK
TR
BE
Belgium Belgique Belgien BE
Daily share Prime time (18:55-22:30)Channels 2004 2005 2006 2007 2008 2004 2005 2006 2007 2008La Une 15,3 14,0 14,7 15,1 15,0 17,5 16,2 16,7 16,8 17,4La Deux 3,4 3,0 4,9 4,5 5,1 3,6 2,6 4,8 4,7 5,6Public channels of the FCB 18,7 17,0 19,6 19,6 20,1 21,1 18,8 21,5 21,5 23,0AB 3 4,4 3,8 3,8 3,6 3,6 3,8 3,8 3,6 3,4 3,1AB 4 – 2,1 1,9 1,5 1,7 1,9 2,3 1,8 1,9 1,9Be1 1,8 0,7 0,4 0,5 0,4 0,9 0,8 0,5 0,6 0,6MTV Wallonia 2,0 0,7Private channels of the FCB 1 29,5 31,1 6,1 5,6 7,7 39,4 40,7 5,9 5,9 6,3RTL TVi 17,9 17,9 19,1 19,3 19,2 24,6 25,6 27,3 27,1 27,5Club RTL 5,4 5,1 5,1 4,8 4,9 6,7 6,1 6,6 6,8 6,9Plug TV – 1,5 1,4 1,5 1,9 1,5 2,1 1,8 1,8 2,2TF1 16,3 16,4 17,5 17,1 17,0 13,0 12,4 13,1 12,9 12,8France 2 9,8 8,5 9,2 9,6 9,4 6,7 6,4 6,7 6,7 6,5France 3 7,0 5,0 5,7 6,1 5,8 4,6 4,4 4,9 4,9 4,5TV5 Europe 1,7 1,2 1,4 1,6 1,7 0,8 0,8 0,8 1,2 1,2Nickelodeon (version in French) 2,0 0,7Foreign channels 1 34,8 31,1 59,4 60,0 61,9 25,1 24,0 61,2 61,4 62,3Eén (VRT) ~ ~ 0,8 0,8 ~ ~ ~ 1,0 0,9 ~Ketnet / Canvas ~ ~ 0,3 0,3 ~ ~ ~ 0,4 0,4 ~Vitaya ~ ~ 0,2 0,1 ~ ~ ~ 0,1 0,1 ~VT4 ~ ~ 0,1 0,1 ~ ~ ~ 0,1 0,1 ~2BE 0,1 0,1 0,1 0,1VTM ~ ~ 0,1 0,1 ~ ~ ~ 0,2 0,1 ~Flemish channels ~ 1,5 1,5 1,5 ~ 1,7 1,8 1,7 1,6 ~Others 17,0 19,3 13,4 13,3 10,3 12,7 14,7 9,7 9,6 8,4
Source: Eurodata TV Worldwide / CIM - GfK Audimetrie SA
Market shares from 01/01/2006 are calculated over Total TV without taking into account external devices such as DVD, VCR, …1 Up until 31.12.2005, RTL TVi, Club RTL and Plug TV were under licence of the CSA of the French Community of Belgium.
Since 1.1.2006, they are broadcasting under a Luxembourg licence.
Prime time (18:55-22:30). In %, 4 years +.
2008
La Une17,4%
Others8,4%
Nickelodeon 0,7%
La Deux5,6%
AB 33,1%
AB 41,9%
Be10,6%RTL TVi
27,5%Club RTL
6,9%Plug TV2,2%
TF112,8%
France 26,5%
France 34,5%
TV5 Europe1,2%
MTV Wallonia0,7%
Daily share. In %, 4 years +.
2004 2005 2006 2007 2008
0
5
15
10
20
RTL TVi
TF1
La Une
France 2
France 3
Club RTL
AB 3
Plug TVAB 4
Be1
La Deux
Flemish channels TV5 Europe
TV audience market share in the French Community of Belgium 2004-2008 In %, 4 years +.
T.1.BE.3G.1.BE.3

26 2 0 0 9 | V o l u m e 1 | B a n d 1
AL
AT
BE
BG
CH
CY
CZ
DE
DK
EE
ES
FI
FR
GB
GR
HR
HU
IE
IS
IT
LT
LU
LV
MK
MT
NL
NO
PL
PT
RO
RU
SE
SI
SK
TR
BE
Belgium Belgique Belgien BE
Source: VRT / European Audiovisual Observatory
Income 2005 2006 2007 2008 2005 2006 2007 2008 2008/07Total public income 253,60 258,31 293,68 298,42 60,5% 54,0% 63,5% 65,2% 1,6%Total commercial income 109,50 60,00 67,87 63,68 26,1% 12,5% 14,7% 13,9% -6,2% - Advertising 39,10 36,66 35,81 33,94 9,3% 7,7% 7,7% 7,4% -5,2% - Sponsorship 21,30 23,34 32,06 29,74 5,1% 4,9% 6,9% 6,5% -7,2% - Programme sales 10,25 ~ ~ ~ 2,4% ~ ~ ~ ~ - Merchandising 1,84 ~ ~ ~ 0,4% ~ ~ ~ ~ - Other commercial income 36,99 36,31 67,16 67,89 8,8% 7,6% 14,5% 14,8% 1,1%Other income 55,74 59,52 17,46 12,75 13,3% 12,4% 3,8% 2,8% -27,0%TOTAL 418,84 478,54 462,47 457,90 100% 100,0% 100,0% 100,0% -1,0%
Expenditure 2005 2006 2007 2008 2005 2006 2007 2008 2008/07 Purchase of goods and services 253,45 256,45 254,06 264,31 57,4% 56,5% 55,1% 56,6% 4,0%
Costs of personnel 169,07 177,98 182,47 179,95 38,3% 39,2% 39,6% 38,5% -1,4%Depreciation 18,88 19,38 24,49 22,54 4,3% 4,3% 5,3% 4,8% -8,0%Operational expenditure 441,41 453,81 461,02 466,80 100% 100% 100% 100% 1,3%
Net result -33,49 16,12 -6,82 -6,72 -1,5%Operating margin (%) -7,83 3,46 -1,32 -1,94
EUR million.
In %.
2004 2005 2006 2007 2008
0
100
200
300
400
500
Public funding
AdvertisingSponsorship
Other commercialOthers
MerchandisingSales of programmes
2004 2005 2006 2007 2008
-25
5
10
0
-5
-10
-15
-20
Return onshareholders’ funds
Pro�t marginReturn on total assets Operating margin
VRT financial situation 2005-2008 EUR million.
T.1.BE.4G.1.BE.4

272 0 0 9 | V o l u m e 1 | B a n d 1
AL
AT
BE
BG
CH
CY
CZ
DE
DK
EE
ES
FI
FR
GB
GR
HR
HU
IE
IS
IT
LT
LU
LV
MK
MT
NL
NO
PL
PT
RO
RU
SE
SI
SK
TR
BE
Belgium Belgique Belgien BE
Daily share Prime time (18:55 - 22:30)Channels 2004 2005 2006 2007 2008 2004 2005 2006 2007 2008Eén 28,2 27,0 28,7 30,1 31,7 31,8 30,8 32,2 33,5 34,2Ketnet/Canvas 9,4 9,4 9,6 9,4 8,6 8,4 8,1 7,8 7,9 7,6Sporza 2,6 – – – – 2,2 – – – –Public Flemish channels 40,2 36,4 38,3 39,5 40,3 42,4 38,9 40,0 41,4 41,8VTM 22,9 22,0 21,3 20,7 21,4 27,7 27,8 27,3 26,6 26,92BE (ex Kanaal 2) 5,2 5,6 6,7 5,9 5,8 5,9 6,2 7,3 6,1 6,4VT4 6,7 6,4 7,0 6,4 6,5 7,3 7,3 7,6 7,4 7,3Vijf TV 0,3 2,4 4,2 4,1 4,4 0,3 2,1 3,3 3,4 3,6Vitaya 1,5 2,4 2,9 3,4 3,5 0,7 1,1 1,7 2,1 1,8Regional TV 1,9 1,9 1,7 1,7 1,4 1,7 1,7 1,5 1,6 1,3Private Flemish channels 38,5 40,7 43,8 42,2 43,0 43,6 46,2 48,7 47,2 47,3La Une 0,7 0,7 0,8 0,7 ~ 0,5 0,6 0,5 0,5 ~La Deux 0,3 0,3 0,4 0,3 ~ 0,3 0,2 0,3 0,3 ~Channels from the FCB 1,7 1,7 1,2 1,0 ~ 1,6 1,5 0,8 0,8 ~Nederland 1 1,5 1,5 1,5 1,8 1,8 1,4 1,4 1,6 1,9 ~Nederland 2 1,8 1,6 1,5 1,0 ~ 1,9 1,7 1,4 0,7 ~Nederland 3 0,9 0,9 1,0 1,0 ~ 0,6 0,5 0,6 0,7 ~Nickelodeon/MTV (NL) 1,5 0,5RTL TVI 0,7 0,7 0,6 0,4 ~ 0,8 0,7 0,6 0,4 ~France 2 0,8 0,7 ~ 0,3 0,3 ~France 3 0,1 0,1 ~ 0,1 0,1 ~TF1 0,2 0,2 ~ 0,2 0,1 ~Foreign channels 4,9 4,7 5,7 5,2 ~ 3,9 3,6 4,8 4,2 ~Others 14,7 16,5 11,0 12,1 16,7 8,5 9,8 5,7 6,4 10,9
Source: Eurodata TV Worldwide / CIM - GfK Audimetrie SA
Market shares from 01/01/2006 are calculated over Total TV without taking into account external devices such as DVD, VCR, …
Daily share. In %, 4 years +.
Prime time (18:55-22:30). In %, 4 years +.
2004 2005 2006 2007 2008
0
5
15
10
30
25
35
20
Nederland 2Nederland 3
Eén
VTM
Ketnet/Canva
VT4
Vijf TVVitayaNederland 1Regional TV
2BE (ex Kanaal 2)
2008
Eén34,2%
Others8,5%
Nickelodeon/MTV (NL)0,5%
Ketnet/Canvas
7,6%
VTM26,9%
2BE (ex Kanaal 2)6,4%
VT47,3%
Vijf TV3,6%
Vitaya1,8%
Regional TV 1,3%
Ned-11,9%
TV audience market share in the Flemish Community of Belgium 2004-2008 In %, 4 years +.
T.1.BE.5G.1.BE.5

28 2 0 0 9 | V o l u m e 1 | B a n d 1
AL
AT
BE
BG
CH
CY
CZ
DE
DK
EE
ES
FI
FR
GB
GR
HR
HU
IE
IS
IT
LT
LU
LV
MK
MT
NL
NO
PL
PT
RO
RU
SE
SI
SK
TR
BE
Belgium Belgique Belgien BE
Source: European Audiovisual Observatory
Rank Companies Genre 2004 2005 2006 2007 2008 2008/071 Studio 100 Children, animation 45 445 46 261 50 054 50 888 ~ ~2 Woestijnvis Formats 18 372 33 940 33 940 35 621 36 964 3,8%3 Endemol Belgie Reality shows 23 486 22 328 21 879 ~ ~ ~4 Eyeworks Entertainment Reality shows 18 522 17 571 19 750 28 383 21 289 -25,0%5 Kanakna Productions Entertainment, fiction 11 288 20 390 18 058 18 349 ~ ~6 Studio-A Entertainment, fiction 11 390 7 889 10 646 13 022 18 809 44,4%7 Demensen Entertainment, fiction 6 797 10 670 13 956 12 986 11 743 -9,6%
8 Eyeworks Film and TV Drama (former MMG) Fiction 4 526 17 425 13 340 9 442 11 367 20,4%
9 Fremantle Productions Belgium Entertainment, fiction 4 476 5 631 8 166 10 357 6 894 -33,4%
10 RV Productions Entertainment, fiction 1 936 2 909 4 302 3 706 ~ ~11 Telesaurus Entertainment, fiction 4 194 ~ ~ 3 618 ~ ~12 Instant News Service News 1 756 1 640 2 199 3 007 ~ ~13 Jok Foe 1 Entertainment, fiction 4 229 ~ ~ 2 997 ~ ~14 CoToon Animation ~ 752 794 2 230 ~ ~
15 Roj Kurdish programmes for Roj TV 3 188 4 429 4 904 2 842 2 726 -4,1%
16 Havana Regional programmes 2 689 2 964 4 218 3 554 2 204 -38,0%17 Ded’s It Entertainment – – 1 111 1 984 ~ ~18 Jan Verbeke Producties News 832 1 494 1 603 1 804 ~ ~19 Kaos Films – 934 1 094 708 1 390 ~ ~20 Archi-Text Production Fiction, documentaries 1 367 ~ 1 145 ~ ~ ~21 Caviar TV Fiction 204 364 735 1 581 980 -38,0%21 Walking the Dog Animation 172 181 411 967 ~ ~22 Les films de la Passerelle Documentaries 982 717 905 963 ~ ~23 Smash Documentaries 1 036 759 837 866 ~ ~
24 Be Films Fiction, feature films, entertainment 1 533 2 982 902 ~ ~ ~
25 Al Jazeera Brussels News – 632 592 495 ~ ~1 2007 over 15 months.
Some of these companies also produce feature films. Various companies are not included in the ranking, as they do not disclose their revenues.
The 25 leading TV production companies in Belgium 2004-2008 Operating revenues in EUR thousand.
T.1.BE.6

292 0 0 9 | V o l u m e 1 | B a n d 1
AL
AT
BE
BG
CH
CY
CZ
DE
DK
EE
ES
FI
FR
GB
GR
HR
HU
IE
IS
IT
LT
LU
LV
MK
MT
NL
NO
PL
PT
RO
RU
SE
SI
SK
TR
BG
Bulgaria Bulgarie Bulgarien BG
T he Bulgarian television market is dominated by the three national ter-
restrial broadcasters: bTV, BNT and Nova TV. The commercial broadcaster bTV still leads, with an audience share of 36.7% in 2008. It is owned by the Balkan News Corporation, part of the News Corpora-tion group. BNT, the state-owned broad-caster, has two television channels: BNT 1, a national terrestrial channel (with several regional windows), and the satellite chan-nel BNT Sat. BNT 1’s audience has been shrinking since the rise of its commercial competitors. It has fallen significantly since 2005, down from 18.7% in 2005 to 13.6% in 2008. The Swedish Modern Times Group took over the assets of the Balkan Media Group (previously co-owned with Apace Media) in August 2009 under the company Nova Televizia. This includes the channel Nova TV, which in 2008 had a market share of 17.1%, confirming its position as the second national channel after bTV (and also the Diema channels and MM channels). The numerous thematic channels are starting to carve out a niche for themselves within this highly concentrated market, and are increasingly eroding the major terrestrial channels’ market share. Bulgar-ia also has more than 600 cable network operators, but the sector is beginning to consolidate with the company EQ TV planning to take over both Cabletel and Eurocom in 2009. Bulgaria also has two satellite platforms, Bulsatcom and ITV Partner (with combined subscriptions in 2009 of 90 000 homes). Telecommunica-tions operator Vestitel has launched the country’s first IPTV service.In January 2008, the Council of Ministers adopted a plan for the implementation of digital terrestrial television broad casting (DVB-T) in Bulgaria. By December 2012, all transmitters for terrestrial ana-logue television broadcasting should stop working. In June 2009 the company Towercom was given licenses to operate two nation-wide DDT multiplexes and later the company Hannu Pro won the tender to operate three nation-wide DTT multiplexes in Bulgaria The Amendment of the Radio and TV Act entered into law in February 2009 setting out the main principles and rules for digital TV broadcasting in Bulgaria, in particular the criteria for licensing digital services.
Le marché bulgare de la télévision est dominé par trois radiodiffuseurs ter-
restres nationaux : bTV, BNT et Nova TV. La chaîne privée bTV reste en tête, avec 36,7 % de parts d’audience en 2008. Celle-ci appartient à Balkan News Corpo-ration, elle-même détenue par le groupe News Corporation. BNT, le radiodif-fuseur public détenu par l’Etat, possède deux chaînes de télévision : BNT1, une chaîne terrestre nationale (avec plusieurs fenêtres régionales), et la chaîne satellite BNT Sat. Avec l’essor de ses concurren-tes privées, l’audience de BNT 1 est en retrait. Elle connaît un recul significatif depuis 2005, chutant de 18,7 % en 2005 à 13,6 % en 2008.En août 2009, le groupe suédois Modern Times a racheté les actifs du groupe Balkan Media (qu’il détenait avec Apace Media) par le biais de la société Nova Televizia. Outre les chaînes Diema et MM, cela concerne la chaîne Nova TV, qui disposait en 2008 d’une part de marché de 17,1 %, confirmant ainsi sa position de seconde chaîne nationale après bTV.Au sein de ce marché très concentré, les très nombreuses chaînes thématiques commencent à se faire une place, érodant progressivement les parts de marché des grandes chaînes terrestres. Le pays compte plus de 600 câblo-opérateurs, mais le sec-teur commence à se consolider avec les plans de la société EQ TV pour prendre le contrôle de Cabletel et Eurocom in 2009. La Bulgarie compte deux plates-formes satellitaires, Bulsatcom et ITV Partner (avec un nombre d’abonnés combiné de 90 000 foyers en 2009). L’opérateur de télécommunications Vestitel a lancé le premier service d’IPTV du pays.En janvier 2008, le Conseil des Minis-tres a adopté le projet de mise en œuvre de la radiodiffusion numérique terrestre (DVB-T) en Bulgarie. D’ici à décembre 2012, les émetteurs de radiodiffusion télévisuelle analogique terrestre devraient cesser leur activité. En juin 2009, la com-pagnie Towercom a obtenu les licences d’exploitation des deux multiplex natio-naux de TNT et peu après, la société Hannu Pro a remporté l’appel d’offres pour l’exploitation de trois multiplex nationaux de TNT.L’amendement de la loi sur la radio et la télévision, entré en vigueur en février 2009, a posé les grands principes et les règles applicables à la télévision numé-rique, et notamment les critères d’octroi des licences pour les services numériques.
Der bulgarische TV-Markt wird von drei landesweiten terrestrischen
Anbietern dominiert: bTV, BNT und Nova TV. Der Privatsender bTV war auch 2008 mit einem Zuschaueranteil von 36,7 % führend. Dabei handelt es sich um ein Unternehmen der Balkan News Corporation, die wiederum zur News Corporation-Gruppe gehört. Dem öffentl ich-rechtl ichen Rundfunk-veranstalter im staatlichen Besitz, BNT, gehören zwei Fernsehdienste: BNT 1, ein landesweiter terrestrischer Sender (mit zahlreichen Regionalfenstern), und der Satellitensender BNT Sat. Seitdem die private Konkurrenz boomt, sinken die Einschaltquoten von BNT 1. Der Rück-gang ist seit 2005 signifikant: von 18,7 % 2005 auf 13,6 % 2008.Die schwedische Modern Times Group (MTG) hat im August 2009 die Über-nahme des Unternehmens Nova Televi-zia von der Balkan Media Group (früher im Besitz der MTG und Apace Media) abgeschlossen. Dazu gehört (neben den Kanälen der Sender Diema und MM) auch der Sender Nova TV, der sich 2008 mit einem Marktanteil von 17,1 % als zweitgrößter Sender hinter bTV behaup-ten konnte.In diesem Markt, in dem wenige Veranstal-ter die Einschaltquoten auf sich konzen-trieren, setzen sich die zahlreichen Spar-tenkanäle Kabelsender langsam durch, was die großen terrestrischen Rundfunkveran-stalter an einem immer stärkeren Rückgang ihrer Marktanteile zu spüren bekommen. In Bulgarien gibt es über 600 Kabelnetz-betreiber, aber mit der für 2009 geplanten Übernahme von Cabletel und Eurocom durch EQ TV hat eine gewisse Konsoli-dierung der Branche eingesetzt. Es gibt auch zwei Satellitenplattformen, Bulsat-com und ITV Partner (2009 zusammen 90 000 Haushalte). Den landesweit ersten IPTV-Dienst hat der Telekom-Anbieter Vestitel ins Leben gerufen.Im Januar 2008 verabschiedete der Mini-sterrat das Projekt zum Start des digitalen terrestrischen Fernsehens (DVB-T) in Bulgarien. Bis Dezember 2012 sollen alle Sendeeinrichtungen für terrestrisches analoges Fernsehen abgeschaltet werden. Im Juni 2009 hat die Firma Towercom Lizenzen für den Betrieb zweier landes-weiter DVB-T-Multiplexe erhalten, die anschließende Ausschreibung für drei weitere DVB-T-Multiplexe hat die Firma Hannu Pro gewonnen.Im Februar 2009 ist die Änderung des Rundfunkgesetzes in Kraft getreten, mit dem die wesentlichen Grundsätze und Regeln für das digitale Fernsehen in Bul-garien festgelegt werden, darunter auch die Kriterien für die Lizenzierung von digitalen Diensten.
Sources: Council for Electronic Media: http://www.cem.bg Legal aspects: IRIS Merlin, http://merlin.obs.coe.int

30 2 0 0 9 | V o l u m e 1 | B a n d 1
AL
AT
BE
BG
CH
CY
CZ
DE
DK
EE
ES
FI
FR
GB
GR
HR
HU
IE
IS
IT
LT
LU
LV
MK
MT
NL
NO
PL
PT
RO
RU
SE
SI
SK
TR
BG
Bulgaria Bulgarie Bulgarien BG
Population and equipment 31.12.08Penetration
(in % HH) In thousand SourcesPopulation (inhabitants) – 7 607 Eurostat
Households – 2 882 Eurostat (as at 1.1.2008)
TV households 95% 2 738 European Audiovisual Observatory
Cable TV households 48% 1 370 Screen Digest / European Audiovisual Observatory
Digital cable TV households 7% 180 Screen Digest / European Audiovisual Observatory
DTH / SMATV households 22% 622 Screen Digest / European Audiovisual Observatory
Pay DTH / SMATV households 14% 415 Screen Digest / European Audiovisual Observatory
IPTV subscriptions 0% 1 Screen Digest / European Audiovisual Observatory
Installed DVB-T receivers 1% 25 Screen Digest / European Audiovisual Observatory
Total digital TV households 22% 621 European Audiovisual Observatory
Households with PC 32% 914 Screen Digest / European Audiovisual Observatory
Households with broadband connection 24% 693 Screen Digest / European Audiovisual Observatory
TV channels distributors 11.09 CompaniesCable operators >650 Eurokom, Cabletel, Tele-Sat, Vereya Kabel, ...Satellite packagers 2 Bulsatkom, Interaktivni TehnologyIPTV packagers 4 Mobiltel, Neterra, Network Bulgaria, VestitelDTT multiplex operator 0 –Mobile phone TV packagers 2 Cosmo Bulgaria Mobile, Mobiltel
Number of TV channels by kind of licence 10.09 Public Private TotalTerrestrial (national) 1 4 5Cable/Satellite/IPTV/Mobile 1 67 68Regional/Local 55 55Regional/Local windows 4 0 4Channels targeting foreign markets 0 0 0Total 6 126 132Foreign channels targeting the country 0 25 25
Source: European Audiovisual Observatory
Supply of TV channels by genre and by platform (including foreign channels) 10.09
Analogue terrestrial
Cable Cabletel
Satellite Bulsatcom
Satellite ITV Partner
IPTV Neterra TV
Generalist - national 5 9 7 7 4Generalist - foreign 10 2Adult 3 3 2Children 4 2 1Culture/ education/ documentary 9 9 7 1Minority interest groupsEntertainment/ TV fiction/ games 15 11 17 3Film 8 5 4Home shopping 1 1International linguistic and cultural 5 2Lifestyle/ specific leisure/ travel 4 4Music 12 9 6 8News/ business 8 3 4 4Parliament/ government/ administrationRegional/ local 4 9ReligionSports 5 2 5Various 1 1 2Total 9 103 60 53 23
Basic figures

312 0 0 9 | V o l u m e 1 | B a n d 1
AL
AT
BE
BG
CH
CY
CZ
DE
DK
EE
ES
FI
FR
GB
GR
HR
HU
IE
IS
IT
LT
LU
LV
MK
MT
NL
NO
PL
PT
RO
RU
SE
SI
SK
TR
BG
Bulgaria Bulgarie Bulgarien BG
Source: Screen DigestSource: Screen Digest
Source: European Audiovisual Observatory
Households TV equipment 2004-2008 Consumers pay-TV gross spend 2004-2008
Number of households accessing multichannel platforms as at 31.12.2008
2004 2005 2006 2007 2008
0
1 500
1 200
900
600
300
Cable households
Satellite households
DTT householdsIPTV households
1 370
1 045
1 115
1 190
1 280
297
0
0 0 1 1 1
0 0 525
422
503
554
622
2004 2005 2006 2007 2008
0
150 000
120 000
90 000
60 000
30 000
Cable TV
Satellite
IPTV
91 697
1 913
0
0 22 48 65
7 394
15 210
25 187
35 327
100 210
113 226
129 941
149 372
In thousands. EUR thousand.
Bulsatkom
Cabletel
Evrokom
ITV Partner
DTT
Neterra TV
0
250
200
150
100
50
204
25
~
200
~ 1
DTT
IPTV
Sat
PC
Cable
In thousands.
Market trends

32 2 0 0 9 | V o l u m e 1 | B a n d 1
AL
AT
BE
BG
CH
CY
CZ
DE
DK
EE
ES
FI
FR
GB
GR
HR
HU
IE
IS
IT
LT
LU
LV
MK
MT
NL
NO
PL
PT
RO
RU
SE
SI
SK
TR
BG
Bulgaria Bulgarie Bulgarien BG
Main broadcasters Channels 2005 2006 2007 2008 2008/07Bolkan Nyuz Korporeushan EAD adtv bTV 50 785 62 204 76 480 81 647 6,8%Nova Televizia Parvi Chasten Kanal EAD adtv Nova Televizia 19 395 27 894 42 435 45 359 6,9%
BNT sptv Kanal 1 ~ 40 000 ~ ~ ~
Diema Vizhan thtv Diema+, Diema2, DiemaExtra, Diema Family 3 491 4 341 5 641 ~ ~
Fox International Channels Bulgaria thtv Fox TV Bulgaria – 2 009 3 845 ~ ~Payner OoD thtv Planeta TV 3 910 3 769 2 934 ~ ~Balkan Bulgarska Televizia AD adtv BBT 1 160 987 2 366 ~ ~TV Sedeam EAD thtv TV-7 68 2 224 1 975 ~ ~Radio Veselina AD thtv Veselina TV ~ 1 243 1 853 ~ ~Telestar Bulgaria Eood hstv Telestar 648 914 1 052 ~ ~Televizia Evropa thtv Evropa TV 686 704 979 ~ ~Ring SV thtv Ring TV 1 512 ~ 832 ~ ~Elit Media Bulgaria Ood thtv SofiaCable Film, SK Folk, Kanal 3 738 617 615 ~ ~Televizia MM OOD thtv M2TV 416 596 399 ~ ~Fen Ti Vi Ood thtv FenTV 205 263 359 ~ ~
Main distributors Services Packages 2005 2006 2007 2008 2008/07Mobiltel EAD 1 IPTV, 3GTV Mobiltel 91 799 586 168 652 846 675 360 3,4%Cosmo Bulgaria Mobile EAD 1 3G TV Globul TV 274 073 342 264 411 585 466 035 13,2%Eurocom Cable Management BG CATV Evrokom Bulgaria ~ 10 880 20 626 29 718 44,1%p.m. Evrokom Plovdiv CATV Evrokom Bulgaria 4 369 5 639 ~ ~ ~p.m. Evrokom Sofia Kabel CATV Evrokom Bulgaria 204 4 439 4 714 ~ ~Bulsatkom AD SATV Bulsatkom 3 630 8 047 20 536 35 536 73,0%Cabletel 1 3Play Cabletel TV 16 931 21 417 ~ ~ ~Neterra EooD 1 IPTV Neterra TV 2 773 4 982 8 674 ~ ~Interaktivni Tehnologii AD SATV ITV Partner 4 169 ~ ~ ~ ~Kabel Sat Zapad OOD 3Play Kabel sat Zapad ~ 990 1 714 2 306 34,5%Vereya Kabel CATV Vereya Kabel 1 210 1 951 1 285 ~ ~Vestitel BG AD 1 3play Vestitel 138 594 432 ~ ~
Source: European Audiovisual Observatory1 Includes telecommunication activities.
EUR thousand.
2004 2005 2006 2007 2008
0
100 000
80 000
60 000
40 000
20 000
Bolkan NyuzKorporeushan EAD
Nova Televizia ParviChasten Kanal EAD
Fox InternationalChannels Bulgaria
BNT
Diema Vizhan
Radio Veselina AD
Operating revenues of main television companies in Bulgaria 2005-2008 EUR thousand.
T.1.BG.1G.1.BG.1

332 0 0 9 | V o l u m e 1 | B a n d 1
AL
AT
BE
BG
CH
CY
CZ
DE
DK
EE
ES
FI
FR
GB
GR
HR
HU
IE
IS
IT
LT
LU
LV
MK
MT
NL
NO
PL
PT
RO
RU
SE
SI
SK
TR
BG
Bulgaria Bulgarie Bulgarien BG
Daily share Prime time (20:00-22:30)Channels 2004 2005 2006 2007 2008 2004 2005 2006 2007 2008Kanal 1 (BNT) 23,4 18,7 16,4 14,6 13,6 31,5 24,0 21,5 18,7 13,8TV Bulgaria (BNT) 0,5 0,7 0,7 0,6 0,6 0,5 0,9 0,7 0,6 0,5Bulgarian public channels 23,9 19,4 17,1 15,2 14,2 32,0 24,9 22,2 19,3 14,3bTV 38,6 36,9 37,5 36,9 36,7 32,6 31,8 32,4 35,1 38,0Nova TV 9,3 12,9 16,7 17,8 17,1 12,6 17,9 22,0 21,7 18,7Diema Family 0,4 1,7 3,2 0,3 1,6 3,3Diema+ 2,5 2,6 1,9 2,0 2,8 1,7 2,0 1,4 1,7 2,8Planeta TV 2,9 3,3 2,8 2,1 1,5 2,2 2,3 1,8 1,3 1,1GTV Gotinata Televizija 0,1 1,0 1,7 1,4 – 0,1 0,8 1,2 0,9TV SKAT 0,8 1,3 1,8 1,6 1,4 1,0 1,8 2,6 2,3 0,8TV Evropa 0,8 0,8 0,8 0,9 0,9 0,6 0,4 0,5 0,5 0,8Diema 2 0,8 1,4 1,2 ~ 0,9 0,6 1,0 0,9 0,7 0,7TV7 Dni 0,4 0,7 0,8 0,4 0,7 0,6FEN TV 0,1 0,8 0,7 0,8 0,6 0,1 0,6 0,5 0,5 0,5BBT Balkan Bulgarian TV 0,6 0,7 0,5 0,5 0,5 0,5 0,7 0,5 0,4 0,4Kanal 3 0,5 0,6 0,5 0,4 0,4 0,5 0,6 0,5 0,4 0,4Evrokom 1,8 1,4 1,2 0,9 0,3 1,8 1,3 0,9 0,7 0,2City TV – 0,5 0,3 0,2 0,2M-Sat 0,7 0,9 0,6 0,4 0,3 0,6 0,9 0,6 0,5 0,2Bulgarian private channels 59,4 63,7 68,0 68,9 69,1 54,8 61,4 66,1 69,5 69,6Eurosport 0,4 0,5 0,5 0,6 – 0,4 0,4 0,4 0,5Fox Life Bulgaria – 0,2 1,5 1,9 1,6 – 0,1 0,7 1,0 1,7Discovery Channel – 0,5 0,5 0,5 0,5 0,4 0,3 0,3 0,3Hallmark Channel Central Europe 0,7 0,6 0,4 0,6 – 0,6 0,5 0,4 0,5Cartoon Network 0,7 0,6 0,4 0,3 – 0,5 0,4 0,3 0,2Foreign channels ~ 2,5 3,7 3,7 3,6 ~ 2,0 2,3 2,4 3,2Others 16,7 14,4 11,2 12,2 13,1 13,2 11,7 9,4 8,8 12,9
Source: Eurodata TV / TNS TV Plan
Daily share. In %, 4 years +.
Prime time (20:00-22:30). In %, 4 years +.
2004 2005 2006 2007 2008
0
10
30
40
20
bTV
Nova TV
Kanal 1 (BNT)
Diema 2
TV SKAT Fox LifeBulgaria
Diema+
Planeta TVEvrokom
2008
Kanal 1 13,8%
TV Bulgaria 0,5%
bTV 38,0%
Nova TV 18,7%
Diema Family3,3%
Diema+ 2,8%
Others14,4%
Other private foreign1,5%
Other privateBulgarian
1,4%
Planeta TV1,1%
GTV GotinataTelevizija
0,9%
TV SKAT0,8%
TV Evropa0,8%
Diema 20,7%
TV7 Dni0,6%
FEN TV0,5%
Fox Life Bulgaria1,7%
TV audience market share in Bulgaria 2004-2008 In %, 4 years +.
T.1.BG.2G.1.BG.2

34 2 0 0 9 | V o l u m e 1 | B a n d 1
AL
AT
BE
BG
CH
CY
CZ
DE
DK
EE
ES
FI
FR
GB
GR
HR
HU
IE
IS
IT
LT
LU
LV
MK
MT
NL
NO
PL
PT
RO
RU
SE
SI
SK
TR
CH
Switzerland Suisse Schweiz CH
Switzerland is a federation made up of 26 cantons and has four national
languages: French, German, Italian and Romansch. This is reflected in the organi-sation of the audiovisual landscape, with French, German and Italian chan-nels having a major presence on the Swiss market as a result.Via its seven corporate units, the public broadcaster SRG SSR idée suisse offers twelve channels in the country’s four national languages and they dominate the market by a wide margin.In German-speaking Switzerland, SF1 and SF zwei have a strong lead with a daily audience market share of 22.4% and 9.1% in the first half of 2009, ahead of the German channels RTL (6.8%) and Sat.1 (5.6%).In Italian-speaking Switzerland, TSI heads the audience ratings, with a 23.2% mar-ket share, ahead of the Italian channels Canale 5 (13.4%), RAI Uno (11.9%) and Italia 1 (7.1%).Finally, TSR1 heads the ratings in the French-speaking part of the country with 21.9% of the daily audience, in front of the French channels TF1, M6 and France 2, with 13.1%, 9.6% and 7.9% of viewers respectively.Some of the foreign channels present in the Swiss market (RTL, RTL 2 or M6) have versions with advertising spots specific to Switzerland, which causes a problem for the regulator OFCOM. For example, in February 2009 the civil court of appeal of the cantonal court of the State of Fribourg ruled against Métropole Télévision for its M6 Suisse advertising slot, stating in its judgment that M6 Suisse was a breach of copyright and constituted unfair competition.Although the public channels in Swit-zerland are powerful and a substantial proportion of the market is held by foreign channels, around twenty private channels are distributed at the national, indeed international, level and there are around twenty local channels, most of which broadcast programmes in German or French.The Swiss channels with international coverage include the music channel i-concerts, which is distributed in France, Belgium and Luxembourg. In 2009, the independent producer Eagle Rock Entertainment acquired a 20% stake in I-concerts SA.Only 8% of Swiss households mainly depend on terrestrial transmission for their television services, so the multi-channel platforms have a significant penetration. For example, according to the Swiss cable operators’ association Swisscable, 86% of homes subscribe to a cable TV service. The main operator is Cablecom (a subsidiary
La Suisse est une fédération constituée de 26 cantons et pourvue de quatre
langues nationales : l’allemand, le français, l’italien et le romanche. Le paysage audio-visuel est organisé en conséquence et les chaînes allemandes, françaises et italiennes sont très présentes sur le marché suisse.Le radiodiffuseur public, SRG SSR idée suisse propose, via ses sept unités d’entre-prises, douze chaînes dans les quatre lan-gues nationales suisses. Ces chaînes publi-ques dominent largement le marché.De fait, en Suisse alémanique, SF1 et SF zwei arrivent en tête des audiences, avec respectivement 22,4 et 9,1 % de part de marché d’audience quotidienne au pre-mier semestre 2009, devant les chaînes alle-mandes RTL (6,8 %) ou Sat.1 (5,6 %).En Suisse italophone, TSI prend aussi la tête des audiences, avec 23,2 % de parts de marché, devant les chaînes italiennes Canale 5 (13,4 %), RAI Uno (11,9 %) ou Italia 1 (7,1 %).Enfin, en Suisse romande, TSR1 arrive aussi en tête avec 21,9 % de l’audience quotidienne, devant les chaînes françaises TF1, M6 et France 2 qui réunissent res-pectivement 13,1 %, 9,6 % et 7,9 % des spectateurs.Parmi les chaînes étrangères présentes sur le marché suisse, certaines (RTL, RTL 2 ou M6) proposent des versions compor-tant des écrans publicitaires spécifiques à la Suisse, ce qui cause problème à l’ins-tance de régulation, l’OFCOM. Ainsi, Métropole Télévision a été condamné en février 2009 pour sa fenêtre M6 Suisse par la Cour d’appel civil du Tribunal canto-nal de l’Etat de Fribourg. L’arrêt considère que M6 Suisse viole le droit d’auteur et représente une concurrence déloyale.Si les chaînes publiques sont puissantes en Suisse et qu’une large part du marché est détenue par les chaînes étrangères, il existe cependant une vingtaine de chaînes privées distribuées à l’échelon national, voire international, ainsi qu’une vingtaine de chaînes locales, dont la plupart diffu-sent des programmes en allemand ou en français.Parmi les chaînes suisses à rayonnement international se trouve la chaîne musicale i-concerts, diffusée en France, Belgique ou au Luxembourg. En 2009, le producteur indépendant Eagle Rock Entertainment a acquis 20 % des parts de I-concerts SA.Seuls 8 % des ménages suisses dépendent principalement de la transmission terres-tre pour la fourniture de leurs services de télévision. La pénétration des plates- formes multi-chaînes est donc très impor-tante. Ainsi, selon Swisscable, l’association des câblo-opérateurs suisses, 86 % des foyers sont abonnés à une offre de télé-vision par câble. Le principal opérateur est Cablecom (filiale du groupe UPC),
Die Schweiz ist ein Bundesstaat mit 26 Kantonen und vier Amtsspra-
chen: deutsch, französisch, italienisch und rätoromanisch. Dementsprechend vielfältig ist auch die audiovisuelle Land-schaft, in der die deutschen, französischen und italienischen Sender in hohem Maß vertreten sind.Die öffentlich-rechtliche Rundfunk-anstalt SRG SSR idée suisse bietet über sieben Unternehmenseinheiten zwölf Sender in den vier Amtssprachen der Schweiz an. Der Markt wird weitgehend von diesen öffentlich-rechtlichen Sendern beherrscht.So erreichen die Sender SF1 und SF zwei im ersten Halbjahr 2009 mit einem durchschnittlichen Zuschaueranteil von 22,4 bzw. 9,1 % die höchsten Einschalt-quoten in der deutschsprachigen Schweiz. Dahinter folgen die deutschen Sender RTL (6,8 %) und Sat.1 (5,6 %).Im italienischen Teil der Schweiz liegt mit einem Marktanteil von 23,2 % ebenfalls der öffentlich-rechtliche Sender TSI vorn, gefolgt von den italienischen Sendern Canale 5 (13,4 %), RAI Uno (11,9 %) und Italia 1 (7,1 %).Auch in der französischsprachigen West-schweiz liegt mit einem Marktanteil von 21,9 % der öffentlich-rechtliche Anbieter (TSR1) auf Platz eins, vor den franzö-sischen Sendern TF1, M6 und France 2 mit einem Zuschaueranteil von 13,1 %, 9,6 % bzw. 7,9 %.Von den ausländischen Sendern auf dem Schweizer Markt bieten einige (z.B. RTL, RTL2 oder M6) Versionen mit speziell auf die Schweiz ausgerichteten Werbe-fenstern an, was der Regulierungsbehörde (BAKOM) Schwierigkeiten bereitet. So ist Métropole Télévision (M6) im Februar 2009 für sein Schweizer M6-Werbefenster vom Zivilappellationshof des Kantonsge-richts Freiburg verurteilt worden. Nach Auffassung des Gerichts hat der Sender M6 Suisse gegen das Urheberrecht versto-ßen und sich des unlauteren Wettbewerbs schuldig gemacht.Auch wenn die öffentlich-rechtlichen Sen-der in der Schweiz sehr stark sind und die ausländischen Sender einen großen Teil des Marktes auf sich vereinen können, so gibt es doch um die 20 Privatsender, deren Programm landesweit und zum Teil sogar international empfangen werden kann, sowie ebenso viele Lokalsender, die ihr Programm überwiegend in deutscher oder französischer Sprache ausstrahlen.Zu den Schweizer Sendern mit internatio-naler Reichweite gehören der Musikkanal i-concerts, der auch in Frankreich, Belgien oder Luxemburg zu empfangen ist. 2009 hat die unabhängige Produktionsfirma Eagle Rock Entertainment 20 % der Anteile an i-concerts SA erworben.

352 0 0 9 | V o l u m e 1 | B a n d 1
AL
AT
BE
BG
CH
CY
CZ
DE
DK
EE
ES
FI
FR
GB
GR
HR
HU
IE
IS
IT
LT
LU
LV
MK
MT
NL
NO
PL
PT
RO
RU
SE
SI
SK
TR
CH
Switzerland Suisse Schweiz CH
Sources: BAKOM – OFCOM – UCOM : http://www.bakom.ch Publica Data : http://www.publicadata.ch Legal aspects: IRIS Merlin, http://merlin.obs.coe.int
of the UPC group), which is planning to adopt the name UPC in 2010. Cablecom has positioned itself as the main quadru-ple play provider and added a personal HD recorder to its services at the end of 2008 and a video on demand service in early 2009.There are three competing IPTV plat-forms in the Swiss market, operated by Swisscom, Orange and Sunrise, the coun-try’s main telecommunications operators. They are attracting a growing number of viewers. For example, Swisscom’s Blue-win service claimed to have 186 000 cus-tomers in September 2009, but the total is still marginal compared with the number of cable customers. Swiss homes are served by two satellite packages: the CanalSat Suisse service was added to that of the public broadcaster Sat-access at the end of 2008. CanalSat had in fact interrupted its transmissions to Switzerland during the spring of 2008 because it possessed no retransmission rights outside France. A new package specially designed for Switzerland was then introduced a few months later but it only had a little over 10 000 subscribers a year after its launch.On 13 May 2008, Swisscom launched Bluewin TV Mobile, its television ser-vice to personal mobiles. This service was expanded in October 2008 and enables subscribers to receive some 30 tele vision channels. Its competitor Sunrise has offered fifteen channels via 3G techno-logy since 2005.The switch-off of the analogue signal by the SRG SSR idée suisse broadcasting services was completed on 28 February 2008. Four public channels are available in each linguistic area via the digital terrestrial television network, except in the German-speaking part of the country, where five channels are transmitted (SF1, SF zwei, TSR1, RSI La 1 and SF Info, which was added to the network in January 2009). There are therefore no commercial DTT services at the present time but OFCOM launched a consultation in September 2008 concerning the award of licences for the operation of two multiplexes in the cantons of Valais and Grisons.
qui envisage d’adopter le nom UPC en 2010. Cablecom s’est positionné comme le principal initiateur de l’offre « qua druple play » et a ajouté à ses services un enre-gistreur personnel HD à la fin de l’année 2008 et une offre de vidéo à la demande au début de l’année 2009.Trois plates-formes IPTV sont en concur-rence sur le marché suisse, par Swisscom, Orange et Sunrise, les principaux opéra-teurs de télécommunications du pays. Celles-ci séduisent un nombre croissant de spectateurs, ainsi l’offre Bluewin de Swisscom revendique 186 000 clients en septembre 2009, mais le nombre total d’abonnés demeure encore marginal par rapport à celui des abonnés au câble. Deux bouquets satellitaires servent les foyers suisses. A l’offre du radiodiffuseur public Sat-access s’est ajouté le service CanalSat Suisse depuis la fin de l’an-née 2008. En effet, CanalSat a interrompu ses transmissions vers la Suisse au cours du printemps 2008, faute de droits de retrans-mission hors de France. Un nouveau bou-quet, spécialement conçu pour la Suisse a alors été lancé quelques mois plus tard, mais celui-ci ne rassemble que légèrement plus de 10 000 abonnés un an après son lancement.Le 13 mai 2008, Swisscom a lancé son offre de télévision mobile personnelle, Bluewin TV Mobile. Cette offre, renfor-cée en octobre 2008, permet aux abonnés de recevoir une trentaine de chaînes de télévision. Son concurrent Sunrise propose depuis 2005 une offre d’une quinzaine de chaînes via la technologie 3G.L’extinction du signal analogique par les services de diffusion de la SSR SRG idée suisse a été finalisée le 28 février 2008. Quatre chaînes publiques sont disponi-bles dans chaque bassin linguistique via le réseau de télévision numérique terrestre, sauf en Suisse alémanique où 5 chaînes sont transmises (SF1, SF zwei, TSR1, RSI La 1 et SF Info, ajoutée au réseau en janvier 2009). La TNT en Suisse ne propose donc jusqu’à présent pas d’offre commerciale, mais l’OFCOM a lancé une consultation en septembre 2008 concernant l’attribu-tion de licences permettant d’opérer deux multiplex dans les cantons du Valais et des Grisons.
Die Marktdurchdringung der Multikanal-Plattformen ist in der Schweiz sehr weit fortgeschritten, nur 8 % der Haushalte sind ganz oder teilweise auf das terre-strische Fernsehen angewiesen. So haben nach Aussage des Verbands der Schwei-zer Kabelnetzbetreiber Swisscable 86 % der Haushalte ein Kabelfernsehangebot abonniert. Größter Betreiber ist Cable-com (eine Tochtergesellschaft des UPC-Konzerns), der für 2010 eine Namens-änderung in UPC plant. Cablecom hat sich als erster Anbieter von „Quadruple Play“-Angeboten profiliert. Seit Ende 2008 bietet das Unternehmen auch einen HD-Recorder und seit Anfang 2009 einen Video-on-Demand-Dienst an.Auf dem IPTV-Markt konkurrieren die Plattformen der drei größten Telekom-Betreiber des Landes (Swisscom, Orange und Sunrise), die eine stetig wachsende Zahl von Zuschauern anziehen. So hatte das Bluewin-Angebot von Swisscom nach eigenen Angaben im September 2009 186 000 Kunden, aber im Vergleich zur Zahl der Kabelkunden ist die Gesamt-zahl der IPTV-Abonnenten noch sehr bescheiden. Die Schweiz wird von zwei Satellitenbou-quets bedient. Neben dem Angebot des öffentlich-rechtlichen Betreibers Sat-access gibt es seit Ende 2008 auch das Bouquet CanalSat Suisse. Zuvor hatte das franzö-sische CanalSat-Paket seine Ausstrahlung in der Schweiz im Frühling 2008 wegen fehlender Übertragungsrechte außerhalb von Frankreich aussetzen müssen. Darauf-hin wurde wenige Monate später ein spe-ziell für die Schweiz zusammengestelltes Bouquet auf den Markt gebracht, das aber ein Jahr nach dem Start erst etwas über 10 000 Abonnenten hat.Am 13. Mai 2008 hat Swisscom ihr Fern-sehangebot fürs Handy gestartet: Blue-win TV Mobile. Dieser Dienst, der im Oktober 2008 erweitert wurde, ermög-licht den Abonnenten den Empfang von etwa 30 Fernsehsendern. Der Wettbewer-ber Sunrise bietet seit 2005 ein um die 15 Kanäle umfassendes Handy-TV-Paket über das 3G-Netz an.Am 28. Februar 2008 hat SRG SSR idée suisse die Ausstrahlung des analogen Signals eingestellt. Über das DVB-T-Netz können in jedem Sprachraum vier öffentlich-rechtliche Sender empfangen werden, in der deutschsprachigen Schweiz sogar fünf (SF1, SF zwei, TSR1, RSI La 1 und seit Januar 2009 auch SF Info). In der Schweiz gibt es bislang noch keine DVB-T-Angebote von kommerziellen Anbietern, aber das BAKOM hat im Sep-tember 2008 eine Konsultation für die Vergabe von Lizenzen für den Betrieb von zwei Multiplexen in den Kantonen Wallis und Graubünden eingeleitet.

36 2 0 0 9 | V o l u m e 1 | B a n d 1
AL
AT
BE
BG
CH
CY
CZ
DE
DK
EE
ES
FI
FR
GB
GR
HR
HU
IE
IS
IT
LT
LU
LV
MK
MT
NL
NO
PL
PT
RO
RU
SE
SI
SK
TR
CH
Switzerland Suisse Schweiz CH
Source: European Audiovisual Observatory
Population and equipment 31.12.08Penetration
(in % HH) In thousand SourcesPopulation (inhabitants) – 7 702 BFS/OFS
Households – 3 362 BFS/OFS
TV households 93% 3 127 BAKOM / OFCOM
Cable TV households 92% 2 890 Swisscable
Digital cable TV households 16% 510 Screen Digest / European Audiovisual Observatory
DTH/SMATV households 15% 472 SSR-SRG idée suisse / European Audiovisual Observatory
Pay DTH/SMATV households 15% 472 SSR-SRG idée suisse / European Audiovisual Observatory
IPTV subscriptions 4% 120 Screen Digest
Installed DVB-T receivers 5% 164 SSR-SRG idée suisse / European Audiovisual Observatory
Total digital TV households 38% 1 266 European Audiovisual Observatory
Households with PC 87% 2 723 BAKOM / OFCOM
Households with broadband connections 70% 2 184 Screen Digest
Mobile phone TV subscriptions – 82 Screen Digest
Mobile broadcast TV subscriptions – 16 Screen Digest
Number of TV channels by kind of licence 11.09 Public Private TotalTerrestrial (national) 5 0 5Cable/Satellite/IPTV/Mobile 7 13 20Regional/Local 0 25 25Regional/Local windows 0 0 0Channels targeting foreign markets 0 7 7Total 12 45 57Foreign channels targeting the country 1 39 40
TV channels distributors 11.09 CompaniesCable operators >260 Cablecom (UPC), Naxoo etc…Satellite packagers 2 CanalSat Suisse, SSR-SRG idée suisse "Sat-Access"
IPTV packagers 3 Swisscom "Bluewin TV", Orange (France Telecom), Sunrise "Sunrise Desktop TV"
DTT multiplex operators 1 SRG-SSR idée suisse Mobile phone TV packagers 2 Swisscom "Bluewin TV mobile", SunriseMobile brodcast TV providers 1 Swisscom "Bluewin TV mobile"
Basic figures

372 0 0 9 | V o l u m e 1 | B a n d 1
AL
AT
BE
BG
CH
CY
CZ
DE
DK
EE
ES
FI
FR
GB
GR
HR
HU
IE
IS
IT
LT
LU
LV
MK
MT
NL
NO
PL
PT
RO
RU
SE
SI
SK
TR
CH
Switzerland Suisse Schweiz CH
Source: European Audiovisual Observatory on the basis of data from Screen Digest, WARC, SSR-SRG Idée suisse
Source: European Audiovisual Observatory
Source: Screen DigestSource: Screen Digest
Households TV equipment 2004-2008
Number of households accessing multichannels platform as at 31.12.2008
Consumers pay-TV gross spend 2004-2008
Gross revenues of radio-television 2004-2008
2004 2005 2006 2007 2008
0
3 000
2 000
1 000
Cable households
Satellite householdsIPTV households
DTT households
2 7952 838 2 883 2 881 2 890
475 460 460 460
605
3
0 3 10
2881
355383
50164
Cablecom
Zattoo
SatAcc
ess
SSR-SRG Idée su
isse
Sunrise TV
Naxoo / T
élégenève
Bluewin TV
0
2 000
1 500
1 000
500
1 600
921
605
164118
~ ~
DTT
IPTV
Sat
PC
Cable
2004 2005 2006 2007 2008
0
800 000
600 000
400 000
200 000
Cable TV
IPTVSatellite
462 588
551 106
592 773 591 664631 441
0 0 10 60 120
5 6 6 6 7
2004 2005 2006 2007 2008
0
800
600
400
200
Radio-TV Licence fee
Consumerspay-TV spend
TV adspend
Radio adspend
Aid/Grants
763
711 719694
677
465
378
86
20
92
7
88
5
83
11
83
13
385 395 393 402
553
595 594
634
In thousands.
In thousands.
EUR thousand.
EUR million.
Market trends

38 2 0 0 9 | V o l u m e 1 | B a n d 1
AL
AT
BE
BG
CH
CY
CZ
DE
DK
EE
ES
FI
FR
GB
GR
HR
HU
IE
IS
IT
LT
LU
LV
MK
MT
NL
NO
PL
PT
RO
RU
SE
SI
SK
TR
CH
Switzerland Suisse Schweiz CH
Main broadcaster Channels 2005 2006 2007 2008 2008/07SSR-SRG idée suisse 1 sptv SR 1,2 TSR, 1, 2 TSI, 1, 2 1026,4 995,1 983,3 1098,5 11,7%
Main distributors Services Packages 2005 2006 2007 2008 2008/07Swisscom (Schweiz) AG 2 4play Bluewin TV 6 278,0 6 007,0 6 693,0 8 240,0 23,1%Sunrise Communications 2 3play Sunrise TV 1 284,4 1 213,6 1 176,3 1 253,7 6,6%Orange Communications SA 2 4play, 3G TV Livebox, Live TV 874,8 848,3 910,8 ~ ~Cablecom GmbH 2 3play Cablecom 536,7 601,5 632,5 741,7 17,3%022 Télégenève S.A. CATV Naxoo ~ ~ 4,8 5,4 12,5%Télédistribution intercommunale SA CATV ESR Téléréseaux 1,3 1,3 1,3 1,4 7,7%
Zattoo AG 3 Online-TV Zattoo ~ ~ ~ ~ ~
Source: European Audiovisual Observatory1 Includes satellite packaging activities (Sat-Access).2 Includes telecommunication activities.3 Zattoo AG is the leading company in Europe for the delivery of a software allowing to receive TV channels on the PC.
Service currently launched in Denmark, France, Germany, Spain, Switzerland, and the UK.
Source: BAKOM-OFCOM
CHF millionSSR-SRG idée suisse 1 129Financing local and regional radio and television broadcasters) 50New technologies 4OFCOM to cover its supervisory tasks regarding the fee collection agency, for executing the complaint procedures against decisions of the fee collection agency and for action against unlicensed viewers and listeners.
4
Audience research 2Collection agency (Billag AG) for collecting reception fees 53
Total 1 242
Operating revenues of TV companies in Switzerland 2005-2008 EUR million.
T.1.CH.1
Sharing of licencing revenues 2008 excluding VAT.
T.1.CH.2

392 0 0 9 | V o l u m e 1 | B a n d 1
AL
AT
BE
BG
CH
CY
CZ
DE
DK
EE
ES
FI
FR
GB
GR
HR
HU
IE
IS
IT
LT
LU
LV
MK
MT
NL
NO
PL
PT
RO
RU
SE
SI
SK
TR
CH
Switzerland Suisse Schweiz CH
Source: SRG SSR idée suisse / European Audiovisual Observatory
Income 2005 2006 2007 2008 2005 2006 2007 2008 2008/07Total public income 725,41 699,95 688,07 775,73 64,2% 63,2% 62,3% 61,5% 12,7% - Aid/Grants 6,76 5,49 10,81 13,14 0,6% 0,5% 1,0% 1,0% 21,6% - Licence fee 718,65 694,46 677,26 762,59 63,6% 62,7% 61,3% 60,5% 12,6%Total commercial income 404,59 408,31 417,06 484,80 35,8% 36,8% 37,7% 38,5% 16,2% - Advertising 296,21 297,80 305,82 354,35 26,2% 26,9% 27,7% 28,1% 15,9% - Sponsorship 32,56 37,62 38,58 43,76 2,9% 3,4% 3,5% 3,5% 13,4% - Programme sales 44,72 41,58 39,52 45,32 4,0% 3,8% 3,6% 3,6% 14,7% - Other commercial income 31,10 31,31 33,14 41,37 2,8% 2,8% 3,0% 3,3% 24,8%Total 1 130,00 1 108,27 1 105,13 1 260,53 100,0% 100,0% 100,0% 100,0% 14,1%Operating revenues 1 026,40 995,08 983,26 1 098,54 11,7%
Expenditure 2005 2006 2007 2008 2005 2006 2007 2008 2008/07 Purchase of goods and services 480,80 494,83 478,63 546,84 46,9% 48,9% 48,3% 47,8% 14,3%
Costs of employees 469,72 452,81 462,85 536,63 45,8% 44,8% 46,7% 46,9% 15,9%Depreciation 74,04 63,99 49,86 61,55 7,2% 6,3% 5,0% 5,4% 23,4%Operating expenditure 1 024,56 1 011,64 991,34 1 145,02 100% 100% 100% 100% 15,5%
Net result -0,19 -14,79 -10,37 -53,56Operating margin (%) 0,18 -1,66 -0,82 -4,23
EUR million.
In %.
2004 2005 2006 2007 2008
0
1 400
1 200
1 000
800
600
400
200
Other commercial income Programme salesSponsorship
Advertising
Aids/Grants
Licence fee
2004 2005 2006 2007 2008
-15
0
3
-3
-6
-9
-12
Operating marginPro�t margin
Return on total assets
Return on shareholders’ funds
SRG SSR idée suisse financial situation 2005-2008 EUR million.
T.1.CH.3G.1.CH.1

40 2 0 0 9 | V o l u m e 1 | B a n d 1
AL
AT
BE
BG
CH
CY
CZ
DE
DK
EE
ES
FI
FR
GB
GR
HR
HU
IE
IS
IT
LT
LU
LV
MK
MT
NL
NO
PL
PT
RO
RU
SE
SI
SK
TR
CH
Switzerland Suisse Schweiz CH
Daily share Prime time (18:00-23:00)Channels 2004 2005 2006 2007 2008 2004 2005 2006 2007 2008SF1 24,8 23,8 23,7 24,1 23,2 33,6 32,9 32,2 32,6 31,4SF2 8,9 8,5 9,7 8,2 9,6 9,5 8,6 9,6 7,5 9,4SF info ~ 1,0 1,1 1,2 1,4 0,7 0,8 0,9 1,13sat 0,9 1,0 1,0 1,1 1,1 0,8 0,9 0,9 1,0 1,0TSR1 0,3 0,4 0,3 0,3 0,3 0,3 0,3 0,3 0,3 0,3TSI1 0,1 0,2 0,1 0,2 0,2 0,1 0,1 0,1 0,1 0,1Swiss public channels 35,0 34,9 35,9 35,1 35,8 44,3 43,5 43,9 42,4 43,3SAT 1 Schweiz 6,2 6,7 6,4 6,0 6,1 4,3 4,7 4,6 4,1 4,0ProSieben Schweiz 5,0 4,6 4,4 4,3 4,6 4,3 3,8 3,7 3,8 4,0TELEZ 1,7 1,7 1,7 1,7 1,5 2,2 2,2 2,0 2,0 1,8Swiss private channel 12,9 13,0 12,5 12,0 12,2 10,8 10,7 10,3 9,9 9,8ARD 5,7 5,8 6,0 5,7 5,5 6,0 6,1 6,1 6,1 5,8ZDF 4,8 5,0 5,2 5,1 5,0 4,9 5,0 5,1 5,0 4,9ORF1 4,1 4,2 3,6 3,4 3,1 3,2 3,6 3,2 3,0 2,7ORF2 2,2 2,2 2,3 1,9 1,8 1,7 1,6 1,6 1,2 1,1SW3 1,6 1,6 1,6 1,7 1,6 1,4 1,3 1,4 1,5 1,3Bayern 3 1,1 1,2 1,3 1,2 1,1 1,1 1,1 1,1 1,2 0,9ARTE – – 0,6 0,7 0,8 0,7 0,8 0,8KIKA ~ – 0,7 ~ ~ 0,4 ~ ~ARTE / KIKA 1 1,5 1,4 – – – –Foreign public channels 21,0 21,4 21,3 19,7 18,9 18,3 18,7 19,6 18,8 17,5RTL 7,9 7,4 7,3 7,0 6,7 6,7 6,3 6,3 6,4 6,3VOX 3,0 3,4 3,1 3,5 3,6 2,6 3,1 2,8 3,3 3,2SuperRTL 3,0 3,0 2,8 2,8 3,1 2,3 2,6 2,4 2,3 2,5RTL 2 3,8 3,1 2,6 2,7 2,8 3,3 2,7 2,3 2,3 2,2Kabel Eins 2,4 2,5 2,3 2,2 2,3 2,0 2,1 2,2 2,1 2,1Eurosport 1,1 1,1 1,1 1,1 1,0 0,8 0,7 0,8 0,7 0,6MTV 0,6 0,5 0,4 0,3DSF ~ 0,6 0,5 0,6 0,4 0,5 0,4 0,5 0,4N-TV ~ 0,4 0,3 0,2 0,2 0,2 0,2 0,1 0,1Foreign private channels 21,2 21,5 20,0 20,7 20,6 17,7 18,2 17,4 18,1 17,7Others 9,9 9,2 10,3 12,5 12,5 8,9 8,9 8,8 10,8 11,7
Source: Eurodata TV Worldwide / Publica Data1 ARTE and KIKA have been measured separately since 2006.
Daily share. In %, 3 years +. Prime time (18:00-23:00). In %, 3 years +.
2004 2005 2006 2007 2008
0
5
15
10
25
20
SF1
SF2
RTLARDPRO 7
SAT 1ZDF
RTL 2VOX
Kabel EinsSuperRTL
ORF1
2008
SF131,4%
SF29,4%
SF info1,1%
3sat1,0%
TSR10,3%
Prosieben Schweiz4,0%
SAT.1 Schweiz 4,0%
TELEZ1,8%
ARD5,8%
ZDF4,9%ORF1
2,7%
ORF21,1%
SW31,3%
RTL6,3%
RTL 22,2%
VOX3,2%
Kabel Eins2,1%
SuperRTL2,5%
Eurosport0,6%
Others 11,7%
TSI10,1%
Bayern 30,9%
ARTE0,8%
TV audience market share in German-speaking Switzerland 2004-2008 In %, 3 years +.
T.1.CH.4G.1.CH.2

412 0 0 9 | V o l u m e 1 | B a n d 1
AL
AT
BE
BG
CH
CY
CZ
DE
DK
EE
ES
FI
FR
GB
GR
HR
HU
IE
IS
IT
LT
LU
LV
MK
MT
NL
NO
PL
PT
RO
RU
SE
SI
SK
TR
CH
Switzerland Suisse Schweiz CH
Daily share Prime time (18:00-23:00)Channels 2004 2005 2006 2007 2008 2004 2005 2006 2007 2008TSI 27,1 26,2 23,7 24,3 24,7 33,8 33,0 31,1 31,6 31,7TSI2 7,0 6,5 7,6 6,2 7,3 7,1 6,4 8,2 6,0 7,7TSR1 0,8 1,1 1,2 0,9 0,9 0,9 1,3 1,3 1,1 1,1SF1 1,6 2,1 2,1 2,2 1,8 2,0 2,7 2,8 2,7 2,0Swiss public channels 36,5 35,9 34,6 33,6 34,7 43,8 43,4 43,4 41,4 42,5Tele Ticino – 1,2 1,4 1,6 1,8 – 1,2 1,4 1,6 1,7Swiss private channels – 1,2 1,4 1,6 1,8 – 1,2 1,4 1,6 1,7RAI 1 10,0 10,0 10,1 10,9 11,0 9,4 8,8 8,8 9,8 9,0RAI 2 6,7 6,8 6,5 6,4 6,7 5,8 5,9 5,2 5,3 6,0RAI 3 4,3 4,3 4,4 4,5 4,3 4,4 4,5 4,6 4,8 4,6Foreign public channels 21,0 21,1 21,0 21,8 22,0 19,6 19,2 18,6 19,9 19,6Canale 5 12,9 11,9 11,6 10,9 11,8 12,2 11,5 10,2 10,1 10,5Italia 1 7,7 7,9 8,0 8,0 7,6 6,4 7,6 8,1 7,6 7,1Rete 4 6,2 5,5 5,5 6,2 6,2 5,4 4,9 4,7 5,0 5,6La 7 1,8 1,7 1,8 1,5 1,3 1,2 1,2 1,3 1,1 1,0Foreign private channels 28,6 27,0 26,9 26,6 26,9 25,2 25,2 24,3 23,8 24,2Others 13,9 14,8 16,1 16,4 14,6 11,4 11,0 12,3 13,3 12,0
Source: Eurodata TV Worldwide / Publica Data
Daily share. In %, 3 years +.
Prime time (18:00-23:00). In %, 3 years +.
2004 2005 2006 2007 2008
0
5
10
20
25
15
30
TSI
Canale 5RAI 1
Italia 1RAI 2
RAI 3
SF1Tele Ticino
La 7
TSI2Rete 4
TSR1
2008
TSI31,7%
Others 12,0%
TSI27,7%
TSR11,1%
Tele Ticino1,7%
RAI 19,0%
RAI 26,0%
RAI 34,6%
Canale 510,5%
Italia 17,1%
Rete 45,6%
La 71,0%
SF12,0%
TV audience market share in Italian-speaking Switzerland 2004-2008 In %, 3 years +.
T.1.CH.5G.1.CH.3
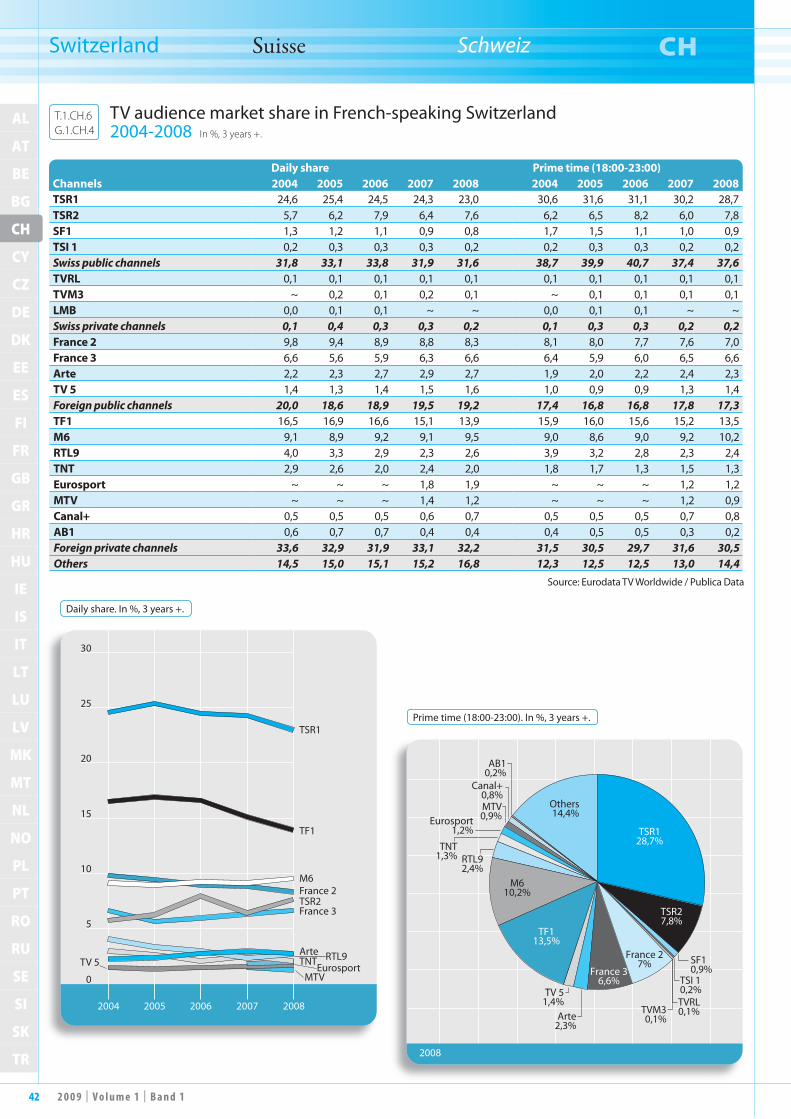
42 2 0 0 9 | V o l u m e 1 | B a n d 1
AL
AT
BE
BG
CH
CY
CZ
DE
DK
EE
ES
FI
FR
GB
GR
HR
HU
IE
IS
IT
LT
LU
LV
MK
MT
NL
NO
PL
PT
RO
RU
SE
SI
SK
TR
CH
Switzerland Suisse Schweiz CH
Daily share Prime time (18:00-23:00)Channels 2004 2005 2006 2007 2008 2004 2005 2006 2007 2008TSR1 24,6 25,4 24,5 24,3 23,0 30,6 31,6 31,1 30,2 28,7TSR2 5,7 6,2 7,9 6,4 7,6 6,2 6,5 8,2 6,0 7,8SF1 1,3 1,2 1,1 0,9 0,8 1,7 1,5 1,1 1,0 0,9TSI 1 0,2 0,3 0,3 0,3 0,2 0,2 0,3 0,3 0,2 0,2Swiss public channels 31,8 33,1 33,8 31,9 31,6 38,7 39,9 40,7 37,4 37,6TVRL 0,1 0,1 0,1 0,1 0,1 0,1 0,1 0,1 0,1 0,1TVM3 ~ 0,2 0,1 0,2 0,1 ~ 0,1 0,1 0,1 0,1LMB 0,0 0,1 0,1 ~ ~ 0,0 0,1 0,1 ~ ~Swiss private channels 0,1 0,4 0,3 0,3 0,2 0,1 0,3 0,3 0,2 0,2France 2 9,8 9,4 8,9 8,8 8,3 8,1 8,0 7,7 7,6 7,0France 3 6,6 5,6 5,9 6,3 6,6 6,4 5,9 6,0 6,5 6,6Arte 2,2 2,3 2,7 2,9 2,7 1,9 2,0 2,2 2,4 2,3TV 5 1,4 1,3 1,4 1,5 1,6 1,0 0,9 0,9 1,3 1,4Foreign public channels 20,0 18,6 18,9 19,5 19,2 17,4 16,8 16,8 17,8 17,3TF1 16,5 16,9 16,6 15,1 13,9 15,9 16,0 15,6 15,2 13,5M6 9,1 8,9 9,2 9,1 9,5 9,0 8,6 9,0 9,2 10,2RTL9 4,0 3,3 2,9 2,3 2,6 3,9 3,2 2,8 2,3 2,4TNT 2,9 2,6 2,0 2,4 2,0 1,8 1,7 1,3 1,5 1,3Eurosport ~ ~ ~ 1,8 1,9 ~ ~ ~ 1,2 1,2MTV ~ ~ ~ 1,4 1,2 ~ ~ ~ 1,2 0,9Canal+ 0,5 0,5 0,5 0,6 0,7 0,5 0,5 0,5 0,7 0,8AB1 0,6 0,7 0,7 0,4 0,4 0,4 0,5 0,5 0,3 0,2Foreign private channels 33,6 32,9 31,9 33,1 32,2 31,5 30,5 29,7 31,6 30,5Others 14,5 15,0 15,1 15,2 16,8 12,3 12,5 12,5 13,0 14,4
Source: Eurodata TV Worldwide / Publica Data
Prime time (18:00-23:00). In %, 3 years +.
2008
TSR128,7%
SF10,9%
Others 14,4%
TSI 10,2%TVRL0,1%TVM3
0,1%
TSR27,8%
AB10,2%
Canal+0,8%MTV0,9%
France 27%
France 36,6%
Arte2,3%
TV 51,4%
TF113,5%
M610,2%
TNT1,3%
Eurosport1,2%
RTL92,4%
Daily share. In %, 3 years +.
2004 2005 2006 2007 2008
0
5
15
10
25
20
30
TSR1
TF1
M6France 2
France 3
ArteTNT
TSR2
RTL9Eurosport
MTVTV 5
TV audience market share in French-speaking Switzerland 2004-2008 In %, 3 years +.
T.1.CH.6G.1.CH.4

432 0 0 9 | V o l u m e 1 | B a n d 1
AL
AT
BE
BG
CH
CY
CZ
DE
DK
EE
ES
FI
FR
GB
GR
HR
HU
IE
IS
IT
LT
LU
LV
MK
MT
NL
NO
PL
PT
RO
RU
SE
SI
SK
TR
CY
Cyprus Chypre Zypern CY
T he audiovisual landscape in Cyprus is composed of the channels operated
by the public broadcaster CYBC (RIK1, RIK2, RIK Sat), two Cypriot private channels (Sigma and CNC plus) and the sister channels of the main Greek com-mercial stations (ANT1 and Mega). The market is completed by two sets of pay-TV channels (Alfa TV and LTV), a number of specialist channels and around 10 local channels.In 2008, Sigma regained its position as the most-watched channel (with a 20% daily audience market share), overtaking ANT1, whose daily reach fell to 17.4% (compared with 21.7% in 2007). ANT1 is followed closely behind by the first public channel RIK1, whose daily reach rose to 15.5% (+2.1 percentage points in one year). As a result, Mega has had to settle for fourth place on the market with just 11.9% (a loss of 4.6 percentage points in two years). The daily audience of the second public channel, RIK2, has stabilised at 5.7%. Finally, CNC Plus, the sixth free-to-air terrestrial channel launched in 2006, is continuing its market penetration with a daily reach of 3.7%.The multi-channel transmission market is dominated by four distributors. Multi-vision, with its Nova package, is the only satellite television provider operating in Cyprus, while Cablenet is the only pro-vider on the cable TV market. Two oper-ators share the ADSL television (IPTV) market: Cyta (which changed the name of its MiVision service to CytaVision in 2008) and PrimeTel. Finally, MTN offers a mobile TV service using 3G techno-logy but the package is limited to four channels.Despite these offerings, a large proportion of Cyprus homes still depend exclusively on terrestrial television. However, digi-tal terrestrial television is yet to be laun-ched. In October 2008, the government confirmed its commitment to switch-ing off terrestrial analogue transmissions in 2011. The country’s political division is reflect-ed in its media landscape. The operators established in the northern part of the country are not recognised by the Cypri-ot administrative authorities. The main operators are the Turkish broadcaster Bayrak Radyo Televizyon Kurumu (BRT), which is totally controlled by the Turkish Cypriot administration, and several local stations.
Le paysage audiovisuel chypriote est composé des chaînes du radio-
diffuseur de service public CYBC (RIK1, RIK2, RIK Sat), de deux stations privées chypriotes (Sigma et CNC plus) et des chaînes sœurs des principales stations commerciales grecques (ANT1 et Mega). Le marché est complété par deux ensem-bles de chaînes à péage (Alfa TV et LTV), quelques chaînes thématiques et une dizaine de chaînes locales.En 2008, Sigma redevient la chaîne la plus regardée (avec 20 % de part de marché d’audience quotidienne), devant ANT1 qui chute fortement à 17,4 % (contre 21,7 % en 2007). ANT1 est presque rat-trapée par la première chaîne publique RIK1, qui remonte à 15,5 % d’audience quotidienne (+2,1 points en un an). De ce fait, Mega se contente de la quatrième place sur le marché avec seulement 11,9 % (soit une perte de 4,6 points en deux ans). La seconde chaîne publique RIK2 se stabilise à 5,7 % d’audience quotidienne, et enfin CNC Plus, la sixième chaîne terrestre gratuite lancée en 2006, continue sa percée en réunissant 3,7 % d’audience quotidienne.Le marché de la transmission multi- chaînes est dominé par quatre distri-buteurs. Multivision, avec son bouquet Nova, est l’unique fournisseur de télévision par satellite opérant à Chypre ; Cablenet est lui aussi seul sur le marché de la télé-vision par câble. Enfin, deux opérateurs se partagent le marché de la télévision par ADSL (IPTV) : Cyta (qui a renommé en 2008 son offre MiVision en Cyta Vision) et Primetel. MTN propose enfin un service de télévision sur téléphone portable grâce à la technologie 3G, mais le bouquet est limité à quatre chaînes.Malgré ces offres, une large part des foyers chypriotes dépendent toujours exclu sivement de la télévision terrestre. Or la télévision numérique terrestre n’a pas encore été lancée. Le gouvernement a confirmé en octobre 2008 sa volonté de procéder à l’extinction des transmissions analogiques terrestres en 2011.La division politique du pays se reflète dans son paysage médiatique. Les opéra-teurs établis dans la partie nord ne sont pas reconnus par l’administration chypriote. Il s’agit principalement de l’organisme de radiotélévision en turc, Bayrak Radyo Televizyon Kurumu (BRT), qui est totale-ment sous le contrôle de l’administration chypriote-turque, ainsi que de plusieurs stations locales.
Die Fernsehlandschaft Zyperns setzt sich zusammen aus den Sendern
des öffentlich-rechtlichen Rundfunk-veranstalters CYBC (RIK1, RIK2, RIK Sat), zwei zypriotischen Privatkanä-len (Sigma und CNC plus) sowie den Schwesterunternehmen der wichtigsten griechischen Privatsender (ANT1 und Mega). Der Markt wird abgerundet durch zwei Pay-TV-Gesellschaften (Alfa TV und LTV), einige Spartenkanäle und ein Dut-zend Lokalsender.2008 hat Sigma mit einem durchschnitt-lichen Zuschaueranteil von 20 % wieder Platz eins bei den Zuschauern in Zypern erreicht. Auf Platz zwei zurückgefallen ist nach einem deutlichen Rückgang auf 17,4 % (gegenüber 21,7 % 2007) ANT1. Knapp dahinter folgt der erste öffentlich-rechtliche Sender (RIK1), der einen Anstieg seines Marktanteils auf 15,5 % verzeichnet (+2,1 Prozentpunkte in einem Jahr). Somit muss sich Mega mit nur 11,9 % (minus 4,6 Prozentpunkte in zwei Jahren) mit Platz vier begnügen. Während sich der zweite öffentlich-rechtliche Sen-der (RIK2) bei einem Zuschaueranteil von 5,7 % stabilisiert, scheint der 2006 gestar-tete sechste terrestrische Free-TV-Sender mit einem durchschnittlichen Zuschau-eranteil von 3,7 % seinen Durchbruch fortsetzen zu können.Der Markt für Mehrkanalfernsehen wird von vier Betreibern beherrscht. So ist Multivision mit seinem Bouquet Nova der einzige Satellitenfernsehanbieter Zyperns, und auf dem Kabelfernsehmarkt ist Cable-net der einzige Anbieter. Den Markt für ADSL-Fernsehen (IPTV) teilen sich zwei Betreiber: Cyta (der 2008 sein früheres Paket MiVision in CytaVision umbe-nannt hat) und Primetel. Von MTN wird ein Mobil-TV-Dienst über ein 3G-Netz angeboten, aber das Paket beschränkt sich derzeit noch auf vier Sender.Trotz dieser Angebote ist ein großer Teil der Haushalte in Zypern immer noch auf das Antennenfernsehen angewiesen, wobei das digitale terrestrische Fernsehen (DVB-T) noch nicht gestartet worden ist. Die Regierung hat im Oktober ihre Absicht bekräftigt, die Abschaltung des analogen Antennenfernsehens 2011 vor-zunehmen. Die politische Teilung des Landes spiegelt sich auch in seiner Medienland-schaft wider. Die im Norden der Insel ansässigen Betreiber werden von der Regierung Zyperns nicht anerkannt. Dabei handelt es sich neben einigen Lokalsen-dern im Wesentlichen um die Rundfunk-anstalt Bayrak Radyo Televizyon Kurumu (BRT), die von der türkisch-zypriotischen Ver waltung kontrolliert wird.
Sources: Cyprus Radio-Television Authority : http://www.crta.org.cy Legal aspects: Iris Merlin, http://merlin.obs.coe.int Audience data: AGB Nielsen Media Research Cyprus: http://www.agbnielsen.net

44 2 0 0 9 | V o l u m e 1 | B a n d 1
AL
AT
BE
BG
CH
CY
CZ
DE
DK
EE
ES
FI
FR
GB
GR
HR
HU
IE
IS
IT
LT
LU
LV
MK
MT
NL
NO
PL
PT
RO
RU
SE
SI
SK
TR
CY
Cyprus Chypre Zypern CY
Population and equipment 31.12.08Penetration
(in % HH) In thousand SourcesPopulation (inhabitants) 1 – 797 Statistical service of the Republic of Cyprus
Households 1 – 270 Statistical service of the Republic of Cyprus (as at 1.1.2008)
TV households 100% 270 European Audiovisual Observatory
Cable TV households 2% 5 European Audiovisual Observatory
Digital cable TV households 2% 5 European Audiovisual Observatory
DTH/SMATV households 8% 22 Screen Digest / European Audiovisual Observatory
Dig. DTH/SMATV households 8% 22 Screen Digest / European Audiovisual Observatory
IPTV subscriptions 21% 56 European Audiovisual Observatory
Installed DVB-T receivers 0% 0Total Digital TV households 31% 83 European Audiovisual Observatory
Households with PC 71% 191 Screen Digest / European Audiovisual Observatory
Households with broadband connections 43% 116 Screen Digest / European Audiovisual Observatory
Number of TV channels by kind of licence 10.09 Public Private TotalTerrestrial (national) 2 6 8Cable/Satellite/IPTV/Mobile 0 19 19Regional/Local 0 9 9Regional/Local windows 0 0 0Channels targeting foreign markets 1 6 7Total 3 40 43Northern part 1 7 8
TV channels distributors 11.09 CompaniesCable operators 1 CablenetSatellite packagers 1 Multichoice Cyprus (Nova package)IPTV packagers 2 Cyta, PrimetelDTT multiplex operator 0Mobile phone TV packagers 1 MTN Cyprus
Source: European Audiovisual Observatory
1 Government controlled area.
Supply of TV channels by genre and by platform (including foreign channels) 10.09 Terrestrial
Cable Cablenet
Satellite Nova Cyprus
IPTV CytaVision
IPTV Primetel
Generalist - national 6 6 1 6 6Generalist - foreign 0 6 1Adult 1 2 1 4Children 4 3 4 6Culture/ education/ documentary 3 1 5 3Minority interest groups 1 1 1Entertainment/ TV fiction/ games 3 4 5 3Film 1 1 5 5 8Home shopping 1International linguistic and cultural 5 3 1 1Lifestyle/ specific leisure/ travel 4 4 3 3Music 5 4 4 2News/ business 14 18 7 10Parliament/ government/ administration 1 1Regional/ local 2 2 3 2Religion 2Sports 1 7 32 14 13VariousTotal 8 59 86 61 62
Basic figures

452 0 0 9 | V o l u m e 1 | B a n d 1
AL
AT
BE
BG
CH
CY
CZ
DE
DK
EE
ES
FI
FR
GB
GR
HR
HU
IE
IS
IT
LT
LU
LV
MK
MT
NL
NO
PL
PT
RO
RU
SE
SI
SK
TR
CY
Cyprus Chypre Zypern CY
Source: Screen Digest / European Audiovisual ObservatorySource: Screen Digest
Source: IP Key Facts / European Audiovisual Observatory
Households TV equipment 2004-2008 Consumers pay-TV gross spend 2004-2008
Number of households accessing multichannel platforms as at 31.12.2008
2004 2005 2006 2007 2008
0
60
40
20 Satellite households
IPTV households
15
1
7
18
39
52
27
3031
22
2004 2005 2006 2007 2008
0
25 000
20 000
15 000
10 000
5 000
IPTV
Satellite
14 990
153
21 072
22 868 22 482
1 158
4 242
9 465
In thousands. EUR thousand.
Cyta Mivisi
onNova
Prime-Te
l
CableNet
0
40
30
20
10
37
22
19
5
DTT
IPTV
Sat
PC
Cable
In thousands.
Market trends

46 2 0 0 9 | V o l u m e 1 | B a n d 1
AL
AT
BE
BG
CH
CY
CZ
DE
DK
EE
ES
FI
FR
GB
GR
HR
HU
IE
IS
IT
LT
LU
LV
MK
MT
NL
NO
PL
PT
RO
RU
SE
SI
SK
TR
CY
Cyprus Chypre Zypern CY
Daily share Prime time (19:00-22:00)Channels 2004 2005 2006 2007 2008 2004 2005 2006 2007 2008RIK1 12,5 14,3 15,2 13,4 15,5 13,9 13,9 14,7 13,2 15,1RIK2 6,9 6,5 7,2 5,8 5,7 4,3 3,8 4,2 3,7 3,0Cyprus public channels 19,4 20,8 22,4 19,2 21,2 18,2 17,7 18,9 16,9 18,1SIGMA 25,4 22,8 19,5 19,1 20,0 31,4 28,6 23,7 22,1 24,1ANT1 20,3 18,9 19,0 21,7 17,4 19,4 17,2 20,0 23,5 20,4MEGA 15,9 17,0 16,5 13,7 11,9 15,7 20,3 19,8 15,2 12,1Plus TV 2,9 3,7 2,5 3,0Cyprus private channels 61,6 58,7 55,0 57,4 53,0 66,5 66,1 63,5 63,3 59,6ERT (Greece) 3,7 3,4 3,2 2,9 2,6 2,8 2,5 2,1 1,9 1,5DVD/VCR 2,1 1,8 2,6 4,2 3,5 1,7 1,5 2,2 4,0 3,1Others 13,2 15,3 16,8 16,3 19,7 10,8 12,2 13,3 13,9 17,7
Source: Eurodata TV Worldwide / AGB NMR CYPRUS
Main broadcasters Channels 2005 2006 2007 2008 2008/07CyBC sptv RIK-1, RIK-2 ~ ~ ~ ~ ~
Main distributors Services Packages 2005 2006 2007 2008 2008/07Cyprus Telecommunications Authority (CYTA) 1 3play Cyta TV ~ ~ ~ ~ ~
Prime-tel 1 3play Prime-tel TV ~ ~ 14 219 24 481 72%Multichoice Cyprus Ltd 2 sat--tv Nova TV 22 868 22 482 ~ ~ ~Cablenet 1 3play Cable-net TV ~ ~ ~ ~ ~
Source: European Audiovisual Observatory1 Includes telecommunication activities.2 In 2007 the company was taken over by the Greek ISP group Forthnet.
Daily share. In %, 4 years +. Prime time (19:00-22:00). In %, 4 years +.
2004 2005 2006 2007 2008
0
5
10
20
25
15
30
SIGMA
ANT1
RIK1
MEGA
RIK2
Plus TVERT
2008
RIK115,1%
RIK23,0%Others
17,7%
SIGMA24,1%
ANT120,4%
MEGA 12,1%
Plus TV3,0%
ERT1,5%
DVD/VCR3,1%
TV audience market share in Cyprus 2004-2008 In %, 4 years +.
T.1.CY.2G.1.CY.1
Operating revenues of main television companies in Cyprus 2005-2008 EUR thousand.
T.1.CY.1

472 0 0 9 | V o l u m e 1 | B a n d 1
AL
AT
BE
BG
CH
CY
CZ
DE
DK
EE
ES
FI
FR
GB
GR
HR
HU
IE
IS
IT
LT
LU
LV
MK
MT
NL
NO
PL
PT
RO
RU
SE
SI
SK
TR
CZ
Czech Republic République tchèque
Tschechische Republik
CZ
The Czech Republic television market is dominated by the private chan-
nel Nova TV (Central European Media Enterprises) which confirmed its position as the leading broadcaster in 2008, with a market share of 37.8% (down 3% since 2006). It is followed by the public service broadcaster Czech TV 1 with 21% and the private channel Prima TV (Modern Times Group), which had a share in 2008 of 17.7% (also down about 2.5% in the last two years). All the main operators have launched additional channels over the past 3-4 years. The Nova TV family channels include Nova Sport and Nova Cinema. The pub-lic service broadcaster has a sport and a news channel (CT 4 Sport and CT 24). Prima TV launched two entertainment channels in 2009: Prima Cool targeting men, and R1, which targets women. The transition to digital terrestrial tele-vision in the Czech Republic has taken off despite the set-backs experienced in recent years. In 2006, the Broadcasting Council issued six digital terrestrial tele-vision licenses, which were later cancelled by the Prague District Court on the grounds of administrative deficiencies. The government drafted a new law on the digitisation of television in 2007 and established a process to develop a ”tech-nical transition plan”. Under the new law, those withdrawn licences were made valid again at the end of the transition period. The licences of the largest private broad-casting com panies, TV Nova and Prima TV, are also valid under the digital regime and were extended by eight years. Both broadcasters can obtain a further (bonus) licence when they give up their analogue capability. In April 2008, the government approved the transition plan submitted by the Czech telecommunications regulator, Cesky Telekomunikacni (CTU), provid-ing for the analogue signal to be switched off completely nationwide by Novem-ber 2011, except some areas, which for technical reasons will make the switch in 2012. There are four DTT multiplexes in operation. Two operated by Ceske Radio-komunikace (one dedicated to the public service broadcaster). One is operated by the Czech Digital Group CDG and the fourth by Telefónica O2.The process of digitisation has been developing rapidly in the Czech Republic. Data from January 2009 (Mediaresearch) showed that almost 52% of Czech house-holds accessed digital television, which was an increase from 28.6% a year earlier. According to data from the Association of Television Organisations, in June 2009 only 16% of households relied on analogue terrestrial television. 29% of households were using digital terrestrial television and 52% cable, satellite or IPTV services.
En République tchèque, la chaîne privée Nova TV (Central European Media
Enterprises) domine le marché de la télévi-sion et a confirmé sa position en 2008 avec 37,8 % de part de marché (en recul de 3 % depuis 2006). Elle est suivie par le radio-diffuseur de service public tchèque TV 1 (21 % de part de marché) et par la chaîne privée Prima TV (Modern Times Group), qui avait une part de marché de 17,7 % en 2008 (également en recul d’environ 2,5 % ces deux dernières années).Tous les principaux opérateurs ont lancé de nouvelles chaînes ces 3-4 dernières années. Les chaînes du groupe Nova TV incluent Nova Sport et Nova Cinema. Le radio-diffuseur de service public dispose d’une chaîne sportive et d’une chaîne d’infor-mation (CT 4 Sport et CT 24). Prima TV a lancé deux chaînes de divertissement en 2009 : Prima Cool qui cible les hommes et R1 qui s’adresse aux femmes.Le passage à la télévision numérique ter-restre en République tchèque se concré-tise malgré les revers des dernières années. En 2006, le Conseil de la radiodiffusion a délivré six licences de télévision numé rique terrestre, qui ont ensuite été annulées par le tribunal d’instance de Prague pour motif d’insuffisance formelle. En 2007, le Gou-vernement a rédigé une nouvelle loi sur la numérisation de la télévision et établi un processus visant à développer un « plan de transition technique ». Conformément à la nouvelle loi, ces licences annulées seront à nouveau valables dès la fin de la période de transition. Les licences des plus gran-des chaînes de télévision privée TV Nova et Prima TV vaudront également dans le domaine du numérique et ont été prolon-gées de huit ans. Chacun des diffuseurs peut, à condition de rendre ses capacités analogiques, se voir délivrer une licence (bonus) supplémentaire.En avril 2008, le Gouvernement a approuvé le plan de transition présenté par le régu-lateur tchèque des télécommunications, Český telekomunikační Urád (ČTU), prévoyant une extinction complète du signal analogique en novembre 2011 pour tout le territoire, à l’exception de quelques régions, qui pour des raisons techniques seront autorisées à effectuer leur transition en 2012. Quatre multiplex TNT sont en service. Deux sont gérés par Ceske Radio-komunikace (un étant dédié au radiodiffu-seur de service public). Le troisième appar-tient au Czech Digital Group CDG et le quatrième à Telefónica O2.Le processus de numérisation se développe rapidement en République tchèque. Les données de janvier 2009 (Mediaresearch) montrent que presque 52 % des foyers tchèques ont accès à la télévision numé-rique, contre 28,6 % un an auparavant. Selon les données de l’Association des organisations de télévision, en juin 2009 seuls 16 % des foyers utilisaient la télévi-
Der tschechische Fernsehmarkt wird vom Privatsender Nova TV (Central
European Media Enterprises) beherrscht, der 2008 mit einem Marktanteil von 37,8 % (minus 3 % seit 2006) seine Rolle als führender Rundfunkanbieter erneut bestätigen konnte. Dahinter folgen der öffentlich-rechtliche Sender Czech TV 1 mit 21 % und der Privatsender Prima TV (Modern Times Group) mit 17,7 % (minus 2,5 % in den letzten zwei Jahren). Alle großen Betreiber haben in den ver-gangenen drei bis vier Jahren weitere Kanäle gestartet. Zur Sendergruppe Nova TV gehören Nova Sport und Nova Cinema. Der öffentlich-rechtliche Sender betreibt einen Sportkanal und einen Nach-richtenkanal (CT 4 Sport bzw. CT 24). Prima TV hat 2009 zwei Unterhaltungs-kanäle ins Leben gerufen: Prima Cool für Männer und R1 für Frauen. Die Umstellung auf das digitale Anten-nenfernsehen ist trotz einiger Rückschlä-ge in den vergangenen Jahren auf einem guten Weg. 2006 hatte der Rundfunkrat sechs DVB-T-Lizenzen vergeben, die später vom Prager Bezirksgericht wegen administrativer Mängel annulliert wurden. Die Regierung legte 2007 einen neuen Gesetzentwurf für die Digitalisierung des Fernsehens vor und verabschiedete einen Prozess für die Ausarbeitung eines „tech-nischen Übergangsplans“. Gemäß dem neuen Gesetz erlangen diese annullierten Lizenzen nach Ablauf der Übergangspha-se erneut ihre Gültigkeit. Die Lizenzen der größten privaten Fernsehsender TV Nova und Prima TV werden auch für den digi-talen Bereich gelten und wurden um acht Jahre verlängert. Jeder Sendeveranstalter kann eine zusätzliche (Bonus-)Lizenz erhalten, vorausgesetzt, die analogen Fre-quenzen werden zurückgegeben.Im April 2008 hat die Regierung dem Übergangsplan der tschechischen Regu-lierungsbehörde, Český telekomunikační Urád (ČTU), zugestimmt, der die voll-ständige landesweite Abschaltung der analogen Signale für November 2011 vorsieht, mit Ausnahme von einigen Regionen, in denen die Übergangsphase aus technischen Gründen bis 2012 dau-ern kann. Derzeit sind vier DVB-T-Mul-tiplexe in Betrieb. Zwei werden von Ceske Radiokomunikace (davon einer für den öffentlich-rechtlichen Sender), einer von der Czech Digital Group (CDG) und der letzte von Telefónica O2 betrieben.Die Digitalisierung des Fernsehens in der Tschechischen Republik schreitet schnell voran. Die Zahlen vom Januar 2009 (Mediaresearch) zeigen, dass fast 52 % der tschechischen Haushalte Zugang zum Digitalfernsehen haben, gegenüber 28,6 % ein Jahr zuvor. Laut Angaben des Ver-bands der Fernsehveranstalter waren im Juni 2009 nur 16 % der Haushalte auf das analoge Antennenfernsehen angewiesen.

48 2 0 0 9 | V o l u m e 1 | B a n d 1
AL
AT
BE
BG
CH
CY
CZ
DE
DK
EE
ES
FI
FR
GB
GR
HR
HU
IE
IS
IT
LT
LU
LV
MK
MT
NL
NO
PL
PT
RO
RU
SE
SI
SK
TR
CZ
Czech Republic République tchèque
Tschechische Republik
CZ
There are now four competing satellite platforms in the Czech Market. At the end of 2008, the company Trade Tec, in co-operation with the Slovak company Tower com launched the Slovak DTH service “Skylink” in the Czech Republic, and had 500 000 customers in July 2009. “CS Link”, one of its main competitors had 350 000 at that time. The “Digi TV” package, controlled by Romanian cable network operator RCS/RDS had approxi-mately 275 000 customers at the end of 2008. UPC Direct (controlled by Ameri-can media giant Liberty Global) had 121 700 subscribers in December 2008), The Digitisation of cable networks is also moving ahead. Liberty Global, through its subsidiary UPC Czech, has the majority of the country’s subscribers. In December 2008 it had approximately 560 000 sub-scribers (slightly down on 2007) and of these 294 000 had digital services (double the figure for the year before).IPTV has taken off in the Czech Repub-lic with a total of 6 competing offers. The telecommunications operator O2 Czech Republic, a subsidiary of the Spanish group Telefonica, launched an IPTV platform in Autumn 2006. “O2 TV”, had approximately 133 000 sub-scribers in June 2009 (almost double that of June 2008). The other offers include: the T-Systems (subsidiary of Deutsche Telekom) “ViaTV” service; Rio Media Group (Mattes AD) with the “822.tv” service; Smartcomp; Maxprogress; and the HDD/ Prozeta’s “Quickmedia TV“ service.
sion terrestre analogique, 29 % des foyers disposaient de la télévision numérique ter-restre et 52 % de services de câble, satellite ou IPTV.Le marché tchèque compte maintenant quatre plates-formes satellitaires concur-rentes. Fin 2008, la société Trade Tec, en coopération avec la société slovaque Towercom, a lancé le service DTH slova-que «Skylink» en République tchèque. Ce service comptait 500 000 abonnés en juillet 2009. « CS Link », l’un de ses principaux concurrents, en annonçait 350 000 à la même époque. Le bouquet « Digi TV », contrôlé par le câblo-opé-rateur roumain RCS/RDS recensait envi-ron 275 000 clients fin 2008. UPC Direct (contrôlé par le géant américain des médias Liberty Global) avait 121 700 abonnés en décembre 2008.La numérisation des réseaux câblés pro-gresse également. Liberty Global, via sa filiale tchèque UPC, compte le plus grand nombre d’abonnés. En décembre 2008, elle avait environ 560 000 abonnés (léger recul par rapport à 2007), dont 294 000 à l’offre numérique (chiffre multiplié par deux par rapport à l’année précédente).Avec 6 offres au total, l’IPTV s’installe en République tchèque. L’opérateur de télécommunications O2 Czech Repu-blic, filiale du groupe espagnol Telefo-nica, a lancé à l’automne 2006 une pla-te-forme IPTV. «O2 TV», comptait quelque 133 000 abonnés en juin 2009 (presque le double par rapport à juin 2008). Les autres offres incluent : T-Sys-tems (filiale de Deutsche Telekom) avec le service « Vi TV » ; Rio Media Group (Mattes AD) avec le service « 822.tv » ; Smartcomp ; Maxprogress ; et le service « Quick media TV » de HDD/ Prozeta.
29 % der Haushalte nutzten DVB-T, 52 % Kabel-, Satelliten- oder IPTV-Dienste. Auf dem tschechischen Markt gibt es inzwischen vier konkurrierende Satelliten-plattformen. Der slowakische DTH-Dienst „Skylink“ wurde Ende 2008 von der Firma Trade Tec in Zusammenarbeit mit der slowakischen Towercom in der Tschechischen Republik gestartet und hat-te im Juli 2009 500 000 Kunden. Einer der größten Wettbewerber, „CS Link“, hatte zum gleichen Zeitpunkt 350 000 Kunden. Das vom rumänischen Kabelnetzbetreiber RCS/RDS kontrollierte Paket „Digi TV“ hatte Ende 2008 ca. 275 000 Kunden. UPC Direct (eine Tochter des amerika-nischen Medienkonzerns Liberty Global) hatte im Dezember 2008 121 000 Abon-nenten. Die Digitalisierung der Kabelnetze macht ebenfalls Fortschritte. Die meisten Abonnenten hat (über seine tschechische Tochter UPC) der Konzern Liberty Global. Im Dezember 2008 waren es ca. 560 000 (leichtes Minus gegenüber 2007), von denen 294 000 digitale Dienste nut-zen (doppelt so viele wie im Vorjahr). IPTV hat sich mit inzwischen sechs kon-kurrierenden Angeboten ebenfalls in der Tschechischen Republik etabliert. Der Telekom-Betreiber O2 Czech Republic, eine Tochter der spanischen Telefónica, hat im Herbst 2006 einen IPTV-Dienst gestartet. Im Juni 2009 hatte „O2 TV“ rund 133 000 Abonnenten (fast doppelt so viel wie im Juni 2008). Zu den weiteren Anbietern gehören: T-Systems (Tochter der Deutschen Telekom) mit dem Dienst „ViaTV“, die Rio Media Group (Mattes AD) mit dem Dienst „822.tv“, Smart-comp, Maxprogress sowie HDD/ Prozeta mit dem Dienst „Quickmedia TV“.
Sources: Rada Ceske Republiki pro Rozhhlasove A Televizni Vysilani (Council for Radio and Television Broadcasting): http://www.rrtv.cz Digital television data: Český telekomunikační úřad (Czech telecommunication office), http://www.ctu.cz Audience and digital television data: Association of Television Organisations (ATO), http://www.ato.cz Legal aspects: Iris Merlin, http://merlin.obs.coe.int

492 0 0 9 | V o l u m e 1 | B a n d 1
AL
AT
BE
BG
CH
CY
CZ
DE
DK
EE
ES
FI
FR
GB
GR
HR
HU
IE
IS
IT
LT
LU
LV
MK
MT
NL
NO
PL
PT
RO
RU
SE
SI
SK
TR
CZ
Czech Republic République tchèque
Tschechische Republik
CZ
Population and equipment 31.12.08Penetration
(in % HH) In thousand SourcesPopulation (inhabitants) – 10 468 Eurostat
Households – 4 319 Eurostat (as at 1.1.2008)
TV households 97,2% 4 198 European Audiovisual Observatory
Cable TV households 19,5% 842 Screen Digest / European Audiovisual Observatory
Digital cable TV households 7,2% 310 Screen Digest / European Audiovisual Observatory
DTH/SMATV households 24,4% 1 054 Screen Digest / European Audiovisual Observatory
Pay DTH/SMATV households 11,8% 494 Screen Digest / European Audiovisual Observatory
IPTV subscriptions 3,4% 147 Screen Digest / European Audiovisual Observatory
Installed DVB-T receivers 13,7% 590 Screen Digest / European Audiovisual Observatory
Total digital TV households 35,7% 1 541 European Audiovisual Observatory
Households with PC 43,4% 1 876 Screen Digest / European Audiovisual Observatory
Households with broadband connections 34% 1 468 Screen Digest / European Audiovisual Observatory
Mobile phone TV subscriptions – 13 Screen Digest
Mobile broadcast TV receivers – 1 Screen Digest
TV channels distributors 11.09 Companies
Cable operators 28 Kabelova Televize Prerov, Kabelova Televize Trinec, Satt, Selfservis, UPC, …
Satellite packagers 4 Digi Czech Republic, Media Vision, Trade Tec, UPCIPTV packagers 5 Rio Media Group, Smat comp, Telefonica O2, T-SystemDTT multiplex operators 2 Czech Digital Group, Radiocumikace
Number of TV channels by kind of licence 10.09 Public Private TotalTerrestrial (national) 4 9 13Cable/Satellite/IPTV/Mobile 1 31 32Regional/Local 89 89Regional/Local windows 0Channels targeting foreign markets 45 45Total 5 174 179Foreign channels targeting the country 30
Supply of TV channels by genre and by platform (including foreign channels) 10.09
Digital terrestrial
Cable UPC
Satellite CS Link
Satellite Digi TV
(Full offer)IPTV
Telefonica O2Generalist - national 4 4 4 4 4Generalist - foreign 4 3 24 2Adult 3 2 2 3Children 5 1 5 7Culture/ education/ documentary 7 5 21 6Minority interest groupsEntertainment/ TV fiction/ games 2 9 3 32 9Film 1 13 9 14 10Home shoppingInternational linguistic and cultural 1 2Lifestyle/ specific leisure/ travel 4 8 5Music 1 10 1 15 9News/ business 2 8 2 12 4Parliament/ government/ administrationRegional/ local 8 7Religion 1 1 1 2Sports 1 11 6 20 12Various 1 3Total 12 89 40 171 71
1 52% according to MediaResearch.
1
Basic figures

50 2 0 0 9 | V o l u m e 1 | B a n d 1
AL
AT
BE
BG
CH
CY
CZ
DE
DK
EE
ES
FI
FR
GB
GR
HR
HU
IE
IS
IT
LT
LU
LV
MK
MT
NL
NO
PL
PT
RO
RU
SE
SI
SK
TR
CZ
Czech Republic République tchèque
Tschechische Republik
CZ
Source: European Audiovisual Observatory on the basis of data from Screen Digest, WARC, CT and CR
Source: European Audiovisual Observatory
Source: Screen DigestSource: Screen Digest
Households TV equipment 2004-2008
Number of households accessing multichannel platforms as at 31.12.2008
Consumers pay-TV gross spend 2004-2008
Gross revenues of radio-television 2004-2008
In thousands.
In thousands.
EUR thousand.
EUR million.
2004 2005 2006 2007 2008
0
1 200
800
400
Satellite households
Cable households
DTT households
IPTV households
512486
518
710
1 054
734752
773
818842
0 050
430
84
147
590
0 0 16
UPC
CT / Digita
l Cze
ch
MediaGroup
CS Link
Digi TV
Telefonica
O2 e
st.
0
200
400
600
800
590
400
275
100
122
559
DTT
IPTV
Sat
PC
Cable
2004 2005 2006 2007 2008
0
150 000
120 000
90 000
60 000
30 000
Cable TV
Satellite
IPTV
147 597
82 526
93 992
102 724
114 148
19 018
0 02 270
12 627
33 336
28 869
44 050
67 260
91 453
2004 2005 2006 2007 2008
0
400
300
200
100
TV adspend
Radio-TV Licence fee
Consumerspay-TV spend
Radio adspend
261
289297
325
361
140
162
215
263
288
102
123
149
194
272
38 42 48 47 52
Market trends

512 0 0 9 | V o l u m e 1 | B a n d 1
AL
AT
BE
BG
CH
CY
CZ
DE
DK
EE
ES
FI
FR
GB
GR
HR
HU
IE
IS
IT
LT
LU
LV
MK
MT
NL
NO
PL
PT
RO
RU
SE
SI
SK
TR
CZ
Czech Republic République tchèque
Tschechische Republik
CZ
Main broadcasters Channels 2005 2006 2007 2008 2008/07CET 21 adtv Nova TV 184 526 194 680 437 260 ~ ~CT - Česká Televízia sptv CT 1, CT 2 155 770 198 810 225 111 242 912 7,9%FTV Prima S.r.o. adtv Prima TV 88 738 81 612 78 970 ~ ~HBO Česká Republika S.r.o. paytv HBO, HBO 2 ~ 14 423 20 169 ~ ~Minimax Media s.r.o. thtv Minimax 4 643 5 917 6 250 ~ ~IKO Cable s.r.o. paytv Filmplusz 359 1 995 5 661 ~ ~Galaxie Sport S.r.o. thtv Nova Sport 4 483 3 758 ~ ~ ~Stanice O A.S. thtv Ocko TV 2 127 3 267 4 666 ~ ~Česká programová společnost paytv Spektrum ~ 3 588 4 627 ~ ~SPI International Czech Republic s.r.o. paytv SPI 1 877 1 009 1 530 ~ ~
Zak TV s.r.o. rtv Zak TV ~ 1 003 ~ ~ ~Genus TV A.S. rtv Genus TV 714 862 894 ~ ~Region Media s.r.o. sptv 24cz 272 904 ~ ~ ~TV Morava rtv TV Morava 311 394 540 ~ ~Publiccom a.s. adtv Public TV – – 529 ~ ~
Main distributors Packages 2005 2006 2007 2008 2008/07Telefonica O2 Czech Republic A.S. 1 3Play, mobile O2 TV 1 129 145 2 333 417 2 257 000 2 148 000 -4,8%
UPC Ceska Republika A.S. 1 3 Play, Sat-TVUPC kabelová televize, Satelitní televize UPC Direct
83 446 100 231 174 734 ~ ~
T-Systems Czech Republic A.S. 1 3Play 24cz 37 353 44 549 ~ 108 461 ~Satt A.S. 1 3Play Satt Televizia 6 064 10 110 5 720 6 237 9,0%
Source: European Audiovisual Observatory1 Includes telecommunication activities.
EUR thousand.
2004 2005 2006 20082007
0
500 000
400 000
300 000
200 000
100 000
CET 21
CT - Česká Televízia
FTV Prima S.r.o.
HBO Česká Republika S.r.o.Minimax Media s.r.o.
Stanice O A.S.
Operating revenues of main television companies in the Czech Republic 2005-2008 EUR thousand.
T.1.CZ.1G.1.CZ.1
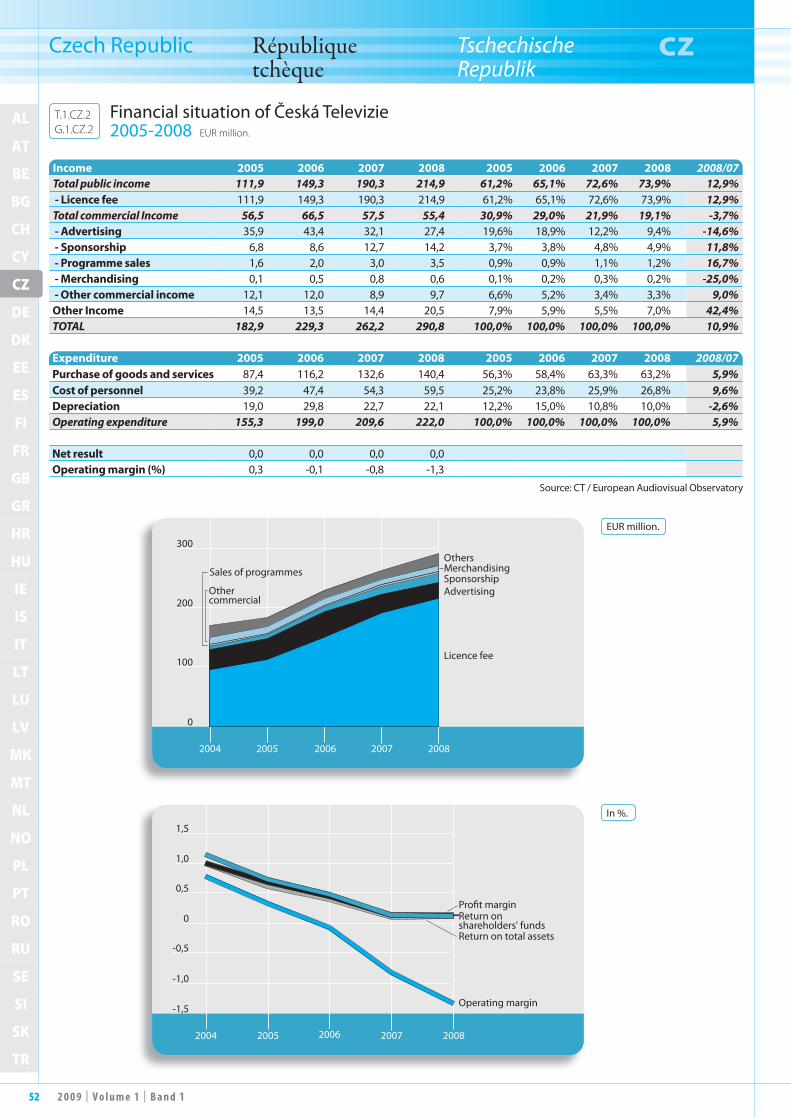
52 2 0 0 9 | V o l u m e 1 | B a n d 1
AL
AT
BE
BG
CH
CY
CZ
DE
DK
EE
ES
FI
FR
GB
GR
HR
HU
IE
IS
IT
LT
LU
LV
MK
MT
NL
NO
PL
PT
RO
RU
SE
SI
SK
TR
CZ
Czech Republic République tchèque
Tschechische Republik
CZ
Source: CT / European Audiovisual Observatory
Income 2005 2006 2007 2008 2005 2006 2007 2008 2008/07Total public income 111,9 149,3 190,3 214,9 61,2% 65,1% 72,6% 73,9% 12,9% - Licence fee 111,9 149,3 190,3 214,9 61,2% 65,1% 72,6% 73,9% 12,9%Total commercial Income 56,5 66,5 57,5 55,4 30,9% 29,0% 21,9% 19,1% -3,7% - Advertising 35,9 43,4 32,1 27,4 19,6% 18,9% 12,2% 9,4% -14,6% - Sponsorship 6,8 8,6 12,7 14,2 3,7% 3,8% 4,8% 4,9% 11,8% - Programme sales 1,6 2,0 3,0 3,5 0,9% 0,9% 1,1% 1,2% 16,7% - Merchandising 0,1 0,5 0,8 0,6 0,1% 0,2% 0,3% 0,2% -25,0% - Other commercial income 12,1 12,0 8,9 9,7 6,6% 5,2% 3,4% 3,3% 9,0%Other Income 14,5 13,5 14,4 20,5 7,9% 5,9% 5,5% 7,0% 42,4%TOTAL 182,9 229,3 262,2 290,8 100,0% 100,0% 100,0% 100,0% 10,9%
Expenditure 2005 2006 2007 2008 2005 2006 2007 2008 2008/07Purchase of goods and services 87,4 116,2 132,6 140,4 56,3% 58,4% 63,3% 63,2% 5,9%Cost of personnel 39,2 47,4 54,3 59,5 25,2% 23,8% 25,9% 26,8% 9,6%Depreciation 19,0 29,8 22,7 22,1 12,2% 15,0% 10,8% 10,0% -2,6%Operating expenditure 155,3 199,0 209,6 222,0 100,0% 100,0% 100,0% 100,0% 5,9%
Net result 0,0 0,0 0,0 0,0Operating margin (%) 0,3 -0,1 -0,8 -1,3
EUR million.
In %.
2004 2005 2006 2007 2008
0
300
200
100
OthersMerchandising
Othercommercial
Sales of programmes
AdvertisingSponsorship
Licence fee
2004 2005 2006 2007 2008
-1,5
1,5
1,0
0,5
0
-0,5
-1,0
Pro�t margin
Return on total assets
Operating margin
Return onshareholders' funds
Financial situation of Česká Televizie 2005-2008 EUR million.
T.1.CZ.2G.1.CZ.2

532 0 0 9 | V o l u m e 1 | B a n d 1
AL
AT
BE
BG
CH
CY
CZ
DE
DK
EE
ES
FI
FR
GB
GR
HR
HU
IE
IS
IT
LT
LU
LV
MK
MT
NL
NO
PL
PT
RO
RU
SE
SI
SK
TR
CZ
Czech Republic République tchèque
Tschechische Republik
CZ
Daily share Prime time (19:00-23:00)Channels 2004 2005 2006 2007 2008 2004 2005 2006 2007 2008CT1 21,5 21,9 21,5 22,7 21,0 21,9 22,0 21,9 24,2 22,2CT2 9,0 7,9 9,3 7,9 7,4 8,2 6,8 8,2 6,3 6,0CT24 0,7 1,3 0,5 0,8CT4 Sport 0,5 0,9 0,4 0,8Czech public channels 30,5 29,8 30,8 31,8 30,6 30,1 28,8 30,1 31,4 29,8TV Nova 42,2 41,1 41,8 39,6 37,8 44,9 42,3 44,9 43,5 42,2Prima 21,1 22,9 20,2 19,1 17,7 20,7 24,4 19,7 18,2 17,7Nova cinema 0,4 0,4Czech private channels 63,3 64,0 62,0 58,7 55,9 65,6 66,7 64,6 61,7 60,3Others 6,2 6,2 7,2 9,5 13,5 4,3 4,5 5,3 6,9 9,9
Source: Eurodata TV Worldwide / ATO - MEDIARESEARCH
Daily share. In %, 4 years +.
Prime time (19:00-23:00). In %, 4 years +.
2004 2005 2006 2007 2008
0
10
30
40
20
50
CT4 Sport
TV Nova
CT1
Prima
CT2
CT24Nova cinema
2008
CT122,2%
Others9,9%
CT26,0% CT24
0,8%
CT4 Sport0,8%TV Nova
42,2%
Novacinema
0,4%
Prima17,7%
TV audience market share in the Czech Republic 2004-2008 In %, 4 years +.
T.1.CZ.3G.1.CZ.3

54 2 0 0 9 | V o l u m e 1 | B a n d 1
AL
AT
BE
BG
CH
CY
CZ
DE
DK
EE
ES
FI
FR
GB
GR
HR
HU
IE
IS
IT
LT
LU
LV
MK
MT
NL
NO
PL
PT
RO
RU
SE
SI
SK
TR
DE
Germany Allemagne Deutschland DE
Germany has the largest television mar-ket in Europe. 37.7 million house-
holds had a TV set at the end of 2008 in Germany, of which 51.7% received tele-vision by cable and 42.4% by satellite. The number of households with access to digi-tal television had reached 54.4% at the end of 2008, according to the figures published by the ALM (Association of State Media Authorities). This is a very competitive market characterised by the existence of a large number of unscrambled channels.The increasing number of channels has led to a steady decline in the viewer ratings of the traditional major channels in recent years. However the two national public service channels (ARD and ZDF) had a combined share of 26.5% in 2008 (down from 27.8% in 2006). Both private channels ProSieben and Sat.1 managed to marginally increase their share, while the shares of VOX and RTL dropped slightly in 2008.Cable represents the most common mode of television distribution, and the digitisa-tion of the network reached 30% at the end of 2008 (almost double that of the year before). The sector has experienced major consolidation in the last few years. There are now just four major operators. Kabel Deutschland, the country’s leading cable operator, had 9.1 million subscribers at the end of 2008, of which approximately 850 000 had digital services. Unity Media (who in recent years took over Ish, Iesy, Tele-Columbus and Arena) had, at the end of 2008, 4.6 million customers, of which 27% had digital cable. A third company is Kabel BW with 2.3m customers at the end of 2008. Orion Cable (with a total of 3.2m subscribers) operates through Telecolum-bus (EWT Multimedia), and also holds some shares in Primacom Cable. In June 2009 Kabel Deutschland announced its interest in buying Primacom and Orion. Germany completed the switch off of ana-logue terrestrial transmission in Decem-ber 2008 (aside from in a few small rural areas) and at the end of 2008, almost 100% of households were covered by digital terrestrial TV. Almost 11% of households depended on DTT as their only means of television reception at the end of 2008, while almost 20% of households have at least one television receiving DTT. Pay-TV remains relatively undeveloped in Germany, largely because the range of free channels is very broad and meets the needs of most German viewers. Football rights are an important driving force for pay tele-vision. In December 2005, Arena, a sub-sidiary of the cable operator Unity Media, acquired the rights to show the Bundesliga for three seasons from 2006/07. Howev-er, after the channel failed to secure the expected 2.5 million subscribers, its losses in the first season amounted to around EUR 158 million. For the following two
L’Allemagne est le plus grand mar-ché télévisuel d’Europe. Il compte
37,7 millions de foyers équipés fin 2008, dont 51,7 % reçoivent la télévision par câble et 42,4 % par satellite. Selon les chiffres publiés par l’ALM (Association des offices régionaux des médias), le taux de foyers avec accès à la télévision numé-rique atteint 54,4 % fin 2008. Il s’agit d’un marché très compétitif, caractérisé par l’existence d’un grand nombre de chaînes en clair.Du fait de l’augmentation du nombre de chaînes, on constate une tendance au déclin progressif de l’audience des grandes chaînes historiques ces dernières années. Toutefois, la part cumulée des deux chaî-nes nationales de service public (ARD et ZDF) est de 26,5 % en 2008 (contre 27,8 % en 2006). La part de marché des deux chaînes privées ProSieben et Sat.1 augmente marginalement alors que celle de VOX et de RTL recule légèrement en 2008.Le câble constitue le premier mode de dis-tribution de la télévision et la numérisation du réseau a atteint 30% fin 2008 (près du double comparé à 2007). Après une forte consolidation ces dernières années, le sec-teur ne compte plus que quatre grands opérateurs. Kabel Deutschland, princi-pal câblo-opérateur du pays, regroupe 9,1 millions d’abonnés fin 2008, dont quelques 850 000 à ses services numéri-ques. Unity Media (qui a racheté Ish, Iesy, Tele-Columbus et Arena) compte, fin 2008, 4,6 millions de clients, dont 27 % pour le câble numérique. La troisième société est Kabel BW, avec 2,3 millions de clients fin 2008. Orion Cable (3,2 millions d’abonnés) fonctionne via Telecolumbus (EWT Multimedia) et détient également des parts dans Primacom Cable. En juin 2009, Kabel Deutschland a annoncé s’intéresser au rachat de Primacom et d’Orion.L’Allemagne a abandonné la transmission analogique terrestre en décembre 2008 (à l’exception de quelques zones rurales limitées) et, fin 2008, presque 100 % des foyers sont couverts par la TNT. Fin 2008, pratiquement 11 % des foyers n’ont que la TNT comme moyen de réception de la télé vision, et presque 20 % disposent au moins d’une télévision recevant la TNT.La télévision à péage reste relativement peu développée en Allemagne, en grande partie car l’offre de chaînes gratuites est très fournie et satisfait la demande d’une majorité de consommateurs allemands. Les droits du football sont un produit d’appel important de la télévision à péa-ge. En décembre 2005, Arena, filiale du câblo-opérateur Unity Media, a acquis les droits de la Bundesliga pour trois saisons à compter de 2006/2007, mais la chaîne n’a pas atteint le nombre escompté de 2,5 millions d’abonnés, de sorte que dès
Deutschland ist der größte Fernseh-markt in Europa. Von den insge-
samt 37,7 Mio. Fernsehhaushalten Ende 2008 empfingen 51,7 % Fernsehen über Kabel und 42,4 % per Satellit. Laut ALM (Arbeitsgemeinschaft der Landesmedi-enanstalten) hatten Ende 2008 54,4 % der Haushalte Zugang zum Digital-fernsehen). Es handelt sich um einen stark umkämpften Markt, der von einer großen Zahl unverschlüsselt verbreiteter Sender geprägt ist.Aufgrund der steigenden Zahl von Sen-dern lassen sich in den letzten Jahren tendenziell sinkende Zuschauerzahlen bei den großen etablierten Sendern beo-bachten. Allerdings verfügten die beiden öffentlich-rechtlichen Sender (ARD und ZDF) 2008 über einen gemeinsamen Marktanteil von 26,5% (gegenüber 27,8% 2006). Die beiden Privatsender Pro Sieben und Sat.1 konnten ihren Marktanteil leicht verbessern, während VOX und RTL leich-te Verluste hinnehmen mussten. Das Kabel ist die wichtigste Verbrei-tungsart für das Fernsehen, und die Digi-talisierung des Netzes lag Ende 2008 bei 30 % (fast doppelt so viel wie 2007). Die Branche hat in den vergangenen Jahren eine deutliche Konsolidierung erlebt. So gibt es nur noch vier große Betreiber. Der größte, Kabel Deutschland, hatte Ende 2008 9,1 Mio. Abonnenten, davon ca. 850 000 für digitale Dienste. Die Unity Media (die in den vergangenen Jahren Ish, Iesy, Tele-Columbus und Arena über-nommen hat), hatte Ende 2008 4,6 Mio. Kunden, davon 27 % mit digitalem Kabelanschluss. Das dritte Unterneh-men ist Kabel BW mit 2,3 Mio. Kunden Ende 2008. Orion Cable (mit insgesamt 3,2 Mio. Kunden) agiert über die Unter-nehmensgruppe Telecolumbus (EWT Multimedia) und hält auch Anteile am Kabelnetzbetreiber Primacom. Im Juni 2009 hat Kabel Deutschland sein Interesse an einer Übernahme von Primacom und Orion verkündet. Deutschland hat die Abschaltung der ter-restrischen analogen Übertragung (bis auf einige wenige ländliche Gebiete) im Dezem-ber 2008 abgeschlossen und Ende 2008 lag die Abdeckung des digitalen Antennen-fernsehens bei nahezu 100 % der Haus-halte. Ende 2008 waren knapp 11 % der Haushalte auf DVB-T als einzige Fernseh-quelle angewiesen, während knapp 20 % der Haushalte mindestens über einen Fern-seher mit DVB-T-Empfang verfügten.Das Bezahlfernsehen ist in Deutschland nach wie vor relativ wenig entwickelt. Zum Großteil ist dies auf ein sehr umfang-reiches Angebot an frei empfangbaren Sendern zurückzuführen, das den mei-sten deutschen Zuschauern ausreicht. Ein wichtiger Motor für das Bezahlfernsehen sind Fußballrechte. Im Dezember 2005 erhielt Arena, ein Tochterunternehmen

552 0 0 9 | V o l u m e 1 | B a n d 1
AL
AT
BE
BG
CH
CY
CZ
DE
DK
EE
ES
FI
FR
GB
GR
HR
HU
IE
IS
IT
LT
LU
LV
MK
MT
NL
NO
PL
PT
RO
RU
SE
SI
SK
TR
DE
Germany Allemagne Deutschland DE
seasons, the broadcasting rights were sub-licensed to pay-TV operator Premiere so that it could show Bundesliga matches. The Federal Competition Authority authorised Premiere’s acquisition of the pay-TV rights and agreed to tolerate col-laboration between the former competi-tors until 30 June 2009. The ArenaSat ser-vice had 191,000 subscribers at the end of 2008 (down from 334,000 a year earlier).In June 2008, the European Commission cleared under the EU Merger Regulation the proposed acquisition of Germany’s pay-TV operator Premiere AG by News Corporation (News Corp) of the US, subject to commitments which ensure third party access to Premiere’s satellite platform. At the end of 2007, 3.65 mil-lion German households were customers of the subscription-based Premiere service, available via satellite and cable, according to company statements. However in Octo-ber 2008, it was revealed that the assess-ment of subscriptions was almost one mil-lion less than the revealed figure, causing a crash in the value of Premiere shares. In July 2009, the Premiere satellite pack-age was rebranded as “Sky Deutschland”, with the Premiere channels rebranded as Sky channels. A third DTH service was launched in June 2009 (“Alles Sehen TV”), which offers three Pay-TV packages and delivers many of the cable channels in the Kabelkiosk package.In October 2007, former media magnate Leo Kirch completed a deal with the DFL to market the Bundesliga rights for six seasons starting in 2009. Following an investigation of this deal by the Federal Cartel Authority (Bundeskartellamt) the deal collapsed in October 2008. The DFL then challenged this decision in court and the case started in August 2009. In the meantime, in November 2008, the rights for 2009-2012 were allocated. The pay-TV rights went to Premiere (now Sky Deutschland), with highlights shared between the two main public service broadcasters and DSF (DSF also has some live matches). Deutsche Telekom was allo-cated IPTV and mobile broadcast rights. There are three IPTV services compet-ing in the German market: T-Entertain (Deutsche Telekom), Alice Home TV (Alice/HanseNet) and Arcor Digital-TV (Arcor). At the end of 2008, Deutsche Telekom claimed to have almost 500 000 subscribers to its IPTV service. In general, IPTV services were being accessed in 0.8% of households at the end of 2008 (up from 0.3% the year before), according to the 2009 report of the ALM. Mobile television has not so far had a suc-cessful history in Germany. In January 2008, the German regulatory authorities officially awarded the licence to use the DVB-H platform to the company Mobile 3.0 (joint venture between Mobiles Fernsehen
la première saison, ses pertes s’élevaient à environ 158 millions EUR. Pour les deux saisons suivantes, les droits de diffusion ont été transférés à Premiere contre une rétro-licence payante permettant à ses abonnés d’accéder aux retransmissions des matchs de la Bundesliga. L’Office fédéral de contrôle de la concurrence a autorisé la reprise des droits de télévision à péage par Premiere et tolère la collaboration des ex-concurrentes jusqu’au 30 juin 2009. Le service ArenaSat compte 191 000 abonnés fin 2008 (contre 334 000 l’année précé-dente).En juin 2008, la Commission euro péenne a autorisé le projet d’acquisition de Premiere AG par la société américaine News Corporation (News Corp), sous réser ve d’engagements garantissant l’accès des tiers à la plate-forme satelli-taire Premiere. Selon Premiere, fin 2007, 3,65 millions de foyers allemands auraient été abonnés au bouquet payant de Pre-miere, distribué par satellite et par câble. Cependant, en octobre 2008, le nombre d’abonnés s’est révélé être inférieur de près d’un million, ce qui a causé une chute du cours des parts de Premiere. En juillet 2009, la plate-forme satellitaire Premiere est renommée « Sky Deutschland », les chaînes Premiere s’appelant chaînes Sky. Un troisième service DTH est lancé en juin 2009 (« Alles Sehen TV ») : il pro-pose trois bouquets de télévision à péage et transmet de nombreuses chaînes du câble du bouquet Kabelkiosk.En octobre 2007, l’ancien magnat des médias Leo Kirch a passé un accord avec la DFL pour six saisons à compter de 2009. Suite à une enquête de l’office fédéral des cartels, cet accord a été annulé en octobre 2008. La DFL a porté l’affaire devant les tribunaux en août 2009. Entre-temps, les droits pour 2009-2012 ont été attribués en novembre 2008. Les droits pour la télévision à péage sont revenus à Premiere (désormais Sky Deutschland), les événe-ments importants étant partagés entre les deux principales chaînes de service public et DSF (DSF dispose également de certains matchs en direct). Deutsche Telekom a gagné les droits pour la diffu-sion par IPTV et par mobile.Trois services IPTV sont en concurrence sur le marché allemand : T-Entertain (Deutsche Telekom), Alice Home TV (Alice/HanseNet) et Arcor Digital-TV (Arcor). Fin 2008, Deutsche Telekom annonce quelque 500 000 abonnés à son service IPTV. Globalement, les services IPTV sont disponibles dans 0,8 % des foyers fin 2008 (en progression de 0,3 % sur un an), selon le rapport 2009 de l’ALM.Pour l’instant, la télévision mobile ne rencontre pas de succès en Allemagne. En janvier 2008, les autorités de régulation allemandes ont officiellement attribué la
des Kabelnetzbetreibers Unity Media, den Zuschlag für die Übertragungsrechte der Fußball-Bundesliga für die Dauer von drei Spielzeiten ab 2006/2007. Allerdings kam der Sender nicht auf die erwartete Zahl von 2,5 Mio. Abonnenten, und bereits in der ersten Spielzeit bezifferten sich seine Verluste auf 158 Mio. EUR. Für die beiden ausstehenden Spielzeiten wurden daher die Senderechte wieder auf den Pay-TV-Anbieter Premiere übertra-gen; Arena erhielt im Gegenzug von Pre-miere eine kostenpflichtige Rücklizenz, damit seine Abonnenten die auf Premiere ausgestrahlten Bundesligaspiele verfol-gen können. Das Bundeskartellamt hatte keine Einwände gegen die Übertra-gung der Pay-TV-Rechte auf Premiere und duldete die Zusammenarbeit der bei-den ehemaligen Konkurrenten bis zum 30. Juni 2009. Ende 2008 hatte Arena-Sat 191 000 Abonnenten (gegenüber 334 000 im Vorjahr).Im Juni 2008 hat die Europäische Kom-mission die geplante Übernahme des deut-schen Pay-TV-Anbieters Premiere durch die US-amerikanische News Corporation (News Corp) unter Auflagen genehmigt, die garantieren, dass andere Anbieter weiterhin Zugang zur Satellitenplattform von Premiere haben. Ende 2007 hatten nach Unternehmensangaben 3,65 Mio. Haushalte in Deutschland das über Kabel und Satellit verbreitete kostenpflichti-ge Bouquet von Premiere abonniert. Im Oktober 2008 wurde allerdings bekannt, dass die Zahl der Abonnenten fast eine Million niedriger ist, was zu einem Kurs-sturz der Premiere-Aktien führte. Im Juli 2009 wurde das Premiere-Paket in „Sky Deutschland“ und die Premiere-Kanäle in Sky-Kanäle umbenannt. Ein dritter DTH-Dienst („Alles Sehen TV“) wur-de im Juni 2009 gestartet und bietet drei Pay-TV-Pakete an. Viele der Kabel-programme werden über das Kabelkiosk-Paket ausgestrahlt.Im Oktober 2007 traf der ehemalige Medienmogul Leo Kirch mit der DFL eine Vereinbarung über die Zentralver-marktung der Fernsehrechte ab 2009. Nach einem Prüfungsverfahren durch das Bundeskartellamt platzte dieser Deal im Oktober 2008. Die DFL legte gegen diese Entscheidung Beschwerde ein, der Fall wurde ab August 2009 verhandelt. In der Zwischenzeit (November 2008) wur-den die Rechte für 2009-2012 vergeben. Die Pay-TV-Rechte gingen an Premiere (heute Sky Deutschland), die Rechte für Zusammenfassungen an ARD/ZDF und DSF (DSF hat dazu einige Live-Spiele). Die IPTV- und Mobilfunkrechte gingen an die Deutsche Telekom. Auf dem deutschen Markt sind drei IPTV-Dienste vertreten: T-Entertain (Deutsche Telekom), Alice Home TV (Alice/Hanse-Net) und Arcor Digital-TV (Arcor). Ende

56 2 0 0 9 | V o l u m e 1 | B a n d 1
AL
AT
BE
BG
CH
CY
CZ
DE
DK
EE
ES
FI
FR
GB
GR
HR
HU
IE
IS
IT
LT
LU
LV
MK
MT
NL
NO
PL
PT
RO
RU
SE
SI
SK
TR
DE
Germany Allemagne Deutschland DE
Deutschland (MFD) and Neva Media). However, in October 2008, the authorities requested the return of the license claim-ing that Mobile 3.0 had failed to realise the concept proposed in the tender. In June 2007, ProSiebenSat1 Media AG bought the SBS group for EUR 3.3 billion. The new group controls 26 free TV chan-nels, 24 pay-TV channels and 22 radio stations spread across 13 countries. It is therefore the largest operator of free tele-vision in Germany.Further amendments have been made to the German Inter-State Broadcasting Treaty. At the beginning of March 2008, the Minister-Presidents of the Länder agreed to increase the audiovisual licence fee for the period 2009 to 2012. Based on a proposal by the Kommission zur Ermittlung des Finanzbedarfs der Rundfunkanstalten (Commission on the analysis of the financial needs of broadcasting bodies – KEF) and dialogue with the broadcasters, the television licence will cost EUR 17.98, a rise of EUR 0.95. This repre-sents the main element of the 11th amend-ment to the Inter-State Broadcasting Treaty. The 12th amendment entered into force in June 2009. The most significant aspect of this amendment is introducing the requirement for public service broad-casters to introduce a “three step test” before launching new telemedia services. Several of the public service broadcasters have already developed and implement-ed such tests. A draft 13th amendment to the Treaty has also been published in 2009. This will deal with, among other things, product placement, which will be permitted in German television but lim-ited and regulated according to the Audio-visual Media Services Directive.
licence d’exploitation de la plate-forme DVB-H à l’entreprise Mobile 3.0 (joint- venture entre Mobiles Fernsehen Deuts-chland (MFD) et Neva Media). Cepen-dant, en octobre 2008, ces autorités ont annulé l’attribution de licence au prétexte que Mobile 3.0 a échoué dans la réalisa-tion du concept proposé lors de l’appel d’offre.En juin 2007, ProSiebenSat1 Media AG a racheté le groupe SBS pour un montant de 3,3 milliards EUR. Le nouveau groupe contrôle 26 chaînes de télévision gratuite, 24 chaînes à péage et 22 stations de radio réparties dans 13 pays. Il constitue ainsi le principal opérateur de télévision gratuite en Allemagne.D’autres amendements ont été appor-tés au traité inter-Länder sur la radio- diffusion. Début mars 2008, les ministres- présidents des Länder se sont mis d’accord sur l’augmentation de la redevance audiovi-suelle pour la période 2009-2012. Sur la base d’une proposition de la Kommis-sion zur Ermittlung des Finanzbedarfs der Rundfunkanstalten (Commission d’étude des besoins financiers des orga-nismes de radiodiffusion - KEF) et de la concertation avec les organismes de radio-diffusion, la redevance télévisée passera à 17,98 EUR par mois, soit une augmenta-tion de 0,95 EUR.Il s’agit du principal élément du 11ème amendement au traité inter-Länder sur la radiodiffusion. Le 12ème amendement est entré en vigueur en juin 2009. Son aspect le plus significatif est l’introduction de l’exigence imposée aux radiodiffuseurs de service public d’introduire un “test en trois étapes” avant de lancer de nouveaux services de télémedia. Plusieurs radio-diffuseurs de service public ont déjà déve-loppé et mis en œuvre ces tests. Un projet de 13ème amendement au traité a égale-ment été publié en 2009. Il concernera, entre autres, le placement de produit, qui sera autorisé à la télévision allemande mais de façon limitée et réglementée, confor-mément à la Directive Services de médias audiovisuels.
2008 hatte die Deutsche Telekom nach eigenen Angaben fast 500 000 Abon-nenten für ihren IPTV-Dienst. Laut Jahres bericht 2009 der ALM wurden 2008 in 0,8 % der Haushalte IPTV-Dienste genutzt (gegenüber 0,3 % im Vorjahr). Das mobile Fernsehen ist in Deutschland bislang noch nicht sehr erfolgreich. Im Januar 2008 erteilte die deutsche Regulie-rungsbehörde offiziell dem Unternehmen Mobile 3.0 (einem Jointventure zwischen Mobiles Fernsehen Deutschland (MFD) und Neva Media) die Betriebslizenz für die DVB-H-Plattform. Diese Lizenz wurde allerdings im Oktober 2008 mit der Begründung widerrufen, Mobile 3.0 habe das im Rahmen der Ausschreibung vorgelegte Konzept nicht umgesetzt.Im Juni 2007 hat die ProSiebenSat.1 Media AG die SBS-Gruppe für einen Betrag von 3,3 Mrd. EUR übernommen. Die neue Gruppe kontrolliert 26 frei emp-fangbare Fernsehsender, 24 Bezahlsender und 22 Radiostationen in 13 Ländern. Damit ist sie wichtigster Betreiber frei empfangbarer Fernsehsender in Deutsch-land.Am Rundfunkstaatsvertrag wurden weitere Änderungen vorgenommen. Anfang März 2008 haben sich die Mini-sterpräsidenten der Bundesländer auf eine Erhöhung der Rundfunkgebühren für den Zeitraum 2009 bis 2012 verständigt. Auf der Grundlage eines Vorschlags der Kom-mission zur Ermittlung des Finanzbedarfs der Rundfunkanstalten (KEF) und nach Absprache mit den Rundfunkveranstal-tern wird die Fernsehgebühr um 0,95 EUR auf 17,98 EUR pro Monat erhöht. Dies ist der Kern des 11. Rundfunkstaatsvertrags. Die 12. Änderung ist im Juni 2009 in Kraft getreten. Wichtigster Punkt ist hier die Einführung des „Drei-Stufen-Tests“ für die öffentlich-rechtlichen Sender zur Legitimierung neuer Online-Angebote (Telemedien). Viele dieser Sender haben bereits solche Tests entwickelt und einge-führt. Ein Entwurf für die 13. Änderung wurde auch bereits 2009 veröffentlicht. Gegenstand dieser Änderung ist unter anderem das Product Placement, das im deutschen Fernsehen im Rahmen der Vor-gaben der Richtlinie über audiovisuelle Mediendienste erlaubt werden soll.
Sources: Arbeitsgemeinschaft der Landesmedienanstalten (ALM) Yearbook 2009: http://www.alm.de Kommission zur Ermittlung der Konzentration im Medienbereich: http://www.kek-online.de Information on the development of DTT: http://www.ueberallfernsehen.de Audience data: http://www.agf.de; http://www.gfk.com Legal aspects: IRIS Merlin, http://merlin.obs.coe.int General information: http://www.digitalfernsehen.de

572 0 0 9 | V o l u m e 1 | B a n d 1
AL
AT
BE
BG
CH
CY
CZ
DE
DK
EE
ES
FI
FR
GB
GR
HR
HU
IE
IS
IT
LT
LU
LV
MK
MT
NL
NO
PL
PT
RO
RU
SE
SI
SK
TR
DE
Germany Allemagne Deutschland DE
Population and equipment 31.12.08Penetration
(in % HH) In thousand SourcesPopulation (inhabitants) – 82 218 Eurostat (as at 1.1.2008)
Households – 39 722 Eurostat (as at 1.1.2008)
TV households 94,2% 37 412 TNS (as at June 2009)
Cable TV households 49,6% 19 700 Screen Digest / European Audiovisual Observatory
Digital cable TV households 8,4% 3 326 Screen Digest / European Audiovisual Observatory
DTH/SMATV households 42,1% 15 750 TNS / European Audiovisual Observatory (at June 2009)
Dig. DTH/SMATV households 31,2% 11 673 TNS / European Audiovisual Observatory (at June 2009)
Pay DTH/SMATV households 2,9% 1 134 Screen Digest / European Audiovisual Observatory
IPTV subscriptions 1,1% 438 Screen Digest / European Audiovisual Observatory
Installed DVB-T receivers 10,4% 4 130 Screen Digest / European Audiovisual Observatory
Total digital TV households 54,4% 21 608 ALM - Association of State Media Authorities
Households with PC 77,0% 30 592 Screen Digest / European Audiovisual Observatory
Households with broadband connections 49,6% 19 710 Screen Digest / European Audiovisual Observatory
Mobile phone TV subscriptions – 334 Screen Digest
Mobile broadcast TV subscriptions – 214 Screen Digest
TV channels distributors 11.09 Companies
Cable operators >100 EWT Multimedia, Kabel Baden-Württemberg, Kabeldeutschland, Orion Cable, Primacom, Unity Media,…
Satellite packagers 4 Allessehen, Arena Sport, Kabeldeutschland, Sky DeutschlandIPTV packagers 3 Arcor (Vodafone), Deutsche Telekom (T-Home), Hansenet (Alice)DTT multiplex operators 10 Media Broadcast and 9 ARD regional stationsMobile phone TV packagers 2 Mobile 3.0, T-MobileMobile brodcast TV packagers 0 Mobile 3.0 closed down in July 2009, T-Mobile to launch an offer in 2010
Number of TV channels by kind of licence 10.09 Public Private TotalTerrestrial (national) 6 15 21Cable/Satellite/IPTV/Mobile 8 185 193Regional/Local 10 110 120Regional/Local windows 22 14 36Channels targeting foreign markets 7 23 30Total 53 347 400Foreign channels targeting the country 2 73 75
Supply of TV channels by genre and by platform (including foreign channels) 10.09
Digital terrestrial
Berlin
Cable Kabel
DeutschlandCable
Unity Media
Satellite Sky
Deutschland
IPTV Deutsche Telekom
T entertainmentGeneralist - national 9 13 15 17Generalist - foreign 14 18Adult 4 2 3 1Children 2 11 3 8 8Culture/ education/ documentary 4 12 10 5 11Minority interest groups 2 4 1Entertainment/ TV fiction/ games 2 12 18 11 12Film 9 8 11 8Home shopping 2 7 10 2International linguistic and cultural 1 14 9 1Lifestyle/ specific leisure/ travel 6 8 2 6Music 1 15 11 3 10News/ business 4 23 22 10Parliament/ government/ administrationRegional/ local 8 5Religion 1 2 3 2Sports 3 10 11 9 12Various 2 3 1 3Total 37 156 160 53 104
Basic figures

58 2 0 0 9 | V o l u m e 1 | B a n d 1
AL
AT
BE
BG
CH
CY
CZ
DE
DK
EE
ES
FI
FR
GB
GR
HR
HU
IE
IS
IT
LT
LU
LV
MK
MT
NL
NO
PL
PT
RO
RU
SE
SI
SK
TR
DE
Germany Allemagne Deutschland DE
Source: European Audiovisual Observatory on the basis of data from Screen Digest, WARC, GEZ, Deutschlandradio
Source: European Audiovisual Observatory
Source: Screen DigestSource: Screen Digest
Households TV equipment 2004-2008
Number of households accessing multichannel platforms as at 31.12.2008
Consumers pay-TV gross spend 2004-2008
Gross revenues of radio-television 2004-2008
In thousands.
In thousands.
EUR thousand.
EUR million.
2004 2005 2006 2007 2008
0
20 000
15 000
10 000
5 000
Cable households
Satellite households
DTT households
IPTV households
20 000 20 000 19 800 19 700 19 700
15 670
900
10 48 104 190 438
1 122
1 942
3 968 4 130
16 570 16 920 16 910 17 021
Kabel Deutsc
hlandDVB-T
Sky Deutsc
hland
Zattoo
Primaco
m
T-Home e
st.
Unity M
edia
Arena Sat
Hansenet
0
8 000
6 000
4 000
2 000
10 000
9 013
4 130
1 0861 2201 000
700 630191
30
DTT
IPTV
Sat
PC
Cable
2004 2005 2006 2007 2008
0
3 000 000
2 000 000
1 000 000
Cable TV
Satellite
IPTV
2 716 845
59 458
2 176 850
2 168 554
2 271 347
2 508 623
936 984
97
1 085 625
900 090
608 585
610 692
481 4 878 20 184
2004 2005 2006 2007 2008
0
8 000
6 000
4 000
2 000
Public funding
TV adspend
Consumerspay-TV spend
Radio adspend
6 859
4 289
3 114
687
7 127
4 366
3 255
737
3 176
756
3 137
826
3 387
790
7 291
4 571
7 304
4 6184 484
7 265
Market trends

592 0 0 9 | V o l u m e 1 | B a n d 1
AL
AT
BE
BG
CH
CY
CZ
DE
DK
EE
ES
FI
FR
GB
GR
HR
HU
IE
IS
IT
LT
LU
LV
MK
MT
NL
NO
PL
PT
RO
RU
SE
SI
SK
TR
DE
Germany Allemagne Deutschland DE
1 Operating revenues include telecommunication and other activities.2 Since August 2009 the Tele Columbus and PrimaCom services are the same.
Main broadcasters Channels 2005 2006 2007 2008 2008/07ZDF sptv ZDF, Kinderkanal, Phoenix, … 2 062 1 966 1 927 1 922 -0,3%RTL Television GmbH adtv RTL 1 660 1 706 1 693 1 704 0,6%WDR - Westdeutscher Rundfunk sptv WDR Fernsehen 1 258 1 298 1 311 1 293 -1,4%SWR - Südwestrundfunk sptv Südwest Fernsehen 1 051 1 081 1 096 1 099 0,3%NDR - Norddeutscher Rundfunk sptv NDR Fernsehen 1 030 1 042 1 042 1 050 0,8%Premiere Fernsehen GmbH packtv Premiere 1 107 1 001 962 ~ ~BR - Bayerischer Rundfunk sptv Bayerisches Fernsehen 928 957 955 928 -2,8%Sat.1 Satellitenfernsehen GmbH adtv Sat.1 866 886 841 ~ ~ProSieben Fernsehen GmbH adtv Pro 7 761 743 777 ~ ~QVC Deutschland GmbH (cons.) est. hstv QVC 629 674 634 654 3,2%
MDR - Mitteldeutscher Rundfunk sptv MDR Fernsehen 615 646 622 630 1,3%HR - Hessischer Rundfunk sptv HR Fernsehen 447 449 459 452 -1,5%Vox Film- und Fernseh- GmbH & Co. Kg adtv Vox 348 400 450 ~ ~
RBB - Rundfunk Berlin Brandenburg sptv rbb Fernsehen 381 394 393 392 -0,3%
Home Shopping Europe AG hstv HSE 305 286 320 ~ ~DW - Deutsche Welle sptv Deutsche Welle 312 295 289 300 3,4%Kabel 1 K1 Fernsehen GmbH adtv Kabel 1 224 257 ~ ~ ~RTL 2 Fernsehen GmbH & Co. Kg adtv RTL 2 279 249 ~ ~ ~The Walt Disney Company (Germany) GmbH thtv Disney Channel ~ 162 222 ~ ~
SuperRTL Disney Fernsehen GmbH & Co. Kg thtv Super RTL 154 163 168 ~ ~
DSF Deutsches Sportfernsehen GmbH thtv DSF 114 116 114 110 -3,3%
RTL Shop GmbH hstv RTL shop 91 100 ~ ~ ~N 24 GmbH thtv N 24 86 92 99 ~ ~Neun Live Fernsehen GmbH thtv Neun Live ~ ~ ~ ~ ~RB - Radio Bremen sptv Radio Bremen TV 66 75 91 91 0,0%SR - Saarländischer Rundfunk sptv SR Südwest Fernsehen 82 83 85 87 2,4%1-2-3.TV GmbH thtv 1-2-3 TV 33 66 78 ~ ~
Main distributors Services Packages 2005 2006 2007 2008 2008/07Deutsche Telekom AG (uncons.) 1 3Play T-Home 27 413 24 993 23 686 23 541 -0,6%
Unitymedia GmbH (cons.) 1 3Play Unitymedia Digital TV 366 870 1 058 1 221 15,4%T-Mobile Deutschland GmbH 1 3G TV Mobile TV 9 023 8 780 ~ ~ ~Kabel Deutschland GmbH 1 3Play Kabel Deutschland 1 021 1 024 1 106 1 209 9,3%Hansenet Telekommunikation GmbH 1 3Play Alice TV 308 554 1 150 1 190 3,5%
Kabel Baden-Württemberg GmbH 1 3Play KabelBW 261 294 357 438 22,6%
Arena Sport Rechte und Marketing GmbH 1 Sat-TV ArenaSat – 82 320 364 14,0%
Orion Cable GmbH 1 3Play Tele Colombus Digital Fernsehen 2 ~ 348 ~ ~ ~
Primacom AG (cons.) 1 3Play PrimaCom Digital Fernshen 2 329 119 117 ~ ~
Operating revenues of main television companies in Germany 2005-2008 EUR million.
T.1.DE.1G.1.DE.1

60 2 0 0 9 | V o l u m e 1 | B a n d 1
AL
AT
BE
BG
CH
CY
CZ
DE
DK
EE
ES
FI
FR
GB
GR
HR
HU
IE
IS
IT
LT
LU
LV
MK
MT
NL
NO
PL
PT
RO
RU
SE
SI
SK
TR
DE
Germany Allemagne Deutschland DE
Source: European Audiovisual Observatory
2004 2005 2006 2007 2008
0
2 500
2 000
1 500
1 000
500
Sat.1 Satellitenfernsehen GmbHProSieben Fernsehen GmbH
RTL Television
ZDF
WDRPremiere Fernsehen GmbH SWR
NDRBR
QVC Deutschland GmbH
Operating revenues of main television companies in Germany (Continued) 2005-2008 EUR million.
T.1.DE.1G.1.DE.1

612 0 0 9 | V o l u m e 1 | B a n d 1
AL
AT
BE
BG
CH
CY
CZ
DE
DK
EE
ES
FI
FR
GB
GR
HR
HU
IE
IS
IT
LT
LU
LV
MK
MT
NL
NO
PL
PT
RO
RU
SE
SI
SK
TR
DE
Germany Allemagne Deutschland DE
Source: ARD / European Audiovisual Observatory
Income 2005 2006 2007 2008 2005 2006 2007 2008 2008/07Total public income 5 119 309 5 229 049 5 241 141 5 215 933 86,1% 86,3% 86,3% 86,3% -0,5% - Licence fee 5 119 309 5 229 049 5 241 141 5 215 933 86,1% 86,3% 86,3% 86,3% -0,5%Total commercial income 808 192 768 782 787 719 777 968 13,6% 12,7% 13,0% 12,9% -1,2% - Advertising 247 726 264 166 268 350 275 285 4,2% 4,4% 4,4% 4,6% 2,6% - Other commercial income 560 466 504 616 519 369 502 583 9,4% 8,3% 8,5% 8,3% -3,2%Other income 21 497 58 437 46 410 49 843 0,4% 1,0% 0,8% 0,8% 7,4%
TOTAL 5 948 998 6 056 268 6 075 270 6 043 744 100,0% 100,0% 100,0% 100,0% -0,5%
Expenditure 2005 2006 2007 2008 2005 2006 2007 2008 2008/07Purchase of goods and services 3 503 651 3 722 690 3 691 919 3 975 568 60,6% 62,4% 63,4% 65,0% 7,7%Costs of personnel 1 970 862 1 943 096 1 820 054 1 844 683 34,1% 32,6% 31,3% 30,2% 1,4%Depreciation 303 920 302 934 308 425 293 125 5,3% 5,1% 5,3% 4,8% -5,0%Operating expenditure 5 778 433 5 968 720 5 820 398 6 113 376 100,0% 100,0% 100,0% 100,0% 5,0%
Net result 240 909 130 732 315 724 -100 909 -132,0%Operating margin (%) 2,17 0,93 3,86
EUR thousand.
In %.
2004 2005 2006 2007 2008
0
70 000
60 000
50 000
40 000
30 000
20 000
10 000
Licence fee
AdvertisingOther commercialOthers
2004 2005 2006 2007 2008
-5
15
20
10
5
0
Return on total assets
Pro�t marginOperating margin
Return on shareholders' funds
ARD financial situation 2005-2008 EUR thousand.
T.1.DE.2G.1.DE.2

62 2 0 0 9 | V o l u m e 1 | B a n d 1
AL
AT
BE
BG
CH
CY
CZ
DE
DK
EE
ES
FI
FR
GB
GR
HR
HU
IE
IS
IT
LT
LU
LV
MK
MT
NL
NO
PL
PT
RO
RU
SE
SI
SK
TR
DE
Germany Allemagne Deutschland DE
Source: ZDF / European Audiovisual Observatory
Income 2005 2006 2007 2008 2005 2006 2007 2008 2008/07Total public income 1 620 474 1 668 931 1 668 550 1 655 475 78,6% 84,9% 86,6% 86,1% -0,8% - Licence fee 1 620 474 1 668 931 1 668 550 1 655 475 78,6% 84,9% 86,6% 86,1% -0,8%Total commercial income 247 447 263 659 248 575 259 164 12,0% 13,4% 12,9% 13,5% 4,3% - Advertising 121 448 154 973 132 873 139 902 5,9% 7,9% 6,9% 7,3% 5,3% - Other commercial income 125 999 108 686 115 702 119 262 6,1% 5,5% 6,0% 6,2% 3,1%Other revenues 193 681 33 031 10 093 7 785 9,4% 1,7% 0,5% 0,4% -22,9%
TOTAL 2 061 601 1 965 622 1 927 218 1 922 424 100,0% 100,0% 100,0% 100,0% -0,2%
Expenditure 2005 2006 2007 2008 2005 2006 2007 2008 2008/07Purchase of goods and services 1 547 737 1 516 796 1 432 571 1 571 593 80,4% 80,2% 78,1% 80,4% 9,7% Costs of employees 329 416 319 423 356 678 338 052 17,1% 16,9% 19,4% 17,3% -5,2%Depreciation 48 073 54 301 45 638 44 105 2,5% 2,9% 2,5% 2,3% -3,4%Operating expenditure 1 925 226 1 890 521 1 834 887 1 953 750 100,0% 100,0% 100,0% 100,0% 6,5%
Net result 121 311 53 508 86 862 -36 737 -142,3%Operating margin (%) 6,6% 3,8% 4,8% -1,63
EUR thousand.
In %.
2004 2005 2006 2007 2008
0
2 500 000
2 000 000
1 500 000
1 000 000
500 000
Licence fee
Other commercialAdvertising
Other revenues
2004 2005 2006 2007 2008
-5
15
25
20
10
5
0 Pro�t marginOperating margin
Return onshareholders' funds
Return on total assets
ZDF financial situation 2005-2008 EUR thousand.
T.1.DE.3G.1.DE.3

632 0 0 9 | V o l u m e 1 | B a n d 1
AL
AT
BE
BG
CH
CY
CZ
DE
DK
EE
ES
FI
FR
GB
GR
HR
HU
IE
IS
IT
LT
LU
LV
MK
MT
NL
NO
PL
PT
RO
RU
SE
SI
SK
TR
DE
Germany Allemagne Deutschland DE
Source: ProSiebenSat.1 Media AG / European Audiovisual Observatory
Income 2005 2006 2007 2008 2005 2006 2007 2008 2008/07Advertising 1 836,1 1 876,0 2 289,2 2 468,1 92,3% 89,5% 84,7% 80,8% 7,8%Barter deals 26,3 24,0 29,4 35,5 1,3% 1,1% 1,1% 1,2% 20,7%Others 127,2 195,1 384,0 550,6 6,4% 9,3% 14,2% 18,0% 43,4%Total 1 989,6 2 095,1 2 702,5 3 054,2 100,0% 100,0% 100,0% 100,0% 13,0%Operating revenues 2 004,0 2 216,7 2 727,2 3 117,5 14,3%
Expenditure 2005 2006 2007 2008 2005 2006 2007 2008 2008/07Purchase of goods and services est. 1 372,9 1 396,9 1 874,3 2 055,0 84,7% 83,5% 80,3% 72,1% 9,6%
Cost of employees 212,6 235,5 323,6 444,2 13,1% 14,1% 13,9% 15,6% 37,3%Depreciation and amortisation 34,8 40,0 137,0 351,8 2,1% 2,4% 5,9% 12,3% 156,8%Operating expenditure 1 620,3 1 672,4 2 334,9 2 851,0 100,0% 100,0% 100,0% 100,0% 22,1%
Net result 221,6 243,9 96,2 -125,5 -230,5%Operating margin (%) 19,2 21,0 14,1 8,6
EUR thousand.
In %.
2004 2005 2006 2007 2008
0
4 000
3 000
2 000
1 000
Advertising
Barter dealsOthers
2004 2005 2006 2007 2008
-20
20
40
30
10
0
-10
Operating margin
Pro�t margin
Return on total assets
Return on shareholders' funds
ProSiebenSat.1 Media AG financial situation 2005-2008 EUR million.
T.1.DE.4G.1.DE.4

64 2 0 0 9 | V o l u m e 1 | B a n d 1
AL
AT
BE
BG
CH
CY
CZ
DE
DK
EE
ES
FI
FR
GB
GR
HR
HU
IE
IS
IT
LT
LU
LV
MK
MT
NL
NO
PL
PT
RO
RU
SE
SI
SK
TR
DE
Germany Allemagne Deutschland DE
Channels 2004 2005 2006 2007 2008ARD 1 13,9 13,5 14,2 14,6 13,4ARD III 13,7 13,6 13,5 15,7 13,2ZDF 13,6 13,5 13,6 14,3 13,13sat 1,0 1,0 1,0 1,0 1,1KI.KA 1,2 1,2 1,1 0,6 1,3PHOENIX 0,5 0,6 0,7 0,6 0,9ARTE 0,4 0,5 0,6 0,8 0,6German public channels 44,3 43,9 44,7 47,6 43,6RTL 13,8 13,2 12,8 12,9 11,7RTL 2 4,9 4,2 3,8 3,5 3,8SuperRTL 2,7 2,8 2,6 2,3 2,4VOX 3,7 4,2 4,8 6,4 5,4SAT.1 10,3 10,9 9,8 8,0 10,3PRO 7 7,0 6,7 6,6 6,2 6,6Kabel Eins 4,0 3,8 3,6 3,4 3,6DSF 1,1 1,2 1,0 1,2 0,9Neun Live 0,2 0,2 0,2 0,1 0,1Das Vierte 1 – 0,5 0,6 0,8 0,8NICK 1 – 0,5 0,5 0,4 0,8Tele 5 – 0,4 0,6 0,7 0,9VIVA – 0,5 0,6 0,3 0,6VIVA PLUS – 0,3 0,2 0,0 –N 24 0,6 1,0Comedy Central 0,2 0,3MTV 0,3 0,5DMAX 0,4 0,6Main German private channels 47,7 49,4 47,7 47,7 50,3Eurosport 0,9 0,9 0,9 0,6 0,9Others 8,0 6,7 7,6 4,7 6,1
Source: Eurodata TV Worldwide / AGF - GfK1 Nick and Das Vierte have been measured since the end of September 2005. Average based on the period “October-December 2005”.
Daily share. In %, 3 years +.
2004 2005 2006 2007 2008
0
4
8
16
12
ARD 1
ZDFARD III
RTL
SAT.1
PRO 7
VOX
RTL 2Kabel Eins
SuperRTL
KI.KAN 24 3sat
TV audience market share in Germany 2004-2008 Daily share. In %, 3 years +.
T.1.DE.5G.1.DE.5

652 0 0 9 | V o l u m e 1 | B a n d 1
AL
AT
BE
BG
CH
CY
CZ
DE
DK
EE
ES
FI
FR
GB
GR
HR
HU
IE
IS
IT
LT
LU
LV
MK
MT
NL
NO
PL
PT
RO
RU
SE
SI
SK
TR
DE
Germany Allemagne Deutschland DE
Channels 2004 2005 2006 2007 2008ARD 1 15,9 15,4 15,5 13,4 15,0ARD III 15,8 15,7 15,7 13,5 15,4ZDF 15,8 15,2 15,2 12,9 14,93sat 0,9 0,9 0,9 1,0 1,0Arte 0,5 0,6 0,7 0,7 0,8Phoenix 0,4 0,5 0,5 0,9 0,7German public channels 49,3 48,3 48,5 42,4 47,8RTL 13,5 12,9 12,7 12,4 12,6RTL 2 4,8 4,0 3,5 3,9 3,5Super RTL 2,2 2,6 2,3 2,6 2,1VOX 3,7 4,4 5,3 5,7 5,8SAT.1 8,9 9,8 8,9 9,6 7,6ProSieben 6,7 6,3 6,3 6,5 6,8Kabel Eins 3,4 3,2 3,2 3,6 3,4DSF 1,2 1,3 1,2 1,1 1,09Live 0,1 0,1 0,1 0,2 0,1n-tv 0,3 0,4 0,4 0,7 0,5KiKa 0,5 0,5 0,5 1,2 0,7Das Vierte 1 – 0,5 0,6 0,8 0,9NICK 1 – 0,2 0,3 0,7 0,5Tele 5 – 0,4 0,6 0,7 0,9VIVA – 0,3 0,3 0,6 0,4VIVA PLUS – 0,1 0,1 0,0 –N 24 0,9 0,7Comedy Central 0,3 0,2MTV 0,5 0,3DMAX 0,5 0,4German private channels 45,3 47,0 46,3 52,5 48,4Eurosport 0,7 0,6 0,6 1,0 0,6Others 4,7 4,1 4,6 4,1 3,2
Source: Eurodata TV Worldwide / AGF - GfK1 Nick and Das Vierte have been measured since the end of September 2005. Average based on the period “October-December 2005”.
Prime time (19:00-23:00). In %, 3 years +.
2008
ARD 1 15,0%
ZDF14,9%
ARD III15,4%
Tele 5: 0,9%
3sat: 1,0%Arte: 0,8%Phoenix: 0,7%
RTL12,6%
Others: 4,1%Eurosport: 0,6%
N 24: 0,7%VIVA: 0,4%
9Live: 0,1%n-tv: 0,5%KiKa: 0,7%
Das Vierte: 0,9%
RTL 2: 3,5%Super RTL: 2,1%
VOX5,8%
SAT.17,6%
ProSieben6,8%
Kabel Eins3,4%
DSF 1,0%
NICK: 0,5%
TV audience market share in Germany 2004-2008 Prime time (19:00-23:00). In %, 3 years +.
T.1.DE.6G.1.DE.6

66 2 0 0 9 | V o l u m e 1 | B a n d 1
AL
AT
BE
BG
CH
CY
CZ
DE
DK
EE
ES
FI
FR
GB
GR
HR
HU
IE
IS
IT
LT
LU
LV
MK
MT
NL
NO
PL
PT
RO
RU
SE
SI
SK
TR
DE
Germany Allemagne Deutschland DE
Source: European Audiovisual Observatory
Rank Companies Genre 2004 2005 2006 2007 2008 2008/071 Bavaria Film GmbH est. Fiction, film 281 700 256 000 264 710 265 220 ~ ~
2 MME Me, Myself & Eye Entertainment AG (cons.) Fiction, entertainment 52 944 92 642 95 837 ~ 88 458 ~
3 Constantin Entertainment GmbH est. Entertainment 68 500 71 019 82 296 ~ ~ ~4 UFA Film und Fernsehen GmbH Fiction, entertainment 55 086 28 802 12 864 81 930 ~ ~5 Studio Hamburg Produktion GmbH Fiction, film 62 405 55 228 80 607 68 689 ~ ~
6 Plazamedia GmbH TV & Film Produktion est. Sports 75 603 ~ 75 000 ~ ~ ~
7 Grundy UFA TV Produktions GmbH est. Fiction 75 000 75 000 75 000 ~ ~ ~
8 Endemol Deutschland GmbH est. Entertainment 100 000 100 000 63 682 62 738 ~ ~9 Neue Deutsche Filmgesellschaft est. Fiction, film 63 300 60 000 60 000 60 000 60 000 ~
10 Brainpool TV GmbH Entertainment, fiction 51 035 ~ ~ 47 915 48 191 0,6%
11 Filmpool, Film und Fernsehproduktion GmbH Fiction ~ 19 723 44 579 ~ ~ ~
12 Raab TV Produktion GmbH est. Entertainment 36 341 38 210 36 916 ~ 46 898 ~
13 Network Movie Film- und Fernsehproduktion GmbH Fiction ~ 37 313 41 263 43 139 ~ ~
14 Granada Produktion für Film und Fernsehen est. Entertainment 17 763 11 437 25 874 27 075 35 000 29,3%
15 Saxonia Media Filmproduktions-gesellschaft GmbH Fiction ~ ~ 27 342 32 709 34 463 5,4%
16 I & U Information und Unterhaltung TV Produktion GmbH est.
Information, entertainment ~ 1 500 32 994 33 000 33 000 ~
17 Innova Film GmbH 20 000 28 202 32 552 ~ ~ ~18 Novafilm Fernsehproduktion GmbH Fiction ~ ~ ~ 45 460 31 399 -30,9%19 Grundy Light Entertainment GmbH Entertainment ~ ~ 23 439 28 687 ~ ~
20 Sony Pictures Film und Fernsehproduktions GmbH Fiction 40 456 29 836 23 422 21 321 26 873 26,0%
21 Ziegler Film GmbH Fiction, film 28 582 ~ 29 060 25 366 ~ ~22 Janus TV GmbH est. Entertainment 29 957 27 000 ~ ~ ~ ~
23 MAT Movies & Television Productions GmbH & co Projects Fiction ~ ~ 25 986 25 503 ~ ~
24 Hofmann & Voges Entertainment GmbH est. Fiction, film 11 000 11 000 18 056 22 533 ~ ~
25 Producers At Work GmbH Fiction ~ ~ 16 615 22 426 ~ ~
26 TVN - Television Programm- und Nachrichten GmbH News 19 500 21 000 ~ ~ ~ ~
27 Tandem Communications Fiction, film ~ ~ 12 025 20 853 ~ ~28 BKN International AG Animation 7 722 11 967 13 893 17 987 20 002 11,2%
29 Polyphon Film und Fernseh GmbH est. Fiction, film ~ ~ 20 000 20 000 ~ ~
30 Action Concept Film- und Stuntproduktion GmbH Fiction 34 371 25 451 23 203 18 759 ~ ~
31 Nostro Film GmbH est. Fiction 18 450 ~ ~ ~ ~ ~32 FFP Entertainment GmbH est. 18 000 18 000 18 000 18 000 ~ ~
33 Phoenix Film Karlheinz Brunneman GmbH Fiction ~ 17 060 20 621 16 271 ~ ~
34 Blue Eyes Film & Television GmbH & Co KG ~ 17 000 15 000 15 000 ~ ~
35 Cinecentrum GmbH Fiction 20 890 14 586 ~ ~ ~ ~
36 Colonia Media Filmproduktions GmbH est.
Fiction, film, documentaries ~ ~ ~ 15 190 13 369 -12,0%
37 Opal Filmproduktion GmbH Fiction, film 15 780 13 027 17 105 13 931 ~ ~38 M4E AG Entertainment ~ ~ ~ 3 724 13 244 255,6%39 GGG Filmproduktion und Vertrieb 7 000 7 000 13 000 ~ ~ ~
40 DFA Deutsche Fernsehnachrichten-Agentur-GmbH est. News 12 900 ~ ~ ~ ~ ~
The 40 leading TV production companies in Germany 2004-2008 Operating revenues in EUR thousand.
T.1.DE.7
672 0 0 9 | V o l u m e 1 | B a n d 1
AL
AT
BE
BG
CH
CY
CZ
DE
DK
EE
ES
FI
FR
GB
GR
HR
HU
IE
IS
IT
LT
LU
LV
MK
MT
NL
NO
PL
PT
RO
RU
SE
SI
SK
TR
DK
Denmark Danemark Dänemark DK
The Danish market is characterised by the strength of its public broadcasters:
DR (three channels) and TV2 (seven chan-nels). In a situation where the audience of the main channels is declining, TV2 still dominates the market (31.3% daily audi-ence in 2008) ahead of DR1 (24.6%). These two public channels even account for 64.5% of the prime time audience. The leading private channel is TV3 (Sweden’s MTG group) and has a decreasing daily audience of less than 5%. The other main private channels are TV3+ (MTG group, 3.6 % daily audience) and Kanal 5 (Pro-SiebenSat.1 Media AG), which is one of the rare channels to increase its daily audi-ence, which reached 2.9% in 2008.Despite its good results in terms of audi-ence, TV2 is in poor financial health and still has an uncertain legal future. The Danish public authorities decided to privatise TV2 in May 2003, but imple-mentation of this decision was delayed after questions were raised concerning the financing of the broadcaster. In May 2004, the European Commission con-cluded that TV2 had received illegal public funding and demanded that it pay back EUR 84.4 million to the Danish authorities. An appeal was lodged against the recapitalisation plan and the Court of First Instance of the European Commu-nities set aside the Commission’s decision in its judgment of 22 October 2008. In spring 2008, for example, the Ministry of Culture announced that emergency aid would be provided to stabilise TV2, which is heavily in debt. This aid, amount-ing to EUR 67 million, was approved by the European Commission in August 2008. Finally, in January 2009 the govern-ment published a plan aimed at partially transforming TV2 into a pay-TV channel from 2012.Analogue terrestrial signals are due to be switched off on 1 November 2009. The first multiplex, controlled by the public broadcasters and offering the main pub-lic channels throughout the country, has been operational since 2006. In August 2009, the Danish authorities published a list of 220 licences, most of them for local and/or non-commercial channels that will transmit on this multiplex from Novem-ber 2009. The company Boxer TV A/S (a subsidiary of the Swedish group of the same name) has won the licence to operate the four other multiplexes until 2020. It has been broadcasting 9 chan-nels in Copenhagen since February 2009, pending the launch of its full commercial service, which will comprise around thirty channels, on 1 November 2009.Several channels have been launched ahead of or in response to the arrival of DTT in November 2009. The competition is form-ing around the sports channels. TV3 Puls (Formula 1, the national football team’s
Le marché danois se caractérise par l’importance de ses radiodiffuseurs
publics : DR (trois chaînes) et TV 2 (sept chaînes). Dans un contexte de baisse de l’audience des principales chaînes, TV 2 continue de dominer le marché (31,3 % d’audience quotidienne en 2008) devant DR1 (24,6 %). Ces deux chaînes publiques rassemblent même 64,5 % de l’audience en prime time. La première chaîne privée est TV3 (groupe suédois MTG) à moins de 5 % d’audience quotidienne et en recul. Les principales autres chaînes privées sont TV3+ (groupe MTG, 3,6 % d’audience quotidienne) et Kanal 5 (ProSiebenSat.1 Media AG), une des rares chaînes à pro-gresser en s’établissant en 2008 à 2,9 % d’audience quotidienne.Malgré ses bons résultats en termes d’audience, TV 2 affiche une santé pré-caire et un avenir juridique toujours incertain. La privatisation de TV 2 a été décidée en mai 2003 par les pouvoirs publics danois mais la mise en œuvre de cette décision a été retardée suite à la mise en cause du financement du radio-diffuseur. En mai 2004, la Commission européenne a considéré que TV 2 avait bénéficié d’aides publiques illégales ; elle a donc exigé le remboursement à l’Etat danois de 84,4 millions d’euros. Le plan de recapitalisation a fait l’objet de recours et le tribunal de première instance des Communautés européennes a finalement annulé la décision de la Commission dans un arrêt du 22 octobre 2008. Parallèle-ment, une aide d’urgence a été annoncée au printemps 2008 par le ministère de la culture visant à assainir TV 2, fortement endettée. Cette aide de 67 millions d’euros a été validée par la Commission européen-ne en août 2008. Enfin, en janvier 2009, le gouvernement a publié un plan visant à transformer partiellement TV 2 en chaîne payante à partir de 2012.La date de l’extinction de l’analogique terrestre est fixée au 1er novembre 2009. Depuis 2006, un premier multiplex est opérationnel, contrôlé par les radio-diffuseurs publics et offrant les principales chaînes publiques sur la totalité du terri-toire. En août 2009, les autorités danoi-ses ont publié une liste de 220 licences essentiellement pour des chaînes locales et/ou non commerciales qui émettront sur ce multiplex à partir de novembre 2009. La firme Boxer TV A/S (filiale du groupe suédois du même nom) a rem-porté la licence d’exploitation des quatre autres multiplex jusqu’en 2020. Boxer diffuse 9 chaînes à Copenhague depuis février 2009, en attendant le lancement de son offre commerciale complète, constituée d’une trentaine de chaînes, le 1er novembre 2009.Plusieurs chaînes ont été lancées dans la perspective ou en réaction face à l’arrivée de la TNT en novembre 2009.
Der dänische Fernsehmarkt ist von einer starken Präsenz des öffentlich-
rechtlichen Rundfunks geprägt: DR (mit drei Sendern) und TV 2 (sieben Sender). Während die wichtigsten Fernsehsender sinkende Einschaltquoten verzeichnen, dominierte TV 2 weiterhin den Markt (mit einer täglichen Einschaltquote von 31,3 % im Jahr 2008) vor DR1 (24,6 %). In der Primetime erreichten beide öffentlich-rechtlichen Anstalten zusammen sogar 64,5 % der Zuschauer. Der wichtigste Privatsender, TV3 (der schwedischen Gruppe MTG), hatte eine Einschaltquo-te von weniger als 5 %, Tendenz fallend. Die wichtigsten anderen Privatsender sind TV3+ (MTG, mit einer täglichen Ein-schaltquote von 3,6 %) und Kanal 5 (Pro-SiebenSat.1 Media AG), einer der wenigen Sender im Aufwind, der 2008 eine tägliche Einschaltquote von 2,9 % hatte.TV 2 erzielte zwar gute Zuschauerergeb-nisse, steht aber wirtschaftlich und weiter-hin auch juristisch vor einer ungewissen Zukunft. Die Privatisierung von TV 2 wurde im Mai 2003 von den dänischen Behörden beschlossen, aber die Umset-zung dieses Beschlusses verzögerte sich, da die Finanzierung des Rundfunkveran-stalters beanstandet wurde. Im Mai 2004 erklärte die Europäische Kommission, dass TV 2 unrechtmäßig öffentliche Beihilfen erhalten habe, und forderte das Unter-nehmen auf, dem Staat 84,4 Mio. EUR zurückzuzahlen. Gegen den Kapitalauf-stockungsplan wurden Rechtsmittel ein-gelegt, und das Europäische Gericht erster Instanz hat schließlich mit seinem Urteil vom 22. Oktober 2008 die Entschließung der Kommission aufgehoben. Im Frühjahr 2008 wurde vom Kulturministerium eine Soforthilfe zur Sanierung des stark ver-schuldeten Senders angekündigt. Diese Hilfe in Höhe von 67 Mio. EUR wurde von der Europäischen Kommission im August 2008 bestätigt. Im Januar 2009 hat die Regierung einen Plan vorgelegt, mit dem TV 2 ab 2012 teilweise in einen Pay-TV-Sender umgewandelt werden soll. Am 1. November 2009 sollte die Verbrei-tung des terrestrischen analogen Signals eingestellt werden. 2006 wurde das erste digitale terrestrische Fernsehnetz von den öffentlich-rechtlichen Runfunkveranstal-tern in Betrieb genommen, auf dem die wichtigsten öffentlich-rechtlichen Sen-der im ganzen Land zu empfangen sind. Im August 2009 haben die dänischen Behörden eine Liste mit 220 Lizenzen veröffentlicht, die hauptsächlich an lokale und/oder nicht-kommerzielle Dien-ste vergeben wurden und die ab November 2009 über die Multiplex-Plattform ver-breitet werden. Das Unternehmen Boxer TV A/S (Tochter der gleichnamigen schwedischen Gruppe) hat den Zuschlag für die Lizenz zum Betrieb der vier ande-ren Multiplexe bis 2020 bekommen. Boxer

68 2 0 0 9 | V o l u m e 1 | B a n d 1
AL
AT
BE
BG
CH
CY
CZ
DE
DK
EE
ES
FI
FR
GB
GR
HR
HU
IE
IS
IT
LT
LU
LV
MK
MT
NL
NO
PL
PT
RO
RU
SE
SI
SK
TR
DK
Denmark Danemark Dänemark DK
Sources: Medie- og Tilskudssekretariatet : http://www.bibliotekogmedier.dk Nordicom : http://www.nordicom.gu.se Legal aspects: IRIS Merlin : http://merlin.obs.coe.int Audience data: TNS Gallup: http://www.gallup.dk
La concurrence se cristallise autour des chaînes sportives. TV3 Puls (Formule 1, équipe nationale de football) a été lan-cée en mars 2009 par le groupe MTG, en complément de TV3 et TV3+, avant le lancement de la plate-forme TNT à laquelle ces trois chaînes ne participeront pas. La chaîne sportive Canal 9, lancée par le groupe suédois TV4 en juillet 2009, sera au contraire transmise par TNT. Canal 9 diffuse les matchs de football des cham-pionnats danois, anglais, italien et espa-gnol. Renforçant l’offre de chaînes sporti-ves, une version en danois de Eurosport 2 a aussi été lancée au cours de l’été 2009.Par ailleurs le groupe public DR a prévu le lancement de trois chaînes à l’occasion du lancement de la plate-forme TNT : DR K (culture et histoire), DR Romasjang (enfants) et DR HD.Le marché de l’offre multi-chaînes est dominé par les câblo-opérateurs, encore nombreux au Danemark même si YouSee A/S (groupe TDC) contrôle pratiquement le marché avec 1,195 millions d’abonnés en juin 2009. Derrière YouSee, Stofa (groupe suédois TeliaSonera) rassemble environ 210 000 abonnés ou encore Canal Digital (groupe norvégien Telenor) seule-ment 35 000 abonnés. Canal Digital dis-tribue aussi un bouquet satellite, concur-rencée en cela par Viasat (groupe MTG). Enfin, de nombreuses offres IPTV coexis-tent telles que Dansk Bredband, Fast TV, Telia TV (TeliaSonera), ou TDC Home Trio (TDC), lancée en janvier 2009.L’opérateur IPTV FastTV.net A/S a été racheté par A+ Holding A/S en mars 2009, entreprise elle-même passée sous le contrôle de YouSee A/S et donc du groupe TDC en juin 2009.La position de l’opérateur historique TDC sur les marchés du câble et de l’IPTV est donc considérable : il reven-dique le fait que 45 % des ménages danois soient abonnés à YouSee. En réaction, l’autorité danoise de régulation des télécommunications (NITA) souhaite contraindre TDC à ouvrir à la concur-rence l’accès en gros à son réseau câblé à large bande. La Commission euro-péenne a approuvé cette proposition en mars 2009.
matches) was launched by the MTG group in March 2009, complementing TV3 and TV3+ before the launch of the DTT platform, which these three channels will not be joining. However, the sports chan-nel Canal 9, which was launched by the Swedish group TV4 in July 2009, will be transmitted over DTT. Canal 9 broadcasts the matches of the Danish, English, Ital-ian and Spanish football championships. An additional sports channel, a Danish version of Eurosport 2, was also launched in summer 2009.The public broadcasting group DR plans to introduce three channels when the DTT platform is launched: DR K (cul-ture and history), DR Romasjang (for children) and DR HD.The multi-channel market is dominated by the cable operators, of which there are still a large number in Denmark, although You-See A/S (TDC group) virtually controls the market with 1.195 million subscribers in June 2009. Following behind YouSee are Stofa (Sweden’s TeliaSonera group), which has about 210 000 subscribers, and Canal Digital (Norway’s Telenor group), which has only 35 000 subscribers. Canal Digital also distributes a satellite package, which competes with Viasat (the MTG group). Finally, many IPTV services are available, such as Dansk Bredband, Fast TV, Telia TV (TeliaSonera) or TDC Home Trio (TDC), which was launched in January 2009.The IPTV operator FastTV.net A/S was taken over in March 2009 by A+ Holding A/S, which itself came under the control of YouSee A/S, and therefore the TDC group, in June 2009.The incumbent operator TDC thus holds a very strong position on the cable and IPTV markets: it claims that 45% of Dan-ish households are YouSee subscribers. In response, the Danish telecommunications regulator (NITA) wants to force TDC to give its competitors bitstream access to its broadband cable network. The European Commission approved this proposal in March 2009.
hat den umfassenden Start seines kommer-ziellen Angebots aus etwa 30 Sendern für den 1. November 2009 geplant und strahlt in der Zwischenzeit seit Februar 2009 in Kopenhagen neun Sender aus.In Erwartung von DVB-T oder als Reak-tion auf seinen Start im November 2009 wurden mehrere neue Sender gegründet. Der Wettbewerb konzentriert sich um die Sportkanäle. Die MTG-Gruppe ging im März 2009 mit TV3 Puls (Formel 1, Spiele der Fußballnationalmannschaft) auf Sendung, als Ergänzung zu TV3 und TV3+. An der künftigen DVB-T-Platt-form sind diese drei Sender nicht betei ligt. Der im Juli 2009 von der schwedischen Gruppe TV4 gestartete Sportkanal Canal 9 wird dagegen per DVB-T ausge-strahlt. Auf diesem Sender sind die Fuß-ballspiele der ersten Liga in Dänemark, England, Italien und Spanien zu sehen. Im Sommer 2009 ging eine dänische Version von Eurosport 2 zur Stärkung des Ange-bots von Sport kanälen auf Sendung.Die öffentlich-rechtliche Gruppe DR hat anlässlich des Starts der DVB-T-Plattform drei neue Sender geplant: DR K (Kultur und Geschichte), DR Romasjang (Kinder) und DR HD.Der Markt für Multikanalangebote wird von den in Dänemark noch zahlreichen Kabelnetzbetreibern beherrscht, auch wenn YouSee A/S (TDC-Gruppe) mit 1,195 Mio. Abonnenten im Juni 2009 den Markt ziemlich fest im Griff hatte. Hinter YouSee kamen Stofa (schwedische TeliaSonera-Gruppe) auf etwa 210 000 Abonnenten und Canal Digital (norwe-gische Telenor-Gruppe) auf gerade mal 35 000. Canal Digital verbreitet auch ein Satellitenbouquet und steht damit in Konkurrenz zu Viasat (MTG). Schließ-lich gibt es zahlreiche parallele IPTV-Angebote, wie etwa Dansk Bredband, Fast TV, Telia TV (TeliaSonera) oder der im Januar 2009 gestartete Dienst TDC Home Trio (TDC).Der IPTV-Betreiber FastTV.net A/S wur-de im März 2009 von A+ Holding A/S übernommen, einem Unternehmen, das wiederum seit Juni 2009 von YouSee A/S und damit von TDC kontrolliert wird.Der klassische Telekomanbieter TDC ver-fügt daher auf dem Kabel- und dem IPTV-Markt über eine beachtliche Marktposi-tion: Nach eigenen Angaben haben über 45 % der dänischen Haushalte YouSee abonniert. Als Reaktion darauf hat die dänische Telekom-Regulierungsbehörde (NITA) vor, TDC zur Öffnung seines Breitbandkabelnetzes für Wettbewerber zu verpflichten. Die Europäische Kommis-sion hat diesen Vorschlag im März 2009 gebilligt.

692 0 0 9 | V o l u m e 1 | B a n d 1
AL
AT
BE
BG
CH
CY
CZ
DE
DK
EE
ES
FI
FR
GB
GR
HR
HU
IE
IS
IT
LT
LU
LV
MK
MT
NL
NO
PL
PT
RO
RU
SE
SI
SK
TR
DK
Denmark Danemark Dänemark DK
Population and equipment 31.12.08Penetration
(in % HH) In thousand SourcesPopulation (inhabitants) – 5 511 Danmarks Statistik
Households – 2 564 Danmarks Statistik
TV households 95,3% 2 443 European Audiovisual Observatory
Cable TV households 61,9% 1 588 Screen Digest / European Audiovisual Observatory
Digital cable TV households 6,5% 167 Screen Digest / European Audiovisual Observatory
DTH/SMATV households 16,9% 434 Screen Digest / European Audiovisual Observatory
Dig. DTH/SMATV households 16,0% 410 European Audiovisual Observatory
Pay DTH/SMATV households 11,9% 304 Screen Digest
IPTV subscriptions 3,3% 84 Screen Digest
Installed DVB-T receivers 25,5% 655 Screen Digest
Total digital TV households 51,3% 1 316 European Audiovisual Observatory
Households with PC 86,4% 2 215 Screen Digest / European Audiovisual Observatory
Households with broadband connections 70,9% 1 818 Screen Digest / European Audiovisual Observatory
Mobile phone TV subscriptions 37 Screen Digest
Number of TV channels by kind of licence 10.09 Public Private TotalTerrestrial (national) 15 1 16Cable/Satellite/IPTV/Mobile 0 11 11Regional/Local 5 165 170Regional/local windows 8 39 47Channels targeting foreign markets 0 2 2Total 28 218 246Foreign channels targeting the country 2 47 49
TV channels distributors 10.09 Companies
Cable operators >350 Canal Digital Danmark Kabel TV, Dansk Bredbaand, Dansk Kabel TV, Telia Stofa, YouSee, etc…
Satellite packagers 2 Canal Digital, Viasat.IPTV packagers 5 Dansk Bredbaand, Fast TV, Smile Content, TDC, Telia.
DTT multiplex operators 2 Boxer (pay DTT), Digi TV (free DTT, the company is owned by DR and TV 2).
Mobile phone TV packagers 3 Hi3G Denmark, TDC, Telenor.
Source: European Audiovisual Observatory
Supply of TV channels by genre and by platform (including foreign channels) 11.09
Digital Terrestrial
Cable YouSee
Cable Telia Stofa
Satellite Canal Digital
(Full Nordic offer)Satellite Viasat
(Full Nordic offer)IPTV
TDC TVGeneralist - national 4 3 3 2 2 3Generalist - foreign 3 30 13 14 21 7Adult 3 1 3 3 1Children 5 6 4 17 18 3Culture/ education/ documentary 5 13 10 15 31 5Minority interest groups 4Entertainment/ TV fiction/ games 6 11 11 26 32 8Film 2 17 2 27 44 6Home shoppingInternational linguistic and cultural 5 2 1Lifestyle/ specific leisure/ travel 3 2 1 6 1Music 3 8 2 8 8 3News/ business 3 8 4 11 8 4Parliament/ government/ administration 1Regional/ local 196 1Religion 1 2 2Sports 3 13 4 25 20 2Various 2 1 4 2Total 38 126 59 156 195 44
1 In addition 196 local stations are available in their respective area.
1
Basic figures

70 2 0 0 9 | V o l u m e 1 | B a n d 1
AL
AT
BE
BG
CH
CY
CZ
DE
DK
EE
ES
FI
FR
GB
GR
HR
HU
IE
IS
IT
LT
LU
LV
MK
MT
NL
NO
PL
PT
RO
RU
SE
SI
SK
TR
DK
Denmark Danemark Dänemark DK
Source: European Audiovisual Observatory on the basis of data from Screen Digest, WARC, DR
Source: European Audiovisual Observatory
Source: Screen DigestSource: Screen Digest
1 Service interrupted in january 2009.
Households TV equipment 2004-2008
Number of households accessing multichannel platforms as at 31.12.2008
Consumers pay-TV gross spend 2004-2008
Gross revenues of radio-television 2004-2008
In thousands.
In thousands.
EUR thousand.
EUR million.
2004 2005 2006 2007 2008
0
2 000
1 500
1 000
500
Cable households
DTT households
Satellite households
IPTV households
1 588
1 475
0
0 2 8
0
260
650 655
1 5321 5821 555
256 260
201
202 204
3584
Yousee
Canal Digita
l
Digi TV
Viasat
Zattoo
TDC TV
Telia
Teleco
m
Dansk Kabel
Telia
Stofa
0
800
400
1 200
1
1 100
861
655
177
84
27~ ~ 1
DTT
IPTV
Sat
PC
Cable
2004 2005 2006 2007 2008
0
600 000
400 000
200 000
Cable TV
Satellite
IPTV
579 750
405 984
436 850
458 161
518 360
112 123
3
125 670
156
146 348
1 157
165 298
5 453
158 920
16 307
2004 2005 2006 2007 2008
0
800
600
400
200
Consumerspay-TV spend
Radio-TV Licence fee
TV adspend
Radio adspend
757
691
608
565
520
401
286
415
302331 338
38373828
314
34
421445 454
Market trends
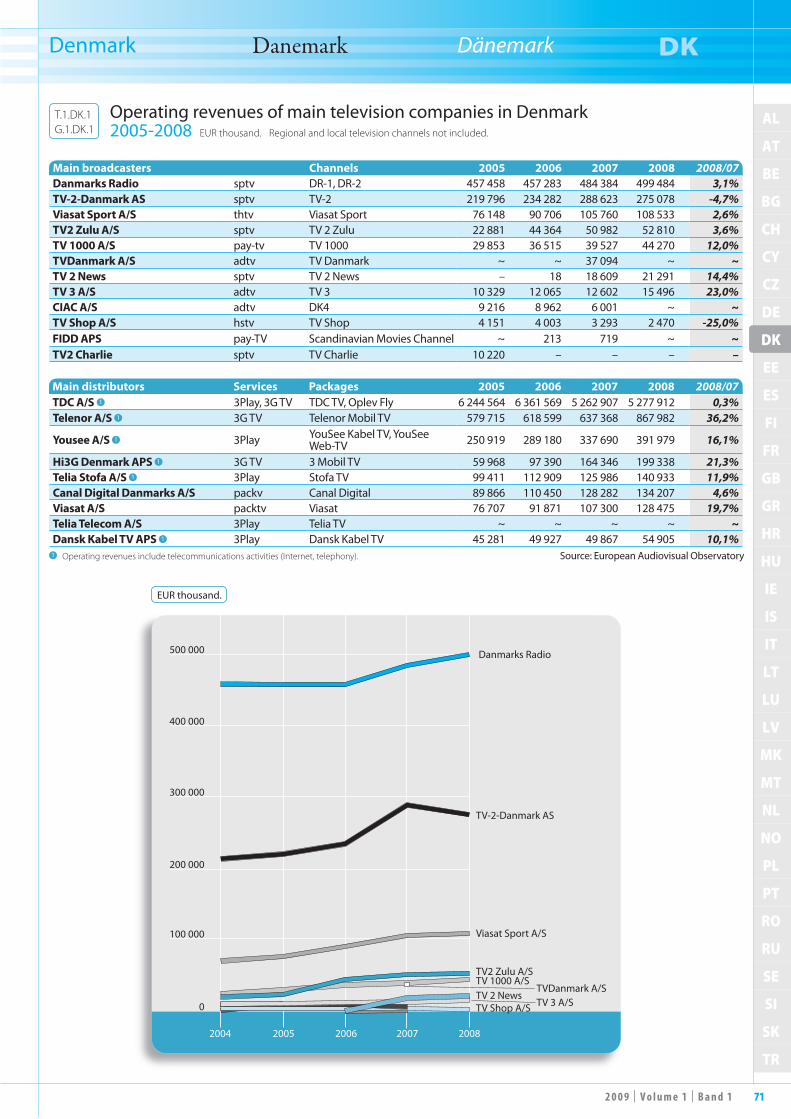
712 0 0 9 | V o l u m e 1 | B a n d 1
AL
AT
BE
BG
CH
CY
CZ
DE
DK
EE
ES
FI
FR
GB
GR
HR
HU
IE
IS
IT
LT
LU
LV
MK
MT
NL
NO
PL
PT
RO
RU
SE
SI
SK
TR
DK
Denmark Danemark Dänemark DK
Main broadcasters Channels 2005 2006 2007 2008 2008/07Danmarks Radio sptv DR-1, DR-2 457 458 457 283 484 384 499 484 3,1%TV-2-Danmark AS sptv TV-2 219 796 234 282 288 623 275 078 -4,7%Viasat Sport A/S thtv Viasat Sport 76 148 90 706 105 760 108 533 2,6%TV2 Zulu A/S sptv TV 2 Zulu 22 881 44 364 50 982 52 810 3,6%TV 1000 A/S pay-tv TV 1000 29 853 36 515 39 527 44 270 12,0%TVDanmark A/S adtv TV Danmark ~ ~ 37 094 ~ ~TV 2 News sptv TV 2 News – 18 18 609 21 291 14,4%TV 3 A/S adtv TV 3 10 329 12 065 12 602 15 496 23,0%CIAC A/S adtv DK4 9 216 8 962 6 001 ~ ~TV Shop A/S hstv TV Shop 4 151 4 003 3 293 2 470 -25,0%FIDD APS pay-TV Scandinavian Movies Channel ~ 213 719 ~ ~TV2 Charlie sptv TV Charlie 10 220 – – – –
Main distributors Services Packages 2005 2006 2007 2008 2008/07TDC A/S 1 3Play, 3G TV TDC TV, Oplev Fly 6 244 564 6 361 569 5 262 907 5 277 912 0,3%Telenor A/S 1 3G TV Telenor Mobil TV 579 715 618 599 637 368 867 982 36,2%
Yousee A/S 1 3Play YouSee Kabel TV, YouSee Web-TV 250 919 289 180 337 690 391 979 16,1%
Hi3G Denmark APS 1 3G TV 3 Mobil TV 59 968 97 390 164 346 199 338 21,3%Telia Stofa A/S 1 3Play Stofa TV 99 411 112 909 125 986 140 933 11,9%Canal Digital Danmarks A/S packv Canal Digital 89 866 110 450 128 282 134 207 4,6%Viasat A/S packtv Viasat 76 707 91 871 107 300 128 475 19,7%Telia Telecom A/S 3Play Telia TV ~ ~ ~ ~ ~Dansk Kabel TV APS 1 3Play Dansk Kabel TV 45 281 49 927 49 867 54 905 10,1%
Source: European Audiovisual Observatory1 Operating revenues include telecommunications activities (Internet, telephony).
EUR thousand.
2004 2005 2006 2007 2008
0
400 000
300 000
200 000
100 000
500 000 Danmarks Radio
TV-2-Danmark AS
Viasat Sport A/S
TV2 Zulu A/STV 1000 A/STV 2 NewsTV Shop A/S TV 3 A/S
TVDanmark A/S
Operating revenues of main television companies in Denmark 2005-2008 EUR thousand. Regional and local television channels not included.
T.1.DK.1G.1.DK.1

72 2 0 0 9 | V o l u m e 1 | B a n d 1
AL
AT
BE
BG
CH
CY
CZ
DE
DK
EE
ES
FI
FR
GB
GR
HR
HU
IE
IS
IT
LT
LU
LV
MK
MT
NL
NO
PL
PT
RO
RU
SE
SI
SK
TR
DK
Denmark Danemark Dänemark DK
Source: DR / European Audiovisual Observatory
Income 2005 2006 2007 2008 2005 2006 2007 2008 2008/07Total public income 414 714 421 029 445 221 454 476 90,7% 92,1% 91,9% 91,0% 2,1% - Licence fee 414 714 421 029 445 221 454 476 90,7% 92,1% 91,9% 91,0% 2,1%Other income 42 691 36 255 39 163 44 908 9,3% 7,9% 8,1% 9,0% 14,7%TOTAL 457 405 457 284 484 384 499 384 100,0% 100,0% 100,0% 100,0% 3,1%
Expenditure 2005 2006 2007 2008 2005 2006 2007 2008 2008/07Purchase of goods and services 176 488 191 683 ~ ~ 39,6% 40,4% ~ ~ ~
Costs of personnel 240 665 240 770 ~ ~ 54,0% 50,7% ~ ~ ~Depreciation 28 148 42 422 47 167 50 320 6,3% 8,9% 9,7% 9,8% 6,7%Operating expenditure 445 301 474 908 485 910 513 597 100,0% 100,0% 100,0% 100,0% 5,7%
Net result 10 803 -21 608 -8 272 -10 619 28,4%Operating margin (%) 2,7 -3,9 2,1 -0,7
EUR thousand.
In %.
2004 2005 2006 20082007
0
500 000
200 000
300 000
400 000
100 000
Other revenues
Licence fee
2004 2005 2006 2007 2008
-20
5
10
0
-5
-10
-15
Operating margin
Return on total assetsPro�t margin
Return on shareholders’ funds
DR financial situation 2005-2008 EUR thousand.
T.1.DK.2G.1.DK.2
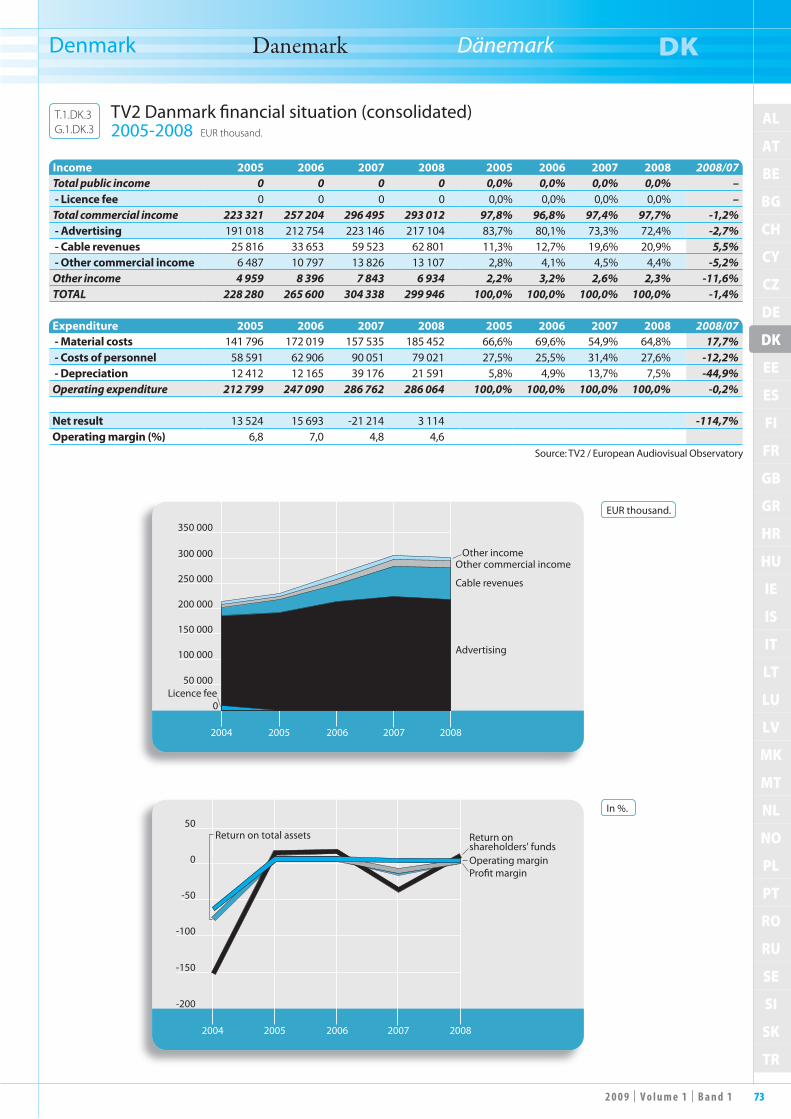
732 0 0 9 | V o l u m e 1 | B a n d 1
AL
AT
BE
BG
CH
CY
CZ
DE
DK
EE
ES
FI
FR
GB
GR
HR
HU
IE
IS
IT
LT
LU
LV
MK
MT
NL
NO
PL
PT
RO
RU
SE
SI
SK
TR
DK
Denmark Danemark Dänemark DK
Source: TV2 / European Audiovisual Observatory
Income 2005 2006 2007 2008 2005 2006 2007 2008 2008/07Total public income 0 0 0 0 0,0% 0,0% 0,0% 0,0% – - Licence fee 0 0 0 0 0,0% 0,0% 0,0% 0,0% –Total commercial income 223 321 257 204 296 495 293 012 97,8% 96,8% 97,4% 97,7% -1,2% - Advertising 191 018 212 754 223 146 217 104 83,7% 80,1% 73,3% 72,4% -2,7% - Cable revenues 25 816 33 653 59 523 62 801 11,3% 12,7% 19,6% 20,9% 5,5% - Other commercial income 6 487 10 797 13 826 13 107 2,8% 4,1% 4,5% 4,4% -5,2%Other income 4 959 8 396 7 843 6 934 2,2% 3,2% 2,6% 2,3% -11,6%TOTAL 228 280 265 600 304 338 299 946 100,0% 100,0% 100,0% 100,0% -1,4%
Expenditure 2005 2006 2007 2008 2005 2006 2007 2008 2008/07 - Material costs 141 796 172 019 157 535 185 452 66,6% 69,6% 54,9% 64,8% 17,7% - Costs of personnel 58 591 62 906 90 051 79 021 27,5% 25,5% 31,4% 27,6% -12,2% - Depreciation 12 412 12 165 39 176 21 591 5,8% 4,9% 13,7% 7,5% -44,9%Operating expenditure 212 799 247 090 286 762 286 064 100,0% 100,0% 100,0% 100,0% -0,2%
Net result 13 524 15 693 -21 214 3 114 -114,7%Operating margin (%) 6,8 7,0 4,8 4,6
EUR thousand.
In %.
2004 2005 2006 20082007
0
350 000
300 000
250 000
100 000
50 000
200 000
150 000
Licence fee
Advertising
Cable revenues
Other commercial incomeOther income
2004 2005 2006 2007 2008
-200
0
50
-50
-100
-150
Operating marginPro�t margin
Return onshareholders' funds
Return on total assets
TV2 Danmark financial situation (consolidated) 2005-2008 EUR thousand.
T.1.DK.3G.1.DK.3

74 2 0 0 9 | V o l u m e 1 | B a n d 1
AL
AT
BE
BG
CH
CY
CZ
DE
DK
EE
ES
FI
FR
GB
GR
HR
HU
IE
IS
IT
LT
LU
LV
MK
MT
NL
NO
PL
PT
RO
RU
SE
SI
SK
TR
DK
Denmark Danemark Dänemark DK
Daily share Prime time (18:30-23:00)Channels 2004 2005 2006 2007 2008 2004 2005 2006 2007 2008DR1 29,9 28,0 27,7 26,5 24,6 36,3 34,0 34,1 33,2 30,9DR2 4,2 4,7 4,7 4,6 4,1 4,6 5,1 5,0 5,1 4,7TV2 Danmark 35,0 35,8 34,2 33,4 31,3 36,5 37,6 35,5 34,9 33,6TV2 Zulu 2,5 2,9 3,0 2,5 2,3 1,9 2,3 2,5 2,1 2,0TV2 Charlie 0,3 1,1 2,0 2,7 2,4 0,3 1,0 2,0 2,2 2,1TV2 News 0,7 1,8 0,2 0,7TV2 Film – 0,2 0,8 1,1 1,1 0,1 0,7 0,9 0,8TV2 Sport 0,9 1,1 0,7 1,0Danish public channels 71,9 72,7 72,4 72,4 68,7 79,6 80,1 79,8 79,3 75,8DK 4 0,7 0,7 0,6 0,6 0,5 0,7 0,7 0,6 0,6 0,56’eren 0,9 1,0 0,7 0,7Danish private channels 0,7 0,7 0,6 1,5 1,5 0,7 0,7 0,6 1,3 1,2TV3 Danmark 6,0 5,4 5,0 5,3 4,9 5,3 4,7 4,5 4,8 4,7TV3+ 3,5 3,6 3,7 3,7 3,6 3,0 3,0 3,3 3,6 3,4Kanal 5 Danmark 2,3 2,3 2,5 2,6 2,9 1,8 2,1 2,5 2,7 2,9Disney Channel 0,5 0,6 1,8 2,4 2,1 0,2 0,2 0,7 1,0 0,9Kanal 4 4,3 3,9 3,1 1,2 1,8 3,0 2,9 2,4 1,1 1,8Cartoon Network 1,8 1,5 1,2 1,2 1,4 1,0 0,8 0,7 0,7 0,8Discovery Channel Danmark 1,1 1,1 1,3 1,3 1,3 0,7 0,7 0,7 0,7 0,8Eurosport 0,8 0,9 0,8 0,9 0,9 0,5 0,5 0,5 0,5 0,5Animal Planet Europe 0,6 0,6 0,6 0,3 0,3 0,3Foreign channels 20,3 19,3 25,2 21,8 22,1 15,5 14,9 15,6 15,4 16,1Others 7,1 7,3 1,8 4,3 7,7 4,2 4,3 4,0 4,0 6,9
Source: Eurodata TV Worldwide / GALLUP TV-METER
Prime time (18:30-23:00). In %, 3 years +.
2008
DR130,9%
TV2 Zulu2,0%
Others 7,2%
Eurosport 0,5%
TV2 Charlie2,1%
TV2 News0,7%
TV2 Film: 0,8%TV2 Sport: 1,0%
DR24,7%TV2 Danmark
33,6%
DK 40,5%
TV3 Danmark4,7%
TV3+3,4%
Kanal 5 Danmark2,9%
Disney Channel0,9%
Kanal 41,8%
Cartoon Network0,8%
Discovery Channel Danmark0,8%
6'eren0,7%
Daily share. In %, 3 years +.
2004 2005 2006 2007 2008
0
10
20
30
40
TV2 Danmark
DR1
TV3 DanmarkDR2TV2 CharlieTV2 Zulu
TV3+Kanal 5Danmark
Kanal 4
CartoonNetwork
TV audience market share in Denmark 2004-2008 In %, 3 years +.
T.1.DK.4G.1.DK.4

752 0 0 9 | V o l u m e 1 | B a n d 1
AL
AT
BE
BG
CH
CY
CZ
DE
DK
EE
ES
FI
FR
GB
GR
HR
HU
IE
IS
IT
LT
LU
LV
MK
MT
NL
NO
PL
PT
RO
RU
SE
SI
SK
TR
EE
Estonia Estonie Estland EE
Driven by the digital transition and the financial crisis, the traditionally con-
centrated Estonian market is undergoing radical change, and several channels have been launched since 2007: Kalev Sport (initially under the control of the Estonian group Kalev, taken over by Videomeedia and finally closed down in 2009), Kanal 11 (which belongs to the Norwegian compa-ny Schibsted), TV6 (owned by Sweden’s Modern Times Group), Neljas (launched by Starman AS, the country’s primary cable operator), ETV2 (the second chan-nel of the public broadcaster ERR) and, finally, TV14 (founded by Toomas Lepp, director of Videomeedia and formerly responsible for public service television). The four traditional market players, Kanal 2, TV3, ETV and PBK, only accounted for a daily audience market share of 66% in 2008, compared with nearly 70% in 2007. ETV’s audience is continuing to fall and ETV2 is not yet enabling the broadcaster to compensate for this decline (taking the two channels together, ETV’s daily audience declined from 17.3% in 2006 to 15.8% in 2008). Kanal 2 remains the market leader despite a marked drop in the size of its audience. TV3 has also lost part of its daily audience but now has more prime time viewers. Only PBK’s audience share is rising. Only the Russian-language channels (PBK, 3+, RTR, NTV mir, etc) have stabilised their audience figures.There are now new distribution methods in addition to the multi-channel offerings of the traditional cable operators (Starman and STV) or the satellite operator Viasat. The IPTV service of Elion (controlled by the Swedish operator TeliaSonera) had 84 000 subscribers in June 2009. Digital terrestrial television, which only enjoyed moderate success after its launch in 2006, is now finally taking off with the introduc-tion of an additional free offering provided by the pay-TV platform (Zuum TV, 100% controlled by Starman). Finally, in March 2009 the European Commission sent Estonia a letter of formal notice concerning its failure to comply with provisions relating to adver-tising. The main Estonian channels are said to be interpreting the term “advertis-ing spots” too narrowly and thus exceeding the limit of 12 minutes an hour laid down by the EU.
Sous l’impulsion de la transition numé-rique et du fait de la crise financière,
le marché estonien, traditionnellement concentré, est en pleine recomposition.Plusieurs chaînes ont été lancées depuis 2007 : Kalev Sport (initialement sous le contrôle du groupe estonien Kalev, rachetée par Videomeedia et fermée fina-lement en 2009), Kanal 11 (appartenant appartenant au groupe norvégien Schibs-ted), TV6 (dépendant du groupe suédois Modern Times Group), Neljas (initiée par Starman AS, le premier cablo opérateur du pays), ETV2 (la seconde chaîne du radio-diffuseur public ERR), et enfin TV14 (fondée par Toomas Lepp, dirigeant de Video meedia et ancien responsable de la télévision publique). Les quatre acteurs traditionnels du mar-ché, Kanal 2, TV3, ETV et PBK, ne rassemblent en 2008 plus que 66 % des parts de marché d’audience quotidienne contre presque 70 % en 2007. L’audience de la chaîne ETV continue de s’effriter, et ETV2 ne lui permet pas encore de compenser ce tassement (en additionant les deux chaînes, ETV passe de 17,3 % d’audience quotidienne en 2006 à 15,8 % en 2008). Kanal 2 demeure leader sur le marché malgré une nette baisse de son audience. TV3 perd elle aussi une partie de son public en audience quotidienne mais réalise une bonne progression en prime time. Seule PBK voit son audience progresser, et de manière générale seules les chaînes russophones (PBK, 3+, RTR, NTV mir etc.) stabilisent leur audience.Face aux offres multi-chaînes tradition-nelles des cablo-opérateurs (Starman et STV) ou de l’opérateur satellite Viasat s’affirment de nouveaux modes de distri-bution. Le service IPTV d’Elion (contrôlé par l’opérateur suédois TeliaSonera) séduit plus de 84 000 abonnés en juin 2009. La télévision numérique terrestre dont le suc-cès était modéré depuis son lancement en 2006 prend enfin son essor avec la mise en place d’une offre gratuite complémen-taire de la plate-forme payante (Zuum TV, contrôlée à 100 % par Starman). Enfin, la Commission européenne a envoyé en mars 2009 une lettre de mise en demeure à l’Estonie à propos du non respect de dispositions relatives à la publi-cité. Les principales chaînes estonien-nes interprètent, selon la lettre, le terme «spots publicitaires » de manière trop restrictive et dépassent donc la limite de 12 minutes par heure fixée par l’UE.
Die Umstellung auf die digitale Über-tragung, aber auch die weltweite
Finanzkrise haben ihre Spuren auf dem estnischen Medienmarkt hinterlassen: Der estnische Markt mit seiner traditio-nell hohen Medienkonzentration befindet sich derzeit mitten im Umbruch.Seit 2007 wurden mehrere neue Sender in Betrieb genommen: Kalev Sport (ursprüng-lich unter der Kontrolle der estnischen Kalev-Gruppe, anschließend von Video-meedia aufgekauft; 2009 musste der Sender Konkurs anmelden), Kanal 11 (gehört zum norwegischen Unternehmen Schibsted), TV6 (im Besitz der schwedischen Modern Times Group), Neljas (lanciert von Star-man AS, dem größten Kabelnetzbetreiber des Landes), ETV2 (der zweite Kanal des öffentlich-rechtlichen Senders ERR), und schließlich TV14 (gegründet von Toomas Lepp, dem Chef von Videomeedia und früheren Leiter des öffentlich-rechtlichen Fernsehens).Die Zuschauermarktanteile der vier traditi-onellen Akteure, Kanal 2, TV3, ETV und PBK, sind 2008 im Vergleich zum Vorjahr zurückgegangen, und zwar von 70 % auf 66 %. Vor allem der öffentlich-rechtliche Sender ETV verliert immer mehr Zuschau-er, und ETV2 ist noch nicht in der Lage, diesen Verlust aufzufangen (beide Sender hatten 2008 zusammen nur noch einen Marktanteil von 15,8 % gegenüber 17,3 % im Jahr 2006). Marktführer ist nach wie vor Kanal 2, obwohl auch dieser Sender Marktanteile abgeben musste. Auch TV3 hat einen Teil seiner Zuschauer verloren, konnte seinen Marktanteil jedoch zur Primetime steigern. Der einzige Sender, der 2008 erheblich zulegen konnte, ist PBK. Die russischsprachigen Sender (PBK, 3+, RTR, NTV mir usw.) konnten ihre Zuschauerzahlen in etwa halten.Neben den Mehrkanalangeboten der Kabelnetzbetreiber (Starman und STV) oder des Satellitenbetreibers Viasat haben inzwischen auch in Estland neue Übertragungstechniken Einzug gehal-ten. Der IPTV-Dienst von Elion (gehört zum schwedischen Konzern TeliaSone-ra) hatte im Juni 2009 immerhin bereits 84 000 Abonnenten. Das digitale terre-strische Fernsehen, seit seinem Sendestart 2006 nur von mäßigem Erfolg gekrönt, konnte mit einem kostenlosen Angebot der Pay-TV-Plattform (Zuum TV, eine 100%ige Tochter von Starman) erstmals die Zahl seiner Kunden erheblich steigern.Im März 2009 hat die Europäische Kom-mission eine Warnung an Estland gerich-tet, weil es die EU-Bestimmungen über die Fernsehwerbung nicht einhält. Die großen estnischen Fernsehsender, so das Schrei-ben der EU, legen den Begriff „Werbe-spot“ offensichtlich zu eng aus und halten sich nicht an die von der EU festgelegte Obergrenze von 12 Minuten Werbung pro Stunde.
Sources: Eesti Rahvusringhääling: http://www.err.ee Legal aspects: IRIS Merlin: http://merlin.obs.coe.int Audience data: TNS Emor: http://www.emor.ee

76 2 0 0 9 | V o l u m e 1 | B a n d 1
AL
AT
BE
BG
CH
CY
CZ
DE
DK
EE
ES
FI
FR
GB
GR
HR
HU
IE
IS
IT
LT
LU
LV
MK
MT
NL
NO
PL
PT
RO
RU
SE
SI
SK
TR
EE
Estonia Estonie Estland EE
Population and equipment 31.12.08Penetration
(in % HH) In thousand SourcesPopulation (inhabitants) – 1 340 Eurostat
Households – 548 Eurostat
TV households 97,1% 532 European Audiovisual Observatory
Cable TV households 47,1% 258 Screen Digest / European Audiovisual Observatory
Digital cable TV households 2,7% 15 Screen Digest / European Audiovisual Observatory
DTH/SMATV households 17,2% 94 Screen Digest / European Audiovisual Observatory
Dig. DTH/SMATV households 8,8% 48 Screen Digest. (TV International : 69)
IPTV subscriptions 13,7% 75 Screen Digest / European Audiovisual Observatory
Installed DVB-T receivers 8,4% 46 Screen Digest / European Audiovisual Observatory
Total digital TV households 33,6% 184 European Audiovisual Observatory
Households with PC 73,7% 404 Screen Digest / European Audiovisual Observatory
Households with broadband connections 50,7% 278 Screen Digest / European Audiovisual Observatory
Number of TV channels by kind of licence 10.09 Public Private TotalTerrestrial (national) 2 5 7Cable/Satellite/IPTV/Mobile 0 4 4Regional/Local 0 5 5Regional/local windows 0 0 0Channels targeting foreign markets 0 0 0Total 2 14 16Foreign channels targeting the country 2 12 14
TV channels distributors 10.09 CompaniesCable operators 4 Elion, Starman, STV, TelsetSatellite packagers 1 ViasatIPTV packagers 1 ElionDTT multiplex operators 2 Levira (free DTT), Starman (Zuum TV, pay DTT)Mobile phone TV packagers 1 EMT
Source: European Audiovisual Observatory
Supply of TV channels by genre and by platform (including foreign channels) 10.09
Digital Terrestrial
Starman (Zuum TV)Cable
StarmanCable
STVSatellite Viasat
(Full nordic offer)IPTV Elion
Generalist - national 2 3 3 2 3Generalist - foreign 3 14 21 21 10Adult 1 6 7 3 5Children 6 12 9 18 31Culture/ education/ documentary 10 24 15 31 22Minority interest groupsEntertainment/ TV fiction/ games 13 20 16 32 26Film 2 6 8 44 4Home shopping 1International linguistic and cultural 1 2 1 2Lifestyle/ specific leisure/ travel 3 6 10 1 8Music 2 10 15 8 15News/ business 2 12 11 8 13Parliament/ government/ administrationRegional/ local 1 1Religion 1 2 2Sports 5 8 12 20 16Various 1 5 4 1Total 49 125 137 195 157
Basic figures

772 0 0 9 | V o l u m e 1 | B a n d 1
AL
AT
BE
BG
CH
CY
CZ
DE
DK
EE
ES
FI
FR
GB
GR
HR
HU
IE
IS
IT
LT
LU
LV
MK
MT
NL
NO
PL
PT
RO
RU
SE
SI
SK
TR
EE
Estonia Estonie Estland EE
Source: European Audiovisual Observatory on the basis of data from Screen Digest, ERR, TNS Emor / IP Key Facts
Source: European Audiovisual Observatory
Source: Screen DigestSource: Screen Digest
Households TV equipment 2004-2008
Number of households accessing multichannel platforms as at 31.12.2008
Consumers pay-TV gross spend 2004-2008
Gross revenues of radio-television 2004-2008
2004 2005 2006 2007 2008
0
300
200
100
Cable households
Satellite households
IPTV households
DTT households
258
213
5750
0
0
26
54
18
1
46
75
60
80
94
229240
250
Viasat
Elion
Starman
Free DTT
ZuumTV
0
80
60
40
20
46
17
48
~
DTT
IPTV
Sat
PC
Cable
754
2004 2005 2006 2007 2008
0
30 000
20 000
10 000
Cable TV
Satellite
IPTV
DTT
26 132
12 689
623
2 131
4 103
750
6 365
3 059
9 046
6 101
1 503
15 991
20 123
23 511
200
398
83
125
2004 2005 2006 2007 2008
0
250
200
150
100
50
TV adspend
Consumerspay-TV spend
Radio-TVpublic income
221
149
1318
25
21
33
25
43
29
In thousands.
In thousands.
EUR thousand.
EUR million.
Market trends

78 2 0 0 9 | V o l u m e 1 | B a n d 1
AL
AT
BE
BG
CH
CY
CZ
DE
DK
EE
ES
FI
FR
GB
GR
HR
HU
IE
IS
IT
LT
LU
LV
MK
MT
NL
NO
PL
PT
RO
RU
SE
SI
SK
TR
EE
Estonia Estonie Estland EE
Main broadcasters Channels 2005 2006 2007 2008 2008/07ERR - Eesti Rahvursringhääling 1 sptv ETV 25 439 27 725 32 065 15,7%p.m. Eesti Televisioon (ETV) 1 sptv ETV 13 896 16 673 – – –Kanal 2 AS adtv Kanal 2 7 773 9 585 14 267 14 021 -1,7%TV 3 AS adtv TV3 10 707 12 443 14 141 13 693 -3,2%MTV Eesti thtv MTV Estonia 262 581 870 49,7%Pervoi Baltiski Kanal thtv PBK 224 271 309 148 -52,1%
Main distributors Services Packages 2005 2006 2007 2008 2008/07EMT AS 2 3G TV EMT TV 172 370 186 981 205 905 197 392 -4,1%Elion Ettevötted AS 2 3Play DigiTV 145 070 155 510 165 514 190 712 15,2%Viasat AS sat-tv Viasat 4 935 10 358 23 294 35 206 51,1%Starman AS 2 3Play ZuumTV 12 207 15 216 18 452 22 892 24,1%STV AS 2 3Play KTV 8 073 10 436 12 038 13 743 14,2%
Source: European Audiovisual Observatory1 The public television company ETV was merged as at 1.6.2007 with the public radio company Eesti Radio to form the Eesti Rahvursringhääling (ERR).
2 Includes telecommunications activities (Internet, telephony).
EUR thousand.
2004 2005 2006 2007 2008
0
35 000
30 000
25 000
20 000
15 000
10 000
5 000
ERR - Eesti Rahvursringhääling
Eesti Televisioon (ETV)
Kanal 2 ASTV 3 AS
MTV EestiPervoi Baltiski Kanal
Operating revenues of main television companies in Estonia 2005-2008 EUR thousand.
T.1.EE.1G.1.EE.1

792 0 0 9 | V o l u m e 1 | B a n d 1
AL
AT
BE
BG
CH
CY
CZ
DE
DK
EE
ES
FI
FR
GB
GR
HR
HU
IE
IS
IT
LT
LU
LV
MK
MT
NL
NO
PL
PT
RO
RU
SE
SI
SK
TR
EE
Estonia Estonie Estland EE
Source: ETV / European Audiovisual Observatory
Income 2006 2007 2008 2006 2007 2008 2008/07Total public income 21 275 25 308 28 700 83,6% 91,3% 89,5% 13,4% - Aid/Grants 20 598 21 994 24 090 81,0% 79,3% 75,1% 9,5%Other public income 677 3 314 4 621 2,7% 12,0% 14,4% 39,4%Total commercial income 1 789 1 895 2 207 7,0% 6,8% 6,9% 16,5% - Advertising 170 174 0 0,7% 0,6% 0,0% -100,0% - Sales of programmes 465 474 316 1,8% 1,7% 1,0% -33,3% - Other commercial 1 154 1 247 1 890 4,5% 4,5% 5,9% 51,6%Others 2 375 522 1 147 9,3% 1,9% 3,6% 119,7%
Total 25 439 27 725 32 065 100,0% 100,0% 100,0% 15,7%
Expenditure 2006 2007 2008 2006 2007 2008 2008/07Total 23 192 26 761 31 013 15,9%
Net result 2 153 1 005 1 136 13,0%Operating margin (%) 8,8 3,5 3,3
EUR thousand.
In %.
2006 2007 2008
0
35 000
30 000
25 000
20 000
15 000
10 000
5 000
Aids/Grants
Other public income
AdvertisingSales of programmesOther commercialOther revenues
2006 2007 2008
0
16
12
8
4
Return on shareholders' funds
Return on total assets
Operating marginPro�t margin
Eesti Rahvursringhääling Financial situation 2006-2008 EUR thousand. Until 31.05.2007 there were two separate organisations for tv (Eeeti Televisioon) and for radio (Eesti Radio).
As at 1.06.2007 they were merged in Eesti Rahvursringhääling (ERR). ERR data for 2006 and 2007 are consolidated pro forma.
T.1.EE.2G.1.EE.2

80 2 0 0 9 | V o l u m e 1 | B a n d 1
AL
AT
BE
BG
CH
CY
CZ
DE
DK
EE
ES
FI
FR
GB
GR
HR
HU
IE
IS
IT
LT
LU
LV
MK
MT
NL
NO
PL
PT
RO
RU
SE
SI
SK
TR
EE
Estonia Estonie Estland EE
Daily share Prime time (19:00-22:00)Channels 2004 2005 2006 2007 2008 2004 2005 2006 2007 2008Eesti Televisioon 18,0 17,1 17,3 16,4 15,6 18,9 19,6 18,1 17,1 16,7ETV 2 0,2 0,4Public Estonian channels 18,0 17,1 17,3 16,4 15,8 18,9 19,6 18,1 17,1 17,1TV3 Estonia 23,6 22,2 20,0 18,9 18,2 24,0 22,7 20,3 18,8 20,0Kanal 2 19,6 19,7 21,9 22,1 19,8 21,9 21,8 26,0 26,9 24,9Kanal 11 0,8 0,6TV 6 0,8 0,8Kalev Sport 0,4 0,4MTV Eesti 0,4 0,3 0,3 0,2Private Estonian channels 43,2 41,9 41,9 41,4 40,3 45,9 44,5 46,3 46,0 46,9Perviy Baltiysky Kanal Estonia 9,6 10,3 10,2 12,4 12,8 10,8 11,6 11,0 12,8 13,3RTR /Rossiya/RTR Planeta 4,6 4,8 4,2 3,7 3,4 4,5 3,7 3,1 2,8 2,5Finnish channels 1,4 1,1 0,8 0,6 ~ 1,5 1,0 0,9 0,6 ~NTV mir – 2,1 2,1 2,5 2,9 1,6 1,9 1,9 2,53+ Estonia – 1,7 3,1 4,1 3,6 2,2 3,7 5,3 3,8Ren TV Estonia 1,9 1,6Foreign channels 15,6 20,0 20,4 23,3 24,6 16,8 20,1 20,6 23,4 23,7Other channels 21,3 18,7 18,0 17,1 17,4 17,1 14,3 13,3 12,4 11,0Video & TV Games 1,9 2,3 2,4 1,8 1,9 1,3 1,5 1,7 1,1 1,3
Source: Eurodata TV Worldwide / TNS EMOR
Daily share. In %, 4 years +.
Prime time (19:00-22:00). In %, 4 years +.
2004 2005 2006 2007 2008
0
5
10
20
15
25
Kanal 2
TV3 Estonia
EestiTelevisioon
PerviyBaltiyskyKanal Estonia
3+ Estonia
RTR /Rossiya/RTR Planeta
NTV mir
2008
Eesti Televisioon 16,7%
Others 11,0%
Video & TV Game1,3%
ETV 20,4%
TV3 Estonia20,0%
Kanal 224,9%
Kanal 110,6%TV 6
0,8%
Kalev Sport0,4%
MTV Eesti0,2%
PBK Estonia 13,3%
RTR channels2,5%
NTV mir2,5%
3+ Estonia3,8%
Ren TV Estonia1,6%
TV audience market share in Estonia 2004-2008 In %, 4 years +.
T.1.EE.3G.1.EE.3

812 0 0 9 | V o l u m e 1 | B a n d 1
AL
AT
BE
BG
CH
CY
CZ
DE
DK
EE
ES
FI
FR
GB
GR
HR
HU
IE
IS
IT
LT
LU
LV
MK
MT
NL
NO
PL
PT
RO
RU
SE
SI
SK
TR
ES
Spain Espagne Spanien ES
The Spanish audiovisual landscape underwent significant changes in 2008
and 2009 with the confirmation of the success of IPTV, the start of pay-DTT and the announcement that the public chan-nels were to stop broadcasting advertising, probably in 2010. Telecinco, which is controlled by the Italian group Mediaset, was still the most-watched channel in Spain in 2008 but nonetheless dipped below the 20% mark with a daily audience market share of just 18.1%. It is followed by the first public channel, La Primera, whose market share dropped to 16.9%, and by Antena 3, which is controlled by the Planeta de Agostini and Bertelsmann groups and also saw its share fall to 16%. Trailing behind them but continuing to increase their mar-ket share are the two most recent channels in Spain’s analogue terrestrial landscape: Cuatro (which replaced Canal+ in 2005) has a daily audience share of 8.6% and La Sexta (created in 2006 by a Spanish-Mexican consortium) has 5.5%. The daily audience of TVE La 2 remains stable at around 5.5%. The remaining third of the total audience is spread among the special-interest channels and, in parti-cular, the many Spanish regional and local channels, including the public channels of the autonomous communities.The extent to which Spanish households subscribe to multi-channel platforms is traditionally low. The market is dominated by the satellite package Digital+, which is owned by Sogecable (Prisa group), which was received by less than 13% of homes in 2009. Its number of subscrib-ers fell below the two million mark in 2009 (1 930 000 in June). Its main com-petitor is the cable operator ONO, which also saw its number of subscribers fall in 2009, dropping below the one million mark with 991,000 subscribers in June 2009. Although there are still a large number of cable operators, they reach less than 10% of homes. Finally, the current market for ADSL television services (IPTV) is dominated by the Imagenio platform (Telefónica de España), which had more than 600,000 subscribers at the end of 2008, thus establishing itself as Spain’s third most important pay-TV player.Despite the good IPTV figures, the multi-channel pay-TV markets are tending to stagnate. This is not the case with digital terrestrial television: the DTT signal could be received by more than 96% of the pop-ulation in July 2009 and more and more households are being equipped. According to sources, the proportion of homes with DTT varies from 56% (October 2009, INE) to 65,5% (May 2009, AIMC and Impulsa TDT). The digital switchover is still scheduled for April 2010. In this connection, the
Le paysage audiovisuel espagnol a connu d’importantes transformations
en 2008 et en 2009 avec la confirmation du succès de l’IPTV, le démarrage de la TNT payante ou encore l’annonce de la suppression de la publicité sur les chaînes publiques, attendue pour 2010. Telecinco, contrôlée par le groupe italien Mediaset, demeure en 2008 la chaîne la plus regardée en Espagne. Elle passe néan-moins sous la barre des 20 % de part de marché avec 18,1 % seulement de l’audien-ce quotidienne. Telecinco est suivie par la première chaîne publique La Primera, en recul avec 16,9 % de part de marché, et par Antena 3, contrôlée par les groupes Planeta de Agostini et Bertelsmann, qui s’établit à 16 %, en recul aussi. Derrière, continuent de progresser les deux chaînes les plus récentes du paysage analogique terrestre espagnol : Cuatro (qui a remplacé Canal+ en 2005) s’établit à 8,6 % et la Sex-ta (crée en 2006 par un consortium hispa-no-mexicain) affiche une part d’audience quotidienne de 5,5 %. TVE La 2 demeure stable autour de 5,5 % d’audience quoti-dienne. Le tiers restant de l’audience se répartit entre les chaînes thématiques et surtout les nombreuses chaînes régio nales et locales espagnoles, dont les chaînes autonomiques publiques.Le taux d’abonnement des foyers aux plates-formes multi-chaînes est tradition-nellement faible en Espagne. Le marché est dominé par le bouquet satellite Digi-tal+, détenu par Sogecable (groupe Prisa), qui équipe moins de 13 % des foyers en 2009. Son nombre d’abonnés a décru en 2009, passant sous la barre des 2 millions (1 930 000 en juin 2009). Son principal concurrent est le câblo-opérateur ONO qui a vu lui-aussi décroître son nombre d’abonnés en 2009, passant sous la barre du million avec 991 000 abonnés en juin 2009. Si les câblo-opérateurs demeurent nombreux, ils équipent moins de 10 % des foyers. Enfin, le marché plus récent des services de télévision par ADSL (IPTV) est dominé par la plate-forme Imagenio (Telefonica de Espana) qui rassemble à la fin de l’année 2008 plus de 600 000 abonnés, s’imposant dès lors comme le troisième acteur de la télévision payante en Espagne.Malgré les bons résultats de l’IPTV, les marchés de la télévision payante multi-chaînes tendent à stagner. Ce qui n’est pas le cas de la télévision numérique terrestre. En effet, le signal numérique terrestre peut être capté par plus de 96 % de la popula-tion en juillet 2009, et l’équipement des foyers ne cesse de progresser. Selon les sources, la part des foyers espagnols rac-cordés à la TNT varie de 56 % (octobre 2009, INE) à 65,5 % (mai 2009, AIMC et Impulsa TDT). La transition vers le numérique terrestre demeure fixée pour avril 2010. Dans ce
Die spanische audiovisuelle Landschaft war 2008 und 2009 von weitrei-
chenden Veränderungen und Neuerungen gekennzeichnet, darunter die Bestätigung des Erfolgs von IPTV, der Start des Bezahl-fernsehens über DVB-T oder die für 2010 angekündigte Abschaffung der Werbung im öffentlich-rechtlichen Rundfunk. Der vom italienischen Medienkonzern Mediaset kontrollierte Sender Telecin-co war auch 2008 wieder der meistge-sehene Sender in Spanien, fällt aber mit einem Zuschaueranteil von nur 18,1 % unter die 20%-Marke. Auf den Plätzen folgen der erste öffentlich-rechtliche Sen-der (La Primera) mit einem ebenfalls rück-läufigen Marktanteil von 16,9 % und der Sender Antena 3 (im Besitz von Planeta de Agostini und Bertelsmann), der eben-falls Zuschauer verloren hat und nun bei 16 % Marktanteil liegt. Dahinter auf dem Vormarsch finden sich die zwei jüngsten Sender im Bereich des analogen Anten-nenfernsehens in Spanien: Cuatro (seit 2005 Nachfolger von Canal+) mit 8,6 % und La Sexta (2006 von einem spanisch-mexikanischen Konsortium gegründet) mit einem Zuschaueranteil von 5,5 %. TVE La 2 liegt stabil bei rund 5,5 % Zuschaueranteil. Das letzte Drittel der Zuschaueranteile verteilt sich auf einige Spartenkanäle und vor allem die zahllosen spanischen Regional- und Lokalsender, darunter die autonomen öffentlich-recht-lichen Sender.Die Haushaltsdurchdringung mit Mehr-kanalplattformen ist in Spanien tradi-tionell schwach. Der Markt wird vom Satellitenbouquet Digital+ von Soge-cable (Prisa-Gruppe) dominiert, das in weniger als 13 % der Haushalte vertreten ist. Die Zahl seiner Abonnenten ist 2009 auf unter zwei Millionen zurückgegangen (1 930 000 im Juni 2009). Hauptwettbe-werber von Sogecable ist der Kabelbetrei-ber ONO, der 2009 ebenfalls einen Rück-gang seiner Kundenzahl auf nunmehr unter eine Million hinnehmen musste (991 000 Abonnenten im Juni 2009). Es gibt zwar nach wie vor viele Kabelbetrei-ber, aber sie bedienen zusammen weniger als 10 % der Haushalte. Der noch junge Markt des ADSL-Fernsehens (IPTV) wird von der Plattform Imagenio (Tele-fonica de España) beherrscht, die Ende 2008 mit über 600 000 Abonnenten zum drittgrößten Pay-TV-Anbieter in Spanien avanciert ist.Der Markt für Mehrkanal-Pay-TV scheint trotz der guten Entwicklung des Internet-fernsehens zu stagnieren. Für das digitale terrestrische Fernsehen ist dies aber nicht der Fall. So konnten im Juli 2009 über 96 % der Bevölkerung DVB-T-Signale empfangen, bei einer weiter zunehmenden Ausstattung der Haushalte. Je nach Quelle schwankt die Zahl der spanischen DVB-T-Haushalte zwischen 56 % (Oktober 2009,

82 2 0 0 9 | V o l u m e 1 | B a n d 1
AL
AT
BE
BG
CH
CY
CZ
DE
DK
EE
ES
FI
FR
GB
GR
HR
HU
IE
IS
IT
LT
LU
LV
MK
MT
NL
NO
PL
PT
RO
RU
SE
SI
SK
TR
ES
Spain Espagne Spanien ES
switchoff of analogue terrestrial trans-missions has already taken place in several local areas, the first being in the province of Soria in July 2008. A decree-law adopt-ed in February 2009 laid down that DTT programmes will have to be made avail-able by satellite for homes not covered by the digital terrestrial signal. Incidentally, the same decree relaxed the provisions on media concentration, especially the pos-sibility of owning shares in more than one DTT licensee.In May 2009, the transmission com-pany Abertis was ordered to pay a fine of 22.6 million euros for abusing its domi-nant position on the Spanish market. The competition authority ruled that the agreements signed between Abertis and the main private channels could impede the emergence of new companies on the local and regional DTT signal trans-mission markets.In August 2009, the Spanish government published a decree authorising the launch of pay-DTT services, despite the resistance of the old-established pay-TV players such as ONO and Sogecable. A first pay-TV channel specialising in football, Gol TV (controlled by the GAMP consortium, which includes Mediapro, and Televisa), was launched in the summer of 2009 on DTT in the place of the free-to-air chan-nel Hogar 10. In turn, the companies Dahlia TV and Sony announced their intention to launch pay services before the end of 2009.Finally, a draft law adopted in April 2009 provides for the total elimination of advertising from the channels of the public broadcaster TVE on 1 January 2010. TVE’s revenues will then come from public funding, the spectrum tax and the introduction of two new taxes (on the revenues of the private broadcasters and the telecommunications operators).
cadre, plusieurs extinctions locales des transmissions analogiques terrestres ont déjà été opérées, la première d’entre elles ayant eu lieu dans la province de Soria en juillet 2008. Un décret loi adopté en février 2009 a établi que les programmes de la TNT devront être rendus disponi-bles via satellite pour les foyers non cou-verts par le signal numérique terrestre. Ce même décret a par ailleurs assoupli les dispositions relatives à la concentration des médias, en particulier la possibilité de détenir des parts dans plus d’un conces-sionnaire de TNT.En mai 2009, l’entreprise de transmission Abertis a été condamnée à une amende de 22,6 millions d’euros pour abus de posi-tion dominante sur le marché espagnol. L’autorité de la concurrence a jugé que les accords signés entre Abertis et les princi-pales chaînes privées pouvaient entraver l’émergence de nouvelles entreprises sur les marchés régionaux et locaux de transmis-sion des signaux de TNT.Le gouvernement espagnol a publié un décret en août 2009 autorisant le lance-ment de services de TNT payants, malgré les réticences des acteurs traditionnels de la télévision payante tels que ONO ou Soge-cable. Une première chaîne payante spécia-lisée dans le football, Gol TV (contrôlée par le consortium GAMP, incluant Media-pro, et Televisa), a été lancée dès l’été 2009 sur la TNT à la place de la chaîne gratuite Hogar 10. Les entreprises Dahlia TV et Sony ont à leur tour annoncé le lancement de services payants avant la fin de 2009.Enfin, un projet de loi adopté en avril 2009 prévoit la suppression totale de la publicité sur les chaînes du radiodiffuseur télévisuel public TVE au 1er janvier 2010. Les recet-tes de la TVE seront alors assurées par une subvention publique, la taxe sur le spectre de fréquences radioélectriques et l’ins-tauration de deux nouvelles taxes (sur les recettes des radiodiffuseurs privés et des opérateurs de télécommunications).
INE) und 65,5 % (Mai 2009, AIMC und Impulsa TDT). Die Umstellung auf das digitale terres-trische Fernsehen ist weiterhin für April 2010 vorgesehen, aber auf lokaler Ebene ist die Abschaltung des Analogbetriebs in mehreren Fällen bereits früher erfolgt, das erste Mal im Juli 2008 in der Provinz Soria. Nach einer im Februar 2009 verab-schiedeten Gesetzesverordnung müssen die DVB-T-Programme für die Haus-halte via Satellit bereitgestellt werden, die keinen Zugang zu DVB-T haben. Mit der gleichen Verordnung wurden darüber hinaus auch die Medienkonzen-trationsbestimmungen gelockert. So ist es nun insbesondere möglich, Anteile an mehreren DVB-T-Lizenzinhabern zu halten.Im Mai 2009 wurde der Netzbetreiber Abertis wegen Missbrauch seiner markt-beherrschenden Stellung auf dem spa-nischen Markt zu einer Geldstrafe von 22,6 Mio. EUR verurteilt. Nach Auf-fassung der Wettbewerbsbehörde waren die Vereinbarungen zwischen Abertis und den wichtigsten Privatsendern dazu angetan, den Markteintritt neuer DVB-T-Netzbetreiber auf lokalen und regionalen Märkten zu behindern.Die spanische Regierung hat im August 2009 eine Verordnung erlassen, mit der der Betrieb von kostenpflichtigen DVB-T-Angeboten genehmigt wird, trotz des Widerstands der etablierten Pay-TV-Anbieter wie ONO oder Sogecable. Der erste Pay-DVB-T-Sender (Gol TV, ein auf Fußball spezialisierter Sender des Konsortiums GAMP, dem auch Medi-apro und Televisa angehören) ist bereits im Sommer 2009 auf dem Sendeplatz des Free-TV-Senders Hogar 10 über DVB-T auf Sendung gegangen. Den Start von kostenpflichtigen Diensten bis zum Jahresende 2009 haben inzwischen auch die Unternehmen Dahlia TV und Sony angekündigt.Ein im April verabschiedeter Gesetzent-wurf sieht die vollständige Abschaffung der Werbung bei den Sendern der öffent-lich-rechtlichen Fernsehanstalt TVE zum 1. Januar 2010 vor. Die Einnahmen von TVE werden dann durch öffentliche Zuschüsse, die Gebühren für die Nut-zung des Funkfrequenzspektrums sowie die Einführung zweier neuer Abgaben (auf die Einnahmen der privaten Rund-funksender und der Telekom-Betreiber) sichergestellt.
Sources: CMT (Comisión del Mercado de las Telecomunicaciones): http://www.cmt.es Audience data: http://www.sofresam.com Impulsa TDT: http://www.impulsatdt.es Legal aspects: IRIS Merlin, http://merlin.obs.coe.int

832 0 0 9 | V o l u m e 1 | B a n d 1
AL
AT
BE
BG
CH
CY
CZ
DE
DK
EE
ES
FI
FR
GB
GR
HR
HU
IE
IS
IT
LT
LU
LV
MK
MT
NL
NO
PL
PT
RO
RU
SE
SI
SK
TR
ES
Spain Espagne Spanien ES
Population and equipment 31.12.08Penetration
(in % HH) In thousand SourcesPopulation (inhabitants) – 45 828 Eurostat
Households – 16 700 Eurostat (as at 1.1.2008)
TV households 100,0% 16 700 European Audiovisual Observatory
Cable TV households 9,1% 1 517 Screen Digest / European Audiovisual Observatory
Digital cable TV households 6,7% 1 112 Screen Digest / European Audiovisual Observatory
DTH/SMATV households 16,0% 2 675 Screen Digest / European Audiovisual Observatory
Pay DTH/SMATV households 12,2% 2 035 Screen Digest / European Audiovisual Observatory
IPTV subscriptions 4,2% 708 Screen Digest / European Audiovisual Observatory
Installed DVB-T Receivers 46,0% 7 207 Screen Digest / European Audiovisual Observatory
Total digital TV households 66,2% 11 062 European Audiovisual Observatory
Households with PC 61,8% 10 318 Screen Digest / European Audiovisual Observatory
Households with broadband connections 43,5% 7 263 Screen Digest / European Audiovisual Observatory
Mobile phone TV subscriptions – 270 CMT
Number of TV channels by kind of licence 10.09 Public Private TotalTerrestrial (national) 5 18 23Cable/Satellite/IPTV/Mobile 13 144 157Regional/Local 85 900 985Regional/local windows 17 0 17Channels targeting foreign markets 6 17 23Total 126 1 079 1 205Foreign channels targeting the country 3 29 32
TV channels distributors 11.09 CompaniesCable operators 510 Ono, Euskaltel, R Cable, Telecable de Asturias, ProconoSatellite packagers 1 Sogecable (Digital+)
IPTV packagers 4 France Telecom Espana (Orange), Grupalia Internet, Jazz Telecom, Telefonica (Imagenio)
DTT multiplex operators >5 Grup Abertis(Retevision), Axion, Itelazpi, Teledifusion Madrid, Retegal
Mobile phone TV packagers 3 France Telecom Espana (Orange), Telefonica (Movistar), Vodafone Espana
Source: European Audiovisual Observatory
Supply of TV channels by genre and by platform (including foreign channels) 10.09
Digital Terrestrial
MadridCable
Ono
Satellite Sogecable (Digital+)
IPTV Telefonica de
Espana (Imagenio)Generalist - national 8 8 8 23Generalist - foreign 2 1Adult 4 2Children 2 12 12 11Culture/ education/ documentary 9 10 14Minority interest groups 2Entertainment/ TV fiction/ games 4 11 10 12Film 13 8 8Home shopping 2 1International linguistic and cultural 17 10 16Lifestyle/ specific leisure/ travel 4 5 6Music 1 11 7 12News/ business 3 10 16 15Parliament/ government/ administration 2 1Regional/ local 11 2Religion 1 1Sports 2 11 14 8Various 7 9 4Total 31 122 113 137
Basic figures

84 2 0 0 9 | V o l u m e 1 | B a n d 1
AL
AT
BE
BG
CH
CY
CZ
DE
DK
EE
ES
FI
FR
GB
GR
HR
HU
IE
IS
IT
LT
LU
LV
MK
MT
NL
NO
PL
PT
RO
RU
SE
SI
SK
TR
ES
Spain Espagne Spanien ES
Source: European Audiovisual Observatory on the basis of data from Screen Digest, WARC and CMT
Source: European Audioviosual Observatory
Source: Screen Digest / CMT / European Audiovisual ObservatorySource: Screen Digest
Households TV equipment 2004-2008
Number of households accessing multichannel platforms as at 31.12.2008
Consumers pay-TV gross spend 2004-2008
Gross revenues of radio-television 2004-2008
2004 2005 2006 2007 2008
0
8 000
6 000
4 000
2 000
DTT households
Satellite households
Cable households
IPTV households475
6207
398571
708
2 537
4 400
7 207
2 400
1 136
2 600
1 242
2 700
1 342
2 700
1 414
2 675
1 517
DTT
Digital+
ONO
Imagenio
Teleca
ble de Asturia
s
R Cable
Euskatel
Orange TV
Zattoo
Jazz
tel
0
8 000
6 000
4 000
2 000
7 207
2 035
1 039
607
121 70 47 87 13 8
DTT
IPTV
Sat
PC
Cable
2004 2005 2006 2007 2008
0
2 000 000
1 000 000
1 500 000
500 000
Satellite
Cable TV
IPTV
Analogue terrestrial
1 542 270
1 236 840
1 387 340
1 473 6601 522 410
325 121
431 451486 680
525 356582 561
787 17 580
79 770
0
130 500185 050
127 94757 057
2004 2005 2006 2007 2008
0
4 000
3 000
2 000
1 000
TV adspend
Consumerspay-TV spend
Radio-TVpublic income
2 670
1 691
726
2 951
1 893
661
3 188
2 040
1 191
3 467
2 178
1 018
3 044
2 310
1 278
In thousands.
In thousands.
EUR thousand.
EUR million.
Market trends

852 0 0 9 | V o l u m e 1 | B a n d 1
AL
AT
BE
BG
CH
CY
CZ
DE
DK
EE
ES
FI
FR
GB
GR
HR
HU
IE
IS
IT
LT
LU
LV
MK
MT
NL
NO
PL
PT
RO
RU
SE
SI
SK
TR
ES
Spain Espagne Spanien ES
1 Includes telecommunications activities.
Main broadcasters Channels 2005 2006 2007 2008 2008/07Sociedad Mercantil Estatal Television Española S.A. sptv TVE-1, TVE-2, … – – 1 013 837 981 785 -3,2%
p.m. Televisión Española S.A. (TVE) sptv TVE-1, TVE-2, … 911 620 961 794 – – –Gestevisión Telecinco S.A. (uncons.) adtv Tele5 805 025 846 228 927 059 838 225 -9,6%Antena 3 de Televisión S.A. (uncons.) adtv Antena 3 864 691 869 754 878 045 722 312 -17,7%Sogecable (Cuatro) adtv Cuatro – – 287 490 326 750 13,7%p.m. Sogecable S.A. pay-tv/adtv Canal+, Cuatro 985 807 752 912 372 157 ~ ~Televisió de Catalunya S.A. sptv TV3, Canal 33 164 906 163 876 154 962 ~ ~Euskal Telebista Televisión Vasca, S.A. sptv ETB1, ETB2 118 796 120 199 124 659 ~ ~Gestora de Inversiones Audiovisuales La Sexta S.A. adtv la Sexta ~ 76 065 109 308 ~ ~
Televisión Autonómica Valenciana S.A. sptv Canal 9, Punt 2 75 276 77 217 80 896 ~ ~Televisión Autonomia Madrid S.A. sptv TVM, La Otra 74 500 68 289 57 418 ~ ~Canal Sur Televisión S.A. sptv Canal Sur, Canal 2 62 579 59 970 56 652 ~ ~Televisión Autonómica de Castilla-La Mancha sptv Castilla La Mancha
Television 38 571 57 557 56 400 ~ ~
Televisión Publica de Canarias S.A. sptv TV Canaria 38 924 39 407 39 829 ~ ~Factoria de Canales S.L. thtv Cinestar, CTK,… 15 487 23 527 38 722 ~ ~Compania Independiente de Televisión S.L. thtv Caza y pesca, Viajar,… 41 900 45 340 36 178 ~ ~
Fox International Channels España thtv Fox Espana 23 705 33 044 34 346 ~ ~Companía Independiente de Noticias de Televisión S.L. thtv CNN+ 18 414 32 665 ~ ~ ~
Canal Club de Distribución de Ocio y Cultura hstv Canal Club 28 278 31 115 33 268 32 547 -2,2%
Grupo Empresarial de Television de Murcia rtv 7RM – 14 845 32 321 ~ ~
NBC Universal Global Networks España S.L. thtv Calle 13 19 325 24 606 28 738 ~ ~
SPTI Networks Iberia paytv AXN 24 196 ~ ~ ~ ~Televisión de Galicia S.A. sptv TVG 30 451 23 072 23 918 ~ ~
Multicanal Iberia S.L. thtv Multicanal (Canal Hollywood, …) 16 702 22 263 21 410 ~ ~
Sociedad publica de Televisión Extremena S.A. sptv Extramadura TV 509 12 357 17 567 ~ ~
Paramount Comedy Channel España thtv Paramount Comedy Channel 13 575 15 413 17 208 ~ ~
MTV Channel España thtv MTV Espana 10 427 10 863 12 560 ~ ~
Main distributors Services Packages 2005 2006 2007 2008 2008/07Telefonica de Espana 1 3play, 3G TV Imagenio, Movistar TV 18 936 000 19 751 000 20 683 000 20 838 000 0,7%Vodafone Espana S.A. 1 3G TV Vodafone live! 5 902 950 5 171 039 7 236 680 ~ ~
France Telecom Espana S.A. 1 3play, 3G TV Orange TV, Orange TV Movil 624 573 4 247 501 4 312 983 ~ ~
Grupo Corporativo ONO SAU 1 3 play ONO 804 433 1 687 707 1 686 549 ~ ~Sogecable (Digital +) sat-tv Digital+ – – 1 809 650 1 872 900 3,5%p.m. CanalSatelite Digital S.L. sat-tv Digital+ 944 548 976 258 1 188 313 ~ ~p.m. DTS Distribuidora de
Televisión Digital S.A. sat-tv Via Digital / Digital+ 205 509 234 464 220 056 ~ ~
Euskatel S.A. 1 3play Euskatel Telebista 327 047 347 057 342 264 ~ ~Jazz Telecom S.A. 1 3play Jazztelia 218 023 273 566 304 536 ~ ~R Cable y Telecomunicaciones Galicia S.A. 1 CATV / ISP R 108 879 124 600 140 778 ~ ~
Telecable de Asturias S.A. 1 3play Telecable TV 71 471 79 126 87 783 ~ ~Procono S.A. 1 3play PTV Telecom 12 644 12 884 13 205 ~ ~Grupalia Internet 1 IPTV/ISP Superbanda 18 656 14 711 7 939 ~ ~
Operating revenues of main television companies in Spain 2005-2008 EUR thousand.
T.1.ES.1G.1.ES.1

86 2 0 0 9 | V o l u m e 1 | B a n d 1
AL
AT
BE
BG
CH
CY
CZ
DE
DK
EE
ES
FI
FR
GB
GR
HR
HU
IE
IS
IT
LT
LU
LV
MK
MT
NL
NO
PL
PT
RO
RU
SE
SI
SK
TR
ES
Spain Espagne Spanien ES
Source: European Audiovisual Observatory
Source: CMT
CompaniesTelecinco 759,99Sogecable 319,11Antena 3 Television 659,52RTVE 596,82La Sexta 157,23Televisio de Catalunya 113,80Canal Sur 47,75Television Autonomica de Madrid 38,43Radiotelevisio Valenciana 27,50ETB 23,37Television de Galicia 18,53Veo Television 11,16Net TV 8,67Others 22,59
2004 2005 2006 2007 2008
0
1 200 000
1 000 000
800 000
600 000
400 000
200 000
TVE
Gestevisión Telecinco S.A.
Antena 3 de Televisión S.A.
Sogecable S.A.
Televisió de Catalunya S.A.Euskal Telebista Televisión Vasca, S.A.Gestora de InversionesAudiovisuales La Sexta S.A.
Sogecable Cuatro
In %.
2008
Telecinco27,1%
Sogecable11,4%
Others0,8%
Antena 3 Television23,5%
RTVE21,3%
La Sexta5,6%
Televisio de Catalunya4,1%
Canal Sur1,7%
Television Autonomica de Madrid1,4%
Radiotelevisio Valenciana1,0%
ETB0,8%
Television de Galicia0,7%Veo Television0,4%Net TV0,3%
Operating revenues of main television companies in Spain (Continued) 2005-2008 EUR thousand.
Breakdown of advertising revenues of Spanish TV companies 2008 EUR million.
T.1.ES.1G.1.ES.1
T.1.ES.2G.1.ES.2

872 0 0 9 | V o l u m e 1 | B a n d 1
AL
AT
BE
BG
CH
CY
CZ
DE
DK
EE
ES
FI
FR
GB
GR
HR
HU
IE
IS
IT
LT
LU
LV
MK
MT
NL
NO
PL
PT
RO
RU
SE
SI
SK
TR
ES
Spain Espagne Spanien ES
Source: RTVE / European Audiovisual Observatory
Income 2005 2006 2007 2008 2005 2006 2007 2008 2008/07Total public income 81 357 579 051 436 900 502 571 9,8% 43,9% 36,9% 45,1% 15,0% - Aid/Grants 81 357 579 051 436 900 502 571 9,8% 43,9% 36,9% 45,1% 15,0%Total commercial income 736 557 729 148 679 300 600 089 88,4% 55,2% 57,4% 53,9% -11,7% Advertising 709 054 697 644 679 300 557 100 85,1% 52,8% 57,4% 50,0% -18,0% Programme sales 11 776 16 130 ~ ~ 1,4% 1,2% ~ ~ ~ Merchandising 9 674 8 350 ~ ~ 1,2% 0,6% ~ ~ ~ Other commercial income 6 053 7 024 ~ 50 900 0,7% 0,5% ~ 4,6% ~Other income 15 270 12 081 67 605 11 321 1,8% 0,9% 5,7% 1,0% -83,3%
TOTAL 833 184 1 320 280 1 183 805 1 113 981 100,0% 100,0% 100,0% 100,0% -5,9%
Expenditure 2005 2006 2007 2008 2005 2006 2007 2008 2008/07 Purchase of goods and services/others 693 197 743 129 816 673 812 339 57,1% 57,8% 69,4% 71,1% -0,5%
Costs of personnel 473 132 492 614 295 939 264 846 39,0% 38,3% 25,1% 23,2% -10,5% Depreciation 47 944 50 627 64 523 66 139 3,9% 3,9% 5,5% 5,8% 2,5%Operating expenditure 1 214 273 1 286 370 1 177 135 1 143 324 100,0% 100,0% 100,0% 100,0% -2,9%
Net result -618 597 -216 713 12 913 -79 991 -719,5%Operating margin (%) -46,5 2,4 0,6 -2,6
In 2007, Grupo RTVE was replaced by the Corporación de Radio y Televisión Española S.A.
EUR thousand.
In %.
2004 2005 2006 20082007
0
1 500 000
600 000
900 000
1 200 000
300 000
Merchandising Other incomeOther commercial income
Advertising
Aids/Grants
Programme sales
2004 2005 2006 2007 2008
-100
0
20
-20
-40
-60
-80
Pro�t margin
Return onshareholders' funds
Operating margin
Return ontotal assets
Corporación de Radio y Televisión Española S.A. (RTVE) financial situation 2005-2008 EUR thousand.
T.1.ES.3G.1.ES.3

88 2 0 0 9 | V o l u m e 1 | B a n d 1
AL
AT
BE
BG
CH
CY
CZ
DE
DK
EE
ES
FI
FR
GB
GR
HR
HU
IE
IS
IT
LT
LU
LV
MK
MT
NL
NO
PL
PT
RO
RU
SE
SI
SK
TR
ES
Spain Espagne Spanien ES
Daily share Prime time (20:30-00:00)Channels 2004 2005 2006 2007 2008 2004 2005 2006 2007 2008TVE La Primera 21,4 19,6 18,3 17,2 16,9 21,8 19,9 18,3 16,8 16,2TVE La 2 6,8 5,8 4,8 4,6 4,5 5,8 4,9 4,3 4,1 3,8Clan TVE 0,1 0,2 0,6 0 0,1 0,3Teledeporte 0 0,1 0,1 0,3 0,4 0,1 0,2 0,3Canal 24 Horas 0 0 0,1 0,2 0 0,1 0,2Spanish national public channels 28,2 25,4 23,3 22,4 22,6 27,7 24,8 22,7 21,3 20,8Canal Sur Televisión 3,9 3,4 3,3 3,2 3,7 3,5 3,1TV3 3,4 3,2 2,8 2,5 3,4 3,2 2,9Telemadrid 2,2 1,7 1,6 1,6 1,6 1,4 1,5Canal 9 2,1 1,8 1,6 1,4 1,8 1,7 1,5ETB 2 1,1 0,9 0,9 0,9 0,9 0,9 0,9TVG Televisión de Galicia 1 0,8 0,8 0,9 1 0,9 1Canal Sur 2 1,1 0,8 0,8 0,8 0,8 0,7 1,1Castilla La Mancha Televisión (CMT) 0,7 0,6 0,6 0,6 0,6 0,6 0,5TVCanaria 0,4 0,4 0,4 0,4 0,4 0,4 0,4Aragon television - 0,2 0,3 - 0,2 0,3Autonomous public channels 17,6 17,3 15,4 14,7 14,5 17,7 17,3 15,7 15,3 14,6Telecinco 22,1 22,3 21,2 20,3 18,1 22,5 22,9 21,4 20,9 20Antena 3 20,8 21,3 19,4 17,4 16 21,1 21,9 19,1 16,8 15,2Cuatro – 0,8 6,4 7,7 8,6 – 0,9 7 8 9,5La Sexta – – 1,8 4 5,5 2,1 4,6 5,5Antena.Neox 0,1 0,2 0,6 0,1 0,4 0,7Antena.Nova 0,1 0,1 0,4 0,1 0,2 0,4Disney Channel España 0,1 0,1 0,2 0,1 0,4 0,1 0,1 0,3Fox 0,2 0,3 0,4 0,5 0,4 0,4 0,5 0,4Calle 13 0,3 0,3 0,3 0,3 0,3 0,2 0,2 0,3Canal+ España 2,1 0,1 0,4 0,4 0,3 1,9 – 0,6 0,6 0,5Spanish private channels 47,3 47,0 53,5 54,7 55,4 45,48 45,65 53,4 55,5 57,1AXN España 0,2 0 0,4 0,4 0,4 0,5 0,5 0,5Foreign channels 1 0,9 1,4 1,3 1,4 1,3 1,2 1,3Others 5,9 9,3 6,4 6,9 6,1 9,1 12,3 6,9 6,7 6,2
Source: Eurodata TV Worldwide / TNS Audiencia de Medios
Daily share. In %, 4 years +. Prime time (20:30-00:00). In %, 4 years +.
2004 2005 2006 2007 2008
0
5
15
10
25
20
Tele 5TVE-1Antena 3
Cuatro
La SextaTVE-2 / La 2Canal SurTelevisiónCanal 9
Telemadrid
AutonomousTV channels
TV3
2008
TVE La Primera16,2%
Others13,1%
Foreignchannels
1,3%
TVE La 23,8% Clan TVE
0,3%
Teledeporte0,3%
Canal 24 Horas0,2%
Autonomouspublic channels
14,6%
Telecinco20%
Antena 315,2%
Cuatro9,5%
La Sexta5,5%
TV audience market share in Spain 2004-2008 In %, 4 years +.
T.1.ES.4G.1.ES.4

892 0 0 9 | V o l u m e 1 | B a n d 1
AL
AT
BE
BG
CH
CY
CZ
DE
DK
EE
ES
FI
FR
GB
GR
HR
HU
IE
IS
IT
LT
LU
LV
MK
MT
NL
NO
PL
PT
RO
RU
SE
SI
SK
TR
ES
Spain Espagne Spanien ES
Sour
ce: T
NS
Chan
nels
Spai
nA
ndal
ucia
Cata
loni
aBa
sque
Co
untr
yG
alic
iaM
adri
dVa
lenc
ian
Com
mun
ity
Cast
illa
La
Man
cha
Cana
ry
Isla
nds
Ara
gon
Ast
uria
sBa
lear
ic
Isla
ndM
urci
aO
ther
re
gion
sTV
E116
,914
,413
,714
,420
,317
,515
,420
,012
,519
,420
,020
,220
,323
,7LA
24,
54,
23,
54,
54,
85,
24,
04,
94,
14,
74,
94,
04,
35,
7TV
E21
,418
,617
,219
,025
,122
,719
,424
,916
,724
,124
,924
,224
,629
,4
T518
,116
,518
,022
,117
,219
,718
,117
,019
,718
,720
,217
,116
,217
,9A
nten
a 3
16,0
16,8
15,2
13,5
15,9
14,0
15,3
18,4
16,1
17,2
14,3
15,3
20,6
18,3
Cuat
ro8,
68,
08,
38,
38,
29,
78,
78,
010
,89,
08,
17,
09,
28,
8La
Sex
ta5,
55,
14,
15,
06,
46,
76,
25,
55,
36,
44,
77,
15,
16,
1Pr
ivat
e ch
anne
ls48
,346
,345
,648
,947
,750
,148
,348
,851
,951
,247
,446
,551
,051
,0
CST
3,2
16,8
––
––
0,0
0,6
––
––
0,4
0,5
CS2
0,8
4,1
––
––
0,0
0,2
––
––
0,2
0,0
TV3
2,5
–14
,6–
––
0,5
0,0
–0,
2–
2,6
0,0
0,0
K3–3
30,
5–
2,9
––
–0,
10,
0–
0,0
–1,
00,
00,
0ET
B10,
2–
–3,
4–
––
––
0,0
––
–0,
2ET
B20,
9–
–15
,1–
––
––
0,5
––
–1,
2TV
G0,
9–
––
15,5
––
––
–0,
1–
–0,
1TV
M1,
6–
––
–10
,5–
2,9
––
––
–1,
3C9
1,4
0,0
0,1
––
–12
,00,
4–
0,1
–1,
11,
20,
0PU
NT2
0,1
0,0
0,0
––
–1,
30,
0–
0,0
–0,
20,
00,
0CM
T0,
60,
0–
––
0,6
0,1
10,2
–0,
0–
–0,
10,
3TV
CAN
0,4
––
––
––
–10
,2–
––
––
ATV
0,3
–0,
1–
––
0,0
0,0
–8,
8–
––
0,0
TPA
0,2
––
–0,
0–
––
––
7,4
––
0,0
IB3
0,1
0,0
0,0
––
–0,
00,
0–
0,0
–4,
70,
00,
07R
M0,
10,
0–
––
–0,
10,
0–
––
–4,
1–
Oth
er a
uton
omic
as0,
60,
30,
30,
20,
10,
40,
70,
40,
50,
61,
00,
50,
81,
7To
tal a
uton
omic
as14
,521
,318
,018
,715
,611
,514
,714
,710
,710
,38,
510
,16,
95,
3
8TV
0,5
–3,
0–
––
0,0
––
0,0
–0,
0–
–O
ND
A 6
TV
0,1
––
––
0,7
–0,
0–
––
––
0,0
Priv
ate
auto
nom
icas
0,6
0,0
3,0
0,0
0,0
0,7
0,0
0,0
0,0
0,0
0,0
0,0
0,0
0,0
Them
atic
cha
nnel
s13
,011
,114
,310
,69,
713
,515
,79,
417
,512
,517
,317
,015
,611
,2Lo
cal T
V2,
22,
61,
92,
91,
91,
51,
72,
13,
11,
91,
92,
11,
73,
1O
ther
s0,
00,
10,
00,
00,
00,
00,
10,
00,
10,
00,
00,
00,
10,
0
TV a
udie
nce
mar
ket s
hare
by
Com
mun
ity in
Spa
in
2008
In
%, 4
+.
T.1.
ES.5

90 2 0 0 9 | V o l u m e 1 | B a n d 1
AL
AT
BE
BG
CH
CY
CZ
DE
DK
EE
ES
FI
FR
GB
GR
HR
HU
IE
IS
IT
LT
LU
LV
MK
MT
NL
NO
PL
PT
RO
RU
SE
SI
SK
TR
ES
Spain Espagne Spanien ES
Source: European Audiovisual Observatory
Rank Companies Genre 2004 2005 2006 2007 2008 2008/071 Imagina (cons.) 1 All genres – 305 000 574 000 805 000 960 000 19,3%
p.m. Mediaproducción SL Fiction, feature films 48 781 55 485 204 021 367 000 ~ ~p.m. Globo Media All genres 84 622 ~ 105 739 118 710 ~ ~p.m. Ovideo TV S.A. Fiction, feature films 16 801 13 618 16 055 13 784 ~ ~
2 Gestmusic Endemol Reality shows 53 788 62 248 73 559 78 478 ~ ~
3 Agencia de Televisión Latinoamericana News 59 224 59 557 60 825 59 873 ~ ~
4 Zeppelin Television Reality shows 42 780 39 041 39 910 ~ ~ ~5 Videomedia SA All genres 21 864 18 821 25 859 36 810 ~ ~
6 El Terrat de Producciones SL Entertainment, fiction, theatre 11 570 33 125 37 155 30 678 ~ ~
7 Alba Adriatica S.L. – – 4 093 29 588 ~ ~8 Cuarzo Producciones SL All genres 12 341 16 659 18 397 28 090 ~ ~9 Diagonal Televisio SA Fiction 9 060 12 796 17 235 27 171 ~ ~
10 Grupo Ganga Producciones SL Fiction 13 915 17 774 14 411 24 902 ~ ~11 Boomerang TV Entertainment, fiction 17 750 19 365 27 465 22 536 ~ ~12 Bocaboca Producciones SL Fiction, feature films 27 251 20 144 30 983 16 953 ~ ~13 Linze Television SA Fiction 8 355 9 451 14 339 16 356 ~ ~14 Magnolia TV Espana S.L. – 30 10 105 16 312 ~ ~15 Tesauro SA Fiction, feature films 8 076 10 839 9 960 12 920 ~ ~16 Europroducciones TV SL Fiction, feature films 18 218 20 167 10 773 12 585 ~ ~
17 Canal Mundo Producciones Audiovisuales S.A. News 8 234 ~ 10 942 12 067 ~ ~
18 Sisifus Producciones S.A. Entertainment 3 475 3 594 9 521 11 807 ~ ~19 La fabrica de la tele S.L. All genres – – 1 323 11 760 ~ ~20 Grundy Producciones S.A. Entertainment 2 712 7 297 11 734 ~ ~ ~
21 Medianews Producciones de Noticias S.L. News 2 271 6 498 8 874 10 721 ~ ~
22 Trivision S.L. Fiction 4 233 2 993 5 892 10 576 ~ ~23 K 2000 SA Fiction, documentary 7 339 7 387 7 071 10 211 ~ ~24 Chip Audiovisual S.A. – 103 8 600 9 969 ~ ~25 Ida y Vuelta Producciones de Ficción Fiction 1 995 11 883 8 955 9 347 ~ ~26 Atlas Media News 6 777 7 097 8 764 ~ ~ ~27 Producciones 52 Andalucia Fiction, feature films 7 425 7 659 8 286 6 894 ~ ~28 BRB Internacional SA Animation 7 054 5 848 6 168 6 834 ~ ~29 Continental Producciones SL Fiction, feature films 7 483 7 075 6 513 6 771 ~ ~30 Cromosoma SA Animation 7 738 6 059 6 357 ~ ~ ~
1 The group Imagina is born from the merger of the two leading groups Mediaproduccion S.L. («Mediapro») and Globo Media. It is envolved in production, distribution, facilities and post-production transmission and consultancy. It is also a shareholder of La Sexta (of which the revenues are not consolidated in the operating revenues).
The 30 leading TV production companies in Spain 2004-2008 Operating revenues in EUR thousand.
T.1.ES.6
912 0 0 9 | V o l u m e 1 | B a n d 1
AL
AT
BE
BG
CH
CY
CZ
DE
DK
EE
ES
FI
FR
GB
GR
HR
HU
IE
IS
IT
LT
LU
LV
MK
MT
NL
NO
PL
PT
RO
RU
SE
SI
SK
TR
FI
Finland Finlande Finnland FI
Finland is clearly one of the most advanced countries in Europe as far
as the digital transition is concerned. This process began with the switching off of analogue terrestrial transmissions in September 2007 followed by the conver-sion of the cable networks in 2008. The question might be asked whether the digital transition and the wider choice offered to viewers have led to a shift in the audience hierarchy in Finland. The public channels (of the YLE group) had a 44.5% combined daily audience share in 2008 (a significant rise), which was mainly due to the success of the two spe-cial-interest channels YLE Teema and YLE FST5 (which broadcast programmes in Swedish).YLE TV1 had an exceptionally stable audience market share of 23.5% in 2008, so it was in first place in front of MTV3. The main private channel has recorded a strong decline since 2006, having lost 6.5 percentage points of its daily audience market share in two years (to stand at 22.7% in 2008).The other private channels have recorded less disappointing results. While Nelonen seems to be experiencing a slight but con-tinuous decline, which saw the channel’s daily audience share drop below the 10% mark in 2008, Sub appears to be moving in a positive direction (6%). Launched in 2007, the channel JIM (like Nelonen owned by the Sanoma group) has estab-lished itself as Finland’s sixth leading channel.The Finnish multi-channel distribution market is on the move. In a country with more than half of households on cable, there are still 24 cable operators. The cable distribution market is dominated by the service provided by the TeliaSonera group, which had 175,000 subscribers in March 2009. At the same time, there are two satellite packages (Viasat and Canal Digital), which have been competing in all the Nordic countries since the end of the 1990s.IPT V ser vices have emerged more recently. The main services are provided by well-established operators, such as Welho (the Sanoma group) or DNA (marketed by the cable operator DNA Oy). However, new services are emerging, such as Alcom (provided by the company AB Ǻlands TV ) or Maxinetti (marketed by the company Maxisat Oy).Finally, Mobiili TV is a free personal mobile television service in the DVB-H mode operated by Digita (a subsidiary of the French transmission company TDF, which runs the digital terrestrial network). Launched in 2006, the service covers 40% of the population and provides access to four channels (YLE TV1, YLE TV2, MTV3 and The Voice).
La Finlande apparait comme l’un des pays les plus avancés en Europe dans le
processus de transition numérique. Celui-ci a débuté par l’abandon des transmissions analogiques terrestres, qui a bien eu lieu en septembre 2007, puis par la conversion des réseaux câblés en 2008. La transition numérique et l’élargissement du choix proposé aux spectateurs bous-culent-ils la hierarchie de l’audience en Finlande ? Les chaînes publiques (du groupe YLE) réunissent 44,5 % de part de marché d’audience quotidienne en 2008, soit une progression intéressante, grâce notamment aux performances des deux chaînes thématiques YLE Teema et YLE FST5 (diffusant des programmes en suédois).YLE TV1 affiche une exceptionnelle stabi-lité à 23,5 % de parts de marché d’audien-ce quotidienne, si bien qu’elle s’installe en première position devant MTV3 en 2008. La première chaîne privée enregistre en effet un fort recul depuis 2006 puisqu’elle perd 6,5 points de parts de mar-ché d’audience quotidienne en deux ans (pour s’établir à 22,7 % d’audience quoti-dienne en 2008).Les autres chaînes privées présentent des résultats moins décevants. Si Nelo-nen semble connaître recul léger mais continu, qui voit la chaîne passer sous la barre des 10 % d’audience quotidienne en 2008, Sub paraît dans une dynamique plutôt positive (6 %). Lancée en 2007, la chaîne JIM (détenue par le groupe Sano-ma, comme Nelonen) s’impose enfin comme la sixième chaîne du paysage finlandais.Le marché finlandais de la distribution multi-chaînes affiche son dynamisme. Dans un pays comptant plus de la moitié des foyers abonnés au câble, on dénom-bre encore 24 câblo-opérateurs. Le mar-ché de la câblodistribution est dominé par l’offre du groupe TeliaSonera, qui enregistre 175 000 abonnés en mars 2009. Parallèlement, on recense deux bouquets satellites (Viasat et Canal Digital), qui sont en concurrence dans tous les pays nordiques depuis la fin des années 1990.Plus récemment ont émergé les offres IPTV. Les principales offres proviennent d’opérateurs déjà bien établis, comme Welho (par le groupe Sanoma) ou DNA (commercialisée par le câblo-opérateur DNA Oy). Mais des nouveaux services émergent tels que Alcom (service fourni par la firme AB Ǻlands TV) ou encore Maxinetti (commercialisé par l’entreprise Maxisat Oy).Enfin, Mobiili TV est un service gratuit de télévision mobile personnelle en mode DVB-H, exploité par Digita (filiale de l’entreprise de transmission française TDF qui opère le réseau numérique terrestre). Lancé en 2006, le service couvre 40 % de la population et propose l’accès à quatre
In Finnland scheint die Umstellung auf die digitale Übertragung am weitesten
von allen europäischen Ländern fortge-schritten zu sein. Dort wurde das analo-ge Signal für das terrestrische Fernsehen bereits im September 2007 ab geschaltet, die Umstellung für die Kabelnetze erfolgte 2008.Haben die Einführung des digitalen Fern-sehens und die Ausweitung des Angebots zu Veränderungen bei den Zuschauer-marktanteilen in Finnland geführt? Die öffentlich-rechtlichen Sender (der YLE-Gruppe) hatten 2008 zusammen einen Marktanteil von 44,5 %. Sie konnten also erheblich zulegen, vor allem dank des Erfolgs der beiden Themensender YLE Teema und YLE FST5 (sie senden schwe-dischsprachige Programme).YLE TV1 hat seinen Zuschauermarkt-anteil von 23,5 % halten können und ist damit 2008 Marktführer vor MTV3. Denn der größte finnische Privatsender musste seit 2006 einen erheblichen Rück-gang seiner Marktanteile in Höhe von 6,5 % hinnehmen (2008 lag sein Markt-anteil nur noch bei 22,7 %).Weniger enttäuschend sind die Ergebnisse der übrigen privaten Sender. Zwar sind die Zuschauermarktanteile von Nelonen im Vergleich zu den vergangenen Jahren leicht, aber kontinuierlich zurückge-gangen, und 2008 sind sie sogar unter die 10 %-Marke gesunken. Sub konnte da gegen zulegen (um 6 %), und der Sender JIM (er gehört wie Nelonen zur Sanoma-Gruppe) hat sich nach seinem Start im Jahr 2007 als sechstgrößter Sender in Finnland etabliert. Das Mehrkanalangebot in Finnland weist nach wie vor eine dynamische Ent-wicklung auf. In einem Land, in dem etwas mehr als die Hälfte aller Haushalte über einen Kabelanschluss verfügt, gibt es noch 24 Kabelnetzbetreiber. Dominiert wird dieser Markt von der Gruppe TeliaSonera, die im März 2009 175 000 Abonnenten zählte. Daneben gibt es zwei Satelliten-Bouquets (Viasat und Canal Digital), die sich seit Ende der neunziger Jahre in allen skandinavischen Ländern einen harten Wettbewerb liefern.IPTV-Angebote sind in Finnland noch nicht so lange auf dem Markt. Wichtigste Anbieter sind bereits etablierte Unter-nehmen wie der Kabelnetzbetreiber Welho (im Besitz der Sanoma-Gruppe) oder DNA (vom Kabelnetzbetreiber DNA OY). Neu auf dem IPTV-Markt sind zum Beispiel Alcom (von der Firma AB Alands TV) oder Maxinetti (von dem Unternehmen Maxisat OY).Mobiles Fernsehen wird von Mo biili TV im DVB-H-Standard angeboten. Der kostenlose Dienst wird von Digita betrie-ben (einer Tochter des französischen Sendeunternehmens TDF, die das digitale

92 2 0 0 9 | V o l u m e 1 | B a n d 1
AL
AT
BE
BG
CH
CY
CZ
DE
DK
EE
ES
FI
FR
GB
GR
HR
HU
IE
IS
IT
LT
LU
LV
MK
MT
NL
NO
PL
PT
RO
RU
SE
SI
SK
TR
FI
Finland Finlande Finnland FI
These services are competing with the digital terrestrial television market in Finland. Apart from fifteen free chan-nels, DTT in Finland offers a choice between two pay-TV services: Plus TV and Canal Digital. The former markets more than ten channels, while the second provides access to five of the Canal+ pay channels.Digi TV Plus Oy, which markets the service Plus TV and had 281,000 subscrib-ers in December 2008, was taken over in 2009 by the Swedish company Boxer, which already has a presence on the DTT market in Sweden and Denmark. Boxer makes no secret of its desire to put together a pan-Nordic group centred on the terrestrial networks and pay-TV services.In order to maintain the momen-tum of digital terrestrial television, in July 2009 the Ministry of Transport and Communication granted the cable opera-tor DNA Oy licences enabling it to implement high definition (MPEG-4) digital terrestrial television. The signal should cover 60% of the population by the end of 2011.Finally, tests on the introduction of non-linear services (video on demand) on the digital terrestrial network have been carried out by the transmission company Digita.The Finnish competition authority (FCA) expressed reservations in November 2008 concerning the takeover by the TV4 group of the company C More Group, the broad-caster of the Canal+ channels in the Nordic countries. TV4 belongs to the Swedish Bonnier group, which already controls the MTV3 channels in Finland. The competition authority was concerned about Bonnier having too strong a com-bined position on the pay-TV market. Adjustments were made to the takeover operation. For example, the C More Group had to relinquish its rights to broadcast the Finnish ice-hockey league.
chaînes (YLE TV1, YLE TV2, MTV3 et The Voice).Ces offres entrent en concurrence avec le marché de la télévision numérique ter-restre en Finlande. La TNT finlandaise propose en effet, outre une quinzaine de chaînes gratuites, le choix entre deux ser-vices de télévision payante : Plus TV et Canal Digital. Le premier commercialise plus d’une dizaine de chaînes tandis que le second offre un accès à cinq des chaînes à péage Canal+.Digi TV Plus Oy, qui commercialise le service Plus TV, fort de ses 281 000 abon-nés en décembre 2008, a été racheté en 2009 par la société suédoise Boxer, déjà présent sur le marché de la TNT en Suède et au Danemark. Boxer ne cache pas sa volonté de forger un groupe pan- nordique centré sur les réseaux terrestres et les services de télévision payants.Afin d’entretenir le dynamisme du numé-rique terrestre, le ministère des transports et de la communication a attribué en juillet 2009 au câblo-opérateur DNA Oy les licences permettant la mise en œuvre de la télévision numérique terrestre haute définition (MPEG-4). Le signal devrait couvrir 60 % de la population d’ici la fin 2011.Enfin des tests ont été réalisés par l’entreprise de transmission Digita relatifs à la mise en place de services non linéaires (vidéo à la demande) sur le réseau numé-rique terrestre.L’autorité de la concurrence en Finlande (FCA) a émis des réserves en novembre 2008 à propos du rachat par le groupe TV4 de l’entreprise C More Group, diffuseur des chaînes Canal+ dans les pays nordiques. En effet, TV4 appartient au groupe suédois Bonnier, qui contrôle déjà les chaînes MTV3 en Finlande. L’auto-rité de la concurrence redoutait une trop forte position combinée de Bonnier sur le marché de la télévision payante. Des aménagements ont donc été apportés à l’opération de rachat : C More Group a dû par exemple renoncer aux droits de diffusion de la ligue finlandaise de hockey sur glace.
terrestrische Netz betreibt). Mobiili TV wurde 2006 lanciert und kann inzwischen von 40 % der finnischen Bevölkerung empfangen werden. Das Angebot umfasst vier Sender (YLE TV1, YLE TV2, MTV3 und The Voice).Diese Angebote treten in Wettbewerb mit dem digitalen terrestrischen Fern-sehen in Finnland. Es gibt mehr als fünfzehn kostenlose Programme, außer-dem können die Zuschauer zwischen zwei Pay-TV-Sendern wählen: Plus TV und Canal Digital. Plus TV vertreibt mehr als zehn Programme, während Canal Digi-tal Zugang zu fünf Pay-TV-Sendern von Canal+ bietet.Digi TV Plus Oy, das den Pay-TV-Dienst Plus TV vertreibt, hatte im Dezember 2008 bereits 281 000 Abonnenten. 2009 wurde Digi TV Plus von dem schwe-dischen Pay-TV-Provider Boxer aufge-kauft, der in Schweden und Dänemark bereits auf dem Markt des digitalen terrestrischen Fernsehens präsent ist. Boxer macht keinen Hehl aus seiner Absicht, eine nordische Gruppe zu schaf-fen, die sich auf das terrestrische Netz und auf Pay-TV-Dienste stützt.Um die Verbreitung des digitalen terres-trischen Fernsehens zu unterstützen, hat der Minister für Verkehr und Kommu-nikation im Juli 2009 dem Kabelnetz-betreiber DNA OY die Lizenz für das hochauflösende digitale terrestrische Fernsehen (MPEG-4) erteilt. Bis 2011 dürfte das Signal von 60 % der finnischen Be völkerung empfangen werden können. Um festzustellen, ob es in Finnland einen Markt für nicht-lineare Diensten (Video- on-Demand) gibt, hat das finnische Medienunternehmen Digita vor kurzem entsprechende Tests durchführen lassen.Die finnische Wettbewerbsbehörde (FCA) hat im November 2008 Vorbehalte gegen-über dem geplanten Kauf der C More Group (die die Canal+-Sender in den skandinavischen Ländern vertreibt) durch die Gruppe TV4 geäußert. TV4 gehört zum schwedischen Bonnier-Konzern, der bereits Hauptanteilseigner von MTV3 in Finnland ist. Die Wettbewerbsbehör-de befürchtete, dass Bonnier durch den Kauf von C More auf dem Pay-TV-Markt eine dominierende Wettbewerbsposition erhalten würde. Daher mussten vor dem Kauf bestimmte Auflagen erfüllt werden: So musste die C More Group zum Beispiel ihre Übertragungsrechte für die Spiele der finnischen Eishockeyliga abtreten.
Sources: Finnish Communications Regulatory Authority- FICORA: http://www.ficora.fi Nordicom: http://www.nordicom.gu.se Legal aspects: IRIS Merli : http://merlin.obs.coe.int Audience data: Finnpanel: http://www.finnpanel.fi

932 0 0 9 | V o l u m e 1 | B a n d 1
AL
AT
BE
BG
CH
CY
CZ
DE
DK
EE
ES
FI
FR
GB
GR
HR
HU
IE
IS
IT
LT
LU
LV
MK
MT
NL
NO
PL
PT
RO
RU
SE
SI
SK
TR
FI
Finland Finlande Finnland FI
Population and equipment 31.12.08Penetration
(in % HH) In thousand SourcesPopulation (inhabitants) – 5 326 Eurostat
Households – 2 453 Eurostat (as at 1.1.2008)
TV households 97,0% 2 379 Eurobarometer / European Audiovisual Observatory
Cable TV households 53,9% 1 323 Screen Digest / European Audiovisual Observatory
Digital cable TV households 53,9% 1 323 Screen Digest / European Audiovisual Observatory
DTH/SMATV households 8,3% 204 Screen Digest / European Audiovisual Observatory
Pay. DTH/SMATV households 3,4% 84 Screen Digest / European Audiovisual Observatory
IPTV subscriptions 0,6% 15 Screen Digest / European Audiovisual Observatory
Installed DVB-T receivers 56,7% 1 390 Screen Digest / European Audiovisual Observatory
Total digital TV households 100,0% 2 453 European Audiovisual Observatory
Households with PC 76,0% 1 916 Screen Digest / European Audiovisual Observatory
Households with broadband connections 89,0% 2 184 Screen Digest / European Audiovisual Observatory
Mobile phone TV subscriptions – 82 Screen Digest
Mobile broadcast TV subscriptions – 16 Screen Digest
TV channels distributors 11.09 CompaniesCable operators 25 DNA, Elisa, SW Television «Welho», TeliaSonera…Satellite packagers 2 Canal Digital Finland, ViasatIPTV packagers 5 Ab Alands, DNA, Finnet, Maxisat, SW Television
DTT multiplex operators and packagers 3 Multiplex operator: Digita / Pay DTT packagers: Digi TV Plus, Canal Digital Finland
Mobile phone TV packager 0Mobile broadcast TV packager 1 DNA
Number of TV channels by kind of licence 10.09 Public Private TotalTerrestrial (national) 5 19 24Cable/Satellite/IPTV/Mobile 1 6 7Regional/Local 1 37 38Regional/Local windows 0 0 0Channels targeting foreign markets 0 0 0Total 7 62 69Foreign channels targeting the country 0 29 29
Source: European Audiovisual Observatory
Supply of TV channels by genre and by platform (including foreign channels) 11.09
Digital Terrestrial
Cable DNA
Cable Teliasonera
Satellite Canal Digital
Full Nordic offer
Satellite Viasat
Full Nordic offerIPTV DNA
Generalist - national (incl.dedicated) 5 4 4 4 4Generalist - foreign 6 5 12 23Adult 2 5 2 3 3 2Children 3 8 8 17 18 7Culture / education / documentary 3 14 15 15 31 7Minority interest groupsEntertainment / TV fiction / games 5 14 t11 26 32 12Film 4 18 15 27 44 10Home shoppingInternational linguistic and cultural 1 3 4 1 2Lifestyle / specific leisure / travel 1 4 2 6 1 4Music 4 10 3 8 8 3News / business 10 5 11 8 10Parliament / government / administrationRegional/Local 2 1Religion 1 2 2 1Sports 5 12 10 25 20 9Various 1 1 4Total 33 111 86 156 195 72
Basic figures

94 2 0 0 9 | V o l u m e 1 | B a n d 1
AL
AT
BE
BG
CH
CY
CZ
DE
DK
EE
ES
FI
FR
GB
GR
HR
HU
IE
IS
IT
LT
LU
LV
MK
MT
NL
NO
PL
PT
RO
RU
SE
SI
SK
TR
FI
Finland Finlande Finnland FI
Source: European Audiovisual Observatory on the basis of data from Screen Digest, WARC and YLE
Source: European Audiovisual Observatory
Source: Screen DigestSource: Screen Digest
Households TV equipment 2004-2008
Number of households accessing multichannel platforms as at 31.12.2008
Consumers pay-TV gross spend 2004-2008
Gross revenues of radio-television 2004-2008
In thousands.
In thousands.
EUR thousand.
EUR million.
2004 2005 2006 2007 2008
0
1 500
1 200
900
600
300
DTT householdsCable households
Satellite households
IPTV households
375
610
720
1 200
1 390
1 1911 242
1 2741 309
1 323
256201 202 204
1
260
2 3 6 15
Digita O
y (Free D
TT)
Viasat
Canal Digita
lElis
a
Telia
Sonera FinlandDNA
Plus TV
0
1 200
900
600
300
1 500
1 390
56
263281
176
~
103
DTT
IPTV
Sat
PC
Cable
2004 2005 2006 2007 2008
0
250 000
200 000
150 000
100 000
50 000
Cable TV
DTT
Satellite
IPTV
241 956245 621
194 929
179 780
155 751
2 3801 9447 290
12 35333 491
72 230
27 17831 340
37 72443 369 44 711
117 289
574 1 048
2004 2005 2006 2007 2008
0
400
300
200
100
Consumerspay-TV spend
TV adspend
Radio adspend
Radio-TV public income
345
252
379387
185
219
246
324
361
256270
291298
52 52 52 56
370
53
Market trends

952 0 0 9 | V o l u m e 1 | B a n d 1
AL
AT
BE
BG
CH
CY
CZ
DE
DK
EE
ES
FI
FR
GB
GR
HR
HU
IE
IS
IT
LT
LU
LV
MK
MT
NL
NO
PL
PT
RO
RU
SE
SI
SK
TR
FI
Finland Finlande Finnland FI
Main broadcasters Channels 2005 2006 2007 2008 2008/07Yleisradio OY sptv YLE1, YLE2,… 415 302 396 374 409 051 397 517 -2,8%MTV OY adtv MTV-3 173 826 176 530 246 932 231 723 -6,2%Sanoma Television Oy adtv Nelonen 76 308 128 914 137 468 142 410 3,6%SubTV Oy. thtv SubTV 11 120 13 140 27 303 44 261 62,1%Suomen Urheilutelevisio Oy thtv Urheilukanava 3 487 4 686 7 763 9 294 19,7%TV 5 Finland Oy thtv The Voice 663 1 222 1 644 1 839 11,9%
Main distributors Services Packages 2005 2006 2007 2008 2008/07Teliasonera Finland Oyj (cons.) 1 3play Sonera TV 2 524 211 2 740 808 2 953 648 ~ ~Elisa Oyj (cons.) 1 3play Elisa TV 1 451 200 1 527 100 1 589 400 1 491 500 -6,2%DNA Oy (cons.) 1 3play, dvb-h DNA TV 377 810 410 420 539 958 652 167 20,8%Vaasan Laanin Puhelin Oy 1 catv, isp Anvia TV 74 458 76 544 83 754 101 982 21,8%Digi TV Plus OY dtt Digi TV – 425 19 831 52 410 164,3%Canal Digital Finland OY packtv Canal Digital 27 944 35 443 37 231 ~ ~Tampereen Tietoverkko Oy catv TTV 9 222 11 075 14 373 17 160 19,4%Kainuun Puhelinosuuskunta 1 catv KPO 15 576 17 320 17 116 17 985 5,1%OY Viasat Finland AB packtv Viasat 6 158 8 565 14 504 18 401 26,9%Oy Turun Kaapelitelevisio catv, isp Turku Cable 5 051 5 688 6 691 7 248 8,3%
Source: European Audiovisual Observatory1 Includes other activities (telecommunications,...)
EUR thousand.
2004 2005 2006 2007 2008
0
400 000
300 000
200 000
100 000
500 000
Yleisradio OY
MTV OY
Sanoma Television Oy
SubTV Oy.
TV 5 Finland OySuomen Urheilutelevisio Oy
Operating revenues of main television companies in Finland 2005-2008 EUR thousand.
T.1.FI.1G.1.FI.1

96 2 0 0 9 | V o l u m e 1 | B a n d 1
AL
AT
BE
BG
CH
CY
CZ
DE
DK
EE
ES
FI
FR
GB
GR
HR
HU
IE
IS
IT
LT
LU
LV
MK
MT
NL
NO
PL
PT
RO
RU
SE
SI
SK
TR
FI
Finland Finlande Finnland FI
Source: YLE / EBU-UER-SIS / European Audiovisual Observatory
Income 2005 2006 2007 2008 2005 2006 2007 2008 2008/07Total public income 369 800 379 400 387 000 ~ 89,0% 95,7% 94,6% ~ ~Licence fee 351 300 363 800 375 500 ~ 84,6% 91,8% 91,8% ~ ~Other public income 18 500 15 600 11 500 ~ 4,5% 3,9% 2,8% ~ ~Other income 45 502 16 974 22 600 ~ 11,0% 4,3% 5,5% ~ ~
Total 415 302 396 374 409 051 397 517 100,0% 100,0% 100,0% 100,0% -2,8%
Expenditure 2005 2006 2007 2008 2005 2006 2007 2008 2008/07Purchase of goods and services 196 635 204 770 202 201 186 361 43,5% 49,2% 48,3% 46,4% -7,8%
Costs of personnel 232 398 189 573 193 118 190 776 51,5% 45,5% 46,1% 47,5% -1,2% Depreciation 22 637 22 193 23 356 24 125 5,0% 5,3% 5,6% 6,0% 3,3%Operating expenditure 451 670 416 536 418 675 401 262 100,0% 100,0% 100,0% 100,0% -4,2%
Net result -28 843 -16 529 -6 641 664 -110,0%Operating margin (%) -8,8 -5,1 -2,35 -0,94
EUR thousand.
In %.
2003 2004 2005 20072006
0
500 000
200 000
300 000
400 000
100 000
Licence fee
Other public income
Other Income
2004 2005 2006 2007 2008
-30
0
5
-5
-10
-15
-20
-25
Operating marginReturn ontotal assets
Pro�t margin
Return on shareholders' funds
YLE financial situation 2005-2008 EUR thousand.
T.1.FI.2G.1.FI.2
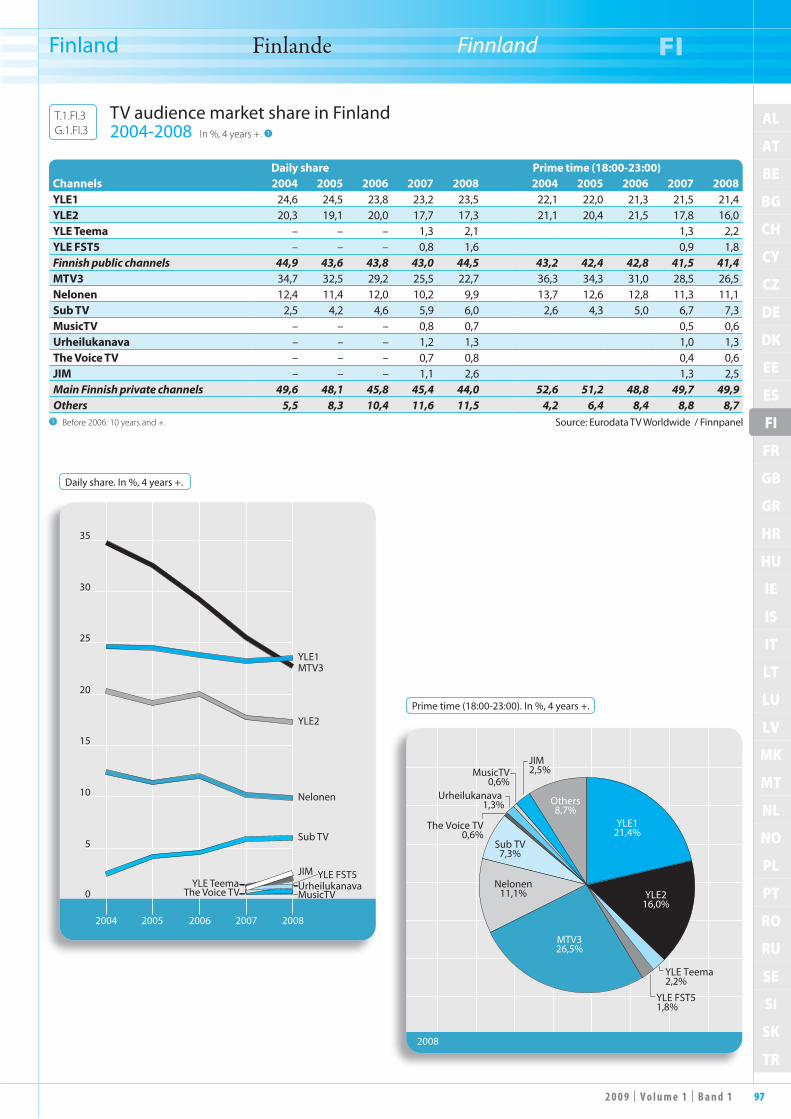
972 0 0 9 | V o l u m e 1 | B a n d 1
AL
AT
BE
BG
CH
CY
CZ
DE
DK
EE
ES
FI
FR
GB
GR
HR
HU
IE
IS
IT
LT
LU
LV
MK
MT
NL
NO
PL
PT
RO
RU
SE
SI
SK
TR
FI
Finland Finlande Finnland FI
Daily share Prime time (18:00-23:00)Channels 2004 2005 2006 2007 2008 2004 2005 2006 2007 2008YLE1 24,6 24,5 23,8 23,2 23,5 22,1 22,0 21,3 21,5 21,4YLE2 20,3 19,1 20,0 17,7 17,3 21,1 20,4 21,5 17,8 16,0YLE Teema – – – 1,3 2,1 1,3 2,2YLE FST5 – – – 0,8 1,6 0,9 1,8Finnish public channels 44,9 43,6 43,8 43,0 44,5 43,2 42,4 42,8 41,5 41,4MTV3 34,7 32,5 29,2 25,5 22,7 36,3 34,3 31,0 28,5 26,5Nelonen 12,4 11,4 12,0 10,2 9,9 13,7 12,6 12,8 11,3 11,1Sub TV 2,5 4,2 4,6 5,9 6,0 2,6 4,3 5,0 6,7 7,3MusicTV – – – 0,8 0,7 0,5 0,6Urheilukanava – – – 1,2 1,3 1,0 1,3The Voice TV – – – 0,7 0,8 0,4 0,6JIM – – – 1,1 2,6 1,3 2,5Main Finnish private channels 49,6 48,1 45,8 45,4 44,0 52,6 51,2 48,8 49,7 49,9Others 5,5 8,3 10,4 11,6 11,5 4,2 6,4 8,4 8,8 8,7
Source: Eurodata TV Worldwide / Finnpanel1 Before 2006: 10 years and +.
Daily share. In %, 4 years +.
Prime time (18:00-23:00). In %, 4 years +.
2004 2005 2006 2007 2008
0
5
10
20
25
15
35
30
YLE1MTV3
YLE2
Nelonen
Sub TV
JIMUrheilukanavaMusicTV
YLE FST5YLE Teema
The Voice TV
2008
YLE121,4%
The Voice TV0,6%
SIGMA24,1%YLE2
16,0%
YLE Teema2,2%
YLE FST51,8%
MTV326,5%
Nelonen11,1%
Sub TV7,3%
Others8,7%
JIM2,5%MusicTV
0,6%Urheilukanava
1,3%
TV audience market share in Finland 2004-2008 In %, 4 years +. 1
T.1.FI.3G.1.FI.3

98 2 0 0 9 | V o l u m e 1 | B a n d 1
AL
AT
BE
BG
CH
CY
CZ
DE
DK
EE
ES
FI
FR
GB
GR
HR
HU
IE
IS
IT
LT
LU
LV
MK
MT
NL
NO
PL
PT
RO
RU
SE
SI
SK
TR
FI
Finland Finlande Finnland FI
Source: European Audiovisual Observatory
Rank Companies Genre 2004 2005 2006 2007 2008 2008/071 Fremantle Entertainment Oy Entertainment, fiction 6 582 7 594 3 324 12 349 14 574 18,0%2 Zodiak Television Finland Oy AB Fiction 6 580 4 921 9 813 7 961 8 819 10,8%3 Moskito Television Oy Fiction 2 417 2 257 2 572 4 177 5 998 43,6%
4 Blue Media Oy 1 Entertainment, feature films 7 194 8 137 5 342 5 871 5 767 -1,8%
5 Nordisk Film & TV Oy All genres 3 549 4 232 5 640 4 847 ~ ~6 Oy Filmteollisuus Fine AB All genres 2 753 3 110 3 377 3 641 ~ ~
7 Tarinatalo Oy Informative programmes, talk shows, documentary 1 688 1 647 1 572 2 990 2 267 -24,2%
8 Oy Anima Vitae Ltd Animation, commercials 969 1 011 1 349 1 121 ~ ~9 Susamuru Oy Formats 702 673 ~ 1 052 ~ ~
10 Nouhau Productions 184 906 958 1 306 941 -27,9%11 Ten Years Productions Oy Music 775 779 996 ~ 939 ~12 Insano Productions Oy Fiction – – 465 523 703 34,4%
13 Aito Media Oy Entertainment, documentary 147 138 305 ~ 673 ~
14 AB Svengcom Production Fiction 985 2 089 629 101 461 356,4%
15 Art Films Production Documentary, fiction, animation 218 345 ~ ~ 430 ~
16 Storytime News 361 382 424 429 404 -5,8%
17 Filmaattiset Oy Documentary, factuals, entertainment 375 166 281 423 416 -1,7%
18 Esa Siltaloppi Productions Oy News, sport, current affairs 315 313 315 325 361 11,1%
19 Yellow Film & TV Oy Fiction – – – – 287 –20 Coolvision Oy News, documentary 257 258 258 163 ~ ~
1 2004 over 18 months.
The 20 leading TV production companies in Finland 2004-2008 Operating revenues in EUR thousand.
T.1.FI.4

992 0 0 9 | V o l u m e 1 | B a n d 1
AL
AT
BE
BG
CH
CY
CZ
DE
DK
EE
ES
FI
FR
GB
GR
HR
HU
IE
IS
IT
LT
LU
LV
MK
MT
NL
NO
PL
PT
RO
RU
SE
SI
SK
TR
FR
France France Frankreich FR
TF1 continues to lead the audience ratings in France, although its market
share dropped significantly again in 2008. The private channel, controlled by the Bouygues group, achieved less than 30% of daily as well as prime time audience figures (27.2% and 29.7% respectively) for the first time. The two leading public service channels, France 2 and France 3, suffered less substantial falls in viewing figures although, like those of TF1, they have been falling steadily since 2005. France 2 nevertheless remains second in the market with 17.2% of daily audiences and France 3 is still third with 13.3%. M6, in fourth position, was down 0.5% to an 11% market share. In total, the seven analogue terrestrial channels only represented 76.4% of daily audiences in 2008, compared to 86.1% in 2006. This is the result of the success enjoyed by new free digital terrestrial television (DTT) channels, which attracted 11.1% of daily audiences in 2008. The most popular of these were TMC (2.1%), W9 (1.8%) and Gulli (1.5%).The rising popularity of DTT channels, combined with the drop in advertising income linked to the economic climate, has disrupted the traditional broadcasters. For example, TF1, aware of its low level of diversification, wanted to buy TMC and NT1, two DTT channels controlled by the AB group. The competition authori-ties announced in September 2009 that they had opened a detailed investigation of this acquisition.A few months earlier, in October 2008, TF1 had sold its stake in the French inter-national news channel, France 24. Owned in equal shares by TF1 and France Télévi-sions when it was launched in 2006, the channel is now completely controlled by the company Audiovisuel Extérieur de la France.Audiovisual equipment in French house-holds continues to evolve. At the end of 2008, according to the Observatoire de l’équipement des foyers pour la réception de la TV numérique (CSA), less than a quarter of households could only receive analogue terrestrial channels (compared to more than a third at the end of 2007). The cable television market is particu-larly concentrated, since the company Numericable (Civen and Altice) has 3.5 million subscribers, which represents virtually all cable households in France.The satellite TV sector is still domi-nated by CanalSat (Canal+ group), with 5.3 million subscribers at the end of 2008. Nevertheless, the company no longer holds a monopoly and faces competi-tion from the Bis package (AB group) launched in December 2007 and, to a lesser extent, from France Télécom’s Orange service (reserved for subscribers
TF1 demeure en tête des audiences en France, mais subit en 2008 une nou-
velle et sensible baisse de sa part de marché. La chaîne privée contrôlée par le groupe Bouygues passe pour la première fois sous la barre des 30 % en termes d’audience quotidienne (27,2 %) mais aussi durant les heures de grande écoute (29,7 %). Les deux premières chaînes publiques France 2 et France 3 accusent des baisses d’audience moins importantes mais tout aussi régu-lières que celles de TF1 depuis 2005. France 2 conforte malgré tout sa position de second sur le marché avec 17,2 % de l’audience quotidienne et France 3 demeu-re troisième avec 13,3 %. M6, en quatrième position, recule de 0,5 points à 11 % de parts de marché. Au final, les sept chaînes analogiques terrestres ne rassemblent plus que 76,4 % de l’audience quotidienne en 2008 contre 86,1 % en 2006. Ceci s’expli-que par le succès des nouvelles chaînes gra-tuites de la TNT qui rassemblent 11,1 % de l’audience quotidienne en 2008. Parmi elles, TMC (2,1 %), W9 (1,8 %) ou Gulli (1,5 %) remportent les plus francs succès.La montée en puissance des chaînes de la TNT conjuguée à la baisse des recet-tes publicitaires liée au contexte écono-mique, bouscule les acteurs historiques. Ainsi TF1, conscient de sa faible diver-sification, souhaite racheter TMC et NT1, deux chaînes de la TNT contrôlées par le groupe AB. Les autorités de la concur-rence ont annoncé en septembre 2009 avoir ouvert une enquête approfondie sur la trans action.Quelques mois plus tôt, en octobre 2008, TF1 était sorti du capital de la chaîne d’information française à vocation inter-nationale, France 24. Détenue à part égale par TF1 et France Télévisions lors de son lancement en 2006, la chaîne est désor-mais entièrement contrôlée par la société Audiovisuel Extérieur de la France.L’équipement audiovisuel des foyers français continue d’évoluer. A la fin de l’année 2008, selon l’Observatoire de l’équipement des foyers pour la réception de la TV numérique (CSA), moins d’un foyer sur quatre dépend exclusivement de l’accès hertzien analogique (contre plus de un sur trois à la fin de l’année 2007). Le marché de la télévision par câble est particulièrement concentré puisque l’en-treprise Numericable (Civen et Altice) revendique 3,5 millions d’abonnés, soit la quasi-totalité des foyers abonnés au câble en France.Le secteur de la télévision par satellite est toujours dominé par CanalSat (groupe Canal+), avec ses 5,3 millions d’abonnés à la fin de l’année 2008. Ceci dit, l’entre-prise n’est plus en monopole et fait face à la concurrence du bouquet Bis (groupe AB) lancé en décembre 2007 et dans une moindre mesure à celle du bouquet
T F1 erzielt weiter die höchsten Ein-schaltquoten in Frankreich, verliert
aber 2008 erneut deutlich an Marktantei-len. Der Privatsender (Bouygues-Gruppe) liegt sowohl bei der täglichen Einschalt-quote (mit 27,2 %) als auch während der Primetime (29,7 %) zum ersten Mal unterhalb der 30-%-Marke. Die beiden ersten öffentlich-rechtlichen Programme France 2 und France 3 verzeichnen seit 2005 zwar einen schwächeren, aber den-noch genauso gleichmäßigen Rückgang der Zuschauerzahlen wie TF1. Trotzdem schafft es France 2, mit einer täglichen Einschaltquote von 17,2 % seinen zweiten Platz zu halten, und France 3 bleibt mit 13,3 % an dritter Stelle. Der viertplatzierte Sender, M6, verliert 0,5 Punkte, womit sich sein Marktanteil auf 11 % reduziert. Insgesamt kamen die sieben analogen terrestrischen Sender 2008 nur noch auf eine tägliche Einschaltquote von 76,4 % gegenüber 86,1 % 2006. Dies ist auf den Erfolg neuer frei empfangbarer DVB-T-Sender zurückzuführen, die 2008 eine Einschaltquote von 11,1 % erzielten. Am erfolgreichsten waren TMC (mit 2,1 %), W9 (1,8 %) und Gulli (1,5 %).Das starke Wachstum der DVB-T-Sender im Zusammenspiel mit dem konjunk-turbedingten Rückgang der Werbeein-nahmen bringt die klassischen Anstalten in schwere Bedrängnis. So will TF1 ange-sichts seiner bisher geringen Diversifizie-rung TMC und NT1 übernehmen, zwei DVB-T-Sender der AB-Gruppe. Die Wettbewerbsbehörde hat im September 2009 die Einleitung einer Untersuchung dieses Vorgangs bekannt gegeben.Im Oktober 2008 hatte sich TF1 aus seiner Beteiligung am internationalen Nachrich-tensender France 24 zurückgezogen. Der war bei seinem Sendestart 2006 zu glei-chen Teilen im Besitz von TF1 und France Télévisions und wird nun vollständig von dem Unternehmen Audiovisuel Extérieur de la France kontrolliert.Die Geräteausstattung der französischen Fernsehhaushalte wird stetig besser. Nach Angaben der Informationsstelle für die Geräteausstattung der Haushalte zum digitalen Fernsehempfang (CSA) hatten Ende 2008 weniger als ein Viertel der Haushalte Zugang nur zum analogen ter-restrischen Fernsehen (gegenüber mehr als einem Drittel Ende 2007). Beim Kabelfernsehen ist die Konzen-tration besonders ausgeprägt: Numericable (Civen und Altice) meldet 3,5 Mio. Abon-nenten, was praktisch sämtlichen Kabel-haushalten in Frankreich entspricht.Das Satellitenfernsehen wird mit 5,3 Mio. Abonnenten Ende 2008 weiterhin von CanalSat (Gruppe Canal+) beherrscht. Allerdings hat das Unternehmen seine Monopolstellung eingebüßt und Kon-kurrenz bekommen: von dem im Dezem-

100 2 0 0 9 | V o l u m e 1 | B a n d 1
AL
AT
BE
BG
CH
CY
CZ
DE
DK
EE
ES
FI
FR
GB
GR
HR
HU
IE
IS
IT
LT
LU
LV
MK
MT
NL
NO
PL
PT
RO
RU
SE
SI
SK
TR
FR
France France Frankreich FR
whose lines are unable to receive television via ADSL). Finally, TNT Sat (Canal+) and FRANSAT (Eutelsat) were launched in 2007 and 2009 respectively. They offer free access via satellite to the DTT channels for households not covered by the terrestrial network.The success of IPTV is a distinctive feature of the French market. According to the ARCEP, at the end of 2008, 6.2 mil-lion households had access to one of the six services available in France: AliceBox (Telecom Italia), Bbox (Bouygues), Dar-tyBox (Darty), Freebox (Free), Livebox (Orange) and NeufBox (SFR). The num-ber of IPTV subscribers rose by more than 1 million in 2008, and more than one in five French households can now receive television via ADSL. Free remains the market leader with 3.3 million subscrib-ers and its parent company, Iliad, initiated an external growth policy by purchasing AliceBox in August 2008.Competition between distributors came to a head with a dispute over the future of Orange’s exclusive channels (sport and cinema), which Free and SFR accused Orange of offering to its own subscribers only. The Paris commercial court ordered that this exclusivity should end in March 2009, a decision that was overturned on appeal in June. The competition author-ity finally published an advisory opinion in July 2009, stating that this exclusivity was questionable and proposing that it be limited to a certain period of time.According to the CSA, more than 65% of French households received digital television at the end of 2008. This 17.9% increase is closely linked to the success of DTT, which more than 9 million house-holds (35.8%) were equipped to receive at the end of 2008. The success of free DTT contrasts with the situation of the subscription-based DTT service, from which two channels withdrew because of a perceived lack of profitability: AB1 at the end of 2008 and the children’s channel Canal J in April 2009.Around 30 local channels are also broad-cast on the digital terrestrial network and calls for tender continue to be launched. However, the market for local chan-nels has never been especially dynamic in France and several of these channels, including Nantes 7, TLT (Toulouse) and LCM (Marseille), are facing enormous financial problems.DTT’s coverage rate reached 88% of the population in July 2009. For the first time, analogue terrestrial signals were switched off in some locations in 2009, such as in Coulommiers (Paris region) and Kaysers-berg (Alsace). The full switchover to digi-tal terrestrial TV will take place in 2011.The development of personal mobile TV has slowed down to the extent that the very
Orange de France Télécom (réservé aux abonnés dont la ligne ne permet pas la réception de la télévision par ADSL). TNT Sat (Canal+) et FRANSAT (Eutel-sat) ont enfin été lancés respectivement en 2007 et 2009. Ils proposent l’accès par satellite aux chaînes de la TNT gratuite pour les foyers non couverts par le réseau hertzien.Le succès de l’IPTV est une particularité du marché français. Selon l’ARCEP, à la fin de l’année 2008, 6,2 millions de foyers ont accès à l’une des six offres proposées en France: AliceBox de Telecom Italia, Bbox de Bouygues, DartyBox de Darty, Freebox de Free, Livebox de Orange et NeufBox de SFR. Le nombre d’abonnés à l’IPTV a progressé de plus d’un million en 2008, et plus d’un foyer français sur cinq a désor-mais la possibilité de recevoir la télévision par ADSL. Free demeure le leader avec 3,3 millions d’abonnés et sa maison mère, Iliad, a entamé une politique de croissance externe avec le rachat de l’offre AliceBox en août 2008.La concurrence entre les distributeurs s’est cristallisée sur le dossier Orange et l’avenir de ses chaînes exclusives (sport et cinéma) : Free et SFR reprochent à Orange de les réserver à ses seuls abonnés. Le tribunal de commerce de Paris a ordonné de mettre fin à cette exclusivité en mars 2009, déci-sion retournée par la cour d’appel en juin. L’autorité de la concurrence a enfin émis un avis consultatif en juillet 2009 estimant cette exclusivité contestable et proposant une exclusivité limitée dans le temps.Selon le CSA plus de 65 % des foyers français reçoivent la télévision numérique à la fin de l’année 2008. La progression de 17,9 % est largement liée au succès de la TNT, qui équipe fin 2008 plus de 9 mil-lions de foyers (35,8 %). Le succès de la TNT gratuite contraste avec la situation de la TNT payante. Deux chaînes se sont ainsi retirées du bouquet payant, jugeant leur présence sur la TNT non rentable : AB1 à la fin de l’année 2008 puis la chaîne pour enfant Canal J en avril 2009.Une trentaine de chaînes locales sont aussi diffusées sur le réseau numérique terrestre, et les appels à candidature se poursuivent. Ceci dit, le marché des chaînes locales n’a jamais été particulièrement dynamique en France, et plusieurs d’entre elles, comme Nantes 7, TLT (Toulouse) ou encore LCM (Marseille), traversent de lourdes difficultés financières.Le taux de couverture de la TNT atteint 88 % de la population en juillet 2009. Quelques extinctions locales des transmis-sions analogiques terrestres ont débuté en 2009, dans les villes de Coulommiers en région parisienne ou encore de Kaysers-berg en Alsace. La date du basculement vers le tout numérique terrestre est fixée à 2011.
ber 2007 gestarteten Bouquet Bis (AB-Gruppe) und, in geringerem Maße, vom Bouquet Orange von France Télécom (nur für Abonnenten, deren Anschluss keinen Fernsehempfang über DSL erlaubt). TNT Sat (Canal+) und FRANSAT (Eutelsat) haben 2007 bzw. 2009 ihren Betrieb auf-genommen und bieten den Haushalten außerhalb des terrestrischen Versorgungs-gebiets einen Satellitenempfang der unver-schlüsselten DVB-T-Sender.Der Erfolg von IPTV ist eine Besonder-heit des französischen Marktes. Ende 2008 hatten nach Angaben von ARCEP 6,2 Mio. Haushalte Zugang zu einem der sechs Angebote in Frankreich: AliceBox (Telecom Italia), Bbox (Bouygues), Darty-Box (Darty), Freebox (Free), Livebox (Orange) und Neuf Box (SFR). Die Anzahl der IPTV-Abonnenten ist 2008 um über eine Million gestiegen, und mehr als ein Fünftel aller Haushalte hat nun die Möglichkeit, Fernsehen per DSL zu empfangen. Free bleibt Marktführer mit 3,3 Mio. Abonnenten und der Mutter-konzern Iliad hat mit der Übernahme der Plattform AliceBox im August 2008 eine Expansionspolitik eingeleitet.Wie stark die Konkurrenz unter den Anbietern ist, haben der Fall Orange und die Frage der Zukunft seiner Exklusiv-kanäle (Sport und Spielfilme) gezeigt: Free und SFR werfen Orange vor, diese den eigenen Abonnenten vorzubehalten. Das Pariser Handelsgericht verfügte im März 2009 ein Ende dieser Exklusivität. Dieses Urteil wurde im Juni vom Beru-fungsgericht aufgehoben. Die Wettbe-werbsbehörde erstellte schließlich im Juli 2009 ein Gutachten, in dem sie diese Exklusivität für anfechtbar hält und ihre zeitliche Begrenzung vorschlägt.Nach Angaben des CSA empfingen Ende 2008 über 65 % der Haushalte digitales Fernsehen. Der Zuwachs um 17,9 % ist wesentlich auf den Erfolg von DVB-T zurückzuführen, das Ende 2008 in über 9 Mio. Haushalten empfangen werden konnte (35,8 %). Der Erfolg des frei empfangbaren digitalen terrestrischen Fernsehens steht im Gegensatz zur Situ-ation beim gebührenpflichtigen DVB-T. So haben sich zwei Sender aus dem Bezahl-Bouquet zurückgezogen, weil sie ihre Präsenz dort für unrentabel hielten: AB1 Ende 2008, gefolgt vom Kinderkanal Canal J im April 2009.Auch etwa dreißig Lokalsender werden digital terrestrisch verbreitet, und es gibt weiter Ausschreibungen. Allerdings war der Markt der Lokalsender in Frankreich noch nie sehr dynamisch, und einige dieser Sender, wie Nantes 7, TLT (Tou-louse) oder LCM (Marseille), stecken in großen finanziellen Schwierigkeiten.Im Juli 2009 erreichte das digitale terres-trische Fernsehen 88 % der Bevölkerung.

1012 0 0 9 | V o l u m e 1 | B a n d 1
AL
AT
BE
BG
CH
CY
CZ
DE
DK
EE
ES
FI
FR
GB
GR
HR
HU
IE
IS
IT
LT
LU
LV
MK
MT
NL
NO
PL
PT
RO
RU
SE
SI
SK
TR
FR
France France Frankreich FR
principle of the launch appears at times to be compromised. The mediator appointed by the Prime Minister, Cyril Viguier, pub-lished his report in July 2009, proposing ways of resolving the issue of the financing of the broadcasting network. Neither the channel providers nor the telecommunica-tions operators (which are already market-ing television services on mobile phones via their 3G networks) are willing to take the risk. One possible solution is to create an ad hoc company involving the operator TDF and the channel providers.In terms of legal developments, 2009 was marked by public broadcasting reforms. Announced and debated in 2008, the relevant texts were promulgated in March 2009. The public broadcasters were grouped together in a single company (France Télévisions), the governance of which was amended. Their channels no longer broadcast advertising between 8 pm and 6 am. The resulting loss of advertising income has proved to be lower than expected for France Télévi-sions, generating controversy over the payment of EUR 70 million in compen-sation in summer 2009. France Télévisions wishes to use this sum to reduce its deficit, while the Ministry of the Economy wants to reduce its payment to the public com-pany. Nevertheless, in September 2009 the European Commission authorised the payment of EUR 450 million in aid to France Télévisions in 2009 and, at the same time, opened an investigation into its financing mechanisms beyond 2010.
Le dossier de la télévision mobile person-nelle s’est enlisé si bien que le principe même de son lancement semble parfois compromis. Le médiateur nommé par le Premier Ministre, Cyril Viguier, a rendu son rapport en juillet 2009, proposant des pistes afin de débloquer la question du financement du réseau de diffusion. Ni les éditeurs de chaînes, ni les opérateurs de télécommunication (qui commercialisent déjà des offres de télévision sur téléphones portables via leurs réseaux 3G) ne souhai-tent prendre le risque. Une solution se dessine autour de la création d’une société ad hoc regroupant l’opérateur TDF et les éditeurs de chaînes.Au niveau juridique, l’année 2009 a été marquée par la réforme de l’audiovisuel public. Annoncée et débattue en 2008, les textes ont été promulgués en mars 2009. Les radiodiffuseurs publics sont regroupés en une entreprise unique (France Télévi-sions), dont la gouvernance a été modifiée. Leurs chaînes ne diffusent plus de publi-cité entre 20 heures et 6 heures. La perte de recettes publicitaires s’est révélée moins importante que prévue pour France Télévi-sions, générant une polémique sur l’affec-tation de la « cagnotte publicitaire » de 70 millions d’euros au cours de l’été 2009. France Télévisions souhaite attribuer cette somme à la réduction de son déficit tandis que le Ministère de l’économie souhaite réduire d’autant son versement à l’entre-prise publique. Ceci étant, la Commission européenne a autorisé en septembre 2009 le versement de l’aide de 450 millions d’euros en 2009 pour France Télévisions et a ouvert simultanément une enquête sur ses mécanismes de financement au-delà de 2010.
In einigen Städten wurde 2009 mit der Abschaltung des analogen terrestrischen Signals begonnen, etwa in Coulommiers im Großraum Paris oder Kaysersberg im Elsass. Die vollständige Umstellung auf terrestrische Digitaltechnik ist für 2011 geplant.Die Einführung des Fernsehempfangs auf mobilen Geräten ist so sehr ins Stocken geraten, dass mitunter sogar fraglich scheint, ob tatsächlich noch mit einer flächendeckenden Verbreitung zu rechnen ist. Der vom Premierminister ernannte Mediator, Cyril Viguier, hat im Juli 2009 seinen Bericht vorgelegt, in dem er verschiedene Lösungsmöglichkeiten nennt, um in die festgefahrene Frage der Finanzierung des Verbreitungsnetzes wieder Bewegung zu bringen. Weder die Fernsehbetreiber noch die Telekomun-ternehmen (die auf ihren 3G-Netzen bereits Handy-Fernsehen vermarkten) wollen ein Risiko eingehen. Eine Lösung könnte darin bestehen, dass TDF und die Fernsehbetreiber eine gemeinsame Ad-hoc-Gesellschaft gründen.Auf rechtlicher Ebene war das Jahr 2009 von der Reform des öffentlich-rechtlichen Fernsehens geprägt. Nach Ankündigung und öffentlicher Diskussion 2008 wur-den die entsprechenden Gesetze im März 2009 erlassen. Die öffentlich-rechtlichen Rundfunkanstalten wurden in einem Unternehmen (France Télévisions) mit veränderter Leitungsstruktur zusammen-gefasst. Seine Sender strahlen zwischen 20 und 6 Uhr keine Werbung mehr aus. Der damit einhergehende Einnahmever-lust hat sich für France Télévisions als nicht so hoch herausgestellt wie erwartet, was im Sommer 2009 eine Polemik über die Zuweisung der Ausgleichsgelder in Höhe von 70 Mio. EUR auslöste. France Télévisions beansprucht diesen Betrag zur Verringerung seines Defizits, während das Wirtschaftsministerium seine Zahlungen an das öffentlich-rechtliche Unternehmen um denselben Betrag verringern möchte. Die Europäische Kommission hat im September 2009 die Zahlung einer Unter-stützung in Höhe von 450 Mio. EUR für 2009 an France Télévisions genehmigt und gleichzeitig eine Untersuchung der Finanzierungsmechanismen für die Zeit nach 2010 begonnen.
Sources: Direction du développement des médias (DDM) : http://www.ddm.gouv.fr Conseil supérieur de l’audiovisuel (CSA), http://www.csa.fr ARCEP : http://www.arcep.fr Audience data: Médiamétrie, http://mediametrie.fr Legal aspects: IRIS Merlin: http://merlin.obs.coe.int

102 2 0 0 9 | V o l u m e 1 | B a n d 1
AL
AT
BE
BG
CH
CY
CZ
DE
DK
EE
ES
FI
FR
GB
GR
HR
HU
IE
IS
IT
LT
LU
LV
MK
MT
NL
NO
PL
PT
RO
RU
SE
SI
SK
TR
FR
France France Frankreich FR
Population and equipment 31.12.08Penetration
(in % HH) In thousand SourcesPopulation (inhabitants) – 64 351 Eurostat
Households – 26 982 Eurostat (as at 1.1.2008)
TV households 96,0% 25 903 Eurobarometer / European Audiovisual Observatory
Cable TV households 14,4% 3 891 Screen Digest / European Audiovisual Observatory
Digital cable TV households 6,1% 1 641 Screen Digest / European Audiovisual Observatory
DTH/SMATV households 23,8% 6 410 Screen Digest / European Audiovisual Observatory
Pay DTH/SMATV households 18,0% 4 859 Screen Digest / European Audiovisual Observatory
IPTV subscriptions 23,6% 6 376 Screen Digest / European Audiovisual Observatory
Installed DVB-T receivers 48,2% 13 005 Médiamétrie / European Audiovisual Observatory
Total digital TV households 63,3% 17 070 European Audiovisual Observatory
Households with PC 59,1% 15 934 Screen Digest / European Audiovisual Observatory
Households with broadband connections 52,3% 14 122 Screen Digest / European Audiovisual Observatory
Mobile phone TV subscriptions – 2 003 Screen Digest
TV channels distributors 1 11.09 CompaniesCable operators 22 NC Numéricable and various small local operators
Satellite packagers 4 AB Sat (Bis TV), Canal+Distribution (Canalsat), France Telecom (Orange), Fransat
IPTV packagers 5 Bouygues Telecom, Darty, France Telecom (Orange), Iliad (Free, Alice), SFR (Neufbox)
DTT multiplex operators and packagers 10 6 operators of multiplex, 4 pay-DTT packagers (Canal+ Distribution/Canalsat, FNAC/LePackTV, Vest@vision/TNTop and TV Numeric)
Mobile phone TV packagers 5 3 operators : Bouygues Telecom, France Telecom (Orange), SFR and 2 packagers : Canal+ Distribution/Canalsat, Mobibase
1 Mainland France.
Number of TV channels by kind of licence 11.09 Public Private TotalTerrestrial (national) 7 20 27Cable/Satellite/IPTV/Mobile 2 182 184Regional/Local 69 104 173Regional/Local windows 22 0 22Channels targeting foreign markets 33 54 87Total 133 360 493Foreign channels targeting the country 2 43 45
Source: European Audiovisual Observatory
Supply of TV channels by genre and by platform (including foreign channels) 11.09
Digital Terrestrial
Cable Numéricable
Satellite CanalSat
IPTV Free
IPTV Neufbox
Generalist - national (incl.dedicated) 9 9 9 9 10Generalist - foreign 8 18 48 33Adult 5 4 8 4Children 1 15 18 11 15Culture / education / documentary 5 12 21 12 15Minority interest groups 3 1 11 7Entertainment / TV fiction / games 1 15 15 23 25Film 2 16 15 23 20Home shopping 3 4 4 3International linguistic and cultural 5 14 23 20Lifestyle / specific leisure / travel 15 16 8 13Music 4 22 25 36 31News / business 3 19 29 44 38Parliament / government / administration 2 2 1 2 2Regional/Local 34 22 2 26 18Religion 1 3 10 2Sports 2 20 21 17 20Various 6 9 6 7Total 29 198 225 321 283
1 In addition 34 local stations are available in their respective area.
1
Basic figures 1

1032 0 0 9 | V o l u m e 1 | B a n d 1
AL
AT
BE
BG
CH
CY
CZ
DE
DK
EE
ES
FI
FR
GB
GR
HR
HU
IE
IS
IT
LT
LU
LV
MK
MT
NL
NO
PL
PT
RO
RU
SE
SI
SK
TR
FR
France France Frankreich FR
Source: European Audiovisual Observatory on the basis of data from Screen Digest, WARC and Ministry of Finance
Source: Screen Digest / European Audiovisual ObservatorySource: Screen Digest / European Audiovisual Observatory
Source: European Audiovisual Observatory1 Service interrupted in 2009.
Households TV equipment 2004-2008
Number of households accessing multichannel platforms as at 31.12.2008
Consumers pay-TV gross spend 2004-2008
Gross revenues of radio-television 2004-2008
In thousands.
In thousands.
EUR thousand.
EUR million.
2004 2005 2006 2007 2008
0
15 000
12 000
9 000
6 000
3 000
DTT households
Satellite households
IPTV households
Cable households
12 511
3 891
0
886
3 167
7 094
6 078 6 032 6 173 6 1646 410
826
1 7843 156
5 202
6 376
3 540 3 567 3 740 3 830
TNT / DTT
Canal+ Dist
ributio
nIlli
adSFR
Numéricâble
Orange
TNT SatDarty
Zattoo
Bbox Bis
0
12 000
9 000
6 000
3 000
15 000
12 511
4 8504 225
3 900
3 000
1 909
1 000
200 178 50 ~
DTT
IPTV
Sat
PC
Cable
1
2004 2005 2006 2007 2008
0
2 000 000
1 500 000
1 000 000
500 000
Satellite
Cable TV
IPTV
Analogue terrestrial
DTT
1 899 698
204 353
1 700 9591 637 081
1 496 4561 441 730
692 014 701 254
843 247
958 709998 931
24 185
120 569
266 081
481 978
707 662757 673 716 890
640 687
534 002
401 248
0 0
45 093
129 361
2004 2005 2006 2007 2008
0
5 000
4 000
3 000
2 000
1 000
Radio adspend
Consumerspay-TV spend
TV adspend
Radio-TV public income
4 212
2 9163 035
3 432
3 801
3 204 3 2363 382
3 4603 304
2 212 2 257 2 2572 388
785 795 807 767 742
Market trends
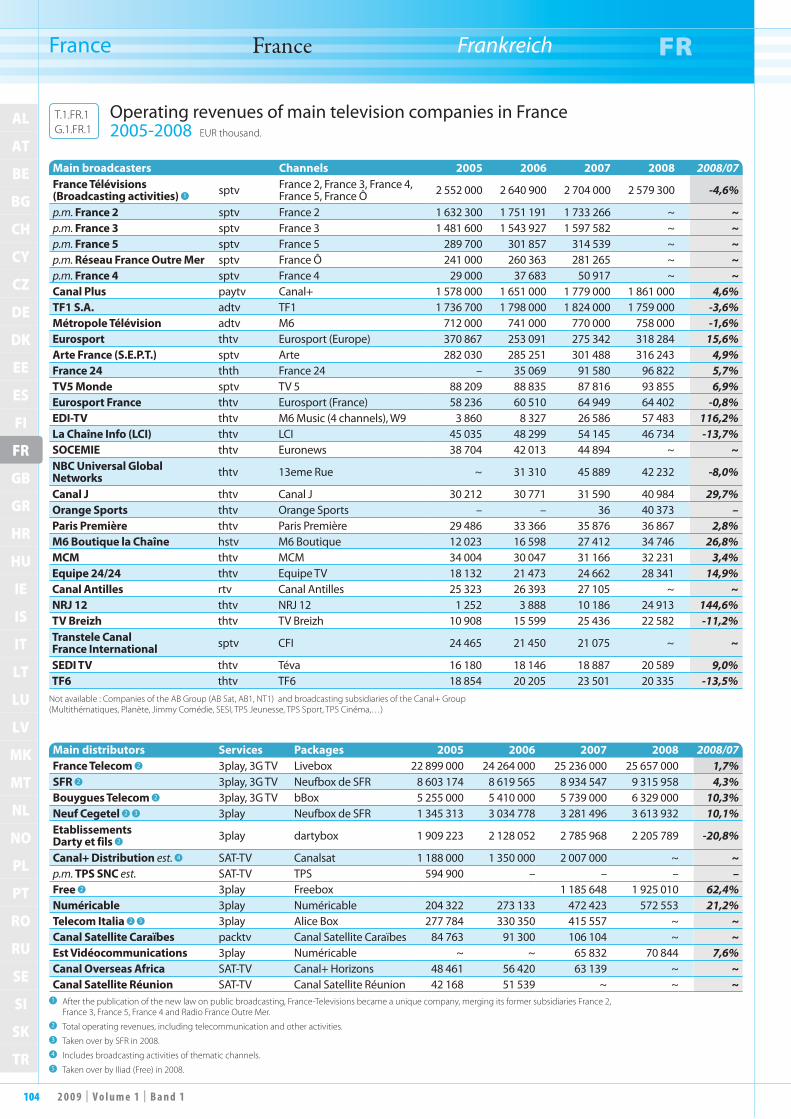
104 2 0 0 9 | V o l u m e 1 | B a n d 1
AL
AT
BE
BG
CH
CY
CZ
DE
DK
EE
ES
FI
FR
GB
GR
HR
HU
IE
IS
IT
LT
LU
LV
MK
MT
NL
NO
PL
PT
RO
RU
SE
SI
SK
TR
FR
France France Frankreich FR
Not available : Companies of the AB Group (AB Sat, AB1, NT1) and broadcasting subsidiaries of the Canal+ Group (Multithématiques, Planète, Jimmy Comédie, SESI, TPS Jeunesse, TPS Sport, TPS Cinéma,…)
1 After the publication of the new law on public broadcasting, France-Televisions became a unique company, merging its former subsidiaries France 2, France 3, France 5, France 4 and Radio France Outre Mer.
2 Total operating revenues, including telecommunication and other activities.3 Taken over by SFR in 2008.4 Includes broadcasting activities of thematic channels.5 Taken over by Iliad (Free) in 2008.
Main broadcasters Channels 2005 2006 2007 2008 2008/07France Télévisions (Broadcasting activities) 1 sptv France 2, France 3, France 4,
France 5, France Ô 2 552 000 2 640 900 2 704 000 2 579 300 -4,6%
p.m. France 2 sptv France 2 1 632 300 1 751 191 1 733 266 ~ ~p.m. France 3 sptv France 3 1 481 600 1 543 927 1 597 582 ~ ~p.m. France 5 sptv France 5 289 700 301 857 314 539 ~ ~p.m. Réseau France Outre Mer sptv France Ô 241 000 260 363 281 265 ~ ~p.m. France 4 sptv France 4 29 000 37 683 50 917 ~ ~Canal Plus paytv Canal+ 1 578 000 1 651 000 1 779 000 1 861 000 4,6%TF1 S.A. adtv TF1 1 736 700 1 798 000 1 824 000 1 759 000 -3,6%Métropole Télévision adtv M6 712 000 741 000 770 000 758 000 -1,6%Eurosport thtv Eurosport (Europe) 370 867 253 091 275 342 318 284 15,6%Arte France (S.E.P.T.) sptv Arte 282 030 285 251 301 488 316 243 4,9%France 24 thth France 24 – 35 069 91 580 96 822 5,7%TV5 Monde sptv TV 5 88 209 88 835 87 816 93 855 6,9%Eurosport France thtv Eurosport (France) 58 236 60 510 64 949 64 402 -0,8%EDI-TV thtv M6 Music (4 channels), W9 3 860 8 327 26 586 57 483 116,2%La Chaîne Info (LCI) thtv LCI 45 035 48 299 54 145 46 734 -13,7%SOCEMIE thtv Euronews 38 704 42 013 44 894 ~ ~NBC Universal Global Networks thtv 13eme Rue ~ 31 310 45 889 42 232 -8,0%
Canal J thtv Canal J 30 212 30 771 31 590 40 984 29,7%Orange Sports thtv Orange Sports – – 36 40 373 –Paris Première thtv Paris Première 29 486 33 366 35 876 36 867 2,8%M6 Boutique la Chaîne hstv M6 Boutique 12 023 16 598 27 412 34 746 26,8%MCM thtv MCM 34 004 30 047 31 166 32 231 3,4%Equipe 24/24 thtv Equipe TV 18 132 21 473 24 662 28 341 14,9%Canal Antilles rtv Canal Antilles 25 323 26 393 27 105 ~ ~NRJ 12 thtv NRJ 12 1 252 3 888 10 186 24 913 144,6%TV Breizh thtv TV Breizh 10 908 15 599 25 436 22 582 -11,2%Transtele Canal France International sptv CFI 24 465 21 450 21 075 ~ ~
SEDI TV thtv Téva 16 180 18 146 18 887 20 589 9,0%TF6 thtv TF6 18 854 20 205 23 501 20 335 -13,5%
Main distributors Services Packages 2005 2006 2007 2008 2008/07France Telecom 2 3play, 3G TV Livebox 22 899 000 24 264 000 25 236 000 25 657 000 1,7%SFR 2 3play, 3G TV Neufbox de SFR 8 603 174 8 619 565 8 934 547 9 315 958 4,3%Bouygues Telecom 2 3play, 3G TV bBox 5 255 000 5 410 000 5 739 000 6 329 000 10,3%Neuf Cegetel 2 3 3play Neufbox de SFR 1 345 313 3 034 778 3 281 496 3 613 932 10,1%Etablissements Darty et fils 2 3play dartybox 1 909 223 2 128 052 2 785 968 2 205 789 -20,8%
Canal+ Distribution est. 4 SAT-TV Canalsat 1 188 000 1 350 000 2 007 000 ~ ~p.m. TPS SNC est. SAT-TV TPS 594 900 – – – –Free 2 3play Freebox 1 185 648 1 925 010 62,4%Numéricable 3play Numéricable 204 322 273 133 472 423 572 553 21,2%Telecom Italia 2 5 3play Alice Box 277 784 330 350 415 557 ~ ~Canal Satellite Caraïbes packtv Canal Satellite Caraïbes 84 763 91 300 106 104 ~ ~Est Vidéocommunications 3play Numéricable ~ ~ 65 832 70 844 7,6%Canal Overseas Africa SAT-TV Canal+ Horizons 48 461 56 420 63 139 ~ ~Canal Satellite Réunion SAT-TV Canal Satellite Réunion 42 168 51 539 ~ ~ ~
Operating revenues of main television companies in France 2005-2008 EUR thousand.
T.1.FR.1G.1.FR.1

1052 0 0 9 | V o l u m e 1 | B a n d 1
AL
AT
BE
BG
CH
CY
CZ
DE
DK
EE
ES
FI
FR
GB
GR
HR
HU
IE
IS
IT
LT
LU
LV
MK
MT
NL
NO
PL
PT
RO
RU
SE
SI
SK
TR
FR
France France Frankreich FR
Source: European Audiovisual Observatory
2004 2005 2006 2007 2008
0
3 000 000
2 500 000
2 000 000
1 500 000
1 000 000
500 000
France Télévisions(Broadcasting activities)
Canal PlusTF1 S.A.
Métropole Télévision
France 24
EurosportArte France (S.E.P.T.)
Operating revenues of main television companies in France (Continued) 2005-2008 EUR thousand.
T.1.FR.1G.1.FR.1

106 2 0 0 9 | V o l u m e 1 | B a n d 1
AL
AT
BE
BG
CH
CY
CZ
DE
DK
EE
ES
FI
FR
GB
GR
HR
HU
IE
IS
IT
LT
LU
LV
MK
MT
NL
NO
PL
PT
RO
RU
SE
SI
SK
TR
FR
France France Frankreich FR
Source: TF1
Income 2004 2005 2006 2007 2008 2007 2008 2008/07Advertising revenues ~ ~ ~ 1 884 1 834 68,8% 70,7% -2,7%Consumers products ~ ~ ~ 339 270 12,4% 10,4% -20,1%Cable and satellite revenues ~ ~ ~ 271 288 9,9% 11,1% 6,4%Production/distribution of rights ~ ~ ~ 129 83 4,7% 3,2% -35,7%Other activities ~ ~ ~ 116 120 4,2% 4,6% 2,7%Total turnover 2 850 2 508 2 654 2 739 2 595 100,0% 100,0% -5,3%Operating revenues 2 853 2 509 2 658 2 764 2 595 -6,1%
Expenditure 2004 2005 2006 2007 2008 2007 2008 2008/07Purchase of goods and services 1 947 1 684 1 866 1 934 1 726 78,7% 75,4% -10,7%Cost of personal 367 349 371 438 445 17,8% 19,4% 1,8%Depreciation 101 80 82 87 118 3,5% 5,2% 35,7%Total expenditures 2 415 2 113 2 320 2 459 2 290 100,0% 100,0% -6,9%
Net result 218,0 244,0 452,3 227,8 163,8 -28,1%Operating margin (%) 15,4 15,8 12,7 11,0 11,8
EUR million.
In %.
2007 2008
0
3 000
2 500
2 000
500
1 500
1 000 Advertising revenues
Consumers products
Cable and satellite revenuesProduction/distribution of rightsOther activities
2004 2005 2006 2007 2008
0
30
40
20
10
Return on total assetsPro�t margin
Operating margin
Return onshareholders' funds
TF1 financial situation (consolidated) 2004-2008 EUR million. The breakdown of revenues has been modified by the Group.
T.1.FR.2G.1.FR.2

1072 0 0 9 | V o l u m e 1 | B a n d 1
AL
AT
BE
BG
CH
CY
CZ
DE
DK
EE
ES
FI
FR
GB
GR
HR
HU
IE
IS
IT
LT
LU
LV
MK
MT
NL
NO
PL
PT
RO
RU
SE
SI
SK
TR
FR
France France Frankreich FR
Source: France Télévisions / European Audiovisual Observatory
Income 2005 2006 2007 2008 2005 2006 2007 2008 2008/07Total public income 1 796,8 1 834,3 1 879,5 1 945,3 65,9% 64,3% 64,2% 70,7% 3,5% - Licence fee 1 796,8 1 834,3 1 879,5 1 945,3 65,9% 64,3% 64,2% 70,7% 3,5%Total commercial income 930,2 1 018,8 1 048,3 805,0 34,1% 35,7% 35,8% 29,3% -23,2% - Advertising and sponsorship 780,5 833,6 823,1 618,5 28,6% 29,2% 28,1% 22,5% -24,9% - Other commercial income 149,7 185,2 225,2 186,5 5,5% 6,5% 7,7% 6,8% -17,2%Other income 58,2 107,9 119,2 ~ – – – – –
Total turnover 2 727,0 2 853,1 2 927,8 2 750,3 100,0% 100,0% 100,0% 100,0% -6,1%Operating revenues 2 785,2 2 961,0 3 047,0 ~
Expenditure 2005 2006 2007 2008 2005 2006 2007 2008 2008/07Purchase of goods and services 1 792,0 1 919,0 1 995,0 ~ 65,4% 66,0% 66,2% ~ ~Costs of personnel 792,0 815,3 857,2 ~ 28,9% 28,0% 28,4% ~ ~Depreciation 158,0 172,9 163,1 ~ 5,8% 5,9% 5,4% ~ ~Operating expenditure 2 742,0 2 907,2 3 015,3 ~ 100,0% 100,0% 100,0% ~ ~
Net result 23,9 17,0 23,0 ~ ~ ~Operating margin (%) 1,5 1,7 1,1
EUR million.
In %.
2004 2005 2006 2007 2008
0
3 500
2 500
3 000
2 000
1 500
1 000
500
Licence fee
Advertising & sponsorship
Other commercialOthers
2003 2004 2005 2006 2007
0
10
12
8
6
4
2
Return onshareholders' funds
Return on total assetsOperating margin Pro�t margin
France Télévisions financial situation (consolidated) 2005-2008 EUR million.
T.1.FR.3G.1.FR.3
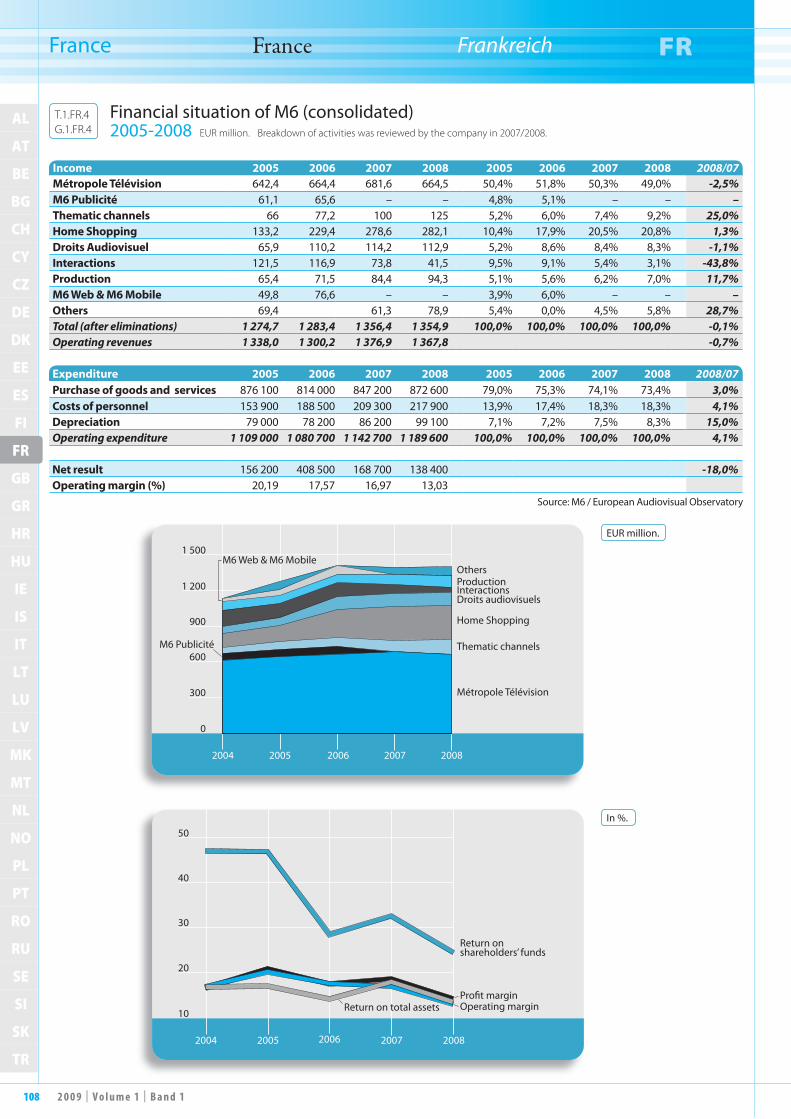
108 2 0 0 9 | V o l u m e 1 | B a n d 1
AL
AT
BE
BG
CH
CY
CZ
DE
DK
EE
ES
FI
FR
GB
GR
HR
HU
IE
IS
IT
LT
LU
LV
MK
MT
NL
NO
PL
PT
RO
RU
SE
SI
SK
TR
FR
France France Frankreich FR
Source: M6 / European Audiovisual Observatory
Income 2005 2006 2007 2008 2005 2006 2007 2008 2008/07Métropole Télévision 642,4 664,4 681,6 664,5 50,4% 51,8% 50,3% 49,0% -2,5%M6 Publicité 61,1 65,6 – – 4,8% 5,1% – – –Thematic channels 66 77,2 100 125 5,2% 6,0% 7,4% 9,2% 25,0%Home Shopping 133,2 229,4 278,6 282,1 10,4% 17,9% 20,5% 20,8% 1,3%Droits Audiovisuel 65,9 110,2 114,2 112,9 5,2% 8,6% 8,4% 8,3% -1,1%Interactions 121,5 116,9 73,8 41,5 9,5% 9,1% 5,4% 3,1% -43,8%Production 65,4 71,5 84,4 94,3 5,1% 5,6% 6,2% 7,0% 11,7%M6 Web & M6 Mobile 49,8 76,6 – – 3,9% 6,0% – – –Others 69,4 61,3 78,9 5,4% 0,0% 4,5% 5,8% 28,7%Total (after eliminations) 1 274,7 1 283,4 1 356,4 1 354,9 100,0% 100,0% 100,0% 100,0% -0,1%Operating revenues 1 338,0 1 300,2 1 376,9 1 367,8 -0,7%
Expenditure 2005 2006 2007 2008 2005 2006 2007 2008 2008/07Purchase of goods and services 876 100 814 000 847 200 872 600 79,0% 75,3% 74,1% 73,4% 3,0%Costs of personnel 153 900 188 500 209 300 217 900 13,9% 17,4% 18,3% 18,3% 4,1%Depreciation 79 000 78 200 86 200 99 100 7,1% 7,2% 7,5% 8,3% 15,0%Operating expenditure 1 109 000 1 080 700 1 142 700 1 189 600 100,0% 100,0% 100,0% 100,0% 4,1%
Net result 156 200 408 500 168 700 138 400 -18,0%Operating margin (%) 20,19 17,57 16,97 13,03
EUR million.
In %.
2004 2005 2006 2007 2008
0
1 500
900
1 200
600
300
OthersProductionInteractionsDroits audiovisuels
Home Shopping
Thematic channels
Métropole Télévision
M6 Publicité
M6 Web & M6 Mobile
2004 2005 2006 2007 2008
10
50
20
40
30
Pro�t marginOperating margin
Return onshareholders’ funds
Return on total assets
Financial situation of M6 (consolidated) 2005-2008 EUR million. Breakdown of activities was reviewed by the company in 2007/2008.
T.1.FR.4G.1.FR.4

1092 0 0 9 | V o l u m e 1 | B a n d 1
AL
AT
BE
BG
CH
CY
CZ
DE
DK
EE
ES
FI
FR
GB
GR
HR
HU
IE
IS
IT
LT
LU
LV
MK
MT
NL
NO
PL
PT
RO
RU
SE
SI
SK
TR
FR
France France Frankreich FR
Source: CANAL+ / European Audiovisual Observatory
Income 2005 2006 2007 2008 2005 2006 2007 2008 2008/07Subscriptions 1 377 1 466 1 581 1 636 91,1% 90,9% 90,9% 90,2% 3,5%Advertising 91 99 111 128 6,0% 6,1% 6,4% 7,1% 15,3%Others 44 47 48 49 2,9% 2,9% 2,8% 2,7% 2,1%Total 1 512 1 612 1 740 1 813 100,0% 100,0% 100,0% 100,0% 4,2%
Expenditure 2005 2006 2007 2008 2005 2006 2007 2008 2008/07Purchase of goods and services est. 1 318 1 475 ~ ~ 90% 95% ~ ~ ~
Cost of personnel 119 65 ~ ~ 8% 4% ~ ~ ~Depreciation 23 19 ~ ~ 2% 1% ~ ~ ~Operating expenditure 1 460 1 559 1 685 1 753 100,0% 100,0% 100,0% 100,0% 4,0%
Net result 35 42 47 47 0%Operating margin (%) 3,4 3,3 3,4 3,3
EUR million.
In %.
2004 2005 2006 2007 2008
0
2 000
1 500
1 000
500
Subscriptions
AdvertisingOthers
2004 2005 2006 2007 2008
0
30
20
10
Return onshareholders' funds
Pro�t margin Operating margin
Return on total assets
Financial situation of CANAL+ (consolidated) 2005-2008 EUR million.
T.1.FR.5G.1.FR.5

110 2 0 0 9 | V o l u m e 1 | B a n d 1
AL
AT
BE
BG
CH
CY
CZ
DE
DK
EE
ES
FI
FR
GB
GR
HR
HU
IE
IS
IT
LT
LU
LV
MK
MT
NL
NO
PL
PT
RO
RU
SE
SI
SK
TR
FR
France France Frankreich FR
Daily share Prime time (19:15-22:00)Channels 2004 2005 2006 2007 2008 2004 2005 2006 2007 2008France 2 20,5 19,8 19,2 18,1 17,5 21,0 20,2 19,6 18,1 17,3France 3 15,2 14,7 14,7 14,1 13,3 16,1 16,7 16,8 16,0 15,3France 5 1 3,0 3,1 3,1 3,0 2,6 – – – – –Arte 1 2,0 1,8 1,6 1,7 1,5 3,7 3,4 3,1 3,2 2,7France 4 ~ ~ ~ ~ 0,9 ~ ~ ~ ~ ~French public channels 40,7 39,4 38,6 36,9 35,8 40,8 40,3 39,5 37,3 35,3TF 1 31,8 32,4 31,6 30,7 27,2 33,4 33,3 33,1 32,6 29,7M6 12,5 12,6 12,5 11,5 11,0 12,9 12,7 12,6 12,0 11,3Canal + 3,8 3,6 3,4 3,4 3,3 4,5 4,5 4,4 4,6 4,8Direct 8 – ~ ~ ~ 0,7 – ~ ~ ~ ~W9 – ~ ~ ~ 1,8 – ~ ~ ~ ~TMC ~ ~ ~ ~ 2,1 ~ ~ ~ ~ ~NT1 – ~ ~ ~ 1,0 – ~ ~ ~ ~NRJ12 – ~ ~ ~ 1,0 – ~ ~ ~ ~BFM TV – ~ ~ ~ 0,4 – ~ ~ ~ ~i>TELE ~ ~ ~ ~ 0,3 ~ ~ ~ ~ ~Virgin 17 – ~ ~ ~ 0,5 – ~ ~ ~ ~Gulli – ~ ~ ~ 1,5 – ~ ~ ~ ~Main French private channels 48,1 48,6 47,5 45,6 50,8 50,8 50,5 50,1 49,2 45,8Others 11,2 12,0 13,9 17,5 13,4 8,4 9,2 10,4 13,5 18,9
Source: Eurodata TV Worldwide / Médiamétrie - Mediamat1 Market shares based on analogue terrestrial viewing only (France 5 before 19:00, Arte after 19:00).
Daily share. In %, 4 years +.
Prime time (19:15-22:00). In %, 4 years +.
2004 2005 2006 2007 2008
0
5
10
20
25
15
35
30
TF 1
France 2
France 3
M6
Canal +France 5 Arte
2008
France 217,3%
Others18,9%
France 315,3%
Arte2,7%
TF 129,7%
M6 11,3%
Canal +4,8%
TV audience market share in France 2004-2008 In %, 4 years +.
T.1.FR.6G.1.FR.6

1112 0 0 9 | V o l u m e 1 | B a n d 1
AL
AT
BE
BG
CH
CY
CZ
DE
DK
EE
ES
FI
FR
GB
GR
HR
HU
IE
IS
IT
LT
LU
LV
MK
MT
NL
NO
PL
PT
RO
RU
SE
SI
SK
TR
FR
France France Frankreich FR
Channels12/2005- 06/2006
09/2006- 02/2007
01/2007- 06/2007
03/2007- 02/2008
3/09/07- 17/02/08
31/12/07- 15/06/08
1/09/08- 15/02/09
29/12/08- 14/06/09
TF 1 25,7 24,7 25,3 24,9 24,9 23,4 22,7 22,5France 2 13,9 13,6 13,5 12,9 12,9 13,3 12,3 13,1M6 8,4 8,1 8,5 8,6 8,6 8,8 8,9 9,2France 3 9,5 9,7 9,6 9 9 9,1 8,9 8,3Canal + 4,3 4,5 4,7 4,4 4,4 4,3 5 4,9France 5 1,5 1,9 1,8 1,8 1,8 1,8 1,9 1,9Arte 0,7 0,8 0,8 0,8 0,8 0,8 0,9 0,9Paris Première 1 1,1 ~ ~ ~ ~ ~ 0,913è Rue 1,5 1,6 1,3 1 0,9 0,8 1 0,9Téva 0,7 0,8 0,9 0,7 0,8 0,8 0,8Tiji 2 1,9 1,7 0,9 0,7 0,8 0,6 0,7Comédie 0,9 0,9 0,8 0,7 0,6 0,6 0,7 0,7Discovery Channel 0,3 0,3 0,5 0,7Jetix / Disney XD 0,3 0,6 0,7 0,7Canal J 1,6 1,5 1 1 1 1 0,7 0,6Disney Channel 1,5 1,6 1,3 0,8 0,5 0,6 0,7 0,6Série Club 1,1 1 0,6 0,8 0,7 0,7 0,7 0,6Sport+ 0,7 0,7 0,8 0,7 0,6 0,5 0,6Playhouse Disney 0,3 0,4 0,5 0,6SciFi 0,3 0,4 0,5 0,5Ciné Cinéma Premier 1,2 1,1 0,9 1 0,6 0,6 0,5 0,4Cine Cinéma Frissons 1,1 0,9 0,8 0,5 0,5 0,4 0,4Planète 0,3 0,3 0,4 0,4Planète No Limit 0,3 0,3 0,3 0,4
Canal+ Sport 2,4 2,5 2,1 2 ~ ~ ~ ~TV Breizh 1,7 1,6 1,5 ~ ~ ~ ~ ~Eurosport 2,4 1,6 1,8 1,4 ~ ~ ~ ~Canal+ Décalé 1,7 1,5 1,2 1,3 ~ ~ ~ ~RTL9 1,5 1,4 1,3 ~ ~ ~ ~ ~TMC Monte Carlo 1,2 ~ ~ ~ ~ ~ ~ ~LCI 1 1 1 ~ ~ ~ ~ ~TF6 2,2 2 1,2 ~ ~ ~ ~ ~Canal+ Cinéma 1,3 1,1 0,9 0,9 ~ ~ ~ ~
Source: Médiamétrie
In % of subscribing population, 4 years +.
0
10
20
30
40
50
60
70
Incumbent analogueterrestrial channels
Thematic channels
Other free DTT channelsOthers (local,regional, foreign)
12/2004-
06/2005
09/2005-
02/2006
12/2005-
06/2006
09/2006-
02/2007
01/2007-
06/2007
03/2007-
02/2008
TV audience market share in households subscribing to cable, Canalsat or TPS 2005-2009 In % of subscribing population, 4 years +.
T.1.FR.7G.1.FR.7

112 2 0 0 9 | V o l u m e 1 | B a n d 1
AL
AT
BE
BG
CH
CY
CZ
DE
DK
EE
ES
FI
FR
GB
GR
HR
HU
IE
IS
IT
LT
LU
LV
MK
MT
NL
NO
PL
PT
RO
RU
SE
SI
SK
TR
FR
France France Frankreich FR
Sour
ce: M
édia
mét
rie
Chan
nels
1st Q
uart
er
2007
06/
2007
07/
2007
08/
2007
09/
2007
10/
2007
11/
2007
12/
2007
01/
2008
02/
2008
03/
2008
07/
2008
09/
2008
06/
2009
07/
2009
08/
2009
09/
2009
TF1
28,5
2931
,432
,532
,431
,428
,928
27,8
27,2
27,6
27,2
28,5
26,2
25,4
27,4
27,3
Fran
ce 2
17,2
16,3
18,6
15,3
16,3
1716
,716
,616
,616
,816
,418
,816
,117
,920
,316
,717
,9Fr
ance
312
,211
,411
,212
,410
,710
,811
,212
,611
,911
,612
,212
,612
,213
,413
,113
,912
,7M
610
,211
,210
,29,
610
,210
10,7
10,2
10,8
10,5
10,7
10,4
10,8
10,3
10,2
9,5
10,6
TMC
3,5
3,6
3,1
3,6
2,9
3,4
3,7
44
4,5
4,3
4,1
4,3
4,1
44,
14,
1W
93,
23,
93,
13,
13,
63,
63,
63,
73,
83,
93,
74,
13,
94,
14
3,9
3,9
Fran
ce 5
3,7
3,8
3,5
3,7
3,4
3,7
3,7
3,7
3,4
3,2
3,2
3,2
3,4
3,7
3,8
4,1
3,5
NT1
2,5
2,5
1,9
1,8
2,3
22,
62,
72,
82,
92,
82,
32
2,3
2,3
2,1
2,4
Gul
li3,
73,
33,
13,
73,
33,
13,
53,
53,
74,
34,
34,
43,
62,
93
2,9
2,3
Dir
ect8
0,7
10,
91
11,
21,
41,
51,
41,
51,
41,
61,
82,
32,
42,
32,
3N
RJ 1
21,
31,
91,
61,
71,
61,
72,
12,
32,
42,
52,
32,
12,
32,
42,
12,
12,
2A
RTE
1,5
1,7
1,6
1,9
1,6
1,5
1,7
1,6
1,7
1,6
1,6
1,7
1,6
1,8
1,9
2,3
2Ca
nal+
2,6
1,8
1,2
1,3
2,1
2,1
1,9
2,1
1,9
2,2
1,8
0,8
1,9
1,6
11,
51,
9Fr
ance
41,
11,
61,
41,
71,
21,
11,
51,
61,
61,
41,
71,
91,
81,
81,
71,
71,
7Eu
rope
2 T
V /
Virg
in 1
71,
62,
41,
91,
61,
31,
21,
31,
21,
51,
51,
21,
41,
21,
41,
21,
21,
2BF
M T
V0,
70,
81
0,9
0,8
0,7
0,8
0,9
0,8
0,7
0,7
10,
61,
51,
40,
70,
6i>
TELE
0,9
0,8
0,8
0,7
0,7
0,6
0,6
0,6
0,5
0,4
0,5
0,7
0,6
0,9
0,8
0,7
0,6
Aut
res
4,9
33,
53,
54,
64,
94,
13,
23,
43,
33,
6%
of T
V ho
useh
olds
eq
uipp
ed w
ith D
TT16
,9%
~20
%~
~23
,5%
~~
28,2
%32
,4%
34,9
%~
~~
40,6
%~
41,1
%
In %
of
popu
latio
n eq
uipp
ed w
ith D
TT,
4 ye
ars
+.
05101520253035
TF1
Fran
ce 2
Fran
ce 3
M6
TMC
Gul
liN
T1
Autr
es
Fran
ce 5
W9
1st Quarte
r2007 06/2
007 07/2007 08/2007 09/2007 10/2007 11/2007
12/2007 01/2008 02/2008 03/2008 07/2008 09/2008
06/2009 07/2009 08/2009 09/2009
TV a
udie
nce
mar
ket s
hare
in h
ouse
hold
s su
bscr
ibin
g to
dig
ital t
erre
stria
l tel
evis
ion
2006
-200
9 In
% o
f po
pula
tion
equi
pped
with
DTT
, 4
year
s +
.
T.1.
FR.8
G.1
.FR.
8

1132 0 0 9 | V o l u m e 1 | B a n d 1
AL
AT
BE
BG
CH
CY
CZ
DE
DK
EE
ES
FI
FR
GB
GR
HR
HU
IE
IS
IT
LT
LU
LV
MK
MT
NL
NO
PL
PT
RO
RU
SE
SI
SK
TR
FR
France France Frankreich FR
Source: European Audiovisual Observatory
Rank Companies Genre 2004 2005 2006 2007 2008 2008/071 GMT Productions Fiction 82 730 ~ ~ ~ ~ ~2 Alma Productions Fiction 27 901 21 460 35 205 70 548 ~ ~
3 Marathon Fiction, animation, children, documentary 49 886 44 649 45 745 49 334 52 720 6,9%
4 Telfrance Serie Fiction 17 813 ~ 47 833 50 572 49 211 -2,7%5 Adventure Line Productions Games, formats 35 370 31 212 35 605 38 572 44 376 15,0%6 DEMD Productions (377608377) Fiction 52 193 46 558 42 081 43 160 ~ ~7 JLA Productions Fiction 53 606 42 536 38 927 39 960 ~ ~8 Métropole Production Animation 31 191 30 656 34 452 37 074 38 574 4,0%9 Alphanim Animation 24 957 30 829 27 015 38 057 ~ ~
10 Tout sur l'écran Productions Entertainment 33 947 ~ ~ 37 536 ~ ~11 Aubes Productions Fiction 29 844 ~ 16 196 33 637 ~ ~12 17 Juin Media News 23 905 27 077 26 296 26 686 32 883 23,2%13 GLEM / TF1 Productions Entertainment 68 004 50 634 43 462 35 013 32 395 -7,5%14 Société Son et Lumière Fiction 31 380 30 532 20 003 30 546 ~ ~15 Cipango Société nouvelle Fiction, feature films 5 865 2 467 13 238 21 817 29 951 37,3%
16 Telfrance Fiction, feature, docu-mentary, entertainment 45 789 34 558 28 517 36 066 29 388 -18,5%
17 Productions DMD Entertainment 28 398 28 398 28 029 30 127 ~ ~18 KM Presse Magazines 8 948 28 634 ~ ~ ~ ~
19 MFP - Multimedia France Production Documentary, science 15 188 20 753 22 485 28 622 ~ ~
20 Chabalier Associates Press Agency (CAPA) News 25 165 27 573 28 457 28 038 ~ ~
21 Marathon Media Animation 14 630 19 492 26 039 21 925 27 685 26,3%22 Jourd'hui Mitchell Productions Fiction 2 495 3 307 16 884 18 232 27 324 49,9%23 Europe News News 23 012 23 404 23 362 26 721 26 249 -1,8%
24 ICT Images cinématographiques et télévisuelles Fiction 8 876 8 239 17 818 26 199 ~ ~
25 Calt Production Fiction 11 489 16 706 12 459 26 136 ~ ~26 Image Compagnie Fiction 15 605 18 797 42 963 24 846 ~ ~27 Carrere Group SA Animation 43 918 27 046 24 794 ~ ~ ~28 Fremantlemedia France Entertainment 24 207 ~ ~ ~ ~ ~29 Air Productions Entertainment 8 992 9 531 10 332 19 817 23 006 16,1%30 Moonscoop SAS Animation 1 859 27 681 22 444 22 703 ~ ~
31 Tout Audiovisuel Productions - TAP Fiction 10 562 12 739 16 555 21 433 ~ ~
32 VM Group Scientific programmes 20 743 ~ ~ ~ ~ ~
33 Gedeon Programmes Documentary, magazines, films 16 345 17 404 17 878 20 595 ~ ~
34 Alizés Films Fiction 14 597 18 786 20 228 ~ ~ ~35 Ellipsanime Animation 25 588 18 101 19 875 ~ ~ ~36 Angel Productions Magazines 41 208 ~ 27 774 19 672 ~ ~37 Merlin Productions Fiction 3 930 2 720 3 521 19 235 ~ ~
38 Agat Films & Cie Documentary, science, animation 25 131 19 720 20 522 17 344 19 046 9,8%
39 Starling Entertainment, events 25 240 24 418 23 459 18 255 18 852 3,3%40 Futurikon Animation 12 815 18 263 23 965 18 796 ~ ~
The 40 leading TV production companies in France 2004-2008 Operating revenues in EUR thousand.
T.1.FR.9
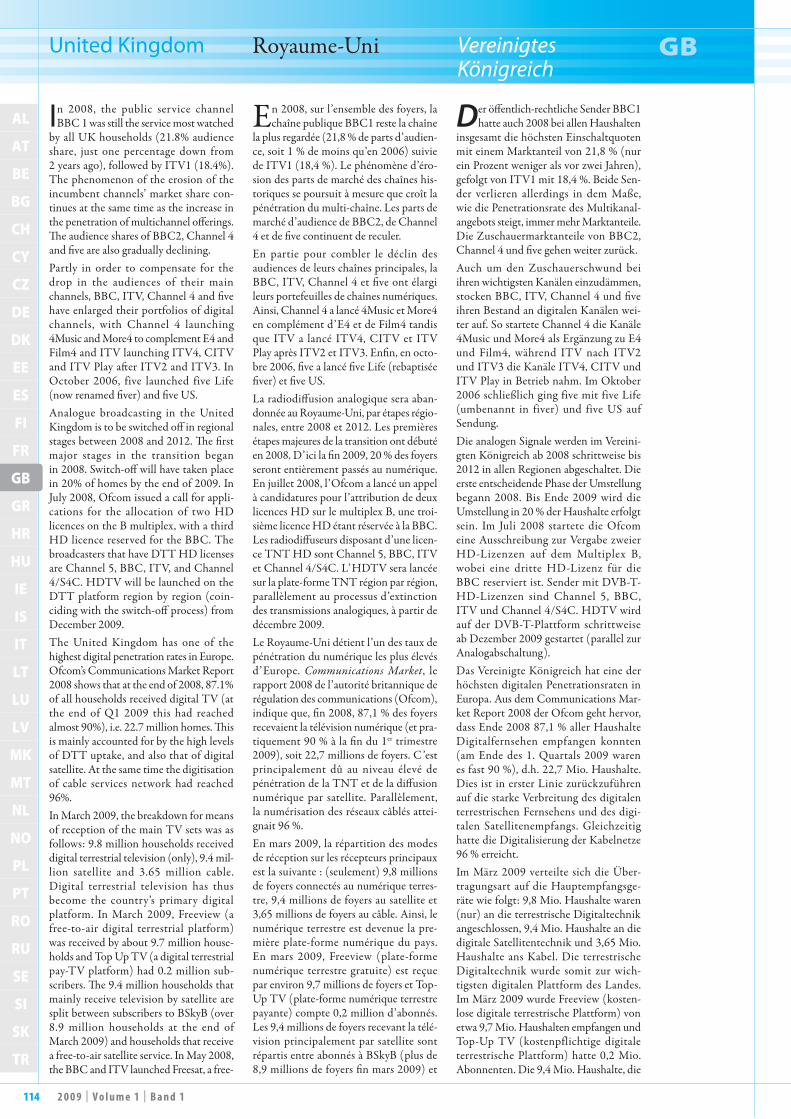
114 2 0 0 9 | V o l u m e 1 | B a n d 1
AL
AT
BE
BG
CH
CY
CZ
DE
DK
EE
ES
FI
FR
GB
GR
HR
HU
IE
IS
IT
LT
LU
LV
MK
MT
NL
NO
PL
PT
RO
RU
SE
SI
SK
TR
GB
United Kingdom Royaume-Uni Vereinigtes Königreich
GB
In 2008, the public service channel BBC 1 was still the service most watched
by all UK households (21.8% audience share, just one percentage down from 2 years ago), followed by ITV1 (18.4%). The phenomenon of the erosion of the incumbent channels’ market share con-tinues at the same time as the increase in the penetration of multichannel offerings. The audience shares of BBC2, Channel 4 and five are also gradually declining.Partly in order to compensate for the drop in the audiences of their main channels, BBC, ITV, Channel 4 and five have enlarged their portfolios of digital channels, with Channel 4 launching 4Music and More4 to complement E4 and Film4 and ITV launching ITV4, CITV and ITV Play after ITV2 and ITV3. In October 2006, five launched five Life (now renamed fiver) and five US. Analogue broadcasting in the United Kingdom is to be switched off in regional stages between 2008 and 2012. The first major stages in the transition began in 2008. Switch-off will have taken place in 20% of homes by the end of 2009. In July 2008, Ofcom issued a call for appli-cations for the allocation of two HD licences on the B multiplex, with a third HD licence reserved for the BBC. The broadcasters that have DTT HD licenses are Channel 5, BBC, ITV, and Channel 4/S4C. HDTV will be launched on the DTT platform region by region (coin-ciding with the switch-off process) from December 2009. The United Kingdom has one of the highest digital penetration rates in Europe. Ofcom’s Communications Market Report 2008 shows that at the end of 2008, 87.1% of all households received digital TV (at the end of Q1 2009 this had reached almost 90%), i.e. 22.7 million homes. This is mainly accounted for by the high levels of DTT uptake, and also that of digital satellite. At the same time the digitisation of cable services network had reached 96%.In March 2009, the breakdown for means of reception of the main TV sets was as follows: 9.8 million households received digital terrestrial television (only), 9.4 mil-lion satellite and 3.65 million cable. Digital terrestrial television has thus become the country’s primary digital platform. In March 2009, Freeview (a free-to-air digital terrestrial platform) was received by about 9.7 million house-holds and Top Up TV (a digital terrestrial pay-TV platform) had 0.2 million sub-scribers. The 9.4 million households that mainly receive television by satellite are split between subscribers to BSkyB (over 8.9 million households at the end of March 2009) and households that receive a free-to-air satellite service. In May 2008, the BBC and ITV launched Freesat, a free-
En 2008, sur l’ensemble des foyers, la chaîne publique BBC1 reste la chaîne
la plus regardée (21,8 % de parts d’audien-ce, soit 1 % de moins qu’en 2006) suivie de ITV1 (18,4 %). Le phénomène d’éro-sion des parts de marché des chaînes his-toriques se poursuit à mesure que croît la pénétration du multi-chaîne. Les parts de marché d’audience de BBC2, de Channel 4 et de five continuent de reculer.En partie pour combler le déclin des audiences de leurs chaînes principales, la BBC, ITV, Channel 4 et five ont élargi leurs portefeuilles de chaînes numériques. Ainsi, Channel 4 a lancé 4Music et More4 en complément d’E4 et de Film4 tandis que ITV a lancé ITV4, CITV et ITV Play après ITV2 et ITV3. Enfin, en octo-bre 2006, five a lancé five Life (rebaptisée fiver) et five US.La radiodiffusion analogique sera aban-donnée au Royaume-Uni, par étapes régio-nales, entre 2008 et 2012. Les premières étapes majeures de la transition ont débuté en 2008. D’ici la fin 2009, 20 % des foyers seront entièrement passés au numérique. En juillet 2008, l’Ofcom a lancé un appel à candidatures pour l’attribution de deux licences HD sur le multiplex B, une troi-sième licence HD étant réservée à la BBC. Les radiodiffuseurs disposant d’une licen-ce TNT HD sont Channel 5, BBC, ITV et Channel 4/S4C. L’HDTV sera lancée sur la plate-forme TNT région par région, parallèlement au processus d’extinction des transmissions analogiques, à partir de décembre 2009.Le Royaume-Uni détient l’un des taux de pénétration du numérique les plus élevés d’Europe. Communications Market, le rapport 2008 de l’autorité britannique de régulation des communications (Ofcom), indique que, fin 2008, 87,1 % des foyers recevaient la télévision numérique (et pra-tiquement 90 % à la fin du 1er trimestre 2009), soit 22,7 millions de foyers. C’est principalement dû au niveau élevé de pénétration de la TNT et de la diffusion numérique par satellite. Parallèlement, la numérisation des réseaux câblés attei-gnait 96 %.En mars 2009, la répartition des modes de réception sur les récepteurs principaux est la suivante : (seulement) 9,8 millions de foyers connectés au numérique terres-tre, 9,4 millions de foyers au satellite et 3,65 millions de foyers au câble. Ainsi, le numérique terrestre est devenue la pre-mière plate-forme numérique du pays. En mars 2009, Freeview (plate-forme numérique terrestre gratuite) est reçue par environ 9,7 millions de foyers et Top-Up TV (plate-forme numérique terrestre payante) compte 0,2 million d’abonnés. Les 9,4 millions de foyers recevant la télé-vision principalement par satellite sont répartis entre abonnés à BSkyB (plus de 8,9 millions de foyers fin mars 2009) et
Der öffentlich-rechtliche Sender BBC1 hatte auch 2008 bei allen Haushalten
insgesamt die höchsten Einschaltquoten mit einem Marktanteil von 21,8 % (nur ein Prozent weniger als vor zwei Jahren), gefolgt von ITV1 mit 18,4 %. Beide Sen-der verlieren allerdings in dem Maße, wie die Penetrationsrate des Multikanal-angebots steigt, immer mehr Marktanteile. Die Zuschauermarktanteile von BBC2, Channel 4 und five gehen weiter zurück.Auch um den Zuschauerschwund bei ihren wichtigsten Kanälen einzudämmen, stocken BBC, ITV, Channel 4 und five ihren Bestand an digitalen Kanälen wei-ter auf. So startete Channel 4 die Kanäle 4Music und More4 als Ergänzung zu E4 und Film4, während ITV nach ITV2 und ITV3 die Kanäle ITV4, CITV und ITV Play in Betrieb nahm. Im Oktober 2006 schließlich ging five mit five Life (um benannt in fiver) und five US auf Sendung.Die analogen Signale werden im Vereini-gten Königreich ab 2008 schrittweise bis 2012 in allen Regionen abgeschaltet. Die erste entscheidende Phase der Umstellung begann 2008. Bis Ende 2009 wird die Umstellung in 20 % der Haushalte erfolgt sein. Im Juli 2008 startete die Ofcom eine Ausschreibung zur Vergabe zweier HD-Lizenzen auf dem Multiplex B, wobei eine dritte HD-Lizenz für die BBC reserviert ist. Sender mit DVB-T-HD-Lizenzen sind Channel 5, BBC, ITV und Channel 4/S4C. HDTV wird auf der DVB-T-Plattform schrittweise ab Dezember 2009 gestartet (parallel zur Analogabschaltung).Das Vereinigte Königreich hat eine der höchsten digitalen Penetrationsraten in Europa. Aus dem Communications Mar-ket Report 2008 der Ofcom geht hervor, dass Ende 2008 87,1 % aller Haushalte Digitalfernsehen empfangen konnten (am Ende des 1. Quartals 2009 waren es fast 90 %), d.h. 22,7 Mio. Haushalte. Dies ist in erster Linie zurückzuführen auf die starke Verbreitung des digitalen terrestrischen Fernsehens und des digi-talen Satellitenempfangs. Gleichzeitig hatte die Digitalisierung der Kabelnetze 96 % erreicht.Im März 2009 verteilte sich die Über-tragungsart auf die Hauptempfangsge-räte wie folgt: 9,8 Mio. Haushalte waren (nur) an die terrestrische Digitaltechnik angeschlossen, 9,4 Mio. Haushalte an die digitale Satellitentechnik und 3,65 Mio. Haushalte ans Kabel. Die terrestrische Digitaltechnik wurde somit zur wich-tigsten digitalen Plattform des Landes. Im März 2009 wurde Freeview (kosten-lose digitale terrestrische Plattform) von etwa 9,7 Mio. Haushalten empfangen und Top-Up TV (kostenpflichtige digitale terrestrische Plattform) hatte 0,2 Mio. Abonnenten. Die 9,4 Mio. Haushalte, die

1152 0 0 9 | V o l u m e 1 | B a n d 1
AL
AT
BE
BG
CH
CY
CZ
DE
DK
EE
ES
FI
FR
GB
GR
HR
HU
IE
IS
IT
LT
LU
LV
MK
MT
NL
NO
PL
PT
RO
RU
SE
SI
SK
TR
GB
United Kingdom Royaume-Uni Vereinigtes Königreich
GB
to-air digital satellite distribution platform that permits access to about 80 television channels and radio stations. In March 2009, about 500,000 households were receiving programmes in this way.The main cable operator, Virgin Media, controls more than 90% of the cable market and has launched the country’s first “quadruple play” service (television, broadband internet, fixed-line and mobile telephony). At the end of 2008, Virgin Media had approximately 3.6 million cable customers, of which 3.5 million had digital cable services. IPTV is not a significant platform in the UK. The main IPTV television pro-viders are the company Video Networks (Homechoice), which was bought by Tiscali in 2006, and the incumbent tele-communications operator BT (BT Vision). In May 2009 Tiscali UK was then sold to the Carphone Wharehouse Group UK. There are no recent figures available for the Tiscali IPTV service subcribers. In March 2009, Ofcom estimated the number of households that mainly receive their tele-vision by ADSL at about 100,000 (50% more than 2008). This figure does not include all the subscribers to BT Vision, some of whom receive programmes trans-mitted via digital terrestrial television and not via the internet. By the end of March 2009, the total number of subscribers to BT Vision was about 423,000.In response to a request made in March 2007 by BT, Setanta, Top Up TV, and Virgin Media, Ofcom opened a new inves-tigation into the pay-TV market, which comprises the television-on-demand and subscription services available on all platforms, i.e. cable, digital terrestrial, satellite and ADSL TV. The investigation examined control over content, ownership of distribution platforms, retail subscriber bases and vertical integration. A second consultation on this issue was launched in May 2009. It is Ofcom’s opinion that Sky has gained a position of market power regarding both premium sports and movies. The proposals under discus-sion include: the separation of standard film rights from video on demand rights; and reviewing the method for allocation of football rights. The satellite operator Setanta experienced a financial crisis in 2009. While the Irish operation survived, Setanta UK dissolved and the channels ceased transmitting in the UK in June 2009. The football rights held by Setanta UK were taken over by the US company ESPN (owned by Disney). In April 2008, the European Commis-sion launched an investigation under EC Treaty state aid rules into state aid pro-posed by the UK authorities for Channel 4 to help it meet the capital costs of digital switchover. The Commission wanted to
foyers recevant une offre satellitaire gra-tuite. En mai 2008, la BBC et ITV ont lancé Freesat, une plate-forme numérique gratuite de distribution par satellite qui permet l’accès à environ 80 chaînes de télévision et stations de radio. En mars 2009, ce mode de réception concerne environ 500 000 foyersLe principal câblo-opérateur, Virgin Media, contrôle plus de 90 % du marché du câble et a lancé la première offre « qua-druple play » du pays (télévision, Internet haut débit, téléphonie fixe et mobile). Fin 2008, Virgin Media comptait quelque 3,6 millions d’abonnés au câble, dont 3,5 millions à des services numériques.L’IPTV n’est pas un mode de distribu-tion important au Royaume-Uni. Les principaux fournisseurs de services de télévision par protocole IP sont la société Video Networks (Homechoice), rachetée en 2006 par Tiscali, ainsi que l’opérateur de télécommunication historique BT (BT Vision). En mai 2009, Tiscali UK a été vendu à Carphone Wharehouse Group UK. Aucun chiffre récent n’est dispo nible sur les abonnés au service IPTV de Tiscali. En mars 2009, l’Ofcom estime à 100 000 environ (50 % de plus qu’en 2008) le nombre de foyers recevant principalement la télévision par ADSL. Ce nombre n’inclut pas tous les abonnés à BT puisque certains reçoivent la télé-vision via le réseau numérique terrestre. Fin mars 2009, le nombre total d’abonnés à BT Vision s’élève à environ 423 000.Suite à une demande déposée en mars 2007 par BT, Setanta, Top Up TV et Vir-gin Media, l’Ofcom a ouvert une enquête sur le marché de la télévision à péage. Ce marché comprend les services de télévision à la demande et par abonnement sur toutes les plates-formes : câble, numérique terres-tre, satellite et TV par ADSL. L’enquête porte sur le contrôle des contenus, la pro-priété des plates-formes de distribution, les bases de données d’abonnés et l’inté-gration verticale. Une seconde consulta-tion sur cette question a été lancée en mai 2009. L’Ofcom estime que Sky a acquis une position dominante sur le marché des sports et des films premium. Les discus-sions portent sur la séparation entre les droits standard des films et les droits de la vidéo à la demande et la modification du procédé d’attribution des droits du football.L’opérateur par satellite Setanta a connu une crise financière en 2009. Alors que la branche irlandaise a survécu, Setanta UK a été dissoute et les chaînes ont arrêté d’émettre au Royaume-Uni en juin 2009. Les droits du football détenus par Setanta UK ont été repris par la compagnie améri-caine ESPN (appartenant à Disney).En avril 2008, la Commission euro péenne a ouvert une enquête sur le financement,
das Fernsehprogramm hauptsächlich über Satellit empfingen, teilen sich auf in Abon-nenten bei BSkyB (über 8,9 Mio. Haus-halte Ende März 2009) und Haushalte mit einem kostenlosen Satellitenangebot. Im Mai 2008 haben BBC und ITV Freesat gestartet, eine kostenlose digitale Satel-litenplattform, die etwa 80 Fernseh- und Hörfunksender anbietet. Im März 2009 betraf dies rund 500 000 Haushalte.Der wichtigste Kabelbetreiber, Virgin Media, kontrolliert über 90 % des Kabel-marktes und startete das erste Quad-Play-Angebot (Fernsehen/Breitbandinternet/Telefon/Handy) des Landes. Ende 2008 hatte Virgin Media bereits rund 3,6 Mio. Kabelkunden, davon 3,5 Mio. mit digi-talem Anschluss.IPTV spielt im UK keine bedeutende Rolle. Die wichtigsten Anbieter von IPTV-Fernsehdiensten sind das Unter-nehmen Video Networks (über seinen Dienst HomeChoice), das 2006 von Tiscali übernommen wurde, sowie der klassische Telekommunikationsbetreiber BT (mit BT Vision). Im Mai 2009 wurde Tiscali UK an die Carphone Warehouse Group UK verkauft. Es gibt keine neueren Zahlen über die Abonnenten des Tiscali IPTV-Dienstes. Im März 2009 schätzte die Ofcom die Zahl der Haushalte, die Fernsehen hauptsächlich via DSL emp-fangen, auf etwa 100 000 (50 % mehr als 2008), von denen ein Teil das Pro-gramm digital terrestrisch und nicht im Internet empfängt. Ende März 2009 hatte BT Vision etwa 423 000 Abonnenten.Nach einer Beschwerde von BT, Setanta, Top Up TV und Virgin Media im März 2007 hat die Regulierungsbehörde Ofcom eine Untersuchung des Pay-TV-Marktes eingeleitet. Dieser Markt umfasst die Abruf- und Abonnement-Fernsehdienste auf allen Plattformen: Kabel, digitale ter-restrische Verbreitung, Satellit und TV über DSL. Die Untersuchung erstreckt sich auf die Kontrolle der Inhalte, den Besitz der Verbreitungsplattformen, die Abonnenten-Datenbanken und die ver-tikale Integration. Eine zweite Unter-suchung zu diesem Thema fand im Mai 2009 statt. Nach Auffassung der Ofcom hat Sky inzwischen seine Marktmacht sowohl beim Premiumsport als auch bei den Spielfilmen ausgebaut. Derzeit wird unter anderem über folgende Vorschlä-ge diskutiert: eine Trennung der Rechte für Standardfilme von den Video-on-Demand-Rechten und eine Überprüfung der Methode für die Vergabe der Fußball-übertragungsrechte.Der irische Pay-TV-Sender Setanta ist 2009 in eine schwere Finanzkrise gera-ten. Setanta Ireland konnte zwar über-leben, doch Setanta UK musste Insolvenz anmelden und stellte im Juni 2009 seinen Sendebetrieb ein. Die Fußballrechte von Setanta UK wurden von dem US-Unter-

116 2 0 0 9 | V o l u m e 1 | B a n d 1
AL
AT
BE
BG
CH
CY
CZ
DE
DK
EE
ES
FI
FR
GB
GR
HR
HU
IE
IS
IT
LT
LU
LV
MK
MT
NL
NO
PL
PT
RO
RU
SE
SI
SK
TR
GB
United Kingdom Royaume-Uni Vereinigtes Königreich
GB
investigate whether this subsidy threat-ens to distort competition in the Single Market. In October 2007, the UK authorities notified to the Commission their proposal to grant GBP 14 million (EUR 21.2 million) of aid to Channel 4 to assist it to meet the capital costs of digital switchover. In November 2008, the UK government decided to abandon this proposal and instead examine switch-over costs in the context of the broader initia-tives for Digital Britain. In May 2009, the UK broadcasting regu-lator Ofcom announced further changes to the rules on advertising and tele-shop-ping in an ongoing review of advertising regulation. The long term aim is to har-monise the rules on amount of advertising applying to private and public broad-casters. Debates on public service continued with the second Ofcom public service review and the publication by the UK govern-ment of “Digital Britain” in January 2009. One major proposal involves the establishment of a second public service organisation alongside the BBC. This could involve a merger of Channel 4 and BBC Worldwide but this has yet to be decided. In March 2009, the UK government announced plans for implementing the Audiovisual Media Services Directive. In September 2009 the UK Culture Secre-tary announced that the ban on product placement would be lifted for commercial television channels. For non-linear/ video on demand services, a co-regulatory system will be established with the industry. The government also announced plans to ensure that non-EU satellite television channels uplinked from the UK will be required to have a broadcasting licence issued by Ofcom.
par les autorités britanniques, des frais d’investissement liés au passage de Channel 4 au numérique. Elle voulait exa-miner si cette subvention était susceptible de fausser la concurrence sur le marché unique. En octobre 2007, les autorités britanniques avaient notifié à la Commis-sion leur intention d’accorder une aide de 14 millions GBP (21,2 millions EUR) à Channel 4 pour lui permettre de faire face aux frais d’investissement liés au pas-sage au numérique. En novembre 2008, le gouvernement britannique a décidé d’abandonner cette proposition et d’exa-miner plutôt les frais de transition dans le contexte des initiatives plus étendues de Digital Britain.En mai 2009, l’Ofcom a annoncé d’autres modifications des règles imposées à la publicité et au téléachat dans le cadre d’une révision continue de la réglementa-tion relative à la publicité. L’objectif à long terme est d’harmoniser les règles relatives à la quantité de publicité s’appliquant aux radiodiffuseurs privés et publics.Les débats sur le service public se sont poursuivis avec le deuxième examen du service public de l’Ofcom et la publica-tion par le gouvernement britannique de « Digital Britain » en janvier 2009. Une proposition majeure concerne l’établisse-ment d’une seconde organisation de servi-ce public à côté de BBC. Une fusion entre Channel 4 et BBC Worldwide est envisa-gée, mais la décision reste à prendre.En mars 2009, le gouvernement britan-nique a annoncé son projet de transpo-sition de la Directive Services de médias audiovisuels. Le placement de produit restera interdit, la politique devant être révisée en 2011-2012. Pour les services non-linéaires/de vidéo à la demande, un système de co-régulation sera établi avec l’industrie. Le gouvernement a également fait part de son intention de s’assurer que les chaînes de télévision par satellite hors UE émettant depuis le Royaume-Uni devront disposer d’une licence de diffu-sion délivrée par l’Ofcom.
nehmen ESPN (einer Disney-Tochter) über nommen. Im April 2008 hat die Europäische Kom-mission gemäß den EG-Beihilfevor-schriften die Prüfung einer staatlichen Beihilfe eingeleitet, mit der das Verei-nigte Königreich die Rundfunkgesell-schaft Channel 4 bei der Finanzierung des Übergangs zum digitalen Rundfunk unter stützen will. Die Kommission wollte prüfen, ob die geplante Beihilfe eine Verzerrung des Wettbewerbs auf dem Gemeinsamen Markt zur Folge haben könnte. Das Vereinigte Königreich hat im Oktober 2007 eine Beihilfe von 14 Mio. GBP (21,2 Mio. EUR) bei der Kommis-sion angemeldet, mit der Channel 4 bei der Finanzierung des Übergangs zum digitalen Rundfunk unterstützt werden soll. Im November 2008 beschloss die bri-tische Regierung, nicht mehr an diesem Vorschlag festzuhalten und stattdessen die Kosten für die Umschaltung im Zusam-menhang mit umfassenderen Initiativen für Digital Britain zu prüfen. Im May 2009 kündigte die britische Regulierungsbehörde Ofcom weitere Änderungen der Regeln für Werbung und Teleshopping im Rahmen einer allgemei-nen Überprüfung der Werberichtlinien an. Langfristig sollen die Vorschriften für den Umfang der Werbung im öffentlich-rechtlichen und im Privatfernsehen ange-glichen werden.Nach der Veröffentlichung des zweiten Ofcom-Berichts über den öffentlich-rechtlichen Rundfunk in Großbritannien und des Regierungsberichts über „Digital Britain“ im Januar 2009 geht die Dis-kussion über den Umbau des öffentlich-rechtlichen Fernsehen weiter. Einer der zentralen Vorschläge ist, einen zweiten öffentlich-rechtlichen Sender neben BBC zu gründen. Dies könnte eine Fusion von Channel 4 und BBC Worldwide bedeu-ten, aber noch ist nichts entschieden.Im März 2009 hat die britische Regierung Pläne für eine Umsetzung der Richtlinie über die audiovisuellen Mediendienste angekündigt. Produkt-Placement soll auch in Zukunft verboten bleiben. Die Maßnahmen sollen 2011-2012 über-prüft werden. Für nicht-lineare Dienste/ Video-on-Demand soll ein Koregulie-rungssystem zusammen mit der Industrie eingeführt werden. Die Regierung hat angekündigt, dass Nicht-EU-Fernsehsen-der, die über einen Satelliten-Uplink aus UK senden, in Zukunft eine Lizenz der Ofcom haben müssen.
Sources: Ofcom, (Communications Market 2008): http://www.ofcom.org.uk Audience data: http://www.barb.co.uk Legal aspects: Iris Merlin, http://merlin.obs.coe.int General information: http://www.broadbandtvnews.com/uk

1172 0 0 9 | V o l u m e 1 | B a n d 1
AL
AT
BE
BG
CH
CY
CZ
DE
DK
EE
ES
FI
FR
GB
GR
HR
HU
IE
IS
IT
LT
LU
LV
MK
MT
NL
NO
PL
PT
RO
RU
SE
SI
SK
TR
GB
United Kingdom Royaume-Uni Vereinigtes Königreich
GB
Population and equipment 31.12.08Penetration
(in % HH) In thousand SourcesPopulation (inhabitants) – 61 635 Eurostat
Households – 26 541 Eurostat (as at 1.1.2008)
TV households 96,1% 25 500 OFCOM
Cable TV households 13,7% 3 630 Screen Digest / European Audiovisual Observatory
Digital cable TV households 13,1% 3 478 Screen Digest / European Audiovisual Observatory
DTH/SMATV households 36,6% 9 725 Screen Digest / European Audiovisual Observatory
Pay DTH/SMATV households 32,6% 8 665 Screen Digest / European Audiovisual Observatory
IPTV subscriptions 1,7% 463 Screen Digest / European Audiovisual Observatory
Installed DVB-T receivers 66,7% 17 700 Screen Digest / European Audiovisual Observatory
Total digital TV households 87,1% 23 117 OFCOM / European Audiovisual Observatory (as at 31.3.2009)
Households with PC 71,0% 19 938 Screen Digest / European Audiovisual Observatory
Households with broadband connections 59,8% 15 883 Screen Digest / European Audiovisual Observatory
Mobile phone TV subscriptions – 559 Screen Digest
Mobile broadcast TV receivers – 1 Screen Digest
TV channels distributors 11.09 CompaniesCable operators 3 Smallworld Cable, Virgin Media, Wight Cable 2005Satellite packagers 2 British Sky Broadcasting (Sky), FreesatIPTV packagers 3 BT, IP Vision (Fech TV), Tiscali UK
DTT multiplex operators and packagers 7 5 multiplex operators and 2 packagers (DTV Services/Freeview and Top-Up TV)
Mobile phone TV packagers 2 Hutchinson 3 G and T-Mobile UK
Number of TV channels by kind of licence 10.09 Public Private TotalTerrestrial (national) 21 63 84Cable/Satellite/IPTV/Mobile 7 473 480Regional/Local 6 4 10Regional/Local windows 13 31 44Channels targeting foreign markets 13 461 474Total 60 1 032 1 092Foreign channels targeting the country 3 15 18
Source: European Audiovisual Observatory
Supply of TV channels by genre and by platform (including foreign channels) 10.09
Digital terrestrial
FreeviewCable
Virgin media
Satellite Sky
(Full offer)Satellite
FreesatIPTV
TiscaliGeneralist - national 5 6 4 6 5Generalist - foreign 1 4Adult 11 21Children 3 18 25 7 14Culture/ education/ documentary 5 17 24 3 11Minority interest groups 4 16 3 1Entertainment/ TV fiction/ games 11 38 57 12 19Film 2 19 31 5 6Home shopping 5 8 28 13 4International linguistic and cultural 1 3 1Lifestyle/ specific leisure/ travel 9 16 2 3Music 2 16 25 7 6News/ business 4 11 28 7 4Parliament/ government/ administration 2 1 2 2 1Regional/ local 1 4 6 2 2Religion 1 18 2Sports 1 16 33 10Various 7 29 55 12 4Total 48 210 396 84 90
Basic figures

118 2 0 0 9 | V o l u m e 1 | B a n d 1
AL
AT
BE
BG
CH
CY
CZ
DE
DK
EE
ES
FI
FR
GB
GR
HR
HU
IE
IS
IT
LT
LU
LV
MK
MT
NL
NO
PL
PT
RO
RU
SE
SI
SK
TR
GB
United Kingdom Royaume-Uni Vereinigtes Königreich
GB
Source: European Audiovisual Observatory on the basis of data from Screen Digest, WARC and BBC data
Source: European Audiovisual Observatory
Source: Screen DigestSource: Screen Digest
Households TV equipment 2004-2008
Number of households accessing multichannel platforms as at 31.12.2008
Consumers pay-TV gross spend 2004-2008
Gross revenues of radio-television 2004-2008
2004 2005 2006 2007 2008
0
20 000
15 000
10 000
5 000
DTT households
Satellite households
Cable households
IPTV households
6 080
3 302
14 40
3 319 3 362
54
3 487
172
3 630
463
7 6478 261
8 7919 100
9 725
8 002
10 600
15 300
17 700
Freeview DTTo
nly
Sky DTH su
bscribers
Virgin M
edia Cable subscr
ibers
Free-to-view Satellit
e
Top U
p TV (pay-D
TT)
Tiscali
Zattoo
0
2 000
4 000
6 000
8 000
10 0009 500
8 900
3 300
600 40096100
DTT
IPTV
Sat
PC
Cable
2004 2005 2006 2007 2008
0
6 000
4 000
2 000
Satellite consumersspend
Cable TV consumersspend
DTT consumers spendIPTV consumer spend
4 725
5 0795 259
5 698
5 018
1 479
10
4
28
11
39
22
57
21
62
41
1 516 1 573 1 6651 514
2004 2005 2006 2007 2008
0
8 000
6 000
4 000
2 000
Consumerspay-TV spend
Public funding radio-TV
Radio adspend
TV adspend
6 219
5 834
4 770
5 997
4 978
5 873
4 804
6 634
6 892
5 735
5 354
7 441
4 767
6 634
4 185
807 762 706 726 572
In thousands.
In thousands.
EUR million.
EUR million.
Market trends

1192 0 0 9 | V o l u m e 1 | B a n d 1
AL
AT
BE
BG
CH
CY
CZ
DE
DK
EE
ES
FI
FR
GB
GR
HR
HU
IE
IS
IT
LT
LU
LV
MK
MT
NL
NO
PL
PT
RO
RU
SE
SI
SK
TR
GB
United Kingdom Royaume-Uni Vereinigtes Königreich
GB
Main broadcasters (local TV not included) Channels 2005 2006 2007 2008 2008/07
BBC (Public Service Broadcasting) sptv BBC 1, 2, 3, 4,…; radio channels 4 478 862 4 810 385 4 288 753 3 807 300 -11,2%
ITV Broadcasting Ltd adtv ITV Anglia 237 018 210 071 1 860 347 ~ ~p.m. Granada Television Ltd 1 adtv ITV Granada 511 790 453 732 – – –p.m. London Weekend Television Ltd 1 adtv ITV LWT 607 434 517 793 – – –
p.m. ITV Central Ltd 2 adtv ITV Central 408 070 368 221 74 447 – –p.m. Carlton Broadcasting Ltd 1 adtv ITV Carlton 367 349 335 068 – – –p.m. Yorkshire Television Ltd 1 adtv ITV Yorkshire 347 669 324 661 – – –p.m. ITV Meridian Ltd 2 adtv ITV Meridian 292 016 253 934 61 087 – –p.m. ITV Wales & West Ltd 2 adtv ITV HTV 146 976 134 871 29 578 – –ITV Network Ltd adtv ITV1 1 497 234 1 673 461 1 461 520 ~ ~Channel Four sptv C 4 1 073 107 1 037 252 973 462 770 461 -20,9%QVC hstv QVC 445 589 493 879 479 890 376 739 -21,5%Viasat Broadcasting UK Ltd adtv TV3, 3+, ZTV,… 330 179 366 646 370 306 370 018 -0,1%Channel 5 Broadcasting Ltd adtv Five 464 771 466 283 459 150 360 755 -21,4%Discovery Communications Europe Ltd thtv Discovery Channel 71 903 114 332 328 842 ~ ~
4 Ventures Ltd sptv E4, Film Four 211 206 338 627 310 425 262 188 -15,5%Sit-Up Ltd hstv Bid TV, Screenshop,… 348 312 335 969 322 730 251 664 -22,0%Turner Entertainment Networks International Ltd thtv Cartoon, TCM,
Boomerang 201 908 202 659 223 466 235 297 5,3%
Turner Broadcasting System Europe Ltd thtv CNNI 203 517 214 528 229 441 223 538 -2,6%
Satellite Information Services (Holdings) Ltd thtv Racing K, SIS Digital 183 050 203 610 199 923 207 899 4,0%
ITV2 Ltd thtv ITV2 125 953 177 661 205 807 ~ ~Living TV thtv Living TV, Living TV2 95 186 108 507 115 382 ~ ~GMTV Ltd adtv GMTV 120 751 111 744 110 380 ~ ~S4C sptv S4C 142 390 144 135 136 172 107 567 -21,0%Ideal Shopping Direct PLC hstv Ideal World 115 588 127 750 131 448 99 088 -24,6%
ITV Digital Channels Ltd thtv ITV 3, ITV4, CITV, Men+Motors 42 478 74 469 91 101 ~ ~
UK Channel Management Ltd thtv
UKTV Drama, UKTV Documentary, UKTV Style, …
100 496 99 483 92 403 73 190 -20,8%
Main distributors Packages 2005 2006 2007 2008 2008/07BT Group (cons.) 3 3play BT Vision 28 315 000 30 076 000 26 476 000 23 414 000 -11,6%Vodafone Limited 3 3G TV Vodafone TV 6 602 926 7 033 346 7 281 342 6 615 291 -9,1%British Sky Broadcasting Ltd 4
sat-tv, ISP, packtv Sky 5 384 030 5 571 149 6 015 438 5 322 906 -11,5%
Virgin Media Finance PLC 4 3play Virgin TV 2 665 093 5 189 346 5 388 406 4 090 579 -24,1%T-Mobile (UK) Ltd 3 3G TV Mobile TV 4 175 633 4 569 329 4 481 618 3 374 041 -24,7%Hutchison 3G UK Holdings Ltd 3 3G TV 3 Add TV 1 525 304 2 018 485 1 770 601 1 621 094 -8,4%
Tiscali UK Limited 4 3play Tiscali TV 322 084 442 976 468 670 379 279 -19,1%1 Merged into ITV Broadcasting Ltd as at 1.1.2007.2 Merged into ITV Broadcasting Ltd as at 1.4.2007.3 Includes revenues of other activities (telecommunication).4 Includes revenues of other activities (broadcasting, telecommunication).
Operating revenues of television companies in the United Kingdom 2005-2008 EUR thousand.
T.1.GB.1G.1.GB.1

120 2 0 0 9 | V o l u m e 1 | B a n d 1
AL
AT
BE
BG
CH
CY
CZ
DE
DK
EE
ES
FI
FR
GB
GR
HR
HU
IE
IS
IT
LT
LU
LV
MK
MT
NL
NO
PL
PT
RO
RU
SE
SI
SK
TR
GB
United Kingdom Royaume-Uni Vereinigtes Königreich
GB
Source: European Audiovisual Observatory
2004 2005 2006 2007 2008
0
5 000 000
2 000 000
3 000 000
4 000 000
1 000 000
BBC (Home Service)
Channel 5Broadcasting Ltd
ITV Broadcasting
ITV Network Ltd
Channel FourQVC Viasat Broadcasting UK Ltd
London WeekendTelevision LtdGranada
Television Ltd
Operating revenues of television companies in the United Kingdom (Continued) 2005-2008 EUR thousand.
T.1.GB.1G.1.GB.1

1212 0 0 9 | V o l u m e 1 | B a n d 1
AL
AT
BE
BG
CH
CY
CZ
DE
DK
EE
ES
FI
FR
GB
GR
HR
HU
IE
IS
IT
LT
LU
LV
MK
MT
NL
NO
PL
PT
RO
RU
SE
SI
SK
TR
GB
United Kingdom Royaume-Uni Vereinigtes Königreich
GB
Main broadcasters 2004 2005 2006 2007 2008 2008/07BBC Group 3 835 4 005 4 177 4 415 4 606 4,3%ITV PLC 2 053 2 177 2 181 2 082 2 029 -2,5%Channel Four Group 843 894 937 945 906 -4,1%Viasat Broadcasting UK Ltd 211 226 246 272 353 29,8%Channel 5 Broadcasting Ltd 286 318 313 337 361 6,9 %
Main distributors 2004 2005 2006 2007 2008 2008/07BT Group (cons.) 1 18 623 19 741 20 456 21 053 21 729 3,2%Vodafone Limited 1 4 547 4 904 4 952 5 260 6 615 25,8%British Sky Broadcasting Ltd 1 2 3 656 4 048 4 148 4 551 4 952 8,8%Virgin Media Finance PLC 1 2 2 230 1 826 3 479 3 959 3 905 -1,4%T-Mobile (UK) Ltd 1 2 989 2 861 3 063 3 293 3 374 2,5%Hutchison 3G UK Holdings Ltd 1 412 1 039 1 340 1 268 1 493 17,8%Tiscali UK Limited 1 2 170 221 297 344 362 5,1%
Source: European Audiovisual Observatory1 Includes telecommunication revenues.2 Includes broadcasting revenues.
GBP million.
GBP million.
2004 2005 2006 2007 2008
0
5 000
4 000
3 000
2 000
1 000
BBC Group
ITV PLC
Channel Four Group
Viasat Broadcasting UK LtdChannel 5 Broadcasting Ltd
2004 2005 2006 2007 2008
0
25 000
20 000
15 000
10 000
5 000
BT Group (cons.)
British SkyBroadcasting Ltd
Virgin Media Finance PLCHutchison 3G UK Holdings Ltd
T-Mobile (UK) Ltd
Tiscali UK Limited
Vodafone Limited
Operating consolidated revenues of main UK broadcasters and distributors 2004-2008 GBP million.
T.1.GB.2G.1.GB.2

122 2 0 0 9 | V o l u m e 1 | B a n d 1
AL
AT
BE
BG
CH
CY
CZ
DE
DK
EE
ES
FI
FR
GB
GR
HR
HU
IE
IS
IT
LT
LU
LV
MK
MT
NL
NO
PL
PT
RO
RU
SE
SI
SK
TR
GB
United Kingdom Royaume-Uni Vereinigtes Königreich
GB
1 From 2008, Pay-TV revenues are included in “Programme sales.” Source: BBC / European Audiovisual Observatory
Income 2006 2007 2008 2009 2006 2007 2008 2009 2009/08Total public income 4 790,2 5 159,3 4 593,2 4 082,2 78,7% 82,4% 81,0% 81,1% -11,1% - Aid/Grants 342,9 391,4 356,7 317,4 5,6% 6,2% 6,3% 6,3% -11,0% - Licence fee 4 447,3 4 767,9 4 236,6 3 764,7 73,1% 76,1% 74,7% 74,8% -11,1%Total commercial income 1 251,8 1 057,4 1 024,3 906,1 20,6% 16,9% 18,1% 18,0% -11,5% - Programme sales 300,2 366,7 509,3 476,7 4,9% 5,9% 9,0% 9,5% -6,4% - Merchandising 387,0 338,6 335,0 310,7 6,4% 5,4% 5,9% 6,2% -7,3% - Pay TV 1 206,0 173,6 ~ ~ 3,4% 2,8% ~ ~ ~ - Other commercial income 358,7 178,4 180,0 118,7 5,9% 2,8% 3,2% 2,4% -34,0%Others 42,3 47,5 53,8 44,6 0,7% 0,8% 0,9% 0,9% -17,1%Sub-total 6 084,4 6 264,2 5 671,3 5 032,9 100,0% 100,0% 100,0% 100,0% -11,3%TOTAL (after group eliminations) 5 744,5 6 141,7 5 552,0 4 962,9
2006 2007 2008 2009 2006 2007 2008 2009 2009/08Expenditure 6 038,9 6 400,7 5 630,2 4 840,0 - Cost of personnel 1 995,6 1 889,3 1 737,5 1 394,6 33,0% 29,5% 30,9% 28,8% -19,7%
Net result 5,2 89,2 127,9 273,4 113,8%Operating margin (%) -4,4 -3,2 -1,4 2,5
EUR million.
In %.
2004 2005 2006 2007 2008
0
7 000
6 000
5 000
4 000
3 000
2 000
1 000
Others
Aid/Grants
Licence fee
Programme salesMerchandising
Pay TVOther commercial income
2004 2005 2006 2007 2008
-40
30
20
10
0
-10
-20
-30
Return onshareholders’ funds
Return on total assets Pro�t marginOperating margin
BBC Group financial situation 2006-2009 As at 31 March. EUR million.
T.1.GB.3G.1.GB.3

1232 0 0 9 | V o l u m e 1 | B a n d 1
AL
AT
BE
BG
CH
CY
CZ
DE
DK
EE
ES
FI
FR
GB
GR
HR
HU
IE
IS
IT
LT
LU
LV
MK
MT
NL
NO
PL
PT
RO
RU
SE
SI
SK
TR
GB
United Kingdom Royaume-Uni Vereinigtes Königreich
GB
1 In 2008, as a result of the estimation of the downturn of the advertising market in 2009 and 2010, the company made an impairment of intangible assets (goodwill) of 2695 millions GBP (2823 millions euros)
Source: European Audiovisual Observatory
2005 2006 2007 2008 2005 2006 2007 2008 2008/07Broadcasting revenues 2 602 2 681 2 365 1 725 102,2% 108,8% 98,5% 73,6% -27,1% - TV advertising 2 381 2 229 2 026 1 493 93,5% 90,4% 84,4% 63,7% -26,3% - ITV1 2 134 1 911 1 666 1 181 83,8% 77,6% 69,3% 50,3% -29,1% - GMTV 85 84 76 59 3,3% 3,4% 3,2% 2,5% -23,0% - Other channels 162 234 284 253 6,4% 9,5% 11,8% 10,8% -10,9% - Sponsorship 60 79 76 61 2,3% 3,2% 3,2% 2,6% -20,3% - SDN (digital multiplex) – 37 49 35 – 1,5% 2,0% 1,5% -29,4% - Other broadcasting revenues 162 336 214 137 6,4% 13,6% 8,9% 5,9% -35,8%Content production and distribution 981 841 768 652 38,5% 34,1% 32,0% 27,8% -15,1%On line – 34 45 38 – 1,4% 1,9% 1,6% -16,0%Other revenues 134 119 91 42 5,3% 4,8% 3,8% 1,8% -54,0%Total revenues 3 718 3 676 3 269 2 456 146,0% 149,2% 136,1% 104,7% -24,9%Total (after eliminations) 3 205 3 254 2 833 2 125 -25,0%
Purchase of goods and services 2 148,6 2 351 1 969,3 1 594,8 79,7% 82,2% 76,6% 32,6% -19,0%Costs of personal 350,3 347,6 440,9 363,5 13,0% 12,2% 17,1% 7,4% -17,6%Depreciation 1 198,5 161,1 161,9 2 929,8 7,4% 5,6% 6,3% 59,9% 1709,6%Total expenditures 2 697,4 2 859,7 2 572,1 4 888,1 100,0% 100,0% 100,0% 100,0% 90,0%
Net result 329,9 331,2 187,8 -2 675,3 -1 524,5%Operating margin 15,1 12,1 9,2 –
EUR million.
In %.
2005 2006 2007 2008
0
4 000
2 000
3 000
1 000TV advertising
SponsorshipSDN (digital multiplex)
Content productionand distribution
On line
Other broadcasting revenues
Other revenues
2004 2005 2006 2007 2008
-100
20
0
-20
-40
-60
-80
Pro�t margin
Return on total assets
Operating margin
Return on shareholders' funds
ITV PLC financial situation 2005-2008 EUR million.
T.1.GB.4G.1.GB.4

124 2 0 0 9 | V o l u m e 1 | B a n d 1
AL
AT
BE
BG
CH
CY
CZ
DE
DK
EE
ES
FI
FR
GB
GR
HR
HU
IE
IS
IT
LT
LU
LV
MK
MT
NL
NO
PL
PT
RO
RU
SE
SI
SK
TR
GB
United Kingdom Royaume-Uni Vereinigtes Königreich
GB
Source: Channel 4 / European Audiovisual Observatory
Income 2005 2006 2007 2008 2005 2006 2007 2008 2008/07Total commercial income 1 345 541 1 432 732 1 310 697 964 640 100,0% 100,0% 100,0% 100,0% -26,4% - Advertising & sponsorship 1 073 107 1 038 108 973 462 700 461 79,8% 72,5% 74,3% 72,6% -28,0% - Programme sales 78 089 90 698 57 975 36 243 5,8% 6,3% 4,4% 3,8% -37,5% - Pay TV 126 181 191 839 212 847 183 312 9,4% 13,4% 16,2% 19,0% -13,9% - Other commercial income 68 164 112 087 66 413 44 623 5,1% 7,8% 5,1% 4,6% -32,8%
TOTAL (after elimination group) 1 305 332 1 396 467 1 285 928 944 423 -26,6%
Expenditure 2005 2006 2007 2008 2005 2006 2007 2008 2008/07Purchase of goods and services 1 122 004 1 267 837 1 184 132 866 280 91,8% 92,1% 91,2% 91,7% -26,8%
Cost of personnel 88 453 96 218 96 761 69 344 7,2% 7,0% 7,5% 7,3% -28,3%Depreciation 11 823 12 680 17 148 9 323 1,0% 0,9% 1,3% 1,0% -45,6%Operating expenditure 1 222 280 1 376 735 1 298 041 944 947 100,0% 100,0% 100,0% 100,0% -27,2%
Net result 70 791 21 630 680 1 885 177,2%Operating margin (%) 6,36 1,49 -0,93 -0,06 -0,935
EUR thousand.
In %.
2004 2005 2006 2007 2008
0
1 500 000
900 000
1 200 000
600 000
300 000
Pay-TVOthers
Advertising& sponsorship
Sales of programmes
2004 2005 2006 2007 2008
-5
20
15
10
5
0
Return on shareholders’ funds
Return on total assetsPro�t marginOperating margin
Channel 4 Group financial situation (consolidated) 2005-2008 EUR thousand.
T.1.GB.5G.1.GB.5

1252 0 0 9 | V o l u m e 1 | B a n d 1
AL
AT
BE
BG
CH
CY
CZ
DE
DK
EE
ES
FI
FR
GB
GR
HR
HU
IE
IS
IT
LT
LU
LV
MK
MT
NL
NO
PL
PT
RO
RU
SE
SI
SK
TR
GB
United Kingdom Royaume-Uni Vereinigtes Königreich
GB
Source: BSkyB / European Audiovisual Observatory
Income 2006 2007 2008 2009 2006 2007 2008 2009 2009/08Retail subscriptions (DTH, BB) 4 582,4 5 059,7 4 761,9 4 902,2 77,7% 74,8% 76,1% 78,1% 2,9%Cable subscriptions 325,1 309,0 228,7 241,4 5,5% 4,6% 3,7% 3,8% 5,5%Advertising 496,4 522,9 414,4 360,9 8,4% 7,7% 6,6% 5,7% -12,9%Sky Bet 53,7 69,8 55,6 56,2 0,9% 1,0% 0,9% 0,9% 1,2%Facilities 314,9 348,7 275,3 4,7% 5,6% 4,4% -21,0%Others 563,2 484,3 447,3 442,9 9,6% 7,2% 7,1% 7,1% -1,0%
Operating revenues 5 897,0 6 760,7 6 256,6 6 278,8 100,0% 100,0% 100,0% 100,0% 0,4%
Expenditure 2006 2007 2008 2009 2006 2007 2008 2009 2009/08Purchase of goods and services 3 885 4 439 4 245 4 154 82,3% 80,0% 79,5% 78,0% -2,1%Cost of personnel 634 822 786 831 13,4% 14,8% 14,7% 15,6% 5,7%Depreciation 202 285 311 341 4,3% 5,1% 5,8% 6,4% 9,6%Operating expenditure 4 721 5 546 5 342 5 326 100,0% 100,0% 100,0% 100,0% -0,3%
Net result 795 741 -160,0 303,0 -289,4%Operating margin (%) 21,14 17,9 14,6 15,2
EUR million.
In %.
2005 2006 2007 2008 2009
0
8 000
6 000
4 000
2 000Retail subscriptions (DTH, BB)
Cable subscriptionsAdvertisingFacilitiesOthers
Sky Bet
2005 2006 2007 2008 2009
0
30
40
20
10
Operating margin
Return on total assetsPro�t margin
British Sky Broadcasting Group PLC financial situation (consolidated) 2006-2009 As at 30 June. EUR million.
T.1.GB.6G.1.GB.6

126 2 0 0 9 | V o l u m e 1 | B a n d 1
AL
AT
BE
BG
CH
CY
CZ
DE
DK
EE
ES
FI
FR
GB
GR
HR
HU
IE
IS
IT
LT
LU
LV
MK
MT
NL
NO
PL
PT
RO
RU
SE
SI
SK
TR
GB
United Kingdom Royaume-Uni Vereinigtes Königreich
GB
Daily share Prime time (18:00-22:30)Channels 2004 2005 2006 2007 2008 2006 2007 2008BBC1 24,7 23,3 22,8 22 21,8 24,2 23,9 23,9BBC2 10 9,4 8,8 8,5 7,8 9 9,2 8,8BBC1 Scotland ~ ~ 2 1,9 1,9 1,9 1,9 1,9Cbeebies 0,8 0,9 1 1,1 1,2 0 0,3 0,3BBC3 0,4 0,6 0,8 0,9 1,1 1,2 1,1 1,3BBC Others ~ ~ 4,1 4,2 4,3 3,6 3,8 3,9Total BBC ~ ~ 39,5 38,6 38,1 39,9 40,2 40,1
ITV1 22,8 21,5 19,7 19,2 18,4 26,8 24,5 23,2ITV2 1,1 1,5 1,6 1,7 1,8 1,3 1,4 1,5ITV3 0,1 0,8 1,1 1,1 1,4 1,1 0,9 1,2ITV Others ~ ~ 0,4 0,5 1,3 0,6 0,6 0,8Total ITV 22,8 22,5 22,9 29,8 27,4 26,7
Channel 4 9,6 9,6 9,6 8,4 7,4 8,6 8,4 7,5E4 0,6 0,9 1,1 1,1 1,1 1,1 1,1 1,2Film 4 ~ ~ 0,3 0,6 0,8 0,4 0,7 0,8More 4 ~ ~ 0,4 0,6 0,8 0,4 0,6 0,8Channel 4 others ~ ~ 0,5 0,8 1,7 0,4 0,7 1,5Total Channel 4 11,9 11,5 11,8 10,9 11,5 11,8
Five 6,6 6,4 5,7 5,1 5 5,5 5,2 5Five Others ~ ~ 0,2 0,8 0,6 0,2 1 1,2Total Five 5,9 5,9 5,6 5,7 6,2 6,2
Sky Sports 1 1,1 1,2 1,3 1,4 1,2 1 1 0,8Sky One 1,5 1,3 1,4 0,9 0,9 1,7 1,2 1,2Sky Three ~ ~ 0,4 0,6 0,6 0,4 0,6 0,6Sky Sports News ~ ~ 0,5 0,5 0,5 0,2 0,3 0,3Sky News ~ ~ 0,4 0,4 0,4 0,1 0,2 0,2Sky others ~ ~ 1 2,2 2,4 1 1,9 2,2Total Sky ~ ~ 5,0 6,0 6,0 4,4 5,2 5,3
Total Viacom ~ ~ 1,9 1,5 2 0,5 0,5 0,6Total Discovery ~ ~ 1,2 1 1,1 0,8 0,7 0,7Total Disney ~ ~ 0,8 1 0,9 0,2 0,4 0,5Total Turner ~ ~ 0,7 0,6 0,5 0,2 0,2 0,2
Others ~ ~ 10,3 11,4 11,1 7,6 7,7 7,9Source: Eurodata TV Worldwide / BARB / TNS UK
TV audience market share in the United Kingdom 2004-2008 In %, 4 years +.
T.1.GB.7

1272 0 0 9 | V o l u m e 1 | B a n d 1
AL
AT
BE
BG
CH
CY
CZ
DE
DK
EE
ES
FI
FR
GB
GR
HR
HU
IE
IS
IT
LT
LU
LV
MK
MT
NL
NO
PL
PT
RO
RU
SE
SI
SK
TR
GB
United Kingdom Royaume-Uni Vereinigtes Königreich
GB
Source: Eurodata TV Worldwide / BARB / TNS UK
Prime time (18:00-22:30). Leading TV groups.
2008
BBC40,1%
ITV26,7%
Others7,9%
Viacom0,6%
Discovery0,7%
Turner0,2%
Disney0,5%
Channel 411,8%
Five6,2%
Sky5,3%
Daily share. Leading TV channels. All day. Main TV groups.
2004 2005 2006 2007 2008
0
5
15
10
20
25
BBC1
ITV1
BBC2
Five
BBC1 ScotlandSky Sports 1
Channel 4
Cbeebies,BBC3, E4
ITV2
ITV3
2006 2007 2008
0
10
20
30
40
BBC
ITV
Channel 4Others
SkyFive
ViacomDiscovery
TurnerDisney
TV audience market share of the leading TV channels and groups 2004-2008 In %, 3 years +.
G.1.GB.7

128 2 0 0 9 | V o l u m e 1 | B a n d 1
AL
AT
BE
BG
CH
CY
CZ
DE
DK
EE
ES
FI
FR
GB
GR
HR
HU
IE
IS
IT
LT
LU
LV
MK
MT
NL
NO
PL
PT
RO
RU
SE
SI
SK
TR
GB
United Kingdom Royaume-Uni Vereinigtes Königreich
GB
Source: European Audiovisual Observatory
Rank Companies Genre 2005 2006 2007 2008 2008/071 ITV Studios Entertainment, fiction ~ ~ 528 558 ~ ~2 All3Media Holdings Ltd 1 Fiction, entertainment, sports – – 338 746 459 528 35,7%
p.m. All3Media Group Ltd Fiction, entertainment, sports 256 892 309 777 – – –p.m. Lime Pictures Ltd 2 Fiction 34 404 48 103 47 549 44 862 -5,7%p.m. North One Television Ltd Entertainment, sports 42 772 55 111 43 766 42 068 -3,9%p.m. Bentley Productions Fiction 28 531 27 318 32 612 29 595 -9,3%p.m. Lion Television Ltd Entertainment, documentary 34 258 29 271 39 380 19 979 -49,3%p.m. Cactus TV Ltd Entertainment 23 825 28 495 16 846 12 144 -27,9%
3 FremantleMedia Group Ltd Entertainment, fiction, factual 281 977 349 463 317 203 289 766 -8,6%
4 Shine Ltd Fiction, entertainment, factual, features 37 735 34 158 125 188 254 024 102,9%
5 Endemol UK PLC Entertainment, fiction, documentary 175 147 258 700 215 980 178 148 -17,5%
6 Tiger Aspect Productions Ltd 3 Fiction, documentary, entertainment 57 504 68 009 110 836 ~ ~
7 Independent Television News News 151 038 147 203 131 647 110 456 -16,1%8 TWI (UK) Ltd Sports 128 732 147 101 118 485 92 092 -22,3%9 Shed Media PLC 4 Fiction, children, factual 37 551 64 579 85 885 85 836 -0,1%
10 Associated Press Television News Ltd News 88 829 83 071 ~ ~ ~11 Brighter Pictures Entertainment 7 088 79 594 85 597 ~ ~
12 RDF Media Ltd Fiction, entertainment, documentary 59 505 76 393 70 836 ~ ~
p.m. Sunset & Vine Productions 5 Sports 35 972 30 007 32 961 31 203 -5,3%
p.m. IWC Media Ltd 6 Fiction, documentary, entertainment 16 066 19 607 16 522 ~ ~
13 DCD Media Fiction 4 648 19 190 39 751 42 966 8,1%14 19 Entertainment Ltd 7 Music 30 389 31316 38 811 ~ ~15 Avalon Entertainment Ltd Fiction, entertainment – – ~ 36 755 ~
p.m. Avalon Television Ltd Fiction, entertainment 20 602 22 826 23 637 25 114 6,2%16 Hit Entertainment Ltd 7 Animation 29 915 29 915 34 313 32 450 -5,4%17 Twofour Group Ltd Fiction, entertainment, factual ~ 18 851 29 268 29 986 2,5%18 Ecosse Films Ltd Fiction 10 248 16 699 29 563 ~ ~19 Carnival Films and Television Ltd 8 Fiction 18 249 24 740 28 765 29 339 2,0%20 Gullane (Thomas) Ltd Animation, children 20 796 23 482 28 876 28 417 -1,6%21 Optomen Television Ltd Entertainment 13 279 16 526 27 307 ~ ~22 Boomerang Plus PLC Fiction, entertainment, music ~ 15 508 26 866 ~ ~23 Hat Trick Holdings Ltd Fiction 38 841 33 571 36 016 26 826 -25,5%24 Impossible Pictures Ltd Documentary, fiction ~ ~ 25 056 ~ ~25 Company Television Productions Ltd Fiction 11 483 10 496 10 052 24 946 148,2%
1 ALL3MEDIA is a company created in 2003 through a GBP 45 million management buy-in of the former Chrysalis TV Group. The companies within the Group are Assembly TV, Bentley Productions, Cactus TV, Lion Television, Mersey Television (since June 2005), North One Television in the UK, IDTV in the Netherlands, South Pacific Pictures in New Zealand and Lion Television in the USA. In August 2006, Permira Europe III Fund belonging to the group acquired the All3Media Group 2007 on 11 months.
2 2005 over 10 months.3 2007 over 17 months.4 2007 over 16 months.5 2006 over 9 months.6 2005 over 13 months. Part of RDF Media since 1.9.2005.7 2005 over 18 months.8 2006 over 18 months.
The 25 leading TV production companies in the United Kingdom 2005-2008 Operating revenues in EUR thousand.
T.1GB.8
1292 0 0 9 | V o l u m e 1 | B a n d 1
AL
AT
BE
BG
CH
CY
CZ
DE
DK
EE
ES
FI
FR
GB
GR
HR
HU
IE
IS
IT
LT
LU
LV
MK
MT
NL
NO
PL
PT
RO
RU
SE
SI
SK
TR
GR
Greece Grèce Griechenland GR
The Greek audiovisual landscape is char-acterised by the dominance of private
channels (Mega, ANT1, Alpha TV, Star, Alter) compared with the public chan-nels of the broadcaster ERT (ET1, ET3 and NET). Mega had the largest audience market share in 2008 with a daily reach of 18.3%, which is a relatively stable figure despite the fact that the channel’s audience figures drop at peak viewing hours (only 20% in 2008). Behind Mega in audience terms are the channels ANT1 (15.2%), Alpha TV (13.6%), Alter (11.2%) and Star Channel (10.4%). With 10.3%, the leading public channel, NET, is thus in only sixth position. It is followed by ET1 and ET3 (each with 3.4%). In 2008, the incumbent terrestrial channels had a col-lective audience share of over 85%, which is a relatively high figure compared with the other European countries.The audience concentration in Greece can be explained by the poor distribution of the multi-channel platforms, which is itself linked to the variety of free-to-air programmes available and the poorly developed broadcasting infrastructure: the country is not cabled and broadcasting is mainly based on the terrestrial transmis-sions of the national and local channels.However, ADSL television (IPTV ) services have been developing since 2007. In 2009, four platforms were in competition: Hellas online with Hol TV, Hellenic Telecommunications (OTE) with Conn-x TV, On Telecoms with On TV and Vivodi Telecommu-nications with its Cable TV package. Conn-x TV and Hol TV were launched in 2009.The main Greek multi-channel plat-form, however, is still the Nova satellite package, which is distributed by Multichoice Hellas and claimed to have 362 000 subscribers in Greece and Cyprus, or about 8% of Greek households, at 31 December 2008. Multichoice Hellas belongs to the Netmed NV group, which was sold to the Greek telecommunica-tions company Forthnet SA by the South African Naspers group in August 2008. The monopoly of Multichoice Hellas on the satellite pay-TV market in Greece is likely to be challenged: in July 2008, the National Council for Radio and Tele vision gave Hellas Sat SA (the Hellas Sat satel-lite operator, which is controlled by Hel-lenic Telecommunications) permission to supply a service. A package made up of a dozen channels has been marketed by the mobile tele-phone operator Vodafone. Apart from the main Greek private channels, the ser-vice provides access to a number of sports and adult channels and to ERT World, the international channel of the public broad-caster ERT.
Le paysage audiovisuel grec se carac-térise par la prépondérance des chaî-
nes privées (Mega, ANT1, Alpha TV, Star, Alter) par rapport aux chaînes publiques du radiodiffuseur ERT (ET1, ET3 et NET). En effet, Mega arrive en tête des audiences en 2008 avec 18,3 % de part de marché d’audience quotidienne, un résul-tat relativement stable, même si la chaîne accuse une baisse de son audience aux heu-res de grande écoute (20 % seulement en 2008). Derrière Mega se trouvent les chaî-nes ANT1 (15,2 %), Alpha TV (13,6 %), Alter (11,2 %) et Star Channel (10,4 %). Ce n’est donc qu’en sixième position que se situe la première chaîne publique, NET (10,3 %), suivie de ET1 (3,4 %) et ET3 (3,4 %). Les chaînes historiques ter-restres rassemblent en 2008 plus de 85 % de l’audience, un chiffre relativement élevé par rapport à la plupart des autres pays européens.La concentration de l’audience en Grèce s’explique par la faible diffusion des plates-formes multi-chaînes, elle-même liée à la richesse de l’offre en clair et au faible niveau de développement des infras-tructures de diffusion. Le pays n’est en effet pas câblé et repose largement sur les transmissions terrestres de chaînes natio-nales et locales.Depuis 2007 se développent toutefois des offres de télévision par ADSL (IPTV). En 2009, quatre plates-formes entrent en concurrence : Hellas online avec Hol TV, Hellenic Telecommunications (OTE) avec Conn-x TV, On Telecoms avec On TV et Vivodi Telecommunications avec son bouquet Cable TV. Parmi ces offres, Conn-x TV et Hol TV ont été lancées en 2009.Mais la principale plate-forme multi-chaînes grecque demeure le bouquet satel-lite Nova, édité par Multichoice Hellas, et qui revendique 362 000 abonnés en Grèce et à Chypre au 31 décembre 2008, soit environ 8 % des foyers grecs. Multichoice Hellas appartient au groupe Netmed NV qui a été revendu en août 2008 par le groupe sud-africain Naspers à l’entreprise grecque de télécommunication Forthnet SA. Le monopole de Multichoice Hellas sur le marché de la télévision payante par satellite en Grèce est susceptible d’être remis en cause. En effet, le Conseil natio-nal de la radio et de la télévision a délivré en juillet 2008 à Hellas Sat SA (l’opérateur du satellite Hellas Sat, contrôlé par Hel-lenic Telecommunications) une autorisa-tion pour délivrer un service de télévision à péage par satellite. Un bouquet composé d’une douzaine de chaînes est par ailleurs commercialisé par l’opérateur de téléphonie mobile Voda-fone. L’offre propose, outre les principa-les chaînes privées grecques, un accès à quelques chaînes sportives, érotiques et à
Die griechische audiovisuelle Land-schaft zeichnet sich durch eine
deutliche Vormachtstellung der privaten Sender (Mega, ANT1, Alpha TV, Star, Alter) gegenüber den öffentlich-recht-lichen Sendern der Rundfunkanstalt ERT (ET1, ET3 und NET) aus. So erreichte Mega 2008 mit 18,3 % den höchsten Zuschaueranteil aller Sender in Grie-chenland – ein trotz eines Rückgangs der Einschaltquoten zur Primetime (nur noch 20 % 2008) vergleichsweise stabiles Ergeb-nis. Dahinter folgen die Sender ANT1 (15,2 %), Alpha TV (13,6 %), Alter (11,2 %) und Star Channel (10,4 %). Der erste öffentlich-rechtliche Sender (NET, 10,3 %) liegt somit nur auf Platz 6, gefolgt von ET1 (3,4 %) und ET3 (3,4 %). Die traditionellen terrestrischen Sender errei-chen 2008 zusammen einen im Vergleich zum Rest Europas relativ hohen Marktan-teil von über 85 %.Grund für diese Konzentration der Zuschauer in Griechenland ist die geringe Präsenz von Multikanalplattformen, die wiederum auf das breite Angebot im Free-TV und auf die schwach entwickelte Übertragungsinfrastruktur zurückzu-führen ist. So ist das Land so gut wie nicht verkabelt und weitgehend auf die terrestrische Übertragung der nationalen und lokalen Sender angewiesen.Seit 2007 gibt es allerdings zunehmend Anbieter für ADSL-Fernsehen (IPTV). 2009 standen vier Plattformen im Wettbewerb: Hellas online mit Hol TV, Hellenic Telecommunications (OTE) mit Conn-x TV, On Telecoms mit On TV sowie Vivodi Telecommunications mit seinem Bouquet Cable TV. Von diesen Angeboten sind Conn-x TV und Hol TV erst 2009 an den Start gegangen.Größte Multikanalplattform in Griechen-land ist aber nach wie vor das Satelliten-bouquet Nova des Betreibers Multichoice Hellas, der nach eigenen Angaben zum 31. Dezember 2008 362 000 Abonnenten in Griechenland und Zypern hatte, was rund 8 % der Haushalte entspricht. Mul-tichoice Hellas gehört zum Unterneh-men Netmed NV, das im August 2008 vom südafrikanischen Konzern Naspers an das griechische Telekommunikations-unternehmen Forthnet SA verkauft wurde. Das derzeitige Monopol von Multichoice Hellas auf dem griechischen Satelliten-Pay-TV-Markt könnte allerdings in Gefahr geraten. So hat der nationale Rundfunkrat im Juli 2008 dem Satelliten-TV-Betreiber Hellas Sat SA (eine Tochter des Unterneh-mens Hellenic Telecommunications) die Genehmigung für den Betrieb eines Pay-TV-Dienstes über Satellit erteilt. Darüber hinaus wird vom Mobilfunk-betreiber Vodafone ein Bouquet aus einem Dutzend Sender angeboten. Das Angebot umfasst neben den größten griechischen Privatsendern einige Sport-

130 2 0 0 9 | V o l u m e 1 | B a n d 1
AL
AT
BE
BG
CH
CY
CZ
DE
DK
EE
ES
FI
FR
GB
GR
HR
HU
IE
IS
IT
LT
LU
LV
MK
MT
NL
NO
PL
PT
RO
RU
SE
SI
SK
TR
GR
Greece Grèce Griechenland GR
Digital terrestrial television could open the way for more multi-channel options, but it is taking a long time to get off the ground. The transition to digital terrestrial TV was launched in 2006 with the inauguration of a pilot service operated by ERT. Since then, ERT has operated a limited service consisting exclusively of its own channels. Special-interest channels created for the digital terrestrial television network – Prisma+, Cine+, Sport+ and Info+ – have been added to the incumbent channels ET1, ET2 and NET. Parallel to the ERT service, seven companies that produce the country’s main private channels (Alpha TV, Alter, ANT1, Makedonia TV, Mega, Star Channel and Skai TV) set up DIGEA in 2009, a new entity tasked with manag-ing the private digital terrestrial platform. In September 2009, DIGEA announced that it had begun digital terrestrial trans-missions of these seven private channels in the Gulf of Corinth area.There were several takeovers and con-solidations in the Greek market in 2008 and 2009, thus proving how attractive it is for the foreign groups. The German group Deutsche Telekom entered the scene in 2008 and acquired in April 2009 a 30% share in the capital of the company Hellenic Telecommunications (OTE, which, inter alia, owns the satellite opera-tor Hellas Sat and the Romanian satel-lite platform Dolce). On the other hand, in September 2008 the Luxembourg group RTL acquired 66.6% of the Alpha Media Group, which controls the national channel Alpha TV.The European Commission decided in March 2007 to bring Greece before the Court of Justice of the European Commu-nities for the second time for its failure to transpose Directive 2002/77/EC on the liberalisation of electronic communica-tions. The Commission was finally able to close the procedure against Greece in February 2008 after a new law on media concentration was passed by the Greek parliament in the summer of 2007.
ERT World, la chaîne internationale du radiodiffuseur public ERT.La télévision numérique terrestre pourrait permettre d’accroître l’offre multi-chaînes, mais celle-ci tarde à démarrer. La transi-tion vers le numérique terrestre a pourtant été entamée en 2006 avec l’inauguration d’un service pilote opéré par l’ERT. Depuis l’ERT opère un bouquet limité, composé uniquement de ses propres chaî-nes. Aux chaînes historiques ET1, ET2 et NET s’ajoutent les chaînes thématiques créées pour le réseau numérique terrestre : Prisma+, Cine+, Sport+ et Info+. Paral-lèlement à l’offre de l’ERT, sept entreprises éditrices des principales chaînes privées du pays (Alpha TV, Alter, ANT1, Makedonia TV, Mega, Star Channel et Skai TV) ont créé en 2009 une nouvelle entité, DIGEA, chargée de gérer la plate-forme numérique terrestre privée. DIGEA a annoncé en septembre 2009 avoir inauguré la trans-mission numérique terrestre de ces sept chaînes privées dans la région du Golfe de Corinthe.Plusieurs rachats et consolidations ont été opérées sur le marché grec en 2008 et 2009, prouvant son attractivité pour les groupes étrangers. Le groupe allemand Deutsche Telekom est entré en 2008 puis monté dans le capital de la société Hel-lenic Telecommunications (OTE, qui détient entre autres l’opérateur satellite Hellas Sat ou la plate-forme satellite rou-maine Dolce) à hauteur de 30 % en avril 2009. D’autre part, en septembre 2008, le groupe luxembourgeois RTL a acquis 66,6 % de Alpha Media Group, qui contrôle la chaîne nationale Alpha TV.La Commission européenne avait décidé en mars 2007 de traduire la Grèce une seconde fois devant la Cour de justice des Communautés européennes du fait de la non transposition de la Directive 2002/77/CE relative à la libéralisation des communications électroniques. Suite à l’adoption lors de l’été 2007 par le Parlement grec d’une nouvelle loi sur la concentration des entreprises de médias, la Commission a finalement pu clore la procédure à l’encontre de la Grèce en février 2008.
und Erotikkanäle sowie ERT World, den inter nationalen Kanal der öffentlich-rechtlichen Rundfunkanstalt ERT.Das digitale terrestrische Fernsehen könnte eigentlich das Multikanalangebot vergrößern, aber der Sendestart zögert sich hinaus. Dabei begann die Umstellung auf terrestrische Digitaltechnik bereits 2006 mit einem von ERT betriebenen Pilot-dienst. Seitdem betreibt die ERT ein begrenztes Bouquet, das nur ihre eigenen Sender umfasst. Neben den traditionellen Sendern ET1, ET2 und NET sind dies die für das digitale terrestrische Fernsehen geschaffenen Spartenkanäle Prisma+, Cine+, Sport+ und Info+. Parallel zum ERT-Angebot haben sieben Betreiber der größten Privatsender des Landes (Alpha TV, Alter, ANT1, Makedonia TV, Mega, Star Channel und Skai TV) 2009 ein neues Unternehmen (DIGEA) für den Betrieb der privaten DVB-T-Plattform gegründet. Laut Angaben von DIGEA wird das Programm dieser sieben Privatsender in der Region am Golf von Korinth seit September 2009 über DVB-T ausgestrahlt.2008 und 2009 hat es auf dem grie-chischen Rundfunkmarkt mehrere Über-nahmen und Konsolidierungen gegeben, was dessen Attraktivität für ausländische Konzerne belegt. So ist die Deutsche Tele-kom 2008 in das Unternehmen Hellenic Telecommunications (OTE, dem unter anderem der Satelliten-TV-Betreiber Hellas Sat und die rumänische Satel-liten-TV-Plattform Dolce gehören) ein-gestiegen und hat seine Beteiligung im April auf 30 % erhöht. Des Weiteren hat die Luxemburger RTL-Gruppe im September 2008 66,6 % der Alpha Media Group übernommen, die den landes weiten Sender Alpha TV kontrolliert.Im März 2007 hatte die Europäische Kommission beschlossen, vor dem Euro-päischen Gerichtshof erneut Klage gegen Griechenland einzureichen, und zwar wegen Nichtumsetzung der Richtlinie 2002/77/EG zur Liberalisierung der Märkte für elektronische Kommuni-kation. Nach der Verabschiedung eines neuen Gesetzes über Medienkonzen-tration durch das griechische Parlament im Sommer 2007 wurde im Februar 2008 das Vertragsverletzungsverfahren gegen-über Griechenland eingestellt.
Sources: Greek National Council for Radio and Television (NCRTV): http://www.esr.gr Audience data: AGB Nielsen Media Research : http://www.agbnielsen.com Legal aspects: IRIS Merlin, http://merlin.obs.coe.int

1312 0 0 9 | V o l u m e 1 | B a n d 1
AL
AT
BE
BG
CH
CY
CZ
DE
DK
EE
ES
FI
FR
GB
GR
HR
HU
IE
IS
IT
LT
LU
LV
MK
MT
NL
NO
PL
PT
RO
RU
SE
SI
SK
TR
GR
Greece Grèce Griechenland GR
Population and equipment 31.12.08Penetration
(in % HH) In thousand SourcesPopulation (inhabitants) – 11 260 Eurostat
Households – 4 233 Eurostat (as at 1.1.2008)
TV households 99,0% 4 191 Greek Observatory for IS / European Audiovisual Observatory
Cable TV households ~ ~Digital cable TV households ~ ~DTH/SMATV households 11,2% 475 Screen Digest / European Audiovisual Observatory
Dig. DTH/SMATV households 9,4% 400 IOM / European Audiovisual Observatory
IPTV subscriptions 1,8% 77 IOM / European Audiovisual Observatory
Installed DVB-T receivers 10,6% 450 IOM / European Audiovisual Observatory
Total digital TV households 17,2% 727 IOM
Households with PC 46,5% 1 970 IOM / European Audiovisual Observatory
Households with broadband connections 35,6% 1 506 IOM / European Audiovisual Observatory
Mobile phone TV subscriptions – 98 Screen Digest
TV channels distributors 11.09 CompaniesCable operators ~Satellite packagers 1 Multichoice Hellas (Nova)
IPTV packagers 4 Hellas on Line (hol), Helletenic Telecommunication Organisation, ON Telecoms, Vivodi
DTT multiplex operators and packagers 2 Digea, ERTMobile phone TV packagers 3 Cosmote, Vodafone, Wind
Number of TV channels by kind of licence 10.09 Public Private TotalAnalogue terrestrial (national) 4 5 9DTT/Cable/Satellite/IPTV/Mobile 4 27 31Regional/Local 0 ca. 139 139Regional/local windows 0 0 0Channels targeting foreign markets 0 10 10Total 8 176 184Foreign channels targeting the country 2 11 13
Source: European Audiovisual Observatory
Supply of TV channels by genre and by platform (including foreign channels) 10.09
Analogue terrestrial
Satellite Multichoice
Hellas
IPTV On Telecoms
On TV
IPTV OTE
Conn-x TVGeneralist - national 5 6 7 3Generalist - foreign 1 2Adult 2 1 3Children 4 4 3Culture/ education/ documentary 1 6 5Minority interest groupsEntertainment/ TV fiction/ games 1 4 4 4Film 5 1Home shoppingInternational linguistic and cultural 3 2Lifestyle/ specific leisure/ travel 4 5 4Music 4 4 3News/ business 1 18 12 9Parliament/ government/ administration 1 1Regional/ local 1 2 2 1ReligionSports 32 7 9VariousTotal 9 87 56 45
Basic figures

132 2 0 0 9 | V o l u m e 1 | B a n d 1
AL
AT
BE
BG
CH
CY
CZ
DE
DK
EE
ES
FI
FR
GB
GR
HR
HU
IE
IS
IT
LT
LU
LV
MK
MT
NL
NO
PL
PT
RO
RU
SE
SI
SK
TR
GR
Greece Grèce Griechenland GR
Source: European Audiovisual Observatory on the basis of data from Screen Digest, WARC and AMADEUS
Source: IOM / European Audiovisual Observatory
Source: European Audiovisual Observatory on the basis of data provided by Netmed, IOM and Screen Digest
Source: Screen Digest /IOM
Households TV equipment 2004-2008
Number of households accessing multichannel platforms as at 31.12.2008
Consumers pay-TV gross spend 2004-2008
Gross revenues of radio-television 2004-2008
In thousands.
In thousands.
EUR thousand.
EUR million.
2004 2005 2006 2007 2008
0
100
200
300
400
500
Satellite households
DTT households
IPTV households
398
418437
458
0
0 0 0
27
84
0 0 5
475
450
ERTNova
ONTVVivodi
Conn-X TV
Hol TV
0
500
400
300
200
100
450
347
100
7 4 ~
DTT
IPTV
Sat
PC
Cable
2004 2005 2006 2007 2008
0
250 000
150 000
200 000
100 000
50 000
Satellite
IPTV
204 488197 404
191 578
172 567
160 846
3 376
14 076
0 0 0
2004 2005 2006 2007 2008
0
1 000
800
600
400
200
TV adspend
Radio-TVpublic income
Consumerspay-TV spend
Radio adspend
819
754
894
745733
260
161
58
173
57
192
60
197
83
204
107
270
320345
370
Market trends

1332 0 0 9 | V o l u m e 1 | B a n d 1
AL
AT
BE
BG
CH
CY
CZ
DE
DK
EE
ES
FI
FR
GB
GR
HR
HU
IE
IS
IT
LT
LU
LV
MK
MT
NL
NO
PL
PT
RO
RU
SE
SI
SK
TR
GR
Greece Grèce Griechenland GR
Main broadcasters Channels 2005 2006 2007 2008 2008/07Greek Radio Television (ERT) S.A. 1 sptv ET-1, NET, ET-3 273 477 321 943 540 088 373 968 –Teletypos S.A. adtv Megachannel 192 217 145 401 173 537 168 072 -3,1%Eleftheri Tileorassi S.A. adtv Kanali 5 72 125 87 204 118 592 147 326 24,2%Antenna TV S.A. adtv ANT 1 155 730 137 615 140 473 ~ ~Alpha Satellite Television S.A. adtv AlphaTV 77 588 104 140 109 403 108 167 -1,1%New Television S.A. adtv Star Channel 66 862 86 667 101 579 94 880 -6,6%Netmed Hellas S.A. 2 paytv Filmnet Hellas 89 132 106 985 112 267 93 421 –Eidisseits Com S.A. adtv Skai TV – 1 641 13 050 31 690 142,8%Mad T.V. S.A. thtv Mad TV 4 702 6 032 9 027 9 576 6,1%Makedonia TV S.A. adtv Makedonia TV 7 032 7 824 7 136 7 677 7,6%Extra Communication Technology rtv Extra 3 5 359 5 061 4 406 3 912 -11,2%Ikaros Radio Television Enterprises S.A. rtv 2 993 3 303 3 621 3 811 5,2%Jeronymo Groovy rtv Jeronymo TV 1 644 2 041 2 511 2 944 17,2%Rethymno TV rtv Nea TV 1 303 1 830 1 853 2 001 8,0%City News S.A. rtv Tele City 1 819 1 791 1 641 1 867 13,8%Star Channel Kentrikis Ellados S.A. adtv Star Channel 1 637 1 623 1 656 1 600 -3,4%
Main distributors Services TV Packages 2005 2006 2007 2008 2008/07Hellenic Telecommunications Organization S.A. 3 3play Conn-x TV 2 746 400 2 810 000 2 730 200 2 626 000 -3,8%
Cosmote Mobile Telecommunications Services S.A. 3 3G TV i-mode 1 532 966 1 646 543 1 757 916 1 900 894 8,1%
Vodafone - Panafon Hellenic Telecommunication company 3 3G TV Live! 1 819 391 1 781 676 1 670 790 1 505 608 -9,9%
ON Telecoms 3 3play ONTV 136 092 165 003 168 330 182 670 8,5%Multichoice Hellas S.A. 2 sat-tv Nova 166 683 185 046 190 673 148 137 –Wind Hellas Telecommunications 3 3G TV 117 415 118 946 114 219 ~ ~Hellas Online S.A. 3 3play Hol TV 4 139 4 651 44 366 108 325 144,2%Vivodi telecommunications S.A. 3 3play Vivodi TV 26 485 40 326 36 681 38 600 5,2%
Source: European Audiovisual Observatory1 To 30 June, until 2006. 2007 over 18 months. 2 2008 on 9 months.3 Includes other activities (telecommunications).
EUR thousand.
2004 2005 2006 2007 2008
0
400 000
300 000
200 000
100 000
Greek Radio Television(ERT) S.A.
Teletypos S.A.Eleftheri Tileorassi S.A.Netmed Hellas S.A. Alpha Satellite Television S.A.New Television S.A.
Eidisseits Com S.A.
Antenna TV S.A.
Operating revenues of television companies in Greece 2005-2008 EUR thousand.
T.1.GR.1G.1.GR.1
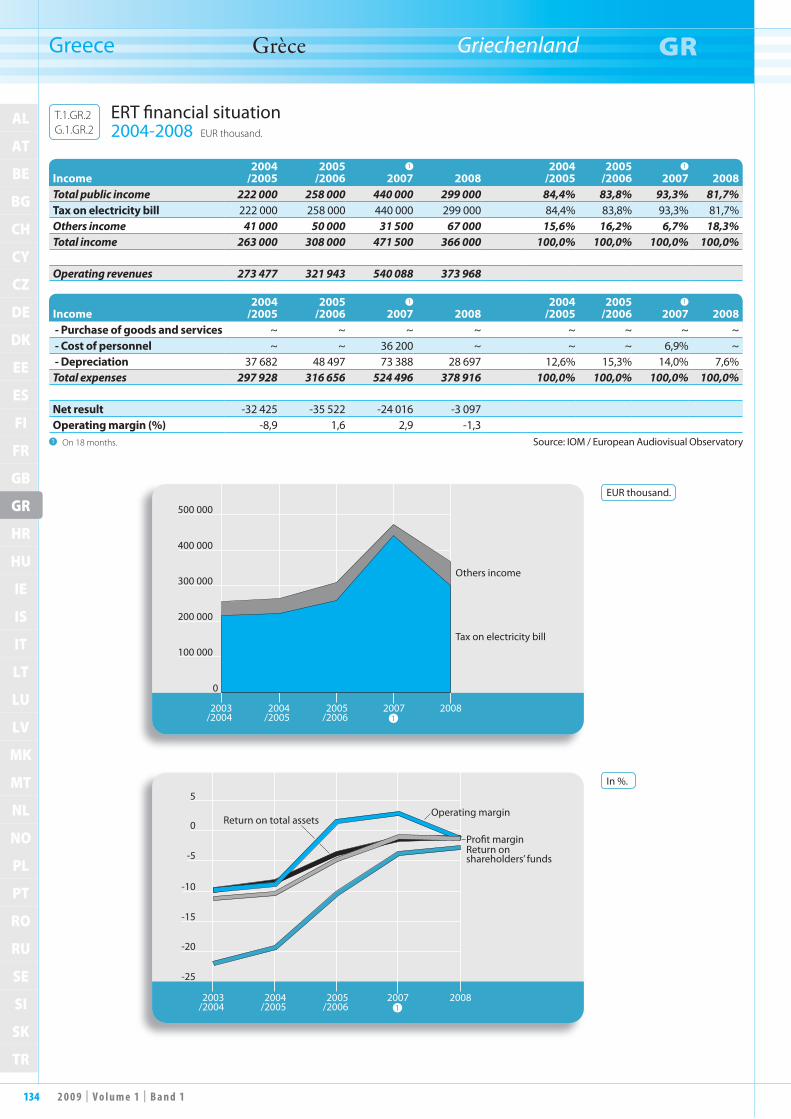
134 2 0 0 9 | V o l u m e 1 | B a n d 1
AL
AT
BE
BG
CH
CY
CZ
DE
DK
EE
ES
FI
FR
GB
GR
HR
HU
IE
IS
IT
LT
LU
LV
MK
MT
NL
NO
PL
PT
RO
RU
SE
SI
SK
TR
GR
Greece Grèce Griechenland GR
Source: IOM / European Audiovisual Observatory
Income2004
/20052005
/20061
2007 20082004
/20052005
/20061
2007 2008Total public income 222 000 258 000 440 000 299 000 84,4% 83,8% 93,3% 81,7%Tax on electricity bill 222 000 258 000 440 000 299 000 84,4% 83,8% 93,3% 81,7%Others income 41 000 50 000 31 500 67 000 15,6% 16,2% 6,7% 18,3%Total income 263 000 308 000 471 500 366 000 100,0% 100,0% 100,0% 100,0%
Operating revenues 273 477 321 943 540 088 373 968
Income2004
/20052005
/20061
2007 20082004
/20052005
/20061
2007 2008 - Purchase of goods and services ~ ~ ~ ~ ~ ~ ~ ~ - Cost of personnel ~ ~ 36 200 ~ ~ ~ 6,9% ~ - Depreciation 37 682 48 497 73 388 28 697 12,6% 15,3% 14,0% 7,6%Total expenses 297 928 316 656 524 496 378 916 100,0% 100,0% 100,0% 100,0%
Net result -32 425 -35 522 -24 016 -3 097Operating margin (%) -8,9 1,6 2,9 -1,3
1 On 18 months.
EUR thousand.
In %.
2003/2004
2004/2005
2005/2006
20082007
0
500 000
400 000
300 000
100 000
200 000
1
Others income
Tax on electricity bill
-25
0
5
-5
-10
-15
-20
2003/2004
2004/2005
2005/2006
200820071
Return on total assets Operating margin
Return on shareholders’ funds
Pro�t margin
ERT financial situation 2004-2008 EUR thousand.
T.1.GR.2G.1.GR.2

1352 0 0 9 | V o l u m e 1 | B a n d 1
AL
AT
BE
BG
CH
CY
CZ
DE
DK
EE
ES
FI
FR
GB
GR
HR
HU
IE
IS
IT
LT
LU
LV
MK
MT
NL
NO
PL
PT
RO
RU
SE
SI
SK
TR
GR
Greece Grèce Griechenland GR
Daily share Prime time (21:00-00:00)Channels 2004 2005 2006 2007 2008 2004 2005 2006 2007 2008ET1 5,2 4,2 4,0 3,8 3,4 6,4 4,1 3,8 3,9 3,6NET 8,8 9,1 10,1 9,6 10,3 10,2 10,4 10,4 9,7 11,1ET3 2,1 2,1 2,5 2,7 3,4 2,1 1,9 2,2 2,5 3,4Public Greek channels 16,1 15,4 16,6 16,1 17,1 18,7 16,4 16,4 16,1 18,1Antenna 1 20,8 19,4 18,0 16,5 15,2 22,4 20,8 18,4 15,0 13,7Mega 16,9 18,5 18,8 18,5 18,3 19,3 20,5 22,8 22,5 20,0Alpha TV 13,0 14,2 15,5 13,9 13,6 11,2 12,7 14,6 15,2 15,5Star 11,5 11,5 10,4 10,8 10,4 10,6 11,1 9,5 10,0 9,7Alter 11,5 10,2 8,9 10,3 11,1 7,9 7,7 6,6 7,6 8,0Makedonia TV ~ 0,9 0,7 0,7 0,5 1,1 1,0 0,9 0,6Main private Greek channels 73,7 74,7 72,3 70,7 69,1 71,4 73,9 72,9 71,2 67,6Others 10,2 9,9 11,1 13,2 13,8 9,9 9,7 10,7 12,7 14,4
Source: Eurodata TV Worldwide / AGB NIELSEN MEDIA RESEARCH
Daily share. In %, 4 years +.
Prime time (21:00-00:00). In %, 4 years +.
2004 2005 2006 2007 2008
0
5
10
20
15
25
Mega
Antenna 1
Alpha TV
AlterNET
ET1ET3
Star
2008
NET11,1%
Others14,4%
Antenna 1 13,7%
ET13,6%
ET33,4%
Mega20,0%
Alpha TV15,5%
Star9,7%
Alter 8,0%
Makedonia TV0,6%
TV audience market share in Greece 2004-2008 In %, 4 years +.
T.1.GR.3G.1.GR.3

136 2 0 0 9 | V o l u m e 1 | B a n d 1
AL
AT
BE
BG
CH
CY
CZ
DE
DK
EE
ES
FI
FR
GB
GR
HR
HU
IE
IS
IT
LT
LU
LV
MK
MT
NL
NO
PL
PT
RO
RU
SE
SI
SK
TR
HR
Croatia Croatie Kroatien HR
The Croatian television market shows a balance of power between, on the
one hand, the two main public service channels, and, on the other hand, the two most important private channels. In 2008, two main channels of the public broadcaster HRT had a combined share of 46.6% (a drop of approximately 6% over the last two years). HTV1 is still the most popular channel. The main private channel RTL Televizija (RTL Group) had a share of 22.9% in 2008 (down almost 2% in the last two years). Nova TV (Central European Media Enterprises) continued to increase its share with 19.5% in 2008 (up 2% since 2007). In Croatia, television is mainly received via terrestrial networks. About 17% of house-holds have cable television and approxi-mately one third of these are digital. There are more than 20 cable operators and the market has undergone some consolidation in recent years. The main cable operator is BT.net, and other significant players are KDS, Kerman, Magic Telekom, and Optika Kabel TV. The reception of satellite television reception has increased in 2008. In particular, the number of households receiving digital satellite tele-vision reached almost 28% at the end of 2008. The one Satellite package in Croa-tia is the Digi TV package operated by the Romanian company RCS & RDS SA. There has also been a rapid take-up of IPTV services (8% of homes at end of 2008). In total over 40% of Croatian households have access to digital tele-vision. There are now 4 IPTV services ope rating in the Croatian market: Maxtv (HT, a subsidiary of Deutsche Telekom), which claimed to have 190 000 subscribers in October 2009; Metronet; Iskon Internet; and Optima (Optima Kabel TV). A digital transition plan was developed in Croatia following the results of two Working Groups established in 2007: the “Working Group for preparing the implementation of the digital broadcast-ing technology and services in the Repub-lic of Croatia”; and the “DVB-T Forum”. “Rules on the Switchover of Radio and TV Programmes from Analogue to Digi-tal Broadcasting and on Granting Access to Positions in a DTT multiplex” were adopted in March 2009. The date for final-ising switch-over is January 1st 2011. In early 2008, a digital terrestrial tele vision multiplex (in the DVB-T standard) was launched on a trial basis with the four main national channels (HTV1, HTV2, Nova TV and RTL). According to the data of the Croatian Post and Electronic Com-munications Agency from April 2009, the signal reaches 85% of the population. The Croatian Post and Electronic Communi-cations Agency (HAKOM) launched a tender for two DTT multiplexes and the
Le marché de la télévision croate pré-sente un équilibre des forces entre,
d’une part, les deux principales chaînes de service public et, d’autre part, les deux plus importantes chaînes privées. En 2008, les deux principales chaînes du radiodif-fuseur de service public HRT ont une part cumulée de 46,6 % (en recul d’en-viron 6 % sur les deux dernières années). HTV1 reste la chaîne la plus populaire. La principale chaîne privée RTL Tele vizija (groupe RTL) a une part de 22,9 % en 2008 (en recul de presque 2 points sur les deux dernières années). Nova TV (Central European Media Enterprises) poursuit sa progression avec une part de 19,5 % en 2008 (plus 2 points depuis 2007).En Croatie, la télévision est principalement diffusée par voie hertzienne. Quelque 17 % des foyers ont la télévision par câble, numérique pour environ un tiers d’entre eux. Le pays compte plus de 20 câblo- opérateurs, le marché ayant connu une certaine consolidation ces dernières années. Le principal câblo-opérateur est BT.net, et les autres acteurs importants sont KDS, Kerman, Magic Telekom et Optika Kabel TV. La télévision par satel-lite a progressé en 2008. Notamment, le nombre de foyers recevant la télévision numérique par satellite a atteint presque 28 % fin 2008. La seule offre par satellite en Croatie est celle du bouquet Digi TV géré par la société roumaine RCS & RDS SA. Les services IPTV ont également rapi-dement décollé (8 % des foyers fin 2008). Au total, plus de 40 % des foyers croates ont accès à la télévision numérique.Désormais, 4 services IPTV sont présents sur le marché croate : Maxtv (HT, filiale de Deutsche Telekom), qui a annoncé 190 000 abonnés en octobre 2009 ; Metro-net ; Iskon Internet ; et Optima (Optima Kabel TV).Un plan de passage au numérique a été mis en œuvre en Croatie sur la base des conclusions de deux groupes de travail établis en 2007 : le “Groupe de travail chargé de préparer la mise en œuvre de la technologie et des services de radiodiffu-sion numérique en République de Croa-tie” ; et le “Forum DVB-T”. Des “Règles sur le passage des programmes de radio et de télévision de la diffusion analogique à la diffusion numérique et sur la garantie de l’accès à des positions dans un multiplex TNT” ont été adoptées en mars 2009. La fin de la transition est fixée au 1er jan-vier 2011.Début 2008, un multiplex de télévision numérique terrestre (norme DVB-T) a été lancé à l’essai avec les quatre princi-pales chaînes nationales (HTV1, HTV2, Nova TV et RTL). Selon les données de l’Agence croate des postes et communi-cations électroniques (HAKOM) d’avril 2009, 85 % de la population sont couverts. L’HAKOM a lancé un appel d’offres pour
Der kroatische Fernsehmarkt zeichnet sich durch ein ungefähres Gleichge-
wicht zwischen den beiden größten öffent-lich-rechtlichen Sendern auf der einen Sei-te und den zwei größten Privatsendern auf der anderen Seite aus. 2008 erreichten die beiden Hauptsender des öffentlich-recht-lichen Rundfunkveranstalters HRT einen gemeinsamen Marktanteil von 46,6 % (rund minus 6 % in zwei Jahren). HTV1 ist nach wie vor der beliebteste Sender. Der größte Privatsender RTL Televizija (RTL Group) kam 2008 auf einen Markt-anteil von 22,9 % (ein Rückgang um fast 2 % in zwei Jahren). Nova TV (Central European Media Enterprises) verzeichnet mit 19,5 % 2008 erneut einen Zuwachs (plus 2 % seit 2007). In Kroatien wird das Fernsehprogramm überwiegend über Antenne empfangen. Rund 17 % der Haushalte haben einen Kabelanschluss, davon rund ein Drittel digital. Es gibt über 20 Kabelnetzbetreiber und in den vergangenen Jahren hat es auf dem Markt eine gewisse Konsolidierungs-welle gegeben. Größter Kabelnetzbetrei-ber ist BT.net, zu den weiteren wichtigen Akteuren gehören KDS, Kerman, Magic Telekom und Optika Kabel TV. Die Nut-zung des Satellitenfernsehens ist im 2008 gestiegen. So lag der Anteil der Haushalte mit Zugang zum digitalen Satellitenfern-sehen Ende 2008 bei knapp 28 %. Einziges Sat-TV-Angebot in Kroatien ist das Paket Digi TV des rumänischen Betreibers RCS & RDS SA. Auch die Nutzung von IPTV-Diensten legt rapide zu (8 % der Haushalte Ende 2008). Insgesamt empfangen über 40 % der Haushalte in Kroatien Digital-fernsehen. Inzwischen gibt es auf dem kroatischen Markt vier IPTV-Dienste: Maxtv (HT, eine Tochter der Deutschen Telekom) mit nach eigenen Angaben 190 000 Abonnenten im Oktober 2009, Metronet, Iskon Internet und Optima (Optima Kabel TV).Für die Umstellung auf Digitalbetrieb wur-de in Kroatien ein Plan auf der Grundlage der Ergebnisse zweier 2007 eingerichteter Arbeitsgruppen – der „Arbeitsgruppe für die Vorbereitung der Einführung der digitalen Rundfunktechnik und digitaler Dienste in der Republik Kroatien“ und des „Forums DVB-T“ – entwickelt. Im März 2009 wurden die „Vorschriften für die Umstellung des Radio- und Fernseh-programms auf Digitalbetrieb und für den Zugang zu Sendeplätzen auf einem DVB-T-Multiplex“ verabschiedet. Die end gültige Umstellung soll am 1. Janu-ar 2011 erfolgen.Anfang 2008 wurde mit den vier größten landesweiten Sendern (HTV1, HTV2, Nova TV und RTL) als Versuchsprojekt ein Multiplex für digitales terrestrisches Fernsehen (DVB-T-Standard) gestartet. Laut den Zahlen der kroatischen Regu-
1372 0 0 9 | V o l u m e 1 | B a n d 1
AL
AT
BE
BG
CH
CY
CZ
DE
DK
EE
ES
FI
FR
GB
GR
HR
HU
IE
IS
IT
LT
LU
LV
MK
MT
NL
NO
PL
PT
RO
RU
SE
SI
SK
TR
HR
Croatia Croatie Kroatien HR
licenses were granted in April 2009 to the transmission company OiV. In June 2008, the public broadcaster HRT announced its intention to launch new services on the digital terrestrial platform. The plans to introduce a sports channel and a news channel were challenged by the private channels RTL Televizija and Nova TV at the end of 2008, claiming that there were no legal provisions for the granting of digital television concessions. These channels will not be introduced until after digital switch-over. The Electronic Media Act was amended in 2007 and made the Agency for Electronic Media an autonomous and independent legal entity. This has two departments: the Director of the Agency and the Council for Electronic Media, which is the regu-latory authority for the electronic media sector. The amendment also had the aim of bringing Croatian media law into line with EU law. A further amendment came into force in July 2009, which regulated the issue of granting concessions for TV and radio services and the establishment of tenders for concessions.
deux multiplex TNT et les licences ont été accordées en avril 2009 à la société de transmission OiV.En juin 2008, le radiodiffuseur public HRT a annoncé son intention de lancer de nouveaux services sur la plate-forme numérique terrestre. Son lancement de chaînes consacrées au sport et à l’infor-mation a été remis en cause, fin 2008, par les chaînes privées RTL Televizija et Nova TV, au motif de l’absence de disposition légale relative à l’octroi de licences pour la télévision numérique. Ces chaînes ne seront lancées qu’après le passage définitif au numérique.La loi sur les médias électroniques, modi-fiée en 2007, fait de l’Agence pour les médias électroniques une entité juridi-que autonome et indépendante. Celle-ci comporte deux services : la direction de l’agence et le conseil des médias élec-triques, autorité de régulation du secteur des médias électroniques. La modification vise également à harmoniser la législation croate relative aux médias avec la législa-tion de l’Union européenne. Une autre modification est entrée en vigueur en juillet 2009, afin de réglementer l’octroi de concessions pour les services de télévi-sion et de radio et l’établissement d’appels d’offres pour ces licences.
lierungsbehörde für Post und Telekom-munikation (HAKOM) vom April 2009 werden mit dem Signal 85 % der Bevöl-kerung erreicht. Die HAKOM hat eine Ausschreibung für den Betrieb von zwei DVB-T-Multiplexen durchgeführt und die Lizenzen hierfür im April 2009 dem Betreiber OiV zugesprochen. Im Juni 2008 hat der öffentlich-recht-liche Rundfunkveranstalter HRT seine Absicht angekündigt, auf der digitalen terrestrischen Plattform neue Dienste zu starten. Die geplante Einführung eines Sportkanals und eines Nachrichtenkanals wurde Ende 2008 von den Privatsendern RTL Televizija und Nova TV mit dem Argument gerichtlich angefochten, dass es noch keine Regelungen für die Ver-gabe von Digitalfernsehlizenzen gebe. Beide Kanäle werden nun erst nach der Umstellung auf Digitalbetrieb an den Start gehen.Das Gesetz über elektronische Medien wurde 2007 geändert. In diesem Zusam-menhang wurde die Agentur für elektro-nische Medien in eine selbständige und unabhängige Behörde mit zwei Organen umgewandelt: dem Direktor der Behörde und dem Rat für elektronische Medien. Ein Ziel dieser Gesetzesänderung war auch die Angleichung des kroatischen Medienrechts an EU-Recht. Eine wei-tere Änderung ist im Juli 2009 in Kraft getreten. Darin werden die Vergabe von Lizenzen für den Betrieb von Radio- und Fernsehdiensten sowie die Modalitäten für die entsprechenden Ausschreibungen geregelt.
Sources: Vijeće za elektroničke medije (Council of the Electronic Media): http://www.vem-mediji.hr Croatian Post and Electronic Communications Agency (HAKOM): http://www.hakom.hr Legal aspects: IRIS Merlin, http://merlin.obs.coe.int

138 2 0 0 9 | V o l u m e 1 | B a n d 1
AL
AT
BE
BG
CH
CY
CZ
DE
DK
EE
ES
FI
FR
GB
GR
HR
HU
IE
IS
IT
LT
LU
LV
MK
MT
NL
NO
PL
PT
RO
RU
SE
SI
SK
TR
HR
Croatia Croatie Kroatien HR
Population and equipment 31.12.08Penetration
(in % HH) In thousand SourcesPopulation (inhabitants) – 4 435 Eurostat
Households – 1 620 Eurostat
TV households 97,4% 1 578 European Audiovisual Observatory
Cable TV households 12,6% 136 HAKOM / European Audiovisual Observatory
Digital cable TV households 4,5% 73 HRT (as at 1.1.2008) / European Audiovisual Observatory
DTH/SMATV households 32,0% 460 SES / European Audiovisual Observatory
Pay DTH/SMATV households 6,8% 110 European Audiovisual Observatory
IPTV subscription 8,3% >135 T-Com Hrvastka / European Audiovisual Observatory
Installed DVB-T Receivers 0,0% 0Total digital TV households 19,6% >318 European Audiovisual Observatory
Households with PC 53,0% 859 Central bureau of Statistics / European Audiovisual Observatory
Households with broadband connections 42,2% 683 HAKOM
TV channels distributors 11.09 CompaniesCable operators 20 BT.net, KDS, Kerman, Magic Telekom, Optika Kabel TV, …Satellite packagers 1 Digi TVIPTV packagers 4 HT D.D. (Max TV), Iskon Internet, Metronet, OptimaDTT multiplex operator 1 Odašiljači VezeMobile phone TV packagers 1 VIPnet
Number of TV channels by kind of licence 10.09 Public Private TotalTerrestrial (national) 2 3 5Cable/Satellite/IPTV/Mobile 1 9 10Regional/Local 0 26 26Regional/Local windows 20 0 20Channels targeting foreign markets 1 0 1Total 24 38 62Foreign channels targeting the country 0 9 9
Source: European Audiovisual Observatory
Supply of TV channels by genre and by platform (including foreign channels) 10.09
Digital terrestrial
Cable BT.net
Satellite Digi TV
(full offer)IPTV
Max TVGeneralist - national 5 5 2 6Generalist - foreign 9 25 12Adult 5 2 4Children 9 5 7Culture/ education/ documentary 6 21 7Minority interest groups 1Entertainment/ TV fiction/ games 9 32 7Film 4 14 2Home shoppingInternational linguistic and cultural 1 2 1Lifestyle/ specific leisure/ travel 4 8 7Music 11 15 10News/ business 4 12 9Parliament/ government/ administration 1Regional/ local 4 7 9Religion 1 2Sports 10 20 12Various 1 3 2Total 5 85 171 96
Basic figures

1392 0 0 9 | V o l u m e 1 | B a n d 1
AL
AT
BE
BG
CH
CY
CZ
DE
DK
EE
ES
FI
FR
GB
GR
HR
HU
IE
IS
IT
LT
LU
LV
MK
MT
NL
NO
PL
PT
RO
RU
SE
SI
SK
TR
HR
Croatia Croatie Kroatien HR
Main broadcasters Channels 2005 2006 2007 2008 2008/07Hrvatska Radiotelevizija sptv HRT-1, HRT-2, HRT-3 184 573 198 040 196 370 211 816 7,9%RTL Hrvatska D.o.o. adtv RTL Televizija 38 407 46 167 48 226 50 239 4,2%Nova TV D.o.o. 1 adtv Nova TV 2 108 3 104 29 925 40 694 36,0%Televizija Sljeme D.o.o. rtv Televizija Sljeme 1 082 1 619 1 803 1 699 -5,8%Kanal Ri D.o.o. rtv Kanal RI 1 265 1 416 1 474 1 415 -4,0%Televizija Moslavina rtv Televizija Moslavina 1 183 1 308 ~ ~ ~Televizija Slavonije i Baranj D.o.o. rtv Slavonska Telvizija 1 141 764 940 1 062 13,0%VTV D.o.o. rtv VKTV 836 944 1 096 1 046 -4,6%Nezavisna Istarska Televizija D.o.o. rtv NITV 298 282 687 1 006 46,4%Slavonsko Brodska Televizija D.o.o. rtv SBTV 391 556 667 662 -0,7%
Main distributors Services Packages 2005 2006 2007 2008 2008/07HT D.D. 2 3play MaxTV 830 337 786 899 795 452 764 970 -3,8%VIPnet D.o.o. 2 3G TV Live TV 428 009 473 298 495 544 527 472 6,4%B.Net Hrvatska D.o.o. 2 3play B.Net 5 352 7 608 7 445 17 566 135,9%Digi Satelitska Televizija d.o.o. sat-tv Digi TV – – 1 998 4 700 135,2%KDS CATV KDS Cakovec 287 521 759 1 968 159,3%Kerman D.o.o. 2 CATV Kerman Cable TV 2 057 2 195 1 917 1 941 1,3%
Source: European Audiovisual Observatory1 Nova TV was taken over in July 2004 by Central European Media Enterprises.2 Includes telecommunications activities.
EUR thousand.
20052004 2006 2007 2008
0
150 000
100 000
50 000
250 000
200 000 Hrvatska Radiotelevizija
RTL Hrvatska D.o.o.Nova TV D.o.o.
Kanal Ri D.o.o.Televizija Sljeme D.o.o.
Operating revenues of television companies in Croatia 2005-2008 EUR thousand.
T.1.HR.1G.1.HR.1

140 2 0 0 9 | V o l u m e 1 | B a n d 1
AL
AT
BE
BG
CH
CY
CZ
DE
DK
EE
ES
FI
FR
GB
GR
HR
HU
IE
IS
IT
LT
LU
LV
MK
MT
NL
NO
PL
PT
RO
RU
SE
SI
SK
TR
HR
Croatia Croatie Kroatien HR
Source: European Audiovisual Observatory (from EBU data and AMADEUS)
Income 2005 2006 2007 2008 2005 2006 2007 2008 2008/07Total public income 144 600 132 300 141 100 ~ 72,9% 64,7% 69,6% ~ ~ - Aids/Grants 23 100 2 000 3 500 ~ 11,6% 1,0% 1,7% ~ ~ - Licence fee 121 500 130 300 137 600 ~ 61,2% 63,7% 67,9% ~ ~Total commercial Income 51 800 56 000 49 700 ~ 26,1% 27,4% 24,5% ~ ~ - Advertising 51 800 56 000 49 700 ~ 26,1% 27,4% 24,5% ~ ~Others 2 000 16 300 11 800 ~ 1,0% 8,0% 5,8% ~ ~TOTAL 198 400 204 600 202 600 ~ 100,0% 100,0% 100,0% ~ ~
Operating revenues 184 573 198 040 196 370 211 816 7,9%
Expenditure 2005 2006 2007 2008 2005 2006 2007 2008 2008/07Consumption goods and services 113 209 109 959 106 985 116 637 61,8% 58,1% 56,3% 55,6% 9,0%
Costs of personnel 60 876 61 796 63 501 70 911 33,2% 32,7% 33,4% 33,8% 11,7%Depreciation 9 036 17 406 19 642 22 306 4,9% 9,2% 10,3% 10,6% 13,6%Operating expenditure 183 121 189 161 190 128 209 854 100,0% 100,0% 100,0% 100,0% 10,4%
Net result 384 80 157 96 -38,9%Operating margin (%) 0,8 4,5 3,2 0,9
EUR thousand.
In %.
2003 2004 2005 2006 2007
0
250 000
200 000
150 000
100 000
50 000
Others
Advertising
Licence fee
Aids/Grants
2004 2005 2006 2007 2008
-5
15
20
10
5
0Pro�t margin
Return on shareholders’ fundsOperating margin
Return ontotal assets
HRT financial situation 2005-2008 EUR thousand.
T.1.HR.2G.1.HR.2

1412 0 0 9 | V o l u m e 1 | B a n d 1
AL
AT
BE
BG
CH
CY
CZ
DE
DK
EE
ES
FI
FR
GB
GR
HR
HU
IE
IS
IT
LT
LU
LV
MK
MT
NL
NO
PL
PT
RO
RU
SE
SI
SK
TR
HR
Croatia Croatie Kroatien HR
Daily share Prime time (19:30-22:00)Channels 2004 2005 2006 2007 2008 2004 2005 2006 2007 2008HTV1 39,1 38,2 34,6 33,2 32,6 46,1 44,2 37,9 34,2 33,2HTV2 17,8 15,8 17,7 16,1 14,0 16,5 13,6 16,4 16,4 14,4HTV3 1,9 – – – – 2,0 – – – –Public Croatian channels 58,8 54,0 52,3 49,3 46,6 64,6 57,8 54,3 50,6 47,6Nova TV 14,3 13,5 15,1 17,6 19,5 11,2 12,5 15,2 18,2 22,3RTL Televizija 16,7 24,8 24,6 23,8 22,9 16,4 23,9 24,6 24,4 21,4Main Croatian private channels 31,0 38,3 39,7 41,4 42,4 27,6 36,4 39,8 42,6 43,7Others 10,2 7,7 8,0 9,3 11,0 7,8 5,8 5,9 6,8 8,7
Source: Eurodata TV Worldwide / AGB NIELSEN MEDIA RESEARCH
Source: ASTRA and HAKOM
Daily share. In %, 4 years +.Prime time (19:30-22:00). In %, 4 years +.
2004 2005 2006 2007 2008
0
20
10
40
30HTV1
RTL Televizija
Nova TV
HTV2
HTV3
2008
HTV1 33,2%
Others8,7%
HTV2 14,4%
Nova TV22,3%
RTL Televizija21,4%
In thousands.
2004 2005 2006 2007 2008
0
500
400
300
200
100
Satellite
Cable
TV audience market share in Croatia 2004-2008 In %, 4 years +.
T.1.HR.3G.1.HR.3
Household TV equipment 2004-2008 In thousands.
G.1.HR.4

142 2 0 0 9 | V o l u m e 1 | B a n d 1
AL
AT
BE
BG
CH
CY
CZ
DE
DK
EE
ES
FI
FR
GB
GR
HR
HU
IE
IS
IT
LT
LU
LV
MK
MT
NL
NO
PL
PT
RO
RU
SE
SI
SK
TR
HU
Hungary Hongrie Ungarn HU
Hungary has one of Central Europe’s most highly developed television
markets. The market is dominated by the two private channels: RTL Klub (RTL Group) and TV2 (ProSiebenSat1), who continue to have the biggest audience market shares. RTL Klub maintained its lead in 2008 with 24.6% (2.5% less than 2006) while TV2 had 21.3% (4.3% less than two years earlier). This gradual decline of market shares has also had an impact on the public service channels, in particular since privatisation was introduced. M1 and M2 had a combined market share in 2008 of 13.1% (down 3% in the last two years). M1 is the more popular of the two with a share of 11%. There continues to be increased competition resulting from the rise in the number of special-interest chan-nels and other private channels. Duna TV, the third public channel, was launched as a satellite channel in 1992 and targets the Hungarian minorities living outside the country. It has also been losing audience share in Hungary but recently launched a HD version which is available on the DTT platform. The penetration rate of multi-channel services has reached almost 75% of TV households (August 2009). These services are mostly provided by cable, which was available in approximately 58% of households at the end of 2008. The sector is made up of a considerable num-ber of local and regional cable operators (more than 400) and a few larger operators (UPC Hungary, Fibernet, and T-Kabel). The digitisation rate for the cable networks is quite low (less than 10% at the end of 2008). UPC’s cable network in Hungary is experiencing a gradual decline in its number of subscribers. The company had 673,300 subscribers (about 12% of which are digital) at the end of December 2008. The proposed merger of T-Kabel with the telecom operator Magyar Telekom (that already owns T-Kabel via subsidiary com-panies) was approved in 2009 and will take place by the end of 2009; UPC also owns the satellite platform UPC Direct, which had about 183,000 subscribers in June 2009. The Satellite market has become very competitive with a total of 5 operators serving approxi-mately 730 000 homes. In addition to UPC Direct and Digi TV, a third satel-lite operator – Hello HD – launched in May 2008. Antenna Hungaria also offers a limited package of channels. In June 2009 Digi TV was the market leader with approximately 57% of subscribers, fol-lowed by UPC with round 25% (accord-ing to research of the National Communi-cations Authority of Hungary). The analogue switch off in Hungary is planned for 2011. In July 2008, the Hungarian telecommunications regu-lator allocated the digital terrestrial tele-
Le marché de la télévision hongrois, l’un les plus développés d’Europe
centrale, est dominé par deux chaînes privées, RTL Klub (groupe RTL) et TV2 (ProSiebenSat1), qui réalisent toujours les plus fortes parts de marché d’audience. En 2008, RTL Klub se maintient en tête avec 24,6 % (2,5 points de moins qu’en 2006), contre 21,3 % pour TV2 (4,3 points de moins qu’en 2006). Ce recul progressif des parts de marché affecte également les chaî-nes de service public, en particulier depuis la privatisation du secteur. En 2008, M1 et M2 ont une part de marché cumulée de 13,1 % (en recul de 3 points sur les deux dernières années). M1 est la plus populaire des deux, avec 11 % de part de marché. En raison de l’augmentation du nombre de chaînes thématiques et des autres chaînes privées, la concurrence reste importante. Duna TV, la troisième chaîne publique a fait son apparition en 1992 sur le satellite. Elle cible les minorités hongroises résidant hors du pays. Bien qu’elle perde également des parts de marché en Hongrie, elle a récemment lancé une version HD dispo-nible sur la plate-forme TNT.Le taux de pénétration des offres multi-chaînes atteint presque 75 % des foyers équipés de la télévision (août 2009). Celles-ci sont majoritairement fournies par le câble qui était présent dans 58 % des foyers à la fin de l’année 2008. Le secteur est constitué d’une multitude de câblo-opérateurs locaux et régionaux (plus de 400), et de quelques opérateurs de taille plus importante (UPC Hungary, Fibernet, T-Kabel). Le taux de numéri-sation des réseaux câblés est assez faible (inférieur à 10 % fin 2008). Le réseau câblé d’UPC en Hongrie voit le nombre de ses abonnés diminuer progressivement. La société compte 673 300 abonnés (dont environ 12 % à l’offre numérique) fin décembre 2008. La fusion proposée entre T-Kabel et l’opérateur de télécommunica-tions Magyar Telekom (qui possède déjà T-Kabel via des filiales) a été approuvée en 2009 et sera effective d’ici la fin 2009.UPC est aussi propriétaire de la plate- forme satellitaire UPC Direct, qui compte quelque 183 000 abonnés en juin 2009. Le marché satellitaire est devenu très com-pétitif, avec 5 opérateurs desservant envi-ron 730 000 foyers. Outre UPC Direct et Digi TV, un troisième opérateur satel-lite – Hello HD – a fait son apparition en mai 2008. Antenna Hungaria propose également une offre limitée de chaînes. En juin 2009, Digi TV occupe la première place avec environ 57 % des abonnés, sui-vie par UPC (environ 25 % des abonnés) (selon une étude de l’autorité nationale hongroise des commu nications).L’extinction du signal analogique en Hongrie est prévue pour 2011. En juillet 2008, le régulateur hongrois des télé-communications a attribué la licence de
Ungarn hat einen der am weitesten entwickelten Fernsehmärkte in Zen-
traleuropa. Der Markt wird von zwei Privatsendern dominiert: RTL Klub (RTL Group) und TV2 (ProSiebenSat1), die nach wie vor die höchsten Einschalt-quoten erzielen. RTL Klub konnte mit 24,6 % (minus 2,5 % gegenüber 2006) 2008 seinen Spitzenplatz behaupten, gefolgt von TV2 mit 21,3 % (4,3 % weni-ger als zwei Jahre zuvor). Dieser schritt-weise Rückgang der Marktanteile hat auch einen gewissen Einfluss auf die öffentlich-rechtlichen Sender gehabt, insbesondere seit der Beginn der Privatisierung. M1 und M2 zusammen hatten 2008 einen Marktanteil von 13,1 % (minus 3 % in zwei Jahren), wobei M1 mit 11 % Markt-anteil der deutlich beliebtere Sender war. Es gibt weiterhin einen steigenden Wett-bewerb durch immer neue Spartenkanäle und andere Privatsender. Duna TV, der dritte öffentlich-rechtliche Sender, wird seit 1992 über Satellit verbreitet. Er rich-tet sich an die ungarischen Minderheiten im Ausland. Duna TV musste ebenfalls Verluste bei den Marktanteilen hinneh-men, hat aber unlängst eine über DVB-T empfangbare HD-Version seines Pro-gramms gestartet.Die Durchdringungsrate bei Mehrkanal-diensten liegt inzwischen bei knapp 75 % der Fernsehhaushalte (August 2009). Die Verbreitung erfolgt im Wesentlichen über Kabel, an das 58 % der Haushalte Ende 2008 angeschlossen waren. Der Sektor setzt sich aus einer Vielzahl lokaler und regionaler Kabelnetzbetrei-ber (über 400) und einigen größeren Betreibern zusammen (UPC Hungary, Fibernet, T-Kabel). Die Digitalisierungs-rate der Kabelnetze ist recht niedrig (unter 10 % Ende 2008). Das ungarische Kabelnetz von UPC verzeichnet einen fortschreitenden Rückgang der Abon-nentenzahlen. Das Unternehmen hatte Ende 2008 673 300 Abonnenten (davon ca. 12 % digital). Der vorgeschlagene Zusammenschluss zwischen T-Kabel und dem Telekom-Betreiber Magyar Telekom (der über Tochterfirmen bereits Eigner von T-Kabel ist) wurde 2009 genehmigt und soll gegen Ende 2009 stattfinden. UPC besitzt darüber hinaus die Satel-litenplattform UPC Direct, die im Juni 2009 rund 183 000 Abonnenten hatte. Mit insgesamt fünf Betreibern, die ca. 730 000 Haushalte bedienen, ist der Satel-litenmarkt inzwischen sehr umkämpft. Neben UPC Direct und Digi TV hat im Mai 2008 ein dritter Satellitenanbieter – Hello HD – den Betrieb aufgenommen. Antenna Hungária bietet ebenfalls ein begrenztes Senderpaket an. Im Juni 2009 war Digi TV mit ca. 57 % der Abonnenten Marktführer, gefolgt von UPC mit rund 25 % (laut Zahlen der nationalen Kom-munikationsbehörde).
1432 0 0 9 | V o l u m e 1 | B a n d 1
AL
AT
BE
BG
CH
CY
CZ
DE
DK
EE
ES
FI
FR
GB
GR
HR
HU
IE
IS
IT
LT
LU
LV
MK
MT
NL
NO
PL
PT
RO
RU
SE
SI
SK
TR
HU
Hungary Hongrie Ungarn HU
vision licence to Antenna Hungária, and the free-to-air platform (Mindig TV) was launched on December 1st 2008 followed by the pay DTT platformTerra+. The license relates to five national tele vision multiplexes and one radio multiplex. The licence also provides for operating a mobile television service (DVB-H) on the third multiplex. This tender was won by Antenna Hungária who launched its DVB-H service in December 2008, which currently features 6 channels.In June 2007, the Hungarian parliament passed legislation on the digital switcho-ver and drew a clear distinction between the regulation of content and that of broadcasting. It also transferred certain regulatory powers from the broadcasting regulator (ORTT) to the communications regulator (NHH). The IPTV sector is beginning to take off. The main providers of ADSL television are T-Online, a subsidiary of the national telecoms operator Magyar Telekom, Invi-tel (InviTV), and TVNet. The launch of a fourth service was announced in Septem-ber 2009. At the end of 2008 more than 30 000 Hungarian homes were subscribing to IPTV services.
télévision numérique terrestre à Antenna Hungária. Cette plate-forme gratuite (Mindig TV) a été lancée le 1er décembre 2008, suivie par l’offre de TNT payante Terra+. La licence concerne cinq multi-plex nationaux de télévision ainsi qu’un multiplex de radio. La licence prévoit en outre la possibilité d’opérer un service de télévision mobile (DVB-H) sur le troi-sième multiplex. Cet appel d’offres a été remporté par Antenna Hungária dont le service DVB-H, lancé en décembre 2008, compte actuellement 6 chaînes.En juin 2007, le Parlement hongrois a adopté une loi relative au passage au numé-rique établissant une nette distinction entre la régulation des contenus et celle de la radiodiffusion. Elle a également trans-féré certaines compétences de régulation de l’autorité de régulation de la radiodif-fusion (ORTT) à l’autorité de régulation des communications (NHH).Le secteur de l’IPTV commence à pren-dre son essor. Les principaux fournisseurs de services de télévision par ADSL sont T-Online, filiale de l’opérateur national de télécommunications Magyar Telekom, Invitel (InviTV) et TVNet. Le lancement d’un quatrième service a été annoncé en septembre 2009. Fin 2008, plus de 30 000 foyers hongrois sont abonnés à des services IPTV.
Die Abschaltung des Analogbetriebs in Ungarn ist für 2011 vorgesehen. Nach der Vergabe der Lizenz für das terres-trische Digitalfernsehen an Antenna Hungária durch die ungarische Regulie-rungsbehörde für Telekommunikation im Juli 2008 sind am 1. Dezember der frei empfangbare DVB-T-Dienst Mindig TV und kurz danach der Pay-TV-Dienst Terra+ auf Sendung gegangen. Die Lizenz betrifft fünf nationale TV-Multiplexe und einen Radio-Multiplex. Die Lizenz sieht darüber hinaus den Betrieb eines Mobil-fernsehdienstes (DVB-H) über den drit-ten Multiplex vor. Den Zuschlag erhielt der Netzbetreiber Antenna Hungária, der mit seinem DVB-H-Dienst im Dezember 2008 an den Start gegangen ist. Der Dienst umfasst derzeit sechs Sender.Das ungarische Parlament hat im Juni 2007 ein Gesetz zur Umschaltung auf Digitalfernsehen verabschiedet und dabei eine klare Unterscheidung zwischen der Regulierung von Inhalten und der Regulie-rung des Sendebetriebs getroffen. Zudem hat es bestimmte Regulierungsbefugnisse von der Rundfunkregulierungsbehörde (ORTT) auf die Telekommunikations-behörde (NHH) übertragen. Der IPTV-Sektor kommt langsam in Gang. Die größten Anbieter von ADSL-Fernsehen sind T-Online, eine Tochter des nationalen Telekom-Betreibers Magyar Telekom, Invitel (InviTV) sowie TVNet. Der Start eines vierten Dienstes wurde im September 2009 angekündigt. Ende 2008 waren über 30 000 Haushalte in Ungarn IPTV-Abonnenten.
Sources: Országos Rádió és Televízió Testület (National Radio and Television Commission - ORTT): http://www.ortt.hu Nemzeti Hírközlési Hatóság (National Communications Authority – NHH): http://www.nhh.hu Legal aspects: IRIS Merlin, http://merlin.obs.coe.int

144 2 0 0 9 | V o l u m e 1 | B a n d 1
AL
AT
BE
BG
CH
CY
CZ
DE
DK
EE
ES
FI
FR
GB
GR
HR
HU
IE
IS
IT
LT
LU
LV
MK
MT
NL
NO
PL
PT
RO
RU
SE
SI
SK
TR
HU
Hungary Hongrie Ungarn HU
Population and equipment 31.12.08Penetration
(in % HH) In thousand SourcesPopulation (inhabitants) – 10 031 Eurostat
Households – 3 800 Eurostat
TV households 97,0% 3 686 European Audiovisual Observatory
Cable TV households 56,8% 2 159 Screen Digest / European Audiovisual Observatory
Digital cable TV households 4,8% 182 Screen Digest / European Audiovisual Observatory
DTH/SMATV households 19,6% 745 Screen Digest / European Audiovisual Observatory
Pay DTH/SMATV households 12,0% 596 Screen Digest / European Audiovisual Observatory
IPTV subscriptions 0,9% 33 Screen Digest / European Audiovisual Observatory
Installed DVB-T receivers 0,3% 10 Screen Digest / European Audiovisual Observatory
Total digital TV households 21,6% 821 European Audiovisual Observatory
Households with PC 60,3% 2 290 Screen Digest / European Audiovisual Observatory
Households with broadband connections 39,4% 1 498 Screen Digest / European Audiovisual Observatory
Mobile phone TV subscriptions – 3 Screen Digest
Mobile broadcast TV receivers – 23 Screen Digest
TV channels distributors 11.09 CompaniesCable operators >400 Fibernet, UPC Hungary, T-Kabel, Vidanet,…Satellite packagers 5 Antenna Hungaria, Digi, HD Platform Kft, Magyar Telekom, UPCIPTV packagers 2 Invitel, Magyar Telekom, TVNetDTT multiplex operators / packagers 1 Antenna Hungaria (1 free platform and 1 pay package)Mobile phone TV packagers 2 Magyar Telekom, VodafoneMobile broadcast TV packager 1 Antenna Hungaria
Number of TV channels by kind of licence 10.09 Public Private TotalTerrestrial (national) 5 10 15Cable/Satellite/IPTV/Mobile 21 21Regional/Local ca500 ca500Regional/Local windows 6 6Channels targeting foreign markets 13 13Total 11 544 ca555Foreign channels targeting the country 2 53 55
Source: European Audiovisual Observatory
Supply of TV channels by genre and by platform (including foreign channels) 10.09
Digital terrestrial
Antenna Hungary Cable
UPC Hungary
Cable Magyar
Telekom
Satellite Digi TV
(full offer)
IPTV Magyar
TelekomGeneralist - national 7 5 5 5 5Generalist - foreign 7 3 23 2Adult 2 4 2 5Children 5 9 5 8Culture/ education/ documentary 11 11 21 10Minority interest groupsEntertainment/ TV fiction/ games 12 13 32 14Film 10 9 14 8Home shoppingInternational linguistic and cultural 5 2 2 1Lifestyle/ specific leisure/ travel 4 8 8 6Music 3 9 15 8News/ business 4 15 16 12 7Parliament/ government/ administrationRegional/ local 6 2 7 1Religion 1 2 2 1Sports 8 14 20 9Various 3Total 11 94 107 171 85
1 Includes three language versions of Euronews: English, French and German.
1
Basic figures

1452 0 0 9 | V o l u m e 1 | B a n d 1
AL
AT
BE
BG
CH
CY
CZ
DE
DK
EE
ES
FI
FR
GB
GR
HR
HU
IE
IS
IT
LT
LU
LV
MK
MT
NL
NO
PL
PT
RO
RU
SE
SI
SK
TR
HU
Hungary Hongrie Ungarn HU
Source: European Audiovisual Observatory on the basis of data from Screen Digest, WARC and Magyar Televizio, Magyar Radio and Duna Televizio
Source: European Audiovisual Observatory
Source: Screen DigestSource: Screen Digest
Households TV equipment 2004-2008
Number of households accessing multichannel platforms as at 31.12.2008
Consumers pay-TV gross spend 2004-2008
Gross revenues of radio-television 2004-2008
2004 2005 2006 2007 2008
0
2 500
2 000
1 500
1 000
500
Cable households
Satellite households
IPTV householdsDTT households
1 9502 031
2 1242 165 2 159
613510
630
731 745
1 6
5 10
33
UPC
Magyar Telekom
DigiTV
Antenna Hungaria
Invitel
FiberNet
TV Net
Hello H
D
0
1 000
800
600
400
200
395
10~ ~ ~ 2
DTT
IPTV
Sat
PC
Cable
673
183
28
423
2004 2005 2006 2007 2008
0
500 000
400 000
300 000
200 000
100 000
Cable TV
Satellite
IPTV
336 198348 657
365 211
403 847
428 123
23 07132 667
52 187
87 527
112 326
133 770 4 010
2004 2005 2006 2007 2008
0
600
400
200
Consumerspay-TV spend
TV adspend
Radio-TV public income est.
Radio adspend
546
362
119 119131 139 139
59
383
295
47
420
285
45
494
312
44
318
41
In thousands.
In thousands.
EUR thousand.
EUR million.
Market trends

146 2 0 0 9 | V o l u m e 1 | B a n d 1
AL
AT
BE
BG
CH
CY
CZ
DE
DK
EE
ES
FI
FR
GB
GR
HR
HU
IE
IS
IT
LT
LU
LV
MK
MT
NL
NO
PL
PT
RO
RU
SE
SI
SK
TR
HU
Hungary Hongrie Ungarn HU
Main broadcasters Channels 2005 2006 2007 2008 2008/07Magyar RTL Televizió Rt. adtv RTL 128 847 132 120 139 785 144 602 3,4%MTV - Magyar Televizió sptv TV1, M2 115 482 120 692 128 568 127 176 -1,1%MTM-SBS Televizió Rt. adtv TV-2 100 947 105 335 100 446 ~ ~Duna Televizió sptv Duna TV 33 961 33 865 34 043 ~ ~Sport1 TV thtv Sport TV 17 167 21 368 26 170 ~ ~Viasat Hungaria adtv Viasat 3 13 321 15 001 20 081 22 884 14,0%HIRTV thtv Hir TV 8 838 10 456 16 577 19 867 19,8%IKO Kabeltévé Szolgaltátó Kft. thtv DoQ 6 007 13 985 ~ 13 529 8,3%HBO Magyarország paytv HBO ~ 11 107 10 031 ~ ~Z+ thtv VIVA 5 879 6 947 7 492 ~ ~AGRO TV-ATV thtv Magyar ATV 2 507 2 723 5 912 8 449 19,8%Spektrum TV thtv Spektrum TV 5 180 6 014 7 263 7 350 -0,6%Humor1 TV thtv Humor TV 1 852 3 774 4 317 ~ ~TV Paprika thtv TV Paprika 12 1 166 2 992 4 827 14,8%Digital Media thtv 4 STory TV – 20 ~ 3 947 25,3%Iko Produktion Media thtv Sport+, Film+ 14 227 7 980 5 137 2 220 -25,8%Filmmuzeum pay-tv Filmmuzeum 2 641 3 223 3 081 2 107 -32,8%Hálózatos Televíziók thtv Halozat / HTV 1 427 1 530 2 453 2 046 -1,3%
Main distributors Services Packages 2005 2006 2007 2008 2008/07
Magyar Telekom (cons.) 1 3play, sat-tv, 3G TV
T-Home TV, Kabel Tv, Sat-TV, T-Mobil TV
2 473 000 2 674 000 2 679 000 2 590 000 -3,3%
p.m. T-Online 1 3play T-Home TV 114 735 146 301 ~ ~ ~p.m. T-Kabel 1 3play Kabel-TV 51 275 60 553 67 446 ~ ~Vodafone Hungary Ltd 1 3G TV Life! 470 422 483 841 570 394 553 012 -3,0%
UPC 1 3play, sat-tvKabel TV, Müholas TV , UPC Direct
156 750 194 522 215 636 243 925 13,1%
Digi Tavozlesi Kft 1 3play, sat-tv KabelTV, DigiTV 11 299 46 626 51 590 ~ ~Fibernet 1 3play Kabel TV 14 972 34 525 ~ ~ ~Vidanet 1 3play Kabeltévé 13 788 17 454 18 634 19 588 5,1%
Source: European Audiovisual Observatory1 Includes telecommunication activities.
EUR thousand.
2004 2005 2006 2007 2008
0
150 000
120 000
90 000
60 000
30 000
Magyar RTL Televizió Rt.
MTV - Magyar Televizió
MTM-SBS Televizió Rt.
Duna Televizió
Sport1 TVViasat Hungaria
HBO MagyarországZ+
HIRTV
Spektrum TV, AGRO TV-ATV, Humor1 TV, …
IKO Kabeltévé Szolgaltátó Kft.TV Paprika
Operating revenues of television companies in Hungary 2005-2008 EUR thousand.
T.1.HU.1G.1.HU.1

1472 0 0 9 | V o l u m e 1 | B a n d 1
AL
AT
BE
BG
CH
CY
CZ
DE
DK
EE
ES
FI
FR
GB
GR
HR
HU
IE
IS
IT
LT
LU
LV
MK
MT
NL
NO
PL
PT
RO
RU
SE
SI
SK
TR
HU
Hungary Hongrie Ungarn HU
Source: Magyar Televizio / European Audiovisual Observatory
Income 2005 2006 2007 2008 2005 2006 2007 2008 2008/07Total public income 84 603 90 616 104 843 104 555 73,3% 75,1% 81,5% 81,6% -0,3% - Aid/Grants 25 896 26 739 27 694 25 427 22,4% 22,2% 21,5% 19,8% -8,2% - Licence fee 39 802 40 526 40 083 39 643 34,5% 33,6% 31,2% 30,9% -1,1% - Other public funding 18 905 23 351 37 066 39 485 16,4% 19,3% 28,8% 30,8% 6,5%Total commercial income 14 171 14 760 15 278 18 928 12,3% 12,2% 11,9% 14,8% 23,9% - Advertising 11 723 11 993 12 047 13 739 10,2% 9,9% 9,4% 10,7% 14,0% - Sponsoring 450 358 128 775 0,4% 0,3% 0,1% 0,6% 505,5% - Other commercial revenues 1 998 2 409 3 103 4 414 1,7% 2,0% 2,4% 3,4% 42,2%Other income 16 708 15 314 8 446 4 622 14,5% 12,7% 6,6% 3,6% -45,3%
TOTAL 115 482 120 690 128 567 128 105 100,0% 100,0% 100,0% 100,0% -0,4%
Income 2005 2006 2007 2008 2005 2006 2007 2008 2008/07Purchase of goods and services 70 335,0 83 380,0 79 061,0 83 656,0 64,9% 63,9% 61,1% 65,8% 5,8%Cost of personnel 35 964 45 024 48 067 40 741 33,2% 34,5% 37,1% 32,0% -15,2%Depreciation 2 132 2 075 2 265 2 767 2,0% 1,6% 1,8% 2,2% 22,2%Operating expenditure 108 431 130 479 129 393 127 164 100,0% 100,0% 100,0% 100,0% -1,7%
Net result 6 496 17 457 353 634 79,6%Operating margin (%) 6,1 -8,1 -0,6 0,0
EUR thousand.
In %.
2004 2005 2006 2007 2008
0
150 000
120 000
90 000
60 000
30 000
Other incomeSponsoringAdvertising
Other public funding
Licence fee
Aid/Grants
Other commercial revenues
2004 2005 2006 2007 2008
-100
400
500
300
200
100
0 Return onshareholders’ fundsOperating margin
Return on total assets
Pro�t margin
Magyar Televizio financial situation 2005-2008 EUR thousand.
T.1.HU.2G.1.HU.2
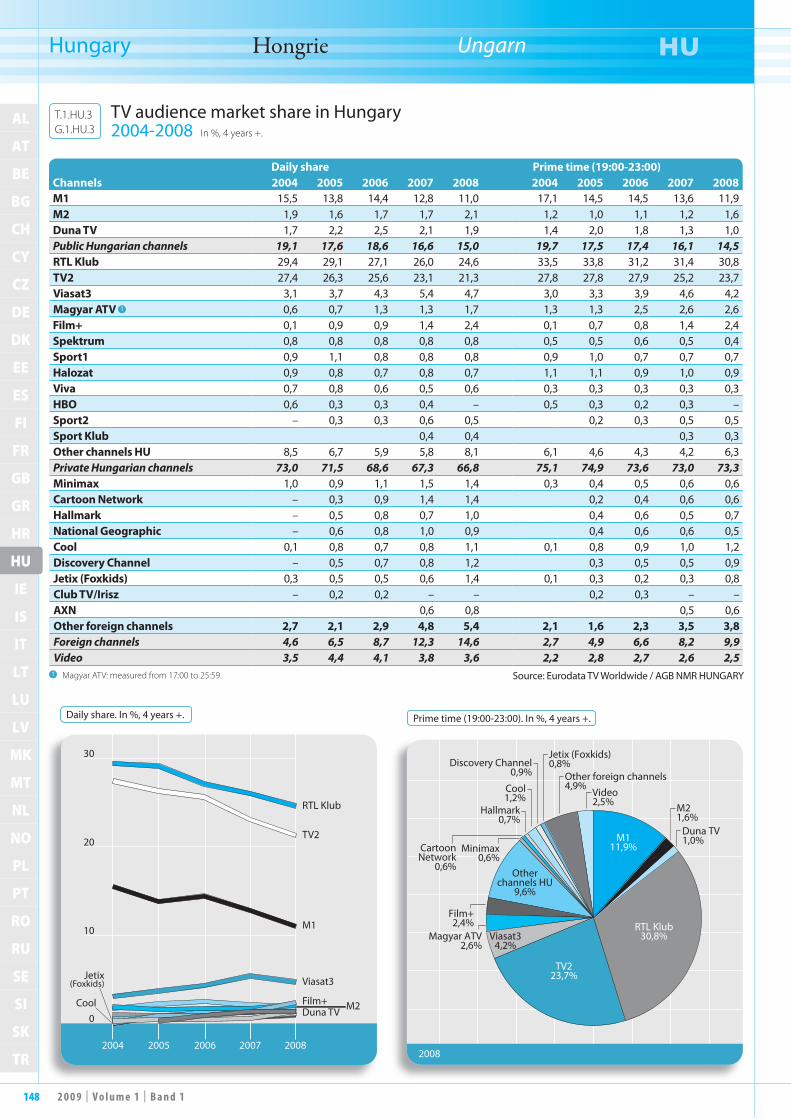
148 2 0 0 9 | V o l u m e 1 | B a n d 1
AL
AT
BE
BG
CH
CY
CZ
DE
DK
EE
ES
FI
FR
GB
GR
HR
HU
IE
IS
IT
LT
LU
LV
MK
MT
NL
NO
PL
PT
RO
RU
SE
SI
SK
TR
HU
Hungary Hongrie Ungarn HU
Daily share Prime time (19:00-23:00)Channels 2004 2005 2006 2007 2008 2004 2005 2006 2007 2008M1 15,5 13,8 14,4 12,8 11,0 17,1 14,5 14,5 13,6 11,9M2 1,9 1,6 1,7 1,7 2,1 1,2 1,0 1,1 1,2 1,6Duna TV 1,7 2,2 2,5 2,1 1,9 1,4 2,0 1,8 1,3 1,0Public Hungarian channels 19,1 17,6 18,6 16,6 15,0 19,7 17,5 17,4 16,1 14,5RTL Klub 29,4 29,1 27,1 26,0 24,6 33,5 33,8 31,2 31,4 30,8TV2 27,4 26,3 25,6 23,1 21,3 27,8 27,8 27,9 25,2 23,7Viasat3 3,1 3,7 4,3 5,4 4,7 3,0 3,3 3,9 4,6 4,2Magyar ATV 1 0,6 0,7 1,3 1,3 1,7 1,3 1,3 2,5 2,6 2,6Film+ 0,1 0,9 0,9 1,4 2,4 0,1 0,7 0,8 1,4 2,4Spektrum 0,8 0,8 0,8 0,8 0,8 0,5 0,5 0,6 0,5 0,4Sport1 0,9 1,1 0,8 0,8 0,8 0,9 1,0 0,7 0,7 0,7Halozat 0,9 0,8 0,7 0,8 0,7 1,1 1,1 0,9 1,0 0,9Viva 0,7 0,8 0,6 0,5 0,6 0,3 0,3 0,3 0,3 0,3HBO 0,6 0,3 0,3 0,4 – 0,5 0,3 0,2 0,3 –Sport2 – 0,3 0,3 0,6 0,5 0,2 0,3 0,5 0,5Sport Klub 0,4 0,4 0,3 0,3Other channels HU 8,5 6,7 5,9 5,8 8,1 6,1 4,6 4,3 4,2 6,3Private Hungarian channels 73,0 71,5 68,6 67,3 66,8 75,1 74,9 73,6 73,0 73,3Minimax 1,0 0,9 1,1 1,5 1,4 0,3 0,4 0,5 0,6 0,6Cartoon Network – 0,3 0,9 1,4 1,4 0,2 0,4 0,6 0,6Hallmark – 0,5 0,8 0,7 1,0 0,4 0,6 0,5 0,7National Geographic – 0,6 0,8 1,0 0,9 0,4 0,6 0,6 0,5Cool 0,1 0,8 0,7 0,8 1,1 0,1 0,8 0,9 1,0 1,2Discovery Channel – 0,5 0,7 0,8 1,2 0,3 0,5 0,5 0,9Jetix (Foxkids) 0,3 0,5 0,5 0,6 1,4 0,1 0,3 0,2 0,3 0,8Club TV/Irisz – 0,2 0,2 – – 0,2 0,3 – –AXN 0,6 0,8 0,5 0,6Other foreign channels 2,7 2,1 2,9 4,8 5,4 2,1 1,6 2,3 3,5 3,8Foreign channels 4,6 6,5 8,7 12,3 14,6 2,7 4,9 6,6 8,2 9,9Video 3,5 4,4 4,1 3,8 3,6 2,2 2,8 2,7 2,6 2,5
Source: Eurodata TV Worldwide / AGB NMR HUNGARY1 Magyar ATV: measured from 17:00 to 25:59.
Daily share. In %, 4 years +. Prime time (19:00-23:00). In %, 4 years +.
2004 2005 2006 2007 2008
0
10
30
20
RTL Klub
TV2
M1
Viasat3
Film+Duna TV M2Cool
Jetix(Foxkids)
2008
Discovery Channel0,9%
M111,9%
M21,6%
Duna TV1,0%
Video2,5%
Other foreign channels4,9%
Jetix (Foxkids)0,8%
RTL Klub30,8%
TV223,7%
Viasat34,2%
Otherchannels HU
9,6%
Magyar ATV2,6%
Film+2,4%
Minimax0,6%
CartoonNetwork
0,6%
Hallmark0,7%
Cool1,2%
TV audience market share in Hungary 2004-2008 In %, 4 years +.
T.1.HU.3G.1.HU.3

1492 0 0 9 | V o l u m e 1 | B a n d 1
AL
AT
BE
BG
CH
CY
CZ
DE
DK
EE
ES
FI
FR
GB
GR
HR
HU
IE
IS
IT
LT
LU
LV
MK
MT
NL
NO
PL
PT
RO
RU
SE
SI
SK
TR
IE
Ireland Irlande Irland IE
The Irish television market is character-ised by a strong national public ser-
vice broadcaster and a strong presence of British channels. The two public service channels, RTÉ1 and RTÉ2, had a com-bined market share of 36.5% in 2008 (2% less than in 2006). The private channel, TV3 (launched in 1998) had an 11.4% market share, close to that of RTÉ2, with11.5%. The five most watched UK channels are ranked in the following order: BBC1, UTV, S4C, BBC2, and Sky 1 (with a combined share of 19.1%). According to data from ComReg for the first quarter of 2009, 61% of Irish house-holds receive digital television. Pay-TV households reached 1.09162 million (75%), divided between satellite and cable/MMDS. The UK satellite packager BSkyB had 578,730 subscribers (53% of pay TV market) in the first quarter of 2009. The success of this package has partly been due to the lack of any alternative for reception of digital television (and/or pay-TV) out-side of the main cities and towns. The cable market is controlled by one operator UPC Ireland (following the takeover by Liberty Global of the second operator, NTL and its merger with Cho-rus). According to ComRreg approxima-tely 54% of cable services are now digital, and Liberty Global’s annual report 2008 claimed a total of 450,100 cable customers. So far there has been no strong develop-ment in the IPTV market, although there are three operators (Magnet networks, 3Play Plus, and Smart Telecom) pro viding IPTV services in Ireland. There is no data available on IPTV subscribers, while broadband Internet had a reach of 60.4% in March 2009.At the beginning of 2007, the network operator Arqiva and the mobile telephone operator O2 launched the first commer-cial personal mobile television trial in the DVB-H format, involving 350 users in the Dublin area. Following various trials and a consultation by the regulator ComReg, it was announced in August 2009 that a ten-der would be launched at the end of 2009 to use part of the UHF band for mobile TV services. The introduction of DTT experienced a set-back in 2009. In March 2008, the tender for three commercial multiplexes was awarded to the Boxer Communicorp consortium by the Broadcasting Commis-sion of Ireland (BCI). However, in April 2009 Boxer handed back its license. They claimed that the reasons were the failure to reach an agreement with RTÉ Networks Limited, the operator of the public ser-vice multiplex, and also the financial cri-sis in Ireland. In May 2009, the BCI then granted the licenses to the consortium that reached second place in the tender: One Vision (including TV3, Eircom and Setanta). One of these partners, the
Le marché irlandais de la télévision est marqué par l’importance de son
radiodiffuseur public et une forte présence des chaînes britanniques. Les deux chaînes publiques, RTÉ1 et RTÉ2, ont réalisé en 2008 une part de marché combinée de 36,5 % (-2% par rapport à 2006). La chaîne privée TV3 (lancée en 1998) détient une part de 11,4 %, proche de celle de RTÉ2 (11,5 %). Les cinq chaînes britanniques les plus regardées sont par ordre décroissant: BBC1, UTV, S4C, BBC2 et Sky 1 (avec une part combinée de 19,1 %). Selon les données de ComReg pour le premier trimestre 2009, 61 % des foyers irlandais reçoivent la télévision numé-rique. Les foyers abonnés à la télévision payante sont au nombre de 1,09 million (75 %), répartis entre le satellite et le câble/SDMM. L’opérateur satellite britannique BSkyB comptait 578 730 abonnés (c’est-à-dire 53 % du marché de la télévision à péage) au premier trimestre 2009. Le suc-cès de son bouquet est dû, notamment, à l’absence d’alternative dans la réception de signaux télévisés numériques (et/ou de services de télévision à péage) en dehors des grandes villes.Suite à la prise de contrôle par Liberty Global du deuxième opérateur, NTL, et sa fusion avec Chorus, le marché du câble est contrôlé par un opérateur, UPC Irland. Selon les données de ComReg, environ 54 % des services câblés sont désormais numériques. Le rapport annuel 2008 de Liberty Global affichait un total de 450 100 abonnés au câble. À ce jour, le marché de l’IPTV ne connaît pas d’évo-lution significative, malgré la présence de trois opérateurs (Magnet networks, 3Play Plus et Smart Telecom). Il n’existe pas de données relatives aux abonnés à l’IPTV ; quant à la pénétration d’Internet à haut débit, il atteint 60,4 % en mars 2009.Début 2007, l’opérateur de réseau Arqiva et l’opérateur de téléphonie mobile O2 ont lancé la première expérimentation commerciale de télévision mobile person-nelle au format DVB-H. L’expérimen-tation concernait 350 utilisateurs dans la région de Dublin. À l’issue de plusieurs tests et d’une consultation menée par le régulateur ComReg, l’annonce a été faite en août 2009 du lancement d’un appel d’offres en vue de la mise en exploitation d’une partie de la bande UHF pour les services de télévision mobile.L’introduction de la TNT a connu un coup d’arrêt en 2009. En mars 2008, suite à un appel d’offres, trois multiplex com-merciaux ont été octroyés au consortium Boxer Communicorp par la Broadcasting Commission of Ireland (BCI). Or Boxer a rendu sa licence en avril 2009, invoquant l’impossibilité de parvenir à un accord avec RTÉ Networks Limited, l’opéra-teur du multiplex de service public, mais aussi la crise financière en Irlande. En mai
Der irische Fernsehmarkt zeichnet sich durch eine starke nationale
öffentlich-rechtliche Sendeanstalt und eine hohe Präsenz britischer Sender aus. Die beiden öffentlich-rechtlichen Sender, RTÉ1 und RTÉ2, erreichten 2008 zusam-men einen Marktanteil von 36,5 % (minus 2 % gegenüber 2006). Der Privatsender TV3 (1998 in Betrieb genommen) kam auf einen Marktanteil von 11,4 %, knapp hinter RTÉ2 (11,5 %). Die fünf stärk-sten britischen Sender sind (sortiert nach Marktanteil): BBC1, UTV, S4C, BBC2 und Sky 1. Zusammen erreichten sie einen Marktanteil von 19,1 %). Laut Erhebung der Regulierungsbehör-de ComReg für das erste Quartal 2009 empfangen 61 % der irischen Haushalte digitales Fernsehen. Die Zahl der Pay-TV-Haushalte (über Satellit oder Kabel/MMDS) beläuft sich auf 1,09 Mio. (75 %). Der britische Satellitenanbie-ter BSkyB hatte im ersten Quartal 2009 578 730 Abonnenten (53 % des Pay-TV-Marktes). Der Erfolg dieses Pakets ist teilweise auf das Fehlen jeglicher Alterna-tive für den Empfang von digitalem Fern-sehen (und/oder Pay-TV) außerhalb der großen Städte zurückzuführen. Der Kabelmarkt wird von einem einzigen Betreiber (UPC Ireland) beherrscht, nachdem der zweite Anbieter (NTL) durch Liberty Global (Mutterkonzern von UPC Ireland) übernommen und mit Chorus (Tochtergesellschaft von UPC Ire-land) fusioniert wurde. Laut ComReg sind inzwischen rund 54 % der Kabeldienste digital und laut Jahresbericht 2008 von Liberty Global hat das Unternehmen ins-gesamt 450 100 Kabelkunden. Auf dem IPTV-Markt hat es noch keine nennens-werten Entwicklungen gegeben, obgleich es drei Betreiber gibt (Magnet networks, 3Play Plus und Smart Telecom), die in Irland IPTV-Dienste anbieten. Zahlen über IPTV-Abonnenten liegen zwar keine vor, aber im März 2009 war Breit-band-Internet in 60,4 % der Haushalten verfügbar.Anfang 2007 haben der Netzbetreiber Arqiva und der Mobilfunkbetreiber O2 mit 350 Nutzern in Dublin den ersten kommerziellen Versuch für mobiles Fern-sehen im DVB-H-Format gestartet. Nach mehreren Versuchen und einer Anhörung durch die ComReg wurde im August 2009 eine Ausschreibung für Ende 2009 zur Nutzung von Teilen des UHF-Bands für mobile TV-Dienste angekündigt. Die Einführung des digitalen Antennen-fernsehens hat 2009 einen Rückschlag erlebt. Im März 2008 hatte das Boxer-Communicorp-Konsortium nach einer Ausschreibung der Broadcasting Com-mission of Ireland (BCI) den Zuschlag für drei kommerzielle Multiplexe erhalten. Im April gab Boxer TV allerdings seine Lizenz zurück. Als Grund gab das Unternehmen
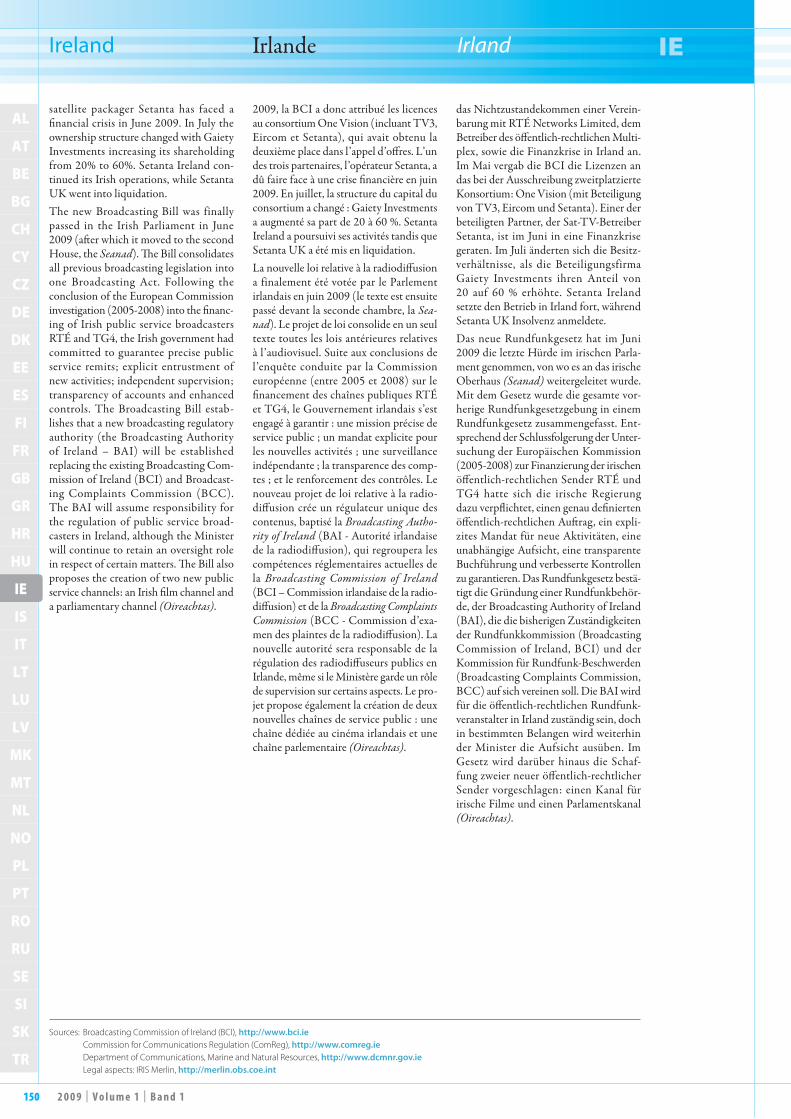
150 2 0 0 9 | V o l u m e 1 | B a n d 1
AL
AT
BE
BG
CH
CY
CZ
DE
DK
EE
ES
FI
FR
GB
GR
HR
HU
IE
IS
IT
LT
LU
LV
MK
MT
NL
NO
PL
PT
RO
RU
SE
SI
SK
TR
IE
Ireland Irlande Irland IE
satellite packager Setanta has faced a financial crisis in June 2009. In July the ownership structure changed with Gaiety Investments increasing its shareholding from 20% to 60%. Setanta Ireland con-tinued its Irish operations, while Setanta UK went into liquidation. The new Broadcasting Bill was finally passed in the Irish Parliament in June 2009 (after which it moved to the second House, the Seanad). The Bill consolidates all previous broadcasting legislation into one Broadcasting Act. Following the conclusion of the European Commission investigation (2005-2008) into the financ-ing of Irish public service broadcasters RTÉ and TG4, the Irish government had committed to guarantee precise public service remits; explicit entrustment of new activities; independent supervision; transparency of accounts and enhanced controls. The Broadcasting Bill estab-lishes that a new broadcasting regulatory authority (the Broadcasting Authority of Ireland – BAI) will be established replacing the existing Broadcasting Com-mission of Ireland (BCI) and Broadcast-ing Complaints Commission (BCC). The BAI will assume responsibility for the regulation of public service broad-casters in Ireland, although the Minister will continue to retain an oversight role in respect of certain matters. The Bill also proposes the creation of two new public service channels: an Irish film channel and a parliamentary channel (Oireachtas).
2009, la BCI a donc attribué les licences au consortium One Vision (incluant TV3, Eircom et Setanta), qui avait obtenu la deuxième place dans l’appel d’offres. L’un des trois partenaires, l’opérateur Setanta, a dû faire face à une crise financière en juin 2009. En juillet, la structure du capital du consortium a changé : Gaiety Investments a augmenté sa part de 20 à 60 %. Setanta Ireland a poursuivi ses activités tandis que Setanta UK a été mis en liquidation.La nouvelle loi relative à la radiodiffusion a finalement été votée par le Parlement irlandais en juin 2009 (le texte est ensuite passé devant la seconde chambre, la Seanad). Le projet de loi consolide en un seul texte toutes les lois antérieures relatives à l’audiovisuel. Suite aux conclusions de l’enquête conduite par la Commission européenne (entre 2005 et 2008) sur le financement des chaînes publiques RTÉ et TG4, le Gouvernement irlandais s’est engagé à garantir : une mission précise de service public ; un mandat explicite pour les nouvelles activités ; une surveillance indépendante ; la transparence des comp-tes ; et le renforcement des contrôles. Le nouveau projet de loi relative à la radio-diffusion crée un régulateur unique des contenus, baptisé la Broadcasting Authority of Ireland (BAI - Autorité irlandaise de la radiodiffusion), qui regroupera les compétences réglementaires actuelles de la Broadcasting Commission of Ireland (BCI – Commission irlandaise de la radio-diffusion) et de la Broadcasting Complaints Commission (BCC - Commission d’exa-men des plaintes de la radiodiffusion). La nouvelle autorité sera responsable de la régulation des radiodiffuseurs publics en Irlande, même si le Ministère garde un rôle de supervision sur certains aspects. Le pro-jet propose également la création de deux nouvelles chaînes de service public : une chaîne dédiée au cinéma irlandais et une chaîne parlementaire (Oireachtas).
das Nichtzustandekommen einer Verein-barung mit RTÉ Networks Limited, dem Betreiber des öffentlich-rechtlichen Multi-plex, sowie die Finanzkrise in Irland an. Im Mai vergab die BCI die Lizenzen an das bei der Ausschreibung zweitplatzierte Konsortium: One Vision (mit Beteiligung von TV3, Eircom und Setanta). Einer der beteiligten Partner, der Sat-TV-Betreiber Setanta, ist im Juni in eine Finanzkrise geraten. Im Juli änderten sich die Besitz-verhältnisse, als die Beteiligungsfirma Gaiety Investments ihren Anteil von 20 auf 60 % erhöhte. Setanta Ireland setzte den Betrieb in Irland fort, während Setanta UK Insolvenz anmeldete.Das neue Rundfunkgesetz hat im Juni 2009 die letzte Hürde im irischen Parla-ment genommen, von wo es an das irische Oberhaus (Seanad) weitergeleitet wurde. Mit dem Gesetz wurde die gesamte vor-herige Rundfunkgesetzgebung in einem Rundfunkgesetz zusammengefasst. Ent-sprechend der Schlussfolgerung der Unter-suchung der Europäischen Kommission (2005-2008) zur Finanzierung der irischen öffentlich-rechtlichen Sender RTÉ und TG4 hatte sich die irische Regierung dazu verpflichtet, einen genau definierten öffentlich-rechtlichen Auftrag, ein expli-zites Mandat für neue Aktivitäten, eine unabhängige Aufsicht, eine transparente Buchführung und verbesserte Kontrollen zu garantieren. Das Rundfunkgesetz bestä-tigt die Gründung einer Rundfunkbehör-de, der Broadcasting Authority of Ireland (BAI), die die bisherigen Zuständigkeiten der Rundfunkkommission (Broadcasting Commission of Ireland, BCI) und der Kommission für Rundfunk-Beschwerden (Broadcasting Complaints Commission, BCC) auf sich vereinen soll. Die BAI wird für die öffentlich-rechtlichen Rundfunk-veranstalter in Irland zuständig sein, doch in bestimmten Belangen wird weiterhin der Minister die Aufsicht ausüben. Im Gesetz wird darüber hinaus die Schaf-fung zweier neuer öffentlich-rechtlicher Sender vorgeschlagen: einen Kanal für irische Filme und einen Parlamentskanal (Oireachtas).
Sources: Broadcasting Commission of Ireland (BCI), http://www.bci.ie Commission for Communications Regulation (ComReg), http://www.comreg.ie Department of Communications, Marine and Natural Resources, http://www.dcmnr.gov.ie Legal aspects: IRIS Merlin, http://merlin.obs.coe.int

1512 0 0 9 | V o l u m e 1 | B a n d 1
AL
AT
BE
BG
CH
CY
CZ
DE
DK
EE
ES
FI
FR
GB
GR
HR
HU
IE
IS
IT
LT
LU
LV
MK
MT
NL
NO
PL
PT
RO
RU
SE
SI
SK
TR
IE
Ireland Irlande Irland IE
Population and equipment 31.12.08Penetration
(in % HH) In thousand SourcesPopulation (inhabitants) – 4 450 Eurostat
Households – 1 562 Eurostat
TV households 99% 1 546 European Audiovisual Observatory
Cable TV households (incl. MMDS) 34% 537 Screen Digest/European Audiovisual Observatory
Digital cable TV households 20% 316 Screen Digest/European Audiovisual Observatory
DTH/SMATV households 40% 625 Screen Digest/European Audiovisual Observatory
Pay DTH/SMATV households 37% 573 Screen Digest/European Audiovisual Observatory
IPTV subscriptions 1% 23 Screen Digest/European Audiovisual Observatory
Installed DVB-T receivers 0% 0Total digital TV households 58% 912 European Audiovisual Observatory
Households with PC 68% 1 056 Screen Digest/European Audiovisual Observatory
Households with broadband connections 45% 699 Screen Digest/European Audiovisual Observatory
Mobile phone TV subscriptions – 74 Screen Digest
TV channels distributors 11.09 CompaniesCable operators 3 Casey Cablevision, SCTV Digital, UPC Broadband IrelandSatellite packagers 0 Irish viewers may access the UK packages BSkyB and FreesatIPTV packagers 3 3Playplus (Homevision), Magnet Networks, Smart telecomsDTT packagers 0 Licence awarded to One Vision Mobile phone TV packagers 2 Telefonica O2 Ireland, Vodafone Ireland
Number of TV channels by kind of licence 10.09 Public Private TotalTerrestrial (national) 3 1 4Cable/Satellite/IPTV/Mobile 1 6 7Regional/Local 7 7Regional/Local windowsChannels targeting foreign marketsTotal 4 14 18Foreign channels targeting the country 2 3 5
Source: European Audiovisual Observatory
Supply of TV channels by genre and by platform (including foreign channels) 10.09 Terrestrial
Cable UPC Broadband
Ireland
Satellite Sky
(Full offer)IPTV
Magnet Generalist - national 4 4 4 4Generalist - foreign 4 4 2Adult 3 21 2Children 11 25 8Culture/ education/ documentary 11 24 11Minority interest groups 16Entertainment/ TV fiction/ games 17 57 16Film 4 31 13Home shopping 1 28 1International linguistic and cultural 1 3Lifestyle/ specific leisure/ travel 5 16 8Music 16 25 4News/ business 6 28 4Parliament/ government/ administration 2Regional/ local 1 6 1Religion 2 18Sports 19 33 13Various 10 55 4Total 4 115 396 91
Basic figures
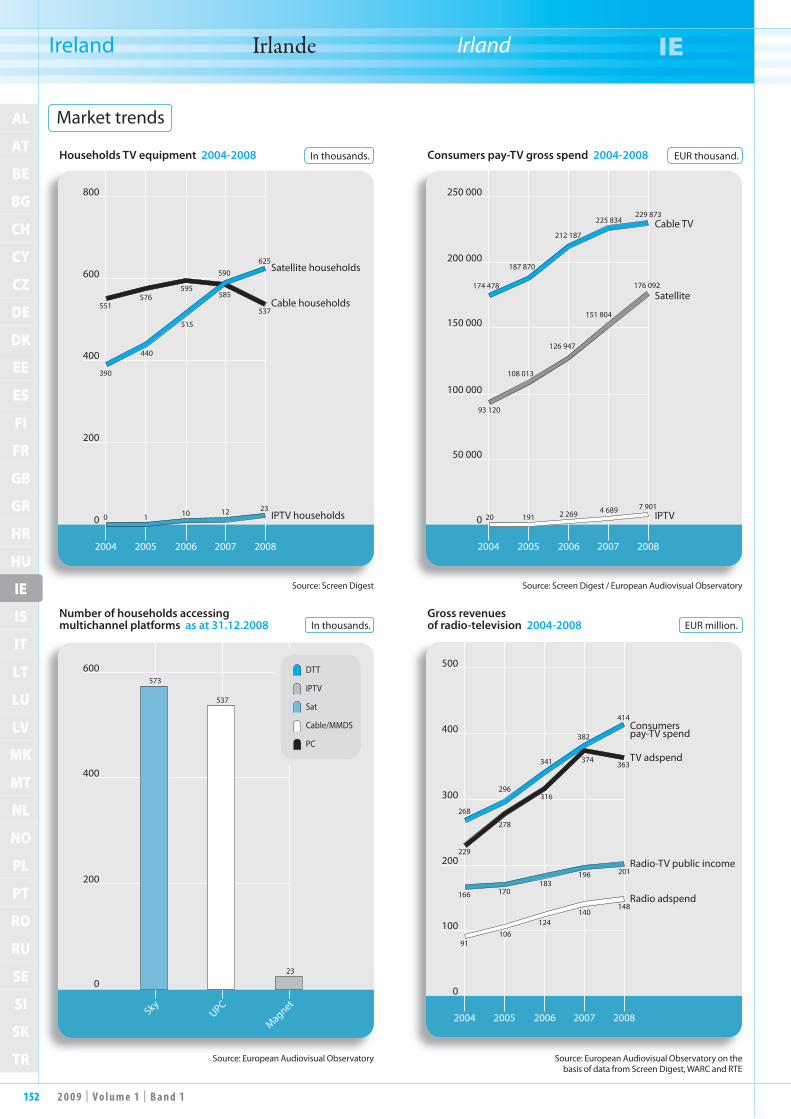
152 2 0 0 9 | V o l u m e 1 | B a n d 1
AL
AT
BE
BG
CH
CY
CZ
DE
DK
EE
ES
FI
FR
GB
GR
HR
HU
IE
IS
IT
LT
LU
LV
MK
MT
NL
NO
PL
PT
RO
RU
SE
SI
SK
TR
IE
Ireland Irlande Irland IE
Source: European Audiovisual Observatory on the basis of data from Screen Digest, WARC and RTE
Source: European Audiovisual Observatory
Source: Screen Digest / European Audiovisual ObservatorySource: Screen Digest
Households TV equipment 2004-2008
Number of households accessing multichannel platforms as at 31.12.2008
Consumers pay-TV gross spend 2004-2008
Gross revenues of radio-television 2004-2008
In thousands.
In thousands.
EUR thousand.
EUR million.
2004 2005 2006 2007 2008
0
800
600
400
200
Satellite households
Cable households
IPTV households
390
0 1 10 12 23
551576
595585
537
440
515
590625
SkyUPC
Magnet
0
600
400
200
573
23
537
DTT
IPTV
Sat
PC
Cable/MMDS
2004 2005 2006 2007 2008
0
250 000
200 000
150 000
100 000
50 000
Cable TV
Satellite
IPTV
174 478
7 901
187 870
212 187
225 834229 873
93 120
108 013
126 947
151 804
176 092
20 191 2 269 4 689
2004 2005 2006 2007 2008
0
500
400
300
200
100
Consumerspay-TV spend
TV adspend
Radio-TV public income
Radio adspend
268
229
166
91106
124140
148
170183
196 201
296
278
341
316
382
374363
414
Market trends

1532 0 0 9 | V o l u m e 1 | B a n d 1
AL
AT
BE
BG
CH
CY
CZ
DE
DK
EE
ES
FI
FR
GB
GR
HR
HU
IE
IS
IT
LT
LU
LV
MK
MT
NL
NO
PL
PT
RO
RU
SE
SI
SK
TR
IE
Ireland Irlande Irland IE
Main broadcasters Channels 2005 2006 2007 2008 2008/07RTÉ (cons.) sptv RTE One, RTE two, radios 369 888 405 021 441 152 440 760 -0,1%Setanta Sport Holdings Ltd thtv Setanta Sports 42 592 62 572 161 413 ~ ~TV3 Television Networks Ltd adtv TV3 – – 62 416 61550 -1,4%p.m. Canwest Granada Media Holdings Ltd adtv TV3 48 499 53 605 – – –
NASN Limited thtv NASN – 4 073 ~ ~ ~
Main distributors 1 Services Packages 2005 2006 2007 2008 2008/07Vodafone Ireland Ltd 2 3G TV Mobile TV ~ ~ 1 254 772 ~ ~Telefonica O2 Ireland Ltd 2 3G TV O2 TV 756 746 834 437 940 897 ~ ~UPC Broadband Ireland 2 3play Chorus NTL TV 82 858 207 823 222 477 ~ ~Magnet Networks Ltd 2 3play Magnet Entertainment ~ ~ 4 896 ~ ~
Source: European Audiovisual Observatory1 In practice, the main distributor in Ireland is the British company British Sky Broadcasting PLC.2 Includes telecommunication activities.
EUR thousand.
2004 2005 2006 2007 2008
0
400 000
300 000
200 000
100 000
500 000
RTÉ (cons.)
Setanta Sport Holdings Ltd
Canwest GranadaMedia Holdings Ltd /TV3 Television Network
NASN Limited
Operating revenues of main television companies in Ireland 2005-2008 EUR thousand.
T.1.IE.1G.1.IE.1

154 2 0 0 9 | V o l u m e 1 | B a n d 1
AL
AT
BE
BG
CH
CY
CZ
DE
DK
EE
ES
FI
FR
GB
GR
HR
HU
IE
IS
IT
LT
LU
LV
MK
MT
NL
NO
PL
PT
RO
RU
SE
SI
SK
TR
IE
Ireland Irlande Irland IE
Source: RTE / European Audiovisual Observatory
Income 2005 2006 2007 2008 2005 2006 2007 2008 2008/07Total public income 170 131 182 835 195 699 200 852 46,0% 45,1% 44,4% 45,6% 2,6% - Licence fee 170 131 182 835 195 699 200 852 46,0% 45,1% 44,4% 45,6% 2,6%Total commercial income 199 757 222 186 235 348 239 908 54,0% 54,9% 53,3% 54,4% 1,9% - Advertising 165 121 183 960 202 422 195 603 44,6% 45,4% 45,9% 44,4% -3,4% - Sponsorship 8 060 9 385 10 105 9 376 2,2% 2,3% 2,3% 2,1% -7,2% - Merchandising 8 591 9 703 9 715 10 306 2,3% 2,4% 2,2% 2,3% 6,1% - Other commercial income 17 985 19 138 23 211 24 623 4,9% 4,7% 5,3% 5,6% 6,1%
TOTAL 369 888 405 021 441 152 440 760 100,0% 100,0% 100,0% 100,0% -0,1%
Expenditure 2005 2006 2007 2008 2005 2006 2007 2008 2008/07Purchase of goods and services est. 196 001 210 162 242 353 263 401 54,2% 52,1% 56,3% 57,2% 8,7%
Cost of personnel 135 528 154 233 169 615 176 077 37,5% 38,2% 39,4% 38,2% 3,8%Depreciation 15 955 17 086 18 846 21 032 4,4% 4,2% 4,4% 4,6% 11,6%Operating expenditure 361 755 403 660 430 189 460 510 100,0% 100,0% 100,0% 100,0% 7,0%
Net result 9 285 10 244 26 629 33 – – – -99,9%Operating margin (%) 2,20 6,05 2,49 -4,48 – –
EUR thousand.
In %.
2004 2005 2006 20082007
0
500 000
400 000
300 000
200 000
100 000 Licence fee
Advertising
Other commercialMerchandisingSponsoring
2004 2005 2006 2007 2008
-15
15
20
10
5
0
-5
-10
Pro�t marginReturn on total assetsOperating margin
Return on shareholders'funds
RTE financial situation 2005-2008 EUR thousand.
T.1.IE.2G.1.IE.2

1552 0 0 9 | V o l u m e 1 | B a n d 1
AL
AT
BE
BG
CH
CY
CZ
DE
DK
EE
ES
FI
FR
GB
GR
HR
HU
IE
IS
IT
LT
LU
LV
MK
MT
NL
NO
PL
PT
RO
RU
SE
SI
SK
TR
IE
Ireland Irlande Irland IE
Daily share Prime time (18:00-23:29)Channels 2004 2005 2006 2007 2008 2004 2005 2006 2007 2008RTÉ One 25,8 25,7 25,5 25,0 25,1 32,3 32,6 32,1 31,5 31,0RTÉ Two 12,4 12,1 13,0 12,1 11,5 11,5 11,6 12,9 12,2 12,1TG4 3,1 3,2 3,0 2,7 2,5 2,7 2,9 2,6 2,4 2,2Public Irish channels 41,3 41,0 41,5 39,8 39,1 46,5 47,1 47,6 46,1 45,3TV3 13,5 12,9 12,3 12,2 11,4 13,8 13,5 12,8 13,1 12,4Setanta Ireland – 0,2 0,5 0,6 0,8 – 0,2 0,4 0,5 0,7Channel 6 – – 0,4 0,6 0,8 – – 0,3 0,5 0,7Private Irish channels 13,5 13,1 13,2 13,4 13,0 13,8 13,7 13,5 14,1 13,8UTV 6,5 5,8 5,5 4,8 4,4 6,1 6,5 6,1 5,1 4,5Channel 4 4,2 4,1 4,2 3,8 3,7 3,9 3,7 3,8 3,6 3,5E4 1,4 1,4 1,3 1,2 1,3 1,1 1,2 1,0 1,1 1,2BBC1 6,6 6,4 6,1 5,4 5,4 3,2 5,8 5,5 4,8 5,0BBC2 3,8 3,7 3,4 3,2 3,1 7,6 3,0 2,9 2,9 3,0Sky One 3,1 2,4 2,2 2,1 2,5 3,1 2,6 2,4 2,3 2,6Sky News 1,6 1,7 1,3 1,3 1,2 0,9 1,0 0,9 0,8 0,8Sky Sports 1 1,1 1,1 1,1 1,1 1,1 0,9 0,9 0,8 0,8 0,7Sky Sports 2 0,6 0,5 0,5 0,5 0,6 0,6 0,5 0,5 0,5 0,5MTV 1,3 1,1 0,9 0,9 1,0 0,9 0,7 0,6 0,6 0,7Nickelodeon 1,3 1,1 1,2 1,0 1,0 0,5 0,4 0,5 0,4 0,5Paramount Comedy – 0,5 0,6 0,7 1,0 – 0,5 0,6 0,6 0,9Living TV – – 0,3 1,2 1,4 – – 0,2 1,1 1,2Nick Jr – – – 0,3 0,7 – – – 0,1 0,4Main foreign channels 31,5 29,8 28,6 27,5 28,4 28,8 26,8 25,8 24,7 25,5Others 13,7 16,1 16,7 19,3 19,5 10,9 12,4 13,1 15,1 15,4
Source: Eurodata TV Worldwide / AGB Nielsen Media Research
Prime time (18:00-23:29). In %, 4 years +.
2008
Others17,5%
RTÉ One31,0%
RTÉ Two12,1%
TG42,2%
TV312,4%
Setanta Ireland0,7%
Channel 60,7%
Channel 43,5%
UTV4,5%
E41,2%
BBC15,0%
BBC23,0%
Sky One 2,6%
Sky News0,8%
Nick Jr0,4%
Living TV 1,2%
Sky Sports 1/21,2%
Daily share. In %, 4 years +.
2004 2005 2006 2007 2008
0
10
20
30
RTÉ One
RTÉ TwoTV3
BBC1UTVChannel 4BBC2
Living TVTG4Sky One
Paramount Comedy
TV audience market share in Ireland 2004-2008 In %, 4 years +.
T.1.IE.3G.1.IE.3

156 2 0 0 9 | V o l u m e 1 | B a n d 1
AL
AT
BE
BG
CH
CY
CZ
DE
DK
EE
ES
FI
FR
GB
GR
HR
HU
IE
IS
IT
LT
LU
LV
MK
MT
NL
NO
PL
PT
RO
RU
SE
SI
SK
TR
IS
Iceland Islande Island IS
T hree television channels dominate the Icelandic market: the public channel
Sjónvarpið (RÚV-TV) and two private channels: Stöð 2 (a pay-TV channel) and Skjár 1. These three channels share most of the country’s television audience. According to the University of Iceland’s Department of Social Sciences, the audi-ence share of Sjónvarpið was 49% in 2007, followed by Stöð 2 with 31% and Skjár 1 with 18%. The audience shares of other domestic channels are far below these. No information whatsoever is available about the viewing of foreign satellite channels.The increase in the concentration of the audience share around the three main channels is all the more surprising as many channels have been created since the deregulation of broadcasting in 1986 and foreign channels are available via the multi-channel distribution platforms.The Icelandic market has around fifteen operational channels. Four are national in scope: the pay-TV channels Stöð 2 and Stöð 2 Sport and the free-to-air chan-nels Sjónvarpið (public) asnd Skjár 1. They can be received by more than 90% of the population. The others, such as Althingi (the parliament channel), INN, N4, Omega, Stöð 2 Extra and the pay-TV channel Stöð 2 Bio reach between 50 and 90% of the population. Finally, Aksjon is a local channel available in about 5% of households.Eight channels belong to 365 ljósva-kamiðlar ehf., a subsidiary of Dagsbrún hf (Stöð 2, Stöð 2 Sport, Stöð 2 Bíó, Stöð 2 Extra and their time-shifted versions). Skjár 1 is controlled by Síminn hf., the former national telecommunications operator Landssími Íslands hf, which was privatised in 2005. Dagsbrún and Síminn, which own the main private Icelandic channels, are also the most important on the pay-TV dis-tribution market. Dagsbrún controls the digital terrestrial television platform and the IPTV service launched by Vodafone in 2007. Síminn operates the IPTV platform Sjonvarp Simans, which was launched in 2004.In 2005, the Post and Telecommunication Authority granted Dagsbrún nationwide digital terrestrial television (DTT) conces-sions for two DTT multiplexes. Another three multiplexes have been granted to RÚV, whereas one is intended for the use of HDTV. No decision has been announced so far by RÚV-TV as to when it will commence digital transmissions. Late in 2005, Dagsbrún commenced the DTT simulcast of its analogue full service and some additional digital only services (eg, Stöð 2+, Sýn Extra) on the Digital Ísland platform. Since 2006, Vodafone, a subsidiary of Dagsbrún, has been operat-ing the DTT service Digital Island, the
Trois chaînes de télévision dominent le marché islandais : la chaîne publique
Sjónvarpið (RÚV-TV) et deux chaînes privées, Stöð 2 (chaîne payante) et Skjár 1. Ces trois chaînes rassemblent pratique-ment tous les téléspectateurs du pays. De fait, selon l’Institut de sciences sociales de l’université d’Islande, la part d’audience de Sjónvarpið était en 2007 de 49 %, suivie par Stöð 2 avec 31 % et Skjár 1 avec 18 %. Les parts d’audience des autres chaînes nationales sont nettement inférieures à celles de ces trois chaînes. Aucune infor-mation n’est disponible en ce qui concerne l’audience des chaînes étrangères.Le renforcement de la concentration de l’audience sur les trois principales chaînes est d’autant plus étonnant que de nom-breuses chaînes ont été créées depuis la déréglementation de la radiodiffusion en 1986 et que les chaînes étrangères sont accessibles via les plates-formes de distri-bution multi-chaînes.Le marché islandais compte une quin-zaine de chaînes actives. Quatre d’entre elles sont d’envergure nationale : les chaî-nes payantes Stöð 2 et Stöð 2 Sport et les chaînes gratuites Sjónvarpið (publique) et Skjár 1. Elles sont disponibles pour plus de 90 % de la population. Les autres, comme Althingi (la chaîne parlementaire), INN, N4, Omega, Stöð 2 Extra et Stöð 2 Bio, qui est payante, touchent entre 50 et 90 % de la population. Enfin, Aksjon est une chaîne locale disponible dans environ 5 % des foyers.Huit chaînes appartiennent à 365 ljós-vakamiðlar ehf., la filiale de Dagsbrún hf (Stöð 2, Stöð 2 Sport, Stöð 2 Bíó, Stöð 2 Extra et leurs versions décalées). La chaîne Skjár 1 est contrôlée par Síminn hf., l’an-cien opérateur national de télécommu-nications Landssími Íslands hf, privatisé en 2005. Dagsbrún et Síminn, propriétaires des principales chaînes privées islandaises, sont aussi les opérateurs les plus importants sur le marché de la distribution de chaînes de télévision payantes. Dagsbrún contrôle la plate-forme de télévision numérique terrestre ainsi que le service IPTV lancé par Vodafone en 2007. Síminn quant à elle opère la plate-forme IPTV Sjonvarp Simans, lancée en 2004.En 2005, l’Autorité de régulation des postes et télécommunications a accordé à Dagsbrún les concessions de deux multi-plex DVB-T pour l’exploitation de la télévision numérique terrestre (TNT) à l’échelle nationale. Trois autres multiplex ont été accordés à RÚV. L’un de ces trois multiplex sera utilisé pour la télévision haute définition (TVHD). RÚV-TV n’a pas encore annoncé de date pour le début de ses transmissions numériques. Vers la fin de l’année 2005, Dagsbrún a commencé à diffuser simultanément
Drei Sender beherrschen den islän-dischen Markt: der öffentlich-recht-
liche Sender Sjónvarpið (RÚV-TV) und die zwei Privatsender Stöð 2 (Pay-TV) und Skjár 1. Zusammen teilen sich diese drei praktisch alle Fernsehzuschauer des Landes. Nach Berechnungen des Instituts für Sozialwissenschaften der Universität von Island lag der Zuschaueranteil von Sjónvarpið 2007 bei 49 %, gefolgt von Stöð 2 mit 31 % und Skjár 1 mit 18 %. Die Zuschaueranteile der anderen einhei-mischen Sender liegen weit unter diesen Werten. Über die Quoten von auslän-dischen Satellitensendern liegen keine Zahlen vor.Die zunehmende Konzentration der Zuschauer auf die drei größten Sender ist umso erstaunlicher, als seit der Deregu-lierung des Rundfunks 1986 zahlreiche neue Sender gegründet wurden und die ausländischen Sender über Multikanal-Plattformen empfangen werden können.Auf dem isländischen Markt gibt es rund 15 Sender, von denen vier landesweit tätig sind: die Pay-TV-Sender Stöð 2 und Stöð 2 Sport sowie die frei empfangbaren Sender Sjónvarpið (öffentlich-rechtlich) und Skjár 1. Diese Sender können von über 90 % der Bevölkerung empf angen werden. Die übrigen Sender wie Althin-gi (Parlamentskanal), INN, N4, Ome-ga, Stöð 2 Extra und Stöð 2 Bio (Pay-TV) erreichen zwischen 50 und 90 % der Bevölkerung. Hinzu kommt noch der Lokalsender Aksjon, den ca. 5 % der Haushalte empfangen.Acht Sender gehören der Firma 365 ljós-vakamiðlar ehf., eine Tochter von Dags-brún hf. (Stöð 2, Stöð 2 Sport, Stöð 2 Bíó, Stöð 2 Extra sowie ihre zeitversetzten Versionen). Der Sender Skjár 1 wird von Síminn hf. kontrolliert, dem früheren nationalen Telekommunikationsbetreiber Landssími Íslands hf, der 2005 privatisiert wurde. Dagsbrún und Síminn, die Eigentümer der größten isländischen Privatsender, sind auch die größten Betreiber auf dem Markt für die Übertragung von Pay-TV-Program-men. Dagsbrún kontrolliert die DVB-T-Plattform sowie den von Vodafone 2007 gestarteten IPTV-Dienst, während Síminn die seit 2004 bestehende IPTV-Plattform Sjonvarp Simans betreibt.2005 erteilte die Post- und Telekom-munikationsbehörde Dagsbrún landes-weite Digital-TV-Konzessionen für zwei DVB-T-Multiplexe. Drei andere Multi-plexe wurden RÚV zugeteilt, während ein weiterer für HDTV vorgesehen ist. Seitens RÚV-TV gab es bislang noch keine Ver-lautbarung darüber, wann der Sender den digitalen Sendebetrieb aufnehmen wird. Ende 2005 begann Dagsbrún mit der par-allelen digitalen Ausstrahlung (Simulcast) seines analogen Vollprogramms sowie

1572 0 0 9 | V o l u m e 1 | B a n d 1
AL
AT
BE
BG
CH
CY
CZ
DE
DK
EE
ES
FI
FR
GB
GR
HR
HU
IE
IS
IT
LT
LU
LV
MK
MT
NL
NO
PL
PT
RO
RU
SE
SI
SK
TR
IS
Iceland Islande Island IS
transmissions of which could be received by about 85% of homes in 2008.According to the Ministry of Commu-nications’ telecommunications blueprint for the years 2005-2010, 99.9% [sic] of households were to have access to digital interactive television, terrestrially and via broadband, before the end of 2007. The shutdown of the analogue system is set for no later than 2010.Apart from DTT and the IPTV services, in 2007 about 40% of Icelandic house-holds subscribed to cable TV services and 11% received satellite TV, according to Statistics Iceland.In spring 2004, the government proposed a highly controversial bill to counter the increased consolidation of media compa-nies. The bill was enacted as law by a razor-thin margin but vetoed by the President. During the 2005/2006 legislative session, a new Media Bill was introduced. It mainly stipulates that no individual or company, or mutually dependent participants, may own more than 25% in a media company that either exceeds a threshold of one-third in terms of market share or in terms of distribution (i.e. one-third of the public daily consumption of newspapers, radio stations or television channels).At the same time, a government bill was introduced concerning the public broad-caster RÚV. The aim was to turn the independent state-owned public institu-tion into a limited liability company under state supervision. The change came into effect in 2007. Finally, the licence fee was abolished at the end of 2008 and replaced by a tax for funding the activities of the public service broadcaster.
l’ensemble de ses programmes par voie analogique et par voie numérique, ainsi que d’autres services par voie numérique exclusivement (par ex. Stöð 2+, Sýn Extra), sur la plate-forme Digital Ísland. Depuis 2006, c’est Vodafone, une filiale de Dags-brún, qui exploite le service TNT Digital Island. Les transmissions numériques de la plate-forme Digital Ísland sont reçues en 2008 par 85 % des foyers environ.Le projet du ministère de la Communica-tion relatif aux télécommunications pour les années 2005-2010, prévoit que 99,9 % [sic] des foyers auront accès à la télévision numérique interactive, par voie hertzienne ou via le réseau câblé en bande large, avant la fin de l’année 2007. L’arrêt du système analogique est prévu pour l’année 2010 au plus tard.Outre la TNT et les services IPTV, en 2007 environ 40 % des foyers islandais sont abonnés à des services de télévision par câble et 11 % reçoivent la télévision par satellite, selon Statistics Iceland.Au printemps 2004, le gouvernement pré-sentait un projet de loi très controversé pour lutter contre le nombre croissant de fusions entre les sociétés de médias. Celui-ci a été promulgué de justesse avant que le Président n’y oppose son veto. Au cours de la session législative de 2005/2006, un nouveau projet de loi sur les médias a été présenté. Il stipule notamment qu’aucun individu, aucune société ou participants interdépendants, ne peuvent posséder plus de 25 % d’une société de médias et ne doivent pas dépasser non plus le seuil limi-te fixé à un tiers, que ce soit en termes de parts de marché, ou en termes de diffusion (c’est-à- dire un tiers de l’utilisation publi-que des journaux, des stations de radio et des chaînes de télévision au quotidien). Parallèlement, un projet de loi gouverne-mental a été présenté au sujet du radiodif-fuseur public RÚV, visant à transformer l’institution publique indépendante appartenant à l’Etat en une société publi-que à responsabilité limitée sous la tutelle de l’Etat. La transformation est entrée en vigueur en 2007. Enfin, la redevance a été supprimée à la fin de l’année 2008 et rem-placée par une taxe, destinée à financer les activités du radiodiffuseur public.
einiger ausschließlich digital angebotener Dienste (z.B. Stöð 2+, Sýn Extra) auf der Plattform Digital Ísland. Der DVB-T-Dienst Digital Ísland wird seit 2006 von Vodafone, einer Tochter von Dagsbrún, betrieben. Das Digitalprogramm der Platt-form Digital Ísland wurde 2008 von rund 85 % der Haushalte empfangen.Laut Telekommunikationsplanung des Ministeriums für Kommunikation für die Jahre 2005-2010 würden bis Ende 2007 99,9 % [sic!] der Haushalte Zugang zum digitalen interaktiven Fernsehen haben, über Antenne und Breitband. Die Abschaltung des Analogfernsehens soll spätestens 2010 erfolgen.Neben DVB-T und IPTV-Diensten hat-ten laut den Zahlen von Statistics Iceland 2007 rund 40 % der isländischen Haus-halte Zugang zum Kabelfernsehen und 11 % zum Satellitenfernsehen.Im Frühjahr 2004 legte die Regierung einen hochgradig kontroversen Gesetz-entwurf vor, um dem zunehmenden Zusammenschluss von Medienunterneh-men zu begegnen. Das Gesetz wurde mit einer hauchdünnen Mehrheit verabschie-det, aber durch ein Veto des Präsidenten gekippt. Im parlamentarischen Jahr 2005/2006 wurde ein neuer Medienge-setzentwurf eingebracht. Darin wird im Wesentlichen festgelegt, dass keine private oder juristische Person – oder gegenseitig voneinander abhängige Personen – mehr als 25 eines Medienunternehmens besit-zen darf, das in Punkto Marktanteil oder Verbreitung (d.h. tägliche Nutzung von Zeitungen bzw. Radio- und Fernsehka-nälen) die Marke von einem Drittel über-schreitet.Gleichzeitig wurde von der Regierung ein Gesetzentwurf über den öffentlich-recht-lichen Sender RÚV eingebracht, um das unabhängige öffentlich-rechtliche Staats-unternehmen in eine öffentlich-rechtliche GmbH unter staatlicher Aufsicht umzu-wandeln. Diese Umwandlung ist 2007 in Kraft getreten. Ende 2008 wurde zur Finanzierung des öffentlich-rechtlichen Senders die Rundfunkgebühr abgeschafft und durch eine Steuer ersetzt.
Sources: Nordicom: http://www.nordicom.gu.se Legal aspects: IRIS Merlin, http://merlin.obs.coe.int

158 2 0 0 9 | V o l u m e 1 | B a n d 1
AL
AT
BE
BG
CH
CY
CZ
DE
DK
EE
ES
FI
FR
GB
GR
HR
HU
IE
IS
IT
LT
LU
LV
MK
MT
NL
NO
PL
PT
RO
RU
SE
SI
SK
TR
IS
Iceland Islande Island IS
Population and equipment 31.12.08Penetration
(in % HH) In thousand SourcesPopulation (inhabitants) 319 Statistics Iceland
Households – 122 Statistics Iceland
TV households 95,9% 117 Statistics Iceland
Cable TV households (passed) 48,4% 59 Statistics Iceland
Digital cable TV households 9,84% 12 estimates OBS
DTH/SMATV households 9,0% 11 Statistics Iceland
IPTV subscriptions ~ ~Installed DVB-T receivers ~ ~Total Digital TV households 57,4% 70 Statistics Iceland
Households with PC 92,0% 112 Statistics Iceland
Households with broadband 88,0% 103 Statistics Iceland
TV channels distributors 10.09 CompaniesCable operators 3 SiminnSatellite packagers 0IPTV packagers 2 Siminn, Vodafone (Dagsbrún group)DTT packagers 1 Vodafone (Dagsbrún group)Mobile phone TV packagers 1 Vodafone (Dagsbrún group)
Number of TV channels by kind of licence 10.09 Public Private TotalTerrestrial (national) 1 9 10Cable/Satellite/IPTV/Mobile 2 3 5Regional/Local 0 1 1Regional/Local windows 0 0 0Channels targeting foreign markets 0 0 0Total 3 13 16Foreign channels targeting the country 0 0 0
Source: European Audiovisual Observatory
Basic figures
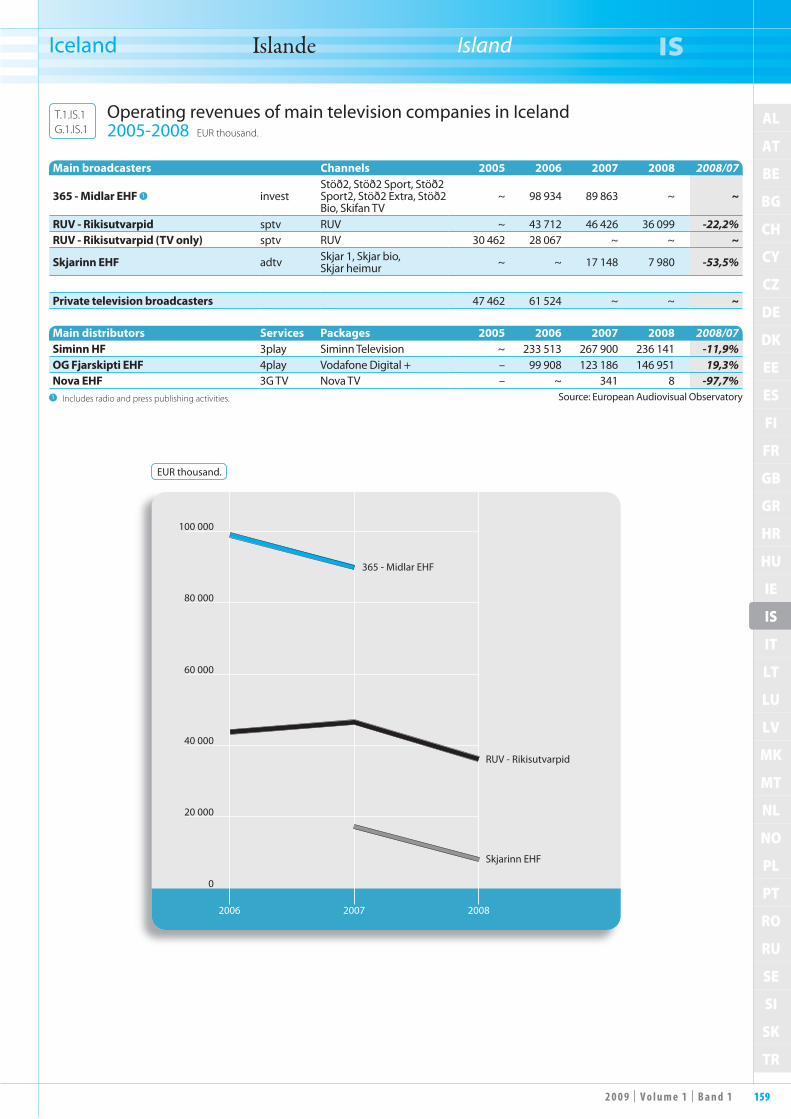
1592 0 0 9 | V o l u m e 1 | B a n d 1
AL
AT
BE
BG
CH
CY
CZ
DE
DK
EE
ES
FI
FR
GB
GR
HR
HU
IE
IS
IT
LT
LU
LV
MK
MT
NL
NO
PL
PT
RO
RU
SE
SI
SK
TR
IS
Iceland Islande Island IS
Main broadcasters Channels 2005 2006 2007 2008 2008/07
365 - Midlar EHF 1 investStöð2, Stöð2 Sport, Stöð2 Sport2, Stöð2 Extra, Stöð2 Bio, Skifan TV
~ 98 934 89 863 ~ ~
RUV - Rikisutvarpid sptv RUV ~ 43 712 46 426 36 099 -22,2%RUV - Rikisutvarpid (TV only) sptv RUV 30 462 28 067 ~ ~ ~
Skjarinn EHF adtv Skjar 1, Skjar bio, Skjar heimur ~ ~ 17 148 7 980 -53,5%
Private television broadcasters 47 462 61 524 ~ ~ ~
Main distributors Services Packages 2005 2006 2007 2008 2008/07Siminn HF 3play Siminn Television ~ 233 513 267 900 236 141 -11,9%OG Fjarskipti EHF 4play Vodafone Digital + – 99 908 123 186 146 951 19,3%Nova EHF 3G TV Nova TV – ~ 341 8 -97,7%
Source: European Audiovisual Observatory1 Includes radio and press publishing activities.
EUR thousand.
2006 2007 2008
0
100 000
60 000
80 000
40 000
20 000
RUV - Rikisutvarpid
Skjarinn EHF
365 - Midlar EHF
Operating revenues of main television companies in Iceland 2005-2008 EUR thousand.
T.1.IS.1G.1.IS.1

160 2 0 0 9 | V o l u m e 1 | B a n d 1
AL
AT
BE
BG
CH
CY
CZ
DE
DK
EE
ES
FI
FR
GB
GR
HR
HU
IE
IS
IT
LT
LU
LV
MK
MT
NL
NO
PL
PT
RO
RU
SE
SI
SK
TR
IS
Iceland Islande Island IS
Source: RUV / EBU and Statistics Iceland / European Audiovisual Observatory
2004 2005 2006 2007 2008 2008/07Licence Fee 19 101 22 062 19 303 21178 16278 -23,1%Advertising 5 186 6 090 6 471 8637 6713 -22,3%Sponsorship 1 108 1 267 1 145 1 1 0,0%Merchandising/Others 722 1 043 974 ~ ~ ~
Total revenues 26 117 30 462 27 893 29 815 22 991 -22,9%
Total expenses ~ ~ ~ ~ 34 575Net result ~ ~ ~ ~ -3 957Operating margin (%) ~ ~ ~ ~ 4,2
1 Included in advertising.
EUR thousand.
2004 2005 2006 2007 2008
0
35 000
30 000
25 000
20 000
15 000
10 000
5 000Licence Fee
Advertising
Merchandising/OthersSponsorship
Breakdown of RUV television revenues 2004-2008 EUR thousand.
T.1.IS.2G.1.IS.2

1612 0 0 9 | V o l u m e 1 | B a n d 1
AL
AT
BE
BG
CH
CY
CZ
DE
DK
EE
ES
FI
FR
GB
GR
HR
HU
IE
IS
IT
LT
LU
LV
MK
MT
NL
NO
PL
PT
RO
RU
SE
SI
SK
TR
IS
Iceland Islande Island IS
Source: Social Science Research Institute at the University of Iceland, IM Gallup/Capacent, Rikisutvarpid/HI
Daily shareChannels 05/2006 09/2006 10/2006 02/2007 06/2007 02/2008 06/2008 10/2008 02/2009 06/2009 10/2009RUV 44 39 45 44 49 47 56 50 49 44 49Stöd 2 28 28 27 32 31 27 24 27 29 30 29Stöd 2 - Movies 2 3 ~ ~ ~ 5 3 2 2 4 2Syn ~ ~ ~ ~ ~ 3 2 3 4 4 4Sirkus 4 5 7 4 1 1 1 1 1 1 2Skjàr 1 15 25 21 20 18 17 15 17 14 16 15
Others 7 ~ ~ ~ ~ ~ ~ ~ ~ ~ ~
05/2006
09/2006
10/2006
02/2007
06/2007
02/2008
06/2008
10/2008
02/2009
06/2009
10/2009
0
20
10
30
40
60
50
Stöd 2 - Movies
RUV
Stöd 2
Skjàr 1
Stöd 2 Sport(previously as Syn)Stöd 2 Extra
Daily share. In %, 12-80 years old.
TV audience market share in Iceland 2005-2009 In %, 12-80 years old.
T.1.IS.3G.1.IS.3

162 2 0 0 9 | V o l u m e 1 | B a n d 1
AL
AT
BE
BG
CH
CY
CZ
DE
DK
EE
ES
FI
FR
GB
GR
HR
HU
IE
IS
IT
LT
LU
LV
MK
MT
NL
NO
PL
PT
RO
RU
SE
SI
SK
TR
IT
Italy Italie Italien IT
The Italian audiovisual landscape is dominated by two channels that have
a daily audience market share of more than 20%. The public channel RAI Uno (21.8%) is still slightly ahead of Canale 5, the most-watched Italian private channel, which is controlled by the Mediaset group. Behind them in terms of audience ratings are four channels that each have a daily reach of approx. 10%: Italia 1 (Mediaset), RAI Due, RAI Tre and Rete 4 (Mediaset). Apart from the seventh terrestrial ana-logue channel La 7, with a stable market share around 3%, no channel has a daily reach of more than 0.5% in Italy. The mar-ket remains concentrated around six main incumbent channels (the three first public channels and the three national channels of the Mediaset group), which still had a collective audience share of more than 80% in 2008.The public broadcaster RAI has contin-ued its policy of increasing its number of channels in 2008 and 2009 by launching several new ones: Raitalia in March 2008 (international channels that replaced the various RAI International channels), RAI 4 in July 2008 (a youth channel), RAI Storia in March 2009 (history and culture), Yes Italia in July 2009 (an inter-national channel for Italians living abroad) and RAIScuola in October 2009 (an edu-cational channel). During the same period, three public channels produced by RAI were closed down: RAI Utile in 2008, followed by RAI Nettuno Sat Due and Raisat Smash Girls in 2009.Three-quarters of Italian homes still depended on the terrestrial reception of television services at the end of 2008. First of all, the country is not cabled; secondly, although IPTV had a fairly positive start, the various platforms only had a total of about 600,000 subscribers at the end of 2008, which is just a small proportion of the country’s households. Four operators were competing with one another at the end of 2008, when Tiscali announced that it was closing its service down. This accord-ingly leaves only Telecom Italia (with its Alice package), Fastweb and Wind on the IPTV market.The main multi-channel pay-TV pro-vider is Sky Italia. The satellite package of the News Corp. group claimed to have 4.8 million subscribers in June 2009, or 20% of households. However, Sky Italia has lost its monopoly on the satellite tele-vision market since the summer of 2009 and the launch of the platform Tivùsat. Modelled on the Freesat package in the UK, Tivùsat offers free access (with a viewing card) to twenty DTT channels. The company TIVU SRL is 48% owned by RAI, 48% by Mediaset and 4% by Telecom Italia. In the summer of 2009, negotiations on the renewal of contracts for the distribution of the Raisat public
Le paysage audiovisuel italien est lar-gement dominé par deux chaînes
qui dépassent les 20 % de part de marché d’audience quotidienne. La chaîne publi-que RAI Uno (21,8 %) devance toujours légèrement Canale 5, la première chaîne privée italienne, contrôlée par le groupe Mediaset. Derrière elles, quatre chaînes rassemblent environ 10 % d’audience quotidienne chacune : Italia 1 (Mediaset), RAI Due, RAI Tre et Rete 4 (Mediaset). Hormis la septième chaîne terrestre ana-logique La 7, stable autour de 3 % de part de marché, aucune chaîne ne dépasse 0,5 % de l’audience quotidienne en Italie. Le marché demeure concentré autour des six principales chaînes historiques (les trois premières chaînes publiques et les trois chaînes nationales du groupe Mediaset), qui rassemblent toujours plus de 80 % de l’audience en 2008.Le radiodiffuseur public RAI a poursuivi sa politique de croissance du nombre de chaînes en 2008 et 2009 en lançant plusieurs nouvelles antennes : Raitalia en mars 2008 (chaînes internationales rem-plaçant les différentes RAI International), RAI 4 en juillet 2008 (chaîne pour adoles-cents), RAI Storia en mars 2009 (chaîne historique et culturelle), Yes Italia en juillet 2009 (chaîne internationale à destination des italiens vivant à l’étranger) ou encore RAIScuola en octobre 2009 (chaîne édu-cative). Au cours de la même période, trois chaînes publiques éditées par la RAI ont aussi été fermées : RAI Utile en 2008, suivie de RAI Nettuno Sat Due et de Raisat Smash Girls en 2009.Les trois quarts des foyers italiens reposent encore à la fin de l’année 2008 sur la récep-tion terrestre des services de télévision. D’abord, le pays n’est pas câblé. Ensuite, bien que l’IPTV démarre plutôt bien, les différentes plates-formes ne rassemblent qu’environ 600 000 abonnés à la fin de l’année 2008, soit une part encore margi-nale des foyers italiens. Quatre opérateurs étaient en concurrence jusqu’à la fin de l’année 2008, quand Tiscali a annoncé la fermeture de son service. Ne restent donc plus sur le marché de l’IPTV que Telecom Italia (avec son bouquet Alice), Fastweb et Wind.Le principal fournisseur de télévision payante multi-chaînes est alors Sky Ita-lia. Le bouquet satellite du groupe News Corp. revendique en 4,8 millions d’abon-nés en juin 2009, soit environ 20 % des foyers. Sky Italia n’est toutefois plus en situation de monopole sur le marché de la télévision par satellite depuis l’été 2009 et le lancement de la plate-forme Tivùsat.Créée sur le modèle du bouquet britanni-que Freesat, Tivùsat propose l’accès gra-tuit (à condition de posséder une carte) à une vingtaine de chaînes de la TNT. La firme TIVU SRL est possédée à 48 % par
Die audiovisuelle Landschaft in Ita-lien wird in hohem Maße von zwei
Sendern dominiert, die jeweils einen Zuschaueranteil von über 20 % für sich verbuchen können. Auf Platz 1 steht nach wie vor der öffentlich-rechtliche Sender RAI Uno (21,8 %), dicht gefolgt von Canale 5, dem größten italienischen Privatsender des Medienkonzerns Medi-aset. Dahinter folgen vier Sender mit jeweils rund 10 % Zuschaueranteil: Italia 1 (Mediaset), RAI Due, RAI Tre und Rete 4 (Mediaset). Vom siebten analogen terre-strischen Sender (La 7) abgesehen, erreicht keiner der übrigen Sender in Italien einen Zuschaueranteil von mehr als 0,5 %. Der Markt wird immer noch von den sechs tradi tionell größten Sendern beherrscht (die drei ersten öffentlich-rechtlichen Sen-der und die drei landesweiten Mediaset- Sender), die 2008 einen Zuschaueranteil von zusammen über 80 % erreicht haben.Die öffentlich-rechtliche Rundfunk-anstalt RAI hat 2008 und 2009 ihre Wachstumsstrategie fortgesetzt und meh-rere neue Sender in Betrieb genommen, darunter beispielsweise Raitalia im März 2008 (internationale Kanäle als Ersatz für RAI International), RAI 4 im Juli 2008 (Kanal für Jugendliche), RAI Storia im März 2009 (Geschichts- und Kulturka-nal), Yes Italia im Juli 2009 (internationa-ler Kanal für Italiener im Ausland) oder RAIScuola im Oktober 2009 (Bildungs-kanal). Im gleichen Zeitraum haben auch drei öffentlich-rechtliche Sender der RAI ihren Betrieb eingestellt: RAI Utile 2008 sowie RAI Nettuno Sat Due und Raisat Smash Girls 2009.Ende 2008 waren noch drei Viertel der Haushalte in Italien auf das terrestrische Fernsehen angewiesen. Hauptgrund hier-für ist, dass das Land nicht verkabelt ist. Des Weiteren erreicht das Internetfern-sehen (IPTV) trotz eines vielverspre-chenden Starts mit rund 600 000 abon-nierten Haushalten (Stand Ende 2008) einen nur sehr geringen Marktanteil. Ende 2008 gab es noch vier Betreiber am Markt, aber dann hat Tiscali die Einstellung sei-nes Dienstes angekündigt. So gibt es nur noch drei Anbieter auf dem IPTV-Markt: Telecom Italia (mit dem Bouquet Alice), Fastweb und Wind.Größter Mehrkanal-Pay-TV-Anbieter ist Sky Italia. Das Satellitenpaket des Medien konzerns News Corp. hatte im Juni 2009 nach eigenen Angaben 4,8 Mio. Abonnenten, d.h. rund 20 % der Haushalte. Sky Italia hat allerdings seine Stellung als Monopolist auf dem Markt für Satellitenfernsehen seit dem Start der Plattform Tivùsat im Sommer 2009 ver-loren. Diese bietet nach dem Modell des britischen Bouquets Freesat einen kosten-losen Zugang zu rund 20 DVB-T-Sendern (eine Chipkarte vorausgesetzt). Anteils-eigner der Firma TIVU SRL sind die

1632 0 0 9 | V o l u m e 1 | B a n d 1
AL
AT
BE
BG
CH
CY
CZ
DE
DK
EE
ES
FI
FR
GB
GR
HR
HU
IE
IS
IT
LT
LU
LV
MK
MT
NL
NO
PL
PT
RO
RU
SE
SI
SK
TR
IT
Italy Italie Italien IT
satellite channels on the Sky platform failed, which meant they were removed from the Sky package at the moment when they appeared in the Tivùsat package.A particular feature of the Italian situa-tion is the dynamic nature of the coun-try’s mobile television market, where mobile telephone operators offer 3G television services (H3G, Telecom Italia and Vodafone Omnitel). H3G and Voda-fone also offer personal mobile television services (using the DVB-H technology). While the Vodafone Sky TV Pass service provides access to some Sky package chan-nels, H3G provides Sky channels as well as the Calcio Premium channels of the Mediaset package.The significance of terrestrial trans missions in Italy is explained by the success of DTT. The network is made up of eight multi-plexes offering a combination of free-to-air channels and pay-TV. According to DGTVI, in April 2009 more than 8.7 mil-lion households, or 41% of Italian homes, mainly depended on DTT for their tele-vision programmes. The date for the swi-tchoff of analogue terrestrial transmissions has been set for 2012 but the switchoff has already taken place in several regions, such as Sardinia or the Aosta Valley from Octo-ber 2008 and Lazio in autumn 2009.Italian viewers are offered two pay-DTT services: firstly, the Mediaset Premium platform (Mediaset group), which pro-vides pay-per-view football channels (Premium Calcio), film channels (Studio Universal, Premium Cinema, Mya, etc) and children’s channels (Disney Channel, Cartoon Network, Hiro, etc). Mediaset claimed to have 3.6 million subscribers in June 2009 and the figure is steadily rising. The second service is offered by Dahlia, which replaced the Cartapiù ser-vice operated by Telecom Italia in March 2009. The platform offers sports chan-nels (Dahlia Calcio and Xtreme), adult channels (Dahlia Eros and Adult) and a documentary channel (Dahlia Explorer). The package is controlled by the Swedish group Airplus, which was also trying to gain a foothold on the pay-DTT market in Spain in 2009.A recurring issue on the Italian audio-visual landscape is the emergence of new players in the light of the RAI/Mediaset duopoly on the analogue terrestrial mar-ket. In this context, the question of the digital dividend associated with the DTT switchover is extremely important. The legal framework laid down by the “Gas-parri Law” did not encourage the emer-gence of new players and led in 2006 and 2007 to criticism from the European Commission, which sent Italy two letters. The “Gentiloni Bill” aimed at reforming this law was abandoned with the fall of the Prodi government in 2008. However, the regulatory authority AGCOM has
la RAI, à 48 % par Mediaset et à 4 % par Telecom Italia.Durant l’été 2009, les négociations concer-nant le renouvellement des contrats de distribution des chaînes satellitaires publi-ques Raisat sur la plate-forme Sky ont échoué. Par conséquent, elles ont disparu du bouquet Sky au moment où elles sont apparues sur le bouquet Tivùsat.Une des particularités du marché ita-lien est le dynamisme de son marché de la télévision mobile. Trois opérateurs de téléphonie mobile proposent des offres de télévision 3G vers les téléphones por-tables (H3G, Telecom Italia et Vodafone Omnitel). H3G et Vodafone proposent parallèlement des services de télévision mobile personnelle (utilisant la techno-logie DVB-H). Si le service Vodafone Sky TV Pass propose l’accès à certaines chaînes du bouquet Sky, H3G fournit des chaînes Sky mais aussi les chaînes Calcio Premium du bouquet Mediaset.L’importance des transmissions terrestres en Italie explique le succès de la TNT. Le réseau est composé de huit multi-plex proposant une combinaison de chaînes gratuites et d’offres payantes. Selon DGTVI, en avril 2009 plus de 8,7 millions de foyers dépendent essen-tiellement de la TNT pour regarder la télévision, soient 41 % des foyers italiens. La date de l’extinction des transmissions analogiques terrestres est fixée à 2012, et plusieurs extinctions régionales ont déjà eu lieu, ainsi en Sardaigne ou dans la Vallée d’Aoste dès octobre 2008 et le Lazio au cours de l’automne 2009.Deux offres de TNT payante sont propo-sées aux spectateurs italiens. D’abord la plate-forme Mediaset Premium (groupe Mediaset). Celle-ci fournit des chaînes de football en pay-per-view (Premium Calcio), des chaînes cinéma (Studio Uni-versal, Premium Cinema, Mya…) et des chaînes pour enfants (Disney Channel, Cartoon Network, Hiro…). Mediaset revendique en juin 2009 3,6 millions d’abonnés, un chiffre en constante aug-mentation. La seconde offre est celle de Dahlia, qui a remplacé en mars 2009 le service Cartapiù, opéré par Telecom Italia. La plate-forme propose des chaînes sporti-ves (Dahlia Calcio et Xtreme), des chaînes pour adultes (Dahlia Eros et Adult) et une chaîne documentaire (Dahlia Explorer). Le bouquet est contrôlé par le groupe suédois Airplus, qui cherche à s’implan-ter aussi en 2009 sur le marché de la TNT payante en Espagne.Une question récurrente relative au pay-sage audiovisuel italien est celle de l’émer-gence de nouveaux acteurs face au duopole constitué sur le réseau analogique terrestre par la RAI et Mediaset. Dans ce contexte, la question du dividende numérique lié au basculement vers la TNT revêt un carac-
RAI (48 %), Mediaset (48 %) und Tele-com Italia (4 %). Während des Sommers 2009 sind die Verhandlungen über die Ver-längerung der Verträge für die Ausstrah-lung öffentlich-rechtlicher Raisat-Sender auf der Sky-Plattform gescheitert. Folglich sind sie mit ihrem Einstieg bei Tivùsat aus dem Sky-Bouquet verschwunden.Eine der Besonderheiten des italienischen Marktes ist auf die Dynamik des Marktes für Mobilfernsehen zurückzuführen. Drei Handy-TV-Betreiber bieten 3G-Fern-sehdienste für Mobiltelefone an (H3G, Telecom Italia und Vodafone Omnitel). H3G et Vodafone bieten parallel hierzu personalisierte Mobilfernsehdienste an (über DVB-H). Während der Dienst Vodafone Sky TV Pass Zugang zu einigen Sendern des Sky-Bouquets bietet. umfasst das Angebot von H3G neben den Sky-Sendern auch die Calcio Premium-Kanäle des Mediaset-Bouquets.Die Bedeutung des Antennenfernsehens in Italien erklärt den großen Erfolg des DVB-T-Fernsehens. Das Netz umfasst acht Multiplexe, die eine Mischung aus Free-TV-Programmen und kostenpflich-tigen Angeboten bereitstellen. Laut DGT-VI waren im April 2009 über 8,7 Mio. Fernsehhaushalte im Wesentlichen auf DVB-T-Angebote angewiesen, d.h. 41 % der Haushalte in Italien. Die landesweite Abschaltung des analogen terrestrischen Fernsehens ist für 2012 vorgesehen, aber in einigen Regionen ist diese Abschaltung bereits erfolgt, so beispielsweise bereits im Oktober 2008 in Sardinien und im Aos-tatal oder im Herbst 2009 in der Region Lazio.Es gibt zwei kostenpflichtige DVB-T-Angebote in Italien. An erster Stelle kommt die Plattform Mediaset Premi-um (des Mediaset-Konzerns), die neben Pay-per-View-Fußball (Premium Calcio), Kinokanäle (Studio Universal, Premium Cinema, Mya…) und Kinderkanäle (Dis-ney Channel, Cartoon network, Hiro…) anbietet. Mediaset hatte nach eigenen Angaben im Juni 2009 3,6 Mio. Abon-nenten, Tendenz steigend. Das zweite Angebot ist die Plattform Dahlia, die im März 2009 die von Telecom Italia betrie-bene Plattform Cartapiù abgelöst hat. Das Dahlia-Paket umfasst Sportkanäle (Dahlia Calcio und Xtreme), Erotik-kanäle (Dahlia Eros und Adult) sowie einen Dokumentarkanal (Dahlia Explo-rer). Kontrolliert wird das Paket von der schwedischen Gruppe Airplus, die 2009 auch in den spanischen Pay-DVB-T-Markt eingestiegen ist.Eine immer wiederkehrende Frage in Verbindung mit der audiovisuellen Land-schaft in Italien betrifft die Chancen neuer Akteure im Wettbewerb mit dem bestehenden Duopol RAI / Mediaset im Bereich des analogen terrestrischen Fernsehens. In diesem Zusammenhang

164 2 0 0 9 | V o l u m e 1 | B a n d 1
AL
AT
BE
BG
CH
CY
CZ
DE
DK
EE
ES
FI
FR
GB
GR
HR
HU
IE
IS
IT
LT
LU
LV
MK
MT
NL
NO
PL
PT
RO
RU
SE
SI
SK
TR
IT
Italy Italie Italien IT
changed the arrangements for the digital dividend after a deliberation in April 2009 on the criteria for the complete digitisa-tion of the Italian terrestrial network. The new criteria could then enable new players to enter the Italian market.The Centro Europa 7 case is another example of the weakening of the Ital-ian duopoly. The long legal battle of the broadcaster of the channel Europa 7 ended in 2008. In 1999, the company had been granted a licence for national terrestrial broadcasting but was unable to implement it because it could not obtain a frequency. The European Court of Justice delivered a judgment in January 2008 condemning Italy’s transitional arrangements for the allocation of frequencies. In response to this judgment, AGCOM ruled in favour of Centro Europa 7 in October 2008 and the government allocated it a national ter-restrial (analogue and digital) frequency in December 2008. Europa 7 should start broadcasting between July 2009 and June 2011 at the latest.The European Commission finally closed the procedure initiated against Italy in 2007 for breaches of the Community rules on television advertising. AGCOM then modified the rules governing adver-tising in the country, thus in particular preventing the failure to take account of tele shopping messages when calculating the time devoted to advertising.
tère crucial. Le cadre juridique fixé par la « loi Gasparri » ne favorisait pas l’émer-gence de nouveaux acteurs, et a suscité les critiques de la Commission européenne en 2006 et 2007, qui avait envoyé deux let-tres à l’Italie. Le projet de loi Gentiloni, visant à réformer cette loi, a été abandonné lors de la chute du gouvernement Prodi en 2008. L’AGCOM a toutefois réformé les modalités du dividende numérique via une délibération du mois d’avril 2009 sur les critères de numérisation complète du réseau terrestre italien. Les nouveaux cri-tères pourraient alors autoriser l’entrée de nouveaux acteurs sur le marché.L’affaire Centro Europa 7 représente une autre symbole de la puissance ébranlée du duopole italien. La longue bataille judi-ciaire de l’entreprise éditrice de la chaîne Europa 7 s’est en effet achevée en 2008. Elle s’était vue attribuer en 1999 une concession pour la radiodiffusion terrestre nationale qu’elle n’avait jamais pu mettre en œuvre, faute d’obtenir une fréquence. La Cour de justice des Communautés européennes a rendu un arrêt en janvier 2008 condamnant les régimes transitoires italiens d’attribution des radiofréquen-ces. Suite à cet arrêt, l’AGCOM a statué en octobre 2008 en faveur de Centro Europa 7 et le gouvernement lui a alloué en décembre 2008 une fréquence natio-nale terrestre (analogique et numérique). La chaîne Europa 7 devrait inaugurer ses émissions entre juillet 2009 et juin 2011 au plus tard.La Commission européenne a clos enfin la procédure engagée en 2007 contre l’Italie au titre des infractions aux règles communautaires en matière de publicité télévisée. L’AGCOM a en effet modifié les règles régissant la publicité dans le pays, empêchant en particulier la non prise en compte des messages de télé-achat dans le décompte du temps consacré à la publi-cité.
kommt der Frage der digitalen Dividende in Verbindung mit der Umschaltung auf das digitale Antennenfernsehen eine ent-scheidende Bedeutung zu. Der mit dem „Gasparri-Gesetz“ geschaffene Rahmen war für den Markteintritt neuer Akteure nicht förderlich und wurde 2006 und 2007 in zwei Schreiben der Europäischen Kommission an die italienische Regie-rung kritisiert. Der vom Minister Genti-loni vorgelegte Entwurf zur Reform dieses Gesetzes wurde 2008 mit dem Rücktritt der Regierung Prodi aufgegeben. Aller-dings hat die AGCOM die Modalitäten der digitalen Dividende per Beschluss vom April 2009 über die Kriterien für die voll-ständige Digitalisierung des italienischen Netzes reformiert. Nach den neuen Kri-terien scheint ein Einstieg neuer Akteure auf dem Markt eher möglich.Die Affäre Centro Europa 7 ist ein wei-teres Symbol für die erschütterte Macht-stellung des italienischen Duopols. Die lange juristische Auseinandersetzung des Betreibers des Senders Europa 7 ist 2008 nach fast zehn Jahren zu Ende gegangen. Das Unternehmen hatte 1999 eine Lizenz für ein nationales terrestrisches Rundfunk-programm erhalten, konnte aber mangels Sendefrequenz nie auf Sendung gehen. Im Januar 2008 hat der Gerichtshof der Euro-päischen Gemeinschaften ein Urteil erlas-sen, in dem die italienischen Übergangs-regelungen für die Funkfrequenzvergabe verurteilt werden. Infolge dieses Urteils hat die AGCOM im Oktober 2008 eine Entscheidung zu Gunsten von Centro Europa 7 getroffen und die Regierung hat dem Unternehmen im Dezember 2008 eine nationale terrestrische Frequenz zugeteilt (analog und digital). Europa 7 dürfte zwischen Juli 2009 und spätestens Juni 2011 auf Sendung gehen.Die Europäische Kommission hat schließ-lich das 2007 gegen Italien eingelei-tete Verfahren wegen Verstoß gegen die EU-Vorschriften für Fernsehwerbung ein-gestellt. So hat die AGCOM die natio-nalen Werbevorschriften geändert und ins-besondere die Nichtberücksichtigung der Teleshopping-Werbung in der Be rechnung der Werbezeiten verhindert.
Sources: AGCOM: http://www.agcom.it News about DTT: DGTVi, http://www.dgtvi.it Audience data: Auditel / AGB Nielsen Media Research Italy, http://www.auditel.it Legal aspects: IRIS Merlin, http://merlin.obs.coe.int

1652 0 0 9 | V o l u m e 1 | B a n d 1
AL
AT
BE
BG
CH
CY
CZ
DE
DK
EE
ES
FI
FR
GB
GR
HR
HU
IE
IS
IT
LT
LU
LV
MK
MT
NL
NO
PL
PT
RO
RU
SE
SI
SK
TR
IT
Italy Italie Italien IT
Population and equipment 31.12.08Penetration
(in % HH) In thousand SourcesPopulation (inhabitants) – 60 045 Eurostat
Households – 24 258 Eurostat
TV households 100% 24 258 European Audiovisual Observatory
Cable TV households ~ ~Digital cable TV households ~ ~DTH/SMATV households 30,6% 7 420 Screen Digest / European Audiovisual Observatory
Pay DTH/SMATV households 19,4% 4 700 Screen Digest / European Audiovisual Observatory
IPTV subscription 2,4% 587 Screen Digest / European Audiovisual Observatory
Installed DVB-T receivers 33,4% 8 100 Screen Digest / European Audiovisual Observatory
Total digital TV households 55,2% 13 387 European Audiovisual Observatory
Households with PC 51,9% 12 584 Screen Digest / European Audiovisual Observatory
Households with broadband connections 39,6% 9 613 Screen Digest / European Audiovisual Observatory
Mobile phone TV subscriptions – 138 Screen Digest
Mobile broadcast TV subscriptions – 735 Screen Digest
TV channels distributors 11.09 CompaniesCable operators ~Satellite packagers 3 Orbit, Sky Italia, TIVUIPTV packagers 3 Fastweb, Telecom Italia (Alice) Wind (Infostrada TV)DTT multiplex operators and/or packagers 8 Elettronica Industriale, Prima TV, Profit Group, Rai Way, Rete 7, Telecom
Italia Media Broadcasting, TivuMobile phone TV packagers 3 H3G, Telecom Italia, Vodafone OmnitelMobile broadcast TV packagers 2 H3G, Vodafone Omnitel
Number of TV channels by kind of licence 10.09 Public Private TotalTerrestrial (national) 8 59 67Cable/Satellite/IPTV channels 16 302 318Regional/Local 7 570 577Regional/local windows 0 0 0Channels targeting foreign markets 4 42 46Total 35 973 1 008Foreign channels targeting the country 3 21 24
Source: European Audiovisual Observatory
Supply of TV channels by genre and by platform (including foreign channels) 10.09
Free national digital
terrestrialSatellite
Sky Italia
IPTV Telecom Italia
AliceIPTV
FastwebGeneralist - national 9 13 9 8Generalist - foreign 9Adult 3 1Children 2 13 2 13Culture/ education/ documentary 1 17 12 8Minority interest groupsEntertainment/ TV fiction/ games 3 27 25 17Film 1 10 10 11Home shopping 1 12 1International linguistic and cultural 8Lifestyle/ specific leisure/ travel 22 9 7Music 1 16 16 10News/ business 6 35 21 8Parliament/ government/ administration 3Regional/ local 30 1Religion 1 6 1Sports 4 51 53 42Various 2 37 20 3Total 31 312 177 131
1 Orbit is established in Italy but targets the Arabic countries.
1
Basic figures

166 2 0 0 9 | V o l u m e 1 | B a n d 1
AL
AT
BE
BG
CH
CY
CZ
DE
DK
EE
ES
FI
FR
GB
GR
HR
HU
IE
IS
IT
LT
LU
LV
MK
MT
NL
NO
PL
PT
RO
RU
SE
SI
SK
TR
IT
Italy Italie Italien IT
Source: European Audiovisual Observatory on the basis of data from Screen Digest, WARC and RAI
Source: European Audiovisual Observatory
Source: Screen DigestSource: Screen Digest
1 IPTV service interrupted on 1.1.2009.
Households TV equipment 2004-2008
Number of households accessing multichannel platforms as at 31.12.2008
Consumers pay-TV gross spend 2004-2008
Gross revenues of radio-television 2004-2008
In thousands.
In thousands.
EUR thousand.
EUR million.
2004 2005 2006 2007 2008
0
10 000
8 000
6 000
4 000
2 000
DTT households
Satellite households
IPTV households
8 100
5871 143
169
3 495
4 254
5 1545 000
5 300
6 6406 900 7 420
192 213 263
Free DTT
Tiscali
Infostrada
Alice TV
Fastw
eb
Sky Italia
Elettronica
Industr
ialeRete 7
0
8 000
6 000
4 000
2 000
10 000
1
DTT
IPTV
Sat
PC
Cable
8 100
4 700
2 900
840
329 2005 5
2004 2005 2006 2007 2008
0
2 500 000
2 000 000
1 500 000
1 000 000
500 000
Satellite
IPTV DTT
1 266 358
26 547
0 0 0 0 38 411
33 339 40 985 58 269 61 962
1 409 488
1 718 180
2 072 032
2 338 055
2004 2005 2006 2007 2008
0
5 000
4 000
3 000
2 000
1 000
TV adspend
Consumerspay-TV spend
Radio-TV publicincome
Radio adspend
4 551
488
4 669 4 599 4 653 4 596
1 2931 443
1 759
2 130
2 438
1 565 1 565
1 587
1 657 1 688
400 409 441 477
Market trends

1672 0 0 9 | V o l u m e 1 | B a n d 1
AL
AT
BE
BG
CH
CY
CZ
DE
DK
EE
ES
FI
FR
GB
GR
HR
HU
IE
IS
IT
LT
LU
LV
MK
MT
NL
NO
PL
PT
RO
RU
SE
SI
SK
TR
IT
Italy Italie Italien IT
1 Includes also the activities of packager for the pay-TV services on the DTT Mediaset 1 & 2 multiplexes.2 Includes also telecommunication activities.3 Includes also broadcasting activities.4 Tiscali has interrupted its TV delivery service as at 31.12.2009.5 The Orbit package is targeting the Arabic markets.6 In December 2008, the Swedish group Airplus has acquired the DTT PPV package La7Cartapiù from
Telecom Italia Media and has created the package Dahlia TV.
Main broadcasters Channels 2005 2006 2007 2008 2008/07RAI S.p.A. sptv RAI 1, RAI 2, RAI 3, … 2 874,7 2 933,5 3 002,1 3 057,7 1,9%Reti Televisive Italiane R.T.I. 1
adtv, thtv, DTT
Canale 5, Rete 4, Italia 1, Boing, … 2 477,1 2 341,9 2 577,0 ~ ~
Telecom Italia Media (cons.) 2 5 thtv La 7, MTV Italia, DTT 195,5 221,2 277,6 ~ ~p.m. MTV Italia thtv MTV Italia 83,4 83,0 91,7 102,4 11,7%Fox International Channels Italy thtv Fox TV 53,7 87,9 124,4 ~ ~RAISAT sptv Raisat 68,1 57,7 63,9 72,6 13,7%Telemarket (cons.) hstv Telemarket 107,1 73,1 79,9 69,4 -13,1%NBC Universal Global Networks Italia s.r.l. thtv Studio Universal 19,3 20,4 21,4 40,6 89,7%
Home Shopping Europe Broadcasting hstv Canale D (HSE) 4,1 29,8 29,5 ~ ~
p.m. Home Shopping Europe hstv Canale D (HSE) 30,2 – – – –Italia 7 Gold thtv Italia 7 15,7 19,1 23,0 28,7 24,8%Profit Progetti Finanziarie Televisivi adtv Odeon TV 28,1 ~ ~ ~ ~
Turner Broadcasting System Italia thtv Boing, Boomerang 21,9 25,0 27,9 26,7 -4,3%
Jetix Europe thtv Jetix Italia 14,7 19,7 22,0 25,6 16,1%Tele Norba rtv Tele Norba 20,3 23,8 ~ ~ ~Radio Italia thtv Playlist Italia, Video Italia 20,5 22,6 20,6 21,0 1,9%Rete A thtv Allmusic 18,5 20,7 21,8 18,6 -14,7%Seasons s.r.l. thtv Jimmy 5,5 19,7 21,2 16,7 -21,1%
Main distributors Packages 2005 2006 2007 2008 2008/07Telecom Italia (cons.) 2 3 3play, 3G TV, DTT Alice TV 31 068,0 32 377,0 31 419,0 30 514,0 -2,9%Vodafone Omnitel 2 3G TV,dvb-h Live!, Sky 8 439,7 8 408,7 8 864,9 ~ ~
Wind Telecommunicazioni 2 3play, 3G TV, DTT Infostrada, Wind Imode 4 613,7 4 789,9 5 130,7 ~ ~
Sky Italia 3 sat-tv Sky Italia 1 897,4 2 234,4 2 479,4 2 668,6 7,6%H3G S.P.A. 2 3 3G TV, dvb-h 3 Internet e TV free 2 179,9 2 372,7 1 990,5 ~ ~Fastweb (cons.) 2 3 3play Fastweb 939,7 1 277,5 1 565,8 1 806,6 15,4%Tiscali Italia S.p.a. 2 3 4 3play Tiscali TV 188,9 214,0 276,8 ~ ~Prima TV S.p.A. 3 DTT dfree 20,0 22,2 27,8 37,4 34,5%Orbit Communications Company 5 packtv Orbit 37,7 21,7 11,1 8,5 -23,4%
Dahlia TV s.r.l. 3 6 DTT Dahlia TV – – – – –
Operating revenues of main television companies in Italy 2005-2008 EUR million.
T.1.IT.1G.1.IT.1

168 2 0 0 9 | V o l u m e 1 | B a n d 1
AL
AT
BE
BG
CH
CY
CZ
DE
DK
EE
ES
FI
FR
GB
GR
HR
HU
IE
IS
IT
LT
LU
LV
MK
MT
NL
NO
PL
PT
RO
RU
SE
SI
SK
TR
IT
Italy Italie Italien IT
Source: European Audiovisual Observatory
2004 2005 2006 2007 2008
0
3 500
3 000
2 500
2 000
1 500
1 000
500
RAI S.p.A.
RAISAT
Reti Televisive Italiane R.T.I.
Telecom Italia Media (cons.)Fox International Channels Italy
Telemarket (cons.)
Operating revenues of main television companies in Italy (Continued) 2005-2008 EUR million.
T.1.IT.1G.1.IT.1
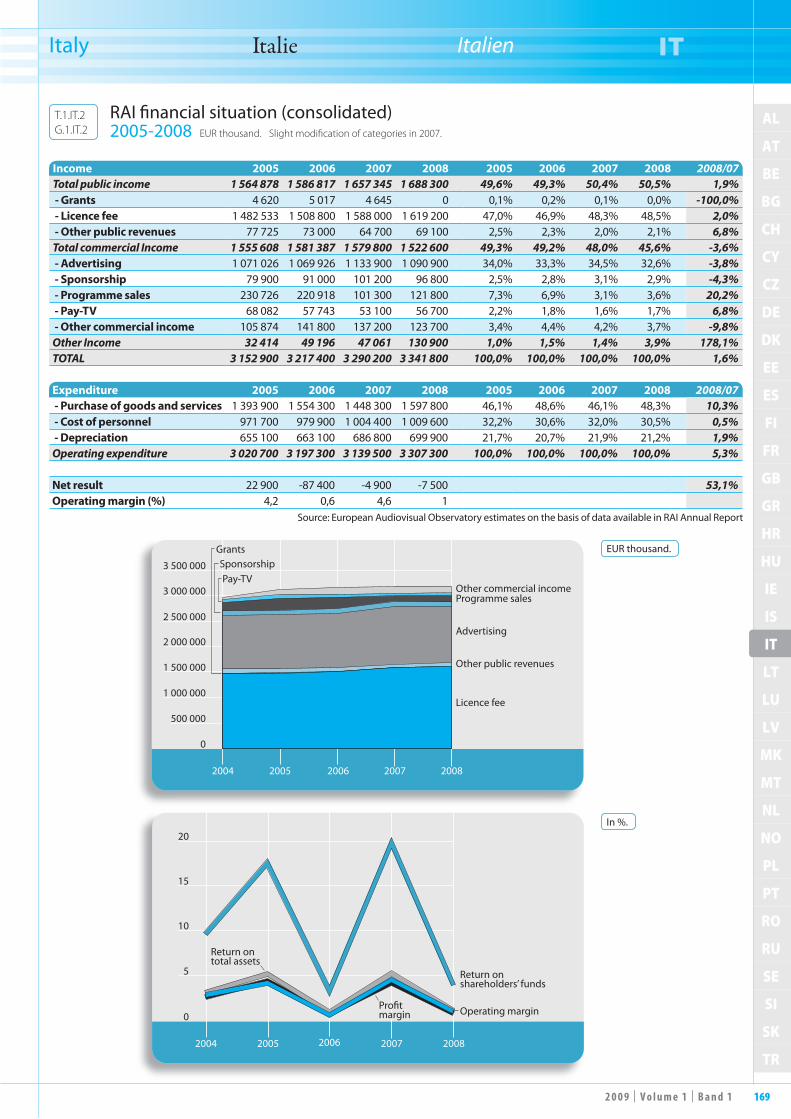
1692 0 0 9 | V o l u m e 1 | B a n d 1
AL
AT
BE
BG
CH
CY
CZ
DE
DK
EE
ES
FI
FR
GB
GR
HR
HU
IE
IS
IT
LT
LU
LV
MK
MT
NL
NO
PL
PT
RO
RU
SE
SI
SK
TR
IT
Italy Italie Italien IT
Source: European Audiovisual Observatory estimates on the basis of data available in RAI Annual Report
Income 2005 2006 2007 2008 2005 2006 2007 2008 2008/07Total public income 1 564 878 1 586 817 1 657 345 1 688 300 49,6% 49,3% 50,4% 50,5% 1,9% - Grants 4 620 5 017 4 645 0 0,1% 0,2% 0,1% 0,0% -100,0% - Licence fee 1 482 533 1 508 800 1 588 000 1 619 200 47,0% 46,9% 48,3% 48,5% 2,0% - Other public revenues 77 725 73 000 64 700 69 100 2,5% 2,3% 2,0% 2,1% 6,8%Total commercial Income 1 555 608 1 581 387 1 579 800 1 522 600 49,3% 49,2% 48,0% 45,6% -3,6% - Advertising 1 071 026 1 069 926 1 133 900 1 090 900 34,0% 33,3% 34,5% 32,6% -3,8% - Sponsorship 79 900 91 000 101 200 96 800 2,5% 2,8% 3,1% 2,9% -4,3% - Programme sales 230 726 220 918 101 300 121 800 7,3% 6,9% 3,1% 3,6% 20,2% - Pay-TV 68 082 57 743 53 100 56 700 2,2% 1,8% 1,6% 1,7% 6,8% - Other commercial income 105 874 141 800 137 200 123 700 3,4% 4,4% 4,2% 3,7% -9,8%Other Income 32 414 49 196 47 061 130 900 1,0% 1,5% 1,4% 3,9% 178,1%TOTAL 3 152 900 3 217 400 3 290 200 3 341 800 100,0% 100,0% 100,0% 100,0% 1,6%
Expenditure 2005 2006 2007 2008 2005 2006 2007 2008 2008/07 - Purchase of goods and services 1 393 900 1 554 300 1 448 300 1 597 800 46,1% 48,6% 46,1% 48,3% 10,3% - Cost of personnel 971 700 979 900 1 004 400 1 009 600 32,2% 30,6% 32,0% 30,5% 0,5% - Depreciation 655 100 663 100 686 800 699 900 21,7% 20,7% 21,9% 21,2% 1,9%Operating expenditure 3 020 700 3 197 300 3 139 500 3 307 300 100,0% 100,0% 100,0% 100,0% 5,3%
Net result 22 900 -87 400 -4 900 -7 500 53,1%Operating margin (%) 4,2 0,6 4,6 1
EUR thousand.
In %.
2004 2005 2006 2007 2008
0
3 500 000
2 500 000
3 000 000
2 000 000
1 500 000
1 000 000
500 000
Other commercial incomeProgramme sales
Advertising
Other public revenues
Licence fee
Pay-TVSponsorship
Grants
2004 2005 2006 2007 2008
0
20
5
15
10
Pro�tmargin
Return on shareholders’ funds
Operating margin
Return ontotal assets
RAI financial situation (consolidated) 2005-2008 EUR thousand. Slight modification of categories in 2007.
T.1.IT.2G.1.IT.2

170 2 0 0 9 | V o l u m e 1 | B a n d 1
AL
AT
BE
BG
CH
CY
CZ
DE
DK
EE
ES
FI
FR
GB
GR
HR
HU
IE
IS
IT
LT
LU
LV
MK
MT
NL
NO
PL
PT
RO
RU
SE
SI
SK
TR
IT
Italy Italie Italien IT
Source: Mediaset / European Audiovisual Observatory
Income 2005 2006 2007 2008 2005 2006 2007 2008 2008/07Television advertising 3 394,6 3 340,8 3 458,2 3 344,5 93,4% 90,0% 85,8% 79,7% -3,3%Other advertising 46,0 55,6 51,7 57,5 1,3% 1,5% 1,3% 1,4% 11,2%Rights and sale of programmes 59,7 93,4 158,3 280,5 1,6% 2,5% 3,9% 6,7% 77,2%Pay-per-view football 35,9 84,2 124,6 199,1 1,0% 2,3% 3,1% 4,7% 59,8%Construction of TV studios 12,1 33,9 69,1 81,5 0,3% 0,9% 1,7% 1,9% 17,9%Film distribution – – 56,8 101,0 – – 1,4% 2,4% 77,8%Other commercial receipts 22,1 25,4 27,8 33,5 0,6% 0,7% 0,7% 0,8% 20,5%Other 63,6 78,1 86,2 100,6 1,8% 2,1% 2,1% 2,4% 16,7%
TOTAL 3 634,1 3 711,5 4 032,8 4 198,2 100,0% 100,0% 100,0% 100,0% 4,1%
Expenditure 2005 2006 2007 2008 2005 2006 2007 2008 2008/07Purchase of goods and services 1 234,9 1 374,2 1 431,0 1 588,0 49,9% 50,7% 48,8% 48,6% 11,0%Costs of personnel 443,1 452,5 485,1 519,1 17,9% 16,7% 16,5% 15,9% 7,0%Depreciation 799,0 885,7 1 017,0 1 160,1 32,3% 32,7% 34,7% 35,5% 14,1%Operating expenditure 2 477,0 2 712,4 2 933,1 3 267,2 100,0% 100,0% 100,0% 100,0% 11,4%
Net result 747,6 661,8 681,2 565,4 -17,0%Operating margin (%) 33,8 27,6 28,0 23,2
EUR million.
In %.
2004 2005 2006 2007 2008
0
5 000
3 000
4 000
2 000
1 000
Television advertising
Other advertisingRights and sale of programmesPay-per-view football
OtherConstruction of TV studiosFilm distributionOther commercial receipts
2004 2005 2006 2007 2008
10
40
30
20
50
Pro�t margin
Operating margin
Return onshareholders' funds
Return on total assets
Mediaset Group financial situation 2005-2008 EUR million.
T.1.IT.3G.1.IT.3
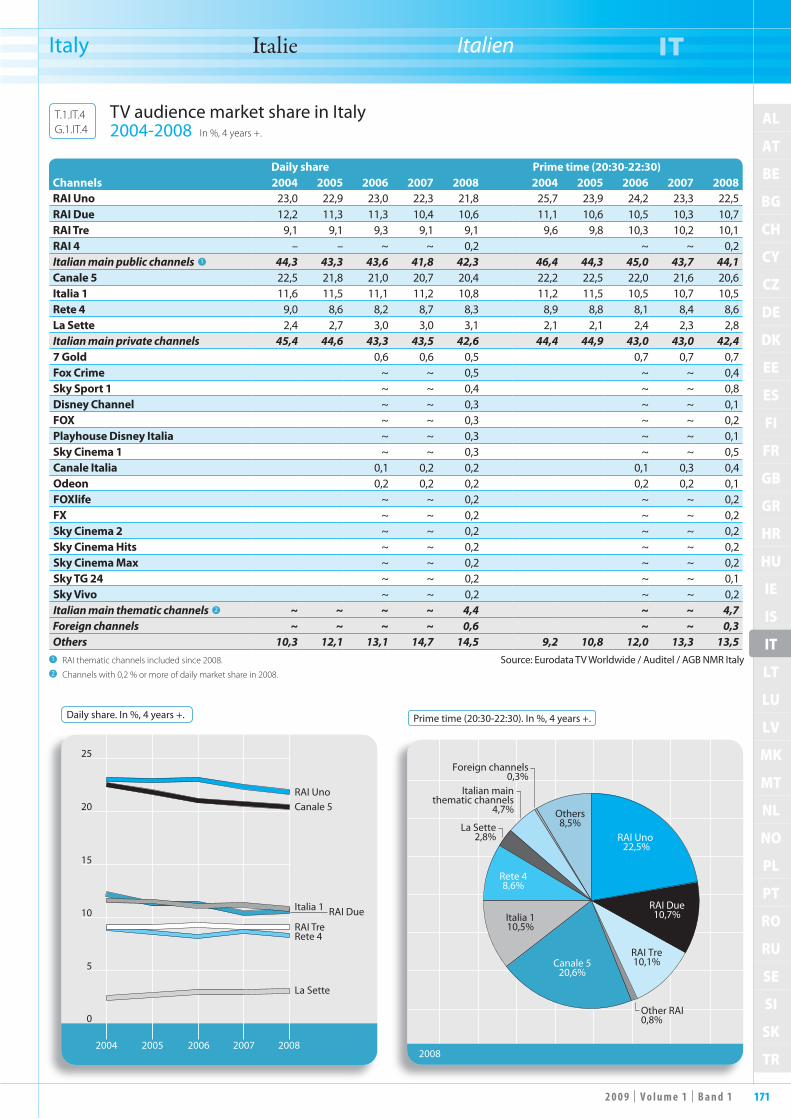
1712 0 0 9 | V o l u m e 1 | B a n d 1
AL
AT
BE
BG
CH
CY
CZ
DE
DK
EE
ES
FI
FR
GB
GR
HR
HU
IE
IS
IT
LT
LU
LV
MK
MT
NL
NO
PL
PT
RO
RU
SE
SI
SK
TR
IT
Italy Italie Italien IT
Daily share Prime time (20:30-22:30)Channels 2004 2005 2006 2007 2008 2004 2005 2006 2007 2008RAI Uno 23,0 22,9 23,0 22,3 21,8 25,7 23,9 24,2 23,3 22,5RAI Due 12,2 11,3 11,3 10,4 10,6 11,1 10,6 10,5 10,3 10,7RAI Tre 9,1 9,1 9,3 9,1 9,1 9,6 9,8 10,3 10,2 10,1RAI 4 – – ~ ~ 0,2 ~ ~ 0,2Italian main public channels 1 44,3 43,3 43,6 41,8 42,3 46,4 44,3 45,0 43,7 44,1Canale 5 22,5 21,8 21,0 20,7 20,4 22,2 22,5 22,0 21,6 20,6Italia 1 11,6 11,5 11,1 11,2 10,8 11,2 11,5 10,5 10,7 10,5Rete 4 9,0 8,6 8,2 8,7 8,3 8,9 8,8 8,1 8,4 8,6La Sette 2,4 2,7 3,0 3,0 3,1 2,1 2,1 2,4 2,3 2,8Italian main private channels 45,4 44,6 43,3 43,5 42,6 44,4 44,9 43,0 43,0 42,47 Gold 0,6 0,6 0,5 0,7 0,7 0,7Fox Crime ~ ~ 0,5 ~ ~ 0,4Sky Sport 1 ~ ~ 0,4 ~ ~ 0,8Disney Channel ~ ~ 0,3 ~ ~ 0,1FOX ~ ~ 0,3 ~ ~ 0,2Playhouse Disney Italia ~ ~ 0,3 ~ ~ 0,1Sky Cinema 1 ~ ~ 0,3 ~ ~ 0,5Canale Italia 0,1 0,2 0,2 0,1 0,3 0,4Odeon 0,2 0,2 0,2 0,2 0,2 0,1FOXlife ~ ~ 0,2 ~ ~ 0,2FX ~ ~ 0,2 ~ ~ 0,2Sky Cinema 2 ~ ~ 0,2 ~ ~ 0,2Sky Cinema Hits ~ ~ 0,2 ~ ~ 0,2Sky Cinema Max ~ ~ 0,2 ~ ~ 0,2Sky TG 24 ~ ~ 0,2 ~ ~ 0,1Sky Vivo ~ ~ 0,2 ~ ~ 0,2Italian main thematic channels 2 ~ ~ ~ ~ 4,4 ~ ~ 4,7Foreign channels ~ ~ ~ ~ 0,6 ~ ~ 0,3Others 10,3 12,1 13,1 14,7 14,5 9,2 10,8 12,0 13,3 13,5
Source: Eurodata TV Worldwide / Auditel / AGB NMR Italy1 RAI thematic channels included since 2008.2 Channels with 0,2 % or more of daily market share in 2008.
Daily share. In %, 4 years +. Prime time (20:30-22:30). In %, 4 years +.
2004 2005 2006 2007 2008
0
5
15
10
25
20RAI UnoCanale 5
Italia 1
RAI TreRete 4
La Sette
RAI Due
2008
Others8,5%
RAI Uno 22,5%
RAI Due10,7%
RAI Tre10,1%
Other RAI0,8%
Canale 520,6%
Italia 110,5%
Rete 48,6%
La Sette2,8%
Italian mainthematic channels
4,7%
Foreign channels0,3%
TV audience market share in Italy 2004-2008 In %, 4 years +.
T.1.IT.4G.1.IT.4

172 2 0 0 9 | V o l u m e 1 | B a n d 1
AL
AT
BE
BG
CH
CY
CZ
DE
DK
EE
ES
FI
FR
GB
GR
HR
HU
IE
IS
IT
LT
LU
LV
MK
MT
NL
NO
PL
PT
RO
RU
SE
SI
SK
TR
IT
Italy Italie Italien IT
Source: European Audiovisual Observatory
Rank Companies Genre 2004 2005 2006 2007 2008 2008/071 Taodue s.r.l. Fiction – – 56 464 109 741 ~ ~
p.m. Taodue Film s.r.l. Fiction 34 106 41 751 26 962 ~ 52 141 ~2 Endemol Italia S.p.A. Entertainment 82 730 72 504 ~ ~ ~ ~3 Grundy Italia Fiction 48 247 39 499 56 848 59 015 57 875 -1,9%4 Cattleya S.P.A Fiction, feature films 35 685 51 321 35 556 57 511 ~ ~5 Magnolia S.p.A. Entertainment 30 483 33 941 45 478 47 969 53 873 12,3%6 Nova Films s.r.l. Fiction, feature films 22 378 28 926 36 021 51 731 ~ ~7 Tevere Films Fiction 16 196 49 094 ~ ~ ~ ~8 Mediavivere Fiction 31 740 49 965 44 885 51 983 49 014 -5,7%9 Mondo TV S.p.A. (cons.) Animation 40 813 50 472 34 724 42 920 44 698 4,1%
10 Publispei Pubblicità Spettacoli Fiction 14 818 9 329 29 668 28 164 44 158 56,8%11 Luxvide Fiction 44 880 57 086 76 960 41 918 ~ ~12 Albatross Entertainment S.P.A. Fiction, feature films – – – 7 572 32 370 327,5%
p.m. Albatross A.M.P. Fiction, feature films 7 176 9 248 ~ ~ ~ ~13 Rainbow spa Animation 7 192 18 976 23 590 31 321 ~ ~14 Film MasterFilm s.r.l. 1 Lifestyle, formats 2 919 6 803 23 370 ~ ~ ~
p.m. Clip Television s.r.l. 1 Formats, music 5 248 5 378 – – – –15 Ballandi Entertainment Music, events 27 106 30 403 30 687 28 316 20 990 -25,9%16 Fidia Film Sarl Fiction – 10 705 22 857 18 372 ~ ~17 Casanova Entertainment Fiction, feature films 4 559 6 610 6 663 17 844 ~ ~18 Palomar S.p.A. Fiction 23 246 31 663 22 967 25 187 17 156 -31,9%19 Cosmo Production Fiction 10 065 7 839 13 930 16 859 ~ ~20 Janus International s.r.l. Fiction 10 484 8 510 16 647 24 706 14 794 -40,1%21 Titanus S;p.a. Fiction 18 407 22 436 19 142 2 960 11 778 297,9%22 Video 80 Fiction 288 7 754 3 138 11 646 ~ ~23 ITC Movie Fiction, feature films 5 293 5 501 11 096 8 515 10 467 22,9%24 Produzioni Alfa S.R.L. Fiction 16 149 34 031 20 429 16 199 9 147 -43,5%25 Red Film s.r.l. 6 029 6 303 8 471 8 804 ~ ~26 Ager 3 Fiction 8 692 329 5 640 8 415 ~ ~27 Titania Produzioni s.r.l. Fiction, feature films 6 689 2 594 10 432 7 894 ~ ~28 Videa S.p.A. Fiction 3 209 9 245 19 748 6 795 ~ ~29 Einstein Fiction S.R.L. Fiction 5 080 411 883 6 413 ~ ~30 Dauphine Film Company S.R.L. Fiction 126 7 228 429 6 295 ~ ~31 Giglio Group S.p.A. Fiction, shows 1 658 7 368 6 194 ~ ~ ~32 Videomedia S.R.L. Entertainment ~ 508 ~ 6 168 ~ ~33 11 Marzo Film Fiction 731 3 748 4 004 6 148 ~ ~34 Rodeo Drive S.R.L. Fiction 6 479 ~ ~ 5 924 ~ ~
p.m. Rodeo Drive Media Fiction 216 1 155 10 311 ~ 5 060 ~35 Paypermoon Italia S.R.L Fiction, entertainment 1 501 4 262 7 419 5 235 ~ ~36 Target Communications 2 558 4 708 5 413 4 815 5 741 19,2%
37 Quadrio S.R.L. Entertainment, documentary 406 1 689 2 224 2 521 4481 77,7%
38 Ruvido Produzioni s.r.l. Entertainment 1 543 2 319 3 515 3 689 ~ ~39 Lotus Production S.R.L. Fiction, feature films 1 042 1 777 2 338 3 658 ~ ~40 Euro Group Line Production 3 723 4 111 4 038 3 642 ~ ~
1 Clip Television and FilmMaster Film were merged at the beginning of 2006 under the name FilmMaster Television.
The 40 leading TV production companies in Italy 2004-2008 Operating revenues in EUR thousand.
T.1.IT.5

1732 0 0 9 | V o l u m e 1 | B a n d 1
AL
AT
BE
BG
CH
CY
CZ
DE
DK
EE
ES
FI
FR
GB
GR
HR
HU
IE
IS
IT
LT
LU
LV
MK
MT
NL
NO
PL
PT
RO
RU
SE
SI
SK
TR
LT
Lithuania Lituanie Litauen LT
The Lithuanian television sector is divided up among the channels oper-
ated by the state-owned broad-caster LRT (LTV and LTV2) and various private groups: MG Baltic Group (LNK, TV1), Achemos Grupe (BTV) and the Swed-ish Modern Times Group (TV3, TV6). Lastly, the Russian channel PBK Lithuania enjoys a significant market share among the Russian-speaking population.TV3 remains the leader in audience terms: despite a slight decline, the group still had a 25.8% daily audience market share in 2008. LNK, the second most viewed chan-nel, once again lost viewers in 2008 and its daily audience market share is now only 20.9%, which is still significantly higher than that of the main public channel, LTV, whose figures were stable at 13.3%.These three players clearly dominate the Lithuanian market but when taken togeth-er they lost more than two market share points in 2008. This can be explained by the arrival of digital terrestrial television and the simultaneous gains (amounting to two points) of the country’s other chan-nels (in 2008, channels with an average audience share, such as BTV, TV6, TV1 or LTV2, did not really make any gains and it was the other small channels that really took advantage of the digitisation of the terrestrial network).Sport1, the only new national channel launched in 2008/09, describes itself as Lithuania’s premier sports channel. The three Baltic MTV channels launched in 2006 have gone through difficult times. All three were initially licensed in Lithu-ania but MTV Estonia is now licensed in Estonia and MTV Latvia has merged with MTV Lithuania. Finally, TV6, which was launched in 2002 and operated under a British licence, is now registered in Lithuania. 3+ will probably do likewise in January 2010. The multi-channel market is still concen-trated (except for cable networks): Viasat (Modern Times Group) operates the only satellite platform available in Lithuania, while Teo LT (TeliaSonera) dominates the IPTV market. Its Interactive GALA is popular with viewers, having recorded 47,900 subscribers in June 2009 compared with 40,100 in December 2008.Teo LT also operates the Digital GALA digital terrestrial television platform, which was launched in March 2008. Digital GALA offers 40 channels in several languages and is now available to virtually all Lithuanians. In June 2009, it had 37 900 subscribers (compared with 26 300 in December 2008).
Le paysage télévisuel lituanien est par-tagé entre les chaînes du diffuseur
public LRT (LTV et LTV2) et diffé-rents groupes privés : MG Baltic Group (LNK, TV1), Achemos Grupe (BTV), et le groupe suédois Modern Times Group (TV3, TV6). Enfin, la chaîne russe PBK Lithuania dispose d’une part de mar-ché significative auprès de la population russophone.TV3 demeure leader en termes d’au-dience : malgré un léger tassement, la chaîne regroupe toujours 25,8 % de part de marché d’audience quotidienne en 2008. En seconde position, LNK perd à nouveau des spectateurs en 2008 et sa part de marché d’audience quotidienne ne s’établit plus qu’à 20,9 %, ce qui demeure tout de même nettement supérieur à celle de la principale chaîne publique, LTV, avec 13,3 %, un résultat stable.Ces trois acteurs dominent nettement le marché lituanien mais elles perdent, lorsqu’on les regroupe, en 2008 plus de deux points de parts de marché. Ceci peut s’expliquer peut être par l’arrivée de la télévision numérique terrestre, et la progression symétrique (de deux points) des autres chaînes dans le pays (en 2008, les chaînes d’importance moyenne comme BTV, TV6, TV1 ou LTV2 n’ont pas vrai-ment progressé, ce sont les autres petites chaînes qui ont vraiment tiré parti de la numérisation du réseau terrestre).Seule nouvelle chaîne nationale lancée en 2008/09, Sport1 se présente comme la première chaîne sportive lituanienne. Par ailleurs, les trois chaînes baltes MTV lan-cées en 2006 ont traversé des temps trou-bles. Toutes trois sont nées initialement sous licence lituanienne. Depuis, MTV Estonie est passée sous licence estonienne et MTV Lettonie a fusionné avec MTV Lituanie. Enfin, TV6, lancée en 2002, qui opérait sous licence britannique est désor-mais enregistrée en Lituanie, et 3+ devrait en faire de même en janvier 2010. L’offre multi-chaînes (à l’exception du câble) demeure concentrée: Viasat (Modern Times Group) opère la seule plate-forme satellite accessible dans le pays et Teo LT (TeliaSonera) domine le mar-ché de l’IPTV. Son bouquet Interactive GALA convainc les spectateurs puisqu’il affiche 47 900 abonnés en juin 2009 contre 40 100 en décembre 2008.Teo LT opère par ailleurs la plate-forme numérique terrestre Digital GALA, lancée en mars 2008, qui propose 40 chaînes dans plusieurs langues. L’offre est désormais accessible pratiquement par tous les Lituaniens et compte 37 900 abonnés en juin 2009 (contre 26 300 en décembre 2008).
Die litauische Fernsehlandschaft besteht aus dem öffentlich-rechtlichen Sektor
mit den Sendern des Rundfunkveranstal-ters LRT (LTV und LTV2) und aus ver-schiedenen privaten Gruppen: MG Baltic Group (LNK und TV1), Achemos Grupe (BTV) sowie der schwedischen Modern Times Group (mit TV3 und TV6).Marktführer ist nach wie vor TV3. Trotz eines leichten Rückgangs konnte der Sender 2008 immer noch einen Zuschau-ermarktanteil von 25,8 % erzielen. An zweiter Stelle folgt LNK, der allerdings 2008 erneut Zuschauer verloren hat und inzwischen nur noch bei 20,9 % liegt. Damit liegt LNK aber immer noch weit über den Werten, die der größte öffent-lich-rechtliche Sender LTV 2008 erzielen konnte (13,3 %). Das Ergebnis von LNK kann daher insgesamt als relativ stabil angesehen werden.Diese drei Sender beherrschen den litau-ischen Fernsehmarkt. Zusammen haben sie jedoch 2008 mehr als zwei Prozentpunkte ihrer Marktanteile verloren. Der Grund dafür dürfte die Einführung des digitalen terrestrischen Fernsehens in Litauen sein, die den anderen Sendern ein leichtes Plus bei den Marktanteilen (um zwei Pro-zentpunkte) beschert hat. Profitiert von der Einführung des digitalen Fernsehens haben 2008 allerdings weniger mittel-große Sender wie BTV, TV6, TV1 oder LTV2 als vielmehr die kleinen Sender.Der einzige Sender, der 2008/09 neu ans Netz gegangen ist, ist Sport1. Er ist der erste reine Sportkanal in Litauen. Die drei baltischen MTV-Ableger, die 2006 auf Sendung gingen, haben turbulente Zeiten hinter sich. Alle drei starteten ursprüng-lich unter litauischer Lizenz. Heute sen-det MTV Estland unter estnischer Lizenz, MTV Lettland hat sich mit MTV Litauen zusammengeschlossen, und TV6 (Sen-destart 2002 unter britischer Lizenz) ist nun in Litauen registriert. Der Sender 3+ wird ab Januar 2010 ebenfalls unter litau-ischer Lizenz senden. Das Mehrkanalangebot bleibt (mit Aus-nahme des Kabels) konzentriert: Viasat (Modern Times Group) betreibt die einzige empfangbare Satellitenplattform, und Teo LT (TeliaSonera) beherrscht den IPTV-Markt. Sein Programmbouquet Interactive GALA scheint die Zuschauer zu überzeugen: Immerhin stieg die Zahl der Kunden von 40 100 im Dezember 2008 auf 47 900 im Juni 2009.Seit März 2008 gibt es in Litauen eine erste terrestrische Digital-Plattform, die von Teo LT betrieben wird. Das Angebot von Digital GALA umfasst 40 Sender in mehreren Sprachen, die inzwischen prak-tisch von allen Litauern empfangen wer-den können. Die Zahl der Abonnenten stieg von 26 300 im Dezember 2008 auf 37 900 im Juni 2009.
Sources: Lietuvos Radijo ir Televizijos Komisija (LRTK): http://www.rtk.lt/lt Legal aspects: IRIS Merlin, http://merlin.obs.coe.int Audience data: TNS Gallup : http://www.tnsglobal.com

174 2 0 0 9 | V o l u m e 1 | B a n d 1
AL
AT
BE
BG
CH
CY
CZ
DE
DK
EE
ES
FI
FR
GB
GR
HR
HU
IE
IS
IT
LT
LU
LV
MK
MT
NL
NO
PL
PT
RO
RU
SE
SI
SK
TR
LT
Lithuania Lituanie Litauen LT
Population and equipment 31.12.08Penetration
(in % HH) In thousand SourcesPopulation (inhabitants) – 2 261 Eurostat
Households – 1 413 Eurostat (as at 1.1.2008)
TV households 95% 1 338 RTK
Cable TV households 30% 422 Screen Digest / European Audiovisual Observatory
Digital cable TV households 3% 38 Screen Digest / European Audiovisual Observatory
DTH/SMATV households 9% 130 Screen Digest / European Audiovisual Observatory
Pay DTH/SMATV households 7% 97 Screen Digest / European Audiovisual Observatory
IPTV subscription 3% 44 Screen Digest / European Audiovisual Observatory
Installed DVB-T receivers 3% 47 Screen Digest / European Audiovisual Observatory
Total digital TV households 16% 226 European Audiovisual Observatory
Households with PC 48% 680 Screen Digest / European Audiovisual Observatory
Households with broadband connections 15% 597 Screen Digest / European Audiovisual Observatory
Number of TV channels by kind of licence 10.09 Public Private TotalTerrestrial (national) 2 13 15Cable/Satellite/IPTV/Mobile 0 0 0Regional/Local 0 43 43Regional/Local windows 0 0 0Channels targeting foreign markets 1 9 10Total 3 65 68Foreign channels targeting the country 2 6 8
TV channels distributors 11.09 CompaniesCable operators (incl. MMDS) 50 Alyataus, Balticum TV, Init, Sugardas, Telerena, Vinita…Satellite packagers 1 ViasatIPTV packagers 1 Teo (Gala TV)DTT packagers 1 Teo Mobile phone TV packagers 2 Omnitel, Bité
Source: European Audiovisual Observatory
Supply of TV channels by genre and by platform (including foreign channels) 10.09
Digital terrestrial
TEOCable
Balticum TV
Satellite Viasat
(Full Nordic offer)IPTV TEO
Generalist - national 4 4 3 4Generalist - foreign 4 17 20 4Adult 1 1 3 2Children 6 10 20 12Culture/ education/ documentary 10 28 31 12Minority interest groupsEntertainment/ TV fiction/ games 7 13 32 21Film 2 7 45 4Home shoppingInternational linguistic and cultural 1 6 1Lifestyle/ specific leisure/ travel 5 15 1 6Music 3 9 8 6News/ business 5 18 8 17Parliament/ government/ administrationRegional/ local 1 1 4Religion 16 2Sports 6 20 15Various 2 4Total 55 147 198 107
Basic figures

1752 0 0 9 | V o l u m e 1 | B a n d 1
AL
AT
BE
BG
CH
CY
CZ
DE
DK
EE
ES
FI
FR
GB
GR
HR
HU
IE
IS
IT
LT
LU
LV
MK
MT
NL
NO
PL
PT
RO
RU
SE
SI
SK
TR
LT
Lithuania Lituanie Litauen LT
Source: European Audiovisual Observatory on the basis of data from Screen Digest, IP KeyFacts and LRT
Source: European Audiovisual Observatory
Source: Screen DigestSource: Screen Digest
Households TV equipment 2004-2008
Number of households accessing multichannel platforms as at 31.12.2008
Consumers pay-TV gross spend 2004-2008
Gross revenues of radio-television 2004-2008
2004 2005 2006 2007 2008
0
500
400
300
200
100
Cable households
Satellite households
DTT householdsIPTV households
285
60
90100
110130
330
359
383
422
0
0 0 5
0 619
12
47
44
Balticum TV
Teo Lt (G
ala)
Viasat
DTT
0
100
80
60
40
20
47
53
85
DTT
IPTV
Sat
PC
Cable
6726
2004 2005 2006 2007 2008
0
30 000
20 000
10 000
Cable TV
Satellite
DTTIPTV
29 432
18 352
20 550
23 457
25 909
511
2 031
5 146
11 248
13 476
92 386
01 024
1 316
19
2004 2005 2006 2007 2008
0
400
300
200
100
TV adspend
Radio-TV public income
Consumerspay-TV spend
332
176
225 240
2329
3845
11 11 12 14
In thousands.
In thousands.
EUR thousand.
EUR million.
Market trends

176 2 0 0 9 | V o l u m e 1 | B a n d 1
AL
AT
BE
BG
CH
CY
CZ
DE
DK
EE
ES
FI
FR
GB
GR
HR
HU
IE
IS
IT
LT
LU
LV
MK
MT
NL
NO
PL
PT
RO
RU
SE
SI
SK
TR
LT
Lithuania Lituanie Litauen LT
Mai
n br
oadc
aste
rsCh
anne
ls20
0520
0620
0720
0820
08/0
7Li
etuv
os N
acio
nalin
is
Radi
jas i
r Tel
eviz
ijasp
tvLT
V1, L
TV2
17 3
0019
800
23 9
00~
~
UA
B La
isva
s ir N
epri
klau
som
as
Kana
las
adtv
LNK,
Info
TV
~20
835
23 0
27~
~
UA
B Ba
ltijo
s TV
adtv
BTV
~2
761
3 82
1~
~
Mai
n di
stri
buto
rsSe
rvic
esPa
ckag
es20
0520
0620
0720
0820
08/0
7U
AB
Om
nite
l 1
3G T
VM
obili
TV
249
159
259
196
264
599
~~
Teo
LT, A
B 1
3pla
yG
ala
TV21
3 64
921
3 40
623
1 64
724
2 26
24,
6%U
AB
Bité
Lie
tuva
13G
TV
Bité
TV
159
939
177
219
178
460
198
445
11,2
%U
AB
Balt
icum
TV
1 2
3pla
yBa
lticu
m T
V5
212
6 19
67
344
~~
UA
B Vi
nita
1 2
3pla
yKT
V Vi
nita
4 15
14
063
4 46
1~
~U
AB
Init
1 2
3pla
yKa
belin
e TV
2 90
63
653
5 95
04
247
-28,
6%U
AB
Tele
rena
1 2
3pla
ySp
lius T
V2
223
2 68
93
309
~~
UA
B Su
gard
as 1
23p
lay
skai
tmen
inė
TV1
916
1 96
12
112
2 00
8-4
,9%
Sour
ce: E
urop
ean
Audi
ovis
ual O
bser
vato
ry1
In
clud
es te
leco
mm
unic
atio
n ac
tiviti
es.
2
Incl
udes
bro
adca
stin
g ac
tiviti
es.
Sour
ce: E
BU-U
ER /
Euro
pean
Aud
iovi
sual
Obs
erva
tory
Inco
me
2004
2005
2006
2007
2004
2005
2006
2007
2007
/06
Tota
l pub
lic in
com
e 11
,011
,112
,314
,063
,6%
63,8
%61
,8%
58,6
%13
,8%
- A
id/G
rant
s 11
,011
,112
,314
,063
,6%
63,8
%61
,8%
58,6
%13
,8%
Tota
l com
mer
cial
Inco
me
6,3
6,3
7,6
9,9
36,4
%36
,2%
38,2
%41
,4%
30,3
% -
Adv
erti
sing
5,
15,
16,
17,
729
,5%
29,3
%30
,7%
32,2
%26
,2%
- Sp
onso
rshi
p0,
10,
10,
21,
00,
6%0,
6%1,
0%4,
2%40
0,0%
- O
ther
com
mer
cial
inco
me
1,1
1,1
1,3
1,2
6,4%
6,3%
6,5%
5,0%
-7,7
%
TOTA
L17
,317
,419
,923
,910
0,0%
100,
0%10
0,0%
100,
0%20
,1%
EUR
mill
ion.
EUR
thou
sand
.
2003
2004
2005
2006
2007
25 0
00
20 0
00
15 0
00
10 0
00
5 00
0 0
UA
B La
isva
s ir
Nep
rikla
usom
asKa
nala
s
UA
B Ba
ltijo
s TV
Liet
uvos
Nac
iona
lnis
Radi
jas
ir Te
levi
zija
2003
2004
2005
2006
2007
25 20 15 10 5 0
Oth
er c
omm
erci
alin
com
eSp
onso
rshi
p
Adve
rtis
ing
Aid
/Gra
nts
Ope
ratin
g re
venu
es o
f TV
com
pani
es in
Lith
uani
a 20
05-2
008
EU
R th
ousa
nd.
T.1.
LT.1
G.1
.LT.1
LNRT
fina
ncia
l situ
atio
n 20
04-2
007
EU
R m
illio
n.
T.1.
LT.2
G.1
.LT.2
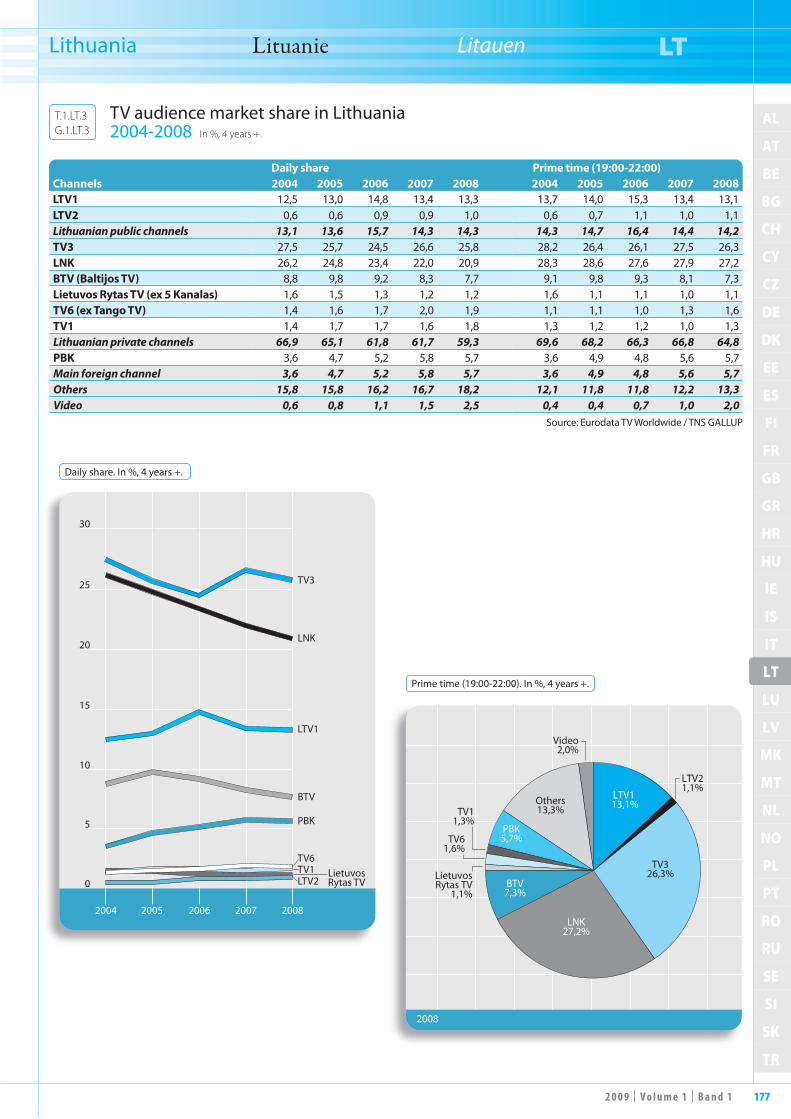
1772 0 0 9 | V o l u m e 1 | B a n d 1
AL
AT
BE
BG
CH
CY
CZ
DE
DK
EE
ES
FI
FR
GB
GR
HR
HU
IE
IS
IT
LT
LU
LV
MK
MT
NL
NO
PL
PT
RO
RU
SE
SI
SK
TR
LT
Lithuania Lituanie Litauen LT
Daily share Prime time (19:00-22:00)Channels 2004 2005 2006 2007 2008 2004 2005 2006 2007 2008LTV1 12,5 13,0 14,8 13,4 13,3 13,7 14,0 15,3 13,4 13,1LTV2 0,6 0,6 0,9 0,9 1,0 0,6 0,7 1,1 1,0 1,1Lithuanian public channels 13,1 13,6 15,7 14,3 14,3 14,3 14,7 16,4 14,4 14,2TV3 27,5 25,7 24,5 26,6 25,8 28,2 26,4 26,1 27,5 26,3LNK 26,2 24,8 23,4 22,0 20,9 28,3 28,6 27,6 27,9 27,2BTV (Baltijos TV) 8,8 9,8 9,2 8,3 7,7 9,1 9,8 9,3 8,1 7,3Lietuvos Rytas TV (ex 5 Kanalas) 1,6 1,5 1,3 1,2 1,2 1,6 1,1 1,1 1,0 1,1TV6 (ex Tango TV) 1,4 1,6 1,7 2,0 1,9 1,1 1,1 1,0 1,3 1,6TV1 1,4 1,7 1,7 1,6 1,8 1,3 1,2 1,2 1,0 1,3Lithuanian private channels 66,9 65,1 61,8 61,7 59,3 69,6 68,2 66,3 66,8 64,8PBK 3,6 4,7 5,2 5,8 5,7 3,6 4,9 4,8 5,6 5,7Main foreign channel 3,6 4,7 5,2 5,8 5,7 3,6 4,9 4,8 5,6 5,7Others 15,8 15,8 16,2 16,7 18,2 12,1 11,8 11,8 12,2 13,3Video 0,6 0,8 1,1 1,5 2,5 0,4 0,4 0,7 1,0 2,0
Source: Eurodata TV Worldwide / TNS GALLUP
Daily share. In %, 4 years +.
Prime time (19:00-22:00). In %, 4 years +.
2004 2005 2006 2007 2008
0
5
10
20
25
15
30
TV3
LNK
LTV1
BTV
PBK
TV1LTV2
LietuvosRytas TV
TV6
2008
LTV1 13,1%
Video2,0%
Others13,3%
LTV21,1%
TV326,3%
LNK27,2%
BTV7,3%
LietuvosRytas TV
1,1%
TV61,6%
PBK5,7%
TV11,3%
TV audience market share in Lithuania 2004-2008 In %, 4 years +.
T.1.LT.3G.1.LT.3
178 2 0 0 9 | V o l u m e 1 | B a n d 1
AL
AT
BE
BG
CH
CY
CZ
DE
DK
EE
ES
FI
FR
GB
GR
HR
HU
IE
IS
IT
LT
LU
LV
MK
MT
NL
NO
PL
PT
RO
RU
SE
SI
SK
TR
LU
Luxembourg Luxembourg Luxemburg LU
In the Grand Duchy of Luxembourg, the private sector has traditionally pre-
vailed over the extremely small public sec-tor, which is confined to one community radio station (100.7). Rather than setting up a national public-service broadcaster, the legislature entrusted a number of public-service functions to a commercial ope rator, CLT-UFA (RTL Group).Audiovisual consumption is divided between the nationwide broadcaster RTL Lëtzebuerg, broadcasters in neigh-bouring countries and the broadcasters targeting immigrant communities, par-ticularly RTP (Portugal). This is a result of the small size of the market, the multi-lingual population and the fact that 40% of the country’s residents are foreigners. The diversity of the population and the importance of the neighbouring countries’ channels are resulting in significant audi-ence fragmentation. Despite a slight fall in its audience, RTL Lëtzebuerg continued to dominate the market with a 10.7% daily audience market share in 2008/09 (which rises to as much as 39% between 7pm and 8pm), ahead of the foreign channels TF1, Pro7, RTL and ARD, which are posting improved results in terms of their audi-ence share. Cable is clearly dominant in Luxembourg households. The main operators are Coditel, which has been renamed Numeri-cable, and Eltrona, which operates the dig-ital channel package Imagin together with Nokia Siemens Network. Although most Luxembourg households are on cable, a quarter also have a satellite receiver. P&T Luxembourg, the incumbent post and telecommunications operator, launched an IPTV service entitled La Télé des P&T in March 2008. Initially offered in nine localities, the service has covered the entire Grand Duchy since September 2008.In September 2009, the establishment of the M7 Group was announced. It consoli-dates in Luxembourg the activities of the Airfield Media Group and Canal Digitaal B.V., which control the satellite pack-ages CanalDigitaal, TV Vlaanderen and TéléSAT, which target the Netherlands and Belgium. On that occasion, M7 also disclosed its intention to launch the first satellite package targeting Luxembourg.A digital terrestrial platform was launched in April 2006 by CLT-UFA and analogue transmissions were switched off in Sep-tember that year. The platform provides access to a dozen channels, ten of which are controlled by the RTL Group. How-ever, terrestrial reception remains fairly marginal in Luxembourg, and it is the digitisation of the cable networks that represents the main element of the digital switchover in Luxembourg.Luxembourg has long had an official policy of welcoming pan-European companies. It
Le secteur privé est traditionnellement prédominant au Grand-Duché du
Luxembourg face à un secteur public extrê-mement réduit qui se limite à une station de radio à vocation socioculturelle (100,7). Au lieu de créer un radiodiffuseur public luxembourgeois, le législateur a confié à un acteur privé, la CLT-UFA (RTL Group), un certain nombre de missions de service public.La consommation audiovisuelle se répartit entre la chaîne nationale RTL Lëtzebuerg, les chaînes des pays voisins et les chaînes touchant les communautés immigrées, en particulier la RTPI (Portugal). Cela est dû à la petite taille du marché, au multi-linguisme de sa population et à la présence de près de 40 % d’étrangers sur le territoire luxembourgeois. La mixité de la popula-tion et l’importance des chaînes des pays voisins entraînent une grande fragmenta-tion de l’audience. Malgré un léger recul, RTL Lëtzebuerg continue de dominer le marché avec 10,7 % de part de marché d’audience quotidienne en 2008/09 (une part qui monte jusqu’à 39 % entre 19 et 20 heures), devant TF1, Pro7, RTL et ARD, des chaînes étrangères qui voient toutes leurs résultats en termes d’audience progresser.Le câble est clairement prédominant dans les foyers luxembourgeois. Les principaux opérateurs sont Coditel, rebaptisé Nume-ricable, ou encore Eltrona qui opère avec Nokia Siemens Network le bouquet de chaînes numérique Imagin. Si la majorité des foyers luxembourgeois sont raccordés au câble, un quart d’entre eux sont aussi équipés d’un récepteur satellite. P&T Luxembourg, l’opérateur historique des postes et télécommunications, a inauguré en mars 2008 une offre IPTV « la Télé des P&T ». Initialement proposée dans neuf localités, le service couvre l’intégralité du Grand Duché depuis septembre 2008.En septembre 2009 a été annoncée la création du groupe M7, regroupant au Luxembourg les activités de Airfield Media group et Canal Digitaal B.V. qui contrô-lent les bouquets satellites CanalDigitaal, TV Vlaanderen et TéléSAT ciblant les Pays-Bas et la Belgique. A cette occasion M7 a aussi dévoilé son intention de lan-cer le premier bouquet satellite ciblant le Luxembourg.Une plate-forme numérique terrestre a été lancée dès avril 2006, opérée par la firme CLT-UFA, puis l’extinction des trans missions analogiques a eu lieu en septembre 2006. La plate-forme propose l’accès à une douzaine de chaînes, dont dix dépendent du groupe RTL. Ceci dit, la réception par voie terrestre demeure quasi marginale au Luxembourg, c’est la numé-risation des réseaux câblés qui constitue le véritable enjeu de la transition numérique luxembourgeoise.
I m Großherzogtum Luxemburg domi-niert der Privatsektor traditionell einen
extrem kleinen öffentlich-rechtlichen Bereich, der sich auf eine Radiostation mit soziokulturellem Anspruch beschränkt (Radio 100,7). Anstatt einen eigenen öffentlich-rechtlichen Rundfunkveran-stalter zu schaffen, zog es der Gesetzgeber vor, eine Reihe von öffentlich-rechtlichen Aufgaben an ein Privatunternehmen, CLT-UFA (RTL Group), zu über antworten.Das Fernsehen teilt sich auf den landes-weiten Sender RTL Lëtzebuerg, die Sen-der der Nachbarländer und diejenigen für die ausländischen Gemeinschaften auf, insbesondere RTPI (Portugal). Dies liegt an der geringen Größe des Marktes, an der Mehrsprachigkeit der Bevölke-rung und an der Präsenz von fast 40 % Ausländern in Luxemburg. Diese Bevöl-kerungsstruktur und die hohe Bedeutung der ausländischen Sender sind auch der Grund für eine hohe Fragmentierung des Publikums. Mit einem durchschnitt-lichen Zuschaueranteil von 10,7 % (bis zu 39 % zwischen 19 und 20 Uhr) ist RTL Lëtzebuerg 2008/2009 nach wie vor der dominierende Sender am Markt. Dahin-ter folgen mit TF1, Pro7, RTL und ARD vier ausländische Sender, die alle steigende Zuschauerzahlen verzeichnen.Die meisten Haushalte empfangen das Fernsehprogramm per Kabel. Größte Kabelnetzbetreiber sind Coditel (inzwi-schen in Numericable umbenannt) und Eltrona, der zusammen mit Nokia Sie-mens Network das Digitalpaket Imagin anbietet. Eine Mehrheit der Haushalte in Luxemburg hat einen Kabelanschluss, aber ein Viertel von ihnen verfügt auch über einen Satelliten-Receiver. P&T Luxembourg, das traditionelle Post- und Telekommunikationsunternehmen, hat im März 2008 unter dem Namen „La Télé des P&T“ ein IPTV-Angebot auf den Markt gebracht. Der ursprünglich in neun Orten angebotene Dienst ist seit September 2008 im ganzen Land verfügbar.Im September 2009 wurde die Gründung der M7 Group SA angekündigt, einem Luxemburger Gemeinschaftsunter-nehmen zwischen Airfield Media Group und Canal Digitaal B.V., den Betreibern der Satellitenbouquets CanalDigitaal, TV Vlaanderen und TéléSAT in den Nie-derlanden und Belgien. M7 hat in diesem Zusammenhang auch den Start des ersten speziell auf Luxemburg ausgerichteten Satellitenpakets bekannt gegeben.Seit April 2006 gibt es eine digitale ter-restrische Plattform von CLT-UFA, im September 2006 erfolgte die Abschaltung des Analogbetriebs. Die DVB-T-Plattform bietet einen Zugang zu einem Dutzend Sender, von denen zehn der RTL-Grup-pe angehören. Dessen ungeachtet ist das Antennenfernsehen in Luxemburg nur sehr schwach vertreten. So ist die Digita-

1792 0 0 9 | V o l u m e 1 | B a n d 1
AL
AT
BE
BG
CH
CY
CZ
DE
DK
EE
ES
FI
FR
GB
GR
HR
HU
IE
IS
IT
LT
LU
LV
MK
MT
NL
NO
PL
PT
RO
RU
SE
SI
SK
TR
LU
Luxembourg Luxembourg Luxemburg LU
is home, for example, to SES Global – the world’s leading satellite operator thanks to its Astra system, to the iTunes Music store (Apple) and to RTL Group, Europe’s leading audiovisual group. Based in Lux-embourg, the latter transmits channels to the Netherlands (RTL4, RTL5, RTL7, RTL8), France (RTL9, RTL9 Lorraine) and Belgium (RTL-TVI, Club RTL and Plug TV).Several channels registered in Luxembourg ceased broadcasting in 2008 and 2009, for example Ciné Pop (AB Group), Setanta Sport 1 and 2 and the very recent satel-lite channel em24 (launched by Eupro-Media in 2008 and no longer available on the European satellites since May 2009). On the other hand, the two international channels of the Turkish Doğan Group, Euro D and Euro Star, which target expatriate Turks, are now registered with Luxembourg’s Media and Communi-cations Service.
Le Luxembourg a depuis longtemps une politique officielle d’accueil d’entreprises à vocation paneuropéenne. Il abrite ainsi le siège social de SES Global, principal opé-rateur satellite mondial avec son système Astra, d’iTunes Music store (Apple) ainsi que de RTL Group, premier groupe audio-visuel européen. Ce dernier diffuse depuis le territoire luxembourgeois des chaînes à destination des Pays-Bas (RTL 4, RTL 5, RTL 7, RTL 8), de la France (RTL 9, RTL 9 Lorraine) et de la Belgique (RTL-TVI, Club RTL et Plug TV). Plusieurs chaînes enregistrées au Luxem-bourg ont cessé d’émettre en 2008 et 2009, ainsi Ciné Pop (groupe AB), Setan-ta Sport 1 et 2 ou encore la toute récente chaîne satellite em24 (lancée par Eupro-media en 2008 et plus disponible sur les satellites européens depuis mai 2009). En revanche, les deux chaînes internationales du groupe turc Dogan, Euro D et Euro Star, qui ciblent les populations turques vivant hors de Turquie, sont désormais enregistrées auprès du service luxembour-geois des médias et des communications.
lisierung der Kabelnetze die eigentliche Herausforderung bei der Umstellung auf Digitaltechnik.Luxemburg verfolgt seit langem eine offizielle Standortpolitik, die Unterneh-men mit gesamteuropäischem Anspruch anzieht. So befindet sich hier der Gesell-schaftssitz von SES Global, dem weltweit wichtigsten Satellitenbetreiber mit sei-nem Satellitensystem Astra, von iTunes Music Store (Apple) und der RTL Group (CLT-UFA), dem führenden europäischen audiovisuellen Medienkonzern. Dieser sendet aus Luxemburg in die Niederlan-de (RTL 4, RTL 5, RTL 7, RTL 8) und nach Frankreich (RTL 9, RTL 9 Lorraine) und Belgien (RTL-TVI, Club RTL und Plug TV).2008 und 2009 haben mehrere in Luxem-burg registrierte Sender ihren Betrieb ein-gestellt, darunter Ciné Pop (AB Groupe), Setanta Sport 1 und 2 oder auch der noch junge Teleshopping-Kanal em24 (2008 von Eupromedia gegründet und seit Mai 2009 nicht mehr über Satellit empfang-bar). Neu beim Luxemburger Medien- und Kommunikationsdienst registriert wurden dagegen Euro D und Euro Star, zwei internationale Sender des türkischen Dogan-Konzerns, die sich an im Ausland lebende Türken wenden.
Sources: Conseil national des programmes : http://www.cnpl.lu Commission indépendante de la radiodiffusion : http://www.mediacom.public.lu Audience data: TNS-ILReS Plurimedia 2009 / IP
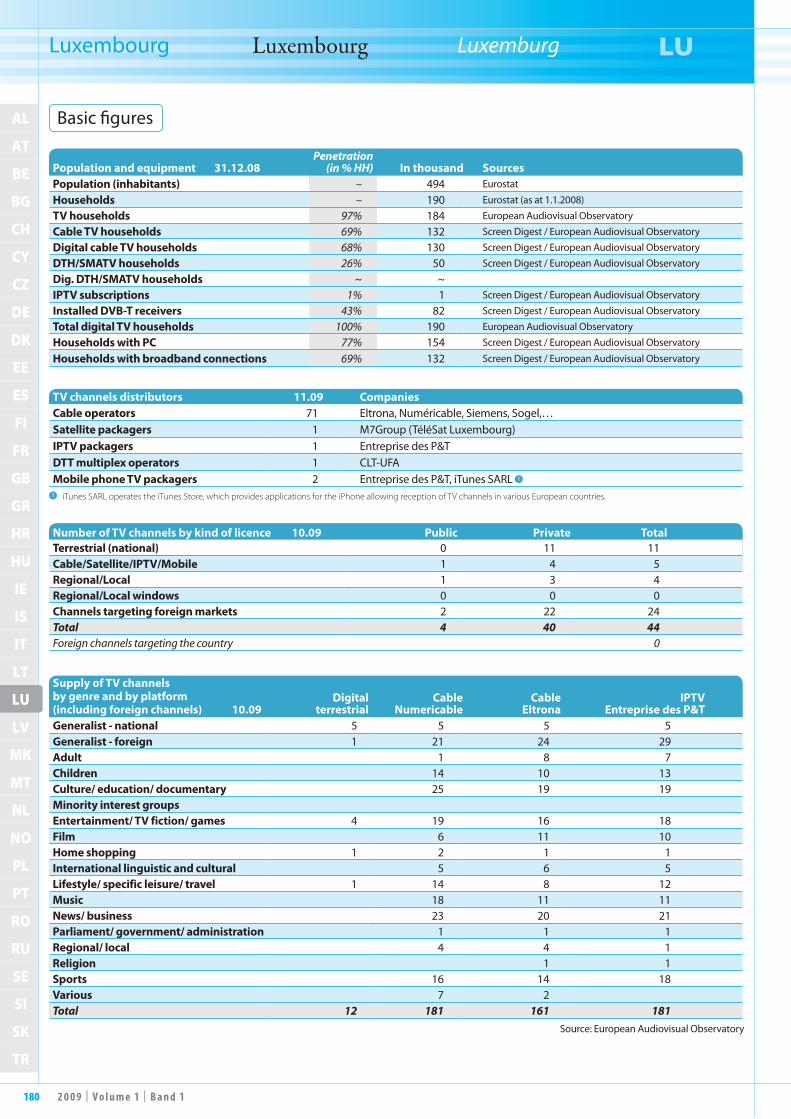
180 2 0 0 9 | V o l u m e 1 | B a n d 1
AL
AT
BE
BG
CH
CY
CZ
DE
DK
EE
ES
FI
FR
GB
GR
HR
HU
IE
IS
IT
LT
LU
LV
MK
MT
NL
NO
PL
PT
RO
RU
SE
SI
SK
TR
LU
Luxembourg Luxembourg Luxemburg LU
Population and equipment 31.12.08Penetration
(in % HH) In thousand SourcesPopulation (inhabitants) – 494 Eurostat
Households – 190 Eurostat (as at 1.1.2008)
TV households 97% 184 European Audiovisual Observatory
Cable TV households 69% 132 Screen Digest / European Audiovisual Observatory
Digital cable TV households 68% 130 Screen Digest / European Audiovisual Observatory
DTH/SMATV households 26% 50 Screen Digest / European Audiovisual Observatory
Dig. DTH/SMATV households ~ ~IPTV subscriptions 1% 1 Screen Digest / European Audiovisual Observatory
Installed DVB-T receivers 43% 82 Screen Digest / European Audiovisual Observatory
Total digital TV households 100% 190 European Audiovisual Observatory
Households with PC 77% 154 Screen Digest / European Audiovisual Observatory
Households with broadband connections 69% 132 Screen Digest / European Audiovisual Observatory
Number of TV channels by kind of licence 10.09 Public Private TotalTerrestrial (national) 0 11 11Cable/Satellite/IPTV/Mobile 1 4 5Regional/Local 1 3 4Regional/Local windows 0 0 0Channels targeting foreign markets 2 22 24Total 4 40 44Foreign channels targeting the country 0
TV channels distributors 11.09 CompaniesCable operators 71 Eltrona, Numéricable, Siemens, Sogel,…Satellite packagers 1 M7Group (TéléSat Luxembourg)IPTV packagers 1 Entreprise des P&TDTT multiplex operators 1 CLT-UFAMobile phone TV packagers 2 Entreprise des P&T, iTunes SARL 1
Source: European Audiovisual Observatory
Supply of TV channels by genre and by platform (including foreign channels) 10.09
Digital terrestrial
Cable Numericable
Cable Eltrona
IPTV Entreprise des P&T
Generalist - national 5 5 5 5Generalist - foreign 1 21 24 29Adult 1 8 7Children 14 10 13Culture/ education/ documentary 25 19 19Minority interest groupsEntertainment/ TV fiction/ games 4 19 16 18Film 6 11 10Home shopping 1 2 1 1International linguistic and cultural 5 6 5Lifestyle/ specific leisure/ travel 1 14 8 12Music 18 11 11News/ business 23 20 21Parliament/ government/ administration 1 1 1Regional/ local 4 4 1Religion 1 1Sports 16 14 18Various 7 2Total 12 181 161 181
1 iTunes SARL operates the iTunes Store, which provides applications for the iPhone allowing reception of TV channels in various European countries.
Basic figures

1812 0 0 9 | V o l u m e 1 | B a n d 1
AL
AT
BE
BG
CH
CY
CZ
DE
DK
EE
ES
FI
FR
GB
GR
HR
HU
IE
IS
IT
LT
LU
LV
MK
MT
NL
NO
PL
PT
RO
RU
SE
SI
SK
TR
LU
Luxembourg Luxembourg Luxemburg LU
Source: European Audiovisual Observatory on the basis of data from Screen Digest and IP Key Facts
Source: European Audiovisual Observatory
Source: Screen DigestSource: Screen Digest
Households TV equipment 2004-2008
Number of households accessing multichannel platforms as at 31.12.2008
Consumers pay-TV gross spend 2004-2008
Gross revenues of radio-television 2004-2008
2004 2005 2006 2007 2008
0
150
100
50
Cable households
DTT households
Satellite households
IPTV households
141 141143 144
132
0 0 13
36
82
4045 45
50 50
DTT
Numericable
Imagin
Entrepris
es P & T
Sogel
0
100
80
60
40
20
82
38
~ 1 ~
DTT
IPTV
Sat
PC
Cable
2004 2005 2006 2007 2008
0
30 000
20 000
10 000
Cable TV
IPTV
23 412
18 35419 102
20 926
22 846
14 74
2004 2005 2006 2007 2008
0
25
20
15
5
10
Consumerspay-TV spend
TV adspend
23
21
19
18
11 11
10 10
23
14
In thousands.
In thousands.
EUR thousand.
EUR million.
Market trends

182 2 0 0 9 | V o l u m e 1 | B a n d 1
AL
AT
BE
BG
CH
CY
CZ
DE
DK
EE
ES
FI
FR
GB
GR
HR
HU
IE
IS
IT
LT
LU
LV
MK
MT
NL
NO
PL
PT
RO
RU
SE
SI
SK
TR
LU
Luxembourg Luxembourg Luxemburg LU
1 Includes telecommunication activities. Taken over by Orange in October 2009. The mobile phone TV offer has been interrupted but should be relaunched in 2010.
2 iTunes SARL is the company operating the iTunes Stores in various European countries. Since 2009, the AppStore also releases applications for the iPhone allowing the access to individual TV channels.
Broadcasters Channels 2005 2006 2007 2008 2008/07
CLT-UFA adtvRTL Tele Lëtzebuerg, RTL4, RTL5, RTL7, RTL8, RTL9, RTL-TVi, Club RTL, …
568,8 638,6 687,4 681,9 -0,8%
p.m. RTL Nederland S.A. adtv RTL4, RTL5 – – – – –DVL.TV thtv Luxe TV – 0,1 ~ ~ ~
Main distributors Services Packages 2005 2006 2007 2008 2008/07Entreprise des P&T 1 3play, 3G TV La Télé des P&T, Mobile TV 531,4 533,2 546,8 556,8 1,8%iTunes SARL 2 3G TV iPhone App Store – 132,2 224,5 353,4 57,4%Voxmobile SA 1 3G TV Voxvision ~ 27,7 ~ ~ ~Sogel CATV Télédistribution 3 26,3 25,5 ~ ~Eltrona Interdiffusion S.A. 1 CATV, ISP Eltrona Câble TV 12,1 12,2 14,1 18,1 28,4%Numéricable (formerly Coditel S.A.) 3play Numéricable TV 1,5 13,3 14,3 ~ ~
Source: European Audiovisual Observatory
Source: RTL Group / European Audiovisual Observatory
Country 2005 2006 2007 2008 2005 2006 2007 2008 2008/07DE 1 858 1 965 1 983 2 046 36,3% 34,8% 34,7% 35,4% 3,2%FR 1 468 1 608 1 547 1 543 28,7% 28,5% 27,1% 26,7% -0,3%GB 370 466 499 432 7,2% 8,3% 8,7% 7,5% -13,4%NL 358 350 408 436 7,0% 6,2% 7,1% 7,6% 6,9%BE 174 186 210 216 3,4% 3,3% 3,7% 3,7% 2,9%LU 110 79 86 93 2,2% 1,4% 1,5% 1,6% 8,1%HR 38 44 48 50 0,7% 0,8% 0,8% 0,9% 4,2%GR – – – 4 – – – 0,1% –FremantleMedia 947 1 128 1 132 1 203 18,5% 20,0% 19,8% 20,8% 6,3%Others 43 31 29 51 0,8% 0,5% 0,5% 0,9% 75,9%Eliminations -251 -217 -235 -280 -4,9% -3,8% -4,1% -4,8% 19,1%
Total 5 115 5 640 5 707 5 774 100,0% 100,0% 100,0% 100,0% 1,2%
Operating revenues of TV companies in Luxembourg 2005-2008 EUR million.
T.1.LU.1
Geographical breakdown of RTL Group revenues 2004-2008 EUR million.
T.1.LU.2

1832 0 0 9 | V o l u m e 1 | B a n d 1
AL
AT
BE
BG
CH
CY
CZ
DE
DK
EE
ES
FI
FR
GB
GR
HR
HU
IE
IS
IT
LT
LU
LV
MK
MT
NL
NO
PL
PT
RO
RU
SE
SI
SK
TR
LU
Luxembourg Luxembourg Luxemburg LU
Source: RTL Group / European Audiovisual Observatory
Income 2005 2006 2007 2008 2005 2006 2007 2008 2008/07Television 4 001 4 346 4 418 4 394 75,1% 74,5% 74,4% 72,7% -0,5%Production/distribution 1 022 1 176 1 176 1 255 19,2% 20,2% 19,8% 20,8% 6,7%Radio 242 250 279 332 4,5% 4,3% 4,7% 5,5% 19,0%Other 65 63 65 64 1,2% 1,1% 1,1% 1,1% -1,5%
Total 5 330 5 835 5 938 6 045 100,0% 100,0% 100,0% 100,0% 1,8%Operating product after eliminations 5 218 5 640 5 707 5 774
Expenditure 2005 2006 2007 2008 2005 2006 2007 2008 2008/07 Purchase of goods and services ~ ~ ~ ~ ~ ~ ~ ~ ~ Cost of personnel 795 ~ ~ ~ 17,5% ~ ~ ~ ~ Depreciation 235 217 213 203 5,2% 4,6% 4,2% 3,8% -4,7%Operating expenditure 4 540 4 756 5 016 5 345 100,0% 100,0% 100,0% 100,0% 6,6%
Net result 616 1 111 674 296,0 -56,1%Operating margin (%) 13 16,9 13,2 8
EUR million.
In %.
2004 2005 2006 20082007
0
7 000
6 000
5 000
4 000
3 000
2 000
1 000
Television
Production/distribution
RadioOther
2004 2005 2006 2007 2008
0
20
15
10
5
Pro�t marginReturn on shareholders'funds Operating margin
Return on total assets
RTL Group financial situation 2005-2008 EUR million.
T.1.LU.3G.1.LU.1

184 2 0 0 9 | V o l u m e 1 | B a n d 1
AL
AT
BE
BG
CH
CY
CZ
DE
DK
EE
ES
FI
FR
GB
GR
HR
HU
IE
IS
IT
LT
LU
LV
MK
MT
NL
NO
PL
PT
RO
RU
SE
SI
SK
TR
LU
Luxembourg Luxembourg Luxemburg LU
Daily share Timeslot 19:00-20:00
Channels2004/ 2005
2005/ 2006
2006/ 2007
2007/ 2008
2008/ 2009
2004/ 2005
2005/ 2006
2006/ 2007
2007/ 2008
2008/ 2009
RTL Tele Lëtzebuerg 14,3 13,1 12,6 10,9 10,7 53,5 44,5 42 41,9 39TF1 9,2 8,7 11,3 7,7 8,9 6,6 8,4 9,4 4,9 7PRO 7 5,6 5,9 6,8 6,4 7,0 3,1 5 3,8 4,3 5,2RTL 8,9 6,7 6,2 6,6 7,0 4,8 4 6,3 6,1 6,9ARD 7,4 6,0 7,8 5,9 6,2 2,4 2,5 3,7 2,7 2,6ZDF 7,2 5,8 6,0 7,6 5,3 3,5 3,2 3,3 3,7 2,8M6 4,3 5,5 4,3 5,0 4,5 2,7 3,1 1,5 3,2 3,4RTP Int. 3,9 4,0 3,8 4,1 3,9 2,3 n.a. 2,1 4,1 2,7France 2 3,2 4,2 3,0 3,7 3,8 1,2 2,4 2,2 1,7 1,9SAT.1 5,4 5,4 4,0 4,0 3,6 2,2 4,1 2,6 1,7 1,7
Others 30,6 34,7 34,2 38,1 39,1 17,7 22,8 23,1 25,7 26,8Source: ILReS TV/IP for 2004-2006, TNS-ILRes Plurimedia for 2006-2009
Daily share. In %, 12 years +.
Timeslot 19:00-20:00. In %, 12 years +.
2004/2005
2005/2006
2006/2007
2007/2008
2008/2009
0
4
12
16
8
RTL TeleLëtzebuerg
TF1
PRO 7
ARD
ZDF
M6RTP Int.SAT.1
RTL
France 2
2008
RTL Tele Lëtzebuerg39%
Others26,8%
TF17%
PRO 75,2%
RTL6,9%
ARD2,6%
ZDF2,8%
M63,4%
RTP Int.2,7%
France 21,9%
SAT.11,7%
TV audience market share in Luxembourg 2005-2009 In %, 12 years +.
T.1.LU.4G.1.LU.2

1852 0 0 9 | V o l u m e 1 | B a n d 1
AL
AT
BE
BG
CH
CY
CZ
DE
DK
EE
ES
FI
FR
GB
GR
HR
HU
IE
IS
IT
LT
LU
LV
MK
MT
NL
NO
PL
PT
RO
RU
SE
SI
SK
TR
LV
Latvia Lettonie Lettland LV
After the significant changes that took place in 2007 – the entry of News
Corp. onto the scene with its takeover of LNT and TV5 and the creation of a new channel (TV6) by Sweden’s MTG group – the Latvian television market consolida-ted in 2008 and the first half of 2009.The audience hierarchy remained unchan-ged in 2008 and LNT strengthened its position as leader. Its main private competitor, TV3 (MTG), saw its daily audience decline significantly to 15.4%, against 19.3% in the case of LNT. Com-pared with its two private competitors, the public broadcaster has stabilised its audience figures by compensating for its loss in the case of LTV1 with a gain in the case of LTV7, ultimately recording a daily audience share of 15.3% (as in 2007). Whereas TV6 made a successful entry into the Latvian market and achie-ved a 1.3% audience market share from its second year of operation, new players are struggling to emerge given the presence of the incumbent channels. The arrival of digital terrestrial television might open up new opportunities in a market in which the average daily television viewing time has risen significantly (from 202 minutes in 2007 to 213 minutes in 2008). The allocation to Lattelecom of the licence to operate the digital terrestrial platform was confirmed in February 2009. Despite persistent privatisation efforts, Lattelecom is 51% owned by the Latvian state and, indirectly, 49% owned by Sweden’s Telia-Sonera group. Encrypted in MPEG-4, the new DTT platform will transmit about 70 free and pay channels. The first phase of commercial development was inaugurated in August 2009 and thirty or so channels were made available to those living within a radius of 70km of Riga.Before the expansion of digital terrestrial television, multi-channel services will mainly be provided by the cable opera-tors. This sector is dominated by Baltkom (230,000 subscribers in June 2009) and Izzi (sold in 2008 to Contaq Latvian Cable, which is owned by a Luxembourg based holding company). Viasat (control-led by the MTG group) markets the country’s only satellite package and Lat-telecom provides the only IPTV service (renamed Interactive TV in 2008) availa-ble in Latvia, with 30,000 subscribers in June 2009.
Après les importantes mutations de 2007 - entrée de News Corp. dans
le pays avec le rachat de LNT et de TV5 et la création d’une nouvelle chaîne par le Suédois MTG, TV6 – les acteurs du mar-ché télévisuel letton ont consolidé leurs positions en 2008 et au cours de la pre-mière moitié de 2009.La hiérarchie des audiences demeure inchangée en 2008 et LNT renforce sa place de leader. Son principal concurrent privé, TV3 (MTG), voit son audience quotidienne en net replis à 15,4 %, contre 19,3 % pour LNT. Face à ses deux concur-rents privés, le radiodiffuseur public stabi-lise son audience grâce à un rééquilibrage entre ses deux chaînes : ce que LTV1 perd, LTV7 le gagne pour rassembler au final, comme en 2007, 15,3 % d’audience quotidienne. Si TV6 réussit une bonne entrée sur le marché letton en réunissant dès sa seconde année 1,3% de part de marché d’audience quotidienne, de nou-veaux acteurs peinent à émerger face aux chaînes historiques. L’arrivée de la TNT ouvrira peut être de nouvelles opportunités dans un marché qui voit significativement progresser le temps moyen quotidien de visionnage de la télévision (de 202 minutes en 2007 à 213 minutes en 2008). L’attribution de la licence permettant d’opérer la plate-forme numérique ter-restre à Lattelecom a été confirmée en février 2009. En dépit de projets per-sistants de privatisation, Lattelecom est toujours possédé à 51 % par l’Etat letton et à 49 %, indirectement, par le suédois Teliasonera. Encodée en MPEG-4, la nouvelle plate-forme TNT transmettra environ 70 chaînes gratuites et payantes. La première phase du développement commercial a été inaugurée en août 2009, rendant accessibles une trentaine de chaî-nes aux populations vivant dans un rayon de 70 km autour de Riga.En attendant l’essor du numérique terres-tre, l’offre multi-chaînes provient essen-tiellement des câblo-opérateurs. Le secteur est dominé par Baltkom (230 000 abon-nés en juin 2009) et Izzi (revendu en 2008 à Contaq Latvian Cable, détenu par une holding luxembourgeoise). Viasat (contrôlée par le groupe MTG) commer-cialise l’unique bouquet satellite du pays et Lattelecom propose le seul service IPTV (rebaptisé Interactive TV en 2008) acces-sible en Lettonie, avec 30 000 abonnés en juin 2009.
Nach den bedeutenden Veränderungen des Jahres 2007 – News Corp. über-
nahm den größten lettischen Privatsender LNT sowie TV5, und die schwedische Modern Times Group (MTG) star-tete ihren neuen Sender TV6 – folgte 2008 und in der ersten Hälfte 2009 eine Phase der Konsolidierung auf dem let-tischen Fernsehmarkt.Was die Zuschauermarktanteile anbe-trifft, so ist die Rangfolge der Sender 2008 unverändert. Marktführer ist nach wie vor LNT mit 19,3 %. Sein stärkster privater Konkurrent, TV3 (MTG), hat im Vergleich zum Vorjahr Marktanteile verloren und liegt inzwischen bei 15,4 %. Gegenüber seinen beiden privaten Konkurrenten konnte das öffentlich-recht-liche Fernsehen seine Zuschauerzahlen insgesamt in etwa halten: Die Zuschauer, die LTV1 verloren hat, gewinnt LTV7 hinzu. Insgesamt kamen die beiden öffentlich-rechtlichen Sender wie schon 2007 auf 15,3 % der Zuschauermarkt-anteile. TV6 ist zwar auf dem lettischen Markt recht erfolgreich gestartet und konnte 2008 einen Marktanteil von 1,3 % ge winnen. Doch neue Akteure haben es generell schwer, sich gegen die etablierten Sender durchzusetzen. Die Einführung des digitalen terres-trischen Fernsehens eröffnet möglicher-weise neue Marktchancen in einem Land, in dem die Zuschauer täglich immer mehr Zeit vor dem Fernseher ver bringen (2008 waren es 213 Minuten täglich gegenüber 202 Minuten 2007). Im Februar 2009 erhielt Lattelecom die Lizenz für den Betrieb einer terrestrischen Digital-Plattform. Trotz der Pläne zur Privatisierung des Senders ist Lattele-com nach wie vor zu 51 % im Besitz des lettischen Staates und zu 49 % indirekt im Besitz des schwedischen Konzerns TeliaSonera. Die neue terrestrische DVB-T-Plattform mit MPEG-4-Co-dierung umfasst etwa 70 Sender, sowohl frei empfangbare als auch Pay-TV. Die erste Phase der kommerziellen Entwick-lung wurde im August 2009 gestartet. In einem Umkreis von 70 km um die lettische Hauptstadt Riga können die Zuschauer inzwischen etwa 30 digitale Programme empfangen.Derzeit kommen die Mehrkanalangebote im Wesentlichen von den Kabelnetz-betreibern. Hier sind die Marktführer Baltkom (230 000 Kunden im Juni 2009) und Izzi (2008 an Contaq Latvian-Kabel verkauft, im Besitz einer luxemburgischen Holding). Viasat (eine Tochter der schwe-dischen MTG) vermarktet das einzige Satelliten-Bouquet des Landes, und Lattelecom bietet den einzigen IPTV-Dienst an (2008 wieder in Interactive TV umbenannt), der in Lettland empfangen werden kann. Die Zahl der Abonnenten des IPTV-Dienstes war im Juni 2009 auf 30 000 gestiegen.
Sources: Nacionala radio un televizijas padome (NRTP): http://www.nrtp.lv Legal aspects: IRIS Merlin, http://merlin.obs.coe.int Audience datas: TNS Latvia : http://www.tns.lv
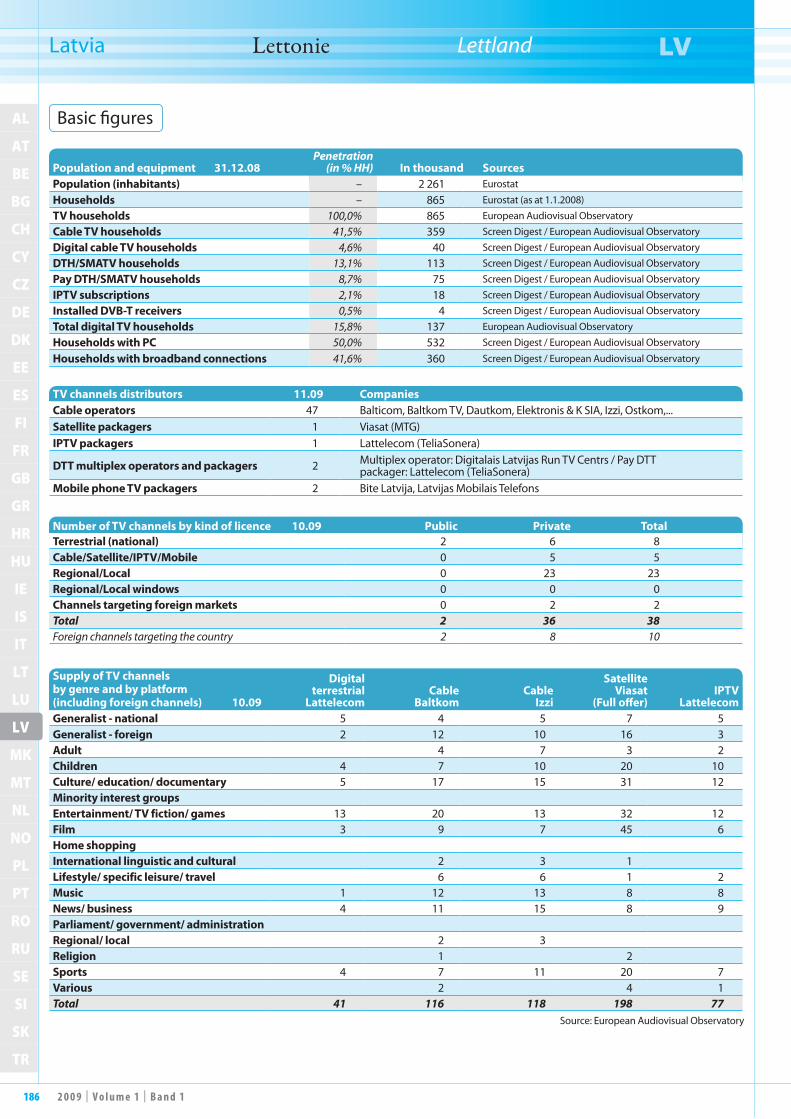
186 2 0 0 9 | V o l u m e 1 | B a n d 1
AL
AT
BE
BG
CH
CY
CZ
DE
DK
EE
ES
FI
FR
GB
GR
HR
HU
IE
IS
IT
LT
LU
LV
MK
MT
NL
NO
PL
PT
RO
RU
SE
SI
SK
TR
LV
Latvia Lettonie Lettland LV
Population and equipment 31.12.08Penetration
(in % HH) In thousand SourcesPopulation (inhabitants) – 2 261 Eurostat
Households – 865 Eurostat (as at 1.1.2008)
TV households 100,0% 865 European Audiovisual Observatory
Cable TV households 41,5% 359 Screen Digest / European Audiovisual Observatory
Digital cable TV households 4,6% 40 Screen Digest / European Audiovisual Observatory
DTH/SMATV households 13,1% 113 Screen Digest / European Audiovisual Observatory
Pay DTH/SMATV households 8,7% 75 Screen Digest / European Audiovisual Observatory
IPTV subscriptions 2,1% 18 Screen Digest / European Audiovisual Observatory
Installed DVB-T receivers 0,5% 4 Screen Digest / European Audiovisual Observatory
Total digital TV households 15,8% 137 European Audiovisual Observatory
Households with PC 50,0% 532 Screen Digest / European Audiovisual Observatory
Households with broadband connections 41,6% 360 Screen Digest / European Audiovisual Observatory
Number of TV channels by kind of licence 10.09 Public Private TotalTerrestrial (national) 2 6 8Cable/Satellite/IPTV/Mobile 0 5 5Regional/Local 0 23 23Regional/Local windows 0 0 0Channels targeting foreign markets 0 2 2Total 2 36 38Foreign channels targeting the country 2 8 10
TV channels distributors 11.09 CompaniesCable operators 47 Balticom, Baltkom TV, Dautkom, Elektronis & K SIA, Izzi, Ostkom,...Satellite packagers 1 Viasat (MTG)IPTV packagers 1 Lattelecom (TeliaSonera)
DTT multiplex operators and packagers 2 Multiplex operator: Digitalais Latvijas Run TV Centrs / Pay DTT packager: Lattelecom (TeliaSonera)
Mobile phone TV packagers 2 Bite Latvija, Latvijas Mobilais Telefons
Source: European Audiovisual Observatory
Supply of TV channels by genre and by platform (including foreign channels) 10.09
Digital terrestrial
LattelecomCable
BaltkomCable
Izzi
Satellite Viasat
(Full offer)IPTV
LattelecomGeneralist - national 5 4 5 7 5Generalist - foreign 2 12 10 16 3Adult 4 7 3 2Children 4 7 10 20 10Culture/ education/ documentary 5 17 15 31 12Minority interest groupsEntertainment/ TV fiction/ games 13 20 13 32 12Film 3 9 7 45 6Home shoppingInternational linguistic and cultural 2 3 1Lifestyle/ specific leisure/ travel 6 6 1 2Music 1 12 13 8 8News/ business 4 11 15 8 9Parliament/ government/ administrationRegional/ local 2 3Religion 1 2Sports 4 7 11 20 7Various 2 4 1Total 41 116 118 198 77
Basic figures

1872 0 0 9 | V o l u m e 1 | B a n d 1
AL
AT
BE
BG
CH
CY
CZ
DE
DK
EE
ES
FI
FR
GB
GR
HR
HU
IE
IS
IT
LT
LU
LV
MK
MT
NL
NO
PL
PT
RO
RU
SE
SI
SK
TR
LV
Latvia Lettonie Lettland LV
Source: European Audiovisual Observatory on the basis of data from Screen Digest, and IP Key Facts
Source: European Audiovisual Observatory
Source: Screen DigestSource: Screen Digest
Households TV equipment 2004-2008
Number of households accessing multichannel platforms as at 31.12.2008
Consumers pay-TV gross spend 2004-2008
Gross revenues of radio-television 2004-2008
2004 2005 2006 2007 2008
0
400
300
200
100
Cable households
Satellite households
IPTV householdsDTT households
299
314
330345
359
70
0
0 0 0 2 40 1
718
90 90100
113
DTT
Lattelekom
Viasat
Baltkom
Baticom
0
250
200
150
100
50
DTT
IPTV
Sat
PC
Cable
230
81
154
~
2004 2005 2006 2007 2008
0
40 000
30 000
20 000
10 000
Cable TV
Satellite
IPTV
34 604
24 10925 187
27 537
31 850
188659
1 900
4 639
7 921
0 0
35530
1 739
2004 2005 2006 2007 2008
0
400
500
100
300
200
TV adspend
Consumerspay-TV spend
134
175
240
334
467
24 26 2937
44
In thousands.
In thousands.
EUR thousand.
EUR million.
Market trends

188 2 0 0 9 | V o l u m e 1 | B a n d 1
AL
AT
BE
BG
CH
CY
CZ
DE
DK
EE
ES
FI
FR
GB
GR
HR
HU
IE
IS
IT
LT
LU
LV
MK
MT
NL
NO
PL
PT
RO
RU
SE
SI
SK
TR
LV
Latvia Lettonie Lettland LV
Main broadcasters Channels 2005 2006 2007 2008 2008/07Latvijas Televizija sptv LTV 1, LTV 7 15 659 19 053 20 362 ~ ~TV 3 Latvia SIA adtv TV3 9 086 12 206 15 694 17 466 11,3%Latvijas Neatkariga Televizija adtv LNT 10 457 13 044 14 060 16 086 14,4%Pirmais Baltijas Kanals SIA thtv PBK Latvia 7 268 8 936 12 299 4 658 -62,1%
Main distributors Packages 2005 2006 2007 2008 2008/07Latvijas Mobilais Telefons 1 3G TV Mobila TV 243 562 263 106 274 159 272 082 -0,8%Lattelecom SIA 1 3play, DTT Interaktiva TV 189 022 186 363 189 896 209 665 10,4%Bité Latvija SIA 1 3G TV Bité Latvia TV 801 8 066 16 611 23 606 42,1%Baltkom TV SIA 1 3play Baltkom Digital TV 9 420 12 690 14 801 ~ ~Izzi SIA 1 3play Izzi TV 4 265 5 166 6 649 9 267 39,4%Dautkom TV SIA CATV Dautkom TV 2 188 2 632 3 295 ~ ~Balticom AS 1 3play Balticom Televizija 1 140 1 726 3 263 ~ ~Elektrons & K SIA CATV Elektrons 1 187 1 420 1 684 ~ ~Skatvis SIA 1 2 3play Kabel televizija 746 899 1 010 ~ ~
Source: European Audiovisual Observatory1 Includes telecommunication activities.2 Includes broadcasting activities.
EUR thousand.
2004 2005 2006 2007 2008
0
25 000
20 000
15 000
10 000
5 000Pirmais Baltijas Kanals SIA
Latvijas Neatkariga Televizija
TV 3 Latvia SIA
Latvijas Televizija
Operating revenues of main television companies in Latvia 2005-2008 EUR thousand.
T.1.LV.1G.1.LV.1

1892 0 0 9 | V o l u m e 1 | B a n d 1
AL
AT
BE
BG
CH
CY
CZ
DE
DK
EE
ES
FI
FR
GB
GR
HR
HU
IE
IS
IT
LT
LU
LV
MK
MT
NL
NO
PL
PT
RO
RU
SE
SI
SK
TR
LV
Latvia Lettonie Lettland LV
Daily share Prime time (19:00-22:00)Channels 2004 2005 2006 2007 2008 2004 2005 2006 2007 2008LTV 1 13,8 12,5 11,1 11,4 10,7 21,5 18,5 16,1 15,5 14,6LTV 7 4,9 4,9 5,3 3,9 4,6 4,8 4,2 5,0 3,6 4,3Latvian public channels 18,7 17,4 16,4 15,3 15,3 26,3 22,7 21,1 19,1 18,9LNT 22,1 21,0 20,4 19,0 19,3 18,9 21,0 20,5 19,3 19,8TV3 17,1 18,5 18,4 18,0 15,4 16,8 18,7 18,4 19,1 16,3Perviy Baltiysky Kanal Latvia 9,6 9,7 10,1 10,4 10,7 11,5 10,9 11,0 11,1 11,5TV5 Riga 2,9 2,9 2,8 2,2 3,3 2 2,2 2,5 2,4 3,6TV6 1,3 1,4Main Latvian private channels 51,7 52,1 51,7 49,6 50,0 49,2 52,8 52,4 51,9 52,63+ 2,4 3,3 4,0 4,9 4,0 1,9 3,5 4,3 5,8 4,1Ren TV Baltija – – 1,7 2,0 2,5 – – 1,9 1,8 2,2MTV Latvija 0,2 0,2 0,1 0,1PBMK 0,4 0,2RTR Planeta Baltija 0,4 0,3Main foreign channels 2,4 3,3 5,7 7,1 7,5 1,9 3,5 6,2 7,7 6,9Others 24,5 25,0 24,4 25,8 24,7 20,3 19,2 19,0 19,6 19,6Video 2,7 2,2 1,8 2,2 2,5 2,3 1,8 1,3 1,7 2,0
Source: Eurodata TV Worldwide / TNS LATVIA
Daily share. In %, 4 years +.
Prime time (19:00-22:00). In %, 4 years +.
2004 2005 2006 2007 2008
0
5
10
20
15
25
LNT
TV3
LTV 1
Perviy BaltiyskyKanal Latvia
LTV 73+TV5 RigaRen TV Baltija
TV6
2008
LTV 114,6%
Video2,0%
LTV 74,3%
LNT19,8%
TV316,3%
PerviyBaltiysky
Kanal Latvia11,5%TV5 Riga
3,6%
TV61,4%
3+4,1%
Ren TVBaltija
2,2%
MTV Latvija0,1%
PBMK0,2%
RTR PlanetaBaltija
0,3%
Others19,6%
TV audience market share in Latvia 2004-2008 In %, 4 years +.
T.1.LV.2G.1.LV.2

190 2 0 0 9 | V o l u m e 1 | B a n d 1
AL
AT
BE
BG
CH
CY
CZ
DE
DK
EE
ES
FI
FR
GB
GR
HR
HU
IE
IS
IT
LT
LU
LV
MK
MT
NL
NO
PL
PT
RO
RU
SE
SI
SK
TR
MK
“The former Yugoslav Republic of Macedonia“
“Ex-République yougoslave de Macédoine”
“ Ehemalige jugoslawische Republik Mazedonien“
MK
The audiovisual landscape in “the for-mer Yugoslav Republic of Mace donia”
is made up of 52 private and 4 public channels, the latter operated by the pub-lic service broadcaster MRT. Five of the 52 private channels have national coverage (A1 TV, TV Alsat, TV Kanal 5, TV Sitel and TV Telma), 10 are regional and 37 are local. The first public channel, MTV1, is a generalist channel, the second, MTV2, is intended to foster the cultural identity of the ethnic minority communities in the Republic of Macedonia (Albanians, Turks, Serbs, Roma, Vlachs and Bosniaks), and the third channel is the Assembly channel. The 4th channel is an international satellite channel that broadcasts the programmes offered by the other MTV stations.The two private channels AT1 and TV Sitel dominate the market, while public television is suffering from consid-erable financial instability. This has led the National Assembly to amend the Broad-casting Act 2005 for the second time. The provisions that came into force in August 2008 allow the filing of bank-ruptcy proceedings or the liquidation of the public service broadcaster, and modify its funding arrangements.The market for the distribution of tele-vision services underwent significant changes in 2008 and 2009. The cable operators, which reach about half of house-holds, have been subject to several consoli-dation processes. At the same time, new methods of distribution are emerging. For example Makedonski Telekom (controlled by Deutsche Telekom) launched MaxTV, the first Macedonian IPTV package, in November 2008. It had 1,952 subscribers at the end of 2008 and 8,301 in September 2009. Cosmofon (a subsidiary of Telekom Slovenije) launched a four-channel 3G package for its mobile telephone network in the summer of 2009.A major development is the imminent launch of digital terrestrial television: following the adoption of the Broad- casting Development Strategy for the period 2007-2012, the Broadcasting Council awarded On.net, a subsidiary of Telekom Slovenije, a ten-year licence to operate three multiplexes in April 2009. On.net has carried out tests in Skopje and plans to launch the pay-DTT platform Boom TV in 2010.
Le paysage audiovisuel macédonien se compose de 52 chaînes privées et de
4 chaînes publiques, opérées par le radio-diffuseur de service public MRT. Parmi les 52 chaînes privées, 5 bénéficient d’une couverture nationale – A1 TV, TV Alsat, TV Kanal 5, TV Sitel, TV Telma – 10 sont régionales et 37 sont locales. La première chaîne publique, MTV1, est de type géné-raliste ; la deuxième, MTV2, a pour objec-tif d’entretenir l’identité culturelle des minorités ethniques présentes en Répu-blique de Macédoine (Albanais, Turcs, Serbes, Roms, Valaques et Bosniaques) ; la troisième est la chaîne parlementaire ; enfin la quatrième est une chaîne satel-lite à vocation internationale qui reprend les programmes proposés par les autres stations MTV.Les deux chaînes privées AT1 et TV Sitel dominent le marché tandis que la télé-vision publique souffre d’une importante instabilité financière, ce qui a conduit l’assemblée parlementaire à amender une seconde fois la loi de 2005 relative aux acti-vités de radiodiffusion. Les dispositions entrées en vigueur en août 2008 autori-sent une procédure de faillite ou de mise en liquidation du radiodiffuseur public et modifient son financement.Le marché de la distribution des servi-ces de télévision a connu d’importantes évolutions en 2008 et 2009. Les câblo- opérateurs, qui équipent environ la moitié des foyers, ont connu plusieurs mouvements de consolidations. Parallèle-ment, de nouveaux modes de distribution émergent. Ainsi Makedonski Telekom (contrôlé par Deutsche Telekom) a lancé MaxTV en novembre 2008, le premier bouquet IPTV macédonien. Celui-ci enregistrait 1 952 clients à la fin de l’année 2008 et 8 301 abonnés en septembre 2009. Cosmofon (filiale de Telekom Slovenije) a lancé pendant l’été 2009 un bouquet 3G, composé de 4 chaînes, pour son réseau de téléphones portables.Surtout, la télévision numérique terrestre est sur le point d’être lancée : suite à l’adop-tion de la Stratégie de développement de la radiodiffusion pour la période 2007-2012, le Conseil de la radiodiffusion a attribué en avril 2009 une licence de dix ans pour trois multiplex à On.net, une filiale de Telekom Slovenije. On.net a mené des tests à Skopje et prévoit de lancer la plate- forme TNT payante « Boom TV » en 2010.
Die audiovisuelle Landschaft Maze-doniens umfasst 52 Privatsender
sowie die vier Sender der öffentlich-rechtlichen Sendeanstalt MRT. Von den 52 Privatsendern sind fünf landes-weit zu empfangen: A1 TV, TV Alsat, TV Kanal 5, TV Sitel, TV Telma. Dazu kommen 37 Regional- und 10 Lokal-sender. Das erste öffentlich-rechtliche Programm, MTV1, ist ein Voll programm, der zweite Kanal, MTV2, will die kultu-relle Identität der ethnischen Minder-heiten in der Republik Mazedonien bewahren (Albaner, Türken, Serben, Roma, Walachen und Bosnier), und der dritte Dienst ist der Parlamentskanal; der vierte Sender ist ein international ausgerichteter Satellitenkanal, der aus-gewählte Sendungen der anderen MTV-Sender übernimmt.Der Markt wird von den beiden Privat-sendern AT1 und TV Sitel beherrscht, während das öffentlich-rechtliche Fern-sehen unter einer großen finanziellen Instabilität leidet. Dies hat das Parlament dazu veranlasst, das Rundfunkgesetz von 2005 ein weiteres Mal zu ändern. Die seit August 2008 geltenden Bestimmungen erlauben nun die Eröffnung eines Kon-kurs- oder Insolvenzverfahrens gegen die öffentlich-rechtliche Rundfunkanstalt und regeln ihre Finanzierung neu.Der Markt für die Verbreitung von Fern-sehdiensten hat 2008 und 2009 deut-liche Veränderungen erlebt, darunter mehrere Konsolidierungswellen bei den Kabelnetzbetreibern, die rund die Hälfte der Haushalte versorgen. Parallel hierzu entstehen neue Distributionsformen. So hat Makedonski Telekom (eine Tochter der Deutschen Telekom) im November 2008 das erste mazedonische IPTV-Paket (MaxTV) auf den Markt gebracht. Ende 2008 zählte es 1 952 und im Septem-ber 2009 8 301 Abonnenten. Der Mobil-funkbetreiber Cosmofon (eine Tochter der Telekom Slovenije) bietet seit dem Sommer 2009 für sein Netz ein 3G-Paket an, das vier Kanäle umfasst.Vor allen Dingen steht aber der Start-schuss für das DVB-T-Fernsehen unmit-telbar bevor: So hat der Rundfunkrat nach der Verabschiedung der Strategie für die Entwicklung des Rundfunks im Zeitraum 2007-2012 dem Betreiber On-net (einer Tochter der Telekom Slovenije) im April 2009 eine zehnjährige Lizenz für den Betrieb von drei Multiplexen erteilt. On.net hat im Raum Skopje Tests durch-geführt und plant für 2010 den Start einer kostenpflichtigen DVB-T-Plattform („Boom TV“).
Sources: Sovet za radiodifuzija (Conseil macédonien de radiodiffusion) : http://www.srd.org.mk Agency for Electronic Communications : http://www.aec.mk Legal aspects: IRIS Merlin: http://merlin.obs.coe.int

1912 0 0 9 | V o l u m e 1 | B a n d 1
AL
AT
BE
BG
CH
CY
CZ
DE
DK
EE
ES
FI
FR
GB
GR
HR
HU
IE
IS
IT
LT
LU
LV
MK
MT
NL
NO
PL
PT
RO
RU
SE
SI
SK
TR
MK
“The former Yugoslav Republic of Macedonia“
“Ex-République yougoslave de Macédoine”
“ Ehemalige jugoslawische Republik Mazedonien“
MK
1 Includes telecommunication activities.2 The Live TV package was launched in August 2009.
Main broadcasters Channels 2004 2005 2006 2007 2007/06MKRT sptv MKTV1, 2, 3 ~ ~ ~ ~ ~A1 Televizija Dooel adtv A1 ~ ~ 6,9 5,2 -24,6%Televizija Sitel adtv Sitel ~ ~ ~ 4,1 ~Kanal 5 d.o.o.e.l. adtv Kanal 5 ~ ~ ~ 3,1 ~Telma d.o.o.el. thtv telma ~ ~ ~ 1,7 ~
Main distributors Services Packages 2004 2005 2006 2007 2007/06Makedonski Telekom AD 1 3play MaxTV 213,5 271,9 280,2 280,3 0,0%Cosmofon 1 2 3G TV Live TV 24,4 41 55,1 63,6 15,4%Robi Dooel CATV Telekabel ~ ~ ~ 2,8 ~
Source: European Audiovisual Observatory
Number of TV channels by kind of licence oct-09 Public Private TotalTerrestrial (national) 3 5 8Cable/Satellite/IPTV/Mobile 1 0 1Regional/Local 0 10 10Regional/local windows 0 37 37Channels targeting foreign markets 0 0 0Total 4 52 56Foreign channels targeting the country 0 ~ ~
TV channels distributors oct-09 Total CompaniesCable operators 53Satellite packagers 0
IPTV packagers 1 Makedonski Telekom (a subsidiary of Deutsche Telekom) with the package "MaxTV"
DTT packagers 0 On.net (a subsidiary of Telekom Slovenije) should start operating the "Boom TV" package in 2010.
Mobile phone TV packagers 1 Cosmofon (a subsidiary of Telekom Slovenije)
Source: European Audiovisual Observatory
Population and equipment 31.12.08Penetration
(in % HH) In thousand SourcesPopulation (inhabitants) 2 039 State Statistical Office
Households 507TV households 93,11% 473Cable TV households 1 66,00% 335 Broadcasting Council of Republic of Macedonia
Digital cable TV households ~ ~DTH/SMATV households 9,70% 50 Broadcasting Council of Republic of Macedonia
Dig. DTH/SMATV households ~ ~IPTV subscription 0,60% 3 Broadcasting Council of Republic of Macedonia
Installed DVB-T receivers ~ ~Total digital TV households ~ ~Households with PC 39,80% 202Households with broadband connections 10,05% 51
1 The number of cable TV households is assessed via audience research commissioned by the Broadcasting Council.
Operating revenues of TV companies in the “Former Yugoslav Republic of Macedonia” 2004-2007 EUR million.
T.1.MK.1
Basic figures

192 2 0 0 9 | V o l u m e 1 | B a n d 1
AL
AT
BE
BG
CH
CY
CZ
DE
DK
EE
ES
FI
FR
GB
GR
HR
HU
IE
IS
IT
LT
LU
LV
MK
MT
NL
NO
PL
PT
RO
RU
SE
SI
SK
TR
MT
Malta Malte Malta MT
An important feature of the Maltese audiovisual landscape is the link
between the main private channels and the political parties: the Nationalist Par-ty owns Net TV and the Malta Labour Party owns One TV (formerly Super One TV).According to studies carried out by the regulator in 2009 (between January and March, and between April and June), the public channel TVM has become again a dominant player on the Maltese market, its daily audience market share having risen from 21.6% at the beginning of 2008 to 34.5% a year later. That of its main competitor, One TV, went down from 28.6% in 2008 (between January and March) to 18.8% a year later and even 14.8% between April and June 2009, which represents a 50% drop in its audi-ence in the space of eighteen months. The market share of Net TV, which had nearly 15% of viewers at the beginning of 2008, stabilised at between 5 and 6% in 2009. Lower audience figures than those for these three channels are reached by some Maltese stations (below 2%) and, in particular, the Italian channels, which to gether have a daily reach of about 20%.Three new channels were launched in 2008 and 2009: the Family Television Network (which ceased operating in spring 2009), Favourite Channel and Calypso Music TV, the first Maltese music channel, which is distributed on the pay-DTT platform.According to the regulator, 88% of house-holds are equipped to receive a multi-channel television service and more than 53% receive a digital signal. However, there are very few distributors in Malta. The only cable operator Melita Cable, serves over three quarters of homes. At the moment, no operator offers an ADSL television service or markets a satellite package targeting Malta. Finally, GO was still the only digital terrestrial television operator in 2009. Its pay-TV platform, which is made up of around sixty chan-nels, had 36,000 subscribers at the end of 2008, representing an increase of 44% in one year. The multiplex operated by the public broadcaster was due to go on air in 2009 but the launch has been postponed. It is expected to result in the emergence of a free DTT service to complement the offering of the pay-TV platform GO. The analogue switchoff is still scheduled for 2010.
Le paysage audiovisuel maltais se carac-térise par le lien entre les principales
chaînes privées et les partis politiques : ainsi, le Parti nationaliste détient la chaîne Net TV et le Malta Labour Party la chaîne One TV (anciennement Super One TV).Selon les études menées en 2009 (entre janvier et mars puis entre avril et juin) par l’autorité de régulation, la chaîne publique TVM a retrouvé une place pré-pondérante sur le marché maltais. Sa part de marché d’audience quotidienne est en effet remontée de 21,6 % en début d’année 2008 à 34,5 % un an plus tard. Sa princi-pale concurrente, la chaîne One TV, est passée de 28,6 % en 2008 (entre janvier et mars) à 18,8 % un an plus tard, et même 14,8 % entre avril et juin 2009, soit une diminution de moitié de son audience en un an et demi. Net TV qui regroupait près de 15 % des spectateurs au début de l’année 2008 s’est stabilisé en 2009 entre 5 et 6 %. Derrière ces trois chaînes se trouvent quelques stations maltaises (en-deçà de 2 %) et surtout les chaînes ita-liennes qui rassemblent environ 20 % de l’audience quotidienne.Trois nouvelles chaînes ont été lancées en 2008 et 2009 : Family Television Network (qui a stoppé ses opérations dès le printemps 2009), Favourite Channel et Calypso Music TV, la première chaîne musicale maltaise, distribuée sur la plate-forme numérique terrestre payante.Selon l’autorité de régulation, 88 % des foyers sont équipés pour recevoir une offre de télévision multi-chaînes, et plus de 53 % reçoivent un signal numérique. Pourtant, le nombre de distributeurs est particuliè-rement réduit à Malte. De fait, l’unique câblo-opérateur, Melitacable, équipe plus de trois quarts des foyers. Aucun opéra-teur ne propose pour le moment d’offre de télévision par ADSL ou ne commer-cialise de bouquet satellite ciblant Malte. Enfin, GO demeure en 2009 l’unique opérateur de télévision numérique ter-restre. Sa plate-forme payante, composée d’une soixantaine de chaînes, enregistrait 36 000 abonnés à la fin de l’année 2008, soit une progression de 44 % en un an. Le lancement du multiplex opéré par le radio-diffuseur public devait avoir lieu en 2009 mais a été différé. Il devrait permettre l’émergence d’une offre de TNT gratuite complémentaire à celle de la plate-forme payante GO. L’extinction du signal analo-gique demeure prévue pour 2010.
Die audiovisuelle Landschaft Maltas zeichnet sich durch eine Verflechtung
zwischen den größten Privatsendern und den politischen Parteien aus: die Nationa-listische Partei besitzt Net TV, während die Malta Labour Party One TV (vormals Super One TV) besitzt.Nach den Ergebnissen zweier Untersu-chungen der Regulierungsbehörde von 2009 (zwischen Januar und März sowie zwischen April und Juni) hat der öffentlich-rechtliche Sender TVM seinen Spitzen-platz auf dem maltesischen Markt zurück-erobert. So ist der Marktanteil des Senders von 21,6 % Anfang 2008 auf 34,5 % ein Jahr später angestiegen. Sein Hauptwettbe-werber, One TV, ist dagegen von 28,6 % im ersten Quartal 2008 auf 18,8 % im gleichen Zeitraum 2009 und sogar auf 14,8 % im zweiten Quartal 2009 abgerutscht. Dies entspricht einer Halbierung der Zuschau-erzahlen innerhalb von 18 Monaten. Der Sender Net TV, der Anfang 2008 noch einen Zuschaueranteil von knapp 15 % hatte, hat sich 2009 zwischen 5 und 6 % stabilisiert. Hinter diesen drei führenden Sendern finden sich einige maltesische Sender (unter 2 %) sowie vor allem die itali-enischen Sender, die zusammen rund 20 % der Zuschauer auf sich vereinen.2008 und 2009 haben drei neue Sender ihren Betrieb aufgenommen: Family Television Network (hat seinen Betrieb bereits im Frühling 2009 wieder einge-stellt), Favourite Channel und Calypso Music TV. Letzterer ist der erste mal-tesische Musikkanal und wird über die kostenpflichtige DVB-T-Plattform an geboten.Laut Erhebung der Regulierungs behörde verfügen 88 % der Haushalte über die notwendige Ausstattung für Mehrkanal-fernsehen und über 53 % haben Zugang zum Digitalfernsehen. Dennoch ist die Zahl der Anbieter in Malta ausgesprochen klein. So versorgt der einzige Kabelnetz-betreiber, Melitacable, über drei Viertel der Haushalte. Es gibt derzeit keinen einzigen Betreiber, der ADSL-Fernsehen anbietet oder ein Satellitenbouquet für Malta vermarktet. Des Weiteren ist GO nach wie vor der einzige DVB-T-Betrei-ber in Malta. Seine Pay-TV-Plattform, die rund 60 Kanäle umfasst, hatte Ende 2008 36 000 Abonnenten, ein Zuwachs um 44 % gegenüber dem Vorjahr. Der Start des vom öffentlich-rechtlichen Sen-der betriebenen Multiplex war für 2009 vorgesehen, wurde aber verschoben. Er sollte die Bereitstellung eines kostenlosen DVB-T-Angebots als Ergänzung zum kostenpflichtigen Angebot der Plattform GO ermöglichen. Die Abschaltung des Analogbetriebs soll nach wie vor 2010 erfolgen.
Sources: Broadcasting Authority Malta : www.ba-malta.org Malta Communications Authoriy (MCA) : www.mca.org.mt Legal aspects: IRIS Merlin, http://merlin.obs.coe.int

1932 0 0 9 | V o l u m e 1 | B a n d 1
AL
AT
BE
BG
CH
CY
CZ
DE
DK
EE
ES
FI
FR
GB
GR
HR
HU
IE
IS
IT
LT
LU
LV
MK
MT
NL
NO
PL
PT
RO
RU
SE
SI
SK
TR
MT
Malta Malte Malta MT
Population and equipment 31.12.08Penetration
(in % HH) In thousand SourcesPopulation (inhabitants) – 414 Eurostat
Households – 138 Eurostat
TV households 99,3% 137 European Audiovisual Observatory
Cable TV households 72,5% 100 Screen Digest / European Audiovisual Observatory
Digital cable TV households 28,3% 39 Screen Digest / European Audiovisual Observatory
DTH/SMATV households 8,0% 17 Screen Digest / European Audiovisual Observatory
Dig. DTH/SMATV households ~ ~IPTV subscriptions 0,0% 0Installed DVB-T receivers 20,4% 36 Screen Digest / European Audiovisual Observatory
Total digital TV households 54,3% 75 European Audiovisual Observatory
Households with PC 60,6% 83 Screen Digest / European Audiovisual Observatory
Household with broadband connections 81,0% 81 Screen Digest / European Audiovisual Observatory
TV channels distributors 11.09 CompaniesCable operators 1 MelitaSatellite packagers 0IPTV packagers 0DTT multiplex operators and packagers 1 Go Mobile phone TV packagers 1 Go
Number of TV channels by kind of licence 10.09 Public Private TotalTerrestrial (national) 2 12 3Cable/Satellite/IPTV/Mobile 0 15 15Regional/Local 0 0 0Regional/Local windows 0 0 0Channels targeting foreign markets 0 0 0Total 2 27 29Foreign channels targeting the country 2 0 2
Source: European Audiovisual Observatory
Supply of TV channels by genre and by platform (including foreign channels) 10.09
Digital Terrestrial Go
Cable Melita Digital
Generalist - national 4 5Generalist - foreign 7 9AdultChildren 7 8Culture/ education/ documentary 9 9Minority interest groupsEntertainment/ TV fiction/ games 6 8Film 2 4Home shopping 1International linguistic and cultural 2Lifestyle/ specific leisure/ travel 2 7Music 4 9News/ business 6 10Parliament/ government/ administrationRegional/ localReligion 1 3Sports 15 21Various 1 5Total 64 101
Basic figures

194 2 0 0 9 | V o l u m e 1 | B a n d 1
AL
AT
BE
BG
CH
CY
CZ
DE
DK
EE
ES
FI
FR
GB
GR
HR
HU
IE
IS
IT
LT
LU
LV
MK
MT
NL
NO
PL
PT
RO
RU
SE
SI
SK
TR
MT
Malta Malte Malta MT
1 Includes telecommunication and broadcasting activities.
Main broadcasters Channels 2004 2005 2006 2007 2007/06Public Broadcasting Services Ltd sptv TVM 7 103 5 738 5 615 6 475 15,3%One Productions Ltd adtv One TV ~ ~ ~ ~ ~
Main distributors Services Packages 2004 2005 2006 2007 2007/06Go PLC 1 4play, 3G TV Go TV ~ ~ 130 891 133 084 1,7%Melita PLC 1 4play Melita TV ~ ~ 31 595 34 374 8,8%
Source: European Audiovisual Observatory
Source: European Audiovisual Observatory
2003 2004 2005 2006 2007 2007/06Operating revenues 8 103 7 103 5 738 5 615 6 475 15,3%Expenditure 7 327 5 105 5 476 5 082 5 340 5,1%
P/L for period 328 2 339 -272 614 1 404 128,7%Operating margin 9,6% 28,1% 4,6% 9,5% 17,5%
In %.
2003 2004 2005 2006 2007
0
60
70
50
40
30
20
10
Pro�t marginOperating margin
Return on shareholders’ funds
Return on total assets
Operating revenues of TV companies in Malta 2004-2007 EUR thousand.
T.1.MT.1
PBS financial situation 2003-2007 EUR thousand.
T.1.MT.2G.1.MT.1

1952 0 0 9 | V o l u m e 1 | B a n d 1
AL
AT
BE
BG
CH
CY
CZ
DE
DK
EE
ES
FI
FR
GB
GR
HR
HU
IE
IS
IT
LT
LU
LV
MK
MT
NL
NO
PL
PT
RO
RU
SE
SI
SK
TR
MT
Malta Malte Malta MT
Daily shareChannels 2004 2005 2006 2007 2007 2007 2008 2008 2009 2009TVM 27,3 30,5 29,7 29,3 28,8 26,8 26,9 33,0 38,2 34,9One TV 15,3 15,6 28,0 23,8 24,4 20,7 21,0 15,1 13,8 11,2NET TV 9,3 10,3 13,3 10,8 8,9 12,1 13,4 8,5 5,50 4,60Family TV – – – – – – – 1,9 0,70 0,30Smash TV 1,2 2,1 0,1 0,1 0,7 0,7 0,5 0,6 0,4 1,0Favourite TV 1,3 0,8Education 22 0,4 0,1 0,1 0,1 ~ 0,1RAI (RAI Uno, RAI Due, RAI Tre) 11,3 7,7 3,5 5,0 5,4 6,0 4,8 13,4 6,8 8,6 - RAI Uno 11,6 3,9 6,5 - RAI Due 1,1 2,1 1,5 - RAI Tre 0,7 0,8 0,6Mediaset (Canale 5, Italia 1, Rete 4) 23,0 20,5 15,4 13,7 18,4 15,8 14,8 12,5 16,3 15,8 - Rete 4 2,9 3,8 3,5 - Canale 5 4,5 6,8 5,6 - Italia 1 5,1 5,7 6,7Discovery Channel 2,2 2,2 3,5MTV 1,1 0,6 2,1BBC Prime 1,0 1,2 0,9BBC World News 0,1 0,3 0,4
Others 12,6 13,3 9,6 17,3 13,4 17,8 18,5 10,5 12,7 15,8Source: Broadcasting Authority of Malta Audience Audit1 June-December 2004.
2 January-July 2005.3 October-December.4 January-March.5 April-June.
12 4 3 5 53 5 4 4
2004 2005 2006 2007 2007 2007 2008 2008 2009 2009
0
10
20
30
40
TVM
Mediaset (Canale 5,Italia 1, Rete 4)
One TV
RAI (RAI Uno,RAI Due, RAI Tre)
NET TVDiscovery ChannelMTVBBC Prime
Smash TV
1 2 3 4 5 3 4 5 4 5
Daily share. In %, 12 years +.
TV audience market share in Malta 2004-2009 In %, 12 years +.
T.1.MT.3G.1.MT.2

196 2 0 0 9 | V o l u m e 1 | B a n d 1
AL
AT
BE
BG
CH
CY
CZ
DE
DK
EE
ES
FI
FR
GB
GR
HR
HU
IE
IS
IT
LT
LU
LV
MK
MT
NL
NO
PL
PT
RO
RU
SE
SI
SK
TR
NL
Netherlands Pays-Bas Niederlande NL
T hree players dominate the Dutch television landscape: the public broad-
casters (the main channels being Ned 1, Ned 2 and Ned 3), the RTL Nederland group (RTL 4, RTL 5, RTL 7, RTL 8 and RTL Lounge) and SBS Broad casting, which was taken over in 2007 by the German group ProSiebenSat.1 Media AG (NET 5, SBS 6 and Veronica).In 2008, Ned 1 was well ahead in audi-ence terms. The public channel only had an audience share of 11.9% in 2005 but had increased it to 21.1% three years later. Its main private competitors, RTL 4 and SBS 6, are a long way behind with 12.7% and 10.9% respectively. The two other public channels (Ned 2 and Ned 3) each have a daily share of about 7%, while the figure for the four private channels is between 3 and 5% (NET 5, RTL 7, RTL 5 and Veronica). Six other channels have a daily audience of between 1 and 2%.Paradoxically, the Dutch audience thus appears extremely fragmented at a moment when the country’s leading channel is attracting more and more viewers. The growing concentration of the audience around Ned 1 seems to be an exception in Europe, where most incumbent chan-nels are experiencing a decline in their ratings.The Dutch public service system is made up of 23 national broadcasters, headed by the NPO, and about 350 local stations. Apart from the three incumbent channels (Nederland 1, 2 and 3), the national pub-lic broadcasters transmit 12 digital special-interest channels, grouped together under the Nederland 24 banner. There were orig-inally 17 of these channels but the number was considered too high and a reorganisa-tion took place in January 2009. Several private channels appeared on the scene in 2008 and 2009, for example Misdaadet (produced by Endemol and specialising in crime series), Garuda TV (Indonesian culture and peoples) or RTL Lounge (an entertainment channel for young people and the most recent of the RTL channels targeting the Nether-lands).The fragmentation of the Dutch audience can be largely explained by the extent to which Dutch are equipped to receive ser-vices and the number of multi-channel offerings available. Nearly 80% of homes subscribe to a cable television service, making the Netherlands the second big-gest cable television European market after Germany. Four cable operators dominate the market: Zesko (the Ziggo package), UPC Nederland, Delta and CAIW. Zesko claimed to have 3.2 million subscribers in June 2009, ahead of UPC with 2 million, but the figures for both are declining.In February 2009, the European Com-mission gave the Dutch telecommuni-
Trois acteurs dominent le paysage télévisuel néerlandais : les radiodiffu-
seurs publics (dont les principales chaînes sont Ned 1, Ned 2 et Ned 3), le groupe RTL Nederland (RTL 4, RTL 5, RTL 7, RTL 8 et RTL Lounge) et SBS Broadcas-ting, racheté en 2007 par le groupe alle-mand ProSiebenSat.1 Media AG (NET 5, SBS 6 et Veronica).En 2008, Ned 1 arrive largement en tête des audiences. La chaîne publique, qui ne réunissait que 11,9 % de l’audience en 2005, rassemble trois ans plus tard 21,1 % de part de marché d’audience quotidien-ne. Ses principales concurrentes privées, RTL 4 et SBS 6 sont loin derrière avec res-pectivement 12,7 et 10,9 % de l’audience. Les deux autres chaînes publiques (Ned 2 et Ned 3) rassemblent environ 7 % de l’audience chacune puis quatre chaînes privées se situent entre 3 et 5 % de part de marché (NET 5, RTL 7, RTL 5 et Vero-nica). Six autres chaînes rassemblent entre 1 et 2 % de d’audience quotidienne.De manière paradoxale, l’audience néer-landaise paraît donc extrêmement frag-mentée, au moment où la première chaîne du paysage audiovisuel rassemble une part toujours plus importante des spectateurs. La concentration croissante de l’audience autour de Ned 1 semble une exception en Europe où la plupart des chaînes histo-riques voient leurs audiences s’éroder.Le système néerlandais de service public se compose de 23 radiodiffuseurs natio-naux, chapeautés par la NPO, et d’envi-ron 350 radiodiffuseurs locaux. Outre les 3 chaînes historiques (Nederland 1, 2 et 3), les diffuseurs publics nationaux émet-tent 12 chaînes thématiques numériques, regroupées sous la bannière Nederland 24. Elles étaient à l’origine 17 chaînes théma-tiques, mais, jugées trop nombreuses, ont été réorganisées en janvier 2009. Plusieurs chaînes privées sont apparues en 2008 et 2009, ainsi Misdaanet (éditée par Endemol), spécialisée dans les séries policières, Garuda TV, sur la culture et les populations indonésiennes, ou RTL Lounge, une chaîne de divertissement ciblant les jeunes femmes et la dernière née des chaînes RTL ciblant les Pays-Bas.La fragmentation de l’audience aux Pays-Bas s’explique en grande partie par l’équi-pement des foyers néerlandais et l’impor-tance des offres multi-chaînes. Près de 80 % des foyers sont abonnés à une offre de télévision par câble. Les Pays-Bas représen-tent ainsi le second plus important marché européen de la télévision par câble, derriè-re l’Allemagne. Quatre câblo-opérateurs dominent le marché : Zesko (le bouquet Ziggo), UPC Nederland, Delta et CAIW. Zesko revendique 3,2 millions d’abonnés en juin 2009, devant UPC avec 2 millions d’abonnés, deux chiffres en baisse.
Die niederländische Fernsehland-schaft wird von drei Akteuren
beherrscht – dem öffentlich-rechtlichen Fernsehen (im Wesentlichen Ned 1, Ned 2 und Ned 3), RTL Nederland (RTL 4, RTL 5, RTL 7, RTL 8 und RTL Lounge) und SBS Broadcasting (NET 5, SBS 6 und Veronica), 2007 von der ProSiebenSat.1 Media AG übernommen.Den mit Abstand höchsten Zuschau-eranteil hat 2008 Ned 1 erzielt. Der öffentlich-rechtliche Sender, der 2005 noch bei 11,9 % Zuschaueranteil lag , erreicht drei Jahre später bereits einen durchschnittlichen Anteil von 21,1 % der täglichen Zuschauerzahlen. Die größten privaten Wettbewerber, RTL 4 und SBS 6, folgen weit dahinter mit 12,7 und 10,9 % Marktanteil. Auf die beiden anderen öffentlich-rechtlichen Sender (Ned 2 und Ned 3) entfallen jeweils ca. 7 %, während die verbleibenden Privatsender (NET 5, RTL 7, RTL 5 und Veronica) auf 3 bis 5 % Marktanteil kommen. Sechs weitere Sender erreichen jeweils einen Marktanteil zwischen 1 und 2 %.In gewisser Hinsicht paradox an der niederländischen Fernsehlandschaft ist die ausgesprochen hohe Zersplitterung auf der einen Seite und die immer stärker werdende Position des Marktführers auf der anderen Seite. Eine Ausnahmeerschei-nung ist auch die zunehmende Konzen-tration der Zuschauer auf den öffentlich-rechtlichen Sender NED 1, während die meisten traditionellen Sender in Europa mit rückläufigen Zuschauerzahlen zu kämpfen haben.Das niederländische System des öffent-lich-rechtlichen Rundfunks umfasst 23 nationale Rundfunkgesellschaften unter dem Schirm der NPO sowie rund 350 lokale Betreiber. Neben den drei tra-ditionellen Sendern (Nederland 1, 2 und 3) strahlen die nationalen Rundfunk-gesellschaften unter dem Namen „Neder-land 24“ 12 digitale Spartensender aus. Diese anfänglich 17 Spartensender wur-den im Januar 2009 neu organisiert, weil ihre Zahl für zu hoch befunden worden war. 2008 und 2009 sind mehrere neue Privat-sender an den Start gegangen, darunter der Krimisender Misdaanet (Endemol), der Kultursender Garuda TV (über indo-nesische Bevölkerung und Kultur) und RTL Lounge, ein Unterhaltungssender für junge Frauen und der jüngste Kanal der RTL-Gruppe für das niederländische Publikum.Die Zersplitterung des Fernsehpublikums in den Niederlanden ist zu einem großen Teil auf die technische Ausstattung der Haushalte und die Fülle der Multikanal-plattformen zurückzuführen. Knapp 80 % der Haushalte haben ein Abo bei einem Kabelfernsehanbieter. Die Niederlande

1972 0 0 9 | V o l u m e 1 | B a n d 1
AL
AT
BE
BG
CH
CY
CZ
DE
DK
EE
ES
FI
FR
GB
GR
HR
HU
IE
IS
IT
LT
LU
LV
MK
MT
NL
NO
PL
PT
RO
RU
SE
SI
SK
TR
NL
Netherlands Pays-Bas Niederlande NL
cations regulator (OPTA) the go-ahead to open up the cable networks of these four operators to competition. They will have to guarantee the other distributors access to their digital television networks and Ziggo and UPC will also be obliged to resell their analogue packages to third-party operators.Apart from cable television, Dutch view-ers also have access to the CanalDigitaal satellite package, which supplies more than 10% of homes, and to four ADSL televi-sion services (IPTV): KPN, Lijbrandt Telecom, Online Breedband and Tele 2, which currently only attract a small pro-portion of households.The most important competition for the cable operators proves to be DTT, with the Digitenne package, which is distrib-uted and marketed by KPN and has also been offered since June 2009 by EDPnet under the name EDPnet Digi TV. Made up of around 20 channels, the offering is meeting with some success in a country little used to terrestrial television. Only 5% of Dutch households watched televi-sion on the terrestrial network before the analogue switchoff in 2006 but about 12% now rely on DTT for their viewing (KPN claimed to have 830 000 sub scribers in June 2009).Two mobile television services coexist on the Dutch market. In June 2008, KPN launched its personal television mobile service (DVB-H technolog y), which offers a dozen channels, and T-Mobile introduced a package of six channels for mobile telephones (3G technology) in September that year.On January 2009, the new Media Act (Mediawet) came into effect. It elimi-nates the distinction between the public service broadcasters’ main and secondary activities, guarantees the presence of the public channels in the digital packages, strengthens the rules on advertising and prohibits the promotion of hate speech.
sind somit hinter Deutschland der zweit-größte Kabelfernsehmarkt in Europa. Der Markt wird von vier Kabelnetzbetreibern beherrscht: Zesko (Bouquet Ziggo), UPC Nederland, Delta und CAIW. Zesko hat-te im Juni 2009 nach eigenen Angaben 3,2 Mio. Abonnenten, gefolgt von UPC mit 2 Mio. Abonnenten, beide rück-läufig.Im Februar 2009 hat die Europäische Kommission der niederländischen Regu-lierungsbehörde für Telekommunikation (OPTA) grünes Licht für die Öffnung der Kabelnetze dieser Betreiber für den Wettbewerb gegeben. So werden sie anderen Betreibern den Zugang zu ihren digitalen Fernsehnetzen gewährleisten müssen. Ziggo und UPC sind darüber hinaus verpflichtet, ihre analogen Bou-quets an Drittanbieter zu verkaufen.Neben dem Kabelfernsehen haben die nie-derländischen Zuschauer auch Zugang zu einem Satellitenbouquet (CanalDigitaal, in über 10 % der Haushalte vertreten) und vier ADSL-TV-Angeboten (IPTV): KPN, Lijbrandt Telecom, Online Breedband und Tele 2. Das Internetfernsehen hat sich allerdings bei den niederländischen Haus-halten noch nicht durchsetzen können.Größter Wettbewerber der Kabelnetzbe-treiber ist das digitale terrestrische Fernse-hen mit dem Bouquet Digitenne, das von KPN angeboten und seit Juni 2009 auch von EDPnet unter dem Namen EDPnet Digi TV vermarktet wird. Dieses rund 20 Sender umfassende DVB-T-Angebot ist durchaus erfolgreich, und dies in einem Land, in dem das Antennenfern-sehen an sich kaum vertreten ist. Vor der Abschaltung des Analogbetriebs 2006 nutzten gerade mal 5 % der niederlän-dischen Haushalte das Antennenfern-sehen, aber inzwischen sind ca. 12 der Haushalte auf DVB-T angewiesen (KPN hatte im Juni 2009 nach eigenen Angaben 830 000 Abonnenten).Auf dem Markt für Mobilfernsehen gibt es derzeit zwei Anbieter. KPN hat im Juni 2008 sein Angebot für personalisiertes mobiles Fernsehen (im DVB-H-Stan-dard) mit einem Dutzend Kanälen auf den Markt gebracht. Im September 2008 ist T-Mobile mit einem Handy-TV-Paket von sechs Sendern gefolgt (3G-Standard) gefolgt.Am 1. Januar 2009 ist das neue Medien-gesetz (Mediawet) in Kraft getreten, mit dem unter anderem die Unterscheidung zwischen Haupt- und Nebenaktivitäten der öffentlich-rechtlichen Sendeanstalten abgeschafft, die Präsenz der öffentlich-rechtlichen Sender in den digitalen Bou-quets gewährleistet, die Regulierung der Werbung verschärft sowie die Förderung von Hassreden bzw. Aufforderung zu Hass verboten wird.
En février 2009, la Commission euro-péenne a donné son feu vert à l’autorité de régulation des télécommunications néerlandaises (OPTA) pour l’ouverture à la concurrence des réseaux câblés de ces quatre opérateurs. Ils devront garan-tir aux autres distributeurs l’accès à leurs réseaux de télévision numérique, et Ziggo et UPC auront en plus l’obligation de revendre leurs bouquets analogiques aux opérateurs tiers.Outre la télévision par câble, le spectateur néerlandais a aussi accès à un bouquet satellite, CanalDigitaal, qui équipe plus de 10 % des foyers, et à quatre offres de télé vision par ADSL (IPTV) : KPN, Lijbrandt Telecom, Online Breedband et Tele 2, qui ne séduisent pour le moment qu’une part modeste des foyers.La plus importante concurrence pour les câblo-opérateurs se révèle la TNT, avec le bouquet Digitenne, distribué et commer-cialisé par KPN et repris aussi depuis juin 2009 par EDPnet sous le nom EDPnet Digi TV. Composé d’une vingtaine de chaînes, l’offre TNT rencontre un succès réel dans le pays pourtant très peu habi-tué à la télévision terrestre. Seuls 5 % des foyers néerlandais regardaient la télévision via le réseau terrestre avant l’extinction des transmissions analogiques, en 2006, mais ils sont désormais environ 12 % des foyers à dépendre de la TNT (KPN revendique 830 000 abonnés en juin 2009).Deux offres de télévision mobile co- existent sur le marché néerlandais. KPN a lancé en juin 2008 son service de télévision mobile personnelle (technologie DVB-H) qui propose une douzaine de chaînes. Puis T-Mobile a inauguré un bouquet de six chaînes pour téléphones mobiles (tech-nologie 3G) en septembre 2008.Le 1er janvier 2009 est entrée en vigueur la nouvelle loi sur les médias (Mediawet) qui supprime la distinction entre activités principales et secondaires des radiodiffu-seurs de service public, garantit la présence des chaînes publiques dans les bouquets numériques, renforce la réglementation relative à la publicité ou encore interdit la promotion de discours d’incitation à la haine.
Sources: Commissariaat voor de Media : http://www.cvdm.nl Audience data: Stichting Kijkonderzoek : http://www.kijkonderzoek.nl Legal aspects: IRIS Merlin, http://merlin.obs.coe.int

198 2 0 0 9 | V o l u m e 1 | B a n d 1
AL
AT
BE
BG
CH
CY
CZ
DE
DK
EE
ES
FI
FR
GB
GR
HR
HU
IE
IS
IT
LT
LU
LV
MK
MT
NL
NO
PL
PT
RO
RU
SE
SI
SK
TR
NL
Netherlands Pays-Bas Niederlande NL
Population and equipment 31.12.08Penetration
(in % HH) In thousand SourcesPopulation (inhabitants) – 16 486 Eurostat
Households – 7 207 Eurostat (as at 1.1.2008)
TV households 98,7% 7 113 European Audiovisual Observatory
Cable TV households 79,0% 5 697 Screen Digest / European Audiovisual Observatory
Digital cable TV households 27,5% 1 979 Screen Digest / European Audiovisual Observatory
DTH/SMATV households 11,5% 826 Screen Digest / European Audiovisual Observatory
Pay DTH/SMATV households 11,1% 800 Screen Digest / European Audiovisual Observatory
IPTV subscriptions 2,1% 154 Screen Digest / European Audiovisual Observatory
Installed DVB-T receivers 11,0% 790 Screen Digest / European Audiovisual Observatory
Total digital TV households 51,7% 3 723 European Audiovisual Observatory
Households with PC 90,0% 6 401 Screen Digest / European Audiovisual Observatory
Households with broadband connections 66,5% 4 795 Screen Digest / European Audiovisual Observatory
Mobile phone TV subscriptions – 47 Screen Digest
Mobile broadcast TV subscriptions – 39 Screen Digest
TV channels distributors 11.09 CompaniesCable operators 21 CAIW, Cogas, Delta, UPC Nederland, Zesko (Ziggo), …Satellite packagers 1 Canal DigitaalIPTV packagers 4 KPN, Lijbrandt, Online Breedband, Tele2DTT multiplex operators and packagers 2 KPN, EDPnetMobile phone TV packagers 1 T-Mobile NederlandsMobile broadcast TV packagers 1 KPN
Number of TV channels by kind of licence 10.09 Public Private TotalTerrestrial (national) 3 9 21Cable/Satellite/IPTV/ Mobile 15 91 106Regional/Local 201 ca 250 ca 451Regional/local windows 0 20 20Channels targeting foreign markets 0 54 54Total 219 ca 424 ca 643Foreign channels targeting the country 2 34 36
Source: European Audiovisual Observatory
Supply of TV channels by genre and by platform (including foreign channels) 10.09
Digital terrestrial
KPNCable
Zesko ZiggoCable
UPCSatellite
CanalDigitaalIPTV
Tele2Generalist - national (incl.dedicated) 6 7 7 7 6Generalist - foreign 1 20 15 24 4Adult 1 5 6 4 1Children 3 11 10 11 3Culture/ education/ documentary 4 17 18 21 4Minority interest groups 3 3 1Entertainment/ TV fiction/ games 6 18 18 18 6Film 10 9 4 4Home shopping 1 3International linguistic and cultural 5 4 16Lifestyle/ specific leisure/ travel 5 5 12Music 2 12 14 20 2News/ business 2 10 12 31 3Parliament/ government/ administration 2Regional/ local 13 18 10 18 14Religion 2 1 7Sports 3 15 12 17 4Various 4 4 2Total 41 163 148 218 51
Basic figures

1992 0 0 9 | V o l u m e 1 | B a n d 1
AL
AT
BE
BG
CH
CY
CZ
DE
DK
EE
ES
FI
FR
GB
GR
HR
HU
IE
IS
IT
LT
LU
LV
MK
MT
NL
NO
PL
PT
RO
RU
SE
SI
SK
TR
NL
Netherlands Pays-Bas Niederlande NL
Source: European Audiovisual Observatory on the basis of data from Screen Digest, WARC and NPO
Source: IP Key Facts / European Audiovisual Observatory
Source: Screen DigestSource: Screen Digest
Households TV equipment 2004-2008
Number of households accessing multichannel platforms as at 31.12.2008
Consumers pay-TV gross spend 2004-2008
Gross revenues of radio-television 2004-2008
In thousands.
In thousands.
EUR thousand.
EUR million.
2004 2005 2006 2007 2008
0
8 000
6 000
4 000
2 000
Cable households
Satellite householdsDTT households
IPTV households
5 697
111
6 290 6 2005 900
5 793
500 595 686 775 826
61184
330535
790154
0 32 58
UPC Nederla
ndKPN
Canal Digita
al
Ziggo
Caiway e
st.
Kabel Noord
est.
Tele 2 e
st.
Delta Kabel e
st.
0
1 000
2 000
3 000
4 000
4555 5060
DTT
IPTV
Sat
PC
Cable
40
790
3 300
2 044
806
57 108
2004 2005 2006 2007 2008
0
1 500 000
1 200 000
900 000
600 000
300 000
Cable TV
SatelliteDTT
IPTV
1 162 002
972 896
1 175 592
1 195 4441 230 604
10 119 24 793
82 330 95 909
0 2 870 8 384 19 40034 771
35 298 52 454
2004 2005 2006 2007 2008
0
2 000
1 500
1 000
500
Consumerspay-TV spend
TV adspend
Radio adspend
Radio-TV public income
1 414
988
757
517
250
779
556
253
810
371
262
863
605
274
867
279
1 2031 265
1 332
Market trends

200 2 0 0 9 | V o l u m e 1 | B a n d 1
AL
AT
BE
BG
CH
CY
CZ
DE
DK
EE
ES
FI
FR
GB
GR
HR
HU
IE
IS
IT
LT
LU
LV
MK
MT
NL
NO
PL
PT
RO
RU
SE
SI
SK
TR
NL
Netherlands Pays-Bas Niederlande NL
Main broadcasters Channels 2005 2006 2007 2008 2008/07NPO - Nederlandse Publiek Omroep sptv – 772 355 630 292 842 627 838 500 -0,5%
- Nederlandse Omroep Stichting (NOS) sptv Ned-1, Ned-2, Ned-3 704 887 553 052 768 386 ~ ~
- Stichting Etherreclame (STER) sptv (advertising sales house) 297 928 207 085 203 578 238 108 17,0% - AVRO sptv Ned-2 77 505 71 391 ~ ~ ~ - Vereniging TROS sptv Ned-2 ~ ~ ~ ~ ~ - Katholieke Radio
Omroep (KRO) sptv Ned-1 74 631 ~ ~ ~ ~
- VARA sptv Ned-1 69 044 71 417 72 180 79 690 10,4% - Evangelische Omroep (EO) sptv Ned-1 ~ 69 513 62 534 63 816 2,1% - Nederlandse Christelijke
Radio Vereniging (NCRCV) sptv Ned-1 57 404 ~ ~ 63 790 ~
- VPRO sptv Ned-3 44 764 57 521 61 965 61 615 -0,6% - Bart’s Neverending Network sptv Ned-1, Ned-3 (BNN) ~ ~ ~ 33 971 ~ - Stichting Teleac/Not sptv Ned-1, Ned-2, Ned-3 20 907 ~ ~ ~ ~ - Nederlandse Programma
Stichting sptv Ned-3 46 834 ~ ~ ~ ~
SBS Broadcasting Holding B.V.B.V. adtv Net-5, SBS5 221 994 1 002 956 549 277 ~ ~
p.m. SBS Broadcasting B.V. adtv Net-5, SBS6 ~ ~ ~ ~ ~Jetix Europe N.V. thtv Jetix 145 329 162 838 166 444 136 917 -17,7%Talpa Service II N.V. adtv Talpa 40 618 134 045 ~ ~ ~Radio Nederland Wereldomroep sptv BVN 50 893 49 696 49 429 49 766 0,7%Chello Media Programming thtv Film1, Sport1 40 484 41 412 43 301 ~ ~MTV Networks B.V. thtv MTV 33 383 69 926 41 740 ~ ~
Main distributors Services Packages 2005 2006 2007 2008 2008/07
KPN 1 3play, DTT, DVB-H
Interactive TV, Digitenne, Mobiel TV 12 048 000 12 169 000 12 775 000 14 602 000 14,3%
Delta N.V. 1 3play Delta Kabel 1 061 094 1 338 371 1 732 191 2 252 886 30,1%Zesko B.V. CATV Ziggo 8 042 238 049 1 093 906 1 238 613 13,2%UPC Nederland 1 3play UPC Televisie 626 809 701 767 773 505 803 707 3,9%Tele2 Netherlands Holding N.V. 1 3play Tele2 TV 378 108 434 528 582 406 650 113 11,6%
Online Breedband B.V. 1 3play, 3G TV
Online TV, Orange Mobile TV 80 584 100 352 106 070 ~ ~
Caiw Diensten B.V. 1 3play Caiway Televisie 37 764 43 332 53 514 ~ ~Canal Digitaal B.V. sattv Canal Digitaal ~ ~ ~ ~ ~
Source: European Audiovisual Observatory1 Includes telecommunication activities.
Operating revenues of main television companies in the Netherlands 2005-2008 EUR thousand.
T.1.NL.1

2012 0 0 9 | V o l u m e 1 | B a n d 1
AL
AT
BE
BG
CH
CY
CZ
DE
DK
EE
ES
FI
FR
GB
GR
HR
HU
IE
IS
IT
LT
LU
LV
MK
MT
NL
NO
PL
PT
RO
RU
SE
SI
SK
TR
NL
Netherlands Pays-Bas Niederlande NL
Source: NOS / EBU-UER-SIS / European Audiovisual Observatory
Income 2004 2005 2006 2007 2004 2005 2006 2007 2007/06Total public revenues 516 500 556 300 370 800 605 300 64,1% 66,4% 54,6% 67,8% 63,2% - Aid/Grants 516 500 556 300 370 800 605 300 64,1% 66,4% 54,6% 67,8% 63,2%Total commercial Income 216 400 187 500 197 600 193 800 26,9% 22,4% 29,1% 21,7% -1,9% - Advertising 214 600 186 300 195 800 192 100 26,6% 22,2% 28,8% 21,5% -1,9% - Sponsorship 1 800 1 200 1 800 1 700 0,2% 0,1% 0,3% 0,2% -5,6%Other Income 73 000 94 100 110 500 94 200 9,1% 11,2% 16,3% 10,5% -14,8%
TOTAL 805 900 837 900 678 900 893 300 100% 100% 100% 100% 31,6%
EUR thousand.
2003 2004 2005 2006 2007
0
1 000 000
600 000
800 000
400 000
200 000Aid/Grants
Advertising
Other revenues
Revenues of the Dutch public broadcasting system 2004-2007 EUR thousand.
T.1.NL.2G.1.NL.1
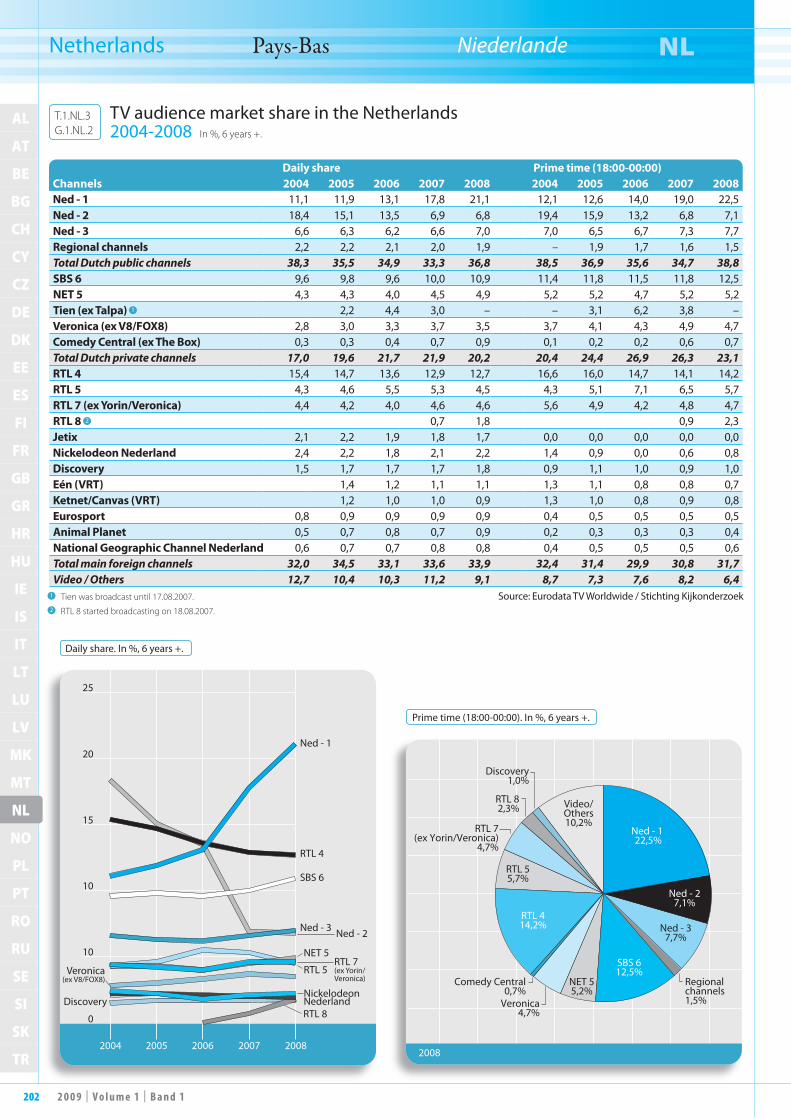
202 2 0 0 9 | V o l u m e 1 | B a n d 1
AL
AT
BE
BG
CH
CY
CZ
DE
DK
EE
ES
FI
FR
GB
GR
HR
HU
IE
IS
IT
LT
LU
LV
MK
MT
NL
NO
PL
PT
RO
RU
SE
SI
SK
TR
NL
Netherlands Pays-Bas Niederlande NL
Daily share Prime time (18:00-00:00)Channels 2004 2005 2006 2007 2008 2004 2005 2006 2007 2008Ned - 1 11,1 11,9 13,1 17,8 21,1 12,1 12,6 14,0 19,0 22,5Ned - 2 18,4 15,1 13,5 6,9 6,8 19,4 15,9 13,2 6,8 7,1Ned - 3 6,6 6,3 6,2 6,6 7,0 7,0 6,5 6,7 7,3 7,7Regional channels 2,2 2,2 2,1 2,0 1,9 – 1,9 1,7 1,6 1,5Total Dutch public channels 38,3 35,5 34,9 33,3 36,8 38,5 36,9 35,6 34,7 38,8SBS 6 9,6 9,8 9,6 10,0 10,9 11,4 11,8 11,5 11,8 12,5NET 5 4,3 4,3 4,0 4,5 4,9 5,2 5,2 4,7 5,2 5,2Tien (ex Talpa) 1 2,2 4,4 3,0 – – 3,1 6,2 3,8 –Veronica (ex V8/FOX8) 2,8 3,0 3,3 3,7 3,5 3,7 4,1 4,3 4,9 4,7Comedy Central (ex The Box) 0,3 0,3 0,4 0,7 0,9 0,1 0,2 0,2 0,6 0,7Total Dutch private channels 17,0 19,6 21,7 21,9 20,2 20,4 24,4 26,9 26,3 23,1RTL 4 15,4 14,7 13,6 12,9 12,7 16,6 16,0 14,7 14,1 14,2RTL 5 4,3 4,6 5,5 5,3 4,5 4,3 5,1 7,1 6,5 5,7RTL 7 (ex Yorin/Veronica) 4,4 4,2 4,0 4,6 4,6 5,6 4,9 4,2 4,8 4,7RTL 8 2 0,7 1,8 0,9 2,3Jetix 2,1 2,2 1,9 1,8 1,7 0,0 0,0 0,0 0,0 0,0Nickelodeon Nederland 2,4 2,2 1,8 2,1 2,2 1,4 0,9 0,0 0,6 0,8Discovery 1,5 1,7 1,7 1,7 1,8 0,9 1,1 1,0 0,9 1,0Eén (VRT) 1,4 1,2 1,1 1,1 1,3 1,1 0,8 0,8 0,7Ketnet/Canvas (VRT) 1,2 1,0 1,0 0,9 1,3 1,0 0,8 0,9 0,8Eurosport 0,8 0,9 0,9 0,9 0,9 0,4 0,5 0,5 0,5 0,5Animal Planet 0,5 0,7 0,8 0,7 0,9 0,2 0,3 0,3 0,3 0,4National Geographic Channel Nederland 0,6 0,7 0,7 0,8 0,8 0,4 0,5 0,5 0,5 0,6Total main foreign channels 32,0 34,5 33,1 33,6 33,9 32,4 31,4 29,9 30,8 31,7Video / Others 12,7 10,4 10,3 11,2 9,1 8,7 7,3 7,6 8,2 6,4
Source: Eurodata TV Worldwide / Stichting Kijkonderzoek1 Tien was broadcast until 17.08.2007.2 RTL 8 started broadcasting on 18.08.2007.
Prime time (18:00-00:00). In %, 6 years +.
2008
Video/Others10,2%
Ned - 1 22,5%
Ned - 27,1%
Ned - 37,7%
Regionalchannels1,5%
SBS 612,5%
NET 55,2%
Veronica4,7%
Comedy Central0,7%
RTL 414,2%
RTL 55,7%
RTL 7(ex Yorin/Veronica)
4,7%
RTL 82,3%
Discovery1,0%
Daily share. In %, 6 years +.
2004 2005 2006 2007 2008
0
10
10
15
20
25
Ned - 1
RTL 4
SBS 6
Ned - 3
NET 5
RTL 5
NickelodeonNederland
RTL 7(ex Yorin/Veronica)
Ned - 2
RTL 8
Veronica(ex V8/FOX8)
Discovery
TV audience market share in the Netherlands 2004-2008 In %, 6 years +.
T.1.NL.3G.1.NL.2

2032 0 0 9 | V o l u m e 1 | B a n d 1
AL
AT
BE
BG
CH
CY
CZ
DE
DK
EE
ES
FI
FR
GB
GR
HR
HU
IE
IS
IT
LT
LU
LV
MK
MT
NL
NO
PL
PT
RO
RU
SE
SI
SK
TR
NO
Norway Norvège Norwegen NO
The audience of the public channels of the group NRK declined in 2008, with
their daily reach dropping to 37.5%, down from 41.1% in 2007. Nonetheless, the channel NRK1, with 31.8%, was ahead of its private competitors. TV 2 had a 24.5% market share, with TVNorge (ProSieben-Sat.1 Media AG) trailing behind with 8% and TV3 (Modern Times Group) with 5.9%. TV3 (MTG), Viasat 4 (MTG) and The Voice TV (ProSiebenSat.1 Media AG) are established in the United Kingdom, requiring them to comply with the Tele-vision without Frontiers directive but not with specific provisions under Norwegian legislation, particularly in respect of pro-gramming and advertising.Several new channels emerged in the Norwegian market in 2008 and 2009. For example, the satellite TV distributor Viasat (MTG) has restructured its sports channels package, closing down Viasat SportN but launching Viasat Sport and Viasat Motor on the Norwegian market. The two main private channels TVNorge and TV 2 launched HD versions in Octo-ber 2008 and June 2009 respectively. Finally, Frikanalen, which was launched in October 2008, started broadcasting on the national digital terrestrial tele-vision network in 2009. This is an open, non-commercial channel and is owned by around sixty non-governmental organisa-tions.Pay-TV has a very high penetration rate in the Norwegian market. The Norwegian group Telenor is present in every sector. In addition to its cable and satellite opera-tions (via Canal Digital), the company’s assets now include an IPTV platform. It also holds a one-third stake in the Norges Television consortium, which is respon-sible for developing DTT.Just under half of all households sub-scribe to a cable television service. Nor-way’s two main cable operators are Canal Digital (Telenor) and Get. About a third of households prefer to subscribe to a satellite TV service. As in the other Nordic countries, there are two platforms competing in this market: Canal Digital (Telenor) and Viasat (MTG). Finally, a growing number of homes have chosen to subscribe to an IP protocol TV (IPTV) service. In a country where 73% of homes have broadband Internet access, the sec-tor is developing apace and there were six competing services in 2009: Comvie, FastTV, Homebase, Lyse Energi, Next-Gen Tel and Telenor.In June 2006, the licence to build and operate the digital terrestrial television network was awarded to the sole appli-cant: Norges Television (NTV). NTV is jointly owned by NRK, TV2 and Telenor Broadcast Holding AS (a subsidiary of
Les chaînes publiques du groupe NRK perdent de l’audience en 2008
puisqu’elles ne rassemblent plus que 37,5 % de part de marché d’audience quotidienne, contre 41,1 % en 2007. Ceci étant, la chaîne NRK1 demeure en tête des audiences (31,8 %), devant ses concurren-tes privées. TV 2 réunit 24,5 % de part de marché, suivie de loin par TVNorge (Pro-SiebenSat.1 Media AG) avec 8 % et TV3 (Modern Times Group) avec 5,9 %. TV3 (MTG), Viasat 4 (MTG) et The Voice TV (ProSiebenSat.1 Media AG) sont établies aux Royaume-Uni, ce qui signifie qu’elles doivent se conformer à la directive Télévision sans Frontières mais pas aux dispositions particulières de la législation norvégienne, notamment en matière de programmation et de publi-cité. Plusieurs nouvelles chaînes sont appa-rues sur le marché norvégien en 2008 et 2009. Ainsi, le distributeur de télévision par satellite Viasat (MTG) a restructuré son offre de chaînes sportives, fermant la chaîne Viasat SportN, mais lançant Viasat Sport et Viasat Motor sur le marché norvégien. Les deux principales chaînes privées TVNorge et TV 2 ont lancé des versions HD, respectivement en octobre 2008 et juin 2009. Enfin, la chaîne Frika-nalen, créée en octobre 2008, a démarré sa diffusion sur le réseau numérique terrestre national en 2009. Cette chaîne de type « open channel » est non commerciale et détenue par une soixantaine d’organisa-tions non gouvernementales (ONG).Le marché norvégien est caractérisé par une forte pénétration de la télévision payante. Le groupe norvégien Telenor est présent sur tous les fronts. Opérateur du câble et du satellite (via Canal Digital), l’entreprise a ajouté à son actif une plate-forme IPTV. Elle détient enfin un tiers des parts du consortium Norges Television, en charge du développement de la TNT. Légèrement moins de la moitié des foyers sont abonnés à une offre de télévision par câble. Les deux principaux câblo-opérateurs norvégiens sont Canal Digital (Telenor) et Get. Environ un tiers des ménages souscrivent plutôt à un service de télévision par satellite. Sur ce marché, deux plates-formes sont en concurrence, com-me dans les autres pays nordiques : Canal Digital (Telenor) et Viasat (MTG). Enfin, un nombre croissant de foyers choisissent de s’abonner à un service de télévision par protocole IP (IPTV). Dans un pays où 73 % des foyers ont un accès à Internet à large bande, le secteur se développe et six services sont en concurrence en 2009 : Comvie, FastTV, Homebase, Lyse Energi, NextGen Tel et Telenor.En juin 2006, la licence pour la construc-tion et l’exploitation du réseau de télévi-sion numérique terrestre a été attribuée
Die öffentlich-rechtlichen Sender des Norwegischen Rundfunks (NRK)
verzeichnen mit einem durchschnittlichen Zuschaueranteil von 37,5 % im Jahr 2008 einen Rückgang gegenüber 2007 (41,1 %). Nichtsdestoweniger liegt der Sender NRK1 bei den Zuschauerzahlen erneut vor den privaten Wettbewerbern auf Platz eins (31,8 %). TV 2 erreicht einen Marktanteil von 24,5 %, dahinter folgen mit großem Abstand TVNorge (ProSie-benSat.1 Media AG) mit 8 % und TV3 (Modern Times Group) mit 5,9 %. TV3 (MTG), Viasat 4 (MTG) und The Voice TV (ProSiebenSat.1 Media AG) haben ihren Sitz im Vereinigten König-reich, was bedeutet, dass sie die Richt linie „Fernsehen ohne Grenzen“ einhalten müssen, nicht aber die einzelnen Bestim-mungen des norwegischen Rechts, insbe-sondere im Hinblick auf Programmierung und Werbung.2008 und 2009 sind mehrere neue Sender auf dem norwegischen Markt auf getaucht. So hat der Sat-TV-Betreiber Viasat (MTG) sein Angebot an Sportkanälen umstrukturiert und in diesem Zusammen-hang den Kanal Viasat SportN eingestellt, aber dafür Viasat Sport und Viasat Motor auf dem norwegischen Markt eingeführt. Die beiden größten Privatsender (TVN-orge und TV 2I) bieten seit Oktober 2008 bzw. Juni 2009 eine HD-Version ihres Programms an. Der im Oktober 2008 gegründete Sender Frikanalen hat 2009 den Sendebetrieb im nationalen DVB-T-Netz aufgenommen. Dieser „offene Kanal“ ist ein nichtkommer-zieller Sender im Besitz von ca. 60 Nicht-regierungsorganisationen.Der norwegische Markt ist durch eine starke Penetrationsrate des Bezahlfern-sehens geprägt. Der norwegische Kon-zern Telenor ist in allen Bereichen präsent. Das Unternehmen ist bereits Kabel- und Satellitenbetreiber (über Canal Digital) und hat sein Angebot nun auch um eine IPTV-Plattform ergänzt. Es hält auch ein Drittel der Anteile des Konsortiums Norges Television, das mit der Entwick-lung von DVB-T beauftragt ist.Etwas weniger als die Hälfte der Haushalte sind an das Kabelfernsehen angeschlossen. Die beiden größten Kabelnetzbetreiber in Norwegen sind Canal Digital (Telenor) und Get. Etwa ein Drittel der Haushalte hat einen Satellitenfernsehdienst abon-niert. Auf diesem Markt konkurrieren, wie auch in den anderen nordischen Ländern, zwei Plattformen mit einander: Canal Digital (Telenor) und Viasat (MTG). Immer mehr Haushalte nutzen das Internet als Fernsehplattform (IPTV). In einem Land, in dem 73 % der Haus-halte über einen Breitbandzugang zum Internet verfügen, ist dieses Marktsegment deutlich auf dem Vormarsch. 2009 gab es bereits sechs Anbieter am Markt: Comvie,

204 2 0 0 9 | V o l u m e 1 | B a n d 1
AL
AT
BE
BG
CH
CY
CZ
DE
DK
EE
ES
FI
FR
GB
GR
HR
HU
IE
IS
IT
LT
LU
LV
MK
MT
NL
NO
PL
PT
RO
RU
SE
SI
SK
TR
NO
Norway Norvège Norwegen NO
the Norwegian telecoms operator). The licence has been awarded for a fifteen-year period. The process of digitising the old analogue television network began in 2007 and NTV is carrying it out region by region.NTV operates three multiplexes, the first offering free-to-air channels and the two others reserved for the pay-TV ser-vice marketed by Riks TV. This platform claimed to have 420 000 subscribers in October 2009. The analogue switchoff took place in December 2009, freeing up two additional multiplexes. A proposal under discussion for a while to award these multiplexes to a second pay-TV platform, competing with Riks TV, was ultimately abandoned by the government in the summer of 2009.In May 2009, a personal mobile televi-sion service using the DMB technology (instead of the DVB-H standard recom-mended in the European Union) was launched. The Mini TV service offers six free-to-air channels and is operated by NMTV (Norwegian Mobile TV Corpora-tion), a joint venture between NRK, TV 2 and the Swedish group MTG. NMTV is a member of IDAG, an association set up in June 2009 and aiming to promote the DMB and DAB formats.The DMB service coexists in Norway with the two mobile television services (using 3G technology) offered by NetCom and Telenor.At the legal level, the European Court of Human Rights delivered a judgment on 11 December 2008 ruling that the fine imposed in 2003 on the local chan-nel TV Vest for broadcasting political advertising was a breach of Article 10 of the European Convention on Human Rights. Following that decision, the Nor-wegian government stated that it wanted to maintain the ban on television adver-tising of a political nature, but planned, however, to change the remit of the public service broadcaster NRK to enable small political parties to have access to the audiovisual media.
à l’unique candidat : la société Norges Television (NTV). NTV est détenue conjointement par NRK, TV2 et Telenor Broadcast Holding AS (filiale de l’opé-rateur télécoms norvégien). Elle a été attribuée pour une durée de quinze ans. Le processus de numérisation de l’ancien réseau de télévision analogique terrestre a débuté en 2007. NTV opère trois multi-plex, le premier proposant les chaînes en clair et les deux autres étant réservés pour l’offre payante commercialisée par Riks TV. La plate-forme payante Riks TV revendique 420 000 abonnés en octo-bre 2009. L’extinction des transmissions analogiques a eu lieu en décembre 2009, libérant deux multiplex supplémentai-res. Un temps évoquée, l’idée d’attribuer ces multiplex à une seconde plate-forme payante, concurrente de Riks TV, a finale-ment été abandonnée par le gouvernement au cours de l’été 2009.En mai 2009, un service de télévision mobile personnelle utilisant la technologie DMB (et non le standard DVB-H recom-mandé dans l’Union Européenne) a été inauguré. Le service Mini TV propose six chaînes en clair et est opéré par la société NMTV (Norwegian Mobile TV Cor-poration), une joint-venture entre NRK, TV 2 et le groupe suédois MTG. NMTV est donc membre de l’IDAG, association créée en juin 2009 et visant à promouvoir les formats DMB et DAB.Le service DMB coexiste en Norvège avec les deux offres de télévision sur téléphone portable (utilisant la technologie 3G) pro-posées par NetCom et Telenor.Au niveau juridique la Cour européenne des droits de l’homme a rendu un arrêt le 11 décembre 2008 estimant que l’amende infligée en 2003 à la chaîne locale TV Vest pour la diffusion de publicités politiques constituait une violation de l’article 10 de la Convention européenne des droits de l’homme. Suite à cette décision, le gouver-nement norvégien a souhaité maintenir l’interdiction de la publicité télévisuelle à caractère politique, mais envisage toutefois de modifier la mission du radiodiffuseur public NRK afin de permettre l’accès des petits partis politiques aux médias audio-visuels.
FastTV, Homebase, Lyse Energi, Next-Gen Tel und Telenor.Im Juni 2006 wurde die Lizenz für Bau und Betrieb des digitalen terrestrischen Fernsehens an den einzigen Bewerber vergeben: die Gesellschaft Norges Tele-vision (NTV). NTV befindet sich im gemeinsamen Besitz von NRK, TV2 und Telenor Broadcast Holding AS (Tochter des norwegischen Telekom-Betreibers). Sie wurde für eine Dauer von fünfzehn Jahren gewährt. Der Umstellungsprozess des alten terrestrischen Analognetzes auf Digitaltechnik hat 2007 begonnen und wird von NTV schrittweise in den einzel-nen Regionen durchgeführt.NTV betreibt drei Multiplexe, davon einen für unverschlüsselte Programme und die beiden anderen ausschließlich für Pay-TV-Angebote der Plattform Riks TV. Diese hatte nach eigenen Angaben im Oktober 2009 420 000 Abonnenten. Die Abschaltung des Analogbetriebs ist im Dezember 2009 erfolgt, wodurch zwei weitere Multiplexe verfügbar wurden. Die zunächst erwogene Idee, diese Multi-plexe einer zweiten Pay-TV-Plattform als Konkurrenz zu Riks TV zuzusprechen, wurde im Sommer 2009 von der Regie-rung wieder verworfen.Im Mai 2009 wurde ein Dienst für per-sonalisiertes Mobilfernsehen im DMB-Format (und nicht im in der EU emp-fohlenen DVB-H-Standard) in Betrieb genommen. Der Dienst Mini TV bietet sechs unverschlüsselte Kanäle und wird von NMTV (Norwegian Mobile TV Corporation) betrieben, einem Gemein-schaftsunternehmen von NRK, TV 2 und der schwedischen MTG-Gruppe. NMTV ist Mitglied der IDAG, ein 2009 gegründetes Konsortium, das den Einsatz der Standards DMB und DAB forcieren will.Neben dem DMB-Dienst gibt es in Norwegen noch zwei weitere Handy- TV-Dienste (im 3G-Standard), die von NetCom bzw. Telenor angeboten werden.Was die rechtliche Lage betrifft, so hat der Europäische Gerichtshof für Men-schenrechte am 11. Dezember 2008 ent-schieden, dass die 2003 gegen den Lokal-sender TV Vest wegen Ausstrahlung von politischer Werbung verhängte Geldstrafe eine Verletzung von Artikel 10 EMRK darstellt. Nach diesem Urteil will die nor-wegische Regierung zwar prinzipiell am Verbot von politischer Fernsehwerbung festhalten, erwägt aber eine Änderung des Auftrags der öffentlich-rechtlichen Rundfunkanstalt NRK, um den kleinen politischen Parteien einen Zugang zu den audiovisuellen Medien zu ermöglichen.
Sources: Medietilsynet, Norwegian Media Authority : http://medietilsynet.no Nordicom : http://www.nordicom.gu.se Legal aspects: IRIS Merlin, http://merlin.obs.coe.int

2052 0 0 9 | V o l u m e 1 | B a n d 1
AL
AT
BE
BG
CH
CY
CZ
DE
DK
EE
ES
FI
FR
GB
GR
HR
HU
IE
IS
IT
LT
LU
LV
MK
MT
NL
NO
PL
PT
RO
RU
SE
SI
SK
TR
NO
Norway Norvège Norwegen NO
Population and equipment 31.12.08Penetration
(in % HH) In thousand SourcesPopulation (inhabitants) – 4 799 Statistics Norway
Households – 2 143 Statistics Norway
TV households 98,0% 2 100 European Audiovisual Observatory
Cable TV households 45,3% 970 Screen Digest / European Audiovisual Observatory
Digital cable TV households 29,4% 630 Screen Digest / European Audiovisual Observatory
DTH/SMATV households 37,9% 812 Screen Digest / European Audiovisual Observatory
Pay DTH/SMATV households 37,0% 792 Screen Digest / European Audiovisual Observatory
IPTV subscriptions 7,0% 151 Screen Digest / European Audiovisual Observatory
Installed DVB-T receivers 14,9% 320 Screen Digest / European Audiovisual Observatory
Total digital TV households 88,3% 1 893 European Audiovisual Observatory
Households with PC 85,3% 1 828 Screen Digest / European Audiovisual Observatory
Households with broadband connections 70,4% 1 509 Screen Digest / European Audiovisual Observatory
Mobile phone TV subscriptions – 13 Screen Digest
Number of TV channels by kind of licence 10.09 Public Private TotalTerrestrial (national) 4 8 12Cable/Satellite/IPTV/Mobile 0 5 5Regional/Local 0 25 25Regional/Local windows 12 0 12Channels targeting foreign markets 0 0 0Total 16 38 54Foreign channels targeting the country 0 37 37
TV channels distributors 10.09 CompaniesCable operators 30 Canal Digital (Telenor), Get etc…Satellite packagers 2 Canal Digital (Telenor), Viasat (Modern Times Group MTG)IPTV packagers 6 Comvie, FastTV, Homebase, Lyse Energi, NextGen Tel, Telenor.DTT multiplex operators and packagers 2 Norges Televisjon - NTV (multiplex operator), Riks TV (pay DTT packager)Mobile phone TV packagers 2 Netcom (TeliaSonera), TelenorMobile broadcast TV providers 1 Norwegian Mobile TV Corporation - NMTV (joint venture NRK, TV 2 and MTG)
Source: European Audiovisual Observatory
Supply of TV channels by genre and by platform (including foreign channels) 10.09
Digital terrestrial
Riks TV Cable GET
Satellite Canal Digital
(Full Nordic offer)
Satellite Viasat
(Full Nordic offer)IPTV
NexGenTelGeneralist - national 6 5 3 3 5Generalist - foreign 13 13 20 5Adult 3 3 3Children 2 7 19 20 5Culture/ education/ documentary 3 10 16 31 7Minority interest groups 3Entertainment/ TV fiction/ games 2 12 27 32 5Film 3 18 28 45 10Home shoppingInternational linguistic and cultural 6 1Lifestyle/ specific leisure/ travel 1 6 6 1 3Music 1 9 8 8 3News/ business 2 10 11 8 4Parliament/ government/ administrationRegional/ local 25Religion 2 2 2 2Sports 3 22 26 20 7Various 1 1 4Total 24 127 162 198 56
1 In addition 25 local stations are available in their respective area.
1
Basic figures

206 2 0 0 9 | V o l u m e 1 | B a n d 1
AL
AT
BE
BG
CH
CY
CZ
DE
DK
EE
ES
FI
FR
GB
GR
HR
HU
IE
IS
IT
LT
LU
LV
MK
MT
NL
NO
PL
PT
RO
RU
SE
SI
SK
TR
NO
Norway Norvège Norwegen NO
Source: European Audiovisual Observatory on the basis of data from Screen Digest, WARC and NRK
Source: European Audiovisual Observatory
Source: Screen DigestSource: Screen Digest
1 Service interrupted in 2009.
Households TV equipment 2004-2008
Number of households accessing multichannel platforms as at 31.12.2008
Consumers pay-TV gross spend 2004-2008
Gross revenues of radio-television 2004-2008
2004 2005 2006 2007 2008
0
1 000
800
600
400
200
Cable households
Satellite households
DTT households
IPTV households
970
879905 916
934
570
640
790812 812
025
320
1645
77107
151
Telenor (C
anal Digita
l)
Get AS e
st.
Free DTT
Riks TV
Viasat
Zattoo
NextGenTe
l
0
1 200
300
600
900
1
DTT
IPTV
Sat
PC
Cable
1 000
320
250
184
31 10
476
539
2004 2005 2006 2007 2008
0
400 000
300 000
200 000
100 000
Satellite
Cable TV
IPTV
DTT
237 122
216 935
289 415
4 032
343 613
13 137
28 650
44 948
6 966
62 413
41 721
251 890
316 567
369 350 375 543
306 664
324 875
2004 2005 2006 2007 2008
0
1 000
200
800
400
600
Consumerspay-TV spend
TV adspend
Radio adspend
Radio-TV public income
823
458
408
286
51 62 62 68 72
431
332362
380 387
441472
554
652
746
In thousands.
In thousands.
EUR thousand.
EUR million.
Market trends

2072 0 0 9 | V o l u m e 1 | B a n d 1
AL
AT
BE
BG
CH
CY
CZ
DE
DK
EE
ES
FI
FR
GB
GR
HR
HU
IE
IS
IT
LT
LU
LV
MK
MT
NL
NO
PL
PT
RO
RU
SE
SI
SK
TR
NO
Norway Norvège Norwegen NO
Main broadcasters Channels 2005 2006 2007 2008 2008/07Norsk Rikskringkasting AS (NRK) sptv NRK-1, NRK-To 456 592 463 731 496 134 439 282 -11,5%TV 2 AS adtv TV2 217 203 248 363 274 583 248 024 -9,7%TVNorge AS adtv TV Norge 68 463 77 378 82 305 69 351 -15,7%TV2 Zebra AS thtv TV2 Zebra – 12 022 33 038 37 647 14,0%TV 1000 Norge AS thtv TV 1000 24 908 29 336 31 131 22 876 -26,5%C More Entertainment Norge thtv Canal+ 7 986 8 063 9 418 16 328 73,4%TV 3 AS adtv TV 3 7 196 6 906 7 752 7 593 -2,1%TV Visjon Norge AS thtv Visjon TV 3 184 4 320 6 888 6 188 -10,2%
Main distributors Packages 2005 2006 2007 2008 2008/07Telenor ASA (cons.) 1 4play, packTV Telenor TV ~ 11 047 087 11 611 293 9 976 909 -14,1%p.m. Canal Digital Norge AS sat-tv Canal Digital 161 022 175 656 205 572 190 524 -7,3%p.m. Canal Digital Kabel TV AS 1 3play Canal Digital Kabel-TV 118 005 129 307 164 354 159 114 -3,2%Netcom AS 1 3G TV NetCom Mobil TV 797 085 887 265 950 269 778 699 -18,1%GET AS 1 3play Get Digital TV 103 342 114 279 139 588 133 137 -4,6%NextGenTel AS 1 3play NextGenTelL Digital-TV 73 393 88 326 96 956 80 106 -17,4%Viasat AS packtv Viasat 70 705 83 735 90 956 75 040 -17,5%Lyse Tele AS 1 4play Lyse Tele AS 28 573 41 871 66 338 70 607 6,4%Rikstv AS DTT Rikstv – – 6 966 41 721 498,9%
Source: European Audiovisual Observatory1 Includes telecommunication activities.
EUR thousand.
2004 2005 2006 2007 2008
0
400 000
300 000
200 000
100 000
500 000
Norsk RikskringkastingAS (NRK)
TV 2 AS
TV2 Zebra AS
TVNorge ASTV 1000 Norge AS
C More EntertainmentTV 3 AS
TV Visjon Norge AS
Operating revenues of main TV companies in Norway 2005-2008 EUR thousand.
T.1.NO.1G.1.NO.1
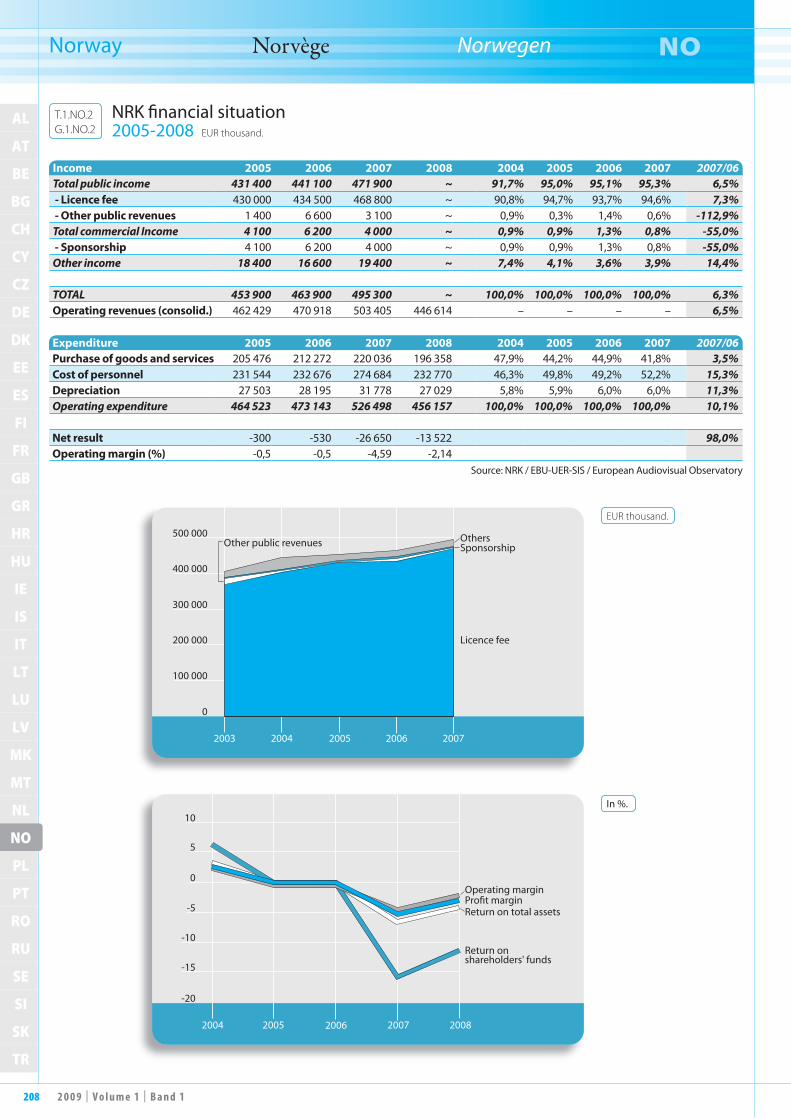
208 2 0 0 9 | V o l u m e 1 | B a n d 1
AL
AT
BE
BG
CH
CY
CZ
DE
DK
EE
ES
FI
FR
GB
GR
HR
HU
IE
IS
IT
LT
LU
LV
MK
MT
NL
NO
PL
PT
RO
RU
SE
SI
SK
TR
NO
Norway Norvège Norwegen NO
Source: NRK / EBU-UER-SIS / European Audiovisual Observatory
Income 2005 2006 2007 2008 2004 2005 2006 2007 2007/06Total public income 431 400 441 100 471 900 ~ 91,7% 95,0% 95,1% 95,3% 6,5% - Licence fee 430 000 434 500 468 800 ~ 90,8% 94,7% 93,7% 94,6% 7,3% - Other public revenues 1 400 6 600 3 100 ~ 0,9% 0,3% 1,4% 0,6% -112,9%Total commercial Income 4 100 6 200 4 000 ~ 0,9% 0,9% 1,3% 0,8% -55,0% - Sponsorship 4 100 6 200 4 000 ~ 0,9% 0,9% 1,3% 0,8% -55,0%Other income 18 400 16 600 19 400 ~ 7,4% 4,1% 3,6% 3,9% 14,4%
TOTAL 453 900 463 900 495 300 ~ 100,0% 100,0% 100,0% 100,0% 6,3%Operating revenues (consolid.) 462 429 470 918 503 405 446 614 – – – – 6,5%
Expenditure 2005 2006 2007 2008 2004 2005 2006 2007 2007/06Purchase of goods and services 205 476 212 272 220 036 196 358 47,9% 44,2% 44,9% 41,8% 3,5%Cost of personnel 231 544 232 676 274 684 232 770 46,3% 49,8% 49,2% 52,2% 15,3%Depreciation 27 503 28 195 31 778 27 029 5,8% 5,9% 6,0% 6,0% 11,3%Operating expenditure 464 523 473 143 526 498 456 157 100,0% 100,0% 100,0% 100,0% 10,1%
Net result -300 -530 -26 650 -13 522 98,0%Operating margin (%) -0,5 -0,5 -4,59 -2,14
EUR thousand.
In %.
2003 2004 2005 2006 2007
0
500 000
300 000
400 000
200 000
100 000
Other public revenues
Licence fee
SponsorshipOthers
2004 2005 2006 2007 2008
-20
5
0
-10
-15
-5
10
Operating marginPro�t marginReturn on total assets
Return onshareholders' funds
NRK financial situation 2005-2008 EUR thousand.
T.1.NO.2G.1.NO.2

2092 0 0 9 | V o l u m e 1 | B a n d 1
AL
AT
BE
BG
CH
CY
CZ
DE
DK
EE
ES
FI
FR
GB
GR
HR
HU
IE
IS
IT
LT
LU
LV
MK
MT
NL
NO
PL
PT
RO
RU
SE
SI
SK
TR
NO
Norway Norvège Norwegen NO
Daily share Prime time (19:00-23:00)Channels 2004 2005 2006 2007 2008 2004 2005 2006 2007 2008NRK1 40,9 40,1 39,9 37,4 31,8 45,2 45,3 45,2 42,3 37,5NRK2 3,3 3,7 3,5 3,3 3,2 3,3 3,7 3,4 3,1 2,6NRK3/Super 0,5 2,5 0,5 1,9Total public Norwegian channels 44,2 43,8 43,4 41,1 37,5 48,5 49,0 48,6 45,9 42,0TV2 29,7 29,0 29,6 28,4 24,5 30,8 28,3 29,7 29,3 26,6TV 2 Zebra 0,2 1,3 2,3 2,8 – 0,2 1,5 2,5 3,2TV2 Nyhetskanalen 0,5 1,0 0,2 0,5TV2 Film 0,5 0,7 0,4 0,5TV 2 Xtra 0,1 0,1 – – – 0,1 0,1 – –TVN 9,2 10,6 9,6 9,1 8,0 8,8 11,2 9,7 9,4 8,7TV3 6,3 6,0 5,8 5,2 5,9 5,8 5,3 4,8 4,4 5,6TV Norge lokal 0,3 0,3 0,3 0,2 0,0 0,0 0,0 0,1ZTV 0,6 0,7 0,6 0,5 – 0,5 0,6 0,6 0,5 –Total private Norwegian channels 46,2 46,9 47,2 45,5 43,1 46,0 45,5 44,8 43,6 45,2Disney Channel 0,2 1,1 0,7 2,0 3,0 0,1 0,4 0,0 0,9 1,4Viasat 4 0,5 2,3 0,6 2,2Discovery 1,0 1,1 1,0 1,4 1,8 0,7 0,8 0,6 0,9 1,2National Geographic 0,5 0,8 0,4 0,6Animal Planet 0,4 0,8 0,3 0,5Cartoon Network 0,5 0,7 0,2 0,4Playhouse Disney 0,4 0,6 0,0 0,0Toon Disney 0,4 0,6 0,2 0,3Eurosport 0,5 0,5 0,4 0,5 0,5 0,3 0,3 0,3 0,3 0,3SVT1 0,3 0,5 0,7 0,5 0,4 0,3 0,4 0,6 0,4 0,4TV4 (SE) 0,5 0,4 0,3 0,3 0,3 0,4 0,2 0,2 0,2 0,2MTV Nordic 0,5 0,4 0,4 0,3 0,3 0,3 0,3 0,3 0,2 0,2SVT2 0,4 0,3 0,4 0,3 0,2 0,3 0,3 0,3 0,3 0,2Total main foreign channels 3,4 4,3 3,9 8,1 12,3 2,4 2,6 2,3 4,8 7,9Others 6,2 5,0 5,5 5,3 7,1 3,1 2,9 4,3 5,7 4,9
Source: Eurodata TV Worldwide / TNS Gallup 1 Before 2008: 3 years and +.
Daily share. In %, 2 years +. 1 Prime time (19:00-23:00). In %, 2 years +.
2004 2005 2006 2007 2008
0
10
30
40
50
20
NRK1
TV2
TVNTV3NRK2TV 2 Zebra
DisneyChannel
Discovery
2008
NRK137,5%
NRK3/Super1,9%
Others8,1%
NRK22,6%
TV 2 Zebra3,2%
TV2Nyhetskanalen
0,5%
TV2 Film0,5%
TV226,6%
TVN8,7%
TV35,6%
Disney Channel1,4%
Viasat 42,2%
Discovery1,2%
TV audience market share in Norway 2004-2008 In %, 2 years +. 1
T.1.NO.3G.1.NO.3
210 2 0 0 9 | V o l u m e 1 | B a n d 1
AL
AT
BE
BG
CH
CY
CZ
DE
DK
EE
ES
FI
FR
GB
GR
HR
HU
IE
IS
IT
LT
LU
LV
MK
MT
NL
NO
PL
PT
RO
RU
SE
SI
SK
TR
PL
Poland Pologne Polen PL
The audiovisual landscape in Poland underwent some significant changes in
2008 and 2009, although these have had little impact on the order of popularity of the major TV channels. The main public channel, TVP1, continued to lead the daily ratings in 2008 with a 22.6% market share, ahead of TVP2, the second public channel. However, TVP2’s audience share continued to fall (down 3.3% in two years to 16.8% in 2008), in contrast to that of TVN, the country’s leading private chan-nel. Run by the ITI group, this channel recorded a daily audience share of 16.7%, almost on a par with TVP2, which it usu-ally beats at peak viewing times. Private channel Polsat (run by the group of the same name) was in fourth position with 15.4% of daily audiences (a 1.4% drop compared to 2007).The four main channels represented a total of 71.5% of the daily audience in 2008, compared to almost 77% in 2006. This fall is due to Polish television viewers’ growing interest in multi-channel services. While two-thirds of Polish households only received analogue terrestrial channels in 2004, the proportions have been reversed and only one-third were in that position in 2008.A further third of households received cable television in 2008, which represents little change since 2007. According to the KRRIT, 677 cable operators were regis-tered in 2009. Of these, UPC, a subsidiary of the Liberty Global group, remains the market leader with 1 015 000 subscribers in June 2009, ahead of Vectra, Multime-dia Polska and Aster City Cable. A certain amount of consolidation is under way: in 2009, Vectra bought Spray, which had 55 000 subscribers in Warsaw, while Mul-timedia Polska acquired several local cable operators. The remaining third of Polish households subscribed to a satellite package in 2008. The number of satellite television sub-scribers rose by around 40% in one year, with the result that they outnumbered cable TV subscribers for the first time in 2008. In fact, five packages are available in Poland, with a sixth to be launched in Autumn 2009 (operated by the public broadcaster based on the Freesat model). The traditional platforms, Cyfra+ (Canal+ group, launched in 1998) and Polsat (Pol-sat group, 1999), were supplemented by a third package, N (ITI group), in 2006. In 2008, TP (traditional telecoms operator controlled by France Telecom) launched the Neostrada service at the same time as ITI launched TNK (Telewizja na Karte), a non-subscription pre-pay service. The other methods of television distribu-tion remain marginal in Poland. However, three operators offer IPTV services, with TP’s Videostrada service leading the mar-ket. A fourth is expected to be launched
Le paysage audiovisuel polonais a connu d’importantes transforma-
tions en 2008 et 2009, mais qui n’ont pas bouleversé la hiérarchie des audiences. La première chaîne publique TVP1 demeure en tête des audiences quotidien-nes en 2008 avec 22,6 % de part de marché, devant TVP2, la seconde chaîne publique. Cependant, l’audience de TVP2 continue de se tasser (-3,3 points en deux ans pour atteindre 16,8 % en 2008) au contraire de celle de TVN, la première chaîne privée du pays. Cette chaîne éditée par le groupe ITI affiche une part de marché d’audience quotidienne de 16,7 %, et rejoint donc presque TVP2, qu’elle a d’ailleurs l’ha-bitude de dépasser au heures de grande écoute. En quatrième position se trouve la chaîne privée Polsat (éditée par le groupe éponyme) à 15,4 % d’audience quotidien-ne (soit un recul de 1,4 point par rapport à 2007).Les quatre principales chaînes rassemblent 71,5 % de l’audience quotidienne en 2008, contre près de 77 % en 2006. Cette éro-sion s’explique par l’intérêt croissant des téléspectateurs polonais pour les offres multi-chaînes. Alors que deux tiers des foyers polonais ne recevaient que les chaî-nes analogiques terrestres en 2004, la pro-portion s’est renversée et ils ne sont plus qu’un tiers en 2008.Le second tiers des foyers reçoit en 2008 la télévision par câble, ce qui représente une proportion relativement stable. Selon le KRRIT, 677 câblo-opérateurs sont enre-gistrés en 2009. Parmi eux, UPC, la filiale du groupe Liberty Global, demeure le lea-der avec 1,015 million d’abonnés en juin 2009, devant Vectra, Multimedia Polska et Aster City Cable. Des mouvements de consolidation sont à l’œuvre : en 2009 Vectra a acheté Spray, qui revendiquait 55 000 abonnés à Varsovie, et Multimedia Polska a lui-aussi racheté plusieurs câblo-opérateurs locaux. Le tiers restant des foyers polonais est en 2009 abonné à un bouquet satellite. Le nombre d’abonnés à la télévision par satellite a progressé d’environ 40 % en un an, si bien qu’il a dépassé celui des abonnés à la télévision par câble pour la première fois en 2008. De fait, cinq bouquets sont distribués en Pologne, et un sixième est annoncé pour l’automne 2009 (bouquet opéré par le radiodiffuseur public sur le modèle de Freesat). Aux offres histori-ques Cyfra+ (Groupe Canal+, bouquet lancé en 1998) et Polsat (groupe Polsat, 1999) s’est ajouté un troisième bouquet, N (groupe ITI), en 2006. En 2008 TP (opérateur historique de télécommunica-tions contrôlé par France Telecom) a lancé le bouquet Neostrada au moment où ITI lançait TNK (Telewizja na Karte), une offre prépayée sans abonnement. Les autres modes de distribution de la télé-vision demeurent marginaux en Pologne.
Die polnische Fernsehlandschaft hat 2008 und 2009 einen tiefgreifenden
Wandel durchgemacht, was jedoch die Rangfolge bei den Einschaltquoten nicht veränderte. Das erste öffentlich-rechtliche Programm TVP1 stand 2008 mit einem Marktanteil von 22,6 % weiter an der Spitze der täglichen Einschaltquoten, vor dem zweiten öffentlich-rechtlichen Programm TVP2. Allerdings gehen die Zuschauerzahlen von TVP2 weiter zurück (-3,3 Punkte in zwei Jahren, auf 16,8 % 2008), im Unterschied zu TVN, dem größten Privatsender des Landes, der zur ITI-Gruppe gehört. Er kommt bei der täglichen Einschaltquote auf 16,7 % Marktanteil und liegt damit fast gleichauf mit TVP2, der während der Primetime meist sogar hinter TVN liegt. An vierter Stelle findet sich der Privatsender Polsat (der gleichnamigen Gruppe) mit einer täglichen Einschaltquote von 15,4 % und damit 1,4 Prozentpunkten weniger als 2007.Die vier größten Sender kamen 2008 zusammen auf eine tägliche Einschalt-quote von 71,5 %, gegenüber fast 77 % 2006. Dieser Rückgang lässt sich auf das steigende Interesse der polnischen Fern-sehzuschauer für die Multikanalangebote zurückführen. 2004 lag der Anteil der Haushalte, die ausschließlich die analog terrestrisch verbreiteten Sender emp-fangen konnten, bei zwei Drittel, 2008 nur noch bei einem Drittel. Ein weiteres Drittel der Haushalte emp-fing 2008 das Fernsehprogramm über das Kabelnetz, was einen relativ stabilen Anteil ausmacht. Nach Angaben der Rundfunk-behörde KRRIT waren 2009 in Polen 677 Kabelnetzbetreiber zugelassen. Davon bleibt UPC, eine Tochter von Liberty Global, Spitzenreiter mit 1,015 Mio. Abonnenten im Juni 2009, vor Vectra, Multimedia Polska und Aster City Cable. Derzeit finden Konsolidierungs bewegungen statt: Spray, nach eigenen An gaben mit 55 000 Abonnenten in Warschau, wur-de 2009 von Vectra übernommen, und auch Multimedia Polska hat mehrere lokale Kabelnetzbetreiber gekauft. Das verbleibende Drittel der polnischen Haushalte hatte 2009 ein Satelliten-bouquet abonniert. Die Zahl der Abon-nenten von Satellitenfernsehen ist inner-halb eines Jahres um etwa 40 % gestiegen und übertraf 2008 zum ersten Mal die der Kabelabonnenten. In Polen werden fünf Bouquets verbreitet und ein sechstes war (vom öffentlich-rechtlichen Rund-funkveranstalter nach dem Modell von Freesat) für Herbst 2009 angekündigt. Zu den klassischen Angeboten Cyfra+ (Gruppe Canal+, seit 1998) und Polsat (Polsat-Gruppe, seit 1999) kam 2006 ein drittes Bouquet hinzu: N (ITI-Gruppe). TP (der klassische Telekombetreiber, der von France Telecom kontrolliert wird)

2112 0 0 9 | V o l u m e 1 | B a n d 1
AL
AT
BE
BG
CH
CY
CZ
DE
DK
EE
ES
FI
FR
GB
GR
HR
HU
IE
IS
IT
LT
LU
LV
MK
MT
NL
NO
PL
PT
RO
RU
SE
SI
SK
TR
PL
Poland Pologne Polen PL
in autumn 2009 by telecommunications operator Netia and the ITI group, which may help to stimulate the market. A licence for operating a mobile television service was granted to the Info TV-FM firm in March 2009. This company was favoured over the consortium formed by the four mobile telephony operators. The licence covers 31 cities until 2015, followed by national coverage until 2023. The service should be operational by the end of 2009.2009 is also the year when digital terres-trial television will be launched in Poland. The first multiplex, comprising seven channels (taken from the analogue ter-restrial network) and broadcasting in the MPEG-4 AVC format, will be launched in September 2009. It should be available throughout the country in 2011. Two other multiplexes are planned and ana-logue signals are due to be switched off on 31 July 2013.The seven channels available on the first DTT multiplex include three public chan-nels (TVP1, TVP2 and TVP Info), the main private channels Polsat, TVN, TV4 (ITI) and the Catholic regional channel TV Puls, which is controlled by the Fran-ciscan order. TV Puls has been seeking an investor since News Corp. sold its 35% share in the company that operates the channel in November 2008.A new Broadcasting Act was debated in Poland and finally adopted by the Parlia-ment (Sejm) in May 2009. The Act’s pro-visions include measures to abolish the licence fee, create a fund to compensate for the public broadcaster’s resulting loss of income, restructure its regional ser-vices and redefine its public service remit. However, in Summer 2009, the Polish President announced that he would not sign the Act, thus reopening the debate on its future.
Trois opérateurs proposent pourtant des offres de télévision par protocole IP, le leader étant TP avec son service Videos-trada. Une quatrième offre est attendue à l’automne 2009 par l’opérateur de télé-communications Netia et le groupe ITI, qui permettra peut être de dynamiser le marché. La licence permettant d’opérer un service de télévision mobile a été octroyée à la firme Info TV-FM en mars 2009. Elle a été préférée au consortium formé par les quatre opérateurs de téléphonie mobile. La licence prévoit la couverture de 31 villes jusqu’en 2015 puis une couverture natio-nale jusqu’en 2023. Le service devrait être opérationnel à la fin de l’année 2009.2009 sera aussi l’année du lancement de la télévision numérique terrestre en Pologne. Le premier multiplex comportant sept chaînes (reprises du réseau analogique terrestre) et émettant en MPEG-4 AVC, sera inauguré en septembre 2009. Sa cou-verture nationale devrait être atteinte en 2011. Deux autres multiplex sont prévus et la date pour l’extinction des transmissions analogiques est fixée au 31 juillet 2013.Parmi les sept chaînes transmises par le premier multiplex du réseau de TNT se trouvent trois chaînes publiques (TVP1, TVP2 et TVP Info), les grandes chaînes privées Polsat, TVN, TV4 (ITI) mais aussi la chaîne régionale catholique TV puls, contrôlée par l’Ordre franciscain. TV Puls cherche un investisseur depuis le départ de News Corp. qui a revendu sa part de 35% dans l’entreprise éditrice de la chaîne en novembre 2008.Une nouvelle loi sur la radiodiffusion a été débattue en Pologne et finalement adoptée par le Parlement (Sejm) en mai 2009. Le texte prévoit entre autres la suppression de la redevance, la mise en place d’un fonds compensant les revenus du radiodiffuseur public, une restructuration de ses anten-nes régionales ou encore la redéfinition des missions de service public. Au cours de l’été 2009, le président polonais a toutefois annoncé son intention de ne pas signer ce texte, relançant le débat sur l’avenir du texte.
hat 2008 das Bouquet Neostrada gestar-tet, zeitgleich mit dem Sendebeginn von TNK (Telewizja na Karte), einem Prepaid-Angebot von ITI ohne Abonnement. Die anderen Verbreitungsarten von Fern-sehprogrammen bleiben in Polen weiter-hin eine Randerscheinung. Dabei haben drei Betreiber ein IPTV-Fernsehangebot, von denen TP mit seinem Dienst Video-strada führend ist. Ein viertes Angebot wird für Herbst 2009 vom Telekom-betreiber Netia und der ITI-Gruppe erwartet, was dem Markt vielleicht neuen Schwung verleihen wird. Die Lizenz zum Betrieb eines Fernseh-dienstes für mobile Empfangsgeräte wur-de im März 2009 an das Unternehmen Info TV-FM vergeben. Es erhielt den Zuschlag vor dem Konsortium aus den vier Mobilfunkbetreibern. Die Lizenz sieht eine Abdeckung von 31 Städten bis 2015 vor und eine landesweite Abdeckung bis 2023. Der Dienst sollte bis Ende 2009 operationell sein.2009 ist auch das Jahr, in dem in Polen das digitale terrestrische Fernsehen den Betrieb aufnimmt. Der erste Multiplex mit sieben Sendern aus dem analogen terrestrischen Netz, die in MPEG-4 AVC ausgestrahlt werden, sollte im Sep-tember 2009 seine Arbeit aufnehmen. Die landesweite Abdeckung soll 2011 erreicht sein. Zwei weitere Multiplexe sind geplant, und das Datum für die Abschal-tung der analogen Übertragung wurde auf den 31. Juli 2013 festgelegt.Unter den ersten sieben DVB-T-Sendern finden sich drei öffentlich-rechtliche Programme (TVP1, TVP2 und TVP Info), die großen Privatsender Polsat, TVN und TV4 (ITI), aber auch den katholischen Regionalsender TV Puls, der vom Franziskanerorden kontrolliert wird. Seitdem News Corp. im November 2008 seinen 35 %-Anteil an dem Fernseh-unternehmen verkauft hat, ist TV Puls auf der Suche nach einem Investor.Ein neues Rundfunkgesetz wurde in Polen diskutiert und schließlich im Mai 2009 vom Parlament verabschiedet. Der Text sieht unter anderem die Abschaffung der Fernsehgebühren vor, die Einrichtung eines Ausgleichsfonds für den öffent-lich-rechtlichen Rundfunkveranstalter, eine Umstrukturierung seiner Regio-nalanstalten und die Neudefinition des öffentlich-rechtlichen Auftrags. Im Som-mer 2009 hat der polnische Staatspräsi-dent allerdings angekündigt, dass er diesen Text nicht unterzeichnen werde, was die Diskussion um die Zukunft des Gesetzes neu entfachte.
Sources: KRRiT : http://www.krrit.gov.pl Legal aspects: IRIS Merlin : http://merlin.obs.coe.int Audience data: AGB Nielsen Media Research, http://www.agbnielsen.pl

212 2 0 0 9 | V o l u m e 1 | B a n d 1
AL
AT
BE
BG
CH
CY
CZ
DE
DK
EE
ES
FI
FR
GB
GR
HR
HU
IE
IS
IT
LT
LU
LV
MK
MT
NL
NO
PL
PT
RO
RU
SE
SI
SK
TR
PL
Poland Pologne Polen PL
Population and equipment 31.12.08Penetration
(in % HH) In thousand SourcesPopulation (inhabitants) – 38 136 Eurostat
Households – 13 051 Eurostat (as at 1.1.2008)
TV households 97,3% 12 699 European Audiovisual Observatory
Cable TV households 34,0% 4 440 Screen Digest / European Audiovisual Observatory
Digital cable TV households 3,8% 492 Screen Digest / European Audiovisual Observatory
DTH/SMATV households 41,9% 5 468 Screen Digest / European Audiovisual Observatory
Pay DTH/SMATV households 36,4% 4 754 Screen Digest / European Audiovisual Observatory
IPTV subscriptions 0,7% 87 Screen Digest / European Audiovisual Observatory
Installed DVB-T receivers 0,2% 20 Screen Digest / European Audiovisual Observatory
Total digital TV households 41,0% 5 353 European Audiovisual Observatory
Households with PC 60,2% 7 861 Screen Digest / European Audiovisual Observatory
Households with broadband connections 28,7% 3 752 Screen Digest / European Audiovisual Observatory
Mobile phone TV subscriptions – 91 Screen Digest
TV channels distributors 11.09 CompaniesCable operators 677 UPC Telewizja Kablowa, Vectra, Multimedia Polska, Aster, Toya etc…
Satellite packagers 5 Canal+ Cyfrowy (Canal+), ITI Neovision (2 packages : "N" and "TNK"), Polsat Cyfrowy, TP SA (France Telecom), TVP
IPTV packagers 3 Multimedia Polska, TP SA (France Telecom), Telefonia DialogDTT multiplex operators and packagers 1 TP EmitelMobile phone TV packagers 3 Centertel SP (France Telecom), Info-TV FM, Polska Telefonia Cyfrowa,
Number of TV channels by kind of licence 10.09 Public Private TotalTerrestrial (national) 3 4 7Cable/Satellite/IPTV/Mobile 5 51 56Regional/Local 0 266 266Regional/Local windows 16 0 16Channels targeting foreign markets 1 1 2Total 25 322 347Foreign channels targeting the country 2 69 71
Source: European Audiovisual Observatory
Supply of TV channels by genre and by platform (including foreign channels) 10.09
Digital terrestrial
(Mux1)Cable
UPC PolskaCable
Vectra
Satellite Cyfrowy
Polsat
Satellite Canal+ Cyfrowy
Cyfra+
IPTV TP SA
VideostradaGeneralist - national 5 7 7 6 5 5Generalist - foreign 2 8 4 4Adult 3 7 1 1Children 11 24 8 6 11Culture/ education/ documentary 22 24 5 11 9Minority interest groupsEntertainment/ TV fiction/ games 1 22 25 11 19 14Film 12 11 14 17 11Home shopping 1 1 1 2International linguistic and cultural 2 3 3 5Lifestyle/ specific leisure/ travel 15 18 9 11 7Music 7 7 2 7 5News/ business 1 18 18 5 12 12Parliament/ government/ administrationRegional/ local 2 2 2 1Religion 2 2 1 2Sports 16 13 29 32 13Various 1 1 1 1 1Total 7 143 171 91 133 102
Basic figures
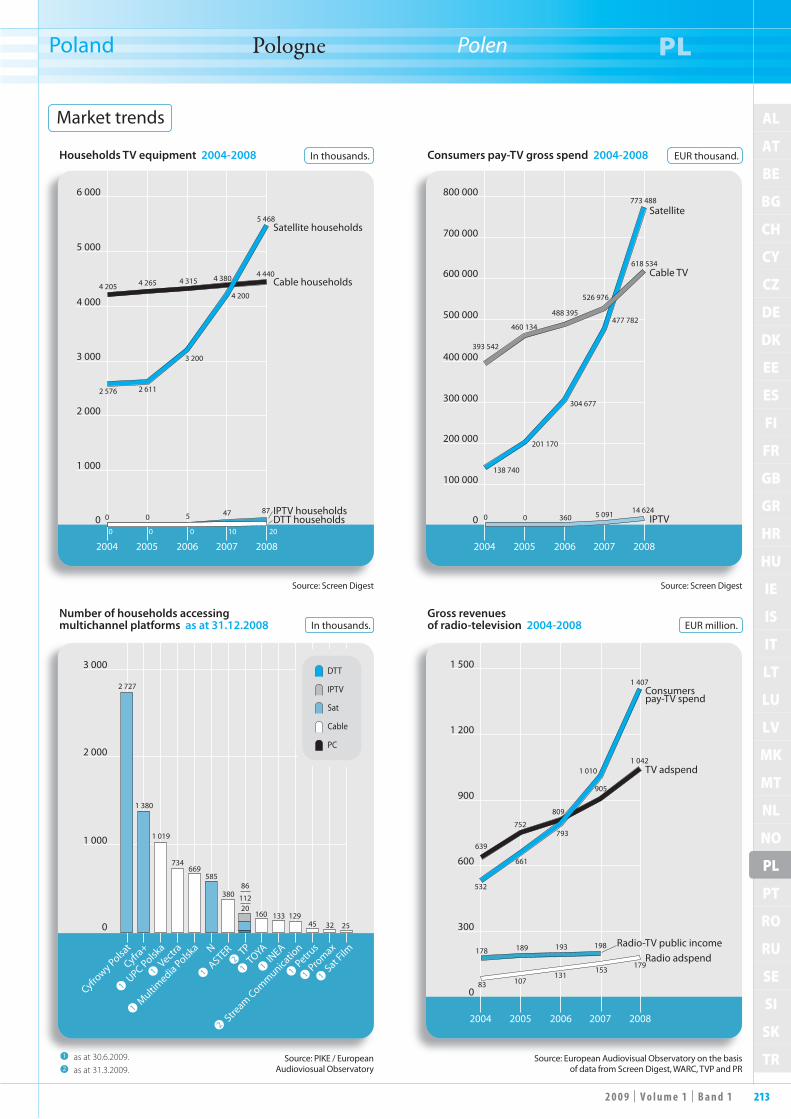
2132 0 0 9 | V o l u m e 1 | B a n d 1
AL
AT
BE
BG
CH
CY
CZ
DE
DK
EE
ES
FI
FR
GB
GR
HR
HU
IE
IS
IT
LT
LU
LV
MK
MT
NL
NO
PL
PT
RO
RU
SE
SI
SK
TR
PL
Poland Pologne Polen PL
Source: European Audiovisual Observatory on the basis of data from Screen Digest, WARC, TVP and PR
Source: Screen DigestSource: Screen Digest
Source: PIKE / European Audioviosual Observatory
1 as at 30.6.2009.2 as at 31.3.2009.
Households TV equipment 2004-2008
Number of households accessing multichannel platforms as at 31.12.2008
Consumers pay-TV gross spend 2004-2008
Gross revenues of radio-television 2004-2008
In thousands.
In thousands.
EUR thousand.
EUR million.
2004 2005 2006 2007 2008
0
6 000
5 000
4 000
3 000
2 000
1 000
Satellite households
Cable households
IPTV householdsDTT households
2 576
0 0 5 47 87
4 205
2 611
4 265 4 315 4 380 4 440
3 200
4 200
5 468
10000 20
Cyfrowy Polsa
t
Cyfra+
UPC Polska
Vectra
Multimedia Polsk
a N
ASTER TPTOYA
INEA
Stream Communica
tionPetru
s
Promax
Sat Film
0
3 000
2 000
1 000
2 727
1 380
1 019
734669
585
380
DTT
IPTV
Sat
PC
Cable
1
1 1 1 1
2
1 1 1
2
1
20112
86
160 133 12945 32 25
393 542
2004 2005 2006 2007 2008
0
800 000
700 000
600 000
500 000
400 000
300 000
200 000
100 000
Satellite
Cable TV
IPTV 14 624
138 740
201 170
304 677
477 782
773 488
488 395
460 134
526 976
618 534
0 0 360 5 091
107
2004 2005 2006 2007 2008
0
1 500
1 200
900
600
300
Consumerspay-TV spend
TV adspend
Radio-TV public incomeRadio adspend
661
793
1 010
179
532
1 407
639
752
809
905
1 042
178 189 193 198
83131
153
Market trends
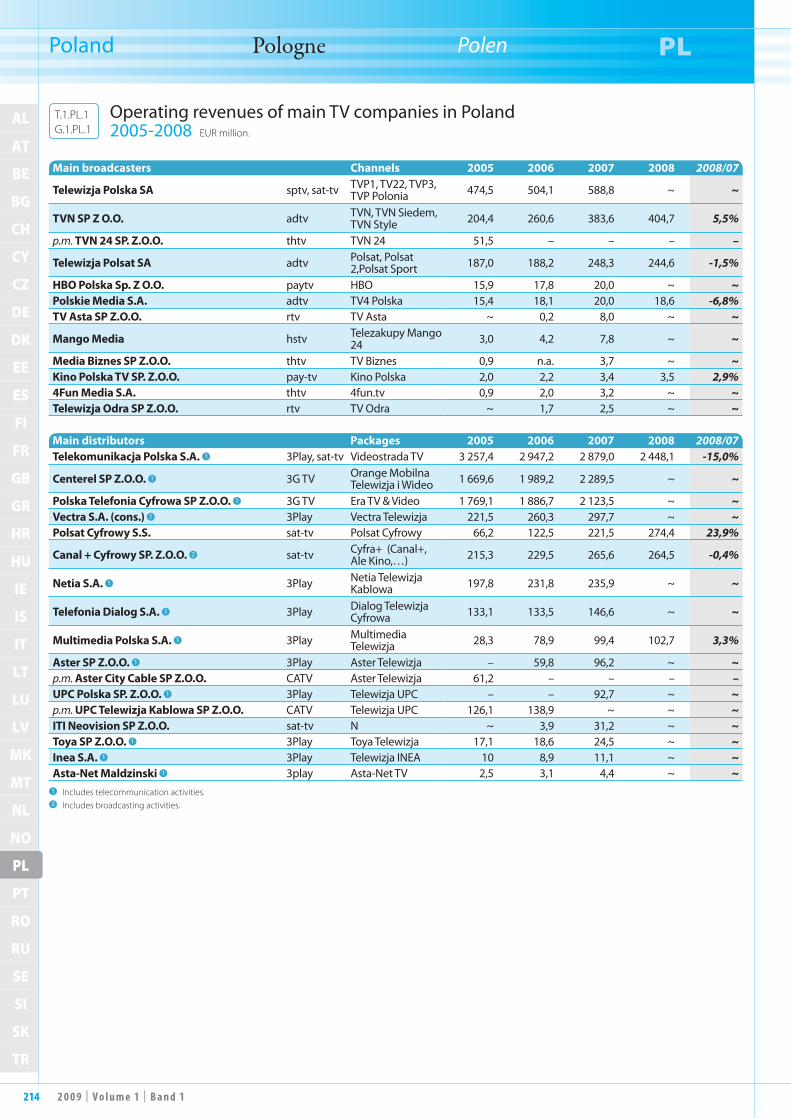
214 2 0 0 9 | V o l u m e 1 | B a n d 1
AL
AT
BE
BG
CH
CY
CZ
DE
DK
EE
ES
FI
FR
GB
GR
HR
HU
IE
IS
IT
LT
LU
LV
MK
MT
NL
NO
PL
PT
RO
RU
SE
SI
SK
TR
PL
Poland Pologne Polen PL
Main broadcasters Channels 2005 2006 2007 2008 2008/07
Telewizja Polska SA sptv, sat-tv TVP1, TV22, TVP3, TVP Polonia 474,5 504,1 588,8 ~ ~
TVN SP Z O.O. adtv TVN, TVN Siedem, TVN Style 204,4 260,6 383,6 404,7 5,5%
p.m. TVN 24 SP. Z.O.O. thtv TVN 24 51,5 – – – –
Telewizja Polsat SA adtv Polsat, Polsat 2,Polsat Sport 187,0 188,2 248,3 244,6 -1,5%
HBO Polska Sp. Z O.O. paytv HBO 15,9 17,8 20,0 ~ ~Polskie Media S.A. adtv TV4 Polska 15,4 18,1 20,0 18,6 -6,8%TV Asta SP Z.O.O. rtv TV Asta ~ 0,2 8,0 ~ ~
Mango Media hstv Telezakupy Mango 24 3,0 4,2 7,8 ~ ~
Media Biznes SP Z.O.O. thtv TV Biznes 0,9 n.a. 3,7 ~ ~Kino Polska TV SP. Z.O.O. pay-tv Kino Polska 2,0 2,2 3,4 3,5 2,9%4Fun Media S.A. thtv 4fun.tv 0,9 2,0 3,2 ~ ~Telewizja Odra SP Z.O.O. rtv TV Odra ~ 1,7 2,5 ~ ~
Main distributors Packages 2005 2006 2007 2008 2008/07Telekomunikacja Polska S.A. 1 3Play, sat-tv Videostrada TV 3 257,4 2 947,2 2 879,0 2 448,1 -15,0%
Centerel SP Z.O.O. 1 3G TV Orange Mobilna Telewizja i Wideo 1 669,6 1 989,2 2 289,5 ~ ~
Polska Telefonia Cyfrowa SP Z.O.O. 1 3G TV Era TV & Video 1 769,1 1 886,7 2 123,5 ~ ~Vectra S.A. (cons.) 1 3Play Vectra Telewizja 221,5 260,3 297,7 ~ ~Polsat Cyfrowy S.S. sat-tv Polsat Cyfrowy 66,2 122,5 221,5 274,4 23,9%
Canal + Cyfrowy SP. Z.O.O. 2 sat-tv Cyfra+ (Canal+, Ale Kino,…) 215,3 229,5 265,6 264,5 -0,4%
Netia S.A. 1 3Play Netia Telewizja Kablowa 197,8 231,8 235,9 ~ ~
Telefonia Dialog S.A. 1 3Play Dialog Telewizja Cyfrowa 133,1 133,5 146,6 ~ ~
Multimedia Polska S.A. 1 3Play Multimedia Telewizja 28,3 78,9 99,4 102,7 3,3%
Aster SP Z.O.O. 1 3Play Aster Telewizja – 59,8 96,2 ~ ~p.m. Aster City Cable SP Z.O.O. CATV Aster Telewizja 61,2 – – – –UPC Polska SP. Z.O.O. 1 3Play Telewizja UPC – – 92,7 ~ ~p.m. UPC Telewizja Kablowa SP Z.O.O. CATV Telewizja UPC 126,1 138,9 ~ ~ ~ITI Neovision SP Z.O.O. sat-tv N ~ 3,9 31,2 ~ ~Toya SP Z.O.O. 1 3Play Toya Telewizja 17,1 18,6 24,5 ~ ~Inea S.A. 1 3Play Telewizja INEA 10 8,9 11,1 ~ ~Asta-Net Maldzinski 1 3play Asta-Net TV 2,5 3,1 4,4 ~ ~1 Includes telecommunication activities.2 Includes broadcasting activities.
Operating revenues of main TV companies in Poland 2005-2008 EUR million.
T.1.PL.1G.1.PL.1

2152 0 0 9 | V o l u m e 1 | B a n d 1
AL
AT
BE
BG
CH
CY
CZ
DE
DK
EE
ES
FI
FR
GB
GR
HR
HU
IE
IS
IT
LT
LU
LV
MK
MT
NL
NO
PL
PT
RO
RU
SE
SI
SK
TR
PL
Poland Pologne Polen PL
Source: European Audiovisual Observatory
2004 2005 2006 2007 2008
0
600
500
400
300
200
100
Telewizja Polska SA
TVN SP Z O.O.
Telewizja Polsat SA
TVN 24 SP. Z.O.O.Polskie Media S.A.
TV Asta SP Z.O.O.
Operating revenues of main TV companies in Poland (Continued) 2005-2008 EUR million.
T.1.PL.1G.1.PL.1

216 2 0 0 9 | V o l u m e 1 | B a n d 1
AL
AT
BE
BG
CH
CY
CZ
DE
DK
EE
ES
FI
FR
GB
GR
HR
HU
IE
IS
IT
LT
LU
LV
MK
MT
NL
NO
PL
PT
RO
RU
SE
SI
SK
TR
PL
Poland Pologne Polen PL
Income 2004 2005 2006 2007 2004 2005 2006 2007 2007/06Total public income 127 800 137 200 138 500 145 900 32,4% 28,2% 27,2% 24,7% 5,3% - Aid/Grants 1 200 800 1 300 800 0,3% 0,2% 0,3% 0,1% -38,5% - Licence fee 126 600 136 400 137 200 145 100 32,1% 28,0% 27,0% 24,6% 5,8%Total commercial income 241 100 292 700 303 900 354 900 61,2% 60,1% 59,7% 60,1% 16,8% - Advertising 223 200 266 300 276 200 324 600 56,6% 54,7% 54,3% 54,9% 17,5% - Sponsorship 17 900 26 400 27 700 30 300 4,5% 5,4% 5,4% 5,1% 9,4%Other income 25 200 56 900 66 600 90 200 6,4% 11,7% 13,1% 15,3% 35,4%
Total 394 100 486 800 509 000 591 000 100,0% 100,0% 100,0% 100,0% 16,1%
Total operating revenues 402 450 474 499 504 119 588 755 16,8%
Expenditure 2004 2005 2006 2007 2004 2005 2006 2007 2007/06Purchase of goods and services 230 229 264 895 286 915 332 109 59,4% 58,6% 59,1% 59,3% 15,8%Cost of personnel 93 799 112 329 120 724 145 484 24,2% 24,8% 24,9% 26,0% 20,5%Depreciation 63 862 74 911 77 714 82 853 16,5% 16,6% 16,0% 14,8% 6,6%Operating expenditure 387 890 452 135 485 353 560 446 100,0% 100,0% 100,0% 100,0% 15,5%
Net result 11 973 15 124 14 941 24 000 60,6%Operating margin (%) 3,62 4,71 3,70
Source: TVP / UER-EBU
Source: Amadeus / European Audiovisual Observatory
EUR thousand.
In %.
2003 2004 2005 20072006
0
500 000
600 000
200 000
300 000
400 000
100 000
Advertising
Licence fee
Sponsorship
Others
2003 2004 2005 2006 2007
2
10
12
8
6
4
Return on shareholders' funds
Return on total assetsPro�t margin Operating margin
TVP financial situation 2004-2007 EUR thousand.
T.1.PL.2G.1.PL.2
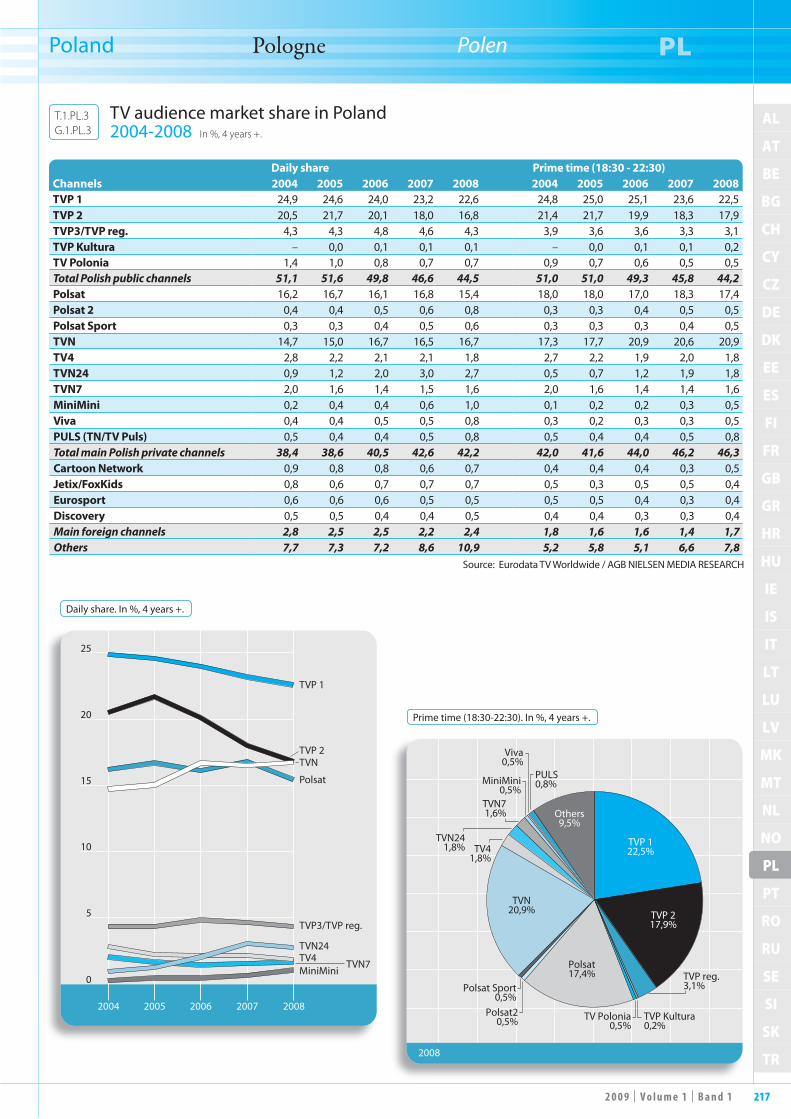
2172 0 0 9 | V o l u m e 1 | B a n d 1
AL
AT
BE
BG
CH
CY
CZ
DE
DK
EE
ES
FI
FR
GB
GR
HR
HU
IE
IS
IT
LT
LU
LV
MK
MT
NL
NO
PL
PT
RO
RU
SE
SI
SK
TR
PL
Poland Pologne Polen PL
Daily share Prime time (18:30 - 22:30)Channels 2004 2005 2006 2007 2008 2004 2005 2006 2007 2008TVP 1 24,9 24,6 24,0 23,2 22,6 24,8 25,0 25,1 23,6 22,5TVP 2 20,5 21,7 20,1 18,0 16,8 21,4 21,7 19,9 18,3 17,9TVP3/TVP reg. 4,3 4,3 4,8 4,6 4,3 3,9 3,6 3,6 3,3 3,1TVP Kultura – 0,0 0,1 0,1 0,1 – 0,0 0,1 0,1 0,2TV Polonia 1,4 1,0 0,8 0,7 0,7 0,9 0,7 0,6 0,5 0,5Total Polish public channels 51,1 51,6 49,8 46,6 44,5 51,0 51,0 49,3 45,8 44,2Polsat 16,2 16,7 16,1 16,8 15,4 18,0 18,0 17,0 18,3 17,4Polsat 2 0,4 0,4 0,5 0,6 0,8 0,3 0,3 0,4 0,5 0,5Polsat Sport 0,3 0,3 0,4 0,5 0,6 0,3 0,3 0,3 0,4 0,5TVN 14,7 15,0 16,7 16,5 16,7 17,3 17,7 20,9 20,6 20,9TV4 2,8 2,2 2,1 2,1 1,8 2,7 2,2 1,9 2,0 1,8TVN24 0,9 1,2 2,0 3,0 2,7 0,5 0,7 1,2 1,9 1,8TVN7 2,0 1,6 1,4 1,5 1,6 2,0 1,6 1,4 1,4 1,6MiniMini 0,2 0,4 0,4 0,6 1,0 0,1 0,2 0,2 0,3 0,5Viva 0,4 0,4 0,5 0,5 0,8 0,3 0,2 0,3 0,3 0,5PULS (TN/TV Puls) 0,5 0,4 0,4 0,5 0,8 0,5 0,4 0,4 0,5 0,8Total main Polish private channels 38,4 38,6 40,5 42,6 42,2 42,0 41,6 44,0 46,2 46,3Cartoon Network 0,9 0,8 0,8 0,6 0,7 0,4 0,4 0,4 0,3 0,5Jetix/FoxKids 0,8 0,6 0,7 0,7 0,7 0,5 0,3 0,5 0,5 0,4Eurosport 0,6 0,6 0,6 0,5 0,5 0,5 0,5 0,4 0,3 0,4Discovery 0,5 0,5 0,4 0,4 0,5 0,4 0,4 0,3 0,3 0,4Main foreign channels 2,8 2,5 2,5 2,2 2,4 1,8 1,6 1,6 1,4 1,7Others 7,7 7,3 7,2 8,6 10,9 5,2 5,8 5,1 6,6 7,8
Source: Eurodata TV Worldwide / AGB NIELSEN MEDIA RESEARCH
Daily share. In %, 4 years +.
Prime time (18:30-22:30). In %, 4 years +.
2004 2005 2006 2007 2008
0
5
15
10
25
20
TVP 1
TVP 2
Polsat
TVP3/TVP reg.
TVN24TV4MiniMini
TVN7
TVN
2008
TVP 122,5%
TVP 217,9%
TVP reg. 3,1%
TVP Kultura0,2%
TV Polonia0,5%
Polsat17,4%
Polsat20,5%
Polsat Sport0,5%
TVN20,9%
Others9,5%
TV41,8%
TVN241,8%
TVN71,6%
MiniMini0,5%
Viva0,5%
PULS0,8%
TV audience market share in Poland 2004-2008 In %, 4 years +.
T.1.PL.3G.1.PL.3

218 2 0 0 9 | V o l u m e 1 | B a n d 1
AL
AT
BE
BG
CH
CY
CZ
DE
DK
EE
ES
FI
FR
GB
GR
HR
HU
IE
IS
IT
LT
LU
LV
MK
MT
NL
NO
PL
PT
RO
RU
SE
SI
SK
TR
PT
Portugal Portugal Portugal PT
T here are three important national channels in Portugal, two private
and the public channel RTP1. In 2008, TVI (Grupa Media Capital) still had the largest audience market share with 30.5%. The other two channels, the private chan-nel SIC (Impresa) with 24.9%, and the public RTP1 with 23.8% remain very close. The second public service channel RTP2 had a share of 5.6%. Plans to intro-duce a fifth national terrestrial channel to be broadcast on the DTT platform have been delayed. The regulatory authority (Entidade Reguladora para a Comunicação Social - ERC) decided in April 2009 to exclude two applicants for the license tender. One of these, Telecinco, has been successful in securing an injunction through the courts regarding the tender process until its case has been reviewed. According to the Autoridade Nacional da Comunicações (Communications Regulatory Authority – Anacom), in June 2009 about 1.45 million households were able to receive pay-TV by cable, of which 46% (672 000) were digital, while 597 000 households subscribed to a satel-lite pay-TV service. Several pay-TV opera-tors offer services on different platforms. Zon Multimedia (formerly PT Multime-dia and separated from PT Comunica-ções (Portugal Telecom) in 2007) is the main pay-TV player in Portugal through its cable and satellite broadcasting sub-sidiary Zon TV Cabo, which had over 1.52 million subscribers at the end of 2008. In July 2009, a significant further consolidation of the cable market occurred when the three cable companies Bragatel, TVTEL and Pluricanal were incorporated into Zon TV Cabo. The company Cabo-visao (owned by the Canadian company Cogeco Cable) is the second player in the cable market with over 360 000 customers in August 2009. Almost one third of these were digital customers. Portugal Telecom offers both an IPTV and a satellite television service known as Meo TV, which in total had more than 500,000 subscribers in October 2009. PT now also operates the DTT multiplex (see below). There are two other IPTV services available in Portugal. Since April 2006 Sonaecom (a subsidiary of Sonae and France Télécom) has offered its broad-band subscribers a triple-play service (Clix SmarTV). Vodafone also have a service “Casa TV” offered as part of double and triple play services. According to Anacom data from June 2009, 322 000 homes were subscribed to such other services (IPTV and FTH).The introduction of DTT was initiated in early 2008 with one tender for a free-to-air multiplex (A) and a second tender for five multiplexes providing pay-TV ser-vices (two with national coverage B and C, and a further three on partial territorial
Le Portugal compte trois grandes chaînes nationales : deux privées et
la chaîne publique RTP1. En 2008, TVI (Grupa Media Capital) réalise toujours la meilleure part de marché (30,5 %). Ses concurrentes, la chaîne privée SIC (Impresa) avec 24,9 % et la chaîne publi-que RTP1 avec 23,8 %, restent très pro-ches. La deuxième chaîne de service public RTP2 a une part de 5,6 %. Le lancement d’une cinquième chaîne terrestre nationa-le, basée sur la plate-forme TNT, est retar-dé. En avril 2009, l’autorité de régulation (Entidade Reguladora para a Comunicação Social - ERC) a décidé d’exclure deux can-didats de l’appel d’offres pour l’octroi de licences. L’un d’eux, Telecinco, a obtenu des tribunaux la suspension provisoire de l’appel d’offres jusqu’à la révision de son affaire.Selon l’Autoridade Nacional da Comunicações (autorité de régulation des com-munications – Anacom), en juin 2009, la diffusion à péage par câble concerne environ 1,45 million de foyers, dont 46 % (672 000) en numérique, tandis que 597 000 foyers sont abonnés à un service de télévision payante par satellite. Plu-sieurs opérateurs de la télévision à péage proposent leurs services sur différentes plates-formes. Zon Multimedia (ancien-nement PT Multimedia, séparée de PT Comunicações (Portugal Telecom) en 2007) constitue le principal acteur de la télévision à péage au Portugal à travers sa filiale de diffusion par câble et satel-lite Zon TV Cabo, qui compte plus de 1,52 million d’abonnés fin 2008. En juillet 2009, la consolidation du marché du câble se poursuit avec le regroupement de trois câblo-opérateurs, Bragatel, TVTEL et Pluricanal, pour créer Zon TV Cabo. La société Cabovisao (appartenant à l’entre-prise canadienne Cogeco Cable) est le deuxième acteur du marché du câble avec plus de 360 000 clients en août 2009, dont presque un tiers bénéficie de l’offre numérique.Portugal Telecom offre un service de télévision disponible par IPTV et par satellite, Meo TV, qui compte plus de 500 000 abonnés en octobre 2009. Désor-mais, PT gère également les multiplex TNT (voir ci-dessous). Deux autres ser-vices IPTV existent au Portugal. Depuis avril 2006, Sonaecom (filiale de Sonae et de France Télécom) propose aussi un service triple- play à ses abonnés haut-débit (Clix SmarTV). Vodafone propose son ser-vice “Casa TV” dans le cadre de ses offres double et triple play. Selon les don-nées de l’Anacom datant de juin 2009, 322 000 foyers sont abonnés à ce type de services (IPTV et FTH).L’introduction de la TNT commence début 2008 avec la publication d’un appel d’offre pour un multiplex (A) gratuit et d’un autre pour cinq multiplex fournissant
I n Portugal gibt es drei große landesweite Sender, zwei private und den öffentlich-
rechtlichen Sender RTP1. Den höchsten Marktanteil hatte 2008 nach wie vor TVI (Grupa Media Capital) mit 30,5 %. Dicht dahinter folgen die Privatsender SIC (Impresa) mit 24,9 % und RTP1 mit 23,8 %. Der zweite öffentlich-rechtliche Sender RTP2 kam auf einen Anteil von 5,6 %. Die geplante Einführung eines fünften landesweiten terrestrischen Sen-ders über die DVB-T-Plattform musste zurückgestellt werden. Die Medienregu-lierungsbehörde (Entidade Reguladora para a Comunicação Social – ERC) hat im April 2009 zwei Bewerber aus dem Ausschreibungsverfahren ausgeschlossen, von denen einer, Telecinco, mit Erfolg vor Gericht eine einstweilige Verfügung erwirkt hat, wonach das Verfahren bis zur Überprüfung des Falls ausgesetzt wird. Nach Angaben der Autoridade Nacional da Comunicações (Regulierungsbehörde für Kommunikation – Anacom) hatten im Juni 2009 rund 1,45 Mio. Haushalte Zugang zu Pay-TV-Sendern über Kabel, davon 46 % (672 000) digital, während 597 000 Haushalte Abonnenten eines kostenpflichtigen Satellitenfernsehdienstes waren. Pay-TV-Dienste werden von mehreren Betreibern über verschiedene Plattformen angeboten. Größter Pay-TV-Akteur in Portugal ist das Unternehmen Zon Multimedia (ehemals PT Multimedia und 2007 aus PT Comunicações (Portu-gal Telecom) ausgegliedert) mit seinem Tochter unternehmen für Kabel- und Satellitenfernsehen Zon TV Cabo, das Ende 2008 über 1,52 Mio. Abonnenten hatte. Im Juli 2009 gab es mit der Über-nahme der drei Kabelnetzbetreiber Bra-gatel, TVTEL und Pluricanal durch Zon TV Cabo eine weitere deutliche Konsoli-dierung des Kabelmarktes. Zweitgrößter Akteur auf dem Kabelmarkt ist mit über 360 000 Kunden im August 2009, davon knapp ein Drittel digital, die Firma Cabo-visao (im Besitz des kanadischen Betrei-bers Cogeco Cable). Portugal Telecom (PT) bietet unter dem Namen Meo TV sowohl einen IPTV-Dienst als auch einen Sat-TV-Dienst an, die im Oktober 2009 zusammen über 500 000 Abonnenten hatten. PT bertreibt inzwischen auch die DVB-T-Multiplexe (siehe weiter unten). Es gibt noch zwei weitere IPTV-Dienste in Portugal. Sonae-com (eine Tochtergesellschaft von Sonae und France Télécom) bietet seinen Breit-bandkunden seit April 2006 einen Triple-Play-Dienst an (Clix SmarTV). Vodafone bietet auch einen Dienst (Casa TV) als Teil eines Double- oder Triple-Play-Pakets an. Nach den Zahlen der Anacom vom Juni 2009 haben 322 000 Haushalte solche Dienste (IPTV und FTH) abonniert.

2192 0 0 9 | V o l u m e 1 | B a n d 1
AL
AT
BE
BG
CH
CY
CZ
DE
DK
EE
ES
FI
FR
GB
GR
HR
HU
IE
IS
IT
LT
LU
LV
MK
MT
NL
NO
PL
PT
RO
RU
SE
SI
SK
TR
PT
Portugal Portugal Portugal PT
coverage, D, E and F). PT Comunica-ções (Portugal Telecom) was awarded the license for the free-to-air multiplex, and the service was officially launched in April 2009. It carries the four national terrestrial channels (RTP 1 and 2, TVI and SIC). In September 2009 PT announced that the service coverage was at 60% of the popu-lation. Portugal Telecom also won the tender for the pay-TV multiplex license, although this decision was contested by the other applicant, the Swedish company Airplus. PT planned to launch these ser-vices in late 2009. Recent legislative developments in Por-tugal include the implementation of the Act of 30 July 2007 that, among other things, addressed television licensing issues, redefined public service financing, and adapted legislation for the introduc-tion of Digital Terrestrial TV. In Febru-ary 2007 a new Act entered into force that added the final touch to the process of merging the public service radio and television broadcasters. Within this new framework the Entidade Reguladora para a Comunicação Social (Media Regulatory Entity) gained increased powers of super-vision over the activities of new entrants and television operators already holding a license.A draft law on pluralism and non-con-centration of the media was approved on 19 June 2008 by the Council of Ministers of the Portuguese government. The text, among other issues, for the first time pro-posed introducing rules on cross media ownership in Portugal. It also proposed provisions preventing government and state authorities from owning the media. Although the law made it through par-liament, the draft law was vetoed by the Portuguese president in March and in May 2009.
des services de télévision à péage (deux avec couverture nationale, B et C, et trois autres avec une couverture partielle, D, E et F). La licence pour le multiplex gratuit est attribuée à PT Comunicações (Portu-gal Telecom) qui lance officiellement son service en avril 2009. Il transmet les quatre chaînes terrestres nationales (RTP 1 et 2, TVI et SIC). En septembre 2009, PT annonce couvrir 60 % de la population. Portugal Telecom remporte également l’offre pour la licence des multpiplex de la télévision à péage, bien que cette déci-sion soit contestée par l’autre candidat, la société suédoise Airplus. PT prévoit de lancer ces services fin 2009.Les récents développements législatifs au Portugal incluent l’entrée en vigueur de la loi du 30 juillet 2007 qui, entre autre, réglemente l’octroi des licences de télé-vision, redéfinit le financement du service public et adapte la législation à l’intro-duction de la TNT. En février 2007 une nouvelle loi apportant une touche finale au processus de fusion des radiodiffuseurs radiophoniques et télévisuels de service public est entrée en vigueur. Dans ce nouveau cadre, l’autorité de régulation des médias (Entidade Reguladora para a Comunicação Social- ERC) dispose de pouvoirs de contrôle accrus des activités des nouveaux opérateurs télévisuels et de ceux déjà titulaires d’une licence.Un projet de loi relative au pluralisme et à la non-concentration des média a été approuvé le 19 juin 2008 par le Conseil des ministres du Gouvernement portugais. Ce texte propose notamment d’introduire des règles sur la propriété croisée de médias au Portugal. Il contient également des dis-positions empêchant le Gouvernement et les autorités nationales de posséder des médias. Bien que la loi ait été adoptée par le Parlement, le président portugais y a opposé son veto en mars et mai 2009.
Die Einführung von DVB-T wurde Anfang 2008 mit einer Ausschreibung für eine Multiplex-Plattform für frei empfangbare Sender (A) und eine weitere Ausschreibung für fünf Multiplex-Platt-formen für Pay-TV-Dienste (B und C landesweit und D bis F regional) auf den Weg gebracht. Die Lizenz für die Free-TV-Plattform wurde PT Comunicações (Por-tugal Telecom) zugesprochen, die offizielle Inbetriebnahme erfolgte im April 2009. Über diesen Multiplex wird das Programm der vier landesweiten terrestrischen Sender (RTP 1 und 2, TVI und SIC) ausgestrahlt. Im September 2009 lag die Abdeckung laut Angaben von PT bei 60 % der Bevöl-kerung. Portugal Telecom wurden auch die Lizenzen für den Betrieb der Pay-TV-Multiplexe zugesprochen, wobei diese Entscheidung vom zweiten Bewerber (der schwedischen Firma Airplus) angefochten wurde. Die Inbetriebnahme dieser Dienste war für Ende 2009 vorgesehen. Zu den jüngsten Entwicklungen in der portugiesischen Gesetzgebung gehört die Umsetzung des Gesetzes vom 30. Juli 2007, mit dem unter anderem die Vergabe von Fernsehlizenzen, die Finanzierung des öffentlich-rechtlichen Rundfunks sowie die Vorschriften in Verbindung mit der Einführung des ter-restrischen Digitalfernsehens neu geregelt wurden. Im Februar 2007 trat ein neues Gesetz in Kraft, das den Zusammenschluss der öffentlich-rechtlichen Hörfunk- und Fernsehveranstalter endgültig abschloss. Innerhalb dieses neuen Rahmens erhielt die Regulierungsbehörde Entidade Reguladora para a Comunicação Social größere Befugnisse bei der Beaufsichti-gung der Aktivitäten der neuen und der bereits zugelassenen Fernsehveranstalter.Am 19. Juni 2008 wurde vom portugie-sischen Kabinett ein Gesetzentwurf für Medienvielfalt und gegen Medienkon-zentration verabschiedet. Darin wird unter anderem zum ersten Mal die Einführung von Vorschriften für diagonale Medien-konzentration in Portugal vorgeschlagen. Hinzu kommen Vorschläge, die eine Betei-ligung von Regierungsorganen oder staat-lichen Stellen an Medien verhindern sol-len. Der Entwurf hat zwar das Parlament passiert, wurde aber durch ein zweimaliges Veto des portugiesischen Präsidenten im März und im Mai 2009 gestoppt.
Sources: ERC, Entidade Reguladora para a Comunicação Social: http://www.erc.pt Anacom, Autoridade Nacional de Comunicações: www.anacom.pt Office for Media and Communications, Gabinete para os Meios de Comunicação Social: http://www.gmcs.pt Legal aspects: IRIS Merlin, http://merlin.obs.coe.int
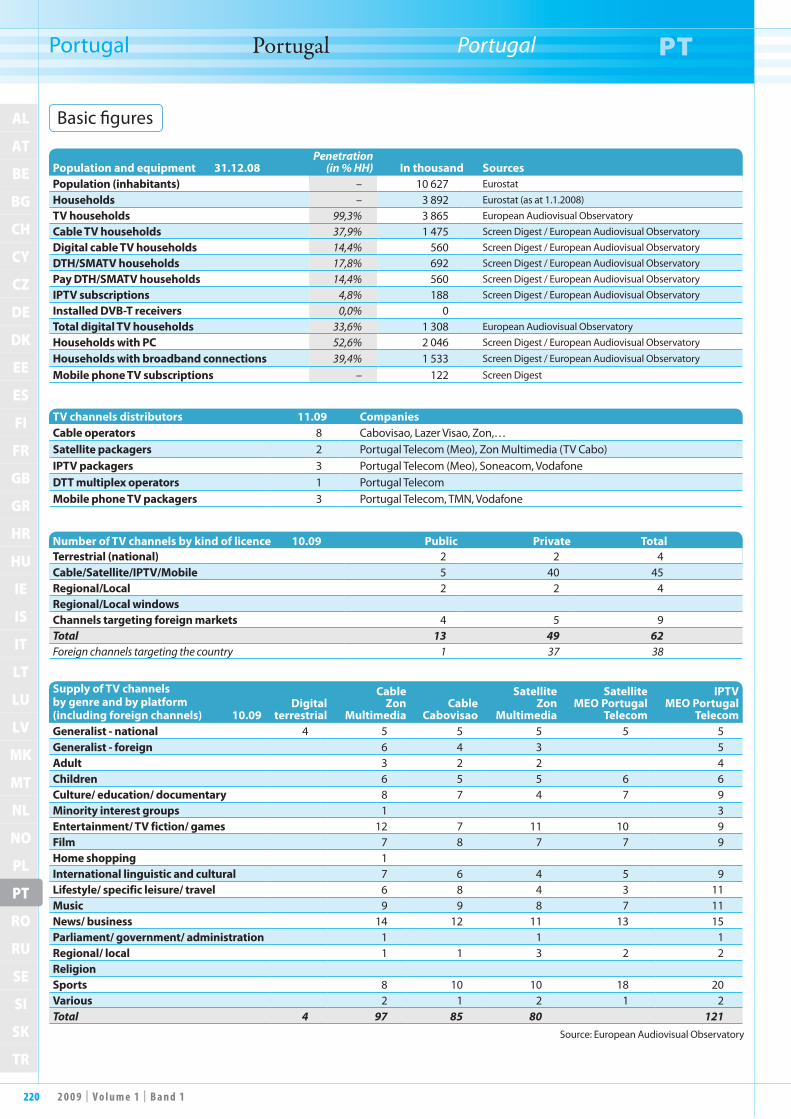
220 2 0 0 9 | V o l u m e 1 | B a n d 1
AL
AT
BE
BG
CH
CY
CZ
DE
DK
EE
ES
FI
FR
GB
GR
HR
HU
IE
IS
IT
LT
LU
LV
MK
MT
NL
NO
PL
PT
RO
RU
SE
SI
SK
TR
PT
Portugal Portugal Portugal PT
Population and equipment 31.12.08Penetration
(in % HH) In thousand SourcesPopulation (inhabitants) – 10 627 Eurostat
Households – 3 892 Eurostat (as at 1.1.2008)
TV households 99,3% 3 865 European Audiovisual Observatory
Cable TV households 37,9% 1 475 Screen Digest / European Audiovisual Observatory
Digital cable TV households 14,4% 560 Screen Digest / European Audiovisual Observatory
DTH/SMATV households 17,8% 692 Screen Digest / European Audiovisual Observatory
Pay DTH/SMATV households 14,4% 560 Screen Digest / European Audiovisual Observatory
IPTV subscriptions 4,8% 188 Screen Digest / European Audiovisual Observatory
Installed DVB-T receivers 0,0% 0Total digital TV households 33,6% 1 308 European Audiovisual Observatory
Households with PC 52,6% 2 046 Screen Digest / European Audiovisual Observatory
Households with broadband connections 39,4% 1 533 Screen Digest / European Audiovisual Observatory
Mobile phone TV subscriptions – 122 Screen Digest
TV channels distributors 11.09 CompaniesCable operators 8 Cabovisao, Lazer Visao, Zon,…Satellite packagers 2 Portugal Telecom (Meo), Zon Multimedia (TV Cabo)IPTV packagers 3 Portugal Telecom (Meo), Soneacom, VodafoneDTT multiplex operators 1 Portugal TelecomMobile phone TV packagers 3 Portugal Telecom, TMN, Vodafone
Number of TV channels by kind of licence 10.09 Public Private TotalTerrestrial (national) 2 2 4Cable/Satellite/IPTV/Mobile 5 40 45Regional/Local 2 2 4Regional/Local windowsChannels targeting foreign markets 4 5 9Total 13 49 62Foreign channels targeting the country 1 37 38
Source: European Audiovisual Observatory
Supply of TV channels by genre and by platform (including foreign channels) 10.09
Digital terrestrial
Cable Zon
Multimedia Cable
Cabovisao
Satellite Zon
Multimedia
Satellite MEO Portugal
Telecom
IPTV MEO Portugal
Telecom Generalist - national 4 5 5 5 5 5Generalist - foreign 6 4 3 5Adult 3 2 2 4Children 6 5 5 6 6Culture/ education/ documentary 8 7 4 7 9Minority interest groups 1 3Entertainment/ TV fiction/ games 12 7 11 10 9Film 7 8 7 7 9Home shopping 1International linguistic and cultural 7 6 4 5 9Lifestyle/ specific leisure/ travel 6 8 4 3 11Music 9 9 8 7 11News/ business 14 12 11 13 15Parliament/ government/ administration 1 1 1Regional/ local 1 1 3 2 2ReligionSports 8 10 10 18 20Various 2 1 2 1 2Total 4 97 85 80 121
Basic figures

2212 0 0 9 | V o l u m e 1 | B a n d 1
AL
AT
BE
BG
CH
CY
CZ
DE
DK
EE
ES
FI
FR
GB
GR
HR
HU
IE
IS
IT
LT
LU
LV
MK
MT
NL
NO
PL
PT
RO
RU
SE
SI
SK
TR
PT
Portugal Portugal Portugal PT
Source: European Audiovisual Observatory on the basis of data from Screen Digest, WARC, RTP
Source: European Audiovisual Observatory
Source: Screen DigestSource:
Households TV equipment 2004-2008
Number of households accessing multichannel platforms as at 31.12.2008
Consumers pay-TV gross spend 2004-2008
Gross revenues of radio-television 2004-2008
In thousands.
In thousands.
EUR thousand.
EUR million.
1 421
436
2004 2005 2006 2007 2008
0
1 500
1 200
900
600
300
Cable households
Satellite households
IPTV households
1 3431 400
1 490 1 475
375 394
484
586
0 0 132
224
Zon Multim
edia
MEO est.
Clix TV e
st.
0
1 500
1 000
500
2 000
52
1 080445
172140
DTT
IPTV
Sat
PC
Cable
435 048
2004 2005 2006 2007 2008
0
600 000
500 000
400 000
300 000
200 000
100 000
Satellite
Cable TV
IPTV
544 261
113 033123 537
136 012161 389
178 446
413 004
464 999
507 107
0 0 105 3 604
28 625
2004 2005 2006 2007 2008
0
1 500
1 200
900
600
300
Consumerspay-TV spend
TV adspend
Radio-TVpublic income
Radio adspend
1 1001 142
1 1641 203
1 232
751
228
99
672
240
102
601
224
103
559
201
106
526
194
103
Market trends

222 2 0 0 9 | V o l u m e 1 | B a n d 1
AL
AT
BE
BG
CH
CY
CZ
DE
DK
EE
ES
FI
FR
GB
GR
HR
HU
IE
IS
IT
LT
LU
LV
MK
MT
NL
NO
PL
PT
RO
RU
SE
SI
SK
TR
PT
Portugal Portugal Portugal PT
Main broadcasters Channels 2005 2006 2007 2008 2008/07Radio e Televisao de Portugal S.A. (cons.) sptv RTP1, LaDos 266 106 292 150 314 853 298 348 -5,2%
SIC (cons.) adtv SIC 161 532 163 392 184 681 173 716 -5,9%TVI est. adtv TVI 146 374 155 745 159 241 158 000 ~Sport TV thtv Sport TV 85 266 103 637 106 491 ~ ~Zon Conteudos S.A. thtv TV Cine, Canal 21, MOV 60 021 60 780 58 266 ~ ~Lisboa Informação e Multimédia thtv SIC Noticias 18 809 19 380 21 296 ~ ~MTV Networks LDA thtv MTV Portugal 3 544 2 662 2 835 ~ ~
Main distributors Packages 2005 2006 2007 2008 2008/07
Portugal Telecom S.A. (cons.) 1 4play, Tv-sat, 3G TV
Meo TV, Meo, Satelite TV 6 385 418 6 342 947 6 148 409 6 734 307 9,5%
p.m. TMN - Telecomunicaçoes Movies Nacionais S.A. 1 3G TV Meo Mobile 1 555 896 1 504 565 1 552 620 ~ ~
Vodafone Portugal S.A. 1 3G TV Vodafone Mobile TV 1 321 715 1 390 524 1 510 062 ~ ~Soanecom - Serviços de Comunicaçoes S.A. 1 3play Clix TV 163 844 205 450 348 540 872 247 150,3%
Zon TV Cabo Portugal S.A. 1 4play Zon TV 493 247 527 224 579 950 632 385 9,0%TV Tel Communicaçoes S.A. 1 CATV, ISP Zon TVTEL 7 760 13 394 20 057 ~ ~Pluricanal Leiria Televisao por Cabo S.A. 1 3play Zon Pluricanal 3 008 3 891 4 633 ~ ~
Bragatel 1 3play Zon Bragatel 3 105 3 698 ~ ~ ~Source: European Audiovisual Observatory1 Includes telecommunication activities.
EUR thousand.
2004 2005 2006 2007 2008
0
150 000
100 000
50 000
200 000
TVI
Sport TV
Zon Conteudos S.A.
Lisboa Informação e Multimédia
MTV Networks LDA
Radio e Televisaode Portugal S.A. (cons.)
SIC (cons.)
Operating revenues of main television companies in Portugal 2005-2008 EUR thousand.
T.1.PT.1G.1.PT.1

2232 0 0 9 | V o l u m e 1 | B a n d 1
AL
AT
BE
BG
CH
CY
CZ
DE
DK
EE
ES
FI
FR
GB
GR
HR
HU
IE
IS
IT
LT
LU
LV
MK
MT
NL
NO
PL
PT
RO
RU
SE
SI
SK
TR
PT
Portugal Portugal Portugal PT
Source: RTP / European Audiovisual Observatory
Income 2005 2006 2007 2008 2005 2006 2007 2008 2008/07Publics funds 200,5 224,3 240,3 227,5 75,3% 76,8% 76,3% 76,2% -5,3%- Compensatory allowances 120,8 124 125,9 117,5 45,4% 42,5% 40,0% 39,4% -6,7%- Contribuçao do Audiovisual 79,7 100,3 114,4 110 30,0% 34,3% 36,3% 36,9% -3,8%Commercial revenues 65,6 67,8 74,6 70,9 24,7% 23,2% 23,7% 23,8% -5,0%- Advertising 47,7 48,1 54,2 51,5 17,9% 16,5% 17,2% 17,3% -5,0%- Others 17,9 19,7 20,5 19,4 6,7% 6,7% 6,5% 6,5% -5,4%
TOTAL 266,1 292,1 314,9 298,4 100,0% 100,0% 100,0% 100,0% -5,2%
Expenditure 2005 2006 2007 2008 2005 2006 2007 2008 2008/07Purchase of goods and services 147,6 151,3 181,1 160,3 55,8% 54,9% 58,8% 55,4% -11,5%
Cost of personnel 98,2 107,2 109,9 111,7 37,1% 38,9% 35,7% 38,6% 1,6%Amortisation 18,8 17,2 16,9 17,5 7,1% 6,2% 5,5% 6,0% 3,6%Operating expenditure 264,6 275,7 307,9 289,5 100,0% 100,0% 100,0% 100,0% -6,0%
Net result -31,9 -24,7 -36,1 -46,8 29,6%Opertaing margin 0,58 5,84 2,2 2,96
EUR million.
In %.
2004 2005 2006 20082007
0
350
300
250
200
150
100
50
Others
Advertising
Contribuçao
Compensatory allowances
2004 2005 2006 2007 2008
5
10
0
-5
-10
-15
-20
Operating margin
Return on total assets
Pro�t margin
Rádio e Televisão de Portugal S.A. financial situation (consolidated) 2005-2008 EUR million .
T.1.PT.2G.1.PT.2

224 2 0 0 9 | V o l u m e 1 | B a n d 1
AL
AT
BE
BG
CH
CY
CZ
DE
DK
EE
ES
FI
FR
GB
GR
HR
HU
IE
IS
IT
LT
LU
LV
MK
MT
NL
NO
PL
PT
RO
RU
SE
SI
SK
TR
PT
Portugal Portugal Portugal PT
All households Daily share Prime time (20:00-00:00)Channels 2004 2005 2006 2007 2008 2004 2005 2006 2007 2008RTP1 24,7 23,6 24,5 25,2 23,8 23,6 22,3 22,4 24,4 21,8RTP2 4,4 5,0 5,4 5,2 5,6 4,2 4,5 4,9 4,8 4,9Portuguese public channels 29,1 28,6 29,9 30,4 29,4 27,8 26,8 27,3 29,2 26,7SIC 29,3 27,2 26,2 25,1 24,9 29,0 27,9 26,7 24,9 24,2TVI 28,9 30,0 30,0 29,0 30,5 33,6 34,1 34,7 33,0 35,8Portuguese private channels 58,2 57,2 56,2 54,1 55,4 62,6 62,0 61,4 57,9 60,0Others 11,9 13,5 13,2 14,6 14,0 9,1 10,7 10,8 12,2 12,3Video 0,8 0,7 0,7 0,9 1,2 0,5 0,5 0,5 0,7 1,0
Cable/satellite households 2004 2005 2006 2007 2008 2004 2005 2006 2007 2008RTP1 20,6 19,1 20,5 20,4 19,1 21,0 19,3 20,2 21,4 18,6RTP2 3,0 3,0 3,4 3,1 3,3 2,9 2,9 3,2 3,0 3,0RTPN 0,7 1,2 1,4 1,6 1,6 0,4 0,8 0,9 1,1 1,1Portuguese public channels 24,3 23,3 25,3 25,1 24,0 24,3 23,0 24,3 25,5 22,7TVI 24,9 26,9 26,8 24,9 27,1 30,4 31,8 32,0 28,4 32,1SIC 23,5 21,0 19,6 18,9 18,5 24,3 22,0 20,2 19,8 19,1SIC Noticias 3,9 3,9 3,6 3,7 3,8 2,5 2,7 2,4 2,6 2,8SIC Radical 1,3 1,5 1,3 1,0 1,3 0,9 1,1 1,3 1,0 1,0SIC Comedia 0,9 0,8 0,9 – – 0,8 0,7 0,8 – –SIC Mulher 1,1 1,1 0,9 1,1 1,2 1,0 0,9 0,8 1,0 1,3SportTV 1,2 1,2 1,1 1,2 1,2 1,7 1,9 1,6 1,7 1,7Portuguese private channels 56,8 56,4 54,2 50,8 53,1 61,6 61,1 59,1 54,5 58,0AXN 0,9 2,1 3,1 3,3 2,8 0,8 1,9 2,9 3,4 3,1Panda 2,6 2,2 2,3 2,6 2,5 1,9 1,7 1,7 2,0 1,9Hollywood 2,1 1,5 1,5 1,6 1,7 1,9 1,3 1,4 1,6 1,6Fox 0,6 1,4 1,7 1,6 0,5 1,3 1,7 1,5Odisseia 1,0 0,9 0,9 1,0 0,7 0,7 0,7 0,6 0,7 0,4Foreign channels 6,6 7,3 9,2 10,2 9,3 5,3 6,1 7,9 9,4 8,5Others 12,3 13,0 11,3 13,9 13,6 8,8 9,8 8,7 10,6 10,8
Source: Eurodata TV Worldwide / Marktest Audimetria
Daily share. In %, 4 years +. Prime time (20:00-00:00). In %, 4 years +.
2004 2005 2006 2007 2008
0
10
40
30
20
TVI
SICRTP1
RTP2
2008
RTP121,8%
Video1,0%
RTP24,9%
SIC24,2%
TVI35,8%
Others12,3%
TV audience market share in Portugal 2004-2008 In %, 4 years +.
T.1.PT.3G.1.PT.3

2252 0 0 9 | V o l u m e 1 | B a n d 1
AL
AT
BE
BG
CH
CY
CZ
DE
DK
EE
ES
FI
FR
GB
GR
HR
HU
IE
IS
IT
LT
LU
LV
MK
MT
NL
NO
PL
PT
RO
RU
SE
SI
SK
TR
RO
Romania Roumanie Rumänien RO
T he Romanian broadcasting sector is one of the stronger examples of how
multichannel television can impact on the shares of the traditional broadcasters. The four main channels still maintain a lead over the others but no individual channel dominates. Pro TV (Central European Media Enterprises - CME) has the highest market share with 12.8% in 2008 (down almost 3% in the last two years). Antena 1 (Intact Media Group) had an audience share of 9.1% in 2008 (down from 13.5% in 2006). Acasa TV (also from CME) has more or less held its audience share, which in 2008 was 7.7%. This channel targets women and presents mainly entertain-ment with drama, tele-novelas and films. Hence CME has a total market share of about 21%. The most dramatic loss of audience share has been that of the public service broadcaster TVR1 with a share in 2008 of 5.1% (down from 16.7% in 2006). The share of TVR2 also declined from 5.3% to 2% between 2006 and 2008. There are four other channels with a share of around 4% in 2008, including the news channel Realitatea. The development of access to multi-channel television, where-by at the end of 2008 approximately 75% of households had cable or satellite televi-sion, is outlined below. As in other countries, the main chan-nels have also expanded their families of channels in recent years. Most recently this includes the news channel of the public service broadcaster, TVR Info in 2008; and from the Romanian company Intact Media the channel Antena 2 in 2007. Reali tatea TV launched three oth-er channels for satellite pay TV in 2009 (CinesStar, ActionStar and Comedy-Star). Foreign investors continue to play an important role in the market such as Central European Media Enterprises (see above), ProSiebenSat.1 Media AG (Prima TV and Kiss TV), News Corporation (B1TV), and the Dogan Media Group (Kanal D). Cable is the most important reception mode in Romania (over 45% of house-holds). The cable network is mainly split between two operators: RCS-RDS and UPC Romania. RCS-RDS has taken over as the main player in the market with 1.4 million subscribers in August 2009. In December 2008, UPC Romania had 1.10 million subscribers (down com-pared with 2006, when the platform had 1.37 million). The cable market has also become more strictly regulated following a scandal in early 2008 where it became apparent that many cable network opera-tors, were distributing television channels without reaching a prior agreement with the programme providers. Operators were obliged by the CNA (Consiliul Naţional al Audiovizualului (National Audiovisual Council) to cease their transmissions after
Le secteur roumain de la radiodiffusion est l’un des meilleurs exemples de la
façon dont la télévision multi-chaînes peut affecter les parts de marché des radio-diffuseurs historiques. Les quatre principa-les chaînes restent en tête, sans qu’aucune ne s’impose réellement. En 2008, Pro TV (Central European Media Enter prises - CME) occupe la première position avec 12,8 % de part de marché (en recul de presque 3 points sur les deux derniè-res années) ; elle est suivie par Antena 1 (Intact Media Group) avec 9,1 % (contre 13,5 % en 2006). Acasa TV (appartenant également à CME) a globalement mainte-nu sa part de marché (7,7 %). Cette chaîne cible les femmes et diffuse principalement des programmes de divertissement tels que drames, telenovelas et films. CME a donc une part de marché totale d’environ 21 %. La perte d’audience la plus importante est celle enregistrée par le radiodiffuseur de service public, TVR1, dont la part de mar-ché en 2008 est de 5,1 % (contre 16,7 % en 2006). La part de TVR2 a également reculé, de 5,3 % à 2 % entre 2006 et 2008. Quatre autres chaînes ont une part de marché d’environ 4 %, y compris la chaî-ne d’information Realitatea. Le dévelop-pement de l’accès à la télévision multi-chaînes, grâce auquel, fin 2008, environ 75 % des foyers reçoivent la télévision par câble ou satellite, est présenté ci-dessous.Ces dernières années, comme dans d’autres pays, les principales chaînes ont étoffé leurs offres : le radiodiffuseur de service public a ainsi lancé en 2008 sa chaîne d’information, TVR Info ; il a été précédé en 2007 par la société roumaine Intact Media et sa chaîne Antena 2. Rea-litatea TV a lancé trois autres chaînes pour la télévision payante par satellite en 2009 (CinesStar, ActionStar et ComedyStar). Les investisseurs étrangers continuent à jouer un rôle important sur le marché, par exemple Central European Media Enter-prises (voir ci-dessus), ProSiebenSat.1 Media AG (Prima TV et Kiss TV), News Corporation (B1TV) et le Dogan Media Group (Kanal D).Le câble est le principal mode de récep-tion en Roumanie (plus de 45 % des foyers sont concernés). Le réseau câblé est prin-cipalement réparti entre deux opérateurs : RCS-RDS et UPC Romania. RCS-RDS occupe la première place sur le marché, avec 1,4 million d’abonnés en août 2009. En décembre 2008, UPC Romania comp-tait 1,1 million d’abonnés (en recul par rapport à 2006, lorsque la plate-forme en comptait 1,37 million). A la suite d’un scandale survenu début 2008, le marché du câble fait désormais l’objet de règles plus strictes : il était alors devenu évident que de nombreux câblo-opérateurs diffu-saient des programmes télévisés sans avoir préalablement conclu d’accord avec les chaînes concernées. Le CNA (Consiliul
Der rumänische Rundfunksektor ist ein gutes Beispiel dafür, wie das
Vielkanalfernsehen die Marktanteile der traditionellen Rundfunkanbieter beein-flussen kann. Die vier größten Sender haben zwar noch einen Vorsprung vor dem Rest, aber der Markt wird nicht mehr von einem einzelnen Sender domi-niert. Pro TV (Central European Media Enterprises - CME) hatte 2008 mit 12,8 % den höchsten Markt anteil (ein Rückgang um fast 3 % in zwei Jahren). Antena 1 (Intact Media Group) kam im gleichen Zeitraum auf einen Marktanteil von 9,1 % (gegenüber 13,5 % 2006), während Acasa TV (ebenfalls CME) seinen Marktanteil mit 7,7 % in etwa halten konnte. Dieser Sender wendet sich an Frauen und bietet in erster Linie eine Mischung aus Dra-ma, Telenovelas und Filmen. Die beiden CME-Sender erreichen somit zusam-men einen Marktanteil von rund 21 %. Den stärksten Einbruch der Marktanteile muss te der öffentlich-rechtliche Sender TVR1 hinnehmen (5,1 % 2008 gegen-über 16,7 % 2006). Auch der Marktanteil von TVR2 ist zwischen 2006 (5,3 %) und 2008 (2 %) deutlich zurückgegangen. Es gibt noch vier weitere Sender, die 2008 zusammen einen Marktanteil von rund 4 % erreichten, darunter der Nachrich-tensender Realitatea. Es folgt eine kur-ze Beschreibung der Entwicklung des Zugangs zum Vielkanalfernsehen, wonach Ende 2008 ca. 75 % der Haushalte Kabel- oder Satellitenfernsehen hatten.Wie in anderen Ländern haben auch die großen Sender in den vergangenen Jahren ihr Programm- bzw. Kanalangebot aus-geweitet. Dazu zählen unter anderem der erst unlängst gegründete Nachrichtenka-nal (TVR Info) des öffentlich-rechtlichen Rundfunkveranstalters sowie der Kanal Antena 2 des rumänischen Unternehmens Intact Media (seit 2007). Drei weitere Satelliten-Pay-TV-Kanäle wurden 2009 von Realitatea TV gestartet (CinesStar, ActionStar und ComedyStar). Auslän-dische Investoren spielen weiterhin eine wichtige Rolle auf dem Markt, darunter beispielsweise Central European Media Enterprises (siehe oben), ProSiebenSat.1 Media AG (Prima TV und Kiss TV), die News Corporation (B1TV) und die Dogan Media Group (Kanal D). Kabelfernsehen ist die in Rumänien am häufigsten genutzte Plattform (über 45 % der Haushalte). Das Kabelnetz teilen sich im Wesentlichen zwei Betreiber: RCS-RDS und UPC Romania. RCS-RDS hat im August 2009 mit 1,4 Mio. Abon-nenten die Position des Marktführers übernommen. Im Dezember 2008 hatte UPC Romania 1,1 Mio. Abonnenten (gegenüber 1,37 Mio. im Jahr 2006). Der Kabelmarkt unterliegt zudem infolge eines Skandals von Anfang 2008 einer strengeren Regulierung. Damals wurde

226 2 0 0 9 | V o l u m e 1 | B a n d 1
AL
AT
BE
BG
CH
CY
CZ
DE
DK
EE
ES
FI
FR
GB
GR
HR
HU
IE
IS
IT
LT
LU
LV
MK
MT
NL
NO
PL
PT
RO
RU
SE
SI
SK
TR
RO
Romania Roumanie Rumänien RO
being penalised by the CNA until they had concluded contracts with the relevant television provider. The satellite broadcasting market is deve-loping rapidly with more than 30% of households subscribing to services at the end of 2008. There are currently five sat-ellite platforms competing in the Roma-nian market. DigiTV (RCS-RDS) had 1.1 million subscribers in 2009 in Roma-nia (the service also operates in Croatia, the Czech Republic, Hungary, Serbia and Slovakia). Dolce (Romtelecom) had 750 000 subscribers in September 2009. The other three packages are: Akta TV (formerly Max TV) owned by DCS; Boom TV (DTH Television Group); and FocusSat (UPC), which had more than 155 000 subscribers at the end of 2008.Since 2005, digital terrestrial television trials have taken place in Bucharest and Paltinis. Romania has set 2012 as the date for the digital switchover. In July 2009, the Romanian government published its plan for the digital switchover. There will be 6 national DTT multiplexes and 1 regional. The first two multiplexes should cover 60% of the population by the end of 2010, and 90% by the end of 2011. In addition the Romanian govern-ment expressed its wish to launch DTT services by the end of 2009. In August 2009, the two main channels of the public service broadcaster – TVR1 and TVR2 – were granted DTT licenses. By September 2009 a multiplex tender had still not been launched. In 2006, the first IPTV platform, Ines, was launched by the Ines group. In 2009, there were at least six other platforms available with all the telecommunications operators offering triple play services. The satellite packager Romtelecom also plans to introduce an IPTV package by the end of 2009.
Naţional al Audiovizualului – Conseil national de l’audiovisuel) a sanctionné les opérateurs fautifs et les a contraints à cesser leurs transmissions jusqu’à ce qu’ils aient conclu les contrats appropriés avec les chaînes concernées.Le marché de la diffusion par satellite se développe rapidement, avec plus de 30 % des foyers abonnés fin 2008. Le marché roumain compte actuellement cinq plates-formes satellitaires. DigiTV (RCS-RDS), avec 1,1 million d’abonnés en 2009 en Roumanie (le service est également dis-ponible en Croatie, République tchèque, Hongrie, Serbie et Slovaquie). Dolce (Romtelecom) avec 750 000 abonnés en septembre 2009. Les trois autres bouquets sont : Akta TV (anciennement Max TV) appartenant à DCS ; Boom TV (DTH Television Group) ; et FocusSat (UPC), avec plus de 155 000 abonnés fin 2008.Depuis 2005, des tests de télévision numé-rique terrestre ont eu lieu à Bucarest et à Paltinis. La Roumanie a fixé la date de son basculement au numérique à 2012. En juillet 2009, le Gouvernement roumain a publié son plan pour le passage au numé-rique. Il y aura 6 multiplex nationaux et 1 régional. Les deux premiers multiplex devraient couvrir 60 % de la population d’ici la fin 2010 et 90 % d’ici la fin 2011. De plus, le Gouvernement roumain a fait part de son désir de lancer des services TNT d’ici la fin 2009. En août 2009, les deux principales chaînes du radiodiffuseur de service public (TVR1 et TVR2) se sont vues accorder des licences de TNT. En sep-tembre 2009, aucun appel d’offres pour un multiplex n’avait encore été lancé.En 2006, la première plate-forme IPTV baptisée Ines a été lancée par le groupe Ines. En 2009, au moins six autres plates-formes sont disponibles, tous les opéra-teurs de télécommunications proposant des services triple play. Le fournisseur de services par satellite Romtelecom prévoit également de lancer une offre IPTV d’ici la fin 2009.
bekannt, dass viele Kabelnetzbetreiber Programme ausstrahlten, ohne mit den jeweiligen Anbietern eine entsprechende Vereinbarung getroffen zu haben. So wur-den diverse Betreiber vom CNA (Consiliul Naţional al Audiovizualului – nationaler audiovisueller Rat) zu einer Geldstrafe ver-urteilt und gezwungen, bis zum Abschluss entsprechender Verträge mit den betrof-fenen Programmanbietern ihren Betrieb einzustellen.Der Satelliten-TV-Markt in Rumänien wächst sehr schnell. So nutzten Ende 2008 bereits über 30 % der Haushalte entsprechende Dienste. Derzeit gibt es auf dem rumänischen Markt fünf kon-kurrierende Satellitendienste. DigiTV (RCS-RDS) hatte 2009 1,1 Mio. Abon-nenten in Rumänien (der Dienst ist auch in Kroatien, der Tschechischen Republik, Ungarn, Serbien und der Slowakei ver-treten). Dolce (Romtelecom) hatte im September 2009 750 000 Abonnenten. Die drei übrigen Pakete sind: Akta TV (ehemals Max TV) von DCS, Boom TV (DTH Television Group) und FocusSat (UPC). Zusammen hatten sie Ende 2008 über 155 000 Abonnenten.Seit 2005 wurden drei DVB-T-Versuche in Bukarest und Paltinis durchgeführt. Die Umstellung auf Digitalbetrieb soll 2012 erfolgen. Im Juli 2009 hat die rumä-nische Regierung ihre Planung für die Umstellung bekannt gegeben. Demnach wird es sechs nationale und einen regio-nalen DVB-T-Multiplex geben. Mit den beiden ersten Multiplexen sollten bis Ende 2010 60 % und bis Ende 2011 90 % der Bevölkerung erreicht werden. Darüber hinaus hat die rumänische Regierung den Wunsch geäußert, bis Ende 2009 die ersten DVB-T-Dienste zu starten. Im August 2009 haben die beiden Hauptsender des öffentlich-rechtlichen Rundfunkveranstal-ters (TVR1 und TVR2) DVB-T-Lizenzen erhalten. Eine DVB-T-Multiplex-Aus-schreibung war bis September 2009 noch nicht eingeleitet worden. 2006 wurde von der Ines Group der erste IPTV-Dienst (Ines) gestartet. 2009 gab es mindestens sechs weitere Plattformen, wobei alle Telekom-Betreiber Triple-Play-Pakete im Angebot haben. Der Satelliten-TV-Anbieter Romtelecom plant ebenfalls die Einführung eines IPTV-Pakets bis Ende 2009.
Sources: Consiliul Naţional al Audiovizualului (Romanian Broadcasting Regulatory Authority -CNA): www.cna.ro Legal aspects: IRIS Merlin, http://merlin.obs.coe.int

2272 0 0 9 | V o l u m e 1 | B a n d 1
AL
AT
BE
BG
CH
CY
CZ
DE
DK
EE
ES
FI
FR
GB
GR
HR
HU
IE
IS
IT
LT
LU
LV
MK
MT
NL
NO
PL
PT
RO
RU
SE
SI
SK
TR
RO
Romania Roumanie Rumänien RO
Population and equipment 31.12.08Penetration
(in % HH) In thousand SourcesPopulation (inhabitants) – 21 499 Eurostat
Households – 7 384 Eurostat (as at 1.1.2008)
TV households 96,0% 7 089 European Audiovisual Observatory
Cable TV households 47,3% 3 490 Screen Digest / European Audiovisual Observatory
Digital cable TV households 2,7% 200 Screen Digest / European Audiovisual Observatory
DTH/SMATV households 33,1% 2 443 Screen Digest / European Audiovisual Observatory
Pay DTH/SMATV households 30,4% 2 243 Screen Digest / European Audiovisual Observatory
IPTV subscriptions 0,0% 0 Screen Digest / European Audiovisual Observatory
Installed DVB-T receivers 0,1% 10 Screen Digest / European Audiovisual Observatory
Total digital TV households 33,2% 2 453 European Audiovisual Observatory
Households with PC 42,8% 3 164 Screen Digest / European Audiovisual Observatory
Households with broadband connections 27,3% 2 014 Screen Digest / European Audiovisual Observatory
TV channels distributors 11.09 CompaniesCable operators >600 RCS & RDS, Soti Cable, UPC Romania,…
Satellite packagers 5 Digital Cable (Akta TV), DTH Television (Boom), Focus Sat, RCS & RDS (Digi TV), Romtelecom (Dolce)
IPTV packagers 4 Air Bites, Ines Group, Gemenii Network, Sky InternetDTT packagers 2 Radiocommunicatii, RomkatelMobile phone TV packagers 2 Orange Romania, Vodafone Romania
Number of TV channels by kind of licence 10.09 Public Private TotalTerrestrial (national) 2 2 4Cable/Satellite/IPTV/Mobile 4 103 107Regional/Local 14 14Regional/local windows 5 5Channels targeting foreign markets 1 11 12Total 12 130 142Foreign channels targeting the country 2 40 42
Source: European Audiovisual Observatory
Supply of TV channels by genre and by platform (including foreign channels) 11.09 Terrestrial
Cable RCS RDS
Cable UPC Romania
Satellite Dolce
Satellite Digi TV
IPTV Ines
Generalist - national 4 8 8 8 5 6Generalist - foreign 4 9 3 23 14Adult 2 3 6 2 9Children 4 6 9 5 8Culture/ education/ documentary 10 12 11 21 11Minority interest groups 7Entertainment/ TV fiction/ games 12 10 10 32 12Film 11 8 9 14 8Home shopping 1 1 1International linguistic and cultural 3 1 2 2 5Lifestyle/ specific leisure/ travel 6 7 8 8 7Music 9 15 12 15 11News/ business 7 15 8 12 16Parliament/ government/ administrationRegional/ local 5 1 7 2Religion 3 1 1 2 3Sports 7 10 8 20 9Various 3 1 1 3 3Total 4 95 108 104 171 125
Basic figures

228 2 0 0 9 | V o l u m e 1 | B a n d 1
AL
AT
BE
BG
CH
CY
CZ
DE
DK
EE
ES
FI
FR
GB
GR
HR
HU
IE
IS
IT
LT
LU
LV
MK
MT
NL
NO
PL
PT
RO
RU
SE
SI
SK
TR
RO
Romania Roumanie Rumänien RO
Source: European Audiovisual Observatory on the basis of data from Screen Digest, TVR, RR and IP Key Facts
Source: European Audiovisual Observatory
Source: Screen DigestSource: Screen Digest
Households TV equipment 2004-2008
Number of households accessing multichannel platforms as at 31.12.2008
Consumers pay-TV gross spend 2004-2008
Gross revenues of radio-television 2004-2008
2004 2005 2006 2007 2008
0
4 000
3 000
2 000
1 000
Cable households
Satellite households
DTT households
3 112
210276
825
1 915
2 443
3 6363 790
3 5503 490
100
Max TV est.
BoomTV est.
Romtelecom D
olce
RCS & RDS est.
UPC Romania
0
3 000
2 000
1 000
DTT
IPTV
Sat
PC
Cable
643
230
104
2 623155
1 400690
2004 2005 2006 2007 2008
0
500 000
400 000
300 000
200 000
100 000
Cable TV
Satellite
IPTV
213 990
342 414
383 071
423 682
377 151
0 1 786
27 317
111 175
182 250
0
66 144 249
2004 2005 2006 2007 2008
0
500
600
200
100
400
300
Consumerspay-TV spend
Radio-TV publicincome est.
TV adspend (net)
560
449
214
344
410
535
474
512
165
230255
430
In thousands.
In thousands.
EUR thousand.
EUR million.
Market trends

2292 0 0 9 | V o l u m e 1 | B a n d 1
AL
AT
BE
BG
CH
CY
CZ
DE
DK
EE
ES
FI
FR
GB
GR
HR
HU
IE
IS
IT
LT
LU
LV
MK
MT
NL
NO
PL
PT
RO
RU
SE
SI
SK
TR
RO
Romania Roumanie Rumänien RO
1 The series do not provide a clear view of the revenues of the channels up to 2004. The licences for the Pro TV and Acasa channels were hold by the audiovisual group Media Pro International (MPI) controlled by Adrian Sarbu, while the channels were operated by the company Pro TV SRL, a subsidiary of the Central European Media Enterprises group. The licence was then transfered in 2004 to Pro TV S.A. (90 % CME, 10 % Adrian Sarbu), while MPI continues to provide various broadcasting services to Pro TV.
2 In December 2007, Pro TV acquired MTS. In connection with this acquisition, Pro TV entered into a trademark and programming agreement with MTV Networks Europe («MTVNE») to operate the MTV ROMANIA channel.
3 In March 2007 Pro TV acquired full control of Sport Radio TV Media4 Includes telecommunication activities.5 Includes broadcasting activities.
Main broadcasters Channels 2005 2006 2007 2008 2008/07
TVR sptv TVR1, TVR2, TVR Cultural, TVRi 119 880 148 441 ~ ~ ~
Pro TV S.A. 1 adtv Pro TV, Acasa, Pro Cinema 27 909 123 260 145 297 ~ ~p.m. Music Television System 2 thtv MTV Romania 1 707 2 001 2 737 ~ ~p.m. Media Pro International SA 1 adtv ProTV, Acasa 55 930 15 213 2 733 2 396 -12,3%p.m. Sport Radio TV Media Srl 3 thtv Sport.ro 3 295 4 650 1 509 ~ ~TV Antena 1 S.A. adtv Antena1 40 127 55 179 67 479 ~ ~SBS Broadcasting Media SRL adtv Prima TV 14 011 34 631 ~ ~ ~Realitatea Media SRL thtv Realitatea TV 13 748 23 979 29 222 ~ ~p.m. Telesport Intermedia srl thtv Telesport 5 593 8 327 ~ ~ ~ABC Plus Media thtv National TV 19 872 ~ ~ ~ ~Antena 3 S.A. adtv Antena 3 3 414 8 972 11 503 ~ ~Global Video Media S.A. rtv Alpha TV 6 554 6 200 7 333 ~ ~Dogan Media International SA thtv Kanal D – ~ 5 208 ~ ~Antena 4 SA thtv Eufora Lifestyle TV – 1 628 3 278 4 374 33,4%HBO Romania SrL thtv HBO 1 778 1 983 2 977 3 293 10,6%Iko Romania Srl thtv Cool TV, Film+, Sport Klub 458 1 834 3 189 ~ ~Minimax Romania SrL thtv Minimax Romania 1 328 2 399 2 558 3 121 22,0%Antena 2 SA thtv Antena 2 – 525 3055 ~ ~News Television Romania S.A. thtv B1 TV 3 324 3 706 2 755 3 039 10,3%Ocram Televizijne thtv OTV 529 973 2 187 2 196 0,4%Etno Folclor Media SrL thtv Etno TV 1 072 1 272 1 476 1 793 21,5%Senso TV SRL thtv Senso 1 497 230 1 085 1 783 64,3%Terra Vision SrL thtv Credo Television Network 8 104 1 183 ~ ~Mass Media Romania de Maine thtv TV Romania de Maine 3 015 1 338 879 ~ ~Dacia RTV Bucuresti rtv Dacia RTV 706 2 796 874 ~ ~
Main distributors Packages 2005 2006 2007 2008 2008/07Orange Romania SA 4 3G TV Orange TV Live 623 411 853 381 1 116 763 1 122 941 0,6%Vodafone Romania SA 4 3G TV Vodafone TV Mobil 588 145 741 928 1 076 603 1 077 909 0,1%Romtelecom SA 4 ISP, sat-TV Dolce 915 677 932 339 805 161 812 219 0,9%RCS & RDS SA 4 3play, sat-tv Digi TV, Digi TV cable 44 729 121 424 248 860 356 932 43,4%UPC Romania SRL CATV, sat-tv UPC Romania 33 972 80 307 182 808 ~ ~Digital Cable System SA 4 3play, sat-tv Akta TV – 2 646 773 6 994 18 604 166,0%Focus Sat Romania S.A. sat-tv Focus-Sat 33 972 80 307 182 808 ~ ~INES Group 4 3play INES IPTV 3 787 5 125 5 643 5 395 -4,4%DTH Television Grup SA 5 sat-tv Boom TV – – 250 5 321 2 028,4%Air Bites SRL 4 3play Airbites – 0 433 2 721 528,4%
Source: European Audiovisual Observatory
Operating revenues of main television companies in Romania 2005-2008 EUR thousand.
T.1.RO.1G.1.RO.1

230 2 0 0 9 | V o l u m e 1 | B a n d 1
AL
AT
BE
BG
CH
CY
CZ
DE
DK
EE
ES
FI
FR
GB
GR
HR
HU
IE
IS
IT
LT
LU
LV
MK
MT
NL
NO
PL
PT
RO
RU
SE
SI
SK
TR
RO
Romania Roumanie Rumänien RO
Source: European Audiovisual Observatory
2004 2005 2006 2007 2008
0
150 000
120 000
90 000
60 000
30 000
TVR
SBS Broadcasting Media SRL
Pro TV S.A.
TV Antena 1 S.A.
Media Pro International SA
Realitatea Media SRL
Telesport Intermedia srl
ABC Plus MediaAntena 3 S.A.Global Video Media S.A.
T.1.RO.1G.1.RO.1
Operating revenues of main television companies in Romania (Continued) 2005-2008 EUR thousand.

2312 0 0 9 | V o l u m e 1 | B a n d 1
AL
AT
BE
BG
CH
CY
CZ
DE
DK
EE
ES
FI
FR
GB
GR
HR
HU
IE
IS
IT
LT
LU
LV
MK
MT
NL
NO
PL
PT
RO
RU
SE
SI
SK
TR
RO
Romania Roumanie Rumänien RO
Daily share Prime time (19:00-23:00)Channels 2004 2005 2006 2007 2008 2004 2005 2006 2007 2008TVR1 22,1 18,9 16,7 11,8 5,1 24,1 22,1 19,4 13,5 6,0TVR2 7,0 5,2 5,3 4,5 2,0 6,9 4,0 4,3 4,2 1,8Total Romanian public channels 29,1 24,1 22,0 16,3 7,1 31,0 26,1 23,7 17,7 7,8PRO TV 15,8 15,7 15,6 14,2 12,8 17,3 16,7 17,1 16,4 14,9Antena 1 12,3 13,6 13,5 11,2 9,1 16,1 16,6 16,7 14,2 11,7Acasa TV 7,4 8,1 7,7 6,8 7,7 7,7 9,2 8,0 6,1 9,2Prima TV 4,9 4,5 4,2 4,7 4,3 4,6 5,1 5,2 5,9 5,0Realitatea TV 2,9 3,4 3,7 3,8 4,6 2,1 2,4 2,7 2,9 3,3National TV 1,6 2,1 2,1 2,3 2,5 1,4 1,8 1,9 2,2 2,6OTV 0,4 1,7 2,1 3,9 4,0 0,3 1,5 1,9 3,9 4,0ETNO ~ ~ 1,6 1,7 1,8 ~ ~ 1,2 1,4 1,4B1TV 1,4 1,2 1,4 1,4 1,3 1,2 1,1 1,4 1,4 1,4Sport.ro (ex TV Sport) 0,8 1,4 1,4 1,8 1,5 0,8 1,2 1,2 1,4 1,2Antena 3 1 – 0,3 1,3 2,0 2,6 – 0,2 1,1 1,6 2,1Favorit TV – 0,6 1,0 1,2 1,4 – 0,5 0,9 1,4 1,6Pro Cinema 0,4 0,8 1,0 1,3 1,2 0,4 0,7 0,9 1,1 1,1Kanal D 1,8 3,9 2,0 4,5Total Romanian private channels 47,9 53,4 56,6 58,1 58,7 51,9 57,0 60,2 61,9 64,0Cartoon Network ~ ~ 1,8 0,5 2,4 ~ ~ 1,1 0,3 1,5Minimax 1,0 1,2 1,4 1,6 2,0 0,4 0,4 0,6 0,6 0,7JETIX 0,9 1,0 1,1 1,2 1,8 0,4 0,5 0,7 0,7 1,2Discovery 0,8 0,8 0,7 0,9 0,7 0,5 0,5 0,5 0,7 0,6Eurosport ~ ~ 0,7 0,7 0,7 ~ ~ 0,6 0,5 0,6Total foreign channels 2,7 3,0 5,7 4,9 7,6 1,3 1,4 3,5 2,8 4,6Others 20,3 19,5 15,7 20,7 26,6 15,8 15,5 12,6 17,6 23,6
Source: Eurodata TV Worldwide / GfK Romania / Copyright: Armadata SRL 21 Broadcast since 1st July 2005.2 Before 2008: Eurodata TV Worldwide / TNS / AGB INTERNATIONAL; ARMADATA SRL.
Prime time (19:00-23:00). In %, 4 years +.
2008
Others25,5% PRO TV
14,9%
Favorit TV1,6%
TVR16,0%
TVR21,8%
Antena 111,7%
Acasa TV9,2%
Prima TV5,0%Realitatea TV
3,3%National TV2,6%OTV
4,0%
ETNO1,4%
B1TV1,4%
JETIX1,2%
CartoonNetwork
1,5%
Kanal D4,5%
Sport.ro 1,2%Antena 3
2,1%
Pro Cinema1,1%
Daily share. In %, 4 years +.
2004 2005 2006 2007 2008
0
10
5
15
20
25
PRO TV
Antena 1
Acasa TV
TVR1
Antena 3
Realitatea TV
Kanal D
Cartoon Network
Prima TV
MinimaxOTV
NationalTV
TVR2
TV audience market share in Romania 2004-2008 In %, 4 years +.
T.1.RO.2G.1.RO.2

232 2 0 0 9 | V o l u m e 1 | B a n d 1
AL
AT
BE
BG
CH
CY
CZ
DE
DK
EE
ES
FI
FR
GB
GR
HR
HU
IE
IS
IT
LT
LU
LV
MK
MT
NL
NO
PL
PT
RO
RU
SE
SI
SK
TR
RU
Russian Federation
Fédération de Russie
Russische Föderation
RU
The Russian media market has combined several trends in the last few years. On
the one hand, all national channels are now owned by the state or by industrial groups either controlled by the state or with close connections to the government. On the other hand, competition has intensified, audiences have naturally segmented, new television projects have emerged, and new broadcast technologies have been devel-oped. Finally, the crisis severely hit the advertising markets, especially television, in the first half of 2009. The main players are, on the one hand, the partially state-owned broadcasters Pervyi Kanal and Rossiya, and, on the other hand, the commercial broadcasters NTV, CTC, REN-TV and TNT. Pervyi Kanal, whose daily audience market share stabilised at 20% in 2008, is still the market leader, fol-lowed by Rossiya (16.6%), NTV (12.7%) and CTC (8.5%). Pervyi Kanal also has the biggest share of television advertising on the Russian market. Kanal Rossiya is the main state- controlled national channel, broad casting all over Russia and reaching 99% of the population. The other public Russian channels include: Vesti (a news channel launched in 2006), Russia Today (the international Russian channel in Eng-lish, launched in 2005), Russia Al-Yaum (the Arabic equivalent of Russia Today, launched in 2007) and the special-interest channels Kultura and Sport.The company NTV, part of Media-Most (a holding company controlled by Gaz-prombank) operates the top commercial channel and also one of the Russian Fed-eration’s two satellite platforms, under the NTV-Plus brand. The regional television network TNT is also part of Media-Most. CTC is the fastest growing television net-work in Russia. The channel belongs to the CTC Media group, which is controlled by Sweden’s Modern Times Group (MTG) and Russia’s Alfa Bank.70% of REN-TV is held by two compa-nies, which are perceived as loyal to the current administration: the Severstal Group and the oil company Surgutneft-egaz. The 30% remaining stock belonging to the Lesnevsky family was purchased by the RTL Group. The same Russian compa-nies own a new pan-Federation TV com-pany ‘Channel Fifth’ (formerly Channel 5 TV and Radio Company), which was awarded the licence for 29 frequencies in November 2006, allowing the com-pany to become one of the largest federal networks, broadcasting in 75 cities.The cable TV market has been actively developing over recent years. Estimates vary, but according to the Groteck study the figures indicate that cable pen-etration is about 28% (14m households). The 6 largest cable companies control
Les dernières années ont révélé plusieurs tendances au sein du marché russe
des médias. D’une part, toutes les chaînes nationales sont désormais la propriété de l’Etat ou de groupes industriels qui sont soit contrôlés par l’Etat, soit liés de près au gouvernement. D’autre part, la concurren-ce s’est intensifiée, les publics se sont natu-rellement segmentés, de nouveaux projets télévisuels ont vu le jour et de nouvelles technologies de diffusion ont été mises au point. Enfin, la crise a frappé durement les marchés publicitaires, en particulier télé-visés, lors du premier semestre 2009. Les principaux acteurs sont, d’une part, les radiodiffuseurs d’Etat ou à financement mixte, – Pervyi Kanal (première chaîne) et Rossiya, et, d’autre part, les chaînes com-merciales NTV, CTC, REN-TV et TNT. Pervyi Kanal reste leader du marché avec une audience stabilisée à 20 % de part de marché d’audience quotidienne en 2008, suivi par Rossiya (16,6 %), NTV (12,7 %) et CTC (8,5 %). Pervyi Kanal détient également la plus grande part du marché publicitaire télé-visuel. Rossiya est la principale chaîne nationale contrôlée par l’Etat : elle diffuse dans toute la Russie et touche 99 % de la population. Parmi les autres chaînes publi-ques russes, on compte : Vesti (chaîne d’in-formation lancée en 2006), Russia Today (la chaîne internationale russe en anglais lancée en 2005), Russia Al-Yaum (l’équi-valent en arabe de Russia Today, lancée en 2007) ou encore les chaînes thématiques Kultura et Sport.La société NTV, qui fait partie de la hol-ding Media-Most (contrôlée par Gaz-prombank), exploite la première chaîne commerciale, ainsi que l’un des deux bou-quets satellite de la Fédération de Russie, sous l’appellation NTV-Plus. Le réseau de radiodiffusion régional TNT appartient également à Media-Most.CTC est le réseau télévisé qui connaît la croissance la plus rapide en Russie. La chaîne appartient au groupe CTC Media, contrôlé par le groupe suédois MTG et par la banque russe Alfa Bank.70% de REN-TV sont détenus par deux sociétés connues pour leur fidélité au gouvernement actuel – le groupe Severs-tal et la société pétrolière Surgutnefte-gaz. Les 30% restants, appartenant à la famille Lesnevsky, ont été achetés par le RTL Group. Ces mêmes sociétés russes détiennent un nouvel établissement TV 100% fédéral Channel Fifth (ancienne-ment Canal 5 Radio et TV), qui s’est vu octroyer 29 fréquences en novembre 2006, devenant ainsi l’un des plus grands réseaux fédéraux diffusant dans 75 villes.Au cours des dernières années, le marché de la télévision câblée s’est développé activement. Les estimations varient mais, selon l’étude Groteck, la pénétration du
D ie vergangenen Jahre zeigten meh-rere Trends auf dem russischen
Medienmarkt. Zum einen befinden sich nunmehr sämtliche landesweiten Fern-sehsender im Besitz des Staates oder von Industriekonzernen, die entweder unter der Kontrolle des Staates stehen oder eng mit der Regierung verbunden sind. Zum anderen verschärfte sich der Wettbewerb, was zu einer natürlichen Aufteilung der Zuschauer führte. Neue Fernsehprojekte sind entstanden, und neue Verbreitungs-technologien wurden entwickelt. Von der Finanzkrise schwer getroffen wurden im ersten Halbjahr 2009 die Werbemärkte, darunter insbesondere der Markt für Fernseh werbung. Die wichtigsten Akteure sind zum einen die staatlichen oder gemischt finanzierten Rundfunkveranstalter Pervyi Kanal (Erstes Programm) und Rossija, zum anderen die Privatsender NTV, CTC, REN-TV und TNT. Marktführer war 2008 erneut Per-vyi Kanal mit einem inzwischen stabilen durchschnittlichen Zuschaueranteil von 20 %, gefolgt von Rossija (16,6 %), NTV (12,7 %) und CTC (8,5 %). Pervyi Kanal erzielte auch bei der Fernseh-werbung den größten Marktanteil. Rossija ist der wichtigste landesweite Sender unter staatlicher Kontrolle. Er wird in ganz Russland verbreitet und erreicht 99 % der Bevölkerung. Zu den übrigen staatlichen Sendern gehören: Vesti (Informationska-nal, seit 2006), Russia Today (der inter-nationale russische Sender in englischer Sprache, seit 2005), Russia Al-Yaum (die arabische Version von Russia Today, seit 2007) oder auch die Spartenkanäle Kultura und Sport.Das Unternehmen NTV, ein Teil der Holding Media-Most (unter der Kon-trolle von Gasprombank), betreibt den wichtigsten Privatsender sowie eines der beiden Satellitenbouquets der Russischen Föderation, NTV-Plus. Der regionale Fernsehsender TNT gehört ebenfalls zu Media-Most. CTC ist der am schnellsten wachsende Fernsehsender in Russland. Der Sender gehört dem Konzern CTC Media, der von der schwedischen MTG-Gruppe und der russischen Alfa Bank kontrolliert wird.70 % von REN-TV gehören zwei regie-rungstreuen Unternehmen: dem Stahl-konzern Severstal und der Ölgesellschaft Surgutneftegaz. Die restlichen 30 %, die der Familie Lesnevsky gehörten, erwarb die RTL-Group. Im Besitz der beiden russischen Unternehmen ist ein neu-er landesweiter Fernsehsender, Fünfter Kanal (früher Kanal 5 TV und Radio), der im November 2006 den Zuschlag für 29 Frequenzen erhielt. Heute zählt dieser Kanal bereits zu einem der größten lan-desweiten Sender und wird in 75 Städten ausgestrahlt.

2332 0 0 9 | V o l u m e 1 | B a n d 1
AL
AT
BE
BG
CH
CY
CZ
DE
DK
EE
ES
FI
FR
GB
GR
HR
HU
IE
IS
IT
LT
LU
LV
MK
MT
NL
NO
PL
PT
RO
RU
SE
SI
SK
TR
RU
Russian Federation
Fédération de Russie
Russische Föderation
RU
8.195 million subscribers (60.7% of the total): Nafta holding, System Mac-Media, Renova-Media, Sviazinvest, ERT-elecom Holding (Perm) and Multiregion. ERTelecom announced that it had 1.67 million subscribers in June 2009, which indicates the cable operator is enjoying considerable growth as it only had 900 000 subscribers at the end of 2008. The regional cable market includes two major participants, UCN and NKS. The former covers 16 regions and the latter covers 7 regions. There are now five satellite packagers in the Russian market with more than 6 mil-lion households (estimate) using this mode of reception (2009). NTV-Plus (Gaz-prom), Russia’s first platform (launched in 1996), was for a long time the only Rus-sian satellite package. Since 2006, it has offered channels in HD and on-demand services with films and sport. Several com-petitors have gradually entered the market: Tricolor TV, Orion Express, Platforma HD (launched in 2008) and Raduga TV (launched in 2009). Orion Express, which claimed to have 250 000 subscribers to its package in 2009, has announced that it will be launching a new pay-TV package, Continent TV, in early 2010. Platforma HD has announced the imminent intro-duction of a Platforma SD package.Tricolor, with more than 5 million sub-scribers (compared with 2.6 million in 2008) was the most popular satellite package in 2009 and offers around thirty channels. In September 2009, Gazprom took over National Satellite, the company that produces the Tricolor TV package. The group now controls NTV-Plus and Tricolor TV, with a total of over 6 million subscribers.IPTV services continue to be developed. The take-up is mostly in the major cit-ies due to the availability of broadband Internet access. The four main packages are linked to four telecommunications companies: Stream-TV (from Comstar-Direct, launched in 2005); Webstream-TV (from Sibir Telecom, launched in 2006); Disel-TV (UTK, launched in 2006); and Qwerty.tv (Central Telegraph, launched in 2006). Stream-TV is the market leader. A number of projects are being considered or in the course of being launched. For example, in the Moscow region, Center-Telecom launched a service in the spring of 2009 and Comstar-UTS expects do the same in 2010. Similarly, VimpelCom expects to launch one in St Petersburg in 2010, where Vestkoli and Interzet became established in 2009.VimpelCom will also be carrying out new personal mobile television tests in Moscow in December 2009, using the DVB-H standard. Several tests of this type have already been conducted but no service has yet been officially launched.
câble serait d’environ 28 % (14 millions de foyers). Les 6 principaux distribu-teurs par câble, Nafta-Holding, Sistema Mass Media, Renova-Media, Sviazinvest, ERTelecom Holding (Perm) et Multi-region, gèrent 8,195 millions d’abon-nés (60,7 % du total). ERTelecom a annoncé 1,67 million d’abonnés en juin 2009, un nombre en forte croissance puisque le câblo-opérateur ne comptait que 900 000 abonnés à la fin de l’année 2008. Le marché régional du câble com-prend deux acteurs principaux, UCN et NKS, qui couvrent respectivement 16 et 7 régions. Il existe aujourd’hui cinq opérateurs satellite sur le marché russe, le nombre de foyers utilisant ce mode de réception étant estimé à plus de 6 millions (2009). Premiè-re plate-forme à avoir été lancée en Russie en 1996, NTV-Plus (Gazprom) est long-temps demeuré l’unique bouquet satellite russe. La plate-forme propose depuis 2006 des chaînes HD ainsi que des services de cinéma et de sport à la demande. Plu-sieurs concurrents sont progressivement entrés sur le marché : Tricolor TV, Orion Express, Platforma HD (lancé en 2008) et Raduga TV (lancé en 2009). Orion Express qui revendique 250 000 abon-nés à son bouquet en 2009 a annoncé le lancement d’un nouveau bouquet payant, Continent TV, au début de l’année 2010. Platforma HD a aussi annoncé l’inau-guration prochaine d’un bouquet Plat-forma SD.C’est Tricolor qui est le bouquet satellite le plus populaire en 2009, avec plus de 5 millions d’abonnés (contre 2,6 millions en 2008). Son offre est composée d’une trentaine de chaînes. En septembre 2009, Gazprom a pris le contrôlé de National Satellite, l’entreprise éditant le bouquet Tricolor TV. Le groupe contrôle désor-mais NTV-Plus et Tricolor TV, soient plus de 6 millions d’abonnés.Les services IPTV continuent de se déve-lopper, surtout dans les grandes villes grâce à l’accès Internet haut débit. Les quatre principales offres sont gérées par quatre sociétés de télécommunications : Stream-TV (Comstar-Direct, 2005), Webstream-TV (Sibirtelecom, 2006), Disel-TV (UTK, 2006) et Qwerty.tv (Central Telegraph, 2006). Stream-TV est leader du marché. De multiples projets sont à l’étude ou en cours de lancement. Ainsi, dans la région de Moscou, Center Telecom a lancé une offre au printemps 2009 et Comstar-UTS compte inaugurer un service en 2010. De même, VimpelCom compte inaugurer un service à Saint-Pétersbourg en 2010, où Vestkoli et Interzet se sont implantés en 2009.VimpelCom va aussi effectuer à Moscou en décembre 2009 de nouveaux tests de transmissions de télévision mobile personnelle, via la norme DVB-H.
Seit einigen Jahren findet eine aktive Entwicklung des Marktes für Kabelfern-sehen statt. Die Schätzungen schwanken zwar, aber der Groteck-Studie zufolge liegt die Kabelpenetration inzwischen bei rund 28 % (14 Mio. Haushalte). Die sechs größten Kabelunternehmen haben zusam-men 8 195 Mio. Abonnenten (60,7 % aller Kabelempfänger): Nafta-Holding, Sistema Mass Media, Renova-Media, Sviazinvest, ERTelecom Holding (Perm) und Multi-region. Der Kabelbetreiber ERTelecom hatte im Juni 2009 nach eigenen Angaben 1,67 Mio. Abonnenten und verzeichnet somit ein deutliches Wachstum gegenüber den 900 000 Abonnenten zum Jahresende 2008. Auf dem regionalen Kabelmarkt gibt es zwei Hauptakteure, UCN und NKS, die je 16 bzw. 7 Regionen abdecken.Es gibt inzwischen fünf Satellitenbetreiber auf dem russischen Markt. Die Zahl der Haushalte mit Satellitenempfang wurde 2009 auf mehr als 6 Millionen geschätzt. Als erste (1996) in Russland gestartete Plattform war NTV-plus (Gazprom) lange Zeit das einzige russische Satellitenbou-quet. Die Plattform bietet seit 2006 auch HD-Kanäle sowie Kino und Sport auf Abruf an. Mit der Zeit sind weitere Wett-bewerber in den Markt eingestiegen: Tri-color TV, Orion Express, Platforma HD (seit 2008) und Raduga TV (seit 2009). Orion Express, mit nach eigenen Anga-ben 250 000 Abonnenten 2009, hat für Anfang 2010 den Start eines weiteren Pay-TV-Pakets (Continent TV) angekündigt. Plateforma HD hat ebenfalls den bevor-stehenden Start des Pakets Plateforma SD angekündigt.Erfolgreichstes Satellitenbouquet war 2009 Tricolor mit über 5 Mio. Abon-nenten (gegenüber 2,6 Mio. im Jahr 2008). Das Angebot umfasst rund 30 Sender. Im September 2009 hat Gazprom die Anteils-mehrheit bei National Satellite übernom-men, dem Betreiber des Pay-TV-Pakets Tricolor TV. Der Konzern kontrolliert inzwischen NTV-Plus und Tricolor TV, d. h. über 6 Mio. Abonnenten.Die Zahl der IPTV-Anbieter steigt wei-ter, insbesondere in den großen Städ-ten, da nur diese über den notwendigen Breitband zugang verfügen. Bisher wird IPTV von vier Telekommunikations-unternehmen angeboten: Stream-TV (Comstar-Direct, seit 2005); Webstream-TV (Sibirtelecom, seit 2006); Disel-TV (UTK, seit 2006); und Qwerty.tv (Cen-tral Telegraph, seit 2006). Marktführer ist Stream-TV. Zahlreiche Vorhaben werden derzeit noch geprüft oder befinden sich in der Startphase. So ist CenterTelecom im Frühling 2009 mit einem Dienst in der Region Moskau an den Markt gegangen, und Comstar-UTS plant den Start eines Dienstes für 2010. In St. Petersburg plant VimpelCom ebenfalls den Start eines Dienstes für 2010, während Vestkoli und

234 2 0 0 9 | V o l u m e 1 | B a n d 1
AL
AT
BE
BG
CH
CY
CZ
DE
DK
EE
ES
FI
FR
GB
GR
HR
HU
IE
IS
IT
LT
LU
LV
MK
MT
NL
NO
PL
PT
RO
RU
SE
SI
SK
TR
RU
Russian Federation
Fédération de Russie
Russische Föderation
RU
On 24 June 2009, the President of the Russian Federation signed a decree on the obligation to broadcast eight free-to-air channels throughout the country and on all platforms. These channels are Per-vyi Kanal, Rossiya, Kultura, Sport, Vesti, Channel 5, NTV and a yet to be created children’s channel. No invitation to tender was organised on that occasion.These eight channels will make up the offer of Russia’s first digital terrestrial television multiplex. As terrestrial television is still the main means of reception (more than 60% of TV households), the DTT swi-tchover is a government priority.In November 2007, the then First Deputy Prime Minister Dimitry Medvedev, appro-ved a plan for the transition to digital ter-restrial television in the DVB-T standard from 2008 to 2015. In September 2009, Prime Minister Putin signed a resolution on the DTT switchover. DTT is gradu-ally being rolled out in several Russian regions but has not yet been launched at the national level. Ultimately, more than twenty channels will be available. The date for the terrestrial analogue switch-off is still fixed for 2015. The end of 2008 saw the creation of the “Russian digital alliance” by the associa-tion of broadcasters, cable operators and the Ministry of Telecommunications and Media. The aim is the resolution of tech-nical, economic and legal problems asso-ciated with the digital switchover. The structure of the regulatory autho-rities was changed by presidential decree in 2007. A new body, the Federal Service for Supervision in the Sphere of Mass Communications, Telecommunications and Protection of Cultural Heritage, was established. The new Service consists of two different bodies, one supervising mass communications and the protection of cultural heritage and another super vising telecommunications.
Plusieurs opérations de ce type ont déjà été menées, mais aucun service n’est encore officiellement lancé.Le 24 juin 2009, le Président de la Fédé-ration de Russie a signé un décret portant sur l’obligation de diffuser gratuitement 8 chaînes sur l’intégralité du territoire et sur l’ensemble des plates-formes. Il s’agit de Pervyi Kanal, Rossiya, Kultura, Sport, Vesti, Channel 5, NTV et une chaîne pour enfant devant être créée. Aucun appel d’offre n’a été organisé à cette occasion.Ces 8 chaînes constitueront l’offre du pre-mier multiplex de la télévision numérique terrestre russe. La télédiffusion terrestre restant le principal type de réception TV (plus de 60% de foyers TV), la transition vers le numérique terrestre est une priorité pour le gouvernement.En novembre 2007, Dimitry Medvedev, alors vice-Premier Ministre, a approuvé un plan de transition vers la télévision numé-rique terrestre, en norme DVB-T, pour la période 2008-2015. En septembre 2009, le Premier ministre a signé une résolution concernant la mise en œuvre du passage au numérique terrestre. La TNT est graduel-lement déployée dans plusieurs régions russes, mais pas encore lancée à l’échelon national. A terme, plus d’une vingtaine de chaînes seront accessibles. La date de l’extinction des transmissions analogiques terrestres demeure fixée en 2015. Fin 2008 a été créée « l’alliance numé-rique de Russie » par l’association des radiodiffuseurs, les câblo-opérateurs et le ministère des télécommunications et des médias. L’objectif est la résolution de pro-blèmes techniques, économiques et juridi-ques liés à la transition numérique. La structure des autorités de réglementa-tion a été modifiée par décret présidentiel en 2007. Un nouvel organisme, le service fédéral de contrôle du secteur des com-munications de masse, des télécommuni-cations et de la protection du patrimoine culturel, a été créé et se compose de deux instances distinctes : l’une supervise les communications de masse et la protection du patrimoine culturel, l’autre contrôle les télécommunications.
Interzet dort schon 2009 an den Start gegangen sind.VimpelCom will des Weiteren im Dezem-ber 2009 in Moskau neue Tests für perso-nalisiertes Mobilfernsehen im DVB-H-Standard durchführen. Es wurden bereits mehrere Versuche in dieser Richtung unternommen, aber Dienste wurden offi-ziell noch keine gestartet.Der Präsident der Russischen Föderation hat am 24. Juni 2009 einen Erlass unter-zeichnet, wonach landesweit und auf allen Plattformen acht Sender kostenlos ausge-strahlt werden müssen. Dabei handelt es sich um Pervyi Kanal, Rossiya, Kultura, Sport, Vesti, Channel 5, NTV und ein noch nicht existierender Kinderkanal. Eine Ausschreibung wurde zu diesem Anlass nicht durchgeführt.Diese acht Sender sollen das Angebot des ersten DVB-T-Multiplex in Russ-land bilden. Da das Antennenfernsehen nach wie vor die am weitesten verbreitete Empfangsart ist (über 60 % der Fernseh-haushalte), ist die Umstellung auf Digital-betrieb für die Regierung von vorrangiger Bedeutung.Im November 2007 stimmte Minister Dimitri Medwedew einem Plan zur Umstellung auf das digitale terrestrische Fernsehen (DVB-T) für 2008-2015 zu. Im September 2009 hat der Premier-minister einen Beschluss zur Umsetzung der Umstellung auf DVB-T unter zeichnet. Das digitale Antennenfernsehen soll schrittweise in mehreren russischen Regi-onen, aber noch nicht auf nationaler Ebe-ne eingeführt werden. Am Ende sollen über zwanzig Sender empfangen werden können. Die Abschaltung des analogen Antennenfernsehens ist nach wie vor für 2015 vorgesehen.Ende 2008 wurde vom Verband der Rund-funkveranstalter, den Kabelbetreibern und dem Ministerium für Kommunikation und Medien die „digitale Allianz Russ-lands“ gegründet. Ziel der Allianz ist die Lösung der technischen, wirtschaftlichen und rechtlichen Probleme in Verbindung mit Umstellung.2007 wurde per Präsidialerlass eine neue Regulierungsbehörde geschaffen, der Föderale Aufsichtsdienst für die Mas-senkommunikation und den Schutz des Kulturerbes. Sie besteht aus zwei unter-schiedlichen Behörden: einer Behörde, die für die Aufsicht über die Massen-kommunikation und den Schutz des kulturellen Erbes zuständig ist, und einer Behörde, die für die Telekommunikation zuständig ist.
Sources: GROTECK, «The Television Market in the Russian Federation», Report for the European Audiovisual Observatory, Strasbourg, 2008 : http://www.obs.coe.int/online_publication/reports/digitaltv_groteck.pdf
Audience data: TNS Gallup Media: http://www.tns-global.ru Legal aspects: IRIS Merlin, http://merlin.obs.coe.int

2352 0 0 9 | V o l u m e 1 | B a n d 1
AL
AT
BE
BG
CH
CY
CZ
DE
DK
EE
ES
FI
FR
GB
GR
HR
HU
IE
IS
IT
LT
LU
LV
MK
MT
NL
NO
PL
PT
RO
RU
SE
SI
SK
TR
RU
Russian Federation
Fédération de Russie
Russische Föderation
RU
Population and equipment 31.12.07Penetration
(in % HH) In thousand SourcesPopulation (inhabitants) – 142 200 GKS
Households – 50 604 European Audiovisual Observatory estimates
TV households 98,0% 49 592 TNS / European Audiovisual Observatory
Cable TV households 28,0% 14 169 Groteck / European Audiovisual Observatory
Digital cable TV households 3,95% 2 000 Groteck / European Audiovisual Observatory
DTH/SMATV households 4,9% 2 500 Groteck / European Audiovisual Observatory
Dig. DTH/SMATV households 4,9% 2 500 Groteck / European Audiovisual Observatory
IPTV subscriptions 0,2% 100 Groteck / European Audiovisual Observatory
Installed DVB-T receivers 0,2% 100 Groteck / European Audiovisual Observatory
Total digital TV households 9,3% 4 700 Groteck / European Audiovisual Observatory
Households with PC 22,0% 11 133 Groteck / European Audiovisual Observatory
Households with broadband connections 7,2% 3 643 Groteck / European Audiovisual Observatory
TV channels distributors 11.07 Companies
Cable operators 600 Nafta-Holding, Sistema Mass Media, Renova-Media, Sviazinvest, ERTelecom Holding, Multiregion,…
Satellite packagers 5 NTV-Plus, Tricolor TV, Orion Express, Plaftorma HD, Raduga TVIPTV packagers 21 Comstar-Direct, Sibirtekecom, UTK, Central Telegraph,…DTT packagers 4 ~Mobile phone TV packagers 3 ~
Number of TV channels by kind of licence 09.06 Public Private TotalTerrestrial analogue (national) 6 9 15Cable/Satellite/DTT/IPTV channels 3 61 64Regional/Local ~ ~ 1 500Regional/local windows 0 12 12Channels targeting foreign markets 4 2 6Total 1 597Foreign channels targeting the country 0 14 14
Source: European Audiovisual Observatory
1 Data as at 1st November 2009.
1
Basic figures

236 2 0 0 9 | V o l u m e 1 | B a n d 1
AL
AT
BE
BG
CH
CY
CZ
DE
DK
EE
ES
FI
FR
GB
GR
HR
HU
IE
IS
IT
LT
LU
LV
MK
MT
NL
NO
PL
PT
RO
RU
SE
SI
SK
TR
RU
Russian Federation
Fédération de Russie
Russische Föderation
RU
EUR thousandMain broadcasters Channels 2005 2006 2007 2008 2008/07Pervyi Kanal sptv Pervyi Kanal 392 248 476 419 574 592 608 223 5,9%VGTRK sptv 373 342 516 906 615 257 599 195 -2,6% - Telekanal Rossiya sptv Rossiya 82 010 94 699 35 881 37 270 3,9% - Kompaniya Kulytura sptv Kulytura 11 965 ~ ~ ~ ~Telekompaniya NTV adtv NTV 258 157 311 323 380 702 427 039 12,2%Aksept adtv Ren TV 83 712 92 948 114 143 117 211 2,7%Teleradiokompanya Petersburg rtv TV Petersburg ~ 5 097 41 787 66 315 58,7%TV Sentr adtv TV Sentr (Center TV) 65 909 28 497 47 209 56 225 19,1%Novyvi Kanal adtv Domashny 10 536 19 800 32 564 45 701 40,3%Teleradiokompanya TVT adtv TBT 8 240 21 773 29 903 31 728 6,1%Marafon TV adtv CTC (STS) 26 080 34 677 32 077 30 234 -5,7%
Main distributors Packages 2005 2006 2007 2008 2008/07Mobilnye Telesystemy (MTS) 1 3GTV MTS TV 2 334 106 3 331 602 4 076 521 4 612 039 13,1%Vimpel Communications 1 3play Beeline TV 2 147 055 3 360 439 4 305 207 4 394 212 2,1%Tsentralnaya Telekommuni-katsionnaya Kompaniya 1 3play CenterTelecom TV 812 727 818 826 896 904 824 560 -8,1%
Severo-Zapadnyi Telekom 1 3play Avangard TV 600 316 591 864 654 816 599 185 -8,5%Yuzhnaya Telekommuni-katsionnaya Kompanya 1 3play Disel-TV (UTK) 534 082 509 384 547 189 510 747 -6,7%
Komstar-Obyedinnye- Telesistemy 1 3play Stream TV 92 535 101 082 171 725 219 493 27,8%
NTV Plyus packtv NTV+ 108 696 143 052 180 710 183 478 1,5%Tsentralnyi Telegraf 1 3play Qwerty.tv 65 463 73 140 94 068 83 660 -11,1%Orion Ekspress packtv Orion Ekspress – 1 409 2 717 5 843 115,1%
Source: Creditreform / BVDEP (Amadeus) / European Audiovisual Observatory1 Includes telecommunication activities.
EUR thousand.
2004 2005 2006 2007 2008
0
700 000
600 000
400 000
300 000
500 000
100 000
200 000
Pervyi KanalVGTRK
Telekompaniya NTV
Aksept
Teleradiokompanya PetersburgNovyvi KanalTeleradiokompanya TVT
TV SentrMarafon TV
Operating revenues of main television companies in the Russian Federation 2005-2008 EUR thousand.
T.1.RU.1G.1.RU.1

2372 0 0 9 | V o l u m e 1 | B a n d 1
AL
AT
BE
BG
CH
CY
CZ
DE
DK
EE
ES
FI
FR
GB
GR
HR
HU
IE
IS
IT
LT
LU
LV
MK
MT
NL
NO
PL
PT
RO
RU
SE
SI
SK
TR
RU
Russian Federation
Fédération de Russie
Russische Föderation
RU
Daily share Prime time (19:00-23:00)Channels 2004 2005 2006 2007 2008 2004 2005 2006 2007 2008Pervyj Kanal 25,7 23,0 20,3 20,2 20,0 29,4 23,9 20,7 22,4 21,1Rossija 20,0 22,5 18,6 16,3 16,6 21,4 25,2 20,3 17,6 18,2Kultura 2,3 2,5 2,4 2,3 2,0 1,9 2,2 2,2 2,2 2,1NTV 11,9 11,2 12,3 13,3 12,7 12,1 11,5 12,5 14,9 13,8CTC (STS) 9,8 10,3 9,8 8,5 8,5 9,7 10,4 11,3 8,7 8,7TNT 6,6 6,6 5,7 6,4 6,9 6,1 6,3 5,9 6,5 7,2REN TV 5,2 4,9 4,0 4,2 4,4 4,2 4,5 3,6 3,7 3,9TV-Center 2,6 2,5 2,5 2,8 2,8 2,4 2,3 2,2 2,3 2,4TV3 1,9 1,9 2,2 2,2 2,7 1,7 1,7 2,0 1,9 2,3SPORT 0,9 1,8 2,4 1,9 2,1 0,7 1,5 2,0 1,5 1,8Domashny 1,0 1,3 1,9 2,1 0,9 1,2 1,6 1,9DTV VIASAT 1,3 1,5 1,6 1,8 1,7 1,0 1,2 1,3 1,4 1,4ZVEZDA 0,3 0,7 1,1 0,3 0,6 0,9Muz TV 1,2 1,0 1,3 1,3 1,0 0,9 0,7 0,9 1,0 0,7MTV Russia 1,4 1,1 1,1 0,9 1,0 0,9 0,7 0,8 0,7 0,7Petersburg-5 Channel 0,1 0,7 1,0 0,1 0,6 0,9Vesti 0,3 0,8 0,2 0,57TV 0,5 0,3 0,3 0,2 0,3 0,4 0,3 0,2 0,2 0,2Euronews 0,2 0,2 0,2 0,2 0,2 0,0 0,0 0,0 0,0 0,1Rambler 0,1 0,3 0,3 0,1 – 0,1 0,3 0,2 0,1 –Others 8,8 7,6 13,8 13,9 12,1 7,5 6,7 12,5 12,0 11,2
Source: Eurodata TV Worldwide / TNS Gallup MediaFrom 2006, market shares are normalised (not taking into account external devices such as DVD, VCR …)
Prime time (19:00-23:00). In %, 4 years +.
2008
Pervyj Kanal21,1%
DTV VIASAT1,4%
Rossija18,2%
Kultura2,1%
NTV13,8%
CTC (STS)8,7%
TNT7,2%
REN TV3,9%
TV-Center2,4%
TV32,3%
SPORT1,8%
Domashny1,9% Others
15,2%
Daily share. In %, 4 years +.
2004 2005 2006 2007 2008
0
10
20
30
Pervyj Kanal
Rossija
NTV
NTV
CTC (STS)
TNT
REN TVDTV VIASATZVEZDADomashny
TV-CenterKultura
SPORT
TV audience market shares in urban population of the Russian Federation 2004-2008 In %, 4 years +.
T.1.RU.2G.1.RU.2

238 2 0 0 9 | V o l u m e 1 | B a n d 1
AL
AT
BE
BG
CH
CY
CZ
DE
DK
EE
ES
FI
FR
GB
GR
HR
HU
IE
IS
IT
LT
LU
LV
MK
MT
NL
NO
PL
PT
RO
RU
SE
SI
SK
TR
SE
Sweden Suède Schweden SE
TV4 (Bonnier group) has established itself as the leader in terms of daily
audience for the third year in a row. How-ever, with only a 20.1% market share the gap has narrowed with the first public channel SVT1 (which recorded a daily audience of 19.5% in 2008). This channel is still the prime time market leader but its progress has been eroded here, too. In other words, the market positions of TV4 and SVT1 have moved closer together. In third place is the second public chan-nel SVT2, which is also losing part of its audience and has a market share of just over 10%.Following on behind these three incumbent channels are three channels established in the United Kingdom: TV3 (Modern Times Group), Kanal 5 (Pro SiebenSat.1 Media AG) and TV6 (Modern Times Group), all of which have maintained stable results compared with 2007, with TV6, the newest channel (launched in 2006) even slightly increas-ing its daily audience to 4.3%.However, these six dominant channels only had a combined daily audience share of 71.3% in 2008 compared with 80% two years earlier, the reason being that ten or so channels have gradually become estab-lished (TV4 Plus, SVT24, SVTB, Kanal 9, TV4 Sport, etc), each with a market share of between 1 and 4% and doubling their combined audience in two years.The spread of the small channels is clearly bound up with the importance of the digital terrestrial platform and the growth of the other multi-channel distribution networks in Sweden. Since its launch in 1997, the DTT platform has been oper-ated by the company Boxer. Long a symbol of the dynamism of the digital transition in Sweden (the analogue switchoff began in 2007), Boxer was, however, faced in 2009 with a drop in its number of sub-scribers. Adding together the Swedish and Danish markets, the company had 673 000 subscribers in June 2009 com-pared with 709 000 in March 2008 on the Swedish market alone. This phenom-enon can no doubt be explained by the increased competition from other means of distribution.The cable television market is highly con-centrated and dominated by the opera-tor Com Hem, which claimed to have 1.76 million subscribers at 31 March 2009 (around half a million of which have access to digital television) and is continuing to increase its subscriber base and posting very positive results.Satellite television is shared between the two Nordic market operators Canal Digital and Viasat.TeliaSonera has established itself as the leader on the IPTV market, with 350 000 subscribers at 30 June 2009.
TV4 (groupe Bonnier) s’affirme pour la troisième année consécutive leader
en termes d’audience quotidienne. Mais avec seulement 20,1 % de part de marché, l’écart s’est réduit par rapport à la première chaîne publique SVT1 (qui affiche 19,5 % d’audience quotidienne en 2008). Cette dernière demeure leader sur le marché en prime time, mais elle subit là aussi une éro-sion de son avance. En d’autres termes, les positions sur le marché de TV4 et SVT1 se sont resserées. En troisième position se trouve la seconde chaîne publique, SVT2, elle aussi en perte d’audience, légèrement au-dessus des 10 % de part de marché.Derrière ces trois chaînes historiques, se trouvent les trois chaînes établies au Royau-me-Uni : TV3 (Modern Times Group), Kanal 5 (ProSiebenSat.1 MediaAG) et TV6 (Modern Times Group). Celles-ci maintiennent des résultats stables par rap-port à 2007 ; TV6, la plus récente (lancée en 2006) progresse même sensiblement pour s’établir à 4,3 % d’audience quoti-dienne.Ceci dit, ces six chaînes dominantes ne représentent plus qu’une part d’audience quotidienne cumulée de 71,3 % en 2008 contre presque 80 % deux ans plus tôt. De fait, une dizaine de chaînes se sont progressivement imposées (TV4 Plus, SVT24, SVTB, Kanal 9, TV4 Sport, etc.), rassemblant chacune entre 1 et 4 % de part de marché, et doublant leur audience cumulée en deux ans.La montée des petites chaînes est évidem-ment liée à l’importance de la plate-forme numérique terrestre et à la multiplication des autres réseaux de distribution multi-chaînes en Suède. La plate-forme TNT est opérée depuis son lancement en 1997 par la société Boxer. Longtemps symbole du dynamisme de la transition vers le numé-rique en Suède (l’extinction des transmis-sions analogiques terrestres a été opérée dès 2007), Boxer est toutefois confronté en 2009 à une décrue de son nombre d’abon-nés. L’entreprise décompte en juin 2009 673 000 abonnés en additionnant les mar-chés suédois et danois contre 709 000 en mars 2008 sur le seul marché suédois. Ce phénomène s’explique sans doute par la concurrence accrue des autres modes de distribution.Le marché de la télévision par câble est largement concentré et dominé par l’opé-rateur Com Hem. Celui-ci revendique 1,76 million d’abonnés au 31 mars 2009 (dont un demi million environ disposent d’un accès à la télévision numérique), il continue d’accroître sa base d’abonnés et affiche des résultats largement positifs.L’offre de télévision par satellite se partage entre les deux opérateurs actifs sur les mar-chés nordiques, Canal Digital et Viasat.C’est TeliaSonera qui s’affirme comme le leader sur le marché de l’IPTV, avec
T V4 (Bonnier-Gruppe) behauptet sich im dritten Jahr in Folge auf sei-
nem Spitzenplatz bei der täglichen Ein-schaltquote. Mit einem Marktanteil von nur 20,1 % verringerte sich allerdings der Abstand zum ersten öffentlich-rechtlichen Programm SVT1 (das 2008 auf eine täg-liche Einschaltquote von 19,5 % kam). SVT1 bleibt im Primetime-Markt zwar weiterhin führend, jedoch ebenfalls bei schwindendem Vorsprung. Mit anderen Worten, die Marktpositionen von TV4 und SVT1 nähern sich an. An dritter Position findet sich das zweite öffentlich-rechtliche Programm, SVT2, das ebenfalls sinkende Einschaltquoten verzeichnet und auf einen Marktanteil von knapp über 10 % kam.Auf die drei klassischen Dienste folgen die drei Sender aus dem Vereinigten König-reich: TV3 (Modern Times Group), Kanal 5 (ProSiebenSat.1 Media AG) und TV6 (Modern Times Group). Ihre Ergebnisse blieben gegenüber 2007 stabil. Die tägliche Einschaltquote von TV6, dem jüngsten unter ihnen (2006 gestartet), legte sogar deutlich zu und kletterte auf 4,3 %.Allerdings kamen diese sechs marktbe-herrschenden Sender 2008 nur noch auf einen kumulierten Marktanteil von 71,3 % gegenüber fast 80 % zwei Jahre zuvor. Tat-sächlich haben sich nach und nach etwa zehn Sender durchgesetzt (TV4 Plus, SVT24, SVTB, Kanal 9, TV4 Sport u. a.), von denen jeder einen Marktanteil von 1 bis 4 % erzielte und innerhalb von zwei Jahren seine kumulierte Einschaltquote verdoppeln konnte. Das Aufkommen der kleinen Sender hängt natürlich mit der Bedeutung der digitalen terrestrischen Plattform und der Vervielfachung der anderen Multi-kanal-Verbreitungsnetze in Schweden zusammen. Die DVB-T-Plattform wird seit dem Start 1997 von Boxer betrie-ben. Dieses Unternehmen stand lange Zeit stellvertretend für die Dynamik der Umstellung auf Digitaltechnik in Schwe-den (die Abschaltung der analogen terre-strischen Signale erfolgte bereits 2007), verzeichnete aber 2009 sinkende Abon-nentenzahlen. Im Juni 2009 hatte das Unternehmen in den Märkten Schweden und Dänemark zusammen 673 000 Abon-nenten, gegenüber 709 000 im März 2008 allein in Schweden. Dieses Phänomen ist sicherlich auf den stärkeren Wettbewerb aufgrund der anderen Verbreitungsarten zurückzuführen. Der Markt für Kabelfernsehen wird stark vom Betreiber Com Hem dominiert. Das Unternehmen hatte am 31. März 2009 nach eigenen Angaben 1,76 Mio. Abon-nenten (davon etwa eine halbe Million mit Zugang zum digitalen Fernsehen), eine Basis, die weiter ausgebaut werden soll, und weist deutlich positive Ergeb-nisse aus.

2392 0 0 9 | V o l u m e 1 | B a n d 1
AL
AT
BE
BG
CH
CY
CZ
DE
DK
EE
ES
FI
FR
GB
GR
HR
HU
IE
IS
IT
LT
LU
LV
MK
MT
NL
NO
PL
PT
RO
RU
SE
SI
SK
TR
SE
Sweden Suède Schweden SE
However, there are many other operators in the market, like Boxer, Canal Digital, Fast TV or, indeed, B2 Bredband (Tele-nor). TeliaSonera is also present in the mobile television (3G) market, with two other operators: Hi3G and Tele 2. They provide access to a few dozen channels, most of them offering news or entertain-ment and sometimes in specific versions for mobile telephones (MTV shorts, TV3 to go, Kanal 5 – Highlights, etc).Finally, the new non-linear services are enjoying increasing success in Sweden. In particular, the public broadcaster’s catch-up television service of “SVT play” regis-tered 204 million views in 2008.Two major events in business terms took place in 2008/2009. First of all, in December 2008 TV4 took over C More Entertainment Group (ProSiebenSat1. Media AG), which is the broadcaster of the Canal+ pay-TV channels in the Nordic countries and had 950 000 sub-scribers in 2009. Then, in June 2009, Boxer took over Digi TV Plus Oy, the operator of the Finnish pay-DTT opera-tor service Plus TV, which had more than 280 000 subscribers at the end of 2008.Concerning legal issues, the Swedish licensing authority RTVV published a report on must-carry rules in Decem-ber 2008. Its conclusions underline the desirability of maintaining these rules but emphasise a number of possible modifica-tions.In addition, the Post and Telecommunica-tions Agency has analysed the terrestrial television markets and proposed in March 2009 that the regulations be maintained on the free terrestrial television market but be relaxed on the pay terrestrial television market. These proposals led to consulta-tions in the spring and summer of 2009.
350 000 abonnés au 30 juin 2009. Mais de nombreux autres opérateurs sont présents sur ce marché, à l’image de Boxer, Canal Digital, Fast TV ou encore B2 bredband (Telenor).TeliaSonera est aussi présent sur le mar-ché de la télévision sur téléphone mobile (3G), avec deux autres opérateurs : Hi3G et Tele 2. Ils proposent des accès à quel-ques dizaines de chaînes, essentiellement d’information ou de divertissement, par-fois dans des versions spécifiques pour télé-phones mobiles (MTV shorts, TV3 to go, Kanal 5 highlights etc…).Les nouveaux services non linéaires ren-contrent enfin un succès grandissant en Suède. En particulier, le service de télé-vision de rattrapage du radio-diffuseur public « SVT play » a enregistré 204 millions de visionnages en 2008.Deux opérations majeures en termes capi-talistiques se sont déroulées en 2008/2009. D’abord, en décembre 2008, TV4 (groupe Bonnier) a racheté C More Entertainment Group (ProSiebenSat1. Media AG), dif-fuseur des chaînes payantes Canal+ dans les pays nordiques. C More Entertainment affiche en 2009 950 000 abonnés. Puis en juin 2009, Boxer a pris le contrôle de Digi TV Plus Oy, l’opérateur du service de TNT payante Plus TV en Finlande, qui compte plus de 280 000 abonnés à la fin 2008.En matière juridique, la RTVV (Conseil Suédois de l’Audiovisuel) a publié un rapport en décembre 2008 relatif aux règles de mustcarry. Les conclusions soulignent l’opportunité de maintenir ces règles, mais pointent quelques aména-gements possibles.Par ailleurs, l’Office des postes et télé-communications a analysé les marchés de la télévision terrestre et proposé en mars 2009 que les régulations soient maintenues sur le marché de la télévision terrestre gratuite mais allégées sur celui de la télévision terrestre payante. Ces propo-sitions ont donné lieu à des consultations au printemps et pendant l’été 2009.
Das Satellitenfernsehangebot ist auf die beiden aktiven Betreiber der nordischen Märkte aufgeteilt: Canal Digital und Viasat.Unter den IPTV-Anbietern behauptet sich TeliaSonera mit 350 000 Abonnenten am 30. Juni 2009 als Marktführer. Allerdings sind zahlreiche weitere Betreiber in die-sem Markt präsent, wie etwa Boxer, Canal Digital, Fast TV oder auch B2 bredband (Telenor).TeliaSonera ist auch im Markt für Handy-Fernsehen (3G) aktiv, wo es noch zwei weitere Betreiber gibt: Hi3G und Tele 2. Sie bieten Zugang zu einigen Dutzend hauptsächlich Informations- und Unter-haltungssendern, manchmal in speziellen Handyversionen (MTV shorts, TV3 to go, Kanal 5 highlights usw.).Die neuen nicht-linearen Dienste haben in Schweden steigenden Zulauf. So verzeich-nete insbesondere der Catch-up-Dienst „SVT play“ des öffentlich-rechtlichen Rundfunkveranstalters 204 Mio. abgeru-fene Videos für das Jahr 2008.2008/2009 ist es zu zwei kapitalintensiven Vorgängen gekommen. Zunächst hat im Dezember 2008 TV4 (Bonnier-Gruppe) die C More Entertainment Group (Pro-SiebenSat1. Media AG) übernommen, den Veranstalter der Bezahldienste von Canal+ in den nordischen Ländern. Für 2009 gibt C More Entertainment 950 000 Abonnenten an. Dann hat im Juni 2009 Boxer die Kontrolle über Digi TV Plus Oy übernommen, den Betreiber des DVB-T-Bezahldienstes Plus TV in Finnland, der Ende 2008 über 280 000 Abonnenten hatte.Auf rechtlicher Ebene hat die schwedische Rundfunk- und Fernsehbehörde RTVV im Dezember 2008 einen Bericht über die Must-carry-Regelungen veröffentli-cht. Die Schlussfolgerungen betonen die Zweckmäßigkeit, diese Regelungen beizu-behalten, weisen aber auf einige mögliche Anpassungen hin.Nach einer Analyse der Märkte für terre-strisches Fernsehen hat die Behörde für Post und Telekommunikation im März 2009 vorgeschlagen, die Regelungen für den Markt des frei empfangbaren terre-strischen Fernsehens beizubehalten, die für das terrestrische Bezahlfernsehen allerdings zu lockern. Diese Vorschläge waren im Frühjahr und Sommer 2009 Gegenstand von Beratungen.
Sources: Granskningsnämnden för radio och TV: http://www.grn.se Radio och TV verket (Conseil suédois de l’audiovisuel) : http://www.rtvv.se Legal aspects: IRIS Merlin : http://merlin.obs.coe.int Audience data: MMS, http://www.mms.se

240 2 0 0 9 | V o l u m e 1 | B a n d 1
AL
AT
BE
BG
CH
CY
CZ
DE
DK
EE
ES
FI
FR
GB
GR
HR
HU
IE
IS
IT
LT
LU
LV
MK
MT
NL
NO
PL
PT
RO
RU
SE
SI
SK
TR
SE
Sweden Suède Schweden SE
Population and equipment 31.12.08Penetration
(in % HH) In thousand SourcesPopulation (inhabitants) – 9 256 Eurostat
Households – 4 200 European Audiovisual Observatory estimates
TV households 97,5% 4 095 European Audiovisual Observatory estimates
Cable TV households 56,5% 2 375 Screen Digest / European Audiovisual Observatory
Digital cable TV households 20,8% 872 Screen Digest / European Audiovisual Observatory
DTH/SMATV households 20,4% 858 Screen Digest / European Audiovisual Observatory
Pay DTH/SMATV households 16,2% 681 Screen Digest / European Audiovisual Observatory
IPTV subscriptions 9,1% 383 Screen Digest / European Audiovisual Observatory
Installed DVB-T Receivers 47,6% 2 000 Screen Digest / European Audiovisual Observatory
Total digital TV households 93,7% 3 936 European Audiovisual Observatory
Households with PC 87,0% 3 653 Screen Digest / European Audiovisual Observatory
Households with broadband connections 64,5% 2 710 Screen Digest / European Audiovisual Observatory
Mobile phone TV subscriptions – 34 Screen Digest
TV channels distributors 11.09 CompaniesCable operators 112 Com Hem, Canal Digital (Telenor), Tele 2 Syd etc…Satellite packagers 2 Canal Digital (Telenor), Viasat (MTG)
IPTV packagers 6 B2 Brendband, Canal Digital (Telenor), Fast TV Net, TeliaSonera, TV-Net I Löddeköping, Viasat (MTG)
DTT multiplex operators and packagers 2 Multiplex operator : Teracom, Pay-TV packager : Boxer TV-Access (owned by Teracom)
Mobile phone TV packagers 3 Hi3G Access, Tele 2, TeliaSonera
Number of TV channels by kind of licence 10.09 Public Private TotalTerrestrial (national) 4 20 24Cable/Satellite/IPTV/Mobile 3 39 42Regional/Local 0 79 79Regional/Local windows 11 16 27Channels targeting foreign markets 1 91 92Total 19 245 264Foreign channels targeting the country 2 39 41
Source: European Audiovisual Observatory
Supply of TV channels by genre and by platform (including foreign channels) 10.09
Terrestrial Digital
BoxerCable
Comhem
Satellite Canal Digital
(Full Nordic offer)
Satellite Viasat
(Full Nordic offer)IPTV
TeliaSoneraGeneralist - national 3 4 4 4 3Generalist - foreign 2 18 12 19 7Adult 1 3 3 2Children 3 7 19 20 7Culture/ education/ documentary 5 17 16 31 11Minority interest groups 1 1Entertainment/ TV fiction/ games 5 12 27 32 10Film 5 16 28 45 15Home shoppingInternational linguistic and cultural 1 10 1 4Lifestyle/ specific leisure/ travel 4 6 1 1Music 3 5 8 8 3News/ business 3 10 11 8 5Parliament/ government/ administrationRegional/ localReligion 2 2 2Sports 3 16 26 20 12Various 1 4 1Total 34 124 162 198 81
Basic figures

2412 0 0 9 | V o l u m e 1 | B a n d 1
AL
AT
BE
BG
CH
CY
CZ
DE
DK
EE
ES
FI
FR
GB
GR
HR
HU
IE
IS
IT
LT
LU
LV
MK
MT
NL
NO
PL
PT
RO
RU
SE
SI
SK
TR
SE
Sweden Suède Schweden SE
Source: European Audiovisual Observatory on the basis of data from Screen Digest, WARC, SVT, SR and UR
Source: European Audiovisual Observatory
Source: Screen DigestSource: Screen Digest
Households TV equipment 2004-2008
Number of households accessing multichannel platforms as at 31.12.2008
Consumers pay-TV gross spend 2004-2008
Gross revenues of radio-television 2004-2008
In thousands.
In thousands.
EUR thousand.
EUR million.
2 398
2004 2005 2006 2007 2008
0
2 500
2 000
1 500
1 000
500
Cable households
DTT households
Satellite households
IPTV households
2 365 2 380 2 406 2 375
413
3 2881
355 383
593
720
1 000
2 000
969 969 958900
858
Free DTT
Boxer
Canal Digita
l
ComHemViasa
t
Telia
SoneraTe
le 2
Bredband Digita
l TV
Telenor
0
1 500
1 000
500
2 000 2 000
689
553610
328 324
220
DTT
IPTV
Sat
PC
Cable
346 595
216 621
251 333
293 751312 608
290 986
2004 2005 2006 2007 2008
0
500 000
400 000
300 000
200 000
100 000
DTT
IPTV
Cable TV
Satellite
359 820371 421
401 621 404 397
75 548
493
120 304
158 192
184 732 187 072
5 29316 850
44 189
98 643
2004 2005 2006 2007 2008
0
1 000
800
600
400
200
Consumerspay-TV spend
Radio-TV public incomeTV adspend
Radio adspend
677 677 689657
559639
417
54 55 65 76 76
451
496511 519
737
840
943981
Market trends

242 2 0 0 9 | V o l u m e 1 | B a n d 1
AL
AT
BE
BG
CH
CY
CZ
DE
DK
EE
ES
FI
FR
GB
GR
HR
HU
IE
IS
IT
LT
LU
LV
MK
MT
NL
NO
PL
PT
RO
RU
SE
SI
SK
TR
SE
Sweden Suède Schweden SE
Main broadcasters Channels 2005 2006 2007 2008 2008/07Sveriges Television AB sptv STV1, SVT-2, 24, … 444 317 452 837 426 682 363 523 -14,8%TV4 AB adtv TV4, TV4 Film, … 238 619 286 746 281 422 255 859 -9,1%C More Entertainment paytv Cmore, Canal+, … 208 746 232 621 232 677 ~ ~Kanal 5 AB adtv Kanal 5 96 729 114 216 120 007 ~ ~TV1000 AB paytv TV 1000 53 790 63 350 75 517 68 912 -8,7%TV4 Syd AB rtv TV4 Syd 30 587 34 680 40 554 43 943 8,4%Sveriges Utbildningsradio AB sptv UR, Kunskapskanalen 35 036 35 517 34 778 28 907 -16,9%Viasat Pay Channels AB thtv Viasat Nature/Action 18 857 22 120 19 749 ~ ~Guthy-Renker Europe AB hstv TV-Shop 32 762 28 289 26 209 16 056 -38,7%TV4 Sport AB thtv Sportexpressen 1 400 2 398 3 224 10 537 226,8%TV4 Sydost AB rtv TV4 Sydost 11 277 12 050 11 236 8 852 -21,2%NonStop Television 1.0 AB 1 thtv NonStop Entertainment TV 3 201 6 332 8 539 7 094 –NonStop Television AB 2.0 1 paytv Showtime 1 123 4 460 5 060 3 850 –
Main distributors Packages 2005 2006 2007 2008 2008/07Teliasonera Sverige AB 2 3play Telia TV 3 528 982 3 473 223 3 580 476 2 661 351 -25,7%Teliasonera Mobile Networks AB 2 3G TV Start 1 562 406 1 917 678 1 140 761 ~ ~
Tele2 Sverige AB 2 3play Tele2 TV 1 105 710 1 168 244 1 228 042 1 116 767 -9,1%Telenor Sverige AB 4play, 3G TV Telenor TV, Mobiel TV 633 282 570 304 843 316 769 146 -8,8%Com Hem AB 2 3play Com Hem TV 203 163 256 242 289 247 331 815 14,7%HI3G Access AB 2 3G TV 3Mobil-TV 257 265 343 587 376 611 333 154 -11,5%B2 Bredband AB 2 3play Bredband Digital TV 160 805 198 212 251 615 229 826 -8,7%Boxer TV-Access AB DTT, 3play Boxer 122 421 171 731 193 285 180 944 -6,4%
Canal Digital Sverige AB CATV, IPTV, sat-tv Canal Digital, Kiosk 173 875 179 190 172 728 163 433 -5,4%
Viasat AB sat-tv Viasat 106 046 134 209 136 308 131 653 -3,4%Telge Nät AC 2 3play Kabel-TV Telge 76 241 82 059 85 322 79 445 -6,9%
Source: European Audiovisual Observatory1 2008 on 8 months.2 Includes telecommunication activities.
EUR thousand.
2004 2005 2006 2007 2008
0
500 000
400 000
300 000
200 000
100 000
Sveriges Television AB
TV1000 ABTV4 Syd ABSveriges Utbildningsradio ABOthers
TV4 ABC More Entertainment
Kanal 5 ABGuthy-Renker Europe AB
Viasat Pay Channels AB
Operating revenues of main television companies in Sweden 2005-2008 EUR thousand.
T.1.SE.1G.1.SE.1

2432 0 0 9 | V o l u m e 1 | B a n d 1
AL
AT
BE
BG
CH
CY
CZ
DE
DK
EE
ES
FI
FR
GB
GR
HR
HU
IE
IS
IT
LT
LU
LV
MK
MT
NL
NO
PL
PT
RO
RU
SE
SI
SK
TR
SE
Sweden Suède Schweden SE
Source: SVT / European Audiovisual Observatory
Income 2005 2006 2007 2008 2005 2006 2007 2008 2008/07Total public income 415 442 411 741 396 973 336 154 93,5% 90,9% 93,0% 92,5% -15,3% - Licence fee 415 442 411 741 396 973 336 154 93,5% 90,9% 93,0% 92,5% -15,3%Other income 28 875 41 096 29 656 27 415 6,5% 9,1% 7,0% 7,5% -7,6%
TOTAL 444 317 452 837 426 682 363 569 100,0% 100,0% 100,0% 100,0% -14,8%
Expenditure 2005 2006 2007 2008 2005 2006 2007 2008 2008/07Purchase of goods and services 310 506 321 875 ~ ~ 70,8% 70,9% ~ ~ ~
Cost of personnel 119 507 123 805 ~ ~ 27,2% 27,3% ~ ~ ~Depreciation 8 606 8 241 9 311 8 335 2,0% 1,8% 2,2% 2,3% -10,5%Operating expenditure 438 619 453 921 422 361 361 407 100,0% 100,0% 100,0% 100,0% -14,4%
Net result 351 708 4 724 3 220 -31,8%Operating margin (%) 1,28 -0,24 1,01 0,58
EUR thousand.
In %.
2004 2005 2006 20082007
0
500 000
400 000
300 000
200 000
100 000
Licence fee
Other revenues
2004 2005 2006 2007 2008
-40
30
20
10
0
-10
-20
-30
Return onshareholders' funds
Return on total assetsPro�t marginOperating margin
SVT financial situation 2005-2008 EUR thousand.
T.1.SE.2G.1.SE.2

244 2 0 0 9 | V o l u m e 1 | B a n d 1
AL
AT
BE
BG
CH
CY
CZ
DE
DK
EE
ES
FI
FR
GB
GR
HR
HU
IE
IS
IT
LT
LU
LV
MK
MT
NL
NO
PL
PT
RO
RU
SE
SI
SK
TR
SE
Sweden Suède Schweden SE
Daily share Prime time (19:00 - 22:00)Channels 2004 2005 2006 2007 2008 2004 2005 2006 2007 2008SVT-1 24,8 24,3 21,8 19,0 19,5 30,7 28,9 28,5 28,2 24,6SVT-2 14,9 14,4 14,5 12,5 10,3 16,4 15,2 14,2 11,2 11,2SVT24 0,3 0,5 1,0 1,4 2,0 0,2 0,3 0,8 1,2 1,8Barnkanalen/Kunskapskanalen 0,3 0,5 1,0 1,5 2,4 0,1 0,1 0,4 0,6 1,3Total Swedish public channels 40,3 39,7 38,2 34,5 34,2 47,4 44,5 43,9 41,2 38,9TV4 24,4 23,2 22,2 21,2 20,1 23,5 22,8 23,3 23,6 21,8TV4 + 1,3 1,8 2,4 3,3 3,9 0,1 1,9 2,4 3,4 3,8TV4 Film 0,1 0,3 0,6 0,8 0,9 0,0 0,3 0,4 0,6 0,7TV4 Fakta – 0,1 0,4 0,6 0,7 – 0,0 0,4 0,4 0,5Total Swedish private channels 25,9 25,4 25,6 25,8 25,6 23,7 25,0 26,5 28,0 26,9TV3 10,1 10,4 9,4 9,3 8,8 9,2 10,0 8,8 8,7 8,7Kanal 5 8,3 9,1 8,8 8,2 7,9 7,6 9,0 8,5 7,0 7,9TV6 0,4 – 3,2 4,5 4,7 0,4 – 2,8 3,7 4,3Discovery 1,3 1,8 1,7 1,9 1,7 0,6 1,5 1,1 1,0 1,0Eurosport 1,8 1,6 1,6 1,4 0,9 1,1 1,0 1,0 0,7 0,5MTV 0,8 0,9 1,1 1,1 1,1 0,5 0,6 0,7 0,6 0,7Disney Channel 0,6 0,8 1,0 1,3 1,1 0,4 0,3 0,5 0,9 0,7Nickelodeon 0,3 0,4 0,8 0,6 0,9 0,1 0,1 0,2 0,1 0,2Total foreign channels 23,7 25,0 27,6 28,2 27,1 19,8 22,5 23,5 22,9 24,1Others 10,2 9,9 8,6 11,5 13,1 9,1 8,0 6,0 7,9 10,1
Source: Eurodata TV Worldwide / MMS MEDIAMÄTNING I SKANDINAVIEN AB
Daily share. In %, 3 years +.
Prime time (19:00-22:00). In %, 3 years +.
2004 2005 2006 2007 2008
0
5
15
10
25
20 TV4SVT-1
SVT-2
TV3Kanal 5
TV6TV4 +
DiscoverySVT24Disney ChannelMTV
Barnkanalen/Kunskapskanalen
2008
Others12,2%
PULS0,8%
Discovery1,0%
SVT-124,6%
SVT-211,2%
SVT241,8%
Barnkanalen/Kunskapskanalen1,3%
TV421,8%
TV4 Film0,7%
TV4 +3,8%
TV4 Fakta0,5%
TV38,7%
Kanal 57,9%
TV64,3%
TV audience market share in Sweden 2004-2008 In %, 3 years +.
T.1.SE.3G.1.SE.3

2452 0 0 9 | V o l u m e 1 | B a n d 1
AL
AT
BE
BG
CH
CY
CZ
DE
DK
EE
ES
FI
FR
GB
GR
HR
HU
IE
IS
IT
LT
LU
LV
MK
MT
NL
NO
PL
PT
RO
RU
SE
SI
SK
TR
SI
Slovenia Slovénie Slowenien SI
T he most important channels in the Slovenian television market are those
of the public broadcaster RTV Slovenija, and the two private channels of the Cen-tral European Media Enterprises (CME) group, Pop TV and Kanal A. The audience market share of the main private channel Pop TV was 24.6% in 2008 (down almost 4% in the last two years). The public channel TVS1 has maintained a steady audience share for the past three years with a market share of 22.6% in 2008. The second CME channel continues to increase its audience with 11.9% in 2008 (up 3% from two years earlier). The third important private channel TV3 (owned by the Modern Times Group) is increasing its audience share, which in 2008 was 5.2%. About 40% of households use cable with approximately 80 cable operators. The main player is UPC Telemach, which had 157,200 subscribers in December 2008 (of which 10 000 had digital services). Liberty Global sold UPC Telemach to Mid Europa Partners in July 2009. The use of IPTV services has reached a similar level of penetration to that of France. The first IPTV platform was launched by the internet access provider SiOL (Telecom Slovenije) in 2003. In August 2009 SiOL had 101 621 IPTV subscriber households, and according to research of the regulator APEK, had 63% of the IPTV market by June 2009. The second main operator is T-2 with almost 33% of the IPTV market. These figures imply that IPTV was used in over 160 000 households (around 20%) by June 2009. The two other IPTV ope rators Tus Telekom and Amis have marginal market shares. There is just one satellite package, Total TV, launched in 2007.In 2007, Slovenia adopted a law on digi-tal broadcasting. Analogue switch-off is scheduled for 2010. The country will have six multiplexes in all. In 2007, the seven licences for the first digital terrestrial tele-vision multiplex were distributed between the public broadcaster (four licences) and the private channels Pop TV, Kanal A and TV3. In April 2009, the three commercial channels Pop TV, Kanal A and TV Pika were dropped from the multiplex A after refusing to pay their fees. They argued that their transmission fees were much higher than those of the public service channels. TV3 had also been dropped for the same reason. The license for the multiplex B was awarded at the end of 2008 to Norwegian company Norkring and the platform was launched in September 2009.
Les chaînes les plus importantes du marché de la télévision slovène sont,
d’une part, celles du radiodiffuseur public RTV Slovenija et, d’autre part, les deux chaînes privées du groupe Central Euro-pean Media Enterprises (CME), Pop TV et Kanal A. La part de marché d’audience de la principale chaîne privée Pop TV est de 24,6 % en 2008 (en recul de presque 4 % sur les deux dernières années). La part d’audience de la chaîne publique TVS1, 22,6 % en 2008, reste stable depuis trois ans. L’audience de la seconde chaîne du groupe CME continue d’augmenter avec 11,9 % en 2008 (plus 3 % par rapport à il y a deux ans). La troisième chaîne privée, TV3, qui appartient au groupe Modern Times, voit sa part d’audience progresser (5,2 % en 2008).Environ 40 % des foyers sont câblés. Le pays compte quelque 80 câblo-opéra-teurs. Le principal est UPC Telemach, avec 157 200 abonnés en décembre 2008 (dont 10 000 à une offre numérique). Liberty Global a vendu UPC Telemach à Mid Europa Partners en juillet 2009.L’utilisation des services IPTV est au même niveau qu’en France. La pre-mière plate-forme IPTV a été lancée par le fournisseur d’accès Internet SiOL (Telecom Slovenije) en 2003. En août 2009, SiOL compte 101 621 abonnés IPTV et représente, selon une étude du régulateur APEK, 63 % du marché IPTV en juin 2009. Le second opérateur est T-2 avec presque 33 % du marché IPTV. Ces chiffres indiquent que l’IPTV est utilisé dans plus de 160 000 foyers (soit environ 20 %) en juin 2009. La part de marché des deux autres opérateurs IPTV, Tus Telekom et Amis, reste marginale. Le pays compte une seule plate-forme satellite, Total TV, lancée en 2007.En 2007, la Slovénie a adopté une loi sur la radiodiffusion numérique. L’extinction de l’analogique est prévue pour 2010. Le pays comptera six multiplex au total. En 2007, les sept licences du premier multi-plex de télévision numérique terrestre ont été réparties entre le radiodiffuseur public (quatre licences) et les chaînes privées Pop TV, Kanal A et TV3. En avril 2009, le multiplex A a perdu les trois chaînes com-merciales Pop TV, Kanal A et TV Pika qui ont refusé de payer leur redevance. Elles ont estimé que leurs droits de trans-mission étaient bien plus élevés que ceux des chaînes du service public. TV3 a suivi leur exemple. La licence pour le multi-plex B a été attribuée fin 2008 à la société norvégienne Norkring et le lance ment de la plate-forme a eu lieu en septembre 2009.
Die wichtigsten Sender auf dem slo-wenischen Fernsehmarkt sind die
der öffentlich-rechtlichen Anstalt RTV Slovenija sowie die beiden Privatsender der Central European Media Enterpri-ses (CME), Pop TV und Kanal A. Der Marktanteil des größten Privatsenders Pop TV lag 2008 bei 24,6 % (knapp minus 4 % in zwei Jahren). Der öffentlich-rechtliche Sender TVS1 erreichte 2008 mit 22,6 % einen seit drei Jahren stabilen Markt anteil. Der zweite CME-Sender verzeichnet 2008 mit 11,9 % Marktanteil erneut einen Zuwachs (plus 3 % in zwei Jahren). Der dritte große Privatsender (TV3, im Besitz der Modern Times Group) erzielt 2008 mit 5,2 % ebenfalls einen Anstieg seines Marktanteils. Rund 40 % der Haushalte haben einen Kabelanschluss und es gibt um die 80 Kabelnetzbetreiber. Der größ-te von ihnen ist UPC Telemach mit 157 200 Abonnenten im Dezember 2008 (darunter 10 000 Abonnenten von digi-talen Diensten). UPC Telemach wurde im Juli 2009 von Liberty Global an Mid Europa Partners verkauft. Die Nutzung von IPTV-Diensten hat in etwa die Durchdringungsrate von Frank-reich erreicht. Die erste IPTV-Plattform wurde 2003 vom Internetprovider SiOL (Telecom Slovenije) gestartet. Im August 2009 hatte SiOL 101 621 IPTV-Abonnenten und nach einer Erhebung der Regulierungsbehörde APEK lag der IPTV-Marktanteil des Unternehmens im Juni 2009 bei 63 %. Zweitgrößter An bieter ist T-2 mit einem IPTV-Marktanteil von knapp 33 %. Aus diesen Zahlen ergibt sich, dass IPTV im Juni 2009 in über 160 000 Haushalten (rund 20 %) genutzt wurde. Die beiden anderen IPTV-Anbieter, Tus Telekom und Amis, haben minimale Marktanteile. Es gibt nur ein Satelliten-paket, Total TV, das 2007 gestartet wurde.In Slowenien wurde 2007 ein Gesetz über den digitalen Rundfunk verabschiedet. Demnach ist die Abschaltung des Analog-fernsehens für 2010 vorgesehen. Das Land wird insgesamt über sechs Multiplexe verfügen. Im Jahr 2007 wurden die sieben Lizenzen für den ersten Multiplex des digi-talen terrestrischen Fernsehens zwischen dem öffentlich-rechtlichen Veranstalter (vier Lizenzen) und den Privatsendern Pop TV, Kanal A und TV3 aufgeteilt. Im April 2009 wurden die drei Privatsender Pop TV, Kanal A und TV Pika aus dem Multiplex A herausgenommen, nachdem sie die Zahlung ihrer Gebühren verweigert hatten. Sie hatten argumentiert, dass die Übertragungsgebühren sehr viel höher als die der öffentlich-rechtlichen Sender sind. Aus dem gleichen Grund war auch TV3 herausgenommen worden. Die Lizenz für den Multiplex B wurde Ende 2008 an das norwegische Unternehmen Norkring ver-geben, die Inbetriebnahme der Plattform erfolgt im September 2009 erfolgen.
Sources: Agencija za pošto in elektronske komunikacije Republike Slovenije (Post and Electronic Communications Agency of the Republic of Slovenia): http://www.apek.si
Legal aspects: IRIS Merlin, http://merlin.obs.coe.int

246 2 0 0 9 | V o l u m e 1 | B a n d 1
AL
AT
BE
BG
CH
CY
CZ
DE
DK
EE
ES
FI
FR
GB
GR
HR
HU
IE
IS
IT
LT
LU
LV
MK
MT
NL
NO
PL
PT
RO
RU
SE
SI
SK
TR
SI
Slovenia Slovénie Slowenien SI
Population and equipment 31.12.08Penetration
(in % HH) In thousand SourcesPopulation (inhabitants) – 2 032 Eurostat
Households – 774 Eurostat (as at 1.1.2008)
TV households 98,2% 760 European Audiovisual Observatory
Cable TV households 37,1% 287 Screen Digest / European Audiovisual Observatory
Digital cable TV households 5,7% 44 Screen Digest / European Audiovisual Observatory
DTH/SMATV households 12,0% 93 Screen Digest / European Audiovisual Observatory
Pay DTH/SMATV households 2,1% 16 Screen Digest / European Audiovisual Observatory
IPTV subscriptions 20,8% 161 Screen Digest / European Audiovisual Observatory
Installed DVB-T receivers 4,1% 32 Screen Digest / European Audiovisual Observatory
Total digital TV households 32,7% 253 European Audiovisual Observatory
Households with PC 71,6% 554 Screen Digest / European Audiovisual Observatory
Households with broadband connections 46,4% 359 Screen Digest / European Audiovisual Observatory
Mobile phone TV subscriptions – 5 Screen Digest
TV channels distributors 11.09 CompaniesCable operators 73 Elektro Turnsek, Skyline, Telemach…Satellite packagers 1 Total TVIPTV packagers 4 Amis, Siol, T-2, TUS TelekomDTT multiplex operator 2 RTVSLO, NorkringMobile phone TV packagers 1 Mobitel
Number of TV channels by kind of licence 11.09 Public Private TotalTerrestrial (national) 3 5 8Cable/Satellite/IPTV/Mobile 25 25Regional/Local 3 36 39Regional/local windowsChannels targeting foreign marketsTotal 6 66 72Foreign channels targeting the country 17 17
Source: European Audiovisual Observatory
Supply of TV channels by genre and by platform (including foreign channels) 11.09
DTT RTV SLO
Cable Telemach
IPTV SIOL
Satellite Total TV
Generalist - national 2 6 8 6Generalist - foreign 22 25 8Adult 2 7 3Children 6 7 3Culture/ education/ documentary 12 12 9Minority interest groups 1 1Entertainment/ TV fiction/ games 12 18 2Film 2 1 3Home shopping 1International linguistic and cultural 5 2Lifestyle/ specific leisure/ travel 4 5 2Music 8 12 7News/ business 6 10 1Parliament/ government/ administration 1 1 1Regional/ local 6 6Religion 1Sports 11 8 9VariousTotal 3 104 122 54
Basic figures

2472 0 0 9 | V o l u m e 1 | B a n d 1
AL
AT
BE
BG
CH
CY
CZ
DE
DK
EE
ES
FI
FR
GB
GR
HR
HU
IE
IS
IT
LT
LU
LV
MK
MT
NL
NO
PL
PT
RO
RU
SE
SI
SK
TR
SI
Slovenia Slovénie Slowenien SI
Source: European Audiovisual Observatory on the basis of data from Screen Digest, IP Key Fracts and RTVSLO
Source: European Audiovisual Observatory
Source: Screen DigestSource: Screen Digest
Households TV equipment 2004-2008
Number of households accessing multichannel platforms as at 31.12.2008
Consumers pay-TV gross spend 2004-2008
Gross revenues of radio-television 2004-2008
In thousands.
In thousands.
EUR thousand.
EUR million.
2004 2005 2006 2007 2008
0
300
200
100
DTT households
Cable households
IPTV households
Satellite households
265 266268
300
287
100
0
0 0 0
0
29
71
12
32
161
100 100 10093
SIOL
UPC Slovenia/
Telemach
Free DTT
Total T
V T-2
0
150
100
50
200
80
161
32
22
DTT
IPTV
Sat
PC
Cable/MMDS
2004 2005 2006 2007 2008
0
50 000
40 000
30 000
20 000
10 000
Satellite
Cable TV
IPTV
38 178
40 24842 121
43 388
48 705
12
8 073
15 208
219
2 888
2004 2005 2006 2007 2008
0
300
200
100
TV adspend
Radio-TV public income
Consumerspay-TV spend
285
245
189
74
38 40 4252
67
193
76 77 8084
194
Market trends

248 2 0 0 9 | V o l u m e 1 | B a n d 1
AL
AT
BE
BG
CH
CY
CZ
DE
DK
EE
ES
FI
FR
GB
GR
HR
HU
IE
IS
IT
LT
LU
LV
MK
MT
NL
NO
PL
PT
RO
RU
SE
SI
SK
TR
SI
Slovenia Slovénie Slowenien SI
Main broadcasters Channels 2005 2006 2007 2008 2008/07
RTVSLO sptv TVS-1, TVS-2, Televizija Koper, Televizija Maribor 109 833 116 877 114 524 114 171 -0,3%
Central European Media Enterprises Ltd est. 1 adtv Pop TV, Kanal A 41 344 41 323 47 311 58179 23,0%
Main distributors Services Packages 2005 2006 2007 2008 2008/07Mobitel 2 3G TV Mobilna TV 368 349 395 523 434 470 450 485 3,7%Telekom Slovenije D.D. 2 3play Siol TV 383 898 406 667 402 905 413 830 2,7%UPC Telemach 3 3play Telemach Televizija 10 933 22 987 26 807 27 155 1,3%AMIS D.O.O. 2 3play Amis TV 12 627 14 063 16 657 25 290 51,8%T-2 D.O.O. 2 4play T2 Televizija 40 3 806 12 379 23120 86,8%TUS Telekom 2 3play TUS TV 7 831 10 058 20 131 ~ ~EVJ Elektroprom Trgovina 2 3play Kabelska TV 9 390 10 617 11 725 11 792 0,6%Skyline Telekomunikacije D.O.O. 2 3play Skyline Televizija 1 414 1 660 ~ ~ ~
Source: European Audiovisual Observatory1 Converted from data in USD. Turnover in thousand USD: 2004: 45 388; 2005: 48770; 2006: 54 534, 2007 : 69 647, 2008 : 80 967.2 Includes telecommunications activities.3 Sold in July 2009 by Liberty Corp. to Mid Europa Partners LLP.
EUR thousand.
2004 2005 2006 2007 2008
0
100 000
80 000
60 000
40 000
20 000
120 000
RTVSLO
Central EuropeanMedia Enterprises Ltd
Operating revenues of main television companies in Slovenia 2005-2008 EUR thousand.
T.1.SI.1G.1.SI.1

2492 0 0 9 | V o l u m e 1 | B a n d 1
AL
AT
BE
BG
CH
CY
CZ
DE
DK
EE
ES
FI
FR
GB
GR
HR
HU
IE
IS
IT
LT
LU
LV
MK
MT
NL
NO
PL
PT
RO
RU
SE
SI
SK
TR
SI
Slovenia Slovénie Slowenien SI
Source: RTVSLO / European Audiovisual Observatory
Income 2005 2006 2007 2008 2005 2006 2007 2008 2008/07Total public income 76 338 77 132 79 611 84 107 69,5% 66,0% 69,5% 73,7% 5,6% - Licence fee 76 338 77 1v32 78 111 79 143 69,5% 66,0% 68,2% 69,3% 1,3% - Grants – – 1 500 4 964 – – 1,3% 4,3% 230,9%Total commercial income 30 348 30 198 21 685 19 946 27,6% 25,8% 18,9% 17,5% -8,0% - Advertising / Sponsorship 19 551 20 425 21 685 19 946 17,8% 17,5% 18,9% 17,5% -8,0% - Other commercial income 10 797 9 773 ~ ~ 9,8% ~ ~ ~ ~Other income 3 147 9 547 13 228 10 117 2,9% 8,2% 11,6% 8,9% -23,5%TOTAL 109 833 116 877 114 524 114 170 100% 100% 100% 100% -0,3%
Expenditure 2005 2006 2007 2008 2005 2006 2007 2008 2008/07Purchase of goods and services 49 015 45 856 48 696 51 242 43,3% 41,5% 42,7% 43,2% 5,2%
Costs of personnel 53 520 54 966 54 605 56 326 47,3% 49,7% 47,9% 47,5% 3,2%Depreciation 10 679 9 794 10 799 11 011 9,4% 8,9% 9,5% 9,3% 2,0%Operating expenditure 113 214 110 616 114 100 118 579 100,0% 100,0% 100,0% 100,0% 3,9%
Net result 39 773 6 436 3 487 82 -97,6%Operating margin (%) -3,1 5,4 0,4 -4,4 -12,9
EUR thousand.
In %.
2004 2005 2006 2007 2008
0
120 000
80 000
40 000 Licence fee
Grants
Advertising / Sponsorship
Other income
Other commercial income
2004 2005 2006 2007 2008
-20
120
100
80
60
40
20
0
Return on shareholders’ fundsOperating margin
Pro�t margin
Return on total assets
RTVSLO financial situation 2005-2008 EUR thousand.
T.1.SI.2G.1.SI.2

250 2 0 0 9 | V o l u m e 1 | B a n d 1
AL
AT
BE
BG
CH
CY
CZ
DE
DK
EE
ES
FI
FR
GB
GR
HR
HU
IE
IS
IT
LT
LU
LV
MK
MT
NL
NO
PL
PT
RO
RU
SE
SI
SK
TR
SI
Slovenia Slovénie Slowenien SI
Daily share Prime time (19:00-23:00)Channels 2004 2005 2006 2007 2008 2004 2005 2006 2007 2008TVS 1 26,0 25,6 22,9 22,9 22,6 28,3 28,0 25,1 26,5 26,1TVS 2 10,4 8,8 8,9 8,2 8,1 9,7 7,4 7,5 6,9 6,3Koper 0,4 0,3 0,3 0,3 0,2 0,2 0,1 0,1 0,2 0,1Tele Maribor 0,4 0,3 0,3 0,4 0,4 0,5 0,3 0,3 0,4 0,4Total Slovenian public channels 37,2 35,0 32,4 31,8 31,3 38,7 35,8 33,0 34,0 32,9Pop TV 27,0 26,8 28,2 25,8 24,6 31,8 32,1 34,3 31,9 31,4Kanal A 8,1 8,3 8,9 11,2 11,9 9,5 9,8 9,9 11,2 11,5TV 3 1,9 2,0 2,2 3,6 5,2 1,6 1,7 1,9 3,0 4,8TV Pika 0,2 0,9 0,2 1,0Total Slovenian private channels 37,0 37,1 39,3 40,8 42,6 42,9 43,6 46,1 46,3 48,7Croatian channels 6,4 7,9 7,9 7,1 6,0 5,0 6,2 6,2 5,9 5,1Others 19,4 20,0 20,4 20,3 20,1 13,4 14,4 14,7 13,8 13,3
Source: Eurodata TV Worldwide / AGB NMR Slovenia
Daily share. In %, 4 years +.
Prime time (19:00-23:00). In %, 4 years +.
2004 2005 2006 2007 2008
0
5
10
20
25
15
30
Pop TV
TVS 1
Kanal A
TVS 2
Croatian stationsTV 3
2008
TVS 126,1%
Others13,3%
TV Pika1,0%
Croatianstations
5,1%
TVS 26,3%
Koper0,1%
TeleMaribor0,4%
Pop TV31,4%
Kanal A11,5%
TV 34,8%
TV audience market share in Slovenia 2004-2008 In %, 4 years +.
T.1.SI.3G.1.SI.3

2512 0 0 9 | V o l u m e 1 | B a n d 1
AL
AT
BE
BG
CH
CY
CZ
DE
DK
EE
ES
FI
FR
GB
GR
HR
HU
IE
IS
IT
LT
LU
LV
MK
MT
NL
NO
PL
PT
RO
RU
SE
SI
SK
TR
SK
Slovak Republic
République slovaque
Slowakische Republik
SK
The main television channels with national terrestrial coverage are those
of the public service broadcaster STV and the private channels TV Markiza (Central European Media Enterprises) and TV Joj. In 2008, STV launched a sports channel, STV3 (Trojka). The commercial chan-nels dominate the market, especially TV Markiza, which has more than a third of the average national audience (a 35.1% market share in 2008, down slightly from 2007). TV Joj and the leading public channel STV1 both have an audience share of approximately 16%.There are more than 20 cable opera-tors in the Slovak Republic and while cable is still the dominant platform for Pay TV, satellite TV is catching up. At the end of December 2008, the main cable operator, UPC, had approximately 255 000 subscribers (one third of the market), of which about 10% had digital services. There are three satellite operators in the Slovak Republic. The market leader DIGI TV (controlled by the Romanian operator RCS/RDS) has approximately 300 000 subscribers. At the end of 2008, the Czech company Trade Tec, in co- operation with the Slovak com-pany Towercom launched the Slovak DTH service “Skylink” in the Czech Republic and Slovakia. In Novem-ber 2009, Skyl ink was reported to have 200 000 subscribers in Slova-kia. UPC Direct had approximately 31 500 sub scribers at the end of 2008. Also the T-Com IPTV service Magio is being offered over Satellite on a trial basis, and this may lead to a fourth DTH plat-form being launched in 2010. In 2007, Slovak Telecom (T-Com AS, 51% controlled by Deutsche Telekom) launched the IPTV service Magio, which includes a video on demand service. The company claimed more than 50 000 subscribers in September 2009. The service now faces competition from three other companies: Orange, Slovanet, and Swan. A tender for two DTT multiplexes (one free-to-air and one Pay-TV) was launched in May 2009 with both licenses going to the company Towercom (DTT operator in Bulgaria). It is expected that the first services will launch at the end of 2009, with switch-off scheduled for 2012.
Les principales chaînes de télévision ayant une couverture nationale ter-
restre sont celles du radiodiffuseur de service public, STV, et les chaînes privées TV Markiza (Central European Media Enterprises) et TV Joj. En 2008, STV a lancé une chaîne consacrée au sport, STV3 (Trojka). Les chaînes commercia-les dominent le marché, en particulier TV Markiza, qui totalise plus d’un tiers de l’audience moyenne nationale (35,1 % de parts de marché en 2008, en léger recul par rapport à 2007). TV Joj et la principale chaîne publique STV1 ont toutes les deux une part d’audience d’environ 16 %.La République slovaque compte plus de 20 câblo-opérateurs et, bien que le câble demeure la plate-forme dominante pour la télévision à péage, la télévision par satellite progresse fortement. Fin décembre 2008, le principal câblo-opérateur, UPC, comp-tait quelque 255 000 abonnés (un tiers du marché), dont 10 % à des offres numéri-ques. La République slovaque dénombre trois opérateurs de télévision par satellite. Le leader du marché, DIGI TV (contrôlé par l’opérateur roumain RCS/RDS) tota-lise environ 300 000 abonnés. Fin 2008, la société tchèque Trade Tec, en coopé-ration avec la société slovaque Tower-com, a lancé le service de DTH slova-que “Skylink” en République tchèque et en Slovaquie. En novembre 2009, Skylink annonçait 200 000 abonnés en Slovaquie. UPC Direct comptait envi-ron 31 500 abonnés fin 2008. Le service IPTV Magio de T-Com est également proposé par satellite à l’essai, ce qui pour-rait déboucher sur le lancement d’une qua-trième plate-forme DTH en 2010. En 2007, Slovak Telecom (T-Com AS, contrôlée à 51 % par Deutsche Telekom) a lancé le service IPTV Magio, incluant la vidéo à la demande. La société a annoncé plus de 50 000 abonnés en septembre 2009. Ce service est désormais concur-rencé par trois autres sociétés : Orange, Slovanet et Swan.Un appel d’offres pour deux multiplex TNT (un gratuit et un payant) a été lancé en mai 2009, les deux licences ayant été attribuées à la société Towercom (opéra-teur de TNT en Bulgarie). Les premiers services devraient être disponibles fin 2009, l’abandon de l’analogique étant prévu pour 2012.
Die wichtigsten landesweiten Sender sind die der öffentlich-rechtlichen
Rundfunkanstalt STV sowie die Pri-vatsender TV Markiza (Central Europe-an Media Enterprises) und TV Joj. 2008 hat STV den Sportkanal STV3 (Trojka) gestartet. Den Markt beherrschen vor allem die privaten Sender, darunter ins-besondere TV Markiza mit einem durch-schnittlichen Zuschaueranteil von über einem Drittel (35,1% Marktanteil 2008, geringfügig weniger als 2007). TV Joj und der führende öffentlich-rechtliche Sender STV1 erreichen jeweils einen Zuschauer-anteil von rund 16 %.In der Slowakischen Republik gibt es über 20 Kabelnetzbetreiber. Das Kabel ist nach wie vor der dominierende Über-tragungsweg für das Bezahlfernsehen, aber das Satellitenfernsehen holt bestän-dig auf. Zum Jahresende 2008 hatte der größte Kabelnetzbetreiber (UPC) rund 255 000 Abonnenten (ein Drittel des Marktes), von denen ca. 10 % digitale Angebote nutzen. In der Slowakischen Republik gibt es drei Satelliten-TV- Betreiber. Marktführer ist DIGI TV (kon-trolliert vom rumänischen Betreiber RCS/RDS) mit rund 300 000 Abonnenten. Ende 2008 hat die tschechische Firma Trade Tec gemeinsam mit der slowakischen Firma Towercom den slowakischen DVB-T-Dienst „Skylink“ gestartet, der in der Slowakei und der Tschechischen Repu-blik angeboten wird. Im November 2009 hatte Skylink angeblich 200 000 Abon-nenten in der Slowakei. UPC Direct hat-te Ende 2008 rund 31 500 Abonnenten. Hinzu kommt der IPTV-Dienst Magio von T-Com, der zunächst nur versuchs-weise über Satellit angeboten wird und dazu führen könnte, dass 2010 eine vierte DTH-Plattform entsteht. Der IPTV-Dienst Magio wurde 2007 von der Slovak Telecom (T-Com AS, zu 51 Prozent im Besitz der Deutschen Telekom) gestartet und umfasst auch ein Video-on-Demand-Angebot. Das Unter-nehmen hatte im September 2009 nach eigenen Angaben über 50 000 Abon-nenten. Inzwischen hat der Dienst drei Wettbewerber: Orange, Slovanet und Swan.Im Mai wurde eine Ausschreibung für den Betrieb von zwei DVB-T-Multiplexen (einer für Free-TV, einer für Pay-TV) gestartet, an deren Ende beide Lizenzen der Firma Towercom (DVB-T-Betreiber in Bulgarien) zugesprochen wurden. Es wird damit gerechnet, dass die ersten Dienste Ende 2009 an den Start gehen werden. Die Abschaltung des Analogbetriebs ist für 2012 vorgesehen.
Sources: Rada pre vysielanie a retransmisiu (Council for Broadcasting and Retransmission of the Slovak Republic): http://www.rada-rtv.sk Legal aspects: IRIS Merlin, http://merlin.obs.coe.int

252 2 0 0 9 | V o l u m e 1 | B a n d 1
AL
AT
BE
BG
CH
CY
CZ
DE
DK
EE
ES
FI
FR
GB
GR
HR
HU
IE
IS
IT
LT
LU
LV
MK
MT
NL
NO
PL
PT
RO
RU
SE
SI
SK
TR
SK
Slovak Republic
République slovaque
Slowakische Republik
SK
Population and equipment 31.12.08Penetration
(in % HH) In thousand SourcesPopulation (inhabitants) – 5 412 Eurostat
Households – 1 714 Eurostat as at 1.1.2007
TV households 99,3% 1 702 European Audiovisual Observatory
Cable TV households 44,2% 758 Screen Digest / European Audiovisual Observatory
Digital cable TV households 2,6% 44 Screen Digest / European Audiovisual Observatory
DTH/SMATV households 40,7% 697 Screen Digest / European Audiovisual Observatory
Pay DTH/SMATV households 24,0% 412 Screen Digest / European Audiovisual Observatory
IPTV subscriptions 2,9% 50 Screen Digest / European Audiovisual Observatory
Installed DVB-T receivers 0,7% 12 Screen Digest / European Audiovisual Observatory
Total digital TV households 30,2% 518 European Audiovisual Observatory
Households with PC 86,3% 1 479 Screen Digest / European Audiovisual Observatory
Households with broadband connections 27,2% 467 Screen Digest / European Audiovisual Observatory
TV channels distributors 11.09 CompaniesCable operators 22 Slovcable, Trnavatel, UPC Broadband Slovakia,...Satellite packagers 3 Digislowakia, Towercom, UPC Broadband SlovakiaIPTV packagers 4 Orange Slovensko, Slovanet, Swan, T-Com A.S.DTT multiplex operators (Towercom awarded licence)Mobile phone TV packagers 0
Number of TV channels by kind of licence 10.09 Public Private TotalTerrestrial (national) 3 3 6Cable/Satellite/IPTV/Mobile 0 18 18Regional/Local 0 80 80Regional/Local windows 0 0 0Channels targeting foreign markets 0 2 2Total 3 103 106Foreign channels targeting the country 2 2 4
Source: European Audiovisual Observatory
Supply of TV channels by genre and by platform (including foreign channels) 11.09
Satellite RCS Digi TV
(full offer)Cable
UPC SlovakiaIPTV
MAGIO Satellite Skylink
Generalist - national 5 4 5 4Generalist - foreign 23 10 10 6Adult 2 3 2 3Children 5 4 4 4Culture/ education/ documentary 21 8 7 15Minority interest groupsEntertainment/ TV fiction/ games 32 6 8 5Film 14 7 10 7Home shoppingInternational linguistic and cultural 2 4 2Lifestyle/ specific leisure/ travel 8 3 2Music 15 7 4 2News/ business 12 13 4 3Parliament/ government/ administrationRegional/ local 7 2Religion 2 1 1Sports 20 6 7 9Various 3 1Total 171 77 65 60
Basic figures

2532 0 0 9 | V o l u m e 1 | B a n d 1
AL
AT
BE
BG
CH
CY
CZ
DE
DK
EE
ES
FI
FR
GB
GR
HR
HU
IE
IS
IT
LT
LU
LV
MK
MT
NL
NO
PL
PT
RO
RU
SE
SI
SK
TR
SK
Slovak Republic
République slovaque
Slowakische Republik
SK
Source: European Audiovisual Observatory on the basis of data from Screen Digest, IP Key Fracts and SVT
Source: European Audiovisual Observatory
Source: Screen DigestSource: Screen Digest
Households TV equipment 2004-2008
Number of households accessing multichannel platforms as at 31.12.2008
Consumers pay-TV gross spend 2004-2008
Gross revenues of radio-television 2004-2008
In thousands.
In thousands.
EUR thousand.
EUR million.
2004 2005 2006 2007 2008
0
800
600
400
200
Cable households
Satellite households
IPTV householdsDTT households
766
704733
743
564
425444
457
758
697
0 0 117
0
12
50
RCS
UPC Slovakia
Skylink
Maggio TV
Orange
Free DTT
0
300
200
100
400
317
115
35
16 12
26032
DTT
IPTV
Sat
PC
Cable/MMDS
2004 2005 2006 2007 2008
0
120 000
100 000
80 000
60 000
40 000
20 000
Satellite
IPTV
Cable TV
60 291
70 587
83 836
95 155
104 220
3 677
0 0
4 598
12 636
731 481
8 493
32 564
55 077
2004 2005 2006 2007 2008
0
1 500
1 200
900
600
300
TV adspend
Consumerspay-TV spend
TV public income
1 346
459
594
800
954
64
44
75
38
97
47
129168
Market trends

254 2 0 0 9 | V o l u m e 1 | B a n d 1
AL
AT
BE
BG
CH
CY
CZ
DE
DK
EE
ES
FI
FR
GB
GR
HR
HU
IE
IS
IT
LT
LU
LV
MK
MT
NL
NO
PL
PT
RO
RU
SE
SI
SK
TR
SK
Slovak Republic
République slovaque
Slowakische Republik
SK
Main broadcasters Channels 2005 2006 2007 2008 2008/07Markiza - Slovakia s.r.o. adtv Markiza TV 45 713 53 392 88 206 108 280 22,8%Slovenská televízia sptv Jednotka, Dvoijka 59 943 64 361 ~ ~ ~MAC TV adtv J@j TV ~ ~ ~ ~ ~CreaTV S.R.O. thtv Music Box ~ 669 737 ~ ~
Main distributors Services Packages 2005 2006 2007 2008 2008/07Orange Slovensko A.S. 1 3play Fiber TV 583 117 ~ ~ ~ ~T-Com A.S. 1 3play Magio TV 471 936 ~ ~ ~ ~UPC Broadband 1 3play, sat-tv UPC Televizia – 29 274 47 942 ~ ~Digi Slovakia 1 sat-tv, catv, ISP Digi TV 2 542 17 184 43 048 ~ ~Slovanet A.S. 1 3play Slovanet Televizia 12 379 16 029 20 610 ~ ~Swan A.S. 1 3play Max TV 8 163 17 055 ~ ~ ~
Source: European Audiovisual Observatory1 Includes telecommunication activities.
EUR thousand.
2004 2005 2006 2007 2008
0
100 000
80 000
60 000
40 000
20 000
120 000
CreaTV S.R.O.
Markiza - Slovakia s.r.o.
Slovenská televízia
Operating revenues of main television companies in Slovakia 2005-2008 EUR thousand.
T.1.SK.1G.1.SK.1

2552 0 0 9 | V o l u m e 1 | B a n d 1
AL
AT
BE
BG
CH
CY
CZ
DE
DK
EE
ES
FI
FR
GB
GR
HR
HU
IE
IS
IT
LT
LU
LV
MK
MT
NL
NO
PL
PT
RO
RU
SE
SI
SK
TR
SK
Slovak Republic
République slovaque
Slowakische Republik
SK
Daily share Prime time (19:00-22:00)Channels 2004 2005 2006 2007 2008 2004 2005 2006 2007 2008Jednotka (STV 1) 19,9 19,3 18,5 17,6 16,1 23,3 21,3 20,0 18,8 17,5Dvojka (STV 2) 4,7 5,7 6,2 5,0 5,7 3,4 4,8 5,6 4,4 4,9Trojka (STV 3) 0,2 0,2Total Slovak public channels 24,6 25,0 24,7 22,6 22,0 26,7 26,1 25,6 23,2 22,6TV Markiza 33,7 31,2 33,7 35,6 35,1 35,4 32,9 35,9 39,6 37,7TV Joj 13,6 14,7 15,7 15,5 16,7 14,8 16,1 17,0 16,9 19,5TA3 1,1 1,3 1,6 1,3 1,5 0,7 0,8 1,0 0,9 1,0TV Joj Plus 0,3 0,2Total Slovak private channels 48,4 47,2 51,0 52,4 53,6 50,9 49,8 53,9 57,4 58,4Czech TV 11,2 11,3 10,0 10,0 8,7 10,3 10,7 9,1 8,4 7,2Hungarian TV 8,5 8,1 7,2 6,8 5,7 7,9 7,7 6,9 6,4 5,7Total main foreign channels 19,7 19,4 17,2 16,8 14,4 18,2 18,4 16,0 14,8 12,9Others 7,3 8,4 7,1 8,2 10,0 4,2 5,7 4,5 4,6 6,1
Source: Eurodata TV Worldwide / PMT / TNS SK1 Before 2005: 12 years and +.
Daily share. In %, 4 years +. 1
Prime time (19:00-22:00). In %, 4 years +.
2004 2005 2006 2007 2008
0
10
20
30
40
TV Markiza
TV Joj Jednotka (STV 1)
Czech TV
Hungarian TVDvojka (STV 2)
TA3
2008
Jednotka17,5%
Trojka0,2%
Dvojka4,9%
TV Markiza37,7%
TV Joj 19,5%
TA31,0%
TV Joj Plus0,2% Czech TV
7,2%
Hungarian TV5,7%
Others6,1%
TV audience market share in Slovakia 2004-2008 In %, 4 years +. 1
T.1.SK.2G.1.SK.2

256 2 0 0 9 | V o l u m e 1 | B a n d 1
AL
AT
BE
BG
CH
CY
CZ
DE
DK
EE
ES
FI
FR
GB
GR
HR
HU
IE
IS
IT
LT
LU
LV
MK
MT
NL
NO
PL
PT
RO
RU
SE
SI
SK
TRTR
Turkey Turquie Türkei TR
With nearly 18 million television households and a significant increase
in the average weekly viewing time, which rose to 226 minutes a day in 2008, Turkey is one of Europe’s major markets.As there are a large number of channels competing with one another in the Turk-ish market, the audience is particularly fragmented. Kanal D (Doğan Group) had the largest audience share in 2008 but only achieved a 14% daily audience market share, ahead of Show TV (Çukuro-va group, with 11.4%), ATV (Çalık Group, 8.9%), Fox Türk (News Corp group, 8%) and Star (Doğan Group, 8%). The public channels of the broadcaster TRT are a long way behind their private com-petitors, with the first public channel TRT 1 only recording a 3.2% daily audience market share in 2008.Apart from its four traditional national channels, TRT has launched a series of new channels since 2008: at the national level, the children’s channel TRT Çocuk in November 2008, followed in January 2009 by the regional channel TRT 5 Anadolu and TRT 6, which broadcasts exclusively in Kurdish. It was possible to launch the latter following the modification of Law No. 2954 of 11 June 2008, which autho-rised TRT to broadcast in languages and dialects other than Turkish.Other plans for national public channels are under discussion: a channel in Arme-nian and another in Arabic (TRT 7), a music channel and a sports channel.Reorganisation has also taken place at the international level. TRT Avaz, the Turkish channel broadcast to Asia, was relaunched in March 2009. In particular, TRT INT changed its name to TRT Türk in May 2009 and the tourism channel TRT Tur-izm, which broadcasts programmes in Turkish, English, German and Russian, went on air in October 2009. Finally, TRT acquired a 15.7% stake in Euronews SA in February 2009, thus becoming the fourth largest shareholder after France Télévisions, RAI and RTR. A Turkish ver-sion of Euronews is due to be launched in January 2010.The multi-channel television market is developing rapidly in Turkey. While 60% of the population only received terrestrial transmissions in 2005 and, consequently, only 40% subscribed to a multi-channel platform, the proportion was the other way round at the end of 2008. Three ser-vices dominate the multi-channel market: the satellite platforms Digitürk (Çukurova group) and D-Smart (Doğan Group) and the cable TV service Türksat (national operator). Digitürk claimed to have 2.3 million subscribers in September 2009, while D-Smart had 972,000 in March 2009. Three mobile TV services, oper-ated by Avea, Türkcell and Türk Telekom,
Avec près de 18 millions de foyers télévisés et un durée moyenne heb-
domadaire d’écoute en nette progression, à 226 minutes par jour en 2008, la Turquie représente l’un des marchés les plus impor-tants d’Europe.Du fait du nombre important de chaî-nes en compétition sur le marché turc, l’audience est particulièrement fragmen-tée. Kanal D (groupe Dogan) arrive en tête des audiences pour l’année 2008, mais ne réunit que 14 % de part de mar-ché d’audience quotidienne, devant Show TV (groupe Çukurova, 11,4 %), ATV (groupe Calik, 8,9 %), Fox Türk (groupe Newscorp, 8 %) et Star (groupe Dogan, 8 %). Les chaînes publiques du radiodif-fuseur TRT se trouvent loin derrière leurs concurrentes privées, TRT 1, la première chaîne publique, ne rassemblant que 3,2 % de part de marché d’audience quotidienne en 2008.Outre ses quatre chaînes nationales tradi-tionnelles, la TRT a lancé une série de nouvelles chaînes depuis 2008. Au niveau national ont été inaugurées TRT Cocuk, une chaîne pour enfants en novembre 2008, suivie en janvier 2009 par les chaînes TRT 5 Anadolu, une chaîne régionale et TRT 6, diffusant intégralement en kurde. Cette dernière chaîne a pu être lancée grâce à la modification de la loi n° 2954 du 11 juin 2008. L’autorisation a alors été donnée à la TRT de diffuser des émissions dans des langues et dialectes autres que le turc.D’autres projets de chaînes publiques nationales sont à l’étude : une chaîne en arménien, une autre en arabe (TRT 7), une chaîne musicale ou encore une chaîne sportive.A l’échelon international, une refonte a aussi été menée. TRT Avaz, la chaîne en turc à destination de l’Asie, a été relan-cée en mars 2009. Surtout, TRT Int s’est transformée en TRT Türk en mai 2009 et la chaîne touristique TRT Turizm, diffusant des programmes en turc, anglais, français, allemand et russe a été inaugurée en octobre 2009. Enfin, la TRT est deve-nue actionnaire de Euronews SA en février 2009, à hauteur de 15,7 %, devenant ainsi le quatrième actionnaire le plus impor-tant derrière France Télévisions, la RAI et RTR. Une version turque d’Euronews devrait alors voir le jour en janvier 2010.Le marché de la télévision multi-chaînes prend son essor en Turquie. Alors que 60 % de la population reposait exclusi-vement sur les transmissions terrestres en 2005 et que par conséquent 40 % était abonnée à une plate-forme multi- chaînes, la proportion s’est inversée à la fin de l’année 2008. Parmi les services multi-chaînes, trois offres dominent : les plates- formes satellitaires Digitürk (groupe Çuku-rova) et D-Smart (groupe Dogan) et l’offre
Mit knapp 18 Millionen Fernseh-haushalten und einem deutlich
zunehmenden Fernsehkonsum auf durch-schnittlich 226 Minuten pro Tag im Jahr 2008 gehört die Türkei zu den wichtigsten Märkten in Europa.Auf Grund der hohen Anzahl an konkur-rierenden Sendern auf dem türkischen Markt ist auch eine sehr hohe Fragmen-tierung des Publikums festzustellen. Platz eins der Zuschauerzahlen erreicht 2008 der Sender Kanal D (Dogan) mit einem Marktanteil von gerade mal 14 %. Dahin-ter folgen Show TV (Çukurova, 11,4 %), ATV (Calik, 8,9 %), Fox Türk (Newscorp, 8 %) und Star (Dogan, 8 %). Die Sender der öffentlich-rechtlichen Rundfunkan-stalt TRT liegen weit hinter ihren privaten Konkurrenten. So erreicht der stärkste öffentlich-rechtliche Sender TRT 1 2008 nur einen durchschnittlichen Zuschauer-anteil von 3,2 %.Neben seinen vier traditionellen landes-weiten Sendern hat TRT seit 2008 eine ganze Reihe neuer Kanäle auf den Markt gebracht, darunter auf nationaler Ebene den Kinderkanal TRT Cocuk im Novem-ber 2008 sowie den Regionalsender TRT 5 Anadolu und den rein kurdischen Sender TRT 6 im Januar 2009. Letzterer konnte erst auf Grund der Änderung des Gesetzes Nr. 2954 vom 11. Juni 2008 auf Sendung gehen. Zuvor war es TRT nicht erlaubt, Sendungen in einer anderen Sprache als türkisch oder in einem Dialekt aus-zustrahlen.Derzeit geprüft werden Möglichkeiten für weitere landesweite öffentlich-rechtliche Sender, darunter ein Sender in arme-nischer und einer in arabischer Sprache (TRT 7), ein Musikkanal oder auch ein Sportkanal.Auch auf internationaler Ebene hat es deutliche Veränderungen gegeben. So ist beispielsweise im März 2009 TRT Avaz, ein auf Asien ausgerichteter Sender in tür-kischer Sprache, neu gestartet worden. Des Weiteren wurde im Mai 2009 der Sender TRT Int in TRT Türk umbenannt und im Oktober 2009 ist der Touristiksender TRT Turizm mit einem Programm in türkischer, englischer, französischer und deutscher Sprache an den Start gegangen. Ferner ist TRT im Februar 2009 mit 15,7 %, bei Euronews SA eingestiegen und so hinter France Télévisions, RAI und RTR zum viertgrößten Anteilseigner avanciert. Mit einer türkischen Version von Euronews dürfte ab Januar 2010 zu rechnen sein.Einen deutlichen Aufschwung erlebt das Multikanal-Fernsehen in der Türkei. Waren 2005 noch 60 % der Bevölkerung ausschließlich auf das Antennenfernsehen angewiesen (d.h. 40 % hatten ein Multi-kanal-Angebot abonniert), so hat sich dieses Verhältnis bis Ende 2008 umge-kehrt. Dieser Markt wird von drei Ange-boten beherrscht: die Sat-TV-Plattformen
2572 0 0 9 | V o l u m e 1 | B a n d 1
AL
AT
BE
BG
CH
CY
CZ
DE
DK
EE
ES
FI
FR
GB
GR
HR
HU
IE
IS
IT
LT
LU
LV
MK
MT
NL
NO
PL
PT
RO
RU
SE
SI
SK
TRTR
Turkey Turquie Türkei TR
are competing with one another in Turkey. Finally, the internet access providers Türk Telekom and TTNET are planning two IPTV services. In 2009, the discussions continued in Turkey concerning the Doğan audiovisu-al group (which owns the channels Kanal D, Star TV, CNN Türk and the D-Smart satellite platform). After being forced to close down eleven channels transmitted by the D-Smart platform in October 2008 because it did not possess any licences, the group, which was accused of tax evasion, was ordered to pay a fine of EUR 332 mil-lion in February 2009 and a further fine of EUR 1.75 billion in September 2009. The amounts involved are higher than the total value of the group, which is reput-edly hostile to the present government, and are jeopardising its future. This has led to international disquiet with regard to media plurality and freedom of expres-sion in the country. In January 2008, ATV-Sabah, one of the main Turkish communications groups, was taken over for USD 1.1 billion by the Çalık Group.On 16 July 2008, the channel Hayat TV was suspended sine die at the request of the Radyo ve Televizyon Ust Kurulu (Turkish Radio and Television Supreme Council - RTÜK). The channel had been accused of contributing to the broadcasts of Roj TV, a Denmark based television station considered by the Turkish authorities to be a propaganda mouthpiece of the Kurd-istan Workers Party (PKK), by providing it with pictures of the Kurdish New Year. It was allowed to resume its transmissions on 6 August after being able to prove that the accusation was unfounded.A “Broadcasting Code of Conduct” consisting of 12 Articles, prepared by the RTÜK and the Turkish Television Broadcasters Association, was signed on 3 July 2007 by a large number of Turkish television broadcasting companies. The main idea of this Code of Conduct is to promote a clean and safe broadcasting environment among all the companies in this sector.
de télévision par câble Türksat (opérateur national). Digitürk revendique 2,3 mil-lions d’abonnés en septembre 2009, D-Smart compte quant à lui 972 000 acti-vations en mars 2009. Trois services de télévision sur téléphones portables sont en concurrence dans le pays, par les opé-rateurs Avea, Türkcell et Türk Telekom. Enfin, deux projets de services IPTV sont à l’étude, par les fournisseurs d’accès à Internet Türk Telekom et TTNET. L’année 2009 en Turquie a vu se pour-suivre les polémiques autour du groupe audiovisuel Dogan (possédant les chaî-nes Kanal D, Star TV, CNN Türk et la plate-forme satellitaire D-Smart). Après avoir dû fermer 11 chaînes transmises par la plate-forme D-Smart en octobre 2008 pour défaut de licences, le groupe, accusé de fraudes fiscales, s’est vu condamné en février 2009 à une amende de 332 mil-lions d’euros, puis à une seconde amende de 1,75 milliard d’euros en septembre 2009. Le montant des amendes, supérieur à la valeur totale du groupe réputé hostile au gouvernement en place, met donc en péril son avenir, ce qui suscité des réactions internationales inquiètes par rapport à la pluralité des médias et à la liberté d’expres-sion dans le pays.En janvier 2008, un des principaux groupes de communication turc, ATV-Sabah, a été racheté pour 1,1 milliard USD par le groupe Calik.Le 16 juillet 2008, la chaîne Hayat TV a été suspendue sine die à la demande du Conseil supérieur de l’audiovisuel turc (RTUK). La chaîne était accusée d’avoir contribué aux émissions de Roj TV - une télévision basée au Danemark et consi-dérée par les autorités turques comme un canal de propagande du Parti des tra-vailleurs du Kurdistan (PKK)- en lui four-nissant des images du nouvel an kurde. Elle a été autorisée à reprendre ses émissions le 6 août, après avoir pu prouver que l’accu-sation n’était pas fondée.Un « Code de conduite de la radiodiffu-sion » comprenant douze articles et éla-boré par le RTÜK et l’Association turque des radiodiffuseurs télévisuels a été signé le 3 juillet 2007 par un grand nombre de société de télévision. Ce Code de conduite a pour objectif essentiel de promouvoir un cadre clair et sûr de la radiodiffusion auprès de l’ensemble des entreprises du secteur.
Digitürk (Çukurova) und D-Smart (Dogan) sowie das Kabel-TV-Paket Türk-sat (nationaler Betreiber). Digitürk hatte nach eigenen Angaben im September 2009 2,3 Mio. Abonnenten, während D-Smart im März 2009 972 000 Freischaltungen verzeichnete. Auf dem Handy-TV-Markt konkurrieren drei Anbieter: Avea, Türkcell und Türk Telekom. Im Bereich Internet-fernsehen sind derzeit zwei IPTV-Dienste der Internetprovider Türk Telekom und TTNET in Planung. Auch das Jahr 2009 war durch pole-mische Debatten um den Medienkonzern Dogan (dem die Sender Kanal D, Star TV, CNN Türk sowie die Sat-TV-Plattform D-Smart gehören) gekennzeichnet. Nach der zwangsweisen Einstellung von elf über D-Smart ausgestrahlten Kanälen im Okto-ber 2009 wegen fehlender Lizenzen ist der Konzern wegen Steuerhinterziehung im Februar 2009 zu einer ersten Geldstrafe in Höhe von 332 Mio. EUR und im Sep-tember 2009 zu einer weiteren Geldstrafe über 1,75 Mrd. EUR verurteilt worden. Die Höhe der Geldstrafen übersteigt den Gesamtwert des Unternehmens, das der aktuellen Regierung bekanntermaßen nicht positiv gegenübersteht, und dürfte somit seine Existenz gefährden. Dies hat international Besorgnis hinsichtlich der Medienvielfalt und der Meinungsfreiheit in der Türkei ausgelöst.Im Januar 2008 wurde einer der wich-tigsten türkischen Kommunikationskon-zerne, ATV-Sabah, für 1,1 Mrd. USD von der Calik-Gruppe übernommen.Am 16. Juli 2008 wurde dem Sender Hayat TV auf Weisung der türkischen Medienaufsichtsbehörde RTUK bis auf weiteres die Ausstrahlung untersagt. Dem Sender wurde vorgeworfen, mit Bildern des kurdischen Neujahrsfestes einen Bei-trag zu Programmen von Roj TV geleistet zu haben, einem Fernsehdienst mit Sitz in Dänemark, der von den türkischen Behör-den als Propagandakanal der Kurdischen Arbeiterpartei (PKK) angesehen wird. Hayat TV konnte am 6. August wieder auf Sendung gehen, nachdem bewiesen werden konnte, dass die Vorwürfe unbe-gründet waren.Am 3. Juli 2007 wurde von türkischen Rundfunkunternehmen ein zwölf Artikel umfassender „Rundfunk-Verhaltenskodex“ unterzeichnet, der vom Radyo ve Televizyon Ust Kurulu (Oberster Radio- und Fernsehrat - RTÜK) und dem Verband der türkischen Fernsehsender ausgearbei-tet worden war. Hauptziel dieses Verhal-tenskodex ist die Förderung einer sauberen und sicheren Rundfunkumgebung für alle Unternehmen in diesem Sektor.
Sources: RTÜK : http://www.rtuk.org.tr Audience data: AGB Nielsen Media Research Turkey / TIAK : http://www.agbnielsen.net Legal aspects: IRIS Merlin, http://merlin.obs.coe.int

258 2 0 0 9 | V o l u m e 1 | B a n d 1
AL
AT
BE
BG
CH
CY
CZ
DE
DK
EE
ES
FI
FR
GB
GR
HR
HU
IE
IS
IT
LT
LU
LV
MK
MT
NL
NO
PL
PT
RO
RU
SE
SI
SK
TRTR
Turkey Turquie Türkei TR
Population and equipment 31.12.08Penetration
(in % HH) In thousand SourcesPopulation (inhabitants) – 71 517 Eurostat
Households – 18 321 Eurostat (as at 1.1.2008)
TV households 98% 17 955 European Audiovisual Observatory
Cable TV households 7% 1 285 Screen Digest / European Audiovisual Observatory
Digital cable TV households ~ ~DTH/SMATV households 50% 9 147 Screen Digest / European Audiovisual Observatory
Dig. DTH/SMATV households ~ ~IPTV subscriptions ~ ~Installed DVB-T receivers ~ ~Total digital TV households ~ ~Households with PC 27% 4 970 Screen Digest / European Audiovisual Observatory
Households with broadband connections 24% 4 324 Screen Digest / European Audiovisual Observatory
TV channels distributors 11.09 CompaniesCable operators 6 Turksat A.S.Satellite packagers 2 Digitürk, D-SmartIPTV packagers 0 Türk Telekom (in project)DTT multiplex operators ~Mobile phone TV packagers 3 Avea, Turkcell, Türk Telekom (announced)
Number of TV channels by kind of licence 10.09 Public Private TotalTerrestrial analogue (national) 6 20 26Cable/Satellite/IPTV/Mobile 1 81 82Regional/Local 3 217 220Regional/Local windows 0 0 0Channels targeting foreign markets 2 4 6Total 12 322 334Foreign channels targeting the country 0 ~ ~
Source: European Audiovisual Observatory
Supply of TV channels by genre and by platform (including foreign channels) 10.09
Analogue terrestrial
Satellite DigiTürk
Satellite D-Smart
Generalist - national 21 22 2Generalist - foreign 3Adult 2 5Children 10 5Culture/ education/ documentary 1 8 8Minority interest groups 1Entertainment/ TV fiction/ games 11 8Film 12 8Home shopping 1 1International linguistic and cultural 4 3Lifestyle/ specific leisure/ travel 4 3Music 1 8 7News/ business 4 19 3Parliament/ government/ administrationRegional/ localReligionSports 1 16 7Various 4 7Total 28 125 67
Basic figures

2592 0 0 9 | V o l u m e 1 | B a n d 1
AL
AT
BE
BG
CH
CY
CZ
DE
DK
EE
ES
FI
FR
GB
GR
HR
HU
IE
IS
IT
LT
LU
LV
MK
MT
NL
NO
PL
PT
RO
RU
SE
SI
SK
TRTR
Turkey Turquie Türkei TR
Source: TV International
Source: Screen DigestSource: Screen Digest
Households TV equipment 2004-2008
Number of households accessing multichannel platforms as at 31.12.2008
Consumers pay-TV gross spend 2004-2008In thousands.
In thousands.
EUR thousand.
2004 2005 2006 2007 2008
0
10 000
8 000
6 000
4 000
2 000
Satellite households
Cable households
6 922 6 962
7 425
8 183
9 147
1 1001 288 1 377 1 250 1 285
Digiturk
D-Smart
0
500
2 000
1 500
1 000919
1 842
DTT
IPTV
Sat
PC
Cable
2004 2005 2006 2007 2008
0
600 000
200 000
400 000
Cable TV
Satellite
233 596
259 418
333 722
437 384
549 558
49 520 52 72668 075
77 97287 713
Market trends

260 2 0 0 9 | V o l u m e 1 | B a n d 1
AL
AT
BE
BG
CH
CY
CZ
DE
DK
EE
ES
FI
FR
GB
GR
HR
HU
IE
IS
IT
LT
LU
LV
MK
MT
NL
NO
PL
PT
RO
RU
SE
SI
SK
TRTR
Turkey Turquie Türkei TR
Daily share Prime time (20:00-23:00)Channels 2004 2005 2006 2007 2008 2004 2005 2006 2007 2008TRT 1 5,8 5,1 4,2 3,9 3,2 4,7 4,1 3,8 3,5 3,6TRT 2 1,3 1,2 1,2 1,1 – 0,9 0,8 0,7 0,6 –Main Turkish public channels 7,2 6,3 5,4 5,0 3,2 5,6 4,9 4,5 4,1 3,6Show TV 17,8 15,8 13,8 11,9 11,4 17,9 16,5 15,2 14,8 15,3Kanal D 15,7 14,3 13,8 14,2 14,0 16,3 15,2 14,9 17,3 18,2ATV 12,4 12,1 12,4 10,4 8,9 14,2 14,4 14,5 12,4 10,1Star TV 6,9 10,3 9,8 9,4 8,0 7,9 10,6 11,1 10,7 8,0Samanyolu TV 4,9 5,7 6,2 5,6 5,5 6,8 7,1 7,6 7,0 7,1Kanal 7 5,7 5,7 6,0 6,5 5,0 6,2 6,1 6,1 5,9 4,0FOX (ex TGRT) 7,4 7,0 4,6 4,7 8,0 7,9 7,8 4,8 4,6 6,8Kanal 1 ~ ~ 2,4 3,3 3,5 ~ ~ 1,9 2,0 3,8Flash TV 3,1 3,0 2,3 1,8 1,9 2,9 2,6 1,7 1,6 1,6Main private Turkish channels 73,8 73,9 71,2 67,9 66,3 80,1 80,3 77,9 76,2 74,9Others 19,0 19,8 23,4 27,1 30,6 14,4 14,8 17,6 19,7 21,5
Source: Eurodata TV Worldwide / AGB NMR TURKEY / TIAK
Daily share. In main urban areas. In %, 5 years +.
Prime time (20:00-23:00). In main urban areas. In %, 5 years +.
2004 2005 2006 2007 2008
0
5
15
10
20
Kanal D
Show TV
ATVStar TVFOX (ex TGRT)
Samanyolu TVKanal 7
Kanal 1TRT 1
Flash TVTRT 2
2008
Show TV15,3%
Others21,5%
TRT 13,6%
Kanal D18,2%
ATV10,1%
Star TV8,0%
Samanyolu TV7,1%
Kanal 74,0%
FOX (ex TGRT)6,8%
Kanal 13,8%
Flash TV1,6%
TV audience market share in Turkey 2004-2008 In main urban areas. In %, 5 years +.
T.1.TR.1G.1.TR.1

2612 0 0 9 | V o l u m e 1 | B a n d 1
AL
AT
BE
BG
CH
CY
CZ
DE
DK
EE
ES
FI
FR
GB
GR
HR
HU
IE
IS
IT
LT
LU
LV
MK
MT
NL
NO
PL
PT
RO
RU
SE
SI
SK
TRTR
Turkey Turquie Türkei TR
Source: RTL Group / European Audiovisual Observatory
Income 2003 2004 2005 2006 2003 2004 2005 2006 2006/05Public funds 201 200 223 200 306 100 321 500 86,9% 87,7% 91,5% 92,4% 5,0% - Grants 58 300 39 300 62 700 – 22,9% 11,7% 18,0% 59,5% - Tax on electricity bill 171 300 164 900 266 800 258 800 74,0% 64,8% 79,7% 74,3% -3,0% - Others 29 900 0 0 0 12,9% 0,0% 0,0% 0,0% –Commercial revenues 28 300 30 700 28 000 24 500 12,2% 12,1% 8,4% 7,0% -12,5% - Advertising 26 400 30 100 27 400 20 200 11,4% 11,8% 8,2% 5,8% -26,3% - Sponsorship 400 3 900 5 000 4 300 0,2% 1,5% 1,5% 1,2% -14,0%Others 1 900 600 600 2 100 0,8% 0,2% 0,2% 0,6% 250,0%
TOTAL 231 400 254 500 334 700 348 100 100,0% 100,0% 100,0% 100,0% 4,0%
EUR thousand.
2002 2003 2004 20062005
0
400 000
300 000
200 000
100 000
Grants
Tax on electricity bill
AdvertisingSponsorshipOthers
Other publicrevenues
Revenues and expenditure of TRT 2003-2006 EUR thousand.
T.1.TR.2G.1.TR.2


2632 0 0 9 | V o l u m e 1 | B a n d 1
Sources
Sources
Quellen
Contents Sommaire Inhalt
Sources Sources Quellen 264
Glossary and methodology
Glossaire et méthodologie
Glossar und Methodik
266
Abbreviations Abréviations Abkürzungen 271

264 2 0 0 9 | V o l u m e 1 | B a n d 1
Sources Sources Quellen
Strategic Information Service (SIS)
The SIS is the re search unit of the EBU
specializing in eco-nomic and market anal-ysis and works with all functional departments within the EBU.
It conducts data collection, primary research, and surveys; compiles and analyses information; and makes results available through published reports, pre-sentations, and other communication. In addition, SIS procures existing published studies/expertise and maintains one of the most extensive and up-to-date repositories of media publications in Europe.SIS is engaged in the ongoing study of media markets throughout Europe. The unit collects information about all EBU Members; tracks actual market conditions and trends in the television, radio, and new media; analyses industry structures; and investigates the competitive environ-ment.Head of SIS: Alexander Shulzycki
Organisations which provided pan-European data for this volume
Service d’information stratégique (SIS)
Le SIS constitue l’unité de recherche de l’Union Européenne de Radio-Télé-
vision (UER) pour l’analyse économique et l’étude des marchés. Le SIS œuvre en collaboration avec les divers départements de l’UER afin de recueillir l’information, mener à bien études, recherche primaire et enquêtes, compiler et analyser les données et mettre à disposition les résultats sous forme de publications, présentations et toute autre forme de communication. De plus, le SIS facilite l’accès aux études et aux connais-sances spécialisées existant par ailleurs, et maintient un référentiel de publications média parmi les plus complets et les plus à jour en Europe.Le SIS poursuit actuellement une étude au long cours portant sur les différents marchés médiatiques à travers l’Europe, recueillant des données relatives aux activi-tés de tous les membres de l’UER, suivant de près l’évolution des marchés ainsi que les tendances des secteurs télévision, radio et nouveaux médias, analysant les struc-tures du paysage audiovisuel et étudiant la situation en matière de concurrence.Responsable du SIS : Alexander Shulzycki
Organismes ayant fourni des données paneuropéennes pour ce volume
Strategic Information Service (SIS)
SIS ist die Recherche-Abteilung der EBU. Sie ist auf Wirtschafts- und
Marktanalysen spezialisiert und arbeitet mit allen operativen Abteilungen der EBU zusammen. SIS führt Datensammlungen, -erhebungen und Umfragen durch; trägt Informationen zusammen und analysiert sie; und veröf-fentlicht die Ergebnisse in Publi kationen, Präsentationen und durch andere Kom-munikationswege. Darüber hinaus stellt SIS bestehende publizierte Studien/Gutachten zur Verfügung und pflegt eine der umfangreichsten und aktuellsten Sammlungen von Medienpublikationen in Europa.SIS befasst sich mit der laufenden Beo-bachtung der europäischen Medienmärkte. Die Abteilung sammelt Informationen zu allen EBU Mitgliedern; verfolgt aktuelle Marktlagen und Entwicklungen in den Bereichen Fernsehen, Radio und Neue Medien; analysiert Industriestrukturen; und untersucht das Wettbewerbsumfeld.Leiter SIS : Alexander Shulzycki
Organisationen, die mit gesamteuropäischen Angaben zu diesem Band beigetragen haben
EUROPEAN BROADCASTING UNION (EBU) http://www.ebu.ch
Publisher of Euro-pean audiovi-
sual information and statistics for the past thirty years. The main activity of Screen Digest is
the publication of a monthly magazine, Screen Digest, which contains the latest news and references on European and global audiovisual developments, as well as statistics. Thematic information areas: market and economic information from the whole of Europe, especially relating to video, new technologies and multimedia.
Screen Digest édite des informations et des statistiques sur l’audiovisuel
depuis 30 ans. Son activité principale est la publication mensuelle du magazine Screen Digest, contenant des informations récentes sur l’audiovisuel, des références bibliographiques sur les développements dans le secteur de l’audiovisuel en général et en Europe en particulier, ainsi que des statistiques. Domaine thématique : informations sur les marchés d’Europe, plus particulière-ment sur les industries du cinéma, de la vidéo, des nouvelles technologies et du multimédia.
V erlag für europäische audiovisuelle Informationen und Statistiken aus
den letzten 30 Jahren. Die Haupttätigkeit von Screen Digest ist die Veröffentlichung der Monatsschrift Screen Digest, die die neuesten Nachrichten und Hinweise auf weitere Informationen über europäische und internationale audiovisuelle Entwick-lungen sowie Statistiken enthält.Themenbereich: Markt- und Wirtschaftsin-formationen aus ganz Europa, besonders für die Bereiche Film, Video, neue Tech-nologien und Multimedia.
SCREEN DIGEST http://www.screendigest.com
2652 0 0 9 | V o l u m e 1 | B a n d 1
Sources Sources Quellen
(Continued) (Suite) (Fortsetzung)
Eurodata TV is the inter-
national data bank for T V p r o g r a m m e logs and rat-ings, based on a
partnership with national institutes oper-ating people meter systems throughout the world. Eurodata TV was created in the early 90’s by Médiamétrie, which is the operating company of the people meter in France. Currently, the Eurodata TV data bank includes more than 1200 channels in 73 territories. In each country, Eurodata TV collects the information directly from the official local TV Research Companies that work with the television industry.The people meter system is the reference tool studying television programming and viewing. The Eurodata TV data bank pro-vides you with all the official information about the broadcast and audience ratings of any TV programme on all the channels measured: title, genre, date, channel, start-ing time, duration, average audience rating and average market share by target group. All this information is readily available via modem, fax, email in a standardised com-puter file format. Eurodata TV clients are broadcasters, TV programme sales and acquisition executives, marketing and strategic plan-ners, sport sponsorship companies, sport federations, legal departments, copyright organisations, etc. The information is used in the areas of production, programming, acquisition and distribution as well as for the control of copyrights on TV. It allows the analysis of TV markets from a stra-tegic, legal or marketing point of view, in order to back up sales argumentation or buying decisions, to identify the success or failure of programmes, etc.
Eurodata TV est la banque de données internationales des diffusions et des
au diences des programmes de télévision, fondée sur un accord de partenariat avec les instituts d’études audimétriques à tra-vers le monde. Eurodata TV a été créé au début des années 90 par Médiamétrie, l’opérateur du système audimétrique en France.Aujourd’hui, Eurodata TV couvre plus de 1 200 chaînes de télévision dans 73 terri-toires et s’étend régulièrement à tous les pays qui viennent de s’équiper d’un sys-tème audimétrique. Dans chaque pays, l’information provient directement de l’institut d’études national mesurant l’audience de la télévision pour les grands acteurs de son marché.L’audimétrie individuelle est l’outil de référence pour suivre la programmation et mesurer l’audience de la télévision. Eurodata TV vous permet d’obtenir rapi dement toute l’information officielle concernant la diffusion et les audiences de tout programme sur les chaînes mesurées : titre de diffusion, date, chaîne, heure de début, durée, genre, taux d’audience et part d’audience moyenne en % pour cha-que cible standard disponible pays par pays. Ces informations sont disponibles dans un format standardisé par modem, fax ou e-mail.Les clients d’Eurodata-TV sont les diffu-seurs, les producteurs, les vendeurs et ache-teurs de programmes télévisés, les direc-tions de la stratégie et des déve loppements, les sponsors d’événements sportifs, les fédérations sportives, les départements juridiques d’entreprises audiovisuelles, les organisations de gestion de droits, les agences, les centrales d’achat d’espa-ces, … Les informations sont utilisées dans le domaine de la production, de la programmation, des acquisitions et de la distribution. Elles permettent d’étudier les marchés télévisuels d’un point de vue stra-tégique, légal ou marketing afin de disposer d’arguments d’aide à la décision mais aussi de détecter des programmes ayant connu le succès ou au contraire un échec.
Eurodata TV ist die internationale Datenbank mit sendungsbezogenen
Daten und Einschaltquoten von Fern-sehprogrammen, die auf der Grundlage einer weltweiten Partnerschaft mit den nationalen Fernseh forschungsinstituten ermittelt werden. Eurodata TV wurde Anfang der 90er-Jahre von Médiamétrie, dem französischen Fernsehforschungsin-stitut, gegründet.Heute wertet Eurodata T V über 1 200 Fernseh sender in 73 Ländern aus und erweitert sein Erfassungsgebiet regelmäßig auf diejenigen Länder, die ein Fernsehforschungssystem einrichten. Die Informationen stammen in jedem Land direkt vom nationalen Fernsehforschungs-institut, das für die wichtigen Akteure auf dem Heimatmarkt die TV-Einschalt-quoten ermittelt. Die Messung der individuellen Sehbe-teiligung ist das Referenzwerkzeug bei der Untersuchung der Fernsehprogram-mierung und -einschaltquoten. Eurodata TV bietet zeitnah sämtliche offiziellen Informationen über Ausstrahlung und Einschaltquoten jedes einzelnen Pro-gramms auf den erfassten Sendern: Sende-titel, Datum, Kanal, Anfangszeit, Dauer, Genre, Sehbeteiligung und durchschnitt-licher prozentualer Marktanteil für jede Standardzielgruppe in den einzelnen Ländern. Diese Informationen sind in einem einheitlichen Format per Modem, Fax oder E-Mail erhältlich.Kunden von Eurodata TV sind Sende-anstalten, Produzenten, Käufer und Verkäufer von Fernsehprogrammen, Pla-nungs- und Entwicklungsabteilungen, Sponsoren von Sportevents, Sport-verbände, Rechtsabteilungen von audi-ovisuellen Unternehmen, Verwertungs-gesellschaften, Agenturen, Zentralen zum Einkauf von Werbeflächen usw. Die Informationen finden Verwendung in den Bereichen Produktion, Programmplanung sowie Einkauf und Vertrieb. Sie bilden die Grundlage zur Analyse der Fernsehmär-kte aus Sicht der Strategen, Juristen oder Marketingexperten, liefern Argumente für Entscheidungsträger und zeigen auf, welche Programme erfolgreich waren und welche nicht.
Organisations which provided pan-European data for this volume
Organismes ayant fourni des données paneuropéennes pour ce volume
Organisationen, die mit gesamteuropäischen Angaben zu diesem Band beigetragen haben
EURODATA-TV WORLDWIDE http://www.eurodatatv.com

266 2 0 0 9 | V o l u m e 1 | B a n d 1
Glossary and methodology
Glossaire et méthodologie
Glossar und Methodik
Population and equipment Population et équipement Bevölkerung und AusstattungPopulation (inhabitants) Population (habitants) Bevölkerung (Einwohner) 1
Households Ménages Haushalte 1
TV households Foyers TV Fernsehhaushalte 2
Cable TV households Foyers abonnés au câble Angeschlossene Kabelhaushalte 3
Digital cable TV households Foyers abonnés au câble numérique Haushalte mit Digital-Kabelabonnement 3
DTH/SMATV households Foyers avec réception directe par satellite Satellitendirektempfang 4
Dig. DTH/SMATV households Foyers avec réception directe par satellite numérique
Haushalte mit digital Satellitendirektempfang
5
Pay DTH/SMATV households Foyers avec réception payante par satellite Haushalte mit gebührenpfl. Sat.-Empfang 3
IPTV subscriptions Abonnements IPTV Haushalte mit IPTV 3
Installed DVB-T receivers Récepteurs DVB-T DVB-T-Haushalte 6
Total digital TV households Total foyers TV numériques Haushalte mit digitalem Fernsehempfang 7
Households with PC Foyers avec PC Haushalte mit PC 8
Households with broadband connections Foyers avec connection large bande Haushalte mit Breitband 3
Mobile phone TV subscriptions Abonnements aux services TV pour téléphone mobile Abonnenten Mobil-TV Unicast 3
Mobile broadcast TV subscriptions/receivers
Abonnements/récepteurs de télévision mobile personnelle (TMP) Abonnenten Handy-TV
Penetration (in % HH) Pénétration (en % des foyers) Penetration (in % der Haushalte)In thousand En milliers In TausendSources Sources Abonnenten Mobil-TV Unicast
1 In general we have used data provided by Eurostat rather than by national sources, as in principal they have a higher level of harmonisation.
2 Estimates by the Observatory. The figures are calculated from the number of households and the latest available rate of penetration.
3 Absolute figures are in general provided by Screen Digest on the basis of data collected directly from national professional organisations, national public sources and individual companies. Rate of penetration calculated by the Observatory on the basis of number of households and data provided by Screen Digest.
4 Absolute figures provided by Screen Digest on the basis of data published by Eutelsat and SES Astra.
5 Absolute figures elaborated by Screen Digest or the Observatory on the basis of declaration by the satellite packagers.
6 Absolute figures established by Screen Digest on the basis of data provided by national sources. In general the data are obtained by modelisation on the basis of sales of syntonisers.
7 The total of households with digital equipment is not always easy to calculate, as some households may have double equipment (for exemple subscribing to a satellite pay-TV package and to an IPTV triple play offer). In countries where no data are available from a specific monitoring, the estimates by the Observatory may be relatively inflated.
8 Data calculated by Screen Digest from national sources.
1 Le plus souvent, nous avons eu recours aux données communiquées par Eurostat plutôt que par les sources nationales, dans la mesure où, en principe, elles ont un plus grand degré d’harmonisation.
2 Estimations par l’Observatoire. Les chiffres sont calculés à partir du nombre de foyers et du dernier taux de pénétration disponible.
3 Les chiffres absolus sont fournis par Screen Digest, sur la base de données collectées directement auprès d’organisations professionnelles nationales, d’organismes publics et des entreprises elles-mêmes. Taux de pénétration calculé par l’Observatoire sur base du nombre de foyers et des données fournies par Screen Digest
4 Chiffres absolus fournis par Screen Digest sur base des données publiées par Eutelsat et SES Astra.
5 Chiffres absolus élaborés par Screen Digest ou l’Observatoire sur base des déclarations des opérateurs de bouquets satellitaires.
6 Chiffres absolus établis par Screen Digest sur la base de données fournies par les sources nationales. Le plus souvent, les données sont élaborées par modélisation sur base des ventes de syntoniseurs.
7 Le nombre total de foyers dotés d’un équipement numérique n’est pas toujours aisé à calculer, dans la mesure où certains foyers peuvent être dotés d’un double équipement (par exemple être à la fois abonné à une offre satellitaire et à une offre «triple play» en IPTV). Dans les pays où des données spécifiques ne sont pas publiées, les estimations de l’Observatoire peuvent être surévaluées.
8 Données calculées par Screen Digest à partir de sources nationales.
1 Üblicherweise haben wir aufgrund der größeren Einheitlichkeit eher auf die von Eurostat übermittelten Daten zurückgegriffen als auf die Angaben nationaler Quellen.
2 Schätzungen der Informationsstelle. Die Berechnung beruht auf der Zahl der Haushalte und der letzten verfügbaren Penetrationsrate.
3 Die absoluten Zahlen stammen von Screen Digest, auf der Grundlage von Daten, die direkt bei nationalen Berufsverbänden, öffentlichen Einrichtungen und den Unternehmen selbst ermittelt wurden. Die Penetrationsrate wurde von der Informationsstelle auf der Grundlage der Zahl der Haushalte und der von Screen Digest übermittelten Daten berechnet.
4 Die absoluten Zahlen stammen von Screen Digest, auf der Grundlage von Daten, die von Eutelsat und SES Astra veröffentlicht wurden.
5 Die absoluten Zahlen stammen von Screen Digest oder der Informationsstelle, auf der Grundlage von Angaben der Anbieter von Satellitenbouquets.
6 Die absoluten Zahlen stammen von Screen Digest, auf der Grundlage von Daten aus nationalen Quellen. Meist wurden die Daten über Modellbildung anhand des Tuner-Verkaufs ermittelt.
7 Die Gesamtzahl der digital ausgestatteten Haushalte lässt sich nicht immer leicht berechnen, da einige Haushalte über eine doppelte Ausstattung verfügen (etwa über ein Abonnement für ein Satellitenangebot und eines für ein Triple-Play-Angebot per IPTV). In Ländern, in denen spezifische Daten nicht veröffentlicht werden, können die Schätzungen der Informationsstelle auch leicht überbewertet sein.
8 Die Daten wurden von Screen Digest aus Angaben nationaler Quellen berechnet.
Basic figures Chiffres clés Schlüsselzahlen

2672 0 0 9 | V o l u m e 1 | B a n d 1
Glossary and methodology
Glossaire et méthodologie
Glossar und Methodik
TV channels distributors Distributeurs de chaînes de TV AnbieterCable operators Opérateurs réseaux câblés Kabelnetzbetreiber 1
Satellite packagers Ensembliers bouquets satellitaires Anbieter von Satelliten-Bouquets 2
IPTV packagers Opérateurs IPTV IPTV-Anbieter 2
DTT multiplex operators / packagers Opérateurs de multiplex TNT / Fournisseurs de bouquet payant pour la TNT
Betreiber DVB-T-Multiplex / Anbieter DVB-T-Bezahlbouquet
2
Mobile phone TV packagers Ensembliers TV pour téléphone mobile Handy-TV-Anbieter 2
Mobile broadcast TV packagers Ensembliers de télévision mobile personnelle (TMP) Mobil-TV-Anbieter
Number of TV channels by type of licence
Nombre de chaînes par genre de licence
Zahl der Dienste nach Art der Lizenz
Terrestrial (national) Numérique terrestre (national) Terrestrisch (national) 2
Cable/Satellite/IPTV/Mobile Câble/satellite/IPTV/Mobile Kabel/Satellit/IPTV/Mobil 2
Regional/Local Régionale/Locale Regional/Lokal 2
Regional/local windows Fenêtres régionales/locales Lokale/nationale Fenster 2
Channels targeting foreign markets Chaînes ciblant les marchés étrangers Dienste mit Zielmarkt im Ausland 2
Total Total Gesamt 2
Foreign channels targeting the country Chaînes étrangères ciblant le pays Ausländ. Dienste mit Inlands-Zielmarkt 2 3
Public Public Öffentl.-rechtl.Private Privé PrivatTotal Total Summe
Supply of TV channels by genre and by platform 4
Offre de chaînes TV par genre et par plate-forme 4
Angebot an TV-Dienstennach Genre und Plattform 4
Generalist - national (incl. dedicated)
Généraliste - national (y compris les chaînes dédiées)
Vollprogramme (mit ausländischen Sendern für das Inland)
5
Generalist - foreign Généralistes étrangères Vollprogramme aus dem AuslandAdults Chaînes pour adultes ErwachseneChildren Chaînes pour enfants KinderFilm Chaînes de films SpielfilmeCulture/Documentary/Education Culture/Documentaires/Education Kultur/Dokumentation/BildungEntertainment/TV Fiction/Games Divertissement/Fiction télévisuelle/Jeux Unterhaltung/Fernsehfilme/SpielenCultural minorities Chaînes pour les minorités culturelles Kulturelle MinderheitenHome shopping Téléachat Homeshopping
News/Business Chaînes d'information (y compris information économique) Nachrichten/Wirtschaft
International channels Chaînes internationales Internationale SenderLifestyle/Specific leisure/Travel Styles de vie/Loisirs/Voyage Lifestyle/Freizeit/ReiseMusic Musique MusikParliamentary Chaînes parlementaires ParlamentskanäleRegional/Local Régionales / locales Regionale/lokale SenderReligion Religion ReligionSports Sports SportVarious Divers Verschiedenes
Terrestrial Terrestre TerrestrischCable Câble Kabel
1 Data from national associations or national regulatory authority.
2 Data from the MAVISE database.3 Channels originating from one other country
in the language of the country of destination, when different from the country of origin.
4 Data are elaborated from the MAVISE database. The harmonised indexation by genre is elaborated by the Observatory and does not necessarily correspond to the indexation by the providers.
5 Dedicated channels are channels established in another country but obviously targetting the considered country.
1 Données communiquées par les associations nationales ou les instances de régulation.
2 Données élaborées à partir de la base de données MAVISE.
3 Chaînes provenant d’un autre pays, dans la langue du pays de destination, lorsqu’elle est différente de celle du pays d’origine.
4 Les données sont élaborées à partir de la base de données MAVISE. L’indexation harmonisée par genre est réalisée par l’Observatoire et ne correspond pas nécessairement à celle proposée par les opérateurs.
5 Les chaînes dédiées sont établies dans un autre pays mais visent de toute évidence le pays considéré.
1 Daten der nationalen Vereinigungen oder der Regulierungseinrichtungen.
2 Angaben aus der Datenbank MAVISE.3 Dienste aus dem Ausland in der Sprache
des Ziellandes, wenn sich diese vom Ursprungsland unterscheidet.
4 Die Daten wurden auf der Grundlage der Datenbank MAVISE ermittelt. Die harmonisierte Indexierung nach Genre erfolgte durch die Informationsstelle und entspricht nicht notwendigerweise der Sicht der Anbieter.
5 Die ausländischen Sender für das Inland haben ihren Sitz im Ausland, strahlen ihr Programm aber offensichtlich gezielt für das jeweilige untersuchte Land aus.
Basic figures (Continued) Chiffres clés (Suite) Schlüsselzahlen (Fortsetzung)

268 2 0 0 9 | V o l u m e 1 | B a n d 1
Glossary and methodology
Glossaire et méthodologie
Glossar und Methodik
Households TV equipments Equipement des foyers TV Ausstattung der FernsehhaushalteDTT households Foyers TNT DVB-TSatellite households Foyers avec réception satellite directe SatellitendirektempfangCable households Foyers abonnés au câble KabelIPTV households Foyers abonnés IPTV IPTV
Consumers pay-TV spend Dépenses des ménages en télévision à péage
Ausgaben der Haushalte für Bezahlfernsehen
Satellite consumers spend Dépenses abonnement satellite Ausgaben für SatellitenabonnementCable TV consumers spend Dépenses abonnement câble Ausgaben für KabelabonnementDTT consumers spend Dépenses abonnement TNT Ausgaben für DVB-T-AbonnementIPTV consumer spend Dépenses abonnement IPTV Ausgaben für IPTV-Abonnement
For most of the countries, data are elaborated by Screen Digest from pay-TV operators revenues. Data are for subscription pay TV revenue only, include taxes but do not include income from technology sale or rental or advertising.
Pour la plupart des pays, les données sont élaborées par Screen Digest. Les données concernent les dépenses d’abonnement. Les taxes sont incluses, mais non les recettes liées à la vente ou location de matériel ou à la publicité.
Für die meisten Länder stammen die Daten von Screen Digest. Die Angaben betreffen die Abonnementkosten. Steuern sind enthalten, aber nicht die Einnahmen aus Verkauf bzw. Vermietung von Filmtechnik oder aus der Werbung.
Data were collected by the Observatory from operators or trade press.
Les données ont été collectées par l’Observatoire auprès des opérateurs ou dans la presse professionnelle.
Die Daten wurden von der Informationsstelle über die Betreiber oder die Fachpresse ermittelt.
1 Screen Digest data.2 Gross advertising expenses as analysed
by WARC or IP Keyfact.3 When possible gross expenses as paid
by consumers. In other cases, broadcasters net licence fee revenues.
4 Gross advertising expenses as analysed by WARC.
5 As communicated in broadcasters net revenues.
1 Données Screen Digest.2 Données élaborées par WARC ou IP Keyfacts.3 Lorsque disponibles, données brutes
relatives aux montants payés par les consommateurs ; dans les autres cas, recettes nettes des diffuseurs.
4 Données élaborées par WARC.5 Montant communiqué dans les
recettes nettes des diffuseurs.
1 Daten von Screen Digest.2 Daten von WARC oder IP Keyfacts ermittelt.3 Wenn verfügbar, Bruttoausgaben
der Verbraucher, ansonsten Nettogebühreneinnahmen der Rundfunkveranstalter.
4 Daten von WARC ermittelt.5 Nach Angaben der Rundfunkveranstalter
über ihre Nettoeinnahmen.
Number of households accessing multichannel platforms
Nombre de foyers accédant aux plates-formes numériques
Anzahl der Haushalte mit Zugang zu digitalen Plattformen
Gross revenues of radio and television
Revenus bruts de la radio et de la télévision
Bruttoeinnahmen in Hörfunk und Fernsehen
Consumers pay-TV spend Dépenses des consommateurs en télévision à péage
Verbraucherausgaben für Bezahlfernsehen
1
TV adspend Investissements publicitaires TV bruts Bruttoinvestitionen in die Fernsehwerbung
2
Radio-TV licence fee Redevance radio-télévision Rundfunkgebühren 3
Radio adspend Investissements publicitaires radio bruts Bruttoinvestitionen in die Hörfunkwerbung
4
State grants Subvention publique Öffentliche Fördermittel 5
Market trends Tendances du marché Markttrends

2692 0 0 9 | V o l u m e 1 | B a n d 1
Glossary and methodology
Glossaire et méthodologie
Glossar und Methodik
TV audience market share Parts de marché d’audience des chaînes de télévision Marktanteile der Fernsehdienste
In %, 4 years +. En %, 4 ans et +. In %, ab 4 Jahre.Daily share Ensemble de la journée GanztägigPrime-time Heures de grande écoute Primetime
Leading TV production companies Principales sociétés de production de programmes de télévision
Die führenden Fernseh-produktionsunternehmen
Income Recettes Erträge 1
Total public income Total recettes publiques Öffentliche ErträgeAid/Grants Subventions SubventionenLicence fee Redevance GebührOther public revenues Autres revenus publics Sonstige öffentliche ErträgeTotal commercial income Total recettes commerciales Kommerzielle ErträgeAdvertising and sponsorship Publicité et parrainage Werbung und SponsoringFacilities Services techniques Technische DienstleistungenMerchandising Ventes de produits MerchandisingProgramme sales Ventes de programmes ProgrammverkaufOther commercial income Autres recettes commerciales Sonstige kommerzielle ErträgeOther income Autres recettes Andere ErträgeTotal Total des recettes Summe 2
Operating revenues Produit d'exploitation Betriebserträge 2
Expenditure Dépenses Aufwendungen 3
Purchase of goods and services Achats de biens et services Waren- und Dienstleistungskäufe 4
Costs of personnel Dépenses de personnel PersonalaufwendungenDepreciation Amortissements AbschreibungOperating expenditure Dépenses opérationnelles BetriebsaufwendungenNet result Résultat net Nettoergebnis
Ratios Ratios KennzahlenReturn on shareholders' funds Retour sur fonds propres EigenkapitalrenditeProfit margin Marge bénéficiaire GewinnspanneReturn on total assets Retour sur actifs Gesamtkapitalrendite
For most of the countries the data are provided by Médiamétrie / Eurodata TV Worldwide on the basis of data communicated by the national audience reference company.
Pour la plupart des pays, les données sont fournies par Médiamétrie / Eurodata TV Worldwide sur la base des données fournies par les entreprises nationales de référence en matière de données d’audience.
Für die meisten Länder stammen die Daten von Médiamétrie/Eurodata TV Worldwide auf Basis der von den nationalen Referenzunternehmen übermittelten Zuschauerergebnissen.
Rankings are elaborated by the Observatory from data available in the AMADEUS database.
Les classements sont établis par l’Observatoire à partir des données disponibles dans la base de données AMADEUS.
Die Ranglisten werden von der Informationsstelle auf der Grundlage von Angaben in der Datenbank AMADEUS erstellt.
1 Data are collected from companies’ annual reports or provided by EBU-SIS
2 Discrepancies between total income (as communicated by EBU-SIS) and operationnal revenues (as collected in AMADEUS database) may arise from inclusion by EBU-SIS of non-operation revenues (in particular financial revenues) in the calculation of total incomes.
3 Data collected by the Observatory from the AMADEUS database.
4 Approximate data, calculated as the Operating expenses less the Cost of personnel and Depreciation.
1 Les données sont collectées dans les rapports d’activités des entreprises ou communiquées par l’UER-SIS
2 Les divergences entre «Total des recettes» (tel que communiqué par l’UER-SIS) et le «Produit opérationnel» (tel qu’élaboré dans la base AMADEUS) s’expliquent généralement par le fait que l’UER-SIS inclus des recettes non opérationnelles (notamment recettes financières) dans «Autres recettes».
3 Données collectées par l’Observatoire à partir de la base de données AMADEUS.
4 Données estimées, calculées comme Dépenses opérationnelles moins les dépenses de personnel et les amortissements.
1 Die Daten stammen aus den Jahresberichten der Unternehmen oder von EBU-SIS.
2 Unterschiede zwischen der «Summe» der Erträge (wie von EBU-SIS übermittelt) und dem «Betriebsertrag» (wie in der Datenbank AMADEUS dargestellt) sind üblicherweise darauf zurückzuführen, dass EBU-SIS nicht-operative Einnahmen unter «Sonstiges» erfasst.
3 Die Angaben wurden von der Informationsstelle aus der Datenbank AMADEUS zusammengestellt.
4 Schätzung, berechnet aus Betriebsausgaben minus Personalkosten und Abschreibungen.
Other tables and graphes
TV company financial situation (consolidated)
Autres tableaux et graphiques
Situation financière d’une entreprise de télévision (consolidé)
Sonstige Tabellen und Grafiken
Wirtschaftliche Lage von Fernsehuneternehmen (konsolidiert)


2712 0 0 9 | V o l u m e 1 | B a n d 1
– not applicable ne s’applique pas trifft nicht zu~ not available non communiqué keine Angabe
adtv private television company financed by advertising
entreprise privée de télévision financée par la publicité
werbefinanzierte private Fernsehunternehmen
CATV Cable Television Télévision par câble KabelfernsehenDTH direct-to-home réception directe par satellite direct-to-homeDTT Digital terrestrial television (=TNT) (=DVB-T)
DVB-H Digital Video Broadcasting - Handheld
Digital Video Broadcasting - Handheld
Digital Video Broadcasting - Handheld
DVB-T (=DTT) (=TNT) Digital Video Broadcasting - Terrestrial
est. estimate estimation Schätzunghs home shopping téléachat Homeshopping
IPTV Internet Protocol Television (television through broadband)
Internet Protocol Television (télévision par réseaux large bande)
Internet Protocol Television (Fernsehen über Breitband)
ISP Internet Service Provider Fournisseurs d’accès à Internet (FAI) Internet-Anbieterp.m. pro memoria pour mémoire pro memoria
MMDS Microwave Multipoint Distribution System
Microwave Multipoint Distribution System
Microwave Multipoint Distribution System
packtv packager/aggregator of TV services ensemblier/agrégateur de services TV Anbieter von Programmpaketen
paytv pay-TV (film premium) télévision à péage (films premium) Pay-TV (Premium-Filme)PPV pay-per-view péage à la consommation Pay-per-ViewPR private privé privatPS public service service public öffentlich-rechtlich
rtv regional or local television company
entreprise de télévision régionale ou locale
regionale oder lokale Fernsehunternehmen
Sat-TV Television by satellite Télévision par satellite Satelitfernsehen
SMATV Satellite Master Antenna Television Satellite Master Antenna Television Satellite Master Antenna Television
sptv public television company entreprise publique de télévision Öffentlich-rechtliche Fernsehanstalt
thtv publisher of private thematic channel(s) éditeur de chaîne(s) thématique(s) Betreiber von privaten
SpartenkanälenTNT (=DTT) télévision numérique terrestre (=DVB-T)VoD Video on Demand vidéo à la demande Video-on-Demand
Abbreviations Abréviations Abkürzungen
Data in italics are estimated or provisional. Les données en italiques sont estimées ou provisoires.
Kursiv gedruckte Daten sind geschätzt oder vorläufig.
List of abbreviations used in this volume
Liste des abréviations utilisées dans le présent volume
In diesem Band verwendete Abkürzungen

European Commission
Directorate-General Communication
Database of tV companies anD tV channels in the european union anD canDiDate countries
The European Television Database
http://mavise.obs.coe.int
Company Listings
n by country
n by type of services offered
n by type of operator: cable, iptV, etc.
TV Market Profiles
n Description of the tV market
n licensing authorities
n Data on population and equipment
n list of channels available and national companies
TV Channel Profiles
n Genre and programming concept
n countries and audience targeted
n related licensing authority
n list of platforms carrying each channel
TV Company Profiles
n address and link to website
n list of main activities
n ownership information
n list of channels owned by each company
MAVISE

EUROPEAN AUDIOVISUAL OBSERVATORY, Yearbook 2009. Film, Television and Video in Europe, 2009 Edition, Vol. 1, “Television in 36 European States”, European Audiovisual Observatory, Strasbourg, 2009.
OBSERVATOIRE EUROPÉEN DE L’AUDIOVISUEL, Annuaire 2009. Cinéma, télévision et vidéo en Europe, Edition 2009, Vol. 1, "La télévision dans 36 Etats européens", Observatoire européen de l’audiovisuel, Strasbourg, 2009.
EUROPÄISCHE AUDIOVISUELLE INFORMATIONSSTELLE, Jahrbuch 2009. Film, Fernsehen und Video in Europa, 2009, Bd 1, Fernsehen in 36 europäischen Staaten, Europäische Audiovisuelle Informationsstelle, Straßburg, 2009.
Director of publication Directeur de la publication Verlagsleitung
Wolfgang Closs
Editor Coordination scientifique Unter der wissenschaftlichen Leitung vonDr. André Lange ([email protected])Head of the Department "Information on Markets and Financing" Responsable du département "Information sur les marchés et les financements" Leiter der Abteilung „Informationen über Märkte und Finanzierungen“
Special thanks to the following Remerciements particuliers à Besonderen Dank an MAVISE Project of the DG Communication of the European Commission (Florence Hartmann, Deirdre Kevin, European Audiovisual Observatory).
BUREAU VAN DIJK ELECTRONIC PUBLISHING (Vincent Leray, Idris Roty), EBU (Alexander Shulzyki, Lisa Benjamin, Anna-Sara Stalvik), EPRA (Emmanuelle Machet), EURODATA-TV ( Jacques Braun, Alexandre Callay, Alexandra Brenkman), LYNGSAT (Christian Lyngemark and his network), SCREEN DIGEST (Allan Hardy, Guy Bisson, Ben Keen).
Pedro Brauman (RTP, PT), Miguel Angel Fontan (SOFRES A.M., ES), Ragnar Karlsson (Statistics Iceland), Eva Harrie (NORDICOM, SE), Constantinos Papavasilopoulos (IOM, GR) and all our correspondents within television companies.
Department for Legal Information of the European Audiovisual Observatory (Dr. Susanne Nikoltchev, Francisco Cabrera) and their network of correspondents.
Editorial Assistant and Yearbook Premium Service Assistante éditoriale et Service premium de l’Annuaire Verlagsassistentin und Jahrbuch Premium ServiceValérie Haessig ([email protected], Tel. : +33 (0)3 90 21 60 11)
Translation and proofreading Traduction et relecture Übersetzung und KorrekturVéronique Campillo, France Courrèges, Michael Finn, Paul Green, Bernard Ludewig, Ralf Pfleger, Sonja Schmidt.
Documentation - Public Relations Documentation - Relations publiques Dokumentation - ÖffentlichkeitsarbeitAlison Hindhaugh ([email protected], Tel. : +33 (0)3 90 21 60 10)
Marketing Promotion MarketingMarkus Booms ([email protected], Tel. : +33 (0)3 90 21 60 06)
Publisher Editeur VerlagEuropean Audiovisual Observatory Observatoire européen de l’audiovisuel Europäische Audiovisuelle Informationsstelle 76, allée de la Robertsau F-67000 STRASBOURGhttp://www.obs.coe.intTél. : +33 (0)3 90 21 60 00 Fax : +33 (0)3 90 21 60 19 [email protected]
Exclusive distribution for Distribution exclusive pour Exklusiver Vertrieb für
Germany, Austria Allemagne, Autriche Deutschland, Österreich
NOMOS VERLAGSGESELLSCHAFT D - 76 520 BADEN-BADEN DEUTSCHLAND Fax: +49 (0) 7221 21 04 27 http://www.nomos.de
Spain, Latin America Espagne, Amérique latine Spanien, Lateinamerika
CINEinforme y TELEinforme Ediciones Exportfilm, S.L. Gran Vía 64 E-28013 MADRID - ESPAÑA Tel. +34 (9)1 541 21 29 / (9)1 541 27 14 Fax +34 (9)1 559 81 10 http://www.cineytele.com
Layout Maquette Gestaltung
Acom Europe, Paris
© 2009 European Audiovisual Observatory Observatoire européen de l’audiovisuel Europäische Audiovisuelle Informationsstelle, Strasbourg
Printed in France Imprimé en France Gedruckt in Frankreich
ISBN : 978-92-871-6812-2 (PDF VERSION)
AL Albania Albanie AlbanienAT Austria Autriche ÖsterreichBE Belgium Belgique BelgienBG Bulgaria Bulgarie BulgarienCH Switzerland Suisse SchweizCY Cyprus Chypre ZypernCZ Czech Republic République tchèque Tschechische RepublikDE Germany Allemagne DeutschlandDK Denmark Danemark DänemarkEE Estonia Estonie EstlandES Spain Espagne SpanienFI Finland Finlande FinnlandFR France France FrankreichGB United Kingdom Royaume-Uni Vereinigtes KönigreichGR Greece Grèce GriechenlandHR Croatia Croatie KroatienHU Hungary Hongrie UngarnIE Ireland Irlande IrlandIS Iceland Islande IslandIT Italy Italie ItalienLI Liechtenstein Principauté du Liechtenstein Fürstentum LiechtensteinLT Lithuania Lituanie LitauenLU Luxembourg Luxembourg LuxemburgLV Latvia Lettonie Lettland
MK “The former Yugoslav Republic of Macedonia“
“Ex-République yougoslave de Macédoine”
“ Ehemalige jugoslawische Republik Mazedonien“
MT Malta Malte MaltaNL Netherlands Pays-Bas NiederlandeNO Norway Norvège NorwegenPL Poland Pologne PolenPT Portugal Portugal PortugalRO Romania Roumanie RumänienRU Russian Federation Fédération de Russie Russische FöderationSE Sweden Suède SchwedenSI Slovenia Slovénie SlowenienSK Slovak Republic République slovaque Slowakische RepublikTR Turkey Turquie Türkei
EUR 15 European Community prior to 1 May 2004
Communauté européenne avant le 1er mai 2004
Europäische Gemeinschaft vor dem 1. Mai 2004
DZ Algeria Algérie AlgerienEG Egypt Egypte ÄgyptenIL Israel Israël IsraelJO Jordan Jordanie JordanienJP Japan Japon JapanLB Lebanon Liban LibanonMA Morocco Maroc MarokkoSA Saudi Arabia Arabie Saoudite Saudi-ArabienSY Syrian Arabic Republic République arabe de Syrie Arabische Republik SyrienTN Tunisia Tunisie TunesienUS United States of America Etats-Unis d'Amérique Vereinigte Staaten von Amerika
BA Bosnia and Herzegovina Bosnie-Herzégovine Bosnien-HerzegowinaBY Belarus Bielorussie WeißrusslandMD Moldova Moldavie MoldawienUA Ukraine Ukraine Ukraine
If you wish to reproduce tables or graphs contained in this publication please contact the European Audiovisual Observatory for prior approval. Please note that the European Audiovisual Observatory can only authorise reproduction of tables or graphs sourced as “European Audiovisual Observatory” or “OBS“. All other entries may only be reproduced with the consent of the original source.
Si vous souhaitez reproduire des tableaux ou graphiques de cette publication, veuillez contacter l’Observatoire européen de l’audiovisuel pour une autorisation préalable. Merci de noter que l’Observatoire européen de l’audiovisuel ne peut autoriser que la reproduction des tableaux et graphiques sourcés avec la mention “Source: European Audiovisual Observatory” ou “OBS”. La reproduction des autres tableaux et graphiques ne peut être effectuée sans l’autorisation préalable des sources originales.
Vor einer eventuellen Reproduktion von in dieser Publikation enthaltenen Tabellen oder Graphiken holen Sie bitte das Einverständnis der Europäischen Audiovisuellen Informationsstelle ein. Bitte beachten Sie, dass die Europäische Audiovisuelle Informationsstelle nur die Reproduktion der Tabellen oder Graphiken, die mit „Source: European Audiovisual Observatory” oder „OBS” gekennzeichnet sind, gestatten kann. Alle anderen Einträge können nur im Einverständnis mit der Originalquelle reproduziert werden.
Members of the European Audiovisual Observatory
Non-European States
European States non- members of the European Audiovisual Observatory
Membres de l’Observatoire européen de l’audiovisuel
Etats non-européens
Etats européens non-membres de l’Observatoire européen de l’audiovisuel
Mitglieder der Europäischen Audiovisuellen Informationsstelle
Außereuropäische Staaten
Europäische Staaten, die nicht Mitglied der Informationsstelle sind

1
2009
Television in 36 European States
La télévision dans 36 Etats européens
Fernsehen in 36 europäischen Staaten
1V o l u m eB a n D
Film, television and video in EuropeYEARBOOK 2009
The three-volume European Audiovisual Observatory Year-book offers a comprehensive
overview of the audiovisual sector in the Observatory’s 36 member states.
Data from more than 1,000 different sources are collected and analysed, and information is presented in over 500 graphs and tables. The result is a unique overview of Europe’s audio-visual markets in film, television and video.
The impartiality of the data presented is guaranteed by the Observatory’s sta-tus as a pan-European public body.
The three volumes of the Yearbook constitute an outstanding source for all those involved in the audiovisual sector, whether policy makers, profes-sionals or academics.
Film, télévision et vidéo en EuropeANNUAIRE 2009
L’Annuaire de l’Observatoire euro-péen de l’audiovisuel présente en trois volumes une analyse
complète du secteur audiovisuel (cinéma, télévision et vidéo) dans ses 36 Etats membres.
La préparation et l’exploitation de données issues de plus de mille sour-ces différentes et la présentation des résultats en plus de cinq cents gra-phiques et tableaux donnent une vue d’ensemble unique du marché en Europe.
Le statut d'organisme de service pu-blic paneuropéen garantit l'impartia-lité de ces données.
Le présent Annuaire en trois volumes constitue de ce fait une remarquable source d’information pour les profes-sionnels, les décideurs et les scienti-fiques.
Film, Fernsehen und Video in EuropaJAHRBUCH 2009
Das Jahrbuch der Europäischen Audiovisuellen Informati-onsstelle gibt für ihre 36 Mit-
gliedstaaten in drei Bänden einen umfassenden Überblick über die Ent-wicklung des audiovisuellen Sektors in den Bereichen Film, Fernsehen und Video.
Die Aufbereitung und Auswertung von mehr als 1000 Einzelquellen und die Darstellung der Ergebnisse in über 500 Graphiken und Tabellen verschaffen in Europa einen einmali-gen Marktüberblick.
Die Neutralität der Darstellung wird durch den öffentlich-rechtlichen Sta-tus der Europäischen Audiovisuellen Informationsstelle garantiert.
Damit bietet das vorliegende Jahr-buch mit seinen drei Bänden eine hervorragende Informationsquelle für alle Zielgruppen in der Politik, in der Industrie und in der Wissenschaft.
The content of the Yearbook is also available online:Le contenu de cet annuaire est également disponible en ligne : Die Inhalte des Jahrbuchs stehen auch online zur Verfügung: http://www.obs.coe.int/yb_premium/ Eu
rope
an A
udio
visu
al O
bser
vato
ry –
Obs
erva
toire
eur
opée
n de
l’au
diov
isue
l – E
urop
äisc
he A
udio
visu
elle
Info
rmat
ions
stel
le20
09
> 6 <
YEARBOOK • ANNUAIRE • JAHRBUCH
Television in 36 European States
La télévision dans 36 Etats européens
Fernsehen in 36 europäischen Staaten
195e272 pages | Seiten
ISBN 978-92-871-6812-2PDF VERSION
Trends in European television
Les tendances de la télévision européenne
Trends im europäischen Fernsehen
195 e224 pages | Seiten
ISBN 978-92-871-6813-9PDF VERSION
Film and home video
Cinéma et vidéo
Film und Video
142,50 e128 pages | Seiten
ISBN 978-92-871-6814-6PDF VERSION
V o l u m eB a n D
V o l u m eB a n D
V o l u m eB a n D1 2 3
PDF VERSION