Kinetic theory based computation of PSRI riser: Part I—Estimate of mass transfer coefficient
11
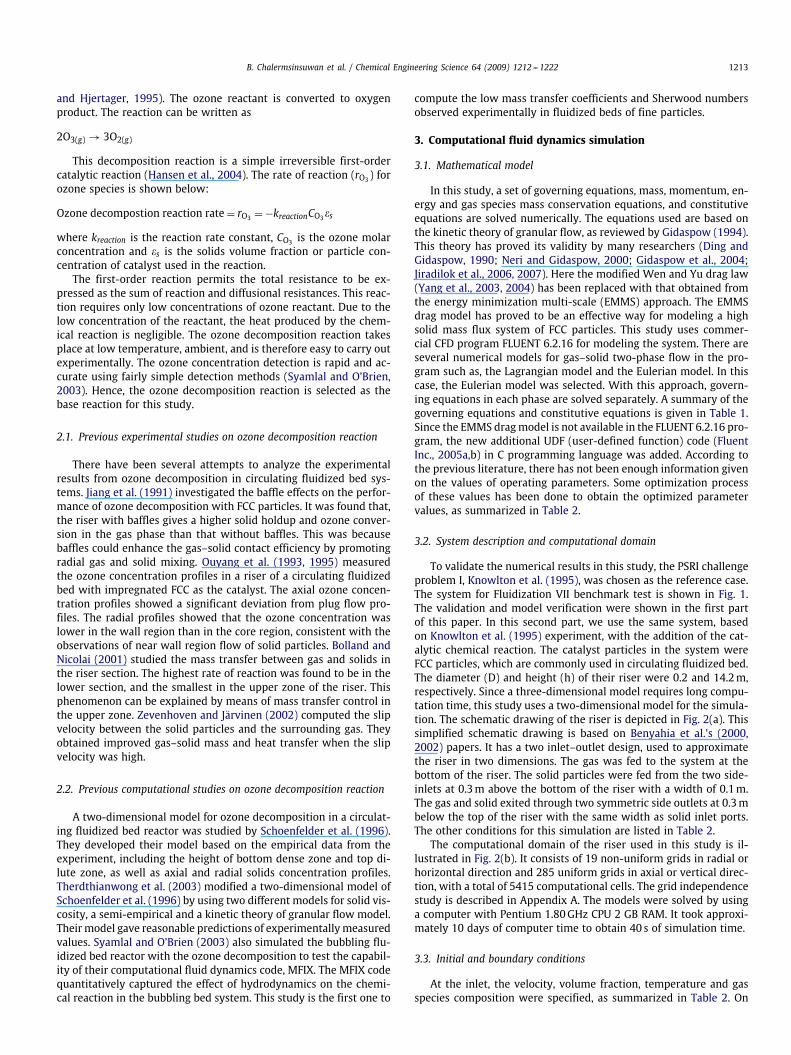
Chemical Engineering Science 64 (2009) 1212--1222 Contents lists available at ScienceDirect Chemical Engineering Science journal homepage: www.elsevier.com/locate/ces Kinetic theory based computation of PSRI riser: Part II—Computation of mass transfer coefficient with chemical reaction Benjapon Chalermsinsuwan a,b , Pornpote Piumsomboon a,b , Dimitri Gidaspow c, ∗ a Fuels Research Center, Department of Chemical Technology, Faculty of Science, Chulalongkorn University, Phayathai Road, Patumwan, Bangkok 10330, Thailand b Center of Excellence for Petroleum, Petrochemicals, and Advanced Materials, Chulalongkorn University, Bangkok 10330, Thailand c Department of Chemical and Biological Engineering, Illinois Institute of Technology, Chicago, IL 60616, USA ARTICLE INFO ABSTRACT Article history: Received 18 February 2008 Received in revised form 2 November 2008 Accepted 7 November 2008 Available online 19 November 2008 Keywords: CFD Clusters Fluidization Mass transfer Sherwood number Ozone decomposition The design of circulating fluidized bed systems requires the knowledge of mass transfer coefficients or Sherwood numbers. A literature review shows that these parameters in fluidized beds differ up to seven orders of magnitude. To understand the phenomena, a kinetic theory based computation was used to simulate the PSRI chal- lenge problem I data for flow of FCC particles in a riser, with an addition of an ozone decomposition reaction. The mass transfer coefficients and the Sherwood numbers were computed using the concept of additive resistances. The Sherwood number is of the order of 4×10 −3 and the mass transfer coefficient is of the order of 2×10 −3 m/s, in agreement with the measured data for fluidization of small particles and the estimated values from the particle cluster diameter in part one of this paper. The Sherwood number is high near the inlet section, then decreases to a constant value with the height of the riser. The Sherwood number also varies slightly with the reaction rate constant. The conventionally computed Sherwood number measures the radial distribution of concentration caused by the fluidized bed hydrodynamics, not the diffusional resistance between the bulk and the particle surface concentration. Hence, the extremely low literature Sherwood numbers for fluidization of fine particles do not necessarily imply very poor mass transfer. © 2008 Elsevier Ltd. All rights reserved. 1. Introduction The design of circulating fluidized bed systems, such as gasifiers (Yoon et al., 1978; Gidaspow and Jiradilok, 2007), requires the knowl- edge of mass transfer coefficients or Sherwood numbers. Transport phenomena texts (e.g., Bird et al., 2002) show that the Sherwood number or the Nusselt number for related heat transfer is two, based on the diameter of particle. Indeed for large particles, Gunn (1978) has shown that the Sherwood number equals two, the diffusion limit, plus a contribution due to convection expressed in terms of Reynolds and Schmidt numbers. The mass transfer and heat transfer coeffi- cients are known to be much lower for fine particles than those given by correlations for large particles (Zabrodsky, 1966; Turton and Levenspiel, 1989; Kunii and Levenspiel, 1991). Recently, Breault (2006) has reviewed the literature and has shown that the Sher- wood numbers differ up to seven orders of magnitude ranging from a low value of 10 −5 , as reported by Bolland and Nicolai (2001). One ∗ Corresponding author. Tel.: +1 312 567 3045; fax: +1 312 567 8874. E-mail address: [email protected] (D. Gidaspow). 0009-2509/$ - see front matter © 2008 Elsevier Ltd. All rights reserved. doi:10.1016/j.ces.2008.11.006 possible explanation for this phenomenon is the formation of particle clusters. The second more plausible explanation is that the conven- tional method of computing mass transfer coefficients in fluidized beds shows the effect of radial distribution of concentration and has little to do with diffusion to an individual particle. Hence, the rep- resentation in terms of the Sherwood number is misleading. In the first part of the paper, the conventional methodology for es- timation of the Sherwood numbers is described. In this second part, a different methodology for computation of the very low Sherwood numbers and mass transfer coefficients, with the chemical reaction is proposed. The computed Sherwood numbers agree with very small values reported in the literature. The variation of the Sherwood num- bers with reactor length is similar to those found from the Leveque solution of laminar convection problems and experimental observa- tions. The Sherwood numbers are high in the entrance region and reach a constant value, like in the developed flow mass transfer. 2. Ozone decomposition reaction The ozone decomposition or dissociation reaction is one of the frequently used chemical reactions for studying reactions in the cir- culating fluidized bed systems (Fryer and Potter, 1976; Samuelsberg
-
Upload
independent -
Category
Documents
-
view
1 -
download
0
Transcript of Kinetic theory based computation of PSRI riser: Part I—Estimate of mass transfer coefficient
Chemical Engineering Science 64 (2009) 1212 -- 1222
Contents lists available at ScienceDirect
Chemical Engineering Science
journal homepage: www.e lsev ier .com/ locate /ces
Kinetic theory based computation of PSRI riser: Part II—Computation of mass transfercoefficientwith chemical reaction
Benjapon Chalermsinsuwana,b, Pornpote Piumsomboona,b, Dimitri Gidaspowc,∗
aFuels Research Center, Department of Chemical Technology, Faculty of Science, Chulalongkorn University, Phayathai Road, Patumwan, Bangkok 10330, ThailandbCenter of Excellence for Petroleum, Petrochemicals, and Advanced Materials, Chulalongkorn University, Bangkok 10330, ThailandcDepartment of Chemical and Biological Engineering, Illinois Institute of Technology, Chicago, IL 60616, USA
A R T I C L E I N F O A B S T R A C T
Article history:Received 18 February 2008Received in revised form 2 November 2008Accepted 7 November 2008Available online 19 November 2008
Keywords:CFDClustersFluidizationMass transferSherwood numberOzone decomposition
The design of circulating fluidized bed systems requires the knowledge of mass transfer coefficients orSherwood numbers. A literature review shows that these parameters in fluidized beds differ up to sevenorders of magnitude.To understand the phenomena, a kinetic theory based computation was used to simulate the PSRI chal-lenge problem I data for flow of FCC particles in a riser, with an addition of an ozone decompositionreaction. The mass transfer coefficients and the Sherwood numbers were computed using the concept ofadditive resistances. The Sherwood number is of the order of 4×10⁻³ and the mass transfer coefficient isof the order of 2×10⁻³ m/s, in agreement with the measured data for fluidization of small particles andthe estimated values from the particle cluster diameter in part one of this paper. The Sherwood number ishigh near the inlet section, then decreases to a constant value with the height of the riser. The Sherwoodnumber also varies slightly with the reaction rate constant. The conventionally computed Sherwoodnumber measures the radial distribution of concentration caused by the fluidized bed hydrodynamics, notthe diffusional resistance between the bulk and the particle surface concentration. Hence, the extremelylow literature Sherwood numbers for fluidization of fine particles do not necessarily imply very poormass transfer.
© 2008 Elsevier Ltd. All rights reserved.
1. Introduction
The design of circulating fluidized bed systems, such as gasifiers(Yoon et al., 1978; Gidaspow and Jiradilok, 2007), requires the knowl-edge of mass transfer coefficients or Sherwood numbers. Transportphenomena texts (e.g., Bird et al., 2002) show that the Sherwoodnumber or the Nusselt number for related heat transfer is two, basedon the diameter of particle. Indeed for large particles, Gunn (1978)has shown that the Sherwood number equals two, the diffusion limit,plus a contribution due to convection expressed in terms of Reynoldsand Schmidt numbers. The mass transfer and heat transfer coeffi-cients are known to be much lower for fine particles than thosegiven by correlations for large particles (Zabrodsky, 1966; Turtonand Levenspiel, 1989; Kunii and Levenspiel, 1991). Recently, Breault(2006) has reviewed the literature and has shown that the Sher-wood numbers differ up to seven orders of magnitude ranging froma low value of 10−5, as reported by Bolland and Nicolai (2001). One
∗ Corresponding author. Tel.: +13125673045; fax: +13125678874.E-mail address: [email protected] (D. Gidaspow).
0009-2509/$ - see front matter © 2008 Elsevier Ltd. All rights reserved.doi:10.1016/j.ces.2008.11.006
possible explanation for this phenomenon is the formation of particleclusters. The second more plausible explanation is that the conven-tional method of computing mass transfer coefficients in fluidizedbeds shows the effect of radial distribution of concentration and haslittle to do with diffusion to an individual particle. Hence, the rep-resentation in terms of the Sherwood number is misleading.
In the first part of the paper, the conventional methodology for es-timation of the Sherwood numbers is described. In this second part,a different methodology for computation of the very low Sherwoodnumbers and mass transfer coefficients, with the chemical reactionis proposed. The computed Sherwood numbers agree with very smallvalues reported in the literature. The variation of the Sherwood num-bers with reactor length is similar to those found from the Levequesolution of laminar convection problems and experimental observa-tions. The Sherwood numbers are high in the entrance region andreach a constant value, like in the developed flow mass transfer.
2. Ozone decomposition reaction
The ozone decomposition or dissociation reaction is one of thefrequently used chemical reactions for studying reactions in the cir-culating fluidized bed systems (Fryer and Potter, 1976; Samuelsberg
B. Chalermsinsuwan et al. / Chemical Engineering Science 64 (2009) 1212 -- 1222 1213
and Hjertager, 1995). The ozone reactant is converted to oxygenproduct. The reaction can be written as
2O3(g) → 3O2(g)
This decomposition reaction is a simple irreversible first-ordercatalytic reaction (Hansen et al., 2004). The rate of reaction (rO3 ) forozone species is shown below:
Ozone decompostion reaction rate = rO3 = −kreactionCO3�s
where kreaction is the reaction rate constant, CO3 is the ozone molarconcentration and �s is the solids volume fraction or particle con-centration of catalyst used in the reaction.
The first-order reaction permits the total resistance to be ex-pressed as the sum of reaction and diffusional resistances. This reac-tion requires only low concentrations of ozone reactant. Due to thelow concentration of the reactant, the heat produced by the chem-ical reaction is negligible. The ozone decomposition reaction takesplace at low temperature, ambient, and is therefore easy to carry outexperimentally. The ozone concentration detection is rapid and ac-curate using fairly simple detection methods (Syamlal and O'Brien,2003). Hence, the ozone decomposition reaction is selected as thebase reaction for this study.
2.1. Previous experimental studies on ozone decomposition reaction
There have been several attempts to analyze the experimentalresults from ozone decomposition in circulating fluidized bed sys-tems. Jiang et al. (1991) investigated the baffle effects on the perfor-mance of ozone decomposition with FCC particles. It was found that,the riser with baffles gives a higher solid holdup and ozone conver-sion in the gas phase than that without baffles. This was becausebaffles could enhance the gas–solid contact efficiency by promotingradial gas and solid mixing. Ouyang et al. (1993, 1995) measuredthe ozone concentration profiles in a riser of a circulating fluidizedbed with impregnated FCC as the catalyst. The axial ozone concen-tration profiles showed a significant deviation from plug flow pro-files. The radial profiles showed that the ozone concentration waslower in the wall region than in the core region, consistent with theobservations of near wall region flow of solid particles. Bolland andNicolai (2001) studied the mass transfer between gas and solids inthe riser section. The highest rate of reaction was found to be in thelower section, and the smallest in the upper zone of the riser. Thisphenomenon can be explained by means of mass transfer control inthe upper zone. Zevenhoven and Jarvinen (2002) computed the slipvelocity between the solid particles and the surrounding gas. Theyobtained improved gas–solid mass and heat transfer when the slipvelocity was high.
2.2. Previous computational studies on ozone decomposition reaction
A two-dimensional model for ozone decomposition in a circulat-ing fluidized bed reactor was studied by Schoenfelder et al. (1996).They developed their model based on the empirical data from theexperiment, including the height of bottom dense zone and top di-lute zone, as well as axial and radial solids concentration profiles.Therdthianwong et al. (2003) modified a two-dimensional model ofSchoenfelder et al. (1996) by using two different models for solid vis-cosity, a semi-empirical and a kinetic theory of granular flow model.Theirmodel gave reasonable predictions of experimentallymeasuredvalues. Syamlal and O'Brien (2003) also simulated the bubbling flu-idized bed reactor with the ozone decomposition to test the capabil-ity of their computational fluid dynamics code, MFIX. The MFIX codequantitatively captured the effect of hydrodynamics on the chemi-cal reaction in the bubbling bed system. This study is the first one to
compute the low mass transfer coefficients and Sherwood numbersobserved experimentally in fluidized beds of fine particles.
3. Computational fluid dynamics simulation
3.1. Mathematical model
In this study, a set of governing equations, mass, momentum, en-ergy and gas species mass conservation equations, and constitutiveequations are solved numerically. The equations used are based onthe kinetic theory of granular flow, as reviewed by Gidaspow (1994).This theory has proved its validity by many researchers (Ding andGidaspow, 1990; Neri and Gidaspow, 2000; Gidaspow et al., 2004;Jiradilok et al., 2006, 2007). Here the modified Wen and Yu drag law(Yang et al., 2003, 2004) has been replaced with that obtained fromthe energy minimization multi-scale (EMMS) approach. The EMMSdrag model has proved to be an effective way for modeling a highsolid mass flux system of FCC particles. This study uses commer-cial CFD program FLUENT 6.2.16 for modeling the system. There areseveral numerical models for gas–solid two-phase flow in the pro-gram such as, the Lagrangian model and the Eulerian model. In thiscase, the Eulerian model was selected. With this approach, govern-ing equations in each phase are solved separately. A summary of thegoverning equations and constitutive equations is given in Table 1.Since the EMMS dragmodel is not available in the FLUENT 6.2.16 pro-gram, the new additional UDF (user-defined function) code (FluentInc., 2005a,b) in C programming language was added. According tothe previous literature, there has not been enough information givenon the values of operating parameters. Some optimization processof these values has been done to obtain the optimized parametervalues, as summarized in Table 2.
3.2. System description and computational domain
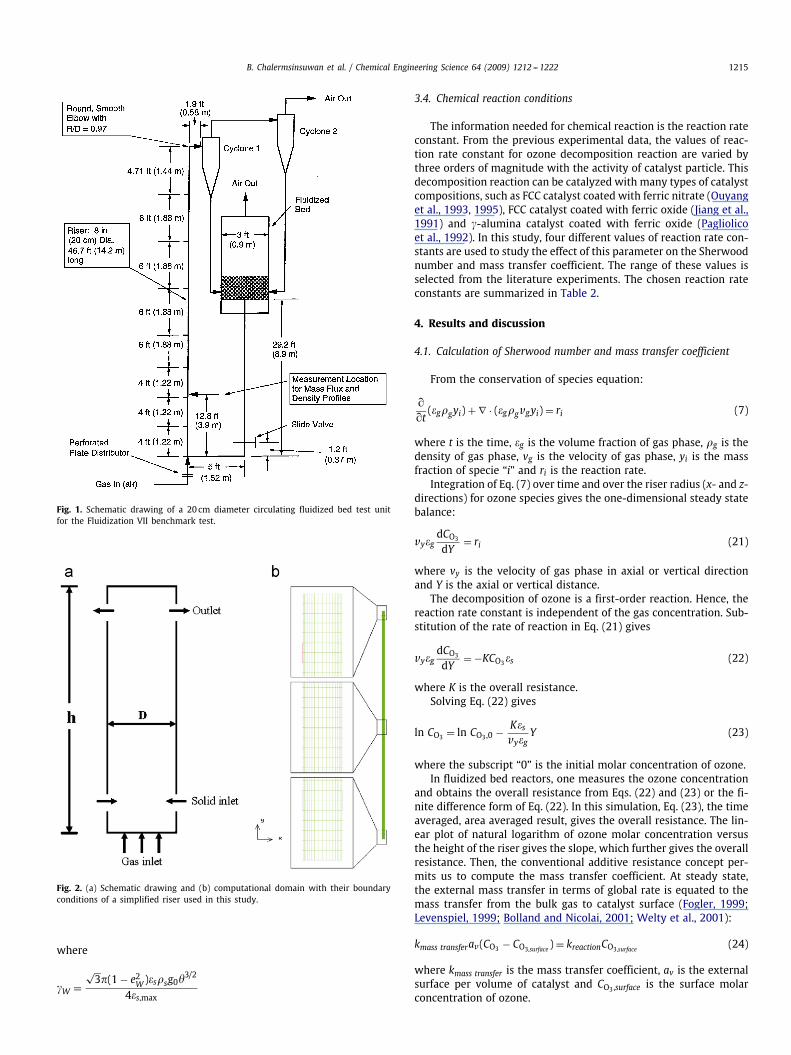
To validate the numerical results in this study, the PSRI challengeproblem I, Knowlton et al. (1995), was chosen as the reference case.The system for Fluidization VII benchmark test is shown in Fig. 1.The validation and model verification were shown in the first partof this paper. In this second part, we use the same system, basedon Knowlton et al. (1995) experiment, with the addition of the cat-alytic chemical reaction. The catalyst particles in the system wereFCC particles, which are commonly used in circulating fluidized bed.The diameter (D) and height (h) of their riser were 0.2 and 14.2m,respectively. Since a three-dimensional model requires long compu-tation time, this study uses a two-dimensional model for the simula-tion. The schematic drawing of the riser is depicted in Fig. 2(a). Thissimplified schematic drawing is based on Benyahia et al.'s (2000,2002) papers. It has a two inlet–outlet design, used to approximatethe riser in two dimensions. The gas was fed to the system at thebottom of the riser. The solid particles were fed from the two side-inlets at 0.3m above the bottom of the riser with a width of 0.1m.The gas and solid exited through two symmetric side outlets at 0.3mbelow the top of the riser with the same width as solid inlet ports.The other conditions for this simulation are listed in Table 2.
The computational domain of the riser used in this study is il-lustrated in Fig. 2(b). It consists of 19 non-uniform grids in radial orhorizontal direction and 285 uniform grids in axial or vertical direc-tion, with a total of 5415 computational cells. The grid independencestudy is described in Appendix A. The models were solved by usinga computer with Pentium 1.80GHz CPU 2 GB RAM. It took approxi-mately 10 days of computer time to obtain 40 s of simulation time.
3.3. Initial and boundary conditions
At the inlet, the velocity, volume fraction, temperature and gasspecies composition were specified, as summarized in Table 2. On
1214 B. Chalermsinsuwan et al. / Chemical Engineering Science 64 (2009) 1212 -- 1222
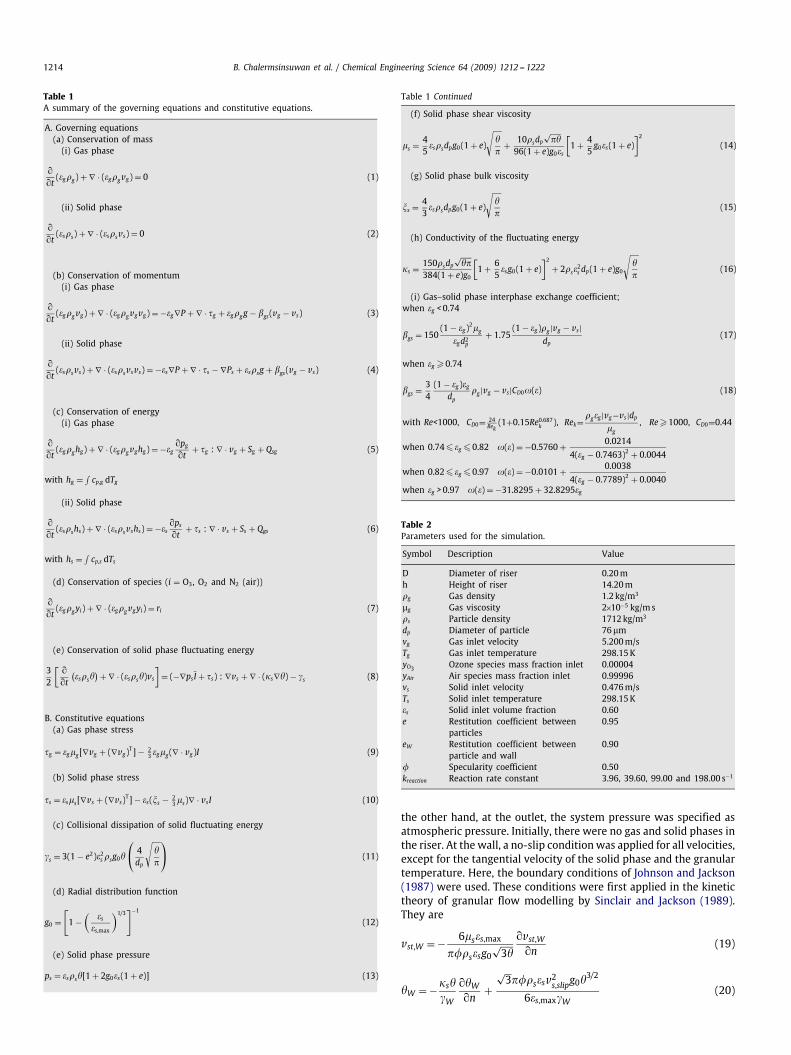
Table 1A summary of the governing equations and constitutive equations.
A. Governing equations(a) Conservation of mass
(i) Gas phase
��t
(�g�g) + ∇ · (�g�gvg) = 0 (1)
(ii) Solid phase
��t
(�s�s) + ∇ · (�s�svs) = 0 (2)
(b) Conservation of momentum(i) Gas phase
��t
(�g�gvg) + ∇ · (�g�gvgvg) = −�g∇P + ∇ · �g + �g�gg − �gs(vg − vs) (3)
(ii) Solid phase
��t
(�s�svs) + ∇ · (�s�svsvs) = −�s∇P + ∇ · �s − ∇Ps + �s�sg + �gs(vg − vs) (4)
(c) Conservation of energy(i) Gas phase
��t
(�g�ghg) + ∇ · (�g�gvghg) = −�g�pg
�t+ �g : ∇ · vg + Sg + Qsg (5)
with hg = ∫cp,g dTg
(ii) Solid phase
��t
(�s�shs) + ∇ · (�s�svshs) = −�s�ps
�t+ �s : ∇ · vs + Ss + Qgs (6)
with hs = ∫cp,s dTs
(d) Conservation of species (i = O3, O2 and N2 (air))
��t
(�g�gyi) + ∇ · (�g�gvgyi) = ri (7)
(e) Conservation of solid phase fluctuating energy
32
[��t
(�s�s�
) + ∇ · (�s�s�)vs
]= (−∇psI + �s) : ∇vs + ∇ · (�s∇�) − �s (8)
B. Constitutive equations(a) Gas phase stress
�g = �gg[∇vg + (∇vg)T] − 2
3 �gg(∇ · vg)I (9)
(b) Solid phase stress
�s = �ss[∇vs + (∇vs)T] − �s(s − 2
3 s)∇ · vsI (10)
(c) Collisional dissipation of solid fluctuating energy
�s = 3(1 − e2)�2s �sg0�
⎛⎝ 4dp
√��
⎞⎠ (11)
(d) Radial distribution function
g0 =[1 −
(�s
�s,max
)1/3]−1
(12)
(e) Solid phase pressure
ps = �s�s�[1 + 2g0�s(1 + e)] (13)
Table 1 Continued
(f) Solid phase shear viscosity
s = 45
�s�sdpg0(1 + e)
√��
+ 10�sdp
√��
96(1 + e)g0�s
[1 + 4
5g0�s(1 + e)
]2
(14)
(g) Solid phase bulk viscosity
s = 43
�s�sdpg0(1 + e)
√��
(15)
(h) Conductivity of the fluctuating energy
�s = 150�sdp
√��
384(1 + e)g0
[1 + 6
5�sg0(1 + e)
]2
+ 2�s�2s dp(1 + e)g0
√��
(16)
(i) Gas–solid phase interphase exchange coefficient;when �g <0.74
�gs = 150(1 − �g)
2g
�gd2p
+ 1.75(1 − �g)�g |vg − vs|
dp(17)
when �g �0.74
�gs = 34(1 − �g)�g
dp
�g |vg − vs|CD0�(�) (18)
with Re<1000, CD0= 24Rek
(1+0.15Re0.687k ), Rek=�g�g |vg−vs|dp
g
, Re�1000, CD0=0.44
when 0.74� �g �0.82 �(�) = −0.5760 + 0.0214
4(�g − 0.7463)2 + 0.0044
when 0.82� �g �0.97 �(�) = −0.0101 + 0.0038
4(�g − 0.7789)2 + 0.0040when �g >0.97 �(�) = −31.8295 + 32.8295�g
Table 2Parameters used for the simulation.
Symbol Description Value
D Diameter of riser 0.20mh Height of riser 14.20m�g Gas density 1.2 kg/m3
�g Gas viscosity 2×10⁻⁵ kg/ms�s Particle density 1712kg/m3
dp Diameter of particle 76�mvg Gas inlet velocity 5.200m/sTg Gas inlet temperature 298.15KyO3 Ozone species mass fraction inlet 0.00004yAir Air species mass fraction inlet 0.99996vs Solid inlet velocity 0.476m/sTs Solid inlet temperature 298.15K�s Solid inlet volume fraction 0.60e Restitution coefficient between
particles0.95
eW Restitution coefficient betweenparticle and wall
0.90
Specularity coefficient 0.50kreaction Reaction rate constant 3.96, 39.60, 99.00 and 198.00 s−1
the other hand, at the outlet, the system pressure was specified asatmospheric pressure. Initially, there were no gas and solid phases inthe riser. At the wall, a no-slip conditionwas applied for all velocities,except for the tangential velocity of the solid phase and the granulartemperature. Here, the boundary conditions of Johnson and Jackson(1987) were used. These conditions were first applied in the kinetictheory of granular flow modelling by Sinclair and Jackson (1989).They are
vst,W = − 6s�s,max
� �s�sg0√3�
�vst,W�n
(19)
�W = −�s��W
��W
�n+
√3� �s�sv
2s,slipg0�
3/2
6�s,max�W(20)
B. Chalermsinsuwan et al. / Chemical Engineering Science 64 (2009) 1212 -- 1222 1215
Fig. 1. Schematic drawing of a 20 cm diameter circulating fluidized bed test unitfor the Fluidization VII benchmark test.
Fig. 2. (a) Schematic drawing and (b) computational domain with their boundaryconditions of a simplified riser used in this study.
where
�W =√3�(1 − e2W )�s�sg0�
3/2
4�s,max
3.4. Chemical reaction conditions
The information needed for chemical reaction is the reaction rateconstant. From the previous experimental data, the values of reac-tion rate constant for ozone decomposition reaction are varied bythree orders of magnitude with the activity of catalyst particle. Thisdecomposition reaction can be catalyzed with many types of catalystcompositions, such as FCC catalyst coated with ferric nitrate (Ouyanget al., 1993, 1995), FCC catalyst coated with ferric oxide (Jiang et al.,1991) and �-alumina catalyst coated with ferric oxide (Pagliolicoet al., 1992). In this study, four different values of reaction rate con-stants are used to study the effect of this parameter on the Sherwoodnumber and mass transfer coefficient. The range of these values isselected from the literature experiments. The chosen reaction rateconstants are summarized in Table 2.
4. Results and discussion
4.1. Calculation of Sherwood number and mass transfer coefficient
From the conservation of species equation:
��t
(�g�gyi) + ∇ · (�g�gvgyi) = ri (7)
where t is the time, �g is the volume fraction of gas phase, �g is thedensity of gas phase, vg is the velocity of gas phase, yi is the massfraction of specie “i” and ri is the reaction rate.
Integration of Eq. (7) over time and over the riser radius (x- and z-directions) for ozone species gives the one-dimensional steady statebalance:
vy�gdCO3
dY= ri (21)
where vy is the velocity of gas phase in axial or vertical directionand Y is the axial or vertical distance.
The decomposition of ozone is a first-order reaction. Hence, thereaction rate constant is independent of the gas concentration. Sub-stitution of the rate of reaction in Eq. (21) gives
vy�gdCO3
dY= −KCO3�s (22)
where K is the overall resistance.Solving Eq. (22) gives
ln CO3 = ln CO3,0 − K�svy�g
Y (23)
where the subscript “0” is the initial molar concentration of ozone.In fluidized bed reactors, one measures the ozone concentration
and obtains the overall resistance from Eqs. (22) and (23) or the fi-nite difference form of Eq. (22). In this simulation, Eq. (23), the timeaveraged, area averaged result, gives the overall resistance. The lin-ear plot of natural logarithm of ozone molar concentration versusthe height of the riser gives the slope, which further gives the overallresistance. Then, the conventional additive resistance concept per-mits us to compute the mass transfer coefficient. At steady state,the external mass transfer in terms of global rate is equated to themass transfer from the bulk gas to catalyst surface (Fogler, 1999;Levenspiel, 1999; Bolland and Nicolai, 2001; Welty et al., 2001):
kmass transferav(CO3 − CO3,surface) = kreactionCO3,surface
(24)
where kmass transfer is the mass transfer coefficient, av is the externalsurface per volume of catalyst and CO3,surface is the surface molarconcentration of ozone.
1216 B. Chalermsinsuwan et al. / Chemical Engineering Science 64 (2009) 1212 -- 1222
0.00E+00
2.00E-07
4.00E-07
6.00E-07
8.00E-07
1.00E-06
1.20E-06
0 2 4 6 8 10 12 14Riser height (m)
Tim
e-av
erag
ed o
zone
mol
ar c
once
ntra
tion
(km
ol/m
3 ) kReaction = 3.96 1/skReaction = 39.60 1/skReaction = 99.00 1/skReaction = 198.00 1/s
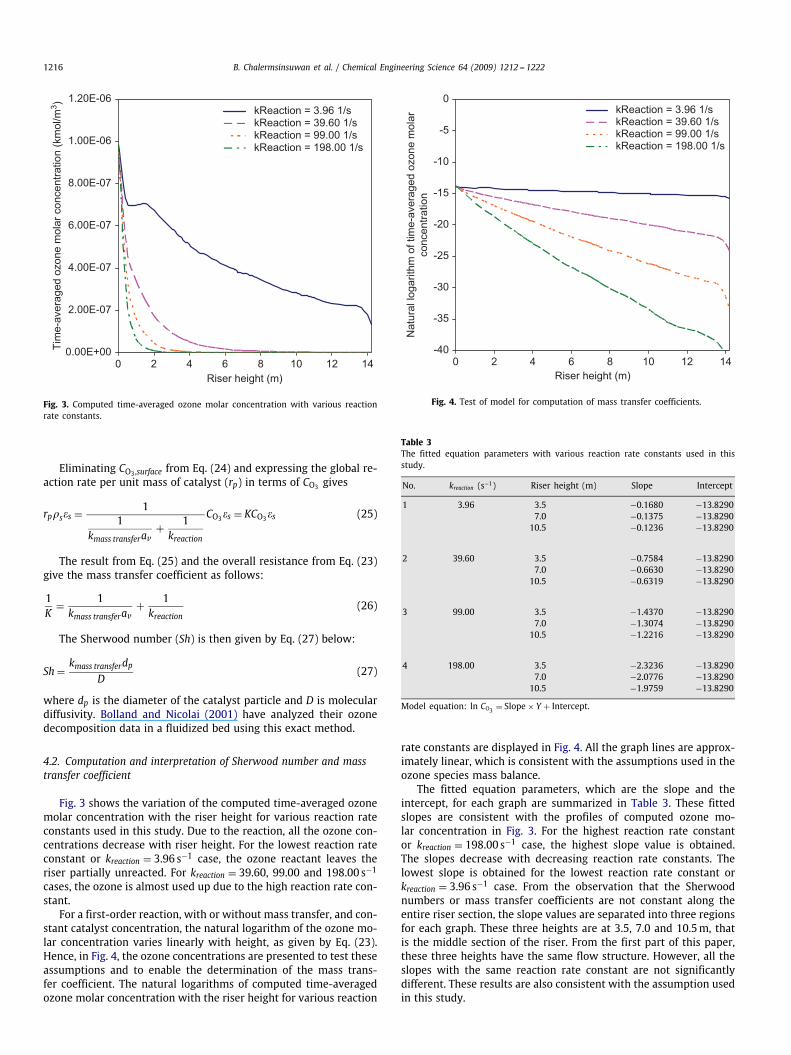
Fig. 3. Computed time-averaged ozone molar concentration with various reactionrate constants.
Eliminating CO3,surface from Eq. (24) and expressing the global re-action rate per unit mass of catalyst (rp) in terms of CO3 gives
rp�s�s = 11
kmass transferav+ 1
kreaction
CO3�s = KCO3�s (25)
The result from Eq. (25) and the overall resistance from Eq. (23)give the mass transfer coefficient as follows:
1K
= 1kmass transferav
+ 1kreaction
(26)
The Sherwood number (Sh) is then given by Eq. (27) below:
Sh = kmass transferdpD
(27)
where dp is the diameter of the catalyst particle and D is moleculardiffusivity. Bolland and Nicolai (2001) have analyzed their ozonedecomposition data in a fluidized bed using this exact method.
4.2. Computation and interpretation of Sherwood number and masstransfer coefficient
Fig. 3 shows the variation of the computed time-averaged ozonemolar concentration with the riser height for various reaction rateconstants used in this study. Due to the reaction, all the ozone con-centrations decrease with riser height. For the lowest reaction rateconstant or kreaction = 3.96 s−1 case, the ozone reactant leaves theriser partially unreacted. For kreaction = 39.60, 99.00 and 198.00 s−1
cases, the ozone is almost used up due to the high reaction rate con-stant.
For a first-order reaction, with or without mass transfer, and con-stant catalyst concentration, the natural logarithm of the ozone mo-lar concentration varies linearly with height, as given by Eq. (23).Hence, in Fig. 4, the ozone concentrations are presented to test theseassumptions and to enable the determination of the mass trans-fer coefficient. The natural logarithms of computed time-averagedozone molar concentration with the riser height for various reaction
-40
-35
-30
-25
-20
-15
-10
-5
0
0 2 4 6 8 10 12 14Riser height (m)
Nat
ural
loga
rithm
of t
ime-
aver
aged
ozo
ne m
olar
conc
entra
tion
kReaction = 3.96 1/skReaction = 39.60 1/skReaction = 99.00 1/skReaction = 198.00 1/s
Fig. 4. Test of model for computation of mass transfer coefficients.
Table 3The fitted equation parameters with various reaction rate constants used in thisstudy.
No. kreaction (s−1) Riser height (m) Slope Intercept
1 3.96 3.5 −0.1680 −13.82907.0 −0.1375 −13.8290
10.5 −0.1236 −13.8290
2 39.60 3.5 −0.7584 −13.82907.0 −0.6630 −13.8290
10.5 −0.6319 −13.8290
3 99.00 3.5 −1.4370 −13.82907.0 −1.3074 −13.8290
10.5 −1.2216 −13.8290
4 198.00 3.5 −2.3236 −13.82907.0 −2.0776 −13.8290
10.5 −1.9759 −13.8290
Model equation: ln CO3 = Slope × Y + Intercept.
rate constants are displayed in Fig. 4. All the graph lines are approx-imately linear, which is consistent with the assumptions used in theozone species mass balance.
The fitted equation parameters, which are the slope and theintercept, for each graph are summarized in Table 3. These fittedslopes are consistent with the profiles of computed ozone mo-lar concentration in Fig. 3. For the highest reaction rate constantor kreaction = 198.00 s−1 case, the highest slope value is obtained.The slopes decrease with decreasing reaction rate constants. Thelowest slope is obtained for the lowest reaction rate constant orkreaction = 3.96 s−1 case. From the observation that the Sherwoodnumbers or mass transfer coefficients are not constant along theentire riser section, the slope values are separated into three regionsfor each graph. These three heights are at 3.5, 7.0 and 10.5m, thatis the middle section of the riser. From the first part of this paper,these three heights have the same flow structure. However, all theslopes with the same reaction rate constant are not significantlydifferent. These results are also consistent with the assumption usedin this study.
B. Chalermsinsuwan et al. / Chemical Engineering Science 64 (2009) 1212 -- 1222 1217
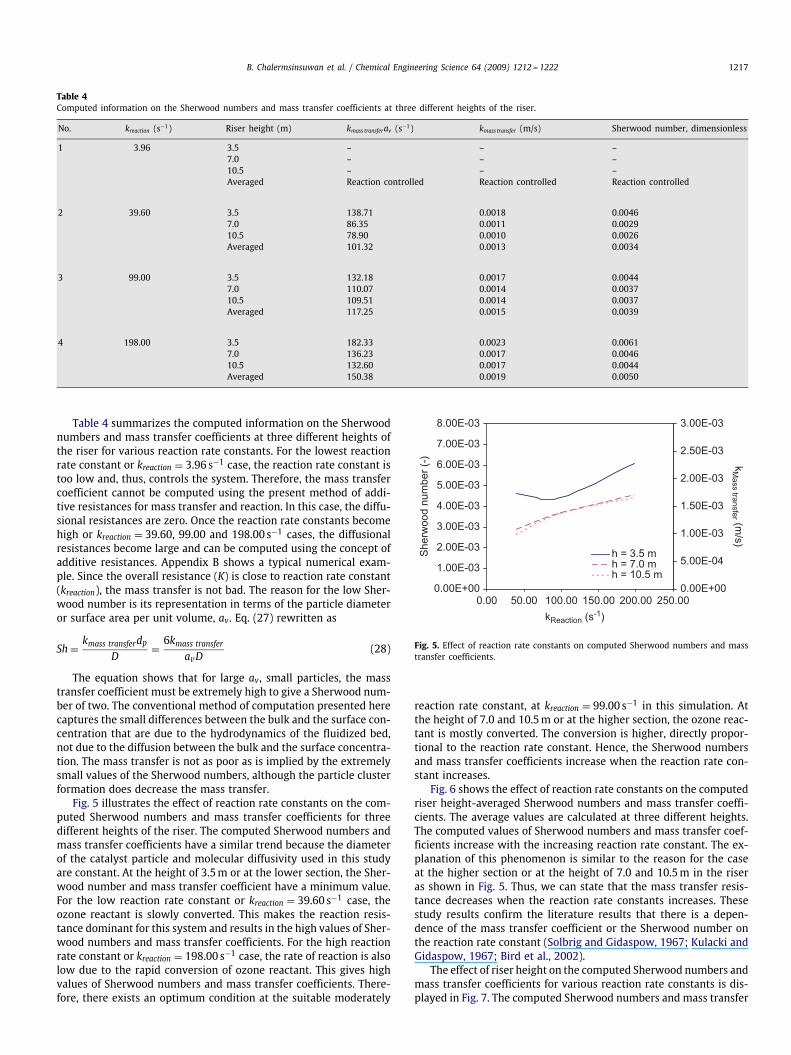
Table 4Computed information on the Sherwood numbers and mass transfer coefficients at three different heights of the riser.
No. kreaction (s−1) Riser height (m) kmass transferav (s−1) kmass transfer (m/s) Sherwood number, dimensionless
1 3.96 3.5 – – –7.0 – – –10.5 – – –Averaged Reaction controlled Reaction controlled Reaction controlled
2 39.60 3.5 138.71 0.0018 0.00467.0 86.35 0.0011 0.002910.5 78.90 0.0010 0.0026Averaged 101.32 0.0013 0.0034
3 99.00 3.5 132.18 0.0017 0.00447.0 110.07 0.0014 0.003710.5 109.51 0.0014 0.0037Averaged 117.25 0.0015 0.0039
4 198.00 3.5 182.33 0.0023 0.00617.0 136.23 0.0017 0.004610.5 132.60 0.0017 0.0044Averaged 150.38 0.0019 0.0050
Table 4 summarizes the computed information on the Sherwoodnumbers and mass transfer coefficients at three different heights ofthe riser for various reaction rate constants. For the lowest reactionrate constant or kreaction = 3.96 s−1 case, the reaction rate constant istoo low and, thus, controls the system. Therefore, the mass transfercoefficient cannot be computed using the present method of addi-tive resistances for mass transfer and reaction. In this case, the diffu-sional resistances are zero. Once the reaction rate constants becomehigh or kreaction = 39.60, 99.00 and 198.00 s−1 cases, the diffusionalresistances become large and can be computed using the concept ofadditive resistances. Appendix B shows a typical numerical exam-ple. Since the overall resistance (K) is close to reaction rate constant(kreaction), the mass transfer is not bad. The reason for the low Sher-wood number is its representation in terms of the particle diameteror surface area per unit volume, av. Eq. (27) rewritten as
Sh = kmass transferdpD
= 6kmass transfer
avD(28)
The equation shows that for large av, small particles, the masstransfer coefficient must be extremely high to give a Sherwood num-ber of two. The conventional method of computation presented herecaptures the small differences between the bulk and the surface con-centration that are due to the hydrodynamics of the fluidized bed,not due to the diffusion between the bulk and the surface concentra-tion. The mass transfer is not as poor as is implied by the extremelysmall values of the Sherwood numbers, although the particle clusterformation does decrease the mass transfer.
Fig. 5 illustrates the effect of reaction rate constants on the com-puted Sherwood numbers and mass transfer coefficients for threedifferent heights of the riser. The computed Sherwood numbers andmass transfer coefficients have a similar trend because the diameterof the catalyst particle and molecular diffusivity used in this studyare constant. At the height of 3.5m or at the lower section, the Sher-wood number and mass transfer coefficient have a minimum value.For the low reaction rate constant or kreaction = 39.60 s−1 case, theozone reactant is slowly converted. This makes the reaction resis-tance dominant for this system and results in the high values of Sher-wood numbers and mass transfer coefficients. For the high reactionrate constant or kreaction = 198.00 s−1 case, the rate of reaction is alsolow due to the rapid conversion of ozone reactant. This gives highvalues of Sherwood numbers and mass transfer coefficients. There-fore, there exists an optimum condition at the suitable moderately
0.00E+00
1.00E-03
2.00E-03
3.00E-03
4.00E-03
5.00E-03
6.00E-03
7.00E-03
8.00E-03
0.00 50.00 100.00 150.00 200.00 250.00kReaction (s-1)
She
rwoo
d nu
mbe
r (-)
0.00E+00
5.00E-04
1.00E-03
1.50E-03
2.00E-03
2.50E-03
3.00E-03
kM
ass transfer (m/s)
h = 3.5 mh = 7.0 mh = 10.5 m
Fig. 5. Effect of reaction rate constants on computed Sherwood numbers and masstransfer coefficients.
reaction rate constant, at kreaction = 99.00 s−1 in this simulation. Atthe height of 7.0 and 10.5m or at the higher section, the ozone reac-tant is mostly converted. The conversion is higher, directly propor-tional to the reaction rate constant. Hence, the Sherwood numbersand mass transfer coefficients increase when the reaction rate con-stant increases.
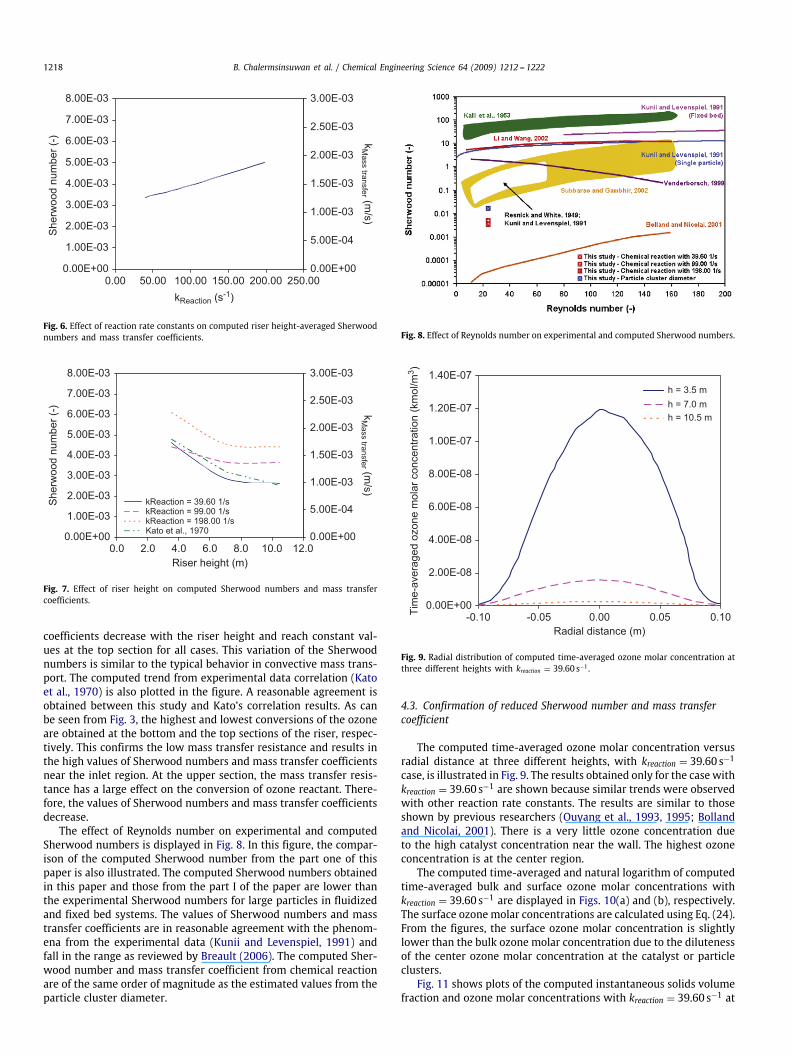
Fig. 6 shows the effect of reaction rate constants on the computedriser height-averaged Sherwood numbers and mass transfer coeffi-cients. The average values are calculated at three different heights.The computed values of Sherwood numbers and mass transfer coef-ficients increase with the increasing reaction rate constant. The ex-planation of this phenomenon is similar to the reason for the caseat the higher section or at the height of 7.0 and 10.5m in the riseras shown in Fig. 5. Thus, we can state that the mass transfer resis-tance decreases when the reaction rate constants increases. Thesestudy results confirm the literature results that there is a depen-dence of the mass transfer coefficient or the Sherwood number onthe reaction rate constant (Solbrig and Gidaspow, 1967; Kulacki andGidaspow, 1967; Bird et al., 2002).
The effect of riser height on the computed Sherwood numbers andmass transfer coefficients for various reaction rate constants is dis-played in Fig. 7. The computed Sherwood numbers and mass transfer
1218 B. Chalermsinsuwan et al. / Chemical Engineering Science 64 (2009) 1212 -- 1222
0.00E+00
1.00E-03
2.00E-03
3.00E-03
4.00E-03
5.00E-03
6.00E-03
7.00E-03
8.00E-03
0.00 50.00 100.00 150.00 200.00 250.00kReaction (s-1)
She
rwoo
d nu
mbe
r (-)
0.00E+00
5.00E-04
1.00E-03
1.50E-03
2.00E-03
2.50E-03
3.00E-03
kM
ass transfer (m/s)
Fig. 6. Effect of reaction rate constants on computed riser height-averaged Sherwoodnumbers and mass transfer coefficients.
0.00E+00
1.00E-03
2.00E-03
3.00E-03
4.00E-03
5.00E-03
6.00E-03
7.00E-03
8.00E-03
0.0 2.0 4.0 6.0 8.0 10.0 12.0Riser height (m)
She
rwoo
d nu
mbe
r (-)
0.00E+00
5.00E-04
1.00E-03
1.50E-03
2.00E-03
2.50E-03
3.00E-03
kM
ass transfer (m/s)
kReaction = 39.60 1/skReaction = 99.00 1/skReaction = 198.00 1/sKato et al., 1970
Fig. 7. Effect of riser height on computed Sherwood numbers and mass transfercoefficients.
coefficients decrease with the riser height and reach constant val-ues at the top section for all cases. This variation of the Sherwoodnumbers is similar to the typical behavior in convective mass trans-port. The computed trend from experimental data correlation (Katoet al., 1970) is also plotted in the figure. A reasonable agreement isobtained between this study and Kato's correlation results. As canbe seen from Fig. 3, the highest and lowest conversions of the ozoneare obtained at the bottom and the top sections of the riser, respec-tively. This confirms the low mass transfer resistance and results inthe high values of Sherwood numbers and mass transfer coefficientsnear the inlet region. At the upper section, the mass transfer resis-tance has a large effect on the conversion of ozone reactant. There-fore, the values of Sherwood numbers and mass transfer coefficientsdecrease.
The effect of Reynolds number on experimental and computedSherwood numbers is displayed in Fig. 8. In this figure, the compar-ison of the computed Sherwood number from the part one of thispaper is also illustrated. The computed Sherwood numbers obtainedin this paper and those from the part I of the paper are lower thanthe experimental Sherwood numbers for large particles in fluidizedand fixed bed systems. The values of Sherwood numbers and masstransfer coefficients are in reasonable agreement with the phenom-ena from the experimental data (Kunii and Levenspiel, 1991) andfall in the range as reviewed by Breault (2006). The computed Sher-wood number and mass transfer coefficient from chemical reactionare of the same order of magnitude as the estimated values from theparticle cluster diameter.
Fig. 8. Effect of Reynolds number on experimental and computed Sherwood numbers.
0.00E+00
2.00E-08
4.00E-08
6.00E-08
8.00E-08
1.00E-07
1.20E-07
1.40E-07
-0.10 -0.05 0.00 0.05 0.10Radial distance (m)
Tim
e-av
erag
ed o
zone
mol
ar c
once
ntra
tion
(km
ol/m
3 )
h = 3.5 mh = 7.0 mh = 10.5 m
Fig. 9. Radial distribution of computed time-averaged ozone molar concentration atthree different heights with kreaction = 39.60 s−1.
4.3. Confirmation of reduced Sherwood number and mass transfercoefficient
The computed time-averaged ozone molar concentration versusradial distance at three different heights, with kreaction = 39.60 s−1
case, is illustrated in Fig. 9. The results obtained only for the case withkreaction = 39.60 s−1 are shown because similar trends were observedwith other reaction rate constants. The results are similar to thoseshown by previous researchers (Ouyang et al., 1993, 1995; Bollandand Nicolai, 2001). There is a very little ozone concentration dueto the high catalyst concentration near the wall. The highest ozoneconcentration is at the center region.
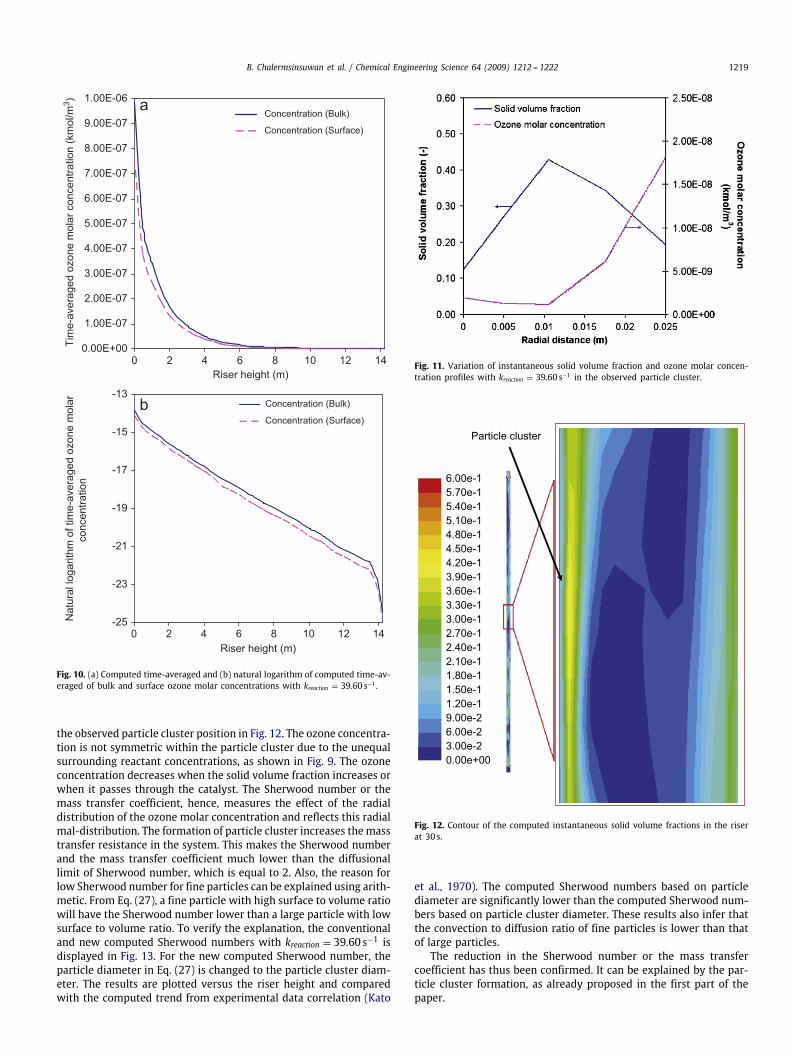
The computed time-averaged and natural logarithm of computedtime-averaged bulk and surface ozone molar concentrations withkreaction = 39.60 s−1 are displayed in Figs. 10(a) and (b), respectively.The surface ozone molar concentrations are calculated using Eq. (24).From the figures, the surface ozone molar concentration is slightlylower than the bulk ozone molar concentration due to the dilutenessof the center ozone molar concentration at the catalyst or particleclusters.
Fig. 11 shows plots of the computed instantaneous solids volumefraction and ozone molar concentrations with kreaction = 39.60 s−1 at
B. Chalermsinsuwan et al. / Chemical Engineering Science 64 (2009) 1212 -- 1222 1219
0.00E+00
1.00E-07
2.00E-07
3.00E-07
4.00E-07
5.00E-07
6.00E-07
7.00E-07
8.00E-07
9.00E-07
1.00E-06
Riser height (m)
Tim
e-av
erag
ed o
zone
mol
ar c
once
ntra
tion
(km
ol/m
3 )
Concentration (Bulk)
Concentration (Surface)
-25
-23
-21
-19
-17
-15
-13
0 2 4 6 8 10 12 14
0 2 4 6 8 10 12 14
Riser height (m)
Nat
ural
loga
rithm
of t
ime-
aver
aged
ozo
ne m
olar
conc
entra
tion
Concentration (Bulk)
Concentration (Surface)
Fig. 10. (a) Computed time-averaged and (b) natural logarithm of computed time-av-eraged of bulk and surface ozone molar concentrations with kreaction = 39.60 s−1.
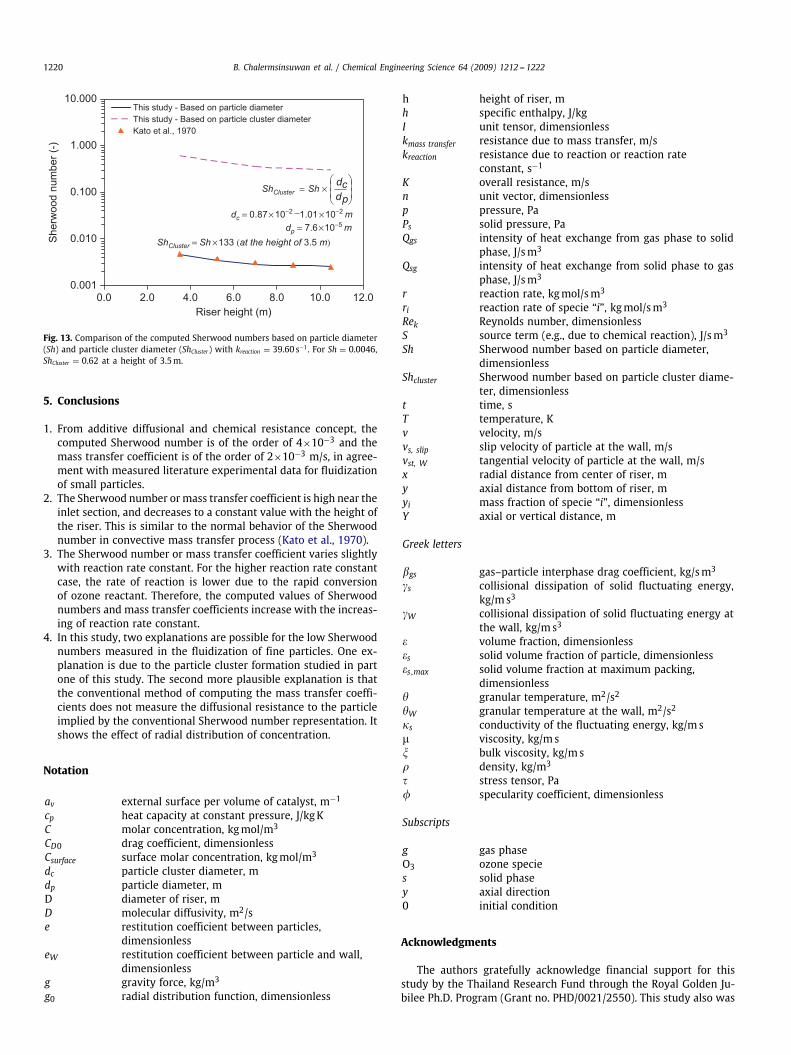
the observed particle cluster position in Fig. 12. The ozone concentra-tion is not symmetric within the particle cluster due to the unequalsurrounding reactant concentrations, as shown in Fig. 9. The ozoneconcentration decreases when the solid volume fraction increases orwhen it passes through the catalyst. The Sherwood number or themass transfer coefficient, hence, measures the effect of the radialdistribution of the ozone molar concentration and reflects this radialmal-distribution. The formation of particle cluster increases themasstransfer resistance in the system. This makes the Sherwood numberand the mass transfer coefficient much lower than the diffusionallimit of Sherwood number, which is equal to 2. Also, the reason forlow Sherwood number for fine particles can be explained using arith-metic. From Eq. (27), a fine particle with high surface to volume ratiowill have the Sherwood number lower than a large particle with lowsurface to volume ratio. To verify the explanation, the conventionaland new computed Sherwood numbers with kreaction = 39.60 s−1 isdisplayed in Fig. 13. For the new computed Sherwood number, theparticle diameter in Eq. (27) is changed to the particle cluster diam-eter. The results are plotted versus the riser height and comparedwith the computed trend from experimental data correlation (Kato
Fig. 11. Variation of instantaneous solid volume fraction and ozone molar concen-tration profiles with kreaction = 39.60 s−1 in the observed particle cluster.
Particle cluster
6.00e-15.70e-15.40e-15.10e-14.80e-14.50e-14.20e-13.90e-13.60e-13.30e-13.00e-12.70e-12.40e-12.10e-11.80e-11.50e-11.20e-19.00e-26.00e-23.00e-20.00e+00
Fig. 12. Contour of the computed instantaneous solid volume fractions in the riserat 30 s.
et al., 1970). The computed Sherwood numbers based on particlediameter are significantly lower than the computed Sherwood num-bers based on particle cluster diameter. These results also infer thatthe convection to diffusion ratio of fine particles is lower than thatof large particles.
The reduction in the Sherwood number or the mass transfercoefficient has thus been confirmed. It can be explained by the par-ticle cluster formation, as already proposed in the first part of thepaper.
1220 B. Chalermsinsuwan et al. / Chemical Engineering Science 64 (2009) 1212 -- 1222
0.001
0.010
0.100
1.000
10.000
0.0 2.0 4.0 6.0 8.0 10.0 12.0Riser height (m)
She
rwoo
d nu
mbe
r (-)
This study - Based on particle diameterThis study - Based on particle cluster diameterKato et al., 1970
pc
dd
ShCluster = Sh ×
dc = 0.87× 10⁻² −1.01 ×10⁻² mdp = 7.6×10⁻⁵ m
ShCluster = Sh ×133 (at the height of 3.5 m)
Fig. 13. Comparison of the computed Sherwood numbers based on particle diameter(Sh) and particle cluster diameter (ShCluster) with kreaction = 39.60 s−1. For Sh = 0.0046,ShCluster = 0.62 at a height of 3.5m.
5. Conclusions
1. From additive diffusional and chemical resistance concept, thecomputed Sherwood number is of the order of 4×10⁻³ and themass transfer coefficient is of the order of 2×10⁻³ m/s, in agree-ment with measured literature experimental data for fluidizationof small particles.
2. The Sherwood number ormass transfer coefficient is high near theinlet section, and decreases to a constant value with the height ofthe riser. This is similar to the normal behavior of the Sherwoodnumber in convective mass transfer process (Kato et al., 1970).
3. The Sherwood number or mass transfer coefficient varies slightlywith reaction rate constant. For the higher reaction rate constantcase, the rate of reaction is lower due to the rapid conversionof ozone reactant. Therefore, the computed values of Sherwoodnumbers and mass transfer coefficients increase with the increas-ing of reaction rate constant.
4. In this study, two explanations are possible for the low Sherwoodnumbers measured in the fluidization of fine particles. One ex-planation is due to the particle cluster formation studied in partone of this study. The second more plausible explanation is thatthe conventional method of computing the mass transfer coeffi-cients does not measure the diffusional resistance to the particleimplied by the conventional Sherwood number representation. Itshows the effect of radial distribution of concentration.
Notation
av external surface per volume of catalyst, m−1
cp heat capacity at constant pressure, J/kgKC molar concentration, kgmol/m3
CD0 drag coefficient, dimensionlessCsurface surface molar concentration, kgmol/m3
dc particle cluster diameter, mdp particle diameter, mD diameter of riser, mD molecular diffusivity, m2/se restitution coefficient between particles,
dimensionlesseW restitution coefficient between particle and wall,
dimensionlessg gravity force, kg/m3
g0 radial distribution function, dimensionless
h height of riser, mh specific enthalpy, J/kgI unit tensor, dimensionlesskmass transfer resistance due to mass transfer, m/skreaction resistance due to reaction or reaction rate
constant, s−1
K overall resistance, m/sn unit vector, dimensionlessp pressure, PaPs solid pressure, PaQgs intensity of heat exchange from gas phase to solid
phase, J/sm3
Qsg intensity of heat exchange from solid phase to gasphase, J/sm3
r reaction rate, kgmol/sm3
ri reaction rate of specie “i”, kgmol/sm3
Rek Reynolds number, dimensionlessS source term (e.g., due to chemical reaction), J/sm3
Sh Sherwood number based on particle diameter,dimensionless
Shcluster Sherwood number based on particle cluster diame-ter, dimensionless
t time, sT temperature, Kv velocity, m/svs, slip slip velocity of particle at the wall, m/svst, W tangential velocity of particle at the wall, m/sx radial distance from center of riser, my axial distance from bottom of riser, myi mass fraction of specie “i”, dimensionlessY axial or vertical distance, m
Greek letters
�gs gas–particle interphase drag coefficient, kg/sm3
�s collisional dissipation of solid fluctuating energy,kg/ms3
�W collisional dissipation of solid fluctuating energy atthe wall, kg/ms3
� volume fraction, dimensionless�s solid volume fraction of particle, dimensionless�s ,max solid volume fraction at maximum packing,
dimensionless� granular temperature, m2/s2
�W granular temperature at the wall, m2/s2
�s conductivity of the fluctuating energy, kg/ms� viscosity, kg/ms bulk viscosity, kg/ms� density, kg/m3
� stress tensor, Pa specularity coefficient, dimensionless
Subscripts
g gas phaseO3 ozone species solid phasey axial direction0 initial condition
Acknowledgments
The authors gratefully acknowledge financial support for thisstudy by the Thailand Research Fund through the Royal Golden Ju-bilee Ph.D. Program (Grant no. PHD/0021/2550). This study also was
B. Chalermsinsuwan et al. / Chemical Engineering Science 64 (2009) 1212 -- 1222 1221
Table 5The computed Sherwood numbers and mass transfer coefficients due to the effect of grid number.
No. kreaction (s−1) Grid number (radial direction×axial direction) kmass transferav (s−1) kmass transfer (m/s) Sherwood number, dimensionless
1 3.96 19×285 – – –29×428 – – –38×570 – – –
2 39.60 19×285 101.32 0.0013 0.003429×428 99.02 0.0013 0.003338×570 96.74 0.0012 0.0032
3 99.00 19×285 117.25 0.0015 0.003929×428 115.30 0.0015 0.003938×570 116.92 0.0015 0.0039
4 198.00 19×285 150.38 0.0019 0.005029×428 153.23 0.0019 0.005138×570 151.77 0.0019 0.0051
partially supported by the Chulalongkorn University Graduate Schol-arship to Commemorate the 72nd Anniversary of His Majesty KingBhumibol Adulyadej and the Centre of Excellence for Petroleum,Petrochemicals and Advanced Materials, as well as by US DOE uni-versity grant, DE-FG26-06NT42736.
Appendix A. The grid independence study
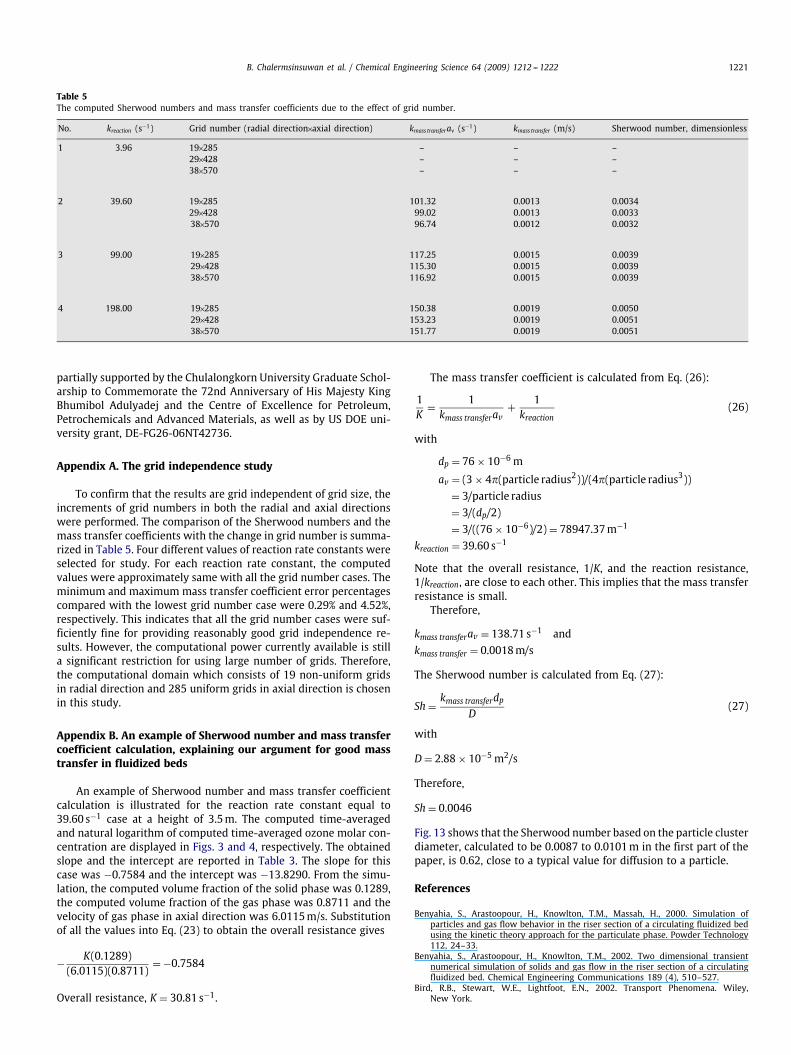
To confirm that the results are grid independent of grid size, theincrements of grid numbers in both the radial and axial directionswere performed. The comparison of the Sherwood numbers and themass transfer coefficients with the change in grid number is summa-rized in Table 5. Four different values of reaction rate constants wereselected for study. For each reaction rate constant, the computedvalues were approximately same with all the grid number cases. Theminimum and maximum mass transfer coefficient error percentagescompared with the lowest grid number case were 0.29% and 4.52%,respectively. This indicates that all the grid number cases were suf-ficiently fine for providing reasonably good grid independence re-sults. However, the computational power currently available is stilla significant restriction for using large number of grids. Therefore,the computational domain which consists of 19 non-uniform gridsin radial direction and 285 uniform grids in axial direction is chosenin this study.
Appendix B. An example of Sherwood number and mass transfercoefficient calculation, explaining our argument for good masstransfer in fluidized beds
An example of Sherwood number and mass transfer coefficientcalculation is illustrated for the reaction rate constant equal to39.60 s−1 case at a height of 3.5m. The computed time-averagedand natural logarithm of computed time-averaged ozone molar con-centration are displayed in Figs. 3 and 4, respectively. The obtainedslope and the intercept are reported in Table 3. The slope for thiscase was −0.7584 and the intercept was −13.8290. From the simu-lation, the computed volume fraction of the solid phase was 0.1289,the computed volume fraction of the gas phase was 0.8711 and thevelocity of gas phase in axial direction was 6.0115m/s. Substitutionof all the values into Eq. (23) to obtain the overall resistance gives
− K(0.1289)(6.0115)(0.8711)
= −0.7584
Overall resistance, K = 30.81 s−1.
The mass transfer coefficient is calculated from Eq. (26):
1K
= 1kmass transferav
+ 1kreaction
(26)
with
dp = 76 × 10−6 m
av = (3 × 4�(particle radius2))/(4�(particle radius3))= 3/particle radius
= 3/(dp/2)
= 3/((76 × 10−6)/2) = 78947.37m−1
kreaction = 39.60 s−1
Note that the overall resistance, 1/K, and the reaction resistance,1/kreaction, are close to each other. This implies that the mass transferresistance is small.
Therefore,
kmass transferav = 138.71 s−1 and
kmass transfer = 0.0018m/s
The Sherwood number is calculated from Eq. (27):
Sh = kmass transferdpD
(27)
with
D = 2.88 × 10⁻⁵ m2/s
Therefore,
Sh = 0.0046
Fig. 13 shows that the Sherwood number based on the particle clusterdiameter, calculated to be 0.0087 to 0.0101m in the first part of thepaper, is 0.62, close to a typical value for diffusion to a particle.
References
Benyahia, S., Arastoopour, H., Knowlton, T.M., Massah, H., 2000. Simulation ofparticles and gas flow behavior in the riser section of a circulating fluidized bedusing the kinetic theory approach for the particulate phase. Powder Technology112, 24–33.
Benyahia, S., Arastoopour, H., Knowlton, T.M., 2002. Two dimensional transientnumerical simulation of solids and gas flow in the riser section of a circulatingfluidized bed. Chemical Engineering Communications 189 (4), 510–527.
Bird, R.B., Stewart, W.E., Lightfoot, E.N., 2002. Transport Phenomena. Wiley,New York.
1222 B. Chalermsinsuwan et al. / Chemical Engineering Science 64 (2009) 1212 -- 1222
Bolland, O., Nicolai, R., 2001. Describing mass transfer in circulating fluidized bedsby ozone decomposition. Chemical Engineering Communications 187, 1–21.
Breault, R.W., 2006. A review of gas–solid dispersion and mass transfer coefficientcorrelations in circulating fluidized beds. Powder Technology 163, 9–17.
Ding, J., Gidaspow, D., 1990. A bubbling fluidization model using kinetic theory ofgranular flow. A.I.Ch.E. Journal 36, 523–538.
Fluent Inc., 2005a. Fluent 6.2 UDF Manual. Fluent Inc., Lebanon.Fluent Inc., 2005b. Fluent 6.2 User's Guide. Fluent Inc., Lebanon.Fogler, H.S., 1999. Elements of Chemical Reaction Engineering. Prentice-Hall, New
Jersey.Fryer, C., Potter, O.E., 1976. Experimental investigation of models for fluidized bed
catalytic reactors. A.I.Ch.E. Journal 22, 38–47.Gidaspow, D., 1994. Multiphase Flow and Fluidization: Continuum and Kinetic Theory
Description. Academic Press, Boston.Gidaspow, D., Jiradilok, V., 2007. Nanoparticle gasifier fuel cell for sustainable energy
future. Journal of Power Sources 166 (2), 400–410.Gidaspow, D., Jung, J., Singh, R.K., 2004. Hydrodynamics of fluidization using kinetic
theory: an emerging paradigm: 2002 Flour-Daniel lecture. Powder Technology148 (2–3), 123–141.
Gunn, D.J., 1978. Transfer of heat or mass to particles in fixed and fluidized beds.International Journal of Heat and Mass Transfer 21, 467–476.
Hansen, K.G., Solberg, T., Hjertager, B.H., 2004. A three-dimensional simulation ofgas/particle flow and ozone decomposition in the riser of a circulating fluidizedbed. Chemical Engineering Science 59, 5217–5224.
Jiang, P., Bi, H., Jean, R., Fan, L., 1991. Baffle effects on performance of catalyticcirculating fluidized bed reactor. A.I.Ch.E. Journal 37, 1392–1400.
Jiradilok, V., Gidaspow, D., Damronglerd, S., Koves, W.J., Mostofi, R., 2006. Kinetictheory based CFD simulation of turbulent fluidization of FCC particles in a riser.Chemical Engineering Science 61, 5544–5559.
Jiradilok, V., Gidaspow, D., Breault, R.W., 2007. Computation of gas and soliddispersion coefficients in turbulent risers and bubbling beds. ChemicalEngineering Science 62, 3397–3409.
Johnson, P.C., Jackson, R., 1987. Frictional–collisional constitutive relations forgranular materials, with application to plane shearing. Journal of Fluid Mechanics176, 67–93.
Kato, K., Kubota, H., Wen, C.Y., 1970. Mass transfer in fixed and fluidized beds.Chemical Engineering Progress Symposium Series 105 (66), 87–99.
Knowlton, T., Geldart, D., Masten, J., King, D., 1995. Comparison of CFB hydrodynamicmodels. PSRI Challenge Problem Presented at the Eighth InternationalFluidization Conference, Tour, France.
Kulacki, F.A., Gidaspow, D., 1967. Convective diffusion in a parallel plate duct withone catalytic wall-laminar flow-first order reaction. Part II—experimental. TheCanadian Journal of Chemical Engineering 45, 72–78.
Kunii, D., Levenspiel, O., 1991. Fluidization Engineering. Butterworth–Heinemann,Boston.
Levenspiel, O., 1999. Chemical Reaction Engineering. Wiley, New York.Neri, A., Gidaspow, D., 2000. Riser hydrodynamics: simulation using kinetic theory.
A.I.Ch.E. Journal 46, 52–67.Ouyang, S., Lin, J., Potter, O.E., 1993. Ozone decomposition in a 0.254m diameter
circulating fluidized bed reactor. Powder Technology 75, 73–78.Ouyang, S., Lin, J., Potter, O.E., 1995. Circulating fluidized bed as a catalytic reactor:
experimental study. A.I.Ch.E. Journal 41 (6), 1534–1542.Pagliolico, S., Tiprigan, M., Rovero, G., Gianetto, A., 1992. Pseudo-homogeneous
approach to CFB reactor design. Chemical Engineering Science 47 (9–11),2269–2274.
Samuelsberg, A., Hjertager, B.H., 1995. Simulation of two-phase gas/particle flow andozone decompositions in a 0.25m I.D. riser. In: Serizawa, A., Fukano, T., Batalille,J. (Eds.), Advances in Multiphase Flow. Elsevier Science B.V., Amsterdam, p. 679.
Schoenfelder, H., Kyuse, M., Werther, J., 1996. Two-dimensional model for circulatingfluidized bed reactors. A.I.Ch.E. Journal 42, 1875–1888.
Sinclair, J.L., Jackson, R., 1989. Gas–particle flow in a vertical pipe withparticle–particle interaction. A.I.Ch.E. Journal 35, 1473–1486.
Solbrig, C.W., Gidaspow, D., 1967. Convective diffusion in a parallel plate ductwith one catalytic wall-laminar flow-first order reaction. Part I—analytical. TheCanadian Journal of Chemical Engineering 45, 35–39.
Syamlal, M., O'Brien, T.J., 2003. Fluid dynamic simulation of O3 decomposition in abubbling fluidized bed. A.I.Ch.E. Journal 49 (11), 2793–2801.
Therdthianwong, A., Pantaraks, P., Therdthianwong, S., 2003. Modeling andsimulation of circulating fluidized bed reactor with catalytic ozonedecomposition reaction. Powder Technology 133, 1–14.
Turton, R., Levenspiel, O., 1989. An experiment investigation of gas–particle heattransfer coefficients in fluidized beds of fine particles. In: Grace, J.R., Schemildt,L.W., Bergougnou, M.A. (Eds.), Fluidization, vol. VI. Engineering Foundation,Alberta, p. 669.
Welty, J.R., Wicks, C.E., Wilson, R.E., Rorrer, G., 2001. Fundamentals of Momentum,Heat and Mass Transfer. Wiley, New York.
Yang, N., Wang, W., Ge, W., Li, J., 2003. CFD simulation of concurrent-up gas–solidflow in circulating fluidized beds with structure-dependent drag coefficient.Chemical Engineering Journal 96, 71–80.
Yang, N., Wang, W., Ge, W., Wang, L., Li, J., 2004. Simulation of heterogeneousstructure in a circulating fluidized-bed riser by combining the two-fluid modelwith the EMMS approach. Industrial and Engineering Chemistry Research 43,5548–5561.
Yoon, H., Wei, J., Denn, M.M., 1978. A model for moving-bed coal gasificationreactors. A.I.Ch.E. Journal 24 (5), 885–903.
Zabrodsky, S.S., 1966. Hydrodynamics and Heat Transfer in Fluidized Beds. MIT Press,Cambridge.
Zevenhoven, R., Jarvinen, M., 2002. CFB combustion, particle slip velocity andparticle/turbulence interactions. Presented at the eighth International Conferenceon Circulating Fluidized Beds, Ontario, Canada.