Inducible mouse models illuminate parameters influencing epigenetic inheritance
Upload
independentCategory
view
3download
0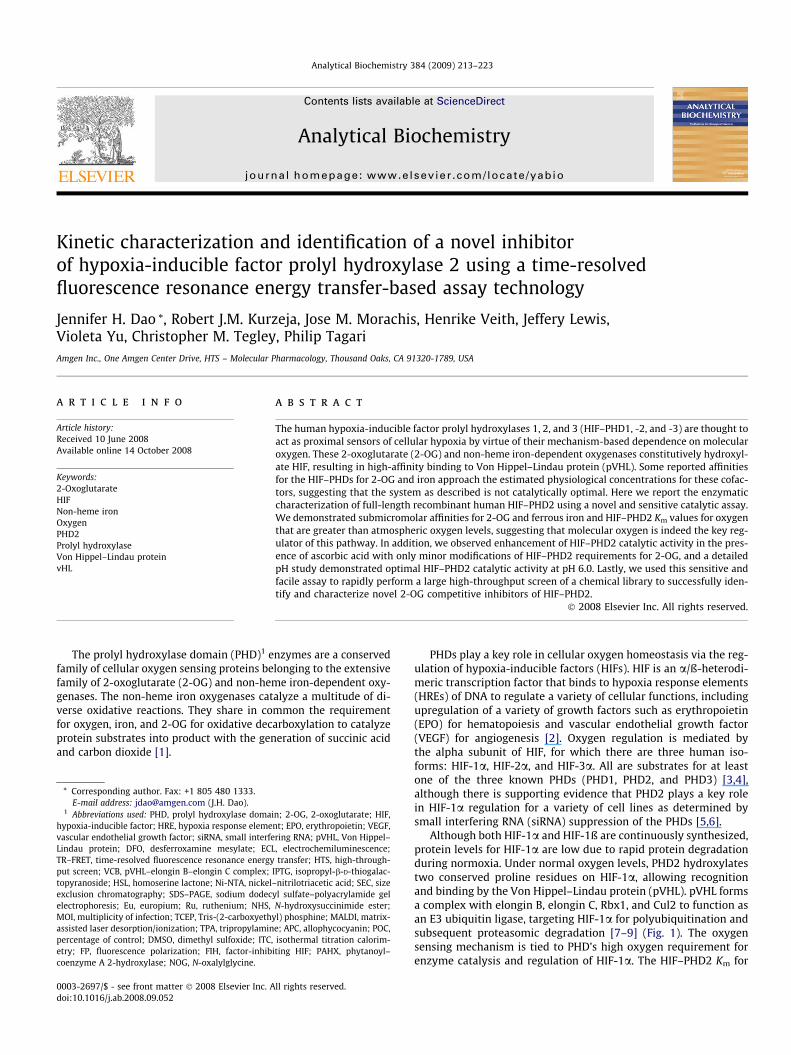
Analytical Biochemistry 384 (2009) 213–223
Contents lists available at ScienceDirect
Analytical Biochemistry
journal homepage: www.elsevier .com/ locate/yabio
Kinetic characterization and identification of a novel inhibitorof hypoxia-inducible factor prolyl hydroxylase 2 using a time-resolvedfluorescence resonance energy transfer-based assay technology
Jennifer H. Dao *, Robert J.M. Kurzeja, Jose M. Morachis, Henrike Veith, Jeffery Lewis,Violeta Yu, Christopher M. Tegley, Philip TagariAmgen Inc., One Amgen Center Drive, HTS – Molecular Pharmacology, Thousand Oaks, CA 91320-1789, USA
a r t i c l e i n f o a b s t r a c t
Article history:Received 10 June 2008Available online 14 October 2008
Keywords:2-OxoglutarateHIFNon-heme ironOxygenPHD2Prolyl hydroxylaseVon Hippel–Lindau proteinvHL
0003-2697/$ - see front matter � 2008 Elsevier Inc. Adoi:10.1016/j.ab.2008.09.052
* Corresponding author. Fax: +1 805 480 1333.E-mail address: [email protected] (J.H. Dao).
1 Abbreviations used: PHD, prolyl hydroxylase domahypoxia-inducible factor; HRE, hypoxia response elemevascular endothelial growth factor; siRNA, small interfeLindau protein; DFO, desferroxamine mesylate; ECLTR–FRET, time-resolved fluorescence resonance energyput screen; VCB, pVHL–elongin B–elongin C complex;topyranoside; HSL, homoserine lactone; Ni-NTA, nickelexclusion chromatography; SDS–PAGE, sodium dodecelectrophoresis; Eu, europium; Ru, ruthenium; NHS,MOI, multiplicity of infection; TCEP, Tris-(2-carboxyethassisted laser desorption/ionization; TPA, tripropylaminpercentage of control; DMSO, dimethyl sulfoxide; ITC,etry; FP, fluorescence polarization; FIH, factor-inhibcoenzyme A 2-hydroxylase; NOG, N-oxalylglycine.
The human hypoxia-inducible factor prolyl hydroxylases 1, 2, and 3 (HIF–PHD1, -2, and -3) are thought toact as proximal sensors of cellular hypoxia by virtue of their mechanism-based dependence on molecularoxygen. These 2-oxoglutarate (2-OG) and non-heme iron-dependent oxygenases constitutively hydroxyl-ate HIF, resulting in high-affinity binding to Von Hippel–Lindau protein (pVHL). Some reported affinitiesfor the HIF–PHDs for 2-OG and iron approach the estimated physiological concentrations for these cofac-tors, suggesting that the system as described is not catalytically optimal. Here we report the enzymaticcharacterization of full-length recombinant human HIF–PHD2 using a novel and sensitive catalytic assay.We demonstrated submicromolar affinities for 2-OG and ferrous iron and HIF–PHD2 Km values for oxygenthat are greater than atmospheric oxygen levels, suggesting that molecular oxygen is indeed the key reg-ulator of this pathway. In addition, we observed enhancement of HIF–PHD2 catalytic activity in the pres-ence of ascorbic acid with only minor modifications of HIF–PHD2 requirements for 2-OG, and a detailedpH study demonstrated optimal HIF–PHD2 catalytic activity at pH 6.0. Lastly, we used this sensitive andfacile assay to rapidly perform a large high-throughput screen of a chemical library to successfully iden-tify and characterize novel 2-OG competitive inhibitors of HIF–PHD2.
� 2008 Elsevier Inc. All rights reserved.
1
The prolyl hydroxylase domain (PHD) enzymes are a conservedfamily of cellular oxygen sensing proteins belonging to the extensivefamily of 2-oxoglutarate (2-OG) and non-heme iron-dependent oxy-genases. The non-heme iron oxygenases catalyze a multitude of di-verse oxidative reactions. They share in common the requirementfor oxygen, iron, and 2-OG for oxidative decarboxylation to catalyzeprotein substrates into product with the generation of succinic acidand carbon dioxide [1].ll rights reserved.
in; 2-OG, 2-oxoglutarate; HIF,nt; EPO, erythropoietin; VEGF,ring RNA; pVHL, Von Hippel–, electrochemiluminescence;transfer; HTS, high-through-
IPTG, isopropyl-b-D-thiogalac-–nitrilotriacetic acid; SEC, sizeyl sulfate–polyacrylamide gelN-hydroxysuccinimide ester;
yl) phosphine; MALDI, matrix-e; APC, allophycocyanin; POC,isothermal titration calorim-
iting HIF; PAHX, phytanoyl–
PHDs play a key role in cellular oxygen homeostasis via the reg-ulation of hypoxia-inducible factors (HIFs). HIF is an a/ß-heterodi-meric transcription factor that binds to hypoxia response elements(HREs) of DNA to regulate a variety of cellular functions, includingupregulation of a variety of growth factors such as erythropoietin(EPO) for hematopoiesis and vascular endothelial growth factor(VEGF) for angiogenesis [2]. Oxygen regulation is mediated bythe alpha subunit of HIF, for which there are three human iso-forms: HIF-1a, HIF-2a, and HIF-3a. All are substrates for at leastone of the three known PHDs (PHD1, PHD2, and PHD3) [3,4],although there is supporting evidence that PHD2 plays a key rolein HIF-1a regulation for a variety of cell lines as determined bysmall interfering RNA (siRNA) suppression of the PHDs [5,6].
Although both HIF-1a and HIF-1ß are continuously synthesized,protein levels for HIF-1a are low due to rapid protein degradationduring normoxia. Under normal oxygen levels, PHD2 hydroxylatestwo conserved proline residues on HIF-1a, allowing recognitionand binding by the Von Hippel–Lindau protein (pVHL). pVHL formsa complex with elongin B, elongin C, Rbx1, and Cul2 to function asan E3 ubiquitin ligase, targeting HIF-1a for polyubiquitination andsubsequent proteasomic degradation [7–9] (Fig. 1). The oxygensensing mechanism is tied to PHD’s high oxygen requirement forenzyme catalysis and regulation of HIF-1a. The HIF–PHD2 Km for
HIF
α
2-oxoglutarate O2
PHDs
succinate CO2
HRE
Fe(II) α
α β
HIF
HIF
VCBHIF
degradation OH
OH
proteasome
(-O2)
Fig. 1. Schematic diagram of HIF-1a regulation by HIF–PHDs. During normoxia, PHDs hydroxylate two proline residues on HIF-1a (P402 and P564) in an O2-, 2-OG-, and iron-dependent manner. VCB (pVHL in a complex with elongin B and elongin C) binds to the hydroxylated HIF-1a proteins, resulting in HIF-1a polyubiquitination and proteasomicdegradation. In hypoxia, the activities of HIF–PHDs are inhibited due to lack of O2. Stabilized HIF-1a proteins translocate to the nucleus and dimerize with HIF-1ß to bind theHREs of DNA, resulting in upregulation of a variety of growth factors in response to the low oxygen levels.
214 Kinetic characterization of HIF–PHD2 / J.H. Dao et al. / Anal. Biochem. 384 (2009) 213–223
oxygen was determined to be that of atmospheric oxygen levels(230–250 lM) [10,11], warranting much greater oxygen sensitivitythan other oxygenases such as collagen PHD where collagen PHDretained activity under hypoxia with a significantly lower mea-sured Km for oxygen (40 lM) [11]. Under conditions of hypoxia,HIF–PHD2 is inactive; hence, HIF-1a is not targeted for proteasom-ic destruction by hydroxylation. The accumulating HIF-1a dimeriz-es with HIF-1ß and binds to HRE in the cell’s nucleus and induces acellular response to ameliorate the low oxygen conditions byincreasing circulatory oxygen-carrying capabilities, thereby restor-ing the affected tissue’s oxygen homeostasis.
Therapeutic interests have been generated in the developmentof specific inhibitors that target the PHD enzymes for the treat-ment of a wide array of medical conditions, including inflamma-tion, ischemia, stroke, and anemia [12]. Desferroxamine mesylate(DFO), a potent iron chelator, was found to upregulate EPO andhemoglobin levels in patients afflicted with chronic disease anemiaand rheumatoid arthritis [13]. Cobalt, shown to inactivate PHD2 bycompeting with iron, was found to upregulate renal HIF-1a proteinexpression as well as reduce ischemic injury in the kidney of rats[14]. Although such data support therapeutic implications of PHDs,inhibition by iron chelation or substitution would lack specificity.
Despite the important physiological roles that PHDs play, theseproteins are largely uncharacterized in terms of enzymatic activity,in part owing to both a lack of facile and sensitive assay methodologyand a dearth of potent nonchelating inhibitors. The lack of high-capacity PHD assays has also hindered the discovery and develop-ment of inhibitors for potential therapeutic implications. A com-monly used 2-OG-dependent oxygenase assay involves captureand detection of 14CO2 gas resulting from oxidative decarboxylationof [1-14 C]2-OG [15]. This assay has the advantage of being a generic2-OG oxygenase assay but is relatively difficult and time-consumingto execute and requires the use of radioactive reagents. As such, wedeveloped a novel and high-throughput nonradioactive electro-chemiluminescence (ECL) assay as well as a homogeneous time-resolved fluorescence resonance energy transfer (TR–FRET) assayto elucidate PHD2 enzymatic reaction by characterizing and exploit-ing the biological affinity of pVHL to the catalytic product. We usedboth assay technologies to quantify PHD2 kinetic activity and tocharacterize the enzyme requirements for iron, 2-OG, oxygen, ascor-bic acid, and the HIF-1a peptide substrate as well as to determinecatalytic activity in various pH levels. The TR–FRET assay was
ultimately used to aid drug discovery by performing a large-scalehigh-throughput screen (HTS) to find small molecule inhibitors ofPHD2. Here we report the novel PHD2 inhibitor that surfaced fromthe screening campaign and the subsequent kinetic characterizationof the active compound discovered.
Materials and methods
Expression and purification of recombinant VCB
The pVHL–elongin B–elongin C heterotrimeric complex (VCB)was coexpressed in Escherichia coli and purified from the solublefraction as described previously [16]. The pVHL amino acidsequence (54–213) containing an N-terminal 6-histidine affinitytag was cloned into pAMG21 (pLux promoter) between the NdeIand XhoI sites. Immediately downstream of this was the elonginC gene cloned into the XhoI site to SacII with a 13-bp spacerbetween the stop codon of VHL and the initiating codon of elonginC. Elongin B was cloned into pTA2 (pACYC184.1-based vector)under the control of a Lac promoter. Induction of the system wasinitiated with the addition of isopropyl-b-D-thiogalactopyranoside(IPTG) and homoserine lactone (HSL) at 30 �C.
Bacterial cells were lysed by a microfluidizer in aqueous bufferof pH 8.0, and the soluble fraction was separated by centrifugationand subjected to nickel–nitrilotriacetic acid (Ni-NTA) chelatingchromatography to bind the 6-histidine affinity tag of the pVHLconstruct. The pooled fractions from the nickel column wereapplied to a Superdex 200 size exclusion chromatography (SEC)column. The protein eluted as a single fraction on SEC, indicatingthat the three protein components formed a complex in solution.The fractions from the SEC column were pooled and applied to aQ Sepharose anion exchange column for the final purification step.The composition of the purified complex was visualized by sodiumdodecyl sulfate–polyacrylamide gel electrophoresis (SDS–PAGE),and the identities of the three protein components were confirmedby N-terminal amino acid sequencing.
Europylation of the VCB complex
Purified VCB was exchanged into 50 mM sodium carbonate buf-fer (pH 9.2) and labeled with LANCE europium (Eu)-W1024 ITC
Kinetic characterization of HIF–PHD2 / J.H. Dao et al. / Anal. Biochem. 384 (2009) 213–223 215
chelate (PerkinElmer) overnight. The chelate was tagged with anisothiocyanate reactive group to specifically react with free or ali-phatic primary amines (e-amines of lysine residues) of the VCBprotein complex. The europylated VCB was purified by desaltingcolumns and quantified by standard means, with the average label-ing yield determined to be 6.6 Eu groups per VCB complex.
Generation of ruthenylated VCB
VCB was ruthenylated by covalent binding of random lysineresidues by mixing 500 ll of VCB (1 mg/ml in 50 mM carbonatebuffer, pH 9.0) with 50 ll of 3 mg/ml BV-TAG N-hydroxy-succinimide ester (BioVeris) for a 12:1 ruthenium (Ru)/VCB molarchallenge ratio. The sample was protected from light, and thechemical conjugation was allowed to occur for 1 h at room temper-ature. The N-hydroxysuccinimide ester (NHS) labeling conjugateproduced a chemically stable ruthenylated Tris–bipyridyl-taggedVCB protein complex by reacting with the primary amines of theprotein. The reaction was quenched and terminated with excessalpha amines by a 20-ll addition of a 2-M glycine solution. Theresulting VCB–Ru was purified from unconjugated Ru tag by dialy-sis into storage buffer (20 mM Tris [pH 7.5] and 150 mM NaCl).
Expression and purification of recombinant HIF–PHD2
Full-length HIF–PHD2 (accession number NM_022051) contain-ing an N-terminal 6-histidine affinity tag was cloned into pFastBac(Invitrogen) between the NcoI and XhoI restriction sites. The result-ing transfer vector was transformed into DH10Bac (Invitrogen)competent cells. A recombinant bacmid was purified and transfec-ted into SF-9 cells for viral production. Single passage amplifiedvirus was added to a culture of Hi5 cells (Invitrogen) with a celldensity of 1.6E+6 cells/ml in 800 ml of Excell405 media to a finalmultiplicity of infection (MOI) of 2.0. The cultures were incubatedin 2.7-L Fernbach flasks at 27 �C on a shaker. Insect cells were sus-pended in 50 mM Hepes (pH 7.2), 0.3 M NaCl, 10% glycerol, 0.1%ß-mercaptoethanol, and 0.1% Chaps and were subjected tosonication.
The lysed cells were centrifuged for 3 h at 13,000 rpm (JA-14),and the supernatant was filtered through a 0.22-lm cellulose ace-tate filter before loading onto an Ni-NTA column (Qiagen). Theprotein was washed with 25 mM imidazole before step elutionwith a buffer containing 250 mM imidazole. Pooled fractions wereapplied to a size exclusion column (Superdex 200, Pharmacia)equilibrated with 50 mM Hepes (pH 7.0), 0.15 M NaCl, 2 mMTris-(2-carboxyethyl) phosphine (TCEP), 10% glycerol, and 0.1%Chaps. Fractions from the monomeric peak were pooled, and pro-tein purity was evaluated by SDS–PAGE and densitometric analy-sis. Protein identity was confirmed by matrix-assisted laserdesorption/ionization (MALDI).
Characterization of VCB binding to P564–HIF-1a peptide
Binding of VCB to P564–HIF-1a peptide was quantified usingboth Ru ECL assay and the homogeneous TR–FRET assay. A 17-ami-no-acid peptide with an N-terminally labeled biotin molecule corre-sponding to amino acid sequences 558 to 574 of the HIF-1a proteinwas synthesized (P564–HIF-1a, biotin-DLEMLAPYIPMDDDFQL)along with a second peptide containing a hydroxylated proline at po-sition 564 (HyP564–HIF-1a, biotin-DLEMLA[Hyp]YIPMDDDFQL) toreplicate the PHD enzyme converted product form of HIF-1a thatis recognized by VCB.
To evaluate VCB–Ru binding specificity to P564–HIF-1a in theECL assay, as well as to explore sensitivity and linear range, boththe P564–HIF-1a and HyP564–HIF-1a peptides were serially di-luted and mixed with varying concentrations of VCB–Ru and
0.33 lg/ll streptavidin-coated paramagnetic beads (Invitrogen)in detection buffer (50 mM Tris–HCl [pH 8.0], 100 mM NaCl,0.05% Tween 20, and 0.5% NaN3). After 2 h incubation at roomtemperature with shaking, the reaction was read on the M-SeriesAnalyzer (BioVeris). A low voltage was applied to the VCB–Ru/bio-tin-HIF-1a peptide binding complexes, resulting in a regeneratingredox reaction producing light at 620 nm in the presence of excesstripropylamine (TPA), the catalysts in the ECL reaction buffer,BV-GLOW (BioVeris).
Similar conditions were used to measure binding constants anddetermine the optimal signal over background and the linear rangeof detection in the TR–FRET VCB–Eu binding assay. The P564–HIF-1a and HyP564–HIF-1a peptides were diluted to varying concen-trations between 0 and 1 lM with a titration of VCB–Eu at varyingconcentrations between 0 and 50 nM. Then 50 nM streptavidin-la-beled allophycocyanin (APC, Prozyme) was added to the titrationsfor a final volume of 100 ll in detection buffer. The bindingreagents were allowed to reach equilibrium by shaking for 1 hbefore it was read on the Discovery instrument (PerkinElmer).The TR–FRET signal is the result of a FRET pairing between twofluorescent species, Eu chelate and APC, a fluor produced in theblue–green algae Spirulina cyanobacteria. Eu is excited at 337 nmand phosphoresces at 615 nm with a large Stokes’ shift. APC, inturn, emits at 655 nm on excitation by Eu. For all data, the TR–FRETsignal is quantified as the ratio of the APC 655-nm signal dividedby the internal Eu reference 615-nm emission signal, with theexception of Kd determination where only the 655-nm outputwas used in the calculation.
Assay of HIF–PHD2 enzyme activity
HIF–PHD2 activity was measured using homogeneous TR–FRETtechnology by detecting the hydroxyl modification of the prolineresidue of the P564–HIF-1a peptide substrate, resulting in recogni-tion by the VCB–Eu complex. HIF–PHD2 was assayed at variousconcentrations between 0 and 10 nM with 2 lM P564–HIF-1a pep-tide in reaction buffer (30 mM Mes [pH 6.0], 10 mM NaCl, 10 mMCaCl2, and 0.25% Brij-35) containing 0.5 lM 2-OG, 2 mM ascorbicacid, and 100 lM FeCl2 in a final volume of 300 ll. The time coursewas ascertained by periodically transferring 5 ll of the reactionreagents into 95 ll of detection buffer containing 50 nM streptavi-din–APC and 2.5 nM VCB–Eu. The TR–FRET reagents were placedon a shaker for 1 h to reach detection binding equilibrium beforereading on the Discovery platform.
The Km values for O2 were determined in a manner similar tothat described above. Reaction buffers were sparged with O2 orN2 to saturate or deplete the buffers with oxygen. Various O2 con-centrations were obtained by mixing the buffers as needed, and thedissolved oxygen concentrations were determined using a FoxyAL-300 Probe (Ocean Optics) calibrated to oxygen-saturated water,water containing ambient oxygen levels, and water depleted ofoxygen by the addition of sodium sulfite. A higher concentrationof HIF–PHD2 was used to shorten the total reaction time to lessthan 5 min. The final reaction mixtures contained 2 lM P564–HIF-1a peptide, 500 lM 2-OG, 2 mM ascorbic acid, 100 lM FeCl2,and 25 nM HIF–PHD2 and were added as a 10-ll total stock vol-ume into a final reaction volume of 500 ll buffer. The substrateconversion rates were obtained by periodically transferring 5 llof the reaction reagents into 95 ll of detection buffer containing50 nM streptavidin–APC and 2.5 nM VCB–Eu. Dissolved oxygenlevels were constantly monitored with the Foxy probe during theentire reaction. The resulting data were fit to the standard Michae-lis–Menten model [GraFit: v = (Vmax [S]) / (Km + [S])].
The Km and KA values for 2-OG and iron were determined usingTR–FRET by titrating varying concentrations of the substrate andcofactors in a two-dimensional matrix with 2 mM ascorbic acid.
216 Kinetic characterization of HIF–PHD2 / J.H. Dao et al. / Anal. Biochem. 384 (2009) 213–223
Then 1 nM HIF–PHD2, 100 nM P564–HIF-1a peptide, 2.5 nM VCB–Eu, and 25 nM streptavidin–APC were added to the mixtures indetection buffer at atmospheric oxygen concentrations. The rateswere measured from the slope of the linear and initial time courseplots resulting from repeated measurements of the assay reactions.Rate data for 2-OG and iron were fit to the Michaelis–Menten ter-nary model in GraFit using nonlinear analysis:
m ¼ Vmax½A�½B�K 0aKb þ Kb½A� þ Ka½B� þ ½A�½B�
:
Ascorbic acid effects were determined by titrating ascorbic acid and2-OG, or ascorbic acid and iron, in a manner similar to that de-scribed above. The resulting data were fit to the standard Michae-lis–Menten model (GraFit).
Peptide Km was determined by ECL by titrating unlabeled P564–HIF-1a peptide in the presence of 100 nM biotin-tagged P564–HIF-1a in a streptavidin-coated plate with built-in electrodes (MesoScale Discovery). The reaction was initiated with 5 nM HIF–PHD2in addition to 100 lM ferrous iron, 8 lM 2-OG, and 2 mM ascorbicacid in reaction buffer. The plates were washed before detectionwith 2 nM VCB–Ru on a Sector Imager 2400 (Meso Scale Discov-ery). The resulting ECL signal was modified by multiplying the dilu-tion factor of the unlabeled peptide substrate after backgroundsubtraction, and the subsequent data were fit to the standardMichaelis–Menten model.
A large-scale compound library screen was performed withHIF–PHD2 using the TR–FRET assay at a single compound concen-tration of 20 lM. Compound inhibitor potency was determinedusing the TR–FRET assay with 1 nM HIF–PHD2, 100 nM P564–HIF-1a peptide, 0.25 lM 2-OG, 100 lM FeCl2, and 2 mM ascorbicacid in reaction buffer. The reaction was terminated after 1 h with50 mM succinic acid in detection buffer containing a final concen-tration of 25 nM streptavidin–APC and 2.5 nM VCB–Eu. The per-centage of control (POC) was determined by comparing thesignal from hydroxylated peptide substrate in the enzyme reactioncontaining inhibitor compound with that from PHD2 enzyme withdimethyl sulfoxide (DMSO) vehicle alone (HI control) and no en-zyme (LO control). Screen quality was determined by calculatingthe Z0 factor from the controls wells on a per plate basis [17]. Com-pound potency was determined by measuring the POC in a titra-tion of the compound. The data were fit to the four-parametermodel using a Levenburg–Marquardt nonlinear regressionalgorithm.
On identification of active compounds in the HIF–PHD2 HTS,inhibitor potency (IC50) was determined followed by elucidationof inhibitor mechanism of action. Inhibitor mechanism of actionwas determined by titrating both the inhibitor and substrate(2-OG in this case) in a matrix with HIF–PHD2 enzyme and re-agents to determine the rate of HIF–PHD2 catalysis by TR–FRET.The subsequent data were fit to the competitive, noncompetitive,or uncompetitive enzyme inhibition models as appropriate.
pH activity and stability profile of the HIF–PHD2 enzyme
In an effort to determine the optimal pH for HIF–PHD2 catalyticactivity and to minimize changes in ionic strength [18], the en-zyme was assayed in a three-component buffer (50 mM acetic acid,50 mM Mes, and 100 mM Tris–HCl) with pH levels ranging from3.5 to 9.0. Catalytic activity was determined after incubating10 nM PHD2 with 2 lM P564–HIF-1a peptide, 0.5 lM 2-OG,2 mM ascorbic acid, and 100 lM FeCl2 in the three-component buf-fer at the various pH levels for 45 min. The reactions were termi-nated by transferring 5 ll of reaction reagent into 95 ll ofdetection buffer containing 50 nM streptavidin–APC and 10 nMVCB–Eu. The 5-ll reaction addition did not significantly alter the
pH of the detection buffer. The detection reagents were placedon a shaker for 1 h before reading on the Discovery platform.
A pH stability study was performed in addition to the pH activ-ity analysis to determine the pH ranges that inactivated the HIF–PHD2 enzyme. This was accomplished by preincubating 1 lMHIF–PHD2 enzyme at various pH levels in the three-componentbuffer for 1 h before diluting and assaying all of the HIF–PHD2samples in reaction buffer at a single pH of 6.0. Enzyme catalysisoccurred for 45 min at a final concentration of 10 nM HIF–PHD2with 2 lM P564–HIF-1a peptide, 0.5 lM 2-OG, 2 mM ascorbic acid,and 100 lM FeCl2. The reaction was terminated and detected usingthe TR–FRET method by transferring 5 ll of reaction reagent into95 ll of detection buffer containing 50 nM streptavidin–APC and10 nM VCB–Eu.
Results and discussion
VCB–Ru and VCB–Eu bind with high affinity to HyP564–HIF-1a peptide
It has been well documented that pVHL recognizes and specifi-cally binds HIF-1a on prolyl hydroxylation of the two conservedresidues, P402 [7] and P564 [8,9,19,20]. We took advantage of thisbiological affinity and used the ECL and TR–FRET technologies todevelop sensitive, nonradioactive, and simple to execute assaysfor detection of HIF–PHD2 catalytic activity. These assays also havethe added benefit of potentially detecting inhibitors that disruptthe protein–protein binding of pVHL to the prolyl hydroxylatedproduct because such inhibitors can function downstream of thePHDs to inactivate HIF-1a. In developing the enzyme assays, weused the ECL and TR–FRET technologies to first determine the spec-ificity of VCB binding to HyP564–HIF-1a as compared with thecontrol peptide P564–HIF-1a. We chose the 17-amino-acidP564–HIF-1a peptide (DLEMLAPYIPMDDDFQL) versus the 19-ami-no-acid peptide (DLDLEMLAPYIPMDDDFQL) due to previous re-ports of an insignificant difference in the catalytic activity andKm constants between the 17-amino-acid and 19-amino-acid pep-tides [11] and because a shorter peptide length can potentially im-prove the signal to background of some assays’ modalities.
Both the ECL and TR–FRET technologies provided sensitive androbust methods for detection of labeled VCB binding to P564–HIF-1a peptide. The linear range of detection for each assay wasdetermined by titrating both the HyP564–HIF-1a and P563–HIF-1a peptide in the presence or absence of VCB–Ru or VCB–Eu,respectively. For the ECL assay, the ratio of the signal producedby HyP564–HIF-1a peptide and the background signal producedby the unmodified peptide demonstrated a linear and robust spe-cific signal in the zero to 1.5 nM peptide concentration range inthe presence of VCB–Ru (data not shown). The signal over back-ground saturated at 40-fold selectivity.
Using the TR–FRET binding technology, the signal was linearfrom zero to 1.75 nM HyP564–HIF-1a peptide in the presence of5 nM VCB, demonstrating the TR–FRET assay to be a sensitive tech-nique for detection of VCB–Eu binding to HyP564–HIF-1a peptide.This high affinity is supported by the potent disruption of Eu–VCBand HyP564–HIF-1a binding by unlabeled HyP564–HIF-1a. Theunlabeled HyP564–HIF-1a peptide inhibited binding of 2.5 nMEu–VCB to 1.5 nM biotinylated HyP564–HIF-1a peptide in adose-dependent manner and displayed an IC50 of 2 nM (data notshown). The TR–FRET assay had both a lower dynamic range anda lower signal to background (20-fold selectivity) compared withthe ECL assay. The TR–FRET assay, however, has the advantage ofbeing a much higher throughput and truly homogeneous assaywith a lower variance than the ECL assay.
The dissociation constants for both VCB–Ru and VCB–Eu bind-ing to the HyP564–HIF-1a peptide were measured in addition to
Kinetic characterization of HIF–PHD2 / J.H. Dao et al. / Anal. Biochem. 384 (2009) 213–223 217
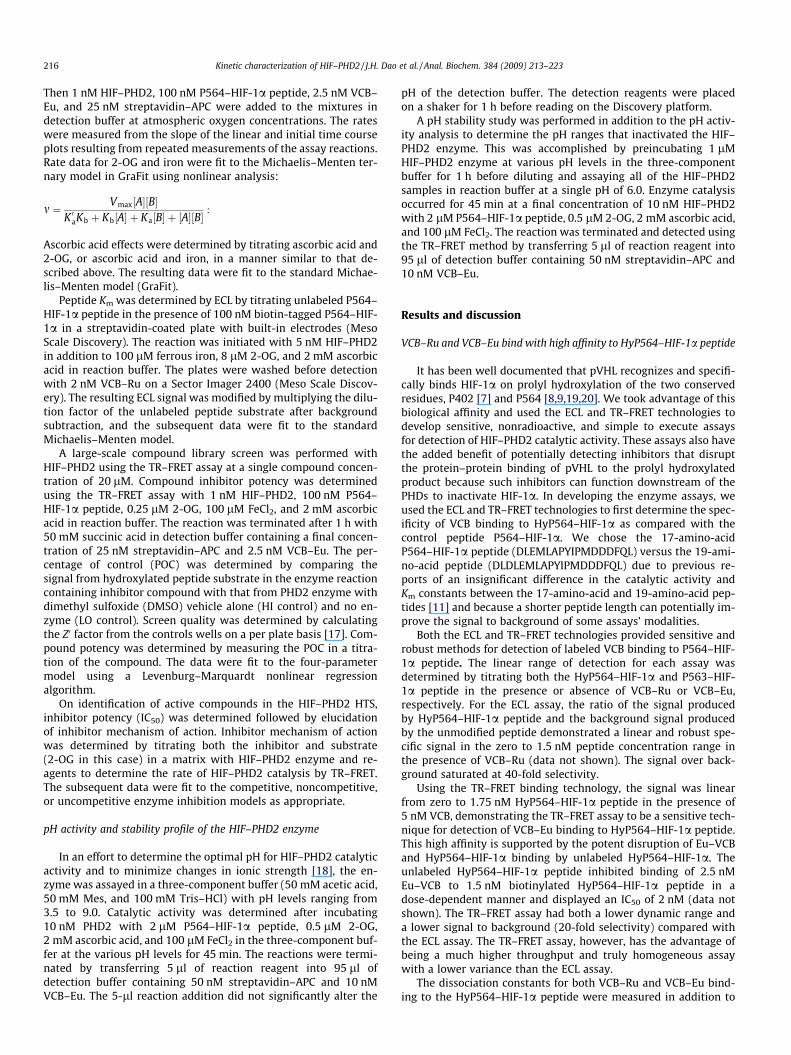
determining the dynamic range of the binding assays (Fig. 2). Thebinding affinity was calculated by ECL detection of the total signalproduced from binding varying concentrations of VCB–Ru to1.6 nM HyP564–HIF-1a peptide to the nonspecific signal producedin the presence of P564–HIF-1a. The nonspecific signal followedthe expected linear patterns and was subtracted from the total sig-nal to determine the specific signal. The dissociation constant ofVCB–Ru binding to HyP564–HIF-1a peptide was determined to be9.4 ± 1.8 nM when fit to the binding equilibrium model [B = Bmax /(1 + Kd/[L])] using nonlinear regression analysis. The Kd was calcu-lated for VCB–Eu in a similar fashion where the dissociation con-stant for VCB–Eu was determined to be 3.1 ± 0.3 nM in thepresence of 1.2 nM HyP564–HIF-1a peptide as determined fromthe resulting 665-nm TR–FRET signal as opposed to the typicallyused 665/615-nm ratio readout. The 615-nm emission output, usu-ally used in the TR–FRET calculation as an internal standard to nor-malize the fluorescent output, is an advantage for high-throughput
VCB-Ru (nM)0 20 40 60
RLU
0
1e5
2e5
3e5
non-specific binding
total binding
specific binding
VCB-Eu (nM)0 5 10 15 20
650n
m e
mis
sion
0
1e4
2e4
3e4
4e4
5e4
A
B
Fig. 2. Determination of HyP564–HIF-1a peptide (biotin-DLEMLA[Hyp]YIP-MDDDFQL) binding affinity to VCB. (A) Binding constant (Kd) determination ofVCB–Ru to HyP564–HIF-1a peptide using paramagnetic bead-based ECL technol-ogy. VCB–Ru was titrated in the presence of 1.6 nM HyP564–HIF-1a. A low voltagewas applied to the VCB–Ru/HIF-1a peptide binding complex, resulting in a redoxreaction in the presence of excess TPA producing luminescence at 620 nm. Theresults are expressed as relative luminescent units (RLU), and VCB–Ru affinity toHyP564–HIF-1a peptide was calculated at 9.4 ± 1.8 nM as determined by nonlinearregression. (B) Measurement of VCB–Eu binding affinity to HyP564–HIF-1a peptideby TR–FRET. VCB–Eu was titrated in the presence of 1.2 nM HyP564–HIF-1a. Thebinding signal was determined from the 665-nm signal resulting from the 615-nmFRET transfer. The Kd for VCB–Eu to HyP564–HIF-1a peptide was calculated at3.1 ± 0.3 nM. Nonspecific binding was quantified using unhydroxylated HIF-1apeptide.
screening but would skew the Kd calculations because the ratioreadout negates the desired measurements given that the 665-nm readout is masked by an increasing 615-nm signal as moreVCB–Eu is used.
The binding affinity for VCB to HyP564–HIF-1a, measured withboth ECL and TR–FRET, is more than 15-fold lower than has beenreported previously. Isothermal titration calorimetry (ITC) wasused to determine a dissociation constant for HIF-1a peptide andpVHL of 220 nM [21]. This disparity may be due to a possibility thatITC values are skewed because tight binders cannot be accuratelydetermined directly by ITC despite highly accurate enthalpy (DH)binding measurements [22]. A binding assay using fluorescencepolarization (FP) also demonstrated a higher dissociation constantof 138 nM by titrating VCB with 100 nM HIF-1a peptide [23]. Thehigher reported dissociation constant is likely due to a limit ofthe FP technology such that high fluorescent peptide concentra-tions were needed for adequate detection and the experimentalbinding assumption of Kd >>> [receptor] no longer holds true. Sucha system displays tight binding kinetics and, as such, can no longerassume that total [ligand] equals free [ligand]. The apparent Kd val-ues measured may, in fact, be dictated by the receptor concentra-tion itself, in this case the HIF peptide concentration, if the receptorconcentrations used surpass the actual Kd.
The low nanomolar affinity of VCB to HyP564–HIF-1a peptide isconsistent with the competition assay data using unlabeledHyP564–HIF-1a peptide mentioned above. It also appears thatboth the Ru and Eu labeling processes either did not affect theVCB binding site or, if so, disrupted the binding sites similarly.Regardless, this level of binding affinity allows sensitive detectionof HyP564–HIF-1a prolyl hydroxylation that will facilitate accurateHIF–PHD2 enzyme characterization.
Assay of HIF–PHD2
Many of the PHD enzymatic assays described in the literatureuse radioactive detection systems that can be difficult and time-consuming to execute, particularly those that require capture ofradioactive gaseous products. We have used sensitive, robust,and nonradioactive detection systems such as the ECL binding as-say and primarily the homogeneous TR–FRET assay to detect forthe HIF–PHDs’ catalytic conversion of the P564–HIF-1a substrateto the prolyl hydroxylated product peptide.
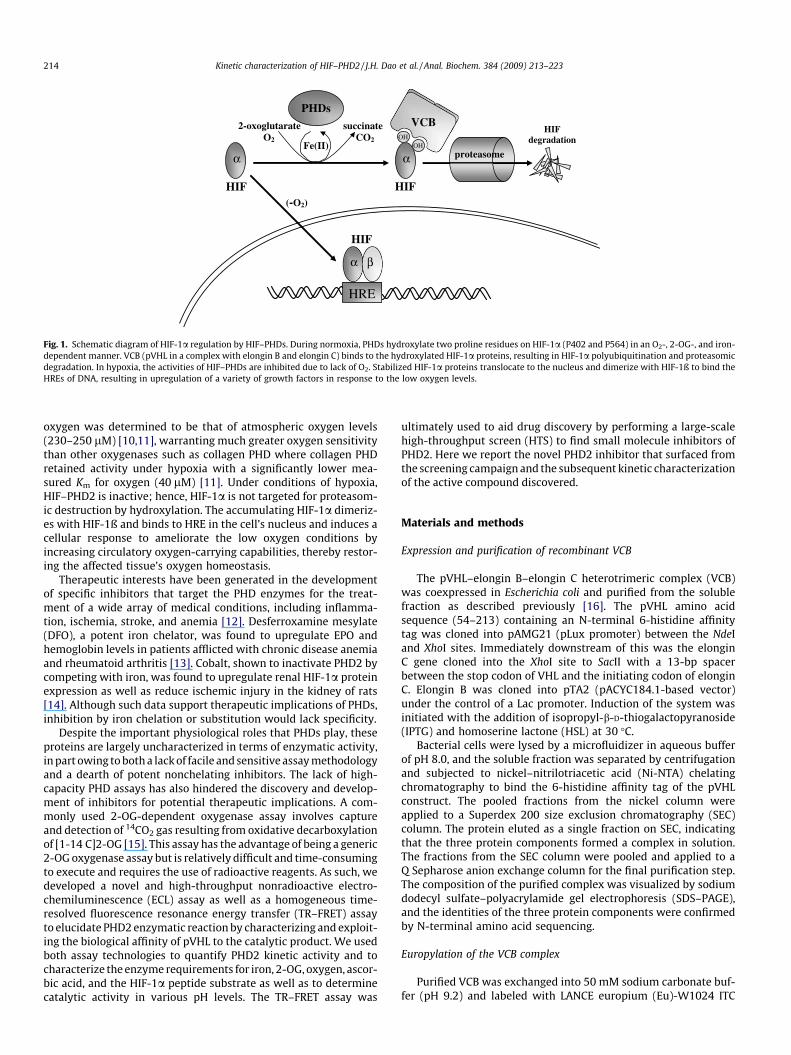
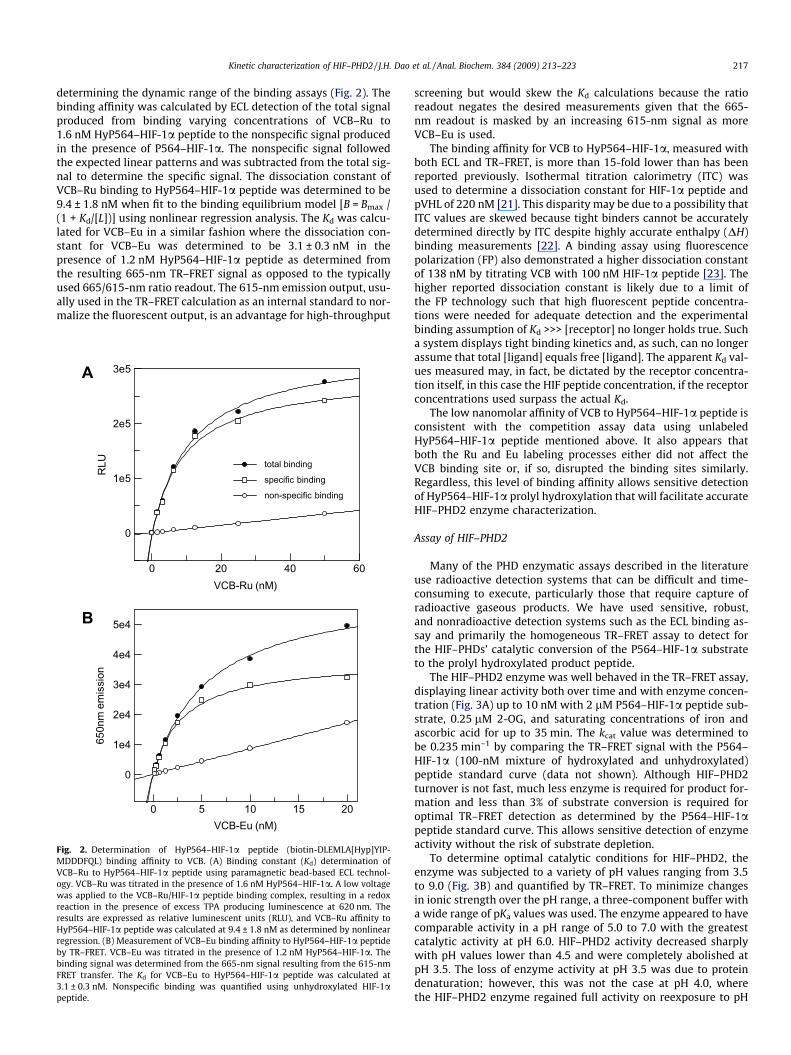
The HIF–PHD2 enzyme was well behaved in the TR–FRET assay,displaying linear activity both over time and with enzyme concen-tration (Fig. 3A) up to 10 nM with 2 lM P564–HIF-1a peptide sub-strate, 0.25 lM 2-OG, and saturating concentrations of iron andascorbic acid for up to 35 min. The kcat value was determined tobe 0.235 min–1 by comparing the TR–FRET signal with the P564–HIF-1a (100-nM mixture of hydroxylated and unhydroxylated)peptide standard curve (data not shown). Although HIF–PHD2turnover is not fast, much less enzyme is required for product for-mation and less than 3% of substrate conversion is required foroptimal TR–FRET detection as determined by the P564–HIF-1apeptide standard curve. This allows sensitive detection of enzymeactivity without the risk of substrate depletion.
To determine optimal catalytic conditions for HIF–PHD2, theenzyme was subjected to a variety of pH values ranging from 3.5to 9.0 (Fig. 3B) and quantified by TR–FRET. To minimize changesin ionic strength over the pH range, a three-component buffer witha wide range of pKa values was used. The enzyme appeared to havecomparable activity in a pH range of 5.0 to 7.0 with the greatestcatalytic activity at pH 6.0. HIF–PHD2 activity decreased sharplywith pH values lower than 4.5 and were completely abolished atpH 3.5. The loss of enzyme activity at pH 3.5 was due to proteindenaturation; however, this was not the case at pH 4.0, wherethe HIF–PHD2 enzyme regained full activity on reexposure to pH
time (min)0 20 40
TR-F
RE
T ra
tio
200
400
600
800
1000
1200
1400
PHD2 (nM)0 5 10
rate
(rat
io /
min
)
0
10
20
pH3 4 5 6 7 8 9
TR-F
RET
ratio
200
400
600
800
pH activitypH stability
A
B
Fig. 3. Assay of HIF–PHD2 enzyme activity and the effects of pH. (A) A time coursefor the hydroxylation of 2 lM HIF-1a peptide was determined with varyingamounts of HIF–PHD2: N, Zero; D, 0.625 nM; j, 1.25 nM; h, 2.5 nM; d, 5 nM; s,10 nM. PHD2 enzyme activity was detected by TR–FRET resulting from VCB–Eubinding to the enzyme-modified P564–HIF-1a peptide (biotin-DLE-MLAPYIPMDDDFQL). Initial rates for prolyl hydroxylation of P564–HIF-1a peptideincreases linearly with PHD2 enzyme concentration (inset). (B) pH analysis of HIF–PHD2 enzyme activity. The activity of the PHD2 enzyme was analyzed in a three-component buffer ranging from pH 3.5 to 9.0. Catalytic activity was determinedafter incubating 10 nM PHD2 with 2 lM P564–HIF-1a peptide, 0.5 lM 2-OG, 2 mMascorbic acid, and 100 lM FeCl2 in the buffer at the various pH levels for 45 min (h).The pH stability analysis determined the pH ranges that destabilized the HIF–PHD2enzyme by preincubating the HIF–PHD2 enzyme at various pH levels in the three-component buffer for 1 h before diluting and assaying all of the HIF–PHD2 samplesin reaction buffer at pH 6.0 under similar assay conditions (d).
218 Kinetic characterization of HIF–PHD2 / J.H. Dao et al. / Anal. Biochem. 384 (2009) 213–223
6.0. The pKa for the gamma carboxylic acid of 2-OG was 4.3, whichmay have contributed to the dramatic loss of catalytic activity atpH 4.0. At the higher pH range, enzyme activity decreased steadilywith increasing pH values and disappeared at pH 9.0. The pKa ofthe imidazole of histidine was 5.5 to 7.0, which may account forthe loss of enzyme activity at the higher pH values given thatHis313 and His374 are required for binding of iron [24]. Interest-ingly, the enzyme pH stability profile at the higher pH range didnot follow the typical all-or-nothing activity pattern; instead, ittracked with the pH activity curve.
Determination of rate constants for substrates of HIF–PHD2
The HIF–PHD2 enzyme exhibited steady-state kinetics for allsubstrates and activators tested. The Km and KA values weredetermined for 2-OG and iron by fitting the matrix results to thetwo-substrate ternary model (GraFit), which is identical to thesteady-state ordered bi–bi model. The Km and KA were determined
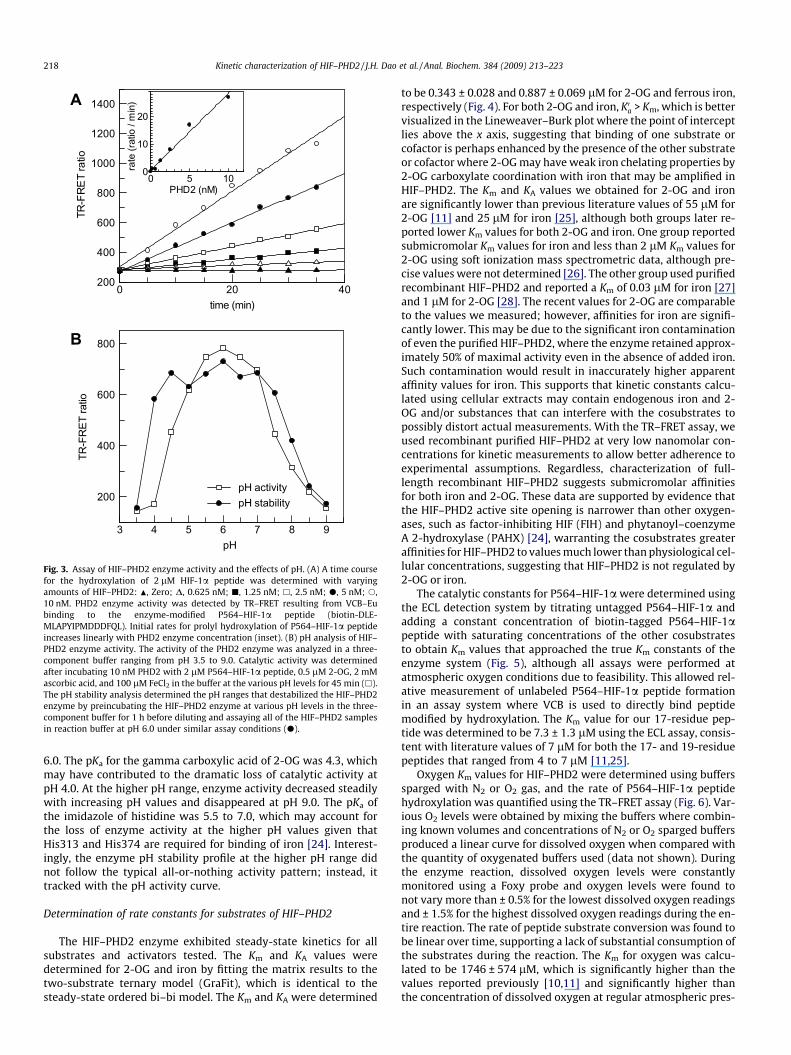
to be 0.343 ± 0.028 and 0.887 ± 0.069 lM for 2-OG and ferrous iron,respectively (Fig. 4). For both 2-OG and iron, K0a > Km, which is bettervisualized in the Lineweaver–Burk plot where the point of interceptlies above the x axis, suggesting that binding of one substrate orcofactor is perhaps enhanced by the presence of the other substrateor cofactor where 2-OG may have weak iron chelating properties by2-OG carboxylate coordination with iron that may be amplified inHIF–PHD2. The Km and KA values we obtained for 2-OG and ironare significantly lower than previous literature values of 55 lM for2-OG [11] and 25 lM for iron [25], although both groups later re-ported lower Km values for both 2-OG and iron. One group reportedsubmicromolar Km values for iron and less than 2 lM Km values for2-OG using soft ionization mass spectrometric data, although pre-cise values were not determined [26]. The other group used purifiedrecombinant HIF–PHD2 and reported a Km of 0.03 lM for iron [27]and 1 lM for 2-OG [28]. The recent values for 2-OG are comparableto the values we measured; however, affinities for iron are signifi-cantly lower. This may be due to the significant iron contaminationof even the purified HIF–PHD2, where the enzyme retained approx-imately 50% of maximal activity even in the absence of added iron.Such contamination would result in inaccurately higher apparentaffinity values for iron. This supports that kinetic constants calcu-lated using cellular extracts may contain endogenous iron and 2-OG and/or substances that can interfere with the cosubstrates topossibly distort actual measurements. With the TR–FRET assay, weused recombinant purified HIF–PHD2 at very low nanomolar con-centrations for kinetic measurements to allow better adherence toexperimental assumptions. Regardless, characterization of full-length recombinant HIF–PHD2 suggests submicromolar affinitiesfor both iron and 2-OG. These data are supported by evidence thatthe HIF–PHD2 active site opening is narrower than other oxygen-ases, such as factor-inhibiting HIF (FIH) and phytanoyl–coenzymeA 2-hydroxylase (PAHX) [24], warranting the cosubstrates greateraffinities for HIF–PHD2 to values much lower than physiological cel-lular concentrations, suggesting that HIF–PHD2 is not regulated by2-OG or iron.
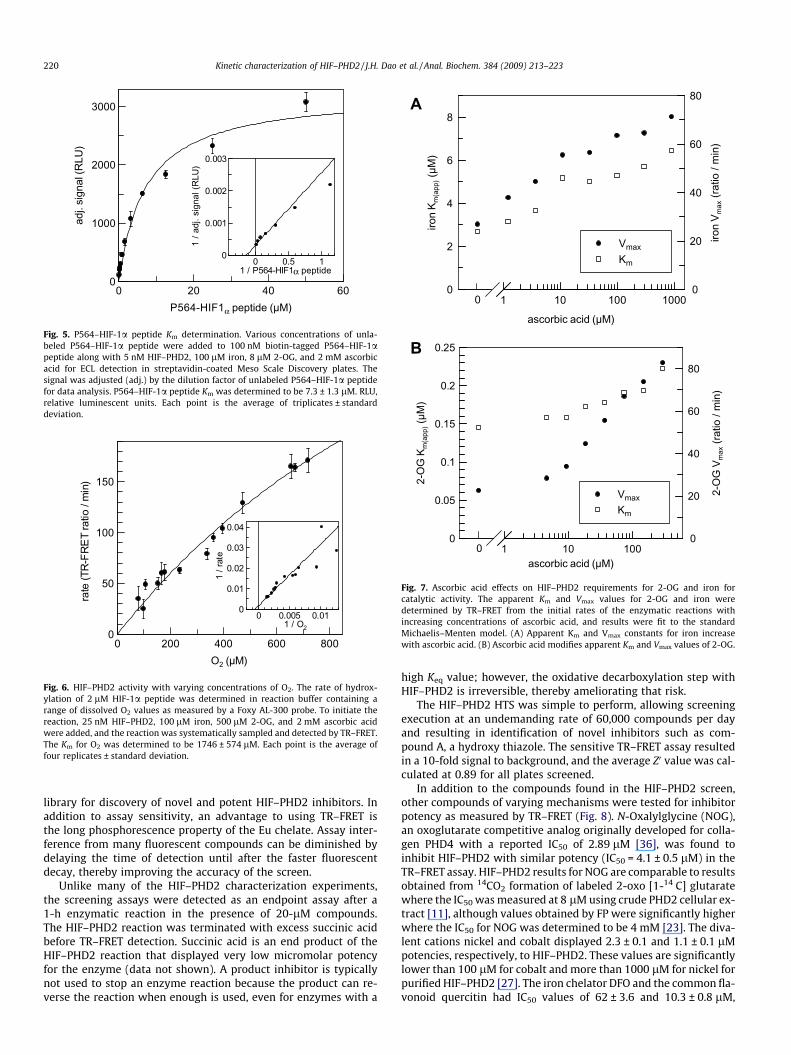
The catalytic constants for P564–HIF-1a were determined usingthe ECL detection system by titrating untagged P564–HIF-1a andadding a constant concentration of biotin-tagged P564–HIF-1apeptide with saturating concentrations of the other cosubstratesto obtain Km values that approached the true Km constants of theenzyme system (Fig. 5), although all assays were performed atatmospheric oxygen conditions due to feasibility. This allowed rel-ative measurement of unlabeled P564–HIF-1a peptide formationin an assay system where VCB is used to directly bind peptidemodified by hydroxylation. The Km value for our 17-residue pep-tide was determined to be 7.3 ± 1.3 lM using the ECL assay, consis-tent with literature values of 7 lM for both the 17- and 19-residuepeptides that ranged from 4 to 7 lM [11,25].
Oxygen Km values for HIF–PHD2 were determined using bufferssparged with N2 or O2 gas, and the rate of P564–HIF-1a peptidehydroxylation was quantified using the TR–FRET assay (Fig. 6). Var-ious O2 levels were obtained by mixing the buffers where combin-ing known volumes and concentrations of N2 or O2 sparged buffersproduced a linear curve for dissolved oxygen when compared withthe quantity of oxygenated buffers used (data not shown). Duringthe enzyme reaction, dissolved oxygen levels were constantlymonitored using a Foxy probe and oxygen levels were found tonot vary more than ± 0.5% for the lowest dissolved oxygen readingsand ± 1.5% for the highest dissolved oxygen readings during the en-tire reaction. The rate of peptide substrate conversion was found tobe linear over time, supporting a lack of substantial consumption ofthe substrates during the reaction. The Km for oxygen was calcu-lated to be 1746 ± 574 lM, which is significantly higher than thevalues reported previously [10,11] and significantly higher thanthe concentration of dissolved oxygen at regular atmospheric pres-
2-oxoglutarate (µM)0 10 20 30
rate
(TR
-FR
ET ra
tio/m
in)
0
20
40
60
80
1 / 2-oxoglutarate0 0.5 1
1 / r
ate
0
0.02
0.04
0.06
0.08
0.1
0.12
0.14
1 / FeCl2
0 0.5 1 21.5
1 / r
ate
0
0.02
0.04
0.06
0.08
0.1
0.12
0.14
FeCl2 (µM)0 20 40 60
rate
(TR
-FR
ET ra
tio/m
in)
0
20
40
60
80
A B
C D
Fig. 4. Effect of 2-OG and ferrous iron on HIF–PHD2 activity. The Km values for 2-OG and iron were determined with TR–FRET by titrating both 2-OG and iron in a matrix. Therates of prolyl hydroxylation were determined from the linear and initial slopes of the reactions as a function of time. The data were fit to the two-substrate bi–bi model andwere displayed in both the Michaelis–Menten and Lineweaver–Burk formats. (A) Effect of 2-OG on the activity of HIF–PHD2 with multiple ferrous iron concentrations: .,zero; r, 0.21 lM; N, 0.62 lM; D, 1.85 lM; j, 5.56 lM; h, 16.7 lM; d, 50 lM; s, 150 lM. The Km for 2-OG was calculated to be 0.343 ± 0.028 lM. (B) Double-reciprocalgraph of HIF–PHD2 activity from 2-OG with varying iron concentrations. (C) Effect of iron on HIF–PHD2 activity with varying 2-OG concentrations: �, zero; e, 0.10 lM; d,0.20 lM; s, 0.39 lM; ., 0.78 lM; r, 1.56 lM; N, 3.13 lM; D, 6.25 lM; +, 12.5 lM; �, 25 lM; j, 50 lM; h, 100 lM. Iron Km was determined to be 0.887 ± 0.069 lM. (D)Double-reciprocal graph of iron with varying 2-OG concentrations.
Kinetic characterization of HIF–PHD2 / J.H. Dao et al. / Anal. Biochem. 384 (2009) 213–223 219
sures (230–250 lM). Because the data do not substantially reachzero-ordered kinetics, the absolute Km value for oxygen lacks pre-cision; however, the data do suggest that HIF–PHD2 is very sensi-tive to changes in oxygen levels and, thus, support HIF–PHD2regulation by oxygen and not 2-OG or iron.
Ascorbic acid effects on the HIF–PHD2 enzyme
HIF regulation by PHDs has been previously shown to requireascorbic acid for full catalytic activity [29,30]. Ascorbic acid hasbeen found to significantly decrease HIF-1a protein levels in hu-man cancer cell lines (using physiological concentrations of25 lM ascorbic acid) [31] and to promote HIF-1a capture by pVHLdue to increased enzyme activity (with 2 mM ascorbic acid) in cel-lular extracts [9]; however, some researchers have not seen similarrequirements for ascorbic acid or iron, and this may be due to con-tamination of their HIF–PHD2 extracts [23]. In the TR–FRET assay,the lack of ascorbic acid did not abolish activity; however, addi-tional ascorbic acid was found to significantly increase HIF–PHD2catalytic activity in a dose-dependent manner when titratedagainst both 2-OG and iron (Fig. 7). Both the Vmax and apparentKm values for iron increased approximately 2.5-fold with the addi-
tion of 900 lM ascorbic acid. Vmax/Km values were stable for ironbut increased for 2-OG with increasing ascorbic acid levels. TheVmax for 2-OG increased nearly 4-fold with 300 lM ascorbic acidversus no ascorbic acid, whereas the apparent Km for 2-OG didnot change significantly. These results are not unexpected giventhat ascorbic acid is believed to interact with iron as a reducingagent, converting ferric iron to ferrous iron, and as an iron chelator,which may explain the higher iron Km and Vmax values. The role ofascorbic acid with HIF–PHD2 is not as simple because ascorbic acidis also believed to convert iron to the reduced ferrous state withinthe enzyme’s active site to remedy uncoupled decarboxylation of2-OG and to possibly function as an alternate substrate [32–35].Care was taken to prevent exposing the PHDs to ascorbic acidand iron in the absence of 2-OG because ascorbic acid and ironcan undergo a Fenton reaction generating oxygen radical speciesas a result of the redox chemistry and can irreversibly inactivatethe enzyme in a matter of minutes.
Inhibition of HIF–PHD2
After thorough characterization of the HIF–PHD2 enzyme, theTR–FRET assay was used to perform an HTS of a large chemical
0
0.001
0.002
0.003
P564-HIF1α peptide (µM)0 20 40 60
adj.
sign
al (R
LU)
0
1000
2000
3000
1 / P564-HIF1α peptide0 0.5 1
1 / a
dj. s
igna
l (R
LU)
Fig. 5. P564–HIF-1a peptide Km determination. Various concentrations of unla-beled P564–HIF-1a peptide were added to 100 nM biotin-tagged P564–HIF-1apeptide along with 5 nM HIF–PHD2, 100 lM iron, 8 lM 2-OG, and 2 mM ascorbicacid for ECL detection in streptavidin-coated Meso Scale Discovery plates. Thesignal was adjusted (adj.) by the dilution factor of unlabeled P564–HIF-1a peptidefor data analysis. P564–HIF-1a peptide Km was determined to be 7.3 ± 1.3 lM. RLU,relative luminescent units. Each point is the average of triplicates ± standarddeviation.
0
0.01
0.02
0.03
0.04
O2 (µM)0 200 400 600 800
rate
(TR
-FR
ET
ratio
/ m
in)
0
50
100
150
1 / O2
0 0.005 0.01
1 / r
ate
Fig. 6. HIF–PHD2 activity with varying concentrations of O2. The rate of hydrox-ylation of 2 lM HIF-1a peptide was determined in reaction buffer containing arange of dissolved O2 values as measured by a Foxy AL-300 probe. To initiate thereaction, 25 nM HIF–PHD2, 100 lM iron, 500 lM 2-OG, and 2 mM ascorbic acidwere added, and the reaction was systematically sampled and detected by TR–FRET.The Km for O2 was determined to be 1746 ± 574 lM. Each point is the average offour replicates ± standard deviation.
0
iron
K m(a
pp) (
µM)
0
2
4
6
8
iron
V max
(rat
io /
min
)
0
20
40
60
80
ascorbic acid (µM)
1 10 100 1000
VmaxKm
0
2-O
G K
m(a
pp) (
µM)
0
0.05
0.1
0.15
0.2
0.25
2-O
G V
max
(rat
io /
min
)
0
20
40
60
80
ascorbic acid (µM)1 10 100
VmaxKm
A
B
Fig. 7. Ascorbic acid effects on HIF–PHD2 requirements for 2-OG and iron forcatalytic activity. The apparent Km and Vmax values for 2-OG and iron weredetermined by TR–FRET from the initial rates of the enzymatic reactions withincreasing concentrations of ascorbic acid, and results were fit to the standardMichaelis–Menten model. (A) Apparent Km and Vmax constants for iron increasewith ascorbic acid. (B) Ascorbic acid modifies apparent Km and Vmax values of 2-OG.
220 Kinetic characterization of HIF–PHD2 / J.H. Dao et al. / Anal. Biochem. 384 (2009) 213–223
library for discovery of novel and potent HIF–PHD2 inhibitors. Inaddition to assay sensitivity, an advantage to using TR–FRET isthe long phosphorescence property of the Eu chelate. Assay inter-ference from many fluorescent compounds can be diminished bydelaying the time of detection until after the faster fluorescentdecay, thereby improving the accuracy of the screen.
Unlike many of the HIF–PHD2 characterization experiments,the screening assays were detected as an endpoint assay after a1-h enzymatic reaction in the presence of 20-lM compounds.The HIF–PHD2 reaction was terminated with excess succinic acidbefore TR–FRET detection. Succinic acid is an end product of theHIF–PHD2 reaction that displayed very low micromolar potencyfor the enzyme (data not shown). A product inhibitor is typicallynot used to stop an enzyme reaction because the product can re-verse the reaction when enough is used, even for enzymes with a
high Keq value; however, the oxidative decarboxylation step withHIF–PHD2 is irreversible, thereby ameliorating that risk.
The HIF–PHD2 HTS was simple to perform, allowing screeningexecution at an undemanding rate of 60,000 compounds per dayand resulting in identification of novel inhibitors such as com-pound A, a hydroxy thiazole. The sensitive TR–FRET assay resultedin a 10-fold signal to background, and the average Z0 value was cal-culated at 0.89 for all plates screened.
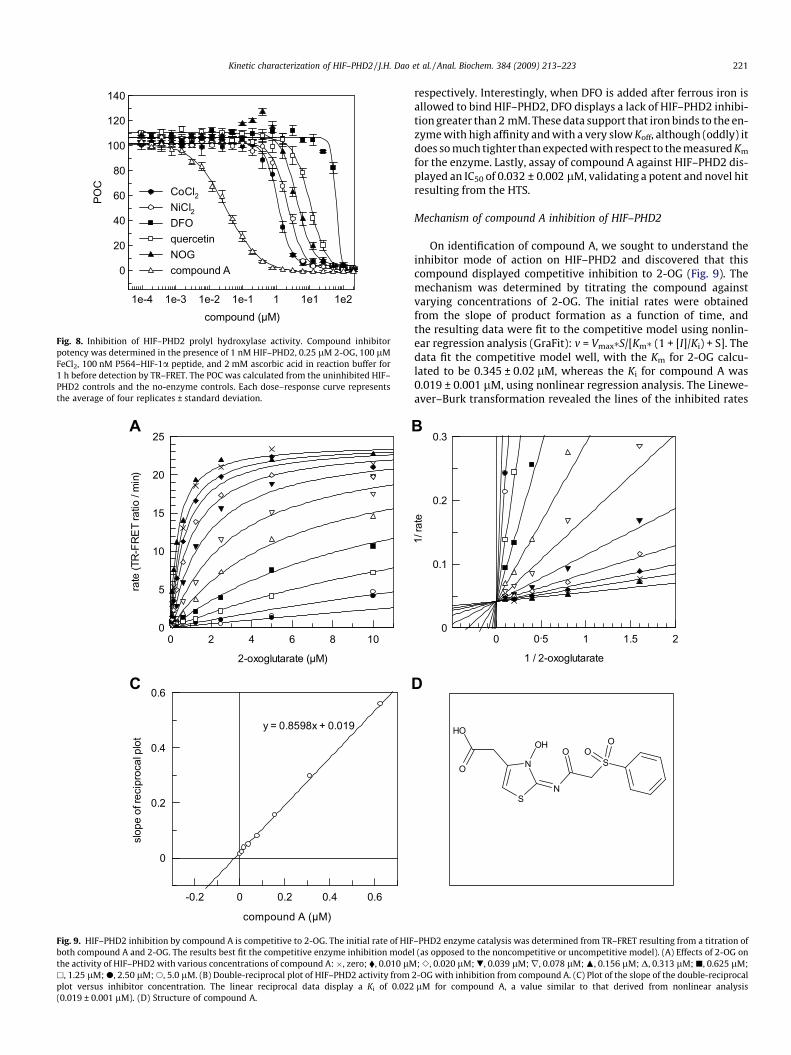
In addition to the compounds found in the HIF–PHD2 screen,other compounds of varying mechanisms were tested for inhibitorpotency as measured by TR–FRET (Fig. 8). N-Oxalylglycine (NOG),an oxoglutarate competitive analog originally developed for colla-gen PHD4 with a reported IC50 of 2.89 lM [36], was found toinhibit HIF–PHD2 with similar potency (IC50 = 4.1 ± 0.5 lM) in theTR–FRET assay. HIF–PHD2 results for NOG are comparable to resultsobtained from 14CO2 formation of labeled 2-oxo [1-14 C] glutaratewhere the IC50 was measured at 8 lM using crude PHD2 cellular ex-tract [11], although values obtained by FP were significantly higherwhere the IC50 for NOG was determined to be 4 mM [23]. The diva-lent cations nickel and cobalt displayed 2.3 ± 0.1 and 1.1 ± 0.1 lMpotencies, respectively, to HIF–PHD2. These values are significantlylower than 100 lM for cobalt and more than 1000 lM for nickel forpurified HIF–PHD2 [27]. The iron chelator DFO and the common fla-vonoid quercitin had IC50 values of 62 ± 3.6 and 10.3 ± 0.8 lM,
compound (µM)1e-4 1e-3 1e-2 1e-1 1 1e1 1e2
POC
0
20
40
60
80
100
120
140
CoCl2NiCl2DFOquercetinNOGcompound A
Fig. 8. Inhibition of HIF–PHD2 prolyl hydroxylase activity. Compound inhibitorpotency was determined in the presence of 1 nM HIF–PHD2, 0.25 lM 2-OG, 100 lMFeCl2, 100 nM P564–HIF-1a peptide, and 2 mM ascorbic acid in reaction buffer for1 h before detection by TR–FRET. The POC was calculated from the uninhibited HIF–PHD2 controls and the no-enzyme controls. Each dose–response curve representsthe average of four replicates ± standard deviation.
2-oxoglutarate (µM)
0 2 4 6 8 10
rate
(TR
-FR
ET
ratio
/ m
in)
0
5
10
15
20
25
compound A (µM)
-0.2 0 0.2 0.4 0.6
slop
e of
reci
proc
al p
lot
0
0.2
0.4
0.6
y = 0.8598x + 0.019
A
C
Fig. 9. HIF–PHD2 inhibition by compound A is competitive to 2-OG. The initial rate of HIFboth compound A and 2-OG. The results best fit the competitive enzyme inhibition modethe activity of HIF–PHD2 with various concentrations of compound A:�, zero; �, 0.010 lMh, 1.25 lM; d, 2.50 lM; s, 5.0 lM. (B) Double-reciprocal plot of HIF–PHD2 activity fromplot versus inhibitor concentration. The linear reciprocal data display a Ki of 0.022(0.019 ± 0.001 lM). (D) Structure of compound A.
Kinetic characterization of HIF–PHD2 / J.H. Dao et al. / Anal. Biochem. 384 (2009) 213–223 221
respectively. Interestingly, when DFO is added after ferrous iron isallowed to bind HIF–PHD2, DFO displays a lack of HIF–PHD2 inhibi-tion greater than 2 mM. These data support that iron binds to the en-zyme with high affinity and with a very slow Koff, although (oddly) itdoes so much tighter than expected with respect to the measured Km
for the enzyme. Lastly, assay of compound A against HIF–PHD2 dis-played an IC50 of 0.032 ± 0.002 lM, validating a potent and novel hitresulting from the HTS.
Mechanism of compound A inhibition of HIF–PHD2
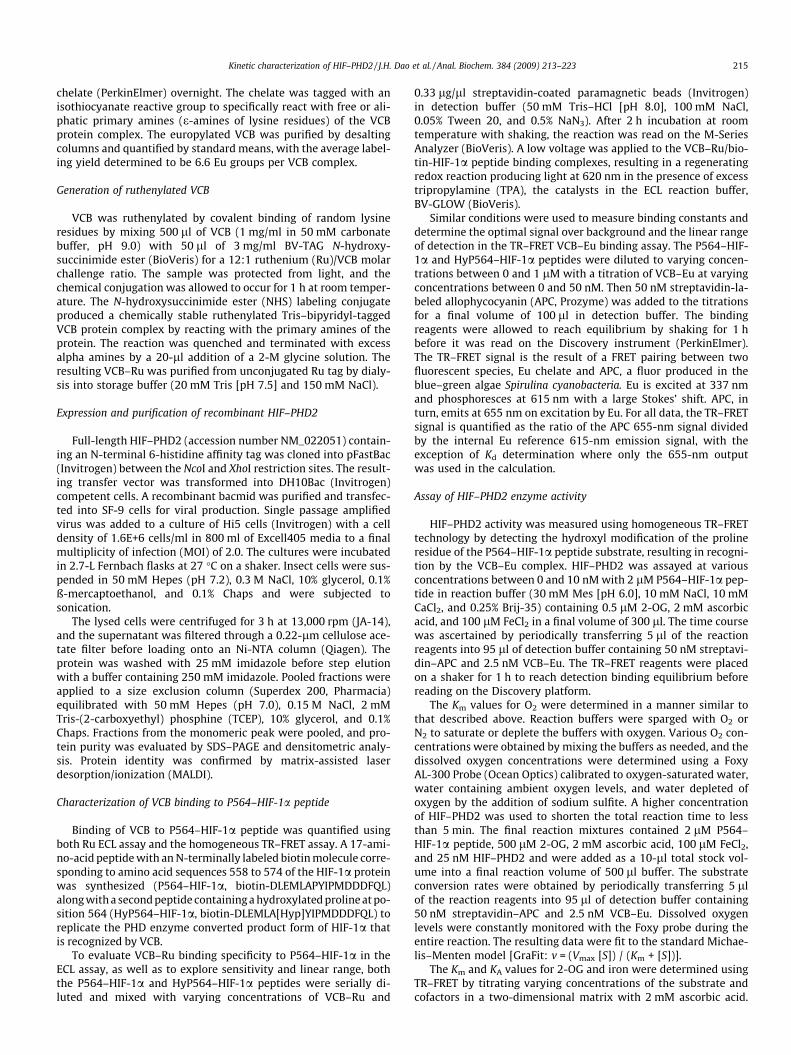
On identification of compound A, we sought to understand theinhibitor mode of action on HIF–PHD2 and discovered that thiscompound displayed competitive inhibition to 2-OG (Fig. 9). Themechanism was determined by titrating the compound againstvarying concentrations of 2-OG. The initial rates were obtainedfrom the slope of product formation as a function of time, andthe resulting data were fit to the competitive model using nonlin-ear regression analysis (GraFit): v = Vmax�S/[Km� (1 + [I]/Ki) + S]. Thedata fit the competitive model well, with the Km for 2-OG calcu-lated to be 0.345 ± 0.02 lM, whereas the Ki for compound A was0.019 ± 0.001 lM, using nonlinear regression analysis. The Linewe-aver–Burk transformation revealed the lines of the inhibited rates
0 0.5 1 1.5 2
1/ ra
te
0
0.1
0.2
0.3
1 / 2-oxoglutarate
S
N
N
OS
OH
O
OO
OH
B
D
–PHD2 enzyme catalysis was determined from TR–FRET resulting from a titration ofl (as opposed to the noncompetitive or uncompetitive model). (A) Effects of 2-OG on
; e, 0.020 lM; ., 0.039 lM;r, 0.078 lM;N, 0.156 lM; D, 0.313 lM; j, 0.625 lM;2-OG with inhibition from compound A. (C) Plot of the slope of the double-reciprocallM for compound A, a value similar to that derived from nonlinear analysis
222 Kinetic characterization of HIF–PHD2 / J.H. Dao et al. / Anal. Biochem. 384 (2009) 213–223
intersecting on the y axis, indicative of a typical competitiveinhibitor. Traditional analysis by plotting the slope of the linear,nonfit reciprocal plot data versus inhibitor concentration revealeda Ki of 0.022 lM obtained from the negative x intercept of thegraph (Fig. 9C). Using Compound A as the reference point, addi-tional chemistry efforts were made to improve inhibitor potencyas well as to study the structure-activity relationship (SAR) of thisclass of novel HIF-PHD2 inhibitors [37]. The SAR efforts resulted ina 20-fold improvement in inhibitor potency against the HIF-PHD2enzyme. Additionally, a single crystal X-ray of Compound A wasused to model and to better understand the mode of inhibitorbinding, with modeling and SAR data pointing to key interactionswith Arg383 and iron within the HIF-PHD2 catalytic binding site.
In conclusion, we have developed highly sensitive, robust, andfacile methodologies for measuring the enzymatic activity of theHIF prolyl hydroxylases (as exemplified by HIF–PHD2), which ex-ploits the affinity of the ubiquitin ligase adaptor pVHL for the reac-tion product. The affinity of VCB for the peptide product wasdetermined to be much stronger than that reported previously,and this facilitated in the overall sensitivity for both the ECL andTR–FRET assays. Less binding reagent is required for detectingproduct formation; hence, a very low concentration of enzymewas needed to convert a very low percentage of total peptide,and this better allows us to adhere to basic assumptions of enzymeand equilibrium binding models that other assay modalities oftendeviate from due to practicality. Characterization of recombinantpurified human HIF–PHD2 revealed an enzyme that bound bothiron and 2-OG very tightly compared with reported physiologicalconcentrations of the substrates; however, HIF–PHD2 was foundto be very sensitive to changes in dissolved oxygen concentrations,supporting HIF–PHD2 regulation by molecular oxygen and not 2-OG and iron. We demonstrated HIF–PHD2 inhibition with com-pounds of varied mechanisms: compounds that chelated iron, cat-ion substitutes, a 2-OG analog, and a novel potent hydroxylthiazole compound discovered by screening. Lastly, we were ableto use the TR–FRET assay to both conduct an HTS and determinethe mechanism of action of the resulting compounds found fromthe screen. Such techniques not only will aid pharmacologicalcharacterization but also will further HIF–PHD2 characterizationbeyond what we demonstrated here. Future studies carefully de-signed with dead-end and product inhibitors should allow us tobetter elucidate the catalytic mechanism of this complex enzyme.
Acknowledgments
We thank Mike Gresser, Kirsty Hewitson, and Christopher Scho-field for thoughtful discussions with regard to analysis of the HIF–PHD2 enzyme and its biochemical complexities. We also thank theMaterials Management team (Amgen, Thousand Oaks, CA, USA)whose members diligently provided us with compounds to aidour HTS campaigns.
References
[1] M.J. Ryle, R.P. Hausinger, Non-heme iron oxygenases, Curr. Opin. Chem. Biol. 6(2002) 193–201.
[2] G.L. Semenza, L.A. Shimoda, N.R. Prabhakar, Regulation of gene expression byHIF-1, Novartis Found, Symp. 272 (2006) 2–8.
[3] R.K. Bruick, S.L. McKnight, A conserved family of prolyl-4-hydroxylases thatmodify HIF, Science 294 (2001) 1337–1340.
[4] M. Ivan, T. Haberberger, D.C. Gervasi, K.S. Michelson, V. Gunzler, K. Kondo, H.Yang, I. Sorokina, R.C. Conaway, J.W. Conaway, W.G. Kaelin Jr, Biochemicalpurification and pharmacological inhibition of a mammalian prolylhydroxylase acting on hypoxia-inducible factor, Proc. Natl. Acad. Sci. USA 99(2002) 13459–13464.
[5] R.J. Appelhoff, Y.M. Tian, R.R. Raval, H. Turley, A.L. Harris, C.W. Pugh, P.J.Ratcliffe, J.M. Gleadle, Differential function of the prolyl hydroxylases PHD1,PHD2, and PHD3 in the regulation of hypoxia-inducible factor, J. Biol. Chem.279 (2004) 38458–38465.
[6] E. Berra, E. Benizri, A. Ginouves, V. Volmat, D. Roux, J. Pouyssegur, HIF prolyl-hydroxylase 2 is the key oxygen sensor setting low steady-state levels of HIF-1a in normoxia, EMBO J. 22 (2003) 4082–4090.
[7] N. Masson, C. Willam, P.H. Maxwell, C.W. Pugh, P.J. Ratcliffe, Independentfunction of two destruction domains in hypoxia-inducible factor-a chainsactivated by prolyl hydroxylation, EMBO J. 20 (2001) 5197–5206.
[8] M. Ivan, K. Kondo, H. Yang, W. Kim, J. Valiando, M. Ohh, A. Salic, J.M. Asara, W.S.Lane, W.G. Kaelin Jr, HIFa targeted for VHL-mediated destruction by prolinehydroxylation: Implications for O2 sensing, Science 292 (2001) 464–468.
[9] P. Jaakkola, D.R. Mole, Y.M. Tian, M.I. Wilson, J. Gielbert, S.J. Gaskell, A.Kriegsheim, H.F. Hebestreit, M. Mukherji, C.J. Schofield, P.H. Maxwell, C.W.Pugh, P.J. Ratcliffe, Targeting of HIF-a to the von Hippel–Lindauubiquitylation complex by O2-regulated prolyl hydroxylation, Science 292(2001) 468–472.
[10] D. Ehrismann, E. Flashman, D.N. Genn, N. Mathioudakis, K.S. Hewitson, P.J.Ratcliffe, C.J. Schofield, Studies on the activity of the hypoxia-inducible factorhydroxylases using an oxygen consumption assay, Biochem. J. 401 (2007) 227–234.
[11] M. Hirsila, P. Koivunen, V. Gunzler, K.I. Kivirikko, J. Myllyharju,Characterization of the human prolyl 4-hydroxylases that modify thehypoxia-inducible factor, J. Biol. Chem. 278 (2003) 30772–30780.
[12] K.S. Hewitson, L.A. McNeill, C.J. Schofield, Modulating the hypoxia-induciblefactor signaling pathway: Applications from cardiovascular disease to cancer,Curr. Pharm. Des. 10 (2004) 821–833.
[13] C. Salvarani, R. Baricchi, D. Lasagni, L. Boiardi, R. Piccinini, C. Brunati, P.Macchioni, I. Portioli, Effects of desferrioxamine therapy on chronic diseaseanemia associated with rheumatoid arthritis, Rheumatol. Intl. 16 (1996) 45–48.
[14] M. Matsumoto, Y. Makino, T. Tanaka, H. Tanaka, N. Ishizaka, E. Noiri, T. Fujita,M. Nangaku, Induction of renoprotective gene expression by cobaltameliorates ischemic injury of the kidney in rats, J. Am. Soc. Nephrol. 14(2003) 1825–1832.
[15] K.I. Kivirikko, R. Myllyla, Posttranslational enzymes in the biosynthesisof collagen: Intracellular enzymes, Methods Enzymol. A 82 (1982) 245–304.
[16] W.C. Hon, M.I. Wilson, K. Harlos, T.D. Claridge, C.J. Schofield, C.W. Pugh, P.H.Maxwell, P.J. Ratcliffe, D.I. Stuart, E.Y. Jones, Structural basis for the recognitionof hydroxyproline in HIF-1a by pVHL, Nature 417 (2002) 975–978.
[17] J.H. Zhang, T.D. Chung, K.R. Oldenburg, A simple statistical parameter for use inevaluation and validation of high throughput screening assays, J. Biomol.Screen. 4 (1999) 67–73.
[18] K.J. Ellis, J.F. Morrison, Buffers of constant ionic strength for studying pH-dependent processes, Methods Enzymol. 87 (1982) 405–426.
[19] F. Yu, S.B. White, Q. Zhao, F.S. Lee, HIF-1a binding to VHL is regulated bystimulus-sensitive proline hydroxylation, Proc. Natl. Acad. Sci. USA 98 (2001)9630–9635.
[20] D.R. Mole, C.W. Pugh, P.J. Ratcliffe, P.H. Maxwell, Regulation of the HIFpathway: Enzymatic hydroxylation of a conserved prolyl residue in hypoxia-inducible factor alpha subunits governs capture by the pVHL E3 ubiquitinligase complex, Adv. Enzyme Regul. 42 (2002) 333–347.
[21] J.H. Min, H. Yang, M. Ivan, F. Gertler, W.G. Kaelin, N.P. Pavletich Jr., Structure ofan HIF-1a–pVHL complex: Hydroxyproline recognition in signaling, Science296 (2002) 1886–1889.
[22] T. Wiseman, S. Williston, J.F. Brandts, L.N. Lin, Rapid measurement of bindingconstants and heats of binding using a new titration calorimeter, Anal.Biochem. 179 (1989) 131–137.
[23] H. Cho, H. Park, E.G. Yang, A fluorescence polarization-based interaction assayfor hypoxia-inducible factor prolyl hydroxylases, Biochem. Biophys. Res.Commun. 337 (2005) 275–280.
[24] M.A. McDonough, V. Li, E. Flashman, R. Chowdhury, C. Mohr, B.M. Lienard, J.Zondlo, N.J. Oldham, I.J. Clifton, J. Lewis, L.A. McNeill, R.J. Kurzeja, K.S.Hewitson, E. Yang, S. Jordan, R.S. Syed, C.J. Schofield, Cellular oxygen sensing:Crystal structure of hypoxia-inducible factor prolyl hydroxylase (PHD2), Proc.Natl. Acad. Sci. USA 103 (2006) 9814–9819.
[25] L.A. McNeill, L. Bethge, K.S. Hewitson, C.J. Schofield, A fluorescence-based assayfor 2-oxoglutarate-dependent oxygenases, Anal. Biochem. 336 (2005) 125–131.
[26] L.A. McNeill, E. Flashman, M.R. Buck, K.S. Hewitson, I.J. Clifton, G. Jeschke, T.D.Claridge, D. Ehrismann, N.J. Oldham, C.J. Schofield, Hypoxia-inducible factorprolyl hydroxylase 2 has a high affinity for ferrous iron and 2-oxoglutarate,Mol. Biosyst. 1 (2005) 321–324.
[27] M. Hirsila, P. Koivunen, L. Xu, T. Seeley, K.I. Kivirikko, J. Myllyharju, Effect ofdesferrioxamine and metals on the hydroxylases in the oxygen sensingpathway, FASEB J. 19 (2005) 1308–1310.
[28] P. Koivunen, M. Hirsila, A.M. Remes, I.E. Hassinen, K.I. Kivirikko, J. Myllyharju,Inhibition of hypoxia-inducible factor (HIF) hydroxylases by citric acid cycleintermediates: Possible links between cell metabolism and stabilization of HIF,J. Biol. Chem. 282 (2007) 4524–4532.
[29] A.C. Epstein, J.M. Gleadle, L.A. McNeill, K.S. Hewitson, J. O’Rourke, D.R. Mole, M.Mukherji, E. Metzen, M.I. Wilson, A. Dhanda, Y.M. Tian, N. Masson, D.L.Hamilton, P. Jaakkola, R. Barstead, J. Hodgkin, P.H. Maxwell, C.W. Pugh, C.J.Schofield, P.J. Ratcliffe, C. elegans EGL-9 and mammalian homologs define afamily of dioxygenases that regulate HIF by prolyl hydroxylation, Cell 107(2001) 43–54.
[30] K.I. Kivirikko, J. Myllyharju, Prolyl 4-hydroxylases and their protein disulfideisomerase subunit, Matrix Biol. 16 (1998) 357–368.

Kinetic characterization of HIF–PHD2 / J.H. Dao et al. / Anal. Biochem. 384 (2009) 213–223 223
[31] H.J. Knowles, R.R. Raval, A.L. Harris, P.J. Ratcliffe, Effect of ascorbate on theactivity of hypoxia-inducible factor in cancer cells, Cancer Res. 63 (2003)1764–1768.
[32] L. de Jong, S.P. Albracht, A. Kemp, Prolyl 4-hydroxylase activity in relationto the oxidation state of enzyme-bound iron: The role of ascorbate inpeptidyl proline hydroxylation, Biochim. Biophys. Acta 704 (1982) 326–332.
[33] R. Myllyla, E.R. Kuutti-Savolainen, K.I. Kivirikko, The role of ascorbate in theprolyl hydroxylase reaction, Biochem. Biophys. Res. Commun. 83 (1978) 441–448.
[34] R. Myllyla, K. Majamaa, V. Gunzler, H.M. Hanauske-Abel, K.I. Kivirikko,Ascorbate is consumed stoichiometrically in the uncoupled reactions
catalyzed by prolyl 4-hydroxylase and lysyl hydroxylase, J. Biol. Chem. 259(1984) 5403–5405.
[35] C.J. Schofield, P.J. Ratcliffe, Oxygen sensing by HIF hydroxylases, Nat. Rev. Mol.Cell Biol. 5 (2004) 343–354.
[36] C.J. Cunliffe, T.J. Franklin, N.J. Hales, G.B. Hill, Novel inhibitors of prolyl 4-hydroxylase: III. Inhibition by the substrate analogue N-oxaloglycine and itsderivatives, J. Med. Chem. 35 (1992) 2652–2658.
[37] C.M. Tegley, V.N. Viswanadhan, K. Biswas, M.J. Frohn, T.N. Peterkin, C. Chang,R.W. Bürli, J.H. Dao, H. Veith, N. Rogers, S.C. Yoder, G. Biddlecome, P. Tagari, J.R.Allen, R.W. Hungate, Discovery of novel hydroxy-thiazoles as HIF-a prolylhydroxylase inhibitors: SAR, synthesis, and modeling evaluation, Bioorg. Med.Chem. Lett. 18 (2008) 3925–3928.
Copyright © 2022 FDOKUMEN