JIil - DSpace@MIT - Massachusetts Institute of Technology
118
CONTROLLING THE FEATURE ANGULARITY OF EXTRUDED ALUMINUM PRODUCTS: AN EFFICIENT METHODOLOGY FOR MANUFACTURING PROCESS IMPROVEMENT by Stephen M. Novakovich B.S., Mechanical Engineering and Economics Northwestern University (1989) Submitted to the MIT Sloan School of Management and to the Department of Mechanical Engineering in Partial Fulfillment of the Requirements for the Degrees of MASTER OF SCIENCE IN MECHANICAL ENGINEERING and MASTER OF SCIENCE IN MANAGEMENT at the MASSACHUSETTS INSTITUTE OF TECHNOLOGY May 6, 1994 ©Massachusetts Institute of Technology, 1994. All rights reserved. Signature of Author Sloan School of Management and Department of Mechanical Engineering May 6, 1994 Certified by Certified by Accepted by JIil Roy E. Welsch Professor of Management Thesis Supervisor Stuart B. Brown Richard Plimmons Associate Professor of Materials Manufactur ing Thesis Supervisor a B~B m Jeffrey Barks ..Associated Dean, Sloan Masters and Bachelors Program i !
-
Upload
khangminh22 -
Category
Documents
-
view
4 -
download
0
Transcript of JIil - DSpace@MIT - Massachusetts Institute of Technology

CONTROLLING THE FEATURE ANGULARITY OF EXTRUDEDALUMINUM PRODUCTS: AN EFFICIENT METHODOLOGY FOR
MANUFACTURING PROCESS IMPROVEMENT
by
Stephen M. Novakovich
B.S., Mechanical Engineering and EconomicsNorthwestern University (1989)
Submitted to the MIT Sloan School of Management and to the Department of MechanicalEngineering in Partial Fulfillment of the Requirements for the Degrees of
MASTER OF SCIENCE IN MECHANICAL ENGINEERINGand
MASTER OF SCIENCE IN MANAGEMENT
at theMASSACHUSETTS INSTITUTE OF TECHNOLOGY
May 6, 1994
©Massachusetts Institute of Technology, 1994. All rights reserved.
Signature of AuthorSloan School of Management and
Department of Mechanical EngineeringMay 6, 1994
Certified by
Certified by
Accepted by
JIil
Roy E. WelschProfessor of Management
Thesis Supervisor
Stuart B. BrownRichard Plimmons Associate Professor of Materials Manufactur ing
Thesis Supervisor
a B~B m
Jeffrey Barks.. Associated Dean, Sloan Masters and Bachelors Program
i !

2

CONTROLLING THE FEATURE ANGULARITY OF EXTRUDEDALUMINUM PRODUCTS: AN EFFICIENT METHODOLOGY FOR
MANUFACTURING PROCESS IMPROVEMENTby
Stephen M. Novakovich
Submitted to theDEPARTMENT OF MECHANICAL ENGINEERING
and theMIT SLOAN SCHOOL OF MANAGEMENT
May 6, 1994 in Partial Fulfillment of the Requirements for the Degrees ofMaster of Science in Mechanical Engineering, and
Master of Science in Managementin Conjunction with the Leaders for Manufacturing Program
Abstract
This study examines the concept of the efficiency of resource usage in the practiceof manufacturing process improvement. A strategy for increasing the efficiency of processimprovement projects was formulated and tested in an industrial setting. The resultingframework is offered as one example of a process improvement methodology which wasdesigned with the efficient use of resources as an explicit goal.
The methodology that was developed is comprised of three overlapping phases: adata survey, an analytical study, and a series of designed experiments. Gains in efficiencycome from an emphasis on strategic pre-project planning and from synergies which resultfrom the real-time integration of data produced by the three phases of the methodology.The result of the methodology is a proven "mental model" which describes therelationships between important process parameters and the quality of the final product,and is subsequently used to generate and evaluate ideas for process improvement. Inaddition, the mental model can have long-term benefits if it is further developed, refined,and integrated into the facility's decision-making processes.
A process improvement project was conducted at an aluminum extrusion facilityand is offered here as a case study of the methodology. The goal of the project was toimprove the extruder's ability to hold tight tolerances for feature angularity in extrudedaluminum aircraft parts. The mental model which resulted was used to identifymodifications to the facility's standard die design which reduced the variation in featureangularity by over 50%.
Thesis Advisors:Professor Stuart B. Brown, Richard P. Simmons Professor of Materials ManufacturingProfessor Roy E. Welsch, Professor of Management
3

4

Acknowledgments
I wish to acknowledge the Leaders for Manufacturing Program and its sponsors for theirsupport of this work.
A special thanks should also be extended to the following individuals at the plant:Dave King and Bill Cooke for their support and willingness to invest in this project; JimShepard for patiently sharing his experience and knowledge regarding extrusion dies;Javier Perez for providing critical assistance on the shop floor; and Jim Smith for being awilling accomplice in many parts of this project and for being a quick study in statistics(keep up the good work!).
I would also like to thank Professors Stuart Brown and Roy Welsch for their assistanceand enthusiasm.
Finally, I want to thank Rebecca, my wonderful wife, whose unwavering support, sense ofadventure, and amazing blueberry pies made this internship great fun!
5

6

Table of Contents
Title Page .................................................................................................................... 1Abstract ...................................................................................................................... 3Acknowledgments ....................................................................................................... 5Table of Contents ........................................................................................................ 7List of Charts and Diagrams .............................................................................. 11Chapter 1: Introduction .............................................................................................. 13
The Process Improvem ent Paradox .................................................................. 13The Problem ......................................... 14The M ethodology ............................................................................................ 16
Planning ............................................................................................... 16Structure .............................................................................................. 16Resource Allocation ......................................... 17Intermediate Goals ......................................... 18Synergy ................................................................................................ 18
Chapter 2: Extrusion Processing ................................................................................. 21Industry Overview ........................................................................................... 21Process Overview ......................................... 22
The Extrusion Process .......................................................................... 22Finishing Processes ......... ......................................................................24
Process Flows ......................................... 26Chapter 3: Data Survey .............................................................................................. 29
Introduction and Definitions ............................................................................. 29Instrum entation................................................................................................ 31Job Selection .................................................................................................... 31Inspection Points .............................................................................................. 32Sam pling.......................................................................................................... 34Production Processes ......................................... 37Variation at the Press ......................................... 40Geom etric Factors at the Press ......................................... 42System Capability ............................................................................................ 46Results ............................................................................................................. 49
Chapter 4: Analytical Study ........................................................................................ 51Introduction ..................................................................................................... 51Extrusion Physics ............................................................................................. 52
Flow Patterns W ithin the Billet ......................................... 52Factors Affecting the Shape of the Dead Metal Zone ............................ 54
Distortion M echanism s ..................................................................................... 57Nonuniform Flow Velocities ................................................................. 57Nonparallel Flow Directions ................................................................. 58
Variation M echanisms ...................................................................................... 65Lengthwise Variation ........................................................................... 65Piece to Piece Variation ........................................................................ 66
7

Strategies for Improvement ................................. 66Improving Process Control ................................................................... 67Improving Process Robustness ............................................................. 67
Results ............................................................................................................. 69Chapter 5: Experimentation ........................................................................................ 71
Goals ............................................................................................................... 72Equipment and Instrumentation ................................. 73Experiment 1 - Proving the M odel ................................................................... 74
Planning ............................................................................................... 75Control Factors ................................. 75Design M atrix ........................................................................... 75Noise Factors ................................. 76Evaluation ................................................................................ 77
Execution ............................................................................................. 77Results ................................................................................................. 78
Raw Data ................................... 78Analysis of M eans ..................................................................... 79Analysis of Variances ................................................................ 80Economic Considerations ................................. 82Conclusions .............................................................................. 83
Experiment 2 - Pushing the Limits .................................................................... 84Planning ............................................................................................... 85Execution ............................................................................................. 86Results ................................................................................................. 86
Experiment 3 - Further Optimization ................................................................ 87Planning ............................................................................................... 88Execution ........................................................ .......................... 89Results ................................................................................................. 89
Experiment 4 - The Effect of Heat Treat .......................................................... 89Planning ............................................................................................... 90Execution ............................................................................................. 90Results ................................................................................................. 90
Chapter 6: Results and Recommendations ................................. 95Results ............... ................................. 95
Data Survey ......................................................................................... 95Analytical Study ................................................................................... 96Experiment 1: ....................................................................................... 97Experiment 2: ....................................................................................... 97Experiment 3: ....................................................................................... 97Experiment 4: ................................................................... 98
Recommendations ............................................................................................ 98Chapter 7: M ethodology Evaluation ........................................ 101
Effectiveness .................................................................................................... 101Resource Efficiency ......................................................................................... 102
Resource Allocation ........................................ 102
8

Synergy ................................................................................................ 103Areas for Improvement ......................................................... 105
Appendix A: Charts and Graphs ......................................................... 107Appendix B: Angularity Measurement Procedures ...................................................... 108Appendix C: Sample Angularity Data Sheet ......................................................... 110Appendix D: Sample Angularity Calculation Sheet ...................................................... 111Appendix E: Confidence Interval for Variances Along and Between Extrusions .......... 112Appendix F: Variance Reduction in Experiment 1 ....................................................... 114Appendix G: Regression Analysis of Experiment 1 ...................................................... 115Appendix H: Confidence Interval for Experiment 2 ..................................................... 116Bibliography ................................................................................................................ 118
9

10

List of Charts and Dia2rams
Figure 1. Typical Shapes of Aerospace Extrusions
Figure 2. Three Phases of Process Improvement
Figure 3. Resources and Questions
Figure 4. Direct Extrusion Press Schematic
Figure 5. 3-Point Measurements vs. Profile Measurements
Figure 6. Residual Plot of 3-Point Measurements vs. Profile Measurements
Figure 7. Variance by Process
Figure 8. Front Variation vs. Back Variation
Figure 9. Front Variation vs. Back Variation
Figure 10. Standard Deviation at Press vs. Aspect Ratio
Figure 11. Standard Deviation vs. Extrusion Circle
Figure 12. Standard Deviation at Press vs. Extrusion Ratio
Figure 13 Extrusion Circle vs. Extrusion Ratio
Figure 14. Flow Regimes During Direct Extrusion
Figure 15. The Effect of Die Layout on the DMZ
Figure 16. The Effect of Billet Length on the Slope of the DMZ
Figure 17. Flat vs. Conical Die
Figure 18. Nonparallel Flow Direction
Figure 19. Free Body Diagram
Figure 20. Coefficient of Frictional Asymmetry (K) vs. Flow Angle
Figure 21. The Effect of Frictional Asymmetry on Runout Direction
Figure 22. The Effect of Die Layout on the DMZ
Figure 23. The Pocket Die Control Strategy
Figure 24. Experiment 1 - Analysis of Means
Figure 25. Experiment 1 - Interaction Terms
Figure 26. Experiment 2 - Die Geometries
Figure 27. The Effect of Heat Treat on Variation
Figure 28. The Effect of Stretch on Variation
Figure 29. The Effect of HT and Stretch on Variation
Figure 30. The Effect of HT and Stretch on an Individual Extrusion
Figure 31. Project Synergies
11

12

Chapter 1: Introduction
Innovation cannot occur except in the presence of slack.-March and Simon, Organizations
In my opinion, the most glaring and significant shortcoming ofWestern management today is the lack of improvement philosophy.
Masaaki Imai, Kaizen
The Process Improvement Paradox
Modem American manufacturers are faced with a paradox. Increased competitive
pressures at home and abroad have forced them to become lean, rethinking production
techniques, slashing inventory, and eliminating "waste" in the name of efficiency. Initially,
opportunities for process improvement abound. Gains are relatively easy as many
operations have not been seriously examined for years. Sooner or later, however,
diminishing marginal returns set in and further improvements become very difficult. At
this stage, when making improvements is most difficult, would-be process improvers are
faced with the dilemma of having fewer resources with which to work. The personnel and
equipment that were shed in "right sizing" exercises are now unavailable for performing
experiments or collecting data. Furthermore, the workers that remain have less time for
process improvement activities, as more of their attention is now devoted to meeting
production goals. In spite of the ubiquitous "Continuous Improvement" slogans, the drive
for efficiency has stripped many manufacturing organizations of the resources they need to
make further gains.
This study examines the concept of efficiency of resource usage in the practice of
process improvement. A strategy for increasing the efficiency of process improvement
projects was formulated, then tested in an industrial setting (an aluminum extrusion facility
13

referred to in this document as "the Plant", which is operated by "The Company"). The
resulting framework is offered as one example of a process improvement methodology
which was designed with the efficient use of resources as an explicit goal.
The Problem
Extruded products are unique in that they have constant cross-sectional geometries
along their lengths. In the aerospace market, several typical shapes make up a large
percentage of aluminum extrusion production. These shapes are angles, zees, and tees
(see Figure 1).
angle zee tee
Figure 1. Typical Shapes of Aerospace Extrusions
These parts, which can be over 20 feet long, are incorporated into aircraft by
airframe builders. At the assembly stage, fit and finish is crucial. Feature angularity,
defined as the angle between adjacent features (e.g., the angle between the stem and cap
of a tee), is of particular importance to airframe builders. If an extrusion does not mate
with adjoining parts in accordance with the engineering design, the parts must be
"shimmed", or, basically, wedged into their mating positions. This is done with the use of
14

aluminum wedges and spacers and with costly production tooling. Rework of this type is
extremely expensive for the assembler, who must employ highly skilled workers to finesse
the ill-fitting members into position. The magnitude and significance of this problem
becomes apparent when one considers that a Boeing 747 has in excess of 4 million
individual parts (including fasteners). One domestic airframe builder has spent an
estimated $ 9M per year on labor alone to rework seat track extrusions for a single airliner
program.
Angularity problems translate into higher costs for end-users as well. The shims
and spacers which are added to correct angularity problems add weight to the airframe,
reducing fuel economy and cargo-carrying capabilities for common carriers. One estimate
places the weight of such remedial fixtures at over 1000 lbs. on a typical 747, a nontrivial
amount. The resulting reduction in efficiency and performance will, of course, endure
throughout the entire life of the airframe, a period of 20 years or more.
To combat these problems, domestic airframe builders are pushing the aluminum
extrusion industry to increase the geometric accuracy of extrusions beyond the published
industry standards. The Aluminum Association guidelines for angularity are listed as
nominal + 1.0°, 1.5°, or 2.0 °, depending on the wall thickness and aspect ratio
(length/thickness) of the feature in question. Recent orders suggest that aerospace
extrusion customers may begin requesting tolerances on angularity of nominal + .5° , or,
perhaps even + .250, on a routine basis in the near future. This development formed the
impetus for the process improvement project described by this thesis. It is hoped that
improving the Company's ability to control critical angles will translate into a strategic
advantage in the competitive market for aluminum aerospace extrusions.
15

The Methodology
The goals of this study were to explore ways of using process improvement
resources more efficiently, and to develop concrete recommendations for improving The
Company's ability to control critical angles. To achieve these goals, a process
improvement methodology was designed and tested at the Plant.
The author of this document hopes that the recommendations offered herein will
be of lasting value to the Plant, but perhaps more importantly that the description of the
successes and failures of the process improvement methodology and the project itself will
serve as a useful guide for process improvement practitioners at the Plant and elsewhere.
Planning
In conducting the pre-project planning for this study, particular care was taken to
design efficiency into the process improvement methodology. Specifically, the
methodology attempted to utilize available resources as efficiently as possible. With this
goal in mind, the following general guidelines were established:
· be realistic in assessing what resources are available for the project,· apply resources where they will yield the greatest benefit,· know when to end each step in the project and move on, and· make full use of synergies between different parts of the project.
Structure
The methodology that resulted consists of three phases: a data survey, an
analytical study, and an experimentation phase. This structure seemed logical since it
corresponds to the three generic questions that most process improvement projects seek
16

to answer: How is the process currently performing? What process variables drive
product quality? And what can be done to improve product quality? Figure 2, below,
illustrates the relationship between the three phases; each phase overlaps with and builds
upon the preceding phase.
Figure 2. Three Phases of Process Improvement
Resource Allocation
This process improvement methodology requires the practitioner to list the
resources that will be invested in each phase. This is done to encourage the thoughtful
identification and allocation of available resources. It also provides an occasion for the
planner to ration scarce resources (e.g., the practitioner's time) by investing more of them
in the phase(s) in which they will yield the greatest benefit and less of them where the
benefit is small. This resource allocation step may also aid in the identification of tradeoffs
that can be made to improve overall efficiency. This is made possible by the fact that a
weakness in one phase may often be addressed by strengthening one or both of the other
17

phases. For example, if data is unreasonably difficult or expensive to collect, a process
improvement practitioner may choose to invest fewer resources on the data survey,
compensating instead by spending additional time performing a more thorough analytical
study or running additional experiments. Efficiency can be increased in this way if the
time that is shifted out of the data survey will yield greater benefits if it were to be
invested in one of the other phases than if it were to be used merely to collect a few more
data points. The general rule-of-thumb here is to maximize the benefit of each unit of
resources by investing it in the phase of the project in which it will yield the greatest
return.
Intermediate Goals
This methodology also includes a list of questions which are to be answered at
each phase of the project. This is done to provide both a clear goal for the phase and a
yardstick with which to measure progress. When the questions are answered sufficiently,
the phase is declared to be complete so that resources can be reallocated to the next phase
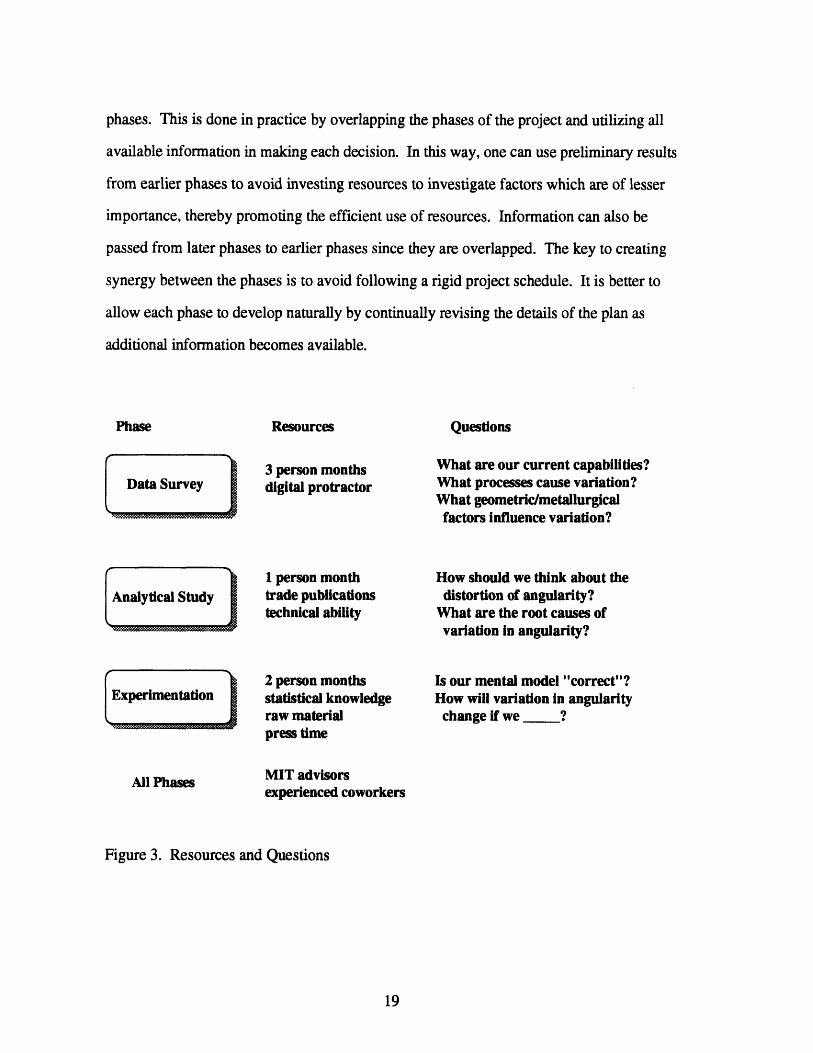
without delay. A summary of the project plan for this study is shown in Figure 3, below.
Note that the questions that were listed are detailed enough to give direction, but are not
specific to the point of becoming leading or constrictive. This is important because
process improvement projects should attempt to uncover truth, not steer results to
predetermined conclusions.
Synergy
Synergy is defined as the condition in which a whole is greater that the sum of its
parts. Synergy can be achieved between the phases of the process improvement
methodology if one is careful to apply the knowledge obtained in each phase to the other
18
phases. This is done in practice by overlapping the phases of the project and utilizing all
available information in making each decision. In this way, one can use preliminary results
from earlier phases to avoid investing resources to investigate factors which are of lesser
importance, thereby promoting the efficient use of resources. Information can also be
passed from later phases to earlier phases since they are overlapped. The key to creating
synergy between the phases is to avoid following a rigid project schedule. It is better to
allow each phase to develop naturally by continually revising the details of the plan as
additional information becomes available.
Phase Resources Questions
3 person monthsdigital protractor
1 person monthtrade publicationstechnical ability
What are our current capabilities?What processes cause variation?What geometric/metallurgicalfactors influence variation?
How should we think about thedistortion of angularity?
What are the root causes ofvariation in angularity?
2 person monthsstatistical knowledgeraw materialpress time
Experimentation
AhM v
All Phases MIT advisorsexperienced coworkers
Figure 3. Resources and Questions
Is our mental model "correct"?How will variation in angularity
change if we ?
19

Constructing a good project plan requires a blend of structure and flexibility.
Structure is needed to keep the project on course, and flexibility is needed to provide the
freedom to take advantage of developments and opportunities that cannot be foreseen at
the outset. This approach can cause anxiety for technically trained individuals who favor
clearly defined tasks and objectives. One must keep in mind, however, that it is the
flexibility of the methodology which boosts efficiency.
20
Chapter 2: Extrusion Processing
Industry Overview
The first aluminum extrusion press in North America was opened by Alcoa in New
Kensington, PA, in 1904. Since then, the North American aluminum extrusion industry
has grown to include 80 extruders operating 140 plants with some 390 presses. In the
1980s, extrusions accounted for an average 19.5% share of aluminum mill products
shipped to end-users and distributors [Purchasing, 1992, p. 68B4].
The Company specializes in the extrusion of 2xxx and 7xxx series aluminum
alloys, commonly referred to as "hard alloys". Hard alloys are more difficult to extrude
but provide greater strength than the softer aluminum alloys. As such, hard alloy
extrusions command a premium price and are used in industries which require light, high
strength parts, such as aircraft manufacturing. Aerospace firms often prefer extrusions
over machined or stamped parts because they can be produced to net shape, requiring little
or no additional processing, and can be manufactured to fairly tight tolerances. The
aerospace segment of the hard alloy aluminum extrusion market is highly prized by
extruders for its high margins. The Company has historically competed in this niche.
While its reputation for quality and on-time delivery performance have enabled it to win a
healthy share of the market, it is now experiencing increasing pressure from customers and
competitors.
The Company's aerospace customers have been hurt by recent reductions in the
U.S. defense budget, the recent drop in orders from the embattled domestic airline
industry, and by increased foreign competition, notably from the European Airbus
consortium. They have responded to these pressures by looking for ways to cut costs and
simplify their assembly processes. As the market for aerospace extrusions has shrunk,
competition among hard alloy extruders has increased. Extrusion industry publications
21
indicate a widespread movement toward Total Quality Management principles and the
tighter control of manufacturing processes. The Company has responded to these
developments by reducing costs and initiating quality improvement programs of its own.
Process Overview
The Extrusion Process
Extrusion is an extremely flexible manufacturing process. Materials from plastic to
steel may be extruded into surprisingly complex cross-sectional geometries (referred to as
"shapes") by forcing cylindrical billets of material through a die. The product which
emerges, called an extrudate, has, in principle, a constant cross-sectional geometry along
its length. The flexibility of extrusion comes from the fact that a single extrusion press
may be used for multiple materials and can produce an infinite number of shapes by simply
changing the die and the associated tooling. Thus, a myriad of products may be produced
with few or no modifications to equipment.
There are two main types of extrusion: direct and indirect. While both methods
involve forcing a billet of material through a die, the difference lies in whether the die or
the billet is held stationary. Direct extrusion is characterized by pushing a billet against a
stationary die. Indirect extrusion, on the other hand, is performed by forcing the die over
a stationary billet.
Indirect extrusion generally provides greater front-to-back dimensional control
over the final product since the absence of friction between the billet and the container
wall results in an extrusion cycle that more closely resembles a steady state process (i.e.
constant exit temperature, extrusion load, and material flow patterns within the billet).
Indirect extrusion, however, cannot match the productivity rates of direct extrusion due to
22

the long dead cycle times which are necessary for removing the "shell" (the skin of the
billet), from the container at the end of the cycle and the greater complexity of indirect
extrusion tooling [Laue, 1976, pp. 75-78]. Economics, therefore, dictate that most
aluminum extrusions are produced by direct extrusion. Dimensional inaccuracies are dealt
with by making slight modifications to the die (referred to as "repairing the die") or by
passing the extrusions through subsequent rework operations. This study concentrated
exclusively on direct extrusion production.
A cross-section of a typical direct extrusion press is shown schematically in Figure
4. It consists of the following basic components:
Container - a hollow steel cylinder which holds the billet as it is compressed
Die - a steel disc with a hole machined through it that molds the extrudate
Ram - a heavy steel rod which drives the billet against the die
Dummy Block - a steel disc which isolates the ram from the billet.
Extrudate
Die -Container
Dummy Block
-Ram
Figure 4. Direct Extrusion Press Schematic
23

The extrusion cycle begins when a preheated billet is loaded into the container. A
dummy block is then inserted behind the billet. The dummy block creates a seal against
the container wall so that billet material cannot squeeze past and prevent the ram from
retracting when the forward stroke is completed. The dummy block is driven forward by
the ram, compressing the billet which deforms to take the shape of the container cavity.
As additional force is applied by the ram, stresses build within the billet, causing local
plastic deformation in accordance with the Von Mises yield criterions. At this point, billet
material is forced through the die opening to form the extrudate. The geometry of the die
opening determines the cross-sectional geometry of the extrudate. The ram will continue
to travel until approximately one inch of billet material is left in the container. At this
time, the motion of the ram stops, then reverses as the ram is pulled from the container.
The extrudate is sheared off, and the remaining billet material (called "butt") and the
dummy block are quickly ejected from the container. The press is now ready to receive
the next billet.
Finishing Processes
Extrusion is only the first step in the manufacturing process. Subsequent finishing
processes are necessary to achieve desired mechanical and metallurgical properties,
correct geometric flaws, and prepare the extruded pieces for shipment. Few lots pass
through all of the finishing processes. The routing a lot will take is determined by the
desired temper and the results of in-process quality inspections. The material flows in
extrusion facilities are similar to those of a job shop.
1 = (1/42)[(a 1 - a2)2
+ (a2 - 03 ) 2+ (03 - 01)2]'2 = 3k at the onset of plastic deformation, assuming
isotropic deformation (k = shear strength)
24
Rough cut is the processing step which removes the distorted front and back ends
from the extrusion. This is performed at the press with a cutting torch.
Heat Treat is a thermal process which is used to increase the mechanical strength
of the aluminum through a heat/quench cycle. Extrusions are hung vertically in a natural
gas-fired heating tower. When the desired heating profile has been achieved (placing
alloying elements in solution) the extrusions are rapidly cooled by quickly lowering them
into a pit that contains a mixture of water and glycol.
Age is a thermal process which is designed to further increase the hardness of heat
treated metal by facilitating the precipitation of alloying elements, namely zinc, copper,
and/or manganese. It is achieved by holding the metal at an elevated temperature for a
specific length of time in order to speed up the precipitation hardening that occurs
naturally at room temperature.
Anneal is a thermal process which is used to soften metal by removing the strain
hardening that occurs during extrusion. It is similar to the Age process in that the metal is
heated to a specific temperature for a specific length of time, then cooled in a controlled
manner.
Stretch is a mechanical process that is used to straighten extrusions. Every
extrusion is stretched before it is shipped. The extrusion is gripped at each end by steel
jaws, placed in tension by a hydraulic press, and elongated a predetermined amount. The
stretch operation is sometimes used to bring cross-section dimensions which are over top
tolerance into tolerance.
25

Finish Cut is typically performed after stretch with a circular saw to reduce the
length of the extrusion to the ordered length.
Roll is a rework operation that is used to restore flatness to an extruded feature or
to adjust the gap between two points on a complex cross-section (for example, the tips on
a part with a C-shaped cross-section). The extrusion is passed between rotating rollers
that have been adjusted to place pressure on the extrusion at specific locations.
Detwist is a rework operation which involves visually inspecting each extrusion
for twist and then using a wrench-like device to torque the extrusion in the opposite
direction.
Pack is the final operation. It involves labeling each extrusion and placing it in a
crate for shipping.
Process Flows
Material flows in an extrusion facility are complex. In some ways they resemble
the material flows in a job shop environment where scheduling decisions are made and
revised on the shop floor in an attempt to accommodate each job's processing needs with
the equipment that is not currently being used.
While the author and personnel at the Plant could make some assumptions
concerning which manufacturing processes degrade the geometric accuracy of critical
angles, data did not exist to validate such assertions. Therefore the project scope included
all production processes, creating a need for detailed process flow information. While
flow diagrams were available for the Plant, they did not include some types of detailed
26

information that would have been useful in the study. A portion of the planning phase of
the project, therefore, involved analyzing material flows in the Plant. The resulting
process flow information was later used in the data survey phase when the rationing of
time became an issue. It enabled the author to prioritize manufacturing processes when
decisions arose regarding the investment of time in data collection.
27

28

Chapter 3: Data Survey
There can be no improvement where there are no standards. Thestarting point in any improvement is to know exactly where one stands.
Masaaki Imai, Kaizen
The first phase of the study began with data collection. This was necessary to
uncover trends which might yield clues concerning quality drivers (to be incorporated into
the analytical study phase of the project) and suggestions as to which manufacturing
processes should be targeted for further study.
Introduction and Definitions
When an airframe builder orders an aluminum extrusion which has a critical feature
angle, two specifications are made: the nominal (target) angle and a tolerance range. A
specification of 90° 2 means that the engineering design calls for an angle of 90°, but
angles ranging from 88° to 92° will be accepted by the purchaser. Tolerance ranges
recognize the fact that no two manufactured products are exactly the same, since all
manufacturing processes have some variation. Similarly, the variation in a batch of parts
may be characterized by calculating the mean and the standard deviation of measurements
of the parameter of interest. If the measurements are normally distributed (as many
measurements of manufactured goods tend to be), 99.73% of them will fall between the
limits of the mean plus and minus three standard deviations [Montgomery, 1991, p. 421.
If the mean of the measurements is equal to the nominal specification, the process is called
"centered". Obviously, the goal of having all of the parts fall within the tolerance interval
is easier to achieve if the process is centered, since the normal distribution is symmetric
29

about the mean just as a tolerance level is typically symmetric about the nominal
specification. If the process is centered, yet parts still fall outside the tolerance range, it is
necessary to reduce the process variance, thereby reducing the standard deviation of the
measurements so that they will be clustered more tightly about the mean and,
consequently, the nominal specification. Process improvement, therefore, can aim to
reduce process variation, center the process, or both. In general, reducing process
variation is considered to be more difficult than centering a process.
Characterizing the quality of a batch of extrusions is complex since parameters
such as feature angularity vary both along each extrusion and between the extrusions in
the batch. One method of characterization is to calculate the standard deviation along
each piece in the batch, then average them. The result is referred to in this study as
"Salong", the sample standard deviation along the extrusions. Then, the mean angle for
each piece in the batch is calculated and a standard deviation is obtained from them. This
is referred to as "Sbtween", the sample standard deviation between extrusions in the batch.
Comparing these two parameters gives an indication which type of variation dominates in
a given batch. A study of six production lots inspected after stretch (the state of an
extrusion after stretch is a good proxy for the state of the final product) showed that
Salong was greater than Sbetween in all six lots. The mean variance between the pieces
was, on average, only 46% as high as the mean variance along the pieces In addition, the
mean variance along the pieces was greater than the mean variance between the pieces to
a 90% confidence level (see Appendix E: Confidence Interval for Variances Along and
Between Extrusions). While this study addressed both Salong and Sbetween, the analytical
study concentrated on Salong since the control of Sbtween falls in the category of
improving billet-to-billet consistency, an area which is currently under investigation at the
Plant.
30
Instrumentation
The measuring instrument that was chosen for the study was a new digital
protractor with the capability of measuring angles to .01 degrees. The angularity study
provided opportunities to experiment with different blade configurations and with various
attachments to increase the accuracy and reduce the difficulty of taking measurements. A
gage capability study of the instrument was performed using two employees who had no
previous training or experience with the tool. It resulted in a precision-to-tolerance ratio
(P/T) of 0.12. While P/T values of 0.10 or less are generally desired [Montgomery, 1991,
p. 393], the reproducibility in the study was high while the repeatability was low,
suggesting that the instrument's accuracy would improve significantly when the user(s)
became more experienced. Furthermore, the digital protractor was the only commercially
available digital angle measuring device. The study proceeded since there were no better
alternatives. Blade modifications were made and measurement guidelines were
established, however, to improve the accuracy of the inspections. All angle measurements
were taken with the same instrument. The author took roughly 80% of the measurements.
An assistant accounted for the other 20%.
Job Selection
A conscious effort was made to select a wide range of jobs in order to sample a
representative cross-section of the Plant's aerospace extrusion production. The following
factors were considered:
31

· shape (tee, zee, or angle),· alloy (both 2xxx and 7xxx),· temper (both 0 and heat treated tempers),· thick:thin ratio (asymmetry in wall thickness), and· aspect ratio (ratio of feature length to wall thickness).
While it was not possible to obtain enough data to conduct a regression study
based on these factors, it was hoped that simpler analytical techniques might still identify
strong correlations between variations in angularity and the preceding factors.
In all, nine production lots were selected: two zees, four tees, and three angles.
All of the lots were extruded on a 6" press and all lots but one were extruded using one-
hole dies. There were two reasons for restricting the study to one-hole dies. First, most
of the shapes extruded on 6" multi-holed dies have very small cross-sections which make
them difficult to measure with the digital protractor. Second, multi-hole dies are affected
by additional sources of variation which can affect angularity and are hard to quantify,
such as slight dimensional differences between each of the holes in the die. It was felt that
these sources of variation could overshadow other sources of variation and add
unnecessary complexity. Furthermore, a study of one-hole dies would yield insights which
could later be applied to the more complex multi-hole situations.
Inspection Points
As previously mentioned, the finishing area of the Plant is operated as a job shop,
with complex material flows and a production schedule that changes constantly as
production lots are routed to whichever processing station is currently available.
Furthermore, decisions regarding roll and detwist may be made at any point in the
production process at which a need for remedial work is identified. As such, even locating
a specific lot after it leaves the press area can be difficult.
32

The ideal situation would have been to inspect the lots immediately after extrusion
and then after every subsequent step in the production process. This, unfortunately, was
not possible due to production considerations. If a job were extruded a week or more
before its scheduled ship date, a hold tag could be used to stop it after a given production
process to facilitate an angularity inspection. For some jobs, however, such processing
delays were not possible and inspections for angularity were missed, especially if the
material was processed and routed on the swing or graveyard shifts.
Most heat treated lots (7xxx series alloys) could not be stopped for inspection
between the heat treat and stretch operations because of the necessity to stretch the
material quickly after heat treat before age hardening occurs. Thus, while every job was
inspected after stretch, none were inspected between heat treat and stretch. A study of
heat treat and stretch was conducted later in conjunction with a designed experiment (see
"Experiment 4" in Chapter 5).
Detwist is a manual process which involves 100% inspection. Only the out-of-
tolerance parts are processed. Detwist involves applying a twisting moment to the
extrusion at a few specific points, not evenly along its entire length. To examine the effect
of detwist on feature angularity, care must be taken to measure feature angles at specific
locations adjacent to the point at which the twisting moment is to be applied, then to
remeasure the same points after processing. Since the sampling techniques and the lot-to-
lot statistical comparisons of the general study would not apply well to detwist, it was
decided that this operation should be studied separately. Furthermore, the process flow
data suggested that less than one third of production lots are routed through detwist. A
majority of the pieces that do go through detwist inspection do not require any remedial
action. Therefore, the detwist operation affects a relatively small portion of production.
No lots were inspected after detwist.
The following table lists the nine lots that were inspected and shows the
inspections that were made. In all, over 1,500 angle measurements were taken.
33

HT STRETCH ROLL AGE/ANN
1 zee T6511
2 zee T6511
3 tee O
4 tee T6511
5 tee O
6 tee T76511
7 Ang T3511
8 Ang T76511
9 Ang T76511
X Inspected
--- Not Inspected
I Not Processed
Sampling
Obtaining accurate angle measurements is very time consuming. Sampling is a
technique that can be used to reduce both the number of measurements that must be taken
along each extrusion, and the number of extrusions that must be measured in each lot. For
most quality indicators (wall thickness, diameter, surface roughness, etc.), experience at
the plant has shown that taking two measurements, one at the front and one at the back, of
5-10% of the extrusions in a lot is adequate for characterizing a production run. This is
due to the fact that these properties vary in predictable ways along each extrusion and
between successive extrusions in a lot, so a considerable amount of information can be
obtained from just a few samples. Such predictability has not been demonstrated for
angularity, however, so it was not obvious what type of sampling plan would be best.
34
SHAPE TEMPER PRESS

The point of the study is to analyze the variation of a feature angle along the
extrusion. Obviously, at least two measurements would be necessary in order to estimate
a variance. While a continuous angularity measurement (100% sampling by, for instance,
pulling the entire length of the extrusion through a measurement fixture) may be optimal
from an accuracy standpoint, the necessary instrumentation was not available.
Conversely, taking only two measurements on each extrusion would be most desirable
operationally, but might also degrade accuracy to an unacceptable level.
The key to minimizing the amount of effort spent on data collection (thereby
maximizing the number of jobs that can be inspected) is understanding the relationship
between accuracy and the number of samples that are measured. To get a feel for the
effect of sampling on variation characterization, two or three extrusions were selected at
random from several production lots. For each extrusion, a reference angle was measured
at three locations, front, center, and back, then the same angle was measured at
approximately 18" intervals, which are referred to here as "profile" measurements. The
standard deviation of the reference angle was estimated from the range of the three-point
measurements, and was calculated from the profile measurements (with a sample size of
three, an estimate of the standard deviation using a range will deviate from the calculated
standard deviation by less than 1% [Montgomery, 1991, p.204]). A scatter plot of these
data points is shown below in Figure 5.
35

0.7
. 0.6
c 0.5
0.4
g 0.3
, 0.2
0.1
00
x__
< *-x regression line- -- - -- 1:1 correlation i
0.1 0.2 0.3 0.4 0.5
Profile Standard Deviation
0.6 0.7
Figure 5. 3-Point Measurements vs. Profile Measurements
0.3
0.2
,, 0.1
~ To
-0.1
-0.2
-0.3
6xl
x
x x
6 0
i X
2 XO
x3 xo
X
x
4 0, 5 0, 7
Profile Standard Deviation
Figure 6. Residual Plot of 3-Point Measurements vs. Profile Measurements
If the three-point estimates were identical to the profile estimates (which are
assumed here to be "true" measures of the reference angle's variation), the data points in
Figure 5 would lie along the dashed, 1:1 correlation line. They do not, which indicates
that sampling error exists in the three-point estimates. A least squares regression line
36
l .- .
I
I
I
I
. e

through the data, however, lies roughly on the 1:1 correlation line. A residual plot (Figure
6, above) confirms that the three-point measurements are relatively unbiased by showing
that the error of the regression model is randomly distributed about a mean of zero with
no discernible trend or pattern. Since the three-point measurements are unbiased, an
average of the three-point standard deviation estimates for an entire lot should be very
close to the "true" standard deviation for the lot, since the sampling errors will tend to
average one another out.
Similar analysis was performed on means calculated from the three-point and
profile measurements. Again, the three-point measurements seem adequate for
characterizing a production lot, especially when data for many individual pieces are
averaged together to reduce the effect of sampling errors.
Armed with this knowledge, front, center, and back angle measurements were
taken on 100% of the pieces comprising each production lot under 40 pieces and on 50%
of the pieces in orders over 40 pieces (Inspection procedures and sample data sheets can
be found in Appendixes B, C, and D). Though this sampling plan appears to be adequate
for the general characterization of production lots (where data from many pieces are
averaged together to produce a single value for the lot), it was significantly altered for
inspecting pieces produced in the designed experiments since they require much greater
accuracy (see Chapter 5).
Production Processes
Inspections were performed at various points in the production process in order to
gain an understanding of how variation in angularity changes as the material is transformed
from billet to finished product. Figure 7, below, summarizes the results of this portion of
the survey. The chart traces the variance of the feature angle for each lot that was
37

included in the study. The markers on the chart show the variance of the feature angle
after the lot is processed by the designated operation (for example, the two markers for
age/anneal show the post-age/anneal variances for the two tee lots that were inspected
after processing by the age/anneal oven). Operations that were not performed or were not
inspected are not designated by markers. The heat treat operation, for instance, would lie
between press and stretch on the chart. Only the two tee lots that are labeled "non-HT"
were not heat treated. No markers are shown for the lots that were heat treated because
they were not inspected between heat treat and stretch.
0.2
0.15
0.1-
0.05
0
Shapes:
non-HT
enon-HT
/A- -- - -A- - - A= = = I. - i I I I
press stretch roll age/anneal
Process
Figure 7. Variance by Process
Several interesting points are illustrated by the process variance chart. First, the
roll and age/anneal operations have very little effect on variation of angularity. Roll shows
a neutral-to-slightly positive effect and age/anneal shows one positive effect and one
slightly negative effect.
38
U.ZIX - - - - - - -
.

Second, variation changes most dramatically between the press and stretching
operations. This is to be expected since both the heat treat and stretch operations involve
large stresses (thermal during quenching and tensile during stretching) which have the
potential to distort feature angles. The two non-heat treated lots show the effect of
stretch alone. Stretching reduces variation in both cases with the higher variation lot
experiencing the greater absolute reduction. It is interesting, however, that the variation
of each lot decreased by approximately 50%. The results for the other seven heat treated
lots are mixed, with four lots experiencing increases in variation, two decreases, and one
no change in variation. If one assumes that stretching can only reduce variation (an
assumption that is reasonable physically and is supported by the data presented here), then
the press-to-stretch data for the heat treated lots would imply that heat treat increases
variation (another logical assumption), while stretch works to reduce it. Thus, the
variation present after stretch (which approximates the eventual variation of the lot at
shipping) depends on three things: the effect of stretch, the effect of heat treat, and the
initial variation created by the extrusion process. The fact that most of the lots
experienced only small changes in variation between the press and stretch implies that the
effects of heat treat and stretch are roughly equal and opposite, and so tend to cancel one
another out. Furthermore, the press-to-stretch change in variation seems to scale with the
gross magnitude of the variation at the press. The lots that were extruded with very little
variation in angularity experienced small press-to-stretch changes in variation (in either
direction) and the lots that were extruded with high degrees of variation experienced
bigger shifts.
Taken as a whole, these observations indicate that controlling variation at the
press is the key to producing a finished product with minimal variation in angularity.
The stratification of the data in the chart further supports this view. With one exception.
the variation of the lots fluctuate within narrow, non-intersecting bands as they pass
through the various finishing operations. Lots that leave the press with low variances are
39

shipped with low variances. Lots that leave the press with high variances have high
variances at shipping. Thus, an improvement in the ability to control angularity during
extrusion would provide the most leverage for reducing variation in the final product.
Variation at the Press
In direct extrusion, most geometric quality parameters (wall thickness, diameter,
etc.) vary in fairly predictable ways from the front to the back of each extrusion. To check
for similar trends in angularity, the profile data was analyzed for signs of changes in the
level of variation along the extrusions and for general front-to-back trends in the raw data.
Figure 8, below, shows a scatter plot containing standard deviation estimates for
the front halves of each billet plotted against the corresponding standard deviation
estimates for the back half of the billet. The data seem to be randomly distributed about
the 1:1 line. Thus it appears there is no significant difference in variation between the
front and back halves of the extrusions. Likewise, as shown in Figure 9, a similar analysis
of standard deviation estimates for the front 2/3 and the back 1/3 of each piece yields the
same conclusion. Confidence intervals for the data shown in Figs. 8 and 9 confirm that no
statistically significant difference exists between the variation data from the fronts and
backs of the extrusions.
40

{.50.-
0.35
0.30.25
0.2
0.150.1
0.05n
0 0.05 0.1 0.15 0.2
Std Deviation of Front
Figure 8. Front Variation vs. Back Variation
0014
co
4.4
0
0.4
0.3
0.2
0.1
0
0.25
1/2
0 0.05 0.1 0.15 0.2 0.25
Std Deviation of Front 2/3
Figure 9. Front Variation vs. Back Variation
0.3 0.35
0.3 0.35
Figures 1 through 4 of Appendix A contain plots of the angle measurements at
each point along the extrusions. The pieces are grouped by length with only three to five
extrusions plotted on each chart for clarity. While Figure 1 seems to imply that the feature
angle drifts away from nominal along the extrusion, the other plots do not. No obvious
patterns exist. Some pieces miss the nominal specification by a degree or more. No
trends are apparent.
Overall, the profile data show no front-to-back trending in either variability or raw
angle measurements.
41
X
I Q Sx .x l- X
,- I

Geometric Factors at the Press
As previously mentioned, the time consuming nature of data collection made it
impossible to obtain enough information to conduct a meaningful regression study which
could identify geometric factors as drivers of variation in angularity. As such, less formal
data analysis techniques, primarily charting, must be relied upon to gain insight into these
relationships. While charting variation versus a single geometric parameter ignores the
potential effects of all other geometric factors as well as differences in running conditions
(speeds, temperatures, etc.), it was hoped that it might reveal any strong relationships
which exist.
Figure 10, below, is a plot of the standard deviation of the feature angle at the
press vs. aspect ratio (length/thickness). The aspect ratio of both legs which define the
feature angle were calculated and the larger one was used for the plot. The dashed line is
a linear regression line that was fit to the data and forced to pass through the origin. This
graph shows that, in general, variation is higher for angles between long, thin legs than for
angles between short, stubby legs. This confirms intuition and agrees with the production
experience at the Plant which has shown that the higher a feature's aspect ratio, the more
difficult it will be to produce it without distortion.
42

0.500.450.400.35
U 0.30
t 0.25d 0.20
0.150.100.05nnn
0 10 20 30 40 50
Length/Thickness
Figure 10. Standard Deviation at Press vs. Aspect Ratio
Figure 11, below, is a plot of the standard deviation of the feature angle at the
press vs. extrusion circle. The extrusion circle is a rough measure of the size of the cross-
section of the part being extruded. It is the diameter of the smallest circle that can fully
contain the cross-section of the extrusion. Since this survey primarily deals with shapes
that were extruded on one-hole dies, extrusion circles also correlate with the proximity of
the extremities of the die opening to the perimeter of the die. For instance, a shape with a
large circle size extends closer to the perimeter of the die than a shape with a small circle
size. Figure 11, therefore, implies that, other things being equal, a die opening that is
close to the perimeter of a die will experience more variation in feature angularity than one
that is closer to the center of the die.
43
X ·
X --
I ---fge'I - E

U.-I
0.450.400.35
e 0.30
E 0.254 0.20
0.150.100.050.00
1.5 2.5 3.5 4.5 5.5
Circle (inches)
Figure 11. Standard Deviation vs. Extrusion Circle
Figure 12 is a plot of the standard deviation of the feature angle at the press vs. the
extrusion ratio (area of the billet/cross-sectional area of the part). Except for one outlier,
the points possess a high degree of linearity. A linear regression line (calculated without
the outlier) is shown on the graph. At first glance, the downward sloping trend is
somewhat surprising. It makes sense, however, if one takes into account the fact that all
of these production lots were extruded on the 6" press and that the wall thicknesses were
similar for all of the jobs. In that case, differences between extrusion ratios are caused
primarily by differences in the lengths of the legs defining feature angles. Therefore, high
extrusion ratio parts have, in general, short legs and low extrusion ratio parts have long
legs. The differences in leg length naturally translate into differences in circle size. Figure
12 verifies this by demonstrating the relationship between circle size and extrusion ratio.
Incidentally, the outlier in Figure 12 is the same data point that is an outlier in Figure 11.
44
11 I 1

0.4
0.35
0.3
,, 0.25
X 0.2
0.15
0.1
0.05
0
0 10 20 30
Extrusion Ratio
40 50 60
Figure 12. Standard Deviation at Press vs. Extrusion Ratio
6
-5¥ 4N
3
.!21
020 25 30 35 40 45
Extrusion Ratio
50 55 60
]Figure 13 Extrusion Circle vs. Extrusion Ratio
Figures 10 through 12 strongly suggest that the variation of a feature angle at the
press is highly influenced by the proximity of the die opening to the perimeter of the die.
Shapes which are concentrated at the center of the die suffer less variation than shapes
which are placed close to or extend to the perimeter of the die. This result suggests that
45
XI
- - regression line x
x='.-- \-~~~~~~~~~~~~~~~~~~~~~~~~~~~~~~~~~~~~~~~~~~~
. X
X'X . X !X-X- .I--
I'.-~~~ I --0 I - f
material flow patterns within the unextruded portion of the billet during extrusion greatly
influence variation in angularity.
The survey data was also analyzed with respect to basic shape type (tee, zee, or
angle), die factor (perimeter of the cross-section/cross-sectional area), and the ratio of the
thicknesses of adjacent legs defining the feature angle. While these factors seemed to be
insignificant with respect to variation in angularity, a larger dataset may have improved the
resolution of the analysis enough to reveal subtle relationships.
System Capability
Estimating the ability of the production system to produce finished extrusions to
nominal specifications for angularity is an important part of the data survey. Statistical
process control typically defines the capability of a process with the Cpk parameter
calculated for a group of parts produced by the process in question. Cpk is defined as
follows:
Cpk=min USL-} -LSL3a 3a
where g is the mean and a is the standard deviation of the data describing the quality
parameter that is of interest and USL and LSL are the upper and lower specification limits
(endpoints of the tolerance interval) for the same parameter. A process is considered
"capable" if Cpk is greater than or equal to 1.25 (or 1.33 according to some sources). The
numerator of the ratios inside the brackets give an indication of where the mean of the
data lies in relation to the specification limits. If the mean is on target (equal to the
46

nominal specification), then USL-g and -LSL will be equal and Cpk reduces to Cp,
which is defined as:
Cp= (USL-LSL)
If the process is not centered (the mean is not equal to the nominal specification),
Cpk penalizes the process for being off target. Therefore, process capability has two
parts: the spread of the data taken from the process (represented by the standard
deviation in the denominator), and the amount the mean is "off target" (represented by the
numerator). Cpk was used exclusively for this study since both variation and the mean of
feature angles are important to the Plant's customers.
Data from the stretch operation was used as a proxy for data from the finished
products as it has been demonstrated that angularity changes very little after stretch. Six
of the nine lots that were inspected had +/- 2° tolerances for angularity and three had +/-
1.50 tolerances based on the aspect ratios of the legs which defined the feature angles (per
the Aluminum Association guidelines). The following table shows the capability of the
production system as inferred by the post-stretch inspection of the nine production lots.
Cpk values are also calculated for varying tolerance intervals to explore the system's
ability to cope with the special tolerances that customers are now demanding with
increasing frequency.
47
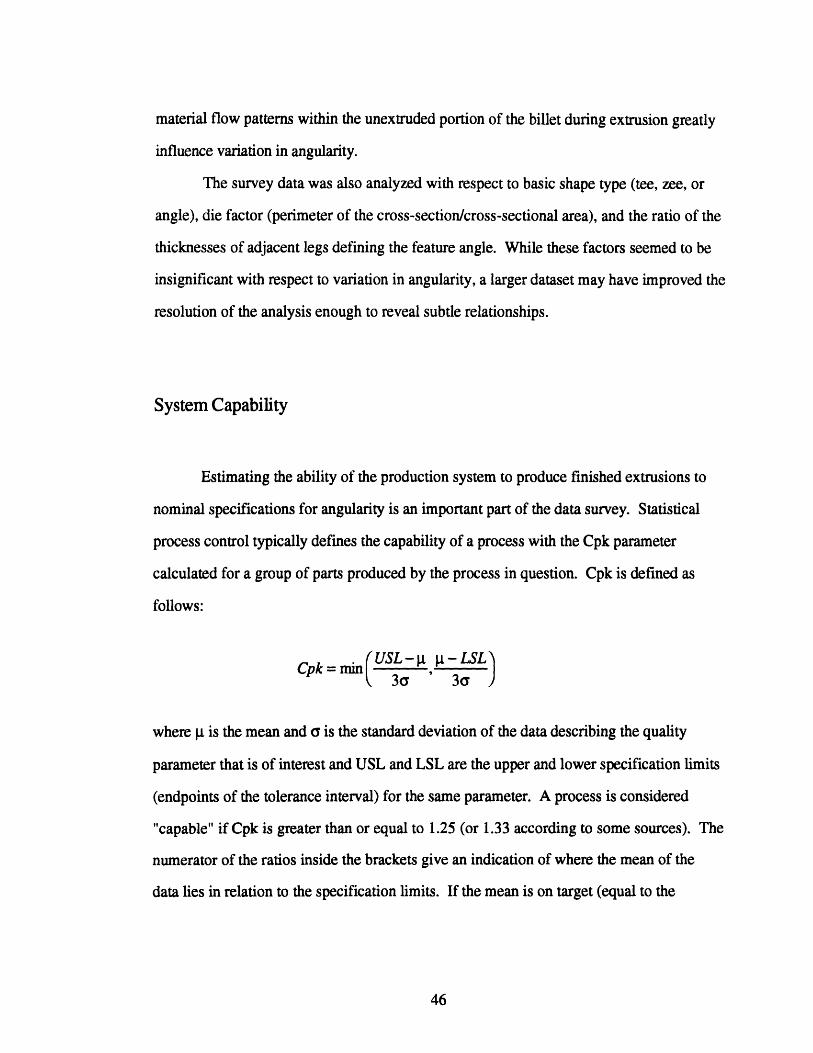
Cpk Estimates
+/- 2.0 +/- 1.5 +/- 1.0 +/-.50
1 zee 1 116 0.80 0.44 0.08
2 zee2 3.50 2.30 1.10 0.00
3 angle 1 1.09 0.72 0.34 0.00
4 angle 2 4.77 3.53 2.30 1.06
5 angle 3 5.57 3.99- 2.42 0.85
6 tee 1 2.19-- - 1.64 1.09 0.54
7 tee 2 -- 2.0- 1.38 0.74 0.11
8 tee 3 1.61:: 1.12 0.64 0.16
9 tee 4 246 1.76 1.07 0.37
* The customer-specified tolerance limits for each production lot areindicated by shading
The previous table shows that with ± 2.0 degrees tolerance limits, seven of the nine
lots are acceptable by the Cpk > 1.25 rule. The shaded values show that seven of the nine
lots were in tolerance by the same criterion using the actual tolerance limits for the
individual lots. This result verifies the Plant's ability to hold the Aluminum Association's
current tolerances for angularity In addition. it should be noted that the Plant has been
able to hold tighter tolerances (usually half-industrv standard tolerances) on angularitv
on individual special orders in the past. This was achieved through greater inspection
and rework. Unfortunately, such measures are too expensive to use on a routine basis in
an environment where most customers demand tight control of angularity. Adjusting the
manufacturing process to achieve better control over angularity seems to be the only
economically feasible solution.
As one tightens the tolerance limits, six, two, and then zero lots would be in
tolerance at +/- 1.5, 1.0, and .5 degrees respectively. Again, it should be noted that these
lots did not receive extra inspection and rework to reduce variation in angularity since
the orders specified standard industry tolerances.
48

While reducing variation without affecting the mean would be sufficient to keep
most lots in tolerance at +/- 1.0 to 1.5 degrees, achieving +/- .5 degrees requires tight
control of both variation and the mean angle. A two-step process for bringing feature
angles into control could work very well in this case since die repair techniques are already
routinely used to adjust the mean angle if a part is considered out of tolerance for
angularity. These techniques, however, do not seem to have an effect on variation in
angularity. If process levers for reducing variation could be discovered, both sets of tools
could be used simultaneously to narrowly focus feature angularity on the nominal
specification, thereby meeting even the most stringent customer specifications for
angularity.
Results
The data survey of feature angularity has determined that the current production
system is capable of producing parts to current tolerances for feature angularity. The
increasing frequency of special tolerance orders, however, is a reminder that today's
acceptable quality levels may not be acceptable tomorrow. Fortunately, the survey has
yielded information which can be used to direct the investigation in the analytical study
phase of the project. Chiefly, it has shown that controlling angularity at the press will
provide the most leverage over the finished product; therefore, the analytical study should
concentrate on the extrusion process. A secondary target for improvement would be the
heat treat operation, which has a negative impact on angularity and counteracts the
beneficial effects of the stretch operation. The strongest geometric factor affecting
variation in angularity was found to be the proximity of the die opening to the perimeter of
the die. This fact suggests that the analytical study should develop a better understanding
49

of the link between material flow in the billet during extrusion and variation in angularity.
When such a link is found, real process improvement will be possible. Finally, the study
has demonstrated that the problem of variation in feature angularity is very complex.
Experimentation will be required to verify and quantify the results of any ideas for
improvement that arise from the analytical work.
50

Chapter 4: Analytical Study
"Mental Models" are deeply ingrained assumptions, generalizations, or evenpictures or images that influence how we understand the world
and how we take action.Peter M. Senge, The Fifth Discipline
Introduction
In simplest terms, direct extrusion involves pushing material through a hole
machined in a disc-shaped metal die. If the hole in the die does not change over time (due
to erosion, aluminum build-up on the bearing surface, distortion from heat and pressure,
etc.), it stands to reason that the extrudate will have a constant cross-section geometry
along its length and that each successive extrudate will be an exact replica of the ones
preceding it. A production run of several billets would then involve a series of repeatable,
steady-state processing steps. Geometric variation should be a non-issue. Unfortunately,
the real world is not so tidy. This highly simplified description of the extrusion process
neglects physical phenomena which conspire to add variation to the process.
In reality, almost no portion of the extrusion cycle is accurately characterized by
steady-state conditions. In addition, successive billets will experience varying processing
parameters which greatly influence repeatability. The net result is the existence of
geometric and metallurgical nonuniformities both along individual extrusions and between
successive extrusions in a production run. To control these variations in the product, one
must first understand the underlying physics of the process well enough to identify the
factors which lead to nonuniformities in the product. Then one must link these factors
with the processing parameters which influence them. The resulting cause and effect
relationships will provide the practitioner with the knowledge he needs to improve the
process.
51

Extrusion Physics
The extrusion press compresses a billet to the point at which it begins to shear.
The billet material, following the path of least resistance, flows through the die opening.
The orientation of stresses within a billet placed in compression is determined by the
mechanical properties and geometry of the billet and the geometry of the tooling. Stresses
within the billet cause local plastic deformation. The resulting material flow patterns
within the billet determine flow patterns within the die, and flow patterns within the die
determine the final geometry of the extrudate. Therefore, conditions within the billet are
of utmost importance for the control of the geometry of the extrudate.
Flow Patterns Within the Billet
Numerous studies have been performed to analyze material flows within billets
during extrusion. In most cases, a billet is sawn in half lengthwise and inscribed with a
uniform grid on the mating surfaces. The pieces are rejoined and inserted into an
extrusion press. The extrusion process is initiated then stopped at the point in the cycle
which is of interest. The billet halves are removed from the press and examined. Flow
patterns in the material can be observed by examining the distortion of the squares of the
grid that was machined onto the mating surfaces. In this way, the level of distortion
(shear) and direction of material flow can be readily identified over the cross-section of the
billet. These studies reveal the existence of several distinct flow regimes during direct
extrusion [Tashiro, 1992, p. 203].
Three distinct flow regions form early in the extrusion cycle. Figure 14 illustrates
metal flows in an aluminum billet extruded through a flat-faced, round, one hole die.
52

dead metal zone
Ltion zone
.ation zone
Figure 14. Flow Regimes During Direct Extrusion
At the center of the billet, material is left unsupported due to the presence of the die
opening and, so, the material here is the first to begin flowing. This region also endures
less shearing due to the material's distance from the container wall and the fact that it can
flow into the die opening without a significant change in flow direction. This region is
called the central deformation zone and is roughly conical in shape, especially near the
front of the billet. Material from the central deformation zone will form the core of the
extrudate.
Surrounding the central deformation zone is another conical region called the main
deformation zone. As the name implies, this is the region in which material is most
intensely sheared. This intense shearing is caused primarily by the redirection of metal
flow at the front of the billet as the flowlines converge on the die opening and, to a lesser
degree, by friction between the billet and the container wall. Material in the main
deformation zone flows closest to the die bearing to form the surface layer of the
extrudate. Figure 14 shows the main deformation zone collapsing in, toward the die
opening at the front of the billet.
The billet material outside of the central deformation zone, adjacent to the
container wall near the die opening, does not flow and so endures very little shearing.
53

This region is called the dead metal zone (DMZ). Material flowing along the interface
between the dead metal zone and the main deformation zone will form the surface of the
extrudate. The shape of the dead metal zone determines the path through which metal
enters the die opening.
Factors Affecting the Shape of the Dead Metal Zone
The shape of the dead metal zone is a function of many factors. Obviously, the
shape of the die opening and its layout on the die will influence the geometry of the dead
metal zone. Generally, the dead metal zone will slope upward from the perimeter of the
die opening to the container wall. For openings that lie at the die's periphery, however,
the close proximity of the container wall changes the shape of the dead metal zone on one
side, causing asymmetry. The slope of the dead metal zone will be higher at points on the
die opening perimeter which are close to the container wall than at points which are closer
to the center of the die (see Figure 15). Thus the dead metal zone is more symmetric for
centered parts with small circle sizes than for non-centered parts or parts with large circle
sizes. This fact seems significant when one recalls Figure 11 from the data survey, which
indicates that a plot of variation in angularity vs. circle size shows a positive correlation.
I - -~·I
Figure 15. The Effect of Die Layout on the DMZ
54

The shape of the dead metal zone is also affected by instability and the level of
shearing inside the billet during the extrusion cycle. At the beginning of the press stroke,
when only a small portion of the billet has been deformed, the DMZ is very large and has a
high slope (see Figure 16, below).
tliiiiiiiiI: I i~i:1fI i~ii~iii'illii iiii g ii::i iiiii!iiiiii ii\· ·\ · ·
,,,,.;,' , . , ' '''' _iiirxriiiii~iiiiii
E'''····'''''
Figure 16. The Effect of Billet Length on the Slope of the DMZ
As more material is sheared, the DMZ shrinks in size and its slope decreases. Late in the
cycle, the DMZ can become very small and metal flow in the main deformation zone may
reverse direction, flowing toward the back of the billet to fill the void that develops
between the billet and the dummy block at the center of the container. This can also affect
average flow velocities across the die opening if the flow reversal is nonsymmetric about
the centerline of the die opening. The intensity of this instability at the end of the
extrusion cycle is influenced by the length of the billet which is not extruded, but removed
from the press as "butt". A billet extruded to a very short butt length may encounter
intense instability as the billet material struggles to fill the void at the back of the billet and
to align its velocity with the runout direction.
55
" rrrrrrrrrrrm�I·.·.·:·:· :::·
�19Caa;l·i�i�ugni!�o!a�
'''
.iIii:i:·:1'''''''·'''i:iiiii: iii
I

Studies [Tashiro, 1992, p. 203] have shown that the shapes of the three
deformation zones are significantly influenced by the temperatures of the billet and the die.
Though the literature reviewed by this author does not provide an explanation for these
phenomena, it would appear reasonable that the softening of aluminum which occurs at
higher temperatures causes a change in the size and slope of the DMZ. It also seems
logical that the difference between the billet and die temperatures is significant, since heat
transfer between the die and the billet can cause localized temperature changes at the front
of the billet. The resulting changes in local flow stresses may also change the shape of the
flow regions adjacent to the die opening.
The same studies have shown that the geometry of the die entrance can have a
drastic effect on the shape of the three flow regions. For example, switching from a flat
faced die to a conical die (see Figure 17) radically altered the shape of the dead metal
zone. These findings suggest that modifications in die opening geometry may be useful
for controlling the shape of the flow regimes in the area immediately adjacent to the die
opening.
Figure 17. Flat vs. Conical Die
56
I I
i
I

Distortion Mechanisms
Imperfections in feature angularity (when the feature angle of the final product is
not the same as the feature angle machined into the die) occur when distortions affect the
locations of the features themselves. To explore the causes of these geometric distortions,
it is useful to think back to the simplified description of the way an extrusion is formed
from the introduction to this chapter and ask the question What can go wrong? From a
final geometry standpoint, there are two things which can go wrong when metal flows into
the die. Metal may flow at velocities which are not uniform across the die opening, and
metal may flow into the die opening in a direction which is not parallel to the stroke of the
press and the intended runout direction. These, then, are the generic causes of distortion
in feature location. Variations in the factors which cause such distortions cause the level
of distortion to fluctuate and, hence, variation in feature angularity.
Nonuniform Flow Velocities
The velocity of metal flowing through a die opening (or a portion of the die
opening) is influenced by several factors. Ram speed obviously affects the velocity of the
metal, as do the length of the bearings (through the effects of friction) and the geometry of
the die opening (geometry of the entrance, cross-sectional area of the opening, etc.).
When one portion of a die opening experiences a higher flow rate than the rest of the
opening, the width and thickness of the fast-flowing feature will be increased slightly by
what is commonly called "better fill". Such a feature will also exhibit an increase in length.
The runout length of the feature will, however, be constrained by adjacent features with
shorter runout lengths. This can cause the extrudate to "hook" away from the intended
runout direction and will result in longitudinal stresses in the extrudate. The fast running
feature will, in general, be placed in compression and the slower running features will be in
57

a state of tension as different portions of the extrudate's cross-section attempt to achieve
their "natural" lengths. Thin, high aspect ratio features placed in compression may buckle
as a means of relieving internal stresses. This causes the "waviness" which is commonly
seen in the stems of large, thin-walled tee shapes. Waves in a feature along the length of
an extrudate will, of course, cause variation in the angle measured between said feature
and adjacent features. While this phenomenon is potentially important from a feature
angularity standpoint, it is, in practice, of less concern than other distortion mechanisms,
since proper die design can virtually eliminate unequal flow velocities across die openings.
Even after a die is manufactured, die repair techniques can alleviate waviness in all but the
most severe cases. Slight differences in flow velocities, however, may go unnoticed or
uncorrected.
This distortion mechanism is easy to identify by checking the extrudate for flatness
along its length. It is also relatively easy to correct. As such, this study will concentrate
on the more perplexing distortion mechanism: nonparallel flow directions.
Nonparallel Flow Directions
The metal flows exhibited in Figure 14 show the redirection that occurs as metal
approaches the die opening. At the front of the billet, metal from the main deformation
zone and from the periphery of the central deformation zone must bend in, toward the axis
of the billet, to enter the die. The shapes of the dead metal zone and of the two
deformation regions in this area will determine the direction from which metal from the
peripheral regions enters the die. In a case where the DMZ exhibits radial symmetry about
the intended runout direction, the mean direction offlow into the die opening will be
parallel to the intended runout direction since symmetry will cause localized nonparallel
flows from the peripheral regions to balance one another. Geometric distortion due to
nonparallel flow directions will not occur in this case. Asymmetry in the DMZ, however,
58

will cause the mean direction of flow into the die opening to deviate from the intended
runout direction. The resulting nonparallel mean flow direction has the potential to cause
geometric distortion in the final product.
The velocity profile at the plane of the die opening is complex, as the attempt to
simplify it by defining a mean flow direction would suggest. The state of stress across the
plane of the die opening is even more difficult to describe. The analysis of this situation
may be greatly simplified if one assumes that the mean direction of flow concept can be
substituted for the complex velocity profile, and that the complex set of forces which act
on the plane of the die opening can be summed vectorally into a resultant force which is
parallel to the mean direction of flow. While it is not clear that these simplifying
assumptions are valid, one's confidence in them would grow if the results of the ensuing
analysis were to agree with the conclusions of the data survey and if the predictions which
result from the analysis could be proven by the experimental phase of the project.
A benefit of first performing a simplified analysis is that it is often sufficient for
capturing the important elements of a problem. This can enable the process improvement
practitioner to invest more time experimenting with process improvement and less time
constructing an exhaustive analytical model. Furthermore, a simplified but reasonably
accurate analysis may actually provide a better basis for building an effective "mental
model", since complexity in a model tends to obscure important relationships and reduce
usefulness.
Figure 18, below, illustrates the simplifying assumptions outlined above in a case in
which asymmetry in the DMZ has caused a nonparallel flow direction. Furthermore, the
resultant force has been decomposed into its longitudinal and lateral portions, or, its 1} and
I components (for parallel and perpendicular to the runout direction).
59

mean flow direction
nout direction
F
Figure 18. Nonparallel Flow Direction
The key to the role of asymmetric flow directions in geometric distortion would
seem to be Fl, the lateral component of the resultant force. Though the inertial effect of
Fl is small (forces found at the die opening are large, but they are accompanied by
relatively low flow velocities), the frictional effects may be quite large. These effects may
be investigated with the help of a free body diagram. Figure 19 shows billet material that
is sandwiched between two die bearings. We will neglect end effects by performing a 2-D
analysis of a slice of material taken from the middle of a long die opening of constant
thickness (t) and constant bearing length (L). Such an element might be found, for
instance, in the center of the stem of a tee-shaped die opening. This analysis also assumes
the extrudate moves along the runout table without any drag so that no force exists at the
die exit to resist runout. The element is affected by the two components of the resultant
force previously mentioned (FII, and Fl), two friction forces (Frl and Fr2, referring to the
friction forces at bearing surfaces 1, and 2 respectively), and two distributed forces along
the bearing surfaces, fl and f2 . fl and f2 are assumed to be uniformly distributed (for
simplicity), and represent the force that the die bearings place on the billet material in
order to deform it into the final geometry of the extrudate.
60

Bearing Surface
fl il L L a
~~~~~~~~~. ..................
~~~~~~~~~~~~. ......... il.2 S fi :::r:~:::: :jg ; ;::::::1:_ _ _ _ _ _7 -... ~~~~~~~~~~~~~~~~~~~~~:::::::::1:::111:m:: .. g g __ t-/ : ~ ~'''',. '·;',.'''.'," ''""""""""""· '' 0''' ''''' .
> 7 _ >.~~~~~~~~~~~~~. ........point A···:::···::;:··:·
nIeanng unace , . IL _
Figure 19. Free Body Diagram
The exact values of the forces shown in Figure 19 would be very difficult to obtain
through measurement or calculation. Simple geometry, however, may be sufficient to
yield insight into the relationship between friction at the bearing surfaces and asymmetric
flow directions.
Starting with a few identities:
1) FIL=FsinO
2) FI= Fcose
61
flowdirection
T-T T--7 1-T T-T- -" -I'i "��"-
1 !

Sum moments around point A:
3) MA Fr2- Fr2)- f2L L)- fL( 2 )=
Sum forces:
4) FI = FcosO- Frl- Fr2 = 0
5) F±J= Fsin + f L- f2L=O
Combine equations 3) and 5):
6) Fr( 2 - Fr2 2 i + 2 Fsin = Y2
Rearrange equation 4:
- Fr2+ Frl7) F= cosCombine 6) and 7):
Combine 6) and 7):
t L sin FrFr
FrL[(L tanE +2 + Fr2( L tan -2 = 0
2 2 2~I/ LII 2 =
62
2· 2
8) Fr2- =F 2r
t +()t4anor, Fr2 = {K}Fr where K = 2 2 the coefficient of frictional asymmetry
2 2
Figure 20 shows K calculated for various values of O. In this example, L is assumed to be
.2 inches. Values for K are give for t values of .115 and .080 inches.
2.5 --
0.5 - - - - -
o - I I l l l l l l l I
0 1 2 3 4 5 6 7 8 9 10
Flow Angle (deg.)
Figure 20. Coefficient of Frictional Asymmetry (K) vs. Flow Angle
63
14 .5 - - - - - - - - ---- 7- - - - - - - -

So far the analysis has established that material flowing symmetrically into the die
opening will encounter equal friction forces at the two parallel bearing surfaces (assuming
equal bearing lengths). In this case, runout will be parallel to the press stroke and no
distortion will occur. If, however, material is flowing into the die opening at an angle to
the intended runout direction (like Figure 19) the friction force at the impinged bearing
surface (bearing surface 2 in the diagram) will be greater than the friction force at the
opposing bearing surface (bearing surface 1 in the diagram) by a factor which is
determined by the coefficient of frictional asymmetry, denoted by K. Material flow at the
high-friction bearing surface will be limited by the increase in drag and a nonsymmetric
velocity profile will develop across the die opening from bearing surface 1 to bearing
surface 2 (see Figure 21, below). This velocity profile will cause the extrudate to "hook"
away from the intended runout orientation in the direction of the angle of flow direction
asymmetry. This effect explains the relationship between runout direction and flow
direction asymmetry that has been observed by researchers [Tashiro, 1992. p. 196].
mean flow
(
Frdirection
Figure 21. The Effect of Frictional Asymmetry on Runout Direction
64

This frictional effect readily translates into variations in feature angles. For
instance, if one leg of a simple L-shaped angle exits the die parallel to the runout direction
but the other leg attempts to exit in a slightly different direction, the angle between the
two legs will differ from the angle between the legs in the die opening. If the flow
direction asymmetries vary throughout the extrusion cycle or vary from billet to billet, the
result will be a feature angle which varies along the extrudate or between successive
billets, respectively. While the mental model that has been developed thus far considers
this to be the primary driver of variation in feature angularity, it should be noted that other
factors which are not included in this two-dimensional model may also play a role in some
cases. The main goal of the experimentation phase of the project will be to test this
mental model. At this point it would be helpful to know what operational factors could
influence the shape of the DMZ, thereby causing variation in angularity.
Variation Mechanisms
As mentioned above, asymmetries in flow directions cause distortions in feature
angularity but do not cause variation. Variation in feature angularity is the result of
physical factors which change the shape of the DMZ, causing changes in flow direction
asymmetries. These factors, some of which were previously mentioned, may be present
throughout the extrusion cycle and from billet to billet in a production run.
Lengthwise Variation
Variation in angularity along an extrusion is caused primarily by changes in the
factors which affect the shape of the DMZ during the extrusion cycle. As outlined earlier,
65

localized temperature changes at the front of the billet and in the die, instability, and flow
reversals are possible causes of variation along an individual extrudate. Die deflection,
which may also vary throughout the direct extrusion cycle, could cause variation if the
shape of the die aperture changes slightly (a recent study suggested that this factor is
insignificant for small presses [Tashiro, 1992, p.196]).
Piece to Piece Variation
Piece to piece variation is caused primarily by changes in the factors which affect
the shape of the DMZfrom billet to billet in a production run. As identified earlier,
changes in billet preheat temperatures (or, equivalently, varying dead cycle times between
billets), steady changes in die temperature throughout a production run, and varying ram
speeds from billet to billet may all be linked to variation in angularity.
Strategies for Improvement
The analytical study has answered the questions it sought to examine. The mental
model it has produced provides a framework to use in thinking about the distortion in
angularity and it has identified potential root causes for variations in angularity: namely,
the factors which affect the shape of the dead metal zone. The task that remains is to
identify what changes to the extrusion process should be tested in the experimentation
phase of the project. Two generic strategies for improvement seem feasible. One could
try to tightly control the process parameters which affect part variation, or, alternatively,
one could try to find a way to decouple the final product from the varying process
parameters, thus making the process more robust.
66

Improving Process Control
Although improving control over process parameters seems straightforward, it is
actually a daunting task. Some important parameters such as die temperature are very
difficult to measure, let alone tightly control. Furthermore, while the shape of the DMZ is
influenced by process parameters, the simple fact that the billet becomes shorter as it is
extruded is sufficient to change the shape of the DMZ. Therefore, it was not clear how
much progress could be made, even if a large engineering project were launched to
upgrade equipment controls.
Improving Process Robustness
Improving process robustness, on the other hand, seemed to be a more promising
approach to controlling variation. Removing process parameters from the quality
equation seemed simpler and cheaper than rebuilding the equipment. Relying on this
strategy and using the mental model as a guide led to a focus on the geometry of the die
entrance. The reason for this was that it seemed it might be possible to alter the die
entrance in such a way as to separate the effects of the fluctuating DMZ from the friction
forces at the die bearing. Thought experiments were conducted using the mental model to
"test" various changes to the die entrance geometry. The most promising idea seemed to
be creating a small "pocket" around the die entrance 2.
Symmetry provided the most convincing rationale for the pocket die. Fluctuations
in the DMZ will cause nonparallel flow directions only in cases where there is asymmetry
in the DMZ to begin with (cases where the distance to the container wall is greater on one
side of the die opening than it is on the other side, see Figure 22 below). While proper die
2 Although pocket dies are used by some soft alloy extruders in Europe, they are not commonly used inthe U.S. The literature suggests using pocket dies for improved dimensional control over shapes whichhave thin-walled sections adjacent to thick areas, but it makes no mention of either positive or negativeeffects on angularity [Laue, 1976, p. 328].
67

design can sometimes be used to center die openings, the economic necessity of running
multi-hole dies and certain geometric limitations usually force extruders to live with
asymmetry in die layout.
1I
\ v
i
:......:.......
a. Symmetric DMZ b. Asymmetric DMZ
Figure 22. The Effect of Die Layout on the DMZ
Machining a pocket around the die opening, however, could provide a second
chance to achieve symmetry, since the pocket would act as a "mini-container" (see Figure
23). A miniature DMZ would form in the pocket, further altering the direction of flow
before metal reaches the die bearings. This time, however, the die designer could choose
to create a symmetric miniature-DMZ that the metal would experience in the last stage of
its trip to the die opening.
68

i'::::: :::::@i'
:ii:::::: :::
iiiiii::::: - :·. .. . . . .:: ::: .. ...
a Flat b. Symmetric Pocket
Figure 23. The Pocket Die Control Strategy
Results
The analytical study was performed in a timely manner and incorporated many
preliminary results from the data survey. Preliminary results from the analytical study
were, likewise, incorporated into the planning of experiments in the third project phase,
which overlapped with the second phase. This was a key factor in avoiding project delays
due to the existence of fairly long lead times on experimental tool orders.
No attempt was made to perform an exhaustive study of the complex physical
phenomena surrounding geometric distortions in extruded products. Instead, the study
concentrated on developing a useful mental model which would capture the most
important relationships that join process parameters to the quality of the final product.
The experimentation phase of the project would provide an opportunity to further refine
the model.
69
.. ............~:i i..............

70

Chapter 5: Experimentation
Inspection alone does nothing to improve the quality of the product, and that productquality should be built at the production stage...build quality into the process.
Masaaki Imai, Kaizen
Experimentation is typically the most expensive phase of a process improvement
project. While the investments made in the earlier phases tend to be weighted heavily
toward the time of a few individuals, investments in experimentation usually include raw
material, special tooling, and machine time in addition to the time of the practitioner(s).
The key to using these resources efficiently is having good process data and a reasonably
accurate mental model. The greater the practitioner's knowledge of the process before
planning experiments, the higher the return will be on investments in experimentation.
This is the reason the experimentation phase is placed last in the process improvement
methodology.
Designed experimentation techniques are essential for maximizing the return on
investments in experimentation. They enable the practitioner to minimize the number of
runs necessary to examine the effects of multiple process parameters without resorting to
the expensive method of changing one parameter at a time while keeping everything else
constant. Performing an initial large-scale designed experiment (DOE) can be a good way
to screen parameters so that cheaper, focused experiments may be used to zero in on the
effects of the most important parameters.
71

Goals
In general, experiments should be performed to verify the mental model that has
been previously developed and to test well-conceived measures to improve the process.
These two objectives were difficult to separate in this study. The mental model identified
changes in the shape of the DMZ as the link between fluctuating process parameters and
variations in the feature angle in a final product. Simply varying machine settings and
measuring the resulting effects on feature angles would not adequately test this model.
Furthermore, the shape of the DMZ could not be explicitly used as a control factor in an
experiment since it is the product of many factors and is not available for direct
manipulation. The best method for testing the mental model, therefore, appeared to be
using die geometry as a control factor which could alter the effect of changes in the shape
of the DMZ on the final product. If the final product changed in accordance with
predictions, the model would be verified. It was also believed that experiments to test the
effect of changes in machine settings (billet temperature, ram speed, etc.) on the shape of
the DMZ were unnecessary, since previous research had confirmed the existence of such
relationships [Tashiro, 1992, p. 203].
The decision to use die geometry as a main control factor for testing the mental
model was quite attractive, since the analytical study identified changes in die geometry as
the most promising tool for reducing variation in the process. Thus it became possible to
design a single experiment which could both verify the mental model and test an idea for
improvement. If the experiment were to be successful, the remaining resources could be
invested to further refine the improvement.
72

Equipment and Instrumentation
Experiments were performed on two extrusion presses that are sized for 6"
diameter billets. These presses were chosen because they are the primary aerospace
extrusion presses in the Plant, and because they are capable of producing extrusions with
relatively large circle sizes. A large circle size is a desirable quality in an extrusion that is
to be inspected with the digital protractor, since extrusions with small cross-sections are
difficult to measure accurately.
Data collection is a critical part of conducting an experiment. It is important
because it allows the practitioner to verify that the plan was followed correctly and
because it can be used to monitor process parameters that may be important but cannot be
tightly controlled. Finally, a complete record of relevant process parameters is extremely
valuable in cases where the results of an experiment are not what the practitioner
expected. Often, such results may be traced to unplanned fluctuations in control variables
or noise factors. Without a complete record of the experiment, false conclusions might be
drawn.
The standard press instrumentation was augmented by an ANAFAZE PC-based
controller/data collection device for the purpose of this study. The following process
parameters were monitored and recorded at ten second intervals:
Billet Temperature (deg. F)Container Temperature (deg. F)Die Temperature (deg. F)Exit Temperature (deg. F)Ram Speed (in/min)Ram Pressure (psi)Hydraulic Pump Stroke (% of max)
73

Experiment 1 - Proving the Model
The first experiment that was performed was intended to verify the mental model
and test the effectiveness of a pocket die in reducing variations in feature angularity. An
important concern throughout the project was the robustness of any proposed process
improvements. This is important because the Plant produces a practically limitless variety
of shapes using more than 10 different alloys of aluminum. Furthermore, many parts are
produced in small batches, making it necessary to perform frequent die changes and
adjustments to machine settings. Any process improvement that is to be useful
operationally would have to be effective in a wide range of conditions. This rationale also
influenced the decision to pursue the process robustness strategy (making die
modifications) rather than the process control strategy (preventing fluctuations in process
parameters).
The robustness issue also influenced the decision to concentrate on Robust Design
techniques in planning experiments rather than classical DOE techniques. The method
that was chosen is described at great length by Phadke [Phadke, 1989]. It involves the use
of a signal-to-noise ratio objective function along with Taguchi's orthogonal matrixes.
The following factors were deemed important in the decision to apply Robust Design:
* it is based on Taguchi's quality loss function,
* it seeks to develop robustness against noise in the manufacturing process, and
* its objective function includes both the mean and the variance of the parameterin question.
74

Planning
Control Factors
The control factors that were chosen for Experiment 1 were:
2 Level Die Geometry (flat, pocket)
3 Level Butt Length (1", 1.5", 2")Alloy (7075, 7050, 2024)Billet Temperature (650° + 50°)
Ram Speed (1.8 in/min + .4)Nitrogen Flow (off, low, high)
Degrees of Freedom
mean 1
1 two level factors 15 three level factors 101 2X3 interaction 2
total 14*
* four degrees of freedom remain for estimating the significance ofeach control factor.
Design Matrix
An Lis (21,37) orthogonal design matrix was chosen for Experiment 1. This matrixcan accommodate up to 8 control factors (one two-level and seven three-level) andrequires 18 runs of the experiment. The following table shows the design matrix that wasused:
75

Experiment 1 Design Matrix
2ddie eom
3 4 5
alloy butt length billet temp ram sod N2 flow
Noise Factors
Several possible noise factors were identified before the experiment was
performed. No special attempts were made to control these factors, since they are present
to some extent in all production scenarios. The Robust Design philosophy discourages
special noise control measures, since their presence will ensure that the optimum control
factor levels will still apply in a production environment. The following items were
considered to be potential noise factors:
A Die Temperature* (probable)A Container Temperature* (unlikely)
Die Bearing Buildup/Erosion/Deflection (possible)A Nitrogen Flow Rate* (unlikely)
A Billet Temperature (probable)
* Will be electronically monitored during experiment
76
6 7 8
billet12
34
56
7
8
9
10
1112
13
1415
16
17
18
flat 7075 1" 600 1.4 offflat 7075 1.5" 650 1.8 low
flat 7075 2" 700 2.2 high
flat 7050 1" 600 1.8 low
flat 7050 1.5" 650 2.2 highflat 7050 2" 700 1.4 off
flat 2024 1" 650 1.4 highflat 2024 1.5" 700 1.8 off
flat 2024 2" 600 2.2 low
pocket 7075 1" 700 2.2 low
pocket 7075 1.5" 600 1.4 highpocket 7075 2" 650 1.8 off
pocket 7050 1" 650 2.2 off
pocket 7050 1.5" 700 1.4 lowpocket 7050 2" 600 1.8 high
pocket 2024 1" 700 1.8 high
pocket 2024 1.5" 600 2.2 off
pocket 2024 2" 650 1.4 low

Evaluation
Angularity data was collected using the digital protractor. Measurements were
taken every foot over a 15-foot segment in the center of the 22-foot extrusions. The
measurement points were marked so that the pieces could be reinspected if necessary with
no loss of accuracy due to differing measurement locations.
The main objective function for this constrained optimization problem was to be
the maximization of rl, which is defined as 10 log( 1 2/a 2), the decibel-scaled signal-to-
noise ratio of the measured angle to its variance. This objective function was chosen due
to the fact that it contains both the mean of angle measurements taken along each
extrusion and the variance of the measurements. This is desirable since improving product
quality involves both centering the manufacturing process and reducing variation about the
mean. -10 log( c 2) was also examined as an objective function.
Execution
Experiment 1 was performed using a tee-shape with a 4.000" stem, a 2.000" cap,
and a uniform wall thickness of .094". Two new dies were used: a standard flat-faced die
and one with a .250" wide x .375" deep pocket machined around the die opening. The
bearings were identical on both dies (the pocket die had .375" less relief on the back of the
die to compensate for the pocket on the face of the die). The dies were inspected by die
repair personnel when they were received to check for manufacturing errors and any other
differences between the dies that could mask the effect of adding a pocket to an otherwise
identical flat die.
A six-control factor DOE is difficult to perform in a production environment. The
skilled and patient operators at the Plant were a great asset in making sure that the special
sensors and data collection equipment were installed properly and that the factor levels
were carried out without any errors.
77

The 18 experimental extrusions were marked with the extrusion number, alloy, and
die number on the cooling rack to avoid recording errors. When the experiment was over,
the pieces were placed in a random order and the identifying inscriptions were covered so
that the inspector could not identify the processing parameters that produced each of the
pieces until the inspection was finished. These measures were taken to ensure inspector
bias did not affect the results of the experiment.
Results
Raw Data
The raw data from Experiment 1 is shown in the tables, below:
flat die data
mean
89.87
89.9089.92
89.9590.0689.9689.8889.8289.89
stdev
0.1090.0740.1010.1390.1560.2050.1220.1130.137
var0.0120.0060.0100.0190.0240.0420.015
0.0130.019
nl *19.22122.58719.88117.16216.13013.74618.242
18.91017.280
S/N **58.2961.6658.9656.2455.2252.8357.3257.9856.35
* - 10 ogO (variance)** 10 og10 (mean^2/variance)
78

nean stdev var nl * SIN **
89.44 0.076 0.006 22.334 61.3689.85 0.065 0.004 23.755 62.8289.46 0.081 0.007 21.796 60.8389.65 0.091 0.008 20.803 59.85
pocket die data 89.55 0.104 0.011 19.688 58.7389.71 0.098 0.010 20.191 59.2589.51 0.072 0.005 22.864 61.9089.30 0.077 0.006 22.304 61.3289.41 0.087 0.008 21.193 60.22
* -10 loglO (variance)** 10 log10 (nan2/variance)
Analysis of Means
Figure 24 shows the analysis of means for the signal-to-noise (S/N) objective
function. The higher the factor scored in the analysis of means, the lower the variation of
angularity. Therefore, due to the additive property of the S/N objective function and
orthogonal matrixes, one could minimize variation by choosing the highest scoring level
for each control factor. This analysis clearly shows that the pocket die performed better
than the flat die. The analysis of variances must be consulted, however, to determine
which control factors are statistically significant.
79

02
60
58
56
54
52
50
m
Figure 24. Experiment 1 - Analysis of Means
Though the main objective function was chosen in the spirit of Taguchi, an
Analysis of Means using -10 log( 2 ) as an objective function yielded the same results as
the signal-to-noise objective function. This implies that the variance response also
contains the essential information which describes the process. Therefore, a two-step
improvement process involving the use of the experimental results to reduce process
variance coupled with existing die repair techniques to center the process on the desired
nominal value should be feasible.
Analysis of Variances
The analysis of variances for the signal-to-noise ratio objective function (shown in
the table below) indicates that only two experimental factors are statistically significant:
die geometry and alloy (the F-test cutoffs are 7.71 and 6.94 for 1 degree of freedom and 2
degrees of freedom factors, respectively). This analysis indicates that the experiment has
80
I�

successfully verified the mental model and seems to have proven the value of the pocket
die in reducing variation in angularity.
Experiment 1 S/N ANOVA
SS DoF MS F
die geo 54.92 1 54.92 82.62alloy 40.12 2 20.06 30.17
butt length 7.60 2 3.80 5.72
billet temp 1.01 2 0.51 0.76
ram speed 4.98 2 2.49 3.74
nitrogen 1.77 2 0.89 1.33
geo x alloy 5.04 2 2.52 3.79
error 2.71 4 0.68total 118.1476 18
The interaction between die geometry and alloy (which can be calculated from the
first two columns of the L18 orthogonal matrix) does not seem to be significant. This
interaction would be very important if the impact of pocket die were found to vary from
alloy to alloy. Figure 25, a plot of the interaction terms, indicates that even if it were
statistically significant it would be very small since the two lines are basically parallel.
81

25
20
9 15
o 10
5
07075 7050 2024
Figure 25. Experiment 1 - Interaction Terms
Economic Considerations
A regression study was conducted using exit temperature data from Experiment 1
(see Appendix G: Regression Analysis of Experiment 1). The resulting model suggests
that the pocket die adds approximately 29° F to the exit temperature of the extrudate.
Likewise, a 1.0 in./min. increase in ram speed adds roughly 490 F to exit temperature, and
a 1.00 F increase in billet temperature adds .20 F. Each individual alloy also affects exit
temperature by a few degrees. This finding is important because it can be used to estimate
the effect of a pocket die on press productivity. This is possible because an excessively
high exit temperature will cause problems with surface quality in some alloys. This limits
the maximum exit temperature that can be achieved, placing a limit on ram speed, and,
consequently, press productivity. The tradeoff, then, is the reduction in ram speed that is
necessary to offset the temperature rise caused by the pocket die. The magnitude of the
reduction in ram speed can be estimated by:
29 degrees F )
49 degrees F / in. per min.
82
This factor could reduce press productivity by <10% to 30% depending on the ram
speed that would be normally achieved with a flat die and the percentage of downtime
inherent in the job (due to setup and dead cycle time). This is a pessimistic estimate
because it assumes that the press would be operating at the maximum ram speed with the
flat die and that compensating factors such as a reduction in the billet preheat temperature
could not be used (for instance in cases where a colder billet temperature is not feasible
due to the inability of the press to initiate extrusion using the harder billet material).
Furthermore, it does not take into account the expense of scrapped parts (which can easily
add 20-30% to the cost of running a small job), die repair work, and rework in the
finishing area. When all factors are considered, a pocket die may actually reduce the total
cost to produce a lot. This is a likely scenario considering that pocket dies are
recommended only in cases where a hard-to-control critical angle cannot be economically
produced to acceptable quality levels with conventional extrusion and rework practices.
Additional experience with pocket die technology, however, will be needed before a full
economic assessment can be made.
Conclusions
The following conclusions were made concerning Experiment 1:
* The mental model is correct.
* The pocket die reduced variance by 55% over the flat die for a centered,symmetric tee-shape (or, equivalently, reduced standard deviation by 33%).
* The analysis of variance indicates that die geometry and alloy are significant at a95% confidence level.
83
* At the speeds and temperatures covered by the experiment, 7075 had the least
variation in feature angularity and 7050 had the most. 7075's standard deviationwas 66% of 7050's and 2024's standard deviation was 77% of 7050.This observation agrees with common perceptions at the Plant.
* Similarities between the analysis of the -10 Log(ac2 ) and 10 Log(g 2 /a 2 )objective functions imply that the log function is a reasonable transformation ofthe data.
* Residual plots show the error in the model to be reasonably random.
Experiment 2 - Pushing the Limits
While Experiment 1 appeared to be very successful, a verification experiment (at
the optimum factor levels) is necessary to confirm that the additive model is adequate
[Phadke, 1989, p. 60]. Furthermore, testing the pocket die concept on a different shape
would increase confidence that the method applies universally.
The initial idea to test a pocket die came from observations about symmetry in the
analytical study. It was surmised that creating a symmetric "mini-container" could
counteract the effect of asymmetry in the DMZ in the container. This proved to be
successful in Experiment 1. An extension of the same logic would imply that an
asymmetric pocket around the die opening could do even more to counteract asymmetry
of the DMZ if the asymmetry of the pocket were in the opposite direction as the
asymmetry in the DMZ (see Figure 26, below). It was decided to expand the scope of the
verification experiment to test this theory as well.
84

V I\\ r
j/
':::iii�iiiii':iiPijii:::::::: :::;;:·:·· , :i:i:::::::::: ::::ii�nr�� ·�'···'·······�·· · ··· ··;·· ·'·�:::::::::::::::: : · �:·:::::::::::::::::::::::::::::::::::::··.·.·.·.·.·.·.·.·· �: ..·: iiiiiiiili�iiiiiiiiiiiiiiiii.·.·.·.·.·.·.·.·.·;·.·.·.·.·. ::.: ..;·.·.·..:I:·:·:·:·:·:·::::::· · · · · · · · · · ·· · · · · · · ·- ·-· ············:.:················ ······ ·········.·.·.·········.·.·.···.··· · · · · · · ·· · · · · · · · · · ·· ·· · · · · · · · · · · ·· · ·......... ,,,,,,,:i i::... ........... __...··························· :···................... .. ................... . :............... �..;.....,. :::::::::::::::::::::::::::::::::::::::::·······································:·:·:·:·:·:·:·:·:·:·:·:·:·:·: · · · · · · ·. · · ·· · · :· · · · · ·· · · · · · · · · · · ·
ii:iiiiiiiiiiiiiiiiiiiii��l ::::::x::' ' ' ' ' ' ' ' ' ' ' ' ' ' ` '"""""""""`''''''''''''''''''''''''''''''''''''' ''""'''''"''�"'''''''''''''''''''''''''''''''''''
:·r :.:I:l:.::::l:.J �·:·:·:·:·:·:·:·:·:·:·:·:·:·:::::' ' ' ' ' ' ' ' ' ' ` '
:·:·:·:·:·:·:·
iiiiiiiiiiiii� Piiiiiiiiiiiiiiiiiiiiiiiiiiii iiiiiiiiiiiii� Biiiiiiiiiiiiiiiiiiiiiiiiiiiii
I,
a. Flat b. Symmetric Pocket c. Asymmetric Pocket
Figure 26. Experiment 2 - Die Geometries
Planning
It was decided to use an "L" shaped angle with a long leg of 3.560", a short leg of
2.750", and a wall thickness of .100" for Experiment 2. The lack of symmetry in the shape
was attractive since it would cause even more asymmetry in the DMZ. Furthermore, the
die was laid out in such a way that the die opening was shifted toward the edge of the die.
This would accentuate asymmetry in the DMZ. Three new dies were ordered for
Experiment 2: a standard flat die, a symmetric pocket die (.250" wide x .375" deep all the
way around the die opening) and an asymmetric pocket die (.125" wide x .375" deep on
the interior of the angle and .375" wide x .375" deep on the exterior of the angle near the
edge of the die). Once again, the dies were carefully inspected upon receipt.
A designed experiment was not needed in this case since die geometry was the
only factor under investigation. All other factors were to be held constant. The plan was
as follows:
1. Run six billets with the flat die at standard billet and containertemperatures and whatever ram speed is necessary to achieve an 840( Fexit temperature.
85
C'i··':'::::: ':':' ::::
iiii1:·::·::i:ii.:.::.:i:i:ii·:IIi�8·e �:jiiiiiiiiiii j': :
·:·:·iiiii
jii�
2. Run six billets with the symmetric pocket die at standard billet andcontainer temperatures and the ram speed established in step 1.
3. Run six billets with the asymmetric pocket die at standard billet andcontainer temperatures and the ram speed established in step 1.
It was hoped that this testing procedure would provide verification for the results
of Experiment 1 (by comparing the results of steps 1 and 2) and then push the limits of the
technique by adding results for an asymmetric pocket die to the comparison.
2024 was chosen as the test alloy and the press was wired for data collection as it
was in Experiment 1.
Execution
Experiment 2 experienced difficulties from the beginning. Both the flat die and the
asymmetric die experienced a problem with waviness in one of the legs of the angle. This
problem, which is common in these types of shapes having long, thin legs, is due to non-
uniform flow velocities as was discussed in Chapter 4. Die repair personnel worked
repeatedly on the dies, using techniques which are known not to affect feature angularity.
After some time it was decided to pull the flat die and the asymmetric pocket die and rerun
them with Experiment 3. This would give die repair more time to make corrections.
While this problem sounds severe, it should be kept in mind that new dies often require
such attention from die repair.
Results
When the flat die and the asymmetric die were finally run with Experiment 3, it
was found that the symmetric pocket die reduced the variance of feature angularity by
80% over the flat die. This result was reassuring. The fact that the symmetric pocket die
86

performed even better than the pocket die in Experiment 1 was not surprising. The mental
model suggests that asymmetry in the DMZ would be a bigger problem for the shape used
in Experiment 2 than the shape used in Experiment 1. Therefore, one might expect the flat
die performance to be worse in Experiment 2. If the symmetric pocket is able to dampen
out the effect of fluctuations in the DMZ to the point where other factors drive variation
in angularity, one would expect a greater amount of variation reduction in Experiment 2.
The asymmetric pocket die did not perform well. The extrusions produced with
the asymmetric pocket die exhibited signs of feed-in from the surface of the billet and a
contour problem on one of the legs. The poor quality of the extrusions made the test
inconclusive. It was felt that the die design may have been too aggressive. The high
degree of asymmetry in the asymmetric pocket die (which was designed to ensure that the
results of the two types of pocket dies would differ significantly) coupled with the off-
center layout of the die opening caused extremely asymmetric material flow patterns to
develop within the billet. The resulting instability of metal flow near the die opening may
have caused the distortion of the extrudates which invalidated the results of the
experiment. A lesser degree of asymmetry should be used in any future tests.
Experiment 3 - Further Optimization
Experiment 1 indicated that die geometry and alloy were the only significant
control factors. This result does not mean that all of the other factors are unimportant;
rather, it indicates that the effects of die geometry and alloy were so strong that they
overshadowed the effects of other, weaker factors. As one addresses the stronger factors
that arise from a DOE study (adopting pocket dies, for instance), the weaker factors
suddenly become significant from a process improvement standpoint. They become the
87

new levers that one may use to further optimize the process. Experiment 3 was planned
with this goal in mind.
Planning
The plan for Experiment 3 was to run a pocket die and vary billet temperature and
ram speed to determine if these process parameters would have an effect on variation in
angularity when the other parameters (including die geometry) are fixed. Three factor
levels were to be used for each variable in order to identify nonlinearities in the response.
This necessitated the use of a Taguchi L9 matrix. The design was as follows:
Billet #
1
23
45678
9
Billet Temp.
650650650625625625600600600
Ram Speed <Empty> <Empty>
2.03.04.02.03.04.02.03.04.0
When problems were encountered with the flat die and the asymmetric pocket die
in Experiment 2, it was decided to try to use the asymmetric pocket die in Experiment 3
after making repairs. This would minimize the amount of die preparation, the number of
experimental runs, and the number of die changes that would be necessary.
88

Execution
As was previously mentioned, the asymmetric pocket die did not perform well in
Experiment 3. The symmetric pocket die could not be made ready on short notice, so it
could not be used when the asymmetric pocket die failed.
Results
The results of Experiment 3 were inconclusive. The contour problems and waves
that were encountered at every factor level destroyed the character of the data (see the
ANOVA table below). It would have been redone using the symmetric pocket die if time
had permitted.
Experiment 3 ANOVA Table
SS
22.2329.20
Billet TempRam Speed
errortotal
38.55
89.98
DoF
2
2
MS
11.1
14.6
F
1.15
1.52
4 9.68 11.2
Experiment 4 - The Effect of Heat Treat
The data survey pointed out that it was not possible to inspect any production lots
immediately after heat treat since it is necessary to stretch heat treated metal very soon
89

after quench. Experiment 4 used the extrusions that were produced in Experiment 1 to
examine the effect of heat treat and stretch on variation in angularity.
Planning
The plan for Experiment 4 was very simple. The effects of the heat treat and
stretch operations would be individually evaluated by inspecting the test lot from
Experiment 1 immediately after heat treat and again after stretch. This was made possible
by the fact that the pieces were not part of a production lot; hence, they could be
scheduled for heat treat whenever it was convenient for inspection without regard for the
shipping schedule. Furthermore, achieving the correct metallurgical properties was not
critical since the pieces would not be shipped to a customer.
Execution
The pieces were already inscribed with the billet number, alloy, and die number,
and the press inspection points were marked on each extrusion at one foot intervals. The
experiment mainly required measurement and data analysis.
Results
The standard deviations of the angle measurements along each piece for each of
the three processes are listed in the table below. In addition, average standard deviations
are given for the pocket die extrusions and the flat die extrusions after each process.
90

Press, HT, and Stretch Standard Deviations
Billet Press HT Stretch1 0.11 0.05 0.102 0.07 0.23 0.103 0.10 0.30 0.124 0.14 0.23 0.175 0.16 0.14 0.11
6 0.21 0.18 0.107 0.12 0.14 0.138 0.11 0.13 0.13
9 0.14 0.13 0.1310 0.08 0.16 0.0611 0.06 0.27 0.1012 0.08 0.14 0.0613 0.09 0.17 0.1314 0.10 0.06 0.0415 0.10 0.11 0.1316 0.07 0.09 0.0617 0.08 0.05 0.06
18 0.09 0.05 0.09
Average Standard Deviations:
Press HT Stretchflat 0.13 0.17 0.12
pocket 0.08 0.12 0.08
From the average standard deviation summary, it is obvious that heat treat and
stretch have roughly equal and opposite effects on variation in angularity. Heat treat, on
average, increased the standard deviation of the angle by .04 in both the flat die case and
the pocket die case. Stretch reduced the standard deviation by a like amount, so the final
variation after stretch is roughly the same as the variation at the press. This result verifies
the assumptions that were made concerning heat treat and stretch in the Production
Processes section of the Data Survey.
91
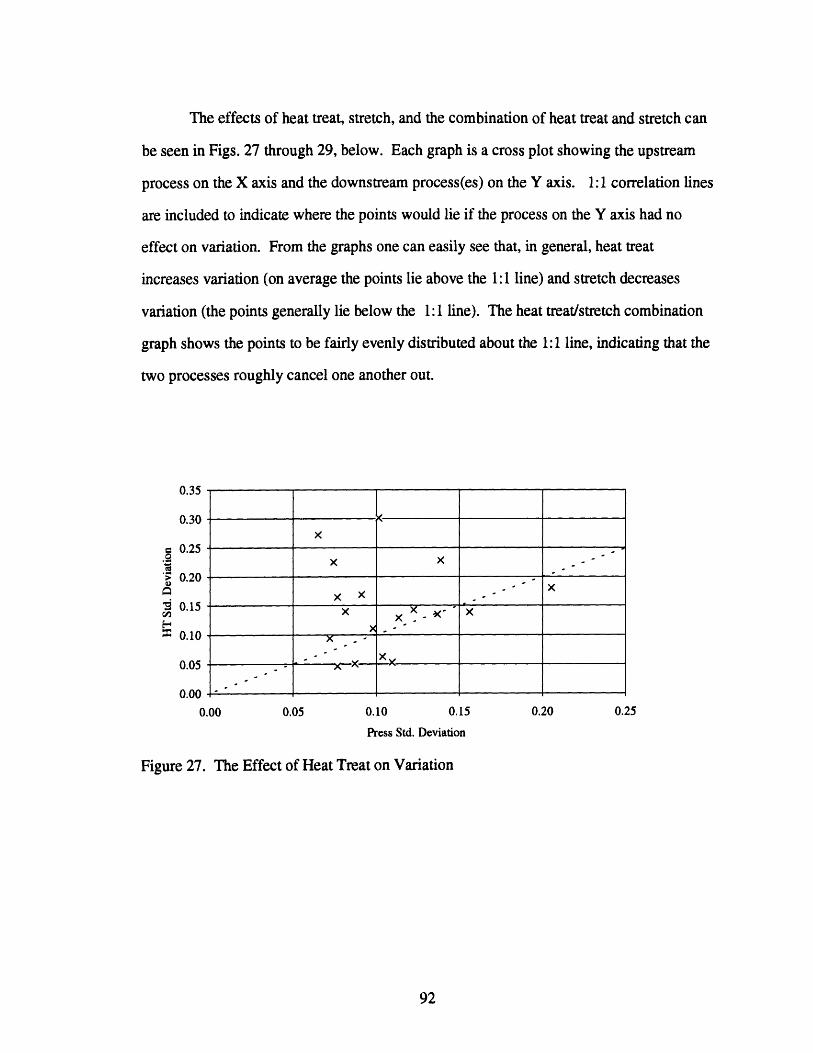
The effects of heat treat, stretch, and the combination of heat treat and stretch can
be seen in Figs. 27 through 29, below. Each graph is a cross plot showing the upstream
process on the X axis and the downstream process(es) on the Y axis. 1:1 correlation lines
are included to indicate where the points would lie if the process on the Y axis had no
effect on variation. From the graphs one can easily see that, in general, heat treat
increases variation (on average the points lie above the 1:1 line) and stretch decreases
variation (the points generally lie below the 1:1 line). The heat treat/stretch combination
graph shows the points to be fairly evenly distributed about the 1:1 line, indicating that the
two processes roughly cancel one another out.
....
0.35
0.30
0.25
0.20
0.15
0.10
0.05
0.00
0 .00 0.05 0.10 0.15
Press Std. Deviation
0.20 0.25
Figure 27. The Effect of Heat Treat on Variation
92
X
X X
x . XX X -
X X - >(-' X
Xx X

X
X, xx ''XX
xx
,-'1 I I
).00 0.05 0.10 0.15 0.20 0.25 0.30 0.:
HT Std. Deviation
The Effect of Stretch on Variation
xx
X Xx
0.05
x
x
-x
X
0.10 0.15
Press Std. Deviation
0.20 0
35
.25
Figure 29. The Effect of HT and Stretch on Variation
93
'r-0
gCn2
Cn
0.18
0.16
0.14
0.12
0.10
0.08
0.06
0.04
0.02
0.00
0
Figure 28.
0
a
oin-6
0.18
0.16
0.14
0.12
0.10
0.08
0.06
0.04
0.02
0.00
0.00
I
x
-
. .
. -

Figure 30, below, shows the effect of the three processes on an individual
extrusion. While heat treat has had a large effect on this piece, stretch has removed much
of the variation so that the end result is close to the variation that was measured at the
press.
U.o I
90 -
89.8 -
89.6 -
§ 89.4 -
co 89.2 -
89 -
88.8
88.6 -
88.4
- \ ------V
I I I I I I t I I I t I I I
1 2 3 4 5 6 7 8 9 10 11 12 13 14 15
Measurement Point
Figure 30. The Effect of HT and Stretch on an Individual Extrusion
Experiment 4 confirmed the decision to address the extrusion process first in the
process improvement project. It also implies, however, that the heat treat process remains
as an additional opportunity for improvement.
94
press
- - - HT
-- stretch
I-\ - 'I,- -

Chapter 6: Results and Recommendations
Results
The results of each phase of the project have been documented in detail in the
relevant sections of Chapters 3, 4, and 5. Chapter 6 is intended to serve as an executive
summary of the project's findings.
Data Survey
* Front, middle, and back measurements are adequate for characterizing the mean and
variance of a production lot for test purposes. Front and back measurements would be
sufficient for routine production inspections if the number of pieces is relatively large (n
> 10 ?). Experimentation requires greater accuracy since, in many cases, a single
extrusion is used to evaluate a given set of operating parameters. Measurements were
taken every foot in this study.
* Variation in angularity did not vary in a predictable way along individual extrusions.
Likewise, raw angle measurements exhibited no trends along individual extrusions.
* Variation in angularity is positively correlated with aspect ratio and circle size, and
negatively correlated with distance from the shape to the edge of the die.
* The extrusion process has the greatest effect on variations in angularity of the final
product. Heat treat increases variation and stretch reduces variation. The effects
roughly cancel in heat treated lots. Other processes have very little effect on
95

angularity.
· the Plant's production system is statistically capable at current industry standards for
angularity. Process improvements will be necessary, however, to produce parts to half
industry tolerances or less without the need for expensive inspection and rework.
· Achieving very tight tolerances (under ± 1.00) will require adjustments to both the mean
and the standard deviation of the manufacturing system. Routine die repair techniques
already exist for adjusting mean angles.
Analytical Study
* A reasonable mental model for describing variations in angularity hinges on the shape of
the dead metal zone. Local asymmetries in the slope of the dead metal zone cause metal
to flow into the die opening in directions which are not parallel to the intended runout
direction (which is perpendicular to the face of the die). The resulting impingement of
metal upon one of the die bearings creates an imbalance between the friction forces at
the two die bearings, causing the feature to exit the die in a direction which is not
parallel to the intended runout direction. The angle between said feature and adjacent
features (which, perhaps, exit parallel to the intended runout direction) will be distorted,
and not correspond to the angle machined into the die. Variations in factors which
influence the shape of the dead metal zone become fluctuations in the level of distortion
experienced by the feature angle, translating into variations in angularity.
· The mental model led to a strategy of increasing the robustness of the extrusion process
to changes in the shape of the dead metal zone. Two changes to the geometry of the die
opening, the symmetric pocket die and the asymmetric pocket die, were proposed for
96

experimentation.
Experiment 1:
· verified the mental model's assertion that die opening geometry and variation in
angularity relate to one another through the influence of the dead metal zone. It further
demonstrated that the effect of die opening geometry overwhelms the effects of changes
in the other control variables.
* demonstrated the effectiveness of the pocket die in reducing variation in angularity. The
symmetric pocket die reduced the variance of feature angularity by an average of 55%
(or, equivalently, reduced the standard deviation of feature angularity by 33%).
* observed no statistically significant interaction between alloy and die geometry.
Experiment 2:
· verified the results of Experiment 1 by demonstrating that, the symmetric pocket die
reduced the variance of feature angularity by 80% (or, equivalently, reduced the
standard deviation of feature angularity by 55%).
· did not produce any inspectable parts using the asymmetric pocket die due to contour
problems and waviness.
Experiment 3:
· proved to be inconclusive due to problems with the asymmetric pocket die (described
above under Experiment 2).
97

Experiment 4:
* demonstrated that heat treat and stretch have roughly equal and opposite effects on
feature angularity. Heat treat increases part variation and stretch decreases variation.
The net result is a level of variation that is approximately the same as the variation that
existed at the press.
Recommendations
The results of this study suggest six areas for further investigation and/or
implementation at the Plant:
1. Adopt symmetric pocket die technology on a trial basis.
The symmetric pocket die has proven its usefulness in two experiments. It is now
ready for further testing on production orders. A good strategy might be to order both
pocket dies and flat dies for special orders which have tight-tolerance critical angles. This
way a standard flat die will be available if difficulties are experienced with the pocket die.
Filling these jobs with flat dies would require extra expense in any case, so that the
additional effort required to apply the new technology will not necessarily add any
incremental expense to the order. The experience and knowledge gained in production
tests, however, could prove to be quite valuable
2. Continue experimenting with variations on the symmetric pocket die.
The asymmetric pocket die did not perform well. The pocket design and the shape
that were chosen were intended to be very aggressive. This was done to provide a clear
98

distinction between the results of the symmetric pocket die and the asymmetric pocket die.
A more conservative design (less asymmetry in the pocket and a layout which is centered
better on the die) could prove to be an improvement over the symmetric pocket die.
Knowledge gained in these studies might also be applied in the development of new repair
techniques for pocket dies.
3. Continue to pursue repeatability improvement projects.
The data survey demonstrated that the variation in angularity along the extrusion
dominates total variation within a production lot. Even so, part-to-part variation is very
important. Fortunately, the effect of a pocket die (decoupling variation in the final
product from changes in the shape of the dead metal zone) apply equally well to process
parameters which vary during the extrusion cycle and those which vary between
consecutive extrusion cycles. Reductions in part-to-part variation, however, would
further improve overall product quality as determined by the control of critical feature
angles.
4. Consider investigating the effect of the heat treat process on angularity.
While the heat treat process is less significant than the extrusion process in
determining the variation in feature angularity of the final product, its importance will
grow as improvements to the extrusion process reduce its relative contribution to total
variation. A study of the heat treat and quench cycle could, potentially, yield large
benefits in the effort to better control critical angles.
99

5. Study the effect of detwist on angularity
A decision was made early in the data survey to bypass this operation due to
resource constraints. It may be significant, however, in cases where certain shapes
typically require a great deal of rework to correct problems with twist. Suggestions were
made in the data survey for ways to study this unconventional process.
6. Build upon the knowledge that was developed in this study.
The policy recommendations and the process improvement methodology that
resulted from the study should be seen as starting points for future investigations, not
conclusions to a project. Mental models have a short shelf life. They soon lose their
usefulness if they are not questioned and refined. Likewise, the real power of a
methodology is that it is merely a place to begin, a set of tools and strategies which cause
the user to think about how a problem is solved rather than what must be done to solve it.
A methodology must be taken off the shelf and challenged occasionally if it is to help a
practitioner or an organization hone their problem-solving skills.
100

capabilities. Placing an emphasis on the creation of a mental model is a unique and
powerful feature of this methodology.
Resource Efficiency
Another significant difference between this process improvement methodology and
others is the way it focuses on resource efficiency. This is a critical factor in production
environments where all resources are limited. A firm that can squeeze more benefits out
of its process improvement resources than its competitors are capable of will make the
same improvements with lower investments or achieve larger gains for the same
investments. Either outcome can be parlayed into a strategic advantage in the
marketplace.
Resource efficiency is addressed by the methodology in two ways: by forcing the
practitioner to address allocation issues early in the project, and by structuring the project
in such a way that synergy can occur between seemingly disconnected, self-contained
project steps.
Resource Allocation
The resource allocation feature of the methodology worked well in this project.
Thinking about resource allocation in the pre-project planning period and scheduling
investments for all phases of the project simultaneously brought many important questions
to mind, such as:
102

Chapter 7: Methodology Evaluation
The preceding text described the features of the process improvement
methodology and the successes and failures of the test case that was performed to
evaluate its suitability for use in a manufacturing production environment. The following
critique is intended to document those features of the methodology which worked well,
and to identify some improvements that could make the methodology more robust against
the types of difficulties that were encountered during this project.
Effectiveness
All process improvement methodologies must ultimately be evaluated on the basis
of their effectiveness in reducing costs or improving product quality. This methodology
succeeded in producing a tangible, credible recommendation for reducing the variation in
feature angularity. The immediate value of this recommendation will be greatly influenced
by decisions made by Plant management regarding implementation, and by the success of
Plant personnel in addressing operational issues associated with the implementation of the
new technology. Additional benefits can be obtained, however, from the mental model
which was built to help make a connection between process data and process physics.
While in the short run the mental model is used primarily to stimulate thought regarding
modifications of the process, it can also have significant long term benefits. This will
occur if the mental model gains sufficient exposure to influence the organization's
perceptions of the process. In such cases, an enhanced knowledge of the process will
improve operational decision making and lead to a greater understanding of system
101
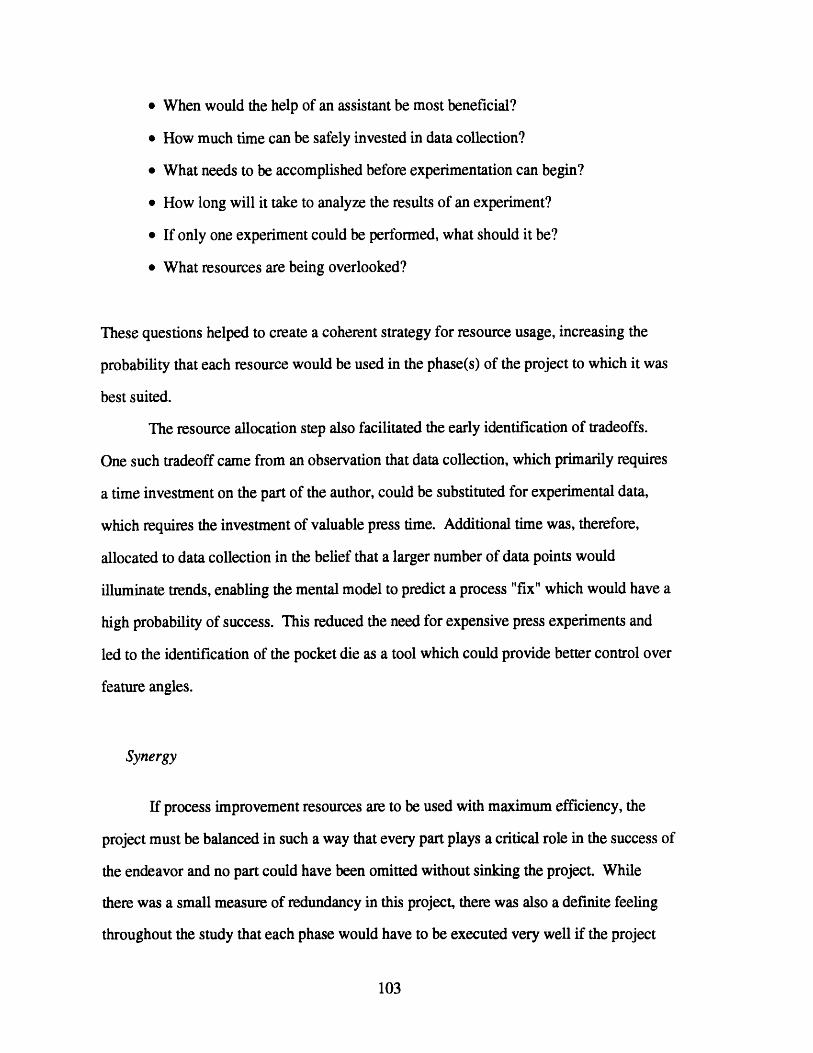
* When would the help of an assistant be most beneficial?
· How much time can be safely invested in data collection?
· What needs to be accomplished before experimentation can begin?
* How long will it take to analyze the results of an experiment?
* If only one experiment could be performed, what should it be?
* What resources are being overlooked?
These questions helped to create a coherent strategy for resource usage, increasing the
probability that each resource would be used in the phase(s) of the project to which it was
best suited.
The resource allocation step also facilitated the early identification of tradeoffs.
One such tradeoff came from an observation that data collection, which primarily requires
a time investment on the part of the author, could be substituted for experimental data,
which requires the investment of valuable press time. Additional time was, therefore,
allocated to data collection in the belief that a larger number of data points would
illuminate trends, enabling the mental model to predict a process "fix" which would have a
high probability of success. This reduced the need for expensive press experiments and
led to the identification of the pocket die as a tool which could provide better control over
feature angles.
Synergy
If process improvement resources are to be used with maximum efficiency, the
project must be balanced in such a way that every part plays a critical role in the success of
the endeavor and no part could have been omitted without sinking the project. While
there was a small measure of redundancy in this project, there was also a definite feeling
throughout the study that each phase would have to be executed very well if the project
103
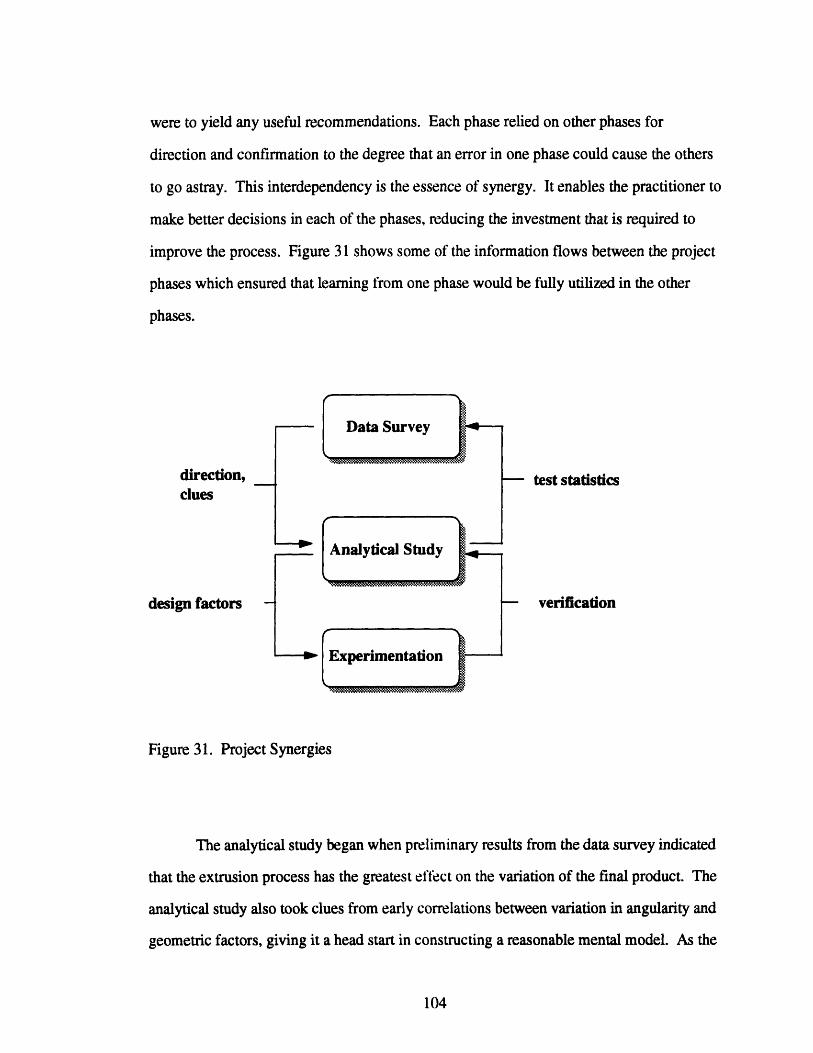
were to yield any useful recommendations. Each phase relied on other phases for
direction and confirmation to the degree that an error in one phase could cause the others
to go astray. This interdependency is the essence of synergy. It enables the practitioner to
make better decisions in each of the phases, reducing the investment that is required to
improve the process. Figure 31 shows some of the information flows between the project
phases which ensured that learning from one phase would be fully utilized in the other
phases.
direction,clues
design factors
test statistics
verification
Figure 31. Project Synergies
The analytical study began when preliminary results from the data survey indicated
that the extrusion process has the greatest eftect on the variation of the final product. The
analytical study also took clues from early correlations between variation in angularity and
geometric factors, giving it a head start in constructing a reasonable mental model. As the
104

analytical study progressed, it predicted other geometric correlations (for instance,
standard deviation vs. extrusion circle), which were then examined and confirmed by the
data survey. This transfer of information between the data survey and the analytical study
ensured that the developing mental model was firmly grounded in reality, and reduced the
amount of time and effort necessary to build an understanding of the extrusion process.
The analytical study continued after the experimentation phase began. The process
knowledge that was developed in the first two phases of the project was a critical factor in
formulating an experimentation strategy that was focused, yet capable of both verifying
the mental model and testing the most promising idea for improvement in a single
experiment. This factor alone greatly reduced the necessary investment in
experimentation. In addition, insights developed by the analytical study were used to
determine the control factors for Experiment 1 and led to the use of special
instrumentation to monitor potential noise factors. Experiment 1 verified the mental
model from the analytical study, indicating that it is a fair representation of reality. This
result facilitated the switch in focus from understanding the extrusion process to
identifying and testing ideas for process improvement. Resources were redeployed
without delay.
Areas for Improvement
The process improvement methodology was designed for implementation in a case
where the practitioner had no prior experience with the manufacturing process. As such,
the project began with a lengthy data collection phase which was necessary to create a
familiarity with the process as well as to build a database for statistical analysis. In many
cases, the practitioner will have a solid basis of experience with the process under study or
access to useful historical data. In such cases, it may be helpful to begin with the
105

analytical study in which the practitioner uses prior knowledge to construct the initial
mental model which is then used to direct a very focused data survey. If the data confirms
the mental model, the investigation can turn to experimentation. In all cases, the structure
of the project must take advantage of all available resources, especially prior knowledge.
The biggest disappointment in the project was the failure to attain useful
information from the asymmetric pocket die. This incident was a byproduct of the lean
nature of the methodology. The methodology achieves efficiency by reducing redundancy
in effort and discouraging investments that are not essential to the success of the project.
This strategy can backfire if an unforeseen problem occurs at a key point in the project
(such as the failure of the asymmetric pocket die due to an overly aggressive design). A
detailed risk management plan should, therefore, be added to the methodology to deal
with this possibility. This plan, which should be done in conjunction with the resource
allocation step, should list the critical factors in the project that could become "show
stoppers" if a failure were to occur. Next, an appropriate level of redundancy must be
planned. For example, in this project, the failure of a die or the data collection equipment
during an experiment would both be considered show stoppers. In the case of a die
failure, perhaps two or three dies of slightly different designs should have been ordered
and made ready for use so that a failure of the most aggressive die would not wreck the
experiment.
It should be stressed again that flexibility is the key to maximizing the return on
resources invested in improving manufacturing processes. This principle applies as well to
the planning of operational details as it does to high-level project planning. The proper
application of flexibility is what enables one to do more with less.
Je plie et ne romps pas
"I bend and I break not"
Jean De La Fontaine (1621-1695)
106

Appendix A: Charts and Graphs
Profile Pieces 1-5Nominal = 90
91
90
89
88
87
.J_ - -7
> , ~~~~~~~~~~~~~IZ
1 2 3 4 5 6 7 8 9 10
Measurement
Figure 1.
Profile Pieces 6-10Nominal = 90
90.5
90
n 89.5
C 89
88.51 2 3 4 5 6 7 8 9 10 11 12 13 14 15 16 17
Measurement
Figure 2.
Profile Pieces 11-15Nominal = 90
90.5'A 90
t 89.5U 89
88.588
1 2 3 4 5 6 7 8 9 10 11 12 13 14 15 16 17 18 19 20
Measurement
Figure 3
Profile Pieces 16-18Nominal = 82.5
8281.8
u 81.6X 81.4u 81.2
8180.8
1 2 3 4 5 6 7 8 9 10
Measurement
Figure 4
107
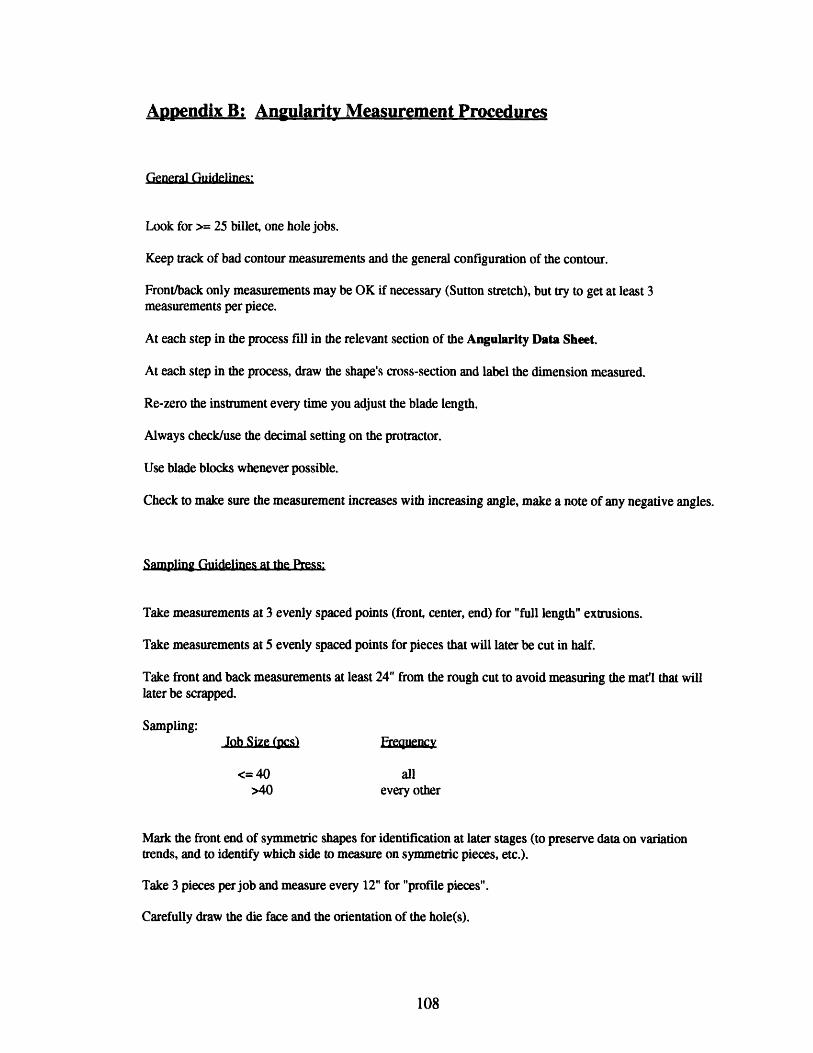
Appendix B: Angularity Measurement Procedures
General Guidelines:
Look for >= 25 billet, one hole jobs.
Keep track of bad contour measurements and the general configuration of the contour.
Front/back only measurements may be OK if necessary (Sutton stretch), but try to get at least 3measurements per piece.
At each step in the process fill in the relevant section of the Angularity Data Sheet.
At each step in the process, draw the shape's cross-section and label the dimension measured.
Re-zero the instrument every time you adjust the blade length.
Always check/use the decimal setting on the protractor.
Use blade blocks whenever possible.
Check to make sure the measurement increases with increasing angle, make a note of any negative angles.
Sampling Guidelines at the Press:
Take measurements at 3 evenly spaced points (front, center, end) for "full length" extrusions.
Take measurements at 5 evenly spaced points for pieces that will later be cut in half.
Take front and back measurements at least 24" from the rough cut to avoid measuring the mat'l that willlater be scrapped.
Sampling:Job Size (cs) Frequency
<= 40 all>40 every other
Mark the front end of symmetric shapes for identification at later stages (to preserve data on variationtrends, and to identify which side to measure on symmetric pieces, etc.).
Take 3 pieces per job and measure every 12" for "profile pieces".
Carefully draw the die face and the orientation of the hole(s).
108

Samnling Guidelines Downstream:
Take three point measurements.
Randomly sample the same number of pieces checked at the press (usually 50% of entire lot).
Keep track of which measurements are fronts and which are backs.
Take 3 pieces per job and measure every 12" for "profile pieces".
Calculations:
* If 2 5% of the pieces measured have bad contour, repeat the calculations leaving out all of the pieceswhich have any bad contour measurements.
Perform calculations per Angularity Calculation Sheet
Preliminary Analysis:
Compare grand means for each lot.
Compare lot standard deviations.
Check normality of each lot (and mean=median)?
Check if Salong is approximately equal to Salong for profile pieces.
Check if (Salong)2 + (Sbetween)2 VARall.
Compare number of bad contour pieces by lot
109

Appendix C: Sample Angularity Data Sheet
General
Shape
Die Number
Lot Number
Customer
Nominal Dimension
Tolerance
Alloy
Temper
Thick/Thin
Aspect Ratio
# Billets Planned
PressDate Extruded
Shift
Press/Container
# Holes
Billet Temp
Billet Length
Container Temp
Die Temp (?)
Measurements Taken
Datafile Name
StretchDate Stretched
Shift
Stretcher
Stretch Goal
Measurements Taken
Datafile Name
Ram Speed
Nitrogen
Operator
Collector
Runout Length
Ext. Ratio
Exit Temp
Metal Temp
Die Repairs
# Data Points
Operator
Metal Temp
Plugs
# Data Points
Final Step?
RBQo
Machine Used
# Rollers
Measurement Taken
Datafile Name
Operator
Leg, # of Passes
# Data Points
Final Step?
DetwistMachine Used
Measurement Taken
Datafile Name
Operator
# Data Points
Final Step?
110
.
. .
.
-
-
-.
.

Appendix D: Sample Angularity Calculation Sheet
Date Sketch:
Part Number
Lot Number
Operation
All Pieces Sampled W/O Bad Contour
grand mean [average(Xi)]
standard deviation [stdev(Xi)]
variance [var(Xi)]
min, median, max
skewness
kurtosis
Salong [average(Si)]
Sbetween [stdev(X-bari)]
estimated variance
Salong for profile pieces
mean
number of pieces with bad contour
general location
Cp / Cpk
111

Appendix E: Confidence Interval for Variances Along and BetweenExtrusions
A log transformation will cause variance data to appear to be approximatelynormally distributed. The resulting data, may then, be used to compute a confidenceinterval for the difference between the variances for the two sets of data.
Along
Stdev1 0.124
2 0.306
3 0.123
4 0.098
5 0.273
6 0.192
Yar0.0150.094
0.0150.010
0.0750.037
Between
-LoY(VU)1.813
1.029
1.820
2.018
1.128
1.433
Stdev0.0960.1770.0950.080
0.1060.172
sample mean 1.540sample variance 0.165
Comparing the sample means of the transformed variances:
0.009
0.031
0.009
0.0060.011
0.030
-Lg(ar)2.0351.504
2.045
2.1941.949
1.529
1.876
0.084
2 2
gI1-2: XI -X2 z(al/2)S +S2nl n2
confidence interval for
a difference in means
- 2 1.876 - 1.540 (1.645) 165 .084:6 6 a = .100 for a 90% two-
sided confidence interval
1 - 2: (.001,.671)
112

The confidence interval does not include zero, therefore, the mean of thetransformed variances describing variation between extrusions is greater than the mean ofthe transformed variances describing variation along the individual extrusions to a 90%confidence level. To put this into perspective, if the transformed variance betweenextrusions is 1.876, the transformed variance along the extrusions will fall in the range of(1.877,2.547) with a 90% certainty. Taking the inverse transform of these values yieldsthe following result:
variance between = .0133 degrees squared, and
variance along = (.003,.0132) degrees squared.
% ofvariance between .033 and .0133
at the endpoints of the confidence interval. This implies that, to a 90% level ofconfidence, variance along will be between 23% and 99% of variance between.
113

Appendix F: Variance Reduction in Experiment 1
0.1090.0740.101
0.1390.1560.2050.122
0.113
0.137
sample meansample variance
Taking the inverse transformation of the sample means yields a mean variance of.0069 degrees-squared for the pocket die and .0 155 degrees-squared for the flat die. Thisreveals a reduction in variance of 55% for the pocket die, or, equivalently, a reduction inthe standard deviation of 33%.
A 95% confidence interval for the difference in means for the two die geometries
clearly shows that g 1, the pocket die mean, is greater than g2, the flat die mean. This
translates into a lower variance for the pocket die when the inverse transformation of thedata is performed to the limits.
2 2
1i-2 : Xl -X2 _ z(ca/2) S + Snl nl2
confidence interval for
a difference in means
0858 .020g - g2: 2.16 - 1.81 ± (1.96) -+
9 9a = .050 for a 95% two-
sided confidence interval
114
Flat Pocket
vat0.012
0.0060.0100.0190.0240.0420.0150.0130.019
log(var)1.921
2.2222.0001.721
1.620
1.377
1.824
1.886
1.721
0.0760.0650.081
0.091
0.1040.0980.0720.0770.087
0.006
0.0060.0040.0070.0080.011
0.010
0.0050.0060.008
2.2222.398
2.1552.0971.959
2.0002.301
2.2222.097
1.810
0.0582.161
0.020
gl - g : (.168,.533)

Appendix G: Regression Analysis of Experiment 1
Data from the 24 billets that were extruded in Experiment 1 (18 test billets and 6billets that were used to test the equipment and heat the tooling) were used in a multiple-regression study to examine the effects of processing parameters on exit temperature. Sixparameters were used in the first run of the model but two of them, container temperatureand nitrogen flow, were dropped from the model when they proved to be insignificant.The variables which remain are:
billet temperatureram speeddie geometryalloy
(in deg. F)(in inJmin.)(0 = flat, 1 = pocket)(2024, 7050, 7075, a 1 means the alloy was used)
The model was generated using the LINEST() function of Microsoft Excel V.2.0a. The summary table is shown below.
Regression Table I
alloy24 I alloy50 alloy75 I pocket ram I billet intercept708 702.8723 710.6522 28.69279 49.14567 0.205111 -190.134
2.57E+08 2.57E+08 2.57E+08 4.544805 5.616679 0.054663 2.57E+08r^2 0.890676 10.81598F 23.08356 17Sum Sq. 16202.62 1988.75
reg. residual I | 9.5887141 11.850171 0.1180921
F.025,6,17=t,.025,17 =
Coeffs
Std Err of CoeffsStd Err of Y est.Degrees of Freedom
2.6986562.109819
The rA2 value of 0.89 implies a reasonably good fit of the data, and the F value of23.08 (which is greater than the test statistic of 2.699) indicates that the model hassignificance at the 95% confidence level. The bottom row of the table shows the teststatistics for die geometry, ram speed, and billet temperature that were calculated bymultiplying the standard error of the coefficients by t,.025,17. The fact that thecoefficients are greater than the test statistics suggests that they are all statisticallysignificant at the 95% confidence level.
115

Appendix H: Confidence Interval for Experiment 2
A log transformation will cause variance data to appear to be approximatelynormally distributed. The resulting data, may then, be used to compute a confidenceinterval for the difference between the variances for the two sets of data.
Flat Die
0.2630.302
0.501
ar0.0690.091
0.251
log(var)
1.1601.040
0.600
stdev
0.192
0.1670.1250.2820.1090.108
Pocket Die
0.0370.028
0.0160.0800.0120.012
log(var)1.433
1.555
1.8061.1001.925
1.933
sample averagesamplevariance
0.137 0.9330.087
Comparing the sample means of the transformed variances:
2 2
R 1- W: XI -- X2 z(a / 2) + '
g1 - g2: 1.625 - .993 (1.96) + 6
confidence interval for
a difference in means
a = .050 for a 95% two-
sided confidence intervalp1 -p2: (.205,1.059)
The confidence interval does not include zero, therefore, the mean of thetransformed variances for the pocket die is greater than the mean of the transformed
116
0.031 1.625
0.107

variances for the flat die at a 95% confidence interval. To put this into perspective, if thetransformed mean variance for the flat die is .993, the transformed mean variance for thepocket die will fall in the range of (1.198,2.052) with a 95% certainty. Taking the inversetransform of these values yields the following result:
flat die variance = .102 degrees squared, and
pocket die variance = (.009,.063) degrees squared.
reduction = flat die variance - pocket die variance, so,
% reduction =.102-.063 = 38%
V .102 )and
.102-.009)
This implies that, to a 95% confidence level, the pocket die couldby as little as 38%, or as much as 91% over the flat die.
reduce variation
117
= 91%

Bibliography
[Hogg & Ledolter, 1987] Hogg, Robert V., Ledolter, Johannes, (1987).Engineering Statistics, Macmillan Publishing Co., New York.
[Imai, 1986] Imai, Masaaki, (1986). Kaizen, The Key to Japan's CompetitiveSuccess, Random House, New York.
[Laue, 1976] Laue, Kurt, and Stenger, Helmut, (1976). Strangpressen,Aluminium-Verlag GmbH, Diisseldorf.Extrusion, (English translation 1981) by American Society forMetals, Ohio
[Montgomery, 1991] Montgomery, Douglas C., (1991). Introduction to StatisticalQuality Control, Wiley, New York.
[Phadke, 1989] Phadke, Madhav S., (1989). Quality Engineering Using RobustDesign, Prentice Hall, New Jersey.
[Purchasing, 1992] Purchasing, August 13, 1992, Vol. 113 ; No. 2.
[Senge, 1990] Senge, Peter M. (1990). The Fifth Discipline, The Art and thePractice of the Learning Organization. Doubleday Currency,New York.
[Tashiro, 1992] Tashiro, M., et al (1992) "Extrusion Conditions and Metal FlowTo Minimize Both Distortion and Variance of Cross SectionalShape", Proceedings of the 5th International Aluminum ExtrusionTechnology Seminar, Vol.II, pp. 191-205.
118