Download - DSpace@MIT - Massachusetts Institute of ...
22
Mena invasive (Mena[superscript INV]) and Mena11a isoforms play distinct roles in breast cancer cell cohesion and association with TMEM The MIT Faculty has made this article openly available. Please share how this access benefits you. Your story matters. Citation Roussos, Evanthia T., Sumanta Goswami, Michele Balsamo, Yarong Wang, Robert Stobezki, Esther Adler, Brian D. Robinson, et al. “Mena invasive (MenaINV) and Mena11a isoforms play distinct roles in breast cancer cell cohesion and association with TMEM.” Clinical & Experimental Metastasis 28, no. 6 (August 12, 2011): 515-527. As Published http://dx.doi.org/10.1007/s10585-011-9388-6 Publisher Springer-Verlag Version Author's final manuscript Citable link http://hdl.handle.net/1721.1/83503 Terms of Use Creative Commons Attribution-Noncommercial-Share Alike 3.0 Detailed Terms http://creativecommons.org/licenses/by-nc-sa/3.0/
-
Upload
khangminh22 -
Category
Documents
-
view
0 -
download
0
Transcript of Download - DSpace@MIT - Massachusetts Institute of ...
Mena invasive (Mena[superscript INV]) andMena11a isoforms play distinct roles in breast
cancer cell cohesion and association with TMEM
The MIT Faculty has made this article openly available. Please share how this access benefits you. Your story matters.
Citation Roussos, Evanthia T., Sumanta Goswami, Michele Balsamo, YarongWang, Robert Stobezki, Esther Adler, Brian D. Robinson, et al.“Mena invasive (MenaINV) and Mena11a isoforms play distinct rolesin breast cancer cell cohesion and association with TMEM.” Clinical& Experimental Metastasis 28, no. 6 (August 12, 2011): 515-527.
As Published http://dx.doi.org/10.1007/s10585-011-9388-6
Publisher Springer-Verlag
Version Author's final manuscript
Citable link http://hdl.handle.net/1721.1/83503
Terms of Use Creative Commons Attribution-Noncommercial-Share Alike 3.0
Detailed Terms http://creativecommons.org/licenses/by-nc-sa/3.0/

Mena invasive (MenaINV) and Mena11a isoforms play distinctroles in breast cancer cell cohesion and association with TMEM
Evanthia T. Roussos1, Sumanta Goswami1,4, Michele Balsamo3, Yarong Wang1, RobertStobezki4, Esther Adler7, Brian D. Robinson5, Joan G. Jones6, Frank B. Gertler3, John S.Condeelis1,2, and Maja H. Oktay7
1Department of Anatomy and Structural Biology, Albert Einstein College of Medicine, Bronx, NY104612Gruss Lipper Biophotonics Center, Albert Einstein College of Medicine, Bronx, NY 104613David H Koch Institute for Integrative Cancer Research, Massachusetts Institute of Technology,Cambridge, MA 021394Depertment of Biology, Yeshiva University, New York, NY 100335Department of Pathology, Johns Hopkins Hospital, Baltimore, MD 212876Department of Pathology and Laboratory Medicine, Weill Cornell Medical College, New York, NY100657Department of Pathology, Montefiore Medical Center, Bronx, NY 10467
AbstractMena, an actin regulatory protein, functions at the convergence of motility pathways that drivebreast cancer cell invasion and migration in vivo. The tumor microenvironment spontaneouslyinduces both increased expression of the MenaINV and decreased expression of Mena11a isoformsin invasive and migratory tumor cells. Tumor cells with this Mena expression pattern participatewith macrophages in migration and intravasation in mouse mammary tumors in vivo. Consistentwith these findings, anatomical sites containing tumor cells with high levels of Mena expressionassociated with perivascular macrophages were identified in human invasive ductal breastcarcinomas and called TMEM. The number of TMEM sites positively correlated with thedevelopment of distant metastasis in humans. Here we demonstrate that mouse mammary tumorsgenerated from EGFP-MenaINV expressing tumor cells are significantly less cohesive and havediscontinuous cell-cell contacts compared to Mena11a xenografts. Using the mouse PyMT modelwe show that metastatic mammary tumors express 8.7 fold more total Mena and 7.5 fold moreMenaINV mRNA than early non-metastatic ones. Furthermore, MenaINV expression in fine needleaspiration biopsy (FNA) samples of human invasive ductal carcinomas correlate with TMEMscore while Mena11a does not. These results suggest that MenaINV is the isoform associated withbreast cancer cell discohesion, invasion and intravasation in mice and in humans. They also implythat MenaINV expression and TMEM score measure related aspects of a common tumor celldissemination mechanism and provide new insight into metastatic risk.
Correspondence: Evanthia T. Roussos [email protected], (718) 678-1131, John [email protected], Maja H. Oktay, (718) 920-6091,[email protected] T. Roussos ([email protected]), Sumanta Goswami ([email protected]), MicheleBalsamo ([email protected]), Yarong Wang ([email protected]), Robert Stobezki ([email protected]), Esther Adler([email protected]), Brian D. Robinson ([email protected]), Joan G. Jones ([email protected]), Frank B. Gertler([email protected]), John S. Condeelis ([email protected]), Maja H. Oktay ([email protected])
NIH Public AccessAuthor ManuscriptClin Exp Metastasis. Author manuscript; available in PMC 2012 September 27.
Published in final edited form as:Clin Exp Metastasis. 2011 August ; 28(6): 515–527. doi:10.1007/s10585-011-9388-6.
NIH
-PA Author Manuscript
NIH
-PA Author Manuscript
NIH
-PA Author Manuscript
KeywordsBreast cancer; metastasis; cell motility; intravasation; TMEM
INTRODUCTIONMultiphoton-based intravital imaging has demonstrated that invasive carcinoma cells inmouse and rat mammary tumors migrate and intravasate when associated with migratory [1]and peri-vascular macrophages [2], respectively. An in vivo invasion assay has been used inmammary tumors of rats, mice, and humans to collect migratory tumor cells associated withmacrophages and these cells have been expression profiled [3]. The gene expression changesoccurring in migratory and macrophage-associated tumor cells are clustered in severalpathways including the motility pathways regulating EGF stimulated locomotion. Many ofthese genes belong to the “minimum motility machine” comprised of the cofilin/LIM kinase,N-WASP/Arp2/3 complex and Mena/capping protein pathways [4-6]. Several genes thatcoordinate and control the activity of these pathways are also up regulated. One of thesegenes is Mena. Mena protein promotes actin polymerization by interfering with the activityof inhibitory capping proteins [7]. The anti-capping function of Mena promotes sustainedactin polymerization, which is essential for directional cell movement in response to growthfactors like EGF.
Mena is upregulated in rat, mouse and human mammary tumors [8-10]. Similarly, inprecursor lesions to cancer of the cervix and colon, Mena expression is increased withprogressive transformation [11, 12]. Mena has been used successfully as part of a marker ofmetastatic risk called TMEM (Tumor Micro-Environment of Metastasis) observed informalin-fixed paraffin-embedded sections of human invasive ductal carcinomas of thebreast [9]. TMEM is an anatomical site consisting of a macrophage in direct contact with aMena expressing tumor cell, and an endothelial cell. TMEM counts are associated with riskof metastasis in breast cancer patients independently of lymph node, ER/PR or HER2 status[9].
Mena, a member of the Ena/VASP family of proteins, regulates membrane protrusion andcell movement in a variety of cell types and contexts by influencing the geometry andassembly of actin filament networks [13-17]. Mena is alternatively spliced. In particular, anexon encoding a sequence of 19 amino acids inserted between the EVH1 domain and theLERER repeats generates a Mena invasion (INV) isoform (previously called Mena+++) [13,18] and inclusion of an exon encoding a 21 amino acid insertion in the EVH2 domainproduces the Mena11a isoform [6]. Until recently, MenaINV was thought to be expressedprimarily in axons of developing neurons [13], wheras expression of Mena11a was found inepithelial cancer cells [6]. However, expression profiling of cells collected using the in vivoinvasion assay revealed that MenaINV expression is specifically upregulated and Mena11a isdownregulated in migratory/macrophage associated tumor cells compared to averageprimary tumor cells (APTCs) isolated from the same rat and mouse mammary tumors byFACS [8]. Expression of MenaINV in a xenograft mouse model increases spontaneous lungmetastases from mammary tumors and alters the dose-response of tumor cells to epidermalgrowth factor (EGF), allowing cells to respond to much lower EGF concentrations thancontrol cells both in vivo and in vitro [17].
Here we demonstrate that MenaINV promotes discohesive tumor morphology in a xenograftmouse model while Mena11a expression promotes cohesive tumor morphology. We alsoshow that increased expression of MenaINV but not Mena11a is associated with metastasis inthe PyMT mouse model of breast cancer. Furthermore, we demonstrate that MenaINV
Roussos et al. Page 2
Clin Exp Metastasis. Author manuscript; available in PMC 2012 September 27.
NIH
-PA Author Manuscript
NIH
-PA Author Manuscript
NIH
-PA Author Manuscript

expression correlates with the assembly of cancer cell intravasation sites in human breastcancers using TMEM score. It seems that both TMEM score and Mena isoform expressionmeasure an aspect of tumor biology unrelated to standard clinical and pathologicalparameters because they do not correlate with tumor, size, lymph node status or ER, PR andHER2/Neu receptor expression. Thus, we suggest that MenaINV may have useful clinicalapplications as a prognostic marker for metastatic risk and target for therapy.
MATERIALS AND METHODSCell lines, molecular cloning, infection, fluorescence-activated cell sorting and cell culture
EGFP-Mena splice isoforms were subcloned into the retroviral vector packaging Murinestem cell virus-EGFP using standard techniques [14]. MTLn3 rat adenocarcinoma cells wereinfected with each Mena isoform construct to create MTLn3-EGFP-Mena (referred to asMena cells), MTLn3-EGFP-MenaINV (referred to as MenaINV cells) and MTLn3-EGFP-Mena11a cells (referred to as Mena11a cells) and used for all orthotopic injections of SCIDmice. Details about the retroviral system used to generate these lines have been describedpreviously [17]. Monoclonal MTLn3 cells were derived from spontaneous lung metastasesin a rat model 13762 [19], and were used in these experiments because they are known tometastasize to the lung when injected into the mammary gland of SCID mice and thus aresuitable for metastatic studies [20]. Additionally, these cells have been used to study Menaisoforms previously [17, 21]; thus we wished to be able to compare current work with workpreviously published. To achieve uniform forced expression, EGFP -MenaINV and -Mena11a cells were FAC sorted to a level of 4-fold overexpression of EGFP-Mena isoformsas compared to EGFP-Mena on the protein level. MTLn3-Cerulean EGFP-Mena spliceisoforms were created using a lentiviral system pCCLsin.PPT.hPGK.Cerulean.pre (courtesyof Dr. Gupta, Albert Einstein College of Medicine). Cytoplasmic expression of Ceruleanwas used to improve visualization of tumor cells during intravital imaging. MTLn3 cellswere cultured in alpha-modified minimum essential medium (MEM) supplemented with 5%fetal bovine serum (FBS) and 0.5% PenStrep (Invitrogen).
Xenograft animal modelsOrthotopic mammary tumors were derived by the subcutaneous injection of 1×10⁶ EGFP-MTLn3 (referred to as GFP), -EGFP-Mena, -EGFP-MenaINV -EGFP-Mena11a, -Cerulean-EGFP-MenaINV or - Cerulean-EGFP-Mena11a cells into the mammary gland of 5–7 week-old female SCID mice (these mice are referred to as xenograft mice) [22]. All experimentsinvolving animals were approved by the Einstein Institute for Animal Studies.
Intravital Imaging (IVI)Intravital multiphoton imaging was performed in tumors of SCID mice expressing MTLn3-cerulean-EGFP-MenaINV or cerulean-EGFP-Mena11a as described previously [23, 24]using a 20× 1.95 NA water immersion objective with correction lens. Briefly, a skin flapsurgery was performed to expose the mammary tumor of an anesthetized mouse and themouse was then placed on the microscope for imaging. Visualization of collagen within theprimary tumor is made possible by the generation of a second harmonic signal which resultsfrom the reflection of light off of collagen helices [25].
Scoring of cohesive and discohesive tumor morphology was done using images obtainedwith intravital multiphoton microscopy. A minimum of 4 fields from each tumor imaged inxenograft mice were divided into quadrants. 5 mice per isoform type were evaluated (a totalof 20 fields were scored per tumor type). A score of C (cohesive) indicated a quadrantcontaining a continuous sheet/ large cluster of tumor cells. A score of D (discohesive)indicated that > ½ of the quadrant lacked continuous sheets or clusters of cells. Data in
Roussos et al. Page 3
Clin Exp Metastasis. Author manuscript; available in PMC 2012 September 27.
NIH
-PA Author Manuscript
NIH
-PA Author Manuscript
NIH
-PA Author Manuscript
figure 1d is represented as percentage of total fields analyzed that received a score of Cversus percentage of fields that received a score of D. Images were scored double blind andthe findings from each correlated with each other.
Fine Needle Aspiration (FNA) of MTLn3 XenograftsMice were euthanized 3 weeks after carcinoma cell injection into the mammary gland. FNAwas performed as previously described [26]. In brief, cells collected with 25 gauge needleswere expelled onto a glass slide and smeared. Smears were stained by standard Diff-Quickprotocol [26]. Each smear was given a score based on the ratio of the number of clusters tothe approximate percentage of single cells, either <30% <60% or <90% as observed in asingle low power field area (40X; 12.56 mm2). A cluster was defined as >10 cells in directcontact with each other. Each smear was also independently described as cohesive ordiscohesive based on the relative abundance of clusters as compared to single cells. Bothmethods were scored double blind and the findings from each correlated with each other.
Real Time PCRPCR analyses were performed using SyBR Green kit and ABI 7300 sequence detector.Primers detected MenaINV and Mena11a as described previously [8]. The data wereanalyzed by ABI Sequence Detection Software (Applied Biosystems Foster City, CA).
Immunofluorescence (IF) and immunohistochemistry (IHC)Following 4 weeks of tumor growth, five primary tumors from xenografts of each tumortype derived from injection of MTLn3-EGFP, -EGFP-Mena, -EGFP-Mena11a and –EGFP-MenaINV, cells were fixed in 10% buffered formalin and paraffin embedded. Sections 10βmthick were cut from each tumor and placed on slides for further staining. IF was done usinganti-GFP (Aves Lab Cat. #1020) at 1:500 dilution with Alexa488 as a secondary, and anti-β-catenin (BD Biosciences Cat. #610153) at 1:500 dilution with Alexa594 as a secondary.Digital images were converted in ImageJ (NIH) and analyzed using macro analysis thatdefines fluorescence intensity starting at the cell periphery and extend into the cell interior[27]. Primary tumor sections were imaged using the Zeiss AxioObserver.Z1 with a 10× 1.4NA Plan Apo objective with the apotome and processed using ImageJ (NIH).
IHC for E-cadherin was done using commercially available monoclonal anti-E cadherinantibody (Dako, Carpinteria, CA) at 1:25 dilution. Antigen retrieval was done in a steamer at90°C for 30 minutes in Target Retrieval solution pH 6.0. The slides were incubated with theprimary antibody for 30 minutes at room temperature and 30 minutes with a secondaryantibody. E-cadherin was visualized using anti-mouse horseradish peroxidase-labeledpolymer (Envision System, Dako) and DAB on an automated immunostainer (Autostainer,Dako) according to the manufacturer’s instructions. The slides were counterstained withhematoxylin using standard technique.
Western BlotsMTLn3 protein lysates were prepared, the samples were resolved by SDS-PAGE,transferred to nitrocellulose, blocked in odyssey blocking solution (LiCor), incubated inprimary antibodies overnight at 4°C, secondary antibodies for 1 hour at room temperature,and analyzed using the Odyssey (LiCor) [28]. Primary antibodies, anti-Mena [1:1000] [29],anti-Mena11a [1:5000] [30], anti-MenaINV [1:500] (unpublished, more informationavailable upon request), anti-beta-actin [1:5000] (Invitrogen), were used at the indicatedconcentrations. Secondary antibodies, Mouse 680 (used against actin and Mena) and Rabbit800 (used against Mena11a and MenaINV) were purchased from LiCor and imaged in
Roussos et al. Page 4
Clin Exp Metastasis. Author manuscript; available in PMC 2012 September 27.
NIH
-PA Author Manuscript
NIH
-PA Author Manuscript
NIH
-PA Author Manuscript
separate channels. Endogenous Mena, Mena11a and MenaINV were detected at lowermolecular weights as compared to EGFP-Mena11a and EGFP-MenaINV.
Collection and Processing of Polyoma Middle T Antigen Induced Mouse Mammary TumorsTransgenic animals with mammary gland-specific expression of Polyoma middle T (PyMT)antigen in the FVB-C3H/B6 background were obtained from the Albert Einstein College ofMedicine mouse repository. FNA was performed with a 25 gauge needle on animalsanesthetized with 5% isoflurane and sacrificed by cervical dislocation. The initial FNAbiopsy was used for quality assessment using standard Diff-Quick stain. Subsequentbiopsies were used for qRT-PCR analysis. Staging of H&E stained tumor sections fromformalin fixed, paraffin embedded tissue was done as previously described [31].
Human Tissue Selection and FNA Biopsy ProcedureLumpectomy and mastectomy specimens received at the Albert Einstein College ofMedicine/ Montefiore Medical Center, Moses and Weiler Divisions for pathologicalexamination were used for FNA-based tissue collection under institutional IRB approval.Four to five FNA aspiration biopsies were performed on grossly visible lesions using 25gauge needles. The adequacy of the sample was assessed by standard Diff-Quick protocol[26]. Only samples composed of 90% of either benign or malignant epithelial cells, asdetermined by standard pathologic characteristics [26], were used in the study.
Tissue Selection for TMEM staining, TMEM staining and scoringAt the time of routine microscopic examination of the lesions on which FNA biopsies hadbeen performed, an appropriate area of the tumor suitable for TMEM analysis was identifiedby low power scanning. The following criteria were used: high density of tumor, adequacyof tumor, lack of necrosis or inflammation, and lack of artifacts such as retraction or folds.TMEM staining and assessment were done as described previously [9]. Briefly, ten digitalimages were acquired at 400x total magnification. Using the “circle” tool available inPhotoshop, all TMEM are “marked” using circles, and the “marked” images are saved asseparate files. The total TMEM count for each image was tabulated, and the counts from allten images are then summed to give a final TMEM density for each patient sample,expressed as the number of TMEM per 10 high power fields (400x total magnification).Two pathologists independently scored all fields. The scores for each case were averaged forthe two pathologists to yield a final score used in the data analysis.
E-Cadherin scoringSimilarly to TMEM scoring, ten digital images were acquired at 400x total magnification foreach xenograft tumor and cells with complete membranous staining were marked withasterisk using Photoshop tools. The total number of cells from all ten images was summed togive a final number of cells with complete E-cadherin membranous stain for each xenograft.There were 3 xenografts per group; thus a total of 30 high power fields (400x totalmagnification) were analyzed per group. The results are expressed as a mean (with SEM) ofnumber of cells with complete membranous stain per group.
Relationship of FNA Sample to TMEMFNA primarily collects loose tumor cells with very few macrophages and no endothelialcells and incurs minimal tissue damage [32]. Thus, after the FNA procedure, the entiretumor was formalin-fixed, paraffin-embedded (FFPE) and sent for pathological examination.A representative block of FFPE tumor tissue was selected and triple immunostained forTMEMs. Therefore, the FNA sample and TMEM count were obtained from the same tumorfor the entire cohort (Figure S3).
Roussos et al. Page 5
Clin Exp Metastasis. Author manuscript; available in PMC 2012 September 27.
NIH
-PA Author Manuscript
NIH
-PA Author Manuscript
NIH
-PA Author Manuscript
Statistical AnalysisStatistical significances were determined using unpaired, two-tailed Student’s t-testsassuming equal variances and an alpha level of 0.05. Differences were consideredsignificant if the p value was <0.05. Actual P-values are listed on graphs within each figure.For differences in Mena isoform expression between metastatic and non-metastatic PyMTtumors and the association between TMEM density or Mena isoform fold change with tumorgrade, lymph node status, tumor size, ER, PR and Her2/Neu status, Wilcoxon Mann-Whitney rank-sum test was used. Given that 6 comparisons were done for human samples,the P values for determining statistical significance was set at 0.008 by applying theBonferroni correction to the standard assumption that P < 0.05 is statistically significant.The strength of association between Mena isoform expression and TMEM density wascalculated using Spearman’s correlation coefficient.
RESULTSExpression of Mena11a, but not MenaINV promotes cohesive primary tumor morphologyand integrity of cell-cell junctions
To investigate the effects of expression of Mena, MenaINV and Mena11a on primary tumormorphology and tumor cell cohesiveness, we generated orthotopic mammary tumors fromMTLn3 rat adenocarcinoma cell lines forced to express Mena, MenaINV and Mena11aisoforms. Our previous studies show that invasive tumor cells spontaneously increaseexpression of MenaINV, and decrease expression of Mena 11a in vivo [8]. We also showedthat MTLn3 mammary carcinoma cells forced to express MenaINV, are sensitized to EGFand are more metastatic [17]. We hypothesized that the highly invasive and metastaticnature of MenaINV cells might be in part caused by decreased tumor cell cohesion [6, 33].Likewise, the expression of Mena 11a, characteristically found in more epithelial tumor cells[6] and non invasive tumor cells in vivo [8], might promote cohesive tumor cellmorphology. These considerations also suggest that FNA of tumors could be used to detectdifferences in Mena expression patterns. To test this, FNA samples were collected fromMTLn3-derived mammary tumors. Examples of cohesive and discohesive FNAcytopathology smear patterns are shown in Figure 1a. We found that FNA smears obtainedfrom Mena11a expressing mammary tumors were more cohesive than smears obtained fromMena and MenaINV expressing mammary tumors (Figure 1b). MTLn3 control tumors(referred to as GFP) and tumors derived from Mena and MenaINV expressing MTLn3 cellshad similar discohesive smear patterns (Figure 1b). Quantification of cell clusters anddiscohesive areas confirmed that Mena11a tumors were significantly more cohesive thanGFP, Mena or MenaINV tumors (Figure 1b).
To further characterize the effects of Mena, Mena11a and MenaINV on tumor cell cohesionwithin the primary tumor we used multiphoton-based intravital imaging (IVI). Within theintact primary tumor of an anesthetized mouse, Mena11a expressing tumors had welldefined cohesive cell-cell contacts, whereas MenaINV expressing tumors had discontinuouscell-cell contacts and the cells were more randomly organized resulting in a discohesiveappearance (Figure 1c, S1). Mena expressing tumors also demonstrated more discohesiveappearance as compared to GFP tumors but did not show as drastic a trend towarddiscohesion as that seen in MenaINV expressing tumors. All images were taken under non-bleached conditions with lower laser power of the multiphoton microscope allowing theweaker cytoplasmic fluorescence to persist. This allowed direct comparison of Mena,MenaINV, and Mena11a expressing tumor cells and demonstrates that Mena is more diffusethan the Mena11a or MenaINV isoforms (Figure 1c).
Roussos et al. Page 6
Clin Exp Metastasis. Author manuscript; available in PMC 2012 September 27.
NIH
-PA Author Manuscript
NIH
-PA Author Manuscript
NIH
-PA Author Manuscript
Primary tumor morphologies were scored based on cohesive and discohesive appearance intumors expressing GFP fused to the Mena isoform indicated. Mena11a tumors had thelargest percentage of cohesive fields while MenaINV tumors had the largest percentage ofdiscohesive fields (Figure 1d).
Given the strong correlation of Mena11a expression with cohesion, and MenaINV expressionwith discohesion of tumor cells, we asked whether MenaINV and Mena11a isoformexpression affects the integrity of cell-cell junctions using β-catenin and E-cadherinimmunofluorescence and immunohistochemistry, respectively. Localization of theseproteins at cell-cell contacts has been used to investigate cell junction integrity [34, 35].Mena11a expressing mammary tumors exhibited continuous β-catenin immunofluorescencestaining at cell-cell contacts while staining for β-catenin in MenaINV expressing mammarytumors was discontinuous (Figure 2a). Mena11a tumor cells also had a significantly higherintensity of β-catenin staining at cell-cell contacts (Figure 2b), and within the whole cell(Figure S2) as compared to MenaINV cells. Mena expressing tumor cells had similarlocalization of β-catenin at cell-cell contacts (Figure 2a) and increased expression within thewhole cell (Figure S2) as compared to GFP control tumors. In addition to a reduction in β-catenin staining, tumor cells from MenaINV expressing tumors also showed a dramaticreduction in continuous E-cadherin staining at cell-cell junctions as compared to that seen inGFP and Mena11a expressing tumors (Figure 2c). E-cadherin staining pattern was similar toβ–catenin; predominantly discontinuous in MenaINV tumors when compared to GFP, Menaor Mena11a expressing tumors (Figure 2c and d). We found significantly lower numbers ofcells with complete membranous staining in MenaINV tumors than in GFP control, Mena orMena11a expressing tumors (Figure 2d), consistent with our finding that Mena11a promotesa cohesive epithelial morphology while MenaINV supports a discohesive morphology invivo.
To rule out if the observed effects of MenaINV and Mena11a cells on invasion are due tocompensatory expression of the different Mena isoforms we performed western blots oneach cell line to check for expression of each Mena isoform. In MenaINV cells the levels ofendogenous Mena or Mena11a were unchanged as compared to GFP control cells (Figure3). In Mena11a there were no detectable differences in Mena or MenaINV levels ascompared to GFP cells (Figure 3).
The expression level of Mena, MenaINV and Mena11a isoform mRNA correlates with cellcohesiveness, and metastatic status in PyMT oncogene induced mouse mammarycarcinomas
To assess how cohesion and Mena isoform expression correlate with metastatic status westudied PyMT mouse mammary carcinoma. These tumors histologically recapitulateprogression of human ductal carcinoma of the breast from ductal hyperplasia and ductalcarcinoma in situ to invasive ductal carcinoma [31]. Invasive ductal carcinomas in PyMTtumors can be additionally stratified into histologically distinct subcategories of early andlate carcinomas. Unlike in humans where cancer morphology does not reflect tumormetastatic potential, late PyMT cancers are associated with tumor cell dissemination andlung metastases [31, 36, 37]. Thus we assessed the FNA smear pattern and Mena isoformexpression in early and late PyMT tumors to determine if Mena isoform mRNA expressioncorrelates with the smear pattern and metastatic outcome. Smear patterns obtained fromearly PyMT mouse mammary tumors were predominantly cohesive, while those obtainedfrom late, metastatic tumors were predominantly discohesive (Figure 4a-i and 4a-ii).Quantitative real time PCR (qRT-PCR) of FNA samples shows a spontaneous 8.7-foldincrease in pan-Mena expression (determined with primers that identify all Mena isoforms =pan-Mena) and 7.5-fold increase in MenaINV expression in late carcinomas when comparedwith early carcinoma, while Mena11a amplicons were decreased by 70% in late carcinomas
Roussos et al. Page 7
Clin Exp Metastasis. Author manuscript; available in PMC 2012 September 27.
NIH
-PA Author Manuscript
NIH
-PA Author Manuscript
NIH
-PA Author Manuscript
(Figure 4b). Thus, the Mena isoform expression pattern in cells collected by FNA from late,metastatic tumors matches that of the invasive cells collected by the in vivo invasion assaywhile the Mena expression pattern from early carcinomas matches that of average primarytumor cells (APTCs) isolated from the same rat and mouse mammary tumors by FACS (2).This finding suggests that the pattern of Mena isoform expression in FNA samples mayreflect invasive potential of FNA collected cancer cells.
MenaINV isoform mRNA expression correlates with the TMEM intravasation score andmetastatic risk in human invasive ductal carcinomas of the breast
The correlation of spontaneously increased MenaINV and decreased Mena11a expressionwith tumor progression and metastatic outcome in transgenic PyMT mouse mammarytumors, and our recent findings showing that MenaINV, but not Mena11a, expressionincreases tumor cell motility, intravasation and dissemination in xenograft mouse mammarytumors [17, 21], led us to ask if the altered expression of these isoforms correlates with anincreased risk of metastasis in humans.
Since our study is prospective we used TMEM score as a measure of increased metastaticrisk. As previously shown TMEMs are visualized by a triple immunostain to detect thedirect contact of macrophages, Mena expressing carcinoma cells and endothelial cells informalin fixed paraffin embedded tissues [9]. The number of TMEM sites has been shownpreviously to be significantly higher in tumors that produce distant metastases [9]. TMEMwas developed based on studies that used multiphoton intravital imaging of mammarytumors in PyMT mice showing breast carcinoma cells intravasating at sites along bloodvessels where peri-vascular macrophages are in direct contact with tumor cells andendothelial cells [38, 39]. Examples of TMEMs (marked by circles) are shown in twohuman invasive ductal carcinomas as identified in histological sections (Figure 5a). TMEMwas also identified in xenograft mammary tumors derived from injection of MTLn3-MenaINV cells (Figure 5b).
We hypothesize that MenaINV expressing tumor cells are involved in the assembly ofTMEM and therefore human tumors with numerous TMEM intravasation sites will have ahigher proportion of discohesive, invasive and migratory tumor cells expressing MenaINV
compared to tumors with few TMEM sites. To investigate this we collected cells from 40patients’ invasive ductal carcinomas (IDC) and 5 fibroadenomas by FNA.
The expression of Mena, Mena11a and MenaINV at the protein level was assessed bywestern blotting. As shown in 4 randomly chosen FNA samples (Figure S4), Mena isoformexpression is detectable at the protein level, but only with long exposure. While these blotsestablish that the Mena isoforms are expressed at the protein level in FNA samples, thenumber of cells collected in FNA samples was variable and not sufficient for western blotanalysis of correlations with TMEM count. Thus, the quantification of Mena isoformexpression was determined by PCR for all FNA samples to be correlated with TMEM count.
Therefore, PCR primers specific to the Mena isoforms of interest were used with all 40 FNAsamples and the results were expressed as a fold change of Mena isoform mRNA expressionin IDC, compared to the mean level of Mena isoforms mRNA obtained from 5fibroadenomas. TMEM counts were scored in tumor samples obtained from the same cohortof 40 patients, and were correlated with the fold change in Mena isoform mRNA expression(Figure 5c). The tissue collection methods are outlined in Figure S3. The Spearman’scorrelation coefficient for the association between MenaINV fold change and TMEM countwas 0.78 (p= 10−6). An inverse association between Mena11a and TMEM was also expectedbut was not found (r = −0.23, p= 0.14).
Roussos et al. Page 8
Clin Exp Metastasis. Author manuscript; available in PMC 2012 September 27.
NIH
-PA Author Manuscript
NIH
-PA Author Manuscript
NIH
-PA Author Manuscript

We also evaluated the collective fold change of all Mena isoforms using primers thatamplify all Mena isoforms (pan-Mena). The expression of pan-Mena did not correlate withTMEM score (r= −0.15, p= 0.37) (Figure 6). These results indicate that MenaINV is theisoform that is correlated with TMEM count and therefore with the metastatic risk in breastcarcinoma.
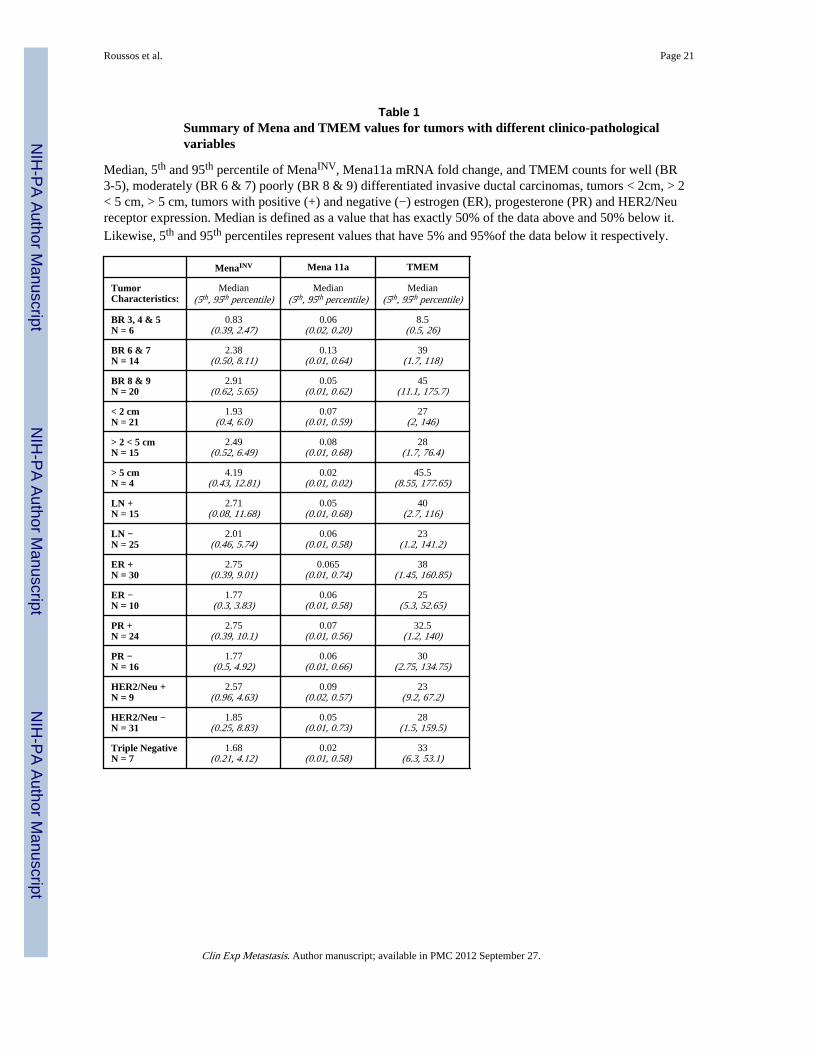
These same tumor samples were also classified according to the modified BloomRichardson scale. Patients’ age, tumor size, tumor grade, lymph node status, estrogen,progesterone and HER2/Neu receptor status were documented along with MenaINV,Mena11a expression level and TMEM score (Table S1). Median values as well as 5th and95th percentiles of MenaINV, Mena11a expression levels and TMEM scores for all recordedtumor characteristics stated above was calculated (Table 1). We found statisticallysignificant difference in TMEM score between the tumors of low and high grade (p =0.004). However, no statistically significant difference in Mena isoform mRNA fold changeamong the tumors of different grades was found. Likewise, there was no statisticallysignificant difference in TMEM score and Mena isoform mRNA fold change among tumorsof different size, lymph node status, ER, PR and HER2/Neu expression, suggesting that bothTMEM score and Mena isoform mRNA expression reflect mechanisms of tumor invasion/progression independent of most currently used clinical and pathological parameters.
These data indicate that the expression of MenaINV mRNA correlates with TMEM score,and are consistent with the PyMT mouse tumor results showing that expression of MenaINV,but not Mena11a, correlates with metastasis (Figure 4b). They are also consistent with theresults of our recent xenograft experiments documenting that MenaINV is the isoformassociated with increased intravasation, dissemination and higher rates of lung metastasis[21].
DISCUSSIONAnimal models indicate that carcinoma cells located in invasion-inducingmicroenvironments undergo transient and sometimes stable epigenetic changes similar tothose that drive morphogenetic cell movements in the developing embryonic organ [2,40-42]. One of the changes is the increased expression of the actin regulatory proteinMenaINV and decreased expression of Mena11a [8]. Here we have found that changes inisoform expression from Mena11a to MenaINV correlate with the loss of epithelial cell-cellcontacts and the emergence of a discohesive cell population in the primary tumor.Additionally, previous studies have reported an increase in cell motility in vivo and lungmetastases in orthotopic mammary tumors derived from MenaINV expressing tumor cells[17]. Thus, the discohesive primary tumor morphology and discontinuous cell-cell adhesioncontacts observed in MenaINV tumors supports the enhanced migratory phenotypepreviously reported [17].
We demonstrate that expression of Mena11a promotes the maintenance of epithelial cell-cellcontacts and a cohesive cell population within a mammary tumor. This is consistent withrecent findings showing that expression of Mena11a delays but does not prevent metastaticprogression in MTLn3 xenograft mammary tumors [21]. These results suggest that theexpression of Mena11a in tumor cells will support their retention in cohesive regions oftissue with relatively stable cell-cell junctions (Figure 7). Thus, the FNA smears from thetumors with the high proportion of Mena11a expressing cells show mostly cohesive clusterslikely reflecting a less malignant clinical outcome.
Previous studies have shown that MenaINV expressing carcinoma cells have increasedmovement in vivo [17] (Figure 7-Box i). Sensitivity of tumor cells to a particular
Roussos et al. Page 9
Clin Exp Metastasis. Author manuscript; available in PMC 2012 September 27.
NIH
-PA Author Manuscript
NIH
-PA Author Manuscript
NIH
-PA Author Manuscript
chemoattractant will determine the direction and speed of their movement within the tissue[22]. Previous studies also show that MenaINV expressing cells are hypersensitive to EGFduring in vivo invasion [17]. This sensitivity could therefore promote migration toward, andassociation with EGF producing perivascular macrophages, resulting in intravasation(Figure 7-Box iii). This hypothesis is supported by previous observations of carcinoma cellmigration toward blood vessels and intravasation in mouse mammary tumors [39]. Wepropose that a high proportion of single cells in FNA smears, and their expression ofMenaINV, is likely to reflect the presence of a migratory, and intravasation competent cellpopulation, and therefore an adverse clinical outcome.
Our results show that the presence of MenaINV expressing carcinoma cells in FNA samplesis correlated with the presence of the anatomical structure called TMEM [9, 17]. Aspreviously mentioned, TMEM is defined as the direct contact of a perivascular macrophage,an endothelial cell and Mena expressing tumor cell (Figure 7-Box ii). In recent findings weshow that MenaINV expressing carcinoma cells have dramatically increased intravasation[21]. Thus, it is possible that the expression of MenaINV can provide an advantage to tumorcells in their ability to find macrophages when located in microenvironments with lowconcentrations of EGF due to the increased sensitivity of MenaINV tumor cells to EGF [17].These findings indicate that increased MenaINV expression may affect metastatic potentialof a particular breast tumor by contributing to macrophage-dependent cell motilitythroughout the primary tumor (Figure 7 Box i), and intravasation at TMEM sites (Figure 7-Box ii and iii). Indeed, our findings in PyMT mice indicate that MenaINV promotesmetastatic progression.
We show here that human invasive ductal carcinomas with high MenaINV expression inFNA samples correlate with a high TMEM score. However, expression of Mena11a does notcorrelate with TMEM score and this is consistent with the recent findings that Mena11aexpressing tumor cells have no effect on intravasation or metastasis relative to GFP controlcells [21]. The observations in human tumors also suggest that expression of the Mena11aisoform does not affect the late stages of metastasis. These results support the involvementof the MenaINV isoform in assembly of TMEM, and intravasation in human breastcarcinomas.
We recently reported a case-control study demonstrating that TMEM density is associatedwith increased risk of metastasis of invasive ductal carcinomas of the breast [9]. That studydemonstrated that TMEM count correlates with tumor grade supporting the fact that lowgrade tumors rarely metastasize. We also found a significant difference in TMEM scorebetween low and high tumor grades in our cohort (p= 0.004). In both the previous andcurrent studies, we did not observe any association between TMEM count and ER, PR,HER2/Neu expression or lymph node metastasis. Since about 10-15% of patients developmetastatic disease within 3 years of diagnosis [4, 5] we would expect about 5 cases from ourcohort of 40 to be metastatic within the same time frame. Indeed, only 5 cases from ourcohort (15%) have TMEM values around or above the 90th percentile (107.6) (Table S1 andFigure 5c). Three of those cases also have MenaINV around or above the 90th percentile(5.64).
In summary, our results indicate that carcinoma cells with an elevated MenaINV expressionare discohesive (Figure 5 Box i), while those with elevated Mena11a expression are morecohesive. Our results also suggest that MenaINV expressing cells assemble TMEM, andintravasate at TMEM sites (Figure 5 Box ii and iii). It will be important to determine howepigenetic changes may affect isoform expression and if these changes act through controlof alternative splicing. Studies are underway to investigate the role of alternative splicingmechanisms in control of Mena isoform expression (FG, unpublished). Future studies will
Roussos et al. Page 10
Clin Exp Metastasis. Author manuscript; available in PMC 2012 September 27.
NIH
-PA Author Manuscript
NIH
-PA Author Manuscript
NIH
-PA Author Manuscript
investigate molecular and biochemical mechanisms of action of the MenaINV and Mena11aisoforms, as well as their utility as predictors of breast cancer outcome and as targets fortherapy.
Supplementary MaterialRefer to Web version on PubMed Central for supplementary material.
AcknowledgmentsWe would like to thank Drs. Jeffery Segall, Diane Cox, Antonia Patsialou, and Daqian Sun for stimulatingdiscussion and helpful suggestions. We also thank Drs. Sasis Sirikanjanapong, Jason Moss, and Zhong, as well asresearch associate Mrs. Felicia Juliano for assistance with FNA biopsy procedures, Dr. Jaya Sunkara for assistancewith E-cadherin staining, and Dr. Olena Dorokhova for help with RNA extraction and cDNA synthesis. Manythanks to David Entenberg, and Jenny Tadros for their technical support, Einstein histopathology, AnalyticalImaging Facilities, and Koch Institute for Microscopy, Histology and Flow Cytometry sorting core facilities fortheir services. Grant support provided by CA100324 (SG, YW), CA113395 (MHO, JSC), CA126511 (MHO, JSC),CA150344 (ETR), AECC9526-5267 (MHO, SG), Ludwig Fund postdoctoral fellowship (MB), GM58801 andfunds from the Ludwig center at MIT (FBG), ICBP grant U54 CA112967 (FBG).
List of Abbreviations
EGF epidermal growth factor
EGFP enhanced green fluorescent protein
FACs fluorescence activated cell sorting
FFPE formalin-fixed paraffin-embedded
FNA fine needle aspiration
IHC immunohistochemistry
IF immunofluorescence
IVI intravital imaging
qRT-PCR quantitative real time polymerase chain reaction
SCID severe combined immunodeficiency
TMEM tumor microenvironment for metastasis
APTC average primary tumor cells
References1. Sahai E, et al. Simultaneous imaging of GFP, CFP and collagen in tumors in vivo using multiphoton
microscopy. BMC Biotechnol. 2005; 5:14. [PubMed: 15910685]
2. Condeelis J, Singer RH, Segall JE. The great escape: when cancer cells hijack the genes forchemotaxis and motility. Annu Rev Cell Dev Biol. 2005; 21:695–718. [PubMed: 16212512]
3. Wang W, et al. Identification and testing of a gene expression signature of invasive carcinoma cellswithin primary mammary tumors. Cancer Res. 2004; 64(23):8585–94. [PubMed: 15574765]
4. Heimann R, et al. Separating favorable from unfavorable prognostic markers in breast cancer: therole of E-cadherin. Cancer Res. 2000; 60(2):298–304. [PubMed: 10667580]
5. Weigelt B, Peterse JL, van ’t Veer LJ. Breast cancer metastasis: markers and models. Nat RevCancer. 2005; 5(8):591–602. [PubMed: 16056258]
6. Di Modugno F, et al. Molecular cloning of hMena (ENAH) and its splice variant hMena+11a:epidermal growth factor increases their expression and stimulates hMena+11a phosphorylation inbreast cancer cell lines. Cancer Res. 2007; 67(6):2657–65. [PubMed: 17363586]
Roussos et al. Page 11
Clin Exp Metastasis. Author manuscript; available in PMC 2012 September 27.
NIH
-PA Author Manuscript
NIH
-PA Author Manuscript
NIH
-PA Author Manuscript
7. Gertler F, Condeelis J. Metastasis: tumor cells becoming MENAcing. Trends Cell Biol. 2010
8. Goswami S, et al. Identification of invasion specific splice variants of the cytoskeletal protein Menapresent in mammary tumor cells during invasion in vivo. Clin Exp Metastasis. 2009; 26(2):153–9.[PubMed: 18985426]
9. Robinson BD, et al. Tumor microenvironment of metastasis in human breast carcinoma: a potentialprognostic marker linked to hematogenous dissemination. Clin Cancer Res. 2009; 15(7):2433–41.[PubMed: 19318480]
10. Di Modugno F, et al. The cytoskeleton regulatory protein hMena (ENAH) is overexpressed inhuman benign breast lesions with high risk of transformation and human epidermal growth factorreceptor-2-positive/hormonal receptor-negative tumors. Clin Cancer Res. 2006; 12(5):1470–8.[PubMed: 16533770]
11. Gurzu S, et al. The expression of cytoskeleton regulatory protein Mena in colorectal lesions. Rom JMorphol Embryol. 2008; 49(3):345–9. [PubMed: 18758639]
12. Gurzu S, et al. The immunohistochemical aspects of protein Mena in cervical lesions. Rom JMorphol Embryol. 2009; 50(2):213–6. [PubMed: 19434313]
13. Gertler FB, et al. Mena, a relative of VASP and Drosophila Enabled, is implicated in the control ofmicrofilament dynamics. Cell. 1996; 87(2):227–39. [PubMed: 8861907]
14. Bear JE, et al. Negative regulation of fibroblast motility by Ena/VASP proteins. Cell. 2000; 101(7):717–28. [PubMed: 10892743]
15. Drees F, Gertler FB. Ena/VASP: proteins at the tip of the nervous system. Curr Opin Neurobiol.2008; 18(1):53–9. [PubMed: 18508258]
16. Neel NF, et al. VASP is a CXCR2-interacting protein that regulates CXCR2-mediated polarizationand chemotaxis. J Cell Sci. 2009; 122(Pt 11):1882–94. [PubMed: 19435808]
17. Philippar U, et al. A Mena invasion isoform potentiates EGF-induced carcinoma cell invasion andmetastasis. Dev Cell. 2008; 15(6):813–28. [PubMed: 19081071]
18. Urbanelli L, et al. Characterization of human Enah gene. Biochim Biophys Acta. 2006; 1759(1-2):99–107. [PubMed: 16494957]
19. Welch DR, Neri A, Nicolson GL. Comparison of ‘spontaneous’ and ‘experimental’ metastasisusing rat 13762 mammary adenocarcinoma metastatic cell clones. Invasion Metastasis. 1983; 3(2):65–80. [PubMed: 6677622]
20. Neri A, et al. Development and biologic properties of malignant cell sublines and clones of aspontaneously metastasizing rat mammary adenocarcinoma. J Natl Cancer Inst. 1982; 68(3):507–17. [PubMed: 6950180]
21. Roussos ET, B.M. Alford SK, Wyckoff JB, Gligorijevic B, Wang Y, Pozzuto M, Stobezki R,Goswami S, Segall JE, Lauffenburger DA, Bresnick AR, Gertler FB, Condeelis JS. Mena invasive(MenaINV) promotes multicellular streaming motility and transendothelial migration in a mousemodel of breast cancer. Journal of Cell Science. 2011 In Press.
22. Wyckoff J, et al. A paracrine loop between tumor cells and macrophages is required for tumor cellmigration in mammary tumors. Cancer Res. 2004; 64(19):7022–9. [PubMed: 15466195]
23. Wang W, et al. Single cell behavior in metastatic primary mammary tumors correlated with geneexpression patterns revealed by molecular profiling. Cancer Res. 2002; 62(21):6278–88. [PubMed:12414658]
24. Wyckoff, J., et al. High resolution multi-photon imaging of tumors in vivo, in Live Cell Imaging;A laboratory manual. Goldman, RD.; Swedlow, JR.; S., DL., editors. Cold Spring HarborLaboratory Press; Cold Spring Harbor: 2010. p. 441-462.
25. Zipfel WR, Williams RM, Webb WW. Nonlinear magic: multiphoton microscopy in thebiosciences. Nat Biotechnol. 2003; 21(11):1369–77. [PubMed: 14595365]
26. Gupta PK, Baloch ZW. Intraoperative and on-site cytopathology consultation: utilization,limitations, and value. Semin Diagn Pathol. 2002; 19(4):227–36. [PubMed: 12469790]
27. Mouneimne G, et al. Phospholipase C and cofilin are required for carcinoma cell directionality inresponse to EGF stimulation. J Cell Biol. 2004; 166(5):697–708. [PubMed: 15337778]
28. Loureiro JJ, et al. Critical roles of phosphorylation and actin binding motifs, but not the centralproline-rich region, for Ena/vasodilator-stimulated phosphoprotein (VASP) function during cellmigration. Mol Biol Cell. 2002; 13(7):2533–46. [PubMed: 12134088]
Roussos et al. Page 12
Clin Exp Metastasis. Author manuscript; available in PMC 2012 September 27.
NIH
-PA Author Manuscript
NIH
-PA Author Manuscript
NIH
-PA Author Manuscript
29. Lebrand C, et al. Critical role of Ena/VASP proteins for filopodia formation in neurons and infunction downstream of netrin-1. Neuron. 2004; 42(1):37–49. [PubMed: 15066263]
30. Pino MS, et al. Human Mena+11a isoform serves as a marker of epithelial phenotype andsensitivity to epidermal growth factor receptor inhibition in human pancreatic cancer cell lines.Clin Cancer Res. 2008; 14(15):4943–50. [PubMed: 18676769]
31. Lin EY, et al. Progression to malignancy in the polyoma middle T oncoprotein mouse breastcancer model provides a reliable model for human diseases. Am J Pathol. 2003; 163(5):2113–26.[PubMed: 14578209]
32. Symmans WF, et al. Total RNA yield and microarray gene expression profiles from fine-needleaspiration biopsy and core-needle biopsy samples of breast carcinoma. Cancer. 2003; 97(12):2960–71. [PubMed: 12784330]
33. Di Modugno F, et al. Human Mena protein, a serex-defined antigen overexpressed in breast cancereliciting both humoral and CD8+ T-cell immune response. Int J Cancer. 2004; 109(6):909–18.[PubMed: 15027125]
34. Giampieri S, et al. Localized and reversible TGFbeta signalling switches breast cancer cells fromcohesive to single cell motility. Nat Cell Biol. 2009
35. Zeineldin R, et al. Mesenchymal transformation in epithelial ovarian tumor cells expressingepidermal growth factor receptor variant III. Mol Carcinog. 2006; 45(11):851–60. [PubMed:16788982]
36. Guy CT, Cardiff RD, Muller WJ. Induction of mammary tumors by expression of polyomavirusmiddle T oncogene: a transgenic mouse model for metastatic disease. Mol Cell Biol. 1992; 12(3):954–61. [PubMed: 1312220]
37. Lin EY, et al. Colony-stimulating factor 1 promotes progression of mammary tumors tomalignancy. J Exp Med. 2001; 193(6):727–40. [PubMed: 11257139]
38. Wyckoff JB, et al. A critical step in metastasis: in vivo analysis of intravasation at the primarytumor. Cancer Res. 2000; 60(9):2504–11. [PubMed: 10811132]
39. Wyckoff JB, et al. Direct visualization of macrophage-assisted tumor cell intravasation inmammary tumors. Cancer Res. 2007; 67(6):2649–56. [PubMed: 17363585]
40. Gertler FC, J. Metastasis:making tumor cells MENAcing. Trends Cell Biol. 2010 In press.
41. Wang W, et al. Tumor cells caught in the act of invading: their strategy for enhanced cell motility.Trends Cell Biol. 2005; 15(3):138–45. [PubMed: 15752977]
42. Wang W, et al. Coordinated regulation of pathways for enhanced cell motility and chemotaxis isconserved in rat and mouse mammary tumors. Cancer Res. 2007; 67(8):3505–11. [PubMed:17440055]
Roussos et al. Page 13
Clin Exp Metastasis. Author manuscript; available in PMC 2012 September 27.
NIH
-PA Author Manuscript
NIH
-PA Author Manuscript
NIH
-PA Author Manuscript
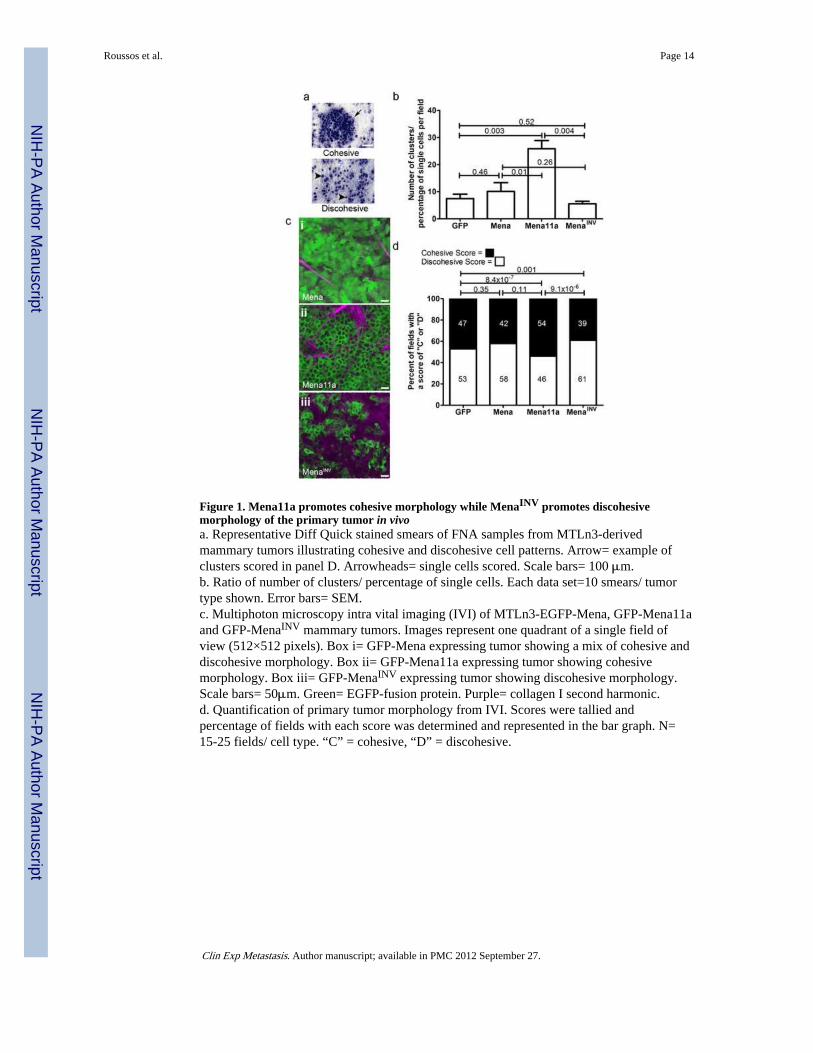
Figure 1. Mena11a promotes cohesive morphology while MenaINV promotes discohesivemorphology of the primary tumor in vivoa. Representative Diff Quick stained smears of FNA samples from MTLn3-derivedmammary tumors illustrating cohesive and discohesive cell patterns. Arrow= example ofclusters scored in panel D. Arrowheads= single cells scored. Scale bars= 100 μm.b. Ratio of number of clusters/ percentage of single cells. Each data set=10 smears/ tumortype shown. Error bars= SEM.c. Multiphoton microscopy intra vital imaging (IVI) of MTLn3-EGFP-Mena, GFP-Mena11aand GFP-MenaINV mammary tumors. Images represent one quadrant of a single field ofview (512×512 pixels). Box i= GFP-Mena expressing tumor showing a mix of cohesive anddiscohesive morphology. Box ii= GFP-Mena11a expressing tumor showing cohesivemorphology. Box iii= GFP-MenaINV expressing tumor showing discohesive morphology.Scale bars= 50μm. Green= EGFP-fusion protein. Purple= collagen I second harmonic.d. Quantification of primary tumor morphology from IVI. Scores were tallied andpercentage of fields with each score was determined and represented in the bar graph. N=15-25 fields/ cell type. “C” = cohesive, “D” = discohesive.
Roussos et al. Page 14
Clin Exp Metastasis. Author manuscript; available in PMC 2012 September 27.
NIH
-PA Author Manuscript
NIH
-PA Author Manuscript
NIH
-PA Author Manuscript
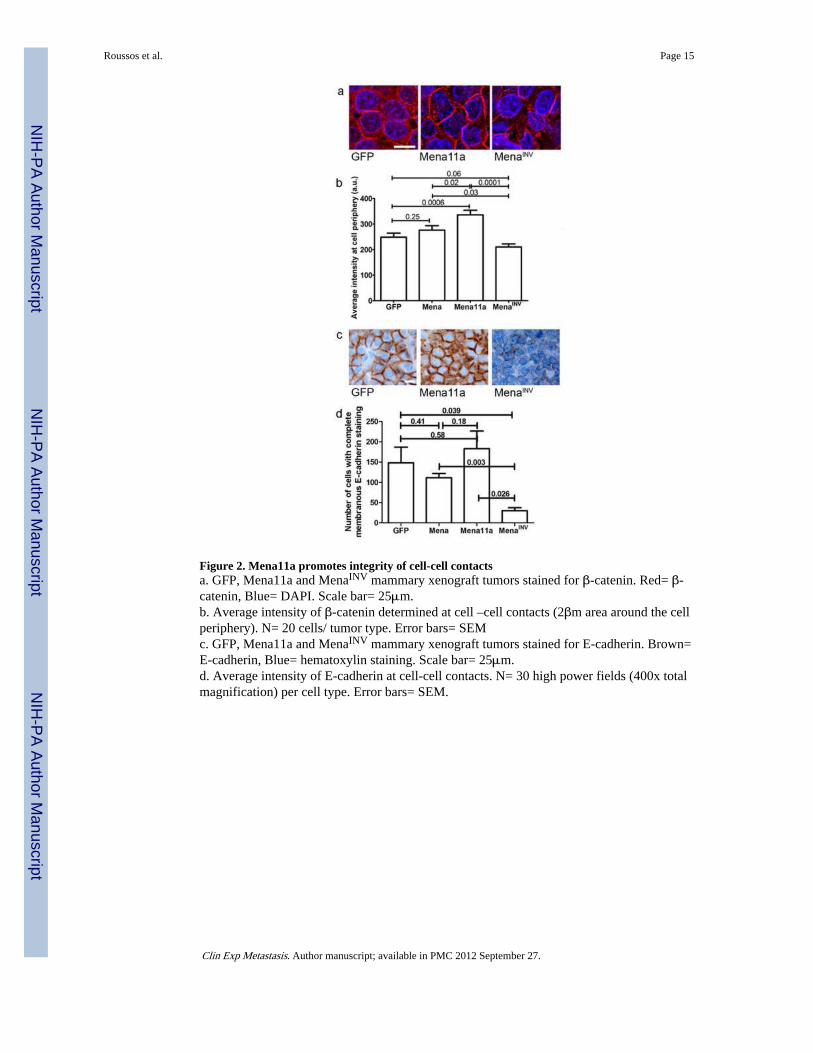
Figure 2. Mena11a promotes integrity of cell-cell contactsa. GFP, Mena11a and MenaINV mammary xenograft tumors stained for β-catenin. Red= β-catenin, Blue= DAPI. Scale bar= 25μm.b. Average intensity of β-catenin determined at cell –cell contacts (2βm area around the cellperiphery). N= 20 cells/ tumor type. Error bars= SEMc. GFP, Mena11a and MenaINV mammary xenograft tumors stained for E-cadherin. Brown=E-cadherin, Blue= hematoxylin staining. Scale bar= 25μm.d. Average intensity of E-cadherin at cell-cell contacts. N= 30 high power fields (400x totalmagnification) per cell type. Error bars= SEM.
Roussos et al. Page 15
Clin Exp Metastasis. Author manuscript; available in PMC 2012 September 27.
NIH
-PA Author Manuscript
NIH
-PA Author Manuscript
NIH
-PA Author Manuscript
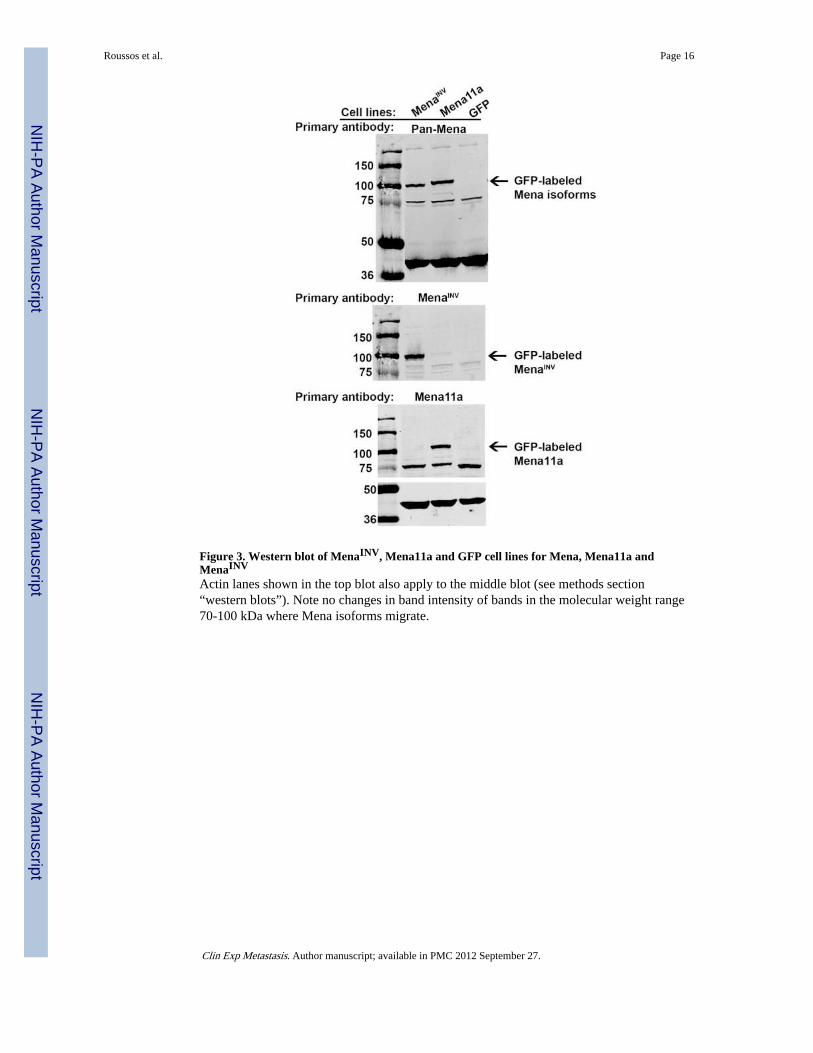
Figure 3. Western blot of MenaINV, Mena11a and GFP cell lines for Mena, Mena11a andMenaINV
Actin lanes shown in the top blot also apply to the middle blot (see methods section“western blots”). Note no changes in band intensity of bands in the molecular weight range70-100 kDa where Mena isoforms migrate.
Roussos et al. Page 16
Clin Exp Metastasis. Author manuscript; available in PMC 2012 September 27.
NIH
-PA Author Manuscript
NIH
-PA Author Manuscript
NIH
-PA Author Manuscript
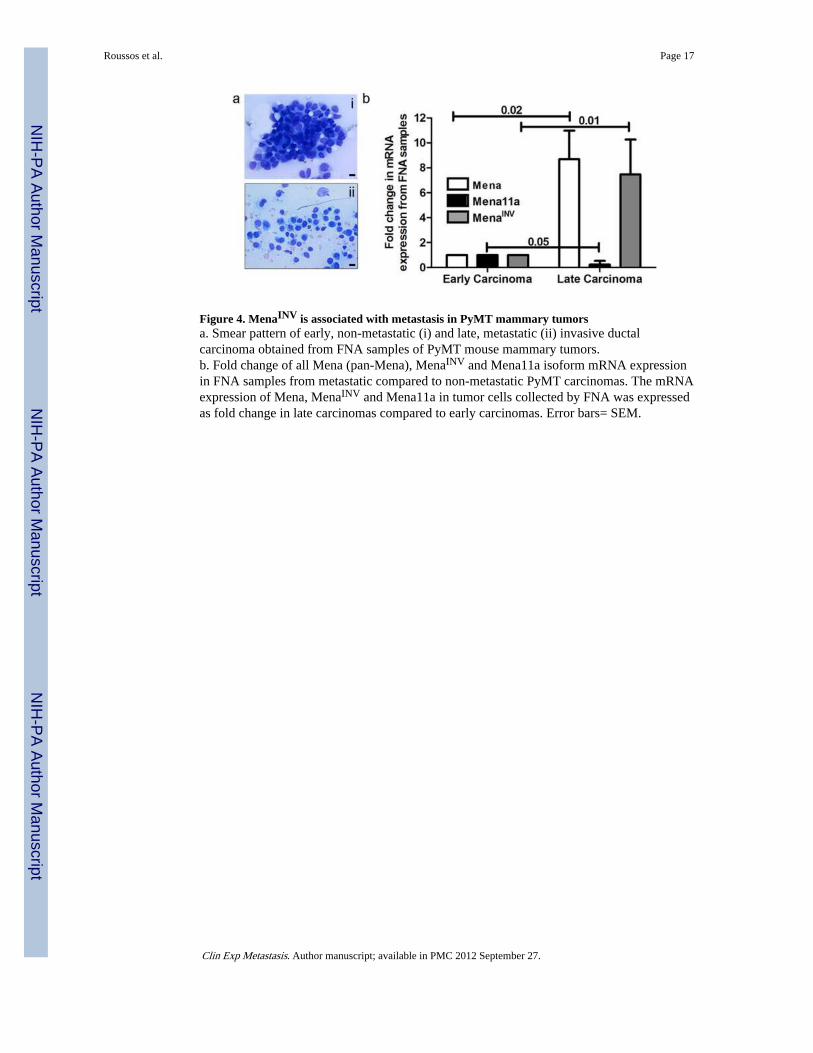
Figure 4. MenaINV is associated with metastasis in PyMT mammary tumorsa. Smear pattern of early, non-metastatic (i) and late, metastatic (ii) invasive ductalcarcinoma obtained from FNA samples of PyMT mouse mammary tumors.b. Fold change of all Mena (pan-Mena), MenaINV and Mena11a isoform mRNA expressionin FNA samples from metastatic compared to non-metastatic PyMT carcinomas. The mRNAexpression of Mena, MenaINV and Mena11a in tumor cells collected by FNA was expressedas fold change in late carcinomas compared to early carcinomas. Error bars= SEM.
Roussos et al. Page 17
Clin Exp Metastasis. Author manuscript; available in PMC 2012 September 27.
NIH
-PA Author Manuscript
NIH
-PA Author Manuscript
NIH
-PA Author Manuscript
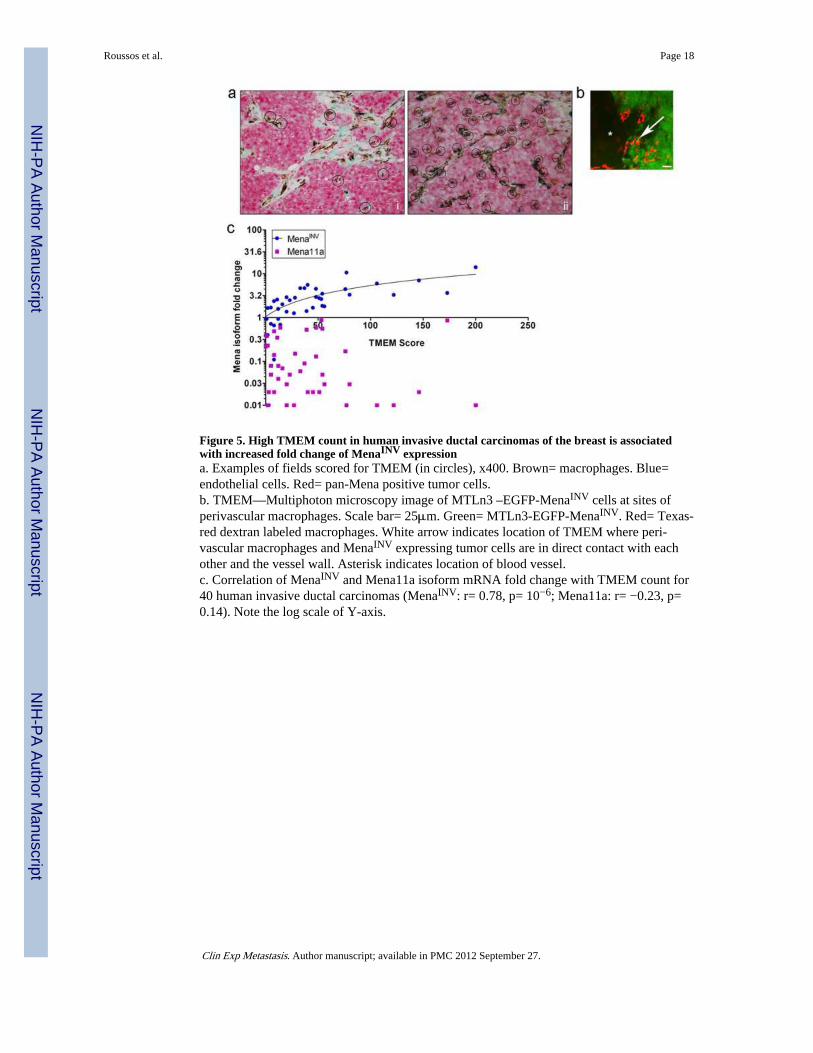
Figure 5. High TMEM count in human invasive ductal carcinomas of the breast is associatedwith increased fold change of MenaINV expressiona. Examples of fields scored for TMEM (in circles), x400. Brown= macrophages. Blue=endothelial cells. Red= pan-Mena positive tumor cells.b. TMEM—Multiphoton microscopy image of MTLn3 –EGFP-MenaINV cells at sites ofperivascular macrophages. Scale bar= 25μm. Green= MTLn3-EGFP-MenaINV. Red= Texas-red dextran labeled macrophages. White arrow indicates location of TMEM where peri-vascular macrophages and MenaINV expressing tumor cells are in direct contact with eachother and the vessel wall. Asterisk indicates location of blood vessel.c. Correlation of MenaINV and Mena11a isoform mRNA fold change with TMEM count for40 human invasive ductal carcinomas (MenaINV: r= 0.78, p= 10−6; Mena11a: r= −0.23, p=0.14). Note the log scale of Y-axis.
Roussos et al. Page 18
Clin Exp Metastasis. Author manuscript; available in PMC 2012 September 27.
NIH
-PA Author Manuscript
NIH
-PA Author Manuscript
NIH
-PA Author Manuscript
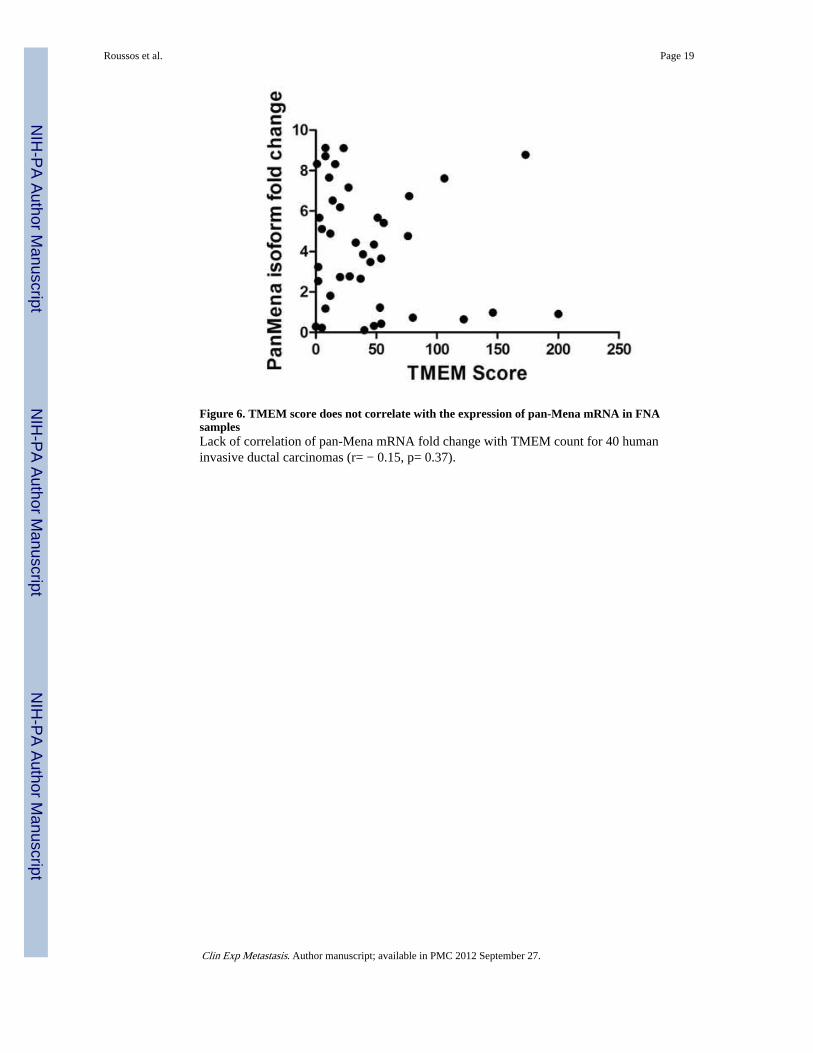
Figure 6. TMEM score does not correlate with the expression of pan-Mena mRNA in FNAsamplesLack of correlation of pan-Mena mRNA fold change with TMEM count for 40 humaninvasive ductal carcinomas (r= − 0.15, p= 0.37).
Roussos et al. Page 19
Clin Exp Metastasis. Author manuscript; available in PMC 2012 September 27.
NIH
-PA Author Manuscript
NIH
-PA Author Manuscript
NIH
-PA Author Manuscript
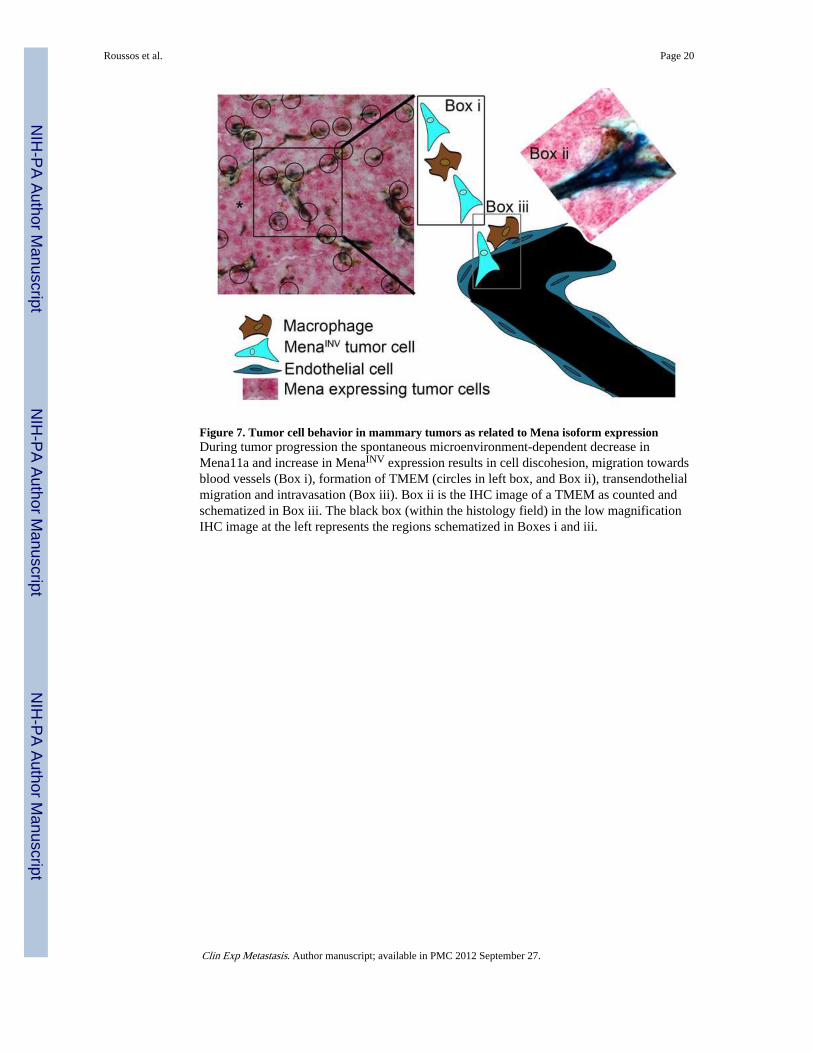
Figure 7. Tumor cell behavior in mammary tumors as related to Mena isoform expressionDuring tumor progression the spontaneous microenvironment-dependent decrease inMena11a and increase in MenaINV expression results in cell discohesion, migration towardsblood vessels (Box i), formation of TMEM (circles in left box, and Box ii), transendothelialmigration and intravasation (Box iii). Box ii is the IHC image of a TMEM as counted andschematized in Box iii. The black box (within the histology field) in the low magnificationIHC image at the left represents the regions schematized in Boxes i and iii.
Roussos et al. Page 20
Clin Exp Metastasis. Author manuscript; available in PMC 2012 September 27.
NIH
-PA Author Manuscript
NIH
-PA Author Manuscript
NIH
-PA Author Manuscript
NIH
-PA Author Manuscript
NIH
-PA Author Manuscript
NIH
-PA Author Manuscript
Roussos et al. Page 21
Table 1Summary of Mena and TMEM values for tumors with different clinico-pathologicalvariables
Median, 5th and 95th percentile of MenaINV, Mena11a mRNA fold change, and TMEM counts for well (BR3-5), moderately (BR 6 & 7) poorly (BR 8 & 9) differentiated invasive ductal carcinomas, tumors < 2cm, > 2< 5 cm, > 5 cm, tumors with positive (+) and negative (−) estrogen (ER), progesterone (PR) and HER2/Neureceptor expression. Median is defined as a value that has exactly 50% of the data above and 50% below it.Likewise, 5th and 95th percentiles represent values that have 5% and 95%of the data below it respectively.
MenaINV Mena 11a TMEM
TumorCharacteristics:
Median(5th, 95th percentile)
Median(5th, 95th percentile)
Median(5th, 95th percentile)
BR 3, 4 & 5N = 6
0.83(0.39, 2.47)
0.06(0.02, 0.20)
8.5(0.5, 26)
BR 6 & 7N = 14
2.38(0.50, 8.11)
0.13(0.01, 0.64)
39(1.7, 118)
BR 8 & 9N = 20
2.91(0.62, 5.65)
0.05(0.01, 0.62)
45(11.1, 175.7)
< 2 cmN = 21
1.93(0.4, 6.0)
0.07(0.01, 0.59)
27(2, 146)
> 2 < 5 cmN = 15
2.49(0.52, 6.49)
0.08(0.01, 0.68)
28(1.7, 76.4)
> 5 cmN = 4
4.19(0.43, 12.81)
0.02(0.01, 0.02)
45.5(8.55, 177.65)
LN +N = 15
2.71(0.08, 11.68)
0.05(0.01, 0.68)
40(2.7, 116)
LN −N = 25
2.01(0.46, 5.74)
0.06(0.01, 0.58)
23(1.2, 141.2)
ER +N = 30
2.75(0.39, 9.01)
0.065(0.01, 0.74)
38(1.45, 160.85)
ER −N = 10
1.77(0.3, 3.83)
0.06(0.01, 0.58)
25(5.3, 52.65)
PR +N = 24
2.75(0.39, 10.1)
0.07(0.01, 0.56)
32.5(1.2, 140)
PR −N = 16
1.77(0.5, 4.92)
0.06(0.01, 0.66)
30(2.75, 134.75)
HER2/Neu +N = 9
2.57(0.96, 4.63)
0.09(0.02, 0.57)
23(9.2, 67.2)
HER2/Neu −N = 31
1.85(0.25, 8.83)
0.05(0.01, 0.73)
28(1.5, 159.5)
Triple NegativeN = 7
1.68(0.21, 4.12)
0.02(0.01, 0.58)
33(6.3, 53.1)
Clin Exp Metastasis. Author manuscript; available in PMC 2012 September 27.