Issues to consider, existing tools and constraints in biofuels sustainability assessments
14
Issues to consider, existing tools and constraints in biofuels sustainability assessments Electo E. Silva Lora a , José C. Escobar Palacio a , Mateus H. Rocha a , Maria L. Grillo Renó a , Osvaldo J. Venturini a, * , Oscar Almazán del Olmo b a NEST e Excellence Group in Thermal Power and Distributed Generation, Federal University of Itajubá, Instituto de Eng. Mecanica e IEM, Av. BPS 1303, CP 50, Itajubá-MG, Brazil b ICIDCA e Instituto Cubano de Investigaciones de los Derivados de la Caña de Azúcar, Via Blanca y Carretera Central 804, San Miguel del Padrón, A.P. 4036, La Habana, Cuba article info Article history: Received 10 November 2009 Received in revised form 3 June 2010 Accepted 9 June 2010 Available online 22 June 2010 Keywords: Biofuels Co-products Stillage Sustainability Indicators Life cycle assessment Integrated environmental assessment abstract Biofuels world production has increased sharply in recent years. Oil reserves depletion, the oil high price and the confidence in biofuels “carbon neutrality” are the main causes of this phenomenon. However, claims related to the negative consequences of biofuel programs are frequent; mainly those related to the biofuels/food competition and sustainability. This paper aims to contribute for the development of a framework for sustainability indicators as a tool for performance assessment. The most used indicators to measure the biofuels sustainability are: Life Cycle Energy Balance (LCEB), quantity of fossil energy substituted per hectare, co-product energy allocation, life cycle carbon balance and changes in soil utilization. On the other hand, existing assessment tools, such as Life Cycle Assessment (LCA) and Integrated Environmental Assessment (IEA), are compared emphasizing their advantages and disad- vantages. Main constraints related to the studied frontiers, as well as the lack of reliable data and their effects are also discussed. Discussions are held on the basis of real life cycle studies carried out by the authors about palm oil biodiesel and different alternatives for the stillage treatment and disposal. Finally, suggestions and recommendations are made to improve existing methodologies for biofuels sustain- ability evaluation, all this from a south perspective. Ó 2010 Elsevier Ltd. All rights reserved. 1. Introduction Liquid biofuels are receiving increasing attention worldwide as a result of the growing concerns about oil supply security and global climate change. In most developing countries, the emerging biofuels industry is perceived as an opportunity to enhance economic growth and create or maintain jobs, particularly in rural areas. The transportation sector is one of the major consumers of fossil fuels and a considerable contributor to environmental pollution, around 23% of GHG (Greenhouse Gases) energy related emissions, which can be reduced by replacing fossil fuels with renewable biofuels. The main biofuels being considered globally are biodiesel and bioethanol for the transport sector. Bioethanol can be produced from a number of crops, including sugarcane, corn (maize), wheat, and sugar beet. Biodiesel is a fuel that can be produced from straight vegetable oils (edible and inedible), recy- cled waste vegetable oils, animal fat and oils from biotechnological sources (yeasts, microalgae, etc.). It is the most widely used biofuel, accounting for more than 96% of the whole worldwide production [1,2]. Fig. 1(a) and (b) below show the historical production of ethanol and biodiesel which are the two main types of biofuel (ethanol and biodiesel) [3]. The main discussion regarding biodiesel is associated with its current environmental, economic and social convenience. Defor- estation, biodiversity extinction, monocropping, soil degradation and water depletion are common claims. Recent researches showed that not all biofuels feedstock’s and technologies have remarkable environmental and social advantages, when compared to fossil fuels [4e8]. These advantages also depend on the local conditions of the geographical region where biofuels production and consumption are implemented [9]. There exist real potential for developing countries to enter into new export markets, to provide local farmers with better oppor- tunities and incomes and to boost national economies via a model of both import substitution (of fossil fuels) and export growth of biofuels. The favourable natural conditions, availability of land, water, and low labour costs, and the fact that sugarcane and palm oil (the most cost-effective and GHG saving crops) grow best in tropical conditions, should provide developing countries in tropical regions with a comparative advantage in growing biofuel feedstock. For Brazil, particularly regarding ethanol export, diesel fuel import reduction and technology transfer are the main incentives for the * Corresponding author. Tel.: þ55 35 36291408; fax: þ55 35 36291355. E-mail address: [email protected] (O. Venturini). Contents lists available at ScienceDirect Energy journal homepage: www.elsevier.com/locate/energy 0360-5442/$ e see front matter Ó 2010 Elsevier Ltd. All rights reserved. doi:10.1016/j.energy.2010.06.012 Energy 36 (2011) 2097e2110
Transcript of Issues to consider, existing tools and constraints in biofuels sustainability assessments
lable at ScienceDirect
Energy 36 (2011) 2097e2110
Contents lists avai
Energy
journal homepage: www.elsevier .com/locate/energy
Issues to consider, existing tools and constraints in biofuelssustainability assessments
Electo E. Silva Lora a, José C. Escobar Palacio a, Mateus H. Rocha a, Maria L. Grillo Renó a,Osvaldo J. Venturini a,*, Oscar Almazán del Olmo b
aNEST e Excellence Group in Thermal Power and Distributed Generation, Federal University of Itajubá, Instituto de Eng. Mecanica e IEM, Av. BPS 1303, CP 50, Itajubá-MG, Brazilb ICIDCA e Instituto Cubano de Investigaciones de los Derivados de la Caña de Azúcar, Via Blanca y Carretera Central 804, San Miguel del Padrón, A.P. 4036, La Habana, Cuba
a r t i c l e i n f o
Article history:Received 10 November 2009Received in revised form3 June 2010Accepted 9 June 2010Available online 22 June 2010
Keywords:BiofuelsCo-productsStillageSustainabilityIndicatorsLife cycle assessmentIntegrated environmental assessment
* Corresponding author. Tel.: þ55 35 36291408; faxE-mail address: [email protected] (O. Venturi
0360-5442/$ e see front matter � 2010 Elsevier Ltd.doi:10.1016/j.energy.2010.06.012
a b s t r a c t
Biofuels world production has increased sharply in recent years. Oil reserves depletion, the oil high priceand the confidence in biofuels “carbon neutrality” are the main causes of this phenomenon. However,claims related to the negative consequences of biofuel programs are frequent; mainly those related to thebiofuels/food competition and sustainability. This paper aims to contribute for the development ofa framework for sustainability indicators as a tool for performance assessment. The most used indicatorsto measure the biofuels sustainability are: Life Cycle Energy Balance (LCEB), quantity of fossil energysubstituted per hectare, co-product energy allocation, life cycle carbon balance and changes in soilutilization. On the other hand, existing assessment tools, such as Life Cycle Assessment (LCA) andIntegrated Environmental Assessment (IEA), are compared emphasizing their advantages and disad-vantages. Main constraints related to the studied frontiers, as well as the lack of reliable data and theireffects are also discussed. Discussions are held on the basis of real life cycle studies carried out by theauthors about palm oil biodiesel and different alternatives for the stillage treatment and disposal. Finally,suggestions and recommendations are made to improve existing methodologies for biofuels sustain-ability evaluation, all this from a south perspective.
� 2010 Elsevier Ltd. All rights reserved.
1. Introduction Fig. 1(a) and (b) below show the historical production of ethanol
Liquid biofuels are receiving increasing attention worldwide asa result of the growing concerns about oil supply security andglobal climate change. In most developing countries, the emergingbiofuels industry is perceived as an opportunity to enhanceeconomic growth and create or maintain jobs, particularly in ruralareas. The transportation sector is one of the major consumers offossil fuels and a considerable contributor to environmentalpollution, around 23% of GHG (Greenhouse Gases) energy relatedemissions, which can be reduced by replacing fossil fuels withrenewable biofuels. Themain biofuels being considered globally arebiodiesel and bioethanol for the transport sector. Bioethanol can beproduced from a number of crops, including sugarcane, corn(maize), wheat, and sugar beet. Biodiesel is a fuel that can beproduced from straight vegetable oils (edible and inedible), recy-cled waste vegetable oils, animal fat and oils from biotechnologicalsources (yeasts, microalgae, etc.). It is the most widely used biofuel,accounting for more than 96% of the whole worldwide production[1,2].
: þ55 35 36291355.ni).
All rights reserved.
and biodiesel which are the two main types of biofuel (ethanol andbiodiesel) [3].
The main discussion regarding biodiesel is associated with itscurrent environmental, economic and social convenience. Defor-estation, biodiversity extinction, monocropping, soil degradationandwater depletion are common claims. Recent researches showedthat not all biofuels feedstock’s and technologies have remarkableenvironmental and social advantages, when compared to fossilfuels [4e8]. These advantages also depend on the local conditionsof the geographical region where biofuels production andconsumption are implemented [9].
There exist real potential for developing countries to enter intonew export markets, to provide local farmers with better oppor-tunities and incomes and to boost national economies via a modelof both import substitution (of fossil fuels) and export growth ofbiofuels. The favourable natural conditions, availability of land,water, and low labour costs, and the fact that sugarcane and palmoil (the most cost-effective and GHG saving crops) grow best intropical conditions, should provide developing countries in tropicalregions with a comparative advantage in growing biofuel feedstock.For Brazil, particularly regarding ethanol export, diesel fuel importreduction and technology transfer are the main incentives for the
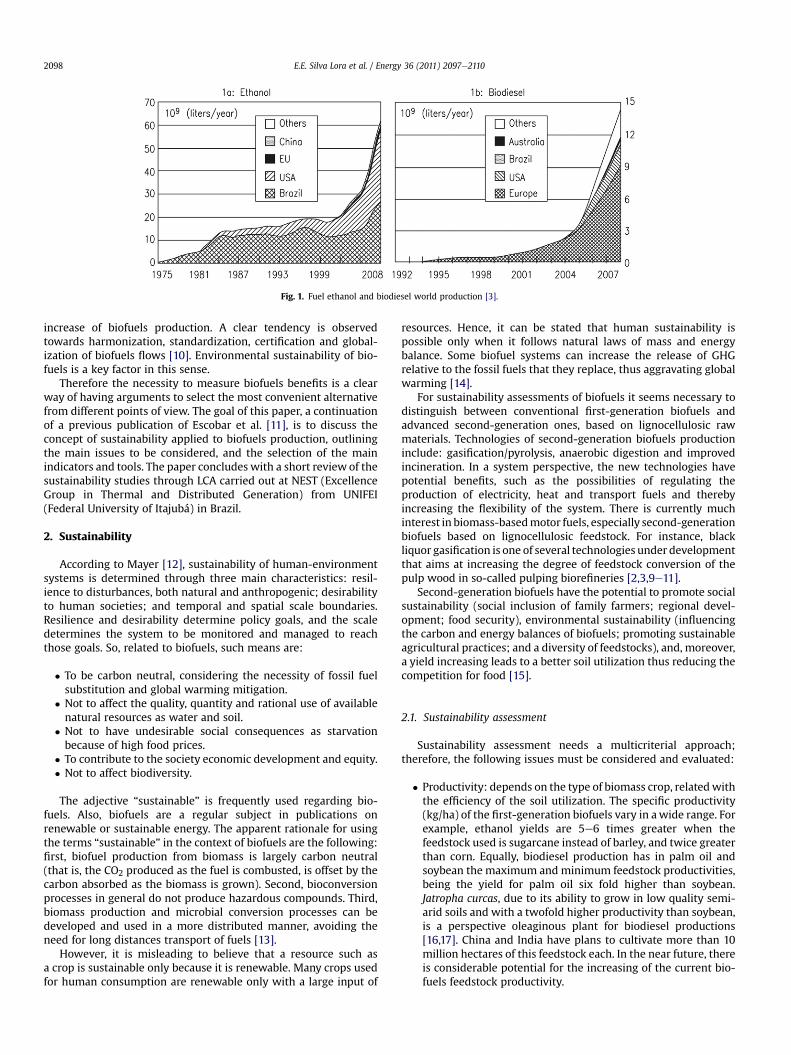
Fig. 1. Fuel ethanol and biodiesel world production [3].
E.E. Silva Lora et al. / Energy 36 (2011) 2097e21102098
increase of biofuels production. A clear tendency is observedtowards harmonization, standardization, certification and global-ization of biofuels flows [10]. Environmental sustainability of bio-fuels is a key factor in this sense.
Therefore the necessity to measure biofuels benefits is a clearway of having arguments to select the most convenient alternativefrom different points of view. The goal of this paper, a continuationof a previous publication of Escobar et al. [11], is to discuss theconcept of sustainability applied to biofuels production, outliningthe main issues to be considered, and the selection of the mainindicators and tools. The paper concludes with a short review of thesustainability studies through LCA carried out at NEST (ExcellenceGroup in Thermal and Distributed Generation) from UNIFEI(Federal University of Itajubá) in Brazil.
2. Sustainability
According to Mayer [12], sustainability of human-environmentsystems is determined through three main characteristics: resil-ience to disturbances, both natural and anthropogenic; desirabilityto human societies; and temporal and spatial scale boundaries.Resilience and desirability determine policy goals, and the scaledetermines the system to be monitored and managed to reachthose goals. So, related to biofuels, such means are:
� To be carbon neutral, considering the necessity of fossil fuelsubstitution and global warming mitigation.
� Not to affect the quality, quantity and rational use of availablenatural resources as water and soil.
� Not to have undesirable social consequences as starvationbecause of high food prices.
� To contribute to the society economic development and equity.� Not to affect biodiversity.
The adjective “sustainable” is frequently used regarding bio-fuels. Also, biofuels are a regular subject in publications onrenewable or sustainable energy. The apparent rationale for usingthe terms “sustainable” in the context of biofuels are the following:first, biofuel production from biomass is largely carbon neutral(that is, the CO2 produced as the fuel is combusted, is offset by thecarbon absorbed as the biomass is grown). Second, bioconversionprocesses in general do not produce hazardous compounds. Third,biomass production and microbial conversion processes can bedeveloped and used in a more distributed manner, avoiding theneed for long distances transport of fuels [13].
However, it is misleading to believe that a resource such asa crop is sustainable only because it is renewable. Many crops usedfor human consumption are renewable only with a large input of
resources. Hence, it can be stated that human sustainability ispossible only when it follows natural laws of mass and energybalance. Some biofuel systems can increase the release of GHGrelative to the fossil fuels that they replace, thus aggravating globalwarming [14].
For sustainability assessments of biofuels it seems necessary todistinguish between conventional first-generation biofuels andadvanced second-generation ones, based on lignocellulosic rawmaterials. Technologies of second-generation biofuels productioninclude: gasification/pyrolysis, anaerobic digestion and improvedincineration. In a system perspective, the new technologies havepotential benefits, such as the possibilities of regulating theproduction of electricity, heat and transport fuels and therebyincreasing the flexibility of the system. There is currently muchinterest in biomass-basedmotor fuels, especially second-generationbiofuels based on lignocellulosic feedstock. For instance, blackliquor gasification is one of several technologies under developmentthat aims at increasing the degree of feedstock conversion of thepulp wood in so-called pulping biorefineries [2,3,9e11].
Second-generation biofuels have the potential to promote socialsustainability (social inclusion of family farmers; regional devel-opment; food security), environmental sustainability (influencingthe carbon and energy balances of biofuels; promoting sustainableagricultural practices; and a diversity of feedstocks), and, moreover,a yield increasing leads to a better soil utilization thus reducing thecompetition for food [15].
2.1. Sustainability assessment
Sustainability assessment needs a multicriterial approach;therefore, the following issues must be considered and evaluated:
� Productivity: depends on the type of biomass crop, relatedwiththe efficiency of the soil utilization. The specific productivity(kg/ha) of the first-generation biofuels vary in awide range. Forexample, ethanol yields are 5e6 times greater when thefeedstock used is sugarcane instead of barley, and twice greaterthan corn. Equally, biodiesel production has in palm oil andsoybean the maximum and minimum feedstock productivities,being the yield for palm oil six fold higher than soybean.Jatropha curcas, due to its ability to grow in low quality semi-arid soils and with a twofold higher productivity than soybean,is a perspective oleaginous plant for biodiesel productions[16,17]. China and India have plans to cultivate more than 10million hectares of this feedstock each. In the near future, thereis considerable potential for the increasing of the current bio-fuels feedstock productivity.
E.E. Silva Lora et al. / Energy 36 (2011) 2097e2110 2099
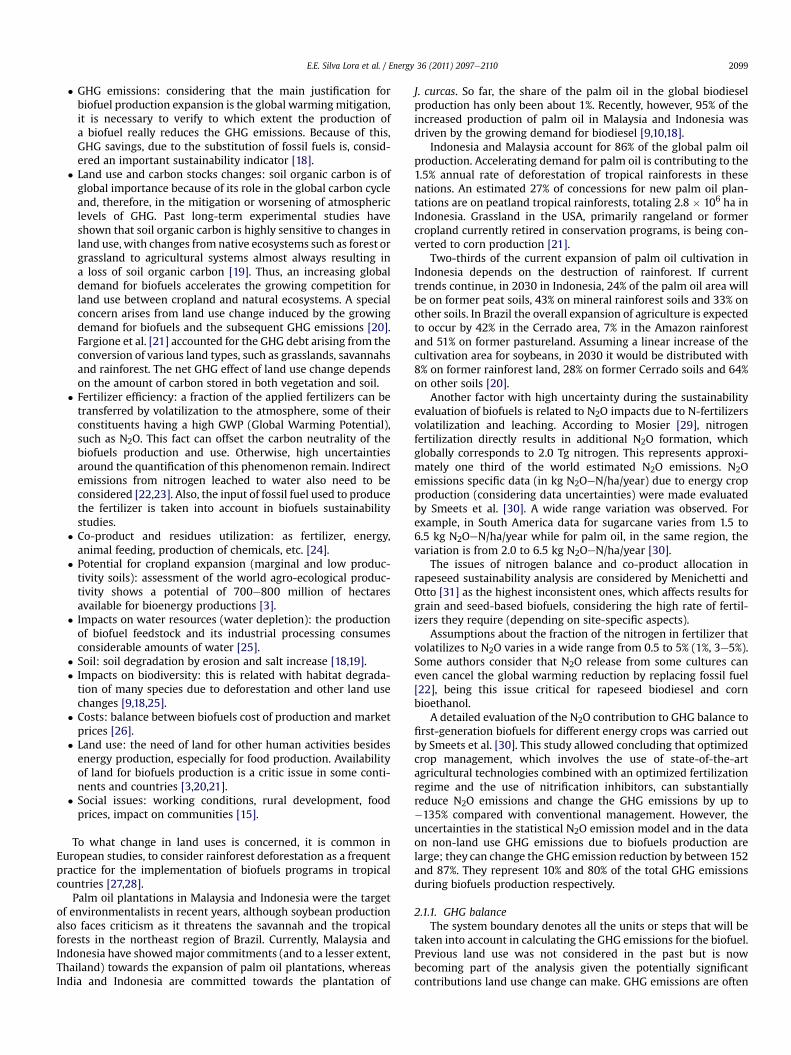
� GHG emissions: considering that the main justification forbiofuel production expansion is the global warmingmitigation,it is necessary to verify to which extent the production ofa biofuel really reduces the GHG emissions. Because of this,GHG savings, due to the substitution of fossil fuels is, consid-ered an important sustainability indicator [18].
� Land use and carbon stocks changes: soil organic carbon is ofglobal importance because of its role in the global carbon cycleand, therefore, in the mitigation or worsening of atmosphericlevels of GHG. Past long-term experimental studies haveshown that soil organic carbon is highly sensitive to changes inland use, with changes from native ecosystems such as forest orgrassland to agricultural systems almost always resulting ina loss of soil organic carbon [19]. Thus, an increasing globaldemand for biofuels accelerates the growing competition forland use between cropland and natural ecosystems. A specialconcern arises from land use change induced by the growingdemand for biofuels and the subsequent GHG emissions [20].Fargione et al. [21] accounted for the GHG debt arising from theconversion of various land types, such as grasslands, savannahsand rainforest. The net GHG effect of land use change dependson the amount of carbon stored in both vegetation and soil.
� Fertilizer efficiency: a fraction of the applied fertilizers can betransferred by volatilization to the atmosphere, some of theirconstituents having a high GWP (Global Warming Potential),such as N2O. This fact can offset the carbon neutrality of thebiofuels production and use. Otherwise, high uncertaintiesaround the quantification of this phenomenon remain. Indirectemissions from nitrogen leached to water also need to beconsidered [22,23]. Also, the input of fossil fuel used to producethe fertilizer is taken into account in biofuels sustainabilitystudies.
� Co-product and residues utilization: as fertilizer, energy,animal feeding, production of chemicals, etc. [24].
� Potential for cropland expansion (marginal and low produc-tivity soils): assessment of the world agro-ecological produc-tivity shows a potential of 700e800 million of hectaresavailable for bioenergy productions [3].
� Impacts on water resources (water depletion): the productionof biofuel feedstock and its industrial processing consumesconsiderable amounts of water [25].
� Soil: soil degradation by erosion and salt increase [18,19].� Impacts on biodiversity: this is related with habitat degrada-tion of many species due to deforestation and other land usechanges [9,18,25].
� Costs: balance between biofuels cost of production and marketprices [26].
� Land use: the need of land for other human activities besidesenergy production, especially for food production. Availabilityof land for biofuels production is a critic issue in some conti-nents and countries [3,20,21].
� Social issues: working conditions, rural development, foodprices, impact on communities [15].
To what change in land uses is concerned, it is common inEuropean studies, to consider rainforest deforestation as a frequentpractice for the implementation of biofuels programs in tropicalcountries [27,28].
Palm oil plantations in Malaysia and Indonesia were the targetof environmentalists in recent years, although soybean productionalso faces criticism as it threatens the savannah and the tropicalforests in the northeast region of Brazil. Currently, Malaysia andIndonesia have showedmajor commitments (and to a lesser extent,Thailand) towards the expansion of palm oil plantations, whereasIndia and Indonesia are committed towards the plantation of
J. curcas. So far, the share of the palm oil in the global biodieselproduction has only been about 1%. Recently, however, 95% of theincreased production of palm oil in Malaysia and Indonesia wasdriven by the growing demand for biodiesel [9,10,18].
Indonesia and Malaysia account for 86% of the global palm oilproduction. Accelerating demand for palm oil is contributing to the1.5% annual rate of deforestation of tropical rainforests in thesenations. An estimated 27% of concessions for new palm oil plan-tations are on peatland tropical rainforests, totaling 2.8 � 106 ha inIndonesia. Grassland in the USA, primarily rangeland or formercropland currently retired in conservation programs, is being con-verted to corn production [21].
Two-thirds of the current expansion of palm oil cultivation inIndonesia depends on the destruction of rainforest. If currenttrends continue, in 2030 in Indonesia, 24% of the palm oil area willbe on former peat soils, 43% on mineral rainforest soils and 33% onother soils. In Brazil the overall expansion of agriculture is expectedto occur by 42% in the Cerrado area, 7% in the Amazon rainforestand 51% on former pastureland. Assuming a linear increase of thecultivation area for soybeans, in 2030 it would be distributed with8% on former rainforest land, 28% on former Cerrado soils and 64%on other soils [20].
Another factor with high uncertainty during the sustainabilityevaluation of biofuels is related to N2O impacts due to N-fertilizersvolatilization and leaching. According to Mosier [29], nitrogenfertilization directly results in additional N2O formation, whichglobally corresponds to 2.0 Tg nitrogen. This represents approxi-mately one third of the world estimated N2O emissions. N2Oemissions specific data (in kg N2OeN/ha/year) due to energy cropproduction (considering data uncertainties) were made evaluatedby Smeets et al. [30]. A wide range variation was observed. Forexample, in South America data for sugarcane varies from 1.5 to6.5 kg N2OeN/ha/year while for palm oil, in the same region, thevariation is from 2.0 to 6.5 kg N2OeN/ha/year [30].
The issues of nitrogen balance and co-product allocation inrapeseed sustainability analysis are considered by Menichetti andOtto [31] as the highest inconsistent ones, which affects results forgrain and seed-based biofuels, considering the high rate of fertil-izers they require (depending on site-specific aspects).
Assumptions about the fraction of the nitrogen in fertilizer thatvolatilizes to N2O varies in a wide range from 0.5 to 5% (1%, 3e5%).Some authors consider that N2O release from some cultures caneven cancel the global warming reduction by replacing fossil fuel[22], being this issue critical for rapeseed biodiesel and cornbioethanol.
A detailed evaluation of the N2O contribution to GHG balance tofirst-generation biofuels for different energy crops was carried outby Smeets et al. [30]. This study allowed concluding that optimizedcrop management, which involves the use of state-of-the-artagricultural technologies combined with an optimized fertilizationregime and the use of nitrification inhibitors, can substantiallyreduce N2O emissions and change the GHG emissions by up to�135% compared with conventional management. However, theuncertainties in the statistical N2O emission model and in the dataon non-land use GHG emissions due to biofuels production arelarge; they can change the GHG emission reduction by between 152and 87%. They represent 10% and 80% of the total GHG emissionsduring biofuels production respectively.
2.1.1. GHG balanceThe system boundary denotes all the units or steps that will be
taken into account in calculating the GHG emissions for the biofuel.Previous land use was not considered in the past but is nowbecoming part of the analysis given the potentially significantcontributions land use change can make. GHG emissions are often
E.E. Silva Lora et al. / Energy 36 (2011) 2097e21102100
reported in two distinct phases, the (WTT) well-to-tankphase includes resource extraction, feedstock production, fuelproduction, refining, blending, transportation and distribution,and the tank-to-wheels (TTW) phase includes refueling,consumption and evaporation. The complete fuel cycle analysis isalso referred to as a well-to-wheels (WTW) analysis. WTW anal-yses are not full life cycle assessments, even if land use change isadded [2,18,25e27,30,31].
GHG emissions associated with changing from one land use typeto another can be considerable and sometimes sufficient to negatetheGHGbenefits of biofuel. Somestudieshave attempted toquantifythese emissions to calculate emission factors thatwould be added tothe fuel-chain emissions. The key variables in the calculations areoften highly uncertain and can lead to substantially different resultsdepending on the scale of assessment. The time period over whichemissions from change of land use is accounted is also important.Allocating total emissions over a shorter period produces highervalues than if they are distributed over a longer time frame [32].
Hill et al. [26] concluded that biofuels would provide greaterbenefits if their biomass feedstock is produced with modest agri-cultural inputs on lands with low agricultural value and with low-input energy for its conversion to biofuel. This is a complex task tobe accomplished, as it requires the optimization of the relationbetween inputs and yields.
The “carbon neutrality” principle has been stated that no CO2 isreleased during combustion of biofuel, since the same CO2 amounthas been absorbed by the crop during its growth. Indeed, the CO2
balance is considered null since there is no land use change for thecultivation of biomass dedicated to first-generation biofuelsproduction [33]. However, the “carbon neutrality” is really partialand the main reasons are: agriculture GHG emissions (machineryusage and soil disturbances), N2O emissions bynitrogen fertilizationand its volatilization, fossil energy consumptions in conversionprocesses, transportation of feedstock, intermediate products andbiofuel itself, indirect GHG emissions due to changes in the prece-dent ecosystems (deforestation, grassland conversion, etc.) releaselarge volumes of carbon belowand above the surface [18e22,30]. Infact the main sustainable goal to be achieved should be a “favorablecarbon balance” and not only the “carbon neutrality”.
GHG savings in biofuels life cycle have been considered as themain indicators for certification procedures. GHG savings ofdifferent biofuels varies in a wide range, depending on the type offeedstock, agro-technologies, conversion technologies and energyefficiency. Ethanol from sugarcane is one of the most effectivebiofuels in this sense, with more than 80% of GHG savings [34].
Sustainability criteria evaluated to be used as the base for bio-fuels environmental certification include: no conversion of highcarbon density land and high nature value land; no activities withinprimary forests and secondary forests with high biodiversity; nochild labor; no forced labor; a proven minimum amount of GHGsavings (proven by default values), gradual increases possible;further aspects, e.g., “soil erosion” issues that are important withinsingle countries should be added [35].
According to Fargione et al. [21] deforestation of tropical rain-forest for biofuel production in Indonesia/Malaysia (palm biodiesel)and of tropical grassland in Brazil (sugarcane ethanol) leads toa carbon debt of 702 and 165 Mg CO2/ha, respectively. These debtscorrespond to 86 and 17 years of repay period through biodieseland ethanol GHG savings. For a high percentage of first-generationbiofuels, the GHG savings will be noticed only after 2030, beingdeforestation and threats to biodiversity their main negativeimpacts. Based on these statements, a fast moving to second-generation fuels is recommended [3].
Another important issue is the GHG consequences of indirectland use [36]. A shift of land use prior to biofuel production to
another area where the land change occurs to maintain theprevious level of production leads to indirect deforestation. It isa complex issue to be solved while trying to account for GHGemissions related to land use changes.
As remarked by Peña [37] developing countries are currentlyconverting native ecosystems to agriculture whereas developedcountries underwent this process some time ago. In the northernhemisphere, only about 20% of land remains in forests, whereasalmost 40% of land in the southern hemisphere is still forested. Asa consequence, the USA and Europe are significantly more likely,than developing countries, to produce biomass for energy on landthat has already been converted.
The USEPA (United States Environmental Protection Agency)launched for discussion a document entitled “Regulation of fuelsand fuels additives: changes to renewable fuel standards” [38]. Thisdocument, for the first time in a regulatory program, suggests theuse of life cycle GHG savings to qualify fuels for different renewablefuel standards. The minimum proposed threshold in life cycle GHGsavings is 20% for any renewable fuel produced in new facilities,50% in order to be classified as biomass-based diesel or advancedbiofuel, and 60% in order to be classified as cellulosic biofuel.
The EU (European Union) decided on a variety of climate targetsin 2007/08. Besides the two targets that are the focus of the EUtransition scenarios analyzed in the Energy Modeling Forum (EMF-22) e a reduction of at least 20% (relative to 1990) in emissions ofGHG by 2020 and a 20% share of renewable energies in the EU’senergy consumption by 2020 e the so-called climate-energypackage ultimately adopted by the Council in April 2009 addi-tionally contains a 10% minimum target for the market share ofrenewable transportation fuels by 2020 [39].
According to Righelato and Spracklen [40], alternative optionsfor GHG savings such as forest recovery by reforestation could beseveral times more effective than biofuels production for transport.The carbon sequestered by reforestation is greater than the emis-sions avoided by the use of the liquid biofuels.
2.1.2. Other impactsAn LCA study for Brazilian ethanol concluded that in terms of
Abiotic Depletion Potential (ADP), GWP, Ozone Layer DepletionPotential (ODP) and POP (Photochemical Oxidation Potential)ethanol fuels are better options than gasoline, while gasoline isa better fuel where Human Toxicity Potential (HTP), EcotoxicityPotential (ECP), Acidification Potential (ACP) and EutrophicationPotential (ETP) are concerned [41]. The future case is promoted dueto the use of bagasse to enhance the production efficiency ofethanol. The overall evaluation of these fuel options depends on theimportance attached to different impacts. According to Luo et al.[41] the results of Life Cycle Costing (LCC) indicate that driving withethanol fuels is more economical than gasoline, and the future caseis economically more attractive than the base case, which has beenthe driving force for the promotion of advanced technologiesconverting bagasse to ethanol.
2.1.3. Co-products and by-products allocationResidual biomasses, such as industrial and agro-industrial
wastes and residues, animalmanures, and source separated organicwastes represent the spatially diffused sources of the by-products.Every agro-industrial system produces a wide variety of organicfeedstock, such as lignocellulosic materials, crop residues, vege-table oils, animal fats, etc. [42].
The production of bioethanol and biodiesel provides a relativelylarge amount of co-products and wastes, such as corn oil, corngluten meal, corn gluten feed, soybean meal, and glycerin. Glycerinis a co-product of the biodiesel production, which is expected togrow steadily in the future. With the increase in the biodiesel

E.E. Silva Lora et al. / Energy 36 (2011) 2097e2110 2101
production, it is presumed that there would be a surplus of glycerinin the world market. Furthermore, the economics of biodieselmight also be influenced by the way glycerin co-product is used. Inthe ethanol production non-energy co-products are made from thefiber contained in bagasse and the organic components of molassesand filter cake. Molasses and filter cake are used for animal feedsand fertilizers. Bagasse is the fibrous outer residue of the cane plant,and can be used to make particleboard and newsprint. Energy co-products include surplus electricity generated using bagasse andcane trash, and methane gas from the wastewater or stillage(vinasse) of ethanol production [42].
All the first-generation biofuels production life cycle has consid-erable amounts of agricultural or industrial by-products and co-products, some of themwith a high polluting potential. They can beconsidered (allocated) during LCA in different ways: regarding theirenergetic, economic or agricultural possible uses. Sometimes thisallocation is not simple, as a co-product can have multiple uses thatexclude one another, or can even lead to different GHG savings [43].Table 1 shows examples of different allocations forms for commonfirst-generation biofuels. Considering the option for ethanol stillageincineration, asanallocationexample, it isnecessary todetermine theGHG savings related to the additional available power. It is alsonecessary to compute GHG emissions increase due to the non utili-zation of stillage as fertilizer and its substitution by a mineral one.Ashes from incineration are also regarded as fertilizers.
3. Methodology
3.1. Tools
A commonly used tool for sustainability studies is LCA, whichincludes evaluation of inputs, products and impacts in all stages ofthe product life cycle. There has been a substantial development of
Table 1Sugarcane ethanol and palm oil biodiesel, co-product allocation forms and remarks.
Biofuels Co-product Alternative use
Sugarcaneethanol
Trash Generation of surplus elect
Bagasse e Cogeneratione Raw material for cellulo
Stillage e Fertilizer, mainly potass(fertirrigation).
e Energy (biodigestion ande Fertilizer (compost).
Yeast e Animal feed (protein com
Palm oilbiodiesel
EFB (Empty Fruit Brunches) e Organic Fertilizer.e Cogeneration.
Shells e Cogeneration.
Fibers e Cogeneration.
POME (Palm Oil Mill Effluent) e Energy by biodigestion
Glycerin e Biodigestion.e Raw materials for differe
life cycle methodologies to assess the energetic and environmentalperformance of product systems from cradle-to-grave. TheISO (International Standard Organization), a worldwide federationof national standards bodies, has standardized this frameworkwithin the ISO 14040 series on LCA, which provide the principles,framework, requirements and guidelines for conducting anLCA study [45].
A graphical simplified representation of the main inputs andoutputs considered during LCA of biofuels is shown in Fig. 2. Anextensive review of LCA studies related to biofuels showed that thenumber of these studies, although increasing, is still relatively smalland most of them take into account European or USA conditions,and first-generation technologies [31]. Therefore, specific studiesare necessary for other countries or regions.
One has to bear in mind, that the LCA methodology, as it stands,cannot capture all the relevant impacts. Land and water use andissues related to indirect land use changes and the competition forfood products do not fit well into the LCA-framework but requirea broader approach [41].
Gallagher [47] recommends the replacement of volume orenergy based targets with comparable GHG saving targets, as soonas practicable to incentivize the supply of fuels with a lower carbonintensity. However, current GHG LCA fails to take account of eitherindirect land change or avoided land use from co-products. Failingto include these factors may create perverse incentives which leadto higher GHG emissions by encouraging feedstocks that lead tohigher net land use. These factors need to be better understoodbefore the basis on which targets are calculated is changed.
A broader approach such as the IEA is required. The terms IEAand Integrated Environmental Assessment Modeling (IEAM) seemto originate in scientific and public policy efforts to understand andcontrol acid deposition in the 19700s in Europe and North America.As policy interest has started to increase in themid-1980s, the need
Remarks
ricity. e GHG savings.e Necessary for soil moisture conservation
and organic matter recycling.
sic ethanol.e GHG savings.e Advanced cogeneration systems implementation.
ium
incineration).
e 11e13 L of stillage per liter of ethanol.Potential reduction through processmodifications and thermal integration.
e No data about soil saturation andunderground water pollution.
e No data about stillage nutrient volatilizationand impact to air pollution.
e Stillage can supply 90% of the potassium, 40% ofnitrogen and 50% of phosphor cane requirements [44].
e Increase of fertilizer use when stillageincineration is implemented.
plement) e Need drying (opportunity for biogas).e Allows the intensification of animal farming.e Improve soil utilization (less area needed for
animal farming).e Usually used as organic fertilizer.e GHG savings when used for cogeneration.e No cogeneration tradition for surplus electricity
in the palm oil sector.e GHG savings.e No cogeneration tradition for surplus electricity
in the palm oil sector.e GHG savings.e Possibility of biogas energy utilization in
engines and microturbines.
nt products.e Presently an unsolved problem.

Fig. 2. Simplified scheme of the main inputs and outputs considered during biofuels LCA [46].
E.E. Silva Lora et al. / Energy 36 (2011) 2097e21102102
for integrating relevant information into rigorous and consistentframeworks became clear. The international response to this needwas the establishment of the Intergovernmental Panel on ClimateChange (IPCC). Another reaction included a whole array of IEAM’sthat try to capture the numerous aspects of global warming bycombining the best available information from relevant disciplines.There are a number of roles for integrated assessment that can besynchronized with similar processes of integrated management:initial monitoring (environmental processes and determiningdriving forces); risk assessment (type, causes and implications);response assessment (ranking options); goal and strategy formu-lation (objectives and strategies needed); implementation (executestrategies); evaluation (assess performance); post-monitoring(effects of policies, actor compliance). The main achievements inthe field of IEA by looking at four areas: modeling; participatoryassessments; a mega-assessment conducted by the IPCC; andorganization and community issues [48,49].
IEA is an important concept in the realm of sustainability andenvironmental sciences. This concept uses a perspective system toanalyze similar environmental and sustainability issues. MaterialFlow Analysis (MFA) and Substance Flow Analysis (SFA) are used toanalyze the flows of materials or specific substances in society andtheir interconnections. The resolution of IEA tools is high in terms ofmaterial flows in society and their interconnections, for examplelinked to product life cycles, and in how thesematerialflows result inemissions. In the environment, on the other hand, the resolution islow: environmental impacts are modeled roughly or not at all like inMFA and SFA, or in terms of potential impacts with low spatial reso-lution like in LCA. The result of most LCA’s is only valid if the differ-ences that are described are marginal from a macro-economic pointof view.MFA’s and SFA’s describe alsonon-marginal changes but theyare not systematically linked to socio-economic developments [50].
IEA takes into account environmental requirements for bothglobal and local sustainable developments and has two compo-nents: the Global Integrated Environmental Assessment (GIEA) andthe Local Integrated Environmental Assessment (LIEA). GIEA’s areto take into account all steps, from the sun and the underground,up to final human needs. They have three stages: I, II and III.The stage I is characterized by the conversion of solar energy byphotosynthesis which is a unique and common feature of allecosystems and therefore of all rural areas. It ends up with
phytomass (or vegetable biomass) which can be harvested by menor animals. The stage II is characterized by all conversions, ofphytomass and non-renewable products, into various products byanimals and/or by various industries. It includes recycling ofmaterials and products, and ends up with products and wastedisposal. These assessments at stage II can be made by essentiallyusing classical LCA. The stage III does not consider products butservices: nutrition, housing, mobility, health, education etc. Productfrom stage II may be arranged in different ways to meet mainly thebasic needs per capita, e.g. calories and proteins in the diet, homeheating systems, energy for mobility, etc. [51].
3.2. Indicators
According to Mayer [12], an indicator “is a variable whichdescribes one characteristic of the state of a system, usuallythrough observed or estimated data”. In the case of sustainabilityevaluation, different data can be used to calculate performanceindicators of biofuels life cycles in relation with the issues, orsustainability criteria, listed below. The most commonly usedsustainability indicators are:
� Economic indicators (cost of production) [3,18,19,26].� Output/Input relation (net energy analysis) [9e11,18,19,25e28].� Substituted fossil fuel per hectare [11,18,19,25,36].� Avoided GHG emissions (CO2 savings) [25e28,32,36,43].� Environmental Impacts evaluation using impact categoriesindicators [18,25,27,28,41,43].
� Carbon emissions due to land use changes [9e11,18e20,25e28].
� Renewability indicators (exergy or emergy accounting) [28,31].
4. Results and discussion
4.1. Biofuels sustainability in Brazil
Throughout the last years some studies about the evaluation ofthe sustainability of biofuels programs have been conducted inBrazil [34,52e54]. It was a natural response of the Brazilianacademic and industrial sector to the criticisms to biofuel envi-ronmental, economic and social performance as a whole, not
E.E. Silva Lora et al. / Energy 36 (2011) 2097e2110 2103
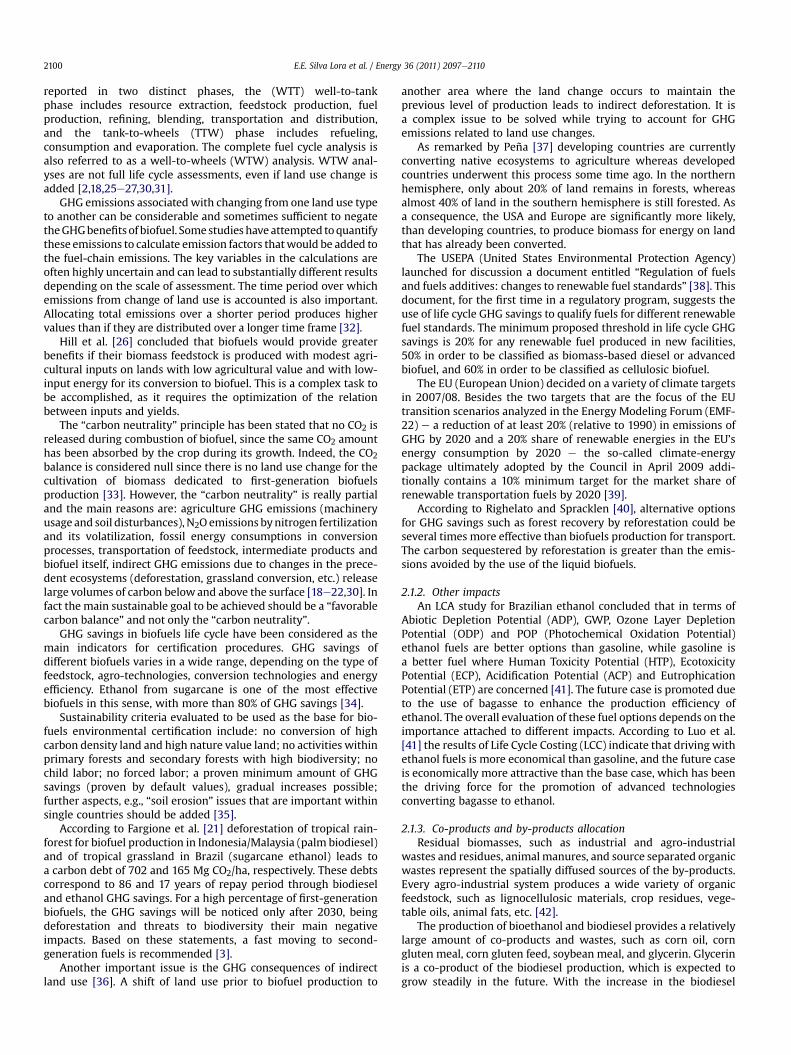
distinguishing different approaches, feedstock and technologies. Asa general conception, it is a worldwide acceptance that the sugar-cane ethanol production in Brazil is an example of how to imple-ment a sustainable biofuel program. However it is not exemptedfrom negative aspects and constraints. Table 2 shows a condensedview of the main findings.
Most studies have found that producing first-generation bio-fuels from current feedstocks results in emission reductions inthe range of 20e60% relative to fossil fuels, provided the mostefficient systems are used and carbon releases deriving from landuse change are excluded. Brazil, which has long experience ofproducing ethanol from sugarcane, shows even greater reduc-tions. Differences in recent results are due to co-productallocation methods, N2O emissions and land use changesconsiderations [56].
4.2. NEST/UNIFEI sustainability studies
Since 2004 NEST/UNIFEI has been carrying out different biofuelsrelated LCA studies. As a support to this study, intensive researcheswere carried out in the fields of techno-economical evaluation ofdifferent routes for biofuel production, process integration indistilleries, cogeneration in the sugar and alcohol industry [57], inthe palm oil industry [58,59], biogas potential utilization for elec-tricity generation [60] and regarding biomass gasification [61]. Thehypothesis, conclusions and difficulties encountered in these LCAstudies are discussed below.
4.2.1. Palm oil biodiesel LCAThe objective of this researchwas to carry out an LCA to evaluate
the impact of a biomass-based cogeneration system [62]. Besides,
Table 2Positive factors and constraints of typical Brazilian biofuels [34,52e55].
Biofuel Positive factors
Sugarcane ethanol e GHG savings more than 80%.e No direct impact on deforestation.e 1% of the whole agricultural land su
50% of the country oil consumptione Cogeneration potential in the sugar
industry in 2020/2021 (14 GW).e Output/input index: 9.3.e Ethanol yields: 6000 l/ha.e Stillage use as fertilizer.e Biological control of plagues.e Water consumption reduction mea
in the industry.e Lower biofuel production cost in
the world (US$ 0.37/l)e Potential for productivity increase
up to 10 400 l/ha.e Job creation.e Improvement of the air quality
in big cities.e Sugarcane is a conservative culture
to soil protection and moisture losse Implementation of agro-ecological
for decision making.Biodiesel from soybean oil e Production capacity 60 000 ton/yea
e Output/input index: 1.5e3.2e Reduction of air pollution in large c
to fossil diesel substitution.e Reductions of expenditures with di
Biodiesel from Castor oil e Family crop.e Output/input index: 2.0e2.9e Reduction of air pollution in large c
to fossil diesel substitution.e Reductions of expenditures with di
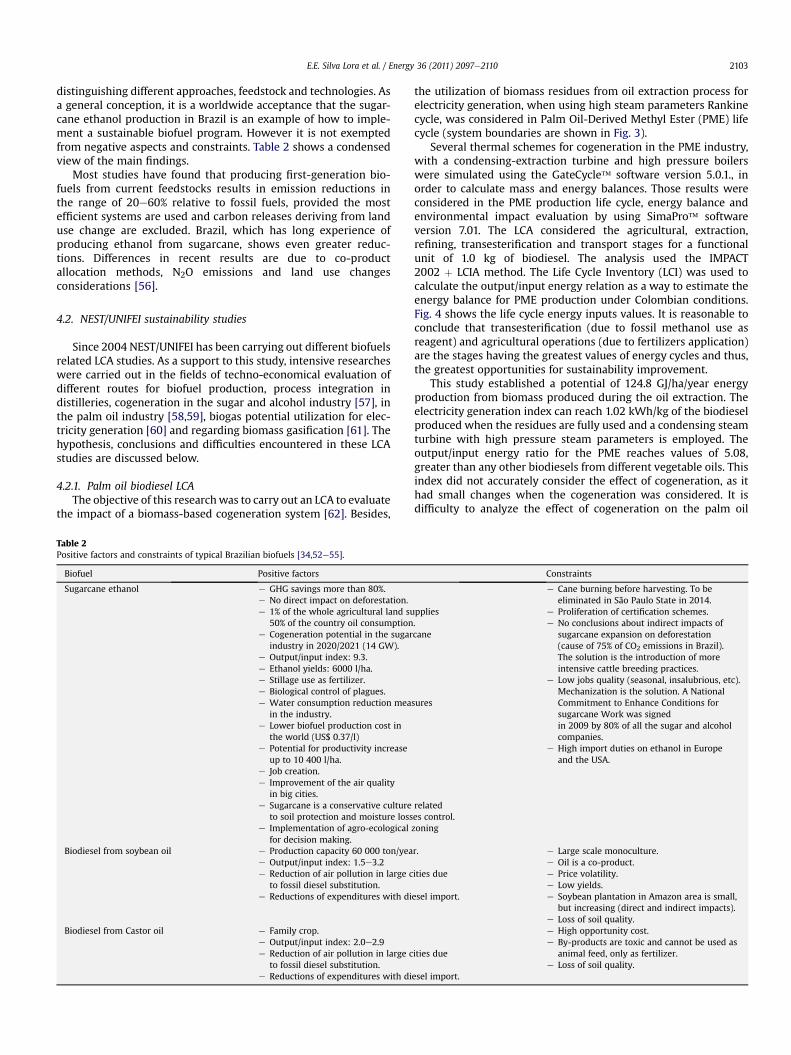
the utilization of biomass residues from oil extraction process forelectricity generation, when using high steam parameters Rankinecycle, was considered in Palm Oil-Derived Methyl Ester (PME) lifecycle (system boundaries are shown in Fig. 3).
Several thermal schemes for cogeneration in the PME industry,with a condensing-extraction turbine and high pressure boilerswere simulated using the GateCycle� software version 5.0.1., inorder to calculate mass and energy balances. Those results wereconsidered in the PME production life cycle, energy balance andenvironmental impact evaluation by using SimaPro� softwareversion 7.01. The LCA considered the agricultural, extraction,refining, transesterification and transport stages for a functionalunit of 1.0 kg of biodiesel. The analysis used the IMPACT2002 þ LCIA method. The Life Cycle Inventory (LCI) was used tocalculate the output/input energy relation as a way to estimate theenergy balance for PME production under Colombian conditions.Fig. 4 shows the life cycle energy inputs values. It is reasonable toconclude that transesterification (due to fossil methanol use asreagent) and agricultural operations (due to fertilizers application)are the stages having the greatest values of energy cycles and thus,the greatest opportunities for sustainability improvement.
This study established a potential of 124.8 GJ/ha/year energyproduction from biomass produced during the oil extraction. Theelectricity generation index can reach 1.02 kWh/kg of the biodieselproduced when the residues are fully used and a condensing steamturbine with high pressure steam parameters is employed. Theoutput/input energy ratio for the PME reaches values of 5.08,greater than any other biodiesels from different vegetable oils. Thisindex did not accurately consider the effect of cogeneration, as ithad small changes when the cogeneration was considered. It isdifficulty to analyze the effect of cogeneration on the palm oil
Constraints
pplies.cane
sures
relatedes control.zoning
e Cane burning before harvesting. To beeliminated in São Paulo State in 2014.
e Proliferation of certification schemes.e No conclusions about indirect impacts of
sugarcane expansion on deforestation(cause of 75% of CO2 emissions in Brazil).The solution is the introduction of moreintensive cattle breeding practices.
e Low jobs quality (seasonal, insalubrious, etc).Mechanization is the solution. A NationalCommitment to Enhance Conditions forsugarcane Work was signedin 2009 by 80% of all the sugar and alcoholcompanies.
e High import duties on ethanol in Europeand the USA.
r.
ities due
esel import.
e Large scale monoculture.e Oil is a co-product.e Price volatility.e Low yields.e Soybean plantation in Amazon area is small,
but increasing (direct and indirect impacts).e Loss of soil quality.
ities due
esel import.
e High opportunity cost.e By-products are toxic and cannot be used as
animal feed, only as fertilizer.e Loss of soil quality.
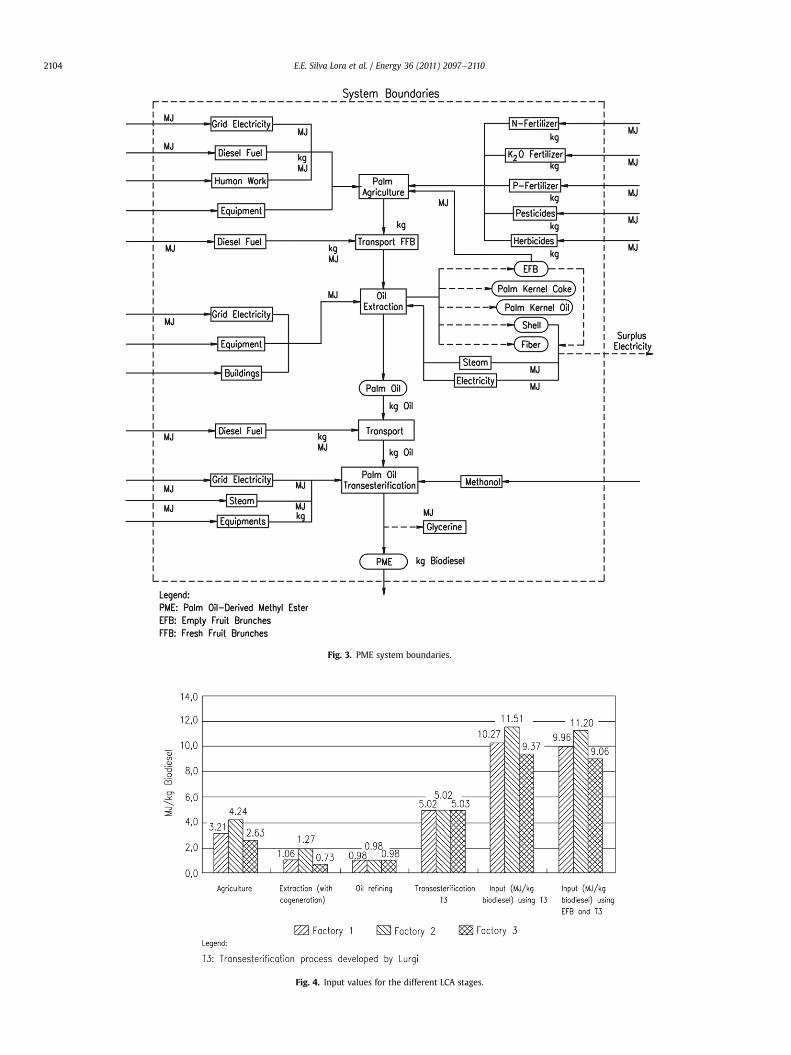
Fig. 3. PME system boundaries.
Fig. 4. Input values for the different LCA stages.
E.E. Silva Lora et al. / Energy 36 (2011) 2097e21102104

Table 3Environmental impacts reduction in relation to diesel fuel due to cogeneration inthe biodiesel life cycle (reference scenario).
Environmental impact category Values (%)
Carcinogenic Substances (CAS) �2,4Inorganic Respiratory Substances (IRP) �4,5Ozone Layer Depletion Potential (ODP) �33,3Aquatic Ecotoxicity Potential (ECPA) �4,2Terrestrial Acidification Potential (ACPT) �1,2Aquatic Eutrophication Potential (ETPA) 3,32Global Warming Potential (GWP) �7,6Non-Renewable Energy (NRE) �16,6
E.E. Silva Lora et al. / Energy 36 (2011) 2097e2110 2105
production process by only considering this index (output/input),hence biomass residues energy output is evaluated based on itscaloric value and the reduction in the environmental impact due toland occupation and substitution of fossil energy supply facilitiesare not considered.
Transesterification stages have the greater fossil energy inputdue to the utilization of methanol obtained from natural gas. Effortsmust be made in the development of the methyl route seeking anincrease of biodiesel life cycle sustainability. The implementation ofcogeneration systems fueled by biomass residues from palm oilextraction presents remarkable advantages to maintain an optimallevel of the LCEB, as well as to get a positive effect on the impact onresources, human health and ecosystem quality. In relation to thereference scenario, the case with cogeneration presents a lowestimpact in relation to diesel fuel (Table 3). Negative values indicatea reduction of the impact when compared to diesel fuel. Thesewereestimated as the most important effects, although most of thecategories showed important reductions.
4.2.2. Second-generation biofuels LCA: methanol from sugarcanebagasse
The scope for methanol LCA involves its production fromsugarcane bagasse, up from the agricultural stage of sugarcaneproduction to the methanol synthesis. The task of the study is tocharacterize the main environmental impacts associated withmethanol production from sugarcane bagasse. The system bound-aries of this study are presented in Fig. 5, and the functional unitused is 1.0 kg of methanol, with the objective to simplify thecomputing of the input and output data.
The methanol from bagasse LCA shows that approximately3.0 MJ of primary energy (biomass energy) is necessary for theproduction of 1.0 MJ of methanol, due to the high sugarcanedemand in the methanol production process (8.30 kg sugarcane foreach kg of methanol). Kumabe et al. [64] computed the life cycleefficiency of methanol production from wood obtaining as result0.33. The output/input index obtained suggests that methanol fuel
Fig. 5. System boundaries of the m
is highly renewable, due to the fact that it is necessary onlyapproximately 1.0 MJ of fossil energy for the production of 8.0 MJ ofmethanol.
For the case of the LCEB for biomass tomixed alcohols produced,the output/input ratio range was from 8.0 to 13.0 [65]. Preliminaryresults indicate that it is necessary to implement a polygenerationsystem and to establish process integration among the differentproduction stages to reach high efficiencies and improve theoutput/input ratio.
4.2.3. Ethanol stillage treatment and disposal LCAThe chemical composition of sugarcane ethanol stillage is vari-
able and depends on the wine raw materials (Table 4). The winecharacteristics depend also on the juice preparation, alcoholicfermentation system, kind of yeast, distillation and flegma sepa-ration. For each liter of ethanol, an average of 10e14 L of stillage aregenerated, with a dry matter concentration that goes from 12%,when molasses is used as the raw product, to 6% when ethanol rawmaterial is the cane juice [67e69].
LCA was used to compare possible stillage treatment options. Itis not a conventional LCA application commonly used for productsLCA. The reference flow considered was 1.0 L of treated stillage.A sugar mill, hypothetically established in the district of Sertão-zinho, state of São Paulo, Brazil, was taken as a model. The totalperiod of operation is 20 years, with 210 days of crop a year (4440useful hours of operation). The milling capacity is of 1.99� 106 tonsof sugarcane per crop, producing 1.54 � 105 tons of sugar and8.10 � 104 m3 of ethanol. The predominant soil in the region isRhodic Hapludox and Typic Hapludox, with an average composi-tion of 33.8% silt and 52.9% of clay. It is considered that 12.0 L ofstillage per liter of ethanol will be produced.
Of all the steps defined by the impact assessment phase in theLCA methodology, only the classification and characterizationstages were considered. Normalization and evaluation wereexcluded since they are optional elements and according to the goaland scope defined here, they would not provide extra usefulinformation. A retrospective LCA for the comparison of four alter-natives for stillage treatment and disposal was carried outaccording to the CML 2 baseline method (midpoint approach) [70].Thismethod results in the definition of an environmental profile forthe assessed product/process/service by quantifying the environ-mental impact on different categories. The LCA software SimaPro�7.01 developed by Pre Consultants [71] was used to perform theimpact assessment stage. Fig. 6 shows the system’s terms ofreference and main inputs and outputs.
The selection of different impacts characterization methods inthe palm oil biodiesel and stillage LCA case studies resulted froma previous evaluation of the main impacts to be considered in eachcase [62,68].
ethanol production LCA [63].
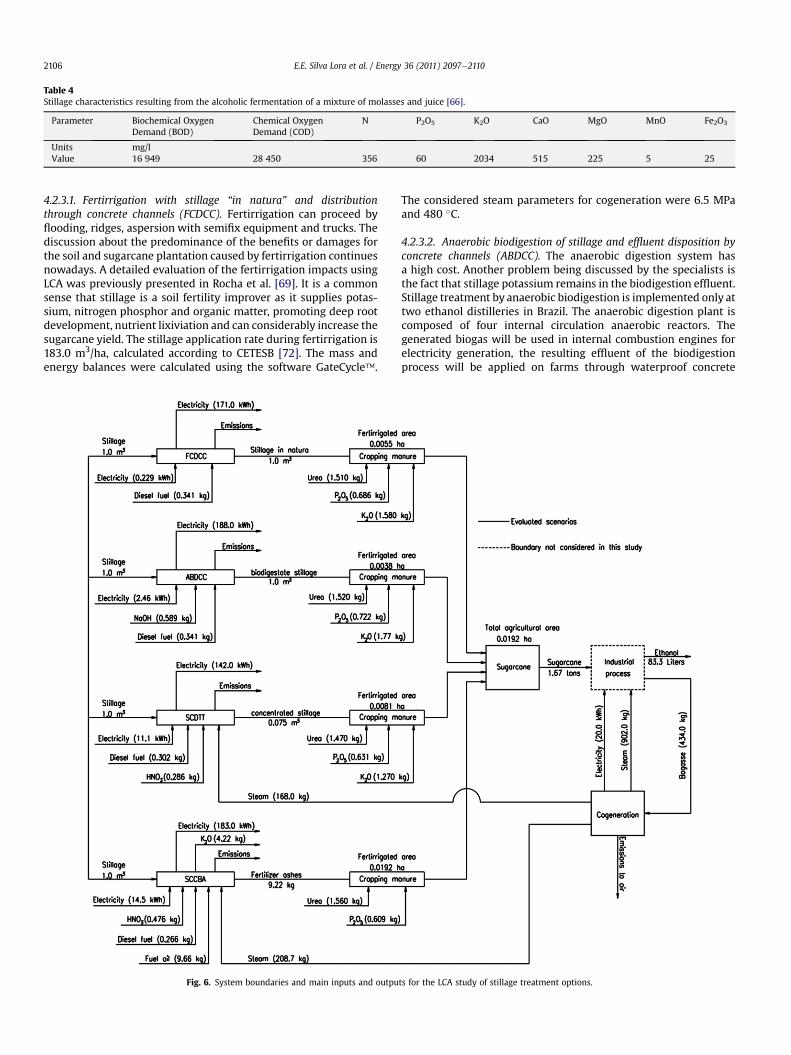
Table 4Stillage characteristics resulting from the alcoholic fermentation of a mixture of molasses and juice [66].
Parameter Biochemical OxygenDemand (BOD)
Chemical OxygenDemand (COD)
N P2O5 K2O CaO MgO MnO Fe2O3
Units mg/lValue 16 949 28 450 356 60 2034 515 225 5 25
E.E. Silva Lora et al. / Energy 36 (2011) 2097e21102106
4.2.3.1. Fertirrigation with stillage “in natura” and distributionthrough concrete channels (FCDCC). Fertirrigation can proceed byflooding, ridges, aspersion with semifix equipment and trucks. Thediscussion about the predominance of the benefits or damages forthe soil and sugarcane plantation caused by fertirrigation continuesnowadays. A detailed evaluation of the fertirrigation impacts usingLCA was previously presented in Rocha et al. [69]. It is a commonsense that stillage is a soil fertility improver as it supplies potas-sium, nitrogen phosphor and organic matter, promoting deep rootdevelopment, nutrient lixiviation and can considerably increase thesugarcane yield. The stillage application rate during fertirrigation is183.0 m3/ha, calculated according to CETESB [72]. The mass andenergy balances were calculated using the software GateCycle�.
Fig. 6. System boundaries and main inputs and outpu
The considered steam parameters for cogeneration were 6.5 MPaand 480 �C.
4.2.3.2. Anaerobic biodigestion of stillage and effluent disposition byconcrete channels (ABDCC). The anaerobic digestion system hasa high cost. Another problem being discussed by the specialists isthe fact that stillage potassium remains in the biodigestion effluent.Stillage treatment by anaerobic biodigestion is implemented only attwo ethanol distilleries in Brazil. The anaerobic digestion plant iscomposed of four internal circulation anaerobic reactors. Thegenerated biogas will be used in internal combustion engines forelectricity generation, the resulting effluent of the biodigestionprocess will be applied on farms through waterproof concrete
ts for the LCA study of stillage treatment options.

E.E. Silva Lora et al. / Energy 36 (2011) 2097e2110 2107
channels and the spraying will be accomplished by diesel motor-pumps. The application rate of the biodigested stillage in theagricultural soil is 266.0 m3/ha.
It is considered that the biogas has the following composition:60% CH4, 39% CO2 and 1% H2S. The Low Heating Value (LHV) andHigh Heating Value (HHV) of the biogas are 18.20 MJ/kg and20.19 MJ/kg respectively, the specific mass is 1.10 kg/m3 and themass flow 0.593 kg/s. The total electric power consumed by thebiodigestion system is 539.0 kW and, for the functional unit, theconsumption will be 2.46 kWh. The sizing of the power generationsystem was accomplished using the software Thermoflex�, andconsisted of 2 motor-generators Jenbacher�, each one witha nominal power of 2.56 MW and global efficiency of 40.0% and 1group motor-generator Wartsila� with a nominal power of1.35 MW and an efficiency of 31.0%; in that way, the groups willgenerate 16.82 kWh/m3 of stillage processed.
4.2.3.3. Stillage concentration and distribution on farms throughtrucks (SCDTT). Stillage concentration is carried out by the evapo-ration of excess water obtaining a product with a high value asfertilizer. The best way to carry out this evaporation is through theuse of multiple effect evaporators. The economic fertirrigationdistance increased from 40 to 55 km and trucks were used insteadof a system of ponds and channels [68,69].
In this scenario, the stillage is concentrated by evaporation up to40.0% of solids. The design of the plant was accomplished using thesoftware Aspen Plus�. In the scheme, 5 effects evaporation station,plus a condenser and a Clean In Place (CIP) systemwere considered.The thermodynamic efficiency of the cycle was 19.0%, therefore173.29 kWh/m3 of stillage are generated. The plant has an intrinsicconsumption of 2430 kW; so, to the functional unit corresponds11.11 kWh. Surplus electricity is 142.14 kWh. The allocation of theatmospheric emissions will be based on the share of generated/consumed electricity in the following way: 11.6% for the process,6.4% for the stillage concentration plant and 82.0% as surpluselectricity. The concentrated stillage will be applied to the soil ata rate of 9.25 m3/ha.
4.2.3.4. Stillage concentration and combustion in boiler for ashesfertilization (SCCBA). The combustion or incineration of the stillageallows an almost complete elimination of its pollution potential.Stillage incineration, after its concentration up to 60 and 70�
(60e70% dry matter content) must be carried out in specialdesigned furnaces, because of the lowmelting point of the ash, andby using fossil fuel to ensure flame stability. The burning process
Fig. 7. Rate of emission of CO2 as a function of
produces ashes with a high potassium content and energy in theform of steam to attend a process demand or for electrical gener-ation. The stillage organic content is completely eliminated. Theonly known stillage combustion plant was installed in Thailand in1986 and was in operation for 12 years up to 1998 [67e69].
The stillage is concentrated up to 65% to enable its combustionin specially designed boilers. The design of the plant was accom-plished using the software Aspen Plus�. The ashes that result fromthe combustion can be used in partial substitution of the mineralfertilizers. The concentration plant will have a scheme equivalent tothe one of the previous scenario; although without additionalevaporation effect.
For the four appraised alternatives, the value of the electricityexported to the net was determined, as well as the emissions ofGHG released during the system operation (emissions of themineral fertilizer, cogeneration, use of diesel oil, decompositionof the stillage, etc.), based on the characterization model devel-oped by IPCC [73]. The characterization factors are expressedusing the global warming for a horizon of 100 years (GWP100),in kg of CO2 equivalent/kg of emitted substance. The substancesconsidered in this study were CO2 (1.0 kg CO2 eq./kg),CH4 (23.0 kg CO2 eq./kg), CO (1.53 kg CO2 eq./kg) and N2O (296 kgCO2 eq./kg). The results are shown in Fig. 7. The smallest emis-sions of GHG per kWh of electricity generated correspond to thescenario ABDCC (1.92 kg CO2 eq./kWh), followed by FCDCC(2.13 kg CO2 eq./kWh), SCCBA (2.16 kg CO2 eq./kWh) and SCDTT(2.28 kg CO2 eq./kWh).
That is clearly shown in Fig. 8, which shows the Life Cycle ImpactAssessment (LCIA) for the impacts characterization. Howeveruncertainties remain, due to stillage nitrogen volatilization andlixiviation, and its impacts on GHG emissions. Another aspect to beconsidered is the emissions real data related to concentrated stil-lage combustion, presently not available. There are also no availabledata about the utilization of stillage digestate for fertirrigation andits environmental consequences. In relation to the impacts char-acterization (Fig. 8), the SCDTT scenario obtained the best envi-ronmental behavior in five categories, FCDCC scenario was better intwo categories, ABDCC scenario was better in one category andSCCBA was better in one category (Table 5).
5. Restrains
The application of LCA for the evaluation of environmentalimpacts related to stillage treatment and disposal, does not allowa complete analysis, due to the uncertainties associated with the
the electricity exported to the public grid.
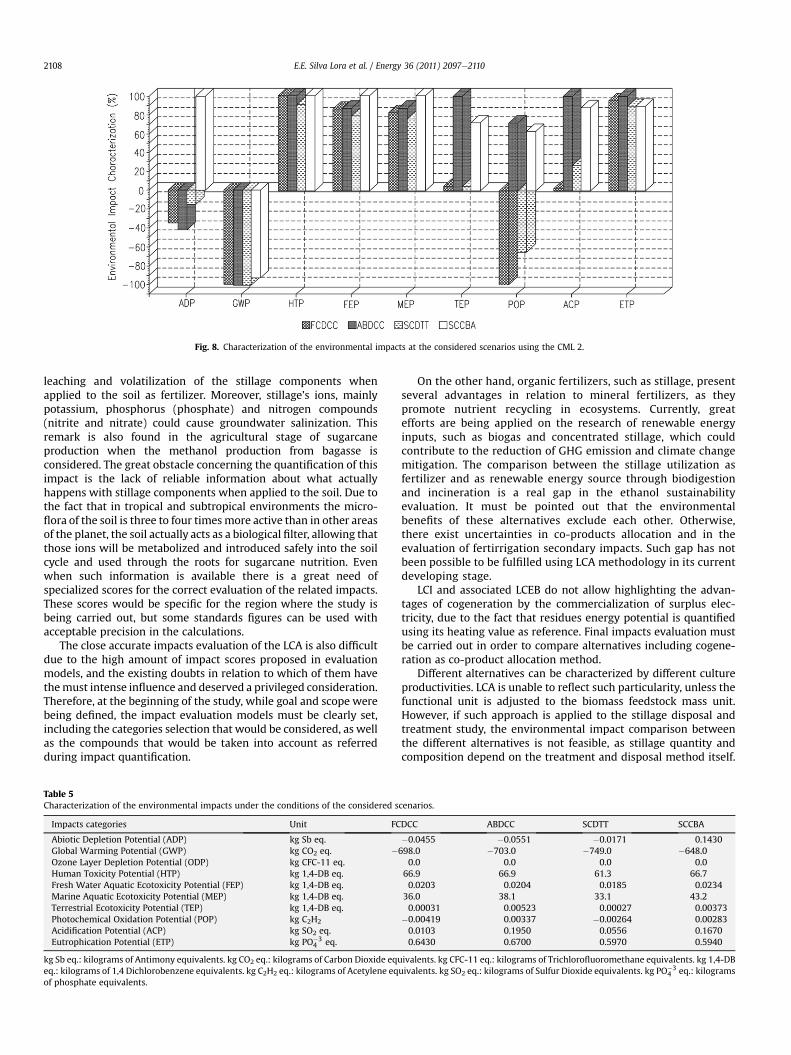
Fig. 8. Characterization of the environmental impacts at the considered scenarios using the CML 2.
E.E. Silva Lora et al. / Energy 36 (2011) 2097e21102108
leaching and volatilization of the stillage components whenapplied to the soil as fertilizer. Moreover, stillage’s ions, mainlypotassium, phosphorus (phosphate) and nitrogen compounds(nitrite and nitrate) could cause groundwater salinization. Thisremark is also found in the agricultural stage of sugarcaneproduction when the methanol production from bagasse isconsidered. The great obstacle concerning the quantification of thisimpact is the lack of reliable information about what actuallyhappens with stillage components when applied to the soil. Due tothe fact that in tropical and subtropical environments the micro-flora of the soil is three to four timesmore active than in other areasof the planet, the soil actually acts as a biological filter, allowing thatthose ions will be metabolized and introduced safely into the soilcycle and used through the roots for sugarcane nutrition. Evenwhen such information is available there is a great need ofspecialized scores for the correct evaluation of the related impacts.These scores would be specific for the region where the study isbeing carried out, but some standards figures can be used withacceptable precision in the calculations.
The close accurate impacts evaluation of the LCA is also difficultdue to the high amount of impact scores proposed in evaluationmodels, and the existing doubts in relation to which of them havethemust intense influence and deserved a privileged consideration.Therefore, at the beginning of the study, while goal and scope werebeing defined, the impact evaluation models must be clearly set,including the categories selection that would be considered, as wellas the compounds that would be taken into account as referredduring impact quantification.
Table 5Characterization of the environmental impacts under the conditions of the considered s
Impacts categories Unit FC
Abiotic Depletion Potential (ADP) kg Sb eq.Global Warming Potential (GWP) kg CO2 eq. �Ozone Layer Depletion Potential (ODP) kg CFC-11 eq.Human Toxicity Potential (HTP) kg 1,4-DB eq.Fresh Water Aquatic Ecotoxicity Potential (FEP) kg 1,4-DB eq.Marine Aquatic Ecotoxicity Potential (MEP) kg 1,4-DB eq.Terrestrial Ecotoxicity Potential (TEP) kg 1,4-DB eq.Photochemical Oxidation Potential (POP) kg C2H2
Acidification Potential (ACP) kg SO2 eq.Eutrophication Potential (ETP) kg PO�3
4 eq.
kg Sb eq.: kilograms of Antimony equivalents. kg CO2 eq.: kilograms of Carbon Dioxide equeq.: kilograms of 1,4 Dichlorobenzene equivalents. kg C2H2 eq.: kilograms of Acetylene eqof phosphate equivalents.
On the other hand, organic fertilizers, such as stillage, presentseveral advantages in relation to mineral fertilizers, as theypromote nutrient recycling in ecosystems. Currently, greatefforts are being applied on the research of renewable energyinputs, such as biogas and concentrated stillage, which couldcontribute to the reduction of GHG emission and climate changemitigation. The comparison between the stillage utilization asfertilizer and as renewable energy source through biodigestionand incineration is a real gap in the ethanol sustainabilityevaluation. It must be pointed out that the environmentalbenefits of these alternatives exclude each other. Otherwise,there exist uncertainties in co-products allocation and in theevaluation of fertirrigation secondary impacts. Such gap has notbeen possible to be fulfilled using LCA methodology in its currentdeveloping stage.
LCI and associated LCEB do not allow highlighting the advan-tages of cogeneration by the commercialization of surplus elec-tricity, due to the fact that residues energy potential is quantifiedusing its heating value as reference. Final impacts evaluation mustbe carried out in order to compare alternatives including cogene-ration as co-product allocation method.
Different alternatives can be characterized by different cultureproductivities. LCA is unable to reflect such particularity, unless thefunctional unit is adjusted to the biomass feedstock mass unit.However, if such approach is applied to the stillage disposal andtreatment study, the environmental impact comparison betweenthe different alternatives is not feasible, as stillage quantity andcomposition depend on the treatment and disposal method itself.
cenarios.
DCC ABDCC SCDTT SCCBA
�0.0455 �0.0551 �0.0171 0.1430698.0 �703.0 �749.0 �648.0
0.0 0.0 0.0 0.066.9 66.9 61.3 66.70.0203 0.0204 0.0185 0.0234
36.0 38.1 33.1 43.20.00031 0.00523 0.00027 0.00373
�0.00419 0.00337 �0.00264 0.002830.0103 0.1950 0.0556 0.16700.6430 0.6700 0.5970 0.5940
ivalents. kg CFC-11 eq.: kilograms of Trichlorofluoromethane equivalents. kg 1,4-DBuivalents. kg SO2 eq.: kilograms of Sulfur Dioxide equivalents. kg PO�3
4 eq.: kilograms
E.E. Silva Lora et al. / Energy 36 (2011) 2097e2110 2109
Therefore, the choice of the functional unit of 1.0 m3 of stillagetreated is a decision that defines a clear andmeasurable base for thecomparison of the evaluated alternatives. IEA methodology couldbe used for a better evaluation of co-products allocation, but needsto be improved.
6. Conclusions
Sustainability evaluation of biofuels is a multicriterial problem.Many issuesmust be further investigated, such as the ones related tofertilizer volatilization, co-product allocation and land use impacts.Intensive work must be carried out in order to define suitablesustainability indicators. Energy efficiency through cogenerationbased on co-products and energy saving in life cycle stages (directand indirect one)must be further considered. The LCAmethodologymust be improved and normalized to ensure the same approach todifficult and different issues, and to compensate the lack of scientificunderstanding. Certification based on GHG emissions reduction,calculated through LCA, are important to ensure a proper or wisecriterial approach to sustainability and to allow distinguishing thedifferences between various feedstock and biofuels productiontechnologies. Brazilian biofuel programs demonstrate the feasibilityof a sustainable way for renewable fuels utilization. GHG emissionsreductions of the Brazilian ethanol are recognized to be greater than80%. However, doubts and constrains remains. The Braziliangovernment is funding and encouraging academic and industrialR&D projects, and is also creating several research institutions,aimed at improving the sustainability of domestic biofuels. In thelast few years we have seen highly interesting and valuable publi-cations on these issues. The NEST/UNIFEI research studies havecontributed to the awareness of the weight of different factors inpalm oil biodiesel LCEB and impacts, although these studiesmust becomplemented with the consideration of the direct and indirectimpacts of the land use changes. Ethanol stillage treatment remainsa problem that deserves further studies, the NEST/UNIFEI LCAcomparison of four treatment options resulted in the identificationof fertirrigation as the one with the best environmental perfor-mance. Issues related with GHG emissions associated with stillagefertirrigation must be further investigated. Methanol from sugar-cane bagasse, can improve the environmental impacts of biodieselproduction chain by the substitution of methanol from fossil gas inthe transesterification stage.
Acknowledgements
We wish to thank the Brazilian National Research and Devel-opment Council (CNPq), the Research Support Foundation of theState of Minas Gerais (FAPEMIG) and the Coordinating Body for theImprovement of Postgraduate Studies in Higher Education (CAPES)for the funding of Research and Development projects, the supportof graduate students and the production grants that allowed theaccomplishment of the research projects whose results areincluded in this paper.
References
[1] Pandey A, editor. Handbook of plant-based biofuels. Boca Raton: Taylor &Francis Group LLC; 2008.
[2] Kromer MA, Bandivadekar A, Evans C. Long-term greenhouse gas emissionand petroleum reduction goals: evolutionary pathways for the light-dutyvehicle sector. Energy 2010;35(1):387e97.
[3] Fischer G, Hizsnyik E, Prieler S, Shah M, van Velthuizen H. Biofuels and foodsecurity. Implications of an accelerated biofuels production. Vienna, Austria:International Institute for Applied Systems Analysis (IIASA), <http://www.globalbioenergy.org/uploads/media/0903_OFID_-_BiofuelAndFoodSecurity.pdf>; 2009.
[4] Melillo JM, Reilly JM, Kicklighter DW, Gurgel AC, Cronin TW, Paltsev S, et al.Indirect emissions from biofuels: how important? Science 2009;326(5958):1397e9.
[5] Searchinger TD, Hamburg SP, Melillo J, Chameides W, Havlik P, Kammen DM,et al. Fixing a critical climate accounting error. Science 2009;326(5952):527e8.
[6] Scharlemann JPW, Laurance WF. How green are biofuels? Science 2008;319(5859):43e4.
[7] Russi D. An integrated assessment of a large-scale biodiesel production inItaly: killing several birds with one stone? Energy Police 2008;36(3):1169e80.
[8] Ulgiati SA. Comprehensive energy and economic assessment of biofuels: when“green” is not enough. Critical Reviews in Plant Sciences 2001;20(1):71e106.
[9] Groom MJ, Gray EM, Townsend PA. Biofuels and biodiversity: principles forcreating better policies for biofuel production. Conservation Biology 2008;22(3):602e9.
[10] Mol APJ. Boundless biofuels? Between environmental sustainability andvulnerability. Sociologia Ruralis 2007;47(4):297e315.
[11] Escobar JCP, Lora EES, Venturini OJ, Yáñez EEA, Castillo EF, Almazán OO.Biofuels: environment, technology and food security. Renewable andSustainable Energy Reviews 2009;13(6e7):1275e87.
[12] Mayer AL. Strengths and weaknesses of common sustainability indices formultidimensional systems. Environment International 2008;34(2):277e91.
[13] Drapcho CM, Nhuan NP, Walker TH. Biofuels engineering process technology.New York: McGraw-Hill Inc,; 2008.
[14] Pereira T. Sustainability: an integral engineering design approach. Renewableand Sustainable Energy Reviews 2009;13(5):1133e7.
[15] Garcez CAG, Vianna JNS. Brazilian biodiesel policy: social and environmentalconsiderations of sustainability. Energy 2009;34(5):645e54.
[16] Duarte A. National hope (Esperança Nacional). Biodieselbr 2008;1(5):25e31[in Brazil].
[17] Achten WMJ, Verchot L, Franken YJ, Mathijs E, Singh VP, Aerts R, et al.Jatropha bio-diesel production and use. Biomass and Bioenergy 2008;32(12):1063e84.
[18] Bringezu S, Schütz H, O’Brien M, Kauppi L, Howarth RW, McNeely J. Towardssustainable production and use of resources: assessing biofuels. Internationalpanel for sustainable resource management. Paris, France: United NationsEnvironment Programme (UNEP), <http://www.unep.fr/scp/rpanel/pdf/Assessing_Biofuels_Full_Report.pdf>; 2009.
[19] Milne E, Easter M, Cerri CE, Paustian K, Williams S. Assessment of soil organiccarbon stocks and change at national scale. Technical report of the globalenvironmental facility co-financed project. Lanxenburg, Austria: UnitedNations Environment Programme (UNEP), <http://www.nrel.colostate.edu/projects/gefsoc-uk/GEFSOC_Technical_Report_web.pdf>; 2006.
[20] Bringezu S, Schütz H, Arnold K, Merten F, Kabasci S, Borelbach P, et al. Globalimplications of biomass and biofuel use in Germany e Recent trends andfuture scenarios for domestic and foreign agricultural land use and resultingGHG emissions. Journal of Cleaner Production 2009;17(Suppl. 1):S57e68.
[21] Fargione J, Hill J, Tilman D, Polasky S, Hawthorne P. Land clearing and thebiofuel carbon debt. Science 2008;319(5867):1235e8.
[22] Crutzen PJ, Mosier AR, Smith KA, WiniwarterW. N2O release from agro-biofuelproduction negates global warming reduction by replacing fossil fuels. Atmo-spheric Chemistry and Physics Discussions 2007;7(4):11191e205.
[23] Snyder CS, Bruulsema TW, Jensen TL, Fixen PE. Review of greenhouse gasemissions from crop production systems and fertilizer management effects.Agriculture, Ecosystems and Environment 2009;133(3e4):247e66.
[24] Nigam PS, Pandey A, editors. Biotechnology for agro-industrial residues uti-lisation. Berlin: Springer; 2009.
[25] Eisentraut A. Sustainable production of second-generation biofuels. Potentialand perspectives in major economies and developing countries. Paris, France:International Energy Agency (IEA), <http://www.iea.org/papers/2010/second_generation_biofuels.pdf>; 2010.
[26] Hill J, Nelson E, Tilman D, Polasky S, Tiffany D. Environmental, economic, andenergetic costs and benefits of biodiesel and ethanol biofuels. Proceedings ofthe National Academy of Sciences (PNAS) 2006;103(30):11206e10.
[27] Jungbluth N, Büsser S, Frischknecht R, Tuchschmid M. Life cycle assessment ofbiomass-to-liquid fuels. Federal Office for energy (BFE), Federal Office for theenvironment (BAFU), Federal Office for agriculture (BLW). Bern, Switzerland:ESU-services GmbH, <http://www.bfe.admin.ch/php/modules/enet/streamfile.php?file¼000000009552.pdf>; 2008.
[28] Zah R, Böni H, Gauch M, Hischier R, Lehmann M, Wäger P. Ökobilanz VonEnergieprodukten: Ökologische Bewertung Von Biotreibstoffen. Bern,Switzerland: Swiss Federal Laboratories for Materials Testing and Research(EMPA), <http://www.news-service.admin.ch/NSBSubscriber/message/attachments/8514.pdf>; 2007.
[29] Mosier AR. Exchange of gaseous nitrogen compounds between agriculturalsystems and the atmosphere. Plant and Soil 2001;228(1):17e27.
[30] Smeets EMW, Bouwman LF, Stehfest E, Van Vuuren DP, Posthuma A. Contri-bution of N2O to the greenhouse gas balance of first-generation biofuels.Global Change Biology 2009;15(1):1e23.
[31] Menichetti E, Otto M. Energy balance & greenhouse gas emissions of biofuelsfrom a life cycle perspective. International biofuels project rapid assessment,22e25 September 2008, Gummersbach, Germany. In: Howarth RW,Bringezu S, editors. Biofuels: environmental consequences and interactionswith changing land use. Proceedings of the scientific committee on
E.E. Silva Lora et al. / Energy 36 (2011) 2097e21102110
problems of the environment (SCOPE). New York, USA: Cornell University;2009. p. 81e109.
[32] Walden D, Chalmers J. The impact of expanding biofuel production on GHGemissions. White paper #1: accessing and interpreting existing data. Arling-ton, Virginia, USA: Winrock International, <http://www.globalbioenergy.org/fileadmin/user_upload/gbep/docs/BIOENERGY_INFO/0904_Winrock_International_-_White_paper__1_GHG_implications_biofuel.pdf>; 2009.
[33] Perry S, Kleme�s Bulatov I. Integrating waste and renewable energy to reducethe carbon footprint of locally integrated energy sectors. Energy 2008;33(10):1489e97.
[34] Macedo IC. Sugarcane’s energy: twelve studies on Brazilian sugarcane agri-business and its sustainability. União da Agroindústria Canavieira do Estadode São Paulo (UNICA). São Paulo: Berlendis & Vertecchia; 2005.
[35] Schmitz N. Certification to ensure sustainable production of biofuels.Biotechnology Journal 2007;2(12):1474e80.
[36] Fehrenbach H, Giegrich J, Reinhardt G, Schmitz J, Sayer U, GretzM, et al. Criteriafor a sustainable use of bioenergy on a global scale. Environmental research ofthe Federal Ministry of the environment, nature conservation and NuclearSafety (BMU). ResearchReport 20641112UBA-FB001176/E, Germany,<http://www.umweltdaten.de/publikationen/fpdf-l/3514.pdf>; 2008.
[37] Peña N. Biofuels for Transportation: a climate perspective. Prepared for thepew center on global climate change. Arlington, USA: Solutions White PaperSeries, <http://www.pewclimate.org/docUploads/BiofuelsFINAL.pdf>; 2008.
[38] Environmental Protection Agency. Notice of proposed rulemaking: regulationof fuels and fuel additives: changes to renewable fuel standards program.Federal Register 2009;74:24904e5143, <http://www.epa.gov/otaq/renewablefuels/rfs2_1-5.pdf>.
[39] European Union. Directive 2009/29/EC of the European Parliament and of theCouncil of 23 April 2009 amending Directive 2003/87/EC so as to improve andextend the greenhouse gas emission allowance trading scheme of theCommunity. Official Journal of the European Union L140/63; 2009.
[40] Righelato R, Spracklen DV. Carbon mitigation by biofuels or by saving andrestoring forests? Science 2007;317(5840):902.
[41] Luo L, Van der Voet E, Huppes G. Life cycle assessment and life cycle costing ofbioethanol from sugarcane in Brazil. Renewable and Sustainable EnergyReviews 2009;13(6e7):1613e9.
[42] Schievano A, D’Imporzano G, Adani F. Substituting energy crops with organicwastes and agro-industrial residues for biogas production. Journal of Envi-ronmental Management 2009;90(8):2537e41.
[43] Larson ED. A review of life-cycle analysis studies on liquid biofuel systems forthe transport sector. Energy for Sustainable Development 2006;10(2):109e26.
[44] Luz PHC. Use of stillage for fertirrigation (Utilização das vinhaças para fer-tirrigação). International Seminar on Impacts of Biofuels Production. Ciencia yTecnología para el Desarrollo (CYTED), BIALEMA, Itajubá, Brazil, <http://www.nest.unifei.edu.br/portugues/pags/novidades/seminario_internacional_2009/files/Fertirrigacao%20vinhaca.pdf>; 2009.
[45] International Organization for Standardization. ISO series. EnvironmentalManagement e Life Cycle Assessment e Principles and Framework, ISO14040, Geneva, Switzerland, 1997. Goal and Scope Definition and Life CycleInventory Analysis, ISO 14041, Geneva, Switzerland, 1998. Life Cycle ImpactAssessment, ISO 14042, Geneva, Switzerland, 1999. Life Cycle Interpretation,ISO 14043, Geneva, Switzerland, 2000.
[46] Kammen DM, Farrel AE, Plevin RJ, Jones AD, Delucchi MA, Nemet GF. Energyand greenhouse impacts of biofuels: a framework for analysis. Organizationfor Economic Co-operation and Development (OECD). Berkeley, USA: Inter-national Transport Forum, <http://pubs.its.ucdavis.edu/download_pdf.php?id¼1131>; 2007.
[47] Gallagher E. The gallagher review of indirect effects of biofuels production. StLeonards-on-Sea, United Kingdom: Renewable Fuels Agency, <http://www.dft.gov.uk/rfa/_db/_documents/Report_of_the_Gallagher_review.pdf>; 2008.
[48] Toth FL, Hizsnyik E. Integrated environmental assessment methods: evolutionand applications. Environmental Modeling and Assessment 1998;3(3):193e207.
[49] Toth FL. State of the art and future challenges for integrated environmentalassessment. Integrated Assessment 2003;4(4):250e64.
[50] Kleijn R, Van der Voet E, Udo de Haes HA. The need for combining IEA and IE:the potential effects of a global ban on PVC on climate change. EcologicalEconomics 2008;65(2):266e81.
[51] Riedacker A. Reconsidering approaches for land use to mitigate climatechange and to promote sustainable development. In: Grover VI, editor. Globalwarming and climate change: ten years after Kyoto and still counting, vol. 1.Enfield, United Kingdom: Science Publishers; 2008. p. 387e424.
[52] De Almeida EF, Bomtempo JV, de Souza e Silva CM. The performance of Bra-zilian biofuels: an economic, environmental and social analysis. Organizationfor Economic Co-operation and Development (OECD). Rio de Janeiro, Brazil:
International Transport Forum, <http://www.internationaltransportforum.org/jtrc/DiscussionPapers/DiscussionPaper5.pdf>; 2007.
[53] Goldemberg J, Coelho ST, Guardabassi P. The sustainability of ethanolproduction from sugarcane. Energy Policy 2008;36(6):2086e97.
[54] Fundação Getúlio Vargas. Food price determining factors: the impact ofbiofuels, <http://www.fgv.br/fgvprojetos/arq/JUBRASILICO_34_5_18_28_11_2008.pdf>; 2008.
[55] Desplechin E. Brazilian sugarcane ethanol: a sustainable contribution toa cleaner transport mix. Clean moves, mobility change conference: chiefrepresentative e European Union, Hanover, Germany, <http://english.unica.com.br/download.asp?mmdCode¼790EE0BC-1BBA-4E74-AC77-0F7E43748C47>; 2009.
[56] Food and Agricultural Organization of the United Nations. The state of foodand agriculture 2008. Biofuels: prospects, risks and opportunities. , Rome,Italy: FAO, <ftp://ftp.fao.org/docrep/fao/011/i0100e/i0100e.pdf>; 2008.
[57] Lora EES, Zampieri M, Venturini OJ, Santos JJCS. A sugar mill cogenerationplant repowering alternatives: evaluation through the combination of ther-modynamic and economic concepts. International Sugar Journal 2008;110(1316):488e95.
[58] Yáñez EEA, Lora EES, Costa RE, Torres EA. The energy balance in the palm oil-Derived methyl Ester (PME) life cycle for the cases in Brazil and Colombia.Renewable Energy 2009;34(12):2905e13.
[59] Arrieta FRP, Teixeira FN, Yáñez EEA, Lora EES, Castillo E. Cogenerationpotential in the Columbian palm oil industry: three case studies. Biomass andBioenergy 2007;31(7):503e11.
[60] Salomon KR, Lora EES. Estimate of the electric energy generation potential fordifferent sources in Brazil. Biomass and Bioenergy 2009;33(9):1101e7.
[61] Lora EES, Andrade RV. Biomass as energy source in Brazil. Renewable andSustainable Energy Reviews 2009;13(4):777e88.
[62] Yáñez EEA. Energetic and environmental impact assessment of cogenerationon the energetic balance and life cycle of palm oil biodiesel. Master Thesis,Mechanical Engineering Institute, Federal University of Itajubá, Brazil; 2008.
[63] Renó MLG, Lora EES, Venturini OJ, Escobar JCP. Life Cycle assessment of themethanol production from sugarcane bagasse considering two case studies.In: Proceedings of the XX international Congress of Mechanical engineering(COBEM), engineering Brazilian Association and Mechanical Sciences (ABCM).Gramado, RS, Brazil: ABCM; 2009.
[64] Kumabe K, Fujimoto S, Yanagida T, Ogata M, Fukuda T, Yabe A, et al. Envi-ronmental and economic analysis of methanol production process via biomassgasification. Fuel 2008;87(7):1422e7.
[65] Spath PL, Dayton DC. Preliminary screening e technical and economicassessment of synthesis gas to fuels and chemicals with emphasis on thepotential for biomass-derived syngas. NREL/TP-510e34929, Contract N DE-AC36-99-GO10337. National Renewable Energy Laboratory (NREL), <http://www.nrel.gov/docs/fy04osti/34929.pdf>; 2003.
[66] Elia Neto A, Nakahodo T. Characterization physical-chemistry of stillage.Project number 9500278, RT 761-95/96. Piracicaba, SP, Brazil: CanavieiraTechnology Center (CTC); 1995. pp. 36 [in Brazil].
[67] Rocha MH, Lora EES, Venturini OJ, Escobar JCP, Santos JJCS, Moura AG. Useof the life cycle assessment (LCA) for comparison of the environmentalperformance of four alternatives for the treatment and disposal of bio-ethanol stillage. In: Proceedings of the XXVII Congress of internationalsociety of sugar cane Technologists (ISSCT). Veracruz, Mexico: Hawk Media;2010. pp. 1e14.
[68] Rocha MH. Use of life cycle assessment for environmental performancecomparison of four alternatives for bioethanol stillage treatment. MasterThesis, Mechanical Engineering Institute, Federal University of Itajubá, Brazil;2009.
[69] Rocha MH, Lora EES, Venturini OJ. Life cycle analysis of different alternativesfor the treatment and disposal of ethanol vinasse. Sugar Industry/Zuck-erindustrie 2008;133(2):88e93.
[70] Guinée JB, Gorrée M, Heijungs R, Huppes G, Kleijn R, de Koning A, et al. Lifecycle assessment. An operational guide to the ISO standards. Leiden, TheNetherlands: Centre of Environmental Science; 2001.
[71] SimaPro 7 software version 7.01. Amersfoort. The Netherlands: PRé Consul-tants; 2008.
[72] Environmental Company of São Paulo State. Technical standard CETESB.Stillage e standards and procedures for application in agricultural soil. SãoPaulo, Brazil: CETESB P4.231; 2006 [in Brazil].
[73] IPCC 2006 Klein C, Novoa RSA, Ogle S, Smith KA, Rochette P, Wirth RC, et al.N2O emissions from managed soils, and CO2 emissions from lime and ureaapplication. In: Eggleston S, Buendia L, Miwa K, Ngara T, Tanabe K, editors.2006 IPCC guidelines for national greenhouse gas inventories: agriculture,foresty and other Land, vol. 4; 2006, <http://www.ipcc-nggip.iges.or.jp/public/2006gl/pdf/4_Volume4/V4_11_Ch11_N2O&CO2.pdf>; 2006. Hayama,Japan.