Financial Firms and Vendors consider themselves well prepared

THE FUZZY SYSTEM IS A KNOWL-edge-based system consisting of linguis-tic if-then rules. The rules can be con-structed using either an expert knowl-edge of the system that we want tomodel or system data acquired throughexperimentation. One of the very attrac-tive aspects of using fuzzy systems isthe realization of nonlinear mappings.When one wishes to approximate anonlinear area and wants to combine ahighly transparent representation with alinguistic interpretation in the form ofrules, fuzzy systems should be thechoice because, in such cases, they aresuperior over the other nonlinearapproximation techniques. The fuzzy-system family classifies mainly upon the
structure of the antecedent (if) andconsequent (then) part of the rules, andit can be roughly divided into
• linguistic fuzzy models, whereboth parts consist of linguistic variablesand linguistic values
• fuzzy relational models, where themapping from the antecedent fuzzy setsAi to the consequent fuzzy sets Bi isrepresented by a fuzzy relation
• Takagi-Sugeno (TS) models, wherethe rule antecedents describe fuzzyregions in the input space (as with thelinguistic models) and the rule conse-quents are crisp functions of the modelinputs, i.e., if x is Ai then yi = fi (x).
This article will focus only on the TS-type models. More on fuzzy modeling
can be found in the paper by Babuskaand Verbruggen.
Consider now a nonlinear area creat-ed by the outputs of a family of func-tions that we use to describe a systemwith uncertain parameters. The mainquestion is how to provide a mathemat-ical representation of the system on thebasis of the nonlinear area? Fuzzy sys-tems seem a very sound choice; in fact,Skrjanc et al. introduced a methodwhere by fixing the rule antecedents(membership functions) and establish-ing the rule consequents such thatwhen the parameters of the consequentpart vary in a certain interval, one isable to define the upper and lowerboundaries of the area. The so-calledinterval fuzzy model (INFUMO) is inthis case very appealing for two rea-sons: first, the optimization of the INFU-MO parameters is based on linear pro-gramming and is therefore easy toimplement and not computationallydemanding; second, in providing thearea boundaries not only do we get thearea approximation but also the confi-dence band in which all possible sys-tem outputs can be found with theprobability value of one. This is particu-larly important when one seeks arobust description of an uncertain sys-tem that also comprises the effects ofthe unknown system’s inputs in itsnominal operating mode. Hence, if thesystem’s output crosses the boundaries,it can be concluded that, knowing thatthe uncertainties are already covered bythe boundaries, a fault has occurred inthe system.
In this study, we are dealing with asystem whose parameters vary in a cer-tain tolerance band. The band is fixedyet unknown to the designer. The prob-lem we are investigating is how todesign a simple and efficient fault-detection system or how to make adecision system that will differentiatebetween an effect of the system uncer-tainty and a serious fault in the system’soperation using only the process inputand output data. The issue of how todesign a robust fault-detection systemhas been extensively studied over thepast two decades. The majority ofpapers focus on the construction of theso-called residual generator, a compara-tor of the process and the process-model output that creates a residual sig-nal. Generally, the signal should bebelow a preassigned threshold in anonfault process operation and abovethe threshold otherwise. The threshold
0278-6648/06/$20.00 © 2006 IEEE18 IEEE POTENTIALS
IF APPROXIMATINGNONLINEAR AREAS,
THEN CONSIDER FUZZY SYSTEMSSIMON OBLAK, IGOR SKRJANC, AND SASO BLAZIC
©E
YE
WIR
E &
MA
ST
ER
SE
RIE
S
NOVEMBER/DECEMBER 2006 19
is usually connected to the influence ofdisturbances and other unknownprocess inputs. Therefore, a great num-ber of papers have been dedicated tothe challenge of constructing a robustresidual generator that will be insensi-tive to the influences of disturbancesand model uncertainties. Some excitingresults have been achieved using vari-ous artificial-intelligence techniquessuch as nonlinear adaptive observers,fuzzy thresholds and fuzzy models, andneural-network-based models. For moreinformation, a dedicated reader isreferred to survey papers by by Frankand Ding, Frank and Koppen-Seliger ormore specialized papers (Patton andChen; Zhang et al.).
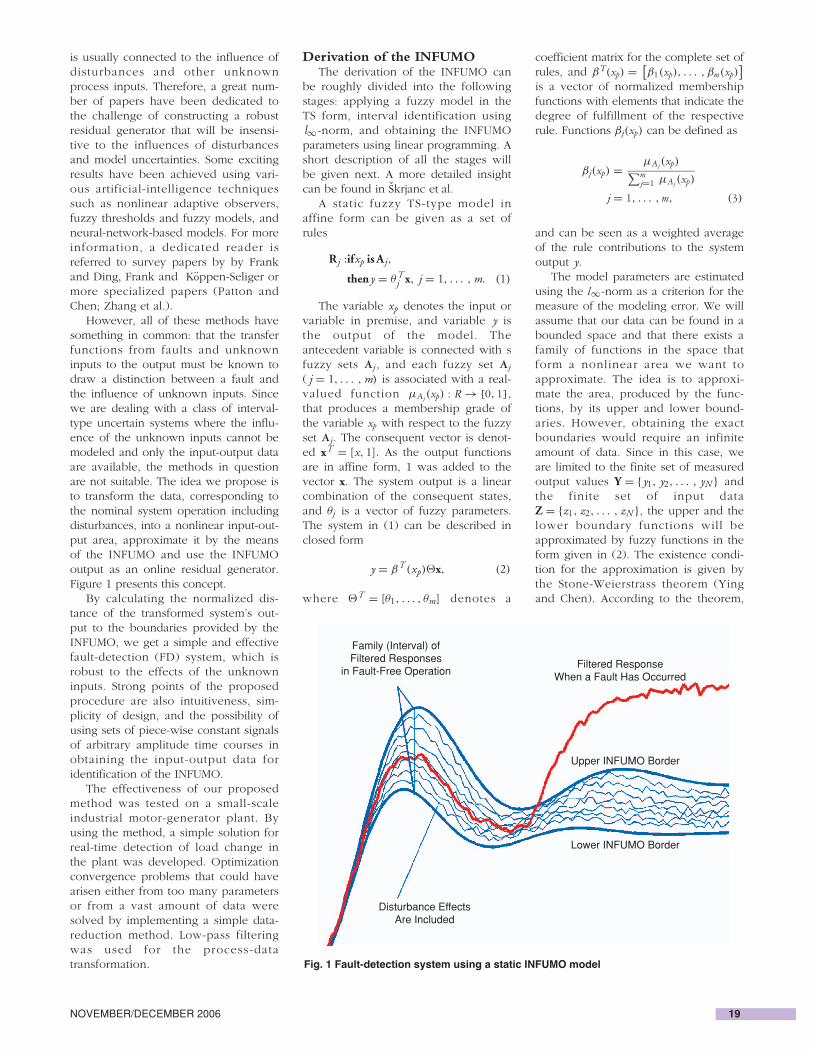
However, all of these methods havesomething in common: that the transferfunctions from faults and unknowninputs to the output must be known todraw a distinction between a fault andthe influence of unknown inputs. Sincewe are dealing with a class of interval-type uncertain systems where the influ-ence of the unknown inputs cannot bemodeled and only the input-output dataare available, the methods in questionare not suitable. The idea we propose isto transform the data, corresponding tothe nominal system operation includingdisturbances, into a nonlinear input-out-put area, approximate it by the meansof the INFUMO and use the INFUMOoutput as an online residual generator.Figure 1 presents this concept.
By calculating the normalized dis-tance of the transformed system’s out-put to the boundaries provided by theINFUMO, we get a simple and effectivefault-detection (FD) system, which isrobust to the effects of the unknowninputs. Strong points of the proposedprocedure are also intuitiveness, sim-plicity of design, and the possibility ofusing sets of piece-wise constant signalsof arbitrary amplitude time courses inobtaining the input-output data foridentification of the INFUMO.
The effectiveness of our proposedmethod was tested on a small-scaleindustrial motor-generator plant. Byusing the method, a simple solution forreal-time detection of load change inthe plant was developed. Optimizationconvergence problems that could havearisen either from too many parametersor from a vast amount of data weresolved by implementing a simple data-reduction method. Low-pass filteringwas used for the process-datatransformation.
Derivation of the INFUMOThe derivation of the INFUMO can
be roughly divided into the followingstages: applying a fuzzy model in theTS form, interval identification usingl∞-norm, and obtaining the INFUMOparameters using linear programming. Ashort description of all the stages willbe given next. A more detailed insightcan be found in Skrjanc et al.
A static fuzzy TS-type model inaffine form can be given as a set ofrules
Rj :ifxp is Aj,
theny = θTj x, j = 1, . . . , m. (1)
The variable xp denotes the input orvariable in premise, and variable y isthe output of the model. Theantecedent variable is connected with sfuzzy sets Aj, and each fuzzy set Aj
( j = 1, . . . , m) is associated with a real-valued function µAj(xp) : R → [0, 1] ,that produces a membership grade ofthe variable xp with respect to the fuzzyset Aj. The consequent vector is denot-ed xT = [x, 1]. As the output functionsare in affine form, 1 was added to thevector x. The system output is a linearcombination of the consequent states,and θj is a vector of fuzzy parameters.The system in (1) can be described inclosed form
y = βT (xp)�x, (2)
where �T = [θ1, . . . , θm] denotes a
coefficient matrix for the complete set ofrules, and β T(xp) = [
β1(xp), . . . , βm(xp)]
is a vector of normalized membershipfunctions with elements that indicate thedegree of fulfillment of the respectiverule. Functions βj(xp) can be defined as
βj(xp) = µAj(xp)∑m
j=1 µAj(xp)
j = 1, . . . , m, (3)
and can be seen as a weighted averageof the rule contributions to the systemoutput y.
The model parameters are estimatedusing the l∞-norm as a criterion for themeasure of the modeling error. We willassume that our data can be found in abounded space and that there exists afamily of functions in the space thatform a nonlinear area we want toapproximate. The idea is to approxi-mate the area, produced by the func-tions, by its upper and lower bound-aries. However, obtaining the exactboundaries would require an infiniteamount of data. Since in this case, weare limited to the finite set of measuredoutput values Y = {y1, y2, . . . , yN } andthe finite set of input dataZ = {z1, z2, . . . , zN }, the upper and thelower boundary functions will beapproximated by fuzzy functions in theform given in (2). The existence condi-tion for the approximation is given bythe Stone-Weierstrass theorem (Yingand Chen). According to the theorem,
Fig. 1 Fault-detection system using a static INFUMO model
Family (Interval) ofFiltered Responses
in Fault-Free OperationFiltered Response
When a Fault Has Occurred
Lower INFUMO Border
Upper INFUMO Border
Disturbance EffectsAre Included

20 IEEE POTENTIALS
there exists a fuzzy system f such that
maxzi∈Z
∣∣ f (zi) − g (zi)
∣∣ < ε, ∀i, (4)
i.e., a fuzzy function f can approximatean arbitrary nonlinear function g with anydesired degree of accuracy for any ε.
To estimate the optimal parametersof the proposed fuzzy function, twotasks must be accomplished: definingand arranging the membership func-tions and calculating the optimal fuzzyparameters. Finding the optimalarrangement of membership functionssurpasses the scope of this article.Hence, let us assume that linear mem-bership functions are used, and theapex positions are calculated using oneof the clustering methods, e.g., c-meansclustering (Ying and Chen).
After arranging the membershipfunctions, the optimal fuzzy parametersare obtained by minimization of themaximum modeling error
maxzi∈Z
∣∣yi − f (zi)
∣∣
= maxzi∈Z
∣∣∣yi − βT (xp)�x (zi)
∣∣∣ (5)
over the whole input set Z. This impliesthe min-max optimization method, andl∞-norm is used here as the maximumdifference between the elements of twovectors. Note that the data are obtainedby sampling different output functions ywith arbitrary values of z. The idea ofrobust interval fuzzy modeling can beseen as finding a lower fuzzy function fand an upper fuzzy function f that sat-isfy the following condition:
f (zi) ≤ yi ≤ f (zi), ∀zi ∈ Z. (6)
This also means that we get a bandof data in which all yi can be foundwith a value probability of one. Themain requirement when defining theband is that it is as narrow as possiblewithin the proposed constraints.
The upper and the lower fuzzy func-tions, respectively, can be found bysolving the following optimizationproblems for ∀i
min�
maxzi∈Z
∣∣∣yi − β T(xpi)�x(zi)
∣∣∣ ,
if yi − β T(xpi)�x(zi) ≥ 0,
min�
maxzi∈Z
∣∣∣yi − β T(xpi)�x(zi)
∣∣∣ ,
if yi − β T(xpi)�x(zi) ≤ 0.
(7)
The solutions to both problems canbe found by linear programming becauseboth problems can be viewed as solvingthe min-max optimization problem, asdescribed in detail in the Skrjanc et al.paper. This brings simplicity to the real-ization of the optimizing process.However, large data sets and a largenumber of parameters will still pose athreat to optimization convergence. Inthe first case, we approach the problemwith data-reduction methods. In the lattercase, we have to find solutions to reducethe number of parameters.
Residual formation and diagnostic scenario
As was shown by Frank and Ding, allresidual generators can be designed by
r (t) = Q (p)(y (t) − y (t)), (8)
with y (t) as an output estimation andQ (p) is a filter that is free to design andenhances the residual robustness to theunknown process inputs. Combining(8) with (2), the following relation canbe written
r(t) = Q (p)(y(t) − βT �u(t))
= Q (p)y(t) − Q (p)βT �u(t)
= yf (t) − βT �u f (t) (9)
where u(t) = [u(t) 1
]Tdenotes the aug-
mented input vector. The main idea ofthe proposed approach is to filter boththe input and the output data, thus
Fig. 3 Schematic representation of the motor-generator plant
A/D
U/n
D/A
+−
um
ug
− +
G MM
Fig. 2 Fault-detection system using a static INFUMO model
u yp
yf
ufd(yf)
LPF
Process
InfumoModel DIST
LPF
yf
yf

obtaining a confidence band of filteredinput-output data pairs, approximatethe band using the optimization proce-dure of the INFUMO, and connect theINFUMO in parallel to the process toget online estimations of the boundaryoutputs. For fault detection, the deci-sion function should consist of verifyingthat each measurement belongs to thecorresponding confidence band. Toprovide quantitative information aboutthe proximity of the measurements tothe closest interval boundaries, dis-tances were used (Fagarasan et al.). If afiltered output value yf (t) belongs to aninterval
[y
f(t), yf (t)
], and if the mean
interval value is denoted yf (t), the pro-posed distance is defined in the follow-ing way:
if yf (t) < y f (t), d (yf ) = yf (t) − y f (t)
yf(t) − y f (t)
if yf (t) > y f (t), d (yf ) = yf (t) − y f (t)
y f (t) − y f (t).
(10)
The distance in (10) is zero whenthe measurement is equal to yf , andapproaches the value one if the mea-surement is close to one of the intervalboundaries. A fault is signaled everytime d(yf ) exceeds the value one.Figure 2 gives a schematic representa-tion of the proposed fault-detection sys-tem. The filter Q(p) is represented by ablock denoted LPF, and the distance iscalculated in the DIST block.
Application of the INFUMO in the fault detection of amotor-generator plant
In this section, the application of theINFUMO in the robust identificationand FD of a process from a class of sys-tems with uncertain and interval-typeparameters will be presented.
The electromechanical process con-sists of two dc motors that are mountedfacing each other, as shown in Fig. 3. Thedriving shafts are rigidly coupled. The leftmotor, marked as G, is the load of themotor M when operating in generatormode. Applying a negative voltage to thegenerator produces mechanical torqueand results in a shift of the operating con-ditions. The system output is the voltageobtained by a tacho generator, which ismounted to the shaft and converts therotary speed to a dc-voltage output sig-nal. um and ug are the input voltages forthe excitation and the load, respectively.
The signals are connected through ananalog/digital-digital/analog converter toa PC. The plant setup enables one to con-trol the shaft speed by changing themotor’s input voltage.
The process parameters are uncer-tain. If consecutive open-loop experi-ments on identical input signals are performed, the output responses willform a set of different trajectories ratherthan a single one. One of the reasonsfor such behavior is that the system per-formance depends on the operatingtemperature.
Experiments show that load valuesranging from ug = 0 V to ug = −0.05 Vdo not shift the operating conditionssubstantially. Hence, the confidenceload interval was defined as [−0.05, 0]V. With reference to the given INFUMOidentification procedure, a confidenceband of input-output data must bedefined. This band will represent themost significant operating range of theplant and include all unexpected devia-tions due to parameter uncertainties. Aset of 30 experiments was carried out,i.e., five series of six identification sig-nals at load voltages from the lowest tothe highest value in 0.01 V steps. Theinputs and associated output signals are
shown in Fig. 4. For the sake of brevity,only the first, the second, and the lastdata sets are presented.
One of the major benefits of theinterval fuzzy model identification,shown in Fig. 4, is that the input signalscan be arbitrary. Normally, to get a confidence band of measurements, itwould be necessary to that experimentswith identical excitation signals are con-ducted. In industrial practice, however,a huge amount of various testing data isusually available when new equipmentis introduced to the production process.
Therefore, we feel that being able tocreate an FD system based on dataacquired from a set of experiments onunequal signals is a benefit that couldcome of great use when applying theproposed method in practice.
According to (8), the input and outputsignals are subjected to low-pass filtering(LFP). The structure of the LPF was cho-sen as a simple first-order system, repre-sented by the transfer function in (11)
G f = 1
Tf s + 1. (11)
Optimal design of the LPF timeconstant was not considered in thisstudy. The cut-off frequency must be
Fig. 4 Process inputs and outputs: the first, the second, and the last experiment
2.2
2
1.8
1.6
1.4
0 100 200
0 100 200
0 100 200
u 1(t
)
y 1(t
)
2.2
1.8
2
1.6
1.4
u 2(t
)
2.2
2
1.8
1.6
1.4
u 30(
t)
0
2
4
6
8
y 2(t
)
0
2
4
6
8
0 100 200
y 30(
t)
0
2
4
6
8
0 100 200
0 100 200t [s] t [s]
NOVEMBER/DECEMBER 2006 21
22 IEEE POTENTIALS
low enough to allow only slowlychanging signals to propagate throughthe filter. As this directly affects thechoice of the time constant, a com-promise has to be made to ensure thatthe system response is not too slow.
Hence, it was chosen as Tf = 30 s.This way, a compact set of measure-ments that represents steady-state sys-tem behavior is obtained. It can beseen as a load-dependent static input-output mapping area.
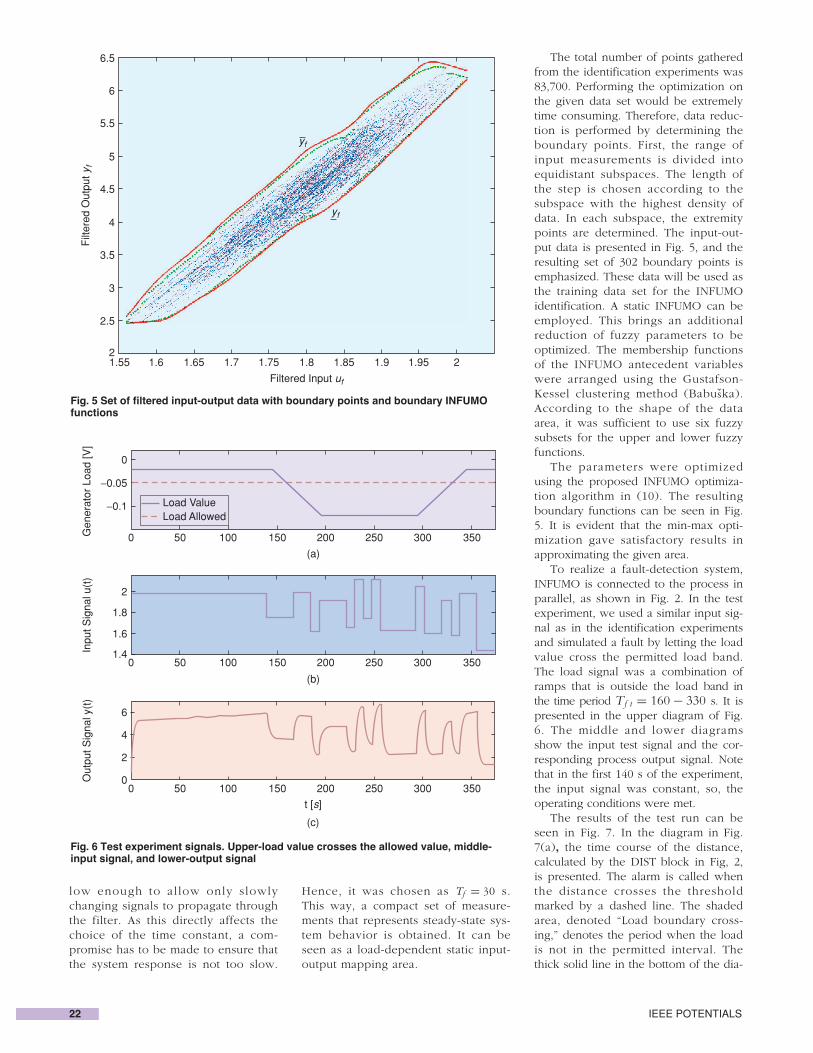
The total number of points gatheredfrom the identification experiments was83,700. Performing the optimization onthe given data set would be extremelytime consuming. Therefore, data reduc-tion is performed by determining theboundary points. First, the range ofinput measurements is divided intoequidistant subspaces. The length ofthe step is chosen according to thesubspace with the highest density ofdata. In each subspace, the extremitypoints are determined. The input-out-put data is presented in Fig. 5, and theresulting set of 302 boundary points isemphasized. These data will be used asthe training data set for the INFUMOidentification. A static INFUMO can beemployed. This brings an additionalreduction of fuzzy parameters to beoptimized. The membership functionsof the INFUMO antecedent variableswere arranged using the Gustafson-Kessel clustering method (Babuska).According to the shape of the dataarea, it was sufficient to use six fuzzysubsets for the upper and lower fuzzyfunctions.
The parameters were optimizedusing the proposed INFUMO optimiza-tion algorithm in (10). The resultingboundary functions can be seen in Fig.5. It is evident that the min-max opti-mization gave satisfactory results inapproximating the given area.
To realize a fault-detection system,INFUMO is connected to the process inparallel, as shown in Fig. 2. In the testexperiment, we used a similar input sig-nal as in the identification experimentsand simulated a fault by letting the loadvalue cross the permitted load band.The load signal was a combination oframps that is outside the load band inthe time period Tf t = 160 − 330 s. It ispresented in the upper diagram of Fig.6. The middle and lower diagramsshow the input test signal and the cor-responding process output signal. Notethat in the first 140 s of the experiment,the input signal was constant, so, theoperating conditions were met.
The results of the test run can beseen in Fig. 7. In the diagram in Fig.7(a), the time course of the distance,calculated by the DIST block in Fig, 2,is presented. The alarm is called whenthe distance crosses the thresholdmarked by a dashed line. The shadedarea, denoted “Load boundary cross-ing,” denotes the period when the loadis not in the permitted interval. Thethick solid line in the bottom of the dia-
Fig. 5 Set of filtered input-output data with boundary points and boundary INFUMOfunctions
2
2.5
3
3.5
4
4.5
5
5.5
6
6.5
Filt
ered
Out
put y
f
Filtered Input uf
1.55 1.6 1.65 1.7 1.75 1.8 1.85 1.9 1.95 2
yf
yf
Fig. 6 Test experiment signals. Upper-load value crosses the allowed value, middle-input signal, and lower-output signal
Load ValueLoad Allowed
0
−0.05
−0.1
Gen
erat
or L
oad
[V]
0 50 100 150 200 250 300 350
0 50 100 150 200 250 300 350
0 50 100 150 200 250 300 350
2
1.8
1.6
1.4Inpu
t Sig
nal u
(t)
Out
put S
igna
l y(t
)
6
4
2
0
(a)
(b)
(c)
t [s]

NOVEMBER/DECEMBER 2006 23
gram, denoted “FD alarm,” indicates theperiods when the alarm is called. Thelower diagram shows the comparisondone by the FD system. The filteredprocess output is compared to theboundaries provided by the INFUMO.
It is evident that the proposed FDsystem successfully tracks the loadcrossing of the permitted band. Thetime needed to detect the fault was21 s. The complete period when thealarm was called coincides with thefault period. There is a time delay incalling the alarm that depends on thewidth of the tolerance band and theway the process responds to the loadchange. On one short occasion, thealarm was not called correspondingly.This will be discussed with reference tothe Fig. 7(b). It can be seen that duringthe second transient after the occur-rence of the fault, the filtered processoutput crossed the boundary area for ashort period of time. It can be conclud-ed that in this case, fault prediction wasnot certain due to the effect of theplant’s unmodeled dynamics. Since thefilter time constant can be seen as atradeoff between robustness to theunknown process inputs and speed ofthe FD system, one way of reducingthis uncertainty would be to find theoptimal structure and parameters of theapplied filter. However, the latter wasnot considered in this work.
ConclusionsA novel approach of INFUMO has
been applied in fault detection. TheINFUMO was derived using the l∞ -norm function approximation. It wasshown that the INFUMO enables theconfining of an arbitrary nonlinear con-fidence band with an upper and lowerfuzzy function. It is therefore suitablefor the identification of systems withuncertain parameters, as all the system
responses in the given interval ofuncertainty can be found in the confi-dence band with a probability value ofone. The benefit in fault detection is tobe able to directly model a family ofinterval-type parameter systems, whichguarantees fault-tolerant action.
An application involving the load-change detection of a motor-generatorpilot plant was presented. To get a con-fidence band of system responses, alarge number of experiments was car-ried out, which resulted in a huge set ofdata. The problem of data reductionwas dealt with by filtering the input andoutput signals using a low-pass filter.The main benefits were the possibilityof using arbitrary input signals and thesimplicity of the fuzzy static model thatwas used. The boundary points of thegathered-data set were determined byusing a simple algorithm and used as atraining-data set for identification by lin-ear programming. Connecting theINFUMO to the process in parallel andemploying an online calculation of thenormalized distance of the filteredprocess output from the nearest bound-ary, the proposed approach was provento be successful in detecting unwantedload changes.
Future work will concentrate on anoptimization of the filter parameters,investigating the performance resultingfrom different choices of filter struc-tures, and investigating possible exten-sions to frequency-based methods andfault-tolerant control.
Read more about it• R. Babuska, Fuzzy Modeling for
Control. Norwell, MA: Kluwer Academic,1998.
• R. Babuska and H.B. Verbruggen,“An overview of fuzzy modeling for con-trol,” Control Eng. Practice, vol. 4, no.11, pp. 1593–1606, 1996.
• I. Fagarasan, S. Ploix, and S. Gentil,“Causal fault detection and isolationbased on a set-membership approach,”Automatica, no. 40, pp. 2099–2110,2004.
• P.M. Frank and X. Ding, “Survey ofrobust residual generation and evalua-tion methods in observer-based faultdetection systems,” J. Proc. Control, vol.7, no. 6, 403–424, 1997.
• P.M. Frank and B. K oppen-Seliger, “New developments using AIin fault diagnosis,” Eng. Applicat.Artificial Intelli., vol. 10, no. 1, pp.3–14, 1997.
• R.J. Patton and J. Chen, “Observer-based fault detection and isolation:Robustness and applications,” ControlEng. Practice, vol. 5, no. 5, pp. 671–682,1997.
• I. Skrjanc, S. Blaz ic , and O.Agamennoni, “Identification of dynami-cal systems with a robust intervalmodel,” Automatica, vol. 41, no. 2, pp.327–332, 2005.
• T. Takagi and M. Sugeno, “Fuzzyidentification of systems and its applica-tions to modeling and control,” IEEETrans. Syst., Man, Cybern., vol. 15, pp.116–132, 1985.
• H. Ying and G. Chen, “Necessaryconditions for some typical fuzzy sys-tems as universal approximators,”Automatica, vol. 33, no. 7, pp.1333–1338, 1997.
• X. Zhang, M.M. Polycarpou, andT. Parisini, “A robust detection and iso-lation scheme for abrupt and incipientfaults in nonlinear systems,” IEEETrans. Automat. Contr., vol. 47, no. 4,pp. 576–593, 2002.
About the authorsSimon Oblak ([email protected]),Igor Skrjanc, and Saso Blazic are withFaculty of Electrical Engineering,University of Ljubljana, Slovenia.
Fig. 7 Results of the fault detection system: (a) distance time course and (b) lower-test results as seen from the FD system
Upper Bound
Tolerance BandFault AreaSimulation ResultLower Bound
FD Alarm:
2.5
2
1.5
1
0.5
0
6
5
4
30 50 100 150 200 250 300 3500 50 100 150 200 250 300 350
Dis
tanc
e
y mu,
ym
l, y l
oadLoad Boundary Crossing
t [s] t [s]
(a) (b)
Copyright © 2022 FDOKUMEN