Issued ACFR 2021 Metropolitan Knoxville Airport Authority
93
Annual Comprehensive Financial Report 2021 An instrumentality of the City of Knoxville, Tennessee For the fiscal years ended June 30, 2021 and 2020 Prepared By: Accounting and Finance Department of the Metropolitan Knoxville Airport Authority FlyKnoxville.com
-
Upload
khangminh22 -
Category
Documents
-
view
1 -
download
0
Transcript of Issued ACFR 2021 Metropolitan Knoxville Airport Authority

Annual Comprehensive Financial Report
2021
An instrumentality of the City of Knoxville, Tennessee
For the fiscal years ended June 30, 2021 and 2020
Prepared By:Accounting and Finance Department of the Metropolitan Knoxville Airport Authority
FlyKnoxville.com

This page intentionally left blank

Metropolitan Knoxville Airport Authority
An instrumentality of the City of Knoxville, TN For the Fiscal Years ended June 30, 2021 and 2020
2021 Annual
Comprehensive Financial Report
Prepared By: Accounting and Finance Department of the Metropolitan Knoxville Airport
Authority
www.flyknoxville.com

This page intentionally left blank

INTRODUCTORY SECTION This section contains the fo llowing subsections: Table of Contents Metropolitan Knoxville Airport Authority Officials Letter of Transmittal and Exhibits Organizational Chart
1

This page intentionally left blank
2

TABLE OF CONTENTS Introductory section Metropolitan Knoxville Airport Authority Officials & Key Staff Members 5 Letter of transmittal and exhibits 7 Organizational chart 16 Financial section Independent auditor’s report 19 Management’s discussion and analysis 22 Financial statements:
Statements of net position 32 Statements of revenues, expenses and changes in net position 34 Statements of cash flows 35 Notes to financial statements 37
Statistical section (unaudited) Schedule 1: Operating revenues and expenses—last ten fiscal years 54 Schedule 2: Debt service coverage—last ten fiscal years 55 Schedule 3: Ratios of debt service and outstanding debt—last ten fiscal years 56 Schedule 4: McGhee Tyson Airport annual terminal rents and landing fees—last ten fiscal years 57 Schedule 5: Airline arrivals and departures—last ten fiscal years 58 Schedule 6: Historical airline passenger activity—last ten fiscal years 59 Schedule 7: Distribution of airline passengers—fiscal year ended June 30, 2021 59 Schedule 8: Cargo—last ten fiscal years 60 Schedule 9: Distribution of cargo—fiscal year ended June 30, 2021 60 Schedule 10: Aircraft landed weights—last ten fiscal years 61 Schedule 11: Aircraft landed weights—ten fiscal year trend history 62 Schedule 12: Total passengers—ten fiscal year trend history 63 Schedule 13: Distribution of total cargo—ten fiscal year trend history 64 Schedule 14: Authority employees and demographic data—population 65 Schedule 15: Demographic data—unemployment information last ten calendar years 66 Schedule 16: Demographic data—per capita personal income last ten calendar years 66 Schedule 17: Demographic data—total personal income last ten calendar years 66 Schedule 18: Demographic data—top employers in Knoxville area for last ten calendar years 67 Schedule 19: Airlines serving McGhee Tyson Airport 68 Schedule 20: Flight information 69 Schedule 21: Companies conducting business on airport property 70 Schedule 22: Use of debt proceeds 71 Schedule 23: Insurance in force 72 Schedule 24: Major airport capital improvements completed 73 Schedule 25: Capital asset information 74
Compliance section Schedule of expenditures of federal awards, state financial assistance and passenger facility
charges collected and expended 76 Schedule of long-term debt principal and interest requirements 79 Schedule of changes in long-term debt by individual issue 80 Independent auditor’s report on internal control over financial reporting and on compliance
and other matters based on an audit of financial statements performed in accordance with Governmental Auditing Standards 82
Independent auditor’s report on compliance for each major federal program and the passenger facility charge program and on internal control over compliance in accordance with the Uniform Guidance 84
Schedule of findings and questioned costs 86 Corrective action plan and schedule of prior year audit findings 87
METROPOLITAN KNOXVILLE AIRPORT AUTHORITY
45
NOTES TO FINANCIAL STATEMENTS (continued)
5. Long-Term Debt (continued)
Scheduled Debt Service Requirements As of June 30, 2016, scheduled debt service requirements of the variable-rate debt and net swap payments, assuming current interest rates remain the same for their term are as follows. As rates vary, variable-rate bond interest payments and net swap payments will vary.
Year ending
Variable Rate Bonds
Interest Rate
June 30
Principal
Interest
Swaps, net
Total
2017
$ 4,590,000
$ 562,983
$ 985,043
$ 6,138,026
2018
4,825,000
522,361
830,113
6,177,474
2019
5,075,000
479,483
667,315
6,221,798
2020
5,335,000
434,090
496,213
6,265,303
2021
5,610,000
386,211
316,408
6,312,619
2022-2026 32,520,000 1,107,156 405,195 34,032,351
2027-2028
12,680,000
86,013
-
12,766,013
Total
$70,635,000
$3,578,297
$3,700,287
$77,913,584
6. Fair Value The Authority categorizes its fair value measurements within the fair value hierarchy established by generally accepted accounting principles. The hierarchy is based on the valuation inputs used to measure the fair value of the assets. Level 1 inputs are quoted prices in active markets for identical assets. Level 2 inputs are significant other observable inputs. Level 3 inputs are significant unobservable inputs. Debt securities are valued based on the securities’ relationship to benchmark quoted prices. Derivative instruments are valued using a market approach that considers benchmark interest rates. The following table sets forth by level, within the fair value hierarchy, the fair value of the Authority’s investments and interest rate swap liabilities as of June 30, 2016:
Level 1 Level 2 Level 3 Total Investments: Government debt securities $ – $ 39,998,469 $ – $ 39,998,469
Interest rate swap liabilities $ – $ 4,502,609 $ – $ 4,502,609
The following table sets forth by level, within the fair value hierarchy, the fair value of the Authority’s investments and derivative investments as of June 30, 2015:
Level 1 Level 2 Level 3 Total Investments: Government debt securities $ – $ 40,071,930 $ – $ 40,071,930
Derivative instruments: Interest rate swaps $ – $ 4,883,863 $ – $ 4,883,863
3

This page intentionally left blank
4

OFFICIALS
As of June 30, 2021
Board of Commissioners Position Term Expires
Brian M. Simmons Chairman June 30, 2025
Jeff W. Smith Vice Chairman June 30, 2023
Charles R. Harr Secretary June 30, 2022
Joseph M. Dawson Assistant Secretary June 30, 2023
Ursula Bailey June 30, 2026
Julia A. Bentley June 30, 2024
Maribel Koella June 30, 2028
Eddie Mannis June 30, 2023
Howard Vogel June 30, 2027
OFFICERS AND KEY STAFF MEMBERS (Related to this report)
Patrick W. Wilson, A.A.E. President
Nancy White, CPA, C.M. Vice President of Finance
James H. Evans, Jr., C.M. Vice President of Marketing & Air Service Development
Trevis D. Gardner, A.A.E. Vice President o f Operations
Bryan White, PE, C.M. Vice Pres ident o f Engineering & Planning
Willie T. Aiken Director o f Publi c Safety
Becky Huckaby, APR, A.A.E. Vice President o f Public Relations
Yin Chen, CPA Contro l l e r
Treva H. Best, CAP, OM Senior Executive Assistant
Adrienne Washington, MA, SPHR, SHRM Director of Human Resources
Mark Mamantov Legal Counsel, Bass, Berry & Sims PLC
METROPOLITAN KNOXVILLE AIRPORT AUTHORITY
45
NOTES TO FINANCIAL STATEMENTS (continued)
5. Long-Term Debt (continued)
Scheduled Debt Service Requirements As of June 30, 2016, scheduled debt service requirements of the variable-rate debt and net swap payments, assuming current interest rates remain the same for their term are as follows. As rates vary, variable-rate bond interest payments and net swap payments will vary.
Year ending
Variable Rate Bonds
Interest Rate
June 30
Principal
Interest
Swaps, net
Total
2017
$ 4,590,000
$ 562,983
$ 985,043
$ 6,138,026
2018
4,825,000
522,361
830,113
6,177,474
2019
5,075,000
479,483
667,315
6,221,798
2020
5,335,000
434,090
496,213
6,265,303
2021
5,610,000
386,211
316,408
6,312,619
2022-2026 32,520,000 1,107,156 405,195 34,032,351
2027-2028
12,680,000
86,013
-
12,766,013
Total
$70,635,000
$3,578,297
$3,700,287
$77,913,584
6. Fair Value The Authority categorizes its fair value measurements within the fair value hierarchy established by generally accepted accounting principles. The hierarchy is based on the valuation inputs used to measure the fair value of the assets. Level 1 inputs are quoted prices in active markets for identical assets. Level 2 inputs are significant other observable inputs. Level 3 inputs are significant unobservable inputs. Debt securities are valued based on the securities’ relationship to benchmark quoted prices. Derivative instruments are valued using a market approach that considers benchmark interest rates. The following table sets forth by level, within the fair value hierarchy, the fair value of the Authority’s investments and interest rate swap liabilities as of June 30, 2016:
Level 1 Level 2 Level 3 Total Investments: Government debt securities $ – $ 39,998,469 $ – $ 39,998,469
Interest rate swap liabilities $ – $ 4,502,609 $ – $ 4,502,609
The following table sets forth by level, within the fair value hierarchy, the fair value of the Authority’s investments and derivative investments as of June 30, 2015:
Level 1 Level 2 Level 3 Total Investments: Government debt securities $ – $ 40,071,930 $ – $ 40,071,930
Derivative instruments: Interest rate swaps $ – $ 4,883,863 $ – $ 4,883,863
5

This page intentionally left blank
6

M E T R O P O L I TA N
K N O X V I L L E A I R P O R T
A U T H O R I T Y
November 17, 2021 To the Board of Commissioners of the Metropolitan Knoxville Airport Authority:
The Annual Comprehensive Financial Report of the Metropolitan Knoxville Airport Authority (the Authority) for the fiscal year ended June 30, 2021, is hereby submitted. The purpose of the report is to present fairly and disclose fully the Authority’s financial position and the results of its operations. The report consists of four sections: Introductory, Financial, Statistical and Compliance. The financial statements were audited by Coulter & Justus, P.C., Certified Public Accountants, and the supplementary information was prepared by the Accounting and Finance Department. This report is published in accordance with the laws and/or regulations of the State of Tennessee. The audit was conducted in accordance with auditing standards generally accepted in the United States of America and the standards applicable to financial audits contained in Government Auditing Standards, issued by the Comptroller General of the United States and requirements prescribed by the Comptroller of the Treasury, State of Tennessee. This report consists of management’s representations concerning the financial position of the Authority. Consequently, management assumes full responsibility for the completeness and reliability of all information presented in this report. To provide a reasonable basis for making these representations, management of the Authority has established a comprehensive internal control framework that has been designed to both protect the Authority’s assets from loss, theft, or misuse and to compile sufficient reliable information for the preparation of the Authority’s financial statements in conformity with accounting principles generally accepted in the United States of America (GAAP). Because the cost of internal controls should not outweigh their benefits, the Authority’s comprehensive framework of internal controls has been designed to provide reasonable rather than absolute assurance that the financial statements will be free from material misstatements. As management, we assert that, to the best of our knowledge and belief, this report is complete and reliable in all material respects. The goal of the independent audit is to provide reasonable assurance that the financial statements of the Authority for the years ended June 30, 2021 and 2020, are free of material misstatement. The independent audit involved examining, on a test basis, evidence supporting the amounts and disclosures in the financial statements, assessing the accounting principles used and any significant estimates made by management and evaluating the overall financial statements presentation. The independent auditor concluded, based upon their audit, that there was a reasonable basis for rendering an unmodified opinion and that the Authority’s financial statements for the years ended June 30, 2021 and 2020, are in conformity with GAAP. The independent auditor’s report is the first component of the financial section of this report. The independent audit of the financial statements is part of the broader mandated provisions of Title 2 U.S. Code of Federal Regulations Part 200, Uniform Administrative Requirements, Cost Principles and Audit Requirements for Federal Awards, relative to federal financial awards received from the U.S. Government. It is also in conformity with the provisions of the September 2000 Audit Compliance and Reporting Guide for Public Agencies relative to the collection and use of Passenger Facility Charges.
METROPOLITAN KNOXVILLE AIRPORT AUTHORITY
45
NOTES TO FINANCIAL STATEMENTS (continued)
5. Long-Term Debt (continued)
Scheduled Debt Service Requirements As of June 30, 2016, scheduled debt service requirements of the variable-rate debt and net swap payments, assuming current interest rates remain the same for their term are as follows. As rates vary, variable-rate bond interest payments and net swap payments will vary.
Year ending
Variable Rate Bonds
Interest Rate
June 30
Principal
Interest
Swaps, net
Total
2017
$ 4,590,000
$ 562,983
$ 985,043
$ 6,138,026
2018
4,825,000
522,361
830,113
6,177,474
2019
5,075,000
479,483
667,315
6,221,798
2020
5,335,000
434,090
496,213
6,265,303
2021
5,610,000
386,211
316,408
6,312,619
2022-2026 32,520,000 1,107,156 405,195 34,032,351
2027-2028
12,680,000
86,013
-
12,766,013
Total
$70,635,000
$3,578,297
$3,700,287
$77,913,584
6. Fair Value The Authority categorizes its fair value measurements within the fair value hierarchy established by generally accepted accounting principles. The hierarchy is based on the valuation inputs used to measure the fair value of the assets. Level 1 inputs are quoted prices in active markets for identical assets. Level 2 inputs are significant other observable inputs. Level 3 inputs are significant unobservable inputs. Debt securities are valued based on the securities’ relationship to benchmark quoted prices. Derivative instruments are valued using a market approach that considers benchmark interest rates. The following table sets forth by level, within the fair value hierarchy, the fair value of the Authority’s investments and interest rate swap liabilities as of June 30, 2016:
Level 1 Level 2 Level 3 Total Investments: Government debt securities $ – $ 39,998,469 $ – $ 39,998,469
Interest rate swap liabilities $ – $ 4,502,609 $ – $ 4,502,609
The following table sets forth by level, within the fair value hierarchy, the fair value of the Authority’s investments and derivative investments as of June 30, 2015:
Level 1 Level 2 Level 3 Total Investments: Government debt securities $ – $ 40,071,930 $ – $ 40,071,930
Derivative instruments: Interest rate swaps $ – $ 4,883,863 $ – $ 4,883,863
7

The standards governing these provisions require the independent auditor not only to report on the fair presentation of the financial statements, but also on the Authority’s internal controls and compliance with legal requirements, with special emphasis on internal controls and legal requirements involving the administration of federal and state grant awards. See independent auditor’s reports presented in the Compliance Section. GAAP requires that management provide a narrative introduction, overview, and analysis to accompany the financial statements in the form of a Management’s Discussion and Analysis (MD&A). This letter of transmittal is designed to complement the MD&A and should be read in conjunction with it. The MD&A is in the financial section immediately following the independent auditor’s report. REPORTING ENTITY The Metropolitan Knoxville Airport Authority was established in 1978 under Chapter No. 174, Public Acts of the State of Tennessee, 1969, and pursuant to Resolution No. R-63-78 of the Council of the City of Knoxville, Tennessee. It was organized for and has as its sole purpose the ownership, management, operation and maintenance of McGhee Tyson Airport and other airports, auxiliary fields and other properties, either acquired by or placed under the control of the Authority as outlined in Chapter 174. The Authority currently operates two airports: McGhee Tyson Airport and Knoxville Downtown Island Airport. The Authority is an instrumentality of the City of Knoxville, governed by a nine-member Board of Commissioners appointed by the Mayor of the City of Knoxville. Each Commissioner is appointed for a seven-year term and must be confirmed by the Knoxville City Council. Since the Authority was established, it has been financially self-sufficient, with no local tax support. The Board employs a President, who is the chief administrative and executive officer of the Authority. The President manages the airports under the Authority’s control with a staff of 144 full-time equivalent employees. The staff is responsible for the day-to-day financial, administration, operational and personnel matters pertaining to the airports and the contractual arrangements with various aviation and non-aviation businesses. An annual operating budget is prepared and approved by the Authority’s Board of Commissioners. All appropriations for operating expenditures lapse at the end of the fiscal year and must be reappropriated for the following year. Separate accounts are maintained for major capital projects, which are closed when the asset is placed in service. Since there is no legal requirement to report on the budgetary basis, no budget information is presented in the accompanying financial statements. McGhee Tyson Airport Located just 15 miles from downtown Knoxville, McGhee Tyson Airport lies in Blount County on 2,734 acres in the rolling foothills of the Great Smoky Mountains and provides employment for approximately 3,000 people. McGhee Tyson has two parallel runways, one is currently under construction, and is served by most major U.S. airlines and/or their regional partner. These airlines provide numerous non-stop flights to destinations throughout the United States for approximately 2 million passengers each year. As a result of the COVID-19 pandemic, the number of passengers dropped to approximately 1.4 million in FY2021. The airport is also home to the Tennessee Air National Guard’s 134th Air Refueling Wing. McGhee Tyson is classified by the Federal Aviation Administration (FAA) as a small air traffic hub airport.
METROPOLITAN KNOXVILLE AIRPORT AUTHORITY
45
NOTES TO FINANCIAL STATEMENTS (continued)
5. Long-Term Debt (continued)
Scheduled Debt Service Requirements As of June 30, 2016, scheduled debt service requirements of the variable-rate debt and net swap payments, assuming current interest rates remain the same for their term are as follows. As rates vary, variable-rate bond interest payments and net swap payments will vary.
Year ending
Variable Rate Bonds
Interest Rate
June 30
Principal
Interest
Swaps, net
Total
2017
$ 4,590,000
$ 562,983
$ 985,043
$ 6,138,026
2018
4,825,000
522,361
830,113
6,177,474
2019
5,075,000
479,483
667,315
6,221,798
2020
5,335,000
434,090
496,213
6,265,303
2021
5,610,000
386,211
316,408
6,312,619
2022-2026 32,520,000 1,107,156 405,195 34,032,351
2027-2028
12,680,000
86,013
-
12,766,013
Total
$70,635,000
$3,578,297
$3,700,287
$77,913,584
6. Fair Value The Authority categorizes its fair value measurements within the fair value hierarchy established by generally accepted accounting principles. The hierarchy is based on the valuation inputs used to measure the fair value of the assets. Level 1 inputs are quoted prices in active markets for identical assets. Level 2 inputs are significant other observable inputs. Level 3 inputs are significant unobservable inputs. Debt securities are valued based on the securities’ relationship to benchmark quoted prices. Derivative instruments are valued using a market approach that considers benchmark interest rates. The following table sets forth by level, within the fair value hierarchy, the fair value of the Authority’s investments and interest rate swap liabilities as of June 30, 2016:
Level 1 Level 2 Level 3 Total Investments: Government debt securities $ – $ 39,998,469 $ – $ 39,998,469
Interest rate swap liabilities $ – $ 4,502,609 $ – $ 4,502,609
The following table sets forth by level, within the fair value hierarchy, the fair value of the Authority’s investments and derivative investments as of June 30, 2015:
Level 1 Level 2 Level 3 Total Investments: Government debt securities $ – $ 40,071,930 $ – $ 40,071,930
Derivative instruments: Interest rate swaps $ – $ 4,883,863 $ – $ 4,883,863
8

Knoxville Downtown Island Airport Knoxville Downtown Island Airport is a general aviation airport located less than three miles from down-town Knoxville and is base for more than one hundred and fifty private and corporate aircrafts. The airport has a 3,500-foot runway and is served by three published instrument approaches: a localizer approach to Runway 26, a GPS-based approach to Runway 26, and a VOR circling approach procedure. ECONOMIC CONDITIONS AND OUTLOOK The primary service area for McGhee Tyson Airport is the City of Knoxville and its Metropolitan Statistical Area (MSA), which comprises the heart of “Tennessee's Resource Valley”. According to the Bureau of the Census in 2020, the population of Knox County was 478,971 and the population for the City of Knoxville was 190,740. The estimated 2020 population for the Knoxville MSA was 864,442.
In addition, a broader regional market is defined as the Tennessee, Kentucky, Virginia, North Carolina, South Carolina and Georgia counties lying within 100 miles of McGhee Tyson Airport, which is the largest airport in the region. Knox County is the principal Gateway to the Great Smoky Mountains National Park, which is the country’s most visited national park. Great Smoky Mountains National Park experienced the second busiest year on record in 2020. In spite of a 46-day, full park closure this spring and partial closures through August due to the COVID-19 pandemic, the park had 12,095,720 visits. This marks the second time in park history that visitation exceeded 12 million visits. More than one-half of the nation’s population lives within 500 miles of the park, which is located half in Tennessee and half in North Carolina. Part of the Appalachian Range, the Great Smoky Mountains National Park contains 16 peaks higher than 6,000 feet, the highest being Clingmans Dome. According to the Federal Aviation Administration’s (FAA) Aerospace Forecast FY2021-2041, the industry experienced an unprecedented period of consolidation with three major mergers in five years. The results of these efforts were impressive. 2019 marked the eleventh consecutive year of profitability of the U.S. airline industry. The outbreak of the COVID-19 pandemic in 2020, however, brought a rapid and cataclysmic end to those boom years. Airline activity and profitability tumbled almost overnight and without the financial and competitive strength built up during the boom, airlines would have faced even greater challenges. Although several small regional carriers ceased operations in 2020, no mainline carriers did. The COVID-19 pandemic had a significant impact on airline passenger performance at Knoxville’s McGhee Tyson Airport during FY2021. The fiscal year began with the airport reeling from the destruction of passenger demand due to the pandemic. Air carrier moves to reduce costs led to numerous flight cancellations and suspensions. PSA Airlines (American Eagle) closed their Knoxville flight crew base and transferred over 300 pilots and flight attendants to other cities. ExpressJet Airlines (United Express) shut down completely, which led to the closing of their large maintenance center at McGhee Tyson Airport and the loss of over 250 skilled technical jobs. Overall airline service was significantly curtailed, but flights began to be restored in the second half of the fiscal year. The demand for international and corporate travel evaporated, but leisure travelers began to return to the skies during FY2021. Ultra-low fare carrier Allegiant Air responded with added capacity to new markets Austin, Boston, Chicago, and Houston while continuing service to nearly a dozen other cities from Knoxville. East Tennessee and the Great Smoky Mountains National Park became a popular place for visitors from major markets to escape the pandemic and enjoy the region’s plentiful outdoor recreation opportunities.
METROPOLITAN KNOXVILLE AIRPORT AUTHORITY
45
NOTES TO FINANCIAL STATEMENTS (continued)
5. Long-Term Debt (continued)
Scheduled Debt Service Requirements As of June 30, 2016, scheduled debt service requirements of the variable-rate debt and net swap payments, assuming current interest rates remain the same for their term are as follows. As rates vary, variable-rate bond interest payments and net swap payments will vary.
Year ending
Variable Rate Bonds
Interest Rate
June 30
Principal
Interest
Swaps, net
Total
2017
$ 4,590,000
$ 562,983
$ 985,043
$ 6,138,026
2018
4,825,000
522,361
830,113
6,177,474
2019
5,075,000
479,483
667,315
6,221,798
2020
5,335,000
434,090
496,213
6,265,303
2021
5,610,000
386,211
316,408
6,312,619
2022-2026 32,520,000 1,107,156 405,195 34,032,351
2027-2028
12,680,000
86,013
-
12,766,013
Total
$70,635,000
$3,578,297
$3,700,287
$77,913,584
6. Fair Value The Authority categorizes its fair value measurements within the fair value hierarchy established by generally accepted accounting principles. The hierarchy is based on the valuation inputs used to measure the fair value of the assets. Level 1 inputs are quoted prices in active markets for identical assets. Level 2 inputs are significant other observable inputs. Level 3 inputs are significant unobservable inputs. Debt securities are valued based on the securities’ relationship to benchmark quoted prices. Derivative instruments are valued using a market approach that considers benchmark interest rates. The following table sets forth by level, within the fair value hierarchy, the fair value of the Authority’s investments and interest rate swap liabilities as of June 30, 2016:
Level 1 Level 2 Level 3 Total Investments: Government debt securities $ – $ 39,998,469 $ – $ 39,998,469
Interest rate swap liabilities $ – $ 4,502,609 $ – $ 4,502,609
The following table sets forth by level, within the fair value hierarchy, the fair value of the Authority’s investments and derivative investments as of June 30, 2015:
Level 1 Level 2 Level 3 Total Investments: Government debt securities $ – $ 40,071,930 $ – $ 40,071,930
Derivative instruments: Interest rate swaps $ – $ 4,883,863 $ – $ 4,883,863
9

As FY2021 drew to a close, Knoxville airline passengers were trending up and approached 80% of pre-pandemic levels. Leisure travel remained dominant as the airport awaited the return of corporate travelers. The business modifications necessitated by the downturn will shape the industry for years to come. In the medium-term, airlines will be focused on trying to foretell the recovery in demand and position themselves to meet it. Long-term, the strengths and capabilities developed over the past decade will become evident again. There is confidence that U.S. airlines have finally transformed from a capital intensive, highly cyclical industry to an industry that can generate solid returns on capital and sustained profits. The general aviation (GA) sector was less affected by the COVID-19 crisis than the airlines. The long-term outlook for general aviation is more promising than before, as growth at the high-end offsets continuing retirements at the traditional low end of the section. Downtown Island Airport is experiencing a similar trend. Tennessee, the nation, and the world are currently in the grips of a health crisis. The COVID-19 pandemic has led to widespread sickness and death and has upended the way we live, the way people work, businesses operate, students learn, and consumers spend. The economic impact would have likely been even worse had it not been for federal stimulus provided through the Coronavirus Aid, Relief, and Economic Security Act (CARES ACT) and aggressive monetary policy by the Federal reserve. McGhee Tyson Airport was awarded $25.8M in CARES ACT funding followed by $5M in funding from an Airport Coronavirus Response Grant and $10.7M funding from the Airport Rescue Grant. AIRLINE INFORMATION During the year ended June 30, 2021, McGhee Tyson Airport’s five passenger airlines and/or their regional affiliates offered over 5,000 daily departing seats in 28 nonstop markets. In addition, two cargo airlines linked the airport with three major air cargo hubs. A complete listing of air carriers and destinations is as follows: Passenger Airlines Allegiant Air American Airlines* Delta Air Lines* Frontier Airlines United Airlines* *some or all service offered through regional airline affiliates shown below Regional Airline Affiliates Air Wisconsin / United Airlines CommutAir /United Airlines Endeavor Air/Delta Air Lines Envoy Airlines/American Airlines GoJet Airlines/United Airlines Mesa Airlines/American Airlines Mesa Airlines/United Airlines
Piedmont Airlines/American Airlines PSA Airlines Inc./American Airlines Republic Airlines/American Airlines Republic Airlines/United Airlines Skywest Airlines/American Airlines Skywest Airlines/United Airlines
Cargo Airlines FedEx, Inc. UPS Airlines, Inc.
METROPOLITAN KNOXVILLE AIRPORT AUTHORITY
45
NOTES TO FINANCIAL STATEMENTS (continued)
5. Long-Term Debt (continued)
Scheduled Debt Service Requirements As of June 30, 2016, scheduled debt service requirements of the variable-rate debt and net swap payments, assuming current interest rates remain the same for their term are as follows. As rates vary, variable-rate bond interest payments and net swap payments will vary.
Year ending
Variable Rate Bonds
Interest Rate
June 30
Principal
Interest
Swaps, net
Total
2017
$ 4,590,000
$ 562,983
$ 985,043
$ 6,138,026
2018
4,825,000
522,361
830,113
6,177,474
2019
5,075,000
479,483
667,315
6,221,798
2020
5,335,000
434,090
496,213
6,265,303
2021
5,610,000
386,211
316,408
6,312,619
2022-2026 32,520,000 1,107,156 405,195 34,032,351
2027-2028
12,680,000
86,013
-
12,766,013
Total
$70,635,000
$3,578,297
$3,700,287
$77,913,584
6. Fair Value The Authority categorizes its fair value measurements within the fair value hierarchy established by generally accepted accounting principles. The hierarchy is based on the valuation inputs used to measure the fair value of the assets. Level 1 inputs are quoted prices in active markets for identical assets. Level 2 inputs are significant other observable inputs. Level 3 inputs are significant unobservable inputs. Debt securities are valued based on the securities’ relationship to benchmark quoted prices. Derivative instruments are valued using a market approach that considers benchmark interest rates. The following table sets forth by level, within the fair value hierarchy, the fair value of the Authority’s investments and interest rate swap liabilities as of June 30, 2016:
Level 1 Level 2 Level 3 Total Investments: Government debt securities $ – $ 39,998,469 $ – $ 39,998,469
Interest rate swap liabilities $ – $ 4,502,609 $ – $ 4,502,609
The following table sets forth by level, within the fair value hierarchy, the fair value of the Authority’s investments and derivative investments as of June 30, 2015:
Level 1 Level 2 Level 3 Total Investments: Government debt securities $ – $ 40,071,930 $ – $ 40,071,930
Derivative instruments: Interest rate swaps $ – $ 4,883,863 $ – $ 4,883,863
10

Passenger Airline Destinations (as of June 30, 2021) Atlanta, Austin, Baltimore/Washington, Boston, Charlotte, Chicago-O’Hare, Chicago-Midway, Dallas/Fort Worth, Denver, Destin/Fort Walton Beach, Detroit, Fort Lauderdale, Houston-Bush, Houston-Hobby, Las Vegas, Miami, Minneapolis/St. Paul, Myrtle Beach, Newark, New York-LaGuardia, Orlando-Sanford, Philadelphia, Punta Gorda/SW Florida, Sarasota, St. Petersburg/Tampa Bay, Washington-Dulles, Washington-National, and West Palm Beach Cargo Airline Destinations Indianapolis, Louisville and Memphis Airline Activity McGhee Tyson Airport’s five passenger airlines and/or their regional affiliates operated approximately 100 daily (arrivals and departures) flights and served 1,391,469 passengers in FY2021, a decrease of 28.7 percent when compared to FY2020. Available airlines seats decreased 19.5 percent during the year. The FY2021 airport load factor (percentage of airline seats filled) was 65.9 percent, down from 72.5 percent in FY2020. There were 88,412,307 pounds of freight and mail that moved through the airport during FY2021, an increase of 5.3 percent compared to the previous year. FINANCIAL INFORMATION Long-term Financial Planning The current Airport Master Plan for McGhee Tyson Airport was adopted by the Board of Commissioners in July 2020. The Master Plan for the Knoxville Downtown Island Airport was approved by the FAA and TDOT Aeronautics Division in September 2021. The Airport Master Plan for McGhee Tyson defines a concept for development of the airport over the course of a 20-year planning period and is prepared in collaboration with the Federal and State agencies, local municipalities and interested airport tenants and users. The primary objective of the Plan is to produce a comprehensive planning guide for the continued development of a safe, effective, and environmentally compatible aviation facility to meet the goals of the Authority. The Plan incorporates a financial model that evaluates the financial impact of the capital projects identified for the 20-year planning horizon, from 2020 through 2040. The Authority prepares an annual operating and capital budget. The capital improvement program included in the budget identifies funding sources for capital projects for planning horizons of five years. The Authority has a five year Airport Lease and Use Agreement with the airlines that serve McGhee Tyson Airport. The current Agreement became effective on July 1, 2018, and expires on June 30, 2023. The Airport Lease and Use Agreement with the signatory airlines is a hybrid agreement. Airfield costs are recovered using the residual method. The Authority recovers the airfield cost by charging commercial aircraft a landing fee and general aviation aircraft a fuel flowage fee. The military pays a joint use fee for their share of the airfield costs. Airline terminal rents are calculated using a compensatory method. The terminal costs are calculated by adding the operating and maintenance cost and the capital expense associated with the terminal complex and allocating the cost to the tenants. Passenger facility charge revenue is applied to the terminal debt service to fund the eligible portions of the terminal capital expense. The applicable terminal rent is then calculated by dividing the total remaining cost by the total usable terminal square footage. The Agreement provides for a mid-year adjustment, if projections vary by more than ten percent, and a year-end settlement. If airline rentals, fees and charges paid during the fiscal year are more than required, the excess will be issued as a credit to the airlines. If they are less, the airlines will be invoiced the deficiency.
METROPOLITAN KNOXVILLE AIRPORT AUTHORITY
45
NOTES TO FINANCIAL STATEMENTS (continued)
5. Long-Term Debt (continued)
Scheduled Debt Service Requirements As of June 30, 2016, scheduled debt service requirements of the variable-rate debt and net swap payments, assuming current interest rates remain the same for their term are as follows. As rates vary, variable-rate bond interest payments and net swap payments will vary.
Year ending
Variable Rate Bonds
Interest Rate
June 30
Principal
Interest
Swaps, net
Total
2017
$ 4,590,000
$ 562,983
$ 985,043
$ 6,138,026
2018
4,825,000
522,361
830,113
6,177,474
2019
5,075,000
479,483
667,315
6,221,798
2020
5,335,000
434,090
496,213
6,265,303
2021
5,610,000
386,211
316,408
6,312,619
2022-2026 32,520,000 1,107,156 405,195 34,032,351
2027-2028
12,680,000
86,013
-
12,766,013
Total
$70,635,000
$3,578,297
$3,700,287
$77,913,584
6. Fair Value The Authority categorizes its fair value measurements within the fair value hierarchy established by generally accepted accounting principles. The hierarchy is based on the valuation inputs used to measure the fair value of the assets. Level 1 inputs are quoted prices in active markets for identical assets. Level 2 inputs are significant other observable inputs. Level 3 inputs are significant unobservable inputs. Debt securities are valued based on the securities’ relationship to benchmark quoted prices. Derivative instruments are valued using a market approach that considers benchmark interest rates. The following table sets forth by level, within the fair value hierarchy, the fair value of the Authority’s investments and interest rate swap liabilities as of June 30, 2016:
Level 1 Level 2 Level 3 Total Investments: Government debt securities $ – $ 39,998,469 $ – $ 39,998,469
Interest rate swap liabilities $ – $ 4,502,609 $ – $ 4,502,609
The following table sets forth by level, within the fair value hierarchy, the fair value of the Authority’s investments and derivative investments as of June 30, 2015:
Level 1 Level 2 Level 3 Total Investments: Government debt securities $ – $ 40,071,930 $ – $ 40,071,930
Derivative instruments: Interest rate swaps $ – $ 4,883,863 $ – $ 4,883,863
11

Relevant Financial Policies Financial policies for the operation of the two airports are detailed in the Authority’s by-laws. Subsequent to year-end, the Authority’s by-laws were updated and policies are being developed outside of the revised by-laws. The Authority adopted a comprehensive set of financial policies in an effort to standardize the issuance and management of debt and provide additional guidance on cash reserves and capital improvements on April 18, 2001. Debt is to be used only to finance capital projects and equipment, except in case of emergency. The Authority has no commitments to issue any additional debt within the next fiscal year. Cash reserves are intended to protect the Authority from unforeseen increases in expenditures or reductions in revenues, or both. Reserves are also to be used to minimize borrowings, provide funding to match grants from other entities, provide liquidity to fund operating expenses and used to generate interest income for the Authority. The Authority will maintain cash reserves at a minimum amount equal to normal cash requirements for operations and capital projects plus $10,000,000 or the outstanding minimum annual debt service on all existing debt, whichever is greater. The Authority currently holds $63,839,316 in unrestricted cash and investments. The Authority actively seeks grants or other contributions to offset capital costs and minimize borrowing for projects that are consistent with the Authority’s Capital Improvement Plan. MAJOR INITIATIVES Current Year Projects The Airport Authority has primarily been focused on the Airfield Modernization Program this year. The Airfield Modernization program is a multi-year program to improve the McGhee Tyson Airport runway and taxiway systems at an estimated cost of $136,900,000 funded primarily with Federal and State grant funds. Eutaw Construction Company was awarded a construction contract for $4,370,847 for Project 5 of the Runway 5L/23R reconstruction in FYE June 30, 2020. This construction contract was subsequently modified in FYE June 30, 2021 to include an additional award for $6,288,883.64. CHA Consulting was awarded a contract for $875,041 for construction administration on the runway Project 5 in FYE June 30, 2020. This contract was subsequently modified in FYE June 30, 2021 to include an additional award for $561,653. Project 5 will be funded with both 100 percent and 90 percent Federal grant funds, a combination of State grant funds and Airport Authority funds. Eutaw Construction Company was awarded an $8,564,637 construction contract for Project 6 of the Runway 5L/23R reconstruction in FYE June 30, 2020. CHA Consulting was awarded a contract for $861,515 for construction administration on the runway Project 6 in FYE June 30, 2020. Project 6 is being funded 100 percent with Federal grant funds. The McGhee Tyson Airport parking garage is in need of maintenance. The Airport Authority awarded a construction contract to Restocon Corporation for $2,577,918.25 in FYE June 30, 2021 for the Parking Garage Maintenance and Repairs project. C2RL Engineering was awarded a contract for $265,820 for construction administration on the Parking Garage Maintenance and Repairs project in FYE June 30, 2021. The project will be funded with 95 percent State grant funds and Airport Authority funds. The Airport Authority awarded a contract to CHA Consulting for the 5L/23L ALP (Airport Layout Plan) Update and Reconstruction Planning in the amount of $929,670. The Airport Authority also awarded a contract to CHA Consulting for the Terminal Apron Expansion Programming in the amount of $236,842. Both contracts were awarded in FYE June 30, 2021 and will be funded by 100 percent Federal grant funds. The Knoxville Downtown Island Airport continued the programming of the Runway Rehabilitation project. The project is funded with a combination of State grant funds and 10 percent Airport Authority funds and is expected to be in construction in FY2022. Future Year Projects The Airport Authority is taking a conservative financial approach on capital project planning and execution due to the pandemic’s effect on the air transportation industry.
METROPOLITAN KNOXVILLE AIRPORT AUTHORITY
45
NOTES TO FINANCIAL STATEMENTS (continued)
5. Long-Term Debt (continued)
Scheduled Debt Service Requirements As of June 30, 2016, scheduled debt service requirements of the variable-rate debt and net swap payments, assuming current interest rates remain the same for their term are as follows. As rates vary, variable-rate bond interest payments and net swap payments will vary.
Year ending
Variable Rate Bonds
Interest Rate
June 30
Principal
Interest
Swaps, net
Total
2017
$ 4,590,000
$ 562,983
$ 985,043
$ 6,138,026
2018
4,825,000
522,361
830,113
6,177,474
2019
5,075,000
479,483
667,315
6,221,798
2020
5,335,000
434,090
496,213
6,265,303
2021
5,610,000
386,211
316,408
6,312,619
2022-2026 32,520,000 1,107,156 405,195 34,032,351
2027-2028
12,680,000
86,013
-
12,766,013
Total
$70,635,000
$3,578,297
$3,700,287
$77,913,584
6. Fair Value The Authority categorizes its fair value measurements within the fair value hierarchy established by generally accepted accounting principles. The hierarchy is based on the valuation inputs used to measure the fair value of the assets. Level 1 inputs are quoted prices in active markets for identical assets. Level 2 inputs are significant other observable inputs. Level 3 inputs are significant unobservable inputs. Debt securities are valued based on the securities’ relationship to benchmark quoted prices. Derivative instruments are valued using a market approach that considers benchmark interest rates. The following table sets forth by level, within the fair value hierarchy, the fair value of the Authority’s investments and interest rate swap liabilities as of June 30, 2016:
Level 1 Level 2 Level 3 Total Investments: Government debt securities $ – $ 39,998,469 $ – $ 39,998,469
Interest rate swap liabilities $ – $ 4,502,609 $ – $ 4,502,609
The following table sets forth by level, within the fair value hierarchy, the fair value of the Authority’s investments and derivative investments as of June 30, 2015:
Level 1 Level 2 Level 3 Total Investments: Government debt securities $ – $ 40,071,930 $ – $ 40,071,930
Derivative instruments: Interest rate swaps $ – $ 4,883,863 $ – $ 4,883,863
12

McGhee Tyson Airport is undergoing a terminal modernization study. A prior study indicated that there is a need for a more extensive study. This study will lead to the planning and design of a solution to address issues identified from the study. The cost will be funded 100 percent with Airport Authority funds. At McGhee Tyson Airport, the replacement of the flight information display system (FIDS) is under evaluation. This project will replace the current system and associated infrastructure, including baggage information display systems (BIDS), display units and equipment, gate equipment, terminal monitors, central processing units, paging stations, boarding pass readers, ticket counters and digital signage throughout the airport. Costs associated with this project and the funding plan are being developed in association with the evaluation. The Master Plan for McGhee Tyson Airport is in the process of being updated. Knoxville Downtown Island Airport’s Master Plan has now been completed and approved by the FAA and TDOT. McGhee Tyson Airport’s Master Plan will be funded 100 percent with Federal grant funds. Knoxville Downtown Island Airport was funded 95 percent by State grant funds and 5 percent Airport Authority funds. CERTIFICATE OF ACHIEVEMENT The Government Finance Officers Association of the United States and Canada (GFOA) awarded a Certificate of Achievement for Excellence in Financial Reporting to the Metropolitan Knoxville Airport Authority for its annual comprehensive financial report for the fiscal year ended June 30, 2020. This was the twenty-eighth consecutive year that the government has achieved this prestigious award. In order to be awarded a Certificate of Achievement, a government must publish an easily readable and efficiently organized annual comprehensive financial report. This report must satisfy both generally accepted accounting principles and applicable legal requirements. A Certificate of Achievement is valid for a period of one year only. We believe that our current annual comprehensive financial report continues to meet the Certificate of Achievement Program’s requirements, and we are submitting it to the GFOA to determine its eligibility for another certificate. ACKNOWLEDGEMENTS The preparation of this report could not have been accomplished without the professional assistance of the entire Finance and Accounting staff and the cooperation of each department within the Metropolitan Knoxville Airport Authority. We also extend our appreciation to the staff of Coulter & Justus, P.C. for their technical assistance and guidance in the preparation of this report. We would also like to thank the individual members of the Board of Commissioners of the Metropolitan Knoxville Airport Authority for their interest, support, and leadership in planning and conducting the financial operations of the Authority in a responsible and progressive manner. Respectfully submitted,
Patrick W. Wilson, A.A.E. President Nancy White, CPA, C.M. Vice President, Finance
METROPOLITAN KNOXVILLE AIRPORT AUTHORITY
45
NOTES TO FINANCIAL STATEMENTS (continued)
5. Long-Term Debt (continued)
Scheduled Debt Service Requirements As of June 30, 2016, scheduled debt service requirements of the variable-rate debt and net swap payments, assuming current interest rates remain the same for their term are as follows. As rates vary, variable-rate bond interest payments and net swap payments will vary.
Year ending
Variable Rate Bonds
Interest Rate
June 30
Principal
Interest
Swaps, net
Total
2017
$ 4,590,000
$ 562,983
$ 985,043
$ 6,138,026
2018
4,825,000
522,361
830,113
6,177,474
2019
5,075,000
479,483
667,315
6,221,798
2020
5,335,000
434,090
496,213
6,265,303
2021
5,610,000
386,211
316,408
6,312,619
2022-2026 32,520,000 1,107,156 405,195 34,032,351
2027-2028
12,680,000
86,013
-
12,766,013
Total
$70,635,000
$3,578,297
$3,700,287
$77,913,584
6. Fair Value The Authority categorizes its fair value measurements within the fair value hierarchy established by generally accepted accounting principles. The hierarchy is based on the valuation inputs used to measure the fair value of the assets. Level 1 inputs are quoted prices in active markets for identical assets. Level 2 inputs are significant other observable inputs. Level 3 inputs are significant unobservable inputs. Debt securities are valued based on the securities’ relationship to benchmark quoted prices. Derivative instruments are valued using a market approach that considers benchmark interest rates. The following table sets forth by level, within the fair value hierarchy, the fair value of the Authority’s investments and interest rate swap liabilities as of June 30, 2016:
Level 1 Level 2 Level 3 Total Investments: Government debt securities $ – $ 39,998,469 $ – $ 39,998,469
Interest rate swap liabilities $ – $ 4,502,609 $ – $ 4,502,609
The following table sets forth by level, within the fair value hierarchy, the fair value of the Authority’s investments and derivative investments as of June 30, 2015:
Level 1 Level 2 Level 3 Total Investments: Government debt securities $ – $ 40,071,930 $ – $ 40,071,930
Derivative instruments: Interest rate swaps $ – $ 4,883,863 $ – $ 4,883,863
13

METROPOLITAN KNOXVILLE AIRPORT AUTHORITY
45
NOTES TO FINANCIAL STATEMENTS (continued)
5. Long-Term Debt (continued)
Scheduled Debt Service Requirements As of June 30, 2016, scheduled debt service requirements of the variable-rate debt and net swap payments, assuming current interest rates remain the same for their term are as follows. As rates vary, variable-rate bond interest payments and net swap payments will vary.
Year ending
Variable Rate Bonds
Interest Rate
June 30
Principal
Interest
Swaps, net
Total
2017
$ 4,590,000
$ 562,983
$ 985,043
$ 6,138,026
2018
4,825,000
522,361
830,113
6,177,474
2019
5,075,000
479,483
667,315
6,221,798
2020
5,335,000
434,090
496,213
6,265,303
2021
5,610,000
386,211
316,408
6,312,619
2022-2026 32,520,000 1,107,156 405,195 34,032,351
2027-2028
12,680,000
86,013
-
12,766,013
Total
$70,635,000
$3,578,297
$3,700,287
$77,913,584
6. Fair Value The Authority categorizes its fair value measurements within the fair value hierarchy established by generally accepted accounting principles. The hierarchy is based on the valuation inputs used to measure the fair value of the assets. Level 1 inputs are quoted prices in active markets for identical assets. Level 2 inputs are significant other observable inputs. Level 3 inputs are significant unobservable inputs. Debt securities are valued based on the securities’ relationship to benchmark quoted prices. Derivative instruments are valued using a market approach that considers benchmark interest rates. The following table sets forth by level, within the fair value hierarchy, the fair value of the Authority’s investments and interest rate swap liabilities as of June 30, 2016:
Level 1 Level 2 Level 3 Total Investments: Government debt securities $ – $ 39,998,469 $ – $ 39,998,469
Interest rate swap liabilities $ – $ 4,502,609 $ – $ 4,502,609
The following table sets forth by level, within the fair value hierarchy, the fair value of the Authority’s investments and derivative investments as of June 30, 2015:
Level 1 Level 2 Level 3 Total Investments: Government debt securities $ – $ 40,071,930 $ – $ 40,071,930
Derivative instruments: Interest rate swaps $ – $ 4,883,863 $ – $ 4,883,863
14

DESTINATIONS
Allegiant Air Delta/Delta Connection Fort Lauderdale Atlanta Orlando-Sanford Detroit St. Petersburg/Tampa Bay Minneapolis/St. Paul Punta Gorda/SW Florida New York-LaGuardia Baltimore/Washington* Destin/Fort Walton* United/United Express Las Vegas Chicago-O’Hare Newark Denver Denver* Washington-Dulles Austin* Houston-Bush Houston – Hobby Airport* Newark
Chicago-Midway Airport* Sarasota American/American Eagle Airlines West Palm Beach Chicago-O’Hare Myrtle Beach * Dallas/Fort Worth
Boston* Charlotte Philadelphia
Frontier Washington-National Denver Miami
*Denotes seasonal service
METROPOLITAN KNOXVILLE AIRPORT AUTHORITY
45
NOTES TO FINANCIAL STATEMENTS (continued)
5. Long-Term Debt (continued)
Scheduled Debt Service Requirements As of June 30, 2016, scheduled debt service requirements of the variable-rate debt and net swap payments, assuming current interest rates remain the same for their term are as follows. As rates vary, variable-rate bond interest payments and net swap payments will vary.
Year ending
Variable Rate Bonds
Interest Rate
June 30
Principal
Interest
Swaps, net
Total
2017
$ 4,590,000
$ 562,983
$ 985,043
$ 6,138,026
2018
4,825,000
522,361
830,113
6,177,474
2019
5,075,000
479,483
667,315
6,221,798
2020
5,335,000
434,090
496,213
6,265,303
2021
5,610,000
386,211
316,408
6,312,619
2022-2026 32,520,000 1,107,156 405,195 34,032,351
2027-2028
12,680,000
86,013
-
12,766,013
Total
$70,635,000
$3,578,297
$3,700,287
$77,913,584
6. Fair Value The Authority categorizes its fair value measurements within the fair value hierarchy established by generally accepted accounting principles. The hierarchy is based on the valuation inputs used to measure the fair value of the assets. Level 1 inputs are quoted prices in active markets for identical assets. Level 2 inputs are significant other observable inputs. Level 3 inputs are significant unobservable inputs. Debt securities are valued based on the securities’ relationship to benchmark quoted prices. Derivative instruments are valued using a market approach that considers benchmark interest rates. The following table sets forth by level, within the fair value hierarchy, the fair value of the Authority’s investments and interest rate swap liabilities as of June 30, 2016:
Level 1 Level 2 Level 3 Total Investments: Government debt securities $ – $ 39,998,469 $ – $ 39,998,469
Interest rate swap liabilities $ – $ 4,502,609 $ – $ 4,502,609
The following table sets forth by level, within the fair value hierarchy, the fair value of the Authority’s investments and derivative investments as of June 30, 2015:
Level 1 Level 2 Level 3 Total Investments: Government debt securities $ – $ 40,071,930 $ – $ 40,071,930
Derivative instruments: Interest rate swaps $ – $ 4,883,863 $ – $ 4,883,863
15

Board of Commissioners
Organizational Chart
Legal Counsel Auditor
Sr. Executive Assistant (1)
Vice President of Operations
Vice President of Engineering and
Planning
Vice President of Finance
Vice President of Marketing and Air Service
Development
Vice President of Public Relations
Director of Public Safety
Director of Human Resources
Director of Administration
(DBELO)
President
METROPOLITAN KNOXVILLE AIRPORT AUTHORITY
45
NOTES TO FINANCIAL STATEMENTS (continued)
5. Long-Term Debt (continued)
Scheduled Debt Service Requirements As of June 30, 2016, scheduled debt service requirements of the variable-rate debt and net swap payments, assuming current interest rates remain the same for their term are as follows. As rates vary, variable-rate bond interest payments and net swap payments will vary.
Year ending
Variable Rate Bonds
Interest Rate
June 30
Principal
Interest
Swaps, net
Total
2017
$ 4,590,000
$ 562,983
$ 985,043
$ 6,138,026
2018
4,825,000
522,361
830,113
6,177,474
2019
5,075,000
479,483
667,315
6,221,798
2020
5,335,000
434,090
496,213
6,265,303
2021
5,610,000
386,211
316,408
6,312,619
2022-2026 32,520,000 1,107,156 405,195 34,032,351
2027-2028
12,680,000
86,013
-
12,766,013
Total
$70,635,000
$3,578,297
$3,700,287
$77,913,584
6. Fair Value The Authority categorizes its fair value measurements within the fair value hierarchy established by generally accepted accounting principles. The hierarchy is based on the valuation inputs used to measure the fair value of the assets. Level 1 inputs are quoted prices in active markets for identical assets. Level 2 inputs are significant other observable inputs. Level 3 inputs are significant unobservable inputs. Debt securities are valued based on the securities’ relationship to benchmark quoted prices. Derivative instruments are valued using a market approach that considers benchmark interest rates. The following table sets forth by level, within the fair value hierarchy, the fair value of the Authority’s investments and interest rate swap liabilities as of June 30, 2016:
Level 1 Level 2 Level 3 Total Investments: Government debt securities $ – $ 39,998,469 $ – $ 39,998,469
Interest rate swap liabilities $ – $ 4,502,609 $ – $ 4,502,609
The following table sets forth by level, within the fair value hierarchy, the fair value of the Authority’s investments and derivative investments as of June 30, 2015:
Level 1 Level 2 Level 3 Total Investments: Government debt securities $ – $ 40,071,930 $ – $ 40,071,930
Derivative instruments: Interest rate swaps $ – $ 4,883,863 $ – $ 4,883,863
16

FINANCIAL SECTION This section contains the following subsections: Independent Auditor’s Report Management’s Discussion and Analysis Financial Statements
17

This page intentionally left blank
18

Independent Auditor’s Report
Board of Commissioners Metropolitan Knoxville Airport Authority
Report on the Financial Statements
We have audited the accompanying financial statements of the Metropolitan Knoxville Airport Authority (the Authority), a component unit of the City of Knoxville, Tennessee as of and for the years ended June 30, 2021 and 2020, and the related notes to the financial statements, which collectively compromise the Authority’s basic financial statements as listed in the table of contents.
Management’s Responsibility for the Financial Statements
The Authority’s management is responsible for the preparation and fair presentation of these financial statements in accordance with accounting principles generally accepted in the United States of America; this includes the design, implementation, and maintenance of internal control relevant to the preparation and fair presentation of financial statements that are free from material misstatement, whether due to fraud or error.
Auditor’s Responsibility
Our responsibility is to express an opinion on these financial statements based on our audits. We conducted our audits in accordance with auditing standards generally accepted in the United States of America and the standards applicable to financial audits contained in Government Auditing Standards, issued by the Comptroller General of the United States. Those standards require that we plan and perform the audits to obtain reasonable assurance about whether the financial statements are free from material misstatement.
An audit involves performing procedures to obtain audit evidence about the amounts and disclosures in the financial statements. The procedures selected depend on the auditor’s judgment, including the assessment of the risks of material misstatement of the financial statements, whether due to fraud or error. In making those risk assessments, the auditor considers internal control relevant to the Authority’s preparation and fair presentation of the financial statements in order to design audit procedures that are appropriate in the circumstances, but not for the purpose of expressing an opinion on the effectiveness of the Authority’s internal control. Accordingly, we express no such opinion. An audit also includes evaluating the appropriateness of accounting policies used and the reasonableness of significant accounting estimates made by management, as well as evaluating the overall presentation of the financial statements.
We believe that the audit evidence we have obtained is sufficient and appropriate to provide a basis for our audit opinion.
Opinion
In our opinion, the financial statements referred to above present fairly, in all material respects, the financial position of the Metropolitan Knoxville Airport Authority as of June 30, 2021 and 2020, and the changes in its financial position and its cash flows for the years then ended in accordance with accounting principles generally accepted in the United States of America.
19

Board of Commissioners Metropolitan Knoxville Airport Authority
Other Matters
Required Supplementary Information
Accounting principles generally accepted in the United States of America require that the Management’s Discussion and Analysis on pages 22 through 31 be presented to supplement the basic financial statements. Such information, although not a part of the basic financial statements, is required by the Governmental Accounting Standards Board, who considers it to be an essential part of financial reporting for placing the basic financial statements in an appropriate operational, economic, or historical context. We have applied certain limited procedures to the required supplementary information in accordance with auditing standards generally accepted in the United States of America, which consisted of inquiries of management about the methods of preparing the information and comparing the information for consistency with management’s responses to our inquiries, the basic financial statements, and other knowledge we obtained during our audits of the basic financial statements. We do not express an opinion or provide any assurance on the information because the limited procedures do not provide us with sufficient evidence to express an opinion or provide any assurance.
Other Information
Our audits were conducted for the purpose of forming an opinion on the financial statements that collectively comprise the Authority’s basic financial statements. The introductory section, Schedule of Long-Term Debt Principal and Interest Requirements, Schedule of Changes in Long-Term Debt by Individual Issue and statistical section are presented for purposes of additional analysis and are not a required part of the basic financial statements. The Schedule of Expenditures of Federal Awards, State Financial Assistance and Passenger Facility Charges Collected and Expended is presented for purposes of additional analysis as required by Title 2 U.S. Code of Federal Regulations, Part 200, Uniform Administrative Requirements, Cost Principles, and Audit Requirements for Federal Awards, and the Passenger Facility Charge Audit Guide for Public Agencies, issued by the Federal Aviation Administration, and is also not a required part of the basic financial statements.
The Schedule of Expenditures of Federal Awards, State Financial Assistance and Passenger Facility Charges Collected and Expended, the Schedule of Long-Term Debt Principal and Interest Requirements and the Schedule of Changes in Long-Term Debt by Individual Issue are the responsibility of management and were derived from and relate directly to the underlying accounting and other records used to prepare the basic financial statements. Such information has been subjected to the auditing procedures applied in the audit of the basic financial statements and certain additional procedures, including comparing and reconciling such information directly to the underlying accounting and other records used to prepare the basic financial statements or to the basic financial statements themselves, and other additional procedures in accordance with auditing standards generally accepted in the United States of America. In our opinion, the information is fairly stated, in all material respects, in relation to the basic financial statements as a whole.
The introductory and statistical sections have not been subjected to the auditing procedures applied in the audit of the basic financial statements and, accordingly, we do not express an opinion or provide any assurance on them.
20

Board of Commissioners Metropolitan Knoxville Airport Authority
Other Reporting Required by Government Auditing Standards
In accordance with Government Auditing Standards, we have also issued our report dated November 17, 2021, on our consideration of the Authority’s internal control over financial reporting and on our tests of its compliance with certain provisions of laws, regulations, contracts, and grant agreements and other matters. The purpose of that report is solely to describe the scope of our testing of internal control over financial reporting and compliance and the results of that testing, and not to provide an opinion on the effectiveness of internal control over financial reporting or on compliance. That report is an integral part of an audit performed in accordance with Government Auditing Standards in considering the Authority’s internal control over financial reporting and compliance.
Coulter & Justus, P.C. November 17, 2021 Knoxville, Tennessee
21

MANAGEMENT’S DISCUSSION AND ANALYSIS The following discussion and analysis of the Metropolitan Knoxville Airport Authority’s financial performance provides an overview of the financial activities of the McGhee Tyson Airport and the Knoxville Downtown Island Airport for the fiscal year ended June 30, 2021. Following this MD&A are the basic financial statements of the Authority together with the notes thereto. Airport activities highlights The details of major airport indicators for the fiscal years 2019-2021 are as follows:
2021 2020 2019 Enplanements 698,270 975,910 1,191,198 % (decrease) increase (28.45)% (18.07)% 12.63% Aircraft operations 86,492 109,071 119,802 % (decrease) increase (20.70)% (8.96)% 6.98% Landed weight (thousand pound units) 1,257,301 1,498,459 1,648,257 % (decrease) increase (16.09)% (9.09)% 9.04% Cargo (pounds) 88,412,307 83,936,760 83,282,205 % (decrease) increase 5.33% 0.78% 1.10%
During fiscal year 2021, McGhee Tyson Airport offered East Tennessee travelers 28 nonstop airline destinations flown by five airlines and their affiliates. Few other communities of this size provide such a broad range of nonstop cities. Financial highlights The Airport Authority is an instrumentality of the City of Knoxville, Tennessee. The Authority issues an Annual Comprehensive Financial Report, which is incorporated in the City of Knoxville’s Annual Comprehensive Financial Report. The financial statements following this MD&A are comprised of the Statements of Net Position, the Statements of Revenues, Expenses and Changes in Net Position, the Statements of Cash Flows and the accompanying Notes to the Financial Statements. The financial information herein is presented at a summarized level for analysis purposes only. See Note 1 to the financial statements for significant accounting policies related to the Authority. 2020-2021: The Airport Authority’s operating revenues decreased by $7,346,374 or 24.67% from FY2020 to FY2021 and operating expenses decreased by $1,490,124 or 6.69% from FY2020 to FY2021. The decrease in revenues and expenses is primarily due to the COVID-19 outbreak as a global pandemic. Detail summary of activity for fiscal year 2021 and 2020 are as follows: The Authority felt the impacts from the COVID-19 pandemic by experiencing a 28.45% decrease in enplanements and a 28.72% decrease in passengers served. Consequently, aviation revenues decreased by 15.68% and terminal area revenues decreased by 28.75%. Even though air cargo weights increased by 5.33%, air cargo and other property revenues decreased by 14.03% as a result of a decrease in the charged rate for air cargo and tenants terminating leases for other property. Aviation area expenses decreased 9.49% and terminal area expenses decreased 13.79% primarily due to the Authority’s overall efforts to reduce costs in response to the COVID-19 pandemic impact.
METROPOLITAN KNOXVILLE AIRPORT AUTHORITY
45
NOTES TO FINANCIAL STATEMENTS (continued)
5. Long-Term Debt (continued)
Scheduled Debt Service Requirements As of June 30, 2016, scheduled debt service requirements of the variable-rate debt and net swap payments, assuming current interest rates remain the same for their term are as follows. As rates vary, variable-rate bond interest payments and net swap payments will vary.
Year ending
Variable Rate Bonds
Interest Rate
June 30
Principal
Interest
Swaps, net
Total
2017
$ 4,590,000
$ 562,983
$ 985,043
$ 6,138,026
2018
4,825,000
522,361
830,113
6,177,474
2019
5,075,000
479,483
667,315
6,221,798
2020
5,335,000
434,090
496,213
6,265,303
2021
5,610,000
386,211
316,408
6,312,619
2022-2026 32,520,000 1,107,156 405,195 34,032,351
2027-2028
12,680,000
86,013
-
12,766,013
Total
$70,635,000
$3,578,297
$3,700,287
$77,913,584
6. Fair Value The Authority categorizes its fair value measurements within the fair value hierarchy established by generally accepted accounting principles. The hierarchy is based on the valuation inputs used to measure the fair value of the assets. Level 1 inputs are quoted prices in active markets for identical assets. Level 2 inputs are significant other observable inputs. Level 3 inputs are significant unobservable inputs. Debt securities are valued based on the securities’ relationship to benchmark quoted prices. Derivative instruments are valued using a market approach that considers benchmark interest rates. The following table sets forth by level, within the fair value hierarchy, the fair value of the Authority’s investments and interest rate swap liabilities as of June 30, 2016:
Level 1 Level 2 Level 3 Total Investments: Government debt securities $ – $ 39,998,469 $ – $ 39,998,469
Interest rate swap liabilities $ – $ 4,502,609 $ – $ 4,502,609
The following table sets forth by level, within the fair value hierarchy, the fair value of the Authority’s investments and derivative investments as of June 30, 2015:
Level 1 Level 2 Level 3 Total Investments: Government debt securities $ – $ 40,071,930 $ – $ 40,071,930
Derivative instruments: Interest rate swaps $ – $ 4,883,863 $ – $ 4,883,863
22

The Authority’s net nonoperating income increased by $7,227,286. In FY2021, the Authority recognized revenue of $14,330,976 from the FAA through the Coronavirus Aid, Relief, and Economic Security Act (CARES) Airport Grant and the Coronavirus Response and Relief Supplemental Appropriations (CRRSA) Act. The Authority used these funds for reimbursement of operational and maintenance expenses, debt service payments, and concession relief. In FY2020, the Authority recognized revenue of $6,374,513 from the FAA and the Tennessee Department of Transportation through the CARES Airport Grant. Interest expense included in the net nonoperating income increased from the prior year by 10.65%. The increase in interest expense is the result of the amortization of the remaining balance of $916,666 of a deferred charge on debt refunding, when the related debt was paid in full in 2021. There was an increase of 11.87% in net position from $282,009,754 at the beginning of FY2021 to $315,478,675 at the end of the fiscal year. The change in net position is an indication of whether the overall fiscal condition of the Authority has improved or worsened during the year. We feel the overall fiscal condition of the Authority remains strong. 2019-2020: The Airport Authority’s operating revenues decreased by $4,022,482 or 11.90% from FY2019 to FY2020 and operating expenses decreased by $1,352,613 or 5.73% from FY2019 to FY2020. The decrease in revenues and expenses is primarily due to the COVID-19 outbreak as a global pandemic. Detail summary of activity for fiscal year 2020 and 2019 are as follows: Aviation revenues decreased 10.08% and terminal area revenues decreased 10.73% primarily due to an 18.07% decrease in enplanements and a 17.81% decrease in passengers served. Air cargo and other property revenues decreased 20.92% primarily as a result of COVID-19. Aviation expenses decreased 6.32% and terminal area expenses decreased 11.04% primarily due to Airport Authority’s overall efforts to reduce costs in response to the COVID-19 impact. The Authority’s net nonoperating income increased by $344,709. In FY2020, the Authority recognized revenue of $6,443,513 from the FAA and the Tennessee Department of Transportation through the Coronavirus Aid, Relief, and Economic Security Act (CARES) Airport Grant. The Authority used these funds for reimbursement of operational and maintenance expenses and debt service payments. This is partially offset by a $5,523,680 gain in FY2019 resulting from a land condemnation action by the Tennessee Department of Transportation in FY2019. The proceeds are being used to partially offset Airport Authority expenses directly related to the land condemnation. Interest expense included in the net nonoperating income was relatively flat with a 1.94% increase from the prior year. There was an increase of 15.52% in net position from $244,125,080 at the beginning of FY2020 to $282,009,754 at the end of the fiscal year. The change in net position is an indication of whether the overall fiscal condition of the Authority has improved or worsened during the year. We feel the overall fiscal condition of the Authority remains strong. 2018 – 2019: The Airport Authority’s operating revenues increased by $3,398,974 or 11.18% from FY2018 to FY2019 and operating expenses increased by $1,906,016 or 8.78% from FY2018 to FY2019. The increase in revenues and expenses is primarily due to overall increased passenger traffic and air service growth. Detail summary of activity for fiscal year 2019 and 2018 are as follows: Aviation revenues increased 13.82% and terminal area revenues increased 11.49% primarily due to a 12.63% increase in enplanements and a 12.64% increase in passengers served. Air cargo and other property revenues increased 6.02% primarily due to additional leased areas at McGhee Tyson Airport and additional rental income for the new T-Hangars at the Downtown Island that went into service in FY2018.
METROPOLITAN KNOXVILLE AIRPORT AUTHORITY
45
NOTES TO FINANCIAL STATEMENTS (continued)
5. Long-Term Debt (continued)
Scheduled Debt Service Requirements As of June 30, 2016, scheduled debt service requirements of the variable-rate debt and net swap payments, assuming current interest rates remain the same for their term are as follows. As rates vary, variable-rate bond interest payments and net swap payments will vary.
Year ending
Variable Rate Bonds
Interest Rate
June 30
Principal
Interest
Swaps, net
Total
2017
$ 4,590,000
$ 562,983
$ 985,043
$ 6,138,026
2018
4,825,000
522,361
830,113
6,177,474
2019
5,075,000
479,483
667,315
6,221,798
2020
5,335,000
434,090
496,213
6,265,303
2021
5,610,000
386,211
316,408
6,312,619
2022-2026 32,520,000 1,107,156 405,195 34,032,351
2027-2028
12,680,000
86,013
-
12,766,013
Total
$70,635,000
$3,578,297
$3,700,287
$77,913,584
6. Fair Value The Authority categorizes its fair value measurements within the fair value hierarchy established by generally accepted accounting principles. The hierarchy is based on the valuation inputs used to measure the fair value of the assets. Level 1 inputs are quoted prices in active markets for identical assets. Level 2 inputs are significant other observable inputs. Level 3 inputs are significant unobservable inputs. Debt securities are valued based on the securities’ relationship to benchmark quoted prices. Derivative instruments are valued using a market approach that considers benchmark interest rates. The following table sets forth by level, within the fair value hierarchy, the fair value of the Authority’s investments and interest rate swap liabilities as of June 30, 2016:
Level 1 Level 2 Level 3 Total Investments: Government debt securities $ – $ 39,998,469 $ – $ 39,998,469
Interest rate swap liabilities $ – $ 4,502,609 $ – $ 4,502,609
The following table sets forth by level, within the fair value hierarchy, the fair value of the Authority’s investments and derivative investments as of June 30, 2015:
Level 1 Level 2 Level 3 Total Investments: Government debt securities $ – $ 40,071,930 $ – $ 40,071,930
Derivative instruments: Interest rate swaps $ – $ 4,883,863 $ – $ 4,883,863
23

Aviation expenses increased 13.14% and terminal area expenses increased 14.95% primarily due to the overall increase in passenger traffic and an increase in repairs and maintenance in the terminal area. The Authority’s net nonoperating income increased by $6,228,189 primarily due to a $5,523,680 gain resulting from a land condemnation action by the Tennessee Department of Transportation. The proceeds will be used to partially offset Airport Authority expenses directly related to the land condemnation. Interest expense included in the net nonoperating income was relatively flat with a 1.58% decrease from the prior year. There was an increase of 18.35% in net position from $206,273,988 at the beginning of FY2019 to $244,125,080 at the end of the fiscal year.
METROPOLITAN KNOXVILLE AIRPORT AUTHORITY
45
NOTES TO FINANCIAL STATEMENTS (continued)
5. Long-Term Debt (continued)
Scheduled Debt Service Requirements As of June 30, 2016, scheduled debt service requirements of the variable-rate debt and net swap payments, assuming current interest rates remain the same for their term are as follows. As rates vary, variable-rate bond interest payments and net swap payments will vary.
Year ending
Variable Rate Bonds
Interest Rate
June 30
Principal
Interest
Swaps, net
Total
2017
$ 4,590,000
$ 562,983
$ 985,043
$ 6,138,026
2018
4,825,000
522,361
830,113
6,177,474
2019
5,075,000
479,483
667,315
6,221,798
2020
5,335,000
434,090
496,213
6,265,303
2021
5,610,000
386,211
316,408
6,312,619
2022-2026 32,520,000 1,107,156 405,195 34,032,351
2027-2028
12,680,000
86,013
-
12,766,013
Total
$70,635,000
$3,578,297
$3,700,287
$77,913,584
6. Fair Value The Authority categorizes its fair value measurements within the fair value hierarchy established by generally accepted accounting principles. The hierarchy is based on the valuation inputs used to measure the fair value of the assets. Level 1 inputs are quoted prices in active markets for identical assets. Level 2 inputs are significant other observable inputs. Level 3 inputs are significant unobservable inputs. Debt securities are valued based on the securities’ relationship to benchmark quoted prices. Derivative instruments are valued using a market approach that considers benchmark interest rates. The following table sets forth by level, within the fair value hierarchy, the fair value of the Authority’s investments and interest rate swap liabilities as of June 30, 2016:
Level 1 Level 2 Level 3 Total Investments: Government debt securities $ – $ 39,998,469 $ – $ 39,998,469
Interest rate swap liabilities $ – $ 4,502,609 $ – $ 4,502,609
The following table sets forth by level, within the fair value hierarchy, the fair value of the Authority’s investments and derivative investments as of June 30, 2015:
Level 1 Level 2 Level 3 Total Investments: Government debt securities $ – $ 40,071,930 $ – $ 40,071,930
Derivative instruments: Interest rate swaps $ – $ 4,883,863 $ – $ 4,883,863
24

Summary of revenues, expenses and changes in net position
Year ended June 30 2021 2020 2019 Operating revenues $ 22,432,902 $ 29,779,276 $ 33,801,758 Operating expenses (20,771,890) (22,262,014) (23,614,627) Operating revenues in excess of operating expenses before depreciation and amortization
1,661,012
7,517,262 10,187,131
Depreciation and amortization (10,139,486) (10,055,598) (9,912,669) Operating (loss) income (8,478,474) (2,538,336) 274,462 Net nonoperating income 17,612,492 10,385,206 10,040,497 Income before capital contributions 9,134,018 7,846,870 10,314,959 Capital contributions 24,334,903 30,037,804 27,536,133 Increase in net position 33,468,921 37,884,674 37,851,092 Net position at beginning of year 282,009,754 244,125,080 206,273,988 Net position at end of year $315,478,675 $282,009,754 $ 244,125,080
Financial summary
Year ended June 30 2021 2020 2019 Unrestricted current assets $ 73,586,269 $ 70,870,042 $ 70,643,754 Restricted current assets 6,304,029 3,570,406 2,400,645 Capital assets, net 273,683,287 256,468,376 233,324,539 Master plans and other plans, net 647,444 583,405 465,993 Other – 5,248 465,227 Total assets 354,221,029 331,497,477 307,300,158 Deferred outflows of resources – deferred charge on debt refunding
–
916,666 1,069,444
Total assets and deferred outflows of resources $354,221,029 $332,414,143 $308,369,602 Current liabilities $ 4,400,854 $ 4,711,889 $ 12,374,043 Long-term debt, less current portion 34,295,000 45,640,000 51,465,000 Investment interest rate swap liability – – 405,479 Unearned revenue 46,500 52,500 – Total liabilities 38,742,354 50,404,389 64,244,522 Net investment in capital assets 238,827,856 210,964,151 173,637,819 Restricted net position 6,304,029 3,570,406 2,400,645 Unrestricted net position 70,346,790 67,475,197 68,086,616 Total net position 315,478,675 282,009,754 244,125,080 Total liabilities and net position $354,221,029 $332,414,143 $308,369,602
METROPOLITAN KNOXVILLE AIRPORT AUTHORITY
45
NOTES TO FINANCIAL STATEMENTS (continued)
5. Long-Term Debt (continued)
Scheduled Debt Service Requirements As of June 30, 2016, scheduled debt service requirements of the variable-rate debt and net swap payments, assuming current interest rates remain the same for their term are as follows. As rates vary, variable-rate bond interest payments and net swap payments will vary.
Year ending
Variable Rate Bonds
Interest Rate
June 30
Principal
Interest
Swaps, net
Total
2017
$ 4,590,000
$ 562,983
$ 985,043
$ 6,138,026
2018
4,825,000
522,361
830,113
6,177,474
2019
5,075,000
479,483
667,315
6,221,798
2020
5,335,000
434,090
496,213
6,265,303
2021
5,610,000
386,211
316,408
6,312,619
2022-2026 32,520,000 1,107,156 405,195 34,032,351
2027-2028
12,680,000
86,013
-
12,766,013
Total
$70,635,000
$3,578,297
$3,700,287
$77,913,584
6. Fair Value The Authority categorizes its fair value measurements within the fair value hierarchy established by generally accepted accounting principles. The hierarchy is based on the valuation inputs used to measure the fair value of the assets. Level 1 inputs are quoted prices in active markets for identical assets. Level 2 inputs are significant other observable inputs. Level 3 inputs are significant unobservable inputs. Debt securities are valued based on the securities’ relationship to benchmark quoted prices. Derivative instruments are valued using a market approach that considers benchmark interest rates. The following table sets forth by level, within the fair value hierarchy, the fair value of the Authority’s investments and interest rate swap liabilities as of June 30, 2016:
Level 1 Level 2 Level 3 Total Investments: Government debt securities $ – $ 39,998,469 $ – $ 39,998,469
Interest rate swap liabilities $ – $ 4,502,609 $ – $ 4,502,609
The following table sets forth by level, within the fair value hierarchy, the fair value of the Authority’s investments and derivative investments as of June 30, 2015:
Level 1 Level 2 Level 3 Total Investments: Government debt securities $ – $ 40,071,930 $ – $ 40,071,930
Derivative instruments: Interest rate swaps $ – $ 4,883,863 $ – $ 4,883,863
25

The largest portion of the Authority’s net position each year represents its investment in capital assets less the related indebtedness outstanding used to acquire those capital assets. The Authority uses these capital assets to provide services to its passengers and visitors; consequently, these assets are not available for future spending. Although the Authority’s investment in its capital assets is reported net of related debt, the resources required to repay this debt must be provided annually from operations, since it is unlikely the capital assets themselves will be liquidated to pay liabilities. Another portion of net position is restricted and primarily represents Passenger Facility Charges (PFC) that are restricted by Federal regulations and Customer Facility Charges (CFC) that are restricted for use or purpose. The remaining portion of net position is externally unrestricted and may be used to meet any of the Authority’s ongoing obligations. Airline signatory rates and charges The Authority and certain airlines negotiated an agreement effective July 1, 2018, for five years, which established how those airlines would be assessed annual rates and charged for their use of the airport. Terminal rates and landing fees are estimated at the beginning of the year with an annual year-end settlement calculation. The rates and charges for the signatory airlines were as follows:
Year ended June 30 2021 2020 2019 Landing fees (per 1,000 lbs. MCLW) $3.02 $2.99 $3.14 Terminal rates (per square foot) $35.49 $40.30 $48.84 Loading bridge rate per bridge $85,178 $95,295 $40,574 Apron charge per gate $72,665 $84,802 $92,101
Cost per enplaned passenger Cost per enplaned passenger or airline cost per passenger is generally considered to be part of an airline’s cost of doing business at an airport. Cost per enplaned passenger is defined as all landing fees, airside usage charges, terminal rents and other airline payments to airports divided by enplaned passengers. The cost per enplaned passenger for McGhee Tyson Airport were as follows:
2021 2020 2019 Cost per enplaned passenger $9.76 $8.31 $7.26
METROPOLITAN KNOXVILLE AIRPORT AUTHORITY
45
NOTES TO FINANCIAL STATEMENTS (continued)
5. Long-Term Debt (continued)
Scheduled Debt Service Requirements As of June 30, 2016, scheduled debt service requirements of the variable-rate debt and net swap payments, assuming current interest rates remain the same for their term are as follows. As rates vary, variable-rate bond interest payments and net swap payments will vary.
Year ending
Variable Rate Bonds
Interest Rate
June 30
Principal
Interest
Swaps, net
Total
2017
$ 4,590,000
$ 562,983
$ 985,043
$ 6,138,026
2018
4,825,000
522,361
830,113
6,177,474
2019
5,075,000
479,483
667,315
6,221,798
2020
5,335,000
434,090
496,213
6,265,303
2021
5,610,000
386,211
316,408
6,312,619
2022-2026 32,520,000 1,107,156 405,195 34,032,351
2027-2028
12,680,000
86,013
-
12,766,013
Total
$70,635,000
$3,578,297
$3,700,287
$77,913,584
6. Fair Value The Authority categorizes its fair value measurements within the fair value hierarchy established by generally accepted accounting principles. The hierarchy is based on the valuation inputs used to measure the fair value of the assets. Level 1 inputs are quoted prices in active markets for identical assets. Level 2 inputs are significant other observable inputs. Level 3 inputs are significant unobservable inputs. Debt securities are valued based on the securities’ relationship to benchmark quoted prices. Derivative instruments are valued using a market approach that considers benchmark interest rates. The following table sets forth by level, within the fair value hierarchy, the fair value of the Authority’s investments and interest rate swap liabilities as of June 30, 2016:
Level 1 Level 2 Level 3 Total Investments: Government debt securities $ – $ 39,998,469 $ – $ 39,998,469
Interest rate swap liabilities $ – $ 4,502,609 $ – $ 4,502,609
The following table sets forth by level, within the fair value hierarchy, the fair value of the Authority’s investments and derivative investments as of June 30, 2015:
Level 1 Level 2 Level 3 Total Investments: Government debt securities $ – $ 40,071,930 $ – $ 40,071,930
Derivative instruments: Interest rate swaps $ – $ 4,883,863 $ – $ 4,883,863
26

Financial details Revenues The following schedule presents a summary of operating revenues and nonoperating income:
Year ended June 30 2021 2020 2019 Operating revenues: Aviation area $ 4,630,643 $ 5,491,542 $ 6,107,314 Terminal area 14,898,453 20,910,056 23,423,378 Air cargo and other properties 2,903,806 3,377,678 4,271,066 Total operating revenues 22,432,902 29,779,276 33,801,758 Nonoperating income and capital contributions:
Passenger facility charges, net 3,109,225 3,890,584 4,842,501 Customer facility charges 1,982,901 512,816 – Interest income 136,738 996,817 984,796 Change in fair value of investment interest rate swap – 405,479 201,530 Federal and state grants 14,310,333 6,437,350 30,007 Other nonoperating income 51,780 118,428 5,735,698 Capital contributions – grant receipts from governmental agencies
24,334,903
30,037,804 27,536,133
Net nonoperating income and capital contributions 43,925,880 42,399,278 39,330,665 Total revenues and nonoperating income $66,358,782 $ 72,178,554 $73,132,423
The following chart shows the operating revenues for the past three fiscal years.
0
5,000,000
10,000,000
15,000,000
20,000,000
25,000,000
30,000,000
35,000,000
20212020
2019
METROPOLITAN KNOXVILLE AIRPORT AUTHORITY
45
NOTES TO FINANCIAL STATEMENTS (continued)
5. Long-Term Debt (continued)
Scheduled Debt Service Requirements As of June 30, 2016, scheduled debt service requirements of the variable-rate debt and net swap payments, assuming current interest rates remain the same for their term are as follows. As rates vary, variable-rate bond interest payments and net swap payments will vary.
Year ending
Variable Rate Bonds
Interest Rate
June 30
Principal
Interest
Swaps, net
Total
2017
$ 4,590,000
$ 562,983
$ 985,043
$ 6,138,026
2018
4,825,000
522,361
830,113
6,177,474
2019
5,075,000
479,483
667,315
6,221,798
2020
5,335,000
434,090
496,213
6,265,303
2021
5,610,000
386,211
316,408
6,312,619
2022-2026 32,520,000 1,107,156 405,195 34,032,351
2027-2028
12,680,000
86,013
-
12,766,013
Total
$70,635,000
$3,578,297
$3,700,287
$77,913,584
6. Fair Value The Authority categorizes its fair value measurements within the fair value hierarchy established by generally accepted accounting principles. The hierarchy is based on the valuation inputs used to measure the fair value of the assets. Level 1 inputs are quoted prices in active markets for identical assets. Level 2 inputs are significant other observable inputs. Level 3 inputs are significant unobservable inputs. Debt securities are valued based on the securities’ relationship to benchmark quoted prices. Derivative instruments are valued using a market approach that considers benchmark interest rates. The following table sets forth by level, within the fair value hierarchy, the fair value of the Authority’s investments and interest rate swap liabilities as of June 30, 2016:
Level 1 Level 2 Level 3 Total Investments: Government debt securities $ – $ 39,998,469 $ – $ 39,998,469
Interest rate swap liabilities $ – $ 4,502,609 $ – $ 4,502,609
The following table sets forth by level, within the fair value hierarchy, the fair value of the Authority’s investments and derivative investments as of June 30, 2015:
Level 1 Level 2 Level 3 Total Investments: Government debt securities $ – $ 40,071,930 $ – $ 40,071,930
Derivative instruments: Interest rate swaps $ – $ 4,883,863 $ – $ 4,883,863
27

The sources and the percentage of operating revenue for fiscal year ended June 30, 2021, are shown below.
Expenses The following schedule presents a summary of operating and nonoperating expenses:
Year ended June 30 2021 2020 2019 Operating expenses: Aviation area $ 2,238,000 $ 2,472,712 $ 2,639,540 Terminal area 5,155,536 5,980,383 6,722,177 Air cargo and other properties 1,620,723 1,452,443 1,595,465 Safety 4,689,051 5,060,627 4,908,770 Administration 7,068,580 7,295,849 7,748,675 Total operating expenses 20,771,890 22,262,014 23,614,627 Depreciation and amortization 10,139,486 10,055,598 9,912,669 Interest expense 1,978,485 1,787,977 1,754,035 Other nonoperating expense – 188,291 – Total expenses $32,889,861 $34,293,880 $35,281,331
Aviation area 21%
Air cargo and other properties
13%Terminal area
66%
METROPOLITAN KNOXVILLE AIRPORT AUTHORITY
45
NOTES TO FINANCIAL STATEMENTS (continued)
5. Long-Term Debt (continued)
Scheduled Debt Service Requirements As of June 30, 2016, scheduled debt service requirements of the variable-rate debt and net swap payments, assuming current interest rates remain the same for their term are as follows. As rates vary, variable-rate bond interest payments and net swap payments will vary.
Year ending
Variable Rate Bonds
Interest Rate
June 30
Principal
Interest
Swaps, net
Total
2017
$ 4,590,000
$ 562,983
$ 985,043
$ 6,138,026
2018
4,825,000
522,361
830,113
6,177,474
2019
5,075,000
479,483
667,315
6,221,798
2020
5,335,000
434,090
496,213
6,265,303
2021
5,610,000
386,211
316,408
6,312,619
2022-2026 32,520,000 1,107,156 405,195 34,032,351
2027-2028
12,680,000
86,013
-
12,766,013
Total
$70,635,000
$3,578,297
$3,700,287
$77,913,584
6. Fair Value The Authority categorizes its fair value measurements within the fair value hierarchy established by generally accepted accounting principles. The hierarchy is based on the valuation inputs used to measure the fair value of the assets. Level 1 inputs are quoted prices in active markets for identical assets. Level 2 inputs are significant other observable inputs. Level 3 inputs are significant unobservable inputs. Debt securities are valued based on the securities’ relationship to benchmark quoted prices. Derivative instruments are valued using a market approach that considers benchmark interest rates. The following table sets forth by level, within the fair value hierarchy, the fair value of the Authority’s investments and interest rate swap liabilities as of June 30, 2016:
Level 1 Level 2 Level 3 Total Investments: Government debt securities $ – $ 39,998,469 $ – $ 39,998,469
Interest rate swap liabilities $ – $ 4,502,609 $ – $ 4,502,609
The following table sets forth by level, within the fair value hierarchy, the fair value of the Authority’s investments and derivative investments as of June 30, 2015:
Level 1 Level 2 Level 3 Total Investments: Government debt securities $ – $ 40,071,930 $ – $ 40,071,930
Derivative instruments: Interest rate swaps $ – $ 4,883,863 $ – $ 4,883,863
28

The following chart shows the operating expenses for the past three fiscal years.
The sources and the percentage of operating expense for fiscal year ended June 30, 2021, are shown below.
0
5,000,000
10,000,000
15,000,000
20,000,000
25,000,000
20212020
2019
Administration 34%
Safety 22%
Air cargo and other properties
8%
Terminal area 25%
Aviation area 11%
METROPOLITAN KNOXVILLE AIRPORT AUTHORITY
45
NOTES TO FINANCIAL STATEMENTS (continued)
5. Long-Term Debt (continued)
Scheduled Debt Service Requirements As of June 30, 2016, scheduled debt service requirements of the variable-rate debt and net swap payments, assuming current interest rates remain the same for their term are as follows. As rates vary, variable-rate bond interest payments and net swap payments will vary.
Year ending
Variable Rate Bonds
Interest Rate
June 30
Principal
Interest
Swaps, net
Total
2017
$ 4,590,000
$ 562,983
$ 985,043
$ 6,138,026
2018
4,825,000
522,361
830,113
6,177,474
2019
5,075,000
479,483
667,315
6,221,798
2020
5,335,000
434,090
496,213
6,265,303
2021
5,610,000
386,211
316,408
6,312,619
2022-2026 32,520,000 1,107,156 405,195 34,032,351
2027-2028
12,680,000
86,013
-
12,766,013
Total
$70,635,000
$3,578,297
$3,700,287
$77,913,584
6. Fair Value The Authority categorizes its fair value measurements within the fair value hierarchy established by generally accepted accounting principles. The hierarchy is based on the valuation inputs used to measure the fair value of the assets. Level 1 inputs are quoted prices in active markets for identical assets. Level 2 inputs are significant other observable inputs. Level 3 inputs are significant unobservable inputs. Debt securities are valued based on the securities’ relationship to benchmark quoted prices. Derivative instruments are valued using a market approach that considers benchmark interest rates. The following table sets forth by level, within the fair value hierarchy, the fair value of the Authority’s investments and interest rate swap liabilities as of June 30, 2016:
Level 1 Level 2 Level 3 Total Investments: Government debt securities $ – $ 39,998,469 $ – $ 39,998,469
Interest rate swap liabilities $ – $ 4,502,609 $ – $ 4,502,609
The following table sets forth by level, within the fair value hierarchy, the fair value of the Authority’s investments and derivative investments as of June 30, 2015:
Level 1 Level 2 Level 3 Total Investments: Government debt securities $ – $ 40,071,930 $ – $ 40,071,930
Derivative instruments: Interest rate swaps $ – $ 4,883,863 $ – $ 4,883,863
29

Summary of cash flow activities
Year ended June 30 2021 2020 2019 Operating activities $ 2,181,096 $ 8,160,920 $ 8,209,523 Investing activities (3,176,312) 30,971,586 (4,050,439) Noncapital financing activities 14,430,894 6,566,451 169,040 Capital and related financing activities (6,389,292) (17,067,703) (801,772) Net increase in cash and equivalents 7,046,386 28,631,254 3,526,352 Cash and cash equivalents at beginning of year 50,341,041 21,709,787 18,183,435 Cash and cash equivalents at end of year $57,387,427 $50,341,041 $21,709,787
Financial statements The Authority’s financial statements are prepared on an accrual basis in accordance with accounting principles generally accepted in the United States of America promulgated by the Governmental Accounting Standards Board. The Authority is structured as a single enterprise fund with revenue recognized when earned, not when received. Expenses are recognized when incurred, not when they are paid. Capital assets are capitalized (except land and construction in progress) and are depreciated over their useful lives. Amounts are restricted for debt service and, where applicable, for construction purposes. See the notes to the financial statements for a summary of the Authority’s significant accounting policies. Capital acquisitions and construction activities During fiscal year ended June 30, 2021, the Authority expended $27,610,634 on capital activities. This included land acquisitions and major construction projects. During fiscal year ended June 30, 2021, completed projects totaling $1,026,927 were closed from construction-in-progress to their respective capital accounts. Property and equipment acquisitions are capitalized at cost. Acquisitions are funded using a variety of financing techniques, including federal grants, state grants, debt issuances, and airport revenues. See Note 4 in the notes to the financial statements for more detailed information on capital asset activity. Long-term debt The outstanding long-term debt of the Authority is $34,295,000 at June 30, 2021, which consists of Notes Payable. The Authority’s most recent issuance of debt was the Airport Revenue Refunding Note, Series 2019A, in the amount of $39,570,000. The note is secured by and payable solely from the net revenues derived from the operations of the airport by the Authority as defined in the Master Plan Resolution. The Series 2019A Note was issued to refund a portion of the Authority’s Series V-A-1 Bonds and to terminate the variable interest rate. The refunding did not extend the maturity date of the bonds but fixed the interest rate for the remaining term due. Maturities range from 2022 to 2028. The principal and interest payable on the debt is paid from airport revenues.
METROPOLITAN KNOXVILLE AIRPORT AUTHORITY
45
NOTES TO FINANCIAL STATEMENTS (continued)
5. Long-Term Debt (continued)
Scheduled Debt Service Requirements As of June 30, 2016, scheduled debt service requirements of the variable-rate debt and net swap payments, assuming current interest rates remain the same for their term are as follows. As rates vary, variable-rate bond interest payments and net swap payments will vary.
Year ending
Variable Rate Bonds
Interest Rate
June 30
Principal
Interest
Swaps, net
Total
2017
$ 4,590,000
$ 562,983
$ 985,043
$ 6,138,026
2018
4,825,000
522,361
830,113
6,177,474
2019
5,075,000
479,483
667,315
6,221,798
2020
5,335,000
434,090
496,213
6,265,303
2021
5,610,000
386,211
316,408
6,312,619
2022-2026 32,520,000 1,107,156 405,195 34,032,351
2027-2028
12,680,000
86,013
-
12,766,013
Total
$70,635,000
$3,578,297
$3,700,287
$77,913,584
6. Fair Value The Authority categorizes its fair value measurements within the fair value hierarchy established by generally accepted accounting principles. The hierarchy is based on the valuation inputs used to measure the fair value of the assets. Level 1 inputs are quoted prices in active markets for identical assets. Level 2 inputs are significant other observable inputs. Level 3 inputs are significant unobservable inputs. Debt securities are valued based on the securities’ relationship to benchmark quoted prices. Derivative instruments are valued using a market approach that considers benchmark interest rates. The following table sets forth by level, within the fair value hierarchy, the fair value of the Authority’s investments and interest rate swap liabilities as of June 30, 2016:
Level 1 Level 2 Level 3 Total Investments: Government debt securities $ – $ 39,998,469 $ – $ 39,998,469
Interest rate swap liabilities $ – $ 4,502,609 $ – $ 4,502,609
The following table sets forth by level, within the fair value hierarchy, the fair value of the Authority’s investments and derivative investments as of June 30, 2015:
Level 1 Level 2 Level 3 Total Investments: Government debt securities $ – $ 40,071,930 $ – $ 40,071,930
Derivative instruments: Interest rate swaps $ – $ 4,883,863 $ – $ 4,883,863
30

The Authority had an Airport Revenue Refunding Note Series 2017A issued May 2017. The remaining principal balance of $6,070,000 was paid off during fiscal year 2021. The notes payable are secured by and payable solely from the net revenues derived from the operations of the airport by the Authority as defined in the Master Plan Resolution. Detailed information on long-term debt activity can be found in Note 5 of the notes to the financial statements. Passenger facility charges On October 6, 1993, the Metropolitan Knoxville Airport Authority received approval from the Federal Aviation Administration (FAA) to collect a $3.00 PFC on each passenger enplaning at McGhee Tyson Airport. On September 16, 2003, the FAA approved an increase in the Authority’s PFC rate to $4.50 per enplaning passenger. The FAA determined that the earliest effective date for the new rate was October 1, 2003. The collection authority has been extended to August 1, 2024. As of June 30, 2021, the Authority had collected $81,825,456 of PFC revenue and expended $79,318,493 on approved projects. The FAA has authorized $92,301,420 PFC collection by the Airport Authority as of June 30, 2021. Customer facility charges On February 1, 2020, the Authority began collecting a $4.00 per day transaction fee, known as a customer facility charge (CFC), from rental car operators serving McGhee Tyson Airport. Fees collected are to fund the planning, design/engineering, construction of new car rental facilities, and/or improvements to the existing car rental facilities, including any associated infrastructure costs or payments of any Authority debt service incurred to finance these costs or ongoing maintenance of rental car facilities. As of June 30, 2021, the Authority has $2,495,717 of CFCs available for authorized use. Request for information The financial report is designed to provide a general overview of the Authority’s finances for all those interested. Questions concerning any of the information provided in this report or requests for additional information should be addressed in writing to the Vice President of Finance or the Controller, Metropolitan Knoxville Airport Authority, P. O. Box 15600, Knoxville, TN 37901 or by email to [email protected] or to [email protected]. Respectfully submitted, Nancy White, CPA, C.M. Yin Chen, CPA Vice President, Finance Controller
METROPOLITAN KNOXVILLE AIRPORT AUTHORITY
45
NOTES TO FINANCIAL STATEMENTS (continued)
5. Long-Term Debt (continued)
Scheduled Debt Service Requirements As of June 30, 2016, scheduled debt service requirements of the variable-rate debt and net swap payments, assuming current interest rates remain the same for their term are as follows. As rates vary, variable-rate bond interest payments and net swap payments will vary.
Year ending
Variable Rate Bonds
Interest Rate
June 30
Principal
Interest
Swaps, net
Total
2017
$ 4,590,000
$ 562,983
$ 985,043
$ 6,138,026
2018
4,825,000
522,361
830,113
6,177,474
2019
5,075,000
479,483
667,315
6,221,798
2020
5,335,000
434,090
496,213
6,265,303
2021
5,610,000
386,211
316,408
6,312,619
2022-2026 32,520,000 1,107,156 405,195 34,032,351
2027-2028
12,680,000
86,013
-
12,766,013
Total
$70,635,000
$3,578,297
$3,700,287
$77,913,584
6. Fair Value The Authority categorizes its fair value measurements within the fair value hierarchy established by generally accepted accounting principles. The hierarchy is based on the valuation inputs used to measure the fair value of the assets. Level 1 inputs are quoted prices in active markets for identical assets. Level 2 inputs are significant other observable inputs. Level 3 inputs are significant unobservable inputs. Debt securities are valued based on the securities’ relationship to benchmark quoted prices. Derivative instruments are valued using a market approach that considers benchmark interest rates. The following table sets forth by level, within the fair value hierarchy, the fair value of the Authority’s investments and interest rate swap liabilities as of June 30, 2016:
Level 1 Level 2 Level 3 Total Investments: Government debt securities $ – $ 39,998,469 $ – $ 39,998,469
Interest rate swap liabilities $ – $ 4,502,609 $ – $ 4,502,609
The following table sets forth by level, within the fair value hierarchy, the fair value of the Authority’s investments and derivative investments as of June 30, 2015:
Level 1 Level 2 Level 3 Total Investments: Government debt securities $ – $ 40,071,930 $ – $ 40,071,930
Derivative instruments: Interest rate swaps $ – $ 4,883,863 $ – $ 4,883,863
31

2021 2020AssetsUnrestricted current assets:
Cash and cash equivalents 52,155,551$ 47,210,695$ Investments 11,683,765 8,411,380 Receivables:
Trade 1,317,303 1,397,448 Government agencies 6,269,301 11,081,742 Other receivables 1,194,638 1,220,248 Interest 9,687 46,637
Prepaid expenses and other current assets 956,024 1,501,892Total unrestricted current assets 73,586,269 70,870,042
Restricted current assets:Cash and cash equivalents 5,231,876 3,130,346Receivables 1,072,153 440,060
Total restricted current assets 6,304,029 3,570,406 Total current assets 79,890,298 74,440,448
Noncurrent assets:Capital assets, net of accumulated depreciation 273,683,287 256,468,376Master plans and other plans, net of accumulated
amortization 647,444 583,405Other - 5,248
Total noncurrent assets 274,330,731 257,057,029
Total assets 354,221,029 331,497,477
Deferred outflows of resourcesDeferred charge on debt refunding - 916,666
Total assets and deferred outflows of resources 354,221,029$ 332,414,143$
STATEMENTS OF NET POSITION
June 30
METROPOLITAN KNOXVILLE AIRPORT AUTHORITY
45
NOTES TO FINANCIAL STATEMENTS (continued)
5. Long-Term Debt (continued)
Scheduled Debt Service Requirements As of June 30, 2016, scheduled debt service requirements of the variable-rate debt and net swap payments, assuming current interest rates remain the same for their term are as follows. As rates vary, variable-rate bond interest payments and net swap payments will vary.
Year ending
Variable Rate Bonds
Interest Rate
June 30
Principal
Interest
Swaps, net
Total
2017
$ 4,590,000
$ 562,983
$ 985,043
$ 6,138,026
2018
4,825,000
522,361
830,113
6,177,474
2019
5,075,000
479,483
667,315
6,221,798
2020
5,335,000
434,090
496,213
6,265,303
2021
5,610,000
386,211
316,408
6,312,619
2022-2026 32,520,000 1,107,156 405,195 34,032,351
2027-2028
12,680,000
86,013
-
12,766,013
Total
$70,635,000
$3,578,297
$3,700,287
$77,913,584
6. Fair Value The Authority categorizes its fair value measurements within the fair value hierarchy established by generally accepted accounting principles. The hierarchy is based on the valuation inputs used to measure the fair value of the assets. Level 1 inputs are quoted prices in active markets for identical assets. Level 2 inputs are significant other observable inputs. Level 3 inputs are significant unobservable inputs. Debt securities are valued based on the securities’ relationship to benchmark quoted prices. Derivative instruments are valued using a market approach that considers benchmark interest rates. The following table sets forth by level, within the fair value hierarchy, the fair value of the Authority’s investments and interest rate swap liabilities as of June 30, 2016:
Level 1 Level 2 Level 3 Total Investments: Government debt securities $ – $ 39,998,469 $ – $ 39,998,469
Interest rate swap liabilities $ – $ 4,502,609 $ – $ 4,502,609
The following table sets forth by level, within the fair value hierarchy, the fair value of the Authority’s investments and derivative investments as of June 30, 2015:
Level 1 Level 2 Level 3 Total Investments: Government debt securities $ – $ 40,071,930 $ – $ 40,071,930
Derivative instruments: Interest rate swaps $ – $ 4,883,863 $ – $ 4,883,863
32

2021 2020Liabilities and net positionCurrent liabilities:
Accounts payable - non-construction 1,494,882$ 1,649,195$ Accounts payable - construction 1,207,875 1,364,296Accrued payroll and other expenses 1,627,925 1,604,399 Accrued interest 70,172 93,999
Total current liabilities 4,400,854 4,711,889
Long-term liabilities:Long-term debt 34,295,000 45,640,000Unearned revenue 46,500 52,500
Total long-term liabilities 34,341,500 45,692,500 Total liabilities 38,742,354 50,404,389
Net position:Net investment in capital assets 238,827,856 210,964,151 Restricted - expendable:
Passenger facility charges 3,349,256 2,635,162 Law enforcement 459,056 422,428 Customer facility charges 2,495,717 512,816
Unrestricted 70,346,790 67,475,197 Total net position 315,478,675 282,009,754
Total liabilities and net position 354,221,029$ 332,414,143$
See accompanying Notes to Financial Statements.
June 30
STATEMENTS OF NET POSITION (continued)
METROPOLITAN KNOXVILLE AIRPORT AUTHORITY
45
NOTES TO FINANCIAL STATEMENTS (continued)
5. Long-Term Debt (continued)
Scheduled Debt Service Requirements As of June 30, 2016, scheduled debt service requirements of the variable-rate debt and net swap payments, assuming current interest rates remain the same for their term are as follows. As rates vary, variable-rate bond interest payments and net swap payments will vary.
Year ending
Variable Rate Bonds
Interest Rate
June 30
Principal
Interest
Swaps, net
Total
2017
$ 4,590,000
$ 562,983
$ 985,043
$ 6,138,026
2018
4,825,000
522,361
830,113
6,177,474
2019
5,075,000
479,483
667,315
6,221,798
2020
5,335,000
434,090
496,213
6,265,303
2021
5,610,000
386,211
316,408
6,312,619
2022-2026 32,520,000 1,107,156 405,195 34,032,351
2027-2028
12,680,000
86,013
-
12,766,013
Total
$70,635,000
$3,578,297
$3,700,287
$77,913,584
6. Fair Value The Authority categorizes its fair value measurements within the fair value hierarchy established by generally accepted accounting principles. The hierarchy is based on the valuation inputs used to measure the fair value of the assets. Level 1 inputs are quoted prices in active markets for identical assets. Level 2 inputs are significant other observable inputs. Level 3 inputs are significant unobservable inputs. Debt securities are valued based on the securities’ relationship to benchmark quoted prices. Derivative instruments are valued using a market approach that considers benchmark interest rates. The following table sets forth by level, within the fair value hierarchy, the fair value of the Authority’s investments and interest rate swap liabilities as of June 30, 2016:
Level 1 Level 2 Level 3 Total Investments: Government debt securities $ – $ 39,998,469 $ – $ 39,998,469
Interest rate swap liabilities $ – $ 4,502,609 $ – $ 4,502,609
The following table sets forth by level, within the fair value hierarchy, the fair value of the Authority’s investments and derivative investments as of June 30, 2015:
Level 1 Level 2 Level 3 Total Investments: Government debt securities $ – $ 40,071,930 $ – $ 40,071,930
Derivative instruments: Interest rate swaps $ – $ 4,883,863 $ – $ 4,883,863
33

2021 2020Operating revenues:
Aviation area 4,630,643$ 5,491,542$ Terminal area 14,898,453 20,910,056 Air cargo and other properties 2,903,806 3,377,678
Total operating revenues 22,432,902 29,779,276
Operating expenses:Aviation area 2,238,000 2,472,712Terminal area 5,155,536 5,980,383Air cargo and other properties 1,620,723 1,452,443General area:
Safety 4,689,051 5,060,627Administration 7,068,580 7,295,849
Total operating expenses 20,771,890 22,262,014 Operating revenues in excess of operating expenses
before depreciation and amortization 1,661,012 7,517,262
Depreciation and amortization (10,139,486) (10,055,598) Operating loss (8,478,474) (2,538,336)
Nonoperating income (expense):Passenger facility charges, net 3,109,225 3,890,584Customer facility charges 1,982,901 512,816 Interest income 136,738 996,817Change in fair value of investment interest rate swap - 405,479 Interest expense (1,978,485) (1,787,977) Federal and state grants 14,310,333 6,437,350 Other nonoperating, net 51,780 (69,863)
Net nonoperating income 17,612,492 10,385,206 Income before capital contributions 9,134,018 7,846,870
Capital contributions 24,334,903 30,037,804
Increase in net position 33,468,921 37,884,674
Net position at beginning of year 282,009,754 244,125,080
Net position at end of year 315,478,675$ 282,009,754$
See accompanying Notes to Financial Statements.
STATEMENTS OF REVENUES, EXPENSES
Year ended June 30
AND CHANGES IN NET POSITION
METROPOLITAN KNOXVILLE AIRPORT AUTHORITY
45
NOTES TO FINANCIAL STATEMENTS (continued)
5. Long-Term Debt (continued)
Scheduled Debt Service Requirements As of June 30, 2016, scheduled debt service requirements of the variable-rate debt and net swap payments, assuming current interest rates remain the same for their term are as follows. As rates vary, variable-rate bond interest payments and net swap payments will vary.
Year ending
Variable Rate Bonds
Interest Rate
June 30
Principal
Interest
Swaps, net
Total
2017
$ 4,590,000
$ 562,983
$ 985,043
$ 6,138,026
2018
4,825,000
522,361
830,113
6,177,474
2019
5,075,000
479,483
667,315
6,221,798
2020
5,335,000
434,090
496,213
6,265,303
2021
5,610,000
386,211
316,408
6,312,619
2022-2026 32,520,000 1,107,156 405,195 34,032,351
2027-2028
12,680,000
86,013
-
12,766,013
Total
$70,635,000
$3,578,297
$3,700,287
$77,913,584
6. Fair Value The Authority categorizes its fair value measurements within the fair value hierarchy established by generally accepted accounting principles. The hierarchy is based on the valuation inputs used to measure the fair value of the assets. Level 1 inputs are quoted prices in active markets for identical assets. Level 2 inputs are significant other observable inputs. Level 3 inputs are significant unobservable inputs. Debt securities are valued based on the securities’ relationship to benchmark quoted prices. Derivative instruments are valued using a market approach that considers benchmark interest rates. The following table sets forth by level, within the fair value hierarchy, the fair value of the Authority’s investments and interest rate swap liabilities as of June 30, 2016:
Level 1 Level 2 Level 3 Total Investments: Government debt securities $ – $ 39,998,469 $ – $ 39,998,469
Interest rate swap liabilities $ – $ 4,502,609 $ – $ 4,502,609
The following table sets forth by level, within the fair value hierarchy, the fair value of the Authority’s investments and derivative investments as of June 30, 2015:
Level 1 Level 2 Level 3 Total Investments: Government debt securities $ – $ 40,071,930 $ – $ 40,071,930
Derivative instruments: Interest rate swaps $ – $ 4,883,863 $ – $ 4,883,863
34

2021 2020Operating activitiesOperating cash received from customers 22,532,657$ 29,367,225$ Cash payments to suppliers of goods and services (7,476,478) (7,508,692) Cash payments to employees for services (12,875,083) (13,697,613) Net cash provided by operating activities 2,181,096 8,160,920
Investing activitiesInterest received 173,688 1,009,174 Purchases of investments (11,700,000) (35,387,588) Proceeds from maturities of investments 8,350,000 65,350,000 Net cash (used in) provided by investing activities (3,176,312) 30,971,586
Noncapital financing activitiesReceipts from governmental agencies and other financing activities 14,430,894 6,566,451 Net cash provided by noncapital financing activities 14,430,894 6,566,451
Capital and related financing activitiesInterest paid (1,085,646) (1,551,984) Repayments on debt (11,345,000) (11,405,000) Purchases of capital assets (27,610,634) (36,158,929) Proceeds from sale of capital assets 44,611 39,732 Receipts of passenger facility charges 2,454,932 4,625,584 Receipts of customer facility charges 2,005,101 260,756 Grant receipts from governmental agencies 29,147,344 27,310,429 Termination of investment interest rate swap - (188,291) Net cash used in capital and related financing activities (6,389,292) (17,067,703)
Net increase in cash and cash equivalents 7,046,386 28,631,254 Cash and cash equivalents at beginning of year 50,341,041 21,709,787Cash and cash equivalents at end of year 57,387,427$ 50,341,041$
Cash and cash equivalents are classfied as:Unrestricted current assets 52,155,551$ 47,210,695$ Restricted current assets 5,231,876 3,130,346
Total cash and cash equivalents at end of year 57,387,427$ 50,341,041$
Continued on next page
Year ended June 30
STATEMENTS OF CASH FLOWS
METROPOLITAN KNOXVILLE AIRPORT AUTHORITY
45
NOTES TO FINANCIAL STATEMENTS (continued)
5. Long-Term Debt (continued)
Scheduled Debt Service Requirements As of June 30, 2016, scheduled debt service requirements of the variable-rate debt and net swap payments, assuming current interest rates remain the same for their term are as follows. As rates vary, variable-rate bond interest payments and net swap payments will vary.
Year ending
Variable Rate Bonds
Interest Rate
June 30
Principal
Interest
Swaps, net
Total
2017
$ 4,590,000
$ 562,983
$ 985,043
$ 6,138,026
2018
4,825,000
522,361
830,113
6,177,474
2019
5,075,000
479,483
667,315
6,221,798
2020
5,335,000
434,090
496,213
6,265,303
2021
5,610,000
386,211
316,408
6,312,619
2022-2026 32,520,000 1,107,156 405,195 34,032,351
2027-2028
12,680,000
86,013
-
12,766,013
Total
$70,635,000
$3,578,297
$3,700,287
$77,913,584
6. Fair Value The Authority categorizes its fair value measurements within the fair value hierarchy established by generally accepted accounting principles. The hierarchy is based on the valuation inputs used to measure the fair value of the assets. Level 1 inputs are quoted prices in active markets for identical assets. Level 2 inputs are significant other observable inputs. Level 3 inputs are significant unobservable inputs. Debt securities are valued based on the securities’ relationship to benchmark quoted prices. Derivative instruments are valued using a market approach that considers benchmark interest rates. The following table sets forth by level, within the fair value hierarchy, the fair value of the Authority’s investments and interest rate swap liabilities as of June 30, 2016:
Level 1 Level 2 Level 3 Total Investments: Government debt securities $ – $ 39,998,469 $ – $ 39,998,469
Interest rate swap liabilities $ – $ 4,502,609 $ – $ 4,502,609
The following table sets forth by level, within the fair value hierarchy, the fair value of the Authority’s investments and derivative investments as of June 30, 2015:
Level 1 Level 2 Level 3 Total Investments: Government debt securities $ – $ 40,071,930 $ – $ 40,071,930
Derivative instruments: Interest rate swaps $ – $ 4,883,863 $ – $ 4,883,863
35

2021 2020Reconciliation of operating loss to net cash
provided by operating activities:Operating loss $ (8,478,474) $ (2,538,336)Adjustments to reconcile operating loss to net cash
provided by operating activities:Depreciation and amortization 10,139,486 10,055,598 Changes in operating assets and liabilities:
Receivables—trade 105,755 (464,551)Prepaid expenses and other assets 551,116 408,217 Accounts payable—non-construction (154,313) 660,567 Accrued payroll and other expenses 23,526 (13,075)Unearned revenue (6,000) 52,500
Net cash provided by operating activities $ 2,181,096 $ 8,160,920
Schedule of noncash related transactions:Noncash capital and related financing transactionsIncrease (decrease) in accounts payable - construction related to capital asset purchases (156,421)$ (2,812,861)$ Noncash and related investing transactionsIncrease (decrease) in fair value of investment rate swap -$ (405,479)$
See accompanying Notes to Financial Statements.
STATEMENTS OF CASH FLOWS (continued)
Year ended June 30
METROPOLITAN KNOXVILLE AIRPORT AUTHORITY
45
NOTES TO FINANCIAL STATEMENTS (continued)
5. Long-Term Debt (continued)
Scheduled Debt Service Requirements As of June 30, 2016, scheduled debt service requirements of the variable-rate debt and net swap payments, assuming current interest rates remain the same for their term are as follows. As rates vary, variable-rate bond interest payments and net swap payments will vary.
Year ending
Variable Rate Bonds
Interest Rate
June 30
Principal
Interest
Swaps, net
Total
2017
$ 4,590,000
$ 562,983
$ 985,043
$ 6,138,026
2018
4,825,000
522,361
830,113
6,177,474
2019
5,075,000
479,483
667,315
6,221,798
2020
5,335,000
434,090
496,213
6,265,303
2021
5,610,000
386,211
316,408
6,312,619
2022-2026 32,520,000 1,107,156 405,195 34,032,351
2027-2028
12,680,000
86,013
-
12,766,013
Total
$70,635,000
$3,578,297
$3,700,287
$77,913,584
6. Fair Value The Authority categorizes its fair value measurements within the fair value hierarchy established by generally accepted accounting principles. The hierarchy is based on the valuation inputs used to measure the fair value of the assets. Level 1 inputs are quoted prices in active markets for identical assets. Level 2 inputs are significant other observable inputs. Level 3 inputs are significant unobservable inputs. Debt securities are valued based on the securities’ relationship to benchmark quoted prices. Derivative instruments are valued using a market approach that considers benchmark interest rates. The following table sets forth by level, within the fair value hierarchy, the fair value of the Authority’s investments and interest rate swap liabilities as of June 30, 2016:
Level 1 Level 2 Level 3 Total Investments: Government debt securities $ – $ 39,998,469 $ – $ 39,998,469
Interest rate swap liabilities $ – $ 4,502,609 $ – $ 4,502,609
The following table sets forth by level, within the fair value hierarchy, the fair value of the Authority’s investments and derivative investments as of June 30, 2015:
Level 1 Level 2 Level 3 Total Investments: Government debt securities $ – $ 40,071,930 $ – $ 40,071,930
Derivative instruments: Interest rate swaps $ – $ 4,883,863 $ – $ 4,883,863
36

NOTES TO FINANCIAL STATEMENTS
1. Significant Accounting Policies Organization and Reporting Entity The Metropolitan Knoxville Airport Authority (the Authority) is an instrumentality of the City of Knoxville, Tennessee (the City), governed by a nine-member Board of Commissioners appointed by the Mayor of the City and confirmed by members of City Council. A Master Resolution was adopted in 2000 whereby the Authority issues its own revenue obligations. The reporting entity, as an instrumentality of the City, includes the accounts of McGhee Tyson Airport and Knoxville Downtown Island Airport. There are no agencies, departments or funds subordinate to the Authority, which might be considered for inclusion in the reporting entity. The Authority operates under, and pursuant to, the authority granted by the Metropolitan Airport Authority Act of 1969 (Tennessee Code Annotated Section 42-4-101, et seq.). Basis of Accounting The Authority reports as a Business Type Activity. Business Type Activities are those that are financed in whole or in part by fees charged to external parties for goods or services. The Authority’s activities are accounted for similar to those often found in the private sector using the flow of economic resources measurement focus and the accrual basis of accounting. All assets, liabilities, net position, revenues and expenses are accounted for through a single enterprise fund with revenues recorded when earned and expenses recorded at the time liabilities are incurred. Current assets include cash and amounts convertible to cash during the next normal operating cycle or one year. Current liabilities include those obligations to be liquidated with current assets. Revenues from airlines, concessions, rental cars and parking are reported as operating revenues. Capital, grants, financing or investing related transactions are reported as nonoperating revenues. All expenses related to operating the Authority are reported as operating expenses. Interest expense and financing costs are reported as nonoperating expenses. Fiscal Year-End The Authority operates on a fiscal year ending June 30. All references in these notes refer to the fiscal year-end unless otherwise specified.
Estimates The preparation of financial statements in conformity with accounting principles generally accepted in the United States of America requires management to make estimates and assumptions that affect certain reported amounts and disclosures. Accordingly, actual results could differ from those estimates. Budgets Under the by-laws of the Authority, management must submit an annual operating budget to the Board of Commissioners for approval. In addition, management must submit to the Board of Commissioners annually a capital-improvements budget covering a period of five years. The Authority is not required to demonstrate statutory compliance with its annual operating or capital-improvements budget. Accordingly, budgetary data is not included in the financial statements. All budgets are prepared in accordance with bond covenants. Unexpended appropriations lapse at year-end.
METROPOLITAN KNOXVILLE AIRPORT AUTHORITY
45
NOTES TO FINANCIAL STATEMENTS (continued)
5. Long-Term Debt (continued)
Scheduled Debt Service Requirements As of June 30, 2016, scheduled debt service requirements of the variable-rate debt and net swap payments, assuming current interest rates remain the same for their term are as follows. As rates vary, variable-rate bond interest payments and net swap payments will vary.
Year ending
Variable Rate Bonds
Interest Rate
June 30
Principal
Interest
Swaps, net
Total
2017
$ 4,590,000
$ 562,983
$ 985,043
$ 6,138,026
2018
4,825,000
522,361
830,113
6,177,474
2019
5,075,000
479,483
667,315
6,221,798
2020
5,335,000
434,090
496,213
6,265,303
2021
5,610,000
386,211
316,408
6,312,619
2022-2026 32,520,000 1,107,156 405,195 34,032,351
2027-2028
12,680,000
86,013
-
12,766,013
Total
$70,635,000
$3,578,297
$3,700,287
$77,913,584
6. Fair Value The Authority categorizes its fair value measurements within the fair value hierarchy established by generally accepted accounting principles. The hierarchy is based on the valuation inputs used to measure the fair value of the assets. Level 1 inputs are quoted prices in active markets for identical assets. Level 2 inputs are significant other observable inputs. Level 3 inputs are significant unobservable inputs. Debt securities are valued based on the securities’ relationship to benchmark quoted prices. Derivative instruments are valued using a market approach that considers benchmark interest rates. The following table sets forth by level, within the fair value hierarchy, the fair value of the Authority’s investments and interest rate swap liabilities as of June 30, 2016:
Level 1 Level 2 Level 3 Total Investments: Government debt securities $ – $ 39,998,469 $ – $ 39,998,469
Interest rate swap liabilities $ – $ 4,502,609 $ – $ 4,502,609
The following table sets forth by level, within the fair value hierarchy, the fair value of the Authority’s investments and derivative investments as of June 30, 2015:
Level 1 Level 2 Level 3 Total Investments: Government debt securities $ – $ 40,071,930 $ – $ 40,071,930
Derivative instruments: Interest rate swaps $ – $ 4,883,863 $ – $ 4,883,863
37

NOTES TO FINANCIAL STATEMENTS (continued)
1. Significant Accounting Policies (continued) Cash and Cash Equivalents Cash and cash equivalents include cash on hand, demand deposits, money market accounts and short-term investments with original maturities of three months or less from the date of acquisition. Investments The Authority’s certificates of deposit are reported at cost. Remaining investments are reported at fair value using quoted market price or the best available estimate thereof. Fair value is defined as the amount at which a financial instrument could be exchanged in a current transaction with willing parties, other than in a forced or liquidation sale. All investment income, including changes in the fair value of investments, is reported as nonoperating income in the accompanying statements of revenues, expenses and changes in net position. Amounts Due from Governmental Agencies Certain expenditures for airport capital improvements are significantly funded through the Airport Improvement Program (AIP) of the Federal Aviation Administration (FAA) and the National Guard Bureau, with certain matching funds provided by the State of Tennessee (State) and the Authority, or from various state allocations or grant programs. Funding provided under government grants is considered earned when the related allowable expenditures are incurred, and the funds are available. Restricted Assets Restricted assets are held to satisfy bond principal and interest sinking fund requirements or are otherwise held for certain capital improvement and certain other restricted expenditures. For expenditures for which both restricted and unrestricted net positions are available, the Authority first applies restricted assets when such expenditures are incurred. Capital Assets Capital assets are stated at cost and defined by the Authority as assets with an initial cost greater than $5,000. Donated capital assets, if any, are reported at acquisition value. Maintenance and repairs are charged to expense as incurred, and renewals and betterments are capitalized. The cost and accumulated depreciation on retired assets are removed from the books and the gain or loss, if any, is reflected in nonoperating activities. Depreciable capital assets are depreciated using the straight-line method over the following estimated useful lives: Land improvements 5 – 20 years Buildings and building improvements 5 – 30 years Equipment, furniture and fixtures 3 – 10 years Master Plans Master plans are stated at cost. Amortization is computed using the straight-line method over the plans’ estimated useful lives of five years.
METROPOLITAN KNOXVILLE AIRPORT AUTHORITY
45
NOTES TO FINANCIAL STATEMENTS (continued)
5. Long-Term Debt (continued)
Scheduled Debt Service Requirements As of June 30, 2016, scheduled debt service requirements of the variable-rate debt and net swap payments, assuming current interest rates remain the same for their term are as follows. As rates vary, variable-rate bond interest payments and net swap payments will vary.
Year ending
Variable Rate Bonds
Interest Rate
June 30
Principal
Interest
Swaps, net
Total
2017
$ 4,590,000
$ 562,983
$ 985,043
$ 6,138,026
2018
4,825,000
522,361
830,113
6,177,474
2019
5,075,000
479,483
667,315
6,221,798
2020
5,335,000
434,090
496,213
6,265,303
2021
5,610,000
386,211
316,408
6,312,619
2022-2026 32,520,000 1,107,156 405,195 34,032,351
2027-2028
12,680,000
86,013
-
12,766,013
Total
$70,635,000
$3,578,297
$3,700,287
$77,913,584
6. Fair Value The Authority categorizes its fair value measurements within the fair value hierarchy established by generally accepted accounting principles. The hierarchy is based on the valuation inputs used to measure the fair value of the assets. Level 1 inputs are quoted prices in active markets for identical assets. Level 2 inputs are significant other observable inputs. Level 3 inputs are significant unobservable inputs. Debt securities are valued based on the securities’ relationship to benchmark quoted prices. Derivative instruments are valued using a market approach that considers benchmark interest rates. The following table sets forth by level, within the fair value hierarchy, the fair value of the Authority’s investments and interest rate swap liabilities as of June 30, 2016:
Level 1 Level 2 Level 3 Total Investments: Government debt securities $ – $ 39,998,469 $ – $ 39,998,469
Interest rate swap liabilities $ – $ 4,502,609 $ – $ 4,502,609
The following table sets forth by level, within the fair value hierarchy, the fair value of the Authority’s investments and derivative investments as of June 30, 2015:
Level 1 Level 2 Level 3 Total Investments: Government debt securities $ – $ 40,071,930 $ – $ 40,071,930
Derivative instruments: Interest rate swaps $ – $ 4,883,863 $ – $ 4,883,863
38

NOTES TO FINANCIAL STATEMENTS (continued) 1. Significant Accounting Policies (continued) Deferred Outflows of Resources In addition to assets, the statement of net position will sometimes report a separate section for deferred outflows of resources. Deferred outflows of resources represent a consumption of net position that applies to a future period and will not be recognized as an outflow of resources (expense) until then. In 2020, the Authority had one item that qualified for reporting in this category. A deferred charge on debt refunding results from the difference in the carrying value of refunded debt and its reacquisition price. The amount was deferred and amortized over the life of the refunded debt. The debt associated with this refunding was paid in full in 2021, accordingly the remaining balance was amortized and is reflected as interest expense in the accompanying statement of revenues, expenses and changes in net position. Compensated Absences Compensated absences are accrued as payable when earned and are cumulative from one fiscal year to the next. The liability is included with accrued payroll in the financial statements. The Authority does not have any long-term liabilities for compensated absences.
Net position Net position is classified in the following categories:
Net investment in capital assets: Capital assets, net of accumulated depreciation, plus capital-related deferred outflows of resources, less outstanding principal of debt attributable to the acquisition, construction or improvement of those assets.
Restricted:
Nonexpendable – Net position subject to externally imposed stipulations that the Authority maintains them permanently. As of June 30, 2021 and 2020, the Authority does not have nonexpendable net position. Expendable – Net position on which use by the Authority is subject to externally imposed stipulations that can be fulfilled by actions of the Authority pursuant to those stipulations or that expire by the passage of time.
Unrestricted: Net position that is not subject to externally imposed stipulations. Unrestricted net position may be designated for specific purposes by action of management or the Board of Commissioners or may otherwise be limited by contractual agreements with outside parties.
Operating Revenues and Expenses Aviation area revenues are those revenues received from the use of the airfield such as landing fees, fuel flowage fees, airfield site leases and military joint use agreements. Terminal area revenues are those revenues received from space rentals paid by airlines conducting operations in the terminal and revenues received from public parking, rental car concessions and other businesses operating in the terminal. Air cargo revenues are those revenues received from space leases in the cargo building and the air cargo complex. Revenues from other properties are those revenues received from the hotel lease and nonaviation property leases. All expenses related to operating the Airport are reported as operating expenses.
METROPOLITAN KNOXVILLE AIRPORT AUTHORITY
45
NOTES TO FINANCIAL STATEMENTS (continued)
5. Long-Term Debt (continued)
Scheduled Debt Service Requirements As of June 30, 2016, scheduled debt service requirements of the variable-rate debt and net swap payments, assuming current interest rates remain the same for their term are as follows. As rates vary, variable-rate bond interest payments and net swap payments will vary.
Year ending
Variable Rate Bonds
Interest Rate
June 30
Principal
Interest
Swaps, net
Total
2017
$ 4,590,000
$ 562,983
$ 985,043
$ 6,138,026
2018
4,825,000
522,361
830,113
6,177,474
2019
5,075,000
479,483
667,315
6,221,798
2020
5,335,000
434,090
496,213
6,265,303
2021
5,610,000
386,211
316,408
6,312,619
2022-2026 32,520,000 1,107,156 405,195 34,032,351
2027-2028
12,680,000
86,013
-
12,766,013
Total
$70,635,000
$3,578,297
$3,700,287
$77,913,584
6. Fair Value The Authority categorizes its fair value measurements within the fair value hierarchy established by generally accepted accounting principles. The hierarchy is based on the valuation inputs used to measure the fair value of the assets. Level 1 inputs are quoted prices in active markets for identical assets. Level 2 inputs are significant other observable inputs. Level 3 inputs are significant unobservable inputs. Debt securities are valued based on the securities’ relationship to benchmark quoted prices. Derivative instruments are valued using a market approach that considers benchmark interest rates. The following table sets forth by level, within the fair value hierarchy, the fair value of the Authority’s investments and interest rate swap liabilities as of June 30, 2016:
Level 1 Level 2 Level 3 Total Investments: Government debt securities $ – $ 39,998,469 $ – $ 39,998,469
Interest rate swap liabilities $ – $ 4,502,609 $ – $ 4,502,609
The following table sets forth by level, within the fair value hierarchy, the fair value of the Authority’s investments and derivative investments as of June 30, 2015:
Level 1 Level 2 Level 3 Total Investments: Government debt securities $ – $ 40,071,930 $ – $ 40,071,930
Derivative instruments: Interest rate swaps $ – $ 4,883,863 $ – $ 4,883,863
39

NOTES TO FINANCIAL STATEMENTS (continued) 1. Significant Accounting Policies (continued) Risk Management The Authority is subject to risks that include personal injury, property damage, employee bodily injury, employee theft, employee medical, cyber security, public officials and employee conduct and workers’ compensation. The Authority has purchased insurance policies that transfer these risks, subject to policy limits. Settlements have not exceeded insurance coverage in any of the past three fiscal years. Recently Issued Accounting Pronouncements In June 2017, the GASB, issued Statement No. 87, Leases. This Statement requires recognition of certain lease assets and liabilities for leases that previously were classified as operating leases and recognized as inflows of resources or outflows of resources based on the payment provisions of the contract. Under this Statement, a lessor is required to recognize a lease receivable and a deferred inflow of resources, with certain exceptions for leases subject to external laws, regulations, or legal rulings, thereby enhancing the relevance and consistency of information about governments’ leasing activities. Statement No. 87 is effective for periods beginning after June 15, 2021. The Authority has elected not to adopt this standard early and is in the process of evaluating the impact of this statement on its financial statements. Reclassifications Certain amounts in prior year have been reclassified to conform with 2021 classifications.
2. Deposits and Investments Deposits Deposits are included in the Authority’s financial statements as “cash and cash equivalents” and “restricted cash and cash equivalents.” As of June 30, 2021 and 2020, all bank balances in excess of federal insurance limits were covered by the bank collateral pool administered by the Treasurer of the State of Tennessee. Banks participating in the pool report the aggregate balance of their public fund accounts to the State. Collateral to secure these deposits must be pledged to the State Treasurer on behalf of the bank collateral pool. The securities pledged to protect these accounts are pledged in aggregate rather than against each individual account. Public fund accounts covered by the pool are considered entirely insured or collateralized. Investments The Authority’s investment policy follows the City of Knoxville and Knox County’s investment policies. These policies authorize the Authority to invest idle funds in direct obligations of the United States Treasury, its agencies and instrumentalities, money market funds, the state local treasurer’s investment pool (Tennessee Local Government Investment Pool), prime commercial paper, bankers’ acceptance notes, certificates of deposit, corporate bonds, equity funds, short-term bonds and debt securities. Interest Rate Risk: To limit the Authority’s exposure to fair value losses arising from changing interest rates, the Authority’s investment policy prohibits more than 20% of investments (as defined) to be invested with maturities of greater than two years from the acquisition date. Also, investment maturities may not exceed five years from the acquisition date. Investments with maturities of greater than two years require approval of the finance committee. Credit Risk: The Authority’s investment policy allows only investments rated in the highest category by two nationally recognized rating services. As of June 30, 2021, all the Authority’s investments in debt securities were rated at least Aaa by Moody’s Investor Services or AA+ by Standard & Poor’s rating services. The Authority’s debt securities investments of U.S. Government Sponsored Enterprises at June 30, 2021 have an implied but not explicit backing of the United States government.
METROPOLITAN KNOXVILLE AIRPORT AUTHORITY
45
NOTES TO FINANCIAL STATEMENTS (continued)
5. Long-Term Debt (continued)
Scheduled Debt Service Requirements As of June 30, 2016, scheduled debt service requirements of the variable-rate debt and net swap payments, assuming current interest rates remain the same for their term are as follows. As rates vary, variable-rate bond interest payments and net swap payments will vary.
Year ending
Variable Rate Bonds
Interest Rate
June 30
Principal
Interest
Swaps, net
Total
2017
$ 4,590,000
$ 562,983
$ 985,043
$ 6,138,026
2018
4,825,000
522,361
830,113
6,177,474
2019
5,075,000
479,483
667,315
6,221,798
2020
5,335,000
434,090
496,213
6,265,303
2021
5,610,000
386,211
316,408
6,312,619
2022-2026 32,520,000 1,107,156 405,195 34,032,351
2027-2028
12,680,000
86,013
-
12,766,013
Total
$70,635,000
$3,578,297
$3,700,287
$77,913,584
6. Fair Value The Authority categorizes its fair value measurements within the fair value hierarchy established by generally accepted accounting principles. The hierarchy is based on the valuation inputs used to measure the fair value of the assets. Level 1 inputs are quoted prices in active markets for identical assets. Level 2 inputs are significant other observable inputs. Level 3 inputs are significant unobservable inputs. Debt securities are valued based on the securities’ relationship to benchmark quoted prices. Derivative instruments are valued using a market approach that considers benchmark interest rates. The following table sets forth by level, within the fair value hierarchy, the fair value of the Authority’s investments and interest rate swap liabilities as of June 30, 2016:
Level 1 Level 2 Level 3 Total Investments: Government debt securities $ – $ 39,998,469 $ – $ 39,998,469
Interest rate swap liabilities $ – $ 4,502,609 $ – $ 4,502,609
The following table sets forth by level, within the fair value hierarchy, the fair value of the Authority’s investments and derivative investments as of June 30, 2015:
Level 1 Level 2 Level 3 Total Investments: Government debt securities $ – $ 40,071,930 $ – $ 40,071,930
Derivative instruments: Interest rate swaps $ – $ 4,883,863 $ – $ 4,883,863
40

NOTES TO FINANCIAL STATEMENTS (continued)
2. Deposits and Investments (continued) Investments (continued) Custodial Credit Risk: For an investment, custodial credit risk is the risk that, in the event of a failure of the custodian, the Authority will not be able to recover the value of the investments or collateral securities that are in the possession of an outside party. The Authority’s investments are typically uninsured and unregistered investments for which the securities are held by the custodian’s trust department or agent in the Authority’s name. Certificates of deposit are secured by collateral held by the bank collateral pool administered by the Treasurer of the State of Tennessee. As of June 30, 2021, each investment of the Authority accounts for more than 5% of total investments and as such, represents a concentration. Investments of the Authority at June 30, 2021 are as follows:
Weighted Average Maturity (Months)
Investments at Fair Value
Investments at Cost
Interest Rates
Maturity Dates
Federal Home Loan Bank 35.50 $ 4,984,700
$ –
0.30% 06/10/2024
Tennessee State School Bond Authority 16.00 1,699,065
–
0.17% 11/01/2022
Certificate of Deposit 20.00 – 5,000,000 0.25% 03/02/2023
Total investments $ 6,683,765 $ 5,000,000 Portfolio weighted average maturity 26.03
3. Leases The Authority, as lessor, leases certain capital assets under operating leases expiring in various years through 2053. As of June 30, 2021, minimum future base rentals to be received on noncancelable leases are as follows:
2022 $ 4,770,728 2023 4,770,518 2024 3,996,972 2025 777,123 2026 777,123 Thereafter 13,990,410 Total minimum future base rentals $29,082,874
Contingent rentals, which consist primarily of airline terminal, rental car concessions and other similar revenues, amounted to $5,361,465 in 2021 and $6,357,551 in 2020.
METROPOLITAN KNOXVILLE AIRPORT AUTHORITY
45
NOTES TO FINANCIAL STATEMENTS (continued)
5. Long-Term Debt (continued)
Scheduled Debt Service Requirements As of June 30, 2016, scheduled debt service requirements of the variable-rate debt and net swap payments, assuming current interest rates remain the same for their term are as follows. As rates vary, variable-rate bond interest payments and net swap payments will vary.
Year ending
Variable Rate Bonds
Interest Rate
June 30
Principal
Interest
Swaps, net
Total
2017
$ 4,590,000
$ 562,983
$ 985,043
$ 6,138,026
2018
4,825,000
522,361
830,113
6,177,474
2019
5,075,000
479,483
667,315
6,221,798
2020
5,335,000
434,090
496,213
6,265,303
2021
5,610,000
386,211
316,408
6,312,619
2022-2026 32,520,000 1,107,156 405,195 34,032,351
2027-2028
12,680,000
86,013
-
12,766,013
Total
$70,635,000
$3,578,297
$3,700,287
$77,913,584
6. Fair Value The Authority categorizes its fair value measurements within the fair value hierarchy established by generally accepted accounting principles. The hierarchy is based on the valuation inputs used to measure the fair value of the assets. Level 1 inputs are quoted prices in active markets for identical assets. Level 2 inputs are significant other observable inputs. Level 3 inputs are significant unobservable inputs. Debt securities are valued based on the securities’ relationship to benchmark quoted prices. Derivative instruments are valued using a market approach that considers benchmark interest rates. The following table sets forth by level, within the fair value hierarchy, the fair value of the Authority’s investments and interest rate swap liabilities as of June 30, 2016:
Level 1 Level 2 Level 3 Total Investments: Government debt securities $ – $ 39,998,469 $ – $ 39,998,469
Interest rate swap liabilities $ – $ 4,502,609 $ – $ 4,502,609
The following table sets forth by level, within the fair value hierarchy, the fair value of the Authority’s investments and derivative investments as of June 30, 2015:
Level 1 Level 2 Level 3 Total Investments: Government debt securities $ – $ 40,071,930 $ – $ 40,071,930
Derivative instruments: Interest rate swaps $ – $ 4,883,863 $ – $ 4,883,863
41

4. Capital Assets
Capital asset activity, including Master Plans, for the years ended June 30, 2021 and 2020, is as follows:
Beginning EndingYear ended June 30, 2021 Balance Increases Decreases Balance
Nondepreciable capital assets:Land 38,686,504$ 749,438$ -$ 39,435,942$ Land easements 625,903 - - 625,903Construction in progress 126,315,255 26,336,841 (1,026,927) 151,625,169
Total nondepreciable capital assets 165,627,662 27,086,279 (1,026,927) 191,687,014
Depreciable capital assets:Land improvements 122,593,552 596,390 - 123,189,942Buildings and building
improvements 173,569,019 - - 173,569,019Equipment, furniture and
fixtures 24,178,779 611,052 (44,721) 24,745,110Total depreciable capital assets 320,341,350 1,207,442 (44,721) 321,504,071 Less accumulated depreciation:
Land improvements (97,964,787) (3,408,971) - (101,373,758) Buildings and building
improvements (118,830,617) (5,379,024) - (124,209,641) Equipment, furniture and
fixtures (12,705,232) (1,228,111) 8,944 (13,924,399) Total accumulated depreciation (229,500,636) (10,016,106) 8,944 (239,507,798) Net depreciable capital assets 90,840,714 (8,808,664) (35,777) 81,996,273 Total capital assets, net of
accumulated depreciation 256,468,376$ 18,277,615$ (1,062,704)$ 273,683,287$
Other capital assets:Master plans and other plans 10,506,539$ 187,419$ -$ 10,693,958$ Accumulated amortization (9,923,134) (123,380) - (10,046,514)
Net other capital assets 583,405$ 64,039$ -$ 647,444$
NOTES TO FINANCIAL STATEMENTS (continued)
METROPOLITAN KNOXVILLE AIRPORT AUTHORITY
45
NOTES TO FINANCIAL STATEMENTS (continued)
5. Long-Term Debt (continued)
Scheduled Debt Service Requirements As of June 30, 2016, scheduled debt service requirements of the variable-rate debt and net swap payments, assuming current interest rates remain the same for their term are as follows. As rates vary, variable-rate bond interest payments and net swap payments will vary.
Year ending
Variable Rate Bonds
Interest Rate
June 30
Principal
Interest
Swaps, net
Total
2017
$ 4,590,000
$ 562,983
$ 985,043
$ 6,138,026
2018
4,825,000
522,361
830,113
6,177,474
2019
5,075,000
479,483
667,315
6,221,798
2020
5,335,000
434,090
496,213
6,265,303
2021
5,610,000
386,211
316,408
6,312,619
2022-2026 32,520,000 1,107,156 405,195 34,032,351
2027-2028
12,680,000
86,013
-
12,766,013
Total
$70,635,000
$3,578,297
$3,700,287
$77,913,584
6. Fair Value The Authority categorizes its fair value measurements within the fair value hierarchy established by generally accepted accounting principles. The hierarchy is based on the valuation inputs used to measure the fair value of the assets. Level 1 inputs are quoted prices in active markets for identical assets. Level 2 inputs are significant other observable inputs. Level 3 inputs are significant unobservable inputs. Debt securities are valued based on the securities’ relationship to benchmark quoted prices. Derivative instruments are valued using a market approach that considers benchmark interest rates. The following table sets forth by level, within the fair value hierarchy, the fair value of the Authority’s investments and interest rate swap liabilities as of June 30, 2016:
Level 1 Level 2 Level 3 Total Investments: Government debt securities $ – $ 39,998,469 $ – $ 39,998,469
Interest rate swap liabilities $ – $ 4,502,609 $ – $ 4,502,609
The following table sets forth by level, within the fair value hierarchy, the fair value of the Authority’s investments and derivative investments as of June 30, 2015:
Level 1 Level 2 Level 3 Total Investments: Government debt securities $ – $ 40,071,930 $ – $ 40,071,930
Derivative instruments: Interest rate swaps $ – $ 4,883,863 $ – $ 4,883,863
42

4. Capital Assets (continued)
Beginning EndingYear ended June 30, 2020 Balance Increases Decreases Balance
Nondepreciable capital assets:Land 38,629,436$ 134,014$ (76,946)$ 38,686,504$ Land easements 625,903 - - 625,903Construction in progress 96,558,646 32,726,869 (2,970,260) 126,315,255
Total nondepreciable capital assets 135,813,985 32,860,883 (3,047,206) 165,627,662
Depreciable capital assets:Land improvements 120,851,163 1,742,389 - 122,593,552Buildings and building
improvements 172,674,934 894,085 - 173,569,019Equipment, furniture and
fixtures 23,474,891 775,587 (71,699) 24,178,779Total depreciable capital assets 317,000,988 3,412,061 (71,699) 320,341,350 Less accumulated depreciation:
Land improvements (94,731,119) (3,233,668) - (97,964,787) Buildings and building
improvements (113,376,996) (5,453,621) - (118,830,617) Equipment, furniture and
fixtures (11,382,319) (1,365,391) 42,478 (12,705,232) Total accumulated depreciation (219,490,434) (10,052,680) 42,478 (229,500,636) Net depreciable capital assets 97,510,554 (6,640,619) (29,221) 90,840,714 Total capital assets, net of
accumulated depreciation 233,324,539$ 26,220,264$ (3,076,427)$ 256,468,376$
Other capital assets:Master plans and other plans 10,386,209$ 120,330$ -$ 10,506,539$ Accumulated amortization (9,920,216) (2,918) - (9,923,134)
Net other capital assets 465,993$ 117,412$ -$ 583,405$
NOTES TO FINANCIAL STATEMENTS (continued)
The Authority is contractually obligated to expend an additional $10,700,000 for various projects.Estimated costs to complete construction in progress for these projects total approximately $33,000,000 asof June 30, 2021. The work will be funded through proceeds from Federal and State grants and otherAuthority funds.
METROPOLITAN KNOXVILLE AIRPORT AUTHORITY
45
NOTES TO FINANCIAL STATEMENTS (continued)
5. Long-Term Debt (continued)
Scheduled Debt Service Requirements As of June 30, 2016, scheduled debt service requirements of the variable-rate debt and net swap payments, assuming current interest rates remain the same for their term are as follows. As rates vary, variable-rate bond interest payments and net swap payments will vary.
Year ending
Variable Rate Bonds
Interest Rate
June 30
Principal
Interest
Swaps, net
Total
2017
$ 4,590,000
$ 562,983
$ 985,043
$ 6,138,026
2018
4,825,000
522,361
830,113
6,177,474
2019
5,075,000
479,483
667,315
6,221,798
2020
5,335,000
434,090
496,213
6,265,303
2021
5,610,000
386,211
316,408
6,312,619
2022-2026 32,520,000 1,107,156 405,195 34,032,351
2027-2028
12,680,000
86,013
-
12,766,013
Total
$70,635,000
$3,578,297
$3,700,287
$77,913,584
6. Fair Value The Authority categorizes its fair value measurements within the fair value hierarchy established by generally accepted accounting principles. The hierarchy is based on the valuation inputs used to measure the fair value of the assets. Level 1 inputs are quoted prices in active markets for identical assets. Level 2 inputs are significant other observable inputs. Level 3 inputs are significant unobservable inputs. Debt securities are valued based on the securities’ relationship to benchmark quoted prices. Derivative instruments are valued using a market approach that considers benchmark interest rates. The following table sets forth by level, within the fair value hierarchy, the fair value of the Authority’s investments and interest rate swap liabilities as of June 30, 2016:
Level 1 Level 2 Level 3 Total Investments: Government debt securities $ – $ 39,998,469 $ – $ 39,998,469
Interest rate swap liabilities $ – $ 4,502,609 $ – $ 4,502,609
The following table sets forth by level, within the fair value hierarchy, the fair value of the Authority’s investments and derivative investments as of June 30, 2015:
Level 1 Level 2 Level 3 Total Investments: Government debt securities $ – $ 40,071,930 $ – $ 40,071,930
Derivative instruments: Interest rate swaps $ – $ 4,883,863 $ – $ 4,883,863
43

NOTES TO FINANCIAL STATEMENTS (continued) 4. Capital Assets (continued) In October 2018, the State of Tennessee (the State) brought four condemnation actions against the Authority under eminent domain laws to acquire certain parcels of real property owned by the Authority in connection with the Alcoa Highway Relocation Project. The State alleges it owes the Authority $6,530,000 for these parcels. The Authority asserts the amount assessed by the State does not reflect the current fair value of the parcels and seeks a jury trial as to the amount of just compensation to be paid by the State. The lawsuits are currently in the discovery phase of litigation and no trial date has been set at this time. During 2019, the Authority received approximately $5,340,000 with the remaining $1,190,000 recorded as a receivable at June 30, 2021. During 2020, the Authority began installation of and replacement of the Runway 5L/23R Instrument Landing Systems (ILS) which is fully funded through grants provided by the FAA. Upon completion of this project, certain related assets constructed, emplaced, or installed will become the property of the FAA. The project will be completed upon the FAA’s inspection of the specific equipment or construction, and acceptance that it is substantially complete and ready for use. The FAA will accept all responsibilities for operations and maintenance requirements of this equipment. Equipment of approximately $3,200,000 as of June 30, 2021, is expected to be transferred to the FAA upon title transfer. 5. Long-Term Debt Long-term debt includes the following Airport Revenue Obligations payable from operating revenues for the year ended June 30, 2021 and 2020:
Beginning Balance Additions Payments
Ending Balance
Year ended June 30, 2021 Notes payable: Series 2017A $ 6,070,000 $ – $ 6,070,000 $ – Series 2019A 39,570,000 – 5,275,000 34,295,000 Total notes payable 45,640,000 – 11,345,000 34,295,000 Total long-term debt 45,640,000 $ – $11,345,000 34,295,000 Less notes payable, current portion – – Long-term portion $45,640,000 $34,295,000
Year ended June 30, 2020 Bonds payable: Series V-A-1 $8,880,000 $ – $ 8,880,000 $ – Notes payable: Series 2017A 8,595,000 – 2,525,000 6,070,000 Series 2019A 39,570,000 – – 39,570,000 Total notes payable 48,165,000 – 2,525,000 45,640,000 Total long-term debt 57,045,000 $ – $11,405,000 45,640,000 Less bonds payable, current portion 4,335,000 – Less notes payable, current portion 1,245,000 – Long-term portion $51,465,000 $45,640,000
METROPOLITAN KNOXVILLE AIRPORT AUTHORITY
45
NOTES TO FINANCIAL STATEMENTS (continued)
5. Long-Term Debt (continued)
Scheduled Debt Service Requirements As of June 30, 2016, scheduled debt service requirements of the variable-rate debt and net swap payments, assuming current interest rates remain the same for their term are as follows. As rates vary, variable-rate bond interest payments and net swap payments will vary.
Year ending
Variable Rate Bonds
Interest Rate
June 30
Principal
Interest
Swaps, net
Total
2017
$ 4,590,000
$ 562,983
$ 985,043
$ 6,138,026
2018
4,825,000
522,361
830,113
6,177,474
2019
5,075,000
479,483
667,315
6,221,798
2020
5,335,000
434,090
496,213
6,265,303
2021
5,610,000
386,211
316,408
6,312,619
2022-2026 32,520,000 1,107,156 405,195 34,032,351
2027-2028
12,680,000
86,013
-
12,766,013
Total
$70,635,000
$3,578,297
$3,700,287
$77,913,584
6. Fair Value The Authority categorizes its fair value measurements within the fair value hierarchy established by generally accepted accounting principles. The hierarchy is based on the valuation inputs used to measure the fair value of the assets. Level 1 inputs are quoted prices in active markets for identical assets. Level 2 inputs are significant other observable inputs. Level 3 inputs are significant unobservable inputs. Debt securities are valued based on the securities’ relationship to benchmark quoted prices. Derivative instruments are valued using a market approach that considers benchmark interest rates. The following table sets forth by level, within the fair value hierarchy, the fair value of the Authority’s investments and interest rate swap liabilities as of June 30, 2016:
Level 1 Level 2 Level 3 Total Investments: Government debt securities $ – $ 39,998,469 $ – $ 39,998,469
Interest rate swap liabilities $ – $ 4,502,609 $ – $ 4,502,609
The following table sets forth by level, within the fair value hierarchy, the fair value of the Authority’s investments and derivative investments as of June 30, 2015:
Level 1 Level 2 Level 3 Total Investments: Government debt securities $ – $ 40,071,930 $ – $ 40,071,930
Derivative instruments: Interest rate swaps $ – $ 4,883,863 $ – $ 4,883,863
44

NOTES TO FINANCIAL STATEMENT S (continued)
5. Long-Term Debt (continued) During 2000, the Authority’s Board of Commissioners adopted a Master Resolution allowing the Authority to issue Airport Revenue Obligations. The Authority has pledged revenues, as defined in the Master Resolution, to repay the long-term debt issued under the Master Resolution for the term of the debt. Under this resolution, the Authority is required to establish certain funds, accounts and subaccounts to deposit funds to be held in trust by the Authority in order to meet the requirements of the resolution. These funds include:
Revenue Fund, including accounts for General Revenue and PFC Revenue into which the Authority is to deposit all such revenues. Sinking Fund, including a payments account and a debt service reserve account, into which the Authority will deposit funds from the Revenue Fund, as needed, to pay revenue obligations as they come due. Renewal and Extension Fund, into which the Authority may deposit any monies or securities held in the Revenue Fund (excluding PFC funds) in excess of 45 days’ estimated expenses.
Project Fund, into which proceeds from issuance of revenue obligations will be deposited to fund project costs.
Outstanding debt during fiscal year 2020 and 2021, consists of the following:
Series V-A-1 – $84,645,000 of Local Government Public Improvement Bonds issued by the Public Building Authority of Sevier County on December 1, 2008. During 2019, the Authority issued Series 2019A to provide funds to retire the 2022 through 2028 maturities. Remaining principal of $8,880,000 was paid in full in 2020. Series 2017A – $11,000,000 Airport Revenue Refunding Note issued on May 25, 2017, bearing interest at a fixed rate of 1.95%. The note was paid in full in 2021. Series 2019A – $39,570,000 Airport Revenue Refunding Note issued on June 27, 2019, bearing interest at a fixed rate of 2.54%. Remaining annual installments range from $5,410,000 to $6,000,000 through June 2028. Interest is paid semiannually.
All outstanding notes payable contain a provision that in an event of default, outstanding amounts may be declared due by the lender if the Authority is unable to make payment.
METROPOLITAN KNOXVILLE AIRPORT AUTHORITY
45
NOTES TO FINANCIAL STATEMENTS (continued)
5. Long-Term Debt (continued)
Scheduled Debt Service Requirements As of June 30, 2016, scheduled debt service requirements of the variable-rate debt and net swap payments, assuming current interest rates remain the same for their term are as follows. As rates vary, variable-rate bond interest payments and net swap payments will vary.
Year ending
Variable Rate Bonds
Interest Rate
June 30
Principal
Interest
Swaps, net
Total
2017
$ 4,590,000
$ 562,983
$ 985,043
$ 6,138,026
2018
4,825,000
522,361
830,113
6,177,474
2019
5,075,000
479,483
667,315
6,221,798
2020
5,335,000
434,090
496,213
6,265,303
2021
5,610,000
386,211
316,408
6,312,619
2022-2026 32,520,000 1,107,156 405,195 34,032,351
2027-2028
12,680,000
86,013
-
12,766,013
Total
$70,635,000
$3,578,297
$3,700,287
$77,913,584
6. Fair Value The Authority categorizes its fair value measurements within the fair value hierarchy established by generally accepted accounting principles. The hierarchy is based on the valuation inputs used to measure the fair value of the assets. Level 1 inputs are quoted prices in active markets for identical assets. Level 2 inputs are significant other observable inputs. Level 3 inputs are significant unobservable inputs. Debt securities are valued based on the securities’ relationship to benchmark quoted prices. Derivative instruments are valued using a market approach that considers benchmark interest rates. The following table sets forth by level, within the fair value hierarchy, the fair value of the Authority’s investments and interest rate swap liabilities as of June 30, 2016:
Level 1 Level 2 Level 3 Total Investments: Government debt securities $ – $ 39,998,469 $ – $ 39,998,469
Interest rate swap liabilities $ – $ 4,502,609 $ – $ 4,502,609
The following table sets forth by level, within the fair value hierarchy, the fair value of the Authority’s investments and derivative investments as of June 30, 2015:
Level 1 Level 2 Level 3 Total Investments: Government debt securities $ – $ 40,071,930 $ – $ 40,071,930
Derivative instruments: Interest rate swaps $ – $ 4,883,863 $ – $ 4,883,863
45

NOTES TO FINANCIAL STATEMENT S (continued)
5. Long-Term Debt (continued) Scheduled Debt Service Requirements All scheduled principal payments for fiscal year 2022 were prepaid in fiscal year 2021. As of June 30, 2021, scheduled debt service requirements of all outstanding debt are as follows.
Year ending June 30 Principal Interest Total 2022 $ – $ 871,093 $ 871,093 2023 5,410,000 860,175 6,270,175 2024 5,545,000 722,489 6,267,489 2025 5,690,000 581,353 6,271,353 2026 5,750,000 436,706 6,186,706 Thereafter 11,900,000 430,645 12,330,645 Total $34,295,000 $3,902,461 $38,197,461
Derivative Instruments In order to protect against the potential of rising interest rates and to balance its mixture of variable and fixed rate debt, the Authority entered into an interest rate swap agreement (the swap). The intention of the swap was to effectively change the Authority’s variable interest rate on the Series V-A-1 bonds to a synthetic fixed rate. The swap had an effective date of June 28, 2001 with a fixed rate paid of 4.355% and a variable rate received of 62.5% of 5 Year LIBOR. The swap was terminated in 2020 in consideration of $188,291. The Authority’s swap associated with the Series V-A-1 bond was considered an investment derivative. Accordingly, the $405,479 decrease in the fair value in fiscal year 2020, is reported as a change in fair value of investment interest rate swap in the nonoperating income portion of the Statements of Revenues, Expenses and Changes in Net Position.
6. Fair Value The Authority categorizes its fair value measurements within the fair value hierarchy established by generally accepted accounting principles. The hierarchy is based on the valuation inputs used to measure the fair value of the assets. Level 1 inputs are quoted prices in active markets for identical assets. Level 2 inputs are significant other observable inputs. Level 3 inputs are significant unobservable inputs. Debt securities classified as Level 2 are valued based on quotes obtained from national exchanges and other observable inputs from market data. The proceeding methods described may produce a fair value calculation that may not be indicative of net realizable value or reflective of future fair values. Furthermore, although management believes the valuation methods are appropriate and consistent with other market participants, the use of different methodologies or assumptions to determine the fair value of certain financial instruments could result in a different fair value measurement at the reporting date.
METROPOLITAN KNOXVILLE AIRPORT AUTHORITY
45
NOTES TO FINANCIAL STATEMENTS (continued)
5. Long-Term Debt (continued)
Scheduled Debt Service Requirements As of June 30, 2016, scheduled debt service requirements of the variable-rate debt and net swap payments, assuming current interest rates remain the same for their term are as follows. As rates vary, variable-rate bond interest payments and net swap payments will vary.
Year ending
Variable Rate Bonds
Interest Rate
June 30
Principal
Interest
Swaps, net
Total
2017
$ 4,590,000
$ 562,983
$ 985,043
$ 6,138,026
2018
4,825,000
522,361
830,113
6,177,474
2019
5,075,000
479,483
667,315
6,221,798
2020
5,335,000
434,090
496,213
6,265,303
2021
5,610,000
386,211
316,408
6,312,619
2022-2026 32,520,000 1,107,156 405,195 34,032,351
2027-2028
12,680,000
86,013
-
12,766,013
Total
$70,635,000
$3,578,297
$3,700,287
$77,913,584
6. Fair Value The Authority categorizes its fair value measurements within the fair value hierarchy established by generally accepted accounting principles. The hierarchy is based on the valuation inputs used to measure the fair value of the assets. Level 1 inputs are quoted prices in active markets for identical assets. Level 2 inputs are significant other observable inputs. Level 3 inputs are significant unobservable inputs. Debt securities are valued based on the securities’ relationship to benchmark quoted prices. Derivative instruments are valued using a market approach that considers benchmark interest rates. The following table sets forth by level, within the fair value hierarchy, the fair value of the Authority’s investments and interest rate swap liabilities as of June 30, 2016:
Level 1 Level 2 Level 3 Total Investments: Government debt securities $ – $ 39,998,469 $ – $ 39,998,469
Interest rate swap liabilities $ – $ 4,502,609 $ – $ 4,502,609
The following table sets forth by level, within the fair value hierarchy, the fair value of the Authority’s investments and derivative investments as of June 30, 2015:
Level 1 Level 2 Level 3 Total Investments: Government debt securities $ – $ 40,071,930 $ – $ 40,071,930
Derivative instruments: Interest rate swaps $ – $ 4,883,863 $ – $ 4,883,863
46

NOTES TO FINANCIAL STATEMENTS (continued) 6. Fair Value (continued) The following table summarizes fair value disclosures and measurements at June 30, 2021 and June 30, 2020:
Level 1 Level 2 Level 3 Total June 30, 2021 Investments: Government debt securities $ – $6,683,765 $ – $6,683,765
June 30, 2020 Investments: Government debt securities $ – $8,411,380 $ – $8,411,380
7. Deferred Compensation Plan The Authority offers its employees a deferred compensation plan created in accordance with Internal Revenue Code Section 457 and is administered by the International City Management Association Retirement Corporation. The plan, available to all full-time Authority employees, permits them to defer a portion of their salary until future years. The deferred compensation is not available to employees until termination, retirement, death, or unforeseeable emergency. Employee contributions to the Plan were $158,060 in 2021 and $131,345 in 2020. Separate audited financial reports are not available for this plan. 8. Retirement Plan The Authority provides retirement benefits for all of its full-time employees through a defined contribution plan (Metropolitan Knoxville Airport Authority Plan) which was established and can be amended under the authority of the Board of Commissioners and is administered by the International City Management Association Retirement Corporation. In a defined contribution plan, benefits depend solely on amounts contributed to the plan plus investment earnings. All full-time employees are eligible to participate from the date of employment. The Authority’s contributions for each employee (and investment income allocated to the employees’ account) are vested after one year of employment. Under the terms of the plan, employer contributions are determined annually by the Board of Commissioners. There are no minimum required employer contributions under the terms of the plan and there is no outstanding employer liability as of June 30, 2021 and 2020. Employee contributions are optional. Employer contribution expense totaled $974,179 in 2021 and $991,835 in 2020. There were minimal forfeitures during 2021 and 2020. Separate audited financial reports are not available for this plan.
METROPOLITAN KNOXVILLE AIRPORT AUTHORITY
45
NOTES TO FINANCIAL STATEMENTS (continued)
5. Long-Term Debt (continued)
Scheduled Debt Service Requirements As of June 30, 2016, scheduled debt service requirements of the variable-rate debt and net swap payments, assuming current interest rates remain the same for their term are as follows. As rates vary, variable-rate bond interest payments and net swap payments will vary.
Year ending
Variable Rate Bonds
Interest Rate
June 30
Principal
Interest
Swaps, net
Total
2017
$ 4,590,000
$ 562,983
$ 985,043
$ 6,138,026
2018
4,825,000
522,361
830,113
6,177,474
2019
5,075,000
479,483
667,315
6,221,798
2020
5,335,000
434,090
496,213
6,265,303
2021
5,610,000
386,211
316,408
6,312,619
2022-2026 32,520,000 1,107,156 405,195 34,032,351
2027-2028
12,680,000
86,013
-
12,766,013
Total
$70,635,000
$3,578,297
$3,700,287
$77,913,584
6. Fair Value The Authority categorizes its fair value measurements within the fair value hierarchy established by generally accepted accounting principles. The hierarchy is based on the valuation inputs used to measure the fair value of the assets. Level 1 inputs are quoted prices in active markets for identical assets. Level 2 inputs are significant other observable inputs. Level 3 inputs are significant unobservable inputs. Debt securities are valued based on the securities’ relationship to benchmark quoted prices. Derivative instruments are valued using a market approach that considers benchmark interest rates. The following table sets forth by level, within the fair value hierarchy, the fair value of the Authority’s investments and interest rate swap liabilities as of June 30, 2016:
Level 1 Level 2 Level 3 Total Investments: Government debt securities $ – $ 39,998,469 $ – $ 39,998,469
Interest rate swap liabilities $ – $ 4,502,609 $ – $ 4,502,609
The following table sets forth by level, within the fair value hierarchy, the fair value of the Authority’s investments and derivative investments as of June 30, 2015:
Level 1 Level 2 Level 3 Total Investments: Government debt securities $ – $ 40,071,930 $ – $ 40,071,930
Derivative instruments: Interest rate swaps $ – $ 4,883,863 $ – $ 4,883,863
47

NOTES TO FINANCIAL STATEMENTS (continued) 9. Passenger Facility Charges Passenger Facility Charges (PFC) are fees imposed on enplaning passengers by airports to finance eligible airport-related projects that preserve or enhance the safety, security or capacity; reduce noise; or increase air carrier competition. Since September 2003, the air carriers have been collecting a $4.50 PFC on qualifying passengers at McGhee Tyson Airport on behalf of the Authority. Both the fee and its intended projects must be reviewed and approved by the FAA. PFCs, along with related interest earnings, are recorded as deferred revenues until authorized to use for construction and related debt services payments under FAA approved Application to Use. Once authorized to use, the PFC receipts are recognized and recorded as nonoperating income in the year collected by the air carriers. PFC revenues totaled $3,109,225 in 2021 and $3,890,584 in 2020. All PFCs were authorized for use, and no deferred revenues were recorded. Subsequent to year-end, the Authority’s application was amended; reducing the amount approved to be received from $95,800,334 to $84,329,833 on currently approved projects, primarily as a result of lower financing and interest costs. The amendment also extended the current maturity from July 2022 through August 2024, unless again extended. Cumulative expenditures to date on these currently approved PFC projects total $71,346,906. As of June 30, 2021 and 2020, the Authority has $3,349,256 and $2,635,162, respectively, of PFCs available and authorized for use. This amount is included in restricted net position on the balance sheet (see Note 12). 10. Customer Facility Charges On February 1, 2020, the Authority began collecting Customer Facility Charges (CFC) fees from rental car operators serving McGhee Tyson Airport. Fees collected are to fund the planning, design/engineering, construction of new car rental facilities and/or improvements to the existing car rental facilities, including any associated infrastructure costs or payment of any Authority debt service incurred to finance these costs or ongoing maintenance of rental car facilities. The CFC is a $4.00 fee per car rental transaction day collected by rental car companies from each of their customers and subsequently remitted to the Authority. CFC receipts are recognized and recorded as nonoperating income. CFC revenues totaled $1,982,901 in 2021 and $512,816 in 2020. As of June 30, 2021 and 2020, the Authority has $2,495,717 and $512,816, respectively, of CFCs available for authorized use. No expenditures were incurred during the year and the amount collected is included in restricted net position on the statements of net position. 11. Business Concentrations The Authority is dependent to a large extent on five major airlines and their regional affiliates in that a significant portion of aviation area revenues are generated by these airlines. These airlines accounted for aviation area revenues totaling $3,503,947 in 2021 and $4,417,297 in 2020 and maintenance facility rent from a regional affiliate accounted for $269,494 of air cargo revenue in 2021 and $706,521 in 2020. In addition, a significant portion of terminal area revenue is directly and indirectly generated from four of these airlines’ passengers, which accounted for approximately 97% of total passengers in 2021 and 2020. As of June 30, 2021 and 2020, 41% and 97%, respectively, of trade accounts receivables are due from these major airlines. As of June 30, 2021, the Authority also had receivables from rental car companies which collectively accounted for 25% of trade accounts.
METROPOLITAN KNOXVILLE AIRPORT AUTHORITY
45
NOTES TO FINANCIAL STATEMENTS (continued)
5. Long-Term Debt (continued)
Scheduled Debt Service Requirements As of June 30, 2016, scheduled debt service requirements of the variable-rate debt and net swap payments, assuming current interest rates remain the same for their term are as follows. As rates vary, variable-rate bond interest payments and net swap payments will vary.
Year ending
Variable Rate Bonds
Interest Rate
June 30
Principal
Interest
Swaps, net
Total
2017
$ 4,590,000
$ 562,983
$ 985,043
$ 6,138,026
2018
4,825,000
522,361
830,113
6,177,474
2019
5,075,000
479,483
667,315
6,221,798
2020
5,335,000
434,090
496,213
6,265,303
2021
5,610,000
386,211
316,408
6,312,619
2022-2026 32,520,000 1,107,156 405,195 34,032,351
2027-2028
12,680,000
86,013
-
12,766,013
Total
$70,635,000
$3,578,297
$3,700,287
$77,913,584
6. Fair Value The Authority categorizes its fair value measurements within the fair value hierarchy established by generally accepted accounting principles. The hierarchy is based on the valuation inputs used to measure the fair value of the assets. Level 1 inputs are quoted prices in active markets for identical assets. Level 2 inputs are significant other observable inputs. Level 3 inputs are significant unobservable inputs. Debt securities are valued based on the securities’ relationship to benchmark quoted prices. Derivative instruments are valued using a market approach that considers benchmark interest rates. The following table sets forth by level, within the fair value hierarchy, the fair value of the Authority’s investments and interest rate swap liabilities as of June 30, 2016:
Level 1 Level 2 Level 3 Total Investments: Government debt securities $ – $ 39,998,469 $ – $ 39,998,469
Interest rate swap liabilities $ – $ 4,502,609 $ – $ 4,502,609
The following table sets forth by level, within the fair value hierarchy, the fair value of the Authority’s investments and derivative investments as of June 30, 2015:
Level 1 Level 2 Level 3 Total Investments: Government debt securities $ – $ 40,071,930 $ – $ 40,071,930
Derivative instruments: Interest rate swaps $ – $ 4,883,863 $ – $ 4,883,863
48

12. Net Position
Net position consists of the following as of June 30:2021 2020
Net investment in capital assetsNoncurrent assets:
Capital assets, net 273,683,287$ 256,468,376$ Master plans and other plans, net 647,444 583,405
Total noncurrent assets 274,330,731 257,051,781
Deferred outflows - deferred charge on debt refundings - 916,666
Less related liabilities:Accounts payable - construction 1,207,875 1,364,296Long-term debt 34,295,000 45,640,000
Total related liabilities 35,502,875 47,004,296 Net investment in capital assets 238,827,856$ 210,964,151$
Restricted net position:Cash and cash equivalents - passenger facility charges 2,506,963$ 2,447,162$ Cash and cash equivalents - law enforcement 459,056 422,428Cash and cash equivalents - customer facility charges 2,265,857 260,756 Receivables - passenger facility charges 842,293 188,000 Receivables - customer facility charges 229,860 252,060
Restricted net position 6,304,029$ 3,570,406$
Unrestricted net position (all other items on statements of net position not reflected above):Assets:
Cash and cash equivalents 52,155,551$ 47,210,695$ Investments 11,683,765 8,411,380 Receivables 8,790,929 13,746,075Prepaid expenses and other current assets 956,024 1,501,892Other noncurrent assets - 5,248
Total unrestricted assets 73,586,269 70,875,290 Less liabilities:
Accounts payable - non-construction 1,494,882 1,649,195Accrued payroll and other expenses 1,627,925 1,604,399Accrued interest 70,172 93,999Unearned revenue 46,500 52,500
Total liabilities 3,239,479 3,400,093 Unrestricted net position 70,346,790$ 67,475,197$
NOTES TO FINANCIAL STATEMENTS (continued)
METROPOLITAN KNOXVILLE AIRPORT AUTHORITY
45
NOTES TO FINANCIAL STATEMENTS (continued)
5. Long-Term Debt (continued)
Scheduled Debt Service Requirements As of June 30, 2016, scheduled debt service requirements of the variable-rate debt and net swap payments, assuming current interest rates remain the same for their term are as follows. As rates vary, variable-rate bond interest payments and net swap payments will vary.
Year ending
Variable Rate Bonds
Interest Rate
June 30
Principal
Interest
Swaps, net
Total
2017
$ 4,590,000
$ 562,983
$ 985,043
$ 6,138,026
2018
4,825,000
522,361
830,113
6,177,474
2019
5,075,000
479,483
667,315
6,221,798
2020
5,335,000
434,090
496,213
6,265,303
2021
5,610,000
386,211
316,408
6,312,619
2022-2026 32,520,000 1,107,156 405,195 34,032,351
2027-2028
12,680,000
86,013
-
12,766,013
Total
$70,635,000
$3,578,297
$3,700,287
$77,913,584
6. Fair Value The Authority categorizes its fair value measurements within the fair value hierarchy established by generally accepted accounting principles. The hierarchy is based on the valuation inputs used to measure the fair value of the assets. Level 1 inputs are quoted prices in active markets for identical assets. Level 2 inputs are significant other observable inputs. Level 3 inputs are significant unobservable inputs. Debt securities are valued based on the securities’ relationship to benchmark quoted prices. Derivative instruments are valued using a market approach that considers benchmark interest rates. The following table sets forth by level, within the fair value hierarchy, the fair value of the Authority’s investments and interest rate swap liabilities as of June 30, 2016:
Level 1 Level 2 Level 3 Total Investments: Government debt securities $ – $ 39,998,469 $ – $ 39,998,469
Interest rate swap liabilities $ – $ 4,502,609 $ – $ 4,502,609
The following table sets forth by level, within the fair value hierarchy, the fair value of the Authority’s investments and derivative investments as of June 30, 2015:
Level 1 Level 2 Level 3 Total Investments: Government debt securities $ – $ 40,071,930 $ – $ 40,071,930
Derivative instruments: Interest rate swaps $ – $ 4,883,863 $ – $ 4,883,863
49

13. Division Information
2021 2020 2021 2020
Unrestricted current assets 73,513,788$ 70,728,374$ 72,481$ 141,668$ Restricted current assets 6,304,029 3,570,406 - - Capital assets, net 269,702,840 252,189,574 4,627,891 4,862,207 Other noncurrent assets, net - - - 5,248 Intercompany receivable 4,016,986 4,091,044 - - Deferred outflows of resources - 916,666 - - Total assets and deferred outflows of resources 353,537,643$ 331,496,064$ 4,700,372$ 5,009,123$
Current liabilities 4,374,275$ 4,686,444$ 26,579$ 25,445$ Intercompany payable - - 4,016,986 4,091,044 Long-term debt, less current portion 34,139,695 45,460,807 155,305 179,193 Unearned revenue 46,500 52,500 - - Total liabilities 38,560,470$ 50,199,751$ 4,198,870$ 4,295,682$
Net position:Net investment in capital assets 234,355,270$ 206,281,137$ 4,472,586$ 4,683,014$ Restricted 6,304,029 3,570,406 - - Unrestricted 74,317,874 71,444,770 (3,971,084) (3,969,573)
Total net position 314,977,173$ 281,296,313$ 501,502$ 713,441$
Operating revenues 21,031,322$ 28,490,253$ 1,401,580$ 1,289,023$ Operating expenses (19,409,939) (20,958,144) (1,361,951) (1,303,870) Depreciation and amortization (9,822,419) (9,807,589) (317,067) (248,009) Operating loss (8,201,036) (2,275,480) (277,438) (262,856) Net nonoperating income (expense) 17,616,211 10,322,830 (3,719) 62,376 Capital contributions 24,265,685 29,581,157 69,218 456,647 Increase (decrease) in net position 33,680,860$ 37,628,507$ (211,939)$ 256,167$
Cash flows:Operating activities $ 2,127,450 $ 8,142,786 $ 53,646 $ 18,134 Investing activities (3,176,312) 30,971,586 - - Noncapital financing activities 14,504,192 6,719,886 (73,298) (153,435)Capital and related financing activities (6,408,898) (17,203,050) 19,606 135,347
Net change in cash and cash equivalents 7,046,432 28,631,208 (46) 46 Cash and cash equivalents at beginning of the year 50,340,595 21,709,387 446 400 Cash and cash equivalents at end of the year $ 57,387,027 $ 50,340,595 $ 400 $ 446
McGhee Tyson Downtown Island
The Metropolitan Knoxville Airport Authority provides services through two divisions - McGhee Tyson Airportand Knoxville Downtown Island Airport. Key financial data as of and for the years ended June 30, 2021 and 2020for the two divisions is as follows:
NOTES TO FINANCIAL STATEMENTS (continued)
METROPOLITAN KNOXVILLE AIRPORT AUTHORITY
45
NOTES TO FINANCIAL STATEMENTS (continued)
5. Long-Term Debt (continued)
Scheduled Debt Service Requirements As of June 30, 2016, scheduled debt service requirements of the variable-rate debt and net swap payments, assuming current interest rates remain the same for their term are as follows. As rates vary, variable-rate bond interest payments and net swap payments will vary.
Year ending
Variable Rate Bonds
Interest Rate
June 30
Principal
Interest
Swaps, net
Total
2017
$ 4,590,000
$ 562,983
$ 985,043
$ 6,138,026
2018
4,825,000
522,361
830,113
6,177,474
2019
5,075,000
479,483
667,315
6,221,798
2020
5,335,000
434,090
496,213
6,265,303
2021
5,610,000
386,211
316,408
6,312,619
2022-2026 32,520,000 1,107,156 405,195 34,032,351
2027-2028
12,680,000
86,013
-
12,766,013
Total
$70,635,000
$3,578,297
$3,700,287
$77,913,584
6. Fair Value The Authority categorizes its fair value measurements within the fair value hierarchy established by generally accepted accounting principles. The hierarchy is based on the valuation inputs used to measure the fair value of the assets. Level 1 inputs are quoted prices in active markets for identical assets. Level 2 inputs are significant other observable inputs. Level 3 inputs are significant unobservable inputs. Debt securities are valued based on the securities’ relationship to benchmark quoted prices. Derivative instruments are valued using a market approach that considers benchmark interest rates. The following table sets forth by level, within the fair value hierarchy, the fair value of the Authority’s investments and interest rate swap liabilities as of June 30, 2016:
Level 1 Level 2 Level 3 Total Investments: Government debt securities $ – $ 39,998,469 $ – $ 39,998,469
Interest rate swap liabilities $ – $ 4,502,609 $ – $ 4,502,609
The following table sets forth by level, within the fair value hierarchy, the fair value of the Authority’s investments and derivative investments as of June 30, 2015:
Level 1 Level 2 Level 3 Total Investments: Government debt securities $ – $ 40,071,930 $ – $ 40,071,930
Derivative instruments: Interest rate swaps $ – $ 4,883,863 $ – $ 4,883,863
50

NOTES TO FINANCIAL STATEMENTS (continued)
14. Risks and Uncertainties During March 2020, a global pandemic was declared related to the rapidly growing outbreak of a novel strain of coronavirus (COVID-19). The pandemic has significantly impacted the economic conditions across the nation creating significant uncertainties in the economy. Demand for air travel has been significantly reduced since the beginning of the pandemic. This situation is rapidly changing, and additional impacts may arise. While the disruption is currently expected to be temporary, there is uncertainty around its duration. The ultimate future impact of the pandemic on results of operations, financial position, liquidity or capital resources cannot be reasonably estimated at this time.
METROPOLITAN KNOXVILLE AIRPORT AUTHORITY
45
NOTES TO FINANCIAL STATEMENTS (continued)
5. Long-Term Debt (continued)
Scheduled Debt Service Requirements As of June 30, 2016, scheduled debt service requirements of the variable-rate debt and net swap payments, assuming current interest rates remain the same for their term are as follows. As rates vary, variable-rate bond interest payments and net swap payments will vary.
Year ending
Variable Rate Bonds
Interest Rate
June 30
Principal
Interest
Swaps, net
Total
2017
$ 4,590,000
$ 562,983
$ 985,043
$ 6,138,026
2018
4,825,000
522,361
830,113
6,177,474
2019
5,075,000
479,483
667,315
6,221,798
2020
5,335,000
434,090
496,213
6,265,303
2021
5,610,000
386,211
316,408
6,312,619
2022-2026 32,520,000 1,107,156 405,195 34,032,351
2027-2028
12,680,000
86,013
-
12,766,013
Total
$70,635,000
$3,578,297
$3,700,287
$77,913,584
6. Fair Value The Authority categorizes its fair value measurements within the fair value hierarchy established by generally accepted accounting principles. The hierarchy is based on the valuation inputs used to measure the fair value of the assets. Level 1 inputs are quoted prices in active markets for identical assets. Level 2 inputs are significant other observable inputs. Level 3 inputs are significant unobservable inputs. Debt securities are valued based on the securities’ relationship to benchmark quoted prices. Derivative instruments are valued using a market approach that considers benchmark interest rates. The following table sets forth by level, within the fair value hierarchy, the fair value of the Authority’s investments and interest rate swap liabilities as of June 30, 2016:
Level 1 Level 2 Level 3 Total Investments: Government debt securities $ – $ 39,998,469 $ – $ 39,998,469
Interest rate swap liabilities $ – $ 4,502,609 $ – $ 4,502,609
The following table sets forth by level, within the fair value hierarchy, the fair value of the Authority’s investments and derivative investments as of June 30, 2015:
Level 1 Level 2 Level 3 Total Investments: Government debt securities $ – $ 40,071,930 $ – $ 40,071,930
Derivative instruments: Interest rate swaps $ – $ 4,883,863 $ – $ 4,883,863
51

This page intentionally left blank
52

STATISTICAL SECTION This part of the Metropolitan Knoxville Airport Authority’s annual comprehensive financial report presents detailed information as a context for understanding what the information in the financial statements, note disclosures, and required supplementary information says about the airport’s overall financial health.
Contents Financial Trends These schedules contain trend information to help the reader understand how the airport’s financial performance and well-being have changed over time. Debt Capacity These schedules present information to help the reader assess the affordability of the airport’s current levels of outstanding debt and the airport’s ability to issue additional debt in the future. Revenue Capacity These schedules contain information to help the reader assess the airport’s most significant local revenue sources. Demographic and Economic Information These schedules offer demographic and economic indicators to help the reader understand the environment within which the airport’s financial activities take place. Operating Information These schedules contain service and infrastructure data to help the reader understand how the information in the airport’s financial report relates to the services the airport provides and activities it performs.
53

2021 2020 2019 2018 2017 2016 2015 2014 2013 2012Operating revenues:Aviation area 4,630,643$ 5,491,542$ 6,107,314$ 5,365,728$ 5,157,606$ 5,133,877$ 5,038,282$ 4,693,762$ 4,453,779$ 4,559,117$ Terminal area 14,898,453 20,910,056 23,423,378 21,008,481 20,075,555 18,848,009 18,625,307 17,922,026 16,327,587 16,909,768 Air cargo and other properties 2,903,806 3,377,678 4,271,066 4,028,575 3,858,125 3,710,606 3,810,517 3,693,140 3,759,280 3,650,100
Total operating revenues 22,432,902 29,779,276 33,801,758 30,402,784 29,091,286 27,692,492 27,474,106 26,308,928 24,540,646 25,118,985
Operating expenses:Aviation area 2,238,000 2,472,712 2,639,540 2,332,940 2,203,523 2,326,391 2,241,790 2,190,390 2,031,595 2,060,220 Terminal area 5,155,536 5,980,383 6,722,177 5,847,724 5,874,317 5,506,569 5,579,811 5,273,861 5,328,985 5,479,501 Air cargo and other properties 1,620,723 1,452,443 1,595,465 1,530,434 1,453,788 1,529,873 1,621,939 1,673,103 1,644,636 1,536,805 General area:
Safety 4,689,051 5,060,627 4,908,770 4,628,650 4,609,726 4,394,476 4,536,099 4,599,895 4,282,979 4,087,663 Administration 7,068,580 7,295,849 7,748,675 7,368,863 7,187,377 6,434,369 5,631,927 5,047,911 5,114,112 5,423,518
Total operating expenses 20,771,890 22,262,014 23,614,627 21,708,611 21,328,731 20,191,678 19,611,566 18,785,160 18,402,307 18,587,707
Operating income before adjustments 1,661,012 7,517,262 10,187,131 8,694,173 7,762,555 7,500,814 7,862,540 7,523,768 6,138,339 6,531,278
Depreciation and amortization (10,139,486) (10,055,598) (9,912,669) (9,499,946) (9,539,399) (9,912,070) (10,717,072) (11,004,758) (11,387,084) (12,269,546)
Operating income (loss) (8,478,474) (2,538,336) 274,462 (805,773) (1,776,844) (2,411,256) (2,854,532) (3,480,990) (5,248,745) (5,738,268)
Net nonoperating income (deductions) 17,612,492 10,385,206 10,040,497 3,812,308 2,620,125 2,599,725 1,933,972 1,345,107 (2,650,537) 358,676
Income (loss) before capital contributions 9,134,018 7,846,870 10,314,959 3,006,535 843,281 188,469 (920,560) (2,135,883) (7,899,282) (5,379,592)
Capital contributions - grant receipts from governmental agencies 24,334,903 30,037,804 27,536,133 19,181,599 31,685,691 14,834,999 9,437,726 4,547,269 14,463,193 5,598,693
Increase in net position 33,468,921 37,884,674 37,851,092 22,188,134 32,528,972 15,023,468 8,517,166 2,411,386 6,563,911 219,101
Net position at the beginning of year 282,009,754 244,125,080 206,273,988 184,085,854 151,556,882 136,533,414 128,016,248 125,604,862 119,040,951 118,821,850 Net position at end of year 315,478,675$ 282,009,754$ 244,125,080$ 206,273,988$ 184,085,854$ 151,556,882$ 136,533,414$ 128,016,248$ 125,604,862$ 119,040,951$
Net position at end of year:Net investment in capital assets 238,827,856$ 210,964,151$ 173,637,819$ 146,198,639$ 123,577,195$ 91,628,740$ 81,407,805$ 75,967,891$ 82,343,430$ 75,944,810$ Restricted-expendable 6,304,029 3,570,406 2,400,645 1,937,806 1,924,721 2,029,096 1,704,693 1,532,747 1,411,832 1,358,687 Unrestricted 70,346,790 67,475,197 68,086,616 58,137,543 58,583,938 57,899,046 53,420,916 50,515,610 41,849,600 41,737,454
Net position at end of year 315,478,675$ 282,009,754$ 244,125,080$ 206,273,988$ 184,085,854$ 151,556,882$ 136,533,414$ 128,016,248$ 125,604,862$ 119,040,951$
Source: Audited Financial Statements, 2012-2021
SCHEDULE 1:Operating revenues and expenses - last ten fiscal years (unaudited)
METROPOLITAN KNOXVILLE AIRPORT AUTHORITY
45
NOTES TO FINANCIAL STATEMENTS (continued)
5. Long-Term Debt (continued)
Scheduled Debt Service Requirements As of June 30, 2016, scheduled debt service requirements of the variable-rate debt and net swap payments, assuming current interest rates remain the same for their term are as follows. As rates vary, variable-rate bond interest payments and net swap payments will vary.
Year ending
Variable Rate Bonds
Interest Rate
June 30
Principal
Interest
Swaps, net
Total
2017
$ 4,590,000
$ 562,983
$ 985,043
$ 6,138,026
2018
4,825,000
522,361
830,113
6,177,474
2019
5,075,000
479,483
667,315
6,221,798
2020
5,335,000
434,090
496,213
6,265,303
2021
5,610,000
386,211
316,408
6,312,619
2022-2026 32,520,000 1,107,156 405,195 34,032,351
2027-2028
12,680,000
86,013
-
12,766,013
Total
$70,635,000
$3,578,297
$3,700,287
$77,913,584
6. Fair Value The Authority categorizes its fair value measurements within the fair value hierarchy established by generally accepted accounting principles. The hierarchy is based on the valuation inputs used to measure the fair value of the assets. Level 1 inputs are quoted prices in active markets for identical assets. Level 2 inputs are significant other observable inputs. Level 3 inputs are significant unobservable inputs. Debt securities are valued based on the securities’ relationship to benchmark quoted prices. Derivative instruments are valued using a market approach that considers benchmark interest rates. The following table sets forth by level, within the fair value hierarchy, the fair value of the Authority’s investments and interest rate swap liabilities as of June 30, 2016:
Level 1 Level 2 Level 3 Total Investments: Government debt securities $ – $ 39,998,469 $ – $ 39,998,469
Interest rate swap liabilities $ – $ 4,502,609 $ – $ 4,502,609
The following table sets forth by level, within the fair value hierarchy, the fair value of the Authority’s investments and derivative investments as of June 30, 2015:
Level 1 Level 2 Level 3 Total Investments: Government debt securities $ – $ 40,071,930 $ – $ 40,071,930
Derivative instruments: Interest rate swaps $ – $ 4,883,863 $ – $ 4,883,863
54

2021 2020 2019 2018 2017 2016 2015 2014 2013 2012Operating revenues:Aviation area 4,630,643$ 5,491,542$ 6,107,314$ 5,365,728$ 5,157,606$ 5,133,877$ 5,038,282$ 4,693,762$ 4,453,779$ 4,559,117$ Terminal area 14,898,453 20,910,056 23,423,378 21,008,481 20,075,555 18,848,009 18,625,307 17,922,026 16,327,587 16,909,768 Air cargo and other properties 2,903,806 3,377,678 4,271,066 4,028,575 3,858,125 3,710,606 3,810,517 3,693,140 3,759,280 3,650,100
Total operating revenues 22,432,902 29,779,276 33,801,758 30,402,784 29,091,286 27,692,492 27,474,106 26,308,928 24,540,646 25,118,985
Operating expenses:Aviation area 2,238,000 2,472,712 2,639,540 2,332,940 2,203,523 2,326,391 2,241,790 2,190,390 2,031,595 2,060,220 Terminal area 5,155,536 5,980,383 6,722,177 5,847,724 5,874,317 5,506,569 5,579,811 5,273,861 5,328,985 5,479,501 Air cargo and other properties 1,620,723 1,452,443 1,595,465 1,530,434 1,453,788 1,529,873 1,621,939 1,673,103 1,644,636 1,536,805 General area:
Safety 4,689,051 5,060,627 4,908,770 4,628,650 4,609,726 4,394,476 4,536,099 4,599,895 4,282,979 4,087,663 Administration 7,068,580 7,295,849 7,748,675 7,368,863 7,187,377 6,434,369 5,631,927 5,047,911 5,114,112 5,423,518
Total operating expenses 20,771,890 22,262,014 23,614,627 21,708,611 21,328,731 20,191,678 19,611,566 18,785,160 18,402,307 18,587,707
Operating income before other income and other expenses 1,661,012 7,517,262 10,187,131 8,694,173 7,762,555 7,500,814 7,862,540 7,523,768 6,138,339 6,531,278
Other income 42,030,002 41,527,252 33,678,402 24,194,735 35,833,765 19,289,065 13,082,418 8,318,110 18,127,924 9,742,814
Net revenues 43,691,014 49,044,514 43,865,533 32,888,908 43,596,320 26,789,879 20,944,958 15,841,878 24,266,263 16,274,092
Less capital contributions - grant receiptsfrom government agencies includedin other income (24,334,903) (30,037,804) (27,536,133) (19,181,599) (31,685,691) (14,834,999) (9,437,726) (4,547,269) (14,463,193) (5,598,693)
Net revenues less grant receipts fromgovernment agencies in other income 19,356,111$ 19,006,710$ 16,329,400$ 13,707,309$ 11,910,629$ 11,954,880$ 11,507,232$ 11,294,609$ 9,803,070$ 10,675,399$
Debt service on airport revenuegeneral obligation debt (a) 2,341,819$ 7,367,977$ 7,104,035$ 6,907,123$ 6,799,043$ 6,476,919$ 6,366,528$ 6,377,790$ 6,645,106$ 6,862,478$
Coverage ratio - airport revenuegeneral obligation debt 826.5% 258.0% 229.9% 198.5% 175.2% 184.6% 180.7% 177.1% 147.5% 155.6%
Source: Audited Financial Statements, 2012-2021(a) Amounts based on scheduled principal payments.Note: Revenues, as defined in the Master Resolutions, are pledged for payments.
SCHEDULE 2:Debt service coverage - last ten fiscal years (unaudited)
METROPOLITAN KNOXVILLE AIRPORT AUTHORITY
45
NOTES TO FINANCIAL STATEMENTS (continued)
5. Long-Term Debt (continued)
Scheduled Debt Service Requirements As of June 30, 2016, scheduled debt service requirements of the variable-rate debt and net swap payments, assuming current interest rates remain the same for their term are as follows. As rates vary, variable-rate bond interest payments and net swap payments will vary.
Year ending
Variable Rate Bonds
Interest Rate
June 30
Principal
Interest
Swaps, net
Total
2017
$ 4,590,000
$ 562,983
$ 985,043
$ 6,138,026
2018
4,825,000
522,361
830,113
6,177,474
2019
5,075,000
479,483
667,315
6,221,798
2020
5,335,000
434,090
496,213
6,265,303
2021
5,610,000
386,211
316,408
6,312,619
2022-2026 32,520,000 1,107,156 405,195 34,032,351
2027-2028
12,680,000
86,013
-
12,766,013
Total
$70,635,000
$3,578,297
$3,700,287
$77,913,584
6. Fair Value The Authority categorizes its fair value measurements within the fair value hierarchy established by generally accepted accounting principles. The hierarchy is based on the valuation inputs used to measure the fair value of the assets. Level 1 inputs are quoted prices in active markets for identical assets. Level 2 inputs are significant other observable inputs. Level 3 inputs are significant unobservable inputs. Debt securities are valued based on the securities’ relationship to benchmark quoted prices. Derivative instruments are valued using a market approach that considers benchmark interest rates. The following table sets forth by level, within the fair value hierarchy, the fair value of the Authority’s investments and interest rate swap liabilities as of June 30, 2016:
Level 1 Level 2 Level 3 Total Investments: Government debt securities $ – $ 39,998,469 $ – $ 39,998,469
Interest rate swap liabilities $ – $ 4,502,609 $ – $ 4,502,609
The following table sets forth by level, within the fair value hierarchy, the fair value of the Authority’s investments and derivative investments as of June 30, 2015:
Level 1 Level 2 Level 3 Total Investments: Government debt securities $ – $ 40,071,930 $ – $ 40,071,930
Derivative instruments: Interest rate swaps $ – $ 4,883,863 $ – $ 4,883,863
55

2021 2020 2019 2018 2017 2016 2015 2014 2013 2012
Principal (a) 1,280,000$ 5,580,000$ 5,350,000$ 5,125,000$ 4,590,000$ 4,365,000$ 4,155,000$ 3,950,000$ 3,755,000$ 3,575,000$
Interest 1,061,819 1,787,977 1,754,035 1,782,123 2,209,043 2,111,919 2,211,528 2,427,790 2,890,106 3,287,478
Total debt service 2,341,819$ 7,367,977$ 7,104,035$ 6,907,123$ 6,799,043$ 6,476,919$ 6,366,528$ 6,377,790$ 6,645,106$ 6,862,478$
Total expenses 31,973,195$ 34,293,880$ 35,281,331$ 32,990,680$ 33,077,173$ 32,215,667$ 32,540,166$ 32,217,708$ 32,679,497$ 34,144,731$
Less depreciation and amortization (10,139,486) (10,055,598) (9,912,669) (9,449,946) (9,539,399) (9,912,070) (10,717,072) (11,004,758) (11,387,084) (12,269,546)
Add principal (a) 1,280,000 5,580,000 5,350,000 5,125,000 4,590,000 4,365,000 4,155,000 3,950,000 3,755,000 3,575,000
Total general expenditures 23,113,709$ 29,818,282$ 30,718,662$ 28,665,734$ 28,127,774$ 26,668,597$ 25,978,094$ 25,162,950$ 25,047,413$ 25,450,185$
Ratio of debt service to expenditures 10.1% 24.7% 23.1% 24.1% 24.2% 24.3% 24.5% 25.3% 26.5% 27.0%
Outstanding debt (b) 34,295,000$ 45,640,000$ 57,045,000$ 62,395,000$ 67,520,000$ 70,635,000$ 75,000,000$ 79,155,000$ 79,850,000$ 80,505,000$
Total number of passengers 1,391,469 1,952,143 2,375,059 2,108,507 1,906,795 1,790,247 1,739,183 1,717,690 1,694,217 1,812,404
Outstanding debt per passenger 24.65$ 23.38$ 24.02$ 29.59$ 35.41$ 39.46$ 43.12$ 46.08$ 47.13$ 44.42$
Debt service per passenger 1.68$ 3.77$ 2.99$ 3.28$ 3.57$ 3.62$ 3.66$ 3.71$ 3.92$ 3.79$
Source: Audited Financial Statements, 2012-2021
(a) Amounts based on scheduled principal payments.
(b) Outstanding debt is for Airport Revenue Obligations, payable from general airport revenue.
SCHEDULE 3:Ratios of debt service and outstanding debt - last ten fiscal years (unaudited)
METROPOLITAN KNOXVILLE AIRPORT AUTHORITY
45
NOTES TO FINANCIAL STATEMENTS (continued)
5. Long-Term Debt (continued)
Scheduled Debt Service Requirements As of June 30, 2016, scheduled debt service requirements of the variable-rate debt and net swap payments, assuming current interest rates remain the same for their term are as follows. As rates vary, variable-rate bond interest payments and net swap payments will vary.
Year ending
Variable Rate Bonds
Interest Rate
June 30
Principal
Interest
Swaps, net
Total
2017
$ 4,590,000
$ 562,983
$ 985,043
$ 6,138,026
2018
4,825,000
522,361
830,113
6,177,474
2019
5,075,000
479,483
667,315
6,221,798
2020
5,335,000
434,090
496,213
6,265,303
2021
5,610,000
386,211
316,408
6,312,619
2022-2026 32,520,000 1,107,156 405,195 34,032,351
2027-2028
12,680,000
86,013
-
12,766,013
Total
$70,635,000
$3,578,297
$3,700,287
$77,913,584
6. Fair Value The Authority categorizes its fair value measurements within the fair value hierarchy established by generally accepted accounting principles. The hierarchy is based on the valuation inputs used to measure the fair value of the assets. Level 1 inputs are quoted prices in active markets for identical assets. Level 2 inputs are significant other observable inputs. Level 3 inputs are significant unobservable inputs. Debt securities are valued based on the securities’ relationship to benchmark quoted prices. Derivative instruments are valued using a market approach that considers benchmark interest rates. The following table sets forth by level, within the fair value hierarchy, the fair value of the Authority’s investments and interest rate swap liabilities as of June 30, 2016:
Level 1 Level 2 Level 3 Total Investments: Government debt securities $ – $ 39,998,469 $ – $ 39,998,469
Interest rate swap liabilities $ – $ 4,502,609 $ – $ 4,502,609
The following table sets forth by level, within the fair value hierarchy, the fair value of the Authority’s investments and derivative investments as of June 30, 2015:
Level 1 Level 2 Level 3 Total Investments: Government debt securities $ – $ 40,071,930 $ – $ 40,071,930
Derivative instruments: Interest rate swaps $ – $ 4,883,863 $ – $ 4,883,863
56

2021 2020 2019 2018 2017 2016 2015 2014 2013 2012Terminal rent:Ticket counter (per linear foot) $35.49 $40.30 $48.84 $43.22 $42.01 $38.76 $38.62 $37.69 $38.90 $39.33
Ticket queuing (per square foot) (a) $35.49 $40.30 $48.84 $43.22 $42.01 $38.76 $38.62 $37.69 $38.90 $39.33
Office space (per square foot) $35.49 $40.30 $48.84 $43.22 $42.01 $38.76 $38.62 $37.69 $38.90 $39.33
Outbound baggage space (per square foot) $35.49 $40.30 $48.84 $43.22 $42.01 $38.76 $38.62 $37.69 $38.90 $39.33
Operations space (per square foot) $35.49 $40.30 $48.84 $43.22 $42.01 $38.76 $38.62 $37.69 $38.90 $39.33
Baggage service office (per square foot) $35.49 $40.30 $48.84 $43.22 $42.01 $38.76 $38.62 $37.69 $38.90 $39.33
Holdroom area (per square foot) $35.49 $40.30 $48.84 $43.22 $42.01 $38.76 $38.62 $37.69 $38.90 $39.33
Baggage claim (per square foot) $35.49 $40.30 $48.84 $43.22 $42.01 $38.76 $38.62 $37.69 $38.90 $39.33
Apron charge (per gate) (a) $72,665.00 $84,802.00 $92,101.00 $86,085.00 $82,788.00 $81,934.00 $77,624.00 $75,751.00 $70,476.00 $67,492.00
Loading bridge rent (per bridge) (a) $85,178.00 $95,295.00 $40,574.00 $43,802.00 $45,176.00 $45,436.00 $51,378.00 $45,955.00 $47,828.00 $43,557.00
Landing fee (per 1,000 pounds) $3.02 $2.99 $3.14 $3.13 $3.23 $3.50 $3.43 $3.28 $3.09 $2.82
(a) Fees and rental charges became effective with beginning of fiscal year for which amounts are shown.Notes: The revenue bases to which these rates are applied and their principal payers can be found in schedules 7, 9 and 11.
SCHEDULE 4:McGhee Tyson Airport annual terminal rents and landing fees
last ten fiscal years (unaudited)
METROPOLITAN KNOXVILLE AIRPORT AUTHORITY
45
NOTES TO FINANCIAL STATEMENTS (continued)
5. Long-Term Debt (continued)
Scheduled Debt Service Requirements As of June 30, 2016, scheduled debt service requirements of the variable-rate debt and net swap payments, assuming current interest rates remain the same for their term are as follows. As rates vary, variable-rate bond interest payments and net swap payments will vary.
Year ending
Variable Rate Bonds
Interest Rate
June 30
Principal
Interest
Swaps, net
Total
2017
$ 4,590,000
$ 562,983
$ 985,043
$ 6,138,026
2018
4,825,000
522,361
830,113
6,177,474
2019
5,075,000
479,483
667,315
6,221,798
2020
5,335,000
434,090
496,213
6,265,303
2021
5,610,000
386,211
316,408
6,312,619
2022-2026 32,520,000 1,107,156 405,195 34,032,351
2027-2028
12,680,000
86,013
-
12,766,013
Total
$70,635,000
$3,578,297
$3,700,287
$77,913,584
6. Fair Value The Authority categorizes its fair value measurements within the fair value hierarchy established by generally accepted accounting principles. The hierarchy is based on the valuation inputs used to measure the fair value of the assets. Level 1 inputs are quoted prices in active markets for identical assets. Level 2 inputs are significant other observable inputs. Level 3 inputs are significant unobservable inputs. Debt securities are valued based on the securities’ relationship to benchmark quoted prices. Derivative instruments are valued using a market approach that considers benchmark interest rates. The following table sets forth by level, within the fair value hierarchy, the fair value of the Authority’s investments and interest rate swap liabilities as of June 30, 2016:
Level 1 Level 2 Level 3 Total Investments: Government debt securities $ – $ 39,998,469 $ – $ 39,998,469
Interest rate swap liabilities $ – $ 4,502,609 $ – $ 4,502,609
The following table sets forth by level, within the fair value hierarchy, the fair value of the Authority’s investments and derivative investments as of June 30, 2015:
Level 1 Level 2 Level 3 Total Investments: Government debt securities $ – $ 40,071,930 $ – $ 40,071,930
Derivative instruments: Interest rate swaps $ – $ 4,883,863 $ – $ 4,883,863
57
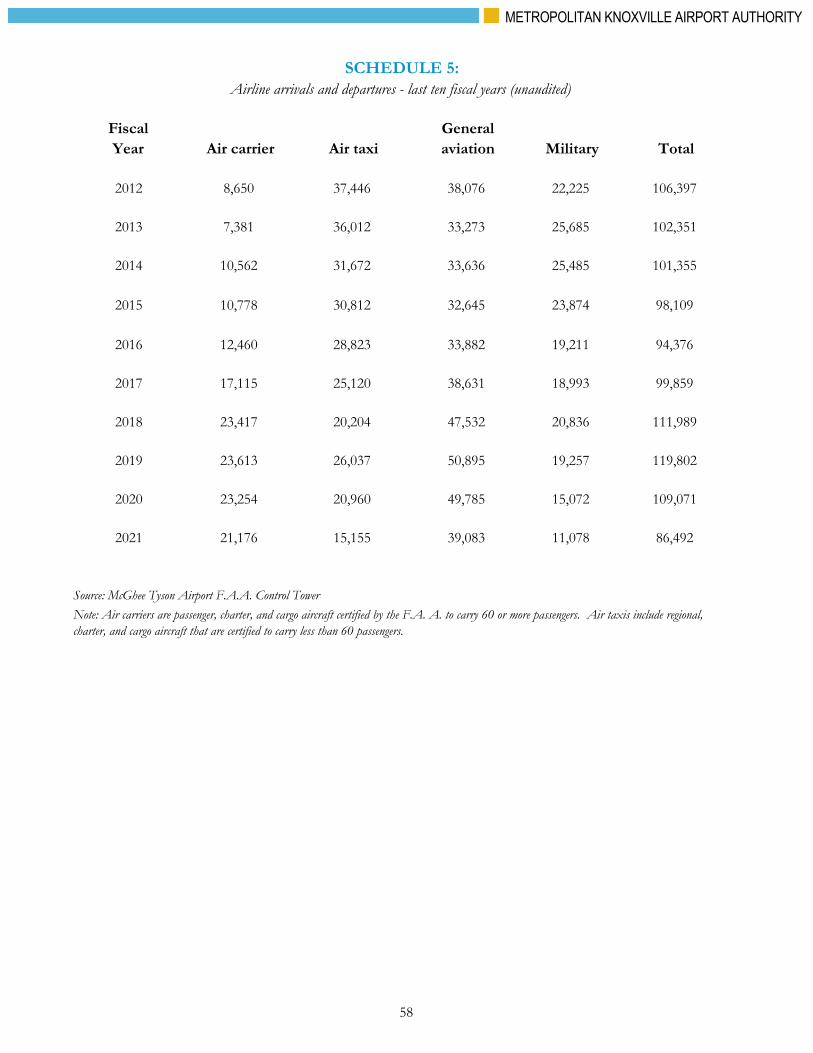
Fiscal General Year Air carrier Air taxi aviation Military Total
2012 8,650 37,446 38,076 22,225 106,397
2013 7,381 36,012 33,273 25,685 102,351
2014 10,562 31,672 33,636 25,485 101,355
2015 10,778 30,812 32,645 23,874 98,109
2016 12,460 28,823 33,882 19,211 94,376
2017 17,115 25,120 38,631 18,993 99,859
2018 23,417 20,204 47,532 20,836 111,989
2019 23,613 26,037 50,895 19,257 119,802
2020 23,254 20,960 49,785 15,072 109,071
2021 21,176 15,155 39,083 11,078 86,492
Note: Air carriers are passenger, charter, and cargo aircraft certified by the F.A. A. to carry 60 or more passengers. Air taxis include regional, charter, and cargo aircraft that are certified to carry less than 60 passengers.
Source: McGhee Tyson Airport F.A.A. Control Tower
SCHEDULE 5:Airline arrivals and departures - last ten fiscal years (unaudited)
METROPOLITAN KNOXVILLE AIRPORT AUTHORITY
45
NOTES TO FINANCIAL STATEMENTS (continued)
5. Long-Term Debt (continued)
Scheduled Debt Service Requirements As of June 30, 2016, scheduled debt service requirements of the variable-rate debt and net swap payments, assuming current interest rates remain the same for their term are as follows. As rates vary, variable-rate bond interest payments and net swap payments will vary.
Year ending
Variable Rate Bonds
Interest Rate
June 30
Principal
Interest
Swaps, net
Total
2017
$ 4,590,000
$ 562,983
$ 985,043
$ 6,138,026
2018
4,825,000
522,361
830,113
6,177,474
2019
5,075,000
479,483
667,315
6,221,798
2020
5,335,000
434,090
496,213
6,265,303
2021
5,610,000
386,211
316,408
6,312,619
2022-2026 32,520,000 1,107,156 405,195 34,032,351
2027-2028
12,680,000
86,013
-
12,766,013
Total
$70,635,000
$3,578,297
$3,700,287
$77,913,584
6. Fair Value The Authority categorizes its fair value measurements within the fair value hierarchy established by generally accepted accounting principles. The hierarchy is based on the valuation inputs used to measure the fair value of the assets. Level 1 inputs are quoted prices in active markets for identical assets. Level 2 inputs are significant other observable inputs. Level 3 inputs are significant unobservable inputs. Debt securities are valued based on the securities’ relationship to benchmark quoted prices. Derivative instruments are valued using a market approach that considers benchmark interest rates. The following table sets forth by level, within the fair value hierarchy, the fair value of the Authority’s investments and interest rate swap liabilities as of June 30, 2016:
Level 1 Level 2 Level 3 Total Investments: Government debt securities $ – $ 39,998,469 $ – $ 39,998,469
Interest rate swap liabilities $ – $ 4,502,609 $ – $ 4,502,609
The following table sets forth by level, within the fair value hierarchy, the fair value of the Authority’s investments and derivative investments as of June 30, 2015:
Level 1 Level 2 Level 3 Total Investments: Government debt securities $ – $ 40,071,930 $ – $ 40,071,930
Derivative instruments: Interest rate swaps $ – $ 4,883,863 $ – $ 4,883,863
58

Fiscal Passengers Passengers TotalYear enplaned deplaned passengers
2012 905,888 906,516 1,812,4042013 850,304 843,913 1,694,2172014 862,706 854,984 1,717,6902015 872,849 866,334 1,739,1832016 898,671 891,576 1,790,2472017 958,429 948,366 1,906,7952018 1,057,578 1,050,929 2,108,5072019 1,191,198 1,183,861 2,375,0592020 975,910 976,233 1,952,1432021 698,270 693,199 1,391,469
Enplaned Deplaned Total PercentageAirline passengers passengers passengers of passengers
United 108,198 108,411 216,609 15.567%Allegiant Air 190,878 190,280 381,158 27.392%
American 233,459 232,094 465,553 33.458%Delta 143,085 140,173 283,258 20.357%
Frontier 18,945 18,726 37,671 2.70%Other 3,705 3,515 7,220 0.52%
Total 698,270 693,199 1,391,469 100.00%
Historical airline passenger activity - last ten fiscal years (unaudited)SCHEDULE 6:
Note: The Authority has elected not to report a ten-year history of passengers by airline because history has shown when a particular airline withdraws from the market, another airline enters the market or an existing airline expands their flights.
SCHEDULE 7:Distribution of airline passengers - fiscal year ended June 30, 2021 (unaudited)
Source: Metropolitan Knoxville Airport Authority Aviation's Activities Statistics Report
Source: Metropolitan Knoxville Airport Authority, Annual Activity Report
METROPOLITAN KNOXVILLE AIRPORT AUTHORITY
45
NOTES TO FINANCIAL STATEMENTS (continued)
5. Long-Term Debt (continued)
Scheduled Debt Service Requirements As of June 30, 2016, scheduled debt service requirements of the variable-rate debt and net swap payments, assuming current interest rates remain the same for their term are as follows. As rates vary, variable-rate bond interest payments and net swap payments will vary.
Year ending
Variable Rate Bonds
Interest Rate
June 30
Principal
Interest
Swaps, net
Total
2017
$ 4,590,000
$ 562,983
$ 985,043
$ 6,138,026
2018
4,825,000
522,361
830,113
6,177,474
2019
5,075,000
479,483
667,315
6,221,798
2020
5,335,000
434,090
496,213
6,265,303
2021
5,610,000
386,211
316,408
6,312,619
2022-2026 32,520,000 1,107,156 405,195 34,032,351
2027-2028
12,680,000
86,013
-
12,766,013
Total
$70,635,000
$3,578,297
$3,700,287
$77,913,584
6. Fair Value The Authority categorizes its fair value measurements within the fair value hierarchy established by generally accepted accounting principles. The hierarchy is based on the valuation inputs used to measure the fair value of the assets. Level 1 inputs are quoted prices in active markets for identical assets. Level 2 inputs are significant other observable inputs. Level 3 inputs are significant unobservable inputs. Debt securities are valued based on the securities’ relationship to benchmark quoted prices. Derivative instruments are valued using a market approach that considers benchmark interest rates. The following table sets forth by level, within the fair value hierarchy, the fair value of the Authority’s investments and interest rate swap liabilities as of June 30, 2016:
Level 1 Level 2 Level 3 Total Investments: Government debt securities $ – $ 39,998,469 $ – $ 39,998,469
Interest rate swap liabilities $ – $ 4,502,609 $ – $ 4,502,609
The following table sets forth by level, within the fair value hierarchy, the fair value of the Authority’s investments and derivative investments as of June 30, 2015:
Level 1 Level 2 Level 3 Total Investments: Government debt securities $ – $ 40,071,930 $ – $ 40,071,930
Derivative instruments: Interest rate swaps $ – $ 4,883,863 $ – $ 4,883,863
59

Fiscal Freight TotalYear Enplaned Deplaned cargo
2012 50,319,694 42,420,949 92,740,6432013 45,918,957 41,562,216 87,481,1732014 38,941,638 38,898,639 77,840,2772015 36,351,492 39,459,681 75,811,1732016 37,089,237 43,381,695 80,470,9322017 37,210,403 48,076,612 85,287,0152018 35,725,317 46,651,705 82,377,0222019 36,427,469 46,854,736 83,282,2052020 34,383,758 49,553,002 83,936,7602021 37,824,291 50,588,016 88,412,307
FreightAirline Enplaned Deplaned Total Percentage
Major:Delta 3,243 6,114 9,357 0.01%
Regional:PSA 15,396 10,535 25,931 0.03%
Cargo:FedEx 25,768,592 35,104,612 60,873,204 68.85%UPS 12,027,539 15,449,325 27,476,864 31.08%AmeriFlight - - 0 0.00%
Other Freight 9,521 17,430 26,951 0.03%
Total 37,824,291 50,588,016 88,412,307 100.00%
Source: Metropolitan Knoxville Airport Authority, Annual Activity ReportNote: The Authority has elected not to report a ten-year history of cargo by airline because history has shown when a particular airline withdraws from the market, another airline enters the market or an existing airline expands their flights.
SCHEDULE 8:Cargo - last ten fiscal years (in pounds) (unaudited)
Source: Metropolitan Knoxville Airport Authority Aviation's Activities Statistics Report
SCHEDULE 9:Distribution of cargo - fiscal year ended June 30, 2021 (in pounds) (unaudited)
METROPOLITAN KNOXVILLE AIRPORT AUTHORITY
45
NOTES TO FINANCIAL STATEMENTS (continued)
5. Long-Term Debt (continued)
Scheduled Debt Service Requirements As of June 30, 2016, scheduled debt service requirements of the variable-rate debt and net swap payments, assuming current interest rates remain the same for their term are as follows. As rates vary, variable-rate bond interest payments and net swap payments will vary.
Year ending
Variable Rate Bonds
Interest Rate
June 30
Principal
Interest
Swaps, net
Total
2017
$ 4,590,000
$ 562,983
$ 985,043
$ 6,138,026
2018
4,825,000
522,361
830,113
6,177,474
2019
5,075,000
479,483
667,315
6,221,798
2020
5,335,000
434,090
496,213
6,265,303
2021
5,610,000
386,211
316,408
6,312,619
2022-2026 32,520,000 1,107,156 405,195 34,032,351
2027-2028
12,680,000
86,013
-
12,766,013
Total
$70,635,000
$3,578,297
$3,700,287
$77,913,584
6. Fair Value The Authority categorizes its fair value measurements within the fair value hierarchy established by generally accepted accounting principles. The hierarchy is based on the valuation inputs used to measure the fair value of the assets. Level 1 inputs are quoted prices in active markets for identical assets. Level 2 inputs are significant other observable inputs. Level 3 inputs are significant unobservable inputs. Debt securities are valued based on the securities’ relationship to benchmark quoted prices. Derivative instruments are valued using a market approach that considers benchmark interest rates. The following table sets forth by level, within the fair value hierarchy, the fair value of the Authority’s investments and interest rate swap liabilities as of June 30, 2016:
Level 1 Level 2 Level 3 Total Investments: Government debt securities $ – $ 39,998,469 $ – $ 39,998,469
Interest rate swap liabilities $ – $ 4,502,609 $ – $ 4,502,609
The following table sets forth by level, within the fair value hierarchy, the fair value of the Authority’s investments and derivative investments as of June 30, 2015:
Level 1 Level 2 Level 3 Total Investments: Government debt securities $ – $ 40,071,930 $ – $ 40,071,930
Derivative instruments: Interest rate swaps $ – $ 4,883,863 $ – $ 4,883,863
60
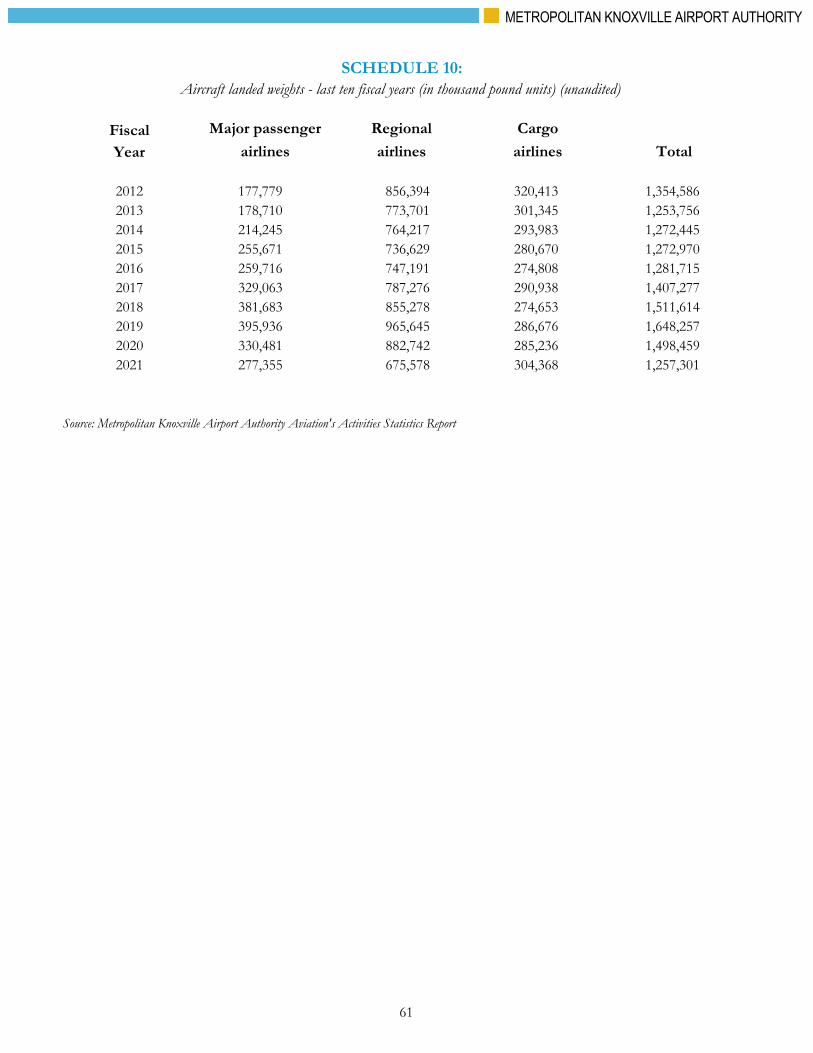
Fiscal Major passenger Regional CargoYear airlines airlines airlines Total
2012 177,779 856,394 320,413 1,354,5862013 178,710 773,701 301,345 1,253,7562014 214,245 764,217 293,983 1,272,4452015 255,671 736,629 280,670 1,272,9702016 259,716 747,191 274,808 1,281,7152017 329,063 787,276 290,938 1,407,2772018 381,683 855,278 274,653 1,511,6142019 395,936 965,645 286,676 1,648,2572020 330,481 882,742 285,236 1,498,4592021 277,355 675,578 304,368 1,257,301
Source: Metropolitan Knoxville Airport Authority Aviation's Activities Statistics Report
SCHEDULE 10:Aircraft landed weights - last ten fiscal years (in thousand pound units) (unaudited)
METROPOLITAN KNOXVILLE AIRPORT AUTHORITY
45
NOTES TO FINANCIAL STATEMENTS (continued)
5. Long-Term Debt (continued)
Scheduled Debt Service Requirements As of June 30, 2016, scheduled debt service requirements of the variable-rate debt and net swap payments, assuming current interest rates remain the same for their term are as follows. As rates vary, variable-rate bond interest payments and net swap payments will vary.
Year ending
Variable Rate Bonds
Interest Rate
June 30
Principal
Interest
Swaps, net
Total
2017
$ 4,590,000
$ 562,983
$ 985,043
$ 6,138,026
2018
4,825,000
522,361
830,113
6,177,474
2019
5,075,000
479,483
667,315
6,221,798
2020
5,335,000
434,090
496,213
6,265,303
2021
5,610,000
386,211
316,408
6,312,619
2022-2026 32,520,000 1,107,156 405,195 34,032,351
2027-2028
12,680,000
86,013
-
12,766,013
Total
$70,635,000
$3,578,297
$3,700,287
$77,913,584
6. Fair Value The Authority categorizes its fair value measurements within the fair value hierarchy established by generally accepted accounting principles. The hierarchy is based on the valuation inputs used to measure the fair value of the assets. Level 1 inputs are quoted prices in active markets for identical assets. Level 2 inputs are significant other observable inputs. Level 3 inputs are significant unobservable inputs. Debt securities are valued based on the securities’ relationship to benchmark quoted prices. Derivative instruments are valued using a market approach that considers benchmark interest rates. The following table sets forth by level, within the fair value hierarchy, the fair value of the Authority’s investments and interest rate swap liabilities as of June 30, 2016:
Level 1 Level 2 Level 3 Total Investments: Government debt securities $ – $ 39,998,469 $ – $ 39,998,469
Interest rate swap liabilities $ – $ 4,502,609 $ – $ 4,502,609
The following table sets forth by level, within the fair value hierarchy, the fair value of the Authority’s investments and derivative investments as of June 30, 2015:
Level 1 Level 2 Level 3 Total Investments: Government debt securities $ – $ 40,071,930 $ – $ 40,071,930
Derivative instruments: Interest rate swaps $ – $ 4,883,863 $ – $ 4,883,863
61

2021 2020 2019 2018 2017 2016 2015 2014 2013 2012Airline Number % Number % Number % Number % Number % Number % Number % Number % Number % Number %PSA 160,805 13% 174,050 12% 197,355 12% 209,086 14% 220,844 16% 214,497 17% 209,479 16% 218,022 17% 214,335 17% 209,437 15%FedEx 220,317 18% 214,658 14% 217,120 13% 207,785 14% 217,078 15% 204,158 16% 191,071 15% 205,937 16% 219,837 18% 260,064 19%Pinnacle 228,647 18% 261,075 17% 275,618 17% 219,571 15% 177,725 13% 164,518 13% 158,198 12% 150,428 12% 153,315 12% 168,394 12%Allegiant Air 254,826 20% 209,124 14% 228,065 14% 180,899 12% 153,689 11% 108,627 8% 102,409 8% 98,940 8% 94,158 8% 101,260 7%ExpressJet 13,536 1% 71,800 5% 123,750 8% 134,215 9% 185,213 13% 213,080 17% 212,354 17% 208,936 16% 193,054 15% 145,580 11%Delta 2,420 0% 83,682 6% 121,759 7% 131,656 9% 137,379 10% 135,749 11% 135,471 11% 101,819 8% 66,746 5% 42,673 3%Skywest 56,710 5% 72,467 5% 125,649 8% 122,505 8% 22,180 2% 13,627 1% 1,081 0% - 0% - 0% 2,000 0%UPS 84,051 7% 70,088 5% 68,774 4% 65,366 4% 72,533 5% 69,146 5% 87,911 7% 86,369 7% 79,585 6% 58,346 4%ASA - 0% - 0% 11,122 1% 28,564 2% 60,625 4% 50,382 4% 36,900 3% 50,999 4% 96,417 8% 114,008 8%United - 0% - 0% 20,225 1% 43,387 3% - 0% - 0% - 0% - 0% - 0% - 0%Republic 2,646 0% 69,600 5% - 0% - 0% - 0% - 0% - 0% - 0% - 0% - 0%Mesa 53,268 4% 43,713 3% 45,153 3% 28,827 2% 14,017 1% - 0% - 0% 3,747 0% - 0% 368 0%Commute Air 64,372 5% 4,312 0% - 0% - 0% - 0% - 0% - 0% - 0% - 0% - 0%Trans States - 0% 24,577 2% 34,956 2% 27,444 2% 35,160 2% 50,646 4% 17,210 1% - 0% - 0% 4,127 0%GO Jets 22,143 2% 2,775 0% 1,943 0% 30,083 2% 19,430 1% 9,330 1% - 0% - 0% - 0% - 0%American Eagle 30,144 2% 78,416 5% 64,854 4% 11,022 1% 21,326 2% 13,737 1% 77,507 6% 95,644 8% 105,611 8% 120,324 9%Frontier 20,109 2% 21,692 1% 25,886 2% 25,741 2% 20,079 1% 15,340 1% 17,792 1% 13,314 1% 17,476 1% 33,846 2%Air Wisconsin 8,742 1% 49,585 3% 53,204 3% 33,417 2% 23,422 2% 15,416 1% 13,066 1% 10,575 1% 611 0% 940 0%AmeriFlight 0% - 0% 740 0% 1,255 0% 1,193 0% 1,376 0% 1,415 0% 1,588 0% 1,604 0% 1,614 0%Piedmont 34,440 2% 46,356 3% 22,611 1% 2,095 0% - 0% - 0% - 0% 2,163 0% 4,216 0% 2,197 0%Mountain Air 0% 481 0% 17 0% 214 0% 100 0% 103 0% 217 0% 36 0% 128 0% 253 0%Shuttle America 0% - 0% - 0% - 0% - 0% 1,957 0% 638 0% - 0% - 0% - 0%Chatauqua 0% - 0% - 0% - 0% - 0% - 0% 5,067 0% 20,519 2% 3,021 0% 1,702 0%Air Net 0% - 0% - 0% - 0% - 0% - 0% 56 0% 54 0% 190 0% 136 0%Compass 0% - 0% - 0% - 0% - 0% - 0% - 0% 3,073 0% 3,074 0% 5,022 0%Continental Express 0% - 0% - 0% - 0% - 0% - 0% - 0% - 0% - 0% 51,532 4%AirTran Airways 0% - 0% - 0% - 0% - 0% - 0% - 0% - 0% - 0% 23,760 2%Comair 0% - 0% - 0% - 0% - 0% - 0% - 0% - 0% 47 0% 4,324 0%Mesaba 0% - 0% - 0% - 0% - 0% - 0% - 0% - 0% - 0% 75 0%Vision Airlines 0% - 0% - 0% - 0% - 0% - 0% - 0% - 0% - 0% 2,604 0%Freedom 0% - 0% - 0% - 0% - 0% - 0% 5,119 0% - 0% - 0% - 0%Other 125 0% 8 0% 9,456 1% 8,482 1% 25,284 2% 26 0% 9 0% 282 0% 331 0% - 0%
Total 1,257,301 100% 1,498,459 100% 1,648,257 100% 1,511,614 100% 1,407,277 100% 1,281,715 100% 1,272,970 100% 1,272,445 100% 1,253,756 100% 1,354,586 100%
Source: Metropolitan Knoxville Airport Authority, Annual Activity Report
SCHEDULE 11:Aircraft landed weights - ten fiscal year trend history (in thousand pound units) (unaudited)
METROPOLITAN KNOXVILLE AIRPORT AUTHORITY
45
NOTES TO FINANCIAL STATEMENTS (continued)
5. Long-Term Debt (continued)
Scheduled Debt Service Requirements As of June 30, 2016, scheduled debt service requirements of the variable-rate debt and net swap payments, assuming current interest rates remain the same for their term are as follows. As rates vary, variable-rate bond interest payments and net swap payments will vary.
Year ending
Variable Rate Bonds
Interest Rate
June 30
Principal
Interest
Swaps, net
Total
2017
$ 4,590,000
$ 562,983
$ 985,043
$ 6,138,026
2018
4,825,000
522,361
830,113
6,177,474
2019
5,075,000
479,483
667,315
6,221,798
2020
5,335,000
434,090
496,213
6,265,303
2021
5,610,000
386,211
316,408
6,312,619
2022-2026 32,520,000 1,107,156 405,195 34,032,351
2027-2028
12,680,000
86,013
-
12,766,013
Total
$70,635,000
$3,578,297
$3,700,287
$77,913,584
6. Fair Value The Authority categorizes its fair value measurements within the fair value hierarchy established by generally accepted accounting principles. The hierarchy is based on the valuation inputs used to measure the fair value of the assets. Level 1 inputs are quoted prices in active markets for identical assets. Level 2 inputs are significant other observable inputs. Level 3 inputs are significant unobservable inputs. Debt securities are valued based on the securities’ relationship to benchmark quoted prices. Derivative instruments are valued using a market approach that considers benchmark interest rates. The following table sets forth by level, within the fair value hierarchy, the fair value of the Authority’s investments and interest rate swap liabilities as of June 30, 2016:
Level 1 Level 2 Level 3 Total Investments: Government debt securities $ – $ 39,998,469 $ – $ 39,998,469
Interest rate swap liabilities $ – $ 4,502,609 $ – $ 4,502,609
The following table sets forth by level, within the fair value hierarchy, the fair value of the Authority’s investments and derivative investments as of June 30, 2015:
Level 1 Level 2 Level 3 Total Investments: Government debt securities $ – $ 40,071,930 $ – $ 40,071,930
Derivative instruments: Interest rate swaps $ – $ 4,883,863 $ – $ 4,883,863
62

2021 2020 2019 2018 2017 2016 2015 2014 2013 2012Airline Number % Number % Number % Number % Number % Number % Number % Number % Number % Number %Delta 283,258 20% 541,604 28% 679,504 29% 592,892 28% 528,295 28% 522,892 29% 225,241 13% 170,569 10% 111,521 7% 73,405 4%Allegiant Air 381,158 27% 400,682 21% 442,824 19% 364,125 17% 300,796 16% 221,807 12% 218,386 13% 211,208 12% 192,626 11% 200,789 11%PSA 244,906 18% 245,357 13% 309,303 13% 328,538 16% 345,775 18% 344,727 19% 343,334 20% 351,352 20% 351,521 21% 338,243 19%American Eagle 49,216 4% 270,167 14% 264,231 11% 240,147 11% 201,287 11% 226,015 13% 170,642 10% 214,523 12% 208,868 12% 214,741 12%ExpressJet 19,415 1% 113,192 6% 193,928 8% 143,002 7% 188,560 10% 188,712 11% 281,754 16% 324,689 19% 328,276 19% 252,579 14%ASA - 0% - 0% 21,298 1% 47,720 2% 105,245 6% 93,217 5% 66,769 4% 92,635 5% 176,697 10% 211,136 12%United - 0% 6,975 0% 31,627 1% 62,791 3% - 0% - 0% - 0% - 0% - 0% - 0%Mesa 82,095 6% 61,672 3% 77,706 3% 43,117 2% 21,227 1% - 0% - 0% 5,113 0% - 0% 673 0%Trans States - 0% 47,423 2% 69,904 3% 47,375 2% 64,306 3% 92,648 5% 30,523 2% - 0% - 0% 6,919 0%Go Jets 27,552 2% 2,887 0% 3,031 0% 48,229 2% 32,603 2% 16,443 1% - 0% - 0% - 0% - 0%Skywest 86,776 6% 35,698 2% 67,784 3% 54,610 3% 23,546 1% 24,891 1% 1,704 0% - 0% - 0% 3,379 0%Frontier 37,671 3% 46,335 2% 56,495 2% 51,815 2% 39,243 2% 30,242 2% 43,348 2% 25,528 1% 28,677 2% 49,355 3%Air Wisconsin 11,832 1% 83,818 4% 91,902 4% 54,865 3% 15,465 1% 20,375 1% 15,695 1% 13,938 1% 950 0% 1,762 0%Commute Air 101,014 7% 5,387 0% 1,402 0% 14,916 1% 10,287 1% - 0% - 0% - 0% - 0% - 0%Shuttle America - 0% - 0% - 0% 3,822 0% - 0% - 0% - 0% 3,811 0% 8,558 1% 3,853 0%Chautauqua - 0% - 0% - 0% - 0% - 0% 3,828 0% 1,175 0% - 0% - 0% - 0%Piedmont 55,848 4% 82,428 4% 44,447 2% - 0% - 0% - 0% 66,955 4% 34,038 2% 4,744 0% 3,578 0%Endeavor Air - 0% - 0% - 0% - 0% - 0% - 0% 269,189 15% 257,707 15% 266,344 16% 292,178 16%Compass - 0% - 0% - 0% - 0% - 0% - 0% - 0% 4,778 0% 5,388 0% 8,321 0%Continental Express - 0% - 0% - 0% - 0% - 0% - 0% - 0% - 0% - 0% 86,317 5%AirTran Airways - 0% - 0% - 0% - 0% - 0% - 0% - 0% - 0% - 0% 41,882 2%Comair - 0% - 0% - 0% - 0% - 0% - 0% - 0% - 0% 95 0% 7,893 0%Vision Airlines - 0% - 0% - 0% - 0% - 0% - 0% - 0% - 0% - 0% 3,534 0%Mesaba - 0% - 0% - 0% - 0% - 0% - 0% - 0% - 0% - 0% - 0%Freedom Airlines - 0% - 0% - 0% - 0% - 0% - 0% - 0% - 0% - 0% - 0%Other 10,728 1% 8,518 0% 19,673 1% 10,543 1% 30,160 2% 4,450 0% 4,468 0% 7,801 0% 9,952 1% 11,867 1%Total 1,391,469 100% 1,952,143 100% 2,375,059 100% 2,108,507 100% 1,906,795 100% 1,790,247 100% 1,739,183 100% 1,717,690 100% 1,694,217 100% 1,812,404 100%
Source: Schedule 7 of Annual Comprehensive Financial Report
Total Passengers - ten fiscal year trend history (unaudited)SCHEDULE 12:
METROPOLITAN KNOXVILLE AIRPORT AUTHORITY
45
NOTES TO FINANCIAL STATEMENTS (continued)
5. Long-Term Debt (continued)
Scheduled Debt Service Requirements As of June 30, 2016, scheduled debt service requirements of the variable-rate debt and net swap payments, assuming current interest rates remain the same for their term are as follows. As rates vary, variable-rate bond interest payments and net swap payments will vary.
Year ending
Variable Rate Bonds
Interest Rate
June 30
Principal
Interest
Swaps, net
Total
2017
$ 4,590,000
$ 562,983
$ 985,043
$ 6,138,026
2018
4,825,000
522,361
830,113
6,177,474
2019
5,075,000
479,483
667,315
6,221,798
2020
5,335,000
434,090
496,213
6,265,303
2021
5,610,000
386,211
316,408
6,312,619
2022-2026 32,520,000 1,107,156 405,195 34,032,351
2027-2028
12,680,000
86,013
-
12,766,013
Total
$70,635,000
$3,578,297
$3,700,287
$77,913,584
6. Fair Value The Authority categorizes its fair value measurements within the fair value hierarchy established by generally accepted accounting principles. The hierarchy is based on the valuation inputs used to measure the fair value of the assets. Level 1 inputs are quoted prices in active markets for identical assets. Level 2 inputs are significant other observable inputs. Level 3 inputs are significant unobservable inputs. Debt securities are valued based on the securities’ relationship to benchmark quoted prices. Derivative instruments are valued using a market approach that considers benchmark interest rates. The following table sets forth by level, within the fair value hierarchy, the fair value of the Authority’s investments and interest rate swap liabilities as of June 30, 2016:
Level 1 Level 2 Level 3 Total Investments: Government debt securities $ – $ 39,998,469 $ – $ 39,998,469
Interest rate swap liabilities $ – $ 4,502,609 $ – $ 4,502,609
The following table sets forth by level, within the fair value hierarchy, the fair value of the Authority’s investments and derivative investments as of June 30, 2015:
Level 1 Level 2 Level 3 Total Investments: Government debt securities $ – $ 40,071,930 $ – $ 40,071,930
Derivative instruments: Interest rate swaps $ – $ 4,883,863 $ – $ 4,883,863
63

2021 2020 2019 2018 2017 2016 2015 2014 2013 2012Airline Number % Number % Number % Number % Number % Number % Number % Number % Number % Number %Passenger:Delta 9,357 0% 256,913 0% 354,524 0% 379,315 0% 353,740 0% 302,992 0% 394,091 1% 366,515 0% 296,038 0% 221,316 0%PSA 25,931 0% 50,072 0% 82,438 0% 107,971 0% 80,491 0% 146,212 0% 175,714 0% 135,896 0% 235,463 0% 233,820 0%American Eagle 22,898 0% 25,148 0% 25,823 0% 7,862 0% 26,849 0% 2,551 0% 10,058 0% - 0% - 0% 2,374 0%Skywest 4,025 0% 525 0% 10,828 0% 6,569 0% 998 0% - 0% - 0% - 0% - 0% - 0%ASA - 0% - 0% - 0% - 0% - 0% - 0% - 0% - 0% 3,159 0% 32,579 0%Pinnacle - 0% - 0% - 0% - 0% - 0% - 0% - 0% - 0% 5,730 0% 10,159 0%Comair - 0% - 0% - 0% - 0% - 0% - 0% - 0% - 0% - 0% 486 0%Chautauqua - 0% 1,568 0% 5 0% - 0% - 0% - 0% - 0% - 0% - 0% - 0%Other - 0% 236 0% 3 0% 1,316 0% 2,576 0% - 0% 162 0% - 0% 8 0% 8 0%
Cargo:FedEx 60,873,204 69% 57,832,977 69% 60,799,647 73% 61,790,777 75% 64,672,651 76% 58,126,733 72% 52,408,255 69% 55,543,110 71% 65,927,562 75% 72,737,084 78%UPS 27,476,864 31% 25,685,666 31% 21,905,421 26% 19,899,283 24% 19,956,038 23% 21,666,452 27% 22,597,174 30% 21,574,987 28% 20,734,712 24% 19,206,871 21%AmeriFlight - 0% - 0% 96,641 0% 150,231 0% 177,325 0% 211,133 0% 219,152 0% 202,459 0% 235,291 0% 251,478 0%Mountain Air - 0% 83,565 0% 1,480 0% 28,582 0% 8,513 0% 9,677 0% - 0% - 0% - 0% 25,179 0%Air Net - 0% - 0% - 0% - 0% - 0% - 0% - 0% 759 0% 21,170 0% 19,289 0%Other 28 0% 90 0% 5,395 0% 5,116 0% 7,834 0% 5,182 0% 6,567 0% 16,551 0% 22,040 0% - 0%Total 88,412,307 100% 83,936,760 100% 83,282,205 100% 82,377,022 100% 85,287,015 100% 80,470,932 100% 75,811,173 100% 77,840,277 100% 87,481,173 100% 92,740,643 100%
Source: Schedule 9 of Annual Comprehensive Financial Report
SCHEDULE 13:Distribution of total cargo - ten fiscal year trend history (in pounds)(unaudited)
METROPOLITAN KNOXVILLE AIRPORT AUTHORITY
45
NOTES TO FINANCIAL STATEMENTS (continued)
5. Long-Term Debt (continued)
Scheduled Debt Service Requirements As of June 30, 2016, scheduled debt service requirements of the variable-rate debt and net swap payments, assuming current interest rates remain the same for their term are as follows. As rates vary, variable-rate bond interest payments and net swap payments will vary.
Year ending
Variable Rate Bonds
Interest Rate
June 30
Principal
Interest
Swaps, net
Total
2017
$ 4,590,000
$ 562,983
$ 985,043
$ 6,138,026
2018
4,825,000
522,361
830,113
6,177,474
2019
5,075,000
479,483
667,315
6,221,798
2020
5,335,000
434,090
496,213
6,265,303
2021
5,610,000
386,211
316,408
6,312,619
2022-2026 32,520,000 1,107,156 405,195 34,032,351
2027-2028
12,680,000
86,013
-
12,766,013
Total
$70,635,000
$3,578,297
$3,700,287
$77,913,584
6. Fair Value The Authority categorizes its fair value measurements within the fair value hierarchy established by generally accepted accounting principles. The hierarchy is based on the valuation inputs used to measure the fair value of the assets. Level 1 inputs are quoted prices in active markets for identical assets. Level 2 inputs are significant other observable inputs. Level 3 inputs are significant unobservable inputs. Debt securities are valued based on the securities’ relationship to benchmark quoted prices. Derivative instruments are valued using a market approach that considers benchmark interest rates. The following table sets forth by level, within the fair value hierarchy, the fair value of the Authority’s investments and interest rate swap liabilities as of June 30, 2016:
Level 1 Level 2 Level 3 Total Investments: Government debt securities $ – $ 39,998,469 $ – $ 39,998,469
Interest rate swap liabilities $ – $ 4,502,609 $ – $ 4,502,609
The following table sets forth by level, within the fair value hierarchy, the fair value of the Authority’s investments and derivative investments as of June 30, 2015:
Level 1 Level 2 Level 3 Total Investments: Government debt securities $ – $ 40,071,930 $ – $ 40,071,930
Derivative instruments: Interest rate swaps $ – $ 4,883,863 $ – $ 4,883,863
64

2021 2020 2019 2018 2017 2016 2015 2014 2013 2012
Administration 12.5 12.0 12.0 11.5 12.0 13.0 12.5 12.5 12.5 12.5
Marketing/Public Relations 7.5 9.0 9.5 8.5 9.0 9.0 7.0 7.0 8.0 7.5
Engineering & Planning 6.0 6.0 6.0 6.0 7.0 7.0 7.0 6.0 6.0 6.0
Safety (Police & Fire) 53.0 58.0 58.0 56.0 49.0 47.0 45.0 42.0 45.0 45.0
Operations Administration 12.0 12.5 11.5 12.0 12.0 13.0 12.0 10.5 9.5 10.0
Building Maintenance 8.0 8.0 7.5 7.5 9.0 10.5 8.0 9.5 9.0 10.0
Airfield Maintenance 16.0 20.5 21.0 20.5 20.0 22.0 22.0 21.5 21.5 24.0
Building Services (Custodial) 22.0 25.5 26.0 26.5 28.0 29.0 29.0 28.5 28.5 31.0
Knoxville Downtown Island Airport 6.5 6.5 6.5 6.0 7.0 7.0 7.0 6.5 7.0 9.0
Total Employees 143.5 158.0 158.0 154.5 153.0 157.5 149.5 144.0 147.0 155.0
hours by 2,080.
Actual
1970
1980
1990
2000
2010
2020
Source: Bureau of the Census(a) Large increase in population due to annexation.
546,488
SCHEDULE 14:Authority employees and demographic data - population (unaudited)
Demographic data - population (unaudited)
City
Notes: A full-time employee is scheduled to work 2,080 hours per year (including vacation and sick leave). Full-time equivalent employment is calculated by dividing total labor
461,876
Metropolitanarea (b)County
687,249
864,442
787,919
173,890
178,874
335,749
190,740
276,293174,587 (a)
319,694175,045
Full-time equivalent employees as of fiscal year-end
Anderson, Blount, Knox, and Union counties.
165,121 585,926
(b) Knoxville's Metropolitan Statistical Area (MSA) includes Anderson, Blount, Knox, Loudon, Sevier, and Union counties. Prior to 1983, statistics were gathered only for
382,032
478,971
432,226
METROPOLITAN KNOXVILLE AIRPORT AUTHORITY
45
NOTES TO FINANCIAL STATEMENTS (continued)
5. Long-Term Debt (continued)
Scheduled Debt Service Requirements As of June 30, 2016, scheduled debt service requirements of the variable-rate debt and net swap payments, assuming current interest rates remain the same for their term are as follows. As rates vary, variable-rate bond interest payments and net swap payments will vary.
Year ending
Variable Rate Bonds
Interest Rate
June 30
Principal
Interest
Swaps, net
Total
2017
$ 4,590,000
$ 562,983
$ 985,043
$ 6,138,026
2018
4,825,000
522,361
830,113
6,177,474
2019
5,075,000
479,483
667,315
6,221,798
2020
5,335,000
434,090
496,213
6,265,303
2021
5,610,000
386,211
316,408
6,312,619
2022-2026 32,520,000 1,107,156 405,195 34,032,351
2027-2028
12,680,000
86,013
-
12,766,013
Total
$70,635,000
$3,578,297
$3,700,287
$77,913,584
6. Fair Value The Authority categorizes its fair value measurements within the fair value hierarchy established by generally accepted accounting principles. The hierarchy is based on the valuation inputs used to measure the fair value of the assets. Level 1 inputs are quoted prices in active markets for identical assets. Level 2 inputs are significant other observable inputs. Level 3 inputs are significant unobservable inputs. Debt securities are valued based on the securities’ relationship to benchmark quoted prices. Derivative instruments are valued using a market approach that considers benchmark interest rates. The following table sets forth by level, within the fair value hierarchy, the fair value of the Authority’s investments and interest rate swap liabilities as of June 30, 2016:
Level 1 Level 2 Level 3 Total Investments: Government debt securities $ – $ 39,998,469 $ – $ 39,998,469
Interest rate swap liabilities $ – $ 4,502,609 $ – $ 4,502,609
The following table sets forth by level, within the fair value hierarchy, the fair value of the Authority’s investments and derivative investments as of June 30, 2015:
Level 1 Level 2 Level 3 Total Investments: Government debt securities $ – $ 40,071,930 $ – $ 40,071,930
Derivative instruments: Interest rate swaps $ – $ 4,883,863 $ – $ 4,883,863
65

2011 2012 2013 2014 2015 2016 2017 2018 2019 2020National 8.9% 8.1% 6.7% 6.2% 5.0% 4.9% 4.1% 3.9% 3.5% 8.1%Tennessee 9.2% 8.2% 7.7% 6.7% 5.8% 5.1% 3.3% 3.3% 3.3% 9.3%
Major Tennesseemetropolitan areas:Chattanooga 8.3% 7.5% 6.7% 6.5% 5.1% 4.9% 3.3% 3.1% 3.2% 8.3%Knoxville (a) 7.3% 6.7% 6.0% 5.8% 5.0% 4.7% 2.9% 2.8% 2.9% 7.9%Memphis 9.9% 9.1% 8.5% 7.6% 6.1% 5.3% 3.7% 3.7% 3.8% 11.7%Nashville 8.0% 6.8% 5.5% 5.2% 4.2% 3.8% 2.4% 2.3% 2.3% 10.0%
Source: Tennessee Department of Labor and Workforce Development(a) Knoxville's Metropolitan Statistical Area (MSA) includes Anderson, Blount, Campbell, Grainger, Knox, Loudon, Morgan, Roane, and Union Counties.
Calendar Year
2011 37,452 42,453 2012 38,771 44,267 2013 38,806 44,462 2014 40,233 46,414 2015 42,094 48,112 2016 43,380 49,255 2017 45,517 51,631 2018 46,900 54,420 2019 48,684 56,469 2020 50,547 59,450
Source: U.S. Department of Commerce Bureau of Economic Analysis
Calendar Year
2011201220132014201520162017201820192020
Source: U.S. Department of Commerce Bureau of Economic Analysis
348,109,172 19,679,715,147
319,400,765
14,068,960,00013,904,485,000
17,572,929,09716,413,551,000
15,463,981,00014,801,624,000
15,912,777,000
Tennessee United States
SCHEDULE 17:Demographic data - total personal income last ten calendar years (thousands of dollars) (unaudited)
SCHEDULE 15:Demographic data - unemployment information last ten calendar years (unaudited)
SCHEDULE 16:Demographic data - per capita personal income last ten calendar years (unaudited)
Tennessee United States
13,233,436,000
18,542,262,000332,472,653
239,633,734250,285,838252,091,031263,437,186277,832,327288,531,063297,292,992
METROPOLITAN KNOXVILLE AIRPORT AUTHORITY
45
NOTES TO FINANCIAL STATEMENTS (continued)
5. Long-Term Debt (continued)
Scheduled Debt Service Requirements As of June 30, 2016, scheduled debt service requirements of the variable-rate debt and net swap payments, assuming current interest rates remain the same for their term are as follows. As rates vary, variable-rate bond interest payments and net swap payments will vary.
Year ending
Variable Rate Bonds
Interest Rate
June 30
Principal
Interest
Swaps, net
Total
2017
$ 4,590,000
$ 562,983
$ 985,043
$ 6,138,026
2018
4,825,000
522,361
830,113
6,177,474
2019
5,075,000
479,483
667,315
6,221,798
2020
5,335,000
434,090
496,213
6,265,303
2021
5,610,000
386,211
316,408
6,312,619
2022-2026 32,520,000 1,107,156 405,195 34,032,351
2027-2028
12,680,000
86,013
-
12,766,013
Total
$70,635,000
$3,578,297
$3,700,287
$77,913,584
6. Fair Value The Authority categorizes its fair value measurements within the fair value hierarchy established by generally accepted accounting principles. The hierarchy is based on the valuation inputs used to measure the fair value of the assets. Level 1 inputs are quoted prices in active markets for identical assets. Level 2 inputs are significant other observable inputs. Level 3 inputs are significant unobservable inputs. Debt securities are valued based on the securities’ relationship to benchmark quoted prices. Derivative instruments are valued using a market approach that considers benchmark interest rates. The following table sets forth by level, within the fair value hierarchy, the fair value of the Authority’s investments and interest rate swap liabilities as of June 30, 2016:
Level 1 Level 2 Level 3 Total Investments: Government debt securities $ – $ 39,998,469 $ – $ 39,998,469
Interest rate swap liabilities $ – $ 4,502,609 $ – $ 4,502,609
The following table sets forth by level, within the fair value hierarchy, the fair value of the Authority’s investments and derivative investments as of June 30, 2015:
Level 1 Level 2 Level 3 Total Investments: Government debt securities $ – $ 40,071,930 $ – $ 40,071,930
Derivative instruments: Interest rate swaps $ – $ 4,883,863 $ – $ 4,883,863
66

2020 2019 2018 2017 2016 2015 2014 2013 2012 2011Employees % Employees % Employees % Employees % Employees % Employees % Employees % Employees % Employees % Employees %
Major Employers:U.S. Department of Energy
Oak Ridge Operations 17,079 4% 15,862 4% 12,387 3% 12,618 3% 11,750 3% 11,986 3% 11,637 3% 11,877 4% 12,947 3% 13,082 4%Covenant Health 11,060 3% 9,792 2% 10,419 2% 10,419 3% 10,119 3% 10,304 3% 10,458 3% 9,122 3% 6,771 2% 9,494 3%Knox County Schools 9,519 2% 7,949 2% 8,082 2% 7,881 2% 8,146 2% 7,241 2% 6,804 2% 7,066 2% 6,409 2% 6,891 2%The University of Tennessee
Knoxville 8,959 2% 9,384 2% 6,689 2% 6,689 2% 6,646 2% 6,609 2% 6,660 2% 6,550 2% 9,328 2% 6,400 2%Wal-Mart Stores, Inc. 6,863 2% 6,863 2% 5,998 1% 5,881 1% 6,206 2% 5,951 2% 6,006 2% 5,776 2% 4,613 1% 4,668 1%University Health
Systems 5,137 1% 5,458 1% 5,547 1% 5,316 1% 5,144 1% 4,941 1% 4,224 1% 4,061 1% 3,986 1% 3,942 1%K-VA-T Food Stores 4,634 1% 3,104 1% 3,487 1% 3,328 1% 3,545 1% 3,913 1% 4,078 1% 3,857 1% 3,537 0% n/a 0%The Dollywood Co. 4,500 1% 4,500 1% 4,000 1% 4,000 1% 4,000 1% 3,000 1% 2,521 1% 2,521 1% 2,558 1% 2,534 1%Clayton Homes 4,262 1% 4,883 1% 3,662 1% 3,188 1% 3,139 1% 2,883 1% 2,784 1% 2,631 1% 2,829 1% n/a 0%Denso Manufacturing
Tennessee 4,200 1% 5,350 1% 5,000 1% 4,439 1% 3,900 1% 3,800 1% 3,500 1% 3,400 1% 2,184 1% 2,346 1%Roark Capital Group 3,530 1% 2,788 1% 2,627 1% 1,902 0% 1,904 0% 1,796 0% 1,796 0% n/a 0% n/a 0% n/a 0%
Source: Knoxville Area Chamber PartnershipNotes: Percentages reported above are based upon total employment in Knoxville and its Metropolitan Statistical Area (MSA).n/a = not available
SCHEDULE 18Demographic data - top employers in Knoxville area for the last ten calendar years (unaudited)
METROPOLITAN KNOXVILLE AIRPORT AUTHORITY
45
NOTES TO FINANCIAL STATEMENTS (continued)
5. Long-Term Debt (continued)
Scheduled Debt Service Requirements As of June 30, 2016, scheduled debt service requirements of the variable-rate debt and net swap payments, assuming current interest rates remain the same for their term are as follows. As rates vary, variable-rate bond interest payments and net swap payments will vary.
Year ending
Variable Rate Bonds
Interest Rate
June 30
Principal
Interest
Swaps, net
Total
2017
$ 4,590,000
$ 562,983
$ 985,043
$ 6,138,026
2018
4,825,000
522,361
830,113
6,177,474
2019
5,075,000
479,483
667,315
6,221,798
2020
5,335,000
434,090
496,213
6,265,303
2021
5,610,000
386,211
316,408
6,312,619
2022-2026 32,520,000 1,107,156 405,195 34,032,351
2027-2028
12,680,000
86,013
-
12,766,013
Total
$70,635,000
$3,578,297
$3,700,287
$77,913,584
6. Fair Value The Authority categorizes its fair value measurements within the fair value hierarchy established by generally accepted accounting principles. The hierarchy is based on the valuation inputs used to measure the fair value of the assets. Level 1 inputs are quoted prices in active markets for identical assets. Level 2 inputs are significant other observable inputs. Level 3 inputs are significant unobservable inputs. Debt securities are valued based on the securities’ relationship to benchmark quoted prices. Derivative instruments are valued using a market approach that considers benchmark interest rates. The following table sets forth by level, within the fair value hierarchy, the fair value of the Authority’s investments and interest rate swap liabilities as of June 30, 2016:
Level 1 Level 2 Level 3 Total Investments: Government debt securities $ – $ 39,998,469 $ – $ 39,998,469
Interest rate swap liabilities $ – $ 4,502,609 $ – $ 4,502,609
The following table sets forth by level, within the fair value hierarchy, the fair value of the Authority’s investments and derivative investments as of June 30, 2015:
Level 1 Level 2 Level 3 Total Investments: Government debt securities $ – $ 40,071,930 $ – $ 40,071,930
Derivative instruments: Interest rate swaps $ – $ 4,883,863 $ – $ 4,883,863
67

Major/domestic passenger airlinesAllegiant AirAmerican Airlines*Delta Air Lines*Frontier AirlinesUnited Airlines*
*Some or all service offered through regional airline affiliates shown below.
Regional Airline AffiliatesAir Wisconsin Airlines/United AirlinesCommute Air /United AirlinesEndeavor Air /Delta Air LinesEnvoy Airlines/American AirlinesGoJet Airlines/United AirlinesMesa Airlines/American AirlinesMesa Airlines/United AirlinesPiedmont Airlines/American AirlinesPSA Airlines/American AirlinesRepublic Airlines/American AirlinesRepublic Airlines/United AirlinesSkywest Airlines/American AirlinesSkywest Airlines/United Airlines
Cargo airlinesFedEx, Inc.UPS Airlines, Inc.
SCHEDULE 19:Airlines serving McGhee Tyson Airport (unaudited)
June 30, 2021
METROPOLITAN KNOXVILLE AIRPORT AUTHORITY
45
NOTES TO FINANCIAL STATEMENTS (continued)
5. Long-Term Debt (continued)
Scheduled Debt Service Requirements As of June 30, 2016, scheduled debt service requirements of the variable-rate debt and net swap payments, assuming current interest rates remain the same for their term are as follows. As rates vary, variable-rate bond interest payments and net swap payments will vary.
Year ending
Variable Rate Bonds
Interest Rate
June 30
Principal
Interest
Swaps, net
Total
2017
$ 4,590,000
$ 562,983
$ 985,043
$ 6,138,026
2018
4,825,000
522,361
830,113
6,177,474
2019
5,075,000
479,483
667,315
6,221,798
2020
5,335,000
434,090
496,213
6,265,303
2021
5,610,000
386,211
316,408
6,312,619
2022-2026 32,520,000 1,107,156 405,195 34,032,351
2027-2028
12,680,000
86,013
-
12,766,013
Total
$70,635,000
$3,578,297
$3,700,287
$77,913,584
6. Fair Value The Authority categorizes its fair value measurements within the fair value hierarchy established by generally accepted accounting principles. The hierarchy is based on the valuation inputs used to measure the fair value of the assets. Level 1 inputs are quoted prices in active markets for identical assets. Level 2 inputs are significant other observable inputs. Level 3 inputs are significant unobservable inputs. Debt securities are valued based on the securities’ relationship to benchmark quoted prices. Derivative instruments are valued using a market approach that considers benchmark interest rates. The following table sets forth by level, within the fair value hierarchy, the fair value of the Authority’s investments and interest rate swap liabilities as of June 30, 2016:
Level 1 Level 2 Level 3 Total Investments: Government debt securities $ – $ 39,998,469 $ – $ 39,998,469
Interest rate swap liabilities $ – $ 4,502,609 $ – $ 4,502,609
The following table sets forth by level, within the fair value hierarchy, the fair value of the Authority’s investments and derivative investments as of June 30, 2015:
Level 1 Level 2 Level 3 Total Investments: Government debt securities $ – $ 40,071,930 $ – $ 40,071,930
Derivative instruments: Interest rate swaps $ – $ 4,883,863 $ – $ 4,883,863
68

Passenger Daily Daily Weekly WeeklyAirlines Destination flights seats flights seats AircraftAllegiant Air Austin 2 340 A320
Baltimore/Washington 2 366 A320Boston 2 361 A320Chicago-Midway 2 370 A320Denver 2 364 A320Destin/Fort Walton 3 479 A320Fort Lauderdale 5 920 A320Houston- Hobby 2 356 A320Las Vegas 2 370 A320Myrtle Beach 2 335 A320Newark 2 385 A320Orlando-Sanford 7 1,343 A320Punta Gorda/SW Florida 3 506 A320Sarasota 2 353 A320St. Petersburg/Tampa Bay 5 1,005 A320West Palm Beach 2 365 A320
American Airlines Charlotte 5 357 36 2,496 CR7, CR9, ER4Chicago-O'Hare 2 80 11 559 CR7, ER4Dallas/Fort Worth 4 281 26 1,969 CR7, CR9, E75Miami 1 32 4 221 ER4, E75Philadelphia 2 83 10 583 CR7, ER4Washington-National 1 70 8 492 CR7, CR9, ER4
Delta Air Lines Atlanta 7 512 48 3,450 CRJ, CR9Detroit 2 135 13 942 CR9, CR7Minneapolis/St. Paul 1 54 5 380 CR9New York-LaGuardia*
Frontier Airlines Denver 3 524 A320
United Airlines Chicago-O'Hare 2 105 14 273ERJ, CRJ, CR5,
CR7Denver 1 97 10 679 CR7, E7WHouston -Bush 3 146 20 1,023 ERJ, CRJNewark*Washington-Dulles 2 90 13 629 ERJ
Totals 33 2,042 266 22,438
Cargo Daily DailyAirlines Destination flights seats AircraftFedEx, Inc Indianapolis 1 N/A A310
Memphis 2 N/A A310
UPS Airlines Louisville 1 N/A B757* Temporarily suspended during FY2021 due to COVID
SCHEDULE 20:Flight information (unaudited)
June 30, 2021
METROPOLITAN KNOXVILLE AIRPORT AUTHORITY
45
NOTES TO FINANCIAL STATEMENTS (continued)
5. Long-Term Debt (continued)
Scheduled Debt Service Requirements As of June 30, 2016, scheduled debt service requirements of the variable-rate debt and net swap payments, assuming current interest rates remain the same for their term are as follows. As rates vary, variable-rate bond interest payments and net swap payments will vary.
Year ending
Variable Rate Bonds
Interest Rate
June 30
Principal
Interest
Swaps, net
Total
2017
$ 4,590,000
$ 562,983
$ 985,043
$ 6,138,026
2018
4,825,000
522,361
830,113
6,177,474
2019
5,075,000
479,483
667,315
6,221,798
2020
5,335,000
434,090
496,213
6,265,303
2021
5,610,000
386,211
316,408
6,312,619
2022-2026 32,520,000 1,107,156 405,195 34,032,351
2027-2028
12,680,000
86,013
-
12,766,013
Total
$70,635,000
$3,578,297
$3,700,287
$77,913,584
6. Fair Value The Authority categorizes its fair value measurements within the fair value hierarchy established by generally accepted accounting principles. The hierarchy is based on the valuation inputs used to measure the fair value of the assets. Level 1 inputs are quoted prices in active markets for identical assets. Level 2 inputs are significant other observable inputs. Level 3 inputs are significant unobservable inputs. Debt securities are valued based on the securities’ relationship to benchmark quoted prices. Derivative instruments are valued using a market approach that considers benchmark interest rates. The following table sets forth by level, within the fair value hierarchy, the fair value of the Authority’s investments and interest rate swap liabilities as of June 30, 2016:
Level 1 Level 2 Level 3 Total Investments: Government debt securities $ – $ 39,998,469 $ – $ 39,998,469
Interest rate swap liabilities $ – $ 4,502,609 $ – $ 4,502,609
The following table sets forth by level, within the fair value hierarchy, the fair value of the Authority’s investments and derivative investments as of June 30, 2015:
Level 1 Level 2 Level 3 Total Investments: Government debt securities $ – $ 40,071,930 $ – $ 40,071,930
Derivative instruments: Interest rate swaps $ – $ 4,883,863 $ – $ 4,883,863
69

Aviation service operators Concessionaires (cont.)Aircraft Technicians, Inc. Paradies-Knoxville, LLCAvflight Services Corporation Rick McGill ToyotaAVZ Flight Academy Ruby Tuesday, Inc.CAVU, LLC Smarte Carte, Inc.Consolidated Aviation Security Point Media, LLCFast Track Flight TrainingG2 Secure Staff, LLC Rental car companiesGrande Aviation, LLC Alamo Rent A CarHorizon Avionics, Inc. Avis Car RentalJani-King Budget Car RentalJetstar Aviation, LLC Dollar Rent-a-CarKnoxville Flight Training Center, Inc. Enterprise Rent-A-CarMaxAir Charters dba Flight Choice Hertz Rent-a-CarSmoky Mountain Air Charter National Car RentalStandard Aero Alliance Payless Car RentalTAC Air Thrifty Rent-a-CarThe Jet Shop, LLCUnited Ground Express OtherXpress Aircraft Maintenance, LLC Airport Office Partners, LLC
ARINCU.S. government agencies Atmos EnergyFederal Aviation Administration Cirrus Design Corp dba Cirrus AviationKnox County Sheriff's Dept. Delta Cargo, Inc.Tennessee Air National Guard East TN Natural Gas, LLCTennessee Army National Guard G2 Secure StaffTransportation Security Administration GAT Security Services, Inc.
LyftAirline maintenance Massey Properties, LLCExpressJet National Safe Skies AllianceEndeavor Air (Delta Connection) R Squared Construction
Remote Area MedicalBank ATMs Republic/REEF Parking SystemFirst Horizon Bank SITARegions Bank UberTruist BankTN State Bank
ConcessionairesClassic ShineFive Star Food ServiceHMS Host CorporationKnoxville Airport Hotel Company dbaKnoxville Airport HiltonKnoxville Coca-Cola Co.
SCHEDULE 21:Companies conducting business on airport property (unaudited)
June 30, 2021
METROPOLITAN KNOXVILLE AIRPORT AUTHORITY
45
NOTES TO FINANCIAL STATEMENTS (continued)
5. Long-Term Debt (continued)
Scheduled Debt Service Requirements As of June 30, 2016, scheduled debt service requirements of the variable-rate debt and net swap payments, assuming current interest rates remain the same for their term are as follows. As rates vary, variable-rate bond interest payments and net swap payments will vary.
Year ending
Variable Rate Bonds
Interest Rate
June 30
Principal
Interest
Swaps, net
Total
2017
$ 4,590,000
$ 562,983
$ 985,043
$ 6,138,026
2018
4,825,000
522,361
830,113
6,177,474
2019
5,075,000
479,483
667,315
6,221,798
2020
5,335,000
434,090
496,213
6,265,303
2021
5,610,000
386,211
316,408
6,312,619
2022-2026 32,520,000 1,107,156 405,195 34,032,351
2027-2028
12,680,000
86,013
-
12,766,013
Total
$70,635,000
$3,578,297
$3,700,287
$77,913,584
6. Fair Value The Authority categorizes its fair value measurements within the fair value hierarchy established by generally accepted accounting principles. The hierarchy is based on the valuation inputs used to measure the fair value of the assets. Level 1 inputs are quoted prices in active markets for identical assets. Level 2 inputs are significant other observable inputs. Level 3 inputs are significant unobservable inputs. Debt securities are valued based on the securities’ relationship to benchmark quoted prices. Derivative instruments are valued using a market approach that considers benchmark interest rates. The following table sets forth by level, within the fair value hierarchy, the fair value of the Authority’s investments and interest rate swap liabilities as of June 30, 2016:
Level 1 Level 2 Level 3 Total Investments: Government debt securities $ – $ 39,998,469 $ – $ 39,998,469
Interest rate swap liabilities $ – $ 4,502,609 $ – $ 4,502,609
The following table sets forth by level, within the fair value hierarchy, the fair value of the Authority’s investments and derivative investments as of June 30, 2015:
Level 1 Level 2 Level 3 Total Investments: Government debt securities $ – $ 40,071,930 $ – $ 40,071,930
Derivative instruments: Interest rate swaps $ – $ 4,883,863 $ – $ 4,883,863
70

SCHEDULE 22: Use of debt proceeds (unaudited)
Descriptions of the uses of proceeds from the Authority's debt are summarized below. Airport revenue refunding note Series 2019A - $39,570,000 Proceeds from this debt issuance was used to partially refund the series 2008 V-A-1 bonds and to terminate the associated variable interest. Series 2017A - $11,000,000 (retired) Proceeds from this debt issuance was used to refund the series 2000 II-D-1 bonds and to terminate the associated interest rate swap. Local government public improvement revenues bonds Series 2008 V-A-1—$84,645,000 (retired) Proceeds from this bond issue were used to refund the Series III-A outstanding bonds in advance of their maturity. Special purpose revenue bonds Series 2002—$8,500,000 (retired) The Authority issued these bonds on behalf of Northwest Airlines, Inc., now Delta Air Lines, to construct a regional jet maintenance hangar for their affiliate airline, Pinnacle Airlines, Inc., in the West Aviation Area. The Authority is not at risk for these bonds.
Local government public improvement revenue bonds Series 2000 II-D-1—$18,500,000 (retired) Proceeds from this bond issue were used to finance a regional jet maintenance facility for ExpressJet, formerly Continental Express, Inc., and for the West Aviation Area at McGhee Tyson Airport. These were the first bonds issued under the new Master Bond Resolution. Series 2001 III-A—$ 95,000,000 (retired) Proceeds from this bond issue were used for repayment of all outstanding General Obligation bonds, including Series E-1, E-2, II-G-2, III-B-1, III-G-2, and IV-A-1. They were also used for completion of the renovation and expansion of the terminal building at McGhee Tyson Airport, for the West Aviation Area, and for land acquisition. Series 1999 IV-A-1—$20,300,000 (retired) Proceeds from this bond issue were used to finance the renovation and expansion of the terminal building at McGhee Tyson Airport, construct a 750-space public parking lot, and refinance the outstanding Airport Revenue-General Obligation Series G and H bonds. Series 1999 III-G-2—$5,500,000 (retired) Proceeds from this bond issue were used to finance the renovation and expansion of the terminal building at McGhee Tyson Airport. Series 1998 III-B-1—$36,500,000 (retired) Proceeds from this bond issue were used to finance the renovation and expansion of the terminal building at McGhee Tyson Airport. Series 1997 II-G-2—$ 8,000,000 (retired) Proceeds from this bond issue were used to finance the renovation and expansion of the terminal building at McGhee Tyson Airport. Series 1996 E-2—$5,350,000 (retired) Proceeds from this bond issue were used to finance the construction of improvements to the air cargo facilities at the McGhee Tyson Airport and aircraft T-hangars at the Knoxville Downtown Island Airport. They were also used to refinance the outstanding Airport Revenue-General Obligation Bonds, Series F. Series 1996 E-1—$7,150,000 (retired) Proceeds from this bond issue were used to expand the public garage in front of the terminal building from 1,394 to 2,811 spaces.
METROPOLITAN KNOXVILLE AIRPORT AUTHORITY
45
NOTES TO FINANCIAL STATEMENTS (continued)
5. Long-Term Debt (continued)
Scheduled Debt Service Requirements As of June 30, 2016, scheduled debt service requirements of the variable-rate debt and net swap payments, assuming current interest rates remain the same for their term are as follows. As rates vary, variable-rate bond interest payments and net swap payments will vary.
Year ending
Variable Rate Bonds
Interest Rate
June 30
Principal
Interest
Swaps, net
Total
2017
$ 4,590,000
$ 562,983
$ 985,043
$ 6,138,026
2018
4,825,000
522,361
830,113
6,177,474
2019
5,075,000
479,483
667,315
6,221,798
2020
5,335,000
434,090
496,213
6,265,303
2021
5,610,000
386,211
316,408
6,312,619
2022-2026 32,520,000 1,107,156 405,195 34,032,351
2027-2028
12,680,000
86,013
-
12,766,013
Total
$70,635,000
$3,578,297
$3,700,287
$77,913,584
6. Fair Value The Authority categorizes its fair value measurements within the fair value hierarchy established by generally accepted accounting principles. The hierarchy is based on the valuation inputs used to measure the fair value of the assets. Level 1 inputs are quoted prices in active markets for identical assets. Level 2 inputs are significant other observable inputs. Level 3 inputs are significant unobservable inputs. Debt securities are valued based on the securities’ relationship to benchmark quoted prices. Derivative instruments are valued using a market approach that considers benchmark interest rates. The following table sets forth by level, within the fair value hierarchy, the fair value of the Authority’s investments and interest rate swap liabilities as of June 30, 2016:
Level 1 Level 2 Level 3 Total Investments: Government debt securities $ – $ 39,998,469 $ – $ 39,998,469
Interest rate swap liabilities $ – $ 4,502,609 $ – $ 4,502,609
The following table sets forth by level, within the fair value hierarchy, the fair value of the Authority’s investments and derivative investments as of June 30, 2015:
Level 1 Level 2 Level 3 Total Investments: Government debt securities $ – $ 40,071,930 $ – $ 40,071,930
Derivative instruments: Interest rate swaps $ – $ 4,883,863 $ – $ 4,883,863
71

Expiration PolicyType of policy Policy insurer date limit Risk Coverage
Airport Liability (a) ACE USA July 12, 2022 $200,000,000 Personal injury andaggregate limit property damage
Commercial Property Travelers June 30, 2022 $239,557,056 Buildings - Fire and(Includes Terrorism) Insurance other perils (includesBoiler & Machinery contents, rental income
and extra expense)
Cybersecurity Insurance Chubb August 1, 2022 $1,000,000 Cyber liability and security
Public Officials and Chubb December 18, 2021 $10,000,000 Commissioners andEmployer Liability employee professional
liability
Commerical Crime Coverage Great American July 27, 2022 $500,000 Employee dishonesty, Insurance Group forgery, computer hacking,
funds transfer fraud
Automobile Liability Cincinnati Insurance July 1, 2022 $1,000,000 Automobile liability Company
Physical Damage - Two National Hangar November 29, 2021 $1,433,250 Property damage -Fire Trucks Insurance Co. two fire trucks
Physical Damage - Refueler National Hangar November 29, 2021 $140,000 Property damage-Trucks Insurance Co. refueler trucks
Liability Only - Two National Hangar November 29, 2021 $150,000 Liability Only - two oldFire Trucks Insurance Co. trucks
Workers' Compensation AIG June 30, 2022 $1,000,000 Employer's liability -employee bodily injury
Employee Health, Vision United Health Care May 31, 2022 Employee medical, visionand Dental and dental
Employee Long-Term Unum May 31, 2022 Employee earningsDisability after 90 days disability
Employee AD&D Unum May 31, 2022 $70,000/Employee Accidental death and$5,000/Spouse dismemberment$1,000/Child
Employee and Dependent Unum May 31, 2022 $70,000/Employee Life and dependent lifeLife $5,000/Spouse
$1,000/Child(a) Includes terrorism and war risk coverage
SCHEDULE 23:Insurance in force (unaudited)
June 30, 2021
METROPOLITAN KNOXVILLE AIRPORT AUTHORITY
45
NOTES TO FINANCIAL STATEMENTS (continued)
5. Long-Term Debt (continued)
Scheduled Debt Service Requirements As of June 30, 2016, scheduled debt service requirements of the variable-rate debt and net swap payments, assuming current interest rates remain the same for their term are as follows. As rates vary, variable-rate bond interest payments and net swap payments will vary.
Year ending
Variable Rate Bonds
Interest Rate
June 30
Principal
Interest
Swaps, net
Total
2017
$ 4,590,000
$ 562,983
$ 985,043
$ 6,138,026
2018
4,825,000
522,361
830,113
6,177,474
2019
5,075,000
479,483
667,315
6,221,798
2020
5,335,000
434,090
496,213
6,265,303
2021
5,610,000
386,211
316,408
6,312,619
2022-2026 32,520,000 1,107,156 405,195 34,032,351
2027-2028
12,680,000
86,013
-
12,766,013
Total
$70,635,000
$3,578,297
$3,700,287
$77,913,584
6. Fair Value The Authority categorizes its fair value measurements within the fair value hierarchy established by generally accepted accounting principles. The hierarchy is based on the valuation inputs used to measure the fair value of the assets. Level 1 inputs are quoted prices in active markets for identical assets. Level 2 inputs are significant other observable inputs. Level 3 inputs are significant unobservable inputs. Debt securities are valued based on the securities’ relationship to benchmark quoted prices. Derivative instruments are valued using a market approach that considers benchmark interest rates. The following table sets forth by level, within the fair value hierarchy, the fair value of the Authority’s investments and interest rate swap liabilities as of June 30, 2016:
Level 1 Level 2 Level 3 Total Investments: Government debt securities $ – $ 39,998,469 $ – $ 39,998,469
Interest rate swap liabilities $ – $ 4,502,609 $ – $ 4,502,609
The following table sets forth by level, within the fair value hierarchy, the fair value of the Authority’s investments and derivative investments as of June 30, 2015:
Level 1 Level 2 Level 3 Total Investments: Government debt securities $ – $ 40,071,930 $ – $ 40,071,930
Derivative instruments: Interest rate swaps $ – $ 4,883,863 $ – $ 4,883,863
72

YearCompleted Description Cost
1989 Parking Garage Phase I (775 spaces) $5.7 million1991 Air Cargo Complex (FedEx and UPS) $12 million1993 Runway 5R/23L 3,000 foot extension $14 million1995 Parking Garage Phase II (619 spaces) $3.2 million1998 Parking Garage Phase III (1,417 spaces) $8.2 million2000 Passenger Terminal Building Renovation and Expansion $72 million2000 Express Jet Maintenance Facility $13.7 million2002 Delta Air Lines Maintenance Facility $8.5 million2008 Airport Rescue and Fire Fighting Facility $11.6 million2009 West Aviation Area $53 million2010 Taxiway B Reconstruction $5.4 million2013 Airfield Maintenance Complex $18.7 million2015 Land acquisition in Runway 23R Runway Protection Zone $6.1 million2016 Aircraft Storage Hangar for Cirrus Design Corp. $2.3 million2017 Air Cargo Building (Delta) $2.0 million2018 Knoxville Downtown Island Airport T-Hangars, Taxiway & Apron $2.7 million2019 Passenger Boarding Bridges (12) $8.4 million
SCHEDULE 24:Major Airport Capital Improvements Completed (unaudited)
As of June 30, 2021
METROPOLITAN KNOXVILLE AIRPORT AUTHORITY
45
NOTES TO FINANCIAL STATEMENTS (continued)
5. Long-Term Debt (continued)
Scheduled Debt Service Requirements As of June 30, 2016, scheduled debt service requirements of the variable-rate debt and net swap payments, assuming current interest rates remain the same for their term are as follows. As rates vary, variable-rate bond interest payments and net swap payments will vary.
Year ending
Variable Rate Bonds
Interest Rate
June 30
Principal
Interest
Swaps, net
Total
2017
$ 4,590,000
$ 562,983
$ 985,043
$ 6,138,026
2018
4,825,000
522,361
830,113
6,177,474
2019
5,075,000
479,483
667,315
6,221,798
2020
5,335,000
434,090
496,213
6,265,303
2021
5,610,000
386,211
316,408
6,312,619
2022-2026 32,520,000 1,107,156 405,195 34,032,351
2027-2028
12,680,000
86,013
-
12,766,013
Total
$70,635,000
$3,578,297
$3,700,287
$77,913,584
6. Fair Value The Authority categorizes its fair value measurements within the fair value hierarchy established by generally accepted accounting principles. The hierarchy is based on the valuation inputs used to measure the fair value of the assets. Level 1 inputs are quoted prices in active markets for identical assets. Level 2 inputs are significant other observable inputs. Level 3 inputs are significant unobservable inputs. Debt securities are valued based on the securities’ relationship to benchmark quoted prices. Derivative instruments are valued using a market approach that considers benchmark interest rates. The following table sets forth by level, within the fair value hierarchy, the fair value of the Authority’s investments and interest rate swap liabilities as of June 30, 2016:
Level 1 Level 2 Level 3 Total Investments: Government debt securities $ – $ 39,998,469 $ – $ 39,998,469
Interest rate swap liabilities $ – $ 4,502,609 $ – $ 4,502,609
The following table sets forth by level, within the fair value hierarchy, the fair value of the Authority’s investments and derivative investments as of June 30, 2015:
Level 1 Level 2 Level 3 Total Investments: Government debt securities $ – $ 40,071,930 $ – $ 40,071,930
Derivative instruments: Interest rate swaps $ – $ 4,883,863 $ – $ 4,883,863
73

Airport Code: TYS DKX
Location: Alcoa, TN Knoxville, TN
Coordinates: N35° 48.66' N35° 57' 49.8"W83° 59.64' W83° 52' 25.2"
Elevation: 979 feet 833.2 feet
Tower: 24/7 121.2 None
Total acreage: 2,734 acres 179.5 acres
Runways: RWY 05L-23R Under construction RWY 08-26 3499 x 75 ftRWY 05R-23L 9,000 x 150 ft.
Apron area-sq ft: Cargo Airlines 314,284 Fixed Base Operator 1,985,064
Terminal Complex Number of passenger gates 12 Number of loading bridges 12 Total area - sq ft 258,871 Useable space - sq ft 227,624 Leasable space - sq ft 98,222 Mechanical - sq ft 31,247
Parking spaces, number: Garage:Short-term 575 Long-term 1,779 Rental Cars 435 Total Garage 2,789
Surface:Short-term 45Long-term 690Surface-Rental Car Ready 51Lot A-Economy 678Lot B-Economy 476Lot C-Monthly/Employee 166Lot D-Monthly/Employee 200Ground Trans. North Lot 178Taxi Ready North Lot 31West Terminal Service Area 23Total Surface 2,538
Total Parking 5,327
Fixed Base Operator TAC Air
Source: Metropolitan Knoxville Airport Authority Engineering and Planning department
As of June 30, 2021Capital Asset Information (unaudited)
SCHEDULE 25:
METROPOLITAN KNOXVILLE AIRPORT AUTHORITY
45
NOTES TO FINANCIAL STATEMENTS (continued)
5. Long-Term Debt (continued)
Scheduled Debt Service Requirements As of June 30, 2016, scheduled debt service requirements of the variable-rate debt and net swap payments, assuming current interest rates remain the same for their term are as follows. As rates vary, variable-rate bond interest payments and net swap payments will vary.
Year ending
Variable Rate Bonds
Interest Rate
June 30
Principal
Interest
Swaps, net
Total
2017
$ 4,590,000
$ 562,983
$ 985,043
$ 6,138,026
2018
4,825,000
522,361
830,113
6,177,474
2019
5,075,000
479,483
667,315
6,221,798
2020
5,335,000
434,090
496,213
6,265,303
2021
5,610,000
386,211
316,408
6,312,619
2022-2026 32,520,000 1,107,156 405,195 34,032,351
2027-2028
12,680,000
86,013
-
12,766,013
Total
$70,635,000
$3,578,297
$3,700,287
$77,913,584
6. Fair Value The Authority categorizes its fair value measurements within the fair value hierarchy established by generally accepted accounting principles. The hierarchy is based on the valuation inputs used to measure the fair value of the assets. Level 1 inputs are quoted prices in active markets for identical assets. Level 2 inputs are significant other observable inputs. Level 3 inputs are significant unobservable inputs. Debt securities are valued based on the securities’ relationship to benchmark quoted prices. Derivative instruments are valued using a market approach that considers benchmark interest rates. The following table sets forth by level, within the fair value hierarchy, the fair value of the Authority’s investments and interest rate swap liabilities as of June 30, 2016:
Level 1 Level 2 Level 3 Total Investments: Government debt securities $ – $ 39,998,469 $ – $ 39,998,469
Interest rate swap liabilities $ – $ 4,502,609 $ – $ 4,502,609
The following table sets forth by level, within the fair value hierarchy, the fair value of the Authority’s investments and derivative investments as of June 30, 2015:
Level 1 Level 2 Level 3 Total Investments: Government debt securities $ – $ 40,071,930 $ – $ 40,071,930
Derivative instruments: Interest rate swaps $ – $ 4,883,863 $ – $ 4,883,863
74

COMPLIANCE SECTION This section contains the following items: Schedule of Expenditures of Federal Awards, State Financial Assistance and Passenger Facility Charges Collected and Expended Schedule of Long-Term Debt Principal and Interest Requirements Schedule of Changes in Long-Term Debt by Individual Issue Independent Auditor’s Reports Schedule of Findings and Questioned Costs
Corrective Action Plan and Schedule of Prior Year Audit Findings
75
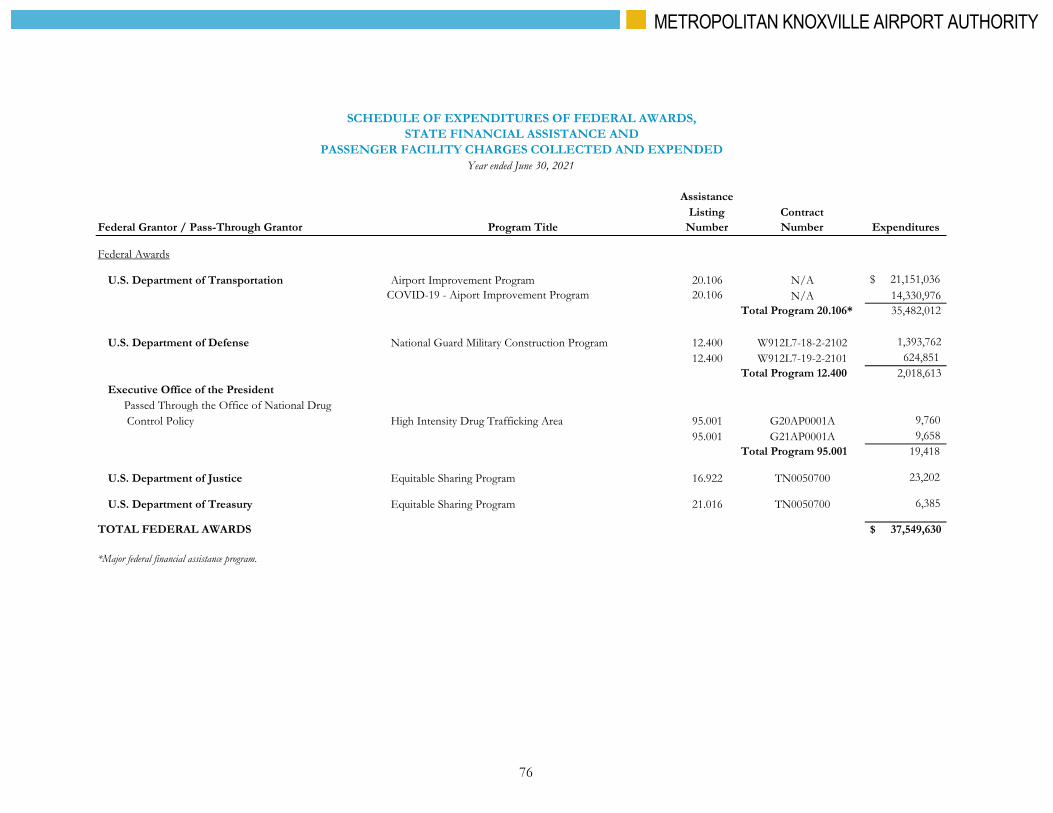
Assistance Listing Contract
Federal Grantor / Pass-Through Grantor Program Title Number Number Expenditures
Federal Awards
U.S. Department of Transportation Airport Improvement Program 20.106 N/A $ 21,151,036 COVID-19 - Aiport Improvement Program 20.106 N/A 14,330,976
35,482,012
U.S. Department of Defense National Guard Military Construction Program 12.400 W912L7-18-2-2102 1,393,762 12.400 W912L7-19-2-2101 624,851
2,018,613 Executive Office of the President
Passed Through the Office of National Drug Control Policy High Intensity Drug Trafficking Area 95.001 G20AP0001A 9,760
95.001 G21AP0001A 9,658 19,418
U.S. Department of Justice Equitable Sharing Program 16.922 TN0050700 23,202
U.S. Department of Treasury Equitable Sharing Program 21.016 TN0050700 6,385
TOTAL FEDERAL AWARDS $ 37,549,630
SCHEDULE OF EXPENDITURES OF FEDERAL AWARDS,STATE FINANCIAL ASSISTANCE AND
PASSENGER FACILITY CHARGES COLLECTED AND EXPENDEDYear ended June 30, 2021
*Major federal financial assistance program.
Total Program 20.106*
Total Program 12.400
Total Program 95.001
METROPOLITAN KNOXVILLE AIRPORT AUTHORITY
45
NOTES TO FINANCIAL STATEMENTS (continued)
5. Long-Term Debt (continued)
Scheduled Debt Service Requirements As of June 30, 2016, scheduled debt service requirements of the variable-rate debt and net swap payments, assuming current interest rates remain the same for their term are as follows. As rates vary, variable-rate bond interest payments and net swap payments will vary.
Year ending
Variable Rate Bonds
Interest Rate
June 30
Principal
Interest
Swaps, net
Total
2017
$ 4,590,000
$ 562,983
$ 985,043
$ 6,138,026
2018
4,825,000
522,361
830,113
6,177,474
2019
5,075,000
479,483
667,315
6,221,798
2020
5,335,000
434,090
496,213
6,265,303
2021
5,610,000
386,211
316,408
6,312,619
2022-2026 32,520,000 1,107,156 405,195 34,032,351
2027-2028
12,680,000
86,013
-
12,766,013
Total
$70,635,000
$3,578,297
$3,700,287
$77,913,584
6. Fair Value The Authority categorizes its fair value measurements within the fair value hierarchy established by generally accepted accounting principles. The hierarchy is based on the valuation inputs used to measure the fair value of the assets. Level 1 inputs are quoted prices in active markets for identical assets. Level 2 inputs are significant other observable inputs. Level 3 inputs are significant unobservable inputs. Debt securities are valued based on the securities’ relationship to benchmark quoted prices. Derivative instruments are valued using a market approach that considers benchmark interest rates. The following table sets forth by level, within the fair value hierarchy, the fair value of the Authority’s investments and interest rate swap liabilities as of June 30, 2016:
Level 1 Level 2 Level 3 Total Investments: Government debt securities $ – $ 39,998,469 $ – $ 39,998,469
Interest rate swap liabilities $ – $ 4,502,609 $ – $ 4,502,609
The following table sets forth by level, within the fair value hierarchy, the fair value of the Authority’s investments and derivative investments as of June 30, 2015:
Level 1 Level 2 Level 3 Total Investments: Government debt securities $ – $ 40,071,930 $ – $ 40,071,930
Derivative instruments: Interest rate swaps $ – $ 4,883,863 $ – $ 4,883,863
76

Assistance Listing Contract
Federal Grantor / Pass-Through Grantor Program Title Number Number Expenditures
State Financial Assistance
Tennessee Department of Transportation Airport Improvements – McGhee Tyson Airport N/A 47-555-0768-16 $ 32,532 Tennessee Department of Transportation Airport Improvements – McGhee Tyson Airport N/A 47-555-0778-18 291,723 Tennessee Department of Transportation Airport Improvements – McGhee Tyson Airport N/A 47-555-0784-20 94,526 Tennessee Department of Transportation Airport Improvements – McGhee Tyson Airport N/A 47-555-0786-20 4,649 Tennessee Department of Transportation Airport Improvements – McGhee Tyson Airport N/A 47-555-0788-20 130,964 Tennessee Department of Transportation Airport Improvements – McGhee Tyson Airport N/A 47-555-0792-21 541,646 Tennessee Department of Transportation Airport Improvements – Downtown Island Airport N/A 47-555-0179-18 54,218 Tennessee Department of Transportation Airport Improvements – Downtown Island Airport N/A 47-555-0790-21 15,000
TOTAL STATE AWARDS $ 1,165,258
TOTAL FEDERAL AND STATE AWARDS $ 38,714,888
Passenger Facility Charges
Available at July 1, 2020 $ 2,635,162 Charges collected 3,111,410 Service charges, net of interest earned (2,185)Total available 5,744,387 Expended (2,395,131)
Available at June 30, 2021 $ 3,349,256
STATE FINANCIAL ASSISTANCE ANDPASSENGER FACILITY CHARGES COLLECTED AND EXPENDED
Year ended June 30, 2021
SCHEDULE OF EXPENDITURES OF FEDERAL AWARDS,
METROPOLITAN KNOXVILLE AIRPORT AUTHORITY
45
NOTES TO FINANCIAL STATEMENTS (continued)
5. Long-Term Debt (continued)
Scheduled Debt Service Requirements As of June 30, 2016, scheduled debt service requirements of the variable-rate debt and net swap payments, assuming current interest rates remain the same for their term are as follows. As rates vary, variable-rate bond interest payments and net swap payments will vary.
Year ending
Variable Rate Bonds
Interest Rate
June 30
Principal
Interest
Swaps, net
Total
2017
$ 4,590,000
$ 562,983
$ 985,043
$ 6,138,026
2018
4,825,000
522,361
830,113
6,177,474
2019
5,075,000
479,483
667,315
6,221,798
2020
5,335,000
434,090
496,213
6,265,303
2021
5,610,000
386,211
316,408
6,312,619
2022-2026 32,520,000 1,107,156 405,195 34,032,351
2027-2028
12,680,000
86,013
-
12,766,013
Total
$70,635,000
$3,578,297
$3,700,287
$77,913,584
6. Fair Value The Authority categorizes its fair value measurements within the fair value hierarchy established by generally accepted accounting principles. The hierarchy is based on the valuation inputs used to measure the fair value of the assets. Level 1 inputs are quoted prices in active markets for identical assets. Level 2 inputs are significant other observable inputs. Level 3 inputs are significant unobservable inputs. Debt securities are valued based on the securities’ relationship to benchmark quoted prices. Derivative instruments are valued using a market approach that considers benchmark interest rates. The following table sets forth by level, within the fair value hierarchy, the fair value of the Authority’s investments and interest rate swap liabilities as of June 30, 2016:
Level 1 Level 2 Level 3 Total Investments: Government debt securities $ – $ 39,998,469 $ – $ 39,998,469
Interest rate swap liabilities $ – $ 4,502,609 $ – $ 4,502,609
The following table sets forth by level, within the fair value hierarchy, the fair value of the Authority’s investments and derivative investments as of June 30, 2015:
Level 1 Level 2 Level 3 Total Investments: Government debt securities $ – $ 40,071,930 $ – $ 40,071,930
Derivative instruments: Interest rate swaps $ – $ 4,883,863 $ – $ 4,883,863
77

NOTES TO SCHEDULE OF EXPENDITURES OF FEDERAL AWARDS, STATE FINANCIAL ASSISTANCE AND
PASSENGER FACILITY CHARGES COLLECTED AND EXPENDED 1. Basis of Presentation The above Schedule of Expenditures of Federal Awards, State Financial Assistance, and Passenger Facility Charges Collected and Expended (the Schedule) summarizes the federal and state expenditures of the Metropolitan Knoxville Airport Authority (the Authority) under programs of the federal and state government for the year ended June 30, 2021 and Passenger Facility Charges (PFCs) collected and expended for the year ended June 30, 2021. These amounts were obtained from the Authority’s general ledger, which is prepared on the accrual basis. Because the Schedule presents only a selected portion of the operations of the Authority, it is not intended to and does not present the financial position, change in net position, and current revenues and expenditures of the Authority. For purposes of the Schedule, federal awards include federal financial assistance received directly from a federal awarding agency or indirectly from a pass-through entity. The awards are classified into major program categories in accordance with the provisions of Title 2 U.S. Code of Federal Regulations Part 200, Uniform Administrative Requirements, Cost Principles, and Audit Requirements for Federal Awards (Uniform Guidance). The Authority did not elect to apply the 10% de minimis indirect cost rate. 2. Passenger Facility Charge Program The objective of the Passenger Facility Charge program is to authorize public agencies controlling commercial service airports to impose a charge of $1 to $4.50 per enplaned passenger. The proceeds from such PFCs are to be used to finance approved, eligible airport-related projects that preserve or enhance safety, capacity, or security; reduce noise; or increase air carrier competition. PFCs are not considered to be federal financial assistance defined by the Uniform Guidance. 3. Summary of Significant Accounting Policies For purposes of the Schedule, expenditures for federal assistance programs and PFCs are recognized on the accrual basis of accounting. Federal expenditures are primarily for administering an Airport Improvement Program for the Authority. The Authority uses PFCs for various improvement project expansions of the airport facilities and payments for debt service on bonds incurred to carry out such projects.
METROPOLITAN KNOXVILLE AIRPORT AUTHORITY
45
NOTES TO FINANCIAL STATEMENTS (continued)
5. Long-Term Debt (continued)
Scheduled Debt Service Requirements As of June 30, 2016, scheduled debt service requirements of the variable-rate debt and net swap payments, assuming current interest rates remain the same for their term are as follows. As rates vary, variable-rate bond interest payments and net swap payments will vary.
Year ending
Variable Rate Bonds
Interest Rate
June 30
Principal
Interest
Swaps, net
Total
2017
$ 4,590,000
$ 562,983
$ 985,043
$ 6,138,026
2018
4,825,000
522,361
830,113
6,177,474
2019
5,075,000
479,483
667,315
6,221,798
2020
5,335,000
434,090
496,213
6,265,303
2021
5,610,000
386,211
316,408
6,312,619
2022-2026 32,520,000 1,107,156 405,195 34,032,351
2027-2028
12,680,000
86,013
-
12,766,013
Total
$70,635,000
$3,578,297
$3,700,287
$77,913,584
6. Fair Value The Authority categorizes its fair value measurements within the fair value hierarchy established by generally accepted accounting principles. The hierarchy is based on the valuation inputs used to measure the fair value of the assets. Level 1 inputs are quoted prices in active markets for identical assets. Level 2 inputs are significant other observable inputs. Level 3 inputs are significant unobservable inputs. Debt securities are valued based on the securities’ relationship to benchmark quoted prices. Derivative instruments are valued using a market approach that considers benchmark interest rates. The following table sets forth by level, within the fair value hierarchy, the fair value of the Authority’s investments and interest rate swap liabilities as of June 30, 2016:
Level 1 Level 2 Level 3 Total Investments: Government debt securities $ – $ 39,998,469 $ – $ 39,998,469
Interest rate swap liabilities $ – $ 4,502,609 $ – $ 4,502,609
The following table sets forth by level, within the fair value hierarchy, the fair value of the Authority’s investments and derivative investments as of June 30, 2015:
Level 1 Level 2 Level 3 Total Investments: Government debt securities $ – $ 40,071,930 $ – $ 40,071,930
Derivative instruments: Interest rate swaps $ – $ 4,883,863 $ – $ 4,883,863
78

Year endingJune 30: Principal Interest Total
2022 -$ 871,093$ 871,093$ 2023 5,410,000 860,175 6,270,175 2024 5,545,000 722,489 6,267,489 2025 5,690,000 581,353 6,271,353 2026 5,750,000 436,706 6,186,706 2027 5,900,000 290,353 6,190,353 2028 6,000,000 140,292 6,140,292
Total 34,295,000$ 3,902,461$ 38,197,461$
Airport Revenue Refunding Note, Series 2019A, fixed rate of 2.54%:
SCHEDULE OF LONG-TERM DEBT PRINCIPALAND INTEREST REQUIREMENTS
June 30, 2021
METROPOLITAN KNOXVILLE AIRPORT AUTHORITY
45
NOTES TO FINANCIAL STATEMENTS (continued)
5. Long-Term Debt (continued)
Scheduled Debt Service Requirements As of June 30, 2016, scheduled debt service requirements of the variable-rate debt and net swap payments, assuming current interest rates remain the same for their term are as follows. As rates vary, variable-rate bond interest payments and net swap payments will vary.
Year ending
Variable Rate Bonds
Interest Rate
June 30
Principal
Interest
Swaps, net
Total
2017
$ 4,590,000
$ 562,983
$ 985,043
$ 6,138,026
2018
4,825,000
522,361
830,113
6,177,474
2019
5,075,000
479,483
667,315
6,221,798
2020
5,335,000
434,090
496,213
6,265,303
2021
5,610,000
386,211
316,408
6,312,619
2022-2026 32,520,000 1,107,156 405,195 34,032,351
2027-2028
12,680,000
86,013
-
12,766,013
Total
$70,635,000
$3,578,297
$3,700,287
$77,913,584
6. Fair Value The Authority categorizes its fair value measurements within the fair value hierarchy established by generally accepted accounting principles. The hierarchy is based on the valuation inputs used to measure the fair value of the assets. Level 1 inputs are quoted prices in active markets for identical assets. Level 2 inputs are significant other observable inputs. Level 3 inputs are significant unobservable inputs. Debt securities are valued based on the securities’ relationship to benchmark quoted prices. Derivative instruments are valued using a market approach that considers benchmark interest rates. The following table sets forth by level, within the fair value hierarchy, the fair value of the Authority’s investments and interest rate swap liabilities as of June 30, 2016:
Level 1 Level 2 Level 3 Total Investments: Government debt securities $ – $ 39,998,469 $ – $ 39,998,469
Interest rate swap liabilities $ – $ 4,502,609 $ – $ 4,502,609
The following table sets forth by level, within the fair value hierarchy, the fair value of the Authority’s investments and derivative investments as of June 30, 2015:
Level 1 Level 2 Level 3 Total Investments: Government debt securities $ – $ 40,071,930 $ – $ 40,071,930
Derivative instruments: Interest rate swaps $ – $ 4,883,863 $ – $ 4,883,863
79

NOTES PAYABLESeries 2017A 11,000,000$ 1.95% 5/25/2017 6/1/2026 6,070,000$ -$ 6,070,000$ -$ -$ Series 2019A 39,570,000 2.54% 6/27/2019 6/1/2028 39,570,000 - 5,275,000 - 34,295,000
Total Notes Payable 45,640,000$ -$ 11,345,000$ -$ 34,295,000$
SCHEDULE OF CHANGES IN LONG-TERM DEBT BY INDIVIDUAL ISSUE
June 30, 2021
Description of Indebtedness
Original Amount of
IssueInterest
RateOutstanding
6/30/2021Date of Issue
Last Maturity
DateOutstanding
7/1/2020
Issued During Period
Paid and/or Matured During Period
Refunded During Period
METROPOLITAN KNOXVILLE AIRPORT AUTHORITY
45
NOTES TO FINANCIAL STATEMENTS (continued)
5. Long-Term Debt (continued)
Scheduled Debt Service Requirements As of June 30, 2016, scheduled debt service requirements of the variable-rate debt and net swap payments, assuming current interest rates remain the same for their term are as follows. As rates vary, variable-rate bond interest payments and net swap payments will vary.
Year ending
Variable Rate Bonds
Interest Rate
June 30
Principal
Interest
Swaps, net
Total
2017
$ 4,590,000
$ 562,983
$ 985,043
$ 6,138,026
2018
4,825,000
522,361
830,113
6,177,474
2019
5,075,000
479,483
667,315
6,221,798
2020
5,335,000
434,090
496,213
6,265,303
2021
5,610,000
386,211
316,408
6,312,619
2022-2026 32,520,000 1,107,156 405,195 34,032,351
2027-2028
12,680,000
86,013
-
12,766,013
Total
$70,635,000
$3,578,297
$3,700,287
$77,913,584
6. Fair Value The Authority categorizes its fair value measurements within the fair value hierarchy established by generally accepted accounting principles. The hierarchy is based on the valuation inputs used to measure the fair value of the assets. Level 1 inputs are quoted prices in active markets for identical assets. Level 2 inputs are significant other observable inputs. Level 3 inputs are significant unobservable inputs. Debt securities are valued based on the securities’ relationship to benchmark quoted prices. Derivative instruments are valued using a market approach that considers benchmark interest rates. The following table sets forth by level, within the fair value hierarchy, the fair value of the Authority’s investments and interest rate swap liabilities as of June 30, 2016:
Level 1 Level 2 Level 3 Total Investments: Government debt securities $ – $ 39,998,469 $ – $ 39,998,469
Interest rate swap liabilities $ – $ 4,502,609 $ – $ 4,502,609
The following table sets forth by level, within the fair value hierarchy, the fair value of the Authority’s investments and derivative investments as of June 30, 2015:
Level 1 Level 2 Level 3 Total Investments: Government debt securities $ – $ 40,071,930 $ – $ 40,071,930
Derivative instruments: Interest rate swaps $ – $ 4,883,863 $ – $ 4,883,863
80

This page intentionally left blank
81

Report on Internal Control Over Financial Reporting and on Compliance and Other Matters Based on an Audit of Financial
Statements Performed in Accordance with Government Auditing Standards
Independent Auditor’s Report
Board of Commissioners Metropolitan Knoxville Airport Authority
We have audited, in accordance with the auditing standards generally accepted in the United States of America and the standards applicable to financial audits contained in Government Auditing Standards issued by the Comptroller General of the United States, the financial statements of the Metropolitan Knoxville Airport Authority (the Authority), a component unit of the City of Knoxville, Tennessee, as of and for the year ended June 30, 2021, and the related notes to the financial statements, which collectively comprise the Authority’s basic financial statements, and have issued our report thereon dated November 17, 2021.
Internal Control over Financial Reporting
In planning and performing our audit of the financial statements, we considered the Authority’s internal control over financial reporting (internal control) as a basis for designing procedures that are appropriate in the circumstances for the purpose of expressing our opinion on the financial statements, but not for the purpose of expressing an opinion on the effectiveness of the Authority’s internal control. Accordingly, we do not express an opinion on the effectiveness of the Authority’s internal control.
A deficiency in internal control exists when the design or operation of a control does not allow management or employees in the normal course of performing their assigned functions, to prevent, or detect and correct misstatements on a timely basis. A material weakness is a deficiency, or a combination of deficiencies, in internal control, such that there is a reasonable possibility that a material misstatement of the Authority’s financial statements will not be prevented, or detected and corrected on a timely basis. A significant deficiency is a deficiency, or a combination of deficiencies, in internal control that is less severe than a material weakness, yet important enough to merit attention by those charged with governance.
Our consideration of internal control was for the limited purpose described in the first paragraph of this section and was not designed to identify all deficiencies in internal control that might be material weaknesses or significant deficiencies. Given these limitations, during our audit we did not identify any deficiencies in internal control that we consider to be material weaknesses. However, material weaknesses may exist that have not been identified.
82

Board of Commissioners Metropolitan Knoxville Airport Authority
Compliance and Other Matters
As part of obtaining reasonable assurance about whether the Authority’s financial statements are free from material misstatement, we performed tests of its compliance with certain provisions of laws, regulations, contracts, and grant agreements, noncompliance with which could have a direct and material effect on the financial statements. However, providing an opinion on compliance with those provisions was not an objective of our audit and, accordingly, we do not express such an opinion. The results of our tests disclosed no instances of noncompliance or other matter that is required to be reported under Government Auditing Standards.
Purpose of this Report
The purpose of this report is solely to describe the scope of our testing of internal control and compliance and the results of that testing, and not to provide an opinion on the effectiveness of the Authority’s internal control or on compliance. This report is an integral part of an audit performed in accordance with Government Auditing Standards in considering the Authority’s internal control and compliance. Accordingly, this communication is not suitable for any other purpose.
Coulter & Justus, P.C. November 17, 2021 Knoxville, Tennessee
83

Report on Compliance for Each Major Federal Program and the Passenger Facility Charge Program and on Internal Control Over Compliance in Accordance with the
Uniform Guidance
Independent Auditor’s Report
Board of Commissioners Metropolitan Knoxville Airport Authority
Report on Compliance for Each Major Federal Program and Passenger Facility Charge Program
We have audited compliance of the Metropolitan Knoxville Airport Authority (the Authority), a component unit of the City of Knoxville, Tennessee, with the types of compliance requirements described in the OMB Compliance Supplement that could have a direct and material effect on the Authority’s major federal program and the compliance requirements of the Passenger Facility Charge (PFC) program as described in the Passenger Facility Charge Audit Compliance and Reporting Guide for Public Agencies for the year ended June 30, 2021. The Authority’s major federal program is identified in the summary of auditor’s results section of the accompanying schedule of findings and questioned costs.
Management’s Responsibility
Management is responsible for compliance with federal statutes, regulations, and the terms and conditions of its federal awards applicable to its federal programs and the PFC program.
Auditor’s Responsibility
Our responsibility is to express an opinion on compliance for the Authority’s major federal program and PFC program based on our audit of the types of compliance requirements referred to above. We conducted our audit of compliance in accordance with auditing standards generally accepted in the United States of America; the standards applicable to financial audits contained in Government Auditing Standards, issued by the Comptroller General of the United States; the audit requirements of Title 2 U.S. Code of Federal Regulations (CFR) Part 200, Uniform Administrative Requirements, Cost Principles, and Audit Requirements for Federal Awards (Uniform Guidance); and the Passenger Facility Charge Audit Compliance and Reporting Guide for Public Agencies (PFC Guidance), issued by the Federal Aviation Administration. Those standards and the Uniform Guidance require that we plan and perform the audit to obtain reasonable assurance about whether noncompliance with the types of compliance requirements referred to above that could have a direct and material effect on the major federal program or the PFC program occurred. An audit includes examining, on a test basis, evidence about the Authority’s compliance with those requirements and performing such other procedures as we considered necessary in the circumstances.
We believe that our audit provides a reasonable basis for our opinion on compliance for the major federal program and PFC program. However, our audit does not provide a legal determination of the Authority’s compliance.
84

Board of Commissioners Metropolitan Knoxville Airport Authority
Opinion on Each Major Federal Program and the PFC Program
In our opinion, the Authority complied, in all material respects, with the types of compliance requirements referred to above that could have a direct and material effect on its major federal program and the PFC program for the year ended June 30, 2021.
Report on Internal Control Over Compliance
Management of the Authority is responsible for establishing and maintaining effective internal control over compliance with the types of compliance requirements referred to above. In planning and performing our audit of compliance, we considered the Authority’s internal control over compliance with the types of requirements that could have a direct and material effect on the major federal program or the PFC program to determine the auditing procedures that are appropriate in the circumstances for the purpose of expressing an opinion on compliance for the major federal program and the PFC program and to test and report on internal control over compliance in accordance with the Uniform Guidance, but not for the purpose of expressing an opinion on the effectiveness of internal control over compliance. Accordingly, we do not express an opinion on the effectiveness of the Authority’s internal control over compliance.
A deficiency in internal control over compliance exists when the design or operation of a control over compliance does not allow management or employees, in the normal course of performing their assigned functions, to prevent, or detect and correct noncompliance with a type of compliance requirement of a federal program on a timely basis. A material weakness in internal control over compliance is a deficiency, or combination of deficiencies in internal control over compliance, such that there is a reasonable possibility that material noncompliance with a type of compliance requirement of a federal program will not be prevented, or detected and corrected on a timely basis. A significant deficiency in internal control over compliance is a deficiency, or a combination of deficiencies, in internal control over compliance with a type of compliance requirement of a federal program that is less severe than a material weakness in internal control over compliance, yet important enough to merit attention by those charged with governance.
Our consideration of internal control over compliance was for the limited purpose described in the first paragraph of this section and was not designed to identify all deficiencies in internal control over compliance that might be material weaknesses or significant deficiencies. We did not identify any deficiencies in internal control over compliance that we consider to be material weaknesses. However, material weaknesses may exist that have not been identified.
….. The purpose of this report on internal control over compliance is solely to describe the scope of our testing of internal control over compliance and the results of that testing based on the requirements of the Uniform Guidance and PFC Guidance. Accordingly, this report is not suitable for any other purpose.
Coulter & Justus, P.C. November 17, 2021 Knoxville, Tennessee
85

SCHEDULE OF FINDINGS AND QUESTIONED COSTS Year ended June 30, 2021
Section I - Summary of Auditors’ Results
Financial Statements
Type of auditors’ report issued on whether the financial statements audited were prepared in accordance with GAAP: Unmodified
Internal control over financial reporting: Material weakness(es) identified? None reported
Significant deficiency(s) identified? None reported
Noncompliance material to financial statements noted? No
Federal Awards
Type of auditors’ report issued on compliance for major federal program: Unmodified
Internal control over major federal program: Material weakness(es) identified? None reported
Significant deficiency(s) identified? None reported
Any audit findings disclosed that are required to be reported in accordance with 2 CFR 200.516(a)? None reported
Identification of major programs: CFDA Number Name of Program 20.106 Airport Improvement Program
Dollar threshold used to distinguish between Type A and Type B programs: $1,126,489
Auditee qualified as low-risk auditee? Yes
Section II – Financial Statement Audit Findings
None reported.
Section III – Single Audit Findings
None reported.
86

CORRECTIVE ACTION PLAN AND SCHEDULE OF PRIOR YEAR AUDIT FINDINGS
Year ended June 30, 2021
Section IV – Corrective Action Plan
Not applicable as there were no 2021 findings reported.
Section V – Schedule of Prior Year Audit Findings
Not applicable as there were no 2020 findings reported.
METROPOLITAN KNOXVILLE AIRPORT AUTHORITY
45
NOTES TO FINANCIAL STATEMENTS (continued)
5. Long-Term Debt (continued)
Scheduled Debt Service Requirements As of June 30, 2016, scheduled debt service requirements of the variable-rate debt and net swap payments, assuming current interest rates remain the same for their term are as follows. As rates vary, variable-rate bond interest payments and net swap payments will vary.
Year ending
Variable Rate Bonds
Interest Rate
June 30
Principal
Interest
Swaps, net
Total
2017
$ 4,590,000
$ 562,983
$ 985,043
$ 6,138,026
2018
4,825,000
522,361
830,113
6,177,474
2019
5,075,000
479,483
667,315
6,221,798
2020
5,335,000
434,090
496,213
6,265,303
2021
5,610,000
386,211
316,408
6,312,619
2022-2026 32,520,000 1,107,156 405,195 34,032,351
2027-2028
12,680,000
86,013
-
12,766,013
Total
$70,635,000
$3,578,297
$3,700,287
$77,913,584
6. Fair Value The Authority categorizes its fair value measurements within the fair value hierarchy established by generally accepted accounting principles. The hierarchy is based on the valuation inputs used to measure the fair value of the assets. Level 1 inputs are quoted prices in active markets for identical assets. Level 2 inputs are significant other observable inputs. Level 3 inputs are significant unobservable inputs. Debt securities are valued based on the securities’ relationship to benchmark quoted prices. Derivative instruments are valued using a market approach that considers benchmark interest rates. The following table sets forth by level, within the fair value hierarchy, the fair value of the Authority’s investments and interest rate swap liabilities as of June 30, 2016:
Level 1 Level 2 Level 3 Total Investments: Government debt securities $ – $ 39,998,469 $ – $ 39,998,469
Interest rate swap liabilities $ – $ 4,502,609 $ – $ 4,502,609
The following table sets forth by level, within the fair value hierarchy, the fair value of the Authority’s investments and derivative investments as of June 30, 2015:
Level 1 Level 2 Level 3 Total Investments: Government debt securities $ – $ 40,071,930 $ – $ 40,071,930
Derivative instruments: Interest rate swaps $ – $ 4,883,863 $ – $ 4,883,863
87


McGhee Tyson Airport P.O. Box 15600
Knoxville, TN 37901
865/342-3000 * Fax 865/342-3050 Email: [email protected]