ISENTROPIC COMPRESSION STUDIES AT THE LOS ... - DTIC
8
D.G. Tasker, C.H. Mielke, G. Rodriguez, and D.W. Rickel Los Alamos National Laboratory, WX-6, MS J566 Los Alamos, NM 87545, USA Abstract A single-turn magnet pulsed power system at the National High Magnetic Field Laboratory (NHMFL) at Los Alamos was originally designed to study actinide samples in extremes of high magnetic field (to 300 Tesla) [1, 2]. A simple modification to the single-turn magnet has converted it to a fast turnaround dynamic high pressure measurement system for Isentropic Compression Experiments (ICE). This paper details the work done including design, theory, modeling and results. The NHMFL system has the advantage of a relatively long- duration current with a ~2.3-µs rise time, which allows for large sample dimensions, i.e., up to 5 mm thickness, see II.D. The maximum stress is ~50GPa (0.5 Mbar) at the maximum bank voltage (60 kV); higher stresses may be obtained with modifications to the load design. For the design and predictions of performance of the NHMFL-ICE experiment it is important to have good numerical models. A novel SPICE code simulation was chosen to model all aspects of the experiment, electrical and physical. To this end, accurate dynamic load models were developed to simulate the compression and expansion of the dynamic load at high pressures using shock physics principles. In this study feasibility of adapting the existing NHMFL capacitor bank for ICE experiments up to 100 GPa is demonstrated. The adaptation saved the expense of building a dedicated capacitor bank yet this new system produces high quality ICE data with a rapid turnaround and very low cost per experiment. A series of proof-of-principle experiments [3] demonstrated the feasibility of the NHMFL-ICE technique; some of the results will be shown here to illustrate the effectiveness of the new technique. I. INTRODUCTION The basic techniques and physics of ICE have been described previously [4]. The original ICE technique is due to Asay [5], and a significant body of ICE work has been conducted on the Z-machine at the Sandia National Laboratory. In an ICE experiment, smoothly rising (shock-free) mechanical compression waves are propagated into matched samples of different thicknesses by electromagnetic loading in a planar geometry. A complete EOS isentrope is acquired in one experiment, i.e., continuously from zero up to the peak stress. High quality isentropic EOS data have been obtained for many materials. A. Comparison of ICE methods ICE experiments are performed by depositing mega- ampere currents in the order of 1 µs from fast capacitor banks [5-10] or by using high explosive techniques [4, 11]; each method has its advantages and disadvantages. The predominant capacitor bank for ICE research is the Z- machine [5] which is capable of delivering currents of tens of MA with rise times of between 100 ns and 600 ns. Pressures of the order of 500 GPa on the Z-machine have been obtained but it is large and expensive to operate. Smaller capacitor banks have been designed specifically for smaller scale ICE experiments, e.g., [7, 10], with good results and these may reach pressures of the order of 50 GPa in approximately 500 ns, but even these machines are relatively expensive to manufacture or purchase. The explosive techniques developed at LANL can be used to produce ICE data at comparable or greater pressures than those on the Z-machine [12]. At pressures of a few hundred GPa the costs of these explosive experiments are comparable to those of the Z-machine, but the higher pressure experiments would be more expensive. The explosive ICE technique is preferred for: very high pressure experiments; the study of noxious materials that could contaminate capacitor banks and or the buildings that house them; the performance of experiments in remote locations because the explosive experiments are portable and compact. The NHMFL-ICE technique described in this paper is an excellent method for measuring equations of state (EOS) at pressures up to 1 Mbar. Because many experiments can be performed in one day, the technique promises to provide high quality EOS data at very low cost. B. Accuracy of the various methods It should be noted that the accuracy of the ICE technique depends primarily on the accuracy of the diagnostics such as VISAR [13], the quality and precision of sample preparation, high resolution time synchronization, and the uniformity of the magnetic drive. As all ICE techniques use similar diagnostics and sample preparation techniques, the accuracies of ICE data produced by capacitor bank or high explosive techniques are essentially the same [4]. One important advantage of the high explosive technique and some of the smaller ISENTROPIC COMPRESSION STUDIES AT THE LOS ALAMOS NATIONAL HIGH MAGNETIC FIELD LABORATORY 978-1-4577-0631-8/11/$26.00 ©2011 IEEE 1516
-
Upload
khangminh22 -
Category
Documents
-
view
2 -
download
0
Transcript of ISENTROPIC COMPRESSION STUDIES AT THE LOS ... - DTIC
D.G. Tasker, C.H. Mielke, G. Rodriguez, and D.W. Rickel
Los Alamos National Laboratory, WX-6, MS J566 Los Alamos, NM 87545, USA
Abstract A single-turn magnet pulsed power system at the
National High Magnetic Field Laboratory (NHMFL) at Los Alamos was originally designed to study actinide samples in extremes of high magnetic field (to 300 Tesla) [1, 2]. A simple modification to the single-turn magnet has converted it to a fast turnaround dynamic high pressure measurement system for Isentropic Compression Experiments (ICE). This paper details the work done including design, theory, modeling and results. The NHMFL system has the advantage of a relatively long- duration current with a ~2.3-µs rise time, which allows for large sample dimensions, i.e., up to 5 mm thickness, see II.D. The maximum stress is ~50GPa (0.5 Mbar) at the maximum bank voltage (60 kV); higher stresses may be obtained with modifications to the load design.
For the design and predictions of performance of the NHMFL-ICE experiment it is important to have good numerical models. A novel SPICE code simulation was chosen to model all aspects of the experiment, electrical and physical. To this end, accurate dynamic load models were developed to simulate the compression and expansion of the dynamic load at high pressures using shock physics principles.
In this study feasibility of adapting the existing NHMFL capacitor bank for ICE experiments up to 100 GPa is demonstrated. The adaptation saved the expense of building a dedicated capacitor bank yet this new system produces high quality ICE data with a rapid turnaround and very low cost per experiment. A series of proof-of-principle experiments [3] demonstrated the feasibility of the NHMFL-ICE technique; some of the results will be shown here to illustrate the effectiveness of the new technique.
I. INTRODUCTION
The basic techniques and physics of ICE have been described previously [4]. The original ICE technique is due to Asay [5], and a significant body of ICE work has been conducted on the Z-machine at the Sandia National Laboratory. In an ICE experiment, smoothly rising (shock-free) mechanical compression waves are propagated into matched samples of different thicknesses by electromagnetic loading in a planar geometry. A complete EOS isentrope is acquired in one experiment, i.e., continuously from zero up to the peak stress. High
quality isentropic EOS data have been obtained for many materials.
A. Comparison of ICE methods ICE experiments are performed by depositing mega-
ampere currents in the order of 1 µs from fast capacitor banks [5-10] or by using high explosive techniques [4, 11]; each method has its advantages and disadvantages. The predominant capacitor bank for ICE research is the Z-machine [5] which is capable of delivering currents of tens of MA with rise times of between 100 ns and 600 ns. Pressures of the order of 500 GPa on the Z-machine have been obtained but it is large and expensive to operate. Smaller capacitor banks have been designed specifically for smaller scale ICE experiments, e.g., [7, 10], with good results and these may reach pressures of the order of 50 GPa in approximately 500 ns, but even these machines are relatively expensive to manufacture or purchase.
The explosive techniques developed at LANL can be used to produce ICE data at comparable or greater pressures than those on the Z-machine [12]. At pressures of a few hundred GPa the costs of these explosive experiments are comparable to those of the Z-machine, but the higher pressure experiments would be more expensive. The explosive ICE technique is preferred for: very high pressure experiments; the study of noxious materials that could contaminate capacitor banks and or the buildings that house them; the performance of experiments in remote locations because the explosive experiments are portable and compact.
The NHMFL-ICE technique described in this paper is an excellent method for measuring equations of state (EOS) at pressures up to 1 Mbar. Because many experiments can be performed in one day, the technique promises to provide high quality EOS data at very low cost.
B. Accuracy of the various methods It should be noted that the accuracy of the ICE
technique depends primarily on the accuracy of the diagnostics such as VISAR [13], the quality and precision of sample preparation, high resolution time synchronization, and the uniformity of the magnetic drive. As all ICE techniques use similar diagnostics and sample preparation techniques, the accuracies of ICE data produced by capacitor bank or high explosive techniques are essentially the same [4]. One important advantage of the high explosive technique and some of the smaller
ISENTROPIC COMPRESSION STUDIES AT THE LOS ALAMOS NATIONAL HIGH MAGNETIC FIELD LABORATORY
U.S. Government work not protected by U.S. copyright978-1-4577-0631-8/11/$26.00 ©2011 IEEE 1516
Report Documentation Page Form ApprovedOMB No. 0704-0188
Public reporting burden for the collection of information is estimated to average 1 hour per response, including the time for reviewing instructions, searching existing data sources, gathering andmaintaining the data needed, and completing and reviewing the collection of information. Send comments regarding this burden estimate or any other aspect of this collection of information,including suggestions for reducing this burden, to Washington Headquarters Services, Directorate for Information Operations and Reports, 1215 Jefferson Davis Highway, Suite 1204, ArlingtonVA 22202-4302. Respondents should be aware that notwithstanding any other provision of law, no person shall be subject to a penalty for failing to comply with a collection of information if itdoes not display a currently valid OMB control number.
1. REPORT DATE JUN 2011
2. REPORT TYPE N/A
3. DATES COVERED -
4. TITLE AND SUBTITLE Isentropic Compression Studies At The Los Alamos National HighMagnetic Field Laboratory
5a. CONTRACT NUMBER
5b. GRANT NUMBER
5c. PROGRAM ELEMENT NUMBER
6. AUTHOR(S) 5d. PROJECT NUMBER
5e. TASK NUMBER
5f. WORK UNIT NUMBER
7. PERFORMING ORGANIZATION NAME(S) AND ADDRESS(ES) Los Alamos National Laboratory, WX-6, MS J566 Los Alamos, NM87545, USA
8. PERFORMING ORGANIZATIONREPORT NUMBER
9. SPONSORING/MONITORING AGENCY NAME(S) AND ADDRESS(ES) 10. SPONSOR/MONITOR’S ACRONYM(S)
11. SPONSOR/MONITOR’S REPORT NUMBER(S)
12. DISTRIBUTION/AVAILABILITY STATEMENT Approved for public release, distribution unlimited
13. SUPPLEMENTARY NOTES See also ADM002371. 2013 IEEE Pulsed Power Conference, Digest of Technical Papers 1976-2013, andAbstracts of the 2013 IEEE International Conference on Plasma Science. IEEE International Pulsed PowerConference (19th). Held in San Francisco, CA on 16-21 June 2013, The original document contains color images.
14. ABSTRACT A single-turn magnet pulsed power system at the National High Magnetic Field Laboratory (NHMFL) atLos Alamos was originally designed to study actinide samples in extremes of high magnetic field (to 300Tesla) [1, 2]. A simple modification to the single-turn magnet has converted it to a fast turnarounddynamic high pressure measurement system for Isentropic Compression Experiments (ICE). This paperdetails the work done including design, theory, modeling and results. The NHMFL system has theadvantage of a relatively long- duration current with a ~2.3-ìs rise time, which allows for large sampledimensions, i.e., up to 5 mm thickness, see II.D. The maximum stress is ~50GPa (0.5 Mbar) at themaximum bank voltage (60 kV); higher stresses may be obtained with modifications to the load design. Forthe design and predictions of performance of the NHMFL-ICE experiment it is important to have goodnumerical models. A novel SPICE code simulation was chosen to model all aspects of the experiment,electrical and physical. To this end, accurate dynamic load models were developed to simulate thecompression and expansion of the dynamic load at high pressures using shock physics principles. In thisstudy feasibility of adapting the existing NHMFL capacitor bank for ICE experiments up to 100 GPa isdemonstrated. The adaptation saved the expense of building a dedicated capacitor bank yet this newsystem produces high quality ICE data with a rapid turnaround and very low cost per experiment. A seriesof proof-of-principle experiments [3] demonstrated the feasibility of the NHMFL-ICE technique; some ofthe results will be shown here to illustrate the effectiveness of the new technique.
15. SUBJECT TERMS

16. SECURITY CLASSIFICATION OF: 17. LIMITATION OF ABSTRACT
SAR
18. NUMBEROF PAGES
6
19a. NAME OFRESPONSIBLE PERSON
a. REPORT unclassified
b. ABSTRACT unclassified
c. THIS PAGE unclassified
Standard Form 298 (Rev. 8-98) Prescribed by ANSI Std Z39-18
capacitor banks is their use of parallel plate loads, see section II.A.
C. The NHMFL-ICE facility The NHMFL-ICE capacitor bank in Figure 1 has a
capacitance of 144 µF, a maximum charge voltage of 60 kV and a peak discharge current of 4.5 MA. The discharge is sinusoidal with a time to peak of 2.2 µs. It uses coaxial cables to couple the capacitors to the load and each individual capacitor has its own triggered spark gap closing switch. In its present configuration these closing switches are synchronized to close at the same time. Consequently tailoring the shape of current pulse shape to delay shock-up [12] in the samples is not yet an
option. However, with the slow rise time of this system shock-up is unlikely to be observed; in none of the calculations to date has shock-up been observed.
II. DESCRIPTION OF ICE
A. Stress-equality condition The basic compression mechanism for ICE is the
isentropic magnetic loading of two or more identical samples of different thicknesses, situated on the rear surfaces of a pair of parallel conductors; the complete configuration is called the load, Figure 2. It is essential that the samples are subjected to identical, simultaneous plane wave compressive loads for this technique to be valid. These samples may be separate from the conductors or may sometimes be integrated into the conductors as one solid piece, i.e., if the samples are good conductors.
In the NHMFL-ICE experiment the load comprises a pair of parallel conductors in a stripline configuration. In contrast, the electrode configuration on the Sandia Z-
machine is a pair of coaxial conductors with a rectangular cross-section. The basic physics of the two configurations is identical, but it has been shown that there are subtleties in the differences of the current flow in the two configurations that affect the accuracy of the techniques [11]; parallel plates are better.
The ICE uses smoothly rising magnetic fields to compress materials to high stresses; this is a ramp or isentropic compression, i.e., without shock. Apart from the shock free compression a significant advantage of the technique is that compression EOS data are obtained at
every stress between the bottom and the top of the ramp in one experiment, i.e., hundreds or thousands of points along the compression curve. By way of contrast, a shock experiment only gives one data point per experiment; so many experiments must be performed to obtain a complete equation of state.
B. Experimental technique Identical materials of different thicknesses are placed on
the rear surfaces of metallic electrical conductors, e.g., copper, Figure 2. When the conductor carries current along its inner surface magnetic compression waves are generated which traverse the conductors into the samples. These waves eventually breakout on the rear surfaces of the samples and the velocities of the surfaces are measured by LASER velocimetry such as VISAR or PDV [13, 14].
Consider two equal and opposing currents (I) flowing in the two flat and parallel conductors of Figure 2 with equal widths (W) and separated by a small distance d. From the Biot-Savart law, the magnetic stresses (B-forces) on the inside surfaces are given by the vector product PB = J × B, where J is the linear current per unit width vector (I/W) and B the magnetic field vector. In the simplest case, when W>>d, J is uniform and equal and opposite in the electrodes, then the magnitude of the magnetic field on the inside surface of one conductor due the current in the opposing surface is ½µ0 J. The magnitude of the common stress normal to the inside surfaces becomes
Figure 1. The NHMFL bank showing the cluster of coaxial cables connecting the bank to the load.
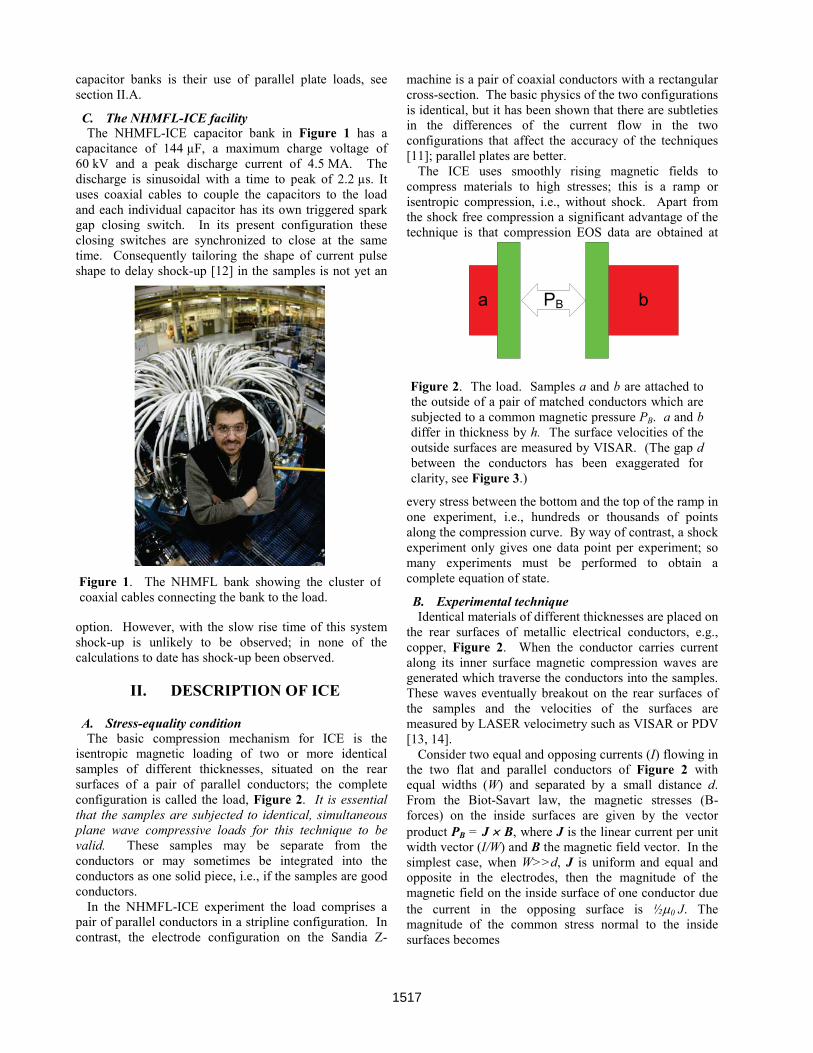
PB ba
Figure 2. The load. Samples a and b are attached to the outside of a pair of matched conductors which are subjected to a common magnetic pressure PB. a and b differ in thickness by h. The surface velocities of the outside surfaces are measured by VISAR. (The gap d between the conductors has been exaggerated for clarity, see Figure 3.)
1517
2102 ( / )µ>>= × →W d
B I WP J B (1) If J = 109 A/m for example, then PB = 200π GPa
(6.28 Mbar)* Figure 3. A NHMFL-ICE load is shown in .
C. Data analysis Because the thicknesses of a and b in Figure 2 differ by
h, the wave speed vL(u) may be calculated using Lagrangian wave analysis [15]; the times for two particle velocity records are measured for each velocity u. In Lagrangian coordinates, h and the density (ρ0) are constant, so the wave velocity is simply the distance h divided by the difference in arrival times, ∆t. The result is a continuous plot of vL as a function of the particle velocity u; ( ) / ( ).= ∆Lv u h t u
The change in stress Δσ is obtained as a function of vL(u) for each step Δu, working up the curves from zero:
0 ( ) ;σ ρ∆ = ∆Lv u u the complete stress history is then obtained by integration.
The particle velocity (u) is commonly taken to be one-half of the free surface velocity, ua = Ua/2 and ub = Ub/2. However, this is inaccurate at high stresses (i.e., above 50 GPa) because of wave perturbations that occur in the reflection of ramp waves. An exact method is to use the Backward technique [16].
D. Reduction of stress rise time by reflections in the load
The sample dimensions limit the duration of the stress on the load and hence the peak stress. Consider the load shown in Figure 4. Compression waves are launched at the left surface of the sample which traverse the sample at the wave velocity until they reach the outside free surface. At that the surface there is only air at atmospheric pressure and therefore little to support a stress rise (see III.G). Consequently, negative going relief waves or rarefactions are initiated at that surface, so that the total
* µ0, free space permeability = 400π nH/m in SI units.
stress of the outgoing compression and reflected relief waves is one atmosphere.
These relief waves then travel back to the slit surface, negating the compression on the way, then reflect back to the outside surface as shown. (Note that the reflection from the inside surface is complicated by the presence of the magnetic diffusion layer.) As these rarefactions waves reflect from the slit surface the stress is reduced and this terminates the stress rise on the sample, even though the current flow may not have peaked.
E. Stress-equality condition and end of experiment As soon as the rarefaction waves arrive back at the slit
surface of the thinnest sample, the stresses in the two samples are no longer equal. This effectively terminates the experiment, after this time no EOS data may be obtained because the stress equality-condition (section II.A) is violated.
The effect of these relief waves in shown in the calculations of Figure 5. The currents and pressures are for copper with the bank charged to 35-kV, the electrode is 10-mm wide and 3 mm thick. After 1.9 µs the first rarefaction waves arrive reflect back to the inner surfaces and terminate the pressure rise. The peak pressure is reached ~400 ns before the peak current. These waveforms were calculated using the design tools described in the next section.
III. DESIGN TOOLS FOR NHMFL-ICE
For the experimental design of the NHMFL-ICE experiment it is important to have good predictive models for the system performance. The tools described here were originally developed for the high explosive ICE experiments [11] and adapted to this NHMFL circuit. A SPICE circuit simulation code [17] was chosen to model all aspects of the experiment, electrical and physical. To this end, accurate dynamic load models were developed to simulate the compression and expansion of the load from shock physics principles.
t
Lagrange x
Diffusion layer
RF
Rarefactions (RF)
Freesurface
Innersurface
start
end
Expt
Figure 4. x-t diagram of compression and relief waves travelling in the sample. The left edge of the rectangle is subjected to magnetic loading and compression waves travel left to right and are reflected at the rightmost surface.
Figure 3. A NHMFL-ICE load. Parallel copper conductors are shown with two tungsten samples on the outside (top and bottom) surfaces.
1518
This model, dubbed “spICE,” was adapted to the NHMFL-ICE circuit. The capacitor bank and closing switches are modeled by simple static circuit parameters
but the load is a complex system dominated by the material dynamics (shock physics) of the materials; it is both time dependent and current dependent.
A. spICE circuit simulation for NHMFL-ICE The NHMFL capacitor bank has a maximum charge
voltage of 60 kV and a capacitance of 144 µF. The connections to the load taper have an inductance of 10 nH and the taper to the load has an estimated inductance of 7.5 nH, see Figure 6. X1 is the load simulation circuit which is the only dynamic component of the experiment, Rbank is the resistance of the circuit, XSw1 is a closing switch and VAload is a zero-voltage supply used as a computational device to monitor current in the load.
The load model provides output values for the inner surface velocities adjacent to the slit, Up1 and Up2; the outer surface velocities which will be observed by the LASER diagnostics, Ufs1 and Ufs2; and the common magnetic pressure, Pmag. What follows is a brief description of the circuit model.
B. Parallel plate load compression As the inner plate separation d(t) increases with time,
the inductance of the load increases with time. Consequently, the model must calculate the velocities of inner surfaces (Up) to obtain d(t). Also, the rarefactions from the outer surfaces, described above, accelerate the separation of the samples when the rarefactions return to the inner surfaces.
C. Pressure simulation The pressure distribution on the samples was modeled
by solving Maxwell’s equations with a PDE solver [18]. The results showed that the magnetic pressures in the central flat region normal to the surface could be fitted to within 5% with a simple logarithmic function,
( ) 212 0 0.11853 0.21641 ln /µ= − ×yP d W J .
The movement (separation) of the electrodes was obtained from the SPICE calculations described below, then the PDE calculations were by repeated for the different load separations. In these calculations it was assumed that the conductivity of the conductors was constant, which is an approximation. Calculations for higher pressure experiments must take the variation of conductivity with pressure and temperature into account.
D. Load inductance The load inductance L(t) of the NHMFL-ICE
experiment was calculated according to the following equation where K(W/d), a function of W/d, is an analytic solution for the correction factor for separation and l is the length of the conductors (the results are identical to published K(W/d) data [19]). K = 1 when W/d is large and K = ½ when W/d = 1.
( )0 ( )
( )( ) µ = ×
Wd t
d tL t K lW
E. Transmission line analog To model the wave propagation and reflection in the
expanding electrodes an electromechanical analog was employed, i.e., the sample was modeled with an electrical transmission line. Mechanical particle velocity was equated to electrical current and mechanical pressure was equated to electrical voltage. Each sample with its free surface was treated as a short-circuited transmission line. To date the effects of the magnetic diffusion layer have not been modeled. In practice this approximation has little effect on the accuracy of the predictions.
The electrical impedance of the transmission line was equated to the acoustic wave impedance of the samples,
0 ( )ρ × Lv P , i.e., the product of the initial density and the velocity vL which is pressure dependent. No published or commercial SPICE models for transmission lines that have voltage (pressure analog) dependent velocities were available. Consequently, a number of different techniques were tried to simulate such a transmission line; most attempts were unsuccessful because those models became numerically unstable. The best solution was found to be a
Figure 5. Effect of relief waves on pressure. The peak pressure (15.2 GPa) is at 1.9 µs after current start yet the peak current (2.3 MA) is at 2.3 µs. (The current was multiplied by 6000 for display purposes.)
Figure 6. spICE simulation of the NHMFL circuit. Here the only dynamic circuit element is the load (X1).
1519
16-stage lumped RCL circuit model for the transmission line where the capacitance of each stage was voltage dependent, C = C(V), i.e., a function of voltage (pressure), Figure 7. Note that the load (Rload and Lload) is a short
circuit for a simple one-piece electrode and sample in air, but the load could be a second transmission line representing the sample in a two- or three-piece electrode–load–window configuration.
The variable capacitance C(V) was set to a function of voltage which mirrored the known velocity versus pressure relationship for the metal of interest, copper or tungsten here. For example, from the isentrope of copper we know the Lagrangian wave velocity, vl, in OFHC copper as a function of pressure. It can be expressed as a fourth order polynomial up to 100 GPa, where the ai coefficients for i = 0 to 4 are: 3945.18; 8.05451×10⁻⁸; -5.59069×10⁻¹⁹; 4.51653×10⁻³⁰; and -1.56767×10-41.
4
0== ∑ i
l ii
v a P
Equations (2) summarize the relationships and their analogs where τ is the delay of the transmission line which is equivalent to the sample thickness λ divided by the wave velocity.
0
0
2
( ) ( )
/ ( )
( ) /
1( )
ρ
τ λλρ
λ
= ≡
= ≡
= ≡
≡
≡
L
L
L
LL
v f V f P
Z L C V v
N LC V v
LN
C vL Nv
(2)
The spICE calculations shown here were for a uniform electrode and sample configuration. In other words, the conductor and sample were of the same material, either copper or tungsten throughout, and therefore only one
transmission line was necessary to model wave reflections in the load. For the last two experiments in the series, tungsten samples were attached to the outside of the copper electrodes. To model these required an additional transmission line was added for each the samples. Additional transmission lines may be added to simulate windows that are often used in ICE experiments.
F. spICE calculation of the NHMFL-ICE load response
The spICE model was used to predict the results of the NHMFL-ICE experiments. The plots in Figure 8 are the experimental results and predictions for a copper sample which was nominally 3.175 mm thick, and 10 mm wide. Note the ringing of the surface velocities in the figure which is caused by the multiple wave reflections in the load. The stress-equality condition is not valid after the arrival of the first reflection, see Figure 4, so the EOS data gathering portion of the experiment would have ended at ~1.8 µs. The calculations appear close to the measured surface velocities up to 3.2 µs when there is a significant divergence of the velocities; the cause is unknown but may have been due to air flash, see below. Before that
time the differences between experiment and calculation can easily be explained by the estimated errors in dimensional measurement (a few percent). Clearly the spICE simulation of these ICE experiments produces good results. Note that any errors in the predictions would not affect the accuracy of the EOS data that is subsequently obtained from the data using the Backward method.
G. Air flash The proof-of-principle experiments were performed in
air for economy; hence air flash may have affected the velocimetry measurements. These errors will be eliminated by performing future experiments in vacuum.
Figure 7. 16-stage variable velocity transmission line. All 16 inductances are equal, as are the 16 resistances. Each capacitor is independent of the others and controlled by the voltage across it.
Figure 8. Comparison of predictions (black) of surface velocity and VISAR results (blue) of the first experiment for a 3.175-mm thick copper sample, 1 cm wide, bank voltage 35 kV.
1520
IV. SUMMARY
The NHMFL-ICE technique has been shown to be an excellent method for measuring high pressure EOS data at pressures approaching 100 GPa. Because a complete EOS can be obtained in one experiment from zero to the peak pressure, and because many shots can be fired in one day, the technique promises to provide high quality EOS data at relatively low cost. The low cost makes ICE accessible to a broader scientific community. For example, the performance of ICE on geological materials becomes economically viable.
As the rise time of the NHMFL capacitor bank is relatively long, circa 2 µs, the sample dimensions are relatively large, i.e., up to 5 mm thickness. Thicker samples improve the accuracy of the technique [11].
Four successful experiments were performed which demonstrated the feasibility of the NHMFL-ICE technique. The measured velocities were close to the predicted values, i.e., within the estimated errors in metrology.
As the NHMFL capacitor bank is compact it is transportable. With it, ICE experiments could be performed at such locations as: the Nevada Test Site; MaRIE, the proposed LANL Matter-Radiation Interactions in Extremes facility; the LANL proton radiography facility; the ANL Advanced Photon Source.
V. ACKNOWLEDGEMENT
The authors are indebted to C. Barnes, T. Taylor, D. Watkins, and R. Martineau of Los Alamos National Laboratory for supporting this work.
VI. REFERENCES
[1] S. E. Sebastian, et al., "Metal-insulator quantum critical point beneath the high Tc superconducting dome," Proceedings of the National Academy of Sciences, vol. 107, pp. 6175-6179, April 6, 2010. [2] A. M. Alsmadi, et al., "Complex conductivity of UTX compounds in high magnetic fields," Journal of Applied Physics, vol. 105, pp. 07E108-3. [3] D. G. Tasker, C. H. Mielke, G. Rodriguez, and D. G. Rickel, "A Simple Isentropic Compression Experiment (ICE) Machine," presented at the APS Shock Conference, American Physical Society, Shock Compression of Condensed Matter, Topical Group, Chicago, 2011. [4] D. G. Tasker, J. H. Goforth, and H. Oona, "High Accuracy Isentropic Compression Studies With High Explosive Pulsed Power," presented at the Proceedings IEEE Pulsed Power Conference, Albuquerque, NM, USA, 2007. [5] J. R. Asay, "Isentropic compression experiments on the Z accelerator," in Topical Conference on Shock Compression of Condensed Matter Snowbird, Utah
(USA), 1999, pp. 261-266. [6] C. Deeney, J. P. Davis, C. A. Hall, M. D. Knudson, and T. J. Vogler, "High-Pressure Isentropic Compression Experiments on the Sandia Z Accelerator," in Plasma Science, 2005. ICOPS '05. IEEE Conference Record - Abstracts. IEEE International Conference on, 2005, pp. 103-103. [7] T. Ao, "Quasi-isentropic Compression of Materials Using the Magnetic Loading Technique," presented at the Shock Compression of Condensed Matter, Nashville, TN, 2009. [8] T. Ao, J. R. Asay, S. Chantrenne, M. R. Baer, and C. A. Hall, "A compact strip-line pulsed power generator for isentropic compression experiments," Review of Scientific Instruments, vol. 79, pp. 013903-16. [9] C. Sun, et al., "Magnetically Driven Isentropic Compression and Flyer Plate Experiments Using a Capacitor Bank," presented at the Shock Compression of Condensed Matter, Waikoloa, Hawai'i, 2007. [10] G. Avrillaud, et al., "GEPI: a compact pulsed power driver for isentropic compression experiments and for non shocked high velocity flyer plates," in 14th IEEE International Pulsed Power Conference. Digest of Technical Papers. PPC-2003. pp. 913-916 Vol.2. [11] D. G. Tasker, "Megabar Isentropic Compression Experiments (ICE) Using High Explosive Pulsed Power (HEPP) " Doctor of Philosophy Department of Electronic and Electrical Engineering Loughborough University Loughborough, UK, 2006. [12] J. H. Goforth, et al., "Design of High Explosive Pulsed Power Systems for 20 MB Isentropic Compression Experiments," presented at the Ninth International Conference on Megagauss Magnetic Field Generation and Related Topics MG-IX, St. Petersburg (RU), 2002. [13] L. M. Barker and R. E. Hollenbach, "Laser Interferometer for Measuring High Velocities of any Reflecting Surface," Journal of Applied Physics, vol. 43, p. 4669. [14] O. T. Strand, D. R. Goosman, C. Martinez, T. L. Whitworth, and W. W. Kuhlow, "Compact system for high-speed velocimetry using heterodyne techniques," Review of Scientific Instruments, vol. 77, pp. 083108-8. [15] J. B. Aidun and Y. M. Gupta, "Analysis of Lagrangian gauge measurements of simple and nonsimple plane waves," Journal of Applied Physics, vol. 69, pp. 6998-7014. [16] D. Hayes, "Backward Integration Of The Equations Of Motion To Correct For Free Surface Perturbations," Sandia National Laboratories, Albuquerque, NM SAND2001-1440, May 2001. [17] Penzar, "TopSPICE/Win32," 7.19 ed: Penzar Development, P.O. Box 10358, Canoga Park, CA 91309, U.S.A., 2009. A generic SPICE code. [18] R. G. Nelson, "FlexPDE Professional ", 5.0.16 ed. Sunol, CA: PDE Solutions Inc, 2007. [19] H. Knoepfel, Magnetic Fields: John Wiley & Sons Inc., 2000.
1521