UV-C treatment delays postharvest senescence in broccoli florets
Upload
independentCategory
view
3download
0
Involvement of the Ink4 proteins p16 and p15 in T-lymphocyte senescence
Sven Erickson, Olle Sangfelt, Mats Heyman, Juan Castro, Stefan Einhorn and Dan Grande r
Department of Oncology and Pathology, Karolinska Hospital and Institute, S-171 76 Stockholm, Sweden
Little is known about the molecular background tosenescence in T-lymphocytes. In ®broblast systemsreplicative senescence has been shown to correlate witha number of changes in the expression of the proteinsnormally regulating progression through the G1 phase ofthe cell cycle, and recently the Ink4 inhibitor p16 wasimplicated as a central regulator of replicative senes-cence in human ®broblasts. It has, however, been claimedthat p16 is not expressed in T-lymphocytes. In thepresent study we have analysed G1 regulating proteins inageing human T-lymphocytes. We show that PHA andIL-2 stimulated T-lymphocytes cease to proliferate afteraround 20 population doublings, these cells can notthereafter be restimulated to growth, and were also foundto exhibit markers for senescence. We found that T-lymphocytes accumulate p16 and p15 protein duringsuccessive population doublings and display high levels ofthese proteins as they enter into replicative senescence.There was also an increased binding of p16 to the Cdk6kinase in senescent cells, and a decreased Cdk6 as wellas Cdk2 kinase activity. The levels of other G1regulating proteins were also altered in the senescentcells, such as slightly elevated levels of p21/WAF1, anddownregulation of Cdk2 and cyclinD3. The levels of p27/Kip1 is down regulated in proliferating cells but rise toapproximately 15% of the levels in un-stimulatedquiescent cells. As a high proportion of T-cell childhoodacute lymphoblastic leukaemias have deletions of bothp15 and p16, our data suggest that inactivation of thesegenes makes it possible for leukemic cells to avoidsenescence.
Keywords: T-lymphocytes; p16; p15; senescence
Introduction
As described by Hay¯ick more than 30 years ago,human cells have a limited lifespan and will, after ade®ned number of population doublings, enter a non-replicative but metabolically active state termedsenescence (Hay¯ick, 1965). The fact that cell culturesderived from human tumours often divide inde®nitely,has lead to the hypothesis that cellular senescence is atumour suppressor mechanism (Smith and Pereira-Smith, 1996). During replicative senescence, cells arrestin the G1 phase of the cell cycle. With the discovery ofa number of proteins normally regulating the cell cycleand G1 progression, some of the molecular eventsinvolved in replicative senescence have been identi®ed(Smith and Pereira-Smith, 1996).
Ordered progression through the cell cycle ismediated by the sequential activation of a family ofserine/threonine protein kinases. These kinases arecomposed of a regulatory subunit, the cyclin, and acatalytic subunit, the cyclin dependent kinase (Cdk).When activated, these kinases will phosphorylate theirsubstrates in order for the cell cycle to proceed. Inmammalian cells, the early G1 phase is regulated bythe D-cyclins together with their catalytic partnersCdk4 and Cdk6. The cyclinE-Cdk2 complex isactivated in late G1, preceding the initiation of S-phase (reviewed in GranÄ a and Reddy, 1995). Recentlya number of inhibitors of these Cdk complexes havebeen identi®ed, falling into two categories (GranÄ a andReddy, 1995; Hirama and Koe�er, 1995). The Cip/Kip family including p21, p27 and p57 are inhibitoryproteins with a broad speci®city, capable of binding toCdk-complexes containing cyclins D, E or A. Bycontrast, members of the Ink4 family, p15, p16, p18and p19, interact with the Cdk4 and Cdk6 kinasesonly, thereby interfering with the binding of the Dtype cyclins.One of the critical substrates for the G1 speci®c
cyclin dependent kinases is the retinoblastoma tumoursuppressor gene product (pRb). Phosphorylation ofpRb by the cyclin-Cdk complexes is accompanied byrelease and activation of transcription factors of theE2F family. Active E2F binds to the promoters ofessential S-phase genes and activate their transcription(La Thangue, 1996).The Ink4 locus, located at band 21 on the short arm
of chromosome 9, comprises the highly homologousp15 and p16 genes as well as an alternatively splicedp16 transcript called p16E1b (Stone et al., 1995b). Thep16INK4A gene, also referred to as CDKN2A, CDKN2Aor MTS1, encodes a 156-amino acid protein which wasidenti®ed, cloned and characterized by its interactionwith Cdk4 (Serrano et al., 1993; Hannon and Beach,1994). Like the other Ink4 proteins it contains multipleankyrin repeats, presumably involved in protein-protein interaction. Over-expression of p16 in cellswith functional pRb results in G1 arrest, but is withoute�ect in cells lacking pRb (Guan et al., 1994; Serranoet al., 1995). Recently, p16 has been implicated as akey regulator in the senescence program, since ageing®broblasts increase their p16 content in proportion tothe number of population doublings (Hara et al.,1996). The stimulation of p16 transcription throughloss of pRb repression coupled with a high stability ofthe p16 transcript are two factors suggested tocontribute to this accumulation (Hara et al., 1996).p15INK4B, also referred to as MTS2, on the other hand,was originally described as a TGFb inducible gene andis involved in TGFb-induced G1 arrest (Hannon andBeach 1994; Reynisdo ttir et al., 1995), but has alsobeen shown to be upregulated in G1 arrested cellsfollowing interferon-a treatment (Sangfelt et al.,
Correspondence: D Grande rThe ®rst two authors contributed equally to this workReceived 23 May 1997; revised 26 February 1998, accepted 11 March1998
Oncogene (1998) 17, 595 ± 602 1998 Stockton Press All rights reserved 0950 ± 9232/98 $12.00
http://www.stockton-press.co.uk/onc

1997a). p15 has to our knowledge not previously beenshown to be involved in senescence.The p16INK4A/p15INK4B locus has been found to be
deleted in established cell lines, primary cells from solidtumours as well as leukaemias (reviewed in Heymanand Einhorn, 1996). A vast amount of data hasaccumulated implicating loss of p16 function in avariety of tumours. Point mutations and smalldeletions are common in for instance pancreaticadenocarcinomas and familiar melanomas (Caldas etal., 1994; Kamb et al., 1994; Hussussian et al., 1994).Large homozygous deletions which in most cases alsoinvolve p15INK4B, are commonly detected in malignantgliomas and acute lymphoblastic leukaemias (ALL)(Sonoda et al., 1995; Rasool et al., 1995). Methylationof the Ink4 locus has been found in breast and coloncancers, exemplifying another possible mechanism forinactivation. No inactivating point mutations havebeen found in the p15 gene and although it is deletedin several malignancies it has not clearly beendemonstrated to be a tumour suppressor gene (Stoneet al., 1995a). Selective methylation of the p15 gene hasbeen demonstrated in ALL cells (Herman et al., 1996),but the signi®cance of this ®nding remains unclear.Knockout mice carrying targeted deletions of the Ink4locus inactivating both the p16 protein and p19ARF, themurine protein encoded by the p16E1b transcript, areviable but develop spontaneous tumours at an earlyage and are highly sensitive to carcinogenic treatment(Serrano et al., 1996).
In this study, the expression of G1-phase regulatoryproteins and the functional properties of Cdk-cyclincomplexes have been studied in T-cells during theiractivation, proliferation and subsequent senescenceutilising the well established system of stimulatingnormal resting T-lymphocytes by sequential addition ofPHA and IL-2 (Firpo et al., 1994).
Results
T-lymphocyte stimulation, proliferation and senescence
Following PHA-stimulation for 72 h 1 ± 2% of thelymphocytes entered S-phase (Figure 1, day 3).Addition of IL-2 at day 3, allows the majority ofcells to enter into a proliferative exponential growth-phase with about 90% of actively proliferating cells asjudged by BrdU labelling (data not shown), and an S-phase fraction of 20 ± 30% from around day 6 (Figure1). At day 18 ± 20 the cells start to re-accumulate in G1despite re-addition of IL-2, and around day 20 ± 30more than 90% of the cells were found in the G1-phase(Figure 1).
Characterization of senescence
The timepoint for reaccumulation in G1 variedsomewhat, from 20 ± 30 days of culture, probablyre¯ecting age di�erences between the di�erent donors
Figure 1 Flow cytometry analysis of DNA content in T-lymphocytes at the indicated timepoints after addition of PHA at day 0.IL-2 was added to the cultures at day 3 and additionally every third day as described in Materials and methods. The percentage ofcells with a G1 DNA-content is indicated
p16 and p15 in T-lymphocyte senescenceS Erickson et al
596

(Campisi, 1996). In order to demonstrate the senescentstate of these cells, several experiments were performed.Restimulation of the cells with two di�erent concentra-tions of PHA following 21 days of culture did not ineither case result in any detectable reinduction ofproliferation (data not shown), which is in agreementwith previous models of T-cell senescence (Perillo et al.,1993; E�ros, 1996). The expression of CD28, which haspreviously been described as a marker for senescence inT-lymphocytes (E�ros, 1996), was studied by ¯owcytometry at di�erent timepoints. At the initiation ofthe culture the majority of the cells expressed CD28(Figure 2a), whereas the non-proliferating cells at theend of the culture had virtually abolished theirexpression of this marker (Figure 2b). b-gal (b-gal)staining at pH 6.0, referred to as Senescence-Asso-ciated b-galactosidase (SA-b-gal), has been shown to bea reliable marker for senescence in other cellularsystems by (Dimri et al., 1995; Uhrbom et al., 1997).We found that 1 ± 2% of un-stimulated T-cells havedetectable SA-b-gal activity. At day 6, when themajority of cells are proliferating, there is no changein the proportion of SA-b-galpositive cells, as againonly 1 ± 2% show a positive staining. However, 90 ±95% of cells from aged cultures (day 30) expressedsigni®cant levels of SA-b-gal activity. Furthermore,double staining of BrdU labelled cells with DAPI and¯ourscent anti-BrdU antibodies and subsequent analy-sis by ¯ow cytometry, showed that the length of thecell cycle during maximum proliferation was less than24 h (data not shown), which would mean that the T-lymphocytes have gone through some 15 ± 25 PD at thetimepoint when replicative senescence occurs, which isin agreement with previous data (Perillo et al., 1993).Together these data strongly implicate that the cellsobtained at day 21 and later timepoints are to consideras senescent.
Regulation of Ink4 inhibitory proteins duringT-lymphocyte activation and senescence
Quiescent T-lymphocytes, or cells stimulated by PHAalone, do not express p16 protein at detectable levels.However, at around 72 h after IL-2 addition a faintband appears, which gradually increases as the cellsenter into logarithmic growth-phase. The amount ofp16 protein then continue to increase with increasingnumber of population doublings (Figure 3a). Theaccumulation rate of p16 is relatively constant duringthe proliferative phase and the highest levels arefound in senescent cells (Figure 3a and b). Similarresults were obtained with immunostaining for p16expression in individual cells; p16 could not bedetected in unstimulated, quiescent cells. A uniformlylow expression was detected during the earlyproliferative phase, whereas the senescent cellsshowed uniform strong p16 staining in the cytoplasm(data not shown).In some contrast to p16, the p15-protein is expressed
at low levels in un-stimulated cells, but similarly to p16it accumulates in proliferating cells (Figure 3a). Theaccumulation kinetics of p15 is, however, slightlydi�erent. There is a lag-time of approximately 9 daysbefore the accumulation begins and the levels reach aplateau around days 14 ± 16, which is somewhat earlierthan for p16 (Figure 3b).
Regulation of the Cip/Kip inhibitors duringT-lymphocyte activation and senescence
High levels of p27 is a hallmark of un-stimulated T-lymphocytes resting in G0 (Nourse et al., 1994; Firpo et
Figure 2 Expression of the cell surface marker CD28 wasanalysed by ¯ow cytometry in early proliferative cells (stimulatedwith PHA for 3 days and IL-2 for 48 h) (a), and senescent cells(day 21) (b). The percentage of CD28-positive cells is given as M1
Figure 3 Western blot analysis of (a) p16 and p15 expression forthe indicated timepoints after stimulation. Stimulation wasperformed as described in Materials and methods. (b), Quantita-tion of p16 and p15 protein levels using scanning densitometry.Values are presented as arbitrary units
p16 and p15 in T-lymphocyte senescenceS Erickson et al
597

al., 1994). p27 protein levels were not detectablya�ected by PHA treatment but rapidly decreasedfollowing IL-2 stimulation, with very low expressionlevels in proliferating cells (Figure 4a). Pre-senescent(days 16 ± 21) and senescent cells re-accumulated p27,but the levels in the senescent culture only reachedaround 15% of the level in the un-stimulated cells.p21 was expressed at very low levels in un-stimulated
and proliferating cells, but was weakly up-regulated insenescent cells (Figure 4a).
Phosphorylation pattern of pRb and p130
The expression and phosphorylation pattern of pRband p130 was examined by Western blotting during thedi�erent stages of lymphocyte stimulation. Un-stimu-lated cells do not express detectable levels of pRb.Following PHA-stimulation a faint band correspond-ing to the hypophosphorylated form of pRb can bedetected. Hyperphosphorylated pRb appears about72 h after IL-2 stimulation and the level of pRbincreases during the proliferative growth-phase, reach-ing a maximum at day 9. The pRb levels remain highduring senescence, but in the senescent cells pRb ismainly found in the hypophosphorylated active form(Figure 4c).p130 is expressed both in un-stimulated and PHA-
stimulated cells, mainly in its hypophosphorylatedform. The p130 protein becomes up-regulated andshifts to the hyperphosphorylated form around 72 hafter IL-2 addition, reaching its maximum levels at day9. In presenescent and senescent cells p130 becomesslightly downregulated, and in these cells it is found inthe hypophosphorylated form (Figure 4c). Themonoclonal p130 antibody used detected a band ofslightly higher molecular weight than the p130 bands(Figure 4c), that was not regulated during the
experiment. To rule out that it was a p130 banduna�ected by T-cell proliferation, a second polyclonalantibody was used. The same p130 band pattern wasobtained with this antibody but the higher molecularweight band could not be detected, making it mostlikely that it represents an unspeci®c band (data notshown).
Regulation of G1 Cdk expression and activity duringT-lymphocyte activation and senescence
Un-stimulated T-lymphocytes contain very low levelsof Cdk2 protein and exclusively in its slowly migrating,inactive form. The faster migrating, active form isdetected 72 h after IL-2 stimulation, and the amount ofCdk2 is also dramatically increased at this point. Insenescent cells, Cdk2 was slightly down-regulated andmainly found in its inactive form (Figure 4b).Cdk2 associated kinase activity, which is rate-
limiting for the progression into S-phase in mamma-lian cells, was assayed using histon H1 as a substrate atdi�erent time-points before and after stimulation withIL-2. In the senescent cells, Cdk2 kinase activity wasreduced by approximately 50% compared with activelyproliferating T-lymphocytes (Figure 5).The Cdk6 kinase was expressed at low levels in un-
stimulated and PHA stimulated cells. Similarly toCdk2, there was a pronounced up-regulation in theexpression of this protein around seventy-two hoursafter IL-2 addition, and the levels remained high alsoin presenescent and senescent cells (Figure 4b). Thehigh p16 levels in senescent cells was accompanied byan increased binding of this inhibitor to Cdk6 asdetected by immunoprecipitation followed by Westernblotting (Figure 6). However, no increase in Cdk6bound p15 could be detected in senescent cells. Thephosphorylating activity of this kinase increased as thecells started to proliferate, whereas the senescent cellsdisplayed approximately 25% of the Cdk6 kinaseactivity found in proliferating cells (Figure 5). Thus,despite high Cdk6 protein levels in the senescent cells,
Figure 4 Western blot analysis of (a), p27 and p21 (b), Cdk2 andCdk6 (c), pRb and p130, protein expression for the indicatedtimepoints after stimulation. Stimulation was performed asdescribed in Materials and methods. * indicates an unspeci®cband which occurs when hybridizing with the monoclonal p130antibody
Figure 5 Cdk2 and Cdk6 associated kinase activity in activelyproliferating (day 9) and senescent T-lymphocytes (day 21). ForCdk2 associated kinase activity, 50 mg of whole protein extractwas used and activity of immunoprecipitated Cdk2 complexes wasassayed using histone H1 as substrate. For determination of Cdk6associated kinase activity, 200 mg of whole protein extract wasused and the activity of immunoprecipitated Cdk6 complexes wasassayed using GST-Rb as substrate. Quantitation of kinaseactivity was performed using scanning densitometry. Proliferat-ing cells were given an arbitrary value of 100%
p16 and p15 in T-lymphocyte senescenceS Erickson et al
598
the increase in Cdk6 bound p16 resulted in a sharpdecrease in kinase activity. Similar results wereobtained studying cyclin D3 associated kinase activity(data not shown).As for Cdk2 and Cdk6, the Cdk4 kinase was
expressed at low levels in un-stimulated and PHAstimulated cells. Following IL-2 addition there was aslight increase in the Cdk4 expression. The levelsincreased somewhat further during maximal prolifera-tion and then gradually declined to a low level in thesenescent cells (data not shown). Repeated Cdk4-kinaseassays did not show any conclusive di�erences inactivity between proliferating and senescent cells,possibly due to the relatively low amounts of Cdk4protein, and di�culties in measuring Cdk4 activitywith the currently available antibodies as experiencedby others (Reynisdo ttir et al., 1995; Hannon andBeach, 1994).The di�erent cyclins active at the G1-S transition
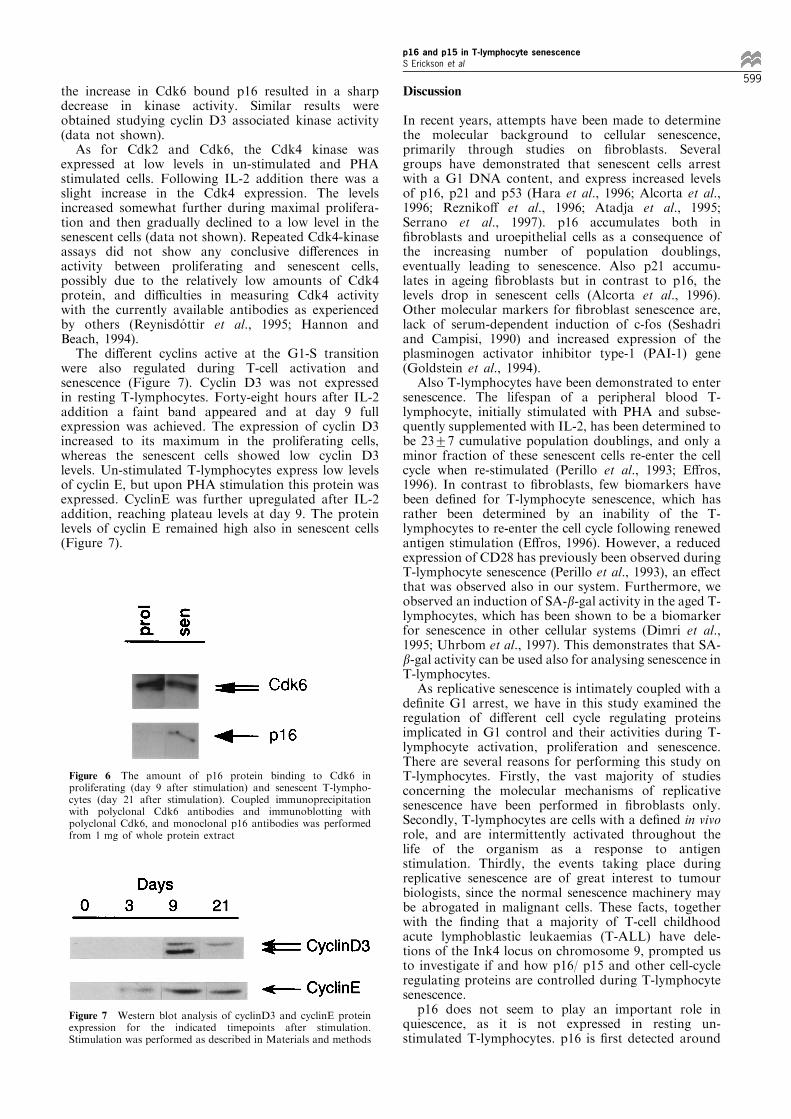
were also regulated during T-cell activation andsenescence (Figure 7). Cyclin D3 was not expressedin resting T-lymphocytes. Forty-eight hours after IL-2addition a faint band appeared and at day 9 fullexpression was achieved. The expression of cyclin D3increased to its maximum in the proliferating cells,whereas the senescent cells showed low cyclin D3levels. Un-stimulated T-lymphocytes express low levelsof cyclin E, but upon PHA stimulation this protein wasexpressed. CyclinE was further upregulated after IL-2addition, reaching plateau levels at day 9. The proteinlevels of cyclin E remained high also in senescent cells(Figure 7).
Discussion
In recent years, attempts have been made to determinethe molecular background to cellular senescence,primarily through studies on ®broblasts. Severalgroups have demonstrated that senescent cells arrestwith a G1 DNA content, and express increased levelsof p16, p21 and p53 (Hara et al., 1996; Alcorta et al.,1996; Rezniko� et al., 1996; Atadja et al., 1995;Serrano et al., 1997). p16 accumulates both in®broblasts and uroepithelial cells as a consequence ofthe increasing number of population doublings,eventually leading to senescence. Also p21 accumu-lates in ageing ®broblasts but in contrast to p16, thelevels drop in senescent cells (Alcorta et al., 1996).Other molecular markers for ®broblast senescence are,lack of serum-dependent induction of c-fos (Seshadriand Campisi, 1990) and increased expression of theplasminogen activator inhibitor type-1 (PAI-1) gene(Goldstein et al., 1994).Also T-lymphocytes have been demonstrated to enter
senescence. The lifespan of a peripheral blood T-lymphocyte, initially stimulated with PHA and subse-quently supplemented with IL-2, has been determined tobe 23+7 cumulative population doublings, and only aminor fraction of these senescent cells re-enter the cellcycle when re-stimulated (Perillo et al., 1993; E�ros,1996). In contrast to ®broblasts, few biomarkers havebeen de®ned for T-lymphocyte senescence, which hasrather been determined by an inability of the T-lymphocytes to re-enter the cell cycle following renewedantigen stimulation (E�ros, 1996). However, a reducedexpression of CD28 has previously been observed duringT-lymphocyte senescence (Perillo et al., 1993), an e�ectthat was observed also in our system. Furthermore, weobserved an induction of SA-b-gal activity in the aged T-lymphocytes, which has been shown to be a biomarkerfor senescence in other cellular systems (Dimri et al.,1995; Uhrbom et al., 1997). This demonstrates that SA-b-gal activity can be used also for analysing senescence inT-lymphocytes.As replicative senescence is intimately coupled with a
de®nite G1 arrest, we have in this study examined theregulation of di�erent cell cycle regulating proteinsimplicated in G1 control and their activities during T-lymphocyte activation, proliferation and senescence.There are several reasons for performing this study onT-lymphocytes. Firstly, the vast majority of studiesconcerning the molecular mechanisms of replicativesenescence have been performed in ®broblasts only.Secondly, T-lymphocytes are cells with a de®ned in vivorole, and are intermittently activated throughout thelife of the organism as a response to antigenstimulation. Thirdly, the events taking place duringreplicative senescence are of great interest to tumourbiologists, since the normal senescence machinery maybe abrogated in malignant cells. These facts, togetherwith the ®nding that a majority of T-cell childhoodacute lymphoblastic leukaemias (T-ALL) have dele-tions of the Ink4 locus on chromosome 9, prompted usto investigate if and how p16/ p15 and other cell-cycleregulating proteins are controlled during T-lymphocytesenescence.p16 does not seem to play an important role in
quiescence, as it is not expressed in resting un-stimulated T-lymphocytes. p16 is ®rst detected around
Figure 6 The amount of p16 protein binding to Cdk6 inproliferating (day 9 after stimulation) and senescent T-lympho-cytes (day 21 after stimulation). Coupled immunoprecipitationwith polyclonal Cdk6 antibodies and immunoblotting withpolyclonal Cdk6, and monoclonal p16 antibodies was performedfrom 1 mg of whole protein extract
Figure 7 Western blot analysis of cyclinD3 and cyclinE proteinexpression for the indicated timepoints after stimulation.Stimulation was performed as described in Materials and methods
p16 and p15 in T-lymphocyte senescenceS Erickson et al
599

72 h after addition of IL-2, whereafter the cells exhibita constant increase in p16 protein levels with increasednumber of population doublings. The appearance ofp16 correlates well with the increased abundance ofhyperphosphorylated pRb. The mechanism for p16accumulation following increased number of popula-tion doublings is not fully understood. However, Haraand colleagues have in a ®broblast system shown thatthe p16 promotor contains an `Rb-element' which isnot an E2F site, repressing p16 expression when pRb ishypophosphorylated and that this repression is releasedwhen pRb becomes hyperphosphorylated (Hara et al.,1996). In the same study it was also shown that the p16transcript is very stabile, and the authors suggest thatthese e�ects are responsible for the accumulation ofp16 protein. Also, other yet unde®ned factors couldin¯uence p16 protein accumulation, including addi-tional regulatory elements in the p16 promotor andother mechanisms for pRb inactivation. Our results arein accordance with the model proposed by Hara andco-workers, implicating that p16 is a major contributorto senescence also in T-lymphocytes.A previous study implicated that p15 expression is
downregulated at the mRNA level in T-lymphocytesfollowing activation (Lois et al., 1995). In contrast tothis study, we found that also p15 protein accumulatesin the lymphocytes during the proliferative phase,reaching its highest levels in senescent cells. Lowlevels of p15 could also be detected in un-stimulatedcells and the accumulation kinetics was similar to thatof p16 (Figure 2b). The p15 protein has previouslybeen shown to be expressed in T-lymphocytes (Stone etal., 1995b), but this is the ®rst study, to our knowledge,in which p15 accumulation has been demonstrated insenescent cells in a fashion similar to p16.The data presented in this paper may explain one of
the mechanisms behind replicative senescence in T-lymphocytes. The gradual accumulation of p15 andp16 following IL-2 stimulation may be responsible forthe G1 arrest when a certain threshold level of theseinhibitors has been reached. While the Ink4 proteinproducts only inhibit the early G1 kinases, Cdk4 andCdk6, the reaccumulation of p27 in the senescent cellscould be a mechanism to ensure that also theremaining active forms of Cdk2 are inactivated. Thefact that we only found an increased binding of p16and not p15, to Cdk6 may indicate that these inhibitorstarget di�erent kinases. p15 has been found to inhibitboth the monomeric Ink4 kinases as well as the activecyclin associated enzyme, while p16 has only beenshown to bind to the monomeric kinase (Reynisdo ttirand Massague , 1997). p15 may target Cdk4 in thesenescent T-cells. However, if so we were unable todetect this probably due to the low levels of Cdk4 (datanot shown). These ®ndings are in accordance withresults obtained in glioma cells stably transfected withp16, where p16 expressing cells were found to have alow expression of Cdk4 making it di�cult to detectCdk4/Ink4 complexes, whereas p16 binding to Cdk6was readily detectable (Uhrbom et al., 1997).The involvement of the p15-/p16-pRb pathway in
T-lymphocyte senescence is further supported by somestudies on the e�ects of viral oncoproteins. Thehuman T-cell leukaemia virus type-1 (HTLV-1)oncoprotein, Tax, which is crucial for transformationby HTLV-1, has recently been shown to bind and
inactivate p16 by interacting with its ankyrin repeats,indicating a mechanism for the transforming abilitiesof this virus (Suzuki et al., 1996). Furthermore,transfection of primary T-lymphocytes with SV40large T, whose protein is known to abrogate thepRb pathway, delays the point of cellular senescence(Ryan et al., 1993).The p16 gene is commonly deleted in leukemic cells
from T-ALL patients, and p15 is co-deleted in many ofthese cases (Rasool et al., 1995). In addition todeletion, the p15 gene is preferentially hypermethy-lated at a 5' CpG island in some cases (Batova et al.,1997; Herman et al., 1996). Taken together these datashow that both p15 and p16 are altered in a majorityof these malignant clones. Several groups havepreviously reported that p16 is not expressed inprimary T-lymphocytes (Tam et al., 1994; Lois et al.,1995); a ®nding which has prompted the question whya malignant cell would inactivate a non-expressed gene.Our data not only show that these proteins are indeedexpressed but also underlines the importance of thesegenes for senescence in T-cells and indicate that theirrole in malignant transformation may be throughalteration of the senescence program.
Materials and methods
All di�erent experiments were performed with cells fromthree to ®ve di�erent donors, with two exceptions mentionedbelow. Furthermore, all data presented in the ®gures arederived from one representative experiment.
T-lymphocyte isolation and cell culture
Bu�y coats from ®ve healthy blood donors wereheparinised, and mononuclear cells isolated by Lympho-prep gradient centrifugation (Nycomed, Oslo, Norway). T-lymphocytes were isolated as previously described (Ullberget al., 1983). In short, the fractionated cells were washedonce in PBS, and the cellular pellet was resuspended incomplete minimal essential medium (MEM) (MEM,supplemented with 10% heat inactivated AB+ serum,2 mM glutamine, 50 mg/ml of streptomycin and 50 mg/mlof penicillin), and incubated for 1 h on plastic dishes fordepletion of adherent cells. The remaining cells insuspension were centrifuged and resuspended in pre-warmed complete MEM. To deplete the cells in suspensionof B-cells and remaining monocytes the cells were layeredonto a nylon wool ®bre column and incubated at 378C for45 min. Non-adherent cells were recovered by passing20 ml of prewarmed complete MEM through the column.The recovered non-adherent cells were then incubated onplastic dishes over night. The cells recovered represent theresting un-stimulated population of T-lymphocytes used inthe subsequent experiments. The puri®ed human T-lymphocytes were tested for purity before stimulation asdescribed below.
The lymphocytes were seeded at a density of 106 cells perml in complete MEM and kept in a humid incubator with5% CO2. The cells were reseeded every third day and freshmedium was added. The resting T-lymphocytes werestimulated in a two stage process, by sequential addition ofPHA and IL-2 for proliferation to start, by addition of0.8 mg/ml of PHA (Sigma) for 72 h and subsequent additionof IL-2 at a concentration of 100 U/ml, as a proliferationsignal (Firpo et al., 1994). IL-2 was then added to thecultures every third day. Senescent cultures were restimulatedby readition of PHA (0.8 or 0.08 mg/ml) together with IL-2(100 U/ml).
p16 and p15 in T-lymphocyte senescenceS Erickson et al
600

DNA labelling and ¯ow cytometric analysis
Fixation and analysis of DNA histograms was performedas previously described (Sangfelt et al., 1997a). Thepresence of non-T-cells in the culture as well as senescenceassociated CD28 expression was determined by ¯owcytometry. These experiments were repeated with cellsfrom two di�erent donors. The following MoAbs werepurchased from Becton Dickinson (Mountain View, CA)CD28, CD3, CD16, 56, CD14 and CD19. The cells werestained as follows and analysed in a FACScan ¯owcytometer using the Lysis II software. Statistics werecalculated from ungated cell-population. 0.56106 cellswere mixed with 10 ml ¯uorochrome-conjugated antibody,incubated in the dark at 48C for 30 min and washed twicewith PBS. Cells were resuspended in 1 ml PBS andanalysed.
The cultures contained less than 5% (CD56 and CD 16positive and CD3 negative) NK cells and less than 1% (CD19positive) B-cells. The remaining 94% were CD3 positive.These proportions were not signi®cantly altered during the®rst 7 days of culture.
BrdU labelling and subsequent ¯ow cytometric analysiswas performed as previously described (Sangfelt et al.,1997b). Cells were eihter pulse labelled for 1 h with BrdU,washed twice in PBS and recultured in complete MEM for2 ± 24 h, or labelled with BrdU for 48 h and then harvested.
Western blot analysis
Western blot analysis was performed essentially aspreviously described (Reynisdo ttir et al., 1995). Brie¯y,whole cell extracts were prepared by lysis throughsonication in equal amounts of LSLD bu�er (50 mM
HEPES at pH 7.4, 50 mM NaCl, 10% Glycerol, 0.1%Tween 20, 0.3 mM Na-orthovanadate, 50 mM NaF, 80 mmb-glycerophosphate, 20 mM Na-pyrosphosphate, 1 mM
dithiothreitol (DTT) and 1 mM phenyl-methyl-sulphonyl¯ouride (PMSF), 10 mg/ml of leupeptin, 10 mg/ml ofantipain, 100 mg/ml of benzamidine hydrochloride, 5 mg/ml of aprotinin and 100 mg/ml of soybean trypsininhibitor). Protein concentration was quantitated spectro-photometrically with a protein assay kit, according to theinstructions of the manufacturer (Bio-Rad, Hercules, CA).70 mg of protein was loaded in each well, and the proteinswere resolved on a 8% (for detection of pRb and p130proteins) or a 12% (for all other proteins) SDS ± PAGEand electroblotted to PVDF-membranes (BoehringerMannheim GMbH, Germany) by semi-dry transfer. The®lters were susbequently stained with Ponceau S (Sigma)0.1% in 5% acetic acid to determine transfer e�ciency andeven loading. All Western blot data presented derive fromprotein from one representative experiment transfered totwo ®lters, one for pocket proteins and one for all otherproteins. These ®lters were rehybridized with the indicatedantibodies without intermediate stripping. Similar resultswere always obtained with protein extracts from the otherdonors. For protein detection the ®lters were hybridizedwith the following monoclonal antibodies (dilution); anti-pRb (1 : 1000), anti-p130 (1 : 2000), anti-p16 (1 : 500), anti-p21 (1 : 500), anti-p27 (1 : 2000), anti-Cdk2 (1 : 2000), anti-cyclinA (1 : 500) and anti-cyclinE (1 : 1000) and thefollowing polyclonal antibodies; anti-p15 (1 : 200), anti-p130 (1 : 1000), anti-Cdk4 (1 : 1000), anti Cdk6 (1 : 2000)and anti-cyclinD3 (1 : 200). Antibody-antigen interaction ofthe monoclonal antibodies was detected by incubation withbiotin-conjugated anti-mouse antibodies followed byincubation with horseradish peroxidase-linked streptavidinand subsequent detection by enhanced chemiluminescence(Amhersham, Aylesbury, UK). For polyclonal antibodies,incubation with horseradish peroxidase-conjugated anti-rabbit antibodies preceded the enhanced chemilumines-cence reaction. pRb, p16, cyclinA, cyclinE, Cdk4 and
Cdk6-antibodies were obtained from PharMingen (SanDiego, CA), p21, p27, p130 and Cdk2 antibodies fromTransduction Laboratories (Lexington, KY). p15, p130and cyclin D3 were purchased from Santa Cruz Biotech-nology (Santa Cruz, CA).
Immunoprecipitation and kinase assays
The same protein extracts were used for immunoprecipita-tion as for Western blots and was performed as previouslydescribed (Sangfelt et al., 1997a). One mg of whole celllysates were incubated with anti-Cdk4 or Cdk6 antibodies(kindly provided by Dr D Beach, Cold Spring Harbor;USA) for 1 ± 2 h at 48C. Immunocomplexes were thenbound to protein-A-sepharose by incubation at 48C for 1 hand subsequently washed several times with LSLD bu�er.Immunoprecipitated proteins were resolved by separationon SDS ± PAGE, electroblotted to ®lters and hybridizedwith di�erent antibodies as described above.
The Cdk2 kinase activity was assayed using histone H1 asa substrate. Cdk2-immunocomplexes were washed three timesin kinase bu�er (50 mM Tris-HCl at pH 7.5, 10 mM MgCl2and 1 mM DTT). Washed complexes were resuspended inkinase bu�er and the enzyme activity was assayed byaddition of 5 mg histone H1 (Sigma), 1 mM ATP and 5 mCi[g-32P]ATP (5000 Ci/mmole) (Amersham Life Sciences), to a®nal volume of 50 ml and incubated for 30 min at 308C. Thereaction was stopped by addition of one volume of 26 SDSsample bu�er and boiling for 5 min. An aliquot was loadedon an 12% SDS±PAGE and separated. The gel was driedand exposed to X-ray ®lm (Amersham Life Sciences).
Cdk6 and cyclinD3 kinase activity was assayed using 2 mgof GST-Rb (Santa Cruz Biotechnology, Santa Cruz, CA) as asubstrate according to (Matsushime et al., 1994), andanalysed as described for Cdk2 kinase assays. The kinaseassays were repeated with material from two di�erent donors.
Immunohistochemistry
p16 expression in individual cells was analysed in cytospinpreparations. The detection was carried out with DAKOLSAB+ Kit, according the instructions of the manufac-turer (DAKO, Carpinteria, CA).The p16 antibody(PharMingen, San Diego, CA) was diluted 1:100.
Senescence-associated b-galactosidase (SA-b-Gal) staining
SA-b-gal activity was assayed in cytospin preparations asdescribed (Dimri et al., 1995; Uhrbom et al., 1997). Cellswere judged positive by showing a blue perinuclear stainingwhen viewed in a light-microscope. Three hundred cellswere counted in several independent experiments and thepercentage of positively staining cells was calculated.
Quantitation of band intensity
Hybridization signals were quantitated by scanningdensitometry using an Ultroscan XL (Pharmacia LKBBiotechnology, Uppsala, Sweden).
AcknowledgementsWe thank Elisabet Anderbring, Ann-Charlotte BjoÈ rklund,Kristina Boman, Ingrid Eriksson and Britt-Marie Graf forskilful assistance during this study. We thank Drs AndersNilsson, Florin Sirzea and David Beach for kindlyproviding antibodies. Supported by grants from theSwedish Cancer Society, the Cancer Society of Stock-holm, Children's Cancer Fund of Sweden and the Gustaf VJubilee Fund.
p16 and p15 in T-lymphocyte senescenceS Erickson et al
601

References
Alcorta DA, Xiong Y, Phelps D, Hannon G, Beach D andBarret C. (1996). Proc. Natl. Acad. Sci. USA, 93, 13742 ±13747.
Atadja P, Wong H, Garkavtsev I, Veilette C and RiabowolK. (1995). Proc. Natl. Acad. Sci. USA, 92, 8328 ± 8352.
Batova A, Dicciani MB, Yu JC, Nobori T, Link MP, Pullen Jand Yu AL. (1997). Cancer Res., 57, 832 ± 836.
Caldas C, Hahn S, da Costa L, Redston M, Schutte M,Seymour A, Weinstein C, Hruban R, Yeo C and Kern S.(1994). Nature Genet., 8, 27 ± 32.
Campisi J. (1996). Cell, 84, 497 ± 500.Dimri GP, Lee X, Basile G, Acosta M, Scott G, Roskelley C,Medrano EE, Linskens M, Rubelj I, Pereira-Smith O,Pereira-Smith D, Peacocke M and Campisi J. (1995) Proc.Natl. Acad. Sci. USA, 92, 9363 ± 9367.
E�ros RB. (1996). Exper. Gerent., 31, 21 ± 27.Firpo JE, Ko� A, Solomon MJ and Roberts JM. (1994).
Mol. Cell. Biol., 14, 4889 ± 4901.GranÄ a X and Reddy PR. (1995). Oncogene, 11, 211 ± 219.Goldstein S, Moerman EJ, Fujii S and Sobel BE. (1994). J.
Cell. Physiol., 161, 571 ± 579.Guan K-L, Jenkins CW, Li Y, Nichols MA, Wu X, O'KeefeCL, Matera AG and Xiong Y. (1994). Genes and Dev., 8,2939 ± 2952.
Hannon GJ and Beach D. (1994). Nature, 371, 257 ± 261.Hara E, Smith R, Parry D, Tahara H, Stone S and Peters G.(1996). Mol. Cell. Biol., 16, 859 ± 867.
Hay¯ick L. (1965). Exp. Cell Res., 37, 614 ± 636.Herman JG, Jen J, Merlo A and Baylin SB. (1996). Cancer
Res., 56, 722 ± 727.Heyman M and Einhorn S. (1996). Leuk Lymph., 23, 235 ±245.
Hirama T and Koe�er PH. (1995). Blood, 86, 841 ± 854.Hussussian CJ, Struewing JP, Goldstein AM, Higgins PA,Ally DS, Sheahan MD, Clark WH Jr., Tucker MA andDracopoli NC. (1994). Nature Genet., 8, 15 ± 21.
Kamb A, Shattuck-Eidens D, Eeles R, Liu Q, Gruis NA,Ding W, Hussey C, Tran T, Miki Y, Weaver-Feldhaus J,McClure M, Aitken JF, Anderson DE, Bergman W,Frants R, Goldar DE, Green A, MacLennan R, MartinNG, Meyer LJ, Youl P, Zone JJ, Skolnick MH andCannon-Albright LA. (1994). Nature Genet., 8, 23 ± 26.
La Thangue NB. (1996). Biochem. Soc. Trans., 24, 54 ± 59.Lois AF, Cooper LT, Geng Y, Nobori T and Carson D.(1995). Cancer Res., 55, 4010 ± 4113.
Matsushime H, Quelle DE, Shurtle� SA, Shibuya M, SherrCJ and Kato JY. (1994). Mol. Cell. Biol., 14, 2066 ± 2076.
Nourse J, Firpo E, Flanagan MW, Coats S, Polyac K, LeeM-H, Massague J, Crabtree GR and Roberts JM. (1994).Nature, 372, 570 ± 573.
Perillo NL, Naeim F, Walford RL and E�ros RB. (1993).Exp. Cell Res., 207, 131 ± 135.
Rasool O, Heyman M, Brander LB, Liu Y, Grande r D,SoÈ derhaÈ ll S and Einhorn S. (1995). Blood, 85, 3431 ± 3436.
Rezniko� CA, Yeager TR, Belair CD, Savelieva E,Puthenveettil JA and Stadler WM. (1996) Cancer Res.,56, 2886 ± 2890.
Reynisdo ttir I, Polyak K, Iavarone A and Massague J.(1995). Genes and Dev., 9, 1831 ± 1845.
Reynisdo ttir I and Massague J. (1997). Genes and Dev., 11,492 ± 503.
Ryan QC, Goonewardene M andMurasko DM. (1993). Cell.Immunol., 149, 65 ± 81.
Sangfelt O, Erickson S, Einhorn S and Grande r D. (1997a).Oncogene, 14, 415 ± 423.
Sangfelt O, Erickson S, Castro J, Heiden T, Einhorn S andGrande r D. (1997b). Cell Growth and Di�., 8, 343 ± 352.
Serrano M, Go mez-Lahoz E, DePinho RA, Beach D andBarSagi D. (1995). Science, 267, 249 ± 252.
Serrano M, Hannon GJ and Beach D. (1993). Nature, 366,704 ± 707.
Serrano M, Lee H, Chin L, Cordon-Cardo C, Beach D andDePinho RA. (1996). Cell, 85, 27 ± 37.
Serrano M, Lin AW, McCurrach ME, Beach D and LoweSW. (1997). Cell, 88, 593 ± 602.
Seshadri T and Campisi J. (1990). Science, 247, 205 ± 209.Smith JR and Pereira-Smith OM. (1996). Science, 273, 63 ±67.
Sonoda Y, Yoshimoto T and Sekiya T. (1995). Oncogene, 11,2145 ± 2149.
Stone S, Dayananth P, Jiang P, Weaver-Feldhaus JM,Tavtigian SV, Albright-Cannon L and Kamb A. (1995a).Oncogene, 11, 987 ± 991.
Stone S, Jiang P, Dayananth P, Tavtigian SV, Katcher H,Parry D, Peters G and Kamb A. (1995b). Cancer Res., 55,2988 ± 2994.
Suzuki T, Kitao S, Matsushime H and Yoshida M. (1996).EMBO J., 15, 1607 ± 1614.
Tam SW, Shay JW and Pagano M. (1994). Cancer Res., 54,5816 ± 5820.
Uhrbom L, Niste r M and Bengt Westermark. (1997).Oncogene, 15, 505 ± 514.
Ullberg M, Jondal M, Lanefelt F and Fredholm BB. (1983).Scand. J. Immunol., 17, 365 ± 373.
p16 and p15 in T-lymphocyte senescenceS Erickson et al
602
Copyright © 2022 FDOKUMEN