Mortality Partitions and their Relevance to Research on Senescence
16
Abstract The reasons for classifying causes of death into aggregate groups are discussed and the impact of mortality partitions on analyses of mortal- ity is described. Special emphasis is given to a mor- tality partition that distinguishes between intrinsic causes of death that arise primarily from the failure of biological processes that originate within an organ- ism, and extrinsic causes of death that are primarily imposed on the organism by outside forces. Examples involving mortality data for mice, dogs, and humans are used to illustrate how this mortality partition in- fuses biological reasoning into mathematical models used to analyze and predict senescent-determined mortality, enhances the information content of the mortality schedules generated from these models, improves mortality comparisons between populations within species separated by time or geographic location, and provides a logical pathology endpoint for making interspecies comparisons of mortality. By bridging biology and the statistics of mortality, a mortality partition based on intrinsic and extrinsic causes of death provides both structure and direction for research on senescent-determined mortality. Keywords Biodemography Comparative mortality Mortality partitions Intrinsic mortality Introduction Since there are many ways for an organism to die, researchers who study mortality often focus on sub- sets of causes drawn from the pool of all possible causes of death. For example, a radiation biologist may be interested in deaths caused by cancer while a cardiologist might focus on deaths caused by mal- functions of the heart. Death caused by the failure of a specific organ may be of more interest to some researchers than the specific disease process that caused the failure. An interest in the broad mortality consequences of smoking or obesity might lead an epidemiologist or demographer to consider cause of B. A. Carnes (&) Reynolds Department of Geriatric Medicine, University of Oklahoma Health Sciences Center, Oklahoma City, OK, USA e-mail: [email protected] L. R. Holden Sielken & Associates Consulting, Inc., Bryan, TX, USA S. J. Olshansky School of Public Health, University of Illinois at Chicago, Chicago, IL, USA T. M. Witten Center for the Study of Biological Complexity, Virginia Commonwealth University, Richmond, VA, USA J. S. Siegel J. Stuart Siegel Demographic Services, North Bethesda, MD, USA Biogerontology (2006) 7: 183–198 DOI 10.1007/s10522-006-9020-3 123 REVIEW ARTICLE Mortality partitions and their relevance to research on senescence Bruce A. Carnes Larry R. Holden S. Jay Olshansky Tarynn M. Witten Jacob S. Siegel Received: 13 January 2006 / Accepted: 28 February 2006 / Published online: 27 May 2006 Ó Springer Science+Business Media, Inc. 2006
Transcript of Mortality Partitions and their Relevance to Research on Senescence

Abstract The reasons for classifying causes of
death into aggregate groups are discussed and the
impact of mortality partitions on analyses of mortal-
ity is described. Special emphasis is given to a mor-
tality partition that distinguishes between intrinsic
causes of death that arise primarily from the failure of
biological processes that originate within an organ-
ism, and extrinsic causes of death that are primarily
imposed on the organism by outside forces. Examples
involving mortality data for mice, dogs, and humans
are used to illustrate how this mortality partition in-
fuses biological reasoning into mathematical models
used to analyze and predict senescent-determined
mortality, enhances the information content of the
mortality schedules generated from these models,
improves mortality comparisons between populations
within species separated by time or geographic
location, and provides a logical pathology endpoint
for making interspecies comparisons of mortality. By
bridging biology and the statistics of mortality, a
mortality partition based on intrinsic and extrinsic
causes of death provides both structure and direction
for research on senescent-determined mortality.
Keywords Biodemography Æ Comparative
mortality Æ Mortality partitions Æ Intrinsic mortality
Introduction
Since there are many ways for an organism to die,
researchers who study mortality often focus on sub-
sets of causes drawn from the pool of all possible
causes of death. For example, a radiation biologist
may be interested in deaths caused by cancer while a
cardiologist might focus on deaths caused by mal-
functions of the heart. Death caused by the failure of
a specific organ may be of more interest to some
researchers than the specific disease process that
caused the failure. An interest in the broad mortality
consequences of smoking or obesity might lead an
epidemiologist or demographer to consider cause of
B. A. Carnes (&)
Reynolds Department of Geriatric Medicine, University
of Oklahoma Health Sciences Center, Oklahoma City,
OK, USA
e-mail: [email protected]
L. R. Holden
Sielken & Associates Consulting, Inc., Bryan, TX, USA
S. J. Olshansky
School of Public Health, University of Illinois at Chicago,
Chicago, IL, USA
T. M. Witten
Center for the Study of Biological Complexity, Virginia
Commonwealth University, Richmond, VA, USA
J. S. Siegel
J. Stuart Siegel Demographic Services, North Bethesda,
MD, USA
Biogerontology (2006) 7: 183–198
DOI 10.1007/s10522-006-9020-3
123
REVIEW ARTICLE
Mortality partitions and their relevance to researchon senescence
Bruce A. Carnes Æ Larry R. Holden ÆS. Jay Olshansky Æ Tarynn M. Witten ÆJacob S. Siegel
Received: 13 January 2006 / Accepted: 28 February 2006 / Published online: 27 May 2006
� Springer Science+Business Media, Inc. 2006
death only incidentally. In each of these cases, the
research interests of the investigator determine the
specific set of causes studied or whether such parti-
tioning of causes of death is even deemed necessary.
A focus on single diseases or individual organs,
however, is not as valuable when the aim of the re-
search is to analyze the mortality consequences of
senescence. Senescence produces a progressive deg-
radation of biological function over time at virtually
every level of biological organization. Death occurs
when that degradation exceeds the ability of the
organism to maintain its biological integrity. As such,
causes of death that are somehow linked to the
internal collapse of the biological system are a logical
point of focus for research on senescent-determined
mortality.
The need to partition total mortality into biologi-
cally relevant subcomponents has been recognized
and accepted as standard procedure in the scientific
literature for nearly 200 years (Carnes and Olshansky
1997). In a paper that gave birth to what is now called
‘competing risk theory,’ the British actuary Makeham
(1867) suggested that mathematical descriptions of
the ‘‘law of mortality’’ proposed by Gompertz (1825)
could be improved by partitioning causes of death
into: (1) a subset that he thought was responsible for
the age-dependent increases in mortality that char-
acterize the law, and (2) a subset ascribed to ‘‘acci-
dental circumstances’’ that do not depend on age. In
so doing, Makeham was the first scientist to provide
both the rationale and the methodology for the
development and use of mortality partitions.
A major difficulty with mortality partitioning,
however, is that knowledge about underlying mech-
anisms of senescence and disease has been and re-
mains incomplete. Makeham was aware of this
deficiency when he noted that advances in the
knowledge of disease causation would lead future
researchers to make improvements to his partitioning
of mortality (Benjamin 1959; Bodenheimer 1938;
Bourgeois-Pichat 1978; Clarke 1950; Deevey 1947;
de Finetti and Rossi 1982; Pearl 1921; Stearns et al.
1998).
A focus on causes of death related to senescence
does not mean that those considered unrelated to
senescence are unimportant or of no interest. To the
contrary, non-senescent related mortality (referred to
as extrinsic mortality) plays a central role in the
evolutionary theories of senescence (Kirkwood and
Holliday 1979). In addition, public health researchers
(Mackenbach et al. 1990) and clinical researchers
(McGinnis and Foege 1993) identify ‘avoidable
mortality’ and ‘actual causes’, respectively, as mod-
ifiable external factors that cause individuals to die
before attaining their life span potential. Despite their
different focus, the common theme that unites all of
these mortality partitions is a distinction made
between deaths that arise primarily from the failure of
biological processes that originate within an organism
(intrinsic mortality), and those that are primarily
imposed on the organism by outside forces (extrinsic
mortality)––(see Eakin and Witten 1995a; Carnes and
Olshansky 1997 for detailed discussions). The latter
group invariably leads to premature death.
In this paper we provide examples from human,
dog, and mouse mortality in order to illustrate how
the intrinsic/extrinsic mortality partition can provide
an informative structure and direction for analyses of
senescent-determined mortality. Biodemographic
concepts as well as methods of analysis and their
interpretation will be explored.
Intrinsic-Extrinsic mortality partitioning
In the terminology of Shryock et al. (1975), endoge-
nous [intrinsic] mortality is described as having a
‘‘biological character’’ such as that arising from ‘‘the
genetic makeup of the individual,’’ and as being
‘‘resistant to scientific progress.’’ It was defined to
include the ‘‘degenerative diseases of later life (e.g.,
heart disease, cancer, diabetes) and certain diseases
peculiar to early infancy.’’ In contrast, exogenous
[extrinsic] mortality results from causes that are
‘‘relatively preventable and treatable’’ and includes
‘‘mortality mainly from infections and accidents.’’
Like Makeham (1867, p. 335), Shryock et al. (1975,
p. 405) warned that their classification was not perfect
and the specifics of its composition would depend on
the prevailing state of biomedical knowledge about
disease processes.
Some researchers, including Makeham (1867,
p. 333), have suggested that age-independence is the
criterion to use when distinguishing extrinsic mor-
tality from intrinsic mortality. We disagree. It is
difficult to envision a cause of death for humans or
any other species, either intrinsic or extrinsic, that
does not exhibit age-dependence. Vulnerability to
184 Biogerontology (2006) 7: 183–198
123

‘‘all’’ mortality risks varies by age, with children and
the elderly being especially likely to succumb to
external risks (e.g., infectious disease, predation,
starvation) that we define as extrinsic. The presence
or absence of age dependence is not the criterion that
we use to distinguish between intrinsic and extrinsic
causes of death. Instead, our distinction is based on
whether the primary cause of death does or does not
originate from within the organism.
Conceptually, intrinsic causes of death are those
that remain after the total elimination of extrinsic
causes of death. Consider a hypothetical experiment
in which animals are maintained in an optimal envi-
ronment where they are completely protected from
infectious diseases, aggression, fatal accidents, etc. In
this admittedly unrealistic (but nevertheless imagin-
able) scenario, all deaths arising from external forces
have been eliminated. Every animal in this hypo-
thetical population would theoretically achieve their
life span potential and succumb to an intrinsic cause
of death (Carnes et al. 2005). The mortality signature
(schedule of age-specific death rates) constructed for
this population is what we refer to as an intrinsic
mortality signature.
Optimum conditions are impossible to know and
impossible to achieve, but they can be approached.
Thus, investigators conducting controlled studies
involving laboratory animals attempt to provide the
optimal conditions of our hypothetical experiment,
but they can never do so with perfection. However, if
extrinsic causes of death can be identified, then it is
possible to filter them out mathematically in order to
arrive at an approximation of the intrinsic mortality
signature. That process is straightforward. If an ani-
mal dies at age T from an intrinsic cause, then the
intrinsic age of death is simply equal to T. However,
for an animal dying from an extrinsic cause at age t, all
we know is that the intrinsic age at death T is greater
than t. That is, only the lower bound for death times is
known for extrinsic deaths. Except under extreme
circumstances, such as analyses involving sparse data,
this so-called ‘‘right censoring’’ presents little prob-
lem for estimating the intrinsic mortality signature.
Mortality partition applied to humans
Deaths for all causes combined are commonly used in
the analysis and comparison of human mortality.
However, our interest in the biodemography of
senescence (Carnes and Olshansky 1993) led us to
conclude that all-cause mortality is a heterogeneous
mixture of mortality dynamics that we labeled
extrinsic and intrinsic mortality (Carnes and
Olshansky 1997). Extrinsic deaths account for the
majority of human mortality early in life, while those
caused by senescence progressively dominate the
intrinsic mortality schedule of both sexes from the
fifth decade onward (Fig. 1).
Our mortality partitioning for humans was based
on public-use demographic data obtained from the
National Center for Health Statistics (NCHS). These
data were tabulated for the underlying cause-of-death
listed on death certificates in the form of standardized
medical codes listed in the 6th, 9th and 10th Revi-
sions of the International Classification of Diseases
(ICD) published by the World Health Organization
(WHO). Coding differences between the revisions are
unlikely to affect our partitions because extrinsic and
intrinsic causes of death were broadly defined.
Finally, intrinsic causes of death were operationally
defined as the ICD codes remaining after those listed
in Table 1 were judged (after ongoing input from
knowledgeable colleagues, pathologists, physicians
and the author’s review of the literature) to be
extrinsic causes of death.
Within a calendar year
The age trajectories of all-cause mortality and its
extrinsic and intrinsic partitions are plotted for Uni-
ted States females (Fig. 2A) and males (Fig. 2B) in
1996 (NCHS 1998, 1999). Although the mortality
trajectories of extrinsic and intrinsic causes of death
are similar (within sex) during the first decade of life,
they begin to separate around the age of sexual
maturity (13–15 years). By age 20, it is apparent that
the hump in the all-cause mortality curve of either
sex is caused by an increase in mortality from
extrinsic causes. By the effective end of the repro-
ductive period (40–50 years), mortality from intrin-
sic causes surpasses that attributable to extrinsic
causes (i.e., a cross-over occurs, Hirsch et al. 2000).
In the post-reproductive period of the life span, the
extrinsic and intrinsic components of all-cause mor-
tality continue to diverge. By age 60, the trajectories
of intrinsic and all-cause mortality are nearly
Biogerontology (2006) 7: 183–198 185
123

indistinguishable. Our mortality partition added
value to this analysis by revealing that all-cause
mortality is a complex mixture of extrinsic and
intrinsic mortality dynamics that varies within and
across age segments of the human life course.
Heterogeneous mixtures of mortality trajectories
can affect quantitative methods of analysis and their
interpretation. For example, the approximate linearity
of death rates as a function of age on a semi-loga-
rithmic plot (as seen in Fig. 2) provides a visual
Fig. 1 The proportion of
age-specific deaths rates
(ages 15 and older)
attributable to intrinsic
causes for males and
females (US 1996)
Table 1 List of ICD codes
(based on the 9th revision)
used to identify extrinsic
causes of death for humans
ICD code Cause of death
E800–E999 Injuries and poisoning
001–139 Infectious and parasitic diseases
162 Lung cancer
180 Cervical cancer
260–269 Nutritional deficiences
278 Obesity, adiposity, hyperalimentation
280–281 Iron and other deficiency anemias
283.1–283.2 Acquired hemolytic anemias
291 Alcoholic psychosis
303 Alcohol dependence syndrome
304 Drug dependence
320–322 Meningitis
390–398 Rheumatic fever and rheumatic heart disease
460–519 Diseases of the respiratory system
571.0–571.3 Chronic liver diseases and cirrhosis, alchohol-related deaths
571.4–571.7 Chronic hepatitis and biliary cirrhosis
590 Infections of the kidney
595 Cystitis
597 Urethritis, not sexually transmitted
598 Urethral stricture
599 Other disorders of the urethra and the urinary tract
601 Inflammatory diseases of the female genitourinary system
630–676 Complications of pregnancy, childbirth, and the puerperium
725 Polymyalgia rheumatica
730 Osteomyelitis, periostitis, and other infections involving bone
186 Biogerontology (2006) 7: 183–198
123
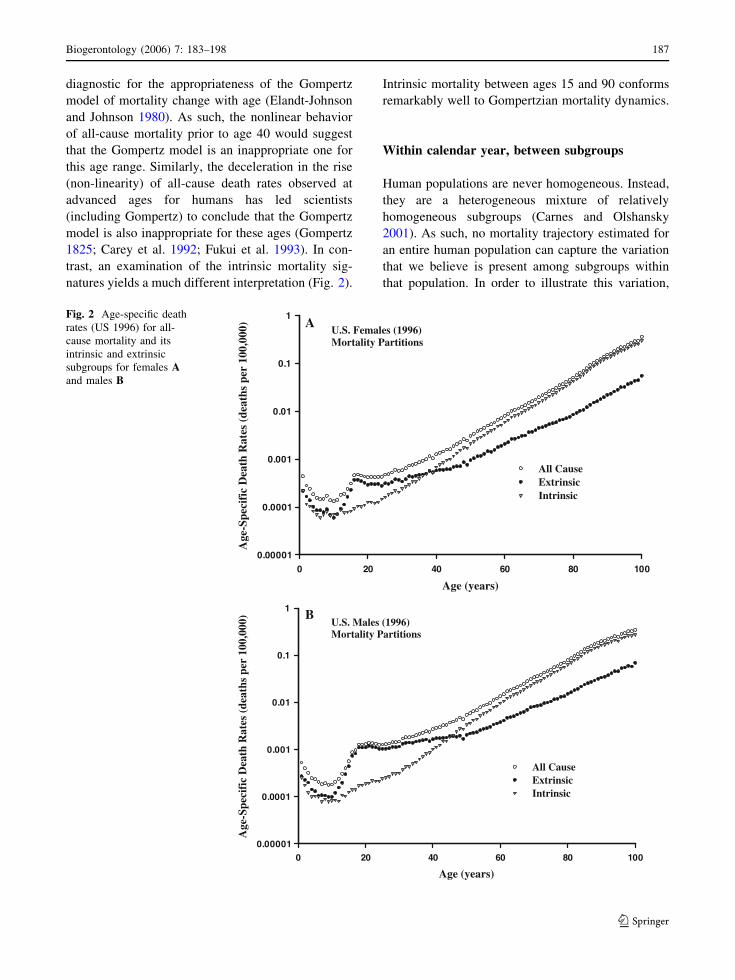
diagnostic for the appropriateness of the Gompertz
model of mortality change with age (Elandt-Johnson
and Johnson 1980). As such, the nonlinear behavior
of all-cause mortality prior to age 40 would suggest
that the Gompertz model is an inappropriate one for
this age range. Similarly, the deceleration in the rise
(non-linearity) of all-cause death rates observed at
advanced ages for humans has led scientists
(including Gompertz) to conclude that the Gompertz
model is also inappropriate for these ages (Gompertz
1825; Carey et al. 1992; Fukui et al. 1993). In con-
trast, an examination of the intrinsic mortality sig-
natures yields a much different interpretation (Fig. 2).
Intrinsic mortality between ages 15 and 90 conforms
remarkably well to Gompertzian mortality dynamics.
Within calendar year, between subgroups
Human populations are never homogeneous. Instead,
they are a heterogeneous mixture of relatively
homogeneous subgroups (Carnes and Olshansky
2001). As such, no mortality trajectory estimated for
an entire human population can capture the variation
that we believe is present among subgroups within
that population. In order to illustrate this variation,
Age (years)
0 20 40 60 80 100
Age
-Spe
cifi
c D
eath
Rat
es (
deat
hs p
er 1
00,0
00)
0.00001
0.0001
0.001
0.01
0.1
1
All CauseExtrinsicIntrinsic
U.S. Females (1996)Mortality Partitions
B
A
Age (years)
0 20 40 60 80 100
Age
-Spe
cifi
c D
eath
Rat
es (
deat
hs p
er 1
00,0
00)
0.00001
0.0001
0.001
0.01
0.1
1
All CauseExtrinsicIntrinsic
U.S. Males (1996)Mortality Partitions
Fig. 2 Age-specific death
rates (US 1996) for all-
cause mortality and its
intrinsic and extrinsic
subgroups for females Aand males B
Biogerontology (2006) 7: 183–198 187
123

differences in mortality trajectories were examined
for three racial groups (white, black, and other) of
females (Fig. 3) and males (Fig. 4) from the same
NCHS data (1996 U.S. population) used previously.
As anticipated, these figures reveal information that
pooling obscured in the previous figures. We now see
that both extrinsic and intrinsic mortality is generally
higher for blacks than whites and that the ‘other’
group has the lowest mortality. To give these differ-
ences a sense of magnitude, age-specific mortality
rates for blacks are over twice those of the ‘other’
group. Extrinsic mortality for blacks and whites
converge around age 60 for females (Fig. 3A), but the
convergence does not occur until beyond 80 for males
(Fig. 4A). Eventually, a mortality crossover occurs
between blacks and whites of each sex. Although the
intrinsic mortality trajectories for each sex (Figs. 3B,
4B) retain their approximate Gompertzian form be-
yond the age of sexual maturity, the bending of the
trajectory (deceleration of the increase in age-specific
death rates) becomes more apparent when the data
are stratified by racial subgroups. The bending of the
intrinsic mortality trajectory is also more apparent for
blacks than for either whites or those listed in the
Age (years)
0 20 40 60 80 100
Age
-Spe
cifi
c D
eath
Rat
es (
deat
hs p
er 1
00,0
00)
0.00001
0.0001
0.001
0.01
0.1
WhiteBlackOther
U.S. Females (1996)Extrinsic Mortality
B
A
Age (years)
0 20 40 60 80 100
Age
-Spe
cifi
c D
eath
Rat
es (
deat
hs p
er 1
00,0
00)
0.00001
0.0001
0.001
0.01
0.1
1
White BlackOther
U.S. Females (1996)Intrinsic Mortality
Fig. 3 Age-specific death
rates (US 1996) for
extrinsic mortality A and
intrinsic mortality B for
females separated by race
into black, white and all
others (Smoothing lines are
shown to improve
visualization)
188 Biogerontology (2006) 7: 183–198
123
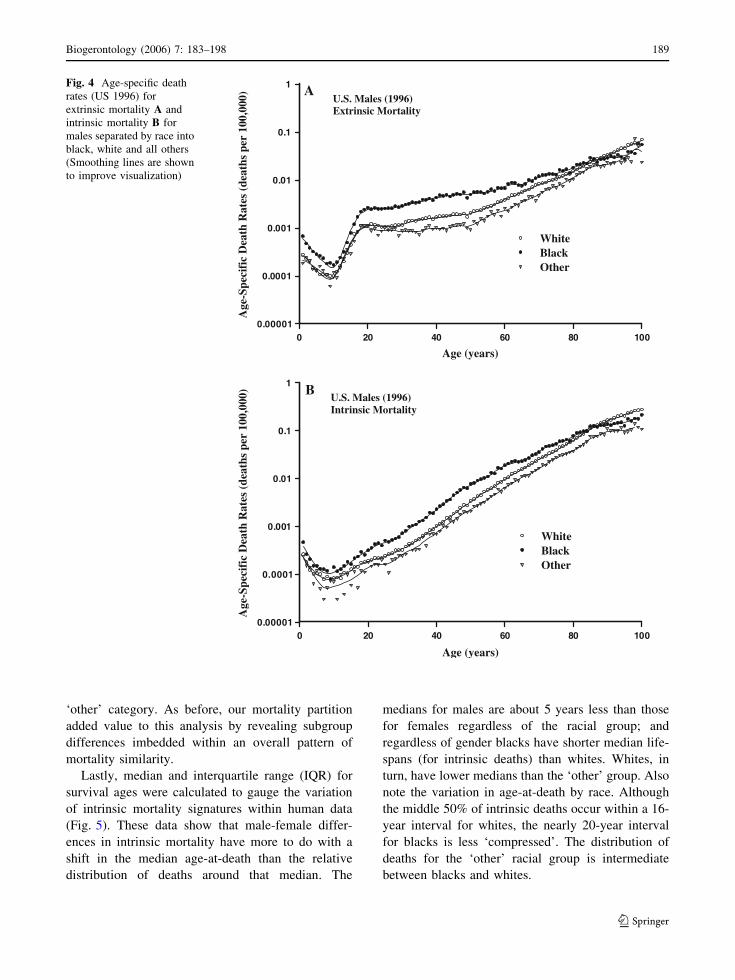
‘other’ category. As before, our mortality partition
added value to this analysis by revealing subgroup
differences imbedded within an overall pattern of
mortality similarity.
Lastly, median and interquartile range (IQR) for
survival ages were calculated to gauge the variation
of intrinsic mortality signatures within human data
(Fig. 5). These data show that male-female differ-
ences in intrinsic mortality have more to do with a
shift in the median age-at-death than the relative
distribution of deaths around that median. The
medians for males are about 5 years less than those
for females regardless of the racial group; and
regardless of gender blacks have shorter median life-
spans (for intrinsic deaths) than whites. Whites, in
turn, have lower medians than the ‘other’ group. Also
note the variation in age-at-death by race. Although
the middle 50% of intrinsic deaths occur within a 16-
year interval for whites, the nearly 20-year interval
for blacks is less ‘compressed’. The distribution of
deaths for the ‘other’ racial group is intermediate
between blacks and whites.
Age (years)0 20 40 60 80 100
Age
-Spe
cifi
c D
eath
Rat
es (
deat
hs p
er 1
00,0
00)
0.00001
0.0001
0.001
0.01
0.1
1
WhiteBlackOther
U.S. Males (1996)Extrinsic Mortality
B
A
Age (years)
0 20 40 60 80 100
Age
-Spe
cifi
c D
eath
Rat
es (
deat
hs p
er 1
00,0
00)
0.00001
0.0001
0.001
0.01
0.1
1
WhiteBlackOther
U.S. Males (1996)Intrinsic Mortality
Fig. 4 Age-specific death
rates (US 1996) for
extrinsic mortality A and
intrinsic mortality B for
males separated by race into
black, white and all others
(Smoothing lines are shown
to improve visualization)
Biogerontology (2006) 7: 183–198 189
123

Between calendar years
Next, we compared US death rates (classified by age,
sex, and cause of death) for 1950 and 2000 (NOVS
1954, NCHS 2002) to see if humans exhibit changes
in partitioned death rates over broad time periods.
During this 50-year period, age-related death rates for
all-cause mortality declined by about 40% for ages 15
and older. The temporal dynamics of the extrinsic and
intrinsic mortality trajectories (10-year age intervals,
sexes combined) for both years were consistent with
the more detailed (1-year age intervals) data pre-
sented for 1996 (Figs. 1–3). In both cases, intrinsic
mortality dominates at older ages (age > 40) while
extrinsic mortality dominates at younger ages, and
the two categories of death have dissimilar mortality
trajectories.
It is only when the extrinsic (Fig. 6A) and intrinsic
(Fig. 6B) mortality trajectories for 1950 and 2000
were superimposed that the temporal differences be-
tween them became evident. The changes in extrinsic
mortality (sexes combined) between 1950 and 2000
were strongly age dependent. Extrinsic death rates
decreased by about 30% over this 50-year period at
ages between 15 and 55, they remained essentially
unchanged in the 55–65 age interval, and they in-
creased by about 30% for people over age 65. In con-
trast, age-specific death rates for intrinsic causes (sexes
combined) decreased uniformly by approximately
50% over this period. Thus, for persons aged 15 years
and older, the changes in extrinsic mortality over this
period were smaller in magnitude and different in
pattern than was the case for intrinsic mortality.
The nearly uniform 50% drop in intrinsic mortality
between 1950 and 2000 was too substantial to be an
artifact. Coding differences between the Sixth (1950
data) and Tenth (2000 data) Revision of the ICD List
are not large enough to explain a change of this
magnitude. It is also unlikely that the biological
nature of the population changed appreciably over
this time period. Instead, the most plausible expla-
nation for this change in the age pattern of intrinsic
mortality is that humans have benefited from an
expansion of life-extending medical interventions
that affect the risk of death from intrinsic disease
processes.
Interventions that delay intrinsic deaths by man-
aging their symptoms (e.g., chemotherapies for can-
cer) or altering their underlying pathogenesis (e.g.,
cardiotonic therapies for congestive heart failure)
manufacture survival time that extends the lives of
individuals and lowers the death rates of populations
(Olshansky et al. 1998). In this case, the ability of
humans to lower death rates for intrinsic disease
processes appears to have exceeded the influence of
factors that can raise them (e.g., pollution, poor life
style choices). Clearly, intrinsic mortality signatures
for human populations depart from the original
thought experiment used to develop the concept;
namely, a mortality schedule calculated for individ-
uals living under optimum conditions where external
perturbations affecting mortality, whether beneficial
or detrimental, do not exist. Despite this added
complexity, the analyses of human data revealed that
useful insights into patterns of human mortality could
be gained from examining the mortality trajectories
of the intrinsic and extrinsic components of all-cause
mortality.
In the next section, we will examine whether the
variable intrinsic mortality signatures of humans bear
any resemblance to the more stable ones expected for
laboratory mice and dogs that were reared in the
controlled environments of the laboratory without the
confounding influence of life-extending interventions.
Interspecies comparison of intrinsic mortality
patterns
As long as intrinsic diseases are influenced to some
degree by genetic factors, then natural selection will
affect their frequency in a population and their age of
US, 1996
Median Age at Death (Years)
70 75 80 85 90 95
Inte
rqua
rtile
Ran
ge, I
QR
(Y
ears
)
10
15
20
25
MaleFemale
BLACK
OTHER
WHITE
Fig. 5 A plot showing differences between racial groups
(black, white and all other; US 1996) and sexes as measured by
the interquartile range and the median age at death (for
intrinsic causes)
190 Biogerontology (2006) 7: 183–198
123

expression (Medawar 1952). For iteroparous species,
the magnitude of this selection effect is greatest dur-
ing the pre-reproductive period, and then diminishes
progressively as the cumulative reproductive output
of a population is achieved. The universality of this
temporal pattern of selection pressure suggests that
the intrinsic mortality signatures that result from it
may be similar for different species when expressed
on an appropriate relative time scale (Carnes et al.
1996). Although species die from many of the same
intrinsic causes, they also die from species-specific
intrinsic causes. However, the interspecies conver-
gence of intrinsic mortality patterns only requires that
intrinsic causes in the collective respond to selection
pressure in the same way.
An alternative portrayal (hazard function, survi-
vorship curve) of intrinsic mortality is provided for the
1996 US human data for females used earlier (Fig. 7).
Mortality rates reach their minimum at the ages of
sexual maturity (12–15 years), climb gradually during
A U.S. Extrinsic Mortality
Age at Death (years)(Rates plotted at midpoints of intervals)
10 20 30 40 50 60 70 80 90 100
Age
-Spe
cifi
c D
eath
Rat
es (
Dea
ths
per
100,
000)
10
100
1000
10000
1950
2000
Source: National Center for Health Statistics
Age at Death (years)(Rates plotted at midpoints of intervals)
10 20 30 40 50 60 70 80 90 100
Age
-Spe
cifi
c D
eath
Rat
es (
Dea
ths
per
100,
000)
10
100
1000
10000
100000
1950
2000
Source: National Center for Health Statistics
B U.S. Intrinsic Mortality
Fig. 6 A comparison of
age-specific death rates
(ages 15 and older, plotted
at midpoints of intervals,
both sexes combined, US)
for extrinsic A and intrinsic
B mortality between 1950
and 2000
Biogerontology (2006) 7: 183–198 191
123

the reproductive period, and then begin a progressive
increase that becomes dramatic by age 80––a mor-
tality pattern mirrored by the temporal behavior of the
cumulative survivorship curve. If dogs and laboratory
mice were now added to this plot, the vast differences
in their average life span––approximately 2.5 years
for mice, 12 years for beagles and 85 years for human
females––would visually dominate the interspecies
comparison of mortality. However, a visual stretching
(i.e., scaling) of the time axes to remove life span
effects reveals intrinsic mortality patterns that share
far more similarities than differences (Fig. 8, Carnes
et al. 1996, Eakin and Witten 1995b).
The human data portrayed in Fig. 2 illustrates the
theoretically appealing and mathematically tractable
behavior of intrinsic mortality compared to either
extrinsic or all-cause mortality. The discussion of
Fig. 8 suggested a visual (proportional) scaling of the
age axis would reveal similarities among the intrinsic
mortality profiles of taxonomically diverse species
that are normally hidden in the absence of scaling.
We now consider the possibility that, for each species
or strain s, there are factors, ks, that give similar
mortality profiles when time, t, is re-expressed as t/ks.
Theoretical considerations also suggest that this
scaling factor, ks, is positively correlated with each
species’ effective end of reproduction (EER) (Carnes
et al. 2003a).
This logic raises two important questions. First,
how do we find the time-scaling factors ks? Second,
how do we then compare mortality patterns that have
been scaled (normalized, aligned)? Although several
viable scaling options exist, the simplest approach is
to use some general life-scale characteristic, such as
the median age at death or other percentile, obtained
from the species’ survival curve (Carnes et al. 1996).
A more sophisticated procedure would be to find ks as
the set of values that optimize some criterion of
similarity among survival curves. Provided the data
were available, it is even feasible to use a life-scale
characteristic that is not derived from time-to-death
Human(Female, US, 1996)
Age (Years)
Pro
bab
ility
0.00 20 40 60 80 100 120
0.2
0.4
0.6
0.8
1.0Mortality RateS(t)
Reproductive Period
Fig. 7 Plot showing the relationship between cumulative
survivorship and mortality rate curves for females (US, 1996)
Fig. 8 Cumulative
survivorship curves for
mice (B6CF1), dogs
(beagle) and humans with
death times normalized to a
common median age of
intrinsic death (Source:
Carnes et al. 1996)
192 Biogerontology (2006) 7: 183–198
123

data, such as EER or resting metabolic rate (Brown
and West 2000; Eakin and Witten 1995a).
We do not intend to obtain values for ks directly.
Instead, our goal is to reveal and quantify interspecies
differences between age patterns of mortality that
cannot be removed by proportional methods of scal-
ing. For example, statistics that measure relative
differences between mortality or survivorship pat-
terns at different ages (e.g., the ratio of mortality rates
or survivorship percentiles) are unaffected by any
proportional scaling of time. Similarly, measures of
relative variation like the coefficient of variation
(CV) are also unaffected by scaling. As such, these
statistics describe the mortality pattern without actu-
ally performing the time scaling directly.
We have chosen to employ a simple empirical
distribution analog of the CV, the relative inter-
quartile range (%IQR), as our measure of variation.
This statistic derived for intrinsic causes is computed
as the difference between the 75th and 25th percen-
tiles of the survivorship distribution (i.e., the IQR)
expressed as a percent of the median. The %IQR is
particularly advantageous for time-to-event data that
is censored, like that produced by mortality parti-
tions, because the three quartiles used in its calcula-
tion are almost always well defined. Deaths that
cluster around the median produce: (1) smaller %IQR
values, (2) ‘rectangular’ or ‘compressed’ survivorship
curves (Eakin and Witten 1995a), and (3) death rate
or hazard curves characterized by low initial mor-
tality followed by a sharp rise later in life (Fig. 9A).
Conversely, larger %IQRs are associated with mor-
tality that increases gradually with age (Fig. 9B).
%IQR was calculated (from the age of sexual
maturity onward) for 23 strains of laboratory mice
(inbreds, hybrids, outcross and marker stock from
experiments conducted at Argonne National Labora-
tory; Grahn 1994; Grahn et al. 1995), six different
beagle colonies from six different laboratories (data
derived from the National Radiobiological Archive
maintained by the Department of Energy; Thomson
1989), the control population from an intensively
scrutinized epidemiological study of human females
(radium dial painters; Mullner 1999), and other human
data (by gender and racial group) for the United States
in 1996. The results are presented graphically for fe-
males (Fig. 10A) and males (Fig. 10B) separately.
The data for laboratory animals and the human epi-
demiological study (radium dial painter controls) were
based on individual death times. As such, %IQR is
subject to sampling error depending on the cohort si-
zes and the degree of censoring by extrinsic deaths.
Uncertainty in these estimates is described by 95%
confidence limits derived from the percentile boot-
strap method (Efron and Tibshirani 1993) with 1000
bootstrap replicates. Except for the dial painter con-
trols, the %IQR estimates for humans came from life
tables in 1-year age intervals (NCHS 1999) partitioned
into three broad racial groups: white, black, and
‘other’. No information on the uncertainty of these
values was available, thus no confidence intervals are
provided. However, in order to aid visual comparison
with animal values, a dashed horizontal line was put
on the graphs to delineate the range of values derived
from the NCHS data for humans.
As a whole, the %IQR values seem clustered in the
vicinity of 20–30%. Mortality that is completely
age-independent (i.e., conforms to an exponential
distribution) would have a %IQR equal to 158.5%.
Thus, %IQR values that are one-fifth to one-eighth
smaller than this value suggest that intrinsic mortality
for all three species is strongly age-dependent. %IQR
values appear to reach a minimum around 16–20%.
While this taxonomically diverse group is not nec-
essarily representative of all mammals, this ‘bot-
toming-out’ effect suggests that there may be a limit
on how compressed intrinsic deaths can be around
their median. Further, while some of this presumed
limit to compression can be attributed to the genetic
heterogeneity produced by sexual reproduction, it is
notable that genetically identical mouse strains are
exhibiting a similar compression. To put this com-
pression in context, a %IQR = 20 implies that half of
the intrinsic deaths (beyond sexual maturity) will
occur within –10% of the median age at death.
The three human racial groups in the 1996 data are
all near this 20% lower limit for %IQR. Interestingly,
this apparent lower limit to mortality compression
also applies to the control population of female dial
painters, a cohort whose lives straddled the boundary
between the 19th and 20th century. The remarkable
similarity between these two populations is interest-
ing because the more recent population has benefited
from interventions for intrinsic diseases that were not
available to the women in the dial painter study. One
possible explanation for this unanticipated similarity
is the ‘healthy worker effect’ that often arises in
epidemiological studies where the control group is
Biogerontology (2006) 7: 183–198 193
123

healthier than an otherwise comparable group drawn
from the general population. Although definitive
conclusions cannot be drawn from such a limited
sample of human variation, these results provide an
initial prediction that a typical intrinsic mortality
signature for humans who survive beyond the age of
sexual maturity will be characterized by a %IQR in
the range of 19–23%.
The median %IQR levels for the six beagle
populations of either sex are nearly identical to
those of the human racial groups. Although the
variation among dog populations is slightly greater
than that among human groups, the greater sampling
error in the dog data may account for much of the
observed inter-population variation. The one excep-
tion is the female population from the Colorado
Smaller IQRAge
Su
rvio
rsh
ip:
S(t
)
0.0
0.2
0.4
0.6
0.8
1.0
Mortality(Hazard)
Rate
Median
T25T75
S(t)
Larger IQR
Age
Su
rviv
ors
hip
: S
(t)
0.0
0.2
0.4
0.6
0.8
1.0
Mortality(Hazard)
Rate
Median
T25T75
S(t)
A
B
Fig. 9 Plots demonstrating
the survivorship and
mortality characteristics of
hypothetical populations
having either a smaller A or
larger B IQR (T25 and T75
are the 25th and 75th
percentiles of age)
194 Biogerontology (2006) 7: 183–198
123
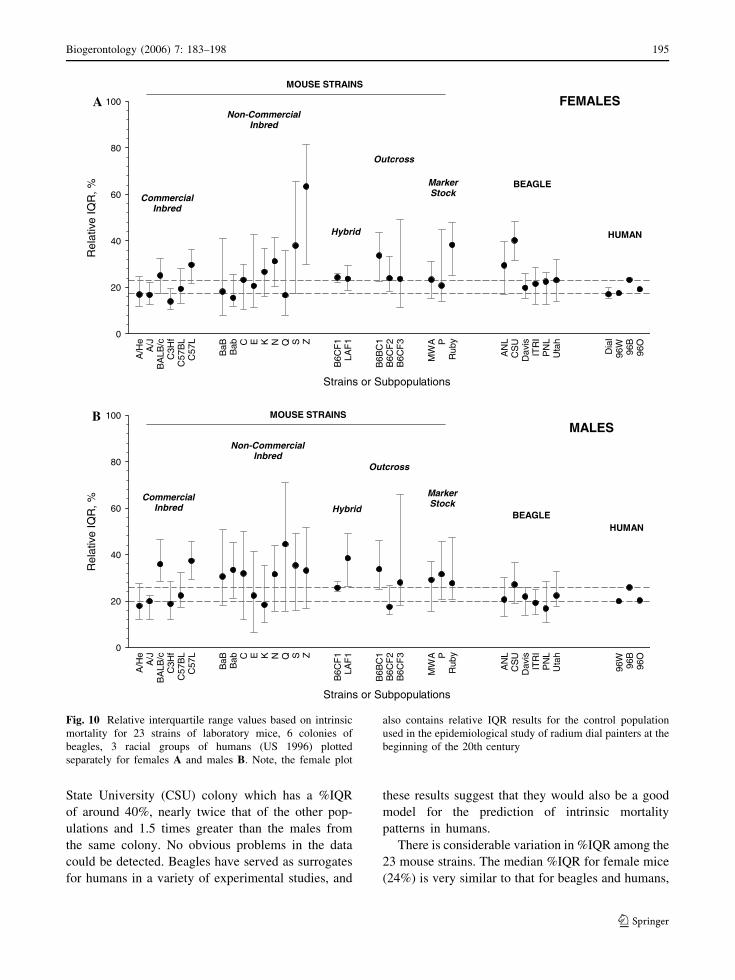
State University (CSU) colony which has a %IQR
of around 40%, nearly twice that of the other pop-
ulations and 1.5 times greater than the males from
the same colony. No obvious problems in the data
could be detected. Beagles have served as surrogates
for humans in a variety of experimental studies, and
these results suggest that they would also be a good
model for the prediction of intrinsic mortality
patterns in humans.
There is considerable variation in %IQR among the
23 mouse strains. The median %IQR for female mice
(24%) is very similar to that for beagles and humans,
FEMALES
Strains or Subpopulations
A/H
eA
/JB
ALB
/cC
3Hf
C57
BL
C57
L
BaB Bab C E K N Q S Z
B6C
F1
LAF
1
B6B
C1
B6C
F2
B6C
F3
MW
A PR
uby
AN
LC
SU
Dav
isIT
RI
PN
LU
tah
Dia
l96
W96
B96
O
Rel
ativ
e IQ
R, %
0
20
40
60
80
100
HUMAN
BEAGLE
MOUSE STRAINS
CommercialInbred
Hybrid
Outcross
MarkerStock
Non-CommercialInbred
MALES
Strains or Subpopulations
A/H
eA
/JB
ALB
/cC
3Hf
C57
BL
C57
L
BaB Bab C E K N Q S Z
B6C
F1
LAF
1
B6B
C1
B6C
F2
B6C
F3
MW
A PR
uby
AN
LC
SU
Dav
isIT
RI
PN
LU
tah
96W
96B
96O
Rel
ativ
e IQ
R, %
0
20
40
60
80
100
HUMANBEAGLE
MOUSE STRAINS
CommercialInbred Hybrid
Outcross
MarkerStock
Non-CommercialInbred
A
B
Fig. 10 Relative interquartile range values based on intrinsic
mortality for 23 strains of laboratory mice, 6 colonies of
beagles, 3 racial groups of humans (US 1996) plotted
separately for females A and males B. Note, the female plot
also contains relative IQR results for the control population
used in the epidemiological study of radium dial painters at the
beginning of the 20th century
Biogerontology (2006) 7: 183–198 195
123
but the value for their male counterparts (31%) is
higher. There were 18 strains (13 female, 5 male) out
of the 46 possible strain/sex combinations with %IQR
values within the range observed for humans and
beagles, and only five instances (two female, three
male) where the confidence intervals for mice failed to
fall within this range. The size of the confidence
intervals suggests that most of the apparent variation
observed for the mice could be due to sampling error.
Finally, the significant positive association between
%IQR and the length of its confidence interval
(r = 0.55, P < 0.0001) is expected since larger
%IQR indicates greater variation in death times that,
in turn, translates into greater uncertainty for the sta-
tistic used to measure the variation.
On balance, a strong age-dependence for intrinsic
mortality characterized by a relative IQR near 20%
is shared by humans, beagles and a considerable
number of mouse strains. A few beagle populations
and several mouse strains have higher %IQR levels,
but they still fall within the range of 30–40%. It
would be interesting to know whether these rela-
tively less compressed mortality patterns provide
information about the true variation of intrinsic
mortality profiles or whether they are merely
experimental anomalies. If the former is true, this
could provide insight into the variation expected of
analogous human populations.
Discussion
Mortality partitions have been the focus of this paper.
There are a nearly unlimited number of ways to
partition mortality. We have chosen to partition total
mortality into intrinsic and extrinsic causes of death
using historically accepted concepts with roots that
can be traced to the origins of numerical efforts to
study the age-determined loss of what scientists many
years ago called ‘‘vital force’’ (Olshansky and Carnes
1997). A perfect classification of causes into extrinsic
and intrinsic categories is not attainable. However,
instead of focusing on the imperfection of the parti-
tion, the important issue is whether analyses using an
imperfect partition provide more useful insights into
senescent-determined mortality than analyses based
on total mortality that ignore cause of death (Carey
2003; Carnes 2004). In this context, uncertainties
become a statement of present knowledge and a
source of future improvement rather than a reason for
rejecting all mortality partitions.
In this paper, we discussed the theoretical rationale
and illustrated the quantitative value of partitioning
all-cause mortality into intrinsic and extrinsic com-
ponents. Our goal for this partition was to achieve a
better approximation of the mortality consequences
of causes of death that arise from the progressive
inability of organisms to maintain their biological
integrity. Although our focus was on intrinsic mor-
tality, we are not implying that extrinsic causes of
death are unimportant. In fact, we called attention to
the central role that extrinsic mortality (e.g., preda-
tion, infectious disease) has played in molding the
biology of species, especially aspects that affect rates
of development and life span determination. On a
much shorter time scale, the mortality and morbidity
consequences of extrinsic causes of death are also of
great interest to epidemiologists, actuaries, and
demographers.
Focusing on the intrinsic component of our mor-
tality partition enabled us to demonstrate that death
rates for intrinsic mortality declined by a nearly
uniform 50% across all ages between 1950 and 2000
in a heterogeneous human population. Intrinsic dis-
eases were not cured during this time interval, nor
could the basic biology of the population have
changed over such a brief period of time. Although
successful medical interventions and better lifestyle
choices could account for these desirable changes to
the intrinsic mortality signature, the key question is
whether the changes are permanent or ephemeral.
Medical interventions that delay death by suppressing
symptoms do not necessarily affect the actual rate of
progression of the underlying disease. Similarly, the
avoidance of deleterious behaviors that elevate
intrinsic mortality risks is not the same as lowering
the intrinsic risks that would apply in their absence.
Although interventions like these that do not affect
the underlying causes of intrinsic disease can appear
to alter the mortality signature, it would revert back
to its fundamental form (the one existing under ideal
conditions and without interventions) in their ab-
sence. Conversely, interventions that alter the
underlying pathogenesis of intrinsic disease processes
could transform the fundamental intrinsic mortality
signature into a new form by providing a degree of
control over the previously immutable determinants
of health and longevity.
196 Biogerontology (2006) 7: 183–198
123

Another implication of this perspective is that
intrinsic diseases are manifestations of senescence,
not its cause (Hayflick 2000). In order to modify the
fundamental intrinsic mortality signature of humans,
the internal (i.e. physical and genetic) senescent
processes themselves must be altered. However, as of
now, no one knows how to stop or reverse the process
of senescence, and experts disagree over whether it
can be slowed (Olshansky et al. 2002). Further, even
the interventions proposed by those who think
senescence can be slowed (e.g., caloric restriction
mimetics) are not yet available. Once again, this logic
suggests that the observed intrinsic signature would
revert to its original form in the absence of inter-
ventions. The improbability of this scenario is why
scaling, mortality comparisons and interspecies pre-
dictions of mortality is a subject worthy of scientific
pursuit. If measures of shape for intrinsic mortality
are similar among species, as illustrated in this paper,
then scaled intrinsic signatures for appropriately se-
lected laboratory animals may provide an estimate for
the fundamental intrinsic signature of humans. The
difference between the observed intrinsic signature
for humans and the more unperturbed signature
estimated from the animal data provides an estimate
of the survival time that has been manufactured for
humans as well as a useful unit of mortality for
exploring the life-saving potential of future inter-
ventions.
Our analyses also revealed differences in intrinsic
mortality that exist by gender and between subgroups
within humans as well as differences that remain
between species after adjusting for differences in life
span (Fig. 10). Differences between genders illustrate
the well-known loss of detail (confounding) that can
occur when data are aggregated over what epidemi-
ologists call effect modifiers (Kleinbaum et al. 1982;
Kier and Witten 2005). Reproductive biology drives
evolutionary theories of senescence and gender dif-
ferences in that biology suggests that each sex should
have its own intrinsic mortality signature.
The variation in %IQR for mice (strains of Mus
musculus) and beagles almost certainly reveals
(within a context of sampling error) information on
the genetic plasticity of those species, and the
uncertainties of their intrinsic mortality signatures.
The human data, however, are simply too aggregated
to speculate on the meaning or significance of the
observed variation. Thus, it appears that while an
aggregate intrinsic mortality signature may have
appealing mathematical properties, it is likely to
sacrifice information on uncertainties (variation) that
could be important in predicting mortality across
species.
Ever since Gompertz, scientists have speculated
that common age patterns of death could be observed
and used to inform both the actuarial and biological
sciences about the mortality of senescence. By
merging the theoretical predictions about the timing
of death from evolutionary biology; the empirical
observations of death from demographers and actu-
aries; and the pathobiology of cause of death from the
pathologists, we have attempted to refine our under-
standing of what many scientists have observed for
centuries––namely, that similarities exist among
patterns of intrinsic deaths (largely senescent-deter-
mined) across many forms of life. It is this similarity
that brings predictability (Carnes et al. 1998, 2003b).
We suggest that a biologically motivated partitioning
of mortality into extrinsic and intrinsic causes of
death provides not only a conceptual framework, but
also a biological rationale and methodology for
making quantitative comparisons of mortality
between populations separated by time, location, or
species taxonomy. As such, intrinsic mortality
provides a needed conceptual bridge between biology
and the statistics of mortality.
Acknowledgments We would like to express our apprecia-
tion to Dr. Fletcher Hahn from the Lovelace Respiratory
Research Institute for providing the Institute’s data on dogs and
his advice on pathology issues. We would also like to thank
Dr. Douglas Grahn for his insights on the animal studies.
Funding for Dr. Carnes was provided by the National Aero-
nautics and Space Administration (NAG9-1518) and the
National Institute on Aging (NIA, 7 K02 AG000979-06). Drs.
Olshansky and Witten were funded by the National Institute on
Aging (K02 AG00785-05) and (R01 AG11079 and the Nathan
and Ethel Shock Memorial Aging Foundation) respectively.
References
Benjamin B (1959) Actuarial aspects of human lifespans. In:
Wolstenholme GEW, O’Connor M (eds) CIBA founda-
tion colloquia on ageing, vol 5. Little Brown, Boston
Bodenheimer FS (1938) Problem of ANIMAL ECOLOGY.
Oxford University Press, Oxford
Bourgeois-Pichat J (1978) Future outlook for mortality decline
in the world. Popul Bull United Nations 11:12–41
Brown JH, West GB (eds) (2000) Scaling in biology. Oxford
University Press, Oxford
Biogerontology (2006) 7: 183–198 197
123

Carey JR (2003) Longevity: the biology and demography of
life span. Princeton University Press, Princeton
Carey JR, Liedo P, Orozco D, Vaupel JW (1992) Slowing of
mortality rates at older ages in large medfly cohorts.
Science 258:457–463
Carnes BA, Olshansky SJ (1993) Evolutionary perspectives on
human senescence. Popul Dev Rev 19:793–806
Carnes BA (2004) Darwinian bodies in a Lamarkian world.
The Gerontologist 44:274–279
Carnes BA, Olshansky SJ (1997) A biologically motivated
partitioning of mortality. Exp Gerontol 32(6):615–631
Carnes BA, Olshansky SJ (2001) Heterogeneity and its bio-
demographic implications for longevity and mortality.
Exp Gerontol 36:419–430
Carnes BA, Olshansky SJ, Grahn D (1996) Continuing the
search for a law of mortality. Popul Dev Rev 22:231–264
Carnes BA, Olshansky SJ, Grahn D (1998) An interspecies
prediction of the risk of radiation-induced mortality. Ra-
diat Res 149:487–492
Carnes BA, Olshansky SJ, Grahn D (2003a) Biological evi-
dence for limits to the duration of life. Biogerontology
4(1):31–45
Carnes BA, Grahn D, Hoel D (2003b) Mortality of atomic-
bomb survivors predicted from laboratory animals. Radiat
Res 160:159–167
Carnes BA, Nakasato YR, Olshansky SJ (2005) Medawar
revisited: unresolved issues in research on ageing. Ageing
Horizons 3:22–27
Clarke RD (1950) A bio-actuarial approach to forecasting rates
of mortality. Proceed Cent Assem Inst Act 2:12–27
de Finetti B, Rossi C (1982) Bio-mathematical models of
mortality. In: Samuel H Preston (ed) Biological and social
aspects of mortality and length of life. Ordina Editions,
Liege (Belgium)
Deevey ES Jr (1947) Life tables for natural populations of
animals. Q Rev Biol 22:283–314
Eakin T, Witten M (1995a) How square is the survival curve of
a given species? Exp Gerontol 30(1):33–64
Eakin T,Witten M (1995b) A gerontological distance metric for
analysis of survival dynamics. Mech Aging Dev 78:85–101
Efron B, Tibshirani RJ (1993) An introduction to the bootstrap.
Chapman & Hall, London, 436 pp
Elandt-Johnson RC, Johnson NL (1980) Survival models and
data analysis. John Wiley and Sons, NY
Fukui HH, Xiu L, Curtsinger JW (1993) Slowing of age-spe-
cific mortality rates in Drosophila melanogaster. Exp
Gerontol 28:585–599
Gompertz B (1825) On the nature of the function expressive of
the law of human mortality and on a new mode of
determining life contingencies. Philos Trans R Soc Lond
115:513–585
Grahn D (1994) Studies of acute and chronic radiation injury at
the Biological and Medical Research Division, Argonne
National Laboratory, 1953–1970: Description of individ-
ual studies, data files, codes, and summaries of significant
findings. Chicago: ANL-94/26
Grahn D, Wright BJ, Carnes BA, Williamson FS, Fox C (1995)
Studies of acute and chronic radiation injury at the
Biological and Medical Research Division, Argonne
National Laboratory, 1970–1992: The Janus Program:
Survival and Pathology Data. Chicago: ANL-95/3
Hayflick L (2000) The future of ageing. Nature 408:267–269
Hirsch HR, Liu X, Witten TM (2000). Mortality-rate cross-
overs and maximum lifespan in advantaged and dis
advantaged populations: accelerated-mortality and sud-
den-death models. J Theor Biol 205:171–180
Kier LB, Witten TM (2005) Cellular automata models of com-
plex biochemical systems. In: Bonchev D, Rouvray DH
(eds) Complexity in chemistry, biology and ecology.
Springer Science+Business Media, NY
Kirkwood TBL, Holliday FRS (1979) The evolution of ageing
and longevity. Proc R Soc Lond B 205:97–112
Kleinbaum DG, Kupper LL, Morgenstern H (1982) Epidemi-
ologic research: principles and quantitative methods. Van
Nostrand Reinhold Company, NY
Mackenbach JP, Bouvier-Colle MH, Jougla E (1990)
‘‘Avoidable’’ mortality and health-services: a review of
aggregate data studies. J Epidemiol Commun Health
44:106–111
Makeham WM (1867) On the law of mortality. J Inst Actuaries
13:325–358
McGinnis JM, Foege WH (1993) Actual causes of death in the
United States. JAMA 270:2207–2212
Medawar PB (1952) An unsolved problem of biology. Lewis,
London
Mullner R (1999) Deadly glow: the radium dial workers
tragedy. American Public Health Association
NCHS [National Center for Health Statistics] (2002) Deaths:
final data for 2000. National Vital Statistics Reports
50(15). National Center for Health Statistics, Hyattsville,
MD. Table 11
NOVS [National Office of Vital Statistics] (1954) Vital Sta-
tistics of the United States. 1950, vol I. US Government
Printing Office, Washington D.C. Table 8.43
NCHS [National Center for Health Statistics] (1998) Technical
appendix. Vital statistics of the United States, vol II,
mortality, part A. Public Health Service, Washington
NCHS [National Center for Health Statistics] (1999) Public use
data file documentation. Multiple cause of death for ICD-
9 1996 data. U.S. Department of Health and Human
Services, Centers for Disease Control and Prevention,
Hyattsville, Maryland
Olshansky SJ, Carnes BA (1997) Ever since Gompertz.
Demography 34: 1–15
Olshansky SJ, Carnes BA, Grahn D (1998) Confronting the
boundaries of human longevity. Am Sci 86:52–61
Olshansky SJ, Hayflick L, Carnes BA et al (2002) Position
statement on human aging. Journal of Gerontology: Bio-
logical Sciences 57A(8):B1–B6
Pearl R (1921) A biological classification of the causes ofdeath. Metron 1:92–99
Shryock HS, Siegel JS, Associates (1975) The methods and
materials of demography, vol 2. U.S. Dept. of Commerce,
Bureau of the Census, U.S. Govt. Printing Office: Wash-
ington, DC
Stearns SC, Ackermann M, Doebeli M (1998) The experi-
mental evolution of aging in fruitflies. Exp Gerontol
33:785–792
Thomson RC (1989) Life-span effects of ionizing radiation in
the Beagle Dog. PNL-6822 UC-408. Pacific Northwest
Laboratory, Richland, WA
198 Biogerontology (2006) 7: 183–198
123