Neutrino oscillations in Caianiello's quantum geometry model
Upload
independentCategory
view
2download
0
Development/Plasticity/Repair
Developmental Tuning and Decay in Senescence ofOscillations Linking the Corticospinal System
Sara Graziadio,1 Anna Basu,1 Leo Tomasevic,3 Filippo Zappasodi,2,3,4 Franca Tecchio,3,4,5 and Janet A. Eyre1
1Developmental Neuroscience, Institute of Neuroscience, Newcastle University, Newcastle upon Tyne NE1 4LP, United Kingdom, 2Department of ClinicalSciences and Bioimaging, “G. D’Annunzio” University, 66013 Chieti-Pescara, Italy, 3Istituto di Scienze e Tecnologie della Cognizione, National Council forResearch, 00186 Rome, Italy, 4Associazione Fatebenefratelli per la Ricerca, Center of Medical Statistics and Information Technology, Fatebenefratelli Hospital, 00186Rome, Italy, and 5Casa di Cura San Raffaele Cassino e Istituto di Ricovero e Cura a Carattere Scientifico, San Raffaele Pisana, 00163 Rome, Italy
There is increasing evidence of the importance of synchronous activity within the corticospinal system for motor control. We comparedoscillatory activity in the primary sensorimotor cortex [EEG of sensorimotor cortex (SMC-EEG)] and a motor neuronal pool [surfaceelectromyogram of opponens pollicis (OP-EMG)], and their coherence in children (4 –12 years of age), young adults (20 –35 years of age),and elderly adults (�55 years of age). The ratio between lower (2–13 Hz) and higher (14 –32 Hz) frequencies in both SMC-EEG andOP-EMG decreased with age, correlating inversely with motor performance. There was evidence for larger, more distributed corticalnetworks in the children and elderly compared with young adults. Corticomuscular coherence (CMC) was present in all age groups andshifted between frontal and parietal cortical areas. In children, CMC was smaller and less stationary in amplitude and frequency than inadults. Young adults had single peaks of CMC clustered near the modal frequency (23 Hz); multiple peaks with a broad spread offrequencies occurred in children and the elderly; the further the frequency of the maximum peak CMC was from 23 Hz, the poorer theperformance. CMC amplitude was inversely related to performance in young adults but was not modulated in relation to performance inchildren and the elderly. We propose that progressive fine-tuning of the frequency coding and stabilization of the dynamic propertieswithin and between corticospinal networks occurs during adolescence, refining the capacity for efficient dynamic communication inadulthood. In old age, blurring of the tuning between networks and breakdown in their integration occurs and is likely to contribute to adecrement in motor control.
IntroductionDetailed studies of task-related changes in the firing of cortico-spinal neurons provide clear evidence of their individual partic-ipation in movement control and reveal the central role of thecorticomotoneuronal projection in fractionated movements ofintrinsic hand muscles (Matsunami and Hamada, 1983; Lemonet al., 1986; Lemon and Mantel, 1989; Crutcher and Alexander,1990; Porter and Lemon, 1993; Bennett and Lemon, 1996;Lemon, 1997). The sensorimotor cortex (SMC) and spinal motorneuronal pools have oscillating networks that display task-dependent phase locking in beta frequencies (Rossignol and Dubuc,1994; Baker et al., 1997; Brown et al., 1998; Hari and Salenius, 1999;Kilner et al., 1999; Mima and Hallett, 1999b; Nistri et al., 2006;Szurhaj and Derambure, 2006). Corticomuscular coherence (CMC)is mediated via fast-conducting corticomotoneuronal projections(Baker et al., 2003) and is related to performance, the degree of
attention, and the precision required in manual tasks (Kristeva-Feigeet al., 2002; Kristeva et al., 2007). Increased coherence is observedafter learning a new task (Perez et al., 2006) and following musclefatigue (Tecchio et al., 2006). These studies provide evidence thatsynchronization of the oscillations in the beta frequency band be-tween corticospinal neurons and spinal alpha motor neurons pro-vides a mechanism for efficient corticomuscular coupling.
Control of fine finger movements matures in adolescence(Garvey et al., 2003) and deteriorates during healthy aging (Incelet al., 2009). At these ages, major changes occur in the cortex,spinal motoneuronal pools, and corticospinal tract. Sensorimo-tor cortex synaptic density decreases markedly in adolescenceand plateaus in young adulthood before a further progressivereduction in synaptic density begins in the fourth decade(Huttenlocher, 1979, 1990; Huttenlocher and Dabholkar, 1997;Dickstein et al., 2007). Intracortical inhibition is not mature untiladulthood and is reduced in the elderly (Peinemann et al., 2001;Mall et al., 2004; Walther et al., 2009). The morphological prop-erties of alpha-motoneurons and their excitatory and inhibitorycontrol mature during development and are altered in the elderly(O’Sullivan et al., 1991; Erim et al., 1999; Mc Donough et al.,2001; Mentis et al., 2002; Furlan et al., 2007; Carlin et al., 2008;Sibilla and Ballerini, 2009). Finally, both the diameter and excit-ability of corticospinal axons increase during adolescence (Eyre etal., 1991; Muller and Homberg, 1992) while white matter hyper-intensities within the corticospinal tract become prevalent in old
Received Nov. 13, 2009; revised Jan. 4, 2010; accepted Jan. 11, 2010.This work was supported by the Wellcome Trust and by the European Community’s Seventh Framework Pro-
gramme under Grant Agreement No. 200859. We thank Dr. Giovanni Assenza and P. Matilde Ercolani for theirexcellent clinical and technical support.
This article is freely available online through the J Neurosci Open Choice option.Correspondence should be addressed to Prof. Janet A. Eyre, Developmental Neuroscience, Sir James Spence
Institute of Child Health, Royal Victoria Infirmary, Queen Victoria Road, Newcastle upon Tyne NE1 4LP, UK. E-mail:[email protected].
DOI:10.1523/JNEUROSCI.5621-09.2010Copyright © 2010 the authors 0270-6474/10/303663-12$15.00/0
The Journal of Neuroscience, March 10, 2010 • 30(10):3663–3674 • 3663

age (Moscufo et al., 2009). All thesechanges are likely to influence oscillatoryactivity and the integrity of corticospinallinkage.
Our aims were to explore changes withage in oscillatory activity in the sensori-motor cortex and spinal cord and theintegrity of corticospinal linkage. Our hy-potheses are: (1) changes in the power andfrequency of oscillations will occur fromchildhood to adulthood, reflecting matu-ration and increased specification of cor-ticospinal neural networks, and will beassociated with the stabilization of corti-cospinal linkage; (2) senescent changes inpower and frequency reflect dedifferenti-ation of the neural assemblies and will beassociated with destabilization of cortico-spinal linkage; (3) age-related changes inoscillatory activity and CMC will be re-lated to motor performance.
Materials and MethodsOur aim was to study children who were �3years of age but preadolescent (4 –12 years ofage, when synapse number plateaus) and el-derly adults (�55 years of age), comparing their data to those of youngadults (20 –35 years of age), who we assume reflect a mature corticospinalsystem that is not yet altered by senescent changes. We studied the oscil-latory behavior of the sensorimotor cortex and spinal alpha motoneu-rons and CMC during a simple motor task: steady isometric contractionof opponens pollicis during a pinch grasp. This task was chosen because:(1) it is known to involve the corticomotoneuronal system (Kuypers,1962; Lawrence and Kuypers, 1968; Lawrence and Hopkins, 1976); (2)even very young subjects perform pinch grasps regularly in everydayactivities, reducing the potential confounding effect of differential learn-ing of a new task among age groups; and (3) sensorimotor cortex oscil-latory synchrony in the 15–30 Hz range and CMC have been shown to bemaximal during the steady-hold period of a pinch grip (Baker et al., 1997;Kilner et al., 1999; Kilner et al., 2002).
The approval of the local ethics committees and informed consentfrom the subjects and the parents of the children were obtained.
SubjectsRecordings were made from 12 children (6 female; mean age, 8.4 years;age range, 4 –12 years), 10 young adults (5 female; mean age, 25 years; agerange, 21–35 years), and 10 elderly adults (7 female; mean age, 64 years;age range, 55– 80 years); the data from 2 children, 2 young adults, and 1elderly adult were subsequently excluded from the analysis because ofexcessive artifacts. All were right-handed [Edinburgh Manuality Test(Oldfield, 1971); mean, 83; range, 70 –100]. None of the subjects had ahistory of a neurological disorders, and all were healthy at the time of theassessments.
Experimental procedureAll subjects sat comfortably in a chair with their arms supported, flexed atthe elbow, and with the forearm semipronated. They were instructed tomaintain a steady, low level of isometric contraction of right opponenspollicis (ROP) by opposition of the right thumb and index finger againstresistance of a compliant object. The task was first demonstrated to sub-jects, and they were instructed to give a gentle but steady squeeze. Partic-ular care was taken to ensure that all the subjects, including the youngestsubjects, understood the task. Since attention to a task modulates CMC(Kristeva et al., 2007), an experimenter sat near the subjects for the du-ration of the data collection, taking particular care that the subject waspaying attention to the task. This simple and short motor task was also
chosen because it does not require a high level of attention for long timeperiods. Visual feedback of the power of contraction was not providedbecause our aim was to assess changes with age in the corticospinal sys-tem. Deficits in visuomotor integration in the elderly are a critical factorin the age-related deterioration in the steadiness of isometric force pro-duction (Vaillancourt et al., 2003; Labyt et al., 2004); therefore, addingvisual feedback would have introduced a confounding factor for com-parisons across age groups. Periods of continuous contraction were keptbrief to avoid fatigue (Tecchio et al., 2006). Periods of rest were alsorecorded from each subject. We collected at least 120 s of contraction and120 s of rest, and included in the analysis only subjects with a minimumof 90 s of artifact-free data in each condition (Fig. 1).
Neurophysiological recordingsElectroencephalography (EEG) and electromyography (EMG) were re-corded simultaneously using Ag/AgCl electrodes, bandpass filtered be-tween 0.48 and 256 Hz, sampled at 1024 Hz, and stored on computer foroff-line processing.
ElectroencephalographyEEG was recorded using either a Micromed System Plus SAM32 (Mi-cromed) for the recordings of the elderly, or a Neuroscan Synamps Sys-tem (Compumedics Neuroscan) for the recording of children and youngadults. The montage comprised 29 channels (FP2, FP1, F8, F4, Fz, F3, F7,FC6, FC2, FC1, FC5, T4, C4, Cz, C3, T3, CP6, CP2, CP1, CP5, T6, P4, Pz,P3, T5, PO4, PO3, O2, and O1) positioned accordingly to the 10 –20International EEG system (Jasper, 1958). For children �8 years of age, a12-channel montage was used (F4, Fz, F3, C4, Cz, C3, P4, Pz, P3, O2, Oz,and O1). A linked mastoid reference and a ground positioned medio-frontally were used.
ElectromyographyEMG indirectly assesses the oscillatory activity of the spinal motor neu-ronal groups, since a spinal motoneuron and the corresponding musclefibers form a motor unit with 1:1 correspondence of their action poten-tials (McAuley et al., 1997). EMG was recorded using surface-mountedelectrodes from ROP (ROP-EMG) and left OP (LOP-EMG) to controlfor possible mirroring of the contraction.
Data analysisSensorimotor cortex activity identificationThe main cortical component of activity, which is synchronous withrhythmic motor-unit firing, is generated in the primary sensorimotor
Figure 1. SMC-EEG and EMG activity at rest and during right hand contraction. Paradigmatic examples in: a child 8 years of age,a young adult 22 years of age, and an elderly adult 75 years of age. The top section was recorded while the subject was at rest, andthe lower section while contracting ROP. The upper two traces for each section are bipolar derivation SMC signals on the left(LSMC-EEG, black line) and on the right (RSMC-EEG, red line). The third and fourth traces are EMG signals recorded from ROP andLOP. The scale bar represents 50 �V for EEG and 200 �V for EMG. While only the LSMC-EEG is suppressed during contraction in theyoung adult, there is bilateral suppression of the LSMC-EEG and RSMC-EEG in the child and in the elderly adult, and no overt activityin LOP-EMG.
3664 • J. Neurosci., March 10, 2010 • 30(10):3663–3674 Graziadio et al. • Tuning Corticospinal System Oscillations

cortex (Brown, 2000; Gerloff et al., 2006). We exploited this property toidentify the bipolar derivation most representative of sensorimotor cor-tical activity by searching for the derivation showing maximal coherencewith muscular activity (CMC). A previous study found that currentsource density was preferable for the estimation of CMC (Mima andHallett, 1999a); however, it is well recognized that the Laplacian estima-tion is dependent on the number of recording electrodes (Nunez andSrinivasan, 2006), and its use is recommended for montages with �64electrodes. When using a more limited number of electrodes, such as wedid, bipolar recordings have been shown to be the best option to improvethe spatial resolution of the EEG (Andrew and Pfurtscheller, 1996; Nunezand Srinivasan, 2006). In agreement with this finding, a preliminaryanalysis of our data confirmed that bipolar derivations were more sensi-tive to CMC than Laplacian derivations, or using average or linked mas-toid referencing (Fig. 2 A). Using bipolar derivations, the peak value ofthe CMC was found to be dependent on the orientation of the electrodepair (Fig. 2 B). Thus, the four topographic maps were built, each con-structed using bipolar pairs separated by �20% of the inion–nasiondistance and oriented on one of the four axes: the medial to lateral;anterior to posterior; and both diagonals (anteromedial to posterolateraland anterolateral to posteromedial). Maximum CMC was found mostcommonly in electrode pairs, typically including C3, oriented along theanterior–posterior axis and/or along the anteromedial-to-posterolateralorientation. This was the case in 19 subjects, who concurrently showednegligible CMC along the other two axes (Fig. 2 B). In the remaining eightsubjects, CMC was maximal in the mediolateral axis and negligible in theother three directions. No subject showed significant CMC along theanterolateral to posteromedial axis.
The bipolar derivation over the left (contralateral) hemisphere show-ing maximum CMC with ROP-EMG was identified, and this electrodepair was used for further analysis [left sensorimotor cortex EEG (LSMC-EEG)]. To investigate possible bilateral sensorimotor cortex involvementin the unimanual task and interhemispheric asymmetries, EEG was alsoanalyzed from the right (ipsilateral) sensorimotor cortex (RSMC-EEG).When significant CMC was observed between ROP-EMG and electrodesover the right SMC, the bipolar derivation showing maximal CMC was
used; otherwise, the electrode pair homologous to that considered overthe left SMC was used.
Estimation of power spectral density and CMCWe set a fixed time period to calculate the rest and contraction powerspectral densities (PSDs) and CMCs as these estimates depend on thenumber of averages. Thus, a 90 s period was analyzed in each subject,which we will call the “whole-period analysis” (Fig. 3).
The transition periods between rest and contraction were disregarded(0.5 s). Periods containing saturated channels were rejected. An indepen-dent component analysis was used, when required, to remove artifactswithout trial exclusion. Right and left SMC-EEG and rectified EMG sig-nals from ROP and LOP were segmented into epochs of 512 ms andHanning-windowed to control spectral leakage (Terry and Griffin,2008), and the Welch procedure (Welch, 1967) with 50% overlap wasused. The PSD depends on the number of synchronously oscillatingneurons and their degree of synchrony at a defined frequency. Power wasestimated in the frequency bands (Niedermeyer, 1998) delta/theta (2–7Hz), alpha (8 –13 Hz), beta (14 –32 Hz), low gamma (33– 46 Hz), andhigh gamma (54 –100 Hz), and were normalized by the number of fre-quency points in each band. In the statistical analysis of SMC-EEG, thedata for the gamma frequency band were not considered because gammaactivity most often appears as bursts of short duration (usually �200 ms),especially during the stationary conditions of rest and sustained isometriccontraction that we were studying (Crone et al., 1998; Donoghue et al.,1998); the PSD analysis, which averages multiple windows of 512 ms, isnot suitable to study transient gamma activity. Furthermore, at rest cor-tical gamma activity is poorly represented (Donoghue et al., 1998), andduring a steady contraction it is not observed in all subjects even usingevent-related synchronization analysis on data recorded with subduralelectrodes (Crone et al., 1998). The gamma frequency bands were in-cluded in the EMG analysis as surface EMG is sensitive to activity in thesebands.
To investigate the relative power of low versus high frequencies in theSMC-EEG and ROP-EMG, we calculated the ratio of lower to higherfrequency power (2–13 Hz/14 –32 Hz).
The power of the surface EMG depends on muscle bulk and the degreeof subcutaneous fat, both of which vary systematically with age (Kuikenet al., 2003; Wehrli et al., 2007). Therefore, in addition to the absoluterectified ROP-EMG PSD, we also analyzed the relative power of therectified ROP-EMG in each of the frequency bands, calculated by divid-ing the power in each frequency band by the total power in the wholerange (2–100 Hz).
CMC was estimated using the methods of Terry and Griffin (2008).The upper 95% confidence limit for a CMC of zero was used todetermine significant results (Terry and Griffin, 2008). The frequencyand amplitude of the significant CMC peaks were determined. Fortopographical purposes, in each subject CMC spectra were also esti-mated between the ROP-EMG and all EEG bipolar derivations in thedirection selected by the maximal CMC procedure described above.
Stationarity of CMC: “sliding window analysis”To investigate the stationarity of CMC in each age group, we used se-quential overlapping time periods, which we will call the “sliding windowanalysis.” Each window comprised 30,720 data points (�30 s), which wasthen advanced by 10,240 points, thereby providing between 7 and 13values for each subject (Fig. 4 A). A 30 s window was used since this hasbeen shown to be the minimum time to provide reliable coherence values(Terry and Griffin, 2008). For stationarity estimate, we used the bipolarderivation with maximal CMC selected for the whole-period analysis, asabove (Fig. 4C).We recorded the amplitude and frequency of the maxi-mum peak of CMC for each window, as illustrated in Figure 4; with thismethod, we were able to estimate three indicators for lack of stationarity:the coefficient of variation of the amplitude and the frequency of theCMC peak, and the proportion of the total windows without significantCMC. Finally, since the sliding window analysis commonly revealed ashift of maximum CMC between a more frontal and a more parietalbipolar derivation, as for example in Figure 4 A, we evaluated a furtherindex of nonstationarity, the “index of spatial shifting.” Although the
Figure 2. CMC and its properties. A, Comparison of the CMC spectra obtained usingLaplacian transformation or different referencing methods, demonstrating higher CMCderived from a bipolar derivation. B, Comparison of the effect on CMC of different orien-tations of the bipolar derivations centered on FC3. On the left, CMC spectra (C3–F3, con-tinuous line; FC1–FC5, dashed line). On the right, the topographic distribution of CMC inthe beta band in the anterior–posterior (continuous line) and medial–lateral (dashedline) directions. For the topographic distribution, the color scale gives CMC values 0 – 0.2.The dotted horizontal line in all the CMC spectra indicates the 95% confidence level for aCMC significantly different from zero. Topographic distributions were realized with EE-GLAB software (Delorme and Makeig, 2004), considering the coordinates of the electrodein the 5–10 system (Oostenvelda and Praamstrac, 2001) corresponding to the midpointbetween the two bipolar derivations and using the CMC values in the frequency band inwhich maximum values were observed.
Graziadio et al. • Tuning Corticospinal System Oscillations J. Neurosci., March 10, 2010 • 30(10):3663–3674 • 3665
amplitude of the peak of the CMC averagedover all the sliding windows was always highestin the bipolar derivation used to identify thesensorimotor cortex, for some subjects thepeak amplitude of the CMC was maximal inthe second, more parietal derivation in a pro-portion of windows. The index of spatial shift-ing was then estimated as the proportion of thetotal windows in which CMC was maximal in asecond bipolar derivation. To exclude poten-tial contamination of volume conduction,CMC in the second derivation was consideredsignificant only if the peak amplitude washigher than in the derivation indicated by thewhole-period analysis in at least one slidingwindow (Fig. 4). For example, for the subjectillustrated in Figure 4, we selected the bipolarderivation indicated in Fig. 4C with the whitecircle to identify the sensorimotor cortex,which is the derivation with maximal averageCMC (0.09); the derivation indicated with thered circle was the second bipolar derivationsince it had the next highest CMC from whole-period analysis (0.06). Since the CMC washigher in this second derivation (red circle) forfive windows (first three and last two windows)and the total number of windows was 10, theindex of spatial shifting for this subject was 0.5.
Thus, for all indices high values are asso-ciated with more variable CMC (in ampli-tude, frequency, and position) and lowerstationarity.
Motor performance indexSince we required isometric contractions, weused the coefficient of variation of the ampli-tude of the rectified EMG as our performanceindicator. The performance index (PI) was es-timated as follows:
PI � 1 �SD(EMGRect)
mean(EMGRect).
For small muscles, such as OP with narrow motor unit recruitmentand force ranges, the relation between force and the average rectifiedvalue of surface EMG is linear (Lawrence and De Luca, 1983; Basmajian andDe Luca, 1985; Solomonow et al., 1990). To confirm this also holdstrue for the coefficient of variation of the EMG and that of the forcegenerated, we compared the PI estimated from the rectified ROP-EMG tothe PIPressure estimated as the coefficient of variation of the pressuregenerated in a subgroup of our subjects (13 subjects; age range, 6 – 80years) performing the same task (Fig. 5A). Pressure was estimatedusing a pressure sensor (40PC100G1A, Honeywell Sensing and Con-trol) connected with the compliant object used during the task. Theperformance index (PIPressure) was estimated as follows:
PIPressure � 1 �SD(Pressure)
mean(Pressure).
Statistical analysisAll analyses were performed using SPSS version 15 (SPSS). The SMC-EEG PSD, ROP-EMG PSD, and CMC peak frequency and amplitudewere normally distributed (Kolmogorov–Smirnov test, p � 0.20); thus, ageneral linear model ANOVA was used. The models for the analysis werehypothesis driven and therefore, when relevant, a one-tailed test of sig-nificance was applied. Significance level was set at p � 0.05, with fullBonferroni correction for multiple comparisons. A Greenhouse–Geissercorrection was applied if the sphericity assumption for ANOVA wasviolated. Since the aim of the study was to investigate age-related effects,
all models included age (child, young adult, elderly adult) as the between-subject factor.
Changes with age in power and frequency of oscillations (fromwhole-period analysis)Sensorimotor cortex EEG activity. A repeated-measures ANOVA was ap-plied to SMC-EEG power values and to the ratio of lower to higherfrequencies (2–13 Hz/14 –32 Hz), including in the model for both anal-yses Hemisphere (contralateral, ipsilateral), and condition (rest, contrac-tion), and, for SMC-EEG power values only, frequency (delta/theta,alpha, beta) as within-subject factors.
EMG activity. Repeated-measures ANOVAs were applied to the absolutepower and to the relative power for ROP-EMG, including frequency (delta/theta, alpha, beta, low gamma, and high gamma) as a within-subject factorfor both and Side (right, left) as a within-subject factor for the absolute EMGpower analysis. The ratio of lower to higher frequencies of the ROP-EMGpower (2–13 Hz/14–32 Hz) was analyzed using a univariate ANOVA.
Changes with age in CMC and its stationarityCMC (from whole-period analysis). A multivariate ANOVA was applied tothe amplitude and frequency of the maximum contralateral CMC peak.
Stationarity of CMC (from sliding window analysis). Since the data werenot normally distributed, the Kruskal–Wallis test (three independent sam-ples) was applied to the coefficient of variation of the amplitude and fre-quency of the contralateral CMC peak in each window, to the proportion oftime windows without significant CMC and to the index of spatial shifting.
PerformanceComparison between PI and PIPressure. Intersubject and intrasubject com-parisons were performed: a one-tailed Pearson correlation between themean PI and mean PIpressure for each subject was applied for the inter-
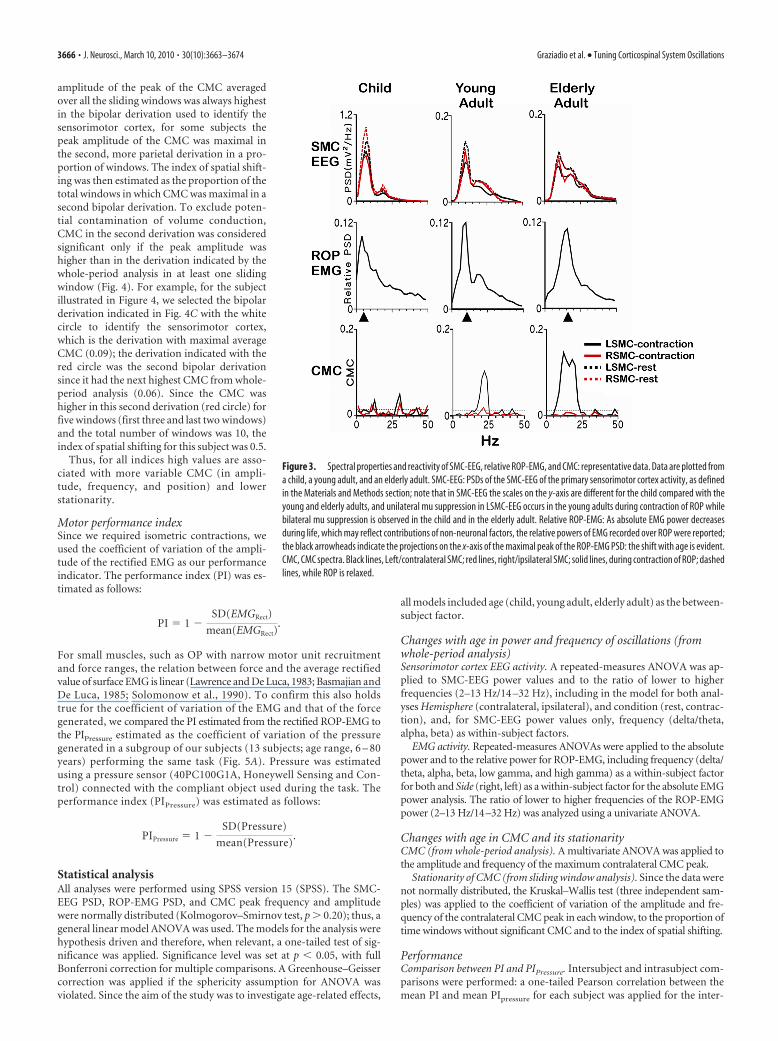
Figure 3. Spectral properties and reactivity of SMC-EEG, relative ROP-EMG, and CMC: representative data. Data are plotted froma child, a young adult, and an elderly adult. SMC-EEG: PSDs of the SMC-EEG of the primary sensorimotor cortex activity, as definedin the Materials and Methods section; note that in SMC-EEG the scales on the y-axis are different for the child compared with theyoung and elderly adults, and unilateral mu suppression in LSMC-EEG occurs in the young adults during contraction of ROP whilebilateral mu suppression is observed in the child and in the elderly adult. Relative ROP-EMG: As absolute EMG power decreasesduring life, which may reflect contributions of non-neuronal factors, the relative powers of EMG recorded over ROP were reported;the black arrowheads indicate the projections on the x-axis of the maximal peak of the ROP-EMG PSD: the shift with age is evident.CMC, CMC spectra. Black lines, Left/contralateral SMC; red lines, right/ipsilateral SMC; solid lines, during contraction of ROP; dashedlines, while ROP is relaxed.
3666 • J. Neurosci., March 10, 2010 • 30(10):3663–3674 Graziadio et al. • Tuning Corticospinal System Oscillations

subject analysis; for the intrasubject analysis a univariate ANOVA of theindividual values for each brief period of contraction was used withsubject as a random factor.
Relationship between PI and other neurophysiological variables (fromwhole-period analysis). For those variables in which a significant age effectwas demonstrated, we evaluated their correlation with PI pooling all thegroups together. We used a Pearson correlation controlling for age. When
overall relationship with PI was found, we evalu-ated the relationship with PI separately withineach group to investigate whether a specific agegroup was driving the relationship.
Relationship between PI and other neurophys-iological variables (from sliding window analy-sis). When no overall relationship with PI wasfound in the intersubject analysis, an intrasu-bject analysis on the data derived from the slidingwindow analysis was performed to determinewhether different relationships occurred withineach age group. For this latter analysis, a univari-ate ANOVA including subject as random factorand age as fixed factor was undertaken.
ResultsThe mean and SEs of the relevant data areshown in the figures or are reported in thetext. The main effects (or trends) and sig-nificant interactions revealed by the fullmodel ANOVAs are reported in Table 1.
Changes in SMC-EEG PSD with ageThe full ANOVA model of the SMC-EEGactivity indicated the main factor age asthe strongest effect, “surviving” all inter-action factors (Table 1, Fig. 6A). Childrenhad higher power than both young andelderly adults ( p � 0.001 for both). Thesignificant interaction factor frequency*age
(Table 1), indicated that activity in different bands contributeddifferently to the age effect, and we therefore performed reducedANOVA models in each frequency band (with conditions andhemispheres still included as within-subject factors). There wasan age effect for both delta/theta ( p � 0.001) and alpha ( p �0.001) frequency bands, where power was always higher in chil-
Figure 4. CMC time variability studied by the sliding window analysis. A, Topographic distribution of CMC in the beta band using bipolar derivations in the anterior–posterior axis (see Materialsand Methods). B–D, The arrow on the bottom gives the color coding for the spectra obtained in consecutive time windows (graphed in B and D) from bipolar derivation indicated in C, where thetopographic distribution of CMC is estimated using the whole-period analysis. The shift in the site of maximum CMC over time is evident. Note that during some time windows (black arrowheads),maximally during the “brown” window, CMC is higher parietally than frontally, implying that the CMC from the sensory cortex is not simply attributable to volume conduction.
Figure 5. Comparison of PI and PIPressure. A, ROP-EMG (in black) and pressure traces (in red) in one representative subject. Thegreen line shows the periods of isometric contraction selected for the analyses. B, C, Intersubject comparison (B) and intrasubjectcomparison (C). The same color represents the same subject in B and C.
Graziadio et al. • Tuning Corticospinal System Oscillations J. Neurosci., March 10, 2010 • 30(10):3663–3674 • 3667
dren than in young and elderly adults (young adults: delta/theta,p � 0.001; alpha, p � 0.004; elderly adults: delta/theta, p � 0.001;alpha, p � 0.001). In the beta band, there was a trend toward anage effect ( p � 0.053) corresponding to higher values in childrenthan young adults ( p � 0.059). The decrease in power betweenchildren and young adults was greater in lower than in higherfrequencies (Fig. 6A). To have an estimate of this, we calculatedthe ratio of power in lower to higher frequencies (2–13 Hz/14 –32Hz) and confirmed an age effect (repeated-measures ANOVA,Table 1) with children having higher ratios than both youngadults ( p � 0.05; children, 19.9 � 2.5; young adults, 10.2 � 2.8)and elderly adults ( p � 0.002; elderly adults, 5.6 � 2.7), and nodifference between condition and hemisphere was found.
The full ANOVA model of the SMC-EEG activity also revealeda clear hemisphere effect (Table 1, Fig. 6A) that we investigatedfurther. A reduced model considering rest data revealed the in-teraction age*hemisphere ( p � 0.012), corresponding to rightSMC-EEG power being higher than left in children (paired sam-ple t test, p � 0.015), a trend in young adults ( p � 0.10) and nosignificant difference in elderly adults ( p � 0.44).
Changes with age in SMC-EEG suppression duringROP contractionSuppression of alpha and beta frequency oscillations (murhythm) is an indicator of sensorimotor cortex activation duringmovement (Pfurtscheller and Berghold, 1989) and, consistentwith this, there was a condition effect for the alpha and beta bandsonly ( p � 0.05) in SMC-EEG power (Fig. 3, SMC-EEG, shows an
example). We therefore estimated mu (alpha and beta) reactivityusing the equation, reactivity � (rest � contraction)/rest; nor-malization for rest power values was applied to control for theage-dependent interhemispheric asymmetry of SMC-EEG powerat rest. Repeated-measures ANOVA revealed an age*hemisphereinteraction for mu reactivity (Table 1). As expected in youngadults during contraction of ROP, suppression of both alpha andbeta oscillations was greater in the contralateral/LSMC-EEG thanin the ipsilateral/RSMC-EEG ( p � 0.050 for both alpha andbeta). This was not the case in children and elderly adults wherethe contralateral/LSMC-EEG and the ipsilateral/RSMC-EEGwere suppressed to an equal degree during contraction of ROP( p � 0.20) for both age groups (Figs. 1, 3, 6A).
Changes in OP-EMG PSD with ageAs expected for an attempted unilateral contraction of ROP therewas a main effect for side (Table 1), with more activity in ROP-EMG than in LOP-EMG in each frequency. We performed areduced model considering LOP-EMG PSD only to look for apossible age effect in the incidence of mirrored EMG activity.There was no age effect ( p � 0.25) or age*frequency interactions( p � 0.2), indicating that, even if mirrored EMG activity didoccur occasionally, its incidence was similar across all age groups.
There were clear age effects in absolute ROP-EMG power,which decreased with age. The reduction was significant in thelower frequencies (delta/theta, p � 0.030; alpha p � 0.049) andthere was a trend in the higher frequencies (beta, p � 0.104; lowgamma, p � 0.105; high gamma, p � 0.129). The reduction inpower observed across all frequencies is likely to reflect, at least inpart, systematic changes with age in muscle bulk and the thick-ness of subcutaneous fat and there may also be a contribution tothe absolute power from cross talk from other adjacent muscles,which may be greater in children (Kuiken et al., 2003; Wehrli etal., 2007). The relative power of ROP-EMG in each frequencyband was therefore investigated.
A shift toward the higher frequencies from childhood to oldage, which was observed in the SMC-EEG, was also found in therelative ROP-EMG power (Fig. 3, ROP EMG, and Fig. 6B), asevidenced by the interaction factor age*frequency (Table 1). Posthoc comparisons in each frequency band showed higher relativepower in the delta/theta frequency band in children comparedwith both young ( p � 0.013) and elderly adults ( p � 0.001) (Fig.6B, delta/theta). In the alpha band, higher relative power wasobserved in young adults compared with elderly adults ( p �0.008) (Fig. 6B, alpha). Elderly adults had higher relative EMGpower activity in the beta (14 –32 Hz) (Fig. 6B, beta) and the lowgamma (33– 46 Hz) frequency bands compared with youngadults ( p � 0.001 for both) and children ( p � 0.001 for both).No significant differences between groups were found in the highgamma frequency band. Reflecting the shift toward higher fre-quencies with increasing age, the frequency at which the highestpeak in the PSD was observed increased significantly with age(children, 4.6 � 0.42 Hz; young adults, 9.5 � 0.82 Hz; elderlyadults, 18.6 � 0.92 Hz; p � 0.001) (Fig. 3, ROP-EMG). All posthoc comparisons between age groups were significant (childrenvs young adults, p � 0.001; children vs elderly adults, p � 0.001;young adults vs elderly adults, p � 0.001).
Finally, we calculated the ratio of relative power in lower tohigher frequencies (2–13 Hz)/ (14 –32 Hz) of the ROP-EMG(children, 1.22 � 0.15; young adults, 1.07 � 0.11; elderly adults,0.49 � 0.03), and a repeated-measures ANOVA revealed an ageeffect (Table 1), with no difference between children and young
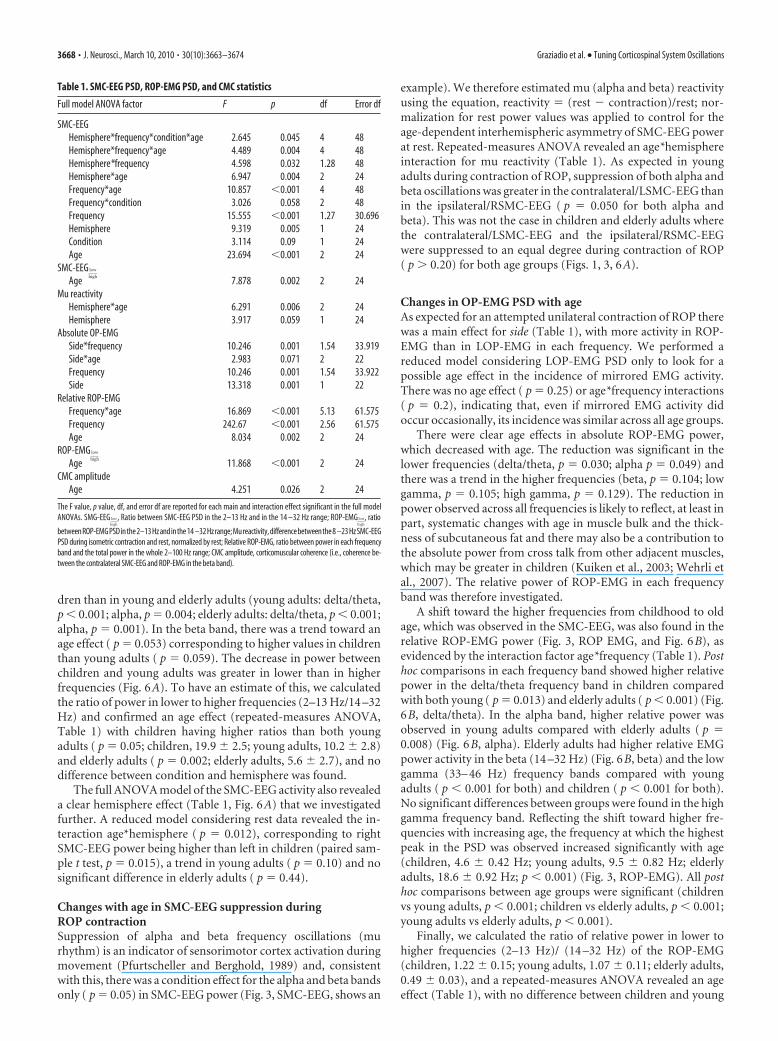
Table 1. SMC-EEG PSD, ROP-EMG PSD, and CMC statistics
Full model ANOVA factor F p df Error df
SMC-EEGHemisphere*frequency*condition*age 2.645 0.045 4 48Hemisphere*frequency*age 4.489 0.004 4 48Hemisphere*frequency 4.598 0.032 1.28 48Hemisphere*age 6.947 0.004 2 24Frequency*age 10.857 �0.001 4 48Frequency*condition 3.026 0.058 2 48Frequency 15.555 �0.001 1.27 30.696Hemisphere 9.319 0.005 1 24Condition 3.114 0.09 1 24Age 23.694 �0.001 2 24
SMC-EEG low
highAge 7.878 0.002 2 24
Mu reactivityHemisphere*age 6.291 0.006 2 24Hemisphere 3.917 0.059 1 24
Absolute OP-EMGSide*frequency 10.246 0.001 1.54 33.919Side*age 2.983 0.071 2 22Frequency 10.246 0.001 1.54 33.922Side 13.318 0.001 1 22
Relative ROP-EMGFrequency*age 16.869 �0.001 5.13 61.575Frequency 242.67 �0.001 2.56 61.575Age 8.034 0.002 2 24
ROP-EMG low
highAge 11.868 �0.001 2 24
CMC amplitudeAge 4.251 0.026 2 24
The F value, p value, df, and error df are reported for each main and interaction effect significant in the full modelANOVAs. SMG-EEG low
high
, Ratio between SMC-EEG PSD in the 2–13 Hz and in the 14 –32 Hz range; ROP-EMG low
high
, ratio
betweenROP-EMGPSDinthe2–13Hzandinthe14 –32Hzrange;Mureactivity,differencebetweenthe8 –23HzSMC-EEGPSD during isometric contraction and rest, normalized by rest; Relative ROP-EMG, ratio between power in each frequencyband and the total power in the whole 2–100 Hz range; CMC amplitude, corticomuscular coherence (i.e., coherence be-tween the contralateral SMC-EEG and ROP-EMG in the beta band).
3668 • J. Neurosci., March 10, 2010 • 30(10):3663–3674 Graziadio et al. • Tuning Corticospinal System Oscillations

adults ( p � 1) but a significantly lower ratio in the elderly than inyoung adults ( p � 0.006) and children ( p � 0.001).
Changes in CMC with ageContralateral CMC amplitudeIn the whole-period analysis all subjects showed significant CMCbetween left SMC-EEG and ROP-EMG. ANOVA revealed a maineffect of age on the amplitude of the peak of CMC (Table 1); posthoc comparisons showed that the peak amplitude of CMC inchildren was smaller than for the young adults ( p � 0.035) (Fig.6C). To investigate whether the reduced amplitude of CMC ob-served in children reflected a lack of stationarity, we evaluated thevariability of CMC with the sliding window analysis. The meanCMC amplitude for all the sliding windows was considerablyabove the significance level of 0.024 in all age groups (0.039 �0.02 in children, 0.078 � 0.04 in the young and 0.066 � 0.05 inthe elderly adults; the mean value included all windows, not justwindows with significant CMC). Although significant contralat-eral CMC was present in the majority of windows for all subjects(mean proportion of significant windows; 0.80 � 0.14), the am-plitude showed large fluctuations over time within subjects,dropping below significance level in some windows (Figs. 4, 7show examples). The proportion of windows without significantCMC was different between the 3 age groups ( p � 0.005) (Fig.8A), with children having more windows without significantCMC than young adults ( p � 0.001) and with the elderly show-ing a trend in the same direction ( p � 0.059). The coefficient of
variation of the amplitude of CMC peak was not significantlydifferent between age groups, since the fluctuation in amplitudeof the CMC peak was large even in the young adults ( p � 0.650)(Fig. 8B).
As already mentioned in the methods, we observed that thepeak of CMC moved dynamically between the bipolar derivationidentified in the whole-period analysis to a second more parietalderivation (Figs. 4, 7). This was observed in all three age groupsand the index of spatial shifting did not show any difference withage ( p � 0.315) (Fig. 8C).
Contralateral CMC peak frequencyThe peak of maximum CMC occurred within the beta frequencyband for all young adults, for 8 of 10 children and for 8 of 9 elderlyadults. Two of the children and one of the elderly adults showedmaximum CMC in the alpha frequency band. All young adultshad a relatively narrow, single peak of significant CMC; six el-derly adults and six children had secondary, smaller peaks ofsignificant CMC (Fig. 3, CMC). One elderly subject had a thirdCMC peak. The modal frequency for the peak of CMC for theyoung adult subjects was 23 Hz (Fig. 6D). There was a significantdifference between the age groups in the distributions of the fre-quency of the maximum CMC peak. The frequency of the CMCpeak for young adults clustered close to the overall modal fre-quency while for children and elderly adults there was a broadspread of frequencies (Fig. 6D) (� 2 test applied to the proportionof subjects below and above 23 Hz; 3 � 2 contingency table;
Figure 6. Spectral properties of SMC-EEG, ROP-EMG, and CMC: group data. A, PSD of SMC-EEG. Filled circles, During contraction; open circles, during rest; black circles, contralateral SMC; redcircles, ipsilateral SMC; children, C; young adults, YA; elderly adults, EA. B, Relative PSD of EMG recorded from ROP. C, The amplitude of the significant CMC peaks. The data are grouped intodelta/theta, alpha, and beta frequency bands. The circles and error bars represent means and SEMs, except for CMC in the alpha frequency band, where individual values are plotted, and in the betafrequency band, where data for the ipsilateral SMC are individual values. D, The frequency of the significant CMC peaks in the three age groups. The frequencies are grouped in 4 Hz blocks, and thefrequencies on the x-axis represent the first frequency of the block; thus, for example, the first block includes all the subjects with CMC peak frequency in the range 11–14 Hz. Black bars representthe maximum peak within the frequency block; hashed bars, the secondary peak within the frequency block; crossed bars, the tertiary peak within the frequency block. The dashed line indicates themodal value for the frequency of CMC in young adults.
Graziadio et al. • Tuning Corticospinal System Oscillations J. Neurosci., March 10, 2010 • 30(10):3663–3674 • 3669

p � 0.001). From the sliding window analysis, we derived thecoefficient of variation of the frequency of the maximum CMCpeak, which was dependent on age ( p � 0.032) with the childrenshowing a significantly higher coefficient than the young adults( p � 0.004) (Fig. 8D).
Performance indexComparison of PI with PIPressure
ROP-EMG and pressure in a representative subject are shown inFigure 5A. Between 7 and 11 values were estimated in each subjectfor the intrasubject correlation. A significant linear relationshipwas found between PI and PIPressure both for the intersubject( p � 0.012, r � 0.621) (Fig. 5B) and the intrasubject ( p � 0.001,B � 0.438) (Fig. 5C) analyses; the intrasubject analysis revealedthat 8 of 13 subjects had individually significant correlations.
Relationship between PI and central and peripheralneurophysiological variablesSMC-EEGThe ratios of the power in low to high frequencies (2–13 Hz/13–32 Hz) in SMC-EEG, during both rest and contraction, wereinversely correlated to PI (rest: p � 0.017, r � �0.416; contrac-tion: p � 0.017, r � �0.415). This relationship was mainly drivenby the children, since the correlations were significant onlywithin the group of the children (rest: p � 0.031, r � �0.641;contraction: p � 0.006, r � �0.789) whereas in the adult groupsthe correlation was not significant (rest: p � 0.114, r � �0.319;contraction: p � 0.189, r � �0.237).
Mu activity power (power in the alpha and beta bandsummed) in the left SMC at rest was inversely correlated with PI( p � 0.036, r � �0.358). This relationship was driven mainly bythe elderly adults with a significant correlation observed onlywithin this age group ( p � 0.013, r � �0.731).
ROP-EMGLow and high gamma power in the relative EMG were both cor-related with PI (low gamma: p � 0.046, r � 0.338; high gamma:p � 0.001, r � 0.651). The ratio of lower to higher frequencies(2–13 Hz/13–32 Hz) in the ROP-EMG was inversely correlatedwith PI ( p � 0.001, r � �0.651), and there was no differencebetween age groups.
CMCFrom the whole-period analysis, a negative relationship wasfound between PI and the difference between the frequency of themaximum CMC peak in each subject and the modal value foryoung adults, i.e., 23 Hz ( p � 0.036, r � �0.351).
Although no intersubject relationship was found between theamplitude of CMC and PI, the coefficient of variation of the CMCpeak amplitude was positively correlated with PI ( p � 0.020, r �0.404). To investigate the latter finding further, we studied theintrasubject relationship between the amplitude of CMC and PIusing the sliding window analysis; a significant interaction age*PIwas revealed ( p � 0.008). In the reduced model by age, there wasan inverse relationship between the peak amplitude of CMC andPI in the young adults (B � �0.963, p � 0.003) with five of eight
Figure 7. CMC time behavior in the three age groups. Representative illustrations of the topographic distributions of CMC estimated using the sliding window analysis (first 4 rows, vertical arrowindicates successive 30 s time windows) compared with the whole-period analysis (last row). CMC in the beta frequency band is plotted from two children (8 and 12 years of age), two young adults(21 and 22 years of age), and two elderly adults (80 and 73 years of age). The color scale indicates CMC values 0 – 0.1 for children and 0 – 0.2 for young and elderly adults. Presence of spatial shiftingis illustrated in one of the subjects in each age group and the figures also illustrate larger networks in the children and the elderly than in young adults.
3670 • J. Neurosci., March 10, 2010 • 30(10):3663–3674 Graziadio et al. • Tuning Corticospinal System Oscillations

subjects showing individually significant negative relationshipsbetween CMC and PI (Fig. 9B). There was no significant relation-ship in the elderly ( p � 0.403), but three subjects did show indi-vidually significant negative relationships (Fig. 9C). Similarly,although there was not significant relationship for the children( p � 0.788) (Fig. 9A), the two oldest children had individuallysignificant negative relationships between CMC and PI.
Other findingsIpsilateral corticomuscular coherenceCMC ipsilateral to ROP was observed in four children, threeyoung adults, and five elderly adults with the whole-period anal-ysis (Figs. 3, CMC, and 7 show examples). Ipsilateral CMC oc-curred typically at similar frequencies to contralateral CMC, inparticular within the beta frequency band for two children, threeyoung adults, and four elderly adults, and in the alpha frequencyfor two children and one elderly adult.
The subjects with ipsilateral CMC did not show a significantlydifferent performance from the subjects without ipsilateral CMC[p � 0.704, ANOVA with between-subject factor: ipsilateralCMC (present/not present)].
The relationship between SMC-EEG and ROP-EMGWhereas no correlation between the ROP-EMG and SMC-EEGactivity in the delta/theta, alpha or beta band was found, therewas a significant correlation between the ratio of the power oflower to higher frequencies (2–13 Hz/13–32 Hz) in the SMC-
EEG and in ratio for the relative power ofthe ROP-EMG (after correcting for ageand PI, p � 0.039; r � 0.358).
DiscussionChanges in power and frequencyof oscillations from childhoodto adulthoodA striking decrease in SMC-EEG power oc-curred between childhood and adulthood,more evident at low frequencies (delta to al-pha bands). It is a limitation of our study,however, that because of the technical limi-tations of EEG recording and our analysis,frequencies higher than beta could not beinvestigated. During adolescence, the num-ber of cortical synapses decreases substan-tially (Huttenlocher and Dabholkar, 1997);with no large-scale neuronal loss, reducedconnectivity between neurons must occur.Resting state functional connectivity MRIconfirms reduction in strongly correlated,cortical connections between childhoodand adulthood (Fair et al., 2007). The higherpower of the SMC-EEG in childhood islikely therefore to reflect greater, nonspe-cific neuronal connectivity, leading to a highdegree of synchrony in neural oscillations.Our observation of bilateral mu suppressionin children performing a simple unilateraltask is indicative also of a more distributedneural network and is consistent with func-tional MRI studies showing more diffusecortical activation in children (Muller et al.,1998).
The decrease in oscillatory power be-tween childhood and adulthood was not
distributed equally across frequencies but was most marked inthe lower frequencies (delta/theta and alpha). Thus the ratio ofpower in lower versus higher frequencies (2–13 Hz/14 –32 Hz)decreased significantly from childhood to adulthood. We pro-pose that the relative preservation of power in the higher fre-quencies reflects maturation of intracortical inhibition duringadolescence since the capacity for synchronous beta and gammaoscillations is largely determined by the temporal and spatial dy-namics of inhibitory input to the network (Pauluis et al., 1999;Mall et al., 2004). A shift toward higher frequencies was alsoobserved in the relative power of ROP-EMG, which may reflectchanges in oscillatory activity in the SMC-EEG, mediated by cor-ticospinal input to spinal motoneuronal pools. Indeed, whilethere was no correlation between the absolute power in eachfrequency between EEG and EMG, we found a significant corre-lation between the ratio of the power in lower and higher fre-quencies in the SMC-EEG and the same ratio in the relativepower of the ROP-EMG. However, the capacity for spinal mo-toneuronal pools to oscillate at higher frequencies is also depen-dent upon fast synaptic inhibition and developmental changes inthe pattern of spinal inhibition will also influence their intrinsicoscillatory activity and may account, at least in part, for the fre-quency shift (O’Sullivan et al., 1991; Mc Donough et al., 2001;Furlan et al., 2007; Sibilla and Ballerini, 2009).
The combination of focused connectivity and the capacity tooscillate at higher frequencies are markers for maturation of neu-
Figure 8. Stationarity of CMC in the three age groups derived from the sliding window analysis. A, Proportion of time windowswithout significant CMC. B, The coefficient of variation (CV) of the amplitude of the CMC peak. C, D, The index reflecting the spatialshifting of the CMC peak (C) and the coefficient of variation (CV) of the frequency of the CMC peak (D). Lack of CMC stationarity isevident in all age groups, but most marked in children.
Figure 9. Intrasubject relationship between CMC and performance. A–C, The residuals from the mean value of PI and CMC foreach subject: children (A); young adults (B); and elderly adults (C). Within each graph, the same color represents the same subject.The colored lines indicate individually significant relationships between PI and CMC. The filled symbols indicate significant CMC,and the open symbols CMC values, which are not significant at the 95% level. Although in children (A) residuals are spread in thefour quadrants, in the young adults (B) they are tightly clustered in the first and third quadrants, and in the elderly adults (C), whenthe relationship between performance and CMC begins to break down, residuals begin again to appear in the second and fourthquadrant.
Graziadio et al. • Tuning Corticospinal System Oscillations J. Neurosci., March 10, 2010 • 30(10):3663–3674 • 3671
ronal networks. The higher the power of the mu rhythm in theLSMC-EEG and the greater the ratio of low to high frequencies inboth EEG and EMG, the poorer was the performance within thegroup of children, supporting the relevance of these processes tothe development of fine motor control of the hand.
Changes in power and frequency of oscillations in the elderlyAlthough there is no overt loss of neurons during normal aging(Haug and Eggers, 1991), the complexity of dendrite arborizationbecomes reduced (Anderson and Rutledge, 1996) and there is asignificant reduction in synaptic density (Huttenlocher, 1979).Given these changes, we anticipated further loss of EEG power inold age but, this was not observed and, if anything, there was atrend toward increased power in the beta frequency. This findingimplies that loss of synapses is counterbalanced by increasednumbers of neurons synchronously oscillating, increasing thepower observed at the scalp. In support of a larger network, bi-lateral mu suppression occurred also in the elderly adults. Thereare a myriad of studies documenting more distributed networksin old age (Ward, 2006), and there is continuing debate aboutwhether it represents functional reorganization recruiting alarger area to compensate for loss of synaptic connections or lossof specificity of neural networks in old age and thereby contrib-uting to decline in performance (Ward, 2006). In our study,higher power in the mu rhythm of LSMC-EEG was associatedwith a poorer performance in the group of elderly adults, sup-porting the latter argument.
Substantial changes occur in CMC during developmentand agingThis is the first time CMC has been demonstrated in children andin elderly adults. Beta frequency EMG-to-EMG coherence be-tween synergistic hand muscles in children has been observed(Farmer et al., 2007), but subsequently CMC was not found(James et al., 2008). However, pooled data were analyzed, whichwould obscure individually significant CMC, since the peaks inchildren are distributed over a broad range of frequencies. Further-more, EMG from forearm extensor muscles during wrist extensionwas used; the strength of EMG-to-EMG and EEG-to-EMG coher-ence follows a distal–proximal gradient, with the greatest values be-ing observed in intrinsic hand muscles (Farmer et al., 1993). Finally,synchronous beta frequency oscillations in the sensorimotor cortexoccur less frequently and are of lower amplitude during wrist exten-sion compared with tasks involving manipulation (Murthy and Fetz,1992).
While we observed CMC in children and the elderly, its char-acteristics were different from young adults. A single peak ofCMC within the beta frequency was observed in young adults,clustered close to 23 Hz; children and elderly adults often hadmultiple peaks of CMC and the frequency of maximum CMC wasmore widely dispersed and included CMC at alpha frequencies.Williams and Baker (2009) modeled the possible contribution ofrecurrent inhibition on reducing CMC at physiological tremorfrequencies. It is possible that immaturity of recurrent inhibitionor its breakdown in old age contribute to the emergence of alphafrequency CMC in childhood and old age.
The fine-tuning of the frequency of CMC within the betafrequency is likely to be functionally relevant since the degree towhich the peak of CMC deviated from 23 Hz was negativelyrelated to performance. Beta frequency oscillation has recentlyattracted attention as the coordinating frequency for large-scaleor widely separated networks because its periodicity is sufficientlylong to coordinate neuronal activity separated in time by appre-
ciable axonal conduction delays (Kopell et al., 2000). Studies inmonkeys highlight the importance of beta frequency activity tothe corticospinal system; during the steady-hold phase of a pre-cision grip, increased synchrony in the beta frequency occursacross the motor cortex (Murthy and Fetz, 1992; Baker et al.,1997; Davies et al., 2006), the modal interspike intervals of corti-cospinal axons lie in the beta frequency (Lemon and Mantel,1989), and there is preferential facilitation of spinal motoneuronsby corticospinal input within the beta frequency band (Lemonand Mantel, 1989).
CMC was considerably smaller in children compared withboth the young and elderly adults, despite higher power of alphaand beta oscillations in their EEG. The increase in the amplitudeof CMC occurring between childhood and adulthood, despite acoincidental reduction in the power of these frequencies in SMC-EEG, implies that active processes are involved in the preferentialtransfer of beta frequency oscillations to spinal motor units,which mature in adolescence (Riddle et al., 2004).
While a lack of stationarity was observed in all age groups,with significant fluctuations occurring in the site, amplitude andfrequency of the peak of CMC, this was most evident in childrenwho had high variability in the frequency of peak CMC and low-est probability of CMC in the sliding window analysis.
CMC probably reflects bidirectional sensorimotor processingThe sliding window analysis revealed that CMC shifts transientlybetween a frontal and a more parietal site, consistent with bidi-rectional sensory and motor cortical components to CMC. Os-cillations synchronized with those in EMG appear in peripheralafferents (Baker et al., 2006), spinal cord interneurons (Takei andSeki, 2008), and sensory and motor cortices (Porcaro et al., 2008),and coherence between oscillations in the primary motor andsensory cortices has been confirmed in man using magnetoen-cephalography (Porcaro et al., 2008) and epicortical recordingsusing subdural grid electrodes (Ohara et al., 2000). Furthermore,evidence for bidirectional information flow in CMC (Meng et al.,2008) supports the proposal that coherent oscillatory networksform connected loops from cortex to the periphery and back andwould be suited to proprioceptive processing during movement(Baker, 2007). We observed in young adults increased CMC whenperformance was poor, consistent with increased, probably bidirec-tional, central–peripheral coupling to correct for variability in thelevel of contraction. [This finding may appear contradictory to thepositive relationship between CMC and performance reported pre-viously (Kristeva et al., 2007). However, unlike our subjects, the sub-jects of Kristeva et al. (2007) performed a complex visuomotor task,where transient reductions in sensorimotor processing would lead toa reduced performance.] Modulation of CMC in relation to perfor-mance was not observed in the majority of elderly adults nor was itpresent in the children, except for the two oldest. The failure tomodulate CMC is likely to reflect immaturity or breakdown of pro-cesses at both the sensorimotor cortex and spinal cord destabilizingcorticospinal bidirectional loops.
ConclusionsWe have previously proposed that representation of the hand inthe human primary sensorimotor cortex is reflected in a “frequencycoding” as well as in areal-based, somatotopic representation(Tecchio et al., 2004). Furthermore, that dynamic properties of net-works such as the degree of frequency specificity and the precision ofinterregional phase locking, code for the relative importance of thenetwork in movement control (Tecchio et al., 2007). This study re-veals that it may also reflect its maturity since progressive fine-tuning
3672 • J. Neurosci., March 10, 2010 • 30(10):3663–3674 Graziadio et al. • Tuning Corticospinal System Oscillations

of the frequency coding occurs during adolescence and stabilizationof the dynamic properties of networks involved in hand control arelikely to contribute to maturation of fine motor control. In old age,blurring of the tuning between networks and breakdown in theirintegration occur and are likely to contribute to a decrement in mo-tor control.
ReferencesAnderson B, Rutledge V (1996) Age and hemisphere effects on dendritic
structure. Brain 119:1983–1990.Andrew C, Pfurtscheller G (1996) Dependence of coherence measurements
on EEG derivation type. Med Biol Eng Comput 34:232–238.Baker SN (2007) Oscillatory interactions between sensorimotor cortex and
the periphery. Curr Opin Neurobiol 17:649 – 655.Baker SN, Olivier E, Lemon RN (1997) Coherent oscillations in monkey
motor cortex and hand muscle EMG show task dependent modulation.J Physiol 501:225–241.
Baker SN, Pinches EM, Lemon RN (2003) Synchronization in monkey mo-tor cortex during a precision grip task. II. Effect of oscillatory activity oncorticospinal output. J Neurophysiol 89:1941–1953.
Baker SN, Chiu M, Fetz EE (2006) Afferent encoding of central oscillationsin the monkey arm. J Neurophysiol 95:3904 –3910.
Basmajian J, De Luca J (1985) Muscles alive: their functions revealed byelectromyography, Ed 5. Baltimore: Williams and Wilkins.
Bennett KM, Lemon RN (1996) Corticomotoneuronal contribution to thefractionation of muscle activity during precision grip in the monkey.J Neurophysiol 75:1826 –1842.
Brown P (2000) Cortical drives to human muscle: the piper and relatedrhythms. Prog Neurobiol 60:97–108.
Brown P, Salenius S, Rothwell JC, Hari R (1998) Cortical correlate of thePiper rhythm in humans. J Neurophysiol 80:2911–2917.
Carlin KP, Liu J, Jordan LM (2008) Postnatal changes in the inactivationproperties of voltage-gated sodium channels contribute to the maturefiring pattern of spinal motoneurons. J Neurophysiol 99:2864 –2876.
Crone NE, Miglioretti DL, Gordon B, Lesser RP (1998) Functional mappingof human sensorimotor cortex with electrocorticographic spectral analy-sis II: event-related desynchronization in the gamma band. Brain121:2301–2315.
Crutcher MD, Alexander GE (1990) Movement-related neuronal activityselectively coding either direction or muscle pattern in three motor areasof the monkey. J Neurophysiol 64:151–163.
Davies RM, Gerstein GL, Baker SN (2006) Measurement of time-dependentchanges in the irregularity of neural spiking. J Neurophysiol 96:906 –918.
Delorme A, Makeig S (2004) EEGLAB: an open source toolbox for analysisof single-trial EEG dynamics. J Neurosci Methods 134:9 –21.
Dickstein DL, Kabaso D, Rocher AB, Luebke JI, Wearne SL, Hof PR (2007)Changes in the structural complexity of the aged brain. Aging Cell6:275–284.
Donoghue JP, Sanes JN, Hatsospoulos NG, Gaal G (1998) Neural dischargeand local field potential oscillations in primate motor cortex during vol-untary movements. J Neurophysiol 79:159 –173.
Erim Z, Beg MF, Burke DT, de Luca CJ (1999) Effects of aging on motor-unit control properties. J Neurophysiol 82:2081–2091.
Eyre JA, Miller S, Ramesh V (1991) Constancy of central conduction delaysduring development in man: investigation of motor and somatosensorypathways. J Physiol 434:441– 452.
Fair DA, Dosenbach NU, Church JA, Cohen AL, Brahmbhatt S, Miezin FM,Barch DM, Raichle ME, Petersen SE, Schlaggar BL (2007) Developmentof distinct control networks through segregation and integration. ProcNatl Acad Sci U S A 104:13507–13512.
Farmer SF, Bremner FD, Halliday DM, Rosenberg JR, Stephens JA (1993)The frequency content of common synaptic inputs to motoneurones dur-ing voluntary isometric contraction in man. J Physiol 470:127–155.
Farmer SF, Gibbs J, Halliday DM, Harrison LM, James LM, Mayston MJ,Stephens JA (2007) Changes in EMG coherence between long and shortthumb abductor muscles during human development. J Physiol579:389 – 402.
Furlan F, Taccola G, Grandolfo M, Guasti L, Arcangeli A, Nistri A, Ballerini L(2007) ERG conductance expression modulates the excitability of ventralhorn GABAergic interneurons that control rhythmic oscillations in thedeveloping mouse spinal cord. J Neurosci 27:919 –928.
Garvey MA, Ziemann U, Bartko JJ, Denckla MB, Barker CA, Wassermann EM
(2003) Cortical correlates of neuromotor development in healthy chil-dren. Clin Neurophysiol 114:1662–1670.
Gerloff C, Braun C, Staudt M, Hegner YL, Dichgans J, Krageloh-Mann I(2006) Coherent corticomuscular oscillations originate from primarymotor cortex: evidence from patients with early brain lesions. Hum BrainMapp 27:789 –798.
Hari R, Salenius S (1999) Rhythmical corticomotor communication. Neu-roreport 10:R1–R10.
Haug H, Eggers R (1991) Morphometry of the human cortex cerebri andcorpus striatum during aging. Neurobiol Aging 12:336 –338.
Huttenlocher PR (1979) Synaptic density in the human frontal cortex—developmental changes and effects of aging. Brain Res 163:195–205.
Huttenlocher PR (1990) Morphometric study of human cerebral cortex de-velopment. Neuropsychologia 28:517–527.
Huttenlocher PR, Dabholkar AS (1997) Regional differences in synaptogen-esis in human cerebral cortex. J Comp Neurol 387:167–178.
Incel NA, Sezgin M, As I, Cimen OB, Sahin G (2009) The geriatric hand:correlation of hand-muscle function and activity restriction in elderly. IntJ Rehabil Res 32:213–218.
James LM, Halliday DM, Stephens JA, Farmer SF (2008) On the develop-ment of human corticospinal oscillations: age-related changes in EEG-EMG coherence and cumulant. Eur J Neurosci 27:3369 –3379.
Jasper R (1958) Report of committee on methods of clinical exam in EEG.Electroencephalogr Clin Neurophysiol 10:370 –375.
Kilner JM, Baker SN, Salenius S, Jousmaki V, Hari R, Lemon RN (1999)Task-dependent modulation of 15–30 Hz coherence between rectifiedEMGs from human hand and forearm muscles. J Physiol 516:559 –570.
Kilner JM, Alonso-Alonso M, Fisher R, Lemon RN (2002) Modulation ofsynchrony between single motor units during precision grip tasks in hu-mans. J Physiol 541:937–948.
Kopell N, Ermentrout GB, Whittington MA, Traub RD (2000) Gammarhythms and beta rhythms have different synchronization properties.Proc Natl Acad Sci U S A 97:1867–1872.
Kristeva R, Patino L, Omlor W (2007) Beta-range cortical motor spectralpower and corticomuscular coherence as a mechanism for effective cor-ticospinal interaction during steady-state motor output. Neuroimage36:785–792.
Kristeva-Feige R, Fritsch C, Timmer J, Lucking CH (2002) Effects of atten-tion and precision of exerted force on beta range EEG-EMG synchroni-zation during a maintained motor contraction task. Clin Neurophysiol113:124 –131.
Kuiken TA, Lowery MM, Stoykov NS (2003) The effect of subcutaneous faton myoelectric signal amplitude and cross-talk. Prosthet Orthot Int27:48 –54.
Kuypers HG (1962) Corticospinal connections: postnatal development inthe rhesus monkey. Science 138:678 – 680.
Labyt E, Szurhaj W, Bourriez JL, Cassim F, Defebvre L, Destee A, DerambureP (2004) Influence of aging on cortical activity associated with a visuo-motor task. Neurobiol Aging 25:817– 827.
Lawrence DG, Hopkins DA (1976) The development of motor control inthe rhesus monkey: evidence concerning the role of corticomotoneuronalconnections. Brain 99:235–254.
Lawrence DG, Kuypers HG (1968) The functional organization of the mo-tor system in the monkey. I. The effects of bilateral pyramidal lesions.Brain 91:1–14.
Lawrence JH, De Luca CJ (1983) Myoelectric signal versus force relation-ship in different human muscles. J Appl Physiol 54:1653–1659.
Lemon RN (1997) Mechanisms of cortical control of hand function. Neu-roscientist 3:389 –398.
Lemon RN, Mantel GW (1989) The influence of changes in the dischargefrequency of corticospinal neurones on hand muscles in the monkey.J Physiol 413:351–378.
Lemon RN, Mantel GW, Muir RB (1986) Corticospinal facilitation of handmuscles during voluntary movement in the conscious monkey. J Physiol381:497–527.
Mall V, Berweck S, Fietzek UM, Glocker FX, Oberhuber U, Walther M,Schessl J, Schulte-Monting J, Korinthenberg R, Heinen F (2004) Lowlevel of intracortical inhibition in children shown by transcranial mag-netic stimulation. Neuropediatrics 35:120 –125.
Matsunami K, Hamada I (1983) Activities of single precentral neurons ofthe monkey during different tasks of forelimb movements. Jpn J Physiol33:309 –322.
Graziadio et al. • Tuning Corticospinal System Oscillations J. Neurosci., March 10, 2010 • 30(10):3663–3674 • 3673

McAuley JH, Rothwell JC, Marsden CD (1997) Frequency peaks of tremor,muscle vibration and electromyographic activity at 10 Hz, 20 Hz and 40Hz during human finger muscle contraction may reflect rhythmicities ofcentral neural firing. Exp Brain Res 114:525–541.
Mc Donough SM, Clowry GJ, Miller S, Eyre JA (2001) Group 1a inhibitionand renshaw (recurrent) inhibition are functional in man at birth. BrainRes 899:66 – 81.
Meng F, Tong KY, Chan ST, Wong WW, Lui KH, Tang KW, Gao X, Gao S(2008) Study on connectivity between coherent central rhythm and elec-tromyographic activities. J Neural Eng 5:324 –332.
Mentis GZ, Díaz E, Moran LB, Navarrete R (2002) Increased incidence ofgap junctional coupling between spinal motoneurons following transientblockade of NMDA receptors in neonatal rats. J Physiol 544:757–764.
Mima T, Hallett M (1999a) Electroencephalographic analysis of cortico-muscular coherence: reference effect, volume conduction and generatormechanism. Clin Neurophysiol 110:1892–1899.
Mima T, Hallett M (1999b) Corticomuscular coherence: a review. J ClinNeurophysiol 16:501–511.
Moscufo N, Guttmann C, Meier D, Csapo I, Hildenbrand P, Healy B, SchmidtJ, Wolfson L (2009) Brain regional lesion burden and impaired mobilityin the elderly. Neurobiol Aging. Advance online publication. RetrievedJan. 28, 2010. doi:10.1016/j.neurobiolaging.2009.04.010.
Muller K, Homberg V (1992) Development of speed repetitive movementsin children is determined by structural changes in corticospinal afferents.Neurosci Lett 144:57– 60.
Muller RA, Rothermel RD, Behen ME, Muzik O, Mangner TJ, Chugani HT(1998) Developmental changes of cortical and cerebellar motor control:a clinical positron emission tomography study with children and adults.J Child Neurol 13:550 –556.
Murthy VN, Fetz EE (1992) Coherent 25- to 35-Hz oscillations in the sen-sorimotor cortex of awake behaving monkeys. Proc Natl Acad Sci U S A89:5670 –5674.
Niedermeyer E (1998) The normal EEG of the waking adult. In: Electroen-cephalography: basic principles, clinical applications and related fields, Ed4 (Niedermeyer E, Lopes da Silva F, eds), pp 149 –173. Baltimore: Lippin-cott Williams and Wilkins.
Nistri A, Ostroumov K, Sharifullina E, Taccola G (2006) Tuning and playinga motor rhythm: how metabotropic glutamate receptors orchestrate gen-eration of motor patterns in the mammalian central nervous system.J Physiol 572:323–334.
Nunez P, Srinivasan R (2006) Electric fields of the brain. New York: OxfordUP.
Ohara S, Nagamine T, Ikeda A, Kunieda T, Matsumoto R, Taki W, Hashimoto N,Baba K, Mihara T, Salenius S, Shibasaki H (2000) Electrocorticogram-electromyogram coherence during isometric contraction of hand muscle inhuman. Clin Neurophysiol 111:2014–2024.
Oldfield RC (1971) The assessment and analysis of handedness: the Edin-burgh inventory. Neuropsychologia 9:97–113.
Oostenveld R, Praamstra P (2001) The five percent electrode system forhigh-resolution EEG and ERP measurements. Clin Neurophysiol 112:713–719.
O’Sullivan MC, Eyre JA, Miller S (1991) Radiation of the phasic stretchreflex in biceps brachii to muscles of the arm in man and its restrictionduring development. J Physiol 439:529 –543.
Pauluis Q, Baker SN, Olivier E (1999) Emergent oscillations in a realisticnetwork: the role of inhibition and the effect of the spatiotemporal distri-bution of the input. J Comput Neurosci 6:27– 48.
Peinemann A, Lehner C, Conrad B, Siebner HR (2001) Age-related decreasein paired-pulse intracortical inhibition in the human primary motor cor-tex. Neurosci Lett 313:33–36.
Perez MA, Lundbye-Jensen J, Nielsen JB (2006) Changes in corticospinaldrive to spinal motoneurones following visuo-motor skill learning in hu-mans. J Physiol 573:843– 855.
Pfurtscheller G, Berghold A (1989) Patterns of cortical activation duringplanning of voluntary movement. Electroencephalogr Clin Neurophysiol72:250 –258.
Porcaro C, Barbi G, Zappasodi F, Rossini PM, Tecchio F (2008) Handsensory-motor cortical network assessed by functional source separation.Hum Brain Mapp 29:70 – 81.
Porter R, Lemon R (1993) Corticospinal function and voluntary move-ment. Oxford: Oxford UP.
Riddle CN, Baker MR, Baker SN (2004) The effect of carbamazepine onhuman corticomuscular coherence. Neuroimage 22:333–340.
Rossignol S, Dubuc R (1994) Spinal pattern generation. Curr Opin Neuro-biol 4:894 –902.
Sibilla S, Ballerini L (2009) GABAergic and glycinergic interneuron expres-sion during spinal cord development: dynamic interplay between inhibi-tion and excitation in the control of ventral network outputs. ProgNeurobiol 89:46 – 60.
Solomonow M, Baratta R, Shoji H, D’Ambrosia R (1990) The EMG-forcerelationships of skeletal muscle; dependence on contraction rate, andmotor units control strategy. Electromyogr Clin Neurophysiol 30:141–152.
Szurhaj W, Derambure P (2006) Intracerebral study of gamma oscillationsin the human sensorimotor cortex. Prog Brain Res 159:297–310.
Takei T, Seki K (2008) Spinomuscular coherence in monkeys performing aprecision grip. J Neurophysiol 99:2012–2020.
Tecchio F, De Lucia M, Salustri C, Montuori M, Bottaccio M, Babiloni C,Pietronero L, Zappasodi F, Rossini PM (2004) District-related fre-quency specificity in hand cortical representation: dynamics of regionalactivation and intra-regional synchronization. Brain Res 1014:80 – 86.
Tecchio F, Porcaro C, Zappasodi F, Pesenti A, Ercolani M, Rossini PM(2006) Cortical short-term fatigue effects assessed via rhythmic brain-muscle coherence. Exp Brain Res 174:144 –151.
Tecchio F, Graziadio S, Barbati G, Sigismondi R, Zappasodi F, Porcaro C,Valente G, Balsi M, Rossini PM (2007) Somatosensory dynamicgamma-band synchrony: a neural code of sensorimotor dexterity. Neu-roimage 35:185–193.
Terry K, Griffin L (2008) How computational technique and spike trainproperties affect coherence detection. J Neurosci Methods 168:212–223.
Vaillancourt DE, Larsson L, Newell KM (2003) Effects of aging on forcevariability, single motor unit discharge patterns, and the structure of 10,20, and 40 Hz EMG activity. Neurobiol Aging 24:25–35.
Walther M, Berweck S, Schessl J, Linder-Lucht M, Fietzek UM, Glocker FX,Heinen F, Mall V (2009) Maturation of inhibitory and excitatory motorcortex pathways in children. Brain Dev 31:562–567.
Ward NS (2006) Compensatory mechanisms in the aging motor system.Ageing Res Rev 5:239 –254.
Wehrli NE, Bural G, Houseni M, Alkhawaldeh K, Alavi A, Torigian DA(2007) Determination of age-related changes in structure and functionof skin, adipose tissue, and skeletal muscle with computed tomography,magnetic resonance imaging, and positron emission tomography. SeminNucl Med 37:195–205.
Welch P (1967) The use of the fast Fourier transform for the estimation ofpower spectra: a method based on time averaging over short modifiedperiodograms. IEEE Trans Audio Electroacoustic 15:70 –73.
Williams ER, Baker SN (2009) Renshaw cell recurrent inhibition improvesphysiological tremor by reducing corticomuscular coupling at 10 Hz.J Neurosci 29:6616 – 6624.
3674 • J. Neurosci., March 10, 2010 • 30(10):3663–3674 Graziadio et al. • Tuning Corticospinal System Oscillations
Copyright © 2022 FDOKUMEN