
INVESTOR PRESENTATION FY 2016-17 - Pricol
27
Copyright © PRICOL Limited Slide 1 INVESTOR PRESENTATION FY 2016-17
-
Upload
khangminh22 -
Category
Documents
-
view
1 -
download
0
Transcript of INVESTOR PRESENTATION FY 2016-17 - Pricol
Copyright © PRICOL Limited Slide 1
INVESTOR PRESENTATION FY 2016-17

This presentation has been prepared by Pricol Limited (the “Company”) solely for your information and for your use and may notbe taken away, distributed, reproduced or redistributed or passed on, directly or indirectly, to any other person (whether withinor outside your organization or firm) or published in whole or in part, for any purpose by recipients directly or indirectly to anyother person. By accessing this presentation, you are agreeing to be bound by the trailing restrictions.
This presentation does not constitute an offer or invitation to purchase or subscribe for any securities in any jurisdiction. No partof it should form the basis of or be relied upon in connection with any investment decision or any contract or commitment topurchase or subscribe for any securities. This presentation should not be copied or disseminated, in whole or in part, and in anymanner.
This presentation contains forward-looking statements based on the currently held beliefs and assumptions of the managementof the Company, which are expressed in good faith and, in their opinion, reasonable. While these forward looking statementsindicate our assessment and future expectations concerning the development of our business, a number of risks, uncertaintiesand other unknown factors could cause actual developments and results to differ materially from our expectations. Given theserisks, uncertainties and other factors, recipients of this presentation are cautioned not to place undue reliance on these forward-looking statements. The Company undertakes no obligation to update/revise these forward-looking statements to reflect futureevents, circumstances or developments.
No representation or warranty, express or implied, is made as to, and no reliance should be placed on, the fairness, quality,completeness or correctness of the information or opinions contained in this presentation. Such information and opinions are inall events not current after the date of this presentation.
DISCLAIMER

Copyright © PRICOL Limited Slide 3
CONTENTS
Introduction
• Key Stakeholders, Vision and Mission• Core Values• Company Profile• Current Geographic Presence
Business Performance – FY 2016-17• Revenue Breakup – Business Segment-wise• Revenue Breakup – Product Group-wise• Revenue Breakup – Vehicle Type-wise
Financial Performance
• Standalone Financials at a glance• Statement of Profit and Loss• Balance Sheet• Leverage Position – Standalone and Consolidated
Growth Outlook • Growth Outlook
Investor Information • Investor Information
Proposed Acquisition• About the Company• Product and Customer Profile• Key Investment Highlights
Pricol do Brasil • Restructuring Plan
Copyright © PRICOL Limited Slide 4
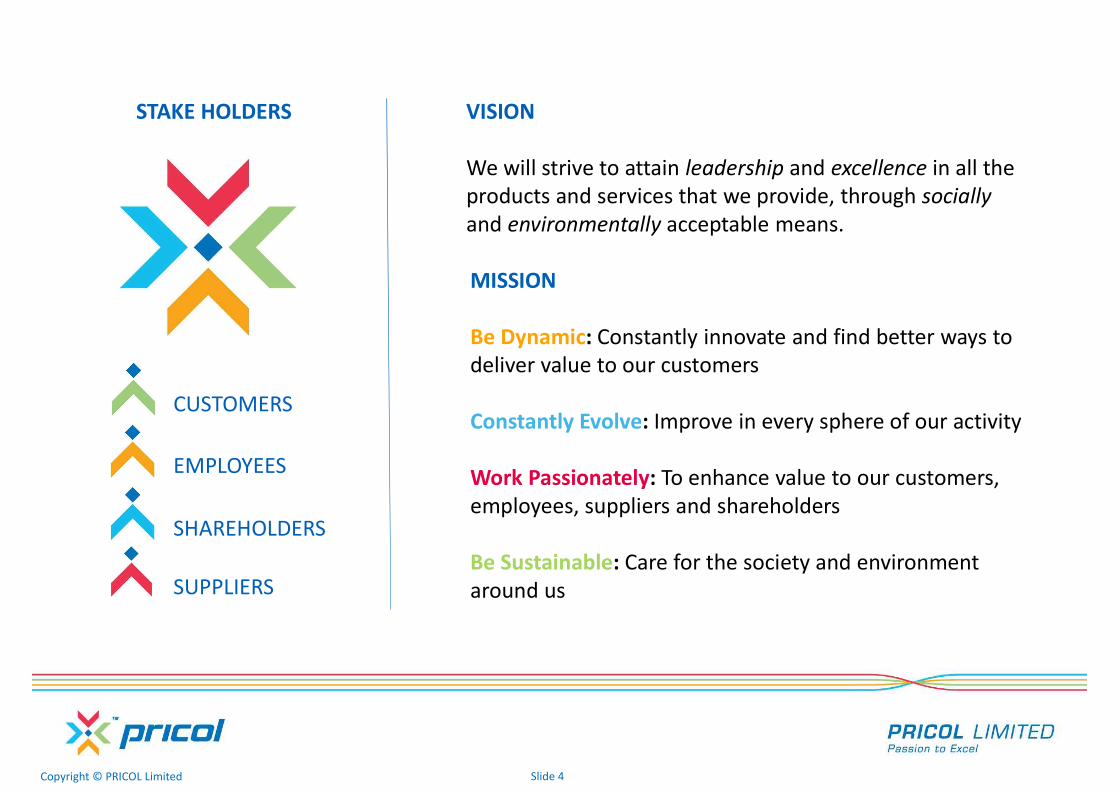
MISSION
Be Dynamic: Constantly innovate and find better ways to deliver value to our customers
Constantly Evolve: Improve in every sphere of our activity
Work Passionately: To enhance value to our customers, employees, suppliers and shareholders
Be Sustainable: Care for the society and environment around us
VISION
We will strive to attain leadership and excellence in all the products and services that we provide, through sociallyand environmentally acceptable means.
STAKE HOLDERS
SUPPLIERS
EMPLOYEES
CUSTOMERS
SHAREHOLDERS

Copyright © PRICOL Limited Slide 5
CORE VALUES
Pricol is built on generating value and propelling positive change. We are transformative; hence, ourcommunication platforms should adhere to creating value for all our stakeholders, i.e. customers, employees,shareholders and suppliers, providers and the communities we are engaged in. We must take care to remainsensitive to our core belief system and must not compromise on consistently delivering value.
Passion Whatever we do, we do it from the bottom of our heart.
Respect We respect those who add value to our lives.
Integrity We never compromise on our values.
Collaborate We believe in working towards a unified goal.
Ownership We take responsibility for all our actions.
Listen We listen to both the spoken and unspoken before we act.

Copyright © PRICOL Limited Slide 6
Listed in :NSE – PRICOLLTD
BSE – 540293
ISO 14001:2004 & OHSAS 18001: 2007(Obtained ISO 9001 in the year 1993)
ISO/TS 16949
Pricol Limited
Pricol Limited commenced operations in 1974 with headquarters in Coimbatore, India
Subsidiary Companies:
• PT Pricol Surya, Indonesia• Pricol do Brasil• Pricol Asia, Singapore
FY 2016-17 Consolidated Income from Operations ₹ 14,816 Million
8 Manufacturing Locations
5 International Offices
Total Employee Strength – 5,290 Employees
R&D Strength – 248 Employees
30 Patents
COMPANY PROFILE
Public 62.7%
Promoter Group37.3%
Shareholding Pattern - March 31, 2017

Copyright © PRICOL Limited Slide 7
GLOBAL PRESENCE
SINGAPORESINGAPORE
JAKARTAJAKARTA
STUTTGARTSTUTTGART
TOKYOTOKYO
SAO PAULOSAO PAULO
PANTNAGARPANTNAGARGURGAONGURGAON
PUNEPUNECOIMBATORECOIMBATORE
CHICAGOCHICAGO
BANGKOKBANGKOK
INTERNATIONAL OFFICESINTERNATIONAL OFFICES MANUFACTURING FACILITIESMANUFACTURING FACILITIES

Copyright © PRICOL Limited Slide 8
REVENUE BREAKUP – PRODUCT GROUP-WISE (STANDALONE)
₹ in Million
• Sales from Sintered Components is grouped under ‘Pumps & Mechanical Products’• Sales from Aftermarket, Industrial Products and Exports are added under respective Product Groups + Sales from Speed Limiting Devices in FY 2015-16 commenced from October 2015 onwards
Product Groups 2015-16 2016-17 % Change
Driver Information Systems 5,352 5,096 -4.8%Switches & Sensors 1,651 1,329 -19.5%Pumps & Mechanical Products 2,919 3,180 8.9%
Asset Management Solutions & Telematics 204 257 26.0%
Auto Accessories & Others 309 298 -3.5%
Subtotal 10,435 10,159 -2.6%
Speed Limiting Devices + 1,586 1,987 25.3%
Total Sales 12,021 12,146 1.0%
Copyright © PRICOL Limited Slide 9
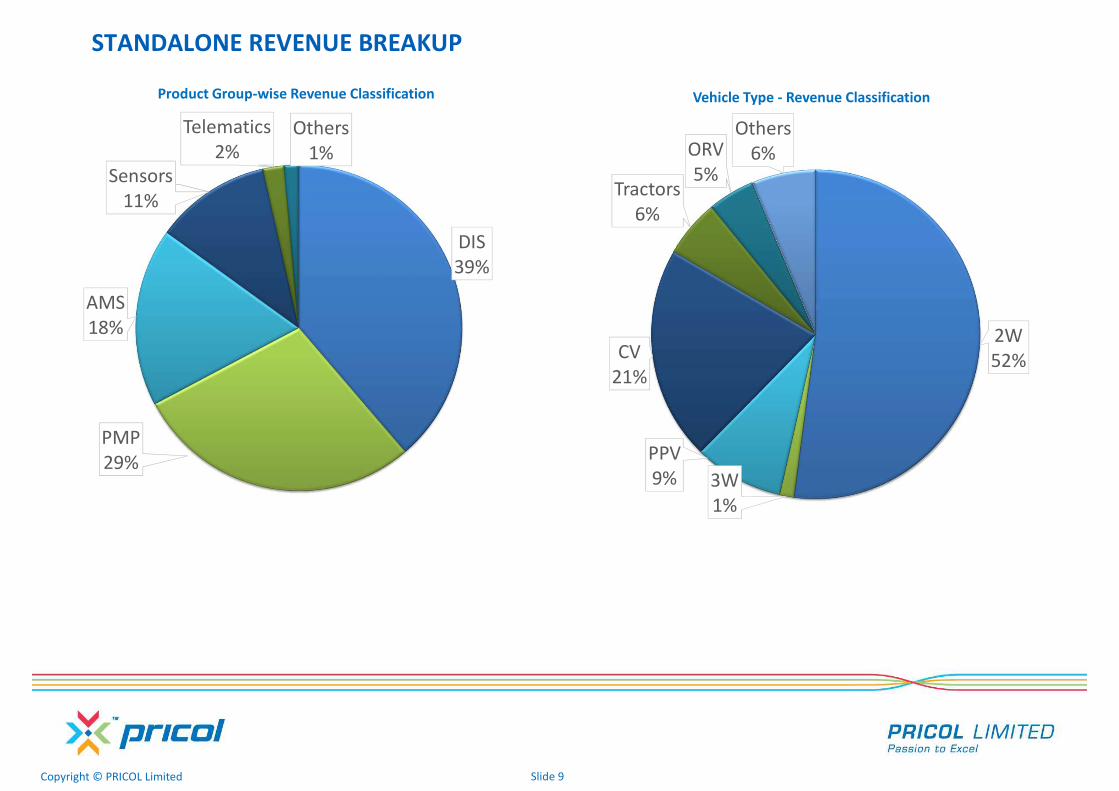
STANDALONE REVENUE BREAKUP
DIS39%
PMP29%
AMS18%
Sensors11%
Telematics2%
Others1%
Product Group-wise Revenue Classification
2W52%
3W1%
PPV9%
CV21%
Tractors6%
ORV5%
Others6%
Vehicle Type - Revenue Classification

Copyright © PRICOL Limited Slide 10
STANDALONE FINANCIALS AT A GLANCE - FY 2016-17
₹ in Million
Particulars Q4 FY 17 Q3 FY 17 Q4 FY 16 FY 2016-17 FY 2015-16
Net Sales 2,586.28 2,913.71 3,602.55 12,146.63 12,020.90 Total Income from Operations 2,720.33 3,050.85 3,744.44 12,684.27 12,580.82 EBITDA 246.67 299.23 488.25 1,362.58 1,231.24 EBITDA Margin (%) 9.1% 9.8% 13.0% 10.7% 9.8%
PBT Before Exceptions 50.32 112.04 271.33 624.38 442.55 PBT After Exceptions 50.32 112.04 353.83 629.72 424.89 PBT Margin (%) 1.8% 3.7% 9.4% 5.0% 3.4%
Note: For comparative purposes, the combined figures (unaudited) of erstwhile Pricol Limited and erstwhile Pricol Pune have been considered.
Copyright © PRICOL Limited Slide 11
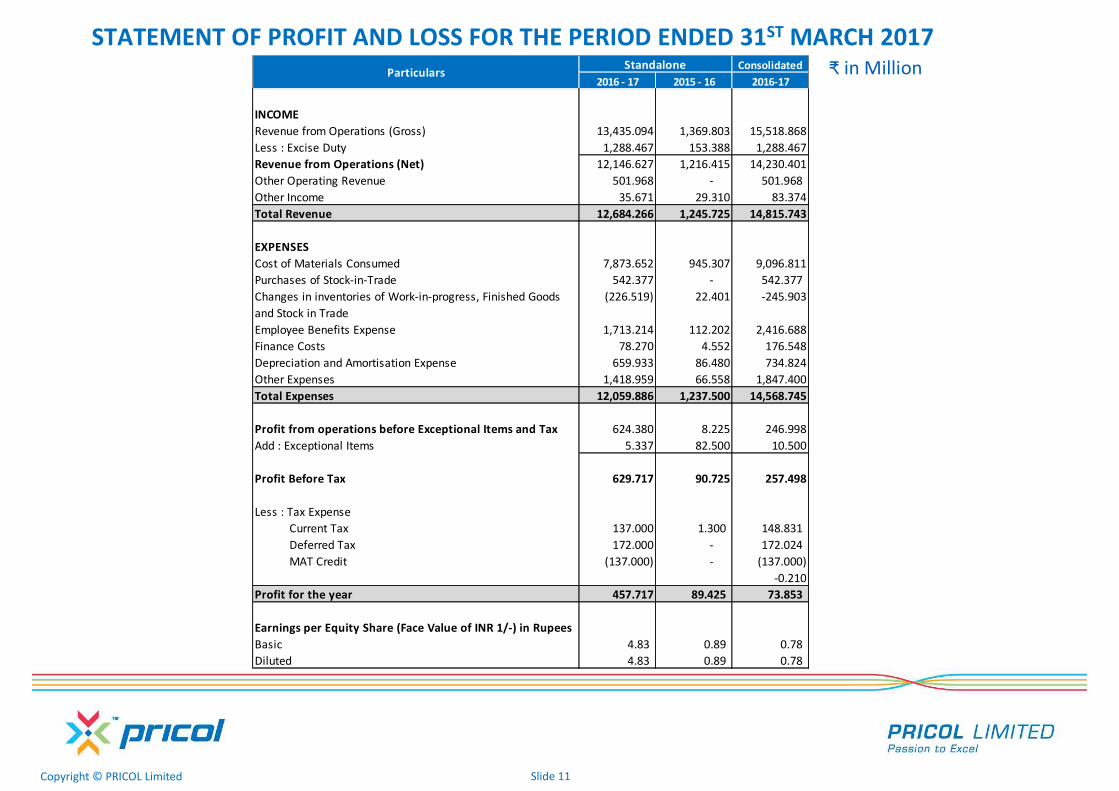
STATEMENT OF PROFIT AND LOSS FOR THE PERIOD ENDED 31ST MARCH 2017Consolidated
2016 - 17 2015 - 16 2016-17
INCOMERevenue from Operations (Gross) 13,435.094 1,369.803 15,518.868Less : Excise Duty 1,288.467 153.388 1,288.467Revenue from Operations (Net) 12,146.627 1,216.415 14,230.401Other Operating Revenue 501.968 - 501.968 Other Income 35.671 29.310 83.374Total Revenue 12,684.266 1,245.725 14,815.743
EXPENSESCost of Materials Consumed 7,873.652 945.307 9,096.811Purchases of Stock-in-Trade 542.377 - 542.377 Changes in inventories of Work-in-progress, Finished Goods (226.519) 22.401 -245.903and Stock in TradeEmployee Benefits Expense 1,713.214 112.202 2,416.688Finance Costs 78.270 4.552 176.548Depreciation and Amortisation Expense 659.933 86.480 734.824Other Expenses 1,418.959 66.558 1,847.400Total Expenses 12,059.886 1,237.500 14,568.745
Profit from operations before Exceptional Items and Tax 624.380 8.225 246.998Add : Exceptional Items 5.337 82.500 10.500
Profit Before Tax 629.717 90.725 257.498
Less : Tax Expense Current Tax 137.000 1.300 148.831 Deferred Tax 172.000 - 172.024 MAT Credit (137.000) - (137.000)
-0.210Profit for the year 457.717 89.425 73.853
Earnings per Equity Share (Face Value of INR 1/-) in RupeesBasic 4.83 0.89 0.78 Diluted 4.83 0.89 0.78
ParticularsStandalone ₹ in Million
Copyright © PRICOL Limited Slide 12
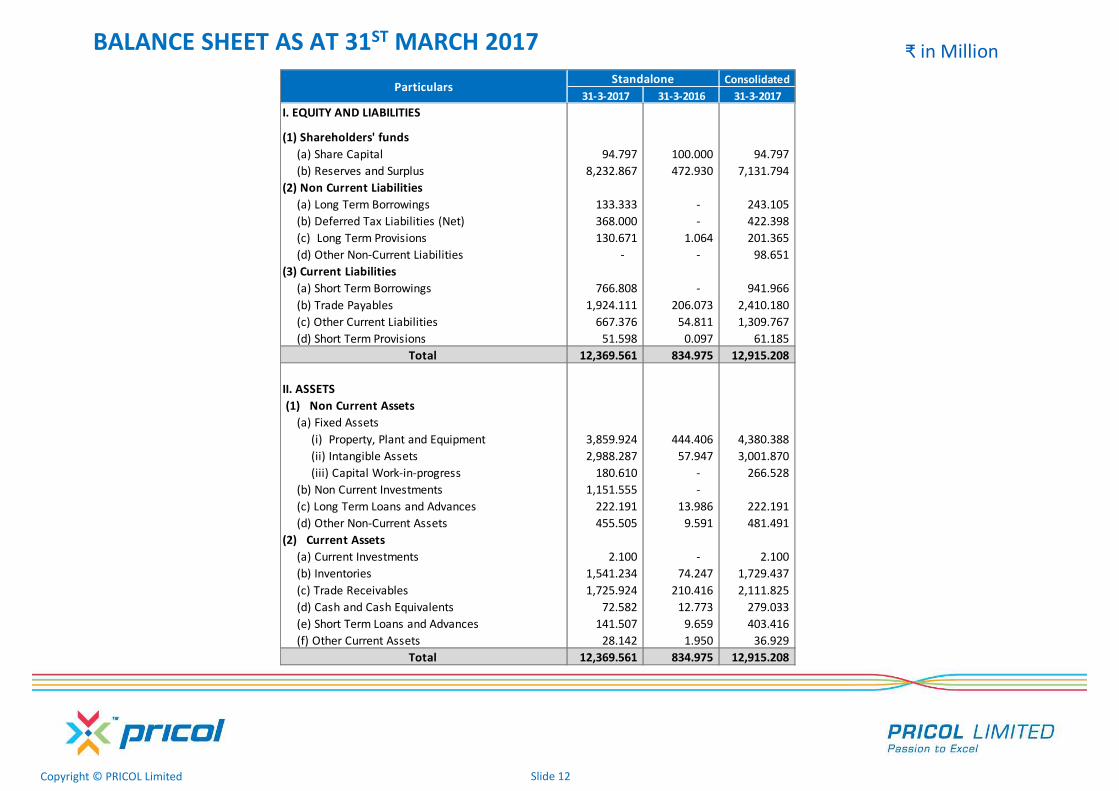
BALANCE SHEET AS AT 31ST MARCH 2017Consolidated
31-3-2017 31-3-2016 31-3-2017I. EQUITY AND LIABILITIES
(1) Shareholders' funds(a) Share Capital 94.797 100.000 94.797 (b) Reserves and Surplus 8,232.867 472.930 7,131.794
(2) Non Current Liabilities(a) Long Term Borrowings 133.333 - 243.105 (b) Deferred Tax Liabilities (Net) 368.000 - 422.398 (c) Long Term Provisions 130.671 1.064 201.365 (d) Other Non-Current Liabilities - - 98.651
(3) Current Liabilities(a) Short Term Borrowings 766.808 - 941.966 (b) Trade Payables 1,924.111 206.073 2,410.180 (c) Other Current Liabilities 667.376 54.811 1,309.767 (d) Short Term Provisions 51.598 0.097 61.185
Total 12,369.561 834.975 12,915.208
II. ASSETS (1) Non Current Assets
(a) Fixed Assets(i) Property, Plant and Equipment 3,859.924 444.406 4,380.388 (ii) Intangible Assets 2,988.287 57.947 3,001.870 (iii) Capital Work-in-progress 180.610 - 266.528
(b) Non Current Investments 1,151.555 - (c) Long Term Loans and Advances 222.191 13.986 222.191 (d) Other Non-Current Assets 455.505 9.591 481.491
(2) Current Assets(a) Current Investments 2.100 - 2.100 (b) Inventories 1,541.234 74.247 1,729.437 (c) Trade Receivables 1,725.924 210.416 2,111.825 (d) Cash and Cash Equivalents 72.582 12.773 279.033 (e) Short Term Loans and Advances 141.507 9.659 403.416 (f) Other Current Assets 28.142 1.950 36.929
Total 12,369.561 834.975 12,915.208
ParticularsStandalone
₹ in Million

Copyright © PRICOL Limited Slide 13
LEVERAGE – STANDALONE AND CONSOLIDATED
₹ in Million
Pricol’s Balance Sheet is under leveraged, which gives it an opportunity to grow faster with better headroom for debt.
ConsolidatedFY 2016-17 FY 2015-16 FY 2016-17
Long Term Borrowings 316.67 320.00 698.99 Short Term Borrowings 766.81 418.62 941.97 Debt [A] 1,083.48 738.62 1,640.96 Equity [B] 8,327.66 7,869.94 7,226.59
EBITDA [C] 1,362.58 1,231.24 1,158.37 Principal Repayment + Interest [D] 294.94 317.67 632.44
Debt / Equity Ratio [A / B] 0.13 0.09 0.23 Debt Service Coverage Ratio [C/D] 4.62 3.88 1.83
StandaloneParticulars

Copyright © PRICOL Limited Slide 14
PROPOSED ACQUISITION – PMP AUTO COMPONENTS PRIVATE LIMITED (WIPING BUSINESS)

Copyright © PRICOL Limited Slide 15
PMP PAL IS A LEADING GLOBAL MANUFACTURER OF AUTOMOTIVE WIPING SYSTEMS
Wiping business(FY16 Sales ~ INR 2,300 mn)
Czech Republic Mexico
Prague Puebla
India
Satara
• With a track record of over 90 years, PMP PALInternational s.r.o. (“PMP PAL”) designs andmanufactures wiping systems, heavy duty wipers,front wiper sets etc. at its state-of-the-artmanufacturing facility in Prague.
• Set-up in 2014, India growth would be driven by costeffective solutions to high volume models in theIndian market. India Wiping division has been able towin marquee accounts such as Renault Kwid, RenaultXBB, Nissan I2 and Maruti Alto.
• Set-up in 2015, Mexico has commenced productionand serves global leaders such as VW and Skoda tobuild presence in Mexico.
KEY CUSTOMERS:
Copyright © PRICOL Limited Slide 16
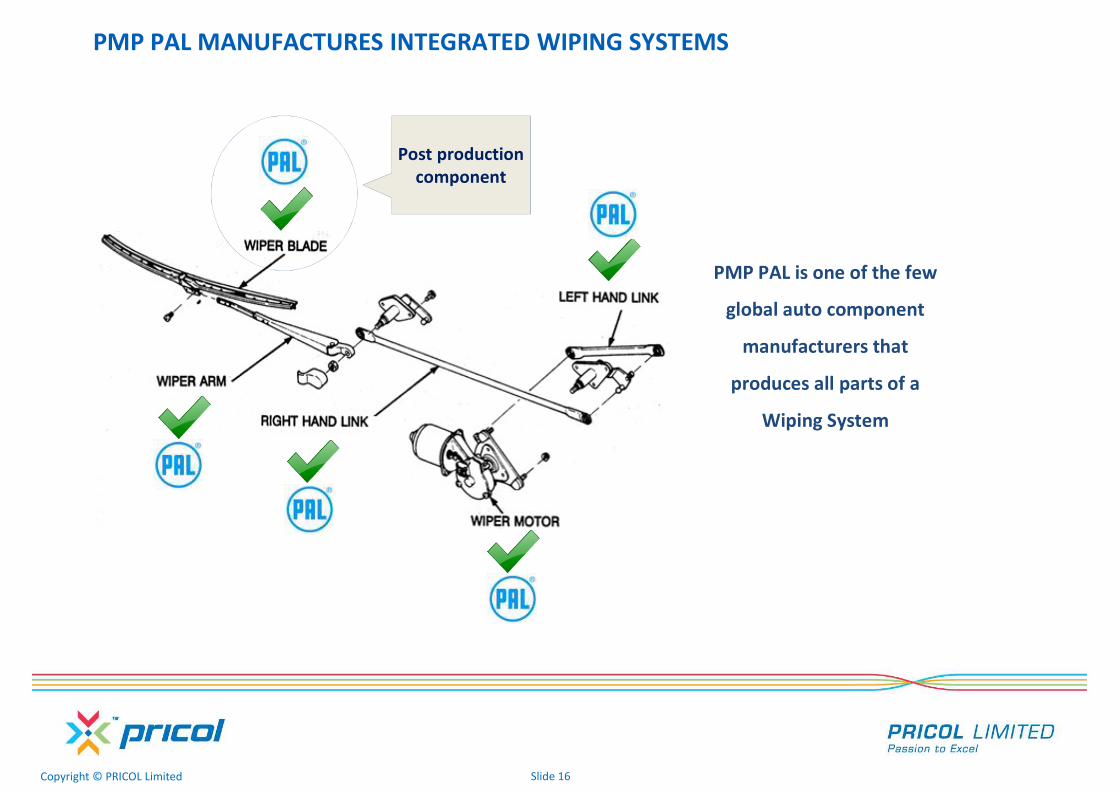
PMP PAL MANUFACTURES INTEGRATED WIPING SYSTEMS
PMP PAL is one of the few
global auto component
manufacturers that
produces all parts of a
Wiping System
Post production component

Copyright © PRICOL Limited Slide 17
KEY INVESTMENT HIGHLIGHTS
• Pricol will benefit from clear revenue visibility with a confirmed order book and steady EBITDA margins of the Target over the next three to four years
• PMP will help Pricol make inroads into the 4W segment and diversify the combined revenue profile and get sizable access to a marquee customer base including VW, Fiat, Renault and Maruti
• Strategically present in three different continents with state-of-the-art facilities with proximity to automotive hubs
• Strong focus on R&D and Quality. In process of developing technologically advanced 4pole motor; which will add revenues and market share in future
• Strongly positioned to capitalize on the growth of Global Wiper Systems Market which is expected to grow at a CAGR of ~5% over 5years

Copyright © PRICOL Limited Slide 18
GLOBAL PRESENCE – POST ACQUISITION
SINGAPORESINGAPORE
JAKARTAJAKARTA
STUTTGARTSTUTTGART
TOKYOTOKYO
SAO PAULOSAO PAULO
PANTNAGARPANTNAGARGURGAONGURGAON
PUNEPUNE
COIMBATORECOIMBATORE
CHICAGOCHICAGO
BANGKOKBANGKOK
INTERNATIONAL OFFICESINTERNATIONAL OFFICES MANUFACTURING FACILITIESMANUFACTURING FACILITIES PMP MANUFACTURING FACILITIESPMP MANUFACTURING FACILITIES
PUEBLAPUEBLA
PRAGUEPRAGUE
SATARASATARA

Copyright © PRICOL Limited Slide 19
PRICOL do BRASIL – RESTRUCTURING PLAN
Copyright © PRICOL Limited Slide 20Copyright © PRICOL Limited Slide 20
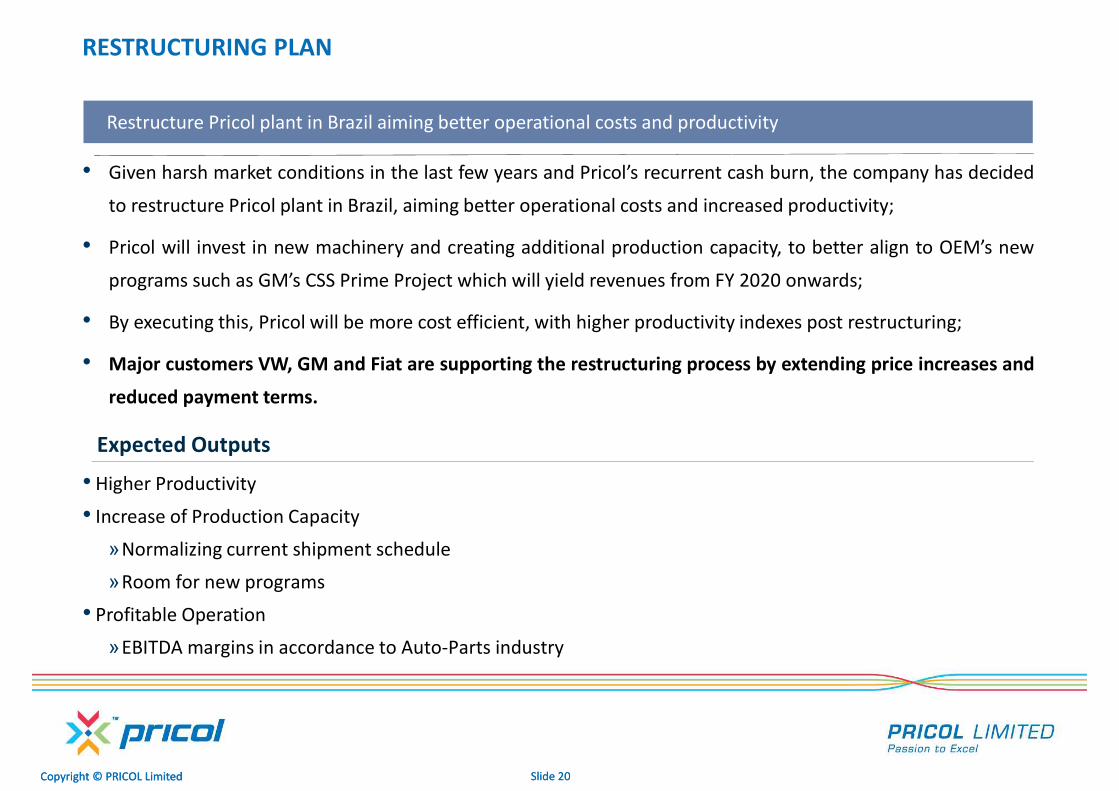
RESTRUCTURING PLAN
Restructure Pricol plant in Brazil aiming better operational costs and productivity
• Given harsh market conditions in the last few years and Pricol’s recurrent cash burn, the company has decided
to restructure Pricol plant in Brazil, aiming better operational costs and increased productivity;
• Pricol will invest in new machinery and creating additional production capacity, to better align to OEM’s new
programs such as GM’s CSS Prime Project which will yield revenues from FY 2020 onwards;
• By executing this, Pricol will be more cost efficient, with higher productivity indexes post restructuring;
• Major customers VW, GM and Fiat are supporting the restructuring process by extending price increases and
reduced payment terms.
Expected Outputs
• Higher Productivity
• Increase of Production Capacity
»Normalizing current shipment schedule
»Room for new programs
• Profitable Operation
»EBITDA margins in accordance to Auto-Parts industry

Copyright © PRICOL Limited Slide 21Copyright © PRICOL Limited Slide 21
CUSTOMER-WISE REVENUE AND OPERATIONAL P&L FORECAST
₹ in Million
Particulars 2016-17 (A) 2017-18 (F) 2018-19 (F) 2019-20 (F) 2020-21 (F)
Revenue 1,289 1,549 1,554 1,912 2,453
- GM 386 389 371 729 1,258
- VW 359 487 549 631 658
- Fiat 309 377 355 260 229
- Others 235 297 279 292 307
Material Cost 714 793 845 1,046 1,311
% of Revenue 55.4% 51.2% 54.3% 54.7% 53.5%
Employee Cost 583 453 362 382 446
% of Revenue 45.2% 29.2% 23.3% 20.0% 18.2%
EBITDA -329 46 110 166 268
% of Revenue -25.5% 3.0% 7.1% 8.7% 10.9%

Copyright © PRICOL Limited Slide 22
PT. PRICOL SURYA INDONESIA – FINANCIAL SNAPSHOT

Copyright © PRICOL Limited Slide 23Copyright © PRICOL Limited Slide 23
PT. PRICOL SURYA INDONESIA – FINANCIAL SNAPSHOT
₹ in Million
Particulars FY 2016-17 FY 2015-16
Revenue 907.47 871.49
Material Cost 606.82 634.81 Employee Cost 135.36 163.28 Operational Cost 107.65 75.12
EBITDA 57.64 (1.72)EBITDA Margin (%) 6.4% -0.2%
PBT Before Exceptions 16.63 (65.84)PBT Margin (%) 1.8% -7.6%
Note: • PTPS Indonesia has witnessed a turnaround this year, with profitable PBT of 1.8%• This has been due to a reduction in Material Cost from ~73% to 67% of Revenue and Employee cost to 15%
of Revenue.

Copyright © PRICOL Limited Slide 24
QUESTIONS

Copyright © PRICOL Limited Slide 25
For more information:http://www.pricol.com/investors/investor-link/
Company SecretaryCPM Towers, 109, Race Course,
Coimbatore – 641 018,
Phone: +91 422 4336238Fax: +91 422 4336299Email: [email protected]
Copyright © PRICOL Limited Slide 26
THANK YOU

Copyright © PRICOL Limited Slide 27