
limiting freedom of religion in a pandemic: the constitutionality ...
Upload
independentCategory
view
0download
0
1228 J. Opt. Soc. Am. B/Vol. 12, No. 7 /July 1995 K. M. Nashold and D. P. Walter
Investigations of optical limiting mechanisms incarbon particle suspensions and fullerene solutions
Karen M. Nashold and Diane Powell Walter
SRI International, 333 Ravenswood Avenue, Menlo Park, California 94025
Received May 2, 1994; revised manuscript received March 6, 1995
Liquid suspensions of carbon act as optical limiters in the presence of high-intensity Q-switched laser pulses.The optical limiting is a result of optical breakdown, which is initiated by absorption in the small carbonparticles. We measured the total energy scattered during the breakdown process and the angular distributionof the scattered light as a function of input energy. We also compared the relative scattered energy createdduring limiting in the carbon suspensions with that generated in solutions of fullerenes in toluene. The ratioof scattered to absorbed energy is different for the suspensions from that for the fullerene solutions, indicatingthat different mechanisms dominate the limiting processes in the two media.
1. INTRODUCTION
A cell filled with a suspension of small absorbing par-ticles placed in a focal plane of an optical system limitsthe transmission of pulsed laser light.1–3 This limitingis a result of the breakdown of absorbing particles andassociated fluid in the focal plane of the limiter cell. Theabsorbing particles act as initiation sites for lowering thethreshold for optical breakdown in the liquid. During theoptical breakdown process a white flash is created inthe focal volume of the liquid. This is assumed2,3 to bedue to plasma generation similar to that created duringoptical breakdown in gases.4 The particles heat up, va-porize, and ionize small regions in the suspension. Shockwaves are also created. The transmission is reduced byabsorption and scatter (including refraction by the shockwave). Measurements of the duration of the attenuationcreated when a Q-switched pulse is focused into a lim-iter cell show that the attenuation lasts 450 ns or longerafter the laser pulse has passed. Sharp dips in trans-mission are seen. These have been attributed to shockwaves generated by rapid bubble formation in related ex-periments in which a laser was used to induce breakdownin water.5 Macroscopic bubbles may also be created andremain in the optical path for hundreds of microseconds.2
The standard suspension studied in this work and inthe work described in Refs. 1–3 consists of carbon black(obtained from India ink) in ethanol. Carbon is chosenfor the absorbing particles because of its high and uniformabsorption over a large spectral range.6 The uniform ab-sorption makes the suspension useful as an optical limiterover the entire transmission band of the liquid in whichthe particles are suspended.
Fullerene solutions have also been investigated for useas an optical limiter.7–10 The small size of fullerenes al-lows them to form solutions with solvents as opposed tosuspensions. [The diameter of C60 molecules is 0.71 nm)(Ref. 11).] Solutions of fullerenes are easily made in sol-vents such as toluene, benzene, and hexane. The ab-sorption spectrum is not flat for the fullerenes, as it isfor carbon black, and depends on the number of atomsin the molecule. Solutions of C60, for example, have a
0740-3224/95/071228-10$06.00
purplish transmission. Solutions of C70 are more yellow.Fullerene molecules have been shown to exhibit nonlinearabsorption,12,13 which is one motivation for investigatingthem for use as an optical limiter. When tested for limit-ing, the carbon suspension provided lower output energies(for the same input energies) than fullerene solutions hav-ing the same linear transmission at the test wavelength.Fullerenes, however, do represent an alternative limit-ing material. Solutions of C60 in toluene provided loweroutput energies at a given input energy than solutionscontaining the larger molecule C70.
We measured the total scattered versus absorbed en-ergy and the angular distribution of scattered energy forthe carbon suspensions. We compared the total scat-tered versus absorbed energy produced by the carbon inethanol with that produced by solutions of fullerenes intoluene. The carbon suspensions and fullerene solutionswere made and diluted to have the same linear transmis-sion over a 1-cm optical pathlength.
We filtered the carbon suspensions through a 0.5-mmpolytetrafluoroethylene (PTFE) membrane filter (afterpassing them through filters with a larger pore size) tokeep particle sizes small compared with the wavelengthof visible light. This produces high visibility throughthe suspension under nonlimiting conditions and aidsin maintaining stable suspensions that do not settle outover time. Particle-size distribution measurements ofthe filtered suspension made by centrifugal sedimenta-tion indicated that the particles are even smaller than0.5 mm (98.7% are less than 0.01 mm).
The C60 and C70 samples, produced in the MolecularPhysics Laboratory at SRI International, were chemicallyextracted from carbon soot generated by vaporizing a car-bon rod by an arc discharge method. We extracted thesamples by sonicating the soot with toluene and filteringthe extract.14
The experimental procedure to measure total scatteredversus absorbed energy is described in Section 2. The re-sults of the absorbed versus scattered energy experimentare given in Section 3 for the carbon suspensions and inSection 4 for the fullerene solutions.
We also performed an experiment to measure the angu-
1995 Optical Society of America

K. M. Nashold and D. P. Walter Vol. 12, No. 7 /July 1995 /J. Opt. Soc. Am. B 1229
Fig. 1. Optical test-bed to measure transmitted, scattered, and absorbed energy.
lar distribution of scattered energy generated in the limit-ing process for the carbon suspensions. Both horizontaland vertical polarizations were measured. In Section 5we describe the experimental procedure used to measurethe relative levels of horizontally and vertically polar-ized scattered energy. In Section 6 we give the resultsof these measurements. In Section 7 we use the datagiven in Section 6 to calculate an estimate of the totalscattered energy integrating over all scattering angles.The results obtained in Section 7 agree closely with theresults obtained in Section 3. A summary of our resultsis given in Section 8.
2. SCATTERED VERSUS ABSORBEDENERGY: EXPERIMENTAL PROCEDUREFigure 1 shows the optical test-bed that we used to mea-sure the transmitted, scattered, and absorbed energy forboth the carbon suspensions and the fullerene solutions.The laser used was a frequency-doubled, Q-switchedNd:YAG laser (Quanta Ray DCR-11). The beam wasspatially filtered with a 100-mm pinhole to provide a moreuniform illumination of the entrance to the lens that fo-cuses the light into the optical limiting cell. A lens witha 300-mm focal length was used to focus the beam into thecenter of the limiter cell. The beam had a 21-mm diam-eter when it entered the 300-mm lens. We measured thespot size in the focal region within the cell by imaging thefocal region onto a charge-coupled device (CCD) camera(put roughly in the position of pyroelectric Detector B inFig. 1). The dimensions of the focused beam shown inFig. 2 have been scaled by the magnification of the lensesused after the cell. The 1ye2 diameter of the beam in thecell was roughly 65 mm. This can be used to calculatethe average fluence levels required to achieve limiting.
A 25.4-cm integrating sphere from Lab Sphere, Inc.,was used to measure the energy scattered by the lim-iter cells. The interior of the sphere was coated with
Spectraflect, a reflective coating that has a reflectivity of0.98 at l 532 nm. The mounting hardware for the cellwas also coated with Spectraflect. The sphere has threeports, as shown in Fig. 1. A Spectraflect-coated bafflewas placed between the cell and the port used to mea-sure scattered energy to prevent light from being directlyscattered to the detector. Meaningful measurements re-quire that the light be reflected several times within thesphere to provide a uniform distribution of radiation onthe sphere walls.15
The transmitted energy was measured with a Molec-
Fig. 2. Image of a spot in the focal plane of the cell.

1230 J. Opt. Soc. Am. B/Vol. 12, No. 7 /July 1995 K. M. Nashold and D. P. Walter
Fig. 3. Transmitted, scattered, and absorbed energy as a func-tion of input energy for carbon suspensions with three differentparticle concentrations.
tron J3-09 pyroelectric detector, labeled Detector B inFig. 1. An identical detector (Detector A in Fig. 1) wasused as a reference detector to measure the input en-ergy to the cell. The scattered energy was measuredwith a Molectron J3S-10 silicon photodetector, labeledDetector C in Fig. 1. The silicon detector is sensitiveto tens of picojoules. For the first set of tests a 532-nm interference filter with a 8.6-nm (full width at half-maximum) bandwidth was used to exclude light that isreradiated as white flash. A Gershun tube16 was placedbefore the filter to limit the angular distribution of thelight reaching the filter, as the filter’s spectral sensitivityis angle dependent. We repeated the experiment withthe filter removed to measure the energy added by thewhite flash.
To calibrate the reading at Detector C, we placed aport cover over the output port of the integrating sphere.The port cover was coated with the same reflective ma-terial as the inside of the sphere. The energy reach-ing Detector C in this configuration is proportional to thetotal input energy. To measure scattered energy we re-moved the port cover. In this configuration the transmit-ted energy passes through the port opening, and energyreaching Detector C is proportional to the scattered en-ergy alone. Neglecting the scattered light that escapesthrough the output port (which is due to multiple re-flections from the sphere walls), the proportionality con-stant between the scattered energy and the reading atDetector C is the same as that between the input energyand the reading at Detector C when the port is closed.(According to Goebel,15 the exit port introduces a 14.5%
loss. The data in Section 3 are not corrected by thisfactor.)
Our measurement method defines all light that leavesthe exit port and is collected by the second 300-mmfocal-length lens in Fig. 1 as transmitted. This actuallyincludes energy scattered into 64.3± off axis. The un-scattered beam subtends an angle of 62.0± as a result ofthe fy14 focusing optics. This slightly skews the data,overrepresenting the transmitted energy and underrep-resenting the scattered energy.
We calculated the absorbed energy for each data pointby subtracting the transmitted energy and the scatteredenergy from the input energy. Defining more of the en-ergy as scattered and less as transmitted does not affectthe calculation of absorbed energy.
3. SCATTERED VERSUS ABSORBEDENERGY FOR CARBON BLACKSUSPENSIONSThree different particle concentrations of the carbon blacksuspensions were tested. The transmissions in the non-limiting state for the suspensions were 90%, 81%, and66% in a 1-cm path-length cell, measured relative to fil-tered ethanol at l 532 nm. Figure 3 shows the trans-mitted, scattered, and absorbed energy measured as afunction of input energy for the three concentrations ofthe carbon black suspension. Figure 4 provides detail ofthe lower input energy range. There is essentially noscattered energy until the transmission becomes nonlin-ear, which occurred in these data at an input energy near1 mJ. At an input energy of 5 mJ the transmitted energyfor the low-concentration sample had dropped from 90% to
Fig. 4. Same as Fig. 3, for low-input energies.
K. M. Nashold and D. P. Walter Vol. 12, No. 7 /July 1995 /J. Opt. Soc. Am. B 1231
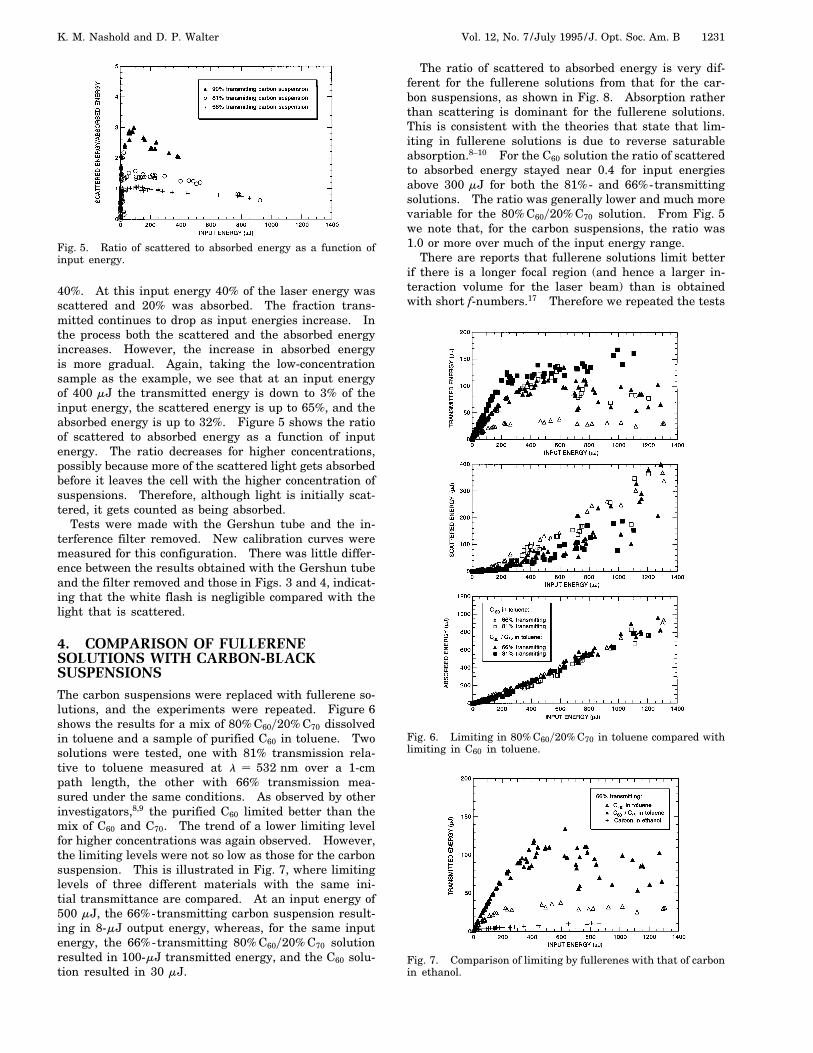
Fig. 5. Ratio of scattered to absorbed energy as a function ofinput energy.
40%. At this input energy 40% of the laser energy wasscattered and 20% was absorbed. The fraction trans-mitted continues to drop as input energies increase. Inthe process both the scattered and the absorbed energyincreases. However, the increase in absorbed energyis more gradual. Again, taking the low-concentrationsample as the example, we see that at an input energyof 400 mJ the transmitted energy is down to 3% of theinput energy, the scattered energy is up to 65%, and theabsorbed energy is up to 32%. Figure 5 shows the ratioof scattered to absorbed energy as a function of inputenergy. The ratio decreases for higher concentrations,possibly because more of the scattered light gets absorbedbefore it leaves the cell with the higher concentration ofsuspensions. Therefore, although light is initially scat-tered, it gets counted as being absorbed.
Tests were made with the Gershun tube and the in-terference filter removed. New calibration curves weremeasured for this configuration. There was little differ-ence between the results obtained with the Gershun tubeand the filter removed and those in Figs. 3 and 4, indicat-ing that the white flash is negligible compared with thelight that is scattered.
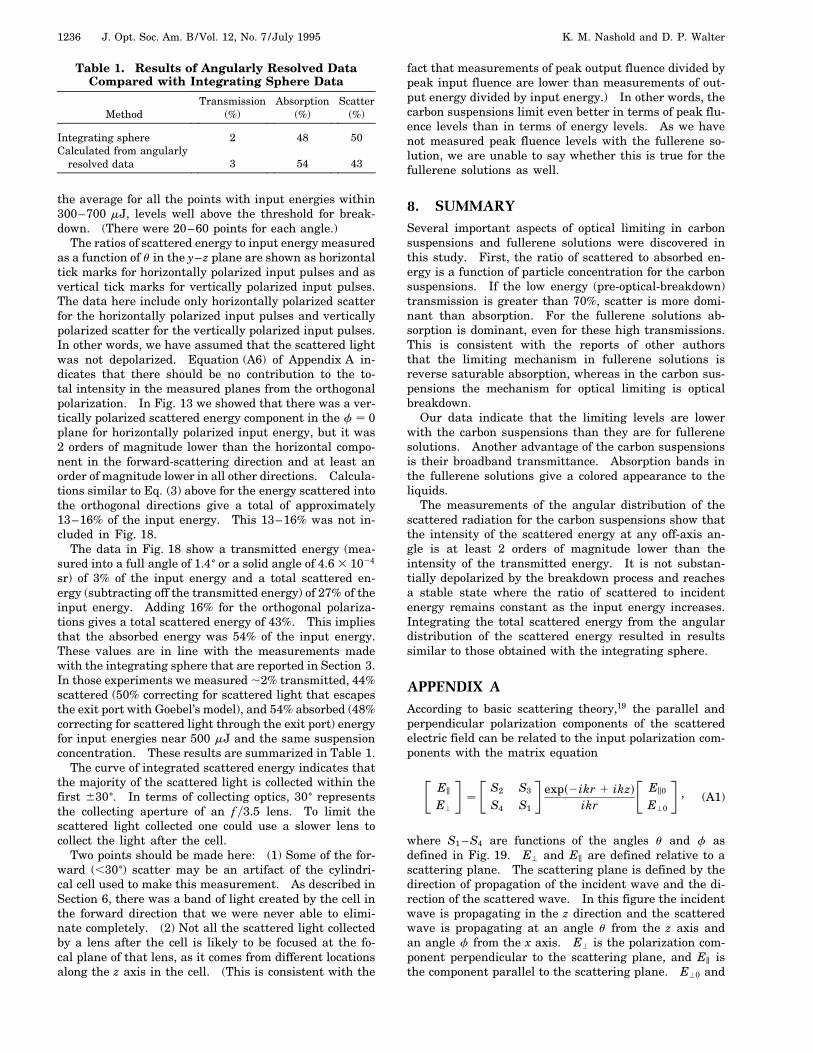
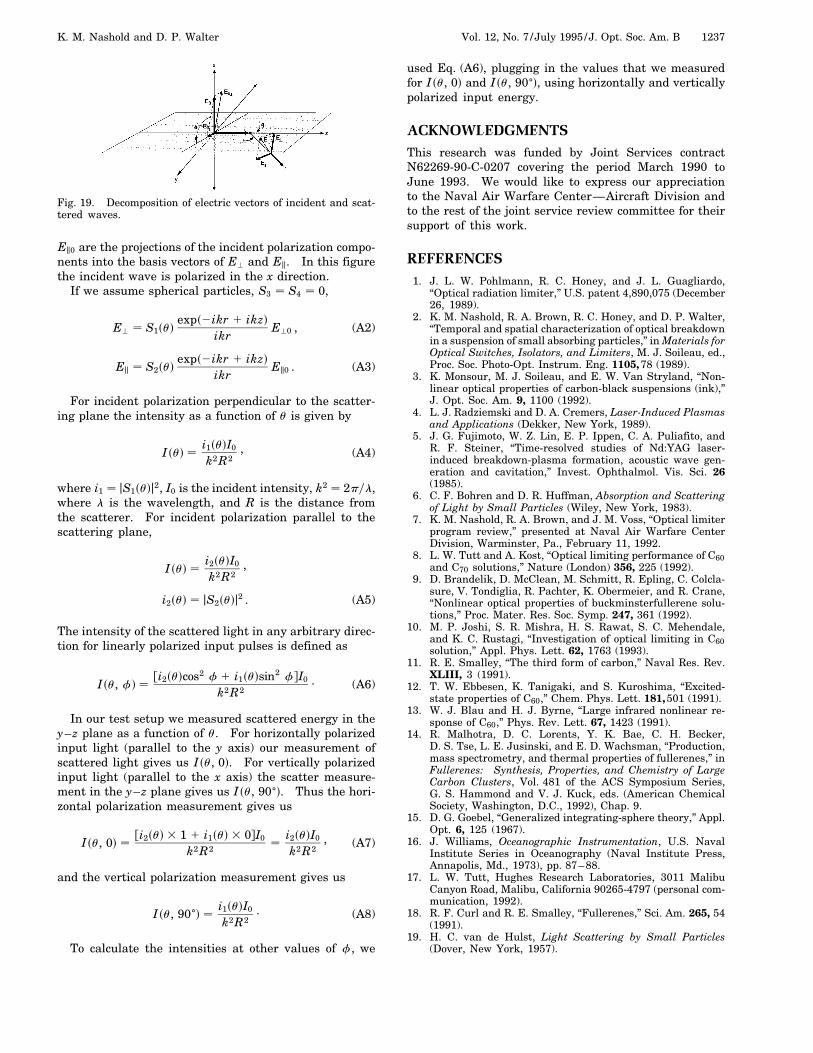
4. COMPARISON OF FULLERENESOLUTIONS WITH CARBON-BLACKSUSPENSIONSThe carbon suspensions were replaced with fullerene so-lutions, and the experiments were repeated. Figure 6shows the results for a mix of 80% C60y20% C70 dissolvedin toluene and a sample of purified C60 in toluene. Twosolutions were tested, one with 81% transmission rela-tive to toluene measured at l 532 nm over a 1-cmpath length, the other with 66% transmission mea-sured under the same conditions. As observed by otherinvestigators,8,9 the purified C60 limited better than themix of C60 and C70. The trend of a lower limiting levelfor higher concentrations was again observed. However,the limiting levels were not so low as those for the carbonsuspension. This is illustrated in Fig. 7, where limitinglevels of three different materials with the same ini-tial transmittance are compared. At an input energy of500 mJ, the 66%-transmitting carbon suspension result-ing in 8-mJ output energy, whereas, for the same inputenergy, the 66%-transmitting 80% C60y20% C70 solutionresulted in 100-mJ transmitted energy, and the C60 solu-tion resulted in 30 mJ.
The ratio of scattered to absorbed energy is very dif-ferent for the fullerene solutions from that for the car-bon suspensions, as shown in Fig. 8. Absorption ratherthan scattering is dominant for the fullerene solutions.This is consistent with the theories that state that lim-iting in fullerene solutions is due to reverse saturableabsorption.8–10 For the C60 solution the ratio of scatteredto absorbed energy stayed near 0.4 for input energiesabove 300 mJ for both the 81%- and 66%-transmittingsolutions. The ratio was generally lower and much morevariable for the 80% C60y20% C70 solution. From Fig. 5we note that, for the carbon suspensions, the ratio was1.0 or more over much of the input energy range.
There are reports that fullerene solutions limit betterif there is a longer focal region (and hence a larger in-teraction volume for the laser beam) than is obtainedwith short f-numbers.17 Therefore we repeated the tests
Fig. 6. Limiting in 80% C60y20% C70 in toluene compared withlimiting in C60 in toluene.
Fig. 7. Comparison of limiting by fullerenes with that of carbonin ethanol.

1232 J. Opt. Soc. Am. B/Vol. 12, No. 7 /July 1995 K. M. Nashold and D. P. Walter
Fig. 8. Ratio of scattered to absorbed energy as a function ofinput energy: 80% C60y20% C70 in toluene compared with C60in toluene.
with carbon in ethanol and C60 in toluene after replacingthe 300-mm focal-length input lens in Fig. 1 with a lensthat has a focal length of 600 mm. The new f-number ofthe system is 29. The results (Fig. 9) show that even atfy29 the carbon suspension provided a factor-of-2 lowertransmission at an input energy of 200 mJ than did theC60 solution, even though the performance of the carbonsuspension was degraded in the fy29 system. The 66%-transmitting carbon suspension transmitted 15 mJ at aninput energy of 200 mJ for the fy29 system, as opposedto 5 mJ with the fy14 system. The 66%-transmitting C60
solution transmitted approximately 30 mJ at an input en-ergy of 200 mJ for both the fy29 and the fy14 systems.
Therefore we believe that there is no obvious advan-tage to using C60 (or C70) solutions in their standard formover the more broadband carbon suspensions for opticallimiting applications. There are means, however, ofchemically tailoring fullerene molecules by attaching orembedding atoms of other elements,18 which, someday,may be used to produce solutions with better nonlinear-optical properties for this application.
5. TESTS TO MEASURE SCATTEREDENERGY AS A FUNCTION OF ANGLEWe used the test-bed shown in Fig. 10 to measure thescattered energy as a function of angle. The f-numberof the focusing optics was set so that the beam justunderfilled the output detector at 0±. (This resultedin an f-number of 48.) A Molectron J3-09 pyroelectricdetector, subtending an angle of 1.4± from the center ofthe cell, was used to measure transmitted energy. AMolectron J3S-10, a silicon detector 3 orders of magnitudemore sensitive than the J3-09, was used to measure thescattered light. The J3S-10 had a slightly larger chip di-ameter than the J3-09 (1.1 instead of 0.9 cm). Differentdetectors had to be used because of the orders-of-magnitude difference between transmitted and scatteredenergy. The scattered energy was measured in incre-ments of 10±. The laser was originally horizontally polar-ized. Both horizontally and vertically polarized scatteredlight were individually measured with Glan–Taylor po-larizer in front of the output detector. We obtainedvertically polarized input pulses by rotating thefrequency-doubling unit on the laser (which rotatesthe crystal and the half-wave plate that fixes the inputpolarization to the crystal.)
We used a cylindrical cell to avoid the effect that re-fraction from flat surfaces and corners would have on thedistribution of scattered light if a square (or rectangular)cell were used. The curved walls of the cell did intro-duce astigmatism into the beam. Without the cell theequal-intensity contours of the focused spot were circular,with a 1ye2 diameter of 54 mm. When the cell was addedto the system the equal-intensity contours of the focusedspot (Fig. 11) became somewhat elliptical, with a 1ye2 mi-nor axis of 54 mm and a 1ye2 major axis of 121 mm. Thepoorer focus in the cell could have affected the limitingperformance of the samples but should not have affectedthe distribution of the scattered light leaving the cell asmuch as a square cell would have.
We also made measurements by using a larger (2.3-cmpath-length) high-optical-quality cell. This removed theastigmatism seen with the cell used for the horizontallypolarized input pulses. However, the cell still causeda low-intensity spread of light in the forward direction,which produced a horizontal stripe through the beam.(This stripe was also present with the lower-optical-quality cell. The intensity of the horizontal strip wasmuch lower than the intensity in the main beam andcould be seen only after the eye had become dark adapted.It was not seen in CCD images of the beam because itsintensity was below the dynamic range of the CCD array.)
6. SPATIAL DISTRIBUTION OFSCATTERED ENERGYFigure 12 shows the limiting curve that we obtained withcarbon in ethanol with 73% transmission over 1.5 cm, us-
Fig. 9. Limiting with fy29 focusing optics: carbon in ethanolcompared with C60 in toluene.

K. M. Nashold and D. P. Walter Vol. 12, No. 7 /July 1995 /J. Opt. Soc. Am. B 1233
Fig. 10. Test-bed for measuring scattering energy as a function of angle.
Fig. 11. Image of the focal plane with the cylindrical cell.
ing the fy48 system in Fig. 10. The limiting (definedby comparing transmitted energy levels at an energywell above the limiting threshold) is not quite so goodas for the fy14 system used to produce the results pre-sented in Section 3, but it is comparable with that of thefy29 system described in Section 4 until input energies of,250 mJ are reached. Between 250 and 320 mJ there isa region where the output energy is much more variablethan usual. This could be due to a temporary depletion ofcarbon particles in the focal volume from previous shots.
Figure 13 shows the angular distribution of the hori-zontally and vertically polarized scattered light for two
ranges of horizontally polarized input energy. At firstglance there is surprisingly little difference between thedistributions for the two ranges. But, looking at thegraphs in Fig. 14, we can see that both of these rangesare from input energies above which the relative scat-tered energies remain constant. The breakdown processcreates a scattering state different from what exists in theunperturbed suspension but consistent regardless of theinput energy (provided that it is large enough to producebreakdown).
Limiting curves for the two different input polariza-tions that we obtained by using the 2.3-cm cell are shownin Fig. 15 for the suspension that was 90% transmittingover 1 cm relative to ethanol at l 532 nm. (The trans-mission over the entire 2.3-cm path length is 78%.) Asexpected, there is very little difference in the limitinglevels for the two input polarizations. The limiting isslightly better with this high-quality cell in spite of thefact that the concentration of particles is lower. The im-proved performance is likely due to the better focus, asit allows higher fluence levels to be achieved. The ratios
Fig. 12. Transmitted energy versus input energy for an fy48system and a 1.5-cm path-length cylindrical cell.

1234 J. Opt. Soc. Am. B/Vol. 12, No. 7 /July 1995 K. M. Nashold and D. P. Walter
Fig. 13. Relative scattered energy versus angle for horizontallypolarized input energy.
Fig. 14. Relative scattered energy as a function of input energy(horizontally polarized input energy).
of scattered to input energy for the two different inputpolarizations are shown in polar coordinates in Fig. 16.Only horizontally polarized scatter is plotted for the hor-izontally polarized input pulses and vertically polarizedscatter for the vertically polarized input pulses. The or-thogonal components of the scatter are orders of magni-tude lower in intensity, as shown in Fig. 15. Figure 16demonstrates how the majority of the scattered light isin the forward direction (within 630± of the transmitteddirection). Some of this energy may be an artifact of thecell as described above. The curves for the horizontaland vertical polarization are very similar. The main dif-ference is near 90± from the transmission direction, where
Fig. 15. Limiting for horizontally and vertically polarized inputenergy (90% transmission over 1 cm at l 532 nm, limiting cellpath length 2.3 cm).
Fig. 16. Ratio of scattered to input energy as a function of angleu, with respect to the optic axis.

K. M. Nashold and D. P. Walter Vol. 12, No. 7 /July 1995 /J. Opt. Soc. Am. B 1235
there is an increase in scattered energy for the verticallypolarized input light (for input energies above threshold)that is not seen for the horizontally polarized light.
7. INTEGRATING SCATTERED ENERGYTO ESTIMATE TOTAL SCATTERED ENERGYAlthough the measurements just described were made ina single scattering plane, they can be used to calculate thescattered energy into various solid angles leaving the cen-ter of the cell. This information is needed if one wants tolimit the amount of scattered light allowed to propagatethrough an optical system placed behind the limiter cell.In this section we estimate the amount of scattered energygoing into annular rings about the optical axis and nu-merically integrate the scattered energy from 0 to 4p sr,using the data presented in Section 6. The theory usedto define our procedure is given in Appendix A.
To integrate the angularly resolved scattered energywe made some assumptions about the distribution of thescattered energy in planes other than the one for whichwe measured the distribution. We approximated the dis-tribution in other planes, using the theory for sphericalparticles. Inasmuch as the total scattered energy calcu-lated from the angular distribution measurements is closeto the value that we obtained by using the integratingsphere, we assume that this approximation is valid.
We integrated the relative scattered energy numeri-cally, as diagrammed in Fig. 17. We calculated the rela-tive scattered energy in each of the bins shown in Fig. 17,using
I sui, fj dI0
fi2suidcos2sfjd 1 i1suidsin2sfjdg
k2R2, (1)
where huij are the locations of the measured data in theu direction and hfjj are separated by 10± incrementsstarting at f 0. The intensity in each bin was scaledby the solid angle of the bin,
2pR sin u
√10
360
!2pR
√Dui
360
!R2
, (2)
divided by the solid angle, pd2y4R2, of the detector usedto measure the energy in the y–z plane. (Dui is mea-sured in degrees.) We then calculated the integratedscattered energy, using
I sund I s0, 0d 1
nXi1
36Xj1
fI sui, 0dcos2sj10±d
1 I sui, 90±dsin2sj10±dgR2 sin uiDui
257.8d2. (3)
The first bin in the summation is defined by the solidangle of the detector. The solid angle of the second binis larger than the solid angles created by the other binsbecause the second bin goes from the end of the detectorto the midpoint of the next sample in the u direction. Wemade this angle larger (rather than extending the size ofthe first bin) because we know from measurements madewith a CCD camera in the forward direction that the in-tensity drops rapidly as we leave 0±. A more accurate
estimate of the total integrated energy could be obtainedif finer-resolution sampling were done. This is more im-portant in the forward direction because it is important tomeasure exactly where the energy begins to drop off. In-terpolating between our measured data points to give 2±
increments before performing the summation in Eq. (3)gave the same value for the relative scattered energywithin 5% as obtained by the method described above butincreased the value for transmitted energy significantlybecause the interpolation did not take into account thatthe function could drop sharply between 0± and 5±.
Figure 18 is a plot of the integrated relative scat-tered energy for the data obtained with the 2.3-cm cell(Section 6, Fig. 16). The ordinate in this plot is scatteredenergy divided by input energy. Each point represents
Fig. 17. Integration process diagram.
Fig. 18. Relative scattered energy integrated from 0± to 180±.
1236 J. Opt. Soc. Am. B/Vol. 12, No. 7 /July 1995 K. M. Nashold and D. P. Walter
Table 1. Results of Angularly Resolved DataCompared with Integrating Sphere Data
Transmission Absorption ScatterMethod (%) (%) (%)
Integrating sphere 2 48 50Calculated from angularly
resolved data 3 54 43
the average for all the points with input energies within300–700 mJ, levels well above the threshold for break-down. (There were 20–60 points for each angle.)
The ratios of scattered energy to input energy measuredas a function of u in the y–z plane are shown as horizontaltick marks for horizontally polarized input pulses and asvertical tick marks for vertically polarized input pulses.The data here include only horizontally polarized scatterfor the horizontally polarized input pulses and verticallypolarized scatter for the vertically polarized input pulses.In other words, we have assumed that the scattered lightwas not depolarized. Equation (A6) of Appendix A in-dicates that there should be no contribution to the to-tal intensity in the measured planes from the orthogonalpolarization. In Fig. 13 we showed that there was a ver-tically polarized scattered energy component in the f 0plane for horizontally polarized input energy, but it was2 orders of magnitude lower than the horizontal compo-nent in the forward-scattering direction and at least anorder of magnitude lower in all other directions. Calcula-tions similar to Eq. (3) above for the energy scattered intothe orthogonal directions give a total of approximately13–16% of the input energy. This 13–16% was not in-cluded in Fig. 18.
The data in Fig. 18 show a transmitted energy (mea-sured into a full angle of 1.4± or a solid angle of 4.6 3 1024
sr) of 3% of the input energy and a total scattered en-ergy (subtracting off the transmitted energy) of 27% of theinput energy. Adding 16% for the orthogonal polariza-tions gives a total scattered energy of 43%. This impliesthat the absorbed energy was 54% of the input energy.These values are in line with the measurements madewith the integrating sphere that are reported in Section 3.In those experiments we measured ,2% transmitted, 44%scattered (50% correcting for scattered light that escapesthe exit port with Goebel’s model), and 54% absorbed (48%correcting for scattered light through the exit port) energyfor input energies near 500 mJ and the same suspensionconcentration. These results are summarized in Table 1.
The curve of integrated scattered energy indicates thatthe majority of the scattered light is collected within thefirst 630±. In terms of collecting optics, 30± representsthe collecting aperture of an fy3.5 lens. To limit thescattered light collected one could use a slower lens tocollect the light after the cell.
Two points should be made here: (1) Some of the for-ward (,30±) scatter may be an artifact of the cylindri-cal cell used to make this measurement. As described inSection 6, there was a band of light created by the cell inthe forward direction that we were never able to elimi-nate completely. (2) Not all the scattered light collectedby a lens after the cell is likely to be focused at the fo-cal plane of that lens, as it comes from different locationsalong the z axis in the cell. (This is consistent with the
fact that measurements of peak output fluence divided bypeak input fluence are lower than measurements of out-put energy divided by input energy.) In other words, thecarbon suspensions limit even better in terms of peak flu-ence levels than in terms of energy levels. As we havenot measured peak fluence levels with the fullerene so-lution, we are unable to say whether this is true for thefullerene solutions as well.
8. SUMMARYSeveral important aspects of optical limiting in carbonsuspensions and fullerene solutions were discovered inthis study. First, the ratio of scattered to absorbed en-ergy is a function of particle concentration for the carbonsuspensions. If the low energy (pre-optical-breakdown)transmission is greater than 70%, scatter is more domi-nant than absorption. For the fullerene solutions ab-sorption is dominant, even for these high transmissions.This is consistent with the reports of other authorsthat the limiting mechanism in fullerene solutions isreverse saturable absorption, whereas in the carbon sus-pensions the mechanism for optical limiting is opticalbreakdown.
Our data indicate that the limiting levels are lowerwith the carbon suspensions than they are for fullerenesolutions. Another advantage of the carbon suspensionsis their broadband transmittance. Absorption bands inthe fullerene solutions give a colored appearance to theliquids.
The measurements of the angular distribution of thescattered radiation for the carbon suspensions show thatthe intensity of the scattered energy at any off-axis an-gle is at least 2 orders of magnitude lower than theintensity of the transmitted energy. It is not substan-tially depolarized by the breakdown process and reachesa stable state where the ratio of scattered to incidentenergy remains constant as the input energy increases.Integrating the total scattered energy from the angulardistribution of the scattered energy resulted in resultssimilar to those obtained with the integrating sphere.
APPENDIX AAccording to basic scattering theory,19 the parallel andperpendicular polarization components of the scatteredelectric field can be related to the input polarization com-ponents with the matrix equation
"Ek
E'
#
"S2
S4
S3
S1
#exps2ikr 1 ikzd
ikr
"Ek0
E'0
#, (A1)
where S1 –S4 are functions of the angles u and f asdefined in Fig. 19. E' and Ek are defined relative to ascattering plane. The scattering plane is defined by thedirection of propagation of the incident wave and the di-rection of the scattered wave. In this figure the incidentwave is propagating in the z direction and the scatteredwave is propagating at an angle u from the z axis andan angle f from the x axis. E' is the polarization com-ponent perpendicular to the scattering plane, and Ek isthe component parallel to the scattering plane. E'0 and
K. M. Nashold and D. P. Walter Vol. 12, No. 7 /July 1995 /J. Opt. Soc. Am. B 1237
Fig. 19. Decomposition of electric vectors of incident and scat-tered waves.
Ek0 are the projections of the incident polarization compo-nents into the basis vectors of E' and Ek. In this figurethe incident wave is polarized in the x direction.
If we assume spherical particles, S3 S4 0,
E' S1sudexps2ikr 1 ikzd
ikrE'0 , (A2)
Ek S2sudexps2ikr 1 ikzd
ikrEk0 . (A3)
For incident polarization perpendicular to the scatter-ing plane the intensity as a function of u is given by
I sud i1sudI0
k2R2, (A4)
where i1 jS1sudj2, I0 is the incident intensity, k2 2pyl,where l is the wavelength, and R is the distance fromthe scatterer. For incident polarization parallel to thescattering plane,
I sud i2sudI0
k2R2,
i2sud jS2sudj2 . (A5)
The intensity of the scattered light in any arbitrary direc-tion for linearly polarized input pulses is defined as
I su, fd fi2sudcos2 f 1 i1sudsin2 fgI0
k2R2. (A6)
In our test setup we measured scattered energy in they–z plane as a function of u. For horizontally polarizedinput light (parallel to the y axis) our measurement ofscattered light gives us I su, 0d. For vertically polarizedinput light (parallel to the x axis) the scatter measure-ment in the y–z plane gives us I su, 90±d. Thus the hori-zontal polarization measurement gives us
I su, 0d fi2sud 3 1 1 i1sud 3 0gI0
k2R2
i2sudI0
k2R2, (A7)
and the vertical polarization measurement gives us
I su, 90±d i1sudI0
k2R2. (A8)
To calculate the intensities at other values of f, we
used Eq. (A6), plugging in the values that we measuredfor I su, 0d and I su, 90±d, using horizontally and verticallypolarized input energy.
ACKNOWLEDGMENTSThis research was funded by Joint Services contractN62269-90-C-0207 covering the period March 1990 toJune 1993. We would like to express our appreciationto the Naval Air Warfare Center—Aircraft Division andto the rest of the joint service review committee for theirsupport of this work.
REFERENCES1. J. L. W. Pohlmann, R. C. Honey, and J. L. Guagliardo,
“Optical radiation limiter,” U.S. patent 4,890,075 (December26, 1989).
2. K. M. Nashold, R. A. Brown, R. C. Honey, and D. P. Walter,“Temporal and spatial characterization of optical breakdownin a suspension of small absorbing particles,” in Materials forOptical Switches, Isolators, and Limiters, M. J. Soileau, ed.,Proc. Soc. Photo-Opt. Instrum. Eng. 1105,78 (1989).
3. K. Monsour, M. J. Soileau, and E. W. Van Stryland, “Non-linear optical properties of carbon-black suspensions (ink),”J. Opt. Soc. Am. 9, 1100 (1992).
4. L. J. Radziemski and D. A. Cremers, Laser-Induced Plasmasand Applications (Dekker, New York, 1989).
5. J. G. Fujimoto, W. Z. Lin, E. P. Ippen, C. A. Puliafito, andR. F. Steiner, “Time-resolved studies of Nd:YAG laser-induced breakdown-plasma formation, acoustic wave gen-eration and cavitation,” Invest. Ophthalmol. Vis. Sci. 26(1985).
6. C. F. Bohren and D. R. Huffman, Absorption and Scatteringof Light by Small Particles (Wiley, New York, 1983).
7. K. M. Nashold, R. A. Brown, and J. M. Voss, “Optical limiterprogram review,” presented at Naval Air Warfare CenterDivision, Warminster, Pa., February 11, 1992.
8. L. W. Tutt and A. Kost, “Optical limiting performance of C60and C70 solutions,” Nature (London) 356, 225 (1992).
9. D. Brandelik, D. McClean, M. Schmitt, R. Epling, C. Colcla-sure, V. Tondiglia, R. Pachter, K. Obermeier, and R. Crane,“Nonlinear optical properties of buckminsterfullerene solu-tions,” Proc. Mater. Res. Soc. Symp. 247, 361 (1992).
10. M. P. Joshi, S. R. Mishra, H. S. Rawat, S. C. Mehendale,and K. C. Rustagi, “Investigation of optical limiting in C60solution,” Appl. Phys. Lett. 62, 1763 (1993).
11. R. E. Smalley, “The third form of carbon,” Naval Res. Rev.XLIII, 3 (1991).
12. T. W. Ebbesen, K. Tanigaki, and S. Kuroshima, “Excited-state properties of C60,” Chem. Phys. Lett. 181,501 (1991).
13. W. J. Blau and H. J. Byrne, “Large infrared nonlinear re-sponse of C60,” Phys. Rev. Lett. 67, 1423 (1991).
14. R. Malhotra, D. C. Lorents, Y. K. Bae, C. H. Becker,D. S. Tse, L. E. Jusinski, and E. D. Wachsman, “Production,mass spectrometry, and thermal properties of fullerenes,” inFullerenes: Synthesis, Properties, and Chemistry of LargeCarbon Clusters, Vol. 481 of the ACS Symposium Series,G. S. Hammond and V. J. Kuck, eds. (American ChemicalSociety, Washington, D.C., 1992), Chap. 9.
15. D. G. Goebel, “Generalized integrating-sphere theory,” Appl.Opt. 6, 125 (1967).
16. J. Williams, Oceanographic Instrumentation, U.S. NavalInstitute Series in Oceanography (Naval Institute Press,Annapolis, Md., 1973), pp. 87–88.
17. L. W. Tutt, Hughes Research Laboratories, 3011 MalibuCanyon Road, Malibu, California 90265-4797 (personal com-munication, 1992).
18. R. F. Curl and R. E. Smalley, “Fullerenes,” Sci. Am. 265, 54(1991).
19. H. C. van de Hulst, Light Scattering by Small Particles(Dover, New York, 1957).
Copyright © 2022 FDOKUMEN