Investigation by combined solid-state NMR and SAXS methods of the morphology and domain size in...
10
Investigation by Combined Solid-State NMR and SAXS Methods of the Morphology and Domain Size in Polystyrene-b-Polyethylene Oxide-b-Polystyrene Triblock Copolymers FA ´ BIO A. BONK, 1 * STEFANO CALDARELLI, 1 TRANG PHAN, 2 DENIS BERTIN, 2 EDUARDO R. DEAZEVEDO, 3 GERSON LUIZ MANTOVANI, 3y TITO J. BONAGAMBA, 3 TOMA ´ S S. PLIVELIC, 4z IRIS L. TORRIANI 5 1 Aix-Marseille Universite ´ ISm2 UMR 6263, Site de Saint Je ´ro ˆ me, 13397 Cedex 20, Marseille, France 2 LCP UMR6264, Universite ´ de Provence, Site de Saint Je ´ro ˆ me, 13397, Marseille, France 3 Instituto de Fı ´sica de Sa ˜ o Carlos, Universidade de Sa ˜o Paulo, Sa ˜ o Carlos SP, Brasil 4 Laborato ´ rio Nacional de Luz Sı ´ncrotron, Campinas SP, Brasil 5 Instituto de Fı ´sica ‘‘Gleb Wataghin’’, Universidade Estadual de Campinas, and Laborato ´ rio Nacional de Luz Sı ´ncrotron, Campinas SP, Brasil Received 15 May 2009; revised 24 August 2009; accepted 26 August 2009 DOI: 10.1002/polb.21843 Published online in Wiley InterScience (www.interscience.wiley.com). ABSTRACT: The microphase structure of a series of polystyrene-b- polyethylene oxide-b-polystyrene (SEOS) triblock copolymers with different compositions and molecular weights has been stud- ied by solid-state NMR, DSC, wide and small angle X-ray scatter- ing (WAXS and SAXS). WAXS and DSC measurements were used to detect the presence of crystalline domains of polyethylene- oxide (PEO) blocks at room temperature as a function of the copol- ymer chemical composition. Furthermore, DSC experiments allowed the determination of the melting temperatures of the crystalline part of the PEO blocks. SAXS measurements, per- formed above and below the melting temperature of the PEO blocks, revealed the formation of periodic structures, but the ab- sence or the weakness of high order reflections peaks did not allow a clear assessment of the morphological structure of the copolymers. This information was inferred by combining the results obtained by SAXS and 1 H NMR spin diffusion experiments, which also provided an estimation of the size of the dispersed phases of the nanostructured copolymers. V C 2009 Wiley Periodicals, Inc. J Polym Sci Part B: Polym Phys 48: 55–64, 2010 KEYWORDS: ABA triblock-copolymers; block copolymers; NMR; SAXS INTRODUCTION The preparation of novel polymeric materi- als with well-defined architectures is a challenge of high in- terest, giving rise materials with superior combinations of properties. 1,2 These polymeric materials can be obtained by blending distinct polymers, for example adding rubber to polystyrene, or by preparing block copolymers. The latter have received considerable attention due to the periodic or- dered morphologies of their microphase separated domains formed as a consequence of the general thermodynamic incompatibility of the blocks. The properties exhibited by these materials allow their use in various applications, e.g. as polymeric surfactants, compatibilizers in polymer blending, dispersions, solid polymer electrolytes, 3–5 and as templates for the preparation of inorganic nanoparticles. 6,7 Such a span of potential applications is strongly related to the size of its characteristic nanodomains and to the thickness of the inter- phase regions. Among various possible materials that can be used to pre- pare block copolymers, poly(styrene) (PS) and poly(ethylene oxide) (PEO) can form interesting phase-segregated struc- tures, mainly because of block dissimilarity and incompatibil- ity. 3,8 Furthermore, as PEO blocks could crystallize, the num- ber of structures and morphologies frequently obtained in block copolymers could exhibit interesting physicochemical properties arising from the competition between microphase separation and crystallization. 9 Despite the structural rich- ness of these materials, the morphological characterizations of triblock copolymers with these components are scarce. 9,10 Additional Supporting Information may be found in the online version of this article. *Present address: Instituto de Quı´mica, Universidade Estadual de Campinas, CP 6154, CEP 13083-970 Campinas, SP, Brasil. † Present address: Centro de Engenharia, Modelagem e Cie ˆ ncias Sociais Aplicadas Universidade Federal do ABC, Santo Andre ´ , SP, Brasil. ‡ Present address: MAXLab, Lund University, P.O. Box 118, SE-22100 Lund, Sweden. Correspondence to: S. Caldarelli (E-mail: [email protected]) Journal of Polymer Science: Part B: Polymer Physics, Vol. 48, 55–64 (2010) V C 2009 Wiley Periodicals, Inc. NMR AND SAXS OF BLOCK COPOLYMERS, BONK ET AL. 55
-
Upload
independent -
Category
Documents
-
view
3 -
download
0
Transcript of Investigation by combined solid-state NMR and SAXS methods of the morphology and domain size in...
Investigation by Combined Solid-State NMR and SAXS Methods of
the Morphology and Domain Size in Polystyrene-b-Polyethylene
Oxide-b-Polystyrene Triblock Copolymers
FABIO A. BONK,1* STEFANO CALDARELLI,1 TRANG PHAN,2 DENIS BERTIN,2 EDUARDO R. DEAZEVEDO,3
GERSON LUIZ MANTOVANI,3y TITO J. BONAGAMBA,3 TOMAS S. PLIVELIC,4z IRIS L. TORRIANI5
1Aix-Marseille Universite ISm2 UMR 6263, Site de Saint Jerome, 13397 Cedex 20, Marseille, France
2LCP UMR6264, Universite de Provence, Site de Saint Jerome, 13397, Marseille, France
3Instituto de Fısica de Sao Carlos, Universidade de Sao Paulo, Sao Carlos SP, Brasil
4Laboratorio Nacional de Luz Sıncrotron, Campinas SP, Brasil
5Instituto de Fısica ‘‘Gleb Wataghin’’, Universidade Estadual de Campinas, and Laboratorio Nacional de Luz Sıncrotron,
Campinas SP, Brasil
Received 15 May 2009; revised 24 August 2009; accepted 26 August 2009
DOI: 10.1002/polb.21843
Published online in Wiley InterScience (www.interscience.wiley.com).
ABSTRACT: The microphase structure of a series of polystyrene-b-
polyethylene oxide-b-polystyrene (SEOS) triblock copolymers
with different compositions and molecular weights has been stud-
ied by solid-state NMR, DSC, wide and small angle X-ray scatter-
ing (WAXS and SAXS). WAXS and DSC measurements were used
to detect the presence of crystalline domains of polyethylene-
oxide (PEO) blocks at room temperature as a function of the copol-
ymer chemical composition. Furthermore, DSC experiments
allowed the determination of the melting temperatures of the
crystalline part of the PEO blocks. SAXS measurements, per-
formed above and below the melting temperature of the PEO
blocks, revealed the formation of periodic structures, but the ab-
sence or the weakness of high order reflections peaks did not
allow a clear assessment of the morphological structure of the
copolymers. This information was inferred by combining the
results obtained by SAXS and 1H NMR spin diffusion experiments,
which also provided an estimation of the size of the dispersed
phases of the nanostructured copolymers.VC 2009 Wiley Periodicals,
Inc. J Polym Sci Part B: Polym Phys 48: 55–64, 2010
KEYWORDS: ABA triblock-copolymers; block copolymers; NMR;
SAXS
INTRODUCTION The preparation of novel polymeric materi-als with well-defined architectures is a challenge of high in-terest, giving rise materials with superior combinations ofproperties.1,2 These polymeric materials can be obtained byblending distinct polymers, for example adding rubber topolystyrene, or by preparing block copolymers. The latterhave received considerable attention due to the periodic or-dered morphologies of their microphase separated domainsformed as a consequence of the general thermodynamicincompatibility of the blocks. The properties exhibited bythese materials allow their use in various applications, e.g.as polymeric surfactants, compatibilizers in polymer blending,dispersions, solid polymer electrolytes,3–5 and as templatesfor the preparation of inorganic nanoparticles.6,7 Such a span
of potential applications is strongly related to the size of itscharacteristic nanodomains and to the thickness of the inter-phase regions.
Among various possible materials that can be used to pre-pare block copolymers, poly(styrene) (PS) and poly(ethyleneoxide) (PEO) can form interesting phase-segregated struc-tures, mainly because of block dissimilarity and incompatibil-ity.3,8 Furthermore, as PEO blocks could crystallize, the num-ber of structures and morphologies frequently obtained inblock copolymers could exhibit interesting physicochemicalproperties arising from the competition between microphaseseparation and crystallization.9 Despite the structural rich-ness of these materials, the morphological characterizationsof triblock copolymers with these components are scarce.9,10
Additional Supporting Information may be found in the online version of this article.
*Present address: Instituto de Quımica, Universidade Estadual de Campinas, CP 6154, CEP 13083-970 Campinas, SP, Brasil.†Present address: Centro de Engenharia, Modelagem e Ciencias Sociais Aplicadas � Universidade Federal do ABC, Santo Andre, SP, Brasil.‡Present address: MAXLab, Lund University, P.O. Box 118, SE-22100 Lund, Sweden.
Correspondence to: S. Caldarelli (E-mail: [email protected])
Journal of Polymer Science: Part B: Polymer Physics, Vol. 48, 55–64 (2010) VC 2009 Wiley Periodicals, Inc.
NMR AND SAXS OF BLOCK COPOLYMERS, BONK ET AL. 55
In this work, we studied a series of ABA triblock copolymerspolystyrene-b-polyethyleneoxide-b-polystyrene (SEOS), inwhich the number-average molecular weight of the PEOblocks was kept constant at 10.0 kg.mol�1 and those of thePS blocks were varied in an extended range. Due to the indi-vidual thermodynamic properties of the block components,commonly four regions with different mobilities areexpected: a mobile region (PEO), a more rigid region (PS andeventually crystalline PEO) and an interphase region. Thislatter is loosely defined and owing to the immiscibility of theblocks, it is normally expected to be thin in comparison withthe size of the PS and PEO domains.
In this work, solid-state 1H NMR spin diffusion and SAXSanalysis were used as complementary techniques to gain in-formation on the domain size and morphology in amorphousand semicrystalline SEOS triblock copolymers. 1H spin-diffu-sion NMR and SAXS11,12 are two common experimentalapproaches for investigating the sizes of the different regionsin phase-separated systems. NMR does not require the for-mation of periodical domains and is sensitive to domainsizes ranging from nanometers to hundred of nanometers,13
but it is not able to yield morphological information directly.SAXS, in contrast, can provide morphological information,but in partially disordered systems it shows strong limita-tions in obtaining details on the domain sizes of the dis-persed phases and interphases. We show in this article that,conversely, precise structural information on the nanostruc-ture of the ABA block copolymers investigated can beobtained by interlacing SAXS and 1H NMR spin diffusionanalysis, overcoming the intrinsic limitations of the twotechniques.
EXPERIMENTAL
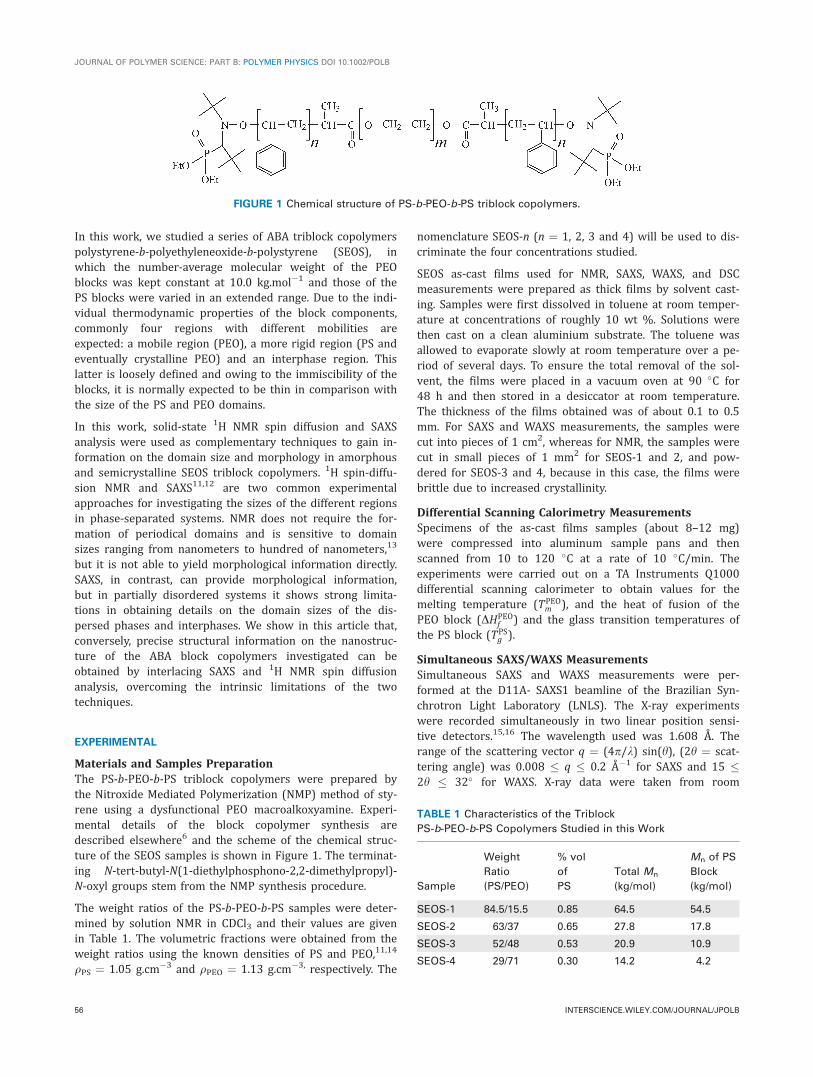
Materials and Samples PreparationThe PS-b-PEO-b-PS triblock copolymers were prepared bythe Nitroxide Mediated Polymerization (NMP) method of sty-rene using a dysfunctional PEO macroalkoxyamine. Experi-mental details of the block copolymer synthesis aredescribed elsewhere6 and the scheme of the chemical struc-ture of the SEOS samples is shown in Figure 1. The terminat-ing N-tert-butyl-N(1-diethylphosphono-2,2-dimethylpropyl)-N-oxyl groups stem from the NMP synthesis procedure.
The weight ratios of the PS-b-PEO-b-PS samples were deter-mined by solution NMR in CDCl3 and their values are givenin Table 1. The volumetric fractions were obtained from theweight ratios using the known densities of PS and PEO,11,14
qPS ¼ 1.05 g.cm�3 and qPEO ¼ 1.13 g.cm�3, respectively. The
nomenclature SEOS-n (n ¼ 1, 2, 3 and 4) will be used to dis-criminate the four concentrations studied.
SEOS as-cast films used for NMR, SAXS, WAXS, and DSCmeasurements were prepared as thick films by solvent cast-ing. Samples were first dissolved in toluene at room temper-ature at concentrations of roughly 10 wt %. Solutions werethen cast on a clean aluminium substrate. The toluene wasallowed to evaporate slowly at room temperature over a pe-riod of several days. To ensure the total removal of the sol-vent, the films were placed in a vacuum oven at 90 �C for48 h and then stored in a desiccator at room temperature.The thickness of the films obtained was of about 0.1 to 0.5mm. For SAXS and WAXS measurements, the samples werecut into pieces of 1 cm2, whereas for NMR, the samples werecut in small pieces of 1 mm2 for SEOS-1 and 2, and pow-dered for SEOS-3 and 4, because in this case, the films werebrittle due to increased crystallinity.
Differential Scanning Calorimetry MeasurementsSpecimens of the as-cast films samples (about 8–12 mg)were compressed into aluminum sample pans and thenscanned from 10 to 120 �C at a rate of 10 �C/min. Theexperiments were carried out on a TA Instruments Q1000differential scanning calorimeter to obtain values for themelting temperature (TPEO
m ), and the heat of fusion of thePEO block (DHPEO
f ) and the glass transition temperatures ofthe PS block (TPS
g ).
Simultaneous SAXS/WAXS MeasurementsSimultaneous SAXS and WAXS measurements were per-formed at the D11A- SAXS1 beamline of the Brazilian Syn-chrotron Light Laboratory (LNLS). The X-ray experimentswere recorded simultaneously in two linear position sensi-tive detectors.15,16 The wavelength used was 1.608 Å. Therange of the scattering vector q ¼ (4p/k) sin(h), (2h ¼ scat-tering angle) was 0.008 � q � 0.2 Å�1 for SAXS and 15 �2h � 32� for WAXS. X-ray data were taken from room
FIGURE 1 Chemical structure of PS-b-PEO-b-PS triblock copolymers.
TABLE 1 Characteristics of the Triblock
PS-b-PEO-b-PS Copolymers Studied in this Work
Sample
Weight
Ratio
(PS/PEO)
% vol
of
PS
Total Mn
(kg/mol)
Mn of PS
Block
(kg/mol)
SEOS-1 84.5/15.5 0.85 64.5 54.5
SEOS-2 63/37 0.65 27.8 17.8
SEOS-3 52/48 0.53 20.9 10.9
SEOS-4 29/71 0.30 14.2 4.2
JOURNAL OF POLYMER SCIENCE: PART B: POLYMER PHYSICS DOI 10.1002/POLB
56 INTERSCIENCE.WILEY.COM/JOURNAL/JPOLB
temperature to 60 �C varying the temperature of a THMLinkam hot stage in steps of 5 �C.
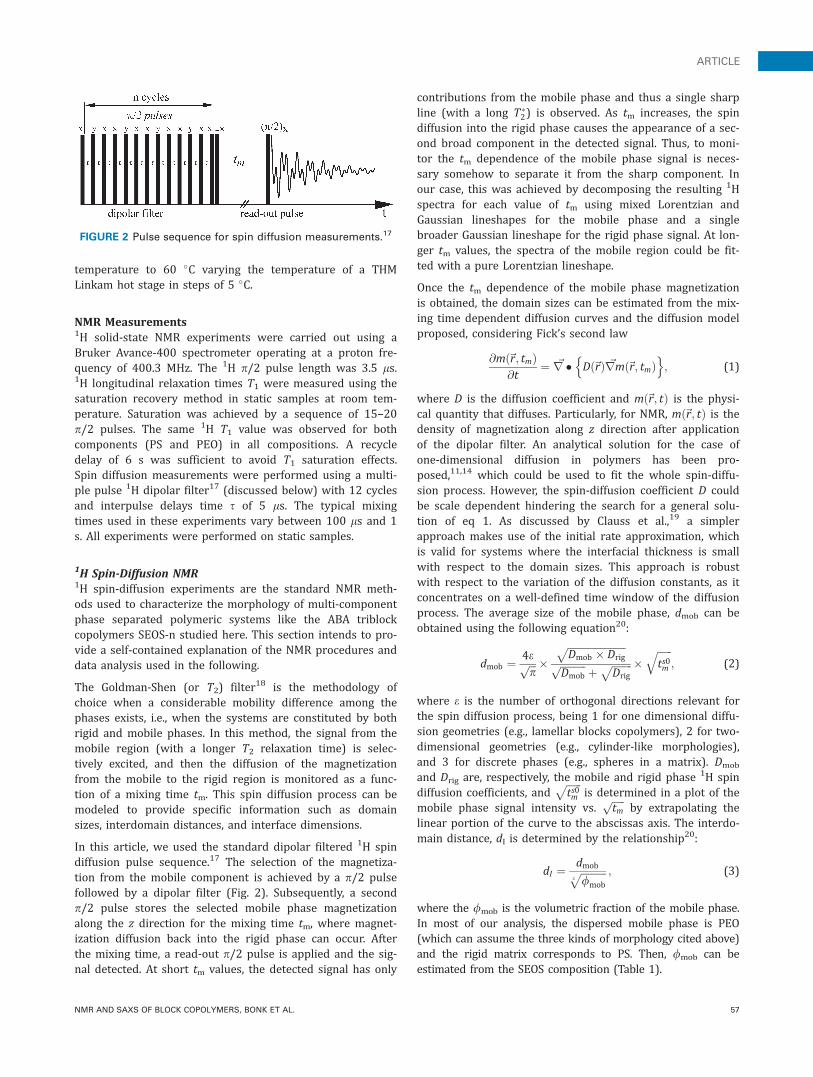
NMR Measurements1H solid-state NMR experiments were carried out using aBruker Avance-400 spectrometer operating at a proton fre-quency of 400.3 MHz. The 1H p/2 pulse length was 3.5 ls.1H longitudinal relaxation times T1 were measured using thesaturation recovery method in static samples at room tem-perature. Saturation was achieved by a sequence of 15–20p/2 pulses. The same 1H T1 value was observed for bothcomponents (PS and PEO) in all compositions. A recycledelay of 6 s was sufficient to avoid T1 saturation effects.Spin diffusion measurements were performed using a multi-ple pulse 1H dipolar filter17 (discussed below) with 12 cyclesand interpulse delays time s of 5 ls. The typical mixingtimes used in these experiments vary between 100 ls and 1s. All experiments were performed on static samples.
1H Spin-Diffusion NMR1H spin-diffusion experiments are the standard NMR meth-ods used to characterize the morphology of multi-componentphase separated polymeric systems like the ABA triblockcopolymers SEOS-n studied here. This section intends to pro-vide a self-contained explanation of the NMR procedures anddata analysis used in the following.
The Goldman-Shen (or T2) filter18 is the methodology ofchoice when a considerable mobility difference among thephases exists, i.e., when the systems are constituted by bothrigid and mobile phases. In this method, the signal from themobile region (with a longer T2 relaxation time) is selec-tively excited, and then the diffusion of the magnetizationfrom the mobile to the rigid region is monitored as a func-tion of a mixing time tm. This spin diffusion process can bemodeled to provide specific information such as domainsizes, interdomain distances, and interface dimensions.
In this article, we used the standard dipolar filtered 1H spindiffusion pulse sequence.17 The selection of the magnetiza-tion from the mobile component is achieved by a p/2 pulsefollowed by a dipolar filter (Fig. 2). Subsequently, a secondp/2 pulse stores the selected mobile phase magnetizationalong the z direction for the mixing time tm, where magnet-ization diffusion back into the rigid phase can occur. Afterthe mixing time, a read-out p/2 pulse is applied and the sig-nal detected. At short tm values, the detected signal has only
contributions from the mobile phase and thus a single sharpline (with a long T�
2) is observed. As tm increases, the spindiffusion into the rigid phase causes the appearance of a sec-ond broad component in the detected signal. Thus, to moni-tor the tm dependence of the mobile phase signal is neces-sary somehow to separate it from the sharp component. Inour case, this was achieved by decomposing the resulting 1Hspectra for each value of tm using mixed Lorentzian andGaussian lineshapes for the mobile phase and a singlebroader Gaussian lineshape for the rigid phase signal. At lon-ger tm values, the spectra of the mobile region could be fit-ted with a pure Lorentzian lineshape.
Once the tm dependence of the mobile phase magnetizationis obtained, the domain sizes can be estimated from the mix-ing time dependent diffusion curves and the diffusion modelproposed, considering Fick’s second law
@mð~r; tmÞ@t
¼ ~r � Dð~rÞ ~rmð~r; tmÞn o
; (1)
where D is the diffusion coefficient and mð~r; tÞ is the physi-cal quantity that diffuses. Particularly, for NMR, mð~r; tÞ is thedensity of magnetization along z direction after applicationof the dipolar filter. An analytical solution for the case ofone-dimensional diffusion in polymers has been pro-posed,11,14 which could be used to fit the whole spin-diffu-sion process. However, the spin-diffusion coefficient D couldbe scale dependent hindering the search for a general solu-tion of eq 1. As discussed by Clauss et al.,19 a simplerapproach makes use of the initial rate approximation, whichis valid for systems where the interfacial thickness is smallwith respect to the domain sizes. This approach is robustwith respect to the variation of the diffusion constants, as itconcentrates on a well-defined time window of the diffusionprocess. The average size of the mobile phase, dmob can beobtained using the following equation20:
dmob ¼ 4effiffiffip
p �ffiffiffiffiffiffiffiffiffiffiffiffiffiffiffiffiffiffiffiffiffiffiffiDmob � Drig
pffiffiffiffiffiffiffiffiffiffiDmob
pþ
ffiffiffiffiffiffiffiffiDrig
p �ffiffiffiffiffiffits0m
q; (2)
where e is the number of orthogonal directions relevant forthe spin diffusion process, being 1 for one dimensional diffu-sion geometries (e.g., lamellar blocks copolymers), 2 for two-dimensional geometries (e.g., cylinder-like morphologies),and 3 for discrete phases (e.g., spheres in a matrix). Dmob
and Drig are, respectively, the mobile and rigid phase 1H spindiffusion coefficients, and
ffiffiffiffiffiffits0m
pis determined in a plot of the
mobile phase signal intensity vs.ffiffiffiffiffitm
pby extrapolating the
linear portion of the curve to the abscissas axis. The interdo-main distance, dI is determined by the relationship20:
dI ¼dmobffiffiffiffiffiffiffiffiffiffi/mob
ep ; (3)
where the /mob is the volumetric fraction of the mobile phase.In most of our analysis, the dispersed mobile phase is PEO(which can assume the three kinds of morphology cited above)and the rigid matrix corresponds to PS. Then, /mob can beestimated from the SEOS composition (Table 1).
FIGURE 2 Pulse sequence for spin diffusion measurements.17
ARTICLE
NMR AND SAXS OF BLOCK COPOLYMERS, BONK ET AL. 57
An important feature of eq 2 is its dependence on the 1Hspin diffusion coefficients Dmob and Drig, which must beknown for evaluating the domain sizes of the system.According to Demco et al.,14 the diffusion coefficients arerelated to the Van Vleck second moment of the NMR reso-nance through its full-line-width-at-half-height D(m)1/2, whichin the case of Gaussian lines is given by
Dmatrix ¼112
ffiffiffiffiffiffiffiffiffiffiffiffiffiffip
2 lnð2Þ
rhr2iDðmÞ1=2 (4)
and for Lorentzian lines by
Ddis ¼1
6hr2i
ffiffiffiffiffiffiffiffiffiffiffiffiffiffiffiffiffiffiffiffiffiðaDðmÞ1=2Þ
q(5)
where hr2i is the mean square distance between the nearest1H spins. For PEO hr2iPEO ¼ 5.032 Å2 and for PS hr2iPS ¼5.83 Å2. a is a cutoff parameter for the Lorentzian line shape(i.e. the value for which the absorption spectrum intensityfor the frequency range |Dm| > a can be neglected). In thiswork a was taken as 10 times D(m)1/2.
RESULTS AND DISCUSSION
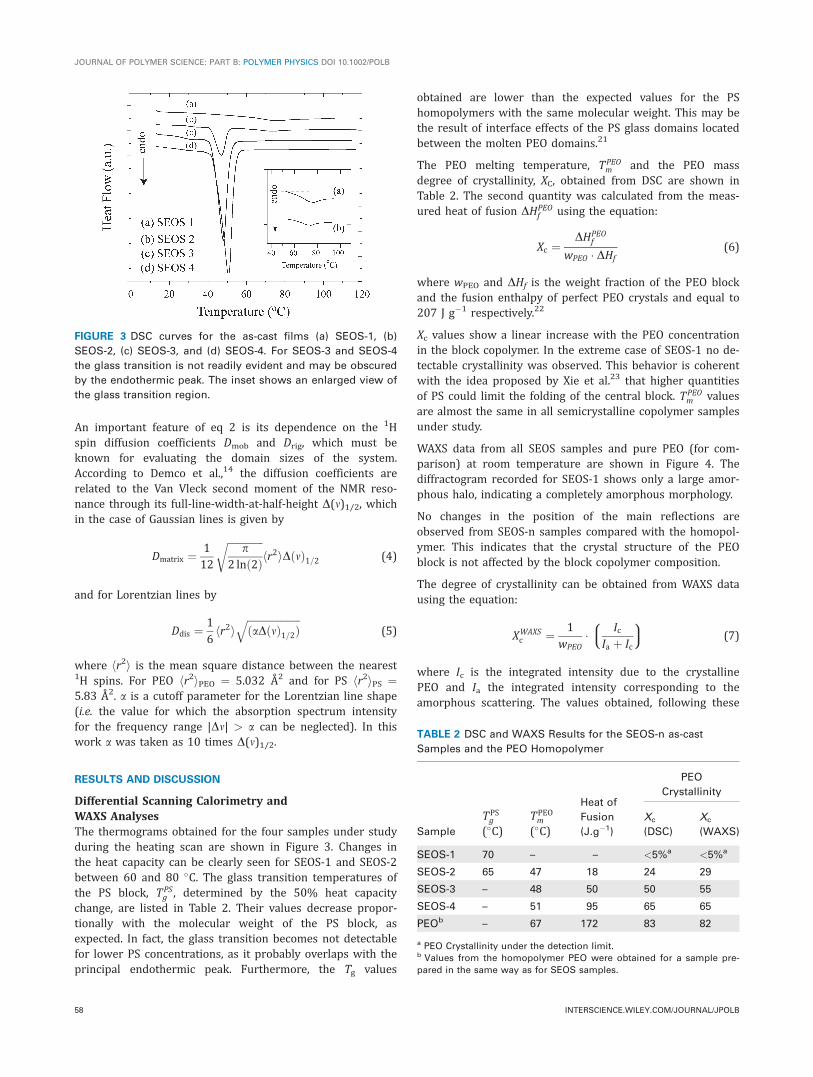
Differential Scanning Calorimetry andWAXS AnalysesThe thermograms obtained for the four samples under studyduring the heating scan are shown in Figure 3. Changes inthe heat capacity can be clearly seen for SEOS-1 and SEOS-2between 60 and 80 �C. The glass transition temperatures ofthe PS block, TPS
g , determined by the 50% heat capacitychange, are listed in Table 2. Their values decrease propor-tionally with the molecular weight of the PS block, asexpected. In fact, the glass transition becomes not detectablefor lower PS concentrations, as it probably overlaps with theprincipal endothermic peak. Furthermore, the Tg values
obtained are lower than the expected values for the PShomopolymers with the same molecular weight. This may bethe result of interface effects of the PS glass domains locatedbetween the molten PEO domains.21
The PEO melting temperature, TPEOm and the PEO mass
degree of crystallinity, XC, obtained from DSC are shown inTable 2. The second quantity was calculated from the meas-ured heat of fusion DHPEO
f using the equation:
Xc ¼DHPEO
f
wPEO � DHf(6)
where wPEO and DHf is the weight fraction of the PEO blockand the fusion enthalpy of perfect PEO crystals and equal to207 J g�1 respectively.22
Xc values show a linear increase with the PEO concentrationin the block copolymer. In the extreme case of SEOS-1 no de-tectable crystallinity was observed. This behavior is coherentwith the idea proposed by Xie et al.23 that higher quantitiesof PS could limit the folding of the central block. TPEO
m valuesare almost the same in all semicrystalline copolymer samplesunder study.
WAXS data from all SEOS samples and pure PEO (for com-parison) at room temperature are shown in Figure 4. Thediffractogram recorded for SEOS-1 shows only a large amor-phous halo, indicating a completely amorphous morphology.
No changes in the position of the main reflections areobserved from SEOS-n samples compared with the homopol-ymer. This indicates that the crystal structure of the PEOblock is not affected by the block copolymer composition.
The degree of crystallinity can be obtained from WAXS datausing the equation:
XWAXSc ¼ 1
wPEO� Ic
Ia þ Ic
8>: 9>; (7)
where Ic is the integrated intensity due to the crystallinePEO and Ia the integrated intensity corresponding to theamorphous scattering. The values obtained, following these
FIGURE 3 DSC curves for the as-cast films (a) SEOS-1, (b)
SEOS-2, (c) SEOS-3, and (d) SEOS-4. For SEOS-3 and SEOS-4
the glass transition is not readily evident and may be obscured
by the endothermic peak. The inset shows an enlarged view of
the glass transition region.
TABLE 2 DSC and WAXS Results for the SEOS-n as-cast
Samples and the PEO Homopolymer
Sample
TPSg
(�C)TPEOm
(�C)
Heat of
Fusion
(J.g�1)
PEO
Crystallinity
Xc
(DSC)
Xc
(WAXS)
SEOS-1 70 – – <5%a <5%a
SEOS-2 65 47 18 24 29
SEOS-3 – 48 50 50 55
SEOS-4 – 51 95 65 65
PEOb – 67 172 83 82
a PEO Crystallinity under the detection limit.b Values from the homopolymer PEO were obtained for a sample pre-
pared in the same way as for SEOS samples.
JOURNAL OF POLYMER SCIENCE: PART B: POLYMER PHYSICS DOI 10.1002/POLB
58 INTERSCIENCE.WILEY.COM/JOURNAL/JPOLB
procedures, are indicated in Table 2, showing a very goodcorrespondence with those obtained by DSC.
Since the microphase separated amorphous state is the pointof comparison of the morphological characterization by X-rayand solid state NMR (see below), the melting of the PEOphase was confirmed in temperature dependent WAXSexperiments. The temperatures observed for complete melt-ing of the crystalline PEO were of 50 �C for SEOS-2 andSEOS-3, and 55 �C for SEOS-4.
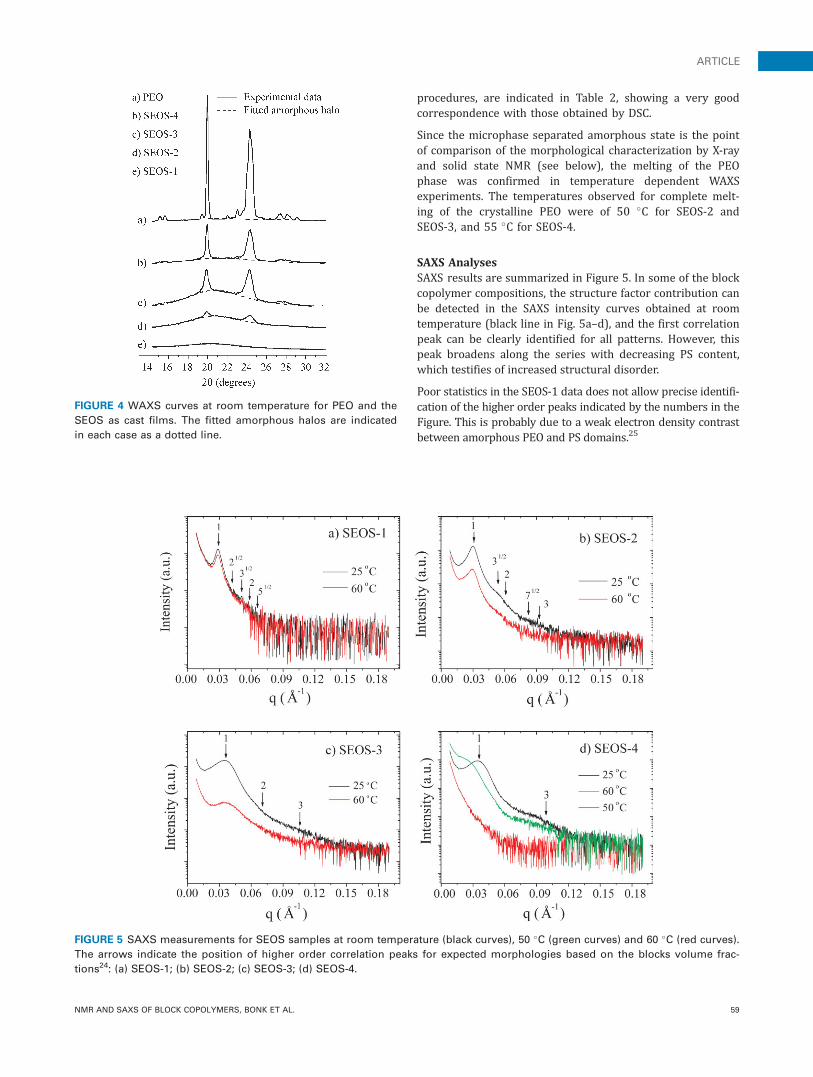
SAXS AnalysesSAXS results are summarized in Figure 5. In some of the blockcopolymer compositions, the structure factor contribution canbe detected in the SAXS intensity curves obtained at roomtemperature (black line in Fig. 5a–d), and the first correlationpeak can be clearly identified for all patterns. However, thispeak broadens along the series with decreasing PS content,which testifies of increased structural disorder.
Poor statistics in the SEOS-1 data does not allow precise identifi-cation of the higher order peaks indicated by the numbers in theFigure. This is probably due to a weak electron density contrastbetween amorphous PEO and PS domains.25
FIGURE 4 WAXS curves at room temperature for PEO and the
SEOS as cast films. The fitted amorphous halos are indicated
in each case as a dotted line.
FIGURE 5 SAXS measurements for SEOS samples at room temperature (black curves), 50 �C (green curves) and 60 �C (red curves).
The arrows indicate the position of higher order correlation peaks for expected morphologies based on the blocks volume frac-
tions24: (a) SEOS-1; (b) SEOS-2; (c) SEOS-3; (d) SEOS-4.
ARTICLE
NMR AND SAXS OF BLOCK COPOLYMERS, BONK ET AL. 59
The scattering SAXS patterns of the SEOS-2 and SEOS-3 samplescontain some indication of the higher order peaks of the struc-ture, but the intensity is also very low and the peaks are poorlydefined, preventing a decisive confirmation of the morphologyexpected for these samples based on other similar systems (hex-agonal PEO cylinders in a PS matrix for sample SEOS-2 and PEO-PS lamellas for sample SEOS-3, which would correspond to peaksindicated with an arrow in Fig. 524).
In the case of sample SEOS-4, a second maximum can bedetected in a position suggesting a contribution from thesemicrystalline lamellar morphology of the PEO matrix.
Other details of the domain structure of the samples can beobtained from SAXS patterns corresponding to temperaturesabove the melting point of the PEO blocks. As shown in Fig-ure 5a–c, similar SAXS curves are obtained at 60 �C (redlines) and room temperature (black lines) for the three sam-ples SEOS-1, 2 and 3. This fact indicates that the microphasemorphology is preserved after melting, and the crystalliza-tion of the PEO block occurred in restricted phase morphol-ogy (confined crystallization). For the higher temperaturepatterns, the decrease in the scattered intensity may be dueto the loss of order and/or of electron density contrast.
A completely different behavior is observed for SEOS-4, inwhich the correlation peak is lost at 60 �C (red line). Thisfact suggests a matrix inversion, the PEO providing the over-all morphology. At the intermediate temperature of 50 �C(green line) the shift of this maximum towards lower q val-ues suggests that the fusion of the PEO lamellae and theincreased mobility of the short PS blocks lead to a completeloss of the correlation peak at 60 �C. It is important to notethat in this sample, the PEO volumetric fraction is 70%,being the major component of the system.
This behavior is characteristic of unconfined crystallization,in which the semi-crystalline lamellar structure overrides thepre-existing phase separation morphology. This is expecteddue to the low molecular weight of the PS block and itsreduced viscosity in this sample.
When PEO is amorphous (T � 60 �C), the increasing broad-ening of the main SAXS peak for lower PS concentrationreflects the loss of organization in the morphology. This factis consistent with the expected increasing loss of rigidity ofthe end blocks. The extreme case is SEOS-4, in which heatingabove the PEO melting point results in the loss of the corre-lation peak. Due to this fact we did not investigate furtherthis sample. The noisy signal observed for higher q values isdue to weak scattering of the samples and a smoothing ofthe end of the curves no longer shows high order peaks.
In the SAXS spectra, the coordinate corresponding to themaximum of the main correlation peak (qm), can be associ-ated with the interdomain distances, dI. In cases in whichthe morphology of the sample is known, the dI values can becalculated as follows24,26:
Lamellar dI ¼2 � pqm
: (8)
HCP dI ¼4 � pffiffiffi3
p� qm
(9)
BCC dI ¼ffiffiffi6
p� p
qm(10)
Table 3 summarizes the interdomain distances calculatedusing equations (8, 9 and 10) for all possible morphologiesof the SEOS-1,2,3 samples. Due to the modest resolution ofthe existing data, the possible existence of a gyroid structurewas not postulated, as was the case in similar experimentsreported in the literature.27
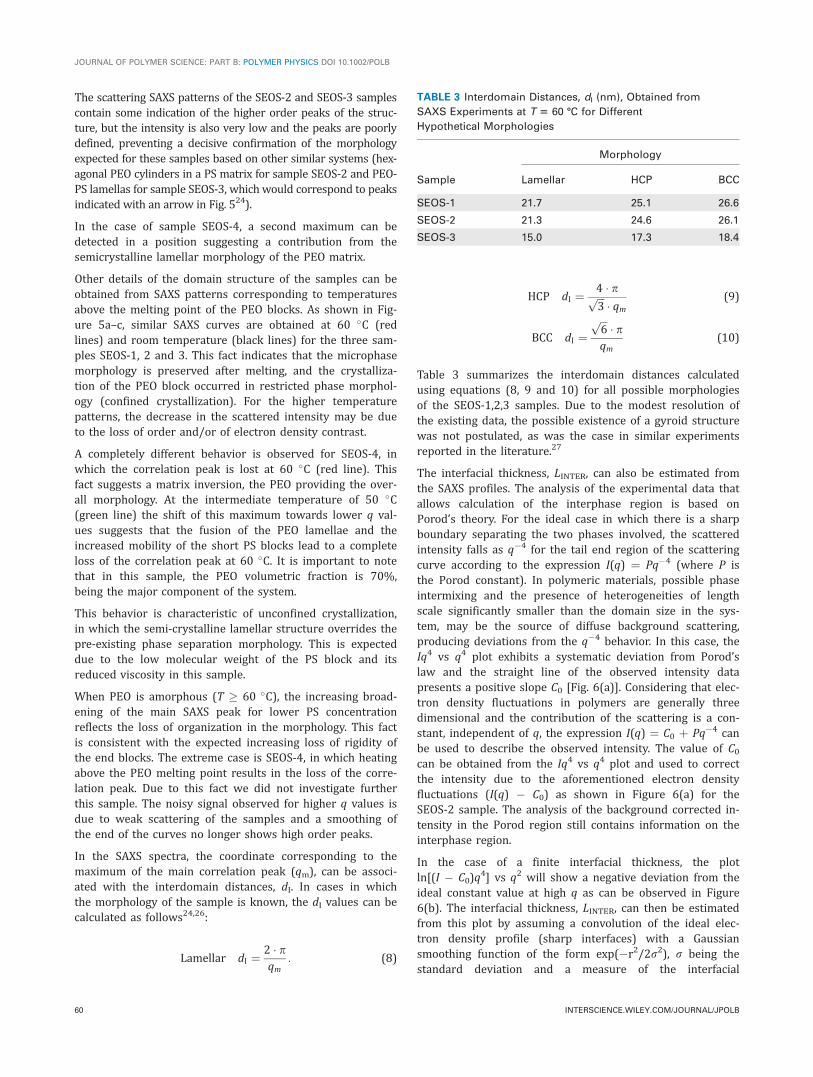
The interfacial thickness, LINTER, can also be estimated fromthe SAXS profiles. The analysis of the experimental data thatallows calculation of the interphase region is based onPorod’s theory. For the ideal case in which there is a sharpboundary separating the two phases involved, the scatteredintensity falls as q�4 for the tail end region of the scatteringcurve according to the expression I(q) ¼ Pq�4 (where P isthe Porod constant). In polymeric materials, possible phaseintermixing and the presence of heterogeneities of lengthscale significantly smaller than the domain size in the sys-tem, may be the source of diffuse background scattering,producing deviations from the q�4 behavior. In this case, theIq4 vs q4 plot exhibits a systematic deviation from Porod’slaw and the straight line of the observed intensity datapresents a positive slope C0 [Fig. 6(a)]. Considering that elec-tron density fluctuations in polymers are generally threedimensional and the contribution of the scattering is a con-stant, independent of q, the expression I(q) ¼ C0 þ Pq�4 canbe used to describe the observed intensity. The value of C0can be obtained from the Iq4 vs q4 plot and used to correctthe intensity due to the aforementioned electron densityfluctuations (I(q) � C0) as shown in Figure 6(a) for theSEOS-2 sample. The analysis of the background corrected in-tensity in the Porod region still contains information on theinterphase region.
In the case of a finite interfacial thickness, the plotln[(I � C0)q
4] vs q2 will show a negative deviation from theideal constant value at high q as can be observed in Figure6(b). The interfacial thickness, LINTER, can then be estimatedfrom this plot by assuming a convolution of the ideal elec-tron density profile (sharp interfaces) with a Gaussiansmoothing function of the form exp(�r2/2r2), r being thestandard deviation and a measure of the interfacial
TABLE 3 Interdomain Distances, dI (nm), Obtained from
SAXS Experiments at T 5 60 8C for Different
Hypothetical Morphologies
Sample
Morphology
Lamellar HCP BCC
SEOS-1 21.7 25.1 26.6
SEOS-2 21.3 24.6 26.1
SEOS-3 15.0 17.3 18.4
JOURNAL OF POLYMER SCIENCE: PART B: POLYMER PHYSICS DOI 10.1002/POLB
60 INTERSCIENCE.WILEY.COM/JOURNAL/JPOLB
thickness.1,27 This value is given by LINTER ¼ (2p)1/2 r. Thesteps outlined for this procedure are exemplified in Figure 6(a and b) for the SEOS-2 sample. The results are summarizedin Table 4.
NMR AnalysesThe DSC and WAXS results showed that in the case of SEOS-2 and 3, the PEO block is semicrystalline at room tempera-
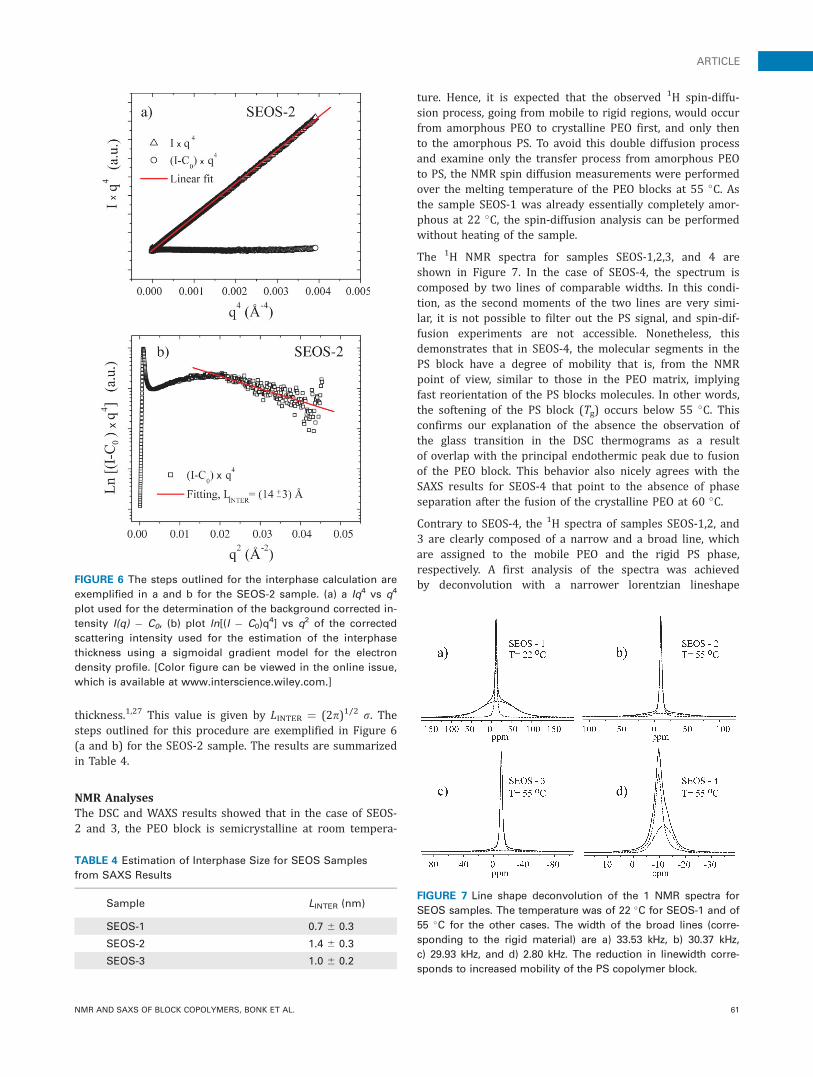
ture. Hence, it is expected that the observed 1H spin-diffu-sion process, going from mobile to rigid regions, would occurfrom amorphous PEO to crystalline PEO first, and only thento the amorphous PS. To avoid this double diffusion processand examine only the transfer process from amorphous PEOto PS, the NMR spin diffusion measurements were performedover the melting temperature of the PEO blocks at 55 �C. Asthe sample SEOS-1 was already essentially completely amor-phous at 22 �C, the spin-diffusion analysis can be performedwithout heating of the sample.
The 1H NMR spectra for samples SEOS-1,2,3, and 4 areshown in Figure 7. In the case of SEOS-4, the spectrum iscomposed by two lines of comparable widths. In this condi-tion, as the second moments of the two lines are very simi-lar, it is not possible to filter out the PS signal, and spin-dif-fusion experiments are not accessible. Nonetheless, thisdemonstrates that in SEOS-4, the molecular segments in thePS block have a degree of mobility that is, from the NMRpoint of view, similar to those in the PEO matrix, implyingfast reorientation of the PS blocks molecules. In other words,the softening of the PS block (Tg) occurs below 55 �C. Thisconfirms our explanation of the absence the observation ofthe glass transition in the DSC thermograms as a resultof overlap with the principal endothermic peak due to fusionof the PEO block. This behavior also nicely agrees with theSAXS results for SEOS-4 that point to the absence of phaseseparation after the fusion of the crystalline PEO at 60 �C.
Contrary to SEOS-4, the 1H spectra of samples SEOS-1,2, and3 are clearly composed of a narrow and a broad line, whichare assigned to the mobile PEO and the rigid PS phase,respectively. A first analysis of the spectra was achievedby deconvolution with a narrower lorentzian lineshapeFIGURE 6 The steps outlined for the interphase calculation are
exemplified in a and b for the SEOS-2 sample. (a) a Iq4 vs q4
plot used for the determination of the background corrected in-
tensity I(q) � C0, (b) plot ln[(I � C0)q4] vs q2 of the corrected
scattering intensity used for the estimation of the interphase
thickness using a sigmoidal gradient model for the electron
density profile. [Color figure can be viewed in the online issue,
which is available at www.interscience.wiley.com.]
TABLE 4 Estimation of Interphase Size for SEOS Samples
from SAXS Results
Sample LINTER (nm)
SEOS-1 0.7 6 0.3
SEOS-2 1.4 6 0.3
SEOS-3 1.0 6 0.2
FIGURE 7 Line shape deconvolution of the 1 NMR spectra for
SEOS samples. The temperature was of 22 �C for SEOS-1 and of
55 �C for the other cases. The width of the broad lines (corre-
sponding to the rigid material) are a) 33.53 kHz, b) 30.37 kHz,
c) 29.93 kHz, and d) 2.80 kHz. The reduction in linewidth corre-
sponds to increased mobility of the PS copolymer block.
ARTICLE
NMR AND SAXS OF BLOCK COPOLYMERS, BONK ET AL. 61
associated to the mobile PEO phase and a broader Gaussianlineshape, corresponding to the rigid PS phase (Table 5 andFig. 7). The values obtained are shown in Table 5 and are infair agreement with the chemical composition of the copoly-mer, as the PS component is shown to decrease along the se-ries. An exception to the trend is observed for SEOS-3, whichcan be explained by the very low intensity of the broad lineand the associated expected large error. For SEOS-4, bothsignals become considerably narrower and well visible, sothat the guess of the relative percentage is again good. It isnoteworthy that the line corresponding to the PS phasebecomes narrower upon decreasing the PS concentration,which corresponds to the increased mobility in this phase.This is again in qualitative agreement with the SAXS resultsthat show increasingly disordered structures upon PS con-centration. At any rate, the incertitude on the determinationof the broad signal is too large to provide reliable quantita-tive results. In the following our analysis has thus been per-formed exclusively following the intensity variations of nar-row 1H signal.
The width of the NMR lines corresponding to the rigid andmobile phase were used to determine the spin diffusioncoefficients Dmob and Drig, respectively, using eqs (4) and (5).The calculated values are shown in Table 6. The resultsobtained for the rigid PS block are very similar to thoseobtained by Chen and Schmidt-Rohr,28 whereas the coeffi-cients relative to the mobile PEO block are in agreementwith those reported in the literature11,13,14,17,19,27,28 for mo-bile domains.
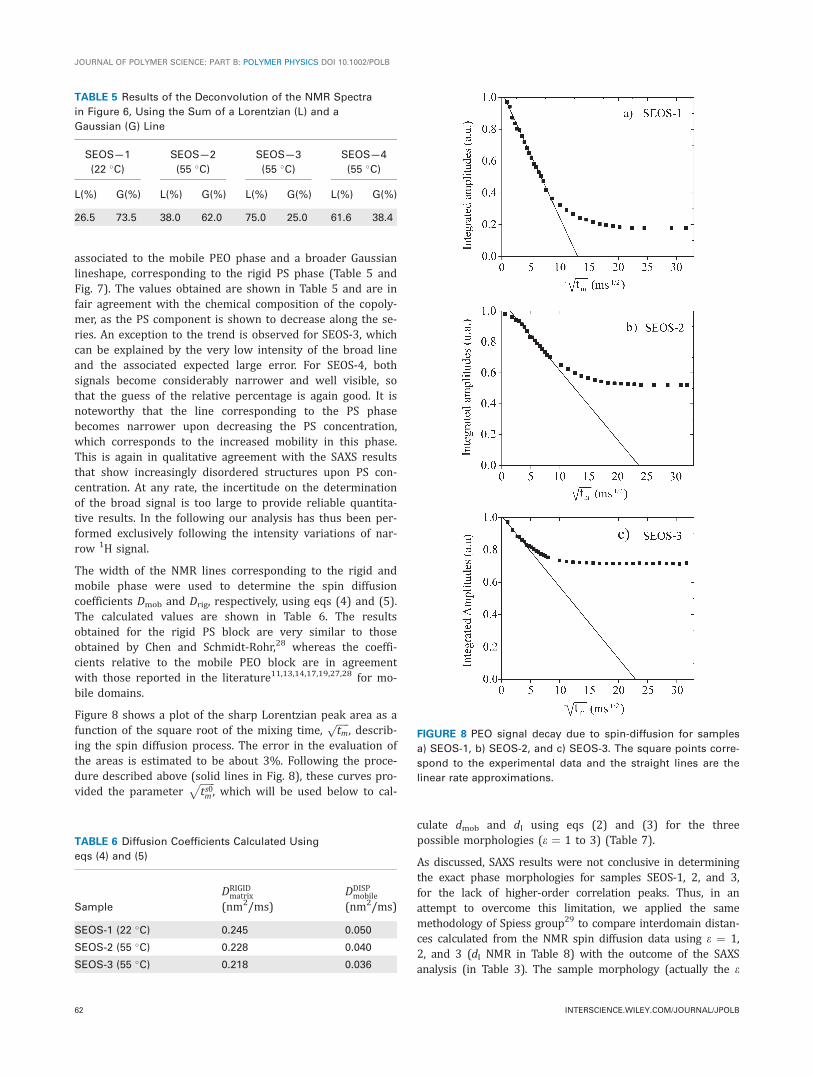
Figure 8 shows a plot of the sharp Lorentzian peak area as afunction of the square root of the mixing time,
ffiffiffiffiffitm
p, describ-
ing the spin diffusion process. The error in the evaluation ofthe areas is estimated to be about 3%. Following the proce-dure described above (solid lines in Fig. 8), these curves pro-vided the parameter
ffiffiffiffiffiffits0m
p, which will be used below to cal-
culate dmob and dI using eqs (2) and (3) for the threepossible morphologies (e ¼ 1 to 3) (Table 7).
As discussed, SAXS results were not conclusive in determiningthe exact phase morphologies for samples SEOS-1, 2, and 3,for the lack of higher-order correlation peaks. Thus, in anattempt to overcome this limitation, we applied the samemethodology of Spiess group29 to compare interdomain distan-ces calculated from the NMR spin diffusion data using e ¼ 1,2, and 3 (dI NMR in Table 8) with the outcome of the SAXSanalysis (in Table 3). The sample morphology (actually the e
TABLE 5 Results of the Deconvolution of the NMR Spectra
in Figure 6, Using the Sum of a Lorentzian (L) and a
Gaussian (G) Line
SEOS—1
(22 �C)
SEOS—2
(55 �C)
SEOS—3
(55 �C)
SEOS—4
(55 �C)
L(%) G(%) L(%) G(%) L(%) G(%) L(%) G(%)
26.5 73.5 38.0 62.0 75.0 25.0 61.6 38.4
TABLE 6 Diffusion Coefficients Calculated Using
eqs (4) and (5)
Sample
DRIGIDmatrix
(nm2/ms)DDISPmobile
(nm2/ms)
SEOS-1 (22 �C) 0.245 0.050
SEOS-2 (55 �C) 0.228 0.040
SEOS-3 (55 �C) 0.218 0.036
FIGURE 8 PEO signal decay due to spin-diffusion for samples
a) SEOS-1, b) SEOS-2, and c) SEOS-3. The square points corre-
spond to the experimental data and the straight lines are the
linear rate approximations.
JOURNAL OF POLYMER SCIENCE: PART B: POLYMER PHYSICS DOI 10.1002/POLB
62 INTERSCIENCE.WILEY.COM/JOURNAL/JPOLB
value) was taken as the one that provided the best agreementbetween the NMR and SAXS data.
At first inspection, comparison of Tables 3 and 8 suggeststhat the best agreement between SAXS and 1H spin-diffusionNMR data points out definitely for a lamellar morphology forSEOS-3, hints toward a BCC one for SEOS-1, whereas forSEOS-2 essentially the same probability is found for a lamel-lar or a hexagonal spatial arrangement. This corresponds toan interdomain length of 26.7, between 21.9 and 25.6, andof 15.2 nm, for samples SEOS-1, -2, and, -3, respectively.
The matrix volume fraction can be estimated from the calcu-lated values for dI (Table 3, SAXS data) and dmob (Table 6,NMR data) and for volumetric consideration of the possiblemicrodomain structures (lamellar, HCP, or BCC). The resultsobtained are shown in Table 9 and confirms, by comparisonwith Table 1, the proposed morphologies. The analysis aboveis prone to error propagation on the SAXS, NMR, and compo-sition parameters. In particular, the error in the position ofthe first SAXS maximum appears to be of most impact. Inter-estingly, good agreement between SAXS and NMR data can-not be achieved if q values differ by more than a few percentfrom the ones reported in Table 3.
Thus, the combined NMR and SAXS analysis confirms theexpected morphologies for SEOS-1 and SEOS-3, but it cannot beconclusive on SEOS-2.
Further structural information can be obtained by detailedinspection of the NMR results. The 1H spin-diffusion decaysplotted in Figure 8 present marked differences for the threecopolymers, namely regarding the length of the linear decayregion and the level of the equilibrium plateau attained forlong mixing times. The later behavior depends on the rela-tive PEO and PS concentrations, which determines theamount of signal transferable from the mobile to the rigidpart after the dipolar filter. Considering the values for theweight % ratios in Table 1, and the number of 1H nuclei per
repetitive unit in PEO and PS blocks, the plateau values forall samples are higher than they would be expected from thestoichiometry. This is an indication of the presence of seg-ments with intermediate mobility, probably in the PS-PEOinterface. Another interesting feature among the decays isthe length of the initial delay before the beginning of the lin-ear decay, tLAG. Although this parameter has a difficult inter-pretation, a link can be drawn between its presence and theexistence of a region in the copolymers where the spin diffu-sion behaves in an intermediate way between a rigid andmobile phase.
In fact, it is well established that block copolymers have a thininterphase between two blocks with different compatibility, defin-ing a gradient of the mobilities between them. It is not an easytask to define the spin-diffusion coefficient of the interphases,DINTER, but as a first approximation it can be assumed as themean value of the mobile and less mobile phases spin diffusioncoefficients. In this case, the width of the interphase region, LINTER,can be linked to the time lag before the beginning of the lineardecay of the spin diffusion curves as13:
LINTER ¼ffiffiffiffiffiffiffiffiffiffiffiffiffiffiffiffiffiffiffiffiffiffiffiffiffiffiffiffiffiffi4 � DINTER � tLAG
3
r: (11)
Table 10 summarizes the calculated diffusion coefficientsand the sizes of the interfacial region for SEOS 1, 2, and 3.
However, the interpretation of LINTER values requires somecare. In fact, while in the case of the SEOS-1 and SEOS-2well-defined lags can be seen and expected on the basis ofthe clear role played by the abundant PS as a matrix, the sit-uation for SEOS-3 is less well defined. In the first two cases,the interface width is found to increase in reducing the PSconcentration, which can be justified as an overall softeningof the matrix. In the latter case, PS and PEO are in compara-ble concentrations and the mobility difference between thetwo phases is also smaller. This low contrast situation mayTABLE 8 Domain Sizes, dmob (nm), and Interdomain Sizes,
dI (nm), from NMR Spin-Diffusion Analysis for Different
Hypothetical Morphologies
dmob (NMR)/nm dI (NMR)a/nm
Sample e 1 2 3 1 2 3
SEOS-1 4.7 9.4 14.0 32.1 24.5 26.7
SEOS-2 7.5 15.0 22.5 21.9 25.6 32.2
SEOS-3 7.0 13.9 20.9 15.2 20.6 27.1
a Best agreement with SAXS (Table 3) in bold italics.
TABLE 9 Matrix Volume Fraction Calculated from SAXS (dL)
and NMR (dmob) Data for Different Hypothetical Morphologies
Sample e
% Matrix
1 2 3
SEOS-1 0.78 0.87 0.90
SEOS-2 0.65 0.66 0.56
SEOS-3 0.53 0.42 0.99
TABLE 10 Estimation of Interphase Size Characteristics for
SEOS Samples
Sample
DINTER
(nm2/ms)
ffiffiffiffiffiffiffiffitLAG
p
(ms1/2)LINTER
(nm)
SEOS-1 0.147 0.81 0.38
SEOS-2 0.134 2.48 1.05
SEOS-3 0.127 1.12 0.46
TABLE 7 CalculatedffiffiffiffiffiffiffiTs0m
pValues
Sampleffiffiffiffiffiffits0m
p(ms1/2)
SEOS-1 (22 �C) 13.5
SEOS-2 (55 �C) 23.6
SEOS-3 (55 �C) 22.9
ARTICLE
NMR AND SAXS OF BLOCK COPOLYMERS, BONK ET AL. 63
bias the determination of the interface thickness from eq(11). The spin-diffusion decay curve [Fig. 8(c)] is also con-firming this point by showing a rather smooth decay behav-ior. The reduced interphase region width calculated for theSEOS-3 case can be thus hypothetically described rather as acharacteristic length of an almost continuous gradient of con-centrations, more than as a discontinuity region.
Finally, from a comparison of the interphase thicknesses calcu-lated from spin diffusion decays and SAXS data, we note a dif-ference in the individual values, but similar trends. It may beinteresting to mention that the negative deviation from thePorod law for large q-values of the background corrected inten-sity, is attributed to fluctuations in electron density in the inter-domain region, and for this reason, the width of the diffuseboundary may correspond to the real interphase region.
CONCLUSION
The combination of temperature dependent SAXS experi-ments and solid-state NMR measurements has proved effec-tive in characterizing the morphology of a series of four sam-ples of PS-b-PEO-b-PS triblock copolymers with variablecomposition.
For the as-cast samples, WAXS and DSC techniques revealedthe effect of the relative block concentration on the degreeof crystallization of PEO. Higher concentrations of PS hinderthe crystallization of the PEO blocks. SAXS results showedmicrophase segregation in all cases, but failed to provideconclusive evidence in most cases on the sample morphologyfor the lack of high order correlation peaks. However, it wasshown that a triblock copolymer with only 30% of PSvolume fraction had a lamellar morphology due to the semi-crystalline characteristics of the PEO matrix.
An analysis of the samples above the melting temperature ofthe PEO block enabled a direct comparison between SAXSand spin-diffusion NMR results, which allowed an estimationof the sample spatial morphology, and concurrently of thesize of the domains, of the interphase and of the interdomaindistances. Furthermore, both techniques (SAXS and NMR)probed an increasing degree of microstructural disorderupon decreasing the PS content in the samples. This resultseems to be correlated with a size of the interphase regioninversely proportional to the PS block concentration.
The authors acknowledge the Region Provence Alpes Coted’Azur (PACA) – France (post-doctoral scholarship), ARKEMA,ARCUS PACA-Bresil, and the FAPESP for financial support.WAXS/SAXS data were collected under the proposals D11A-SAXS1 5428 and 4816 of the Brazilian Synchrotron Light Labo-ratory (LNLS) and at the 711 beamline of the MAXLab synchro-tron facility using beamtime granted to TSP.
REFERENCES AND NOTES
1 Yu, H. S.; Natansohn, A.; Singh, M. A.; Plivelic, T. Macromolecules
1999, 32, 7562–7571.
2 Ruzette, A. V.; Leibler, L. Nat Mater 2005, 4, 19–31.
3 Sheiko, S. S. In New Developments in Polymer Analytics; Springer
Verlag: Heidelberg, Berlin, 2000, 61–174.
4 Dixit, S. G.; Mahadeshwar, A. R.; Haram, S. K. Colloids Surf A 1998,
133, 69–75.
5 Bertin, D.; Phan, T.; Bouchet, R. Fr. Demande (2007). CODEN:
FRXXBL FR 2899235 AL 20071005 CAN 147:430265 AN 2007:
1117916 CAPLUS, 2007; p 55.
6 Bloch, E.; Phan, T.; Bertin, D.; Llewellyn, P.; Hornebecq, V. Micropo-
rous Mesoporous Mater 2008, 112, 612–620.
7 Sun, Z. C.; Gutmann, J. S. Phys Stat Mech Appl 2004, 339, 80–85.
8 Landfester, K.; Spiess, H. W. Acta Polym 1998, 49, 451–464.
9 Xu, J. T.; Yuan, J. J.; Cheng, S. Y. Eur Polym J 2003, 39, 2091–2098.
10 Skoulios, A. E.; Tsouladze, G.; Franta, E. J Polym Sci C 1963, 4,
507.
11 Buda, A.; Demco, D. E.; Bertmer, M.; Blumich, B.; Reining, B.; Keul,
H.; Hocker, H. Solid State Nucl Magn Reson 2003, 24, 39–67.
12 Yu, H. S.; Wang, J. H.; Natansohn, A.; Singh, M. A. Macromolecules
1999, 32, 4365–4374.
13 Mirau, P. A. A Practical Guide to Understanding the NMR of Poly-
mers; John Wiley & Sons: New Jersey, 2005.
14 Demco, D. E.; Johansson, A.; Tegenfeldt, J. Solid State Nucl Magn
Reson 1995, 4, 13–38.
15 Plivelic, T. S.; Cassu, S. N.; Gonçalves, M. C.; Torriani, I. L. Polimers Cienc
Technol 2005, 15, 199–206.
16 Plivelic, T. S.; Cassu, S. N.; Goncalves, M. D.; Torriani, I. L. Macro-
molecules 2007, 40, 253–264.
17 Mellinger, F.; Wilhelm, M.; Spiess, H. W. Macromolecules 1999, 32,
4686–4691.
18 Goldman, M.; Shen, L. Phys Rev 1966, 144, 321–331.
19 Clauss, J.; Schmidt-Rohr, K.; Spiess, H. W. Acta Polym 1993, 44,
1–17.
20 Schmidt-Rohr, K.; Spiess, H. W. Multidimensional Solid-State NMR
and Polymers; Academic Press: San Diego CA, 1994.
21 Zhu, L.; Cheng, S. Z. D.; Calhoun, B. H.; Ge, Q.; Quirk, R. P.; Thomas,
E. L.; Hsiao, B. S.; Yeh, F.; Lotz, B. Polymer 2001, 42, 5829–5839.
22 Vidotto, G.; Levy, D.; Kovacs, A. J. Kolloid Z Z Polym 1969, 230,
289.
23 Xie, H. Q.; Zhou, P. G. In In Multicomponent Polymer Materials;
Paul D. R.; Sperling, L. H., Eds.; ACS: Washington DC, 1896; pp 139.
24 Hamley, I. W. The Physics of Block Copolymers; Oxford University
Press: Oxford, 1998.
25 Sperling, L. H. Introduction to Physical Polymer Science; John
Wiley & Sons: New York, 2001.
26 Sakurai, S.; Kawada, H.; Hashimoto, T.; Fetters, L. J. Macromole-
cules 1993, 26, 5796–5802.
27 Yu, H. S.; Natansohn, A.; Singh, M. A.; Torriani, I. Macromolecules
2001, 34, 1258–1266.
28 Chen, Q.; Schmidt-Rohr, K. Solid State Nucl Magn Reson 2006, 29,
142–152.
29 Domjam, A.; Erdodi, G.; Wilhelm, M.; Neidhofer, M.; Landfester, K.;
Ivan, B.; Spiess, H. W. Macromolecules 2003, 36, 9107–9114.
JOURNAL OF POLYMER SCIENCE: PART B: POLYMER PHYSICS DOI 10.1002/POLB
64 INTERSCIENCE.WILEY.COM/JOURNAL/JPOLB