Investigating Solar Power in Different Weather Conditions - Preliminary Results
33
Investigating solar power in different weather conditions. Cronton Sixth Form Physics Department
Transcript of Investigating Solar Power in Different Weather Conditions - Preliminary Results

Investigating solar power in different weather conditions.
Cronton Sixth Form Physics Department

Solar Power – Photovoltaic Cells

Is this
really true?

Who was involved?
• Approximately 250 students have made measurements including: Cronton Sixth Form College
Knowsley Park School, Prescot.
Sir Thomas Boteler School, Warrington.
Wade Deacon High School, Widnes.
Lord Derby Academy, Huyton.
The Grange School, Runcorn.
Sandymoor School, Runcorn.
St Gregory’s School, Warrington
Bridgewater School, Warrington.

Aims of project
• Measure the electrical power generated by a photovoltaic solar panel.
• Compare our measurements with measurements made by other students at different times of the year / different weather conditions / different types of cloud /different times of day.

Types of Cloud

The experiment
• Build simple circuits powered by solar panels.
• Take our circuits outside to make some measurements (electrical and weather conditions)
• Return to the physics lab to do some maths calculations / graph drawing etc.
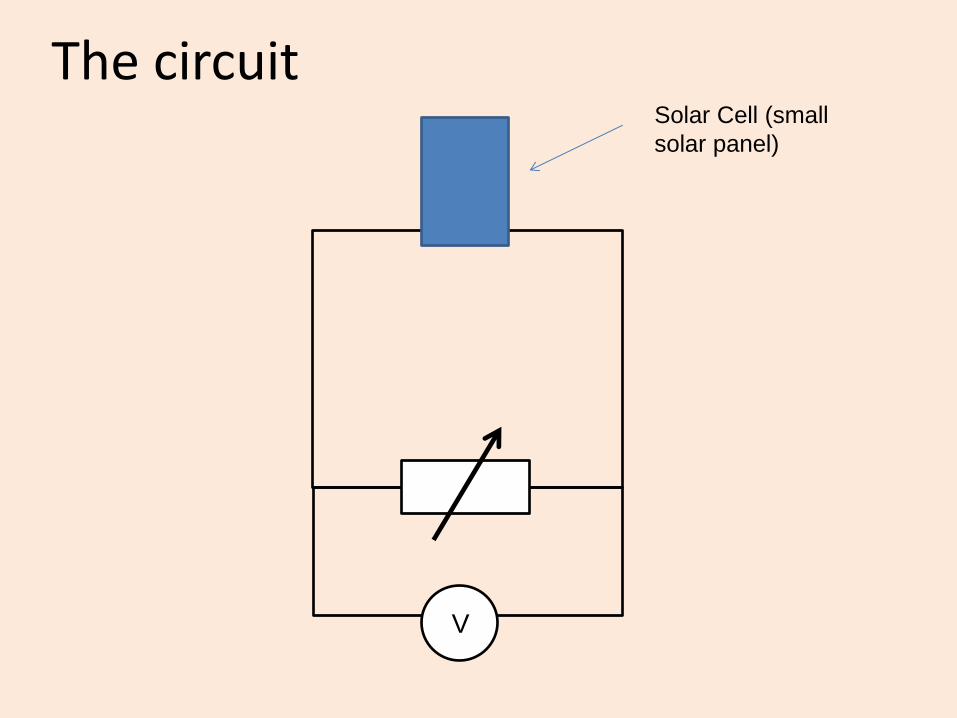
The circuit
V
Solar Cell (small
solar panel)

Early experimental work
• Standard school PV devices (left over from an AQA practical exam)
• Fixed load resistance 100 W
• Measurements completed by Year 9 St Peter and Paul’s Catholic College and BTEC Yr1 Applied Science at Cronton Sixth Form college.

% power compared with July (clear and sunny)
Group 1 54 Group 2 57 Group 3 68 Group 4 61 Group 5 44 Group 6 30
Preliminary Results:
Type of Solar Cell: Photovoltaic Rapid 37-0434 (0.5V)
Date: 5th December 2013
Time: 12.30 pm
Weather: Dull, wet and windy
Load Resistance: 100 W
Students: Year 1 BTEC Applied Science (Helen Costello)

Astronomy Festival March 2014
• Public science event at the Heath Business Park in Runcorn.
• Students from Cronton Sixth Form, local schools and members of the public (& some police officers!)
• First measurements with the 5V and 12V devices.

0.5 V

0.5 V
5.0 V

0.5 V
5.0 V 12 V

Astronomy Day Results
• We completed simple experiments with the 0.5 V, 5.0 V and 12.0 V solar cells.
• We found that the 5.0 V solar cells were the most stable [best for our experiment]
• We found that the voltage (and power) generated by a solar cell depends on:
a) The amount of light
b) The size of the resistance in the circuit for the 5V and 12 V cells*
* Data taken by Cronton Sixth Form students at the Knowledge Observatory
Astronomy Day, Heath Business Park, 8th March 2014

Results for 5 V Solar Cell
Circuit resistance / W
Voltage /
V
13:45 8/3/2014 Air Temp: 12C Sky Temp: -5.5C Clouds: 80% Altostratus 20%
clear, sun not visible.
Operating
voltage

Results for 5 V Solar Cell
Circuit resistance / W
Pow
er
/ W
13:45 8/3/2014 Air Temp: 12C Sky Temp: -5.5C Clouds: 80% Altostratus 20%
clear, sun not visible.
Peak voltage

The test circuit
• This was a simple circuit with the PV array connected in series with a resistance box, and a voltmeter connected in parallel with the resistance box. We recorded a voltage and resistance for each experiment. We found that under constant illumination outside:
• For the 0.5 V PV array, the reading on the voltmeter was the same for all values of load resistance,
• For the 5.0 V PV array, the reading on the voltmeter changed when the load resistance was changed,
• For the 12.0 V PV array, the reading on the voltmeter changed when the load resistance was changed.

Load Matching
• We think that this is related to an electrical engineering phenomena called ‘load matching’. This tells us that the maximum power from a device in a circuit arises when the resistance of the load (circuit) e.g. a motor, lamp or resistor is the same as the internal resistance of the power source e.g. battery or PV. To make sure that we always get the maximum power from a PV, professional systems use Maximum Power Point Tracking.

Maximum Power Point Tracking
• MPPT or Maximum Power Point Tracking is algorithm that included in charge controllers used for extracting maximum available power from PV module under certain conditions. The voltage at which PV module can produce maximum power is called ‘maximum power point’ (or peak power voltage). Maximum power varies with solar radiation, ambient temperature and solar cell temperature.
• http://www.leonics.com/support/article2_14j/articles2_14j_en.php

0.5 V device 5 V device 12 V device
Dark lab
1 kW 65 kW 100 kW
Light lab
0.22 kW 10 kW 5.8 kW
Outdoors in
March @
The Heath
No results
can be
collected i.e.
Rpeak < 100W
0.47 kW 2.2 kW
To investigate this further some Year 11 students conducted experiments in the lab with the lights on and off and we compared these results to those taken outdoors on the 8th March. Table showing load resistance in ohms at peak power for the 0.5 V, 5 V and 12 V PV arrays under three different illumination conditions:

This means…. • That we have to be careful when we choose
the value of the circuit resistor as it can change our results and always make measurements for a range of resistive loads.

Group Activities • Work in teams to:
Record the air temperature, sky temperature, cloud type and coverage and note whether the sun is visible or not (if outside).
Measure the output voltage from a solar cell for different values of circuit resistance. Record your results in a table, and plot a graph.
Compare your results to the data collected in March.
Extension activities: Calculate the power output from the solar cell and find the peak power.

International Sun Day (22/06/2014)

International Sun Day: Measurements taken in direct sunshine
Voltage /
V
Circuit resistance / W
Pow
er
/ W

International Sun Day: Measurements taken when the sun was behind cloud.
Pow
er
/ W
Drop in peak power by a factor of 2.

Measurements made at College
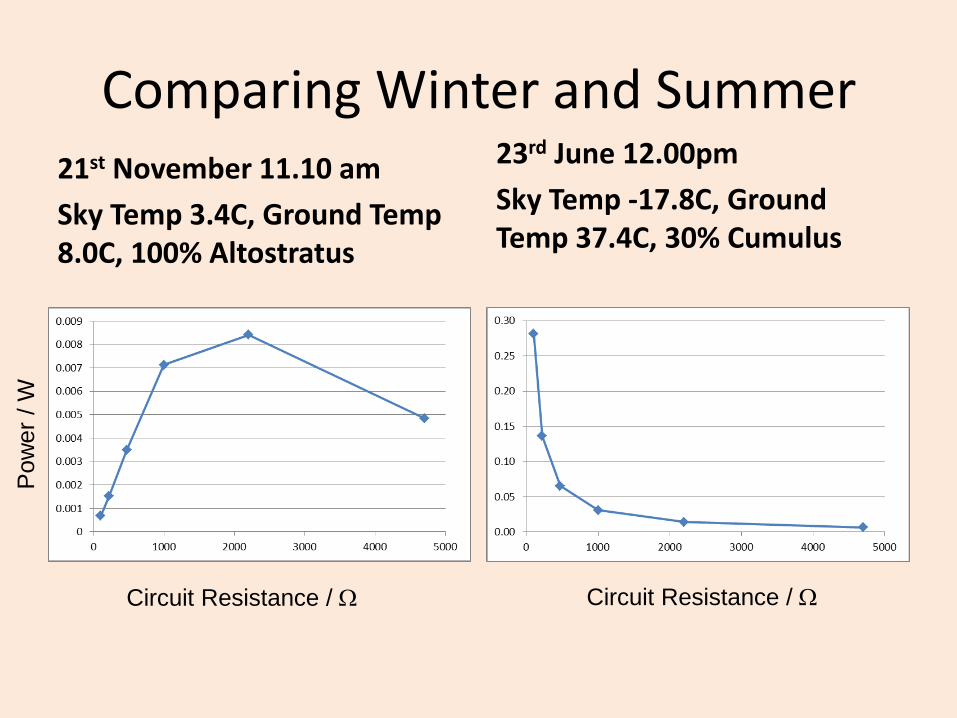
Comparing Winter and Summer 21st November 11.10 am
Sky Temp 3.4C, Ground Temp 8.0C, 100% Altostratus
23rd June 12.00pm
Sky Temp -17.8C, Ground Temp 37.4C, 30% Cumulus
Pow
er
/ W
Circuit Resistance / W Circuit Resistance / W
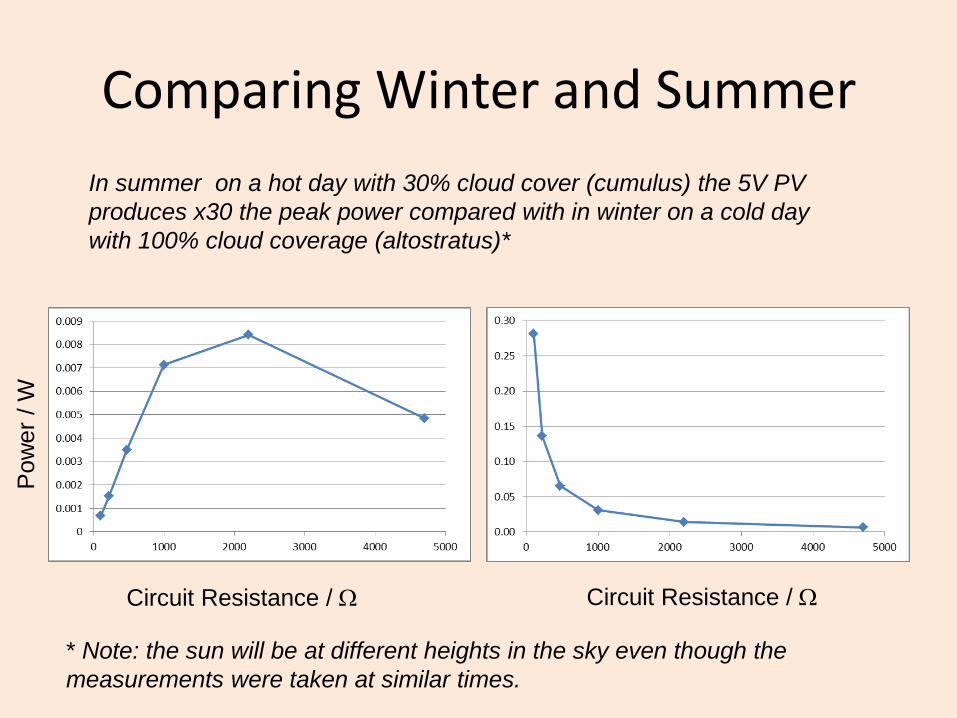
Comparing Winter and Summer
Pow
er
/ W
Circuit Resistance / W Circuit Resistance / W
In summer on a hot day with 30% cloud cover (cumulus) the 5V PV
produces x30 the peak power compared with in winter on a cold day
with 100% cloud coverage (altostratus)*
* Note: the sun will be at different heights in the sky even though the
measurements were taken at similar times.

Questions for Our Research Partners
Professor Stuart Irvine Dr Rachael Rowlands - Jones
Task: Write a question for Stuart or Rachael
• About your experiment (results, ways to improve your measurements, how
they do similar experiments? etc)
• About different types of solar cell, different materials that can be used.
• Is solar power going to solve the energy crisis? Other options?
• What is it like working as a research scientist? How do you get a job as a
professor? What did they study at school?
http://www.youtube.com/embed/S2MezUQ9ljg


Conclusions
• In summer, a passing cloud can lead to a peak power reduction of a factor of 2.
• In winter, cloud coverage (and the fact that the sun is lower in the sky) reduces the peak power by a factor of 30 compared to a clear summer’s day.
• Professional systems need to use Maximum Power Point Tracking because peak power occurs at different load resistances for different levels of illumination.