
Bin weather data for Turkey
21
Bin weather data for Turkey Hu¨samettin Bulut, Orhan Bu¨yu¨kalaca*, Tuncay Yılmaz Department of Mechanical Engineering, University of C ¸ ukurova, 01330 Adana, Turkey Received 16 April 2001; received in revised form 7 May 2001; accepted 9 June 2001 Abstract One of the well-known and simple steady-state methods used to predict heating and cooling energy consumption of buildings is the bin method that requires reliable and detailed bin data. In this study, the bin data for Turkey are determined by using long-term measured data. The bin data for dry-bulb temperature from 36 C to 45 C with 3 C increments are calculated in six daily 4-h shifts for 78 provinces of Turkey. # 2001 Elsevier Science Ltd. All rights reserved. Keywords: Energy analysis; Bin data; Turkey 1. Introduction Total yearly energy consumption is needed to evaluate the operating cost, which is an essential step if one wants to come close to an optimal design, in the sense of minimizing the life cycle cost of a building [1]. There exist a large number of methods for evaluation of heating and cooling energy consumption of buildings. They range from simple steady-state models to comprehensive dynamic simulation procedures. Today, there is a variety of dynamic simulation programs available (such as DOE- 2, BLAST and TRNSYS) in which the influence of many parameters that are mainly function of time are taken into consideration. Although these models have gained widespread acceptance as reliable estimative tools, they have also become very complex and tedious to use [2]. The steady-state models, which are also called single-measure methods, are simple procedures developed for estimation of energy consumption in buildings. The degree- day methods are the most known and the simplest methods among the steady-state models. These type of methods can estimate energy consumption very accurately if the Applied Energy 70 (2001) 135–155 www.elsevier.com/locate/apenergy 0306-2619/01/$ - see front matter # 2001 Elsevier Science Ltd. All rights reserved. PII: S0306-2619(01)00029-0 * Corresponding author. Tel;+90-322-3386485; fax: +90-322-3386126. E-mail address: [email protected] (O. Bu¨yu¨kalaca).
-
Upload
independent -
Category
Documents
-
view
1 -
download
0
Transcript of Bin weather data for Turkey

Bin weather data for Turkey
Husamettin Bulut, Orhan Buyukalaca*, Tuncay Yılmaz
Department of Mechanical Engineering, University of Cukurova, 01330 Adana, Turkey
Received 16 April 2001; received in revised form 7 May 2001; accepted 9 June 2001
Abstract
One of the well-known and simple steady-state methods used to predict heating and cooling
energy consumption of buildings is the bin method that requires reliable and detailed bin data. Inthis study, the bin data for Turkey are determined by using long-term measured data. The bindata for dry-bulb temperature from �36 �C to 45 �C with 3 �C increments are calculated in six
daily 4-h shifts for 78 provinces of Turkey.# 2001 Elsevier Science Ltd. All rights reserved.
Keywords: Energy analysis; Bin data; Turkey
1. Introduction
Total yearly energy consumption is needed to evaluate the operating cost, which is anessential step if one wants to come close to an optimal design, in the sense of minimizingthe life cycle cost of a building [1]. There exist a large number of methods for evaluationof heating and cooling energy consumption of buildings. They range from simplesteady-state models to comprehensive dynamic simulation procedures.Today, there is a variety of dynamic simulation programs available (such as DOE-
2, BLAST and TRNSYS) in which the influence of many parameters that are mainlyfunction of time are taken into consideration. Although these models have gainedwidespread acceptance as reliable estimative tools, they have also become verycomplex and tedious to use [2].The steady-state models, which are also called single-measure methods, are simple
procedures developed for estimation of energy consumption in buildings. The degree-day methods are the most known and the simplest methods among the steady-statemodels. These type of methods can estimate energy consumption very accurately if the
Applied Energy 70 (2001) 135–155
www.elsevier.com/locate/apenergy
0306-2619/01/$ - see front matter # 2001 Elsevier Science Ltd. All rights reserved.
PI I : S0306-2619(01 )00029 -0
* Corresponding author. Tel;+90-322-3386485; fax: +90-322-3386126.
E-mail address: [email protected] (O. Buyukalaca).

heat loss coefficient of the building, the efficiency of the heating, ventilating, and air-conditioning (HVAC) system, utilization of the building, which affect the internal heatgains, indoor temperature, and the ventilation rate, or the balance-point temperatureare sufficiently constant. However, for many applications, at least one of the aboveparameters varies with time. For instance, the pattern of utilization of the building,especially of commercial buildings, may generally exhibit large variations during a dayand during a week. The efficiency of a heat pump system and HVAC equipment maybe affected directly or indirectly by outdoor temperature. Examples to the sourcesfor non-steadiness can be increased.In such cases the bin method can be used. This method is based on the calculation
of the energy consumption for different values of the outdoor temperature (To,i) andmultiplying it by the corresponding number of hours (Nbin,i) in the temperatureinterval (bin) centered on that temperature [1]:
Qbin;i ¼ Nbin;iKtot
�Tb � To;i
� ��ð1Þ
where Ktot and � are, respectively, total heat loss coefficient of the building, and theefficiency of the HVAC system. The balance point temperature Tb is the value of out-door temperature below or above which heating or cooling is needed [3,4]. The binmethod can be used for predicting both heating and cooling energy requirements. Theplus subscript on the parenthesis of Eq. (1) is for heating and indicates that only positivevalues are to be counted. For cooling, only negative values should be considered.Qbin,i values are calculated separately using Eq. (1) for each temperature interval
(bin) and summed to obtain total energy consumption:
Qtot ¼Xm
i¼1
Qbin;i ð2Þ
where m is the total number of the temperature intervals (bins).
Nomenclature
� Efficiency of HVAC systemKtot Total heat loss coefficient (W/�C)Nbin Number of hours (h)Qbin Energy consumption (Wh)Tb Base temperature (�C)To Outdoor temperature (�C)
Subscript and superscripti Temperature interval (bin)m Total number of temperature intervals (bin)tot Total
136 H. Bulut et al. / Applied Energy 70 (2001) 135–155

Since the bin method is based on hourly weather data rather than daily averages, itis more accurate than the degree-day method [5]. The bin method can account for thepart-load performance of HVAC equipment and has been specially used for analysisof heat pump systems. Additionally, by performing separate calculations for differenttime periods, variations of indoor loads with time, occupancy patterns and operatingschedules of HVAC systems can be considered. The latent loads at each temperaturebin can also be calculated, by the use of wet-bulb temperatures [6].The bin method has several advantages over the degree-day method in that it pro-
vides information on concurrent weather conditions. Along with hours of occurrence ofdry-bulb temperature, the mean coincident values of wet-bulb temperature, solarradiation, and wind speed can also be provided. This can lead to more precise evalua-tion of cooling tower performance, passive solar design, peak load conditions, andventilative and/or evaporative cooling potential [2].History of the analysis of weather data for design of HVAC systems and energy con-
sumption predictions in Turkey is quite new. This subject has been considered seriouslyonly in recent years and it is not complete yet. A comprehensive analysis of the degree-days data for 78 weather stations located in 78 different provinces of Turkey is presentedby the present authors [7]. Although there are some studies on the degree-day anddegree-hour data for Turkey [8–10], the bin data studies are very limited. I
.leri and Uner
[11] presented yearly bin data for dry-bulb temperature for 12 weather stations of Tur-key obtained from typical meteorological year data generated from 7 years data. Theycalculated bin data only in two separate time periods (08:00–16:00 and 16:00–08:00).A complete and detailed bin weather data are not available for Turkey. The need
to fill the gap in bin data for Turkey provided stimulus for this study. The binweather data for 78 provinces of Turkey are presented in this study.
2. Meteorological data
Accuracy and reliability of calculations for building energy consumption dependdirectly on the weather data used. This necessitates use of a weather database that isbased on a long term and recent values. In this study, bin weather data were calcu-lated using hourly dry-bulb temperatures measured during at least 13 years between1981 and 1998. The raw data were taken from The State Meteorological AffairsGeneral Directorate (DMI
.) in diskettes for 78 provinces. Information for the
weather stations and the periods of the data considered are given in Table 1.Based on the database shown in Table 1, bin data for dry-bulb temperature from
�36 �C to 45 �C with 3 �C increments were calculated in six daily 4-h shifts (1–4, 5–8,9–12, 13–16, 17–20 and 21–24 h) for 78 provinces of Turkey.The number of the hours (Nbin) within each temperature interval (bin) was calcu-
lated separately for every month of the year. The calculations were performedseparately for every year of the period considered. Averaging over the years con-sidered, the numbers of the hours are obtained for six separate time periods of theday for each month. Using these data, the monthly total and yearly total number ofthe hours were calculated.
H. Bulut et al. / Applied Energy 70 (2001) 135–155 137

Table 1
Information for the provinces considered in the study
Location Longitude Latitude Elevation (m) Period Total years
Adana 35.18 36.59 20 1983–1998 16
Adapazarı 30.25 40.47 30 1982–1998 17
Adıyaman 38.17 37.45 678 1981–1998 18
Afyon 30.32 38.45 1034 1981–1998 18
Agrı 43.08 39.31 1585 1981–1998 18
Aksaray 34.03 38.23 980 1981–1998 18
Amasya 35.51 40.39 412 1981–1998 18
Ankara 32.53 39.57 894 1983–1995 13
Antakya 36.07 36.15 100 1983–1998 16
Antalya 30.42 36.53 42 1983–1998 16
Ardahan 42.42 41.08 1829 1981–1998 17
Artvin 41.49 41.10 597 1981–1998 18
Aydın 27.50 37.51 57 1983–1998 16
Balıkesir 27.52 39.39 147 1983–1997 15
Bartın 32.21 41.38 30 1981–1998 18
Batman 41.10 37.52 540 1983–1998 15
Bayburt 40.15 40.16 1550 1981–1998 18
Bilecik 29.58 40.09 526 1981–1998 17
Bingol 40.30 38.52 1177 1981–1998 18
Bitlis 42.06 38.22 1559 1981–1998 18
Bolu 31.36 40.44 742 1981–1998 18
Burdur 30.20 37.40 967 1981–1998 18
Bursa 29.04 40.11 100 1983–1998 16
Canakkale 26.24 40.08 3 1981–1998 17
Cankırı 33.37 40.36 751 1981–1995 13
Corum 34.58 40.33 798 1981–1998 18
Denizli 29.05 37.47 428 1983–1998 16
Diyarbakır 40.12 37.55 660 1983–1998 16
Edirne 26.34 41.40 48 1983–1998 16
Elazıg 39.13 38.40 1105 1981–1998 18
Erzincan 39.30 39.44 1215 1981–1998 18
Erzurum 41.16 39.55 1869 1983–1998 14
Eskisehir 30.31 39.46 800 1983–1998 15
Gaziantep 37.22 37.05 855 1983–1998 16
Giresun 38.24 40.55 38 1981–1998 18
Gumushane 39.27 40.27 1219 1981–1998 18
Hakkari 43.46 37.34 1720 1981–1998 18
Igdır 44.02 39.56 858 1981–1998 16
I.skenderun 36.07 36.37 3 1981–1998 18
Isparta 30.33 37.45 997 1981–1998 18
I.stanbul 29.05 40.58 39 1983–1998 16
I.zmir 27.10 38.24 25 1983–1998 16
K.Maras 36.56 37.36 549 1984–1998 15
Karaman 33.14 37.11 1025 1981–1998 18
Kars 43.05 40.36 1775 1983–1998 15
Kastamonu 33.46 41.22 791 1981–1998 18
Kayseri 35.29 38.43 1068 1983–1998 16
Kilis 37.05 36.44 638 1981–1998 17
(continued on next page)
138 H. Bulut et al. / Applied Energy 70 (2001) 135–155

3. Results and discussion
Although bin data are calculated in this study for each month of the year for 78provinces, it is not practical to present all of them in this paper due to space limita-tions. Monthly bin data are given in Table 2 for Adana in 4-h periods, as an exam-ple. Also given in this table at the last row of the data group for each month is themonthly total number of hours (Nbin’s).Fig. 1 shows distribution of monthly total Nbin values for Adana. The smallest
temperature bin observed in Adana is �1.5 �C (�3 �C/0 �C) with a yearly total valueof 12 h, whilst the maximum bin observed is 40.5 �C (39 �C/42 �C ) with a yearlytotal value of 5 h. Heating and cooling seasons can be estimated from Fig. 1. Heat-ing requirement is maximum in December and January, during which Nbin is max-imum (Nbin=227 h in December and Nbin=226 h in January) for the temperaturebin of 10.5 �C (9 �C/12 �C). Transitions from heating to cooling and cooling to
Table 1 (continued)
Location Longitude Latitude Elevation (m) Period Total years
Kırıkkale 33.30 39.50 725 1981–1995 15
Kırklareli 27.13 41.44 232 1981–1998 18
Kırsehir 34.10 39.08 985 1981–1995 15
Kocaeli 29.54 40.46 76 1981–1998 18
Konya 32.30 37.52 1028 1983–1998 16
Kutahya 29.58 39.24 969 1981–1998 17
Malatya 38.18 38.21 998 1983–1998 16
Manisa 27.26 38.36 71 1983–1998 16
Mardin 40.44 37.18 1080 1983–1998 16
Mersin 34.36 36.49 5 1983–1998 16
Mugla 28.21 37.12 646 1983–1998 16
Mus 41.31 38.44 1283 1981–1998 18
Nevsehir 34.40 38.25 1260 1981–1998 18
Nigde 34.40 37.59 1208 1981–1998 18
Ordu 37.52 40.59 4 1981–1998 18
Rize 40.30 41.02 4 1983–1998 16
Samsun 36.20 41.17 44 1983–1998 16
Siirt 41.56 37.56 875 1981–1998 18
Sinop 35.10 42.02 32 1981–1998 18
Sivas 37.01 39.49 1285 1983–1998 16
Sanlıurfa 38.46 37.08 547 1983–1998 16
Tekirdag 27.29 40.59 4 1983–1998 16
Tokat 36.54 40.18 608 1981–1998 17
Trabzon 39.43 41.00 30 1983–1998 16
Tunceli 39.32 39.06 979 1981–1998 18
Usak 29.29 38.40 919 1981–1998 18
Van 43.41 38.28 1725 1983–1998 16
Yalova 29.16 40.39 2 1981–1998 18
Yozgat 34.49 39.50 1298 1983–1998 16
Zonguldak 31.48 41.27 136 1981–1998 18
H. Bulut et al. / Applied Energy 70 (2001) 135–155 139

Table 2
Monthly total Nbin values (h/month) for Adana
Temperature bin (�C)
Time �3/0 0/3 3/6 6/9 9/12 12/15 15/18 18/21 21/24 24/27 27/30 30/33 33/36 36/39 39/42
January
1–4 1 8 29 49 31 6 0 0 0 0 0 0 0 0 0
5–8 2 13 35 44 26 4 0 0 0 0 0 0 0 0 0
9–12 0 1 8 27 46 31 10 1 0 0 0 0 0 0 0
13–16 0 0 1 4 25 41 41 12 0 0 0 0 0 0 0
17–20 0 1 5 24 52 33 9 0 0 0 0 0 0 0 0
21–24 0 4 19 45 46 9 1 0 0 0 0 0 0 0 0
Total 3 27 97 193 226 124 61 13 0 0 0 0 0 0 0
February
1–4 2 8 22 36 35 8 1 0 0 0 0 0 0 0 0
5–8 4 11 23 39 29 6 0 0 0 0 0 0 0 0 0
9–12 0 2 7 17 34 29 19 4 0 0 0 0 0 0 0
13–16 0 0 2 8 15 24 38 21 4 0 0 0 0 0 0
17–20 0 1 6 15 34 35 17 3 1 0 0 0 0 0 0
21–24 1 5 16 27 45 16 2 0 0 0 0 0 0 0 0
Total 7 27 76 142 192 118 77 28 5 0 0 0 0 0 0
March
1–4 0 2 10 31 48 26 6 1 0 0 0 0 0 0 0
5–8 1 3 12 31 47 23 5 2 0 0 0 0 0 0 0
9–12 0 0 1 6 20 34 33 22 7 1 0 0 0 0 0
13–16 0 0 0 2 9 18 32 37 18 7 1 0 0 0 0
17–20 0 0 1 6 23 37 35 15 6 1 0 0 0 0 0
21–24 0 1 5 19 43 40 13 3 0 0 0 0 0 0 0
Total 1 6 29 95 190 178 124 80 31 9 1 0 0 0 0
April
1–4 0 0 1 4 25 45 31 12 2 0 0 0 0 0 0
5–8 0 0 1 3 25 43 33 12 3 0 0 0 0 0 0
9–12 0 0 0 0 2 7 29 38 25 12 5 2 0 0 0
13–16 0 0 0 0 1 5 11 28 33 22 12 6 2 0 0
17–20 0 0 0 0 3 13 34 34 20 10 4 2 0 0 0
21–24 0 0 0 2 11 35 45 20 6 1 0 0 0 0 0
Total 0 0 2 9 67 148 183 144 89 45 21 10 2 0 0
May
1–4 0 0 0 0 1 19 43 44 15 2 0 0 0 0 0
5–8 0 0 0 0 2 15 34 46 22 4 1 0 0 0 0
9–12 0 0 0 0 0 1 6 17 34 35 18 8 4 1 0
13–16 0 0 0 0 0 1 3 9 18 34 29 16 10 3 1
17–20 0 0 0 0 0 2 9 25 36 28 15 6 2 1 0
21–24 0 0 0 0 0 7 29 46 31 10 1 0 0 0 0
Total 0 0 0 0 3 45 124 187 156 113 64 30 16 5 1
(continued on next page)
140 H. Bulut et al. / Applied Energy 70 (2001) 135–155

Table 2 (continued)
Temperature bin (�C)
Time �3/0 0/3 3/6 6/9 9/12 12/15 15/18 18/21 21/24 24/27 27/30 30/33 33/36 36/39 39/42
June
1–4 0 0 0 0 0 0 5 34 67 14 0 0 0 0 0
5–8 0 0 0 0 0 0 3 26 61 28 2 0 0 0 0
9–12 0 0 0 0 0 0 0 0 6 36 52 21 4 1 0
13–16 0 0 0 0 0 0 0 1 2 10 41 49 14 3 0
17–20 0 0 0 0 0 0 0 2 14 45 42 14 2 1 0
21–24 0 0 0 0 0 0 1 13 58 46 2 0 0 0 0
Total 0 0 0 0 0 0 9 76 208 179 139 84 20 5 0
July
1–4 0 0 0 0 0 0 0 2 28 86 7 1 0 0 0
5–8 0 0 0 0 0 0 0 2 24 78 19 1 0 0 0
9–12 0 0 0 0 0 0 0 0 0 4 48 58 12 2 0
13–16 0 0 0 0 0 0 0 0 0 1 6 65 44 7 1
17–20 0 0 0 0 0 0 0 0 1 11 61 43 7 1 0
21–24 0 0 0 0 0 0 0 1 5 80 36 1 1 0 0
Total 0 0 0 0 0 0 0 5 58 260 177 169 64 10 1
August
1–4 0 0 0 0 0 0 0 1 21 86 16 0 0 0 0
5–8 0 0 0 0 0 0 0 2 24 76 21 1 0 0 0
9–12 0 0 0 0 0 0 0 0 0 2 40 62 18 2 0
13–16 0 0 0 0 0 0 0 0 0 0 3 47 63 9 2
17–20 0 0 0 0 0 0 0 0 0 11 58 44 9 2 0
21–24 0 0 0 0 0 0 0 0 4 63 56 1 0 0 0
Total 0 0 0 0 0 0 0 3 49 238 194 155 90 13 2
September
1–4 0 0 0 0 0 0 4 21 60 34 1 0 0 0 0
5–8 0 0 0 0 0 1 5 23 58 30 3 0 0 0 0
9–12 0 0 0 0 0 0 0 0 4 20 48 39 8 1 0
13–16 0 0 0 0 0 0 0 1 1 2 15 59 32 9 1
17–20 0 0 0 0 0 0 0 2 5 43 46 19 4 1 0
21–24 0 0 0 0 0 0 2 8 37 65 8 0 0 0 0
Total 0 0 0 0 0 1 11 55 165 194 121 117 44 11 1
October
1–4 0 0 0 0 2 16 43 41 21 1 0 0 0 0 0
5–8 0 0 0 0 4 20 43 40 15 2 0 0 0 0 0
9–12 0 0 0 0 0 1 6 20 28 31 23 10 4 1 0
13–16 0 0 0 0 0 0 2 7 14 25 33 26 12 5 0
17–20 0 0 0 0 0 2 11 24 37 32 13 4 1 0 0
21–24 0 0 0 0 1 8 31 42 34 8 0 0 0 0 0
Total 0 0 0 0 7 47 136 174 149 99 69 40 17 6 0
(continued on next page)
H. Bulut et al. / Applied Energy 70 (2001) 135–155 141

heating occur in the months April–May and October–November, respectively. Themost repeated temperature bin in cooling season is 25.5 �C (24 �C/27 �C) withNbin=260 h in July and Nbin=238 h in August.In Table 3, yearly total Nbin values for six separate time periods of the day are
presented. Only 7 main provinces of Turkey that can be accepted the provincesrepresenting the climatic conditions of their regions are considered in the table dueto space limitations.
Table 2 (continued)
Temperature bin (�C)
Time �3/0 0/3 3/6 6/9 9/12 12/15 15/18 18/21 21/24 24/27 27/30 30/33 33/36 36/39 39/42
November
1–4 0 1 4 9 31 46 24 4 1 0 0 0 0 0 0
5–8 0 1 5 12 35 42 22 3 0 0 0 0 0 0 0
9–12 0 0 0 3 10 22 35 27 16 5 2 0 0 0 0
13–16 0 0 0 0 3 12 20 29 29 20 5 2 0 0 0
17–20 0 0 1 3 11 27 41 26 9 2 0 0 0 0 0
21–24 0 0 2 7 22 46 35 7 1 0 0 0 0 0 0
Total 0 2 12 34 112 195 177 96 56 27 7 2 0 0 0
December
1–4 0 3 18 42 42 17 2 0 0 0 0 0 0 0 0
5–8 1 5 24 43 35 14 2 0 0 0 0 0 0 0 0
9–12 0 0 3 19 37 39 19 6 1 0 0 0 0 0 0
13–16 0 0 0 4 20 32 41 22 5 0 0 0 0 0 0
17–20 0 0 3 19 44 40 16 2 0 0 0 0 0 0 0
21–24 0 1 10 35 49 25 4 0 0 0 0 0 0 0 0
Total 1 9 58 162 227 167 84 30 6 0 0 0 0 0 0
Fig. 1. Monthly total Nbin values for Adana.
142 H. Bulut et al. / Applied Energy 70 (2001) 135–155

Table 3
Yearly total Nbin values (h/year) for six separate time periods of the day for representative provinces of Turkey
Temperature bin (�C)
Time �36/
�33
�33/
�30
�30/
�27
�27/
�24
�24/
�21
�21/
�18
�18/
�15
�15/
�12
�12/
�9
�9/
�6
�6/
�3
�3/
0
0/
3
3/
6
6/
9
9/
12
12/
15
15/
18
18/
21
21/
24
24/
27
27/
30
30/
33
33/
36
36/
39
39/
42
42/
45
Adana
1–4 0 0 0 0 0 0 0 0 0 0 0 3 22 84 171 215 183 159 160 215 223 24 1 0 0 0 0
5–8 0 0 0 0 0 0 0 0 0 0 0 8 33 100 172 203 168 147 156 207 218 46 2 0 0 0 0
9–12 0 0 0 0 0 0 0 0 0 0 0 0 3 19 72 149 164 157 135 121 146 236 200 50 8 0 0
13–16 0 0 0 0 0 0 0 0 0 0 0 0 0 3 18 73 133 188 167 124 121 145 270 177 36 5 0
17–20 0 0 0 0 0 0 0 0 0 0 0 0 2 16 67 167 189 172 133 129 183 239 132 25 6 0 0
21–24 0 0 0 0 0 0 0 0 0 0 0 1 11 52 135 217 186 163 140 176 273 103 2 1 0 0 0
Total 0 0 0 0 0 0 0 0 0 0 0 12 71 274 635 1024 1023 986 891 972 1164 793 607 253 50 5 0
Ankara
1–4 0 0 0 0 0 0 0 4 15 37 73 118 164 172 171 173 191 189 120 30 3 0 0 0 0 0 0
5–8 0 0 0 0 0 0 2 8 21 40 77 124 170 176 158 165 177 177 120 40 5 0 0 0 0 0 0
9–12 0 0 0 0 0 0 0 1 5 19 45 87 124 138 127 117 113 124 159 168 139 70 20 4 0 0 0
13–16 0 0 0 0 0 0 0 0 1 3 23 65 95 117 128 120 104 117 123 138 156 153 87 27 3 0 0
17–20 0 0 0 0 0 0 0 0 2 13 44 77 124 127 133 126 123 127 135 141 136 100 42 10 0 0 0
21–24 0 0 0 0 0 0 0 1 8 28 56 104 146 148 159 150 158 165 166 117 48 6 0 0 0 0 0
Total 0 0 0 0 0 0 2 14 52 140 318 575 823 878 876 851 866 899 823 634 487 329 149 41 3 0 0
Diyarbakır
1–4 0 0 0 0 0 1 0 2 5 20 54 101 150 161 163 147 130 119 132 139 99 34 3 0 0 0 0
5–8 0 0 0 0 0 0 3 3 8 21 61 102 153 150 146 136 116 118 124 122 100 66 29 2 0 0 0
9–12 0 0 0 0 0 0 1 0 3 6 10 33 88 128 132 121 106 100 92 90 104 116 142 126 55 7 0
13–16 0 0 0 0 0 0 0 0 1 3 6 14 48 82 130 135 112 104 97 82 81 108 103 140 153 57 4
17–20 0 0 0 0 0 0 0 1 4 5 12 44 96 124 138 122 113 104 92 89 92 105 117 112 74 15 1
21–24 0 0 0 0 0 1 0 3 4 9 34 85 131 142 155 136 124 105 115 122 131 111 45 7 0 0 0
Total 0 0 0 0 0 2 4 9 25 64 177 379 666 787 864 797 701 650 652 644 607 540 439 387 282 79 5
Erzurum
1–4 2 4 9 14 26 28 36 50 56 88 117 146 175 171 185 162 114 61 14 2 0 0 0 0 0 0 0
5–8 1 5 9 19 26 28 38 50 64 89 115 139 163 162 155 152 122 83 36 4 0 0 0 0 0 0 0
9–12 0 1 2 6 11 17 28 39 55 71 82 99 120 101 112 105 115 129 147 130 68 20 2 0 0 0 0
(continued on next page)
H.Bulutetal./Applied
Energy70(2001)135–155
143

Table 3 (continued)
Temperature bin (�C)
Time �36/
�33
�33/
�30
�30/
�27
�27/
�24
�24/
�21
�21/
�18
�18/
�15
�15/
�12
�12/
�9
�9/
�6
�6/
�3
�3/
0
0/
3
3/
6
6/
9
9/
12
12/
15
15/
18
18/
21
21/
24
24/
27
27/
30
30/
33
33/
36
36/
39
39/
42
42/
45
13–16 0 0 0 0 2 5 12 26 43 67 93 100 119 96 95 106 95 105 118 126 135 90 25 2 0 0 0
17–20 0 0 1 3 10 19 27 38 54 73 92 106 128 102 119 110 117 123 117 101 74 38 8 0 0 0 0
21–24 0 3 5 11 23 27 35 43 60 73 102 122 144 140 145 154 149 129 71 22 2 0 0 0 0 0 0
Total 3 13 26 53 98 124 176 246 332 461 601 712 849 772 811 789 712 630 503 385 279 148 35 2 0 0 0
I.stanbul
1–4 0 0 0 0 0 0 0 0 0 0 3 22 88 186 205 203 192 200 223 127 11 0 0 0 0 0 0
5–8 0 0 0 0 0 0 0 0 0 0 3 22 95 179 198 198 180 171 205 162 45 2 0 0 0 0 0
9–12 0 0 0 0 0 0 0 0 0 0 2 11 48 120 189 165 154 147 155 175 195 87 12 0 0 0 0
13–16 0 0 0 0 0 0 0 0 0 0 1 10 38 102 170 162 150 144 149 157 185 153 36 3 0 0 0
17–20 0 0 0 0 0 0 0 0 0 0 3 13 52 149 188 171 164 149 160 198 156 49 7 1 0 0 0
21–24 0 0 0 0 0 0 0 0 0 0 3 17 68 177 194 191 185 172 213 201 37 2 0 0 0 0 0
Total 0 0 0 0 0 0 0 0 0 0 15 95 389 913 1144 1090 1025 983 1105 1020 629 293 55 4 0 0 0
I.zmir
1–4 0 0 0 0 0 0 0 0 0 0 0 8 46 113 157 204 197 177 181 211 142 22 2 0 0 0 0
5–8 0 0 0 0 0 0 0 0 0 0 0 11 55 121 159 192 191 168 170 212 146 32 3 0 0 0 0
9–12 0 0 0 0 0 0 0 0 0 0 0 1 14 49 113 160 180 153 136 132 176 199 115 29 3 0 0
13–16 0 0 0 0 0 0 0 0 0 0 0 0 5 24 63 138 180 165 137 128 142 182 188 88 17 3 0
17–20 0 0 0 0 0 0 0 0 0 0 0 1 13 49 111 171 191 162 142 140 172 176 104 25 3 0 0
21–24 0 0 0 0 0 0 0 0 0 0 0 4 29 84 146 191 203 165 148 178 194 102 14 2 0 0 0
Total 0 0 0 0 0 0 0 0 0 0 0 25 162 440 749 1056 1142 990 914 1001 972 713 426 144 23 3 0
Samsun
1–4 0 0 0 0 0 0 0 0 0 0 4 18 83 174 209 189 205 230 227 108 12 1 0 0 0 0 0
5–8 0 0 0 0 0 0 0 0 0 0 3 18 82 172 198 176 194 195 212 156 51 3 0 0 0 0 0
9–12 0 0 0 0 0 0 0 0 0 0 0 6 37 106 179 174 161 171 176 199 199 50 2 0 0 0 0
13–16 0 0 0 0 0 0 0 0 0 0 0 2 28 92 173 189 157 173 175 190 216 63 2 0 0 0 0
17–20 0 0 0 0 0 0 0 0 0 0 1 9 51 129 208 188 176 167 177 199 142 13 0 0 0 0 0
21–24 0 0 0 0 0 0 0 0 0 0 1 15 69 163 210 188 194 198 220 169 32 1 0 0 0 0 0
Total 0 0 0 0 0 0 0 0 0 0 9 68 350 836 1177 1104 1087 1134 1187 1021 652 131 4 0 0 0 0
144
H.Bulutetal./Applied
Energy70(2001)135–155

Table 4
Yearly total Nbin values (h/year) for 78 provinces of Turkey
Province Temperature bin �C
�36/
�33
�33/
�30
�30/
�27
�27/
�24
�24/
�21
�21/
�18
�18/
�15
�15/
�12
�12/
�9
�9/
�6
�6/
�3
�3/
0
0/
3
3/
6
6/
9
9/
12
12/
15
15/
18
18/
21
21/
24
24/
27
27/
30
30/
33
33/
36
36/
39
39/
42
42/
45
Adana 0 0 0 0 0 0 0 0 0 0 0 12 71 274 635 1024 1023 986 891 972 1164 793 607 253 50 5 0
Adapazarı 0 0 0 0 0 0 0 0 0 2 22 152 545 886 1053 977 1035 1090 1089 864 578 332 109 24 2 0 0
Adıyaman 0 0 0 0 0 0 0 0 0 6 40 151 464 811 971 887 737 687 689 708 726 641 521 391 256 69 5
Afyon 0 0 0 0 0 0 2 13 63 149 332 598 797 917 947 916 924 893 761 583 432 285 129 19 0 0 0
Agrı 6 25 42 78 105 142 170 213 290 373 572 678 785 671 695 774 728 663 551 448 360 258 111 21 0 0 0
Aksaray 0 0 0 0 0 3 9 29 73 159 283 511 753 793 892 883 881 896 812 652 519 366 193 50 3 0 0
Amasya 0 0 0 0 0 0 2 4 8 36 147 428 751 874 887 888 903 987 899 727 560 382 196 64 15 2 0
Ankara 0 0 0 0 0 0 2 14 52 140 318 575 823 878 876 851 866 899 823 634 487 329 149 41 3 0 0
Antakya 0 0 0 0 0 0 0 0 0 0 2 35 160 362 736 1055 992 918 802 942 1412 869 374 71 25 5 0
Antalya 0 0 0 0 0 0 0 0 0 0 0 6 103 336 755 1080 1113 1138 970 955 884 733 406 188 73 18 2
Ardahan 0 3 22 50 85 170 234 333 435 530 623 724 757 793 902 923 760 590 402 257 129 35 3 0 0 0 0
Artvin 0 0 0 0 0 0 0 0 2 30 159 477 846 915 892 929 1037 1231 1165 656 287 94 32 7 1 0 0
Aydın 0 0 0 0 0 0 0 0 0 0 2 59 245 478 810 1066 1082 995 955 916 704 544 461 309 117 16 1
Balıkesir 0 0 0 0 0 0 0 0 1 12 68 251 572 825 1013 972 932 909 959 867 623 448 222 69 15 2 0
Bartın 0 0 0 0 0 0 0 0 3 15 74 336 725 969 1112 1034 1063 1050 902 669 509 229 59 11 0 0 0
Batman 0 0 0 0 0 0 0 5 20 34 96 273 540 755 871 847 756 705 687 697 645 542 450 368 306 149 14
Bayburt 0 0 0 1 18 45 102 186 300 433 577 728 843 805 887 978 881 694 523 362 240 122 32 3 0 0 0
Bilecik 0 0 0 0 0 0 0 0 3 26 174 491 811 904 923 936 975 1088 962 664 436 253 92 20 2 0 0
Bingol 0 0 0 0 2 9 21 48 98 198 368 639 917 768 722 704 682 696 715 661 522 386 332 207 64 1 0
Bitlis 0 0 0 0 0 5 13 42 114 252 474 858 1085 788 734 795 770 689 645 531 422 335 172 35 1 0 0
Bolu 0 0 0 0 0 0 3 20 45 105 275 667 925 901 985 1061 1090 946 714 473 327 163 51 8 1 0 0
Burdur 0 0 0 0 0 0 0 0 4 52 176 406 689 949 1077 935 841 867 834 698 535 390 240 65 2 0 0
Bursa 0 0 0 0 0 0 0 0 2 5 36 237 568 810 1028 981 942 985 1011 829 618 428 224 49 7 0 0
Canakkale 0 0 0 0 0 0 0 0 0 1 27 152 405 738 981 1048 1126 1017 991 977 689 416 168 22 2 0 0
Cankırı 0 0 0 0 0 0 8 22 60 167 358 659 943 874 826 831 869 867 749 581 435 284 165 53 9 0 0
Corum 0 0 0 0 0 4 8 16 55 153 348 664 950 899 918 948 943 862 704 535 392 233 96 29 3 0 0
Denizli 0 0 0 0 0 0 0 0 0 3 31 171 418 684 930 1023 923 848 876 896 750 564 386 199 55 3 0
Diyarbakır 0 0 0 0 0 2 4 9 25 64 177 379 666 787 864 797 701 650 652 644 607 540 439 387 282 79 5
Edirne 0 0 0 0 0 0 0 2 13 55 166 414 749 880 871 864 886 961 915 694 537 406 253 83 9 2 0
Elazıg 0 0 0 0 0 0 3 16 53 136 305 573 836 837 787 750 692 705 730 703 601 447 351 191 43 1 0
(continued on next page)
H.Bulutetal./Applied
Energy70(2001)135–155
145

Table 4 (continued)
Province Temperature bin (�C)
�36/
�33
�33/
�30
�30/
�27
�27/
�24
�24/
�21
�21/
�18
�18/
�15
�15/
�12
�12/
�9
�9/
�6
�6/
�3
�3/
0
0/
3
3/
6
6/
9
9/
12
12/
15
15/
18
18/
21
21/
24
24/
27
27/
30
30/
33
33/
36
36/
39
39/
42
42/
45
Erzincan 0 0 0 0 2 12 29 61 131 253 425 639 781 787 812 820 795 812 733 600 471 330 202 59 6 0 0
Erzurum 3 13 26 53 98 124 176 246 332 461 601 712 849 772 811 789 712 630 503 385 279 148 35 2 0 0 0
Eskisehir 0 0 0 0 0 0 2 12 52 168 365 708 870 887 904 876 920 886 747 546 421 252 118 24 2 0 0
Gaziantep 0 0 0 0 0 0 0 0 2 20 84 294 638 920 958 857 738 705 739 794 689 504 425 293 95 5 0
Giresun 0 0 0 0 0 0 0 0 0 0 0 42 290 785 1252 1114 1085 1123 1219 1177 570 101 2 0 0 0 0
Gumushane 0 0 0 0 0 5 20 47 113 261 475 702 859 846 890 946 995 940 662 447 298 151 76 22 4 1 0
Hakkari 0 0 0 0 0 6 29 88 203 359 599 794 831 659 616 661 630 704 769 697 543 364 178 30 0 0 0
Igdır 0 0 0 0 0 4 22 48 104 207 440 723 691 649 661 724 740 787 790 708 557 419 324 144 18 0 0
I.skenderun 0 0 0 0 0 0 0 0 0 0 0 0 8 78 311 809 1232 1258 1023 1017 1477 1317 217 13 0 0 0
Isparta 0 0 0 0 0 0 0 2 20 86 240 528 802 939 1078 975 844 833 743 612 488 351 184 35 0 0 0
I.stanbul 0 0 0 0 0 0 0 0 0 0 15 95 389 913 1144 1090 1025 983 1105 1020 629 293 55 4 0 0 0
I.zmir 0 0 0 0 0 0 0 0 0 0 0 25 162 440 749 1056 1142 990 914 1001 972 713 426 144 23 3 0
K.Maras 0 0 0 0 0 0 0 0 0 3 30 155 420 775 977 925 788 708 723 883 892 634 460 264 105 17 1
Karabuk 0 0 0 0 0 0 0 0 0 10 109 381 750 948 965 934 1054 1085 930 651 463 302 149 23 6 0 0
Karaman 0 0 0 0 4 7 17 36 70 162 336 520 654 811 914 907 874 881 786 615 514 373 216 58 5 0 0
Kars 0 0 7 30 62 119 202 285 411 504 596 691 775 746 839 900 824 651 473 323 210 98 14 0 0 0 0
Kastamonu 0 0 0 0 0 0 2 17 55 133 378 802 1034 940 903 965 996 866 642 456 316 176 63 16 0 0 0
Kayseri 0 0 0 1 7 16 28 61 121 237 416 680 804 804 864 907 886 780 656 528 426 312 167 55 4 0 0
Kilis 0 0 0 0 0 0 0 0 0 0 12 80 298 713 1059 976 794 733 854 984 774 568 461 313 125 16 0
Kırıkkale 0 0 0 0 0 0 5 12 33 118 278 561 833 885 842 823 826 890 826 683 528 369 186 56 6 0 0
Kırklareli 0 0 0 0 0 0 0 1 9 55 140 359 770 883 905 964 938 963 957 670 516 374 199 47 9 1 0
Kırsehir 0 0 0 0 0 3 13 39 83 182 347 579 824 825 847 872 861 903 815 644 482 302 118 21 0 0 0
Kocaeli 0 0 0 0 0 0 0 0 0 1 14 115 502 852 1025 978 994 1097 1153 941 592 351 123 21 1 0 0
Konya 0 0 0 0 2 3 9 33 76 169 373 643 796 847 843 808 808 835 799 652 516 344 168 35 1 0 0
Kutahya 0 0 0 0 0 0 2 13 45 144 343 652 822 937 969 968 976 926 724 523 383 224 94 15 0 0 0
Malatya 0 0 0 0 0 0 0 4 32 103 253 540 795 833 792 728 693 715 761 763 651 492 364 188 50 3 0
Manisa 0 0 0 0 0 0 0 0 0 0 13 137 363 668 932 973 899 858 830 883 814 606 427 255 88 13 1
Mardin 0 0 0 0 0 0 0 0 1 19 99 297 613 881 870 798 664 620 631 715 832 763 566 305 83 3 0
Mersin 0 0 0 0 0 0 0 0 0 0 0 2 42 170 480 943 1108 1148 977 1034 1304 1301 243 8 0 0 0
Mugla 0 0 0 0 0 0 0 0 0 4 47 220 487 781 1153 1113 868 805 802 793 660 478 347 168 33 1 0
Mus 0 1 6 26 50 82 116 167 233 294 485 683 826 585 631 693 709 695 687 583 462 371 267 99 9 0 0
(continued on next page)
146
H.Bulutetal./Applied
Energy70(2001)135–155

Table 4 (continued)
Province Temperature bin (�C)
�36/
�33
�33/
�30
�30/
�27
�27/
�24
�24/
�21
�21/
�18
�18/
�15
�15/
�12
�12/
�9
�9/
�6
�6/
�3
�3/
0
0/
3
3/
6
6/
9
9/
12
12/
15
15/
18
18/
21
21/
24
24/
27
27/
30
30/
33
33/
36
36/
39
39/
42
42/
45
Nevsehir 0 0 0 0 0 1 11 35 95 224 372 545 807 959 937 954 946 866 727 575 405 218 74 9 0 0 0
Nigde 0 0 0 0 1 8 20 42 97 198 341 586 776 814 879 912 919 907 765 605 478 291 109 12 0 0 0
Ordu 0 0 0 0 0 0 0 0 0 0 3 63 358 811 1221 1154 1089 1099 1174 982 592 207 7 0 0 0 0
Rize 0 0 0 0 0 0 0 0 0 0 3 52 392 820 1178 1155 1067 1114 1165 1081 615 113 5 0 0 0 0
Samsun 0 0 0 0 0 0 0 0 0 0 9 68 350 836 1177 1104 1087 1134 1187 1021 652 131 4 0 0 0 0
Siirt 0 0 0 0 0 0 0 1 10 30 79 281 670 869 890 782 685 644 645 705 740 638 502 374 190 25 0
Sinop 0 0 0 0 0 0 0 0 0 0 4 48 287 845 1357 1153 1074 1080 1229 1097 504 81 1 0 0 0 0
Sivas 0 0 0 1 9 22 54 98 178 292 460 658 865 844 859 934 947 808 614 466 353 195 81 21 1 0 0
Sanlıurfa 0 0 0 0 0 0 0 0 0 2 23 99 323 687 951 902 749 657 662 712 756 738 616 449 320 109 5
Tekirdag 0 0 0 0 0 0 0 0 1 14 60 183 498 893 1074 1084 969 1002 1084 968 688 222 19 1 0 0 0
Tokat 0 0 0 0 0 2 3 7 21 71 209 476 767 807 885 1003 1019 1028 904 650 460 286 123 34 5 0 0
Trabzon 0 0 0 0 0 0 0 0 0 0 6 54 286 788 1205 1095 1044 1141 1233 1153 638 106 10 1 0 0 0
Tunceli 0 0 0 0 2 6 21 42 85 175 300 534 911 791 743 710 694 691 706 679 588 455 347 220 56 4 0
Usak 0 0 0 0 0 0 0 0 7 50 186 423 748 981 1065 940 873 876 814 668 514 373 195 45 2 0 0
Van 0 0 0 0 0 4 22 70 149 287 470 748 941 827 781 803 785 802 717 588 495 228 39 4 0 0 0
Yalova 0 0 0 0 0 0 0 0 0 0 8 88 398 836 1088 1091 1042 1095 1125 972 652 312 49 4 0 0 0
Yozgat 0 0 0 0 0 3 17 52 122 272 467 680 940 930 894 928 984 838 658 484 308 138 43 2 0 0 0
Zonguldak 0 0 0 0 0 0 0 0 0 0 12 122 505 1018 1024 989 1120 1228 1339 1018 324 55 6 0 0 0 0
H.Bulutetal./Applied
Energy70(2001)135–155
147

Summing up the Nbin values for six separate time periods of the day produces totalnumber of hours within each temperature bin in a year. The results are given inTable 4 for 78 provinces of Turkey. Analysis of the table reveals that Turkey has avery non-uniform climate. The temperature bins observed vary between �34.5 �C(�36 �C/�33 �C) and 43.5 �C (42 �C/45 �C).Fig. 2 shows average frequency distribution of temperature bins. The frequency
values were obtained by averaging Nbin values for all the weather stations consideredin this study for each temperature bin separately. As can be seen from the figure,frequency of very low and very high temperature bins are quite small in Turkey. Themost repeated bins are between 4 �C and 22 �C (frequency is higher than 8%).Frequency exhibits a maximum at temperature bin of 10.5 �C (9 �C/12 �C). At themaximum point, frequency is 10.6%, corresponding an average total number ofhours of 928. Increase of frequency with temperature bin at low temperature bins isslower than the decrease of frequency at high temperature bins.The combined influence of latitude and longitude on bin data for Turkey is shown
in the form of three-dimensional graphs in Fig. 3 for some selected temperature bins.Nbin is usually zero at low temperature bins (Fig. 3a). However, it has small values ineastern and especially in northeastern Turkey. This means that winter is quite severein the cities located in these regions. At relatively higher temperature bins (Fig. 3band c), Nbin starts to increase in inner and eastern Turkey. The most repeated binsare moderate ones (Fig. 3d–f) and for these temperature bins, Nbin is high androughly uniform all over Turkey, although there are some non-uniformities. Withthe increase of temperature bin, Nbin starts to decrease (Fig. 3g), although Nbin isstill high in southern and southeastern Turkey. At high temperature bins (Fig. 3h),Nbin is usually zero except a few provinces located in southeastern Turkey. Summeris quite severe in these cities and cooling is a necessity.The landscape of Turkey, which contains large plains, high plateaus, high moun-
tains and mountain chains, is quite non-uniform. Elevation of the cities variesbetween 0 and 1869 m. A correlation between Nbin and elevation is evident from
Fig. 2. Average frequency distribution of Nbin values for Turkey.
148 H. Bulut et al. / Applied Energy 70 (2001) 135–155

Fig. 4a at low temperature bins (�31.5 �C/�1.5 �C). The value of Nbin increases withelevation, although the data points scatter. The picture is not so clear in the case ofmoderate (4.5 �C/19.5 �C) and high (25.5 �C/40.5 �C) temperature bins. However, itcan be concluded roughly that elevation has a weak influence on Nbin at moderatetemperature bins (Fig. 4b) and Nbin decreases with the increase of elevation at hightemperature bins (Fig. 4c).
Fig. 3. Variation of yearly total Nbin with latitude and longitude for various temperature bins (tempera-
ture bins are (a) �25.5 �C; (b) �7.5 �C; (c) �1.5 �C; (d) 4.5 �C; (e) 13.5 �C, (f) 19.5 �C; (g) 28.5 �C; (h)
40.5 �C) (continued on next page).
H. Bulut et al. / Applied Energy 70 (2001) 135–155 149

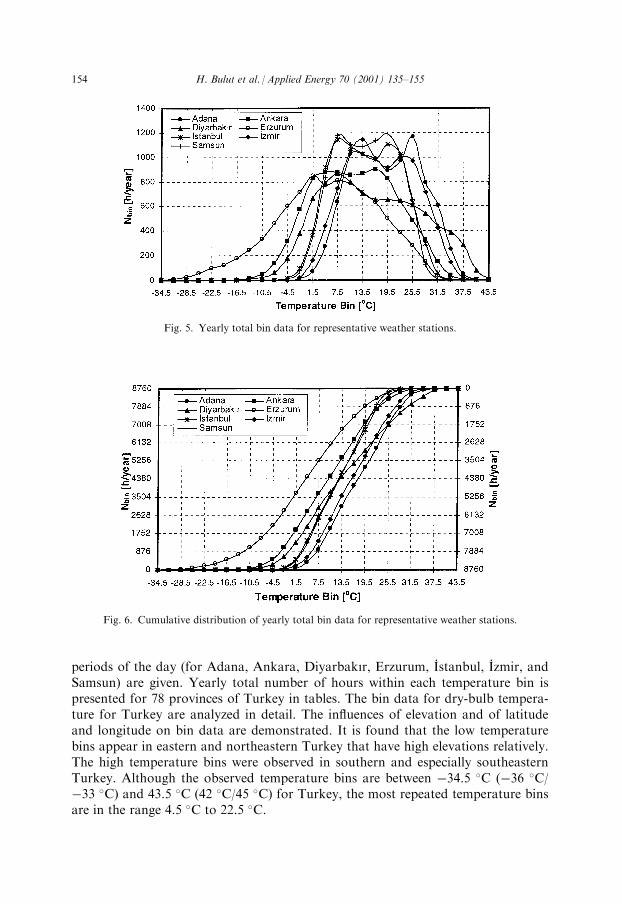
Yearly total bin data for some representative cities of Turkey are shown in Fig. 5.The difference in climatic conditions of extreme provinces (e.g. Adana and Erzurum)can be clearly seen from the figure. The most repeated bin is 1.5 �C in Erzurum and25.5 �C in Adana. While, temperature can drop down to �36/�33 �C in Erzurum,only �3/0 �C is observed in Adana.Cumulative distribution of yearly bin data for the same provinces is shown in
Fig. 6. From the figure, one can get approximately the number of hours for heating
Fig. 3. (continued)
150 H. Bulut et al. / Applied Energy 70 (2001) 135–155

season or cooling season by choosing a base temperature (here selecting the outdoordry-bulb temperature). For example, a building located in Adana without any sig-nificant internal and external heat gain needs heating for approximately 4000 h peryear and cooling for about 2850 h per year. The heating period is taken as the periodwith temperatures less than 18 �C. The cooling period is taken as the time whenoutdoor temperature is higher than 22 �C. For Erzurum, while heating hours are7500 h/year, cooling hours are only 450 h/year. These values show that, a building
Fig. 3. (continued)
H. Bulut et al. / Applied Energy 70 (2001) 135–155 151

having moderate internal and external heat gains located in Erzurum needs nocooling, but the same building requires more cooling than heating in Adana.
4. Conclusions
The bin data for dry-bulb temperature from �36 �C to 45 �C with 3 �C incrementsare calculated in six daily 4-h shifts for 78 provinces of Turkey. The heating and
Fig. 3. (continued)
152 H. Bulut et al. / Applied Energy 70 (2001) 135–155

cooling energy requirements of buildings can be estimated according to the binmethod using the data obtained. The monthly and yearly total bin data for six-timeperiods of the day are also calculated. Examples to the monthly total bin data forsix-time periods of the day (for Adana) and to the yearly total bin data for six-time
Fig. 4. Variation of yearly total Nbin with elevation: (a) low temperature bins; (b) medium temperature
bins; (c) high temperature bins.
H. Bulut et al. / Applied Energy 70 (2001) 135–155 153
periods of the day (for Adana, Ankara, Diyarbakır, Erzurum, I.stanbul, I
.zmir, and
Samsun) are given. Yearly total number of hours within each temperature bin ispresented for 78 provinces of Turkey in tables. The bin data for dry-bulb tempera-ture for Turkey are analyzed in detail. The influences of elevation and of latitudeand longitude on bin data are demonstrated. It is found that the low temperaturebins appear in eastern and northeastern Turkey that have high elevations relatively.The high temperature bins were observed in southern and especially southeasternTurkey. Although the observed temperature bins are between �34.5 �C (�36 �C/�33 �C) and 43.5 �C (42 �C/45 �C) for Turkey, the most repeated temperature binsare in the range 4.5 �C to 22.5 �C.
Fig. 5. Yearly total bin data for representative weather stations.
Fig. 6. Cumulative distribution of yearly total bin data for representative weather stations.
154 H. Bulut et al. / Applied Energy 70 (2001) 135–155

Acknowledgements
The authors wish to express their gratitude to The State Meteorological AffairsGeneral Directorate (DMI
.) for providing meteorological data.
References
[1] Kreider JF, Rabl A. Heating and cooling of buildings. New York: McGraw Hill, 1994.
[2] Degelmen LO. Bin weather data for simplified energy calculations and variable degree-day infor-
mation. ASHRAE Transactions 1985;91(1A):3–14.
[3] ASHRAE Handbook–fundamentals (SI). Energy Estimating Methods, Chapter 28, 1993.
[4] Said SAM. Degree-day base temperature for residential building energy prediction in Saudi Arabia.
ASHRAE Transactions 1992;98(1):346–53.
[5] Al-Homoud MS. Computer-aided building energy analysis techniques. Building and Environment
2001;36:421–33.
[6] Papakostas KT. Bin weather data of Athens, Greece. Renewable Energy 1999;17:265–75.
[7] Buyukalaca O, Bulut H, Yılmaz T. Analysis of variable-base heating and cooling degree-days for
Turkey. Applied Energy 2001;(4):269–83.
[8] Dagsoz AK, Bayraktar KG, The number of degree-day in Turkey and energy politics. Journal of
Sanitary Engineering 1999; July–August:32–40 (in Turkish).
[9] Buyukalaca O, Bulut H, Yılmaz T. Degree-days values for some provinces of Turkey, Conference
Proceeding of 12 Turkish National Conference on Thermal Sciences and Technologies with Inter-
national Participation, Sakarya, Turkey, 2000; 1: 107–12 (in Turkish).
[10] Satman A, Yalcinkaya N. Heating and cooling degree-hours for Turkey. Energy 1999;24:833–40.
[11] I.leri A, Uner M. Typical weather data of main Turkish cities. Engineer and Machine 1998;39(463):
31–42 (in Turkish).
H. Bulut et al. / Applied Energy 70 (2001) 135–155 155