Investigating in-service failures of water pipes from a ...
30
This is a repository copy of Investigating in-service failures of water pipes from a multiaxial notch fatigue point of view: A conceptual study. White Rose Research Online URL for this paper: http://eprints.whiterose.ac.uk/84117/ Version: Accepted Version Article: Brevis, W., Susmel, L. and Boxall, J.B. (2014) Investigating in-service failures of water pipes from a multiaxial notch fatigue point of view: A conceptual study. Proceedings of the Institution of Mechanical Engineers, Part C: Journal of Mechanical Engineering Science.. ISSN 0954-4062 https://doi.org/10.1177/0954406214553020 [email protected] https://eprints.whiterose.ac.uk/ Reuse Unless indicated otherwise, fulltext items are protected by copyright with all rights reserved. The copyright exception in section 29 of the Copyright, Designs and Patents Act 1988 allows the making of a single copy solely for the purpose of non-commercial research or private study within the limits of fair dealing. The publisher or other rights-holder may allow further reproduction and re-use of this version - refer to the White Rose Research Online record for this item. Where records identify the publisher as the copyright holder, users can verify any specific terms of use on the publisher’s website. Takedown If you consider content in White Rose Research Online to be in breach of UK law, please notify us by emailing [email protected] including the URL of the record and the reason for the withdrawal request.
-
Upload
khangminh22 -
Category
Documents
-
view
0 -
download
0
Transcript of Investigating in-service failures of water pipes from a ...

This is a repository copy of Investigating in-service failures of water pipes from a multiaxialnotch fatigue point of view: A conceptual study.
White Rose Research Online URL for this paper:http://eprints.whiterose.ac.uk/84117/
Version: Accepted Version
Article:
Brevis, W., Susmel, L. and Boxall, J.B. (2014) Investigating in-service failures of water pipes from a multiaxial notch fatigue point of view: A conceptual study. Proceedings of the Institution of Mechanical Engineers, Part C: Journal of Mechanical Engineering Science.. ISSN 0954-4062
https://doi.org/10.1177/0954406214553020
[email protected]://eprints.whiterose.ac.uk/
Reuse
Unless indicated otherwise, fulltext items are protected by copyright with all rights reserved. The copyright exception in section 29 of the Copyright, Designs and Patents Act 1988 allows the making of a single copy solely for the purpose of non-commercial research or private study within the limits of fair dealing. The publisher or other rights-holder may allow further reproduction and re-use of this version - refer to the White Rose Research Online record for this item. Where records identify the publisher as the copyright holder, users can verify any specific terms of use on the publisher’s website.
Takedown
If you consider content in White Rose Research Online to be in breach of UK law, please notify us by emailing [email protected] including the URL of the record and the reason for the withdrawal request.

Please cite this article as: Brevis , W., Susm e l, L. and Boxall J. B. (2014) Investigating in-service failures of w ater pipes from a m ultiaxial notch fatigue point of view : A conceptual study . Proceedings of the Institution of Mechanical Engineers, Part C: Journal of Mechanical Engineering Science. DOI: 10.1177/0954406214553020
1
Inves tigating in -se rvice failu res o f w ate r p ipes from a
m u ltiaxial no tch fatigue po in t o f view : a conceptual s tudy
W. Brevis1, L. Susm e l2 and J. Boxall1 1Peninne Water Group, Department of Civil and Structural Engineering,
The University of Sheffield, Sheffield, S1 3JD, UK
2Department of Civil and Structural Engineering, The University of Sheffield,
Sheffield, S1 3JD, UK
ABSTRACT
Many mechanisms and processes can cause deterioration and ultimately failure of water
distribution pipes during in-service operation, amongst these is damage caused by metal
fatigue. This paper summarises an attempt at formalising a novel methodology suitable for
estimating the number of years taken for a through thickness fatigue crack to form in this
complex scenario. The devised method is based on the so-called Modified Wöhler Curve
Method and can be applied to estimate fatigue damage of water pipes independently from
the degree of multiaxiality and non-proportionality of the load history. The computational
approach of the proposed fatigue life estimation technique makes full use of an incremental
procedure: fatigue damage is evaluated year by year by assuming that all variable involved in
the process can change over time. The detrimental effect of corrosion pits is directly
accounted for by treating them as conventional notches whose size increases with time.
Finally, by taking as reference information the number of years for a blowout hole to form,
the proposed approach is used to show how the lifetime of grey cast iron pipes can be
remarkably shortened by fatigue.
Keyw o rds : Water pipes, Multiaxial Notch Fatigue, Pitting, In-service lifetime
1. INTRODUCTION
The secure supply of safe potable water is fundamental to society, for public health and
wellbeing. Yet we distribute this vital product through an ageing, undervalued, buried
infrastructure. Failures of water distribution systems do occur, including both catastrophic
(i.e. directly visible and customer impacting) and non-catastrophic (i.e. leakage) failures.
Both failure types are unacceptable in the long term, although a level of leakage may be
accepted such as under the guise of the �Economic Level of Leakage� as adopted in England
and Wales, currently around 25% of the water put into supply. Despite the low value
Please cite this article as: Brevis , W., Susm e l, L. and Boxall J. B. (2014) Investigating in-service failures of w ater pipes from a m ultiaxial notch fatigue point of view : A conceptual study . Proceedings of the Institution of Mechanical Engineers, Part C: Journal of Mechanical Engineering Science. DOI: 10.1177/0954406214553020
2
associated with water distribution infrastructure, investment and asset rehabilitation and
replacement does occur. Due to low investment levels it is vital that expenditure is carefully
targeted to maximise benefit to service delivery. Paramount to such investment planning is
the ability to estimate when a pipe has reached the end of its useful life. A variety of
stochastic models exist to address this need, providing useful predictions of pipe cohort
behaviour, vital for master investment planning [1]. However, for detailed proactive
management pipe level estimation is needed. Attempts to extend stochastic tools to pipe
level have had limited success due to the complexities and uncertainties of the interacting
factors effecting an individual pipe�s useful lifetime [2-5]. Load models offer the potential to
provide lifetime estimation for individual pipes and could potentially provide valuable new
insight into the loading conditions most detrimental to a pipe. To date load models have had
limited success, insufficiently capturing the full range and complexities of interacting static
and dynamic loads [6]. This study proposes a contribution to the field of pipe lifetime
estimation through the consideration of multi-axial loading and material fatigue.
2 . PIPE FAILURES
During their operational lifetime water distribution, and most other buried pipe
infrastructure, is subjected to a complex systems of forces. The result of these complex
loading conditions is a variety of different failure mechanisms [7, 8]. In spite of the
complexity of load histories, the different forces/moments that are involved can be
subdivided into the following quasi-static and time-variable events [after 9, 10]:
1. Quasi-static events
1.1. Ground weight
1.2. Pipe self-weight
1.3. Weight of contained fluid
1.4. Swelling load, the expected frequency depending on the specific characteristics of
the rainy season(s) (typically, one event per year)
1.5. Frost load, the expected frequency being on an annual basis
1.6. Thermal stresses resulting from differences between the temperatures of ground
and water
2. Time-variable events
2.1. Operational internal pressure, the expected frequency being cyclic patterns
repeating on a daily basis
2.2. Transient internal pressure related to operational, control and demand changes,
the expected frequency being highly uncertain and variable across and between

Please cite this article as: Brevis , W., Susm e l, L. and Boxall J. B. (2014) Investigating in-service failures of w ater pipes from a m ultiaxial notch fatigue point of view : A conceptual study . Proceedings of the Institution of Mechanical Engineers, Part C: Journal of Mechanical Engineering Science. DOI: 10.1177/0954406214553020
3
different networks, ranging from small repeated events on an hourly basis to
monthly events
2.3. Traffic load with an expected frequency of several events per hour.
In addition to the above complex systems of interacting forces/moments, a pipe�s overall
mechanical strength is also reduced by the presence of manufacturing defects [11] as well as
deterioration such as corrosion of cast iron pipes [12].
The combined effects of applied load history, corrosion, and dimensions of a given pipe
result in different failure modes which can be summarised as [13]: (i) blowout holes; (ii)
circumferential, longitudinal and spiral cracking; (iii) bell splitting and shearing.
Amongst the different damaging mechanisms resulting in the breakage of water pipes, recent
studies [10, 15] have proven that, under particular circumstances, in-service failures can be
caused by fatigue: for instance, during the summer of 2009 the city of Los Angeles was
exposed to an anomalous increase in blowouts, retrospective analysis suggests that this was
due to metal fatigue resulting from a cyclic increase of the internal pressure due to water
rationing [16].
Following the recognition of the role played by fatigue in the failure of water pipes, several
attempts (for instance, [10, 15]) have been made to formalise approaches suitable for
estimating the lifetime of cracked water pipes subjected to cyclic loading. Such methods take
as a starting point the assumption that an initial crack/flaw is present with the residual
lifetime estimated according to classical Linear-Elastic Fracture Mechanics (LEFM) [17].
Whilst such LEFM based approaches are very useful to model the propagation of
longitudinal cracks resulting in the final catastrophic burst failure, they cannot be used to
understand and evaluate the damage caused by fatigue during the crack initiation phase and
hence this component of pipe �lifetime�.
The aim of this paper is to formalise a multiaxial notch fatigue methodology capable of
estimating the period of time taken for fatigue cracks to initiate in the walls of grey cast iron
water pipes. Cast iron is chosen at it is the dominant, by length, pipe material in water
distribution systems worldwide.
3 . STRENGTH REDUCTION DUE TO CORROSION PITS AND FAT IGUE
3.1 Corrosion
Corrosion is a complex phenomenon widely accepted to have a strong influence on the in-
service lifetime of buried pipes. The corrosion behaviour of cast iron water pipes has been
investigated by considering the variety of chemical/physical processes that are involved (see
Refs [5, 18, 19] and references reported therein). Grey cast iron can be damaged by the
following different corrosive phenomena [20, 21]: uniform corrosion, pitting, stress

Please cite this article as: Brevis , W., Susm e l, L. and Boxall J. B. (2014) Investigating in-service failures of w ater pipes from a m ultiaxial notch fatigue point of view : A conceptual study . Proceedings of the Institution of Mechanical Engineers, Part C: Journal of Mechanical Engineering Science. DOI: 10.1177/0954406214553020
4
corrosion, fatigue corrosion, dissimilar metal corrosion, concentration cells, crevice stray
current, graphitisation, impingement attack, and cavitation. Of these, it is believed that
pitting has the greatest detrimental effect on the overall mechanical strength of cast iron
water pipes [13]. Pitting corrosion usually takes place at anodic locations (usually small
defects) on either the internal or external surface of water pipes. Subsequently, pits grow due
to a gradual loss of matter as a consequence of the cathodic behaviour of the material in the
vicinity of the anodic initiation point. Experimental methods suitable for mapping the
presence of pits in in-service water pipes [20] have proven that, in general, the corrosion rate
resulting in the formation of pits is much greater in new pipes, decreasing over time [21, 22].
For buried cast iron pipes the external pitting rate is seen to depend mainly on the
corrosivity of the soil, the metallurgical characteristics of the material itself having less
influence. Accordingly, the pit growth rate in such circumstances tends to decrease as the soil
resistivity increases [23].
Different approaches have been proposed to model the growth of pits in corroded grey cast
iron pipes, with validation through experimental investigations. Such approaches have been
based on different mathematical formalisations involving either linear, power, or
exponential functions [5]. Arguably, one of most reliable models is the exponential solution
proposed by Rajani and c0-workers [24] which can be formalized as follows:
tcp e1ktad (1)
where dp is the pit depth [m m ] (see Figure 1a) and t is time [year]. Further, a [m m / year], k
[m m ] and c [year -1] are constants whose values depend on the corrosion properties of the
considered combination of cast iron and ground. As an example, Figure 1b shows the
increase of the pith depth over a period of 50 years under the following corrosive conditions
[5]:
Very-high Corrosion Rate: a=0.0336 mm/year, k=15.6 mm, c=0.058 year-1
Low Corrosion Rate: a=0.0210 mm/year, k=9.75 mm, c=0.058 year-1
3.2 Corrosion pits and internal flow
The effect of flow on the development of pits is complex and depends on the chemical,
biological and physical characteristics of the system under analysis. As any other turbulent
flow, the flow in pipes is governed by a non-linear interaction of vortex structures of different
length-scales, which produce important temporal and spatial fluctuations of the velocity

Please cite this article as: Brevis , W., Susm e l, L. and Boxall J. B. (2014) Investigating in-service failures of w ater pipes from a m ultiaxial notch fatigue point of view : A conceptual study . Proceedings of the Institution of Mechanical Engineers, Part C: Journal of Mechanical Engineering Science. DOI: 10.1177/0954406214553020
5
field. These fluctuations can have important effects on the initiation and evolution of several
phenomena related to structural integrity, such as corrosion.
Early experimental research on the relationship between the evolution of pits, due to
corrosion, and flow characteristics, have shown evidence of a velocity threshold, for a fixed
pit size, where hydrodynamics dominates the growth of the pits [25], however and as pointed
out by Efird [26], the real crucial variable defining the effect of flow on corrosion, thus on
pits evolution, is turbulence. According to Efird [25], high levels of turbulence can produce
flow-induced corrosion, erosion-corrosion, or cavitation, being the first one the most
common corrosion mechanism of the flow in pipes. In general turbulence controls the
complex interrelationship between the mass transfer rate of oxygen and momentum transfer
at the solid-fluid interface [27], thus can affect near-wall chemical processes and the
magnitude of instantaneous wall shear stresses. Several researches have investigated the
structure and characteristics of the boundary layer and have shown that large velocity
fluctuation in that zone are not only a function of the properties of the near-wall region, but
that are also affected by the dynamic of large-scale coherent structures associated to burst
and sweep events [28, 29]. The literature discusses the characteristics of near wall turbulent
structures, however, up to our knowledge, there is limited information regarding the
magnitude and dominant frequencies of stresses within small pits and how these are
influenced by the dynamic of large-scales coherent structures.
The flow structure within pits or wall-cavities is highly important to model the associated
structural phenomena, thus it is necessary to investigate the flow physics associated to
boundary layer wall-cavities, with special focus on how the fluid loads can be described as a
function of characteristics length and velocity scales of the adjacent outer flow. Even though
the flow in wall cavities have been widely studied, their geometrical dimensions are normally
large compared with the thickness of the sub-laminar boundary layer. A large cavity is
defined here as those with characteristics length-scales several order of magnitude larger
than the sub-laminar boundary layer thickness, and a small cavity as those with a size of the
order of the layer thickness. It is necessary to take into account that the evolution of a pit can
span both sizes, starting with a flow corresponding to small cavities up to those with a size
governed by a flow structure typical of large cavities. A Kelvin-Helmholtz (KH) instability
generated at the interface between the cavity and the external main flow governs the flow
within large cavities [30]. A recirculating flow defines the flow conditions in a large area of
the cavity [31] being the interfacial structure or shear layer, through the impingement of KH
billows, the main responsible for the mass and momentum exchange [32]. In general, the KH
instability controls the mass and momentum exchange by means of convective patterns
called Kelvin billows. When the Kelvin billows are transported, they hit the downstream
corner of the cavity surrounding fluid of the main flow that is incorporated into the cavity.
Please cite this article as: Brevis , W., Susm e l, L. and Boxall J. B. (2014) Investigating in-service failures of w ater pipes from a m ultiaxial notch fatigue point of view : A conceptual study . Proceedings of the Institution of Mechanical Engineers, Part C: Journal of Mechanical Engineering Science. DOI: 10.1177/0954406214553020
6
This process is not continuous, due to oscillations of the shear layer generated by
perturbations acting over the interface. The perturbation changes the size and direction of
the Kelvin billows, producing a structure able to exchange a significant volume of fluid [33].
On the other hand, one of the few works focusing on the flow characteristics within small
cavities was presented by Taniguchi and Evans [34]. They analysed cavities with a width
between 2 and 10 mm. Their preliminary results showed that turbulence generated at the
main flow is able to penetrate the cavity, and that some particular length scales are more
likely to enter that region. The mean velocities presented in that work show different
characteristics than those observed in large cavities, however no definitive description of the
flow structure can be obtained from their measurements.
From the literature it is possible to conclude that further research on the characterisation of
the load magnitudes produced by the flow within small cavities is necessary to advance on
the physical description on the structural problem associate to the pits development. In this
context it is important to clarify how the turbulent structure of the outer-flow can affect the
magnitude and frequencies of the dominant loads. It would be also relevant to investigate if a
transitional regime between small and large cavities exists, and to improve the
understanding of the relation between the magnitude of wall-loads and the widely studied
flow structure of large cavities.
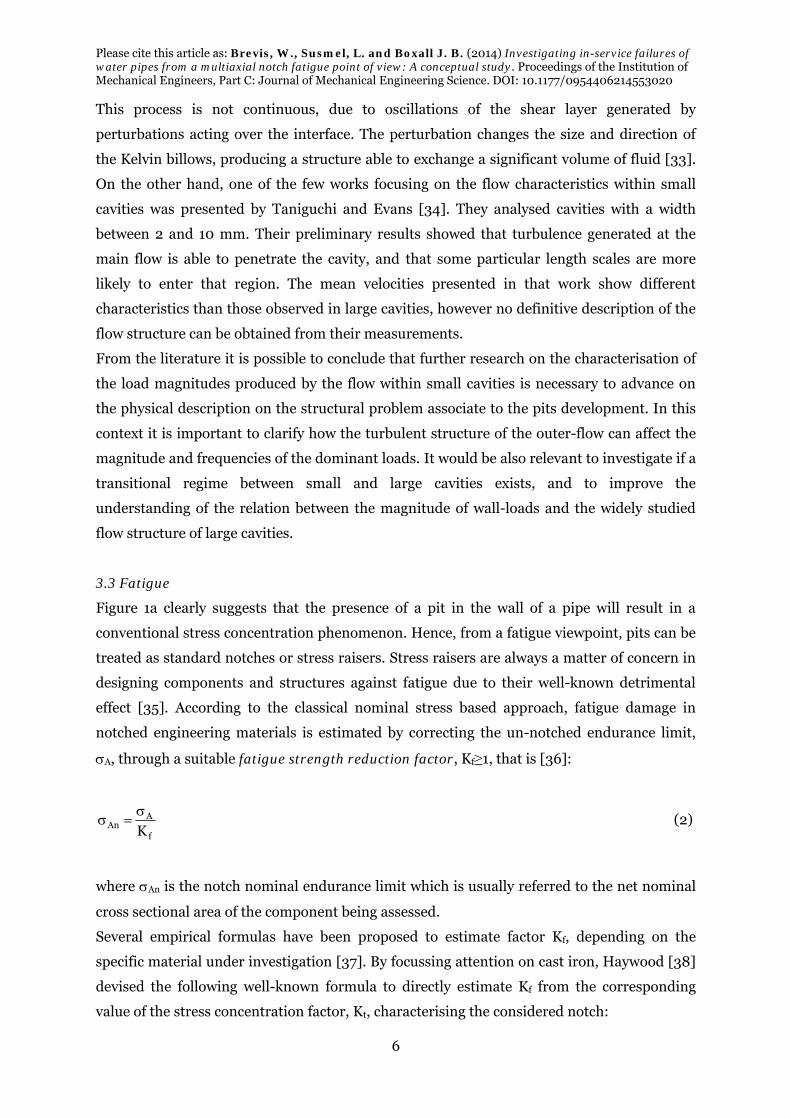
3.3 Fatigue
Figure 1a clearly suggests that the presence of a pit in the wall of a pipe will result in a
conventional stress concentration phenomenon. Hence, from a fatigue viewpoint, pits can be
treated as standard notches or stress raisers. Stress raisers are always a matter of concern in
designing components and structures against fatigue due to their well-known detrimental
effect [35]. According to the classical nominal stress based approach, fatigue damage in
notched engineering materials is estimated by correcting the un-notched endurance limit,
A, through a suitable fatigue strength reduction factor, Kf≥1, that is [36]:
f
AAn
K
(2)
where An is the notch nominal endurance limit which is usually referred to the net nominal
cross sectional area of the component being assessed.
Several empirical formulas have been proposed to estimate factor Kf, depending on the
specific material under investigation [37]. By focussing attention on cast iron, Haywood [38]
devised the following well-known formula to directly estimate Kf from the corresponding
value of the stress concentration factor, Kt, characterising the considered notch:

Please cite this article as: Brevis , W., Susm e l, L. and Boxall J. B. (2014) Investigating in-service failures of w ater pipes from a m ultiaxial notch fatigue point of view : A conceptual study . Proceedings of the Institution of Mechanical Engineers, Part C: Journal of Mechanical Engineering Science. DOI: 10.1177/0954406214553020
7
t
t
p
H
tf
K
1K
r
a21
KK (3)
where factor Kt is the ratio between the linear-elastic notch tip stress and the corresponding
nominal stress [39]. Further, in the above formula rp [m m ] is the notch root radius, whereas
Ha is a material characteristic length which is equal to 176/UTS mm and to 0.605 m m for
cast iron with spheroid and with flake graphite, respectively.
If corrosion pits are schematised either as hemispherical or as hyperbolic notches (Figure
1a), it is possible to estimate, as shown in Figure 1c, the corresponding Kf value from Eq. (3)
as the pit depth, rp, increases. In more detail, the curves reported in the above chart were
calculated through Eq. (3) by considering cast iron with flake graphite, Ha =0.605 mm
[38], whereas the adopted Kt values are those reported in Ref. [39] for a semi-infinite body
with a hemispherical depression under equal biaxial stress (Kt=2.23) as well as for a
hyperbolic depression simulating a pit in the surface of a finite thickness plate under equal
biaxial stress (Kt=3.2÷3.6).
From these considerations, and when considering time-variable loadings, it seems feasible
that the weakening effect of corrosion pits in cast iron pipes could be explicitly modelled by
taking a notch fatigue point of view. In order to correctly apply the classical nominal stress
based fatigue approach, and since pit depth increases with time (Figure 1b), fatigue damage
has to be estimated over time by assuming that the adopted reference design curves change
as the pit root radius varies.
4 . STRESS ANALYSIS
In order to estimate fatigue damage, firstly the stress states damaging the assumed critical
locations must be considered. In general the magnitude of the forces experienced by water
distribution pipes, certainly grey cast iron pipes, is insufficient to cause localised plastic
deformations. Further, corrosion phenomena, such as graphitisation, result in a slight
tendency for the material to embrittle. These considerations suggest that stress analysis can
be carried out using a simple linear-elastic constitutive law to model the material behaviour.
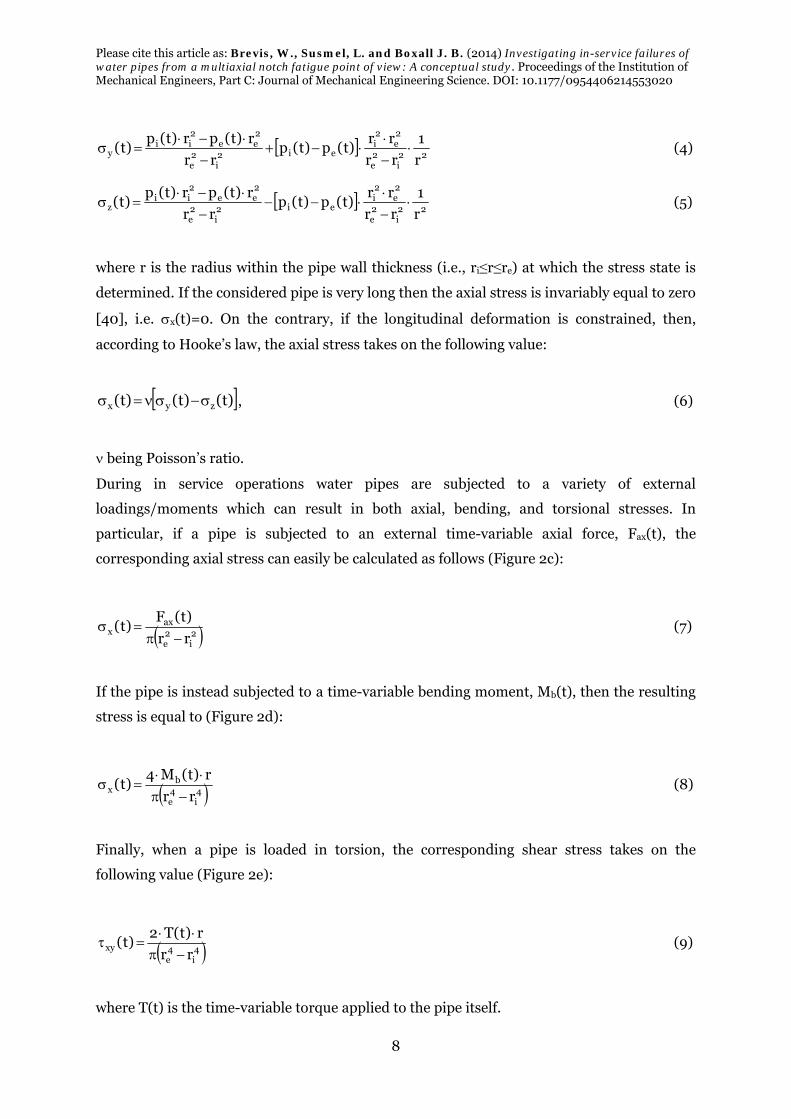
Consider now the cylindrical pipe sketched in Figure 2b and assume that it subjected to an
internal, pi(t), and external, pe(t), time-variable pressure, the adopted frame of reference
being defined in Figure 2a. The external radius of the pipe is denoted as re, and the internal
as ri. According to Lame�s equations, the resulting stress state acting on the pipe wall can be
calculated as [40]:
Please cite this article as: Brevis , W., Susm e l, L. and Boxall J. B. (2014) Investigating in-service failures of w ater pipes from a m ultiaxial notch fatigue point of view : A conceptual study . Proceedings of the Institution of Mechanical Engineers, Part C: Journal of Mechanical Engineering Science. DOI: 10.1177/0954406214553020
8
22
i2e
2e
2i
ei2i
2e
2ee
2ii
yr
1
rr
rr)t(p)t(p
rr
r)t(pr)t(p)t(
(4)
22
i2e
2e
2i
ei2i
2e
2ee
2ii
zr
1
rr
rr)t(p)t(p
rr
r)t(pr)t(p)t(
(5)
where r is the radius within the pipe wall thickness (i.e., ri≤r≤re) at which the stress state is
determined. If the considered pipe is very long then the axial stress is invariably equal to zero
[40], i.e. x(t)=0. On the contrary, if the longitudinal deformation is constrained, then,
according to Hooke�s law, the axial stress takes on the following value:
)t()t()t( zyx , (6)
being Poisson�s ratio.
During in service operations water pipes are subjected to a variety of external
loadings/moments which can result in both axial, bending, and torsional stresses. In
particular, if a pipe is subjected to an external time-variable axial force, Fax(t), the
corresponding axial stress can easily be calculated as follows (Figure 2c):
2i
2e
axx
rr
)t(F)t(
(7)
If the pipe is instead subjected to a time-variable bending moment, Mb(t), then the resulting
stress is equal to (Figure 2d):
4i
4e
bx
rr
r)t(M4)t(
(8)
Finally, when a pipe is loaded in torsion, the corresponding shear stress takes on the
following value (Figure 2e):
4i
4e
xyrr
r)t(T2)t(
(9)
where T(t) is the time-variable torque applied to the pipe itself.
Please cite this article as: Brevis , W., Susm e l, L. and Boxall J. B. (2014) Investigating in-service failures of w ater pipes from a m ultiaxial notch fatigue point of view : A conceptual study . Proceedings of the Institution of Mechanical Engineers, Part C: Journal of Mechanical Engineering Science. DOI: 10.1177/0954406214553020
9
From a stress analysis point of view, the most important advantage of assuming a linear-
elastic behaviour for the wall material is that the total stress state at the assumed critical
locations can be determined by separately computing the contribution of every single
force/moment. Attention should be paid to not lose the synchronism amongst the loads
when coupling their effects. Managing complex time-variable stress states in such a manner
allows the contribution of both superimposed static stresses and non-zero out-of-phase
angles to correctly be taken into account [41].
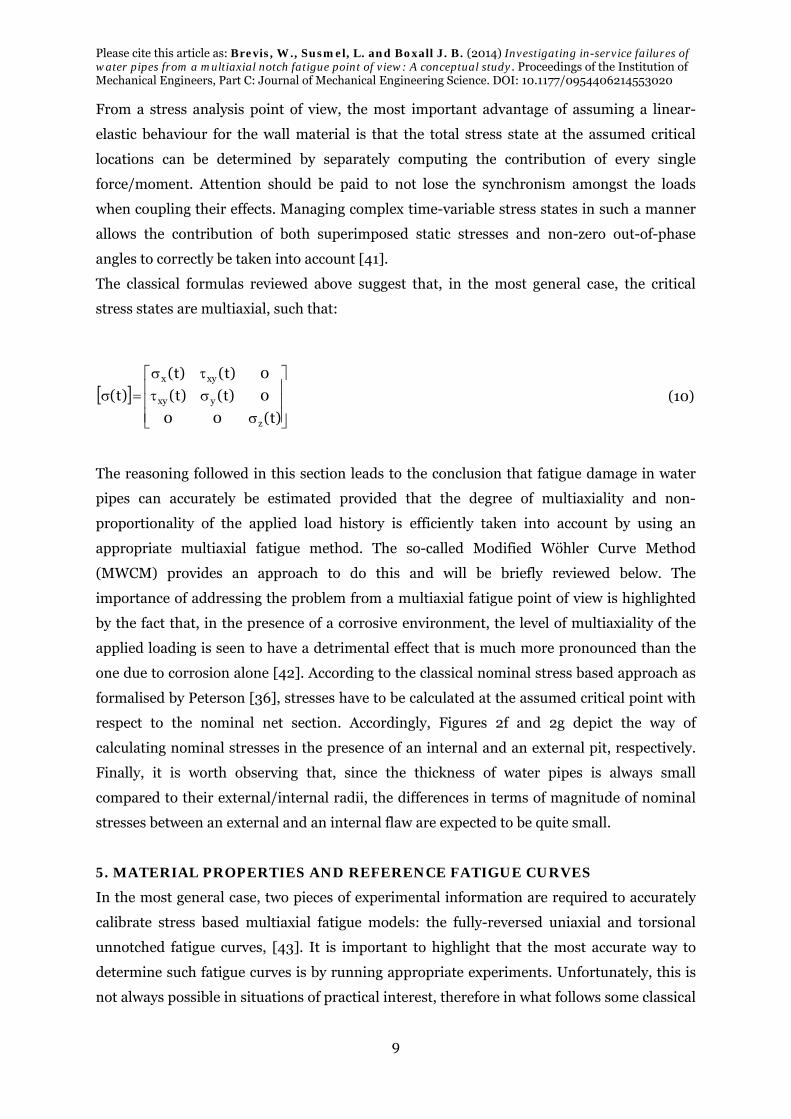
The classical formulas reviewed above suggest that, in the most general case, the critical
stress states are multiaxial, such that:
)t(00
0)t()t(
0)t()t(
)t(
z
yxy
xyx
(10)
The reasoning followed in this section leads to the conclusion that fatigue damage in water
pipes can accurately be estimated provided that the degree of multiaxiality and non-
proportionality of the applied load history is efficiently taken into account by using an
appropriate multiaxial fatigue method. The so-called Modified Wöhler Curve Method
(MWCM) provides an approach to do this and will be briefly reviewed below. The
importance of addressing the problem from a multiaxial fatigue point of view is highlighted
by the fact that, in the presence of a corrosive environment, the level of multiaxiality of the
applied loading is seen to have a detrimental effect that is much more pronounced than the
one due to corrosion alone [42]. According to the classical nominal stress based approach as
formalised by Peterson [36], stresses have to be calculated at the assumed critical point with
respect to the nominal net section. Accordingly, Figures 2f and 2g depict the way of
calculating nominal stresses in the presence of an internal and an external pit, respectively.
Finally, it is worth observing that, since the thickness of water pipes is always small
compared to their external/internal radii, the differences in terms of magnitude of nominal
stresses between an external and an internal flaw are expected to be quite small.
5. MATERIAL PROPERTIES AND REFERENCE FATIGUE CURVES
In the most general case, two pieces of experimental information are required to accurately
calibrate stress based multiaxial fatigue models: the fully-reversed uniaxial and torsional
unnotched fatigue curves, [43]. It is important to highlight that the most accurate way to
determine such fatigue curves is by running appropriate experiments. Unfortunately, this is
not always possible in situations of practical interest, therefore in what follows some classical
Please cite this article as: Brevis , W., Susm e l, L. and Boxall J. B. (2014) Investigating in-service failures of w ater pipes from a m ultiaxial notch fatigue point of view : A conceptual study . Proceedings of the Institution of Mechanical Engineers, Part C: Journal of Mechanical Engineering Science. DOI: 10.1177/0954406214553020
10
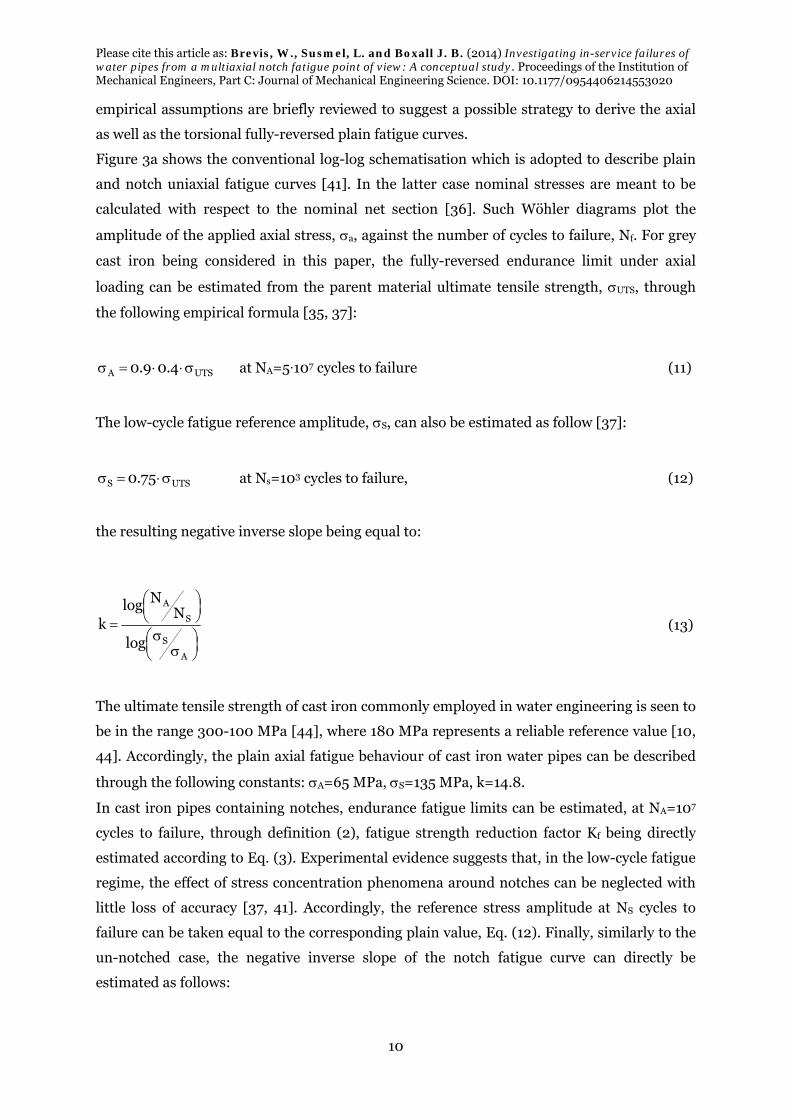
empirical assumptions are briefly reviewed to suggest a possible strategy to derive the axial
as well as the torsional fully-reversed plain fatigue curves.
Figure 3a shows the conventional log-log schematisation which is adopted to describe plain
and notch uniaxial fatigue curves [41]. In the latter case nominal stresses are meant to be
calculated with respect to the nominal net section [36]. Such Wöhler diagrams plot the
amplitude of the applied axial stress, a, against the number of cycles to failure, Nf. For grey
cast iron being considered in this paper, the fully-reversed endurance limit under axial
loading can be estimated from the parent material ultimate tensile strength, UTS, through
the following empirical formula [35, 37]:
UTSA 4.09.0 at NA=5·107 cycles to failure (11)
The low-cycle fatigue reference amplitude, S, can also be estimated as follow [37]:
UTSS 75.0 at Ns=103 cycles to failure, (12)
the resulting negative inverse slope being equal to:
A
S
S
A
log
NN
log
k (13)
The ultimate tensile strength of cast iron commonly employed in water engineering is seen to
be in the range 300-100 MPa [44], where 180 MPa represents a reliable reference value [10,
44]. Accordingly, the plain axial fatigue behaviour of cast iron water pipes can be described
through the following constants: A=65 MPa, S=135 MPa, k=14.8.
In cast iron pipes containing notches, endurance fatigue limits can be estimated, at NA=107
cycles to failure, through definition (2), fatigue strength reduction factor Kf being directly
estimated according to Eq. (3). Experimental evidence suggests that, in the low-cycle fatigue
regime, the effect of stress concentration phenomena around notches can be neglected with
little loss of accuracy [37, 41]. Accordingly, the reference stress amplitude at NS cycles to
failure can be taken equal to the corresponding plain value, Eq. (12). Finally, similarly to the
un-notched case, the negative inverse slope of the notch fatigue curve can directly be
estimated as follows:

Please cite this article as: Brevis , W., Susm e l, L. and Boxall J. B. (2014) Investigating in-service failures of w ater pipes from a m ultiaxial notch fatigue point of view : A conceptual study . Proceedings of the Institution of Mechanical Engineers, Part C: Journal of Mechanical Engineering Science. DOI: 10.1177/0954406214553020
11
An
S
S
A
n
log
NN
log
k (14)
As far as constant amplitude fatigue loadings are concerned, the presence of an aggressive
environment results in the elimination of the fatigue limit [45]. In such circumstances, the
high-cycle fatigue behaviour of both the plain and notched material can efficiently be
described according to the classical constant k assumption (dashed straight lines in Figure
3a). However, when the material being assessed is subject to in-service variable amplitude
load histories, as is the case for water pipes, the negative inverse slope in the high-cycle
fatigue regime should be corrected as recommended by Haibach [46], i.e. (Figure 3a):
1k2m and 1k2m nn (15)
For plain and notched materials, for the sake of simplicity, the position of the knee point,
Nkp, can be taken coincident with reference number of cycles to failure NA.
Turning to the torsional case, the Wöhler diagram sketched in Figure 3b summarises the way
plain and notch torsional fatigue curves are usually described. If the fatigue behaviour of the
employed material cannot be investigated experimentally, then the plain torsional fatigue
curve can be estimated as follows [35, 37]:
AA 8.0 at NA=5·107 cycles to failure (16)
UTSS 17.1 at NS=103 cycles to failure (17)
A
S
S
A
0
log
NN
log
k (18)
According to the above identities, the fully-reversed plain torsional curve for grey cast iron
having UTS=180 MPa is then characterised by the following values: A=52 MPa, S=210 MPa,
k=7.8.
There are only a few empirical formulas suitable for deriving the fatigue strength reduction
factor for notched materials loaded in torsion [37]. Hence, to estimate the torsional notch

Please cite this article as: Brevis , W., Susm e l, L. and Boxall J. B. (2014) Investigating in-service failures of w ater pipes from a m ultiaxial notch fatigue point of view : A conceptual study . Proceedings of the Institution of Mechanical Engineers, Part C: Journal of Mechanical Engineering Science. DOI: 10.1177/0954406214553020
12
fatigue curve the notch torsional endurance limit can be evaluated from the corresponding
uniaxial one by taking advantage of the following empirical rule [41]:
AnAn 57.0 at NA=5·107 cycles to failure (19)
Further, since the value of the low-cycle fatigue reference shear stress, S, can be assumed to
be independent from the sharpness of the investigated notch (see Figure 3b), the negative
inverse slope of the notch torsional fatigue curve takes on the following value:
An
S
S
A
0
log
NN
log
k , (20)
reference stress S being then estimated from Eq. (17) directly.
Finally, as done for the axial case, also under constant amplitude cyclic torsion, the negative
inverse slope in the high-cycle fatigue regime can be assumed to be constant (dashed straight
lines in Figure 3b). Under variable amplitude torsion, the curve slope is suggested as being
corrected according to Haibach�s rule [46] (continuous straight lines in Figure 3b), i.e.:
1k2m 00 and 1k2m n0n0 (21)
It is worth observing that, to accurately estimate fatigue curves from the material ultimate
tensile strength, other important factors should be taken into account including size effects,
surface finishing, statistical dispersion, and the role played by corrosion which deserve to be
mentioned explicitly.
Fatigue curves with different probabilities of survival, due to data scatter, can be calculated
[35, 37], with design curves characterised by a probability of survival greater than 97.7%
being recommended for fatigue assessment [41]. However, as the scope of this paper is an
initial understanding of the way multiaxial notch fatigue can affect the lifetime of water pipes
and in the absence of suitable experimental data, all the calculations summarised below will
be performed using fatigue curves estimated for a probability of survival equal to 50%, that is
by adopting the calibration uniaxial and torsional curves derived in the previous paragraphs.
Previous research suggests that size effects in tubular components are only important in the
presence of reference sections having thickness much larger than 10 mm [35, 37]. In light of
the fact that the majority (by length) of standard water pipes generally have thicknesses

Please cite this article as: Brevis , W., Susm e l, L. and Boxall J. B. (2014) Investigating in-service failures of w ater pipes from a m ultiaxial notch fatigue point of view : A conceptual study . Proceedings of the Institution of Mechanical Engineers, Part C: Journal of Mechanical Engineering Science. DOI: 10.1177/0954406214553020
13
which are close to or less than the above reference value, no correction will be adopted in the
quantitative validation exercise discussed in the next sections.
In what follows fatigue lifetime of water pipes will be attempted to be estimated by explicitly
modelling the presence of corrosion pits, treating them as notches. The overall detrimental
effect of the assessed geometrical features will be assumed to prevail over the local effect of
the material roughness at the pit root.
It is well known that for metallic materials corrosion can significantly reduce overall fatigue
strength. This results in fatigue curves that are not only characterised by a lower value of
endurance limit, but also by a lower value of the negative inverse slope [47]. The only reliable
way to quantify the detrimental effect of corrosive environments is by running appropriate
experiments. If this is not possible, fatigue properties can then be attempted to be estimated
from the corroded material ultimate tensile strength by taking full advantage of the practical
rules summarised in the previous paragraphs. Focussing on water distribution pipes, it is
seen from the experiments that the ultimate tensile strength of grey cast iron decreases with
time, the most important detrimental role in the process being played by the weakening
effect of pits [44]. Accordingly, the assumption can be formed that the average value of UTS
for corroded grey cast iron can be taken constant and equal to 180 MPa [10]. Thus the effect
of corrosion on the overall fatigue strength is directly taken into account by assuming that
the pit size increases over time, resulting in a progressive increase of the notch effect.
6 . FUNDAMENTALS OF THE MODIFIED WÖHLER CURVE METHOD
The MWCM is a bi-parametrical multiaxial fatigue criterion which postulates that initiation
and initial propagation of fatigue cracks occur on those material planes of maximum shear
stress amplitude [41, 48, 49].
Consider a pipe subjected to a complex system of time-variable forces that result in a
multiaxial stress state at the assumed critical location (point O in Figure 4a). As soon as the
stress state at the critical location is known, the orientation of the critical plane can be
determined by locating the material plane containing the direction, MV, experiencing the
maximum variance of the resolved shear stress [50, 51] (Figure 4b). The shear stress
amplitude relative to the critical plane, a, can then be determined through the variance of
stress signal MV(t), i.e. [51] (Figure 4c):
)t(Var2 MVa , (22)
where
Please cite this article as: Brevis , W., Susm e l, L. and Boxall J. B. (2014) Investigating in-service failures of w ater pipes from a m ultiaxial notch fatigue point of view : A conceptual study . Proceedings of the Institution of Mechanical Engineers, Part C: Journal of Mechanical Engineering Science. DOI: 10.1177/0954406214553020
14
T
0
MVm dt)t(T
1
T
0
2mMVMV dt)t(
T
1)t(Var
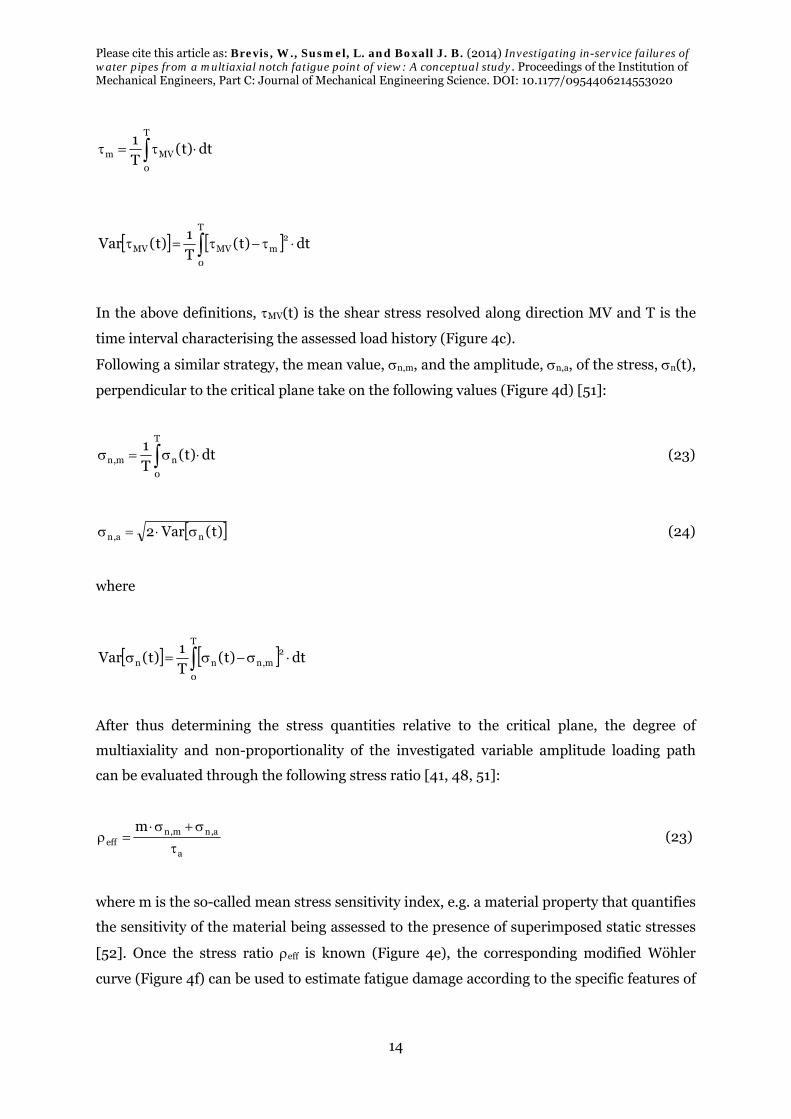
In the above definitions, MV(t) is the shear stress resolved along direction MV and T is the
time interval characterising the assessed load history (Figure 4c).
Following a similar strategy, the mean value, n,m, and the amplitude, n,a, of the stress, n(t),
perpendicular to the critical plane take on the following values (Figure 4d) [51]:
T
0
nm,n dt)t(T
1 (23)
)t(Var2 na,n (24)
where
T
0
2m,nnn dt)t(
T
1)t(Var
After thus determining the stress quantities relative to the critical plane, the degree of
multiaxiality and non-proportionality of the investigated variable amplitude loading path
can be evaluated through the following stress ratio [41, 48, 51]:
a
a,nm,neff
m
(23)
where m is the so-called mean stress sensitivity index, e.g. a material property that quantifies
the sensitivity of the material being assessed to the presence of superimposed static stresses
[52]. Once the stress ratio eff is known (Figure 4e), the corresponding modified Wöhler
curve (Figure 4f) can be used to estimate fatigue damage according to the specific features of

Please cite this article as: Brevis , W., Susm e l, L. and Boxall J. B. (2014) Investigating in-service failures of w ater pipes from a m ultiaxial notch fatigue point of view : A conceptual study . Proceedings of the Institution of Mechanical Engineers, Part C: Journal of Mechanical Engineering Science. DOI: 10.1177/0954406214553020
15
the assessed load history. The modified curve has negative inverse slope, k, and amplitude of
the reference shear stress amplitude (at NA cycles to failure) equal, respectively, to [51]:
0eff0eff kkkk (24)
AeffAA
efffRe,A2
, (25)
the meaning of the quantities used to calibrate such functions being explained in Figure 3.
By comparing the conventional stress-life diagrams of Figure 3 to the modified Wöhler
diagram sketched in Figure 4f, it is easy to observe that, in the latter case, multiaxial fatigue
strength is summarised in a log-log chart plotting the shear stress amplitude relative to the
critical plane, a, against the number of cycles to failure, Nf. This non-conventional
schematisation allows the degree of multiaxiality and non-proportionality of the assessed
load history to be directly taken into account when estimating fatigue damage [41, 48].
It is worth observing that to effectively handle situations characterised by values of ratio eff
larger than lim, the reference shear stress and the negative inverse slope are taken as
constant and equal to A,Ref(lim) and k(lim), respectively, where [41, 49, 52]:
AA
Alim
2
(26)
Another important aspect is that under variable amplitude fatigue loading, to correctly take
into account the damaging effect of those cycles of low stress amplitude, the negative inverse
slope of the modified Wöhler curves can be assumed to change in the high-cycle fatigue
regime. Therefore, as done under uniaxial loading [46], Eq. (15), for Nf larger than Nkp the
negative inverse slope is suggested as being recalculated as follows (see Figure 4f):
1k2m effeff (27)
For in-field usage of the MWCM, the resolved shear stress cycles can now be accounted for
by taking full advantage of the classical Rain-Flow method [53] (Figs 4c and 4g), where the
determined load spectrum (Fig. 4h) is subsequently used to evaluate the damage content
characterising any counted shear stress cycle (Figs. 4h and 4f). Finally, the number of cycles
to failure can directly be estimated by making use of the classical linear rule devised by
Palmgren [54] and Miner [55], i.e.:

Please cite this article as: Brevis , W., Susm e l, L. and Boxall J. B. (2014) Investigating in-service failures of w ater pipes from a m ultiaxial notch fatigue point of view : A conceptual study . Proceedings of the Institution of Mechanical Engineers, Part C: Journal of Mechanical Engineering Science. DOI: 10.1177/0954406214553020
16
j
1i i,f
i
N
nD
j
1i
icr
e,f nD
DN (28)
Theory as formalised in Refs [54, 55] takes as its starting point the assumption that fatigue
failures under variable amplitude load histories take place as soon as the critical damage sum
equals unity, e.g., Dcr=1 in Eq. (28). However, experimental evidence suggests that Dcr occurs
in the range 0.02-5, with an average value equal to 0.27 for steel and to 0.37 for aluminium
[56]. The presence of a corrosive environment has been found to result in a further reduction
of the critical value [57]. In what follows, when attempting to use the MWCM to estimate
lifetime of water pipes, all the variable amplitude calculations will be performed by taking Dcr
equal to 0.2 [58]
The methodology reviewed above can also be used to perform multiaxial fatigue assessment
of engineering materials containing notches [41]. In such circumstances, the MWCM can be
applied by following two alternative strategies, i.e., either by performing the stress analysis
in terms of nominal stresses [39, 51, 59], or by determining the critical stress state according
to the Theory of Critical Distances [60-63]. Owing to its simplicity, the nominal stress based
strategy will then be adopted in the next Sections to perform the failure analysis of grey cast
iron water pipes. The MWCM can also be employed to estimate fatigue lifetime under
constant amplitude fatigue loading [41, 49], such a situation being just a simple sub-case of
the more complex variable amplitude multiaxial fatigue problem considered in the present
section.
7. SENSITIVITY ANALYSIS
Due to its particular features, the MWCM seems to be an appropriate multiaxial fatigue
criterion to use to estimate the lifetime of grey cast iron water pipes subjected to cyclic in-
service loading. However, before formalising a failure analysis methodology based on such a
method, its sensitivity to the different stress components that can result in the ultimate
breakage of water pipes is conducted. This will be undertaken considering grey cast iron
water pipe with flake graphite having an ultimate tensile strength, UTS, equal to 180 MPa,
corresponding uniaxial and torsional plain fatigue curves being those estimated according to
the reasoning summarised in Section 5. In order to properly use the MWCM, two other
material properties have to be estimated, the limit value of ratio eff and the mean stress
sensitivity index. According to definition (26), for the grey cast iron under investigation, lim
takes on the following value:

Please cite this article as: Brevis , W., Susm e l, L. and Boxall J. B. (2014) Investigating in-service failures of w ater pipes from a m ultiaxial notch fatigue point of view : A conceptual study . Proceedings of the Institution of Mechanical Engineers, Part C: Journal of Mechanical Engineering Science. DOI: 10.1177/0954406214553020
17
34.165522
52
2 AA
Alim
(29)
The mean stress sensitivity index, it can be calculated through the following explicit formula
[41]:
*a
*a,n
AA
*aA
*m,n
*a
22m (30)
where *a , *
m,n and *a,n are the critical plane stress components referred to an endurance
limit condition determined experimentally under non-zero mean stresses [52]. Since the
necessary endurance limit is not available, it can be estimated under a load ratio
(R=min/max) equal to zero according to the classical relationship after Goodman [41], i.e.:
UTS
AA
UTS
mA0R,A 11 41.5 MPa
Under axial cyclic loading with a superimposed static stress resulting in an R ratio invariably
equal to zero, the stress quantities relative to the critical plane can be determined as follows
[41]:
2
0R,A*a,n
*a 20.8 MPa;
2
0R,A*m,n 20.8 MPa
The above values together with Eq. (30) result in a mean stress sensitivity index of 0.6. Given
a load history, this value for m can then be used to estimate, according to definition (23), the
stress ratio relative to the critical plane, eff.
Consider a nominal 6� diameter pipe having (approximately) an external radius, re, of 75 mm
and an internal radius, ri, of 65 mm, resulting in a wall thickness, th, of 10 mm (Fig. 2a). Such
a pipe may be assumed to be constrained axially, so that, under internal/external pressure,
the axial stress can be determined according to Eq. (6), with =0.25. Initially, such a pipe is
assumed to be subjected to an internal pressure, pi(t), which varies sinusoidally, i.e.:
tf2pp)t(p ia,im,ii (31)
Please cite this article as: Brevis , W., Susm e l, L. and Boxall J. B. (2014) Investigating in-service failures of w ater pipes from a m ultiaxial notch fatigue point of view : A conceptual study . Proceedings of the Institution of Mechanical Engineers, Part C: Journal of Mechanical Engineering Science. DOI: 10.1177/0954406214553020
18
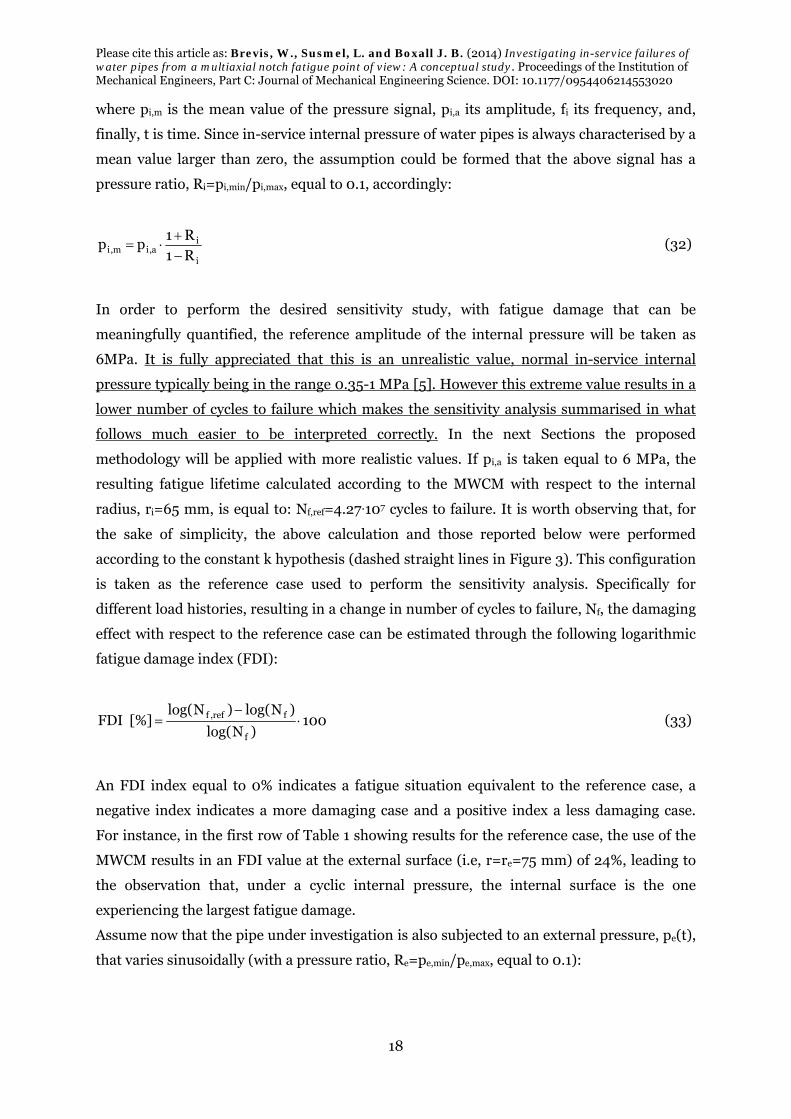
where pi,m is the mean value of the pressure signal, pi,a its amplitude, fi its frequency, and,
finally, t is time. Since in-service internal pressure of water pipes is always characterised by a
mean value larger than zero, the assumption could be formed that the above signal has a
pressure ratio, Ri=pi,min/pi,max, equal to 0.1, accordingly:
i
ia,im,i
R1
R1pp
(32)
In order to perform the desired sensitivity study, with fatigue damage that can be
meaningfully quantified, the reference amplitude of the internal pressure will be taken as
6MPa. It is fully appreciated that this is an unrealistic value, normal in-service internal
pressure typically being in the range 0.35-1 MPa [5]. However this extreme value results in a
lower number of cycles to failure which makes the sensitivity analysis summarised in what
follows much easier to be interpreted correctly. In the next Sections the proposed
methodology will be applied with more realistic values. If pi,a is taken equal to 6 MPa, the
resulting fatigue lifetime calculated according to the MWCM with respect to the internal
radius, ri=65 mm, is equal to: Nf,ref=4.27·107 cycles to failure. It is worth observing that, for
the sake of simplicity, the above calculation and those reported below were performed
according to the constant k hypothesis (dashed straight lines in Figure 3). This configuration
is taken as the reference case used to perform the sensitivity analysis. Specifically for
different load histories, resulting in a change in number of cycles to failure, Nf, the damaging
effect with respect to the reference case can be estimated through the following logarithmic
fatigue damage index (FDI):
100)Nlog(
)Nlog()Nlog([%]FDI
f
fref,f
(33)
An FDI index equal to 0% indicates a fatigue situation equivalent to the reference case, a
negative index indicates a more damaging case and a positive index a less damaging case.
For instance, in the first row of Table 1 showing results for the reference case, the use of the
MWCM results in an FDI value at the external surface (i.e, r=re=75 mm) of 24%, leading to
the observation that, under a cyclic internal pressure, the internal surface is the one
experiencing the largest fatigue damage.
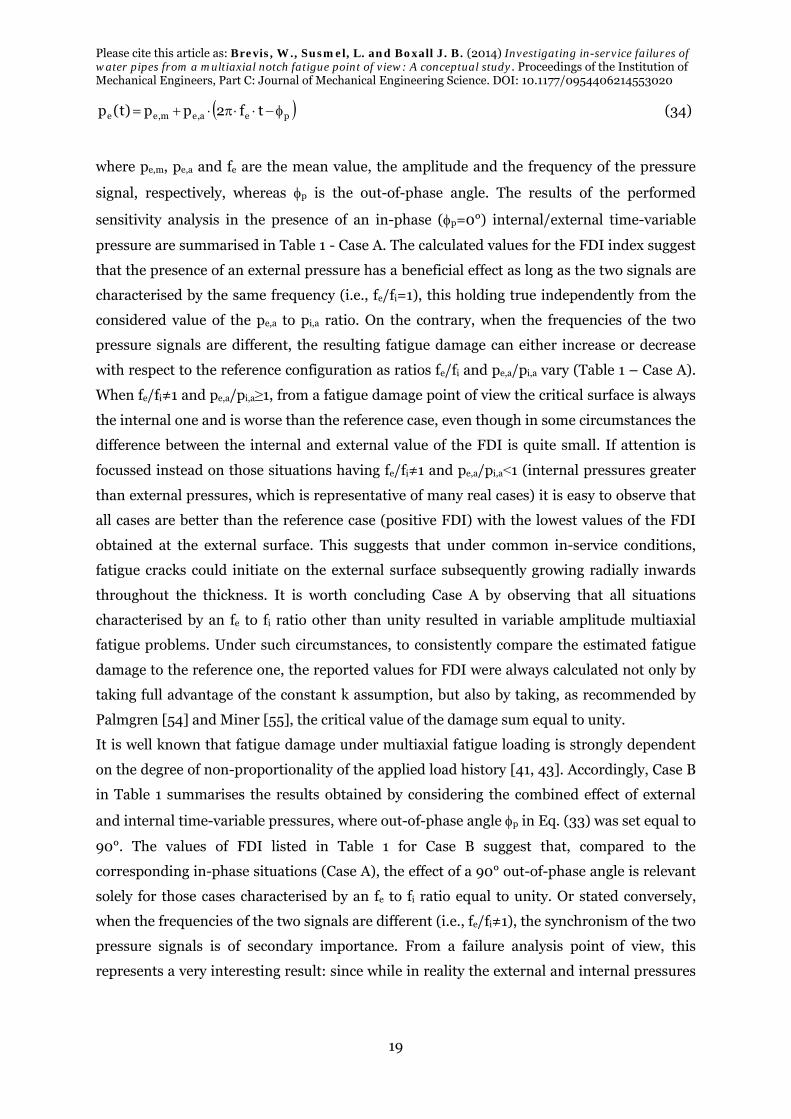
Assume now that the pipe under investigation is also subjected to an external pressure, pe(t),
that varies sinusoidally (with a pressure ratio, Re=pe,min/pe,max, equal to 0.1):
Please cite this article as: Brevis , W., Susm e l, L. and Boxall J. B. (2014) Investigating in-service failures of w ater pipes from a m ultiaxial notch fatigue point of view : A conceptual study . Proceedings of the Institution of Mechanical Engineers, Part C: Journal of Mechanical Engineering Science. DOI: 10.1177/0954406214553020
19
pea,em,ee tf2pp)t(p (34)
where pe,m, pe,a and fe are the mean value, the amplitude and the frequency of the pressure
signal, respectively, whereas p is the out-of-phase angle. The results of the performed
sensitivity analysis in the presence of an in-phase (p=0°) internal/external time-variable
pressure are summarised in Table 1 - Case A. The calculated values for the FDI index suggest
that the presence of an external pressure has a beneficial effect as long as the two signals are
characterised by the same frequency (i.e., fe/fi=1), this holding true independently from the
considered value of the pe,a to pi,a ratio. On the contrary, when the frequencies of the two
pressure signals are different, the resulting fatigue damage can either increase or decrease
with respect to the reference configuration as ratios fe/fi and pe,a/pi,a vary (Table 1 � Case A).
When fe/fi≠1 and pe,a/pi,a≥1, from a fatigue damage point of view the critical surface is always
the internal one and is worse than the reference case, even though in some circumstances the
difference between the internal and external value of the FDI is quite small. If attention is
focussed instead on those situations having fe/fi≠1 and pe,a/pi,a<1 (internal pressures greater
than external pressures, which is representative of many real cases) it is easy to observe that
all cases are better than the reference case (positive FDI) with the lowest values of the FDI
obtained at the external surface. This suggests that under common in-service conditions,
fatigue cracks could initiate on the external surface subsequently growing radially inwards
throughout the thickness. It is worth concluding Case A by observing that all situations
characterised by an fe to fi ratio other than unity resulted in variable amplitude multiaxial
fatigue problems. Under such circumstances, to consistently compare the estimated fatigue
damage to the reference one, the reported values for FDI were always calculated not only by
taking full advantage of the constant k assumption, but also by taking, as recommended by
Palmgren [54] and Miner [55], the critical value of the damage sum equal to unity.
It is well known that fatigue damage under multiaxial fatigue loading is strongly dependent
on the degree of non-proportionality of the applied load history [41, 43]. Accordingly, Case B
in Table 1 summarises the results obtained by considering the combined effect of external
and internal time-variable pressures, where out-of-phase angle p in Eq. (33) was set equal to
90°. The values of FDI listed in Table 1 for Case B suggest that, compared to the
corresponding in-phase situations (Case A), the effect of a 90° out-of-phase angle is relevant
solely for those cases characterised by an fe to fi ratio equal to unity. Or stated conversely,
when the frequencies of the two signals are different (i.e., fe/fi≠1), the synchronism of the two
pressure signals is of secondary importance. From a failure analysis point of view, this
represents a very interesting result: since while in reality the external and internal pressures

Please cite this article as: Brevis , W., Susm e l, L. and Boxall J. B. (2014) Investigating in-service failures of w ater pipes from a m ultiaxial notch fatigue point of view : A conceptual study . Proceedings of the Institution of Mechanical Engineers, Part C: Journal of Mechanical Engineering Science. DOI: 10.1177/0954406214553020
20
are characterised by different frequencies, accurate fatigue estimates can be obtained
without the need for rigorously synchronising their acquisition.
As briefly stated in Section 2, the loadings experienced by water pipes during in-service
operation can be subdivided into two categories, i.e., (i) quasi-static and (ii) time-variable
forces/moments. We characterised quasi-static situations as events occurring a few times per
year and time-variable ones as events occurring several times per day or even more
frequently (multiple times per second) [9, 10]. Accordingly, the hypothesis can be formed
that quasi-static events can be treated as time-independent loadings/moments resulting in
both bending, b, axial, ax, and torsional, t, static stresses. Cases C, D and E reported in
Table 1 shows that, when superimposed on a cyclic internal pressure, the presence of the
above stress components does not result in any increase of the overall fatigue damage
(compared to the fatigue damage extent characterising the reference configuration). Finally,
Case F (Table 1) shows that the above consideration, no additional fatigue damage due to
quasi-static loading, applies also to those situations involving all the static stresses, internal
and external time-variable pressures.
The last sensitivity analysis discussed in the present section is summarised in Table 2 (Case
G) and was carried out considering a grey cast iron pipe containing an external
hemispherical pit (Figure 2g) with a root radius of 2.5 mm resulting in a Kt value of 2.23 (see
Figure 1a, where ri=65 mm and re=72.5 mm). By taking full advantage of the strategy
summarised in Section 5, the adopted notch calibration curves were then as follows (see
Figure 2):
Fully-reversed axial notch curve: An=41.5 MPa (Kf=1.57); S=135 MPa; k=9.2
Fully-reversed torsional notch curve: An=23.6 MPa; S=210 MPa; k=5.0
resulting in a lim value equal to [41]:
14.45.416.232
6.23
2 AnAn
Anlim
(35)
According to the results summarised in Table 1 and determined in the absence of pits, the
notch analysis was then carried out, at the pit tip, by considering solely the combined effect
of an internal/external pressure signal. Table 2 clearly shows that the presence of a stress
concentration phenomenon resulted, as expected, in an evident increase of the fatigue
damage extent compared to the corresponding un-notched situations reported in Table 1.

Please cite this article as: Brevis , W., Susm e l, L. and Boxall J. B. (2014) Investigating in-service failures of w ater pipes from a m ultiaxial notch fatigue point of view : A conceptual study . Proceedings of the Institution of Mechanical Engineers, Part C: Journal of Mechanical Engineering Science. DOI: 10.1177/0954406214553020
21
In conclusion, the most important outcomes of this sensitivity analysis can be summarised as
follows:
1) from a fatigue damage point of view, the effect of the quasi-static loadings/moments
to which pipes are subjected during in-service operations can be neglected with little
loss of accuracy; it should be noted that ultimate �failure� may still be due to quasi-
static stresses, such as the commonly speculated bending stresses induced by ground
movement during freeze/thaw cycles, but that these stresses are not significant in the
long term fatigue damage;
2) the overall fatigue damage in water pipes depends mainly on the internal as well as
on the external time-variable pressures, rather than any combination of quasi-static
loading;
3) the relative frequency of the internal and external pressure signals strongly affects
the resulting fatigue damage;
4) the degree of non-proportionality of the two pressure signals has a negligible effect
on the overall fatigue damage, provided that, the two pressure signals are
characterised by different frequencies. In reality these pressures are characterised by
different frequencies, hence accurate fatigue estimates can be obtained without the
need for rigorous synchronisation of internal and external pressure data acquisition;
5) under common in-service conditions, fatigue cracks could initiate on the external
pipe surface subsequently growing radially inwards throughout the wall thickness
6) the presence of pits has a detrimental effect on the overall fatigue strength of water
pipes, remarkably reducing their lifetime.
8 . TOWARDS A REALISTIC FATIGUE FAILURE ANALYSIS
The sensitivity study suggests that the most important roles in the fatigue process of water
distribution pipes are played by: the dynamic internal and external pressures, and their
interaction; and surface defects such as notches or corrosion pits. From this, fatigue damage
and hence lifetime can be estimated by following an incremental approach taking into
account: possible variations over the years of the profiles of the load spectra; dynamic
internal and external pressures; and both the increasing damaging effect of corrosion pits
and the progressive reduction in the wall thickness.
The methodology proposed in the present paper to address the intractable problem of
estimate pipe lifetime due to fatigue damage is summarised in Figure 5, where fatigue
damage is assumed to be estimated at the i-th year of service (Fig. 5a). The proposed
incremental approach may be described by the following stages:

Please cite this article as: Brevis , W., Susm e l, L. and Boxall J. B. (2014) Investigating in-service failures of w ater pipes from a m ultiaxial notch fatigue point of view : A conceptual study . Proceedings of the Institution of Mechanical Engineers, Part C: Journal of Mechanical Engineering Science. DOI: 10.1177/0954406214553020
22
1. According to the specific conditions being investigated (Fig. 5b), the relevant
pressures/forces/moments have to be evaluated over a representative period of time
(Figs 5c and 5d).
2. After determining the input stress signals, the geometrical characteristics of surface
defects (such as pit depth and tip radius) in the i-th year should be estimated (Fig.
5e). Necessary information could be either determined experimentally, from in-situ
inspection, or for corrosion derived from past empirical evidence as presented in
Figure 1.
3. Given the aspect ratio of the pits, the corresponding Fatigue Strength Reduction
Factor, Kf, can be estimated (Fig. 5f) either experimentally or by taking full advantage
of the existing empirical relationships, for instance Eq. (3).
4. By so doing, the notch fatigue curves to be used to calibrate the MWCM can be
derived from the corresponding plain ones (Fig. 5g).
5. After calibrating the MWCM, the procedure summarised in Figure 4 allows the
number of cycles to failure, Nf,i, to be directly estimated through the investigated load
history (Figs 5h and 5i).
6. Finally, the fatigue damage extent associated with the i-th year of service can be
directly evaluated according to the following classical formula [55] (Fig. 5k):
i,f
iiy
N
nD , (36)
ni being the applied number of cycles during the i-th year of service, whereas Nf,i is
the number of cycles which would result in the fatigue breakage under the
investigated load history.
The procedure summarised in Figure 5 can be applied to estimate fatigue damage year by
year, where the number of years to failure, Yf, can directly be predicted through the following
linear relationship [56]:
cr
Y
1i i,f
iY
1i
iytot DN
nDD
ff
(37)
where Dcr is the critical value of the damage sum as defined in Section 6. It should be noted
that the value of Dcr is uncertain, with very little evidence derived from or directly applicable
to water distribution infrastructure. Data collection and/or physical experimentation to
determine applicable values of Dcr are highly desirable.
Please cite this article as: Brevis , W., Susm e l, L. and Boxall J. B. (2014) Investigating in-service failures of w ater pipes from a m ultiaxial notch fatigue point of view : A conceptual study . Proceedings of the Institution of Mechanical Engineers, Part C: Journal of Mechanical Engineering Science. DOI: 10.1177/0954406214553020
23
It is worth observing that the procedure summarised in Figure 5 can be applied both by
estimating the necessary pieces of information (as discussed in the previous Sections) or by
running appropriate experiments. Further, since the proposed methodology is based on an
incremental calculation, the temporal development of all the involved variables can easily
and directly be taken into account. For instance, in the case of a water pipe buried under a
road, fatigue damage estimated could include the effect of a gradual increment of the traffic
volume.
To conclude the proposed approach can be used to estimate the number of years required to
generate a through thickness crack. While the pipe has technically failed at this point, and
will certainly be contributing to leakage, it may still have useful life particularly under the
auspice of the �economic level of leakage� as used in England and Wales. The further
development of this initial breach through to unacceptable performance or ultimate
catastrophic burst failure could be estimated by coupling the current method with ones
based on the LEFM concepts (see, for instance, Ref. [10] and references reported therein).
9 . SOME REALISTIC EXAMPLES
This section reports results obtained when applying the methodology summarised in Figure
5 to some practically realistic situations by considering the parameter variables listed in
Table 3, three different cast iron pipes are considered Class A 6�, 3� and 15�. Before
contemplating the calculations performed, it is worth observing that water pipes have only
been conclusively shown to fail solely due to fatigue when exposed to particular in-service
conditions [10, 15, 16]. Accordingly, the scenarios considered in what follows are
characterised by large peaks of the applied loadings, greater than those which are thought to
be experienced by pipes during normal service. Further, for the reasons discussed in Section
6, the critical vale of the damage sum, Dcr, was taken as 0.2 for all validation case, even
though in the presence of corrosive environments this definitively represents an optimistic
assumption [58].
Consider the water pipe sketched in Figure 5b assumed to be buried under a road, so that,
vehicles� wheels results in a cyclic external pressure, pe(t), and subjected to an internal time-
variable pressure pi(t). Figure 6 shows the load spectra adopted to generate the daily load
histories. The external pressure resulting from the traffic was described through spectrum
Road_SP which contains 500 cycles per day. The spectrum was built by considering a heavy
traffic road, where time-variable pressure signal pe(t) was assumed to be the average result of
the transit of 10 vehicles per hour. The daily variation of the internal pressure was described
through two different load spectra each containing 1000 cycles. A concave upwards spectrum
pi_CUS was determined by considering a conventional Rayleigh distribution [64], whereas a
concave downwards spectrum pi_CDS was derived from those usually employed to

Please cite this article as: Brevis , W., Susm e l, L. and Boxall J. B. (2014) Investigating in-service failures of w ater pipes from a m ultiaxial notch fatigue point of view : A conceptual study . Proceedings of the Institution of Mechanical Engineers, Part C: Journal of Mechanical Engineering Science. DOI: 10.1177/0954406214553020
24
investigate the damaging effect of cycles of low stress amplitude [65]. In the present
validation exercise, spectra pi_CUS and pi_CDS were assumed to summarise two appreciably
different, but potentially realistic daily variations of the internal pressure that are significant
from a fatigue damage point of view. However, this is a poorly documented area with most
pressure data from distribution systems only being available as 15 minute instantaneous
values. To model the presence of non-zero mean stresses, these spectra were applied by
setting pressure ratios Ri=pi,min/pi,max and Re=pe,min/pe,max equal to 0.1. Experiments have
shown that the pressure applied to asphalt by a heavy lorry is of the order of 1 MPa [66].
Taking this to represent an extreme value, the maximum external pressure can be calculated
in order to run specific calculations, i.e. Case F in Table 3. For the other scenarios maximum
pressure pe,max was instead taken equal to 0.5 MPa, where such a value was estimated by
modelling the mitigating effect of the soil through the classical equation due to Boussinesq
[67]. The maximum value of the internal pressure, pi,max, was initially taken as 1.8 MPa, that
is, as large as the maximum pressure which was adopted in Ref. [16] to explain the
anomalous increase in blowouts to which the city of Los Angeles was exposed during
Summer 2009. Since this value was much larger than the usual ones observed during the in-
service operations of conventional water pipes [5], a number of predictions were also made
under pi,max=1 MPa. While 1MPa is still a large value, it is believably realistically of short
duration pressures experienced within water distribution systems under transient hydraulic
conditions, such as due to pump failures. Corrosive effect of the soil were considered for the
two situations summarised in Figure 1b, the adopted pit depth vs. time relationship being the
exponential one proposed by Rajani and c0-workers [24], Eq. (1). According to such a
corrosion law, pits were assumed to initiate on the external surface of the pipe to
subsequently grow inwards throughout the thickness. Accordingly, all the calculations were
performed by determining the nominal net stress at the pit tip (i.e., for r=re in Figure 2g).
Finally, as sketched in Figure 1c, pits were assumed to have either an hyperbolic (Kt=3.4) or
an hemispherical (Kt=2.23) shape.
Initially our methodology was applied to model Case A and B, different external corrosion pit
shape and hence stress concentration factor (see Table 3). The two Dtot vs. time curves
plotted in the chart of Figure 7a show that the shape of the pit did affect the estimated
lifetime of the pipe, lifetime for Case A being slightly shorter than the one calculated for Case
B. The fact that the difference between the two estimated values for Yf is not so pronounced
can be ascribed to the fact that, given the pit profile, Kt was kept constant and equal to the
one suggested in Ref. [39]. On the contrary, if the Kt value had been calculated rigorously
(for instance, by doing refined finite element models), one would have discovered that, given
the gross thickness, Kt increases almost exponentially as the notch grows into the pipe wall.
However, in spite of such a simplifying hypothesis, the characteristics of Figure 7a makes it

Please cite this article as: Brevis , W., Susm e l, L. and Boxall J. B. (2014) Investigating in-service failures of w ater pipes from a m ultiaxial notch fatigue point of view : A conceptual study . Proceedings of the Institution of Mechanical Engineers, Part C: Journal of Mechanical Engineering Science. DOI: 10.1177/0954406214553020
25
evident that our methodology is fully sensitive, through stress concentration factor Kt, to the
aspect ratio of the modelled pit. Lastly, it is worth noticing that, independently from the pit
geometry, our fatigue model predicted a remarkable reduction in the lifetime of the pipes
compared to the number of years resulting in a conventional blowout breakage (i.e., the
number of years taken for a through-thickness pit to grow).
The sensitivity of our method to the profile of the internal load spectrum may be observed by
comparing Case C with CDS profile (Yf=49 years) plotted in Figure 7b to Case A with CUS
profile (Yf=39 years) shown in Figure 7a. From this it is apparent that our methodology is
fully sensitive to the profile of the adopted load spectrum. Despite the maximum pressure
being constant, spectrum CDS was less damaging than spectrum CUS due to the cumulative
stress effects and Case C resulted in a longer fatigue lifetime.
Case D, reported in Figure 7b, considers the presence of a very aggressive corrosion
environment. The result shows that the pit growth rate can prevail over the yearly increase of
fatigue damage, with little difference between blowout breakage lifetime and fatigue lifetime.
In such a situation, from a structural integrity point of view, fatigue does not represent an
issue.
Case E considers a reduction in the peak internal pressure and then Case F an increase in the
peak external pressure, with results shown in Figure 7c. Comparing the curves for cases A
and E it can be seen that the increase in estimated lifetime is only from 39 to 48, despite the
reduction in peak internal loading from 1.8 to 1 MPa. Comparing curves for cases E and F it
can then be observed that doubling the external load only reduces the estimated lifetime by 2
years. These curves make it evident that our approach is fully sensitive to the absolute
magnitude of the internal and external pressures, with the number of years to fatigue failure,
Yf, being in both cases lower than the ones taken for the pit to grow throughout the wall
thickness. Interestingly our methodology seems to predict a greater sensitivity to internal
than external loads for the peak values considered here.
The effect of changing pipe diameter can be considered by comparing Cases G (Fig. 7d, 3�,
33yrs) and I (Fig. 7e, 65yrs) to Case A (Fig. 7a, 6�, 39yrs). From this it can be observed that,
as it should be, the fatigue lifetime estimated by our method depends on the absolute
dimension of the assessed pipe. It is interesting to note that while close to a linear trend with
diameter the trend for fatigue life is a perfect (R2 regression fit of 1.00) fit to an exponential
trend. This is in agreement with statistical cohort modelling, previously associated with
cross sectional moment of area and ability to resist loading and in particular bending
stresses [3].
Finally according to the Dtot vs. time curves reported in Figure 7, fatigue damage starts
playing a crucial role as soon as the wall thickness is reduced due to the presence of the pits
by about 70%. The validity of this important outcome is fully supported by the detailed
Please cite this article as: Brevis , W., Susm e l, L. and Boxall J. B. (2014) Investigating in-service failures of w ater pipes from a m ultiaxial notch fatigue point of view : A conceptual study . Proceedings of the Institution of Mechanical Engineers, Part C: Journal of Mechanical Engineering Science. DOI: 10.1177/0954406214553020
26
investigations reported in Ref. [16]. In particular, during Summer 2009 the number of
failures in Los Angeles was seen to increase as a consequence of two concomitant events: a
drastic reduction of the thickness due to physiological corrosion (from about 10 mm down to
3 mm in the example explicitly discussed in Ref. [16]) and a daily unusual cyclic increase of
the internal pressure due to water rationing.
10 . CONCLUSIONS
1) The proposed multiaxial notch fatigue approach is seen to be sensitive to:
the size of the pipe;
the material of which the pipe is made;
the size, the profile, and the growth rate of the corrosion pits;
the profile as well as the degree of multiaxiality and non-proportionality of the
applied load history.
2) Such an approach can be used to accurately predict in-service lifetime of water pipes
susceptible to fatigue.
3) The devised method is a powerful tool to manage the maintenance of and investment in
water distribution systems.
4) More works needs to be done in this area to properly quantify and efficiently standardise
all the involved variables.
REFERENCES
[1] Skipworth P, Engelhardt M, Cashman A, Savic D, Saul A, Walters G. Whole life costing for water distribution network management. Thomas Telford Publishing, London, ISBN 0727731661, 2002.
[2] Boxall JB, O�Hagan A, Pooladsaz S, Saul AJ, Unwin DM. Pipe level estimation of burst rates in water distribution mains. In: Proc. of �8th Conference on Computing and Control for the Water Industry: Water Management for the 21st Century�, 5-7 September 2005, Exeter, UK.
[3] Boxall JB, O�Hagan A, Pooladsaz S, Saul AJ, Unwin DM. Estimation of burst rates in water distribution mains. In: Proceedings of the Institution of Civil Engineers Water Management 2007; 160(WM2):73-82.
[4] Boxall JB, O'Hagan A, Pooladsaz S, Saul AJ, Unwin DM. Estimation of burst rates in water distribution mains. Water Management 2007:160:73-82.
[5] Rajani B, Tesfamariam S. Estimating time to failure of ageing cast iron water mains under uncertainties. In: In: Proc. of �8th Conference on Computing and Control in the Water Industry: Water Management for the 21st Century�, 5-7 September 2005, Exeter, UK, pp. 1-7.
[6] Kleiner Y, Balvant R. Comprehensive review of structural deterioration of water mains: statistical methods. Urban Water 2001;3:131-150.
[7] Makar, MJ. Failure Analysis for Grey Cast Iron Water Pipes. 1999 AWWA Distribution System Symposium, Reno, Nevada, Sept. 19-21, 1999.

Please cite this article as: Brevis , W., Susm e l, L. and Boxall J. B. (2014) Investigating in-service failures of w ater pipes from a m ultiaxial notch fatigue point of view : A conceptual study . Proceedings of the Institution of Mechanical Engineers, Part C: Journal of Mechanical Engineering Science. DOI: 10.1177/0954406214553020
27
[8] Makar, MJ. A preliminary analysis of failures in grey cast iron water pipes. Engineering Failure Analysis 2000; 7(1):43-53.
[9] Rajani B, Zhan C, Kuraoka S. Pipe-soil interaction analysis of jointed water mains. Canadian Geotechnical Journal 1966; 33(3):393-404.
[10] Rajani BB, Kleiner Y. Fatigue failure of large-diameter cast iron mains. Water Distribution System Analysis 2010 - WDSA2010, Tucson, AZ, USA, September 12-15, 2010, pp. 1-13.
[11] Makar JM, McDonald SE. The Mechanical Behaviour of Spun-cast Grey Iron Pipe. Journal of Materials in Civil Engineering 2007; 19(10): 826-833.
[12] Makar JM, Rajani B. Grey Cast Iron Water Pipe Metallurgy. Journal of Materials in Civil Engineering, 200;12(3):245-253.
[13] Makar JM; Desnoyers R, McDonald SE. Failure modes and mechanisms in gray cast iron pipe. Underground Infrastructure Research: Municipal, Industrial and Environmental Applications, Proceedings, Kitchener, Ontario, June 10-13, 2001, pp. 1-10.
[14] Kleiner Y, Sadiq R, Rajani B. Modeling Failure Risk in Buried Pipes Using Fuzzy Markov Deterioration Process. ASCE International Conference on Pipeline Engineeringand Construction, San Diego, August 2-4, 2004.
[15] Mohebbi H, Jesson DA, Mulheron MJ, Smith PA. Characterisation of the fatigue properties of cast irons used in the water industry and the effect on pipe strength and performance. Journal of Physics: Conference Series 2009; 181; 012039.
[16] Bardet JP, Ballantyne D, Bell GEC, Donnellan A, Foster S, Fu TS, List J, Little RG, O�Rourke TD, Palmer MC. Expert Review of Water System Pipeline Breaks in the City of Los Angeles during Summer 2009. Report to the Steering Committee on Water Pipeline Breaks of the City of Los Angeles. April 9, 2010.
[17] Anderson TL. Fracture mechanics: Fundamentals and applications. Boca Raton, CRC Press, 1995.
[18] Rajani B, Makar J. A methodology to estimate remaining service life of grey cast iron water mains. Canadian Journal of Civil Engineering 2000; 27: 1259�1272.
[19] Mohebbi M, Li CQ. Experimental Investigation on Corrosion of Cast Iron Pipes. International Journal of Corrosion, Article ID: 506501, 2011.
[20] Makar JM, Desnoyers R. Three Dimensional Mapping of Corrosion Pits in Cast Iron Pipe Using the Remote Field Effect. Underground Infrastructure Research: Municipal, Industrial and Environmental Applications, Proceedings, Kitchener, Ontario, June 10-13, 2001, pp. 1-10.
[21] Ahammed M, Melchers RE. Reliability of underground pipelines subject to corrosion. Journal of Transportation Engineering, ASCE 1994; 120(6):989-1002.
[22] Shreir LL. Corrosion. John Wiley & Sons, Inc., New York, 1963
[23] LaQue FL. The Corrosion Resistance of Ductile Iron. In Corrosion of Ductile Corrosion of Ductile Iron Piping, Edited by Michael J. Szeliga, NACE International, 1995.
[24] Rajani B, Makar J, McDonald S, Zhan C, Kuraoka S, Jen C-K, Viens, M. Investigation of grey cast iron water mains to develop a methodology for estimating service life. American Water Works Association Research Foundation, Denver, CO, USA, 2000.
[25] Beck TR, Chan SG. Experimental Observations and Analysis of Hydrodynamic Effects on Growth of Small Pits. Corrosion 1981; 37(11):665-671.
[26] Efird KD. Flow effects on corrosion. In Uhlig�s Corrosion Handbook. John Wiley & Sons, 2011.
Please cite this article as: Brevis , W., Susm e l, L. and Boxall J. B. (2014) Investigating in-service failures of w ater pipes from a m ultiaxial notch fatigue point of view : A conceptual study . Proceedings of the Institution of Mechanical Engineers, Part C: Journal of Mechanical Engineering Science. DOI: 10.1177/0954406214553020
28
[27] Wharton JA, Wood RJK. Influence of flow conditions on the corrosion of AISI 304L stainless steel. Wear 2004;256:525�536.
[28] Jimenez J. Cascades in wall-bounded turbulence. Annu. Rev. Fluid Mech. 2012;44:47-45.
[29] Adrian RJ, Marusevic I. Coherent structures in flow over hydraulic engineering surfaces. Journal of Hydraulic Research 2012;50(5):451-464.
[30] Sarohia V. Experimental and Analytical Investigation of Oscillations in Flows Over Cavities, PhD thesis, California Institute of Technology, 1975.
[31] Faure TM, Adrianos P, Lusseyran F, Pastur L. Visualization of the flow inside an open cavity at medium range Reynolds numbers. Experiments in Fluids 2007;42(2):169-184.
[32] Garrison B, Rogers C. An experimental study of enhanced fluid transfer mechanism between a channel and a cavity, Physics of fluids 1994;6:421�423.
[33] Strang E, Fernando H. Shear-induced mixing and transport from a rectangular cavity�, Journal of Fluids Mechanic 2004;520:23�49.
[34] Taniguchi Y, Evans JW. Some measurements of the penetration of turbulence into small cavities. Int. J. Heat Mass Transfer. 1993; 36(4):961-965.
[35] Juvinall RC, Marshek KM. Fundamentals of Machine Component Design. John Wiley & Sons, New York, USA, 1991.
[36] Peterson R E. Notch Sensitivity. In: Metal Fatigue, Edited by G. Sines and J. L. Waisman, McGraw Hill, New York, pp. 293-306, 1959.
[37] Lee Y-L, Pan J, Hathaway RB, Barkey ME. Fatigue Testing and Analysis. Elsevier Butterworth�Heinemann, 2005.
[38] Heywood RE. Designing against fatigue. Chapman and Hall, London, 1962.
[39] Pilkey WD, Pilkey DF. Peterson�s stress concentration factors. John Wiley and Sons, US, 3rd Edition, 2008.
[40] Iurzolla E. Il calcolo dei recipienti in pressione. Cortina, Padova, Italy, 1981.
[41] Susmel L. Multiaxial Notch Fatigue: from nominal to local stress-strain quantities. Woodhead & CRC, Cambridge, UK, 2009.
[42] Wahab MA, Sakano M. Corrosion and biaxial fatigue of welded structures. Journal of Materials Processing Technology 2003;143-144:410�415.
[43] Socie, D. F. , Marquis, G. B. Multiaxial Fatigue, SAE, 2000.
[44] Rajani B. Investigation of Grey Cast Iron Water Mains to Develop a Methodology for Estimating Service Life. AWWA Research Foundation & American Water Work Association, USA, 2000. ISB 1-58321-063-6.
[45] Miller KJ, O�Donnell WJ. The fatigue limit and its elimination. Fatigue & Fracture of Engineering Materials & Structures 1999; 22:545-557.
[46] Haibach, E. Betriebsfestigkeit�Verfahren und Daten zur Bauteilberechnung. VDI-Verlag GmbH, Düsseldorf, Germany, 1989.
[47] Lin C-K, Yang C-H, Wang J-H. Corrosion fatigue of austempered ductile iron. Journal of Materials Science 2003;38(8):1667-1672.
[48] Susmel L, Lazzarin P. A Bi-Parametric Modified Wöhler Curve for High Cycle Multiaxial Fatigue Assessment. Fatigue Fract. Engng. Mater. Struct. 2002;25:63-78.
[49] Lazzarin P, Susmel L. A Stress-Based Method to Predict Lifetime under Multiaxial Fatigue Loadings. Fatigue Fract. Engng. Mater. Struct 2003;26:1171-1187.
Please cite this article as: Brevis , W., Susm e l, L. and Boxall J. B. (2014) Investigating in-service failures of w ater pipes from a m ultiaxial notch fatigue point of view : A conceptual study . Proceedings of the Institution of Mechanical Engineers, Part C: Journal of Mechanical Engineering Science. DOI: 10.1177/0954406214553020
29
[50] Susmel L. A simple and efficient numerical algorithm to determine the orientation of the critical plane in multiaxial fatigue problems. International Journal of Fatigue 2010;32:1875�1883.
[51] Susmel L, Tovo R. Estimating Fatigue Damage under Variable Amplitude Multiaxial Fatigue Loading. Fatigue Fract Engng Mater Struct 2011;34:1053-1077.
[52] Susmel L. Multiaxial Fatigue Limits and Material Sensitivity to Non-Zero Mean Stresses Normal to the Critical Planes. Fatigue Fract Engng Mater Struct 2008;31:295-309.
[53] Matsuishi M, Endo T. Fatigue of metals subjected to varying stress. Presented to the Japan Society of Mechanical Engineers, Fukuoka, Japan, 1968.
[54] Palmgren A. Die Lebensdauer von Kugellagern. Verfahrenstechnik, Berlin, 1924;68:339-341.
[55] Miner MA. Cumulative damage in fatigue. J Appl Mech, 1945, 67, AI59-AI64.
[56] Sonsino CM. Fatigue testing under variable amplitude loading. Int J Fatigue 2007;29 6:1080-1089.
[57] Stephens RI, Fatemi A, Stephens RR, Fuchs HO. Metal Fatigue in Engineering. 2nd Edition, Wiley, New York, USA, 2000.
[58] Schijve J. Fatigue of structures and materials. Kluver, Netherlands, 2001.
[59] Susmel L, Taylor D., Taking full advantage of nominal stresses to design notched components against variable amplitude multiaxial fatigue. Key Engineering Materials 2012;488-489:747-750.
[60] Susmel L, Taylor D. Two methods for predicting the multiaxial fatigue limits of sharp notches. Fatigue Fract. Engng. Mater. Struct. 2003;26:821-833.
[61] Susmel L. A unifying approach to estimate the high-cycle fatigue strength of notched components subjected to both uniaxial and multiaxial cyclic loadings. Fatigue Fract. Engng. Mater. Struct. 2004;27:391-411.
[62] Susmel L. Taylor D. The Modified Wöhler Curve Method applied along with the Theory of Critical Distances to estimate finite life of notched components subjected to complex multiaxial loading paths. Fatigue & Fracture of Engineering Materials & Structures 2008;31 12:1047-1064.
[63] Susmel L, Taylor D. A critical distance/plane method to estimate finite life of notched components under variable amplitude uniaxial/multiaxial fatigue loading. Int J Fatigue 2012;38:7-24.
[64] Susmel L, Taylor D. The Theory of Critical Distances to estimate lifetime of notched components subjected to variable amplitude uniaxial fatigue loading. International Journal of Fatigue 2011;33:900-911.
[65] Gurney T. Cumulative damage of welded joints. Woodhead Publishing, Cambridge, England, 2006.
[66] Kim OK, Bell CA, Wilson JE. Effect on Increased Truck Tire Pressure on Asphalt Concrete Pavement. ASCE Journal of Transportation Engineering 1989;115(4):329-350.
[67] Powrie W. Soil Mechanics: Concepts and Applications. Spon Press, Oxfor, Uk, 2002.