
Investigating dynamics of inhibitory and feedback loops in ERK signalling using power-law models
30
Investigating dynamics of inhibitory and feedback loops in ERK signalling using power-law models Julio Vera 1,&. * , Oliver Rath 2,& , Eva Balsa-Canto 3,& , Julio R. Banga 3 , Walter Kolch 2, 4, 5 and Olaf Wolkenhauer 1 1 Systems Biology and Bioinformatics Group, University of Rostock, 18051 Rostock, Germany 2 The Beatson Institute for Cancer Research, Cancer Research UK Garscube Estate Bearsden, Glasgow G61 1BD, United Kingdom 3 Process Engineering Group, IIM-CSIC, Eduardo Cabello 6, 36208 Vigo, Spain 4 Sir Henry Wellcome Functional Genomics Facility, University of Glasgow Glasgow G12 8QQ, United Kingdom 5 Current address: Systems Biology Ireland, Conway Institute, University College Dublin, Dublin 4, Ireland & These authors made equal contributions Table of content This work emphasizes the role of dynamic modulation of signal inhibitors like RKIP as regulatory mechanisms in ERK signalling * Corresponding author: Julio Vera. Junior Research Group on Systems Biology and Cancer. Chair in Systems Biology and Bioinformatics. Department of Computer Science, University of Rostock. 18051 Rostock, Germany. E-mail: [email protected] Web: www.sbi.uni-rostock.de Tel.: +49 381 498 75 77 Fax: +49 381 498 76 81
Transcript of Investigating dynamics of inhibitory and feedback loops in ERK signalling using power-law models

Investigating dynamics of inhibitory and feedback loops
in ERK signalling using power-law models
Julio Vera1,&. *
, Oliver Rath2,&
, Eva Balsa-Canto3,&
, Julio R.
Banga3, Walter Kolch
2, 4, 5 and Olaf Wolkenhauer
1
1Systems Biology and Bioinformatics Group, University of Rostock, 18051 Rostock, Germany
2The Beatson Institute for Cancer Research, Cancer Research UK Garscube Estate
Bearsden, Glasgow G61 1BD, United Kingdom 3Process Engineering Group, IIM-CSIC, Eduardo Cabello 6, 36208 Vigo, Spain
4Sir Henry Wellcome Functional Genomics Facility, University of Glasgow
Glasgow G12 8QQ, United Kingdom 5Current address: Systems Biology Ireland, Conway Institute, University College Dublin, Dublin 4, Ireland
&These authors made equal contributions
Table of content
This work emphasizes the role of dynamic modulation of signal inhibitors like RKIP as
regulatory mechanisms in ERK signalling
* Corresponding author: Julio Vera. Junior Research Group on Systems Biology and Cancer. Chair in Systems
Biology and Bioinformatics. Department of Computer Science, University of Rostock. 18051 Rostock, Germany.
E-mail: [email protected] Web: www.sbi.uni-rostock.de
Tel.: +49 381 498 75 77 Fax: +49 381 498 76 81
2
Investigating dynamics of inhibitory and feedback loops
in ERK signalling using power-law models
Julio Vera1,&. *
, Oliver Rath2,&
, Eva Balsa-Canto3,&
, Julio R.
Banga3, Walter Kolch
2, 4, 5 and Olaf Wolkenhauer
1
1Systems Biology and Bioinformatics Group, University of Rostock, 18051 Rostock, Germany
2The Beatson Institute for Cancer Research, Cancer Research UK Garscube Estate
Bearsden, Glasgow G61 1BD, United Kingdom 3Process Engineering Group, IIM-CSIC, Eduardo Cabello 6, 36208 Vigo, Spain
4Sir Henry Wellcome Functional Genomics Facility, University of Glasgow
Glasgow G12 8QQ, United Kingdom 5Current address: Systems Biology Ireland, Conway Institute, University College Dublin, Dublin 4, Ireland
&These authors made equal contributions
Abstract
Background. The investigation of the structure and dynamics of signal transduction systems
through data-based mathematical models in ordinary differential equations or other paradigms
has proved to be a successful approach in recent times. Extending this concept, we here analysed
the use of kinetic models based on power-law terms with non-integer kinetic orders in the
validation of hypotheses concerning regulatory structures in signaling systems.
Methods. We integrated pre-existent biological knowledge, hypotheses and experimental
quantitative data into a power-law model to validate the existence of certain regulatory loops in
the Ras/Raf-1/MEK/ERK pathway, a MAPK pathway involved in the transduction of mitogenic
and differentiation signals. Towards this end, samples of a human mammary epithelial cell line
(MCF-10A) were used to obtained time-series data characterising the behaviour of the system
after epidermal growth factor stimulation in different scenarios of expression for the critical
players of the system regarding the investigated loops (e.g., the inhibitory protein RKIP). The
mathematical model was later calibrated using a computational procedure that included: analysis
of structural identifiability; global ranking of parameters to detect the most sensitivity ones
towards the experimental setup; model calibration using global optimization methods to find the
parameter values that better fit the data; and practical identifiability analysis to estimate the
confidence in the estimated values for the parameters. The obtained model was used to perform
computational simulations concerning the role of the investigated regulatory loops in the time
response of the signaling pathway.
Results. Our findings suggest that the special regularity in the structure of the power-law terms
make them suitable for a data-based validation of regulatory loops in signalling pathways. Using
this approach, we could perform a quantitative data based validation of the existence of two
regulatory loops in the pathway. The model-based analysis performed identifed RKIP as an
actual inhibitor of the activation of the ERK pathway, but also suggest the existence of an intense
feedback-loop control of the pathway by the activated ERK that maybe responsible for the
dumped oscillations we see in the fraction of activated MEK both in the experiments and
simulations. In addition, the model analysis suggests that phosphorylation/deactivation of RKIP
during the transient stimulation may have a significant effect on the signalling peaks of both
* Corresponding author: Julio Vera. Junior Research Group on Systems Biology and Cancer. Chair in Systems
Biology and Bioinformatics. Department of Computer Science, University of Rostock. 18051 Rostock, Germany.
E-mail: [email protected] Web: www.sbi.uni-rostock.de
Tel.: +49 381 498 75 77 Fax: +49 381 498 76 81

3
MEK and ERK. This later result suggests that dynamic modulation of signal inhibitors during
stimulation may be a regulatory mechanism in ERK signalling and other pathways.
Introduction
The mammalian MAPK pathways play a crucial role in tumourigenesis [1]. The extracellular
signal regulated (ERK) MAPK pathway transduces many different signals including mitogenic
and differentiation signals that are deregulated in cancer [1]. The ERK pathway is typically
activated by receptor tyrosine kinases, such as the epidermal growth factor receptor (EGFR),
which stimulates a cascade of three kinases, where Raf phosphorylates and activates MEK, and
MEK phosphorylates ERK (Fig. 1). While no other substrates for Raf and MEK are known, ERK
features more than 150 substrates including transcription factors in the nucleus such as Fos and
CREB, which ERK phosphorylates directly or via activation of its substrate RSK [2]. The ERK
pathway features a complex regulation both in terms of temporal activation kinetics and spatial
activity that is still incompletely understood, but coordinated through scaffolds, feedbacks and
crosstalk [3]-[4]. An important regulator of this pathway is the Raf kinase inhibitor protein
(RKIP) [5]. RKIP binds to Raf-1, MEK and ERK, and competitively disrupts the interaction
between Raf-1 and its substrate MEK. As a consequence over-expression of RKIP interferes
with the activation of MEK and ERK while down-regulation of RKIP increases ERK activation
and also resulted in activation of ERK dependent transcription [6].
RKIP function is lost in metastatic breast cancer suggesting that RKIP is a metastasis suppressor
gene [7]. This function may be independent of RKIP’s role in the ERK pathway, and related to
the ability of RKIP to also suppress signalling by the NF B pathway [8]. There is evidence that
RKIP physically interacts with four kinases of the NF B pathway, namely NF B-inducing
kinase (NIK), transforming growth factor beta-activated kinase 1 (TAK1), I B kinases (IKK-
and IKK- , and as a consequence inhibits the phosphorylation of I B by IKKs, which is
required for NF B activation.
In recent years, the analysis of biochemical systems through data-based models in either ordinary
differential equations (ODE, [9],[10]) or other paradigms [11] has emerged as an invaluable tool
to understand the underlying complexity of the protein interactions happening in cellular signal
transduction. Compared to other biochemical systems, the modelling of cell signalling pathways
faces additional difficulties related to the difficulties of quantifying changes in protein
concentrations but also to the lack of complete information about the topology of the considered
network interactions. Contrary to many metabolic systems, where the network structure and its
interactions are often well understood, for cell signalling systems the real structure of the
pathways is usually an open question to be elucidated either in parallel to or through
mathematical modelling [12].
In this context, the flexibility of kinetic models based on power-law equations with non-integer
kinetic orders (see [10] for further details) has been validated in recent times as a tool to
elucidate the structure of biochemical pathways via quantitative data based modelling ([13],[14]).
In our previous work we have suggested that particular power-law formalisms could be a
suitable tool for investigations into the structure and systemic properties of cell signalling
pathways ([15]-[18]). In the present work we show how pre-existent biological knowledge and
quantitative data can be integrated through mathematical modelling, using power-law terms to
validate hypotheses concerning regulatory structures and feedback loops in the Ras/Raf-
1/MEK/ERK pathway.

4
Figure 1. Sketch of the overall structure of the Ras/Raf1/MEK/ERK pathway. The mitogen-activated protein
kinases (MAPK) cascades are a family of signalling pathways composed by three kinases that overcome sequential
activation: StimulusMAPKKKMAPKKMAPKCell response. In case of Ras/Raf1/MEK/ERK pathway, the
MAP kinases are Raf1, MEK and ERK, the latter two getting double phosphorylated during the signal transduction
[1]. Legend: epidermal growth factor, EGF; inactive epidermal growth factor receptor, EGFR; activated epidermal
growth factor receptor, EGFR*; inactive (Grb2/SOS) and activated (Grb2/SOS*) complex Grb2/SOS; inactive
(Raf1) and activated (Raf1*) Raf1; inactive (Ras) and activated (Ras*) Ras; complex Grb2/SOS; inactive (MEK),
single (pMEK) and double phosphorylated (ppMEK) MEK; inactive (ERK), single (pERK) and double
phosphorylated (ppERK); inactive (RSK2) and active (RSK2*) RSK2; inactive and (CREB); and Ser-133
phosphorylated (pCREB) CREB; active (RKIP) and phosphorylated/inactive (pRKIP) RKIP. Lines finished in a
solid black arrow represent phosphorylation or dephosphorylation processes, while lines finished in empty arrow
account for regulatory processes affecting the pointed interaction. Red lines account for inhibitory loops.
1. Material and Methods
1.1. Experimental techniques. In this study, all experiments were performed with MCF-10A, a
spontaneously immortalised, but non-transformed human mammary epithelial cell line [19].
Cells were grown on standard tissue culture plastic in a 5% CO2 humidified incubator at 37°C.
Normal growth medium consisted of DMEM/F12 (Invitrogen) supplemented with 5% horse
serum (Invitrogen), 20 ng/ml epidermal growth factor (Roche), 10 g/ml insulin (Sigma),
0.5 g/ml hydrocortisone (Sigma), 100 ng/ml cholera toxin (BioMol), and a standard supplement
of penicillin/streptomycin (Invitrogen).

5
Transfection of cells. Cells were transfected with 2 µg pcDNA3.1-FLAG-RKIP encoding for
full-length human RKIP or 100 pmol RKIP siRNA (Qiagen) per 1.10
6 cells for manipulation of
the RKIP expression level. For manipulation of the ERK1/2 levels, cells were either transfected
with 1 µg of each pDEST/N-SF-TAP-puro-ERK1 and pDEST/N-SF-TAP-puro-ERK2 encoding
for full-length human ERK1 or ERK2, respectively, or 100 pmol of each ERK1 or ERK2 siRNA
(Smartpool, Dharmacon) per 1.10
6 cells. Transfections were performed using an Amaxa
Nucleofector according to the manufacturer’s protocol. Afterwards, cells were seeded on 6-well
plates (Falcon) for Western blotting experiments or on white luminescence 96-well plates (Nunc)
for ELISA experiments. Forty-eight hours post transfection, the normal growth medium was
removed and cells were starved overnight with medium containing no epidermal growth factor
and only 0.1% FBS. On the next day, cells were stimulated with 100 ng/ml EGF for the indicated
timepoints and processed for Western blotting experiments and ELISA assays.
MEK-pMEK/ERK-pERK ELISA.This assay was performed as described in the
manufacturer’s protocol (Active Motif, Rixensart, Belgium). Briefly, the medium was removed
after stimulation of the cells. Then, cells were fixed with 4% formaldehyde for 20 minutes.
Afterwards, cells were washed three times before quenching buffer was added for 20 min. Again,
after washing twice, blocking buffer was added for one hour. This was followed by two wash
steps before the primary antibody (either MEK, pMEK, ERK or pERK-specific) was added and
incubated overnight at 4°C. On the next day, the primary antibody was removed, the cells were
washed three times before the secondary antibody was added and incubated for one hour. After
five wash steps, developing solution was added for 20 min. Then, the stop solution was added.
Absorbance of the wells was measured at 450 nm. A medium (without cells) and a cell blank
were subtracted from every measurement point.
pCREB ELISA. This assay was performed as described in the manufacturer’s protocol (Active
Motif, Rixensart, Belgium). Briefly, cells were grown in 6-wells and starved overnight (0.1%
horse serum, no EGF). On the next day, cells were stimulated with 100 ng/ml EGF for the
indicated timepoints and subsequently lysed. After centrifugation for 10 min at 10 000 g, the
supernatant was taken, the protein concentration was determined and 1 µg protein was pipetted
in triplicates into each well of the provided microwell strips of the kit.. Then, binding buffer was
added and incubation was performed under gentle agitation at room temperature for three hours
to bind the proteins to the well. Afterwards, the supernatant was discarded and three washing
steps were performed. Next, primary antibody (pCREB) was added to each well. Plates were
incubated for an hour at room temperature before they were washed three times with washing
buffer. Then, secondary antibody was added and plates were incubated for another hour at room
temperature. Finally, each well was washed four times with washing buffer before developing
solution was added. After incubation for 15 min, stop solution was added and absorbance was
measured at 450 nm. A medium (without cells) and a cell blank were subtracted from every
measurement point.
Western Blotting. For this, cells were lysed in ice-cold HKMEN lysis buffer (10 mM HEPES
pH 7.2, 140 mM KCl, 5 mM MgCl2, 2 mM EGTA, 0.1% NP-40) containing protease and
phosphatase inhibitors (Roche). Afterwards, the lysates were sonicated three times for 5 sec each.
After centrifugation for 10 min at 10 000 g, the supernatant was taken and protein concentrations
were determined by using the BCA protein assay kit (Pierce, Perbio Science UK Ltd.,
Cramlington, UK). 20 g protein per sample were separated by sodium dodecyl sulfate (SDS)-
gel electrophoresis and transferred to Hybond-PVDF membrane (GE Healthcare, Amersham,
UK) followed by immunoblotting and ECL detection. For detection of the proteins, the following
antibodies were used: RKIP (Millipore, 1:1000), MEK1/2 (Sigma, 1:1000), pMEK1/2 (Cell
Signalling, 1:1000), pERK1/2 (Sigma, 1:5000), ERK1/2 (Sigma, 1:2000), -tubulin (Santa Cruz,
1:2000).

6
1.2. Mathematical modelling. One of the usual approaches to model biochemical pathways is the
use of mathematical models in ordinary differential equations (ODEs). Power-law models
([10],[15],[20]) are a particular kind of ODE representation in which the processes that make up
a biochemical network are described by power-law expansions in the variables of the system and
then combined in non-linear ODEs with the following structure:
d
j
p
k
gjk
kjiji niXc
dt
dX,...,1
1
(1)
where Xi are the nd variables of the model (proteins or activated proteins), and cij (stoichiometric
coefficients), j
(rate constants) and gjk (kinetic orders) are parameters characterising the
dynamics of the system. While in conventional kinetic models [9], the kinetic orders are pre-
determined and are always integer values (usually 1, or 2 in case of dimerisation), in power-law
models kinetic orders can have non-integer values, even negative values when inhibition is
modelled. Parameters to be estimated from experimental data are then not only the rate
constants, j, (always real positive numbers) but also kinetic orders, gjk. Initially derived for
metabolic systems ([10],[21]) and gene circuits [22], in the last years power-law models have
been explored by some groups for the analysis of cell signalling systems, including investigation
of non-linear dynamics ([16],[18],[23]), design principles ([17],[24]) and multi-level modelling
[25]. The most remarkable property of power-law models is that the features of a power-law rate
may vary from the description of an inhibitory process to the description of activation and
cooperativity by just modifying the numeric value of the kinetic orders [15]. Negative values for
the kinetic order represent inhibition, while a zero indicates that the variable does not affect the
described process. When positive values are considered for a kinetic order, several alternatives
are possible: a kinetic order equal to one means that the system is reproducing a perfectly linear
kinetic behaviour; values between zero and one mimic a saturation-like behaviour in certain
concentration ranges and can be represented as approximations of the Michaelis-Menten
kinetics; finally, with values higher than one the rate equation models cooperative processes.
Thus, a unique power-law rate can represent many different dynamics observed in biochemical
systems by keeping intact its mathematical structure and changing only the numerical value for
the kinetic orders, here considered as model parameters (See Sup. Mat. 0). This structural
property has been used in the last years as well to develop efficient computational methodologies
to analyse a number of dynamical and structural properties of biochemical systems ([26]-[29]).
The appropriate use of this property allows a modeller to evaluate different hypotheses
concerning the nature of interactions without modifying the formal structure of the equations.
This property of power-law models has been exploited in recent times in gene networks where
no initial information about the nature of the interactions between the compounds of the network
was available or if these interactions actually even existed at all ([13],[14],[28],[30],[31]). In
Kikuchi et al. [14] a conventional parameter estimation genetic algorithm was refined to
investigate the structure of unknown gene networks using dynamical data and S-system models
[10], a subclass of power-law models. S-systems were also used to investigate different
properties of the MAPK cascade, such as the adjustment of the stimulus to response delay or
how parallel interacting MAP kinase cascades, are capable of implementing various signal
processing functions ([32],[33]). The objective function contains a term that converts the kinetic
orders, which the method detects that have actually no influence on the dynamics (described by
the experimental data) of the other state variables of the model, into zero. In this way,
nonexistent interactions are automatically discarded and candidates for the actual structure of the
network can be proposed for further verification.
7
For the present study, we combine partial knowledge of the system structure with hypotheses
about additional interactions that we can explore through the use of what we call simplified
power-law models [15]. First, we have to derive a mathematical model in the form of power-law
equations, which incorporate the available knowledge and hypotheses about the regulatory
mechanisms and stoichiometry of the network. Subsequently, the fit of the quantitative
experimental data allows us to confirm or discard the hypothesis proposed: kinetic orders for the
structural hypothesis studied with values near to zero will indicate the incorrectness of the stated
hypothesis. Further predictive simulations are designed and performed to investigate the
dynamical features induced by the data-validated regulatory structures. In this paper we explore
this heuristic approach, integrating a power-law mathematical model with specifically designed
quantitative experimental data concerning the dynamics of the MEK/ERK pathway under RKIP
regulation. Although the overall structure and dynamical features of this pathway has been
extensively investigated in the last years ([4],[34]), here we focus on the testing of hypotheses
concerning the inhibition of MEK activation by RKIP and the feedback loop regulation by
phosphorylated ERK through predictive modelling and experimental validation.
1.3. Model calibration. Mathematical models such as the ones proposed in equation (1) depend
on a number of unknowns -parameters, namely j and gjk, and probably some initial conditions-
which are not accessible to experimental determination and must therefore be estimated by
fitting the model to experimental data (model calibration). The model calibration problem is
mathematically formulated as a nonlinear optimization problem, where the objective is to find
the sets of unknowns that minimize the function quantifying the goodness of the fit subject to the
system dynamics (set of differential equations) and possibly bounds on the unknown values.
Let ,o
sY denote the component of the vector of data corresponding to the experiment , the
observable o and the sampling time s for the general case of performing n experiments, with
on observables per experiment and ,o
sn sampling times per experiment and observable, and
assume that ,o
sY verifies:
, , , ,( ( , ))o o o o
s o s s sY f X t eθ (2)
with ,( ( , ))o
o sf X t θ the observation function which relates the states in the model with the
observables in the laboratory, a vector which compiles the parameters and initial conditions to
be estimated and , 0o
s and , 0o
se are independent and standard Gaussian distributed
random variables. In these conditions, the goodness of the fit may be measured by the log-
likelihood function corresponding to Gaussian homoscedastic noise with known varying
variance as follows:
, 2, ,
,1 1 1
( ( , ))( )
oo sn n n o o
s o sllk o
o s s
Y f X tJ
θθ (3)
We notice here that this formulation requires information about noise, i.e. the variance of each
data per sampling time, observable and experiment, which can be extracted from experiment
replicates. The numerical solution of such optimization problem involves an outer iterative
procedure to generate values for the unknown parameters and initial conditions, the nonlinear
programming method (NLP) and an iterative procedure to solve the differential equations.
Although it may appear simple, nonlinear model calibration is usually a very challenging task
due to a number of reasons. These include (i) the presence of non identifiability problems, that is,
the impossibility of finding a unique solution for all the parameters and the existence of sub-

8
optimal solutions; and (ii) narrow curved or very flat valleys where progress towards the solution
is hard to achieve [35].The nonlinear character of signalling-related models, particularly power-
law models, both in the states and the parameters, often results in this type of difficulties ([36]-
[38]). Although practical identifiability problems are hard to deal with, and usually require a
suitable experimental design (see for example, [39],[40],[41]), finding the best solution in the
presence of several suboptimal solutions may be accomplished by the use of global optimization
techniques. In this context the use of global stochastic methods has received attention, see, for
example, [42] for the application of simulated annealing; [43] and [44] for the application of
evolutionary search algorithms and other metaheuristics or [45] for genetic programming.
Despite the fact that many stochastic methods can locate the vicinity of global solutions very
rapidly, the computational cost associated to the refinement of the solution is usually very large.
In order to surmount this difficulty, hybrid methods and metaheuristics have been recently used
for the solution of parameter estimation problems that speed up these methodologies while
retaining their robustness. In particular, the Scatter Search metaheuristic ([44],[46]) and the
sequential hybrid with automatic switching [47] increased the speed between one and two orders
of magnitude with respect to the use of stochastic global methods.
1.4 Sensitivity analysis and rank of parameters. Parametric sensitivities measure how the model
outputs, i.e. the observables, are affected by a slight modification on the parameter values.
Observables depend differently on different parameters and this may be used to rank the
parameters in order of their relative influence on model predictions. Local, absolute and relative,
parametric sensitivities are calculated for a given value of the parameters and experimental
conditions as follows:
,,
*
oo
p
p
dgS
d and
,,
,
*
opo
p o
p
dgs
g d respectively.
where regards the experiment and o the observable. Unfortunately, the values of the parameters
are not known a priori and even optimal values are subject to uncertainty. Consequently, the
analysis for a given value of the parameters may be of limited value. Alternatively, one may
compute sensitivities for a sufficiently large number of parameter vectors in the feasible
parameter space. In this regard, the Latin hypercube sampling (LHS) approach allows exploring
the parameter space without requiring an excessively large number of samples (nlhs). Values
obtained for the sensitivities allow computing the importance factors that may be used to rank
the parameters. The most widely used importance factor r msqr defined for each of the model
unknowns reads:
,2
, ,
,1 1 1 1
1o
lhs o sn n n no o
msqr so mcmc o slhs o s
r s tn n n n
(4)
This sensitivity measure may be used to assess the individual parameter influence or importance,
hat is to establish a ranking of parameters (see further details in [41]). When the number of
parameters in the model is relatively large, the ranking of parameters may be used to partition the
vector of parameters θ into two new vectors θ andθ , where κ is a subset of k ≤ n parameters,
in such a way that only the components of θ , the most important, are to be estimated from the
experimental data whereas the parameters in set θ are kept constant.
1.5. Practical identifiability analysis. Practical identifiability analysis enables the evaluation of
the quality of the parameter estimates after model calibration. Possibly the simplest approach to

9
perform such analysis is to draw contours of the log-likelihood function (Jllk( ), Equation 3) by
pairs of parameters for the given set of available experimental data. This helps to rapidly detect
typical practical identifiability problems, such as strong correlation between parameters, the lack
of identifiability for some parameters when the contours extend to infinity, or the presence of
sub-optimal solutions. In addition, parameter values should be accompanied by a measure of
their confidence interval. In this sense, the most widely used approach to estimate the confidence
intervals is based on the use of the Crammèr-Rao inequality [48], which establishes a
relationship between the so called Fisher Information Matrix (FIM) and the covariance matrix (C
) for the case that the least-squares estimator is asymptotically unbiased:
1( )FIMC (5)
The confidence interval of parameter i
is then given by: / 2i iit C where / 2t is given by
Student’s t-distribution, corresponds to the number of degrees of freedom and is the (1- )
100% confidence interval selected by the user. The correlation matrix may be calculated from
the covariance matrix as follows: ij
ij
ii jj
CCr
C C, in such a way that two parameters ( )i j will
be completely uncorrelated if 0ijCr or completely correlated if 1ijCr .
2. Results and Discussion
2.1. Model setup and calibration
Mathematical modelling. In the model we represent the activation of the Raf-1/MEK/ERK
pathway stimulated by EGFR and subsequent phosphorylation of the CREB transcription factor
downstream the ERK pathway, which is carried out by the ERK substrate RSK (Figure 2). Since
the quantitative data available are constrained to the amount and activation level of some of the
variables, namely MEK, CREB, RKIP and ERK, the effects of steps upstream MEK in the
pathway are aggregated into a simplified power-law term, which accounts for the activation of
MEK. In addition, the data available do not permit us to properly characterise the process of
double phosphorylation of MEK and we therefore aggregate such process into a single power-
law term and represent the pool of mono and double phosphorylated MEK with the variable
pMEK. Thus, we consider two possible states for MEK: deactivated and dephosphorylated MEK,
MEK, and activated MEK, pMEK. We make a similar assumption about the double
phosphorylation of ERK and we consider also two states for this protein: deactivated and
dephosphorylated ERK, ERK, and activated ERK, pERK. For CREB we considereded the states
of deactivated and dephosphorylated CREB, CREB, and Ser-133 phosphorylated CREB,
pCREB.
10
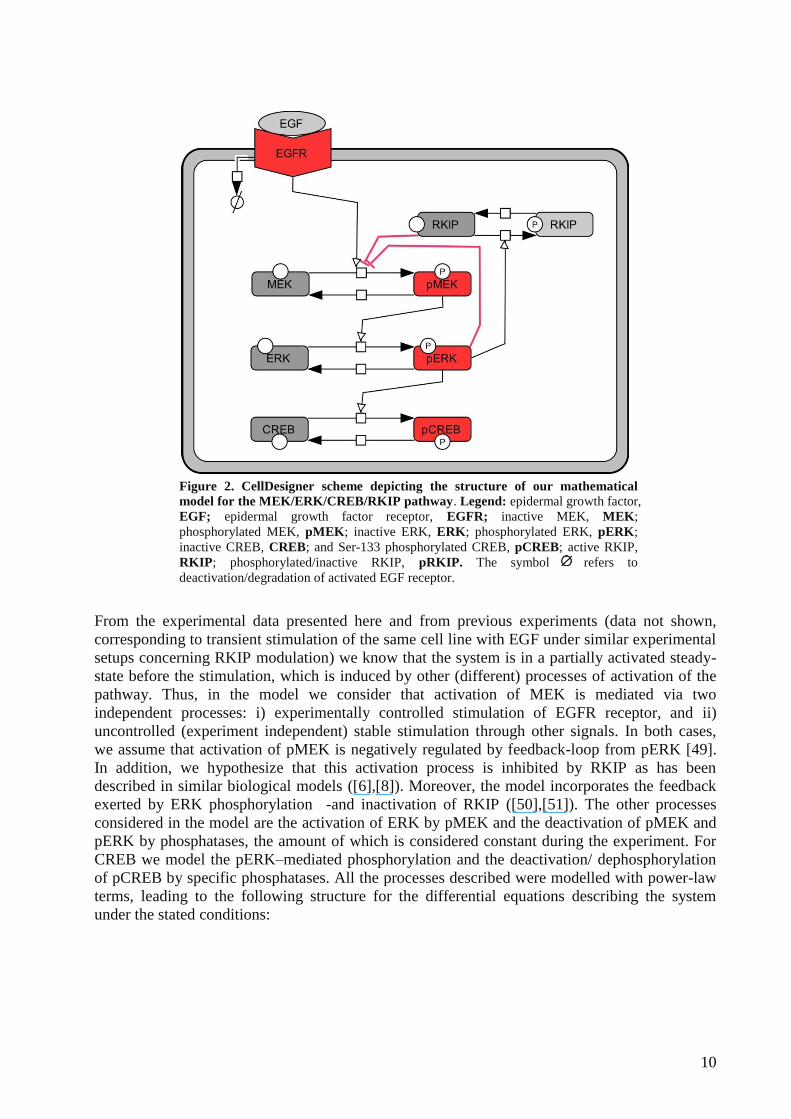
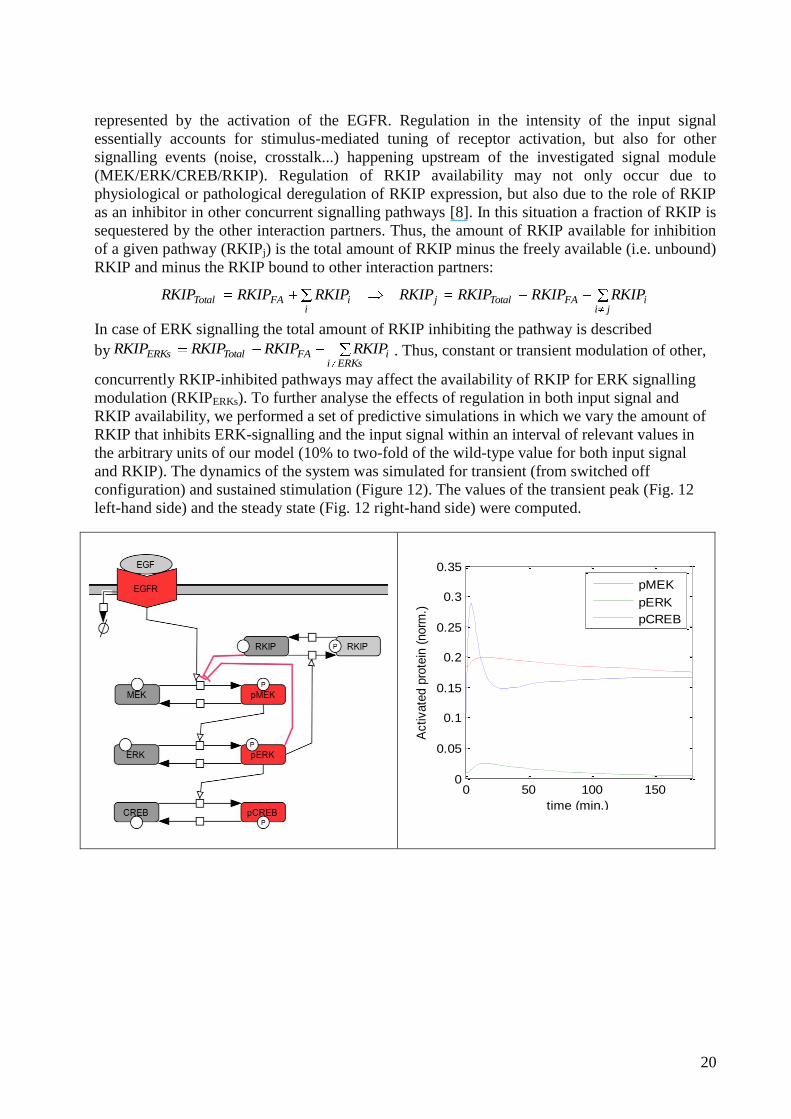
Figure 2. CellDesigner scheme depicting the structure of our mathematical
model for the MEK/ERK/CREB/RKIP pathway. Legend: epidermal growth factor,
EGF; epidermal growth factor receptor, EGFR; inactive MEK, MEK;
phosphorylated MEK, pMEK; inactive ERK, ERK; phosphorylated ERK, pERK;
inactive CREB, CREB; and Ser-133 phosphorylated CREB, pCREB; active RKIP,
RKIP; phosphorylated/inactive RKIP, pRKIP. The symbol refers to
deactivation/degradation of activated EGF receptor.
From the experimental data presented here and from previous experiments (data not shown,
corresponding to transient stimulation of the same cell line with EGF under similar experimental
setups concerning RKIP modulation) we know that the system is in a partially activated steady-
state before the stimulation, which is induced by other (different) processes of activation of the
pathway. Thus, in the model we consider that activation of MEK is mediated via two
independent processes: i) experimentally controlled stimulation of EGFR receptor, and ii)
uncontrolled (experiment independent) stable stimulation through other signals. In both cases,
we assume that activation of pMEK is negatively regulated by feedback-loop from pERK [49].
In addition, we hypothesize that this activation process is inhibited by RKIP as has been
described in similar biological models ([6],[8]). Moreover, the model incorporates the feedback
exerted by ERK phosphorylation -and inactivation of RKIP ([50],[51]). The other processes
considered in the model are the activation of ERK by pMEK and the deactivation of pMEK and
pERK by phosphatases, the amount of which is considered constant during the experiment. For
CREB we model the pERK–mediated phosphorylation and the deactivation/ dephosphorylation
of pCREB by specific phosphatases. All the processes described were modelled with power-law
terms, leading to the following structure for the differential equations describing the system
under the stated conditions:

11
modulatedexpRKIP
constantCREBpCREBCREBCREB
modulatedexpERKpERKERKERK
modulatedexpMEKpMEKMEKMEK
pCREBCREBpERKdt
dpCREB
pERKERKpMEKdt
dpERK
pMEKMEKpERKRKIPtEGFRdt
dpMEK
TT
TT
TT
ggg
ggg
gghA
g g
:
:
:
:
11109
876
542
1
76
54
3*
21
(6)
Furthermore, our model describes the effects of the feedback exerted by ERK phosphorylation
and inactivation of RKIP with a power-law term with the structure k
A pERKRKIPRKIP .
When we combine RKIP inhibition and pERK feedback loop into the same power-law term we
get:
32222 gghgkghgA pERKRKIPpERKpERKRKIPpERKRKIP
and the differential equation for pMEK becomes:
543213
*21
gggggpMEKMEKpERKRKIPtEGFR
dt
dpMEK (7)
We notice that the kinetic order g3 accounts now for the combined effect of pERK in MEK
activation and RKIP inhibition, , which illustrates how power-law models can be used to analyse
systems where the experimental setup available cannot precisely discriminate convergent
regulatory loops [15]. As we can see, in the model all the processes are represented with kinetic
equations in which kinetic orders are parameters (potentially non-integer numbers) to be
estimated from the available data. If the inhibition by RKIP and the feedback loop from pERK to
MEK actually exist in the experimental system, the associated kinetic orders g2 and g3 must be
negative non-integer negative numbers. In contrast, other kinetic orders will be positive real
numbers, higher, equal or smaller than one depending on whether saturation, linear behaviour or
cooperativity occurs. The structure of the model is described in Figure 2. Further details of the
dynamics of RKIP regulation are not considered in the current version of our model, but in the
later discussion.
Since the main purpose of our investigation was to determine whether the regulatory structures
associated with RKIP- and pERK-mediated inhibition of MEK activation actually occur in the
experimental model investigated, an experimental setup was designed to generate quantitative
data describing the dynamics of the system under different expression levels for RKIP and ERK
(Figure 3). Towards this end, quantitative data were produced by ELISA [46] that describe the
dynamics of the pathway after stimulation and activation with EGF under three different
experimental conditions for RKIP and ERK: i) RKIP (or ERK) repression by siRNA, modelled
as RKIP=0.1; ii) wild-type concentration of RKIP (or ERK), RKIP=1.00; and iii) overexpression
of RKIP (or ERK), RKIP=2.00. Combining the different expression conditions for ERK and
RKIP we get a total of nine different experimental setups (Figure 3).
Other assumptions used in the model and based on the experimental data obtained are the
following. From the experimental data, we assume the total amount of MEK, ERK, and CREB to
be constant during each time series experiment (see Supplementary Material SM2). In addition,

12
for different experimental realisations the total amount of ERK and RKIP were modulated in a
way that we can define wild-type configuration, ERK/RKIP overexpression and siRNA-induced
ERK/RKIP downregulation as discussed before.
In an independent but analogous experiment we verified that the total concentration of MEK,
ERK and RKIP does not change during the duration of the experiment. Thus, we consider
protein recruitment/degradation processes as negligible during the experiment and assume the
total amounts of the proteins to be constant throughout the duration of the experiment (See Sup.
Mat SM2). For our experimental setup we modelled the input signal of the system EGFR* with
the mathematical description discussed in Sup Mat SM1.
Sensitivity analysis and rank of parameters. As a first approximation to the problem a global
sensitivity analysis was performed so as to assess the relative influence of each of the unknowns
in the power-law model proposed under the available experimental scheme. A total of 9
experiments were performed under different combinations of experimentally modulated RKIP
and ERK expression levels (e.g., over expression, wild type and down regulation). In all
experiments 6 quantitative measurements for pERK, pCREB and total MEK were performed
after stimulation with EGF at the following sampling times: 0, 5, 15,30, 90, 180 minutes (Figure
3). The value of MEKT was experimentally estimated, while there was no quantitative
information about total ERK. In a similar manner, the initial conditions for pMEK and pCREB
were assumed to be known and equal to the mean measured value, while for pERK this
information was not available.
Figure 3. Depiction of the set of experiments performed to calibrate the mathematical model.
A total of 9 experimental conditions were assayed and quantified, corresponding to different
combinations of RKIP (left-hand half sphere) and ERK (right-hand half sphere) expression levels
(downregulation, grey, wild-type, green, over expression, red) In each experimental condition, time
series measurements of pERK, pCREB and total MEK were performed for the sampling times 0, 5,
15,30, 90 and 180 minutes. Three replicates for each time series experiment allowed the
computation of the mean and the standard deviation for each measurement.
The hyperrectangle of the allowed values for the unknowns of the model was defined as follows:

13
1 4,...,11
2 3
1,..,7
, [0, 4];
, [ 4,0];
[0,10];
[0.1,1];
( 0) [0,1];
i
i
T
g g
g g
ERK
pERK t
The Latin Hypercube Sampling was used to sample the hyperrectangle for the purpose of the
global sensitivity analysis (see further details in [41]), for each vector of unknowns, ODESSA
[53] was used to numerically obtain the parametric sensitivities. The overall ranking of
parameters computed for the above mentioned experimental conditions is shown in Figure 4. It
should be noted here that the rank assess the effect of the parameters for the measured quantities
pERK and pCREB, over the described experimental scheme and within the unknowns
hyperrectangle defined above. Results reflect that, as expected, dynamics of pERK and pCREB
are highly sensitive to the values of the kinetic orders and rates corresponding to pMEK and
pERK mediated phosphorylation, respectively, and the ones corresponding to the deactivation by
phosphatases. In addition, the parameters affecting activation of MEK are less relevant to pERK
and pCREB evolution. We remark that g3, which accounts for the combined effect of pERK in
MEK activation and RKIP inhibition, is positively affecting the activation of pERK and pCREB,
whereas g2 that accounts for the inhibition by RKIP is affecting negatively to, i.e. inhibiting, the
activation of pERK and pCREB.
Figure 4. Different measures of the global relative sensitivity of the observables with respect to the
model parameters. Global r msqr stands for a measure of the summation of the square of the
sensitivities computed for all parameter vector samples, experiments, observables and sampling times;
equivalently, Global r mabs represents a measure of the absolute value of the sensitivities; Global r mean,
represents a measure of the mean value and Global r max and Global r min represent a measure of the
maximum and minimum sensitivity values respectively. Parameters are ordered by the Global r msqr
value.

14
Figure 4 does not provide any information about the sensitivity for the different observables
(pCREB and pMEK) nor about the sensitivity for the different experiments. A more detailed
look at the results (Figure 5) reveals that pCREB is more sensitive to parameter variations than
pMEK. This means that pCREB measurements are providing, in principle, more information for
the purpose of model calibration. Considering the experiments independently, it may be
concluded that under downregulation of RKIP and ERK (RKIP d/ ERK d) both pMEK and
pCREB become more sensitive to the parameters. The minimum mean sensitivity is achieved for
the experiment under wild-type RKIP and downregulation of ERK (RKIP wt/ ERK d) for the
case of pMEK and for the experiment RKIP d/ ERK o for pCREB. Finally, the observables are
rather insensitive to the initial condition for pERK and the parameter g1 related to the EGFR
receptor stimulation, indicating poor or lack of identifiability for these unknowns.
Figure 5. Global r msqr values for the different observables, pMEK and pCREB,
for the different experiments. ‘o’ stands for overexpression, ‘d’ for
downregulation and ‘wt’ for wild-type. In general pCREB is more sensitive to
parameters under the experimental conditions considered.
15
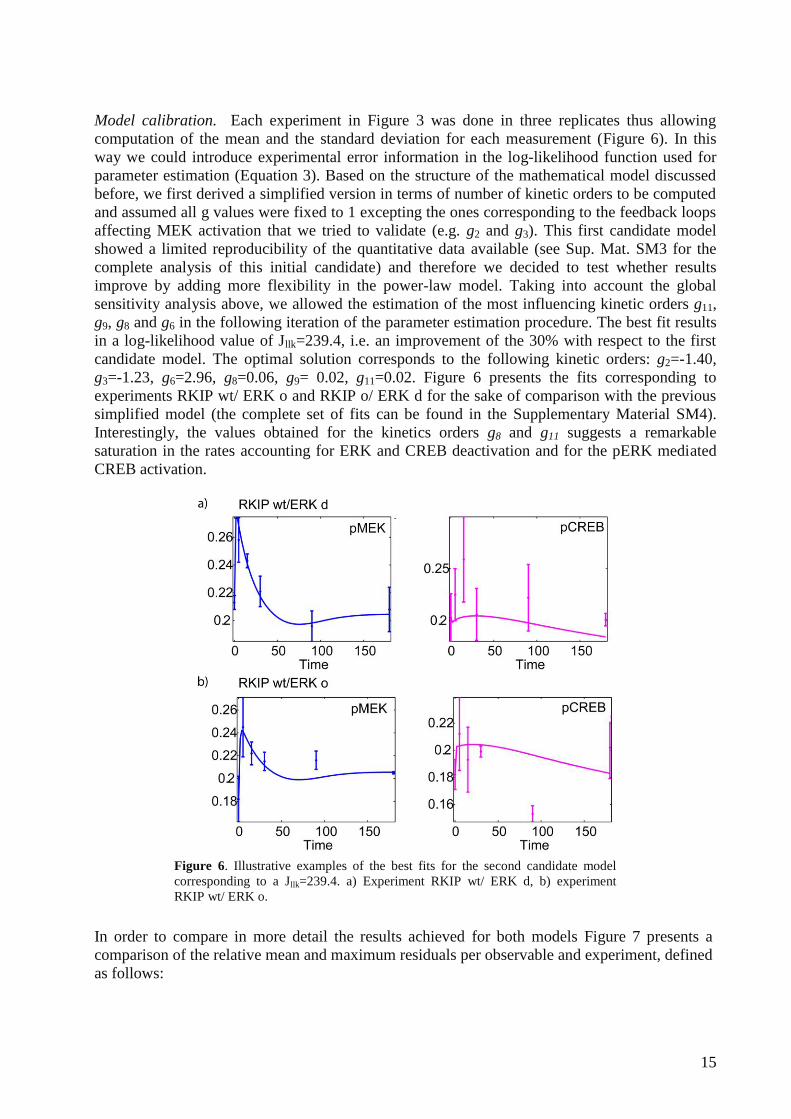
Model calibration. Each experiment in Figure 3 was done in three replicates thus allowing
computation of the mean and the standard deviation for each measurement (Figure 6). In this
way we could introduce experimental error information in the log-likelihood function used for
parameter estimation (Equation 3). Based on the structure of the mathematical model discussed
before, we first derived a simplified version in terms of number of kinetic orders to be computed
and assumed all g values were fixed to 1 excepting the ones corresponding to the feedback loops
affecting MEK activation that we tried to validate (e.g. g2 and g3). This first candidate model
showed a limited reproducibility of the quantitative data available (see Sup. Mat. SM3 for the
complete analysis of this initial candidate) and therefore we decided to test whether results
improve by adding more flexibility in the power-law model. Taking into account the global
sensitivity analysis above, we allowed the estimation of the most influencing kinetic orders g11,
g9, g8 and g6 in the following iteration of the parameter estimation procedure. The best fit results
in a log-likelihood value of Jllk=239.4, i.e. an improvement of the 30% with respect to the first
candidate model. The optimal solution corresponds to the following kinetic orders: g2=-1.40,
g3=-1.23, g6=2.96, g8=0.06, g9= 0.02, g11=0.02. Figure 6 presents the fits corresponding to
experiments RKIP wt/ ERK o and RKIP o/ ERK d for the sake of comparison with the previous
simplified model (the complete set of fits can be found in the Supplementary Material SM4).
Interestingly, the values obtained for the kinetics orders g8 and g11 suggests a remarkable
saturation in the rates accounting for ERK and CREB deactivation and for the pERK mediated
CREB activation.
Figure 6. Illustrative examples of the best fits for the second candidate model
corresponding to a Jllk=239.4. a) Experiment RKIP wt/ ERK d, b) experiment
RKIP wt/ ERK o.
In order to compare in more detail the results achieved for both models Figure 7 presents a
comparison of the relative mean and maximum residuals per observable and experiment, defined
as follows:

16
, ,
,
,1
( ( , ))100 so on
s o so
oss s
Y f X trmeanr
n Y
θ;
, ,
,
,
( ( , ))100max
o o
s o so
o
s
Y f X trmaxr
Y
θ
(8)
for both models.
Figure 7. Comparison of the mean and maximum residual per observable and experiment for the 1
st
and 2nd
candidate models. The second candidate model substantially improves results with respect to
the first candidate in terms of both mean and maximum residual.
The plot reveals how second candidate model outperforms first candidate in terms of both mean
and max relative residual in almost all cases. The fit achieved for pMEK is better in terms of
mean relative residual for all experiments but for the case under RKIP o/ERK d. Regarding the
results achieved for pCREB, second candidate model is more limited to reproduce the data for
the experiments under wt RKIP. This may be explained considering that pCREB is in general
less sensitive to the model parameters under these experiments (see Figure 5). Note, in addition,
that the log-likelihood assesses more reliability to data with less relative experimental error, in
this case to the data obtained pMEK.
Practical identifiability analysis. In order to assess the quality of the solution we computed the
FIM based confidence intervals. It should be noted that in this case the FIM was nearly singular
thus already indicating some identifiability problems. As expected the confidence regions for g2
and g3 are reasonable of the 8% and the 17% respectively, g6 is also identifiable with a
confidence of the 12%, g8 is identifiable with a confidence of the 90% and for the remaining
parameters the confidence is over the 100% (see the Supplementary Material SM4).
Interestingly pCREB showed large sensitivity to g8, g9 and g11 however the experimental error
for pCREB is larger than for pMEK and this may have induced the poor identifiability of those
parameters.
The correlation matrix (Figure 8) reveals that g2 is, in general, not substantially correlated to the
other parameters whereas g3 is slightly more correlated. The rate constants are in some cases
highly correlated thus being more complicated to accurately estimate their values. This could be
anticipated in view of the low sensitivity of the observables with respect to for example or
3 (Figures 4 and 5) under the current experimental scheme. Further optimally designed
experiments would be required to improve confidence for rate constants [39].

17
Figure 8. Correlation matrix of the global unknowns corresponding to the best
solution for the second candidate model. Figure reveals that the parameters are
in general poorly correlated. Only some particular pairs such as g6– , g9–
g11, or seem to be highly correlated.
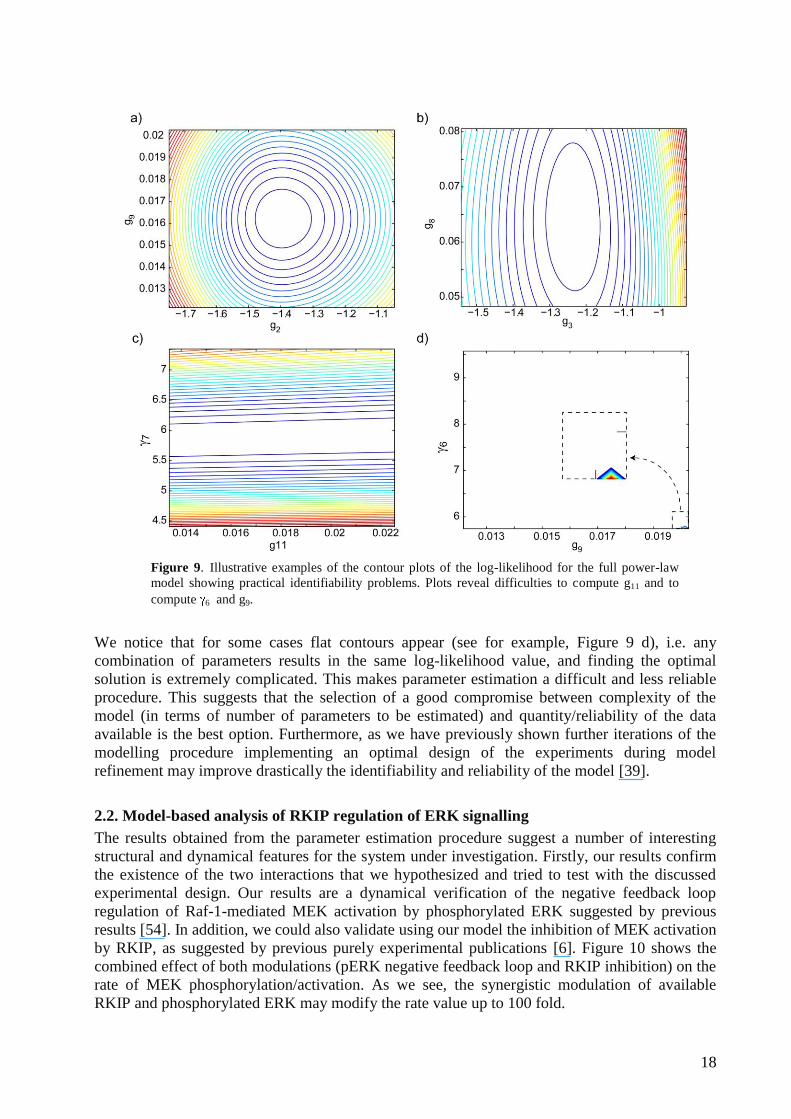
To analyse in more detail the results we computed the projection of the maximum likelihood by
pairs of parameters within the 25% error of the optimal solution. Figure 9 presents some
illustrative examples: a) presents an illustrative example of (almost) uncorrelated parameters g9 -
g2 , b) presents an example of low correlation between parameters (g8 - g3) and c) presents an
example of highly correlated parameters 7 – g11 and d) presents an example of an almost flat
cost contour 6 – g9.
18
Figure 9. Illustrative examples of the contour plots of the log-likelihood for the full power-law
model showing practical identifiability problems. Plots reveal difficulties to compute g11 and to
compute 6 and g9.
We notice that for some cases flat contours appear (see for example, Figure 9 d), i.e. any
combination of parameters results in the same log-likelihood value, and finding the optimal
solution is extremely complicated. This makes parameter estimation a difficult and less reliable
procedure. This suggests that the selection of a good compromise between complexity of the
model (in terms of number of parameters to be estimated) and quantity/reliability of the data
available is the best option. Furthermore, as we have previously shown further iterations of the
modelling procedure implementing an optimal design of the experiments during model
refinement may improve drastically the identifiability and reliability of the model [39].
2.2. Model-based analysis of RKIP regulation of ERK signalling
The results obtained from the parameter estimation procedure suggest a number of interesting
structural and dynamical features for the system under investigation. Firstly, our results confirm
the existence of the two interactions that we hypothesized and tried to test with the discussed
experimental design. Our results are a dynamical verification of the negative feedback loop
regulation of Raf-1-mediated MEK activation by phosphorylated ERK suggested by previous
results [54]. In addition, we could also validate using our model the inhibition of MEK activation
by RKIP, as suggested by previous purely experimental publications [6]. Figure 10 shows the
combined effect of both modulations (pERK negative feedback loop and RKIP inhibition) on the
rate of MEK phosphorylation/activation. As we see, the synergistic modulation of available
RKIP and phosphorylated ERK may modify the rate value up to 100 fold.

19
0.1 0.5 10.1
0.5
1
RKIP (a.u.)
RKIPg2*pERKg3
pE
RK
(a.u
.)
1
10
100
Figure 10. Modulation in the rate of MEK
phosphorylation/activation when total amount of RKIP and
fraction of phosphorylated pERK are tuned within an
interval of physiologically relevant values (in the arbitrary
units of our model). For these simulations, we assumed
MEK=1 and normalised the rate dividing by the rate constant.
In addition, the model shows other interesting dynamical features, namely saturation in the rates
of pERK dephosphorylation (Figure 11, left-hand side), pERK-mediated CREB activation and
pCREB dephosphorylation and cooperativity in the rate of pMEK-mediated ERK activation
(Figure 11, right-hand side). As a combination of all these regulatory features, the system
appears to have a highly non-linear behaviour, which is further analysed in the coming predictive
simulations regarding RKIP and input signal regulation.
0 0.5 10
0.5
1
pERK (a.u.)
pE
RK
g8
0 0.5 10
0.5
1
pMEK (a.u.)
pM
EK
g6
Figure 11. Left-hand side: modulation in the rate of pERK dephosphorylation when the fraction of
phosphorylated pERK is tuned within an interval of physiologically relevant values; Left-hand side:
modulation in the rate of pMEK-mediated ERK activation when the fraction of phosphorylated MEK is
tuned within an interval of physiologically relevant values. For these simulations, we used a procedure
similar to the one described in Figure 10 assuming one the other variables involved in the rate equation and
dividing by the rate constant.
RKIP regulation of ERK signalling under sustained and transient stimulation. Using predictive
simulation we investigated the dynamics of the system when transient and sustained stimulation
is applied to the system. We considered different experimental conditions regarding the
availability of RKIP for signal inhibition and the intensity of the system’s input signal
20
represented by the activation of the EGFR. Regulation in the intensity of the input signal
essentially accounts for stimulus-mediated tuning of receptor activation, but also for other
signalling events (noise, crosstalk...) happening upstream of the investigated signal module
(MEK/ERK/CREB/RKIP). Regulation of RKIP availability may not only occur due to
physiological or pathological deregulation of RKIP expression, but also due to the role of RKIP
as an inhibitor in other concurrent signalling pathways [8]. In this situation a fraction of RKIP is
sequestered by the other interaction partners. Thus, the amount of RKIP available for inhibition
of a given pathway (RKIPj) is the total amount of RKIP minus the freely available (i.e. unbound)
RKIP and minus the RKIP bound to other interaction partners:
jiiFATotalj
iiFATotal RKIPKIPRRKIPRKIPRKIPRKIPRKIP
In case of ERK signalling the total amount of RKIP inhibiting the pathway is described
byERKsi
iFATotalERKs RKIPKIPRRKIPRKIP . Thus, constant or transient modulation of other,
concurrently RKIP-inhibited pathways may affect the availability of RKIP for ERK signalling
modulation (RKIPERKs). To further analyse the effects of regulation in both input signal and
RKIP availability, we performed a set of predictive simulations in which we vary the amount of
RKIP that inhibits ERK-signalling and the input signal within an interval of relevant values in
the arbitrary units of our model (10% to two-fold of the wild-type value for both input signal
and RKIP). The dynamics of the system was simulated for transient (from switched off
configuration) and sustained stimulation (Figure 12). The values of the transient peak (Fig. 12
left-hand side) and the steady state (Fig. 12 right-hand side) were computed.
0 50 100 1500
0.05
0.1
0.15
0.2
0.25
0.3
0.35
time (min.)
Activate
d p
rote
in (
norm
.)
pMEK
pERK
pCREB

21
0.1 1 20.1
1
2
RKIP (a.u.)
pMEKpeak
EG
FR
(t=
0)
(a.u
.)
0.2
0.3
0.4
0.5
0.6
0.7
0.8
0.1 1 20.1
1
2
RKIP (a.u.)
pMEKss
EG
FR
(t=
0)
(a.u
.)
0.17
0.18
0.19
0.2
0.21
0.22
0.1 1 20.1
1
2
RKIP (a.u.)
pERKpeak
EG
FR
(t=
0)
(a.u
.)
0.05
0.1
0.15
0.2
0.25
0.1 1 20.1
1
2
RKIP (a.u.)
pERKss
EG
FR
(t=
0)
(a.u
.)
0.05
0.1
0.15
0.2
0.25
0.3
0.35
0.4
0.1 1 20.1
1
2
RKIP (a.u.)
pCREBpeak
EG
FR
(t=
0)
(a.u
.)
0.19
0.2
0.21
0.22
0.23
0.1 1 20.1
1
2
RKIP (a.u.)
pCREBss
EG
FR
(t=
0)
(a.u
.)
0.17
0.18
0.19
0.2
0.21
0.22
0.23
0.24

22
pMEK pERK pCREB0
0.2
0.4
0.6
0.8
1
Fra
ction t
ota
l pro
tein
(a.u
.)
Global Variation peak
pMEK pERK pCREB0
0.1
0.2
0.3
0.4
0.5
Fra
ction t
ota
l pro
tein
(a.u
.)
Global Variation Steady-state
Fig. 12. Dynamics of the system for transient and sustained stimulation when available amount of RKIP and
intensity of the input signal are tuned. Right-hand-side top: simulation for transient stimulation in wild-type
conditions (EGFR*o=1; RKIP=1); initial conditions MEKo=0.99; pMEKo=0.01; ERKo=0.99; pERKo=0.99;
CREBo=0.99; CREBo=0.01. Left column figures: results computed for transient stimulation; Right column
figures: Steady-state values; Left hand-side bottom: Global variation in the peak values for the set of simulation
computed 2,1.0,2,1.00 RKIPEGFR . Right hand-side bottom: Global variation in the steady-state values
for the set of simulation computed 2,1.0,2,1.00 RKIPEGFR . Black dot accounts for average value, red
triangle up for minimum and triangle down for maximum.
As one would expect, maximum intensity in the peaks of activation occurs for intense transient
stimulation (EGFR(0)=2.0) and reduced amount RKIP (RKIP=0.1, Fig. 12, left-hand column).
Interestingly, RKIP and input signal modulation induces a wide variation in the peak of
activation of MEK and to a certain extent also of ERK, while the variations in the peak of
activation for CREB occur in a reduced interval of values around the 20% of the available RKIP
protein (Fig. 12, left-hand side bottom). In case of sustained stimulation, maximum steady-state
signal occurs for intense sustained stimulation (EGFR(0)=2.0) and reduced amount of RKIP
(RKIP=0.1, Fig. 12, right-hand column). But in sustained stimulation, the steady-states of
pMEK are constrained to a small interval around 20% of the available RKIP protein (the same
applies to pCREB), while steady-state levels of pERK are in a wider interval of values ranging
from signal cessation to almost 50% of the total protein for intense stimulation and reduced
amount of RKIP (Fig. 12, right-hand side bottom). Taken together these simulations suggest
quite remarkable dynamics for the system with variations of both MEK and ERK activation
under conditions of transient stimulation and inhibitor availability, but only modulation in ERK
activation under conditions of sustained stimulation. On the other hand, CREB activation
remains quite stable in both transient and sustained stimulation conditions, which we
hypothesize is a consequence of the saturation kinetics exhibited by the model for the interval of
values considered.
Another remarkable dynamical property relates to the emergence of a dumped oscillation in the
dynamics of pMEK after stimulation as it can be seen for the “wild-type” simulation accounting
for wild-type amount of RKIP (RKIP=1) and transient stimulation identical to the one used in
the experimental setup, EGFR*(0)=1 (Figure 12, left-hand side). We hypothesize this dumped
oscillation of pMEK is induced by the feedback loop structure of the system. To further
substantiate this, we computed under which experimental conditions the dumped oscillation in

23
pMEK appears; our simulations suggest that the dumped oscillation becomes important in
conditions of intense EFGR stimulation and downregulation of RKIP (Figure 13, right-hand
side). Our simulations may suggest a role of RKIP as stabiliser of the MEK activation, impeding
this dumped oscillation for high expression of RKIP. Interestingly, the oscillation does not
propagate downstream to pERK or pCREB, which we think may relate to the saturation in the
pERK and pCREB dephosphorylation rates.
0 50 100 1500
0.05
0.1
0.15
0.2
0.25
0.3
0.35
time (min.)
Activate
d p
rote
in (
norm
.)
pMEK
pERK
pCREB
0.1 1 20.1
1
2
RKIP (a.u.)
Dumped oscillation in pMEK
EG
FR
(t=
0)
(a.u
.)
Figure 13. Emergence of dumped oscillations in pMEK under transient stimulation. Left-hand side:
dynamics of pMEK after transient stimulation EGFR*(0)=1and wild-type amount of RKIP (RKIP=1)
showing dumped oscillation in pMEK; Right-hand side: experimental conditions (RKIP amount and
intensity of transient EGFR* stimulation) under which dumped oscillation appears in pMEK.
Modelling dynamical modulation of RKIP and its effects on ERK signalling. We later considered
the implications in the system dynamics of a dynamical regulation for RKIP as the one suggested
in [4]. In their mathematical model EGFR activation induces through a number of signal
mediators the phosphorylation and subsequent deactivation of RKIP as MEK activation inhibitor
(See Fig. 12 left-hand side, top). To consider the implications of their hypothesis in our model,
we further expanded our model by including an additional equation accounting for the dynamics
of RKIP under EGFR* mediated deactivation and dephosphorylation:
RKIPRKIPRKIP
RKIPkRKIPEGFRkdt
dRKIP
TI
I9
*8
Where RKIP is the active (MEK activation inhibiting) fraction of RKIP, RKIPI accounts for the
inactive fraction of RKIP and RKIPT is the total amount of the protein as described in the
previous algebraic equation. k8 is the rate constant for the EGFR*
mediated RKIP deactivation,
while k9 is the rate constant for the dephosphorylation and subsequent reactivation of RKIP. We
later performed a number of iterative predictive simulations in which we investigated the effect
of this dynamic regulation of RKIP. Precisely, we computed the peaks of activation for pMEK,
pERK and pCREB for transient stimulation (EGFR*(0) =1) under distinct conditions of RKIP
regulation (RKIPT=1), described by different values for the rate constants k8 and k9 (k8, 9 [10-2
,
10], Fig. 14, second and third row). In this parameter subspace, conditions in which k8, k9<<1 or

24
k8<<1 and k9>>1 accounts for weak dynamic RKIP regulation (a reduced fraction of the total
available RKIP is actually inhibited), while conditions in which k8>>1 and k9<<1 relate to
intense long-time regulation (a considerable fraction of the available RKIP is inhibited during a
long-time period in terms of the experimental timing). Interestingly, conditions in which k8,
k9>>1 suggest intense short-time RKIP regulation. Simulations suggest that dynamic regulation
of RKIP during the transient stimulation has significant effects on the intensity of peaks for
pMEK and pERK. Conditions described as intense long-time regulation of RKIP availability and
intense-short time regulation of RKIP increase significantly pMEK peak intensity, while pERK
seems significantly affected only for conditions of intense long-time RKIP deactivation, which
seems to be a consequence of the non-linear regulatory structure of the system. As in the
previous simulated experimental conditions, pCREB is barely affected by the regulation of RKIP
as a result of the remarkable saturated-like dynamics in its phosphorylation/dephosphorylation
and pCREB peaks are in all the simulated conditions around the 20% of the total available
protein.
0 50 100 150 200 2500
0.2
0.4
0.6
0.8
1
time (min.)
Activate
d p
rote
in (
norm
.)
pMEK
pERK
pCREB
EGFR*
RKIP
10-2
10-1
100
101
10-2
10-1
100
101
k8 (RKIP deact)
pMEKpeak
k9 (
RK
IP r
eact)
0.3
0.4
0.5
0.6
0.7
0.8
0.9
10-2
10-1
100
101
10-2
10-1
100
101
k8 (RKIP deact)
pERKpeak
k9 (
RK
IP r
eact)
0.1
0.2
0.3
0.4
0.5
0.6
0.7
0.8
0.9

25
10-2
10-1
100
101
10-2
10-1
100
101
k8 (RKIP deact)
pCREBpeak
k9 (
RK
IP r
eact)
0.2
0.21
0.22
0.23
0.24
0.25
pMEK pERK pCREB0
0.2
0.4
0.6
0.8
1
Fra
ction t
ota
l pro
tein
(a.u
.)
Global Variation peak
Fig 14. Dynamics of the system when dynamical deactivation of RKIP by EGFR signalling during transient
stimulation is assumed (von Kriegsheim et al. 2009). Under these conditions, we expand the model with an
additional equation accounting for RKIP dynamics:
RKIPRKIPRKIPRKIPkRKIPEGFRkdt
dRKIPT
II
9
*
8.
Right hand-side top: Simulation for transient stimulation (EGFR*o=1) in case of dynamical regulation of RKIP.
Initial conditions MEKo=0.99; pMEKo=0.01; ERKo=0.99; pERKo=0.99; CREBo=0.99; CREBo=0.01; RKIPo=1.
Right hand-side bottom: Global variation in the peak for the set of simulations computed
10,10,10,10 2
9
2
8 kk . Black dot accounts for average value, red triangle up for minimum and triangle down
for maximum.
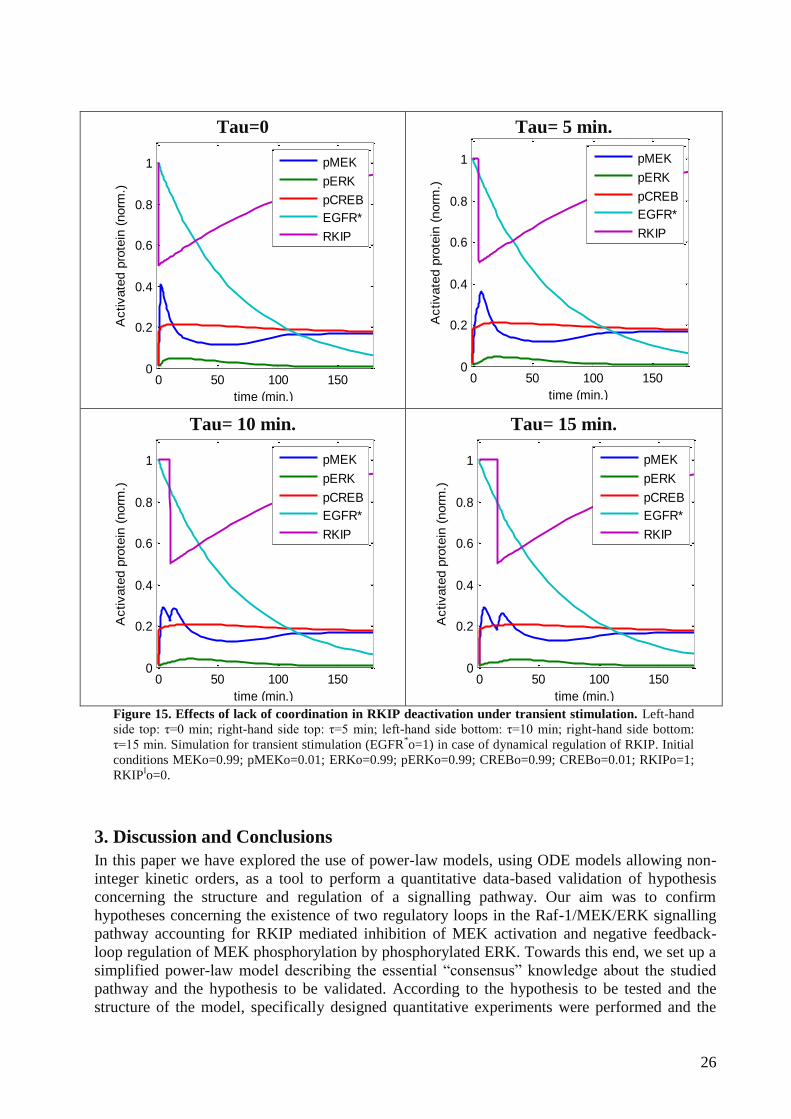
We furthermore considered the potential effect of EGFR-mediated MEK activation and the
EGFR-induced deactivation of RKIP occurring as independent events. Towards this end, we
introduced a time delay (with respect to MEK activation) in the deactivation of RKIP:
RKIPRKIPRKIP
RKIPkRKIPtEGFRkdt
dRKIP
TI
I9
*8
We then simulated the system’s dynamics under different time delay between both processes.
Due to the remarkably fast activation of the pathway, RKIP affects signal intensity in case of the
short-time delay and we therefore simulated the dynamics of the system only under those
conditions (τ [0,15] min, Figure 15). Our simulations suggest that coordinated RKIP inhibition
increases the peak of activation for the system (Figure 15 Left-hand side, top), while a short-time
delay induces a slight reduction in the peak intensity but an increase in the duration. An
intermediate delay induces the emergence of a second activation peak in pMEK, which in turn
prolongs pERK peak duration.
26
Tau=0
0 50 100 1500
0.2
0.4
0.6
0.8
1
time (min.)
Activate
d p
rote
in (
norm
.)
pMEK
pERK
pCREB
EGFR*
RKIP
Tau= 5 min.
0 50 100 1500
0.2
0.4
0.6
0.8
1
time (min.)
Activate
d p
rote
in (
norm
.)
pMEK
pERK
pCREB
EGFR*
RKIP
Tau= 10 min.
0 50 100 1500
0.2
0.4
0.6
0.8
1
time (min.)
Activate
d p
rote
in (
norm
.)
pMEK
pERK
pCREB
EGFR*
RKIP
Tau= 15 min.
0 50 100 1500
0.2
0.4
0.6
0.8
1
time (min.)
Activate
d p
rote
in (
norm
.)
pMEK
pERK
pCREB
EGFR*
RKIP
Figure 15. Effects of lack of coordination in RKIP deactivation under transient stimulation. Left-hand
side top: τ=0 min; right-hand side top: τ=5 min; left-hand side bottom: τ=10 min; right-hand side bottom:
τ=15 min. Simulation for transient stimulation (EGFR*o=1) in case of dynamical regulation of RKIP. Initial
conditions MEKo=0.99; pMEKo=0.01; ERKo=0.99; pERKo=0.99; CREBo=0.99; CREBo=0.01; RKIPo=1;
RKIPIo=0.
3. Discussion and Conclusions
In this paper we have explored the use of power-law models, using ODE models allowing non-
integer kinetic orders, as a tool to perform a quantitative data-based validation of hypothesis
concerning the structure and regulation of a signalling pathway. Our aim was to confirm
hypotheses concerning the existence of two regulatory loops in the Raf-1/MEK/ERK signalling
pathway accounting for RKIP mediated inhibition of MEK activation and negative feedback-
loop regulation of MEK phosphorylation by phosphorylated ERK. Towards this end, we set up a
simplified power-law model describing the essential “consensus” knowledge about the studied
pathway and the hypothesis to be validated. According to the hypothesis to be tested and the
structure of the model, specifically designed quantitative experiments were performed and the
27
obtained data were used to calibrate the mathematical model using optimisation algorithms based
on the principle of the maximum likelihood.
An iterative parametric identification procedure was pursued to achieve a model which is able to
reproduce the main characteristics of the generated experimental data. While a power-law model
with non-integer kinetic orders in most of the terms was able to fit the data, a pseudo-kinetic
model with all the kinetic orders shifted to one (expecting the inhibition and feedback-loop)
could not reproduce the data and therefore was not a valid representation for the system in the
experimental conditions stated. The special regularity of the power-law terms allows us to
reproduce high non-linearity without any other assumption on the nature of the process but the
species involved in it [15]. Thus, the further model calibration based on the experimental data
makes it possible to characterize the processes (whether they present saturation inhibition or
cooperativity) and even to discard initial hypotheses about the system. We notice here that
although the ability of the model to reproduce the experimental data is satisfactory, improved
identifiability and therefore increased confidence on the parameter estimates could be reached
through optimally experiment design [35].
With the values estimated for the parameters, the model shows some remarkable properties about
the dynamics of the analysed system and the hypotheses we attempted to validate. Firstly, the
kinetic order representing the inhibition of MEK activation by RKIP has in all the realisations of
the parameter estimation process a value around one, which indicates with high certainty that
RKIP is actually inhibiting the activation of the pathway in the cell line and experimental
conditions used. Since the experiments were designed to elucidate the role of RKIP in the
pathway, the parameter describing this interaction could be estimated with a high confidence in
the results. With regard to the feedback-loop included in the structure of the system (pMEK →
pERK ┤ pMEK), our data-based analysis suggests an intense feedback-loop control of the
pathway by the activated ERK, represented by a significant high value associated kinetic order
(g3=-2). We think that this intense regulation could be in principle responsible of the damped
oscillations we see in the fraction of activated MEK both in the experiments and simulations.
The data-driven mathematical modelling detects as well remarkable saturation-like behaviour in
some reactions rates, which is in agreement with previous mathematical models [48]. Regarding
the activation of CREB, the model suggests saturation-like behaviour in both phosphorylation
and dephosphorylation, but we cannot conclude from our analysis whether this is a structural
feature of the system or a peculiarity of the experimental setup and cell line employed, hiding the
main role of other interacting partners as regulator of these processes.
The predictive simulations performed with the model indicate a remarkable regulatory dynamics
for the system. Thus, the models suggests modulation of MEK and ERK activation under
conditions of transient stimulation and RKIP inhibitor availability, but only modulation of ERK
activation under conditions of sustained stimulation. On the other hand and as a consequence of
the saturation-like behaviour displayed by the model equations, CREB activation remains quite
stable in both transient and sustained stimulation conditions.
We found the results of our analysis concerning the dynamic regulation of RKIP during the
transient stimulation particularly interesting. Our simulations indicate that
phosphorylation/deactivation of RKIP during the transient stimulation has a significant effect on
the signalling peaks of both MEK and ERK, while intense long-time regulation or intense-short
time regulation of RKIP significantly increase the pMEK peak only. On the other hand, ERK
activation only seems affected for conditions associated with intense long-time RKIP
deactivation, which we hypothesize is a consequence of the non-linear regulatory structure of the
system.
Our modelling efforts do not intend to give a complete and detailed picture of ERK signalling,
but focuses in the analysis of RKIP regulation of the pathway and the use of power-law models,

28
sensitivity and identifiability analysis as well as adequate model calibration techniques, as a tool
to test hypothesis in signalling systems. Further modelling efforts should include the signalling
regulation prior MEK activation, including the signal mediators upstream MEK activation and
the fine-tuning in the receptor activation ([4],[34],[55],[56]), but also the effects of growth factor
context in the topology and dynamics of the signalling network [57]. The dynamical features
associated with the double phosphorylation in both MEK and ERK should be included for a
precise description of the system [54], as well as the existence of isoforms for ERK [58]. In our
case, the strong simplification applied to model MEK and ERK activation relates to the
limitations of the common experimental techniques used to measure MEK and ERK
phosphorylation, which do not discriminate between single and double phosphorylation.
Therefore, we decided to adopt a simplified description of the process and allow the non-integer
kinetic orders to absorb the inherent complexity. Furthermore, pERK nucleo-cytoplasmic
shuttling of pERK should be considered in a completed picture of the system due to its ability to
induce rapid oscillations in the signalling system [59].
Acknowledgements
J.V., O.R. and E.B.C. are equal contributors. MCF-10A cells were a kind gift of Steven J.
Santner. The authors would like to thank Anne Lempens for helping to generate the ERK-
expression vectors. This work was supported by the European Commission 6th
Framework
program and as part of the COSBICS project under contract LSHG-CT-2004-512060
(www.sbi.uni-rostock.de/cosbics). The contribution of J.V. is partly funded by the German
Federal Ministry of Education and Research (BMBF) as part of the project CALSYS-FORSYS
under contract 0315264 (www.sbi.uni-rostock.de/calsys). O.W. acknowledges support by the
Helmholtz Society within their Systems Biology Alliance. W.K. is supported by Science
Foundation Ireland under Grant No. 06/CE/B1129. J.R.B and E.B.C. acknowledge support by
the Spanish Ministry of Science and Innovation (MICINN project MultiSysBio ref. DPI2008-
06880-C03-02).
References 1. Dhillon AS, Hagan S, Rath O, Kolch W (2007) MAP kinase signalling pathways in cancer. Oncogene 26,
3279-3290.
2. Yoon S, Seger R (2006) The extracellular signal-regulated kinase: multiple substrates regulate diverse
cellular functions. Growth Factors 24, 21-44.
3. Kolch W (2005) Coordinating ERK/MAPK signalling through scaffolds and inhibitors. Nat Rev Mol Cell
Biol 6, 827-837.
4. von Kriegsheim A, Baiocchi D, Birtwistle M, Sumpton D, Bienvenut W et al. (2009) Cell fate decisions are
specified by the dynamic ERK interactome. Nat Cell Biol. 11(12):1458-64.
5. Granovsky, A.E., and Rosner, M.R. (2008). Raf kinase inhibitory protein: a signal transduction modulator
and metastasis suppressor. Cell Res 18, 452-457.
6. Yeung K, Seitz T, Li S, Janosch P, McFerran B, et al. (1999) Suppression of Raf-1 kinase activity and
MAP kinase signalling by RKIP. Nature 401(6749):173-7.
7. Hagan S, Al-Mulla F, Mallon E, Oien K, Ferrier et al. (2005) Reduction of Raf-1 kinase inhibitor protein
expression correlates with breast cancer metastasis. Clin. Cancer Res. 11(2005):7392-7.
8. Yeung K, Janosch P, McFerran B, Rose DW, Mischak HJM, et al. (2000) Mechanism of suppression of the
Raf/MEK/extracellular signal-regulated kinase pathway by the raf kinase inhibitor protein. Mol. Cell. Biol.
20:3079-85.
9. Heinrich R, Schuster S (1996) The Regulation of Cellular Systems. Chapman and Hall, New York.
10. Voit EO (2000) Computational Analysis of Biochemical Systems. A Practical Guide for Biochemists and
Molecular Biologists. Cambridge University Press,UK.
11. Van Kampen, NG (2001) Stochastic Processes in Physics and Chemistry (2nd
edition). Elsevier, Amsterdam.
12. Vera J, Wolkenhauer O (2008) A system biology approach to understand functional activity of cell
communication systems. Methods Cell Biol. 2008;90:399-415.

29
13. Akutsu T, Miyano S, Kuhara S (2000) Inferring qualitative relations in genetic networks and metabolic
pathways. Bioinformatics 16(8):727-734.
14. Kikuchi S, Tominaga D, Arita M, Takahashi K, Tomita M (2003) Dynamic modeling of genetic networks
using genetic algorithm and S-system. Bioinformatics 19(5):643–650.
15. Vera J, Balsa-Canto E, Wellstead P, Banga JR, Wolkenhauer O (2007) Power-Law Models of Signal
Transduction Pathways. Cellular Signalling 19:1531-41.
16. Vera J, Bachmann J, Pfeifer AC, Becker V, Hormiga J et al. (2008) A systems biology approach to analyse
amplification in the JAK2-STAT5 signalling pathway. BMC Systems Biology 2, 38.
17. Vera J, Millat T, Kolch W and Wolkenhauer O (2008) Dynamics of receptor and protein transducer
homodimerisation. BMC Systems Biology 2:92.
18. Vera J, Schultz J, Ibrahim S, Raatz Y, Wolkenhauer O et al. (2010) Dynamical effects of epigenetic
silencing of 14-3-3sigma expression. Mol Biosyst, 6(1):254-63.
19. Soule, HD, Maloney, TM, Wolman SR, Peterson WD, Brenz R et al. (1990) Isolation and characterization
of a spontaneously immortalized human breast epithelial cell line, MCF-10. Cancer Res. 50: 6075–6086.
20. Savageau MA (1969) Biochemical systems analysis. I. Some mathematical properties of the rate law for the
component enzymatic reactions. J Theor Biol. 25(3):365-9
21. Alvarez-Vasquez F, Sims KJ, Cowart LA, Okamoto Y, Voit EO et al. (2005) Simulation and validation of
modelled sphingolipid metabolism in Saccharomyces cerevisiae. Nature. 2005 Jan 27;433(7024):425-30.
22. Atkinson MR, Savageau MA, Myers JT, Ninfa AJ (2003) Development of genetic circuitry exhibiting
toggle switch or oscillatory behavior in Escherichia coli. Cell. 2003 May 30;113(5):597-607.
23. Hormiga J, González-Alcón C, Sevilla A, Cánovas M and Torres NV (2010) Quantitative analysis of the
dynamic signaling pathway involved in the cAMP mediated induction of l-carnitine biosynthesis in E. coli
cultures.Mol Biosyst. 2010 Apr;6(4):699-71
24. Nikolov S, Vera J, Rath O, Kolch W, Wolkenhauer O (2009) Role of inhibitory proteins as modulators of
oscillations in NFB signalling.IET Syst Biol., 3(2):59-76.
25. Lai X, Nikolov S, Wolkenhauer O, Vera J. (2009) A multi-level model accounting for the effects of JAK2-
STAT5 signal modulation in erythropoiesis. Comput Biol Chem., 33(4):312-24
26. Alves R, Savageau MA (2000) Extending the method of mathematically controlled comparison to include
numerical comparisons. Bioinformatics.; 16(9):786-9
27. Vera J, de Atauri P, Cascante M, Torres NV (2003) Multicriteria optimization of biochemical systems by
linear programming: application to production of ethanol by Saccharomyces cerevisiae. Biotechnol
Bioeng.; 83(3):335-43
28. Veflingstad SR, Almeida J, Voit EO (2004) Priming nonlinear searches for pathway identification. Theor
Biol Med Model. 14;1:8.
29. Vilaprinyo E, Alves R, Sorribas A (2006) Use of physiological constraints to identify quantitative design
principles for gene expression in yeast adaptation to heat shock. BMC Bioinformatics.; 7:184.
30. Kimura S, Ide K, Kashihara A, Kano M, Hatakeyama M et al. (2005) Inference of S-system models of
genetic networks using a cooperative coevolutionary algorithm. Bioinformatics 21(7):1154-1163.
31. Vilela M, Chou IC, Vinga S, Vasconcelos AT, Voit EO et al. (2008) Parameter optimization in S-system
models. BMC Syst Biol. 16;2:35.
32. Schwacke JH, Voit EO (2005) Computation and analysis of time-dependent sensitivities in Generalized
Mass Action systems. J. Theor. Biol. 236(1): 21-38
33. Schwacke JH, Voit EO (2007) The potential for signal integration and processing in interacting MAP
kinase cascades. J. Theor. Biol. 246(4): 604-620
34. Kholodenko BN (2006) Cell-signalling dynamics in time and space. Nat Rev Mol Cell Biol.; 7(3):165-76
35. Schittkowski K (2002). Numerical Data Fitting in Dynamical Systems – A Practical Introduction with
Applications and Software. Kluwer Academic.
36. Vilela M, Vinga S, Grivet Mattoso Maia MA, et al. (2009) Identification of neutral biochemical network
models from time series data. BMC Systems Biology, 3:47.
37. Chou I-Chun, Voit EO (2009) Recent developments in parameter estimation and structure identification of
biochemical and genomic systems. Mathematical Biosciences, 219: 57-83.
38. Srinath S, Gunawan R (2010) Parameter identifiability of power-law biochemical system models. J. of
Biotechnology, In press. doi: 10.1016/j.jbiotec.2010.02.019
39. Balsa-Canto E, Alonso AA, Banga JR (2008) Computational Procedures for Optimal Experimental Design
in Biological Systems. IET Systems Biology 2(4):163-172
40. Banga JR, Balsa-Canto E (2008) Parameter estimation and optimal experimental design. Essays in
Biochemistry 45:195–210.
41. Balsa-Canto E, Alonso AA, Banga JR (2010) An iterative identification procedure for dynamic modeling of
biochemical networks. BMC Systems Biology, 4:11.

30
42. Mendes P, Kell DB (1998) Nonlinear optimization of biochemical pathways: Applications to metabolic
engineering and parameter estimation. Bioinformatics, 14:869-883.
43. Moles C, Mendes P, Banga J (2003) Parameter estimation in biochemical pathways: a comparison of global
optimization methods. Genome Research , 13:2467-2474.
44. Rodriguez-Fernandez M, Egea JA, Banga JR (2006) Novel Metaheuristic for Parameter Estimation in
Nonlinear Dynamic Biological Systems. BMC Bioinformatics 7:483.
45. Sugimoto M, Kikuchi S, Tomita M (2005) Reverse engineering of biochemical equations from time-course
data by means of genetic programming. BioSystems, 80:155-164.
46. Egea J A, Rodriguez-Fernandez M, Banga JR, Martí R (2007) Scatter Search for Chemical and Bio-Process
Optimization. J. Global Optim. 37(3):481-503.
47. Balsa-Canto E, Peifer M, Banga JR et al (2008) Hybrid optimization method with general switching
strategy for parameter estimation. BMC Systems Biology, 2:26.
48. Ljung L (1999) System identification: Theory for the user. Prentice Hall, New Jersey.
49. Catalanotti F, Reyes G, Jesenberger V, Galabova-Kovacs G et al. (2009) Input-output behavior of ErbB
signaling pathways as revealed by a mass action model trained against dynamic data. Mol Syst Biol.; 5:239.
50. Cho KH, Shin SY, Kim HW, Wolkenhauer O, McFerran B et al. (2003) Mathematical Modelling of the
Influence of RKIP on the ERK Signalling Pathway. In Computational Methods in Systems Biology, G.
Goos, J. Hartmanis, and J. van Leeuwen, eds. (Springer Verlag), pp. 127-141.
51. Shin SY, Rath O, Choo SM, Fee F, McFerran et al. (2009) Positive- and negative-feedback regulations
coordinate the dynamic behavior of the Ras-Raf-MEK-ERK signal transduction pathway. J Cell Sci 122,
425-435.
52. Heyman J (2006) Quantification of Activated Signal Transduction Proteins Using Fast Activated Cell-
based ELISAs (FACETM). Nature Application Notes. doi:10.1038/an1562
53. Leis JR, Kramer MA (1985) Sensitivity analysis of systems of differential and algebraic equations. Comp.
& Chem. Eng. 9 (3), 93–96.
54. Kholodenko B (2000) Negative feedback and ultrasensitivity can bring about oscillations in the mitogen-
activated protein kinase cascades. Eur. J. Biochem., 2000, 267, 1583-1588
55. Schoeberl B, Eichler-Jonsson C, Gilles ED, Müller G. (2002) Computational modeling of the dynamics of
the MAP kinase cascade activated by surface and internalized EGF receptors. Nat Biotechnol.; 20(4):370-5.
56. Chen WW, Schoeberl B, Jasper PJ, Niepel M, Nielsen UB et al. (2009) Input-output behavior of ErbB
signaling pathways as revealed by a mass action model trained against dynamic data. Mol Syst Biol.; 5:239.
57. Santos SD, Verveer PJ, Bastiaens PI (2007) Growth factor-induced MAPK network topology shapes Erk
response determining PC-12 cell fate. Nat Cell Biol. 2007 Mar;9(3):324-30
58. Schilling M, Maiwald T, Hengl S, Winter D, Kreutz C et al. (2009) Theoretical and experimental analysis
links isoform-specific ERK signalling to cell fate decisions. Mol Syst Biol. 2009;5:334
59. Shankaran H, Ippolito DL, Chrisler WB, Resat H, Bollinger N et al. (2009) Rapid and sustained nuclear-
cytoplasmic ERK oscillations induced by epidermal growth factor. Mol Syst Biol, 5:332.