Linking inhibitory control to math achievement via comparison ...
16
Cognition 214 (2021) 104767 Available online 11 June 2021 0010-0277/© 2021 Elsevier B.V. All rights reserved. Linking inhibitory control to math achievement via comparison of conflicting decimal numbers Linsah Coulanges a, 1 , Roberto A. Abreu-Mendoza a , Sashank Varma b , Melina R. Uncapher c , Adam Gazzaley c , Joaquin Anguera c , Miriam Rosenberg-Lee a, d, * a Department of Psychology, Rutgers University, Newark, USA b School of Interactive Computing and School of Psychology, Georgia Tech, USA c Neuroscape, Department of Neurology, Weill Institute for the Neurosciences, University of California, San Francisco, USA d Behavioral Neural Sciences Graduate Program, Rutgers University, Newark, USA A R T I C L E INFO Keywords: Inhibitory control Rational numbers Decimals Executive functions Mathematics achievement Individual differences ABSTRACT The relationship between executive functions (EF) and academic achievement is well-established, but leveraging this insight to improve educational outcomes remains elusive. Here, we propose a framework for relating the role of specific EF on specific precursor skills that support later academic learning. Starting from the premise that executive functions contribute to general math skills both directly – supporting the execution of problem solving strategies – and indirectly – supporting the acquisition of precursor mathematical content, we hypothesize that the contribution of domain-general EF capacities to precursor skills that support later learning can help explain relations between EF and overall math skills. We test this hypothesis by examining whether the contribution of inhibitory control on general math knowledge can be explained by inhibition’s contribution to processing rational number pairs that conflict with individual’s prior whole number knowledge. In 97 college students (79 female, age = 20.58 years), we collected three measures of EF: working memory (backwards spatial span), in- hibition (color-word Stroop) and cognitive flexibility (task switching), and timed and untimed standardized measures of math achievement. Our target precursor skill was a decimals comparison task where correct re- sponses were inconsistent with prior whole number knowledge (e.g., 0.27 vs. 0.9). Participants performed worse on these trials relative to the consistent decimals pairs (e.g., 0.2 vs. 0.87). Individual differences in the Stroop task predicted performance on inconsistent decimal comparisons, which in turn predicted general math achievement. With respect to relating inhibitory control to math achievement, Stroop performance was an in- dependent predictor of achievement after accounting for age, working memory and cognitive flexibility, but decimal performance mediated this relationship. Finally, we found inconsistent decimals performance mediated the relationship of inhibition with rational number performance, but not other advanced mathematical concepts. These results pinpoint the specific contribution of inhibitory control to rational number understanding, and more broadly are consistent with the hypothesis that acquisition of foundational mathematical content can explain the relationships between executive functions and academic outcomes, making them promising targets for intervention. 1. Introduction Robust evidence for relations between executive functions (EF) and academic achievement has accumulated for decades (Diamond, 2013; Peng, Namkung, Barnes, & Sun, 2016; Zelazo, Blair, & Willoughby, 2017). Yet, the practical utility of this insight has been limited: efforts to train executive functions in order to improve educational outcomes have largely failed (Melby-Lervag & Hulme, 2013). A separate line of research has focused on identifying early domain specific skills and capacities, which predict later achievement. By analogy to the role of phonological awareness in reading, tasks like nonsymbolic and symbolic comparison and estimation have been proposed as precursor skills in mathematics (De Smedt, No¨ el, Gilmore, & Ansari, 2013; Gersten & Chard, 1999; Halberda, Mazzocco, & Feigenson, 2008; Sasanguie, Lyons, De Smedt, & * Corresponding authors. E-mail address: [email protected] (M. Rosenberg-Lee). 1 Linsah Coulanges is now at the Department of Psychology, University of Pittsburgh, USA. Contents lists available at ScienceDirect Cognition journal homepage: www.elsevier.com/locate/cognit https://doi.org/10.1016/j.cognition.2021.104767 Received 5 June 2020; Received in revised form 30 April 2021; Accepted 5 May 2021
-
Upload
khangminh22 -
Category
Documents
-
view
2 -
download
0
Transcript of Linking inhibitory control to math achievement via comparison ...

Cognition 214 (2021) 104767
Available online 11 June 20210010-0277/© 2021 Elsevier B.V. All rights reserved.
Linking inhibitory control to math achievement via comparison of conflicting decimal numbers
Linsah Coulanges a,1, Roberto A. Abreu-Mendoza a, Sashank Varma b, Melina R. Uncapher c, Adam Gazzaley c, Joaquin Anguera c, Miriam Rosenberg-Lee a,d,*
a Department of Psychology, Rutgers University, Newark, USA b School of Interactive Computing and School of Psychology, Georgia Tech, USA c Neuroscape, Department of Neurology, Weill Institute for the Neurosciences, University of California, San Francisco, USA d Behavioral Neural Sciences Graduate Program, Rutgers University, Newark, USA
A R T I C L E I N F O
Keywords: Inhibitory control Rational numbers Decimals Executive functions Mathematics achievement Individual differences
A B S T R A C T
The relationship between executive functions (EF) and academic achievement is well-established, but leveraging this insight to improve educational outcomes remains elusive. Here, we propose a framework for relating the role of specific EF on specific precursor skills that support later academic learning. Starting from the premise that executive functions contribute to general math skills both directly – supporting the execution of problem solving strategies – and indirectly – supporting the acquisition of precursor mathematical content, we hypothesize that the contribution of domain-general EF capacities to precursor skills that support later learning can help explain relations between EF and overall math skills. We test this hypothesis by examining whether the contribution of inhibitory control on general math knowledge can be explained by inhibition’s contribution to processing rational number pairs that conflict with individual’s prior whole number knowledge. In 97 college students (79 female, age = 20.58 years), we collected three measures of EF: working memory (backwards spatial span), in-hibition (color-word Stroop) and cognitive flexibility (task switching), and timed and untimed standardized measures of math achievement. Our target precursor skill was a decimals comparison task where correct re-sponses were inconsistent with prior whole number knowledge (e.g., 0.27 vs. 0.9). Participants performed worse on these trials relative to the consistent decimals pairs (e.g., 0.2 vs. 0.87). Individual differences in the Stroop task predicted performance on inconsistent decimal comparisons, which in turn predicted general math achievement. With respect to relating inhibitory control to math achievement, Stroop performance was an in-dependent predictor of achievement after accounting for age, working memory and cognitive flexibility, but decimal performance mediated this relationship. Finally, we found inconsistent decimals performance mediated the relationship of inhibition with rational number performance, but not other advanced mathematical concepts. These results pinpoint the specific contribution of inhibitory control to rational number understanding, and more broadly are consistent with the hypothesis that acquisition of foundational mathematical content can explain the relationships between executive functions and academic outcomes, making them promising targets for intervention.
1. Introduction
Robust evidence for relations between executive functions (EF) and academic achievement has accumulated for decades (Diamond, 2013; Peng, Namkung, Barnes, & Sun, 2016; Zelazo, Blair, & Willoughby, 2017). Yet, the practical utility of this insight has been limited: efforts to train executive functions in order to improve educational outcomes have
largely failed (Melby-Lervag & Hulme, 2013). A separate line of research has focused on identifying early domain specific skills and capacities, which predict later achievement. By analogy to the role of phonological awareness in reading, tasks like nonsymbolic and symbolic comparison and estimation have been proposed as precursor skills in mathematics (De Smedt, Noel, Gilmore, & Ansari, 2013; Gersten & Chard, 1999; Halberda, Mazzocco, & Feigenson, 2008; Sasanguie, Lyons, De Smedt, &
* Corresponding authors. E-mail address: [email protected] (M. Rosenberg-Lee).
1 Linsah Coulanges is now at the Department of Psychology, University of Pittsburgh, USA.
Contents lists available at ScienceDirect
Cognition
journal homepage: www.elsevier.com/locate/cognit
https://doi.org/10.1016/j.cognition.2021.104767 Received 5 June 2020; Received in revised form 30 April 2021; Accepted 5 May 2021

Cognition 214 (2021) 104767
2
Reynvoet, 2017; Siegler & Booth, 2004). Here, we define a precursor skill as a lower-level math task that is thought to index understanding of a foundational mathematical concept.
When studies of precursor skills consider the effects of domain gen-eral skills like EF, they typically report one of two results: either (1) the relationship between the skill and math achievement remains significant after including the EF measure, such as fraction arithmetic predicts later math achievement after controlling for working memory (e.g., Siegler et al., 2012); (2) or EF explains the relationship between the precursor skill and math achievement and the precursor skill is no longer signifi-cant, such as inhibitory control explaining the contribution of nonsymbolic dot comparison tasks to math achievement (e.g., Gilmore et al., 2013). This all-or-none approach overlooks the fact that in either case, EF is usually explaining some, but not all, of the variance in the relationship between the precursor skill and the academic outcome.
Rather than pit domain-general and domain-specific capacities against each other, here, we outline a more nuanced framework for relating EF to mathematics. Specifically, we propose that executive functions contribute to general math skills both directly – supporting the execution of problem solving strategies – and indirectly – supporting the acquisition of precursor mathematical content (Bascandziev, Tardiff, Zaitchik, & Carey, 2018) (Fig. 1A), which in turn support broader mathematical learning. Thus, the crucial prediction of this framework is that individual differences in specific precursor mathematical skills should explain (some of) the relationship between specific executive functions and overall math skills. Moreover, we should see these re-lationships especially in cases where there is a theoretically motivated relationship between the specific executive function, the precursor skill,
and the mathematical content domain. In this study, we investigate this hypothesis for the case of inhibitory control and rational number processing.
1.1. Inhibitory control contributions to math achievement
Among the canonical measures of EF – working memory, the ability to hold and manipulate information in mind; inhibitory control, the capacity to withhold prepotent responses; and cognitive flexibility, the ability to switch between task goals (Diamond, 2013) – recent meta analyses confirm the robust contribution of working memory to math achievement and a smaller but consistent contribution of cognitive flexibility (Friso-van den Bos, van der Ven, Kroesbergen, & van Luit, 2013; Peng et al., 2016). Less clear is the contribution of inhibitory control to math learning, as findings in this domain are not as robust, especially when taking into account other EF measures (Bull & Lee, 2014; Lee & Lee, 2019; Van Dooren & Inglis, 2015). Moreover, the majority of work on executive function has been done in preschool and primary school aged children, with a growing focus on middle and secondary school. Given the ongoing development of executive func-tions in adolescence and early adulthood (Constantinidis & Luna, 2019), the first aim of this study was to establish the contributions of inhibitory control, independent of working memory and cognitive flexibility, to math achievement among a sample of college undergraduates (Fig. 1A, Direct Pathway).
1.2. Role of inhibitory control in rational number understanding
One possible explanation for the relatively weaker effects for inhi-bition compared to working memory is that this EF capacity may be particularly important for mastering mathematical domains that involve acquiring new knowledge that contradicts one’s prior knowledge (Wil-kinson et al., 2019). Indeed, recent work in science learning reveals a specific role for inhibition in domains that require conceptual change, such as vitalist theories of biology, but not in the rapid acquisition of factual knowledge (Bascandziev et al., 2018). Broad measures of mathematics achievement typically mix together these kinds of learning, potentially washing out the effects of inhibitory control. Among math-ematical content domains, rational numbers are often cited as a para-digmatic example of conceptual change, requiring expanding one’s definition of number beyond the discrete count list view of whole numbers (Carey, 2011; Vamvakoussi & Vosniadou, 2004), making it an ideal domain to examine the need for inhibitory control in mathematics learning.
Rational numbers are a critical bottleneck in the elementary school curriculum (National Mathematics Advisory Panel, 2008). One proposal for the source of difficulties with rational number learning comes from the fact that properties of rational numbers often contradict learners’ prior knowledge of whole numbers (Carey, 2011; Rosenberg-Lee, 2021). Applying whole number properties when working with rational numbers – termed whole number bias (Ni & Zhou, 2005) – manifests in children not understanding that, for example, multiplying rationals can result in a smaller number or that there is an infinite set of rational numbers between any two numbers (Kainulainen, McMullen, & Lehti-nen, 2017; Van Hoof, Degrande, Ceulemans, Verschaffel, & Van Dooren, 2018). The classic demonstration of this phenomenon is in fraction comparison, where individuals are slower and less accurate to select the larger fractions when the correct response is incongruent with whole number knowledge (e.g., 1/2 is larger than 1/9, yet 2 is smaller than 9) (e.g., Bonato, Fabbri, Umilta, & Zorzi, 2007). Moreover, negative priming studies demonstrate that solving these counterintuitive prob-lems lowers performance on subsequent consistent problems suggesting participants have inhibited their whole number knowledge, making it less available for consistent problems (Rossi, Vidal, Letang, Houde, & Borst, 2019).
Despite general agreement that resolving interference from whole
Indirect Pathway-1
ExecutiveFunction
AcademicOutcome
PrecursorSkill
Direct Pathway
Indirect Pathway-2
StroopRCS
WJ -Calculation
InconsistentDecimals
A
B
c = .214*
a x b = .098*
a = .265* b = .371***
c' = .116
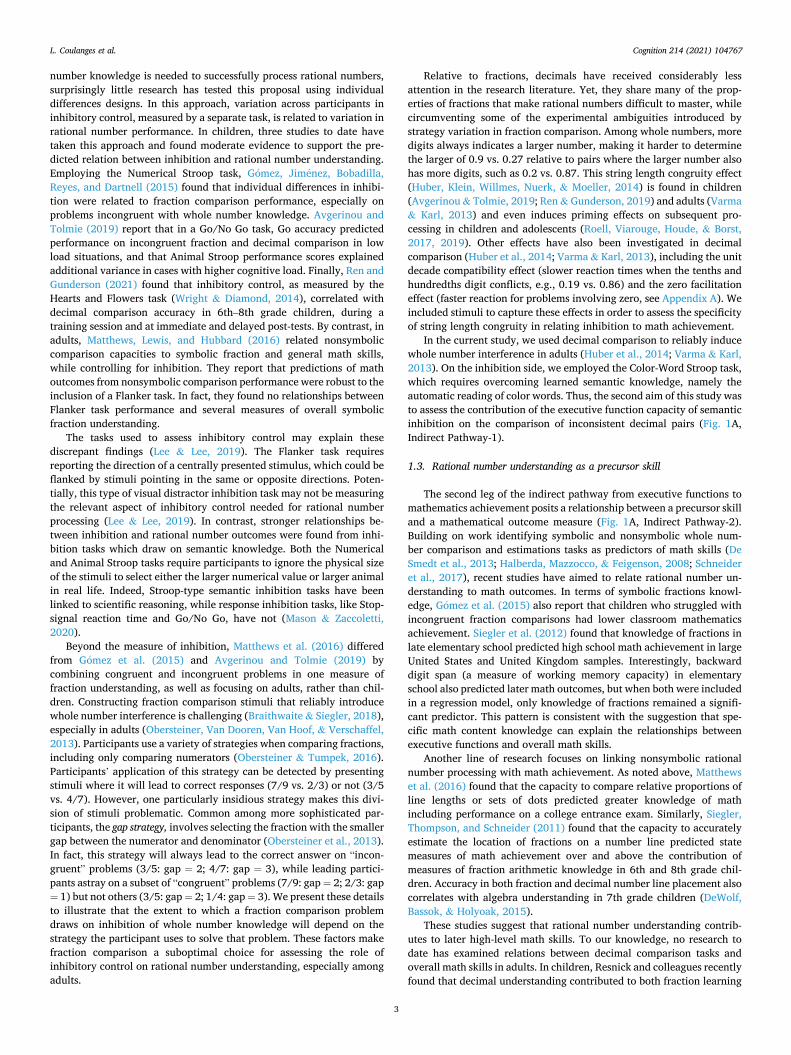
Fig. 1. A) Framework for relating executive functions to academic outcomes. The Direct Pathway captures the contribution of a specific executive function on the academic measure. The Indirect Pathways captures the contribution of that executive function in supporting content learning (Indirect Pathway-1), which in turn contributes to performance on the academic measure (Indirect Pathway-2). B) Mediation analysis of the role of inhibitory control on mathe-matics achievement via decimal processing. The total effect of Stroop Rate Correct Score (RCS, inhibitory control) on Woodcock-Johnson (WJ) – Calcu-lation scores (math achievement) is significant (c = .214*, standardized betas). Stroop RCS also predicts Mixed Inconsistent Decimals performance (a = .265*), which in turn predicts WJ – Calculation scores (b = .371***). When including the mediating term, the indirect mediation effect is significant (a x b = .098**), while the effect of Stroop RCS on calculation performance is no longer signif-icant (c’ = .116). * p < .05, ** p < .01, *** p < .001.
L. Coulanges et al.
Cognition 214 (2021) 104767
3
number knowledge is needed to successfully process rational numbers, surprisingly little research has tested this proposal using individual differences designs. In this approach, variation across participants in inhibitory control, measured by a separate task, is related to variation in rational number performance. In children, three studies to date have taken this approach and found moderate evidence to support the pre-dicted relation between inhibition and rational number understanding. Employing the Numerical Stroop task, Gomez, Jimenez, Bobadilla, Reyes, and Dartnell (2015) found that individual differences in inhibi-tion were related to fraction comparison performance, especially on problems incongruent with whole number knowledge. Avgerinou and Tolmie (2019) report that in a Go/No Go task, Go accuracy predicted performance on incongruent fraction and decimal comparison in low load situations, and that Animal Stroop performance scores explained additional variance in cases with higher cognitive load. Finally, Ren and Gunderson (2021) found that inhibitory control, as measured by the Hearts and Flowers task (Wright & Diamond, 2014), correlated with decimal comparison accuracy in 6th–8th grade children, during a training session and at immediate and delayed post-tests. By contrast, in adults, Matthews, Lewis, and Hubbard (2016) related nonsymbolic comparison capacities to symbolic fraction and general math skills, while controlling for inhibition. They report that predictions of math outcomes from nonsymbolic comparison performance were robust to the inclusion of a Flanker task. In fact, they found no relationships between Flanker task performance and several measures of overall symbolic fraction understanding.
The tasks used to assess inhibitory control may explain these discrepant findings (Lee & Lee, 2019). The Flanker task requires reporting the direction of a centrally presented stimulus, which could be flanked by stimuli pointing in the same or opposite directions. Poten-tially, this type of visual distractor inhibition task may not be measuring the relevant aspect of inhibitory control needed for rational number processing (Lee & Lee, 2019). In contrast, stronger relationships be-tween inhibition and rational number outcomes were found from inhi-bition tasks which draw on semantic knowledge. Both the Numerical and Animal Stroop tasks require participants to ignore the physical size of the stimuli to select either the larger numerical value or larger animal in real life. Indeed, Stroop-type semantic inhibition tasks have been linked to scientific reasoning, while response inhibition tasks, like Stop- signal reaction time and Go/No Go, have not (Mason & Zaccoletti, 2020).
Beyond the measure of inhibition, Matthews et al. (2016) differed from Gomez et al. (2015) and Avgerinou and Tolmie (2019) by combining congruent and incongruent problems in one measure of fraction understanding, as well as focusing on adults, rather than chil-dren. Constructing fraction comparison stimuli that reliably introduce whole number interference is challenging (Braithwaite & Siegler, 2018), especially in adults (Obersteiner, Van Dooren, Van Hoof, & Verschaffel, 2013). Participants use a variety of strategies when comparing fractions, including only comparing numerators (Obersteiner & Tumpek, 2016). Participants’ application of this strategy can be detected by presenting stimuli where it will lead to correct responses (7/9 vs. 2/3) or not (3/5 vs. 4/7). However, one particularly insidious strategy makes this divi-sion of stimuli problematic. Common among more sophisticated par-ticipants, the gap strategy, involves selecting the fraction with the smaller gap between the numerator and denominator (Obersteiner et al., 2013). In fact, this strategy will always lead to the correct answer on “incon-gruent” problems (3/5: gap = 2; 4/7: gap = 3), while leading partici-pants astray on a subset of “congruent” problems (7/9: gap = 2; 2/3: gap = 1) but not others (3/5: gap = 2; 1/4: gap = 3). We present these details to illustrate that the extent to which a fraction comparison problem draws on inhibition of whole number knowledge will depend on the strategy the participant uses to solve that problem. These factors make fraction comparison a suboptimal choice for assessing the role of inhibitory control on rational number understanding, especially among adults.
Relative to fractions, decimals have received considerably less attention in the research literature. Yet, they share many of the prop-erties of fractions that make rational numbers difficult to master, while circumventing some of the experimental ambiguities introduced by strategy variation in fraction comparison. Among whole numbers, more digits always indicates a larger number, making it harder to determine the larger of 0.9 vs. 0.27 relative to pairs where the larger number also has more digits, such as 0.2 vs. 0.87. This string length congruity effect (Huber, Klein, Willmes, Nuerk, & Moeller, 2014) is found in children (Avgerinou & Tolmie, 2019; Ren & Gunderson, 2019) and adults (Varma & Karl, 2013) and even induces priming effects on subsequent pro-cessing in children and adolescents (Roell, Viarouge, Houde, & Borst, 2017, 2019). Other effects have also been investigated in decimal comparison (Huber et al., 2014; Varma & Karl, 2013), including the unit decade compatibility effect (slower reaction times when the tenths and hundredths digit conflicts, e.g., 0.19 vs. 0.86) and the zero facilitation effect (faster reaction for problems involving zero, see Appendix A). We included stimuli to capture these effects in order to assess the specificity of string length congruity in relating inhibition to math achievement.
In the current study, we used decimal comparison to reliably induce whole number interference in adults (Huber et al., 2014; Varma & Karl, 2013). On the inhibition side, we employed the Color-Word Stroop task, which requires overcoming learned semantic knowledge, namely the automatic reading of color words. Thus, the second aim of this study was to assess the contribution of the executive function capacity of semantic inhibition on the comparison of inconsistent decimal pairs (Fig. 1A, Indirect Pathway-1).
1.3. Rational number understanding as a precursor skill
The second leg of the indirect pathway from executive functions to mathematics achievement posits a relationship between a precursor skill and a mathematical outcome measure (Fig. 1A, Indirect Pathway-2). Building on work identifying symbolic and nonsymbolic whole num-ber comparison and estimations tasks as predictors of math skills (De Smedt et al., 2013; Halberda, Mazzocco, & Feigenson, 2008; Schneider et al., 2017), recent studies have aimed to relate rational number un-derstanding to math outcomes. In terms of symbolic fractions knowl-edge, Gomez et al. (2015) also report that children who struggled with incongruent fraction comparisons had lower classroom mathematics achievement. Siegler et al. (2012) found that knowledge of fractions in late elementary school predicted high school math achievement in large United States and United Kingdom samples. Interestingly, backward digit span (a measure of working memory capacity) in elementary school also predicted later math outcomes, but when both were included in a regression model, only knowledge of fractions remained a signifi-cant predictor. This pattern is consistent with the suggestion that spe-cific math content knowledge can explain the relationships between executive functions and overall math skills.
Another line of research focuses on linking nonsymbolic rational number processing with math achievement. As noted above, Matthews et al. (2016) found that the capacity to compare relative proportions of line lengths or sets of dots predicted greater knowledge of math including performance on a college entrance exam. Similarly, Siegler, Thompson, and Schneider (2011) found that the capacity to accurately estimate the location of fractions on a number line predicted state measures of math achievement over and above the contribution of measures of fraction arithmetic knowledge in 6th and 8th grade chil-dren. Accuracy in both fraction and decimal number line placement also correlates with algebra understanding in 7th grade children (DeWolf, Bassok, & Holyoak, 2015).
These studies suggest that rational number understanding contrib-utes to later high-level math skills. To our knowledge, no research to date has examined relations between decimal comparison tasks and overall math skills in adults. In children, Resnick and colleagues recently found that decimal understanding contributed to both fraction learning
L. Coulanges et al.

Cognition 214 (2021) 104767
4
and math achievement scores (Resnick, Rinne, Barbieri, & Jordan, 2019). If processing inconsistent decimals indexes a more general measure of rational number understanding (Avgerinou & Tolmie, 2019), then we might expect relations to general math skills comparable to those found with fraction tasks. Potentially, the effects could be even stronger for decimals as they are less contaminated by strategy variation than fractions. Alternatively, fractions may be a particularly challenging concept relative to decimals (Kainulainen et al., 2017; Van Hoof et al., 2018), and lack of variation in the capacity among adults may render decimal comparison a weak predictor of math skills. Thus, the third aim of this study was to examine relations between decimal comparison performance (especially of inconsistent problems) and mathematics achievement (Fig. 1A, Indirect Pathway-2).
As previous studies have found that executive functions vary in their contribution depending on the type of math measure (Lee & Bull, 2016; Peng et al., 2016), here we also decomposed our primary outcome measure, the Calculation subtest Woodcock Johnson-III, into two sets of items, rational numbers and advanced concepts not involving rational numbers (i.e., logarithms, trigonometry, calculus, etc.). This division enabled us to assess the extent to which variation in decimal perfor-mance could explain the contribution of inhibitory control to rational numbers versus other challenging mathematical content. If decimal understanding is a precursor to a broad range of mathematical topics, we would expect it to explain the contribution of inhibition to both sub- measures. Alternatively, it may be a particular stumbling block in rational number learning, and hence explain relatively more of the contribution of inhibition to this domain than advanced concepts such as algebra and trigonometry.
1.4. The current study
In the current study, we aimed to relate executive function measures to math achievement via a precursor skill. We employed tablet-based rapid assessments of EF capacities (Younger et al., 2021, April 20). Working memory and inhibition were assessed using computerized versions of classic tasks in the field: backward Corsi Block Tapping to measure visual spatial working memory and Color-Word Stroop to measure inhibitory control. Cognitive flexibility was measured using TaskSwitch, a task where participants switched between applying rules to evaluate a centrally presented visual stimuli. Our target precursor skill was a decimal comparison task where correct responses were inconsistent with prior whole number knowledge (e.g., 0.27 vs. 0.9). In terms of mathematics achievement, our primary outcome measure was the Calculation subtest of the Woodcock Johnson; we also collected Math Fluency to account for lower level math knowledge. Also, relations between EF factors and mathematical outcomes likely vary depending on the type of mathematics assessed (Lee & Bull, 2016; Peng et al., 2016). Accordingly, we decomposed our primary untimed measure of mathematics knowledge into a rational number and advanced math sub- scores.
We first sought to establish that inhibitory control is an independent predictor of math achievement in young adults (Direct Pathway). Next, we hypothesized that individual differences in inhibitory control would predict inconsistent decimal comparison performance (Indirect Pathway-1), which in turn would predict mathematical outcomes (In-direct Pathway-2). This pattern of results would lend support to our framework, emphasizing that the contributions of executive functions to mathematical outcomes can be explained in part by their role in the acquisition of precursor skills which support advanced mathematical knowledge. Finally, we examined whether inconsistent decimal com-parison performance explains more of the relationship of inhibition with rational numbers than with advanced concepts.
2. Methods
2.1. Participants
Participants were Rutgers University-Newark undergraduate stu-dents taking psychology courses who received course credit for partic-ipation. Among the 114 individuals that participated in the study, technical issues resulted in data loss for 8 participants (2 missing math measures, 1 missing the Decimals task, and 5 missing one or more ex-ecutive function tasks). Only participants with full data sets were included. Further, following Gomez et al. (2015), we only considered data from participants who performed above 30% in overall accuracy on the Decimals task (n = 9 failed to meet this criterion).
The final sample consisted of 97 participants (Mean age = 20.58 years, SD = 1.79, Table 1). Participants were asked both their self- identified gender and their sex assigned at birth. For gender, 79 par-ticipants identified as female and 18 as male. Among the female self- identified, four declined to provide a sex at birth, while among self- identified males one participant gave female as their sex at birth. In all other cases, sex assigned at birth and gender self-identification cor-responded (95% of participants). For race, 28% were Black/African American, 21% were Hispanic/Latino, 19% were Asian/Pacific Islander, 11% Middle Eastern/Arab/Persian and 11% were White/European. The remaining participants identified as other (7%) or declined to answer (3%). In terms of academic major, science majors were most common including psychology (25%), biology (20%), computer science (4%) and 1–2% of students in neuroscience, engineering or nursing. Among the remaining participants with declared majors, area of study included social sciences (8%), criminal justice (7%), humanities (5%), social work (5%), business (3%) and fine arts (1%). Finally, 10% of participants had yet to declare a major and 6% declined to answer.
Based on prior work suggesting common effect sizes in correlational studies of mathematical precursor skills of r = 0.30 (Schneider et al., 2017), we determined that a sample sizes of 84 participants would be sufficient to detect these effects with 80% power and alpha = 0.05. Given prior recruitment rates and the uncertainties of data loss, we reasoned that two semesters of data collection (Fall 2017, Spring 2018) through the departmental participant pool would ensure a sample exceeding that size. Informed consent was obtained prior to data collection and the study was approved by the Rutgers University Insti-tutional Review Board.
2.2. Decimals comparison task
Stimuli, conditions, and task timing were modeled after Experiment 3 of Varma and Karl (2013), except participants did not receive feedback on their performance and some of the stimuli were modified to better balance across conditions (see Appendix A for the full stimuli set). The task was implemented in PsychoPy 1.85.2 (Peirce, 2007), on a 14 in. Lenovo ThinkPad laptop and began with a practice block consisting of two trials of whole number comparison followed by four trials of one-
Table 1 Average performance on standardized math measures (raw scores) and experi-mental task (percent correct, or modified spatial span).
Measure M SD Range
Age (years) 20.58 1.79 18.0–24.8 WJ - Math Fluency 110.40 23.71 50–160 WJ - Calculation 29.11 5.28 14–43 Decimal Comparison 91.9% 8.7% 58.5–99.4% Stroop 85.5% 9.4% 65.3–100% TaskSwitch 72.8% 2.4% 10.0–100% Spatial Span 4.52 1.27 2.0–7.0
Note: Decimals, Stroop & TaskSwitch values represent average percent correct in each task. Spatial Span value is average modified location span. WJ = Wood-cock-Johnson.
L. Coulanges et al.

Cognition 214 (2021) 104767
5
digit decimal comparison. Each trial began with a 500 ms fixation screen, followed by presentation of the decimal pairs for 3000 ms, fol-lowed by a blank screen for 500 ms. Participants were instructed to indicate which decimal was greater by pressing either the “z” key if the larger quantity was on the left or the “m” key if it was on the right (corresponding to the spatial locations of the decimals on the screen). See Fig. 2 for an example of stimulus presentation. All text was rendered in Arial font in white characters with a black background. The decimals stimuli were displayed with letter height of 0.15 (normalized units in PsychoPy), which resulted in numbers of height 1 cm on the laptop.
All decimal stimuli began with “0.”, but differed in number and type of digits following the decimal. 1) Uniform stimuli consisted of pairs where both decimals had 2 digits after the decimal point. 2) Mixed stimuli comprised of one decimal with one digit after the decimal point and the other had 2 digits. Finally, 3) Zero stimuli were constructed by adding a “0” after the single-digit decimal in the Mixed condition. Consistency was also manipulated (consistent and inconsistent) but indexed different effects depending on condition. For Uniform trials, the tenths and hundredths values were manipulated so that either comparing both numbers led to the same conclusion (consistent: 0.21 vs. 0.87) or not (inconsistent: 0.29 vs. 0.83), an effect termed the unit- decade compatibility effect in whole numbers (Nuerk, Moeller, Klein, Willmes, & Fischer, 2011; Nuerk, Weger, & Willmes, 2001). For Mixed stimuli, both the number of digits and the numerical quantity led either to the same conclusion (consistent: 0.2 vs. 0.87) or not (inconsistent: 0.27 vs. 0.9). For the Zero stimuli, adding the zero removes the
inconsistency between number of digits and magnitude; however, we still use the terminology of consistent (0.20 vs. 0.87) and inconsistent (0.27 vs. 0.90) to align with the corresponding Mixed conditions (Appendix A). Including Zero stimuli enabled us to confirm that poorer performance in the Mixed Inconsistent condition was due to interference from the number of digits, not the specific numerical values employed. There were 14 unique pairs in each of the six conditions and each were presented twice – once with the larger stimuli on the right and once with the larger on the left – for a total of 168 trials. Presentation of decimal pairs were counterbalanced across two blocks, with a self-paced break between them, which also reminded participants of the task instructions. We excluded anticipatory responses (reaction times shorter than 250 ms) and outlier responses (reaction times 3 SD above an individual’s mean). After applying these criteria, we analyzed 15,874 (97.9%) out of a total of 16,212 trials. Due to experimenter error one participant had only one block (84 trials) on the Decimals Comparison Task, but otherwise a full data set, and so was included in all analyses. We computed accuracy and reaction times for the six conditions, and our primary measure of interest was accuracy on the Mixed Inconsistent condition.
2.3. Standardized measures of mathematical achievement
Participants were administered the Woodcock Johnson III Test of Achievement (Woodcock, McGrew, & Mather, 2001) subtests of Calcu-lation and Math Fluency, form Version A. Calculation measures a
+
SHAPE
RED WHITE
Timing: AdaptiveInitialized: 800 ms
Congruent
Cue
Delay
Test Probe
Cue Sequence Test Probe
Fixation
Stimulus
500 ms
3000 ms
0.2 0.87+
IncongruentMixed Consistent Mixed Inconsistent
Timing: AdaptiveInitialized: 800 ms
Timing: RandomRange: 800-1200 ms
Timing: RandomRange: 800-1200 ms
StroopDecimal Comparison
TaskSwitch Backward Spatial Span
Fixation
Stimulus
500 ms
3000 ms
0.27 0.9+
1000 ms
1000 ms
1000 ms
Timing: Unlimited
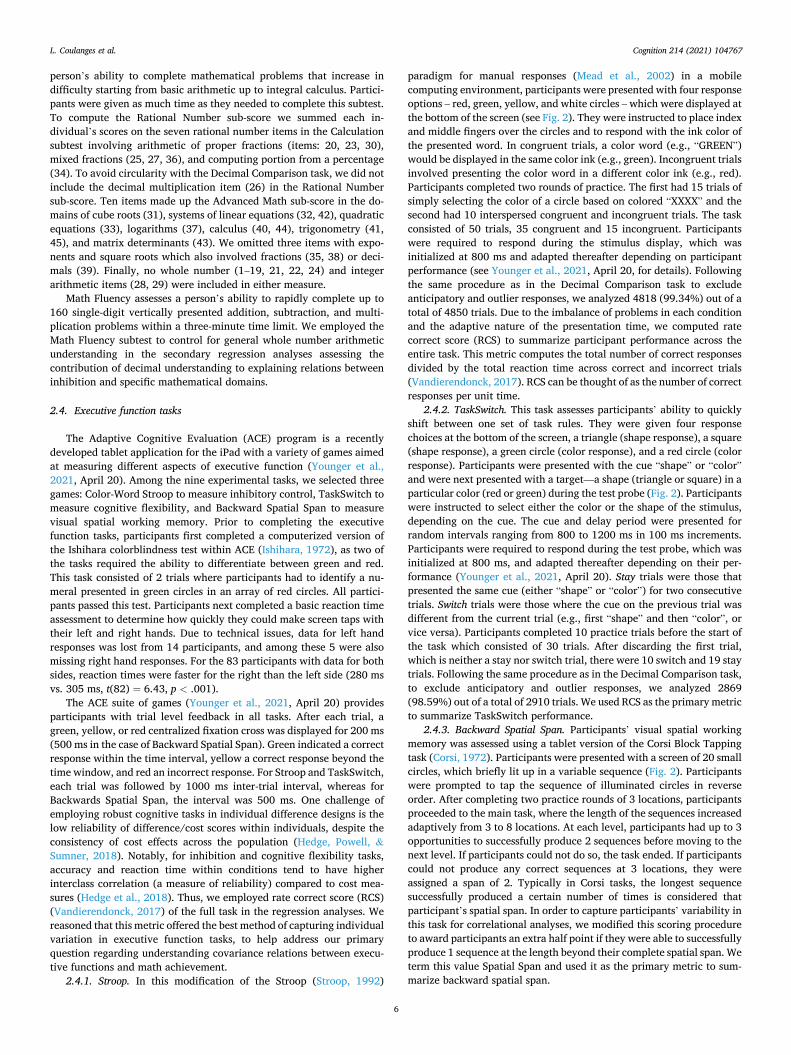
Fig. 2. Schematic representations of experimental tasks. The Decimal Comparison task had a fixed timing structure of 500 ms Fixation cross followed by a 3000 ms Stimulus presentation. Mixed stimuli compared 1 digit decimals with 2 digit decimals which could be Consistent or Inconsistent with whole number knowledge (not shown: Zero and Uniform conditions, see Appendix A). Participants indicated the larger numerical quantity with a left or right keyboard press. Stroop task stimuli were initially presented for 800 ms, but subsequent timing adapted depending on participants’ performance. Participants viewed a centrally presented color word whose ink color could be Congruent or Incongruent, and indicated the font color, via touch screen, of the corresponding colored circle. TaskSwitch task began with a Cue (800–1200 ms) alerting participants to the feature they should report in the test probe, followed by a Delay period with fixation cross (800–1200 ms). In the Test Probe, a centrally presented shape, either a triangle or square, was presented in either green or red. Participants indicated the corresponding value for the cued feature on the touch screen. In this example, the trial began with the cue “shape”, followed by the target of a green triangle. The correct response in this case would be the triangle. Presentation time of the text probe was initially 800 ms, but subsequent timing adapted depending on participants performance. Stay trials were those that presented the same cue (either “shape” or “color”) for two consecutive trials. Switch trials were those where the cue on the previous trial was different from the current trial (e.g., first “shape” and then “color” or vice versa). Backward Spatial Span presented sequences of illuminated circles (Cue Sequence) for 1000 ms each. During the Test Probe, participants had to recreate the sequence in reverse presentation order on the touch screen. Participants had unlimited time to make their responses. (For interpretation of the references to color in this figure legend, the reader is referred to the web version of this article.)
L. Coulanges et al.
Cognition 214 (2021) 104767
6
person’s ability to complete mathematical problems that increase in difficulty starting from basic arithmetic up to integral calculus. Partici-pants were given as much time as they needed to complete this subtest. To compute the Rational Number sub-score we summed each in-dividual’s scores on the seven rational number items in the Calculation subtest involving arithmetic of proper fractions (items: 20, 23, 30), mixed fractions (25, 27, 36), and computing portion from a percentage (34). To avoid circularity with the Decimal Comparison task, we did not include the decimal multiplication item (26) in the Rational Number sub-score. Ten items made up the Advanced Math sub-score in the do-mains of cube roots (31), systems of linear equations (32, 42), quadratic equations (33), logarithms (37), calculus (40, 44), trigonometry (41, 45), and matrix determinants (43). We omitted three items with expo-nents and square roots which also involved fractions (35, 38) or deci-mals (39). Finally, no whole number (1–19, 21, 22, 24) and integer arithmetic items (28, 29) were included in either measure.
Math Fluency assesses a person’s ability to rapidly complete up to 160 single-digit vertically presented addition, subtraction, and multi-plication problems within a three-minute time limit. We employed the Math Fluency subtest to control for general whole number arithmetic understanding in the secondary regression analyses assessing the contribution of decimal understanding to explaining relations between inhibition and specific mathematical domains.
2.4. Executive function tasks
The Adaptive Cognitive Evaluation (ACE) program is a recently developed tablet application for the iPad with a variety of games aimed at measuring different aspects of executive function (Younger et al., 2021, April 20). Among the nine experimental tasks, we selected three games: Color-Word Stroop to measure inhibitory control, TaskSwitch to measure cognitive flexibility, and Backward Spatial Span to measure visual spatial working memory. Prior to completing the executive function tasks, participants first completed a computerized version of the Ishihara colorblindness test within ACE (Ishihara, 1972), as two of the tasks required the ability to differentiate between green and red. This task consisted of 2 trials where participants had to identify a nu-meral presented in green circles in an array of red circles. All partici-pants passed this test. Participants next completed a basic reaction time assessment to determine how quickly they could make screen taps with their left and right hands. Due to technical issues, data for left hand responses was lost from 14 participants, and among these 5 were also missing right hand responses. For the 83 participants with data for both sides, reaction times were faster for the right than the left side (280 ms vs. 305 ms, t(82) = 6.43, p < .001).
The ACE suite of games (Younger et al., 2021, April 20) provides participants with trial level feedback in all tasks. After each trial, a green, yellow, or red centralized fixation cross was displayed for 200 ms (500 ms in the case of Backward Spatial Span). Green indicated a correct response within the time interval, yellow a correct response beyond the time window, and red an incorrect response. For Stroop and TaskSwitch, each trial was followed by 1000 ms inter-trial interval, whereas for Backwards Spatial Span, the interval was 500 ms. One challenge of employing robust cognitive tasks in individual difference designs is the low reliability of difference/cost scores within individuals, despite the consistency of cost effects across the population (Hedge, Powell, & Sumner, 2018). Notably, for inhibition and cognitive flexibility tasks, accuracy and reaction time within conditions tend to have higher interclass correlation (a measure of reliability) compared to cost mea-sures (Hedge et al., 2018). Thus, we employed rate correct score (RCS) (Vandierendonck, 2017) of the full task in the regression analyses. We reasoned that this metric offered the best method of capturing individual variation in executive function tasks, to help address our primary question regarding understanding covariance relations between execu-tive functions and math achievement.
2.4.1. Stroop. In this modification of the Stroop (Stroop, 1992)
paradigm for manual responses (Mead et al., 2002) in a mobile computing environment, participants were presented with four response options – red, green, yellow, and white circles – which were displayed at the bottom of the screen (see Fig. 2). They were instructed to place index and middle fingers over the circles and to respond with the ink color of the presented word. In congruent trials, a color word (e.g., “GREEN”) would be displayed in the same color ink (e.g., green). Incongruent trials involved presenting the color word in a different color ink (e.g., red). Participants completed two rounds of practice. The first had 15 trials of simply selecting the color of a circle based on colored “XXXX” and the second had 10 interspersed congruent and incongruent trials. The task consisted of 50 trials, 35 congruent and 15 incongruent. Participants were required to respond during the stimulus display, which was initialized at 800 ms and adapted thereafter depending on participant performance (see Younger et al., 2021, April 20, for details). Following the same procedure as in the Decimal Comparison task to exclude anticipatory and outlier responses, we analyzed 4818 (99.34%) out of a total of 4850 trials. Due to the imbalance of problems in each condition and the adaptive nature of the presentation time, we computed rate correct score (RCS) to summarize participant performance across the entire task. This metric computes the total number of correct responses divided by the total reaction time across correct and incorrect trials (Vandierendonck, 2017). RCS can be thought of as the number of correct responses per unit time.
2.4.2. TaskSwitch. This task assesses participants’ ability to quickly shift between one set of task rules. They were given four response choices at the bottom of the screen, a triangle (shape response), a square (shape response), a green circle (color response), and a red circle (color response). Participants were presented with the cue “shape” or “color” and were next presented with a target—a shape (triangle or square) in a particular color (red or green) during the test probe (Fig. 2). Participants were instructed to select either the color or the shape of the stimulus, depending on the cue. The cue and delay period were presented for random intervals ranging from 800 to 1200 ms in 100 ms increments. Participants were required to respond during the test probe, which was initialized at 800 ms, and adapted thereafter depending on their per-formance (Younger et al., 2021, April 20). Stay trials were those that presented the same cue (either “shape” or “color”) for two consecutive trials. Switch trials were those where the cue on the previous trial was different from the current trial (e.g., first “shape” and then “color”, or vice versa). Participants completed 10 practice trials before the start of the task which consisted of 30 trials. After discarding the first trial, which is neither a stay nor switch trial, there were 10 switch and 19 stay trials. Following the same procedure as in the Decimal Comparison task, to exclude anticipatory and outlier responses, we analyzed 2869 (98.59%) out of a total of 2910 trials. We used RCS as the primary metric to summarize TaskSwitch performance.
2.4.3. Backward Spatial Span. Participants’ visual spatial working memory was assessed using a tablet version of the Corsi Block Tapping task (Corsi, 1972). Participants were presented with a screen of 20 small circles, which briefly lit up in a variable sequence (Fig. 2). Participants were prompted to tap the sequence of illuminated circles in reverse order. After completing two practice rounds of 3 locations, participants proceeded to the main task, where the length of the sequences increased adaptively from 3 to 8 locations. At each level, participants had up to 3 opportunities to successfully produce 2 sequences before moving to the next level. If participants could not do so, the task ended. If participants could not produce any correct sequences at 3 locations, they were assigned a span of 2. Typically in Corsi tasks, the longest sequence successfully produced a certain number of times is considered that participant’s spatial span. In order to capture participants’ variability in this task for correlational analyses, we modified this scoring procedure to award participants an extra half point if they were able to successfully produce 1 sequence at the length beyond their complete spatial span. We term this value Spatial Span and used it as the primary metric to sum-marize backward spatial span.
L. Coulanges et al.

Cognition 214 (2021) 104767
7
2.5. Experimental procedure
The experimental session consisted of the Decimals Comparison task, completed on a ThinkPad laptop (Lenovo, Hong Kong), followed by the two paper measures of math achievement from the Woodcock Johnson III Tests of Achievement (WJ-III). Participants next completed the ACE tablet assessments of EF on a 9.7 in. iPad 2017 (Apple, Cupertino, CA). Finally, using Qualtrics (Provo, UT) accessed through the tablet’s browser, participants completed a demographics questionnaire.
2.6. Analyses
Analyses were conducted in R (R Core Team, 2018) and Jamovi (The jamovi project, 2020). For regression analyses, all mentions of variance explained use adjusted-R2, and “additional variance” refers to the dif-ference between adjusted-R2 for nested regression models. To compute the significance of direct and indirect effects in the mediation analyses, we modified the Sobel function of the R library multilevel (Bliese) to allow for multiple control regressors. To compute percent mediation, we
used the formula (BetaDirect – BetaIndirect)/BetaDirect (Kenny, Korch-maros, & Bolger, 2003).
3. Results
3.1. Standardized math performance
Aged-normed standardized scores indicate that participants gener-ally performed in the average range on Math Fluency (M = 93.51, SD =13.77) and Calculation (M = 101.84, SD = 13.09). Due to the negative correlations between age and standardized math scores (Math Fluency: r (95) = − .23, p = .025; Calculation: r(95) = − .48, p < .001), we used raw scores, along with age, in subsequent regression analyses (Table 1).
3.2. Decimals comparison
In the Decimals Comparison task, accuracy was lowest on the critical Mixed Inconsistent trials (77.6%), where the correct rational number response conflicted with whole number knowledge, and quite high for
Fig. 3. Decimals Task performance. Participants were less accurate (p < .001) and slower (p < .001) in Mixed Inconsistent (0.27 vs. 0.9) than Mixed Consistent (0.2 vs. 0.87). There were no differences in accuracy (ps = 1.00) or reaction time (ps > .18) between Zero Consistent (0.20 vs. 0.87) or Inconsistent (0.90 vs. 0.27), nor between Uniform Consistent (0.21 vs. 0.87) and Inconsistent (0.29 vs. 0.83). Note: 5 participants had 0% in the Mixed Inconsistent condition, thus data in Reaction Time dpanel only depicts participants with full data sets (n = 92).
L. Coulanges et al.

Cognition 214 (2021) 104767
8
all the other conditions (94.1–95.7%, Fig. 3, Table 2). A 2-way repeated measures ANOVA confirmed a significant interaction (F(2, 192) =31.66, p < .001, partial η2 = .248) between Format (Mixed, Zero, Uni-form) and Type (Consistent, Inconsistent). There were also main effects of Format (F(2, 192) = 39.75, p < .001, partial η2 = .293) and Type (F(1, 96) = 18.04, p < .001, partial η2 = .158). Post-hoc Bonferroni-corrected t-tests confirmed that Mixed Inconsistent trials were significantly less accurate than each of the five other conditions (all ps < .001), and that none of these conditions differed from each other (all ps = 1.000). To capture the string length congruity effect on accuracy we used an F-test to compare Mixed Consistent and Inconsistent trials (F(1, 96) = 29.23, p < .001, partial η2 = 0.233).
This pattern of results was mirrored in the reaction time (RT) data where Mixed Inconsistent was the slowest condition (1048 ms); the other conditions each averaged less than a second (923–962 ms, Fig. 3, Table 2). (The five participants with 0% accuracy in the Mixed Incon-sistent condition were excluded from the RT analyses.) A 2-way repeated measures ANOVA confirmed a significant Format by Type interaction (F (2, 182) = 28.33, p < .001, partial η2 = .237). There were also main effects of Format (F(2, 182) = 17.24, p < .001, partial η2 = .159) and Type (F(1, 91) = 28.06, p < .001, partial η2 = 0.236). Post-hoc Bonfer-roni-corrected t-tests confirmed that Mixed Inconsistent trials were significantly slower than all the other conditions (all ps < .001) and no other conditions differed from each other (all ps > .18). Again, to cap-ture the string length congruity effect on RTs an F-test comparing Mixed Consistent and Inconsistent trials was computed (F(1, 91) = 37.78, p <.001, partial η2 = .293). Together with the accuracy findings, these re-sults demonstrate the robustness of interference from whole number knowledge when comparing decimals quantities.
3.3. Inhibitory control
As expected participants had lower accuracy on Stroop Incongruent (63.0%) than Congruent trials (95.0%), a significant difference (t(96) =10.60, p < .001, Cohen’s d = 1.08, Fig. 4). Moreover, when participants were able to respond correctly, they had slower RTs on the Incongruent (676 ms) than Congruent (616 ms) trials (t(90) = − 7.83, p < .001, Cohen’s d = − 0.82, Fig. 4). Note that 6 participants were excluded from RT analysis due to 0% accuracy in the Stroop Incongruent condition. We used the Rate Correct Score (RCS) measure for subsequent correlation and regression analyses to combine both accuracy and reaction time over the entire task (M = 1.36, SD = 0.25, Fig. 5).
3.4. Cognitive flexibility
In the TaskSwitch task, accuracy was fairly low for both Stay (73.6%) and Switch (73.0%) trials and there was no significant difference be-tween the conditions (t(96) = − 0.36, p = .718, Cohen’s d = 0.04, Fig. 4). Average accuracy on the first trial, which could not be considered either a Stay or Switch trial, was 54.6%. In RT, Stay (663 ms) trials were actually slightly slower than Switch (625 ms) trials, but this difference was not significant (t(95) = − 1.04, p = .301, Cohen’s d = 0.11, Fig. 3). Note that one participant was excluded from the RT analyses for 0% accuracy on the Switch trials. As can be seen in Fig. 4, several partici-pants had very long average RT in the TaskSwitch task. To confirm that these participants were not contributing to the null reaction time results, we removed participants with average RT on either Stay or Switch trials
greater than 1758 ms, which corresponds to the mean RT in the task (M = 648 ms) plus 2 standard deviations (SD = 555 ms). This criterion removed an additional 4 participants, but the effect of trial type remained insignificant (t(91) = 0.66, p = .513, Cohen’s d = 0.07). As in Stroop, we used the RCS measure to summarize TaskSwitch performance (M = 1.36, SD = 0.25, Fig. 5) for correlation and regression analyses.
3.5. Visual-spatial working memory
Performance on the Backward Spatial Span task ranged from 2 to 7 with average span length of 4.52. See Fig. 5 for distribution of Spatial Span scores and Table 1 for the summary statistics.
3.6. Correlations between math, decimal and EF measures
We examined correlations between raw scores on the two mathe-matics measures, the three executive function tasks, (i.e., Stroop RCS, TaskSwitch RCS, Spatial Span) and the Decimal Comparison task (i.e., Mixed Inconsistent Decimals) (Table 3). Rate correct score (RCS), which indexes the number of correct responses per unit of task time, was used to summarize performance on the Stroop and TaskSwitch tasks, to ac-count for the adaptivity and imbalanced condition counts in these tasks. Although the raw scores of the two standardized math measures were moderately significantly correlated with each other (r(95) = .45, p <.001), they differed in their relations with the executive function mea-sures. For Math Fluency, there were no significant correlations with any of the EF measures (all ps > .13). By contrast, each of the EF measures correlated with Calculation: Stroop RCS (r(95) = .28, p = .006, Fig. 6), TaskSwitch RCS (r(95) = .21, p = .037), and Spatial Span (r(95) = .25, p = .012).
Next, we considered correlations with performance on the Decimal Comparison task, specifically the Mixed Inconsistent trials. Here, we found a significant relationship with both Calculation (r(95) = .47, p <.001, Fig. 6) and Fluency (r(95) = .36, p < .001) performance. In terms of executive functions, performance on this task was also correlated with Stroop RCS (r(95) = .29, p = .003, Fig. 6) and Spatial Span (r(95) = .30, p = .003), but not with TaskSwitch RCS (r(95) = .09, p = .384). For completeness, Supplementary Table S1 lists the correlations of all six decimal task conditions with Calculation and with the EF tasks. Mixed Inconsistent comparison was the only condition to correlate signifi-cantly with Stroop RCS (all other rs <0.18), and it had the highest correlation with Calculation (all other rs < .28). We also examined correlations of Calculation and the EF tasks with performance on the basic reaction time task among the participants for whom we had data. With the exception of a significant correlation of TaskSwitch RCS with left hand responses (r(81) = − .23, p = .040) and a marginal relation with right hand responses (r(90) = − .19, p = .078), there were no other significant correlations with the basic reaction time tasks (all ps > .65, Supplementary Table S1).
3.7. Regression analyses – controlling for executive functioning
First, we sought to establish that inhibitory control has an indepen-dent contribution to inconsistent decimal comparison, over and above the other canonical executive functions. A model with just measures of working memory and cognitive flexibility was significant (F(2, 93) =3.627, p = .016, Table 4, Model A) and explained 7.6% of the variance in
Table 2 Means and standard deviations for all the conditions in the Decimals Comparison task (n = 97).
Mixed Zero Uniform
Consistent Inconsistent Consistent Inconsistent Consistent Inconsistent
Accuracy (percent correct) 94.6 (12.4) 77.6 (28.5) 94.1 (10.7) 95.0 (9.4) 95.7 (6.7) 94.4 (7.2) Reaction time (ms) 923 (179) 1048 (214)a 935 (160) 955 (151) 960 (161) 948 (163)
a 5 participants had zero accuracy in this condition, resulting in n = 92.
L. Coulanges et al.

Cognition 214 (2021) 104767
9
Mixed Inconsistent Decimal accuracy, although only Spatial Span was a significant predictor (p = .003). Adding in inhibitory control to the model fit the data significantly better (Fchange(1, 92) = 5.089, p = .026, Table 4, Model B), and explained an additional 3.9% of the variance. Both Spatial Span (p = .027) and Stroop RCS (p = .026) were significant predictors. (Although age did not predict decimals performance, we included it in this model to facilitate later computations of mediation effects.)
Second, we examined the independent contributions of each execu-tive function measure on math achievement, as measured by the WJ-III subtest Calculation. We included age here due its negative relationship with Calculation raw scores (Table 2). This model was significant (F(4,
92) = 9.391, p < .001, Table 5, Model A) and explained 25.9% of the variance in scores. Inhibitory control, as measured by performance on the Stroop RCS, was the only EF measure to independently predict Calculation scores (p = .049), although Spatial Span was marginal (p =.082).
Next, we examined whether this relationship is maintained in the presence of performance on the Mixed Inconsistent Decimal trials. This model fit the data significantly better (Fchange(1, 91) = 17.91, p < .001, Table 5, Model B) and explained an additional 11.5% of the variance. Mixed Inconsistent Decimals was the only significant predictor in the full model (p < .001). Further, none of the EF measures were significant predictors (all ps > .25).
0.00
0.25
0.50
0.75
1.00
Congruent Incongruentn = 910.4
0.5
0.6
0.7
0.8
0.9
1.0
Congruent Incongruent
RT(sec)
Accuracy
Stroop Task
0.00
0.25
0.50
0.75
1.00
Stay Switch
Accuracy
TaskSwitch Task
n = 960.00.51.01.52.02.53.03.54.04.5
Stay Switch
RT(sec)
Fig. 4. Accuracy and reaction time on Stroop and TaskSwitch. Stroop: Participants were slower (p < .001) and less accurate (p < .001) on Stroop Incongruent than Congruent. TaskSwitch: There were no differences between Stay and Switch trials in the TaskSwitch Task for accuracy (p = .718) or reaction time (RT, p = .301). Note: Reaction time (RT) data from participants with full data sets, p-values from paired t-tests.
Fig. 5. Distribution of performance on executive function tasks. Histograms of the Rate Correct Score (RCS) for Stroop (the measure of inhibitory control), TaskSwitch (the measure of cognitive flexibility), and Spatial Span (the measure of working memory). Dashed lines represent the means.
L. Coulanges et al.

Cognition 214 (2021) 104767
10
Finally, to quantify the change of inhibition from a significant to a non-significant predictor of math achievement in the presence of the decimal performance measure, we used mediation analysis. Fig. 1B shows that each indirect path in the model is significant and that mediation effect is also significant (a x b = 0.098, p = .042), which represents 43.8% mediation for the direct effect (c = 0.214).
3.8. Regression analyses – mathematical specificity
In a final series of regression analyses, we sought to examine the specificity of the contribution of decimals in explaining the relationship between inhibition and general math achievement. We considered two
dimensions of specificity: (1) the mathematical domain of the outcome measure and (2) the mathematical knowledge captured by decimal comparison. For the first dimension, we expect that decimals should explain more of the contribution of inhibitory control to Rational Numbers items than to Advanced Math items. For the second dimension, we reasoned that if performance on Mixed Inconsistent Decimals simply reflects basic mathematical knowledge, including Math Fluency should account for this contribution. However, if decimals performance cap-tures important unique variance for that mathematical domain, it would remain a significant predictor even after including Math Fluency in the model. As our focus in these models was on the relative contributions of
Table 3 Correlations between age, standardized math measures, key executive function and decimal conditions.
Age Fluency Calculation Stroop TaskSwitch Span
Math Fluency − .128 Calculation − .445*** .452*** Stroop RCS − .046 .154 .280** TaskSwitch RCS − .224* .038 .212* .507*** Spatial Span − .014 .105 .253* .465*** .441*** Mixed Inconsistent Decimals − .109 .362*** .474*** .294** .089 .297**
* p < .05. ** p < .01. *** p < .001.
r(95) = .28** r(95) = .29** r(95) = .47***
Fig. 6. Correlations between nodes in pathway model. Accuracy on the Stroop RCS trials correlated with Woodcock-Johnson (WJ) – Calculation scores and with accuracy on the Mixed Inconsistent trials of the Decimal Comparison task. Mixed Inconsistent Decimal performance also correlated with WJ – Calculation scores. * p < .05, ** p < .01, *** p < .001.
Table 4 Hierarchical regression analysis of Mixed Inconsistent Decimal Comparison performance. (A) Contributions of executive function measures of visuo-spatial working memory (Spatial Span) and cognitive flexibility (TaskSwitch RCS). (B) Addition of inhibitory control (Stroop RCS) to model significantly improved the fit.
Mixed Inconsistent Decimal Accuracy
B SE Beta t p
Model A Intercept 0.898 0.354 2.540 .013 Age − 0.020 0.016 − 0.124 − 1.226 .223 TaskSwitch RCS − 0.041 0.054 − 0.085 − 0.758 .450 Spatial Span 0.075 0.025 0.333 3.030 .003
Model B Intercept 0.671 0.360 1.861 .066 Age − 0.022 0.016 − 0.136 − 1.370 .174 TaskSwitch RCS − 0.091 0.058 − 0.188 − 1.575 .119 Spatial Span 0.057 0.025 0.255 2.254 .027 Stroop RCS 0.302 0.134 0.265 2.256 .026
RCS = rate correct score.
Table 5 Hierarchical regression analysis of Calculation scores. (A) Independent contri-butions of executive function measures: inhibitory control (Stroop), visuo- spatial working memory (Spatial Span), and cognitive flexibility (TaskSwitch). (B) Executive function and the inclusion of counterintuitive decimal comparisons.
Calculation Scores
B SE Beta t p
Model A Intercept 47.782 6.120 7.807 < .001 Age − 1.328 0.267 − 0.451 − 4.966 < .001 TaskSwitch RCS − 0.700 0.976 − 0.078 − 0.717 .475 Spatial Span 0.758 0.431 0.182 1.758 .082 Stroop RCS 4.534 2.276 0.214 1.992 .049
Model B Intercept 43.162 5.730 7.533 < .001 Age − 1.180 0.248 − 0.400 − 4.751 < .001 TaskSwitch RCS − 0.076 0.909 − 0.009 − 0.084 .933 Spatial Span 0.364 0.407 0.087 0.894 .374 Stroop RCS 2.452 2.149 0.116 1.141 .257 Mixed Inconsistent Decimal 6.885 1.627 0.371 4.232 < .001
L. Coulanges et al.

Cognition 214 (2021) 104767
11
inhibition, decimals, and fluency, and to avoid overfitting, we did not include Spatial Span or TaskSwitch RCS in these analyses.
After accounting for age, Stroop RCS was a marginal predictor of Rational Number item performance (p = .083, Table 6, Model A), and the overall model was significant (F(2, 94) = 11.02, p < .001) and explained 17.3% of the variance. Adding Mixed Inconsistent Decimals to the model increased the fit (Fchange(1, 93) = 13.68, p < .001, Table 6, Model B) and explained an additional 9.8% of variance. Critically, Stroop RCS was no longer a marginal predictor (p = .482). Finally, adding Math Fluency to this model did not improve the fit (Fchange(1, 92) = 1.55, p = .200, 0.5% additional variance), and decimals performance remained a significant predictor (p = .003, Table 6, Model C).
Finally, we examined this same series of regression models for more advanced items from Calculation that do not require knowledge of rational numbers (Advanced Math items). After accounting for age, Stroop RCS was a significant predictor (p = .003, Table 7, Model A), and the overall model was significant (F(2, 94) = 15.03, p < .001) and explained 22.6% of the variance. Adding Mixed Inconsistent Decimals to the model increased the fit (Fchange(1, 93) = 4.35, p = .040, Table 7, Model B) and explained an additional 2.7% of the variance, but Stroop RCS remained a significant predictor (p = .021). Further, adding Math Fluency to this model significantly improved the fit (Fchange(1, 92) =4.860, p = .030, 3.0% extra variance explained), and critically Mixed Inconsistent Decimal performance was no longer a significant predictor (p = .201, Table 7, Model C).
Considering these models from a mediation perspective, decimal performance mediated 60.7% of the relationship between inhibition and rational number performance, but only 15.3% of the relationship with advanced math performance. Conversely, fluency explained only 12.1% of the influence of decimals on rational numbers, but 35.8% of its contribution on advanced math.
4. Discussion
This study investigated the relationship between EF and academic achievement by focusing on a theoretically motivated connection be-tween inhibitory control and a precursor mathematical skill: the pro-cessing of rational numbers in the context of conflicting whole number knowledge. First, we established that inhibitory control is an indepen-dent predictor of math achievement in young adults. Then, we deter-mined that performance on a conflicting decimal comparison task explained that relationship. Finally, we found that the contribution of
decimal understanding to math achievement was concentrated in the rational number items of this measure. These results are consistent with our framework proposing that mathematical precursor skills can explain the relationship between specific executive functions and specific do-mains of mathematical achievement.
4.1. Executive function contributions to math achievement in young adults
The relations between EF and academic achievement has received considerable attention in recent years, yet most of this work is concen-trated in the preschool and early elementary school age children (Bull, Espy, & Wiebe, 2008; Bull & Lee, 2014; Clark, Pritchard, & Woodward, 2010; Lee & Bull, 2016). Far less is known about the contributions of these skills to the mathematical content taught in secondary school and even less at the college level. Among EF measures, the consensus emerging from meta-analyses is a robust contribution of working memory across mathematical domains and age groups (Peng et al., 2016), with less consistent effects for inhibitory control and cognitive flexibility (Friso-van den Bos et al., 2013; Lee & Lee, 2019). In the current study, measures of all three executive functions were associated with performance on the untimed, progressive math measure, while there were no relations of EF with the timed math fluency measure. This result points towards a continued role for EF in more advanced mathe-matics. It also suggests that simpler skills like arithmetic no longer depend on EF in adulthood, consistent with the findings of a shift from effortful counting strategies to more memory-based retrieval approaches in early elementary school (Qin et al., 2014; Roussel, Fayol, & Bar-rouillet, 2002; Siegler, 1996).
Of the EF measures, only inhibition was a significant independent predictor of Calculation performance, with a marginal effect for working memory and no effect for cognitive flexibility. In contrast to the well- established measures of working memory and inhibitory control (Corsi block tapping and color-word Stroop, respectively), our measure of cognitive flexibility was newly developed for the ACE platform (Younger et al., 2021, April 20), and did not display the expected pattern of switching costs. The lack of reliability in this measure may have contributed to the null effects found here, and point to the need to examine other measures of cognitive flexibility, such as the Wisconsin Card Sorting Test (Grant & Berg, 1948) and the Alternative Uses Test (Guilford, 1967) to fully gauge the contribution of this construct to more advanced mathematical understanding. Building on our framework,
Table 6 Hierarchical regression analysis of Rational Number items from the Calculation subtest of the WJ-III. (A) Contributions of inhibitory control (Stroop RCS), after accounting for age. (B) Inclusion of counterintuitive decimal comparisons (Mixed Inconsistent Decimal). (C) Inclusion of general arithmetic knowledge (Math Fluency subtest).
Rational Number Items
B SE Beta t p
Model A Intercept 10.619 2.185 4.861 < .001 Age − 0.401 0.094 − 0.397 − 4.272 < .001 Stroop RCS 1.181 0.675 0.163 1.750 .083
Model B Intercept 9.240 2.084 4.433 < .001 Age − 0.368 0.089 − 0.364 − 4.156 < .001 Stroop RCS 0.468 0.662 0.064 0.706 .482 Mixed Inconsistent Decimal 2.157 0.583 0.339 3.698 < .001
Model C Intercept 8.260 2.211 3.735 < .001 Age − 0.358 0.089 − 0.354 − 4.031 < .001 Stroop RCS 0.423 0.661 0.058 0.640 .524 Mixed Inconsistent Decimal 1.897 0.615 0.298 3.085 .003 Math Fluency 0.009 0.007 0.121 1.290 .200
Table 7 Hierarchical regression analysis of Advanced Math items from the Calculation subtest of the WJ-III. (A) Contributions of inhibitory control (Stroop RCS), after accounting for age. (B) Inclusion of counterintuitive decimal comparisons (Mixed Inconsistent Decimal). (C) Inclusion of general arithmetic knowledge (Math Fluency subtest).
Advance Math Items
B SE Beta t p
Model A Intercept 7.445 2.212 3.526 < .001 Age − 0.402 0.091 − 0.397 − 4.423 < .001 Stroop RCS 1.980 0.653 0.273 3.034 .003
Model B Intercept 6.659 2.109 3.157 .002 Age − 0.383 0.090 − 0.379 − 4.269 < .001 Stroop RCS 1.573 0.670 0.217 2.346 .021 Mixed Inconsistent Decimal 1.230 0.590 0.193 2.085 .040
Model C Intercept 4.993 2.200 2.269 .026 Age − 0.364 0.088 − 0.361 − 4.129 < .001 Stroop RCS 1.497 0.658 0.206 2.276 .025 Mixed Inconsistent Decimal 0.789 0.612 0.124 1.289 .201 Math Fluency 0.016 0.007 0.206 2.205 .030
L. Coulanges et al.

Cognition 214 (2021) 104767
12
which emphasizes the need for theoretical relations between constructs, the contributions of cognitively flexibility may be more apparent in some mathematical domains and instructional approaches than others. For example, productive failure, the curriculum approach where students generate solutions to challenging problems before receiving relevant instruction, may draw especially on cognitive flexibility capacities (Kapur, 2008; Schwartz & Martin, 2004).
Beyond the canonical EF measures, studies of higher cognitive ca-pacities must also consider the contributions of lower-level capacities like processing speed, which have been related to academic achievement and executive functioning (Gordon, Smith-Spark, Newton, & Henry, 2020; Peterson et al., 2017). While we lacked a full dataset to assess the contribution of basic reaction time, among the remaining participants, we found no relationship of this task with either math or inhibition measures, suggesting processing speed differences are not driving the results reported here.
Our finding of the prominent role for inhibitory control among col-lege students suggests this capacity may become especially important as the sophistication of mathematical concepts increases. As the number of mathematical domains students must master expands in secondary school, inhibitory control may be increasingly recruited to identify and apply the appropriate conceptual construct for a given problem (Brookman-Byrne, Mareschal, Tolmie, & Dumontheil, 2018). In the current context, the significant, independent contribution of inhibitory control on general math achievement establishes the direct pathway between these constructs, setting the stage for identifying specific pre-cursor skills that help explain that relationship.
4.2. Identifying an appropriate precursor skill in decimal comparison
The precursor skill that we considered to potentially mediate the relationship between inhibitory control and math achievement was susceptibility to the string length congruity effect (also called the semantic interference effect) in decimal comparison. We focused on this effect as prior work suggested that interference from whole number knowledge results in reduced performance on problems where the number of digits is inconsistent with the correct response (Huber et al., 2014; Varma & Karl, 2013). As expected, performance was slower and less accurate when the larger number had fewer digits, relative to problems when the larger number had more digits. Our experimental design also enabled examination of other interference and facilitation effects in decimal comparison stimuli. Potentially, these effects could also act as precursor skills, which could relate executive functions to broader mathematical knowledge. To assess the unit decade compatibility effect (Nuerk et al., 2011; Varma & Karl, 2013), and the zero facilitation effect (Varma & Karl, 2013), we included the Uniform and Zero conditions, respectively. Although we found no evidence for these effects in performance, in each case, the Inconsistent condition had a modest correlation with Calcu-lation performance. However, these associations were weaker than the relationship between our target skill (Mixed Inconsistent performance) and Calculation. Moreover, neither the Uniform nor the Zero condition showed any relationship to inhibitory control. Together, these results confirm the robustness of the string length congruity effect among decimal comparison manipulations, and suggest that it is a promising target for examining the role of inhibitory control on rational number processing and overall math skills.
4.3. Types of inhibitory control and their contributions to rational number processing
Inhibitory control is not a unitary concept, and a common division contrasts semantic inhibition – the capacity to resolve interference from acquired knowledge – with response inhibition – the capacity to with-hold prepotent behavioral responses. Establishing which construct most strongly relates to rational number understanding is potentially impor-tant for identifying diagnostic predictors of future rational number
learning difficulties. Further, if semantic inhibition were the more consistent predictor of rational number outcomes, it would lend support to the interpretation that learned knowledge (i.e., whole number knowledge) is the source of interference in rational number tasks. Se-mantic inhibition is often assessed via Stroop tasks, which use bivalent stimuli and require participants to attend to one dimension and ignore information from the other. Evidence for the importance of semantic inhibition in rational number processing comes from Gomez et al. (2015), who find that children with poorer performance on a Numerical Stroop task also struggle with inconsistent fraction comparison. Further, Avgerinou and Tolmie (2019) report that when children are comparing conflicting fractions and decimals embedded in low-load word prob-lems, performance correlates with a Go/No-Go task (measure of response inhibition), but in a high-load situation, they found that Ani-mal Stroop scores became a critical predictor.
While these results pointed towards the importance of semantic in-hibition for rational number understanding, two recent studies have found that the Hearts and Flowers task, a developmentally appropriate measure of response inhibition (Wright & Diamond, 2014), also relates to rational number outcomes in children. Abreu-Mendoza, Coulanges, Ali, Powell, and Rosenberg-Lee (2020) found that better inhibitory control was related to better performance on a discrete proportional reasoning task, specifically when the number of segments conflicted with the correct response. Ren and Gunderson (2021) report that chil-dren with better inhibitory control displayed less use of an incorrect whole number strategy during a decimal comparison training task, and also at post-test. By contrast, one study to date did not find a role for inhibitory control in either symbolic fraction understanding and nonsymbolic proportional reasoning, in college students (Matthews et al., 2016). Notably, in that study, they did not separately examine conflicting vs. compatible stimuli in either format, potentially washing out the specific contribution of inhibitory control to the inconsistent stimuli. Further, the inhibition measure employed, the Flanker task, is considered by some (Lee & Lee, 2019) as neither semantic or response inhibition, but rather a measure of visual distraction suppression.
In the current study, we employed the color-word Stroop task, which requires inhibiting prior knowledge of the meanings of symbols strings in order to correctly identify the font color of a presented color word. We selected this measure based on the earlier literature (Avgerinou & Tol-mie, 2019; Gomez et al., 2015) pointing to the importance of semantic inhibition in rational number outcomes. Our finding that color-word Stroop performance predicts performance specifically on conflicting decimal comparison (Indirect Pathway-1) extends the prior literature to demonstrate that semantic measures of inhibitory control that do not require any knowledge of numerical or physical magnitude (as found in Numerical and Animal Stroop tasks) also relate to rational number un-derstanding. However, given the growing evidence that response inhi-bition also contributes, it is necessary to design studies that collect multiple measures of inhibitory control within the same subjects. This approach is required to establish if semantic, response and visual dis-tractor suppression inhibition contribute to conflicting rational perfor-mance, and whether they do so independently.
4.4. Decimal comparison and overall math skills
Relations between numerical comparison tasks and math skills are well-established (Halberda, Mazzocco, & Feigenson, 2008; Schneider et al., 2017), and more recently, researchers have asked whether rational number comparisons skills might also relate to overall math skills. A handful of fraction studies find associations between compari-son performance and measures of general mathematics achievement. For example Gomez et al. (2015) related performance on incongruent fraction comparison to classroom math measures, and Matthews et al. (2016) found that comparing line lengths and dot proportions predicted math skills in college students.
We found that performance on the Mixed Inconsistent trials of the
L. Coulanges et al.

Cognition 214 (2021) 104767
13
decimal comparison task correlated with overall math achievement (Indirect Pathway-2). This result is, to our knowledge, the first demon-stration of a relationship between decimal comparison and overall math skills in adults, although similar effects have been found in children (Resnick et al., 2019). Notably, we did not find any relationship between the math assessment and performance on the Mixed Consistent trials, arguing against the possibility that the relationship found for Mixed Inconsistent reflects general number knowledge tapped by any form of decimal comparison. However, the high accuracy and low variance in the Mixed Consistent condition suggest ceiling effects may be driving this null result. Further, they point towards the need for studies to include both whole number and decimal comparison tasks to establish whether the contribution of processing conflicting rational numbers to math achievement is independent of general numerical understanding (Van Hoof, Verschaffel, & Van Dooren, 2017).
Given prior work relating fraction comparison and estimation to general math skills, we can ask whether both fraction and decimal comparison of conflicting rational number problems index the same underlying capacity, that is, the ability to appropriately process rational number magnitude in the face of interference from whole number in-formation. If so, we would expect both factors to contribute to later math skills, as found for fraction and decimal number line placement and algebra understanding (DeWolf et al., 2015; Siegler et al., 2012). We would also expect them to correlate with each other. One study to date has looked at correlation between these measures, in terms of distance effects in a comparison to a fixed value. DeWolf, Grounds, Bassok, and Holyoak (2014) report that distance effects for decimals were more similar to those for integers than for fractions. However, this study did not systematically vary interference from whole numbers in the decimal stimuli nor did it directly assess individual differences in this capacity across a large sample. (Note, Avgerinou and Tolmie (2019) collected both measures but then averaged them together for subsequent analyses.)
One complicating factor for fractions is that comparison tasks are rife with strategy variation, including componential strategies like selecting the fraction with the largest numerator or the largest denominator and more sophisticated approaches such as the gap strategy of selecting the fraction with the smaller gap between its numerator and denominator. Thus, abstracting a single index of fraction understanding from com-parison tasks may be challenging without considering strategy infor-mation (Braithwaite, Pyke, & Siegler, 2017). Decimal comparison is not without strategy variation (Ren & Gunderson, 2019; Resnick et al., 1989). A further complication is that inconsistent decimals comparison involves interference from both numerical values of stimuli and also their physical length, as demonstrated by recent negative priming studies (Roell, Viarouge, Hilscher, Houde, & Borst, 2019; Roell, Viarouge, Houde, et al., 2019),. Collecting data from the same partici-pants completing both decimals and fraction comparison tasks (that manipulate whole number interference) is needed to determine if frac-tion and decimal precursor skills make independent contributions to math achievement, or if both reflect an underlying construct of “rational number understanding”.
Nevertheless, some evidence already points towards a foundational role for decimal knowledge relative to fractions. For example, Van Hoof et al. (2018) documented trajectories through rational number knowl-edge, and finds that rational number ordering/comparison is usually mastered first, followed by understanding of arithmetic operations (i.e., that multiplication does not always lead to a larger number), and finally density concepts (i.e., the infinity of rational numbers between any two numbers). In each of these domains, proficiency with decimals precedes fraction understanding, suggesting that understanding decimal magni-tude is the first rational number skill to fully develop. The relative simplicity of decimals, which maintain much of the base-ten place value system of whole numbers, may facilitate its earlier emergence, despite typically being taught after fractions (Tian & Siegler, 2018).
If conflicting decimal comparison is acting as precursor skill for
higher mathematical concepts, as we found in the current study, then we can ask what foundational ability does this task index? Assuming that the primary source of difficulty in this task is interference from one’s prior whole number knowledge that more digits indicate a larger value (Huber et al., 2014), then greater proficiency in this task may capture decoupling the association between the number of digits and magnitude. This aspect of whole number knowledge also interferes with fraction comparison, as children will judge double-digit fractions as larger than their equivalent single-digit fraction (e.g., 20/25 > 4/5) (Braithwaite & Siegler, 2018). Decimal comparison difficulties have also been attrib-uted to interference from the whole number referents (i.e., ignoring the decimal points) (Varma & Karl, 2013). Thus, proficiency on this task could also represent breaking the association between number symbols and magnitude, which could contribute more generally to fraction comparison, where magnitude information must be gleaned holistically, rather than from the individual components (Meert, Gregoire, & Noel, 2009). In the realm of rational arithmetic, a better sense of the magni-tude of numbers, regardless of notation, could minimize nonsensical responses (like adding numerators and denominators, or misplaced decimal points) (Braithwaite et al., 2017; Resnick et al., 1989). Thus, grasping conflicting decimals requires flexibly mapping between num-ber symbols and magnitude, expanding one’s conceptual understanding of abstract number classes (Carey, 2011; Rosenberg-Lee, 2021).
4.5. Relating inhibitory control to math achievement through decimal processing
Having found evidence that inhibition independently contributes to math achievement, and that decimal comparison relates to both inhib-itory control and math achievement, we next asked whether decimal comparison could explain some of the relationship between an executive function measure and a math outcome. We found that performance on conflicting decimals accounted for almost half of the relationship be-tween inhibition and general math achievement. The remainder of that relationship could be due to the requirement of inhibition during the test itself (Bascandziev et al., 2018) and any number of other precursor skills we have not measured, whose acquisition may have also be supported by inhibitory control. Other numerical domains with counterintuitive properties, such as integers, are promising targets for precursor content that requires inhibition to learn, and supports later mathematical un-derstanding (Blair, Rosenberg-Lee, Tsang, Schwartz, & Menon, 2012; Brookman-Byrne et al., 2018; Varma & Schwartz, 2011).
The current pattern of results is consistent with our starting premise that single time-point correlations between executive functions and general math skills reflect both a direct role for EF in the execution of problem solving strategies and an indirect role supporting the acquisi-tion of precursor mathematical content. While we cannot measure these contributions directly with our current design, we note that the relative contributions of these factors likely change over time. For example, in the realm of arithmetic, EFs did not predict fluency in our college-aged sample, despite their well-established contribution to arithmetic fluency in childhood (Geary, 2003; Meyer, Salimpoor, Wu, Geary, & Menon, 2010; Peng et al., 2016). Thus, EFs likely supported the initial acquisi-tion of arithmetic skills, but by young adulthood, everyone has mastered these skills and can generally solve single-digit problems without relying on EFs. Still, this finding does not mean that EFs should be uncorrelated with later math achievement. Rather, earlier mastery of arithmetic could facilitate better learning of later content, which thus contributes to re-lations between EF and higher mathematics. Consistent with this pro-posal is our finding that arithmetic fluency mediated the relationship between inhibition and advanced math items. Longitudinal designs, which focus on the prediction of learning gains, can help disentangle the contribution of EF to performance in the moment versus future learning.
More broadly, we offer these methods as an alternative to the usual approaches to investigating precursor skills and math cognition. Re-searchers typically aim to support the finding of a correlation result by
L. Coulanges et al.

Cognition 214 (2021) 104767
14
showing that it is robust to the inclusion of measures of executive function (Hiniker, Rosenberg-Lee, & Menon, 2016; Matthews et al., 2016; Siegler et al., 2012), or to challenge a finding by showing that including EF eliminates an association (Gilmore et al., 2013). (Or, less frequently, they aim to show that math ability explains the relationship between EF and a precursor skill (Gomez et al., 2015).) Fundamentally, these approaches assume there are more interesting effects that must be shown to be robust to the inclusion of less interesting factors. Rather than consider some factors as nuisances to be controlled for, we suggest instead that considering plausible pathways to connect factors may be more fruitful. Here, we explore the proposal that correlations between executive functions and overall math skills arise, in part, because of the support those EFs provide in acquiring specific precursor skills, which in turn support later mathematical content (Fig. 1A).
This perspective also affords research that can eventually leverage these associations into classroom-applicable insights via training studies (Rosenberg-Lee, 2018). For example, if inhibitory control specifically contributes to understanding conflicting decimals, which then supports acquisition of later mathematical content, then we would expect specific training in processing these decimals to be more effective in boosting math outcomes than a more general inhibitory control training program. By the same token, we would expect that training programs which emphasize conflicting aspects of rational numbers to be more effective than those that emphasize similarities between whole and rational numbers (Rosenberg-Lee, 2021). By contrast, if relations of precursor skills to math achievement simply reflect the role of EF on both mea-sures, then we should not expect to see any benefits for shoring up a particular challenging content domain. If these predictions regarding the effectiveness of training decimal precursors skills are borne out, our approach could also be applied in other content domains, by identifying bottlenecks in precursor skills engendered by executive function deficits, and then developing education programs to target these pressure points.
4.6. Decomposing math achievement to assess the specificity of decimal comparison
To understand further the contribution of inhibitory control to math achievement via the acquisition of precursor skills, such as conflicting
decimal comparison, we decomposed the Calculation subtest into Rational Number items and Advanced Math items. We found that Inconsistent Decimal performance mediated much more of the rela-tionship of Stroop with rational numbers than with advanced math. While the contribution of decimal comparison to rational numbers may not be surprising on the surface, it should be noted that we purposely excluded decimal arithmetic items in the sub-measure. This finding fits with the suggestion that decimal comparison taps vital knowledge for rational number understanding, that is, the decoupling of associations between notation and numerical magnitude.
Further evidence for the specificity of the contribution of decimal comparison to rational number understanding comes from our analyses of Math Fluency. While this measure was significantly related to con-flicting decimal performance, it did not predict rational number items. Interestingly, Math Fluency did contribute to the advanced math items, and it mediated the contribution of conflicting decimals to those items. It is notable that inhibitory control had a smaller contribution to rational number items than advanced math items. This result may reflect the small number of items in this rational sub-measure (Rational Number: 7 items, vs. Advanced Math: 11 items), in which case a more compre-hensive measure of rational number understanding (Kainulainen et al., 2017; Van Hoof et al., 2018) might reveal a more robust relationship. Alternatively, inhibitory control may be most crucial in the acquisition of new, counterintuitive knowledge and the specific contribution of in-dividual differences in this capacity may be washed out over time. In-dividual difference studies in children, when they are first learning about decimals and fractions (typically in late elementary school), are needed to fully capture the role of inhibition in acquiring rational number understanding.
Supplementary data to this article can be found online at https://doi. org/10.1016/j.cognition.2021.104767.
Acknowledgements
The authors wish to thank Jessica W. Younger for her efforts in compiling the Adaptive Cognitive Evaluation (ACE) methods. This research was supported in part by NSF Award SMA-1540854 (MU and AG).
Appendix A. Decimal Comparison task stimuli
Mixed Zero Uniform
Consistent Inconsistent Consistent Inconsistent Consistent Inconsistent
0.1 vs. 0.23 0.16 vs. 0.4 0.10 vs. 0.23 0.16 vs. 0.40 0.13 vs. 0.24 0.17 vs. 0.25 0.1 vs. 0.26 0.18 vs. 0.9 0.10 vs. 0.26 0.32 vs. 0.50 0.13 vs. 0.29 0.19 vs. 0.73 0.1 vs. 0.76 0.21 vs. 0.8 0.10 vs. 0.76 0.18 vs. 0.90 0.13 vs. 0.74 0.19 vs. 0.83 0.1 vs. 0.78 0.21 vs. 0.9 0.10 vs. 0.78 0.21 vs. 0.80 0.13 vs. 0.89 0.19 vs. 0.86 0.1 vs. 0.83 0.23 vs. 0.4 0.10 vs. 0.83 0.21 vs. 0.90 0.21 vs. 0.87 0.24 vs. 0.83 0.2 vs. 0.87 0.23 vs. 0.8 0.20 vs. 0.87 0.23 vs. 0.40 0.23 vs. 0.89 0.27 vs. 0.91 0.2 vs. 0.91 0.26 vs. 0.3 0.20 vs. 0.91 0.23 vs. 0.80 0.24 vs. 0.95 0.29 vs. 0.83 0.3 vs. 0.91 0.26 vs. 0.9 0.30 vs. 0.91 0.26 vs. 0.30 0.31 vs. 0.48 0.35 vs. 0.92 0.3 vs. 0.93 0.27 vs. 0.9 0.30 vs. 0.93 0.26 vs. 0.90 0.31 vs. 0.93 0.47 vs. 0.75 0.4 vs. 0.56 0.32 vs. 0.5 0.40 vs. 0.56 0.27 vs. 0.90 0.32 vs. 0.54 0.48 vs. 0.71 0.4 vs. 0.62 0.36 vs. 0.9 0.40 vs. 0.62 0.36 vs. 0.90 0.35 vs. 0.97 0.49 vs. 0.72 0.6 vs. 0.78 0.42 vs. 0.5 0.60 vs. 0.78 0.42 vs. 0.50 0.51 vs. 0.67 0.74 vs. 0.93 0.8 vs. 0.92 0.43 vs. 0.6 0.80 vs. 0.92 0.43 vs. 0.60 0.61 vs. 0.78 0.79 vs. 0.96 0.8 vs. 0.97 0.67 vs. 0.9 0.80 vs. 0.97 0.67 vs. 0.90 0.73 vs. 0.94 0.89 vs. 0.92
References
Abreu-Mendoza, R. A., Coulanges, L., Ali, K., Powell, A. B., & Rosenberg-Lee, M. (2020). Children’s discrete proportional reasoning is related to inhibitory control and enhanced by priming continuous representations. Journal of Experimental Child Psychology, 199, 104931. https://doi.org/10.1016/j.jecp.2020.104931.
Avgerinou, V. A., & Tolmie, A. (2019). Inhibition and cognitive load in fractions and decimals. The British Journal of Educational Psychology.. https://doi.org/10.1111/ bjep.12321.
Bascandziev, I., Tardiff, N., Zaitchik, D., & Carey, S. (2018). The role of domain-general cognitive resources in children’s construction of a vitalist theory of biology. Cognitive Psychology, 104, 1–28. https://doi.org/10.1016/j.cogpsych.2018.03.002.
L. Coulanges et al.

Cognition 214 (2021) 104767
15
Blair, K. P., Rosenberg-Lee, M., Tsang, J. M., Schwartz, D. L., & Menon, V. (2012). Beyond natural numbers: Negative number representation in parietal cortex. Frontiers in Human Neuroscience, 6(7), 1–15. https://doi.org/10.3389/ fnhum.2012.00007.
Bonato, M., Fabbri, S., Umilta, C., & Zorzi, M. (2007). The mental representation of numerical fractions: Real or integer? Journal of Experimental Psychology: Human Perception and Performance, 33(6), 1410–1419. https://doi.org/10.1037/0096- 1523.33.6.1410.
Braithwaite, D. W., Pyke, A. A., & Siegler, R. S. (2017). A computational model of fraction arithmetic. Psychological Review, 124(5), 603–625. https://doi.org/10.1037/ rev0000072.
Braithwaite, D. W., & Siegler, R. S. (2018). Developmental changes in the whole number bias. Developmental Science, 21(2), 13. https://doi.org/10.1111/desc.12541.
Brookman-Byrne, A., Mareschal, D., Tolmie, A. K., & Dumontheil, I. (2018). Inhibitory control and counterintuitive science and maths reasoning in adolescence. PLoS One, 13(6). https://doi.org/10.1371/journal.pone.0198973.
Bull, R., Espy, K. A., & Wiebe, S. A. (2008). Short-term memory, working memory, and executive functioning in preschoolers: Longitudinal predictors of mathematical achievement at age 7 years. Developmental Neuropsychology, 33(3), 205–228. https:// doi.org/10.1080/87565640801982312.
Bull, R., & Lee, K. (2014). Executive functioning and mathematics achievement. Child Development Perspectives, 8(1), 36–41. https://doi.org/10.1111/cdep.12059.
Carey, S. (2011). Precis of “The origin of Concepts”. The Behavioral and Brain Sciences, 34 (3), 113–124. discussion 124-162 https://doi.org/10.1017/S0140525X10000919.
Clark, C. A. C., Pritchard, V. E., & Woodward, L. J. (2010). Preschool executive functioning abilities predict early mathematics achievement. Developmental Psychology, 46(5), 1176–1191. https://doi.org/10.1037/a0019672.
Constantinidis, C., & Luna, B. (2019). Neural substrates of inhibitory control maturation in adolescence. Trends in Neurosciences, 42(9), 604–616. https://doi.org/10.1016/j. tins.2019.07.004.
Corsi, P. (1972). Human memory and the medial temporal region of the brain. ProQuest Dissertations Publishing.
De Smedt, B., Noel, M.-P., Gilmore, C., & Ansari, D. (2013). How do symbolic and non- symbolic numerical magnitude processing skills relate to individual differences in children’s mathematical skills? A review of evidence from brain and behavior. Trends in Neuroscience and Education, 2(2), 48–55. https://doi.org/10.1016/j. tine.2013.06.001.
DeWolf, M., Bassok, M., & Holyoak, K. J. (2015). From rational numbers to algebra: Separable contributions of decimal magnitude and relational understanding of fractions. Journal of Experimental Child Psychology, 133, 72–84. https://doi.org/ 10.1016/j.jecp.2015.01.013.
DeWolf, M., Grounds, M. A., Bassok, M., & Holyoak, K. J. (2014). Magnitude comparison with different types of rational numbers. Journal of Experimental Psychology. Human Perception and Performance, 40(1), 71–82. https://doi.org/10.1037/a0032916.
Diamond, A. (2013). Executive functions. Annual Review of Psychology, 64, 135–168. https://doi.org/10.1146/annurev-psych-113011-143750.
Friso-van den Bos, I., van der Ven, S. H. G., Kroesbergen, E. H., & van Luit, J. E. H. (2013). Working memory and mathematics in primary school children: A meta- analysis. Educational Research Review, 10, 29–44. https://doi.org/10.1016/j. edurev.2013.05.003.
Geary, D. C. (2003). Learning disabilities in arithmetic: Problem-solving differences and cognitive deficits. In H. L. Swanson, K. R. Harris, & S. Graham (Eds.), Handbook of learning disabilities (pp. 199–212). New York, NY: Guilford Press.
Gersten, R., & Chard, D. (1999). Number sense: Rethinking arithmetic instruction for students with mathematical disabilities. Journal of Special Education, 33(1), 18–28. https://doi.org/10.1177/002246699903300102.
Gilmore, C., Attridge, N., Clayton, S., Cragg, L., Johnson, S., Marlow, N., … Inglis, M. (2013). Individual differences in inhibitory control, not non-verbal number acuity, correlate with mathematics achievement. PLoS One, 8(6). https://doi.org/10.1371/ journal.pone.0067374.
Gomez, D. M., Jimenez, A., Bobadilla, R., Reyes, C., & Dartnell, P. (2015). The effect of inhibitory control on general mathematics achievement and fraction comparison in middle school children. Zdm, 47(5), 801–811. https://doi.org/10.1007/s11858-015- 0685-4.
Gordon, R., Smith-Spark, J. H., Newton, E. J., & Henry, L. A. (2020). Working memory and high-level cognition in children: An analysis of timing and accuracy in complex span tasks. Journal of Experimental Child Psychology, 191, 104736. https://doi.org/ 10.1016/j.jecp.2019.104736.
Grant, D. A., & Berg, E. (1948). A behavioral analysis of degree of reinforcement and ease of shifting to new responses in a Weigl-type card-sorting problem. Journal of Experimental Psychology, 38(4), 404–411. https://doi.org/10.1037/h0059831.
Guilford, J. P. (1967). Creativity: Yesterday, today and tomorrow. The Journal of Creative Behavior, 1(1), 3–14. https://doi.org/10.1002/j.2162-6057.1967.tb00002.x.
Halberda, J., Mazzocco, M. M. M., & Feigenson, L. (2008). Individual differences in non- verbal number acuity correlate with maths achievement. Nature, 455(7213), 665–U662. https://doi.org/10.1038/nature07246.
Hedge, C., Powell, G., & Sumner, P. (2018). The reliability paradox: Why robust cognitive tasks do not produce reliable individual differences. Behavior Research Methods, 50(3), 1166–1186. https://doi.org/10.3758/s13428-017-0935-1.
Hiniker, A., Rosenberg-Lee, M., & Menon, V. (2016). Distinctive role of symbolic number sense in mediating the mathematical abilities of children with autism. Journal of Autism and Developmental Disorders, 46(4), 1268–1281. https://doi.org/10.1007/ s10803-015-2666-4.
Huber, S., Klein, E., Willmes, K., Nuerk, H. C., & Moeller, K. (2014). Decimal fraction representations are not distinct from natural number representations - evidence from
a combined eye-tracking and computational modeling approach. Frontiers in Human Neuroscience, 8, 172. https://doi.org/10.3389/fnhum.2014.00172.
Ishihara, S. (1972). Tests for colour-blindness. Tokyo, Japan: Kanehara Shuppan Co. Kainulainen, M., McMullen, J., & Lehtinen, E. (2017). Early developmental trajectories
toward concepts of rational numbers. Cognition and Instruction, 35(1), 4–19. https:// doi.org/10.1080/07370008.2016.1251287.
Kapur, M. (2008). Productive failure. Cognition and Instruction, 26(3), 379–424. https:// doi.org/10.1080/07370000802212669.
Kenny, D. A., Korchmaros, J. D., & Bolger, N. (2003). Lower level mediation in multilevel models. Psychological Methods, 8(2), 115–128. https://doi.org/10.1037/1082- 989x.8.2.115.
Lee, K., & Bull, R. (2016). Developmental changes in working memory, updating, and math achievement. Journal of Educational Psychology, 108(6), 869–882. https://doi. org/10.1037/edu0000090.
Lee, K., & Lee, H. W. (2019). Inhibition and mathematical performance: Poorly correlated, poorly measured, or poorly matched? Child Development Perspectives, 13 (1), 28–33. https://doi.org/10.1111/cdep.12304.
Mason, L., & Zaccoletti, S. (2020). Inhibition and conceptual learning in science: A review of studies. Educational Psychology Review. https://doi.org/10.1007/s10648- 020-09529-x.
Matthews, P. G., Lewis, M. R., & Hubbard, E. M. (2016). Individual differences in nonsymbolic ratio processing predict symbolic math performance. Psychological Science, 27(2), 191–202. https://doi.org/10.1177/0956797615617799.
Mead, L. A., Mayer, A. R., Bobholz, J. A., Woodley, S. J., Cunningham, J. M., Hammeke, T. A., & Rao, S. M. (2002). Neural basis of the Stroop interference task: Response competition or selective attention? Journal of the International Neuropsychological Society, 8(6), 735–742. https://doi.org/10.1017/ S1355617702860015.
Meert, G., Gregoire, J., & Noel, M. P. (2009). Rational numbers: Componential versus holistic representation of fractions in a magnitude comparison task. Quarterly Journal of Experimental Psychology (Colchester), 62(8), 1598–1616. https://doi.org/10.1080/ 17470210802511162.
Melby-Lervag, M., & Hulme, C. (2013). Is working memory training effective? A meta- analytic review. Developmental Psychology, 49(2), 270–291. https://doi.org/ 10.1037/a0028228.
Meyer, M. L., Salimpoor, V. N., Wu, S. S., Geary, D. C., & Menon, V. (2010). Differential contribution of specific working memory components to mathematics achievement in 2nd and 3rd graders. Learning and Individual Differences, 20(2), 101–109. https:// doi.org/10.1016/j.lindif.2009.08.004.
National Mathematics Advisory Panel. (2008). Foundations for success: The final report of the National Mathematics advisory panel. Retrieved from Washington, DC.
Ni, Y., & Zhou, Y.-D. (2005). Teaching and learning fraction and rational numbers: The origins and implications of whole number Bias. Educational Psychologist, 40(1), 27–52. https://doi.org/10.1207/s15326985ep4001_3.
Nuerk, H.-C., Moeller, K., Klein, E., Willmes, K., & Fischer, M. H. (2011). Extending the mental number line. Zeitschrift für Psychologie, 219(1), 3–22. https://doi.org/ 10.1027/2151-2604/a000041.
Nuerk, H.-C., Weger, U., & Willmes, K. (2001). Decade breaks in the mental number line? Putting the tens and units back in different bins. Cognition, 82(1), B25–B33. https:// doi.org/10.1016/S0010-0277(01)00142-1.
Obersteiner, A., & Tumpek, C. (2016). Measuring fraction comparison strategies with eye-tracking. Zdm-the International Journal on Mathematics Education, 48(3), 255–266. https://doi.org/10.1007/s11858-015-0742-z.
Obersteiner, A., Van Dooren, W., Van Hoof, J., & Verschaffel, L. (2013). The natural number bias and magnitude representation in fraction comparison by expert mathematicians. Learning and Instruction, 28, 64–72. https://doi.org/10.1016/j. learninstruc.2013.05.003.
Peirce, J. W. (2007). PsychoPy–psychophysics software in python. Journal of Neuroscience Methods, 162(1–2), 8–13. https://doi.org/10.1016/j. jneumeth.2006.11.017.
Peng, P., Namkung, J., Barnes, M., & Sun, C. (2016). A Meta-analysis of mathematics and working memory: Moderating effects of working memory domain, type of mathematics skill, and sample characteristics. Journal of Educational Psychology, 108 (4), 455–473. https://doi.org/10.1037/edu0000079.
Peterson, R. L., Boada, R., McGrath, L. M., Willcutt, E. G., Olson, R. K., & Pennington, B. F. (2017). Cognitive prediction of Reading, math, and attention: Shared and unique influences. Journal of Learning Disabilities, 50(4), 408–421. https://doi.org/10.1177/0022219415618500.
Qin, S. Z., Cho, S., Chen, T. W., Rosenberg-Lee, M., Geary, D. C., & Menon, V. (2014). Hippocampal-neocortical functional reorganization underlies children’s cognitive development. Nature Neuroscience, 17(9), 1263–1269. https://doi.org/10.1038/ Nn.3788.
R Core Team. (2018). R: A language and environment for statistical computing. Retrieved from https://www.R-project.org.
Ren, K., & Gunderson, E. A. (2019). Malleability of whole-number and fraction biases in decimal comparison. Developmental Psychology, 55(11), 2263–2274. https://doi.org/ 10.1037/dev0000797.
Ren, K. X., & Gunderson, E. A. (2021). The dynamic nature of children’s strategy use after receiving accuracy feedback in decimal comparisons. Journal of Experimental Child Psychology, 202. https://doi.org/10.1016/j.jecp.2020.105015.
Resnick, I., Rinne, L., Barbieri, C., & Jordan, N. C. (2019). Children’s reasoning about decimals and its relation to fraction learning and mathematics achievement. Journal of Educational Psychology, 111(4), 604–618. https://doi.org/10.1037/edu0000309.
Resnick, L., Nesher, P., Leonard, F., Magone, M., Omanson, S., & Peled, I. (1989). Conceptual bases of arithmetic errors: The case of decimal fractions. Journal for Research in Mathematics Education, 20(1), 8–27. https://doi.org/10.2307/749095.
L. Coulanges et al.

Cognition 214 (2021) 104767
16
Roell, M., Viarouge, A., Hilscher, E., Houde, O., & Borst, G. (2019). Evidence for a visuospatial bias in decimal number comparison in adolescents and in adults. Scientific Reports, 9(1), 14770. https://doi.org/10.1038/s41598-019-51392-6.
Roell, M., Viarouge, A., Houde, O., & Borst, G. (2017). Inhibitory control and decimal number comparison in school-aged children. PLoS One, 12(11), Article e0188276. https://doi.org/10.1371/journal.pone.0188276.
Roell, M., Viarouge, A., Houde, O., & Borst, G. (2019). Inhibition of the whole number bias in decimal number comparison: A developmental negative priming study. Journal of Experimental Child Psychology, 177, 240–247. https://doi.org/10.1016/j. jecp.2018.08.010.
Rosenberg-Lee, M. (2018). Training studies: An experimental design to advance educational neuroscience. Mind, Brain, and Education, 12(1), 12–22. https://doi.org/ 10.1111/mbe.12166.
Rosenberg-Lee, M. (2021). Probing the neural basis rational number difficulties: The role of inhibitory control and magnitude processing. In A. Henik, & W. Fias (Eds.), Learning and education in numerical cognition. Elsevier. In press.
Rossi, S., Vidal, J., Letang, M., Houde, O., & Borst, G. (2019). Adolescents and adults need inhibitory control to compare fractions. Journal of Numerical Cognition, 5(3), 314–336. https://doi.org/10.5964/jnc.v5i3.197.
Roussel, J. L., Fayol, M., & Barrouillet, P. (2002). Procedural vs. direct retrieval strategies in arithmetic: A comparison between additive and multiplicative problem solving. European Journal of Cognitive Psychology, 14(1), 61–104. https://doi.org/10.1080/ 09541440042000115. Retrieved from ://000173108300005.
Sasanguie, D., Lyons, I. M., De Smedt, B., & Reynvoet, B. (2017). Unpacking symbolic number comparison and its relation with arithmetic in adults. Cognition, 165, 26–38. https://doi.org/10.1016/j.cognition.2017.04.007.
Schneider, M., Beeres, K., Coban, L., Merz, S., Susan Schmidt, S., Stricker, J., & De Smedt, B. (2017). Associations of non-symbolic and symbolic numerical magnitude processing with mathematical competence: A meta-analysis. Developmental Science, 20(3), 1–16. https://doi.org/10.1111/desc.12372.
Schwartz, D. L., & Martin, T. (2004). Inventing to prepare for future learning: The hidden efficiency of encouraging original student production in statistics instruction. Cognition and Instruction, 22(2), 129–184. https://doi.org/10.1207/ s1532690xci2202_1.
Siegler, R. S. (1996). A grand theory of development. Monographs of the Society for Research in Child Development, 61(1–2), 266–275. https://doi.org/10.1111/j.1540- 5834.1996.tb00550.x.
Siegler, R. S., & Booth, J. L. (2004). Development of numerical estimation in young children. Child Development, 75(2), 428–444. Retrieved from https://doi.org/10. 1111/j.1467-8624.2004.00684.x.
Siegler, R. S., Duncan, G. J., Davis-Kean, P. E., Duckworth, K., Claessens, A., Engel, M., … Chen, M. C. (2012). Early predictors of high school mathematics achievement. Psychological Science, 23(7), 691–697. https://doi.org/10.1177/ 0956797612440101.
Siegler, R. S., Thompson, C. A., & Schneider, M. (2011). An integrated theory of whole number and fractions development. Cognitive Psychology, 62(4), 273–296. https:// doi.org/10.1016/j.cogpsych.2011.03.001.
Stroop, J. (1992). “Reprint of” Studies of interference in serial verbal reactions: original work published 1935 (Vol. 18, pp. 643-662). Journal of Experimental Psychology. General, 121(1), 15. https://psycnet.apa.org/doi/10.1037/0096-3445.121.1.15.
The jamovi project. (2020). jamovi. Tian, J., & Siegler, R. S. (2018). Which type of rational numbers should students learn
first? Educational Psychology Review, 30(2), 351–372. https://doi.org/10.1007/ s10648-017-9417-3.
Vamvakoussi, X., & Vosniadou, S. (2004). Understanding the structure of the set of rational numbers: A conceptual change approach. Learning and Instruction, 14(5), 453–467. https://doi.org/10.1016/j.learninstruc.2004.06.013.
Van Dooren, W., & Inglis, M. (2015). Inhibitory control in mathematical thinking, learning and problem solving: A survey. ZDM Mathematics Education, 47(5), 713–721. https://doi.org/10.1007/s11858-015-0715-2.
Van Hoof, J., Degrande, T., Ceulemans, E., Verschaffel, L., & Van Dooren, W. (2018). Towards a mathematically more correct understanding of rational numbers: A longitudinal study with upper elementary school learners. Learning and Individual Differences, 61, 99–108. https://doi.org/10.1016/j.lindif.2017.11.010.
Van Hoof, J., Verschaffel, L., & Van Dooren, W. (2017). Number sense in the transition from natural to rational numbers. The British Journal of Educational Psychology, 87(1), 43–56. https://doi.org/10.1111/bjep.12134.
Vandierendonck, A. (2017). A comparison of methods to combine speed and accuracy measures of performance: A rejoinder on the binning procedure. Behavior Research Methods, 49(2), 653–673. https://doi.org/10.3758/s13428-016-0721-5.
Varma, S., & Karl, S. R. (2013). Understanding decimal proportions: Discrete representations, parallel access, and privileged processing of zero. Cognitive Psychology, 66(3), 283–301. https://doi.org/10.1016/j.cogpsych.2013.01.002.
Varma, S., & Schwartz, D. L. (2011). The mental representation of integers: An abstract- to-concrete shift in the understanding of mathematical concepts. Cognition, 121(3), 363–385. https://doi.org/10.1016/j.cognition.2011.08.005.
Wilkinson, H. R., Smid, C., Morris, S., Farran, E. K., Dumontheil, I., Mayer, S., … Thomas, M. S. C. (2019). Domain-specific inhibitory control training to improve children’s learning of counterintuitive concepts in mathematics and science. Journal of Cognitive Enhancement.. https://doi.org/10.1007/s41465-019-00161-4.
Woodcock, R. W., McGrew, K. S., & Mather, N. (2001). Woodcock–Johnson III Tests of Achievement. Istasca, IL: Riverside Publishing.
Wright, A., & Diamond, A. (2014). An effect of inhibitory load in children while keeping working memory load constant. Frontiers in Psychology, 5, 213. https://doi.org/ 10.3389/fpsyg.2014.00213.
Younger, J., O’Laughlin, K. D., Anguera, J., Bunge, S., Ferrer, E., Hoeft, F., … Uncapher, M. R. (2021, April 20). Development of executive function in middle childhood: A large-scale, in-school, longitudinal investigation. https://doi.org/ 10.31234/osf.io/xf489.
Zelazo, P. D., Blair, C., & Willoughby, M. T. (2017). Executive function : Implications for education. Washington, D.C: U.S. Department of Education, Institute of Education Sciences.
L. Coulanges et al.