Intrathecal activation of the IL17/IL8 axis in opticospinal multiple sclerosis
15
doi:10.1093/brain/awh453 Brain (2005), 128, 988–1002 Intrathecal activation of the IL-17/IL-8 axis in opticospinal multiple sclerosis Takaaki Ishizu, 1 Manabu Osoegawa, 1 Feng-Jun Mei, 1 Hitoshi Kikuchi, 1 Masahito Tanaka, 1 Yuka Takakura, 1 Motozumi Minohara, 1 Hiroyuki Murai, 1 Futoshi Mihara, 2 Takayuki Taniwaki 1 and Jun-ichi Kira 1 1 Department of Neurology, Neurological Institute and 2 Division of Neuroradiology, Department of Radiology, Graduate School of Medical Sciences, Kyushu University, Fukuoka, Japan Correspondence to: Professor J. Kira, Department of Neurology, Neurological Institute, Graduate School of Medical Sciences, Kyushu University, 3-1-1 Maidashi, Higashiku, Fukuoka 812-8582, Japan E-mail: [email protected] Summary There are two distinct subtypes of multiple sclerosis in Asians, opticospinal (OS-multiple sclerosis) and conven- tional (C-multiple sclerosis). In OS-multiple sclerosis, selective and severe involvement of the optic nerves and spinal cord is characteristic, though its mechanisms are unknown. The present study aimed to find out possible differences in the cytokine/chemokine profiles in CSF between OS-multiple sclerosis and C-multiple sclerosis and to delineate the relationships between these profiles and neuroimaging and pathological features. Sixteen cytokines/chemokines, namely interleukin (IL)-1b, IL-2, IL-4, IL-5, IL-6, IL-7, IL-8, IL-10, IL-12 (p70), IL-13, IL- 17, interferon (IFN)-g, tumour necrosis factor (TNF)-a, granulocyte colony-stimulating factor (G-CSF), monocyte chemoattractant protein-1 (MCP-1) and macrophage inflammatory protein-1b (MIP-1b), were measured sim- ultaneously in CSF supernatants from 40 patients with relapsing–remitting multiple sclerosis (20 OS-multiple sclerosis and 20 C-multiple sclerosis) at relapse and 19 control patients with spinocerebellar degeneration (SCD), together with intracellular production of IFN-g and IL-4 in CSF CD4 + T cells. In CSF supernatants relative to controls, IL-17, MIP-1b, IL-1b and IL-13 were only sig- nificantly increased in OS-multiple sclerosis patients, while TNF-a was only significantly increased in C- multiple sclerosis patients, using a cut-off level of 1 pg/ml. IL-8 was significantly elevated in both OS-multiple sclerosis and C-multiple sclerosis patients. MCP-1 was significantly decreased in both OS-multiple sclerosis and C-multiple sclerosis patients, while IL-7 was only significantly decreased in C-multiple sclerosis patients. IL-17, IL-8 and IL-5 were significantly higher in OS- multiple sclerosis patients than in C-multiple sclerosis patients. The increases in IL-17 and IL-8 in OS- multiple sclerosis were still significant even after exclusion of the patients undergoing various immunomodulatory therapies. Assays of intracellular cytokine production revealed that both the IFN-g + IL-4 – T-cell percentage and intracellular IFN-g/IL-4 ratio in CSF cells were sig- nificantly greater in C-multiple sclerosis patients than in controls. Contrarily, OS-multiple sclerosis patients showed not only a significantly greater percentage of IFN-g + IL-4 – T cells than controls but also a significantly higher percentage of IFN-g IL-4 + T cells than C-multiple sclerosis patients. Among the cytokines elevated in mul- tiple sclerosis, only IL-8 showed a significant positive correlation with the Expanded Disability Status Scale of Kurtzke score. Both the length of the spinal cord lesions on MRI and the CSF/serum albumin ratio had a signific- ant positive correlation with IL-8 and IL-17 in multiple sclerosis, in which the spinal cord lesions were signific- antly longer in OS-multiple sclerosis than in C-multiple sclerosis. Three of six spinal cord specimens from autop- sied OS-multiple sclerosis cases demonstrated numerous myeloperoxidase-positive neutrophils infiltrating necrotic lesions. These findings strongly suggest that in OS- multiple sclerosis, in addition to the Th1 cell upregulation seen in C-multiple sclerosis, intrathecal activation of the IL-17/IL-8 axis inducing heavy neutrophil infiltration contributes to extensive spinal cord lesion formation. Keywords: multiple sclerosis; cytokine; chemokine; cerebrospinal fluid; neutrophil Abbreviations: C-multiple sclerosis = conventional form of multiple sclerosis; EAE = experimental allergic encephalomyelitis; EDSS = Expanded Disability Status Scale of Kurtzke; G-CSF = granulocyte colony-stimulating factor; IFN = interferon; IL = interleukin; LP = lumbar puncture; MCP-1 = monocyte chemoattractant protein-1; MIP-1b = macrophage # The Author (2005). Published by Oxford University Press on behalf of the Guarantors of Brain. All rights reserved. For Permissions, please email: [email protected] by guest on July 25, 2016 http://brain.oxfordjournals.org/ Downloaded from
-
Upload
independent -
Category
Documents
-
view
3 -
download
0
Transcript of Intrathecal activation of the IL17/IL8 axis in opticospinal multiple sclerosis
doi:10.1093/brain/awh453 Brain (2005), 128, 988–1002
Intrathecal activation of the IL-17/IL-8 axis inopticospinal multiple sclerosis
Takaaki Ishizu,1 Manabu Osoegawa,1 Feng-Jun Mei,1 Hitoshi Kikuchi,1 Masahito Tanaka,1
Yuka Takakura,1 Motozumi Minohara,1 Hiroyuki Murai,1 Futoshi Mihara,2 Takayuki Taniwaki1
and Jun-ichi Kira1
1Department of Neurology, Neurological Institute and2Division of Neuroradiology, Department of Radiology,
Graduate School of Medical Sciences, Kyushu University,
Fukuoka, Japan
Correspondence to: Professor J. Kira, Department of
Neurology, Neurological Institute, Graduate School of
Medical Sciences, Kyushu University, 3-1-1 Maidashi,
Higashiku, Fukuoka 812-8582, Japan
E-mail: [email protected]
SummaryThere are two distinct subtypes of multiple sclerosis in
Asians, opticospinal (OS-multiple sclerosis) and conven-
tional (C-multiple sclerosis). In OS-multiple sclerosis,
selective and severe involvement of the optic nerves and
spinal cord is characteristic, though its mechanisms are
unknown. The present study aimed to find out possibledifferences in the cytokine/chemokine profiles in CSF
between OS-multiple sclerosis and C-multiple sclerosis
and to delineate the relationships between these profiles
and neuroimaging and pathological features. Sixteen
cytokines/chemokines, namely interleukin (IL)-1b, IL-2,
IL-4, IL-5, IL-6, IL-7, IL-8, IL-10, IL-12 (p70), IL-13, IL-
17, interferon (IFN)-g, tumour necrosis factor (TNF)-a,
granulocyte colony-stimulating factor (G-CSF), monocytechemoattractant protein-1 (MCP-1) and macrophage
inflammatory protein-1b (MIP-1b), were measured sim-
ultaneously in CSF supernatants from 40 patients with
relapsing–remitting multiple sclerosis (20 OS-multiple
sclerosis and 20 C-multiple sclerosis) at relapse and 19
control patients with spinocerebellar degeneration (SCD),
together with intracellular production of IFN-g and IL-4
in CSF CD4 + T cells. In CSF supernatants relative tocontrols, IL-17, MIP-1b, IL-1b and IL-13 were only sig-
nificantly increased in OS-multiple sclerosis patients,
while TNF-a was only significantly increased in C-
multiple sclerosis patients, using a cut-off level of 1 pg/ml.
IL-8 was significantly elevated in both OS-multiple
sclerosis and C-multiple sclerosis patients. MCP-1 was
significantly decreased in both OS-multiple sclerosis
and C-multiple sclerosis patients, while IL-7 was only
significantly decreased in C-multiple sclerosis patients.
IL-17, IL-8 and IL-5 were significantly higher in OS-
multiple sclerosis patients than in C-multiple sclerosis
patients. The increases in IL-17 and IL-8 in OS-
multiple sclerosis were still significant even after exclusion
of the patients undergoing various immunomodulatorytherapies. Assays of intracellular cytokine production
revealed that both the IFN-g+ IL-4– T-cell percentage
and intracellular IFN-g/IL-4 ratio in CSF cells were sig-
nificantly greater in C-multiple sclerosis patients than in
controls. Contrarily, OS-multiple sclerosis patients
showed not only a significantly greater percentage of
IFN-g+ IL-4– T cells than controls but also a significantly
higher percentage of IFN-g�IL-4+ T cells than C-multiplesclerosis patients. Among the cytokines elevated in mul-
tiple sclerosis, only IL-8 showed a significant positive
correlation with the Expanded Disability Status Scale of
Kurtzke score. Both the length of the spinal cord lesions
on MRI and the CSF/serum albumin ratio had a signific-
ant positive correlation with IL-8 and IL-17 in multiple
sclerosis, in which the spinal cord lesions were signific-
antly longer in OS-multiple sclerosis than in C-multiplesclerosis. Three of six spinal cord specimens from autop-
sied OS-multiple sclerosis cases demonstrated numerous
myeloperoxidase-positive neutrophils infiltrating necrotic
lesions. These findings strongly suggest that in OS-
multiple sclerosis, in addition to the Th1 cell upregulation
seen in C-multiple sclerosis, intrathecal activation of the
IL-17/IL-8 axis inducing heavy neutrophil infiltration
contributes to extensive spinal cord lesion formation.
Keywords: multiple sclerosis; cytokine; chemokine; cerebrospinal fluid; neutrophil
Abbreviations: C-multiple sclerosis = conventional form of multiple sclerosis; EAE = experimental allergic encephalomyelitis;
EDSS = Expanded Disability Status Scale of Kurtzke; G-CSF = granulocyte colony-stimulating factor; IFN = interferon;
IL = interleukin; LP = lumbar puncture; MCP-1 = monocyte chemoattractant protein-1; MIP-1b = macrophage
# The Author (2005). Published by Oxford University Press on behalf of the Guarantors of Brain. All rights reserved. For Permissions, please email: [email protected]
by guest on July 25, 2016http://brain.oxfordjournals.org/
Dow
nloaded from
inflammatory protein-1b; NMO = neuromyelitis optica; OS-multiple sclerosis = opticospinal form of multiple sclerosis;
PBL = peripheral blood lymphocyte; SCD = spinocerebellar degeneration; TNF = tumour necrosis factor
Received September 20, 2004. Revised October 24, 2004. Accepted January 26, 2005. Advance Access publication
March 2, 2005
IntroductionMultiple sclerosis is a chronic inflammatory disease of the
CNS characterized by macrophage and lymphocyte infiltra-
tion, demyelination, axonal injury and loss of neurological
function. It has been hypothesized, but not yet proven, to be
caused by an autoimmune mechanism targeting CNS myelin.
Cytokines are soluble proteins that mediate and regulate
interactions between cells of the immune system, and are
key mediators of autoimmune attack against CNS myelin
(Huang et al., 1999). In multiple sclerosis, many prior studies
have documented that proinflammatory (Th1 type) cytokines
such as interferon (IFN)-g, tumour necrosis factor (TNF)-a,
interleukin (IL)-1, IL-2 and IL-12 (p40) are involved in the
onset and perpetuation of the disease, while, in contrast, anti-
inflammatory (Th2 type) cytokines such as IL-4, IL-10 and
transforming growth factor-bare downregulated during phases
of disease activity and upregulated in phases of disease remis-
sion (Panitch et al., 1987; Sharief and Hentges, 1991; Sharief
and Thompson,1993;Linket al., 1994; Rieckmannetal., 1994;
Matusevicius et al., 1996; Navikas and Link, 1996; Navikas
et al., 1996; Monteyne et al., 1997; Fassbender et al., 1998;
Link, 1998; Huanget al., 1999; van Boxel-Dezaire et al., 1999).
It has been hypothesized that the progression of multiple
sclerosis, and perhaps even its induction, may be causally
related to dysregulation of the balance between Th1 and
Th2 cytokines (Olsson, 1995). However, other reports have
suggested that the Th1/Th2 cytokine paradigm for multiple
sclerosis is an oversimplification, and that various other
immune cells, including Th2, CD8 + T and B cells, are
involved in the complex and heterogeneous mechanisms in
this condition (Laman et al., 1998; Hemmer et al., 2002;
Lassmann and Ransohoff, 2004). Multiple cytokines often
function as complexes, with the function of one inducing
the function of another in a cascade effect. In this regard,
multiplexed fluorescent bead-based immunoassays, which
have a dynamic range of standard curves and require only
small amounts of material for simultaneous measurements of
numerous cytokines and chemokines, are more useful than
enzyme-linked immunosorbent assay (ELISA) methods
(Vignali, 2000; Kellar et al., 2001; de Jager et al., 2003).
Multiple sclerosis is rare in Asians but, when it does
appear, the destruction of the optic nerves and spinal cord
is striking (Kira, 2003). We previously reported the existence
of two subtypes of multiple sclerosis in Japanese, the optico-
spinal form (OS-multiple sclerosis) that shows selective and
severe involvement of the optic nerves and spinal cord, and
the conventional form (C-multiple sclerosis) that shows
disseminated lesions in the CNS including the cerebrum,
cerebellum and brainstem (Kira et al., 1996). The two
subtypes have different clinical and neuroimaging features,
and immunogenetic backgrounds (Kira et al., 1996;
Yamasaki et al., 1999; Kira, 2003). OS-multiple sclerosis
has distinct features, such as a higher age at onset, marked
female preponderance and a higher Kurtzke’s Expanded Dis-
ability Status Scale (EDSS) score (Kurtzke, 1983), resulting
from severe visual impairment and marked spinal cord dys-
function compared with C-multiple sclerosis. Severe inflam-
matory destruction has been suggested in OS-multiple
sclerosis, because of the occasionally higher cell counts and
protein amounts in the CSF, as well as long swollen lesions
extending over several vertebral segments on spinal cord MRI
(Kira, 2003). Furthermore, pathological studies have revealed
not only demyelination, but also axonal loss, necrosis, cavity
formation, thickened vessel wall and capillary proliferation in
OS-multiple sclerosis lesions (Shiraki, 1965; Ikuta et al., 1982;
Tabira and Tateishi, 1982). These clinico-pathological
features of OS-multiple sclerosis in Asians are similar to
those of a relapsing–remitting form of Devic’s neuromyelitis
optica (NMO) in a Western population (Wingerchuk et al.,
1999; Cree et al., 2002; Lucchinetti et al., 2002). Considerable
overlap and common mechanisms between the two conditions
are supposed, as seen in the recent discovery of NMO-IgG,
commonly found in both (Lennon et al., 2004); however, the
immune mechanisms responsible for such distinct clinico-
pathological features remain unknown.
Although many studies have been published on cytokine/
chemokine alterations in multiple sclerosis, subtype-related
alterations have been poorly characterized. We previously
reported that OS-multiple sclerosis showed a significant
Th1/Tc1 shift through relapse and remission phases in peri-
pheral blood lymphocytes (PBLs), while C-multiple sclerosis
only showed a significant Th1 shift during a relapse phase
(Horiuchi et al., 2000; Wu et al., 2000; Ochi et al., 2001). In
CSF, except for one report disclosing a greater increase in
macrophage migration inhibitory factor (MIF) in OS-multiple
sclerosis than in C-multiple sclerosis (Niino et al., 2000), OS-
multiple sclerosis-related changes in CSF cytokine/chemo-
kine profiles have not been investigated, probably because
of the low concentrations of cytokines/chemokines and the
fragility and limited numbers of CSF cells.
Therefore, in the present study, we attempted to uncover
OS-multiple sclerosis-related cytokine/chemokine alterations
in CSF that could explain the distinct neuroimaging and
pathological features. First, we simultaneously measured
16 cytokines/chemokines, namely IL-1b, IL-2, IL-4, IL-5,
IL-6, IL-7, IL-8, IL-10, IL-12 (p70), IL-13, IL-17, IFN-g,
TNF-a, granulocyte colony-stimulating factor (G-CSF),
IL-17/IL-8 axis in opticospinal multiple sclerosis 989
by guest on July 25, 2016http://brain.oxfordjournals.org/
Dow
nloaded from
monocyte chemoattractant protein 1 (MCP-1) and
macrophage inflammatory protein 1b (MIP-1b), in the
CSF from OS-multiple sclerosis and C-multiple sclerosis
patients at relapse using a multiplexed fluorescent bead-
based immunoassay. Secondly, we examined the intracellular
production of IFN-g and IL-4 in CSF CD4 + T cells from OS-
multiple sclerosis and C-multiple sclerosis patients by flow
cytometry. Thirdly, we analysed relationships among CSF
cytokine/chemokine changes and clinical and spinal cord
MRI findings, as well as neuropathological findings for autop-
sied spinal cord specimens from multiple sclerosis patients.
Materials and methodsPatientsCytokine and chemokine assays of CSF supernatants were per-
formed using CSF from multiple sclerosis patients exclusively at
the time of clinical relapse (within 30 days of the onset of acute or
subacute exacerbation). For these assays, 40 patients with relapsing–
remitting multiple sclerosis [five males and 35 females; age at exam-
ination: 41.5 6 15.9 years (mean 6 SD), range: 18–89] who were
diagnosed with multiple sclerosis based on McDonald’s diagnostic
criteria (McDonald et al., 2001) at the Department of Neurology,
Kyushu University Hospital were enrolled in this study. In addition,
19 patients with spinocerebellar degeneration (SCD) (nine males and
10 females; age: 59.4 6 10.9 years, range: 32–80) were used as
controls. The multiple sclerosis patients were clinically classified
into two subtypes: OS-multiple sclerosis and C-multiple sclerosis, as
described previously (Kira et al., 1996). Briefly, patients who
showed a relapsing–remitting course and had both optic nerve
and spinal cord involvement without any clinical evidence of disease
in either the cerebrum or cerebellum were considered to have OS-
multiple sclerosis. Patients who showed minor brainstem signs, such
as transient double vision and nystagmus, in addition to optico-
spinal involvement, were included in this subtype. All other patients
who showed multiple involvement of the CNS, including the cer-
ebrum and cerebellum, were considered to have C-multiple scler-
osis. The disability status of the patients was scored by one of the
authors (T.I.) throughout the study, according to the EDSS (Kurtzke,
1983). The mean times from symptom onset to lumbar puncture (LP)
were 13.9 days (range: 1–30 days) for OS-multiple sclerosis and
12.8 days (range: 1–30 days) for C-multiple sclerosis; the two did
not differ significantly. Of the 40 multiple sclerosis patients, five C-
multiple sclerosis and 10 OS-multiple sclerosis patients had received
IFN-b or high-dose corticosteroids at the time of LP. The demo-
graphic features of the patients are summarized in Table 1. The ages
at onset and LP, the EDSS score and CSF/serum albumin ratio were
significantly higher in OS-multiple sclerosis than in C-multiple
sclerosis (P = 0.0000064, 0.0000049, 0.019 and 0.023, respectively),
while the disease duration, number of relapses, CSF cell count, total
protein amount and IgG index did not differ significantly between
the two.
For analysis of intracellular IFN-g and IL-4 in CSF cells,
24 patients with multiple sclerosis (two males and 22 females; age:
45.2 6 18.2 years, range: 21–89) who fulfilled McDonald’s criteria
and 12 control patients with various other non-inflammatory
neurological diseases (seven males and five females; age: 52.4 6
17.2 years, range: 20–75) were enrolled. In the multiple sclerosis
group, 11 had OS-multiple sclerosis and 13 had C-multiple sclerosis.
Of these, 21 were relapsing–remitting multiple sclerosis (11 OS-
multiple sclerosis and 10 C-multiple sclerosis) and three were sec-
ondary progressive multiple sclerosis (three C-multiple sclerosis).
The control group of 12 patients was comprised of two with amyo-
trophic lateral sclerosis, two with Alzheimer’s disease, two with
cervical spondylosis, one with SCD, one with Parkinson’s disease,
one with progressive supranuclear palsy, one with spinal cord infarc-
tion, one with epilepsy and one with conversion hysteria. The demo-
graphic features of the patients are also summarized in Table 1. The
ages at onset and LP, and CSF/serum albumin ratio were signific-
antly higher in OS-multiple sclerosis than in C-multiple sclerosis
(P = 0.017, 0.028 and 0.028, respectively).
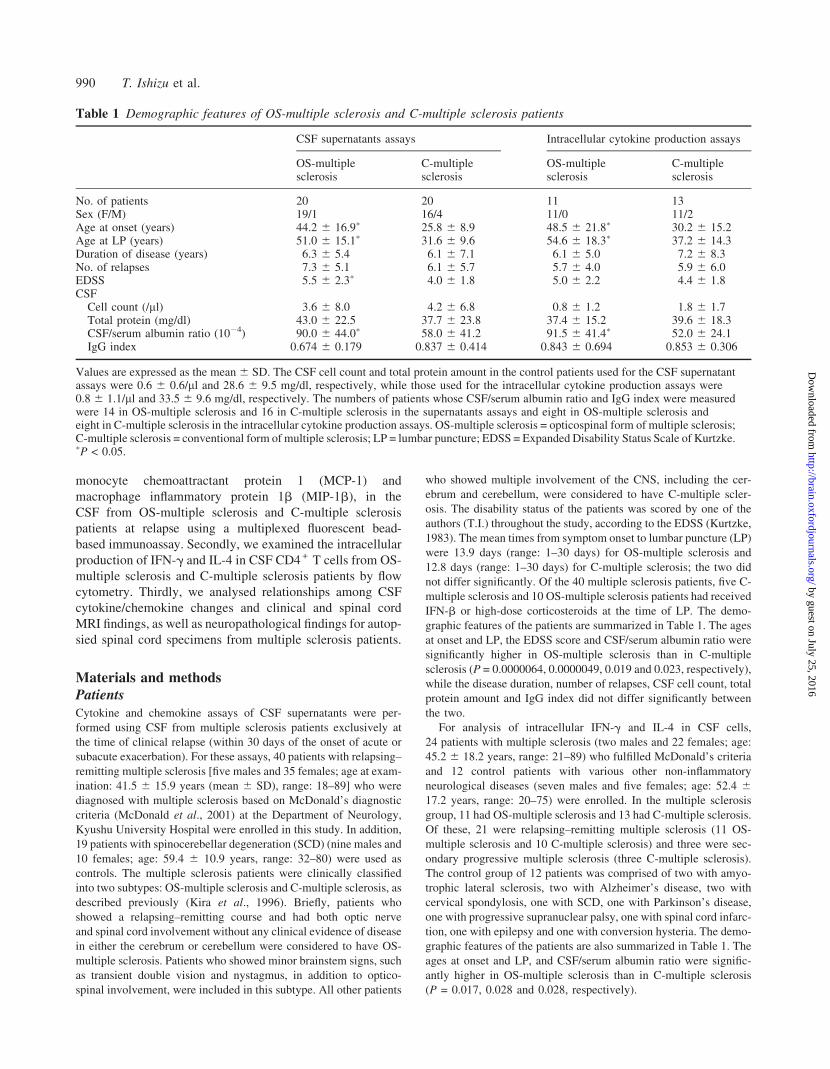
Table 1 Demographic features of OS-multiple sclerosis and C-multiple sclerosis patients
CSF supernatants assays Intracellular cytokine production assays
OS-multiplesclerosis
C-multiplesclerosis
OS-multiplesclerosis
C-multiplesclerosis
No. of patients 20 20 11 13Sex (F/M) 19/1 16/4 11/0 11/2Age at onset (years) 44.2 6 16.9� 25.8 6 8.9 48.5 6 21.8� 30.2 6 15.2Age at LP (years) 51.0 6 15.1� 31.6 6 9.6 54.6 6 18.3� 37.2 6 14.3Duration of disease (years) 6.3 6 5.4 6.1 6 7.1 6.1 6 5.0 7.2 6 8.3No. of relapses 7.3 6 5.1 6.1 6 5.7 5.7 6 4.0 5.9 6 6.0EDSS 5.5 6 2.3� 4.0 6 1.8 5.0 6 2.2 4.4 6 1.8CSF
Cell count (/ml) 3.6 6 8.0 4.2 6 6.8 0.8 6 1.2 1.8 6 1.7Total protein (mg/dl) 43.0 6 22.5 37.7 6 23.8 37.4 6 15.2 39.6 6 18.3CSF/serum albumin ratio (10�4) 90.0 6 44.0� 58.0 6 41.2 91.5 6 41.4� 52.0 6 24.1IgG index 0.674 6 0.179 0.837 6 0.414 0.843 6 0.694 0.853 6 0.306
Values are expressed as the mean 6 SD. The CSF cell count and total protein amount in the control patients used for the CSF supernatantassays were 0.6 6 0.6/ml and 28.6 6 9.5 mg/dl, respectively, while those used for the intracellular cytokine production assays were0.8 6 1.1/ml and 33.5 6 9.6 mg/dl, respectively. The numbers of patients whose CSF/serum albumin ratio and IgG index were measuredwere 14 in OS-multiple sclerosis and 16 in C-multiple sclerosis in the supernatants assays and eight in OS-multiple sclerosis andeight in C-multiple sclerosis in the intracellular cytokine production assays. OS-multiple sclerosis = opticospinal form of multiple sclerosis;C-multiple sclerosis = conventional form of multiple sclerosis; LP = lumbar puncture; EDSS = Expanded Disability Status Scale of Kurtzke.�P < 0.05.
990 T. Ishizu et al.
by guest on July 25, 2016http://brain.oxfordjournals.org/
Dow
nloaded from
CSF sample collectionAt least 5 ml of CSF was obtained from all patients by non-traumatic
LP. Twenty-three CSF samples (all at the relapse phase) from 20 OS-
multiple sclerosis patients, 22 CSF samples (all at the relapse phase)
from 20 C-multiple sclerosis patients, and 19 CSF samples from
19 control patients were obtained for extracellular cytokine analysis.
Neither multiple sclerosis nor control patients had any ongoing or
recent infection at the time of LP. Intracellular IFN-g and IL-4
analyses were performed using 11 CSF samples (10 at the relapse
phase and one at the remission phase) from 11 OS-multiple sclerosis
patients, 13 CSF samples (seven at the relapse phase, three at the
remission phase and three at the progressive phase) from 13 C-
multiple sclerosis patients, and 12 CSF samples from 12 control
patients. CSF samples were immediately centrifuged at
800 r.p.m./min at 4�C for 5 min, and the supernatants stored at
�70�C until analysis. The cell counts, total protein amounts, CSF/
serum albumin ratio and IgG index used for the study are shown in
Table 1.
Multiplexed fluorescent bead-based immunoassayCSF supernatants were collected and analysed simultaneously for 16
different cytokines and chemokines, namely IL-1b, IL-2, IL-4, IL-5,
IL-6, IL-7, IL-8, IL-10, IL-12 (p70), IL-13, IL-17, IFN-g, TNF-a,
G-CSF, MCP-1 and MIP-1b, using the Bio-Plex Cytokine Assay
System (Bio-Rad Laboratories, Hercules, CA) according to the
manufacturer’s instructions (Kellar et al., 2001; de Jager et al.,
2003). Briefly, 50 ml of each CSF supernatant and various con-
centrations of each cytokine standard (Bio-Rad) were added to 50
ml of antibody-conjugated beads (Bio-Rad) in a 96-well filter plate
(Millipore, Billerica, MA). After a 30 min incubation, the plate was
washed and 25 ml of a biotinylated antibody solution (Bio-Rad) was
added to each well, followed by another 30 min incubation. The
plate was then washed and 50 ml of streptavidin-conjugated phyco-
erythrin (PE; Bio-Rad) was added to each well and incubated for
10 min. Following a final wash, the contents of each well were
resuspended in 125 ml of assay buffer (Bio-Rad) and analysed
using a Bio-Plex Array Reader (Bio-Rad). The cytokine concentra-
tions were calculated by reference to a standard curve for each
cytokine derived using various concentrations of the cytokine stand-
ards (0.2, 0.78, 3.13, 12.5, 50, 200, 800 and 3200 pg/ml) assayed in
the same manner as the CSF samples. The same lots of monoclonal
antibodies for Bio-Plex Cytokine Assay System were used through-
out the experiments, and the inter- and intra-assay variability was
reported to be <10% (manufacturer’s instructions). The detection
limit of each cytokine was determined by the recovery of the cor-
responding cytokine standard, and the lowest values showing >50%
recovery were set as the lower detection limits. The lower detection
limit for each cytokine was as follows: 0.2 pg/ml for IL-2, IL-4, IL-5,
IL-7, IL-8, IL-10, IL-12 (p70), IL-13, IL-17, IFN-g and TNF-a, 0.78
pg/ml for IL-1b and IL-6, and 3.13 pg/ml for G-CSF, MCP-1 and
MIP-1b. All samples were analysed undiluted in duplicate.
Intracellular cytokine analysis by flow cytometryEach CSF supernatant was carefully removed and the cell sediment
was suspended in RPMI 1640 (Nipro, Tokyo, Japan) supplemented
with 10% fetal calf serum (FCS; Gibco BRL, Gaithersburg, MD;
Lot # 3217341S), followed by incubation with 25 ng/ml phorbol 12-
myristate 13-acetate (PMA; Sigma, St Louis, MO), 1.0 mg/ml
ionomycin (Sigma) and 10 mg/ml brefeldin A (BFA; Sigma) in a
24-well plate at 37�C for 4 h under 5% CO2. After washing with
phosphate-buffered saline containing 0.1% bovine serum albumin
(0.1% BSA–PBS), cells were stained with perCP-conjugated anti-
CD4 monoclonal antibodies (Immunotech, Marseille, France) and
incubated on ice in the dark for 15 min. Following another wash
with 0.1% BSA–PBS, fluorescence-activated cell sorting (FACS)
permeabilizing solution (Becton Dickinson, San Jose, CA) was
added and the cells were placed in the dark for 10 min. After
two washes with 0.1% BSA–PBS, the cells were stained with
fluorescein isothiocyanate (FITC)-conjugated anti-IFN-g (Immu-
notech) and PE-conjugated anti-IL-4 (Immunotech) antibodies for
intracellular cytokine analysis, or with mouse IgG2a–FITC (Immu-
notech) and IgG1–PE (Immunotech) as controls, respectively. After
a 30 min incubation on ice in the dark, the percentages of intra-
cellular IFN-g- and IL-4-producing cells were immediately analysed
by flow cytometry using an Epics XL System II (Coulter, Hialeah,
FL). Analysis gates were first set on lymphocytes according to the
forward and side scatter properties and then on CD4 + lymphocytes.
Cases with a CD4 + cell count of <500 were discarded from the
analysis to increase the reliability.
Neuroimaging of the spinal cordFor spinal cord MRI, T2-weighted (SE 2500–4900/113–116) and
T1-weighted (SE 400–500/11–12) images were obtained in the
sagittal and axial planes. For the contrast-enhanced study, MRI was
initiated 2–3 min after intravenous administration of gadolinium-
pentetic acid (0.1 mmol/kg), using the T1-weighted sequences in the
sagittal and axial planes. Lengths of spinal cord lesions were
expressed in cm. Longitudinally extensive spinal cord lesions
were defined as those extending over three vertebral spine lengths,
which are considered to be exceptional in multiple sclerosis
(McDonald et al., 2001). Spinal cord MRIs taken at the time of
relapse when the CSF samples were drawn (within 30 days of the
onset of acute or subacute exacerbation) were evaluated independ-
ently by two examiners, of whom one (F.M.) was an experienced
neuroradiologist and was blinded to the diagnosis. Spinal cord MRIs
at the relapse were available for 34 of 40 multiple sclerosis patients
(17 OS-multiple sclerosis and 17 C-multiple sclerosis patients) and,
of these, 30 had spinal cord symptomatology (17 OS-multiple scler-
osis and 13 C-multiple sclerosis).
Histopathological analysis of infiltrating cells inautopsied spinal cord specimens of OS-multiplesclerosis and C-multiple sclerosisFor the neuropathological analysis, spinal cord specimens obtained
at autopsy from six OS-multiple sclerosis and two C-multiple scler-
osis cases were used. Each autopsied specimen was fixed in 10%
buffered formalin for several weeks, and then embedded in paraffin.
Sections were either stained with haematoxylin and eosin, or
immunostained using rabbit polyclonal antibodies against myeloper-
oxidase (1 : 500; NeoMarkers, Fremont, CA) or myelin basic protein
(1 : 200; DAKO, Denmark) or mouse monoclonal antibodies against
phosphorylated neurofilaments (1 : 200; DAKO; clone 2F11),
macrophages (1 : 500; DAKO; clone KP1), T-cell antigen (1 : 500;
DAKO; clone UCHL1) or B-cell antigen (1 : 500; DAKO; clone
L26). Autoclave or microwave pre-treatment was performed to
retrieve the antigens for immunostaining. The number of infiltrating
cells, including neutrophils, macrophages, and T and B cells, was
averaged for four separate fields (each field 3200) in the lesion in
the same cross-section of the spinal cord.
IL-17/IL-8 axis in opticospinal multiple sclerosis 991
by guest on July 25, 2016http://brain.oxfordjournals.org/
Dow
nloaded from
Statistical analysisFisher’s exact probability test was employed for comparisons of the
detection rates of cytokines and chemokines in each group. The non-
parametric Mann-Whitney U test was employed for comparison of
the cytokine and chemokine levels in each group. The difference
between PBLs and CSF in each group was analysed by Wilcoxon
signed-rank test. Statistical significance was set at P < 0.05.
Spearman’s rank correlation analysis was used for statistical analysis
of correlations between various clinical parameters and CSF
cytokine levels.
ResultsDetection rates of each cytokine andchemokine in CSF supernatantsThe detection rate of IL-10 was significantly higher in OS-
multiple sclerosis and C-multiple sclerosis patients than in
control patients (91.3 versus 36.8%, P = 0.00027 in OS-
multiple sclerosis; 81.8 versus 36.8%, P = 0.0046 in
C-multiple sclerosis), while that of IL-7 was significantly
lower in OS-multiple sclerosis and C-multiple sclerosis
patients than in control patients (60.9 versus 100%, P =
0.002 in OS-multiple sclerosis; 68.2 versus 100%, P =
0.0098 in C-multiple sclerosis). In addition, IL-17 was sig-
nificantly higher in OS-multiple sclerosis patients than in
control patients (73.9 versus 36.8%, P = 0.028), while
TNF-a was significantly higher in C-multiple sclerosis
patients than in control patients (77.3 versus 42.1%, P =
0.029). The detection rates of other cytokines did not differ
significantly between control patients and the two multiple
sclerosis subtypes. When the five C-multiple sclerosis and 10
OS-multiple sclerosis patients on immunomodulatory therap-
ies were excluded, essentially the same results were obtained,
except that the increased detection rate of TNF-a in C-
multiple sclerosis lost significance. IL-2 was not used for
further statistical analysis because of its extremely low
detection rate (<20% in total) in CSF.
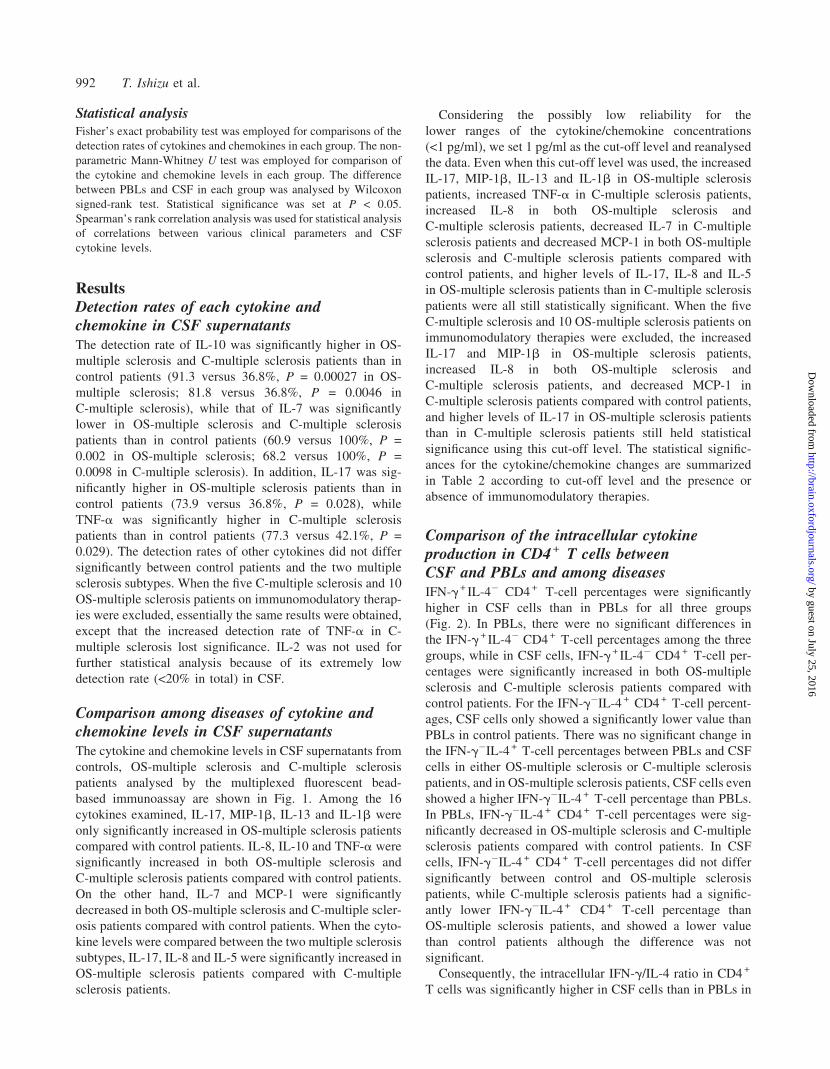
Comparison among diseases of cytokine andchemokine levels in CSF supernatantsThe cytokine and chemokine levels in CSF supernatants from
controls, OS-multiple sclerosis and C-multiple sclerosis
patients analysed by the multiplexed fluorescent bead-
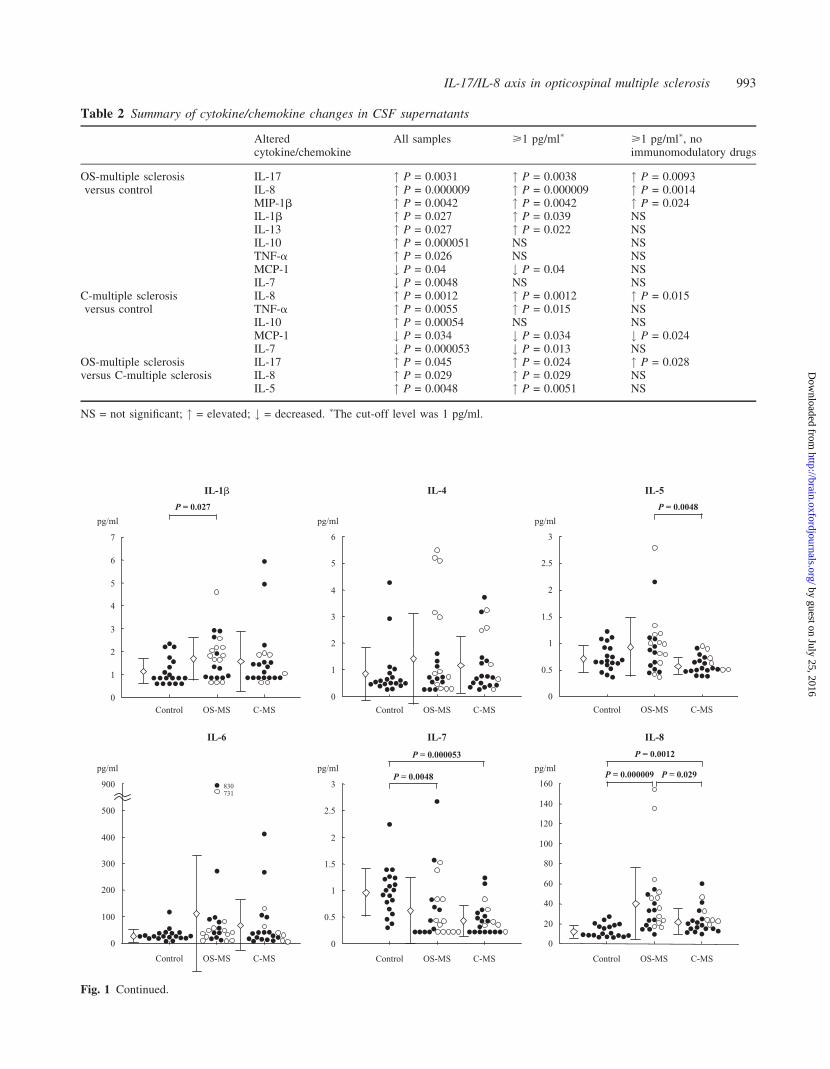
based immunoassay are shown in Fig. 1. Among the 16
cytokines examined, IL-17, MIP-1b, IL-13 and IL-1b were
only significantly increased in OS-multiple sclerosis patients
compared with control patients. IL-8, IL-10 and TNF-a were
significantly increased in both OS-multiple sclerosis and
C-multiple sclerosis patients compared with control patients.
On the other hand, IL-7 and MCP-1 were significantly
decreased in both OS-multiple sclerosis and C-multiple scler-
osis patients compared with control patients. When the cyto-
kine levels were compared between the two multiple sclerosis
subtypes, IL-17, IL-8 and IL-5 were significantly increased in
OS-multiple sclerosis patients compared with C-multiple
sclerosis patients.
Considering the possibly low reliability for the
lower ranges of the cytokine/chemokine concentrations
(<1 pg/ml), we set 1 pg/ml as the cut-off level and reanalysed
the data. Even when this cut-off level was used, the increased
IL-17, MIP-1b, IL-13 and IL-1b in OS-multiple sclerosis
patients, increased TNF-a in C-multiple sclerosis patients,
increased IL-8 in both OS-multiple sclerosis and
C-multiple sclerosis patients, decreased IL-7 in C-multiple
sclerosis patients and decreased MCP-1 in both OS-multiple
sclerosis and C-multiple sclerosis patients compared with
control patients, and higher levels of IL-17, IL-8 and IL-5
in OS-multiple sclerosis patients than in C-multiple sclerosis
patients were all still statistically significant. When the five
C-multiple sclerosis and 10 OS-multiple sclerosis patients on
immunomodulatory therapies were excluded, the increased
IL-17 and MIP-1b in OS-multiple sclerosis patients,
increased IL-8 in both OS-multiple sclerosis and
C-multiple sclerosis patients, and decreased MCP-1 in
C-multiple sclerosis patients compared with control patients,
and higher levels of IL-17 in OS-multiple sclerosis patients
than in C-multiple sclerosis patients still held statistical
significance using this cut-off level. The statistical signific-
ances for the cytokine/chemokine changes are summarized
in Table 2 according to cut-off level and the presence or
absence of immunomodulatory therapies.
Comparison of the intracellular cytokineproduction in CD4 + T cells betweenCSF and PBLs and among diseasesIFN-g+ IL-4� CD4 + T-cell percentages were significantly
higher in CSF cells than in PBLs for all three groups
(Fig. 2). In PBLs, there were no significant differences in
the IFN-g + IL-4� CD4 + T-cell percentages among the three
groups, while in CSF cells, IFN-g+ IL-4� CD4 + T-cell per-
centages were significantly increased in both OS-multiple
sclerosis and C-multiple sclerosis patients compared with
control patients. For the IFN-g�IL-4 + CD4 + T-cell percent-
ages, CSF cells only showed a significantly lower value than
PBLs in control patients. There was no significant change in
the IFN-g�IL-4 + T-cell percentages between PBLs and CSF
cells in either OS-multiple sclerosis or C-multiple sclerosis
patients, and in OS-multiple sclerosis patients, CSF cells even
showed a higher IFN-g�IL-4 + T-cell percentage than PBLs.
In PBLs, IFN-g�IL-4 + CD4 + T-cell percentages were sig-
nificantly decreased in OS-multiple sclerosis and C-multiple
sclerosis patients compared with control patients. In CSF
cells, IFN-g�IL-4 + CD4 + T-cell percentages did not differ
significantly between control and OS-multiple sclerosis
patients, while C-multiple sclerosis patients had a signific-
antly lower IFN-g�IL-4 + CD4 + T-cell percentage than
OS-multiple sclerosis patients, and showed a lower value
than control patients although the difference was not
significant.
Consequently, the intracellular IFN-g/IL-4 ratio in CD4 +
T cells was significantly higher in CSF cells than in PBLs in
992 T. Ishizu et al.
by guest on July 25, 2016http://brain.oxfordjournals.org/
Dow
nloaded from
pg/ml
0
1
2
3
4
5
6
7
Control OS-MS C-MS
IL-1�
P = 0.027
IL-6
pg/ml
Control OS-MS C-MS
0
100
200
300
400
500
900 830731
pg/ml
Control OS-MS C-MS
IL-4
6
0
1
2
3
4
5
pg/ml
IL-7
3
0
0.5
1
1.5
2
2.5
Control OS-MS C-MS
P = 0.000053
P = 0.0048
pg/ml
Control OS-MS C-MS
P = 0.0048
IL-5
0
0.5
1
1.5
2
2.5
3
IL-8
Control OS-MS C-MS
P = 0.000009
P = 0.0012
pg/ml
0
20
40
60
80
100
120
140
160P = 0.029
Fig. 1 Continued.
Table 2 Summary of cytokine/chemokine changes in CSF supernatants
Alteredcytokine/chemokine
All samples >1 pg/ml� >1 pg/ml�, noimmunomodulatory drugs
OS-multiple sclerosis IL-17 " P = 0.0031 " P = 0.0038 " P = 0.0093versus control IL-8 " P = 0.000009 " P = 0.000009 " P = 0.0014
MIP-1b " P = 0.0042 " P = 0.0042 " P = 0.024IL-1b " P = 0.027 " P = 0.039 NSIL-13 " P = 0.027 " P = 0.022 NSIL-10 " P = 0.000051 NS NSTNF-a " P = 0.026 NS NSMCP-1 # P = 0.04 # P = 0.04 NSIL-7 # P = 0.0048 NS NS
C-multiple sclerosis IL-8 " P = 0.0012 " P = 0.0012 " P = 0.015versus control TNF-a " P = 0.0055 " P = 0.015 NS
IL-10 " P = 0.00054 NS NSMCP-1 # P = 0.034 # P = 0.034 # P = 0.024IL-7 # P = 0.000053 # P = 0.013 NS
OS-multiple sclerosis IL-17 " P = 0.045 " P = 0.024 " P = 0.028versus C-multiple sclerosis IL-8 " P = 0.029 " P = 0.029 NS
IL-5 " P = 0.0048 " P = 0.0051 NS
NS = not significant; " = elevated; # = decreased. �The cut-off level was 1 pg/ml.
IL-17/IL-8 axis in opticospinal multiple sclerosis 993
by guest on July 25, 2016http://brain.oxfordjournals.org/
Dow
nloaded from
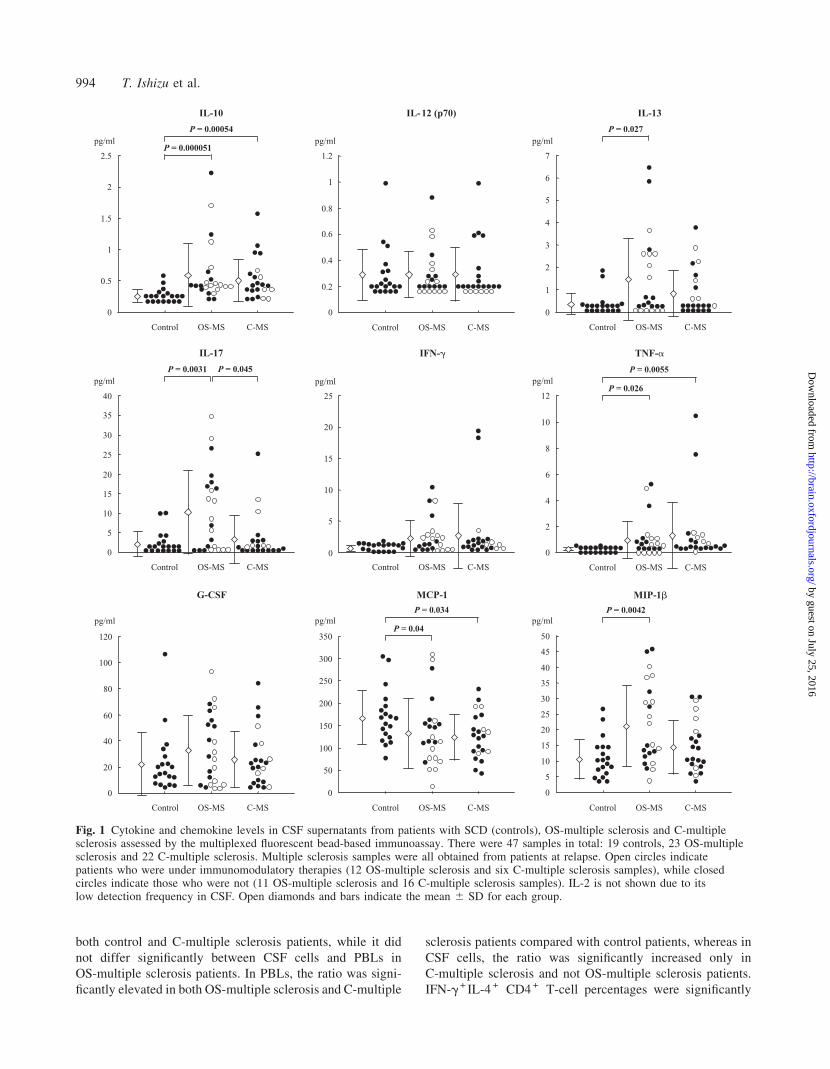
both control and C-multiple sclerosis patients, while it did
not differ significantly between CSF cells and PBLs in
OS-multiple sclerosis patients. In PBLs, the ratio was signi-
ficantly elevated in both OS-multiple sclerosis and C-multiple
sclerosis patients compared with control patients, whereas in
CSF cells, the ratio was significantly increased only in
C-multiple sclerosis and not OS-multiple sclerosis patients.
IFN-g+ IL-4 + CD4 + T-cell percentages were significantly
pg/ml
0
5
10
15
20
25
Control OS-MS C-MS
IFN-�
pg/ml
0
2
4
6
8
10
12
OS-MS C-MSControl
TNF-�
P = 0.0055
P = 0.026pg/ml
0
5
10
15
20
25
30
35
40
P = 0.0031 P = 0.045
Control OS-MS C-MS
IL-17
pg/ml
0
20
40
60
80
100
120
Control OS-MS C-MS
G-CSF
pg/ml
0
50
100
150
200
250
300
350
Control OS-MS C-MS
MCP-1
P = 0.034
P = 0.04
0
5
10
15
20
25
30
35
40
45
50
pg/mlP = 0.0042
Control OS-MS C-MS
MIP-1�
Control OS-MS C-MS
IL-12 (p70)
pg/ml
0
0.2
0.4
0.6
0.8
1
1.2
pg/ml
0
1
2
3
4
5
6
7
Control OS-MS C-MS
IL-13
P = 0.027pg/ml
Control OS-MS C-MS
0
0.5
1
1.5
2
2.5
P = 0.00054
P = 0.000051
IL-10
Fig. 1 Cytokine and chemokine levels in CSF supernatants from patients with SCD (controls), OS-multiple sclerosis and C-multiplesclerosis assessed by the multiplexed fluorescent bead-based immunoassay. There were 47 samples in total: 19 controls, 23 OS-multiplesclerosis and 22 C-multiple sclerosis. Multiple sclerosis samples were all obtained from patients at relapse. Open circles indicatepatients who were under immunomodulatory therapies (12 OS-multiple sclerosis and six C-multiple sclerosis samples), while closedcircles indicate those who were not (11 OS-multiple sclerosis and 16 C-multiple sclerosis samples). IL-2 is not shown due to itslow detection frequency in CSF. Open diamonds and bars indicate the mean 6 SD for each group.
994 T. Ishizu et al.
by guest on July 25, 2016http://brain.oxfordjournals.org/
Dow
nloaded from
higher in CSF cells than in PBLs in all three groups.
IFN-g+ IL-4 + CD4 + T-cell percentages did not differ signi-
ficantly among control, OS-multiple sclerosis and C-multiple
sclerosis patients in either PBLs or CSF cells.
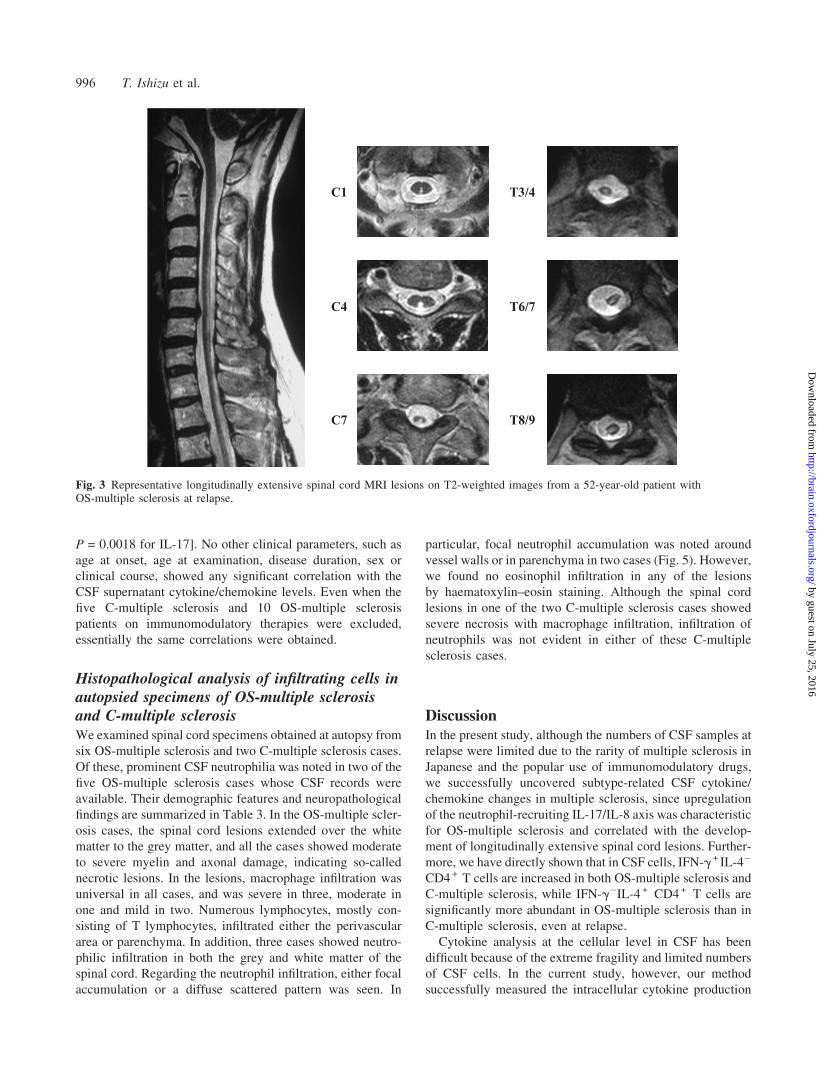
Neuroimaging findings of spinal cordLongitudinally extensive spinal cord lesions (Fig. 3) were
found in 17 of 34 (50.0%) multiple sclerosis patients around
the time their CSF was examined. The frequency of longit-
udinally extensive spinal cord lesions was higher in OS-
multiple sclerosis than in C-multiple sclerosis (12 out of
17, 70.6 versus five out of 17, 29.4%, P = 0.038). In addition,
the spinal cord lesions were also longer in OS-multiple
sclerosis than in C-multiple sclerosis (5.5 6 3.1 versus
2.7 6 3.3 cm, P = 0.021).
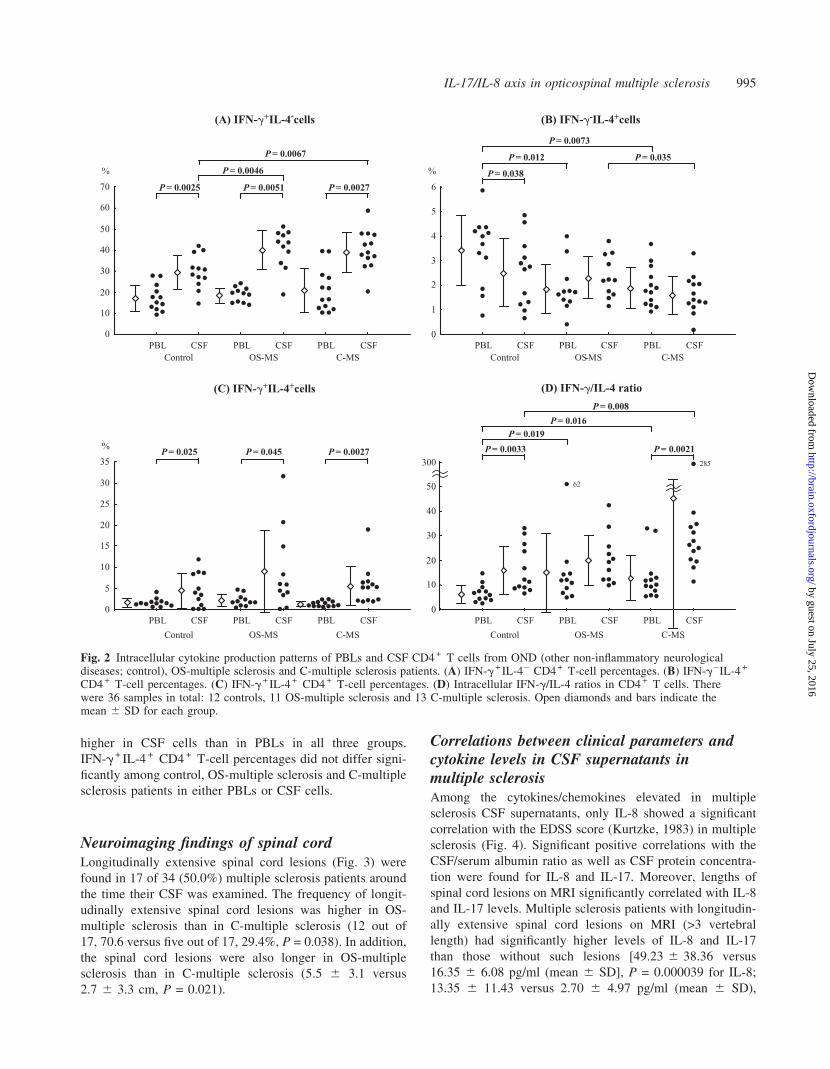
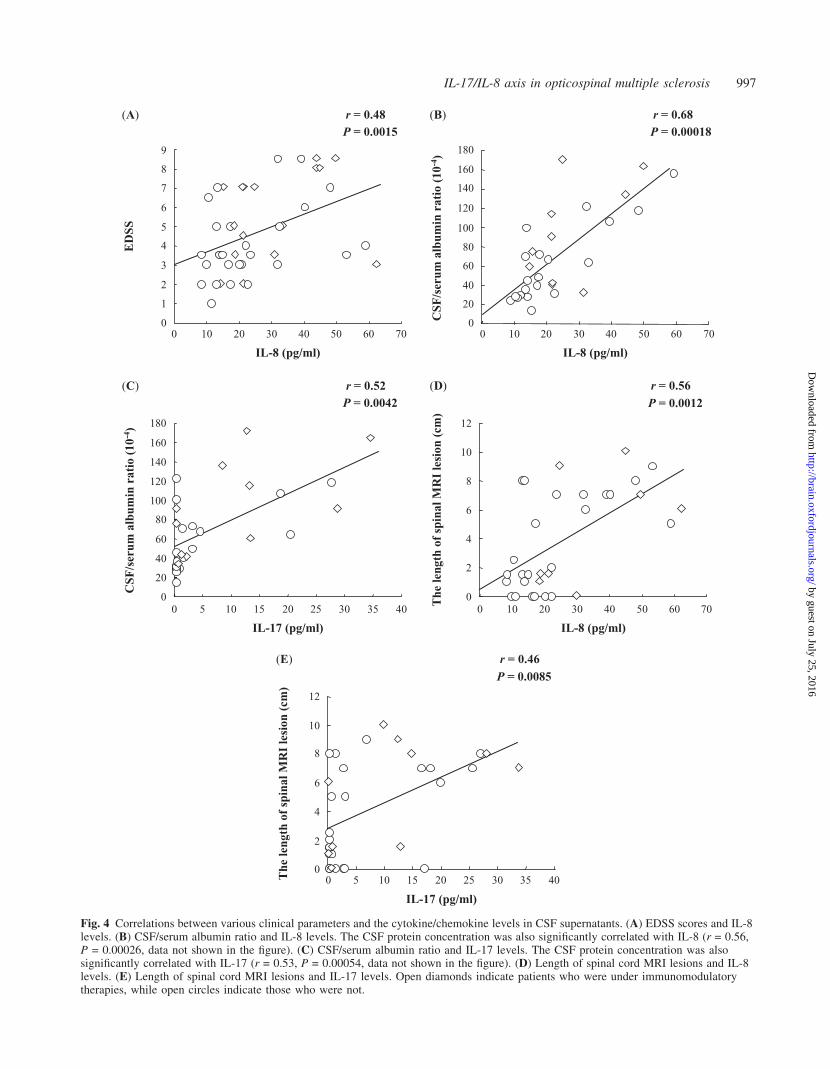
Correlations between clinical parameters andcytokine levels in CSF supernatants inmultiple sclerosisAmong the cytokines/chemokines elevated in multiple
sclerosis CSF supernatants, only IL-8 showed a significant
correlation with the EDSS score (Kurtzke, 1983) in multiple
sclerosis (Fig. 4). Significant positive correlations with the
CSF/serum albumin ratio as well as CSF protein concentra-
tion were found for IL-8 and IL-17. Moreover, lengths of
spinal cord lesions on MRI significantly correlated with IL-8
and IL-17 levels. Multiple sclerosis patients with longitudin-
ally extensive spinal cord lesions on MRI (>3 vertebral
length) had significantly higher levels of IL-8 and IL-17
than those without such lesions [49.23 6 38.36 versus
16.35 6 6.08 pg/ml (mean 6 SD], P = 0.000039 for IL-8;
13.35 6 11.43 versus 2.70 6 4.97 pg/ml (mean 6 SD),
0
5
10
15
20
25
30
35
%
(C) IFN-�+IL-4+cells
Control OS-MS C-MS
PBL CSF PBL CSF PBL CSF
P = 0.025 P = 0.045 P = 0.0027
(D) IFN-�/IL-4 ratio
0
10
20
30
40
50
300
Control OS-MS C-MS
PBL CSF PBL CSF PBL CSF
P = 0.0033 P = 0.0021
P = 0.019P = 0.016
P = 0.008
0
10
20
30
40
50
60
70
%
(A) IFN-�+IL-4-cells
Control OS-MS C-MSPBL CSF PBL CSF PBL CSF
P = 0.0025 P = 0.0051 P = 0.0027
P = 0.0046
P = 0.0067
0
1
2
3
4
5
6
%
Control OS-MS C-MSPBL CSF PBL CSF PBL CSF
(B) IFN-�-IL-4+cells
P = 0.012
P = 0.0073
P = 0.035
P = 0.038
285
62
Fig. 2 Intracellular cytokine production patterns of PBLs and CSF CD4 + T cells from OND (other non-inflammatory neurologicaldiseases; control), OS-multiple sclerosis and C-multiple sclerosis patients. (A) IFN-g+ IL-4� CD4 + T-cell percentages. (B) IFN-g�IL-4 +
CD4 + T-cell percentages. (C) IFN-g+ IL-4 + CD4 + T-cell percentages. (D) Intracellular IFN-g/IL-4 ratios in CD4 + T cells. Therewere 36 samples in total: 12 controls, 11 OS-multiple sclerosis and 13 C-multiple sclerosis. Open diamonds and bars indicate themean 6 SD for each group.
IL-17/IL-8 axis in opticospinal multiple sclerosis 995
by guest on July 25, 2016http://brain.oxfordjournals.org/
Dow
nloaded from
P = 0.0018 for IL-17]. No other clinical parameters, such as
age at onset, age at examination, disease duration, sex or
clinical course, showed any significant correlation with the
CSF supernatant cytokine/chemokine levels. Even when the
five C-multiple sclerosis and 10 OS-multiple sclerosis
patients on immunomodulatory therapies were excluded,
essentially the same correlations were obtained.
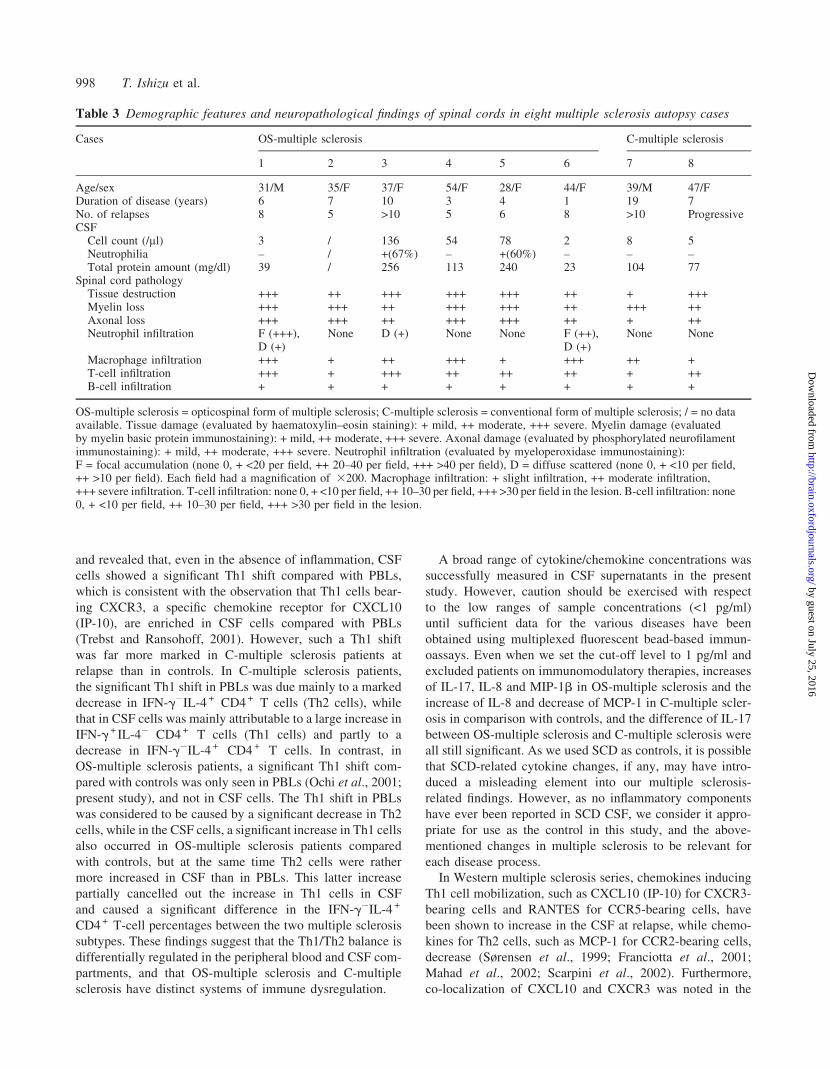
Histopathological analysis of infiltrating cells inautopsied specimens of OS-multiple sclerosisand C-multiple sclerosisWe examined spinal cord specimens obtained at autopsy from
six OS-multiple sclerosis and two C-multiple sclerosis cases.
Of these, prominent CSF neutrophilia was noted in two of the
five OS-multiple sclerosis cases whose CSF records were
available. Their demographic features and neuropathological
findings are summarized in Table 3. In the OS-multiple scler-
osis cases, the spinal cord lesions extended over the white
matter to the grey matter, and all the cases showed moderate
to severe myelin and axonal damage, indicating so-called
necrotic lesions. In the lesions, macrophage infiltration was
universal in all cases, and was severe in three, moderate in
one and mild in two. Numerous lymphocytes, mostly con-
sisting of T lymphocytes, infiltrated either the perivascular
area or parenchyma. In addition, three cases showed neutro-
philic infiltration in both the grey and white matter of the
spinal cord. Regarding the neutrophil infiltration, either focal
accumulation or a diffuse scattered pattern was seen. In
particular, focal neutrophil accumulation was noted around
vessel walls or in parenchyma in two cases (Fig. 5). However,
we found no eosinophil infiltration in any of the lesions
by haematoxylin–eosin staining. Although the spinal cord
lesions in one of the two C-multiple sclerosis cases showed
severe necrosis with macrophage infiltration, infiltration of
neutrophils was not evident in either of these C-multiple
sclerosis cases.
DiscussionIn the present study, although the numbers of CSF samples at
relapse were limited due to the rarity of multiple sclerosis in
Japanese and the popular use of immunomodulatory drugs,
we successfully uncovered subtype-related CSF cytokine/
chemokine changes in multiple sclerosis, since upregulation
of the neutrophil-recruiting IL-17/IL-8 axis was characteristic
for OS-multiple sclerosis and correlated with the develop-
ment of longitudinally extensive spinal cord lesions. Further-
more, we have directly shown that in CSF cells, IFN-g+ IL-4�
CD4 + T cells are increased in both OS-multiple sclerosis and
C-multiple sclerosis, while IFN-g�IL-4 + CD4 + T cells are
significantly more abundant in OS-multiple sclerosis than in
C-multiple sclerosis, even at relapse.
Cytokine analysis at the cellular level in CSF has been
difficult because of the extreme fragility and limited numbers
of CSF cells. In the current study, however, our method
successfully measured the intracellular cytokine production
C1
C4
C7 T8/9
T6/7
T3/4
Fig. 3 Representative longitudinally extensive spinal cord MRI lesions on T2-weighted images from a 52-year-old patient withOS-multiple sclerosis at relapse.
996 T. Ishizu et al.
by guest on July 25, 2016http://brain.oxfordjournals.org/
Dow
nloaded from
ED
SS(A)
(C)
0
1
2
3
4
5
6
7
8
9
0 10 20 30 40 50 60 70
IL-8 (pg/ml)
r = 0.48P = 0.0015
(B)
(D)
0
20
40
60
80
100
120
0 10 20 30 40 50 60 70
IL-8 (pg/ml)
CSF
/ser
um a
lbum
in r
atio
(10
-4)
r = 0.68P = 0.00018
140
160
180
IL-17 (pg/ml)
CSF
/ser
um a
lbum
in r
atio
(10
-4)
r = 0.52P = 0.0042
0 5 10 15 20 25 30 35 400
20
40
60
80
100
120
140
160
180
0 10 20 30 40 50 60 70
IL-8 (pg/ml)
The
leng
th o
f sp
inal
MR
I le
sion
(cm
)
r = 0.56P = 0.0012
0
2
4
6
8
10
12
(E)
IL-17 (pg/ml)
The
leng
th o
f sp
inal
MR
I le
sion
(cm
)
r = 0.46P = 0.0085
0
2
4
6
8
10
12
0 5 10 15 20 25 30 35 40
Fig. 4 Correlations between various clinical parameters and the cytokine/chemokine levels in CSF supernatants. (A) EDSS scores and IL-8levels. (B) CSF/serum albumin ratio and IL-8 levels. The CSF protein concentration was also significantly correlated with IL-8 (r = 0.56,P = 0.00026, data not shown in the figure). (C) CSF/serum albumin ratio and IL-17 levels. The CSF protein concentration was alsosignificantly correlated with IL-17 (r = 0.53, P = 0.00054, data not shown in the figure). (D) Length of spinal cord MRI lesions and IL-8levels. (E) Length of spinal cord MRI lesions and IL-17 levels. Open diamonds indicate patients who were under immunomodulatorytherapies, while open circles indicate those who were not.
IL-17/IL-8 axis in opticospinal multiple sclerosis 997
by guest on July 25, 2016http://brain.oxfordjournals.org/
Dow
nloaded from
and revealed that, even in the absence of inflammation, CSF
cells showed a significant Th1 shift compared with PBLs,
which is consistent with the observation that Th1 cells bear-
ing CXCR3, a specific chemokine receptor for CXCL10
(IP-10), are enriched in CSF cells compared with PBLs
(Trebst and Ransohoff, 2001). However, such a Th1 shift
was far more marked in C-multiple sclerosis patients at
relapse than in controls. In C-multiple sclerosis patients,
the significant Th1 shift in PBLs was due mainly to a marked
decrease in IFN-g�IL-4 + CD4 + T cells (Th2 cells), while
that in CSF cells was mainly attributable to a large increase in
IFN-g+ IL-4� CD4 + T cells (Th1 cells) and partly to a
decrease in IFN-g�IL-4 + CD4 + T cells. In contrast, in
OS-multiple sclerosis patients, a significant Th1 shift com-
pared with controls was only seen in PBLs (Ochi et al., 2001;
present study), and not in CSF cells. The Th1 shift in PBLs
was considered to be caused by a significant decrease in Th2
cells, while in the CSF cells, a significant increase in Th1 cells
also occurred in OS-multiple sclerosis patients compared
with controls, but at the same time Th2 cells were rather
more increased in CSF than in PBLs. This latter increase
partially cancelled out the increase in Th1 cells in CSF
and caused a significant difference in the IFN-g�IL-4 +
CD4 + T-cell percentages between the two multiple sclerosis
subtypes. These findings suggest that the Th1/Th2 balance is
differentially regulated in the peripheral blood and CSF com-
partments, and that OS-multiple sclerosis and C-multiple
sclerosis have distinct systems of immune dysregulation.
A broad range of cytokine/chemokine concentrations was
successfully measured in CSF supernatants in the present
study. However, caution should be exercised with respect
to the low ranges of sample concentrations (<1 pg/ml)
until sufficient data for the various diseases have been
obtained using multiplexed fluorescent bead-based immun-
oassays. Even when we set the cut-off level to 1 pg/ml and
excluded patients on immunomodulatory therapies, increases
of IL-17, IL-8 and MIP-1b in OS-multiple sclerosis and the
increase of IL-8 and decrease of MCP-1 in C-multiple scler-
osis in comparison with controls, and the difference of IL-17
between OS-multiple sclerosis and C-multiple sclerosis were
all still significant. As we used SCD as controls, it is possible
that SCD-related cytokine changes, if any, may have intro-
duced a misleading element into our multiple sclerosis-
related findings. However, as no inflammatory components
have ever been reported in SCD CSF, we consider it appro-
priate for use as the control in this study, and the above-
mentioned changes in multiple sclerosis to be relevant for
each disease process.
In Western multiple sclerosis series, chemokines inducing
Th1 cell mobilization, such as CXCL10 (IP-10) for CXCR3-
bearing cells and RANTES for CCR5-bearing cells, have
been shown to increase in the CSF at relapse, while chemo-
kines for Th2 cells, such as MCP-1 for CCR2-bearing cells,
decrease (Sørensen et al., 1999; Franciotta et al., 2001;
Mahad et al., 2002; Scarpini et al., 2002). Furthermore,
co-localization of CXCL10 and CXCR3 was noted in the
Table 3 Demographic features and neuropathological findings of spinal cords in eight multiple sclerosis autopsy cases
Cases OS-multiple sclerosis C-multiple sclerosis
1 2 3 4 5 6 7 8
Age/sex 31/M 35/F 37/F 54/F 28/F 44/F 39/M 47/FDuration of disease (years) 6 7 10 3 4 1 19 7No. of relapses 8 5 >10 5 6 8 >10 ProgressiveCSF
Cell count (/ml) 3 / 136 54 78 2 8 5Neutrophilia – / +(67%) – +(60%) – – –Total protein amount (mg/dl) 39 / 256 113 240 23 104 77
Spinal cord pathologyTissue destruction +++ ++ +++ +++ +++ ++ + +++Myelin loss +++ +++ ++ +++ +++ ++ +++ ++Axonal loss +++ +++ ++ +++ +++ ++ + ++Neutrophil infiltration F (+++),
D (+)None D (+) None None F (++),
D (+)None None
Macrophage infiltration +++ + ++ +++ + +++ ++ +T-cell infiltration +++ + +++ ++ ++ ++ + ++B-cell infiltration + + + + + + + +
OS-multiple sclerosis = opticospinal form of multiple sclerosis; C-multiple sclerosis = conventional form of multiple sclerosis; / = no dataavailable. Tissue damage (evaluated by haematoxylin–eosin staining): + mild, ++ moderate, +++ severe. Myelin damage (evaluatedby myelin basic protein immunostaining): + mild, ++ moderate, +++ severe. Axonal damage (evaluated by phosphorylated neurofilamentimmunostaining): + mild, ++ moderate, +++ severe. Neutrophil infiltration (evaluated by myeloperoxidase immunostaining):F = focal accumulation (none 0, + <20 per field, ++ 20–40 per field, +++ >40 per field), D = diffuse scattered (none 0, + <10 per field,++ >10 per field). Each field had a magnification of 3200. Macrophage infiltration: + slight infiltration, ++ moderate infiltration,+++ severe infiltration. T-cell infiltration: none 0, + <10 per field, ++ 10–30 per field, +++ >30 per field in the lesion. B-cell infiltration: none0, + <10 per field, ++ 10–30 per field, +++ >30 per field in the lesion.
998 T. Ishizu et al.
by guest on July 25, 2016http://brain.oxfordjournals.org/
Dow
nloaded from
multiple sclerosis lesions (Sørensen et al., 2002). These
observations are consistent with the Th1 shift found during
the intracellular cytokine analysis of CSF cells in C-multiple
sclerosis in the current study.
Among the cytokines and chemokines measured in the CSF
supernatant, both IL-17 and IL-8 had a significant correlation
with the CSF/serum albumin ratio and the length of the spinal
cord lesions on MRI in multiple sclerosis, suggesting an
involvement of both cytokines in the destruction of the
blood–brain barrier and the formation of inflammatory spinal
cord lesions. In the present CSF study, the increases in IL-17
and IL-8 were significantly greater in OS-multiple sclerosis
patients than in C-multiple sclerosis patients. A previous
report on IL-17 in Western multiple sclerosis series found
no change at the protein level in CSF (Saruhan-Direskeneli
et al., 2003), although all multiple sclerosis samples were
below the detection limit, while IL-17 mRNA expression
in CSF mononuclear cells was elevated in a fraction of mul-
tiple sclerosis patients, especially during clinical exacerbation
(Matusevicius et al., 1999), and gene microarray analysis of
multiple sclerosis plaques revealed an increased level of
IL-17 transcripts (Lock et al., 2002). Our findings extend
the latter observations at the mRNA level and suggest that
the IL-17 response is much more prominent in OS-multiple
sclerosis than in C-multiple sclerosis at the protein level.
IL-17 is produced by activated memory Th1 cells (Aarvak
et al., 1999) and induces various downstream cytokines and
chemokines, such as IL-8, IL-6, G-CSF and prostaglandin
E2 (Fossiez et al., 1996; Dudler et al., 2000; Hwang et al.,
2004). IL-17 causes neutrophil recruitment mainly through
the release of IL-8, a CXC chemokine for neutrophils, and
induces neutrophil activation, i.e. increases in myeloperoxi-
dase and elastase activity (Laan et al., 1999; Hoshino et al.,
2000; Linden and Adachi, 2002; Miyamoto et al., 2003;
Witowski et al., 2004). Upregulation of IL-17 and IL-8
has been reported to cause severe destruction of tissues by
neutrophilic inflammation in Th1 diseases, such as
rheumatoid arthritis (Kotake et al., 1999; Ziolkowska et al.,
2000; Miossec, 2003), as well as Th2 diseases, such as bron-
chial asthma (Linden, 2001; Molet et al., 2001). CSF neut-
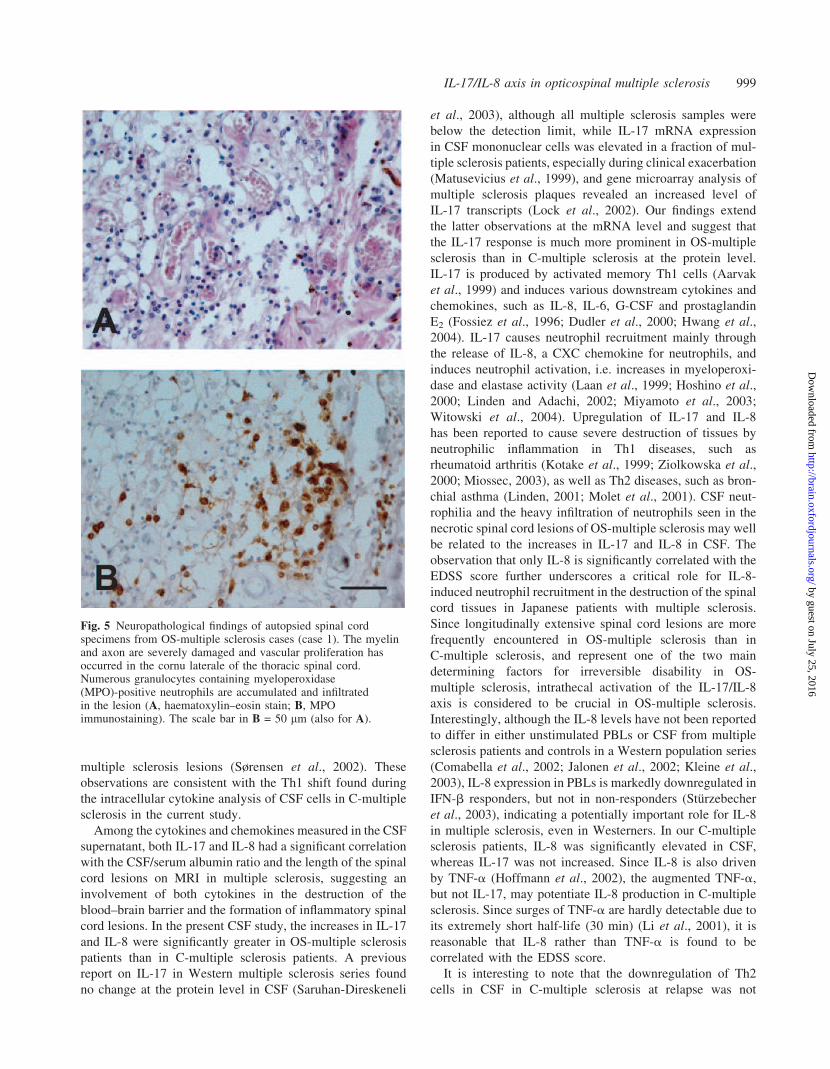
rophilia and the heavy infiltration of neutrophils seen in the
necrotic spinal cord lesions of OS-multiple sclerosis may well
be related to the increases in IL-17 and IL-8 in CSF. The
observation that only IL-8 is significantly correlated with the
EDSS score further underscores a critical role for IL-8-
induced neutrophil recruitment in the destruction of the spinal
cord tissues in Japanese patients with multiple sclerosis.
Since longitudinally extensive spinal cord lesions are more
frequently encountered in OS-multiple sclerosis than in
C-multiple sclerosis, and represent one of the two main
determining factors for irreversible disability in OS-
multiple sclerosis, intrathecal activation of the IL-17/IL-8
axis is considered to be crucial in OS-multiple sclerosis.
Interestingly, although the IL-8 levels have not been reported
to differ in either unstimulated PBLs or CSF from multiple
sclerosis patients and controls in a Western population series
(Comabella et al., 2002; Jalonen et al., 2002; Kleine et al.,
2003), IL-8 expression in PBLs is markedly downregulated in
IFN-b responders, but not in non-responders (Sturzebecher
et al., 2003), indicating a potentially important role for IL-8
in multiple sclerosis, even in Westerners. In our C-multiple
sclerosis patients, IL-8 was significantly elevated in CSF,
whereas IL-17 was not increased. Since IL-8 is also driven
by TNF-a (Hoffmann et al., 2002), the augmented TNF-a,
but not IL-17, may potentiate IL-8 production in C-multiple
sclerosis. Since surges of TNF-a are hardly detectable due to
its extremely short half-life (30 min) (Li et al., 2001), it is
reasonable that IL-8 rather than TNF-a is found to be
correlated with the EDSS score.
It is interesting to note that the downregulation of Th2
cells in CSF in C-multiple sclerosis at relapse was not
Fig. 5 Neuropathological findings of autopsied spinal cordspecimens from OS-multiple sclerosis cases (case 1). The myelinand axon are severely damaged and vascular proliferation hasoccurred in the cornu laterale of the thoracic spinal cord.Numerous granulocytes containing myeloperoxidase(MPO)-positive neutrophils are accumulated and infiltratedin the lesion (A, haematoxylin–eosin stain; B, MPOimmunostaining). The scale bar in B = 50 mm (also for A).
IL-17/IL-8 axis in opticospinal multiple sclerosis 999
by guest on July 25, 2016http://brain.oxfordjournals.org/
Dow
nloaded from
found in OS-multiple sclerosis, and Th2 cells were rather
increased in CSF at relapse in comparison with PBLs. Th2
polarized cells directed against myelin proteins are enceph-
alitogenic in immunocompromised animals (Lafaille et al.,
1997) and exacerbate experimental allergic encephalomyel-
itis (EAE) in non-human primates (Genain and Hauser,
1996). Moreover, in certain animal strains with Th2-prone
genetic backgrounds, myelin oligodendrocyte glycoprotein
(MOG)-induced EAE shows severe and selective involve-
ment of the optic nerves and spinal cord (Storch et al.,
1998; Stefferl et al., 1999). In these models, the accumulation
of numerous neutrophils is a dominant feature (Lafaille et al.,
1997; Storch et al., 1998; Stefferl et al., 1999). We previously
reported that MOG-autoreactive T cells were more frequently
established than those reactive to myelin basic protein or
proteolipid protein epitopes in OS-multiple sclerosis patients
(Minohara et al., 2001). Thus, in OS-multiple sclerosis,
intrathecal activation of the IL-17/IL-8 axis by memory
Th1 cells specific for myelin proteins such as MOG may
contribute to the neutrophilic recruitment and destruction
of the tissues under Th2-prone genetic backgrounds or
even together with myelin protein-specific Th2 cells. There-
fore, Th2-related genetic backgrounds as well as Th2 cell
reactivity to myelin proteins could be future targets for stud-
ies on OS-multiple sclerosis.
IL-17 expression is induced by IL-23, a product of activ-
ated dendritic cells and macrophages/microglial cells (Becher
et al., 2003; Cua et al., 2003), while IL-12 (p70), a disulphide-
linked heterodimer of p35 and p40, has only marginal effects
on IL-17 production (Aggarwal et al., 2003), yet both IL-23
and IL-12 (p70) share a common p40 subunit. Furthermore,
IL-23, but not IL-12 (p70), has been shown to be a critical
cytokine for autoimmune inflammation of the brain in an
EAE model using knockout mice for each of their subunits
(Cua et al., 2003). Previous reports have described that IL-12
(p40) was increased in multiple sclerosis patients with
gadolinium-enhanced lesions on MRI (Fassbender et al.,
1998), whereas IL-12 (p70) was only detectable in CSF in
�10% of multiple sclerosis patients (Drulovic et al., 1997;
Fassbender et al., 1998). Since we also found no increase in
IL-12 (p70) in CSF from our multiple sclerosis patients, we
consider that a further study on IL-23 in the CSF compart-
ment is urgently required.
We found that IL-5 levels were significantly higher in OS-
multiple sclerosis than C-multiple sclerosis patients. In the
latter, the IL-5 level was possibly depressed in some cases,
reflecting an intrathecal down-modulation of Th2 cells in the
acute stage. Instead, some OS-multiple sclerosis patients
showed an increase in IL-5 in the CSF, although the increase
was not statistically significant in comparison with control
patients as a whole. Although we could not find any eosino-
phil infiltration in OS-multiple sclerosis spinal cord lesions,
degranulated eosinophils are hard to detect by haematoxylin–
eosin staining. Thus, immunostaining of activated eosinophil
products is required to determine eosinophil involvement in
OS-multiple sclerosis.
Lucchinetti et al. (2002) reported that in nine autopsied
cases of Devic’s NMO, eight relapsing and one monophasic,
56% had prominent infiltration of neutrophils and eosinophils
into the spinal cord lesions, and marked deposition of
immunoglobulins and complements were seen in all cases.
A distinction between and the identities of relapsing NMO
and OS-multiple sclerosis have long been discussed (Cree
et al., 2002) and, in the recent study by Lennon et al.
(2004), newly identified IgG autoantibody (NMO-IgG) was
detected in both NMO and Japanese OS-multiple sclerosis
patients. The considerable overlap between the two condi-
tions suggests common pathomechanisms are operative. Our
finding of marked increases of IL-17 and IL-8 in CSF may be
relevant to neutrophil infiltration, while an IL-5 increase may
relate to eosinophil infiltration. Moreover, a relative increase
of Th2 cells in CSF compared with PBLs may correspond to
the involvement of humoral immunity in relapsing NMO
(Lucchinetti et al., 2002; Lennon et al., 2004). Further
investigation into the deposition of immunoglobulins and
complement proteins as well as activated eosinophil products
in OS-multiple sclerosis may shed light on the contribution of
the Th2 cell-mediated effector arm in this condition, and
clarify the disease entities of relapsing NMO and OS-
multiple sclerosis.
In summary, we successfully identified OS-multiple
sclerosis-related CSF cytokine/chemokine changes, which
may be useful both for monitoring disease activity and for
developing future subtype-specific therapies, such as pharma-
cological blocking of neutrophil activation in OS-multiple
sclerosis.
AcknowledgementsWe wish to thank Professor Toru Iwaki, Department of
Neuropathology, Neurological Institute, Graduate School
of Medical Sciences, Kyushu University, for his advice
and providing the autopsied specimens for neuropathological
study. This work was supported in part by grants from the
Ministry of Education, Science, Sports and Culture of Japan,
a Neuroimmunological Disease Research Committee and the
Ministry of Health and Welfare of Japan for Research on
Brain Science.
References
Aarvak T, Chabaud M, Miossec P, Natvig JB. IL-17 is produced by some
proinflammatory Th1/Th0 cells but not by Th2 cells. J Immunol 1999; 162:
1246–51.
Aggarwal S, Ghilardi N, Xie MH, de Sauvage FJ, Gurney AL. Interleukin-23
promotes a distinct CD4 T cell activation state characterized by the
production of interleukin-17. J Biol Chem 2003; 278: 1910–4.
Becher B, Durell BG, Noelle RJ. IL-23 produced by CNS-resident
cells controls T cell encephalitogenicity during the effector phase of
experimental autoimmune encephalomyelitis. J Clin Invest 2003; 112:
1186–91.
Comabella M, Imitola J, Weiner HL, Khoury SJ. Interferon-beta treatment
alters peripheral blood monocytes chemokine production in MS patients.
J Neuroimmunol 2002; 126: 205–12.
Cree BA, Goodin DS, Hauser SL. Neuromyelitis optica. Semin Neurol 2002;
22: 105–22.
1000 T. Ishizu et al.
by guest on July 25, 2016http://brain.oxfordjournals.org/
Dow
nloaded from
Cua DJ, Sherlock J, Chen Y, Murphy CA, Joyce B, Seymour B, et al.
Interleukin-23 rather than interleukin-12 is the critical cytokine for
autoimmune inflammation of the brain. Nature 2003; 421: 744–8.
de Jager W, te Velthuis H, Prakken BJ, Kuis W, Rijkers GT. Simultaneous
detection of 15 human cytokines in a single sample of stimulated peripheral
blood mononuclear cells. Clin Diagn Lab Immunol 2003; 10: 133–9.
Drulovic J, Mostarica-Stojkovic M, Levic Z, Stojsavljevic N, Pravica V,
Mesaros S. Interleukin-12 and tumor necrosis factor-alpha levels in
cerebrospinal fluid of multiple sclerosis patients. J Neurol Sci 1997;
147: 145–50.
Dudler J, Renggli-Zulliger N, Busso N, Lotz M, So A. Effect of interleukin 17
on proteoglycan degradation in murine knee joints. Ann Rheum Dis 2000;
59: 529–32.
Fassbender K, Ragoschke A, Rossol S, Schwartz A, Mielke O, Paulig A, et al.
Increased release of interleukin-12p40 in MS: association with intra-
cerebral inflammation. Neurology 1998; 51: 753–8.
Fossiez F, Djossou O, Chomarat P, Flores-Romo L, Ait-Yahia S, Maat C, et al.
T cell interleukin-17 induces stromal cells to produce proinflammatory and
hematopoietic cytokines. J Exp Med 1996; 183: 2593–603.
Franciotta D, Martino G, Zardini E, Furlan R, Bergamaschi R, Andreoni L,
et al. Serum and CSF levels of MCP-1 and IP-10 in multiple sclerosis
patients with acute and stable disease and undergoing immunomodulatory
therapies. J Neuroimmunol 2001; 115: 192–8.
Genain CP, Hauser SL. Allergic encephalomyelitis in common marmosets:
pathogenesis of a multiple sclerosis-like lesion. Methods 1996; 10: 420–34.
Hemmer B, Cepok S, Nessler S, Sommer N. Pathogenesis of multiple
sclerosis: an update on immunology. Curr Opin Neurol 2002; 15: 227–31.
Hoffmann E, Dittrich-Breiholz O, Holtmann H, Kracht M. Multiple control of
interleukin-8 gene expression. J Leukoc Biol 2002; 72: 847–55.
Horiuchi I, Kawano Y, Yamasaki K, Minohara M, Furue M, Taniwaki T, et al.
Th1 dominance in HAM/TSP and the optico-spinal form of multiple
sclerosis versus Th2 dominance in mite antigen-specific IgE myelitis.
J Neurol Sci 2000; 172: 17–24.
Hoshino H, Laan M, Sjostrand M, Lotvall J, Skoogh BE, Linden A. Increased
elastase and myeloperoxidase activity associated with neutrophil
recruitment by IL-17 in airways in vivo. J Allergy Clin Immunol 2000;
105: 143–9.
Huang WX, Huang P, Link H, Hillert J. Cytokine analysis in multiple sclerosis
by competitive RT–PCR: a decreased expression of IL-10 and an increased
expression of TNF-alpha in chronic progression. Mult Scler 1999; 5:
342–8.
Hwang SY, Kim JY, Kim KW, Park MK, Moon Y, Kim WU, et al. IL-17
induces production of IL-6 and IL-8 in rheumatoid arthritis synovial
fibroblasts via NF-kappaB- and PI3-kinase/Akt-dependent pathways.
Arthritis Res Ther 2004; 6: R120–8.
Ikuta F, Koga M, Takeda S, Ohama E, Takeshita I, Ogawa H, et al. Com-
parison of MS pathology between 70 American and 75 Japanese autopsy
cases. In: Kuroiwa Y, Kurland LT, editors. Multiple sclerosis East and
West. Fukuoka: Kyushu University Press; 1982. p. 298–306.
Jalonen TO, Pulkkinen K, Ukkonen M, Saarela M, Elovaara I. Differential
intracellular expression of CCR5 and chemokines in multiple sclerosis
subtypes. J Neurol 2002; 249: 576–83.
Kellar KL, Kalwar RR, Dubois KA, Crouse D, Chafin WD, Kane BE.
Multiplexed fluorescent bead-based immunoassays for quantitation of
human cytokines in serum and culture supernatants. Cytometry 2001;
45: 27–36.
Kira J. Multiple sclerosis in the Japanese population. Lancet Neurol 2003; 2:
117–27.
Kira J, Kanai T, Nishimura Y, Yamasaki K, Matsushita S, Kawano Y, et al.
Western versus Asian types of multiple sclerosis: immunogenetically and
clinically distinct disorders. Ann Neurol 1996; 40; 569–74.
Kleine TO, Zwerenz P, Graser C, Zofel P. Approach to discriminate
subgroups in multiple sclerosis with cerebrospinal fluid (CSF) basic
inflammation indices and TNF-alpha, IL-1beta, IL-6, IL-8. Brain Res
Bull 2003; 61: 327–46.
Kotake S, Udagawa N, Takahashi N, Matsuzaki K, Itoh K, Ishiyama S,
et al. IL-17 in synovial fluids from patients with rheumatoid arthritis
is a potent stimulator of osteoclastogenesis. J Clin Invest 1999; 103:
1345–52.
Kurtzke JF. Rating neurologic impairment in multiple sclerosis: an expanded
disability status scale (EDSS). Neurology 1983; 33: 1444–52.
Laan M, Cui ZH, Hoshino H, Lotvall J, Sjostrand M, Gruenert DC, et al.
Neutrophil recruitment by human IL-17 via C-X-C chemokine release in
the airways. J Immunol 1999; 162: 2347–52.
Lafaille JJ, Keere FV, Hsu AL, Baron JL, Haas W, Raine CS, et al. Myelin
basic protein-specific T helper 2 (Th2) cells cause experimental auto-
immune encephalomyelitis in immunodeficient hosts rather than protect
them from the disease. J Exp Med 1997; 186: 307–12.
Laman JD, Thompson EJ, Kappos L. Balancing the Th1/Th2 concept in
multiple sclerosis. Immunol Today 1998; 19: 489–90.
Lassmann H, Ransohoff RM. The CD4-Th1 model for multiple sclerosis: a
crucial re-appraisal. Trends Immunol 2004; 25: 132–7.
Lennon VA, Wingerchuk DM, Kryzer TJ, Pittock SJ, Lucchinetti CF,
Fujihara K, et al. A serum autoantibody marker of neuromyelitis optica:
distinction from multiple sclerosis. Lancet 2004; 364: 2106–12.
Li YP, Pei YY, Zhou ZH, Zhang XY, Gu ZH, Ding J, et al. PEGylated
recombinant human tumor necrosis factor alpha: pharmacokinetics and
anti-tumor effects. Biol Pharm Bull 2001; 24: 666–70.
Linden A. Role of interleukin-17 and the neutrophil in asthma. Int Arch
Allergy Immunol 2001; 126: 179–84.
Linden A, Adachi M. Neutrophilic airway inflammation and IL-17. Allergy
2002; 57: 769–75.
Link H. The cytokine storm in multiple sclerosis. Mult Scler 1998; 4: 12–5.
Link J, Soderstrom M, Olsson T, Hojeberg B, Ljungdahl A, Link H. Increased
transforming growth factor-beta, interleukin-4, and interferon-gamma in
multiple sclerosis. Ann Neurol 1994; 36: 379–86.
Lock C, Hermans G, Pedotti R, Brendolan A, Schadt E, Garren H, et al.
Gene-microarray analysis of multiple sclerosis lesions yields new targets
validated in autoimmune encephalomyelitis. Nat Med 2002; 8: 500–8.
Lucchinetti CF, Mandler RN, McGavern D, Bruck W, Gleich G,
Ransohoff RM, et al. A role for humoral mechanisms in the pathogenesis
of Devic’s neuromyelitis optica. Brain 2002; 125: 1450–61.
Mahad DJ, Howell SJ, Woodroofe MN. Expression of chemokines in the CSF
and correlation with clinical disease activity in patients with multiple
sclerosis. J Neurol Neurosurg Psychiatry 2002; 72: 498–502.
Matusevicius D, Kivisakk P, He B, Kostulas N, Ozenci V, Fredrikson S, et al.
Interleukin-17 mRNA expression in blood and CSF mononuclear cells is
augmented in multiple sclerosis. Mult Scler 1999; 5: 101–4.
Matusevicius D, Navikas V, Soderstrom M, Xiao BG, Haglund M,
Fredrikson S, et al. Multiple sclerosis: the proinflammatory cytokines
lymphotoxin-alpha and tumour necrosis factor-alpha are upregulated in
cerebrospinal fluid mononuclear cells. J Neuroimmunol 1996; 66:
115–23.
McDonald WI, Compston A, Edan G, Goodkin D, Hartung HP, Lublin FD,
et al. Recommended diagnostic criteria for multiple sclerosis: guidelines
from the International Panel on the diagnosis of multiple sclerosis. Ann
Neurol 2001; 50: 121–7.
Minohara M, Ochi H, Matsushita S, Irie A, Nishimura Y, Kira J. Differences
between T-cell reactivities to major myelin protein-derived peptides in
opticospinal and conventional forms of multiple sclerosis and healthy
controls. Tissue Antigens 2001; 57: 447–56.
Miossec P. Interleukin-17 in rheumatoid arthritis: if T cells were to contribute
to inflammation and destruction through synergy. Arthritis Rheum 2003;
48: 594–601.
Miyamoto M, Prause O, Sjostrand M, Laan M, Lotvall J, Linden A.
Endogenous IL-17 as a mediator of neutrophil recruitment caused by
endotoxin exposure in mouse airways. J Immunol 2003; 170: 4665–72.
Molet S, Hamid Q, Davoine F, Nutku E, Taha R, Page N, et al. IL-17 is
increased in asthmatic airways and induces human bronchial fibroblasts to
produce cytokines. J Allergy Clin Immunol 2001; 108: 430–8.
Monteyne P, Van Laere V, Marichal R, Sindic CJ. Cytokine mRNA expres-
sion in CSF and peripheral blood mononuclear cells in multiple sclerosis:
detection by RT–PCR without in vitro stimulation. J Neuroimmunol 1997;
80: 137–42.
IL-17/IL-8 axis in opticospinal multiple sclerosis 1001
by guest on July 25, 2016http://brain.oxfordjournals.org/
Dow
nloaded from
Navikas V, Link H. Review: cytokines and the pathogenesis of multiple
sclerosis. J Neurosci Res 1996; 45: 322–33.
Navikas V, He B, Link J, Haglund M, Soderstrom M, Fredrikson S, et al.
Augmented expression of tumour necrosis factor-alpha and lymphotoxin in
mononuclear cells in multiple sclerosis and optic neuritis. Brain 1996; 119:
213–23.
Niino M, Ogata A, Kikuchi S, Tashiro K, Nishihira J. Macrophage migration
inhibitory factor in the cerebrospinal fluid of patients with conventional
and optic-spinal forms of multiple sclerosis and neuro-Behcet’s disease.
J Neurol Sci 2000; 179: 127–31.
Ochi H, Wu XM, Osoegawa M, Horiuchi I, Minohara M, Murai H, et al. Tc1/
Tc2 and Th1/Th2 balance in Asian and Western types of multiple
sclerosis, HTLV-I-associated myelopathy/tropical spastic paraparesis
and hyperIgEaemic myelitis. J Neuroimmunol 2001; 119: 297–305.
Olsson T. Critical influences of the cytokine orchestration on the outcome of
myelin antigen-specific T-cell autoimmunity in experimental autoimmune
encephalomyelitis and multiple sclerosis. Immunol Rev 1995; 144:
245–68.
Panitch HS, Hirsch RL, Haley AS, Johnson KP. Exacerbations of multiple
sclerosis in patients treated with gamma interferon. Lancet 1987; 1: 893–5.
Rieckmann P, Albrecht M, Kitze B, Weber T, Tumani H, Broocks A, et al.
Cytokine mRNA levels in mononuclear blood cells from patients with
multiple sclerosis. Neurology 1994; 44: 1523–6.
Saruhan-Direskeneli G, Yentur SP, Akman-Demir G, Isik N, Serdaroglu P.
Cytokines and chemokines in neuro-Behcet’s disease compared to
multiple sclerosis and other neurological diseases. J Neuroimmunol
2003; 145: 127–34.
Scarpini E, Galimberti D, Baron P, Clerici R, Ronzoni M, Conti G, et al. IP-10
and MCP-1 levels in CSF and serum from multiple sclerosis patients with
different clinical subtypes of the disease. J Neurol Sci 2002; 195: 41–6.
Sharief MK, Hentges R. Association between tumor necrosis factor-alpha and
disease progression in patients with multiple sclerosis. N Engl J Med 1991;
325: 467–72.
Sharief MK, Thompson EJ. Correlation of interleukin-2 and soluble
interleukin-2 receptor with clinical activity of multiple sclerosis. J Neurol
Neurosurg Psychiatry 1993; 56: 169–74.
Shiraki H. Neuropathological findings of demyelinating encephalomyelitides
of unknown etiology in Japan. Saishin Igaku 1965; 20: 1036–52.
Stefferl A, Brehm U, Storch M, Lambracht-Washington D, Bourquin C,
Wonigeit K, et al. Myelin oligodendrocyte glycoprotein induces experi-
mental autoimmune encephalomyelitis in the ‘resistant’ Brown Norway
rat: disease susceptibility is determined by MHC and MHC-linked effects
on the B cell response. J Immunol 1999; 163: 40–9.
Storch MK, Stefferl A, Brehm U, Weissert R, Wallstrom E,
Kerschensteiner M, et al. Autoimmunity to myelin oligodendrocyte
glycoprotein in rats mimics the spectrum of multiple sclerosis pathology.
Brain Pathol 1998; 8: 681–94.
Sturzebecher S, Wandinger KP, Rosenwald A, Sathyamoorthy M, Tzou A,
Mattar P, et al. Expression profiling identifies responder and non-responder
phenotypes to interferon-beta in multiple sclerosis. Brain 2003; 126:
1419–29.
Sørensen TL, Tani M, Jensen J, Pierce V, Lucchinetti C, Folcik VA, et al.
Expression of specific chemokines and chemokine receptors in the
central nervous system of multiple sclerosis patients. J Clin Invest
1999; 103: 807–15.
Sørensen TL, Trebst C, Kivisakk P, Klaege KL, Majmudar A, Ravid R, et al.
Multiple sclerosis: a study of CXCL10 and CXCR3 co-localization in the
inflamed central nervous system. J Neuroimmunol 2002; 127: 59–68.
Tabira T, Tateishi J. Neuropathological features of MS in Japan. In: Kuroiwa
Y, Kurland LT, editors. Multiple sclerosis East and West. Fukuoka: Kyushu
University Press; 1982. p. 273–95.
Trebst C, Ransohoff RM. Investigating chemokines and chemokine receptors
in patients with multiple sclerosis: opportunities and challenges. Arch
Neurol 2001; 58: 1975–80.
van Boxel-Dezaire AH, Hoff SC, van Oosten BW, Verweij CL, Drager AM,
Ader HJ, et al. Decreased interleukin-10 and increased interleukin-
12p40 mRNA are associated with disease activity and characterize
different disease stages in multiple sclerosis. Ann Neurol 1999; 45:
695–703.
Vignali DA. Multiplexed particle-based flow cytometric assays. J Immunol
Methods 2000; 243: 243–55.
Wingerchuk DM, Hogancamp WF, O’Brien PC, Weinshenker BG. The
clinical course of neuromyelitis optica (Devic’s syndrome). Neurology
1999; 53: 1107–14.
Witowski J, Ksiazek K, Jorres A. Interleukin-17: a mediator of inflammatory
responses. Cell Mol Life Sci 2004; 61: 567–79.
Wu XM, Osoegawa M, Yamasaki K, Kawano Y, Ochi H, Horiuchi I, et al.
Flow cytometric differentiation of Asian and Western types of multiple
sclerosis, HTLV-1-associated myelopathy/tropical spastic paraparesis
(HAM/TSP) and hyperIgEaemic myelitis by analyses of memory CD4
positive T cell subsets and NK cell subsets. J Neurol Sci 2000; 177:
24–31.
Yamasaki K, Horiuchi I, Minohara M, Kawano Y, Ohyagi Y, Yamada T, et al.
HLA-DPB1�0501-associated opticospinal multiple sclerosis: clinical,
neuroimaging and immunogenetic studies. Brain 1999; 122: 1689–96.
Ziolkowska M, Koc A, Luszczykiewicz G, Ksiezopolska-Pietrzak K,
Klimczak E, Chwalinska-Sadowska H, et al. High levels of IL-17 in
rheumatoid arthritis patients: IL-15 triggers in vitro IL-17 produc-
tion via cyclosporin A-sensitive mechanism. J Immunol 2000; 164:
2832–8.
1002 T. Ishizu et al.
by guest on July 25, 2016http://brain.oxfordjournals.org/
Dow
nloaded from