International VLBI Service for Geodesy and Astrometry 2013 ...
382
NASA/TP–2014–217522 International VLBI Service for Geodesy and Astrometry 2013 Annual Report Karen D. Baver (ed.) NVI, Inc., Greenbelt, Maryland Dirk Behrend (ed.) NVI, Inc., Greenbelt, Maryland Kyla L. Armstrong (ed.) NVI, Inc., Greenbelt, Maryland May 2014
-
Upload
khangminh22 -
Category
Documents
-
view
2 -
download
0
Transcript of International VLBI Service for Geodesy and Astrometry 2013 ...

NASA/TP–2014–217522
International VLBI Service forGeodesy and Astrometry 2013Annual Report
Karen D. Baver (ed.)NVI, Inc., Greenbelt, Maryland
Dirk Behrend (ed.)NVI, Inc., Greenbelt, Maryland
Kyla L. Armstrong (ed.)NVI, Inc., Greenbelt, Maryland
May 2014

NASA STI Program … in Profile
Since its founding, NASA has been dedicated to
the advancement of aeronautics and space sci-
ence. The NASA scientific and technical infor-
mation (STI) program plays a key part in helping
NASA maintain this important role.
The NASA STI program operates under the
auspices of the Agency Chief Information Of-
ficer. It collects, organizes, provides for archiv-
ing, and disseminates NASA’s STI. The NASA
STI program provides access to the NTRS Reg-
istered and its public interface, the NASA Tech-
nical Reports Server, thus providing one of the
largest collections of aeronautical and space
science STI in the world. Results are published
in both non-NASA channels and by NASA in the
NASA STI Report Series, which includes the
following report types:
TECHNICAL PUBLICATION. Reports of
completed research or a major significant
phase of research that present the results of
NASA Programs and include extensive data
or theoretical analysis. Includes compila-
tions of significant scientific and technical
data and information deemed to be of con-
tinuing reference value. NASA counterpart
of peer-reviewed formal professional papers
but has less stringent limitations on manu-
script length and extent of graphic presenta-
tions.
TECHNICAL MEMORANDUM.
Scientific and technical findings that are pre-
liminary or of specialized interest, e.g., quick
release reports, working papers, and bibliog-
raphies that contain minimal annotation.
Does not contain extensive analysis.
CONTRACTOR REPORT. Scientific and
technical findings by NASA-sponsored con-
tractors and grantees.
CONFERENCE PUBLICATION. Collected
papers from scientific and technical confer-
ences, symposia, seminars, or other meet-
ings sponsored or co-sponsored by NASA.
SPECIAL PUBLICATION. Scientific, tech-
nical, or historical information from NASA
programs, projects, and missions, often
concerned with subjects having substantial
public interest.
TECHNICAL TRANSLATION. English-
language translations of foreign scientific
and technical material pertinent to NASA’s
mission.
Specialized services also include organizing and
publishing research results, distributing special-
ized research announcements and feeds,
providing information desk and personal search
support, and enabling data exchange services.
For more information about the NASA STI pro-
gram, see the following:
Access the NASA STI program home page
at http://www.sti.nasa.gov
E-mail your question to [email protected]
Phone the NASA STI Information Desk at
757-864-9658
Write to:
NASA STI Information Desk
Mail Stop 148
NASA Langley Research Center
Hampton, VA 23681-2199
Available from:
NASA Center for AeroSpace Information
7115 Standard Drive
Hanover, MD 21076-1320
443-757-5802

Preface
This volume of reports is the 2013 Annual Reportof the International VLBI Service for Geodesy andAstrometry (IVS). The individual reports were con-tributed by VLBI groups in the international geodeticand astrometric community who constitute the perma-nent components of IVS.
The IVS 2013 Annual Report documents the workof the IVS components for the calendar year 2013,our fifteenth year of existence. The reports describechanges, activities, and progress of the IVS. Manythanks to all IVS components who contributed to thisAnnual Report.
With the exception of the first section and the lastsection, the contents of this Annual Report also appearon the IVS Web site at
http://ivscc.gsfc.nasa.gov/publications/ar2013
This book and the Web site are organized as follows:
• The first section contains general information aboutIVS, a map showing the locations of the compo-nents, information about the Directing Board mem-bers, and the annual report of the IVS Chair.
• The second section holds four special reports. Thefirst report, “Final Report of IVS Working Group4 (WG4) on Data Structures”, presents the work ofWorking Group 4, which was established in 2007to design a data structure to meet requirementsfor VLBI sessions and to prepare for the transi-tion to the new structure. This report gives thehistory of Working Group 4’s efforts, a descrip-tion of the final data structure, and the remainingsteps neeeded to implement it. The second report,
IVS 2013 Annual Report
“IVS WG6 Final Report”, presents the work ofWorking Group 6, which was established in 2009to promote education and training within the IVS.Working Group 6’s specific mandates were to de-velop contacts at educational institutions related toVLBI in order to raise interest in VLBI among stu-dents, to develop educational material that could bedistributed to educational institutions, and to seekfunding, develop a concept, and prepare for pro-viding training, e.g., through VLBI schools. TheWG6 report assesses how well WG6 has met itsmandates. The report lists contacts identified underthe first mandate, material collected under the sec-ond mandate, and funding efforts made under thethird mandate. The report concludes by discussingand evaluating its first training school, which washeld in Helsinki, Finland in conjunction with theEVGA meeting in March 2013, co-sponsored bythe European Geosciences Union (EGU), OnsalaSpace Observatory, and RadioNet, and supportedby Aalto University and the Finnish Geodetic Insti-tute. The third report, “VGOS Data Recorder Com-parison”, presents tables that assess data recordersfor compliance with the VGOS (VLBI Global Ob-serving System) standards. The fourth report, “Pro-posal for VGOS Observing Plan”, presents the planof the VPEG (VGOS Project Executive Group) togradually introduce VGOS observing over the nextseveral years. By means of trial sessions and pi-lot projects, the proposed observing plan transitionsfrom basically no VGOS observing in 2014 to afully established 24/7 VGOS observing program bythe end of the decade. The plan was endorsed by theIVS Directing Board at its most recent meeting andwill be implemented by the IVS Coordinating Cen-ter and the OPC (Observing Program Committee).
iii

iv Preface
• The next seven sections hold the reports from theCoordinators and the reports from the IVS Per-manent Components: Network Stations, OperationCenters, Correlators, Data Centers, Analysis Cen-ters, and Technology Development Centers.
• The next section contains a compilation of publica-tions in the field of geodetic and astrometric VLBIduring 2013.
• The last section includes reference informationabout IVS. This year the information sectionhas been streamlined, and the majority of it willonly be provided on-line. This change conservespaper, but it also recognizes that some categoriesof information (most notably the list of Asso-ciate Members) change within a year, rendering
the printed information out-of-date. Therefore,this year the information section only includesthe Terms of Reference and a table of links to theMember and Affiliated organizations, the AssociateMembers, and the permanent components.As a replacement for the list of acronyms previ-ously included in the Annual Report, the Coordi-nating Center plans to develop an on-line list ofacronyms to be posted on the IVS web site in thefuture. The list of addresses of institutions that con-tributed to this year’s Annual Report has been dis-continued.
IVS 2013 Annual Report

Table of Contents
Preface . . . . . . . . . . . . . . . . . . . . . . . . . . . . . . . . . . . . . . . iii
About IVS . . . . . . . . . . . . . . . . . . . . . . . . . . . .1IVS Organization . . . . . . . . . . . . . . . . . . . . . . . . . . . . . . . 2IVS Component Map . . . . . . . . . . . . . . . . . . . . . . . . . . . 4IVS Directing Board . . . . . . . . . . . . . . . . . . . . . . . . . . . . 6IVS Chair’s Report . . . . . . . . . . . . . . . . . . . . . . . . . . . . . 8
Special Reports . . . . . . . . . . . . . . . . . . . . . . .9Final Report of IVS Working Group 4 (WG4) on DataStructures . . . . . . . . . . . . . . . . . . . . . . . . . . . . . . . . . . . . .11IVS WG6 Final Report . . . . . . . . . . . . . . . . . . . . . . . . .26VGOS Data Recorder Comparison . . . . . . . . . . . . . . 64Proposal for VGOS Observing Plan . . . . . . . . . . . . . 70
IVS Coordination . . . . . . . . . . . . . . . . . .81Coordinating Center Report . . . . . . . . . . . . . . . . . . . . 83The 2013 Analysis Coordinator Report . . . . . . . . . . 86Network Coordinator Report . . . . . . . . . . . . . . . . . . . 89IVS Technology Coordinator Report . . . . . . . . . . . . 95
Network Stations . . . . . . . . . . . . . . . . . . .99Badary Radio Astronomical Observatory 2013 IVSAnnual Report . . . . . . . . . . . . . . . . . . . . . . . . . . . . . . . 101Effelsberg Radio Observatory 2013 Annual Re-port . . . . . . . . . . . . . . . . . . . . . . . . . . . . . . . . . . . . . . . . . 104Fortaleza Station 2013 Annual Report . . . . . . . . . . 106Goddard Geophysical and Astronomical Observa-tory . . . . . . . . . . . . . . . . . . . . . . . . . . . . . . . . . . . . . . . . . 108Hartebeesthoek Radio Astronomy Observatory (Har-tRAO) . . . . . . . . . . . . . . . . . . . . . . . . . . . . . . . . . . . . . . .111AuScope VLBI Project and Hobart 26-m Antenna 115Kashima 34-m VLBI Station . . . . . . . . . . . . . . . . . . 119Kokee Park Geophysical Observatory . . . . . . . . . . 123
IVS 2013 Annual Report
Kashima and Koganei 11-m VLBI Stations . . . . . 126Matera CGS VLBI Station 2013 Annual Report . 130Medicina Station Status Report . . . . . . . . . . . . . . . . 133Metsahovi Radio Observatory Network Station 2013Annual Report . . . . . . . . . . . . . . . . . . . . . . . . . . . . . . . 135VERA 2013 Geodetic Activities . . . . . . . . . . . . . . . 139Noto Station Status Report . . . . . . . . . . . . . . . . . . . . 142Ny-Alesund Geodetic Observatory 2013 AnnualReport . . . . . . . . . . . . . . . . . . . . . . . . . . . . . . . . . . . . . . 145German Antarctic Receiving Station (GARS)O’Higgins . . . . . . . . . . . . . . . . . . . . . . . . . . . . . . . . . . . 148Onsala Space Observatory – IVS Network StationActivities During 2013 . . . . . . . . . . . . . . . . . . . . . . . . 151Korea Geodetic VLBI Station, Sejong . . . . . . . . . . 155Sheshan VLBI Station Report for 2013 . . . . . . . . . 158The Simeiz Fundamental Geodynamics Area . . . . 160Svetloe Radio Astronomical Observatory 2013 IVSAnnual Report . . . . . . . . . . . . . . . . . . . . . . . . . . . . . . . 164JARE Syowa Station 11-m Antenna, Antarctica . 167Status of the TIGO VLBI Station in Concepcion .171Tsukuba 32-m VLBI Station . . . . . . . . . . . . . . . . . . .173Nanshan VLBI Station Report 2013 . . . . . . . . . . . . 177Warkworth Radio Astronomical Observatory, NewZealand . . . . . . . . . . . . . . . . . . . . . . . . . . . . . . . . . . . . . 180Westford Antenna 2013 Annual Report . . . . . . . . . 184Geodetic Observatory Wettzell - 20-m Radio Tele-scope and Twin Telescopes . . . . . . . . . . . . . . . . . . . . 187Instituto Geografico Nacional of Spain . . . . . . . . . 191Zelenchukskaya Radio Astronomical Observatory2013 IVS Annual Report . . . . . . . . . . . . . . . . . . . . . . 195
Operation Centers . . . . . . . . . . . . . . . . .199The Bonn Geodetic VLBI Operation Center . . . . .201CORE Operation Center 2013 Annual Report . . . 203NEOS Operation Center . . . . . . . . . . . . . . . . . . . . . . 206
v

vi Table of Contents
Correlators . . . . . . . . . . . . . . . . . . . . . . .207The Bonn Astro/Geo Correlator . . . . . . . . . . . . . . . .209Haystack Observatory VLBI Correlator . . . . . . . . .213IAA Correlator Center 2013 Annual Report . . . . . 217Correlation Processing in NICT Kashima . . . . . . . 221Shanghai VLBI Correlator 2013 Annual Report . 224Tsukuba VLBI Correlator . . . . . . . . . . . . . . . . . . . . . 227Washington Correlator . . . . . . . . . . . . . . . . . . . . . . . . 231
Data Centers . . . . . . . . . . . . . . . . . . . . . .233BKG Data Center . . . . . . . . . . . . . . . . . . . . . . . . . . . . 235CDDIS Data Center Summary for the IVS 2013Annual Report . . . . . . . . . . . . . . . . . . . . . . . . . . . . . . . 237Italy INAF Data Center Report . . . . . . . . . . . . . . . . 240Data Center at NICT . . . . . . . . . . . . . . . . . . . . . . . . . .241Paris Observatory (OPAR) Data Center . . . . . . . . . 244
Analysis Centers . . . . . . . . . . . . . . . . . .247Analysis Center of Saint Petersburg University . . 249Geoscience Australia Analysis Center 2013 AnnualReport . . . . . . . . . . . . . . . . . . . . . . . . . . . . . . . . . . . . . . 251Report for 2013 from the Bordeaux IVS AnalysisCenter . . . . . . . . . . . . . . . . . . . . . . . . . . . . . . . . . . . . . . .253BKG/DGFI Combination Center Annual Report2013 . . . . . . . . . . . . . . . . . . . . . . . . . . . . . . . . . . . . . . . . 257Matera CGS VLBI Analysis Center . . . . . . . . . . . . 261DGFI Analysis Center Annual Report 2013 . . . . . 263GFZ Analysis Center 2013 Annual Report . . . . . . 265The BKG/IGGB VLBI Analysis Center . . . . . . . . 268GSFC VLBI Analysis Center Report . . . . . . . . . . . 272Haystack Observatory Analysis Center . . . . . . . . . 276IAA VLBI Analysis Center Report 2013 . . . . . . . . 280Italy INAF Analysis Center . . . . . . . . . . . . . . . . . . . 283JPL VLBI Analysis Center Report for 2013 . . . . . 285KASI Combination Center 2013 Annual Report . 288KTU-GEOD IVS Analysis Center Annual Report2013 . . . . . . . . . . . . . . . . . . . . . . . . . . . . . . . . . . . . . . . . 292Analysis Center at National Institute of Informationand Communications Technology . . . . . . . . . . . . . . 295NMA Analysis Center 2013 Annual Report . . . . . 299Paris Observatory (OPAR) Analysis Center . . . . . 301Onsala Space Observatory – IVS Analysis CenterActivities during 2013 . . . . . . . . . . . . . . . . . . . . . . . . 304PMD Analysis Center 2013 Annual Report . . . . . 308Pulkovo IVS Analysis Center (PUL) 2013 AnnualReport . . . . . . . . . . . . . . . . . . . . . . . . . . . . . . . . . . . . . . 312SAI VLBI Analysis Center 2013 Annual Report . 316SHAO Analysis Center 2013 Annual Report . . . . 318Tsukuba VLBI Analysis Center . . . . . . . . . . . . . . . . 321
U.S. Naval Observatory VLBI Analysis Center . . 325USNO Analysis Center for Source Structure Re-port . . . . . . . . . . . . . . . . . . . . . . . . . . . . . . . . . . . . . . . . . 328Vienna Special Analysis Center Annual Report2013 . . . . . . . . . . . . . . . . . . . . . . . . . . . . . . . . . . . . . . . . 330
Technology Development Centers . . 335Canadian VLBI Technology Development CenterReport . . . . . . . . . . . . . . . . . . . . . . . . . . . . . . . . . . . . . . 337GSFC Technology Development Center Report . .338Haystack Observatory Technology DevelopmentCenter . . . . . . . . . . . . . . . . . . . . . . . . . . . . . . . . . . . . . . .341NICT Technology Development Center 2013 AnnualReport . . . . . . . . . . . . . . . . . . . . . . . . . . . . . . . . . . . . . . 345Onsala Space Observatory – IVS Technology Devel-opment Center Activities during 2013 . . . . . . . . . . 349
Bibliography . . . . . . . . . . . . . . . . . . . . . .353Bibliography . . . . . . . . . . . . . . . . . . . . . . . . 355
IVS Information . . . . . . . . . . . . . . . . . . .367IVS Terms of Reference . . . . . . . . . . . . . . . . . . . . . . 369Links to Additional IVS Information . . . . . . . . . . . 376
IVS 2013 Annual Report

Abou
t IVS

2
IVS Organization
Objectives
IVS is an international collaboration of organizations which operate or support Very Long Baseline Interferometry (VLBI) components. The goals are:
1. To provide a service to support geodetic, geophysical and astrometric research and operational activities.
2. To promote research and development activities in all aspects of the geodetic and astrometric VLBI technique.
3. To interact with the community of users of VLBI products and to integrate VLBI into a global Earth observing system.
The IVS• Interacts closely with the IERS, which is tasked by
IAU and IUGG with maintaining the international celestial and terrestrial reference frames (ICRF and ITRF),
• coordinates VLBI observing programs, • sets performance standards for the observing stations, • establishes conventions for data formats and products, • issues recommendations for analysis software,• sets standards for analysis documentation,• institutes appropriate product delivery methods in
order to insure suitable product quality and timeliness.
Realization And Status Of IVS
IVS consists of• 32 Network Stations, acquiring high performance
VLBI data,• 3 Operation Centers, coordinating the activities of a
network of Network Stations,• 7 Correlators, processing the acquired data, provid-
ing feedback to the stations and providing processed data to analysts,
• 5 Data Centers, distributing products to users, providing storage and archiving functions,
• 28 Analysis Centers, analyzing the data and producing the results and products,
• 6 Technology Development Centers, developing new VLBI technology,
• 1 Coordinating Center, coordinating daily and long term activities.
Altogether• 82 Permanent Components, representing 43 institu-
tions in 21 countries,• ~280 Associate Members.
In addition the IVS has:• Directing Board, determining policies, standards and
goals; the board is composed of 16 members (elected and ex officio), including
• Coordinators for the network, analysis and technology.
ORGANIZATION OF INTERNATIONAL VLBI SERVICE

3
IVS Affiliated Organizations
The following organizations cooperate with IVS on issues of common interest, but do not support an IVS component. Affiliated Organizations express an interest in establishing and maintaining a strong working association with IVS to mutual benefit. Listed alphabetically by country.
Products
The VLBI technique contributes uniquely to• Definition and realization of the International Celestial
Reference Frame (ICRF)• Monitoring of Universal Time (UT1) and length of day
(LOD)• Monitoring the coordinates of the celestial pole (nuta-
tion and precession)
Further significant products are• All components of Earth Orientation Parameters at
regular intervals• Station coordinates and velocity vectors for the real-
ization and maintenance of the International Terrestrial Reference Frame (ITRF)
All VLBI data and results in appropriate formats are ar-chived in data centers and publicly available for research in related areas of geodesy, geophysics and astrometry.
IVS Member OrganizationsThe following organizations contribute to IVS by supporting one or more IVS components. They are considered IVS Members. Listed alphabetically by country.
Organization CountryGeoscience Australia AustraliaUniversity of Tasmania AustraliaCSIRO AustraliaVienna University of Technology AustriaCentro de Rádio Astronomia e Aplicações Espaciais
Brazil
Geodetic Survey Division, Natural Resources Canada
Canada
Dominion Radio Astrophysical Observatory
Canada
Universidad de Concepción ChileInstituto Geográfico Militar ChileChinese Academy of Sciences ChinaFinnish Geodetic Institute, Aalto University FinlandObservatoire de Paris FranceLaboratoire d’Astrophysique de Bordeaux FranceDeutsches Geodätisches Forschungsinstitut
Germany
Bundesamt für Kartographie und Geodäsie GermanyInstitut für Geodäsie und Geoinformation der Universität Bonn
Germany
Forschungseinrichtung Satellitengeodäsie, TU-Munich
Germany
Max-Planck-Institut für Radioastronomie GermanyGeoForschungsZentrum Potsdam GermanyIstituto di Radioastronomia INAF ItalyAgenzia Spaziale Italiana ItalyPolitecnico di Milano DIIAR ItalyGeospatial Information Authority of Japan JapanNational Institute of Information and Communications Technology
Japan
National Astronomical Observatory of Japan
Japan
National Institute of Polar Research JapanAuckland University of Technology New
ZealandNorwegian Mapping Authority NorwayAstronomical Institute of St.-Petersburg University
Russia
Institute of Applied Astronomy RussiaPulkovo Observatory RussiaSternberg Astronomical Institute of Moscow State University
Russia
Organization CountryHartebeesthoek Radio Astronomy Observatory
South Africa
Korea Astronomy and Space Science Institute
South Korea
National Geographic Information Institute S. KoreaInstituto Geográfico Nacional SpainChalmers University of Technology SwedenKaradeniz Technical University TurkeyMain Astronomical Observatory, National Academy of Sciences, Kiev
Ukraine
Laboratory of Radioastronomy of Crimean Astrophysical Observatory
Ukraine
NASA Goddard Space Flight Center USAU. S. Naval Observatory USAJet Propulsion Laboratory USA
Organization CountryAustralian National University AustraliaUniversity of New Brunswick CanadaFÖMI Satellite Geodetic Observatory HungaryJoint Institute for VLBI in Europe (JIVE) NetherlandsWesterbork Observatory NetherlandsNational Radio Astronomy Observatory USA

4
IVS Component Map
IVS Components by Country
Country Qty.
Australia 3
Austria 1
Brazil 1
Canada 1
Chile 1
China 4
Finland 1
France 3
Germany 10
Italy 7
Japan 12
New Zealand 1
Norway 2
Russia 9
South Africa 1
South Korea 2
Spain 1
Sweden 3
Turkey 1
Ukraine 2
USA 16
Total 82Network StationFormer StationOperation CenterCorrelatorData CenterAnalysis CenterTechnology Development CenterCoordinating Center
O’Higgins
TIGO
Fortaleza
Haystack
Canadian VLBIAlgonquin
Yellowknife
Gilmore Creek
JPL
Kokee Park
GGAO
NEOS
GSFCUSNO

5
GSINICT
Kashima 34
Kashima 11Koganei
Katherine
ParkesGA
HobartWarkworth
YarragadeeHartebeesthoek
Syowa
MizusawaTsukuba
KASIShanghai
SeshanSejong
Nanshan
Badary
Zelenchukskaya
KTU
Simeiz
SAI
IAA
AIStPbU
Svetloe
NMA
GFZ
Metsähovi
Onsala
IGGB Effelsberg
ParisFGS(BKG,IGGB)
Bordeaux
WettzellTU ViennaMedicina
MateraNotoPMD
YebesINAF
DGFI
PUL
BKG MAO
Ny Alesund

6
IVS Directing Board
NAME: Hayo Hase
AFFILIATION: Bundesamt für Kartographie und Geodäsie/TIGO, Germany/Chile
POSITION: Networks Representative
TERM: Feb 2011 to Feb 2015
NAME: Rüdiger Haas
AFFILIATION: Chalmers University of Technology, Sweden
POSITION: Technology Develop-ment Centers Representative
TERM: Feb 2013 to Feb 2017
NAME: Dirk Behrend
AFFILIATION: NVI, Inc./Goddard Space Flight Center, USA
POSITION: Coordinating Center Director
TERM: ex officio
NAME: John Gipson
AFFILIATION: NVI, Inc./Goddard Space Flight Center, USA
POSITION: Analysis Coordinator
TERM: permanent
NAME: Patrick Charlot
AFFILIATION:Laboratoire d’Astrophysique de Bordeaux, France
POSITION: IAU Representative
TERM: ex officio
NAME: Alessandra Bertarini
AFFILIATION: University of Bonn, Germany
POSITION: Correlatorsand Operation CentersRepresentative
TERM: Feb 2011 to Feb 2015
NAME: Axel Nothnagel
AFFILIATION: University of Bonn, Germany
POSITION: Chair, Analysis and Data Centers Representative
TERM: Feb 2013 to Feb 2017
NAME: Ed Himwich
AFFILIATION: NVI, Inc./Goddard Space Flight Center, USA
POSITION: NetworkCoordinator
TERM: permanent

7
NAME: Shinobu Kurihara
AFFILIATION: Geospatial Information Authority, Japan
POSITION: At Large Member
TERM: Feb 2013 to Feb 2015
NAME: Chopo Ma
AFFILIATION: NASA Goddard Space Flight Center, USA
POSITION: IERS Representative
TERM: ex officio
NAME: James Lovell
AFFILIATION: University of Tasmania, Australia
POSITION: Networks Representative
TERM: Feb 2013 to Feb 2017
NAME: Fengchun Shu
AFFILIATION: Shanghai Astronomical Observatory, China
POSITION: At Large Member
TERM: Feb 2013 to Feb 2015
NAME: Alexander Ipatov
AFFILIATION: Institute of Applied Astronomy, Russia
POSITION: At Large Member
TERM: Feb 2013 to Feb 2015
NAME: Arthur Niell
AFFILIATION: MIT Haystack Observatory, USA
POSITION: Analysis and Data Centers Representative
TERM: Feb 2013 to Feb 2015
NAME: William Petrachenko
AFFILIATION: Natural Resources Canada, Canada
POSITION: TechnologyCoordinator
TERM: permanent
NAME: Harald Schuh
AFFILIATION: GFZ German Research Center for Geosciences, Germany
POSITION: IAG Representative
TERM: ex officio

8
IVS Chair’s Report
Axel Nothnagel
Institut für Geodäsie und Geoinformation der Universität Bonn
On March 8, 2013 at the 29th IVS Directing Board Meet-ing, I was elected the third chair of the IVS following my successful predecessors, Wolfgang Schlüter and Harald Schuh. In the last six years, Harald has done a tremen-dous job, pushing the IVS forward in our initiative which is now called VGOS, the VLBI Global Observing System. I should state that Harald’s name will always be linked directly to the VGOS acronym.
For my own person, I am proud to be chairing the IVS with its many motivated and active individuals, as I indi-cated at various occasions already. I hope that I will be a chair who fulfills most if not all expectations which the community puts onto me.
Since my election, only a few but still noteworthy activi-ties fell into my responsibility. Most of them are rather of administrative nature which also have to do with seeking approval of the directing board. The most important one certainly is that the VGOS Observing Plan was adopted and is now available on the IVS web site for reference. The VGOS Observing Plan should guide us during the transition period from legacy to VGOS operations which is purely based on wide-band observations.
Another highlight in 2013 was the approval of the South African Government to fund the construction of a fully equipped VGOS telescope at the Hartebeesthoek Ra-dio Astronomy Observatory near Johannesburg, South Africa. We are really looking forward to this new contribu-tor which will be fundamental to VGOS in the southern hemisphere. Independently of this, the Directing Board also voted unanimously for holding the 9th IVS General Meeting scheduled for 2016 in South Africa.
In my function as the IVS Chair I attended the IERS Lo-cal Tie Workshop in Paris, France, on May 21/22, 2013, and presented the IVS status and prospects at the IAG Scientific Assembly in Potsdam, Germany, on September 4, 2013.
All in all, I can state that I have taken over a well function-ing entity from my predecessor, Harald Schuh, where there is little to no necessity for fundamental changes. Our way of developing the IVS further by the establish-ment of VGOS is certainly something which will need our full attention in the next few years. However, we should not forget that there is ample scope of application also for the legacy antennas with the current setup of S/X
band observations in the future. We should try to keep and operate them as long as possible. In between the two standard configurations, there may be a need for mixed-mode operations to link the VGOS telescopes into the VLBI terrestrial reference frame. All of this requires strong endeavors of research and development. At the same time, however, let us always remember that we are a service which serves quite a number of customers and that the majority of activities has to follow the concept of a service.
In this respect, I thank already all contributors to this an-nual report and our colleagues at the IVS Coordinating Center for compiling, printing and distributing this issue. The timely appearance and distribution of the annual re-port has always been a trademark of the IVS.

Spec
ial R
epor
ts


11
Final Report of IVS Working Group 4 (WG4)
on Data Structures
John Gipson
1, Johannes Böhm
2, Sergei Bolotin
1, David Gordon
1, Thomas Hobiger
3, Chris Ja-
cobs4, Sergey Kurdobov
5, Axel Nothnagel
6, Ojars Sovers
7, Oleg Titov8, Hiroshi Takiguchi9
1NVI, Inc at NASA Goddard Spaceflight Center, United States,
2Department of Geodesy and Geoinformation, Vienna University of Technology, Austria
3National Institute of Information and Communications Technology, Japan
4Jet Propulsion Laboratory, United States
5Institute of Applied Astronomy, St. Petersburg, Russia
6Institute of Geodesy and Geoinformation, University of Bonn, Germany
7Remote Sensing Analysis, Inc., United States
8Geosciences Australia, Australia
9Auckland University of Technology, New Zealand
1 History At the 15 September 2007 IVS Directing Board meeting I proposed establishing a “Working
Group on VLBI Data Structures”. The thrust of the presentation was that, although the VLBI da-
tabase system has served us very well these last 30 years, it is time for a new data structure that
is more modern, flexible, and extensible. This proposal was unanimously accepted, and the board
established IVS Working Group 4. Quoting from the IVS Web site [1]:
“The Working Group will examine the data structure currently used in VLBI data processing
and investigate what data structure is likely to be needed in the future. It will design a data
structure that meets current and anticipated requirements for individual VLBI sessions including
a cataloging, archiving, and distribution system. Further, it will prepare the transition capability
through conversion of the current data structure as well as cataloging and archiving softwares
to the new system.”
2 Organization of the Working Group Any change to the VLBI data format affects everyone in the VLBI community. Therefore, it is
important that the working group have representatives from a broad cross-section of the IVS
community. The initial membership was arrived at in consultation with the IVS Directing Board.
Table 1 lists the current and past members of WG4 together with the
Table 1. Past and Current Members of IVS Working Group 4
John Gipson Chair/Solve
Sergei Bolotin Steelbreeze
Roger Capallo Correlators
Axel Nothnagel Analysis Coordinator

12
We were all saddened at the premature death of Anne-Marie Gontier during this period. In addi-
tion some members left the Working group because of a change in professional status or retire-
ment.
3 Earlier Related Work There have been proposals to redesign how geodetic VLBI data is stored and archived. We want
to particularly mention two of these. We want to particularly mention:
1. A memo written by Leonid Petrov “Specifications of a geo-VLBI format” in the late
1990s. [See reference to undated memo by L. Petrov in Reference.]
2. The work of Anne-Marie Gontier on the Gloria database.
In addition, at the second IVS Analysis Workshop in February 2001, a working group was set up
to develop a VLBI exchange format independent of platforms and operating systems. This work-
ing group included Gontier and Petrov, as well as other members of the VLBI community. The
working group resulted in the definition of the PIVEX format [Gontier, 2002]. Several Mark3
databases, including an Intensive (01DEC31XU), a NEOS (01DEC11XE) and an RDV session
(01MAY09XA) were converted to PIVEX format. Unfortunately, PIVEX was never widely
adopted in the VLBI community.
Since the goals of this earlier working group were substantially similar to IVS Working Group 4
It is not surprising that WG4 was strongly influenced by this earlier work since the goals of this
earlier working group were so similar. We learned from both the successes and failures of this
earlier work. In terms of success much of the way the data is organized is similar to the organiza-
tion proposed by Petrov and/or Gontier. In particular, organizing data by scope (how broadly ap-
plicable is the data) and the concept of wrapper are very similar to L. Petrov. Both of these are
discussed below. A major difference is that WG4 proposes relying on an established format
(NetCDF) to store the VLBI data instead of defining an entirely new format.
4 History and Goals WG4 held its first meeting at the 2008 IVS General Meeting in St. Petersburg, Russsia. This
meeting was open to the general IVS community. Roughly 25 scientists attended: ten WG4
members and fifteen others. This meeting was held after a long day of proceedings. The number
David Gordon Calc/Solve
Chris Jacobs
Ojars Sovers
Modest
Oleg Titov
Volker Tesmer
Occam
Johannes Böhm Vievs
Sergey Kurdobov IAA
Anne-Marie Gontier PIVEX
Thomas Hobiger
Hiroshi Takiguchi
NICT/C5++

13
of participants and the lively discussion that ensued is strong evidence of the interest in this sub-
ject.
A set of design goals, displayed in Table 1, emerged from this discussion. In some sense the de-
sign goals imply a combination and extension of the current VLBI databases, the information
contained on the IVS session Web-pages, and much more information [2].
During the next year the working group communicated via email and telecon and discussed how
to meet the goals that emerged from the St. Petersburg meeting. A consensus began to emerge
about how to achieve most of these goals.
Table 1. Design Goals of Working Group IV
Goal Description
Provenance Users should be able to determine the origin of the data and what was
done to it.
Compactness The data structure should minimize redundancy and the storage format
should emphasize compactness.
Speed Data retrieval should be fsat.
Platform/OS/
Language Support
Data should be accessible by programs written in different languages,
running on a variety of computers and operating systems.
Extensible It should be easy to add new data types.
Open Data should be accessible without the need of proprietary software.
Decoupled Different types of data should be separate from each other.
Multiple data levels Data should be available at different levels of abstraction. For example,
levels most users are only interested in the delay and rate observables.
Specialists may be interested in correlator output.
Completeness All VLBI data required to process (and understand) a VLBI session
from start to finish should be available: schedule files, email, log-files,
correlator output, and final ‘database’.
Web Accessible All data should be available via the Web.
The next face-to-face meeting of WG4 was held at the 2009 European VLBI Meeting in Bor-
deaux, France. This meeting was also open to the IVS community. At this meeting a proposal
was put forward to split the data contained in the current Mark3 databases into smaller files
which are organized by a special ASCII file called a wrapper. Overall the reaction was positive.
In the summer of 2009 we worked on elaborating these ideas, and in July a draft proposal was
circulated to Working Group 4 members. The ideas continued to be refined over the next years.
Because of the desire for the new format to be open, and as a nod to Mark3 database structure,
we originally called the new format openDB. A subsequent internet search revealed that this
name was already taken, and the new format was renamed to vgosDB.

14
5 Current Organization of VLBI Data Currently the smallest piece of VLBI data that is routinely analyzed is a VLBI session. This in-
formation is archived and stored in Mark3 database. These databases contain information used in
the analysis of a VLBI session, which are usually 1-hour (intensives) or 24-hours. With very few
exceptions, there are usually gaps between sessions, and hence a VLBI session is a natural piece
of VLBI data to work with.
5.1 Mark3 Databases
The Mark3 database organizes data by “Lcodes” with each Lcode corresponding to a different
data item. The data associated with a given Lcode can be stored as ASCII Strings, Integer*2, In-
teger*4 or Real*8. The Mark3 database was designed to contain all1 the data necessary to ana-
lyze a VLBI session within a single file. The database file contains the observables but it also
contains theoretical values, partials and calibrations.
There are two types of Lcodes:
1. Type-1 Lcodes contain data that is applicable for the entire session.
a. Examples: station names and positions, source names and positions, session
name, etc.
b. This information occurs only once in the database.
c. There are roughly 100 different Lcodes.
2. Type-2 and -3 Lcodes are conceptually identical. Type-3 Lcodes were introduced because
of limitations of the HP operating system in the 1980s. These Lcodes contain observation
dependent data:
a. Examples: EOP data, a priori nutation, various partials, delay, rate, sigmas.
b. The database contains data for each Lcode and each observation, e.g., each obser-
vation has an associated EOP value, met values, etc.
c. There are around 400 different Type-2 and Type-3 Lcodes.
The Mark3 databases are fundamentally organized by observation, as illustrated below.
Table 2. Mark3 databases are organized by session- and observation-dependent data.
Type 1 Lcodes: Session Data
Source List Station List Correlator Principle Investi-
gator
Flags Etc...
Type 2 and 3 Lcodes: Observation Data
Lcode1
SourceName
Lcode2
1st Station
Lcode3
2nd
Station
Lcode3
EOP
… LcodeM
Observable
Obs1
Obs2
…
ObsN
1 Over time this proved impractical, and some of data is now stored in external files. Examples include EOP files,
pressure loading, episodic motion, etc.

15
It is important to note that the Mark3 database format is both a method of organizing data and a
means of storing data. Data is organized by Lcodes, where the Lcodes are Session-dependent or
Observation dependent. The data is stored in a proprietary format.
The Mark3 database format has some nice features which we do not want to lose. Among these
are:
1. Table of Contents. You can easily see what data is available in a given database.
2. Self-descriptive data. Each data item has a brief description of what it is.
3. History. Each database contains a history of its processing.
The specific Lcodes within a database vary depending on the age of the database and how the
data was processed. Older databases contain obsolete Lcodes which are relics of how the data
was analyzed at the time. In addition databases contain information about the fringing process,
and this information is different for each kind of correlator. The number of Lcodes has increased
over time as a result of model changes, the desire to use new kinds of data, etc. A consequence of
this is that a Mark3 database contains data that is obsolete and never used.
Some problems associated with Mark3 databases are:
1. Requires proprietary software.
2. Only used by the calc/solve user community.
3. Redundancy.
a. Much VLBI data is really scan-dependent, not observation dependent.
b. There is one database for each band.
4. Mixing of observations and theoretical models.
5. Changing a model or adding new kinds of data means updating the entire database.
6. Difficult or impossible to exchange partial information, i.e., ambiguity resolution or edit-
ing criteria.
7. Contains obsolete data and models.
8. Contains data that is very seldom used.
9. Contains data that is calc/solve specific.
10. Slow data access which makes it prohibitively time-consuming to use the Mark3 database
in large VLBI solutions.
In spite of the above problems, the Mark3 database has been in use for over 35 years which is a
testament to the many virtues it has.
5.2 NGS Card Format
Because of the proprietary nature of the Mark3 database an alternative format called "NGS card"
format was developed to exchange VLBI information. This consists of a single ASCII file with a
series of lines. The top of the file contains header information which describes the session as a
whole, such as stations, sources and their positions. This is analogous to the Type-1 Lcodes in
the Mark3 database. This is followed by information about the observations. This is analogous to
the information contained in the Type-2 Lcodes.
The advantage of the NGS format is that it is fairly easy to write software to parse the file. Some
of the disadvantages are:

16
1. Inflexible. Hard to add new data types.
2. Does not contain all of the VLBI data needed to analyze a solution from the beginning.
Hence errors in the initial data editing and ambiguity resolution are 'baked-into’ the data
and become impossible to fix down-stream.
3. Machine access is slower than for binary files.
5.3 PIVEX Format
Pivex was an ASCII format designed to archive and store VLBI data [Gontier 2002]. It was nev-
er widely adopted.
5.4 Other Formats
Because of the speed advantages that storing data in binary files has, most VLBI analysis soft-
ware uses a custom format specific to the particular software.
For doing large global solutions which combine data from many sessions, solve stores data in
'superfiles'. These superfiles are essentially binary dumps of Fortran common blocks which con-
tain subsets of the data in a Mark3 database. The organization is also roughly similar to that of
Mark3 databases. One common block contains information common to the session as a whole.
Another common block contains information applicable to a given observation. Solve uses this
information by reading in the common-block for a particular observation en-masse.
Other software packages such as Steelbreeze, Occam and VieVs use their own proprietary for-
mat. This makes it difficult to exchange data.
As mentioned above, one of the primary reasons for using a proprietary format is that Mark3 da-
tabase access is slow. Proprietary binary formats were developed in part as a reaction to this. On
the other hand the NetCDF format is designed for fast access. One of the goals of the vgosDB is
to encourage the use of a common format for data processing and exchange.

17
6 Overview of vgosDB format In this section we present a brief overview of the new format.
6.1 Organizing Data by Sessions
The smallest piece of VLBI data routinely analyzed is the data contained in a Mark3 database.
Each database contains the data for a single session. Sessions are usually 24 hours (standard ses-
sions) or 1 hour (intensives). With a few exceptions such as the CONT series (campaigns where
VLBI data is taken over an extended period of time, usually around 2 weeks), there are usually
gaps between sessions, and hence a VLBI session is natural piece of VLBI data to work with.
In the most optimistic VLBI2010 scenario, there are never gaps in the observing. Some stations
may stop observing for a time (for example, for scheduled maintenance), but there will always be
a number of stations observing. This is analogous to the situation in GPS and SLR, where some
instruments are always on. However, both of these techniques find it useful to divide data into
smaller pieces for analysis.
A crucial difference between VLBI and the other space-geodetic techniques is that VLBI is a co-
operative venture—stations must observe in a coordinated manner, i.e., two or more stations
must observe the same source at the same time, and the observing modes must be the same or
similar. If the observing mode is substantially different, then you cannot correlate the data be-
tween two stations, and hence there are no observables.
We propose to continue to organize data by session. However, instead of storing most of the data
related to a particular session in a Mark3 database, the vgosDB format breaks the data into
smaller pieces which are stored in files (see below). All of the data associated with a particular
session is stored under a directory named after that session, e.g., 10JAN04XA would contain all
of the information related to IVS session R1412.
6.2 Modularization
A solution to many of the design goals of Table 3 is to modularize the data, that is to break up
the data associated with a session into smaller pieces. These smaller pieces are organized by
‘type’; e.g., group delay observable, pressure data, temperature data, editing criteria, station
names, and station positions. In many, though not all, cases, each ‘type’ corresponds to a Mark3
database Lcode. We refer to each data item as an vgosDB variable.
Different data types are stored in different files, with generally only one or a few closely related
data types in each file. For example, it is logical to store all of the met-data for a station together
in a single file. This data usually comes from a single instrument. However, there is no compel-
ling reason to store the met-data together with pointing information. Splitting the data in this way
has numerous advantages, some of which are outlined below. The first three directly address the
design goals. The last was not originally specified, but is a consequence of this design decision.
1. Separable. Users can retrieve only that part of the data in which they are interested.

18
2. Extensible. As new data types become used, for example, source maps, they can be easily
added without having to rewrite the whole scheme. All you need to do is specify a new
data type and the file format.
3. Decoupled. Different kinds of data are separated from each other. Observables are sepa-
rated from models. Data that won’t change is separated from data that might change.
4. Partial Data Update. Instead of updating the entire database, as is currently done, you on-
ly need to update that part of the data that has changed.
6.2.1 Reducing Redundancy.
Data will also be organized by ‘scope’, that is how broadly applicable it is: A) The entire session
(for example, source position); B) A particular scan (EOP); C) A particular scan and station
(met-data); D) or for a particular observation (delay observable and sigma). The current Mark3
database is observation oriented: all data required to process a given observation is stored once
for each observation. This results in tremendous redundancy for some data. For example, in an
N-station scan, there are N*(N-1)/2 observations, and each station participates in N −1 observa-
tions. Scan dependent data, such as EOP or source information, is the same for all observations
in a scan. However in Mark3 databases, this information is stored once for each observation, re-
sulting in an N*(N-1)/2 times redundancy. Station dependent data which is the same for all ob-
servations in a scan, such as pointing or met-data, is stored N-1 once for each observation the
station participates in the scan, resulting in an (N − 1)-fold redundancy. Organizing data by
scope allows you to reduce redundancy.
6.3 NetCDF as Default Storage Format
Working Group 4 reviewed a variety of data storage formats including NetCDF, HCDF, CDF,
and FITS. In some sense, all of these formats are equivalent—there exist utilities to convert from
one format to another. Ultimately we decided to use NetCDF, because it has a large user com-
munity since numerical weather models are stored in NetCDF files. Several members of the
Working Group have experience using NetCDF. In addition, Thomas Hobiger [Hobiger 2008]
wrote a program to store Mark3 databases in NetCDF format and developed analysis software
that uses the NetCDF format [Hobiger 2010].
At its most abstract, NetCDF is a means of storing arrays in files. The arrays can be of different
sizes and shapes, and contain different kinds of data—strings, integer, real, double, etc. Most
VLBI data used in analysis is some kind of array. From this point of view using NetCDF is a
natural choice. These files can contain history entries which aid in provenance. Storing data in
NetCDF format has the following advantages:
1. Platform/OS/Language Support. NetCDF has interface libraries to all commonly used
computer languages running on a variety of platforms and operating systems.
2. Speed. NetCDF is designed to access data fast.
3. Compactness. The data is stored in binary format, and the overhead is low. A NetCDF
file is much smaller than an ASCII file storing the same information.
4. Open. NetCDF is an open standard, and software to read/write NetCDF files is freely
available.

19
5. Transportability. NetCDF files use the same internal format regardless of the machine ar-
chitecture. Access to the files is transparent. For example, the interface libraries take care
of automatically converting from big-endian to little-endian.
6. Large User Community. Because of the large user community, there are many tools de-
veloped to work with NetCDF files.
Figure 1. A NetCDF file is a container to hold arrays.
6.3.1 NetCDF Attributes.
Another feature of NetCDF is the ability to easily store meta-data related to a variable. This meta
data is called an ‘attribute’ arbitrary, and can be used to store information such as:
1. Units
2. Definition
3. Creation date of data.
4. Corresponding LCODE name if any.
5. Any other used-specified characteristic.
6.4 Organizing Data Within a Session Using Wrappers
In contrast to the current Mark3 databases where all (actually most) of the data required to ana-
lyze a data is one file, the new scheme proposes dividing the data up into smaller pieces. This
allows updating the individual pieces separately and gives great flexibility in what is used. Be-
cause we split the data into smaller pieces, there must be another means of organizing the data.
Wrappers solve this problem.
1. A wrapper is an ASCII file which contains
a. Information about the session
b. Pointers to files which contain the actual data
Array1
M1xN1xO1
Integer*2
Array2
M2xN2
Real*8
Array3
M3xN3
Character
Array4
M4xN4
Real*4
Array5
M5xN5
Real*8

20
2. A wrapper file is distinguished by the extension “.wrp”.
3. Wrappers are never over written. Instead, as the results of analysis, or as needs change, a
new wrapper is created.
openDB Format
Schedule
Info
Observables
Editing
Etc
Mapping
functions
Wrapper
Met Data
O-C Partials .
The wrapper is an ASCII file that contains pointers to other files in netCDF format that contain the data. Typically each of these other files contain a ‘few’ data items corresponding to different Lcodes.
Wrappers have many advantages, a few of which are mentioned below.
1. Ability to easily test different models by pointing to different netCDF files.
2. Ability to only update that part of the data which has changed.
3. Ability to try different editing criteria.
6.5 VgosDB Manual
The above is mentioned as an overview of the vgosDB format. It is not meant to completely
define the format—instead it is meant to give the flavor of the format. A preliminary manual is
avialable via anonymous ftp from:
ftp::/gemini.gsfc.nasa.gov/pub/misc/jmg/vgosDBv_v2013Jun11.pdf
The final version of the manual will be put on the IVS website when it is completed.

21
7 Feasibility Demonstrations In August of 2009 John Gipson began a partial implementation of these ideas and wrote software
to convert a subset of the data in a Mark3 database into the new format. This subset of data in-
cluded all of the data available in NGS card format. The subset was chosen because many VLBI
analysis packages including Occam, Steelbreeze, and VieVS use NGS cards as input. The GSFC
VLBI group made available via anonymous FTP an Intensive, an R1 and a RDV session.
In the fall of 2010, Andrea Pany of the Technical University of Vienna developed an interface to
VieVS working with the draft proposal. During this process the definition of a few of the data
items needed to be clarified, which emphasizes the importance of working with the data hands
on. With these changes VieVs was able to process data in the new format without problem.
At roughly the same time at NASA’s Goddard Spaceflight center, Sergei Bolotin interfaced a
variant of this format to Steelbreeze. Steelbreeze uses its own proprietary format, and one moti-
vation for interfacing to the new format was to see if there was a performance penalty associated
with using the new format. Bolotin found a small performance penalty of 40μs/ observation. Pro-
cessing all 7 million then-available VLBI observations would result in a total performance penal-
ty of 280 seconds, or 6 minutes 40 seconds. This seemed to be a relative modest price to pay for
the many advantages of this format.
In late 2010 and early 2011 Gipson modified the VLBI analysis program solve to use a subset of
the data stored in vgosDB format. This subset contained some observation dependent data such
as the delay observable and pointing information. The remaining data was extracted from the
solve-superfiles. (A superfile is a binary file containing a sub-set of all the data in the Mark3 da-
tabase that is used in global solutions. Superfiles lack the flexibility of Mark3 databases, but data
access is much faster.) This test had two distinct purposes. First, it was a demonstration of the
feasibility of using netCDF files to store VLBI data. Second, it was a required first step in the
conversion of solve to use the new format.
8 Conversion of Mark3 Database to VgosDB format In 2011 and 2012 Gipson worked on a utility db2openDB to convert all of the data in all of
Mark3 databases into the openDB format. As mentioned above, this format was subsequently
renamed to vgosDB. (A modified version of this program called db2vgosDB is available as part
of the calc/solve distribution.) As there approximately 500 different Lcodes this process took
longer than anticipated. In addition many of the Mark3 databases, especially the older ones, had
problems that needed to be fixed. A partial listing of some of the problems follows:
1. All of the Mark3 databases have an LCODE ‘NUM OBS’ that is supposed give the total
number of observations in the database. However, several of the older databases actually
had fewer observations than indicated, while a few had more.
2. Many of the Mark3 databases had duplicated data. There were two different Lcodes (a
type-2 and a type-3 lcode) containing exactly the same data. In these cases the duplicate
data was removed.

22
3. Many databases had bad or incorrect values for some of the data items. Each case had to
be examined to determine how to handle the situation. In some cases the missing data
could be inferred from data that was present in the database. In other cases the observa-
tion had to be flagged as bad.
In the spring of 2012 the conversion was essentially complete. All of the existing Mark3 data-
bases were converted to openDB format and the results made accessible via anonymous ftp at:
ftp:://gemini.gsfc.nasa.gov/pub/openDB.
8.1 Conversion of Calc/Solve to Use vgosDB Format
Historically the default storage format for geodetic VLBI sessions is Mark3 databases. This is
the data format that the VLBI data is archived in, and the format that many IVS analysis centers
use to process and store their results in. Other formats, such as NGS cards, or the custom format
used by other analysis packages are all derived either directly or indirectly from the Mark3 data-
bases. The software that produces edited and fully resolved Mark3 databases is the Calc/Solve
analysis suite. Because of this, as part of the transition to the vgosDB format it is necessary to
modify Calc/Solve to use the new format.
Figure 3 on the following pages lists the necessary processing steps before VLBI data is ready
for use. We give a brief summary of each of the steps below. Depending on the VLBI analysis
package the names of the programs involved may differ, but the steps remain the same.
1. The correlator takes the recorded data from the stations and produces correlator output
files.
2. dbedit reads the correlator files, extracts the relevant information, and produces an initial
Mark3 database. It actually produces both an X-band and S-band database.
3. Calc adds additional information to the X-band database. Some of this information, such
as pointing information, is used by all analysis packages. Other information is specific to
the solve.
4. Cable-cal and met-data is added to the X-band database by dbcal. The order of steps two
and three can be reversed.
5. The data is read into solve. An analyst performs an initial solution where they resolve
ambiguities and edit the data. The X-band database is written out and now includes a sub-
set of the S-band data.
At this stage the Mark3 database is ready to be used in geodetic analysis. Many analysis packag-
es use NGS-card format as input. (NGS cards contain a subset of the data in the Mark3 database
in an ASCII file). Most analysis software, including calc/solve, convert the data into a proprie-
tary binary format before using it. In the case of calc/solve this format is called ‘superfiles.
In converting to the vgosDB format we need to develop software that reproduces all of the above
steps. Since the Goddard VLBI group is the group that maintains calc/solve, this work was un-
dertaken at Goddard.

23
Figure 2. VLBI processing steps.

24
The approach was to start at the end of the processing chain and work backwards. The first step
was to modify the globl mode of solve to use the vgosDB format instead of superfiles. The utility
db2vgosDB read in edited and fully resolved Mark3 databases and produced vgosDB format ses-
sions. Conversion of globl to use vgosDB sessions was completed in the summer of 2012. Tim-
ing tests showed that smaller sessions such as intensives run somewhat slower using the vgosDB
format. In contrast larger sessions such as the RDV sessions or CONT11 sessions run up to 40%
faster. A solution using all of the VLBI runs slightly faster using the vgosDB format.
The remaining programs displayed on the right-hand-side of Figure 2 were developed at God-
dard during late 2012 and early 2013. Several sessions including an R1s, RDVs and intensives
were processed completely, starting from correlator output and ending in fully resolved vgosDB
sessions. The results were consistent with or identical with the normal processing using Mark3
databases. (In the process of developing this software the Goddard VLBI group found and fixed
some bugs in the normal processing chain.)
The process of developing the processing software was very useful and lead to some refinements
in the vgosDB specification. One example of this involves changing which NetCDF files contain
some particular data items. For example, in the first implementation of the vgosDB format, both
the Names and Positions of stations were stored in the file ‘Head.nc’ which contains general in-
formation about the session. This worked satisfactorily when we were starting with a version 4 a
fully resolved Mark3 database which contains all of this information. However if we are creating
the vgosDB session by scratch the station position information is not available until after the data
has been calc-ed. Because of this it is logical to remove the station position (and source position)
information from Head.nc and store it separately. Other examples include renaming vgosDB var-
iables and filenames to make them more consistent.
9 Next Steps In this section we describe next steps in the implementation and decimation of the vgosDB for-
mat to the IVS community.
The ‘development’ version of the Calc/Solve analysis suite at Goddard has the ability to use ei-
ther superfiles or vgosDB files in global solutions. In addition, υSolve, the replacement for inter-
active solve, can read and write vgosDB files. These capabilities will be made widely available
with the next general release of Calc/Solve scheduled for fall 2013.
Beginning in 2014, the Goddard VLBI group will take on responsibility for producing vgosDB
versions of all VLBI sessions available to IVS. This includes sessions for which Goddard has
primary responsibility (e.g., R1s and RDVs) and also sessions for which other analysis centers
have primary responsibility. This will be done by using the utility db2vgosDB to convert fully
edited and resolved Mark3 databases to vgosDB format. As the year progresses and as other
Calc/Solve analysis centers (which are responsible for producing the Mark3 databases) get famil-
iar with the handling and producing vgosDB sessions Goddard will reduce the number of
vgosDB sessions it produces. For at least 1-year both Mark3 databases and vgosDB sessions will
be available on the IVS website.

25
The VLBI analysis software suite VieVs, developed at the Technical University of Vienna, can
use vgosDB sessions in its analysis. This capability will be maintained and enhanced as time
permits. For example, currently VieVs must start with a fully resolved Mark3 database. As time
permits this capability will be added to VieVs and it will use the vgosDB format to store the re-
lated information.
It is hoped that other software packages such as Occam, C5++ are modified to read and write
vgosDB format. This will allow the easy exchange of information among these software pack-
ages.
10 References 1. Petrov, L. “Specifications of a proposed geo-VLBI dataformat”,
http://gemini.gsfc.nasa.gov/development/gvf/gvf.html. Undated memo
2. Abdekar, K., Gontier, A-M, “The Gloria VLBI tables”, http:
3. Gontier, A-M. and Feissel, M., “PIVEX: a Proposal for a Platform Independent VLBI
Exchange Format”, The 2nd
IVS General Meeting Proceedings, 2002 p. 248-254.
4. Gipson, J., “IVS Working Group 4 on VLBI Data Structures”, The 5th
IVS General Meet-
ing Proceedings, 2008 p. 143-152
5. Hobiger, et al, “MK3TOOLS – Seamless Interfaces for the Creation of VLBI Databases
from Post-Correlation Output”, The 5th
IVS General Meeting Proceedings, 2008 p. 143-
153-156.
6. Gipson, J., “IVS Working Group 4 on VLBI Data Structures”, The 6th
IVS General Meet-
ing Proceedings, 2010 p. 187-191
7. Hobiger, et al., “C5++ - Multi-technique Analysis Software for Next Generation Geodet-
ic Instruments”, The 6th
IVS General Meeting Proceedings, 2010 p. 212-216.
8. Gipson, J., Report on IVS-WG4, 20th
EVGA Meeting, p 142-146.
9. Gipson, J., IVS Working Group 4 on VLBI Data Structures, The 7th
IVS General Meeting
Proceedings, 2012 p. 212-221.
10. Gipson, J. IVS Working Group 4 on VLBI Data Structures,
11. Draft openDB Manual version 2013Jun11:
ftp::/gemini.gsfc.nasa.gov/pub/misc/jmg/openDBv_v2013Jun11.pdf

26
IVS WG 6 Final report
Rüdiger Haas
September 2013
Introduction
The IVS Directing Board established on its meeting in March 2009 in Bordeaux a working group on Education and Training. This working group is IVS WG6 and its work was to be reviewed regularly by the IVS DB at its meeting. The general aim of IVS WG6 is to support education and training in the field of geodetic and astrometric VLBI, in order to hand over and maintain expertise in this field for the next generations.
The Terms of Reference (ToR) of IVS WG6 were:
to establish contacts to education institutions in geodesy, geosciences and astrometry worldwide
with the aim to raise interest in geodetic and astrometric VLBI among students
to develop education material that can be distributed to education institutions
to seek funding and to develop a concept and prepare the organization of training in form of for
example IVS summer schools for master and PhD students
The WG was chaired by Rüdiger Haas: other initial members were Oleg Titov, Hayo Hase, Bjørn
Engen, Johannes Böhm, Dirk Behrend, and Alan Whitney. Further candidate members were to be
asked later to support the group.

27
ToR-1
The task was to establish contacts to education institutions in geodesy, geosciences and
astrometry worldwide with the aim to raise interest in geodetic and astrometric VLBI among
students. For this purpose several experts were asked to take care of the different continents:
Continent Responsible team North America Alan Whitney and Dirk Behrend South America Hayo Hase and Alan Whitney Europe Rüdiger Haas and Johannes Böhm Asia Dirk Behrend and Oleg Titov Australia and Oceania Oleg Titov and Bjørn Engen Africa Lucia Plank and Rüdiger Haas
The responsible teams collected information on educational institutes that provide student
education in geodesy, geosciences and astrometry. Unfortunately is the distribution of such
institutions not equal for all continents. For some of the continents only a few contact addresses
could be collected so far. There is more work to be done to collect potential contacts. Below we
give a list of so far collected contacts addresses.
a) NORTH AMERICA:
Canada
– York University, Earth and Space Science Engineering, Spiros Pagiatakis, spiros (at) yorku.ca
– University of Calgary, Department of Geomatics Engineering, Prof. Michael G. Sideris, sideris (at) ucalgary.ca
México
– Universidad Autonoma de México, Departamento de Geodesia y Cartografía, Ing. Bartolo Lara
Andrade, larandraba (at) gmail.com
– Instituto Politécnico Nacional, Unidad Ticomán Ciencias de la Tierra (ESIA), Ing. Julio
Morales de la Garza, jmoralesd (at) ipn.mx
USA
– University of Colorado, Prof. Kristine Larson, kristinem.larson (at) gmail.com
– University of Nevada, Prof. Jeff Blewitt, gblewitt (at) unr.edu
– Lamont-Doherty Earth Observatory, Prof. James Davis, jdavis (at) ldeo.columbia.edu
– Ohio State University, Prof. Michael Bevis, mbevis (at) osu.edu
b) SOUTH AMERICA:
Argentina
– Universidad Nacional de La Plata – UNLP, Carrera de Ingeniería en Agrimensura, Dr. Ing.
Marcos Actis, depagrim (at) ing.unlp.edu.ar
– Universidad Nacional de La Plata – UNLP, Carrera de Geofísica, Decano Dr. Adrián Brunini,

28
agrimen (at) fi.uba.ar
– Universidad Nacional de Buenos Aires – UNBA, Carrera de Ingeniería en Agrimensura, Dr.
Ing. Carlos Rosito, agrimen (at) fi.uba.ar
– Universidad Nacional de Tucumán – UNT, Carrera de Ingeniería Geodésica y Geofísica,
Decano Ing. Sergio José Pagani, Dr. José Luis Vacaflor, jvacaflor (at) herrera.unt.edu.ar
– Universidad Nacional de Cordoba – UNC, Carrera de Ingeniería en Agrimensura, Decano
Hector Gabriel Tavella, Ing. Susana Talquenca, comunicaciones (at) efn.uncor.edu
– Universidad Santiago del Estero, Carrera de Ingeniería en Agrimensura, Decano Héctor Rúben
Paz, info-fce (at) unse.edu.ar
– Universidad Nacional del Sur – UNS, Carrera de Ingeniería en Agrimensura, Decano Carlos
Rossit, dtoinge (at) criba.edu.ar
– Universidad Nacional de Catamarca – UNCA, Carrera de Ingeniería en Agrimensura, Rector
Ing. Flavio Fama
– Universidad de Morón, Carrera de Ingeniería en Agrimensura, Rector Héctor Norberto Porto
Lemma, ingenieria (at) unimoron.edu.ar
– Universidad Nacional Juan Maza, Carrera de Ingeniería en Agrimensura, Decano Vicente
Gonzalo Cremades, gorelo (at) umaza.edu.ar
– Universidad Nacional del Litoral – UNL, Carrera de Ingeniería en Agrimensura, Decano Ing.
Mario Schreider, fich (at) fich.unl.edu.ar
– Universidad Nacional del Nordeste – UNNE, Carrera de Ingeniería en Agrimensura, Decana
Dra. Lidia Itatí Ferraro de Corona, estudios (at) exa.unne.edu.ar sae (at) exa.unne.edu.ar
– Universidad Nacional del Nordeste – UNNE, Carrera de Ingeniería Civil, Decano Dr. Jorge
Victor Pilar, info (at) ing.unne.edu.ar
– Universidad Nacional de Rosario – UNR, Carrera de Ingeniería en Agrimensura, Decano Ing.
Elect. Oscar Enrique Peire, [email protected] many (at) fceia.unr.edu.ar
Brazil
– UNESP - Universidade Estadual Paulista Júlio de Mesquita Filho, Departamento de
Cartografia, Dr. João Carlos Chaves, jcchaves (at) fct.unesp.br
– USP - Universidade de São Paulo, Departamento de Engenharia de Transportes, Dr. Edvaldo
Simões da Fonseca Junior, edvaldoj (at) usp.br
– UFRGS - Universidade Federal do Rio Grande do Sul, Departamento de Geodésia, Dra. Andrea
Lopes Iescheck, andrea.iescheck (at) ufrgs.br
– UFPE - Universidade Federal de Pernambuco, Departamento de Engenharia Cartográfica, Dr.
Carlos A. Pessoa M. Galdino, galdino (at) ufpe.br
– IME - Instituto Militar de Engenharia, Seção de Ensino de Engenharia Cartográfica, Dr.
Leonardo Castro de Oliveira, se6_chefia (at) ime.eb.br
– UERJ - Universidade do Estado do Rio de Janeiro, Departamento de Engenharia Cartográfica,
Dr. Amauri Ribeiro Destri, destri (at) uol.com.br
– INPE - Instituto Nacional de Pesquisas Espaciais, Serviço de Pós-Graduação, Jose Carlos
Becceneri, [email protected] posgraduacao (at) pgrad.inpe.br
– ON – Observatório Nacional, Geofísica, Dr. Sergio Luiz Fontes, sergio (at) on.br
– UFPR - Universidade Federal do Paraná, Engenharia Cartográfica e de Agrimensura, Dr. Luís
Augusto Koenig Veiga, kngveiga (at) ufpr.br
Chile
– ACAPOMIL – Academia Politécnica Militar, Jefatura de Estudios, Teniente Coronel Neira,

29
geografia (at) acapomil.mil
– Universidad de Concepción, Ingeniería Geomática, Dr. Juan Carlos Báez Soto, jbaez (at)
udec.cl
– Universidad de Santiago de Chile, Ingeniería en Geomensura, Dr. Belfor Portal Valenzuela,
belfor.portal (at) usach.cl
– Universidad Técnica Metropolitana, Escuela de Geomensura, Luis del Canto Harboe,
geomensura (at) utem.cl
– Universidad de Antofagasta, Ingeniería en Geomensura, Luis Fernández San Martín, uovando
(at) uantof.cl
– Universidad Bernardo O'Higgins, Ingeniería en Geomensura y Cartografía, Sr. Abel Fuentes,
geomensura (at) ubo.cl
– Universidad de Talca, Geomática, Yony Ormazábal, yormazabal (at) utalca.cl
– INACAP Maipú, Ingeniería en Geomensura, Sr. René Martínez Muñoz, maipu (at) inacap.cl
Colombia
– Universidad Distrital Francisco José de Caldas, Ingeniería Catastral y Geodesia, Coordinador -
Ingeniería Catastral y Geodesia, ingcatastral (at) udistrital.edu.co
Costa Rica
– Universidad Nacional, Escuela de Topografia Catastro y Geodesia, Steven Oreamuno Herra,
soreamun (at) una.ac.cr
Ecuador
– Escuela Politecnica del Ejercito, Carrera de Ingenieria Geográfica y Medio Ambiente, Dr
Alfonso Tierra, fleon (at) espe.edu.ec
– Instituto Geográfico Militar, Proceso de Geodesia, Capitan Nicolay Vaca, nicolay.vaca (at)
mail.igm.gob.ec
Honduras
– –
Panamá
– Universidad Tecnológica de Panamá, Escuela de Geotecnia Ingenería en Geomática, Chun
Quan Huang Lin, chun.huang (at) utp.ac.pa
Venezuela
– Universidad de Zulia, Departamento de Geodesia Superior, Escuela de Ingeniería Geodésica,
Prof. Dr.-Ing. Eugen Wildermann, Prof. Msc-Ing. Karina Acurero, ewildermann (at)
fing.luz.edu.ve kacurero (at) fing.luz.edu.ve
c) EUROPE:
Albania
– Tirana University, Department of Geography, Prof. Dr. Pal Nikolli, palnikolli (at) yahoo.com
Andorra
– –

30
Austria – TU Graz, Institute of Theoretical Geodesy and Satellite Geodesy, Prof. Dr. Torsten Mayer-Gürr: mayer-
guerr (at) tugraz.at
– TU Wien, Institute of Geodesy and Geophysics, Prof. Dr. Johannes Böhm: johannes.boehm (at) tuwien.ac.at
Belarus – –
Belgium – Royal Observatory of Belgium, Prof. Veronique Dehant, v.dehant (at) oma.be
Bosnia and Herzegovina
– –
Bulgaria – University of Architecture, Civil Engineering and Geodsy, Department of Geodesy, Prof. Georgi Mitrev,
gmitrev_fgs (at) uacg.bg
Croatia
– University of Zagreb, Faculty of Geodesy, Institute of Geomatics, Prof. Zeljko Bacic, zbacic
(at) geof.hr
Cyprus
– –
Czech Republic – Research Institute of Geodesy Topography and Cartography, Department of Geodesy and Geodynamics,
Prof. Dr. Jakub Kostelecky, kakub.kostelecky (at) pecny.cz
– Czech Technical University in Prague, Department of Advanced Geodesy, Prof. Dr.Ing. Leoš Mervart,
k152 (at) fsv.cvut.cz
– Brno University of Technology, Institute of Geodesy, Prof. Otakar Svabensky, svabensky.o (at)
fce.vutbr.cz
– VSB – Technical University of Ostrava, Faculty of Mining and Geology, Institute of Geoinformatics,
Prof. Dr. Zdenek Divis, zdenek.divis (at) vsb.cz
– Charles University in Prague, Faculty of Mathematics and Physics, Department of Geophysics, Prof.
Zdenek Martinec, zdenek (at) hervam.troja.mff.cuni.cz
Denmark – Aalborg University (AAU), Kai Borre, borre (at) es.aau.dk
– Technical University of Denmark (DTU), Niels Andersen, na (at) space.dtu.dk
– Technical University of Denmark (DTU), Per Knudsen, pk (at) space.dtu.dk
Estonia – University of Tartu,
– University of Tallinn‚ Artu Ellman, Harli Jurgensen
Finland – Aalto University, Martin Vermeer, martin.vermeer (at) aalto.fi
– Finnish Geodetic Institute (FGI), Markku Poutanen, martin.poutanen (at) fgi.fi

31
France – –
Georgia – –
Germany – Bonn University, PD Axel Nothnagel, nothnagel (at) uni-bonn.de
– TU München, Prof. Hugentobler, urs.hugentobler (at) bv.tum.de
– Karlsruhe Institute of Technology, Prof. Heck, bernhard.heck (at) kit.edu
– Stuttgart University, Prof. Nico Sneuw
– Leibniz University Hannover, Prof. Jürgen Müller, mueller (at) ife.uni-hannover.de
Greece
– –
Hungary
– –
Iceland
– –
Ireland
– –
Italy
– –
Kazakhstan
– –
Latvia
– Univertity of Latvia, Prof. Janis Kaminski, janis.kaminski (at) gmail.com
Liechtenstein – –
Lithuania – –
Luxembourg
– University of Luxembourg, Prof. Olivier Francis, olivier.francis (at) uni.lu
– University of Luxembourg, Prof. Felix Norman Teferle, norman.teferle (at) uni.lu
– University of Luxembourg, Prof. Tonie van Dam, tonie.vandam (at) uni.lu
Republic of Macedonia
– State University of Tetova, Faculty of Natural Sciences and Mathematics, Prof. Dr. Bashkim
Idrizi, bashkim.idrizi (at) unite.edu.mk

32
Malta, Moldova, Monaco, Montenegro
– –
Netherlands
– Delft University of Technology, Prof. Ambrosius, b.a.c.ambrosius (at) tudelft.nl
Norway
– University Ås, Geomatics, Bjørn Rangvald Pettersson
– University Ås, Oddgeir Kristiansen
Poland
– Polish Academy of Sciences, Space Research Centre, Prof. Dr. Aleksander Brzezninski, alek
(at) cbk.waw.pl
Portugal – –
Romania
– –
Russia
– St.Petersburg University, St Petersburg, Prof. Veniamin Vityazev
San Marino, Serbia, Slovakia, Slovenia
– –
Spain
– –
Sweden
– Royal Institute, Stockholm, Prof. Lars Sjöberg
– Högskolan i Gävle, Stieg-Göran Mårtensson
Switzerland
– ETH Zürich, Prof. Markus Rothacher,
– University Bern, Rolf Dach
Turkey
– –
Ukraine
– –
United Kingdom
– University of Nottingham, Prof. Terry Moore
– Newcastle University, Prof. Matt King, m.a.king (at) ncl.ac.uk

33
Vatican City
– –
d) ASIA:
Afghanistan
– –
Armenia
– –
Azerbaijan
– –
Bahrain
– –
Bangladesh
– –
Bhutan
– –
Brunei
– –
Burma (Myanmar)
– –
Cambodia
– –
China
– Wuhan University, Prof. Erhu Wei, ehwei (at) sgg.whu.edu.cn
Hong Kong
– –
India
– –
Indonesia
– –
Iran – –

34
Iraq
– –
Israel
– –
Japan
– Sapporro University, Prof. Kosuke Heki
Jordan
– –
Kazakhstan
– –
Korea, North
– –
Korea, South
– –
Kuwait
– –
Kyrgyzstan
– –
Laos
– –
Lebanon
– –
Malaysia
– –
Maldives
– –
Mongolia
– –
Myanmar
– –
Nepal
– –
Oman
– –

35
Pakistan
– –
Philippines
– –
Qatar
– –
Saudi Arabia
– –
Singapore
– –
Sri Lanka
– –
Syria
– –
Taiwan
– –
Tajikistan
– –
Thailand
– –
Turkey
– –
Turkmenistan
– –
United Arab Emirates
– –
Uzbekistan
– –
Vietnam
– –
Yemen
– –
e) Australia and Oceania

36
Australia
– –
Fiji
– –
Kiribati
– –
Marshall Islands
– –
Micronesia
– –
Nauru
– –
New Zealand
– –
Palau
– –
Papua New Guinea
– –
Samoa
– –
Solomon Islands
– –
Tonga
– –
Tuvalu
– –
Vanuatu
– – f) Africa
Algeria
– –

37
Angola
– –
Benin
– –
Botswana
– –
Burkina Faso
– –
Burundi
– –
Cameroon
– –
Cape Verde
– –
Central African Republic
– –
Chad
– –
Comoros
– –
Congo-Brazzaville
– –
Congo-Kinshasa
– –
Cote d'Ivoire
– –
Djibouti
– –
Egypt
– –

38
Equatorial Guinea
– –
Eritrea
– –
Ethiopia
– –
Gabon
– –
Gambia
– –
Ghana
– –
Guinea
– –
Guinea Bissau
– –
Kenya
– –
Lesotho
– –
Liberia
– –
Libya
– –
Madagascar
– –
Malawi
– –
Mali
– –
Mauritania – –
Mauritius
– –

39
Morocco
– –
Mozambique
– –
Namibia
– –
Niger
– –
Nigeria
– –
Rwanda
– –
Senegal
– –
Seychelles
– –
Sierra Leone
– –
Somalia
– –
South Africa
– Hartebeesthoek Radio Astronomical Observtory, Prof. Ludwig Combrinck, ludwig (at)
hartrao.ac.za
South Sudan
– –
Sudan
– –
Swaziland
– –
São Tomé and Príncipe
– –
Tanzania
– –

40
Togo
– –
Tunisia
– –
Uganda
– –
Western Sahara
– –
Zambia
– –
Zimbabwe

41
ToR-2
The task was to develop education material that can be distributed to education institutions.
The WG decided to start by collecting existing educational material. Material provided by
Johannes Böhm and Harald Schuh from the Vienna Technical University, Austria, Chris Jacobs
from the Jet Propoulsion Laboratory, USA, and Rüdiger Haas from Chalmers University of
Technology, Sweden. The material consists of pdf-files and is available at
http://www.evga.org/edumaterial.html
As a next step, the plan was to collect and compile the material presented at the IVS VLBI
school. This material consists of 14 lectures and 3 exercises and is available at
http://www.evga.org/material_vlbi_school_2013.html , see Figure 1 below.
Figure 1 Webpage http://www.evga.org/material_vlbi_school_2013.html with the lecture
material developed for the EGU and IVS Training school on VLBI for Geodesy and
Astrometry, held in Espoo and Masala, Finland, March 2-5, 2013.

42
ToR-3
The task was to seek funding and to develop a concept and prepare the organization of training in
form of for example IVS summer schools for master and PhD students.
Several attempts were done to apply for funding for a VLBI-school:
The first attempt was directed in the spring of 2011 towards NordForsk. NordForsk is an
organisation under the Nordic Council of Ministers that provides funding for Nordic research
cooperation as well as advice and input on Nordic research policy. We sent in an application to
NordFork’s call for ”Research Training Courses 2011” and applied for about 230 kNOK funding
of a VLBI-school that was planned for the summer of 2011. For this call, NordForsk received in
total 52 applications, out of which 20 were funded. Unfortunately, our application did not get any
support.
The second attempt was an application to the “Training of Radio Astronomers” program of
RadioNet. RadioNet is a project supported by the European Commission under the 7th
Framework Programme (FP7). A support by RadioNet on the order of up to 2 k€ was granted for
the organisation of a VLBI-school.
The third attempt was an application to the European Geosciences Union (EGU) in the fall of
2011. We submitted a proposal for a VLBI-school to the “Topical Meetings and Training Schools
for 2012” program of the EGU outreach committee. We applied for a total budget of 23.5 k€ to
organise a VLBI-school in the late summer of 2012 at Onsala. In November 2011 the EGU
informed us that they would support the VLBI-school by 5 k€.
Since we so far had only 7k€ support from RadioNet and EGU, we decided to organise the
VLBI-school not as a stand-alone occasion, but in connection to another VLBI-related meeting.
We anticipated that this would make it easier for teachers and students to participate. We chose
the EVGA meeting in March 2013 in Finland and EGU agreed to move the VLBI-school to 2013.
We also discussed further support for the VLBI-school with the Aalto University in Espoo, the
Finnish Geodetic Institute in Masala, and the Onsala Space Observatory. These three institutions
granted additional support in terms of access to lecture halls, bus transport, coffee breaks,
lunches, and a school dinner. The logos of the sponsors of the VLBI-school are presented in
Figure 2. IVS supported the VLBI-school though teachers that are members of IVS. A report on
the VLBI-school is given on the following pages.
Figure 2 The logos of the sponsors of the EGU and IVS Training School on VLBI for Geodesy and Astrometry, held in March 2013 in Finland.

43
Report on the
EGU and IVS Training School
on VLBI for Geodesy and
Astrometry
Held 2013, March 2-5, at Aalto University, Espoo (Finland) and the Finnish
Geodetic Institute, Masala (Finland)
Rüdiger Haas, Markku Poutanen, Minttu Uunila, 2013-04-22
A) GENERAL INFORMATION
The “EGU and IVS Training School on VLBI for Geodesy and Astrometry” was held March 2-5,
2013, in Finland. It was organized by Rüdiger Haas, head of IVS Working Group 6 on VLBI
Education, in collaboration with Markku Poutanen, head of the geodesy division at the Finnish
Geodetic Institute (FGI), and Minttu Uunila from Aalto University, Metsähovi Radio
Observatory, Finland. The main goal of the VLBI school was to educate and provide training for
the next generation VLBI researchers that will work with the next generation VLBI system for
Geodesy and Astrometry. For that purpose, four days of lectures and exercises were arranged,
with the intention to cover the VLBI system for Geodesy and Astrometry as complete as possible.
The lectures covered technical aspects, scheduling and observations, details of the correlation
process, modeling and data analysis, and interpretation of the results. There were in total 14
lectures and 3 hands-on exercises. Some impressions on the activities during the VLBI-school are
shown in Figures 3-6. The final session of the VLBI-school was held together with the 14th
IVS
Analysis Workshop.

44
The teachers that were giving lectures at the VLBI school are international experts in their fields
and come from several research institutions worldwide:
· Thomas Artz (University of Bonn, Germany)
· Alessandra Bertarini (Max Planck Institute for Radioastronomy, Germany)
· Johannes Böhm (Vienna Technical University, Austria)
· Roger Cappallo (MIT Haystack Observtory, USA)
· Patrick Charlot (Bordeaux Observatory, France)
· John Gipson (NASA, NVI Inc., USA)
· Rüdiger Haas (Chalmers University of Technology, Sweden)
· Chris Jacobs (JPL, NASA, USA)
· Dan MacMillan (NASA, NVI Inc., USA)
· Axel Nothnagel (University of Bonn, Germany)
· Bill Petrachenko (National Resources Canada, Canada)
· Harald Schuh (GeoForschungsZentrum Potsdam, Germany)
· Manuela Seitz (DGFI, Germany)
· Alan Whitney (MIT Haystack Observatory, USA)
There were more than 60 applications for participation in the VLBI school, from interested
students worldwide, including all continents. Finally, more than 50 students really could attend
the VLBI-school, see the list of participants in Section 3. More than 50 % of the participants are
active in educational programs on master’s or PhD level, while the rest were more senior
researchers. More than 35 % of the participants were female. The lecture slides are available via
the webpages of the European VLBI Group for Geodesy and Astrometry (EVGA,
www.evga.org/material_vlbi_school_2013.html).
The VLBI-school received some financial support from the European Geosciences Union (EGU)
that was entirely used to support parts of the travel expenses of the master’s and PhD students.
The Onsala Space Observatory provided support for food in terms of coffee breaks and lunches
during the VLBI-school. Aalto University provided the lecture room on Saturday, Monday and
Tuesday, while the Finnish Geodetic Institute provided the lecture room on Sunday and some
food. A small number of master’s and PhD students sent in claims to RadioNet3 and were
refunded for additional travel expenses.

45
Figure 4: Alessandra Bertarini giving a lecture for the VLBI-school at the
Finnish Geodetic Institute, Masala.
Figure 3: Students listening to a lecture during the VLBI-school in the lecture
hall at Aalto University, Espoo.

46
Figure 6: Axel Nothnagel (left) supervising a student group during Exercise-3
on data analysis.
Figure 5: Roger Cappallo (right) advising a student group during Exercise-2 on
software correlation.

47
B) THE PROGRAM OF THE TRAINING SCHOOL
Day-1 (Saturday, 2013-03-02, @ Aalto University, Espoo)
09:00-09:15 Welcome and practical information (R. Haas, M. Poutanen)
09:15-10:00 "General overview on geodetic and astrometric VLBI and the IVS" (H. Schuh)
10:00-10:30 --- coffee break ---
10:30-12:00 "Radio telescopes, feed horns and receivers" (B. Petrachenko)
12:00-13:00 --- lunch break ---
13:00-14:30 "Digital backends and data acquisition" (A. Whitney)
14:30-15:00 --- coffee break ---
15:00-16:30 "Experiment scheduling" (J. Gipson)
16:30-17:15 "Observing an experiment" (R. Haas)
17:15-18:00 Exercise-1 (theoretical calculations, B. Petrachenko)
Day-2 (Sunday, 2013-03-03, @ FGI, Masala)
08:30-09:00 bus leaves from Helsinki downtown to Radissson blu Otaniemi Espoo
09:00-09:30 bus leaves from Radiosson blu Otaniemi Espoo to FGI Masala
09:30-11:00 "Correlator Architectures and VLB2010" (R. Cappallo)
11:00-11:30 --- coffee break ---
11:30-13:00 "Correlation preparation and post-correlation analysis" (A. Bertarini)
13:00-14:00 --- lunch break ---
14:00-15:30 "Geophysical models" (D. MacMillan)
15:30-16:00 --- coffee break ---
16:00-17:30 Exercise-2 (software correlation) (A. Bertarini & R. Cappallo)
17:30-20:00 "VLBI-school dinner"
20:00-21:00 bus transport back to Radiosson blu Otaniemi Espoo & Helsinki downtown
Day-3 (Monday, 2013-03-04, @ Aalto University, Espoo)
09:00-10:30 "Atmospheric propagation" (J. Böhm)
10:30-11:00 --- coffee break ---
11:00-12:30 "Data modeling and analysis" (Th. Artz)
12:30-13:30 --- lunch break ---
13:30-15:00 "Terrestrial reference frame" (R. Haas on behalf of M. Seitz)
15:00-15:30 --- coffee break ---
15:30-17:00 Exercise-3 (data analysis) (Th. Artz et al.)
Day-4 (Tuesday, 2013-03-05, @ Aalto University , Espoo)
09:00-10:30 "Radio sources" (P. Charlot)
10:30-11:00 --- coffee break ---
11:00-12:30 "Celestial Reference Frames" (Ch. Jacobs)
12:30-13:30 --- lunch break ---
13:30-15:00 "Earth rotation and orientation" (A. Nothnagel)
15:00-15:30 --- coffee break ---
15:30-18:00 14th IVS Analysis Workshop (A. Nothnagel et al.)

48
C) DISCUSSION AND EVALUATION OF THE TRAINING SCHOOL
The event was a Training School on VLBI for Geodesy and Astrometry with in total 14 lectures
and 3 exercises. All lectures were 90 minutes long, except one that was only 45 minutes long.
The exercises were between 45 and 90 minute long, and very much appreciated by the students.
The first exercise covered purely technical aspects and focused on aspects like the calculation of
sensitivity of radio astronomical systems. The students worked individually and had to solve
several small tasks. The second exercise was on software correlation. The students worked in
small groups of 4-5 persons and used the DiFX software correlator and the Haystack fringe-
fitting software to derive VLBI group delay observables for the baseline Wettzell-Onsala of a real
experiment. The third exercise then concentrated on the analysis of geodetic VLBI data. The
students worked again in small groups of 4-5 people and performed the necessary ambiguity
resolution and ionospheric corrections, and the final parameter estimation.
There was plenty of opportunity for the students to ask questions after the lectures, and there
were lively discussions in the coffee breaks and lunch breaks. The students had access to all
teachers and could ask questions and discuss various topics.
At the end of the last day an evaluation questionnaire was handed out to the students and they
were asked to evaluate the VLBI Training School. Copies of the original answers can be provided
on request. A summary of the results of the evaluation is presented below.
Figure 7: Question: “What is your impression on the exercises ‘technique’
(Exercise-1), ‘correlation’ (Exercise-2) and ‘analysis’ (Exercise-3) that we did
during the VLBI school”?

49
Figure 9: Question: “What was/is your knowledge on ‘digital backends and data
acquisition’ before and after the VLBI school”?
Figure 8: Question: “What was/is your knowledge on ‘radio telescopes, feed horns
and receivers’ before and after the VLBI school”?

50
Figure 11: Question: “What was/is your knowledge on ‘correlator architecture’
before and after the VLBI school”?
Figure 10: Question: “What was/is your knowledge on ‘experiment scheduling’
before and after the VLBI school”?

51
Figure 13: Question: “What was/is your knowledge on ‘geophysical models’ before
and after the VLBI school”?
Figure 12: Question: “What was/is your knowledge on ‘correlation and post-
correlation analysis’ before and after the VLBI school”?

52
Figure 15: Question: “What was/is your knowledge on ‘data modeling and analysis’
before and after the VLBI school”?
Figure 14: Question: “What was/is your knowledge on ‘atmospheric propagation’
before and after the VLBI school”?

53
Figure 17: Question: “What was/is your knowledge on ‘radio sources’ before and
after the VLBI school”?
Figure 16: Question: “What was/is your knowledge on ‘terrestrial reference frames’
before and after the VLBI school”?

54
Figure 19: Question: “What was/is your knowledge on ‘earth rotation and
orientation’ before and after the VLBI school”?
Figure 18: Question: “What was/is your knowledge on ‘celestial reference frames’
before and after the VLBI school”?

55
The evaluation shows that the three exercises were appreciated by the students and evaluated as
‘good’ to ‘very good’. Several participants answered in the free-text comments of the evaluation
questionnaire that the practical exercises were the best part of the VLBI Training School. There
was however also some concern that the time was too short to work on some of the exercises.
Some participants thought that there should be even more exercises during potential future VLBI
Training Schools.
The evaluation also shows that the personal impression of the participants is that they know more
on the particular topics after the VLBI Training School than before. More people feel that they
have ‘good’ and ‘very good’ knowledge after the VLBI Training School. So there appears to be
again in knowledge and the goal to provide education and training has been achieved to a large
extend. Many of the free-text comments on the lectures said that the lectures gave a very good
overview of all features of VLBI.
The lecture slides are available at the webpages of the European VLBI Group for Geodesy and
Astrometry (EVGA, www.evga.org/material_vlbi_school_2013.html). The intention is that they
can be used as a basis for teaching at educational institutes.
The IVS Directing Board had a directing board meeting in Metsähovi on March 8, after the
“EGU and IVS Training School on VLBI for Geodesy and Astrometry”. The IVS DB regarded
that the “EGU and IVS Training School on VLBI for Geodesy and Astrometry” held in Espoo
and Masala was a success. For the next IVS DB in the fall of 2013 a final report of the IVS WG 6
needs to be prepared, so that IVS WG 6 can be closed down. However, then an IVS Committee
on Training and Education shall be established, with the task to continue the work started by IVS
WG 6. It is anticipated to organize VLBI Training Schools on a regular basis, preferably every
third year alternating in connection with the IVS General Meetings and the European VLBI
meetings.

56
D) ATTENDANCE LIST
There were 43 participants in the VLBI Training School coming from 16 different countries. The
countries with more than 1 participant were Germany (10), Finland (7), Austria (6), France (3),
China (3), Norway (2), Australia (2) and the Netherlands (2). The distribution of the countries is
presented in Figure 20. A group photo taken on the second day of the VLBI Training School
when lectures and exercise were held at the headquarters of the Finnish Geodetic Institute (FGI)
in Masala, is shown in Figure 21.
Figure 21: The participants of the “EGU and IVS Training School on VLBI for
Geodesy and Astrometry” on Sunday, March 2, 2013, at the Finnish Geodetic
Institute, Masala, Finland.
Figure 20: Distribution of participants of the “EGU and IVS Training School on
VLBI for Geodesy and Astrometry” per country.

57
LIST OF PARTICIPANTS:
Bachmann, Sabine
Federal Agency for Cartography and Geodesy
Richard-Strauss-Allee 11
DE-60598 Frankfurt am Main
Germany
Bocanegra-Bahamón, Tatiana Marcela
Joint Institute For VLBI In Europe
P.O. Box 2
NL-7990 AA Dwingeloo
The Netherlands
Bouffet, Romuald
Laboratoire d'Astrophysique de Bordeaux (LAB)
Observatoire Aquitain des Sciences de l'Univers
Université Bordeaux 1 - CNRS UMR 5804
2 rue de l'Observatoire
BP89
FR-33271 Floirac Cedex
France
Collilieux, Xavier
IGN/LAREG
Université Paris Diderot
35 rue Hélène Brion
FR-75013 Paris
France
de Witt, Aletha
Hartebeesthoek Radio Astronomy Observatory
Farm 502 JQ, Hartebeesthoek
Broederstroom Road
Krugersdorp District, Gauteng
South Africa
Esch, Christina
Kirschenallee 7
DE-53879 Euskirchen
Germany

58
García-Espada, Susana
Centro de Desarrollos Tecnológicos
Subdirección General de Astronomía, Geodesia y Geofísica
D.G.IGN (Ministerio de Fomento)
Cerro de la Palera s/n
ES‐19141 Yebes (Guadalajara)
Spain
Halsig , Sebastian
Institut f r Geod sie und Geoinformation
Nußallee 17
DE‐53115 Bonn
Germany
Iddink , Andreas
Institut fürGeodäsie und Geoinformation
Nußallee 17
DE-53115 Bonn
Germany
Kallio, Ulla
Finnish Geodetic Institute
Geodeetinrinne 2
P.O. Box 15
FI-02431 Masala
Finland
Karbon, Maria
Advanced Geodesy Institute of Geodesy and Geophysics (E128)
TU Wien
Gußhausstr. 27‐29
AT‐1040 Wien
Austria
Kareinen, Niko
Aalto University
Metsähovi Radio Observatory
Metsähovintie 114
FI-02540 Kylmälä
Finland

59
Kirkvik Ann-Silje
Kartverket
Kartverksveien 21
NO-3511 Hønefoss
Norway
Krásná Hana Department für Geodäsie und Geoinformation
Technische Universität Wien
Gußhausstraße 27-29
AT-1040 Wien
Austria
Kunkel, Annemarie
Institut für Geodäsie und Geoinformation
Nußallee 17
DE-53115 Bonn
Germany
Madzak, Matthias
Department für Geodäsie und Geoinformation
Technische Universität Wien
Gusshausstraße 27-29
AT-1040 Wien
Austria
McCallum Jamie
University of Tasmania
School of Mathematics and Physics
Private Bag 37
Hobart TAS 7001
Australia
Meschini, Diego
Finnish Geodetic Institute
Geodeetinrinne 2
P.O. Box 15
FI-02431 Masala
Finland
Mishra, Aum Niranjana

60
Franz‐Mehring‐Platz 3
Zi. Nr. 27.30.16.82
DE‐10243 Berlin
Germany
Molera-Calvés, Guifré
Joint Institute for VLBI in Europe
Oude Hoogeveensedijk 4
NL-7991 Dwingeloo
The Netherlands
Mora-Diaz, Julian Andres
Technische Universität München
Fachgebiet Satellitengeodäsie
Arcisstraße 21
DE-80333 München
Germany
Orosz, Gábor
Department of Geodesy and Surveying
Budapest University of Technology and Economics
Müegyetem rkp. 3
HU–1111 Budapest
Hungary
Plank, Lucia
Technische Universität Wien
Department für Geodäsie und Geoinformation
Forschungsgruppe Höhere Geodäsie, E120/4
Gußhausstraße 27-29,
AT‐1040 Wien
Austria
Ramakrishnan,Venkatessh
Aalto University
Metsähovi Radio Observatory
Metsähovintie 114
FI-02540 Kylmälä
Finland
Raposo-Pulido, Virginia

61
Helmholtz‐Zentrum Potsdam
DeutschesGeoForschungsZentrum GFZ
Telegrafenberg, A17
DE-14473 Potsdam
Germany
Rastorgueva-Foi, Elizaveta
Aalto University, Metsähovi Radio Observatory
Metsähovintie 114
FI-02540 Kylmälä
Finland
Schönberger, Caroline
Josef‐Gall‐Gasse 3/5
AT‐1020 Wien
Austria
Searle, Anthony
Natural Resources Canada
Geodetic Survey Division
615 Booth Street
Ottawa, Ontario
K1A 0E9
Canada
Shabala, Stanislav
University of Tasmania
School of Mathematics and Physics
Private Bag 37
Hobart TAS 7001
Australia
Shang, Luyao
VLBI Laboratory
Shanghai Astronomical Observatory
Chinese Academy of Sciences
80 Nandan Road
Xuhui District
Shanghai City
China

62
Siebert, Moritz Ny-Ålesund
Geodetic Observatory
NO-9173 Ny-Ålesund
Norway
Soja, Benedikt
Forschungsgruppe Höhere Geodäsie / E‐120‐4
Department für Geodäsie und Geoinformation
Technische Universität Wien
AT‐1040 Wien
Austria
Stetter, Monika
Forschungseinrichtung Satellitengeodäsie (FESG)
Technische Universität München (TUM)
DE‐80290 München
Germany
Teke, Kamil
Hacettepe University
Department of Geomatics Engineering
Beytepe
TR-06800 Ankara
Turkey
Tornatore, Vincenza
DIIAR Politecnico di Milano
(Sezione rilevamento)
Piazza Leonardo da Vinci 32
IT-20133 Milano
Italy
Trofimov, Dmitrii
Astronomical Institute St. Petersburg State University
Universitetskaya nab 7-9
St. Petersburg
Russia
Tkachuk, Vadym
Taras Shevchenko National University of Kyiv
Glushkova ave. 4
UA-03127 Kyiv

63
Ukraina
Ullrich, Dieter
Bundesamt für Kartographie und Geodäsie
VLBI-Gruppe
Karl-Rothe-Straße 10-14
DE-04105 Leipzig
Germany
Uunila, Minttu
Aalto University, Metsähovi Radio Observatory
Metsähovintie 114
FI-02540 Kylmälä
Finland
Verma, Ashok Kumar
Observatoire de Besançon
BP 1615
FR-25010 Besançon
France
Zhang, Jinwei
Shanghai Astronomical Observatory
Chinese Academy of Sciences
80 Nandan Road
CN-200030 Shanghai
China
Zubko, Nataliya
Finnish Geodetic Institute
Geodeetinrinne 2
P.O. Box 15
FI-02431 Masala
Finland
Xu, Minghui
Shanghai Astronomical Observatory
Chinese Academy of Sciences
80 Nandan Road
CN-200030 Shanghai
China

64
VGOS Data Recorder Comparison Compiled by Bill Petrachenko (NRC Canada) & Alan Whitney (MIT Haystack Observatory)
June 2013 Introduction. The minimum VGOS data rate requirements are 16 Gbps ’burst’ for 10 sec with ~4 Gbps sustained average rate. This is based on a typcial VGOS schedule which alternates between on-source and slew/wait/cal periods with antennas being on source about 25% of the time (but could be greater under some circumstances) and the network slewing to the next source the rest of the time. The maximum on-source period for normal operations is set to 10 s but could be longer at times to achieve greater sensitivity.
At the present time only two VLBI data recorders fully satisfy VGOS operational requirements, the Mark 6 (already available) and the K6/iDAS (still under development). Because the K6/iDAS does not support removable media, it can only be used for e-transfer and not for physical transport of media. See Table 1 for more details.
Another pair of recorders, the Mark 5C and K5/VSI do not themselves meet VGOS data rate requirements. They are however close enough that if preceeded by an external RAM buffer or combined in a group of four (plus some format conversions for the K5/VSI), they would become compliant. This solution is neither cost effective nor convenient and hence the Mark 5C and K5/VSI are not recommended for use in VGOS. See Table 2 for more details.
For completeness, other VLBI data recorders that are still in use but not suitable for VGOS are summarized in Tables 3a and 3b.
Fully Compliant VGOS Data Recorders, Table 1
Mark 6. The Mark 6 recorder is an outgrowth of the Haystack/Conduant Mark 5 development. Like its predecessor, the Mark 5C, I/O is based on fixed length Ethernet packets (e.g. VDIF), with the output being an exact replica of the input. Like all Mark 5/6 systems, recording media is removable and packaged as 8-disk SATA modules. Mechanically the Mark 6 includes a system enclosure, a disk module enclosure, and a cable management panel, all produced by Conduant. In terms of data electronics there has been a marked shift toward COTS components with only the disk-module-related hardware produced by Conduant; the motherboard (MB), NIC, and disk interface cards are all COTS. In contrast to the Mark 5 family that uses a proprietary Conduant media file-system format, the Mark 6 uses standard Linux files with ’scattered’ data. All software has been developed at Haystack and is open source. The Mark 6 is ideally suited for use in VGOS. It has four 10GigE inputs (one per VGOS band), a maximum aggregate input data rate of a minimum of 16 Gbps into ~64GB of high-speed RAM, and a sustained record rate per installed disk module of ~7 Gbps (for mechanical disks; much higher for SSDs). Hence, it is possible to achieve a sustained record rate significantly greater than the VGOS requirement (~4 Gbps) using only a single 8-disk module, thus minimizing shipping costs. In order to support sustained rates up to 16Gbps or to support unattended operation over longer periods at lower rates, as many as four 8-disk media modules can be simultaneously mounted. Options are available to upgrade existing Mark 5 systems to Mark 6, as well as to upgrade existing Mark 5 SATA disk modules to Mark 6 compatibility.
K6/iDAS. The K6/iDAS means the ``K6 intelligent Data Acquisition and Streaming’’ system, which is the name of the sampler with DBBC for VGOS operation developed in Japan. There is no dedicated recorder to the K6/iDAS sampler because it allows us to use itself with a fully COTS server, 10GigE-network switch, and storage system as recorder. You can adopt a server with a 10GigE network interface and a large amount of RAID as a recorder for K6/iDAS. GSI adopted IBM System x3650 M3, Arista 7050S64-T, Data Direct Networks (DDN) Storage with StorNext to be compliant with a sustained record rate of 32 Gbps, which leaves room for future enhancement of the VGOS requirements. The recording system adopted by GSI does not support removable media so it can only be used for e-transfer and not for physical transport of media. It also does not support the IVS standard VSI-S control protocol but is controlled directly by logging into the system.

65
Mark 6 K6/iDAS
(the recording system adoped by GSI)
VGOS Compatibility Full eVLBI (yes)
Media physical transport (no)
Data Input Connection 4x10GigE 2x10GBASE-SR
Max data-rate per input connection
8 Gbps 8 Gbps
Max aggregate input data rate 16 Gbps 32 Gbps (4 sampler units/8
servers)
Max sustained record rate ~7 Gbps x # of media packages
installed (for hard disks); much faster for SSDs
32 Gbps
RAM buffer size 64 Gbyes (~30 s at 16 Gbps) N. A.
Removable media? Y N
Recording media packaging Mk6 8-disk SATA module SATA & SAS Linux RAID with
StoreNext
Max # of media packages per system
4 1
# media packages for max recording data rate
2 to 4 depending on speed of disks
1
Input data format VDIF or Mk5B Ethernet packets VDIF (UDP/IP)
Record-data format VDIF VDIF
Media file-system format Linux files w/’scattered’ data Linux files
Resilient to slow recording media?
Y Y
Max aggregate playback rate Up to 16 Gbps (depends on
playback system details) 32 Gbps
Playback data interface type 10GigE or Infiniband 1x10GigE x 16 servers
Playback data format Recorded data payload
in Ethernet frame VDIF
OS type Linux Linux
Software developer (’proprietary’ or ’open’)
Haystack (open) GSI/Nitsuki
(open by GSI)
Command interface connection
GigE GigE
Command language VSI-S Direct control by logging into
the system
Current status Available Under development, partially
available
Cost (USD) ~$14K USD depend on rate and capacity
Contact <[email protected]> Shinobu Kurihara <[email protected]>
Table 1. VGOS Data Recorders – systems fully meeting the VGOS specification. However, the K6/iDAS does not support removable media and hence only works at stations dedicated to eVLBI.
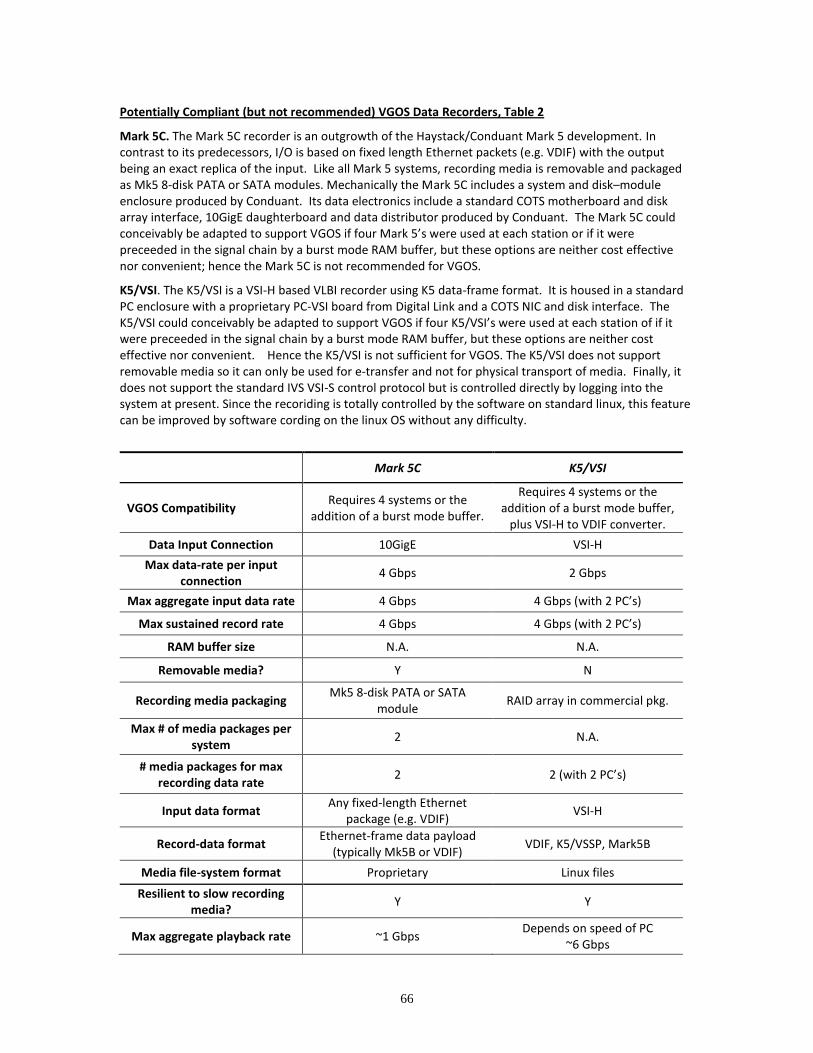
66
Potentially Compliant (but not recommended) VGOS Data Recorders, Table 2
Mark 5C. The Mark 5C recorder is an outgrowth of the Haystack/Conduant Mark 5 development. In contrast to its predecessors, I/O is based on fixed length Ethernet packets (e.g. VDIF) with the output being an exact replica of the input. Like all Mark 5 systems, recording media is removable and packaged as Mk5 8-disk PATA or SATA modules. Mechanically the Mark 5C includes a system and disk–module enclosure produced by Conduant. Its data electronics include a standard COTS motherboard and disk array interface, 10GigE daughterboard and data distributor produced by Conduant. The Mark 5C could conceivably be adapted to support VGOS if four Mark 5’s were used at each station or if it were preceeded in the signal chain by a burst mode RAM buffer, but these options are neither cost effective nor convenient; hence the Mark 5C is not recommended for VGOS.
K5/VSI. The K5/VSI is a VSI-H based VLBI recorder using K5 data-frame format. It is housed in a standard PC enclosure with a proprietary PC-VSI board from Digital Link and a COTS NIC and disk interface. The K5/VSI could conceivably be adapted to support VGOS if four K5/VSI’s were used at each station of if it were preceeded in the signal chain by a burst mode RAM buffer, but these options are neither cost effective nor convenient. Hence the K5/VSI is not sufficient for VGOS. The K5/VSI does not support removable media so it can only be used for e-transfer and not for physical transport of media. Finally, it does not support the standard IVS VSI-S control protocol but is controlled directly by logging into the system at present. Since the recoriding is totally controlled by the software on standard linux, this feature can be improved by software cording on the linux OS without any difficulty.
Mark 5C K5/VSI
VGOS Compatibility Requires 4 systems or the
addition of a burst mode buffer.
Requires 4 systems or the addition of a burst mode buffer,
plus VSI-H to VDIF converter.
Data Input Connection 10GigE VSI-H
Max data-rate per input connection
4 Gbps 2 Gbps
Max aggregate input data rate 4 Gbps 4 Gbps (with 2 PC’s)
Max sustained record rate 4 Gbps 4 Gbps (with 2 PC’s)
RAM buffer size N.A. N.A.
Removable media? Y N
Recording media packaging Mk5 8-disk PATA or SATA
module RAID array in commercial pkg.
Max # of media packages per system
2 N.A.
# media packages for max recording data rate
2 2 (with 2 PC’s)
Input data format Any fixed-length Ethernet
package (e.g. VDIF) VSI-H
Record-data format Ethernet-frame data payload
(typically Mk5B or VDIF) VDIF, K5/VSSP, Mark5B
Media file-system format Proprietary Linux files
Resilient to slow recording media?
Y Y
Max aggregate playback rate ~1 Gbps Depends on speed of PC
~6 Gbps

67
Playback data interface type GigE 1GigE or 10GigE
Playback data format Same as input format 1GigE or 10GigE
OS type Linux Linux
Software developer (’proprietary’ or ’open’)
Conduant (prop) and Haystack (open)
Data Link (prop) NICT (open)
Command interface connection
GigE GigE
Command language VSI-S Direct control by logging into
the system
Current status Available Available
Cost (USD) ~23K USD ~20K USD
Contact <[email protected]> Mamoru Sekido
Table 2. Potentially compliant (but not recommended) VGOS Data Recorders.
VLBI Data Recorders that are not VGOS compliant, Table 3a
Mark 5A/B. The Mark 5A recorder was the first entry in the Mark 5 family and as such was designed to have minimal disruption from existing tape based systems. Hence it used a VLBA/Mark4 input data format and a recorded data-frame format that is based on the VLBA/Mark4 tape systems. The Mark5B represents a move towards IVS standards and uses a VSI-H input data format and a Mark 5B data-frame format. In both cases, recording media is removable and packaged as Mk5 8-disk PATA or SATA modules and the media file-system format is proprietary to Conduant. Mechanically, the Mark 5A/B uses a system and disk module enclosure produced by Conduant. Its data electronics include a standard COTS motherboard with proprietary disk array interface and data distributor produced by Conduant. Mark 5A/B data rates are too low to be useful for VGOS and the systems are no longer available.
Mark 5A Mark 5A+ Mark 5B Mark 5B+
VGOS Compatibility No No No No
Data Input Connection VLBA VLBA VSI-H VSI-H
Max data-rate per input connection
1 Gbps 1 Gbps 1 Gbps 2 Gbps
Max aggregate input data rate
1 Gbps 1 Gbps 1 Gbps 2 Gbps
Max sustained record rate 1 Gbps 1 Gbps 1 Gbps 2 Gbps
RAM buffer size N.A. N.A. N.A. N.A.
Removable media? Yes Yes Yes Yes
Recording media packaging Mark 5 8-disk PATA or SATA module
Max # of media packages per system
2 2 2 2
# media packages for max recording data rate
1 1 1 1
Input data format VLBA/Mark 4 VLBA/Mark VSI-H VSI-H

68
Record-data format VLBA/Mark 4 data frame format Mark 5B data frame format
Media file-system format Proprietary (Conduant)
Resilient to slow recording media?
Yes Yes Yes Yes
Max aggregate playback rate
1 Gbps 1 Gbps 1 Gbps 1 Gbps
Playback data interface type
GigE GigE GigE GigE
Playback data format VLBA VLBA Mark 5B Mark 5B
OS type Linux Linux Linux Linux
Software developer (’proprietary’ or ’open’)
Conduant (proprietary); Haystack (open)
Command interface connection
GigE GigE GigE GigE
Command language VSI-S VSI-S VSI-S VSI-S
Current status obsolete obsolete obsolete Obsolete
Cost (USD) N.A. N.A. N.A. N.A.
Contact [email protected]
Table 3a. Legacy Mark 5 Data Recorders – not compatible with VGOS and obsolete.
VLBI Data Recorders that are not VGOS compliant, Table 3b.
LBADR. The LBADR is a data recorder designed for the Australian LBA. It uses VSI-H data interfaces and Linux files with ’scattered’ data. It is packaged as a Standard PC (with optional disk array) and uses standard PC electronics plus a PCI data-capture board from Metsahovi (which is no longer available). LBADR data rates are too low to be useful for VGOS.
K5/VSSP32. The K5/VSSP32 is a highly COTS recorder. Its input connection is USB, its file system is linux, and it uses a standard COTS PC system with NIC disk interface. It does not support the standard IVS VSI-S control protocol but is controlled directly by logging into the system. K5/VSSP32 data rates are too low to be useful for VGOS.
LBADR K5/VSSP32
VGOS Compatibility No No
Data Input Connection 2xVSI-H USB
Max data-rate per input connection
512 Mbps 256 Mbps
Max aggregate input data rate 512 Mbps 256 Mbps
Max sustained record rate 512 Mbps 256 Mbps
RAM buffer size N.A. N.A.
Removable media? ? Y
Recording media packaging RAID array in commercial pkg. PC removable disk
Max # of media packages per system
? Flexible

69
# media packages for max recording data rate
1 1
Input data format ? K5-VSSP32
Record-data format ? K5/VSSP *
Media file-system format Linux files w/’scattered’ data Linux files
Resilient to slow recording media?
Y Y
Max aggregate playback rate ? Depends on speed of PC
~6 Gbps
Playback data interface type GigE 1GigE or 10GigE
Playback data format VSI-H or optional software
defined through 1GigE 1GigE or 10GigE
OS type Linux Linux
Software developer (’proprietary’ or ’open’)
? Nitsuki (prop) NICT (open)
Command interface connection
? GigE
Command language ? Direct control by logging into
the system
Current status PCI data-capture board no
longer available Available
Cost (USD) N.A. Price of a PC with USB
Contact Chris Phillips
<[email protected]> Mamoru Sekido
* K5/VSSP Data Format: http://www2.nict.go.jp/aeri/sts/stmg/K5/VSSP/vssp32_format.pdf
Table 3b. Other VLBI Data Recorders – not compatible with VGOS

70
Proposal for VGOS Observing Plan
Bill Petrachenko, Dirk Behrend, Hayo Hase, Chopo Ma,
Arthur Niell, Axel Nothnagel, Xiuzhong Zhang
February 13, 2014
Over the past several years, VGOS development has been guided by the VLBI2010
Project Executive Group (V2PEG) and VLBI2010 Committee (V2C) with the V2C
focusing on completion of the VLBI2010 system and the V2PEG concentrating on
network expansion. In this document the V2PEG presents an operational plan to bridge
the gap between the bold targets of VGOS and the current operational programmes of the
IVS.
As an initial operational target, VGOS aims for sustained daily product performance at
the level of the CONT sessions or better by the end of 2017. This represents a daily
performance improvement that gives the IVS an unambiguous direction for the next four
years; and it makes clear the IVS’s resolve for a significantly improved VLBI component
in a tangible time frame.
This plan provides an operational context for VGOS broadband stations and hence
motivates both new and legacy stations to seek funds to upgrade to broadband capability.
It places a priority on early high quality but cost effective daily operations with
performance improving as operational capacity increases. It assumes that most of the new
broadband antennas will be dedicated to VGOS operations and will not be shared with
other applications such as astronomy or spacecraft tracking.
Deployment of VGOS Systems
The VGOS system design is described in detail in the VLBI2010 project specification
(Petrachenko et al. 2009). Over the past year a number of actions have been undertaken
in the realization of the concept:
Broadband feed, digital back end (DBE) and recorder comparisons have been
completed including information on commercial availability.
The broadband systems have been improved—specifically towards increased
reliability and greater compliance with VLBI2010 specifications.
Geodetic tests have been successfully undertaken (so far only on the GGAO to
Westford baseline).
An RFI study was undertaken indicating that:
o A large number of stations will be able to operate in the full 2–14 GHz
range without front end saturation.
o A small number of sites will be limited to operating in the 3-14 GHz range
to avoid front end saturations.
Over the next year it is recommended that the following further steps be encouraged:
RFI studies continue at potential VGOS sites.

71
The DORIS/SLR RFI co-location problem is addressed.
Geodetic broadband observations continue on the GGAO-Westford baseline.
Broadband observations begin with a third more distant station (e.g. Kokee or
Wettzell) to demonstrate performance over longer baselines.
Broadband development continues with the goal of achieving full VLBI2010
compliance (with commercial availability wherever possible), specifically
including
o cryogenic front ends for both QRFH and Eleven Feed.
o DBE’s with 1-GHz bandwidth.
o flexible down converters with full 2–14 GHz.
o completion of high capacity data systems.
o a cable calibration system.
o demonstration of the DBBC3 direct sample system.
o demonstration of a Stirling cycle cryogenic system.
A convenient and effective ‘mixed-mode’ methodology (i.e., legacy S/X with
VGOS broadband in S/X mode) needs to be developed so that strong geodetic ties
can be developed between new VGOS stations and the legacy S/X network.
Short baseline phase delay measurements be made between new antennas and co-
located legacy antennas.
Expansion and Testing of the VGOS Network in 2014
By the end of 2014 as many as eight antennas are expected to have achieved broadband
capability (see Table 1 and Figure 1).
Table 1. Antennas achieving broadband capability by the end of 2014.
Station When Antenna Notes
GGAO12 Now Fast Ishioka Mid-2014 Very fast 2 years of S/X/Ka legacy ties Kokee 2014 Legacy Very fast antenna in 2015 Noto 2014 Legacy Direct sampling approach Sheshan 2014 Very fast Westford Now Legacy Shared with Lincoln Laboratory Wettzell Mid-2014 Very fast Yebes Mid-2014 Very fast

72
Figure 1. North polar projection of antennas achieving
broadband capability by the end of 2014.
Throughout 2014 there will be four main VGOS-related activities:
1. the qualification of new VGOS stations as they come on line in broadband and (if
RFI permits) S/X modes;
2. preparations for the VGOS trial operations scheduled for 2015 (see next section
for details of the trials). Preparations include ensuring that adequate station, media
and correlator resources are available and that as many processes as possible are
automated for smooth and sustained operations;
3. the development and testing of processes for mixed-mode (legacy S/X with
VGOS broadband in S/X mode) operations including the qualification of digital
back ends at legacy S/X stations; and
4. the execution of mixed-mode sessions (i.e., VGOS broadband stations in S/X
sessions, e.g., T2, R1, R4) to establish strong ties between legacy and VGOS
sites.
To help achieve the first two items, the OPC has scheduled seven sessions in 2014
specifically for VGOS operations. If needed other ad hoc sessions (e.g., for fringe tests)
can also be added. In order to have a clean spectrum for VGOS broadband observing, the
VGOS sessions are planned to operate solely in the 3–14 GHz range. The V2PEG
encourages stations to seek the required funding to join the VGOS sessions of 2014 and
the VGOS trial operations of 2015.
For the latter two items it is recognized that RFI around the current S-band frequency
may preclude the use of a full 2–14 GHz broadband receiver at certain locations, so that
these broadband stations will not be able to participate in mixed-mode observations. If
RFI does not inhibit observation at 2–3 GHz, however, broadband conversions and new
broadband facilities should be encouraged to cover the full 2–14 GHz VGOS range.
Kokee
Ishioka
Sheshan
GGAO12
Westford
Wettzell
Noto Yebes

73
Trial Operations of the VGOS Network in 2015
During 2015 there will be three trial VGOS campaigns to evaluate and improve aspects
of VGOS operations. To properly assess the sustainability of the three aspects of
operations, each trial will last at least 6–8 weeks thus ensuring that the full ‘schedule–
acquire–ship/transmit–correlate/process/analyse–ship/transmit’ cycle can be completed
without developing a back-log. Each trial should further be separated by 8–10 weeks to
allow for the eventuality of a back-log, to assess performance, to recommend
improvements, and to prepare for the next trial. This effort will be coordinated by the IVS
Coordinating Center.
Trial 1: Sustained Weekly 24-hour Sessions, Jan–Feb. This trial involves observing one
24-hour session each week in VGOS broadband mode. The network will include all
available qualified VGOS stations, i.e., about 8 stations. Schedules will be optimized to
best use all VGOS characteristics, in particular the very fast slewing of the new antennas.
It is recommended that the broadband day be inserted as day 7 (e.g., B7nnn) to best
bridge the largest gap in the week between R4 and R1 and start at 0 hr UT to match the
satellite geodetic techniques (see Figure 2). Although an observation on the weekend is
required, this should not be a problem for a fully qualified VGOS antenna that can safely
operate in automated or remote control mode. As broadband operations mature, it should
be possible to record a full 24-hour session on a single recording module. [Given a
detection limit of SNR=10 per band, a typical source flux distribution and a minimum
correlated flux of 250 mJy, the average observation at a station should require only about
10 GB. At 10 GB per observation, a single 32-TB module will record up to 3200
observations (i.e., 1 observation every 27 s), more than enough to record a full 24-hour
session on a single module even for “very fast” VGOS antennas.] For sustained
operations, a pool of four 32-TB modules per station will be required along with funds to
ship one module per station per week back and forth between the correlator and station.
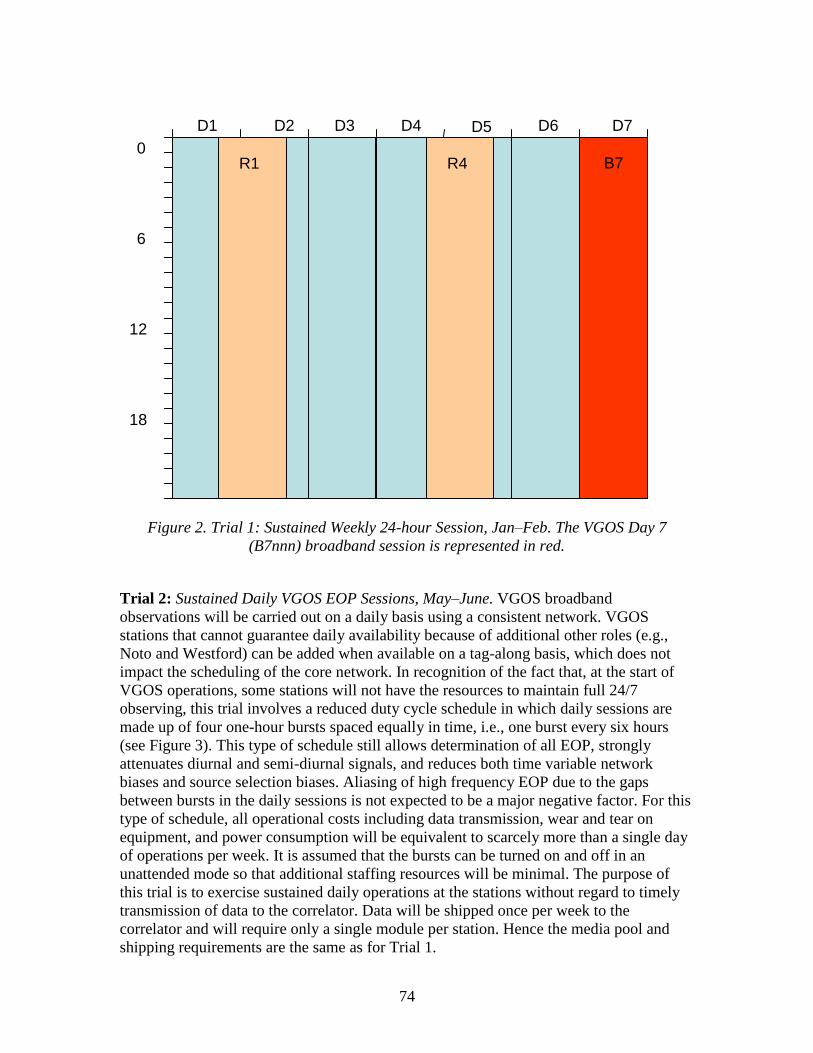
74
Figure 2. Trial 1: Sustained Weekly 24-hour Session, Jan–Feb. The VGOS Day 7
(B7nnn) broadband session is represented in red.
Trial 2: Sustained Daily VGOS EOP Sessions, May–June. VGOS broadband
observations will be carried out on a daily basis using a consistent network. VGOS
stations that cannot guarantee daily availability because of additional other roles (e.g.,
Noto and Westford) can be added when available on a tag-along basis, which does not
impact the scheduling of the core network. In recognition of the fact that, at the start of
VGOS operations, some stations will not have the resources to maintain full 24/7
observing, this trial involves a reduced duty cycle schedule in which daily sessions are
made up of four one-hour bursts spaced equally in time, i.e., one burst every six hours
(see Figure 3). This type of schedule still allows determination of all EOP, strongly
attenuates diurnal and semi-diurnal signals, and reduces both time variable network
biases and source selection biases. Aliasing of high frequency EOP due to the gaps
between bursts in the daily sessions is not expected to be a major negative factor. For this
type of schedule, all operational costs including data transmission, wear and tear on
equipment, and power consumption will be equivalent to scarcely more than a single day
of operations per week. It is assumed that the bursts can be turned on and off in an
unattended mode so that additional staffing resources will be minimal. The purpose of
this trial is to exercise sustained daily operations at the stations without regard to timely
transmission of data to the correlator. Data will be shipped once per week to the
correlator and will require only a single module per station. Hence the media pool and
shipping requirements are the same as for Trial 1.
0 hr
6 hr
12 hr
18 hr
D1 D2 D3 D4 D5 D6 D7
B76
R1 R4

75
Figure 3. Trials 2 & 3: Sustained Daily VGOS EOP Sessions, May-June and Sept-Oct.
Daily hour-long VGOS bursts are represented in red.
Trial 3: Repeat of Sustained Daily VGOS EOP Sessions but with Timely Transmission of
Data, Sept-Oct. The observations for Trial 2 and Trial 3 are identical (see Figure 3).
However, the focus of Trial 3 is the timely transport of data to the correlator. As much as
possible, the data will be transported electronically. With this reduced duty cycle mode of
operation, a sustained data rate of 500 Mbps will be sufficient to transmit the full 4 hour
data volume within a day, even for the fastest antennas. For stations where the required
data rate cannot be sustained, media will need to be physically transported. Daily
shipment of disk packs only ~15% full is highly inefficient. Efficiency can be increased
by transferring data to a single disk before shipping. [Note: In the future, as more hours
of data are collected per day, higher data rates will be required with 3 Gbps being
sufficient to transmit a full 24 hour session within a day.]
VGOS Pilot Project in 2016
Given the successful completion of the three sets of trial operations, a VGOS Pilot
Project can begin at the start of 2016 and continue throughout the year. The purpose of a
pilot project is to gain experience with an operational mode without making a full
commitment to product delivery. Operations in this period will be a combination of all
aspects of the trial campaigns. There will be a single 24-hour VGOS session per week
and daily VGOS EOP sessions on the remaining days (see Figure 4). Data will be
0 hr
6 hr
12 hr
18 hr
D1 D2 D3 D4 D5 D6 D7
R1 R4

76
transmitted to the correlator in a timely fashion with as much data transmitted
electronically as possible.
Figure 4. VGOS Pilot Project: One 24-hour VGOS Session and six Daily VGOS EOP
Sessions per week, 2016.
As new VGOS stations come on line, they will initially be qualified by tagging along
with the B7nnn 24-hour sessions. This mode of operation leaves six days a week for the
newly introduced antenna to deal with problems as they arise. After weekly operations
smooth out, the antenna can be added to the daily VGOS EOP sessions.
As more operational resources become available at a particular station, the number of
hour-long burst periods at that station can be increased (Figure 5), providing a smooth
transition to full 24/7 operation. This can be done on a station-by-station basis, provided
enough stations are available to form baselines.
0 hr
6 hr
12 hr
18 hr
D1 D2 D3 D4 D5 D6 D7
B7 R1 R4

77
Figure 5. As operational resources increase at a station, the number of hourly bursts can
be increased.
Operations of the VGOS Network in 2017 and Beyond
Given the successful completion of the VGOS Pilot Project in 2016, the pilot project can
be converted to standard operations.
By the end of 2017, it is anticipated that a substantial VGOS network will be in place
(first column in Table 2 and Figure 6). Based on information available today, the network
could include as many as 16 stations, 13 of which will be very fast slewing (full VGOS
slew rate) antennas. The four Russian antennas will however operate in S/X/Ka-band
mode. The network will be unbalanced geographically with 15 antennas in the Northern
Hemisphere, one in the Southern Hemisphere, and a significant concentration in Europe.
By the end of 2019 the network will be augmented by Ny Ålesund which will be
operational by then; in the same time frame it is expected that the NASA Space Geodesy
Project (SGP) will also have constructed a number of new VGOS antennas as part of
multi-technique GGOS sites (second column in Table 2 and Figure 7). In terms of
antennas available, the list represents a fairly conservative estimate since it mainly counts
antenna projects that have already been funded. All the same, it represents a significant
extrapolation with respect to the number of antennas outfitted with full broadband
systems. This is an area where the V2PEG needs to participate actively by organizing and
promoting the acquisition of broadband systems as stations become available.
0 hr
6 hr
12 hr
18 hr
D1 D2 D3 D4 D5 D6 D7
B7 R1 R4

78
Station 2017 2019
Yebes 1 1
Santa Maria 1 1
Tenerife 1 1
Flores 1 1
Onsala 2 2
Metsahövi 1 1
Wettzell 2 2
Noto 1 1
Ny Alesund 2
Badary 1
Zelenchukskaya 1
Ussurisk 1
Kaliningrad 1
Kazan ? ?
Ishioka 1 1
Changchun 1 1
Kunming 1 1
Sheshan 1 1
Greenbelt 1 1
Westford 1 1
Kokee 2 2
NASA (new stations) ~3
Total Stations – North Hemisphere 15 23
Hobart 1
Katherine 1
Yarragadee 1
Warkworth 1
Hartebeesthoek 1 1
NASA (new stations) ~2
Total Stations – South Hemisphere 1 7
Total – South and North 16 30
Table 2. Projection of VGOS broadband network that might be available by 2017 and 2019. [Note: As can
be seen in the table, some stations incorporate more than one broadband antenna. Performance benefits
are expected at these sites. However, for the purpose of calculating station totals, each pair is considered a
single station.]

79
Figure 6. Projected VGOS broadband network at the end of 2017. Concentric circles
represent sites that incorporate two broadband antennas.
Figure 7. Projected VGOS broadband network for the end of 2019. Concentric circles
represent sites that incorporate two broadband antennas. Cyan dots represent new NASA
sites hypothetically placed in Colombia, California, and Alaska in the Northern
Hemisphere and Brazil and Argentina in the Southern Hemisphere.
Petrachenko B et al.(2009): Design Aspects of the VLBI2010 System. Progress Report of
the VLBI2010 Committee. NASA Technical Memorandum NASA/TM-2009-214180.
North Polar Projection South Polar Projection
North Polar Projection
South Polar Projection
R4 R1 D7 D6 D5 D4 D3 D2 D1 18 hr 12 hr 6 hr 0 hr


IVS
Coo
rdin
atio
n


Coordinating Center Report
Dirk Behrend
Abstract This report summarizes the activities of theIVS Coordinating Center during the year 2013 andforecasts activities planned for the year 2014.
1 Coordinating Center Operation
The IVS Coordinating Center is based at the God-dard Space Flight Center and is operated by NEOS(National Earth Orientation Service), a joint effort forVLBI by the U.S. Naval Observatory and the NASAGoddard Space Flight Center.
The mission of the Coordinating Center is toprovide communications and information for the IVScommunity and the greater scientific community andto coordinate the day-to-day and long-term activitiesof IVS.
The Web server for the Coordinating Center is pro-vided by Goddard. The address is
http://ivscc.gsfc.nasa.gov.
2 Activities during 2013
During the period from January through December2013, the Coordinating Center supported the followingIVS activities:
• Directing Board support: Coordinated, with localcommittees, two IVS Directing Board meetings, in
NVI, Inc.
Coordinating Center
IVS 2013 Annual Report
Metsahovi, Finland (March 2013) and Potsdam,Germany (September 2013). Notes from eachmeeting were published on the IVS Web site.
• Meetings: Coordinated, with the Local Committee,the seventh IVS Technical Operations Workshop,held at Haystack Observatory in May 2013.Chaired the Program Committee for the meeting.
Technical Operations WorkshopMIT Haystack Observatory
6-9 May 2013
IzVzS T
O W 2z���0 z1z3
Fig. 1 Logo of the seventh IVS Technical Operations Workshop.
Coordinated, with the Local Committee, the eighthIVS General Meeting, to be held in Shanghai,China in March 2014. Chaired the ProgramCommittee for the meeting.
• Communications support: Maintained the Webpages, e-mail lists, and Web-based mail archivefiles. Generated analysis reports and included theminto the 24-hour session Web pages. MaintainedIntensive session Web pages.
83

84 Behrend
• Publications: Published the 2012 Annual Report insummer 2013. Published three editions of the IVSNewsletter in April, August, and December 2013.All publications are available electronically as wellas in print form.
• Observing Program Committee (OPC): Coor-dinated meetings of the OPC to monitor theobserving program, review problems and issues,and discuss changes.
• 2013 Master Schedule: Generated and maintainedthe master observing schedule for 2013. Coordi-nated VLBI resources for observing time, correla-tor usage, and disk modules. Coordinated the usageof Mark 5 systems at IVS stations and efficient de-ployment of disk modules.
• 2014 Master Schedule: Generated the proposedmaster schedule for 2014 and received approvalfrom the Observing Program Committee.
• VGOS: Supported the activities for establishingthe VLBI Global Observing System (VGOS)through participation in the VLBI2010 Committee(V2C) and the VLBI2010 Project Executive Group(V2PEG).
3 CONT14 Campaign
The Continuous VLBI Campaign 2014 (CONT14) isbeing organized for observation in early May 2014.Sixteen IVS stations (see Figure 2) will observe for 15consecutive days at a rate of 512 Mbps from 6 - 20May 2014. The observing will be done on the basis ofUT days with each CONT14 day running from 0 UT to24 UT. UT day observing will allow for the most accu-rate combination and comparison of results with othertechniques.
The Coordinating Center, in collaboration with theOPC, is responsible for:
• the overall planning and coordination of the cam-paign,
• the media usage and shipment schedule, and• the preparation of the detailed observing schedules
and notes.
More information about the CONT14 campaigncan be found on the IVS Web site under the URLhttp://ivscc.gsfc.nasa.gov/program/cont14.
BADARY
FORTLEZA
HART15M
HOBART12
KATH12M
KOKEE MATERA
NYALES20
ONSALA60
TSUKUB32
WARK12M
WESTFORD WETTZELL
YARRA12M
YEBES40M ZELENCHK
Fig. 2 Geographical distribution of the sixteen CONT14 sites.
4 Staff
The staff of the Coordinating Center is drawn from in-dividuals who work at Goddard. The staff and their re-sponsibilities are listed in Table 1.
Table 1 IVS Coordinating Center staff.
Name Title ResponsibilitiesDirkBehrend
Director Web site and e-mail system maintenance,Directing Board support, meetings, pub-lications, session Web page monitoring
CynthiaThomas
OperationManager
Master schedules (current year), resourcemanagement and monitoring, meetingand travel support, special sessions
FrankGomez
WebManager
Web server administration, mail systemmaintenance, Data Center support, ses-sion processing scripts, mirror site liaison
KarenBaver
GeneralProgrammerand Editor
Publication processing programs, LaTeXsupport and editing, session Web pagesupport and scripts
KylaArm-strong
Data Tech-nician
Publications support and Web site sup-port
5 Plans for 2014
The Coordinating Center plans for 2014 include thefollowing:
• Maintain IVS Web site and e-mail system.• Publish the 2013 Annual Report (this volume).
IVS 2013 Annual Report

Coordinating Center Report 85
• Coordinate, with the local committee, the eighthIVS General Meeting to be held in Shanghai, Chinain March 2014.
• Support Directing Board meetings in 2014.• Coordinate the 2014 master observing schedules
and IVS resources.• Publish Newsletter issues in April, August, and De-
cember.• Support the VGOS activities within the V2C and
the V2PEG.
IVS 2013 Annual Report

The 2013 Analysis Coordinator Report
John Gipson
Abstract This report presents the IVS Analysis Coor-dination issues of 2013. The IVS Analysis Coordinatoris responsible for generating and disseminating the of-ficial IVS products. This requires consistency of the in-put data by strict adherence to models and conventions.
1 Changing of the Guard
In September 2012, Axel Nothnagel gave notice to theIVS Directing Board that he was resigning as the IVSAnalysis Coordinator effective February 2013. Axelhad been the Analysis Coordinator for 13 years. Dur-ing this time, the IVS matured from a young, untriedorganization into a mature organization providing sci-entific data for use by geodesists and geophysicists.His contributions as Analysis Coordinator were many.The annual IVS Analysis Workshops were an impor-tant way for different groups to exchange informationand to advance the VLBI technique. Axel’s insistenceon consistency of models used in different softwarepackages, adherence to the IERS standards, and con-tinual improvement in geophysical modeling resultedin high-quality VLBI data. Fortunately Axel is not go-ing away; instead he took a position with more respon-sibility. At the IVS Directing Board meeting on March8, 2014, Axel was elected chair of the IVS DirectingBoard, and I was elected Analysis Coordinator. I willendeavor to be as successful an Analysis Coordinatoras Axel.
NVI, Inc./GSFC
IVS Analysis Coordinator
IVS 2013 Annual Report
2 IVS Analysis Workshop
Axel’s last role as Analysis Coordinator was to chairthe “14th IVS Analysis Workshop” held in Helsinki,Finland on Tuesday, March 5, 2013. As always, thisworkshop provided an informal means for everyoneinvolved in VLBI data processing and analysis to ex-change information, voice concerns, and decide how toproceed.
One of the items that surfaced at this meetingwas the apparent reversal of time-tags in some recentdatabases. Explicitly, you would have a situationwhere two Scans A and B appear in this order inthe schedule file, with Scan B starting after Scan A.However, the observations for Scan B had a time tagin the database before Scan A. Further investigationrevealed that this only happened with databases thatwere processed using the DiFX software correlator.This was ultimately traced to the way the DiFXsoftware correlators were handling time-tags; theepoch assigned to all observations in a scan washalfway through the longest observation in the scan.In contrast, the Mark IV correlator used a time-tagwhich was halfway through the shortest observationin the scan. Roger Cappallo agreed to modify thesoftware difx2mk4 that converted correlator outputinto a format that could be read by fourfit. That wouldmake the time-tags consistent with the old hardwarecorrelator. Alessandra Bertarini agreed to reprocesssome databases using the new time-tags. When thesewere analyzed using Calc/Solve, the Goddard VLBIgroup found a slight improvement in session fit. Asa consequence of this, all sessions processed aftermid-2013 with DiFX use the same time-tag conventionas the Mark IV hardware correlator.
86
Analysis Coordinator Report 87
The above paragraph is a perfect example of howthe IVS Analysis Workshop should run. An issue israised and discussed. People volunteer to do somework. After further discussion and feedback the VLBItechhique is improved. I hope to encourage this sort ofactivity in future Analysis Workshops.
3 ITRF2013
In March 2013, Zuheir Altamini issued a call for partic-ipation in ITRF2013 made by Altamini. The last ITRFwas generated in 2008. A major difference betweenthe ITRF2008 and the ITRF2013 call for participationwas the introduction of changes to the IERS standards.The new IERS standards have better models for high-frequency EOP, UT1 in particular. These include theeffects of libration in UT1. The IERS2010 standardsalso have a different nutation model.
An area of controversy in generating solutions forITRF2013 is the application of atmospheric pressureloading corrections. VLBI has been a leader in apply-ing atmosphere loading effects, first using local pres-sure data in the early 1990s to develop empirical load-ing corrections [1] and then using numerical weathermodels to determine the a priori loading at a site [2].In principal there are two ways of applying pressureloading corrections. You could determine the a prioripressure loading corrections at the epoch of the obser-vations and apply them at the observation level. Alter-nately, you could determine the average pressure load-ing for a station and apply it a posteriori, after the anal-ysis was done. As [3] shows, there are many argumentsthat applying a priori pressure loading at the observa-tion level is the correct thing to do. This is exactly whatthe current generation of VLBI analysis packages does.
It was the strong desire of the IVS Directing Boardthat the VLBI contribution to ITRF2013 include at-mosphere pressure loading effects at the observationlevel; however GPS does not do so. After extended con-versations with Zuheir, I decided to recommend thatthe VLBI solutions also not apply a priori atmospherepressure loading. One reason for not doing so was tomakes it easier for Zuheir to combine results. If VLBIhad applied a priori pressure loading, Zuheir wouldhave had to remove the effect of pressure loading us-ing the a posteriori correction before he combined ourVLBI results with those of other techniques. By not
including the effect of atmosphere pressure loading atthe observation level, we reduce the chance that errorswould be made in removing it.
In preparation for the VLBI solution to ITRF2013I wrote submission instructions and a submissionchecklist. I drew upon instructions that Axel had sentout for ITRF2008. Unlike ITRF2008, I asked AnalysisCenters to submit their solutions to the IVS DataCenters. That way all of the data submitted is publiclyavailable. Frank Gomez at GSFC wrote and debuggedscripts to handle the submissions. Karen Baver, alsoat GSFC, helped to design an ITRF2013 web page,http://lupus.gsfc.nasa.gov/IVS-ACITRF2013.htmwhich gathers all information related to VLBIsubmissions for ITRF2013.
4 Analysis Coordinator Web Pages
One of the first things I did as Analysis Coordinatorwas, together with Karen Baver, to design a set of IVSAnalysis Coordinator Web pages, accessible throughhttp://lupus.gsfc.nasa.gov/IVS-ACcontact.htm. Ourstarting point was the excellent AC Web site of AxelNothnagel. My long term goal for these pages is togather all VLBI data required or useful for VLBIsolutions. Examples include information about thesources, stations, etc, as well as links to other sites,for example the IERS. If there is information that youthink should be on this page, please let me know.
5 Conclusions
At the end of 2013, I completed my first ten monthsas the Analysis Coordinator, and I still have much tolearn. This is a position with a lot of responsibility —both within IVS and outside of IVS. One goal is topromote the advancement of the VLBI technique withthe IVS — making sure that we use the best models,making sure that our data is of high quality, and en-couraging new ways of doing things. Another goal isto promote the use of VLBI data to the broader scien-tific community. This is an impossible task for one per-son to do alone, and I am aided in this by people bothwithin Goddard and within the wider IVS community.
IVS 2013 Annual Report
88 Gipson
I welcome your support and suggestions on how I cando things better.
References
1. MacMillan, D. S. and J. M. Gipson, Atmospheric PressureLoading Parameters from Very Long Baseline Interferomet-ric Observations. J.Geophys. Res., 99, 1994. pp. 18,081.
2. Petrov L., J. P. Boy, Study of the Atmospheric PressureLoading Signal in VLBI Observations, Journal of Geophys-ical Research Vol. 109, No. B03405, 2004.
3. Bohm, J., Heinkelmann, R., Cerveira, P., Pany, A., Schuh, H.Atmospheric Loading Corrections at the Observation Levelin VLBI Analysis. Journal of Geodesy, 2009, 83: 1107-1113.
IVS 2013 Annual Report

Network Coordinator Report
Ed Himwich, Rich Strand
Abstract This report includes an assessment of thenetwork performance in terms of lost observing timefor the 2013 calendar year. Overall, the observing timeloss was about 16.2%, which is about 4% higher thanthe previous year due primarily to scheduled antennamaintenance. A table of relative incidence of problemswith various subsystems is presented. The most signif-icant identified causes of loss were the scheduled an-tenna maintenance (accounting for about 40% of thelosses), followed by electronics rack problems (20%),miscellaneous problems (9%), receiver problems (8%),and RFI (6%). About 6% of the losses occurred for un-known reasons. New antennas are under developmentin the USA, Germany, and Spain. There are plans fornew telescopes in Norway and Sweden. Other activitiesof the Network Coordinator are summarized.
1 Network Performance
The overall network performance was for the most partgood. As was the case last year, we have returned to re-porting a detailed assessment, which was not providedfor 2010 and 2011.
This network performance report is based on cor-relator reports for experiments in calendar year 2013.This report includes results for the 159 24-hour exper-iments that had detailed correlator reports available asof March 4, 2014. The data set examined includes ap-proximately 515,000 dual frequency observations. Re-
NASA Goddard Space Flight Center
IVS Network Coordinator
IVS 2013 Annual Report
sults for 29 experiments were omitted because eitherthey were correlated at the VLBA, they were not cor-related yet, or correlation reports were not availableon the IVS data centers. Experiments processed at theVLBA correlator were omitted because the informa-tion provided for them is not as detailed as that fromMark IV correlators. The experiments that were notcorrelated or did not have correlator reports availableyet include some JADE, CRF, APSG, AUST13, OHIG,R&D, T2, and EUR experiments. In summary, roughly90% of the data from scheduled 24-hour experimentsfor 2013 are included in this report. That is similar tothe coverage of reports for many previous years.
An important point to understand is that in thisreport, the network performance is expressed in termsof lost observing time. This is straightforward incases where the loss occurred because operationswere interrupted or missed. However, in other cases,it is more complicated to calculate. To handle this, anon-observing time loss is typically converted into anequivalent lost observing time by expressing it as anapproximate equivalent number of recorded bits lost.As an example, a warm receiver will greatly reduce thesensitivity of a telescope. The resulting performancewill be in some sense equivalent to the station havinga cold receiver but observing for (typically) only one-third of the nominal time and therefore recording theequivalent of only one-third of the expected bits. In asimilar fashion, poor pointing can be converted into anequivalent lost sensitivity and then equivalent fractionof lost bits. Poor recordings are simply expressed asthe fraction of total recorded bits lost.
Using correlator reports, an attempt was made todetermine how much observing time was lost at eachstation and why. This was not always straightforwardto do. Sometimes the correlator notes do not indicate
89

90 Himwich and Strand
that a station had a particular problem, while the qual-ity code summary indicates a significant loss. Recon-structing which station or stations had problems—andwhy—in these circumstances does not always yield ac-curate results. Another problem was that it is hard todetermine how much RFI affected the data, unless oneor more channels were removed and that eliminated theproblem. It can also be difficult to distinguish betweenBBC and RFI problems. For individual station days,the results should probably not be assumed to be accu-rate at better than the 5% level.
The results here should not be viewed as an ab-solute evaluation of the quality of each station’s per-formance. As mentioned above, the results themselvesare only approximate. In addition, some problems suchas weather and power failures are beyond the controlof the station. Instead the results should be viewed inaggregate as an overall evaluation of what percentageof the observing time the network is collecting datasuccessfully. Development of the overall result is or-ganized around individual station performance, but theresults for individual stations do not necessarily reflectthe quality of operations at that station.
Since stations typically observe with more than oneother station at a time, the average lost observing timeper station is not equal to the overall average loss ofVLBI data. Under some simplifying assumptions, theaverage loss of VLBI data is roughly twice the averageloss of station observing time. This approximation isdescribed in the Network Coordinator’s section of theIVS 2001 Annual Report. For 2013, this agrees reason-ably well with the number of (single frequency: S or X)single baseline observations on which the correlator re-ported failure, approximately 36%, but other factors,particularly the dual frequency nature of useful geode-tic observations, complicate the picture. For 2013, theactual percentage of data (dual frequency) that was notincluded by the analysts was approximately 41%. Thisis even larger (by approximately 5%) than the singlebaseline observations reported lost by the correlator.It is expected that this number should be higher bothbecause of the dual frequency nature of the final ob-servable and the fact that analysts use additional cri-teria beyond what is discussed here to decide when toexclude observations. However, it means in effect thatonly about 59% of the observations we attempted tocollect were useful.
For the 159 experiments from 2013 examined here,there were 1,432 station days or approximately 9.0 sta-
tions per experiment on average. This compares to 148experiments considered in the report for 2011, whichincluded 1,261 station days with 8.5 stations per exper-iment. The increase in the number of analyzed experi-ments mostly reflects the increase in the number of ex-periments from 2013. The increase in the average num-ber of stations per experiment is due to the schedulingof large networks in experiments. Of the station daysfor 2013, approximately 16.2% (or approximately 231days) of the observing time was lost, which is about 4%higher than last year. For comparison to reports fromearlier years, please see Table 1.
Table 1 Lost observing time.
Year Percentage1999-2000* 11.82001 11.62002 12.22003 14.42004 12.52005 14.42006 13.62007 11.42008 15.12009 21.52012 12.32013 16.2* The percentage applies to a subset
of the 1999-2000 experiments.Percentages for 2010 and 2011 are
omitted but should be 10-20%.
The lost observing time for 2013 is in line with re-sults from 2012 and years before 2009. The results for2009 may be artificially high due to a change in theway the results were tabulated for that year. We believethis year’s calculations are more in line with how theywere made before 2009.
An assessment of each station’s performance is notprovided in this report. While individual station in-formation was presented in some previous years, thispractice seemed to be counter-productive. Althoughmany caveats were provided to discourage people fromassigning too much significance to the results, therewas feedback that suggested that the results were beingover-interpreted. Additionally, some stations reportedthat their funding could be placed in jeopardy if theirperformance appeared bad, even if it was for reasonsbeyond their control. Last and least, there seemed to
IVS 2013 Annual Report

Network Coordinator Report 91
be some interest in attempting to “game” the analy-sis methods to apparently improve individual stationresults. Consequently, only summary results are pre-sented here. Detailed results are presented to the IVSDirecting Board. Each station can receive the resultsfor their station by contacting the Network Coordina-tor ([email protected]).
For the purposes of this report, the stations weredivided into two categories:large N: those that wereincluded in 25 or more network experiments amongthose analyzed here andsmall N: those in 16 or fewer(no stations were in the 17-24 experiment range). Thedistinction between these two groups was made on theassumption that the results would be more meaning-ful for the stations with more experiments. The aver-age observing time loss from the large N group wasmuch smaller than the average from the small N group,14.6% versus 26.0%. There are many more station daysin the large N group than the small N group, 1,306 ver-sus 161, so the large N group is dominant in determin-ing the overall performance.
There are 22 stations in the large N group. Tenstations observed in 50 or more experiments. Of the22 stations, 13 successfully collected data for approxi-mately 90% or more of their expected observing time.Four more stations collected 80% or more of the time.Four more stations collected data about 70% or moreof the time. The remaining stations collected data forabout 42% of their observing time. These results arenot significantly different from previous years.
There are 24 stations in the small N group. Therange of lost observing time for stations in this cate-gory was 0%-100%. The median loss rate was approx-imately 15%, a little worse than last year.
The losses were also analyzed by sub-systemfor each station. Individual stations can contact theNetwork Coordinator ([email protected]) forthe sub-system breakdown (and overall loss) fortheir station. A summary of the losses by sub-system(category) for the entire network is presented in Table2. This table includes results since 2003 sorted bydecreasing loss in 2012.
The categories in Table 2 are rather broad and re-quire some explanation, which is given below.
Antenna This category includes all antenna prob-lems, including mis-pointing, antenna control com-puter failures, non-operation due to wind, and me-
chanical breakdowns of the antenna. It also includesscheduled antenna maintenance.
Clock This category includes situations where cor-relation was impossible because the clock offset ei-ther was not provided or was wrong, leading to “nofringes”. Maser problems and coherence problemsthat could be attributed to the Maser were also in-cluded in this category. Phase instabilities reportedfor Kokee were included in this category. DBBCclock errors are included in this category.
Miscellaneous This category includes several smallproblems that do not fit into other categories, mostlyproblems beyond the control of the stations, such aspower (only prior to 2012), (non-wind) weather, ca-bles, scheduling conflicts at the stations, and errorsin the observing schedule provided by the Opera-tion Centers. For 2006 and 2007, this category alsoincludes errors due to tape operations at the stationsthat were forced to use tape because either they didnot have a disk recording system or they did nothave enough media. All tape operations have sinceceased. This category is dominated by weather andscheduling conflict issues.
Operations This category includes all operational er-rors, such as DRUDG-ing the wrong schedule, start-ing late because of shift problems, operator (as op-posed to equipment) problems changing recordingmedia, and other problems.
Power This category includes data lost due to powerfailures at the sites. Prior to 2012, losses due topower failures were included in the Miscellaneouscategory.
Rack This category includes all failures that could beattributed to the rack (DAS), including the formatterand BBCs. There is some difficulty in distinguishingBBC and RFI problems in the correlator reports, sosome losses are probably mis-assigned between theRack category and the RFI category.
Receiver This category includes all problems relatedto the receiver, including outright failure, loss ofsensitivity because the cryogenics failed, designproblems that impact the sensitivity, LO failure, andloss of coherence that was due to LO problems. Inaddition, for lack of a more clearly accurate choice,loss of sensitivity due to upper X-band Tsys androll-off problems were assigned to this category.
Recorder This category includes problems associ-ated with data recording systems. Starting with
IVS 2013 Annual Report
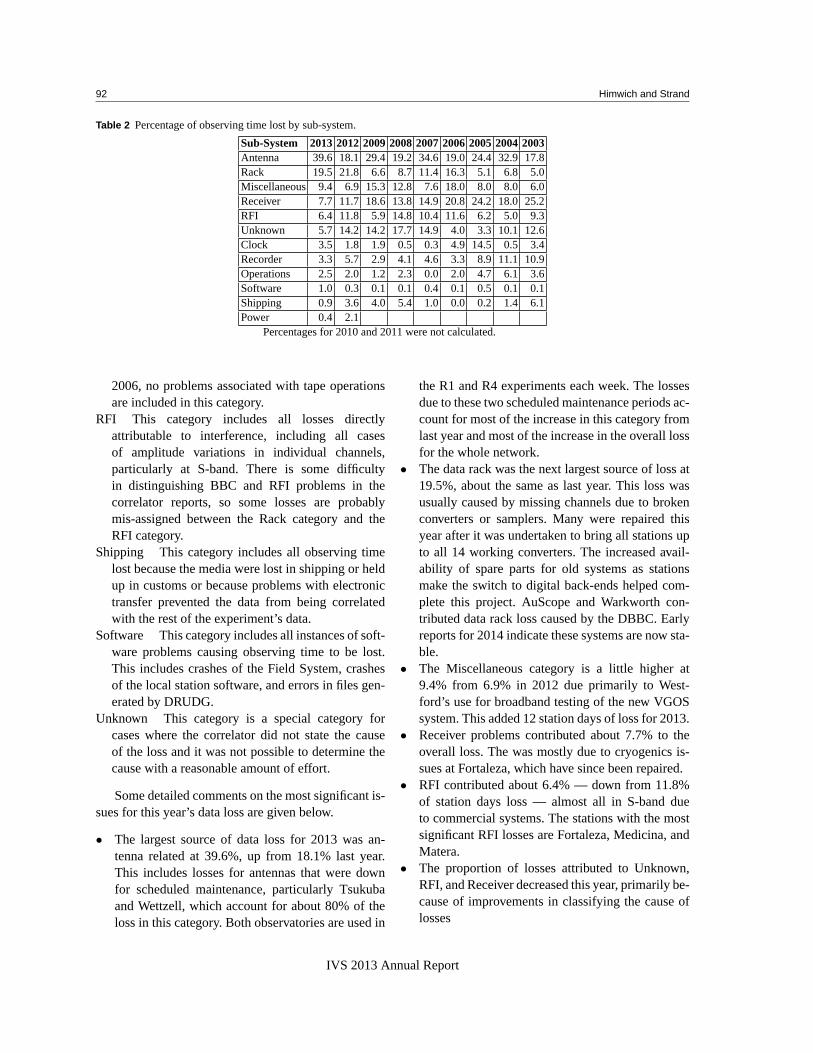
92 Himwich and Strand
Table 2 Percentage of observing time lost by sub-system.
Sub-System 2013 2012 2009 2008 2007 2006 2005 2004 2003Antenna 39.6 18.1 29.4 19.2 34.6 19.0 24.4 32.9 17.8Rack 19.5 21.8 6.6 8.7 11.4 16.3 5.1 6.8 5.0Miscellaneous 9.4 6.9 15.3 12.8 7.6 18.0 8.0 8.0 6.0Receiver 7.7 11.7 18.6 13.8 14.9 20.8 24.2 18.0 25.2RFI 6.4 11.8 5.9 14.8 10.4 11.6 6.2 5.0 9.3Unknown 5.7 14.2 14.2 17.7 14.9 4.0 3.3 10.1 12.6Clock 3.5 1.8 1.9 0.5 0.3 4.9 14.5 0.5 3.4Recorder 3.3 5.7 2.9 4.1 4.6 3.3 8.9 11.1 10.9Operations 2.5 2.0 1.2 2.3 0.0 2.0 4.7 6.1 3.6Software 1.0 0.3 0.1 0.1 0.4 0.1 0.5 0.1 0.1Shipping 0.9 3.6 4.0 5.4 1.0 0.0 0.2 1.4 6.1Power 0.4 2.1
Percentages for 2010 and 2011 were not calculated.
2006, no problems associated with tape operationsare included in this category.
RFI This category includes all losses directlyattributable to interference, including all casesof amplitude variations in individual channels,particularly at S-band. There is some difficultyin distinguishing BBC and RFI problems in thecorrelator reports, so some losses are probablymis-assigned between the Rack category and theRFI category.
Shipping This category includes all observing timelost because the media were lost in shipping or heldup in customs or because problems with electronictransfer prevented the data from being correlatedwith the rest of the experiment’s data.
Software This category includes all instances of soft-ware problems causing observing time to be lost.This includes crashes of the Field System, crashesof the local station software, and errors in files gen-erated by DRUDG.
Unknown This category is a special category forcases where the correlator did not state the causeof the loss and it was not possible to determine thecause with a reasonable amount of effort.
Some detailed comments on the most significant is-sues for this year’s data loss are given below.
• The largest source of data loss for 2013 was an-tenna related at 39.6%, up from 18.1% last year.This includes losses for antennas that were downfor scheduled maintenance, particularly Tsukubaand Wettzell, which account for about 80% of theloss in this category. Both observatories are used in
the R1 and R4 experiments each week. The lossesdue to these two scheduled maintenance periods ac-count for most of the increase in this category fromlast year and most of the increase in the overall lossfor the whole network.
• The data rack was the next largest source of loss at19.5%, about the same as last year. This loss wasusually caused by missing channels due to brokenconverters or samplers. Many were repaired thisyear after it was undertaken to bring all stations upto all 14 working converters. The increased avail-ability of spare parts for old systems as stationsmake the switch to digital back-ends helped com-plete this project. AuScope and Warkworth con-tributed data rack loss caused by the DBBC. Earlyreports for 2014 indicate these systems are now sta-ble.
• The Miscellaneous category is a little higher at9.4% from 6.9% in 2012 due primarily to West-ford’s use for broadband testing of the new VGOSsystem. This added 12 station days of loss for 2013.
• Receiver problems contributed about 7.7% to theoverall loss. The was mostly due to cryogenics is-sues at Fortaleza, which have since been repaired.
• RFI contributed about 6.4% — down from 11.8%of station days loss — almost all in S-band dueto commercial systems. The stations with the mostsignificant RFI losses are Fortaleza, Medicina, andMatera.
• The proportion of losses attributed to Unknown,RFI, and Receiver decreased this year, primarily be-cause of improvements in classifying the cause oflosses
IVS 2013 Annual Report

Network Coordinator Report 93
Overall, while the network operated well for themost part, there are a few notable issues (in alphabet-ical order of station), while some situations improvedfrom the previous year:
• Crimea had a problem related to a previous repairof a sampler. This caused the lower four channels ofX-band to be lost in 2013. The problem was foundand repaired.
• Fortaleza had a significant cryogenic problem,which has since been repaired.
• Hobart12 and Hobart26 have a new and serious RFIissue.
• Hobart, Katherine, and Yarragadee timing issuesin the DBBCs have improved due to local main-tenance work including improved grounding.
• Kokee Park had a power outage that caused somedamage that was difficult to repair. The station wasable to observe with somewhat reduced sensitivityuntil the repair was completed.
• Matera’s Mark 5 samplers for S-band channels 5and 6 were repaired. A rare and intermittent uniden-tified loss of fringes from 2012 and 2013 were di-agnosed in 2014 as being due to the first LO un-locking and re-locking at the wrong frequency dueto a power supply issue. This has been repaired.
• The cryogenic system in the receiver at Medicinawas repaired on September 2013 (after initially fail-ing in November 2011). The station is now able toobserve with normal sensitivity.
• TIGO has shown higher than normal SEFDs forseveral years. There has been no success in resolv-ing this issue.
• The Tskuba32 telescope underwent scheduled an-tenna maintenance for a period of several weeks.
• Warkworth lost a few station days due to a maserfailure.
• The Westford azimuth antenna drives continue totrip off sometimes when the site is unattended.They also lost several days supporting broadbandtesting and a few days for a maser failure.
• The Wettzell telescope underwent scheduled an-tenna maintenance for a period of several weeks.
• Yarragadee lost several days due to a filter problemin their DBBC. This has been repaired.
2 New Stations
There are prospects for new stations on several fronts.These include (in approximate order of how soon theywill start regular observations):
• At Wettzell in Germany, the new Twin TelescopeWettzell (TTW) for VGOS has been commissioned.
• At GSFC in the USA, a new 12-m antenna has beenerected and is undergoing testing. While this an-tenna is primarily for use in the development of theVGOS system, it is expected that it will eventuallyjoin the network for regular observing.
• South Korea has a new antenna for geodesy at Se-jong, built by the National Geographic InformationInstitute (NGII). There is also interest in geodeticuse of the Korean VLBI Network (KVN), whichconsists of three stations intended primarily for as-tronomy.
• At Arecibo in Puerto Rico, a new 12-m antenna hasbeen erected and is expected to be used for geodeticobserving.
• In Spain/Portugal, the RAEGE (Atlantic Networkof Geodynamical and Space Stations) project aimsto establish a network of four fundamental geodeticstations including radio telescopes that will fulfillthe VGOS specifications: Yebes (1), Canary Islands(1), and Azores (2).
• In Norway, the Norwegian Mapping Authority(NMA) is in the process of procuring a twintelescope.
• Onsala has applied for funds for a twin telescopesystem.
• In Russia, an effort is underway to get 12-m VGOSantennas at some of the QUASAR network sites.
• There is interest in India in building a network offour telescopes that would be useful for geodesy.
• Saudi Arabia is investigating having a combinedgeodetic observatory, which would presumably in-clude a VLBI antenna.
• Colombia is investigating having a combinedgeodetic observatory, which would presumablyinclude a VLBI antenna.
Many of these antennas will become available foruse in the next few years. Efforts are being made toensure that these antennas will be compatible withVGOS.
IVS 2013 Annual Report

94 Himwich and Strand
3 Network Coordination Activities
Network coordination involved dealing with variousnetwork and data issues. These included:
• Reviewing all experiment “ops” messages, correla-tor reports, and analysis reports for problems andworking with stations to resolve them
• Responding to requests from stations for assistance• Identifying network station issues and working
with the IVS Coordinating Center and the stationsto resolve them. This year these included:
– Encouraging timely delivery of log files– Providing a DBBC Validation Plan– Maintaining the FS PC kernel
• Participating in development of the new VEX2schedule file standard.
• Providing catalog update information for stationequipment and track lay-outs.
• Recognizing and reporting DBBC issues to stationobserving staff.
• Reviewing Mark 5 recording error checks for prob-lems and informing correlator staff and station staff.
• Assisting in troubleshooting the Kokee X-band IFfailure.
• Troubleshooting power supplies and identifying thecorrect parts for shipping.
• Troubleshooting video converters and organizingshipments to stations.
• Providing telescope pointing analysis and advice.• Support, including software development, for the
12-m antenna at GSFC and VGOS observing sys-tem.
4 Future Activities
Network coordination activities are expected to con-tinue next year. The activities will largely be a contin-uation of the previous year’s activities:
• Reviewing all experiment “ops” messages, correla-tor reports, and analysis reports for problems andworking with stations to resolve them.
• Responding to requests from stations for assistance.• Identifying network station issues and working
with the IVS Coordinating Center and the stationsto resolve them.
• Updating Network Station configuration files.• Helping to coordinate a Mark 5A/5B firmware up-
date for large module directories and bigger disks.• Helping to plan and support CONT14 observing.• Providing support, including software develop-
ment, for the 12-m antenna at GSFC and the VGOSobserving system.
• Other activities as needed.
IVS 2013 Annual Report

IVS Technology Coordinator Report
Bill Petrachenko
Abstract Highlights of IVS technology developmentof the past year are summarized. This includes VGOStechnology development, mixed mode observing is-sues, global VLBI standards, the VGOS technical com-mittee (VTC) and its Wiki, the 2nd International VLBITechnology Workshop (IVTW), and the IVS GeodeticVLBI School.
1 VGOS Observing Plan
Over the past year, the VGOS Project Executive Group(VPEG) developed an observing plan to guide the tran-sition from current S/X to future VGOS broadband op-erations. The plan spans five years. It begins with a se-ries of test campaigns in 2015 with as many as eightsites expected to participate. IVS technology develop-ment over the next year focuses on ensuring that sys-tems and processes are ready for the test campaigns.
Each campaign introduces a different aspect of thenew VGOS mode of operation so that by 2016 the IVSwill be ready to begin the VGOS pilot project. All cam-paigns will be roughly six weeks in duration to exercisethe full “schedule to final products” operational chainin a sustained format.
• The first campaign focuses on automation of pro-cesses unique to broadband operations. It uses asingle 24-hour session per week, which has the ben-efit of allowing six days per week to prepare for the
Canadian Geodetic Survey, Natural Resources Canada
IVS Technology Development Coordinator
IVS 2013 Annual Report
next session. Data will be recorded and shipped af-ter each session.
• The second campaign focuses on producing a fullset of EOP products on a daily basis. It involvesobserving four hours per day in equispaced one-hour bursts. As with the first campaign, data willbe recorded and shipped once per week.
• The final campaign focuses on producing initialEOP products within 24 hours. Observationally, itwill be identical to the second campaign but withthe exception that data will be e-transferred insteadof being shipped.
2 VGOS Technology Development
Development of the VGOS broadband system beganin a serious way in about 2008 when the Eleven Feedwas identified as a suitable candidate for use in the nextgeneration VLBI system. As a result of work carriedout in the subsequent years, the system is now in a use-able state although not completely finalized. Severalbroadband test sessions were carried out on the∼600km Westford to GGAO baseline with the first 24-hourgeodetic session having been carried out in late May2013.
The new broadband system required nearly a com-plete reworking of the legacy S/X system including thefrontend, backend, and even the connection betweenthem. There has been significant progress over the pastyear in a number of areas.
95

96 Petrachenko
2.1 Broadband Feeds
It is no surprise that active research into broadbandfeeds continues today because it is one of the keytechnological innovations that makes the new VGOSbroadband system possible. The workhorse feedsfor the Westford/GGAO broadband baseline areQuadridge Feed Horns (QRFH) developed at CalTech.These feeds perform at a high level, are cost effectiveand are easy to integrate into cryogenic front ends.So far they are the only broadband feeds that havebeen successfully deployed in a working VGOSsystem. Although the QRFH is naturally a dual linearpolarization feed, circular polarization is handledmore naturally by VLBI and is hence preferred. ChrisBeaudoin recently suggested a method for effectivelycombining the QRFH linear outputs, post-LNA, intodual circular outputs. There is also an Auscope/Callistocollaboration to build a QRFH feed into a cryogenicsystem based on a Stirling cycle cooler. This config-uration promises to be cost effective, to be very lowmaintenance, and to still meet the VGOS SEFD specwhen used with a 12-m antenna.
Work continues on the integration of the ElevenFeed developed at Chalmers University into a cryo-genic front end; a broadband feed developed in Italyis being tested at Noto, and an innovative conical feedthat naturally produces circular polarized output is be-ing proposed for the Spanish/Portuguese RAEGE an-tennas.
2.2 Digital-backends (DBEs)
Digital-backend (DBE) development continues inChina, Europe, Japan, Russia, and the United States.A VLBI Digital-backend Intercomparison Workshopwas conducted at Haystack Observatory in October2012 to test inter-compatibility between independentlydeveloped DBE units. The results were very positiveshowing that in most cases the systems can operatesuccessfully together.
In addition, to help understand the similarities anddifferences between various DBEs, a document namedthe VLBI Receiver Back End Comparison, in whichthe features of all known DBEs are compared in a table,was produced. The document can be found on the IVSWebsite and the VTC Wiki. Of the DBEs compared,
the ROACH-based DBE (RDBE) and DBBC2010 werethe most applicable to the VGOS system.
Gino Tuccari is prototyping a new cutting edgeDBE system, the DBBC3-H, in which an 8-bit 28 Gspsdigitizer samples the complete VGOS 2-14 GHz RFspectrum. Unfortunately, the project has been delayeddue to a requirement by the manufacturer that only verylarge orders will be filled. To get around this problem,Gino is looking into the possibility of a joint order withthe the Square Kilometer Array (SKA). In the mean-time he is moving forward with a less aggressive broad-band sampler, the DBBC3-L, which needs to be cou-pled with external analog electronics in order to satisfyVGOS requirements.
2.3 The Mark 6 Data System
The Mark 6 data system is now ready to enter opera-tional service. It is an excellent fit for VGOS. It canaccept data at the VGOS data rate of 16 Gbps, writingit directly into a 30 s RAM buffer and then moving itfrom the buffer to a (single) disk pack at a sustainedrate just under 8 Gbps. With proper care in the devel-opment of a schedule it should be easy to ensure thatthe buffer is ready to be refilled by the time the VGOSantenna has slewed to the next source. This mode of op-eration opens the possibility of writing a complete 24-hour VGOS session onto a single 32 Tbyte disk packthat is very efficient for media shipment.
2.4 Delay Calibrator
Phase calibration (PCAL) has always been an impor-tant aspect of geodetic VLBI, required both to accountfor independent local oscillator (LO) offsets and tocompensate for delay and phase drifts in the system.It was hoped that the advent of DBEs, with their de-terministic linear phase response, would reduce the de-pendence on PCAL. But for the VGOS broadband sys-tem where phase is connected between bands, the needfor PCAL is as great as ever.
A modern PCAL pulse generator has recently beensuccessfully designed and deployed. However, PCALperformance is also limited by the stability of the refer-ence signal that drives the pulse generator. The stability
IVS 2013 Annual Report

IVS Technology Coordinator Report 97
of this signal is corrupted by thermal and mechanicaldrifts in the cable that connects the hydrogen maser fre-quency reference to the pulse generator (which is typ-ically located near the receiver frontend). Although itwas initially hoped that a very stable cable could befound for this purpose, tests over the past year haveshown that the required stability could not be achieved.
As a result, a next generation delay calibrator sys-tem is under development at Haystack Observatory.The principle behind the new system is very similarto that of the old Mark 3 delay calibrator, although de-tailed implementation is significantly different. Initialtests indicate that performance of the new design al-ready nearly meets VGOS requirements.
2.5 Correlator
Although a number of different types of correlatorsare currently used for geodetic VLBI, the most com-monly used is the DiFX software correlator. DiFX wasoriginally developed at Swinburne University in Aus-tralia by Adam Deller for use in astronomical VLBI.As its popularity increased, a global DiFX user groupwas formed to coordinate continued improvements andadditions. A recent addition is an interface that al-lows DiFX output to be input to the Mark IV post-correlation software. This opened the door for the useof DiFX in geodetic VLBI, and since then DiFX corre-lators have become operational at the Bonn, Haystack,and Washington IVS Correlation Centers. Features thatbenefit geodetic VLBI continue to be added to DiFX,but equally important are the additions to the MarkIV post-correlation software that are needed to handleVGOS broadband modes. Some noteworthy additionsinclude: the use of all available PCAL tones to seam-lessly connect interferometer phase across the full 2-14GHz input frequency range; the use of a total electroncontent (TEC) search parameter to account for the cur-vature of phase vs. frequency caused by the ionosphere;and the addition of the ability to form a pseudo totalintensity observable out of the linear polarized outputsthat are naturally produced by broadband QRFH feeds.New features continue to be added to both DiFX andthe post correlation software, and these are tested usingdata from the Westford/GGAO broadband baseline.
3 Mixed Mode Observing
In order to establish robust geodetic ties between newbroadband stations and the legacy S/X network, a seriesof observing sessions that include both broadband andS/X stations is required. These sessions are referred toas mixed mode sessions. There is nothing fundamentalthat makes these sessions difficult. However, in prac-tice they are complicated by restrictions built into thedetails of the systems being used. There are a numberof different types of backends that need to be consid-ered: analog Mark IV; analog VLBA; DBBC in eitherdigital down converter (DDC) or polyphase filter bank(PFB) mode; and RDBE in DDC or PFB mode. Beyondthat, S/X stations use a number of different fixed IFdown conversion schemes. This proliferation of back-ends and down conversion schemes makes compatibil-ity in terms of net LO frequency, sideband, and chan-nel bandwidth difficult to achieve. To help navigatethese issues, a document was prepared entitled MixedMode (Broadband vs. S/X) Configuration Issues. It canbe found on the VTC Wiki. Many of these incompat-ibilities can be handled in the correlator, but for nowmost of the relevant correlator features are not yet fullytested.
Mixed mode observing also suffers from a sensi-tivity issue. VGOS broadband antennas are generallysmaller than S/X antennas (which was done to make iteasier for them to achieve high slew rates). For VGOSobservations, this lack of sensitivity is more than com-pensated by the 16 Gbps instantaneous VGOS datarate. But when VGOS antennas co-observe with S/Xantennas, data rate is limited to less than 1 Gbps bythe S/X systems. This results in long on-source pe-riods for mixed mode baselines, and this in turn de-grades schedules and geodetic performance. The obvi-ous solution is to increase the S/X data rate. However,this is currently not possible because the analog sys-tems still commonly used at many S/X sites are oper-ationally limited to 8 MHz channel bandwidths whichcorresponds to a maximum total data rate of about 1Gbps. To solve this problem there is currently an ef-fort to decommission analog systems and replace themwith DBEs.
IVS 2013 Annual Report

98 Petrachenko
4 Global VLBI Standards
Over the past decade, the previous IVS TechnologyCoordinator, Alan Whitney, did a great service by co-ordinating the definition of a number of Global VLBIstandards, including VSI-H, VSI-S, VDIF, VDIF2, andVTP. Most recently it was recognized that VEX, thepseudo-language that describes the detailed configura-tion of each station (as well as the schedule of observa-tions), needs to be upgraded to handle new componentsthat are part of the VGOS system. For obvious reasons,VEX2, the next generation VEX program, must be inplace before automation of VGOS processes (which inturn is required to reduce operational costs and henceenable the VGOS goal of 24/7 operation) can begin.VEX2 is now nearly complete; its imminent release iseagerly awaited.
5 The VGOS Technical Committee (VTC)and its Wiki
The VLBI2010 Committee (V2C), was established in2006 to encourage the realization of VLBI2010. Overthe years its focus narrowed towards the technical as-pects of the next generation system with the followingseven main topic areas identified: system development,RFI, automation, schedule optimization, source struc-ture, site ties, and the atmosphere. Recently, to reflectthe approaching transition to the operational phase ofthe project, the name of the committee was changed tothe VGOS Technical Committee (VTC).
As more VGOS systems are designed and built,there is an increasing need for communication andcoordination between groups. To serve this purpose,the VTC established a Wiki that can be found athttps://wikis.mit.edu/confluence/display/VTC/Home.Wiki contributions related to all VGOS activities arewelcome. Everyone is encouraged to access the wikito learn about VGOS developments. But its usefulnessobviously depends on the quality and completenessof the information on it. So please think about whatdocuments you have that might be of interest to theVGOS world. For more information on the Wiki,please see the related article written by Brian Corey inthe April 2014 issue of the IVS Newsletter.
6 2nd International VLBI TechnologyWorkshop (IVTW)
The 2nd IVTW was hosted by the Korean Astron-omy and Space Science Institute (KASI) at Seogwipoon Jeju Island, South Korea. The workshop focusedon four topics: station status reports, e-VLBI/Science,wideband developments, and frequency standards. At-tendees at this very well organized workshop weretreated to a field trip to the nearby 21-m Tamna radiotelescope which is an element in the Korean VLBI Net-work (KVN).
The 3rd IVTW will be held on November 10-13,2014 at JIVE, Groningen, Netherlands. I encourageanyone who is interested in VLBI technology to at-tend this very informative and useful workshop. Strongrepresentation from the IVS will ensure that geode-tic VLBI has a voice in defining a coherent directionfor global multidisciplinary VLBI technology develop-ment.
7 Geodetic VLBI School at AltooUniversity
On March 2-5, 2013, just prior to the 21st EVGAWorking Meeting, a geodetic VLBI school was heldat Aalto University, Espoo, Finland. The school wassponsored by the IVS, the EGU, Onsala Observatory,the Finnish Geodetic Institute, Aalto University, andRadioNet. It was part of the activities of IVS WorkingGroup 6, “VLBI Education”, led by Rudiger Haas.
Lectures and exercises were prepared on a widerange of topics from Radio Telescopes, Feed Horns,and Receivers to the Terrestrial Reference Frame. Itwas an opportunity for young participants to get abroad introduction to the field and at the same timefor technology experts to learn about analysis and viceversa. Since this was the first running of the school,an important result was the production of learning ma-terial on a broad range of topics related to geodeticVLBI. It was agreed that a school of this type shouldbe held roughly every three years.
IVS 2013 Annual Report

Netw
ork
Stat
ions


Badary Radio Astronomical Observatory 2013 IVS Annual Report
Sergey Smolentsev, Valery Olifirov
Abstract This report provides information about theBadary network station: general information, facilities,staff, present status, activities during 2013, and out-look.
1 General Information
The Badary Radio Astronomical Observatory (Fig-ure 1) was founded by the Institute of AppliedAstronomy (IAA) as one of three stations of theRussian VLBI network QUASAR. The sponsoringorganization of the project is the Russian Academyof Sciences (RAS). The Badary Radio AstronomicalObservatory is situated in the Republic Buryatia(East Siberia) about 130 km east of Baikal Lake(see Table 1). The geographic location of the ob-servatory is shown on the IAA RAS Web site(http://www.ipa.nw.ru/PAGE/rusipa.htm). Basic in-struments of the observatory are a 32-m radio telescopeequipped with special technical systems for VLBIobservations, GPS/GLONASS/Galileo receivers, aDORIS antenna, and an SLR system.
Table 1 Badary Observatory location and address.
Longitude 102◦14′
Latitude 51◦46′
Republic Buryatia671021, Russia
Institute of Applied Astronomy of RAS
Badary Network Station
IVS 2013 Annual Report
Fig. 1 Badary observatory.
2 Technical Staff
Table 2 Staff related to VLBI operations at Badary.
Valery Olifirov observatory chiefRoman Sergeev chief engineer, FS, pointing system controlRoman Kuptsov engineerAndrey Mikhailov FS, pointing system control
101

102 Smolentsev and Olifirov
3 Component Description
3.1 Technical and Scientific Information
Characteristics of the radio telescope are presented inTable 3.
Table 3 Technical parameters of the radio telescope.
Year of construction 2005Mount AZELAzimuth range ±270◦ (from south)Elevation range from−5◦ to 95◦
Maximum azimuth- velocity 0.83 ◦/s- tracking velocity 2.5 ′/s- acceleration 12.0 ′/s2
Maximum elevation- velocity 0.5 ◦/s- tracking velocity 0.8 ′/s- acceleration 12.0 ′/s2
Pointing accuracy better than 10′′
Configuration Cassegrain (withasymmetrical subreflector)
Main reflector diameter 32 mSubreflector diameter 4 mFocal length 11.4 mMain reflector shape quasi-paraboloidSubreflector shape quasi-hyperboloidMain reflector surface accuracy± 0.5 mmFrequency range 1.4–22 GHzAxis offset 3.7±2.0 mm
3.2 Co-location of VLBI, GPS/GLONASS,DORIS, and SLR System
Badary observatory is equipped with the JavadGPS/GLONASS/Galileo receiver, The SLR system“Sazhen-TM” (Figure 3), beacon “DORIS”, andautomatic meteorological station WXT-510 are inoperation (Figure 2).
4 Current Status and Activities during2013
Badary observatory participates in IVS and domesticVLBI observing programs. During 2013, Badary sta-
Fig. 2 Javad GPS/GLONASS/Galileo receiver and beacon“DORIS” at the Badary observatory.
Fig. 3 “Sazhen-TM” SLR system at Badary observatory ob-served 1278 passes of Lageos, GLONASS et al. and obtained11430 normal dots.
tion participated in 31 diurnal IVS sessions — IVS-R4,IVS-T2, and EURO.
Badary participated in 48 diurnal sessions in theframe of the domestic Ru-E program for determinationof all Earth orientation parameters and in 191 one-hourRu-U sessions for obtaining Universal Time using e-VLBI data transfer. Since April 2013 we have usede-VLBI data transfer for Badary observation data forRu-E sessions.
Finally, an antenna tower for the 13.2-m dish wasbuilt.
IVS 2013 Annual Report

Badary IVS Annual Report 103
Fig. 4 Autumn 2013, building in progress.
Fig. 5 Antenna tower for 13.2-m dish.
Fig. 6 Main reflector 13.2-m and antenna tower.
5 Future Plans
Our plans for the coming year are the following:
• To participate in IVS observations includingCONT14 IVS campaign,
• To carry out domestic observing programs forobtaining Universal Time daily and for obtainingEarth orientation parameters with e-VLBI datatransfer weekly,
• To carry out SLR observations of geodetic and nav-igation satellites,
• To participate in EVN and RADIOASTRON ob-serving sessions,
• To continue geodetic monitoring of the RT-32 pa-rameters,
• To install a WVR, and• To finish VLBI2010 antenna installation in 2014.
References
1. Finkelstein A., Ipatov A., Smolentsev S. The Network“Quasar”: 2008-2011 // “Measuring the future”, Proc. of theFifth IVS General Meeting, A. Finkelstein, D. Behrend (eds.),St. Petersburg, “Nauka”, 2008. pp. 39–46.
IVS 2013 Annual Report

Effelsberg Radio Observatory 2013 Annual Report
Uwe Bach, Alex Kraus
Abstract The 100-m radio telescope of the Max-Planck-Institut fur Radioastronomie (MPIfR) is oneof the two largest fully steerable single-dish radiotelescopes in the world and a unique high-frequencyradio telescope in Europe. The telescope can be usedto observe radio emission from celestial objects in awavelength range from 90 cm (∼300 MHz) down to3.5 mm (∼90 GHz).
1 General Information
The Effelsberg radio telescope was inaugurated in 1971and was (for almost 30 years) the largest fully steer-able single-dish radio telescope in the world. It is situ-ated in a protected valley near Bad Munstereifel (about40 km southwest of Bonn) and operated by the Max-Planck-Institut fur Radioastronomie (MPIfR) on behalfof the Max-Planck-Society (MPG). To this day, it is thelargest radio telescope in Europe and is mostly used forastronomical observations.
The extremely versatile and flexible instrument canbe used to observe radio emission from celestial objectsin a wavelength range from about 1 m (correspond-ing to a frequency of∼300 MHz) down to 3.5 mm(86 GHz). The combination of the high surface accu-racy of the reflector (the mean deviation from the idealparabolic form is∼0.5 mm RMS) and the constructionprinciple of ‘homologous distortion’ (i.e., the reflectorin any tilted position has a parabolic shape with a well-
Max-Planck-Institut fur Radioastronomie, Bonn, Germany
Effelsberg Network Station
IVS 2013 Annual Report
defined, but shifted, focal point) enables very sensitiveobservations at high frequencies (i.e.,ν >10 GHz).
The wide variety of observations with the 100-mradio telescope is made possible by the good angularresolution, the high sensitivity, and a large number ofreceivers which are located either in the primary or inthe secondary focus. Together with a number of dis-tinguished backends dedicated to different observingmodes, this provides excellent observing conditions forspectroscopic observations (atomic and molecular tran-sitions in a wide frequency range), and also for hightime-resolution (pulsar observations), mapping of ex-tended areas of the sky and participation in a num-ber of interferometric networks (mm-VLBI, EVN, andGlobal VLBI etc.).
Table 1 Telescope properties.
Name EffelsbergCoordinates 6:53:01.0 E,+50:31:29.4 NMount azimuthalTelescope type Gregorian (receivers in prime
and secondary focus)Diameter of main reflector100 mFocal length of prime focus30 mFocal length of secondary387.7 mfocussurface accuracy 0.55 mm RMSSlew rates Azi: 25 deg/min, Elv: 16 deg/minReceivers for Geodetic 3.6 cm/13 cm secondary-observations focus (coaxial)T sys (3.6 cm/13 cm) 25 K, 200 KSensitivity (3.6 cm/13 cm)1.4 K/Jy, 0.5 K/JyHPBW (3.6 cm/13 cm) 81 arcsec, 350 arcsec
104

Effelsberg 2013 Report 105
Fig. 1 Aerial image of the Effelsberg radio observatory. Shown are the100-m Effelsberg antenna and the institute building. Effelsberghosts also a station of the European Low Frequency Array (LOFAR), seen in the lower part of the picture.
2 Activities during the Past Year
About 30% of the observing time of the Effelsberg an-tenna is used for VLBI observations. Most of them areastronomical observations for the European VLBI Net-work (EVN), High Sensitivity Array (HSA), GlobalMM VLBI Array (GMVA) or other global networks,but also geodetic VLBI observations are performed.Effelsberg has regularly participated in the EUROPEIVS sessions since 1991. In autumn 2013, the slewrates of the antenna had to be reduced because of workat the main power supply of the station. Therefore theschedule for EUR126 had to be adapted to the slowerspeeds.
3 Current Status
Effelsberg is using the DBBC2 and a Mark 5B+recorder for all EVN, global, and geodetic VLBIobservations. In addition, there are two NRAO RDBEs
and a Mark 5C recorder that are used for observa-tions with the VLBA and HSA. The observatory isconnected via a 10 GE optical fiber to the e-VLBInetwork and can do real time e-VLBI observations ande-transfer of data to Bonn and JIVE.
4 Future Plans
Upgrades for several receiving systems are planned for2014. In January, a new K-band receiver (18 to 26GHz) was installed into the secondary focus and isjust being commissioned. The construction of a newC-band system (4-8/9.3 GHz) for wide band observa-tions and the installation of a new Q-band receiver (38to 50 GHz) are planned for 2014 as well. The new re-ceivers will provide wide band IF signals of 2.5 GHzband width which can be used with the next genera-tion of digital VLBI backends and recorders, like theDBBC3 and Mark 6, to record data at recording ratesof up to 16 Gbps.
IVS 2013 Annual Report

Fortaleza Station 2013 Annual Report
Pierre Kaufmann 1, A. Macilio Pereira de Lucena 2,Adeildo Sombra da Silva 1
Abstract This is a brief report about the activities car-ried out at the Fortaleza geodetic VLBI station (ROEN:Radio Observatorio Espacial do Nordeste), located inEusebio, CE, Brazil, during the period from Januaryuntil December 2013. The total observed experimentsconsisted of 99 VLBI sessions and continuous GPSmonitoring recordings.
1 General Information
The Radio Observatorio Espacial do Nordeste, ROEN,located at INPE facilities in Eusebio, nearly 30 km eastof Fortaleza, Ceara State, Brazil, began operations in1993. Geodetic VLBI and GPS observations are car-ried out regularly, as contributions to international pro-grams and networks. ROEN is part of the Brazilianspace geodesy program, which was initially conductedby CRAAE (a consortium of the Brazilian institutionsMackenzie, INPE, USP, and UNICAMP) in the early1990’s. The program began with antenna and instru-mental facilities erected, with activities sponsored bythe U.S. agency NOAA and the Brazilian Ministry ofScience and Technology’s FINEP agency.
ROEN is currently coordinated by CRAAM,Center of Radio Astronomy and Astrophysics, Engi-neering School, Mackenzie Presbyterian University,Sao Paulo, in agreement with the Brazilian NationalSpace Research Institute, INPE. The activities are cur-
1. Universidade Presbiteriana Mackenzie, CRAAM and INPE,Radio Observatorio Espacial do Nordeste, ROEN2. Instituto Nacional de Pesquisas Espaciais, ROEN
Fortaleza Network station
IVS 2013 Annual Report
rently carried out under an Agreement of Cooperationsigned between NASA—representing research inter-ests of NOAA and USNO—and the Brazilian SpaceAgency, AEB, which has been extended until 2021.Under the auspices of the NASA-AEB Agreement,a contract was signed between NASA and CRAAM,Mackenzie Presbyterian Institute and University topartially support the activities at ROEN.
The counterpart of the operational costs, staff, andsupport of infrastructure are provided by INPE and byMackenzie.
Fig. 1 14.2-m radio telescope.
106

Fortaleza 2013 Report 107
2 Main Instruments
The largest instrument at ROEN is the 14.2-m radiotelescope, on an alt-azimuth positioner. It is operated atS- and X-bands, using cryogenic radiometers. The sys-tem is controlled by the Field System, version 9.10.4.Observations are recorded with a Mark 5 system. OneSigma-Tau hydrogen maser clock standard is operatedat ROEN. GPS monitoring is performed within a co-operative program with NOAA (USA). There is a Le-ica System 1200 installed at the station that operatescontinuously. The collected data are provided to theNOAA/IGS center and to the Brazilian IBGE cen-ter. ROEN has all basic infrastructures for mechanical,electrical, and electronic maintenance of the facilities.
3 Staff
The Brazilian space geodesy program is coordinatedby one of the authors (PK), who is Brazil’s AEB rep-resentative in the NASA-AEB Agreement. The co-ordination receives support from the Sao Paulo of-fice at CRAAM/Instituto and Universidade Presbiteri-ana Mackenzie, with administrative support from Val-domiro M. S. Pereira and Lucıola Melissa Russi. TheFortaleza Station facilities and geodetic VLBI and GPSoperations are managed on site by Dr. Antonio MacilioPereira de Lucena (INPE), assisted by Eng. AdeildoSombra da Silva (Mackenzie), and the technicians Avi-cena Filho (INPE) and Francisco Renato Holanda deAbreu (Mackenzie).
4 Current Status and Activities
4.1 VLBI Observations
In the year 2013, Fortaleza station participated ingeodetic VLBI experiments as listed in Table 1.
Most of the recorded data are being transferred tothe correlators through a high speed network from theMark 5A recorder unit. The data from the Fortaleza sta-tion is uploaded either to the correlators in the U.S.through FIU (Florida International University) or di-rectly to the Bonn correlator.
Table 1 2013 session participation.
ExperimentNumber of SessionsIVS-R1 40IVS-R4 45IVS-T2 06IVS-R&D 01IVS-RDV 01IVS-CRF 02IVS-CRMS 02IVS-OHIG 04
4.2 Operational and MaintenanceActivities
The summary of activities performed in the period islisted below:
1) Repair and maintenance of the cryogenic system,Mark IV video converters, and antenna pointing sys-tem;
2) Survey on RFI in S-band;3) Maintenance and adjustment of DC azimuth and
elevation motors;4) Operation and maintenance of geodetic GPS
(NOAA within the scope of the NASA contract);5) Operation and maintenance of power supply
equipment at the observatory (main and diesel drivenstandby);
6) Welding at some points of the antenna structure;7) Maintenance of the Web site and the local server
computer (http://www.roen.inpe.br).
4.3 GPS Operations
The IGS network GPS receiver operated regularly at alltimes during 2013. Data were collected and uploadedto an IGS/NOAA computer.
IVS 2013 Annual Report

Goddard Geophysical and Astronomical Observatory
Ricardo Figueroa, Jay Redmond, Katherine Pazamickas
Abstract This report summarizes the technical param-eters and the technical staff of the VLBI system at thefundamental station GGAO. It also gives an overviewabout the VLBI activities during the 2013 report year.The outlook lists the outstanding tasks to improve theperformance of GGAO.
1 GGAO at Goddard
The Goddard Geophysical and Astronomical Observa-tory (GGAO) consists of a 5-meter radio telescope forVLBI, a new 12-meter radio telescope for VLBI2010development, a 1-meter reference antenna for mi-crowave holography development, an SLR site thatincludes MOBLAS-7, the NGSLR developmentsystem, a 48′′ telescope for developmental two-colorSatellite Laser Ranging, a GPS timing and develop-ment lab, a DORIS system, meteorological sensors,and a hydrogen maser. In addition, we are a fiducialIGS site with several IGS/IGSX receivers.
GGAO is located on the east coast of the UnitedStates in Maryland. It is approximately 15 miles NNEof Washington, D.C. in Greenbelt, Maryland (Table 1).
NASA Goddard Space Flight Center
GGAO Network Station
IVS 2013 Annual Report
Table 1 Location and addresses of GGAO at Goddard.
Longitude 76.4935◦ WLatitude 39.0118◦ N
MV3Code 299.0
Goddard Space Flight Center (GSFC)Greenbelt, Maryland 20771
http://cddisa.gsfc.nasa.gov/ggao/vlbi.html
2 Technical Parameters of the VLBI RadioTelescopes at GGAO
The 5-m radio telescope for VLBI at MV3 was orig-inally built as a transportable station; however, it wasmoved to GGAO in 1991 and has been used as a fixedstation. In the winter of 2002 the antenna was taken offits trailer and permanently installed at GGAO.
In October of 2010, construction of the new12-meter VLBI2010 developmental antenna was com-pleted. This antenna features all-electric drives and aCassegrain feed system. Integration of the broadbandreceiver and the associated sub-systems is underwayas a joint effort between Exelis and the MIT HaystackObservatory.
The technical parameters of the radio telescopes aresummarized in Table 2.
3 Technical Staff of the VLBI Facility atGGAO
GGAO is a NASA R&D and data collection facility.It is operated under the Space Communication Net-work Services (SCNS) contract by Exelis Inc. The staff
108

GGAO IVS Report for 2013 109
Fig. 1 Goddard Geophysical and Astronomical Observatory.
Table 2 Technical parameters of the radio telescopes at GGAO.
Parameter 5-m 12-m
Owner and operating agency NASA NASAYear of construction 1982 2010Diameter of main reflectord 5−m 12−mAzimuth range +/−270◦ +/−270◦
Azimuth velocity 3◦/s 5◦/sAzimuth acceleration 1◦/s2 1◦/s2
Elevation range +/−90◦ 5−88◦
Elevation velocity 3◦/s 1.25◦/s(Avg.)Elevation acceleration 1◦/s2 1◦/s2
Receiver SystemFocus Cassegrain CassegrainReceive Frequency 2−14GHz 2−14GHzTsys 100K 50K(T heoretical)Bandwidth 512MHz, 4 bands512MHz, 4 bandsG/T 26dB/K 43dB/K
VLBI terminal type CDP VLBI2010Recording media Mark IV Mark 5C
at GGAO consists mainly of two operators and onebackup engineer. The Exelis staff includes Jay Red-mond and Katherine Pazamickas conducting VLBI op-erations and maintenance at GGAO with the support ofRicardo Figueroa.
4 Status of MV3 and VLBI2010 at GGAO
Having ceased VLBI operations in May 2007, MV3continues on a full time basis to be a major compo-nent in the program to demonstrate the feasibility ofthe VLBI2010 broadband delay concept. Working un-
IVS 2013 Annual Report

110 Figueroa et al.
der the guidance of the Exelis team, the majority ofMV3’s S/X components have been upgraded, and an-tenna refurbishing should be completed by early 2014to provide additional support to the VLBI2010 Sys-tem. The 2013 accomplishments for the 5-m antennainclude:
• The 017 Electronic Box was refurbished and in-stalled with new wiring and upgraded components.
• The Cryogenic Dewar and the components were re-stored for X-band operations. Also, the cryogenicthermometer, vacuum gauge, and bias voltage boxwere installed and tested.
• The FSS Subreflector and Feed assembly, includ-ing the FSS, was recoated with a highly reflectivesurface, repaired, and placed back on the antenna.
• The ACU and control panel are in the process ofupgrade and troubleshooting.
• Two of the Sargent Welch Directorr Model 8816-B were refurbished using a repair kit. One wasmounted and tested in the antenna.
Much of the 2013 activities at GGAO have beenfocused on performance testing and upgrading of theVLBI2010 12-m antenna. However, there were someother activities worth noting:
• Installation of the new Broadband self-retractablefeed positioner for the 12-meter antenna. The posi-tioner is controlled remotely to lower the cryogen-ics and perform receiver maintenance.
• Continuation of wideband system testing and char-acterization of the 12-m antenna.
• Procurement of new test equipment for characteri-zation of the wideband RF hardware.
• Continuation of Broadband Phase Cal performancetesting.
• Integration of RDBEs, Mark 5Cs, and Field Systemcomputer software.
• Installation of receiver radome.• VLBI observations between Westford and GGAO
and processing of data.• Monitoring and Control Interface (MCI) installa-
tion and testing. The MCI is currently used for re-mote cryogenics and electronic status.
• Performance testing of the 16 Gbps VLBI record-ing, demonstrated using Mark 6.
• Installation of the high frequency optical fiber linksystem.
5 Outlook
GGAO will continue to support VLBI2010, e-VLBI,and other developmental activities during the upcom-ing year. Tentative plans for 2014 include:
• Continuing to upgrade the VLBI2010 broadbandreceiver system on the 12-m antenna.
• Conducting IVS observations using the Mark 5Cand Mark 6 recorders to demonstrate the VLBI2010capabilities.
• Continuing testing of the new broadband phase cal-ibrator for the VLBI2010 system.
• Continuing the upgrade of the 5-m antenna ACUand initiating testing of the S/X band.
• Continuing to measure the baseline between the 5-m and the 12-m antennas for position ties to thereference frame.
• Trying to understand the source of the azimuth andelevation gearboxes’ oil contamination.
• Trying to understand why the antenna will notmove in elevation under computer control whenfirst started up on cold mornings.
IVS 2013 Annual Report

Hartebeesthoek Radio Astronomy Observatory (HartRAO)
Marisa Nickola, Jonathan Quick, Ludwig Combrinck
Abstract HartRAO provides the only fiducial geodeticsite in Africa, and it participates in global networks forVLBI, GNSS, SLR and DORIS. This report providesan overview of geodetic VLBI activities at HartRAOduring 2013, including the 15-m radio telescope offi-cially joining geodetic VLBI operations as well as thefunding of the first African VGOS site.
1 Geodetic VLBI at HartRAO
Hartebeesthoek is located 65 km northwest of Johan-nesburg, just inside the provincial boundary of Gaut-eng, South Africa. The nearest town, Krugersdorp, is32 km away. The telescopes are situated in an iso-lated valley which affords protection from terrestrialradio frequency interference. HartRAO currently usesboth a 26-meter and a 15-meter radio telescope. The26-m is an equatorially mounted Cassegrain radio tele-scope built by Blaw Knox in 1961. The telescope waspart of the NASA deep space tracking network until1974 when the facility was converted to an astronom-ical observatory. The 15-m is an alt-az radio telescopebuilt as a Square Kilometre Array (SKA) prototypeduring 2007 and converted to an operational geode-tic VLBI antenna during 2012. The telescopes are co-located with an ILRS SLR station (MOBLAS-6), anIGS GNSS station (HRAO), and an IDS DORIS sta-tion (HBMB) at the adjoining South African National
HartRAO
HartRAO Network Station
IVS 2013 Annual Report
Space Agency Earth Observation (SANSA EO) site.HartRAO is also a full member of the EVN.
Fig. 1 The HartRAO 26 m under repair after a thunderstorm andlightning strike during the Ultra-rapid R1579 on 2 April 2013(with the 15 m in the background).
2 Technical Parameters of the 26-m and15-m Telescopes of HartRAO
Table 1 contains the technical parameters of the Har-tRAO 26-m and 15-m radio telescopes, while Table 2and Table 3 contain technical parameters of the Har-tRAO 26-m and 15-m receivers, respectively. The cur-rent data acquisition systems consist of a DBBC termi-nal and a Mark 5B+ recorder for both the 26 m and the15 m. A Mark 5B and a Mark 5C recorder are used fore-transfer of data and conditioning and testing of diskpacks. Three hydrogen masers are available for use,
111

112 Nickola et al.
namely the iMaser 72, which is currently employed forVLBI on the 26 m, as well as two spares — EFOS-28,currently employed on the 15 m, and the resuscitatedEFOS-6.
Table 1 Antenna parameters.
Parameter HartRAO Hart15MOwner and operating agency HartRAO HartRAOYear of construction 1961 2007Radio telescope mount Offset equatorialAz-ElReceiving feed Cassegrain Prime focusDiameter of main reflectord 25.914m 15mFocal lengthf 10.886m 7.5mFocal ratiof/d 0.42 0.5Surface error of reflector (RMS)0.5mm 1.6mmShort wavelength limit 1.3cm 2cmPointing resolution 0.001◦ 0.001◦
Pointing repeatability 0.004◦ 0.004◦
Slew rate on each axis HA: 0.5◦ s−1 Az: 2◦ s−1
Dec: 0.5◦ s−1 El: 1◦ s−1
Table 2 26-m receiver parameters (degraded performance due todichroic reflector being used for simultaneous S-X VLBI).
Parameter X-band S-bandFeeds dual CP conicaldual CP conicalAmplifier type cryo HEMT cryo HEMTTsys (K) 52 40SSEFD (Jy) 849 1190PSS (Jy/K) 16.3 29.83 dB beamwidth (◦) 0.096 0.418
Table 3 15-m co-axial receiver parameters.
Parameter X-band S-bandFeeds stepped hornwide-angle corrugated hornAmplifier type cryo HEMT cryo HEMTTsys (K) 40 42SSEFD (Jy) 1400 1050PSS (Jy/K) 35 253 dB beamwidth (◦) 0.16 0.57
3 Current Status
The 15 m was operating in test mode at the start of2013, participating in three Ultra-Rapid sessions with
Tsukuba and Onsala during January and February2013. One of these sessions, R1573 on 18 February2013, was run in tag-along mode. The 15 m madeits official debut during another Ultra-rapid sessionwith Tsukuba and Onsala — R1580 on 8 April 2013.It joined the 26 m for the first time on 5 August2013 during the Ultra-rapid, R1597, with Onsalaand Yarragadee. Another seven dual experimentswere performed during the year with the 15-m maserhaving to be offset in frequency to prevent PCALcross-correlation. R1597 was also to be the firstformal session with HART15M using the DBBCunder FS control. On the 19th of September, the 15m participated in its first official R4, followed byanother three R4s for 2013, with the last one, R4616on 19 December 2013, wrapping up 2013 observingsession proceedings at HartRAO. The 15 m alsoreplaced the 26 m in the penultimate session of theyear adding an RD session to its tally. The 15 mparticipated in the AUSTRAL sessions, a SouthernHemisphere observing program, together with theAuScope antennas and Warkworth’s 12 m. AUSTRALsessions 10-16 were run over a period stretching fromJuly to November 2013 with a 15-day continuousAUSTRAL-CONT campaign starting on the 28th ofNovember and finishing up on 16 December 2013.All AUSTRALs, and most other sessions in which the15 m participated, were run under remote control byJonathan Quick. During 2013, the 26 m participated in,amongst others, nine Ultra-rapid sessions (R1/T2/RD)— seven together with Onsala and Tsukuba and twowith Onsala and Yarragadee. The 26 m switchedto using DBBC and Mark 5B+ in its penultimatesession for 2013, R1616 on the 16th of December.Geodetic VLBI data for all but the RDV sessions(excluding those sessions where disk packs failed)were e-transferred to the correlators. Telescope timeallocation for geodetic VLBI in 2013 consisted of 56and 37 24-hour experiments for the 26 m and 15 m,respectively (Table 4). Webcams installed for bothtelescopes may be accessed via HartRAO’s webpage.During September 2013, Ludwig Combrinck installeda tide gauge on Gough Island. A seismic vault contain-ing a seismometer, gravimeter, and accelerometer hasalso been installed on site at HartRAO.
IVS 2013 Annual Report

HartRAO 113
Table 4 Geodetic VLBI experiments in which HartRAO partici-pated during 2013.
Experiment No. of sessions on 26 m No.of sessions on 15 mR1 25 10RD 8 1T2 7 0CRDS 6 0CRF 4 0OHIG 3 0RDV 3 0R4 0 4AUST 0 7AUST13 0 15Total 56 37
4 Personnel
Table 5 lists the HartRAO station staff who areinvolved in geodetic VLBI. Jonathan Quick (VLBIfriend) provides technical support for the Field Systemas well as for hardware problems. Radio astronomerAlet de Witt attended the VLBI Training Schooland the 21st European VLBI for Geodesy and As-trometry (EVGA) Working Meeting held in Espoo,Finland in March 2013. During this meeting and thesubsequent Journees 2013 “Systemes de ReferenceSpatio-Temporels” at the Observatoire de Paris, Francein September 2013, Alet represented HartRAO in theIAU’s ICRF3 working group. Alet and microwaveengineer Ronnie Myataza participated in the SeventhIVS Technical Operations Workshop presented atHaystack Observatory in May 2013. Space Geodesystudent Denise Dale and Marisa Nickola (geodeticVLBI support) attended the VieVS Fourth UserWorkshop in Vienna, Austria during September 2013.
Table 5 Staff supporting geodetic VLBI at HartRAO.
Name Function ProgramL. Combrinck Program Geodesy
LeaderJ. Quick Hardware/Astronomy
SoftwareR. Botha Operator GeodesyJ. Grobler Operator TechnicalL. Masongwa Operator TechnicalR. Myataza Operator TechnicalM. Nickola Logistics/ Geodesy
OperationsP. Stronkhorst Operator TechnicalC. Zondi Operator Technical
5 Future Plans
Looking at the preliminary schedule for 2014, the26-m antenna’s geodetic workload has been reducedsignificantly, with only 25 of the 131 sessions allocatedto HartRAO being run on the 26 m. Hart15M will par-ticipate in both the CONT14 and AUST14 continuouscampaigns during May 2014 and November/December2014, respectively. The good news is that funds havebeen allocated for the VLBI2010 VGOS antenna. Itis to be built on site, and an appropriate location forthe antenna has already been identified to the north ofthe 26 m and the SLR station. With funding for theVGOS antenna having been allocated over the nextthree years (2014-2016), the process of procuring theantenna is expected to start in 2014. A VGOS siteinvestigation, including geotechnical and RFI studies,will be pursued during 2014. A site tie is also plannedfor the early part of the year. Work on the Lunar LaserRanger (LLR) project will continue during 2014.HartRAO intends sending a sizeable delegation tothe 8th IVS General Meeting to be held in Shanghai,China, in early March 2014, in order to put in a bid forhosting the next IVS General Meeting in 2016. Duringthis meeting, Alet will once again participate in theIAU’s ICRF3 working group discussions.
Acknowledgements
HartRAO is a National facility operating underthe auspices of the National Research Foundation(NRF), South Africa. The Space Geodesy Programmeis an integrated program, combining VLBI, SLR,and GNSS, and it is active in several collaborativeprojects with GSFC, JPL, and GFZ (Potsdam) aswell as numerous local institutes. Collaboration alsoincludes CNES/GRGS/OCA and the ILRS commu-nity in a Lunar Laser Ranger (LLR) project withlocal support from the University of Pretoria andthe National Laser Centre (CSIR), among others.General information as well as news and progresson geodesy and related activities can be found athttp://geodesy.hartrao.ac.za/.
IVS 2013 Annual Report

114 Nickola et al.
Fig. 2 Ronnie and Lerato in the microwave lab measuringTrec ofthe 26 m’s 3.5-cm Dicke switch cryogenically cooled receiver.
Fig. 3 Tsys measurements of the 26-m antenna’s 3.5-cm Dickeswitch cryogenically cooled receiver and feed.
Fig. 4 Ronnie at the entrance to the vault with the 26 m and the15 m behind him and the SLR and the LLR to his right.
Fig. 5 Ludwig installing a tide gauge on Gough Island in theSouth Atlantic Ocean.
Fig. 6 Hardware gecko — luckily these days data are being e-transferred.
IVS 2013 Annual Report

AuScope VLBI Project and Hobart 26-m Antenna
Jim Lovell 1, John Dickey 1, Brett Reid 1, Jamie McCallum 1, Stas Shabala 1, Christopher Watson 2, LuciaPlank 1, Simon Ellingsen 1, Anthony Memin 1
Abstract This is a report on the activities carried out atthe University of Tasmania in support of the three AuS-cope VLBI observatories and the Hobart 26-m antenna.In 2013 the antennas participated in 110 IVS sessionsfor a total of 262 antenna days of observing, 116 morethan in 2012. An increase in operations funding in 2013has enabled us to increase our observing load, includ-ing 60 days per year for AUSTRAL which is focusedon high priority geodetic and astrometric programs inthe southern hemisphere. In this report we also brieflyhighlight our research activities during 2013 and ourplans for 2014.
1 General Information
As part of AuScope (www.auscope.org.au), the Univer-sity of Tasmania (UTAS) operates the AuScope VLBIArray (Lovell et al., 2013), three 12-m diameter ra-dio telescopes on the Australian continent, located nearHobart (Tasmania), Yarragadee (Western Australia),and Katherine (Northern Territory).
The Hobart telescope (Hb) is co-located with theexisting 26-m telescope (Ho) to preserve the more than20-year VLBI time series at the site. Midway betweenthe 26-m and 12-m telescopes is the HOB2 GNSS in-stallation which has been a core site of the InternationalGNSS Service (IGS) since its conception. A hut capa-ble of housing a mobile gravimeter is also co-located
1. School of Mathematics and Physics, University of Tasmania2. School of Geography and Environmental Studies, Universityof Tasmania
Hobart 12-m and 26-m, Katherine, and Yarragadee
IVS 2013 Annual Report
on the site. The Yarragadee telescope (Yg) provides afar western point on the continent and is co-locatedwith multiple existing geodetic techniques includingSLR, GNSS, DORIS, and gravity. The Katherine site(Ke) is new and provides a central longitude, north-ern site. The telescope at Katherine is co-located with anew GNSS site that forms part of the AuScope GNSSnetwork.
Each AuScope VLBI observatory is equipped witha 12.1-m diameter main reflector. The telescope speci-fications include: 0.3 mm of surface precision (RMS),fast slewing rates (5 deg/s in azimuth and 1.25 deg/sin elevation), and acceleration (1.3 deg/s/s). All threesites are equipped with dual polarization S- and X-bandfeeds with room temperature receivers covering 2.2 to2.4 GHz at S-band and 8.1 to 9.1 GHz at X-band. Sys-tem Equivalent Flux Densities (SEFDs) are 3500 Jy inboth bands. Data digitization and formatting is man-aged by the Digital Base Band Converter (DBBC) sys-tem, and data are recorded using the Mark 5B+ system.Each site is equipped with a Hydrogen maser time andfrequency standard.
All three observatories were designed and con-structed to be remotely controlled and monitored tokeep operating costs at a minimum. Operation ofthe AuScope VLBI array is being carried out from adedicated operations room on the Sandy Bay campusof the University of Tasmania.
2 Staff
Staff at UTAS consists of academics Prof. John Dickey(director), Dr. Simon Ellingsen, Dr. Christopher Wat-son, and Prof. Peter McCulloch. Dr. Jim Lovell is
115

116 Lovell et al.
Project Manager for the AuScope VLBI project. Dr.Jamie McCallum, Dr. Stas Shabala, Dr. Lucia Plank,and Dr. Anthony Memin are post-doctoral fellows whoare carrying out research aimed at improving geodeticsolutions in the southern hemisphere. Mr. Brett Reidis the Observatory Manager whose position is fundedby the university. In addition we have an electronicstechnical officer, Mr. Eric Baynes. For operation ofthe observatories during geodetic observations we relyheavily on support from astronomy PhD and post grad-uate students. Logistical and maintenance support atKatherine is provided by Mr. Martin Ephgrave and atYarragadee by Mr. Randall Carman and team at theMOBLAS5 SLR station.
3 AuScope VLBI Project Status
The AuScope VLBI array is currently funded for op-erations at the level of up to 170 observing days peryear until mid 2015. This includes 60 days per yearfor the AUSTRAL program and, in 2014, the CONT14campaign. The Hobart 26-m antenna will continue toparticipate in IVS observations at the level of twelvedays per year, primarily to assist in the maintenanceand enhancement of the Celestial Reference Frame inthe southern hemisphere. The 26 m will also participatein CONT14.
4 Geodetic VLBI Observations
In 2013 the AuScope and Hobart 26-m antennas partic-ipated in 110 IVS sessions (up from 72 in 2012) for atotal of 262 antenna days of observing, 116 more thanthe previous year. A summary of the observations ispresented in Table 1.
4.1 The AUSTRAL Program
The 60 day per year AUSTRAL Program commencedin July 2013 and will run for two years initially. Obser-vations are being made with the three AuScope anten-nas as well as the Warkworth 12 m and Hartebeesthoek15 m (Figure 1). The Hobart 26 m and Hartebeesthoek
Table 1 AuScope and Hobart 26-m antenna participation (num-ber of days) in IVS sessions in 2013. The AUST13 series of ob-servations was a 15-day CONT-like session as part of the AUS-TRAL program.
Session AntennaHo Hb Ke Yg
APSG 2AUST13 15 15 15AUSTRAL 9 9 9CRDS 6 5 5 3CRF 1 3 3 4OHIG 3 3 3R&D 6 1 1 1R1 28 26 22R4 27 22 23T2 2 2 1Total 13 95 86 81
26 m also participate for some observations. Schedul-ing is carried out in VieVS, and data are correlated atthe Curtin University software correlator.
The AUSTRAL observing program is divided intothree streams focused on high priority geodetic and as-trometric aims in the southern hemisphere:
1. astrometric observations to monitor and enhancethe southern hemisphere reference frame in prepa-ration for ICRF3;
2. regular observations to improve the density of thegeodetic time series for the southern antennas andmeasure and monitor the motion and deformationof the Australian plate;
3. four 15-day CONT-like sessions over two years todemonstrate the full capabilities of the array, char-acterize the level of systematic errors caused by thetroposphere and source structure, and develop andtry error mitigation strategies.
For four experiments during 2014, the 26-m anten-nas at Hartebeesthoek and Hobart will join the AUS-TRAL array. With the same atmosphere and clocks ateach site, and with baselines to each pair observingthe same source structure, we hope to further under-stand the systematic uncertainties due to troposphereand source structure.
4.1.1 Post-correlation Data Processing
Starting in late 2012, the University of Tasmaniahas begun handling the post-correlation processing
IVS 2013 Annual Report

AuScope VLBI 117
Hartebeesthoek
Katherine
Yarragadee
Hobart
Warkworth
Fig. 1 The AUSTRAL array comprising the AuScope VLBI array, Hartebeesthoek and Warkworth.
of the AUSTRAL experiments correlated at CurtinUniversity. After the Mark IV data are made availablefrom Curtin, they are processed using fourfit, and acorrelation report is drafted. We would like to thankAlessandra Bertarini from Bonn for her extensiveassistance with these procedures. The database cre-ation is currently handled by David Gordon at NASAGSFC, as the University of Tasmania does not haveCALC/SOLVE currently installed. When the stan-dalone version of dbedit is available, this will be usedto generate and submit the NGS databases directly.AUSTRAL experiments AUST10 — AUST15 and thefirst two sessions of the AUST13 campaign have beenprocessed and submitted as NGS databases to date.
5 Research Activities
5.1 Source Structure
A key area of research over the past year has involvedinvestigating the effects of quasar structure and evo-lution on geodetic solutions. In particular, we haveinvestigated a number of astrophysical metrics relat-ing to quasars, to see whether these are good pre-dictors of position stability. In Schaap et al. (2013)
we found that scintillating sources (sources that twin-kle, showing flux density variability of a few percenton timescales of days) are significantly more stablethan non-scintillating sources. We have also consid-ered multi-frequency variability of radio sources onlonger timescales in Shabala et al. (2014) and foundthat sources which show small time lags between Sand X-band light curves have more stable positions.We plan to develop this work further in the comingyear, with the ultimate goal of helping schedulers de-cide which quasars should be included in a given IVSsession.
With TU Wien colleagues Lucia Plank and Jo-hannes Bohm, we have also developed a sourcestructure simulator to assess the impact of structurein geodetic VLBI observations. This simulator isimplemented in the VieVS software, and it allows forstudies of different analysis and scheduling strategies.In the coming year, we plan to use the simulator toinvestigate various analysis and scheduling-basedsource structure mitigation techniques, including“clever” scheduling that takes into account some apriori knowledge of source structure.
IVS 2013 Annual Report

118 Lovell et al.
5.2 Antenna Structural Deformation Study
Preliminary terrestrial surveys of the Hobart 12-m tele-scope were undertaken in 2013 in order to:
1. assess our ability to resolve time dependent refrac-tion coefficients throughout a longer automated sur-vey and
2. test the limits of Automated Target Recognition(ATR) on the Australian Geophysical ObservingSystem (AGOS) robotic telescope monitoring in-frastructure (Leica TDRA6000).
Progress was slower than hoped; however the surveyhas now been integrated with local site tie surveys un-dertaken by Geoscience Australia, with the Hobart sur-vey underway at the time of writing. We aim to com-pare time dependent IVP determinations using both thetraditional circle fit and the transformation approach,with results to be submitted in 2014. This submissionwill include an analysis of a telescope-wide deploy-ment of thermistors used to characterize the spatialvariability of temperature throughout the small 12-msteel and aluminium structure. Further work is requiredto complete the Finite-Element Analysis of the struc-ture.
References
1. Lovell, J. E. J. et al., 2013, J. Geod 87, 527.2. Schaap et al. 2013, MNRAS, 434, 585.3. Shabala et al. 2014, J. Geod. in press, arXiv:1306.0696.
IVS 2013 Annual Report

Kashima 34-m VLBI Station
M. Sekido, E. Kawai
Abstract The Kashima 34-m radio telescope has re-covered from the damages to the azimuth wheel andrail caused by the ‘Tohoku Earthquake’ in March 2011.VLBI observations, including IVS sessions and singledish observations, have restarted from April 2013. Anewly developed wideband feed was mounted on theantenna. The frequency range of 6.4-14 GHz obser-vations in single linear polarization became available.Further development of the improved feed for the 2-18GHz frequency range is under progress and expectedto be ready in 2014.
1 General Information
Fig. 1 The Kashima 34-m Radio Telescope in November 2013.
NICT Space-Time Standards Laboratory/Kashima Space Tech-nology Center
NICT Kashima Network Station
IVS 2013 Annual Report
The main facility of the Kashima VLBI station isthe 34-m diameter antenna of modified Cassegrain fo-cus type. This antenna is maintained and operated bythe VLBI group of Space Time Standard Laboratoryin the National Institute of Information and Communi-cations Technology (NICT). The station is also a partof the Kashima Space Technology Center (KSTC) as alocal branch of the NICT.
Kashima city is located on the east coast of themain island of Japan. The “Tohoku earthquake” thatoccurred in March 2011 affected Kashima city and theKSTC by destruction of some buildings and a tsunami.An azimuth wheel and rails of the 34-m antenna weredamaged by the earthquake. The replacement work ofthe four azimuth wheels and all the azimuth rail wear-strip plates was done by the end of March 2013. Figure2 shows the new wheel installed in March 2013. Align-ment of each wheel was adjusted by using a telescopeattached at the wheel axis, so that the wheel axis is ex-actly aligned to the central axis of azimuth circle withaccuracy of 1.e-5 radians. It is important so that the
Fig. 2 Installation work of new azimuth wheel.
119

120 Sekido and Kawai
wheel rolls on the azimuth rail circle without stress.The flatness of the rail height was required to be within0.1 mm RMS over the 10-m radius azimuth circle,which comes from the requirement of antenna track-ing accuracy within a tenth beam width for the 43 GHzreceiver. The repair work was completed by the endof March 2013, and work began with the same perfor-mance as before the earthquake.
2 Component Description
2.1 Receivers
The Kashima 34-m antenna is equipped with multiplereceivers from its lowest frequency in L-band up to Q-band. The performance parameters for each frequencyare listed in Table 1. Multiple receivers are changed byexchanging receiver systems at the focal point of theantenna. Each receiver is mounted on one of the fourtrolleys and only one trolley can be at the focal posi-tion. The focal position can also be moved by changingthe position and direction of sub-reflector via five axesof actuators. Thus optimum sub-reflector positions areadjusted for each receiver. When a feed system is newlymounted the sub-reflector position is adjusted for that.
L-band:
Radio Frequency Interference (RFI) from the cellphone base station (1,480 MHz) has become toostrong even to saturate the low noise amplifier (LNA)of the first stage in the L-band receiver. We installeda superconductor filter in front of the LNA, whosepass-band is 1405-1440 MHz and 1600-1720 MHz.Installation of the filter was completed in December2013, and we confirmed that the problem of LNAsaturation has been solved.
S-band:
A high temperature superconductor filter has been usedin the S-band receiver since 2002 to avoid RFI of cellphone IMT-2000. It was located after the LNA insteadof before it because the RFI was not severe enough tosaturate the LNA. On 12 November 2013, the super-
Fig. 3 Superconductor Filter installed inside L-band receiver de-war.
conductor filter lost its function because of the increaseof the filter temperature caused by aging of the cryo-genic system. We replaced the filter with a standardbandpass filter in December. Consequently, its obser-vation frequency range was slightly changed to 2,210-2,350 MHz.
Wideband:
As one of the important components of the Gala-Vproject, which is aimed to make precise frequencycomparisons over a long baseline, a new feed system(code name: IGUANA) with wideband observation ca-pability was developed and mounted in place of the C-band receiver trolley of the 34-m antenna. Room tem-perature wideband LNA is used for one linear polariza-tion in that receiver. The current performance of thisantenna is 20-40% efficiency for the 6.4-14 GHz fre-quency range [1]. A more improved feed is planned tobe installed in 2014.
32 GHz and 43 GHz Receivers:
Startup work on these two receivers is currently notcompleted. Therefore, system performance parametersare not measured in this report.
IVS 2013 Annual Report

Kashima 34-m Station 121
Table 1 Antenna Performance parameters of the Kashima 34-m telescope.
Receiver Pol. Frequency Parameter (2013)
L-band RHCP/LHCP1405-1440MHz, 1600-1720MHzSEFD∼ 500JyS-band RHCP/LHCP 2210-2350MHz SEFD∼ 250JyX-band RHCP/LHCP 8180-9080MHz SEFD∼ 370JyWIDE V-Linear Pol. 6.4-15GHz SEFD∼ 1500 JyK-band LHCP 22 - 24 GHz SEFD∼ 1300 JyKa-band RHCP 31.7-33.7GHz NAQ-band 42.3-44.9GHz NA
Fig. 4 Wideband (IGUANA) feed installed in the receiver roomof Kashima 34m telescope.
2.2 Data Acquisition System
Several VLBI data acquisition systems have been de-veloped and installed in the Kashima 34-m telescope.
K5/VSSP32 [2]: has been employed for all geodeticVLBI observations as a multi-channel data acquisi-tion system.
K5/VSI data recording systems: is composed of aPC-VSI data capture card (PCI-X interface) and aPC with raid disk systems. This system has beenused in combination with an ADS3000+ samplerfor wideband observations (1024Msps/1ch/1bit,128Msps/1ch/8bit).
K6/OCTAD-G (code name ‘GALAS’) sampler: isthe newly developed sampler for the Gala-V project[3]. The GALAS samples the RF signal withoutfrequency conversion and acquires four widebandsignals with 1024 MHz bandwidth via the digitalfilter function implemented in it. This sampler
is under evaluation and will be employed for theproject in 2014.
K4/VSOP terminal: has been used for joint astro-nomical observations with JVN [4].
Network Connections and Data Server
Due to the collaboration with JGN-X, a high speed re-search network provider hosted by NICT, the 10 Gbpsnetwork is available between the Kashima and Koganeistations. Due to the limiting of network switch and con-nection, the VLBI data server used for e-VLBI datatransfer is connected via 1 Gbps network to the Inter-net. Therefore about 600 Mbps in/out transfer speedis constantly available. Currently three data servers areoperated for e-VLBI data exchanges (Table 2).
Table 2 Data servers at Kashima Station and its capacity.
Hostname Path Disk Size
vlbi2.jp.apan.net /vlbi2/ 12 T Bytesk51b.jp.apan.net /vlbi3/ 26 T Bytesk51c.jp.apan.net /vlbi4/ 24 T Bytes
3 Staff
Kawai Eiji: is the main engineering researcherin charge of the hardware maintenance and theoperation of the Kashima 11-m and 34-m antennas[5]. He is responsible for routine geodetic VLBIobservations for IVS.
Hasegawa Shingo: is supporting staff for IVS obser-vation preparation and maintenance of file serversfor e-VLBI data transfer.
IVS 2013 Annual Report

122 Sekido and Kawai
Tsutsumi Masanori: is supporting staff for data ac-quisition PCs and networks.
Takefuji Kazuhiro: is a researcher using the 34-mantenna for the Gala-V project and the Pulsar obser-vations. He performed startup work of the widebandIGUANA receiver including adjusting sub-reflectorposition and measured the SEFD of the new re-ceiver.
Ujihara Hideki: has designed the new widebandIGUANA feed.
Ichikawa Ryuichi: is in charge of keeping GNSS sta-tions and GNSS observations.
Sekido Mamoru: is responsible for the Kashima 34-m antenna as the group leader. He is maintainingField System FS9 software for this station and oper-ating the Kashima and Koganei 11-m antennas [5]for IVS sessions.
4 Current Status and Activities
The Kashima 34-m telescope has completely recov-ered from the damage of the “Tohoku earthquake” andhas rejoined VLBI observations (IVS-T2, IVS-CRF,JADE, and JVN) and single dish observations (Sgr-A* and Jupiter) since April 2013. Strong RFIs in L-band became more severe from cell phone base sta-tions. We observed saturation of LNA in the worst casescenario and decided to introduce a superconductor fil-ter in front of the LNA as a countermeasure. Productionand installation of the filter was completed in Decem-ber 2013. Now we confirmed that the filter suppressesRFI signal from cell phone base stations and receiverperformance was recovered.
The main mission of the VLBI group of NICTis the development of VLBI systems for distant fre-quency comparison. That project, named GALA-V [3],includes upgrading the receiver of the 34-m telescopeto enable wideband observation in frequency range 2.2- 18 GHz, which covers the frequency range (2-14GHz) of VGOS [6]. Based on the requirement of nar-row beam width on the wideband feed, original design-ing of the feed system was made for the 34-m tele-scope.
5 Future Plans
Evaluation of the wideband receiver system will be per-formed in 2014. Additionally, an improved version ofthe feed is under development and expected to be readyin the first half of 2014. Wideband VLBI observationsin combination with small diameter antennas and theKashima 34-m telescope will be performed, and engi-neering evaluation including feed, sampler, and phasecalibration systems will be made.
Acknowledgements
The development of the wideband feed was supportedby the “Joint Development Research” fund providedfrom the National Astronomical Observatory of Japanin 2013. We acknowledge Professor K. Fujisawa of Ya-maguchi University and M. Honma and M. Matsumotoof NAOJ for supporting this development. We thankthe research network JGN-X and the Information Sys-tem Section of NICT for supporting the network envi-ronment for e-VLBI.
References
1. Takefuji, K., H. Ujihara, “NICT Technology DevelopmentCenter 2013 Annual Report”, International VLBI Servicefor Geodesy and Astrometry 2013 Annual Report, edited byK. D. Baver, D. Behrend, and K. L. Armstrong, this volume,2014.
2. Kondo,T., Y. Koyama, R.Ichikawa, M.Sekido, E.Kawai, andM.Kimura, Development of the K5/VSSP System, J. Geod,Soc. Japan, Vol. 54, No 4, pp. 233-248, 2008.
3. Sekido M., et al., Development of Wide-band VLBI system(Gala-V), IVS NICT-TDC News No 33, pp.11-14, 2013.
4. Doi, A., Japanese VLBI Network, Proceedings of the 8thEuropean VLBI Network Symposium. September 26-29,2006,Torun, Poland., pp.71-74, 2006.
5. Sekido, M., E. Kawai, “Kashima and Koganei 11-m VLBIStations”, International VLBI Service for Geodesy and As-trometry 2013 Annual Report, edited by K. D. Baver, D.Behrend, and K. L. Armstrong, this volume, 2014.
6. Petrachenko, B.: VLBI2010: Progress and Challenges, IVS2012 General Meeting Proceedings, edited by D. Behrendand K. D. Baver, NASA/CP-2012-217504, p.42-46, 2012.
IVS 2013 Annual Report

Kokee Park Geophysical Observatory
Ron Curtis
Abstract This report summarizes the technical param-eters of the VLBI system at the Kokee Park Geophysi-cal Observatory and provides an overview of the activ-ities that occurred in 2013.
1 Location
The Kokee Park Geophysical Observatory (KPGO) islocated at Kokee State Park on the island of Kauaiin Hawaii at an elevation of 1,100 meters near theWaimea Canyon, often referred to as the Grand Canyonof the Pacific. KPGO is located on the map at longitude159.665◦ W and latitude 22.126◦ N.
2 Technical Parameters
The receiver is of NRAO (Green Bank) design (dualpolarization feed using cooled 15 K HEMT ampli-fiers). The antenna is of the same design and manufac-ture as those used at Green Bank and Ny-Alesund. AMark 5B+ recorder is currently used for all data record-ing.
Timing and frequency is provided by a Sigma TauMaser with a NASA NR Maser providing backup.Monitoring of the station frequency standard perfor-mance is provided by a CNS (GPS) Receiver/Computer
1. USNO2. NASA GSFC
Kokee Park Network Station
IVS 2013 Annual Report
system. The Sigma Tau performance is also monitoredvia the IGS Network.
3 Staff
The staff at Kokee Park consists of six full time peopleemployed by ITT Exelis under the SCNS contract toNASA for the operation and maintenance of the obser-vatory. Chris Coughlin, Lawrence Chang, Kiah Imai,and Ron Curtis conduct VLBI operations and mainte-nance. Ben Domingo is responsible for antenna main-tenance, with Amorita Apilado providing administra-tive, logistical, and numerous other support functions.Kelly Kim also supports VLBI operations and mainte-nance during 24-hour experiments and as backup sup-port.
4 Mission Support
Kokee Park has participated in many VLBI sessions in-cluding IVS R4 and R1. KPGO also participates in theRDV, CRF, and OHIG sessions. KPGO averaged twoexperiments of 24-hour duration each week, with dailyIntensive experiments, in 2013. KPGO began support-ing the Saturday INT2 weekend Intensive experimentsin May 2013 while the Tsukuba VLBI station was per-forming repairs. The KPGO support of the weekendIntensive experiments concludes in January 2014.
Kokee Park hosts other systems — a DopplerOrbitography and Radiopositioning Integrated bySatellite (DORIS) beacon and remote control, aQuasi-Zenith Satellite System (QZSS) monitoring
123
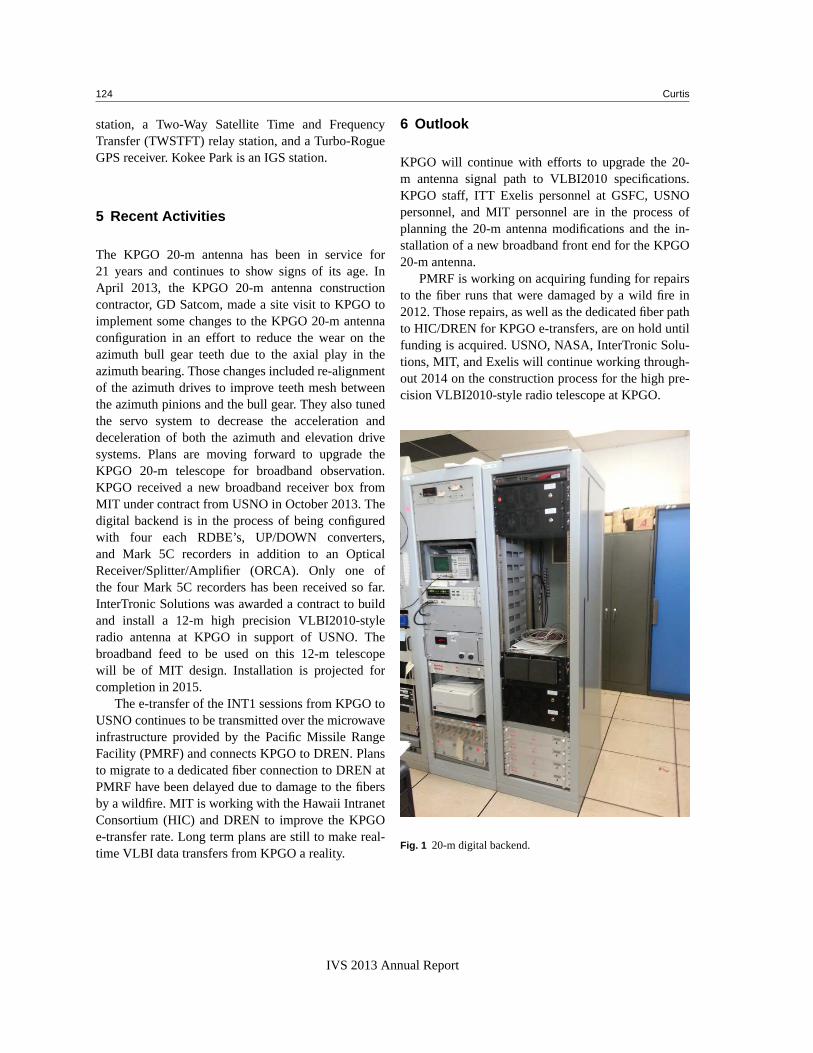
124 Curtis
station, a Two-Way Satellite Time and FrequencyTransfer (TWSTFT) relay station, and a Turbo-RogueGPS receiver. Kokee Park is an IGS station.
5 Recent Activities
The KPGO 20-m antenna has been in service for21 years and continues to show signs of its age. InApril 2013, the KPGO 20-m antenna constructioncontractor, GD Satcom, made a site visit to KPGO toimplement some changes to the KPGO 20-m antennaconfiguration in an effort to reduce the wear on theazimuth bull gear teeth due to the axial play in theazimuth bearing. Those changes included re-alignmentof the azimuth drives to improve teeth mesh betweenthe azimuth pinions and the bull gear. They also tunedthe servo system to decrease the acceleration anddeceleration of both the azimuth and elevation drivesystems. Plans are moving forward to upgrade theKPGO 20-m telescope for broadband observation.KPGO received a new broadband receiver box fromMIT under contract from USNO in October 2013. Thedigital backend is in the process of being configuredwith four each RDBE’s, UP/DOWN converters,and Mark 5C recorders in addition to an OpticalReceiver/Splitter/Amplifier (ORCA). Only one ofthe four Mark 5C recorders has been received so far.InterTronic Solutions was awarded a contract to buildand install a 12-m high precision VLBI2010-styleradio antenna at KPGO in support of USNO. Thebroadband feed to be used on this 12-m telescopewill be of MIT design. Installation is projected forcompletion in 2015.
The e-transfer of the INT1 sessions from KPGO toUSNO continues to be transmitted over the microwaveinfrastructure provided by the Pacific Missile RangeFacility (PMRF) and connects KPGO to DREN. Plansto migrate to a dedicated fiber connection to DREN atPMRF have been delayed due to damage to the fibersby a wildfire. MIT is working with the Hawaii IntranetConsortium (HIC) and DREN to improve the KPGOe-transfer rate. Long term plans are still to make real-time VLBI data transfers from KPGO a reality.
6 Outlook
KPGO will continue with efforts to upgrade the 20-m antenna signal path to VLBI2010 specifications.KPGO staff, ITT Exelis personnel at GSFC, USNOpersonnel, and MIT personnel are in the process ofplanning the 20-m antenna modifications and the in-stallation of a new broadband front end for the KPGO20-m antenna.
PMRF is working on acquiring funding for repairsto the fiber runs that were damaged by a wild fire in2012. Those repairs, as well as the dedicated fiber pathto HIC/DREN for KPGO e-transfers, are on hold untilfunding is acquired. USNO, NASA, InterTronic Solu-tions, MIT, and Exelis will continue working through-out 2014 on the construction process for the high pre-cision VLBI2010-style radio telescope at KPGO.
Fig. 1 20-m digital backend.
IVS 2013 Annual Report

Kokee Park 2013 Report 125
Fig. 2 20-m broadband feed.
Table 1 Technical parameters of the radio telescope at KPGO.
Parameter Kokee Park
owner and operating agency USNO-NASAyear of construction 1993radio telescope system Az-Elreceiving feed primary focusdiameter of main reflectord 20mfocal lengthf 8.58mf/d 0.43surface contour of reflector 0.020inchesrmsazimuth range 0. . .540◦
azimuth velocity 2◦/sazimuth acceleration 1◦/s2
elevation range 0. . .90◦
elevation velocity 2◦/selevation acceleration 1◦/s2
X-band(referenceν = 8.4GHz,λ = 0.0357m)
8.1−8.9GHz
Tsys 40KSSEFD(CASA) 900JyG/T 45.05dB/Kη 0.406
S-band(referenceν = 2.3GHz,λ = 0.1304m)
2.2−2.4GHz
Tsys 40KSSEFD(CASA) 665JyG/T 35.15dB/Kη 0.539
VLBI terminal type VLBA/VLBA4-Mark 5Field System version 9.11.1
IVS 2013 Annual Report

Kashima and Koganei 11-m VLBI Stations
M. Sekido, E. Kawai
Abstract The Kashima and Koganei 11-m stationshave been used for geodetic and astronomical moni-toring observations and as an R&D test bed of VLBItechnology. Unfortunately the Kashima 11-m stationhas stopped due to an accidental cable break that hap-pened in October 2013. This will be fixed in earlyMarch 2014. The Koganei 11-m antenna has been con-stantly operated for VLBI and satellite down-link ob-servations.
1 General Information
A pair of 11-m diameter antennas is operated bythe VLBI group of Space-Time Standard Laboratory(STSL) of the National Institute of Information andCommunications Technology (NICT). The Kashima11-m antenna is located in Kashima Space TechnologyCenter (KSTC), on the east coast of the Japanesemain island. The Koganei 11-m antenna is located inthe headquarters of the NICT in Tokyo (Figure 1).The 11-m VLBI antennas at Kashima and Koganei(Figure 2) were established and have been operatedfor the monitoring of crustal deformation of the Tokyometropolitan area (Key Stone Project) since 1995[1]. After regular VLBI observations, the KSP VLBINetwork terminated in 2001. Since then, the 11-mVLBI stations at Kashima and Koganei have mainlybeen used for research and technology developments.“The Tohoku earthquake” that occurred in March 2011
NICT Space-Time Standards Laboratory/Kashima Space Tech-nology Center
NICT KSP Network Station
IVS 2013 Annual Report
Fig. 1 Location of NICT-Koganei Headquarters, and Kashima.
affected Kashima city and the KSTC by the destructionof some buildings and by a tsunami. Fortunately thedamage to the Kashima 11-m antenna was not assevere as that of the Kashima 34-m antenna. TheKoganei 11-m antenna in Tokyo was also safe. Thustwo antennas could be used for measurements of post-seismic crustal deformation of the Kashima-Koganeibaseline. The Kashima and Koganei 11-m stationsparticipated in IVS-R1, T2, and APSG sessions fromMay 2011 and August 2011, respectively.
126

Kashima and Koganei VLBI Stations 127
Fig. 2 11-m VLBI antennas at Kashima (left panel) and Koganei (right panel).
Table 1 The antenna parameters of the 11-m antennas.
Kashima Koganei
Antenna Type Cassegrain typeDiameter 11-mMount Style Az El mountLatitude N 35◦ 57’ 19.46” N 35◦ 42’ 37”.89Longitude E 140◦ 39’ 26.86” E 139◦ 29’ 17”.06Altitude 62.4 m 125.4 m
S band 2212∼ 2360 2212∼ 2360Rx Freq. X Low band 7700∼ 8200 7700∼ 8200[ MHz ] X High band 8180∼ 8680 8100∼ 8600
S band 3000 3000Local Freq.X Low band 7200 7200[ MHz ] X High band 7680 7600SEFD [ Jy ]X-band 5700 9500
S-band 3300 5500
2 Component Description
2.1 Antenna
The antenna parameters of Kashima-11 and Koganei-11 are summarized in Table 1. The band-pass filters forS-band (2212-2360 MHz) were installed in 2010 for ra-dio frequency interference mitigation at both stations.
2.2 Data Acquisition System: Sampler
Two sorts of sampler are available at both stations assummarized in Table 2. The K5/VSSP32 [2] has fourchannels of video band signal input per unit. Four unitsof K5/VSSP32 constitute one geodetic VLBI termi-nal with 16 inputs. This system is constantly used forgeodetic VLBI observations. This sampler has digitalfilter functionality realized by FPGA in it. The inputvideo signal is digitized with 8-bit quantization with64 MHz sampling. Then the frequency bandwidth isrestricted and output by reduced data rate for requestedsampling mode. The output data is written to a standardLinux file system in K5/VSSP32 format. Data formatconversion from K5/VSSP32 to Mark IV, VLBA, andMark 5B are possible with conversion tools1.
The ADS3000+ [3] is a sampler with digital base-band conversion (DBBC) function. Several kinds ofdata acquisition modes (personalities) are switchableby loading FPGA program. The DBBC mode enablesflexible selection of 16 video frequency channels withany of 4/8/16/32 MHz bandwidth. Therefore this canbe compatible with conventional 16 channels of geode-tic VLBI observations. One channel of 8 bits with 128MHz sampling mode has been used for astronomicalobservations with a higher dynamic range, such as pul-sar observations. Another channel of 1/2-bit 1024 MHz
1 Observation and data conversion software for K5/VSSP arefreely available fromhttp://www2.nict.go.jp/aeri/sts/stmg/K5/VSSP/index-e.html
IVS 2013 Annual Report

128 Sekido and Kawai
Table 2 VLBI data sampler/DAS system available at theKashima and Koganei 11-m stations.
System K5/VSSP32(4 units)ADS3000+(K5/VSI)
Video Converter K4/KSP 16ch not necessary# of Input Channels 4 /unit x 4 units 1 or 2
# of Output Channels 16 1,2, 16Input Freq. Range 0 - 300 MHz 0 - 2 GHz
Sampling Rate 0.04,0.1,0.2,0.5,1, 128, 256, 1024,[Msps] 2,4,8,16,32,64 2048,4096
Quantization bit 1,2,4,8 bitMax. data rate [Mbps] 256 /unit x 4 4096
Output Interface USB 2.0 VSI-H
sampling is used for wide-band single channel VLBIobservations. This mode is going to be used in theGala-V project [4].
2.3 Network Connection
The local area network connections from the Kashima34-m antenna site to the Kashima 11 m and the Ko-ganei 11 m are 10 Gbps and 1 Gbps, respectively. Theobservational data of IVS sessions are gathered to thee-VLBI data server at the Kashima 34-m site, and thenthose data are provided to the correlator through a 1Gbps network link of the Japanese research networkJGN-X.
3 Staff
Kawai Eiji: In charge of station care/maintenanceand IVS observations.
Hasegawa Shingo: Supporting staff for IVS observa-tion preparation, operation, and maintenance of fileservers for e-VLBI data transfer.
Ichikawa Ryuichi: In charge of GNSS station careand GNSS observations.
Sekido Mamoru: In charge of overall activities of theKashima and Koganei VLBI stations.
4 Current Status and Activities
The Kashima and the Koganei 11-m stations are par-ticipating in geodetic VLBI sessions IVS-T2, APSG,and JADE, about once a month. These two stations areused as a test bed of R&D experiments including a fea-sibility study of frequency comparison with VLBI. Inaddition, flux monitoring of Sgr-A* with the Kashima— Koganei baseline has been performed in collabora-tion with S. Takekawa and T. Oka of Keio University[5].
However a tear of cables (coaxial cables and status-control lines) happened at the Kashima 11-m antennain October 2013 by accident. It was caused by agingand the breaking of strings for cable binding. Loos-ened cables were caught on the antenna structure dur-ing observing. Then they were stretched and torn byantenna motion. The work of replacing the cables wascontracted and expected to be finished by early March2014.
The Koganei 11-m antenna is jointly operated bytwo groups in the NICT; the STSL and the SpaceWeather and Environment Informatics Laboratory(SWEIL). When the antenna is not used for VLBIobservations, it is used for down link observationsfrom the Stereo satellite2 by the SWEIL.
5 Future Plans
As medium size radio telescopes, the Kashima and theKoganei 11-m antennas have good slew speed (3 de-grees/sec) and stable observation performance. This in-terferometer will be continuously used for good R&DVLBI experiments.
Acknowledgements
We thank the research network JGN-X and the Infor-mation System Section of NICT for supporting the net-work environment for e-VLBI.
2 http://www.nasa.gov/missionpages/stereo/main/index.html
IVS 2013 Annual Report
Kashima and Koganei VLBI Stations 129
References
1. Special issue for the Key Stone Project, J. Commun. Res.Lab., Vol. 46, No. 1, pp.1-221, 1999.
2. Kondo,T., Y. Koyama, R. Ichikawa, M. Sekido, E. Kawai,and M. Kimura, Development of the K5/VSSP System, J.Geod, Soc. Japan, Vol. 54, No 4, pp. 233-248, 2008.
3. Takefuji, et al., “Next-generation A/D Sampler ADS3000+for VLBI2010”, in VLBI2010: From Vision to Reality, Pro-ceedings from the Sixth IVS General Meeting. Held 7-13February, 2010 in Hobart, Tasmania, Australia. Edited by D.Behrend and K.D. Baver. NASA/CP 2010-215864., p.378-382, 2010.
4. Sekido M., et al., Development of Wide-band VLBI system(Gala-V), IVS NICT-TDC News No.33, pp.11-14, 2013.
5. Takekawa, S.; Oka, T.; Sekido, M., “Progress Report of theNICT VLBI Monitoring Observations of Sgr A* at 2 GHzand 8 GHz”, The Astronomer’s Telegram, #5467, 2013.
IVS 2013 Annual Report

Matera CGS VLBI Station 2013 Annual Report
Giuseppe Bianco 1, Giuseppe Colucci 2, Francesco Schiavone 2
Abstract This report presents the status of the MateraVLBI station. An overview of the station, some tech-nical characteristics of the system, and staff addressesare also given.
1 General Information
The Matera VLBI station is located at the Italian SpaceAgency’s ‘Centro di Geodesia Spaziale G. Colombo’(CGS) near Matera, a small town in the south of Italy.The CGS came into operation in 1983 when the Satel-lite Laser Ranging SAO-1 System was installed. Fullyintegrated into the worldwide network, SAO-1 wasin continuous operation from 1983 up to 2000, pro-viding high precision ranging observations of severalsatellites. The new Matera Laser Ranging Observatory(MLRO), one of the most advanced Satellite and LunarLaser Ranging facilities in the world, was installed in2002, replacing the old SLR system. CGS also hostedmobile SLR systems MTLRS (Holland/Germany) andTLRS-1 (NASA).
In May 1990, the CGS extended its capabilities toVery Long Baseline Interferometry (VLBI), installing a20-m radio telescope. Since then, Matera has observedin 876 sessions up through December 2012.
In 1991 we started GPS activities, participatingin the GIG 91 experiment and installing at Materaa permanent GPS Rogue receiver. In 1994, six Tur-boRogue SNR 8100 receivers were purchased in
1. Agenzia Spaziale Italiana 12. e-geos - an ASI/Telespazio company
Matera Network Station
IVS 2013 Annual Report
order to create the Italian Space Agency GPS fiducialnetwork (IGFN). At the moment 12 stations arepart of the IGFN, and all data from these stations,together with 24 other stations in Italy, are archivedand made available by the CGS Web server GeoDAF(http://geodaf.mt.asi.it).
In 2000, we started activities with an AbsoluteGravimeter (FG5 Micro-G Solutions). The gravimeteroperates routinely at CGS and is available for externalcampaigns on request.
Thanks to the co-location of all precise position-ing space based techniques (VLBI, SLR, LLR, andGPS) and the Absolute Gravimeter, CGS is one of thefew “fundamental” stations in the world. With the ob-jective of exploiting the maximum integration in thefield of Earth observations, in the late 1980s, ASI ex-tended CGS’ involvement to include remote sensingactivities for present and future missions (ERS-1, ERS-2, X-SAR/SIR-C, SRTM, ENVISAT, and COSMO-SkyMed).
The Matera VLBI antenna is a 20-meter dish witha Cassegrain configuration and an AZ-EL mount. TheAZ axis has±270 degrees of available motion. Theslewing velocity is 2 deg/sec for both the AZ and theEL axes.
The technical parameters of the Matera VLBI an-tenna are summarized in Table 1.
The Matera time and frequency system consists ofthree frequency sources (two Cesium beam and one H-maser standard) and three independent clock chains.The iMaser 3000 H-maser from Oscilloquartz is usedas a frequency source for VLBI.
130

CGS/Matera 2013 Report 131
Fig. 1 VLBI antenna and MLRO dome.
Table 1 Matera antenna technical specification.
Parameter name Values (S/X)Input frequencies 2210−2450 MHz / 8180−8980 MHzNoise temperature <20 Kat dewar flangeIF output frequencies 190−430 MHz
100−900 MHzIF Output Power(300 K at inp. flange) 0.0 dBm to +8.0 dBmGain compression <1 dB at +8 dBm output levelImage rejection >45 dB within the IF passbandInter modulation At least 30 dB below each of 2 carriersproducts at an IF output level of 0 dBm per carrierTsys 55/65 KSEFD 800/900 Jy
2 Activities during the Past Year
At the end of 2013, the new T4SCIENCE iMaser 3000was installed. It replaced the>20 years old EFOS-8maser that was installed at the beginning of the VLBIactivities in Matera.
Specifications for this new maser can be foundhere: http://www.t4science.com/product/imaser3000
IVS 2013 Annual Report

132 Bianco et al.
Fig. 2 Observation time.
3 Current Status
In 2013, 52 sessions were observed. Figure 2 shows asummary of the total acquisitions per year, starting in1990.
In 2004, in order to fix the existing rail problems,a complete rail replacement was planned. In 2005, dueto financial difficulties, it was instead decided that onlythe concrete pedestal under the existing rail would berepaired. From then on, no rail movements have beennoted [1]-[3].
4 Future Plans
In order to plan the eventual building of a VLBI2010system, the fund raising investigation process has be-gun. At this moment it is not clear when the budget forstarting the project will be ready.
IVS 2013 Annual Report

Medicina Station Status Report
Andrea Orlati, Alessandro Orfei, Giuseppe Maccaferri
Abstract General information about the MedicinaRadio Astronomy Station, the 32-m antenna status,and the staff in charge of VLBI observations areprovided. Updates to the hardware were performedand are briefly described.
1 The Medicina 32-m Antenna: GeneralInformation
The Medicina 32-m antenna is located at the MedicinaRadio Astronomy Station. The station is run by the Is-tituto di Radioastronomia and is located approximately33 km east of Bologna. The Consiglio Nazionale delleRicerche was the funding agency of the Istituto diRadioastronomia until the end of 2004. Since Jan-uary 1, 2005, the funding agency has been the IstitutoNazionale di Astrofisica (INAF). The antenna, whichwas inaugurated in 1983, has regularly taken part inIVS observations since 1985 and is an element of theEuropean VLBI network.
A permanent GPS station (MEDI), which is a partof the IGS network, is installed in the vicinity. AnotherGPS system (MSEL) is installed near the VLBI tele-scope and is part of the EUREF network.
Istituto di Radioastronomia INAF, Medicina
Medicina Network Station
IVS 2013 Annual Report
2 Current Status and Activities
• Antenna - VLBI and e-VLBI experimental testswere performed by using fiber optic link insteadof coaxial cables to send receiver outputs to VLBIdata acquisition system. Fringes were found andcompared to the fringes obtained by the coaxiallink, nothing of significantly different was ob-served. Fiber optic link allows much less banddisequalization with respect to coaxial connectionwhen using large bandwidth receivers, so Medicinawill use fiber optics from now on.
• DBBC - Many VLBI tests were performed incombination with a Mark 5C in parallel withthe Mark IV. We are currently running version104 (Aug14) of the firmware. The FILA10G isnow equipped with a new release of the firmware(provided byHAT LAB), in order to work aroundthe problem related to the decimation and the trackmapping of the Mark 5C (see below).
• Mark 5C - After the repair and upgrade by Cond-uant, the unit still showed many problems, even ifthe larger part of them has been solved. The crucialissues still under investigation are:
133

134 Orlati et al.
Fig. 1 View of the Medicina 32-m dish taken during a geodetic VLBI observations.
– decimation and track mapping capabilities arenot yet implemented in Mark 5C software, Thisprevents the unit to work fully compliant toMark 5B mode.
– reliability and robustness ofdrs program. Weare currently running a buggy version 0.9.9−1.The latest release 0.9.9−19 is not usable at all,the system crashes every timereset=eraseis performed.
• Field System - Release 9.11.4 was installed and al-most completed with testing. In order to make ourFS able to command our Mark 5C, we put in placesome ad-hoc solutions. Hopefully we are now ableto run a VLBI observation fully compliant to otherMark 5B stations.
The new H-Maser was installed and is regularlyused for observation.
The cryogenics of the S/X receivers were restored.
3 Staff
Giuseppe Maccaferri returned to his full-time positionduring 2013.
4 Geodetic VLBI Observations
In 2013, Medicina took part in 31 24-hour rou-tine geodetic sessions (namely three IVS-T2, 20IVS-R4, three EUROPE, two RDV, and three R&Dexperiments).
IVS 2013 Annual Report

Metsahovi Radio Observatory Network Station 2013 AnnualReport
Minttu Uunila 1, Nataliya Zubko 2, Markku Poutanen 2, Juha Kallunki 1, Ulla Kallio 2
Abstract In 2013, Metsahovi Radio Observatory, to-gether with Finnish Geodetic Institute, observed sevenIVS sessions, five T2 sessions, and two EUROPE ses-sions. Old analog BBCs and Mark 5A were retiredduring the year, and were replaced by a DBBC anda Mark 5B+. In September, Metsahovi participated ina 4 Gbps e-VLBI demo with a FlexBuff recorder andvlbi streamer software that were both developed at thesite. Both worked perfectly. A new axis offset for theantenna was calculated.
1 General Information
Aalto University Metsahovi Radio Observatory andFinnish Geodetic Institute (FGI) are two separate insti-tutes which together form the Metsahovi IVS NetworkStation. Metsahovi Radio Observatory operates a 13.7meter radio telescope on the premises of Aalto Univer-sity at Metsahovi, Kylmala, Finland, about 35 km fromthe university campus. In the same area near MetsahoviRadio Observatory, there is the Metsahovi Fundamen-tal Geodetic Station of FGI.
2 Component Description
The Metsahovi Radio Observatory has been opera-tional since 1974. The telescope was upgraded between
1. Aalto University Metsahovi Radio Observatory2. Finnish Geodetic Institute
Metsahovi Network Station
IVS 2013 Annual Report
1992-1994. The radome was replaced with a new one,and new surface panels were installed. Metsahovi andFGI began observing IVS T2 sessions and EUROPEsessions in 2004. Approximately six to eight sessionsare observed per year. The surface accuracy of thepresent telescope is 0.1 mm (rms). The speed of theMetsahovi antenna is 1.2 degrees per second.
Metsahovi is known for its long-term quasar mon-itoring. Astronomical VLBI observations are carriedout with the 22 GHz receiver. The geodetic VLBI re-ceiver of Metsahovi uses right circular polarization and8.15-8.65 and 2.21- 2.35 GHz frequency bands.
2.1 Metsahovi Fundamental Station
Finnish Geodetic Institute is running the MetsahoviFundamental Station. It is a part of the IAG GGOSCore station network. The instrumentation includesgeodetic VLBI (in co-operation with Aalto Uni-versity), Satellite Laser Ranging (SLR), DORIS,GNSS, and absolute and superconducting gravimeters.Currently, instrumentation is being renewed basedon special funding from the Ministry of Agricultureand Forestry. During the next four years, the planincludes a new VGOS compatible radio telescope. FGIis committed to maintain and develop Metsahovi as ageodetic fundamental station.
135

136 Uunila et al.
Fig. 1 Metsahovi Radio Observatory (photo by Riku Pihlanto).
3 Staff
FGI is responsible for the geodetic VLBI observationsand is the owner of the S/X receiver. The radio tele-scope is owned and operated by the Aalto University,and an annual agreement is made on its use for geodeticVLBI sessions. It is not possible to increase the numberof annual sessions (currently six to eight) because thetelescope is mainly used for astronomical observations.Operation during the geo-VLBI sessions and technicalquestions are handled jointly; all other technical work,telescope maintenance, and maintenance of instrumen-tation are done by the personnel of the radio telescope.
Metsahovi Radio Observatory personnel workingwith IVS observations are listed in Table 1. From June2013 D.Sc.(tech.) Minttu Uunila has been in chargeof IVS VLBI observations at Metsahovi replacing, Dr.Elizaveta Rastorgueva-Foi. The preparation, operationof IVS observations, and submission of data are pro-vided by staff from FGI. The personnel engaged in thework are listed in Table 1.
4 Current Status and Activities
4.1 IVS Sessions
Metsahovi and FGI observed seven IVS sessions, fiveT2 sessions and two EUROPE sessions in 2013. Thefirst session, T2089, was observed with two record-ing systems in parallel: the old system with analogueBBCs and Mark 5A and the new one with DBBCand Mark 5B. During the T2089, some problems withthe DBBC in channels 05-08 were detected. The datawith an analog system were of better quality and wereused by correlators. All next sessions were recordedonly with the new system (DBBC and Mark 5B). Theproblems with the DBBCs channels 05-08 continuedthroughout 2013. DBBC boards will be repaired in2014 (see in BBC/DBBC status). Due to problems withDBBC and Mark 5 during session T2090, the amountof correlated data was only 40 %. T2093, EUR126and T2094 were almost problem free. However, duringsome scans, the antenna was slewing.
IVS 2013 Annual Report

Metsahovi 2013 Report 137
Table 1 Staff at Metsahovi Radio Observatory and at FGI involved in geodetic observations during 2013.
Staff at Metsahovi Radio ObservatoryName Title ResponsibilityDr. Juha Kallunki Laboratory manager VLBI equipment, NEXPReSM.Sc.(tech.) Ari Mujunen Laboratory manager NEXPReSDr. Elizaveta Rastorgueva-FoiVLBI friend VLBI observationsD.Sc.(tech.) Minttu Uunila post-doctoral researcher, IVS on-site technical contactVLBI equipment, IVS observationsM.Sc.(tech.) Petri Kirves Operating engineer ReceiversTomi Salminen Research assistant (until 6/2013) NEXPReS
Staff at Finnish Geodetic InstituteName Title ResponsibilityProf. Markku Poutanen Head of the Department of Geodesy and GeodynamicsMetsahovi research stationDr. Nataliya Zubko Senior research scientist IVS observations, analysisM.Sc. Veikko Saaranen Special research scientist operation of IVS observationsM.Sc. Ulla Kallio Senior research scientist Local ties measurementsM.Sc. Simo Marila Research scientist operation of IVS observationsDr. Diego Meschini Research scientist research on correlationDr. Jyri Naranen Special research Scientist Metsahovi infrastructure
4.2 Technical Activities and Issues
4.2.1 BBC/DBBC status
The old analog rack retaired in early 2013. TheDBBC arrived in September 2012 with the stand-aloneFILA10G. We had some issues with one group-of-fourBBCs (BBC05-08) and the boards will be repaired inJanuary 2014.
4.2.2 Recording systems
We developed a new DAQ system, the FlexBuff, usingCOTS components. Local UDP streaming performancetests were performed with wirespeed 10GE. Long (30minute) tests demonstrated the ability to write at max-imum wire speed with zero packet loss. Writing 34disks without a network (using local machines), the ar-chitecture can handle 40 Gbps, and it can always han-dle >30 Gbps. A 4 Gbps e-VLBI demo in Septem-ber proved that the FlexBuff and its recording soft-ware vlbi streamer work impeccably. Also FILA10Gwas imployed in the test to enable 4 Gbps recording.
Our old Mark 5A was retired. We had problemswith our Mark 5B+ Stream Stor board, but now at theend of the year we received it back from warranty re-pair by Conduant. We have loaned a Mark 5C Stream-Stor board from the Max Planck Institute for RadioAstronomy. 2014 will start with testing the repairedboard.
We have switched to using JIVE’s jive5ab insteadof DIMino.
4.3 Data Analysis
In 2010, FGI and Metsahovi Radio Observatory re-ceived funding for four years from the Academy ofFinland to start geodetic VLBI data analysis. In 2013,one doctoral dissertation was finished (M. Uunila: “Im-proving geodetic VLBI: UT1 accuracy, latency of re-sults and data quality monitoring”).
Data analysis at FGI is performed by N. Zubko. Theproject of source structure study and its influence on es-timated geodetic VLBI parameters has been continuedin cooperation with E. Rastorgueva-Foi. Diego Mes-chini is responsible for correlation.
Fig. 2 Metsahovi radio telescope.
IVS 2013 Annual Report

138 Uunila et al.
4.3.1 Axis offset calculations
The new value of the axis offset -3.6 mm was estimatedfrom local tie measurements performed by Ulla Kallioduring the geo-VLBI sessions since 2008. The offsetis different from the earlier value +5.1mm estimatedusing the time delay observations. We investigated theeffect of changing the offset on the coordinates by an-alyzing the geodetic VLBI campaigns with the old andthe new axis offset values [1]. The difference betweenthe old and new coordinates show that the agreementbetween the vectors from the IGS GPS point METSto the reference point of the VLBI telescope Metsahovcalculated from ITRF coordinates and estimated fromlocal tie data could improve when using the new value.
4.3.2 Local Ties between VLBI and GPS atMetsahovi
The local tie measurements between the co-located in-struments at Metsahovi are provided by Ulla Kallio.A local tie between IGS station METS and the VLBIantenna reference point was regularly performed withkinematic GPS measurements during the geo-VLBIcampaigns starting in 2008. Testing shows that a mil-limeter level accuracy can be achieved in local tievector determination with the kinematic GPS method.In 2013, the influence of thermal deformations in thelocal tie vector were studied and taken into accountin data processing. In June 2013, the GPS antennaswere taken down and sent to Gottfried Wilhelm Leib-niz Universitaet Hannover and Rheinische Friedrich-Wilhelms-Universitaet Bonn for calibration as a part ofthe EMRP SIB60 (European Metrology Research Pro-gramme, Metrology for long distance surveying). Theantennas will be re-established in January 2014.
4.3.3 Meetings
An IVS training school on VLBI for Geodesy andAstrometry was organized at Aalto University in Es-poo, Finland on March 2–5, 2013. The meeting wassponsored by IVS, the European Geosciences Union(EGU), Onsala Space Observatory (OSO), RadioNet,Aalto University and the Finnish Geodetic Institute. Atotal of 60 people participated in the School.
Fig. 3 Group photo of EVGA excursion to Metsahovi.
The school was followed by the 21st Meeting ofthe European VLBI Group for Geodesy and Astrome-try (EVGA) and the 14th IVS Analysis Workshop onMarch 5–8, 2013. The number of participants was 70.A half-day trip to Metsahovi was made on the last dayof the meeting.
5 Future Plans
In 2014, Metsahovi is scheduled to participate in threeEUROPE sessions and four T2 sessions. Minttu Uunilawill be EVN VLBI and technical friend for Metsahovistarting from January 2014 and will be in charge of allVLBI observations at Metsahovi Radio Observatory.The DBBC boards will be repaired in January 2014.
Acknowledgements
FGI and Metsahovi teams acknowledge support fromthe Academy of Finland (grant number 135101).
References
1. U. Kallio and N. Zubko. The effect of the systematic errorin the axis offset value on the coordinates estimated in VLBIdata analysis. Proceedings of the 21th Meeting of the EVGA,edited by N. Zubko and M. Poutanen, p. 237-241, 2013.
IVS 2013 Annual Report

VERA 2013 Geodetic Activities
Takaaki Jike, Yoshiaki Tamura, Makoto Shizugami
Abstract The geodetic activities of VERA in theyear 2013 are briefly described. The regular geode-tic observations are carried out both in K- and S/X-bands. The frequency of regular observations are threetimes a month—twice for the VERA internal obser-vations in K-band. The networks of the S/X sessionsare JADE of GSI and IVS-T2. The raw data of theT2 and JADE sessions are electronically transferredto the Bonn, Haystack, and GSI correlators via In-ternet. Gravimetric observations are carried out at theVERA stations. Superconducting gravimeters installedat Mizusawa and Ishigakijima in order to monitor pre-cise gravity change, and the observations continuedthroughout this year. The crustal movements generatedby the 11-March-2011 earthquake off the Pacific coastof Tohoku continued during 2013, and displacement ofthe VERA-Mizusawa position by post-seismic creep-ing continued.
1 General Information
VERA is a Japanese domestic VLBI network consist-ing of the Mizusawa, Iriki, Ogasawara, and Ishigaki-jima stations. Each station is equipped with a 20-m ra-dio telescope and a VLBI backend. The VERA Mizu-sawa 20-m antenna is shown on the left in Figure 1.The small antenna on the right is the Mizusawa 10-mantenna. The VERA array is controlled from the ArrayOperation Center (AOC) at Mizusawa via Internet.
Mizusawa VLBI Observatory, National Astronomical Observa-tory of Japan
VERA Network Station
IVS 2013 Annual Report
Fig. 1 VERA Mizusawa 20-m antenna (left) and 10-m antenna.
The primary scientific goal of VERA is to reveal thestructure and the dynamics of our galaxy by determin-ing three-dimensional force field and mass distribution.Galactic maser sources are used as dynamical probes,the positions and velocities of which can be preciselydetermined by phase referenced VLBI relative to ex-tragalactic radio sources. The distance is measured as aclassical annual trigonometric parallax. The observingfrequency bands of VERA are S and X, K (22 GHz),and Q (43 GHz). Geodetic observations are made inS/X- and K-bands. Q-band is currently not used forgeodesy. Only a single beam is used even in K-bandin geodetic observations, although VERA can observetwo closely separated (0.2◦< separation angle< 2.2◦)radio sources simultaneously by using the dual beamplatforms.
General information about the VERA stations issummarized in Table 1, and the geographic locationsare shown in Figure 2. The lengths of the baselinesrange from 1000 km to 2272 km. The skyline at Oga-sawara station ranges from 7◦ to 18◦ because it is lo-cated at the bottom of an old volcanic crater. The north-east sky at Ishigakijima station is blocked by a nearby
139

140 Jike et al.
high mountain. However, the majority of the skyline isbelow 9◦. The skylines at Mizusawa and Iriki are lowenough to observe sources with low elevation. SinceOgasawara and Ishigakijima are small islands in theopen sea and their climate is subtropical, the humid-ity in the summer is very high. This brings about highsystem temperatures in the summer, in particular in Kand Q bands. These stations and Iriki station are fre-quently hit by strong typhoons. The wind speed some-times reaches up to 60–70 m/s.
Fig. 2 Distribution of the stations in the VERA Network.
Table 1 Location.
Site name Longitude Latitude AltitudeMizusawa 141◦ 07’ 57”.199 E 39◦ 08’ 00”.726 N 75.7 m
Iriki 130◦ 26’ 23”.593 E 31◦ 44’ 52”.437 N 541.6 mOgasawara 142◦ 12’ 59”.809 E 27◦ 05’ 30”.487 N 223.0 m
Ishigakijima 124◦ 10’ 15”.578 E 24◦ 24’ 43”.834 N 38.5 m
2 Current Status
Parameters of the antennas and front- and back-endsare summarized in Tables 2 and 3, respectively. Twoobserving modes are used in geodetic observations.One is the VERA internal observation in K-band withthe recording rate of 1 Gbps. The other is the con-ventional S/X-band observation with K5-VSSP. JADE,which is GSI’s domestic observation project, and IVS-T2 sessions belong to this class. Only Mizusawa andIshigakijima participated in these sessions.
Table 2 Antenna parameters.
Diameter of main reflector 20-mMount type AZ-ELSurface accuracy 0.2mm (rms)Pointing accuracy <12”(rms)
Azimuth ElevationSlew range -90◦ – 450◦ 5◦ – 85◦
Slew speed 2.1◦/sec 2.1◦/secAcceleration 2.1◦/sec2 2.1◦/sec2
S X KHPBW 1550” 400” 150”Aperture efficiency 0.25 0.4 0.47
Table 3 Front-end and back-end parameters.
Front-end parametersFrequency band S X KFrequency range (GHz)2.18–2.368.18–8.60 21.5–24.5Receiver temperature >100◦K 100◦K 39±8 ◦KPolarization RHC RHC LHCReceiver type HEMT HEMT cooled HEMTFeed type Helical array Horn
Back-end parametersObservation type VERA T2 and JADEchannels 16 16Bandwidth/channel16MHz 4MHzFilter Digital Analog video bandRecorder DIR2000 K5VSSPRecording rate 1 Gbps 128 MbpsDeployed station 4 VERA Mizusawa, Ishigakijima
3 Staff
Noriyuki Kawaguchi is the director of Mizusawa VLBIObservatory. The geodesy group consists of Yoshi-aki Tamura (scientist), Takaaki Jike (scientist), andMakoto Shizugami (engineer).
4 Activities during the Past Year
VERA observes seven days a week, except for a main-tenance period in June and July. The 24-hour geodeticsessions are allocated twice or three times in a month.Among these geodetic sessions, VERA internal geode-tic observations in K-band are performed once or twicein a month, and Mizusawa and Ishigakijima participatein JADE by GSI or IVS-T2 sessions in S/X-band on aonce-a-month basis. The main purpose of the VERA
IVS 2013 Annual Report

VERA 2013 Report 141
internal geodetic observations is to determine relativepositions of the VERA antennas accurate enough forastrometric requirements. The purpose of the S/X ses-sions is to make the VERA coordinates refer to the IVSreference frame.
In VERA internal geodetic sessions, the regularly-used frequency changed from S/X-band to K-band in2007. The reason for the shift of the observing fre-quency band from S/X-band to K-band is to avoid thestrong radio interference by mobile phones in S-band,particularly at Mizusawa. The interfering signal whichhas line spectra is filtered out. However, this filter-ing considerably degrades the system noise tempera-ture. The interference zone is increasing, so it is likelythat S-band observations will become impossible in thenear future. On the other hand, VERA has the highestsensitivity in K-band as shown in Table 3. Thanks tothe high sensitivity in this band, the maximum numberof scans in K-band is 800/station/24-hours while thatin S/X-band is 500 at most. It has been confirmed thatthe K-band observations are far more precise. In fact,standard deviations of the individual determinations ofthe antenna positions in K-band are less than half ofthose in S/X-band.
In 2013, the long maintenance period from the be-ginning of June to the middle of August was allocated.Except for this period, VERA carried out regular VLBIobservations. We participated in seven T2 sessions andin four JADE sessions.VERA internal geodetic obser-vations were carried out 16 times. The final estimationof the geodetic parameters was derived by using thesoftware developed by the VERA team.
Continuous GPS observations were carried out ateach VERA station throughout the year. The supercon-ducting gravimeter (SG) installed within the enclosureof the Mizusawa VLBI observatory, in order to accu-rately monitor gravity change for the purpose of mon-itoring height change at the VERA Mizusawa station,continued acquisition of gravity data. Four water levelgauges surrounding the SG were used for monitoringthe groundwater level. The preliminary results showthat gravity variation due to the variation of the wa-ter table can be corrected as accurately as the 1 microgal level. An SG was newly installed also in the VERAIshigakijima station, and observations were started inJanuary 2012. The observations continued also dur-ing 2013. This observing aims at solving the cause ofthe slow slip event which occurs frequently around theIshigaki island.
5 State of the Crustal Movement after the11-Mar-2011 Earthquake at Mizusawa
After the 2011 earthquake off the Pacific coast ofTohoku (Mw=9.0) [Epoch=11 March 2011, 14:16:18JST], VERA-Mizusawa was displaced by co-seismiccrustal movement and post-seismic creeping. Alsoduring 2013, the creeping continued, although thespeed declined. According to the newest analysis, theco-seismic steps are X=-2.013 m, Y=-1.380 m, andZ=-1.072 m, and the displacement by creeping during2013 is X= -0.110 m, Y= -0.089 m, and Z= -0.036 m.
6 Future Plans
Currently, the examination into increasing the record-ing rate from 1 Gbps to 4 Gbps with direct sampling(OCTAD) is being carried out. The reconstruction ac-companying this specification change is planned alsoat SX system. Furthermore, the examination of chang-ing the recording system from tape recorder to HDD(OCTADISK) is also in force. With these changes, theoperation of the new software correlation system (OC-TACOR2) is due to become regular.
IVS 2013 Annual Report

Noto Station Status Report
Gino Tuccari
Abstract The Noto VLBI station was fully operationalin 2013. Important progress was achieved in thetechnological and instrumentation area. A great effortwas made to develop and realize VGOS (formerlyVLBI2010) compatible front- and back-end systems.The fast connection at 10 Gbps was installed.
1 Antenna and Receivers
The mechanical parts for the frequency agility installa-tion in the antenna are ready and will be transferred tothe Noto site at the beginning of 2014. The installationis planned to be after the first EVN session in 2014,when the company specialized for this type of opera-tions will be available to visit Noto. The new VGOSbroadband DBBR receiver operating in the range of 1-16 GHz is progressing. The feed and cryogenic sec-tions were completed. The choice of possible front-end LNAs is under evaluation. This receiver was devel-oped to operate on a typical 12-meter VGOS antennaand will be adapted to the Noto 32-m radio telescope,making use of a tertiary mirror operating in the ver-tex room. The receiver after appropriate amplificationof the entire broadband is operating entirely in the dig-ital domain. It indeed is part of the DBBC3 system,even though it can be operated also in an independentenvironment. The two receivers operating in the rangeof 80-100 GHz for the secondary focus and purchasedfrom IRAM will not be installed for now in the antenna
Istituto di Radioastronomia INAF, Noto
Noto Network Station
IVS 2013 Annual Report
because of a lack of funds. Indeed a dedicated tertiarymirror for properly focusing the beam is necessary asthe replacement of the existing secondary mirror. Wait-ing for the proper financing one such receiver will beadapted for measuring the atmospheric transparency,with the help of a small antenna and a pointing struc-ture, providing that a dedicated local oscillator can berealized with the existing resources.
2 H-maser
The new maser was installed in October, while the oldEFOS-5 was modified to be kept active in parallel withthe new one. Additional equipment is going to be in-stalled in order to have a continuous comparison be-tween the two atomic clocks.
3 e-VLBI
The connection at 10 Gbps was activated in October2013. Nowadays in the station e-VLBI observations at1 Gbps are routine operations.
4 DBBC
The DBBC2 system is now active as the main VLBIbackend even if the system is still not fully completefor VLBI2010. A full implementation is expected inthe next months. Since autumn all the observations,including the EVN session, have been observed with
142

Noto 2013 Report 143
this terminal. The Ethernet interface FILA10G is nowavailable, so having the 10 G connection available, 4and 8 Gbps e-VLBI experiments are today possiblewith Noto.
The DBBC3 project, a collaboration of IRA (Italy)- MPI (Germany) - (OSO) Sweden, is progressing asexpected in the scheduled time. The main parts thathave been realized are: the sampler ADB3, operatingat 4 GHz bandwidth, and the CORE3 board, able toprocess pieces of the same bandwidth in DDC and PFBmode. The FILA40G unit has been assembled. Its func-tionality is to receive multiple 10G connections comingfrom the output of the CORE3 boards and handling thedata Ethernet packets for different functionalities. Oneof them is the recording capability at 32 Gbps. A firstDBBC3 unit will be tested in Noto during 2014 withthe DBBR receiver. Figure 1 and Figure 2 show a stackof ADB3 and CORE3, and a FILA40G, respectively.
5 Observations
During 2013, 12 geodetic experiments have been ob-served: CRF73, EUR121, EUR122, CRF74, EUR123,EUR124, CRF75, T2091, EUR125, T2092, EUR126,and T2094.
IVS 2013 Annual Report

144 Tuccari
Fig. 1 Stack of DBBC3 boards for dual polarization.
Fig. 2 FILA40G.
IVS 2013 Annual Report

Ny-Alesund Geodetic Observatory 2013 Annual Report
Moritz Sieber
Abstract In 2013, the 20-m telescope at Ny-Alesund,Svalbard, operated by the Norwegian Mapping Author-ity (NMA), took part in 209 out of 211 scheduled ses-sions of the IVS program.
1 General Information
The Geodetic Observatory of the Norwegian MappingAuthority (NMA) is situated at 78.9◦ N and 11.9◦ E inNy-Alesund, in Kings Bay, at the west side of the islandSpitsbergen. This is the biggest island in the Svalbardarchipelago. In 2013, Ny-Alesund was scheduled for125 24-hour VLBI sessions, including R1, R4, EURO,RD, T2, and RDV sessions, and 86 one-hour sessionswithin the Intensives-program.
In addition to the 20-meter VLBI antenna, theGeodetic Observatory has two GNSS antennas in theIGS system and a Super Conducting Gravimeter in theGlobal Geodynamics Project (GGP) installed at thesite. A second gravimeter (a GWR “iGrav”) got setup in September and will replace the former systemafter a period of parallel measurements. The French-German AWIPEV research base in Ny-Alesundoperates a DORIS station. In October 2004, a GISTM(GPS Ionospheric Scintillation and TEC Monitor)receiver was installed at the Mapping Authority’sstructure in the frame of ISACCO, an Italian researchproject on ionospheric scintillation observations, ledby Giorgiana De Franceschi of the Italian Institute
Norwegian Mapping Authority, Geodetic Institute
NYALES20 Network Station
IVS 2013 Annual Report
Fig. 1 Telescope seen from east.
of Volcanology and Geophysics (INGV). AnotherReal-Time Ionospheric Scintillation (RTIS) Monitorwas set up by the NMA in November 2012.
1.1 Component Description
The antenna with 20-m diameter is intended for geode-tic use and receives in S- and X-band. Its design andconstruction are similar to those at Green Bank and Ko-kee Park. A rack with 14 video-converters, Mark IVdecoder, and Mark 5 sampler streams the data to aMark 5B+ recorder. A Mark 5A-unit is used to trans-fer data via network to the correlators. Timing and fre-quency is provided by a NASA NR maser, which ismonitored by a CNS system.
145

146 Sieber
1.2 Staff
The staff at Ny-Alesund consists of four people em-ployed at 75 %, which means that three full-time posi-tions are covered (see Table 1 for an overview). Eachposition goes with a three-year contract that can be ex-tended up to 12 years, but in average people stay 3–4 years. The observatory is part of the Geodetic Di-vision of the Norwegian Mapping Authority with itsmain office at Hønefoss (near Oslo).
During 2013,Asmund Skjæveland moved back tothe mainland to the love he found—all the best wishesfor the two of you. He is still within reach however,working at the NMA’s control center for the SATREF-network. His open position was covered by SusanaGarcıa-Espada, who was previously working at the sta-tion in Yebes, and she brought some sun and Spanishair to Ny-Alesund. Welcome to the Arctic!
Table 1 Staff related to VLBI operations at Ny-Alesund.
Hønefoss Section Manager Reidun KittelsrudTechnical ManagerLeif Morten Tangen
Ny-AlesundStation Manager Moritz SieberEngineer Susana Garcıa-Espada
(≥ Sept.)Engineer Geir MathiassenEngineer Kent RoskifteEngineer Asmund Skjæveland
(≤ May)
2 Current Status and Activities
2.1 Maintenance
The main bearings in one of the Az-gearboxes showedwear; as well, the top radial shaft seal was broken, lead-ing to both oil leakage and water contamination of thelubrication system. So the whole gearbox was replacedduring the maintenance period in summer, which hadto be extended by one week. Everything worked well,and the gearbox that was taken down will be over-hauled to provide a working spare one again.
2.2 Monitoring
The monitoring system has been extended by the abil-ity to send alerts by VHF radio (see Figure 2 for aflowchart). Due to the situation in Ny-Alesund (be-ing in a small village without mobile phone coverageand living and working at the same place) this waspreferred to sending e-mails or short-messages. Thewatchdog runs as a cron-job on the Field System com-puter. It checks if the Field System is running and asksfor the current logfile-name. This is the only interactionbetween these two processes; once the logfile is known,the data since the last run is searched for keywords andfigures such as:
• receiver 20K/70K temperature levels• Dewar pressure• Helium supply pressure• wind speed• Field System error codes<cc>,-<nnn>
If one of the values exceeds a threshold or an error codematches one on a predefined list, either a warning oralarm message is broadcast via VHF. Once received onthe operators’ radio it triggers an alarm.
watchdog
MET−data
Fieldsystem
receiverparameter
currentlogfile
VHF−alarm
Fig. 2 VHF alerting system.
In combination with the e-control software byA. Neidhardt et al., this is an excellent tool to reactquickly even at night, thus making night shifts unnec-essary and enabling operators to work together duringordinary working hours (sharing knowledge) insteadof going on separate shifts.
IVS 2013 Annual Report

Ny-Alesund Geodetic Observatory 147
2.3 GPS Campaign
During late August, the triennial GPS campaign wascarried out by Knut Gjerde from the Geodetic Institute,Hønefoss. 18 bolts of the reference network aroundNy-Alesund were measured over a period of five dayseach.
2.4 Session Performance
By the end of 2012, Ny-Alesund was scheduled for121 24h- and 46 1h-sessions. By the end of 2013, 123of 125 24h- and 86 1h-sessions were observed. Theincrease in the number of 1h-Intensives is due to re-placing Wettzell in the Int1 and Int2 series during theirrepair between July and September. For one R1- andone R4-session Ny-Alesund had to be taken out of theschedule due to the extension of maintenance work; asa compensation, three sessions during December andone in May were added. Four of the remaining sessionswere recorded with 98% or less. A summary can befound in Table 2.
Table 2 Sessions with trouble (that recorded 98% or less).
SessionCommentsR4576 not scheduled (announced maintenance period), but in
performance matrixRV100 interrupted observation for participation in Int1T2091 interrupted observation for participation in Int1
RD1308receiver warming up. stopped to cool down in time forsucceeding R4
R4606 missed some scans by troubleshooting receiver moni-toring issues
R1605 does not appear in schedule statistics, but observed asscheduled
R1606 not observed due to warm receiverR4596 removed from schedule, extending maintenance period
2.5 New Observatory
Due to the proximity of the airfield to the current lo-cation, the new observatory has to be built furtheraway. A road must be built first, and due to the Arcticand environmental conditions (removal and regrowthof top soil), this can only happen during the “summer”
months between June and October. More than the firsthalf of it, including a bridge and a culvert section tocross a riverbed, was finished in 2013, and work willcontinue next year.
2.6 New Instrumentation
In September, a new GWR instrument iGrav 007gravimeter was installed. It will replace the oldsuperconducting gravimeter which needed a refill withliquid helium every now and then. The former systemwill be shipped to the mainland after some months ofparallel measurements.
3 Future Plans
Ny-Alesund will participate in CONT14. Related tothat, the media pool has to be upgraded. The currentMark IV rack will be replaced by a digital backendsystem, both to replace the aged video converters andto gain experience with the new system that will beinstalled at the new site. The road construction willcontinue, and first preparations on the new observa-tory’s site will be performed. By end of the year thelast remaining hundred miles between Ny-Alesund andLongyearbyen will be covered by fiber cable, replacingthe current radio link. The cable is supposed to be op-erational in early spring 2015.
IVS 2013 Annual Report

German Antarctic Receiving Station (GARS) O’Higgins
Alexander Neidhardt 1, Christian Plotz 2, Thomas Klugel 2, Torben Schuler 2
Abstract In 2013, the German Antarctic ReceivingStation (GARS) O’Higgins contributed to the IVSobserving program with four observation sessions inFebruary. Maintenance and upgrades were made andare in progress; e.g. the complete receiver was dis-mounted and shipped to Wettzell. A new replacementdewar was finished in the labs of the observatory inYebes, Spain.
1 General Information
The German Antarctic Receiving Station (GARS) isjointly operated by the German Aerospace Center(DLR) and the Federal Agency for Cartographyand Geodesy (BKG, belonging to the duties of theGeodetic Observatory Wettzell (GOW)). The Institutefor Antarctic Research Chile (INACH) coordinatesthe activities and logistics. The 9-m radio telescope atO’Higgins is mainly used for downloading of remotesensing data from satellites such as TanDEM-X andfor the commanding and monitoring of spacecrafttelemetry. During dedicated campaigns in the Antarc-tic summer it is also used for geodetic VLBI. In 2013,the station was again manned by DLR staff and by ateam for the maintenance of the infrastructure (e.g.power and freshwater generation) the entire year.BKG staff was there from January to the beginning ofMarch. The VLBI campaign in November—December
1. Forschungseinrichtung Satellitengeodasie (FESG), Technis-che Universitat Munchen2. Bundesamt fur Kartographie und Geodasie (BKG)
GARS O’Higgins Network Station
IVS 2013 Annual Report
2013 had to be canceled again, as the VLBI receiver iscurrently in Wettzell for maintenance.
Over the last few years, special flights using “Her-cules C-130”-aircrafts and small “Twin Otter DHC-6”-aircrafts as well as transportation by ship were or-ganized by INACH in close collaboration with theChilean Army, Navy and Airforce and with the Brazil-ian and Uruguayan Airforce in order to transport staff,technical material and food for the entire stay fromPunta Arenas via Base Frei on King George Islandto O’Higgins on the Antarctic Peninsula. The condi-tions for landing on the glacier are strongly weatherdependent and involve an increasing risk; in general,transport of personnel and cargo is always a challeng-ing task. Arrival and departure times strongly dependon the climate conditions and on the logistic circum-stances.
After each Antarctic winter the VLBI equipment atthe station must be initialized again. Damages result-ing from the winter conditions or strong storms haveto be identified and repaired. Shipment of each kind ofmaterial, such as spare parts or upgrade kits, has to becarefully prepared in advance.
Besides the 9-m VLBI antenna, which is used forthe dual purposes of receiving data from and sendingcommands to remote sensing satellites and performinggeodetic VLBI, other geodetically relevant instrumentsare also operated upon on location:
• an H-maser, an atomic Cs-clock, a GPS time re-ceiver, and a Total Accurate Clock (TAC) offer timeand frequency.
• two GNSS receivers both operating in the frame ofthe IGS network, while one receiver is additionallypart of the Galileo CONGO network. The receiversworked without failure.
148

GARS O’Higgins 149
Fig. 1 The Web cam image of the VLBI antenna and some real-time penguin cams from the O’Higgins Web page.
• a meteorological station providing pressure, tem-perature, and humidity and wind information, aslong as the temporarily extreme conditions did notdisturb the sensors.
• a radar tide gauge which was installed in 2012. Theradar sensor itself is space referenced by a GPS-antenna mounted on top and Earth referenced viathe local survey network. The radar gauge is oper-ated only during the Antarctic summer.
• an underwater sea level gauge for permanent mon-itoring of water pressure, temperature, and salinity.
2 Staff
The members of staff for operation, maintenance andupgrade of the VLBI system and other geodetic devicesare summarized in Table 1.
Table 1 Staff - members of RTW.Name Affiliation Function Mainly
working forTorben Schuler BKG head of the GOW GOW
(since January 2013)Christian Plotz BKG electronic engineer O’Higgins,
(chief engineer RTW) RTW, TTWChristian Schade BKG geodesist O’Higgins
operator, SLRReiner Wojdziak BKG software engineer O’Higgins,
IVS Data CenterLeipzig
Andreas Reinhold BKG geodesist O’Higginsoperator
Thomas Klugel BKG geologist administrationlaser gyro/local systemsWettzell
Rudolf Stoeger BKG geodesist logistics forO’Higgins,GNSS
Alexander NeidhardtFESG head of the VLBI groupRTW, TTWand VLBI station chief
Gerhard KronschnablBKG electronic engineer TTW, RTW,(chief engineer TTW) TIGO
3 Observations in 2013
GARS participated in the following sessions of the IVSobserving program during the Antarctic summer cam-paign (January-March 2013):
• IVS-OHIG82 February 11 - 12, 2013• IVS-OHIG83 February 13 - 14, 2013• IVS-T2088 February 19 - 20, 2013• IVS-OHIG84 February 20 - 21, 2013
The observations were recorded with Mark 5A. Therelated data modules were carried from O’Higgins toPunta Arenas by the staff members on their way backhome. From Punta Arenas, the disk units were shippedby regular air freight back to Wettzell and then to thecorrelator in Bonn, Germany.
4 Technical Improvements andMaintenance
The extreme environment conditions in the Antarcticrequire special attention to the GARS telescope and theinfrastructure. Corrosion frequently results in problemswith connectors and capacitors. Defective equipmentneeds to be detected and replaced. The antenna, theS/X-band receiver, the cooling system, and the data ac-quisition system have to be activated properly. A prob-
IVS 2013 Annual Report

150 Neidhardt et al.
lem is the low transfer rates (often with only 50 kbps)on the communication connection, so the Internet andphone access were reduced. Also, the Web cams areregularly maintained.
Special maintenance tasks focused on the stabiliza-tion of the timing system, where the NTP-server is nowconnected to the external PPS-signal of the Cesiumstandard. The GNSS-antennas had to be cleaned fromsalt debris, and the acquisition PC of the GNSS pointOHI2 was replaced by a low maintenance PC box.
The meteorological data are now directly availableon the Web pages with an update interval of oneminute. Because of some defective connectors, theradar gauge had to be dismounted and repaired.
The construction of the new dewar is finished nowin order to replace the original O’Higgins dewar. Thecurrent one must be evacuated permanently by a turbomolecular pump to maintain the required vacuum dueto leakage. The new one is currently at the observatoryat Wettzell to be tested.
Fig. 2 The new dewar for the VLBI system at O’Higgins.
The dismounted receiver is currently at the obser-vatory at Wettzell for maintenance. The idea is to fixoveraged parts and to integrate a new control equip-ment.
The remote control of complete VLBI sessionscould be extended. Using the newly developedWettzell software the O’Higgins Field System canbe controlled over a secure Internet connection fromWettzell. This is a key feature to extend the operationperiods in GARS O’Higgins. Another technique, usingthe download and commanding gaps for geodetic
VLBI, was discussed with the DLR and is planned tobe realized. But it requires a suitable communicationwith the scheduling and control programs of the DLR.
A complete geodetic survey was performed withequipment from Wettzell (total station TCA 2003) inaddition to the VLBI observations, to determine the lo-cal ties. Additional leveling surveys were included, us-ing the equipment DNA 03.
5 Future Plans
The replacement dewar must be installed again afterthe tests at Wettzell. The maintained receiver must alsobe installed again. A dedicated plan should offer ashared, interleaved observation of satellites (DLR) andVLBI sources (BKG) during the whole year. In orderto optimize the operating procedure and the dispositionof staff, a common control room for DLR and BKGstaff is in preparation. Some antenna motors must bereplaced, and a gear needs to be inspected.
IVS 2013 Annual Report

Onsala Space Observatory – IVS Network Station ActivitiesDuring 2013
Rudiger Haas, Gunnar Elgered, Johan Lofgren, Tong Ning, Hans-Georg Scherneck
Abstract We participated in 40 IVS sessions. As inthe previous five years, we used several of the ses-sions that involved both Onsala and Tsukuba to per-form ultra-rapid UT1-UTC observations together withour colleagues in Tsukuba. Additionally, we observedtwo dedicated ultra-rapid sessions. The first was to-gether with Tsukuba, Hobart, and HartRAO and aimedat determining ultra-rapid EOP. The second was to-gether with Tsukuba and aimed at a northern hemi-sphere ultra-rapid UT1-UTC determination in paral-lel with the AUST-13-06 session. We also performed ashort session in which we observed a GLONASS satel-lite using the Onsala 25-m telescope and the Wettzell20-m telescope. The progress of the Onsala Twin Tele-scope (OTT) project was unfortunately delayed due toissues concerning wildlife protection. Extensive OTTsimulation studies were performed, trying to optimizethe sky visibility from a number of possible antenna lo-cations. An updated application for the installation wassubmitted to the authorities at the end of 2013.
1 General Information
The Onsala Space Observatory is the national facil-ity for radio astronomy in Sweden with the mission tosupport high-quality research in radio astronomy andgeosciences. The observatory was established in 1949and is located at Rao on the Onsala Peninsula on theSwedish west coast, about 40 km south of Gothen-
Chalmers University of Technology, Department of Earth andSpace Sciences, Onsala Space Observatory
Onsala IVS Network Station
IVS 2013 Annual Report
Fig. 1 An aerial photo of Rao with the Onsala Space Observa-tory. The white spot approximately in the center of the photo isthe 30-m diameter radome that encloses the 20-m radio telescopewhich is used for geodetic VLBI observations. (Credit: OnsalaSpace Observtory/Vastkustflyg, 2011)
burg. Onsala belongs to the municipality of Kungs-backa. Figure 1 shows an aerial photo of Rao.
The geoscience instrumentation at Onsala includesequipment for geodetic VLBI, GNSS, a superconduct-ing gravimeter with a platform for visiting absolutegravimeters, several microwave radiometers for atmo-spheric measurements, both GNSS based and pres-sure based tide gauges, and a seismometer. The OnsalaSpace Observatory can thus be regarded as a funda-mental geodetic station.
In the coming years, the Onsala Twin Telescope(OTT) will be installed at the observatory and willconsist of a pair of two new antennas following theVLBI2010 recommendations.
The staff members associated with the IVS Net-work Station at Onsala are listed in Table 1.
151

152 Haas et al.
Table 1 Staff members associated with the IVS Network Station at Onsala. All e-mail addresses havethe ending @chalmers.se, and the complete telephone numbers startwith the prefix +46-31-772.
Function Name e-mail telephoneResponsible P.I. for geodetic VLBI Rudiger Haas rudiger.haas 5530
Observatory director Hans Olofsson (– 2013.11.30) hans.olofsson 5520John Conway (2013.12.01 –) john.conway 5520
Head of department Gunnar Elgered gunnar.elgered 5565
Ph.D. students and postdocs Johan Lofgren johan.lofgren 5566involved in geodetic VLBI Niko Kareinen (2013.08.19 –) niko.kareinen 5566
Tong Ning tong.ning 5578
Responsible for the Michael Lindqvist michael.lindqvist 5508VLBI Field System Rudiger Haas rudiger.haas 5530
Responsible for the Karl-Ake Johansson karl-ake.johansson 5571VLBI equipment Leif Helldner leif.helldner 5576
VLBI operator Roger Hammargren roger.hammargren 5551
Telescope scientist Henrik Olofsson henrik.olofsson 5564
Software engineer Mikael Lerner mikael.lerner 5581
Responsible for gravimetry Hans-Georg Scherneck hans-georg.scherneck 5556
2 Geodetic VLBI Observations
We participated in all of the 40 planned IVS sessions.In order to gain experience with the modern digitalbackends, for about 2/3 of these sessions we usedboth VLBI backends at Onsala, i.e. the Mark IV andthe DBBC, and recorded in parallel on the Mark 5Aand the Mark 5B+ data acquisition systems, respec-tively. We asked the staff at the Bonn correlator todo fringe-tests for these parallelly recorded sessions,or we did zero-baseline correlation tests ourselveswith the software correlator DiFX at Onsala. Therewere some difficulties in the handling of the DBBC inthe beginning, but we gained experience and learnedhow to use the DBBC/Mark 5B+ system successfully.Fringes were found with the DBBC/Mark 5B+, andthe Bonn correlator could not detect any systematicchanges w.r.t. the Mark IV/Mark 5A observations.Several databases were produced by the Bonn corre-lator that include Onsala both as a Mark IV/Mark 5Aand a DBBC/Mark 5B+ station. We analyzed thesedatabases and could not find any significant effects onthe geodetic results due to the type of backend andrecording system. As a consequence we decided ona smooth transition to the DBBC/Mark 5B+ VLBIsystem for regular IVS production in the fall of 2013.
In addition to the 40 regular IVS sessions, we alsoobserved two dedicated ultra-rapid sessions, a four-station session UR-13-01 together with Tsukuba, Ho-
bart, and HartRAO, and a one-baseline session UR-13-03 together with Tsukuba.
Furthermore, we did a test experiment together withWettzell to observe signals from the GLONASS satel-lites.
3 Monitoring Activities
We continued with the monitoring activities as de-scribed in previous annual reports:Vertical height changes of the telescope tower.
We continued to monitor the vertical heightchanges of the telescope tower using the invar rod sys-tem at the 20-m telescope. The measurements are avail-able athttp://wx.oso.chalmers.se/pisa/.Calibration of pressure sensor.
We continued to calibrate the Onsala pressuresensor using a Vaisala barometer borrowed from theSwedish Meteorological and Hydrological Institute(SMHI). This instrument was installed at Onsala inlate 2002 and has been calibrated at the SMHI mainfacility in Norrkoping every one to two years sincethen. The latest calibration was on October 11, 2011.Since the installation of a new VLBI pressure sensorin 2008 the agreement between the Onsala VLBIpressure and the pressure read by the calibrated sensoris on the level of±0.1 hPa.
IVS 2013 Annual Report

OSO – IVS Network Station 153
Table 2 Geodetic VLBI observations at Onsala during 2013. Informationis given on which VLBI backend was used, whether datawere e-transferred in real-time (RT) and/or off-line (OL) andto which correlator, whether modules were shipped to a correlator,and whether Ultra-rapid UT1-UTC results were produced. The last column gives some general remarks and information on thepercentage of the scheduled Onsala observations that were used in the analysis (as reported in the Web pages for the IVS sessionanalyses), compared to the station average percentage per experiment.
Exper. Date VLBI-backend E-transfer Module Ultra-rapid General remarks and % of scheduled observations used in theMark IV DBBC RT OL shipment UT1-UTC analysis as reported in the IVS Web pages’ analysis reports.
R1-566 01.02 yes yes – Bonn – – Mark IV in production, Onsala: 93.2 % (station avg. 88.8 %)R1-567 01.07 yes yes – Bonn – – Mark IV in production, Onsala: 96.5 % (station avg. 93.2 %)EUR-121 01.21 yes yes – Bonn – – Mark IV in production, Onsala: 85.4 % (station avg. 70.3 %)R1-569 01.22 yes yes Tsuk Bonn – yes Mark IV in production, Onsala: 80.2 % (station avg. 65.6 %)G-0128 01.28 yes – – JIVE – – GLONASS observations together withWettzell, 1 h, OKR1-570 01.28 yes yes Tsuk Bonn – – Mark IV in production, Onsala:91.4 % (station avg. 89.6 %)RD-13-01 01.29 yes yes Tsuk Hays – – not correlated yet in HaystackUR-13-01 01.30 yes – Tsuk – – yes scheduled for ultra-rapid UT1-UTC determinationR1-572 02.12 yes yes – Bonn – – Mark IV in production, Onsala: 90.5 % (station avg. 85.6 %)R1-573 02.18 yes yes Tsuk Bonn – yes Mark IV in production, Onsala: 96.5 % (station avg. 94.4 %)T2-088 02.19 yes – Tsuk Bonn – yes Mark IV in production, Onsala:78.8 % (station avg. 63.2 %)R1-578 03.25 yes – – Bonn – – Mark IV in production, Onsala: 94.7% (station avg. 90.0 %)R1-579 04.02 yes – Tsuk Bonn – – Mark IV in production, Onsala: 90.5 % (station avg. 85.6 %)R1-580 04.08 yes – Tsuk Bonn – – Mark IV in production, Onsala: 94.4 % (station avg. 90.3 %)RD-13-02 04.09 yes – – Hays – – Mark IV in production, Onsala: 95.2 % (station avg. 92.8 %)R1-582 04.22 yes – Tsuk Bonn – – Mark IV in production, Onsala: 96.5 % (station avg. 94.7 %)EUR-123 05.06 yes yes – Bonn – – Mark IV in production, Onsala: 82.8 % (station avg. 72.6 %)R1-585 05.13 yes yes – Bonn – – Mark IV in production, Onsala: 94.1 % (station avg. 90.1 %)RD-13-03 05.14 yes yes – Hays – – Mark IV in production, Onsala:92.5 % (station avg. 87.3 %)R1-591 06.24 yes yes – Bonn – yes Mark IV in production, Onsala:97.3 % (station avg. 94.3 %)T2-090 06.25 yes yes Tsuk Bonn – yes Mark IV in production, Onsala: 72.9 % (station avg. 52.4 %)R1-592 07.01 yes yes Tsuk Bonn – yes Mark IV in production, Onsala: 94.3 % (station avg. 93.0 %)EUR-124 07.04 yes yes – Bonn – – Mark IV in production, Onsala: 83.4 % (station avg. 71.1 %)R1-598 08.12 yes yes Tsuk Bonn – – Mark IV in production, Onsala:92.7 % (station avg. 79.0 %)R1-599 08.19 yes yes – Bonn – – Mark IV in production, Onsala: 71.7 % (station avg. 58.9 %)RD-13-06 08.21 yes yes Tsuk Hays – – Mark IV in production, Onsala: 79.2 % (station avg. 70.7 %)R1-600 08.26 yes yes – Bonn – – Mark IV in production, Onsala: 58.8 % (station avg. 48.0 %)EUR-125 09.02 yes yes – Bonn – – Mark IV in production, Onsala: 64.6 % (station avg. 46.3 %)R1-601 09.03 yes yes – Bonn – yes Mark IV in production, Onsala:95.5 % (station avg. 92.8 %)R1-602 09.09 yes yes – Bonn – yes Mark IV in production, Onsala:86.0 % (station avg. 79.3 %)RDV-101 09.11 yes – – – Socc – Mark IV in production, Onsala: 86.2 % (station avg. 69.2 %)R1-604 09.24 yes yes – Bonn – yes Mark IV in production, Onsala:67.0 % (station avg. 52.2 %)T2-092 10.01 yes – – Bonn – yes Mark IV in production, Onsala: 66.6 % (station avg. 55.8 %)RD-13-08 10.02 yes – – Hays – yes Mark IV in production, Onsala:81.1 % (station avg. 82.9 %)R1-606 10.07 yes – – Bonn – yes Mark IV in production, Onsala: 69.5 % (station avg. 57.2 %)R1-612 11.18 yes yes – Bonn – yes Mark IV in production, Onsala:81.8 % (station avg. 68.7 %)T2-093 11.19 yes yes – Bonn – yes DBBC in production, Onsala: 38.8 % (station avg. 26.9 %)UR-13-06 12.05 yes – Tsuk – – yes scheduled for ultra-rapid UT1-UTC determinationR1-615 12.09 yes yes Tsuk Bonn – yes Mark IV in production, Onsala: 92.5 % (station avg. 88.2 %)RDV-102 12.11 yes – – – Socc – Mark IV in production, Onsala: 85.9 % (station avg. 55.4 %)R1-616 12.16 yes yes Tsuk Bonn – yes DBBC in production, Onsala:92.5 % (station avg. 88.2 %)T2-094 12.17 yes yes – Bonn – yes not correlated yet in BonnRD-13-10 12.18 yes – – Hays – yes Mark IV in production, Onsala:87.1 % (station avg. 77.6 %)
IVS 2013 Annual Report

154 Haas et al.
2004 2006 2008 2010 2012 2014
−1
−0.8
−0.6
−0.4
−0.2
0
0.2
0.4
0.6
0.8
1
Time, Year
Diff
eren
ce in
Pre
ssur
e, h
Pa
VLBI(NASA/Setra) − SMHI(Vaisala)VLBI(Vaisala) − SMHI(Vaisala)
Fig. 2 Time series of pressure differences between the VLBIpressure sensors and the calibrated pressure sensor from SMHI.
Microwave radiometry.The water vapor radiometer Konrad was in
operation continuously observing in a so-called sky-mapping mode. The second water vapor radiometer,Astrid, was operated in the winter, but its 31 GHzchannel malfunctioned since the spring. Thus, duringcloudy conditions (liquid water drops in the atmo-sphere) less useful data were acquired with Astrid afterthat.Sea-level monitoring.
The GNSS-based tide gauge was operated continu-ously. A tide gauge based on pressure sensors was op-erated next to it throughout the year. In August an ad-ditional new bubbler sensor was installed at a new tide-gauge site under development at a distance of approxi-mately 300 m from the GNSS/pressure-sensor site.Superconducting gravimetry.
The superconducting gravimeter operated con-tinuously and produced a highly precise record ofgravity variations. Near real-time analysis resultsof the superconducting gravimeter are continuouslyupdated athttp://holt.oso.chalmers.se/hgs/SCG/monitor-plot.html.Absolute gravimetry.
We supported a visiting absolute gravity measure-ment campaign by Lantmateriet, the Swedish mapping,cadastral, and land registration authority.Seismological observations.
The seismometer owned by Uppsala University andthe Swedish National Seismic Network (SNSN) wasoperated throughout the year.
4 A New Onsala Tide Gauge Station
We signed a contract with SMHI to install an officialSMHI tide gauge station at the observatory. This newtide gauge will have several sensors, e.g. one radar andtwo bubbler sensors for the sea-level observations. Inaddition these data will be complemented by severaltemperature and salinity sensors. Figure 3 depicts anartist’s impression of this planned tide gauge site.
Fig. 3 An artist’s impression of the future SMHI tide gauge sta-tion at the Onsala Space Observatory.
5 Future Plans
• For 2014 we plan to observe a total of 50 IVSsessions, including the CONT14 campaign. Mostlikely there will, however, be an interruption in theobservations after the summer. The original radomeenclosing the 20-m telescope, installed in 1975, hasaged and will be replaced by a new one.
• We strive to operate most of the IVS sessions asultra-rapid UT1-UTC sessions, together with ourcolleagues at Tsukuba, Hobart, and HartRAO. Thisincludes the CONT14 campaign.
• We will use the digital VLBI system, i.e. the DBBCand the Mark 5B+, for all the sessions for whichthis is possible. The old Mark IV VLBI system willbe decommissioned in the spring of 2014.
• We will continue the usual monitoring activities atthe observatory, and we plan to perform a new localtie measurement.
• As mentioned above a new tide gauge station willbe installed, and the Onsala Twin Telescope projectwill be officially started when all necessary permis-sions have been received from the authorities.
IVS 2013 Annual Report

Korea Geodetic VLBI Station, Sejong
Yi Sangoh, Ahn Kiduk, Oh Hongjong, Han Sangcheol
Abstract This report summarizes activities of Sejongstation as an IVS network station during 2013.
1 General Information
The station is located about 120 km south of Seoul,in the middle of Sejong city, which serves as a new ad-ministrative capital. The Sejong antenna is 22 meters indiameter, and its slew speed is 5◦/sec in both azimuthand elevation. Its specification was designed with con-sideration for the possible additional set up of small an-tennas in the future. Sejong has set up a simultaneousmulti frequency band (S/X, K, and Q) receiving sys-tem. The S/X system can cover regular IVS sessions,and the K,Q system can use the Korean Geodetic VLBINetwork with KVN (Korean VLBI Network managedby the Korea Astronomy and Space Science Institute).
National Geographic Information Institute (NGII,http://ngii.go.kr) manages the observatory, and Table 1shows the staff members of the Sejong station. A newlyappointed site director, Mr. Ahn Ki Duk, joined us inNovember 2013.
2 Sejong VLBI System
The Sejong VLBI configuration is listed in Table 2.The antenna is Cassegrain shaped, and the 22-m mainreflector consists of 200 rectangular aluminum panels.
National Geographic Information Institute
Sejong Network Station
IVS 2013 Annual Report
Fig. 1 Layout of the VLBI 22-m antenna, monument pillars 1 to4, GNSS and UCP (Unified Control Point).
Table 1 Staff members of the Sejong station.
Name Function e-mail
Ahn Kiduk Site Director [email protected] Sangoh S/W engineer [email protected] Hongjong H/W engineer [email protected] Sangcheol Antenna [email protected]
Each panel has four elevation adjustments at the edgeof the panel, so that the antenna main reflector surfacecan be properly arranged.
155

156 Yi et al.
Table 2 Sejong antenna parameters.
Parameters Sejong VLBIIVS letter codes Sejong (Kv)CDP number 7368DOMES number 23907S001Location 127◦18′E, 36◦31′N
Elevation 177mDiameter of main reflector 22mAntenna type Shaped CassegrainReflector surface accuracy 86µmOperation range AZ: ±270◦
EL: 0 to 90◦
Slew speed 5◦/sec (AZ and EL)FS Version 9.10.4Data acquisition Rack/Recorder K4/K5
3 2013 Activities
3.1 Fringe Tests with Tsukuba Antenna
The Sejong antenna carried out several fringe testswith the Tsukuba antenna. We estimated the SEFDs(S: about 30000 / X:2500) of the Sejong antenna withseveral fringe tests. Its operation has been stopped bywork to improve the S-band peformance to the requiredlevel.
3.2 X-band VLBI Observation with one ofthe KVN (Korean VLBI Network)Antennas
KASI constructed the KVN of three VLBI antennas.An X-band receiver was installed at the Ulsan station;it proceeded to make a fringe test and a pulsar observa-tion with the Sejong station. The data were transferredto KJCC at KASI.
3.3 H-maser Repair
The DAC20 and cable were replaced and repaired, be-cause we found an error in their reference values duringinspection of the H-maser.
3.4 Antenna Motor Controller Repair
An operational failure was found in the four motorcontrollers for the az/el drive. As a countermeasurefor that, one device was delivered to the manufacturer,and it was repaired by them. We have repaired one atpresent. The full repair is expected to be completed in2014.
3.5 Filter Exchange
The existing filter frequency was changed to minimizeRFI signals in S-band (original: 2.22 Ghz to 2.37 Ghz,new: 2.2 Ghz to 2.3 Ghz).
3.6 Monitoring System
A VLBI monitoring system was installed to allow con-tinuous monitoring of the receiver and back-end de-vice.
4 KASI’s SLR Installation Plan
KASI developed an SLR system with a 40 cm telescopein 2012. It will be installed at a place very near to theSejong observatory. Co-location with VLBI, GNSS,and SLR can be possible at Sejong observatory.
IVS 2013 Annual Report

Sejong Station 157
§ ARGO-M Structure
Pier Ground
Supports
Optical
table Ground
Target
Pedestal(Ri
sing block)
Power
Dome
Telescope
UPS & Surge PD
ROOM 1 ROOM 2 ROOM 3
LAS
OES
TMS
AOS
13
Fig. 2 ARGO-mobile system (by KASI, 2013).
IVS 2013 Annual Report

Sheshan VLBI Station Report for 2013
Zhiqiang Shen,Qingyuan Fan,Qinghui Liu,Xiaoyu Hong,Bo Xia
Abstract This report summarizes the observing ac-tivities at the Sheshan station (SESHAN25) in 2013.It includes the international VLBI observations for as-trometry, geodesy, and astrophysics, as well as domes-tic observations for satellite monitoring. We also reporton updates to and development of the facilities at thestation.
1 General Information
The Sheshan VLBI station (“SESHAN25”) is locatedat Sheshan, 30 km west of Shanghai. It is hosted bythe Shanghai Astromomical Observatory (SHAO),Chinese Academy of Sciences (CAS). A 25-meterradio telescope is in operation at 1.3, 3.6/13, 5, 6,and 18 cm wavelengths. The Sheshan VLBI stationis a member of the IVS and EVN. The SESHAN25telescope takes part in international VLBI experimentsfor astrometric, geodetic, and astrophysics research.Apart from its international VLBI activities, thetelescope spent a large amount of time on the ChineseLunar Project, including the testing before the launchof the Chang’e-3 satellite and the tracking campaignafter the launch of Chang’e-3.
Shanghai Astronomical Observatory, CAS
Sheshan Network Station
IVS 2013 Annual Report
2 VLBI Observations in 2013
In 2013, SESHAN25 participated in 38 IVS sessions(including 25 INT3 Intensive sessions). SESHAN25also participated in the EVN sessions in February,June, and October. We participated in the R1601session instead of the R1600 session due to an antennamotor problem. In order to participate in the ChineseChang’e-3 Lunar Project, SESHAN25 observed theChang’e-3 satellite with a long term routine VLBItracking model for two or three days per week. Wemissed the sessions of J13273 due to a receiverproblem.
3 Development and Maintenance of theSheshan Telescope in 2013
We have upgraded the Mark 5B+ Firmware Version to16.31 (API 11.25, SDK 9.2).
4 The Staff of the Sheshan VLBI Station
Table 1 lists the group members of the Sheshan VLBIStation. The staff are involved in the VLBI program atthe station with various responsibilities.
158

Report of Sheshan Station 159
Table 1 The staff of the Sheshan VLBI Station.
Name Background Position and Duty ContactXiaoyu HONG Astrophysics Director, Astrophysics [email protected] SHEN Astrophysics Head of VLBI Division [email protected] FAN Ant. control Chief Engineer, Antenna [email protected] XUE Software Professor, FS [email protected] LING Electronics Professor, VLBI terminal [email protected] AN Astrophysics Astrophysics [email protected] LI Microwave Technical friend, receiver [email protected] XIA Electronics VLBI friend, VLBI terminal [email protected] FU Ant. mechanicsEngineer, Antenna [email protected] WANG Electronics Engineer, Antenna [email protected] WANG Software Engineer, VLBI terminal [email protected] ZHAOSoftware Engineer, VLBI terminal [email protected] ZHONG Microwave Engineer, receiver [email protected] YUAN Microwave Engineer, receiver [email protected] ZUO Software Engineer, Antenna [email protected] GOU Electronics Engineer [email protected] YU Electronics Engineer [email protected] JIANG Electronics Engineer [email protected] SUN HVAC Engineer, Refrigeration [email protected] WU Electronics Engineer [email protected] GUO Electronics Engineer [email protected]
5 Outlook
In 2014 the Sheshan radio telescope will take part in26 IVS sessions and three EVN sessions. The telescopewill regularly monitor the Chang’e-3 satellite in its lu-nar orbit in 2014.
IVS 2013 Annual Report

The Simeiz Fundamental Geodynamics Area
A. E. Volvach, G. S. Kurbasova
Abstract This report gives an overview about the as-trophysical and geodetic activities at the the fundamen-tal geodynamics area Simeiz-Katsively. It also summa-rizes the wavelet analysis of the ground and satellitemeasurements of local insolation on the “Nikita gar-den” of Crimea.
1 General Information
The Radio Astronomy Laboratory of the Crimean As-trophysical Observatory with its 22-m radio telescopeis located near Simeiz, 25 km to the west of Yalta. TheSimeiz geodynamics area consists of the radio tele-scope RT-22, two satellite laser ranging stations, a per-manent GPS receiver, and a sea level gauge. All thesecomponents are located within 3 km (Figure 1).
RT-22, the 22-meter radio telescope, which beganoperations in 1966, is among the five most efficienttelescopes in the world.
Various observations in the centimeter and millime-ter wave ranges are being performed with this tele-scope now and will be performed in the near future.First VLBI observations were performed in 1969 on theSimeiz (RT-22) to Green Bank (RT-43, USA) intercon-tinental baseline. RT-22 is equipped with radiometersat the 92 cm, 18 cm, 13 cm, 6 cm, 3.5 cm, 2.8 cm, 2.3cm, 2.0 cm, 13.5 mm, and 8 mm wavelengths.
Radio Astronomy Lab of Crimean Astrophysical Observatory
Simeiz Network Station
IVS 2013 Annual Report
2 Activities during the Past Year andCurrent Status
During the past year, the Space Geodesy and Geo-dynamics stations regularly participated in the Inter-national Network programs — IVS, the InternationalGPS Service (IGS), and the International Laser Rang-ing Service (ILRS).
During the period 2013 January 1 through 2013December 31, the Simeiz VLBI station participatedin 14 24-hour geodetic sessions. Simeiz regularlyparticipated in the EUROPE and T2 series of geodeticsessions.
2.1 Multi-Frequency Molecular LineObservations
Study of the star-forming regions in molecular linesstarted in 1978. Two main types of observation are car-ried out at the radio telescope:1) observations of maser sources (hydroxyl masers,water masers, and SiO masers) at the frequencies of1.6 GHz, 4.8 GHz, 22 GHz, and 86 GHz.2) observations of millimeter molecular emission at thefrequency range from 85 GHz to 115 GHz.
The radio telescope is equipped with high-sensitivecryogenic receivers with the noise temperatures of: 1)30 K at 22 GHz; 2) 39 K at 4.8 GHz; 3) 70 K at frequen-cies from 85 GHz to 115 GHz. At the 3 mm wavelengthand with a beam width of 40 arcsecs, the effective aper-ture area of the antenna is 100m2. The spectrum ana-lyzers for line observations are 1) a 128 channel filter
160

Simeiz VLBI Station 161
bank spectrum analyzer with frequency band 12 MHz;2) a digital spectrum analyzer for maser observationswith the frequency band of 4 MHz and the frequencyresolution of 8 kHz; 3) a 64 channel filter bank spec-trum analyzer with a frequency band of 64 MHz.
Using the RT-22, a comet was investigated in theOH line at the wavelength of 18 cm. Comets C/2009R1 (McNaught) and 17P/Holmes were observed. Forcomet C/2009 R1 (McNaught), we determined thegas productivity of OH molecules as a function ofheliocentric distance. The comet-gas productivityincreases rapidly approaching perihelion [1].
2.2 The Testing of the Ground-BasedSegment of the Radioastron Missionat Wavelengths of 1.35 cm.
In accordance with the scientific cooperation betweenUkraine and Russia a series of studies for the prepa-ration of the operation of the ground segment of the“RadioAstron” mission was held. Using the 22-m ra-dio telescope RT-22 the scientific program of measure-ments, a substantial part of which is the study of thecompact structures in the extragalactic sources, wasprepared. For testing of the model of the ground seg-ment of “Radioastron”, RT-22 of Crimean Astrophys-ical Observatory in Simeiz and RT-70 (P-2500) in Ev-patoria jointly conducted groundbased VLBI test ex-periments at 1.35 cm [2].
2.3 Wavelet Analysis of Ground andSatellite Measurements of LocalInsolation
[3] presented the possibility of using wavelet analy-sis on the signals from long sequences of local terres-trial and NASA satellite observations of the insolationof the Center of HydroMeteorology (CHM) “NikitaGarden” (latitude 44.5, longitude 34.2 degrees). Thechoice of the method, the type of wavelets, and theirparameters for analysis were found. Then the waveletanalysis was applied to the signals to determine andremove the noise and to establish the spectral composi-
tion of the signal data. The local terrestrial signal mea-surements and data from the signals of the satellite ob-servations were presented in [3], along with the noisefound from the statistical analysis of the observations.
3 Future Plans
Our plans for the coming year are the following: toput into operation the VLBI Data Acquisition SystemDBBC, to upgrade the laser of the SLR Simeiz-1873station, and to set up a new GPS station near the SimeizVLBI station.
References
1. Volvach L.N., Berezhnoi A.A., Volvach A.E.Bulletin ofthe Crimean Astrophysical Observatory, 109 (1), pp.71-75,2012.
2. Volvach A.E., Kostenko V.I., Larionov M.G., Volvach L.N.,et al. Bulletin of the Crimean Astrophysical Observatory,108 (1), pp.158-162, 2012.
3. Kurbasova G.S., Volvach A.E.Bulletin of the Crimean As-trophysical Observatory, in press, 2014.
IVS 2013 Annual Report

162 Volvach and Kurbasova
Table 1 The antenna parameters of the Simeiz station.
Diameter D, m 22Surface tolerance, mm (root mean square) 0.25Wavelength limit, mm 2Feed System Cassegrain system or primary focusFocal length F, m 9.525Focal ratio F/D 0.43Effective focal length for Cassegrain system, m134.5Mounting Azimuth-ElevationPointing accuracy, arc sec. 10Maximum rotation rate, degree/sec 1.5Maximum tracking rate, arcsec/sec 150Working range in Azimuth, degrees (0 to South)-270± 270Degrees in Elevation 0 - 85
KATS-PIL KATS-SLR
RT 22
SIMI -SLR
GPS-CRAO
Fig. 1 The Simeiz geodynamics area.
1,E+29
1,E+30
1,E+31
1,E+32
0,4 0,45 0,5 0,55 0,6 0,65
Q(OH), mol s-1
r, AU
Fig. 2 The relationship between the gas productivity of comet C/2009R1 (McNaught) and the heliocentric distance.
IVS 2013 Annual Report

Simeiz VLBI Station 163
Kara Dag+
Perecop
+
Sarich+
+
Fonar
+
Kara Mrun
+ Simferopol
(φ=46.2°, λ=33.7°)
(φ=45.4°, λ=36.6°)
(φ=45.4°, λ=32.7°)(φ=44.96°, λ=34.11°, H=255м)
(φ=44.93°, λ=35.22°, H=577м)
(φ=44.4°, λ=33.7°)
Fig. 3 Crimean area.
1983.5 1986 .2 1989 1991 .7 1994 .4 1997 .2 1999.2 200 2.7 200 5.4 2008.13.4
3.5
3.6
3.7
3.8
3.9
4
4.1
4.2
4.3
4.4
Dat a
Av era ge Inso la tion Inc ident On A Horiz on ta l Surfac e ( tendency)
swv
kWh/
m2 /d
ay
K ara DagS imferop olP erekop (N )S ar ich (S )F ona r ( E)K ara Mr un (W )
K ara Dag
S
W
ESimfero pol
N
NAS A S urface m eteoro logy an d So lar Ene rgy: Daily Av eraged Da ta
Fig. 4 The insolation for the Crimean area.
IVS 2013 Annual Report

Svetloe Radio Astronomical Observatory 2013 IVS Annual Report
Sergey Smolentsev, Ismail Rahimov
Abstract This report provides information about theSvetloe Radio Astronomical Observatory during 2013.The report also provides an overview of current geode-tic VLBI activities and gives an outlook for the nextyear.
1 General Information
Svetloe Radio Astronomical Observatory (Figure 1)was founded by the Institute of Applied Astronomy(IAA) as the first station of the Russian VLBI networkQUASAR. The sponsoring organization of the projectis the Russian Academy of Sciences (RAS). TheSvetloe Radio Astronomical Observatory is situatednear Svetloe village in the Priozersky district of theLeningrad region (Table 1). The geographic locationof the observatory is shown on the IAA RAS Web site:http://www.ipa.nw.ru/PAGE/rusipa.htm. The basic in-struments of the observatory are a 32-m radio telescopeequipped with special technical systems for VLBIobservations, GPS/GLONASS/Galileo receivers, theSLR system, and a Water Vapor Radiometer (WVR).
Table 1 Svetloe Observatory location and address.
Longitude 29◦47′
Latitude 60◦32′
Leningrad region, Priozerski district188833 Russia
Institute of Applied Astronomy of RAS
Network Station Svetloe
IVS 2013 Annual Report
Fig. 1 Svetloe observatory.
2 Technical Staff
Table 2 Staff related to VLBI operations at Svetloe.
Prof. Ismail Rahimov observatory chiefVladimir Tarasov chief engineerTatiana Andreeva engineerAndrey Mikhailov FS, pointing system control
164

Svetloe IVS Annual Report 165
3 Component Description
3.1 Technical and Scientific Information
Characteristics of the radio telescope are presented inTable 3.
Table 3 Technical parameters of the radio telescope.
Year of construction 2000Mount AZELAzimuth range ±270◦ (from south)Elevation range from−5◦ to 95◦
Maximum azimuth- velocity 0.83 ◦/s- tracking velocity 2.5 ′/s- acceleration 12.0 ′/s2
Maximum elevation- velocity 0.5 ◦/s- tracking velocity 0.8 ′/s- acceleration 12.0 ′/s2
Pointing accuracy better than 10′′
Configuration Cassegrain (withasymmetrical subreflector)
Main reflector diameter 32 mSubreflector diameter 4 mFocal length 11.4 mMain reflector shape quasi-paraboloidSubreflector shape quasi-hyperboloidMain reflector surface accuracy± 0.5 mmFrequency range 1.4–22 GHzAxis offset 3.7±2.0 mm
3.2 Co-location of VLBI, GPS/GLONASS,SLR System, and WVR
The Topcon GPS/GLONASS/Galileo receiver withmeteo station WXT-510 is in operation (Figure 2).
The SLR system “Sazhen-TM” (Figure 3) wasmounted in October 2011 and joined the ILRS inMarch 2012. The SLR system at Svetloe observatoryobserved 353 passes of LAGEOS, GLONASS, andothers and obtained 3,040 normal dots during 2013.
Fig. 2 Topcon GPS/GLONASS/Galileo receiver at the Svetloeobservatory.
Fig. 3 “Sazhen-TM” SLR system at Svetloe observatory.
Fig. 4 WVR and RT-32 at Svetloe observatory.
IVS 2013 Annual Report

166 Smolentsev and Rahimov
4 Current Status and Activities during2013
Svetloe observatory participates in IVS and domesticVLBI observational programs. During 2013, Svetloestation participated in 29 diurnal IVS sessions — 24IVS-R4 sessions, one IVS-T2 session, four EURO ses-sions – and in 36 IVS-Intensive sessions.
Svetloe participated in 48 diurnal sessions in theframe of the domestic Ru-E program for determinationof all Earth orientation parameters and in 20 one-hourRu-U sessions for obtaining Universal Time using e-VLBI data transfer. Since April 2013, we have usede-VLBI data transfer for Svetloe observational data forthe Ru-E 24-hour sessions.
In 2013, the WVR was installed and is successfullyworking (Figure 5).
Fig. 5 WVR at Svetloe observatory.
5 Future Plans
Our plans for the coming year are the following:
• To participate in IVS observations,• To carry out domestic observational programs for
obtaining Universal Time daily and for obtainingEarth orientation parameters weekly with e-VLBIdata transfer,
• To carry out SLR observations of geodetic and nav-igation satellites,
• To participate in EVN and RADIOASTRON obser-vational sessions,
• To continue geodetic monitoring of the RT-32 pa-rameters, and
• To continue WVR observations.
IVS 2013 Annual Report

JARE Syowa Station 11-m Antenna, Antarctica
Yuichi Aoyama, Koichiro Doi, Kazuo Shibuya
Abstract In 2013, the 53rd , the 54th, and the 55th
Japanese Antarctic Research Expeditions (hereinafter,referred to as JARE–53, JARE–54, and JARE–55,respectively) participated in six OHIG sessions —OHIG82, 83, 84, 85, 86, and 87. These data wererecorded on hard disks through the K5 terminal. Thehard disks for the OHIG82 session were broughtback from Syowa Station to Japan in April 2013 bythe icebreaker Shirase while those for the other fivesessions are scheduled to arrive in April 2014. The dataobtained from the OHIG79, 80, 81, and 82 sessionsby JARE–53 and JARE–54 were transferred to theBonn Correlator via the servers of National Instituteof Information and Communications Technology(NICT). At Syowa Station, JARE–55 will participatein six OHIG sessions in 2014.
1 General Information
To investigate polar science, the National Institute ofPolar Research (NIPR) is managing Japanese Antarc-tic Research Expeditions (JAREs). The 30 members ofJARE–54 overwintered at Syowa Station, East OngulIsland, East Antarctica in 2013.
Syowa Station has become one of the key observa-tion sites in the Southern Hemisphere’s geodetic andgeophysical networks (as shown in Figure 1, see [1]for details). As a part of these geodetic measurements,the JAREs have been operating the 11-m S/X–band an-
National Institute of Polar Research
JARE Syowa Station 11-m antenna
IVS 2013 Annual Report
tenna at Syowa Station (69.0◦S, 39.6◦E) for geodeticVLBI experiments since February 1998. A cumulativetotal of 108 quasi-regular geodetic VLBI experimentswere performed by the end of 2013.
2 Component Description
For VLBI, the Syowa antenna is registered as IERSDomes Number 66006S004 and as CDP Number 7342.The basic configuration of the Syowa VLBI frontendsystem has not changed from the description in [2].Syowa’s K4 recording terminal was fully replaced byK5 simultaneously with the termination of the SYWsession at the end of 2004. Syowa has participated inthe OHIG sessions in the austral summer season since
Fig. 1 Syowa VLBI antenna.
167

168 Aoyama et al.
Table 1 Staff members.
Name Affiliation Function Notes
Kazuo SHIBUYA NIPR Project coordinator until March 2013Koichiro DOI NIPR Project coordinator since April 2013Yuichi AOYAMA NIPR Liaison officerHideaki HAYAKAWA NIPR Chief operator of JARE–53Takeshi YOSHIOKA NEC Antenna engineer for JARE–53Noriaki OBARA NIPR Chief operator of JARE–54Hiroshi TANAKA NEC Antenna engineer for JARE–54Takuya MASUNAGA NIPR Chief operator of JARE–55 from Nov. 2013 to Jan. 2015JARE–53: February 2012 – January 2013 JARE–54: February 2013– January 2014
1999. Data transfer through an Intelsat satellite linkfrom Syowa Station to NIPR has been available since2004. However, its recent bandwidth has been about2 MB and its effective speed of FTP transfer has beenabout 100kB/sec, which is too slow to practically trans-fer the huge VLBI data.
3 Staff of the JARE Syowa Station 11-mAntenna
The Syowa Station 11–m antenna is operated andmaintained by JARE and NIPR. The staff members arelisted in Table 1. Prof. Shibuya retired on March 31,2013, so K. Doi took over as the project coordinator ofour institute. OHIG sessions in 2013 were performedprimarily by the staff of JARE–54 as shown in Fig-ure 2. The staff of JARE–53 supported them in theOHIG82 session, in order to hand over the operationand maintenance of the 11–m antenna to them. T.Masunaga, a member of an advance team of JARE–55,came to Syowa Station on November 15 by airplane.Consequently, he could join the OHIG87 session astheir successor.
4 Current Status and Activities
4.1 Notes on System Maintenance
There used to be two hydrogen masers, AnritsuRH401A HM–1001C, and HM–1002C at SyowaStation. However, HM–1002C was brought back toJapan in January 2011 for an overhaul. We attempted
Fig. 2 Syowa VLBI staff of JARE–54, N. Obara (left) and H.Tanaka (right).
to return HM–1002C to Syowa Station immediately.But it was impossible to transport it, because theicebreaker Shirase could not approach Syowa Stationin the 2011/2012 and 2012/2013 austral summerseasons due to dense and thick sea ice. Because itwas expected that it would be difficult for Shiraseto approach Syowa Station in the 2013/2014 australsummer season, we decided to maintain HM1002Cat Anritsu Co., Ltd. without transporting it to SyowaStation.
The other hydrogen maser, HM–1001C, has oper-ated for VLBI observations since January 2011. OnMarch 11, 2011, trouble occurred in its ion pump andin an uninterruptible power supply (UPS) for HM–1002C because of instability in both voltage and fre-quency of the generator for power supplies at SyowaStation. In January 2013, the UPS was repaired by re-placing sealed batteries and the failed charging circuit.
IVS 2013 Annual Report

JARE Syowa Station 169
Table 2 Status of OHIG sessions as of December 2013.
Code Date Station Hour Correlation Solution Notes
OHIG76 2012/Feb/15 Sy, Ft, Hh, Kk, Oh, Tc 24 h Yes Yes J53OHIG77 2012/Feb/28 Ft, Kk, Oh, Tc -Sy 24 h – – †1OHIG78 2012/Feb/29 Ft, Hh, Kk, Oh, Tc -Sy 24 h No No †2OHIG79 2012/Nov/06 Sy, Hb, Kk 24 h Yes YesOHIG80 2012/Nov/07 Sy, Ft, Hb, Kk, Tc 24 h Yes YesOHIG81 2012/Nov/14 Sy, Hb, Hh, Kk, Tc 24 h Yes YesOHIG82 2013/Feb/11 Sy, Hh, Kk, Oh, Tc 24 h Yes Yes J54OHIG83 2013/Feb/13 Sy, Hh, Kk, Oh, Tc 24 h – –OHIG84 2013/Feb/20 Sy, Ft, Kk, Oh, Tc 24 h – –OHIG85 2013/Nov/11 Sy, Ft, Hb, Ke, Kk, Tc, Ww, Yg 24 h – –OHIG86 2013/Nov/13 Sy, Ft, Hb, Ke, Kk, Tc, Ww, Yg 24 h – –OHIG87 2013/Nov/20 Sy, Ft, Hb, Hh, Ke, Kk, Tc, Ww, Yg 24 h – –J53: JARE–53, op H. Hayakawa eng T. Yoshioka J54: JARE–54, op N. Obara eng H. Tanaka†1 : Canceled because of malfunction of HM–1001C.†2 : No fringes because of malfunction of HM–1001C.
On the other hand, the ion pump began to ab-normally stop on occasion since March 11, 2011. In2013, such abnormal stops, which caused a low vac-uum inside the HM–1001C and attenuated the hydro-gen maser oscillator, occurred on January 6, May 8,July 5, September 11, November 5, November 21,and November 26. The JARE–54 staff had to formhigh vacuum and check the hydrogen maser genera-tion at all such times. Especially, abnormal stops oc-curred on November 21 during the OHIG87 session.The ion pump stopped suddenly at 00:00 UTC just be-fore the 36th scan, and the staff could not restart theion pump until 00:12 UTC. The IF level of the hydro-gen maser was recovered and synchronized with GPSaround 01:55 UTC before the 45th scan. There maybe about two hours of unavailable data in the OHIG87recorded data.
To avoid such critical situations, we purchased anew hydrogen maser, SD1T03B, last year. SD1T03Bwas miniaturized in order to be loaded on a helicopter.Therefore, we could transport it to Syowa Station onDecember 16. SD1T03B was connected to UPS forHM1002C, and its startup was accomplished on De-cember 20.
In preparing the OHIG82 session, the power mod-ules of units 1 and 2 of K5 were broken. The mal-functioning modules were replaced with spare parts, sothat there was no apparent influence on the subsequentOHIG sessions.
A system for Delay calibration (D–Cal) recordingis independent of the K5 system. D–Cal signals used
to be recorded at start/end of each Syowa scan ontofloppy disk (FD) by using an N88 BASIC program onan ancient NEC PC. Although its FD drive broke downin November 2012, it was replaced by a spare in Jan-uary 2013, and D–Cal signals resumed being stored onFD. The D–Cal recording program hung-up twice (45th
and 85th scans) during the OHIG85 session. As a con-sequence, the D–Cal signal data from scans 1 to 44 wasbroken.
In the direction of north in the field of view of theantenna, a few interference waves in S band were de-tected in the output signal of the video converter witha spectrum analyzer. The obvious peaks appeared inthe frequencies of 212.1 MHz and 260.0 MHz in theintermediate frequency of S band. We continue to in-vestigate their source.
4.2 Session Status
Table 2 summarizes the status of processing as ofDecember 2013 for the sessions starting in 2012. TheOHIG sessions involved Fortaleza (Ft), O’Higgins(Oh), Kokee Park (Kk), TIGO Concepcion (Tc), Ho-bart 12-m antenna (Hb), HartRAO (Hh), Warkworth(Ww), Katherine (Ke), Yarragadee (Yb), and Syowa(Sy). In 2005, Syowa joined the CRD sessions, butafter 2006, Syowa participated only in OHIG sessions.Syowa took part in six OHIG sessions in 2013.
K5 HDD data brought back from Syowa Stationwere transferred to NICT servers and converted to the
IVS 2013 Annual Report

170 Aoyama et al.
Mark 5 format data there. The converted data weretransferred from the NICT servers to the Bonn Corre-lator by FTP.
4.3 Analysis Results
As of December 2013, Syowa had contributed 97 ses-sions from May 1999. According to the results ana-lyzed by the BKG IVS Analysis Center, the length ofthe Syowa–Hobart baseline is increasing with a rateof 52.6± 0.9 mm/yr. The Syowa–HartRAO baselineshows a slight increase in its length with a rate of13.1± 0.6 mm/yr. The Syowa–O’Higgins baseline alsoshows a slight increase, although its rate is only 3.0±
1.1 mm/yr. Detailed results from the data until the endof 2003 as well as comparisons with those from otherspace geodetic techniques were reported in [3].
5 Future Plans
Dismantling the current Syowa VLBI antenna is sched-uled for the 2015/2016 austral summer season. We pre-sented a budget proposal for construction of a newVGOS antenna after 2017. We will make every effortuntil this proposal is approved. Simultaneously, we arepreparing to install a small geodetic VLBI antenna incollaboration with NICT. We would like to shorten thediscontinuation period of VLBI observations as muchas possible.
References
1. Shibuya, K., Doi, K., and Aoki, S. (2003): Ten years’progress of Syowa Station, Antarctica, as a global geodesynetwork site. Polar Geoscience, 16, 29-52.
2. Shibuya, K., Doi, K., and Aoki, S. (2002): JARE Syowa Sta-tion 11-m Antenna, Antarctica, in International VLBI Ser-vice for Geodesy and Astrometry 2002 Annual Report, 149-152, NASA/TP-2003-211619, ed. by N. R. Vandenberg andK. D. Baver.
3. Fukuzaki, Y., Shibuya, K. Doi, K., Ozawa, T., Nothnagel,A., Jike, T., Iwano, S., Jauncey, D.L., Nicolson, G.D., andMcCulloch, P.M. (2005): Results of the VLBI experimentsconducted with Syowa Station, Antarctica. J. Geod., 79,379-388.
IVS 2013 Annual Report

Status of the TIGO VLBI Station in Concepci on
Hayo Hase 1, Cristian Herrera 2, Pedro Pino 2, Cristian Beltran 2
Abstract The main activities at the TIGO VLBI sta-tion during 2013 were observing 117 scheduled VLBIsessions and progressing with the future cooperationwith Argentina for the new site near La Plata. Theacronym TIGO will be replaced by AGGO, once theTigo radio telescope is installed in Argentina.
1 General Information
Since 2002, TIGO has been located in the terrain of theUniversidad de Concepcion (longitude 73.025 degreesWest, latitude 36.843 degrees South), in Concepcion,Chile.
2 Component Description
The IVS network station TIGOCONC constitutes theVLBI part of the Geodetic Observatory TIGO, whichwas designed to be a fundamental station for geodesy.Hence, the VLBI radio telescope is co-located with anSLR telescope (ILRS site), a GPS/Glonass permanentreceiver (IGS site), and other instruments such as aseismometer, a superconducting gravimeter, and an ab-solute gravity meter.
The atomic clock ensemble of TIGO consists ofthree hydrogen masers, three cesium clocks and four
1. Bundesamt fur Kartographie und Geodasie2. Universidad de Concepcion
TIGOCONC Network Station
IVS 2013 Annual Report
Fig. 1 The TIGO radio telescope.
GPS time receivers realizing the Chilean contributionto the Universal Time scale (Circular T, BIPM).
The technical parameters of the TIGO radio tele-scope as published in [1] have not been changed.
3 Staff
The 2012 VLBI staff consisted of three persons, aslisted in Table 1. Pedro Pino left TIGO in Septem-ber and was replaced by Cristian Beltran. The teamwas complemented by students Pablo Figueroa and Dr.Sabina Rayo performing night shifts.
171

172 Hase et al.
Table 1 TIGO VLBI support staff in 2013.
Staff Function Email Remark
Hayo Hase Head [email protected] Herrera Informatic Engineer [email protected] Pino Electronic Engineer [email protected] until September 2013Cristian Beltran Electronic Engineer [email protected] until end of 2013Sabina Rayo student of mechanical engineering [email protected] Figueroa student of telecommunications [email protected] VLBI operators [email protected]
4 Current Status and Activities
4.1 IVS Operation
During 2013, TIGO was scheduled to participate in114 regular IVS experiments. Three 24-hour additionalparticipations were carried out within the TANAMIproject [2]. Table 2 gives an overview about the partic-ipation of TIGOCONC in 2013. Out of 117 requestedobservation days, 113 could be observed successfully,reaching an efficiency of 96.5%. The main reasons fordata loss have been related to technical problems inthe refrigerating system of the receiver, recording prob-lems on bad data carriers, and unexpected delays in thecustoms liberation procedure of data carriers.
Table 2 TIGO’s observation statistics for 2013.
Name R1xxx R4xxx OHIGxx T2 RD TANAMI Total
# of Exp. 51 50 6 4 3 3 117Correlated 49 48 6 4 3 3 113No result 2 2 0 0 0 0 4
4.2 Search for New Site for TIGO
The TIGO project is carried out on the basis of gov-ernmental decree 489. During the past few years theChilean government did not respond to the call to sup-port this bilateral cooperation project. For this rea-son the German Federal Agency of Cartography andGeodesy (BKG) looked for a new project partner inSouth America, and an agreement with the Argen-tinean science foundation Conicet was signed in Oc-tober 2013. In the year 2014, the TIGO project will be
closed in Chile and moved to the vicinity of the town ofLa Plata. The project will then be calledArgentineanGerman Geodetic Observatory (AGGO).
The future site was decided to be 500 m away fromthe existing Instituto Argentino de Radioastronomia(IAR). AGGO will be dependent on Conicet but in-dependent from IAR. BKG and Conicet have laid outa development plan. In phase 1 AGGO will make useof TIGO as it was operated in Concepcion. In phase 2the installations within the containers will be moved toan operations building, so that containers older than 20years can be abandoned.
5 Future Plans
The VLBI activities in 2014 will be focused on:
• execution of the IVS observation program for 2014,• photogrammetric reflector survey, and• overhaul and preparing the VLBI equipment for the
move to Argentina.
References
1. Vandenberg, N.R.: International VLBI Service for Geodesyand Astrometry 1999 Annual Report, NASA/TP–1999-209243, 1999.
2. M. Kadler, R. Ojha, S. Tingay and J. Lovell,The TANAMIProgram: Southern-Hemisphere VLBI Monitoring of Rela-tivistic Jets in Active Galaxies, American Astronomical So-ciety, AAS Meeting #211, #04.13; Bulletin of the AmericanAstronomical Society, Vol. 39, p.732.
IVS 2013 Annual Report

Tsukuba 32-m VLBI Station
Takahiro Wakasugi1, Ryoji Kawabata1, Shinobu Kurihara1, Yoshihiro Fukuzaki1, Jiro Kuroda1, Tadashi Tanabe1,Syota Mizuno1,2, Takafumi Ishida1,2
Abstract The Tsukuba 32-m VLBI station is oper-ated by the Geospatial Information Authority of Japan.This report summarizes activities of the Tsukuba 32-mVLBI station in 2013. 115 sessions were observed byusing Tsukuba 32-m and other GSI antennas in accor-dance with the IVS Master Schedule of 2013 exceptfor the interruption period due to the repair of the an-tenna base of Tsukuba 32-m. We have been construct-ing the new observing facilities that will be fully com-pliant with VGOS for the first time in Japan.
Fig. 1 Tsukuba 32-m VLBI station.
1. Geospatial Information Authority of Japan2. Advanced Engineering Service Co., Ltd.
Tsukuba Network Station
IVS 2013 Annual Report
1 General Information
The Tsukuba 32-m VLBI station (Figure 1) is locatedat the Geospatial Information Authority of Japan (here-after GSI) in Tsukuba science city, which is about 50km to the northeast of Tokyo. GSI has three regionalstations besides Tsukuba: Shintotsukawa, Chichijima,and Aira, which form a geodetic VLBI network inJapan covering the whole country (Figure 2).
GSI has carried out the domestic VLBI session se-ries called “JADE (JApanese Dynamic Earth observa-tion by VLBI)” since 1996. The main purposes of theJADE series are to maintain the reference frame of
120˚
120˚
130˚
130˚
140˚
140˚
150˚
150˚
20˚ 20˚
30˚ 30˚
40˚ 40˚
50˚ 50˚
Chichijima
Tsukuba
Ishigakijima(NAOJ)
Mizusawa(NAOJ)
Aira
Shintotsukawa
Fig. 2 Geodetic VLBI network in Japan.
173

174 Wakasugi et al.
Japan and to monitor plate motions for the advancedstudy of crustal deformation around Japan. Addition-ally, some JADE sessions include Mizusawa and Ishi-gakijima, which are part of the VERA network of theNational Astronomical Observatory of Japan (NAOJ),and two antennas in Kashima (11-m and 34-m) and theKoganei 11-m station, which belong to the National In-stitute of Information and Communications Technol-ogy (NICT).
2 Component Description
The specifications of the Tsukuba 32-m antenna aresummarized in Table 1.
Table 1 Tsukuba 32-m antenna specifications.
Owner and operating agencyGeospatial InformationAuthority of Japan
Year of construction 1998Radio telescope mount type Az-ElAntenna optics CassegrainDiameter of main reflector 32 mAzimuth range 10 – 710◦
Elevation range 5 – 88◦
Az/El drive velocity 3◦/secTsys at zenith (X/S) 50 K / 65 KSEFD (X/S) 320 Jy / 360 JyRF range (X1) 7780 – 8280 MHzRF range (X2) 8180 – 8680 MHzRF range (X3) 8580 – 8980 MHzRF range (S with BPF) 2215 – 2369 MHzRecording terminal K5/VSSP32,
ADS3000+ with DDC
3 Staff
Table 2 lists the regular members belonging to theGSI VLBI observation group. Takahiro Wakasuginewly joined in our group and was in charge of stationoperation mainly. Routine operations were primarilyperformed under contract with Advanced EngineeringService Co., Ltd. (AES). Syota Mizuno and TakafumiIshida replaced Yasuko Mukai and Takashi Nishikawaas new operators since November.
Table 2 Member list of the GSI VLBI group.
Name Main FunctionTadashi TANABE SupervisorJiro KURODA Management, Co-locationYoshihiro FUKUZAKI Installation of VGOSShinobu KURIHARA Correlation, Analysis,
IVS Directing Board memberRyoji KAWABATA Operation, Co-locationTakahiro WAKASUGI OperationKazuhiro TAKASHIMA ResearchSyota MIZUNO Operation(AES, Co., Ltd)Takafumi ISHIDA Operation(AES, Co., Ltd)Toshio NAKAJIMA System engineer(I-JUSE)
4 Current Status
4.1 Geodetic VLBI Observations
The regular sessions in the IVS Master Schedule thatwere observed by using the GSI antennas are shownin Table 3. The Tsukuba 32 m participated in 39domestic and international 24-hr VLBI sessions and in56 Intensive 1-hr sessions for dUT1 measurement in2013. The Tsukuba 32 m could not participate in theIVS sessions from the beginning of May to the end ofNovember due to the repair of the antenna base (seeSection 4.2). The other GSI antennas, Shintotsukawa,Chichijima, and Aira participated in not only domesticbut also some international sessions.
Table 3 The number of regular sessions carried out by using theGSI antennas in 2013.
Sessions TsukubaShintotsukawaChichijima AiraIVS-R1 21 – – 10IVS-R4 5 – – –IVS-T2 3 – 7 7APSG 1 2 2 2VLBA 3 – – –IVS-R&D 3 – – –IVS-CRF 0 – – –JADE 3 7 9 9IVS-INT1 7 – – –IVS-INT2 34 – – –IVS-INT3 15 – – –Total 95 9 18 28
IVS 2013 Annual Report

Tsukuba 32-m VLBI Station 175
4.2 Repair of the Tsukuba 32-m Antenna
At the end of April, we found that the damage of theantenna base was very serious from the results of apointing check with X-band and decided to interrupt allexperiments after early May. We investigated the dam-age of the antenna immediately and found that therewere some gaps between the sole plates under the railtracks and cementitious grout, which could cause thesubsidence of the antenna (Figure 3). Then, we filledall gaps with new firm grout in order to prevent the an-tenna from subsiding. After confirming that the resultof the pointing check was alright, we resumed IVS ses-sions with the Tsukuba 32 m from the end of Novem-ber. Although we confirmed that the rail track level wasalmost the same as before the repair, we will performfield surveys in early 2014 in order to make sure thereference point does not move.
We carried out R1 sessions 10 times by using Airafrom the end of September to the end of November onbehalf of the Tsukuba 32 m after modifying the downconverter to receive the R1 sessions’ frequency band.These sessions were performed with a high-speed A/Dsampler ADS3000+ and K5/VSI system, which havebeen developed by our collaborator NICT. We plan tocontinue R1 sessions by using Aira until the end ofMarch 2014 in parallel with the Tsukuba 32 m.
Fig. 3 A gap under a sole plate detected after excavating grout.
4.3 VGOS Project by GSI
In 2012, we had started construction of the new GSIVGOS observing facilities in Ishioka city located about17 km northeast from Tsukuba (Figure 4). Some partof the antenna and observing cabin were delivered tothe site by the end of 2013 and the construction of theantenna will be completed by the end of March 2014(Figure 5). The other equipment such as a front-endfeed, up-down converter, data processing and acquisi-tion system and so on were already delivered to GSI.We decided to call the new site iGOS (Ishioka GeodeticObserving Station) that includes GNSS continuous ob-servation system and gravity observing point in orderto play an important role of the geodetic site based onGGOS (Global Geodetic Observing System) in Japan.
Tsukuba
iGOS
Koganei(NICT)
Kashima(NICT)
Tokyo
17km
Fig. 4 Location of iGOS site.
5 Future Plans
As mentioned above, the new VGOS station in Ishiokawill be installed by the end of March 2014. We willcarry out some tests and adjustments to obtain fringesbetween the existing system and the new one. Subse-quently, we plan to carry out parallel operation from2015 to 2016. After these sessions, we plan to partici-pate in VGOS sessions thoroughly from 2017.
On the other hand, we have to consider the dete-rioration of the regional stations. We decided to closeShintotsukawa, which was installed in 1995, from the
IVS 2013 Annual Report

176 Wakasugi et al.
Fig. 5 Construction of the antenna.
beginning of 2014 because of aging. We will also con-tinue to consider the other GSI stations.
IVS 2013 Annual Report

Nanshan VLBI Station Report 2013
Ming Zhang, Ali Yusup
Abstract Urumqi Nanshan station is a key node ofthe Chinese VLBI Network (CVN). It participatesin global VLBI observations for the IVS, EVN, andEAVN networks. This report provides an overviewof geodetic and astronomical activities and technicaldevelopment at XAO during 2013.
1 Introduction
Fig. 1 The 25-m antenna at Nanshan station.
The Nanshan VLBI station is located 70 km south ofUrumqi, the capital city of the Xinjiang Uyghur Au-tonomous Region of China. The station is affiliatedwith the Xinjiang Astronomical Observatory of the Na-tional Astronomical Observatories of CAS. In 2013,we have participated in geodetic observations for IVS
Xinjiang Astronomical Observatory, Chinese Academy of Sci-ences
Xinjiang Astronomical Observatory
IVS 2013 Annual Report
as well as in astronomical observations for EVN, CVNand EAVN.
2 Current Status
2.1 Antenna
• Coordinates: Longitude: 87◦10′41′′ E; Latitude:43◦28′17′′ N; Altitude: 2080 m
• Diameters: Primary: 25 m; Secondary: 7 m• Antenna type: Modified Cassegrain• Seat-rack type: Azimuth-pitching ring• Main surface precision: 0.40 mm (rms)• Pointing precision: 15′′ (rms)• Turning angle: Azimuth: ±270◦; Elevation: 5◦-
88◦
• Slew speed: Azimuth: 0.9◦/sec; Elevation: 0.5◦/sec
2.2 Receivers
The receiver parameters of the 25-m antenna are shownin Table 1.
2.3 Recording System
The recording systems available at the Nanshan VLBIstation are Mark 5B+, Mark IV, Mark II, and K5. TheMark 5 StreamStor SDK has been upgraded from ver-sion 8.1 to 9.2. The Field System now is being up-graded from version 9.10.4 to 9.11.4. The analog BBC
177

178 Zhang and Yusup
Table 1 The receiver parameters of the 25-m antenna.
Band Wave Freq BW LO Pol(cm) (MHz) (MHz) (MHz)
L 18 1400-1720 320 1300 dualS 13 2150-2450 300 2000 dualC 6 4750-5150 400 4620 dualX 3.6 8200-9100 500 8100/8600 dualK 1.3 22100-24200 500 22000-23700 dual
Band Type T rec T sys Eff SEFD(K) (K) (%) (Jy)
L room 10 24 52 300S room 50 70 48 560C room 9 22 55 250X cryo 20 50 50 350K cryo 17 40 35 850
used here is old but still able to record at a maximumrate of 2,048 Mbps with a maximum channel widthof 16 MHz and a maximum of 16 channels. The dig-ital backend system we have here is a Chinese DataAcquisition System (CDAS), which was developed byShanghai Astronomical Observatory.
3 IVS Observations
We have observed 12 scheduled IVS sessions in 2013.All of them were observed normally.
Table 2 The observed IVS sessions.
Session Date RemarksR4569 JAN 24 NormalR4579 APR 04 NormalAPSG32 APR 17 NormalR4582 APR 25 NormalAPSG33 MAY 20 NormalR4595 JUL 25 NormalR1604 SEP 24 NormalR1612 NOV 18 NormalT2093 NOV 19 NormalR1613 NOV 25 NormalR1617 DEC 23 NormalR1618 DEC 30 Normal
4 Personnel
See Table 3 for Urumqi personnel.
5 Future Plans
A planned reconstruction of the 25-m antenna will takeplace in March 2014 and will be completed in October2014. A digital backend RDBE and a DBBC are bothin our purchase plan.
IVS 2013 Annual Report

Nanshan VLBI Station 179
Table 3 The staff supporting the 25-m antenna.
Name Position Field E-mailNa Wang Director Astrophysics [email protected] Yusup Chief Engineer Antenna [email protected] Chen Senior Engineer Receiver [email protected] Ma Senior Engineer Receiver [email protected] Yang Senior Engineer Terminal [email protected] Zhang Senior Engineer Terminal [email protected] Wang Senior Engineer Antenna [email protected] Nie Senior Engineer Computing [email protected] Li Engineer Computing [email protected] Chen Engineer Antenna [email protected] Li Engineer Time and Frequency [email protected] Liu Scientist Astrophysics [email protected] Zhang Scientist Astronomy [email protected]
IVS 2013 Annual Report

Warkworth Radio Astronomical Observatory, New Zealand
Hiroshi Takiguchi, Stuart Weston, Tim Natusch, Sergei Gulyaev
Abstract We describe geodetic research activi-ties related to the Warkworth 12-m VLBI Station:WARK12M. We present a summary of baseline lengths(obtained with the participation of WARK12M) basedon IVS results for the 2.5 year period, from the begin-ning of 2011 to August 2013, and compare them withbaselines for the corresponding (co-located) GNSSstations.
1 Introduction
New Zealand′s location on the boundary of the Pa-cific and Australian Plates makes it one of the mostactive geological areas in the world [1]. Figure 1 showsthe plate boundary, epicenters of earthquakes in thelast 3.5 years and location of major volcanoes in NewZealand. Two continuous GNSS networks are used inNew Zealand to monitor these geological processes:PositioNZ and GeoNet [2]. The PositioNZ network of31 GNSS stations has been used to support the NewZealand Geodetic Datum 2000 (NZGD2000) [3]. Priorto 2008, New Zealand had no VLBI capability; theNZGD2000 was therefore based solely on GNSS dataand ITRF96. GeoNet is a network designed for moni-toring earthquakes, volcanic activity, and crustal defor-mation. The New Zealand Velocity Model has been es-timated by using GeoNet network data [4]. This modelis referenced to the Australian Plate, so points nearAuckland move little, points near Christchurch move
Institute for Radio Astronomy and Space Research, AucklandUniversity of Technology
Warkworth Network Station
IVS 2013 Annual Report
southwest at about 40 mm/yr. About 5 mm/yr uplift isreported in the Southern Alps of the South Island fromGNSS observations [5].
The Global Geodetic Observing System (GGOS)aims to achieve a challenging 1 mm positioning and0.1 mm/yr velocity accuracy by using and integratingadvanced geodetic techniques [6], [7]. To achieve thesegoals, geodetic (GGOS) stations should be equippedwith two or more co-located geodetic observation tech-niques (e.g., GNSS and VLBI).
New Zealand first obtained the space geodetic tech-nique of VLBI in 2008 when Auckland Universityof Technology (AUT) established a 12-m geodetic ra-dio telescope near Warkworth, 60 km north of Auck-land (Figure 1). In 2010, WARK12M became an IVSnetwork station. Within the scope of global geode-tic VLBI observations, WARK12M plays an importantrole in improving the geographic distribution of VLBIstations in the Southern Hemisphere and contribut-ing to the definition of both the International Celes-tial Reference Frame (ICRF) and the International Ter-restrial Reference Frame (ITRF) [8]. Locally, withinthe New Zealand context, WARK12M provides impor-tant geodetic information which can be used (in con-junction with GNSS data) to support the NZGD2000and contribute to establishment of the next generation,GGOS inspired, New Zealand Geodetic Datum.
In addition to participating in regular IVS sessions,WARK12M is engaged in joint geodetic research withthe National Institute of Information and Communica-tions Technology (NICT), Japan and with the AuScopeproject [9]. The latter operates three 12-m radio tele-scopes located in Hobart (HOBART12), Yarragadee(YARRA12M), and Katherine (KATH12M). Locatedon the Australian tectonic plate, both WARK12Mand AuScope radio telescopes are ideally placed
180

Warkworth Observatory 181
for measurements of intra-plate deformation. TheWARK12M–AuScope baselines are long enoughto contribute to Earth Orientation Parameter (EOP)observations, particularly when coupled together withNew Zealand–Japan (NICT) baselines (Figure 2).
2 Warkworth Developments
Specifications of Warkworth 12-m and 30-m antennaare provided in Table 1 and Table 2.
During 2013, work continued on the 30-m(Cassegrain beam-waveguide NEC antenna) dishas first reported in [10]. In February 2013, the dishbecame fully steerable with the commissioning of anew control system and motors supplied by ControlTechnologies and Antenna Measurement and Consul-tancy Services. In October and November 2013, withthe assistance of Ed Himwich, we commenced workto develop a first pointing model using the existingSatellite Communication C-Band RF system and anew Field System. An uncooled C-band receiver iscurrently under development; significant improvementin performance is anticipated once it is fitted to theantenna.
In 2014, the existing 1 Gbps network connection toWarkworth will be upgraded to 10 Gbps, greatly en-hancing our eTransfer throughput for IVS. CurrentlyeTransfers to the Curtin correlator (for example) arelimited to a maximum sustained rate of just over 800Mbps with the existing 1 Gbps link via KAREN andAARNET. The 15-day continuous AUST experimentof December 2013 conducted with AuScope and Har-tRAO required some two weeks to eTransfer the ap-proximately 100TBytes of data collected with the ex-isting service.
3 Analysis of VLBI and GNSS Baselinesfor Warkworth
Since 2012, AUT has been engaged in collaborativeresearch with NICT, which operates three IVS networkstations (KASHIM34, KASHIM11, KOGANEI).Teams at both institutions have worked towardsestablishing a “geodetic environment” — correlationprocessing, bandwidth synthesis, VLBI data analysis,
Table 1 Specifications of the Warkworth 12-m antenna.
Antenna type Dual-shaped CassegrainManufacturer Cobham/Patriot, USAMain dish Diam. 12.1 mSecondary refl. Diam. 1.8 mFocal length 4.538 mSurface accuracy 0.35 mmPointing accuracy 18′′
Mount alt-azimuthAzimuth axis range 90◦±270◦
Elevation axis range 4.5◦ to 88◦
Azimuth axis max speed 5◦/sElevation axis max speed 1◦/s
Table 2 Specifications of the Warkworth 30-m antenna.
Antenna type Cassegrain, beam waveguideManufacturer NEC, JapanMain dish Diam. 30 mFrequency range 3.5 — 7 GHzMount alt-azimuth, wheel and trackAzimuth axis range −179.0◦ to 354.0◦
Elevation axis range 6.0◦ to 90.1◦
Azimuth axis max speed 15.0◦/minElevation axis max speed 21.6◦/min
and Time and Frequency Transfer by using VLBI.The baseline WARK12M–KASHIM11 is a longNorth-South baseline of over 8000 km (Figure 2).The first observation of the WARK12M–KASHIM11baseline carried out in 2012 resulted in the baselinelength of 8,075,003,545±150 mm. More observationsfor monitoring this baseline are in preparation, as wellas an experiment aimed to derive Earth OrientationParameters in an Ultra-rapid mode by using existingUT1 products and high-speed data transfer networks.
Since 2011, AUT has also been engaged in col-laborative research with the AuScope project. Herewe analyse Warkworth–AuScope baseline lengths andtheir rates of change using IVS Analysis Center re-sults. The number of sessions and session types (R1,R4, AUSTRAL) are listed separately in Table 3.
We analyzed databases of the three types (R1, R4,AUSTRAL) using Calc/Solve software. Different typesof IVS sessions are optimised for different purposes.For example, R1 and R4 sessions are optimised forproviding twice-weekly EOP results; the purpose ofAUSTRAL sessions is to determine the station coordi-nates and their evolution in the WARK12M–AuScopenetwork. It is important, therefore, to apply a uniformstrategy across all session types when analyzing theVLBI databases. When analyzing AUSTRAL sessions,
IVS 2013 Annual Report

182 Takiguchi et al.
we used only WARK12M and AuScope station data.For R1 and R4 sessions, we excluded TIGOCONCand Japanese stations (TSUKUM32, KASHIM34 andKASHIM11) in order to avoid the effects of potentialearthquake after-slip.
Figure 3 shows the baseline length residuals vs.time for three baselines that include Warkworth. Thelinear trends of baselines estimated for different typesof sessions are provided in each graph in brackets alongwith the standard errors. The rates of change deter-mined from VLBI data and the corresponding standarderrors are of the same order of magnitude, so based onthis data we cannot as yet conclude that the above ratesof change are statistically significant.
WARK12M and AuScope VLBI stations are co-located with the corresponding GNSS stations WARK,HOB2, KAT1, and YAR2 (Figure 2). We analyzedGNSS data of the co-located IGS (and PositioNZ) sta-tions using GAMIT/GLOBK software. We combinedthe results with the SOPAC global network file.
Figure 4 shows the baseline length residuals and thelinear trends of three baselines between Warkworth andAuScope co-located GNSS stations. Rates of changeindicated in Figure 4 were estimated by formally fit-ting linear functions to all sets of GNSS baseline data.All GNSS rates of change are very small (about 1-2mm/yr), which seems realistic given that all four sta-tions are located on the same tectonic plate. Due to thesmall number of observations, the errors of VLBI ratesare greater than the order of magnitude of the ratesthemselves. There is a clear annual/seasonal periodicpattern in GNSS baseline data (Figure 4) with an am-plitude of about 5-10 mm. We do not have enough datato identify an annual pattern in VLBI data that includeWARK12M.
4 Conclusion
Auckland University of Technology operates a 12-m geodetic radio telescope in New Zealand andparticipates in collaborative research programs inspace geodesy with IVS, NICT, and AuScope. Wehave analyzed the first 2.5 years of IVS observationsin which WARK12M participated and comparedthe Warkworth–AuScope baseline lengths and theirchanges with the corresponding GNSS results. Wedo not find long term (>1 year) changes in GNSS
baselines, but do find an annual periodic pattern withan amplitude of 5-10 mm. The small number of VLBIbaseline measurements and large errors do not allowrobust conclusions about VLBI baseline changes withcertainty at this time.
To monitor tectonic dynamics with high precision,a large number of observations is necessary. It is impor-tant to carry out observations continuously with mini-mal gaps. This was not the case in the first 2.5 yearsof WARK12M geodetic VLBI observations. We hoperegular and more frequent observations will improvethe accuracy of WARK12M VLBI measurements in thefuture.
AustralianPlate
PacificPlate
Fig. 1 New Zealand’s geological situation. Tectonic plateboundary is shown with the white curve. Dots indicate the earth-quake epicenter locations (M ≥ 1, from January 2010 to July2013) according to the USGS/NEIC earthquake catalog. Tri-angles indicate locations of major volcanoes. The location ofWARK12M is marked with a star.
Table 3 The number of sessions used for calculations over thetotal number of sessions of a given type.
WARK12M WARK12M WARK12MHOBART12 KATH12M YARRA12M
ALL 15/23 10/12 7/8R1 4/6 5/6 2/2R4 6/7 2/2 3/3AUSTRAL 4/4 3/3 2/3Others 1/6 0/1 0/0
IVS 2013 Annual Report

Warkworth Observatory 183
8075 km
2416 km
4753 km
5362 km
HOB2
KAT1
YAR2
WARK
KASHIM11
HOBART12
KATH12M
YARRA12M
WARK12M
Fig. 2 The geographical distribution of VLBI stations(WARK12M, AuScope, KASHIM11) with baseline lengths.
−40
−20
0
20
40
2011/01 2011/07 2012/01 2012/07 2013/01 2013/07
mm
WARK12M − HOBART12 (−3.30 ± 1.31 mm/yr)
−40
−20
0
20
40
2011/01 2011/07 2012/01 2012/07 2013/01 2013/07
mm
WARK12M − KATH12M ( 6.73 ± 5.46 mm/yr)
−40
−20
0
20
40
2011/01 2011/07 2012/01 2012/07 2013/01 2013/07
mm
WARK12M − YARRA12M ( 3.28 ± 3.55 mm/yr)
Fig. 3 Time series of the baseline length residuals of WARK12Mand AuScope baselines. Points and squares indicate R1 andR4 session respectively. Asterisks indicate AUSTRAL session.Rates of change (linear trends) and standard errors are shown inbrackets.
−40
−20
0
20
40
2011/01 2011/07 2012/01 2012/07 2013/01 2013/07
mm
WARK − HOB2 (−2.40 ± 0.34 mm/yr)
−40
−20
0
20
40
2011/01 2011/07 2012/01 2012/07 2013/01 2013/07
mm
WARK − KAT1 (−0.81 ± 0.46 mm/yr)
−40
−20
0
20
40
2011/01 2011/07 2012/01 2012/07 2013/01 2013/07
mm
WARK − YAR2 (−1.64 ± 0.44 mm/yr)
Fig. 4 Time series of the baseline length residuals calculatedfrom GNSS data (WARK, HOB2, KAT1, YAR2). Rates ofchange (linear trends) and standard errors are shown in brack-ets.
Acknowledgements
The authors would like to acknowledge organisationsand institutions such as IVS, IGS, LINZ, GNS Sci-ence, NICT, Geoscience Australia, University of Tas-mania and CSIRO. We are grateful to the makers ofCalc/Solve, GAMIT/GLOBK, and Generic MappingTools developers for providing the software.
References
1. Rafferty, John P. (2010), Plate tectonics, volcanoes, andearthquakes, p312.
2. Beavan, R. J. (2005), Noise properties of continuous GPSdata from concrete pillar geodetic monuments in NewZealand, and comparison with data from US deep drilledbraced monuments. Journal of geophysical research. Solidearth, 110(B8): B08410, doi:10.1029/2005JB003642.
3. Pearse, M. (2000), Realisation of the New Zealand GeodeticDatum 2000, OSG Technical Report, 5.
4. GNS Science, http://www.gns.cri.nz/Home/Our-Science/Earth-Science/Plate-Tectonics/Deformation-of-NZ.
5. Beavan, J., et al. (2010), Distribution of present-day ver-tical deformation across the Southern Alps, New Zealand,from 10 years of GPS data, Geophysical research letters, 37:L16305, doi:10.1029/2010GL044165.
6. H.-P. Plag, M. Pearlman (eds.) (2009), Global Geodetic Ob-serving System, DOI 10.1007/978-3-642-02687-41.
7. GGOS Vision, Mission and Goals. (2011). Officiallyadopted by the Global Geodetic Observing System Steer-ing Committee at its 21st Meeting on July 2, 2011 atthe IUGG XXV General Assembly, Melbourne, Australia.http://www.ggos.org/
8. Takiguchi, H., S. Gulyaev, T. Natusch, S. Weston, andL. Woodburn (2011), Towards Synergy of VLBI andGNSS Geodetic Techniques in Geologically Dynamic NewZealand, Advances in Geosciences, Vol. 31, 33-42.
9. Lovell, J.E.J., McCallum, J.N., Reid, P.B., McCulloch, P.M.,Baynes, B.E., Dickey, J.M., Shabala, S.S., Watson, C.S.,Titov, O., Ruddick, R., Twilley, R., Reynolds, C., Tingay,S.J., Shield, P., Adada, R., Ellingsen, S.P., Morgan, J.S. andBignall, H.E. (2013), The AuScope geodetic VLBI array,Journal of Geodesy, 87, 6, 527-538, doi:10.1007/s00190-013-0626-3.
10. Weston, S., H. Takiguchi, T. Natusch, L. Woodburn,S. Gulyaev (2013), Warkworth 12-m VLBI Station:WARK12M, IVS 2012 Annual Report, NASA/TP-2013-217511.
IVS 2013 Annual Report

Westford Antenna 2013 Annual Report
Mike Poirier
Abstract Technical information is provided about theantenna and VLBI equipment at the Westford site ofthe Haystack Observatory and about changes to thesystems since the IVS 2012 Annual Report.
1 Westford Antenna at HaystackObservatory
Since 1981, the Westford antenna has been one of theprimary geodetic VLBI sites in the world. Located∼70km northwest of Boston, Massachusetts, the antenna ispart of the MIT Haystack Observatory complex.
The Westford antenna was constructed in 1961 aspart of the Lincoln Laboratory Project West Ford thatdemonstrated the feasibility of long-distance commu-nication by bouncing radio signals off a spacecraft-deployed belt of copper dipoles at an altitude of 3600km. In 1981, the antenna was converted to geodetic useas one of the first two VLBI stations of the NationalGeodetic Survey Project POLARIS. Westford has con-tinued to perform geodetic VLBI observations on a reg-ular basis since 1981. Westford has also served as a testbed in the development of new equipment and tech-niques now employed in geodetic VLBI worldwide.Funding for geodetic VLBI at Westford is provided bythe NASA Space Geodesy Program.
MIT Haystack Observatory
Westford Antenna
IVS 2013 Annual Report
Fig. 1 The radome of the Westford antenna.
Table 1 Location and addresses of the Westford antenna.
Longitude 71.49◦ WLatitude 42.61◦ NHeight above m.s.l. 116 m
MIT Haystack ObservatoryOff Route 40
Westford, MA 01886-1299 U.S.A.http://www.haystack.mit.edu
2 Technical Parameters of the WestfordAntenna and Equipment
The technical parameters of the Westford antenna,which is shown in Figure 2, are summarized in Table 2.
The antenna is enclosed in a 28-meter diameter air-inflated radome made of 1.2 mm thick Teflon-coatedfiberglass—see Figure 1. When the radome is wet, sys-tem temperatures increase by 10–20 K at X-band andby a smaller amount at S-band. The major components
184

Westford Antenna 185
Fig. 2 Wide-angle view of the Westford antenna inside theradome. The VLBI S/X receiver is located at the prime focus.The subreflector in front of the receiver is installed when observ-ing with the TAL receiver (see Section 4), which is located at theCassegrain focus.
Table 2 Technical parameters of the Westford antenna forgeodetic VLBI.
Parameter Westford
primary reflector shape symmetric paraboloidprimary reflector diameter 18.3 metersprimary reflector material aluminum honeycombS/X feed location primary focusfocal length 5.5 metersantenna mount elevation over azimuthantenna drives electric (DC) motorsazimuth range 90◦−470◦
elevation range 4◦−87◦
azimuth slew speed 3◦ s−1
elevation slew speed 2◦ s−1
X-band system S-band systemfrequency range 8180-8980 MHz2210-2450 MHzTsys at zenith 50–55 K 70–75 Kaperture efficiency 0.40 0.55SEFD at zenith 1400 Jy 1400 Jy
of the VLBI data acquisition system are a Mark IVelectronics rack, a Mark 5B recording system, and aPentium-class PC running PC Field System version9.10.2. The primary frequency and time standard isthe NR-4 hydrogen maser. A CNS Clock GPS receiversystem provides a 1 pps reference clock to which themaser 1 pps is compared.
Westford also hosts the WES2 GPS site of the IGSnetwork. A Dorne-Margolin chokering antenna is lo-cated on top of a tower∼60 meters from the VLBIantenna, and a LEICA GRX1200 Reference Station re-ceiver acquires the GPS data.
3 Westford Staff
The personnel associated with the geodetic VLBI pro-gram at Westford and their primary responsibilities are:
Chris Beaudoin broadband developmentJoe Carter antenna servo supportBrian Corey VLBI technical supportKevin Dudevoir pointing system softwareDave Fields technician, observerAlex Burns technician, observerGlenn Millson observerArthur Niell principal investigatorMichael Poirier site managerColin Lonsdale site director
4 Standard Operations
From January 1, 2013, through December 31, 2013,Westford participated in 52 standard 24-hour sessions.Westford regularly participated in IVS-R1, IVS-R&D,IVS-T2, and RD-VLBA observations.
Use of the Westford antenna is shared with the Ter-restrial Air Link (TAL) Program operated by the MITLincoln Laboratory. In this project, Westford serves asthe receiving end on a 42-km long terrestrial air linkdesigned to study atmospheric effects on the propaga-tion of wideband communications signals at 20 GHz.
IVS 2013 Annual Report

186 Poirier
5 Research and Development
In its role as a test bed for VLBI developments theWestford antenna was implemented several times dur-ing the year with the VGOS broadband feed assemblyand used successfully as the second element of the in-terferometer with the GGAO 12-m VGOS system.
The first VGOS geodetic observations were sched-uled and observed in October 2012. Two six-hour ses-sions were run on successive days. The initial resultsagree at the few millimeter level, consistent with theexpected performance of the two systems. In May 2013the first 24-hour session was observed. When brokeninto four six-hour sections, the session showed geode-tic repeatability among the segments of better than 2mm. An important goal of that session was to demon-strate unattended operation following setup, and the an-tenna functioned as expected.
The antenna was also equipped with the Mark 6prototype data recorder for a demonstration of 16 Gbpsrecording capability. The equipment has been left inplace for additional Mark 6 testing and development.
6 Outlook
Westford is expected to participate in 87 24-hour ses-sions in 2014. These will include the 15-day CONT14campaign and several VGOS sessions, along with theoccasional fringe test and support of the VGOS broad-band development program.
Westford is planning to upgrade the PC Field Sys-tem and complete the pointing system upgrade, whichwill facilitate compatibility with the VGOS/MCI sys-tem to be installed on the Westford antenna.
The Westford broadband system will see severalupgrades in 2014, including improvements to the De-war, implementation of noise diode calibration, andseparation of the RF signal path into two bands to re-duce senstivity to S-band RFI.
Acknowledgements
I would like to thank Arthur Niell, Christopher Beau-doin, and Chester Ruszczyk for their contributions tothis report.
IVS 2013 Annual Report

Geodetic Observatory Wettzell - 20-m Radio Telescope and TwinTelescopes
Alexander Neidhardt 1, Gerhard Kronschnabl 2, Raimund Schatz 1, Torben Schuler 2
Abstract In 2013 the 20-m radio telescope at theGeodetic Observatory Wettzell, Germany contributedagain very successfully to the IVS observing program.2013 was the anniversary year of the antenna as itstarted its operations in the year 1983. Technicalchanges, developments, improvements, and upgradeshave been made to increase the reliability of theentire VLBI observing system. Therefore, a completeshutdown was necessary in the months from July toSeptember to replace the complete servo and gearsystem. In parallel the new Twin radio TelescopeWettzell (TTW) was officially inaugurated during aceremony with international guests. Additionally, firstlight and correlation tests were successfully performedin August.
1 General Information
The 20-m Radio Telescope in Wettzell (RTW) is anessential component of the Geodetic ObservatoryWettzell (GOW) and is jointly operated by Bun-desamt fur Kartographie und Geodasie (BKG) andForschungseinrichtung Satellitengeodasie (FESG)of the Technische Universitat Munchen (TechnicalUniversity Munich). In addition to the RTW an ILRSlaser ranging system, several IGS GPS permanentstations, a large laser gyroscope G (ringlaser) andthe corresponding local techniques, e.g. time and
1. Forschungseinrichtung Satellitengeodasie (FESG), Technis-che Universitat Munchen2. Bundesamt fur Kartographie und Geodasie (BKG)
RTW/TWIN Wettzell Network Station
IVS 2013 Annual Report
frequency, meteorology and super conducting gravitymeters, etc., are also being operated. Currently alsothe first antenna of the fully VLBI2010-compliantTwin radio Telescope is in an operational test phase. Itshould extend the observation possibilities accordingto the technical suggestions of the IVS Working Group3 (WG3) and the VLBI Global Observing System(VGOS) observations.
Within the responsibility of the GOW are the TIGOsystem in Concepcion, Chile, operated mainly togetherwith the Universidad de Concepcion (see separate re-port about TIGO), and the German Antarctic Receiv-ing Station (GARS) O’Higgins on the Antarctic penin-sula, operated together with the German Space Center(DLR) and the Institute for Antarctic Research Chile(INACH) (see separate report about O’Higgins).
2 Staff
The staff of the GOW consists in total of 34 members(excluding students) for operations, maintenance, andrepair issues and for improvement and development ofthe systems. The staff operating RTW is summarized inTable 1. In 2013, two chief engineers were appointedto be responsible for the technical issues at the two ra-dio telescope systems of the GOW. Christian Plotz tookover the duty for the 20-m RTW and Gerhard Kron-schnabl for the TTW.
Until March 2013, one additional engineer was ona research position which was funded by the “NovelEXploration Pushing Robust e-VLBI Services” (NEX-PReS) project in cooperation with the Max-Planck-Institute for Radioastronomy (MPIfR), Bonn. Anotherresearch position, which is partly involved in VLBI
187

188 Neidhardt et al.
Table 1 Staff - members of RTW.Name Affiliation Function Mainly
working forTorben Schuler BKG head of the GOW GOW
(since January 2013)Alexander NeidhardtFESG head of the VLBI groupRTW, TTW
and VLBI station chiefErhard Bauernfeind FESG mechanical engineer RTWEwald Bielmeier FESG technician RTWGerhard KronschnablBKG electronic engineer TTW, RTW,
(chief engineer TTW) TIGOChristian Plotz BKG electronic engineer O’Higgins,
(chief engineer RTW) RTW, TTWRaimund Schatz FESG software engineer RTWWalter Schwarz BKG electronic engineer RTW,
WVR)Reinhard Zeitlhofler FESG electronic engineer RTWMartin Ettl FESG/ Computer scientist NEXPReS
MPIfR (until March 2013) (EU FP7)Jan Kodet FESG appl. phys. engineer DFG FOR1503Gordon Klingl FESG/ student Operator
BKG RTW/SLRYvonne Klingl FESG/ student Operator
BKG RTW/SLR
developments, is founded by the DFG research groupFOR1503 about reference systems, local ties, and co-location on ground and space.
3 Observations in 2013
The 20-m RTW has been supporting the geodetic VLBIactivities of the IVS and partly other partners, suchas the EVN, for almost 30 years. All successfully ob-served sessions in the year 2013 are summarized inTable 2. After the repair of the bearings in 2010, itwas also necessary to replace the gears, the motors, theservo system, and the control system with a new, state-of-the-art technique. This was realized in the monthsfrom July to September 2013. Nevertheless, the tele-scope is in a very good and stable state. The main pri-ority in operations was participation in all daily one-hour INTENSIVE-sessions (INT) in order to determineUT1-UTC. According to the implementation of a FieldSystem extension for remote control, weekend INTEN-SIVEs were partly done in the new observation modesby remote attendance, remote control from studentsat the laser ranging system (WLRS), or completelyunattended. Meanwhile, all data are transferred with e-VLBI techniques. RTW now routinely uses the Internetconnection capacities of 1 Gbit/sec for the e-transfers
with the Tsunami protocol to the correlators in Bonn,Tsukuba, Haystack, and Washington.
Table 2 RTW observations in 2013.program number of special program number of
24h-sessions 1h-sessionsIVS R1 40 1h-INT1 179IVS R4 41 1h-INT2/K 56IVS T2 6 1h-INT3/K 25IVS R&D 7 VEX/MEX/RadioAstron 31RDV/VLBA 3 VLBA102 24EUROPE 5 Satellite tracking 1total 103 total (in hours) 316(in hours) 2472
In addition to the standard sessions, RTW was ac-tive for other special observations such as the trackingof the ESA Venus Express (VEX) spacecraft, the MarsExpress (MEX) spacecraft (Phobos fly-by) and the Ra-dioAstron satellite for the EVN. More progress waspossible for the tracking of Glonass and GPS satellites.Additional developments of an L-band receiver and theactivation of a permanent satellite tracking mechanism,using the new antenna control unit after the modifica-tion of the RTW, enabled frequent observations. A co-operation with the technical university in Vienna alsoallowed to extend the scheduling module of the ViennaVLBI Software (VieVS) to produce VEX files for satel-lite observations.
4 Technical Improvements andMaintenance
Regularly, tasks and maintenance days (obtaining re-placements for the hardware, 8-pack repair, gear main-tenance, exchange of motors after reaching their life-time, NASA Field System updates, cryo-system main-tenance, servo replacements, and improvements for e-VLBI issues) were scheduled for the usual mainte-nance work. As the components of the servo systemwere overaged, it was possible to commission a re-placement of the whole system and to upgrade it toa similar, modern technique such as the one installedin the Twin telescopes. The upgrade was performedby the company Vertex Antennentechnik GmbH, Duis-burg, Germany from July to September. During this up-grade the gears for the azimuth and elevation axes werereplaced. The new gears have new AC-servos and a
IVS 2013 Annual Report

Wettzell - 20-m and Twin Radio Telescopes 189
completely digital control system. Therefore the com-plete servo and control racks were replaced and the ca-ble wrap was reconfigured. As a new Twin-like antennacontrol unit controls the whole system, the station com-puter software was re-written. The new software sup-ports the classic tracking modes and additional satellitetracking possibilities and modes, which reduce powerconsumption for the slewing between sources with op-timal acceleration behavior. In addition to the upgradeof the servo system, the complete surface of the reflec-tor and sub-reflector was polished and varnished again.To improve the de-icing of the reflector, the heatingsystem in dedicated reflector panels was replaced.
Fig. 1 Some replacement work at the RTW: new setup of thecable wrap (left), replacement of the gears and motors (upperright), and new varnishing of the reflector surface (lower right).
Upgrades and repairs were also necessary for theMark IV data acquisition rack. The revision of the re-placement dewar systems for Wettzell and O’Higginswere completed by the labs at the astronomical obser-vatory in Yebes, Spain.
The usage of the EVN-PC for e-transfer wascontinuously extended. In addition the usage ofe-transfer for the 24-hour sessions to the correlatorsin Bonn, Haystack, Washington, and Tsukuba wasroutinely used with up to 600 Mbit per second. Acombination of the Mark 5 software “fuseMk5” andthe communication protocol “Tsunami” is used on aregular Mark 5B system.
The usage of the new Digital Baseband Converters(DBBC) was forced. Several test data were correlatedat the Bonn correlator to check functionality and qual-ity (especially in combination with the Twin operation
tests). Additionally new CoMo boards were installedto upgrade to a standard version of the equipment. Thedevelopment is still under progress.
The remote control software “e-RemoteCtrl” wasalso extended, mainly by the TUM. In close coopera-tion with the developers of the NASA Field System andwith other test sites at Australia (e.g. Hobart, Kather-ine, and Yarragadee) new features were established.The AuScope network and the Wettzell site alreadyuse the software routinely. The software developmentwas funded in task 3 of work package 5 of the NEX-PReS project and is performed in cooperation with theMPIfR.
Another new field is the preparation for trackingof global navigation satellites. Therefore new ampli-fier and receiver boards were improved. These can beused after the waveguides for S-band to receive the L-band of the satellite. Additionally the software is nowable to track satellites permanently, using orbits in theTwo-line Elements format.
5 The TWIN Radio Telescope Wettzell(TTW)
The Twin Telescope Wettzell project is Wettzell’s real-ization of a complete VLBI2010 conformity. The me-chanical system is now completely functional, and theinstallation work of the receiving and the data acqui-sition systems was continued. The new tri-band hornwas put into operation. Quality checks together withthe company Vertex Antennentechnik GmbH demon-strated the very good performance of the feed horn incombination with the antenna for S- and X-band. Thenew control room was completely set up to control boththe Twin telescopes and the old 20-m antenna. Addi-tionally connections to the TIGO telescope and to theAuScope telescopes in Australia was established.
The Twin telescopes started their operational testphase with an official inauguration with internationalguests on April 26th. After the ceremonial act, the Un-dersecretary of State of the German Ministry of theInterior Cornelia Rogall-Grothe, the Vice-President ofthe Technical University Munich (TUM) Prof. HansPongratz, and the President of the Federal Agency forCartography and Geodesy (BKG) Prof. Hansjorg Kut-terer symbolically started the operations under a clearand sunny sky by pushing a red start button.
IVS 2013 Annual Report

190 Neidhardt et al.
Fig. 2 The Twin radio Telescope Wettzell (TTW) as Wettzell’srealization of a complete VLBI2010 conformity.
Fig. 3 A “symbolic” start of the new telescopes.
The first operational test sessions were then per-formed in August. The north tower of the Twin tele-scope joined the regular INT3 session together with the20-m antenna. To test different digital baseband con-verters, one session used the Japanese ADS3000 sys-tem, while another used the DBBC. The scans werecorrelated in Bonn and resulted in good results, whichgave also some hints for improvements of the dataquality. Revised versions of the S-/X-receiver in com-bination with Ka and dual-polarization are under de-velopment. New software components for the new re-ceiver and data acquisition system are designed and un-der implementation. A new transfer technique with theMark 5 software “Jive5ab” from the Joint Institute for
VLBI in Europe (JIVE) allows the sending of record-ing data from one Mark 5 to another in real-time, whichshould be used to record all streams in the new DataCenter in the Twin operations building.
Fig. 4 The new control room and Data Center in the Twin oper-ations building.
The broadband feed horn (Eleven feed) for the sec-ond telescope (south tower), which is built by Omnisysin Sweden, is almost finished and is currently in qual-ity control. Chalmers University recently measured theradiation patterns and the data of the coherence andcross-polarization. The feed is expected for 2014.
Within a pilot study, a student of the Applied Uni-versity Dresden ran a permanent survey of the refer-ence point of the south tower, using two total stationsand 20 to 30 reflectors in the back structure. The anal-ysis showed very good stability over time.
6 Future Plans
Dedicated plans for 2014 are:
• Update of the de-icing control system,• Upgrade of the RTW for complete remote control
from the Twin control room,• Completion of the Twin implementations of the
north tower and continuation of the operationaltests, and
• Development of new receiver and system monitor-ing software.
IVS 2013 Annual Report

Instituto Geogr afico Nacional of Spain
Jesus Gomez-Gonzalez 1, Jose Antonio Lopez-Fernandez 2, Francisco Colomer 1, Luis Santos 3
Abstract The National Geographic Institute (IGN)of Spain has been involved in space geodesy activi-ties since 1995. Since 2008, the new 40-m radio tele-scope at Yebes Observatory has been a network sta-tion for IVS and has participated regularly in IVS cam-paigns. Currently, IGN is involved in the establishmentof an Atlantic Network of Geodynamical and SpaceStations (project RAEGE). The first antenna, at YebesObservatory, has been completed. The construction ofits first receiver (triband, S/X/Ka) has been finishedand is ready to be installed at the telescope. Moreover,the erection of a second antenna of RAEGE (in SantaMaria, Azores islands, Portugal) is almost complete. Inorder to comply with the VGOS specifications, a newbroadband receiver is being developed at Yebes and isexpected to be available for observations in 2015.
1 General Information
The National Geographic Institute of Spain (InstitutoGeografico Nacional, Ministerio de Fomento), has rungeodetic VLBI programs at Yebes Observatory since1995, nowadays operating a 40-m radio telescopewhich is a network station for IVS. Yebes Observatoryis also the reference station for the Spanish GNSSnetwork and holds permanent facilities for gravimetry.A new VLBI2010-type antenna has been built in
1. Instituto Geografico Nacional (IGN)2. IGN Yebes Observatory3. Secretaria Regional da Ciencia, Tecnologia e Equipamentos(Azores, Portugal)
IGN-Yebes Network Station
IVS 2013 Annual Report
Yebes as part of the RAEGE project (the acronymRAEGE stands for “Red Atlantica hispano-portuguesade Estaciones Geodinamicas y Espaciales”).
2 Current Status and Activities
The 40-m radio telescope has participated in 35 ses-sions (17 R1, 13 R4, three T2, and two EUROPE). Allthe data is being routinely transferred by Internet to thecorrelators.
We have purchased 64 Tb of Mark 5 disks to sup-port our participation in the IVS CONT14 campaign.
2.1 RAEGE
IGN, together with the Portuguese colleagues inDSCIG (Azores Islands), continues the constructionof a network of four new Fundamental Geodynam-ical and Space Stations. The RAEGE project wasdescribed in previous IVS Annual Reports. TheSpanish-Portuguese VGOS network RAEGE will becovering three continental plates with sites in Spainat Yebes (Eurasian Plate) and Tenerife (African Plate)and in Portugal on the Azorean islands of Santa Maria(Eurasian Plate) and Flores (North American Plate).
On October 21, 2013, the first VGOS radio tele-scope of the RAEGE Project was inaugurated in Yebesby the Spanish Minister of Development, Da Ana Pas-tor, and the President of the Regional Government ofCastilla-La Mancha, Da Marıa Dolores de Cospedal.Both officials unveiled a bronze dedication plaque withthe name “Jorge Juan” for the new radio telescope
191

192 Gomez-Gonzalez et al.
Fig. 1 RAEGE first radio telescope, “Jorge Juan”, at Yebes Observatory. In the background, the 40-m radio telescope which currentlyparticipates in all IVS campaigns.
(see Figure 2). Jorge Juan was a Spanish Admiral andcosmographer who participated, together with LaCon-domine, in the 18th century expedition to Peru (nowEcuador) to measure the length of a degree of latitudeat the equator and check the polar flatness of the Earth.After his return, the Spanish King Carlos III entrustedhim with founding the Royal Observatory in Madrid(ROM, in 1757); today the observatory is part of the In-stituto Geografico Nacional, which – through ROM –is also the host institute of the Yebes Observatory. The“Jorge Juan” radio telescope, designed by MT Mecha-tronics GmbH and mostly built by Spanish companies,will be fully dedicated to geodetic VLBI. The instru-ment is the first of four very fast RAEGE telescopesthat will be fully VGOS compliant (see Figure 1).
It will be shortly followed by the antenna in SantaMarıa (Azores, see the status of the onsite works inFigure 3 and the control building in Figure 4), whosefirst light is expected in early 2015.
Fig. 2 Bronze dedication plaque for the RAEGE “Jorge Juan”radio telescope, unveiled on October 21, 2013 by the SpanishMinister of Development, Da Ana Pastor, and the President ofthe Autonomous Regional Government of Castilla-La Mancha,Da Marıa Dolores de Cospedal.
The engineers of the Yebes laboratories have com-pletely designed and built a tri-band receiver and op-
IVS 2013 Annual Report

IGN - Yebes Station Report 193
Fig. 3 Status of construction of the RAEGE antenna in Santa Maria (Azores islands, Portugal).
Table 1 RAEGE instrumentation parameters.
Parameter ValueRT Diameter 13.2 mOptics Ring focusSurface rms 180µmDesigner MT Mechatronics GmbHAz/El slew speed 12o/sec / 6o/secReceivers triband (S, X, Ka)
dual pol (RCP+LCP)Band Frequency (GHz) Trec (K)S band 2.2-2.7 21X band 7.5-9.0 23Ka band 28-33 GHz 25DBBC type European DBBC (IRA/INAF)Recorder Mark 5B+/Mark 5CYebes connectivity 10 Gbit/s fiber
tics for the S (2 GHz), X (8 GHz), and Ka (32 GHz)frequency bands (see Figure 5). This receiver will beinstalled at the Yebes RAEGE telescope, which is ex-pected to become available for the IVS in the firsthalf of 2014. An identical receiver was built for GSI
Fig. 4 Status of construction of the control and auxiliary build-ings of the RAEGE station in Santa Maria.
(Japan), and it will be installed at their new antenna inIshioka.
Detailed information on RAEGE is available on theWeb at http://www.raege.net/
IVS 2013 Annual Report

194 Gomez-Gonzalez et al.
Table 2 Staff in the IGN VLBI group (e-mail:[email protected]).
Name Background Role Address∗
Francisco Colomer Astronomer VLBI Project coordinator IGNJesus Gomez–Gonzalez Astronomer Deputy Director for IGN
Astronomy, Geophysics, and Space ApplicationsJose Antonio Lopez–Fdez Engineer RAEGE Director YebesPablo de Vicente Astronomer VLBI technical coordinator YebesJose Antonio Lopez–Perez Engineer Receivers YebesFelix Tercero Engineer Antennas YebesSusana Garcıa–Espada Engineer geoVLBI expert YebesJavier Lopez–Ramasco Geodesist Geodesist YebesAlvaro Santamarıa Geodesist Geodesist Yebes
Fig. 5 Tri-band (S/X/Ka) receiver, designed and built at the lab-oratories in Yebes Observatory.
3 IGN Staff Working on VLBI Projects
Table 2 lists the IGN staff who are involved in spacegeodesy studies and operations. The VLBI activitiesare also supported by other staff such as receiver en-gineers, computer managers, telescope operators, sec-retaries, and students.
4 Future Plans
First light of the RAEGE radio telescope at Yebes isexpected in early 2014. The construction of the secondantenna of RAEGE, in Santa Maria (Azores), will alsobe completed in 2014.
In order to comply with the VGOS specifications,a new broadband receiver is being developed at Yebesand should be available for observations in 2015.
IGN expects to participate in the IVS CONT14campaign with the Yebes 40-m radio telescope and willalso take part in the early VGOS tests starting in 2015with the new RAEGE 13.2-m “Jorge Juan” antenna.
RAEGE is to be completed with two more sta-tions, in Tenerife (Canary islands) and Flores (Azoresislands). Site selection for the former is very advanced,near the city of Tegueste, in the northern and most geo-logically stable part of the island of Tenerife. Figure 4displays the project of the station infrastructures, in-cluding the radio telescope (under construction at MTMechatronics GmbH) and auxiliary buildings for con-trol, time and frequency, gravimeters, etc. The con-struction of this station is expected in 2016 and the onein Flores in 2017.
IVS 2013 Annual Report

Zelenchukskaya Radio Astronomical Observatory 2013 IVSAnnual Report
Sergey Smolentsev, Andrei Dyakov
Abstract This report summarizes information on ac-tivities at the Zelenchukskaya Radio Astronomical Ob-servatory in 2013. During the previous year a numberof changes were carried out at the observatory to im-prove some technical parameters and to upgrade someunits to required status. The report also provides anoverview of current geodetic VLBI activities and givesan outlook for the next year.
1 General Information
Zelenchukskaya Radio Astronomical Observatory(Figure 1) was founded by the Institute of AppliedAstronomy (IAA) as one of three stations of theRussian VLBI network QUASAR. The sponsoringorganization of the project is the Russian Academyof Sciences (RAS). The Zelenchukskaya RadioAstronomical Observatory is situated in Karachaevo-Cherkesskaya Republic (the North Caucasus) about70 km south of Cherkessk, near Zelenchukskayavillage (Table 1). The geographic location of theobservatory is shown on the IAA RAS Web site:http://www.ipa.nw.ru/PAGE/rusipa.htm. The basicinstruments of the observatory are a 32-m radiotelescope equipped with special technical systemsfor VLBI observations, GPS/GLONASS/Galileoreceivers, and an SLR system.
Institute of Applied Astronomy of RAS
Network Station Zelenchukskaya
IVS 2013 Annual Report
Table 1 Zelenchukskaya Observatory location and address.
Longitude 41◦34′
Latitude 43◦47′
Karachaevo-Cherkesskaya Republic369140, Russia
Fig. 1 Zelenchukskaya observatory.
2 Technical Staff
Table 2 Staff related to VLBI operations at Zelenchukskaya.
Andrei Dyakov observatory chiefDmitry Dzuba FS, pointing system controlAnatoly Mishurinsky front end and receiver supportAndrey Mikhailov FS, pointing system control
195
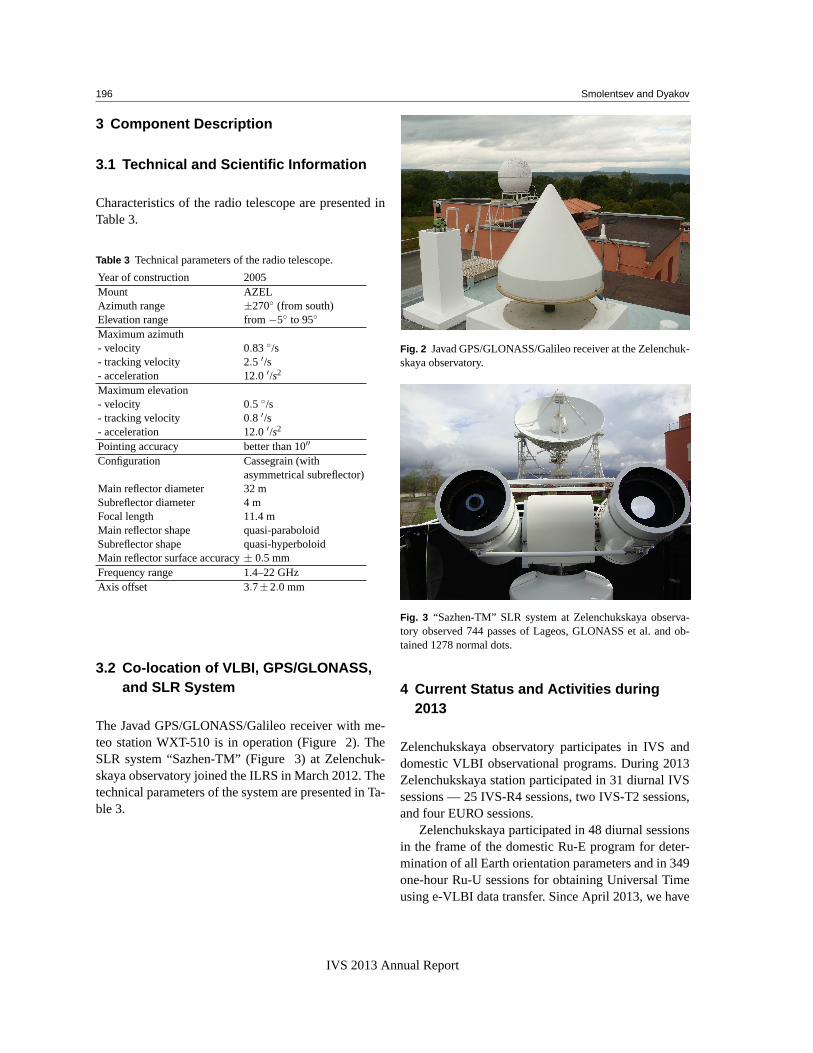
196 Smolentsev and Dyakov
3 Component Description
3.1 Technical and Scientific Information
Characteristics of the radio telescope are presented inTable 3.
Table 3 Technical parameters of the radio telescope.
Year of construction 2005Mount AZELAzimuth range ±270◦ (from south)Elevation range from−5◦ to 95◦
Maximum azimuth- velocity 0.83 ◦/s- tracking velocity 2.5 ′/s- acceleration 12.0 ′/s2
Maximum elevation- velocity 0.5 ◦/s- tracking velocity 0.8 ′/s- acceleration 12.0 ′/s2
Pointing accuracy better than 10′′
Configuration Cassegrain (withasymmetrical subreflector)
Main reflector diameter 32 mSubreflector diameter 4 mFocal length 11.4 mMain reflector shape quasi-paraboloidSubreflector shape quasi-hyperboloidMain reflector surface accuracy± 0.5 mmFrequency range 1.4–22 GHzAxis offset 3.7±2.0 mm
3.2 Co-location of VLBI, GPS/GLONASS,and SLR System
The Javad GPS/GLONASS/Galileo receiver with me-teo station WXT-510 is in operation (Figure 2). TheSLR system “Sazhen-TM” (Figure 3) at Zelenchuk-skaya observatory joined the ILRS in March 2012. Thetechnical parameters of the system are presented in Ta-ble 3.
Fig. 2 Javad GPS/GLONASS/Galileo receiver at the Zelenchuk-skaya observatory.
Fig. 3 “Sazhen-TM” SLR system at Zelenchukskaya observa-tory observed 744 passes of Lageos, GLONASS et al. and ob-tained 1278 normal dots.
4 Current Status and Activities during2013
Zelenchukskaya observatory participates in IVS anddomestic VLBI observational programs. During 2013Zelenchukskaya station participated in 31 diurnal IVSsessions — 25 IVS-R4 sessions, two IVS-T2 sessions,and four EURO sessions.
Zelenchukskaya participated in 48 diurnal sessionsin the frame of the domestic Ru-E program for deter-mination of all Earth orientation parameters and in 349one-hour Ru-U sessions for obtaining Universal Timeusing e-VLBI data transfer. Since April 2013, we have
IVS 2013 Annual Report

Zelenchukskaya IVS Annual Report 197
used e-VLBI data transfer for Zelenchukskaya obser-vational data for the Ru-E 24-hour sessions.
Finally, an antenna tower for the 13.2-m dish wasbuilt.
Fig. 4 Antenna tower for the 13.2-m dish and RT-32 at Ze-lenchukskaya observatory.
5 Future Plans
Our plans for the coming year are the following:
• To participate in IVS observations including theCONT14 IVS campaign,
• To carry out domestic observational programs forobtaining Universal Time daily and for obtainingEarth orientation parameters weekly with e-VLBIdata transfer,
• To carry out SLR observations of geodetic and nav-igation satellites,
• To participate in EVN and RADIOASTRON obser-vational sessions,
• To continue geodetic monitoring of the RT-32 pa-rameters,
• To install a WVR, and
• To finish VLBI2010 antenna installation in 2014.
References
1. Finkelstein A., Ipatov A., Smolentsev S. The Network“Quasar”: 2008-2011 // “Measuring the future”, Proc. of theFifth IVS General Meeting, A. Finkelstein, D. Behrend (eds.),St. Petersburg, “Nauka”, 2008. pp. 39–46.
IVS 2013 Annual Report


Ope
ratio
n C
ente
rs


The Bonn Geodetic VLBI Operation Center
A. Nothnagel, A. Muskens
Abstract The IGGB Operation Center has continued tocarry out its tasks of organizing and scheduling variousobserving sessions of the IVS-T2, IVS-OHIG, IVS-INT3, and EUROPE series.
1 Center Activities
The IGGB VLBI Operation Center is part of the Insti-tute of Geodesy und Geoinformation of the Universityof Bonn, Nußallee 17, D-53115 Bonn, Germany. It hasbeen organizing and scheduling VLBI observing ses-sions for almost 30 years. The work of the OperationCenter is closely related to the Bonn Correlator. Forthis reason, distribution of media (Mark 5 disk units) tothe stations after correlation is still the most costly partof the operations since network capacity has remainedconstant at 1 Gb/s for financial reasons.
• Measurement of Vertical Crustal Motion inEurope by VLBI (EUROPE)Since the late 1980s, a series of special sessionsis regularly being scheduled in Europe for precisedetermination of station coordinates and for longterm stability monitoring. This year, six networkobserving sessions with Ny-Alesund (six sessions),Onsala (four sessions), Metsahovi (one session),DSS65a (one session), Svetloe (four sessions),Zelenchukskaya (four sessions), Badary (threesessions), Effelsberg (two sessions), Wettzell(five sessions), Simeiz (five sessions), Medicina
Institut fur Geodasie und Geoinformation der Universitat Bonn
Bonn Operation Center
IVS 2013 Annual Report
(three sessions), Matera (two sessions), Noto (sixsessions), and Yebes (YEBES40M) (two sessions)were scheduled employing the frequency setup of16 channels and 4 MHz bandwidth (identical to thesetup of the IVS-T2 sessions).
• IVS-T2 seriesThis series was observed roughly every secondmonth (seven sessions in 2013) primarily for main-tenance and stabilization of the VLBI terrestrialreference frame as well as for Earth rotation mon-itoring as a by-product. Each station of the globalgeodetic VLBI network is planned to participatein the T2 sessions at least once per year. In viewof the limitations in station days, priority wasgiven to strong and robust networks with manysites over more observing sessions. Therefore,generally 15 to 24 stations have been scheduledin each session. The scheduling of these sessionshas to take into account that a sufficient numberof observations is planned for each baseline ofthese global networks. The recording frequencysetup is 16 channels and 4 MHz channel bandwidth.
• Southern Hemisphere and Antarctica Series(OHIG):In February 2013, three sessions of the South-ern Hemisphere and Antarctica Series with theAntarctic stations Syowa (Japanese) and O’Higgins(German) plus Fortaleza, HartRAO, and Kokeehave been organized (OHIG82-83-84). Further-more, O’Higgins was also included successfullyin the T2088 session. The (southern) winterO’Higgins burst (OHIG85-86-87) was scheduled,but it had to be observed without O’Higgins for
201
202 Nothnagel and Muskens
various reasons. Other participating stations wereFortaleza, HartRAO, Kokee, Syowa, HOBART12,KATH12M, Kokee, WARK12M, TIGOCONC,and YARR12M. The purpose of these sessions isthe maintenance of the VLBI terrestrial referenceframe (TRF) and the monitoring of Earth rotationas a by-product. The recording frequency setupis 16 channels and 4 MHz channel bandwidth.Due to the fact that Syowa is not able to deliverthe recorded data for nearly one year after theobservations, the correlation and the generation ofthe databases is always delayed considerably.
• UT1 determination with near-real-time e-VLBI(INT3):The so-called INT3 sessions were originally set upfor the telescopes of Ny-Alesund, Tsukuba, andWettzell for weekly UT1 determinations aiming atvery quick delivery of results. The sessions are al-ways scheduled to start on Monday morning at 7:00a.m. UT.Due to maintenance activities at Tsukuba, Ny-Alesund, and Wettzell, one or more of thesestations sometimes had to be replaced by othersuitable telescopes. From May to December,Seshan replaced Tsukuba in 26 sessions. Sincethen, Seshan has taken part in the INT3 sessionson a monthly basis. Svetloe replaced Wettzelland Ny-Alesund during June to September, andYebes replaced them during August. No suitableobserving configuration could be established for17 sessions, which had to be canceled entirely.The operations part of the INT3 sessions also in-cludes rapid data transmission and correlation. Theraw VLBI observation data of four sites is trans-ferred to the Bonn Correlator by Internet connec-tions directly after the session is completed in orderto speed up delivery of the results. The transmis-sion rate is about 400-600 Mb/s from Tsukuba andWettzell, 300 Mb/s from Seshan, and 100 Mb/s forNy-Alesund. For the latter, the data rate is limiteddue to the use of a radio link for the first part ofthe distance. All transmissions share the “last mile”which is limited to 1 Gb/s due to financial limita-tions.Altogether, 33 INT3 sessions were observed andtransmitted successfully in 2013. 96% of the ses-sions were correlated and the databases delivered
within the first four hours after the end of the ob-servations. A further 2% were completed within tenhours. The rest took between ten and 48 hours dueto difficulties with networking hardware and/or sta-tion and processor problems.
2 Staff
Table 1 Personnel at IGGB Operation Center.
Arno Muskens [email protected] [email protected]
IVS 2013 Annual Report

CORE Operation Center 2013 Annual Report
Cynthia C. Thomas, Daniel S. MacMillan
Abstract This report gives a synopsis of the activitiesof the CORE Operation Center from January 2013 toDecember 2013. The report forecasts activities plannedfor the year 2014.
1 Changes to the CORE OperationCenter’s Program
The Earth orientation parameter goal of the IVS pro-gram is to attain precision at least as good as 3.5µs forUT1 and 100µas for pole position.
The IVS program, which started in 2002, used theMark IV recording mode for each session. The IVSprogram began using the Mark 5 recording mode inmid-2003. By the end of 2007, all stations were up-graded to Mark 5. Due to the efficient Mark 5 correla-tor, the program continues to be dependent on stationtime and media. The following are the network config-urations for the sessions for which the CORE Opera-tion Center was responsible in 2013:
• IVS-R1: 53 sessions, scheduled weekly and mainlyon Mondays, five to twelve station networks
• RDV: Six sessions, scheduled evenly throughoutthe year, 14 to 16 station networks
• IVS-R&D: Ten sessions, scheduled monthly, six toten station networks
NVI, Inc.
CORE Operation Center
IVS 2013 Annual Report
2 IVS Sessions from January 2013 toDecember 2013
This section displays the purpose of the IVS sessionsfor which the CORE Operation Center is responsible.
• IVS-R1: In 2013, the IVS-R1s were scheduledweekly with five to twelve station networks. Duringthe year, 19 different stations participated in theIVS-R1 network, but there were only eight stationsthat participated in at least half of the scheduledsessions—Tigo (51), Ny-Alesund (47), Wettzell(41), Fortaleza (40), Westford (39), Hobart12 (28),Kokee (28), and Katherine (26). Aira participatedin the IVS-R1 sessions for the first time during2013.The purpose of the IVS-R1 sessions is to provideweekly EOP results on a timely basis. These ses-sions provide continuity with the previous COREseries. The “R” stands for rapid turnaround becausethe stations, correlators, and analysts have a com-mitment to make the time delay from the end ofrecording to the results as short as possible. Thetime delay goal is a maximum of 15 days. Eighty-one percent of the IVS-R1 sessions were completedin 15 or fewer days. The remaining 19% were com-pleted in 16 to 24 days [16 days (four), 17 days(one), 20 days (two), 23 days (two), and 24 days(one)]. Participating stations are requested to shipdisks to the correlator as rapidly as possible or totransfer the data electronically to the correlator us-ing e-VLBI. The “1” indicates that the sessions aremainly on Mondays.
• RDV: There are six bi-monthly coordinated astro-metric/geodetic experiments each year that use the
203

204 Thomas and MacMillan
full ten-station VLBA plus up to six geodetic sta-tions.These sessions are being coordinated by the geode-tic VLBI programs of three agencies: 1. USNO per-forms repeated imaging and correction for sourcestructure; 2. NASA analyzes this data to determinea high accuracy terrestrial reference frame; and 3.NRAO uses these sessions to provide a service tousers who require high quality positions for a smallnumber of sources. NASA (the CORE OperationCenter) prepares the schedules for the RDV ses-sions.
• R&D: The purpose of the ten R&D sessions in2013, as decided by the IVS Observing ProgramCommittee, was to support mixed mode observing(RD1301), vet sources for the good geodeticcatalog (RD1302 and RD1304), vet sources for thegood geodetic catalog and GAIA proposal sources(category 4) (RD1303), observe linked sourcesbetween GAIA and ICRF-2 (RD1305 throughRD1308), and test the 512 Mbps recording modefor the CONT14 Campaign.
3 Current Analysis of the CORE OperationCenter’s IVS Sessions
Table 1 gives the average formal errors for the R1, R4,RDV, R&D, and T2 sessions from 2013. The R1 ses-sion formal uncertainties are not significantly differentfrom the 2011-2012 errors. The R4 uncertainties for the2012-2013 sessions are much better than for 2011. R4stations performed better in 2012-2013 than in 2011,where 37 sessions lost one or more stations from theoriginal scheduled network. R1 uncertainties for 2011-2013 could be reduced if we used a GPS a priori modelto obtain the post-earthquake behavior at Tsukuba in-stead of estimating the TSUKUB32 position for eachsession, thereby weakening its contribution to EOP.
RDV uncertainties are about 10% larger for 2013than for 2011 and 2012. The RDV formal errors arestill better than the other experiment series. This is dueto the large number of stations in the RDV sessions aswell as to better global geometry. T2 uncertainties forX-pole and nutation in longitude are clearly better in2013 than for 2011-2012. For comparison, we also in-cluded the formal uncertainties for the CONT11, which
are much better than any of the networks discussedabove that observed in 2013.
Table 2 shows EOP differences with respect to theIGS series for the R1, R4, T2, RDV, and CONT11series. The WRMS differences were computed afterremoving a bias, but estimating rates does not affectthe residual WRMS significantly. Except for the R4X-pole, R1 and R4 series have worse WRMS agree-ment in X-pole, Y-pole, and LOD for 2013 than forthese series since 2000. Part of this may be explainedby the treatment of TSUKUB32 in solutions as dis-cussed above. Adopting the improved GPS a priorimodel strategy above improves the R1 agreement withIGS by 20%. It is not understood why the R4 Y-poleWRMS difference relative to IGS is so much greaterfor 2013 than for the long-term series. Both the X-poleand Y-pole biases of the R1 and R4 sessions relativeto IGS differ by 70 uas, which is much greater thanthe uncertainty of the bias estimates. Of all the series,the RDV series has the best WRMS agreement of X-pole and Y-pole with IGS estimates in 2013 and forthe full period, 2000-2013. For comparison with the2013 sessions discussed here, we included the statis-tics for the 15 CONT11 sessions, which shows the bestWRMS agreement with IGS. This is expected becausethe CONT11 network 1) has better geometry and 2) isunchanged over the period of 15 days of continuousobserving.
4 The CORE Operations Staff
Table 3 lists the key technical personnel and their re-sponsibilities so that everyone reading this report willknow whom to contact about their particular question.
5 Planned Activities during 2014
The CORE Operation Center will continue to be re-sponsible for the following IVS sessions during 2014:
• The IVS-R1 sessions will be observed weekly andrecorded in Mark 5 mode.
• The IVS-R&D sessions will be observed ten timesduring the year.
• The RDV sessions will be observed six times dur-ing the year.
IVS 2013 Annual Report

CORE Operation Center Report 205
Table 1 Average EOP Formal Uncertainties for 2013.
Session Num X-pole Y-pole UT1 DPSI DEPSType (µas) (µas) (µs) (µas) (µas)
R1 51 67(73,67) 66(63,65) 3.1(3.4,3.0) 105(110,111) 42(44,45)R4 5l 68(70,84) 66(67,75) 2.9(2.8,3.2) 120(124,160) 49(49,65)RDV 6 54(48,49) 54(48,46) 2.8(2.5,2.5) 82(68,75) 33(28,30)T2 6 67(83,89) 66(66,90) 3.4(3.9,4.3) 130(146,176) 50(57,67)CONT11 15 39 38 1.7 42 17Values in parentheses are for 2012 and then 2011.
Table 2 Offset and WRMS Differences (2013) Relative to the IGS Combined Series.
X-pole Y-pole LODSession Type Num Offset WRMS Offset WRMS Offset WRMS
(µas) (µas) (µas) (µas) (µs/d) (µs/d)
R1 51(620) -103(-1) 124(104) 6(12) 122(91) 2.6(0.8) 22(17)R4 51(618) -33(-22) 97(113) 72(21) 134(115) 0.8(1.8) 18(18)RDV 6(84) 41(58) 68(81) -46(2) 70(68) 2.1(-0.2) 12(14)T2 6(81) 0.3(3) 108(141) 47(5) 128(117) 10.8(2.2) 16(19)CONT11 15 42 36 9 29 7.0 7Values in parentheses are for the entire series (since 2000) foreach session type.
Table 3 Key Technical Staff of the CORE Operations Center.
Name Responsibility Agency
Dirk Behrend Organizer of CORE program NVI, Inc./GSFCBrian Corey Analysis HaystackRicky Figueroa Receiver maintenance ITT ExelisJohn Gipson SKED program support and development NVI, Inc./GSFCFrank Gomez Software engineer for the Web site Raytheon/GSFCDavid Gordon Analysis NVI, Inc./GSFCEd Himwich Network Coordinator NVI, Inc./GSFCDan MacMillan Analysis NVI, Inc./GSFCKatie PazamickasMaser maintenance ITT ExelisDavid Rubincam Procurement of materials necessary for CORE operations GSFC/NASABraulio Sanchez Procurement of materials necessary for CORE operations GSFC/NASADan Smythe Tape recorder maintenance HaystackCynthia Thomas Coordination of master observing schedule and preparation of
observing schedulesNVI, Inc./GSFC
IVS 2013 Annual Report

NEOS Operation Center
David M. Hall, Merri Sue Carter
Abstract This report covers the activities of the NEOSOperation Center at USNO for 2013. The OperationCenter schedules IVS-R4 and the INT1 Intensive ex-periments.
1 VLBI Operations
NEOS operations in the period covered consisted,each week, of one 24-hour duration IVS-R4 observingsession, on Thursday-Friday, for Earth Orientation,together with five daily one-hour duration “Intensives”for UT1 determination, Monday through Friday.In 2013, the operational IVS-R4 network includedVLBI stations at Kokee Park (Hawaii), Wettzell(Germany), Ny-Alesund (Norway), TIGO (Chile),Fortaleza (Brazil), Tsukuba (Japan), Svetloe, Badaryand Zelenchukskaya (Russia), Hobart, Katherine andYarragadee (Australia), Yebes (Spain), and Matera andMedicina (Italy). A typical R4 consisted of eight totwelve stations.
The regular stations for the weekday IVS Inten-sives were Kokee Park and Wettzell. Intensives includ-ing Kokee Park, Wettzell, and Svetloe were occasion-ally scheduled in order to characterize the Kokee Park— Svetloe baseline so that Svetloe can be used as analternate for Wettzell should it be needed. Odd-day In-tensives were scheduled with the scheduling techniqueused since 2000; even-day Intensives were scheduled
U.S. Naval Observatory
NEOS Operation Center at USNO
IVS 2013 Annual Report
with an experimental scheduling technique developedin 2009.
The Operation Center updated the version of skedas updates became available.
All sessions are correlated at the Washington Cor-relator, which is located at USNO and is run by NEOS.
Table 1 Experiments Scheduled during 2013.
Number of Experiments Type52 IVS-R4 experiments227 Intensives
2 Staff
D. M. Hall and M. S. Carter are the only staff mem-bers of the NEOS Operation Center. Mr. Hall is respon-sible for the overall management, and Carter makesthe schedules. M. S. Carter is located at the USNOFlagstaff Station (NOFS).
206

Cor
rela
tors


The Bonn Astro/Geo Correlator
Laura La Porta 1, Walter Alef 2, Alessandra Bertarini 1,2, Simone Bernhart 1,2, Gabriele Bruni 2, Arno Muskens 1,Helge Rottmann 2, Alan Roy 2, Gino Tuccari 2,3
Abstract The Bonn Distributed FX (DiFX) correlatoris a software correlator operated jointly by the Max-Planck-Institut fur Radioastronomie (MPIfR), the In-stitut fur Geodasie und Geoinformation der UniversitatBonn (IGG), and the Bundesamt fur Kartographie undGeodasie (BKG) in Frankfurt, Germany.
1 Introduction
The Bonn correlator is located at the MPIfR1 inBonn, Germany. It is operated jointly by the MPIfRand the BKG2 in cooperation with the IGG3. It isa major correlator for geodetic observations andastronomical projects (for instance, those involvingpulsar gating, millimeter wavelengths, astrometry, andRadioAstron4).
1. Institut fur Geodasie und Geoinformation der UniversitatBonn2. Max-Planck-Institut fur Radioastronomie3. Istituto di Radioastronomia - INAF
Bonn Correlator
IVS 2013 Annual Report
1 http://www.mpifr-bonn.mpg.de/2 http://www.bkg.bund.de/3 http://www.gib.uni-bonn.de/4 http://www.asc.rssi.ru/radioastron/
2 Present Correlator Capabilities
The DiFX correlator5 was developed at SwinburneUniversity in Melbourne by Adam Deller and othercollaborators. It was adapted to the VLBA operationalenvironment by Walter Brisken and the NRAO staff,and it is constantly updated by the worldwide DiFXdevelopers group. In Bonn, the DiFX is running ona High Performance Compute Cluster (HPC cluster),whose features are:• 60 nodes (eight compute cores each)• four TFlops in the Linpack benchmark test• 20 Gbps Infiniband interconnection• 13 RAIDs (about 480 TB storage capacity)• one control node for correlation (fxmanager)• one computer (frontend) for executing parallelized
jobs on the cluster, e.g. post-correlation applica-tions
• one control computer (appliance) for installing andmonitoring the cluster
• closed loop rack coolingThe HPC cluster connected via 20 Gbps Infiniband to14 Mark 5 units6 is used for playing back the data. Ifmore than 14 playback units are required, and in thecase of e-VLBI, the data are copied to the RAIDs priorto correlation. The Mark 5 units can deal with all typesof Mark 5 formats (A/B/C). The disk modules in theMark 5 are controlled via the NRAO’s mk5daemonprogram. The available functionality includes record-ing the directories of the modules, resetting and reboot-ing the units, and module conditioning. In 2013, the
5 DiFX: A Software Correlator for Very Long Baseline Inter-ferometry using Multiprocessor Computing Environments, 2007,PASP, 119, 3186 http://www.haystack.mit.edu/tech/vlbi/mark5/
209

210 La Porta et al.
Software Development Kit (SDK) of the Mark 5 unitswas upgraded to version 9.1, which enables the usageof larger disks. A summary of the capabilities of theDiFX software correlator is presented in Table 1.
3 Staff
The people in the Geodesy VLBI group at the Bonncorrelator are:Arno M uskens - group leader and scheduler of T2,OHIG, EURO, and INT3 sessions.Simone Bernhart - support scientist, e-transfer super-vision and operations, experiment setup and evaluationof correlated data for geodesy and RadioAstron, andmedia shipping.Alessandra Bertarini - Friend of the correlator, exper-iment setup and evaluation of correlated data for bothastronomy (e.g. APEX) and geodesy, and digital base-band converter (DBBC) testing.Laura La Porta - support scientist, e-transfer super-vision and operations, geodetic experiment setup andevaluation of correlated data, media shipping, DBBCtesting, and programmer for automated preparation ofcorrelator reports.
The people in the astronomical group at the Bonncorrelator are:Walter Alef - head of the VLBI technical department,computer systems, and cluster administration.Alan Roy - deputy group leader, support scientist(water vapor radiometer, technical assistance, de-velopment of FPGA firmware for linear to circularpolarization conversion, and project manager forequipping APEX for millimeter VLBI).Gabriele Bruni - support scientist for RadioAstron,experiment setup and evaluation of correlated data,and e-transfer supervision and operations.Armin Felke - FPGA programming for DBBC.Heinz Fuchs- correlator operator, responsible for thecorrelator operator schedule, daily operations, andmedia shipping.David Graham - consultant (technical development,DBBC development, and testing).Rolf M artens - technician maintaining cluster hard-ware and Mark 5 playbacks.Helge Rottmann - software engineer for correlatordevelopment and operation, cluster administration,DBBC and RDBE control software, and the Field
System.Hermann Sturm - correlator operator, correlatorsupport software, media shipping, and Web pagedevelopment.Gino Tuccari - guest scientist from INAF, DBBCdevelopment, and DBBC project leader.Jan Wagner - PhD student, support scientist forAPEX, DBBC development, and DiFX developer.Michael Wunderlich - engineer, development andtesting of DBBC components.
4 Status
Experiments: In 2013 the Bonn group correlated 54R1, six EURO, seven T2, six OHIG, 35 INT3, andabout 40 astronomical sessions (including data fromEarly-Science and the first two A0-1 projects of Ra-dioAstron).e-VLBI : The total disk space available for e-VLBI datastorage at the correlator is about 130 TB. The Web pagethat shows current active e-transfers and helps to co-ordinate transfer times and rates on a first come-firstserved basis7, reports also the storage capacity at thethree correlators (Washington, Haystack, and Bonn).On average≥ 80 % of the stations do e-transfer. Theaverage amount of e-transferred data per week is about8 TB, considering only the regular INT3 and R1 ex-periments. Most transfers are done using the UDP-based Tsunami protocol, and the achieved data ratesrange from 100 Mb/s to 800 Mb/s. The upgrade of the1 Gbps Internet connection to meet the requirements ofVLBI2010 Global Observing System (VGOS) has notbeen realized yet, due to funding issues.DiFX software correlator : The DiFX software corre-lator has been operated in Bonn since 2009 and is con-tinuously updated. The stable DiFX release 2.2 was in-stalled in 2013.
Two other branch versions of the DiFX softwarecorrelator are available in Bonn: a DiFX version forRFI mitigation, developed by J. Wagner, and a DiFXversion dedicated to RadioAstron (a Russian satellitethat observes in conjunction with ground-based tele-scopes), developed by J. Anderson.DBBC: The Bonn group is involved in the develop-
7 http://www3.mpifr-bonn.mpg.de/cgi-bin/showtransfers.cgi
IVS 2013 Annual Report

The Bonn Correlator 211
Table 1 Correlator capabilities.
Playback UnitsNumber available 14 Mark 5 (four Mark 5A, two Mark 5B, eight Mark 5C)Playback speed 1.5 GbpsFormats Mark 5A, Mark 5B, VDIFSampling 1 bit, 2 bitsFan-out (Mark 5A)1:1, 1:2, 1:4No. channels ≤ 16 USB and/or LSBBandwidth/channel(2, 4, 6, 8, 32) MHzSignal Single-, dual-frequency; all four Stokes parameters for circular
and linear polarizationCorrelationGeometric model CALC 9Phase cal Phase-cal extraction of all tones in a sub-band simultaneouslyPre-average time Milliseconds to secondsSpectral channels Max no. of FFT tested 218
Export FITS export. Interface to Mk IV data format which enables the use ofgeodetic analysis software and Haystack fringe fitting program.
Pulsar Pulsar with incoherent de-dispersion
ment and testing of the DBBC for the European VLBINetwork (EVN) and geodesy. The DBBC is designedas a full replacement for the existing analog BBCs.The following stations have already bought one ormore DBBCs: APEX, AuScope (Australia), HartRAO(Africa), Effelsberg, Medicina, Onsala, Pico Veleta,Yebes, Wettzell, and Warkworth. Recently, the Har-tRAO and Onsala stations switched to DBBCs also forgeodetic experiments, whereas Yebes, Medicina, andWettzell are still in the testing process. The remainingstations routinely use the DBBCs.
A prototype of the next generation DBBC(DBBC3-L) was realized, which can handle a largerbandwidth of 4 GHz. In a second stage the DBBC3-Hwill be able to sample the full frequency range of 1 to14 GHz without performing any downconversion.APEX: The Bonn VLBI group has equipped theAPEX telescope for VLBI observations at 1 mm. In2013 APEX got into science operations by takingpart in the Event Horizon Telescope (EHT) campaign.Observations were carried out at 4 Gbps, lasted about50 hours and provided good detections for severalsources (see Figure 1 for an example).
5 Outlook for 2014
DiFX Correlator : A proposal to replace the now sixyear old cluster with a more modern system is being
prepared. Two Mark 6 units with 16 Gbps recordingcapability have been bought to comply with VGOSrequirements. The Mark 6 units will be installed andtested. The RadioAstron DiFX branch versions will bemerged with the current development version of theDiFX.e-VLBI : Purchase of a new 80 TB RAID for RadioAs-tron.DBBC: Continue testing for the stations that recentlyacquired DBBCs. Wide bandwidth modes are also un-der test. Testing of DBBC3.Phasing up ALMA : The group is involved in an in-ternational project to add array phasing capability toALMA. ALMA will record with a data rate of 64 Gbps,thus being an extremely sensitive station in 1 mm VLBIexperiments, which will be correlated in Bonn.
IVS 2013 Annual Report

212 La Porta et al.
Mk4/DiFX fourfit 3.8 rev 805 BLLAC.xfspqo, No0002, AF�APEX - CARMAFL, fgroup B, pol LL
2
66.9417.280
1.257-152.8
0.0e+00
0.0048220.005357
-0.081631 0.00
228881.00000.640
a25gl16383
2013:084121502.56122159.84121830.00
2013:352:1346122013:354:0812352013:182:123017
22h02m43.2914s+42˚16’39.980"
Fringe quality
SNRInt timeAmpPhasePFDDelays (us)SBDMBDFringe rate (Hz)
Ion TEC Ref freq (MHz)
AP (sec)
Exp.Exper #Yr:dayStartStopFRTCorr/FF/build
RA & Dec (J2000)
Fig. 1 1 mm observations of the source BL Lacertae in March 2013, baseline APEX-Combined Array for Research in Millimeter-wave Astronomy (CARMA, California). The fringe spacing was 29 microarcseconds, the finest yet achieved.
IVS 2013 Annual Report

Haystack Observatory VLBI Correlator
Mike Titus, Roger Cappallo, Brian Corey, Kevin Dudevoir, Arthur Niell, Jason SooHoo, Alan Whitney
Abstract This report summarizes the activities at theHaystack Correlator during 2013. Highlights includethe transition from Mark IV to DiFX for full time pro-duction and the decommissioning of the Mark IV inJuly, enhancement of the DiFX cluster with additionaldisk space for increased flexibility, and processing oftwo 24-hour broadband delay experiments and new u-VLBI Galactic Center observations that included sev-eral new antennas. Non-real-time e-VLBI transfers andsoftware support of other correlators continued.
1 Introduction
The Mark IV and DiFX VLBI correlators of the MITHaystack Observatory, located in Westford, Mas-sachusetts, are supported by the NASA Space GeodesyProgram and the National Science Foundation. Theyare dedicated mainly to the pursuits of the IVS, witha smaller fraction of time allocated to processingradio astronomy observations for the Ultra HighSensitivity VLBI (u-VLBI) project. The Haystackcorrelators serve as development systems for testingnew correlation modes, for hardware improvementssuch as the Mark 6 system, and in the case of the MarkIV, for diagnosing correlator problems encounteredat Haystack and at the identical correlator at the U.S.Naval Observatory. This flexibility is made possibleby the presence on-site of the team that designed theMark IV correlator hardware and software. Some
MIT Haystack Observatory
Haystack Correlator
IVS 2013 Annual Report
software support is provided to the Max PlanckInstitute for Radioastronomy in Bonn, Germany andto the general IVS community, for DiFX processing ofIVS experiments.
2 Summary of Activities
2.1 DiFX Transition
The switch over to full-time DiFX production occurredin early July. The first IVS experiment fully processedon DiFX was RD1304, and all correlation is now doneon the DiFX cluster. Because our cluster setup differsgreatly from the other large installations on which ourthe DiFX software suite is based, various programs hadto be modified from their default behaviors in order towork in the Haystack production environment. A par-ticularly critical one wasgenmachines, which had tobe modified to re-allocate core processors efficientlyfor us.startdifx also had to be adapted, and problemswith corrupt module directories and Mark 5 playbackunit readpos errors had to be resolved. These issueshave been largely overcome, and production process-ing runs smoothly most of the time, but work remainsto be done to improve the flexibility of the productionenvironment to efficiently handle the inevitable prob-lems that arise.
2.2 DiFX Cluster Developments
The amount of storage space was greatly increasedover the last year with the addition of two new file
213

214 Titus et al.
servers and more disks for the compute cores. The>
142 TB of additional space has made it possible tocorrelate more stations from files, to supplement theMark 5 playback units. This, along with the increasednumber of stations sending their data via e-VLBI, al-lows experiments with a large number of stations to becorrelated in one pass. Another file server and a newhead node are due to be added to the cluster shortly.
2.3 DiFX Software Support
Support for the community continues fordifx2mark4,fourfit, and HOPS. This support includes addition offeatures requested by users, other enhancements, andbug fixes.
2.4 USNO GUI Installation
John Spitzak of USNO visited Haystack in Decemberto install the USNO GUI for setting up and runningexperiments. The GUI was demonstrated to work inour environment, which is the first time it had been in-stalled outside of USNO.
2.5 DiFX-Mark IV Correlator Comparisonof Experiment RD1208
RD1208 was processed in its entirety on DiFX in asnearly identical a way as possible to the Mark IV in or-der to use it for a comprehensive comparison. Analysisof this data is pending.
2.6 Broadband Delay
Major broadband delay experiments were conductedin January and May. In January the 24-hour “mixedmode” RD1301 session was observed, with the GGAO12-m and Westford antennas recording broadband dataand seven other IVS stations recording standard S/Xdata at frequencies partially in common with the broad-band. But further development of “zoom mode” in
DiFX is needed before the mixed wide/narrow banddata can be processed. In May broadband data wererecorded at GGAO and Westford over 24 hours pri-marily as a test of amplitude calibration. Processingof the amplitude data for the May session is complete,and work has begun to obtain geodetic results from thedata.
2.7 DBE Testing
Various DBE testing projects were conducted duringthe year. Testing RDBE-H v1.4 vs. 1.5 firmware both inthe lab and between GGAO-Wf is one example. Test-ing of RDBE v3.0 with complex mode format has be-gun.
2.8 Mark 6
A Mark 6 playback unit was added to the DiFX clusterlate in the year. Zero-baseline data of various kindshave been obtained from the RDBEs to test Mark 6recording, playback, and correlation. VDIF formatfixes were initially needed in order to make correlationof this recording format work.
2.9 Galactic Center Observations
Further u-VLBI observations of the Galactic Centerand other target sources, with dual polarization at mostsites, were recorded and correlated in 2013. These in-cluded three stations in addition to those participatinglast year: APEX in Chile, Pico Veleta in Spain, andPlateau de Bure in France. In July, fringes were foundto the LMT (Large MM Telescope), a new antenna inMexico. This antenna will be added to Event HorizonTelescope (EHT) observations in the future.
2.10 2013 IVS TOW
For the IVS TOW meeting in May, the Haystack DiFXcluster was used for a “practical correlation” class. A
IVS 2013 Annual Report

Haystack Correlator 215
small computer lab was set up to give students practicein setting up an IVS experiment for correlation.
2.11 Support for Other Correlators
There were various projects to assist other correlators.The USNO Mark IV experienced a failure of cratetwo after some maintenance. This was diagnosed as aFIFO chip failure and repaired. Support was providedto Bonn for help with EHT co-processing of the Marchobservations. Help was provided to the Seshan groupso they could reproduce one of the DBE tests con-ducted in October 2012 at Haystack, in order for themto validate their DiFX installation. Similar support wasgiven to the ASIAA group in Taiwan to assist them ingetting started with EHT project correlation on DiFX.
2.12 e-VLBI
Non-real-time transfers have continued. Data from 17sessions were transferred to Haystack this year from20 stations (eight in Japan, four in Western Europe,four in Australia, two in South America, and twoin South Africa): Kashima34, Kashima11, Koganei,Tsukuba, Chichijima, Ishigaki, Aira, Mizusawa, On-sala, Ny-Alesund, Wetzell, Noto, Hobart, Yarragadee,Katherine, Warkworth, Fortaleza, Concepcion (viaBonn), Hart15M and HartRAO. The number and speedof e-VLBI transfers increased significantly this yearafter an upgrade to Haystack’s Internet connectivity in2012 enabled data transfer rates up to 1.4 Gb/sec.
3 Experiments Correlated
In 2013, 31 geodetic VLBI sessions were processed,at least in part, consisting of 15 R&Ds, five T2s, and11 tests of various types. The test sessions includedthe broadband sessions and fringe tests and an assort-ment of other projects, some of which were touchedon in the summary above. As usual, smaller tests werenot included in the above count because they were toosmall to warrant individual experiment numbers. Rou-tine production (i.e., not test experiments) was per-
fomed full time on the Mark IV at the beginning of theyear, then switched to the the DiFX correlator in July,as noted previously.
4 Current/Future Hardware andCapabilities
The Mark IV hardware correlator configuration de-scribed in last year’s report has been powered down.The DiFX cluster currently consists of six PCs, eachwith dual hex core 2.66 GHz Intel Xeon processors.Two file storage servers, which can also act as DiFXcompute nodes, provide 120 TB of file storage. Theseare all connected through a 40 Gb/sec infinibandnetwork fabric using a Qlogic switch. Currently sixMark 5B playback units with DiFX fully installed areconnected to the infiniband fabric. We have processedup to 19 stations in one pass with this setup through acombination of playback units and files.
In 2014 we plan to add more storage, more computenodes, and a new head node, as currently one of thecompute nodes serves in the latter role.
5 Staff
5.1 Software Development Team
• John Ball - Mark 5A/5B; e-VLBI, retired in August2013
• Roger Cappallo - HOPS post-processing software;Mark 6 development; DiFX software development;correlation trouble-shooting
• Geoff Crew - DiFX correlator development, post-processing software; Mark 6
• Kevin Dudevoir - correlation; mainte-nance/support; Mark 5A/5B/5C; e-VLBI;Linux conversion; correlator software and buildsystem development; computer system sup-port/development; DiFX correlator development
• Jason SooHoo - e-VLBI; Mark 5A/5B/5C/6; com-puter system support
• Chester Ruszczyk - e-VLBI; Mark 5A/5B/5C/6• Alan Whitney - system architecture; Mark
5A/5B/5C/6; e-VLBI
IVS 2013 Annual Report

216 Titus et al.
5.2 Operations Team
• Peter Bolis - correlator maintenance• Alex Burns - playback drive maintenance; Mark
5 installation and maintenance; general technicalsupport
• Brian Corey - experiment correlation oversight; sta-tion evaluation; technique development
• Glenn Millson - correlator operator• Arthur Niell - technique development• Don Sousa - correlator operator; experiment setup;
tape library and shipping• Mike Titus - correlator operations oversight; exper-
iment setup; computer services; software and hard-ware testing
• Ken Wilson - correlator maintenance; playbackdrive maintenance; general technical support
6 Conclusion/Outlook
Operational correlation at Haystack has fully migratedto the DiFX software correlator. Enhancement of ourmodest cluster is expected to continue in 2014 with theaddition of a dedicated head node and additional fileservers. Efforts to improve the production environmentwill continue. Testing and full integration of Mark 6recording systems and RDBE v3.0 into operations areunderway. More broadband observations, including theaddition of the Kokee 20-m antenna with a new broad-band system, are anticipated.
IVS 2013 Annual Report

IAA Correlator Center 2013 Annual Report
Igor Surkis, Voytsekh Ken, Yana Kurdubova, Alexey Melnikov, Vladimir Mishin, Dmitry Pavlov, Nadezda Sokolova,Violet Shantyr, Vladimir Zimovsky
Abstract The activities of the six-station IAA RAScorrelator include regular processing of nationalgeodetic VLBI programs Ru-E, Ru-U, and Ru-F. TheRu-U sessions have been transferred in e-VLBI modeand correlated in the IAA Correlator Center since2011. In addition, the new FX correlator is beingdesigned.
1 General Information
The IAA Correlator Center is located at and staffed bythe Institute of Applied Astronomy in St.-Petersburg,Russia.
The IAA Correlator Center is devoted to process-ing geodetic, astrometric, and astrophysical observa-tions made with the Russian national VLBI networkQuasar.
2 Component Description
The ARC (Astrometric Radiointerferometric Correla-tor) (Figure 1) was the main data processing device inthe IAA Correlator Center in 2013. The ARC was de-signed and built in the IAA RAS from 2007 - 2009.The correlator has XF design and is based on FPGAtechnology.
The ARC is a six-station, 15-baseline correlator.It is able to process up to 16 frequency channels on
Institute of Applied Astronomy RAS
IAA Correlator
IVS 2013 Annual Report
each baseline, for a total of 240 channels. The correla-tor accesses two-bit VLBI signals with 32 MHz max-imal clock frequency. The maximal data range fromeach station is 1 Gbit per second. The correlator re-quires VSI-H input VLBI signals, and it is equippedwith Mark 5B playback terminals.
Since 2011, the DiFX software correlator has beenused for some astrophysical experiments. DiFX is in-stalled at the IAA on a Sun Fire X4450 Server as avirtual machine under the VMware.
3 Staff
• Igor Surkis — leading investigator, software devel-oper;
• Voytsekh Ken — GPU software developer;• Alexey Melnikov — DiFX processing, scheduler of
the Ru-sessions;• Vladimir Mishin — software developer, data pro-
cessing;• Nadezda Sokolova — software developer;• Yana Kurdubova — software developer;• Dmitry Pavlov — software developer;• Violet Shantyr — software developer, post process-
ing;• Vladimir Zimovsky — leading data processing;• Ekaterina Medvedeva — data processing;• Alexander Salnikov — leading e-VLBI data trans-
fer;• Ilya Bezrukov — e-VLBI data transfer.
217

218 Surkis et al.
Fig. 1 View of the six-station ARC correlator, showing four racks containing (left to right) signal distribution and synchronizationsystem (SDSS) and three Mark 5B playback units, two correlator crates and KVM, three correlator crates, and one more cabinet withSDSS and three Mark 5B playback units.
4 Current Status and Activities
4.1 Ru Sessions
The ARC correlator was used for processing all of thenational geodetic VLBI observations in the IAA Cor-relator Center in 2013. The Ru-E and Ru-U geodeticVLBI sessions were carried out in IAA RAS.
The three-station, 24-hour EOP determination Ru-E sessions were carried out once per week, as in 2012.
The two-station, one-hour UT1-UTC determinationsessions in e-VLBI mode were carried out once perday. The Ru-U sessions were executed with frequencychannel bandwidth 8 MHz and total bitrate 256 Mbps.The data transfer speed from stations to correlator wasimproved in 2012, and near to realtime correlation pro-cessing with data bitrate 256 Mbps was achieved.
4.2 DiFX Processing
In 2013, the DiFX software correlator continued to bethe main spectral line source processing tool. Targetsources are Orion KL, W49N, W3OH, and W75. It isused to correlate data streams of 16-64 Mbps bitrate.Output data resolution was up to 8,192 spectral chan-nels which allows achievement of a frequency resolu-tion of 0.25 kHz for W3OH in L-band. 41 Ru-P experi-ments were scheduled and observed in 2013, includingCrab nebula observations at L-band. Several experi-ments to monitor RFI were conducted. One experimentwith 2 Gbps bitrate and standard wideband geodeticfrequency mode and one experiment with 2 Gbps and512 MHz bandwidth in X-band were done. The latterexperiment is planned to be processed in early 2014.Three experiments were done with the Effelsberg ra-dio telescope in collaboration with the Max Planck In-stitute for Radioastronomy. Data were transferred fromBonn to Saint Petersburg using tsunami protocol at datarates up to 400 Mbps. Medicina and Noto also joined
IVS 2013 Annual Report

IAA Correlator 2013 Report 219
one experiment and e-transferred data to Saint Peters-burg directly from the stations to the Correlator Cen-ter. DiFX is installed on a GNU/Linux VMware virtualmachine on a Sun Fire X4450 Server. Test installationon a new hybrid-blade cluster was done.
4.3 FX Correlator Design
The design of a new FX software correlator intendedfor the new small antenna VLBI network was startedin 2012. The correlator design is supposed to processdata streams of up to 16 Gb/s from each observatory.VLBI data are recorded from four frequency bandswith bandwidths of up to 1024 MHz in one circular po-larization or up to 512 MHz in two linear polarizationsusing 2-bit sampling. The input data format is VDIF.The correlator computes cross-spectra with a resolu-tion of up to 4,096 spectral channels and extracts up to32 phase calibration tones in each frequency band ofeach station.
In 2013, we elaborated the correlator’s structureand developed the two-station software prototype.“T-Platforms” company developed and mounted thehigh-performance computing cluster at IAA (Fig-ure 2). The software was installed and successfullytested and benchmarked.
The main conception of the correlator comes fromthe DiFX correlator, although it has several distinc-tive features. The most significant one is the usage ofgraphical processing units (GPUs) for the main com-putations such as bit repacking, Fourier transformation,doppler tracking, spectra multiplication, and phase calextraction.
The correlator equipment includes a data transfersystem based on fiber optic cable, power supply, con-ditioning system, and high performance compute clus-ter. The correlator’s hardware is based on hybrid bladeserver technology. Each blade server contains two IntelCPUs and two Nvidia Tesla GPUs. The present hard-ware of the one-baseline correlator’s prototype con-tains five blade servers made by “T-Platforms” com-pany, which are inserted into chassis. The cluster alsoincludes power supply and power distribution units,two cache servers, one head server, data storage withcapacity of 20 TB, an infiniband data commutator anda fiber optic commutator. The cluster’s components aremounted in a cabinet.
Fig. 2 View of the high-performance computing cluster based onthe hybrid blade servers.
The correlator’s topology consists of head, station,and correlation software modules. The head modulecontrols all interblock processes and collects the re-sults. Each station module processes data stream fromone station and provides phase calibration signal ex-traction, data synchronization, delay tracking, and bitrepacking. Each correlation module provides cross-and autocorrelation spectra computing for all the sta-tions.
Pcal extraction is realized using the method pro-posed by S. Pogrebenko. According to this method,data are shifted by the offset frequency, so the phasetones are in the equidistant frequency spacing. The
IVS 2013 Annual Report

220 Surkis et al.
shifted data are divided into frames with a size of dou-bled pcal tones, and then all the frames are summed. Asa result, white noise from the cosmic data is averagedto zero, and only the phase tone information remains.Then the FFT should be accomplished to get the pcaldata.
The cross-spectra computing algorithm is realizedin the following way. The received data blocks fromthe station modules are copied to the GPU’s DRAM,where unpacking of bits to single-precision numbersand the fringe rotation are done. Then the FFT oper-ation is completed, and finally the obtained data aretransferred to the spectra multipliers kernel, where theyare multiplied together and averaged within the chosentime period. The output spectra are transferred to thehead module.
For six stations with data streams of 16 Gbps, thesealgorithms require 76 Fermi GPUs for near real-timeprocessing.
5 Future Plans
The next two years will be devoted to development ofthe cluster and software for the near-real time six sta-tion correlator. “T-Platforms” company will have de-veloped and mounted a high-performance computingcluster which will contain 40 blade servers by June,2014.
IVS 2013 Annual Report

Correlation Processing in NICT Kashima
Mamoru Sekido, Kazuhiro Takefuji, Masanori Tsutsumi
Abstract Correlation processing of VLBI observa-tion data has been performed by two sorts of softwarecorrelation systems in NICT. One is the multi-channel‘K5/VSSP software correlator’, and the other one is thefast wideband correlator called ‘GICO3’. These corre-lators are used for processing of VLBI observationsconducted for R&D experiments. This paper reportsthe activities of the correlation center in NICT.
1 General Information
Software correlator has become popular at recent VLBIcorrelation centers. This trend was driven by the rapidincrease of processing capabilities of computer tech-nologies and the increase of hard disk drive capacity.VLBI group of NICT Kashima has played the leadingrole in the development of operational software cor-relator from early 2000 [1, 2]. VLBI group of Space-Time Standard Laboratory (STSL) of the National In-stitute of Information and Communications Technol-ogy (NICT) has been working on VLBI technologydevelopment in collaboration with domestic institutesand universities in the fields of geodesy, astronomy,and space science. The current mission of our groupis precise frequency comparison between atomic stan-dards at distant locations. In this development, VLBIexperiments have been conducted for research and de-velopment (R&D) purposes, and the data have beenprocessed by our own software correlation systems.
NICT Space-Time Standards Laboratory/Kashima Space Tech-nology Center
NICT Correlator
IVS 2013 Annual Report
The correlation system is located in the Kashima SpaceTechnology Center (KSTC), although correlation pro-cessing is performed by sharing data with the networkfile system (NFS) over the local area network (LAN)spanning between the NICT headquarters in Tokyo andKSTC.
Fig. 1 Location of the NICT-Koganei Headquarters andKashima.
2 Component Description
The correlation system is composed of high perfor-mance computer servers and a data recording systemwith a RAID disk system. They are not always storedin the same racks in the computer room but are locatedseparately and connected via 1000BASE-T network.
221

222 Sekido et al.
2.1 K5/VSSP Correlator
Conventional 16 channel geodetic VLBI observationdata is processed with the K5/VSSP software corre-lator, which was developed by T. Kondo [1]. A typ-ical processing time for 256-Mbps (32-Mbps x 16-channels) observations for the correlation of one base-line takes about two times the real observation scanlengths when 16 cores of the servers A and B in Ta-ble 1 are used.
Table 1 CPU Servers used for correlation processing.
Servers CPU type and Core CPU clock Memory Size
A Intel Corei7 8 cores 3.0 GHz 16 GBytesB Intel Corei7 8 cores 1.6 GHz 12 GBytesC Xeon E5-2680 40 cores 1.2 GHz 66 GBytesD Intel Corei7-3960X 12 cores 1.2GHz 66 GBytes
2.2 GICO3 Correlator
Fast wideband correlation software written byM. Kimura [3] has been used with Giga-bit data acqui-sition system (ADS1000, ADS3000/ADS3000+). Thedata acquired at 512-MHz or 1024-MHz bandwidth(1024-Msps or 2048-Msps x 1 or 2-bit sampling =1024-Mbps or 2048-Mbps) are processed with GICO3.Correlation processing has been peformed with serversC and D in Table 1. The processing time for 2-Gbpsmode (2048-Msps x 1-bit x 2-ch) for one baseline(Kashima 34-m - Koganei 11-m) takes aproximatelyfive times the real data acquisition rate at present. Itsrate is thought to be limited by the 1-Gbps networkspeed at the Koganei 11-m station.
2.3 Network Connection
The Kashima 34-m antenna site and the Kashima 11-mstation are connected via 10 Gbps LAN. The networkspeed between the Kashima site and the Koganei 11-mis currently 1 Gbps (Figure 2), but this will be upgradedto 10 Gbps soon. The 10 Gbps network connection be-tween KSTC and the NICT Koganei headquarters issupported by research network JGN-X (Next Genera-
JGN−XKashima34m
11mKashima
KoganeiMARBLE2
Koganei 11m
10Gbps 1Gbps
10Gbps
Fig. 2 Network speed between the Kashima and Konganei sites.
tion Network Test bed). For correlation processing ofthe Kashima — Koganei baseline, the observation dataare not transferred before processing but are shared vianetwork file system (NFS) over the LAN. Therefore,data processing can be started just after the observa-tion. That is useful for a quick fringe check and a per-formance test.
3 Staff
Tsutsumi Masanori: In charge of maintenance ofdata processing servers and data acquisition RAIDsystems.
Takefuji Kazuhiro: Uses GICO3 correlator for R&DVLBI experiments.
Sekido Mamoru: Uses K5/VSSP correlator for con-ventional VLBI observations and is in charge ofoverall activities.
4 Current Status and Activities
The VLBI group of NICT Kashima has been conduct-ing R&D VLBI observations for technology develop-ment. The current mission of our group is developmentof a wideband VLBI observation system (named Gala-V) for precise frequency comparison between newlydeveloped atomic standards. The Gala-V system em-ploys similar radio frequency coverage (3-14 GHz)with VGOS but acquires data of four 1 GHz band-width signals. Currently, R&D observing for the Gala-V project has been performed with a single channel in2013, and that data processing was performed with theGICO3 software correlator.
IVS 2013 Annual Report

Correlation in Kashima 223
Fig. 3 Servers used for corelation processing.
5 Future Plans
The VLBI correlator NICT used was for R&D exper-iments conducted by NICT. Following the progress ofthe Gala-V project, the load for data processing will in-crease. Therefore, increasing processing capacity andmore systematic configuration of the system are to beconsidered.
Acknowledgements
We thank the research network JGN-X and the Infor-mation System Section of NICT for supporting the net-work environment for e-VLBI.
References
1. T. Kondo, et al., ‘Development of the new real-time VLBItechnique using the Internet Protocol’, IVS CRL-TDC NewsNo. 17, pp.22-24, 2000.
2. Hiro Osaki, Tetsuro Kondo, and Moritaka Kimura, ‘Devel-opment of Versatile Scientific Sampling Processor (VSSP)-A Practical Approach’, IVS CRL-TDC News, No.20, pp.7-9, 2002.
3. M. Kimura, and J. Nakajima, ‘The implementation of the PCbased Giga bit VLBI system’, IVS CRL-TDC News No.21,pp.31-33, 2002.
IVS 2013 Annual Report

Shanghai VLBI Correlator 2013 Annual Report
Fengchun Shu, Weimin Zheng, Wu Jiang, Zhong Chen, Renjie Zhu
Abstract This report summarizes the activities of theShanghai VLBI Correlator during 2013. We have im-proved the delay model accuracy and real time process-ing capability. We also managed to develop an offlinesoftware function to convert the correlator output intoFITS-IDI format. Furthermore, we obtained some ex-perience in operating an ad hoc DiFX correlator andHOPS software.
1 Introduction
The Shanghai VLBI Correlator is hosted and operatedby the Shanghai Astronomical Observatory, ChineseAcademy of Sciences. It is dedicated to the data pro-cessing of the Chinese domestic VLBI observing pro-grams, inclusive of the CMONOC project for moni-toring the Chinese regional crustal movement, and theChinese deep space exploration project for spacecrafttracking.
As shown in Figure 1, the VLBI stations nearShanghai, Kunming, and Urumqi participate in somedomestic geodetic sessions on an annual basis, whilethe Beijing station is mainly used for spacecraft datadownlink and VLBI tracking. In 2013, we beganto process the VLBI data from the Shanghai 65-mantenna, namely the Tianma Radio Telescope. A fewfringe tests with Chinese deep space stations Kashiand Jiamus were also performed.
Shanghai Astronomical Observatory
Shanghai Correlator
IVS 2013 Annual Report
75oE 90oE 105oE 120oE 135oE 16oN
24oN
32oN
40oN
48oN
56oN
SHANGHAI
KUNMING
URUMQI
KASHI
BEIJING
JIAMUS
Fig. 1 Distribution of the VLBI stations in China.
2 Component Description
Based on the FX type VLBA correlator, we have beendesigning two correlators since 2003. One is the hard-ware correlator using the FPGA technology. The otherone is the software correlator. The first version of oursoftware correlator has been operational since 2006and was installed on AMD Opteron 2200 CPU comput-ers and later on Intel X5400 CPU computers. Becausethe software correlator was much easier to modify, weadopted the second version of the software correla-tor for geodetic applications. By using Message Pass-ing Interface (MPI) and the POSIX threads APIs, thesoftware correlator was migrated to a computer clusterbased on blade servers to get better performance since2010. It was formally accepted as an IVS correlator inMarch 2012.
In 2013, the Shanghai VLBI data processing centerwas moved to the Sheshan area, just a few kilometersfrom Tianma65 and Seshan25. A new hardware plat-
224

Shanghai Correlator 225
form was installed at the new VLBI center. Features ofthe software correlator cluster are listed below.
• DELL M1000e Blade Server with 32 computingnodes
• Computing node configuration: a two-socket IntelE5-2640 CPU (2.5 GHz, six cores) with 24 GB ofmemory
• Five I/O nodes with 264 TB raw storage capacity• Two redundant administration nodes with BCM
cluster management software• 40 G Infiniband for blade internal computing net-
work connection• 10 G Ethernet for blade internal and external data
network connection
A summary of the capabilities of the software cor-relator is presented in Table 1.
3 Staff
The people involved in the development and operationof the Shanghai Correlator are listed below.
• Weimin Zheng: group head, software correlatordevelopment
• Xiuzhong Zhang: CDAS and other technique de-velopment
• Fengchun Shu: scheduler, experiment oversight,CDAS evaluation
• Zhong Chen: e-VLBI, cluster administration• Weihua Wang: lead correlator operator, automatic
correlation process development• Juan Zhang: correlator software development and
maintenance• Yun Yu: operator, experiment support• Wu Jiang: operator, experiment support• Wenbin Wang: media library, computer services• Renjie Zhu: CDAS development• Zhijun Xu: FPGA programming, hardware corre-
lator development• Yajun Wu: FPGA programming• Li Tong: postdoctor, correlator software develop-
ment and maintenance
4 Summary of Activities
4.1 Correlator Software
In order to improve the accuracy of differential VLBIobservations to the level of better than 0.1 ns, we haveincorporated more corrections such as tidal station mo-tion and gravitational delay in the correlator model.We compared the time series of geometric delays withthose calculated by VieVS and DiFX-Calc. Our soft-ware results agree with DiFX-Calc at the level of 50 psand agree with VieVS better than 15 ps.
Great effort was made to shorten the data latencyfor the navigation of spacecraft. For the navigation ofthe Chang’E-3 lunar mission, we have improved therealtime ability, and the total data turnaround time canbe shorter than one minute.
We also managed to develop an offline softwarefunction to convert the correlator output into FITS-IDIformat. Thus we can make a comparison of correlationresults between our own correlator and DiFX in AIPS.The average fringe phase difference for a two-minutescan is about 0.1 degree.
4.2 Development of Hardware Correlator
We have built a new hardware correlator which hasperformed well for the Chang’E-3 lunar mission. Thehardware correlator can perform real time correlationat 128 Mbps per station. It includes five FPGA boards.Each board has the same hardware, one Xilinx Virtex-4FX60 and four LX160 FPGAs. A new hardware corre-lator based on Uniboard was also under design. It canperform real time correlation at 2 Gbps per station fora maximum of eight stations.
4.3 Performance of CDAS
The Chinese VLBI Data Acquisition System (CDAS)is a type of digital backend designed to replace the tra-ditional analog BBCs. The new digital system has bet-ter bandpass and wider bandwidth. In order to demon-strate the capability of CDAS, we used 1 Gbps (16 x32 MHz, 1bit sampling, S/X) recording mode and de-
IVS 2013 Annual Report

226 Shu et al.
Table 1 Correlator capabilities.
Number available 5 Mark 5BPlayback speed 1.8 GbpsInput data formats Mark 5BSampling 1 bit, 2 bitsIF channels ≤ 16Bandwidth/channel (2, 4, 6, 8, 32) MHzSpectral points/channel≤ 65536Geometric model supports plane wave front and curved wave frontonline averaging time 0.1s∼4sPhase Cal extraction yesOutput CVN matrix format, FITS-IDI format, or NGS card file
tected 18 weak sources at the level of 0.1 Jy with theVLBI method for the first time.
In addition to the DDC version currently beingused, we are also developing a PFB version of CDASwith much more compact design. It contains two XilinxK7 FPGAs for data processing. The input signals arefrom two IFs with 512 MHz bandwidth each or one IFwith 1024 MHz bandwidth. Comparing with the previ-ous platform which consists of four Xilinx V4 FPGAs,the new one not only updated the key chips for DSP butalso added two TenGiga Ethernet SFP+ ports for datatransmission. For the application, the PFB version canbe configured with 32 MHz bandwidth x 16 channelsand 64 MHz bandwidth x 16 channels.
4.4 e-VLBI
The data link between the Shanghai VLBI center, Se-shan25, and Tianma65 was upgraded to 10 Gbps. Thedata link to other stations is 155 Mbps for domestice-VLBI observations. In the Chang’E-3 lunar mission,the data transfer performed well at 64 Mbps for eachstation.
4.5 DiFX Operation
We installed the DiFX 2.1 in an ad hoc 36 Intel X5650(2.67 GHz) core cluster. With the help of the Bonn cor-relator and the GSFC group, we have obtained someexperience in using DiFX, HOPS, and DBedit to gen-erate FITS-IDI data and Mark IV database files.
4.6 Experiments Correlated
In 2013, four domestic geodetic VLBI experimentswere carried out using 16 channels allocated at S/Xband, three experiments recorded at a data rate of256 Mbps, and one at 1024 Mbps with a 32 MHzbandwidth in each channel. After the Mark 5 moduleswere shipped to the Shanghai VLBI center, the datacorrelations were done by both the domestic correlatorand the DiFX correlator. The output of the DiFX cor-relator was further processed with HOPS. Meanwhile,two milli-second pulsar astrometric observationswith the Chinese VLBI network were successfullycorrelated with the DiFX correlator.
The differential VLBI observations continued tosupport the navigation of the Chang’E-3 spacecraftfrom the trans-lunar orbit to soft landing on the moon.The DOR (Differential One-way Range) signalstransmitted from the spacecraft were received andprocessed. Data processing was performed largely ine-VLBI mode. The post-fit RMS delay residuals oforbit determination were as good as 0.5 ns.
5 Future Plans
We will continue to support the data correlation of Chi-nese domestic VLBI observations and make compar-isons of correlation results between our own correlatorand DiFX at different levels of data products. A hard-ware platform dedicated to DiFX correlation will be in-stalled to meet the requirements of more astronomicalVLBI experiments and VGOS technique developmentin China. We will also make some efforts to provideservice for international VLBI experiments.
IVS 2013 Annual Report

Tsukuba VLBI Correlator
Shinobu Kurihara 1, Tetsuya Hara 1,2
Abstract This report summarizes the activities of theTsukuba VLBI Correlator during 2013. The weekendIVS Intensive (INT2) and the Japanese domestic VLBIobservations (JADE) were regularly processed usingthe K5/VSSP correlation software.
1 Introduction
The Tsukuba VLBI Correlator, located in Tsukuba,Japan, is hosted and operated by the Geospatial Infor-mation Authority of Japan (GSI). It is fully devoted toprocessing geodetic VLBI observations of the Interna-tional VLBI Service for Geodesy and Astrometry. Allof the weekend IVS Intensive (INT2) for UT1-UTC (=dUT1) determination and the Japanese domestic VLBIobservations for geodesy called JADE organized byGSI were processed at the Tsukuba VLBI Correlator.The K5/VSSP correlation software developed by theNational Institute of Information and CommunicationsTechnology (NICT) is used for all processing.
1. Geospatial Information Authority of Japan2. Advanced Engineering Service Co., Ltd.
Tsukuba VLBI Correlator
IVS 2013 Annual Report
2 Component Description
2.1 e-VLBI
The Tsukuba VLBI Correlator has been connectedto a broadband network, and most of observed VLBIdata is delivered via the network. The Tsukuba VLBICorrelator has a 10 Gbps dedicated link to the SINET4operated by the National Institute of Informatics (NII),which is connected to some research networks inthe world such as Internet2 in the U.S., GEANT2 inEurope, and TEIN4 at Singapore. It enabled us totransfer massive amounts of data between the TsukubaVLBI Correlator and the overseas IVS Components.The ultra-rapid EOP experiment (see Section 4.3) isalso performed by this network.
2.2 K5/VSSP Correlation Software
The K5/VSSP correlation software consists of severalprograms for the calculation of a priori values of delayand delay rate (apri calc), for the correlation process-ing for all observations (fx cor or cor), and for moni-toring the results of the correlation processing by per-forming a so-called “coarse search” (sdelay), follow-ing several utilities [1].Komb is a bandwidth synthe-sis software that was developed on an HP-1000 se-ries minicomputer by using the FORTRAN programlanguage when the K-3 VLBI system was being de-veloped. It has been ported to a Linux operating sys-tem by using the C language. All these programs weredeveloped and have been maintained by NICT. TheK5/VSSP correlation software can be used not only for
227

228 Kurihara and Hara
Fig. 1 Processing servers and Lustre File System at the Tsukuba VLBI Correlator.
K5 data processing but also for the Mark 5 data pro-cessing by using the data format conversion program(m5tok5).
The following are processes of the K5 correlationand programs used in each process.
1. Transferring data from network stations to the cor-relator (tsunami and tsunamid).
2. Data format conversion from Mark 5 to K5 (m5tok5or m5btok5).
3. Preparation of a priori parameter files (apri calc).4. Fringe search to find a clock offset at each pair of
stations (fx cor or cor).5. Running correlation processing for all observations
(fx cor or cor).6. Coarse search for estimating residual delay and de-
lay rate, and plotting them on a 3-D diagram (sde-lay).
7. Bandwidth synthesis to derive a multi-band de-lay (komb), and making Mark III databases byMK3TOOLS to be submitted to the IVS DataCenter.
We developed several management programs to runthe above processes consecutively and ultra-rapidly.
The program for the management of data transferrapid transfer accesses the hosts in observing stations,executestsunamid there, and then at the correlatorside, executestsunami to transfer data automaticallywhen an observation starts. The data is converted fromMark 5 to K5 format by a programrapid conv asnecessary.Rapid cor is a program to search for fringesof each baseline according to the clock informationof each station written in the FS log. Once the fringeis detected, the main correlation processing is runsequentially with the clock offset and rate found in thefringe search until the last observation.Rapid kombexecuteskomb one after another for bandwidth syn-thesis process. The fully automated VLBI analysissoftwarec5++ developed by NICT can read the komboutput files directly and derives a VLBI solution [2].
2.3 Correlator Hardware Capabilities
The hardware supporting the activities of the TsukubaVLBI Correlator is summarized in Table 1. All thesepieces of equipment are general purpose and commer-
IVS 2013 Annual Report

Tsukuba Correlator 229
Fig. 2 New high performance servers and storage at the Tsukuba VLBI Correlator.
cially available products (Figure 1). It means that nodedicated hardware is required in the K5 correlationprocessing. In the correlator, mass data storage is re-quired. Moreover, since some executed correlation pro-cesses access a data file simultaneously, the processingcapability of correlator depends on the Read I/O of thedata storage. The Lustre File System enables us to usenumerous HDDs mounted on a lot of servers like onepartition as if it were a large virtual disk. Thus, the I/Operformance is dramatically improved compared withNFS.
Additionally, a set of high performance servers andhuge storage was newly installed (Figure 2). The newsystem was originally purchased for the new VGOSstation Ishioka, but it can be used for operational cor-relation processing too. The specification of the newsystem is also shown in Table 1. The new system canshorten the time of correlation processing.
3 Staff
The technical staff at the Tsukuba VLBI Correlator are
• Shinobu Kurihara — correlator/analysis chief,management.
• Tetsuya Hara (AES) — correlator/analysis opera-tor, software development.
4 Correlator Operations
4.1 IVS Intensive for UT1-UTC
In 2013, 72 Intensive sessions in total were processedat the Tsukuba Correlator. The details are described inTable 2. In April, because the Kokee Park station an-tenna was repaired, the Intensives on weekdays weredone as INT2 sessions with the Tsukuba—Wettzellbaseline and processed at the Tsukuba Correlator. Justafter that, we found that there was a fatal flaw in thepedestal of the track of the Tsukuba antenna. Sincethen all Intensive sessions that included the Tsukubastation were canceled, and Kokee was substituted forTsukuba in the Intensives on Sunday. Wettzell, Ny-
IVS 2013 Annual Report

230 Kurihara and Hara
Table 1 Correlator Hardware Capabilities.
Current system New System
Number of servers 43 18- 16 for correlation processing - 16 for correlation processing- 1 for controlling correlation processing - 2 for controlling correlation processing- 26 for data storage
Operating System CentOS version 5.3, 5.4 or 5.5 Red Hat Enterprise Linux 6.3CPU Intel Xeon X3360 @2.83 GHz quad CPU Intel Xeon X5687 @3.60GHz quad CPU x 2
Intel Xeon 5160 @3.00 GHz dual CPU x 2Intel Xeon X3480 @3.07 GHz quad CPUIntel Xeon @3.80 GHz CPU x 2
Total storage capacity Lustre File System: 24.9 Tbytes Data Direct Networks storage: 513 TbytesNetwork 10 Gbps dedicated line connected to SINET4 by NII
Alesund, and Svetloe made a baseline with Kokee al-ternatively.
The observed data at Wettzell is transferred to theTsukuba Correlator in real-time with the VDIF/SUDPprotocol and is recorded on a data storage devicein the K5 format directly. The observed data at theTsukuba station is also transferred to the correlatorimmediately. Since the whole process from datatransfer through analysis is implemented by therapidprograms (see Section 2.2), a dUT1 solution of theTsukuba—Wettzell baseline can be derived withina few minutes after the end of the last scan of thesession. In the case of the Kokee baselines, becausethe observed data at Kokee was transferred via theU.S. Naval Observatory (USNO), it took a few hoursto derive a solution.
Table 2 Intensive sessions processed at Tsukuba Correlator.
Baseline Period # of sessions
Intensive 1 TsWz Apr 22 – Apr 30 7
Intensive 2 TsWz Jan 05 – Apr 28 34KkWz May 12 – Jul 07 19
Oct 06 – Dec 29KkNy Jul 14 – Jul 28 9
Aug 25 – Sep 29KkSv Aug 04 – Aug 18 3
Total 72
4.2 JADE
JADE is the domestic geodetic VLBI series involv-ing four GSI stations (Tsukuba, Aira, Chichijima, and
Shintotsukawa), three NICT stations (Kashima 34-m,Kashima 11-m, and Koganei 11-m), and two VERAstations of the National Astronomical Observatory ofJapan (NAOJ) located in Mizusawa and Ishigakijima.Nine JADE sessions were correlated in 2013.
4.3 Ultra-Rapid EOP Experiment
This experiment is the joint project with Sweden, Aus-tralia, and South Africa having been continued since2007. Several ultra-rapid EOP experiments were im-plemented and processed at Tsukuba Correlator. Fordetails refer to the report “Tsukuba VLBI AnalysisCenter” in this volume.
5 Outlook
We will continue to process the IVS Intensive andJADE correlation. For more stable operation, we willmake further improvements to therapid programs andstart to use the new high performance servers and stor-age for our routine processing.
References
1. Kondo, T., et al.: Development of the K5/VSSP System,Jour-nal of the Geodetic Society of Japan, 54(4), 233-248, 2008.
2. Hobiger, T., et al.: Fully automated VLBI analysis with c5++for ultra-rapid determination of UT1,Earth Planets Space,62, 933-937, 2010.
IVS 2013 Annual Report

Washington Correlator
David M Hall, Daniel Veillette
Abstract This report summarizes the activities of theWashington Correlator for 2013. The Washington Cor-relator provides up to 80 hours of attended processingper week plus up to 40 hours of unattended operation,primarily supporting Earth Orientation and astrometricobservations. In 2013, the major programs supportedincluded the IVS-R4, IVS-INT01, APSG, and CRF ob-serving sessions.
1 General Information
The Washington Correlator (WACO) is located at andstaffed by the U.S. Naval Observatory (USNO) inWashington, DC, USA. The correlator is sponsoredand funded by the National Earth Orientation Ser-vice (NEOS), which is a joint effort of the USNOand NASA. Dedicated to processing geodetic andastrometric VLBI observations, the facility spent 100percent of its time on these sessions. All of the weeklyIVS-R4 sessions, all of the IVS-INT01 Intensives,and the APSG and CRF sessions were processed atWACO. The facility houses a Mark IV Correlator andthe WACO DiFX correlator.
U. S. Naval Observatory
WACO Correlator
IVS 2013 Annual Report
2 Activities during the Past Year
The Washington Correlator continues to operate 80hours per week with an operator on duty. The corre-lator has continued to function well unattended, allow-ing another 40 hours per week, on average, of extraprocessing.
The correlator staff continues the testing and repairof Mark 5 modules.
Intensive observations from Kokee Park andWettzell were routinely transferred via e-VLBI during2013. 24-hour sessions from both Hobart antennas,Katherine, Yarragadee, Warkworth, Ny-Alesund,Fortaleza, Yebes, Noto, HartRAO, Wettzell, Tsukuba,Aira, Kashima, Chichijima, and Sintotu were alsotransferred by high-speed networks.
The USNO’s high speed Internet capability was up-graded to a full 1 GB/s in 2013.
Table 1 lists the experiments processed during2013.
Table 1 Experiments processed during 2013.
Number of Sessions Type49 IVS-R4 sessions12 CRF (Celestial Reference Frame)4 APSG2 AUST
228 Intensives
231

232 Hall and Veillette
3 Staff
The Washington Correlator is under the managementand scientific direction of the Earth Orientation Depart-ment of the U.S. Naval Observatory.
Table 2 Staff.
Staff DutiesDavid Hall Chief VLBI Operations Division and
Correlator Project ScientistDaniel Veillette VLBI Correlator Project ManagerBruce ThorntonLead Physical Science TechnicianRoxanne InnissMedia LibrarianMaria Davis Physical Science Technician
4 Future Plans
Transition to the DiFX Software correlator began nearthe end of 2013 and should be completed by mid-2014.
IVS 2013 Annual Report

Data
Cen
ters


BKG Data Center
Volkmar Thorandt, Reiner Wojdziak
Abstract This report summarizes the activities andbackground information of the IVS Data Center for theyear 2013. Included are information about functions,structure, technical equipment, and staff members ofthe BKG Data Center.
1 BKG Data Center Functions
The BKG (Federal Agency for Cartography andGeodesy) Data Center is one of the three IVS PrimaryData Centers. It archives all VLBI related data ofIVS components and provides public access for thecommunity. The BKG Data Center is connected to theOPAR and GSFC CDDIS Data Centers by mirroringthe OPAR and the CDDIS file stocks several times perday. The sketch in Figure 1 shows the principle ofmirroring:
IVS components can choose one of these Data Cen-ters to put their data into the IVS network by using itsincoming area, which each Data Center has at its dis-posal. The BKG incoming area is protected, and usersneed to obtain a username and password to get access.
An incoming script watches the incoming area andchecks the syntax of the files sent by IVS components.If it is okay, the script moves the files into the DataCenter directories. Otherwise the files will be sent to abadfile area. Furthermore, the incoming script informsthe responsible staff at the Data Center by sending e-mails about its activities. The incoming script is part
BKG
BKG Data Center
IVS 2013 Annual Report
Fig. 1 Principle of mirroring.
of the technological unit which is responsible for man-aging the IVS and the Operational Data Center, andfor carrying out the first analysis steps in an automaticmanner. All activities are monitored to guarantee dataconsistency and to control all analysis steps from dataarrival to delivery of analysis products to IVS.
Public access to the BKG Data Center is availablethrough FTP and HTTP:
ftp://ivs.bkg.bund.de/pub/vlbi/
http://ivs.bkg.bund.de/vlbi/
235

236 Thorandt and Wojdziak
Structure of BKG IVS Data Center:
vlbi/ : root directoryivs-special/ : special CRF investigationsivscontrol/ : controlfiles for the data centerivsdata/ : VLBI observation filesivsdocuments/ : IVS documentsivs-iers/ : old IERS solutionsivsproducts/ : analysis products
crf/ : celestial framestrf/ : terrestrial frameseops/ : earth orientation (24h sessions)eopi/ : earth orientation (Intensive sessions)daily_sinex/ : daily sinex files (24h sessions)int_sinex/ : daily sinex files (Intensive sessions)trop/ : troposphere
2 Technical Equipment
The BKG IVS Data Center is based on a DELL Server(SUSE Linux operating system), disk space of 500GBytes (Raid system), and a backup system operatedby an automatic tape library.
3 Staff Members
Volkmar Thorandt (coordination, data analysis, datacenter, [email protected])
Reiner Wojdziak (data center, Web design,[email protected])
Dieter Ullrich (data analysis, data center, [email protected])
Gerald Engelhardt (data analysis, [email protected])
IVS 2013 Annual Report

CDDIS Data Center Summary for the IVS 2013 Annual Report
Carey Noll
Abstract This report summarizes activities during theyear 2013 and future plans of the Crustal DynamicsData Information System (CDDIS) with respect to theInternational VLBI Service for Geodesy and Astrome-try (IVS). Included in this report are background infor-mation about the CDDIS, the computer architecture,staff supporting the system, archive contents, and fu-ture plans for the CDDIS within the IVS.
1 General Information
The Crustal Dynamics Data Information System (CD-DIS) has supported the archiving and distribution ofVery Long Baseline Interferometry (VLBI) data sinceits inception in 1982. The CDDIS is a central facilityproviding users access to data and derived products tofacilitate scientific investigation. The CDDIS archiveof GNSS (GPS, GLONASS, etc.), laser ranging, VLBI,and DORIS data are stored on-line for remote access.Information about the system is available via the Webat the URL http://cddis.gsfc.nasa.gov. In addition to theIVS, the CDDIS actively supports other IAG servicesincluding the International GNSS Service (IGS), theInternational Laser Ranging Service (ILRS), the Inter-national DORIS Service (IDS), the International EarthRotation and Reference Frame Service (IERS), and theGlobal Geodetic Observing System (GGOS). The cur-rent and future plans for the system’s support of theIVS are discussed below.
NASA Goddard Space Flight Center
CDDIS Data Center
IVS 2013 Annual Report
2 System Description
The CDDIS archive of VLBI data and products is ac-cessible to the public through anonymous ftp.
2.1 Computer Architecture
The CDDIS is operational on a dedicated server, cd-dis.gsfc.nasa.gov. The system has over 32 Tbytes ofon-line disk storage; at this time, over 180 Gbytes aredevoted to VLBI activities. The CDDIS is located atNASA GSFC and is accessible to users 24 hours perday, seven days per week.
3 Archive Content
The CDDIS has supported GSFC VLBI and IVSarchiving requirements since 1979.
The IVS Data Center content and structure isshown in Table 1 (a figure illustrating the flow of in-formation, data, and products between the various IVScomponents was presented in the CDDIS submissionto the IVS 2000 Annual Report). In brief, dedicatedftp-only accounts have been established on the CDDISincoming computer, cddisin.gsfc.nasa.gov. Usingspecified filenames, Operation and Analysis Centersdeposit data files and analyzed results to appropriatedirectories within their ftp-only accounts. Automatedarchiving routines, developed by GSFC VLBI staff,peruse the directories and move any new data to the ap-propriate public disk area. These routines migrate thedata based on the filename to the appropriate directory
237

238 Noll
as described in Table 1. Index files in the main sub-directories under ftp://cddis.gsfc.nasa.gov/pub/vlbiare updated to reflect data archived in the filesystem.Furthermore, mirroring software was installed on theCDDIS host computer, as well as all other IVS DataCenters, to facilitate equalization of data and productholdings among these Data Centers. At this time,mirroring is performed between the IVS Data Centerslocated at the CDDIS, the Bundesamt fur Kartographieund Geodasie in Leipzig, and the Observatoire deParis.
The public file system in Table 1 on the CDDIScomputer, accessible via anonymous ftp, consists ofa data area, which includes auxiliary files (e.g., ex-periment schedule information, session logs, etc.) andVLBI data (in both database and NGS card image for-mats). A products disk area was also established tohouse analysis products from the individual IVS Anal-ysis Centers as well as the official combined IVS prod-ucts. A documents disk area contains format, software,and other descriptive files.
4 Data Access
During 2013, nearly 1,200 distinct hosts accessed theCDDIS on a regular basis to retrieve VLBI related files.These users, which include other IVS Data Centers,successfully downloaded over 158 Gbytes of data andproducts (1.2 M files) from the CDDIS VLBI archivelast year.
5 Future Plans
The CDDIS staff will continue to work closely with theIVS Coordinating Center staff to ensure that our sys-tem is an active and successful participant in the IVSarchiving effort.
The CDDIS staff is currently assessing the sys-tem hardware architecture and near-term requirements.Plans are to procure new server hardware in mid-2014to expand on-line storage and ensure system reliabilityfor the next few years.
IVS 2013 Annual Report

CDDIS 2013 Report 239
Table 1 IVS Data and Product Directory Structure
Directory DescriptionData Directoriesvlbi/ivsdata/db/yyyy VLBI database files for yearyyyyvlbi/ivsdata/ngs/yyyy VLBI data files in NGS card image format for yearyyyyvlbi/ivsdata/aux/yyyy/ssssss Auxiliary files for yearyyyy and sessionssssss;
these files include: log files, wx files, cable files, schedule files, correlator notesProduct Directoriesvlbi/ivsproducts/crf CRF solutionsvlbi/ivsproducts/eopi EOP-I solutionsvlbi/ivsproducts/eops EOP-S solutionsvlbi/ivsproducts/dailysinexDaily SINEX solutionsvlbi/ivsproducts/intsinex Intensive SINEX solutionsvlbi/ivsproducts/trf TRF solutionsvlbi/ivsproducts/trop Troposphere solutionsProject Directoriesvlbi/ivs-iers IVS contributions to the IERSvlbi/ivs-pilotbl IVS Analysis Center pilot project (baseline)Other Directoriesvlbi/ivscontrol IVS control files (master schedule, etc.)vlbi/ivsdocuments IVS document files (solution descriptions, etc.)vlbi/raw Raw VLBI datavlbi/dserver dserver software and incoming files
IVS 2013 Annual Report

Italy INAF Data Center Report
Monia Negusini, Pierguido Sarti
Abstract This report summarizes the activities of theItalian INAF VLBI Data Center. Our Data Center islocated in Bologna, Italy and belongs to the Institute ofRadioastronomy, which is part of the National Instituteof Astrophysics.
1 Introduction
The main analysis activity and storage is concen-trated in Bologna, where we store and analyze singledatabases, using CALC/SOLVE software.
The IRA started to store geodetic VLBI databasesin 1989, but the databases archived in Bologna mostlycontain data including European antennas from 1987onward. In particular most of the databases availablehere have VLBI data with at least three European sta-tions. However we also store all the databases with theNy-Alesund antenna observations. In 2002 we decidedto store the complete set of databases available on theIVS Data Centers, although we limited the time spanto the observations performed from 1999 onwards. Allthe databases were processed and saved with the bestselection of parameters for the final arc solutions. Inorder to perform global solutions, we have computedand stored the superfiles for all the databases.
In some cases we have introduced GPS-derived wetdelays into the European databases (1998 and 1999EUROPE experiments, for the time being), as if theywere produced by a WVR. These databases are avail-
Istituto di Radioastronomia INAF, Bologna
INAF Data Center
IVS 2013 Annual Report
able and stored with a different code from the originaldatabases. In order to produce these databases, we havemodified DBCAL, and this new version is available toexternal users.
2 Computer Availability and RoutingAccess
To date, the main computer is a Linux workstation, onwhich Mark 5 Calc/Solve version 10 was installed andto which all VLBI data analysis was migrated. The In-ternet address of this computer is sarip.ira.inaf.it. Since2011, a new server with a storage capacity of 5 TBhas been available, and, therefore, all experiments per-formed in the previous years were downloaded andarchived, thus completing the catalog. The older ex-periments will be analyzed in order to perform globallong term analysis. At present, the databases are storedin the following directories:
1 = /data2/dbase22 = /geo1/dbase13 = /geo1/dbase4 = /geo1/dbase3
The superfiles are stored in:/data1/super1
The list of superfiles is stored in the file/data2/mk5/savefiles/SUPCAT. The username foraccessing the databases is geo. The passwordmay be requested by sending an e-mail to [email protected].
240

Data Center at NICT
Ryuichi Ichikawa 1, Mamoru Sekido 2
Abstract The Data Center at the National Institute ofInformation and Communications Technology (NICT)archives and releases the databases and analysis resultsprocessed at the Correlation Center and the AnalysisCenter at NICT. Regular VLBI sessions of the KeyStone Project VLBI Network were the primary objec-tive of the Data Center. These regular sessions contin-ued until the end of November 2001. In addition to theKey Stone Project VLBI sessions, NICT has been con-ducting geodetic VLBI sessions for various purposes,and these data are also archived and released by theData Center.
1 General Information
The IVS Data Center at National Institute of Informa-tion and Communications Technology (NICT) archivesand releases the databases and analysis results pro-cessed by the Correlation Center and the Analysis Cen-ter at NICT. Major parts of the data are from the KeyStone Project (KSP) VLBI sessions [1], but other re-gional and international VLBI sessions conducted byNICT are also archived and released. Since routine ob-servations of the KSP network terminated at the endof November 2001, there have been no additional datafrom the KSP regular sessions since 2002.
On March 11th, 2011, the devastating megaquake(Mw 9.0) hit our antennas. The azimuth track and one
1. National Institute of Information and Communications Tech-nology (NICT)2. Kashima Space Research Center, NICT
NICT Data Center
IVS 2013 Annual Report
azimuth wheel of the Kashima 34 m were damaged asa consequence of the megaquake. The antenna repairwas finished in March 2013. On the other hand, the 11-m antennas at Kashima and Koganei were not damagedby the earthquake. We have carried out 20 VLBI ex-periments using the 11-m antennas including time andfrequency transfer experiments, international and do-mestic geodetic experiments, and astrophysical experi-ments.
The analysis results in SINEX (Solution INdepen-dent EXchange) format as well as in other formatsare available on the WWW server. Database files ofnon-KSP sessions, i.e. other domestic and interna-tional geodetic VLBI sessions, are also available onthe WWW server. Table 1 lists the WWW serverlocations maintained by the NICT Data Center. In thepast, an FTP server was used to provide data files, butit was decided to terminate the FTP service because ofthe security risks of maintaining an anonymous FTPserver. Instead, the www3.nict.go.jp WWW server wasprepared to provide large size data files.
The responsibility for the maintenance of theseserver machines was moved from the VLBI researchgroup in 2001 to a common division which handles allinstitutional network service of the laboratory in orderto improve the network security of these systems.
2 Activities during the Past Year
2.1 KSP VLBI Sessions
The KSP VLBI sessions were performed with fourKSP IVS Network Stations at Kashima, Koganei,Miura, and Tateyama on a daily or bi-daily basis
241

242 Ichikawa and Sekido
Table 1 URL of the WWW server systems.
Service URLKSP WWW pages http://ksp.nict.go.jp/IVS WWW mirror pageshttp://ivs.nict.go.jp/mirror/Database files http://www3.nict.go.jp/aeri/sts/stmg/database/e-VLBI Sessions http://www2.nict.go.jp/aeri/sts/stmg/research/e-VLBI/UT1/
until May 1999. The high-speed ATM (AsynchronousTransfer Mode) network line to the Miura stationbecame unavailable in May 1999, and real-timeVLBI observations with the Miura station becameimpossible. Thereafter, the real-time VLBI sessionswere performed with the three other stations. Onceevery six days (every third session), the observeddata were recorded to the K4 data recorders at threestations, and the Miura station participated in thesessions with the tape-based VLBI technique. In thiscase, the observed data at the three stations other thanthe Miura station were processed in real-time, andthe analysis results were released promptly after theobservations completed. A day later, the observedtapes were transported from the Kashima, Miura, andTateyama stations to the Koganei station for tape-basedcorrelation processing with all six baselines. Afterthe tape-based correlation processing was completed,the data set produced with the real-time VLBI dataprocessing was replaced by the new data set.
In July 2000, unusual site motion of the Tateyamastation was detected from the KSP VLBI data series,and the frequency of the sessions was increased frombi-daily to daily on July 22, 2000. The daily sessionswere continued until November 11, 2000, and the sitemotions of the Tateyama and Miura stations were mon-itored in detail. During the period, it was found thatTateyama station moved about 5 cm to the northeastdirection. The Miura station also moved about 3 cm tothe north. The unusual site motions of these two sta-tions gradually settled, and the current site velocitiesseem to be almost the same as the site velocities be-fore June 2000. The investigation into the time seriesof the site positions shows that the unusual site mo-tion started sometime between the end of June 2000and the beginning of July 2000. At the same time, vol-canic and seismic activities near the Miyakejima andKozushima Islands began. These activities are believedto have caused the regional crustal deformation in thearea, explaining the unusual site motions at Tateyamaand Miura.
2.2 Other VLBI Sessions
In recent years, we have carried out time and frequencytransfer experiments using VLBI. In addition, domesticand international geodetic and astronomical VLBI ses-sions were conducted by NICT in cooperation with theGeospatial Information Authority of Japan (GSI), theNational Astronomical Observatory (NAO), and otherorganizations. These sessions are listed in Table 2. Therecent observed data of these sessions were mainly pro-cessed by the K5 software correlator at NICT either atKoganei or at Kashima or by using a real-time hard-ware correlator developed by NAO.
3 Current Status
The repair of the Kashima 34-m antenna was finishedin March 2013, and the antenna participated in variousexperiments until now.
4 Future Plans
The IVS Data Center at NICT will continue its ser-vice and will archive and release the analysis resultsaccumulated by the Correlation Center and the Anal-ysis Center at NICT. In addition, a number of VLBIsessions will be conducted for the purposes of varioustechnology developments.
References
1. Special issue for the Key Stone Project, J. Commun. Res.Lab., Vol. 46, No. 1, March 1999.
IVS 2013 Annual Report

Data Center at NICT 243
Table 2 VLBI sessions conducted by NICT (since 2005). In 2012, all experiments were carried out using the 11-m antennas atKashima and Koganei since the 34-m antenna was under repair to recover from the earthquake damage. At the end of March 2013,the repair of the 34-m antenna was finished.
Year exp. names sessions2005 Geodetic c0505 (CONT05, partial participation), GEX13
Hayabusa 14 sessions2006 Geodetic GEX14, viepr2, CARAVAN (three sessions)
Spacecraft Geotail: one sessionPulsar one session
2007 Ultra Rapid e-VLBI 15 times, 29 sessionsTime Transfer four sessions, 12 days in totalCs-Gas-Cell one sessionSpacecraft Hayabusa: one session
2008 Ultra Rapid e-VLBI eight times, 33 sessionsTime Transfer 26 sessionsVariable Star e-VLBI 31 sessions
2009 e-VLBI 15 sessions, 90.5 hours in totalIVS 12 sessions, 332 hours in totalTime Transfer nine sessions, 72 hours in totalVERA 16 sessions, 149 hours in totalSurvey 26 sessions, 276 hours in total
2010 IVS 38 sessions, 442 hours in totalRadio astronomy 34 sessions, 324 hours in totalSpacecraft (IKAROS, UNITEC-1, QZSS) 33 sessions, 259 hours in totalDomestic geodetic 13 sessions, 94 hours in totalTime Transfer nine sessions, 86 hours in totale-VLBI nine sessions, 27 hours in total
2011 IVS two sessions, 48 hours in totalRadio astronomy 100 hours in totalearthquake damage investigation 216 hours in total
2012 IVS nine sessions, 216 hours in totalRadio astronomy (Sgr-A⋆) 13 sessions, 28 hours in totalDomestic geodetic three sessions, 72 hours in totalInternational fringe test (New Zealand and Korea) two sessions, 16 hours in totalInternational geodetic (New Zealand) one session, 24 hours in totalTime transfer 11 sessions, 264 hours in total
2013 IVS five sessions, 120 hours in totalRadio astronomy (including Sgr-A⋆ obs.) 71 sessions, 266 hours in totalDomestic geodetic 14 sessions, 213 hours in totalTime transfer two sessions, 46 hours in totalInternational fringe test (New Zealand and Korea) two sessions, 16 hours in totalPulsar 39 session, 274 hours in total
IVS 2013 Annual Report

Paris Observatory (OPAR) Data Center
Christophe Barache, Sebastien Lambert
Abstract This report summarizes the OPAR Data Cen-ter activities in 2013. Included is information aboutfunctions, architecture, status, future plans, and staffmembers of OPAR data center.
1 General Information
The Paris Observatory (OPAR) has provided a DataCenter for the International VLBI Service for Geodesyand Astrometry (IVS) since 1999. The OPAR as well asCDDIS and BKG is one of the three IVS primary DataCenters. Their activities are done in close collaborationfor collecting files (data and analysis files), and mak-ing them available to the community as soon as theyare submitted. The three Data Centers have a commonprotocol and each of them:
• has the same directory structure (with the same con-trol file),
• has the same script,• is able to receive all IVS files (auxiliary, database,
products, and documents),• mirrors the other ones every three hours, and• gives free FTP access to the files.
This protocol gives the IVS community a transpar-ent access to a Data Center through the same directory,and a permanent access to files in case of a Data Centerbreakdown.
Observatoire de Paris/SYRTE – CNRS – UMPC – GRGS
OPAR Data Center
IVS 2013 Annual Report
2 Architecture
To be able to put a file in a data center, operational andanalysis centers have to be registered by the IVS Coor-dinating Center. The file names have to conform to thename conventions. A script checks the file and puts itin the right directory. The script undergoes permanentimprovement and takes into account the IVS compo-nents’ requests. The structure of the IVS Data Centersis detailed in Table 1.
3 Current Status
The OPAR Data Center is operated on a PC server(PowerEdge 2800 - Xeron 3.0 GHz) located at the ParisObservatory and running the Fedora Linux operatingsystem. To make all IVS products available on-line,the disk storage capacity was significantly increased,and the server is equipped now with a RAID 3 TB diskextensible up to 4.7 TB.
The OPAR server is accessible 24 hours a day,seven days per week through Internet connection with2 Mbit/s rate. Users can get the IVS products by usingthe FTP protocol. Access to this server is free for users.
FTP access: ftp ivsopar.obspm.frusername : anonymouspassword : your e-mailcd vlbi (IVS directory)
This year, the OPAR successfully used the new mir-roring method based on lftp. The OPAR Web statis-
244

OPAR Data Center 245
Table 1 Directories of the IVS Data Center.
RECENT used for the new mirroring methodivscontrol control files needed by the Data Center (session code,station code, solution code...)ivsdocuments documents about IVS productsivsdata files related to the observations
aux auxiliary files (schedule, log...)db observation files in database CALC formatngs observation files in NGS formatsinex observation files in SINEX format
ivsproducts results from analysis centerseopi Earth orientation parameters, Intensive sessionseops Earth orientation parameters, 24-h sessionscrf celestial reference framestrf terrestrial reference framesdaily sinex 24-hour time series solutions of Earth orientation and sitepositions in SINEX FORMATint sinex daily Intensive solution in SINEX format, mainly designed for combinationtrop tropospheric time series (starting July 2003)
tics increased in 2013 — about 4,000 different visitorsreached the server in 2013. They viewed 33,500 pagesand downloaded three Go. The OPAR staff will con-tinue to work with the IVS community and in closecollaboration with the two other primary Data Centersin order to provide public access to all VLBI relateddata. To obtain information about the OPAR Data Cen-ter please e-mail [email protected].
IVS 2013 Annual Report


Anal
ysis
Cen
ters


Analysis Center of Saint Petersburg University
Dmitriy Trofimov, Veniamin Vityazev
Abstract This report briefly summarizes the activitiesof the Analysis Center of Saint Petersburg Universityduring 2013. The current status, as well as our futureplans, are described.
1 General Information
The Analysis Center of Saint Petersburg University(SPU AC) was established in the Sobolev Astronom-ical Institute of the SPb University in 1998. The mainactivity of the SPU AC for the International VLBI Ser-vice before 2007 consisted of routine processing of 24-hour and one-hour observational sessions for obtainingEarth Orientation Parameters (EOP) and rapid UT1-UTC values, respectively. In 2008 we began submittingthe results of 24-hour session processing.
2 Activities during the Past Year
• In 2013, the routine estimation of the five Earth Ori-entation Parameters was performed. The OCCAMsoftware package (version 62) was used for cur-rent processing of VLBI data [1]. The time seriesis named spu00004.eops. It includes data obtainedby the IRIS-A, NEOS-A, R1, R4, RDV, and R&Dobserving programs, and it covers 25 years of ob-servations (from January 2, 1989 until the end of2013). The total number of experiments processed
Sobolev Astronomical Institute of Saint Petersburg University
AI SPbU Analysis Center
IVS 2013 Annual Report
at the SPU AC is about 1960, of which about 100VLBI sessions were processed in 2013. Our expe-rience and the equipment of the Analysis Centerwas used for giving lectures and practical work onthe basics of radio interferometry to university stu-dents. We use our original manual on the trainingin modern astrometry and in particular VLBI [2].In 2013, the work of the SPU AC was performedwithin the projects “Acquisition and analysis oftime-series in astronomy and study of astronomi-cal catalogs” and “GLONASS, GPS and VLBI ob-servations as the basis of astronomical, gravimetric,and geodynamic studies” (SPU grants for funda-mental research 6.0.161.2010 and 6.37.110.2011).
• All parameters were adjusted using the Kalman fil-ter technique. For all stations (except the referencestation), the wet delay, clock offsets, clock rates,and troposphere gradients were estimated. Tropo-sphere wet delay and clock offsets were modeledas a stochastic process such as a random walk. Theclock rates and the troposphere gradients were con-sidered to be the constant parameters.
• The main details of the preparation of the EOP timeseries spu00004.eops are summarized below:
– Data span: 1989.01–2013.12– CRF: fixed to ICRF-Ext.2– TRF: VTRF2005 was used as an a priori TRF– Estimated parameters:
1. EOP:x,y,UT1−UTC,dψ,dε;2. Troposphere: troposphere gradients were es-
timated as constant parameters, and wet tro-posphere delays were modeled as a randomwalk process;
3. Station clocks were treated as follows: offsetas a random walk process, rate as a constant.
249

250 Trofimov and Vityazev
– nutation model: IAU 1980– mapping function: VMF1– technique: Kalman filter– software: OCCAM v.62
3 Current Status
The assistant professor of Saint Petersburg University,Dmitriy Trofimov, was in charge of the routine pro-cessing of the VLBI observations. General coordina-tion and support for the activities of the SPU AC atthe Astronomical Institute was performed by ProfessorVeniamin Vityazev.
4 Future Plans
In 2014, we are going to continue our regular process-ing of the VLBI sessions as well as giving lectures andpractical training for students in a special course on ra-dio astrometry. This course is a part of the systematiccurriculum of astronomical education at SPb Univer-sity.
References
1. O. Titov, V. Tesmer, J. Boehm. OCCAM v. 6. 0 Softwarefor VLBI Data Analysis, In International VLBI Service forGeodesy and Astrometry 2004 General Meeting Proceed-ings, N. R. Vandenberg and K. D. Baver (eds.), NASA/CP-2004-212255, pp. 267-271, 2004.
2. V. Vityazev, I. Guseva, V. Kiyaev, M. Mishchenko, O. Titov,A. Tsvetkov. Celestial and Terrestrial Coordinates (In Rus-sian), Manual on Astrometry, p. 301, SPb University, 2011.
IVS 2013 Annual Report

Geoscience Australia Analysis Center 2013 Annual Report
Oleg Titov
Abstract This report gives an overview of the activ-ities of the Geoscience Australia IVS Analysis Centerduring 2013.
1 General Information
The Geoscience Australia (GA) IVS Analysis Centeris located in Canberra within the National GeospatialReference System Section, Mineral and Natural Haz-ard Division (MNHD).
2 Activities during the Past Year
Several celestial reference frame (CRF) solutions havebeen prepared using the OCCAM 6.2 software. The lat-est solution was uploaded in September 2013. VLBIdata consisting of 4,353 daily sessions from 25-Nov-1979 to 03-September-2013 have been used to com-pute several global solutions with different sets of ref-erence radio sources. This includes 5,927,370 observa-tional delays from 2,950 radio sources having three ormore observations.
Station coordinates were also estimated usingNo-Net-Rotation (NNR) and No-Net-Tranlation(NNT) constraints. The long-term time series of thestation coordinates have been used to estimate thecorresponding velocities for each station. The tectonicmotion for the Gilcreek VLBI site after the Denali
Geoscience Australia
GA Analysis Center
IVS 2013 Annual Report
earthquake was modeled using an exponential functiontypical of post-seismic deformation. The tectonicmotion of the Tigoconc (2010) and Tsukub32 (2011)VLBI sites after recent strong earthquakes is currentlyunder study.
The adjustment was made by least squares colloca-tion, which considers the clock offsets, wet tropospheredelays, and tropospheric gradients as stochastic param-eters with a priori covariance functions. The gradientcovariance functions were estimated from GPS hourlyvalues.
Our first CRF solution, aus2013a.crf, was not im-posed by the NNR constraints. The second CRF solu-tion, aus2013b.crf, was imposed by NNR constraints.This second solution is consistent with the CRF solu-tions submitted by other Analysis Centers.
In 2013, all three new AuScope 12-meter radio tele-scopes were actively working in different IVS geodeticand astrometric programs. Two other Australian radiotelescopes – Hobart26, operated by the University ofTasmania (UTAS), and Parkes, operated by the Aus-tralia Telescope National Facility (ATNF) — partici-pated in the geodetic VLBI programs occasionally.
A program for optical identification and spec-troscopy of the reference radio sources continued incollaboration with the Australian Telescope NationalFacility, University of Sydney and Nordic OpticalTelescope. A paper that includes redshifts of 126reference radio sources has been published.
New observing runs at Gemini North, GeminiSouth (service mode) and New Telescope Technology(ESO) (visitor mode) were ongoing in 2013.
251

252 Titov
3 Staff Changes
Dr. Laura Stanford was actively involved in all the pro-grams during the year and left this job in October 2013.
Acknowledgements
This report was published with the permission of theCEO, Geoscience Australia.
IVS 2013 Annual Report

Report for 2013 from the Bordeaux IVS Analysis Center
Patrick Charlot, Antoine Bellanger, Romuald Bouffet, Geraldine Bourda, Arnaud Collioud, Alain Baudry
Abstract This report summarizes the activities of theBordeaux IVS Analysis Center during the year 2013.The work focused on (i) regular analysis of the IVS-R1 and IVS-R4 sessions with the GINS software pack-age, also extending our present solution back to 2002;(ii) systematic VLBI imaging of the RDV sessions andcalculation of the corresponding source structure in-dex and compactness values; (iii) investigation of thecorrelation between astrometric position instabilitiesand source structure variations; (iv) continuation ofour VLBI observational program to identify optically-bright radio sources suitable as transfer sources to alignthe International Celestial Reference Frame (ICRF)and the future Gaia frame; and (v) assessment of thecurrent IVS observing scheme for those Gaia transfersources comprised in ICRF2. Also to be mentioned isthe organization of a joint workshop with the KoreanSpace Science Institute and participation in meetingsof the Working Group on the next ICRF realization.
1 General Information
TheLaboratoire d’Astrophysique de Bordeaux (LAB),formerly Bordeaux Observatory, is located in Floirac,near Bordeaux, in the southwest of France. It is fundedby the University of Bordeaux and theCentre Nationalde la Recherche Scientifique (CNRS). VLBI activitiesare primarily developed within theMetrologie del’espace, Astrodynamique, Astrophysique (M2A)team.
Laboratoire d’Astrophysique de Bordeaux
Bordeaux Analysis Center
IVS 2013 Annual Report
The contribution of the Bordeaux group to the IVShas been mostly concerned with the maintenance, ex-tension, and improvement of the International CelestialReference Frame (ICRF). This includes regular imag-ing of the ICRF sources and evaluation of their astro-metric suitability, as well as developing specific VLBIobserving programs for enhancing the celestial frame.
In addition, the group is in charge of the VLBI com-ponent in the multi-technique GINS software pack-age [1] as part of a collaborative effort within theFrenchGroupe de Recherches de Geodesie Spatiale(GRGS) to combine VLBI and space geodetic data(SLR, GPS, and DORIS) at the observation level. Thiseffort also involves institutes in Toulouse, Nice, andParis.
2 Description of Analysis Center
The Bordeaux IVS group routinely analyzes theweekly IVS-R1 and IVS-R4 sessions with the GINSsoftware package. During the past year, weeklynormal equations for all such sessions in 2013 (withsix-hour EOP resolution) have been produced andintegrated in the multi-technique solutions derived bythe GRGS. We also worked at extending our solutionto the past, analyzing all IVS-R1 and IVS-R4 sessionsback to 2002. This extension was motivated by thegoal of producing test solutions combining all spacegeodetic data at the observation level for the upcomingITRF2013.
The group is also focused on imaging the ICRFsources on a regular basis by systematic analysis of thedata from the RDV sessions which are conducted sixtimes a year. This analysis is carried out with the AIPS
253

254 Charlot et al.
and DIFMAP software packages. The aim of such reg-ular imaging is to characterize the astrometric suitabil-ity of the sources based on the so-called “structure in-dex” and to compare source structural evolution andpositional instabilities. Such studies are essential foridentifying sources of high astrometric quality, whichis required, i.e., for the future Gaia link.
3 Scientific Staff
During the past year, there were no changes in the IVSstaff. In all, six individuals contributed to one or moreof our IVS analysis and research activities during 2013.A description of what each person worked on, alongwith the time spent on it, is given below.
• Patrick Charlot (20%): person with overall respon-sibility for Analysis Center work and data process-ing. His research interests include the ICRF densifi-cation, extension, and link to the Gaia frame, stud-ies of radio source structure effects in astrometricVLBI data, and astrophysical interpretation.
• Antoine Bellanger (100%): engineer with a back-ground in statistics and computer science. He istasked to process VLBI data with GINS and to de-velop procedures and analysis tools to automatesuch processing. He is also the M2A Web master.
• Romuald Bouffet (30%): Ph. D. student from Uni-versity of Bordeaux whose thesis is focused onthe study of the relationship between radio sourcestructure and position instabilities. He is using as-trometric data and VLBI images from IVS sessions.
• Geraldine Bourda (50%): astronomer in charge ofdeveloping the VLBI part of GINS and responsi-ble for the analysis results derived from GINS. Sheis also leading a VLBI observational program forlinking the ICRF and the future Gaia optical frame.
• Arnaud Collioud (100%): engineer with a back-ground in astronomy and interferometry. His tasksare to image the sources in the RDV sessions usingAIPS and DIFMAP, to develop the Bordeaux VLBIImage Database andIVS Livetool, and to conductsimulations for the next generation VLBI system.
• Alain Baudry (10%): radioastronomy expert withspecific interest in radio source imaging and astro-metric VLBI. He is a Professor Emeritus and hasa part-time ESO contract to work on the ALMA
phasing for ultra-high resolution millimeter VLBIscience.
4 Analysis and Research Activities in 2013
As noted above, a major part of our activity consistsof imaging the sources observed during the RDV ses-sions on a systematic basis. During 2013, two suchsessions were processed (RDV90 and RDV92), result-ing in 347 VLBI images at either X- or S-band for161 different sources. The imaging work load has beenshared with USNO since 2007 (starting with RDV61);the USNO group processes the odd-numbered RDVsessions while the Bordeaux group processes the even-numbered ones. The VLBI images are used in a secondstage to derive structure correction maps, and visibil-ity maps along with values for structure indices andsource compactness (see [2, 3] for a definition of thesequantities) in order to assess astrometric source qual-ity. All such information is made available through theBordeaux VLBI Image Database (BVID)1. At present,the BVID comprises a total of 3,691 VLBI imagesfor 1,126 different sources (with links to an additional7,851 VLBI images from the Radio Reference FrameImage Database of USNO) along with 11,542 structurecorrection maps and as many visibility maps.
In addition to such regular imaging, studies aimedat characterizing correlations between astrometric po-sition instabilities and source structural variations werepursued further. Moving from qualitative comparisons,we calculated correlation coefficients between time se-ries of source positions and brightness centroid mo-tions (as derived from the available VLBI images) forour previously selected set of 68 sources. Based onthis calculation, an overall positive correlation coeffi-cient was found, indicating that on average source posi-tion instabilities and structural variations are linked [4].However, the comparison also revealed that a fractionof the sources show a negative correlation. Possible ex-planations for such discrepancies include misidentifi-cation of the core components over the epochs in thesuccessive VLBI maps and effects of the S-band datawhich have not been considered in this work. Furtherinvestigations are continuing through a careful exami-
1 The Bordeaux VLBI Image Database may be accessed athttp://www.obs.u-bordeaux1.fr/BVID.
IVS 2013 Annual Report

Bordeaux AC Report for 2013 255
nation of every individual source and assessment of thesignificance of the calculated correlation coefficients.
Another major project carried within the group isthe identification and characterization of appropriateradio sources to align the ICRF and the future Gaiaoptical frame. To this end, two complementary direc-tions are followed: (i) the identification of such sourceswithin ICRF2, and (ii) the search for additional sources(outside of ICRF2) to increase the pool of transfersources. As noted in our 2012 IVS report, the examina-tion of ICRF2 led to the identification of 195 transfersources. These were further characterized as 89 sourceswhich are sufficiently observed in current IVS pro-grams (i.e., at least once a month), 62 sources whichare not observed well enough in these programs (i.e.,less than once a month), 20 sources which have aproper position accuracy but were only occasionallyobserved, and 24 sources which have a poor positionaccuracy, requiring further observations and improve-ment in accuracy to qualify as transfer sources. Follow-ing this analysis and previously proposed observations,the IVS has now begun to insert some of these sourcesinto the regular IVS observing programs. The seconddirection (i.e. searching for new sources) has led to theidentification of an additional 119 sources [5], all ofwhich were observed during a dedicated 72-hour as-trometric VLBI session conducted with the combinedVery Long Baseline Array and European VLBI Net-work in May 2012. These data are now correlatedand are awaiting analysis. Also to be mentioned inthis framework is the extension of our work to thesouthern hemisphere with the submission of a proposalto the Australian Long Baseline Array (supplementedwith additional VLBI stations) to characterize potentialtransfer sources in the south.
Most of this work (source imaging, assessmentof structural effects, identification of Gaia transfersources, etc.) naturally fits within the tasks of thenewly formed IAU Working Group on the next ICRFrealization which was set up at the 2012 IAU GeneralAssembly. As such, we contributed to the first twomeetings of this Working Group, held on 7 March2013 in Espoo (Finland) and 18 September 2013 inParis.
5 Dissemination and Outreach
A joint VLBI astrometry workshop was organizedby the Bordeaux and KASI (Korean Astronomyand Space Science) VLBI groups as part of bilat-eral agreements between France and Korea. Theworkshop was held in Bordeaux on 24-25 October2013. Sessions were devoted to radio interferometrytechniques, high-resolution astrometry, radio sourcesand reference frames, as well as to time and frequencystandards. Dissemination activities also included a talkgiven by P. Charlot at theBureau des LongitudesinParis on 6 November 2013, highlighting recent VLBIdevelopments and the next generation VLBI system.
The IVS LiveWeb site [6], dedicated to monitor-ing IVS sessions and viewing VLBI images of the ob-served sources, was updated on a regular basis dur-ing 2013. It now includes 5,825 IVS sessions (with 68stations participating) and 1,736 sources. Monitoringof the connections indicates that there were 866 vis-its from around the world (40 countries, 286 locations)during 2013, with 70% originating from different indi-viduals. On the other hand, the Bordeaux VLBI ImageDatabase was accessed from 85 different locations in33 countries. In all, there were 547 connections, withone-third originating from different individuals.
6 Outlook
Our plans for the coming year are focused on movingtowards operational analysis of the IVS-R1 and IVS-R4 sessions with the GINS software package. Imagingof the RDV sessions and evaluation of the astromet-ric suitability of the sources will continue along thesame lines. On the observational side, the immediateplan will be to analyze the astrometric data that we ac-quired on the 119 Gaia transfer sources identified fromour program (see Section 4). We also expect the IVSto continue and expand observations of the 195 ICRF2transfer sources now that Gaia has been launched andis soon to begin operations. In this respect, it wouldbe desirable to schedule VLBI observations that are si-multaneous with Gaia so that time series of radio andoptical positions can be compared on a detailed basis.Depending on the outcome of our southern hemisphereproposal, observations in the south should also beginto develop. Finally, we expect to contribute to the work
IVS 2013 Annual Report

256 Charlot et al.
towards the next realization of the ICRF in line withthe plans that were set up during the initial meetings ofthe IAU Working Group in charge of this task.
Acknowledgements
We would like to thank theObservatoire Aquitain desSciences de l’Univers (OASU)for supporting IVS ac-tivities in Bordeaux.
References
1. Bourda, G., Charlot, P., Biancale, R.: 2007, GINS: A NewTool for VLBI Geodesy and Astrometry, 18th EVGA Work-ing Meeting, Eds. J. Bohm, A. Pany, and H. Schuh, IGGVienna, p. 59–63.
2. Fey, A. L., Charlot, P.: 1997, VLBA Observations of RadioReference Frame Sources. II. Astrometric Suitability Basedon Observed Structure, ApJS, 111, pp.95–142.
3. Charlot, P.: 2008, Astrophysical Stability of Radio Sourcesand Implication for the Realization of the Next ICRF, 5thIVS General Meeting, St Petersburg, Eds. A. Finkelstein andD. Behrend, p. 345–354.
4. Bouffet, R., Charlot, P., Lambert, S.: 2013, Correlation be-tween source structure evolution and VLBI position insta-bilities, Proceedings of the 21st Meeting of the EuropeanVLBI Group for Geodesy and Astrometry, Eds. N. Zubkoand M. Poutanen, Report of the Finnish Geodetic Institute,p. 185–188.
5. Bourda, G., Collioud, A., Charlot, P., Porcas, R., Garring-ton, S.: 2012, Towards an Accurate Alignment of the VLBIFrame and the Future Gaia Optical Frame: Global VLBIImaging Observations of a Sample of Candidate Sourcesfor this Alignment, IVS 2012 General Meeting Proceedings,Eds. Dirk Behrend and Karen D. Baver, NASA/CP-2012-217504, p. 334–338.
6. Collioud, A.: 2011, IVS Live: All IVS on your deskstop,Proceedings of the 20th Meeting of the European VLBIGroup for Geodesy and Astronomy, Eds. W. Alef, S.Bernhart, and A. Nothnagel, Universitat Bonn, Institut furGeodasie und Geoinformation, Schriftenreihe 22, p. 14–18.
IVS 2013 Annual Report

BKG/DGFI Combination Center Annual Report 2013
Sabine Bachmann 1, Michael Losler 1, Linda Messerschmitt 1, Ralf Schmid 2, Mathis Bloßfeld 2, Daniela Thaller 1
Abstract This report summarizes the activities of theBKG/DGFI Combination Center in 2013 and outlinesthe planned activities for 2014. The main focus in 2013was on the inclusion of source positions in the combi-nation process and the preparation for the IVS contri-bution to ITRF2013.
1 General Information
The BKG/DGFI Combination Center was establishedin October 2008 as a joint effort of the Federal Agencyfor Cartography and Geodesy (Bundesamt fur Kar-tographie und Geodasie, or BKG) and the GermanGeodetic Research Institute (Deutsches GeodatischesForschungsinstitut, or DGFI). The participating insti-tutions, as well as the tasks and the structure of theIVS Combination Center, are described in [1]. Thetasks comprise quality control and a timely combina-tion of the session-based intermediate results of theIVS Analysis Centers into a final combination product(e.g., Earth orientation parameters, EOP). In coordina-tion with the IVS Analysis Coordinator, the combina-tion results are released as official IVS products. TheCombination Center is also expected to contribute tothe generation of the official IVS input to any ITRFactivities.
1. Federal Agency for Cartography and Geodesy (BKG), Frank-furt/Main, Germany2. German Geodetic Research Institute (DGFI), Munich, Ger-many
BKG/DGFI Combination Center
IVS 2013 Annual Report
The BKG/DGFI Combination Center performs acombination of session-based results of the IVS Anal-ysis Centers on an operational basis. The strategy forthe combination is based on the combination of normalequations and was adopted from the combination pro-cess as developed and performed by the IVS AnalysisCoordinator (cf. [2], [3]). At BKG, the following tasksare performed:
• Quality control of the Analysis Center results:checking the format of the results and theirsuitability for combination, identification, andreduction of outliers, comparison of the AnalysisCenters’ results with each other, and comparisonof the results with external time series provided byIERS or IGS.
• Feedback to the Analysis Centers: quality controlresults are available at the BKG IVS CombinationCenter Web page [5].
• Generation of high-quality combination productsand timely archiving and distribution: combinationproducts are created by using the combination partDOGS-CS of DGFI’s software package DOGS(DGFI orbit and geodetic parameter estimationsoftware) [4].
• Submission of official IVS combination products tothe IERS: the products are submitted to the respon-sible IERS components to be used for IERS productgeneration (e.g., EOP rapid products and the EOPseries IERS C04).
• Generation of the official IVS input to the ITRF: thecombined session products (from 1984 to present)are submitted for ITRF computation in the form ofnormal equations in SINEX format. This work isalso supported by the staff of the IERS Central Bu-reau, hosted by BKG.
257

258 Bachmann et al.
• Final results are archived in the BKG Data Centerand mirrored to the IVS Data Centers at Observa-toire de Paris (OPAR) and Goddard Space FlightCenter (GSFC). This work is assisted by the staffof the BKG Data Center in Leipzig.
The inclusion of new Analysis Centers has contin-ued, a newly designed Web page was brought online,and the Web-based analysis tools have been enhanced.
DGFI is in charge of the following CombinationCenter functions:
• DGFI is developing state-of-the-art combinationprocedures. This work, as well as the followingitem, is also related to the ITRS CombinationCenter at DGFI and DGFI’s efforts within theIERS WG on Combination at the ObservationLevel (COL).
• The software DOGS-CS is updated by implement-ing and documenting the developed state-of-the-artcombination procedures.
• Adhering to IERS Conventions: the DGFI DOGSsoftware package is continuously updated to be inaccordance with the IERS Conventions.
2 Activities During the Past Year
At BKG, the following activities were performed dur-ing 2013:
• Generation of a combined solution of IVS 24h rapidsessions twice a week.
• Generation of a combined long-term (quarterly) so-lution of IVS 24h sessions every three months.
• Further development of the IVS Combination Cen-ter’s Web sites [5].
• Refinements of the combination procedure and im-plementation of source parameter combination.
• Development of an alternative combination proce-dure using the Bernese GNSS Software; implemen-tation of the basic VLBI combination functions andpreprocessing routines in cooperation with the Uni-versity of Bonn.
• Participation in a pilot project on digital objectidentifiers (DOI) for data in cooperation withR. Heinkelmann (Deutsches GeoForschungsZen-trum, Germany); feasibility investigation forproviding data and meta data.
• A guideline for potential Analysis Centers thatintend to contribute to the combined solutionhas been drafted in cooperation with R. Heinkel-mann (GFZ). This guideline is available athttp://ccivs.bkg.bund.de/bid.
Figure 1 shows an example plot of the differencesin declination and right ascension for selected sourcesbetween combined source positions and their ICRF2position. The differences are in the range of±0.4 mas.
0003−066 0014+813 0048−097 0059+581 0104−408 0106+013 0119+115 0133+476 0201+113 0235+164 0336−019 0458−020 0528+134 0537−441 0552+398 0556+238 0602+673
−1.2
−1
−0.8
−0.6
−0.4
−0.2
0
0.2
0.4
0.6
0.8
Di
ere
nce
s w
.r.t
. IC
RF
2 [
ma
s]
Right Ascension
Declination
Fig. 1 Difference in right ascension (+) and declination (*) be-tween combined and ICRF2 source positions.
At DGFI the following activities were performedduring 2013:
• Application of tidal corrections to UT1 accordingto IERS Conventions (2010) by DOGS-CS.
• Development of an EOP routine to switch betweenpiecewise linear (offsets at 0h) and offset+drift rep-resentation.
• Improved realization of observation epochs inDOGS-CS with 8-byte precision.
• Handling of radio source position parameters withDOGS-CS.
2.1 Staff
The list of the staff members of the BKG/DGFI Com-bination Center in 2013 is given in Table 1.
Figure 2 shows the VLBI and IERS group at BKGin Frankfurt. From left to right: Ole Roggenbuck (DFGproject on reference frames; combination at the obser-vation level), Dr. Wolfgang Dick (IERS Central Bu-reau), Michael Losler (IVS combination; replaced by
IVS 2013 Annual Report

BKG/DGFI Report 2013 259
Table 1 Staff members of the BKG/DGFI Combination Center.
Name Affiliation Function E-MailMichael Gerstl DGFI Software maintenance [email protected] Schmid DGFI Combination strategies [email protected] Bloßfeld DGFI Combination strategies [email protected] Bachmann BKG Combination procedure development [email protected] Messerschmitt1 BKG Operational Combination /Web site [email protected] Losler2 BKG Operational Combination /Web site maintenance [email protected]
Linda Messerschmitt), Sabine Bachmann (IVS combi-nation) and Dr. Daniela Thaller (head of section).
Fig. 2 IVS combination and IERS group at BKG in Frankfurt.
More details on the IVS Combination Center atBKG can be found in an interview for the IVS Newslet-ter [6].
3 Current Status
In 2013, six IVS Analysis Centers (BKG, DGFI,GSFC, IAA, OPA, and USNO) contributed to theIVS combined product (see [5]). The rapid solutionscontain only R1 and R4 sessions, and new data pointsare added twice a week as soon as the SINEX filesof at least four IVS Analysis Centers are available.
1 Linda Messerschmitt joined the BKG Combination Center inOctober 2013.2 Michael Losler left the BKG Combination Center in July 2013.
Long-term series are generated quarterly and includeevery 24h session since 1984. The quarterly seriesinclude long-term EOP, station positions, and ve-locities. Furthermore, a VLBI TRF is generated andpublished. The preprocessing to read and write sourcepositions was implemented, and the software wasextended to process source parameters. The resultsof the combination process are archived by the BKGData Center in Leipzig. The combined rapid EOPseries, as well as the results of the quality control ofthe Analysis Center results, are also available directlyat the BKG/DGFI Combination Center Web page [5]or via the IVS Analysis Coordinator Web site.
4 Future Plans
In 2014, the work of the BKG/DGFI Combination Cen-ter will focus on the following aspects:
• Generation of the IVS contribution to ITRF2013:input data investigation, combination strategy andevaluation of the combined EOP and station coor-dinate time series as well as the comparison of theindividual contributions of the Analysis Centers.
• Investigation into combination of source coordi-nates for time series of source coordinates andgeneration of a combined celestial reference framebased on VLBI intra-technique combination.
• Establish the digital object identifier (DOI) forcombined VLBI products in cooperation withGFZ.
References
1. Schwegmann, W., Gerstl, M., Heinkelmann, R., BKG/DGFICombination Center Annual Report 2008, in:InternationalVLBI Service for Geodesy and Astrometry Annual Report
IVS 2013 Annual Report

260 Bachmann et al.
2008, NASA/TP-2009-214183, D. Behrend and K. D. Baver(eds.), 250–252, 2009.
2. Nothnagel, A., Bockmann, S., Artz, T.,Analysis Coordina-tor Report, in: International VLBI Service for Geodesy andAstrometry 2007 Annual Report, NASA/TP-2008-214162,D. Behrend and K. D. Baver (eds.), 16-17, 2008.
3. Nothnagel, A., Bockmann, S., Artz, T.,Analysis Coordina-tor Report, in: International VLBI Service for Geodesy andAstrometry Annual Report 2009, NASA/TP-2010-215860,D. Behrend and K. D. Baver (eds.), 45–47, 2010.
4. http://ilrs.dgfi.badw.de/fileadmin/dogs/csmanual.psDOGS-CS software manual (German version only).
5. http://ccivs.bkg.bund.de/ BKG Combination Center Webpage.
6. Hase, H., BKG/DGFI Combination Center at Frankfurt, IVSNewsletter 36, 2-3, 2013. http://ivscc.gsfc.nasa.gov/publica-tions/newsletter/issue36.pdf.
IVS 2013 Annual Report

Matera CGS VLBI Analysis Center
Roberto Lanotte
Abstract This paper reports the VLBI data analysisactivities at the Space Geodesy Center (CGS) Matera,from January 2013 through December 2013, and thecontributions that the CGS intends to provide for thefuture as an IVS Analysis Center.
1 General Information
The Matera VLBI station became operational at theSpace Geodesy Center (CGS) of the Italian SpaceAgency (ASI) in May 1990. Since then, it has beenactive in the framework of the most important inter-national programs. The CGS, operated by e-geos (aTelespazio/ASI company) on behalf of ASI, providesfull scientific and operational support using the mainspace geodetic techniques: VLBI, SLR, and GPS.
2 Activities during the Past Year
During 2013, the following activities were performedat CGS:
• Global VLBI Solution cgs2013aThe main VLBI data analysis activities at the CGSin the year 2013 were directed towards the realiza-tion of a global VLBI solution, named cgs2013a,using the CALC/SOLVE software (developed at
Centro di Geodesia Spaziale (CGS) - e-geos SpA
CGS Analysis Center
IVS 2013 Annual Report
NASA/GSFC). The main and final characteristicsof this solution are:
– Data span:1984.01.04 - 2012.12.27 (4356 sessions)
– Estimated Parameters:· Celestial Frame: Right ascension and decli-
nation as global parameters for 845 sources,· Terrestrial Frame: Coordinates and veloci-
ties for 81 stations as global parameters, and· Earth Orientation: Unconstrained X pole, Y
pole, UT1, Xp rate, Yp rate, UT1 rate, dpsi,and deps.
• IVS Tropospheric ProductsRegular submission of tropospheric parameters(wet and total zenith path delays, and east andnorth horizontal gradients) for all VLBI stationsobserving in the IVS R1 and R4 sessions continuedduring 2013. Currently, 1,205 sessions have beenanalyzed and submitted, covering the period from2002 to 2013. The results are available at the IVSproducts ftp site.
• CGS Contribution to IERS EOP Operational SeriesSince 2008, CGS has been delivering IERS R1 andR4 session EOP estimates as a regular contribu-tion to the IERS EOP operational series. The wholecgs2007a solution, available when the contributionstarted, has been delivered to IERS as a referenceseries updated by periodic EOP solution submis-sions.
261

262 Lanotte
2.1 Staff at CGS Contributing to the IVSAnalysis Center
• Dr. Giuseppe Bianco, responsible for CGS/ASI(primary scientific/technical contact).
• Dr. Rosa Pacione, responsible for scientific activi-ties, e-geos.
• Dr. Roberto Lanotte, geodynamics data analyst, e-geos.
3 Future Plans
• Continue and improve the realization of our globalVLBI solution, providing its regular update ontime.
• Continue to participate in the IVS analysis projects.• Start to contribute to the “Daily Solution Files
(DSNX)” project of the IVS, providing thedatum-free normal equations.
IVS 2013 Annual Report

DGFI Analysis Center Annual Report 2013
Ralf Schmid, Michael Gerstl, Manuela Seitz, Detlef Angermann
Abstract This report presents the activities of theDGFI Analysis Center during 2013. Besides theregular IVS submissions, DGFI started to reprocess24-hour sessions including the estimation of sourcepositions. DOGS-RI, the new VLBI analysis softwareto be used at DGFI, is near completion.
1 General Information and ComponentDescription
The DGFI Analysis Center (AC) is located at the Ger-man Geodetic Research Institute (Deutsches Geoda-tisches Forschungsinstitut, or DGFI) in the city centerof Munich in Germany. DGFI is an autonomous and in-dependent research institution affiliated with the Bavar-ian Academy of Sciences and Humanities (BAdW) andfunded by the Free State of Bavaria.
Research performed at DGFI covers many differentfields of geodesy (geometric techniques, gravity field,Earth system modeling, etc.) and includes the contri-bution to national and international scientific servicesand research projects as well as various functions inscientific organizations (see http://www.dgfi.badw.de).DGFI closely cooperates with BAdW and the Tech-nische Universitat Munchen (TUM, including person-nel at the Geodetic Observatory Wettzell) within theframework of the Center of Geodetic Earth System Re-search (CGE).
Deutsches Geodatisches Forschungsinstitut (DGFI)
DGFI Analysis Center
IVS 2013 Annual Report
DGFI has been acting as an IVS AC since the es-tablishment of the IVS in 1999. Since November 2008,DGFI has been an operational AC regularly submittingconstraint-free normal equations for 24-hour sessionsin the SINEX format. Since 2008, DGFI has also beeninvolved in the BKG/DGFI Combination Center.
2 Staff
In 2013, the DGFI AC had to cope with a rather lownumber of personnel. After Robert Heinkelmann leftDGFI in autumn 2012 to become the head of the VLBIgroup at the German Research Centre for Geosciences(GFZ) in Potsdam, Julian Andres Mora-Diaz joined hisgroup in early 2013. And since spring 2013, ManuelaSeitz has been on maternity leave.
Table 1 Staff members and their main areas of activity.
Dr. Detlef Angermann Group leaderDr. Michael Gerstl Development of the analysis
software DOGS-RIMr. Julian Andres Routine data analysisMora-Diaz (now at GFZ)Dr. Ralf Schmid Routine data analysis, combination
of different space geodetictechniques
Dr. Manuela Seitz CRF/TRF combination, ICRF3,(currently on combination of different spacematernity leave) geodetic techniques
As all these vacancies could not be filled in themeantime, the activities of the DGFI AC were moreor less limited to the routine analysis of 24-hour ses-sions which has been performed by Ralf Schmid since
263

264 Schmid et al.
the end of May 2013. In addition, Michael Gerstl is en-gaged in the development of a new VLBI analysis soft-ware called DOGS-RI (DGFI Orbit and Geodetic Pa-rameter Estimation Software - Radio Interferometry).
Table 1 lists the staff members and their main areasof activity.
3 Current Status and Activities
Analysis Activities
The DGFI AC tries to analyze all 24-hour sessionsfor which a database file of at least version 4 is avail-able using the VLBI analysis software OCCAM. Sincethe end of 2012, source positions are among the es-timated parameters contained in the normal equationsthat are submitted to the IVS Combination Center. Be-fore, source positions were fixed to their a priori values.
In June 2013, the handling of the cable calibrationdata changed. Since then, the cable calibration of cer-tain stations is turned off in case it degrades the solu-tion. Before, the database settings were applied. There-fore, in the case of an extreme degradation, stationssometimes had to be excluded from the solution.
At the same time, the DGFI AC started to reanalyzesessions in the case in which recorrelated data consid-ering additional stations become available. As recorre-lated sessions are usually stored at the IVS Data Cen-ters with the same name as the original database file,updated sessions are not automatically detected. If arecorrelation is announced via IVSmail, the downloadis started manually.
In order to have consistent SINEX files, a repro-cessing was started in autumn 2013 including the esti-mation of source positions, the proper handling of ca-ble calibration data, and the consideration of recorre-lated observation files. At the end of December 2013,consistent DGFI normal equations were available fromJuly 2011 to December 2013.
If operational and reprocessed solutions aresummed up, in 2013 DGFI analyzed 325 sessions al-together from four different years (2008 and 2011-13)and submitted the corresponding daily SINEX filesto IVS. Among them were 124 IVS-R1, 123 IVS-R4,19 IVS-R&D, 15 CONT11, 11 EUROPE, ten VLBA,eight IVS-T2, six IVS-OHIG, five CONT08, andfour APSG sessions (see Table 2).
Table 2 Sessions analyzed in 2013.
Session type2008201120122013TotalAPSG – 1 2 1 4CONT08 5 – – – 5CONT11 – 15 – – 15EUROPE – 2 4 5 11IVS-OHIG – 1 4 1 6IVS-R1 – 24 52 48 124IVS-R4 – 23 52 48 123IVS-R&D – 3 9 7 19IVS-T2 – 1 4 3 8VLBA – 3 3 4 10Total 5 73 130 117 325
Software Development
In order to follow IERS 2010 Conventions, OCCAM isrefined to become part of DOGS. The theoretical mod-els for the group delay need time derivatives and, incase of the delay rate, also the second time derivativesof the input parameters. The former approach to ap-proximate these derivatives by divided differences witha fixed time step of two seconds was superseded.
Parameter and observation models were expandedto provide analytically calculated first and secondtime derivatives. This conversion is complete exceptfor some routines calculating the equinox-basedtransformation matrix from the nutation parameters∆ψ and ∆ε. Thus, only the branch based onXCIP,YCIP, and the celestial intermediate origin is operative.The correlations between (XCIP, YCIP) and (xpol, ypol)are not yet theoretically modeled; condition equationsto prevent subdiurnal retrograde motions are missing.
4 Future Plans
In 2014, we would like to keep on reprocessing 24-hoursessions backward from July 2011 besides our opera-tional contributions to IVS. Apart from that, detailedcomparisons between DOGS-RI and OCCAM will benecessary, before we can switch to the new software.
Acknowledgements
We would like to thank Robert Heinkelmann for hiscontinued support of the DGFI AC activities.
IVS 2013 Annual Report

GFZ Analysis Center 2013 Annual Report
Robert Heinkelmann 1, Maria Karbon 1, Li Liu 1,2, Cuixian Lu 1, Julian A. Mora-Diaz 1, Tobias J. Nilsson 1,Virginia Raposo-Pulido 1,3, Benedikt Soja 1, Minghui Xu 1,2, Harald Schuh 1
Abstract This report briefly provides general infor-mation and a component description of the recently es-tablished IVS Analysis Center at GFZ and outlines theplanned activities.
1 General Information
Helmholtz Center Potsdam, GFZ German ResearchCenter for Geosciences is the national research centerfor Earth sciences in Germany. The main tasks of GFZaccording to its website (www.gfz-potsdam.de) are:
System Earth—Research Focus of the GFZ German Re-search Center for Geosciences
The Earth is a dynamic planet. Under the influence ofexternal and internal forces, it is continuously changing.The solid Earth, the atmosphere, the hydrosphere and thethings living within them are always interacting. In short,the Earth is a complex system, with forces and interac-tions between many different partners. To understand theworld in which we live, from our regional environmentto the entire planet, it is necessary to understand how theSystem Earth works in all details. In the analysis, we haveto include the activities of mankind and their influence onthe natural processes in this complex, nonlinear system,which in turn affects the environment we live in.
The overarching research aim of the GFZ is one of de-veloping strategies and demonstrating practical options,e.g. to preserve natural resources and to exploit them in
1. Helmholtz Center Potsdam, GFZ German Research Center forGeosciences2. Shanghai Astronomical Observatory, Chinese Academy ofSciences3. Instituto Geografico Nacional, Centro Nacional de Infor-macion Geografica
GFZ Analysis Center
IVS 2013 Annual Report
an environmentally friendly way, to guard against natu-ral catastrophes, to assess changes in the climate and theenvironment and man’s impact on these, and to researchand utilise our world below ground, all based on a com-prehensive understanding of systems and processes.
At this research facility within Department 1’Geodesy and Remote Sensing’ and its Section1.1 ‘GPS/GALILEO Earth Observation,’ a VLBIgroup was established in November 2012.
2 Component Description
Since December 2012, GFZ has been an associateAnalysis Center (AC) of IVS. We are installing andautomating our VLBI analysis process in preparationfor becoming an operational AC. We will analyzeall incoming geodetic/astrometric types of sessionsand provide interim results in the SINEX formatwithin 24 hours after the provision of database filesof version 4 or higher at IVS Data Centers. At theend of 2013 we started a complete re-processingof all available IVS databases to get prepared for acontribution to ITRF2013. We are also performing asan IVS Combination Center for tropospheric products.In 2013 the IVS rapid combination product wasdetermined at GFZ, while results and written outputwere still provided via the Deutsches GeodatischesForschungsinstitut (DGFI) webpage. In 2014, wewill finish the migration of the IVS troposphereCombination Center from DGFI to GFZ.
265

266 Heinkelmann et al.
3 Staff
At the GFZ IVS AC, the operational work is doneby Robert Heinkelmann, Tobias Nilsson, and JulianMora-Diaz. In addition, Maria Karbon and BenediktSoja work within project VLBI-ART about the appli-cation of Kalman filtering to VLBI analysis, and Vir-ginia Raposo-Pulido works on the ICRF and relatedsystematic effects. Liu Li and Minghui Xu are guestPhD students from Shanghai, China, and Cuixian Lu isa guest PhD student from Wuhan, China. Harald Schuhis managing our group and, as long as his schedule al-lows, he is still very active for the IVS. A photo of usis shown in Figure 1.
Fig. 1 The GFZ VLBI group in October 2013.
4 Current Status and Activities
• IVS Associate Analysis Center at GFZAt GFZ we use VieVS for VLBI data analysis start-ing at DB version 4 or higher. Together with theIVS Analysis Center at the Department of Geodesyand Geoinformation, Vienna University of Technol-ogy, we develop VieVS.
• Space applicationsOur scientific work focuses on VLBI applicationsin space, on GNSS observations using VLBI an-tennas, and on co-location in space of the variousspace geodetic techniques (VLBI, GNSS, SLR, andDORIS). One of the next steps will be the devel-
opment of the differential VLBI (D-VLBI) methodand its application for geodetic purposes.
• VLBI data analysis using Kalman filteringWithin the project VLBI-ART (VLBI Analysis inReal-Time, [1]) we plan to implement a Kalman fil-ter solution in the Vienna VLBI Sotware (VieVS)[2], as an alternative to the classical least squaressolution (LSQ). The aim of the Kalman filter solu-tion is that it should be able to analyze VLBI datain near real-time. Thus, the software will be readyfor a possible future scenario where the VLBI ob-servations are available with a much shorter latencythan today.An advantage of a Kalman filter is that the parame-ters can be modeled as stochastic processes insteadof with the piece-wise linear parametrization nor-mally used in the LSQ solution. This allows bettermodeling of the random variations in e.g. the tro-pospheric delays. Furthermore, a Kalman filter re-quires less computer memory compared to the LSQmethod, what will be an advantage for VLBI2010where the amount of data will increase by severalmagnitudes. We will also investigate the possibilityof including data from other sensors in the Kalmanfilter. These could for example be data on geophysi-cal excitations of Earth rotations (e.g. from numeri-cal weather prediction models), tropospheric delaysfrom water vapor radiometers or GNSS, or Earthrotation parameters from GNSS and ring laser gy-roscopes.As a first step we have performed various investi-gations in which we applied Kalman filtering forcombining VLBI results (produced with the LSQsolution in VieVS) with results from other tech-niques. For example we made several tests combin-ing VLBI data with atmospheric excitations fromnumerical weather prediction models. Furthermore,we combined hourly EOP estimated from VLBIand GNSS [3].An interesting possibility is to use a Kalman filterto combine UT1-UTC parameters estimated fromthe VLBI Intensive sessions with Length of Day(LOD) data obtained from GNSS [4]. The LODfrom GNSS provides precise information about theshort term (one week or less) UT1-UTC variations,while the VLBI Intensives have the long-term sta-bility. In addition, other parameters common toboth VLBI and GNSS can be combined in theKalman filter, i.e. polar motion, station coordinates,
IVS 2013 Annual Report

GFZ 2013 Report 267
and tropospheric delays. Because correlations be-tween the VLBI UT1-UTC estimates and errors ofother parameters exist, this will additionally help toimprove the UT1-UTC results. As an example, Fig-ure 2 shows UT1-UTC from 2008-2010 estimatedwhen also combining the tropospheric delays in theKalman filter, compared to when not doing this.We found that the WRMS differences relative tothe UT1-UTC values estimated from normal IVS-R1/R4 sessions slightly decreased from 27.1µs to26.1µs.
2008 2008.5 2009 2009.5 2010 2010.5 2011−200
−150
−100
−50
0
50
100
150
200
Year
U
T1−
UT
C [
µs]
Kalman filter ERPKalman filter ERP+Trop
Fig. 2 UT1-UTC estimated from a Kalman filter combinationof the results of the VLBI Intensive sessions and the GNSSLOD estimates, relative to estimates from the IVS-R1/R4 ses-sions. Shown are the results obtained when combining the UT1-UTC/LOD and polar motion, as well as the case when also com-bining the tropospheric delay estimates.
• Long-term troposphere combined productIt is planned to generate a new updated version ofthe long-term tropospheric combination product in-cluding the most recent observational data.
5 Future Plans
• IVS Operational Analysis Center at GFZAt GFZ we would like to become an operationalAnalysis Center of IVS. Therefore we are installingand automating the standard VLBI data process-ing using VieVS in least squares estimation mode.Once we have finished a complete re-processing ofall available IVS databases of version 4 or higher,
we will submit our solution to IVS, applying to be-come operational.
Acknowledgements
The VLBI-ART project is funded by the Austrian Sci-ence Fund (FWF), project number P24187-N21.
References
1. M. Karbon, T. Nilsson, C. Tierno Ros, R. Heinkelmann,and H. Schuh. VLBI-Art: VLBI analysis in real-time. InN. Zubko and M. Poutanen, editors,Proceedings 21th Meet-ing of the European VLBI Group for Geodesy and Astrome-try, pages 95–97, Espoo, Finland, 2013.
2. J. Bohm, S. Bohm, T. Nilsson, A. Pany, L. Plank, H. Spi-cakova, K. Teke, and H. Schuh. The new Vienna VLBI soft-ware. In S. Kenyon, M. C. Pacino, and U. Marti, editors,IAGScientific Assembly 2009, number 136 in International As-sociation of Geodesy Symposia, pages 1007–1011, BuenosAires, Argentina, 2012. Springer.
3. T. Nilsson, M. Karbon, and H. Schuh. A Kalman filter forcombining high frequency Earth rotation parameters fromVLBI and GNSS. In N. Zubko and M. Poutanen, editors,Proceedings 21th Meeting of the European VLBI Group forGeodesy and Astrometry, pages 117–120, Espoo, Finland,2013.
4. T. Nilsson, M. Karbon, B. Soja, V. Raposo-Pulido,R. Heinkelmann, J. Mora-Diaz, C. Lu, L. Liu, and H. Schuh.Rapid UT1 estimation by combining VLBI Intensives withGNSS. InProceedings of the IAG Scientific Assembly, Pots-dam, Germany, 2013. submitted.
IVS 2013 Annual Report

The BKG/IGGB VLBI Analysis Center
Volkmar Thorandt 1, Axel Nothnagel 2, Gerald Engelhardt 1, Dieter Ullrich 1, Thomas Artz 2, Sebastian Halsig2,Andreas Iddink2, Judith Leek 2
Abstract In 2013, the activities of the BKG/IGGBVLBI Analysis Center, as in previous years, consistedof routine computations of Earth orientation parame-ter (EOP) time series and of a number of research top-ics in geodetic VLBI. The VLBI group at BKG con-tinued its regular submissions of time series of tropo-spheric parameters and the generation of daily SINEX(Solution INdependent EXchange format) files. Quar-terly updated solutions were computed to produce ter-restrial reference frame (TRF) and celestial referenceframe (CRF) realizations. The analysis of all Intensivesessions for UT1–UTC estimation was continued. Ad-ditionally, the a priori pole coordinates were recordedin the Intensive time series. The VLBI group at BKGdeveloped a procedure to get meteorological data froma numerical weather model for stations with missingmeteorological data in the station log file. At IGGB,the emphasis has been placed on individual researchtopics.
1 General Information
The BKG/IGGB VLBI Analysis Center was estab-lished jointly by the analysis groups of the FederalAgency for Cartography and Geodesy (BKG), Leipzig,and the Institute of Geodesy and Geoinformation ofthe University of Bonn (IGGB). Both institutions co-operate intensely in the field of geodetic VLBI. The re-sponsibilities include both data analysis for generating
1. BKG2. IGGB
BKG/IGGB Analysis Center
IVS 2013 Annual Report
IVS products and special investigations with the goalof increasing accuracy and reliability. BKG is respon-sible for the computation of time series of EOP andtropospheric parameters, for the generation of SINEXfiles for 24-hour VLBI sessions and one-hour Intensivesessions, and for the generation of quarterly updatedglobal solutions for TRF and CRF realizations. Besidesdata analysis, the BKG group is also responsible forwriting schedules for the Int2 UT1-UTC observing ses-sions. Details of the research topics of IGGB are listedin Section 3.
2 Data Analysis at BKG
At BKG, the Mark 5 VLBI data analysis software sys-tem Calc/Solve, release 2010.05.21 [1], has been usedfor VLBI data processing. It is running on a Linux op-erating system. As in the previous releases, the ViennaMapping Function (VMF1) has been implemented in aseparate Solve version. This modified version was usedfor all data analysis. The VMF1 data were downloadeddaily from the server of the Vienna University of Tech-nology. Additionally, the technological software envi-ronment for Calc/Solve was refined to link the DataCenter management with the pre- and post-interactiveparts of the EOP series production and to monitor allAnalysis and Data Center activities.
• Processing of correlator outputThe BKG group continued the generation of cali-brated databases for the sessions correlated at theMPIfR/BKG Astro/Geo Correlator at Bonn (e.g.,EURO, OHIG, and T2) and submitted them to theIVS Data Centers.
268

BKG/IGGB VLBI Analysis Center 269
• SchedulingBKG continued scheduling the Int2 Intensivesessions, which are observed on the TSUKUBA-WETTZELL baseline. Altogether, 41 schedulefiles for this baseline were created in 2013. Dueto maintenance combined with the shutdownof the TSUKUBA antenna from the middle of2013, 22 schedule files for baseline KOKEE-WETTZELL, nine schedule files for baselineKOKEE-NYALESUND, and three schedule filesfor baseline KOKEE-SVETLOE were also madeavailable.
• BKG EOP time seriesThe BKG EOP time series bkg00013 was con-tinued. The main features of this solution werenot changed. But the station coordinates of threeVLBI sites in Australia (HOBART12, KATH12M,and YARRA12M) and one site in New Zealand(WARK12M) were estimated as global parametersbecause of an observation period of up to threeyears for each station. Furthermore the fact of un-available meteorological data in station log filescould be compensated by the use of meteorologi-cal data from European Centre for Medium-RangeWeather Forecasts (ECMWF) contained in VMF1data files. This procedure was integrated into thetechnological process of EOP series generation.Each time after the preprocessing of any newVLBI session (correlator output database version1), a new global solution with 24-hour sessionssince 1984 was computed, and the EOP timeseries bkg00013 was extracted. Altogether, 4,540sessions were processed. The main parametertypes in this solution are globally estimated stationcoordinates and velocities together with radiosource positions. The datum definition was realizedby applying no-net-rotation and no-net-translationconditions for 25 selected station positions andvelocities with respect to VTRF2008a and ano-net-rotation condition for 295 defining sourceswith respect to ICRF2. The station coordinates ofthe telescopes AIRA (Japan), CHICHI10 (Japan),CTVASTJ (Canada), DSS13 (USA), HART15M(South Africa), KASHIM34 (Japan), KOGANEI(Japan), PTREYES (USA), SEST (Chile), SIN-TOTU3 (Japan), TIGOCONC (Chile), TSUKUB32(Japan), UCHINOUR (Japan), WIDE853 (USA),VERAISGK (Japan), VERAMZSW (Japan), and
YEBES40M (Spain) were estimated as localparameters in each session.
• BKG UT1 Intensive time seriesRegular analysis of the UT1-UTC Intensive timeseries bkgint09 was continued. Moreover, report-ing was extended to also list the a priori pole co-ordinates in each session. The series bkgint09 wasgenerated with fixed TRF (VTRF2008a) and fixedICRF2. The a priori EOP were taken from finalUSNO series [2]. The estimated parameter typeswere only UT1-TAI, station clock, and zenith tro-posphere.The algorithms of the semi-automatic process forhandling the Intensive sessions Int2/3 with stationTSUKUBA after the Japan earthquake [3] wasfurther used; i.e. before the regular analysis canbe started, the most probable station positions ofTSUKUBA for the epochs of the Int2/3 sessionshave to be estimated.A total of 4,584 UT1 Intensive sessions were ana-lyzed for the period from 1999.01.01 to 2013.12.31.
• Quarterly updated solutions for submission toIVSIn 2013 one quarterly updated solution was com-puted for the IVS products TRF and CRF. Thereare no differences in the solution strategy com-pared to the continuously computed EOP time se-ries bkg00013. The results of the radio source po-sitions were submitted to IVS in IERS format. TheTRF solution is available in SINEX format, version2.1, and includes station coordinates, station veloc-ities, and radio source coordinates together with thecovariance matrix, information about constraints,and the decomposed normal matrix and vector.
• Tropospheric parametersThe VLBI group of BKG continued regular sub-missions of long time series of tropospheric param-eters to the IVS (wet and total zenith delays andhorizontal gradients) for all VLBI sessions since1984. The tropospheric parameters were extractedfrom the standard global solution bkg00013 andtransformed into SINEX format.
• Daily SINEX filesThe VLBI group of BKG also continued regularsubmissions of daily SINEX files for all available24-hour sessions for the IVS combined productsand for the IVS time series of baseline lengths. Inaddition to the global solutions, independent ses-sion solutions were computed for the station coor-
IVS 2013 Annual Report

270 Thorandt et al.
dinates, radio source coordinates, and EOP param-eters including the X,Y-nutation parameters. The apriori datum for TRF is defined by the VTRF2008a,and ICRF2 is used for the a priori CRF information.
• SINEX files for Intensive sessionsThe parameter types are station coordinates, polecoordinates and their rates, and UT1-TAI andits rate. But only the normal equations stored inthe SINEX files are important for further intra-technique combination or combination with otherspace geodetic techniques.
3 Research Topics at IGGB
• Delay correction model for gravitational defor-mations of the Effelsberg radio telescopeAfter having carried out and analyzed terrestriallaser scanner observations of the main reflector ofthe Effelsberg 100-m radio telescope, we have em-barked on the construction of a full delay correctionmodel for the gravitation deformations. The maineffect is a bending of the support beam which holdsthe vertex of the paraboloid. The second largest ef-fect is a variation of the position of the sub-reflectoralong the line of sight. With only a small impact, thevariations in the focal length enter the path lengthvariations. At the same time, the illumination func-tion has to be taken into account and serves as aweighting function for the path lengths dependingon the distance of the rays from the optical axis.The total effect would range from zero to -100 mmif observations at zero and 90 degrees elevationare compared. The complete delay model for Ef-felsberg was prepared for publication in Journal ofGeodesy.
• Development of an automatic scheduling proce-dureThe automatic scheduling method developedat IGGB has been extended by useful steeringparameters to create flexible observing plans. Thesimulation tool for assessment and evaluationwas further developed and improved. Variousobserving scenarios of Intensives including twinradio telescopes were examined and compared withone other. Furthermore, the software has been ex-tended to schedule typical 24-hour multi-baselinesessions. An additional option to use artificial
satellites as possible sources was implemented.Finally, the question of whether a cluster analysisof observed source positions can be used to classifyand compare different VLBI observing plans hasbeen investigated [4].
• Studies on VLBI observations of satellitesThe observation of artificial Earth orbiting satel-lites with VLBI telescopes is one of the major chal-lenges in the near future. In initial studies, thiswas addressed at IGGB. Starting with considera-tions about the signals’ characteristics and neces-sary adaptations of the correlator model, schedul-ing of VLBI sessions including satellite observa-tions have been performed. The scheduling wasperformed with the NASA/GSFC scheduling pack-age SKED [5] as well as the IGGB scheduling ap-proach mentioned above. For the scheduled obser-vations, clock noise, and atmospheric noise as wellas baseline dependent noise terms were added togenerate realistic observations [6]. Finally, geode-tic parameters as well as simplistic orbit parame-ters were estimated by using the VLBI Time Delaylibrary [7].
• Application of inequality constraintsRefractivity variations in the neutral atmospherecontribute considerably to the error budget ofVLBI. Generally, the tropospheric delay pa-rameters are divided into two components; thehydrostatic a priori information is taken into ac-count by applying an adequate model whereas thewet delay is estimated within the VLBI analysis.Sometimes, the standard VLBI analysis leads tonegative tropospheric parameters, which do notreflect actual meteorological and physical condi-tions. For this purpose, an Inequality ConstrainedLeast Squares adjustment from the field of convexoptimization has been used to constrain theseparameters to non-negative values. This method-ology has been applied to VLBI data analysis toimprove the parameter estimation. However, asthe hydrostatic a priori information is not alwaysperfect, the approach is currently not applicable ona routine basis.
• Modification of the stochastic modelBesides long periodic variations, micro-scale phe-nomena also affect geodetic observations and there-fore the tropospheric parameters. Such turbulentprocesses can be best described stochastically us-ing the widely accepted Kolmogorov turbulence
IVS 2013 Annual Report
BKG/IGGB VLBI Analysis Center 271
theory. However, the correlations between observa-tions are generally not considered in the standardVLBI analysis, leading to deficiencies in model-ing the stochastic properties of the observations. Inorder to receive a more reliable stochastic model,the additional stochastic properties are now incor-porated into the VLBI analysis. That means that thestandard variance-covariance matrix is enhanced bythe additional stochastic information derived fromdifferent turbulence models.
• Determination of a combination approach to de-rive the next generation of the ICRFThe currently existing realizations of the Interna-tional Celestial Reference System (ICRS), the In-ternational Celestial Reference Frame 1 (ICRF1)and ICRF2, are based on solutions estimated by asingle VLBI group. In contrast, the InternationalTerrestrial Reference Frame (ITRF) is based ona multi-technique combination with contributionsfrom different geodetic space techniques. Further-more, these individual technique-specific solutionsare generated in an intra-technique combination. Toovercome the shortcomings of the past ICRF de-termination, one of the main goals for the upcom-ing realizations of the ICRS and ITRS is an en-tirely consistent and simultaneous computation ofboth frames. This includes inter- as well as intra-technique combinations. Focusing on consistencybetween different VLBI solutions is the first neces-sary step before passing on to multiple space tech-niques. For this purpose, a concept for the gen-eration of a VLBI intra-combined CRF was de-veloped. This includes the identification of the re-quirements, difficulties, and individual steps of theintra-technique combination procedure. Based onthe knowledge that has been gained, the combi-nation software BonnSolutionCombination (BoSC)has been gradually developed. This software sup-ports the combination on the level of normal equa-tion systems and contains several special analy-sis and settings features. These features will be-come indispensable for any upcoming CRF investi-gations dealing with combinations. Preliminary re-sults confirm the proper functioning of the com-bination procedure and the corresponding softwaredeveloped at the IGG.
4 Personnel
Table 1 Personnel at BKG/IGGB Analysis Center
Thomas Artz IGGB +49-228-733563 [email protected] EngelhardtBKG [email protected] Halsig IGGB +49-228-732623 [email protected] Iddink IGGB +49-228-732623 [email protected] Leek IGGB +49-228-733565 [email protected] Nothnagel IGGB +49-228-733574 [email protected] ThorandtBKG [email protected] Ullrich BKG [email protected] Wojdziak BKG [email protected]
References
1. GSFC, NASA (2010): Release of Mark 5 VLBI AnalysisSoftware Calc/Solve from May 21, 2010 (Web reference:http://gemini.gsfc.nasa.gov/solve).
2. USNO (2013): Earth orientation parameters se-ries from finals USNO series 2013, (Web reference:http://gemini.gsfc.nasa.gov/500/oper/solveapriori files/usnofinals.erp).
3. Engelhardt G., Thorandt V., Ullrich D. (2013): Rapid UT1Estimation Derived from Tsukuba VLBI Measurements af-ter 2011 Earthquake. In: Proceedings of the 21st Meetingof the European VLBI Group for Geodesy and Astronomy2013, edited by N. Zubko and M. Poutanen, pages 85-87,Kirkkonummi 2013, Finland.
4. Leek J., Artz T., Nothnagel A.. (2013): Assessment of VLBIIntensive Schedules by Means of Cluster Analysis. In: Pro-ceedings of the 21st Meeting of the European VLBI Groupfor Geodesy and Astronomy 2013, edited by N. Zubko andM. Poutanen, pages 211-215, Kirkkonummi 2013, Finland.
5. J. Gipson (2012): GSFC VLBI SKEDSoftware Package,(Web reference:http://lupus.gsfc.nasa.gov/softwaresked.htm), 2012.
6. Artz T., Nothnagel A., La Porta, L. (2013): VLBI Observa-tions of Geostationary Satellites. In: Proceedings of the 21stMeeting of the European VLBI Group for Geodesy and As-tronomy 2013, edited by N. Zubko and M. Poutanen, pages217-221, Kirkkonummi 2013, Finland.
7. Petrov L. (2013): Library VTD for computation of VLBItime delay from October 10, 2013 (Web reference:http://astrogeo.org/vtd).
IVS 2013 Annual Report

GSFC VLBI Analysis Center Report
David Gordon 2, Chopo Ma 1, Dan MacMillan 2, John Gipson 2, Sergei Bolotin 2, Karine Le Bail 2, Karen Baver 2
Abstract This report presents the activities of theGSFC VLBI Analysis Center during 2013. The GSFCVLBI Analysis Center analyzes all IVS sessions,makes regular IVS submissions of data and anal-ysis products, and performs research and softwaredevelopment aimed at improving the VLBI technique.
1 Introduction
The GSFC VLBI Analysis Center is located at NASA’sGoddard Space Flight Center in Greenbelt, Maryland.It is part of a larger VLBI group which also includesthe IVS Coordinating Center, the CORE OperationCenter, a Technology Development Center, and aNetwork Station. The Analysis Center participates inall phases of geodetic and astrometric VLBI analysis,software development and research. We maintain aWeb site at http://lupus.gsfc.nasa.gov. We provide apressure loading service to the geodetic communityat http://gemini.gsfc.nasa.gov/results/aplo and a newray tracing service. We provide additional servicesfor hydrology loading, nontidal ocean loading, andmeteorological data. These services can be found byfollowing the links on the GSFC VLBI group Website: http://lupus.gsfc.nasa.gov/dataresultsmain.htm.
1. NASA Goddard Space Flight Center2. NVI, Inc./NASA Goddard Space Flight Center
GSFC Analysis Center
IVS 2013 Annual Report
2 Analysis Activities
The GSFC VLBI Analysis Center analyzes all IVSsessions using theCalc/Solveand νSolve systems,and performs thefourfit fringing and Calc/Solveanalysis of the VLBA-correlated RDV sessions. Thegroup submits the analyzed databases to IVS for allR1, RDV, R&D, APSG, AUST, INT01 and INT03sessions. During 2013, GSFC analyzed 163 24-hoursessions (52 R1, 50 R4, six RDV, ten R&D, five AUST,three APSG, seven EURO, five T2, five OHIG, eightCRF, five CRDS, and seven JADE) and 333 one-hourUT1 sessions (243 INT01, 53 INT02, and 37 INT03),and we submitted updated EOP and daily Sinex filesto IVS immediately following analysis.
3 Research Activities
• Intensive (IVS-INT01) Scheduling: We continuedto study the Uniform Sky Strategy (USS), an al-ternative INT01 scheduling strategy proposed andtested in 2009/2010 and used for the INT01s onalternating days since mid-2010. We focused onrefining the USS to address ways in which it un-derperforms the original scheduling strategy. Weinvestigated the effects of schedule characteristics(e.g., temporal distribution of the observations) onschedule metrics (e.g., protection against randomnoise). We also investigated changing the sched-ule characteristics, and in turn the metric values, bypassing new parameter values to programsked.
• Source Monitoring: Together with USNO wecontinued monitoring all ICRF2 defining sourcesand all good geodetic sources, and this year we
272

GSFC Analysis Center 273
added the Gaia transfer sources. The goal is toobserve all geodetic and Gaia transfer sources12 times/year and the remaining ICRF2 definingsources five times/year. The R1, R4, and RDVsessions participate in the source monitoringprogram.
• Good Geodetic Source Catalog: Good geodeticsources are scarce. In 2011, many were removedbecause of time variability of their positions(special handling sources). In 2013, there were 266geodetic sources in the good geodetic catalog. Tosearch for additional sources, we used an approachsimilar to that described by Jing Sun (ShanghaiAstronomical Observatory) in her PhD thesis.Our criteria was as follows: a structure index (SI)less than or equal to 2.5 (701 sources in IERSTechnical Note No 35, Table 1) and an X-band fluxgreater than 0.25 Jy (658 sources in flux.cat). Ofthe 152 sources meeting both criteria, 105 werealready in the good list and 47 were not. We wrotea proposal to observe these 47 sources in R&Dsessions to verify if they could be detected andto measure their fluxes. They were observed inRD1302, RD1303, and RD1304. After analysis, 35were found to be suitable and were added to thegood geodetic source catalog.
• Gaia Transfer Sources: In preparation for linkingthe future ICRF3 and Gaia optical referenceframes, four lists of transfer sources (quasars thatshould be visible by both systems) were compiledby Observatory of Bordeaux personnel. Class4, with 24 sources, had the weakest and leastobserved sources. We scheduled these 24 sourcesin R&D and RDV sessions. Some were detectedin the R&Ds, and all were detected in the RDVs.Their fluxes were added to theskedflux catalog.These will be re-observed occasionally in futureR&D and/or RDV sessions.
• Thermal Deformation Modeling: Thermal expan-sion can affect a VLBI antenna’s height by as muchas 20 mm. In Le Bail et al. (2013), we investigatedthe impact of thermal expansion, as well as the opti-mal time lags for steel telescope structures and con-crete foundations, using the Nothnagel model (J.Geodesy,83, pages 787–792, 2009). We compareddifferent solutions of the R1 and R4 sessions fromJanuary 2002 to March 2011 with and without thethermal expansion model and with different timelags. Thermal deformation modeling significantly
improved the VLBI solutions, improving the base-line length repeatability on more than 75% of thebaselines by more than 1 mm on average, and re-ducing the WRMS per station. The time lag for thesteel structures was optimal when set to zero, one,or two hours. However, for concrete foundations,no sensitivity to time lag was found. We believethis is because the concrete foundations are muchsmaller than the steel structures. Also, preliminaryresults show significant correlations between 1) themaximum WRMS improvement and the height ofthe foundation, 2) the maximum WRMS improve-ment and the distance from the movable axis to theantenna vertex, and 3) the optimal time lag for theantenna and the antenna diameter.
• Nutation Analysis: We rehabilitated nutkal2012.f, aFortran routine that uses the Kalman filter to regu-larize the nutation time series. The model is definedby a linear trend and specified harmonics, and theprogram includes an indicator of the quality of theestimate (goodness of fit).
• Analysis of LOD Time Series with the SSA: Varia-tions in the temporal length-of-day (LOD) containinformation on phenomena related to the continu-ous evolution of Earth processes: tidal energy dissi-pation and core-mantle coupling (decadal and secu-lar) and meteorological and solar-lunar tide effects(annual and semiannual). We studied an LOD timeseries obtained from VLBI and extracted its princi-pal components using Singular Spectrum Analysis(SSA) (Le Bail et al., 2014). After removing thelong-term trend which explains 73.8% of the sig-nal, three remaining components explain a further22.0% of the signal: an annual and a semi-annualsignal as well as a second trend. Using the com-plex demodulation method, we obtained the vari-ations in the amplitudes of the annual and semi-annual components. We compared the MultivariateENSO index (MEI) with these series and with thesecond trend obtained by the SSA. The correlationsare significant: 0.58 for the annual component, -0.48 for the semi-annual component and 0.46 forthe second trend.
• Troposphere Raytracing: We wrote a paper on thecalculation of troposphere raytrace delays and theapplication of raytraced delay corrections. It will besubmitted to the Journal of Geophysical Research.These delays were calculated by raytracing 3D re-fractivity fields computed from the NASA/GSFC
IVS 2013 Annual Report

274 Gordon et al.
GEOS 5.9.1 numerical weather model. Repeatabil-ities were reduced for 70% of CONT11 baselinelengths and for 84% of CONT11 vertical site coor-dinates. We set up a raytracing service that providesraytrace delays for all VLBI sessions since 2000 athttp://lacerta.gsfc.nasa.gov/tropodelays.
• Hydrology Loading: We wrote a paper on hydrol-ogy loading entitled, “Continental hydrology load-ing observed by VLBI measurements”, which wassubmitted to Journal of Geodesy. It discusses theVLBI analysis results due to applying a hydrologyloading series calculated from either 1) the GSFCGLDAS hydrology model or 2) GRACE (GravityRecovery and Climate Experiment) mascons. Weobtained a reduction in 1) baseline length repeata-bilities for 80% of baselines, 2) site vertical re-peatabilities for 80% of the sites, and 3) annual sitevertical amplitudes for 90% of the sites.
• Space Geodesy Project Simulations: We are work-ing with Erricos Pavlis (UMBC) to optimize thechoice of a global network of co-located techniquesites and specifically to decide where NASAshould establish new sites. We have provided theVLBI observations and solution setup input forGeodynSLR+VLBI+GPS combination solutions.Simulated observed VLBI delays consist of tro-posphere turbulence, clock, and observation noisecontributions. We have done simulations of currentobserving networks of legacy antennas and areworking on the simulations for future networks ofbroadband antennas, which are expected to grow to15-20 antennas by around 2018.
• Second Epoch VCS Observations: A proposal to re-observe up to 2400 VCS (VLBA Calibrator Survey)sources was submitted to the VLBA and approved.The investigators are D. Gordon (PI), C. Ma, sixother IVS members and two NRAO astronomers.This project was granted eight 24-hour sessions andwill use the RDBE system at X- and S-bands with16 32-MHz channels. The observations will run in2014.
4 Software Development
The GSFC VLBI Analysis Center develops andmaintains theCalc/Solveanalysis system, a packageof ∼120 programs and 1.2 million lines of code.
During 2013, modifications were made to enableCalc/Solveto be compiled, loaded, and run on 64-bitmachines. Additional modifications to allow it to becompiled with gfortran, instead of the Intel compiler,are underway.
Programcalc was updated to version 11 for com-pliance with the IERS 2010 Conventions.Calc11usesthe IAU2006/2000 Precession/Nutation model, a newocean loading model (Hardisp) with 342 constituenttides, an ocean pole tide loading model, and improvedhigh frequency EOP corrections. We also began workon a specialized version,dcalc, for use with thedifxsoftware correlator.Dcalc also contains a near-fielddelay model, based on the model of Sekido and Fuk-ishima (J. Geodesy,80, pages 137–149, 2006), to al-low better correlation of Earth satellites and planetaryprobes.
We continued development of theνSolveanalysisprogram. The vgosDB part of the I/O module was im-proved and redesigned. Also, essential parts of the soft-ware were optimized to improve performance. Numer-ous comparisons of interactiveSolveandνSolvehaveshown the two to be comparable.νSolveis now thestandard tool for processing the IVS-R4 and IVS-INTsessions at GSFC.
We continued to develop and refine thevgosDBdata format to store VLBI data. This year we concen-trated on programs to reproduce all stages of the pro-cessing of Mark III databases.vgosDBmaketakes cor-relator output and knits the files together into the newformat.vgosDBcalcis analogous tocalc in that it addstheoretical and partials to the vgosDB session.vgos-DBcal reads the log files and adds cable cal and metdata. SinceνSolvecan read the vgosDB format, we arenow able to perform all stages of analysis starting withcorrelator output. We also developed the utilitiesvgos-DBview to view and modify data in this format, andvgosDBcomparewhich will compare files in the newformat and find the differences.
It is well known that the scatter of baseline length islarger than it should be, based on the formal errors ofthe Solvesolutions. One possible explanation for thisis the presence of unmodeled station dependent noise.We developed software to determine this noise. Thesoftware takes as input baseline length measurementsfrom some set of sessions, for example CONT11. Itthen adds station-dependent-noise to the formal errorsuntil the chi-square of the baseline scatter is approxi-mately equal to 1.
IVS 2013 Annual Report
GSFC Analysis Center 275
Table 1 Staff members and their main areas of activity.
Ms. Karen Baver Intensive analysis, monitoring, and improvement; software development; Web site development;quarterly nuvel updates.
Dr. Sergei Bolotin Database analysis,νSolvedevelopment, ICRF3.Dr. John Gipson Source monitoring, high frequency EOP, parameter estimation, new data structure, station de-
pendent noise.Dr. David Gordon Database analysis, RDV analysis, ICRF3, astronomical source catalogs,calc/dcalcdevelopment,
quarterly ITRF updates.Dr. Karine Le Bail Time series statistical analysis (EOP, nutation, source positions), database meteorological data
analysis.Dr. Chopo Ma ICRF3, CRF/TRF/EOP, VGOS development.Dr. Daniel MacMillan CRF/TRF/EOP, mass loading, antenna deformation, VGOS and SGP simulations,
VLBI/SLR/GPS combinations.Mr. David Eriksson Mass loading, troposphere raytracing (intern).Mr. Tobias Forsberg Station stabilities, vgosDB development (intern).Ms. Julia Ringsby vgosDB development (intern).Mr. Ronny Videkull vgosDB development (intern).Ms. Emma Woxlin Station stabilities, vgosDB development (intern).
5 Staff
During 2013, the Analysis Center staff consisted ofone GSFC civil servant, Dr. Chopo Ma, six NVI,Inc. employees who work under contract to GSFC,and five temporary student interns from ChalmersUniversity of Technology (Sweden). Dr. Ma overseesthe GSFC VLBI project for GSFC and is also theIVS co-representative to the IERS. Dr. John Gipson isthe GSFC VLBI Project Manager as well as the IVSAnalysis Coordinator. Table 1 lists the staff membersand their main areas of activity.
6 Future Plans
Plans for the next year include ICRF2 maintenance,second epoch VCS observations, preparations forICRF3, participation in VGOS development, contin-ued development ofνSolveand the new vgosDB dataformat, upgrade of programdcalc, and further researchaimed at improving the VLBI technique.
References
1. K. Baver and J. Gipson, “Refining the Uniform Sky Strat-egy for IVS-INT01 Scheduling”, Proceedings of the 21st
Meeting of the EVGA, N. Zubko and M. Poutanen (Edi-tors), pages 205–209, 2013.
2. S. Bolotin, K. Baver, J. Gipson, D. Gordon, D. MacMillan,“Status of nuSolve”, Proceedings of the 21st Meeting of theEVGA, N. Zubko and M. Poutanen (Editors), pages 77-80,2013.
3. K. Le Bail, J. M. Gipson, J. Juhl, D. S. MacMillan, “Opti-mal time lags to use in modeling the thermal deformationof VLBI Antennas”, Proceedings of the 21st Meeting of theEVGA, N. Zubko and M. Poutanen (Editors), pages 165–168, 2013.
4. K. Le Bail, J. M. Gipson, D. S. MacMillan, “Quantifyingthe correlation between the MEI and LOD variations by de-composing LOD with Singular Spectrum Analysis”, Pro-ceedings of the IAG General Assembly, Melbourne, Aus-tralia, June 28–July 2, 2011; IAG Symposia, Vol. 139; Ri-zos, Chris; Willis, Pascal (Editors), pages 473-480, 2014.
5. David Gordon, Chopo Ma, Dan MacMillan, Sergei Bolotin,Karine Le Bail, and John Gipson, “Effects of ICRF2 on theTRF, CRF, and EOP”, Reference Frames for Applications inGeosciences, IAG Symposia, Vol. 138; Z. Altimimi and X.Collilieux (Editors), pages 175-180, 2013.
6. C. Ma, D. MacMillan, S. Bolotin, K. Le Bail, D. Gordon,and J. Gipson, “Comparison of Realizations of the Terres-trial Reference Frame”, Reference Frames for Applicationsin Geosciences, IAG Symposia, Vol. 138; Z. Altimimi andX. Collilieux (Editors), pages 51-56, 2013.
IVS 2013 Annual Report
Haystack Observatory Analysis Center
Arthur Niell, Roger Cappallo, Brian Corey, Jason SooHoo, Mike Titus
Abstract Analysis activities at Haystack Observa-tory are directed towards improving the accuracy ofgeodetic measurements, whether these are from VLBI,GNSS, SLR, or any other technique. Those analysisactivities that are related to technology developmentare reported elsewhere in this volume. In this reportwe present some preliminary results of an analysis ofa 24-hour broadband VGOS session from May 22,2013. The data were calibrated to obtain correlatedflux densities at X-band for a subset of the sources,and a geodetic solution was obtained. Both analysesled to improvements in the DiFX correlator and thepost-correlation software.
1 Introduction
The broadband instrumentation for the next generationgeodetic VLBI system, previously called VLBI2010but now referred to as VGOS (for VLBI2010 GlobalObserving System), was implemented on a new 12-mantenna at the Goddard Space Flight Center near Wash-ington, D.C., USA, and on the Westford 18-m antennaat Haystack Observatory near Boston, Massachusetts,USA. In October 2012 the first geodetic observing ses-sions were conducted using the broadband system. Re-sults from these sessions were described in last year’sAnalysis Center Annual Report. In this report we high-light the procedures for obtaining correlated flux den-
MIT Haystack Observatory
Haystack Analysis Center
IVS 2013 Annual Report
sities and baseline results for a 24-hour session on May22, 2013.
The features of the VGOS system are repeated herefor reference:
• four bands of 512 MHz each, rather than the two (Sand X) for standard IVS sessions
• dual linear polarization in all bands• multitone phase cal delay for every channel in both
polarizations• simultaneous estimation of the total electron con-
tent difference (dTEC) between sites along withthe ionosphere-free group delay using the phasesacross all four bands spanning 3.2 GHz to approxi-mately 8.8 GHz for this session.
The features indicated in the last three bullets haverequired changes to the analysis of the geodetic de-lays, and these have been implemented in the post-correlation softwaredifx2mark4 and fourfit.
2 The Observations
The main objective of the 24-hour session on May 22,2013 was to validate the quality of the calibration ofcorrelated flux densities on the GGAO12M-Westfordbaseline. Since the largest number of potential compar-ison values is from the S/X observations of the geodeticVLBI program, the highest frequency band was chosento lie within the range of the geodetic X-band, cover-ing approximately 8.3 – 8.8 GHz. The frequencies ofthe other three bands were the same as used in October2012, covering 512 MHz beginning at 3.2, 5.2, and 6.3GHz. S-band was not observed because the presence
276
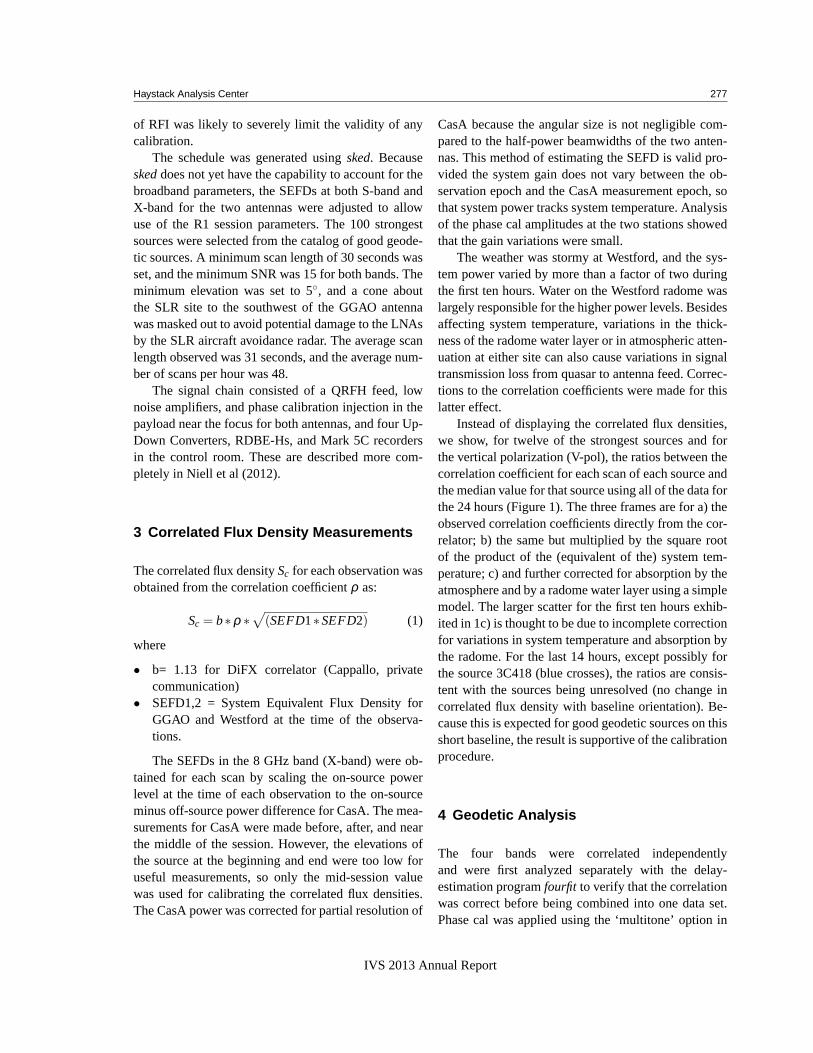
Haystack Analysis Center 277
of RFI was likely to severely limit the validity of anycalibration.
The schedule was generated usingsked. Becauseskeddoes not yet have the capability to account for thebroadband parameters, the SEFDs at both S-band andX-band for the two antennas were adjusted to allowuse of the R1 session parameters. The 100 strongestsources were selected from the catalog of good geode-tic sources. A minimum scan length of 30 seconds wasset, and the minimum SNR was 15 for both bands. Theminimum elevation was set to 5◦, and a cone aboutthe SLR site to the southwest of the GGAO antennawas masked out to avoid potential damage to the LNAsby the SLR aircraft avoidance radar. The average scanlength observed was 31 seconds, and the average num-ber of scans per hour was 48.
The signal chain consisted of a QRFH feed, lownoise amplifiers, and phase calibration injection in thepayload near the focus for both antennas, and four Up-Down Converters, RDBE-Hs, and Mark 5C recordersin the control room. These are described more com-pletely in Niell et al (2012).
3 Correlated Flux Density Measurements
The correlated flux densitySc for each observation wasobtained from the correlation coefficientρ as:
Sc = b∗ρ ∗
√
(SEFD1∗SEFD2) (1)
where
• b= 1.13 for DiFX correlator (Cappallo, privatecommunication)
• SEFD1,2 = System Equivalent Flux Density forGGAO and Westford at the time of the observa-tions.
The SEFDs in the 8 GHz band (X-band) were ob-tained for each scan by scaling the on-source powerlevel at the time of each observation to the on-sourceminus off-source power difference for CasA. The mea-surements for CasA were made before, after, and nearthe middle of the session. However, the elevations ofthe source at the beginning and end were too low foruseful measurements, so only the mid-session valuewas used for calibrating the correlated flux densities.The CasA power was corrected for partial resolution of
CasA because the angular size is not negligible com-pared to the half-power beamwidths of the two anten-nas. This method of estimating the SEFD is valid pro-vided the system gain does not vary between the ob-servation epoch and the CasA measurement epoch, sothat system power tracks system temperature. Analysisof the phase cal amplitudes at the two stations showedthat the gain variations were small.
The weather was stormy at Westford, and the sys-tem power varied by more than a factor of two duringthe first ten hours. Water on the Westford radome waslargely responsible for the higher power levels. Besidesaffecting system temperature, variations in the thick-ness of the radome water layer or in atmospheric atten-uation at either site can also cause variations in signaltransmission loss from quasar to antenna feed. Correc-tions to the correlation coefficients were made for thislatter effect.
Instead of displaying the correlated flux densities,we show, for twelve of the strongest sources and forthe vertical polarization (V-pol), the ratios between thecorrelation coefficient for each scan of each source andthe median value for that source using all of the data forthe 24 hours (Figure 1). The three frames are for a) theobserved correlation coefficients directly from the cor-relator; b) the same but multiplied by the square rootof the product of the (equivalent of the) system tem-perature; c) and further corrected for absorption by theatmosphere and by a radome water layer using a simplemodel. The larger scatter for the first ten hours exhib-ited in 1c) is thought to be due to incomplete correctionfor variations in system temperature and absorption bythe radome. For the last 14 hours, except possibly forthe source 3C418 (blue crosses), the ratios are consis-tent with the sources being unresolved (no change incorrelated flux density with baseline orientation). Be-cause this is expected for good geodetic sources on thisshort baseline, the result is supportive of the calibrationprocedure.
4 Geodetic Analysis
The four bands were correlated independentlyand were first analyzed separately with the delay-estimation programfourfit to verify that the correlationwas correct before being combined into one data set.Phase cal was applied using the ‘multitone’ option in
IVS 2013 Annual Report

278 Niell et al.
Fig. 1 The correlation coefficient ratios to the median valuesat X-band for twelve sources: a) correlation coefficients fromthe correlator; b) correlation coefficients corrected for on-sourcepower; c) furthur correction for atmospheric and radome loss.
fourfit which calculates the delay for each 32 MHzchannel from the six or seven tones spaced 5 MHzapart. The four bands, each having two polarizations,were then combined into one file usingfourmer; thenfourfit was used to coherently estimate the group delayfor all four bands and to obtain the coefficient of theinverse frequency dependence of the phase which isattributed to the differenced Total Electron Content(dTEC) between the two stations. With the applicationof multitone phase cal delay, there were no cycleambiguities.
In order to process the observed delays throughcalcto obtain the observed-minus-model residuals, it wasnecessary to modify the programdbedit (D. Gordon,private communication) to accept delays obtained from64 channels and from which the dispersive term hadalready been removed. The data were then analyzedusing the programnuSolvewhich is in developmentby Sergei Bolotin to serve initially as a preprocessorfor batch-modesolveprocessing but ultimately as a re-placement forsolve.
For thenuSolveanalysis, because this is only a sin-gle 24-hour session, the model parameterization wasrelatively simple. Only the clock behavior at GGAO,the position of GGAO for the day, and the atmosphere
zenith delays and gradients at both stations were es-timated. The clock and atmospheres were modeled asstochastic processes using the default process valuesfrom nuSolve. Tests were made for comparison usingpiecewise linear functions with intervals of ten min-utes and longer, but the fits were not as good after re-weighting.
Short of having a series of observations on differentdays with which to assess the repeatability of observa-tions with the two antennas, a similar comparison canbe made with independent segments within a session.Therefore the 24-hour session was separated into in-dependent six-hour segments. With the high observedscan rate, there were still over 250 useful observationsin each segment. This is comparable to the number ofscans per station for a full 24 hours in an IVS session.
The length estimates for the full 24 hours and foreach of the six hour segments are shown in Figure 2.
Independent measurements of this baseline weremade in two six-hour sessions in October 2012 (Niellet al.). The agreement for successive days for the in-dependent polarizations was at the millimeter level.While it would be tempting to compare the baselinelength of this May 2013 session, there is reason to re-frain: measurements of the phase cal delay obtainedfrom the multitone phase cal processing for both ses-sions showed a strong dependence of delay on azimuthfor the Westford antenna, although the range of varia-tion was different by a factor of about two. For the May2013 data, the range of delay was about 50 psec, whilefor October 2012 it was about 25 psec.
Since an uncorrected variation of azimuthal instru-mental delay would be interpreted in the estimationprocess as an apparent error in the horizontal positionof the antenna, it is not useful to compare the baselinelengths for the 2012 and 2013 sessions. In the future acable delay measurement system will be deployed atthe sites to reduce these errors to a negligible value(see the Technology Development Center Report forHaystack Observatory, Beaudoin et al, this volume).
5 Outlook
Observations using the 12 m and Westford are ex-pected to become more frequent beginning in mid-2014. The correlation and data analysis chain (correla-tor/fourfit/solve) for the stand-alone broadband VGOS
IVS 2013 Annual Report

Haystack Analysis Center 279
Fig. 2 Baseline length between Westford and GGAO12M on2013 May22. Red square: solution for all 24 hours of data; bluediamonds: independent six hour segment analyzed with the sameparameterization as the full 24-hour solution.
observations and for the mixed broadband-Mark IV ob-servations needs to be developed and made operational.
As a first step in facilitating these developmentsnu-Solvehas been installed at Haystack and was used formost of the geodetic analysis described in this report.A next step will be to begin to use the vgosDB format,followed by installation of the fullcalc/solve/nuSolvesuite of programs.
Acknowledgements
We thank the Broadband Development group for theirefforts in constructing, implementing, and operatingthe systems at GGAO and at Westford and for assistingin the testing and observations; John Gipson for guid-ance in gettingskedto work; David Gordon for get-ting the broadband output into databases; and SergeiBolotin for developingnuSolve, getting it to work withthe new broadband observable, and providing some ofthe solutions.
References
1. Niell et al., “First Broadband Results with a VLBI2010 Sys-tem”, IVS 2012 General Meeting Proceedings, edited by D.Behrend and K. Baver, NASA-CP-2012-217504, pages 13-17.
IVS 2013 Annual Report

IAA VLBI Analysis Center Report 2013
Elena Skurikhina, Sergey Kurdubov, Vadim Gubanov, Daniil Shigaev
Abstract This report presents an overview of the IAAVLBI Analysis Center activities during 2013 and theplans for the coming year.
1 General Information
The IAA IVS Analysis Center (IAA AC) is locatedat the Institute of Applied Astronomy of the RussianAcademy of Sciences in St. Petersburg, Russia. TheIAA AC contributes to IVS products, such as dailySINEX files, TRF, CRF, rapid and long-term seriesof EOP, baseline lengths, and tropospheric parameters.EOP, UT1, and station positions were estimated fromdomestic observation programs Ru-E and Ru-U. TheIAA AC generates NGS files.
2 Activities during the Past Year
2.1 Software Development for VLBIProcessing
The QUASAR software is capable of calculating alltypes of IVS products. The possibility of outputingsource positions to DSNX files was realized.
Institute of Applied Astronomy of RAS
IAA Analysis Center
IVS 2013 Annual Report
2.2 Routine Analysis
During 2013 the IAA AC continued to submit dailySINEX files for the IVS-R1 and IVS-R4 sessions asrapid solution (iaa2010a.snx) and SINEX files basedon all 24-hour experiments for the quarterly solution.
The routine data processing was performed with theOCCAM/GROSS software using a Kalman Filter. TheIAA AC operationally processed the “24h” and Inten-sive VLBI sessions and submitted the results to theIERS and IVS on a regular basis. Processing of theIntensive sessions is fully automated. The EOP seriesiaa2007a.eops and iaa2005a.eopi and troposphere pa-rameters iaa2007a.trl were continued. Long-term se-ries of station coordinates, baseline lengths, and tro-pospheric parameters (ZTD and gradients) were com-puted with the station position catalog ITRF2005.
2.3 Global Solution
iaa2012crf and iaa2012trf were submitted to IVS. Anew global solution was calculated using all avail-able data from 1980 until 2012 (through the end ofSeptember 2012 we had 5,654 sessions). A total of6,912,198 delays were processed. The CRF was fixedby NNR constraints to 212 radio sources. The TRFwas fixed by NNR and NNT constraints to the sta-tion positions and velocities of 15 stations: MATERA,KOKEE, WETTZELL, FORTALEZA, WESTFORD,ALGOPARK, NYALES20, ONSALA60, HARTRAO,BR-VLBA, FD-VLBA, HN-VLBA, KP-VLBA, LA-VLBA, and NL-VLBA. Stochastic signals were esti-mated by means of the least-squares collocation tech-nique. The radio source coordinates, station coordi-
280

IAA AC 2013 AR 281
nates, and corresponding velocities were estimated asglobal parameters. EOP, WZD, troposphere gradientsand station clocks were estimated as arc parameters foreach session. 6,690 global parameters were estimated:3,635 source positions, and the positions of the veloci-ties of 156 VLBI stations.
2.4 EOP Parameter Calculation fromDomestic “Quasar” NetworkObservations
VLBI observations using the “Quasar” network forEOP monitoring are carried out in the framework oftwo domestic programs: Ru-E and Ru-U.
The purpose of the Ru-E program is to provide EOPresults on a regular basis from 24-hour sessions usingthree-station network: “Svetloe” – “Zelenchukskaya” –“Badary”.
The purpose of the Ru-U program is to provideUT1-UTC results on a regular basis from Intensive ses-sions using one baseline “Badary” – “Zelenchukskaya”(“Badary” – “Svetloe”).
Correlation analysis is performed using the IAAARC correlator.
Observational data from 1-hour Ru-U sessionsare transmitted to the correlator using e-VLBI datatransfer. Calculation of UT1 time series is performedautomatically. The result is a UT1-UTC time seriesavailable at ftp://quasar.ipa.nw.ru/pub/EOS/IAA/eopi-ru.dat.
Since April 2013 we have used e-VLBI data trans-fer for the data of 24-hour observations from “Badary”and “Zelenchukskaya”. Data of 24-hour sessions areshipped to the IAA correlator on disk modules onlyfrom “Svetloe” observatory. The EOP time series isavailable at ftp://quasar.ipa.nw.ru/pub/EOS/IAA/eops-ru.dat.
During 2013, 48 Ru-E and 356 Ru-U sessions wereobserved. AC IAA performed analysis of these obser-vations. The accuracy obtained in 2013 for EOPs incomparison to the IAA EOP 08 C04 series is presentedin Table 1.
Table 1 RMS differences with EOP IERS 08 C04.
EOP Nsess Bias RMSXp, mas 48 0.45 0.97Yp, mas 48 -0.67 1.23UT1-UTC,µs 48 -15 35Xc,mas 48 -0.13 0.34Yc, mas 48 -0.19 0.33UT1-UTC Int.,µs 356 25 67
2.5 CONT11 Data Analysis
Secondary treatment of the CONT11 program’s obser-vations was carried out using software package OC-CAM/GROSS. In the calculation of diurnal EOP, 15daily sessions were combined into one 15-day ses-sion (consisting of 16,430 scans and 145,214 delays),which was processed using package OCCAM/GROSSusing the forward run of the Kalman filter to estimatethe stochastic parameters. As stochastic parameters areconsidered EOP (pole coordinates and universal time),the date, time, wet component of the tropospheric delayat the zenith (WZD).
Diurnal variations ofXpol , Ypol , and dUT1 werecompared with the model of diurnal variations from theEOP IERS Conventions (2003) model of subdaily EOPvariations (designated here as “model”). The results arepresented in Figure 1. RMS differences between EOPand the model are presented in Table 2.
Table 2 CONT11: RMS differences between EOP and “model”.
EOP Npoint RMSXp, µas 16123 167Yp, µas 16123 164dUT1,µs 16123 18
The values of Tropospheric Total Zenith Delay(TZD) obtained during CONT11 from VLBI arein good agreement with data obtained from GPSobservations. The results are presented in Figure 2.
IVS 2013 Annual Report

282 Skurikhina et al.
-100
0
100
0 1 2 3 4 5 6 7 8 9 10 11 12 13 14 15
dU
T1
, µs
CONT11 day number (MJD - 55819.0)
dUT1 errordUT1
model
-1
0
1
Yp,
ma
s
Yp errorYp
model
-1
0
1
Xp,
ma
s
Xp errorXp
model
Fig. 1 EOP intra-day variations from CONT11.
2.6 Study of Systematic Errors ofReference Frames
First, directly from the data processing of VLBI ob-servations from about 30 years and using systematicerrors obtained from the QUASAR software, coordi-nates for ICRF2 radio sources were calculated as two-dimensional maps of distributions of radio source po-sition errors on the celestial sphere and orthonormalexpansion in spherical harmonics up to the ninth order.At some areas, the value of the errors is about 1 mas.Radio source and station position variations were thenanalyzed to study reference frame stability.
3 Current Status
The IAA AC performs data processing of all kinds ofVLBI observation sessions. For VLBI data analysis,we use the QUASAR and the OCCAM/GROSS soft-ware packages. All reductions are performed in agree-ment with IERS Conventions (2010). Both packagesuse NGS files as input data.
The IAA AC submits to the IVS Data Center allkinds of products: daily SINEX files for EOP and EOP-rates and station position estimates, TRF, CRF, base-line length, and tropospheric parameters.
The QUASAR and the OCCAM/GROSS softwarepackages are supported and being developed.
2000
2200
0 1 2 3 4 5 6 7 8 9 10 11 12 13 14 15 16
CONT11 day number (MJD - 55819.0)
Zelenchukskaya, rms TZD(VLBI-GPS) = 7,4 mm, bias = -3.3 mm
2100
2200
2300Yebes, rms [TZD(VLBI-GPS)] = 5,5 mm, bias = -4.7 mm
2200
2400Wettzell, rms [TZD(VLBI-GPS)] = 4,6 mm, bias = -1.0 mm
2400
2600 Westford, rms [TZD(VLBI-GPS)] = 5,4 mm, bias = -2.0 mm
2300
2400Concepcion, rms [TZD(VLBI-GPS)] = 4,4 mm, bias = -2.4 mm
2400
2600
Tsukuba, rms [TZD(VLBI-GPS)] = 5,6 mm, bias = -1.2 mm
2300
2400
Ny Alesund, rms [TZD(VLBI-GPS)] = 4,6 mm, bias = -1.2 mm
2300
2500Onsala, rms [TZD(VLBI-GPS)] = 4,7 mm, bias = -1.4 mm
2100
2200Kokee, rms [TZD(VLBI-GPS)] = 2,8 mm, bias = 0.3 mm
2300
2400
Hobart12, rms [TZD(VLBI-GPS)] = 2,5 mm, bias = 0.2 mm
2000
2200Hartebeeshoek, rms [TZD(VLBI-GPS)] = 1,7 mm, bias = 0.3 mm
2150
2250 Badary, rms [TZD(VLBI-GPS)] = 1,3 mm, bias = 0.1 mm
Fig. 2 TZD intra-day (VLBI compared with GPS) variationsfrom CONT11.
4 Future Plans
We plan to:
• Continue to submit all types of IVS product contri-butions.
• Continue investigations into VLBI estimation ofEOP, station coordinates, and tropospheric parame-ters, and comparison with satellite techniques.
• Further improve algorithms and software for pro-cessing VLBI observations.
• Contribute to ICRF3 Working Group study.
IVS 2013 Annual Report

Italy INAF Analysis Center
Monia Negusini, Pierguido Sarti
Abstract This report summarizes the activity of theItalian INAF VLBI Analysis Center. Our AnalysisCenter is located in Bologna, Italy and belongs to theInstitute of Radio Astronomy (IRA), which is part ofthe National Institute of Astrophysics (INAF). IRAruns the observatories of Medicina and Noto, wheretwo 32-m twin VLBI AZ-EL telescopes are located.This report contains the AC’s VLBI data analysisactivities and illustrates the local surveys carried out in2013 at IRA observatories.
1 Current Status and Activity
The ITRF2013 Call for Participation (CfP) was issuedat the end of March 2013. According to the call,“theowners of co-location sites are solicited and highly en-couraged to consider conducting new local tie surveysusing the most up to date survey methods. The resultsof least squares adjustments of the survey observationsshould be provided to the ITRS Center in the form ofSINEX format, with full variance-covariance informa-tion.” The submission of the new tie vectors linking theco-located space geodetic instruments was due as earlyas possible and no later than the end of February 2014.
The CfP and its deadline induced us to plan newlocal tie surveys at both Medicina and Noto by thesummer of 2013. In particular, the tie vector at theMedicina site was surveyed during June 2013 (fromJune 11th until June 14th) and the tie vector at Noto
Istituto di Radioastronomia INAF, Bologna
INAF Analysis Center
IVS 2013 Annual Report
was surveyed during three full days from July 10th un-til July 12th, 2013. The method that was adopted toconduct the surveys is based on the well-establishedprotocol described in several papers [1, 2]. As usual,the surveys were carried out in close cooperation withthe Department of Civil, Chemical, Environmental, andMaterial Engineering (DICAM) of the University ofBologna. Three high quality total stations from Le-ica (TDA5005, TS30, and TCA2003, http://www.leica-geosystems.com) were contemporarily used to mini-mize the observation time and increase the total num-ber of measurements available to estimate the conven-tional reference point of the VLBI telescopes. Follow-ing the ITRF2013 CfP requirements, the GPS antennaswere not removed to avoid undesirable possible dis-continuity in the position time series when the antennais restored back to its original marker. This was easilyachieved following the GPS choke ring antenna surveyapproach described in detail in [1].
The surveys and the computation of the tie vectorsat both sites were performed as part of a ten-week in-ternship project agreed upon between the IRA and theIGN School in Geomatic Sciences, Ecole Nationale desSciences Geographiques (ENSG) in Marne la Vallee,France. The internship involved Mr. Clement Iphar, astudent of the school interested in geodesy and in theapplications of terrestrial geodetic techniques for thecomputation of the ITRF.
The alignment of the tie vectors into the ITRF fromthe local topocentric frame was achieved using a setof points surveyed with both terrestrial techniques andGPS. The tie vectors were submitted in September2013 to the ITRS Center in Paris and are now availablefor the computation of the new ITRF2013.
It is worth mentioning that the 2013 survey inMedicina confirms the general trends reported in
283

284 Negusini and Sarti
[3], with a striking stability of the tie vector Upcomponent. The details and the results of the surveyswill be summarized and discussed in two reports thatwill be submitted to the ITRS Center.
2 Data Analysis and Results
The IRA started to analyze VLBI geodetic databases in1989, using a CALC/SOLVE package on the HP1000at the Medicina station. In subsequent years, the samesoftware was installed first on an HP360 workstationand later on an HP715/50 workstation. In more recentyears, two HP785/B2600 workstations and an HP282workstation were used. In 2007, a new Linux worksta-tion was set up for the migration of all the VLBI dataanalysis, and Mark 5 Calc/Solve was installed. During2013, our Analysis Center continued its participationin the IVS TROP Project on Tropospheric Parameters.Tropospheric parameters (wet and total zenith delayand horizontal gradients) of all IVS-R1 and IVS-R424-hour VLBI sessions were regularly submitted.
3 Outlook
We will continue with the regular submission of INAFtropospheric parameters to the IVS Data Center. Weare also going to monitor the GPS-VLBI tie vectors atour sites on a regular basis, possibly every second year,to continue the investigations into the local movementsand into the local site stability.
References
1. Sarti, P., Sillard, P., Vittuari, L. (2004) Surveying co-located space geodetic instruments for ITRF computation.J Geodesy 78(3):210–222, doi: 10.1007/s00190-004-0387-0.
2. Sarti, P., Abbondanza, C., Vittuari, L. (2009) Gravity depen-dent signal path variation in a large VLBI telescope mod-elled with a combination of surveying methods. J Geodesy83(11):1115–1126, doi: 10.1007/s00190-009-0331-4.
3. Sarti, P., C. Abbondanza, J. Legrand, C. Bruyninx, L. Vit-tuari, J. Ray. (2013) Intrasite motions and monument in-stabilities at Medicina ITRF co-location site. Geophys J Int192:1042–1051, doi: 10.1093/gji/ggs092.
IVS 2013 Annual Report

JPL VLBI Analysis Center Report for 2013
Christopher S. Jacobs
Abstract This report describes the activities of theJPL VLBI Analysis Center for the year 2013. High-lights for the year include the start of operations for thecombined NASA-ESA Ka-band network, installationof our Digital Back Ends enabling 1024–2048 Mbpsoperations, and our first installation of a Ka-band phasecalibrator. We continue to support VLBI-based navi-gation using our combined spacecraft, celestial refer-ence frame, terrestrial reference frame, earth orienta-tion, and planetary ephemeris VLBI systems.
1 General Information
The Jet Propulsion Laboratory (JPL) Analysis Center isin Pasadena, California. Like the rest of JPL, the centeris operated by the California Institute of Technologyunder contract to NASA. JPL has done VLBI analysissince about 1970. We focus on spacecraft navigation,including:
1. Celestial Reference Frame (CRF) and TerrestrialReference Frame (TRF), which are efforts that pro-vide infrastructure to support spacecraft navigationand Earth orientation measurements.
2. Time and Earth Motion Precision Observations(TEMPO), which measures Earth orientationparameters based on single baseline semi-monthlymeasurements. These VLBI measurements are thencombined with daily GPS measurements as well asother sources of Earth orientation information. The
Jet Propulsion Laboratory, California Institute of Technology
JPL Analysis Center
IVS 2013 Annual Report
combined product provides Earth orientation forspacecraft navigation.
3. Delta differenced one-way range (∆DOR), whichis a differential VLBI technique that measuresthe angle between a spacecraft and an angularlynearby extragalactic radio source. This techniquethus complements the radial information fromspacecraft doppler and range measurementsby providing plane-of-sky information for thespacecraft trajectory.
2 Technical Capabilities
The JPL Analysis Center acquires its own data and sup-plements it with data from other centers. The data weacquire are taken using NASA’s Deep Space Network(DSN).
1. Antennas: Most of our work uses 34-m antennaslocated near Goldstone (California, USA), Madrid(Spain), and Tidbinbilla (Australia). These includethe following Deep Space Stations (DSS): the“High Efficiency” subnet comprised of DSS 15,DSS 45, and DSS 65 which has been the mostoften used set of JPL antennas for VLBI. Morerecently, we have been using the DSN’s beamwaveguide (BWG) antennas: DSS 13, DSS 24,DSS 25, DSS 26, DSS 34, DSS 54, and DSS 55.Less frequent use is made of the DSN’s 70-mnetwork (DSS 14, DSS 43, and DSS 63). TypicalX-band system temperatures are 35K on the HEFantennas. The 70-m and BWGs are about 20K.Antenna efficiencies are typically well above 50%at X-band.
285

286 Jacobs
2. Data acquisition: We use ROACH-based DigitalBack Ends with Mark 5C VLBI recorders. Theseunits are now in the field and are expected to be-come fully operational in 2014. In addition, wehave JPL-unique systems called the VLBI ScienceRecorder (VSR) and the Wideband VSRs (WVSR)which have digital baseband converters and recorddirectly to hard disk. The data are later transferredvia network to JPL for processing with our softwarecorrelator.
3. Correlators: The JPL VLBI Correlator has been ex-clusively based on the SOFTC software which han-dles the∆DOR, TEMPO, and CRF correlations aswell as tests of antenna arraying.
4. Solution types: We run several different typesof solutions. For∆DOR spacecraft tracking wemake narrow field (≈ 10◦) differential solutions.The TEMPO solutions typically have a highlyconstrained terrestrial (TRF) and celestial frame(CRF) as a foundation for estimating Earth ori-entation parameters. These reference frames areproduced from global solutions which then providethe framework needed for use by TEMPO and∆DOR.
3 Staff
Our staff are listed below along with areas of concen-tration. Note that not all of the staff listed work onVLBI exclusively as our group is involved in a num-ber of projects in addition to VLBI.
• Durgadas Bagri: TEMPO and Ka-band phase cali-brators.
• James Border:∆DOR spacecraft tracking.• Cristina Garcıa-Miro: Madrid data acquisition,
NASA-ESA southern declination collaboration,and educational outreach.
• Shinji Horiuchi: Canberra data acquisition andNASA-ESA southern declination collaboration.
• Chris Jacobs: NASA-ESA southern declination col-laboration, X/Ka CRF, TRF, and S/X CRF.
• Christina King: source stability studies.• Peter Kroger:∆DOR spacecraft tracking.• Gabor Lanyi: MODEST, Fringe fitting and correla-
tion support,∆DOR, and TRF.• Steve Lowe: Software correlator, fringe fitting soft-
ware, and∆DOR.
• Walid Majid: pulsars,∆DOR, and VLBA phase ref-erencing.
• Chuck Naudet: NASA-ESA southern declinationcollaboration and source stability studies.
• Andres Romero-Wolf:∆DOR, CRF and TRF.MODEST scripts. Source stability studies.
• Lawrence Snedeker: Goldstone data acquisition.NASA-ESA southern declination collaboration.
• Ojars Sovers: S/X, and X/Ka CRFs and TRF. Main-tains MODEST analysis code.
• Alan Steppe: TEMPO and TRF.
4 Current Status and Activities
The TEMPO task’s EOP measurements continue.Our S/X CRF work is being downsized in favor ofX/Ka-band (8.4/32 GHz) CRF which continues tomake major strides forward. In particular, in 2013,ESA’s Malargue, Argentina antenna became a regularpart of our Ka-band network adding much neededsouthern coverage, and DSN operations moved to1024 to 2048 Mbps.
VLBI spacecraft tracking continues to providemeasurements of angular position in support ofmission navigation and planetary ephemeris develop-ment. The New Horizons trajectory toward Pluto wasverified with a series of Delta-DOR measurementsin June-August 2013. Delta-DOR data were used toassure the Earth-flyby targeting for Juno in October2013. Dawn is being supported with Delta-DORduring its low thrust cruise from Vesta to Ceres.Monthly Delta-DOR measurements of MRO and MarsOdyssey continue to improve the ephemeris of Mars.Delta-DOR measurements have begun on both theNASA mission Maven and the ISRO mission MOM tosupport navigation during their cruise to Mars.
5 Future Plans
In 2014, we hope to improve our VLBI system by mak-ing our Digital Back End, the DVP, compatible with theJIVE and DiFX correlators, thereby enabling broadercalibrations. We hope to deploy operational Ka-bandphase calibrators at our overseas sites. We expect thecombined NASA-ESA deep space network to reach
IVS 2013 Annual Report
JPL Analysis Report 287
sub-nanoradian (200µas) Ka-band CRF results overthe south polar cap (−90◦ < δ <−45◦). On the space-craft front, we plan to continue supporting a numberof operational missions while further improving tech-niques for using VLBI for spacecraft tracking.
Acknowledgements
Research described herein done in part at the JetPropulsion Laboratory, California Institute of Tech-nology under contract with the National Aeronauticsand Space Administration. Government sponsor-ship acknowledged. Copyrightc©2014. All RightsReserved.
References
1. A. Bertarini, A de Witt, C.S. Jacobs, J. McCallum, T. Jung,J. Quick, S. Horiuchi, J. Lovell, B. Won Sohn, R. Ojha,‘Extending the K-band Celestial Frame with Emphasis onthe Southern Hemisphere,’ Journees Systemes de ReferenceSpatio-Temporels, Paris, 16 Sept. 2013.syrte.obspm.fr/journees2013/powerpoint/bertarinijsr13.pdf
2. David W. Curkendall and James S. Border, ‘Delta-DOR:The One-Nanoradian Navigation Measurement System ofthe Deep Space Network: History, Architecture, and Com-ponentry,’ Interplanetary Network Progress Report, vol. 42-193, Jet Propulsion Laboratory, Pasadena, CA, pp. 1–46,May 15, 2013.http://ipnpr.jpl.nasa.gov/progressreport/42-193/193D.pdf
3. A. de Witt, A. Bertarini, C.S. Jacobs, J. McCallum, T. Jung,J. Quick, S. Horiuchi, J. Lovell, B. Won Sohn, R. Ojha,‘Experimental plan for improving the K-band CelestialFrame,’ Journees Systemes de Reference Spatio-Temporels,Paris, 16 Sept. 2013.syrte.obspm.fr/journees2013/powerpoint/dewittposterjsr13.pdf
4. R. Gaume, C.S. Jacobs, and ICRF-3 working group, ICRSProduct Center and IAU ICRF-3 WG Update, IERS direct-ing board meeting #57, San Francisco, 8 Dec 2013.
5. R. Heinkelmann, C.S. Jacobs and ICRF-3 working group‘The ICRF-3: A Proposed Roadmap to the next genera-tion International Celestial Reference Frame,’ IAG, Pots-dam, Germany, 1-6 Sept 2013.http://www.iag2013.org/IAG2013/Potsdam.html
6. S. Horiuchi, J.E. Clark, C. Garcıa-Miro, C.S. Jacobs, R.Madde, M. Mercolino, L.G. Snedeker, I. Sotuela, L.A.White ‘X/Ka Celestial Frame,’ Asia-Pacific Radio ScienceConference, Tapei, Taiwan, 3-7 Sept. 2013.http://aprasc13.ntu.edu.tw/Program2/AdvanceProgram.asp#J1b
7. C.S. Jacobs, ‘Celestial Reference Frames,’ overview lecturefor the 1st EVGA School, Aalto University, Otaniemi,Espoo, Finland, 5 March 2013.http://www.evga.org/teaching/VLBIschool2013/VLBI-school-201316 Jacobs.pdf
8. C.S. Jacobs, J.E. Clark, J. de Vicente, M. Dugast, C.Garcıa-Miro, C.E. Goodhart, S. Horiuchi, S.T. Lowe,R. Madde, M. Mercolino, C.J. Naudet, L. G. Snedeker,I. Sotuela, L.A. White, ‘Extending the X/Ka CelestialReference Frame to the South Polar Cap: Results fromCombined NASA-ESA Baselines to Malargue, Argentina,’21st EVGA Symposium, Espoo, Finland, 7 March 2013.http://evga.fgi.fi/sites/default/files/u3/JacobsXKa EVGA-2013.pdfhttp://adsabs.harvard.edu/abs/2013evga.confE...1J
9. C.S. Jacobs, J. Bohm, P. Charlot, and the joint IAU ICRF-3working group and IAG sub-comission 1.4 ‘ICRF-3: An As-sessment of Needs and Plans for the Future,’ ICRF-3 jointIAU/IAG splinter meeting to 21st EVGA Symposium, Es-poo, Finland, 7 March, 2013.http://evga.fgi.fi/node/9
10. C.S. Jacobs, R. Gaume, C. Ma, and ICRF-3 working group,‘ICRF-3 Overview,’ IERS Directing Board Retreat, Paris,France, 23 May 2013
11. C.S. Jacobs and the ICRF-3 working group, ‘The ICRF-3:Proposed Roadmap to the Next Generation Interna-tional Celestial Reference Frame,’ Journees Systemes deReference Spatio-Temporels, Paris, 16 Sept. 2013.http://syrte.obspm.fr/journees2013/powerpoint/jacobsjsr13.pdf
12. C.S. Jacobs, ‘Celestial Reference Frames,’ Journees 2013,Tutorial session, Paris, 15 Sept 2013.syrte.obspm.fr/jsr/journees2013//powerpoint/TutorialCRFJacobsjsr13.pdf
13. M. Soriano, C. Jacobs, R. Navarro, C. Naudet, S. Rogstad,L. White, S. Finley, C. Goodhart, E. Sigman, J. Trinh, J.Lobo Garcia, C. Garcıa-Miro, M. Mercolino, R. Madde,‘Improved Spacecraft Tracking and Navigation Using aPortable Radio Science Receiver,’ IEEE, Big Sky Montana,2-9 March 2013.doi: 10.1109/AERO.2013.6496851http://adsabs.harvard.edu/abs/2013aero.confE...1Shttp://ieeexplore.ieee.org/stamp/stamp.jsp?tp=&arnumber=649685
IVS 2013 Annual Report

KASI Combination Center 2013 Annual Report
Younghee Kwak, Jungho Cho
Abstract This report presents the activities of theKorea Astronomy and Space Science Institute (KASI)Combination Center during 2013 and outlines theplanned tasks for 2014. In 2013, we focused oncoordinate time series and a VLBI terrestrial referenceframe using seven-year IVS products. During thecombination using Bernese GNSS Software Version5.0, we found restrictions on combining products. Wereport those and desirable features.
1 General Information
KASI is a government-funded research institute for As-tronomy and Space Science. Thus, it has a wide rangeof research areas observing the Earth, the Sun, stars,and galaxies based on various instruments. For Earthobservation, space geodesy is one of the important re-search fields of KASI. KASI operates GNSS, VLBI,and SLR stations and analyzes their observation data.
2 Component Description
KASI is in charge of operating an IVS CombinationCenter. KASI has rich experience in GNSS data pro-cessing and analysis using Bernese GNSS Software(hereafter Bernese). Bernese, especially the subpro-gram ADDNEQ2, supports stacking of normal equa-tions and estimation of parameters [1]. We adopted
Korea Astronomy and Space Science Institute
KASI Combination Center
IVS 2013 Annual Report
Bernese to combine the sessionwise VLBI products ofthe IVS Analysis Centers (ACs) at the normal equationlevel. We modified the software, which was developedfor GNSS data processing and analysis, to handle IVSproducts properly. The inputs to Bernese are the normalequation matrices and vectors from the daily SINEXfiles of the individual ACs (Table 1). The outputs aredaily SINEX files including combined station coordi-nates and Earth orientation parameters (EOPs). Themissions of the KASI Combination Center are creationof high quality combination products, mutual verifica-tion with the BKG/DGFI Combination Center, qualitycontrol of the ACs’ results, provision of feedback to theAnalysis Centers, and adherence to the IERS Conven-tions.
Table 1 IVS ACs which KASI combined.
AC Time span Software Number of sessions
BKG 2003.0-2010.0CALC/SOLVE 938DGFI 2003.0-2010.0OCCAM 891GSFC 2003.0-2010.0CALC/SOLVE 939OPA 2003.0-2010.0CALC/SOLVE 928USNO 2003.0-2010.0CALC/SOLVE 802
3 Staff
The staff members of the KASI Combination Centerare listed below.
288

KASI 2013 Report 289
Table 2 Personnel of the KASI Combination Center.
Jungho Cho +82-42-865-3234 [email protected]∗ Younghee [email protected]∗ until March 21, 2014
4 Current Status and Activities
(1) Coordinate Time Series
The station position coordinates for each sessionwere combined and estimated using the normal equa-tions of each IVS AC summarized in Table 1 in order toverify the VLBI combination capability of Bernese. Intotal, 43 station coordinates were estimated. Figures 1,2 and 3 show the examples of the time series for the lat-itude, longitude, and height of three of the 43 stations(Westford, Wettzell, and Kokee). In the figures, the red(darker) line represents the estimated values, and thegreen (lighter) line shows the a priori values based onITRF2008. In each plot, a single tick mark of the ver-tical axis corresponds to about 1 m. It is obvious thatthe errors of the longitude components are relativelylarger than those of the latitude and height components.For 43 stations, the root mean square (RMS) errors ofthe latitude and longitude components are 15.6 mm and37.7 mm, respectively, and the error of the height com-ponent is 30.9 mm, with respect to ITRF2008 (a priorivalue).
Most VLBI results provide UT1-TAI values,while Bernese, which is the software for GNSS, canprocess only UT1-UTC values at the moment. For thenormal equations of some ACs (BKG, GSFC, OPA,and USNO), which were entered in the software, thedifference (leap seconds) between the UT1-TAI andUT1-UTC values was included. UT1 is a parameterthat represents the rotation of the Earth, and it iscorrelated with longitude that has the same direction.Consequently, the UT1 errors of some ACs wereincluded in the results of the longitude, and thus thelongitude component showed a larger RMS error thanthe latitude and height components. In the future,the software needs to be improved regarding UT1correction.
(2) VLBI TRF
We estimated TRF by combining the normal equa-tions of five ACs (Table 1) during seven years (2003-
Fig. 1 Coordinate time series of Westford during 2003-2009.
2009) as one normal equation. Figure 4 shows the ve-locity vectors of the combined TRF (red arrows) byKASI and the ITRF2008 (blue arrows). ITRF2008 isthe result that combined the data from the four spacegeodetic techniques (GNSS, VLBI, SLR, and DORIS)which had been accumulated for 25 years (1984-2008).Thus, the stations, which had performed observationsup to 2003, exist only on ITRF2008. The YEBES sta-
IVS 2013 Annual Report

290 Kwak and Cho
Fig. 2 Coordinate time series of Wettzell during 2003-2009.
tion in Spain dismantled the 14-m antenna that hadbeen used from 1995 to 2003. Accordingly, as for thedata from the YEBES station used for the combinedTRF, the observation period was very short (less thanone year), and thus the estimation of a proper velocityvector was not available. Therefore, it had a completelydifferent magnitude and direction, compared to the ve-locity vector from ITRF2008, and it was excluded from
Fig. 3 Coordinate time series of Kokee during 2003-2009.
Figure 4. The velocity vector of the remaining 42 sta-tions excluding the YEBES station showed a magni-tude difference of 7.3 mm/yr (30.2%) and a directiondifference of 13.8◦ (3.8%), with respect to ITRF2008.Those errors are thought to be due to the longitudecomponent error mentioned above. As there is a largeerror in the longitude component, the Helmert transfor-mation, which represents the relation between TRFs, is
IVS 2013 Annual Report

KASI 2013 Report 291
180˚
180˚
210˚
210˚
240˚
240˚
270˚
270˚
300˚
300˚
330˚
330˚
0˚
0˚
30˚
30˚
60˚
60˚
90˚
90˚
120˚
120˚
150˚
150˚
180˚
180˚
−60˚ −60˚
−30˚ −30˚
0˚ 0˚
30˚ 30˚
60˚ 60˚
2 cm/y
Fig. 4 Velocity map of ITRF2008 (blue/slightly darker) and combined TRF (red) by KASI.
not meaningful at the moment. Thus, it was not consid-ered in this report.
5 Future Plans
In 2014 and beyond, we will focus on the followingtasks:
• Proper UT1 correction in Bernese• Combining whole period IVS products (1984-
present)• Outlier rejection• Weighting the individual solutions• Comparing with BKG/DGFI Combination Center
[2], IERS 08C04 [3], and IGS solutions [4]• Providing IVS EOP format solutions [2] (Rapid and
Quarterly)• Providing VLBI TRF
References
1. Dach, R., Hugentobler, U., Fridez, P., and Meindl, M. (eds.),Bernese GPS Software Version 5.0 User manual, Astronom-ical Institute, Universtiy of Bern, 2007
2. http://ccivs.bkg.bund.deBKG/DGFI Combination Center Web page
3. http://hpiers.obspm.fr/eop-pcIERS Earth Orientation Center Web page
4. http://igscb.jpl.nasa.gov/components/prods.htmlIGS Products Table
IVS 2013 Annual Report

KTU-GEOD IVS Analysis Center Annual Report 2013
Emine Tanır Kayıkcı 1, Kamil Teke 1,2
Abstract This report summarizes the activities ofthe KTU-GEOD IVS Analysis Center (AC) in 2013and outlines the planned activities for the year 2014.Determination of optimal weights of constraints onVLBI auxiliary parameters as well as estimation inter-val lengths have been our specific interests in 2013.
1 General Information
KTU-GEOD IVS Analysis Center (AC) is located atthe Department of Geomatics Engineering, KaradenizTechnical University, Trabzon, Turkey.
2 Staff at KTU-GEOD Contributing to theIVS Analysis Center
The staff who are contributing to the research at theKTU-GEOD IVS Analysis Center (AC) in 2013 arelisted in Table 1 with their working location.
3 Current Status and Activities
During 2013, we focused on determining estimationintervals and the optimal weights of constraints on
1. Karadeniz Technical University, Department of GeomaticsEngineering2. Hacettepe University, Department of Geomatics Engineering
KTU-GEOD Analysis Center
IVS 2013 Annual Report
Table 1 Staff.
Name Working LocationEmine Tanır Karadeniz Technical University,Kayıkcı Dept. of Geomatics Engineering,
Trabzon, Turkey.Kamil Teke Hacettepe University,
Dept. of Geomatics Engineering,Ankara, Turkey.
the estimated VLBI auxiliary parameters. The mainpart of this study was conducted during the researchstay of AC member Dr. Tanır Kayıkcı at Helmholtz-Zentrum Potsdam Deutsches GeoForschungsZentrumGFZ from July to September 2013. The first results ofthis study were presented at the International Associ-ation of Geodesy (IAG) Scientific Assembly held atPotsdam from 1st to 6th of September 2013 [4]. Theproceedings paper of this report was submitted to theInternational Association of Geodesy Symposia Series(still under review process).
The variety of the parameterizations in VLBI anal-ysis causes significant differences in the estimates evenif the same observations (sessions) are involved (c.f.[2]). The space geodetic technique specific parame-ters in a least-squares adjustment are not standardized— e.g., several reduction models are recommended bythe IERS Conventions 2010 ([3]). The current versionof Vienna VLBI Software (VieVS, [1]) in the least-squares adjustment mode uses a standard parameteri-zation for the auxiliary parameters, i.e., a piece-wiselinear offset representation with a default temporal res-olution of e.g. 60 minutes for clocks and zenith wetdelays (ZWD) and six hours for troposphere horizon-tal north and east gradients (NGR and EGR). From thephysical point of view, the interval length should be
292

KTU-GEOD Annual Report 2013 293
as short as possible to optimally represent the behav-iors of the underlying processes: from the mathemati-cal point of view, however, the interval length shouldbe long enough to achieve an appropriate redundancyof observations required to obtain a stable (regular)normal equation system. In this study, three differentapproaches are investigated for achieving optimizedparameterizations of the auxiliary parameters per sta-tion for each session. The performance of the three ap-proaches is investigated by analyzing VLBI data withthe least-squares adjustment model of VieVS.
3.1 Approach1: Solution IntervalsConsidering the Time DependentBehaviours of the Parameters
In the standard VLBI least-squares solution, the esti-mation intervals of the auxiliary parameters are usu-ally set to be constant for the sake of simplicity, be-cause there is no a priori information about the vari-ability of the modelled phenomena, e.g. troposphere.Consequently, our first optimization (approach1) real-izes the idea of a flexible parameter estimation inter-val depending on the behavior of the parameters de-termined with a prior estimation featuring an equallyspaced standard parameterization. Thus, if the varia-tion is relatively large, the parameter estimation inter-val will be decreased to allow for a larger degree offreedom for this specific parameter over an appropriateduration. With this approach it is possible to flexiblyhandle the parameter estimation interval according to afirst standard solution while keeping the overall num-ber of parameters constant. It would also be possibleto repeat the application ofapproach1in an iterativeway whenever the session is reanalyzed. This iterativeoptimization will be considered in future, but it is nottreated in this report.
3.2 Approach2: Solution IntervalsConsidering Data Gaps
There is a usual time difference of several minutes ormore between successive VLBI observations. A sig-nificant number of VLBI sessions show gaps betweensuccessive observations at certain stations. For exam-
ple, during the CONT08 session WETTZELL stoppedand performed an Intensive VLBI session of about onehour duration together with another network station(see Figure 1). In our investigation, we consider a timedifference of at least 45 minutes between successiveobservations at a station as a data gap. With our sec-ond approach (approach2), in the case of a data gapbetween observations, our method considers the obser-vation data in two subsets, the one before and the oneafter the data gap while leaving the data gap empty.
0 100 200 300 4000
0.5
1
1.5
2VLBI observations at WETTZELL during 24th of August 2008 (CONT08)
total number of observationsob
serv
atio
n tim
e di
ffere
nces
in h
ours
Fig. 1 Time differences in hours between successive observa-tions at station WETTZELL during a daily CONT08 session,08AUG24.
3.3 Approach3: Solution IntervalsConsidering the Total Number ofObservations
We determine the estimation intervals depending onthe number of observations in our third approach (ap-proach3). This approach ensures an equal redundancyfor each auxiliary parameter. Figures 2 and 3 showhow much the total number of observations supportingan auxiliary parameter can vary, in the case of havingequally spaced time intervals for auxiliary parameterestimation by the standard parameterization. The num-ber and geometry of observations in equally spaced es-timation intervals of a VLBI station, specific parametershould be optimized when, for example, scheduling asession or the estimation intervals for a specific param-eter at each antenna should be optimized consideringthe number and geometry of observations when ana-lyzing a session.
IVS 2013 Annual Report

294 Tanır Kayıkcı and Teke
1000 1500 2000 25000
10
20
30
40
50
60
70
80
90
minutes elapsed since MJD 52583.00
num
ber
of o
bser
vatio
ns p
er e
stim
atio
n in
terv
alEstimated parameter: clock offsets
GILCREEK
KOKEE
TSUKUB32
SESHAN25
URUMQI
HOBART 26
Fig. 2 Total number of observations per clock offset estimationinterval: 60 minutes (as a standard parameterization) during ses-sion 02NOV05.
720 1080 1440 1800 2160 25200
50
100
150
200
250
300
350
400
450
minutes elapsed since MJD 52583.00
num
ber
of o
bser
vatio
ns p
er e
stim
atio
n in
terv
al
Estimated parameter: troposphere north gradients
GILCREEKKOKEE TSUKUB32SESHAN25URUMQI HOBART 26
Fig. 3 Total number of observations per troposphere gradientoffset estimation interval: 360 minutes (as a standard parame-terization) during session 02NOV05.
4 Future Plans
Our preliminary results show thatapproach1andap-proach3 provide better results for VLBI single ses-sion analysis than the standard parameterization. Thenext step will be to practically assess theapproach2.Thereafter we will develop an optimized parameteri-zation for auxiliary parameters in VLBI single sessionleast-squares analysis probably based on all three ap-proaches.
Acknowledgements
We are thankful to all the Directing Board of IVS.We are grateful to Karadeniz Technical University fortheir financial support of KTU-GEOD IVS AC re-search activities. One of the co-authors, Emine TANIRKAYIKCI, acknowledges Council of Higher Educationof Turkey (YOK) for the financial support of her re-search stay at GFZ.
References
1. J. Bohm, S. Bohm, T. Nilsson, A. Pany, L. Plank, H. Spi-cakova, K. Teke, H. Schuh, The new Vienna VLBI Soft-ware VieVS. Geodesy for Planet Earth, Proceedings of the2009 IAG Symposium, Buenos Aires, Argentina, 31 August— 4 September 2009,International Association of GeodesySymposia Series, 136, 1007–1011, edited by Steve Kenyon,Maria Christina Pacino, Urs Marti.
2. R. Heinkelmann, J. Bohm, S. Bolotin, G. Engelhardt,R. Haas, R. Lanotte, D. S. MacMillan, M. Negusini,E. Skurikhina, O. Titov, H. Schuh, VLBI-derived tropo-sphere parameters during CONT08,Journal of Geodesy, 85,7, 377–393.
3. G. Petit, B. Luzum, IERS Conventions 2010, IERS Techni-cal Note 36, Frankfurt am Main: Verlag des Bundesamts furKartographie und Geodasie, 179, ISBN 3-89888-989-6.
4. E. Tanır Kayıkcı, R. Heinkelmann, M. Karbon, T. Nilsson,V. Raposo-Pulido, B. Soja, H. Schuh, Optimal size of con-straints and interval lengths for VLBI auxiliary parameters,IAG Scientific Assembly 2013, September 1-6, 2013, Pots-dam.
IVS 2013 Annual Report

Analysis Center at National Institute of Information andCommunications Technology
Thomas Hobiger, Mamoru Sekido
Abstract This report summarizes the activities of theAnalysis Center at National Institute of Informationand Communications Technology (NICT) for 2013.
1 General Information
The NICT Analysis Center is operated by the space-time standards group of NICT and is located inKashima, Ibaraki; its headquarters are in Koganei,Tokyo. The Analysis Center focuses on the processingof VLBI experiments which are related to NICT’sresearch goals. Effort is spent on developing newVLBI technology for time and frequency transfer, thedevelopment of a modern multi-technique analysissoftware package, prototyping of a compact VLBIsystem, real-time EOP determination, and atmosphericpath delay studies.
2 Staff
Members who are contributing to the Analysis Centerat the NICT are listed below (in alphabetical order, withworking locations in parentheses):
• HOBIGER Thomas (Koganei, Tokyo): analysissoftware development and atmospheric modeling
• ICHIKAWA Ryuichi (Koganei, Tokyo): coordina-tion of activities
NICT, Japan
NICT Analysis Center
IVS 2013 Annual Report
• KONDO Tetsuro (Bangkok, Thailand andKashima): software correlator development
• SEKIDO Mamoru (Kashima): development ofVLBI systems, coordination of activities
3 Activities during the Past Year
3.1 Development of a Multi-techniqueSpace-geodetic Analysis SoftwarePackage
����������
���� �����
���
���
�
����
��������
Fig. 1 The basic concept of c5++ allows processing of single-and multi-technique space geodetic observations by taking ad-vantage of the usage of identical geophysical models (from [4]).
Driven by the need to update existing space geode-tic analysis software and motivated by the demandinggoals of GGOS, a new analysis package named “c5++”was developed. In contrast to the prior version, whichwas written in Java, the new software was coded inC++, which led to its naming. In doing so, the softwarewas designed to support combination of space geode-tic data from Satellite Laser Ranging (SLR), VLBI,
295

296 Hobiger and Sekido
and Global Navigation Satellite System (GNSS) onthe observation level, but it also enables processingof single-technique solutions. VLBI, GNSS, and SLRmodules (see Figure 1) share the same library, whichcontains all geophysical models according to the latestIERS Conventions. In addition, local tie informationcan be included as virtual observations which relate be-tween technique-specific reference points. The libraryalso provides interfaces to various space geodetic dataformats, enables reading/writing of SINEX files, andsupports all necessary mathematical functions for theparameter adjustment process. c5++ does not have agraphical user interface (GUI) but is called directlyfrom the command line and controlled via a config-uration file. In the current version of c5++, a Gauss-Markov model is used for the least-squares adjustment;however, a Kalman filter is expected to be implementedin the future as well.
c5++ was compared against other software pack-ages [6] and is currently being used by the GeospatialInformation Authority of Japan (GSI) for ultra-rapiddetermination of UT1 (see section 3.3 and [1]) on aroutine basis.
In contrast to combination of space geodetic resultswhere parameters are derived individually from eachtechnique, combination of all available space geodeticobservations on the observation level is expected to ob-tain more robust parameters. Outliers are less likely tobias the solution as data from other techniques helps toidentify such data artifacts. Moreover, weaknesses ofone technique can be compensated by adding a sec-ond technique, improving geometrical coverage andstabilizing the estimation of parameters which other-wise would depend on observations from that singletechnique. In order to demonstrate the capability of thesoftware to combine data at the observation level, SLRand VLBI observations were processed together, withthe goal of studying site motions at TIGO and revealingthe benefits of this approach [3]. In doing so, it couldbe demonstrated that the coordinate time series beforethe Chile 2011 earthquake derived from the combinedsolution has less scatter than either of the two single-technique solutions (see Figure 2).
In addition to local tie information, site-wise com-mon parameters, i.e. troposphere and clocks, can beestimated when microwave based techniques are com-bined on the observation level. [4] discusses how com-mon parameters between GNSS and VLBI have to beestimated and where biases/offsets need to be taken
into account. In order to test this concept, GPS andVLBI data from the CONT11 campaign were utilized.Obtained results show that the combination of spacegeodetic data on the observation level leads to a consis-tent improvement of station position repeatability andEarth orientation parameters as well as nuisance pa-rameters like troposphere estimates. Furthermore, esti-mation of common parameters (troposphere or clocks)at co-located sites helps to improve the solution furtherand derive an utmost physically consistent model of theconcerned parameters (see details in [4]).
3.2 Frequency Transfer by Means of VLBI
Space geodetic techniques like GNSS have beenproven to be a useful tool for time and frequencytransfer purposes. Besides SLR, which is currentlytested under the name T2L2, VLBI could be anotherspace geodetic technique that can be utilized forfrequency transfer. In contrast to GNSS, VLBI doesnot require any orbital information as it directly refersto an inertial reference frame defined by the locationof the quasi stellar objects. As summarized by [7],current VLBI systems can provide a frequency linkstability of about 2 x 10-15 @ 1d (ADEV). NICT’sSpace-Time Standards Laboratory is working on therealization of a frequency transfer system based on theprinciples of VLBI, whereas developments from theupcoming geodetic VLBI2010 system are expected tohelp to reach these goals. Our new analysis software(see prior section) is ready to combine VLBI andGNSS data on the observation level and thus supportthe efforts of this project.
3.3 Ultra-rapid EOP Experiments
Geospatial Information Authority of Japan (GSI), On-sala Space Observatory, University of Tasmania, andthe Hartebeesthoek Radio Astronomy Observatory car-ried out several ultra-rapid EOP experiments whichwere automatically analyzed with c5++. The analysisprocess was adopted to handle automated ambiguityresolution of a multi-baseline session and allow for arobust estimation of the three EOP components. Firstresults demonstrated that all three EOPs can be esti-
IVS 2013 Annual Report

Analysis Center at NICT 297
0
5
10
15
20
25
30
35
-15 -10 -5 0 5 10 15
freq
. []
[cm]
SLR (NS)
0
5
10
15
20
25
30
35
-15 -10 -5 0 5 10 15
freq
. []
[cm]
SLR (EW)
0
2
4
6
8
10
12
14
16
18
-15 -10 -5 0 5 10 15
freq
. []
[cm]
SLR (UD)
0
5
10
15
20
25
30
0 2 4 6 8 10 12 14
freq
. []
[cm]
SLR (3D)
singlecombined
RMS(sing.)=3.4 cmRMS(comb.)=2.4 cm
0
5
10
15
20
25
30
35
-15 -10 -5 0 5 10 15
freq
. []
[cm]
VLBI (NS)
0
5
10
15
20
25
30
35
-15 -10 -5 0 5 10 15
freq
. []
[cm]
VLBI (EW)
0
2
4
6
8
10
12
14
16
-15 -10 -5 0 5 10 15
freq
. []
[cm]
VLBI (UD)
0
5
10
15
20
25
30
0 2 4 6 8 10 12 14
freq
. []
[cm]
VLBI (3D)
singlecombined
RMS(sing.)=4.1 cmRMS(comb.)=2.4 cm
Fig. 2 Histograms of the detrended coordinate time series of the single technique and combined solutions between January 1, 2008and March 10, 2008 (i.e. the occurrence of the Chile 2010 earthquake) as discussed in [3].
mated from such a dedicated ultra-rapid observationnetwork. However, given the weak geometry of thenetwork and the rather low number of observations,it is not clear whether the current observation strat-egy is sufficient for an accurate and reliable determi-nation of all three EOP components. In addition tothese dedicated ultra-rapid experiments, GSI regularlysubmits UT1 results automatically processed by c5++from INT2 sessions on an operational basis (see [1] fordetails on the processing strategy).
3.4 Ray-traced Troposphere Slant DelayCorrection for Space Geodesy
Kashima Ray-tracing Tools (KARAT) is a softwarepackage that is capable of transforming numericalweather model data sets to geodetic reference frames,
computing fast and accurate ray-traced slant delays,and correcting geodetic data on the observation level.A recent comparison [8] of troposphere delays fromspace geodetic techniques, water vapor radiome-ters, and numerical weather models confirmed theray-tracing concept but made clear that one requiresaccurate numerical weather models in order to com-pute a realistic refractivity field around space geodeticinstruments.
In addition, KARAT was extended to supportfrequency dependency of the refractivity in the mi-crowave domain following the Liebe model [5]. Bythe use of this model, it is possible to compute thecomplex refractivity based on atmosphere quantitieslike pressure, temperature and relative humidity.Using these new features, it was studied whethermodern space-geodetic microwave techniques (in-cluding VLBI2010 and higher dual-frequency VLBIconfigurations) should be corrected for dispersive
IVS 2013 Annual Report

298 Hobiger and Sekido
troposphere delays. Although the frequency dependentdelay contribution appears to be of small order, onehas to consider that signals are propagating througha range of a few kilometers of troposphere at highelevations to hundredths of kilometers at low eleva-tions. Thus, it has been investigated whether suchan effect has a magnitude above the noise floor ofmodern space- geodetic instruments or whether it canbe safely neglected. The frequency dependent KARATmodule was also utilized for the development of asemi-empirical correction model for the microwavelink of the Atomic Clock Ensemble in Space (ACES)[2].
In addition, a model for optical (laser) techniquesis currently being implemented in order to support allspace geodetic techniques, including SLR.
4 Future Plans
For 2014, the plans of the Analysis Center at NICT in-clude:
• Combination of multi-technique space-geodeticdata on the observation level with c5++
• Implementation of an interface for c5++, which al-lows reading and creation of OpenDB data
• Time and frequency transfer experiments by VLBIand combination with other techniques like GNSSor Two-Way Satellite Time and Frequency Transfer(TWSTFT)
• Usage of multi-processors and multi-core process-ing platforms for the acceleration of space geodeticapplications
Acknowledgements
Parts of this work were supported by a Grant-in-Aidfor Young Scientists B (No.25740011). Design and im-plementation of c5++ was a huge effort, requiring theparticipation and support of many individuals.
References
1. T. Hobiger, T. Otsubo, M. Sekido, T. Gotoh, T. Kubooka,and H. Takiguchi, Fully automated VLBI analysis with c5++for ultra-rapid determination of UT1,Earth, Planets, Space,45, 2, 75–79, 2010.
2. T. Hobiger, D. Piester, and P. Baron, A correction model ofdispersive troposphere delays for the ACES microwave link,Radio Science, 48(2), 131–142, 2013.
3. T. Hobiger, T. Otsubo, and M. Sekido, Combination of spacegeodetic observations from SLR and VLBI on the observa-tion level with c5++,Adv. in Space Research, 53(1), 119–129, doi:10.1016/j.asr.2013.10.004, 2014.
4. T. Hobiger and T. Otsubo, Combination of GPS and VLBIon the observation level during CONT11 - common param-eters, ties and inter-technique biases,under review, 2014.
5. H.J. Liebe, MPM-An atmospheric millimeter-wave propa-gation model,Int. J. Infrared and Millimeter Waves, 10, 631-650, 1989.
6. L. Plank, J. Boehm, and H. Schuh (2011), DeDeCC - Com-parison of VLBI data analysis software - results;12th IVSAnalysis Workshop, March 31, 2011, Bonn, Germany, 2011.
7. C. Rieck, R. Haas, R.T.K. Jaldehag, and J.M. Johansson,VLBI time-transfer using CONT08 data,Proceedings of the6th IVS General Meeting, 365-369, 2010.
8. K. Teke, T. Nilsson, J. Boehm, T. Hobiger, P. Steigenberger,S. Garcia-Espada, R. Haas, and P. Willis, Troposphere de-lays from space geodetic techniques, water vapor radiome-ters, and numerical weather models over a series of con-tinuous VLBI campaigns,Journal of Geodesy, 87(10-12),981–1001, 2013.
IVS 2013 Annual Report

NMA Analysis Center 2013 Annual Report
Halfdan Pascal Kierulf, Ann-Silje Kirkvik, Per Helge Andersen
Abstract During the last few years, the NorwegianMapping Authority (NMA) has had a close coopera-tion with the Norwegian Defence Research Establish-ment (FFI) in the analysis of space geodetic data us-ing the GEOSAT software. NMA has taken over thefull responsibility for the GEOSAT software. NMAhas been an Associate Analysis Center of IVS since28 October 2010. NMA’s contributions to the IVS asan Analysis Center focuses primarily on routine pro-duction of session-by-session unconstrained and con-sistent normal equations by GEOSAT as input to theIVS combined solution. Several test solutions were up-loaded to an IVS Combination Center during 2013. Af-ter the last improvements, the VLBI results producedwith GEOSAT are in good agreement with results fromthe other VLBI Analysis Centers.
1 General Information
A number of co-located geodetic stations with morethan one observation technique were established. Inprinciple, all instruments at a given co-located stationmove with the same velocity, and it should be possi-ble to determine one set of coordinates and velocitiesfor each co-located site. In addition, a constant eccen-tricity vector from the reference point of the co-locatedstation to each of the individual phase centers of the co-located antennas is estimated using constraints in ac-cordance with a priori information given by the ground
Norwegian Mapping Authority (NMA)
NMA Analysis Center
IVS 2013 Annual Report
surveys. One set of Earth orientation parameters (EOP)can be estimated from all involved data types, while,for instance, geocenter coordinates only can be esti-mated from satellite techniques and source positionsonly can be estimated from VLBI. Combining the indi-vidual techniques at the observation level gives the pos-sibility of taking the benefit of the strengths of the in-dividual techniques and suppressing their weaknesses.As one example, the present dominating error sourceof VLBI is the water content of the atmosphere, whichmust be estimated. The introduction of GPS data with acommon VLBI and GPS parameterization of the zenithwet delay and atmospheric gradients will strengthenthe solution for the atmospheric parameters. The in-clusion of SLR data, which is nearly independent ofwater vapor, gives new information which will help inthe de-correlation of atmospheric and other solve-forparameters and will lead to more accurate parameterestimates.
These, and many more advantages with thecombination of independent and complementaryspace geodetic data at the observation level, are fullyprovided by the GEOSAT software developed by FFI[1, 2]. GEOSAT is also useful for single techniqueanalysis. The VLBI module of GEOSAT is now furtherdeveloped by the NMA [4]. The goals are both to act asan IVS Analysis Center delivering session-by-sessionunconstrained and consistent normal equations tothe IVS Combination Centers and to provide qualitycontrol for the different modules used in GEOSAT.
299

300 Kierulf et al.
2 Activities during the Past Year
During 2013, the NMA continued the work of makingthe VLBI module of the GEOSAT software compatiblewith other VLBI analysis software delivering results toIVS. In addition, there is a lot of activity going on atNMA to further develop the multi-technique softwareGEOSAT (see the FFI TDC 2011 annual report). TheVLBI module has been upgraded to be compliant withIERS Conventions 2010 [3], and some errors have beeneliminated — for instance errors in the SINEX files dueto misinterpretation of the format specification. NMAsubmitted several smaller solutions to an IVS Combi-nation Center, and adjustments were made in GEOSATbased on the feedback from the IVS Combination Cen-ter. Finally, all R1 and R4 sessions from 2006 weresubmitted to the IVS Combination Center, and the so-lutions were found to be comparable to that of the otherAnalysis Centers (S. Bachmann, private communica-tion). With this stabilized version of the software, 11years (2003-2013) of R1 and R4 sessions were pro-cessed and are awaiting evaluation.
3 Future Plans
As soon as the 11-year test is compared with the indi-vidual solutions from the other ACs and the combinedsolutions from IVS and the outcome of the compar-isons are found to be satisfactory, NMA will implementthe GEOSAT VLBI processing in an automated pro-cessing chain. We will integrate the VLBI processinginto the NMA control center which already monitorsseveral geodetic applications. The NMA control centeris always manned during working hours.
In addition, a lot of effort is being put into passingon the knowledge of Per Helge Andersen to the teamthat will maintain GEOSAT in the future. This workwill continue in 2014 and has a very high priority. Thenew GEOSAT team will consist of five to seven mem-bers, where a few members are only partially involved.
NMA will start to deliver unconstrained normalequations in the SINEX format to the IVS Combina-tion Center on a routine basis. As soon as this work issatisfactory, NMA will apply for the status of a full IVSAnalysis Center.
Unlike most of the other VLBI analysis softwareGEOSAT is based on a UD Kalman filter. This al-
lows changing the stochastic behavior of the system.NMA will test different stochastic parameters espe-cially for the troposphere. Station and epoch dependentstochastic parameters based on input from numericalweather models and IGS tropospheric products will betested and evaluated. Tests of different models are alsoplanned — for instance, a comparison of results usingVMF1 and 3D ray tracing.
To produce VLBI solutions for IVS is the first partof a larger strategic plan from NMA. The next step isto include other geometric geodetic techniques (GNSS,SLR, and DORIS) in a common solution where thedifferent techniques are combined at the observationlevel. The long-term goal of this large effort is to alsoinclude data from the gravity satellites GRACE andGOCE and from altimeter satellites.
4 Staff
Ann-Silje Kirkvik - Master of Science (NMA),Dr. Halfdan Pascal Kierulf - Research geodesist ofNorwegian Mapping Authority (NMA and UiO), Dr.Per Helge Andersen - Research geodesist (NMA),Dr. Ingrid Fausk - Research geodesist (NMA), Dr.Oddgeir Kristiansen - Section Manager (NMA), LailaLøvhøiden - Project leader (NMA).
References
1. Andersen, P. H., 1995. High-precision station posi-tioning and satellite orbit determination. PhD Thesis,NDRE/Publication 95/01094
2. Andersen, P. H., 2000. Multi-level arc combination withstochastic parameters.Journal of Geodesy74:531-551 (doi:10.1007/s001900000115)
3. Petit, G and Luzum B. (Eds.), 2010. IERS Conventions(2010).(IERS Technical Note ; 36) Frankfurt am Main: Ver-lag des Bundesamts fur Kartographie und Geodasie, 179pp., ISBN 3-89888-989-6
4. Kierulf, H.P., Andersen, P.-H., Boeckmann, S., and Kris-tiansen, O. 2010, VLBI Analysis with the Multi-techniqueSoftware GEOSAT.IVS 2010 General Meeting Proceedingspp. 207-211, edited by Dirk Behrend and Karen D. Baver(NASA/CP-2010-215864)
IVS 2013 Annual Report

Paris Observatory (OPAR) Analysis Center
Sebastien Lambert, Christophe Barache, Cesar Gattano
Abstract We report on operational and research ac-tivities at the Paris Observatory VLBI Analysis Center(OPAR) for calendar year 2013. Our achievements in-clude the reanalysis of opa2013a and two research top-ics concerning the time stability of the ICRF2 axes andthe more accurate determination of the Solar systemacceleration.
1 Analysis Service
1.1 Operational Solutions
A reanalysis of the complete diurnal session databasewas done (identified as opa2013a), and the resultingEOP series and radio source catalogs were sent to theIVS. This solution estimated EOP and rates as sessionparameters, most of the station coordinates and the ve-locities as global parameters, and most of the sources’coordinates as global parameters. Stations undergoingstrong nonlinear displacements were estimated as ses-sion parameters (e.g., TIGOCONC, TSUKUB32) in-stead of with the spline parameterization used in theprevious OPAR solutions. Troposphere and clock pa-rameters were estimated every 20 minutes and 60 min-utes, respectively, and gradients were estimated everysix hours (at all sites). Axis offsets were estimated asglobal parameters for a list of 80 stations. We usedup-to-date geophysical and astronomical modeling tocompute the theoretical delay and partials, including
Observatoire de Paris/SYRTE – CNRS – UMPC – GRGS
OPAR Analysis Center
IVS 2013 Annual Report
the IAU 2006 nutation and precession, the Vienna map-ping functions 1, the FES 2004 ocean loading model,and the antenna thermal deformations as provided byA. Nothnagel (2009, J. Geod., 83, 787). Constraintswere applied to the 295 ICRF2 defining sources (no-net rotation), and to 24 stations (no-net rotation and no-net translation of positions and velocities). We used thelatest version of the Calc/Solve geodetic VLBI analysissoftware package.
Diurnal sessions were analyzed routinely within 24hours after version 4 of the observation file was sub-mitted to the IVS. The operational solution is alignedto the opa2013a global solution. Unconstrained normalequations relevant to EOP, rates, and station and sourcecoordinates were sent to the IVS in SINEX format forcombination in the framework of the IVS Analysis Co-ordinator’s task.
An operational solution analyzing Intensive ses-sions after 2006, started in 2011, was also continued(opa2011i) together with corresponding SINEX files.The solution opa2011i processed Intensive sessions inorder to produce UT1 consistent with VTRF 2008A,ICRF2, and the IERS EOP 08 C 04 Earth orientationdata.
All the above products, except SINEX files, werepublished on the OPAR Web site at
http://ivsopar.obspm.fr
together with exhaustive explanations and plots.SINEX files were only sent to the data centers.
301
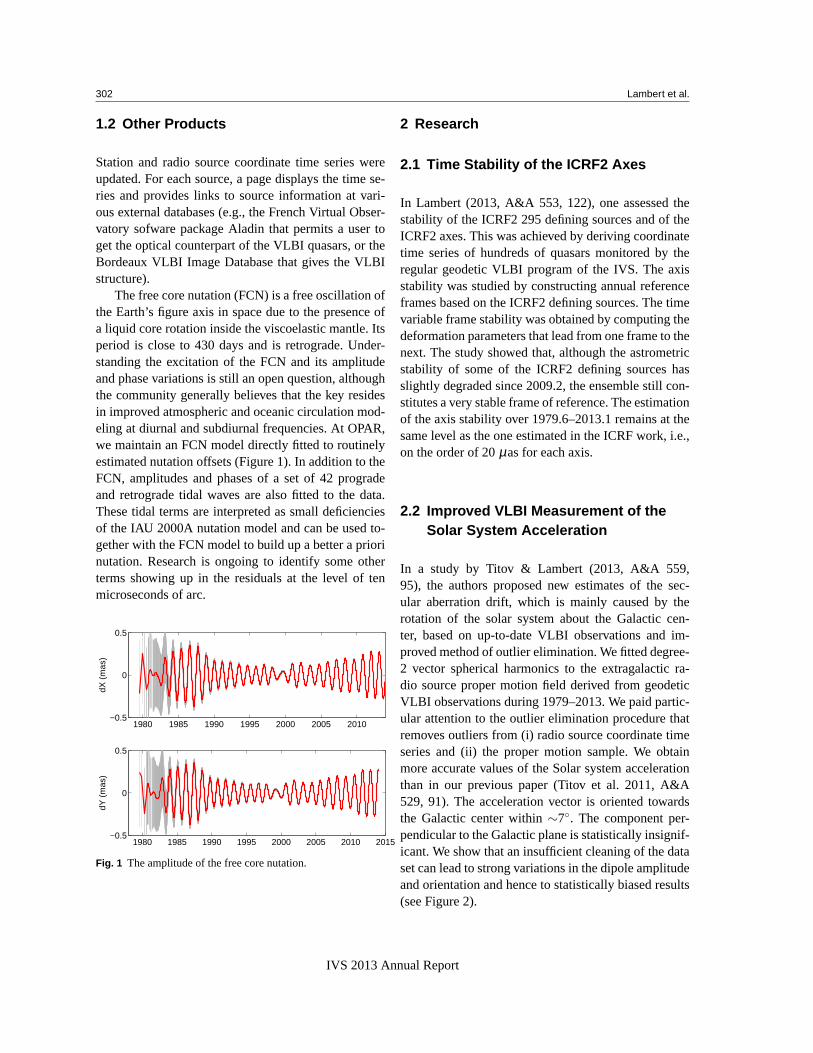
302 Lambert et al.
1.2 Other Products
Station and radio source coordinate time series wereupdated. For each source, a page displays the time se-ries and provides links to source information at vari-ous external databases (e.g., the French Virtual Obser-vatory sofware package Aladin that permits a user toget the optical counterpart of the VLBI quasars, or theBordeaux VLBI Image Database that gives the VLBIstructure).
The free core nutation (FCN) is a free oscillation ofthe Earth’s figure axis in space due to the presence ofa liquid core rotation inside the viscoelastic mantle. Itsperiod is close to 430 days and is retrograde. Under-standing the excitation of the FCN and its amplitudeand phase variations is still an open question, althoughthe community generally believes that the key residesin improved atmospheric and oceanic circulation mod-eling at diurnal and subdiurnal frequencies. At OPAR,we maintain an FCN model directly fitted to routinelyestimated nutation offsets (Figure 1). In addition to theFCN, amplitudes and phases of a set of 42 progradeand retrograde tidal waves are also fitted to the data.These tidal terms are interpreted as small deficienciesof the IAU 2000A nutation model and can be used to-gether with the FCN model to build up a better a priorinutation. Research is ongoing to identify some otherterms showing up in the residuals at the level of tenmicroseconds of arc.
1980 1985 1990 1995 2000 2005 2010−0.5
0
0.5
dX (
mas
)
1980 1985 1990 1995 2000 2005 2010 2015−0.5
0
0.5
dY (
mas
)
Fig. 1 The amplitude of the free core nutation.
2 Research
2.1 Time Stability of the ICRF2 Axes
In Lambert (2013, A&A 553, 122), one assessed thestability of the ICRF2 295 defining sources and of theICRF2 axes. This was achieved by deriving coordinatetime series of hundreds of quasars monitored by theregular geodetic VLBI program of the IVS. The axisstability was studied by constructing annual referenceframes based on the ICRF2 defining sources. The timevariable frame stability was obtained by computing thedeformation parameters that lead from one frame to thenext. The study showed that, although the astrometricstability of some of the ICRF2 defining sources hasslightly degraded since 2009.2, the ensemble still con-stitutes a very stable frame of reference. The estimationof the axis stability over 1979.6–2013.1 remains at thesame level as the one estimated in the ICRF work, i.e.,on the order of 20µas for each axis.
2.2 Improved VLBI Measurement of theSolar System Acceleration
In a study by Titov & Lambert (2013, A&A 559,95), the authors proposed new estimates of the sec-ular aberration drift, which is mainly caused by therotation of the solar system about the Galactic cen-ter, based on up-to-date VLBI observations and im-proved method of outlier elimination. We fitted degree-2 vector spherical harmonics to the extragalactic ra-dio source proper motion field derived from geodeticVLBI observations during 1979–2013. We paid partic-ular attention to the outlier elimination procedure thatremoves outliers from (i) radio source coordinate timeseries and (ii) the proper motion sample. We obtainmore accurate values of the Solar system accelerationthan in our previous paper (Titov et al. 2011, A&A529, 91). The acceleration vector is oriented towardsthe Galactic center within∼7◦. The component per-pendicular to the Galactic plane is statistically insignif-icant. We show that an insufficient cleaning of the dataset can lead to strong variations in the dipole amplitudeand orientation and hence to statistically biased results(see Figure 2).
IVS 2013 Annual Report

OPAR Analysis Center 303
0 60 120 180 240 300 360−90
−60
−30
0
30
60
90
5 µas/yr
Right Ascension (°)
Dec
linat
ion
(°)
DR
Fig. 2 The dipole pattern in the radiosource apparent proper mo-tion field.
IVS 2013 Annual Report

Onsala Space Observatory – IVS Analysis Center Activitiesduring 2013
Rudiger Haas, Hans-Georg Scherneck, Johan Lofgren, Tong Ning, Niko Kareinen
Abstract This report briefly summarizes the activitiesof the IVS Analysis Center at the Onsala Space Ob-servatory during 2013 and gives examples of results ofongoing work.
1 General Information
We concentrate on research topics that are relevant forspace geodesy and geosciences. These research topicsare related to data observed with geodetic VLBI andcomplementing techniques.
2 Activities during the Past Year
We worked primarily with the following topics:
• Automated reference point determination• Simulations for the Onsala Twin Telescope project• Analog vs. digital VLBI observations• Coastal sea level observations with GNSS• Ocean Tide Loading• Gravimetry observations.
Chalmers University of Technology, Department of Earth andSpace Sciences, Onsala Space Observatory
Onsala Analysis Center
IVS 2013 Annual Report
3 Automated Reference PointDetermination
We developed a strategy to obtain an automated andcontinual reference point determination of radio tele-scopes with sub-mm accuracy. This approach can beused both in dedicated survey campaigns (stop-and-gomode) as well as during ongoing VLBI sessions (con-tinuous motion). The method was tested successfullyalready in 2012, and the corresponding results werepublished in [3].
4 Simulations for the Onsala TwinTelescope Project
We performed simulations for the Onsala Twin Tele-scope (OTT) project, concerning both the actual loca-tion of the antennas and their local horizon masks aswell as future scheduling and use of the antennas.
Figure 1 depicts a digital elevation model of theOTT plan that was submitted to the local authorities inDecember 2013. Compared to a previously submittedplan in 2012 [1] the antenna OTT1 has been moved to-wards the southwest. The local horizons for two anten-nas and for the combined OTT are shown in Figure 2.Table 1 gives information on the horizon blockage atdifferent elevation limits.
The future use of the OTT was also studied by sim-ulating possible observing schedules [4]. Several dif-ferent scheduling strategies were tested with the VieVssoftware. These simulations showed that the so-calledcontinuous mode approach with four radio sources ata time gives the best results in terms of station po-
304

OSO – IVS Analysis Center 305
0 50 100 150 200 250 300 350 400 450 5000
50
100
150
200
250
300
350
400
2
2
4
10
4
The sea
6
Wetland
8
10
6
18
2
8
20
OTT2
1416
OTT1
6
2
28
6
4
26
6
east (m)
4
4
22
4
6
30
4
32
4
6
The sea
12
24
6
2
2
16
8
25 m
1820
22
2
6
4
4
10
14
2
2
4
2
12
2
22
6
24
nort
h (m
)
The sea
Fig. 1 Digital elevation model of a selected area of the OnsalaSpace Observatory, showing the location of the 25-m telescope,and the planned Onsala Twin Telescope antennas, OTT1, andOTT2 (plan of December 2013). These three telescopes are ona small peninsula that is surrounded by the sea from southwestto southeast and wetland in the east. In the north, there is a rockyhill of more than 32-m height.
0 45 90 135 180 225 270 315 3600
2.5
5
7.5
10
12.5
15
17.5
20
azimuth (deg)
elev
atio
n (d
eg)
OTT blocked > 5.0° : 7.5%
OTT blocked > 7.5° : 0%
OTT blocked > 10.0° : 0%
OTT1OTT2OTT
Fig. 2 Horizon masks for the individual twin telescopes, OTT1(dashed line, red) and OTT2 (dashed-dotted line, blue), and com-bined for both OTT antennas together (solid line, black), as seenfrom the lower edge of the prime reflectors. The OTT telescopessee each other (at about 30◦ and 240◦ azimuth), and they see the25-m telescope at about 210◦ and 290◦ azimuth. However, thecommon horizon is completely free above 7.5◦ and only blockedby 7.5 % at elevation 5◦.
sitions and EOP. However, the continuous mode ap-proach with two radio sources at a time strategy ap-peared to be superior in terms of accuracy of tropo-spheric parameters. Further investigations are neces-sary.
Table 1 Horizon blockage at different elevation limits.
antenna blocking> 5◦ > 10◦ > 15◦
OTT1 18.1 % 9.4 % 5.0 %OTT2 22.5 % 5.8 % 0 %OTT 7.5 % 0 % 0 %25 m 14.7 % 4.7 % 0 %
5 Analog vs. Digital VLBI Observations
About 2/3 of the geodetic VLBI sessions performed in2013 at Onsala were observed both with the old analogMark IV rack and the new digital DBBC. Zero-baselinetests were performed using the DiFX software correla-tor at Onsala and at the Bonn correlator. Figure 3 de-picts as an example the zero-baseline correlation forone scan of the experiment R1567.
The Bonn correlator also prepared for several ofthese parallely recorded experiment databases that in-
Mk4/DiFX fourfit 3.8 rev 756 0800+618.wpscuq, 007-1714, WX�ONSADBBC - ONSALA60, fgroup X, pol RR
9
70659.693.440
9598.447-53.6
0.0e+00
-1.926363-0.000063
0.000008 0.00
8212.99001.280
R156716383
2013:007171426.28171559.72171512.00
2013:014:1029172013:015:1036592012:201:081500
08h05m18.1796s+61˚44’23.700"
Fringe quality
SNRInt timeAmpPhasePFDDelays (us)SBDMBDFringe rate (Hz)
Ion TEC Ref freq (MHz)
AP (sec)
Exp.Exper #Yr:dayStartStopFRTCorr/FF/build
RA & Dec (J2000)
Amp. and Phase vs. time for each freq., 25 segs, 3 APs / seg (3.84 sec / seg.), time ticks 5 sec
UValidity
L
WX
8212.99 Freq (MHz)-49.9 Phase10569.4 Ampl.451.1 Sbd box73/73 APs usedU/L5010 PC freqsW5010 PC freqsX61:136 PC phaseW:X0:0 Manl PCW:X
PC ampW 2425XX00U,X01L Chan idsW
X00U,X01L Chan idsX
8252.99-59.59584.9451.273/050105010168:1330:02224X02U
X02U
8352.99-54.411389.4451.173/050105010-57:-1480:02326X03U
X03U
8512.99-57.310459.7451.073/05010501048:-780:02224X04U
X04U
8732.99-55.08945.4451.773/05010501077:-880:02022X05U
X05U
8852.99-49.09344.4451.773/050105010-42:-470:02123X06U
X06U
8912.99-47.39265.8451.973/050105010-114:500:02122X07U
TracksX07U
Tracks
8932.99-57.78052.0451.773/7350105010-141:20:02222X08U,X09L
X08U,X09L
All-53.6
9623.2451.4
Group delay (usec)Sband delay (usec)Phase delay (usec)Delay rate (us/s)Total phase (deg)
-8.23964039918E-05-1.92638223394E+00-3.78093981831E-053.02254897572E-10
-111.8
Apriori delay (usec)Apriori clock (usec)Apriori clockrate (us/s)Apriori rate (us/s)Apriori accel (us/s/s)
-1.96744755904E-050.0000000E+000.0000000E+00
-7.97208722291E-102.18162936353E-13
Resid mbdelay (usec)Resid sbdelay (usec)Resid phdelay (usec)Resid rate (us/s)Resid phase (deg)
-6.27219E-05-1.92636E+00-1.81349E-051.09946E-09
-53.6
+/-+/-+/-+/-+/-
8.0E-097.0E-074.0E-101.0E-11
0.0
RMS Theor. Amplitude 9598.447 +/- 0.136 Pcal mode: NORMAL, NORMAL Pcal period (AP’s) 9999, 9999ph/seg (deg) 0.1 0.0 Search (256X256) 9225.956 Pcal rate: -9.549E-09, -9.393E-09 (us/s) sb window (us) -16.000 16.000amp/seg (%) 0.0 0.0 Interp. 9225.956 Bits/sample: 1 SampCntNorm: disabled mb window (us) -0.025 0.025ph/frq (deg) 4.2 0.0 Inc. seg. avg. 9598.457 Sample rate(MSamp/s): 16 dr window (ns/s) -0.048 0.048amp/frq (%) 10.3 0.0 Inc. frq. avg. 9623.221 Data rate(Mb/s): 160 nlags: 512 t_cohere infinite ion window (TEC) 0.00 0.00
W: az 39.0 el 42.9 pa -45.8 X: az 39.0 el 42.9 pa -45.9 u,v (fr/asec) 0.000 -0.000 iterative interpolator
Control file: ../cf_1234 Input file: /Exps/r1567/1234/007-1714/WX..wpscuq Output file: Suppressed by test mode
Fig. 3 Fringe plot for a zero-baseline test for an X-band obser-vation during session R1567.
IVS 2013 Annual Report

306 Haas et al.
clude Onsala both as an analogue station (On) and asa digital station (Od). We analyzed several of thesedatabases, and our preliminary results are that there areno significant effects on the geodetic results, in partic-ular on the earth orientation parameters, if either theanalog or digital data are used for the data analysis.Further investigations with a larger set of databases arenecessary.
6 Coastal Sea Level Observations withGNSS
We used the GNSS-based tide gauge installation at theobservatory to derive the local sea level and its varia-tion using reflected GNSS signals.
Besides using phase-delay analysis of the datarecorded with the special dual-antenna GNSS tidegauge installation at Onsala, we also used signal-to-noise-ratio (SNR) analysis of the data observed onlyby the upward-looking GNSS antenna [2]. The studyproved that this SNR analysis method can be appliedto coastal single-antenna installations.
A comparison of relative sea levels derived fromthe GNSS tide gauge, a co-located pressure-based tidegauge, and a recently installed co-located tide gaugebased on a pneumatic sensor is shown for the monthof September in Figure 4. The tide gauge based on the
1 2 3 4 5 6 7 8 9 10 11 12 13 14 15 16 17 18 19 20 21 22 23 24 25 26 27 28 29 30−0.5
0
0.5
1
1.5
Day in September 2013
Rel
ativ
e se
a le
vel (
m)
Bubbler Pressure GNSS
1 2 3 4 5 6 7 8 9 10 11 12 13 14 15 16 17 18 19 20 21 22 23 24 25 26 27 28 29 30−400
−200
0
200
400
600
Rel
ativ
e se
a le
vel d
iffer
ence
s (m
m)
Day in September 2013
Pressure − Bubbler
GNSS − Bubbler
Standard deviation: 13 mm
Standard deviation: 46 mm
−600
−400
−200
0
200
Fig. 4 Top: Relative sea levels derived from the pneumatic sen-sor (“bubbler”), a pressure sensor, and the GNNS tide gauge, forSeptember 2013. The data are offset from each other to improvereadability. Bottom: Relative sea level differences with respectto the bubbler.
pneumatic sensor (the “bubbler”) has according to themanufacturer a measurement uncertainty of±3 mm.The two other techniques (pressure sensor and GNSStide gauge) result in an agreement with the bubbler onthe order of 13 mm and 46 mm (standard deviation af-ter bias removal), respectively.
7 Ocean Tide Loading
The Automatic Ocean Tide Loading service was oper-ated throughout the year. It is heavily used by the inter-national scientific community.
8 Gravimetry Observations
Since January 2013 the superconducting gravimeter inthe gravity laboratory at the Onsala Space Observatorycommunicates one-second data to the world. Theinstantaneous measurements are presented on thewebpage http://holt.oso.chalmers.se/hgs/SCG/monitor-plot.html. The presentedvalues are reduced for air pressure and astronomicaltides and shown in the largest diagram. A summary ofthe last 30 days and a spectrogram of the short-periodnoise are also shown. A link makes numeric dataavailable for download with a latency of less than twominutes; other links allow the identification of seismicevents and the causes of microseismic noises (mostlyremote action due to high waves in specific areas ofthe North Atlantic region).
9 Future Plans
The IVS Analysis Center at the Onsala Space Obser-vatory will continue its efforts to work on specific top-ics relevant to space geodesy and geosciences. For thefuture we plan to intensify our activities, in particularconcerning horizontal gradients in the atmosphere us-ing VLBI, GNSS, and radiometers. A special focus forthe coming years will be work related to the OnsalaTwin Telescope project.
IVS 2013 Annual Report

OSO – IVS Analysis Center 307
References
1. Haas R. The Onsala Twin Telescope Project.Reports of theFinnish Geodetic Institute, Proceedings of the 21st Meetingof the European VLBI Group for Geodesy and Astronomy,Ed. by N. Zubko and M. Poutanen, 2013:1 (1), 61–65, 2013.
2. Larson K., Lofgren J., Haas R. Coastal Sea Level Measure-ments Using a Single Geodetic GPS Receiver.Advances inSpace Research, 51(8), 1301–1310, 2013.
3. Losler M., Haas R., Eschelbach C. Automated and continualdetermination of radio telescope reference points with sub-mm accuracy: results from a campaign at the Onsala SpaceObservatory.Journal of Geodesy, 87(8), 791–804, 2013.
4. Schonberger C. Simulations of VLBI observationswith the Onsala Twin Telescope. Master of Sci-ence Thesis, Chalmers University of Technology,http://publications.lib.chalmers.se/records/fulltext/185857/185857.pdf, 2013.
IVS 2013 Annual Report

PMD Analysis Center 2013 Annual Report
Vincenza Tornatore
Abstract This report summarizes the activities of thePolitecnico di Milano(PMD) IVS Analysis Center dur-ing the year 2013 and outlines the planned aspectsof work for 2014. The main focuses in 2013 were inthe framework of the IAG WG 1.4.2 onCo-locationon Earth and in Space for the determination of theCelestial Reference Frame. Studies carried out con-cern e.g. simulations for some European VLBI anten-nas performed to investigate if the VLBI phase refer-encing technique can be used for precise determina-tion of GNSS state vectors. Furthermore, investigationsinto possible deformations introduced by the change toICRF2 [1] were also made for the processing of 24-hour observational sessions.
1 General Information
Throughout 2013, Milan University of Technology(Politecnico di Milano) celebrated the 150th anniver-sary of its establishment with several events, seeFigure 1 and Figure 2; some of these events are listedin [2].
The department, supporting activities of the PMDIVS Analysis Center, changed since January 2013. Thenew one is called Department of Civil and Environ-mental Engineering (DICA) [3]. Therefore the nameof the Analysis center PMD stands for Politecnico diMilano Dica now. This new department belongs, likethe previous one (called Diiar), to Milan University of
Politecnico di Milano, Department of Civil and EnvironmentalEngineering (DICA), Geodesy and Geomatic area
PMD Analysis Center
IVS 2013 Annual Report
Fig. 1 2013 marked the 150th year of the establishment of thePolitecnico di Milano.
Fig. 2 People celebrating the 150th anniversary of thePolitec-nico di Milano.
Technology. It deals with plentiful research areas incivil and environmental engineering, enhancing an in-tegrated approach among them.
308

PMD 2013 Report 309
The research area called Geodesy and Geomatichosts and operates the PMD IVS AC and IGeS (In-ternational Geoid Service), an official Service of theInternational Association of Geodesy (IAG), see [4].PMD started officially its activity in October 2010 [5].DICA supplies hardware equipment, software licensesand assistance, and the personnel necessary to manageit.
2 Staff
During 2013, the following persons contributed to thePMD activity:
1. Vincenza Tornatore — team coordinator, projectdeveloper, data analysis;
2. Cinzia Vajani — software maintenance;3. Daniele Passoni — data processing.
3 Current Status and Activities
During 2013, the main activities developed by thePMD IVS Analysis Center were addressed to studyingif the observing technique calledphase referencing(largely used for high precision VLBI astrometry, seee.g. [6] and [7]) could be applied to observing GNSSsatellites with the aim of improving the precision ofthe determination of the satellite state vector and ofobtaining satellite positions directly in ICRF. It is wellknown that the strong power emitted by the satellitescompared to the very low emission of natural radiosources (calibrators) could represent a limiting factor,because the satellite signal can be easily detectedthrough near sidelobes when observing, at the samesatellite frequency, the natural calibrator in the mainbeam.
To get an indication of this problem, some prelimi-nary investigations were carried out. We ran some sim-ulations, in collaboration with the University of Milan(Physics Department), using GRASP (General Reflec-tor antenna Analysis Software Package) v.10, to assessthe relative power contribution of satellites in the nearsidelobes when observing in L-band a natural calibra-tor in the main beam. For each examined station, weevaluated the minimum angular distance between the
satellite and the calibrator to avoid near-sidelobe stray-light contamination from the satellite emission whenthe calibrator is tracked.
Three European VLBI antennas, Medicina, Notoand Onsala85, were considered. All three antennashave a Cassegrain configuration with a parabolicprimary dish and a hyperbolic secondary dish. TheL-band receiver is mounted at the primary focus onlyat Medicina, while for Noto and Onsala85 it is atthe secondary focus. Figure 3 shows the GRASP 3Dmodel of the optics of the three antennas, while thecorresponding beam patterns are shown in Figure 4.
Detailed results and discussions on this work havebeen published in [8]. To briefly summarize, we canwrite that the key role in avoiding calibrator signal con-tamination due to a strong satellite signal seems to beplayed by the telescope optical configuration, with bet-ter results obtained for Medicina (with the L-band re-ceiver at the primary focus), than for Noto and On-sala85 (with the L-band receiver at the secondary fo-cus).
During 2013, another subject tackled by PMD ACconcerned investigations into possible deformations in-troduced by the change to ICRF2. In tight collaborationwith the VIE IVS Analysis Center and the PUL IVSAC, 27 years of suitable VLBI experiments, measuredin 24-hour sessions, were analyzed. The starting yearwas 1984. IERS (International Earth Rotation and Ref-erence Systems Service) [9] and IVS conventions onVLBI data [10] were followed in the data processing.Session-wise solutions were computed with the ViennaVLBI Software VieVS [11]. Results are going to bepublished, after an in-depth analysis and complemen-tary studies are completed.
4 Future Plans
In 2014, the work of the PMD Analysis Center willfocus on the following aspects:
• Co-location on Earth and in Space for the determi-nation of the Celestial Reference Frame.
• Investigation into dedicated algorithms for tro-pospheric parameter estimation, particularlyaddressed to a territory not very broad, such as theItalian region.
• Continuation of investigations into ICRF2.
IVS 2013 Annual Report

310 Tornatore
Fig. 3 VLBI radio telescope optics simulated with GRASP, inthe order from top to bottom: Medicina, Noto, and Onsala85.
Acknowledgements
The author wishes to thank IRA/INAF, Istituto di Ra-dioastronomia, Italy (S. Mariotti, G. Nicotra, and F.Schilliro), and Onsala85 radio telescope, operated by
Fig. 4 VLBI radio telescope optics simulated with GRASP, inthe order from top to bottom: Medicina, Noto, and Onsala85.
the Swedish National Facility for Radio Astronomy,Sweden (M. Lundqvist and M. Pantaleev), for hav-ing provided the values about antenna dish geometryand feed characteristics used to make simulations withGRASP.
IVS 2013 Annual Report

PMD 2013 Report 311
References
1. IERS technical note 35,The second realization of the inter-national celestial reference frame by very long baseline in-terferometry, Fey A.L., Gordon D., Jacobs C.S. (eds) Verlagdes Bundesamts fur Kartographie und Geodasie, Frankfurtam Main, 2009 (http://www.iers.org/TN35).
2. http://www.150.polimi.it.3. http://www.dica.polimi.it/en/.4. http://www.iges.polimi.it/.5. Tornatore V.,New Associate Analysis Center Established
at PMD, in International VLBI Service for Geodesy andAstrometry 2010 Annual Report, NASA/TP-2011-215880,Behrend D. and Baver K.D. (eds), 244-246, 2011.
6. Lane B. F.and Muterspaugh M.W.,Phase referencing andnarrow-angle astrometry in current and future interferom-etersin Proceedings of SPIE, V. 5491, N.1Traub W.A. ed,SPIE Bellingham, WA, 47-55, 2004.
7. Asaki Y., Sudou H., Kono Y., Doi A., Dotson R., Pradel N.,Murata Y., Mochizuki N., Edwards P.G., Sasao T., Foma-lont E.B.Verification of the Effectiveness of VSOP-2 PhaseReferencing with a Newly Developed Simulation Tool, ARIS,Publ. Astron. Soc. Japan, 59, 397, 2007.
8. Tornatore V., Mennella A.On the possibility of using VLBIphase referencing to observe GNSS satellites, in: 21th Eu-ropean VLBI for Geodesy and Astrometry (EVGA) WorkingMeeting Proceedings, Zubko N., Poutanen M., (eds), 227-231, 2013.
9. Petit G., Luzum B. (eds.),IERS Conventions (2010), IERSTechnical Note 36, Frankfurt am Main: Verlag des Bunde-samts fur Kartographie und Geodasie, 2010.
10. Nothnagel A.Conventions on thermal expansion modelingof radio telescopes for geodetic and astrometric VLBI, inJournal of Geodesy, 83, 787—792, 2008.
11. Bohm J., Bohm S., Nilsson T., Pany A., Plank L., Spi-cakova H., Teke K., Schuh H.The new Vienna VLBISoftware VieVSin IAG Symposium 139, Kenyon S., Pa-cino M.C., Marti U. (eds), 1007-1012, 2012.
IVS 2013 Annual Report

Pulkovo IVS Analysis Center (PUL) 2013 Annual Report
Zinovy Malkin, Yulia Sokolova
Abstract This report briefly presents the PUL IVSAnalysis Center activities during 2013 and plans forthe coming year. The main topics of the investigationsof the PUL staff in that period were ICRF related stud-ies, computation and analysis of EOP series, celestialpole offset (CPO) and free core nutation (FCN) model-ing, and VLBI2010 related issues.
1 General Information
The PUL IVS Analysis Center was organized inSeptember 2006. It is located at and sponsored bythe Pulkovo Observatory of the Russian Academyof Sciences. It is a part of the Pulkovo EOP andReference Systems Analysis Center (PERSAC) [1].The main topics of our IVS related activity are:
• Improvement of the International Celestial Refer-ence Frame (ICRF).
• Computation and analysis of the Earth orientationparameters (EOP) from Intensives and 24-hour IVSsessions.
• Analysis of EOP and position time series.• Modeling of the celestial pole offset (CPO) and free
core nutation (FCN).• Comparison of VLBI products, primarily EOP,
with results of other space geodesy techniques.• Computation and analysis of observation statistics.
The PUL Analysis Center Web page [2] is sup-ported. It contains the following sections:
Pulkovo Observatory
Pulkovo Analysis Center (PUL)
IVS 2013 Annual Report
• General Information on the PUL Analysis Center.Includes brief history, activity overview, and a sci-entific staff list.
• VLBI data analysis. Includes results of VLBI dataanalysis, such as UT1 Intensive series, CPO/FCNseries, and mean Pole coordinates. These data areupdated daily.
• OCARS catalog. Includes the latest version of thecatalog of optical characteristics of astrometric ra-dio sources (OCARS) [3]. The catalog is continu-ally updated as new information becomes available.
• Approaches and occultations. Includes tables forforthcoming mutual events of planets and astromet-ric radio sources, such as close angular approachesand occultations for the period until 2050 [4].
• PUL members’ publications and presentations.• VLBI technology overview.• Links to the VLBI World. Includes links to (pri-
marily geodetic and astrometric) VLBI coordinat-ing bodies, stations, analysis centers, software, etc.
• Contact information.
2 Staff
In 2013 the following persons contributed to the PULactivity:
1. Zinovy Malkin (70%) — team coordinator, EOPand CRF analyst;
2. Natalia Miller (5%) — EOP analyst; and3. Yulia Sokolova (100%) — CRF analyst.
312

Pulkovo Analysis Center (PUL) 313
3 Activities and Results
The main activities and results of the PUL IVS Analy-sis Center during 2013 included:
• ICRF related research. The main directions of thisactivity were comparison and combination of radiosource catalogs and investigation of their stochasticand systematic errors. In 2013, the following resultswere obtained:
– A new Pulkovo combined catalog was com-puted [5]. Using CRF realizations from eightIVS Analysis Centers (aus, bkg, cgs, gsf, igg,opa, sha, and usn), we computed two combinedcatalogs: PUL (2013) C01 and PUL (2013)C02. The method used generally follows ourprevious work [6]. Besides using more data,several developments were realized as com-pared with the previous version of the Pulkovocombined catalog of 2007 [6]. The PUL (2013)C01 catalog is constructed in the ICRF2 [7]system and is aimed at improving ICRF2random errors, while the final, PUL (2013) C02catalog is constructed in an independent systemand thus provides both stochastic and system-atic improvement of the ICRF2. Comparisonof the Pulkovo combined catalog with ICRF2gives evidence of ICRF2 systematic errors at alevel of 15–20µas.
– Impact of the correlation information on the re-sults of determination of the angles of mutualorientation between catalogs was investigated[8]. This work continues the work of Jacobset al. [9]. Test computations were performedwith nine catalogs computed in eight centers ofanalysis of the VLBI observations. The mutualorientation between these CRF realizations wascomputed with three methods of accounting forthe correlation information: using the positionerrors only, using only the RA/DE correlationsreported in radio source position catalogs in theIERS format, and using the full correlation ma-trix. Only two of these catalogs, igg and gsf,were provided together with full covariance ma-trices (thanks to the authors of these catalogswho made them available for our work); sevenother catalogs were published with RA/DE cor-relations only. Our analysis has shown that us-ing the RA/DE correlations only slightly influ-
ences the computed rotational angles, whereasusing the full correlation matrices leads to sub-stantial change in the orientation parameters be-tween the compared catalogs.
– A new approach to estimation of the stochas-tic errors of radio source position catalogs wasproposed [10]. It is based on the three-cornered-hat technique, extended to the N-cornered-hattechnique. A key point of the method is a newapproach to computation of the correlations be-tween the compared catalogs. As an additionalrefinement, the concept of weighted correlationcoefficient was introduced. This technique wasapplied to nine recently published radio sourceposition catalogs. We also found large system-atic differences between catalogs that signifi-cantly impact determination of their stochasticerrors.
– A study was performed aimed at a search foran optimal strategy for using limited observa-tional resources in the southern hemisphereto improve ICRF in the bandδ < −40◦ [11].We investigated the possibility of increasingthe number of observations of existing andprospective southern ICRF radio sources byinclusion of more such sources in the regularIVS sessions like R1 and R4. With MonteCarlo simulations, we tested the influence ofadding supplementary southern sources to theIVS R1541 (12JUL09XA) session on EOPand baseline length repeatability. We foundthat adding more observations of southernsources to the standard schedule causes a slightdegradation of some geodetic products and aslight improvement of others, depending onthe number of added southern sources. Sim-ilar results were obtained for the IVS R1591(13JUN24XA) session. Generally, it was shownthat it is possible to increase the number ofobservations of southern sources without lossof the overall accuracy of geodetic products.
– The OCARS catalog [3] has been supportedsince 2008. The catalog provides redshift infor-mation, as well as visual and NIR magnitudes.The improvements made in 2013 include addi-tion of new sources and new measurements ofredshift and magnitude. The current basic statis-tics of the catalog are given in Table 1.
IVS 2013 Annual Report

314 Malkin and Sokolova
Table 1 Current basic statistics of the OCARS catalog.
All sources ICRF2 sources ICRF2 definingSources 8246 3414 295Sources with known redshift 4353 (52.8%) 2249 (65.9%) 261 (88.5%)Sources with known magnitude 5395 (65.4%) 2618 (76.7%) 285 (96.6%)
• CPO and FCN related research. The main activitiesand results in 2013 were the following:
– Two CPO and two FCN series were updateddaily and are available at the PERSAC Webpage [1].
– FCN amplitude and phase variations derivedfrom VLBI observations were investigated.Comparison of the epochs of the changes in theFCN amplitude and phase with the epochs ofthe geomagnetic jerks (GMJs) indicated thatthe observed extremes in the FCN amplitudeand phase variations were closely related to theGMJ epochs. In particular, the FCN amplitudebegins to grow one to three years after theGMJs. Thus, processes that cause GMJs areassumed to be sources of FCN excitation [13].
– Several VLBI-derived CPO time series were an-alyzed with the goal of detecting the Free In-ner Core Nutation (FICN) [14]. The series wereinvestigated by means of spectral and waveletanalysis. It was shown that there are several pe-riodic signals with close amplitude around theexpected FICN period without a prevailing one,which can be associated with the FICN. So, itseems to be necessary to improve the theoreticalestimates of the FICN period to make searchingfor it in the observational series more promis-ing.
– A study was made to investigate optimal CPOmodelling for operational determination of UT1from hourly sessions with the Quasar VLBInetwork (Institute of Applied Astronomy). Itwas found that the systematic differences be-tween the UT1 estimates computed with differ-ent models (trend and seasonal terms) are at alevel of 1-3 µs. On the other hand, the formalerror of the UT1 estimates practically does notdepend on the CPO model used [12].
• Studies in the framework of the IAG SC 1.4 activ-ity on investigation of the mutual impact of celes-tial and terrestrial reference frames and impact ofastronomical and geophysical modelling on ICRF.
A study was performed to investigate the impactof seasonal station movement on the UT1 Inten-sives results [15]. It was found that a significantannual term is present in the time series for moststations, and its amplitude can reach 8 mm in theheight component and 2 mm in the horizontal com-ponents. However, the annual signals found in thedisplacements of the co-located VLBI and GPS sta-tions at some sites differ substantially in amplitudeand phase. The semiannual harmonics are relativelysmall and unstable, and for most stations no pre-vailing signal was found in the corresponding fre-quency band. Then two UT1 Intensives series werecomputed with and without including the seasonalterm found in the previous step in the station move-ment model. Comparison of these series has shownthat neglecting the seasonal station position varia-tions can cause a systematic error in UT1 estimates,which can exceed 1µs, depending on the observingprogram.
• Operational data processing of IVS Intensive ses-sions in automated mode and submission of resultsto IVS was continued. The UT1 time series is avail-able at IVS Data Centers and at the PERSAC Webpage [1].
• The PUL archive of VLBI data and productsobtained in the framework of IVS activity issupported. At present, all available databases andcorresponding NGS cards for 1979-2013 are stored(about 9.4 million observations) along with themain IVS and IERS products. These archives arecontinually updated as new databases becomeavailable.
• Development of algorithms and software for dataprocessing and analysis continued. The resultsof two studies were published in 2013. The firstpaper deals with improvement of the applicationof the Allan variance technique to astronomicaland geodetic time series with unevenly weightedmeasurements [16]. Modifications of the standardAVAR definition for unevenly spaced and multi-dimensional series were proven to be an effective
IVS 2013 Annual Report

Pulkovo Analysis Center (PUL) 315
tool for data processing. In the second study, theproblem of computation of the uncertainty ofa weighted mean of several measurements wasconsidered [17]. It was found that two classical ap-proaches have serious shortcomings when appliedto real data. Therefore, a combined estimate for theuncertainty of the weighted mean was proposedand successfully tested.
• PUL staff members participated in activities of sev-eral IERS, IAG, and IVS projects, committees, andworking groups.
4 Future Plans
Plans for the coming year include:
• Continuing VLBI related studies.• Continuing UT1 Intensive data processing.• Continuing OCARS catalog support.• Continuing with development of algorithms and
software for data processing.• Continuing support of the PUL archives of data and
products.
References
1. http://www.gao.spb.ru/english/as/persac/index.htm2. http://www.gao.spb.ru/english/as/acvlbi/3. http://www.gao.spb.ru/english/as/acvlbi/ocars.txt4. http://www.gao.spb.ru/english/as/acvlbi/
occultationsapproaches.pdf5. Sokolova Yu, Malkin Z. Pulkovo combined catalog of radio
source coordinates PUL 2013. Astronomy Letters, 2013, ac-cepted.
6. Sokolova Ju., Malkin Z. On comparison and combination ofcatalogs of radio source positions. Astron. Astrophys., 2007,474, 665–670.
7. Ma C., E. F. Arias, G. Bianco, D. A. Boboltz, S. L. Bolotin, P.Charlot, G. Engelhardt, A. L. Fey, R. A. Gaume, A. M. Gon-tier, R. Heinkelmann, C. S. Jacobs, S. Kurdubov, S. B. Lam-bert, Z. M. Malkin, A. Nothnagel, L. Petrov, E. Skurikhina,J. R. Sokolova, J. Souchay, O. J. Sovers, V. Tesmer, O. A.Titov, G. Wang, V. E. Zharov, C. Barache, S. Boeckmann,A. Collioud, J. M. Gipson, D. Gordon, S. O. Lytvyn, D. S.MacMillan, R. Ojha. The Second Realization of the Inter-national Celestial Reference Frame by Very Long BaselineInterferometry. IERS Technical Note No. 35, A. L. Fey, D.Gordon, C. S. Jacobs (Eds.), Verlag des Bundesamts fuer Kar-tographie und Geodaesie, Frankfurt am Main, 2009.
8. Sokolova Ju. R., Malkin Z. M. On impact of the correlationinformation on the orientation parameters between celestialreference frames. Vestnik of the St. Petersburg State Univer-sity, Ser. 1, No. 4, 146–151, 2013. (in Russian)
9. Jacobs C. S., Heflin M. B., Lanyi G. E., Sovers O. J., SteppeJ. A. Rotational Alignment Altered by Source Position Corre-lations. In: IVS 2010 General Meeting Proc, Eds. D. Behrend,K.D. Baver, NASA/CP-2010-215864, 305–309, 2010.
10. Malkin Z. A new approach to the assessment of stochas-tic errors of radio source position catalogues. Astron. Astro-phys., v. 558, A29, 2013.
11. Malkin Z., Sun J., Boehm J., Boehm S., Krasna H. Search-ing for an Optimal Strategy to Intensify Observations of theSouthern ICRF sources in the framework of the regular IVSobserving programs. In: Proc. 21st Meeting of the EVGA,Eds. N. Zubko, M. Poutanen, Rep. Finn. Geod. Inst., Vol.2013:1, 199–203. ISBN: 978-951-711-296-3, 2013.
12. Malkin Z. M., Skurikhina E. A. Dependence of the rapidUT1 results obtained from the VLBI network “Quasar” onnutation model. Proc. of the All-Russian Astrometry Confer-ence Pulkovo-2013, Izvestiya GAO, No. 220, St. Petersburg:Pulkovo Observatory, 119–124, 2013. (in Russian)
13. Malkin Z. Free core nutation and geomagnetic jerks. J. ofGeodynamics, v. 72, 53–58, 2013.
14. Malkin Z. M. On the observability of the free inner corenutation. Proc. of the All-Russian Astrometry ConferencePulkovo-2013, Izvestiya GAO, No. 220, St. Petersburg:Pulkovo Observatory, 115–118, 2013. (in Russian)
15. Malkin Z. Impact of seasonal station motions on VLBI UT1Intensives results. J. of Geodesy, v. 87, 505–514, 2013. DOI:10.1007/s00190-013-0624-5
16. Malkin Z. Using modified Allan variance for time seriesanalysis. In: Reference Frames for Applications in Geo-sciences, Z. Altamimi, X. Collilieux (eds.), IAG Symposia,v. 138, 271–276, 2013. DOI: 10.1007/978-3-642-32998-239
17. Malkin Z. M. On the Calculation of Mean-Weighted Valuein Astronomy. Astronomy Reports, v. 57, 882–887, 2013.DOI: 10.1134/S1063772913110048
IVS 2013 Annual Report

SAI VLBI Analysis Center 2013 Annual Report
Vladimir Zharov
Abstract This report presents an overview of the SAIVLBI Analysis Center activities during 2013 and theplans for 2014. The AC SAI analyzes all IVS sessionsfor computations of the Earth orientation parameters(EOP) and time series of the ICRF source positions andperforms research and software development aimed atimproving the VLBI technique.
1 General Information
The SAI VLBI Analysis Center is located at SternbergState Astronomical Institute of Lomonosov MoscowState University in Moscow, Russia. The Analysis Cen-ter participates in geodetic and astrometric VLBI anal-ysis, software development, and research aimed at im-proving the VLBI technique, especially for support ofthe Radioastron mission.
2 Component Description
AC SAI performs data processing of all kinds of VLBIobservation sessions. For VLBI data analysis we usethe ARIADNA software package developed at SAI.Version 4 was finished and tested in 2012. All reduc-tions are performed in agreement with the IERS Con-ventions (2010).
Sternberg State Astronomical Institute (SAI) of LomonosovMoscow State University
SAI Analysis Center
IVS 2013 Annual Report
The package uses files in the NGS format as inputdata.
Package ARIADNA (v. 4) is the basis of softwarenamed ORBITA installed on the correlator of the As-troSpace Center of Lebedev Physical Institute. It isused for correlation of the ground-space interferome-ter data during the Radioastron mission.
3 Staff
• Vladimir Zharov, Prof.: development of the ARI-ADNA software, development of the methods ofparameter estimation;
• Leila Kuznetsova, post-graduate student: VLBIdata processing, nutation modeling;
• Nikolay Voronkov, scientific researcher: global so-lution;
• Svetlana Nosova, engineer: VLBI data processing;• Natalya Shmeleva, engineer: VLBI data process-
ing.
4 Current Status and Activities
• Software development for VLBI processingThe ARIADNA software is being developed to pro-vide contributions to IVS products. The software isused for calculating all types of IVS products. Ver-sion 4 was developed in 2012. The main features ofthis version are performing all reductions in agree-ment with the IERS Conventions (2010), genera-tion of the SINEX files, and combination of someof the SINEX files to stabilize solution.
316

SAI 2013 Report 317
This version of the software was corrected in 2013:now it is possible to use the CIO based transforma-tion matrix. A new series of the EOP was obtainedfrom observations that were made in 2013.The method that uses calculation of the equinox-based transformation matrix for precession-nutation was kept to compare new series withold ones. The equinox-based matrixQ(t) thattransforms from the true equinox and equatorof date system to the GCRS is composed of theclassical nutation matrix, the precession matrixincluding four rotations, and a separate rotationmatrix for the frame biases. A new series of thenutation angles will be used for the preparation ofour suggestion for improving the nutation theory.Some corrections of the model of delay for theground-space interferometer were made and real-ized in software ORBITA, which is used for thecorrelation and routine analysis of the Radioastronobservations.
• Routine analysisDuring 2013 the routine data processing wasperformed with the ARIADNA software using theleast-squares method with rigid constraints, andnon-rigid constraints were used for generation ofSINEX files.AC SAI operationally processed the 24-hour andIntensive VLBI sessions. The formation of thedatabases of the VLBI sessions and processing ofall sessions is fully automated. The EOP seriessai2013a.eops and sai2013a.eopi were calculated.These series were computed with the VTRF2008catalog of station positions and velocities. Exper-imental series sai2013c.eops was calculated withthe CIO based transformation matrix. New EOPseries will be used for the development of newnutation theory.
IVS 2013 Annual Report

SHAO Analysis Center 2013 Annual Report
Guangli Wang, Jinling Li, Minghui Xu, Li Guo, Li Liu, Fengchun Shu, Zhihan Qian, Liang Li
Abstract This report presents the routine work and thepertinent research of the SHAO VLBI Analysis Center(AC) during 2013. The SHAO AC continued routineVLBI data analysis of 24-hour geodetic/astrometricobservations to make products. The activities of SHAOAC in 2013 also included reduction of data from theChinese VLBI Network (CVN), providing navigationfor Chang’E-3 using the VLBI technique, and basicresearch in Astrometry, specifically theoretical discus-sions on the Celestial Reference Frame and the effectof aberration.
1 General Information
In 2013, one of the important activities at SHAOAC was real-time navigation by using VLBI for theChang’E 3 satellite that launched on December 02,2013. This work involved scheduling, observing,processing, and analyzing VLBI experiments, whichlasted until early 2014. Our routine data analysiscontained two parts: the IVS 24-hour sessions andthe CVN experiments that aim to monitor the crustalmovement of the Chinese mainland. In addition, re-search topics focused on the CRF and the astrometriceffects that are outlined in Section 3. The membersinvolved in these activities were Guangli Wang, JinlingLi, Minghui Xu, Li Guo, Liang Li, Fengchun Shu, andZhihan Qian.
SHAO, Chinese Academy of Sciences
SHAO Analysis Center
IVS 2013 Annual Report
2 Activities and Data Analysis at SHAO
SHAO is in charge of the CVN and is an AnalysisCenter of the IVS. Routine VLBI activities at SHAOincluded:
-The geodetic experiments and observations ofMSP by the CVN
As usual, in 2013, the CVN conducted six 24-hour geodetic sessions which aimed at monitoringthe CVN network and at determining the accurateposition for the new 65-meter antenna in Shanghai, theTIANMA65. The experiment of MSP J1939+2134,with three CVN antennas — SH 25 m, UR 25 m,and KM 40 m — was on September 30, 2013. Thecalibrator of MSP J1939+2134 in our observationwas J1935+2031, which has 1.5 degrees of separationfrom the pulsar and has a position precision of∼ 0.1mas. The CVN observation mode was fast-switchingbetween the pulsar and calibrator with a cycle time of180 s on the pulsar and 80 s on the calibrator, and thetotal recording rate reached 1024 Mbps.
-Post processing of the VLBI observations forthe navigation of Chang’E 3 satellite.
We conducted the post processing of the VLBIobservations for the navigation of the Chang’E 3satellite, and obtained the differential group delaybetween the rover and the satellite with accuracy to alevel better than 0.5 ns. The accuracy of the relativeposition of the rover and the satellite finally is atthe meter level, based on the research of differentialobservations.
318

SHAO AC 2013 Annual Report 319
-Data processing and analysis of the CVN geode-tic experiments
The relative work consists of the calculation ofthe delay and delay rate of CVN observations atevery band, the resolution of group delay ambiguities,and the computation of ionosphere calibrations. Inaddition, SHAO is responsible for the generation ofthe VLBI group delay in NGS format and for theanalysis of all CVN sessions by the softwareshops,which has been developed based on the softwareOCCAM6.1E(Linux) with modifications mainly inVLBI data process models.
-Regular data analysis of the IVS 24h sessionsand product submission
We continued to routinely analyze all IVS 24-hoursessions using the CALC/SOLVE software, and weregularly submitted our analysis products (EOP,TRF, and CRF) to the IVS Data Centers. In order tocontribute to the forthcoming ITRF2013 activity, weupdated the geophysical and astronomical models,including the IAU 2006 nutation/precession, the oceanloading model, atmospheric pressure loading, theVienna Mapping Function, and the antenna thermaldeformation model.
3 Research Topics at SHAO
3.1 Validation of Solar Acceleration
In 2011 and 2012, we obtained the acceleration vectorin the three components in the Galactic coordinate sys-tem (7.47±0.46, 0.17±0.57, 3.95±0.47)mm·s−1
·yr−1
[1]. Traditionally, it was generally believed that the ac-celeration component in the direction normal to theGalactic plane was too small to be detected and that theacceleration vector should nearly point to the Galacticcenter, but our results showed that the vertical accel-eration is notable. This year, we tried variant methodsto validate this result. For example, we made two so-lutions with the same parameterizations and the samestrategy except for a defining source, 2136+141. Onesolution took into account the effect of the accelera-tion on all sources, while another one took into accountthe effect of the acceleration on all except 2136+141.
These two solutions treated the position of this sourceas a local parameter to obtain the time series of itsposition. Figure 1 shows the difference of these twotime series, which demonstrates that the accordancebetween the predicted model and the time series ob-tained from VLBI data is quite well. The time series ofthe position of a single source clearly show the effectof the Solar acceleration, which demonstrates that thesoftware and data are sensitive to the microarcsecondlevel.
Fig. 1 The time series of 2136+141, obtained from two solu-tions.
3.2 The Aberration Effect
There was a groundbreaking step in the history of as-tronomy in 1728 when the effect of aberration was dis-covered by James Bradley (1693-1762). Recently, dueto the variations in the aberrational effect of extragalac-tic sources caused by the Solar acceleration, the latterhas been determined from VLBI observations with theuncertainty of about 0.5 mm/s/yr level. As a basic con-cept in astrometry with a nearly 300-year history, thedefinition of aberration is still equivocal and discordantin much of the literature. It has been under a continu-ing debate whether it depends on the relative motionbetween the observer and the observed source or onlyon the motion of the observer with respect to the frameof reference. We think that the aberration is essentiallycaused by the transformation between coordinate sys-
IVS 2013 Annual Report

320 Wang et al.
tems and is consequently quantified by the velocityof the observer with respect to the selected referenceframe, independent of the motion of the source [2]. Ob-viously, this nature is totally different from that of thedefinition given by the IAU WG NFA in 2006, which isstated as “The apparent angular displacement of the ob-served position of a celestial object from its geometricposition, caused by the finite velocity of light in com-bination with the motions of the observer and of theobserved object” [3, 4]. The IAU’s definition has al-ready led to some confusion and misunderstandings inthe recent studies.
4 Plans for 2014
We will make a contribution to the ITRF2013 cam-paign and study the potentially systematic variances inthe direction displacements of radio sources with theaim to improve the accuracy of their positions.
References
1. M. H. Xu, G. L. Wang, and M. Zhao, A New concept of theInternational Celestial Reference Frame: the Epoch ICRF.MNRAS, 2013.
2. G. L. Wang, M. H. Xu, and M. Zhao, On the Definition ofAberration. (In preparation)
3. N. Capitaine, A. H. Andrei, M. R. Calabretta et al., Pro-posed Terminology in Fundamental Astronomy Based onIAU 2000 Resolutions. Highlights of Astronomy, 2007, 14,474C475
4. 4 IAU 2006 NFA GLOSSARY, 2006, URLhttp://syrte.obspm.fr/iauWGnfa/
IVS 2013 Annual Report

Tsukuba VLBI Analysis Center
Shinobu Kurihara 1, Tetsuya Hara 1,2
Abstract This report summarizes the activities ofthe Tsukuba VLBI Analysis Center during 2013. Theweekend IVS Intensive (INT2) sessions were regularlyanalyzed usingc5++ analysis software. Several ultra-rapid EOP experiments were implemented in associa-tion with Onsala, Hobart, and HartRAO.
1 Introduction
The Tsukuba VLBI Analysis Center located inTsukuba, Japan, is operated by the Geospatial Infor-mation Authority of Japan (GSI). A major role of us isto regularly analyze the weekend IVS Intensive (INT2)sessions using the fully automated VLBI analysissoftwarec5++ developed by the National Institute ofInformation and Communications Technology (NICT)[1]. It should be noted that the UT1-UTC (= dUT1)solution becomes available within a few minutes afterthe end of the last scan of the session. A 10 Gbpsdedicated link to the SINET4 operated by the NationalInstitute of Informatics (NII) and several processmanagement programs make it possible to derive asolution rapidly. Other than that, the ultra-rapid EOPexperiments behind 14 regular IVS 24-hour sessionsand three dedicated ultra-rapid experiments wereimplemented in 2013.
1. Geospatial Information Authority of Japan2. Advanced Engineering Service Co.,Ltd.
Tsukuba VLBI Analysis Center
IVS 2013 Annual Report
2 Component Description
2.1 Fully Automated VLBI AnalysisSoftware c5++
c5++, which is an analysis software for space geodesyincluding SLR, GNSS, and VLBI, has been undergoingseveral modifications and updates by NICT and was in-stalled on a host at the Tsukuba Analysis Center in thesummer of 2012. In April 2013, we officially started tousec5++ and to provide a dUT1 solution in the regu-lar INT2 session.C5++ supports flexible parameteri-zation (X-pole, Y-pole, dUT1, nutation, station clocks,and troposphere) and SINEX input/output with covari-ance matrix. Therefore it is also used in the ultra-rapidEOP experiments (see Section 4.2).
2.2 Calc/Solve
Calc/Solve has been in use throughout from the earlydays of VLBI work in GSI. It is used for the analysisof JADE, which is the Japanese domestic observationfor geodesy, in its interactive mode and for global anal-ysis in the batch mode, which is for the purpose of ourinternal use, not for the IVS products as an AnalysisCenter.
2.3 Potential to Use VieVS
VieVS, developed by the Institute of Geodesy and Geo-physics (IGG) of the Vienna University of Technol-
321

322 Kurihara and Hara
Table 1 Analysis Center Hardware Capabilities.
Number of servers 4 for VLBI analysis (c5++, Calc/Solve, andVieVS)Operating System CentOS version 5.4, 5.5, or Red Hat Enterprise Linux 6.3CPU Intel Xeon @3.80GHz CPU x 2, Intel Xeon 5160
@3.00GHz dual CPU x 2, Intel Xeon X3360 @2.83GHz quad CPU,Intel Xeon X5687 @3.60GHz quad CPU x 2
Total storage capacity individual RAIDs: 2.79 Tbytes in total
ogy, has already been installed in the Tsukuba AnalysisCenter [2]. But it has not been operational yet.VieVS isquite interesting VLBI analysis software, having someunique features that are not seen in other software. Wewould like to start to use it soon and to utilize the fea-tures for our analysis work.
2.4 Analysis Center Hardware Capabilities
Both c5++ and Calc/Solve are installed on severalgeneral-purpose and commercially-produced Linuxcomputers (Table 1). MATLAB as a platform forVieVS is also available on a host. Individual RAIDs aremounted on each host for storing a lot of VLBI datafiles such as Mark III databases.
3 Staff
The technical staff in the Tsukuba Analysis Center are
• Shinobu Kurihara: correlator/analysis chief, man-agement.
• Tetsuya Hara (AES): correlator/analysis operator,software development.
4 Analysis Operations
4.1 IVS Intensive for UT1-UTC
72 IVS Intensive sessions were analyzed at theTsukuba Analysis Center, and dUT1 results weresubmitted as gsiint2b.eopi to the IVS Data Center(Table 2). Only the dUT1 parameter was estimatedwith station positions fixed to a-priori. For the Tsukubastation after the 2011 Tohoku Earthquake, the position
correcting its non-linear post-seismic motion providedby NASA/GSFC was used.
In 2013, the Tsukuba—Wettzell baseline and sev-eral other baselines were analyzed. The observed dataat Wettzell is transferred to the Tsukuba Correlator inreal-time with the VDIF/SUDP protocol. The corre-lated data is rapidly analyzed byc5++ as soon as allthe correlator outputs come in, and then a dUT1 so-lution is derived. Figure 1 shows that 90% of the to-tal sessions complete analysis within five minutes afterthe end of the last scan. The end time of IVS-INT2 ses-sion is 8:30 UT on every Saturday and Sunday. Thus,the dUT1 solution is available at latest by 8:40. Thisis really an advantage of the Tsukuba Analysis Cen-ter. The eopi file, a product of Intensive analysis fromthe Analysis Center, is submitted immediately after theanalysis and becomes accessible to users as an IVSproduct. The whole process of work from data trans-fer through submission of products is automated. Ourproducts are utilized for more accurate dUT1 predic-tion by the U.S. Naval Observatory (USNO) as theIERS Rapid Service/Prediction Centre, which is re-sponsible for providing earth orientation parameters ona rapid turnaround basis, primarily for real-time usersand others needing the highest quality EOP informa-tion sooner than that available in the final EOP series.In the case of Kokee baselines, because the observeddata at Kokee was transferred via USNO, it took a fewhours to derive a solution.
Table 2 Intensive sessions analyzed at the Tsukuba AnalysisCenter.
Baseline # of sessionsAverage of dUT1 sigma
Intensive 1 TsWz 7 9.7 µsec
Intensive 2 TsWz 34 8.1 µsecKkWz 19 14.6µsecKkNy 9 17.3µsecKkSv 3 19.9µsec
Total 72 11.6µsec
IVS 2013 Annual Report
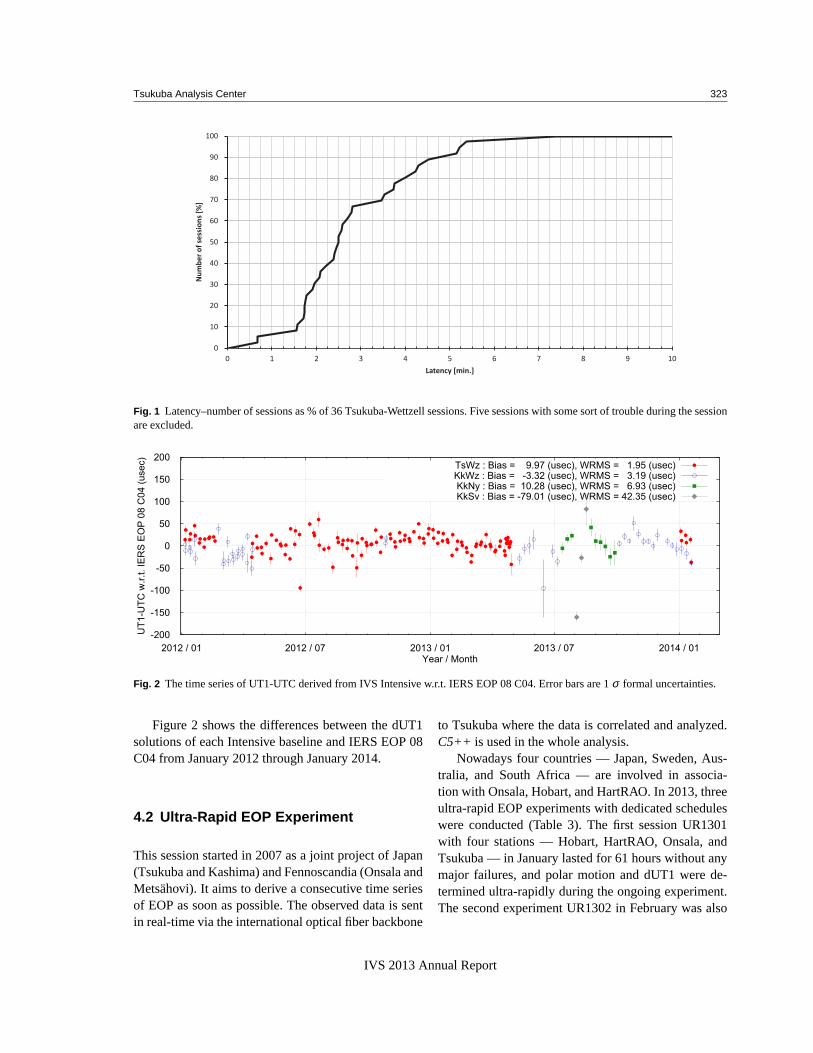
Tsukuba Analysis Center 323
0
10
20
30
40
50
60
70
80
90
100
0 1 2 3 4 5 6 7 8 9 10
Nu
mb
er
of
sess
ion
s [%
]
Latency [min.]
Fig. 1 Latency–number of sessions as % of 36 Tsukuba-Wettzell sessions. Fivesessions with some sort of trouble during the sessionare excluded.
-200
-150
-100
-50
0
50
100
150
200
2012 / 01 2012 / 07 2013 / 01 2013 / 07 2014 / 01
UT
1-U
TC
w.r
.t. IE
RS
EO
P 0
8 C
04 (
usec)
Year / Month
TsWz : Bias = 9.97 (usec), WRMS = 1.95 (usec)KkWz : Bias = -3.32 (usec), WRMS = 3.19 (usec)KkNy : Bias = 10.28 (usec), WRMS = 6.93 (usec)KkSv : Bias = -79.01 (usec), WRMS = 42.35 (usec)
Fig. 2 The time series of UT1-UTC derived from IVS Intensive w.r.t. IERS EOP 08 C04. Error bars are 1σ formal uncertainties.
Figure 2 shows the differences between the dUT1solutions of each Intensive baseline and IERS EOP 08C04 from January 2012 through January 2014.
4.2 Ultra-Rapid EOP Experiment
This session started in 2007 as a joint project of Japan(Tsukuba and Kashima) and Fennoscandia (Onsala andMetsahovi). It aims to derive a consecutive time seriesof EOP as soon as possible. The observed data is sentin real-time via the international optical fiber backbone
to Tsukuba where the data is correlated and analyzed.C5++ is used in the whole analysis.
Nowadays four countries — Japan, Sweden, Aus-tralia, and South Africa — are involved in associa-tion with Onsala, Hobart, and HartRAO. In 2013, threeultra-rapid EOP experiments with dedicated scheduleswere conducted (Table 3). The first session UR1301with four stations — Hobart, HartRAO, Onsala, andTsukuba — in January lasted for 61 hours without anymajor failures, and polar motion and dUT1 were de-termined ultra-rapidly during the ongoing experiment.The second experiment UR1302 in February was also
IVS 2013 Annual Report

324 Kurihara and Hara
-80700
-80600
-80500
-80400
-80300
-80200
-80100
-80000
20:00 00:00 04:00 08:00 12:00 16:00
UT
1-U
TC
[usec]
Time (2013/12/16-17:00:00 - 2013/12/17-17:00:00)
predictionUT1-UTC
Fig. 3 The time series of UT1-UTC derived from the Onsala–Tsukuba baseline from IVS-R1616 ultra-rapid processing with theprediction (Rapid Service/Prediction of Earth Orientation, finals2000A.daily).
successful with three stations — Hobart, HartRAO, andTsukuba.
In addition, 14 regular IVS 24-hour sessions thatinvolved at least two stations out of Hobart, HartRAO,Onsala, and Tsukuba were also operated with the ultra-rapid processing. The sessions are listed in Table 3. Sixof them were originally scheduled with three of thestations. But a fourth station was added to them viathe tag-along function of SKED, and these six sessionsobserved a four-station/six-baseline network. Two ex-periments in December with one baseline, Onsala—Tsukuba, were completed without even any minor fail-ures, and a dUT1 time series was produced in nearreal-time. Figure 3 shows the time series of dUT1 fromIVS-R1616 ultra-rapid processing.
5 Outlook
We will continue to analyze the data of the IVS-INT2sessions and submit dUT1 products with a low latency.CONT14 planned for May 2014 is a good opportunityto conduct the 15-day continuous ultra-rapid process-ing. And we might start to useVieVS in part of ouranalysis work.
Table 3 The ultra-rapid experiments in 2013. “*” means the sta-tion is not included in the original schedule but added by SKEDtag-along.
Exper. Date Time Dur. Stations #obs.(skd) (cor)
with dedicated scheduleUR1301 Jan 30 18:00 61 HbHtOnTs 1467 1326UR1302 Feb 05 17:30 48.5 HbHtTs 943 815UR1303 Dec 05 18:30 24 OnTs 611 606behind IVS 24-hr scheduleR1569 Jan 22 17:00 24 HbHhOnTs 541 539R1570 Jan 28 17:00 24 HhOnTs 309 297RD1301 Jan 29 17:30 24 HhOnTsHb* 394 392R1573 Feb 18 17:00 24 HbOnTsHt* 565 513T2088 Feb 19 17:30 24 HhOnTsHb* 275 247R1579 Apr 02 17:00 24 HhOnTs 293 276R1580 Apr 08 17:00 24 HtOnTsHb* 432 229RD1302 Apr 09 17:30 24 HhOnTsHb* 482 -R1582 Apr 22 17:00 24 HhOnTsHb* 348 332R1592 Jul 01 17:00 24 HbHhOn 122 114R1598 Aug 12 17:00 24 HbHhHtOn 323 262RD1306 Aug 21 18:00 24 HoHhOn 140 110R1615 Dec 09 17:00 24 OnTs 171 171R1616 Dec 16 17:00 24 OnTs 196 195
References
1. Hobiger, T., et al.: Fully automated VLBI analysis with c5++for ultra-rapid determination of UT1,Earth Planets Space,62, 933-937, 2010.
2. Bohm, J., et al.: The New Vienna VLBI Software VieVS, InProceedings of IAG Scientific Assembly 2009,InternationalAssociation of Geodesy Symposia Series, 136, edited by S.Kenyon, M. C. Pacino, and U. Marti, doi: 10.1007/978-3-642-20338-1126, 1007-1011, 2012.
IVS 2013 Annual Report

U.S. Naval Observatory VLBI Analysis Center
Alan Fey, Nicole Geiger, Chris Dieck
Abstract This report summarizes the activities ofthe VLBI Analysis Center at the United States NavalObservatory for calendar year 2013. Over the courseof the year, Analysis Center personnel continuedanalysis and timely submission of IVS-R4 databasesfor distribution to the IVS. During the 2013 calendaryear, the USNO VLBI Analysis Center continued touse the VLBI global solution designated usn2012b.Earth orientation parameters (EOP) based on thissolution and updated by the latest diurnal (IVS-R1and IVS-R4) experiments, were routinely submittedto the IVS. Sinex files based upon the bi-weekly24-hr experiments were also submitted to the IVS.During the 2013 calendar year, Analysis Centerpersonnel continued a program to use the Very LongBaseline Array (VLBA) operated by the NRAO forthe purpose of measuring UT1–UTC. Routine daily1.5-hour duration Intensive observations continuedusing the VLBA antennas at Pie Town, NM and MaunaKea, HI. High-speed network connections to thesetwo antennas are now routinely used for electronictransfer of VLBI data over the Internet to a USNOpoint of presence. A total of 345 VLBA Intensiveexperiments were observed, electronically transferredto, and processed at USNO in 2013.
U.S. Naval Observatory
USNO Analysis Center
IVS 2013 Annual Report
1 Introduction
The USNO VLBI Analysis Center is supported and op-erated by the United States Naval Observatory (USNO)in Washington, DC. The primary services provided bythe Analysis Center are the analysis of diurnal exper-iments, the production of periodic VLBI global solu-tions for estimation of the Terrestrial Reference Frame(TRF), the Celestial Reference Frame (CRF), and EarthOrientation Parameters (EOP). The Analysis Centercontinued the submission to the IVS of Intensive (EOP-I) and session-based (EOP-S) Earth orientation param-eters based on USNO VLBI global solutions. Analy-sis Center personnel maintain the necessary softwarerequired to continue these services to the IVS includ-ing periodic updates of the GSFC CALC/SOLVE soft-ware package. In addition to operational VLBI analy-sis, Analysis Center personnel are actively engaged inresearch related to future reference frames, the elec-tronic transfer of VLBI data, and software correlation.
2 Current Analysis Center Activities
2.1 IVS Experiment Analysis andDatabase Submission
During the 2013 calendar year, personnel at the USNOVLBI Analysis Center continued to be responsible forthe timely analysis of the IVS-R4 experiments, withthe resulting databases submitted within 24 hours ofcorrelation for dissemination by the IVS. AnalysisCenter personnel continue to be responsible for theanalysis and database submission for the periodic
325

326 Fey et al.
IVS-CRF experiments. In 2013, USNO scheduledand analyzed 12 CRF related experiments includingIVS-CRF73 through IVS-CRF79 and IVS-CRDS63through IVS-CRDS68. The analyzed databases weresubmitted to the IVS. Analysis Center personnel alsocontinued analyzing IVS Intensive experiments foruse in the USN-EOPI time series and continued a newseries of Intensive sessions using the VLBA antennasat Pie Town, NM and Mauna Kea, HI.
2.2 Global VLBI Solutions, EOP and SinexSubmission
USNO VLBI Analysis Center personnel continuedto use the periodic global TRF/CRF/EOP solutionusn2012b over the course of the 2013 calendar year.Analysis Center personnel continued to submit theUSN-EOPS series, which is based upon the currentglobal solution, and updated with new IVS-R1/R4experiments. The updated EOPS series is submitted tothe IVS twice weekly within 24 hours of experimentcorrelation and is included in the IERS Bulletin A.Analysis Center personnel also continued routinesubmission of Sinex format files based upon the 24-hrVLBI sessions. In addition to EOPS and Sinex series,USNO VLBI Analysis Center personnel continued toproduce and submit an EOPI series based upon theIVS Intensive experiments.
2.3 Software Correlator
Over the course of the 2013 calendar year, AnalysisCenter personnel continued the implementation, test-ing and evaluation of the DiFX software correlator.Phase I of the software correlator has two manage-ment nodes, 33 compute nodes (with each node hav-ing a 2.9 GHz dual-core processor with eight cores perprocessor for a total of 528 processing cores) and hasbeen operating since September 2012. Phase II of thesoftware correlator is expected to be delivered in thesecond quarter of 2014 and will double the process-ing power of the Phase I correlator. Post-correlationcalibration and analysis of software correlated data isnow routinely performed using the standard geodeticdata reduction path including the use of the Haystack
Observatory Post-processing System (HOPS) for datacalibration and the GSFC CALC/SOLVE package fordata analysis.
2.4 VLBA Intensive Experiments
During the 2013 calendar year, Analysis Center per-sonnel continued a program to use the Very Long Base-line Array (VLBA) operated by the NRAO for thepurpose of measuring UT1–UTC. Routine daily 1.5-hour duration Intensive observations continued usingthe VLBA antennas at Pie Town, NM and Mauna Kea,HI. High-speed network connections to these two an-tennas are now routinely used for electronic transfer ofVLBI data over the Internet to a USNO point of pres-ence.
A total of 345 VLBA Intensive experiments wereobserved, electronically transferred to and processed atUSNO in 2013. Once fully operational, these VLBAIntensive sessions will be scheduled as IVS-INT4 anddata will be released to the IVS for community-widedistribution.
3 Staff
The staff of the VLBI Analysis Center is drawn fromindividuals in both the Astrometry and Earth Orienta-tion departments at the U.S. Naval Observatory. Thestaff and their responsibilities are as follows:
Name ResponsibilitiesAlan Fey Periodic global CRF/TRF/EOP solutions
and comparisons; CRF densification re-search; software correlator implementa-tion; VLBI data analysis.
Nicole Geigersoftware correlator implementation;VLBI data analysis; EOP, database andSinex submission.
Chris Dieck software correlator implementation;VLBI data analysis; EOP, database andSinex submission.
IVS 2013 Annual Report

USNO Analysis Center 327
4 Future Activities
The following activities for 2014 are planned:
• Continue analysis and submission of IVS-R4 ex-periments for dissemination by the IVS.
• Continue the production of periodic globalTRF/CRF/EOP solutions and the submissionof EOP-S estimates to the IVS updated by theIVS-R1/R4 experiments.
• Continue submission of Sinex format files based onthe 24-hr experiments, and begin production of aSinex series based upon the Intensive experiments.
• Continue the analysis of IVS Intensive experimentsand submission of EOP-I estimates to the IVS.
• Continue the scheduling, analysis and databasesubmission for IVS-CRF, IVS-CRMS and IVS-CRDS experiments.
• Continue testing and evaluation of the USNOimplementation of the DiFX software correlator.Streamline pre- and post-correlation processing.
• Continue routine electronic transfer, correlation,post-processing and analysis of VLBI Intensivedata from the MK and PT VLBA stations.
• Continue graphical user interface (GUI) develop-ment for the USNO implementation of the DiFXsoftware correlator.
IVS 2013 Annual Report

USNO Analysis Center for Source Structure Report
Alan Fey, Ralph Gaume
Abstract This report summarizes the activities of theUnited States Naval Observatory Analysis Center forSource Structure for calendar year 2013 and the activi-ties planned for the year 2014.
1 Analysis Center Operation
The Analysis Center for Source Structure is supportedand operated by the United States Naval Observatory(USNO). The charter of the Analysis Center is to pro-vide products directly related to the IVS determina-tion of the “definition and maintenance of the celes-tial reference frame.” These include, primarily, radiofrequency images of International Celestial ReferenceFrame (ICRF) sources, intrinsic structure models de-rived from the radio images, and an assessment of theastrometric quality of the ICRF sources based on theirintrinsic structure.
The Web server for the Analysis Center is hostedby the USNO and can be accessed by pointing yourbrowser to
http://rorf.usno.navy.mil/ivs saac/
The primary service of the Analysis Center is theRadio Reference Frame Image Database (RRFID), aWeb accessible database of radio frequency images ofICRF sources. The RRFID contains 7,279 Very LongBaseline Array (VLBA) images of 782 sources at ra-dio frequencies of 2.3 GHz and 8.4 GHz. Additionally,the RRFID contains 1,867 images of 285 sources at
U.S. Naval Observatory
USNO Analysis Center for Source Structure
IVS 2013 Annual Report
frequencies of 24 GHz and 43 GHz. The RRFID canbe accessed from the Analysis Center Web page or di-rectly at
http://rorf.usno.navy.mil/rrfid.shtml
The RRFID also contains 74 images of 69 SouthernHemisphere ICRF sources using the Australian LongBaseline Array (LBA) at a radio frequency of 8.4 GHz.
Images of ICRF sources can also be obtained fromthe Bordeaux VLBI Image Database (BVID) at
http://www.obs.u-bordeaux1.fr/m2a/BVID
2 Current Activities
Maintaining the Radio Reference Frame ImageDatabase as a Web accessible database of radiofrequency images of ICRF sources.
3 Staff
The staff of the Analysis Center is drawn from individ-uals who work at the USNO. The staff are: Alan L. Feyand Ralph A. Gaume.
328

Center for Source Structure 329
4 Future Activities
The Analysis Center currently has a program of ac-tive research investigating the effects of intrinsic sourcestructure on astrometric position determination. Re-sults of this program are published in the scientific lit-erature.
The following activities for 2014 are planned:
• Continue with the imaging and analysis of VLBA2.3/8.4/24/43 GHz experiments.
• Maintain the Radio Reference Frame ImageDatabase (RRFID) as a Web accessible database ofradio frequency images of ICRF sources.
5 Relevant Publications
Publications of relevance to Analysis Center activities:
• “Relativistic Jets in the Radio Reference Frame Im-age Database. II. Blazar Jet Accelerations from theFirst 10 Years of Data (1994-2003),” Piner, B. G.,Pushkarev, A. B., Kovalev, Y. Y., Marvin, C. J.,Arenson, J. G., Charlot, P., Fey, A. L., Collioud, A.,& Voitsik, P. A. 2012, ApJ, 758, 84
• “Characterization of long baseline calibrators at 2.3GHz,” Hungwe, F., Ojha, R., Booth, R. S., Bieten-holz, M. F., Collioud, A., Charlot, P., Boboltz, D.,& Fey, A. L. 2011, MNRAS, 418, 2113.
• “The Position/Structure Stability of Four ICRF2Sources,” Ed Fomalont, Kenneth Johnston, AlanFey, Dave Boboltz, Tamoaki Oyama, and MarekiHonma, 2011, AJ, 141, 91.
IVS 2013 Annual Report

Vienna Special Analysis Center Annual Report 2013
Johannes Bohm 1, Sigrid Bohm 1, Andreas Hellerschmied 1, Armin Hofmeister 1, Hana Krasna 1, MatthiasMadzak 1, David Mayer 1, Lucia Plank 1, Benedikt Soja 2,1, Jing Sun 3,1, Claudia Tierno Ros 1
Abstract The main activities in 2013 of the VLBIgroup at the Department of Geodesy and Geoinforma-tion of the Vienna University of Technology were re-lated to scheduling and simulations of VLBI observa-tions, global solutions with the determination of celes-tial and terrestrial reference frames, and satellite obser-vations with VLBI radio telescopes. A highlight wascertainly the fourth VieVS User Workshop in Septem-ber 2013 in Vienna with the release of VieVS Version2.1.
1 General Information
The Department of Geodesy and Geoinformation(GEO) in the Faculty of Mathematics and Geoinfor-mation of the Vienna University of Technology isdivided into seven research groups. One of those, theresearch group Higher Geodesy (Hohere Geodasie)with about 15 members, is focusing on satellitegeodesy, system Earth, and geodetic VLBI.
2 Staff
Personnel at GEO associated with the IVS SpecialAnalysis Center in Vienna (VIE) and their main re-search fields and activities are summarized in Table 1.
1. Vienna University of Technology2. GeoForschungsZentrum Potsdam3. Shanghai Astronomical Observatory
VIE Analysis Center
IVS 2013 Annual Report
The staff members are partly paid by the university andpartly by project money.
Fig. 1 Members of the Vienna VLBI group in front of the VLBIradio telescope in Metsahovi during the EVGA Working Meet-ing 2013 (from left): Caroline Schonberger (Master student),Matthias Madzak, Johannes Bohm, Hana Krasna, Lucia Plank,Benedikt Soja, Kamil Teke (Hacettepe University).
3 Activities during the Past Year
3.1 Global Solutions with VieVS
Our latest realizations of global reference framesare the VieTRF13b terrestrial reference frame,the VieCRF13b celestial reference frame, andthe corresponding Earth orientation parameters(EOP) VieEOP13b, all of them being provided athttp://vievs.geo.tuwien.ac.at/results/ and made avail-able as an input option in VieVS. In addition to the“operational” generation of reference frames andEOP, the global solution in VieVS was extended by
330

VIE Analysis Center Report 331
Table 1 Staff members ordered alphabetically.
Johannes Bohm VGOS, atmospheric effectsSigrid Bohm VieVS Chair (until 06/2013), Earth orientationAndreas Hellerschmied (since 11/2013)Satellite observations with radio telescopesArmin Hofmeister (since 05/2013) Ray-traced delays in VLBI analysisHana Krasna VieVS Chair (since 06/2013), global solution, celestial and terrestrial reference framesMatthias Madzak GUIs and special files in VieVS, Earth rotationDavid Mayer (since 11/2013) Scheduling and simulationLucia Plank Satellite tracking with VLBIBenedikt Soja (until 04/2013) Sun corona studies with VLBIJing Sun (until 01/2013) Development of scheduling optionsClaudia Tierno Ros (until 04/2013) European VLBI sessions, simulations
the ability to estimate amplitudes of seasonal stationmotions at annual and semi-annual periods. We notonly compared those variations against hydrologicalmodels, but we used that tool to investigate thepropagation of neglected seasonal station movementsto radio source positions (Krasna et al. 2014, [4]) andwe assessed the impact on EOP by the analysis of realand artificial VLBI observations (Krasna and Bohm2013, [2]). Several other parameters, such as antennaaxis offsets or atmosphere pressure loading regressioncoefficients were also added to the normal equationsystem in VieVS.
Furthermore, the global solution in VieVS was usedto analyze the European VLBI sessions. Krasna et al.(2013, [3]) published the velocities of geodetic VLBIsites as derived from all European VLBI sessions, in-cluding a comparison with two global tectonic platemodels, NUVEL-1A and MORVEL, with an earlierstudy of European crustal motion from VLBI data pre-sented by Haas et al. (2003, [1]), and with veloci-ties derived from Global Navigation Satellite Systems(GNSS) observations.
3.2 Ray-traced Delays in the Atmospherefor Geodetic VLBI
Within the project RADIATE VLBI, funded by theAustrian Science Fund (FWF), we developed new ray-tracing software, which is capable of determining slantpath delays for the complete history of VLBI observa-tions. With the use of real meteorological weather datadelivered by numerical weather models, e.g. from theEuropean Centre for Medium-range Weather Forecasts(ECMWF), it is possible to determine the actual ray
path and calculate the slant path delay for each obser-vation. In 2013, we successfully set up the routines forglobal grids of meteorological data (0.125o) and val-idated the delays against those from an internationalcomparison campaign of ray-tracing software (Nafisiet al., 2012, [5]).
3.3 VLBI Observations to Satellites
At GEO Vienna, research on VLBI observations tosatellites is ongoing. Within the research projectD−
VLBI, which is part of the DFG Research UnitSpace-Time Reference Systems for Monitoring Global Changeand for Precise Navigation in Space, a number of sim-ulation studies using VLBI observations to Earth satel-lites were performed. The goal of these investigationswas to determine station position repeatabilities fromeither weekly or session-wise VLBI satellite observa-tions. After certain amendments of VieVS, such obser-vations can now also be integrated into routine VLBIsessions, and a combined analysis, e.g. estimating com-mon clocks and the troposphere, is possible. As docu-mented in several publications on this topic, we identi-fied observation strategies to determine station positionrepeatabilities at the sub-centimeter level, respectivelyframe ties in terms of Helmert parameters between theGNSS frame and the VLBI frame of better than 1 mil-limeter (Plank, 2013, [6]; Plank et al., 2013, [7]).
Although some satellite observation experimentshave been conducted in the recent years, it has not be-come a routine operation. To overcome that limitation,Andreas Hellerschmied in his Master thesis has ex-panded the current Vienna VLBI Software by addinga module capable of generating satellite observation
IVS 2013 Annual Report

332 Bohm et al.
schedules, where the observation plan is set up in aninteractive process. The schedule files (VEX format)can then be used to perform real experiments. Duringthis project a close cooperation with the Geodetic Ob-servatory Wettzell (http://www.bkg.bund.de/Wettzell)evolved. This collaboration made it possible to performtests on site and to prove the viability of the developedsoftware utilizing the instruments at this station.
3.4 Assessing the Sun Corona with VLBI
By using the observational data of twelve dedicatedVLBI experiments in 2011 and 2012, the electron den-sity of the solar corona was determined. It was the firsttime that VLBI data was used for this purpose. The re-sults agree well with those obtained by different tech-niques such as spacecraft tracking (Soja et al., 2013,[8]). The effect of the coronal plasma had to be sepa-rated from other dispersive effects caused by the iono-sphere and hardware delays. As a byproduct of our in-vestigations, a procedure to estimate the ionospherictotal electron content of each radio telescope was im-plemented into VieVS.
Fig. 2 Constellation of Sun corona and close radio sources on 10July 2012 at 17:30 UT.
3.5 Scheduling and Simulations
Scheduling and simulations with VieVS have playeda very important role for the Vienna VLBI group in2013. This is certainly based on the close cooperationwith Jing Sun who returned to Shanghai AstronomicalObservatory in February 2013. She has made furtheramendments to the scheduling tool of VieVS, e.g. byproviding the tag-along mode capability and other re-finements. The scheduling tool in VieVS (VieSCHED,Sun et al., 2014, [9]) is now used operationally toschedule the AUSTRAL VLBI sessions.
Additionally, Vie SCHED has been used toschedule the continuous VLBI campaign in Novem-ber/December 2013 with stations in Australia, NewZealand, and South Africa. This campaign has beencarried out to demonstrate the capabilities of thesouthern stations and to investigate the influence ofsources with high structure index on geodetic results.Figure 3 shows simulation results of source coordinateestimates in right ascension for “good sources” (struc-ture index 1) and “bad sources” (structure index 4).Furthermore, there have been studies with the schedul-
Fig. 3 Simulation results of estimates of source positions in rightascension as derived from simulations for the 15 day continuousVLBI campaign with stations in Australia, New Zealand, andSouth Africa.
ing and simulation tools in VieVS to demonstrate theimportance of specific VLBI sites. For example, weevaluated the importance of the Hartebeesthoek RadioAstronomy Observatory (HartRAO) for the currentand future VLBI network. The results suggest thatHartRAO is of high importance for the estimation of
IVS 2013 Annual Report
VIE Analysis Center Report 333
EOP. In particular polar motion and nutation estimatesbenefit from HartRAO’s remote location. Based onscheduling and simulation analysis of the VLBI2010network, an upgrade from the current antenna to a fastslewing VLBI2010 antenna was recommended.
4 Future Plans
In 2014, we will continue the development of VieVS,with special focus on satellite tracking, scheduling,and the estimation of terrestrial and celestial refer-ence frames. In particular, we will contribute to theITRF2013, and we will organize the 5th VieVS UserWorkshop in September 2014.
Acknowledgements
We are very grateful to the Austrian Science Fund(FWF) for supporting our work through projectsP23143 (Integrated VLBI), P25320 (RADIATE VLBI)and P24813 (SPOT). We also acknowledge the Ger-man Research foundation (DFG) for funding projectD-VLBI (SCHU 1103/4-1).
References
1. R. Haas, A. Nothnagel, J. Campbell, E. Gueguen. Recentcrustal movements observed with the European VLBI net-work: geodetic analysis and results.J Geodyn, 35, pp. 391—414, 2003.
2. H. Krasna, J. Bohm. Impact of seasonal station motion onglobal reference frames and Earth rotation.AGU Fall Meet-ing, Poster G13B-0936, San Francisco, USA, 2013.
3. H. Krasna, C. Tierno Ros, P. Pavetich, J. Bohm, T. Nils-son, H. Schuh. Investigation of crustal motion in Europe byanalysing the European VLBI sessions.Acta Geodaetica etGeophysica, 48/4, pp. 389–404, 2013.
4. H. Krasna, Z. Malkin, J. Bohm. Impact of seasonal stationdisplacement models on radio source positions. Proceed-ings of the Journees 2013, Paris, September 2013, submitted2014.
5. V. Nafisi, L. Urquhart, M. Santos, F. Nievinski, J. Bohm,D. Wijaya, H. Schuh, A. Ardalan, T. Hobiger, R. Ichikawa,F. Zus, J. Wickert, P. Gegout. Comparison of Ray-TracingPackages for Troposphere Delays.IEEE Transactions onGeoscience and Remote Sensing, Vol. 50, No. 2, pp. 469–481, 2012.
6. L. Plank. VLBI satellite tracking for the realization of frameties. Dissertation at the Vienna University of Technology,http://www.ub.tuwien.ac.at/diss/AC11121594.pdf ,2013.
7. L. Plank, J. Bohm, H. Krasna, H. Schuh. VLBI satellitetracking for precise coordinate determination - a simula-tion study.Proceedings of the 21st Meeting of the Euro-pean VLBI Group for Geodesy and Astrometry, N. Zubko,M. Poutanen (ed.), ISBN: 978-951-711-296-3, pp. 105–109,2013.
8. B. Soja, J. Sun, R. Heinkelmann, H. Schuh, J. Bohm. SunCorona Electron Densities Derived from VLBI Sessions in2011/2012.Proceedings of the 21st Meeting of the Euro-pean VLBI Group for Geodesy and Astrometry, N. Zubko,M. Poutanen (ed.), ISBN: 978-951-711-296-3, pp. 159–163.
9. J. Sun, J. Bohm, T. Nilsson, H. Krasna, S. Bohm, H. Schuh.New VLBI2010 scheduling strategies and implications onthe terrestrial reference frames.Journal of Geodesy, in press2014.
IVS 2013 Annual Report


Tech
nolog
y Dev
elopm
ent C
ente
rs


Canadian VLBI Technology Development Center Report
Bill Petrachenko
Abstract The Canadian VLBI Technology Develop-ment Center (TDC) is involved in activities related tothe realization of the VLBI Global Observing System(VGOS).
1 General Information
The Canadian TDC is a collaborative effort of theNational partners interested in the advancement ofVLBI technology, namely the Canadian GeodeticSurvey (CGS) of Natural Resources Canada (NRCan)and the Dominion Radio Astrophysical Observatory(DRAO) of the National Research Council of Canada(NRC).
2 Activities during the Past Year
The Canadian TDC is primarily focused on encour-aging the realization of VGOS. This is done by BillPetrachenko of NRCan who is the IVS TechnologyDevelopment Coordinator, the chairman of the VGOSTechnical Committee (VTC), and a member of theVGOS Project Executive Group (VPEG). In collabo-ration with others, this year’s activities focused on thefollowing areas:
• Development of the VGOS Observing Plan.• Compilation of a comparison of VGOS recorders.
Canadian Geodetic Survey, Natural Resources Canada
Canadian VLBI Technology Development Center
IVS 2013 Annual Report
• Compilation of a memo on mixed mode obervingissues.
• Analysis of RFI survey responses.• Development of FPGA code for VGOS digital back
ends.
In addition, NRC is involved in a number of SquareKilometer Array (SKA) related activities that have po-tential applications to the IVS.
• Digital signal processing including development ofcorrelators, beam formers, and systems for pulsarprocessing.
• Fabrication of a light, stiff, and cost effective 15-moff-axis Gregorian top-fed composite antenna.
• Development of focal plane arrays.
3 Future Plans
The Canadian TDC plans to continue to actively en-courage the realization of VGOS.
337

GSFC Technology Development Center Report
Ed Himwich, John Gipson
Abstract This report summarizes the activities ofthe GSFC Technology Development Center (TDC) for2013 and describes plans for 2014. The GSFC TDCdevelops station software including the Field System(FS), scheduling software (SKED), hardware includ-ing tools for station timing and meteorology, schedul-ing algorithms, and operational procedures. It providesa pool of individuals to assist with station implementa-tion, check-out, upgrades, and training.
1 Technology Center Activities
The GSFC IVS Technology Development Center(TDC) develops hardware, software, algorithms, andoperational procedures. It provides manpower forstation visits for training and upgrades. Other technol-ogy development areas at GSFC are covered by otherIVS components such as the GSFC Analysis Center.The current staff of the GSFC TDC consists of JohnGipson, Ed Himwich, and Rich Strand, all employedby NVI, Inc. The remainder of this report covers thestatus of the main areas supported by the TDC.
2 Field System
The GSFC TDC is responsible for development, main-tenance, and documentation of the Field System (FS)software package. The FS provides equipment con-
NASA Goddard Space Flight Center
GSFC Technology Development Center
IVS 2013 Annual Report
trol at VLBI stations. It interprets the .snp scheduleand .prc procedure files (both as prepared by DRUDGfrom the .skd schedule). The FS controls the antenna,data acquisition hardware, and related ancillary equip-ment needed for making VLBI measurements. All ma-jor VLBI data acquisition backends are supported. TheFS is customizable to allow it to control station spe-cific equipment. It is used at almost all the IVS Net-work Stations (more than 35) and also at many stationsthat do VLBI only for astronomical observations. Theonly major VLBI facilities not using it are the VLBAand VERA.
There was one minor release of the FS (9.11.0) dur-ing this year. Full details can be found in the FS releasenotes, but some of the major changes are listed here:
• Support for the DBBC DDC personality was added,both for continuous and on-off noise diodes.
• A work around for the “Day 49” kernel issue wasincluded.
• A new version of thegnplt program, written inPython, was included.
• A new command,satellite, was added to allow sim-ple pointing at satellites.
• A new command,holog, was added to facilitatecollecting data from holographic antenna measure-ments.
• The pointing data analysis programs were modifiedto plot first antenna coordinate offsets in “cross”coordinate units, e.g., to use “Cross-El” instead ofAzimuth and to use “cross” coordinate reweightingconstants when fitting the first coordinate offsets.
• The metserver/metclient programs were improvedto better support multiple clients.
• The handling of Mark 5 communications was im-proved to prevent partial responses from terminat-
338

GSFC Technology Development Center Report 339
ing input prematurely. There were general improve-ments to error messages for Mark 5 communica-tions.
In addition several development projects were un-derway. These include:
• Patriot 12 m Interface. Development of the inter-face for Patriot Antenna Control Unit (ACU) con-tinued. Several improvements were made includingthe handling and the reporting of status word repre-sented errors and improvements in cable-wrap han-dling to make it independent of the limits for anyparticular antenna.
• Mark 5C/RDBE. Preliminary support for Mark 5Crecorders and RDBE DASs was developed to facil-itate VGOS test activities. This support will be fedinto the distributed FS next year.
• Miscellaneous. Many small improvements and bugfixes were made for the new releases expected in2014. These included a new “time-out” feature forthe onsource command to facilitate local antennameasurements, making all DBBC IF power mea-surement displays all consistent support for theDBBC astro2 mode, and preventing the changingof schedules while recording.
• VEX2. Considerable effort has gone into definingthe second version of VEX, which will provideschedule file format support for new “sampling-before-channelization” systems such as the RDBE.
2.1 Plans for 2014
Several other improvements are expected in future re-leases, including:
• Support for RDBE racks.• Support for DBBC PFB personality.• Support for Mark 5C and Mark 6 recorders.• Use ofidl2rpc for remote operation.• A complete update to the documentation and con-
version to a more modern format that will be easierto use and maintain.
• Conversion of the FORTRAN source to use thegfortran compiler, which will enable use of thesource level debugger,gdb, for development andfield debugging.
• Chekr support for Mark 5A and Mark 5B systems.
• FS Linux 9 (based on Debianwheezy, skippingsqueeze) distribution.
• Support for periodic firing of the noise diode duringobservations.
• Support for NMEA standard wind sensors.• Completion of the VEX2 standard and implemen-
tation of it.
3 SKED and DRUDG
The GSFC TDC is responsible for the development,maintenance, and documentation of SKED andDRUDG. These two programs are very closely related,and they operate as a pair for the preparation of thedetailed observing schedule for a VLBI session and itsproper execution in the field. In the normal data flowfor geodetic schedules, first SKED is run at the Op-eration Centers to generate the .skd file that containsthe full network observing schedule. Then stationsuse the .skd file as input to DRUDG for making thecontrol files and procedures for their station. Catalogsare used to define the equipment, stations, sources, andobserving modes which are selected when writing aschedule with SKED.
Changes to SKED and DRUDG are driven bychanges in equipment and by feedback from the users.The following summarizes some of the importantchanges to these programs in 2012.
3.1 SKED Changes
• Better calculation of SNR. The calculation now in-cludes the effects of 1- and 2-bit sampling and thecorrelator efficiency factor.
• Addition of the descriptive parameters“SCHEDULING SOFTWARE”, “SOFTWAREVERSION”, and “SCHEDULECREATE DATE”.This was done becausevie-sched is now being usedto write some schedules, and we wanted to be ableto tell which software wrote a schedule.
• Addition of the $BROADBAND section to theschedule file, which provides limited support forbroadband. This section lists the stations that areobserving in broadband and gives the bandwidth ofthe observing.
IVS 2013 Annual Report

340 Himwich and Gipson
• Correction of a problem with adding a station to aschedule that already has observations. This prob-lem occured because each station has a preferredone-character station code. It is possible to havetwo stations with the same preferred code in thesame schedule. In this case, one of the stations willuse another code. Previously, if you added a stationto a schedule and the one-letter code of the stationwas already in use, sked would sometimes changethe code for a station in the schedule.
3.2 DRUDG Changes
Many changes were made to support new equipment inthe field, particularly DBBCs. A fuller description canbe found in the FS release notes.
3.3 Plans for 2014
Plans for 2014 include the following:
• In 2012, we began work on making VEX the nativeformat for SKED. We plan to finish this project in2014.
• We also plan to expand support for RDBEs and DB-BCs. This will involve changes to SKED, DRUDG,and the catalogs.
• If time permits, we will convert SKED to compileusing a freely available compiler such asgfortran.
IVS 2013 Annual Report

Haystack Observatory Technology Development Center
Christopher Beaudoin, Arthur Niell, Roger Cappallo
Abstract Technology development at MIT HaystackObservatory focused on three areas in 2013:
• Mark 6• RDBE 3.0• KPGO 20-m VGOS Receiver Upgrade
1 Mark 6 High Speed Data Recorder
In 2013, the development and the implementation ofthe Mark 6 recording system continued. The softwarecan now record up to four 2 Gb/s Mark 5B streams,which are converted on the fly to vdif datastreams dif-ferentiated by thread ID. A single 8 disk module ingood health is able to record that 8 Gb/s datarate, orslightly less. Given that the Mark 6 has a∼60 GB rambuffer, the fifo allows scans of several minute dura-tion to be captured in this mode, so long as there issome time between scans for draining the fifo. Usingthe nominal 2-module/16-disk configuration, the fulldatastream can be recorded continuously. Similarly, a16 Gb/s input data rate can be captured for short peri-ods in two modules (= 16 disks), although for continu-ous recording four modules should be used.
Manufacture of the Mark 6 was transferred to Con-duant Corp., and they began filling orders mid-year.The software is open source, and it is available onthe Haystack website. In addition to the Mark 6 con-trol software, there are various utilities there to allowfor data quality assessment, as well as interim conver-
MIT Haystack Observatory
Haystack Technology Development Center
IVS 2013 Annual Report
sion software for use at correlators. A python programcalled RM6CC allows for control of the hardware viaan XML schedule. Multiple test observation sessionswere held, employing Mark 6s at the Westford andGGAO antenna sites.
2 RDBE Version 3.0
Development of a new RDBE firmware version 3.0 wasinitiated in 2013. The RDBE v3.0 is an operations-oriented personality that represents an enhancement tothe RDBE v1.4 personality. The version 3.0 personal-ity incorporates a number of operations and diagnosticcapabilities that include the following:
• Integrated 1PPS Delay Measurement• Pulse Calibration Extraction• 1PPS-triggered raw ADC capture• Arbitrary test vector injection
In addition to these features, the v3.0 firmwarerepresents a complete re-engineering of the v1.4 PFBfirmware code. This new development simplified thefirmware signal processing and has been verifiedagainst the theoretical PFB algorithm implementedin a MATLAB model. The verification process en-sures that the RDBE v3.0 signal processing that isimplemented on the Xilinx FPGA IC is performingthe correct operations, and it is anticipated that a testvector procedure will be incorporated to verify fieldinstallations of the RDBE running this personality.This verification process is conducted by introducinga known digital test vector at the frontend (input)port of the FPGA, recording the resultant output2-bit samples generated by the FPGA operations, and
341

342 Beaudoin et al.
directly comparing (differencing) the RDBE outputsamples to the theoretical sample values computed bythe MATLAB model.
As part of the v3.0 firmware development, theRDBE server software, which interprets commandsfrom an external RDBE user, was rewritten to incorpo-rate the additional firmware features that are availablein the v3.0 firmware. As part of the re-write, thecomplexity was reduced from approximately 50,000lines of code to approximately 4,000 lines.
The server software also captures VLBI-critical di-agnostic data on each 1PPS pulse, packages the datainto a multicast network packet, and transmits the dataover the 1 GigE network interface for reception by anyclient listening on the designated network port. Thisdiagnostic data includes the current UT time as main-tained by the RDBE firmware as well as the delay off-sets of this clock relative to the RDBE operating sys-tem clock (i.e., server clock), the GPS 1PPS signal, andthe MASER 1PPS signal. Also contained in this multi-cast packet are the samples of the pulse calibration sig-nal as reconstructed by the pulse calibration extractionfeature and the first 4,000 samples of the 8-bit frontendADC samples as triggered by the RDBE 1PPS.
The server also provides an information-rich nu-merical and graphical output data display that is in-tended to provide feedback to the RDBE user. Thisgraphical display updates on each 1PPS pulse and plotsthe ADC raw capture samples with the associated his-togram and spectrum. This display also plots the re-constructed pulse calibration signal and the noise diodeon and off accumulator counts for each PFB frequencychannel. Figure 1 displays an example of the RDBEserver’s graphical output display.
3 KPGO 20-m VGOS Receiver Upgrade
In 2013, Haystack Observatory developed and fab-ricated a VGOS receiver frontend upgrade for theKPGO 20-m radio telescope. Diagrams of the newreceiver frontend are shown in Figure 2. The receiverenclosure, which is identical in design to the existingS/X KPGO 20-m receiver enclosure, was providedby NASA/Excelis and was recovered from a decom-missioned/damaged NASA radio telescope. Haystackrefurbished the receiver enclosure and developed afull 3D mechanical design in the CAD software suite
SolidWorks. This mechnical model also serves aselectronic documentation for the KPGO site personneland can be viewed by downloading a free SolidWorksviewer available at the software vendor’s website.
Similar to previous Haystack broadband receiverfrontend designs, the KPGO frontend incorporates acustomized QRFH feed. This feed was optimized forthe 0.43 focal-length-to-diameter ratio characteristicof the KPGO 20-m optics. Receive pattern measure-ments of the cryogenic frontend demonstrate that theexpected broadband aperture efficiency of the KPGO20-m VGOS system should be approximately 50%over the 2 to 14 GHz frequency range as shown in Fig-ure 3. The measured noise temperature of the new 20-m VGOS receiver frontend is shown in Figure 4. Basedon these noise temperature and aperture efficiency esti-mates, the SEFD of the KPGO 20-m telescope follow-ing the VGOS upgrade is expected to be approximately900 Jy which is equivalent to that of the X-band sectionin the existing system. The VGOS receiver frontendupgrade for the KPGO 20-m antenna was delivered toKokee Park in September 2013.
Presently, a failure in the KPGO 20-m frontend re-ceiver “box” rail system is inhibiting removal of theS/X band receiver frontend section from the antenna.Installation of the VGOS frontend is awaiting mechan-ical refurbishment of this rail mechanism.
IVS 2013 Annual Report

Haystack Technology Development 343
Fig. 1 Graphical output display generated by the RDBE v3.0.
Fig. 2 KPGO 20-m VGOS receiver frontend upgrade.
IVS 2013 Annual Report

344 Beaudoin et al.
Fig. 3 Expected aperture efficiency of the KPGO 20-m following the VGOS receiver frontend upgrade.
Fig. 4 Noise temperature of the KPGO 20-m VGOS receiver frontend upgrade.
IVS 2013 Annual Report

NICT Technology Development Center 2013 Annual Report
Kazuhiro Takefuji, Hideki Ujihara
Abstract The National Institute of Information andCommunications Technology (NICT) is developingand testing VLBI technologies and conducts obser-vations with this new equipment. This report givesan overview of the Technology Development Center(TDC) at NICT and summarizes recent activities.
1 NICT as IVS-TDC and Staff Members
The National Institute of Information and Communi-cations Technology (NICT) publishes the newsletter“IVS NICT-TDC News (formerly IVS CRL-TDCNews)” at least once a year in order to informabout the development of VLBI related technol-ogy as an IVS Technology Development Center.The newsletter is available at a following URLhttp://www2.nict.go.jp/aeri/sts/stmg/ivstdc/news-index.html. Table 1 lists the staff members at NICTwho are contributing to the Technology DevelopmentCenter.
2 General Information
We have been developing a new VLBI system calledGala-V, which has the VGOS (VLBI2010 Global Ob-serving System) requirements. Distinguishing featuresof Gala-V are a direct sampler called Galas and a
Kashima Space Technology Center, National Institute of Infor-mation and Communications Technology
NICT Technology Development Center
IVS 2013 Annual Report
Table 1 Staff Members of NICT TDC as of January 2013 (al-phabetical).
HASEGAWA, ShingoHOBIGER, ThomasICHIKAWA, Ryuichi KAWAI, EijiKONDO, Tetsuro KOYAMA, YasuhiroMIYAUCHI, Yuka SEKIDO, MamoruTAKEFUJI, KazuhiroTSUTSUMI, MasanoriUJIHARA, Hideki
broadband feed horn called Iguana. Here we will re-port the current activities. First, we evaluated a jitterand frequency response of Galas. Secondly, a prototypeof Iguana feed was deployed to the Kashima 34-meterantenna at the end of December 2013. We could detectsimultaneously methanol maser lines of 6.7 GHz and12.2 GHz from the star forming region W3OH.
3 Evaluation of Direct Sampler Galas
The broadband signal from 1 GHz to 18 GHz transferswithout frequency conversion via a high sensitivityoptical transmitter and receiver from the antennato the sampler Galas. For this reason, Gala-V hasa quite simple system. Actually, our system has noanalog frequency conversion, but we realized thedown-conversion with high order sampling and digitalbaseband conversion by digital signal technique insideGalas. Figure 1 shows the design of Galas. It hasfour analog inputs and four 10 GbE outputs. Galaswill sample an input signal at 16 GHz speed and3-bit quantization and will perform digital frequencyconversion. At first, we evaluated jitter performance
345

346 Takefuji and Ujihara
and a frequency response. We input the sinusoidalsignal from a signal synthesizer to Galas at eachfrequency, then calculated the phase noise as a jitterfrom the digitized signal. The jitter is shown in Figure2, where we obtain a result of 0.191 picoseconds.We expect good sampler performance even at thefrequency of 20 GHz based on the obtained jittervalues. Figure 3 shows the frequency response ofGalas from comparing the amplitude from quantizedbit distribution between reference signal and targetsignal.
In 2013, we conducted VLBI experiments betweenthe direct sampler Galas and the existing widebandsampler ADS3000+ of 1 GHz bandwidth. And we hadsuccessfully obtained a consistent geodetical result. Wehave more plans for broadband VLBI after Iguana feedinstallation.
Display LED indicators
Power switch
Four 10 GbE interfaces
Four signal inputs
Fig. 1 The design of the direct sampler Galas.
4 Developing the Broad Band Feed Iguana
The prototype Iguana feeds were multimode horns,which were designed for 6.4-15 GHz. Their beam pat-terns were measured at Microwave Energy Transmis-sion Laboratory (METLAB) in Kyoto University. Thefirst prototype of 133 mm aperture diameter was set on
0.2
0.4
0.6
0.8
1
1.2
1.4
0 2 4 6 8 10 12 14 16
Pha
se n
oise
[deg
]
Frequency [GHz]
Fig. 2 The jitter performance of the direct sampler Galas.
-8
-7
-6
-5
-4
-3
-2
-1
0
0 2 4 6 8 10 12 14 16 18 20
Atte
nuat
ion
[dB
]
Frequency [GHz]
Fig. 3 The frequency response of the direct sampler Galas.
the Kashima 34 meter for testing our wideband fron-tend system. The aperture size of the second feed is120 mm.
They can be replaced to select the most efficientfrequency for various observations. Also, waveguidehigh-pass filters are ready forfcut=6.4 GHz, 8.0 GHz,and 9.6 GHz cut-off frequencies to suppress RFI, fol-lowing WRD580 waveguide and SMA adapter output.
Our configuration is for one linear polarizationnow.
5 First Light of Gala-V, Deployed to theKashima 34-Meter Antenna
We have deployed the prototype feed to the Kashima34-meter antenna. The feed after deployment is shown
IVS 2013 Annual Report

NICT TDC 2013 Report 347
in Figure 4. The Kashima 34-meter antenna has fourpedestals for the feed and receiver. We can choose onepedestal from four pedestals moving exclusively. Fig-ure 5 shows two methanol lines at 6.7 GHz and 12.2GHz from the star forming region W3OH detected bythe Gala-V system. It was a memorable first light. Thesystem temperature of the prototype system is shown inFigure 6. We are currently using ambient temperatureLNA; thus the system temperatures are plausible. Theaperture efficiency of the prototype feed is also shownin Figure 7. Until 12 GHz, the effieciency is about 40%.Then the effiency begins to decrease, to 20% at 15 GHzwith the first prototype feed.
Fig. 4 The prototype Iguana feed was deployed to the Kashima34-meter antenna
6 Future Plans
The upgrade to the Kashima 34-m antenna for widerbandwidths such as 2.2-18 GHz is on-going. TheIguana and broadband receiver will be fully in-
stalled by this spring, and we will install a new dualpolarization feed by next winter.
Fig. 5 The first light of methanol maser of W3OH. The methanollines of 6.7 GHz and 12.2 GHz were simultaneously obtained.
Acknowledgements
The development of Gala-V is supported by a jointdevelopment of National Astronomical ObservatoryJapan (NAOJ). It is titled “Development of ultrabroadband system for Kashima 34 meter antenna”.
IVS 2013 Annual Report

348 Takefuji and Ujihara
0
100
200
300
400
500
0 5 10 15 20
Sys
tem
term
pera
ture
[K]
Frequency [GHz]
Fig. 6 Gala-V system temperature with the prototype Iguanafeed.
0
20
40
60
80
100
0 5 10 15 20
Effi
cien
cy [%
]
Frequency [GHz]
Fig. 7 Gala-V aperture efficiency with the prototype Iguanafeed.
IVS 2013 Annual Report

Onsala Space Observatory – IVS Technology DevelopmentCenter Activities during 2013
Miroslav Pantaleev1, Rudiger Haas1, Bhushan Billade1, Leif Helldner1, Karl-Ake Johansson1, Lars Petterson1,Marianna Ivashina2, Jian Yang2, Carlo Bencivenni2, Oleg Iupikov2
Abstract We give a brief overview on the technicaldevelopment related to geodetic VLBI done during2013 at Onsala Space Observatory.
1 Activities during 2013
Our activities in technical development for VLBI con-centrated on the following topics:
• The Onsala Twin Telescope project• Broadband feeds for VLBI2010 operations• A dual-polarized S-band system• A new IF distribution• A GNSS installation for local-tie measurements.
2 The Onsala Twin Telescope Project
We worked on the preparation of the procurement doc-uments for the Onsala Twin Telescope (OTT). We de-cided to separate the procurement into two parts. Onepart exclusively covers the antennas while the otherpart covers the signal chain and electronics. The re-quest for a building permit for the OTT and the re-quest for an exemption from the law for shoreline pro-tection (i.e., a permit for construction within 300 mfrom the shoreline) had been submitted to the Kungs-backa municipality already in late 2012. The local au-
1. Chalmers University of Technology, Department of Earth andSpace Sciences, Onsala Space Observatory2. Chalmers University of Technology, Department of Signalsand Systems, Antenna Systems
OSO Technology Development Center
IVS 2013 Annual Report
thorities in Kungsbacka community granted both nec-essary permits in early April 2013. The environmentaldepartment of the next level of authority, the countyof Halland, inspected the planned area for the OTT inMay 2013. The inspector concluded that one of the twoplanned telescopes, at the eastern location, could be apotential disturbance for the local birdlife and in par-ticular disturb the breeding of waders in the area. Atthe time of the inspection several birds of the North-ern Lapwing (vanellus vanellus) family were seen inthe wetlands. Additionally, the county has plans to in-clude these wetlands into a natural reserve. As a conse-quence, the county decided in June 2013 to withdrawthe exemption from the law for shoreline protection.This meant a temporary stop for the whole project,because now a new location for the second telescopehad to be found. Besides nature protection and local
Fig. 1 An artist’s impression of the planned Onsala Twin Tele-scope (the two smaller antennas on the right side) together withthe existing 25-m antenna (left). This is the new updated proposalof December 2013.
349

350 Pantaleev et al.
birdlife, another difficulty is a number of archeologicalfindings from the Iron Age that need to be protected.After several discussions with the Kungsbacka author-ities, an environmental consultant, and the county’sarcheologist, a suitable location for the second tele-scope was found. A corresponding request for a build-ing permit and request for an exemption from the lawfor shoreline protection was submitted to the Kungs-backa municipality in December 2013. An artist’s im-pression of the new planned OTT location is presentedin Figure 1.
3 Broadband Feeds for VLBI2010
We continued our collaboration with the Gothenburg-based company Omnisys Instruments. We providedsupport for the cryogenic and mechanical design of acryostat for the integration of the Eleven Feed and forfurther issues related to system integration and tests.We worked on three parallel tracks of the Eleven feeddevelopment. The first one is the implementation ofa center-bridge connection between the opposite portsof the Eleven Feed (see Figure 2). This concept wassuccessfully implemented in a feed for the 0.4–2 GHz
Fig. 2 Geometry of the center-bridge connection for the Elevenfeed. Upper plot: center connection. Lower plot: cross section.
Fig. 3 Reflection coefficients for both polarization ports of thedesigned Quad Ridged Feed Horn (QRFH).
Fig. 4 Aperture efficiency (black dashed line) of a prime-focusreflector antenna system with a subtended semi-angle of 50 de-grees fed with the simulated far-field patterns of the designedQuad Ridged Feed Horn (QRFH). Also shown are (black solidline) corresponding results published by [1] which are based onmeasured patterns.
range. Currently we are investigating different fabrica-tion approaches and technologies to implement this so-lution for the VLBI2010 frequency range. The seconddevelopment track was the implementation of a novelbalun design. This will allow, together with the pre-viously mentioned bridge, reduction of the number ofports from eight to four. The third track is a novel ideaof designing the dipole array pattern that will give theability to control the beam shape and make the feedtunable for a given F/D.
We also worked on the design of a Quad RidgedFeed Horn (QRFH). The CST model was used to studyhow shaping of the tapers of the ridges, feeding point,
IVS 2013 Annual Report

OSO – IVS Technology Development Center 351
back-short and other parameters of the design affectthe S11 and beam shape. The study was extended tooptimize the performance for the 2–12 GHz band. Fig-ure 3 depicts the reflection coefficient of the final de-sign and Figure 4 the feed efficiency in a prime focusreflector. The same figure shows for comparison the ef-ficiency of the QRFH design described in [1]. As seen,the achieved performance is quite close to that reportedin the article. So far there is no decision about fabrica-tion of a prototype to measure beam patterns.
4 A Dual-polarization S-band System
The currently used S-band receiver has one single cir-cular polarization channel while the X-band receiverhas both circular polarizations. To prepare for futuremixed-mode observations with dual-polarized VGOSsystems, we decided to upgrade the S-band receiver todual circular polarization, too. One Low Noise Ampli-fier (LNA) was purchased from the Spanish companyTTI. The cryogenic box accommodating the LNAs forX- and S-band was modified to integrate the new po-larization channel and the new S-band LNA (see Fig-ure 5). Gain and noise of the LNA are presented in Fig-ure 6.
Fig. 5 Interior of the cryogenic box for two polarizations (S- andX-band).
The performance of the receiver (excluding thewarm part) was verified in the lab, and the receiverwas installed back on the telescope in November 2013.A septum polarizer was designed for S-band and is
Fig. 6 Gain and noise of the new LNA for S-band.
Fig. 7 CAD drawing presenting the view towards the focal planeof the 20-m antenna with the tertiary mirror for S-band, the newdesign of the horn, and the waveguide for S-band.
Fig. 8 Cross-section of the polarizer for S-band.
currently being manufactured. The waveguide forS-band was re-designed to accommodate a polarizerand room temperature waveguide couplers for noise
IVS 2013 Annual Report

352 Pantaleev et al.
and phase calibration signals. Figure 7 depicts adrawing of the focal plane of the 20-m telescope withthe tertiary reflector for S-band and the new design ofthe horn and waveguides for S-band. A cross-sectionof the polarizer for S-band is shown in Figure 8. Theplan is to install the new waveguides and polarizer forS-band in March 2014 and to perform on-sky testingprior to CONT14.
5 Development of a New IF Distribution
After several months of parallel recordings with theanalog Mark IV backend and the digital DBBC, andafter extensive evaluation, we decided in mid 2013 tofinally phase-out the Mark IV rack and to replace itwith a second DBBC. A corresponding second DBBCunit was ordered in September 2013 and is expectedto be delivered in April 2014. To be able to includeit quickly into the VLBI system, a new IF distribu-tion unit was developed. This new IF distribution isflexible and computer-controlled. It allows full flexi-bility to connect the receivers used for geodetic VLBIon the 20-m telescope, or the receivers used for astro-nomical VLBI on the 20-m or 25-m telescope, to eitherof the two DBBC units in various configurations. Ex-tensive preparations were performed to minimize thedown-time that will be caused by decommissioning theMark IV-rack and installing the second DBBC.
6 A New GNSS Installation on the 20-mTelescope for Local-tie Measurements
Two GNSS antennas were mounted on each side ofthe prime reflector of the 20-m telescope at the heightof the telescope elevation axis. Special gimbal mountswith counterweights were constructed to keep theGNSS antennas in the horizontal plane at all times,independently of the elevation angle of the 20-mtelescope. The GNSS antennas are connected withcoaxial cables to a pair of GNSS receivers inside theCassegrain cabin of the 20-m telescope. The recordeddata are downloaded automatically from the receiversvia TCP/IP.
7 Future Plans
We have started a design study for the installation of a4–12.25 GHz receiver front-end on our 20-m antenna.The system will extend the bandwidth of the currentS/X system used for IVS observations. An additionaladvantage of this 4–12.25 GHz front-end is that it canbe used not only for IVS sessions but also for C- and X-band observations for EVN. The horn will be designedby BAE Systems Australia Ltd. Preliminary results forthe expected aperture efficiency of this horn are shownin Figure 9. The cryogenic frond-end will use an Ortho-Mode transducer from CSIRO, Australia and LNAs ofthe Gothenburg-based company LNF. As part of thestudy we will investigate the possibility of using thehorn with the current S-band tertiary, thus maintainingcompatibility with the S/X band legacy systems. Theplan is to complete the design study by the middle of2014 and to decide on manufacturing and telescope in-stallation shortly afterwards, so that the system wouldbe available on the telescope by the end of 2014.
Fig. 9 Preliminary results for the aperture efficiency of the 4–12.25 GHz horn for the Onsala 20-m telescope.
References
1. A. Akgiray, S. Weinreb, W. Imbriale, and C. Beaudoin.Circular Quadruple-Ridged Flared Horn Achieving Near-Constant Beamwidth Over Multioctave Bandwidth: Designand Measurements.IEEE Transactions on Antennas andPropagation, 61(3), 1099–1108, 2013.
IVS 2013 Annual Report

Bibl
iogr
aphy


Bibliography
1 Introduction
The following bibliography compiles papers that werepublished in the field of geodetic and astrometric VLBIduring the year 2013. There is no distinction betweenpeer-reviewed, reviewed, or proceedings publications.This list is by no means exhaustive.
2 Geodetic and Astrometric VLBIPublications of 2013
W. ALEF, A. NOTHNAGEL, S. BERNHART, A.BERTARINI, L. LA PORTA, A. M USKENS, H.ROTTMANN : “Status and future plans for theBonn Software Correlator”. In: Proceedings of the21st Meeting of the European VLBI Group forGeodesy and Astrometry, edited by N. Zubko andM. Poutanen, ISBN: 978-951-711-296-3, 21–24,2013.
R. AMBROSINI, A. BOLLI , P. BOFFA: “The SardiniaRadio Telescope: Overview and Status”. In: Interna-tional Conference on Electromagnetics in AdvancedApplications (ICEAA), ISBN 978-1-4673-5705-0,82–85, 2013.
Y. AOYAMA , K. DOI, K. SHIBUYA : “JARE SyowaStation 11-m Antenna, Antarctica”. In: InternationalVLBI Service for Geodesy and Astrometry 2012Annual Report, edited by K. D. Baver, D. Behrendand K. L. Armstrong, NASA/TP-2013-217511,150–153, 2013.
IVS 2013 Annual Report
T. ARTZ, A. NOTHNAGEL, L. LA PORTA: “VLBIObservations of Geostationary Satellites”. In: Pro-ceedings of the 21st Meeting of the European VLBIGroup for Geodesy and Astrometry, edited by N.Zubko and M. Poutanen, ISBN: 978-951-711-296-3, 217–222, 2013.
S. BACHMANN AND M. L OSLER: “Activities andProducts at IVS combination center at BKG”.In: Proceedings of the 21st Meeting of the Euro-pean VLBI Group for Geodesy and Astrometry,edited by N. Zubko and M. Poutanen, ISBN:978-951-711-296-3, 169–174, 2013.
S. BACHMANN , M. L OSLER, R. HEINKELMANN ,M. GERSTL: “BKG/DGFI Combination CenterAnnual Report 2012”. In: International VLBIService for Geodesy and Astrometry 2012 AnnualReport, edited by K. D. Baver, D. Behrend and K.L. Armstrong, NASA/TP-2013-217511, 245–248,2013.
D. BAEK , S. YI , H. OH, S. HAN : “Korea Geode-tic VLBI Station, Sejong”. In: International VLBIService for Geodesy and Astrometry 2012 AnnualReport, edited by K. D. Baver, D. Behrend and K.L. Armstrong, NASA/TP-2013-217511, 135–138,2013.
C. BARACHE AND S. LAMBERT: “Paris Observatory(OPAR) Data Center”. In: International VLBI Ser-vice for Geodesy and Astrometry 2012 Annual Re-port, edited by K. D. Baver, D. Behrend and K.L. Armstrong, NASA/TP-2013-217511, 231–233,2013.
K. BAVER AND J. GIPSON: “Refining the UniformSky Strategy for IVS-INT01 Scheduling”. In: Pro-ceedings of the 21st Meeting of the European VLBIGroup for Geodesy and Astrometry, edited by N.
355

356 Bibliography
Zubko and M. Poutanen, ISBN: 978-951-711-296-3, 205–209, 2013.
C. BEAUDOIN, B. COREY, A. NIELL , R. CAPPALLO,A. WHITNEY: “Haystack Observatory TechnologyDevelopment Center”. In: International VLBI Ser-vice for Geodesy and Astrometry 2012 Annual Re-port, edited by K. D. Baver, D. Behrend and K.L. Armstrong, NASA/TP-2013-217511, 335–338,2013.
C. BEAUDOIN, P. BOLIS, J. BYFORD, S. CAPPALLO,T. CLARK , B. COREY, I. DIEGEL, M. DEROME,C. ECKERT, C. MA , A. NIELL , B. PETRA-CHENKO, A. WHITNEY: “Receiver Upgrade forthe GGAO 12m VLBI system”. In: Proceedings ofthe 21st Meeting of the European VLBI Group forGeodesy and Astrometry, edited by N. Zubko andM. Poutanen, ISBN: 978-951-711-296-3, 13–16,2013.
D. BEHREND: “Coordinating Center Report”. In: In-ternational VLBI Service for Geodesy and Astrom-etry 2012 Annual Report, edited by K. D. Baver,D. Behrend and K. L. Armstrong, NASA/TP-2013-217511, 55–57, 2013.
S. BERNHART, W. ALEF, A. BERTARINI, L. LA
PORTA, A. M USKENS, H. ROTTMANN , A. ROY:“The Bonn Astro/Geo Correlator”. In: InternationalVLBI Service for Geodesy and Astrometry 2012Annual Report, edited by K. D. Baver, D. Behrendand K. L. Armstrong, NASA/TP-2013-217511,193–196, 2013.
G. BIANCO, G. COLUCCI, F. SCHIAVONE: “MateraCGS VLBI Station”. In: International VLBI Servicefor Geodesy and Astrometry 2012 Annual Report,edited by K. D. Baver, D. Behrend and K. L. Arm-strong, NASA/TP-2013-217511, 106–109, 2013.
D. A. BOBOLTZ, A. L. FEY, N. GEIGER, C. DIECK,D. HALL : “U. S. Naval Observatory VLBI Anal-ysis Center”. In: International VLBI Service forGeodesy and Astrometry 2012 Annual Report,edited by K. D. Baver, D. Behrend and K. L.Armstrong, NASA/TP-2013-217511, 319–322,2013.
J. BOHM, S. BOHM, H. KRASNA , M. MADZAK , T.NILSSON, L. PLANK , V. RAPOSO, H. SCHUH, B.SOJA, J. SUN, K. TEKE, C. TIERNO ROS: “Vi-enna Special Analysis Center Annual Report 2012”.In: International VLBI Service for Geodesy and
Astrometry 2012 Annual Report, edited by K. D.Baver, D. Behrend and K. L. Armstrong, NASA/TP-2013-217511, 325–328, 2013.
J. BOHM, C. TIERNO ROS, J. SUN, S. BOHM, H.KRASNA , T. NILSSON: “New VLBI2010 schedul-ing options and implications on terrestrial and celes-tial reference frames”. In: Proceedings of the 21stMeeting of the European VLBI Group for Geodesyand Astrometry, edited by N. Zubko and M. Pouta-nen, ISBN: 978-951-711-296-3, 39–44, 2013.
S. BOLOTIN, K. BAVER, J. GIPSON, D. GORDON, D.MACM ILLAN : “Current status ofνSolve”. In: Pro-ceedings of the 21st Meeting of the European VLBIGroup for Geodesy and Astrometry, edited by N.Zubko and M. Poutanen, ISBN: 978-951-711-296-3, 77–80, 2013.
R. BOUFFET, P. CHARLOT, S. LAMBERT: “Correla-tion between source structure evolution and VLBIposition instabilities”. In: Proceedings of the 21stMeeting of the European VLBI Group for Geodesyand Astrometry, edited by N. Zubko and M. Pouta-nen, ISBN: 978-951-711-296-3, 185–188, 2013.
R. CAPPALLO, C. RUSZCZYK, A. WHITNEY:“Mark 6: Design and Status”. In: Proceedings ofthe 21st Meeting of the European VLBI Group forGeodesy and Astrometry, edited by N. Zubko andM. Poutanen, ISBN: 978-951-711-296-3, 9–12,2013.
P. CHARLOT, A. BELLANGER, R. BOUFFET, G.BOURDA, A. COLLIOUD , A. BAUDRY: “Reportfor 2012 from the Bordeaux IVS Analysis Cen-ter”. In: International VLBI Service for Geodesyand Astrometry 2012 Annual Report, edited byK. D. Baver, D. Behrend and K. L. Armstrong,NASA/TP-2013-217511, 241–244, 2013.
A. COLLIOUD , A. NEIDHARDT: “When ‘IVS Live’meets ‘e-RemoteCtrl’ real-time data”. In: Proceed-ings of the 21st Meeting of the European VLBIGroup for Geodesy and Astrometry, edited by N.Zubko and M. Poutanen, ISBN: 978-951-711-296-3, 17–20, 2013.
F. COLOMER, S. GARCIA -ESPADA, J. GOMEZ-GONZALEZ , J. LOPEZ-FERNANDEZ, A. SAN-TAMAR IA -GOMEZ, P. DE V ICENTE: “InstitutoGeografico Nacional of Spain”. In: InternationalVLBI Service for Geodesy and Astrometry 2012Annual Report, edited by K. D. Baver, D. Behrend
IVS 2013 Annual Report

Bibliography 357
and K. L. Armstrong, NASA/TP-2013-217511,173–176, 2013.
R. CURTIS: “Kokee Park Geophysical Observatory”.In: International VLBI Service for Geodesy andAstrometry 2012 Annual Report, edited by K. D.Baver, D. Behrend and K. L. Armstrong, NASA/TP-2013-217511, 102–105, 2013.
A. DE WITT, M. GAYLARD , J. QUICK , L. COM-BRINCK: “An Overview of Geodetic and Astromet-ric VLBI at the Hartebeesthoek Radio AstronomyObservatory”. In: Proceedings of the 21st Meet-ing of the European VLBI Group for Geodesy andAstrometry, edited by N. Zubko and M. Poutanen,ISBN: 978-951-711-296-3, 45–48, 2013.
G. ENGELHARDT, V. THORANDT, D. ULLRICH :“Rapid UT1 Estimation Derived from TsukubaVLBI Measurements after 2011 Earthquake”. In:Proceedings of the 21st Meeting of the Euro-pean VLBI Group for Geodesy and Astrometry,edited by N. Zubko and M. Poutanen, ISBN:978-951-711-296-3, 85–88, 2013.
C. ESCHELBACH, R. HAAS, M. L OSLER: “Auto-mated IVS Reference Point Monitoring – FirstExperience from the Onsala Space Observatory”.In: Proceedings of the 21st Meeting of the Euro-pean VLBI Group for Geodesy and Astrometry,edited by N. Zubko and M. Poutanen, ISBN:978-951-711-296-3, 249–254, 2013.
A. L. FEY, D. A. BOBOLTZ, R. A. GAUME : “USNOAnalysis Center for Source Structure Report”.In: International VLBI Service for Geodesy andAstrometry 2012 Annual Report, edited by K.D. Baver, D. Behrend and K. L. Armstrong,NASA/TP-2013-217511, 323–324, 2013.
R. FIGUEROA: “Goddard Geophysical and Astronom-ical Observatory”. In: International VLBI Servicefor Geodesy and Astrometry 2012 Annual Report,edited by K. D. Baver, D. Behrend and K. L. Arm-strong, NASA/TP-2013-217511, 82–85, 2013.
A. GIRDIUK AND O. TITOV: “Plan for VLBI Ob-servations of Close Approaches of Jupiter toCompact Extragalactic Radio Sources in 2014–2016”. In: Proceedings of Journees-2013, 2013.(arXiv:1311.0092)
D. GORDON, C. MA , D. MACM ILLAN , J. GIPSON,S. BOLOTIN, K. LE BAIL , K. BAVER: “GSFCVLBI Analysis Center”. In: International VLBI Ser-
vice for Geodesy and Astrometry 2012 Annual Re-port, edited by K. D. Baver, D. Behrend and K.L. Armstrong, NASA/TP-2013-217511, 261–264,2013.
R. HAAS: “The Onsala Twin Telescope Project”. In:Proceedings of the 21st Meeting of the EuropeanVLBI Group for Geodesy and Astrometry, editedby N. Zubko and M. Poutanen, ISBN: 978-951-711-296-3, 61–68, 2013.
R. HAAS, G. ELGERED, J. LOFGREN, T. NING,H. SCHERNECK: “Onsala Space Observatory -IVS Network Station”. In: International VLBIService for Geodesy and Astrometry 2012 AnnualReport, edited by K. D. Baver, D. Behrend and K.L. Armstrong, NASA/TP-2013-217511, 130–133,2013.
R. HAAS, H. SCHERNECK, G. ELGERED, T. NING,J. LOFGREN: “Onsala Space Observatory - IVSAnalysis Center”. In: International VLBI Servicefor Geodesy and Astrometry 2012 Annual Report,edited by K. D. Baver, D. Behrend and K. L. Arm-strong, NASA/TP-2013-217511, 298–301, 2013.
D. HALL AND D. BOBOLTZ: “Washington Correla-tor”. In: International VLBI Service for Geodesyand Astrometry 2012 Annual Report, edited byK. D. Baver, D. Behrend and K. L. Armstrong,NASA/TP-2013-217511, 216–218, 2013.
D. HALL AND M. S. CARTER: “NEOS Opera-tion Center”. In: International VLBI Service forGeodesy and Astrometry 2012 Annual Report,edited by K. D. Baver, D. Behrend and K. L.Armstrong, NASA/TP-2013-217511, 189, 2013.
H. HASE, G. GANCIO, D. PERILLI , J. J. LARRARTE,L. GUARRERA, L. GARCIA , G. KRONSCHNABL,C. PLOTZ: “Radio Frequency Interference Observa-tions at IAR La Plata”. In: Proceedings of the 21stMeeting of the European VLBI Group for Geodesyand Astrometry, edited by N. Zubko and M. Pouta-nen, ISBN: 978-951-711-296-3, 49–54, 2013.
H. HASE, C. HERRERA, F. PEDREROS, O. ZAPATA ,P. PINO: “Status of the TIGO VLBI Station inConcepcion”. In: International VLBI Service forGeodesy and Astrometry 2012 Annual Report,edited by K. D. Baver, D. Behrend and K. L.Armstrong, NASA/TP-2013-217511, 154–156,2013.
IVS 2013 Annual Report
358 Bibliography
R. HEINKELMANN , M. KARBON, T. NILSSON,V. RAPOSO, H. SCHUH: “GFZ Analysis Cen-ter”. In: International VLBI Service for Geodesyand Astrometry 2012 Annual Report, edited byK. D. Baver, D. Behrend and K. L. Armstrong,NASA/TP-2013-217511, 255–256, 2013.
R. HEINKELMANN , M. SEITZ, J. MORA-DIAZ ,M. BLOSSFELD, M. GERSTL, R. SCHMID :“DGFI Analysis Center Annual Report 2012”.In: International VLBI Service for Geodesy andAstrometry 2012 Annual Report, edited by K.D. Baver, D. Behrend and K. L. Armstrong,NASA/TP-2013-217511, 251–254, 2013.
R. HEINKELMANN AND V. TESMER: “SystematicInconsistencies Between VLBI, CRF and TRFSolutions Caused by Different Analysis Options”.In: Reference Frames for Applications in Geo-sciences, edited by Z. Altamimi and X. Collilieux,DOI:10.1007/978-3-642-32998-227, 181–189,2013.
E. HIMWICH AND J. GIPSON: “GSFC TechnologyDevelopment Center Report”. In: InternationalVLBI Service for Geodesy and Astrometry 2012Annual Report, edited by K. D. Baver, D. Behrendand K. L. Armstrong, NASA/TP-2013-217511,332–334, 2013.
E. HIMWICH AND R. STRAND: “Network Coordi-nator Report”. In: International VLBI Service forGeodesy and Astrometry 2012 Annual Report,edited by K. D. Baver, D. Behrend and K. L.Armstrong, NASA/TP-2013-217511, 60–67, 2013.
T. HOBIGER, M. SEKIDO, R. ICHIKAWA : “AnalysisCenter at National Institute of Information andCommunications Technology”. In: InternationalVLBI Service for Geodesy and Astrometry 2012Annual Report, edited by K. D. Baver, D. Behrendand K. L. Armstrong, NASA/TP-2013-217511,287–290, 2013.
R. ICHIKAWA AND M. SEKIDO: “Data Center atNICT”. In: International VLBI Service for Geodesyand Astrometry 2012 Annual Report, edited byK. D. Baver, D. Behrend and K. L. Armstrong,NASA/TP-2013-217511, 227–230, 2013.
A. I PATOV, S. SMOLENTSEV, A. SALNIKOV ,I. SURKIS, I. GAYAZOV, S. KURDUBOV, I.RAHIMOV, A. DIAKOV, V. SHPILEVSKY, A.MELNIKOV, V. ZIMOVSKY, L. FEDOTOV, E.
SKURIKHINA : “The state-of-the-art of RussianVLBI network”. In: Proceedings of the 21st Meet-ing of the European VLBI Group for Geodesy andAstrometry, edited by N. Zubko and M. Poutanen,ISBN: 978-951-711-296-3, 155–158, 2013.
C. JACOBS: “JPL VLBI Analysis Center Report for2012”. In: International VLBI Service for Geodesyand Astrometry 2012 Annual Report, edited byK. D. Baver, D. Behrend and K. L. Armstrong,NASA/TP-2013-217511, 273–276, 2013.
T. JIKE , Y. TAMURA , M. SHIZUGAMI , VERAGROUP: “VERA Geodetic Activities”. In: Interna-tional VLBI Service for Geodesy and Astrometry2012 Annual Report, edited by K. D. Baver, D.Behrend and K. L. Armstrong, NASA/TP-2013-217511, 116–119, 2013.
U. KALLIO AND N. ZUBKO: “The effect of the sys-tematic error in the axis offset value on the coor-dinates estimated on VLBI data analysis”. In: Pro-ceedings of the 21st Meeting of the European VLBIGroup for Geodesy and Astrometry, edited by N.Zubko and M. Poutanen, ISBN: 978-951-711-296-3, 237–242, 2013.
N. KAREINEN, M. UUNILA : “Automated analysis ofdUT1 with VieVS using new post-earthquake coor-dinates for Tsukuba”. In: Proceedings of the 21stMeeting of the European VLBI Group for Geodesyand Astrometry, edited by N. Zubko and M. Pouta-nen, ISBN: 978-951-711-296-3, 99–104, 2013.
P. KAUFMANN , A. MACILIO PEREIRA DE LUCENA,A. SOMBRA DA SILVA : “Fortaleza Station Reportfor 2012”. In: International VLBI Service forGeodesy and Astrometry 2012 Annual Report,edited by K. D. Baver, D. Behrend and K. L.Armstrong, NASA/TP-2013-217511, 79–81, 2013.
R. KAWABATA , S. KURIHARA , Y. FUKUZAKI , J.KURODA, T. TANABE , Y. MUKAI , T. NISHIKAWA :“Tsukuba 32-m VLBI Station”. In: InternationalVLBI Service for Geodesy and Astrometry 2012Annual Report, edited by K. D. Baver, D. Behrendand K. L. Armstrong, NASA/TP-2013-217511,157–160, 2013.
H. P. KIERULF AND P. H. ANDERSEN: “NMAAnalysis Center”. In: International VLBI Servicefor Geodesy and Astrometry 2012 Annual Report,edited by K. D. Baver, D. Behrend and K. L.
IVS 2013 Annual Report

Bibliography 359
Armstrong, NASA/TP-2013-217511, 291–293,2013.
J. KODET, CHR. PLOTZ, K. U. SCHREIBER, A. NEI-DHARDT, S. POGREBENKO, R. HAAS, G. MOL-ERA, I. PROCHAZKA: “Co-location of space geode-tics techniques in Space and on the ground”. In: Pro-ceedings of the 21st Meeting of the European VLBIGroup for Geodesy and Astrometry, edited by N.Zubko and M. Poutanen, ISBN: 978-951-711-296-3, 223–226, 2013.
H. KRASNA , J. BOHM, R. HAAS, H. SCHUH: “ZonalLove and Shida numbers estimated by VLBI”. In:Proceedings of the 21st Meeting of the EuropeanVLBI Group for Geodesy and Astrometry, editedby N. Zubko and M. Poutanen, ISBN: 978-951-711-296-3, 121–126, 2013.
S. L. KURDUBOV : “Comparison of Russian and IVSintensive series”. In: Proceedings of the 21st Meet-ing of the European VLBI Group for Geodesy andAstrometry, edited by N. Zubko and M. Poutanen,ISBN: 978-951-711-296-3, 147–150, 2013.
S. KURIHARA AND K. NOZAWA : “Tsukuba VLBIAnalysis Center”. In: International VLBI Servicefor Geodesy and Astrometry 2012 Annual Report,edited by K. D. Baver, D. Behrend and K. L. Arm-strong, NASA/TP-2013-217511, 315–318, 2013.
S. KURIHARA AND K. NOZAWA : “Tsukuba VLBICorrelator”. In: International VLBI Service forGeodesy and Astrometry 2012 Annual Report,edited by K. D. Baver, D. Behrend and K. L.Armstrong, NASA/TP-2013-217511, 212–215,2013.
S. KURIHARA , K. NOZAWA , R. HAAS, J. LOVELL ,J. MCCALLUM , J. QUICK , T. HOBIGER: “4-stationultra-rapid EOP experiment with e-VLBI techniqueand automated correlation/analysis”. In: Proceed-ings of the 21st Meeting of the European VLBIGroup for Geodesy and Astrometry, edited by N.Zubko and M. Poutanen, ISBN: 978-951-711-296-3, 233–236, 2013.
Y. K WAK AND J. CHO: “VLBI TRF Combination Us-ing GNSS Software”. Journal of Astronomy andSpace Sciences, 30(4), 315–320, 2013.
Y. K WAK AND J. CHO: “KASI Combination Cen-ter Report”. In: International VLBI Service forGeodesy and Astrometry 2012 Annual Report,edited by K. D. Baver, D. Behrend and K. L.
Armstrong, NASA/TP-2013-217511, 277–280,2013.
S. LAMBERT AND C. BARACHE: “Paris ObservatoryAnalysis Center (OPAR): Report on Activities, Jan-uary - December, 2012”. In: International VLBI Ser-vice for Geodesy and Astrometry 2012 Annual Re-port, edited by K. D. Baver, D. Behrend and K.L. Armstrong, NASA/TP-2013-217511, 294–297,2013.
R. LANOTTE: “Matera CGS VLBI Analysis Center”.In: International VLBI Service for Geodesy andAstrometry 2012 Annual Report, edited by K. D.Baver, D. Behrend and K. L. Armstrong, NASA/TP-2013-217511, 249–250, 2013.
K. L E BAIL , J. M. GIPSON, J. JUHL , D. S. MACM IL -LAN : “Optimal time lags to use in modeling thethermal deformation of VLBI Antennas”. In: Pro-ceedings of the 21st Meeting of the European VLBIGroup for Geodesy and Astrometry, edited by N.Zubko and M. Poutanen, ISBN: 978-951-711-296-3, 165–168, 2013.
J. LEEK, T. ARTZ, A. NOTHNAGEL: “Assessmentof VLBI Intensive Schedules by means of Clus-ter Analysis”. In: Proceedings of the 21st Meet-ing of the European VLBI Group for Geodesy andAstrometry, edited by N. Zubko and M. Poutanen,ISBN: 978-951-711-296-3, 211–216, 2013.
M. L OSLER, A. NEIDHARDT, S. MAHLER: “Impactof Different Observation Strategies on ReferencePoint Determination - Evaluations from a Campaignat the Geodetic Observatory Wettzell”. In: Proceed-ings of the 21st Meeting of the European VLBIGroup for Geodesy and Astrometry, edited by N.Zubko and M. Poutanen, ISBN: 978-951-711-296-3, 255–260, 2013.
J. LOVELL , J. DICKEY, B. REID, J. MCCALLUM ,S. SHABALA , C. WATSON, S. ELLINGSEN, A.MEMIN : “AuScope VLBI Project and Hobart26-m Antenna”. In: International VLBI Servicefor Geodesy and Astrometry 2012 Annual Report,edited by K. D. Baver, D. Behrend and K. L.Armstrong, NASA/TP-2013-217511, 90–93, 2013.
J. LOVELL , J. MCCALLUM , P. REID, P. MCCUL-LOCH, B. BAYNES, J. DICKEY, S. SHABALA ,C. WATSON, O. TITOV, R. RUDDICK , R. TWIL -LEY, C. REYNOLDS, S. TINGAY, P. SHIELD ,R. ADADA , S. ELLINGSEN, J. MORGAN, H.
IVS 2013 Annual Report

360 Bibliography
BIGNALL : “The AuScope Geodetic VLBI Array”.Journal of Geodesy, 87(6), 527–538, 2013.
D. S. MACM ILLAN AND D. ERIKSSON: “NontidalOcean Loading Observed by VLBI Measurement”.In: Proceedings of the 21st Meeting of the EuropeanVLBI Group for Geodesy and Astrometry, edited byN. Zubko and M. Poutanen, ISBN: 978-951-711-296-3, 135–140, 2013.
M. M ADZAK , J. BOHM, S. BOHM, H. KRASNA , T.NILSSON, L. PLANK , C. TIERNO ROS, H. SCHUH,B. SOJA, J. SUN, K. TEKE: “Vienna VLBI Soft-ware – Current release and plans for the future”. In:Proceedings of the 21st Meeting of the EuropeanVLBI Group for Geodesy and Astrometry, editedby N. Zubko and M. Poutanen, ISBN: 978-951-711-296-3, 73–76, 2013.
Z. MALKIN : “On Assessment of the stochastic errorsof source position catalogs”. In: Proceedings of theAll-Russian Astrometry Conference Pulkovo 2013,No. 220, 59–64, 2013. (in Russian)
Z. MALKIN : “Catalog of optical characteristics of as-trometric radio sources OCARS”. In: Proceedingsof the All-Russian Astrometry Conference Pulkovo-2013, No. 220, 507–510, 2013. (in Russian)
Z. MALKIN : “On Application of the 3-Cornered HatTechnique to Radio Source Position Catalogs”. In:Proceedings of the 21st Meeting of the EuropeanVLBI Group for Geodesy and Astrometry, editedby N. Zubko and M. Poutanen, ISBN: 978-951-711-296-3, 175–178, 2013.
Z. MALKIN : “On the Impact of the Seasonal StationMotions on the Intensive UT1 Results”. In: Pro-ceedings of the 21st Meeting of the European VLBIGroup for Geodesy and Astrometry, edited by N.Zubko and M. Poutanen, ISBN: 978-951-711-296-3, 89–94, 2013.
Z. MALKIN AND E. SKURIKHINA : “Dependence ofthe rapid UT1 results obtained from the VLBI net-work ‘Quasar’ on nutation model”. In: Proceedingsof the All-Russian Astrometry Conference Pulkovo-2013, No. 220, 119–124, 2013. (in Russian)
Z. MALKIN AND J. SOKOLOVA : “Pulkovo IVS Anal-ysis Center (PUL) 2012 Annual Report”. In: Inter-national VLBI Service for Geodesy and Astrom-etry 2012 Annual Report, edited by K. D. Baver,D. Behrend and K. L. Armstrong, NASA/TP-2013-217511, 305–308, 2013.
Z. MALKIN , J. SUN, J. BOHM, S. BOHM, H.KRASNA : “Searching for an Optimal Strategy to In-tensify Observations of the Southern ICRF sourcesin the fremework of the regular IVS observingprograms”. In: Proceedings of the 21st Meetingof the European VLBI Group for Geodesy andAstrometry, edited by N. Zubko and M. Poutanen,ISBN: 978-951-711-296-3, 199–204, 2013.
D. MARSHALOV, E. NOSOV, L. FEDOTOV: “IAATechnology Development Center”. In: InternationalVLBI Service for Geodesy and Astrometry 2012Annual Report, edited by K. D. Baver, D. Behrendand K. L. Armstrong, NASA/TP-2013-217511,339–341, 2013.
M. NEGUSINI AND P. SARTI : “Italy INAF DataCenter Report”. In: International VLBI Servicefor Geodesy and Astrometry 2012 Annual Report,edited by K. D. Baver, D. Behrend and K. L.Armstrong, NASA/TP-2013-217511, 226, 2013.
M. NEGUSINI AND P. SARTI : “Italy INAF Analy-sis Center Report”. In: International VLBI Servicefor Geodesy and Astrometry 2012 Annual Report,edited by K. D. Baver, D. Behrend and K. L. Arm-strong, NASA/TP-2013-217511, 271–272, 2013.
A. NEIDHARDT, M. ETTL , W. BRISKEN, R. DASS-ING: “Continuous integration and quality controlfor scientific software”. In: Proceedings of the 21stMeeting of the European VLBI Group for Geodesyand Astrometry, edited by N. Zubko and M. Pouta-nen, ISBN: 978-951-711-296-3, 81–84, 2013.
A. NEIDHARDT, M. ETTL , M. M UHLBAUER, G.KRONSCHNABL, W. ALEF, E. HIMWICH , C.BEAUDOIN, C. PLOTZ, J. LOVELL : “Safe andsecure remote control for the Twin Radio TelescopeWettzell”. In: Proceedings of the 21st Meetingof the European VLBI Group for Geodesy andAstrometry, edited by N. Zubko and M. Poutanen,ISBN: 978-951-711-296-3, 25-28, 2013.
A. NEIDHARDT, G. KRONSCHNABL, R. SCHATZ:“Geodetic Observatory Wettzell - 20-m Radio Tele-scope and Twin Telescope”. In: International VLBIService for Geodesy and Astrometry 2012 AnnualReport, edited by K. D. Baver, D. Behrend and K.L. Armstrong, NASA/TP-2013-217511, 169–172,2013.
A. NEIDHARDT, C. PLOTZ, T. KLUGEL: “VLBI2010Receiver Back End Comparison”. In: International
IVS 2013 Annual Report

Bibliography 361
VLBI Service for Geodesy and Astrometry 2012Annual Report, edited by K. D. Baver, D. Behrendand K. L. Armstrong, NASA/TP-2013-217511,126–129, 2013.
M. N ICKOLA , M. GAYLARD , J. QUICK , L. COM-BRINCK: “Hartebeesthoek Radio Astronomy Obser-vatory (HartRAO)”. In: International VLBI Servicefor Geodesy and Astrometry 2012 Annual Report,edited by K. D. Baver, D. Behrend and K. L. Arm-strong, NASA/TP-2013-217511, 86–89, 2013.
A. N IELL , C. BEAUDOIN, R. CAPPALLO, B. COREY,M. T ITUS: “First results with the GGAO12MVGOS System”. In: Proceedings of the 21st Meet-ing of the European VLBI Group for Geodesy andAstrometry, edited by N. Zubko and M. Poutanen,ISBN: 978-951-711-296-3, 29–32, 2013.
A. N IELL , R. CAPPALLO, B. COREY, M. TITUS:“Haystack Analysis Center”. In: International VLBIService for Geodesy and Astrometry 2012 AnnualReport, edited by K. D. Baver, D. Behrend and K.L. Armstrong, NASA/TP-2013-217511, 265–268,2013.
T. NILSSON, M. KARBON, H. SCHUH: “A Kalman fil-ter for combining high frequency Earth rotation pa-rameters from VLBI and GNSS”. In: Proceedings ofthe 21st Meeting of the European VLBI Group forGeodesy and Astrometry, edited by N. Zubko andM. Poutanen, ISBN: 978-951-711-296-3, 117–120,2013.
C. NOLL : “CDDIS Data Center Summary for the IVS2012 Annual Report”. In: International VLBI Ser-vice for Geodesy and Astrometry 2012 Annual Re-port, edited by K. D. Baver, D. Behrend and K.L. Armstrong, NASA/TP-2013-217511, 223–225,2013.
A. NOTHNAGEL: “Analysis Coordinator Report”.In: International VLBI Service for Geodesy andAstrometry 2012 Annual Report, edited by K.D. Baver, D. Behrend and K. L. Armstrong,NASA/TP-2013-217511, 58–59, 2013.
A. NOTHNAGEL, P. CHARLOT, V. DEHANT, A.FIENGA, H. HASE, L. PLANK , H. SCHUH: “ShortReport of IVS Working Group 5 (WG5) on SpaceScience Applications”. In: International VLBIService for Geodesy and Astrometry 2012 AnnualReport, edited by K. D. Baver, D. Behrend and
K. L. Armstrong, NASA/TP-2013-217511, 13–20,2013.
A. NOTHNAGEL, M. EICHBORN, C. HOLST: “Im-proved focal length results of the Effelsberg 100 mradio telescope”. In: Proceedings of the 21st Meet-ing of the European VLBI Group for Geodesy andAstrometry, edited by N. Zubko and M. Poutanen,ISBN: 978-951-711-296-3, 55–60, 2013.
A. NOTHNAGEL AND A. M USKENS: “The BonnGeodetic VLBI Operation Center”. In: InternationalVLBI Service for Geodesy and Astrometry 2012Annual Report, edited by K. D. Baver, D. Behrendand K. L. Armstrong, NASA/TP-2013-217511,183–184, 2013.
A. ORFEI, A. ORLATI , G. MACCAFERRI: “TheMedicina Station Status Report”. In: InternationalVLBI Service for Geodesy and Astrometry 2012Annual Report, edited by K. D. Baver, D. Behrendand K. L. Armstrong, NASA/TP-2013-217511,110-111, 2013.
M. PANTALEEV, U. KYLENFALL , L. HELLDNER,K. JOHANSSON, R. HAAS, M. IVASHINA , O.IUPIKOV: “Onsala Space Observatory - IVS Tech-nology Development Center”. In: InternationalVLBI Service for Geodesy and Astrometry 2012Annual Report, edited by K. D. Baver, D. Behrendand K. L. Armstrong, NASA/TP-2013-217511,346–349, 2013.
B. PETRACHENKO: “Canadian VLBI Technology De-velopment Center”. In: International VLBI Servicefor Geodesy and Astrometry 2012 Annual Report,edited by K. D. Baver, D. Behrend and K. L. Arm-strong, NASA/TP-2013-217511, 331, 2013.
B. PETRACHENKO: “VLBI2010 Feed Comparison”.In: International VLBI Service for Geodesy andAstrometry 2012 Annual Report, edited by K. D.Baver, D. Behrend and K. L. Armstrong, NASA/TP-2013-217511, 48–51, 2013.
B. PETRACHENKO: “VLBI2010 Receiver Back EndComparison”. In: International VLBI Service forGeodesy and Astrometry 2012 Annual Report,edited by K. D. Baver, D. Behrend and K. L.Armstrong, NASA/TP-2013-217511, 39–47, 2013.
B. PETRACHENKO, B. COREY, C. BEAUDOIN:“VGOS RFI Survey”. In: Proceedings of the 21stMeeting of the European VLBI Group for Geodesy
IVS 2013 Annual Report

362 Bibliography
and Astrometry, edited by N. Zubko and M.Poutanen, ISBN: 978-951-711-296-3, 33–38, 2013.
L. PLANK , J. BOHM, H. KRASNA , H. SCHUH:“VLBI satellite tracking for precise coordinate de-termination - a simulation study”. In: Proceedingsof the 21st Meeting of the European VLBI Groupfor Geodesy and Astrometry, edited by N. Zubkoand M. Poutanen, ISBN: 978-951-711-296-3,105–110, 2013.
M. POIRIER: “Westford Antenna”. In: InternationalVLBI Service for Geodesy and Astrometry 2012Annual Report, edited by K. D. Baver, D. Behrendand K. L. Armstrong, NASA/TP-2013-217511,165–168, 2013.
M. POUTANEN, U. KALLIO , H. KOIVULA , J.NARANEN, A. RAJA-HALLI , N. ZUBKO: “Re-newal of Metsahovi Observatory”. In: Proceedingsof the 21st Meeting of the European VLBI Groupfor Geodesy and Astrometry, edited by N. Zubkoand M. Poutanen, ISBN: 978-951-711-296-3,67–72, 2013.
V. RAPOSO-PULIDO , H. KRASNA , T. NILSSON, R.HEINKELMANN , H. SCHUH: “Time Series Analy-sis and Stability of ICRF2 sources”. In: Proceedingsof the 21st Meeting of the European VLBI Groupfor Geodesy and Astrometry, edited by N. Zubkoand M. Poutanen, ISBN: 978-951-711-296-3, 179–184, 2013.
J. REYNOLDS: “Parkes 2012 IVS Report”. In: Inter-national VLBI Service for Geodesy and Astrom-etry 2012 Annual Report, edited by K. D. Baver,D. Behrend and K. L. Armstrong, NASA/TP-2013-217511, 134, 2013.
P. SARTI , C. ABBONDANZA , J. LEGRAND, C.BRUYNINX , L. V ITTUARI , J. RAY: “IntrasiteMotions and Monument Instabilities at MedicinaITRF Co-location Site”. Geophysical JournalInternational, Volume 192, Issue 3, 1042–1051,2013.
R. SCHAAP, S. SHABALA , S. ELLINGSEN, O.TITOV, J. LOVELL : “Scintillation is an indicator ofastrometric stability”. Monthly Notices of the RoyalAstronomical Society (MNRAS), 434(1), 585–594,2013.
M. SEKIDO AND E. KAWAI : “Kashima 34-m RadioTelescope”. In: International VLBI Service forGeodesy and Astrometry 2012 Annual Report,
edited by K. D. Baver, D. Behrend and K. L.Armstrong, NASA/TP-2013-217511, 94–97, 2013.
M. SEKIDO AND E. KAWAI : “Kashima and Koganei11-m VLBI Stations”. In: International VLBIService for Geodesy and Astrometry 2012 AnnualReport, edited by K. D. Baver, D. Behrend and K.L. Armstrong, NASA/TP-2013-217511, 98–101,2013.
M. SEKIDO AND K. TAKEFUJI: “VLBI Correlatorsin Kashima”. In: International VLBI Service forGeodesy and Astrometry 2012 Annual Report,edited by K. D. Baver, D. Behrend and K. L.Armstrong, NASA/TP-2013-217511, 204–207,2013.
F. SHU, W. ZHENG, Z. CHEN: “Shanghai VLBICorrelator”. In: International VLBI Service forGeodesy and Astrometry 2012 Annual Report,edited by K. D. Baver, D. Behrend and K. L.Armstrong, NASA/TP-2013-217511, 208–211,2013.
M. SIEBER: “Ny-Alesund Geodetic Observatory”.In: International VLBI Service for Geodesy andAstrometry 2012 Annual Report, edited by K.D. Baver, D. Behrend and K. L. Armstrong,NASA/TP-2013-217511, 123–125, 2013.
E. SKURIKHINA , S. KURDUBOV, V. GUBANOV:“IAA VLBI Analysis Center Report 2012”. In:International VLBI Service for Geodesy andAstrometry 2012 Annual Report, edited by K.D. Baver, D. Behrend and K. L. Armstrong,NASA/TP-2013-217511, 269–270, 2013.
S. SMOLENTSEV AND A. DYAKOV : “ZelenchukskayaRadio Astronomical Observatory”. In: InternationalVLBI Service for Geodesy and Astrometry 2012Annual Report, edited by K. D. Baver, D. Behrendand K. L. Armstrong, NASA/TP-2013-217511,177–180, 2013.
S. SMOLENSTEV AND V. OLIFIROV: “Badary RadioAstronomical Observatory”. In: International VLBIService for Geodesy and Astrometry 2012 AnnualReport, edited by K. D. Baver, D. Behrend and K. L.Armstrong, NASA/TP-2013-217511, 75–78, 2013.
S. SMOLENTSEV AND I. RAHIMOV : “Svetloe RadioAstronomical Observatory”. In: International VLBIService for Geodesy and Astrometry 2012 AnnualReport, edited by K. D. Baver, D. Behrend and K.
IVS 2013 Annual Report

Bibliography 363
L. Armstrong, NASA/TP-2013-217511, 146–149,2013.
B. SOJA, J. SUN, R. HEINKELMANN , H. SCHUH,J. BOHM: “Sun Corona Electron Densities Derivedfrom VLBI Sessions in 2011/2012”. In: Proceedingsof the 21st Meeting of the European VLBI Groupfor Geodesy and Astrometry, edited by N. Zubkoand M. Poutanen, ISBN: 978-951-711-296-3, 159–164, 2013.
R. SOKOLOVA AND Z. MALKIN : “On the Impact ofthe Correlation Information on the Orientation Pa-rameters Between Celestial Reference Frames”. In:Vestnik of the St. Petersburg State University, Ser.1, No. 4, 146–151, 2013. (in Russian)
I. SURKIS, V. KEN, A. MELNIKOV, V. M ISHIN, N.SOKOLOVA , V. SHANTYR , V. ZIMOVSKY: “IAACorrelator Center”. In: International VLBI Servicefor Geodesy and Astrometry 2012 Annual Report,edited by K. D. Baver, D. Behrend and K. L. Arm-strong, NASA/TP-2013-217511, 201–203, 2013.
K. TAKEFUJI AND H. UJIHARA: “Technology Devel-opment Center at NICT”. In: International VLBIService for Geodesy and Astrometry 2012 AnnualReport, edited by K. D. Baver, D. Behrend and K.L. Armstrong, NASA/TP-2013-217511, 342–345,2013.
E. TANIR KAYIKC I AND K. TEKE: “KTU-GEOD IVSAnalysis Center Annual Report 2012”. In: Inter-national VLBI Service for Geodesy and Astrom-etry 2012 Annual Report, edited by K. D. Baver,D. Behrend and K. L. Armstrong, NASA/TP-2013-217511, 281–284, 2013.
K. TEKE, J. BOHM, T. NILSSON, H. KRASNA : “Sub-daily Antenna Position Estimates from the CONT11Campaign”. In: Proceedings of the 21st Meeting ofthe European VLBI Group for Geodesy and As-trometry, edited by N. Zubko and M. Poutanen,ISBN: 978-951-711-296-3, 131–134, 2013.
C. THOMAS AND D. MACM ILLAN : “CORE Opera-tion Center Report”. In: International VLBI Servicefor Geodesy and Astrometry 2012 Annual Report,edited by K. D. Baver, D. Behrend and K. L. Arm-strong, NASA/TP-2013-217511, 185–188, 2013.
V. THORANDT, A. NOTHNAGEL, G. ENGELHARDT,D. ULLRICH , T. ARTZ, J. LEEK: “The BKG/IGGBVLBI Analysis Center”. In: International VLBI Ser-vice for Geodesy and Astrometry 2012 Annual Re-
port, edited by K. D. Baver, D. Behrend and K.L. Armstrong, NASA/TP-2013-217511, 257–260,2013.
V. THORANDT AND R. WOJDZIAK: “BKG Data Cen-ter”. In: International VLBI Service for Geodesyand Astrometry 2012 Annual Report, edited byK. D. Baver, D. Behrend and K. L. Armstrong,NASA/TP-2013-217511, 221–222, 2013.
O. TITOV AND S. LAMBERT: “Improved VLBI Mea-surement of the Solar System Acceleration”. As-tronomy & Astrophysics, 559, A95, 5pp, 2013.
O. TITOV AND L. STANFORD: “Comparison of wettroposphere variations estimated from VLBI andWVR”. In: Proceedings of the 21st Meeting of theEuropean VLBI Group for Geodesy and Astrome-try, edited by N. Zubko and M. Poutanen, ISBN:978-951-711-296-3, 151–154, 2013.
O. TITOV AND L. STANFORD: “Geoscience AustraliaAnalysis Center”. In: International VLBI Servicefor Geodesy and Astrometry 2012 Annual Report,edited by K. D. Baver, D. Behrend and K. L. Arm-strong, NASA/TP-2013-217511, 239–240, 2013.
O. TITOV, L. STANFORD, H. JOHNSON, T. PUR-SIMO, R. HUNSTEAD, D. JAUNCEY, K. MASLEN-NIKOV, A. BOLDYCHEVA : “Optical Spectraof Candidate International Celestial ReferenceFrame (ICRF) Flat-Spectrum Radio Sources”. TheAstronomical Journal, 146(1), 10pp, 2013.
M. T ITUS, R. CAPPALLO, B. COREY, K. DUDEVOIR,A. N IELL , A. WHITNEY: “Haystack ObservatoryVLBI Correlator”. In: International VLBI Servicefor Geodesy and Astrometry 2012 Annual Report,edited by K. D. Baver, D. Behrend and K. L. Arm-strong, NASA/TP-2013-217511, 197–200, 2013.
V. TORNATORE: “PMD IVS Analysis Center”. In: In-ternational VLBI Service for Geodesy and Astrom-etry 2012 Annual Report, edited by K. D. Baver,D. Behrend and K. L. Armstrong, NASA/TP-2013-217511, 302–304, 2013.
V. TORNATORE AND A. M ENNELLA : “On the possi-bility of using VLBI phase referencing to observeGNSS satellites”. In: Proceedings of the 21st Meet-ing of the European VLBI Group for Geodesy andAstrometry, edited by N. Zubko and M. Poutanen,ISBN: 978-951-711-296-3, 227–232, 2013.
D. TROFIMOV AND V. V ITYAZEV : “Analysis Centerof Saint Petersburg University”. In: International
IVS 2013 Annual Report

364 Bibliography
VLBI Service for Geodesy and Astrometry 2012Annual Report, edited by K. D. Baver, D. Behrendand K. L. Armstrong, NASA/TP-2013-217511,237–238, 2013.
G. TUCCARI, W. ALEF, M. WUNDERLICH, S.BUTTACCIO, D. GRAHAM , G. COMORETTO, A.BERTARINI, S. CASEY, A. ROY, J. WAGNER,M. L INDQVIST: “DBBC3 - Full digital EVNand VLBI2010 Backend, Project Progress”. In:Proceedings of the 21st Meeting of the Euro-pean VLBI Group for Geodesy and Astrometry,edited by N. Zubko and M. Poutanen, ISBN:978-951-711-296-3, 3–8, 2013.
G. TUCCARI, S. BUTTACCIO, P. CASSARO, C. CON-TAVALLE , G. NICOTRA, C. NOCITA, L. PAPALEO,M. PATERNO, P. R. PLATANIA , F. SCHILLIR O:“Noto Station Status Report”. In: InternationalVLBI Service for Geodesy and Astrometry 2012Annual Report, edited by K. D. Baver, D. Behrendand K. L. Armstrong, NASA/TP-2013-217511,120–122, 2013.
M. UUNILA , A. NOTHNAGEL, J. LEEK, N.KAREINEN: “Influence of source distributionon UT1 derived from IVS INT1 sessions”. In:Proceedings of the 21st Meeting of the Euro-pean VLBI Group for Geodesy and Astrometry,edited by N. Zubko and M. Poutanen, ISBN:978-951-711-296-3, 111–116, 2013.
M. UUNILA , N. ZUBKO, M. POUTANEN, J.KALLUNKI , U. KALLIO : “Metsahovi Radio Ob-servatory - IVS Network Station”. In: InternationalVLBI Service for Geodesy and Astrometry 2012Annual Report, edited by K. D. Baver, D. Behrendand K. L. Armstrong, NASA/TP-2013-217511,112–115, 2013.
A. E. VOLVACH : “Simeiz VLBI Station - Geodeticand Astrophysical Study”. In: International VLBIService for Geodesy and Astrometry 2012 AnnualReport, edited by K. D. Baver, D. Behrend and K.L. Armstrong, NASA/TP-2013-217511, 142–145,2013.
G. WANG, J. LI , M. XU, L. GUO, L. L IU , F. SHU,Z. QIAN , L. L I : “SHAO Analysis Center 2012Annual Report”. In: International VLBI Servicefor Geodesy and Astrometry 2012 Annual Report,edited by K. D. Baver, D. Behrend and K. L.
Armstrong, NASA/TP-2013-217511, 311–314,2013.
S. WESTON, H. TAKIGUCHI , T. NATUSCH, L.WOODBURN, S. GULYAEV : “Warkworth 12-mVLBI Station: WARK12M”. In: International VLBIService for Geodesy and Astrometry 2012 AnnualReport, edited by K. D. Baver, D. Behrend and K.L. Armstrong, NASA/TP-2013-217511, 161–164,2013.
A. WHITNEY: “IVS Technology Coordinator Report”.In: International VLBI Service for Geodesy andAstrometry 2012 Annual Report, edited by K. D.Baver, D. Behrend and K. L. Armstrong, NASA/TP-2013-217511, 68–72, 2013.
A. WHITNEY: “Report on 2012 Digital Backend In-tercomparison Testing”. In: Proceedings of the 21stMeeting of the European VLBI Group for Geodesyand Astrometry, edited by N. Zubko and M. Pouta-nen, ISBN: 978-951-711-296-3, 1–2, 2013.
A. WHITNEY, C. BEAUDOIN, R. CAPPALLO, A.NIELL , B. PETRACHENKO, C. A. RUSZCZYK, M.TITUS: “VLBI Digital-Backend IntercomparisonTest Report”. In: International VLBI Service forGeodesy and Astrometry 2012 Annual Report,edited by K. D. Baver, D. Behrend and K. L.Armstrong, NASA/TP-2013-217511, 21–38, 2013.
B. X IA , Z. SHEN, X. HONG, Q. FAN : “Sheshan VLBIStation Report for 2012”. In: International VLBIService for Geodesy and Astrometry 2012 AnnualReport, edited by K. D. Baver, D. Behrend and K.L. Armstrong, NASA/TP-2013-217511, 139–141,2013.
M. H. XU AND G. L. WANG: “The comparison be-tween the UT1 results determined by the IVS In-tensive observations”. In: Proceedings of the 21stMeeting of the European VLBI Group for Geodesyand Astrometry, edited by N. Zubko and M. Pouta-nen, ISBN: 978-951-711-296-3, 141–146, 2013.
Y. YATSKIV: “IVS Analysis Center at Main Astro-nomical Observatory of National Academy of Sci-ences of Ukraine”. In: International VLBI Servicefor Geodesy and Astrometry 2012 Annual Report,edited by K. D. Baver, D. Behrend and K. L. Arm-strong, NASA/TP-2013-217511, 285–286, 2013.
J. ZHANG AND J. LI : “On the monitoring model ofreference point of VLBI antenna”. In: Proceedingsof the 21st Meeting of the European VLBI Group
IVS 2013 Annual Report

Bibliography 365
for Geodesy and Astrometry, edited by N. Zubkoand M. Poutanen, ISBN: 978-951-711-296-3, 243–248, 2013.
V. ZHAROV: “New time series of the EOP andthe source coordinates”. In: Proceedings of the21st Meeting of the European VLBI Group forGeodesy and Astrometry, edited by N. Zubko andM. Poutanen, ISBN: 978-951-711-296-3, 127–130,2013.
V. ZHAROV: “SAI VLBI Analysis Center Report2012”.In: International VLBI Service for Geodesy
and Astrometry 2012 Annual Report, edited byK. D. Baver, D. Behrend and K. L. Armstrong,NASA/TP-2013-217511, 309–310, 2013.
N. ZUBKO AND E. RASTORGUEVA-FOI: “A casestudy of source structure influence on geodeticparameter estimation”. In: Proceedings of the21st Meeting of the European VLBI Group forGeodesy and Astrometry, edited by N. Zubko andM. Poutanen, ISBN: 978-951-711-296-3, 193–198,2013.
IVS 2013 Annual Report


IVS
Info
rmat
ion

IVS Terms of Reference
1 Summary
1.1 Charter
The International VLBI Service for Geodesy and As-trometry (IVS) is an international collaboration of or-ganizations which operate or support Very Long Base-line Interferometry (VLBI) components. IVS providesa service which supports geodetic and astrometric workon reference systems, Earth science research, and oper-ational activities. IVS is a Service of the InternationalAssociation of Geodesy (IAG) and of the InternationalAstronomical Union (IAU).
1.2 Objectives
IVS fulfills its charter through the following objectives:
1. foster and carry out VLBI programs. This is accom-plished through close coordination of the partici-pating organizations to provide high-quality VLBIdata and products.
2. promote research and development activities in allaspects of the geodetic and astrometric VLBI tech-nique.
3. advance the education and training of VLBI partici-pants through workshops, reports, and other means.
4. support the integration of new components intoIVS.
5. interact with the community of users of VLBI prod-ucts. IVS represents VLBI in the Global Geodetic
IVS 2013 Annual Report
Observing System (GGOS) of the IAG and inter-acts closely with the International Earth Rotationand Reference Systems Service (IERS).
In support of these objectives, IVS coordinatesVLBI observing programs, sets performance stan-dards for VLBI stations, establishes conventionsfor VLBI data formats and data products, issuesrecommendations for VLBI data analysis software,sets standards for VLBI analysis documentation, andinstitutes appropriate VLBI product delivery methodsto ensure suitable product quality and timeliness.IVS coordinates its activities with the astronomicalcommunity because of the dual use of many VLBIfacilities and technologies for both astronomy andastrometry/geodesy.
1.3 Data Products
VLBI data products contribute uniquely to these im-portant activities:
• defining and maintaining the celestial referenceframe,
• monitoring universal time (UT1), and• monitoring the coordinates of the celestial pole (nu-
tation and precession).
These results are the foundation of many scien-tific and practical applications requiring the use of anaccurate quasi-inertial reference frame, such as high-precision positioning, navigation, and timing. In ad-dition IVS provides a variety of VLBI products withdiffering applications, timeliness, detail, and temporalresolution, such as:
369

370 IVS Terms of Reference
• all components of Earth orientation parameters,• terrestrial reference frame,• baseline lengths, and• tropospheric parameters.
All VLBI data and products are publicly availablein appropriate formats from IVS Data Centers.
1.4 Research
The IVS data and products are used for research inmany areas of geodesy, geophysics, and astronomy,such as:
• UT1 and polar motion excitation over periods ofhours to decades,
• solid Earth interior research (e.g., mantle rheology,anelasticity, libration, and core modes),
• characterization of celestial reference framesources and improvements to the frame,
• tidal variations (solid Earth, oceanic, and atmo-spheric),
• improvements in the terrestrial reference frame, es-pecially in the scale,
• climate studies (e.g., sea level change, deglaciation,and water vapor),
• regional and global geodynamics, and• general relativity.
To support these activities, there are ongoing re-search efforts to improve and extend the VLBI tech-nique in areas such as:
• instrumentation, data acquisition, and correlation,• data analysis techniques,• spacecraft tracking and navigation (Earth-orbiting
and interplanetary), and• combination of VLBI data and results with other
techniques.
2 Permanent Components
IVS acquires, correlates, and analyzes VLBI data toproduce geodetic, astrometric, and other results that arearchived and publicized. IVS accomplishes its objec-tives through the following permanent components:
• Network Stations,• Operation Centers,• Correlators,• Analysis Centers,• Data Centers,• Technology Development Centers, and• Coordinating Center.
2.1 Network Stations
The IVS observing network consists of high perfor-mance VLBI stations.
• Stations may either be dedicated to geodesy or havemultiple uses (including astronomical observationsor satellite tracking applications).
• Stations comply with performance standards fordata quality and operational reliability specified bythe Directing Board.
• Stations provide local tie information, timing andmeteorological data to the IVS Data Centers.
• VLBI data acquisition sessions are conducted bygroups of Network Stations that may be distributedeither globally or over a geographical region.
2.2 Operation Centers
The IVS Operation Centers coordinate the routine op-erations of specific networks. Operation Center activi-ties include:
• planning network observing programs,• supporting the network stations in improving their
performance,• generating the detailed observing schedules for use
in data acquisition sessions by IVS Network Sta-tions, and
• posting the observing schedule to an IVS Data Cen-ter for distribution and archiving.
IVS Operation Centers follow guidelines from theCoordinating Center for timeliness and schedule fileformats.
IVS 2013 Annual Report
IVS Terms of Reference 371
2.3 Correlators
The IVS Correlators process raw VLBI data. Theirother tasks are to:
• provide timely feedback to the Network Stationsabout data quality,
• jointly maintain the geodetic/astrometric commu-nity’s media pool and transport,
• manage electronic data transfer,• make processed data available to the Data Centers,
and• regularly compare processing techniques, models,
and outputs to ensure that data from different Cor-relators are identical.
2.4 Analysis Centers
The IVS coordinates VLBI data analysis to providehigh-quality products for its users. The analyses areperformed by:
• Operational Analysis Center,• Associate Analysis Centers,• Special Analysis Centers for Specific Observing
Sessions, and• Combination Centers.
All Analysis Centers maintain and/or develop ap-propriate VLBI analysis software.
Operational Analysis Centers are committed to pro-ducing results to the specifications of the IVS AnalysisCoordinator and always on schedule to meet IVS re-quirements. In addition, Operational Analysis Centersmay produce Earth orientation parameters, station co-ordinates, and source positions in regular intervals.
Operational Analysis Centers place their finalresults in IVS Data Centers for dissemination toresearchers and other users. They adhere to IVSrecommendations for the creation of high-qualityproducts and their timely archiving and distribution.Any deviations that an Operational Analysis Centermakes from IVS recommendations are properlydocumented. Operational Analysis Centers providetimely feedback about station performance. In additionto these regular services, Operational Analysis Centersmay also perform any task of an Associate AnalysisCenter.
Associate Analysis Centers are committed to reg-ularly submit specialized products using complete se-ries or subsets of VLBI observing sessions. The anal-ysis is performed for specific purposes as recognizedby the Directing Board, such as exploitation of VLBIdata for new types of results, investigations of regionalphenomena, reference frame maintenance, or specialdeterminations of Earth orientation parameters. TheAssociate Analysis Centers place their final results inIVS Data Centers for dissemination to researchers andother users. They adhere to IVS recommendations forthe creation of high-quality products and their timelyarchiving and distribution. Any deviations that an As-sociate Analysis Center makes from IVS recommenda-tions are properly documented.
Special Analysis Centers for Specific ObservingSessions have responsibility for ongoing series-relatedinvestigations of one or more existing session types.They perform detailed and comparative analyses ofeach session of a series within a reasonable time aftercorrelation. In addition, they report deficits and techni-cal complications to the observing sites, the correlators,and to the schedulers as well as to the IVS Network andAnalysis Coordinators.
Combination Centers are committed to producecombination results from the individual submissionsof the Operational Analysis Centers as official IVSproducts. For this purpose they monitor the quality ofthe submissions. The official IVS products include,but are not limited to, EOP time series derived fromsession-based results for 24-hour network sessions andone-hour Intensive sessions. Combination Centers alsocontribute to the generation of the official IVS inputto International Terrestrial Reference Frame (ITRF)computations. The combination work is done in atimely fashion and in close cooperation with the IVSAnalysis Coordinator.
2.5 Data Centers
The IVS Data Centers are repositories for VLBI ob-serving schedules, station log files, data and products.Data Centers may mirror other Data Centers to makethe distribution and maintenance of data more efficientand reliable.
• Data Centers are the primary means of distributingVLBI products to users.
IVS 2013 Annual Report

372 IVS Terms of Reference
• Data Centers work closely with the CoordinatingCenter and with the Analysis Centers to ensure thatall the information and data required by IVS com-ponents are quickly and reliably available.
Data Centers provide the following functions:
• receive and archive schedule files from OperationCenters,
• receive and archive log files and ancillary data filesfrom the Network Stations,
• receive and archive data products from the AnalysisCenters, and
• provide access and public availability to IVS dataproducts for all users.
2.6 Technology Development Centers
The IVS Technology Development Centers contributeto the development of new VLBI technology for im-provement of the VLBI technique. They:
• investigate new equipment and approaches,• develop, test, and document new hardware,
firmware, and software for operations,• assist with deployment, installation, and training
for any new approved technology, and• maintain and support operational equipment.
2.7 Coordinating Center
The IVS Coordinating Center is responsible for coordi-nation of both the day-to-day and the long-term activ-ities of IVS, consistent with the directives and policiesestablished by the Directing Board. Specifically, theCoordinating Center monitors, coordinates, and sup-ports the activities of the Network Stations, OperationCenters, Correlators, Data Centers, Analysis Centers,and Technology Development Centers. The Coordinat-ing Center works closely with the Technology Coordi-nator, the Network Coordinator, and the Analysis Co-ordinator to coordinate IVS activities.
The primary functions of the Coordinating Centerare to:
• coordinate observing programs approved by the Di-recting Board,
• create and maintain the master schedule of observ-ing sessions in coordination with IVS Network Sta-tions and astronomical observing programs,
• foster communications among all components ofthe IVS,
• coordinate the best use of community resources,• develop standard procedures for IVS components,• organize training in VLBI techniques,• organize workshops and meetings, including IVS
technical meetings,• produce and publish reports of activities of IVS
components,• maintain the IVS information system and archive
all documents, standards, specifications, manuals,reports, and publications,
• coordinate IVS outreach and educational activities,• provide liaison with the IAU, IAG, GGOS, IERS,
and other organizations, and• provide the Secretariat of the Directing Board.
2.8 Becoming a Permanent Component
IVS will accept proposals at any time to become a per-manent component. Such proposals will be reviewedfor approval by the Directing Board.
3 Coordinators
Specific IVS activities regarding network data quality,products, and technology are accomplished through thefunctions performed by three coordinators: a NetworkCoordinator, an Analysis Coordinator, and a Technol-ogy Coordinator.
3.1 Network Coordinator
The IVS Network Coordinator is selected by the Di-recting Board from responses to an open solicitation toall IVS components. The Network Coordinator repre-sents the IVS Network Stations on the Directing Boardand works closely with the Coordinating Center. TheNetwork Coordinator is responsible for stimulating themaintenance of a high quality level in the station oper-
IVS 2013 Annual Report
IVS Terms of Reference 373
ation and data delivery. The Network Coordinator per-forms the following functions:
• monitors adherence to standards in the network op-eration,
• participates in the quality control of the data acqui-sition performance of the network stations,
• tracks data quality and data flow problems and sug-gests actions to improve the level of performance,and
• coordinates software development for station con-trol and monitoring.
The Network Coordinator works closely with thegeodetic and astronomical communities who are usingthe same network stations for observations. The Net-work Coordinator takes a leading role in ensuring thevisibility and representation of the network stations.
3.2 Analysis Coordinator
The IVS Analysis Coordinator is selected by the Di-recting Board from responses to an open solicitation tothe IVS Analysis Centers. The Analysis Coordinatoris responsible for coordinating the analysis activitiesof IVS and for stimulating VLBI product developmentand delivery. The Analysis Coordinator performs thefollowing functions:
• fosters comparisons of results from different VLBIanalysis software packages and different analysisstrategies,
• encourages documentation of analysis and combi-nation software,
• participates in comparisons of results from differentspace geodetic techniques,
• monitors Analysis Centers’ products for high qual-ity results and for adherence to IVS standards andIERS Conventions,
• ensures that IVS analysis and combination prod-ucts from all Analysis Centers are archived and areavailable to the scientific community, and
• supervises the formation of the official IVS prod-ucts specified by the IVS Directing Board.
The Analysis Coordinator plays a leadership role inthe development of methods for generation and distri-bution of VLBI products so that the products reach the
users in a timely manner. The Analysis Coordinator in-teracts with GGOS and the IERS and promotes the useof VLBI products by the broader scientific community.The Analysis Coordinator works closely with the astro-nomical communities who are using some of the sameanalysis methods and software.
3.3 Technology Coordinator
The IVS Technology Coordinator is selected by the Di-recting Board from responses to an open solicitation tothe IVS Technology Development Centers. The Tech-nology Coordinator performs the following functions:
• stimulates advancement of the VLBI technique,• maintains awareness of all current VLBI technolo-
gies and ongoing development,• coordinates development of new technology among
all IVS Technology Development Centers,• encourages technical compatibility with the astro-
nomical community,• encourages and oversees development of VLBI-
related technical standards,• coordinates the distribution of and access to techni-
cal documents and standards, and• helps promulgate new technologies to the IVS com-
munity.
The Technology Coordinator works closely withthe astronomical community, both to maintain techni-cal compatibility between the geodetic and astronom-ical communities and to take advantage of technologydevelopment activities in the astronomical community.
4 Directing Board
4.1 Roles and Responsibilities
The Directing Board sets objectives, determines poli-cies, adopts standards, and sets the scientific and oper-ational goals for IVS. The Directing Board exercisesgeneral oversight of the activities of IVS includingmodifications to the organization that are deemed ap-propriate and necessary to maintain efficiency and reli-ability. The Directing Board may determine appropri-ate actions to ensure the quality of the IVS products.
IVS 2013 Annual Report

374 IVS Terms of Reference
The Directing Board will receive and review pro-posals for non-IVS research programs that request IVSresources.
4.2 Membership
The Directing Board consists of representatives of theIVS components, members at-large, appointed mem-bers, and ex officio members. The members are:
Representatives of IVS Components (see below):
• Correlators and Operation Centers representative(1)
• Analysis and Data Centers representatives (2)• Networks representatives (2)• Technology Development Centers representative
(1)
Elected by the Directing Board upon recommenda-tion from the Coordinating Center (see below):
• Members at large (3)
Selected by Directing Board upon review of propos-als from IVS Member Organizations:
• Coordinating Center Director• Network Coordinator• Analysis Coordinator• Technology Coordinator
Appointed members:
• IAU representative• IAG representative• IERS representative
Through a reciprocity agreement between IVS andIERS, the IVS serves as the VLBI Technique Centerfor IERS, and as such its designated representative(s)serve on the IERS Directing Board. In turn, the IERSDirecting Board designates a representative to the IVSDirecting Board. This arrangement is to assure full co-operation between the two services.
Total number: 16
The members appointed by IAU, IAG, and IERSare not subject to institutional restrictions.
The six members who are the representatives ofthe IVS components are elected by the IVS AssociateMembers. All elected members serve staggered four-year terms once renewable.
At-large members are intended to ensure represen-tation on the Directing Board of each of the compo-nents of IVS and to balance representation from asmany countries and institutions and IVS interests aspossible. At-large members serve two-year terms oncerenewable.
A Directing Board member who departs before theend of his/her term is replaced by a person selected bythe Directing Board. The new member will serve un-til the next official elections. The position will then befilled for a full term.
An individual can only serve two consecutive fullterms on the Board in any of the representative andat-large positions. Partial terms are not counted to thislimit. After serving two consecutive full terms, an in-dividual becomes eligible again for a position on theBoard following a two-year absence.
The three Coordinators are selected by the Direct-ing Board on the basis of proposals from IVS Mem-ber Organizations. On a two-thirds vote the DirectingBoard may call for new proposals for any Coordinatorwhen it determines that a new Coordinator is required.Coordinators are encouraged to give at least six monthsnotice before resigning.
4.3 Elections
Election of Board members from the IVS componentsshall be conducted by a committee of three DirectingBoard members, the chair of which is appointed by thechair of the Directing Board. The committee solicitsnominations for each representative from the relevantIVS components. For each position, the candidate whoreceives the largest number of votes from the AssociateMembers will be elected. In case of a tie the DirectingBoard will make the decision.
4.4 Chair
The chair is one of the Directing Board members and iselected by the Board for a term of four years with the
IVS 2013 Annual Report

IVS Terms of Reference 375
possibility of reelection for one additional term. Thechair is the official representative of IVS to externalorganizations.
4.5 Decisions
Most decisions by the Directing Board are made byconsensus or by simple majority vote of the memberspresent. In case of a tie, the chair decides how to pro-ceed. If a two-thirds quorum is not present, the voteshall be held later by electronic mail. A two-thirds voteof all Board members is required to modify the Termsof Reference, to change the chair, or to replace any ofthe members before their normal term expires.
4.6 Meetings
The Directing Board meets at least annually, or morefrequently if meetings are called by the chair or at therequest of at least three Board members. The Boardwill conduct periodic reviews of the IVS organizationand its mandate, functions, and components.
5 Definitions
5.1 Member Organizations
Organizations that support one or more IVS compo-nents are IVS Member Organizations. Individuals as-sociated with IVS Member Organizations may becomeIVS Associate Members.
5.2 Affiliated Organizations
Organizations that cooperate with IVS on issues ofcommon interest, but do not support an IVS compo-nent, are IVS Affiliated Organizations. Affiliated Orga-nizations express an interest in establishing and main-taining a strong working association with IVS to mu-tual benefit. Individuals affiliated with IVS Affiliated
Organizations may become IVS Corresponding Mem-bers.
5.3 Associate Members
Individuals associated with organizations that supportan IVS component may become IVS Associate Mem-bers. Associate Members take part in the election of theincoming members of the Directing Board representingthe IVS components.
5.4 Corresponding Members
IVS Corresponding Members are individuals who ex-press interest in receiving IVS publications, wish toparticipate in workshops or scientific meetings orga-nized by IVS, or generally are interested in IVS activi-ties. Ex officio Corresponding Members are the follow-ing:
• IAG Secretary General• Chair of GGOS• President of IAG Commission 1 – Reference
Frames• President of IAG Commission 3 - Earth Rotation
and Geodynamics• President of IAU Division I – Fundamental Astron-
omy• President of IAU Commission 8 – Astrometry• President of IAU Commission 19 – Rotation of the
Earth• President of IAU Commission 31 – Time• President of IAU Commission 40 – Radio Astron-
omy• President of URSI Commission 52 – Relativity in
Fundamental Astronomy• President of URSI Commission J – Radio Astron-
omy
Individuals are accepted as IVS CorrespondingMembers upon request to the Coordinating Center.
Last modified: 23 September 2011
IVS 2013 Annual Report

Links to Additional IVS Information
This page provides links to information about theindividuals and groups that support IVS. Memberorganizations are organizations that support one ormore permanent components. Permanent componentsare groups that formally commit to provide supportin one of six categories: coordination of networkoperations (Operation Centers), collection of VLBIdata (Network Stations), processing of raw data (Cor-relators), archival and distribution of data and products(Data Centers), analysis of data and generation ofproducts (Analysis Centers), and development of newtechnology (Technology Development Centers).
Information Category Link
Associate Members(listed alphabetically by last name) ivscc.gsfc.nasa.gov/about/org/members/assocname.pdf(listed alphabetically by their organization’s country)ivscc.gsfc.nasa.gov/about/org/members/assocorg.pdf
Permanent ComponentsNetwork Stations http://ivscc.gsfc.nasa.gov/about/org/components/ns-list.htmlOperation Centers http://ivscc.gsfc.nasa.gov/about/org/components/oc-list.htmlCorrelators http://ivscc.gsfc.nasa.gov/about/org/components/co-list.htmlData Centers http://ivscc.gsfc.nasa.gov/about/org/components/dc-list.htmlAnalysis Centers http://ivscc.gsfc.nasa.gov/about/org/components/ac-list.htmlTechnology Development Centers http://ivscc.gsfc.nasa.gov/about/org/components/td-list.html
Member Organizations http://ivscc.gsfc.nasa.gov/about/org/members/memberorgs.htmlAffiliated Organizations http://ivscc.gsfc.nasa.gov/about/org/members/affilmemberorgs.html
IVS 2013 Annual Report
Associate Members are individuals that are associatedwith a member organization and have been granted As-sociate Member status. Associate Members generallysupport IVS by participating in the activities of one ormore components.
Affiliated organizations cooperate with IVS onmatters of common interest but do not support acomponent.
376