Astrometry with the MCAO instrument MAD
10
A&A 532, A16 (2011) DOI: 10.1051/0004-6361/201016053 c ESO 2011 Astronomy & Astrophysics Astrometry with the MCAO instrument MAD An analysis of single-epoch data obtained in the layer-oriented mode E. Meyer 1,2 , M. Kürster 1 , C. Arcidiacono 3,4 , R. Ragazzoni 3 , and H.-W. Rix 1 1 Max Planck Institute for Astronomy (MPIA), Königstuhl 17, 69117 Heidelberg, Germany 2 Leiden Observatory, Leiden University, PO Box 9513, 2300 RA Leiden, The Netherlands e-mail: [email protected] 3 INAF Osservatorio Astronomico di Padova, Vicolo dell’Osservatorio, 5, 35122 Padova, Italy 4 INAF Osservatorio Astrofisico di Arcetri, Largo Enrico Fermi, 5, 50125 Firenze, Italy Received 3 November 2010 / Accepted 11 May 2011 ABSTRACT Context. Current instrument developments at the largest telescopes worldwide involve the installation of multi-conjugated adaptive optics (MCAO) modules. The large field of view and more uniform correction provided by these systems is not only highly beneficial for photometric studies but also for astrometric analysis of, e.g., large dense clusters and exoplanet detection and characterization. The Multi-conjugated Adaptive optics Demonstrator (MAD) is the first such instrument and was temporarily installed and tested at the ESO/VLT in 2007. Aims. We analyzed the first available MCAO imaging data in the layer-oriented mode obtained with the MAD instrument in terms of astrometric precision and stability. Methods. We analyzed two globular cluster data sets in terms of achievable astrometric precision. Data were obtained in the layer- oriented correction mode, one in full MCAO correction mode with two layers corrected (NGC 6388) and the other applying ground- layer correction only (47 Tuc). We calculated Strehl maps for each frame in both data sets. Distortion corrections were performed and the astrometric precision was analyzed by calculating mean stellar positions over all frames and by investigating the positional residuals present in each frame after transformation to a master-coordinate frame. Results. The mean positional precision for stars of brightnesses K = 14−18 mag is ≈1.2 mas in the full MCAO correction mode data of the cluster NGC 6388. The precision measured in the GLAO data (47 Tuc) reaches ≈1.0 mas for stars corresponding to 2MASS K magnitudes between 9 and 12. The observations were such that stars in these magnitude ranges correspond to the same detector flux range. The jitter movement used to scan a larger field of view introduced additional distortions in the frames, leading to a degradation of the achievable precision. Key words. instrumentation: adaptive optics – techniques: image processing – astrometry – methods: observational 1. Introduction In classical adaptive optics correction, with one reference star, the field of view (FoV) is limited by the effect of anisopla- natism, as only the integrated phase error over the column above the telescope in the direction to the guide star is measured and corrected. Turbulence outside this column, e.g. in the direction of the target, if it cannot be used itself as a guide star, is not mapped and the correction degrades rapidly with growing sep- aration from the guide star. The average wavefront phase error is limited to <1 rad only within the so-called isoplanatic angle, which for typical astronomical sites corresponds to 10 −20 in the K s -band and only 3 in the visible. In the case of a laser guide star as reference source, the phase error is even larger, be- cause of the low focussing altitude and the resulting cone-effect (Tallon & Foy 1990; Yan et al. 2005). Multi conjugated adaptive optics (MCAO; Beckers 1988; Ellerbroek et al. 1994) provides a way of achieving diffraction-limited image quality over larger FoVs of up to 2–4 arcmin, hence overcoming anisoplanatism. Based on observations collected at the European Southern Observatory, Paranal, Chile, as part of the MAD Guaranteed Time Observations. Moderate averaged Strehl-ratios, in the range of 10% to 25%, can be achieved, but with a higher uniformity of the point spread function (PSF) over the FoV. This is desired for resolving struc- tures of extended sources, such as galaxies or the cores of star clusters. In MCAO, the three-dimensional structure of the tur- bulence is reconstructed by means of the information coming from several guide stars, natural or laser. Instead of correcting the turbulence integrated over a single direction, turbulence from different layers is corrected by using several deformable mir- rors conjugated to these layers. The maximum achievable per- formance for the single reference stars is not as good as with classical adaptive optics (AO), because of the turbulence above and below the single corrected layers, but instead the correc- tion is more uniform over a significantly larger FoV. Two layers are typically corrected, the ground layer close to the telescope and a higher layer at around 8–10 km height (depending on the site). Most of the turbulence in the atmosphere is generated in the ground layer. Correcting only this layer (GLAO = ground- layer adaptive optics), one can remove the major contributor to the phase aberrations of the incoming wavefronts (Rigaut 2002). Two different modes are used to combine the signals from the different reference stars, the star oriented (SO) and the layer Article published by EDP Sciences A16, page 1 of 10
-
Upload
khangminh22 -
Category
Documents
-
view
0 -
download
0
Transcript of Astrometry with the MCAO instrument MAD
A&A 532, A16 (2011)DOI: 10.1051/0004-6361/201016053c© ESO 2011
Astronomy&
Astrophysics
Astrometry with the MCAO instrument MAD
An analysis of single-epoch data obtained in the layer-oriented mode�
E. Meyer1,2, M. Kürster1, C. Arcidiacono3,4, R. Ragazzoni3, and H.-W. Rix1
1 Max Planck Institute for Astronomy (MPIA), Königstuhl 17, 69117 Heidelberg, Germany2 Leiden Observatory, Leiden University, PO Box 9513, 2300 RA Leiden, The Netherlands
e-mail: [email protected] INAF Osservatorio Astronomico di Padova, Vicolo dell’Osservatorio, 5, 35122 Padova, Italy4 INAF Osservatorio Astrofisico di Arcetri, Largo Enrico Fermi, 5, 50125 Firenze, Italy
Received 3 November 2010 / Accepted 11 May 2011
ABSTRACT
Context. Current instrument developments at the largest telescopes worldwide involve the installation of multi-conjugated adaptiveoptics (MCAO) modules. The large field of view and more uniform correction provided by these systems is not only highly beneficialfor photometric studies but also for astrometric analysis of, e.g., large dense clusters and exoplanet detection and characterization.The Multi-conjugated Adaptive optics Demonstrator (MAD) is the first such instrument and was temporarily installed and tested atthe ESO/VLT in 2007.Aims. We analyzed the first available MCAO imaging data in the layer-oriented mode obtained with the MAD instrument in terms ofastrometric precision and stability.Methods. We analyzed two globular cluster data sets in terms of achievable astrometric precision. Data were obtained in the layer-oriented correction mode, one in full MCAO correction mode with two layers corrected (NGC 6388) and the other applying ground-layer correction only (47 Tuc). We calculated Strehl maps for each frame in both data sets. Distortion corrections were performedand the astrometric precision was analyzed by calculating mean stellar positions over all frames and by investigating the positionalresiduals present in each frame after transformation to a master-coordinate frame.Results. The mean positional precision for stars of brightnesses K = 14−18 mag is ≈1.2 mas in the full MCAO correction mode dataof the cluster NGC 6388. The precision measured in the GLAO data (47 Tuc) reaches ≈1.0 mas for stars corresponding to 2MASSK magnitudes between 9 and 12. The observations were such that stars in these magnitude ranges correspond to the same detector fluxrange. The jitter movement used to scan a larger field of view introduced additional distortions in the frames, leading to a degradationof the achievable precision.
Key words. instrumentation: adaptive optics – techniques: image processing – astrometry – methods: observational
1. Introduction
In classical adaptive optics correction, with one reference star,the field of view (FoV) is limited by the effect of anisopla-natism, as only the integrated phase error over the column abovethe telescope in the direction to the guide star is measured andcorrected. Turbulence outside this column, e.g. in the directionof the target, if it cannot be used itself as a guide star, is notmapped and the correction degrades rapidly with growing sep-aration from the guide star. The average wavefront phase erroris limited to <1 rad only within the so-called isoplanatic angle,which for typical astronomical sites corresponds to 10′′−20′′ inthe Ks-band and only 3′′ in the visible. In the case of a laserguide star as reference source, the phase error is even larger, be-cause of the low focussing altitude and the resulting cone-effect(Tallon & Foy 1990; Yan et al. 2005). Multi conjugated adaptiveoptics (MCAO; Beckers 1988; Ellerbroek et al. 1994) providesa way of achieving diffraction-limited image quality over largerFoVs of up to 2–4 arcmin, hence overcoming anisoplanatism.
� Based on observations collected at the European SouthernObservatory, Paranal, Chile, as part of the MAD Guaranteed TimeObservations.
Moderate averaged Strehl-ratios, in the range of 10% to 25%,can be achieved, but with a higher uniformity of the point spreadfunction (PSF) over the FoV. This is desired for resolving struc-tures of extended sources, such as galaxies or the cores of starclusters. In MCAO, the three-dimensional structure of the tur-bulence is reconstructed by means of the information comingfrom several guide stars, natural or laser. Instead of correctingthe turbulence integrated over a single direction, turbulence fromdifferent layers is corrected by using several deformable mir-rors conjugated to these layers. The maximum achievable per-formance for the single reference stars is not as good as withclassical adaptive optics (AO), because of the turbulence aboveand below the single corrected layers, but instead the correc-tion is more uniform over a significantly larger FoV. Two layersare typically corrected, the ground layer close to the telescopeand a higher layer at around 8–10 km height (depending on thesite). Most of the turbulence in the atmosphere is generated inthe ground layer. Correcting only this layer (GLAO= ground-layer adaptive optics), one can remove the major contributor tothe phase aberrations of the incoming wavefronts (Rigaut 2002).Two different modes are used to combine the signals from thedifferent reference stars, the star oriented (SO) and the layer
Article published by EDP Sciences A16, page 1 of 10
A&A 532, A16 (2011)
oriented (LO) modes. In the SO mode, each reference star is ob-served by one wavefront sensor (WFS) and one detector. The in-formation from the different directions of the guide stars is com-bined to generate information of the three-dimensional structureof the atmosphere within the mapped FoV. By adopting this ap-proach of turbulence tomography (Tallon & Foy 1990), the in-fluence of a single layer can be computed and corrected withone deformable mirror conjugated to this layer. The first verifi-cation of this approach was made in an open loop measurementat the Telescopio Nazionale di Galileo (TNG) (Ragazzoni et al.2000b). In the layer-oriented approach (Ragazzoni et al. 2000a),each WFS and detector is conjugated to one layer in the atmo-sphere instead of to a single star. The light of several guide starsis optically co-added to increase the signal-to-noise ratio (SNR)on the detector, such that fainter stars can also be used as guidestars. This increases the sky coverage, the fraction of regions onthe sky that can provide a suitable natural asterism, essentiallyfor this approach. In addition the number of wavefront sensorsand detectors needed is reduced, reducing the detector read-outnoise and the needed computing power compared to the SO ap-proach.
High precision astrometry combined with high angular res-olution is essential to many science cases in astronomy. For in-stance, observations of stars around the supermassive black holein the center of our own Milky Way (e.g. Trippe et al. 2008;Schödel et al. 2009) and the central regions of globular clus-ters are only possible with space-based facilities or adaptive-optics-supported observations from the ground. Multi-epochhigh-precision proper-motion studies with the Hubble SpaceTelescope (HST) have made it possible to distinguish clustermembers from foreground field stars and to study the internal dy-namics and kinematics of several globular clusters and galacticstarburst clusters (e.g. King & Anderson 2001; McLaughlin et al.2006; Rochau et al. 2010). Another field of high precision as-trometry is the detection and characterization of extrasolar plan-ets by measuring the astrometric reflex-motion of the star (e.g.Benedict et al. 2002; Bean et al. 2007, FGC/HST; Meyer et al.,NACO/VLT, in prep.). This important technique complementsthe radial velocity method, which is the most efficient detectionmethod. A larger FoV enhances the number of usable referencestars for the measurement of the relative astrometric motion andtherefore the achievable precision significantly.
The Multi-conjugated Adaptive optics Demonstrator (MAD)is a prototype instrument for MCAO correction and observa-tion that was installed at the ESO VLT UT3 at the ParanalObservatory in 2007 (Marchetti et al. 2007). MAD was designedto study and test different MCAO systems, both in the lab andon-sky (Hubin et al. 2002; Marchetti et al. 2003; Arcidiaconoet al. 2006). MAD employs adaptive optics sensing and correc-tion in the star-oriented and the layer-oriented mode. Two layersare sensed and corrected in the full MCAO mode. The groundlayer at the telescope’s pupil and a high layer at 8.5 km altitude.
Future AO instruments will use the MCAO technique, suchas the Gemini MCAO System (GeMS) at the Gemini SouthObservatory on Cerro Pachon, Chile. The Fizeau InterferometerLINC-NIRVANA for the Large Binocular Telescope (LBT) onMt. Graham in Arizona, will be equipped with four layer-oriented correction units, two for each telescope, which will cor-rect the ground layer and a high layer (e.g. Farinato et al. 2008).One of the science cases for LINC-NIRVANA is the detectionand characterization of extrasolar planets.
All the above-mentioned aspects and the uniqueness of thevery first MCAO data available encouraged us to analyze thisdata in terms of astrometric precision and stability. The aim
of this present study is to estimate the achievable precisionand stability in astrometric measurements obtained with MCAOimaging.
2. Observations and data reduction
The observations analyzed here were conducted with the multi-pyramid wavefront sensor of the MAD instrument in theLO mode (Ragazzoni 1996; Ragazzoni et al. 2000b; Arcidiaconoet al. 2008). This sensor has the advantage that it can use up toeight guide stars simultaneously, which can be relatively faint(V < 18) and have an integrated light reaching V = 13. Auniform distribution of these stars is preferable but they can beeverywhere in the 2′ × 2′ FoV. A NIR science camera is usedfor the observations, which is also used in the SO mode, calledCAMCAO=CAmera for MCAO. It has a 57′′ × 57′′ FoV butcan scan a circular FoV of 2 arcmin diameter. The HgCdTeHAWAII2 IR-detector built by Rockwell has 2048× 2048 pixelswith a pixel scale of 0.028′′/px, a readout noise of 13.8 erms, afull well capacity of 65 000 ADU, and a loss of linearity above35 000 ADU. Two data sets were analyzed, one in the globu-lar cluster NGC 6388 and the other one in the globular cluster47 Tuc. Both data sets are test data obtained during the first on-sky test of the LO correction mode with MAD at the VLT.
The goal of the observations was to verify and show the capa-bilities of MCAO observations in LO mode. The original focuswas the photometric analysis, since high precision photometricstudies in crowded fields, such as clusters, benefit in particularfrom the large AO-corrected FoV. We therefore note that the ob-servations analyzed here were not obtained in the context of highprecision astrometry. Nevertheless, they represent a unique dataset to investigate the possibilities of high precision astrometrywith MCAO.
2.1. MCAO – NGC 6388
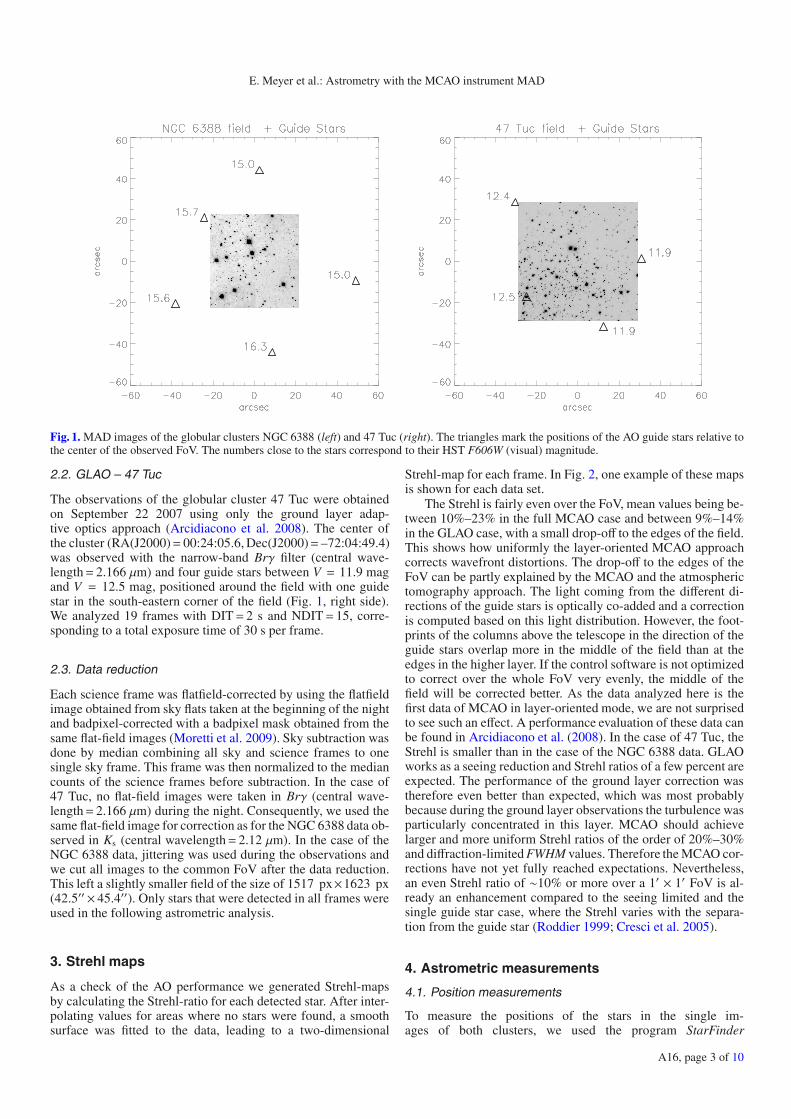
The data of the globular cluster NGC 6388 were obtainedon September 27 2007 using the full MCAO capability ofMAD. The observations were made in the Ks band (centralwavelength= 2.12 μm) using five guide stars with V = 15.0,15.0, 15.6, 15.7, and 16.3 mag1, corresponding to an inte-grated magnitude of 13.67 (Arcidiacono et al. 2008). Theguide stars are positioned around the FoV (see Fig. 1,left). The observed field lies at the south-eastern rim of thecluster at RA(J2000)=17:36:22.86, Dec(J2000)= –44:45:35.53.Altogether 30 frames were obtained, the first five in GLAO modeand the last 25 in full MCAO mode. A jitter pattern of five posi-tions was used, which was repeated six times with three slightlydifferent central points, to scan part of the 2′ × 2′ FoV, to helpus remove the effects of bad pixel incidents and achieve sky es-timation. The first ten frames were obtained with a detector in-tegration time of DIT= 10 s and N = 24 of these DITs (=NDIT)are directly co-added onto one frame, resulting in 240 s total ex-posure time per frame. In the last twenty frames, the number ofexposures was reduced to NDIT= 12, resulting in 120 s of to-tal integration time per frame. In Table 1, the observations aresummarized together with performance indicators such as theFWHM of the fitted PSF and the seeing measured by the DIMMmonitor. The same data were also analyzed to derive photometryby Moretti et al. (2009).
1 HST F606W photometry data.
A16, page 2 of 10
E. Meyer et al.: Astrometry with the MCAO instrument MAD
Fig. 1. MAD images of the globular clusters NGC 6388 (left) and 47 Tuc (right). The triangles mark the positions of the AO guide stars relative tothe center of the observed FoV. The numbers close to the stars correspond to their HST F606W (visual) magnitude.
2.2. GLAO – 47 Tuc
The observations of the globular cluster 47 Tuc were obtainedon September 22 2007 using only the ground layer adap-tive optics approach (Arcidiacono et al. 2008). The center ofthe cluster (RA(J2000)= 00:24:05.6, Dec(J2000)= –72:04:49.4)was observed with the narrow-band Brγ filter (central wave-length= 2.166 μm) and four guide stars between V = 11.9 magand V = 12.5 mag, positioned around the field with one guidestar in the south-eastern corner of the field (Fig. 1, right side).We analyzed 19 frames with DIT= 2 s and NDIT= 15, corre-sponding to a total exposure time of 30 s per frame.
2.3. Data reduction
Each science frame was flatfield-corrected by using the flatfieldimage obtained from sky flats taken at the beginning of the nightand badpixel-corrected with a badpixel mask obtained from thesame flat-field images (Moretti et al. 2009). Sky subtraction wasdone by median combining all sky and science frames to onesingle sky frame. This frame was then normalized to the mediancounts of the science frames before subtraction. In the case of47 Tuc, no flat-field images were taken in Brγ (central wave-length= 2.166 μm) during the night. Consequently, we used thesame flat-field image for correction as for the NGC 6388 data ob-served in Ks (central wavelength= 2.12 μm). In the case of theNGC 6388 data, jittering was used during the observations andwe cut all images to the common FoV after the data reduction.This left a slightly smaller field of the size of 1517 px×1623 px(42.5′′ × 45.4′′). Only stars that were detected in all frames wereused in the following astrometric analysis.
3. Strehl maps
As a check of the AO performance we generated Strehl-mapsby calculating the Strehl-ratio for each detected star. After inter-polating values for areas where no stars were found, a smoothsurface was fitted to the data, leading to a two-dimensional
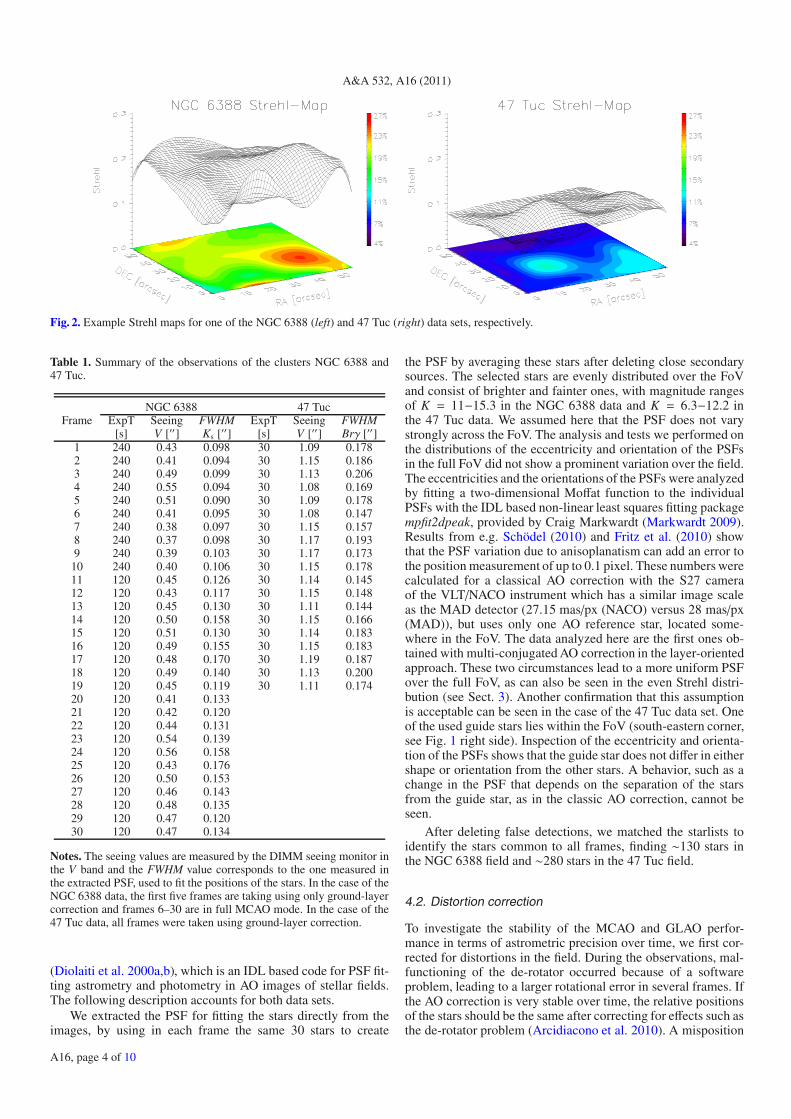
Strehl-map for each frame. In Fig. 2, one example of these mapsis shown for each data set.
The Strehl is fairly even over the FoV, mean values being be-tween 10%–23% in the full MCAO case and between 9%–14%in the GLAO case, with a small drop-off to the edges of the field.This shows how uniformly the layer-oriented MCAO approachcorrects wavefront distortions. The drop-off to the edges of theFoV can be partly explained by the MCAO and the atmospherictomography approach. The light coming from the different di-rections of the guide stars is optically co-added and a correctionis computed based on this light distribution. However, the foot-prints of the columns above the telescope in the direction of theguide stars overlap more in the middle of the field than at theedges in the higher layer. If the control software is not optimizedto correct over the whole FoV very evenly, the middle of thefield will be corrected better. As the data analyzed here is thefirst data of MCAO in layer-oriented mode, we are not surprisedto see such an effect. A performance evaluation of these data canbe found in Arcidiacono et al. (2008). In the case of 47 Tuc, theStrehl is smaller than in the case of the NGC 6388 data. GLAOworks as a seeing reduction and Strehl ratios of a few percent areexpected. The performance of the ground layer correction wastherefore even better than expected, which was most probablybecause during the ground layer observations the turbulence wasparticularly concentrated in this layer. MCAO should achievelarger and more uniform Strehl ratios of the order of 20%–30%and diffraction-limited FWHM values. Therefore the MCAO cor-rections have not yet fully reached expectations. Nevertheless,an even Strehl ratio of ∼10% or more over a 1′ × 1′ FoV is al-ready an enhancement compared to the seeing limited and thesingle guide star case, where the Strehl varies with the separa-tion from the guide star (Roddier 1999; Cresci et al. 2005).
4. Astrometric measurements
4.1. Position measurements
To measure the positions of the stars in the single im-ages of both clusters, we used the program StarFinder
A16, page 3 of 10
A&A 532, A16 (2011)
Fig. 2. Example Strehl maps for one of the NGC 6388 (left) and 47 Tuc (right) data sets, respectively.
Table 1. Summary of the observations of the clusters NGC 6388 and47 Tuc.
NGC 6388 47 TucFrame ExpT Seeing FWHM ExpT Seeing FWHM
[s] V [′′] Ks [′′] [s] V [′′] Brγ [′′]1 240 0.43 0.098 30 1.09 0.1782 240 0.41 0.094 30 1.15 0.1863 240 0.49 0.099 30 1.13 0.2064 240 0.55 0.094 30 1.08 0.1695 240 0.51 0.090 30 1.09 0.1786 240 0.41 0.095 30 1.08 0.1477 240 0.38 0.097 30 1.15 0.1578 240 0.37 0.098 30 1.17 0.1939 240 0.39 0.103 30 1.17 0.173
10 240 0.40 0.106 30 1.15 0.17811 120 0.45 0.126 30 1.14 0.14512 120 0.43 0.117 30 1.15 0.14813 120 0.45 0.130 30 1.11 0.14414 120 0.50 0.158 30 1.15 0.16615 120 0.51 0.130 30 1.14 0.18316 120 0.49 0.155 30 1.15 0.18317 120 0.48 0.170 30 1.19 0.18718 120 0.49 0.140 30 1.13 0.20019 120 0.45 0.119 30 1.11 0.17420 120 0.41 0.13321 120 0.42 0.12022 120 0.44 0.13123 120 0.54 0.13924 120 0.56 0.15825 120 0.43 0.17626 120 0.50 0.15327 120 0.46 0.14328 120 0.48 0.13529 120 0.47 0.12030 120 0.47 0.134
Notes. The seeing values are measured by the DIMM seeing monitor inthe V band and the FWHM value corresponds to the one measured inthe extracted PSF, used to fit the positions of the stars. In the case of theNGC 6388 data, the first five frames are taking using only ground-layercorrection and frames 6–30 are in full MCAO mode. In the case of the47 Tuc data, all frames were taken using ground-layer correction.
(Diolaiti et al. 2000a,b), which is an IDL based code for PSF fit-ting astrometry and photometry in AO images of stellar fields.The following description accounts for both data sets.
We extracted the PSF for fitting the stars directly from theimages, by using in each frame the same 30 stars to create
the PSF by averaging these stars after deleting close secondarysources. The selected stars are evenly distributed over the FoVand consist of brighter and fainter ones, with magnitude rangesof K = 11−15.3 in the NGC 6388 data and K = 6.3−12.2 inthe 47 Tuc data. We assumed here that the PSF does not varystrongly across the FoV. The analysis and tests we performed onthe distributions of the eccentricity and orientation of the PSFsin the full FoV did not show a prominent variation over the field.The eccentricities and the orientations of the PSFs were analyzedby fitting a two-dimensional Moffat function to the individualPSFs with the IDL based non-linear least squares fitting packagempfit2dpeak, provided by Craig Markwardt (Markwardt 2009).Results from e.g. Schödel (2010) and Fritz et al. (2010) showthat the PSF variation due to anisoplanatism can add an error tothe position measurement of up to 0.1 pixel. These numbers werecalculated for a classical AO correction with the S27 cameraof the VLT/NACO instrument which has a similar image scaleas the MAD detector (27.15 mas/px (NACO) versus 28 mas/px(MAD)), but uses only one AO reference star, located some-where in the FoV. The data analyzed here are the first ones ob-tained with multi-conjugated AO correction in the layer-orientedapproach. These two circumstances lead to a more uniform PSFover the full FoV, as can also be seen in the even Strehl distri-bution (see Sect. 3). Another confirmation that this assumptionis acceptable can be seen in the case of the 47 Tuc data set. Oneof the used guide stars lies within the FoV (south-eastern corner,see Fig. 1 right side). Inspection of the eccentricity and orienta-tion of the PSFs shows that the guide star does not differ in eithershape or orientation from the other stars. A behavior, such as achange in the PSF that depends on the separation of the starsfrom the guide star, as in the classic AO correction, cannot beseen.
After deleting false detections, we matched the starlists toidentify the stars common to all frames, finding ∼130 stars inthe NGC 6388 field and ∼280 stars in the 47 Tuc field.
4.2. Distortion correction
To investigate the stability of the MCAO and GLAO perfor-mance in terms of astrometric precision over time, we first cor-rected for distortions in the field. During the observations, mal-functioning of the de-rotator occurred because of a softwareproblem, leading to a larger rotational error in several frames. Ifthe AO correction is very stable over time, the relative positionsof the stars should be the same after correcting for effects such asthe de-rotator problem (Arcidiacono et al. 2010). A misposition
A16, page 4 of 10
E. Meyer et al.: Astrometry with the MCAO instrument MAD
of the reference star from the tip of the pyramid-WFS exceed-ing a few λ/D (where λ is the wavelength and D the telescopediameter) with respect to the theoretical (unrotated) positions,also affects the closed loop performance, generating a correc-tion under-performance. We set up a master-coordinate frame towhich the single frame coordinates are later mapped. To createthis coordinate frame, we used the best frame, chosen accordingto the highest mean Strehl ratio in the images, as a first referenceframe and mapped all the stellar positions from each individualframe onto this reference frame by calculating the shift and scalein x- and y-direction and the rotation between these frames. TheMIDAS2 data reduction software and simple affine transforma-tions were used for the transformations. We did not apply anyinterpolation directly to the images, but instead worked with themeasured coordinates. After correcting for the derived rotationfor each frame, as well as for the shift and scale in x and y ofeach stellar position, a master-coordinate frame was created byaveraging the position of each star over all frames. The coordi-nate frame with averaged positions derived in this way was thenused as the master-coordinate frame in the subsequent analysis.
In the following, to complete the necessary distortion cor-rection of each single frame, we analyzed the data using twoapproaches.
In a first attempt, we corrected only basic distortions,including shift, scale, and rotation. To furthermore explore thefull capacity of astrometry with MCAO, we performed a seconddistortion correction, which included higher order terms.
4.2.1. Basic distortion correction
Once we created the reference frame for each data set, all coor-dinates from each single frame were then mapped to this masterframe, leading to a more reliable calculation of the transforma-tion parameters for the individual frames. One might assume thatone can achieve even better transformations between the framesby applying this method iteratively, creating once more a master-coordinate frame. If the distortions in the images, those left overfrom the AO or systematic ones, were homogeneous over theFoV, the transformations should neither greatly change nor en-hance the positions of the master-coordinate frame. But if thedistortions are not homogeneous, but depend, for example, onthe camera position in the FoV, one would introduce warpings inthe master-coordinate frame which one cannot map with a sim-ple combination of shifting, scaling and rotation anymore. Wetherefore stopped after one iteration.
We then calculated the residual separations between thepositions of the stars in the master-coordinate frame and in theindividual frames, which were calculated using the obtainedtransformation parameters, and analyzed them as a measure ofastrometric precision.
4.2.2. Separation measurements
To evaluate the astrometric precision and stability ofMCAO data, we measured the relative separations be-tween various pairs of stars all over the FoV before and afterapplying the calculated distortion corrections. For this, wederived a time sequence of the separation over all frames.If only a steady distortion is present in the single frames,then the separations should be stable over time or only scatterwithin a certain range given by the accuracy of the determination
2 http://www.eso.org/sci/data-processing/software/esomidas/
of the position of the stars, which is 0.33 mas for the fainteststar used in this analysis. If differential distortions between thesingle frames are present but these distortions are random, thenthe scatter in the separations is expected to increase, dependingon the strength/amplitude of the differential distortions. Anon-perfectly corrected defocus, for example, would changethe absolute separation between two stars, but, to first order,not the relative one measured in the individual frames, if thisdefocus is stable over time. An uncorrected rotation betweenthe frames would change the separation of two stars in the x andy-directions, but not their separation, r =
√Δx2 + Δy2.
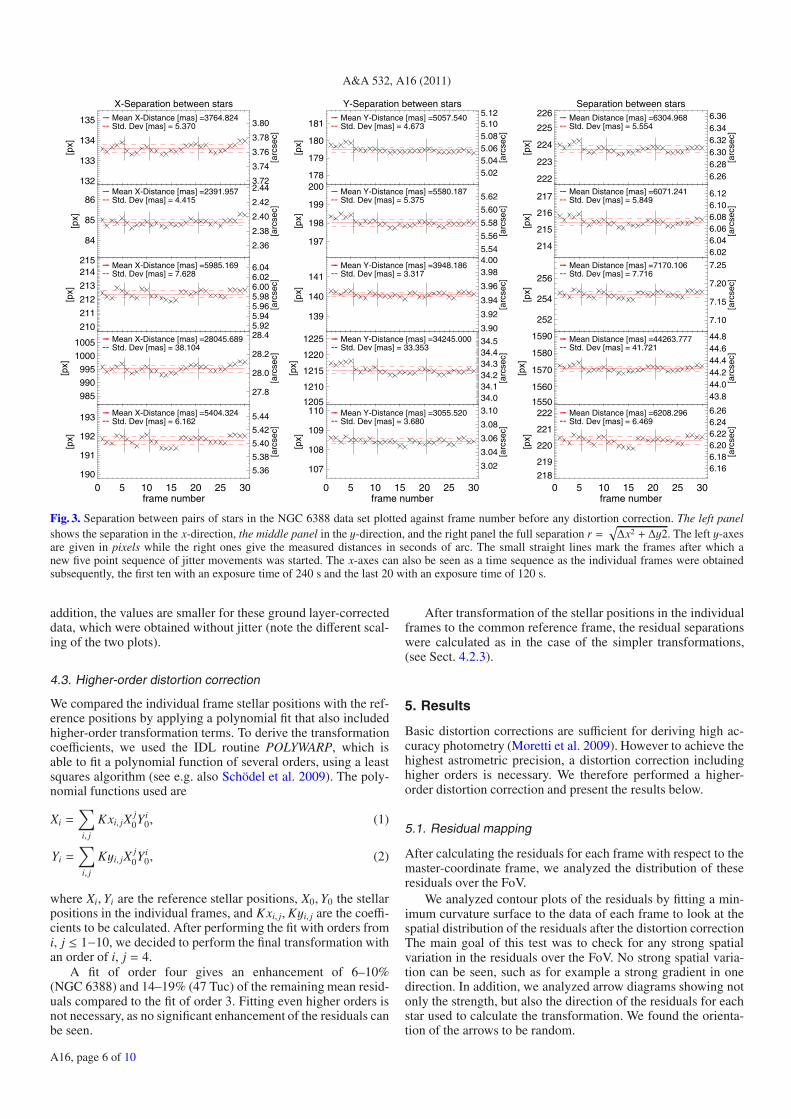
Performing this test for several star pairs with short andlarge separations and with different position angles between thestars before any distortion correction, showed in the case of theNGC 6388 data a recurring pattern in the separation in x, y, r,which is not observable in the 47 Tuc data. Figure 3 shows theseparation in x, y, and r over the frame number for five repre-sentative pairs of stars in the NGC 6388 data. Looking at thepattern, we find that it repeats itself after five frames for the firstten frames and after ten frames for subsequent frames (wheretwo images were always taken at the same jitter position beforemoving to the next position), and that this change in separationseems to be correlated with the jitter movement during the ob-servations, which also has a five points pattern with an additionalchange in the center position. In the case of the MAD instrumentthe camera itself is moved in the focal plane to execute the jitterpattern. This can lead to vignetting effects for larger jitter offsetsand to distortions, which depend on the position of the camera inthe FoV. It is unlikely that this pattern is due to problems with thede-rotator because of the uniform repetition of the pattern. Thispattern is also not seen in the 47 Tuc data, which was obtainedwithout jitter movements, but experienced the same de-rotatorproblems.
We performed the same measurements of the same star pairsafter applying the calculated distortion correction for shift, scale,and rotation. The strong pattern was found to have disappeared,leaving a more random variation in the separation. In addition,the calculated standard deviation is much smaller, ranging from afactor of ∼3 up to a factor of ∼19 times smaller. Comparing thesingle standard deviations shows a smaller scatter among theirvalues than before the distortion correction. All this leads to theconclusion, that the calculated and applied distortions remove alarge amount of the separation scatter, but not all of it. The re-maining scatter in the separations between the stars in the singleframes is still in the range ∼1.2−2.8 mas, well above the scatterexpected from photon statistics, pointing to uncorrected higher-order distortions.
4.2.3. Basic distortion parameters
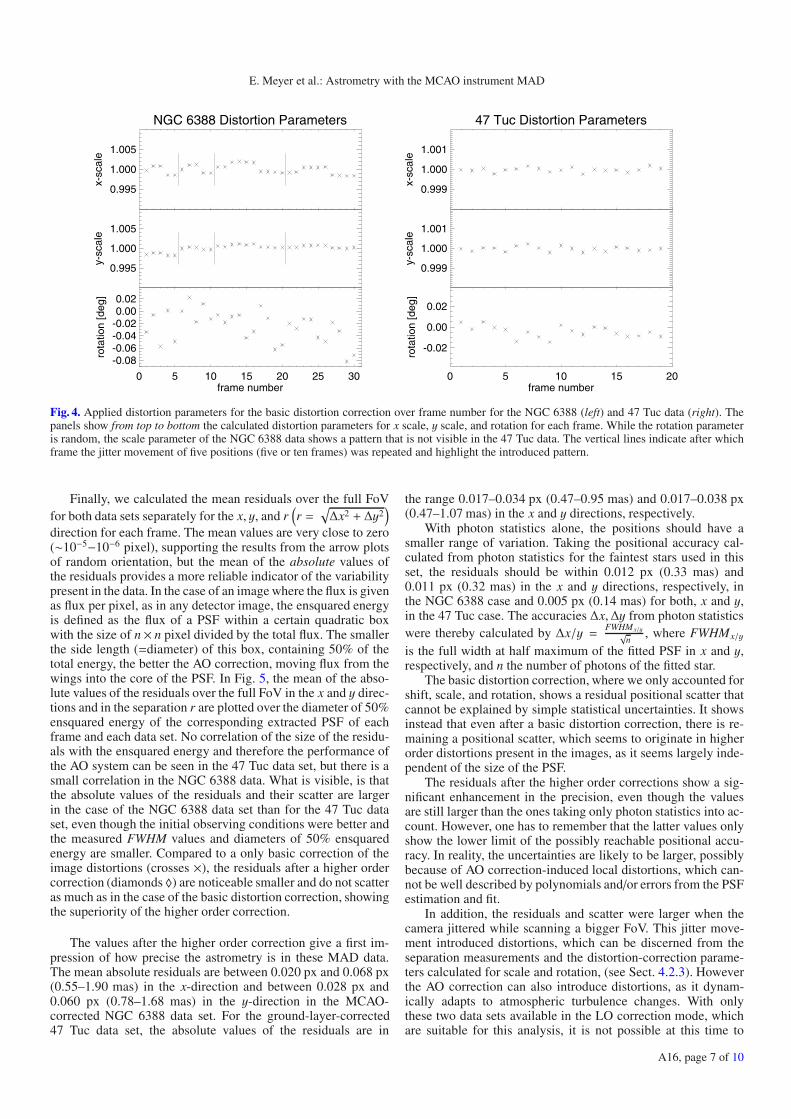
The calculated distortion parameters from the basic distortioncorrection for x-scale, y-scale, and rotation over the frame num-ber, which can be seen as a time-series, are plotted in Fig. 4 forboth data sets. Whereas the parameter for the rotation correc-tion looks random, but has a fairly large scatter that reflects thede-rotator problem, the correction parameters for the scale in xand y show a pattern in the case of the NGC 6388 data set (left).This pattern repeats after five (ten) frames, as does the patternfor the separation measurement. As these are the applied correc-tion parameters, they nicely show the existence of the pattern andour ability to correct for this induced scale variation due to thejitter movement. In the 47 Tuc data, there is also some scatter,which can be expected, but no repeating pattern can be seen. In
A16, page 5 of 10
A&A 532, A16 (2011)
X-Separation between stars
132
133
134
135
[px]
3.72
3.74
3.76
3.78
3.80
[arc
sec]
--- Mean X-Distance [mas] =3764.824-- Std. Dev [mas] = 5.370
84
85
86
[px]
2.36
2.38
2.40
2.42
2.44
[arc
sec]
--- Mean X-Distance [mas] =2391.957-- Std. Dev [mas] = 4.415
210
211
212
213
214215
[px]
5.925.945.965.986.006.026.04
[arc
sec]
--- Mean X-Distance [mas] =5985.169-- Std. Dev [mas] = 7.628
985
990
995
1000
1005
[px]
27.8
28.0
28.2
28.4
[arc
sec]
--- Mean X-Distance [mas] =28045.689-- Std. Dev [mas] = 38.104
0 5 10 15 20 25 30frame number
190
191
192
193
[px]
5.36
5.38
5.40
5.42
5.44
[arc
sec]
--- Mean X-Distance [mas] =5404.324-- Std. Dev [mas] = 6.162
Y-Separation between stars
178
179
180
181
[px]
5.025.045.065.085.105.12
[arc
sec]
--- Mean Y-Distance [mas] =5057.540-- Std. Dev [mas] = 4.673
197
198
199
200
[px]
5.54
5.56
5.58
5.60
5.62
[arc
sec]
--- Mean Y-Distance [mas] =5580.187-- Std. Dev [mas] = 5.375
139
140
141
[px]
3.90
3.92
3.94
3.96
3.984.00
[arc
sec]
--- Mean Y-Distance [mas] =3948.186-- Std. Dev [mas] = 3.317
1205
1210
1215
1220
1225
[px]
34.034.134.234.334.434.5
[arc
sec]
--- Mean Y-Distance [mas] =34245.000-- Std. Dev [mas] = 33.353
0 5 10 15 20 25 30frame number
107
108
109
110
[px]
3.02
3.04
3.06
3.08
3.10
[arc
sec]
--- Mean Y-Distance [mas] =3055.520-- Std. Dev [mas] = 3.680
Separation between stars
222
223
224
225
226
[px]
6.266.286.306.326.346.36
[arc
sec]
--- Mean Distance [mas] =6304.968-- Std. Dev [mas] = 5.554
214
215
216
217
[px]
6.026.046.066.086.106.12
[arc
sec]
--- Mean Distance [mas] =6071.241-- Std. Dev [mas] = 5.849
252
254
256
[px]
7.10
7.15
7.20
7.25
[arc
sec]
--- Mean Distance [mas] =7170.106-- Std. Dev [mas] = 7.716
1550
1560
1570
1580
1590
[px]
43.844.044.244.444.644.8
[arc
sec]
--- Mean Distance [mas] =44263.777-- Std. Dev [mas] = 41.721
0 5 10 15 20 25 30frame number
218
219
220
221
222
[px]
6.166.186.206.226.246.26
[arc
sec]
--- Mean Distance [mas] =6208.296-- Std. Dev [mas] = 6.469
Fig. 3. Separation between pairs of stars in the NGC 6388 data set plotted against frame number before any distortion correction. The left panelshows the separation in the x-direction, the middle panel in the y-direction, and the right panel the full separation r =
√Δx2 + Δy2. The left y-axes
are given in pixels while the right ones give the measured distances in seconds of arc. The small straight lines mark the frames after which anew five point sequence of jitter movements was started. The x-axes can also be seen as a time sequence as the individual frames were obtainedsubsequently, the first ten with an exposure time of 240 s and the last 20 with an exposure time of 120 s.
addition, the values are smaller for these ground layer-correcteddata, which were obtained without jitter (note the different scal-ing of the two plots).
4.3. Higher-order distortion correction
We compared the individual frame stellar positions with the ref-erence positions by applying a polynomial fit that also includedhigher-order transformation terms. To derive the transformationcoefficients, we used the IDL routine POLYWARP, which isable to fit a polynomial function of several orders, using a leastsquares algorithm (see e.g. also Schödel et al. 2009). The poly-nomial functions used are
Xi =∑
i, j
Kxi, jXj0Yi
0, (1)
Yi =∑
i, j
Kyi, jXj0Yi
0, (2)
where Xi, Yi are the reference stellar positions, X0, Y0 the stellarpositions in the individual frames, and Kxi, j,Kyi, j are the coeffi-cients to be calculated. After performing the fit with orders fromi, j ≤ 1−10, we decided to perform the final transformation withan order of i, j = 4.
A fit of order four gives an enhancement of 6–10%(NGC 6388) and 14–19% (47 Tuc) of the remaining mean resid-uals compared to the fit of order 3. Fitting even higher orders isnot necessary, as no significant enhancement of the residuals canbe seen.
After transformation of the stellar positions in the individualframes to the common reference frame, the residual separationswere calculated as in the case of the simpler transformations,(see Sect. 4.2.3).
5. Results
Basic distortion corrections are sufficient for deriving high ac-curacy photometry (Moretti et al. 2009). However to achieve thehighest astrometric precision, a distortion correction includinghigher orders is necessary. We therefore performed a higher-order distortion correction and present the results below.
5.1. Residual mapping
After calculating the residuals for each frame with respect to themaster-coordinate frame, we analyzed the distribution of theseresiduals over the FoV.
We analyzed contour plots of the residuals by fitting a min-imum curvature surface to the data of each frame to look at thespatial distribution of the residuals after the distortion correctionThe main goal of this test was to check for any strong spatialvariation in the residuals over the FoV. No strong spatial varia-tion can be seen, such as for example a strong gradient in onedirection. In addition, we analyzed arrow diagrams showing notonly the strength, but also the direction of the residuals for eachstar used to calculate the transformation. We found the orienta-tion of the arrows to be random.
A16, page 6 of 10
E. Meyer et al.: Astrometry with the MCAO instrument MAD
NGC 6388 Distortion Parameters
0.995
1.000
1.005
x-sc
ale
0.995
1.000
1.005
y-sc
ale
0 5 10 15 20 25 30frame number
-0.08-0.06-0.04-0.020.000.02
rota
tion
[deg
]
47 Tuc Distortion Parameters
0.999
1.000
1.001
x-sc
ale
0.999
1.000
1.001
y-sc
ale
0 5 10 15 20frame number
-0.02
0.00
0.02
rota
tion
[deg
]Fig. 4. Applied distortion parameters for the basic distortion correction over frame number for the NGC 6388 (left) and 47 Tuc data (right). Thepanels show from top to bottom the calculated distortion parameters for x scale, y scale, and rotation for each frame. While the rotation parameteris random, the scale parameter of the NGC 6388 data shows a pattern that is not visible in the 47 Tuc data. The vertical lines indicate after whichframe the jitter movement of five positions (five or ten frames) was repeated and highlight the introduced pattern.
Finally, we calculated the mean residuals over the full FoVfor both data sets separately for the x, y, and r
(r =√Δx2 + Δy2
)
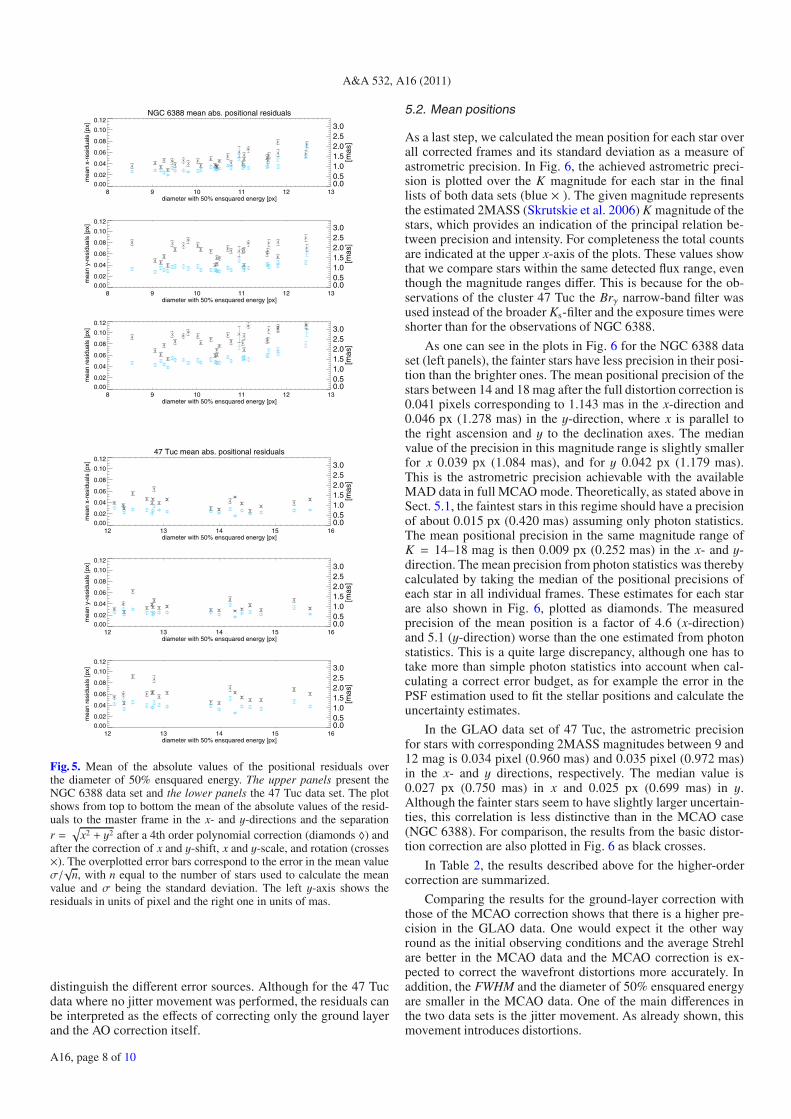
direction for each frame. The mean values are very close to zero(∼10−5−10−6 pixel), supporting the results from the arrow plotsof random orientation, but the mean of the absolute values ofthe residuals provides a more reliable indicator of the variabilitypresent in the data. In the case of an image where the flux is givenas flux per pixel, as in any detector image, the ensquared energyis defined as the flux of a PSF within a certain quadratic boxwith the size of n× n pixel divided by the total flux. The smallerthe side length (=diameter) of this box, containing 50% of thetotal energy, the better the AO correction, moving flux from thewings into the core of the PSF. In Fig. 5, the mean of the abso-lute values of the residuals over the full FoV in the x and y direc-tions and in the separation r are plotted over the diameter of 50%ensquared energy of the corresponding extracted PSF of eachframe and each data set. No correlation of the size of the residu-als with the ensquared energy and therefore the performance ofthe AO system can be seen in the 47 Tuc data set, but there is asmall correlation in the NGC 6388 data. What is visible, is thatthe absolute values of the residuals and their scatter are largerin the case of the NGC 6388 data set than for the 47 Tuc dataset, even though the initial observing conditions were better andthe measured FWHM values and diameters of 50% ensquaredenergy are smaller. Compared to a only basic correction of theimage distortions (crosses ×), the residuals after a higher ordercorrection (diamonds ♦) are noticeable smaller and do not scatteras much as in the case of the basic distortion correction, showingthe superiority of the higher order correction.
The values after the higher order correction give a first im-pression of how precise the astrometry is in these MAD data.The mean absolute residuals are between 0.020 px and 0.068 px(0.55–1.90 mas) in the x-direction and between 0.028 px and0.060 px (0.78–1.68 mas) in the y-direction in the MCAO-corrected NGC 6388 data set. For the ground-layer-corrected47 Tuc data set, the absolute values of the residuals are in
the range 0.017–0.034 px (0.47–0.95 mas) and 0.017–0.038 px(0.47–1.07 mas) in the x and y directions, respectively.
With photon statistics alone, the positions should have asmaller range of variation. Taking the positional accuracy cal-culated from photon statistics for the faintest stars used in thisset, the residuals should be within 0.012 px (0.33 mas) and0.011 px (0.32 mas) in the x and y directions, respectively, inthe NGC 6388 case and 0.005 px (0.14 mas) for both, x and y,in the 47 Tuc case. The accuracies Δx,Δy from photon statisticswere thereby calculated by Δx/y = FWHMx/y√
n, where FWHMx/y
is the full width at half maximum of the fitted PSF in x and y,respectively, and n the number of photons of the fitted star.
The basic distortion correction, where we only accounted forshift, scale, and rotation, shows a residual positional scatter thatcannot be explained by simple statistical uncertainties. It showsinstead that even after a basic distortion correction, there is re-maining a positional scatter, which seems to originate in higherorder distortions present in the images, as it seems largely inde-pendent of the size of the PSF.
The residuals after the higher order corrections show a sig-nificant enhancement in the precision, even though the valuesare still larger than the ones taking only photon statistics into ac-count. However, one has to remember that the latter values onlyshow the lower limit of the possibly reachable positional accu-racy. In reality, the uncertainties are likely to be larger, possiblybecause of AO correction-induced local distortions, which can-not be well described by polynomials and/or errors from the PSFestimation and fit.
In addition, the residuals and scatter were larger when thecamera jittered while scanning a bigger FoV. This jitter move-ment introduced distortions, which can be discerned from theseparation measurements and the distortion-correction parame-ters calculated for scale and rotation, (see Sect. 4.2.3). Howeverthe AO correction can also introduce distortions, as it dynam-ically adapts to atmospheric turbulence changes. With onlythese two data sets available in the LO correction mode, whichare suitable for this analysis, it is not possible at this time to
A16, page 7 of 10
A&A 532, A16 (2011)
NGC 6388 mean abs. positional residuals
8 9 10 11 12 13diameter with 50% ensquared energy [px]
0.00
0.02
0.04
0.06
0.08
0.10
0.12
mea
n x-
resi
dual
s [p
x]
0.00.51.01.52.02.53.0
[mas
]
8 9 10 11 12 13diameter with 50% ensquared energy [px]
0.00
0.02
0.04
0.06
0.08
0.10
0.12
mea
n y-
resi
dual
s [p
x]
0.00.51.01.52.02.53.0
[mas
]
8 9 10 11 12 13diameter with 50% ensquared energy [px]
0.00
0.02
0.04
0.06
0.08
0.10
0.12
mea
n re
sidu
als
[px]
0.00.51.01.52.02.53.0
[mas
]
47 Tuc mean abs. positional residuals
12 13 14 15 16diameter with 50% ensquared energy [px]
0.00
0.02
0.04
0.06
0.08
0.10
0.12
mea
n x-
resi
dual
s [p
x]
0.00.51.01.52.02.53.0
[mas
]
12 13 14 15 16diameter with 50% ensquared energy [px]
0.00
0.02
0.04
0.06
0.08
0.10
0.12
mea
n y-
resi
dual
s [p
x]
0.00.51.01.52.02.53.0
[mas
]
12 13 14 15 16diameter with 50% ensquared energy [px]
0.00
0.02
0.04
0.06
0.08
0.10
0.12
mea
n re
sidu
als
[px]
0.00.51.01.52.02.53.0
[mas
]
Fig. 5. Mean of the absolute values of the positional residuals overthe diameter of 50% ensquared energy. The upper panels present theNGC 6388 data set and the lower panels the 47 Tuc data set. The plotshows from top to bottom the mean of the absolute values of the resid-uals to the master frame in the x- and y-directions and the separationr =√
x2 + y2 after a 4th order polynomial correction (diamonds ♦) andafter the correction of x and y-shift, x and y-scale, and rotation (crosses×). The overplotted error bars correspond to the error in the mean valueσ/√
n, with n equal to the number of stars used to calculate the meanvalue and σ being the standard deviation. The left y-axis shows theresiduals in units of pixel and the right one in units of mas.
distinguish the different error sources. Although for the 47 Tucdata where no jitter movement was performed, the residuals canbe interpreted as the effects of correcting only the ground layerand the AO correction itself.
5.2. Mean positions
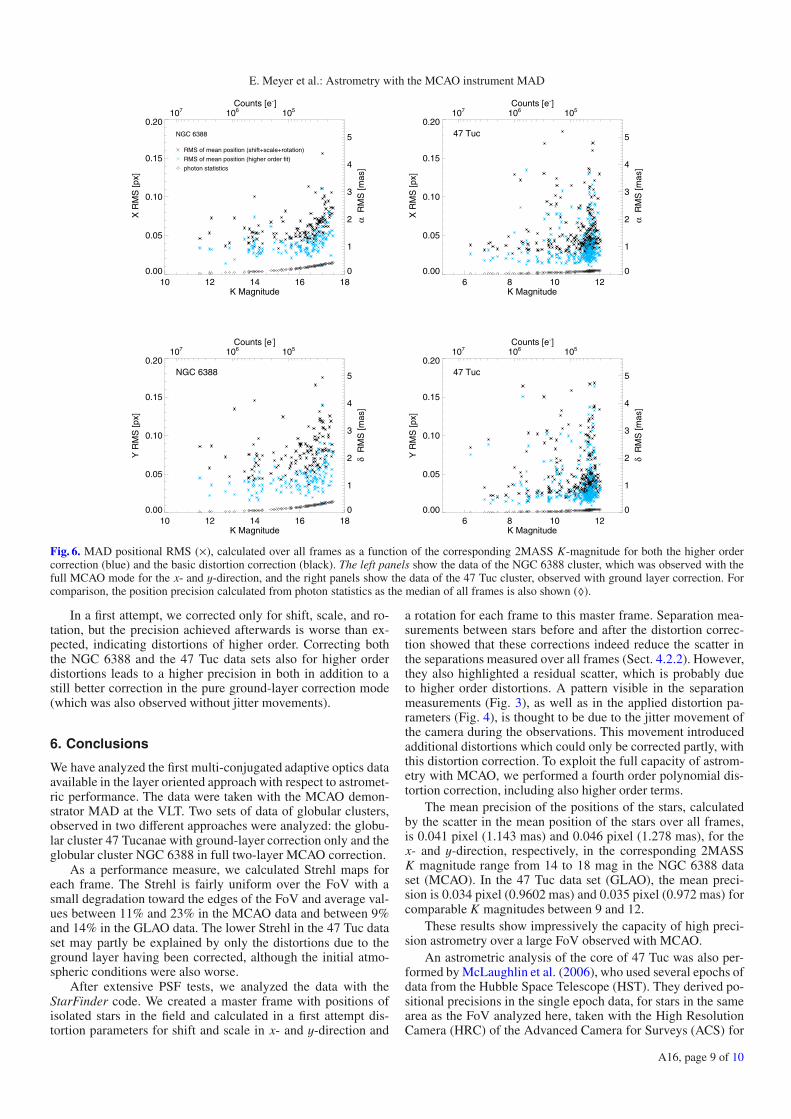
As a last step, we calculated the mean position for each star overall corrected frames and its standard deviation as a measure ofastrometric precision. In Fig. 6, the achieved astrometric preci-sion is plotted over the K magnitude for each star in the finallists of both data sets (blue × ). The given magnitude representsthe estimated 2MASS (Skrutskie et al. 2006) K magnitude of thestars, which provides an indication of the principal relation be-tween precision and intensity. For completeness the total countsare indicated at the upper x-axis of the plots. These values showthat we compare stars within the same detected flux range, eventhough the magnitude ranges differ. This is because for the ob-servations of the cluster 47 Tuc the Brγ narrow-band filter wasused instead of the broader Ks-filter and the exposure times wereshorter than for the observations of NGC 6388.
As one can see in the plots in Fig. 6 for the NGC 6388 dataset (left panels), the fainter stars have less precision in their posi-tion than the brighter ones. The mean positional precision of thestars between 14 and 18 mag after the full distortion correction is0.041 pixels corresponding to 1.143 mas in the x-direction and0.046 px (1.278 mas) in the y-direction, where x is parallel tothe right ascension and y to the declination axes. The medianvalue of the precision in this magnitude range is slightly smallerfor x 0.039 px (1.084 mas), and for y 0.042 px (1.179 mas).This is the astrometric precision achievable with the availableMAD data in full MCAO mode. Theoretically, as stated above inSect. 5.1, the faintest stars in this regime should have a precisionof about 0.015 px (0.420 mas) assuming only photon statistics.The mean positional precision in the same magnitude range ofK = 14–18 mag is then 0.009 px (0.252 mas) in the x- and y-direction. The mean precision from photon statistics was therebycalculated by taking the median of the positional precisions ofeach star in all individual frames. These estimates for each starare also shown in Fig. 6, plotted as diamonds. The measuredprecision of the mean position is a factor of 4.6 (x-direction)and 5.1 (y-direction) worse than the one estimated from photonstatistics. This is a quite large discrepancy, although one has totake more than simple photon statistics into account when cal-culating a correct error budget, as for example the error in thePSF estimation used to fit the stellar positions and calculate theuncertainty estimates.
In the GLAO data set of 47 Tuc, the astrometric precisionfor stars with corresponding 2MASS magnitudes between 9 and12 mag is 0.034 pixel (0.960 mas) and 0.035 pixel (0.972 mas)in the x- and y directions, respectively. The median value is0.027 px (0.750 mas) in x and 0.025 px (0.699 mas) in y.Although the fainter stars seem to have slightly larger uncertain-ties, this correlation is less distinctive than in the MCAO case(NGC 6388). For comparison, the results from the basic distor-tion correction are also plotted in Fig. 6 as black crosses.
In Table 2, the results described above for the higher-ordercorrection are summarized.
Comparing the results for the ground-layer correction withthose of the MCAO correction shows that there is a higher pre-cision in the GLAO data. One would expect it the other wayround as the initial observing conditions and the average Strehlare better in the MCAO data and the MCAO correction is ex-pected to correct the wavefront distortions more accurately. Inaddition, the FWHM and the diameter of 50% ensquared energyare smaller in the MCAO data. One of the main differences inthe two data sets is the jitter movement. As already shown, thismovement introduces distortions.
A16, page 8 of 10
E. Meyer et al.: Astrometry with the MCAO instrument MAD
10 12 14 16 18K Magnitude
0.00
0.05
0.10
0.15
0.20 X
RM
S [p
x]
RMS of mean position (shift+scale+rotation)
RMS of mean position (higher order fit)
photon statistics
107 106 105Counts [e−]
0
1
2
3
4
5
α R
MS
[mas
]
NGC 6388
6 8 10 12K Magnitude
0.00
0.05
0.10
0.15
0.20
X R
MS
[px]
107 106 105Counts [e−]
0
1
2
3
4
5
α R
MS
[mas
]
47 Tuc
10 12 14 16 18K Magnitude
0.00
0.05
0.10
0.15
0.20
Y R
MS
[px]
107 106 105Counts [e-]
0
1
2
3
4
5
δ R
MS
[mas
]NGC 6388
6 8 10 12K Magnitude
0.00
0.05
0.10
0.15
0.20
Y R
MS
[px]
107 106 105Counts [e−]
0
1
2
3
4
5
δ R
MS
[mas
]
47 Tuc
Fig. 6. MAD positional RMS (×), calculated over all frames as a function of the corresponding 2MASS K-magnitude for both the higher ordercorrection (blue) and the basic distortion correction (black). The left panels show the data of the NGC 6388 cluster, which was observed with thefull MCAO mode for the x- and y-direction, and the right panels show the data of the 47 Tuc cluster, observed with ground layer correction. Forcomparison, the position precision calculated from photon statistics as the median of all frames is also shown (♦).
In a first attempt, we corrected only for shift, scale, and ro-tation, but the precision achieved afterwards is worse than ex-pected, indicating distortions of higher order. Correcting boththe NGC 6388 and the 47 Tuc data sets also for higher orderdistortions leads to a higher precision in both in addition to astill better correction in the pure ground-layer correction mode(which was also observed without jitter movements).
6. Conclusions
We have analyzed the first multi-conjugated adaptive optics dataavailable in the layer oriented approach with respect to astromet-ric performance. The data were taken with the MCAO demon-strator MAD at the VLT. Two sets of data of globular clusters,observed in two different approaches were analyzed: the globu-lar cluster 47 Tucanae with ground-layer correction only and theglobular cluster NGC 6388 in full two-layer MCAO correction.
As a performance measure, we calculated Strehl maps foreach frame. The Strehl is fairly uniform over the FoV with asmall degradation toward the edges of the FoV and average val-ues between 11% and 23% in the MCAO data and between 9%and 14% in the GLAO data. The lower Strehl in the 47 Tuc dataset may partly be explained by only the distortions due to theground layer having been corrected, although the initial atmo-spheric conditions were also worse.
After extensive PSF tests, we analyzed the data with theStarFinder code. We created a master frame with positions ofisolated stars in the field and calculated in a first attempt dis-tortion parameters for shift and scale in x- and y-direction and
a rotation for each frame to this master frame. Separation mea-surements between stars before and after the distortion correc-tion showed that these corrections indeed reduce the scatter inthe separations measured over all frames (Sect. 4.2.2). However,they also highlighted a residual scatter, which is probably dueto higher order distortions. A pattern visible in the separationmeasurements (Fig. 3), as well as in the applied distortion pa-rameters (Fig. 4), is thought to be due to the jitter movement ofthe camera during the observations. This movement introducedadditional distortions which could only be corrected partly, withthis distortion correction. To exploit the full capacity of astrom-etry with MCAO, we performed a fourth order polynomial dis-tortion correction, including also higher order terms.
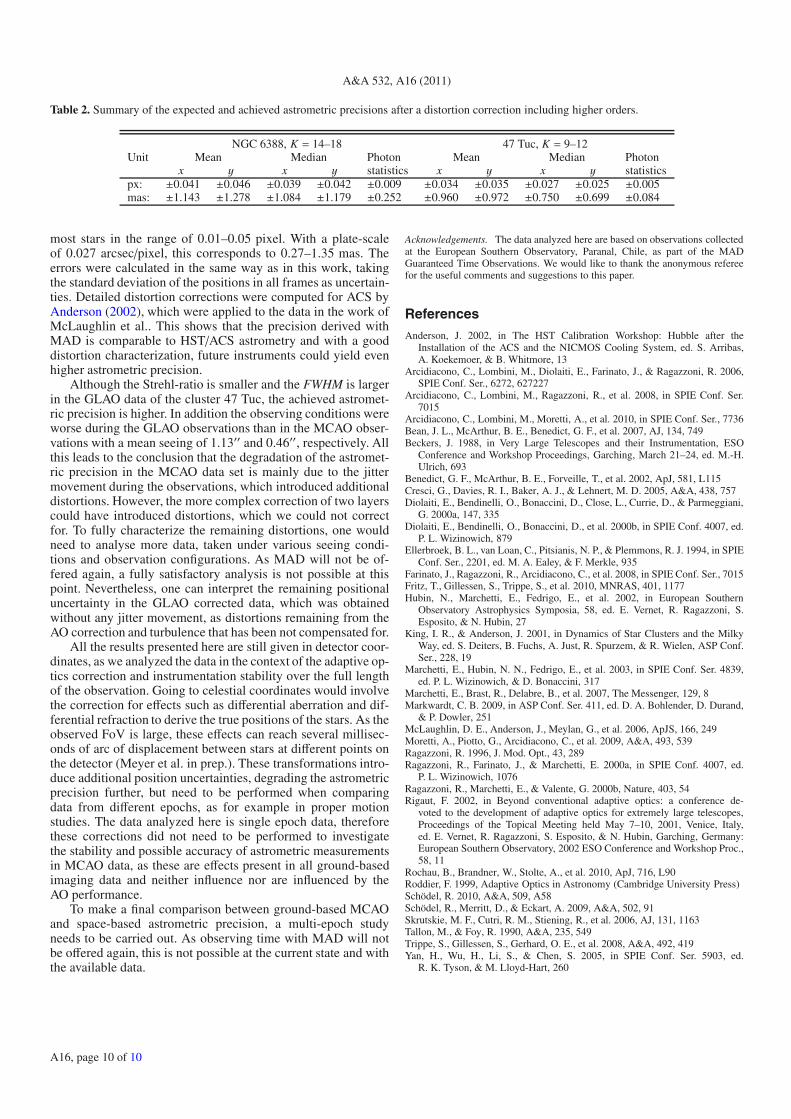
The mean precision of the positions of the stars, calculatedby the scatter in the mean position of the stars over all frames,is 0.041 pixel (1.143 mas) and 0.046 pixel (1.278 mas), for thex- and y-direction, respectively, in the corresponding 2MASSK magnitude range from 14 to 18 mag in the NGC 6388 dataset (MCAO). In the 47 Tuc data set (GLAO), the mean preci-sion is 0.034 pixel (0.9602 mas) and 0.035 pixel (0.972 mas) forcomparable K magnitudes between 9 and 12.
These results show impressively the capacity of high preci-sion astrometry over a large FoV observed with MCAO.
An astrometric analysis of the core of 47 Tuc was also per-formed by McLaughlin et al. (2006), who used several epochs ofdata from the Hubble Space Telescope (HST). They derived po-sitional precisions in the single epoch data, for stars in the samearea as the FoV analyzed here, taken with the High ResolutionCamera (HRC) of the Advanced Camera for Surveys (ACS) for
A16, page 9 of 10
A&A 532, A16 (2011)
Table 2. Summary of the expected and achieved astrometric precisions after a distortion correction including higher orders.
NGC 6388, K = 14–18 47 Tuc, K = 9–12Unit Mean Median Photon Mean Median Photon
x y x y statistics x y x y statisticspx: ±0.041 ±0.046 ±0.039 ±0.042 ±0.009 ±0.034 ±0.035 ±0.027 ±0.025 ±0.005mas: ±1.143 ±1.278 ±1.084 ±1.179 ±0.252 ±0.960 ±0.972 ±0.750 ±0.699 ±0.084
most stars in the range of 0.01–0.05 pixel. With a plate-scaleof 0.027 arcsec/pixel, this corresponds to 0.27–1.35 mas. Theerrors were calculated in the same way as in this work, takingthe standard deviation of the positions in all frames as uncertain-ties. Detailed distortion corrections were computed for ACS byAnderson (2002), which were applied to the data in the work ofMcLaughlin et al.. This shows that the precision derived withMAD is comparable to HST/ACS astrometry and with a gooddistortion characterization, future instruments could yield evenhigher astrometric precision.
Although the Strehl-ratio is smaller and the FWHM is largerin the GLAO data of the cluster 47 Tuc, the achieved astromet-ric precision is higher. In addition the observing conditions wereworse during the GLAO observations than in the MCAO obser-vations with a mean seeing of 1.13′′ and 0.46′′, respectively. Allthis leads to the conclusion that the degradation of the astromet-ric precision in the MCAO data set is mainly due to the jittermovement during the observations, which introduced additionaldistortions. However, the more complex correction of two layerscould have introduced distortions, which we could not correctfor. To fully characterize the remaining distortions, one wouldneed to analyse more data, taken under various seeing condi-tions and observation configurations. As MAD will not be of-fered again, a fully satisfactory analysis is not possible at thispoint. Nevertheless, one can interpret the remaining positionaluncertainty in the GLAO corrected data, which was obtainedwithout any jitter movement, as distortions remaining from theAO correction and turbulence that has been not compensated for.
All the results presented here are still given in detector coor-dinates, as we analyzed the data in the context of the adaptive op-tics correction and instrumentation stability over the full lengthof the observation. Going to celestial coordinates would involvethe correction for effects such as differential aberration and dif-ferential refraction to derive the true positions of the stars. As theobserved FoV is large, these effects can reach several millisec-onds of arc of displacement between stars at different points onthe detector (Meyer et al. in prep.). These transformations intro-duce additional position uncertainties, degrading the astrometricprecision further, but need to be performed when comparingdata from different epochs, as for example in proper motionstudies. The data analyzed here is single epoch data, thereforethese corrections did not need to be performed to investigatethe stability and possible accuracy of astrometric measurementsin MCAO data, as these are effects present in all ground-basedimaging data and neither influence nor are influenced by theAO performance.
To make a final comparison between ground-based MCAOand space-based astrometric precision, a multi-epoch studyneeds to be carried out. As observing time with MAD will notbe offered again, this is not possible at the current state and withthe available data.
Acknowledgements. The data analyzed here are based on observations collectedat the European Southern Observatory, Paranal, Chile, as part of the MADGuaranteed Time Observations. We would like to thank the anonymous refereefor the useful comments and suggestions to this paper.
ReferencesAnderson, J. 2002, in The HST Calibration Workshop: Hubble after the
Installation of the ACS and the NICMOS Cooling System, ed. S. Arribas,A. Koekemoer, & B. Whitmore, 13
Arcidiacono, C., Lombini, M., Diolaiti, E., Farinato, J., & Ragazzoni, R. 2006,SPIE Conf. Ser., 6272, 627227
Arcidiacono, C., Lombini, M., Ragazzoni, R., et al. 2008, in SPIE Conf. Ser.7015
Arcidiacono, C., Lombini, M., Moretti, A., et al. 2010, in SPIE Conf. Ser., 7736Bean, J. L., McArthur, B. E., Benedict, G. F., et al. 2007, AJ, 134, 749Beckers, J. 1988, in Very Large Telescopes and their Instrumentation, ESO
Conference and Workshop Proceedings, Garching, March 21–24, ed. M.-H.Ulrich, 693
Benedict, G. F., McArthur, B. E., Forveille, T., et al. 2002, ApJ, 581, L115Cresci, G., Davies, R. I., Baker, A. J., & Lehnert, M. D. 2005, A&A, 438, 757Diolaiti, E., Bendinelli, O., Bonaccini, D., Close, L., Currie, D., & Parmeggiani,
G. 2000a, 147, 335Diolaiti, E., Bendinelli, O., Bonaccini, D., et al. 2000b, in SPIE Conf. 4007, ed.
P. L. Wizinowich, 879Ellerbroek, B. L., van Loan, C., Pitsianis, N. P., & Plemmons, R. J. 1994, in SPIE
Conf. Ser., 2201, ed. M. A. Ealey, & F. Merkle, 935Farinato, J., Ragazzoni, R., Arcidiacono, C., et al. 2008, in SPIE Conf. Ser., 7015Fritz, T., Gillessen, S., Trippe, S., et al. 2010, MNRAS, 401, 1177Hubin, N., Marchetti, E., Fedrigo, E., et al. 2002, in European Southern
Observatory Astrophysics Symposia, 58, ed. E. Vernet, R. Ragazzoni, S.Esposito, & N. Hubin, 27
King, I. R., & Anderson, J. 2001, in Dynamics of Star Clusters and the MilkyWay, ed. S. Deiters, B. Fuchs, A. Just, R. Spurzem, & R. Wielen, ASP Conf.Ser., 228, 19
Marchetti, E., Hubin, N. N., Fedrigo, E., et al. 2003, in SPIE Conf. Ser. 4839,ed. P. L. Wizinowich, & D. Bonaccini, 317
Marchetti, E., Brast, R., Delabre, B., et al. 2007, The Messenger, 129, 8Markwardt, C. B. 2009, in ASP Conf. Ser. 411, ed. D. A. Bohlender, D. Durand,
& P. Dowler, 251McLaughlin, D. E., Anderson, J., Meylan, G., et al. 2006, ApJS, 166, 249Moretti, A., Piotto, G., Arcidiacono, C., et al. 2009, A&A, 493, 539Ragazzoni, R. 1996, J. Mod. Opt., 43, 289Ragazzoni, R., Farinato, J., & Marchetti, E. 2000a, in SPIE Conf. 4007, ed.
P. L. Wizinowich, 1076Ragazzoni, R., Marchetti, E., & Valente, G. 2000b, Nature, 403, 54Rigaut, F. 2002, in Beyond conventional adaptive optics: a conference de-
voted to the development of adaptive optics for extremely large telescopes,Proceedings of the Topical Meeting held May 7–10, 2001, Venice, Italy,ed. E. Vernet, R. Ragazzoni, S. Esposito, & N. Hubin, Garching, Germany:European Southern Observatory, 2002 ESO Conference and Workshop Proc.,58, 11
Rochau, B., Brandner, W., Stolte, A., et al. 2010, ApJ, 716, L90Roddier, F. 1999, Adaptive Optics in Astronomy (Cambridge University Press)Schödel, R. 2010, A&A, 509, A58Schödel, R., Merritt, D., & Eckart, A. 2009, A&A, 502, 91Skrutskie, M. F., Cutri, R. M., Stiening, R., et al. 2006, AJ, 131, 1163Tallon, M., & Foy, R. 1990, A&A, 235, 549Trippe, S., Gillessen, S., Gerhard, O. E., et al. 2008, A&A, 492, 419Yan, H., Wu, H., Li, S., & Chen, S. 2005, in SPIE Conf. Ser. 5903, ed.
R. K. Tyson, & M. Lloyd-Hart, 260
A16, page 10 of 10