Exam: TBA4231 APPLIED GEOMATICS Question 1: Geodesy
11
TBA4231 Applied geomatics, English, 2017a. Page 1 of 11 NTNU Geomatics Exam: TBA4231 APPLIED GEOMATICS Date: 9.12.2016 Time: 0900 – 1300 Solution example, version 2.1.2017 For the theory questions check also the curriculum. For some of the questions the answers are in keyword form (some more text is required to obtain top score). Grades in 2016, including the project assignments counting 30 % of the final grade: 2A-12B-3C-0D-0E-0F Question 1: Geodesy There are plans to build a new large sports hall with space for ca. 10 000 spectators in Trondheim. One of the alternatives is to build it on Øya, see the map in figure 1.1. The building is rectangular. The corner points 1, 2, 3 and 4 are shown on figure 1.1. Figure 1.1 Map with existing halls and the new hall which can be built at Øya The corner points 1 and 4 have known coordinates in EUREF89-UTM. All the 4 corners have known coordinates in the NTM system. Coordinates in EUREF89-UTM zone 32, and NTM zone 10: UTM NTM Height Point N(orth) E(ast) N E NN2000 1 7033991,204 568588,255 1604793,362 93724,850 5,000 m 2 ? ? 1604860,299 93788,040 3 ? ? 1604804,055 93847,619 4 7033936,389 568649,114 1604737,118 93784,430 Table 1.1 Coordinates and heights 3 1 2 4
-
Upload
khangminh22 -
Category
Documents
-
view
4 -
download
0
Transcript of Exam: TBA4231 APPLIED GEOMATICS Question 1: Geodesy

TBA4231 Applied geomatics, English, 2017a. Page 1 of 11
NTNU
Geomatics
Exam: TBA4231 APPLIED GEOMATICS
Date: 9.12.2016 Time: 0900 – 1300
Solution example, version 2.1.2017
For the theory questions check also the curriculum. For some of the questions the answers are in
keyword form (some more text is required to obtain top score).
Grades in 2016, including the project assignments counting 30 % of the final grade:
2A-12B-3C-0D-0E-0F
Question 1: Geodesy There are plans to build a new large sports hall with space for ca. 10 000 spectators in
Trondheim. One of the alternatives is to build it on Øya, see the map in figure 1.1.
The building is rectangular. The corner points 1, 2, 3 and 4 are shown on figure 1.1.
Figure 1.1 Map with existing halls and the new hall which can be built at Øya
The corner points 1 and 4 have known coordinates in EUREF89-UTM. All the 4 corners have
known coordinates in the NTM system.
Coordinates in EUREF89-UTM zone 32, and NTM zone 10:
UTM NTM Height
Point N(orth) E(ast) N E NN2000
1 7033991,204 568588,255 1604793,362 93724,850 5,000 m
2 ? ? 1604860,299 93788,040
3 ? ? 1604804,055 93847,619
4 7033936,389 568649,114 1604737,118 93784,430
Table 1.1 Coordinates and heights
3
1
2
4

TBA4231 Applied geomatics, English, 2017a. Page 2 of 11
1.1 Coordinate calculations
The building is rectangular (the angles in the corners are 100 gon) with the corner points 1, 2, 3
and 4.
(a) Explain what a bearing is.
See the textbook. The horizontal angle from the northern
part of a parallel of the north axis going through a point
(1 on the figure) to the vector from the same point to
another point (4).
Clockwise.
Numerical value between 0 and 400 gon.
(b) Use the EUREF89-UTM-coordinates in table 1.1.
Verify with your own calculations that the bearing from corner 1 to corner 4 is
φ1-4 = 146,6767 gon and that the distance D1-4 = 81,905 m.
From the given coordinates:
tan (𝐸4 − 𝐸1
𝑁4 − 𝑁1) =
+60,859
−54,815
Two solutions of the atan formula, two steps to get the bearing:
1: The bearing from 1 to 4 from the calculator: 1-4 = -53,3233 gon
2: From the signs of ∆E and ∆N (and looking at figure 1.1 or the figure above) we find the
bearing to be in the 2nd quadrant: 1-4 = -53,3233 + 200 = +146,6767 gon (= grads)
The building is rectangular: The UTM distance between 2 and 3, D2-3, is equal to the distance
between 1 and 4, D1-4. From the coordinates of 1 and 4, using Pythagoras, D2 = ΔN2 + ΔE2:
From-to ΔN ΔE Distance, D
1-2 and 4-3 D1-2 = D4-3 = 92,020 m (known)
1-4 and 2-3 -54,815 60,859 D1-4 = D2-3 = 81,905 m
(c) The distance between points 1 and 2 in UTM is D1-2 = 92,020 m.
Calculate the UTM coordinates of the corner points 2 and 3.
Notice that ΔN and ΔE pairwise have the same values, as the building is rectangular. Thus ΔN1-4
= ΔN2-3 and ΔN1-2 = ΔN4-3 etc., and you can save time doing the coordinate calculations.
Bearings: From the given bearing, 1-4 = +146,6767 gon, we can calculate the other bearings, see
figure 1.1: 2-3 = 1-4 = 146,6767 gon
1-2 = 4-3 = 146,6767 - 100 = 46,6767 gon
The coordinates can be calculated by the polar method, as we have the bearings and distances:
ΔN(orth) = Δx = D ∙ cos φ ΔE(ast) = Δy = D ∙ sin φ
You always obtain the correct sign and result of the ΔN and ΔE by using these formulas,
independent of the quadrant the bearing is in. If you draw triangles and use the angle in this
triangle and in this way obtain the values and the signs of ΔN and ΔE it is Ok, but you lose time
and it is easier to make mistakes.
Coordinates, point 3 can be calculated from either 2 or 4. Here both are shown (not necessary to
do at exam, but bonus points if this check is done). Results:
From - to Bearing, φ Distance, D ΔN ΔE N E Point
1-2 46,6767 92,020 68,374 61,584 7034059,578 568649,839 2
4-3 46,6767 92,020 68,374 61,584 7034004,764 568710,698 3
2-3 146,6767 81,905 60,859 -54,815 7034004,764 568710,698 3
1
4
1-4
N

TBA4231 Applied geomatics, English, 2017a. Page 3 of 11
1.2 Reference systems
In the building process there are several coordinate and heights systems etc. which are relevant
to use.
(a) Describe what EUREF89 is and give an example of where EUREF89 is in use.
EUREF89. Keywords: A reference system or a datum for calculations of coordinates. Regional
datum for Europe, etc. New datum in Norway from ca. 1997, replacing the old NGO1948. Is ca.
the same as WGS84, which GPS is using as a global datum. The differences in the coordinate
values between EUREF89 and WGS84 are mainly due to movements of the tectonic plates and
the land uplift (after the ice age). In Norway EUREF89 is also a datum for ellipsoidal heights.
(b) Describe what UTM is and give an example where UTM is in use.
UTM: Universal Transversal Mercator. UTM is a map projection which is in use in several
datums in the world. In Norway UTM is used in the national datum EUREF89 (onshore) and in
ED50 (offshore, in the North Sea). Conformal (angles are correct) map projection. ”Shrinked”
cylinder. The UTM traps: Scale factor of 0,9996 and E = 500000 m on the N(orth) axis. 60
zones, 3 in use in Norway (32, 33, 35). See the textbooks etc. for more, also for figures.
(c) Describe what NTM is and give an example where NTM is in use.
The coordinates can be given in NTM. NTM is defined by:
Zone width: 1 degree. 26 zones are covering Norway, the zones 5-30
The north axis in the zones: On each half degree: 5°30' East of Greenwich for zone 5,
6°30' for zone 6, etc., ending with zone 30 with the north axis on longitude 30°30ʹ E.
The scale factor along the north axis: m = 1,0000 along the north axis
Offset of the north value: 1 000 000 m (N = 1 000 000 on the north axis at the latitude B
= 58° North)
Offset in the east direction: 100 000 m (E = 100 000 on the north axis)
Geoid and ellipsoid models: Same as in EUREF89-UTM
Why NTM and not UTM?: Key words: The main reason is the UTM traps. 40 cm in map
projection correction can be critical in the building and construction section, gives 4 mm per 10
m. Prefabrication with real measures, and planning in UTM can be problematic. Solution: NTM.
NTM is used in the planning and in the setting out of the plan. Built buildings/constructions are
transformed to UTM for updating the official map. NTM can be seen on as a local datum.
1.3 2D-transformation (Helmert)
In table 1.1 the coordinates are given in: EUREF89-UTM and NTM. See also figure 1.1.
A transformation formula between EUREF89-UTM coordinates and NTM coordinates must be
developed. The transformation parameters in a 2D (conformal) transformation from UTM
coordinates to NTM coordinates are to be calculated in question 1.3. For formulas, check the
formula sheet in the appendix; two pages at the end of this exam text.
The transformation parameters a and b have been calculated by using values from table 1.1:
a = 1,000073336 b = –0,023414451
(a) Calculate the parameters c and d in the transformation formulas by using values from
table 1.1.
From the formula sheet, notation of the two unknown parameters: d = Cx = CN and c = Cy = CE
NNTM = CN + a ∙ NUTM + b ∙ EUTM ENTM = CE – b ∙ NUTM + a ∙ NUTM
2 unknowns and 2 equations for 1 point.
Using point 1, inserting numerical values:
1, N: 1604793,362 = CN + 1,000073336 ∙ 7033991,204 + (–0,023414451) ∙ 568588,255
1, E: 93724,850 = CE – (–0,023414451) ∙ 7033991,204 + 1,000073336 ∙ 568588,255
Results: CN = –5416400,505 m CE = –639602,145 m
Using point 4:
4, N: 1604737,118 = CN + 1,000073336 ∙ 7033936,389 + (–0,023414451) ∙ 568649,114
4, E: 93784,430 = CE – (–0,023414451) ∙ 7033936,389 + 1,000073336 ∙ 568649,114
Results: CN = –5416400,505 m CE = –639602,145 m => Ok, same values

TBA4231 Applied geomatics, English, 2017a. Page 4 of 11
NB: The calculated values are very dependent on the number of digits used in the calculations.
As values from table 1.1 are used, the transformation parameters must have been calculated by
using the UTM and the NTM coordinates of corners 1 and 4, the only points that have
coordinates in the from and the to coordinate systems (UTM and NTM). This is the reason for
getting exact the same coordinates. For quality assurance we must generally more than 2 points
to calculate the 4 transformation parameters.
(b) Transform the corner point 1 from UTM coordinates to NTM coordinates.
How do the results (the coordinates) correspond with the values in table 1.1?
This is a check of the calculations in 1.2.a.
Using the calculated coordinates of point 1 in table 1.1:
1, NNTM: CN + 1,000073336 ∙ 7033991,204 + (–0,023414451) ∙ 568588,255 = 1604793,362 m
1, ENTM: CE – (–0,023414451) ∙ 7033991,204 + 1,000073336 ∙ 568588,255 = 93724,850 m
Ok, same values as in table 1.1.
(Not asked for: Check, using the calculated coordinates of point 2 from 1.1.c:
2, NNTM: CN + 1,000073336 ∙ 7034059,578 + (–0,023414451) ∙ 568649,839 = 1604860,299
2, ENTM: CE – (–0,023414451) ∙ 7034059,578 + 1,000073336 ∙ 568649,839 = 93788,039
Ok, same values as in table 1.1., just 1 mm off)
(c) The scale factor.
Calculate the scale factor when going from UTM coordinates to NTM coordinates.
Comment on the result, among other things why this scale factor is ca. 1,0004.
The scale factor when going from UTM to NTM, using a formula from the formula sheet:
𝑘 = 𝑚 = √𝑎2 + 𝑏2 = 1,000347379
The scale factor is larger in NTM than in UTM. The main reason is the shrinkage of 0,9996
along the north axis in the UTM projection (one of the UTM traps). In practice there is no
shrinkage in NTM (the scale = 1 along the north axis, and only 1 degree broad zones), this is one
of the reasons to use NTM instead of UTM.
Alternative methods:
We can calculate the distance 1-4 both in UTM and NTM from the given coordinates
(using Pythagoras), and then calculate the ratio: m = DNTM / DUTM = 81,934/ 81,905 = 1,000352845 => same result (short distances)
We can also calculate the map projection correction on a distance in the UTM projection,
will give ca. the same result (but more calculations than the first method).
Answer: m = 1,000347 is Ok, concerning the numbers of digits.
1.4 Instruments and accuracy
The most relevant land surveying instruments used for setting out plans and measuring-in points,
are: GNSS(GPS) receivers (for x, y and H), total stations (x, y and H) and levellers (only H).
Historical figures (= empirical values) of the accuracy of the instruments are shown in table 1.2:
Type of instrument and method/measurement Assumed accuracy, emphirical values
GNSS (GPS), ground plane, static measurement: 7 mm + 1 mm/km
GNSS (GPS), ground plane, RTK: 15 mm + 1 mm/km
GNSS (GPS), height, RTK: 25 mm + 2 mm/km
Total station, ground plane: 2 mm + 2 mm/km
Total station, height: 3 mm + 20 mm/km
Levelling, height: 1 mm + 4 mm ∙√(L) , where L is in km
Table 1.2 Accuracy of various instruments and measurements

TBA4231 Applied geomatics, English, 2017a. Page 5 of 11
(a) Instruments
Starting point: Assumed/empirical accuracy of the instruments in table 1.2, assumed
accuracy tolerances of the new points, the range of use of the equipment and an efficient
fieldwork (setting out and measuring-in).
Substantiate briefly your choices. What kind of instruments do you choose for the following
tasks:
1. Setting out the centre line of a new road
In ground plane (x/y) a total station is more accurate than GNSS, but RTK with GNSS is much
faster to use. GNSS as long the tolerances are met, for precise measurements a total station.
When using total station we need known control points as station points along the new road. And
ca. 200 m between the control points. Leveling is for heights only.
2. Setting out heights of a building under construction
The most accurate method is leveling (check the table). A rotating height laser is often used, is a
king of a leveler.
3. Setting out the centre line of a tunnel
Loaded question... (lurespørsmål…), GNSS does not work in a tunnel, must have sight to the
satellites. Use total station, it is the only alternative. You get some plus points if laser is
mentioned as an aid in the setting out work. (Nobody at the exam suggested to use GNSS in the
tunnel.)
4. Measuring-in new control points
Static GNSS, efficient. Normally there are long distances between the new point and the known
control points, 1-5 km, and for long distances GNSS is best and most effective. With a long
observation period the accuracy will also be improved. See the example from the lecture:
Establishing of a base/reference station at HiST/NTNU) and also see the results of the short-
time-static measurements at the Fortress in the project assignment (ca. 12 min observation
periods). RTK with GNSS is not so accurate as static GNSS, check the table.
Generally, GNSS (GPS) has replaced total station as the main instrument in use in land
surveying, but the total station must be used where there are many obstacles (narrow valleys,
high buildings in a town, tunnels etc.), and if high accuracy of the heights is
required/demanded, we must use total stations and levelers instead of GPS (GNSS).
The questions are not giving the whole situations for the tasks above. Your assumptions will
be taken into considerations when evaluating your answers, for instance about the tolerances.
(b) Accuracy
The empirical values in table 1.2 are results of accuracy tests of instruments and methods.
A test was carried out to find the accuracy of a measured height difference by using a
particular total station: The height difference between the two points A and B was measured
7 times. The distance A-B between the total station and the aiming point was ca. 400 m.
The result of the 7 measurements of the height difference between A and B are (unit: meter):
ΔH1 = 22,912
ΔH2 = 22,907
ΔH3 = 22,910
ΔH4 = 22,920
ΔH5 = 22,939
ΔH6 = 22,914
ΔH7 = 22,909
1. Calculate the standard deviation of 1 measurement of the height difference between
A and B of a distance of 400 m.
Calculate the standard deviation of the mean value of the measured height difference
between A and B.
Compare the result with the value in table 1.2.
Comment on the result of the comparison.

TBA4231 Applied geomatics, English, 2017a. Page 6 of 11
Observation,
li = ΔHi
Correction v = x - l
in millimeters
v2
Weight,
p
22,912 0,00 0,00 1
22,907 5,00 25,00 1
22,910 2,00 4,00 1
22,920 -8,00 64,00 1
22,939 not used*
22,914 -2,00 4,00 1
22,909 3,00 9,00 1
Arithmetical mean value:
x = 22,9120 Sum = 0,00 Ok Sum v2 = 106,00
*: Observation no. 5 with the value of 22,939 m is left out (it varies a bit from the other
observations). A simple test is: A gross error occurs if the actual observation is more than 3
times the standard deviation (3s0) away from the mean value, where the mean value is calculated
without using observation no. 5. See the text book. See below for a numerical value of this test.
The observation with unit weight (p = 1) is 1 observation, see the weights in the table.
The number of excess measurements (the degree of freedom) is n – e = 6 – 1 = 5.
The standard deviation of the unit weight is obtained by using the given formula in the formula
page, arithmetical mean with pi = 1, see the table for Sum v2, s = s0:
0
( ) ( ) 1064,60 mm
6 1
pvv vvs
n e n e
The standard deviation on the arithmetic mean value of 6 observations, sx:
0
1
x x
vv ss
n n n= 1,88 mm
If all the 7 observations are used, the results are: xmean = 22,9159, s0 = 11,04 mm, sx = 4,17 mm
You get full score if you have used all 7 observations and commented on that ΔH5 is a candidate
for having a gross error.
* Is observation l5 = 22,939 m Ok? The simple test described above: Limit = x + 3 · s0 =
22,9120 + 3 · 0,0046 = 22,9258 m, which is less than l5 = 22,939 m. => Ok not to use ΔH5.
Comparison with table 1.2:
Table 1.2 gives an assumed accuracy of a trigonometrically measured height difference over a
distance of 400 m measured one time. We assume that the values are standard deviations:
3 mm + 20 mm/km = 3 + 20 · 0,4 km = 11,0 mm
Comments:
When comparing with the assumed value of 11,0 mm, we must use the calculated standard
deviation of the unit weight (measured 1 time, s0 = 4,6 mm), not sx = 1,88 mm of the mean value.
The assumed standard deviation is larger by a factor of ca. 2. Probably the actual total station is
better than the average total station with the assumed accuracy in table 1.2. See also comments to
point 2 below.
2. The total station which is tested in question 1.4.b is considered to be used in the
building project in figure 1.1, the sports hall. The results from the accuracy test in
question 1.4.b shows that it is required to have a better accuracy and quality assurance
of the height measurements on the building and the construction site.
Suggest actions that will reduce the numerical values of the standard deviations in
questions 1.4.b, and that will give a good quality assurance.

TBA4231 Applied geomatics, English, 2017a. Page 7 of 11
Key words:
Use a better total station, with lower (and thus better) values of the standard deviations
of the height observations.
Use another and better equipment: Leveler is more accurate than the total station, see the
table showing the assumed accuracies of different instrument.
Measure over shorter distances, will give lower and better values of the standard
deviation.
Better geometry: I.e. more measurements, as the standard deviation of a mean value is
lower than the standard deviation of a single measurement (see above).
Question 2: Photogrammetry, airplane and drone for mapping
2.1 Drones
It is planned to use a drone to make a map of the project area in figure 1.1 in question 1, the
sports hall. The area is ca. 200 x 200 m. See also table 1.1 for data you possibly may need here.
(a) The camera in the drone has the following technical data:
The principal distance/focal length: c = f = 5,2 mm
Size of the picture: A 7,6 mm by 5,7 mm sensor, with 4000 pixels by 3000 pixels.
We want a resolution of 0,03 m on the terrain (GSD = 0,03 m).
Calculate the flying height of the drone in height datum NN2000 to obtain a GSD of
0,03 m.
The resolution on the image is 1 pixel. The size of 1 pixel is found by using the size of the sensor
and the number of pixels:
1px = 7,6 / 4000 = 0,0019 mm and 1px = 5,7 / 3000 = 0,0019 mm
1 pixel is 0,0019 mm x 0,0019 mm
The height above the terrain, Ht:
Ht / c = GSD / px => Ht = c· GSD / px = 0,0052 · 0,03 / 0,0000019 = 82,105 m
The NN2000 height of the plane, adding the terrain height:
HNN2000 = Ht + 5,000 m = 82,105 + 5,000 = 87,105 m
Area: How many square meters of the terrain is covered by one image/picture?
Assuming that the terrain is flat, HNN2000_terrain = 5,0 m (from table 1.1).
The two sides of the image in the terrain, two fromulas are used:
S1 = Ht / c · s1 = 82,105 / 0,0052 · 0,0076 = 120,000 m
S2 = GSD · 3000 = 0,03 · 3000 = 90,000 m
Area 1 image in terrain: 120 · 90 = 10800 m2.
Ht
GSD HNN2000
px
c
NB: The proportions on the sketch is very wrong,
but the connections between the image and the
terrain can easily be found from the sketch.
c is the principal distance, 5,2 mm.
Ht is the height above the terrain.
HNN2000 is the height of the terrain, is 5 m
(from table 1.1).
px is 1 pixel of the image.
GSD is the ground sample distance
«fotavtrykket» of 1 pixel, here 0,03 m

TBA4231 Applied geomatics, English, 2017a. Page 8 of 11
(b) When a relatively large area like this is to be mapped with drone, the drone must fly in
several stripes to cover the actual area with vertical images. See figure 2.1.
Figure 2.1 Flight plan for capturing images. Here: 7 stripes
Why is it important to have overlap between the vertical images taken by a drone or an
airplane?
From the Drone chapter: UAV flight paths or mapping projects should be designed to ensure a
sufficient amount of both forward and lateral photographic overlap, which will better allow post
processing software to identify common points between each image.
Common to use 75-80 % forward overlap (along the flight line) and 60-80 % lateral or side
overlap (between two lines). The chosen overlaps make it possible for the processing software to
merge the images.
Main reason for lower percentage overlaps in classical photogrammetry (20 % sideway and 60 %
forward) is the good quality of the cameras compared to the cameras onboard in a drone. Also
using other orientation processing techniques.
Large overlaps also make it easier to cover vertical sides of an object in 3D.
(c) Planning. Use the information and the calculations in question 2.1.a and 2.1.b above; and
make your own choices that are necessary for the calculations:
Make an estimate of ca. how many images must be taken with the drone to cover the
actual project area of 200 m x 200 m.
How many images in each stripe and how many stripes?
Assuming 80 % overlap along the stripe and 60 % overlap between the stripes.
From figure 2.1 we see that the shortest side of the image, S2, is along the stripe and the
longest side, S1, is normal to the flight path (stripe).
The area is 200 m x 200 m.
Along the stripe 1 model is covering: MF = S2 · 80 % = 90 · 80 / 100 = 72 m
Between 2 stripes the overlap is covering: MS = S1 · 60 % = 120 · 60 / 100 = 72 m
Along the stripe the distance between the exposures is: 90 – 72 = 18 m
No. of exposures to cover 200 m: NE = 1(the first 90 m) + (200 – 90) / 18 = 6,1 images
In addition: 1 extra exposure before the first and after the last image to obtain 3D at the start
and at the end of the stripe.
We need 1 + 1 + 6,1 + 1 = 9,1 images in each stipe, => 10 images (as 9 is not enough)
The number of stripes: The distance between the stripes is 120 – 72 = 48 m
No. of stripes to cover 200 m: NS = 1(the first 120 m) + (200 – 120) / 48 = 1,7 stripes
We need 1 + 1,7 = 2,7 stipes, => 3 stripes (as 2 is not enough)
The total number of images: NI = 10 per stripe · 3 stripes = 30 images
TBA4231 Applied geomatics, English, 2017a. Page 9 of 11
2.2 and 2.3 Orientation of images in a photogrammetric workstation (DPW) Use figures to support your explanations.
2.2 Interior orientation and relative orientation
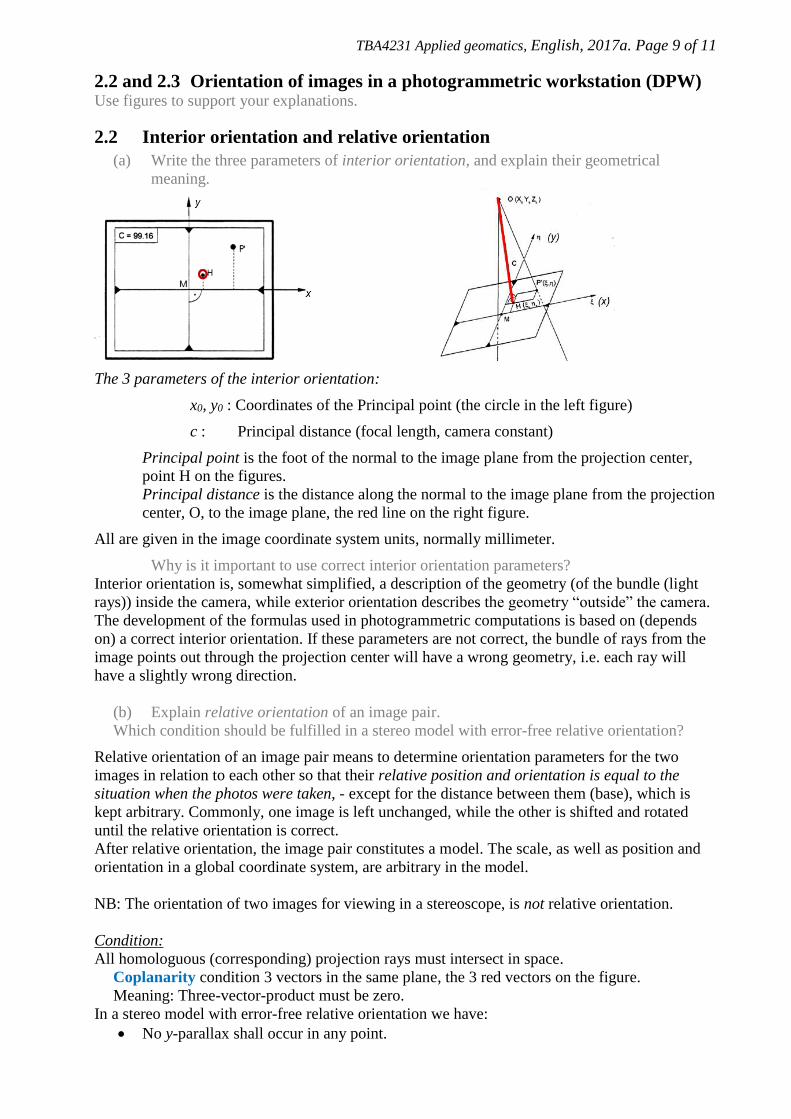
(a) Write the three parameters of interior orientation, and explain their geometrical
meaning.
The 3 parameters of the interior orientation:
x0, y0 : Coordinates of the Principal point (the circle in the left figure)
c : Principal distance (focal length, camera constant)
Principal point is the foot of the normal to the image plane from the projection center,
point H on the figures.
Principal distance is the distance along the normal to the image plane from the projection
center, O, to the image plane, the red line on the right figure.
All are given in the image coordinate system units, normally millimeter.
Why is it important to use correct interior orientation parameters?
Interior orientation is, somewhat simplified, a description of the geometry (of the bundle (light
rays)) inside the camera, while exterior orientation describes the geometry “outside” the camera.
The development of the formulas used in photogrammetric computations is based on (depends
on) a correct interior orientation. If these parameters are not correct, the bundle of rays from the
image points out through the projection center will have a wrong geometry, i.e. each ray will
have a slightly wrong direction.
(b) Explain relative orientation of an image pair.
Which condition should be fulfilled in a stereo model with error-free relative orientation?
Relative orientation of an image pair means to determine orientation parameters for the two
images in relation to each other so that their relative position and orientation is equal to the
situation when the photos were taken, - except for the distance between them (base), which is
kept arbitrary. Commonly, one image is left unchanged, while the other is shifted and rotated
until the relative orientation is correct.
After relative orientation, the image pair constitutes a model. The scale, as well as position and
orientation in a global coordinate system, are arbitrary in the model.
NB: The orientation of two images for viewing in a stereoscope, is not relative orientation.
Condition:
All homologuous (corresponding) projection rays must intersect in space.
Coplanarity condition 3 vectors in the same plane, the 3 red vectors on the figure.
Meaning: Three-vector-product must be zero.
In a stereo model with error-free relative orientation we have:
No y-parallax shall occur in any point.

TBA4231 Applied geomatics, English, 2017a. Page 10 of 11
Homologuous (light) rays must intersect in space (is explained above)
Any of these two answers is regarded sufficient as correct answer.
y-parallaxis von Gruber areas in the image
(c) What is the lowest number of image points that must be measured in order to
compute the relative orientation of a stereo model? Tell the reasons for your answer,
and explain why we normally will use more than the minimal number of points.
At least 5 points must be measured (in both images!) to perform relative orientation.
5 parameters are to be determined (commonly parameters of the right image related to the left,
given by 3 angles (rotations) and 2 base components, see the figure above:
, , , ,y zb b
To determine 5 parameters, 5 equations are needed. The co-planarity equation should be valid
for any imaged point. I.e. each point measured in the two images will give one equation.
Thus, at least 5 points must be measured to perform relative orientation. One will normally
use more points, to improve reliability and accuracy.
More than 5 points:
a. Always provide for overdetermination (general rule in all Geomatics).
b. Relative orientation has inherently weak reliability. Better reliability with more points. If
possible, the 6 von Gruber points should be used, giving optimal point distribution in the
model. Then, additional points should be measured. They may also be picked in the von
Gruber areas (the 6 squares on the figure).
The drawing pin (“tegnestift”) method: The best way to pin a sheet of paper to the wall is to
place the drawing pins in the von Gruber areas (they are close to the edge of the paper.
2.3 Absolute orientation The two questions below are a bit correlated and you have information in question (b) that you
can use for answering question (a), etc.
(a) What is the lowest number of known points (passpoints, ground control points) that
must be measured to perform absolute orientation? Give the reasons for your answer,
and explain why one normally would use more than the minimal number of points.
Passpoints are points with known terrain coordinates. Passpoints are identified and measured in
the model. Based on measured model coordinates and known terrain coordinates, the
transformation parameters are computed.
At least three well distributed passpoints are needed to obtain the parameters. However, normally
four or five are used: One in each corner and one in the middle of the model. Better reliability
and accuracy is achieved by using two or more points in each of the four/five areas of the model.

TBA4231 Applied geomatics, English, 2017a. Page 11 of 11
Minimum passpoints are 3, can also be seen from the transformation formula below in (b): A 7-
parameter transformation with 3 rotations, 3 translations (moving the origin) and 1 scale. As we
have 3 equations for each 3D passpoint, the minimum is two 3D passpoints and one passpoint
with known height. The 3 points must form a plane (well spread). See the left figure below.
The left figure above:
Good reliability and accuracy:
4 3D passpoints in the corners (known XYH) and 1 1D passpoint in the middle (known
height). In assignment 5 the point in the middle was a 3D passpoint.
(b) The parameters in an absolute orientationare the coefficients in a three dimensional (3D)
transformation of points from one coordinate system to another.
When we calculate the transformation, the following transformation formula is used:
0
0
0
X X x
Y Y m y
Z Z z
R where
11 12 13
21 22 23
31 32 33
r r r
r r r
r r r
R
Between which coordinate systems is the transformation performed in absolute
orientation?
The formula gives the transformation from model coordinates to terrain coordinates. I.e. we can
compute terrain coordinates for all points measured in the model.
“From image to terrain” is wrong. That would be from a 2D system to a 3D system, - and
from which of the two images? We are here using a pure 3D transformation.
Write a list of the parameters defining the absolute orientation, and explain the meaning
of each parameter.
Transformation parameters for absolute orientation are:
, , (ev. , , ) Orientation angles; embedded in the rotation matrix R in the formula
0 0 0, ,X Y Z Translation, i.e. shift along the coordinate axes
m Scale factor (scale number)
In the formula, also the following symbols are found:
11 12, , ...r r Elements of the rotation matrix R: trigonometric functions of , ,
, ,x y z Model coordinates for the point
, ,X Y Z Terrain coordinates for the point. For instance in EUREF89-UTM and
NN2000 height. See right figure above.