International Journal of Physical E ducation, Fitness and S ...
55
International Journal of Physical Education, Fitness and Sports-IJPEFS 1 International Journal of Physical Education, Fitness and Sports-IJPEFS Vol.2. No.1.March 2013, ISSN 2277-5447 Website: http://www.ijpefs.nonolympictimes.org A COMPARISON OF SELECTED BIOMECHANICAL PARAMETERS OF FRONT ROW SPIKE BETWEEN SHORT SET AND HIGH SET BALL PAPAN MONDAL a AND SUDARSAN BHOWMICK b a Assistant Professor, Department of Physical Education, Jadavpur University, Kolkata-32 b Professor, Department of Physical Education, University of Kalyani, Kalyani, Nadia Abstract Introduction: The purpose of this study was to compare the selected biomechanical parameters of front row spike between short set and high set ball for intervarsity level volleyball players. Methods: Eight Intervarsity level male volleyball players (22.5±2.00 yrs, 1.78±0.05m and 65.09±6.83kg) were selected as the subjects for this study from University of Kalyani and Visva-Bharati University, West Bengal, India. All subjects were right-handed volleyball players. The players were allowed to have warm-up and trials. The action of short and high set ball spiking was recorded by a digital video camera (Sony, 24 fps). Recorded data were analyzed with the help of power DVD software. The selected kinematics variables were approach speed, jump height, duration of flight and ball velocity. The other segmental take off angles were also be studied in this study those were ankle angle, knee angle and hip angle. The mean, standard deviation and t-test was used for statistical analysis of the data. Result and Discussion: The results revealed that insignificant difference exists between short set and high set ball front row spike performance for intervarsity level volleyball players except jump height and duration of flight which were significantly differ for short set and high set ball front row spike. Conclusion: This study describes the kinematic characteristics of the male volleyball short set and high set front row spike. It was noted that short set front row spike had a greater approach speed and shorter duration of flight, jump height and ball velocity than that of high set front row spike. Keywords: Volleyball, spike, intervarsity, ball velocity Introduction: The volleyball game has a number of fundamental techniques of which the spike is one of the most difficult to master but demanding for high performance. Spike is the most dramatic and popular skills in volleyball which provides an exciting and dynamic skill that is captivating for players and spectators alike. The athlete is expected to jump and hit the ball with maximum force and accuracy at the approximate peak of the jump. Analysis of this technique has become the focus of attention of biomechanical research for last a few decades. Prsala (1982) identified four phases of the spike technique: the approach, preparation, hitting, and landing. The approach involves two or three controlled running strides, a transitional last step to prepare for the transfer of horizontal momentum to vertical momentum, and a double footed vertical jump. In the preparatory phase, the striking arm is swung upward in an abducted and laterally rotated position. The elbow is flexed at approximately 90 degrees and the wrist is hyper- extended. During hitting phase, the shoulder is elevated; the upper arm is inwardly rotated and adducted; the forearm is extended at the elbow and the wrist is flexed. The athlete absorbs the downward momentum by flexing the joints of the lower extremities when landing. Coleman et al. (1993) studied on ten male international male volleyball players who spiked the ball in the front row at the 1991 World Students Games. They reported the mean vertical velocity of the Centre of Mass (COM) at take off was 3.59 m/s and height of the jump was 0.62m. Saunder (1980) studied the effects of approach speed on one and two-foot vertical jump performances. He found that vertical velocities of two-foot jump peaked when the approach speed was up to 50-60 % of maximum sprint speed and the vertical velocities of one-foot jumps were up to 60-70 % of maximum sprint speed. It is important to understand the mechanical factors, which contribute to the successful spiking action. The purpose of this study was to analyze the selected kinematic factors - approach speed, jump height, duration of flight, ball velocity and segmental angles during takeoff in front row spike
-
Upload
khangminh22 -
Category
Documents
-
view
1 -
download
0
Transcript of International Journal of Physical E ducation, Fitness and S ...

Inte
rnat
ion
al J
ou
rnal
of
Physi
cal
Edu
cati
on
, F
itn
ess
and
Sp
ort
s-IJ
PE
FS
1
International Journal of Physical Education, Fitness and
Sports-IJPEFS Vol.2. No.1.March 2013, ISSN 2277-5447
Website: http://www.ijpefs.nonolympictimes.org
A COMPARISON OF SELECTED BIOMECHANICAL PARAMETERS OF FRONT
ROW SPIKE BETWEEN SHORT SET AND HIGH SET BALL
PAPAN MONDALa AND SUDARSAN BHOWMICKb aAssistant Professor, Department of Physical Education, Jadavpur University, Kolkata-32 bProfessor, Department of Physical Education, University of Kalyani, Kalyani, Nadia
Abstract
Introduction: The purpose of this study was to compare the selected biomechanical parameters of front row spike between
short set and high set ball for intervarsity level volleyball players.
Methods: Eight Intervarsity level male volleyball players (22.5±2.00 yrs, 1.78±0.05m and 65.09±6.83kg) were selected as
the subjects for this study from University of Kalyani and Visva-Bharati University, West Bengal, India. All subjects were
right-handed volleyball players. The players were allowed to have warm-up and trials. The action of short and high set ball
spiking was recorded by a digital video camera (Sony, 24 fps). Recorded data were analyzed with the help of power DVD
software. The selected kinematics variables were approach speed, jump height, duration of flight and ball velocity. The other
segmental take off angles were also be studied in this study those were ankle angle, knee angle and hip angle. The mean,
standard deviation and t-test was used for statistical analysis of the data.
Result and Discussion: The results revealed that insignificant difference exists between short set and high set ball front row
spike performance for intervarsity level volleyball players except jump height and duration of flight which were significantly
differ for short set and high set ball front row spike.
Conclusion: This study describes the kinematic characteristics of the male volleyball short set and high set front row spike.
It was noted that short set front row spike had a greater approach speed and shorter duration of flight, jump height and ball
velocity than that of high set front row spike.
Keywords: Volleyball, spike, intervarsity, ball velocity
Introduction:
The volleyball game has a number of fundamental techniques of which the spike is one of the most difficult to master but
demanding for high performance. Spike is the most dramatic and popular skills in volleyball which provides an exciting and
dynamic skill that is captivating for players and spectators alike. The athlete is expected to jump and hit the ball with
maximum force and accuracy at the approximate peak of the jump. Analysis of this technique has become the focus of
attention of biomechanical research for last a few decades. Prsala (1982) identified four phases of the spike technique: the
approach, preparation, hitting, and landing. The approach involves two or three controlled running strides, a transitional last
step to prepare for the transfer of horizontal momentum to vertical momentum, and a double footed vertical jump. In the
preparatory phase, the striking arm is swung upward in an abducted and laterally rotated position. The elbow is flexed at
approximately 90 degrees and the wrist is hyper- extended. During hitting phase, the shoulder is elevated; the upper arm is
inwardly rotated and adducted; the forearm is extended at the elbow and the wrist is flexed. The athlete absorbs the
downward momentum by flexing the joints of the lower extremities when landing. Coleman et al. (1993) studied on ten male
international male volleyball players who spiked the ball in the front row at the 1991 World Students Games. They reported
the mean vertical velocity of the Centre of Mass (COM) at take off was 3.59 m/s and height of the jump was 0.62m. Saunder
(1980) studied the effects of approach speed on one and two-foot vertical jump performances. He found that vertical
velocities of two-foot jump peaked when the approach speed was up to 50-60 % of maximum sprint speed and the vertical
velocities of one-foot jumps were up to 60-70 % of maximum sprint speed. It is important to understand the mechanical
factors, which contribute to the successful spiking action. The purpose of this study was to analyze the selected kinematic
factors - approach speed, jump height, duration of flight, ball velocity and segmental angles during takeoff in front row spike

Inte
rnat
ion
al J
ou
rnal
of
Physi
cal
Edu
cati
on
, F
itn
ess
and
Sp
ort
s-IJ
PE
FS
2
International Journal of Physical Education, Fitness and
Sports-IJPEFS Vol.2. No.1.March 2013, ISSN 2277-5447
Website: http://www.ijpefs.nonolympictimes.org
performed by male volleyball players. Therefore, it was the aim of this study to provide descriptive kinematics of some of
the biomechanical factors involved in the front row spike.
Methodology:
The principal method used is comparative kinematics method, aimed at finding the differences in Kinematics variables
purpose in gaining information of front row spike performance between short set and high set ball.
Selection of Subject:
A total eight (8) Intervarsity male volleyball players were taken as the subject for the study from the Visva-Bharati
University and University of Kalyani. The mean age, height and body weight of intervarsity players were 22.5 years (±2.00),
1.78m (±0.05), 65.09kg (±6.83) respectively. All subjects in this study were right-handed volleyball players. They all were
healthy and don‘t had any injury reported within the last year.
Tools and Equipments:
For the purpose of this study a high speed video camera (Sony, 24fps), camera tripod, measuring tape, marking powder,
volleyballs, volleyball court, motion analysis software (power DVD) and computer system were used.
Procedure for Data Collection:
For the kinematical data a high speed video camera (Sony, 24fps) was used to capture the spike performance. Data was
collected from the movement of the spiking action for each subject. The camera was placed perpendicular at a distance of
10.50m on the left side of the players mounted at a height of 1.30m above the ground and capture video clips of sufficient
coverage to clearly see the spike process. All subjects performed five officially allotted spikes but the best one (successful)
spike was selected for further analysis for measuring the selected kinematic parameters using freeze frame technique. After
projecting a particular frame the stickman configuration was drawn from the each frame. Distance and time information
were obtained from the ‗kinegram‘ and the camera frequency respectively. Velocity of movement was calculated as the first
derivative time of (Distance-time) information. Time information was obtained from the frequency of the camera
(24fps).The selected kinematics variables were approach speed, jump height, duration of flight and ball velocity. The other
selected parameters were ankle angle, knee angle, and hip angle during the take off phase.
Result:
The result of the statistical analysis revealed that there was no significant differences exist between short set and high set ball
front row spiking in respect to approach speed and ball velocity whereas there was a significant difference exist between
short set and high set ball front row spiking in respect to the duration of flight and jump height. It has showed that the
calculated t values of approach speed and ball velocity were less than tabulated t value (2.36) at0.05 level of significance
with 7degree of freedom. The result of the statistical analysis of front row spike revealed that there was no significant
difference exists between short set and high set ball in all the variables studies presented in table-3 (ankle angle, knee angle
and hip angle during takeoff). It has showed that the calculated t values of approach speed and ball velocity were less than
tabulated t value (2.36) at0.05 level of significance with 7degree of freedom.
Discussion: It was the aim of this study to examine the mechanical factors between short set and high set ball front row
spike. The result of the present study indicated that there were no significant differences between short set and high set ball
front row spike in the approach speed and ball velocity whereas there were significant differences between short set and high
set ball front row spike in the jump height and duration of flight. Further insignificant differences were found between these
two types of set in case of different body joint angles (ankle, knee and hip). This might be due to the fact that the variation in
the approach speed and ball velocity of short set and high set ball front row spike is very less. Secondly the angle of the
segments during takeoff between short set and high set ball may be same but the movement forces applied on the ball may
be differ and not dependent on the angle of segment but on the speed of change of angle which was return increase the
velocity of segment to

Inte
rnat
ion
al J
ou
rnal
of
Physi
cal
Edu
cati
on
, F
itn
ess
and
Sp
ort
s-IJ
PE
FS
3
International Journal of Physical Education, Fitness and
Sports-IJPEFS Vol.2. No.1.March 2013, ISSN 2277-5447
Website: http://www.ijpefs.nonolympictimes.org
transfer to the ball. It was clearly noted that there was differences in mean values of speed of approach for short and high set
ball spiking but this difference was not statistically significant. This result was perhaps due to the fact that in this case the
length of approach was considerably small in the case of short set ball spiking. In the spike for high set ball the ball was set
about more than 4ft. above the net. In order to get the ball and spike it forcefully the spikers has to achieve the greater jump
height than the short set ball spike. In duration of flight mean values were difference from one another, the minimum value
(0.64s) was for the spike of short set ball and the maximum value (0.70s) for the spike of height set ball. In case of spike for
high set ball the body achieved greater vertical distance. So the ascending time was more than the short set spike and
consequently the descending time is also greater and as a result the duration of flight is more in case of spike for high set
ball.
Conclusion:
On the basis of the results obtained in the present study, the following conclusions were drawn:
i. The short set front row spike involves a greater approach speed and a shorter duration of flight than those of high set front
row spike.
ii. The high set front row spike has a greater jump height than that of short set front row spike.
iii. The high set front row spike has a greater spiked ball velocity than short set front row spike.
Figure 1: Showing Comparison of Approach Speed, Jump Height, Duration of Flight and Ball Velocity between Short
Set and High Set Ball Front Row pike
Figure 2: Showing Comparison of Different Joint Angles at Takeoff between Short Set and High Set Ball Front Row
Spike.
2.83
3.23.43.63.8
Short Set Ball High Set Ball
Ap
pro
ach
Sp
eed
(m/s
)
Approach Speed (m/s)
50
55
60
65
70
Short Set Ball High Set BallJu
mp
Hei
gh
t (c
m)
Jump Height (cm)
0.60.620.640.660.68
0.70.72
Short Set Ball
High Set Ball
Du
rati
on
of
Fli
gh
t (s
)
Duration of Flight (s)
17
17.5
18
18.5
19
19.5
Short Set Ball
High Set Ball
Sp
iked
Ba
ll V
elo
city
(m
/s)
Spiked Ball Velocity (m/s)

Inte
rnat
ion
al J
ou
rnal
of
Physi
cal
Edu
cati
on
, F
itn
ess
and
Sp
ort
s-IJ
PE
FS
4
International Journal of Physical Education, Fitness and
Sports-IJPEFS Vol.2. No.1.March 2013, ISSN 2277-5447
Website: http://www.ijpefs.nonolympictimes.org
Table 1: Mean Age, Height and Weight of the Subjects (n=8).
Parameter Minimum Maximum Mean±SD
Age(Years) 19.00 25.00 22.50±2.00
Height(M) 1.70 1.85 1.78±0.05
Weight(Kg) 58.70 79.18 65.09±6.83
Table 2: Indicating Mean, Standard Deviation and t Values of Selected Biomechanical Parameters of Front Row
Spike Performance between Short Set and High Set Ball.
Biomechanical
Parameters
Short Set Ball
Spiking
High Set Ball
Spiking
Cal.t P-Value
Mean SD Mean SD
Approach Speed(m/s) 3.61 0.39 3.19 0.80 1.87 0.104
Duration of Flight (s) 0.64 0.06 0.70 0.02 2.94 0.021
Jump Height(cm) 56.99 4.49 65.40 2.48 6.78 0.000
Spiked Ball Velocity (m/s) 18.02 3.20 19.09 1.98 0.81 0.442
*Required value for being significant – 0.05 = 2.36 and 0.01 = 3.50
Table 3: Indicating t Values of Selected Body Joint Angles during Takeoff for Short Set and High Set Ball Front Row
Spiking.
Segmental Angle Short Set Ball Spiking High Set Ball
Spiking
Cal.t P-Value
Mean SD Mean SD
Ankle Angle (Degree) 97.50 10.06 98.50 15.55 0.16 0.880
Knee Angle (Degree 124.38 17.28 128.88 11.91 0.67 0.526
Hip Angle (Degree) 143.13 12.91 141.63 16.70 0.38 0.710
* Required value for being significant – 0.05 = 2.36 and 0.01 = 3.50
0
50
100
150
200
Ankle Knee Hip
Join
ts A
ngl
e(D
egr
ee
)
Segmental Joints
Short Set
High Set
Inte
rnat
ion
al J
ou
rnal
of
Physi
cal
Edu
cati
on
, F
itn
ess
and
Sp
ort
s-IJ
PE
FS
5
International Journal of Physical Education, Fitness and
Sports-IJPEFS Vol.2. No.1.March 2013, ISSN 2277-5447
Website: http://www.ijpefs.nonolympictimes.org
References:
[1] Bunn, J.W: Scientific principles of coaching, 2nd Ed. Englewood Cliffs, New Jersey Prentice Hall, Inc., 1973
[2] Coleman, S., Benham, A., Northcott, S. (1993). A Three-Dimensional Cinematographical Analysis of the
Volleyball Spike. Journal of Sports Sciences. Vol. 11, Issue 4.259-302.
[3] Coleman, S. (1997). A 3D kinematic analysis of the volleyball jump serve. Proceedings of the XV International
Symposium on Biomechanics in Sports. Denton, Texas Women University, Texas, USA.
[4] Dyson, G.H.G (1977). The Mechanics of Athletes (7th ed.). New York, New York: Holmes & Meier.
[5] Endo Toshiro et al. (2008). A biomechanical analysis of pipe spike motion for elite male volleyball players in
official games. ISBS Conference 2008, July 14-18,2008, Seoul, Korea.
[6] Hay, J.G, Reid, J.G(1982). The Anatomical and Mechanical Bases of Human Motion. Englewood Cliffs Nz:
Prentice-Hall,
[7] Huang, C. F., Liu, G. C., & Sheu, T. Y. (1998). A three dimensional analysis of the volleyball one-foot jump
spike. ISBS‘98-Proceeding II.
[8] Hsieh,and. Heise(2006). Arm swing of Volleyball spike jump performance between advanced and recreational
female players.
[9] Kuhlman Class et al. (2007). Aspects of a three dimensional motion analysis of the volleyball spike in high level
competition. XXV ISBS Symposium 2007, Ouro Preto-Brazil.
[10] Marquez, W.Q., Masumura,M.,Ae, M. (2005). ―A biomechanical analysis of spike motion for different skill
levels of male volleyball players‖. Proceedings of XXI ISB Congress(pp.158),Cleveland:ISB
[11] Prsala, J. (1982). Improve your spiking in volleyball. Volleyball Technical Journal, 7 (2), 57-64.
[12] Samson. J. and Roy, B. (1976). Biomechanical analysis of the volleyball spike. In Biomechanics V-B (edited by
P. Komi), pp.332-336. Baltimore, MD. : University Park Press.
[13] Saunder, H. L. (1980). A cinematographically study of the relationship between speed of movement and available
force. Unpublished doctoral dissertation, Texas A & M University, College Station.
Inte
rnat
ion
al J
ou
rnal
of
Physi
cal
Edu
cati
on
, F
itn
ess
and
Sp
ort
s-IJ
PE
FS
6
International Journal of Physical Education, Fitness and
Sports-IJPEFS Vol.2. No.1.March 2013, ISSN 2277-5447
Website: http://www.ijpefs.nonolympictimes.org
ATTITUDE TOWARDS HEALTH AND FITNESS OF MIDDLE AGE
AND OLD AGE CITIZENS OF GWALIOR
DR. RAJENDER SINGHa, DR. PRADEEP KUMARb,
MR. SONU KUMARcAND MR. PRABAL PRATAP SINGHd
acdJiwaji University, Gwalior, bAsst. Professor, Dept. of Physical Education Veerbhumi Govt. P.G. College, Mahoba, Uttar Pradesh, India
Abstract
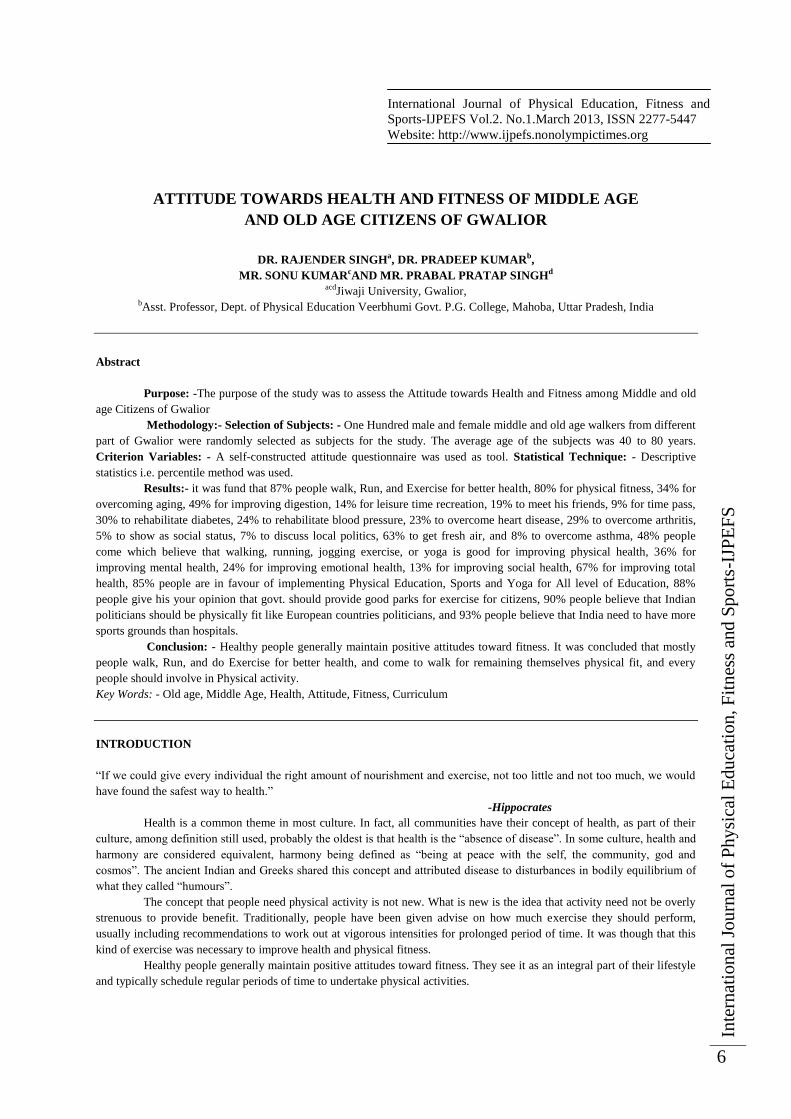
Purpose: -The purpose of the study was to assess the Attitude towards Health and Fitness among Middle and old
age Citizens of Gwalior
Methodology:- Selection of Subjects: - One Hundred male and female middle and old age walkers from different
part of Gwalior were randomly selected as subjects for the study. The average age of the subjects was 40 to 80 years.
Criterion Variables: - A self-constructed attitude questionnaire was used as tool. Statistical Technique: - Descriptive
statistics i.e. percentile method was used.
Results:- it was fund that 87% people walk, Run, and Exercise for better health, 80% for physical fitness, 34% for
overcoming aging, 49% for improving digestion, 14% for leisure time recreation, 19% to meet his friends, 9% for time pass,
30% to rehabilitate diabetes, 24% to rehabilitate blood pressure, 23% to overcome heart disease, 29% to overcome arthritis,
5% to show as social status, 7% to discuss local politics, 63% to get fresh air, and 8% to overcome asthma, 48% people
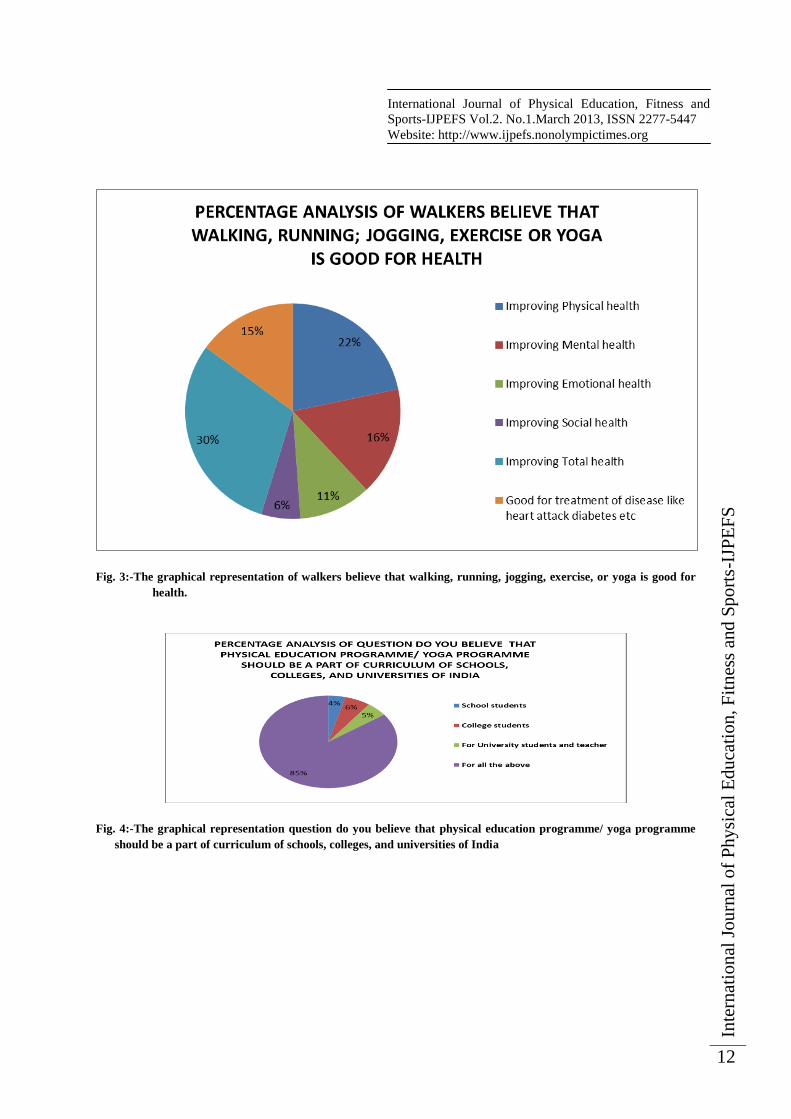
come which believe that walking, running, jogging exercise, or yoga is good for improving physical health, 36% for
improving mental health, 24% for improving emotional health, 13% for improving social health, 67% for improving total
health, 85% people are in favour of implementing Physical Education, Sports and Yoga for All level of Education, 88%
people give his your opinion that govt. should provide good parks for exercise for citizens, 90% people believe that Indian
politicians should be physically fit like European countries politicians, and 93% people believe that India need to have more
sports grounds than hospitals.
Conclusion: - Healthy people generally maintain positive attitudes toward fitness. It was concluded that mostly
people walk, Run, and do Exercise for better health, and come to walk for remaining themselves physical fit, and every
people should involve in Physical activity.
Key Words: - Old age, Middle Age, Health, Attitude, Fitness, Curriculum
INTRODUCTION
―If we could give every individual the right amount of nourishment and exercise, not too little and not too much, we would
have found the safest way to health.‖
-Hippocrates
Health is a common theme in most culture. In fact, all communities have their concept of health, as part of their
culture, among definition still used, probably the oldest is that health is the ―absence of disease‖. In some culture, health and
harmony are considered equivalent, harmony being defined as ―being at peace with the self, the community, god and
cosmos‖. The ancient Indian and Greeks shared this concept and attributed disease to disturbances in bodily equilibrium of
what they called ―humours‖.
The concept that people need physical activity is not new. What is new is the idea that activity need not be overly
strenuous to provide benefit. Traditionally, people have been given advise on how much exercise they should perform,
usually including recommendations to work out at vigorous intensities for prolonged period of time. It was though that this
kind of exercise was necessary to improve health and physical fitness.
Healthy people generally maintain positive attitudes toward fitness. They see it as an integral part of their lifestyle
and typically schedule regular periods of time to undertake physical activities.
Inte
rnat
ion
al J
ou
rnal
of
Physi
cal
Edu
cati
on
, F
itn
ess
and
Sp
ort
s-IJ
PE
FS
7
International Journal of Physical Education, Fitness and
Sports-IJPEFS Vol.2. No.1.March 2013, ISSN 2277-5447
Website: http://www.ijpefs.nonolympictimes.org
Now a days People are more aware towards health and fitness. Now people have more positive attitude towards
health fitness. The reason of walking or exercise may be different like some for recreation, some for fitness, some for to keep
them away from disease like obesity and diabetes a number of student has been conducted on effect of walking or exercise or
fitness or other aspect of fitness but there is no study which Researcher the attitude of walkers towards health and fitness.
Researcher take the middle age and old age population because the generally the people this age suffer from lower fitness or
any disease in last ten years there is a drastical change in number of walkers specially in cities so the author to conducts a
study on attitude of walkers.
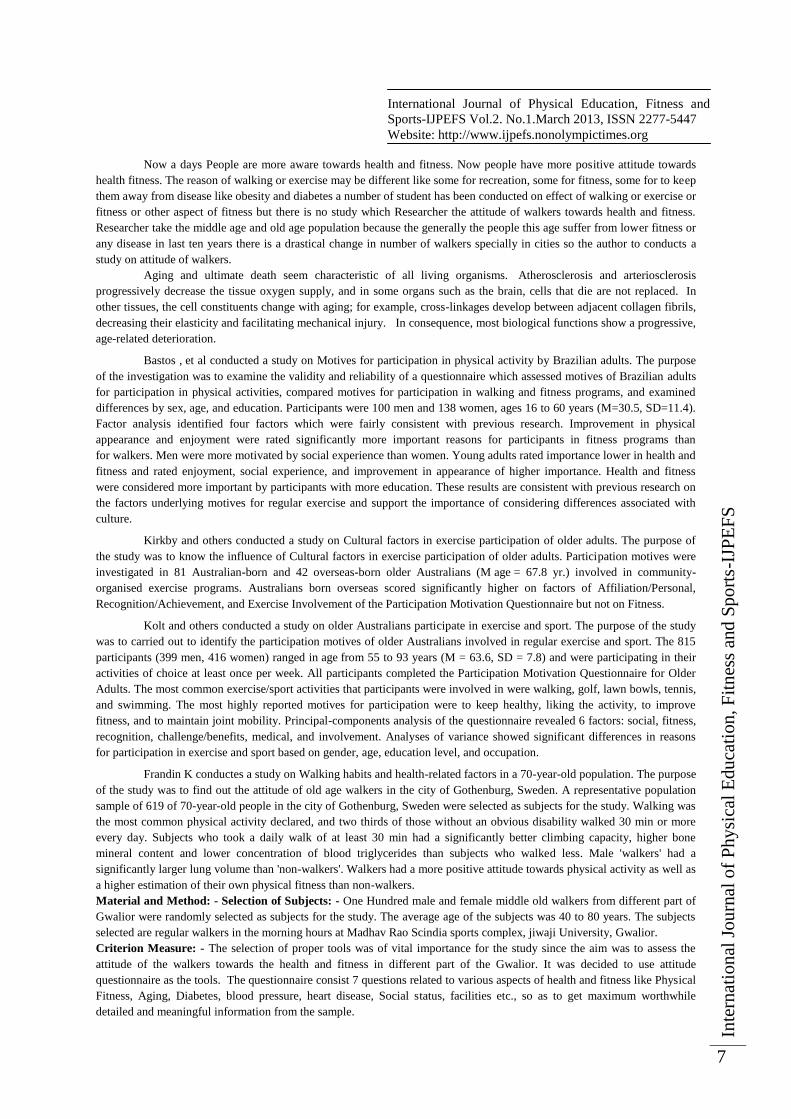
Aging and ultimate death seem characteristic of all living organisms. Atherosclerosis and arteriosclerosis
progressively decrease the tissue oxygen supply, and in some organs such as the brain, cells that die are not replaced. In
other tissues, the cell constituents change with aging; for example, cross-linkages develop between adjacent collagen fibrils,
decreasing their elasticity and facilitating mechanical injury. In consequence, most biological functions show a progressive,
age-related deterioration.
Bastos , et al conducted a study on Motives for participation in physical activity by Brazilian adults. The purpose
of the investigation was to examine the validity and reliability of a questionnaire which assessed motives of Brazilian adults
for participation in physical activities, compared motives for participation in walking and fitness programs, and examined
differences by sex, age, and education. Participants were 100 men and 138 women, ages 16 to 60 years (M=30.5, SD=11.4).
Factor analysis identified four factors which were fairly consistent with previous research. Improvement in physical
appearance and enjoyment were rated significantly more important reasons for participants in fitness programs than
for walkers. Men were more motivated by social experience than women. Young adults rated importance lower in health and
fitness and rated enjoyment, social experience, and improvement in appearance of higher importance. Health and fitness
were considered more important by participants with more education. These results are consistent with previous research on
the factors underlying motives for regular exercise and support the importance of considering differences associated with
culture.
Kirkby and others conducted a study on Cultural factors in exercise participation of older adults. The purpose of
the study was to know the influence of Cultural factors in exercise participation of older adults. Participation motives were
investigated in 81 Australian-born and 42 overseas-born older Australians (M age = 67.8 yr.) involved in community-
organised exercise programs. Australians born overseas scored significantly higher on factors of Affiliation/Personal,
Recognition/Achievement, and Exercise Involvement of the Participation Motivation Questionnaire but not on Fitness.
Kolt and others conducted a study on older Australians participate in exercise and sport. The purpose of the study
was to carried out to identify the participation motives of older Australians involved in regular exercise and sport. The 815
participants (399 men, 416 women) ranged in age from 55 to 93 years (M = 63.6, SD = 7.8) and were participating in their
activities of choice at least once per week. All participants completed the Participation Motivation Questionnaire for Older
Adults. The most common exercise/sport activities that participants were involved in were walking, golf, lawn bowls, tennis,
and swimming. The most highly reported motives for participation were to keep healthy, liking the activity, to improve
fitness, and to maintain joint mobility. Principal-components analysis of the questionnaire revealed 6 factors: social, fitness,
recognition, challenge/benefits, medical, and involvement. Analyses of variance showed significant differences in reasons
for participation in exercise and sport based on gender, age, education level, and occupation.
Frandin K conductes a study on Walking habits and health-related factors in a 70-year-old population. The purpose
of the study was to find out the attitude of old age walkers in the city of Gothenburg, Sweden. A representative population
sample of 619 of 70-year-old people in the city of Gothenburg, Sweden were selected as subjects for the study. Walking was
the most common physical activity declared, and two thirds of those without an obvious disability walked 30 min or more
every day. Subjects who took a daily walk of at least 30 min had a significantly better climbing capacity, higher bone
mineral content and lower concentration of blood triglycerides than subjects who walked less. Male 'walkers' had a
significantly larger lung volume than 'non-walkers'. Walkers had a more positive attitude towards physical activity as well as
a higher estimation of their own physical fitness than non-walkers.
Material and Method: - Selection of Subjects: - One Hundred male and female middle old walkers from different part of
Gwalior were randomly selected as subjects for the study. The average age of the subjects was 40 to 80 years. The subjects
selected are regular walkers in the morning hours at Madhav Rao Scindia sports complex, jiwaji University, Gwalior.
Criterion Measure: - The selection of proper tools was of vital importance for the study since the aim was to assess the
attitude of the walkers towards the health and fitness in different part of the Gwalior. It was decided to use attitude
questionnaire as the tools. The questionnaire consist 7 questions related to various aspects of health and fitness like Physical
Fitness, Aging, Diabetes, blood pressure, heart disease, Social status, facilities etc., so as to get maximum worthwhile
detailed and meaningful information from the sample.
Inte
rnat
ion
al J
ou
rnal
of
Physi
cal
Edu
cati
on
, F
itn
ess
and
Sp
ort
s-IJ
PE
FS
8
International Journal of Physical Education, Fitness and
Sports-IJPEFS Vol.2. No.1.March 2013, ISSN 2277-5447
Website: http://www.ijpefs.nonolympictimes.org
Administration of the Questionnaire and Collection of The Data: - The questionnaire was distributed personally by the
scholar to the Male and Female old walkers who come at Jiwaji University Ground for walking or doing exercise from
different area of the Gwalior. The responses were collected in the same way. For collecting data the questionnaire distributed
to hundred walkers during morning and evening session. The questionnaire was given to them for 20 min. completing the
questionnaire and after completing the time the questionnaire was collected.
Statistical Procedure: - In order to analyse the Attitude towards Health and Fitness among middle and old age citizens of
Gwalior, Descriptive statistics i.e. percentile method was used.
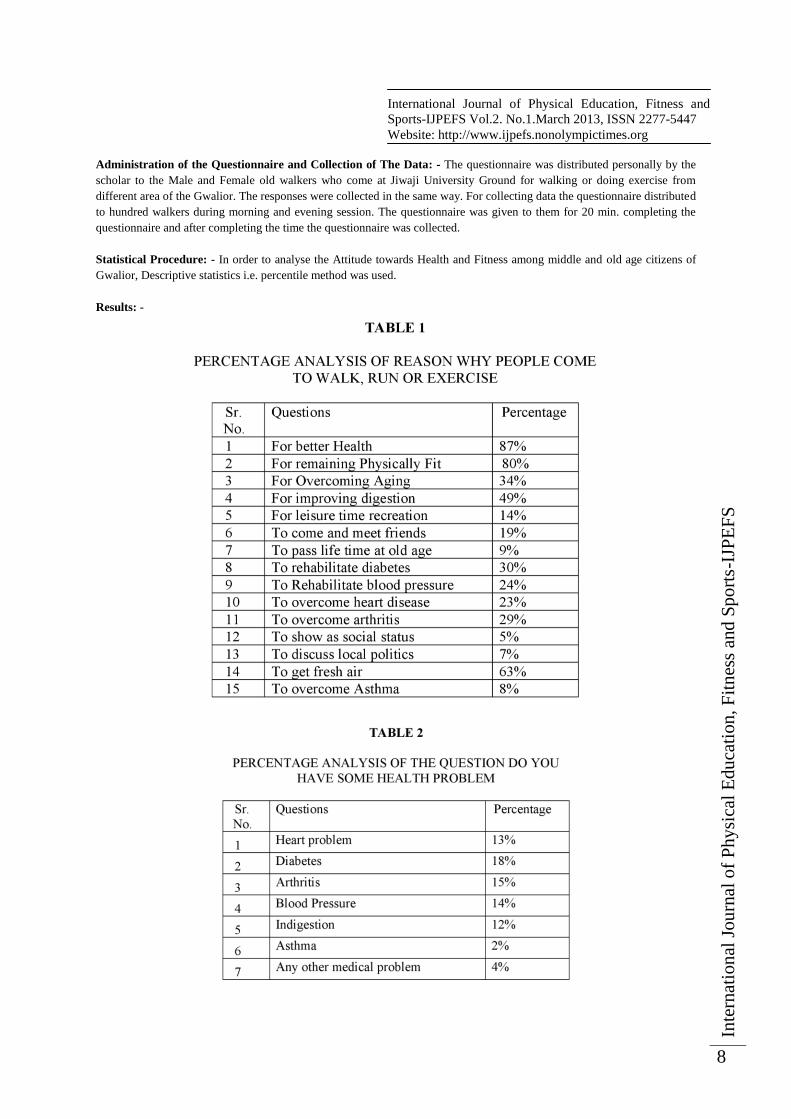
Results: -

Inte
rnat
ion
al J
ou
rnal
of
Physi
cal
Edu
cati
on
, F
itn
ess
and
Sp
ort
s-IJ
PE
FS
9
International Journal of Physical Education, Fitness and
Sports-IJPEFS Vol.2. No.1.March 2013, ISSN 2277-5447
Website: http://www.ijpefs.nonolympictimes.org

Inte
rnat
ion
al J
ou
rnal
of
Physi
cal
Edu
cati
on
, F
itn
ess
and
Sp
ort
s-IJ
PE
FS
10
International Journal of Physical Education, Fitness and
Sports-IJPEFS Vol.2. No.1.March 2013, ISSN 2277-5447
Website: http://www.ijpefs.nonolympictimes.org
The results show that that 87% people walk, Run, Exercise for better health, 80% people come for remaining
themselves physical fit, 34% people come for overcoming aging, 49% people come for improving digestion, 14% people
come for leisure time recreation, 19% people come for to meet his friends, 9% people come for pass free time at old age,
30% people come to rehabilitate diabetes, 24% people come to rehabilitate blood pressure, 23% people overcome due to
heart disease, 29% people overcome due to arthritis, 5% people come to show as social status, 7% people come to discuss
local politics, 63% people come to get fresh air, and 8% people to overcome the asthma.
It is also evident from the table that 23% people come due to heart problem, 18% people come due to diabetes, 15%
people come due to arthritis, 14% people come due to blood pressure, 12% people come due to Indigestion, 2% people come
due to Asthma, and 4% people come due to other medical problem.
The results also show that 48% people come which believe that walking, running, jogging exercise, or yoga is good for
improving physical health, 36% people come for improving mental health, 24% people come for improving emotional
health, 13% people come for improving social health, 67% people come for improving total health, and 33% people come
good for treatment of disease like heart attack diabetes etc.
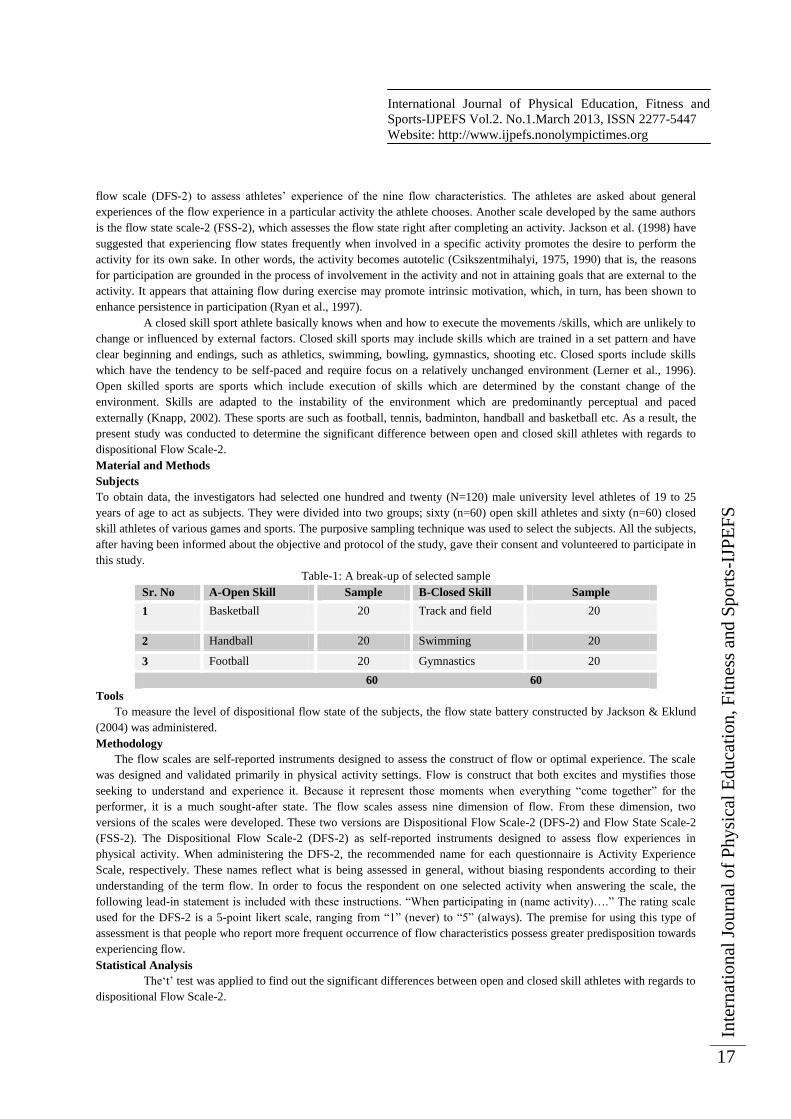
It is clear from the table that 4% people wants that physical education is compulsory for only school student, 6% people
wants only for college students, 5% people favour of university students and teacher, and 85% people favour of all the
above, 88% people give his your opinion that govt. should provide good parks for exercise of citizens , and 12% people
think that no need of providing the parks for exercise of citizens.
90% people believe that Indian politicians should be physically fit like European countries politicians.
It is also evident from the table that 93% people believe that India need to have more sports grounds than hospitals
and 7% people believe that India no need to have more sports ground compare to hospital.

Inte
rnat
ion
al J
ou
rnal
of
Physi
cal
Edu
cati
on
, F
itn
ess
and
Sp
ort
s-IJ
PE
FS
11
International Journal of Physical Education, Fitness and
Sports-IJPEFS Vol.2. No.1.March 2013, ISSN 2277-5447
Website: http://www.ijpefs.nonolympictimes.org
The graphical representation of findings
Fig. 1 :- The graphical representation of the reason why people come to walk?
Fig. 2 :-The graphical representation of the question do you have some health problem
17%
23%
19%
18%
15%
3% 5%
PERCENTAGE ANALYSIS OF THE QUESTION DO YOU HAVE SOME
HEALTH PROBLEM
Heart problem
Diabetes
Inte
rnat
ion
al J
ou
rnal
of
Physi
cal
Edu
cati
on
, F
itn
ess
and
Sp
ort
s-IJ
PE
FS
12
International Journal of Physical Education, Fitness and
Sports-IJPEFS Vol.2. No.1.March 2013, ISSN 2277-5447
Website: http://www.ijpefs.nonolympictimes.org
Fig. 3:-The graphical representation of walkers believe that walking, running, jogging, exercise, or yoga is good for
health.
Fig. 4:-The graphical representation question do you believe that physical education programme/ yoga programme
should be a part of curriculum of schools, colleges, and universities of India

Inte
rnat
ion
al J
ou
rnal
of
Physi
cal
Edu
cati
on
, F
itn
ess
and
Sp
ort
s-IJ
PE
FS
13
International Journal of Physical Education, Fitness and
Sports-IJPEFS Vol.2. No.1.March 2013, ISSN 2277-5447
Website: http://www.ijpefs.nonolympictimes.org
Fig.5:-The graphical representation of walkers opinion that govt. should provide good parks for exercise of citizens.
Fig.6:-The graphical representation of view of walkers believes that Indian politicians be physically fit like European
countries politician.

Inte
rnat
ion
al J
ou
rnal
of
Physi
cal
Edu
cati
on
, F
itn
ess
and
Sp
ort
s-IJ
PE
FS
14
International Journal of Physical Education, Fitness and
Sports-IJPEFS Vol.2. No.1.March 2013, ISSN 2277-5447
Website: http://www.ijpefs.nonolympictimes.org
Fig.7:-The graphical representation of walkers that India need to have more sports grounds than hospitals.
Discussion of Findings
It was found that middle age and old age citizens of Gwalior are very conscious about their health. The people of this age
want to do the exercise and they want to make Yoga a part of their life. People like to walk, run, or o other type of exercise
for coming out of their old age problems. The old age peoples want that Physical Education, Sports and Yoga should be a
compulsory part of the curriculum at every level of Education. They want that there should be more and more sports grounds
and parks for doing physical activities. Most of the peoples want that Indian politicians should be as fit as European Country
politicians; so that they can put an example for the society. Physical Education, Sports and Yoga should be a part of general
education because fitness is basic requirement of every life.
Conclusion
Within the limitations of the present study the following conclusions may be drawn:
1. It was concluded that mostly people walk, Run, and do Exercise for better health, and come to walk for remaining
themselves physical fit, some of them come for overcoming aging, some to improving digestion, and some of them
come for leisure time recreation to meet his friends or pass free time at old age.
2. It was also concluded that some people come to rehabilitate diabetes blood pressure, to overcome due to heart disease,
and some of them come to show as social status, to discuss local politics, to get fresh air etc.
3. It was Concluded that very less people wants to physical education is compulsory for school student or college
students, or university students and teacher only, but more than 85% people are in favour of that Physical Education
should be compulsory for all including school, college or university students and Teachers..
4. It was again concluded that more than 88% people give his opinion that govt. should provide good parks for exercise
of citizens , and very less people think that no need of providing the parks for exercise of citizens.
5. It was also concluded that from the table that 93% people believe that India need to have more sports grounds than
hospitals and rest people believe that hospitals are more important than grounds hospitals cannot be replaced by Sports
grounds or exercise parks.

Inte
rnat
ion
al J
ou
rnal
of
Physi
cal
Edu
cati
on
, F
itn
ess
and
Sp
ort
s-IJ
PE
FS
15
International Journal of Physical Education, Fitness and
Sports-IJPEFS Vol.2. No.1.March 2013, ISSN 2277-5447
Website: http://www.ijpefs.nonolympictimes.org
References:-
[1] A Bastos de Andrade , Salguero A, González-Boto R, Marquez S. (April 2006), ―Motives for participation in
physical activity by Brazilian adults., Journal of Perceptual and Motor Skill,;102(2):pp.358-67.
[2] A. Comfort(1979). Aging. The Biology of Senescence. 2nd Ed. New York: Holt, Rinehart, Winston,;p.247.
[3] AC Sollerhed, G Ejlertsson, E.Apitzsch (2005), ―Predictors of strong sense of coherence and positive attitudes to
physical education in adolescents., Scandanial Journal of Public Health;33(5):pp.334-342.
[4] Brown Kelli McCormack, David Q. Thomas, and Jerome E. Kotecki, ―Foundation of Physical Activity‖, Physical
Activity and Health an Interactive Approach Jones and Bartlett Publishers, International, Barb House, Barb Mews,
London, W6 7P, UK,p.235-238.
[5] Brown Kelli McCormack, Thomas Q. David, and Kotecki Jerome E., ―Foundation of Physical Activity‖, Physical
Activity and Health an Interactive Approach Jones and Bartlett Publishers, International, Barb House, Barb Mews,
London, W6 7P, UK,p.22.
[6] Cowell C. Charles (1969), ―Research method in Health Physical Education Recreation‖ (Washington D.C.
AAPHER, , P.155.
[7] De Andrade Bastos A, Salguero A, González-Boto R, Marquez S (April 2006)., ―Motives for participation in
physical activity by Brazilian adults., Journal of Perceptual and Motor Skill,;102(2):pp.358-67.
[8] E. Asmussen, & S.V. Molbech (1959) ―Methods and standards for evaluation of the physiological working capacity
of patients. Hellerup, Denmark: Communications of the Testing and Observation Institute‖,.p.97.
[9] F.W Kasch,., J.P Wallace,., Camp Van, S.P. & L Verity ( 1988), ―A longitudinal study of cardiovascular stability in
active men aged 45 to 65 years‖. Physician and Sportsmed, ,p.117-126.
[10] GS Kolt, RP Driver, LC Giles (April 2004) ―Why older Australians participate in exercise and sport.‖ Journal of
aging and Physical Activity, , 12(2):185-98.
[11] J Holviala , WJ Kraemer , E Sillanpää , H Karppinen , J Avela , A Kauhanen , A Häkkinen , K. Häkkinen
(July 2011) , ―Effects of strength, endurance and combined training on muscle strength, walking speed and dynamic
balance in aging men.‖ European Journal of Applied Physiology, p. 28
[12] J. Shephard (1991), Fitness and aging. In: Aging into the Twenty First Century. C. Blais (ed.). Downsview, Ont.:
Captus University Publications, pp. 342-355.
[13] J.F. Fries (1989), Aging Well. Reading, Mass.: Addison-Wesley,p.324-326
[14] JN Morris, AE.Hardman (August 1997),―Walking to health‖ Journal of Sports Medicinde, Aukland,
Newzeland;23(5):pp.306-332.
[15] K Park (1987), ―Text book of Preventive and Social Medicine 18th Edition‖, Banarsidas Bhanot Publishers, Jabalpur,
India; 2005: p. 12.Shephard, R.J. Physical Activity and Aging. 2nd Ed. London: Croom Helm Publishing,;p.134.
[16] Kirkby RJ, Kolt GS, Habel K (December 1998), ―Cultural factors in exercise participation of older adults‖ Journal of
Perceptual Motor Skill,;87(3 Pt 1):p.890.
[17] Kolt GS, Driver RP, Giles LC (April 2004) ―Why older Australians participate in exercise and sport.‖ Journal of
aging and Physical Activity, , 12(2):185-98.
[18] L Di Pietro (October 2001) , ―Physical activity in aging: changes in patterns and their relationship to health and
function‖. The journal of Gerontology, Series A Biological Sciences and Medical Sciences, 56 Spec No 2:pp. 13-22.
[19] LL Lee, M Avis, A. Arthur (Jul 2007), ―The role of self-efficacy in older people's decisions to initiate and maintain
regular walking as exercise -- Findings from a qualitative study‖ Journal of Preventive Medicine,;45(1):62-5.
[20] Park K (2005), ―Text book of Preventive and Social Medicine 18th Edition‖, Banarsidas Bhanot Publishers, Jabalpur,
India;: p. 12.
[21] R.J. Shephard, & W. Montelpare (1988), Geriatric benefits of exercise as an adult. Journal of Gerontology (Med.
Sci.), 43, M86-M90,p.51-73.
[22] R.J. Shephard (1987), ―Physical Activity and Aging.‖ 2nd Ed. London: Croom Helm Publishing,;p.134.
[23] R.J. Shephard, Fitness and aging. In: Aging into the Twenty First Century. C. Blais (ed.). Downsview, Ont.: Captus
University Publications, 1991, pp. 22-35.
[24] R.J. Shephard (1993), Health and Aerobic Fitness. Champaign, IL.: Human Kinetics Publishers, p.233-235.
[25] R.J. Shephard (1993), Health and Aerobic Fitness. Champaign, IL.: Human Kinetics Publishers,p.67-68.
[26] RJ Kirkby, GS Kolt, K. Habel (December 1998), ―Cultural factors in exercise participation of older adults‖ Journal
of Perceptual Motor Skill,;87(3 Pt 1):p.890.
[27] S Allender, G Cowburn, C.Foster (December 2006), ―Understanding participation in sport and physical activity
among children and adults: a review of qualitative studies.‖ Health Education Research;21(6):pp.826-835.

Inte
rnat
ion
al J
ou
rnal
of
Physi
cal
Edu
cati
on
, F
itn
ess
and
Sp
ort
s-IJ
PE
FS
16
International Journal of Physical Education, Fitness and
Sports-IJPEFS Vol.2. No.1.March 2013, ISSN 2277-5447
Website: http://www.ijpefs.nonolympictimes.org
FLOW STATE BETWEEN OPEN AND CLOSED SKILL ATHLETES: A
PSYCHOLOGICAL PROBE DALWINDER SINGHa AND DAVINDER SINGHb
aAssociate Professor, Department of Physical Education, Panjab University, Chandigarh, India bDepartment of Centre for Sports Coaching & Management, Lakshmibai National University of Physical Education,
Gwalior, India
Abstract
The present study was conducted to examine the flow state between open and closed skill athletes. To obtain
required data, the investigators had selected one hundred and twenty (N=120) male university level athletes of 19 to 25 years
of age to act as subjects. They were divided into two groups; sixty (n=60) open skill athletes and sixty (n=60) closed skill
athletes of various games and sports. The purposive sampling technique was used to select the subjects. All the subjects,
after having been informed about the objective and protocol of the study, gave their consent and volunteered to participate in
this study. To measure the level of dispositional flow state of the subjects, the flow state battery constructed by Jackson &
Eklund (2004) was administered. The‗t‘ test was applied to find out the significant differences between open and closed skill
athletes with regards to dispositional Flow Scale-2. To test the hypothesis, the level of significance was set at 0.05. The
results revealed significant differences between open and closed skill athletes on the sub-variables; challenge skill balance,
action awareness merging, unambiguous feedback, autotelic experience and overall dispositional flow scale-2. It is further
revealed that the open skill athletes have performed significantly better than closed skill athletes on the above said sub-
variables. However, no significant differences were found with regard to the sub-variables; clear goals, concentration on the
task at hand, sense of control, loss of self-consciousness and transformation of time.
Keywords: Flow, Dispositional Flow State, Open and Closed, Skill, Athletes
INTRODUCTION
Theoretically, flow, as an optimal mental state, would be expected to be associated with optimal athletic
performance as well as providing an optimal experience. Flow is generally viewed as a peak performance state, and there is
some support for this assumption (e.g., Jackson & Roberts, 1992; McInman & Grove, 1991). Nonetheless, more research is
needed to empirically examine the relationship between flow and performance in sport. To advance knowledge in this area,
it is important to examine specific psychological constructs with theoretical relevance to optimal performance in order to
understand what psychological processes might be contributing to quality of performance. The first and primary construct
examined was flow. Flow is an optimal psychological state that occurs when there is a balance between perceived challenges
and skills in an activity (Csikszentmihalyi, 1990). It is a state of concentration so focused that it amounts to absolute
absorption in an act concentration so focused that it amounts to absolute absorption in an activity. Research on flow in sport
and exercise has increased in recent years (e.g., Jackson, 1992; 1995; 1996; Jackson, Kimiecik, Ford, & Marsh, 1998;
Jackson & Marsh, 1996; Kimiecik & Stein, 1992) has encouraged application of flow theory to physical activity settings,
which is where some of his initial research into flow began. Based on their respective research findings, Jackson and
Csikszentmihalyi (1999) have recently written a book describing flow in sport and how to attain this optimal mental state.
Knowledge of factors associated with the attainment of flow is an important goal for those interested in the quality of
athletes‘ experience and performance in competition.
According to Jackson (1996) flow experience during exercise can lead to high enjoyment, which, in turn, appears
to play an important role in exercise adherence (Martin and Dubbert, 1982; Dishman et al., 1985; Wankel, 1985). Empirical
research has substantiated this prediction (Ryan et al., 1997). Hence, an understanding of factors that promote flow states in
exercise will inform the strategies of exercise practitioners who are interested in promoting enjoyment and adherence to
exercise. In addition, Kimiecik and Harris (1996) suggested that flow leads to positive affective reactions, which they equate
with enjoyment. Research has shown that each one of these dimension is part of the definition of flow (Jackson &
Csikszentmihalyi, 1999; Jackson & Eklund, 2004; Jackson et al., 1998; Jackson, Thomas, Marsh, & Smethurst, 2001).
However, Jackson and Eklund (2004) have proposed that some of these flow dimensions can be more relevant than others,
and for different kinds of athletes. The challenge-skill ratio has been an important part of the definition of flow
(Csikszentmihalyi, 1991). Thus, the challenge-skill balance, which is based on the challenge-skill ratio, seems to be of
special importance. Since Csikszentmihalyi‘s (1975) initial research on flow, there have been few studies concerning flow in
athletes (Sugiyama & Inomata, 2005) except for the work done by Jackson (Jackson & Csikszentmihalyi, 1999; Jackson &
Eklund, 2004; Jackson et al., 1998; Jackson et al., 2001). Jackson and Eklund (2004) developed and revised the dispositional
Inte
rnat
ion
al J
ou
rnal
of
Physi
cal
Edu
cati
on
, F
itn
ess
and
Sp
ort
s-IJ
PE
FS
17
International Journal of Physical Education, Fitness and
Sports-IJPEFS Vol.2. No.1.March 2013, ISSN 2277-5447
Website: http://www.ijpefs.nonolympictimes.org
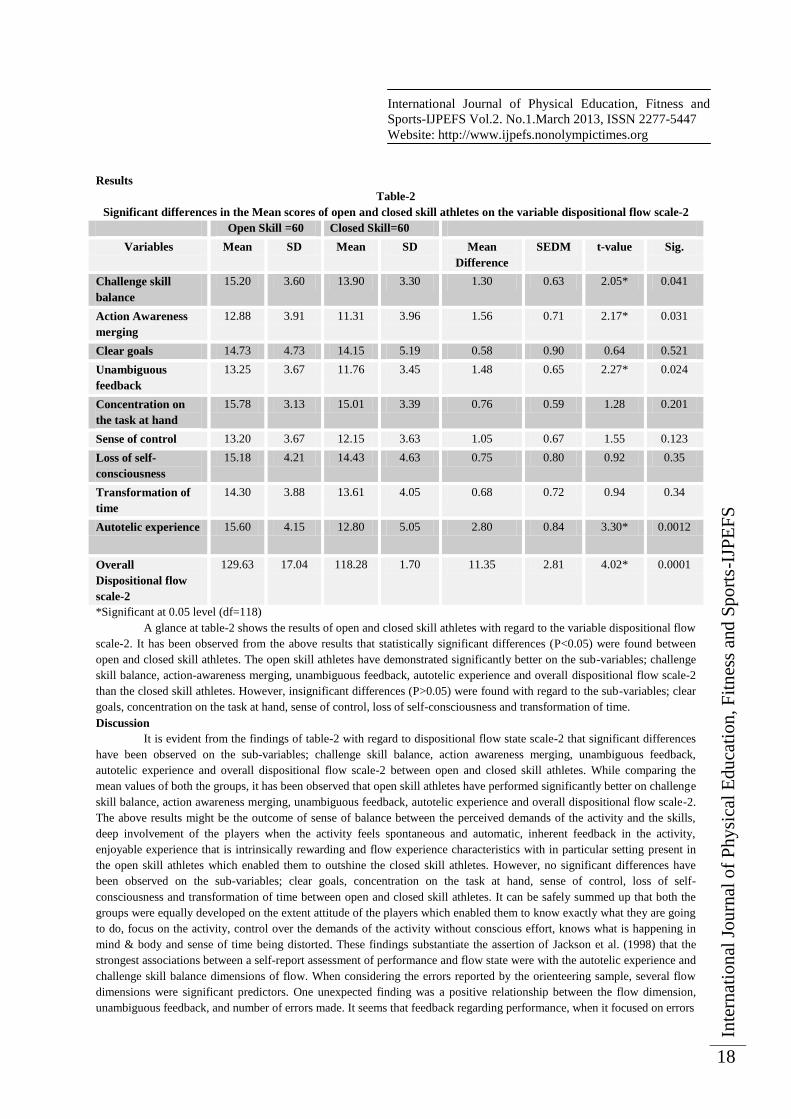
flow scale (DFS-2) to assess athletes‘ experience of the nine flow characteristics. The athletes are asked about general
experiences of the flow experience in a particular activity the athlete chooses. Another scale developed by the same authors
is the flow state scale-2 (FSS-2), which assesses the flow state right after completing an activity. Jackson et al. (1998) have
suggested that experiencing flow states frequently when involved in a specific activity promotes the desire to perform the
activity for its own sake. In other words, the activity becomes autotelic (Csikszentmihalyi, 1975, 1990) that is, the reasons
for participation are grounded in the process of involvement in the activity and not in attaining goals that are external to the
activity. It appears that attaining flow during exercise may promote intrinsic motivation, which, in turn, has been shown to
enhance persistence in participation (Ryan et al., 1997).
A closed skill sport athlete basically knows when and how to execute the movements /skills, which are unlikely to
change or influenced by external factors. Closed skill sports may include skills which are trained in a set pattern and have
clear beginning and endings, such as athletics, swimming, bowling, gymnastics, shooting etc. Closed sports include skills
which have the tendency to be self-paced and require focus on a relatively unchanged environment (Lerner et al., 1996).
Open skilled sports are sports which include execution of skills which are determined by the constant change of the
environment. Skills are adapted to the instability of the environment which are predominantly perceptual and paced
externally (Knapp, 2002). These sports are such as football, tennis, badminton, handball and basketball etc. As a result, the
present study was conducted to determine the significant difference between open and closed skill athletes with regards to
dispositional Flow Scale-2.
Material and Methods
Subjects
To obtain data, the investigators had selected one hundred and twenty (N=120) male university level athletes of 19 to 25
years of age to act as subjects. They were divided into two groups; sixty (n=60) open skill athletes and sixty (n=60) closed
skill athletes of various games and sports. The purposive sampling technique was used to select the subjects. All the subjects,
after having been informed about the objective and protocol of the study, gave their consent and volunteered to participate in
this study.
Table-1: A break-up of selected sample
Sr. No A-Open Skill Sample B-Closed Skill Sample
1 Basketball 20 Track and field 20
2 Handball 20 Swimming 20
3 Football 20 Gymnastics 20
60 60
Tools
To measure the level of dispositional flow state of the subjects, the flow state battery constructed by Jackson & Eklund
(2004) was administered.
Methodology
The flow scales are self-reported instruments designed to assess the construct of flow or optimal experience. The scale
was designed and validated primarily in physical activity settings. Flow is construct that both excites and mystifies those
seeking to understand and experience it. Because it represent those moments when everything ―come together‖ for the
performer, it is a much sought-after state. The flow scales assess nine dimension of flow. From these dimension, two
versions of the scales were developed. These two versions are Dispositional Flow Scale-2 (DFS-2) and Flow State Scale-2
(FSS-2). The Dispositional Flow Scale-2 (DFS-2) as self-reported instruments designed to assess flow experiences in
physical activity. When administering the DFS-2, the recommended name for each questionnaire is Activity Experience
Scale, respectively. These names reflect what is being assessed in general, without biasing respondents according to their
understanding of the term flow. In order to focus the respondent on one selected activity when answering the scale, the
following lead-in statement is included with these instructions. ―When participating in (name activity)….‖ The rating scale
used for the DFS-2 is a 5-point likert scale, ranging from ―1‖ (never) to ―5‖ (always). The premise for using this type of
assessment is that people who report more frequent occurrence of flow characteristics possess greater predisposition towards
experiencing flow.
Statistical Analysis
The‗t‘ test was applied to find out the significant differences between open and closed skill athletes with regards to
dispositional Flow Scale-2.
Inte
rnat
ion
al J
ou
rnal
of
Physi
cal
Edu
cati
on
, F
itn
ess
and
Sp
ort
s-IJ
PE
FS
18
International Journal of Physical Education, Fitness and
Sports-IJPEFS Vol.2. No.1.March 2013, ISSN 2277-5447
Website: http://www.ijpefs.nonolympictimes.org
Results
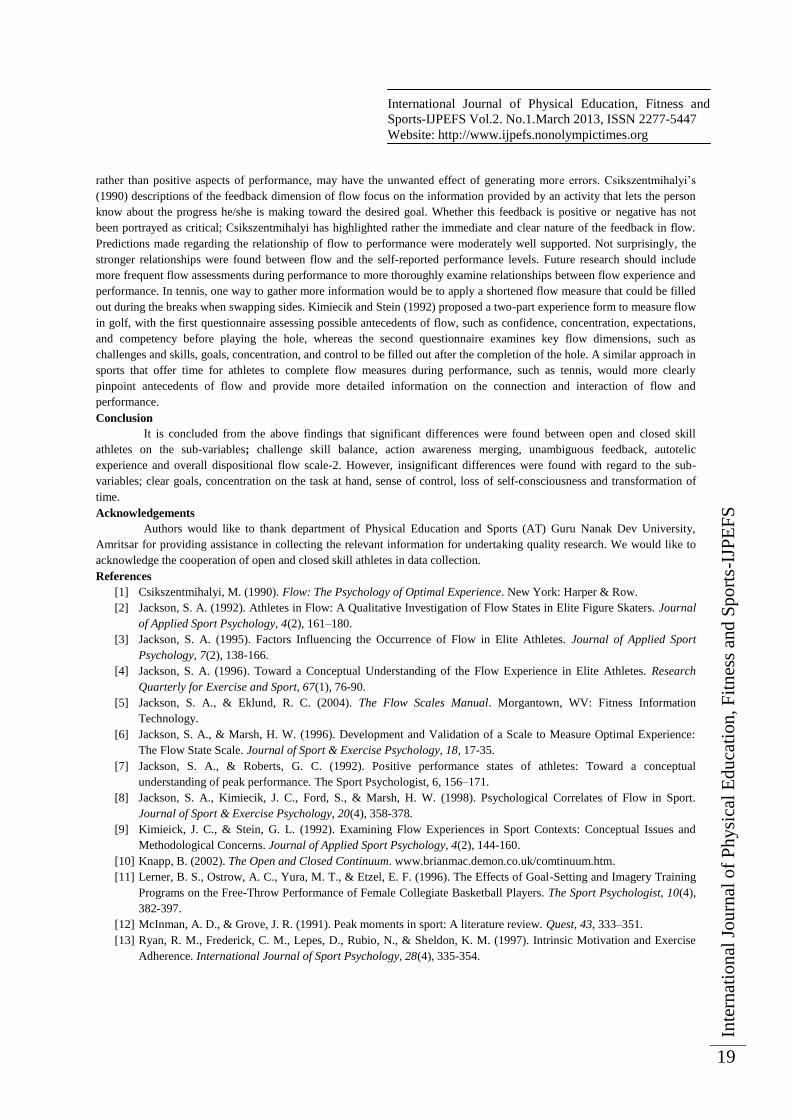
Table-2
Significant differences in the Mean scores of open and closed skill athletes on the variable dispositional flow scale-2
Open Skill =60 Closed Skill=60
Variables Mean SD Mean SD Mean
Difference
SEDM t-value Sig.
Challenge skill
balance
15.20 3.60 13.90 3.30 1.30 0.63 2.05* 0.041
Action Awareness
merging
12.88 3.91 11.31 3.96 1.56 0.71 2.17* 0.031
Clear goals 14.73 4.73 14.15 5.19 0.58 0.90 0.64 0.521
Unambiguous
feedback
13.25 3.67 11.76 3.45 1.48 0.65 2.27* 0.024
Concentration on
the task at hand
15.78 3.13 15.01 3.39 0.76 0.59 1.28 0.201
Sense of control 13.20 3.67 12.15 3.63 1.05 0.67 1.55 0.123
Loss of self-
consciousness
15.18 4.21 14.43 4.63 0.75 0.80 0.92 0.35
Transformation of
time
14.30 3.88 13.61 4.05 0.68 0.72 0.94 0.34
Autotelic experience 15.60 4.15 12.80 5.05 2.80 0.84 3.30* 0.0012
Overall
Dispositional flow
scale-2
129.63 17.04 118.28 1.70 11.35 2.81 4.02* 0.0001
*Significant at 0.05 level (df=118)
A glance at table-2 shows the results of open and closed skill athletes with regard to the variable dispositional flow
scale-2. It has been observed from the above results that statistically significant differences (P<0.05) were found between
open and closed skill athletes. The open skill athletes have demonstrated significantly better on the sub-variables; challenge
skill balance, action-awareness merging, unambiguous feedback, autotelic experience and overall dispositional flow scale-2
than the closed skill athletes. However, insignificant differences (P>0.05) were found with regard to the sub-variables; clear
goals, concentration on the task at hand, sense of control, loss of self-consciousness and transformation of time.
Discussion
It is evident from the findings of table-2 with regard to dispositional flow state scale-2 that significant differences
have been observed on the sub-variables; challenge skill balance, action awareness merging, unambiguous feedback,
autotelic experience and overall dispositional flow scale-2 between open and closed skill athletes. While comparing the
mean values of both the groups, it has been observed that open skill athletes have performed significantly better on challenge
skill balance, action awareness merging, unambiguous feedback, autotelic experience and overall dispositional flow scale-2.
The above results might be the outcome of sense of balance between the perceived demands of the activity and the skills,
deep involvement of the players when the activity feels spontaneous and automatic, inherent feedback in the activity,
enjoyable experience that is intrinsically rewarding and flow experience characteristics with in particular setting present in
the open skill athletes which enabled them to outshine the closed skill athletes. However, no significant differences have
been observed on the sub-variables; clear goals, concentration on the task at hand, sense of control, loss of self-
consciousness and transformation of time between open and closed skill athletes. It can be safely summed up that both the
groups were equally developed on the extent attitude of the players which enabled them to know exactly what they are going
to do, focus on the activity, control over the demands of the activity without conscious effort, knows what is happening in
mind & body and sense of time being distorted. These findings substantiate the assertion of Jackson et al. (1998) that the
strongest associations between a self-report assessment of performance and flow state were with the autotelic experience and
challenge skill balance dimensions of flow. When considering the errors reported by the orienteering sample, several flow
dimensions were significant predictors. One unexpected finding was a positive relationship between the flow dimension,
unambiguous feedback, and number of errors made. It seems that feedback regarding performance, when it focused on errors
Inte
rnat
ion
al J
ou
rnal
of
Physi
cal
Edu
cati
on
, F
itn
ess
and
Sp
ort
s-IJ
PE
FS
19
International Journal of Physical Education, Fitness and
Sports-IJPEFS Vol.2. No.1.March 2013, ISSN 2277-5447
Website: http://www.ijpefs.nonolympictimes.org
rather than positive aspects of performance, may have the unwanted effect of generating more errors. Csikszentmihalyi‘s
(1990) descriptions of the feedback dimension of flow focus on the information provided by an activity that lets the person
know about the progress he/she is making toward the desired goal. Whether this feedback is positive or negative has not
been portrayed as critical; Csikszentmihalyi has highlighted rather the immediate and clear nature of the feedback in flow.
Predictions made regarding the relationship of flow to performance were moderately well supported. Not surprisingly, the
stronger relationships were found between flow and the self-reported performance levels. Future research should include
more frequent flow assessments during performance to more thoroughly examine relationships between flow experience and
performance. In tennis, one way to gather more information would be to apply a shortened flow measure that could be filled
out during the breaks when swapping sides. Kimiecik and Stein (1992) proposed a two-part experience form to measure flow
in golf, with the first questionnaire assessing possible antecedents of flow, such as confidence, concentration, expectations,
and competency before playing the hole, whereas the second questionnaire examines key flow dimensions, such as
challenges and skills, goals, concentration, and control to be filled out after the completion of the hole. A similar approach in
sports that offer time for athletes to complete flow measures during performance, such as tennis, would more clearly
pinpoint antecedents of flow and provide more detailed information on the connection and interaction of flow and
performance.
Conclusion
It is concluded from the above findings that significant differences were found between open and closed skill
athletes on the sub-variables; challenge skill balance, action awareness merging, unambiguous feedback, autotelic
experience and overall dispositional flow scale-2. However, insignificant differences were found with regard to the sub-
variables; clear goals, concentration on the task at hand, sense of control, loss of self-consciousness and transformation of
time.
Acknowledgements
Authors would like to thank department of Physical Education and Sports (AT) Guru Nanak Dev University,
Amritsar for providing assistance in collecting the relevant information for undertaking quality research. We would like to
acknowledge the cooperation of open and closed skill athletes in data collection.
References
[1] Csikszentmihalyi, M. (1990). Flow: The Psychology of Optimal Experience. New York: Harper & Row.
[2] Jackson, S. A. (1992). Athletes in Flow: A Qualitative Investigation of Flow States in Elite Figure Skaters. Journal
of Applied Sport Psychology, 4(2), 161–180.
[3] Jackson, S. A. (1995). Factors Influencing the Occurrence of Flow in Elite Athletes. Journal of Applied Sport
Psychology, 7(2), 138-166.
[4] Jackson, S. A. (1996). Toward a Conceptual Understanding of the Flow Experience in Elite Athletes. Research
Quarterly for Exercise and Sport, 67(1), 76-90.
[5] Jackson, S. A., & Eklund, R. C. (2004). The Flow Scales Manual. Morgantown, WV: Fitness Information
Technology.
[6] Jackson, S. A., & Marsh, H. W. (1996). Development and Validation of a Scale to Measure Optimal Experience:
The Flow State Scale. Journal of Sport & Exercise Psychology, 18, 17-35.
[7] Jackson, S. A., & Roberts, G. C. (1992). Positive performance states of athletes: Toward a conceptual
understanding of peak performance. The Sport Psychologist, 6, 156–171.
[8] Jackson, S. A., Kimiecik, J. C., Ford, S., & Marsh, H. W. (1998). Psychological Correlates of Flow in Sport.
Journal of Sport & Exercise Psychology, 20(4), 358-378.
[9] Kimieick, J. C., & Stein, G. L. (1992). Examining Flow Experiences in Sport Contexts: Conceptual Issues and
Methodological Concerns. Journal of Applied Sport Psychology, 4(2), 144-160.
[10] Knapp, B. (2002). The Open and Closed Continuum. www.brianmac.demon.co.uk/comtinuum.htm.
[11] Lerner, B. S., Ostrow, A. C., Yura, M. T., & Etzel, E. F. (1996). The Effects of Goal-Setting and Imagery Training
Programs on the Free-Throw Performance of Female Collegiate Basketball Players. The Sport Psychologist, 10(4),
382-397.
[12] McInman, A. D., & Grove, J. R. (1991). Peak moments in sport: A literature review. Quest, 43, 333–351.
[13] Ryan, R. M., Frederick, C. M., Lepes, D., Rubio, N., & Sheldon, K. M. (1997). Intrinsic Motivation and Exercise
Adherence. International Journal of Sport Psychology, 28(4), 335-354.

Inte
rnat
ion
al J
ou
rnal
of
Physi
cal
Edu
cati
on
, F
itn
ess
and
Sp
ort
s-IJ
PE
FS
20
International Journal of Physical Education, Fitness and
Sports-IJPEFS Vol.2. No.1.March 2013, ISSN 2277-5447
Website: http://www.ijpefs.nonolympictimes.org
EFFECTS OF VARIED COMBINATIONS OF RESISTANCE TRAINING AEROBIC
TRAINING AND YOGIC PRACTICES ON AEROBIC CAPACITY AND
CARDIOVASCULAR PARAMETERS OF OBESE ADOLESCENT CHILDREN
R. RAJARATHIa, DR. T. PITCHAIAPPAb AND DR. B. CHITTIBABUc aPhD Scholar, Department of Physical Education, Karpagam University, Coimbatore bPrincipal, M.R. College of Physical Education, Thathanur, Udayarpalayam, Ariyalur
cAssistant Professor, Department of Physical Education and Sports Sciences, Annamalai University,
Chidambaram
ABSTRACT
The purpose of this study was to investigate the effect of varied combinations of resistance training, aerobic
training and yogic practices on cardiorespiratory fitness of obese adolescent children. To fulfill the purpose of this study
forty five (45) male obese subjects having BMI 30.0 – 39.9 were selected for the study. Their age ranged between 10 to 14
years. These subjects were randomly distributed in three groups namely resistance aerobic training group (RATG), resistance
and yoga training group (RYTG) and control group (CG) each group consisting of 15 subjects each. All subjects undergo
serious health checkup prior to the study to avoid death during training or testing. Each subject reported to the Department of
Physical Education, E. R. Higher Secondary School, Trichy and they were tested aerobic capacity before and after training.
Aerobic capacity was measured by one mile run and walk test. Prior to the formal study sessions, a pilot study was
conducted to validate research procedure and the initial capacity of the participants to design the training programme. The
RATG and RYTG group underwent 8 weeks of training. The result showed that adjusted post test of aerobic capacity,
resting heart rate and systolic blood pressure found to be significant. However, diastolic blood pressure showed no
significant difference among the groups. The covariate is significant, indicating that aerobic capacity, resting heart rate and
systolic blood pressure before training had a significant improvement after 8 weeks of training. RATG is better than RYTG
in improving cardiorespiratory fitness of obese children.
Keywords: Obese, Cardiorespiratory fitness, One mile run and walk test, Resting heart rate, Systolic blood pressure,
Diastolic blood pressure, Adolescent
Introduction
Obesity is recognized as a major global burden to health (Wearing, et al., 2006). In India when the child reaches
adolescence their level of physical activity declines. There is evidence (Wang, et al., 2002) that children and adolescents of
urban families are more overweight than rural, possibly because of decreased physical activities, sedentary lifestyle, altered
eating patterns and increased fat content of the diet. Increase in sedentary activities, such as television viewing and computer
games, is suspected to be responsible for the decline in physical activity levels.
Poor cardiorespiratory fitness (CRF) and muscle strength and abnormalities in the autonomic nervous system
(ANS) are important predictive factors of morbidity and mortality associated with obesity (Miyatake, et al., 2004; Wei, et
al., 1999; Hulens, et al., 2001; Grassi, et al., 2004; Piccirillo, et al., 1998). Physical exercise is a key strategy in the
management of obesity. Numerous health-related benefits have been observed in overweight and obese people who
participate in exercise training programs, even in those without significant weight loss (ACSM, 2009; Ciolac and Guimaraes,
2004). For example, CRF improves in overweight and obese subjects following exercise training programs (Church, et al.,
2007; Irving, et al., 2008; Menshikova, et al., 2005).
The normal heart rate depends upon your age, gender and health and can vary greatly for both athletes and non-
athletes. In general, a person's resting heart rate indicates their basic fitness level. The stronger the heart, the more blood it
can pump during each contraction, and the less frequently it needs to beat to get adequate blood flow (circulation) and
oxygen to the body tissues. A well trained athlete can have a very low resting heart rate and pump more blood than an
unconditioned individual.
The amount of blood pumped out of the left ventricle of heart with each contraction is called the stroke volume.
Although some conditions can affect a person's stroke volume, endurance and high intensity cardiovascular exercise training
often increases stroke volume (Bonaduce, et al.,1998). A larger stroke volume results in a lower (resting) heart rate (Nottin,
et al., 2002). However, longer diastole influences the resting heart rate in athletes (Nottin, et al., 2002). In order to eradicate
obesity it is therefore important to encourage sustainable physical activity habits in children, and further reinforcing these

Inte
rnat
ion
al J
ou
rnal
of
Physi
cal
Edu
cati
on
, F
itn
ess
and
Sp
ort
s-IJ
PE
FS
21
International Journal of Physical Education, Fitness and
Sports-IJPEFS Vol.2. No.1.March 2013, ISSN 2277-5447
Website: http://www.ijpefs.nonolympictimes.org
habits in adolescents, which will help establish desirable healthy lifestyle patterns that continue into adulthood. The aim of
this study was to investigate the effect of varied combinations of resistance training, aerobic training and yogic practices on
aerobic capacity and cardiovascular parameters of obese adolescent children.
Methods
Subjects and variable
A total of forty five (45) male obese subjects having BMI 30.0 – 39.9 were selected for the study. Their age ranged
between 10 to 14 years. These subjects were randomly distributed in three groups namely resistance aerobic training group
(RATG), resistance and yoga training group (RYTG) and control group (CG) each group consisting of 15 subjects each. All
subjects undergo serious health checkup prior to the study to avoid death during training or testing. Each subject reported to
the Department of Physical Education, E. R. Higher Secondary School, Trichy and they were tested cardiorespiratory fitness
before and after training. Aerobic capacity, resting heart rate, systolic blood pressure and diastolic blood pressure was
measured. Aerobic capacity was measured by one mile run and walk test and Omron blood pressure monitor was used to
measure cardiovascular parameters.
Pilot Study
Prior to the formal study sessions, a pilot study was conducted to validate research procedure and the initial
capacity of the participants to design the training programme. For the purpose, twelve participants (n=10) were selected at
random, who had BMI 30.0 – 39.9 were selected (ACSM, guidelines, 2000). The selected subjects underwent combination
of resistance and aerobic training group (n=10). This group underwent 5 session of training under the watchful eyes of the
investigator. The initial loads of the participants were fixed and the training programme for both groups were designed
separately based on the performance in the pilot study.
Resistance training Programme schedule
Resistance training was administered to obese subject for 90 min/workout. The equipments used are free weights
and exercise meachines available in E.R. Higher Secondary School, Trichy. The load designed for these subjects as intensity
between 60-85% 1RM, 6-12 repetitions, 3-4 sets and 1 min rest between tri-sets. The training load was increased by 5%
every week. These subjects performed resistance training 3days/week (Monday, Wednesday & Friday) for eight weeks.
Aerobic training Programme schedule
Aerobic training was given for 2 days per week (Tuesday and Thusday). We used the formula proposed by
Gerbeaux et al., (1991) to calculate Maximal aerobic speed (MAS). The MAS was used as a criterion velocity to set running
paces for high-intensity short intermittent exercises. The MAS of the obese subjects are 2.70 m/s and intensities are fixed
from 100 to 130%. Each session was preceded by a standardized warm-up: 1× (10×10s), (7× 15s), (5× 20s) at 100% of MAS
(one set of 10 repetitions of 10 s or 7 repetitions of 15s or 5 repetitions of 20 s of running at 100% of MAS, punctuated by
10s, 15s, 20s of recovery). Between each set, the recovery was of 3 min. Exercise time was 30min for each session. The
training schedule followed for eight weeks.
Yoga training
The yoga group practiced a mixed set of yoga techniques daily, in the form of asana. They performed two asanas
every week and keep on adding two asanas for six week and last two week they performed sixth week schedule. The asanas
are Ekpada Uttan Asana, Uttanpada Asana, Bhujanga Asana, Shalabha Asana, Santulan Asana, Pawanmukta Asana,
Suryanamaskar Asana, Dhanur Asana, Ardha Vakra Asana, Paschimottan Asana, Supta Vajra Asana, Matsyendra Asana.
After practicing asana they rest is shava Asana for the sipulated period. They practice yoga daily.
Statistical analysis
For this study Analysis of Covariance (ANCOVA) was used. The proposed hypothesis was tested at 0.05 level of
confidence. Beside this mean and standard deviation were also calculated. SPSS statistic software package (SPSS Company,
America, version 17.0) was used.
Results
It is clear from the table 1 that the pre test and post test showed no significant difference in aerobic capacity,
resting heart rate, systolic blood pressure and diastolic blood pressure. However, adjusted post test mean value showed
significant difference in aerobic capacity (F = 9.515, p < 0.05), resting heart rate (F = 4.904, p < 0.05), systolic blood
pressure (F = 4.107, p < 0.05). The covariate is significant, indicating that aerobic capacity, resting heart rate and systolic
blood pressure before training had a significant improvement after 8 weeks of training. Since, adjusted post test mean is
significant Scheffé S post hoc was applied and presented in table 2.

Inte
rnat
ion
al J
ou
rnal
of
Physi
cal
Edu
cati
on
, F
itn
ess
and
Sp
ort
s-IJ
PE
FS
22
International Journal of Physical Education, Fitness and
Sports-IJPEFS Vol.2. No.1.March 2013, ISSN 2277-5447
Website: http://www.ijpefs.nonolympictimes.org
Table 1
Summary of ANCOVA on Aerobic capacity and Cardiovascular parameters
The tabulated F ratio for: 0.05 level (df 2 & 42 = 3.220; df 2 & 41 = 3.226)
From Table 2, the Scheffé S post hoc test showed significant difference between the groups on aerobic capacity at
0.05 level of confidence. Thus, it is concluded that 8 weeks of RATG found to be better than RYTG in improving aerobic
capacity, resting heart rate and systolic blood pressure among adolescent male obese childrens.
Table 2
Scheffé S test for difference between paired means on Aerobic capacity and Cardiovascular parameters among
RATG, RYTG and CG
Variables RATG RYTG CG MD CI
Aerobic capacity
37.79 32.43 5.36* 2.326
37.79 32.08 5.71* 2.326
32.43 32.08 0.35 2.326
Resting heart rate 72.76 72.87 0.11 2.66
72.76 78.56 5.8* 2.66
72.87 78.56 5.69* 2.66
Systolic blood
pressure
113.43 114.90 1.47 1.71
113.43 117.21 3.78* 1.71
114.90 117.21 2.31* 1.71
*Significant at 0.05 level.
Discussion findings
It is evident in this study that significant improvement in cardiorespiratory fitness noticed in combined training
effect of resistance and aerobic training. These results were also in line with the previous literature that endurance training
Variable Groups Tests F value
Pre Post Adjusted Pre Post Adjusted
Aerobic
capacity
RATG 32.30
±7.95
38.10
±7.42 37.79
0.032 3.082 9.515* RYTG 31.90
±7.90
32.41
±8.02 32.43
CG 31.58
±7.73
31.79
±7.58 32.08
Resting heart
rate
RATG 78.20
±7.29
72.80
±8.85 72.76
0.128 2.922 4.904* RYTG 77.40
±9.04
72.26
±9.26 72.87
CG 78.86
±7.43
79.13
±7.5 78.56
Systolic blood
pressure
RATG 117.67
±6.27
113.24
±6.50 113.34
0.016 0.834 4.107* RYTG 118.05
±7.47
115.17
±8.94 114.90
CG 117.60
±7.90
117.04
±8.52 117.21
Diastolic blood
pressure
RATG 82.18
±6.40
80.88
±7.47 81.17
0.155 0.171 2.004 RYTG 83.25
±6.71
81.95
±7.28 81.14
CG 81.95
±7.28
82.46
±7.76 82.98
Inte
rnat
ion
al J
ou
rnal
of
Physi
cal
Edu
cati
on
, F
itn
ess
and
Sp
ort
s-IJ
PE
FS
23
International Journal of Physical Education, Fitness and
Sports-IJPEFS Vol.2. No.1.March 2013, ISSN 2277-5447
Website: http://www.ijpefs.nonolympictimes.org
improves both aerobic capacity (Rognmo, et al., 2004; Wisløff, et al., 2007) and endothelial function (Wisløff, et al., 2007;
Meyer, et al., 2006), and is now increasingly recommended in the prevention and treatment of overweight and obesity
(Haskell, et al., 2007). Scientific evidence and clinical observations support the contention that participation in strength-
building activities gives obese children and adolescents a chance to experience success and gain confidence in their abilities
to be physically active (Shabi, et al., 2006; Sothern, 2001; Sothern, et al., 2000).
Although endurance training can increase stroke volume (Bonaduce, et al.,1998). A larger stroke volume results in
a lower (resting) heart rate (Nottin, et al., 2002) and lowered systolic blood pressure (Nottin, et al., 2002).
In addition to enhancing muscular strength and local muscular endurance, appropriately prescribed and
competently supervised resistance training programs may also positively influence bone mineral density, cardiorespiratory
fitness, blood lipids, and psychosocial well-being (Faigenbaum, 2007).
Conclusion
RATG for 8 weeks is better than RYTG in significantly altering improving aerobic capacity, resting heart rate and
systolic blood pressure of obese children.
References
[1] American College of Sports Medicine. (2009). American College of Sports Medicine Position Stand on the
Appropriate physical activity intervention strategies for weight loss and prevention of weight regain for adults. Med
Sci Sports Exerc, 41:459-71.
[2] Bonaduce, D., Petretta, M., Cavallaro, V., Apicella, C., Ianniciello, A., Romano, M., et al. (1998). Intensive training
and cardiac autonomic control in high level athletes. Med Sci Sports Exerc, 30: 691-6.
[3] Church TS, Earnest CP, Skinner JS, Blair SN. (2007). Effects of different doses of physical activity on
cardiorespiratory fitness among sedentary, overweight or obese postmenopausal women with elevated blood
pressure: A randomized controlled trial. JAMA, 297:2081-91.
[4] Ciolac EG, Guimaraes GV. (2004). Physical exercise and metabolic syndrome. Rev Bras Med Esporte, 10:325-30.
[5] Faigenbaum, A. (2007). Resistance training for youth: are there health outcomes? American Journal of Lifestyle
Medicine, 1: 190-200.
[6] Grassi G, Dell‘Oro R, Facchini A, Quarti Trevano F, Bolla GB, Mancia G. (2004). Effect of central and peripheral
body fat distribution on sympathetic and baroreflex function in obese normotensives. J Hypertens, 22:2363-9.
[7] Haskell, et al. (2007). Physical activity and public health: updated recommendation for adults from the American
College of Sports Medicine and the American Heart Association. Med. Sci. Sports Exercise, 39, 1423–1434.
[8] Hulens M, Vansant G, Lysens R, Claessens AL, Muls E, Brumagne S. (2001). Study of differences in peripheral
muscle strength of lean versus obese women: an allometric approach. Int J Obes, 25:676-81.
[9] Irving BA, Davis CK, Brock DW, Weltman JY, Swift D, Barrett EJ, et al. (2008). Effect of exercise training
intensity on abdominal visceral fat and body composition. Med Sci Sports Exerc, 40:1863-72.
[10] Menshikova EV, Ritov VS, Toledo FGS, Ferrell RE, Goodpaster BH, Kelley DE. (2005). Effects of weight loss and
physical activity on skeletal muscle mitochondrial function in obesity. Am J Physiol Endocrinol Metab, 288:E818-
25.
[11] Meyer, et al., (2006). Improvement of early vascular changes and cardiovascular risk factors in obese children after a
six-month exercise program. J. Am. Coll. Cardiol, 48, 1865–1870
[12] Miyatake N, Takanami S, Kawasaki Y, Fujii M. (2004). Relationship between visceral fat accumulation and physical
fitness in Japanese women. Diab Res Clin Pract, 64:173-9.
[13] Nottin, S., Vinet, A., Stecken, F., N‘Guyen, L.D., Ounissi, F., Lecoq, A.M., Obert, P. (2002). Central and peripheral
cardiovascular adaptations to exercise in endurance- trained children. Acta Physiol Scand, 175:85-92.
[14] Piccirillo G, Vetta F, Viola E, Santagada E, Ronzoni S, Cacciafesta M, et al. (1998). Heart rate and blood pressure
variability in obese normotensive subjects. Int J Obes Relat Metab Disord, 22:741-50.
[15] Rognmo, et al. (2004). High intensity aerobic interval exercise is superior to moderate intensity exercise for
increasing aerobic capacity in patients with coronary artery disease. Eur. J. Cardiovasc. Prev. Rehabil, 11, 216–222
[16] Shabi, et al. (2006). Effects of resistance training on insulin sensitivity in overweight Latino adolescent males.
Medicine and Science in Sports and Exercise, 38, 1208-1215.
[17] Sothern, (2001). Exercise as a modality in the treatment of childhood obesity. Pediatric Clinics of North America,
48: 995-1015.
[18] Sothern, et al. (2000). Safety, feasibility, and efficacy of a resistance training program in preadolescent obese
children. American Journal of Medical Sciences, 319(6), 370-375.

Inte
rnat
ion
al J
ou
rnal
of
Physi
cal
Edu
cati
on
, F
itn
ess
and
Sp
ort
s-IJ
PE
FS
24
International Journal of Physical Education, Fitness and
Sports-IJPEFS Vol.2. No.1.March 2013, ISSN 2277-5447
Website: http://www.ijpefs.nonolympictimes.org
[19] Wang Y, Monteiro C, Popkin BM. (2002). Trends of obesity and underweight in older children and adolescents in
the United States, Brazil, China, and Russia. Am J Clin Nutr, 75:971–7.
[20] Wearing, et al. (2006). The impact of childhood obesity on musculoskeletal form. Obesity reviews, 7: 209-218
[21] Wei M, Kampert JB, Barlow CE, Nichaman MZ, Gibbons LW, Paffenbarger Jr RS, et al. (1999). Relationship
between low cardiorespiratory fitness and mortality in normal-weight, overweight, and obese men. JAMA, 282:1547-
53.
[22] Wisløff, et al., (2007). Superior cardiovascular effect of aerobic interval training versus moderate continuous training
in heart failure patients: a randomized study. Circulation, 115, 3086–3094

Inte
rnat
ion
al J
ou
rnal
of
Physi
cal
Edu
cati
on
, F
itn
ess
and
Sp
ort
s-IJ
PE
FS
25
International Journal of Physical Education, Fitness and
Sports-IJPEFS Vol.2. No.1.March 2013, ISSN 2277-5447
Website: http://www.ijpefs.nonolympictimes.org
DIURNAL RHYTHMS IN SELECTED PHYSICAL VARIABLES BEFORE AND
DURING RAMADAN FASTING B. CHITTIBABUa
aAssistant Professor, Department of Physical Education and Sports Sciences, Annamalai University
Chidambaram, Tamilnadu.
.
Abstract
The purpose of the present study was to assess diurnal variations in selected physical variables before and during
Ramadan fasting. The physical variables (speed, speed endurance, agility and power) were documented around the clock at
five 4-hourly intervals before Ramadan began and on the twenty-third day of Ramadan (daytime fasting). Ten healthy non-
smoking male handball players volunteers were included in the study after routine clinical and laboratory examinations.
These subjects were selected from Department of Physical Education and Sports Sciences, Annamalai University. Their ages
averaged 27 ± 1.9 years. Time series were analysed with repeated measures ANOVA which revealed that there was a
statistically significant changes as a result of Ramadan fasting among experimental days and times on speed, speed
endurance, agility and power. Experimental day and time interaction showed that during Ramadan, compared with control
period, time related variations of speed, speed endurance, agility and power changed significantly. To evaluate rhythmicity,
the single cosinor method was used. Cosinor analysis clearly shows the shift in acrophase obtained from the subjects before
to the 23rd day of Ramadan fasting. Ramadan induces day time changes in speed, speed endurance, agility and power.
Keywords: Ramadan, fasting, speed, speed endurance, agility and power.
Introduction
Rhythmicity is a fundamental feature of existence and circadian rhythms have been observed in the vast majority
of human physiological variables (Reilly, Atkinson, Waterhouse, 1997). One of the more fundamental rhythms is that of the
sleep–wakefulness cycle which is harmonised with the natural alternation of daylight and darkness in the environment.
Patterns of food and fluid ingestion also fit a diurnal rhythm, in time with arrangements for sleeping and being active. The
ingestion of food and liquid is highly influenced not only by immediate biological needs but also by external factors such as
social circumstances, habit and individual and family choices.
Normal patterns of fluid and food intake are broken when the sleep–wake cycle is disrupted. Different types of
disturbance are attributable to time-zone transitions, working on rotating shift systems and sleep deprivation. Sleep–wake
cycles are also affected by ageing (Reilly, Atkinson, Waterhouse, 1997) and so is the autonomic drive to imbibe fluid
(Ainslie, et al, 2002). This study is on Ramadan, a holy month for Muslims.
During Ramadan one of the most important rules of Islam is that any healthy adult Muslim must refrain from
eating, drinking, smoking, and sexual relations from sunrise to sunset during the month of Ramadan, the ninth month of the
Muslim calendar. Since this is a lunar calendar, the timing of this month of fast changes each year and the duration of
restricted food and beverage intake can vary from between twelve to sixteen hours. Intake is restricted to the night hours
within a short span of time, which thus delays sleep and reduces its duration. Environmental factors such as the timing of the
rest-activity cycle (Apfelbaum, Reinberg, Nillus, Halberg, 1969) and meals (Zigmond, Shoemaker, Larin, Wurtman, 1969;
Halberg, 1974; Nelson, Scheving, Halberg, 1975) play a part in the synchronization of individuals to the 24-h day (and are
accordingly known as synchronisers). They modulate or modify one or several of the parameters characterising the circadian
rhythm of a biologic variable (Reinberg, 1991; Touitou, Haus, 1994). We have previously shown that changes in the
circadian rhythms of nutrition-related biological variables (Iraki, Bogdan, Hakkou, Abkari, Touitou, 1997) occur during
Ramadan. The purpose of the present study was to assess diurnal variations in selected physical variables before and during
Ramadan fasting.
Methods
Subjects
Volunteers meeting the inclusion criteria participated in this study after giving their informed written consent. The study
design was in accordance with the guidelines issued by the ethics committee Annamalai University. The investigation

Inte
rnat
ion
al J
ou
rnal
of
Physi
cal
Edu
cati
on
, F
itn
ess
and
Sp
ort
s-IJ
PE
FS
26
International Journal of Physical Education, Fitness and
Sports-IJPEFS Vol.2. No.1.March 2013, ISSN 2277-5447
Website: http://www.ijpefs.nonolympictimes.org
conforms to the principles outlined in the declaration of India. Ten healthy non-smoking male handball players volunteers
were included in the study after routine clinical and laboratory examinations. These subjects were selected from Department
of Physical Education and Sports Sciences, Annamalai University. Their ages ranged from 25 to 29 years (mean ± SD = 27 ±
1.9 yr.). None took any medication either before or during the study; none had any chronic or acute somatic or psychiatric
disorder; and none had taken a transmeridian flight within two months of the study.
Protocol
The volunteers were studied twice over a 12-h span: one week before Ramadan (control: end of December) and on
the twenty-third day of Ramadan (Ramadan: end of January). On both test days, speed, speed endurance, agility and power
were measured at the following clock hours: 0600 h, 0900 h, 1200 h, 1500 h and 1800 h.
Before Ramadan started, the subjects were synchronised to nocturnal rest from 2000 h ± 0115 h to 0600 h ±
0130 h and to diurnal activity. On test days they were awakened at 0500 h, to have their physical variables. Physical activity
did not differ qualitatively or quantitatively during Ramadan, compared with the control day (they had the same tasks and
working hours before and during Ramadan). One week before Ramadan the sunrise was at 06:27 hours, sunset was at 17:54
hours and length of the day was 11 hours 26 minutes and 19 seconds during the study. On the twenty-third day of Ramadan
the sunrise was at 06:36 hours, sunset was at 18:13 hours and length of the day was 11 hours 37 minutes and 18 seconds
during the study. The difference between these two days on length of the day was 29 seconds. During and before Ramadan
the subjects slept uninterruptedly from 2130 h to 0530 h. All meals were quantitatively and qualitatively standardised by a
nutritionist and were eaten at fixed hours that fit the subjects usual schedules and Ramadan customs.
Meal timing and composition before Ramadan was:
0800 h: idly or dosa or pongal, coffee and milk (< 400 kcal)
1200 h: meat, vegetables, rice and fruit (< 1500 kcal)
2000 h: soup, chapatti, chicken (< 1100 kcal).
Meal timing and composition during Ramadan was:
1900 h: milk, dates, soup, meat, vegetables, rice, fruit, coffee and pastry (< 2200 kcal)
0001 h: semolina, milk, fruit and pastry (< 800 kcal).
Statistical analysis
Time series were analysed with a repeated measures analysis of variance (ANOVA; 2 within, 0 between) with
SPSS software (11.5 version) to test the time-related variations (effect of time in both experimental conditions), the influence
of Ramadan upon the 12-h mean concentrations (Ramadan vs. control) and the possible interaction of Ramadan upon the
time-related variations (experimental day and time interaction).
To evaluate rhythmicity, the single cosinor method (Nelson, Tong, Lee, Halberg, 1979) was used. The single
cosinor method identifies and evaluates the cosine mathematical function best fitting the data as a function of time. The
function, f(t) = M + A cos (ωt + ϕ), defines three parameters characteristic of each statistically significant rhythm: MESOR;
amplitude; acrophase. MESOR (midline estimating statistic of rhythm) approximates the arithmetical mean of the data for a
24-hour period, and amplitude is the measure of one half the extent of HR rhythmic variation in a cycle.
Results
ANOVA (Table 1) shows statistically significant time related variations (time effect) and during Ramadan
(Ramadan vs. control) for speed, speed endurance, agility and power. Experimental day and time interaction showed that
during Ramadan, compared with control period, time related variations of speed, speed endurance, agility and power
changed significantly.
The mean cosinor were calculated for speed, speed endurance, agility and power before and 23rd day of Ramadan
with day time fasting. Table 2 shows the parameters that characterize the diurnal variation of the subjects were monitored
in two different experimental conditions. A different situation appears for the Achrophase, the speed peaks at 13:57 (before
Ramadan) to 14:59 (23rd day of Ramadan fasting). It means a delay of at least 1:02 hours. The speed endurance peaks at
12:52 (before Ramadan) to 16:54 (23rd day of Ramadan fasting). It means a delay of at least 4:02 hours. The agility peaks at
13:17 (before Ramadan) to 14:32 (23rd day of Ramadan fasting). It means a delay of at least 1:05 hours. The power peaks at
16:33 (before Ramadan) to 14:52 (23rd day of Ramadan fasting). It means an advance of at least 1:42 hours. This analysis
clearly shows the shift in acrophase obtained from the subjects before to the 23rd day of Ramadan fasting.

Inte
rnat
ion
al J
ou
rnal
of
Physi
cal
Edu
cati
on
, F
itn
ess
and
Sp
ort
s-IJ
PE
FS
27
International Journal of Physical Education, Fitness and
Sports-IJPEFS Vol.2. No.1.March 2013, ISSN 2277-5447
Website: http://www.ijpefs.nonolympictimes.org
Discussion
Ramadan is the month during which Muslims must refrain from eating and drinking from sunrise until sunset
while maintaining their usual social and occupational activities. These long-lasting modifications—daytime fasting
accompanied by a delay and shortening of night-time sleep and changes in behaviour and social habits—have been shown to
result in a phase delay of many biological rhythms (André Bogdan, Belal Bouchareb, Yvan Touitou, 2001).
There is fairly comprehensive evidence of circadian rhythms in many aspects of human performance. In fasting
individuals, this rhythm is likely to be reduced in amplitude, due to the length of time without food at the time of day that
performance capabilities should be at their zenith. There are also likely to be peripheral (local muscular) as well as central
(cerebral) influences on the variations in muscle performance over the solar day, both of which are likely to be impaired by
food deprivation. All these expected changes in performance with time of day are likely to be due not only to the body clock
(Atkinson, Drust, Reilly, Waterhouse, 2003) but also to exogenous influences including lifestyle and nutrition.
A factor that is obviously relevant to the fasting athlete during the period of Ramadan is the timing of training.
Normally, high intensity exercise is best tolerated at the time that resting core temperature is at its high-point (Atkinson,
Reilly, 1996). Dehydration and lack of food intake are likely to mean that the quality of the training stimulus will be
impaired if training is conducted in the middle or towards the end of a diurnal fast. There is some suggestion of habituating
to training at a particular time of day, Edwards et al. (Edwards, Edwards, Waterhouse, Atkinson, Reilly, 2005) reporting that
competitive performance in cycle time-trials is influenced positively by training at that time in the days before racing. Whilst
exercising in the daytime during Ramadan may lead to such a habituation effect, performance is still likely to be impaired by
nutritional restrictions after sunrise.
The decreases in muscle performance were corroborated for psychomotor measures (Roky, Houti, Moussamih,
Qotbi, Aadil, 2004). There is also evidence of increased incidence of traffic accidents occurring in the month of Ramadan
(Roky, Houti, Moussamih, Qotbi, Aadil, 2004). Whether these events are related to changes in insulin, blood glucose, low
energy levels or mood changes, or a combination of these factors, are unclear. Irritability has been found to increase during
Ramadan (Kadri, Tilane, El-Betal, Taltit, Tahiri, Moussaoui, 2000; Ennigrou, Zenaidi, Ben Slama, Zouari, Nacef, 2001),
peaking at the end of the month.
Kirkendall, Zerguini, Dembri, Junge, Dvorak (2006) focused on two professional teams in Algiers in their
investigation of the impact of Ramadan on biochemical and performance indices of soccer players. By the end of the period
of fasting, the players displayed decreases in sprinting speed, agility, speed of dribbling and 12-min run performance. These
changes were accompanied by reductions in blood cholesterol, low-density lipoproteins, triglycerides and glucose. Most
players felt they had poorer quality of sleep, training and match performance during the period of fasting. These negative
states would in turn have an adverse effect on motivation for exercise. When players were re-examined 2 weeks after the end
of Ramadan, many of the blood variables had recovered to normal but performance measures were still below initial baseline
values.
In conclusion, the studies completed so far are of limited value in helping to understand how performance is
affected by the intermittent fasting practised during Ramadan. A fall in performance may be caused by alterations in
circadian rhythms, fatigue due to disturbances of the sleep–wake cycle or a reduction in energy reserves—or, more likely, by
an interaction of all these factors. The time of day at which testing has been conducted, the fitness levels of subjects and the
measurements made may be critical. In certain circumstances, athletes may be exempt from the fast and so may not
experience the same dietary discomfort as strict religious adherents. Dispensations apply when athletes are ill or are
travelling. For those reasons it is not clear how practicing Muslims might best maintain their training programmes in
harmony with altered circadian rhythms during Ramadan. The temporal programming of physical activity is a tool capable
of modifying the temporal structure of physical, physiological and biochemical variables. This approach can be of great
interest for coaches who plan training programs and it may benefit athletes when time zone adjustment is an issue, such as
transferring to a different continent for a competitive event.
Inte
rnat
ion
al J
ou
rnal
of
Physi
cal
Edu
cati
on
, F
itn
ess
and
Sp
ort
s-IJ
PE
FS
28
International Journal of Physical Education, Fitness and
Sports-IJPEFS Vol.2. No.1.March 2013, ISSN 2277-5447
Website: http://www.ijpefs.nonolympictimes.org
References
[1] Ainslie PN, Campbell IT, Frayn KN, Humphreys SM, MacLaren DP, Reilly T, et al. Energy balance, metabolism,
hydration and performance during strenuous hill walking: the effect of age. J Appl Physiol 2002;93:714–23.
[2] André Bogdan, Belal Bouchareb, Yvan Touitou, Ramadan fasting alters endocrine and neuroendocrine circadian
patterns. Meal–time as a synchronizer in humans? Life Sciences 2001; 68: 1607–1615.
[3] Apfelbaum M, Reinberg A, Nillus P, Halberg F. Rythmes circadiens de l‘alternance veille/sommeil pendant
l‘isolement. La Presse Médicale 1969; 77: 879–82.
[4] Atkinson G, Drust B, Reilly T, Waterhouse J. The relevance of melatonin to sports medicine and science. Sports Med
2003;33:809–31.
[5] Atkinson G, Reilly T. Circadian variation in athletic performance. Sports Med 1996;21:292–312.
[6] Edwards BJ, EdwardsW,Waterhouse J, Atkinson G, Reilly T. Can cycling performance in an early morning, laboratory-
based cycle time-trial be improved by morning exercise the day before? Int J Sports Med 2005;26 (8):651–66.
[7] Ennigrou S, Zenaidi M, Ben Slama F, Zouari B, Nacef T. Ramadan and customs of life: investigation with 84 adult
residents in the district of Tunis. Tunis Med 2001;79:508–14.
[8] Halberg F. Protection by timing treatment according to bodily rhythms. An analogy to protection by scrubbing before
surgery. Chronobiologia 1974; 1 [Suppl. 1]: 27–72.
[9] Iraki L, Bogdan A, Hakkou F, Abkari A, Touitou Y. Ramadan diet restrictions modify the circadian time structure in
humans. A study on plasma gastrin, insulin, glucose and calcium and on gastric pH. Journal of Clinical Endocrinology
and Metabolism 1997; 82: 1261–73.
[10] Kadri N, Tilane A, El-Betal M, TaltitY, Tahiri SM, Moussaoui D. Irritability during the month of Ramadan. Psychosom
Med 2000;62:280–5.
[11] Kirkendall D, Zerguini Y, Dembri H, Junge A, Dvorak J. Impact of Ramadan on biochemical and performance indices
in professional soccer players. Med Sci Sports Exerc 2006;38(5 Suppl):S240.
[12] Nelson W, Scheving LE, Halberg F. Circadian rhythms in mice fed a single daily meal and different stages of lighting
regimen. Journal of Nutrition 1975; 105: 171–84.
[13] Nelson W, Tong LY, Lee JK, Halberg F. Methods of cosinor rhythmometry. Chronobiologia 1979;6:305-323.
[14] Reilly T, Atkinson G, Waterhouse J. Biological rhythms and exercise. Oxford: Oxford University Press; 1997.
[15] Reinberg A. Chronobiologie et Chronothérapeutique; Heure Optimale d‘Administration des Médicaments. Paris:
Flammarion Médecine-Sciences, 1991.
[16] Roky R, Houti I, Moussamih S, Qotbi S, Aadil N. Physiological and chronobiological changes during Ramadan
intermittent fasting. Ann Nutr Metab 2004;48:296–303.
[17] Touitou Y, Haus E. Biologic Rhythms in Clinical and Laboratory Medicine. Berlin, New York, London, Paris, Tokyo,
Hong Kong, Barcelona: Springer Verlag, 1994.
[18] Zigmond MJ, Shoemaker WJ, Larin F, Wurtman RJ. Hepatic tyrosine transaminase rhythm: interaction of
environmental lighting, food consumption and dietary protein content. Journal of Nutrition 1969; 98: 71–5.

Inte
rnat
ion
al J
ou
rnal
of
Physi
cal
Edu
cati
on
, F
itn
ess
and
Sp
ort
s-IJ
PE
FS
29
International Journal of Physical Education, Fitness and
Sports-IJPEFS Vol.2. No.1.March 2013, ISSN 2277-5447
Website: http://www.ijpefs.nonolympictimes.org
Table 1 ANOVA for repeated measures for physical variables documented before (control) and on the twenty third day
(Ramadan) of daytime fasting during the month of Ramadan.
Variables Effects df F – Value P - Value
Speed Ramadan vs. Control 1 18.95 0.001
Time 4 29.42 0.0001
Experimental day and time interaction 4 27.53 0.0001
Speed endurance Ramadan vs. Control 1 21.62 0.001
Time 4 36..41 0.0001
Experimental day and time interaction 4 30.62 0.0001
Agility Ramadan vs. Control 1 42.60 0.0001
Time 4 18.12 0.0001
Experimental day and time interaction 4 20.64 0.01
Power Ramadan vs. Control 1 30.12 0.01
Time 4 48.21 0.001
Experimental day and time interaction 4 39.65 0.0001
Table 2 Rhythmometric analysis (mean cosinor) of Diurnal variation on the selected physical variables before and 23rd day
of Ramadan fasting.
Variables Speed Speed endurance Agility Power
Before After Before After Before After Before After
MESOR 5.9 6.3 45.7 50.8 10.2 11.6 44.4 38.9
Amplitude 0.1 0.1 0.9 1.6 0.4 0.8 2.4 7.8
Acrophase 13:57 14:59 12:52 16:54 13:17 14:32 16:33 14:52

Inte
rnat
ion
al J
ou
rnal
of
Physi
cal
Edu
cati
on
, F
itn
ess
and
Sp
ort
s-IJ
PE
FS
30
International Journal of Physical Education, Fitness and
Sports-IJPEFS Vol.2. No.1.March 2013, ISSN 2277-5447
Website: http://www.ijpefs.nonolympictimes.org
INFLUENCE OF DIFFERENT INTENSITY RESISTANCE TRAINING
ON SELECTED SPEED PARAMETERS DR. R. SAVARIRAJANa
aDirector of Physical Education, Arignar Anna Govt. Arts & Science College, Karaikal, Puducherry State.
ABSTRACT
The purpose of the study was to examine the influence of different intensity resistance training on selected speed
parameters. To achieve this, sixty men students of bachelor‘s degree were selected as subjects at random. The selected
subjects were divided into four groups of fifteen subjects each namely, high velocity resistance training followed by speed
training group, medium velocity resistance training followed by speed training group, low velocity resistance training
followed by speed training group and control group. The experimental groups were trained for four non-alternative days in a
week for twelve weeks. Speed, Stride Length and Stride Frequency were selected as criterion variables. The collected data
were analyzed statistically by using dependent ‗t‘– test to determine the improvements, if any, among the groups; and
analysis of covariance (ANCOVA) was used to determine the differences, if any, among the adjusted post-test means on
selected dependent variables, separately. The results of the study indicate that the experimental groups have significantly
improved on speed, stride length and stride frequency and also indicate that the speed parameters showed significant
difference between high velocity resistance training followed by speed training group, medium velocity resistance training
followed by speed training group and low velocity resistance training followed by speed training group. It is also found that
the improvement caused by high velocity resistance training followed by speed training was greater when compared to the
effects caused by both medium and low velocity resistance training followed by speed training.
INTRODUCTION
Sports in the present world has become extremely competitive. It is not the mere participation or practice that
brings out victory to an individual. Therefore, sports life is affected by various factors, like Physiology, Biomechanics,
Sports Training, Sports Medicine, Sociology and Psychology etcetera. All the coaches, trainers, physical education
personnels and doctors are doing their best to improve the performance of the players of their country. Athlete / Player of all
the countries are also trying hard to bring laurels / medals for their countries in International Competitions (Ghuman and
Dhillon,2000). Sports training is done for improving sports performance. The sports performance as any other type of
human performance, is not the product of single system or aspect of human personality. On the contrary, it is the product of
the total personality of the sports person. The personality of a person has several dimensions e.g. physical, physiological,
social and psychic. In order to improve sports performance, the social and psychic capacities of the sports person also have
to be improved in addition to the physical and physiological ones. In other words, the total personality of a sportsman has to
be improved in order to enhance his performance. Sport‘s training, therefore, directly and indirectly aims at improving the
personality of the sportsman. No wonder, therefore, sports training is an educational process (Hardayal
Singh,1991).Scientific training methods and application of basic principles of body mechanics in sports skill have been
attributed to the higher level of performance in sports skills performance is the combined result of co-ordinated exertion and
integration of a variety of functions. Genetic factor probably plays an important role in an individual‘s performance. It
appears that upto seventy percent of an individual‘s maximal force, power or capacity is a matter of genetic factor. The
environments as well as geographic location too play an important role in performance. Moreover performance to a certain
extent depends upon the physical and motor fitness qualities in which definite improvement can be achieved through
appropriate training (Bourchers and Malina,1999). According to Fox sports training is a programme of exercise designed
to improve the skills and increase the energy capacities of an athlete for a particular event. These basic training procedures
will serve better when utilized with modifications suited to individuals or a group dealt with. The training programme should
look into improving the performance of the athletes and at the same time should prevent injury from taking place. Sports
training is a basic preparation for better performance through physical exercise. It is based on scientific principles of aiming
at education and performance enhancement. Sports activities consist of motor movement and action and their success
depends to a great extent on how correctly they are performed. Techniques of training and improvement of tactical efficiency
play a vital role in a training process. Resistance training is an anaerobic form of exercise. This training programme can be
used to enhance the ability of the body to perform at very high force and / or power outputs for a very short period of time to
improve the ability of the body to perform repeated bouts of maximal activity (Baechle,1994). The importance of resistance
training to sports performance has been supported by studies which have demonstrated that resistance training in the form of

Inte
rnat
ion
al J
ou
rnal
of
Physi
cal
Edu
cati
on
, F
itn
ess
and
Sp
ort
s-IJ
PE
FS
31
International Journal of Physical Education, Fitness and
Sports-IJPEFS Vol.2. No.1.March 2013, ISSN 2277-5447
Website: http://www.ijpefs.nonolympictimes.org
weight training and more recently, plyometric training have enchanced some competitive performances. Most typically this
has been reported as an improvement in vertical jumping ability. Many studies have reported that resistance training has
enhanced muscular strength, but failed to induce changes in dynamic sporting performance. Over the past 20 years, the use
of resistance training has progressed from an activity performed by relatively few strength athletes to a permanent feature of
the training routines of most sportspersons. Although there is a variety of resistance training methods one can use to enhance
muscular power. During the past two decades, speed training programmes have been successfully developed for several
sports in which running is a basic skill. More recently however, coaches who have athletes in other sports have been using
similar methods to increase the speed of their performers, with very good results. Speed training, like strength, flexibility and
mental skills training has now become an important ingredient in the total programme, particularly where speed of
movement is essential in the sport. The aim of speed training is to condition the athlete to move at high velocity, employing
maximal power when needed. In order to do this, the neuromuscular system must be conditioned to very fast movements and
training need to be very specific, with a very high anaerobic component. If an athlete is to reach full potential in a sport and
if speed of movement is a necessary component, the speed and velocity demands of the sport must be carefully analyzed
(Bloomfield et al., 1994). Speed is one of the most important physical qualities required for successful performance in
jumps, especially in the horizontal jump and in the pole vault. The amount of speed required is slightly different in the event
due to differing emphasis in the take off. It is said that sprinters are born not made and it is certainly true that natural ability
will always play a major role in sports events. However, the standard is high and the competition is so fierce at present that
no sprinter can achieve real success without correct techniques and proper training. It has been established that running
speed can be improved through training. Eicher (1975) is of the opinion that speed is the product of two factors, stride
length and stride frequency. Increasing either factor automatically increases a runner‘s sprinting speed. From training point
of view, it appears that the stride length can be increased by increasing the leg strength. Though stride frequency is an inborn
quality, it might be possible to improve slightly through training. It appears that this improvement also brings about a
corresponding shortening of stride length. In stride frequency, time becomes our concern. When we reduce the time
necessary to apply force at take off and eliminate wasted time in the air, then stride frequency will improve. Stride frequency
is the time required to complete a stride and is limited by the length of the stride. Thus, although stride length is determined
when force is applied by pushing against the ground, stride frequency is merely the time required to complete that stride.
Again, maximum speed is achieved when stride length and stride frequency are in correct proportion (Dintiman et al.,
1998). The relationship between strength and speed is well known. Speed performance can be improved rapidly by
improving the explosive strength of the concerned muscle groups. A decrease in strength always has negative effect on speed
performance. Because of the importance of explosive strength and its high trainability most of the times, speed performance
is improved by improving explosive strength. Explosive strength further depends on muscle co-ordination. It also depends
on metabolic process. Except muscle composition, all other factors can be improved through training
(Hardayal Singh, 1991).
METHODOLOGY
In this context, the investigator made an attempt to analyze the effect of three different intensity resistance training
on motor fitness. The purpose of the present investigation was to find out the influence of different intensity resistance
training on selected speed parameters such as speed, stride length and stride frequency. To achieve the purpose of this study,
sixty men students studying bachelor‘s degree course in the department of physical education and sports sciences,
Annamalai University, Annamalai Nagar, Tamil Nadu were randomly selected as subjects. The subjects were divided into
four groups namely high velocity resistance training followed by speed training group, medium velocity resistance training
followed by speed training group, low velocity resistance training followed by speed training group and control group of
fifteen subjects each. The experimental groups were trained for four non-alternative days in a week for twelve weeks.The
control group who were not engaged in any special activities other than their regular curricular activities during the period of
training. Among the speed parameters, the following variables were selected as criterion variables namely speed, stride
length and stride frequency. All the subjects were tested on selected criterion variables prior to and immediately after the
training period. Speed was assessed by 50mts run, stride length and stride frequency was assessed by Videograph. The
collected data were analyzed statistically by using ‗t‘- test to determine the differences, if any, among the groups prior to and
immediately after the training period on selected criterion variables separately. Analysis of Covariance (ANCOVA) was
used to determine the differences, if any, among the adjusted post test means on selected dependent variables separately.
Whenever the ‗F‘ ratio for adjusted post test was found to be significant, the Scheffe‘s test was applied as post-hoc test to
find out paired mean differences. The level of significance was fixed at .05 level of confidence, which was considered as
appropriate.
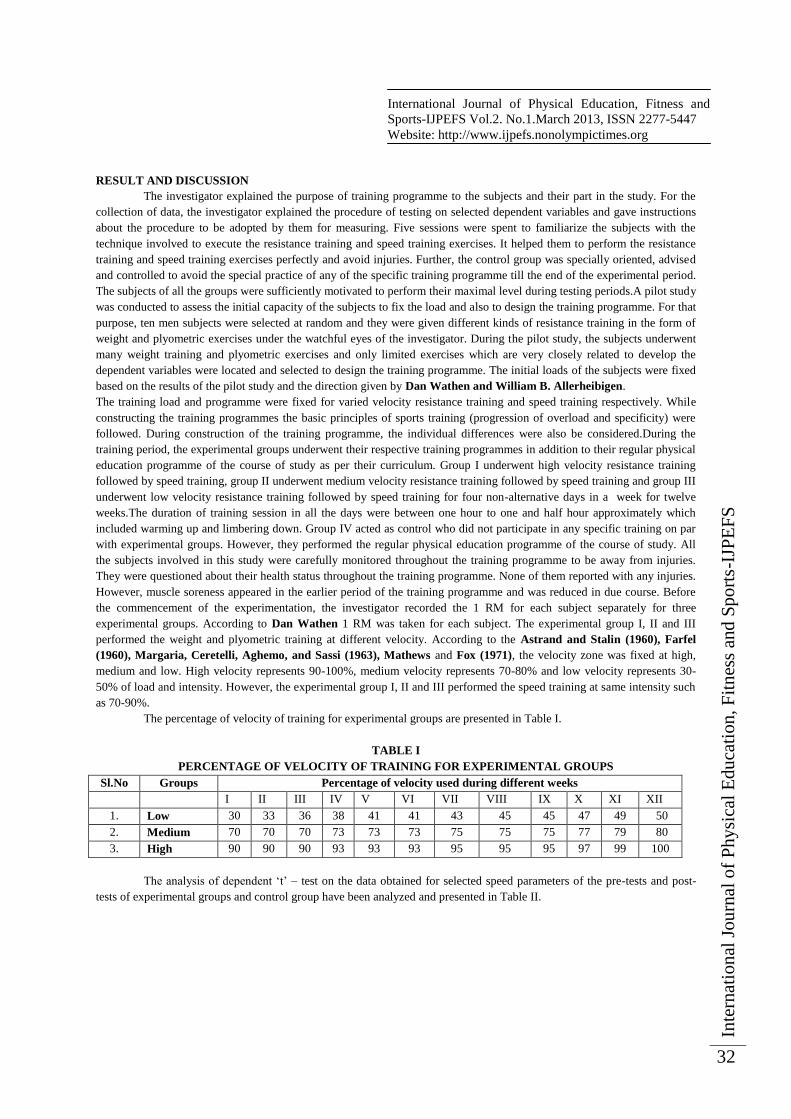
Inte
rnat
ion
al J
ou
rnal
of
Physi
cal
Edu
cati
on
, F
itn
ess
and
Sp
ort
s-IJ
PE
FS
32
International Journal of Physical Education, Fitness and
Sports-IJPEFS Vol.2. No.1.March 2013, ISSN 2277-5447
Website: http://www.ijpefs.nonolympictimes.org
RESULT AND DISCUSSION
The investigator explained the purpose of training programme to the subjects and their part in the study. For the
collection of data, the investigator explained the procedure of testing on selected dependent variables and gave instructions
about the procedure to be adopted by them for measuring. Five sessions were spent to familiarize the subjects with the
technique involved to execute the resistance training and speed training exercises. It helped them to perform the resistance
training and speed training exercises perfectly and avoid injuries. Further, the control group was specially oriented, advised
and controlled to avoid the special practice of any of the specific training programme till the end of the experimental period.
The subjects of all the groups were sufficiently motivated to perform their maximal level during testing periods.A pilot study
was conducted to assess the initial capacity of the subjects to fix the load and also to design the training programme. For that
purpose, ten men subjects were selected at random and they were given different kinds of resistance training in the form of
weight and plyometric exercises under the watchful eyes of the investigator. During the pilot study, the subjects underwent
many weight training and plyometric exercises and only limited exercises which are very closely related to develop the
dependent variables were located and selected to design the training programme. The initial loads of the subjects were fixed
based on the results of the pilot study and the direction given by Dan Wathen and William B. Allerheibigen.
The training load and programme were fixed for varied velocity resistance training and speed training respectively. While
constructing the training programmes the basic principles of sports training (progression of overload and specificity) were
followed. During construction of the training programme, the individual differences were also be considered.During the
training period, the experimental groups underwent their respective training programmes in addition to their regular physical
education programme of the course of study as per their curriculum. Group I underwent high velocity resistance training
followed by speed training, group II underwent medium velocity resistance training followed by speed training and group III
underwent low velocity resistance training followed by speed training for four non-alternative days in a week for twelve
weeks.The duration of training session in all the days were between one hour to one and half hour approximately which
included warming up and limbering down. Group IV acted as control who did not participate in any specific training on par
with experimental groups. However, they performed the regular physical education programme of the course of study. All
the subjects involved in this study were carefully monitored throughout the training programme to be away from injuries.
They were questioned about their health status throughout the training programme. None of them reported with any injuries.
However, muscle soreness appeared in the earlier period of the training programme and was reduced in due course. Before
the commencement of the experimentation, the investigator recorded the 1 RM for each subject separately for three
experimental groups. According to Dan Wathen 1 RM was taken for each subject. The experimental group I, II and III
performed the weight and plyometric training at different velocity. According to the Astrand and Stalin (1960), Farfel
(1960), Margaria, Ceretelli, Aghemo, and Sassi (1963), Mathews and Fox (1971), the velocity zone was fixed at high,
medium and low. High velocity represents 90-100%, medium velocity represents 70-80% and low velocity represents 30-
50% of load and intensity. However, the experimental group I, II and III performed the speed training at same intensity such
as 70-90%.
The percentage of velocity of training for experimental groups are presented in Table I.
TABLE I
PERCENTAGE OF VELOCITY OF TRAINING FOR EXPERIMENTAL GROUPS
Sl.No Groups Percentage of velocity used during different weeks
I II III IV V VI VII VIII IX X XI XII
1. Low 30 33 36 38 41 41 43 45 45 47 49 50
2. Medium 70 70 70 73 73 73 75 75 75 77 79 80
3. High 90 90 90 93 93 93 95 95 95 97 99 100
The analysis of dependent ‗t‘ – test on the data obtained for selected speed parameters of the pre-tests and post-
tests of experimental groups and control group have been analyzed and presented in Table II.

Inte
rnat
ion
al J
ou
rnal
of
Physi
cal
Edu
cati
on
, F
itn
ess
and
Sp
ort
s-IJ
PE
FS
33
International Journal of Physical Education, Fitness and
Sports-IJPEFS Vol.2. No.1.March 2013, ISSN 2277-5447
Website: http://www.ijpefs.nonolympictimes.org
TABLE II
THE SUMMARY OF MEAN AND DEPENDENT ‘t’ TEST FOR THE PRE AND POST- TEST ON SELECTED
SPEED PARAMETERS OF EXPERIMENTAL
AND CONTROL GROUPS
Variable
Test Mean
High Velocity
Group
Medium
Velocity Group
Low Velocity
Group
Control Group
Speed Pre-test 7.31 7.32 7.19 7.25
Post-test 6.79 6.93 7.04 7.26
‗t‘- test 17.54* 11.42* 7.99* 0.37
Stride Length Pre-test 1.65 1.66 1.66 1.69
Post-test 1.75 1.74 1.71 1.69
‗t‘- test 13.38* 10.33* 3.58* 0.00
Stride
Frequency
Pre-test 4.16 4.12 4.23 4.08
Post-test 4.23 4.16 4.26 4.07
‗t‘- test 2.66* 3.53* 0.61 0.48
*Significant at .05 level
(Table value required for significance at .05 level with df 14 is 2.14)
The ‗t‘- test values between the pre and post-test means of experimental groups and control group on speed were
17.54, 11.42, 7.99 and 0.37 respectively. Since the obtained ‗t‘-test value of experimental groups are greater than the
required table value 2.14 with df 14 at .05 level of confidence, it is concluded that high, medium, and low velocity resistance
training followed by speed training groups had significant improvement in the performance of speed. However, control
group has no significant improvement in the performance of speed. The ‗t‘-test values between the pre and post-test means
of experimental groups and control group on stride length were 13.38, 10.33,3.58 and 0.00 respectively. Since the obtained
‗t‘-test value of experimental groups are greater than the required table value 2.14 with df 14 at .05 level of confidence, it is
concluded that high, medium, and low velocity resistance training followed by speed training groups had significant
improvement in the performance of stride length. However, control group has no significant improvement in the
performance of stride length. The ‗t‘-test values between the pre and post-test means of experimental groups and control
group on stride frequency were 2.66, 3.53, 0.61 and 0.48 respectively. Since the obtained ‗t‘-test value of high and medium
velocity resistance training followed by speed training groups are greater than the required table value 2.14 with df 14 at .05
level of confidence. However, the obtained ‗t‘-test value of low velocity resistance training followed by speed training and
control groups are less than the required table value of 2.14 with df 14 at .05 level of confidence. It is concluded that high
and medium velocity resistance training followed by speed training groups had significant improvement in the performance
of stride frequency. However, low velocity resistance training followed by speed training group and control group has no
significant improvement in the performance of stride frequency.
The analysis of covariance on the data obtained for selected speed parameters of the adjusted post-tests of
experimental groups and control group have been analyzed and presented in Table III.
TABLE III
ANALYSIS OF COVARIANCE ON SPEED, STRIDE LENGTH AND STRIDE FREQUENCY BETWEEEN
ADJUSTED POST-TEST MEANS OF
EXPERIMENTAL AND CONTROL GROUPS
Variable
Adjusted post test means Source of
Variance
Sum of
Squares
df Mean
Squares
‘F’ ratio
High
Velocity
Group
Medium
Velocity
Group
Low
Velocity
Group
Control
Group
Speed 6.75 6.88 7.11 7.28 Between
Within
2.49
0.77
3
55
0.83
0.01
59.04*
Stride
Length
1.77 1.75 1.71 1.67 Between
Within
0.08
0.08
3
55
0.03
0.001
19.06*
Stride
Frequency
4.21 4.18 4.11 4.10 Between
Within
0.08
0.43
3
55
0.03
0.01
3.61*
*Significant at .05 level of confidence

Inte
rnat
ion
al J
ou
rnal
of
Physi
cal
Edu
cati
on
, F
itn
ess
and
Sp
ort
s-IJ
PE
FS
34
International Journal of Physical Education, Fitness and
Sports-IJPEFS Vol.2. No.1.March 2013, ISSN 2277-5447
Website: http://www.ijpefs.nonolympictimes.org
(The table value required for significance at .05 level with df 3 and 55 is 2.78)
The adjusted post test mean values of speed for high, medium, and low velocity resistance training followed by
speed training groups and control group are 6.75, 6.88, 7.11 and 7.28 respectively. The obtained ‗F‘- ratio of 59.04 for
adjusted post test mean is more than the table value of 2.78 for df 3 and 55 required for significance at .05 level of
confidence. The results of the study indicate that there is significant difference among the adjusted post test means of high,
medium, and low velocity resistance training followed by speed training groups and control group on the development of
speed. The adjusted post test mean values of stride length for high, medium, and low velocity resistance training followed by
speed training groups and control group are 1.77, 1.75, 1.71 and 1.67 respectively. The obtained ‗F‘- ratio of 19.06 for
adjusted post test mean is more than the table value of 2.78 for df 3 and 55 required for significance at .05 level of
confidence. The results of the study indicate that there is significant difference among the adjusted post test means of high,
medium, and low velocity resistance training followed by speed training groups and control group on the development of
stride length. The adjusted post test mean values of stride frequency for high, medium, and low velocity resistance training
followed by speed training groups and control group are 4.21, 4.18, 4.11 and 4.10 respectively. The obtained ‗F‘- ratio of
3.61 for adjusted post test mean is more than the table value of 2.78 for df 3 and 55 required for significance at .05 level of
confidence. The results of the study indicate that there is significant difference among the adjusted post test means of high,
medium, and low velocity resistance training followed by speed training groups and control group on the development of
stride frequency.
The scheffe‘s test for the differences between the adjusted post-test paired means on selected speed parameters of
experimental and control groups have been analyzed and presented in Table IV.
TABLE IV
THE SCHEFFE’S TEST FOR THE DIFFERENCES BETWEEN THE ADJUSTED POST TEST PAIRED MEANS
ON SPEED, STRIDE LENGTH AND
STRIDE FREQUENCY
Variable
Adjusted post test means Mean
Difference
Confidence
Interval High
Velocity
Group
Medium
Velocity
Group
Low Velocity
Group
Control
Group
Speed 6.75
6.75
6.75
---
---
---
6.88
---
---
6.88
6.88
---
---
7.11
---
7.11
---
7.11
---
---
7.28
---
7.28
7.28
0.13*
0.36*
0.53*
0.23*
0.40*
0.17*
0.10
0.10
0.10
0.10
0.10
0.10
Stride
Length
1.77
1.77
1.77
---
---
---
1.75
---
---
1.75
1.75
---
---
1.71
---
1.71
---
1.71
---
---
1.67
---
1.67
1.67
0.03*
0.06*
0.10*
0.03*
0. 07*
0.04*
0.03
0.03
0.03
0.03
0.03
0.03
Stride
Frequency
4.21
4.21
4.21
---
---
---
4.18
---
---
4.18
4.18
---
---
4.11
---
4.11
---
4.11
---
---
4.10
---
4.10
4.10
0.03
0.10*
0.11*
0.07
0.08
0.01
0.10
0.10
0.10
0.10
0.10
0.10
*Significant at .05 level of confidence

Inte
rnat
ion
al J
ou
rnal
of
Physi
cal
Edu
cati
on
, F
itn
ess
and
Sp
ort
s-IJ
PE
FS
35
International Journal of Physical Education, Fitness and
Sports-IJPEFS Vol.2. No.1.March 2013, ISSN 2277-5447
Website: http://www.ijpefs.nonolympictimes.org
The adjusted post test mean difference on speed between high and medium velocity resistance training followed by speed
training groups, high and low velocity resistance training followed by speed training groups, high velocity resistance training
followed by speed training group and control group, medium and low velocity resistance training followed by speed training
groups, medium velocity resistance training followed by speed training group and control group and between low velocity
resistance training followed by speed training group and control group are 0.13, 0.36, 0.53, 0.23, 0.40 and 0.17 respectively.
These values are greater than the confidence interval value 0.10, which shows significant difference at .05 level of
confidence. It may be concluded from the results of the study that there is a significant difference in speed between the
adjusted post test means of high and medium velocity resistance training followed by speed training groups, high and low
velocity resistance training followed by speed training group and high velocity resistance training followed by speed training
group and control group, medium and low velocity resistance training followed by speed training groups, medium velocity
resistance training followed by speed training group and control group and between low velocity resistance training followed
by speed training group and control group. However, the improvement of speed was significantly higher for high velocity
resistance training followed by speed training group than medium and low velocity resistance training group followed by
speed training groups. It may be concluded that high velocity resistance training followed by speed training is better than the
medium and low velocity resistance training followed by speed training in improving speed. The adjusted post test mean
difference on stride length between high and medium velocity resistance training followed by speed training groups, high
and low velocity resistance training followed by speed training groups, high velocity resistance training followed by speed
training group and control group, medium and low velocity resistance training followed by speed training groups, medium
velocity resistance training followed by speed training group and control group and between low velocity resistance training
followed by speed training group and control group are 0.03, 0.06, 0.10, 0.03, 0.07 and 0.04 respectively. These values are
greater than the confidence interval value 0.03, which shows significant difference at .05 level of confidence. It may be
concluded from the results of the study that there is a significant difference in stride length between the adjusted post test
means of high and medium velocity resistance training followed by speed training groups, high and low velocity resistance
training followed by speed training group and high velocity resistance training followed by speed training group and control
group, medium and low velocity resistance training followed by speed training groups, medium velocity resistance training
followed by speed training group and control group and between low velocity resistance training followed by speed training
group and control group. However, the improvement of stride length was significantly higher for high velocity resistance
training followed by speed training group than medium and low velocity resistance training group followed by speed training
groups. It may be concluded that high velocity resistance training followed by speed training is better than the medium and
low velocity resistance training followed by speed training in improving stride length. The adjusted post test mean difference
on stride frequency between high and low velocity resistance training followed by speed training groups, high velocity
resistance training followed by speed training group and control group are 0.11 and 0.10 respectively. These values are
greater than the confidence interval value 0.10 which shows significant difference at .05 level of confidence. It may be
concluded from the results of the study that there is a significant difference in stride frequency between high and low
velocity resistance training followed by speed training groups, high velocity resistance training followed by speed training
group and control group. The adjusted post test mean difference in stride frequency between high and medium velocity
resistance training followed by speed training groups, medium and low velocity resistance training followed by speed
training groups, medium velocity resistance training followed by speed training group and control group, low velocity
resistance training followed by speed training group and control group are 0.03, 0.07, 0.08 and 0.01 respectively. These
values are less than the confidence interval value 0.10. It may be concluded from the results of the study that there is no
significant difference exist in stride frequency between the adjusted post test means of high and medium velocity resistance
training followed by speed training groups, medium and low velocity resistance training followed by speed training groups,
medium velocity resistance training followed by speed training group and control group, low velocity resistance training
followed by speed training group and control group. However, the improvement of stride frequency was significantly higher
for high velocity resistance training followed by speed training group than medium and low velocity resistance training
group followed by speed training groups. It may be concluded that high velocity resistance training followed by speed
training is better than the medium and low velocity resistance training followed by speed training in improving stride
frequency. These findings are in line with the findings of (Wilson,1994), (Jones, 1996), (Schwendal,1991),
(Rajasekaran,1999), (Donali,1995), (Delecluse,1995). It is inferred from the results of the present study that all the
dependent variables were significantly improved due to the effect of high, medium, and low velocity resistance training
followed by speed training.

Inte
rnat
ion
al J
ou
rnal
of
Physi
cal
Edu
cati
on
, F
itn
ess
and
Sp
ort
s-IJ
PE
FS
36
International Journal of Physical Education, Fitness and
Sports-IJPEFS Vol.2. No.1.March 2013, ISSN 2277-5447
Website: http://www.ijpefs.nonolympictimes.org
FINDINGS
1. Experimental groups namely high, medium and low velocity resistance training followed by speed training
group had significantly improved the selected dependent variables namely speed, stride length and stride frequency when
compared to the control group.
2. It is also found that the improvement caused by high velocity resistance training followed by speed training was
greater when compared to the effects caused by both medium and low velocity resistance training followed by speed
training.
CONCLUSION
It may be concluded that high velocity resistance training followed by speed training group is found to
be better than medium and low velocity resistance training followed by speed training to increase speed, stride length and
stride frequency.
REFERENCES
[1] Allerheibigen B. Willial and Dan Wathen., Periodisation: Concepts and Applications as Cited Thomas R.
Baechle., Essentials of Strength Training and
[2] Condition‖, (Champaign: Human Kinetics, 1994). Astrand, and Saltin.,‖Periodization: Theory and
Methodology of Training‖,
[3] Champaign, Illinois: Human Kinetics Publishers, 1999.Baechle, Thomas R., ― Essentials of Strength Training
and Condition‖, Champaign : Human Kinetics, 1994.
[4] Bloomfield, J. et al., ―Applied Anatomy and Biomechanics in Sport Publishers, Blackwell Scientific
Publications, 1994.
[5] Bourchers, C., and R.M. Malina., ― Genetics of Physical Fitness and Performance‖, Exercise and Sports
Sciences Reviews, 1999.
[6] Delecluse C, et al., ―Influence of High - Resistance and High - Velocity Training On Sprint Performance‖,
Medical Science and Sports Exercise, 27:8, 1995.
[7] Dintiman, George, Bobward and Tom Tellez, ― Sports Speed‖, Champaign Illinois : Human Kinetic Publishers,
1998.
[8] Donati, Allessandro., ―The Development of Stride Length and Stride Frequency In Sprinting‖, New Studies in
Athletics, 10:1, 1995.
[9] Eicher, Tom., ―Improving Sprinting Speed Through Strength Training‖, Athletic Journal, 1975.
[10] Fox, Edward L., ―Sports Physiology‖, Philadelphia : Saunders College Publishers, 1984.
[11] Fox and Mathews., ―A Comparison of Linear and Daily Undulating Periodized Programs With Equated
Volume and Intensity for Strength”, The Journal Of Strength and Conditioning Research, 2002.
[12] Ghuman, P.S., and B.S. Dhillon, ―A Study Of Factors Influencing Sports Carrer", Scientific Journal, SAI
NSNIS, 23:1, 2000.
[13] Jones, K., et al., ― The Effect of Compensatory Acceleration on Upper Body Strength and Power‖, Journal of
Strength and Conditioning Research, 10:4, 1996.
[14] Margaria, Ceretelli, Aghemo and Sassi., ―Improving Strength and Power‖, Journal of Strength and Conditioning
Research, 10:4, 1996.
[15] Rajasekaran, M., ―Effect of Maximum Strength and Speed Training in Series and Parallel on Elastic Strength
Components‖, Unpublished Doctoral Thesis, Annamalai University, 1999.
[16] Schwendel, P.J., ―Traditional Baseball Weight Training Versus Power Weight Training Effects on Bat Velocity‖,
M.S. Thesis – Abstract, Microform Publication Bulletin, 1991.
[17] Singh, Hardayal, ―Science of Sports Training”, New Delhi : D.V.S Publications, 1991.

Inte
rnat
ion
al J
ou
rnal
of
Physi
cal
Edu
cati
on
, F
itn
ess
and
Sp
ort
s-IJ
PE
FS
37
International Journal of Physical Education, Fitness and
Sports-IJPEFS Vol.2. No.1.March 2013, ISSN 2277-5447
Website: http://www.ijpefs.nonolympictimes.org
APPENDIX I
EXERCISES PRESCRIBED FOR RESISTANCE TRAINING DURING THE TRAINING PERIOD
1. Flat Bench Press
2. Shoulder Press
3. Biceps Curl
4. Back Squat
5. Leg Press
6. Power Clean
7. Crunch
8. Bent Over Row
9. Incline Bench Press
10. Front Squat
11. Lunge
12. Dead Lift
13. Wrist Curl
14. Leg Curl
15. Step Up
16. Snatch
Resistance training programme was designed as per (1RM) repetition maximum of the subject. To assess the 1RM,
each subjects were tested for his maximum ability of each exercise and the percentages were calculated separately to fix the
intensity as prescribed by Dan Wathen. Each training session only eight exercises were given among the above sixteen
exercises.
APPENDIX II
EXERCISES PRESCRIBED FOR SPEED TRAINING DURING THE TRAINING PERIOD
SL.NO
EXERCISE
PHASE*
I II III IV
1. Alternative pace run
75 m – 50 m – 75 m – 50 m
75 m – 50 m
2 sets
10 min rest in between set
70
– 7
5 %
of
Inte
nsi
ty
76
– 8
0 %
of
Inte
nsi
ty
81
– 8
5 %
of
Inte
nsi
ty
86
– 9
0 %
of
Inte
nsi
ty 2. 2 x 4 x 60 m run
5 min rest in between repetitions
5 min rest in between set
3. Ins and out training
Running course 120 m ( In zone 30 m and out zone
30 m)
4 sets
5 min rest in between set
4. Acceleration sprint
30 m – 40 m – 60 m – 80 m
2 sets
10 min rest in between set
* A phase consists of 3 weeks duration
Initial load was fixed according to response made at pilot study by subjects.

Inte
rnat
ion
al J
ou
rnal
of
Physi
cal
Edu
cati
on
, F
itn
ess
and
Sp
ort
s-IJ
PE
FS
38
International Journal of Physical Education, Fitness and
Sports-IJPEFS Vol.2. No.1.March 2013, ISSN 2277-5447
Website: http://www.ijpefs.nonolympictimes.org
OBESITY DETRIMENTAL TO WOMEN’S HEALTH
DR. UDAY N. MANJAREa AND MS. KAVITA KHOLGADEb
aDegree College of Physical Education bDirector of Physical education, Amravat, S.M.R.K.-B.K.-A.K. Mahila Mahavidyalaya, Nashik
Abstract
Obesity is the detrimental to overall health and physical performance. Excess amount of body fat is linked to several diseases
including type 2 diabetes mellitus, hypertension, hyperlipidemia, cardiovascular diseases and certain type of cancers, and
they increase the morbidity and mortality. The mortality rate increases by 50% to 100% when the body mass index (BMI) is
equal to or greater than 30Kg.m-2 .Most of the women after 30‘s suffered from abdominal obesity or disproportion in hip and
waist ratio. It appears to serve as platform for variety of clinical health problems, in addition to greater risk of serious illness.
It poses other mechanical limitation that limit performance of daily activities. As individual ages, they may lose the ability to
regulate energy intake based on physiologic cues, leading to overeating and weight gain. High caloric food with low in
nutrients density and sedentary life style are two major causes of obesity. Several methods are used to determine a person‘s
ideal body weight; however in many cases especially for athletes, ideal body weight may be unrealistic. Thus, it is better to
focus on a healthy body weight rather than ideal body weight. Healthy body weight is different for each individual, athlete or
non athlete, and is one that is relative to a person‘s overall health profile. Prevention of weight gain would likely to decrease
chronic disease, improve quality of life and decrease health care cost. So, weight management is required by an every
individual by increasing the physical activity every day with proper diet.
Key words: obesity, BMI, weight management, healthy body weight.
INTRODUCTION:
Obesity has reached epidemic proportions in India in the 21st century, with morbid obesity affecting 5% of the country's
population. India is following a trend of other developing countries that are steadily becoming more obese. Obesity is
detrimental to overall health and physical performance. In India women‘s health is never considered a priority in compare to
men‘s health. But now this concept is changing and women‘s are also aware of their health. In today‘s glamorous world
every woman wants to be slim with flat abs. Excess amount of body fat is linked to several diseases including type 2 diabetes
mellitus, hypertension, hyperlipidemia, cardiovascular diseases and certain type of cancers, and they increase the morbidity
and mortality. The mortality rate increases by 50% to100% when the body mass index (BMI) is equal to or greater than
30Kg.m-2 .Most of the women after 30‘s suffered from abdominal obesity or disproportion in hip and waist ratio. It appears
to serve as platform for variety of clinical health problems, in addition to greater risk of serious illness. It poses other
mechanical limitation that limit performance of daily activities. As individual ages, they may lose the ability to regulate
energy intake based on physiologic cues, leading to overeating and weight gain. High caloric food with low in nutrients
density and sedentary life style are two major causes of obesity.Several methods are used to determine a person‘s ideal body
weight; however in many cases especially for athletes, ideal body weight may be unrealistic. Thus, it is better to focus on a
healthy body weight rather than ideal body weight. Healthy body weight is different for each individual, athlete or non
athlete, and is one that is relative to a person‘s overall health profile. Obesity (BMI ≥ 30 Kg. m-2) and overweight (BMI 25 to
29.5 Kg.m -2) are serious health issue in India and other developing countries. Body weight is one of the components of
Body composition. It is measured by a balance beam or digital scale and compared with height and weight table. Now the
question arises, how the normal body weight is important. Normal bodyweight is very important for healthy life; it reduces
the risk of disease. Because overweight is one of the biggest cause of many disease. The normal body weight range in Body
mass index is 18.5 to 24.5. i.e. if, the person is having the BMI within the range of 18.5 to 24.5 is normal weight.
Inte
rnat
ion
al J
ou
rnal
of
Physi
cal
Edu
cati
on
, F
itn
ess
and
Sp
ort
s-IJ
PE
FS
39
International Journal of Physical Education, Fitness and
Sports-IJPEFS Vol.2. No.1.March 2013, ISSN 2277-5447
Website: http://www.ijpefs.nonolympictimes.org
WHAT RESEARCH SAYS?
Obesity is prevalent among all the age groups and is on the rise among adults especially the women worldwide in both
developed and developing countries (Wang and Hoy 2004, Flegal 2005). In 2008, 34% of U.S adults were considered obese.
―Recent data from the Indian National Family Health Survey of 1998-1999 shows the major nutrition problem facing women
continues to be under-nutrition, but 12 percent of the women found classified as overweight, and 2 percent were obese,‖
(postdoctoral fellow Dr. Paula Griffiths). ―In the large cities of Andhra Pradesh, where 4 percent of the sample lives,
researcher found 37 percent of women were overweight or obese.‖ Research revels about 10% cause of infertility is because
of obesity. The major affect of obesity in women is hormonal imbalance which causes infertility. The production of excess
fat cell manufactures plenty of hormone estrogen. Too much of estrogen in women works in similar manner as if it were on
birth control pills. It results in the egg not being released. This situation may give rise to some medical condition known as
polycystic ovary syndrome (PCOS).
According to NFHS (National Family Health Survey) based data from 2007, In India 16% females are obese and rank 15 in
world, in Maharashtra 18.1% females are obese and rank 13 in Indian states.
CAUSES OF OBESITY
1. Diet - Diet high in fat, salt and sugar are directly linked to obesity. ―Fast food‖ diets are significant weight gain issues.
Meal size is also related to obesity. In many cases, people that typically eat oversized portions at meal time will be at a
higher risk for obesity.
2. Genetics - Some people have a family history of chronic illness, and obesity can be one of them. Weight loss is more
difficult in people with slower metabolisms than an average person. If the person has inherit a sluggish metabolism, insulin
insensitivity or even diabetes, than the person is at higher risk category for obesity and need medical and possibly dietary,
intervention to prevent obesity.
3. Lack of Exercise - It is one of the important causes to obesity. Sedentary lifestyle and stressful working conditions leads to
obesity. Person has to spend a majority of day moving instead of sitting (at computers, in front of the TV, playing video
games. etc.).
4. Medical Abnormalities - Sometimes, healthy people suddenly start gaining weight rapidly, without deviating from their
normal diet or exercise routine. That could be a sign of a medical problem (like stress hyperthyroidism or diabetes) or a
hormone imbalance.
TYPE OF OBESITY
1. Android type – It is characterized by a distribution of fat on abdominal wall, oblique, chest and upper back. Weight loss
with this fat pattern is usually easier, but the risk of diseases is high. This type is more common in men but after
menopause common in women.
2. Gynoid type - It is characterized by a distribution of fat on buttock, hips and thighs. This type of fat is more difficult to
lose, and the risk of diseases is less. This type is more common in women.
OBJECTIVE:
1. To study the percentage of overweight and obese women in Nasik city.
2. To know the health risk factor in overweight and obese women.
METHODOLOGY:
The study was undertaken to know the overweight and health related risk factors in women‘s of Nasik city.

Inte
rnat
ion
al J
ou
rnal
of
Physi
cal
Edu
cati
on
, F
itn
ess
and
Sp
ort
s-IJ
PE
FS
40
International Journal of Physical Education, Fitness and
Sports-IJPEFS Vol.2. No.1.March 2013, ISSN 2277-5447
Website: http://www.ijpefs.nonolympictimes.org
Sample size:
Women respondents between the age of 30-60 years were selected from Nasik city for survey, with help of random sampling
100 women were selected and their height and weight were measured for calculating the BMI. Questionnaire was prepared
to elicit the information about the health related risk factors in overweight and obese women.
For calculating the (Body Mass Index) the following formula was adopted.
BMI= Weight (Kg) /Height (meters2)
RESULTS:
Table No.1: Frequency and Percentage Distribution of the respondents as per their BMI
Age Range
n=100
Under weight
(BMI ≥ 18 Kg m-2 )
Normal weight
BMI(18.5kg m-2to
24.5Kg m-2
Overweight
BMI(25 to 29.5
Kg.m -2)
Obese (BMI≥ 30
Kg. m-2 )
f % f % f % f %
30yrs -40yrs(40 sample) 11 11%
04 04% 17 17% 08 8%
40yrs -50yrs(40 sample) 08 08% 06 06% 16 16% 10 10%
50yrs -60yrs (20 sample) 00 00 05 5% 08 8% 07 7%
Total
19 19% 15 15% 41 41% 25 25%
From the above table it can be interpreted that from the total no. of respondents forty one respondents were overweight and
twenty five respondents were obese.

Inte
rnat
ion
al J
ou
rnal
of
Physi
cal
Edu
cati
on
, F
itn
ess
and
Sp
ort
s-IJ
PE
FS
41
International Journal of Physical Education, Fitness and
Sports-IJPEFS Vol.2. No.1.March 2013, ISSN 2277-5447
Website: http://www.ijpefs.nonolympictimes.org
Table no.2 Percentage distribution of the respondents showing health related risk
Health risk Under weight
Normal weight Overweight Obese
Primary risk 8% 2% 24% 15%
Secondary risk - - 7% 10%
It can be concluded that twenty four percent overweight and fifteen percent obese women are at primary health risk and only
seven percent and ten percent of them are at secondary risk.
CONCLUSION:
The study shows that out of hundred women‘s 41% are overweight and 25% are obese by calculating there BMI. Overweight
and obesity may increase the health risk among the women. It was found during the study that 24% overweight women‘s are
at primary risk category and 7% are at secondary health risk, similarly 15% of obese women‘s are at primary risk and 10% at
secondary risk. Obesity in women with sedentary lifestyle can
lead to health risk factors and may rise to many diseases like hypertension, Diabetes type II, bone and joint problem etc
.Weight management has to be very important with proper diet and exercise and hence weight loss exercise was
recommended to the overweight and obese respondents
REFERENCES:
[1] Calhoun, S. and et.al. (1999): ―Personal Training‖. San Pedro, CA.
[2] Mahapotra, Priya (Nov.2008): ―Obesity affects Fertility‖, Pune.
[3] Wolters, Kluwer, sixth edition (2010),‖ACSM‘s Resource Manual for Guidelines for Exercise Testing and
Prescription‖ 351 West Camden Street Baltimor, MDI 21201.

Inte
rnat
ion
al J
ou
rnal
of
Physi
cal
Edu
cati
on
, F
itn
ess
and
Sp
ort
s-IJ
PE
FS
42
International Journal of Physical Education, Fitness and
Sports-IJPEFS Vol.2. No.1.March 2013, ISSN 2277-5447
Website: http://www.ijpefs.nonolympictimes.org
ANTHROPOLOGICAL MEASUREMENT OF WOMEN’S NATIONAL AND
INTERNATIONAL LEVEL FOOTBALL PLAYERS OF MANIPUR
NONGMAITHEM SUNDERLAL SINGHa aKakching Paji Leikai (makha Lou), P.O/P.S: Kakching, Dist: Thoubal, Manipur, Pin: 795103
Abstract
Body measurement was one of the important factors which affect to our performance level. The purpose of this
research was to measure the level of selected anthropological measurements between the goalkeepers, backs, midfielders and
strikers of national and international level women‘s football players of Manipur. Under the Descriptive research comparison
was predicted from 81 women‘s players those who had participated national and international level of competition and these
players are recently participating in state level competition organized by All Manipur Football Association. The collected
data was analysis by using Duncan‘s Range Test significant at 0.05 level of confidence.
Goal keepers were significantly found higher in weight than Half, striker; backs were significantly higher in
weight than striker; Goal keepers were significantly higher in height than all the position of players back, Half, striker;
goalkeepers were significantly different in BMI then the back and backs were significantly higher than strikers; in neck
circumference the significant different found in goalkeeper than the half and striker position of players; goalkeepers were
significantly lower in upper arm circumference than back and half, backs were significantly higher in upper arm
circumference than the striker position of players; backs were significant higher in fore arm circumference than strikers but
no significant different found to other different position of players; back were higher thigh circumference than Goalies, Half
and Strikers; no significant difference found in calf circumference.
Keywords: Anthropological, comparative study, national and international, Duncan‘s range test, body girth.
Introduction:
From the origin of our life, our first view comes to the body. Even now our ancestor uses to say about the body
size, height and posture. They classified the body type suited to the related event of sport. In Manipur, football women team
are considerable one, as per Senior National Women‘s Football Championship Manipur become top most, most time winner
of the championship is Manipur, and 3 times become only the runner since from 1991-1992 championship to till 2010-2011
championship. The contributions are very high in national level, but still there is need of improvement for better
performance. Sports historians claim that soccer is the oldest team sport in the world. While no one is quite sure exactly
where it began, they know that a kicking game called tsu chu was played by the Chinese over 2,500 years ago, ‗‗where
participants tried to kick a leather ball filled with hair between bamboo poles‖. There are many factors which are related to
sport performance; in common we can say the performance is combination of fitness, skill ability, motor control and motor
educability. Ideally speaking person having good performance is not enough with practice. Genetic play vital role in
performing physical activities. Generally we look first the structure of the body who big the individual is, how height or how
weight. It gives the some idea that the common thinking may have the change to be right in reality.
Sorojini had conducted a study to 38 Meitei women football players and another 100 non- athlete women
individuals, who have at least attained 18 years of age been collected. Majority of the football players (71.05%) were
national and international level players, while the rest (28.95%) were state level players. Based on 27 anthropometric
variables inclusive of 3 skin fold measurement, reports for the first time, on women football players, specially of India. At
large, the football players with 153.84 cm as mean stature show quite similar features in linear and limb measurements with
the controlled group who also have a mean stature of153.94 cm, except that of the former have significantly larger bi-
trochanteric and bi-iliocristale breadths and of neck, upper arm girth, fore arm girth and thigh and calf girth measurements.
Moreover, the players too show larger proportions or mean Z values in the same above 4 limb girth measurements, bi-
iliocristale breadths and lean body mass, than the controlled group and the differences are significant. Having
withstructurally larger physical features and body proportions, specially, of upper arm, fore arm, thigh and calf girth
measurements, bi-trochanteric and bi-iliocristale breadths and heavier body weight from the non athletes, when many other
linear and limb measurements are found to be similar between the two groups of the Meitei women sample, may be due to
the course of development which took place after the long term regular and rigorous physical exercise and nutritional intake
pattern among the players. Drawing of athlete and the non-athlete samples in bigger size comparatively from the larger
families and also from the lower social class status families, may be in consonant with the general sociodemographic and
economic background of the population of the state which belonged to the lower per capita income of Rs 12,228/- against Rs

Inte
rnat
ion
al J
ou
rnal
of
Physi
cal
Edu
cati
on
, F
itn
ess
and
Sp
ort
s-IJ
PE
FS
43
International Journal of Physical Education, Fitness and
Sports-IJPEFS Vol.2. No.1.March 2013, ISSN 2277-5447
Website: http://www.ijpefs.nonolympictimes.org
17,530/ - for all India (Finance Department, Govt. of Manipur, 2002). The trend of producing more athletes of
team games such as football, hockey and basketball etc. not from the higher social class groups have also been observed
even in western societies (Roy and Uday, 1996). Apart from all, encouragement and the apparent socio-cultural sanction of
the women in games and sports like in the field of arts and culture, seems to have contributed profoundly in enhancing sports
pursuits of the Meitei women. Nandalal conducted a comparative study on selected muscular strength, flexibility and body
composition of state and national level football, volleyball and handball players of Manipur, 300 male players age range
from 17-25 years has taken 50 players for each group were randomly selected. The data pertaining to all the selected
variables obtained through 3 groups were statistically analysed employing F-test (analysis of variance) for selected muscular
strength, flexibility and body composition. Significant difference obtained on muscular strength (abdominal strength) body
composition (fat %) body composition (lean body mass) among state level football, volleyball and handball players and no
significant difference were obtained in the shoulder strength, back strength, explosive leg strength, flexibility and body
composition (total body fat) . No significant different obtain among national level football, volleyball and handball players.
No significance differences obtained among state and national level football players. Significant different obtained on back
strength among state and national level volleyball player. Where as no significant different were obtain in abdominal
strength, shoulder strength, explosive leg strength, flexibility, body fat % , lean body mass and total body fat. Significant
difference obtained on back strength, flexibility, % of body fat among state and national level handball players where as no
significant differences obtained in abdominal strength, shoulder strength, explosive leg strength, flexibility, body
composition (lean body mass and total body fat). Tujare had conducted a profile study of collegiate football players in Pune
University. Health related physical fitness, motor fitness, football skill and psychological profiles of attackers, goalkeepers,
defenders and midfielders are not parallel. It seems that the health related fitness, motor fitness; football skill profiles could
contribute better psychological profiles of the football players. Health related physical fitness, motor fitness, football skill
and physiological profiles of attackers, goalkeepers, defenders and midfielders are not parallel. It seems that the health
related fitness, motor fitness; football skill profiles could contribute better physiological profiles of the football players.
Health related physical fitness, motor fitness; football skill profiles of attackers, goal keepers, defenders are parallel. It seems
to be Health related physical fitness profiles could not contribute better motor fitness profiles of the football players. Motor
fitness profiles could not contribute better skill profiles of the football players. The results help to consider seeing the
different aspect of physical responses with related to the position of the play the research had chosen this research work to
find out the different level of anthropological measurement of the women‘s football players.
Method:
The scholar would like to compare the selected nine variables (viz. Height, weight, BMI and neck, upper arm, fore
arm, waist, thigh and calf circumference.) of anthropological measurement between women‘s football players. The subjects
for this study were 81 (eighty one) women‘s football players who participate in national and international competitions.
Besides, the subjects had participated recently in the state level competitions organized by All Manipur Football Association.
It was found that the maximum six clubs participate in the state competitions and from that the maximum 81 players were
drawn out. The players‘ distribution in women‘s football players are shown in table no. 1 below. The tester‘s reliability was
established with the help of test retest method, the performance of ten subjects selected at random on the selected variables
were recorded several times under identical conditions by the research scholar. A Pearson‘s Product Moment Correlation
was computed between the two measures of each variable, the reliability coefficient had shown higher values. Body weight
(.992), stature or standing height(.990), body mass index (BMI) (.993), Neck circumference (.980), upper (.943) and fore
arm (.949) circumference, waist circumference (.913), thigh circumference (.906) and calf circumferences (.895). The
subject of different position of play namely goalie, back, half and striker groups were compared in the selected body
measurement variables statistically analyses with Duncan‘s multi-group design- four groups with unequal N‘s the significant
difference level was fix at 0.05 level of confidence.
Result:
Comparison of body weights between the goalie Gr1, back Gr2, half Gr3 and striker Gr4: The comparison of mean
weight among goalie, back, half and striker of national and international level of Manipur women‘s football players is
presented in Table 2. Group 4 was reliably inferior to groups 2 (mean diff. Rp value -3.06352> Rp = 2.304728 at 0.05 level)
and 1(mean diff. Rp value -3.50389 > Rp = 2.575544 at 0.05 level), but no reliable difference with group 3. Group 3 was
reliably inferior to group 1(mean diff. Rp value -3.18889 > Rp = 2.304728 at 0.05 level), but no reliable difference with 2.
Group 2 had no reliable difference with group 1. Group 1 was reliably superior to groups 3 and 4.
Comparison of height between the goalie, back, half and striker of women’s football players: The comparison of mean
height among Goalie, back, half and striker of National and International level Manipur women‘s football players is
presented in Table 3. Group 4 was reliably inferior to group 1(mean diff. Rp value -0.053 > Rp = 0.030216 at 0.05 level), but

Inte
rnat
ion
al J
ou
rnal
of
Physi
cal
Edu
cati
on
, F
itn
ess
and
Sp
ort
s-IJ
PE
FS
44
International Journal of Physical Education, Fitness and
Sports-IJPEFS Vol.2. No.1.March 2013, ISSN 2277-5447
Website: http://www.ijpefs.nonolympictimes.org
no reliable difference with groups 2 and 3. Group 3 was reliably inferior to group 1(mean diff. Rp value -0.0792 > Rp =
0.027039 at 0.05 level), but no reliable difference with 2. Group 2 was reliably inferior to group 1(mean diff. Rp value -
0.05852 > Rp= 0.03559 at 0.05 level). Group 1 was superior in height from other three groups.
Comparison of BMI between the goalie, back, half and striker: The comparison of mean BMI (body mass index) among
Goalie, back, half and striker of National and International level women‘s football players is presented in Table 4. Group 4
had no reliable difference with groups 1 and 3, but was reliably inferior to group2 (mean diff. Rp value -1.40664 > Rp =
0.935017 at 0.05 level). Group 3 had no reliable difference with groups 1 and 2. Group 2 was reliably superior to group
1(mean diff. Rp value 1.468569 > Rp = 1.230704 at 0.05 level).
Comparison of Neck circumference between the goalie, back, half and striker: The comparison of mean score of neck
circumferences among Goalie, back, half and striker of National and International level women‘s football players is
presented in Table 5. Group 4 was reliably inferior to group 1(mean diff. Rp value -0.35944 > Rp = 0.331567 at 0.05 level),
but no reliable difference with groups 2 and 3. Group 3 was reliably inferior to group 1 (mean diff. Rp value -0.43644 > Rp =
0.296793 at 0.05 level), but no reliable difference with group 2. And there were no reliable difference between the group 2
and group 1.
Comparison of Upper arm circumferences between the goalie, back, half and striker: The comparison of mean score of
upper arm (circumference) among Goalie, back, half and striker of National and International level Manipur women‘s
football players is presented in Table 6. Group 4 had no reliable difference with groups 1 and 3, but reliably inferior to group
2 striker (mean diff. Rp value -0.5625 > Rp = 0.495902 at 0.05 level). Group 3 was reliably superior to group 1 (mean diff. Rp
value 0.523778 > Rp = 0.495902 at 0.05 level), no reliable difference with group 2. Group 2 was reliably superior to group 1
(mean diff. Rp value 0.727778 > Rp = 0.652724 at 0.05 level).
Comparison of fore arm circumferences between the goalie, back, half and striker: The comparison of mean score of
fore arm (circumferences) among Goalie, back, half and striker of National and International level women‘s football players
is presented in Table 7. Gr4 was reliably inferior to Gr2 (mean diff. Rp value -0.49398 > Rp = 0.466183 at 0.05 level) and no
reliable differences between Gr4-Gr1, Gr4-Gr3 and Gr3-Gr2.
Comparison of waist circumferences between the goalie, back, half and striker: The comparison of mean score of waist
circumference among Goalie, back, half and striker of National and international level Manipur women‘s football players is
presented in Table 8. Group 4 had no reliable differences with groups 1, 2 and 3. Group 3 was reliably inferior to groups
1(mean diff. Rp value -1.15333 > Rp = 0.924618 at 0.05 level) and 2 (mean diff. Rp value -1.2737 > Rp = 1.217017 at 0.05
level). But there were no reliable differences between Gr2-Gr1.
Comparison of thigh circumferences between the goalie, back, half and striker: The comparison of mean score of thigh
circumference among Goalie, back, half and striker of National and international level Manipur women‘s football players is
presented in Table 9. Group 4 was no reliable differences with groups 1 and 3, but was reliably inferior to group 2 (mean
diff. Rp value -1.30685 > Rp = 0.560856 at 0.05 level). Group 3 had no reliable difference with group 1, but was reliably
inferior to group 2(mean diff. Rp value -0.89185 > Rp = 0.738219 at 0.05 level). Group 2 was reliably superior to group 1
(mean diff. Rp value 1.085185 > Rp = 0.738219 at 0.05 level).
Comparison of calf circumferences between the goalie, back, half and striker: The comparison of mean score of calf
circumference among Goalie, back, half and striker of National and International level women‘s football players is presented
in Table 10. The comparisons of group‘s values are compared with the related Rp value, from the comparison of calf
circumference between goalie, back, half and striker: There are no reliable difference between the Groups 1, 2, 3 and 4.
Discussion:
Goal keepers were significantly higher in weight than Half (mean diff. Rp value -3.18889 > Rp = 2.304728 at 0.05
level), striker (mean diff. Rp value -3.50389 > Rp = 2.575544 at 0.05 level), backs were significantly higher in weight than
striker (mean diff. Rp value -3.06352 > Rp = 2.304728 at 0.05 level); table 25 and 26 indicated Goal keepers were
significantly higher in height than all the position of players back (mean diff. Rp value -0.05852 > Rp= 0.03559 at 0.05 level),
Half (mean diff. Rp value -0.0792 > Rp = 0.027039 at 0.05 level), striker (mean diff. Rp value -0.053 > Rp = 0.030216 at 0.05
level); goalkeepers were significantly different in BMI then the back (mean diff. Rp value 1.468569 > Rp = 1.230704 at 0.05
level) and backs were significantly higher than strikers (mean diff. Rp value -1.40664 > Rp = 0.935017 at 0.05 level); in neck
circumference the significant different were sown in table 31 and 32 by goalkeeper than the half (mean diff. Rp value -
0.43644 > Rp = 0.296793 at 0.05 level) and striker (mean diff. Rp value -0.35944 > Rp = 0.331567 at 0.05 level) position of
players; goalkeepers were significantly lower in upper arm circumference than back (mean diff. Rp value 0.727778 > Rp =
0.652724 at 0.05 level) and half (mean diff. Rp value 0.523778 > Rp = 0.495902 at 0.05 level), backs were significantly
higher than the striker (mean diff. Rp value -0.5625 > Rp = 0.495902 at 0.05 level) position of players; backs were significant
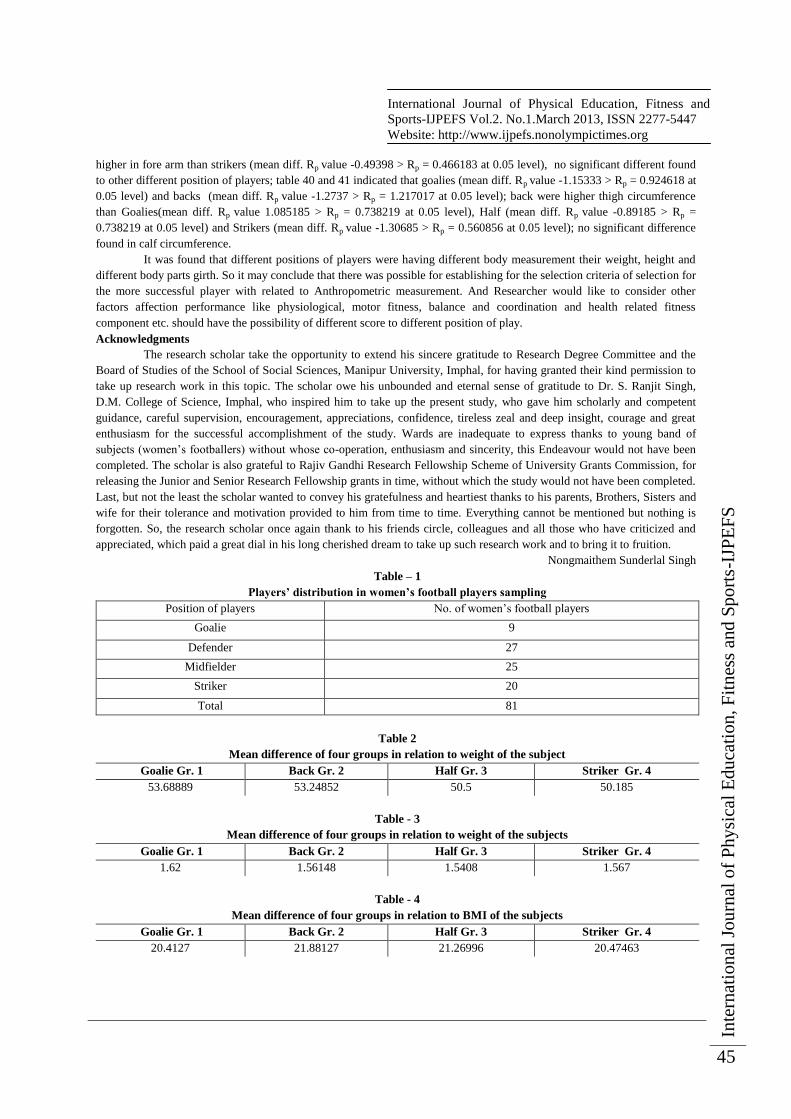
Inte
rnat
ion
al J
ou
rnal
of
Physi
cal
Edu
cati
on
, F
itn
ess
and
Sp
ort
s-IJ
PE
FS
45
International Journal of Physical Education, Fitness and
Sports-IJPEFS Vol.2. No.1.March 2013, ISSN 2277-5447
Website: http://www.ijpefs.nonolympictimes.org
higher in fore arm than strikers (mean diff. Rp value -0.49398 > Rp = 0.466183 at 0.05 level), no significant different found
to other different position of players; table 40 and 41 indicated that goalies (mean diff. Rp value -1.15333 > Rp = 0.924618 at
0.05 level) and backs (mean diff. Rp value -1.2737 > Rp = 1.217017 at 0.05 level); back were higher thigh circumference
than Goalies(mean diff. Rp value 1.085185 > Rp = 0.738219 at 0.05 level), Half (mean diff. Rp value -0.89185 > Rp =
0.738219 at 0.05 level) and Strikers (mean diff. Rp value -1.30685 > Rp = 0.560856 at 0.05 level); no significant difference
found in calf circumference.
It was found that different positions of players were having different body measurement their weight, height and
different body parts girth. So it may conclude that there was possible for establishing for the selection criteria of selection for
the more successful player with related to Anthropometric measurement. And Researcher would like to consider other
factors affection performance like physiological, motor fitness, balance and coordination and health related fitness
component etc. should have the possibility of different score to different position of play.
Acknowledgments
The research scholar take the opportunity to extend his sincere gratitude to Research Degree Committee and the
Board of Studies of the School of Social Sciences, Manipur University, Imphal, for having granted their kind permission to
take up research work in this topic. The scholar owe his unbounded and eternal sense of gratitude to Dr. S. Ranjit Singh,
D.M. College of Science, Imphal, who inspired him to take up the present study, who gave him scholarly and competent
guidance, careful supervision, encouragement, appreciations, confidence, tireless zeal and deep insight, courage and great
enthusiasm for the successful accomplishment of the study. Wards are inadequate to express thanks to young band of
subjects (women‘s footballers) without whose co-operation, enthusiasm and sincerity, this Endeavour would not have been
completed. The scholar is also grateful to Rajiv Gandhi Research Fellowship Scheme of University Grants Commission, for
releasing the Junior and Senior Research Fellowship grants in time, without which the study would not have been completed.
Last, but not the least the scholar wanted to convey his gratefulness and heartiest thanks to his parents, Brothers, Sisters and
wife for their tolerance and motivation provided to him from time to time. Everything cannot be mentioned but nothing is
forgotten. So, the research scholar once again thank to his friends circle, colleagues and all those who have criticized and
appreciated, which paid a great dial in his long cherished dream to take up such research work and to bring it to fruition.
Nongmaithem Sunderlal Singh
Table – 1
Players’ distribution in women’s football players sampling
Position of players No. of women‘s football players
Goalie 9
Defender 27
Midfielder 25
Striker 20
Total 81
Table 2
Mean difference of four groups in relation to weight of the subject
Goalie Gr. 1 Back Gr. 2 Half Gr. 3 Striker Gr. 4
53.68889 53.24852 50.5 50.185
Table - 3
Mean difference of four groups in relation to weight of the subjects
Goalie Gr. 1 Back Gr. 2 Half Gr. 3 Striker Gr. 4
1.62 1.56148 1.5408 1.567
Table - 4
Mean difference of four groups in relation to BMI of the subjects
Goalie Gr. 1 Back Gr. 2 Half Gr. 3 Striker Gr. 4
20.4127 21.88127 21.26996 20.47463

Inte
rnat
ion
al J
ou
rnal
of
Physi
cal
Edu
cati
on
, F
itn
ess
and
Sp
ort
s-IJ
PE
FS
46
International Journal of Physical Education, Fitness and
Sports-IJPEFS Vol.2. No.1.March 2013, ISSN 2277-5447
Website: http://www.ijpefs.nonolympictimes.org
Table - 5
Mean difference of four groups in relation to Neck circumference
Goalie Gr. 1 Back Gr. 2 Half Gr. 3 Striker Gr. 4
12.44444 12.16852 12.008 12.085
Table - 6
Mean difference of four groups in relation to upper arm (circumferences) of the subjects
Goalie Gr. 1 Back Gr. 2 Half Gr. 3 Striker Gr. 4
8.922222 9.65 9.446 9.0875
Table - 7
Mean difference of four groups in relation to fore arm (circumferences) of the subjects
Goalie Gr. 1 Back Gr. 2 Half Gr. 3 Striker Gr. 4
8.5 8.481481 8.344 7.9875
Table - 8
Mean difference of four groups in relation to waist (circumference) of the subjects
Goalie Gr. 1 Back Gr. 2 Half Gr. 3 Striker Gr. 4
30.83333 30.9537 29.68 30.125
Table – 9
Mean difference of four groups in relation to thigh (circumferences) of the subjects
Goalie Gr. 1 Back Gr. 2 Half Gr. 3 Striker Gr. 4
18.91667 20.00185 19.11 18.695
Table - 10
Mean score difference of four groups in relation to calf circumferences of the women’s football players
Goalie Gr. 1 Back Gr. 2 Half Gr. 3 Striker Gr. 4
12.95 13.27593 13.142 12.975
References:
[1] David Ominsky and P. J. Harari (1999), ―Soccer Made Simple: A Spectator‘s Guide, rev. ed.‖, Los Angeles: First
Base Sports, Pp 75-76.
[2] Dr. Devinder K. Kansal (1996), ―Test and Measurement in sports and physical education‖, New Delhi: D.V.S.
Publications, P-111.
[3] Dr. L. Santosh Singh (2010), ―An Outline of All Manipur Football Association (AMFA) in Historical
Perspective‖, 90 MINUTES. Vol no.2, Issue – 2, Baghajatin, Kolkata- 700092, west Bengal, India, Pp 41-42.
[4] Hijam Sorojini Devi (2002), ―Anthropometry of Meitei Women Athletes of Manipur‖, Ph.D Thesis, Department of
Anthropology, Manipur University, Canchipur, Imphal.
[5] http://en.wikipedia.org/wiki/India_women's_football_championship (accessed on November 2011).
[6] M. Rajamanickam (2001), ―Statistical Method in Psychological and Educational Research‖, New Delhi: Ashok
kumar Mittal concept publishing company, P.123-125.
[7] Penny Hastings (1999), ―Sports for Her: A Reference Guide for Teenage Girls‖, Greenwood Publishing Group:
Westport, Connecticut, London, Pp. 79-80
[8] Th. Nandalal Singh (2005), ―Comparison of selected muscular strength, flexibility and body composition of state
and national level players of Manipur‖, Ph. D Thesis, Department of Education, Manipur University, Canchipur,
Imphal.
[9] Vinayak Peter Tujare (2006), ―Psycho-physiological fitness and skill profiles of collegiate football players in Pune
University‖, Ph. D Thesis, Pune University.

Inte
rnat
ion
al J
ou
rnal
of
Physi
cal
Edu
cati
on
, F
itn
ess
and
Sp
ort
s-IJ
PE
FS
47
International Journal of Physical Education, Fitness and
Sports-IJPEFS Vol.2. No.1.March 2013, ISSN 2277-5447
Website: http://www.ijpefs.nonolympictimes.org
SIGNIFICANCE OF PHYSICAL EDUCATION FOR SCHOOL STUDENTS
DR. SANTOSH KUMAR MISHRAa aTechnical Assistant, Population Education Resource Centre,
Department of Continuing and Adult Education and Extension Work, S. N. D. T. Women's University,
Patkar Hall Building, First Floor, New Marine Lines, Mumbai - 400020, Maharashtra, India,
Abstract
Physical education fosters personal and community wellness by empowering students to attain healthy, lifelong attitudes and
behaviors through physical activity as part of the total educational experience. It:
promotes a physically active lifestyle;
o is a link to good health;
o is a preventive measure against disease;
o is a program for muscle strength and fitness;
o promotes academic learning;
o builds self esteem; and
o develops cooperation, teamwork and sportsmanship skill
The purpose of physical education is to instill in students, at an early age, the value of self preservation and choosing a
lifestyle that is good for both the mind and body. Most physical education programs are holistic. The program allows student
to interact together to a common goal and that is to win and excel physically. It brings out the competitive sides of students
working both body and mind but also promotes sportsmanship. This paper primarily aims to ―give an insight into the health
benefits of physical education programs for students within the school system‖. It also provides legislative / regulatory
recommendations for the purpose of improving the quality of physical education. The paper concludes that by addressing the
quality, quantity and intensity of physical education across the country (the educational as well as the activity component),
policymakers will maximize children‘s potential for a lifetime of:
physical activity,
health, and
wellness.
Key words: Physical education, school, students, active living, health, program, education, and strategies.
1. Introduction:
Quality, daily physical education in the nation‘s schools is an important part of a student‘s comprehensive, well-rounded
education program and a means of positively impacting life-long health and well-being. The optimal physical education
program will foster a lifetime commitment to physical activity as part of a healthy lifestyle. Ultimately, improved
coordinated school health programs, of which physical education is a central component, will augment other prevention
efforts and help to reverse the growing epidemic of childhood obesity which threatens to undo decades of progress in the
fight against cardiovascular disease. Effective efforts made now will help children avoid a lifetime of chronic disease and
disability.
Physical education develops the students‘ motor skills and hand-eye coordination. It also develops the upper body muscles
through activities like doing pushups as well the lower body muscles (for instance, through stationary jumping jacks, running
and jumping exercises, etc.). Programs usually have core training exercises also like doing abdominal crunches. Physical
health allows students to function even better in classrooms. A good cardiovascular system developed from regular exercise
promotes excellent blood and oxygen circulation. This means more nutrients circulate throughout the body which includes
the brain. This circulation produces longer attention span during classes allowing longer concentration and absorption.
Students who are active in physical activities like basketball, volleyball, martial arts and running just to name a few are more
confident with themselves. It is because of the self discipline and dedication to excel in a sport that brings out the best in
students. In school, the physical education program introduces these sport activities to students, allowing them to make
choices to which sport areas they want to get involved in. This paper aims to give an insight into the health benefits of
physical education programs for students within the school system. It also provides legislative / regulatory recommendations
for the purpose of improving the quality of physical education.

Inte
rnat
ion
al J
ou
rnal
of
Physi
cal
Edu
cati
on
, F
itn
ess
and
Sp
ort
s-IJ
PE
FS
48
International Journal of Physical Education, Fitness and
Sports-IJPEFS Vol.2. No.1.March 2013, ISSN 2277-5447
Website: http://www.ijpefs.nonolympictimes.org
2. Conceptual Framework of Physical Education:
Physical Education fosters personal and community wellness by empowering students to attain healthy, lifelong attitudes and
behaviours through physical activity as part of the total educational experience. A Curriculum Framework for Physical
Education: Adjusting the Focus builds on the belief that learners in a school setting have a fundamental need and desire for
movement. This framework defines physical education as ―that part of the educational experience which provides learners
with the opportunity to become aware of and engage in physical activity that is whole-bodied, intrinsically valuable and
personally meaningful within the context of the learners' social and environmental setting‖.
Physical education, in its broadest sense, contributes to the followings among school students:
Personal Development: Students will be able to, for example:
o make appropriate decisions in relation to physical activity and take responsibility for those decisions;
o explore movement activities purposefully both independently and in groups;
o demonstrate understanding of the relationship between health and an active lifestyle;
o discriminate among a wide variety of active living career opportunities;
o demonstrate leadership and interpersonal skills in relation to active living programs; and
o reflect critically on personal-global issues in relation to active living.
Citizenship: Students will be able to, for example:
o demonstrate understanding of the importance of rules and regulations in society through the application
of rules and principles of fair play in game situations;
o demonstrate understanding of sustainable development and its implications for the environment;
o demonstrate co-operative group skills; and
o demonstrate understanding of the need for social interdependence.
Communication: Students will be able to, for example:
o explore, reflect on, and express their own ideas, learning, perceptions and feelings relating to movement;
o demonstrate understanding of facts and relationships presented through words, numbers, symbols,
graphs and charts, in relation to game or group activities;
o access, process, evaluate and share information relating to health and active living;
o present information and instructions clearly, logically, concisely and accurately for a variety of
audiences;
o interpret, evaluate and express data in everyday language; and
o critically reflect on and interpret ideas presented through a variety of media.
Problem Solving: Students will be able to, for example:
o identify, describe, formulate and reformulate movement problems;
o formulate tentative ideas, and question assumptions to solve movement problems individually and
collaboratively;
o acquire, process and interpret information critically to make informed decisions related to active living;
o use a variety of strategies and perspectives with flexibility and creativity for solving problems;
o frame and test hypotheses;
o ask questions, observe interpersonal relationships, make inferences and draw conclusions;
o identify, describe and interpret different points of view related to active living and distinguish fact from
opinion.
Aesthetic Expression: Students will be able to, for example:
o use various movements as a means of formulating and expressing ideas, perceptions and feelings;
o demonstrate understanding of the contribution of movement to daily life, cultural identity and diversity,
and the economy;
o demonstrate understanding of the ideas, perceptions and feelings of others as expressed in various
movement forms; and
o demonstrate understanding of the significance of cultural resources such as gymnasiums and outdoor
recreational facilities.
Inte
rnat
ion
al J
ou
rnal
of
Physi
cal
Edu
cati
on
, F
itn
ess
and
Sp
ort
s-IJ
PE
FS
49
International Journal of Physical Education, Fitness and
Sports-IJPEFS Vol.2. No.1.March 2013, ISSN 2277-5447
Website: http://www.ijpefs.nonolympictimes.org
Technological Competence: Students will be able to, for example:
o demonstrate understanding of and use existing and developing technologies relating to health and active
living;
o locate, evaluate, adapt, create and share information relating to active living, using a variety of sources
and technologies;
o demonstrate understanding of the impact of technology on health and active living; and
o demonstrate understanding of ethical issues related to the use of technology in a local and personal-
global context.
Spiritual and Moral Development: Students will be able to, for example:
o demonstrate an understanding in game situations that rules of ethical conduct are for the good of society;
o demonstrate a commitment to an active living philosophy that is consistent with the pursuit of peace,
social justice, and respect for the sacredness and dignity of human life; and
o demonstrate an understanding that their actions involve the good of others as well as oneself.
3. Rationale:
Regular physical activity is associated with a healthier, longer life and with a lower risk of heart disease, high blood
pressure, diabetes, obesity, and some cancers. Current recommendations are for children to engage in at least 60 minutes of
physical activity each day. Children spend over half their day in school, so it is reasonable to require that they should get at
least 30 minutes of that time in school.
Physical education should be an important part of that requirement and does more than provide some minutes of moderate-
vigorous activity. It also exposes students to lifetime activities and teaches students how to integrate exercise into their lives.
Since childhood obesity rates continue to rise across the regions of the globe, there is public support for more physical
education in schools. A study conducted by Opinion Research Corporation International for the National Association for
Sport and Physical Education (NASPE) in 2003 indicated that 81% of adults believe that daily physical education should be
mandatory in schools. In a systematic review of physical education programs that increased the amount of time that students
were physically active, students‘ aerobic and physical fitness increased. Additionally, modifying the school physical
education curricula has been found to be effective across diverse racial, ethnic, and socioeconomic groups, among boys and
girls, elementary and high-school students, and in urban and rural settings. Recent research shows that regular exercise can
restore blood vessel function and improve cardiovascular risk factors in obese children. A six-month exercise program has
been found to reduce:
body mass index,
diabetes risk factors, and
low-degree inflammation.
Evidence from the Early Childhood Longitudinal Study published in 2004 showed that physical education programs do have
an impact in combating childhood obesity, especially in young adolescent girls. Just an extra hour of exercise a week
lessened obesity in young overweight girls.
Benefits extend beyond improvement in health status. Studies in California suggest that children who are more physically fit
perform better on standardized mathematics and reading test scores. It has been discovered that:
o children who participate in school physical education programs do not experience a harmful effect on their
standardized test scores, and
o higher grades are associated with vigorous activity.
The quality of the physical education program, not just the time spent being active during physical education, is the foremost
concern. Physical education policy should prioritize quality while, simultaneously and/or subsequently, trying to ―increase
the amount of time children spend in class‖.
The need for children and youth to engage in regular physical activity as a pre-requisite for achieving optimum health has
long been recognized. Regular physical activity results in mental and physical well-being. The best documented evidence
indicates that:

Inte
rnat
ion
al J
ou
rnal
of
Physi
cal
Edu
cati
on
, F
itn
ess
and
Sp
ort
s-IJ
PE
FS
50
International Journal of Physical Education, Fitness and
Sports-IJPEFS Vol.2. No.1.March 2013, ISSN 2277-5447
Website: http://www.ijpefs.nonolympictimes.org
o Active children have more positive attitudes toward physical activity, school and themselves, and academic
performance improves significantly.
o Children who participate in regular positive physical activity programs, especially aerobic activities, have a more
positive self-concept and develop high levels of self- esteem. They exhibit better concentration, show
improvements in discipline, and are less aggressive.
o Regular physical activity can alleviate stress as well as teach children how to recognize and prevent stress.
o Regular physical activity is positively related to muscle strength, size and endurance.
o Regular physical activity generally results in an increase in lean body mass and a decrease in body fat, without any
significant change in body weight.
o Regular physical activity, started in childhood, can increase the peak bone mass of early adulthood, and delay the
onset of osteoporosis (bone loss).
o Active lifestyles are associated with an improvement of eating habits and with a decline in substance abuse such as
smoking and drinking.
o Physical exercise can result in additional years of life expectancy.
4. Dimensions of Physical Education:
The term ―physical education‖ evolved from the more restrictive phrase, ―physical training‖, which has been in use in North
America since the turn of the 20th century. Physical education denotes that the subject is a bona fide field of study in the
public school system. The subject matter of physical education is human movement. This content distinguishes physical
education as a critical and essential component of school curricula. Physical education, as a school subject, is directed
towards understanding human movement, including the human and environmental factors that affect and are affected by
movement. The ways in which people use this ability is related to other aspects of their functioning as whole persons.
Human movement can be viewed in three dimensions:
Education about movement involves the cognitive processes that are concerned with learning concepts, rules and
procedures ranging from simple spontaneous movements to complex structured movements. Learners may draw
upon games, sport, athletics, swimming, rhythmics and dance, and outdoor pursuits in combination with other
disciplines such as anatomy, physiology, physics, psychology, or aesthetics to conduct study and inquiry. At the
primary or elementary level, the theme of ‗movement‘ might take on a project with references to pastimes and
games. This may be conducted within a physical education unit or integrated with other subjects. Movement
concepts such as running, jumping, throwing, catching, turning and twisting might be introduced, observed and
practiced. At the intermediate and senior high levels, knowledge about movement may be broken down into
specialty areas (anatomy, physiology, biomechanics, movement as culture, history of games) or integrated with
other subjects. Education about movement is confined to the transmission and transaction of ―movement
knowledge‖.
Education through movement is concerned with the affective contribution of movement as a means to an end. In
this dimension, movement is used to achieve outcomes such as moral values and conduct, aesthetic understanding
and appreciation, social interaction and socialization, or the use of leisure time that may be extrinsic to any specific
activity.
Education in movement is concerned with the qualities that are an inherent part of movement itself. In this
dimension, movement provides an opportunity to participate in activities that are intrinsically valuable, holistic,
culturally significant, and an important source of personal meaning and knowledge. Education in movement has to
do with knowing how to move, engaging in physical activities and having a direct, lived-body experience with
movement that is intrinsic to any particular physical activity. While education in movement emphasizes the
―learner-as- mover‖, it relates to and draws upon the other dimensions at different times and in varying degrees
according to the situation and setting. It is here, in movement, when the three dimensions meet, that education as
transformation can take place in physical education.
Viewed within these three dimensions, physical education is a form of human knowledge in and about movement that
emphasizes content and process (the what and how of education). Through movement, learners can strive to achieve physical
education outcomes that foster citizenship. All three dimensions are inter-connected to encompass the entire physical activity
experience. Physical education, as a school subject, contributes to the promotion and building of active living schools and
communities.

Inte
rnat
ion
al J
ou
rnal
of
Physi
cal
Edu
cati
on
, F
itn
ess
and
Sp
ort
s-IJ
PE
FS
51
International Journal of Physical Education, Fitness and
Sports-IJPEFS Vol.2. No.1.March 2013, ISSN 2277-5447
Website: http://www.ijpefs.nonolympictimes.org
5. Physical Education as a Medium for Active Living:
Physical Education as a medium for active living in a school setting engages the ―whole person‖:
Physically: through high level participation in appropriately selected activities,
Mentally: through concentration and intensity while learning new concepts and skills,
Emotionally: through the confidence that comes from enjoying established skills,
Socially: through associating with others, and
Spiritually: through satisfaction, contentment, and a sense of inner peace.
Active living contributes to individual wellness through the innate ―experience of the moment‖ and is reinforced on a daily
basis through the knowledge, skills and feelings of enhanced self-esteem and wellness that develop over time. Active living
is a way of life in which physical activity is valued and integrated into daily living. Active living is anchored in three
fundamental axioms that lead to the guiding principles for school physical education:
o Individual: It recognizes that people are active for all sorts of reasons: work, play, challenge and achievement,
health and personal development, contemplation and relaxation, creative and cultural expression, and social
interaction.
o Social: It focuses on the individual, but it also recognizes that social norms and values, available resources,
influential learners and other factors affect our choices and opportunities for participation. Our choices, in turn,
affect these factors.
o Inclusive: It provides essential ways to express who we are as individuals or groups. It is a right of all citizens,
regardless of:
a) ability,
b) age,
c) gender,
d) race,
e) ethnic background,
f) religion,
g) socio-economic status, or
h) educational achievement.
6. Active Living is more than Personal Well-being:
An active living philosophy acknowledges learners as ―being multidimensional persons in an interdependent world‖. Rooted
in the active living axioms, a rationale for physical education must be conceptualized in a way that starts with a holistic view
of learners within a societal and ecological context. This conception must identify the interdependence of personal health
with societal health and environmental or ecological health. On an individual level, physical education, as an agent for health
and wellness, can promote personal responsibility and control for active lifestyles.
However, equally as important, physical education must focus school students‘ attention towards understanding the problems
of the social environment that may inhibit them and others from pursuing active lifestyles. The challenge for physical
education is to engage learners in experiences which require them to take personal responsibility for active and healthy
lifestyles, while critically examining how society and the environment influences individual health in both positive and
negative ways. As examples, provision for outdoor play space in a school yard provides opportunities for active living, while
offering rhythmic activities to females only in a school prolongs stereotyping and restricts male access to valuable movement
experiences. School personnel, as well as students, need to critically examine the social and environmental factors within
their specific school-community settings that both facilitate and impede student participation in physical activity.
Socialization (defined as ―the process by which individuals become involved in physical activity and the roles they adopt‖)
surrounding physical activity appears to occur at a very early age, with males and females encountering differential
treatment. Through study and inquiry in physical education, teachers can encourage students to confront and reshape cultural
norms and values about physical activity, countering the socialization of students toward inequity and inactivity.
Inte
rnat
ion
al J
ou
rnal
of
Physi
cal
Edu
cati
on
, F
itn
ess
and
Sp
ort
s-IJ
PE
FS
52
International Journal of Physical Education, Fitness and
Sports-IJPEFS Vol.2. No.1.March 2013, ISSN 2277-5447
Website: http://www.ijpefs.nonolympictimes.org
7. Suggested Strategies:
A high quality physical education program enhances the physical, mental, and social/emotional development of every child
and incorporates fitness education and assessment to help children understand, improve and/or maintain their physical well-
being. In this matter, following legislative and/or regulatory strategies can be recommended:
Require all schools to develop and implement a planned, sequential physical education curriculum that adheres to
national and state standards for health and physical education;
Hire a physical education coordinator at the state level to provide resources and offer support to school districts
across the state;
Offer regular professional development opportunities to physical education teachers which are specific to the field
and require teachers to keep aware of emerging technologies, model programs, and improved teaching methods;
Add requirements for fitness, cognitive, and affective assessment in physical education that are based on student
improvement and knowledge gain;
Assure that programs have appropriate equipment and adequate indoor and outdoor facilities;
Require that students are active in moderate-vigorous physical activity for at least 50% of class time;
Disallow substitutions for physical education with activities such as marching band or school sports;
Do not allow students to opt out of physical education to prepare for other classes or standardized tests; and
Require physical education for graduation and count the physical education grade as part of students‘ overall
grade-point averages.
8. Conclusion:
Authentic physical education means the use of physical activity as a medium in, through and about which students are
informed and their minds opened. Students who are comfortable with their bodies tend to exhibit a general boost in
confidence and soon become more willing to take risks in other areas of school life, including their academic studies.
Students need to understand that their world is socially constructed, that all knowledge is historically, culturally and socially
situated, and linked to their own personal histories and experiences. Through the process of personal development, students
become active agents in re-creating or transforming the social conditions in their lives on a personal and global level.
Physical education plays a vital role in the students‘ development and growth. According to recent medical studies, physical
well being of a student is directly related to his or her performance whether in class or in the office. At least 50 percent of
class time should be spent in moderate to vigorous physical activity. To sum up, ―by addressing the quality, quantity and
intensity of physical education across the country (the educational as well as the activity component), policymakers will
maximize children’s potential for a lifetime of physical activity, health and wellness‖. Physical education is a social
construct, ―a selection from culture, which contains explicit and implicit values about appropriate missions, goals and
objectives‖.
References:
[1] Meyer, AA, Kundt, G, Lenschow, U, Schuff-Werner, P. Kienast W. (2006). Improvement of early vascular
changes and cardiovascular risk factors in obese children after a six-month exercise program. 48:1865- 1870.
[2] Datar A, Sturm R. (2004). Physical Education in Elementary School and Body Mass Index: Evidence from the
Early Childhood Longitudinal Study. American Journal of Public Health. 94, 9.
[3] public/@wcm/@adv/documents/downloadable/ucm_301654.pdf, Accessed on January 16, 2013.
[4] Sallis, JF, McKenzie, TL, Kolody, B., Lewis, M., Marshall, S., Rosengard P. (1999). Effects of Health-Related
Physical Education on Academic Achievement: SPARK. Research Quarterly for Exercise and Sport. Vol. 70,
No.2.
[5] Coe DP, Pivarnik JM, Womack CJ, Reeves MJ, Malina RM. (2006).Effect of physical education and activity
levels on academic achievement in children. Medicine and Science in Sports and Exercise. Vol. 38, No. 8, 1515-
1519.
[6] http://www.ed.gov.nl.ca/edu/k12/curriculum/documents/physed/ch1.pdf, Accessed on January 16, 2013.
[7] http://bcsd.k12.ny.us/middle/wood/7%20reasons%20why%20PE%20is%20important%2011%2009.htm, Accessed
on January 16, 2013.

Inte
rnat
ion
al J
ou
rnal
of
Physi
cal
Edu
cati
on
, F
itn
ess
and
Sp
ort
s-IJ
PE
FS
53
International Journal of Physical Education, Fitness and
Sports-IJPEFS Vol.2. No.1.March 2013, ISSN 2277-5447
Website: http://www.ijpefs.nonolympictimes.org
SPORTS COMMUNICATION & MODERN TECHNOLOGY MR. TUSHAR KUMAR GANDHIa aField Of Education, Gujarat, India.
Abstract
The best place to see the new world of communication may be the sports field. It encompasses some of the best in
journalism, broadcasting, electronic communication, marketing, advertising, public relations, visual communication and new
media. The stakes for understanding communicative practices may be even greater at the professional level. Especially
because professional sports are inextricably linked to the media that broadcast, report, and opine about the games, it is next
to impossible to escape the influence of professional sports. Live sporting events more available through satellite providers
and Internet feeds, or that fantasy sports have produced an entire industry that is dependent on, but also separate from, sports
themselves, or that community officials often insist that the key to urban development or city pride is to invest in a
professional sports franchise and/or arena, or that player salaries continue to rise, often driving up the cost of attendance
along with them. There are many other features to add to this list. What is critical, once again, is that communication
practices are essential to the success of professional sports from expressions of collective identity found at live events to the
images produced by sports media to the importance granted to sports in the vitality of a community.
Keywords: Sports, communication, social media, historical review, technology
INTRODUCTION
Sports communication I think about the advancement in technology that has broadened the spectrum of sports and athletes.
This includes a radio broadcast, to newspaper articles, to the mass media, the internet and social media. Sport
communication is the engine that reaches out to sport fans and its audience in the sports industry. We have seen that without
sport communication, the many facts of covering sports scores, news updates, and issues within the industry would not be
communicated in a timely manner.
NEWS PAPER AND MAGAZINE
The press is the oldest medium regularly informing people about sports. From the beginning, sports teams showed keen
interest in print media coverage: Newspapers formed the principal means of bringing news of coming events and results of
past events. News of coming events built audiences for sporting contests and, together with the results of past events, helped
to sell newspapers
One of the first publications dealing exclusively
With sports appeared in 18th century England: the Racing Calendar edited by the English Jockey Club. Founded in 1751,
this club for upper-class people regularly informed its members about sporting rules and forthcoming horse races through its
publications. The first sports magazines were also released in England: Sporting Magazine, founded in 1792; and Sporting
Life, in 1821. Both magazines mainly covered horse races as betting on horses became very popular at that time, people
needed information and hints to place their bets. An American pioneer of sports writing was William T. Porter who founded
The Spirit of the Times at the beginning of the 1830s.
RADIO & TELEVISION
Up to the early 20th century, the only way to share the immediate drama of a sports event was either to play or to
attend. But then came radio. The added value of the radio compared to the printed media is the opportunity of live reporting.
From the very beginning the radio took advantage of this asset. Live radio reporting gave the impression of being there, of
being a witness of something emotional and suspenseful. Announcers learned very quickly to give the impression of dense
and dramatic events. Another advantage of the radio was and still is its very fast speed. Results and scores can be diffused
instantaneously in a very flexible program. And the radio medium can reach people at any time anywhere, i.e., in the car, at
the workplace, on the beach, etc. Technically, radio stations and their reporters can very easily be interconnected so that
radio listeners can virtually move from one place to another.
In Great Britain, the BBC radio channel forbade sports news before 7 o‘clock in the evening until 1926. Even in
1928, during the Olympic Summer Games in Amsterdam, BBC sports reporters were only allowed to read news agency
bulletins and only after 6 o‘clock in the evening. At the 1932 Olympic Summer Games in Los Angeles, broadcasting time
was limited to 15 minutes per day.
Television has clearly become the leading medium in the context of sports. Like the radio, this medium allows live
reporting, but because it transmits not Only sound but also live images, the feeling of ―being there‖ is even stronger for
television spectators than for radio listeners. So, with television, major sporting contests are no longer available just to
spectators witnessing the event in person, but also to many millions more who can view the spectacle in their own homes,
thanks to their television sets. The added

Inte
rnat
ion
al J
ou
rnal
of
Physi
cal
Edu
cati
on
, F
itn
ess
and
Sp
ort
s-IJ
PE
FS
54
International Journal of Physical Education, Fitness and
Sports-IJPEFS Vol.2. No.1.March 2013, ISSN 2277-5447
Website: http://www.ijpefs.nonolympictimes.org
value stemming from this medium is evident: close-ups, replays, slow motion, and the different angles from different
cameras, and cameras that follow the action. It can be more exciting to be a spectator in front of the television screen than to
be a spectator in the stadium, far away from the playing field or the arena floor. And, what is most important, television
shows live people, sports-men and -women, usually perfectly built, completely fit, attractive, and highly trained young
people.
The increased number of TV channels due to cable and satellite television made it possible in 1979 to start the first
network in the USA specializing
In sports, ESPN (Entertainment and Sports Programming Network). Other sports channels followed. In Europe, where the
monopoly of public service broadcasters was broken in most countries in the 1970s and 1980s, Euro sport and DSF, a
German sports channel, went on air. The specialized sports channels have also changed the nature of sports reporting by
introducing more entertaining elements.
INTERNET
The Internet allows a fast worldwide transfer of data, so it is well suited to the transmission of short sports news. Portal sites
specialized in sports and the official websites maintained by organizers of sports events continuously report the latest news
and results. These services are very popular, especially during big sports events. The official websites of the 2000 Summer
Olympic Games in Sydney, the 2002 Winter Olympics in Salt Lake City, and the 2002 Soccer World Cup in Japan and
Korea registered billions of page views within a few weeks. Independent sports portal sites are also frequently used.
Websites are comparatively easy to produce and use; with the aid of a search engine, fans can easily find even detailed
information about special topics. So the World Wide Web is also an ideal place for sports information and for those sports
neglected in other media. One of the first websites successfully covering a sports event did not deal with one of the major
sports:
CONCLUSIONS
The modes of sport communication are now more instant than others, for example the newspaper and magazines are a way to
communicate to their fans, but it takes several hours or days after the event has transpired. The more immediate form of
communication is the internet or electronic media, which in today‘s era is where people have the ability to obtain sports
information they are looking for virtually by a click of a mouse, smart phones or tablets. They are the source of information
accessed through various websites, networks, channels and satellite subscriptions. They market themselves for all types of
ages, ethnic groups and demographically because the information is updated by the minute that gives sports fans information
what they desire. In the sports industry, sport communication plays a vital role and as the advancements of technology is
among us the mass media is only going to get bigger moving forward to the future? The communication of sports has the
most powerful influences on society and the lives we live. My belief of the evolution of sport communication with
technology is that you will not have to attend a sporting event in person. There is going to be a venue in place of being able
to attend it from the luxury of your house as if you were really there.
REFERENCES
[1] Aristotle. The Nicomachean Ethics. London: Penguin Books, 2004. Print.
[2] Bryant, J, D Brown, P.W. Comisky, and Drew Zillman. ―Sports and Spectators: Commentary and Appreciation.‖
Journal of Communication. 32.1 (1982): 109-119. Print.
[3] ―Code of Ethics.‖ Society of Professional Journalists, 1996. Web. 11 May 2010. Retrieved from http://www.spj.
org/ethicscode.asp
[4] ESPN.com Home Page. Web. 14 January 2011. Retrieved from http://www.espn.com
[5] Formica, Brian. Elon University, Elon, NC. 12 April 2010. Lecture.
[6] Formica, Brian. ―UPDATE: Conflicting Sources Confirm/Deny Duke‘s Cutcliffe Future.‖ WFMY News 2 Sports
1/14/2010: n. pag. Web. 11 May 2010. Retrieved from http://www.digtriad.com/sports/article.
aspx?storyid=135820&catid=13
[7] Halberstam, David. The Best American Sports Writing of the Century. New York: Houghton Mifflin Company,
1999. Print
[8] Hocking, J.E. ―Sports and Spectators: Intra-audience Effects.‖ Journal of Communication. 32.1 (1982): 100- 108.
Print.
Inte
rnat
ion
al J
ou
rnal
of
Physi
cal
Edu
cati
on
, F
itn
ess
and
Sp
ort
s-IJ
PE
FS
55
International Journal of Physical Education, Fitness and
Sports-IJPEFS Vol.2. No.1.March 2013, ISSN 2277-5447
Website: http://www.ijpefs.nonolympictimes.org
[9] MacCambridge, Michael. The Franchise: A History of Sports Illustrated Magazine. New York, NY: Hyperion,
1998. Print.
[10] McKay, Jim. The Real McKay: My Wide World of Sports. New York, NY: Macmillan, 1973. Print.
[11] Olney, Buster. Elon University, Elon, NC. 14 April 2010. Lecture.
[12] Olney, Buster. ―Sources: Phillies discuss Ryan Howard for Albert Pujols deal.‖ ESPN.com 3/15/2010: n. pag.
Web. 11 May 2010. Retrieved fromhttp://sports.espn.go.com/mlb/news/story?id=4994845
[13] O‘Neil, T. The Game Behind the Game: High Pressure, High Stakes in Television Sports. New York, NY: Harper
and Row, 1989. Print.
[14] Patterson, Ted. The Golden Voices of Baseball. Sports Publishing LLC, 2002. Print.
[15] Pember, Don, and Clay Calvert. Mass Media Law. 2009-2010. New York: McGraw-Hill, 2009. Print.
[16] Powers, R. Supertube: The Rise of Television Sports. New York, NY: Coward-McCann, 1984. Print.
[17] Rader, B.G. In Its Own Image: How Television Has Transformed Sports. New York, NY: Free Press, 1984. Print.
[18] Rice, Grantland. ―Alumnus Football by Grantland Rice.‖ The Running Center. Blogspot.com, 08 Dec 2007. Web.
18 Nov 2010. Retrieved from http://runalot.blogspot.com/2007/12/alumnus-football-by-grantland-rice.html
[19] Rushin, Steve. ―1954-1994: How We Got Here.‖ Sports Illustrated. 16 Aug 1994: 1. Print.
[20] Simmons, Bill. ―The Case of the Accidental Tweeter.‖ ESPN.com 13 OCT 2010: n. pag. Web. 18 Nov 2010.
Retrieved from http://sports.espn.go.com/espn/page2/story?page=simmons/101013&sportCat=nfl
[21] Simmons, Bill. ―Bill Simmons.‖ Twitter. Twitter, 18 Nov 2010. Web. 18 Nov 2010. Retrieved from http://twitter.
com/#!/sportsguy33
[22] Spence, J. Up Close and Personal: The Inside Story of Network Television Sports. New York, NY: Atheneum,
1988. Print.