The Journal of Physical Chemistry 1961 Vol.65 No.5
196
/Vol. 65 May, 1961 No. 5 THE JOURNAL OF PHYSICAL CHEMISTRY (Registered in U. S. Patent Office) CONTENTS Clark M. Welch, Hilton A. Smith and James B. Cole: The Adsorption of Organic Compounds on Raney Nickel. . J. A. Weil, K. V. Sane and J. M. Kinkade, Jr.: The Reac- tion between 2,2-Diphenyl-l-picrylhydrazyl and Ni- trogen Dioxide..................................................................... Mabel M. Chen, Krishna V. Sane, Robert I. Walter and John A. Weil: Solution Paramagnetic Resonance Studies of p-Substituted Hydrazyl Free Radicals........ Patrick N. Walsh and Norman O. Smith: Sublimation Pressure of Solid Solutions. II. The Systems p-Di- ehlorobenzene-p-Dibromobenzene, p-Dichloroben- zene-p-Bromo chlorobenzene, and p-Dibromobenzene- p-Bromochlorobenzene at 50° ........................................... John H. Sullivan: The Thermal Reactions of Hydrogen Iodide with Alkyl Iodides.................................................. F. J. Johnston, Tung-Ho Chen and K. Y. W ong: Effects of Temperature and Added Hexachloroethane on the Radiolysis of Carbon Tetrachloride and Chloroform... B. D. Pollock: The Vaporization Behavior and Thermody- namic Stability of Zirconium Carbide at High Temper- ature....................................................................................... J. Charette, G. Neirynck and Ph. Teyssie: Structural Dependence of Absorption Spectra of beta-Diketone Chelated. II. Ultraviolet............................................. Pasupati Mukerjee: On Ion-Solvent Interactions. I. Partial Molal Volumes of Ions in Aqueous Solution___ Pasupati Mukerjee: On Ion-Solvent Interactions. II. Internal Pressure and Electrostriction of Aqueous So- lutions of Electrolytes......................................................... D. J. C. Yates: Infrared Studies of the Surface Hydroxyl Groups on Titanium Dioxide, and of the Chemisorp- tion of Carbon Monoxide and Carbon Dioxide.............. Assa Lifshitz and B. Perlmutter-Hayman: The Kinetics of the Hydrolysis of Chlorine. II. The Hydrolysis in the Presence of Acetate...................................................... J. F. Mathews and J. J. McKetta: The Thermodynamic Properties of Normal Propyl Alcohol.............................. Richard M. Noyes: More Rigorous Kinetic Expressions for Competitive Processes in Solution............................. D. H. Desty and W. T. Swanton: Gas-Liquid Chroma- tography—Some Selective Stationary Phases for Hy- drocarbon Separations........................................................ Alexander I. Popov and Roger D. Holm: Electric Moment of 3-Ethyl-3-methylglutarimide....................................... Andrew G. De Rocco: On the Second Virial Coefficient for Uncharged Spherical Macromolecules............................ Stuart R. Gunn and LeRoy G. Green: The Heats of For- , mation of Some Unstable Gaseous Hydrides.................. * ' J. P. McCullough, H. L. Finke, W. N. Hubbard, S. S. Todd, J. F. Messerly, D. R. Douslin and Guy Waddington: Thermodynamic Properties of Four Linear Thia- alkanes..................................................... ............................. Margaret Goodgame and F. Albert Cotton: Magnetic In- vestigations of Spin-Free Cobaltous Complexes. IV. Magnetic Properties and Spectrum of Gqbalt(II) Orthosilicate.......................................................... -............. J. P. Dismukes, L. H. Jones and John C. Bailar, Jr. : The . Measurement of Metal-Ligand Bond Vibrations in - Acetylacetonate Complexes........................ L. Newman and P. Klotz: The Interaction of Tri-zT octylamine with Thenoyltrifluoroaeetone and with Hydrochloric Acid...................................... .. . ............... John G. Miller: An Infrared Spectroscopic Study,of the Isothermal Dehydroxylation of Kao Unite at 47G°_:.:. V ..’ A. R. Anderson and Edwin J.ilart: Hydrogen! Yields in- the Radiolysis of Aqueous Hydrogen Peroxide.............. 804 705 L. G. Hepler and W. F. O’Hara: Thermodynamic Theory of Acid Dissociation of Methyl Substituted Phenols in Aqueous Solution................................................................. 811 710 E. J. Lawton and J. S. Balwit: Electron Paramagnetic Resonance Study of Irradiated Polyvinyl Chloride.... 815 S. W. Mayer, T. H. Mills, R. C. Alden and B. B. Owens: 713 Liquidus Curves for Molten Alkali Metaphosphate- Sulfate Systems.................................................................... 822 E. Matijevic, K. G. Mathai, R. H. Ottewill and M. Kerker: Detection of Metal Ion Hydrolysis by Coagulation. III. Aluminum.................................................................. 826 718 Thair L. Higgins and Edgar F. Westrum, Jr.: Thermo- chemical Study of the Sodium and Ammonium Hy- 722 drogen Fluorides in Anhydrous Hydrogen Fluoride 830 R. Lumry, H. Matsumiya, F. A. Bovey and A. Kowalsky: The Study of the Structure and Denaturation of 728 Hemeproteins by Nuclear Magnetic Relaxation............ 837 O. J. Kleppa, M. Kaplan and C. E. Thalmayer: The Volume Change on Mixing in Liquid Metallic Solu- 731 tions. II. Some Binary Alloys Involving Mercury, Zinc and Bismuth................................................................ 843 Robert L. Potter and Vincent N. DiStefano: Thermody- 735 namic Functions of Some Phosphorus Compounds.. . . 849 Michael Hoch and Herrick L. Johnston: A High Tempera- 740 ture Drop Calorimeter. The Heat Capacities of Tantalum and Tungsten between 1000° and 3000°K. . 855 W. D. Good, J. L. Lacina and J. P. McCullough: Tetra- 744 methylthiuram Monosulfide and Tetramethylthiuram Disulfide: Heats of Formation by Rotating-Bomb Calorimetry; The S-S Thermochemical Bond Energy. 860 746 John O. Edwards and Richard J. Sederstrom: The Ther- modynamics of Ionization of Benzeneboronic Acid .. . . 862 Agnes Shih-chuen Chia and R. F. Trimble, Jr.: Acid-Base 753 Properties of Some Pyrazines............................................. 863 C. H. Brubaker, Jr., and T. E. Haas: The Activity Coefli- 758 cients of Aqueous Solutions of Tris-ethylenediamine- cobalt(III) Perchlorate...................................................... 866 763 C. H. Brubaker, Jr., and J. A. Sincius: The Electron Ex- change Reaction between Antimony(III) and Anti- mony(V) in Sulfuric-Hydrochloric Acid Mixtures....... 867 766 Medina Kanta Pal and Maxwell Schubert: Ultracentrifu- gal Separation of the Metachromatic Compound of 774 Methylene Blue and Chrondroitin Sulfate...................... 872 Louis J. Stief and P. Ausloos: Vapor Phase 7 -Radiolysis of 777 Azomethane........................................................................... 877 Oscar Sandus and Betty B. Lubitz: Dielectric Relaxation 779 of Aqueous Glycine Solutions at 3.2 Centimeter Wave length........................... 881 G. Allen, A. D. Kennedy and H. O. Pritchard: Infrared Evidence of Specific Molecular Interactions in Rigid 784 Media at Low Temperatures.............................................. 885 NOTES 791. Manfred J. D. Low: Rates of Chemisorption of Hydrogen , on Hydrogen-Covered Ruthenium Surfaces.................... 887 ■ ” J. Pf McCullough and Irmela C. Zimmerman: Thermody- 792 7 ; -; «samic Studies of the Iodine Complexes of the Five Sul- ' ■ * • * ' , ‘£ur and Selenium Analogs of 1,4-Dioxane in Carbon Tetrachloride Solution....................................................... 888 796 M. Azzaria and Frank Dachille: High Pressure Poly- ; morphism of Manganous Fluoride..................................... 889 SOf) t W. H..Stock player, M. A. Reid and C. W. Garland: Equiv- • - •J »ten' Conductance of Borohydride Ion...................... 891
-
Upload
khangminh22 -
Category
Documents
-
view
2 -
download
0
Transcript of The Journal of Physical Chemistry 1961 Vol.65 No.5
/Vol. 65 May, 1961 No. 5
THE JOURNAL OF
PHYSICAL CHEMISTRY(Registered in U. S. Patent Office)
CONTENTSClark M. Welch, Hilton A. Smith and James B. Cole: The
Adsorption of Organic Compounds on Raney Nickel. .J. A. Weil, K. V. Sane and J. M . Kinkade, Jr.: The Reac
tion between 2,2-Diphenyl-l-picrylhydrazyl and Nitrogen Dioxide.....................................................................
Mabel M. Chen, Krishna V. Sane, Robert I. Walter and John A. W eil: Solution Paramagnetic ResonanceStudies of p-Substituted Hydrazyl Free Radicals........
Patrick N. Walsh and Norman O. Smith: Sublimation Pressure of Solid Solutions. II. The Systems p-Di- ehlorobenzene-p-Dibromobenzene, p-Dichloroben- zene-p-Bromo chlorobenzene, and p-Dibromobenzene-p-Bromochlorobenzene at 5 0 °...........................................
John H. Sullivan: The Thermal Reactions of HydrogenIodide with Alkyl Iodides..................................................
F. J. Johnston, Tung-Ho Chen and K. Y. W ong: Effects of Temperature and Added Hexachloroethane on the Radiolysis of Carbon Tetrachloride and Chloroform...
B. D. Pollock: The Vaporization Behavior and Thermodynamic Stability of Zirconium Carbide at High Temperature.......................................................................................
J. Charette, G. Neirynck and Ph. Teyssie: Structural Dependence of Absorption Spectra of beta-DiketoneChelated. II. Ultraviolet.............................................
Pasupati M ukerjee: On Ion-Solvent Interactions. I.Partial Molal Volumes of Ions in Aqueous Solution___
Pasupati M ukerjee: On Ion-Solvent Interactions. II. Internal Pressure and Electrostriction of Aqueous Solutions of Electrolytes.........................................................
D. J. C. Yates: Infrared Studies of the Surface Hydroxyl Groups on Titanium Dioxide, and of the Chemisorption of Carbon Monoxide and Carbon Dioxide..............
Assa Lifshitz and B. Perlmutter-Hayman: The Kinetics of the Hydrolysis of Chlorine. II. The Hydrolysis inthe Presence of Acetate......................................................
J. F. Mathews and J. J. M cKetta: The ThermodynamicProperties of Normal Propyl Alcohol..............................
Richard M . Noyes: More Rigorous Kinetic Expressionsfor Competitive Processes in Solution.............................
D. H. Desty and W . T. Swanton: Gas-Liquid Chromatography— Some Selective Stationary Phases for Hydrocarbon Separations........................................................
Alexander I. Popov and Roger D. H olm : Electric Momentof 3-Ethyl-3-methylglutarimide.......................................
Andrew G. De R occo: On the Second Virial Coefficient forUncharged Spherical Macromolecules............................
Stuart R. Gunn and LeRoy G. Green: The Heats of For-, mation of Some Unstable Gaseous Hydrides..................* ' J. P. McCullough, H. L. Finke, W . N. Hubbard, S. S. Todd,
J. F. Messerly, D. R. Douslin and Guy Waddington: Thermodynamic Properties of Four Linear Thia-alkanes..................................................... .............................
Margaret Goodgame and F. Albert Cotton: Magnetic Investigations of Spin-Free Cobaltous Complexes. IV. Magnetic Properties and Spectrum of Gqbalt(II)Orthosilicate.......................................................... -.............
J. P. Dismukes, L. H. Jones and John C. Bailar, Jr. : The . Measurement of Metal-Ligand Bond Vibrations in -Acetylacetonate Complexes........................
L. Newman and P. Klotz: The Interaction of Tri-zT octylamine with Thenoyltrifluoroaeetone and withHydrochloric Acid........................................ . ...............
John G. M iller: An Infrared Spectroscopic Study,of the Isothermal Dehydroxylation of Kao Unite at 47G°_:.:. V ..’
A. R. Anderson and Edwin J .ila r t : Hydrogen! Yields in-
the Radiolysis of Aqueous Hydrogen Peroxide.............. 804705 L. G. Hepler and W. F. O ’Hara: Thermodynamic Theory
of Acid Dissociation of Methyl Substituted Phenols inAqueous Solution................................................................. 811
710 E. J. Lawton and J. S. Balwit: Electron ParamagneticResonance Study of Irradiated Polyvinyl Chloride.. . . 815
S. W. Mayer, T. H. Mills, R. C. Alden and B. B. Owens:713 Liquidus Curves for Molten Alkali Metaphosphate-
Sulfate Systems.................................................................... 822E. Matijevic, K. G. Mathai, R. H. Ottewill and M. Kerker:
Detection of Metal Ion Hydrolysis by Coagulation.III. Aluminum.................................................................. 826
718 Thair L. Higgins and Edgar F. Westrum, Jr.: Thermochemical Study of the Sodium and Ammonium Hy-
722 drogen Fluorides in Anhydrous Hydrogen Fluoride 830R. Lumry, H. Matsumiya, F. A. Bovey and A. Kowalsky:
The Study of the Structure and Denaturation of728 Hemeproteins by Nuclear Magnetic Relaxation............ 837
O. J. Kleppa, M. Kaplan and C. E. Thalmayer: The Volume Change on Mixing in Liquid Metallic Solu-
731 tions. II. Some Binary Alloys Involving Mercury,Zinc and Bismuth................................................................ 843
Robert L. Potter and Vincent N. DiStefano: Thermody- 735 namic Functions of Some Phosphorus Compounds.. . . 849
Michael Hoch and Herrick L. Johnston: A High Tempera- 740 ture Drop Calorimeter. The Heat Capacities of
Tantalum and Tungsten between 1000° and 3000°K. . 855W. D. Good, J. L. Lacina and J. P. McCullough: Tetra-
744 methylthiuram Monosulfide and TetramethylthiuramDisulfide: Heats of Formation by Rotating-Bomb Calorimetry; The S-S Thermochemical Bond Energy. 860
746 John O. Edwards and Richard J. Sederstrom: The Thermodynamics of Ionization of Benzeneboronic A cid .. . . 862
Agnes Shih-chuen Chia and R. F. Trimble, Jr.: Acid-Base753 Properties of Some Pyrazines............................................. 863
C. H. Brubaker, Jr., and T. E. H aas: The Activity Coefli- 758 cients of Aqueous Solutions of Tris-ethylenediamine-
cobalt(III) Perchlorate...................................................... 866763 C. H. Brubaker, Jr., and J. A. Sincius: The Electron Ex
change Reaction between Antimony(III) and Anti-mony(V) in Sulfuric-Hydrochloric Acid Mixtures....... 867
766 Medina Kanta Pal and Maxwell Schubert: Ultracentrifugal Separation of the Metachromatic Compound of
774 Methylene Blue and Chrondroitin Sulfate...................... 872Louis J. Stief and P. Ausloos: Vapor Phase 7-Radiolysis of
777 Azomethane........................................................................... 877Oscar Sandus and Betty B. Lubitz: Dielectric Relaxation
779 of Aqueous Glycine Solutions at 3.2 Centimeter Wavelength........................... 881
G. Allen, A. D. Kennedy and H. O. Pritchard: Infrared Evidence of Specific Molecular Interactions in Rigid
784 Media at Low Temperatures.............................................. 885
NOTES791. Manfred J. D. Low : Rates of Chemisorption of Hydrogen, on Hydrogen-Covered Ruthenium Surfaces.................... 887
■ ” J. P f McCullough and Irmela C. Zimmerman: Thermody- 792 7 ; - ; «samic Studies of the Iodine Complexes of the Five Sul- ' ■ * • * ' ,‘£ur and Selenium Analogs of 1,4-Dioxane in Carbon
Tetrachloride Solution....................................................... 888796 M. Azzaria and Frank Dachille: High Pressure Poly-
; morphism of Manganous Fluoride..................................... 889SOf) t W . H..Stockplayer, M. A. Reid and C. W. Garland: Equiv-
• - • J »ten' Conductance of Borohydride Ion...................... 891
A
THE JOURNAL OF PHYSICAL CHEMISTRY(Registered in U. S. Patent Office)
W. A l b e r t N o y e s , Jr ., E d it o r
A l l e n D . B l i s s A s s is t a n t E d it o r s
E d i t o r i a l B o a r d
A . 0 . A l l e nC. E. H. BawnJ . B i g e l e i s e nD. D. E l e y
D. H. E v e r e t t S. C . L in d F . A . L o n g K. J. M y s e l s
J . E. R ic c i R . E. R u n d l e W. H. S t o c k m a y e r A . R . U b b e l o h d e
A. B. F. D u n c a n
E . R . V a n A r t s d a l e n M. B. W a l l e n s t e i n W . W e s tE d g a r F . W e s t r u m , J r .
Published monthly by the American Chemical Society at 20th and Northampton Sts., Easton, Pa.
Second-class mail privileges authorized at Easton, Pa. This publication is authorized to be mailed at the special rates of postage prescribed by Section 131.122.
The J o u rn a l o f P h y s ica l C hem istry is devoted to the publication of selected symposia in the broad field of physical chemistry and to other contributed papers.
Manuscripts originating in the British Isles, Europe and Africa should be sent to F. C. Tompkins, The Faraday Society, 6 Gray’s Inn Square, London W. C. 1, England.
Manuscripts originating elsewhere should be sent to W. Albert Noyes, Jr., Department of Chemistry, University of Rochester, Rochester 20, N. Y.
Correspondence regarding accepted copy, proofs and reprints should be directed to Assistant Editor, Allen D. Bliss, Department of Chemistry, Simmons College, 300 The Fenway, Boston 15, Mass.
Business Office: Alden H. Emery, Executive Secretary, American Chemical Society, 1155 Sixteenth St., N. W., Washington 6, D. C.
Advertising Office: Reinhold Publishing Corporation, 430 Park Avenue, New York 22, N. Y.
Articles must be submitted in duplicate, typed and double spaced. They should have at the beginning a brief Abr stract, in no case exceeding 300 words. Original drawings should accompany the manuscript. Lettering at the sides of graphs (black on white or blue) may be pencilled in and will be typeset. Figures and tables should be held to a minimum consistent with adequate presentation of information. Photographs will not be printed on glossy paper except by special arrangement. All footnotes and references to the literature should be numbered consecutively and placed in the manuscript at the proper places. Initials of authors referred to in citations should be given. Nomenclature should conform to that used in C hem ical A bstracts , mathematical characters be marked for italic, Greek letters carefully made or annotated, and subscripts and superscripts clearly shown. Articles should be written as briefly as possible consistent with clarity and should avoid historical background unnecessary for specialists.
N o tes describe fragmentary or incomplete studies but do not otherwise differ fundamentally from articles and are subjected to the same editorial appraisal as are articles. In their preparation particular attention should be paid to brevity and conciseness. Material included in Notes must be definitive and may not be republished subsequently.
C om m u n ica tion s to the E d itor are designed to afford prompt preliminary publication of observations or discoveries whose value to science is so great that immediate publication is imperative. The appearance of related work from other; laboratories is in itself not considered sufficient justification1
for the publication of a Communication, which must in addition meet special requirements of timeliness and significance. Their total length may in no case exceed 1000 words or their equivalent. They differ from Articles and Notes in that their subject matter may be republished.
Symposium papers should be sent in all cases to Secretaries of Divisions sponsoring the symposium, who will be responsible for their transmittal to the Editor. The Secretary of the Division by agreement with the Editor will specify a time after which symposium papers cannot be accepted. The Editor reserves the right to refuse to publish symposium articles, for valid scientific reasons. Each symposium paper may not exceed four printed pages (about sixteen double spaced typewritten pages) in length except by prior arrangement with the Editor.
Remittances and orders for subscriptions and for single copies, notices of changes of address and new professional connections, and claims for missing numbers should be sent to the American Chemical Society, 1155 Sixteenth St., N. W., Washington 6, D. C. Changes of address for the J o u rn a l o f P h y s ica l C h em istry must be received on or before the 30th of the preceding month.
Claims for missing numbers will not be allowed (1) if received more than sixty days from date of issue (because of delivery hazards, no claims can be honored from subscribers in Central Europe, Asia, or Pacific Islands other than Hawaii), (2) if loss was due to failure of notice of change of address to be received before the date specified in the preceding paragraph, or (3) if the reason for the claim is “missing from files.”
Subscription rates (1961): members of American Chemical Society, $12.00 for 1 year; to non-members, $24.00 for 1 year. Postage to countries in the Pan-American Union $0.80; Canada, $0.40; all other countries, $1.20. Single copies, current volume, $2.50; foreign postage, $0.15; Canadian postage $0.10; Pan-American Union, $0.10. Back volumes (Vol. 56-64) $30.00 per volume; foreign postage, per volume $1.20, Canadian, $0.40; Pan-American Union, $0.80. Single copies: back issues, $3.00; for current year, $2.50; postage, single copies: foreign, $0.15; Canadian, $0.10; Pan-American Union, $0.10.
The American Chemical Society and the Editors of the J ou rn a l o f P h y s ica l C hem istry assume no responsibility for the statements and opinions advanced by contributors to T h is J o u r n a l .
The American Chemical Society also publishes J o u rn a l o f the A m erica n C hem ical S ociety , C hem ical A bstra cts , In d u s tr ia l a n d E n g in eer in g C hem istry , International Edition of In d u s trial a n d E n g in eer in g C hem istry , C hem ical a n d E n g in eer in g N ew s, A n a ly tica l C hem istry, J ou rn a l o f A g r icu ltu ra l a n d F ood
; C hem istry , J o u rn a l o f O rgan ic C hem istry , J o u rn a l o f C h em i- ■ ca l a n d 'E n gin eerin g D a ta , C hem ical R ev iew s, C h em ica l T itles 1 '¿A d 'J ou rn al o f C h em ica l D o cu m en ta tio n . Rates on request.
Richard C. Schoonmaker: Long Range Attractive Potsa- ' , ‘ ' • ; COMMUNICATION TO THE EDITORtials from Molecular Beam Studies oa the; Systems Wafren H. Watanabe, Charles F. Ryan, Paul C. Fleischer,K,Nj(g) and KCl,N2(g)........................... ........................... 892 Jr., and B. S. Garrett: Measurement of the Tacticity
Jay Palmer and Norman Bauer: Sorption of Amines by of Syndiotactic Poly-methyl methacrylate by the GelMontmorillonite.................................................................. 894 Melting Point........................................................................ 896
13.afUoU4
THE JOURNAL OFP H Y S IC A L C H E M IS T R Y
(Registered in U. S. Patent Office) ((C) Copyright, 1961, by the American Chemical Society)
V olume 65 MAY 25, 1961 N umber 5
TH E ADSORPTION OF ORGANIC COMPOUNDS ON R A N E Y N IC K E LBy C l a r k M. W e l c h , H il t o n A. S m it h a n d Ja m e s B. C o le
Department of Chemistry, University of Tennessee, Knoxville, Tennessee, and Department of Chemistry, Louisiana State University, Baton Rouge, Louisiana
Received March SI, 1960
Coordinating agents such aB amines, phenols and carboxylic acids show high adsorption on Raney nickel. Alkanes, alcohols and esters are but slightly adsorbed. Effects produced by changing the molecular size, shape and concentration of the solute indicate much adsorption in pores and capillaries in the nickel. The diameter of many capillaries appears to be less then 10 A. Closing up the capillaries with a fatty acid greatly decreases the B.E.T. nitrogen adsorption of the catalyst. Caproic and adipic acids have been observed to displace adsorbed palmitic acid. The stoichiometry is largely independent of the number of carboxyl groups in the displacing molecule, and appears to depend on the relative size of the displacing and displaced species. Adsorbed palmitic acid is not extracted by hydrocarbon solvents, but is partially removed by polar or basic solvents. Nickel palmitate is also removed in some cases. Adsorbed adipic acid is not removed even by triethyl- amine. After being freed of adsorbate by alkali, Raney nickel can again take up fatty acids. An explanation is offered for the higher activity of long chain acids than of short chain acids, as hydrogenation promoters for Raney nickel.
Raney nickel is remarkable as a hydrogenation catalyst which contains chemisorbed and internally bound hydrogen in large amounts. The hydrogen can be removed by heat1'23 or by treatment with unsaturated compounds.211 When this is done, the catalytic activity of the Raney nickel and its adsorptive capacity for hydrogen decrease.ub In some cases, a minimum is reached after which the activity increases with decreasing hydrogen content.8 Migration of hydrogen from the interior to the surface can occur even in an external atmosphere of hydrogen, if the rate of hydrogenation exceeds the rate of adsorption of hydrogen. A decrease in catalyst activity then occurs.4
Adsorbed organic molecules also affect the activity of Raney nickel. The hydrogenation of terpenes is accelerated by a variety of long chain compounds.6 Fatty acids being especially effec-
(1) H. A. Smith, A. J. ChadweU and S. S. Kirslis, J. Phys. Chem., 59, 820 (1955).
(2) (a) R. J. Kokes and P. H. Emmett, J. Am. Chem. Soc., 81, 5032 (1959); 82, 4497 (1960); (b) L. Kh. Freidlin and N. I. Ziminova, lzvest. Ahad. Nauk S.S.S.R., Otdel Khim. Nauk, 145 (1951).
(3) P. H. Emmett, J . Phys. Chem., 63, 449 (1959).. (4) L. Kh. Freidlin and K. G. Rudneva, lzvest. Akad. Nauk S.S.S.R. Otdel Khim. Nauk, 491 (1954); (b) it was reported by P. Mars, J. J. F. Seholten and P. Zwietering at the International Congress on Catalysis, Paris, France, July 1960, preprint No. 60, that much of the hydrogen in Raney nickel actually is not present as such but is generated by the reaction of residual aluminum with water either adsorbed on the catalyst or bound in hydrated alumina.
(5) (a) H. A. Smith, W. C. Bedoit and J. F. Fuzek, J. Am. Chem. Soc., 71, 3769 (1949); H. A. Smith, J. F. Fuzek and H. T. Men*
five, their adsorption on Raney nickel has been studied.6 For acids of 10-22 carbon atoms, the adsorption appeared to be essentially independent of chain length, concentration or solvent. Agreement between surface areas calculated from fatty acid adsorption and from nitrogen adsorption made it appear that the catalyst pores were large compared to the length of the adsorbed fatty acid molecules.
There is ample evidence to indicate that Raney nickel is highly porous. In one case X-ray studies,7 and more recently magnetic and density measurements,2“ have pointed to a “skeleton” or “defect” structure. A more complete study of the adsorption characteristics of the catalyst therefore has been made to determine the type of surface present and the way it interacts with compounds which promote catalytic hydrogenation.
ExperimentalAdsorption Measurements.— W-4 Raney nickel was pre
pared as described previously.8 A fresh batch was made every two months and was allowed to stand 48 hours to minimize aging effects.5“ Reagent grade organic compounds were used. Caproic acid was made from ra-amyl bromide via the nitrile.9 The adsorption measurementswether, ibid., 71, 3765 (1949); (b) H. A. Smith and J. F. Fuzek, ibid.,72, 3454 (1950).
(6) H. A. Smith and J. F. Fuzek, ibid., 68, 229 (1946).(7) A. Taylor and J. Weiss, Nature, 141, 1055 (1938).(8) A. A. Pavlic and H. Adkins, J. Am. Chem. Soc., 68, 1471
(1946).(9) I. Simon, Bull. soc. chim. Belg., 38, 50 (1929),
705
706 C. M. W elch, H. A. Smith and J. B. Cole Voi. 65
were made as previously described.6 Usually the volume of solvent used was 20.0 ml. and the weight of catalyst was 2.5-3.5 g. Whenever the solute concentration was 0.2 M or greater, the volume increase due to the solute was determined. When very high adsorption occurred, correction was made for the decrease in volume of solution as adsorption went on. The addition of 25-50 ml. of water to 10-ml. aliquots of the lower fatty acids permitted their titration to a phenolphthalein endpoint. With heptanoic, octanoic and nonanoic acids, 15 ml. of acetone and 50 ml. of water were added to the aliquots. Butylamine in benzene was titrated with hydrochloric acid after water and methyl orange were added. Other solutes were freed of solvent at 50° in a filtered air stream and weighed. The liquid phase was tested for nickel ions by removal of solvent, acidification and addition of dimethyl- glyoxime and ammonia. The solid phase was shaken with 0.2 M ammonium hydroxide for 10 minutes, the extract similarly being tested for nickel ions.
On a given batch of catalyst, the precision of the adsorption measurements was ± 2.5 or ± 10% on different batches from the same alloy sample. Variations up to ± 3 0 % occurred on catalysts from different lots of alloy.
The Extraction of Adsorbed Fatty Acids.— The nickel and its adsorbate were freed of solution, rinsed with benzene, and transferred while covered with benzene to a folded filter paper which was slit to permit drainage, and was inserted in an extraction thimble and quickly placed in solvent in the extractor. The latter was designed so as to cycle either refluxing solvent or cooled solvent as desired through the thimble. At intervals during extraction, aliquots of solution were analyzed. Palmitic acid was identified by melting point and mixed melting point. Nickel palmitate was identified by acidification, isolation of palmitic acid and tests for nickel on the filtrate. When caproic acid was extracted with triethylamine as solvent, the solution was freed of amine by distillation in a 15-in. Vigreux column. The residue, diluted with 25 ml. of water and 0.09 ml. of coned, hydrochloric acid, was extracted with two 50-ml. portions of ether. Removal of ether, addition of water, and titration followed. Adipic acid extracted from nickel by triethylamine was treated similarly, except that 8 g. of sodium chloride was added to the diluted, acidified distillation residue, and the solution was extracted with three 100-ml. portions of ether. This procedure recovered 99% of the adipic acid present. For palmitic acid extracted by amine, the diluted, acidified distillation residue was filtered, the solid being taken up in benzene and isolated as usual.
The Displacement of Palmitic Acid by Other Acids.—- After equilibration of palmitic acid solution with catalyst, an aliquot was removed and the second acid in the same volume of solvent was introduced. Agitation was resumed. At intervals, aliquots were replaced by pure solvent and were analyzed. They were freed of benzene by distillation through a 7-in. Vigreux column. The residue was dissolved in 5 ml. of methanol, diluted with 100 ml. of water, stirred to coagulate the palmitic acid, and filtered. The solid was washed with water, redissolved in benzene, and worked up as usual. The aqueous filtrate and washings were combined and titrated to determine the amount of caproic or adipic acid present. When methanol was the adsorption solvent, distillation was unnecessary. The error in the adsorption and desorption values was 3 -6% , and the error in their ratio was less than 5% , as shown by control experiments.
Surface Area Measurements by the B.E.T. Method.— The apparatus used for surface area measurements was constructed according to the directions of Barr and Anhorn.10 Samples of Raney nickel with and without adsorbed palmitic acid were transferred in ethanol or benzene to the adsorption bulb, freed of solvent by aspiration at room temperature, degassed at five different temperatures and the surface area measured after each degassing. Degassing was considered complete when a pressure as low as 5 X 10~i mm. could bo reached. Slow heating was essential to avoid explosive surges of gas. Plots of P/Uads(Ro — P) vs. P/P0 were linear through 7-8 points determined at relative pressures in the range 0.05-0.27.
Results and ConclusionsA. Types of Compounds Adsorbed by Raney
(10) W. E. Barr and V. J. Anhorn, “Scientific and Industrial Glass- blowing and Laboratory Techniques,” Instruments Publishing Co., Pittsburgh, Pa., 1949, Ch. XII (with L. G. Joyner), p. 257 ff.
Nickel.— Carboxylic acids, phenols and amines were very readily adsorbed, while the alcohol and ester studied gave only slight adsorption and n - octadecane showed no detectable interaction (TableI). In a long chain acid it is, therefore, the carboxyl group and not the hydrocarbon chain which is adsorbed. It also appears that the adsorption involves a type of coordination complex formation, rather than van der Waals forces. Alcohols and esters have considerable polarity but are weak complexing agents; whereas acids, phenols and amines have both the polarity and strong coordinating power. The adsorption of carboxylic acids did not involve the deposition of insoluble nickel salts. Nickel salts of a number of these acids are soluble in the solvents used; moreover, free acid was recoverable in considerable amounts from the treated nickel, as seen later.
T able IT he A dsorption of Organic C ompounds from B en zene
Solution b y W -4 R a n e y N ickel
C o m p o u n d
S p e c if ica d s o r p t io n “
X 104, m o le s g.-1F in a l c o n e n .,
m o le s 1. -1
ra-Octadecane 0 . 0 0 0 . 0 1 2 - 0 . 6 7
n-Hexadecyl alcohol . 1 8 . 0 3 0
Methyl palmitate . 1 6 .0 3 1
Palmitic acid 1 . 3 4 . 0 3 0
Valeric acid 3 . 9 . 0 2 7
Benzoic acid 4 . 7 . 0 4 6
Butyric acid 4 . 4 - 5 . 2 . 0 0 5 1 - 0 . 0 2 7
Isobutyric acid 3 . 9 . 0 1 0
Trimethylacetic acid 2 . 3 - 2 . 8 . 0 1 2 - 0 . 0 2 4
Propionic acid 5 . 0 - 6 . 4 . 0 0 6 7 - 0 . 0 4 2
Acetic acid 6 . 0 - 8 . 4 . 0 2 7 - 0 . 0 4 6
o-Hydroxybiphenyl 1 . 3 5 6 . 0 4 8
o-Dihydroxybenzene 3 . 8 5 - 5 . 0 9 . 0 1 7 - 0 . 0 3 2
rt-Octadecylamine 0 . 6 4 . 0 2 5
w-Butylamine 2 . 7 1 - 3 . 0 5 . 0 3 8 - 0 . 0 5 9
° Two or more determinations were made on each compound, except for benzoic acid. The catalyst was prepared from the same lot of alloy used by Smith, Bedoit and Fuzek.6“ b The value after 70 min. when a maximum was reached. After 10 hr., the adsorption had decreased to 0.38 X 10~4. Solute recovered after 30 min. contact melted at 52-56°; mixed m.p. with o-hydroxybiphenyl, 53-58°. After 70 min. contact, the m.p. was 44-52°; mixed m.p. 48-57°. After 135 min., m.p. was 30-54°. After 5 hr., the solute was a liquid which dissolved added o-hydroxybiphenyl.
Short chain molecules invariably gave higher adsorption than their long chain homologs. This is incompatible with oriented adsorption normal to a smooth surface. Moreover, comparison of propionic, isobutyric and trimethylacetic acids shows the other dimensions of the molecule to be important, the rod-shaped molecule giving higher adsorption than its umbrella-shaped isomer. These effects are reasonable for adsorption in capillaries whose diameter and accessible depth are of the same order of magnitude as the molecules adsorbed.
o-Ilydroxybiphenyl appeared to undergo slow hydrogenation by the Raney nickel at room temperature, the product being desorbed. Catechol showed no decrease in adsorption even after several days.
B. The Adsorption of Straight-Chain Fatty Acids.— On a molar basis, the adsorption decreases rapidly as the chain length of the fatty acid is raised

May, 1961
from two carbons up to ten carbon atoms (Fig. la). At sixteen to eighteen carbons, the adsorption is nearly constant. It appears that essentially all of the stearic acid is adsorbed on or near the surface, and this permits calculation of the surface area. Values of 13.9 and 19.0 sq. m./g. were obtained for catalysts from two different alloy samples (No. 4 and No. 2 of Fig. 1). Curve 4 is for the same alloy used by Smith, Bedoit and Fuzek.5a
At the concentrations used, the weight of acid adsorbed was almost independent of chain length (Fig. lb). However, the values for the short chain acids were concentration-dependent, while those for long chain acids were not, making this relationship somewhat fortuitous.
Taking the surface adsorption of a given acid as equal to the total adsorption given by stearic acid, the percentage of adsorbate in capillaries can be calculated by difference. Average values of 8% for palmitic acid, 59% for caproic acid, and 75% for acetic acid were obtained. Earlier data of Smith and Fuzek6 on Raney nickel catalyst made from a different alloy sample gave somewhat different results for chain lengths of 10-22 carbon atoms, possibly caused by a different range of pore sizes in their catalyst.
Adipic and caproic acid adsorption were 3.12 X 10~4 and 3.95 X 10~4 mole/g., respectively, in one series. The values are surprisingly similar, considering that one acid has twice as many carboxyl groups as the other. Judging from palmitic acid adsorption (1.89 X 10_4mole/g.), 72% of the adipic acid adsorption is in the capillaries, if both carboxyl groups of each molecule are adsorbed. The unusual strength of adipic acid adsorption described below may indicate the attachment of both groups to the surface. The rates of adsorption of adipic and palmitic acids are compared in Fig. 2.
C. The Extent of Reversibility of Fatty Acid Adsorption.— Although dilution of fatty acid to 1CM M does not reverse the adsorption,6 automatic extraction slowly removes a part of the adsorbate. The results for palmitic, caproic and adipic acid appear in Fig. 3. Non-polar solvents removed only a little palmitic acid. Acetone slowly removed some free acid but no nickel palmitate. Triethylamine removed more than half the adsorbate, the extract being triethylammonium palmitate. From one catalyst preparation, nickel palmitate also was obtained on amine extraction. Methanol at 25° removed nickel palmitate exclusively; but at 60°, removed palmitic acid, gummy products, and often no nickel palmitate whatever. The adsorbate therefore contains both free acid and its nickel salt, both being strongly bound to the surface.
Caproic acid was similar to palmitic acid in its rate of extraction by triethylamine. In great contrast was adipic; acid which resisted all efforts at solvent extraction. Both carboxyl groups of this molecule may be adsorbed. It was quantitatively removed by aqueous alkali, isolated, identified and titrated.
A sample of Raney nickel and adsorbed palmitic acid was methanol-extracted to remove 41% of the
Adsorption of Organic Compounds on R aney Nickel 707
Fig. 1.— The adsorption of normal fatty acids on Raney nickel from benzene solution. The four curves are for catalyst made from four different alloy samples. Average final molar concentrations: curve 1 (triangles), 0.020;curve 2 (circles), 0.020; curve 3 (shaded circles), 0.017; curve 4 (two batches of catalyst denoted by diamonds and squares), 0.0055 and 0.029. Adipic acid (curve 2) was adsorbed from methanol-benzene (1:10 v ./v .).
Fig. 2.— The rate of adsorption of adipic and palmitic acids by Raney nickel from methanol solution. Initial molarity/wt. of catalyst: curve 1 (adipic acid), 0.056;curve 2 (adipic acid), 0.020; curve 3 (palmitic acid), 0.020 (left hand scale); curve 4, same as 3 (right hand scale).
adsorbate. Treatment with methanolic alkali removed the rest (total was 102%). The catalyst was washed with water and ethanol and again equilibrated with palmitic acid in benzene. The new adsorption was 1.71 X 10^4 mole/g., or 57% of the original value. Some adsorption sites are evidently quite durable, and may simply have exchanged carboxylate ions for hydroxyl ions. Nickel powder11 made from nickel carbonyl and having a particle size of 2-20 y adsorbed 5 X 10⁻⁶ mole/g. of palmitic acid, or 3% as much as did Raney nickel. The adsorbate was completely removed by acetone extraction at 55°.
D. The Extent of Formation of Extractable Nickel Soaps.—The adsorption of acetic, propionic, butyric, valeric, caproic and adipic acids from their 0.01-0.05 M solutions in benzene gave no trace of nickel salts in the liquid phase. Extraction of the solid phase with aqueous ammonia also failed to remove nickel salts of propionic, valeric or palmitic acids, but with acetic acid, nickel dimethylglyoxi-
(11) Furnished by the International Nickel Company.
70S C. M. W elch, H. A. Smith and J. B. Cole Vol. 65
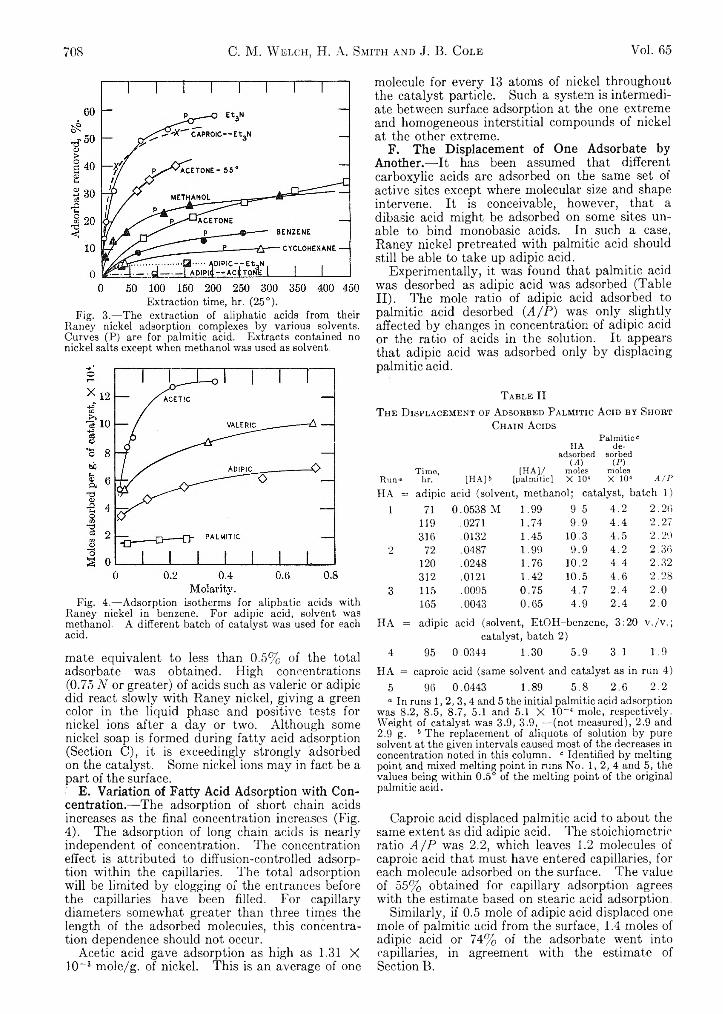
Extraction time, hr. (25°).Fig. 3.— The extraction of aliphatic acids from their
Raney nickel adsorption complexes by various solvents. Curves (P) are for palmitic acid. Extracts contained no nickel salts except when methanol was used as solvent.
Fig. 4.— Adsorption isotherms for aliphatic acids with Raney nickel in benzene. For adipic acid, solvent was methanol. A different batch of catalyst was used for each acid.
mate equivalent to less than 0.5% of the total adsorbate was obtained. High concentrations (0.75 N or greater) of acids such as valeric or adipic did react slowly with Raney nickel, giving a green color in the liquid phase and positive tests for nickel ions after a day or two. Although some nickel soap is formed during fatty acid adsorption (Section C), it is exceedingly strongly adsorbed on the catalyst. Some nickel ions may in fact be a part of the surface.f E. Variation of Fatty Acid Adsorption with Concentration.—The adsorption of short chain acids increases as the final concentration increases (Fig.4). The adsorption of long chain acids is nearly independent of concentration. The concentration effect is attributed to diffusion-controlled adsorption within the capillaries. The total adsorption will be limited by clogging of the entrances before the capillaries have been filled. For capillary diameters somewhat greater than three times the length of the adsorbed molecules, this concentration dependence should not occur.
Acetic acid gave adsorption as high as 1.31 X 10~3 mole/g. of nickel. This is an average of one
molecule for every 13 atoms of nickel throughout the catalyst particle. Such a system is intermediate between surface adsorption at the one extreme and homogeneous interstitial compounds of nickel at the other extreme.
F. The Displacement of One Adsorbate by Another.— It has been assumed that different carboxylic acids are adsorbed on the same set of active sites except where molecular size and shape intervene. It is conceivable, however, that a dibasic acid might be adsorbed on some sites unable to bind monobasic acids. In such a case, Raney nickel pretreated with palmitic acid should still be able to take up adipic acid.
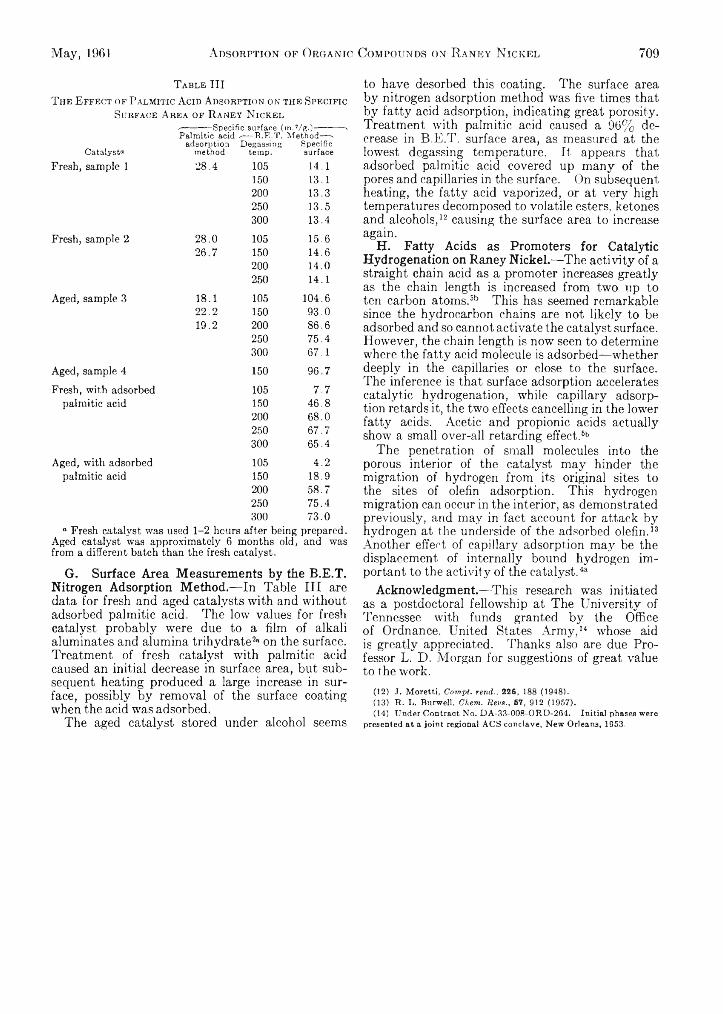
Experimentally, it was found that palmitic acid was desorbed as adipic acid was adsorbed (TableII). The mole ratio of adipic acid adsorbed to palmitic acid desorbed (A / P ) was only slightly affected by changes in concentration of adipic acid or the ratio of acids in the solution. It appears that adipic acid was adsorbed only by displacing palmitic acid.
T able IIT he D isplacem ent of A dsorbed P almitic A cid b y Short
C hain A cidsPalmitic c
HA de-adaorbed sorbed
(A) (P)Time, [HA]/ moles moles
Run« hr. [HA] 6 [palmitic] X 10* X 10* A/PHA = adipic acid (solvent, methanol; catalyst, batch 1)
1 71 0.0538 M 1.99 9.5 4.2 2.26119 .0271 1.74 9.9 4 .4 2.27316 .0132 1.45 10.3 4.5 2.29
2 72 .0487 1.99 9.9 4.2 2.36120 .0248 1.76 10.2 4.4 2.32312 .0121 1.42 10.5 4.6 2.28
3 115 .0095 0.75 4.7 2 .4 2.0165 .0043 0.65 4.9 2.4 2.0
HA = adipic acid (solvent, EtOH-benzene, catalyst, batch 2)
, 3:20 v ./v .;
4 95 0.0344 1.30 5.9 3.1 1.9
HA = caproic acid (same solvent and catalyst as in run 4)5 96 0.0443 1.89 5.8 2.6 2.2° In runs 1, 2, 3, 4 and 5 the initial palmitic acid adsorption
was 8.2, 8.5, 8.7, 5.1 and 5.1 X 10“ 4 mole, respectively. Weight of catalyst was 3.9, 3.9, — (not measured), 2.9 and 2.9 g. b The replacement of aliquots of solution by pure solvent at the given intervals caused most of the decreases in concentration noted in this column. c Identified by melting point and mixed melting point in runs No. 1, 2, 4 and 5, the values being within 0.5° of the melting point of the original palmitic acid.
Caproic acid displaced palmitic acid to about the same extent as did adipic acid. The stoichiometric ratio A / P was 2.2, which leaves 1.2 molecules of caproic acid that must have entered capillaries, for each molecule adsorbed on the surface. The value of 55% obtained for capillary adsorption agrees with the estimate based on stearic acid adsorption.
Similarly, if 0.5 mole of adipic acid displaced one mole of palmitic acid from the surface, 1.4 moles of adipic acid or 74% of the adsorbate went into capillaries, in agreement with the estimate of Section B.
May, 1961 Adsorption of Organic Compounds on R aney Nickel 709
T able IIIT he E ffect of P alm itic A cid A dsorption on the Specific
Surface A rea of R a n ey N ickelx-----------Specific surface (m.2/g.)----------- ■.Palmitic acid /— B.E.T. Method— s
Catalyst“adsorption
methodDegassing
temp.Specificsurface
Fresh, sample 1 28.4 105 14.1150 13.1200 13.3250 13.5300 13.4
Fresh, sample 2 28.0 105 15.626.7 150 14.6
200 14.0250 14.1
Aged, sample 3 18.1 105 104.622.2 150 93.019.2 200 86.6
250 75.4300 67.1
Aged, sample 4 150 96.7Fresh, with adsorbed 105 7.7
palmitic acid 150 46.8200 68.0250 67.7300 65.4
Aged, with adsorbed 105 4.2palmitic acid 150 18.9
200 58.7250 75.4300 73.0
“ Fresh catalyst was used 1-2 hours after being prepared. Aged catalyst was approximately 6 months old, and was from a different batch than the fresh catalyst.
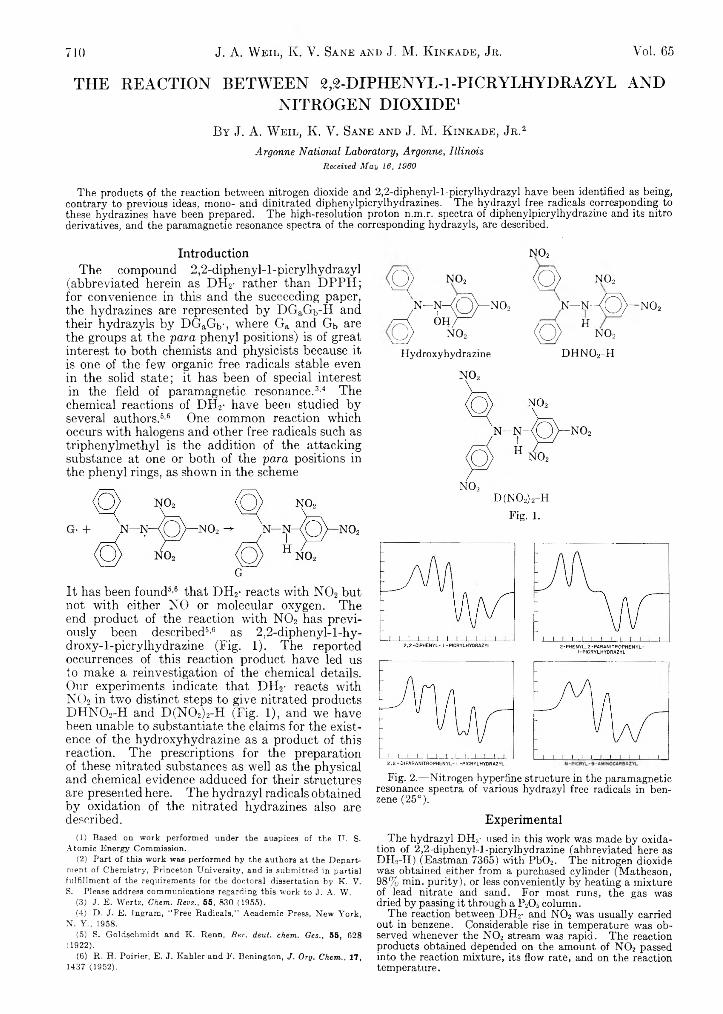
G. Surface Area Measurements by the B.E.T. Nitrogen Adsorption Method.—In Table III are data for fresh and aged catalysts with and without adsorbed palmitic acid. The low values for fresh catalyst probably were due to a film of alkali aluminates and alumina trihydrate2“ on the surface. Treatment of fresh catalyst with palmitic acid caused an initial decrease in surface area, but subsequent heating produced a large increase in surface, possibly by removal of the surface coating when the acid was adsorbed.
The aged catalyst stored under alcohol seems
to have desorbed this coating. The surface area by nitrogen adsorption method was five times that by fatty acid adsorption, indicating great porosity. Treatment with palmitic acid caused a 96% decrease in B.E.T. surface area, as measured at the lowest degassing temperature. It appears that adsorbed palmitic acid covered up many of the pores and capillaries in the surface. On subsequent heating, the fatty acid vaporized, or at very high temperatures decomposed to volatile esters, ketones and alcohols,12 causing the surface area to increase again.
H. Fatty Acids as Promoters for Catalytic Hydrogenation on Raney Nickel.—The activity of a straight chain acid as a promoter increases greatly as the chain length is increased from two up to ten carbon atoms.6b This has seemed remarkable since the hydrocarbon chains are not likely to be adsorbed and so cannot activate the catalyst surface. However, the chain length is now seen to determine where the fatty acid molecule is adsorbed—whether deeply in the capillaries or close to the surface. The inference is that surface adsorption accelerates catalytic hydrogenation, while capillary adsorption retards it, the two effects cancelling in the lower fatty acids. Acetic and propionic acids actually show a small over-all retarding effect.6b
The penetration of small molecules into the porous interior of the catalyst may hinder the migration of hydrogen from its original sites to the sites of olefin adsorption. This hydrogen migration can occur in the interior, as demonstrated previously, and may in fact account for attack by hydrogen at the underside of the adsorbed olefin.13 Another effect of capillary adsorption may be the displacement of internally bound hydrogen important to the activity of the catalyst.4a
Acknowledgment.—This research was initiated as a postdoctoral fellowship at The University of Tennessee with funds granted by the Office of Ordnance, United States Army,14 whose aid is greatly appreciated. Thanks also are due Professor L. D. Morgan for suggestions of great value to the work.
(12) J. Moretti, Compt. rend., 226, 188 (1948).(13) R. L. Burwell, Chem. Revs., 57, 912 (1957).(14) Under Contract No. DA-33-008-ORD-264. Initial phases were
presented at a joint regional ACS conclave, New Orleans, 1953.
710 J. A. W eil, Iv. V. Sane and J. M. K inkade, Jr . Vol. 65
TH E R EAC TIO N BETW EEN 2 ,2 -D IP H EN YL-l-P IC R YLH YD R AZYL ANDN ITRO G EN D IO X ID E 1
B y J. A . W e il , K . Y . Sa n e a n d J. M . K in k a d e , Jr .2
Argonne National Laboratory, Argonne, IllinoisReceived May 16, i960
The products of the reaction between nitrogen dioxide and 2,2-diphenyl-l-picrylhydrazyl have been identified as being, contrary to previous ideas, mono- and dinitrated diphenylpicrylhydrazines. The hydrazyl free radicals corresponding to these hydrazines have been prepared. The high-resolution proton n.m.r. spectra of diphenylpicrylhydrazine and its nitro derivatives, and the paramagnetic resonance spectra of the corresponding hydrazyls, are described.
IntroductionThe compound 2,2-diphenyl-l-picrylhydrazyl
(abbreviated herein as DH2- rather than DPPH; for convenience in this and the succeeding paper, the hydrazines are represented by DGaGb-H and their hydrazyls by DGaGb-, where Ga and Gb are the groups at the p a r a phenyl positions) is of great interest to both chemists and physicists because it is one of the few organic free radicals stable even in the solid state; it has been of special interest in the field of paramagnetic resonance.3'4 The chemical reactions of DH2- have been studied by several authors.6’6 One common reaction which occurs with halogens and other free radicals such as triphenylmethyl is the addition of the attacking substance at one or both of the p a r a positions in the phenyl rings, as shown in the scheme
G
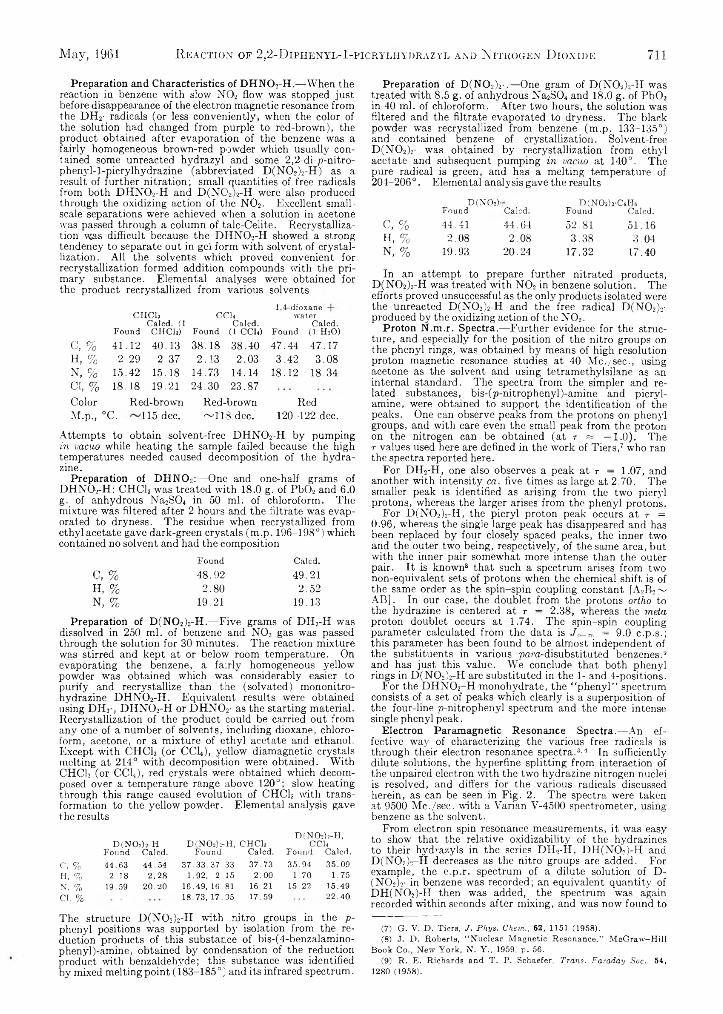
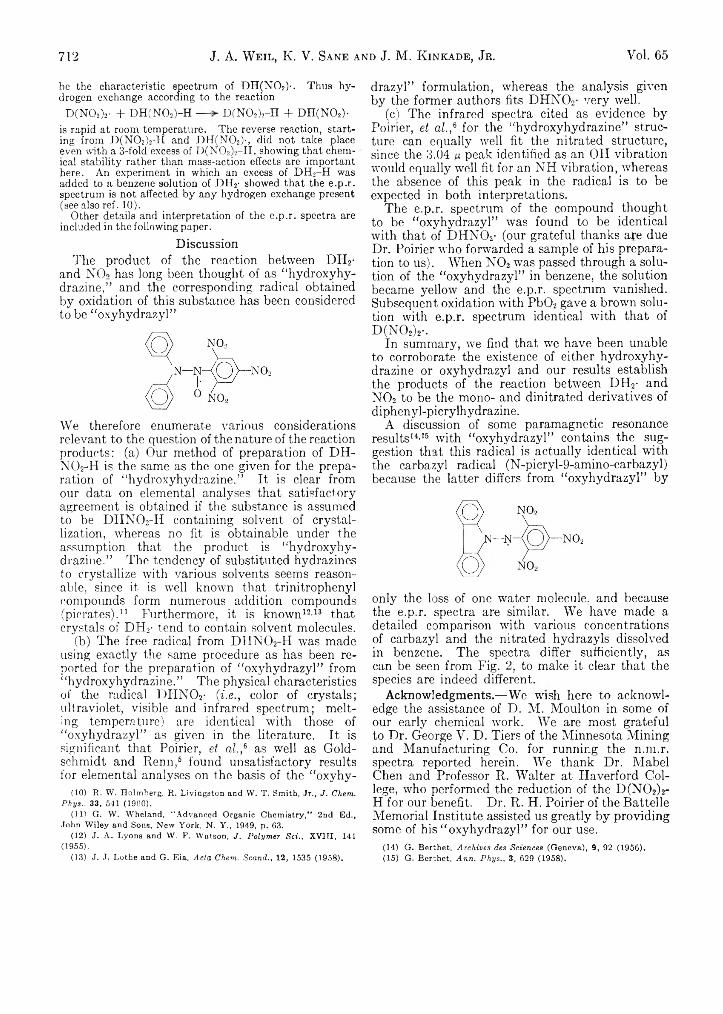
It has been found5-6 that DH2- reacts with N 02 but not with either NO or molecular oxygen. The end product of the reaction with N 02 has previously been described6-6 as 2,2-diphenyl-l-hy- droxy-l-picrylhydrazine (Fig. 1). The reported occurrences of this reaction product have led us to make a reinvestigation of the chemical details. Our experiments indicate that DH2- reacts with N 02 in two distinct steps to give nitrated products DHN02-H and D(N02)2-H (Fig. 1), and we have been unable to substantiate the claims for the existence of the hydroxyhydrazine as a product of this reaction. The prescriptions for the preparation of these nitrated substances as well as the physical and chemical evidence adduced for their structures are presented here. The hydrazyl radicals obtained by oxidation of the nitrated hydrazines also are described.
Q > NO,
N—N—{ ( S ) — N 0 2
A ¿hK 'Q > NO,
Hydroxyhydrazine
n o 2
< Q > NO,
n - n -a O ) — N ° 2
<Q) Hno2d h n o 2- h
Fig. 1.
Fig. 2.— Nitrogen hyperfine structure in the paramagnetic resonance spectra of various hydrazyl free radicals in benzene (25°).
Experimental(1) Based on work performed under the auspices of the U. S.
Atomic Energy Commission.(2) Part of this work was performed by the authors at the Depart
ment of Chemistry, Princeton University, and is submitted in partial fulfillment of the requirements for the doctoral dissertation by K. V. S. Please address communications regarding this work to J. A. W.
(3) J. E. Wertz, Chem. Revs., 55, 830 (1955).(4) D. J. E. Ingram, “Free Radicals,” Academic Press, New York,
N. Y., 1958.(5) S. Goldschmidt and K. Renn, Ber. deut. chem. Ges., 55, 628
(1922).(6) R. H. Poirier, E. J. Kahler and F. Benington, J. Org. Chem., 17,
1437 (1952).
The hydrazyl DH2- used in this work was made by oxidation of 2,2-diphenyl-l-picrylhydrazine (abbreviated here as DH2-H) (Eastman 7365) with P b02. The nitrogen dioxide was obtained either from a purchased cylinder (Matheson, 98% min. purity), or less conveniently by heating a mixture of lead nitrate and sand. For most runs, the gas was dried by passing it through a P20 5 column.
The reaction between DH 2- and N 0 2 was usually carried out in benzene. Considerable rise in temperature was observed whenever the N 0 2 stream was rapid. The reaction products obtained depended on the amount of N 0 2 passed into the reaction mixture, its flow rate, and on the reaction temperature.
May, 1961 R eaction of 2,2-Diphenyl-I-picryliiydrazyl and N itrogen D ioxide 711
Preparation and Characteristics of DHNO2-H.—When the reaction in benzene with slow N0 2 flow was stopped just before disappearance of the electron magnetic resonance from the DH2- radicals (or less conveniently, when the color of the solution had changed from purple to red-brown), the product obtained after evaporation of the benzene was a fairly homogeneous brown-red powder which usually contained some unreacted hydrazyl and some 2 ,2 -di-p-nitro- phenyl-l-picrylhydrazine (abbreviated D(N0 2 )2-H) as a result of further nitration; small quantities of free radicals from both DHN02-H and D(N02)2-H were also produced through the oxidizing action of the N02. Excellent small- scale separations were achieved when a solution in acetone was passed through a column of talc-Celite. Recrystallization was difficult because the DHN02-H showed a strong tendency to separate out in gel form with solvent of crystallization. All the solvents which proved convenient for recrystallization formed addition compounds with the primary substance. Elemental analyses were obtained for the product recrystallized from various solvents
1,4-dioxaneCHCI3 CCU waterF o u n d
C a lc d . (1 C T IC b ) F o u n d
C a lc d . (1 C C k ) F o u n d
C a lc d . (1 H2O)C, % 41.12 40.13 38.18 38.40 47.44 47.17H, % 2.29 2.37 2.13 2.03 3.42 3.08N, % 15.42 15.18 14.73 14.14 18.12 18.34Cl, % 18.18 19.21 24.30 23.87Color Red-brown Red-brown RedM.p., °C. 115 dec. ~113 dec. 1 2 0 - 1 2 2 dec.
Attempts to obtain solvent-free DHN02-H by pumping in vacuo while heating the sample failed because the high temperatures needed caused decomposition of the hydrazine.
Preparation of DHN02;—One and one-half grams of DHN02-H: CHCh was treated with 18.0 g. of Pb02 and 6.0 g. of anhydrous Na2S0 4 in 50 ml. of chloroform. The mixture was filtered after 2 hours and the filtrate was evaporated to dryness. The residue when recrystallized from ethylacetate gave dark-green crystals (m.p. 196-198°) which contained no solvent and had the composition
F o u n d C a lc d .
c, % 4 8 . 9 2 4 9 . 2 1
H, % 2 . 8 0 2 . 5 2
N, % 1 9 . 2 1 1 9 . 1 3
Preparation of D(N02 )2-H.—Five grams of DH2-H wasdissolved in 250 ml. of benzene and N02 gas was passed through the solution for 30 minutes. The reaction mixture was stirred and kept at or below room temperature. On evaporating the benzene, a fairly homogeneous yellow powder was obtained which was considerably easier to purify and recrystallize than the (solvated) mononitro- hydrazine DHN02-H. Equivalent results were obtained using DH2-, DHNO2-FI or DHN02- as the starting material. Recrystallization of the product could be carried out from any one of a number of solvents, including dioxane, chloroform, acetone, or a mixture of ethyl acetate and ethanol. Except with CHCI3 (or CCh), yellow diamagnetic crystals melting at 214° with decomposition were obtained. With CHCI3 (or CCLs), red crystals were obtained which decomposed over a temperature range above 1 2 0 °; slow heating through this range caused evolution of CHC13 with transformation to the yellow powder. Elemental analysis gave the results
D(N02)2-II,D(N02)2-H D(N02)».-H, CHCh CC1.F o u n d C a lc d . F o u n d C a lc d . F o u n d C a lc d .
c, % 44.63 44.54 37.33,37.33 37.73 35.94 35.09H, % 2.18 2.28 1.92, 2.15 2.00 1.70 1.75N, % 19.59 20.20 16.49, 16.81 16.21 15.22 15.49C l, % 18.73, 17.05 17.59 22.40
The structure D(N02)2-H with nitro groups in the p - phenyl positions was supported by isolation from tlm reduction products of this substance of bis-(4-benzalamino- phenyl)-amine, obtained by condensation of the reduction product with benzaldehyde; this substance was identified by mixed melting point (183-185°) and its infrared spectrum.
Preparation of D(N02)2-.—One gram of D(N02)2-H was treated with 8 . 5 g. of anhydrous Na2S04 and 1 8 . 0 g. of Pb02
in 40 ml. of chloroform. After two hours, the solution was filtered and the filtrate evaporated to dryness. The black powder was recrystallized from benzene (m.p. 1 3 3 - 1 3 5 ° ) and contained benzene of crystallization. Solvent-free D(N02)2- was obtained by recrystallization from ethyl acetate and subsequent pumping in vacuo at 1 4 0 ° . The pure radical is green, and has a melting temperature of 2 0 4 - 2 0 6 0 . Elemental analysis gave the results
D ( N O A D ( N 0 2)i-C oIi6F o u n d C a lc d . F o u n d C a lc d .
c, % 44.41 44.64 52.81 51.16H, % 2.08 2.08 3.38 3.04N, % 19.93 2 0 . 2 4 1 7 . 3 2 17.40
In an attempt to prepare further nitrated products, D(N02)2-H was treated with N02 in benzene solution. The efforts proved unsuccessful as the only products isolated were the unreacted D(N02)2-H and the free radical D(N02)2- produced by the oxidizing action of the N02.
Proton N.m.r. Spectra.—Further evidence for the structure, and especially for the position of the nitro groups on the phenyl rings, was obtained by means of high resolution proton magnetic resonance studies at 40 Me./sec., using acetone as the solvent and using tetramethylsilane as an internal standard. The spectra from the simpler and related substances, bis-(p-nitrophenyl)-amine and picryl- amine, were obtained to support the identification of the peaks. One can observe peaks from the protons on phenyl groups, and with care even the small peak from the proton on the nitrogen can be obtained (at r « —1.0). The r values used here are defined in the work of Tiers, 7 who ran the spectra reported here.
For DH2-H, one also observes a peak at r = 1.07, and another with intensity ca. five times as large at 2.70. The smaller peak is identified as arising from the two picryl protons, whereas the larger arises from the phenyl protons.
For D(N02 )2-H, the picryl proton peak occurs at r = 0.96, whereas the single large peak has disappeared and has been replaced by four closely spaced peaks, the inner two and the outer two being, respectively, of the same area, but with the inner pair somewhat more intense than the outer pair. It is known8 that such a spectrum arises from two non-equivalent sets of protons when the chemical shift is of the same order as the spin-spin coupling constant [A2B2~ ABj. In our case, the doublet from the protons ortho to the hydrazine is centered at r = 2.38, whereas the meta proton doublet occurs at 1.74. The spin-spin coupling parameter calculated from the data is J 0- m = 9.0 c.p.s.; this parameter has been found to be almost independent of the substituents in various para-disubstituted benzenes, 9
and has just this value. We conclude that both phenyl rings in D(N02)2-H are substituted in the 1- and 4-positions.
For the DHN02-H monohydrate, the “ phenyl” spectrum consists of a set of peaks which clearly is a superposition of the four-line p-nitrophenyl spectrum and the more intense single phenyl peak.
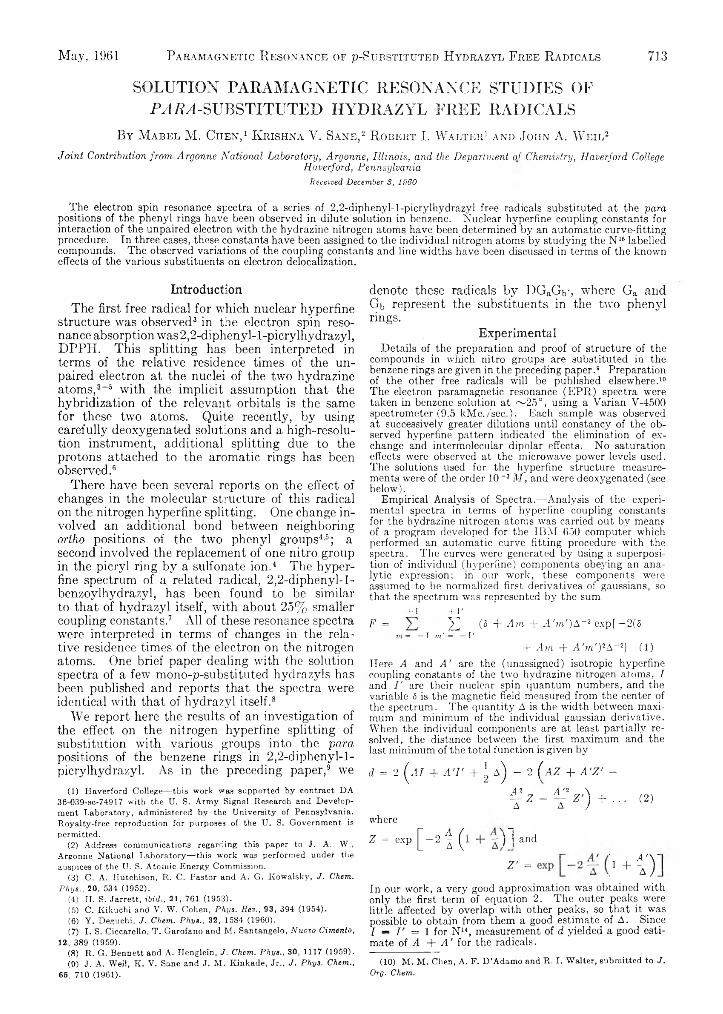
Electron Paramagnetic Resonance Spectra.—An effective way of characterizing the various free radicals is through their electron resonance spectra. 3 ' 4 In sufficiently dilute solutions, the hvperfine splitting from interaction of the unpaired electron with the two hydrazine nitrogen nuclei is resolved, and differs for the various radicals discussed herein, as can be seen in Fig. 2. The spectra were taken at 9500 Me./sec. with a Varian V-4500 spectrometer, using- benzene as the solvent.
From electron spin resonance measurements, it was easy to show that the relative oxidizability of the hydrazines to their hydrazyls in the series DH2-H, DH(N02)-H and D(N02)2-H decreases as the nitro groups are added. For example, the e.p.r. spectrum of a dilute solution of D- (N02)r in benzene was recorded; an equivalent quantity of DH(N02)-H then was added, the spectrum was again recorded within seconds after mixing, and was now found to
(7) G. V. D. Tiers, J. Phys. Chem., 62, 1151 (1958).(8) J- D. Roberts, “Nuclear Magnetic Resonance,” McGraw-Hill
Book Co., New York, N. Y., 1959, p. 56.(9) R. E. Richards and T. P. Schaefer, Trans. Faraday Soc., 54,
1280 (1958).
712 J. A. W eil, K. V. Sane and J. M. K inkade, Jr. Yol. 65
be the characteristic spectrum of DH(N02)'. Thus hydrogen exchange according to the reaction
D(NO,V + DH(NOs)-H — D(N02)2-H + DH(N02)-is rapid at room temperature. The reverse reaction, starting from D(N02)2TI and DH(N02)-, did not take place even with a 3-fold excess of D(N02)2-H, showing that chemical stability rather than mass-action effects are important here. An experiment in which an excess of DH2-H was added to a benzene solution of DH2- showed that the e.p.r. spectrum is not affected by any hydrogen exchange present (see also ref. 1 0 ).
Other details and interpretation of the e.p.r. spectra are included in the following paper.
DiscussionThe product of the reaction between DH2-
and NO. has long been thought of as “hydroxyhydrazine,” and the corresponding radical obtained by oxidation of this substance has been considered to be “oxyhydrazyl”
We therefore enumerate various considerations relevant to the question of the nature of the reaction products: (a) Our method of preparation of DH- N 02-H is the same as the one given for tine preparation of “hydroxyhydrazine.” It is clear from our data on elemental analyses that satisfactory agreement is obtained if the substance is assumed to be DHN02-H containing solvent of crystallization, whereas no fit is obtainable under the assumption that the product is “hydroxyhydrazine.” The tendency of substituted hydrazines to crystallize with various solvents seems reasonable, since it is well known that trinitrophenyl compounds form numerous addition compounds (picrates).11 Furthermore, it is known12’13 that crystals of DH2- tend to contain solvent molecules.
(b) The free radical from DIIN02-H was made using exactly the same procedure as has been reported for the preparation of “oxyhydrazyl” from ‘ ‘hydroxyhydrazine. ” The physical characteristics of the radical DIIN02- ( i.e ., color of crystals; ultraviolet, visible and infrared spectrum; melting temperature) are identical with those of “oxyhydrazyl” as given in the literature. It is significant that Poirier, et a l . ,6 as well as Goldschmidt and Renn,6 found unsatisfactory results for elemental analyses on the basis of the “oxyhy-
(10) R. W. Holmberg, R. Livingston and W. T. Smith, Jr., J. Chern. Phys., 33, 541 (1960).
(11) G. W. Wheland, “Advanced Organic Chemistry,'’ 2nd Ed., John Wiley and Sons, New York, N. Y., 1949, p. 63.
(12) J. A. Lyons and W. F. Watson, J, Polymer Sci., XVIII, 141 (1955).
(13) J. J. Lothe and G. Eia, Acta Chem. Scand., 12, 1535 (1958).
drazyl” formulation, whereas the analysis given by the former authors fits DHN02- very well.
(c) The infrared spectra cited as evidence by Poirier, et a l.,* for the “hydroxyhydrazine” structure can equally well fit the nitrated structure, since the 3.04 ¡x peak identified as an OH vibration would equally well fit for an NH vibration, whereas the absence of this peak in the radical is to be expected in both interpretations.
The e.p.r. spectrum of the compound thought to be “oxyhydrazyl” was found to be identical with that of DHN02- (our grateful thanks are due Dr. Poirier vrho forwarded a sample of his preparation to us). When N 02 was passed through a solution of the “oxyhydrazyl” in benzene, the solution became yellow and the e.p.r. spectrum vanished. Subsequent oxidation with Pb02 gave a brown solution with e.p.r. spectrum identical with that of D(N02)2-.
In summary, we find that we have been unable to corroborate the existence of either hydroxyhydrazine or oxyhydrazyl and our results establish the products of the reaction between DH2- and N 02 to be the mono- and dinitrated derivatives of diphenyl-picrylhydrazine.
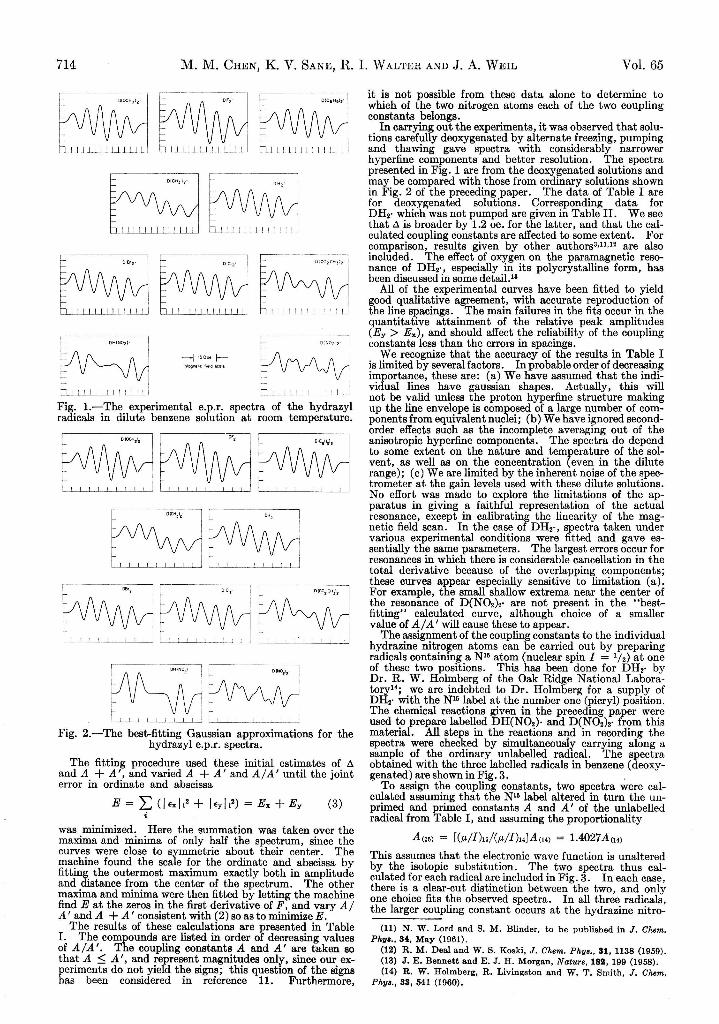
A discussion of some paramagnetic resonance results14'16 with “oxyhydrazyl” contains the suggestion that this radical is actually identical with the carbazyl radical (N-picryl-9-amino-carbazyl) because the latter differs from “oxyhydrazyl” by
only the loss of one water molecule, and because the e.p.r. spectra are similar. We have made a detailed comparison with various concentrations of carbazyl and the nitrated hydrazyls dissolved in benzene. The spectra differ sufficiently, as can be seen from Fig. 2, to make it clear that the species are indeed different.
Acknowledgments.— We wash here to acknowledge the assistance of D. M. Moulton in some of our early chemical work. We are most grateful to Dr. George V. D. Tiers of the Minnesota Mining and Manufacturing Co. for running the n.m.r. spectra reported herein. We thank Dr. Mabel Chen and Professor R. Walter at Haverford College, who performed the reduction of the D(N02)2- H for our benefit. Dr. R. IP. Poirier of the Battelle Memorial Institute assisted us greatly by providing some of his “ oxyhydrazyl” for our use.
(14) G. Berthet, Archives des Sciences (Geneva), 9, 92 (1956).(15) G. Berthet, Ann. Phys., 3, 629 (1958).
May, 1961 Paramagnetic R esonance of ^-Substituted Hydrazyl Free R adicals 713
SOLUTION PAR AM AG N ETIC RESONANCE STUDIES OF PAR A-SU B STITU TED H YD R A ZYL FREE RAD ICALS
By M a b e l M . C h e n , 1 K r i s h n a V. S a n e , 2 R o b e r t I. W a l t e r 1 a n d J o h n A. W e i l 2
Joint Contribution from. Argonne National Laboratory, Argonne, Illinois, and the Department of Chemistry, Haverford CollegeHaverford, Pennsylvania
Received December 3, 1960
The electron spin resonance spectra of a series of 2,2-diphenyl-l-picrylhydrazyl free radicals substituted at the para positions of the phenyl rings have been observed in dilute solution in benzene. Nuclear hyperfine coupling constants for interaction of the unpaired electron with the hydrazine nitrogen atoms have been determined by an automatic curve-fitting procedure. In three cases, these constants have been assigned to the individual nitrogen atoms by studying the N 16 labelled compounds. The observed variations of the coupling constants and line widths have been discussed in terms of the known effects of the various substituents on electron delocalization.
IntroductionThe first free radical for which nuclear hyperfine
structure was observed3 in the electron spin resonance absorption was2,2-diphenyl-l-picrylhydrazyl, DPPH. This splitting has been interpreted in terms of the relative residence times of the unpaired electron at the nuclei of the two hydrazine atoms,3-6 with the implicit assumption that the hybridization of the relevant orbitals is the same for these two atoms. Quite recently, by using carefully deoxygenated solutions and a high-resolu- tion instrument, additional splitting due to the protons attached to the aromatic rings has been observed.6
There have been several reports on the effect of changes in the molecular structure of this radical on the nitrogen hyperfine splitting. One change involved an additional bond between neighboring o r t h o positions of the two phenyl groups4-6; a second involved the replacement of one nitro group in the picryl ring by a sulfonate ion.4 The hyperfine spectrum of a related radical, 2,2-diphenyl-l- benzoylhydrazyl, has been found to be similar to that of hydrazyl itself, with about 25% smaller coupling constants.7 All of these resonance spectra were interpreted in terms of changes in the relative residence times of the electron on the nitrogen atoms. One brief paper dealing with the solution spectra of a few mono-p-substituted hydrazyls has been published and reports that the spectra were identical with that of hydrazyl itself.8
We report here the results of an investigation of the effect on the nitrogen hyperfine splitting of substitution with various groups into the p a r a positions of the benzene rings in 2,2-diphenyl-l- picrylhydrazyl. As in the preceding paper,9 we
(1) Haverford College— this work was supported by contract DA 36-039-SC-74917 with the U. S. Army Signal Research and Development Laboratory, administered by the University of Pennsylvania. Royalty-free reproduction for purposes of the U. S. Government is permitted.
(2) Address communications regarding this paper to J. A. W., Argonne National Laboratory— this work was performed under the auspices of the U. S. Atomic Energy Commission.
(3) C. A. Hutchison, R. C. Pastor and A. G. Kowalsky, J. Chem. Phys., 20, 534 (1952).
(4) PL S. Jarrett, ibid., 21, 761 (1953).(5) C. Kikuchi and V. W. Cohen, Phys. Rev., 93, 394 (1954).(6) Y. Deguchi, J. Chem. Phys., 32, 1584 (1960).(7) I. S. Ciccarello, T. Garofano and M. Santangelo, Nuovo Cimento,
12, 389 (1959).(8) R. G. Bennett and A. Plenglein, J. Chem. Phys., 30, 1117 (1959).(9) J. A. Weil, K. V. Sane and J. M. Kinkade, Jr., J. Phys. Chem.,
65, 710 (1961).
denote these radicals by DGaGb-, where Ga and Gb represent the substituents in the two phenyl rings.
ExperimentalDetails of the preparation and proof of structure of the
compounds in which nitro groups are substituted in the benzene rings are given in the preceding paper. 9 Preparation of the other free radicals will be published elsewhere. 10
The electron paramagnetic resonance (EPR) spectra were taken in benzene solution at ~25°, using a Varian V-4500 spectrometer (9.5 kMc./'sec.). Each sample was observed at successively greater dilutions until constancy of the observed hyperfine pattern indicated the elimination of exchange and intermolecular dipolar effects. No saturation effects were observed at the microwave power levels used. The solutions used for the hyperfine structure measurements were of the order 1 0 ~ 3 M , and were deoxygenated (see below).
Empirical Analysis of Spectra.—Analysis of the experimental spectra in terms of hyperfine coupling constants for the hydrazine nitrogen atoms was carried out by means of a program developed for the IBM 650 computer which performed an automatic curve fitting procedure with the spectra. The curves were generated by using a superposition of individual (hyperfine) components obeying an analytic expression; in our work, these components were assumed to be normalized first derivatives of gaussians, so that the spectrum was represented by the sum
+ 1 +BF = 2 (5 + A m + A 'm ') A ~ 3 exp[ — 2(6
m = — I m' = — I'+ A m + A 'm ') 2A ~ 2] (1)
Here A and A ' are the (unassigned) isotropic hyperfine coupling constants of the two hydrazine nitrogen atoms, I and / ' are their nuclear spin quantum numbers, and the variable 5 is the magnetic field measured from the center of the spectrum. The quantity A is the width between maximum and minimum of the individual gaussian derivative. When the individual components are at least partially resolved, the distance between the first maximum and the last minimum of the total function is given by
d = 2 (.A I + A T + U ) - 2 ( a .Z + A ' Z ’ -A 2 A ' 2 \— zA - I y ) + . . . (2 )
whereZ = exp [ - * 1 0 )~j and
Z ' = U DIn our work, a very good approximation was obtained with only the first term of equation 2. The outer peaks were little affected by overlap with other peaks, so that it was possible to obtain from them a good estimate of A. Since I — I ’ = 1 for N14, measurement of d yielded a good estimate of A + A ' for the radicals.
(10) M. M. Chen, A. F. D ’Adamo and R. I. Walter, submitted to J. Org. Chem,
May, 1961 Paramagnetic R esonance of ^-Substituted Hydrazyl Free R adicals 715
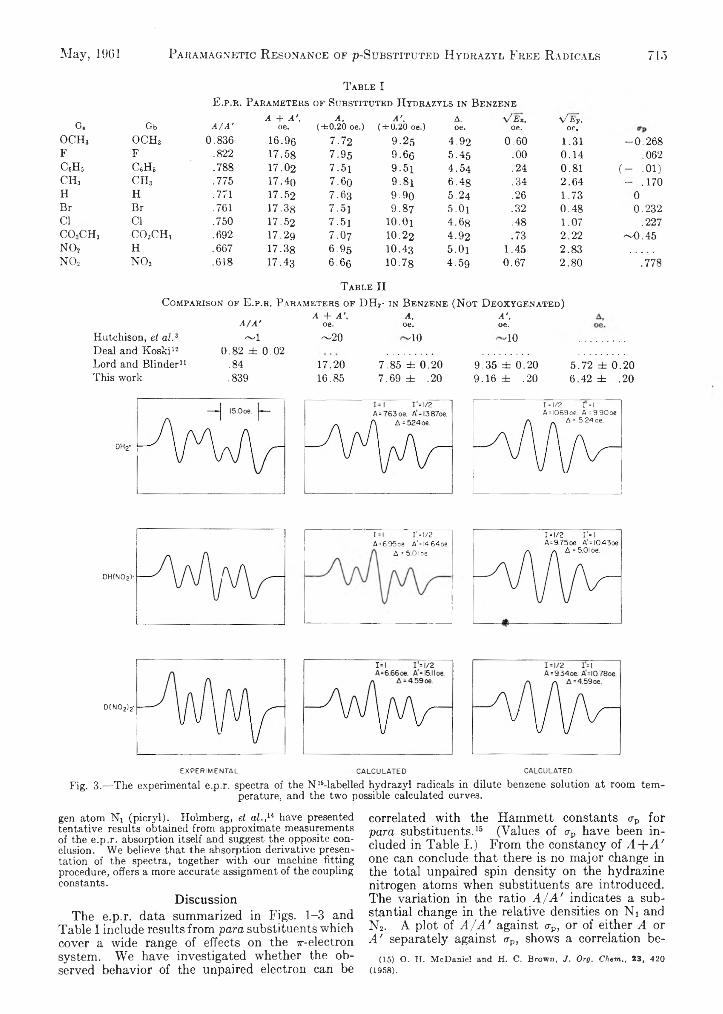
T a b l e IE.p.r . P a r a m e t e r s of Su b st it u t e d H y d r a zy l s in B e n ze n e
G. Gb A / A ’A + A ',
oe.A ,
(±0 .20 oe.)A ',
(db0.20 oe.)A,oe.
V-Ex,oe.
y/ Ey,oe.
OCHa o c h 3 0.836 16.96 7.72 9.25 4.92 0.60 1.31 -0 .2 6 8F F .822 17.58 7.95 9.66 5.45 .00 0.14 .062c 6h 5 C6H6 .788 17.02 7 .5 l 9 .5 i 4.54 .24 0.81 ( - -01)c h 3 c h 3 .775 17.40 7.6o 9 .8 i 6.4g .34 2.64 - .170H H .771 17.52 7 .63 9.90 5.24 .26 1.73 0Br Br .761 17.38 7 .5 i 9.87 5 .0 i .32 0.48 0.232Cl Cl .750 17.52 7 .5 i 10.Ox 4.68 .48 1.07 .227c o ,c h 3 CO,CH, .692 17.29 7 .O7 10.22 4.92 .73 2.22 ~ 0 .4 5NO, H .667 17.38 6.95 10.43 5 .0 i 1.45 2.83NO, NO, .618 17.43 6.66 10.78 4.59 0.67 2.80 .778
T a b l e II
C o m pa r iso n o f E .p .r . P a r a m e t e r s o f D H 2- in B e n ze n e (N o t D e o x y g e n a t e d )
Hutchison, et al.3 Deal and Koski12 Lord and Blinder11 This work
A / A '
‘—'10.82 ± 0.02
.84
.839
A + A ', oe.~ 20
17.2016.85
A ,oe.
-40
7.85 ± 0.20 7.69 ± .20
A '.oe .
-10
9.35 ± 0.20 9.16 ± .20
5.72 ± 0.20 6.42 ± .20
1 = 1/2 1=1 A = l0.69oe. A‘ = 9.90oe.
A = 5.24 oe.
DH(N02)'
IA
1 I'= 1/2 =695oe. A' = l4.64oe.
A = 5.01 oe.
d(no2)2-
EXPERIMENTALFig. 3.— The experimental e.p.r. spectra of the N 15-labelled hydrazyl radicals in dilute benzene solution at room tem
perature, and the two possible calculated curves.
gen atom Ni (picryl). Holmberg, et al.,14 have presented tentative results obtained from approximate measurements of the e.p.r. absorption itself and suggest the opposite conclusion. We believe that the absorption derivative presentation of the spectra, together with our machine fitting procedure, offers a more accurate assignment of the coupling constants.
DiscussionThe e.p.r. data summarized in Figs. 1-3 and
Table I include results from p a r a substituents which cover a wide range of effects on the x-electron system. We have investigated whether the observed behavior of the unpaired electron can be
correlated with the Hammett constants crp for p a r a substituents.15 (Values of vp have been included in Table I.) From the constancy of A + A ' one can conclude that there is no major change in the total unpaired spin density on the hydrazine nitrogen atoms when substituents are introduced. The variation in the ratio A / A ' indicates a substantial change in the relative densities on Nj and N2. A plot of A / A ' against crp, or of either A or A ' separately against <rp, shows a correlation be-
(15) O. H. McDaniel and H. C. Brown, J . Org. Chem ., 23 , 420 (1958).
716 M. M. Chen, K. V. Sane, R. I. W alter and J. A. W eil Vol. 65
tween these variables, but with appreciable scatter.The larger coupling constant A ' has been as
signed to nitrogen atom Ni (picryl) by the labelling experiments for the three free radicals containing the p a r a groups -H and -NO 2. Since the substituents studied cover without large gaps the range of properties from the moderately strong electron donor -OCH3 to the strong electron acceptor -N 0 2, it is reasonable to expect that the groups of constants associated with Ni and N2 would show no abrupt discontinuities. Indeed, the values of A cover the range 6.6 to 8.0 oe. and those for A ' the range 9.3-10.8 oe.; the difference between these sets of numbers exceeds the probable error in their assignment. Consequently, we shall in the following assume that all of the constants A ' are associated with the (picryl) nitrogen atoms Ni and the constants A with the nitrogen atoms N2.
Several papers have appeared which deal with the effects of substituents on e.p.r. line widths in polycrystalline samples of these and other free radicals.7’16'17 The powder line widths are determined largely by dipolar and exchange interactions, and it was proposed16 that any increase in delocalization of the unpaired electron by placing substituents in the phenyl rings would cause line narrowing because of the improved averaging-out of the local fields. This delocalization has been discussed in terms of possible valence bond structures of the radicals. Since an accurate and tractable theory is still not available, we shall use these structures also in presenting a qualitative discussion of our present results.
The interpretation of the isotropic hyperfine coupling constants, as well as of the anisotropic terms, has been discussed in considerable detail for the unsubstituted hydrazyl radical.11'14 Analysis of the isotropic constants is complicated by the fact that two mechanisms can contribute to the hyperfine interaction. The presence of s-char- acter in the ground state wate function at the atom in question will cause hyperfine splitting v ia the contact interaction. In addition, coupling of the unpaired electron with the electrons of the various doubly-occupied orbitals attached to the atom will place unpaired spin density in the bonding orbitals, thus making use of the s-character of the latter. In this “spin polarization” mechanism, unpaired spin density on a given atom will cause unpairing and consequently hyperfine splitting at its neighboring atoms. Thus one would not necessarily find proportionality between the hyperfine coupling constant and the unpaired spin density of a given atom. Furthermore, estimation of the relative importance of the various valence-bond structures and the changes in them after introducing substituents will be qualitative at best. Nonetheless, because we deal with a series of compounds in which the wave function of the unpaired electron should change only slightly and in a systematic manner, we shall interpret these changes by assuming approximate proportionality between A (and A ') and the unpaired spin densities on N2
(16) R. I. Walter, R. S. Codrington, A. F. D ’Adamo, Jr., and H. C. Torrey, J. Chem. Phys., 25, 310 (1966).
(17) R. O. Matevosyan, I. Ya, Postovakii and A. K. Chirkov,J. Gen. Chem. USSR (Engl. Transl.), 29, 843 (1959).
(and Ni). An argument which supports this assumption is given by Lord and Blinder.11
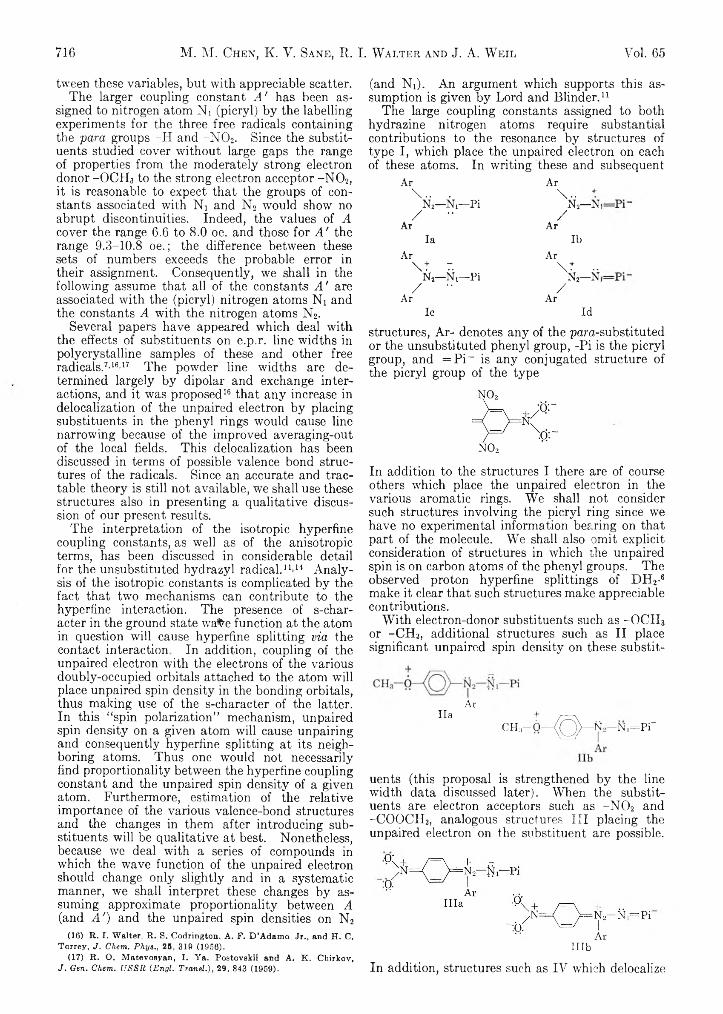
The large coupling constants assigned to both hydrazine nitrogen atoms require substantial contributions to the resonance by structures of type I, which place the unpaired electron on each of these atoms. In writing these and subsequent
Ar Ar\ . . . \ . . +
N2— N r -P i N2— Nj/ " /
Ar Arla lb
Ar Ar\ t 7. \ t ••
N2— N,— Pi N2— Nj/ - /
Ar ArIc Id
structures, Ar- denotes any of the para-substituted or the unsubstituted phenyl group, -Pi is the picryl group, and =Pi~ is any conjugated structure of the picryl group of the type
N 02
In addition to the structures I there are of course others wrhich place the unpaired electron in the various aromatic rings. We shall not consider such structures involving the picryl ring since we have no experimental information bearing on that part of the molecule. We shall also omit explicit consideration of structures in which the unpaired spin is on carbon atoms of the phenyl groups. The observed proton hyperfine splittings of DH2-6 make it clear that such structures make appreciable contributions.
With electron-donor substituents such as -OCH3 or -CH 3, additional structures such as II place significant unpaired spin density on these substit-
ArHa + /— ^
CH:,— 0 — (Q l>—N — N ,= P f
uents (this proposal is strengthened by the line width data discussed later). When the substituents are electron acceptors such as -N 0 2 and -COOCH3, analogous structures III placing the unpaired electron on the substituent are possible.
I llb
In addition, structures such as IV which delocalize
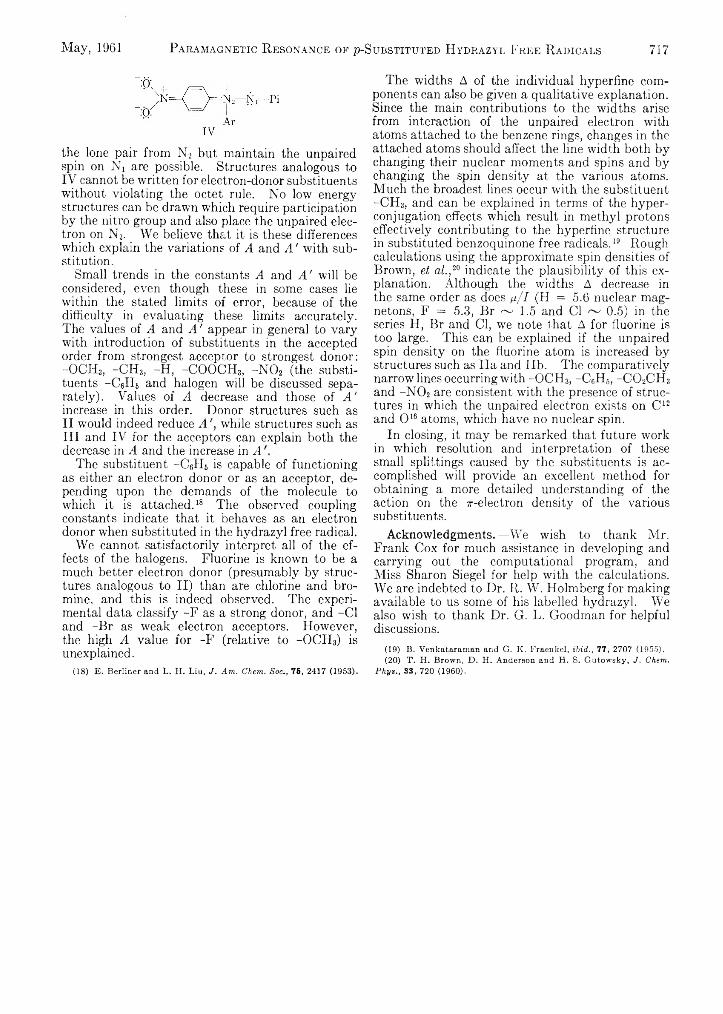
May, 1961 Paramagnetic R esonance of ^-Substituted Hydrazyl Free R adicals 717
the lone pair from N2 but maintain the unpaired spin on Ni are possible. Structures analogous to IV cannot be written for electron-donor substituents without violating the octet rule. No low energy structures can be drawn which require participation by the nitro group and also place the unpaired electron on N2. We believe that it is these differences which explain the variations of A and A ' with substitution.
Small trends in the constants A and A ' will be considered, even though these in some cases lie within the stated limits of error, because of the difficulty in evaluating these limits accurately. The values of A and A ' appear in general to vary with introduction of substituents in the accepted order from strongest acceptor to strongest donor: -OCH3, -CH3, -H, -COOCH3, -N 0 2 (the substituents -C 6H6 and halogen will be discussed separately). Values of A decrease and those of A ' increase in this order. Donor structures such asII would indeed reduce A while structures such asIII and IV for the acceptors can explain both the decrease in A and the increase in A
The substituent -Cells is capable of functioning as either an electron donor or as an acceptor, depending upon the demands of the molecule to which it is attached.18 The observed coupling constants indicate that it behaves as an electron donor when substituted in the hydrazyl free radical.
We cannot satisfactorily interpret all of the effects of the halogens. Fluorine is known to be a much better electron donor (presumably by structures analogous to II) than are chlorine and bromine, and this is indeed observed. The experimental data classify -F as a strong donor, and -Cl and -Br as weak electron acceptors. However, the high A value for -F (relative to -OCH3) is unexplained.
(18) E. Berliner and L. H. Liu, J. Am. Chem. Soc., 76, 2417 (1953).
The widths A of the individual hyperfine components can also be given a qualitative explanation. Since the main contributions to the widths arise from interaction of the unpaired electron with atoms attached to the benzene rings, changes in the attached atoms should affect the line width both by changing their nuclear moments and spins and by changing the spin density at the various atoms. Much the broadest lines occur with the substituent -CH3, and can be explained in terms of the hyperconjugation effects which result in methyl protons effectively contributing to the hyperfine structure in substituted benzoquinone free radicals.19 Rough calculations using the approximate spin densities of Brown, et a l . , i0 indicate the plausibility of this explanation. Although the widths A decrease in the same order as does n / I (H = 5.6 nuclear magnetons, F = 5.3, Br ~ 1.5 and Cl ~ 0.5) in the series H, Br and Cl, we note that A for fluorine is too large. This can be explained if the unpaired spin density on the fluorine atom is increased by structures such as Ila and lib. The comparatively narrow lines occurring with -OCH3, -C 6H6, -CO2CH3 and -NO2 are consistent with the presence of structures in which the unpaired electron exists on C12 and O16 atoms, which have no nuclear spin.
In closing, it may be remarked that future work in which resolution and interpretation of these small splittings caused by the substituents is accomplished will provide an excellent method for obtaining a more detailed understanding of the action on the -electron density of the various substituents.
Acknowledgments.— We wish to thank Mr. Frank Cox for much assistance in developing and carrying out the computational program, and Miss Sharon Siegel for help with the calculations. We are indebted to Dr. R. W. Holmberg for making available to us some of his labelled hydrazyl. We also wish to thank Dr. G. L. Goodman for helpful discussions.
(19) B. Venkataraman and G. K. Fraenkel, ibid., 77, 2707 (1955).(20) T. H. Brown, D. H. Anderson and H. S. Gutoweky, J. Chem.
Phys., 33, 720 (1960).
Patrick N. Walsh and N orman Ó. Smith Voi. 65
SUBLIM ATIO N PRESSURE OF SOLID SOLUTIONS. I I . TH E SYSTEMS p-DICHLOROBENZENE-p-DIBROM OBENZENE. p-D ICHLOROBENZENE-
p-BROMOCHLOROBENZENE AND p-DIBROM OBENZENE- p-BROM OCHLOROBENZENE1 A T 50°
B y P a t r ic k N . W a l s h 2 a n d N o r m a n 0 . S m it h
Department of Chemistry, Fordham University, New York, N. Y.Received May 20, 1960
718
The sublimation pressure of solid solutions as a function of composition has been measured at 50.0° for the systems p- CeEhCh-p-CelLB^, p-CeHiBrCl-p-CeHiBri, p-C6H4Cl2-p -C 6H4BrCl. An analytical method has been applied to the total pressure curves to derive partial pressures and thermodynamic properties of the components in each solution. The systems formed by p-CeHtBr« with p-CeEhCh and with p-C6H4BrCl show small positive deviations from Raoult’s law over the entire composition range. The system p-CsEhCk-p-CelRBrCl, on the other hand, is unusual in that positive deviations for one component and negative for the other appear to prevail over a wide range of composition.
The thermodynamic properties of non-ionic non-metallic solid solutions have received relatively little attention in the literature, and what work has been done has been concerned chiefly with fusion equilibria, where interpretation is difficult. This difficulty is eliminated by the sublimation pressure approach used in the present work. The partial pressures are low enough to permit the identification of partial pressure with fugacity and thus the determination of solid state activities and excess partial molar free energies of mixing. Raoult’s law was chosen as the criterion of ideality and the pure solid components as the standard states for the solid phases.
Studies of sublimation equilibria in systems where intermolecular bonding is chiefly the result of van der Waals forces have been few in number, presumably because most solids have very low pressures at convenient temperatures, causing experimental difficulties. The earlier literature on the subject has been reviewed in the first paper of this series.3 As far as previous work with the present systems is concerned, Speranski4 determined total pressures in the system p-CetRCk-p-CeiLBrs and p-CelRBrCl-p-CeHiB^, while Kuster5 measured total pressures and vapor compositions in the first of these systems. The latter was also investigated by Kruyt,6 who determined the course of the three-phase line.
The poor agreement of the previous measurements on p-CeKUCk-p-CeBliB solutions suggested its restudy. The binary systems of these compounds with the isomorphous p-CelRBrCl were included in this investigation to determine whether varying the substituents would result in any systematic alteration in the properties of the solid solutions. The temperature of 50.0° was chosen as being just below the maximum temperature at which liquid phases do not appear in any of the three binary systems. The sublimation
(1) Taken from the Ph.D. thesis of P. N. Walsh, Fordham University, June 1956. Portions of this work were reported to the Division of Physical and Inorganic Chemistry of the American Chemical Society in Minneapolis, September, 1955, and the New York Section’s Meet- ing-in-Miniature, February, 1954.
(2) National Science Fellow, 1952-1953.(3) J. J. Keavney and N. O. Smith, J. Phys. Chem., 64, 737 (1960).(4) A. Speranski, Z. physik. Chem,., 51, 45 (1905).(5) F. W. Kuster, ibid., 51, 222 (1905).(6) H. H. Kruyt, ibid., 79, 657 (1912).
pressures of the pure components already had been measured in this Laboratory.7
ExperimentalMaterials.—The materials used were those purified by
Walsh and Smith.1
Apparatus.—The design and operation of the apparatus in the measurement of sublimation pressures in unary systems has been described elsew'here. 3 ' 7 The procedure with the binary systems studied here was essentially identical, with the following variations. First, after the degassing procedure had been carried out, the sample was remelted (with the stopcock between the large bulb and the sample holder closed), and allowed to cool slowly while the portions of the apparatus adjacent to S (Fig. 1, ref. 3) were heated to prevent distillation. Supercooling of five to ten degrees, followed by instantaneous freezing, occurred under these conditions, thus preserving the homogeneity of the liquid into the solid phase. Second, approximately 100 hr. was allowed for attainment of equilibrium, experiment having shown that steady pressures were achieved within 48 hr. Third, after the pressure had been recorded the solid and vapor phases were separated by closing all the stopcocks. The vapor was then frozen out into a small side tube (previously sealed on to bulb B), the solid in S similarly cooled, and the two removed from the system.
Analysis.— The solid and vapor samples so obtained were dissolved in toluene and treated with sodium biphenyl reagent8 to convert the organic halogen to halide. An aliquot portion of the resulting solution was titrated poten- tiometrically with silver nitrate to determine total halide. The bromide in another aliquot was removed by the procedure of McAlpine9 and the remaining chloride titrated. The composition of the starting material could be deduced from the chloride to total halide ratio. Duplicate analyses were run on all samples. Blank runs were made to correct for the halide content of the reagents used, which proved to be negligible. The procedure was tested on three samples, A, B, C, of high, intermediate and low Cl/Br ratio, with these results: A, mixture of C6H4C12 and CfH4Br2, Acmci! = 0.963 (taken), 0.955 (found); B, C6H4BrCl, C1/(C1 + Br) = 0.501 (found); C, mixture of C6H4Br2 and C6H4- BrCl, XciHiBrz = 0.924 (taken), 0.918 (found).
Results and DiscussionThe solid-vapor equilibrium diagrams, at 50.0°,
of the three systems investigated are shown in Figs. 1, 2 and 3. It is obvious that the experimental vapor compositions (open circles nearest the vapori) do not fall on smooth, or even continuous curves, but are erratically displaced toward the solidi. This possibly was caused by partial condensation having occurred in the vapor volume prior to separation of solid and vapor phases, as a result of small temperature gradients in the bath.
(7) P. N. Walsh and N. O. Smith, J. C hem . Eng. Data, 6, 33 (1961).(8) L. M. Liggett, Anal. Chem., 26, 748 (1954).(9) R. K. McAlpine, J. Am. Chem. Soc., 51, 1065 (1929).
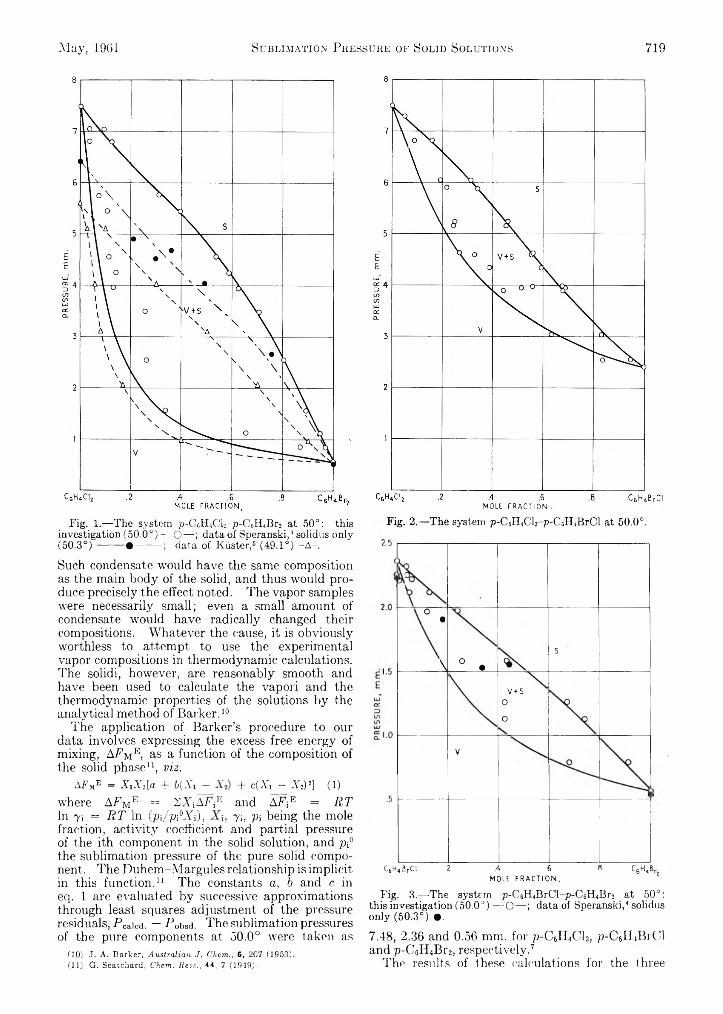
May, 1961 Sublimation Pressure of Solid Solutions 719
Fig. 1.— The system p-C6H4Cl2-p -C 6H4Br2 at 50°: this investigation (50.0°) — O — ; data of Speranski,4 solidus only (5 0 .3 °)-------- • -------- ; data of Kiister,6 (49.1°) -A -.
Such condensate would have the same composition as the main body of the solid, and thus would produce precisely the effect noted. The vapor samples were necessarily small; even a small amount of condensate would have radically changed their compositions. Whatever the cause, it is obviously worthless to attempt to use the experimental vapor compositions in thermodynamic calculations. The solidi, however, are reasonably smooth and have been used to calculate the vapori and the thermodynamic properties of the solutions by the analytical method of Barker.10
The application of Barker’s procedure to our data involves expressing the excess free energy of mixing, AFme, as a function of the composition of the solid phase11, viz.
AFV = X,.Y2[a + b ( X + c (X ,_ - XJ* ] (1)where AFme = 2X ;AFiE and A F;E = R T In 7 i = R T In (p i/ p i°X i) , 71, pi being the molefraction, activity coefficient and partial pressure of the ith component in the solid solution, and p i0 the sublimation pressure of the pure solid component. The Duhem-Margules relationship is implicit in this function.11 The constants a, b and c in eq. 1 are evaluated by successive approximations through least squares adjustment, of the pressure residuals, F Caicd. — F 0bSd. The sublimation pressures of the pure components at 50.0° were taken as
CIO) J. A. Barker, Australian J. Chem., 6, 207 (1953).(11) G. Scatchard, Chem. Revs., 44, 7 (1949).
MOLE FRACTION .Fig. 2.— The system p-C6H4Cl2-p -C 6H4BrCl at 50.0°.
°/
•
o •s
v+soo
V
C6H,3rCl .2 .4 .6 .8 C6H4BMOLE FRACTION.
Fig. 3.— The system p-C6H4BrCl-p-C6H4Br2 at 50°: this investigation (50.0°) — O — ; data of Speranski,4 solidus only (50.3°) #.
7.48, 2.36 and 0.56 mm. for p-CelifCb, p-CslIiBi C'l and p-CoH4Br2, respectively.7
The results of these calculations for the three
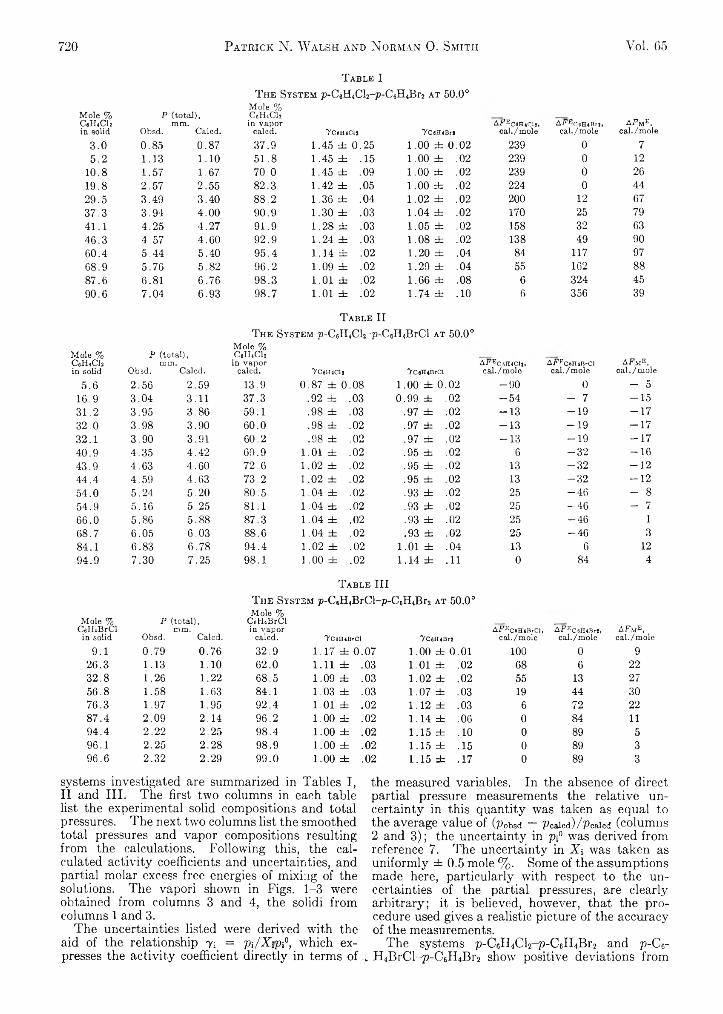
720 Patrick N. Walsi-i and N orman 0 . Smith Vol. 65
T able IT he System p -CethCh-p-CiH JIr, a t 50.0°
M o le % C e H iC h in s o lid
P ( t o t a l ) , m m .
O b s d . C a le d .
M o le % C flH 4C l2
in v a p o r ca le d . 7c< im cii YCsHiBr,
A f EC0H4CIî, c a l . /m o le
A i?EC6H4BrJ,c a l . /m o le
A F m E,c a l . /m o le
3 . 0 0 . 8 5 0 . 8 7 3 7 . 9 1 . 4 5 ± 0 . 2 5 1 . 0 0 ± 0 . 0 2 2 3 9 0 7
5 . 2 1 . 1 3 1 . 1 0 5 1 . 8 1 . 4 5 ± . 1 5 1 . 0 0 ± . 0 2 2 3 9 0 1 2
1 0 . 8 1 . 5 7 1 . 6 7 7 0 . 0 1 . 4 5 ± . 0 9 1 . 0 0 ± . 0 2 2 3 9 0 2 6
1 9 . 8 2 . 5 7 2 . 5 5 8 2 . 3 1 . 4 2 ± . 0 5 1 . 0 0 ± . 0 2 2 2 4 0 4 4
2 9 . 5 3 . 4 9 3 . 4 0 8 8 . 2 1 . 3 6 ± . 0 4 1 . 0 2 ± . 0 2 2 0 0 1 2 6 7
3 7 . 3 3 . 9 4 4 . 0 0 9 0 . 9 1 . 3 0 ± . 0 3 1 . 0 4 ± . 0 2 1 7 0 2 5 7 9
4 1 . 1 4 . 2 5 4 . 2 7 9 1 . 9 1 . 2 8 ± . 0 3 1 . 0 5 ± . 0 2 1 5 8 3 2 6 3
4 6 . 3 4 . 5 7 4 . 6 0 9 2 . 9 1 . 2 4 ± . 0 3 1 . 0 8 ± . 0 2 1 3 8 4 9 9 0
6 0 . 4 5 . 4 4 5 . 4 0 9 5 . 4 1 . 1 4 ± . 0 2 1 . 2 0 ± . 0 4 8 4 1 1 7 9 7
6 8 . 9 5 . 7 6 5 . 8 2 9 6 . 2 1 . 0 9 ± . 0 2 1 . 2 9 ± . 0 4 5 5 1 6 2 8 8
8 7 . 6 6 . 8 1 6 . 7 6 9 8 . 3 1 . 0 1 ± . 0 2 1 . 6 6 ± . 0 8 6 3 2 4 4 5
9 0 . 6 7 . 0 4 6 . 9 3 9 8 . 7 1 . 0 1 ± . 0 2 1 . 7 4 ± . 1 0 6 3 5 6 3 9
T able IIT he System /j-GcWCU-p-CcHiBrCl at 50.0°
Mole %M o le % C 6H ,C 1 2 in so lid
P ( t o t a l ) , m m .
O b s d . C a le d .
C .H < C h in v a p o r
ca le d . 7 c «H401i 7o«n «n ro iA F EC6H4Cla,c a l . /m o le
A F r C6H4BrClc a l . /m o le
A F m e .c a l . / m o l e
5 . 6 2 . 5 6 2 . 5 9 1 3 . 9 0 . 8 7 ± 0 . 0 8 1 . 0 0 ± 0 . 0 2 - 9 0 0 - 5
1 6 . 9 3 . 0 4 3 . 1 1 3 7 . 3 . 9 2 ± . 0 3 0 . 9 9 ± . 0 2 - 5 4 - 7 - 1 5
3 1 . 2 3 . 9 5 3 . 8 6 5 9 . 1 . 9 8 ± . 0 3 . 9 7 ± . 0 2 - 1 3 - 1 9 - 1 7
3 2 . 0 3 . 9 8 3 . 9 0 6 0 . 0 . 9 8 ± . 0 2 . 9 7 ± . 0 2 - 1 3 - 1 9 - 1 7
3 2 . 1 3 . 9 0 3 . 9 1 6 0 . 2 . 9 8 ± . 0 2 . 9 7 ± . 0 2 - 1 3 - 1 9 - 1 7
4 0 . 9 4 . 3 5 4 . 4 2 6 9 . 9 1 . 0 1 ± . 0 2 . 9 5 ± . 0 2 6 - 3 2 - 1 6
4 3 . 9 4 . 6 3 4 . 6 0 7 2 . 6 1 . 0 2 ± . 0 2 . 9 5 ± . 0 2 1 3 - 3 2 - 1 2
4 4 . 4 4 . 5 9 4 . 6 3 7 3 . 2 1 . 0 2 ± . 0 2 . 9 5 ± . 0 2 1 3 - 3 2 - 1 2
5 4 . 0 5 . 2 4 5 . 2 0 8 0 . 5 1 . 0 4 ± . 0 2 . 9 3 ± . 0 2 2 5 - 4 6 - 8
5 4 . 9 5 . 1 6 5 . 2 5 8 1 . 1 1 . 0 4 ± . 0 2 . 9 3 ± . 0 2 2 5 - 4 6 — 7
6 6 . 0 5 . 8 6 5 . 8 8 8 7 . 3 1 . 0 4 ± . 0 2 . 9 3 ± . 0 2 2 5 - 4 6 1
6 8 . 7 6 . 0 5 6 . 0 3 8 8 . 6 1 . 0 4 ± . 0 2 . 9 3 ± . 0 2 2 5 - 4 6 3
8 4 . 1 6 . 8 3 6 . 7 8 9 4 . 4 1 . 0 2 ± . 0 2 1 . 0 1 ± . 0 4 1 3 6 1 2
94.9 7 . 3 0 7 . 2 5 9 8 . 1 1 . 0 0 d z . 0 2 1 . 1 4 ± . 1 1 0 8 4 4
T able IIIT he System p-C6H4BrCl-p-C6HiBr2 at 50.0°
Mole % CeHiBrCl in solid
P (total), mm.
Obsd. Caled.
Mole % CelLBrCl in vapor
caled. 7C6H4BrCl TcemBr,AFEC6H4BrCl,
cal./moleAFEC6mBrJ,cal./mole
AFME,cal./mole
9.1 0.79 0.76 32.9 1.17 ± 0.07 1.00 ± 0 .01 100 0 926.3 1.13 1.10 62.0 1.11 ± .03 1.01 ± .02 68 6 2232.8 1.26 1.22 68.5 1.09 ± .03 1.02 ± .02 55 13 2756.8 1.58 1.63 84.1 1.03 ± .03 1.07 ± .03 19 44 3076.3 1.97 1.95 92.4 1.01 ± .02 1.12 ± .03 6 72 2287.4 2.09 2.14 96.2 1.00 ± .02 1.14 ± .06 0 84 1194.4 2.22 2.25 98.4 1.00 ± .02 1.15 ± .10 0 89 596.1 2.25 2.28 98.9 1.00 ± .02 1.15 ± .15 0 89 396.6 2.32 2.29 99.0 1.00 ± .02 1.15 ± .17 0 89 3
systems investigated are summarized in Tables I, II and III. The first two columns in each table list the experimental solid compositions and total pressures. The next two columns list the smoothed total pressures and vapor compositions resulting from the calculations. Following this, the calculated activity coefficients and uncertainties, and partial molar excess free energies of mixing of the solutions. The vapori shown in Figs. 1-3 were obtained from columns 3 and 4, the solidi from columns 1 and 3.
The uncertainties listed were derived with the aid of the relationship 7 ; = P \ / X ¡p f , which expresses the activity coefficient directly in terms of
the measured variables. In the absence of direct partial pressure measurements the relative uncertainty in this quantity was taken as equal to the average value of (p„bsd -7 Scaled)/?W cd (columns 2 and 3); the uncertainty in p f was derived from reference 7. The uncertainty in X; was taken as uniformly ± 0 .5 mole % . Some of the assumptions made here, particularly with respect to the uncertainties of the partial pressures, are clearly arbitrary; it is believed, however, that the procedure used gives a realistic picture of the accuracy of the measurements.
The systems p-CrJTCU-p-CJFB^ and p-C6- k FT4BrC 1-p -CeTT4Br2 show positive deviations from
May, 1901 Sublimation Pressure of Solid Solutions 721
Raoult’s law over the entire composition range. In the latter system the excess free energy of mixing is quite small, and nearly symmetrical in the mole fraction. This appears reasonable, as the two substances crystallize in monoclinic lattices with unit cell volumes differing by only about 1% .12’13 Hence the amount of strain created in the lattice by the substitution of a molecule of one kind for one of the other might be expected to be small and to be about the same at corresponding mole fractions of foreign molecules in either parent lattice. The data of Speranski4 shewn in Fig. 3 are obviously too ragged to make a comparison worthwhile.
It is apparent from Fig. 1 that the studies of Speranski4 and Kiister6 are in qualitative agreement with the results of this investigation for the system p-CrdhCR p-CelLBrs. Positive deviations from ideality, in terms of the difference between the observed and Raoult’s law total pressures relative to the latter, are more marked in this system, by a factor of four or five, than in the system /j-CeHiBrCl- p-CeHiBrs. This readily may be associated with the larger differences in molar volumes in this system,13 as may the fact that the partial molar excess free energy of mixing of p-C6H4Br2 in p-CeFRCL is greater than that of p-C6H4Cl2 in C6H4Br2 at equivalent concentrations. Another, probably less important, factor giving rise to deviations from ideality in this system is that the stable modification of p-C6H4Cl2 at 50° is the triclinic (/?) form. The stable form of p-C6H4BrCl at this temperature, on the other hand, is presumably the monoclinic. In spite of this, a complete series of solid solutions is found at this temperature, no evidence to the contrary having appeared in the present work or in that of Campbell and Prodan.14 Apparently the monoclinic and triclinic lattices of the components are sufficiently similar to permit the gradation of one into the other, a situation that is not unknown elsewhere. The close similarity in the energies of the monoclinic and triclinic lattices of p-CeFLCL itself, as already
(12) S, B. Hendricks, Z. Krist., 84, 85 (1933).(13) U. Croatto and S. Bezzi, Gazz. chim. i t a l 79, 240 (1949).(14) A. N. Campbell and L. W. Prodan, J . Am. Ckem. Soc., 70, 553
(1948).
demonstrated in this Laboratory,7 supports this possibility.
Analysis of the system p-CeH^L-CeHJIrCl (Fig. 2, Table II) by the Barker procedure leads to positive deviations being calculated for one component and negative for the other over a wide composition range. Such behavior is unusual, but has been observed previously in the liquid solutions pyridine-water,16 Cd-Bi,16 Cd-Sb,17 Zn-Sb,17 and naphthalene-l-hexadecene,15 and in the solid solution AgCl-N&Cl and PbCL-PbBi^.19 The effects involved are small, but greater than can be attributed to experimental errors in the measurements of pressures and compositions, as indicated in columns 5 and 6 of Table II. It is, however, not clear to what extent the analytical treatment may have affected the calculated activity coefficients, i .e ., whether the three-parameter equation (eq. 1) used here is adequate to describe a system like this. Furthermore, and possibly of greater significance, the Barker treatment implicitly accepts the solid compositions as errorless and fits the data by adjusting the pressures only. There is a significant uncertainty in the solid compositions determined in this investigation; at low concentrations of a component the uncertainty in the composition is predominant in determining the uncertainty in 7 by our method of calculation. These imperfections in the method should not have any serious effect on the systems p-C6H4Cl2- p-C6H4Br2 and p -C c }\ 4Bi Cl-p-Csil.iBi'z, where the shapes of the solidi are simple, but in the system p - C6H4Cl2-p-C6H4BrCl, where the behavior is more complex, it would not be surprising to find another set of activity coefficients which would fit the data equally well within the experimental uncertainty and yet not show the unusual behavior found here. Clearly, additional measurements, especially direct determination of vapor compositions, would be valuable in elucidating the character of this interesting system.
(15) J. Zawidski, Z. physik. Chem., 35, 129 (1900).(16) N. W. Taylor, J. Am. Chem. Soc., 45, 2865 (1923).(17) B. De Witt and Ii. Seitz, ibid., 61, 3170 (1939).(18) S. H. Ward and M. Van Winkle Ind. Eng. Chem., 46, 338
(1954).(19) A. Wachter, J. Am. Chem. Soc., 54, 919, 2271 (1932).
722 John H. Sullivan Vol. 65
THE THERMAL REACTIONS OF HYDROGEN IODIDE WITH ALKYLIODIDES1
B y J o h n H. Su l l iv a n
Los Alamos Scientific Laboratory, University of California, Los Alamos, New MexicoReceived July 18, 1960
The experimental data of Ogg2 on the rates of reaction of hydrogen iodide with methyl, ethyl and w-propyl iodides have been reinterpreted considering the slow rate determining step to be a reaction between an iodine atom and the alkyl iodide. The experimental data are in agreement with the mechanism: RI —*■ R + I (1 ); I + R I - - R + I 2 (2); R + I2 — R I + I (3); R + HI —► RH + I (4); R + RI —*■ R 'l + RH (5); I2 = 21. Independent constants which can be obtained from this system are fa, fa, fa/fa, and fc/fa. The rate of reaction 1 for each of the alkyl iodides is shown to be small compared to the rate of (2). For methyl iodide, log fa (m ole/cc.)-1 sec.-1 = 14.3 — 19,800/4.575!T, fa/fa = 8, and fa/fa = 0.03. For ethyl iodide, log fa = 13.62 — 16,700/4.575T, and fa/fa = 8. When the activation energies for (3) are taken to bezero, the C -I bond strengths in CH J and C2H5I, as determini good agreement with values obtained by other techniques. F and fa/fa could not be made, but the ratios fa/fa and fa/fa are and ethyl iodides; the data are fitted by fa/fa = 3 + 5 fa/fa.
The rates of reaction of hydrogen iodide with methyl, ethyl and n-propyl iodide were measured by Ogg2 who showed that the over-all reaction was HI + RI —► RH + I2. The over-all rates were shown to be well represented by the equationd(I2)/d f = fa(R I)(H I) + fa (R I)(H I)/[(H I) + (I2)] (E l)
which, in a given run, since (HI) + (I2) = (HI)0, reduces to
d(Is)/d i = fa,(RI)(HI) (E2)where /+ is constant only during a given run. These equations were considered to support the following mechanism from which they were derived assuming fc3 = fc4.
HI + RI - —> RH + I2 (a)RI — :>- R + I (1)
R + I2- — RI + I (3)R + HI - —> RH + I (L
h i V- 2 1
From the activation energies of (1) Ogg deduced that the C-I bond strength was 43 kcal. for each of the alkyl iodides. However, from fast flow pyrolysis of these iodides,3 thermochemical measurements,4 and later electron impact data,6 these bond strengths are now known to be in the range 50-55 kcal. This discrepancy has thrown doubt on the above mechanism.6
Since these early experiments, a large body of information on the rates of radical reactions has been obtained, and it is now possible to interpret Ogg’s extensive kinetic data in terms of a mechanism which uses some of this information. This reinterpretation yields rate constants and bond strengths which are in agreement with results from
(1) This work was sponsored by the U. S. Atomic Energy Commission.
(2) R. A. Ogg, Jr., J. Am. Chem. Soc., 56, 526 (1934).(3) E. T. Butler and M. Polanyi, Trans. Faraday Soc., 39, 19 (1943).
C. Iiorrex and R. Lapage, Disc. Faraday Soc., 10, 233 (1951). See also E. W. R. Steacie, “Atomic and Free Radical Reactions,” Reinhold Publ. Corp., New York, N. Y., 1954, pp. 81-84, where the Butler and Polanyi results are critically discussed.
(4) References listed in reference 5.(5) C. A. McDowell and B. G. Cox, J. Chem. Phys., 20, 1496
(1952).(6) E. W. R. Steacie, “Atomic and Free Radical Reactions,” Rein-
hold Publ. Corp., New York, N. Y., 1954, pp. 264-267. Also A. F. Trotman-Dickenson, “Gas Kinetics,” Butterworth Scientific Publications, 1955, p. 258.
3d from the activation energies of (2), are 55 and 52 kcal., in or n-propyl iodide an unequivocal determination of fa, fa/fa, found to be significantly different from the ratios for methyl
other kinetics investigations, together with new results.
A mechanism which fits all of Ogg’s data for each of the alkyl iodides is7
R I — s -R + I (1)I + RI — ^ R + I2 (2)R + I2 — >- R I + I (3)
R + HI — > RH + I (4)R + RI ■— ^ R 'l + RH (5)
I2 21 (d) (r)Reaction 5 is included since it occurs in the photolysis and pyrolysis of alkyl iodides8; the present analysis indicates that it occurred in Ogg’s experiments to a slight extent. R 'l is either CH2I, C2H4I or C3H6I; in the methyl and ethyl iodide systems the subsequent reactions of this radical are unimportant since (5) is slow compared to (4) and it is unlikely that R 'l is chain initiating. The slow rate-determining steps are (1) and (2) with the contribution of (1) to the total rate being slight after a small amount of iodine has been produced.
Ogg’s data, when interpreted using this mechanism, gives values of fc2 which are constant over the total (and very large) range of experimental concentrations, i .c ., one hundred-fold in CH3I and in HI, thirty-fold in C2H5I and in HI, and fivefold in HI in the ?i-propyl iodide runs where the n - C3II7I concentration was relatively constant. Further evidence in favor of the present mechanism comes from the results: (1) the ratio /c3/fc4 for methyl iodide, when calculated using this mechanism, is in good agreement with that determined in a different type of experiment by Williams and Ogg9; (2) reaction 3 is generally considered to have a very low activation energy,10 and when this is taken to be zero, the activation energies for reaction 2 are in excellent agreement with bond strengths determined from electron impact data.
(7) A similar mechanism, but without reactions 3 and 5, is suggested in N. N. Semenov, “Some Problems in Chemical Kinetics and Reactivity,” Vol. II, Princeton University Press, 1959, p. 11. S. W. Benson and E. O’Neal, J. Chem-. Phys., 31, 514 (1961), have also quantitatively reinterpreted Ogg’s data with reactions 2-4, d, r.
(8) G. R. McMillan and W. Albert Noyes, Jr., J. Am. Chem. Soc., 8 0 , 2108 (1958). J. L . Holmes and Allan Maccoll, Proc. Chem. Soc., 175 (1957). See also Steacie, pp. 265-270 and pp. 397-404, and M. Szwarc, Chem. Revs., 47, 75 (1950).
(9) R. R. Williams, Jr., and R. A. Ogg, Jr., J. Chem. Pays., 15, 696(1947).
(10) See Steacie. p. 742.
May, 1961 T hermal R eactions of Hydrogen Iodide with Alkyl I odides 723
Treatment of DataOgg followed each reaction by measuring the
iodine concentration colorimetrically as a function of time. For one typical run for each alkyl iodide he presented the initial concentrations of the reactants and a table of iodine pressures vs. time. Since more than one hundred runs were made, such detailed data for every run could not be given and, instead, the data were summarized for each run by the presentation of the initial concentrations of hydrogen iodide and alkyl iodide and the experimental values of fca, kb and k i determined from the run. The calculation of the rate constants in the present mechanism are therefore necessarily of two types: (a) calculation from concentration vs. time data of each of the three typical runs; and (b) in the case of all other runs, calculation from what will be referred to as the “summarized data” of each run.
Calculation from Concentration vs. Time Data.—The rate equation for the above mechanism, derived with the usual steady state assumption d(R)/di = 0, isd(I)2/d i = [fe(RI) + fe (R I )(I )] /[ l + fc,(I2)/fc4(H I)[l +
fc(RI)/fei(HI)]] + kp( I)*M - U h X M ) - U n i A(E3)
The methyl iodide run was at 280°, the ethyl iodide run at 260°. As will be shown later, the rate of reaction 1 at these temperatures was negligible compared to the rate of (2) after a small amount of iodine had been formed, and in integrating this equation for these two runs fci(RI) was taken to be zero. Further, to facilitate integration, the slowly varying quantity (RI)/ (HI) was set equal to time average values [(RI)/HI)]av. The slowly varying concentration of the reactant present in the larger amount, (RI) in these two runs, was also set equal to time average values. With these substitutions and with (I) = KdC )'7* where A d is the dissociation constant for I2, the integrated equation is
= £ D(RI)avi [(l2)t'/2 " (W “172] +h ________________2________________h fcD(RI)avi[l + ([R I)/(H I)]avfc6/k ]
R H iyA (H I)0‘A + (IjVA (HIV A - (I2)o'A L 2 10g (HIVA - (I2yA (H iyA + (I2)01A
KWt'A - (Ido'A]] = y(t) + h x (<) (E4)
In using this equation zero time was considered to be at Ogg’s first optically measured concentration, i .e ., for methyl iodide at 480 sec. after mixing, and for ethyl iodide, at 600 sec. after mixing, during which times sufficient iodine had been formed so that A;2(RI)(I) > > fcj(RI). Each subsequent time was measured from either of these zero times. The time average values of concentrations were taken to be one-half the sum of the initial and final values for each time interval. Iodine equilibrium constants were A d = 8.51 X 10~8 and 15.6 X 10~8 (mole/ce.)1/2 at 260 and 280°.12
(11) I am indebted to a referee for pointing out that this equation is more accurate than the equation originally derived.
(12) “Selected Values of Chemical Thermodynamic Properties,” Series III, National Bureau of Standards, Washington, D. C., March 1, 1 9 5 4 .
When y ( t ) was plotted against x{t) for the methyl iodide run and the ethyl iodide run, good straight lines were obtained from which fc3//c4 and k 2 were obtained as the slope and the intercept at x{t) = 0. As /c6//c4 could not be determined from these runs, we used in these calculations k 6/k.t = 0.03 for CH3I and fc6/fc4 = 0 for C2H6I obtained from treating the summarized data below.
The dependence of concentrations on time was also given for one n-propyl iodide run at 290°. However, fewer measurements were made on this run and the scatter in the data does not permit k s/ k i and k 2 to be determined accurately.
Calculation from the Summarized Data.— Rates for each alkyl iodide were measured by Ogg at 10° intervals in the ranges; methyl iodide 270-320°, ethyl iodide 250-300°, and n-propyl iodide 260- 300°. The following data were given for each run: temperature, initial concentrations of hydrogen iodide and alkyl iodide, and the calculated values of fca, kb and % Each run was followed until “at least one-half of the reactant present in the smaller amount was consumed,” and measurements of the rates were started when the “reactions had proceeded some 10% toward completion.”
In principle, these data from four or more runs at each temperature permit the calculation of k h k'2, k z/k i and k s/k t from an integrated form of E3. However, the approximations used in deriving E4 are not valid for many of the runs and without these approximations the integral of E3 is too complicated to be used in determining the rate constants. Rate constants were therefore obtained with the following method.
Ogg’s value of kb was strongly dependent on the initial concentrations (as was shown by him), but was fairly constant over the time intervals of each run. If the present mechanism is correct, U in each run must have been an average value of a slightly varying function k(c) of the concentrations of the reactants. Thus, if we set the rate expression E2 equal to E3, we obtaink(c) = kb = [fci + fe (I )] /(H I )[l + h (h )/ h (m ){ l +
fe(R I)/A (H I)]] + [&r(I )2(M ) - /cd(I2)(M ) - Ai(RI)]/(H I)(R I) (E5)
Equation E5 may be used to calculate k h k 2, kz/ki, and /c6/fc4 from the values of fcb given by Ogg. Since k(c) was fairly constant over the periods of rate measurements, we may take kb for each run to be a time average of the slowly varying /c(c) and equal to the time average of the right hand side of E5. If we replace (I) by (I) = [[fci(RI) + Aid (12) ■ (M)]//cr(M)]I/2 and take the time average of the right hand side of E5 to be equal to the algebraic combinations of the time averages of the individual terms, theniqi/ihXAW + feAc = kb [(H I)/I2)'A]av +
kzA14 [(IT A] '/[■
% (
+ I [(RI)/(HI)].,]
u m _ , % 1A _Fi(FXM) + / (EG)
This equation is in the form of a straight line, with [1 / (I2) 1/5]av as abscissa, the right hand side (RHSE6) as ordinate and h as slope. The last term, a result of the steady state (I) being slightly
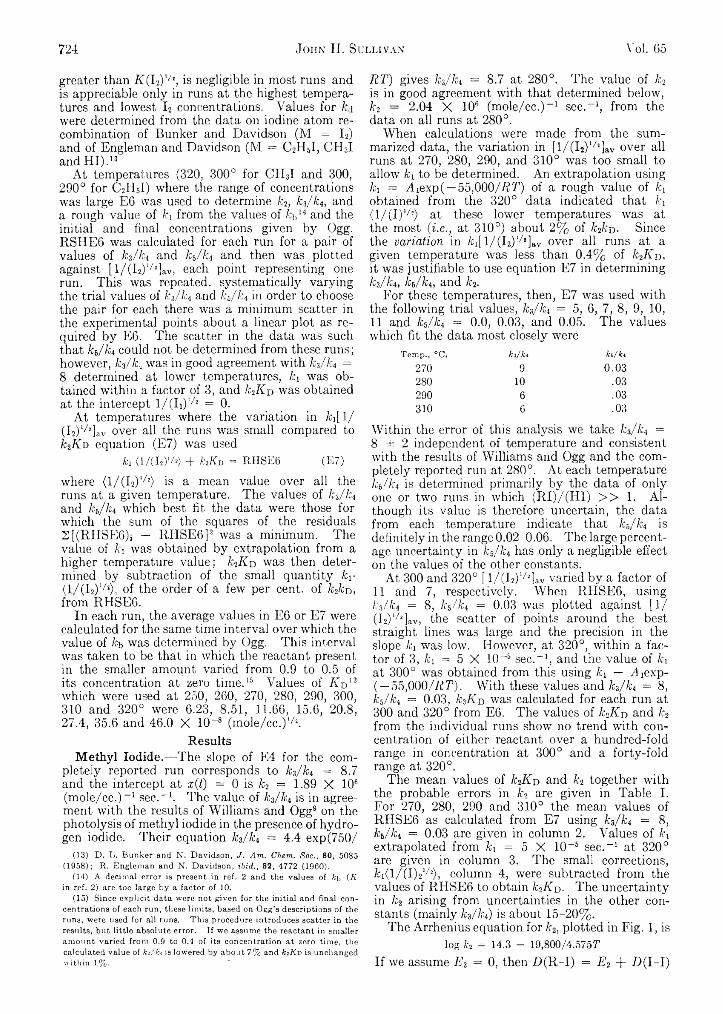
724 John H. Sullivan Vol. G5
greater than K ( I 2) '/t, is negligible in most runs and is appreciable only in runs at the highest temperatures and lowest I2 concentrations. Values for /cj were determined from the data on iodine atom recombination of Bunker and Davidson (M = I2) and of Engleman and Davidson (M = C2HSI, CH3I and HI).13
At temperatures (320, 300° for CH3I and 300, 290° for C2H5I) where the range of concentrations was large E6 was used to determine fc2, kz/k4, and a rough value of k 1 from the values of /q,14 and the initial and final concentrations given by Ogg. RSHE6 was calculated for each run for a pair of values of /c3//c4 and k j k t and then was plotted against [ l /( I 2)1/ ! ]av, each point representing one run. This was repeated, systematically varying the trial values of fc3/fc4 and /f6/fc4 in order to choose the pair for each there was a minimum scatter in the experimental points about a linear plot as required by E6. The scatter in the data was such that fc6/fc4 could not be determined from these runs; however, fc3/fc., was in good agreement with fc3/fc4 =8 determined at lower temperatures, k i was obtained within a factor of 3, and k 2K d was obtained at the intercept l/(Ii)1/! = 0.
At temperatures where the variation in k x[ 1/(I2)1/2]av over all the runs was small compared to JczK d equation (E7) was used
h <1/(I2)-A) + k2K D = RHSE6 (E7)
where (1/(L2)‘/2) is a mean value over all the runs at a given temperature. The values of fc3//c4 and k 6/ k i which best fit the data were those for which the sum of the squares of the residuals S[(RHSE6)i — RHSE6]2 was a minimum. The value of k i was obtained by extrapolation from a higher temperature value; k 2Kr> was then determined by subtraction of the small quantity k v <(1 / (I2)l//s), of the order of a few per cent, of k 2k v , from RHSE6.
In each run, the average values in E6 or E7 were calculated for the same time interval over which the value of kb was determined by Ogg. This interval was taken to be that in which the reactant present in the smaller amount varied from 0.9 to 0.5 of its concentration at zero time.16 Values of K -o 12 which were used at 250, 260, 270, 280, 290, 300, 310 and 320° were 6.23, 8.51, 11.66, 15.6, 20.8,27.4, 35.6 and 46.0 X 10⁻⁸ (mole/cc.)‘/2.
ResultsMethyl Iodide.—The slope of E4 for the com
pletely reported run corresponds to k z /k i = 8.7 and the intercept at x(t) = 0 is k 2 = 1.89 X 10⁶ (mole/cc.)-1 sec.-1. The value of k z/k i is in agreement with the results of Williams and Ogg8 on the photolysis of methyl iodide in the presence of hydrogen iodide. Their equation k z /k i = 4.4 exp(750/
(13) D. L. Bunker and N. Davidson, J. Am. Chem. Soc., 80, 5085 (1958); R. Engleman and N. Davidson, ibid., 82, 4772 (1960).
(14) A decimal error is present in ref. 2 and the values of kb ( K in ref. 2) are too large by a factor of 10.
(15) Since explicit data were not given for the initial and final concentrations of each run, these limits, based on Ogg’s descriptions of the runs, were used for all runs. This procedure introduces scatter in the results, but little absolute error. If we assume the reactant in smaller amount varied from 0.9 to 0.4 of its concentration at zero time, the calculated value of kz/bi is lowered by about 7% and ktKi) is unchanged within 1%.
R T ) gives k z /k i = 8.7 at 280°. The value of k 2 is in good agreement with that determined below, kt — 2.04 X 10⁶ (mole/cc.)-1 sec.-1, from the data on all runs at 280°.
When calculations were made from the summarized data, the variation in [l/(I2)1/!]av over all runs at 270, 280, 290, and 310° was too small to allow fci to be determined. An extrapolation using k i = Aiexp( — 55,000/I2T) of a rough value of k x obtained from the 320° data indicated that k , <1/(I)1/ ’) at these lower temperatures was at the most ( i.e ., at 310°) about 2% of k 2k n - Since the v a ria t io n in /ci[l/(I2)1/2]av over all runs at a given temperature was less than 0.4% of k 2K d, it was justifiable to use equation E7 in determining k z / K k j k i , and /c2.
For these temperatures, then, E7 was used with the following trial values, k z/k i = 5, 6, 7, 8, 9, 10, 11 and k z /k i = 0.0, 0.03, and 0.05. The values which fit the data most closely were
Temp., °C. kz/k. kb/hi
270 9 0.03280 10 .03290 6 .03310 6 .03
Within the error of this analysis we take fc3/&4 = 8 ± 2 independent of temperature and consistent with the results of Williams and Ogg and the completely reported run at 280°. At each temperature fc6/fc4 is determined primarily by the data of only one or two runs in which (RI)/(I4I) > > 1. Although its value is therefore uncertain, the data from each temperature indicate that k 6/ k 4 is definitely in the range 0.02-0.06. The large percentage uncertainty in k z/k i has only a negligible effect on the values of the other constants.
At 300 and 320° [ l /( I2)I/2]av varied by a factor of 11 and 7, respectively. When RHSE6, using k z /k i = 8, k z /k i = 0.03 was plotted against [1/ (I2)1/2]av, the scatter of points around the best straight lines was large and the precision in the slope k i was low. However, at 320°, within a factor of 3, /ci = 5 X 10⁻⁶ sec.-1, and the value of k x at 300° was obtained from this using k x — Aiexp- ( — 5 5 ,0 0 0 / R T ) . With these values and k z/k i = 8, k z /k i = 0.03, k sK n was calculated for each run at 300 and 320° from E6. The values of k 2K~D and fc2 from the individual runs show no trend with concentration of either reactant over a hundred-fold range in concentration at 300° and a forty-fold range at 320°.
The mean values of k iK o and k 2 together with the probable errors in k 2 are given in Table I. For 270, 280, 290 and 310° the mean values of RHSE6 as calculated from E7 using fc3/fc4 = 8, k z/k i = 0.03 are given in column 2. Values of k x extrapolated from fc4 = 5 X 10⁻⁶ sec.-1 at 320° are given in column 3. The small corrections, fci(l/(I)21/2), column 4, were subtracted from the values of RHSE6 to obtain k 2K v . The uncertainty in k2 arising from uncertainties in the other constants (mainly fc3//c4) is about 15-20%.
The Arrhenius equation for k 2, plotted in Fig. 1, is log h = 14.3 - 19,800/4.575T
If we assume E 3 = 0, then D(R-I) = E 2 + D(I-I)
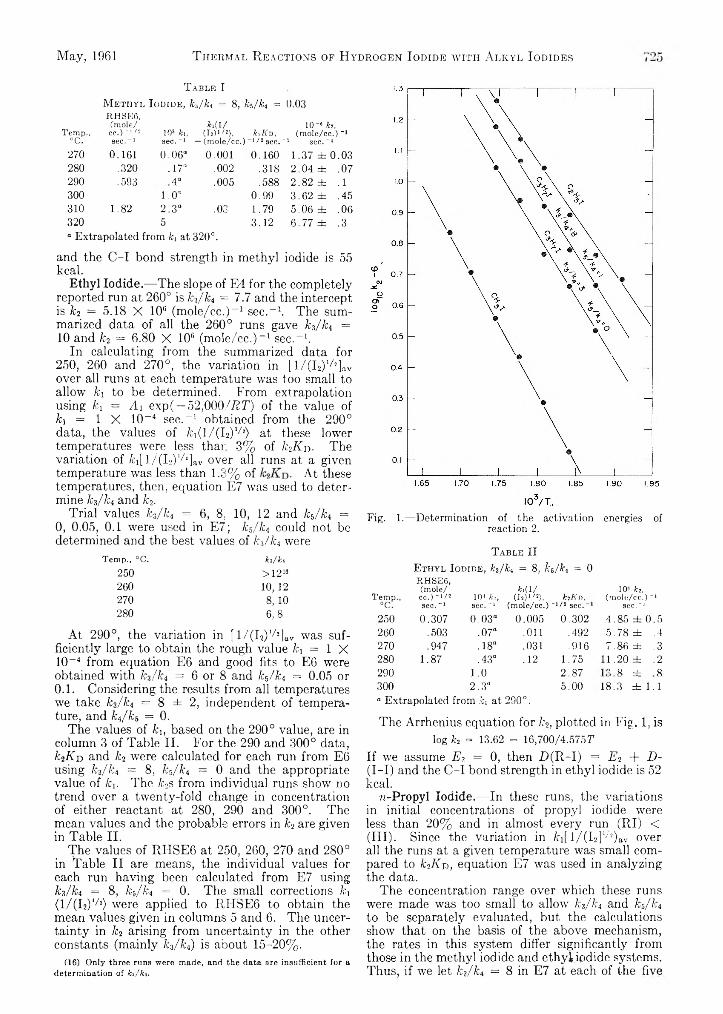
May, 1961 T hermal R eactions of Hydrogen Iodide with Alkyl Iodides
T able IM ethyl I odide, k3/k t = 8, h / k t = 0.03
Temp.,•c.
RHSEG, (mole/ ce.) -1/2 sec.~1
105 ki, sec.-l
H i/(h )1' 2), h K d,
— (mole/cc.) 1/ 2sec. "10-« h ,
(mole/cc.) -1 1 sec.-1
270 0.161 0 .0 6 “ 0.001 0.160 1.37 ± 0 .03280 .320 .17° .002 .318 2 .04 ± .07290 .593 4“ .005 .588 2 .82 ± .1300 1 .0 “ 0.99 3 .62 ± .45310 1.82 2 .3 “ .03 1.79 5.06 ± .06320 5 3.12 6.77 ± .3“ Extrapolated from ki at 320°.
and the C-I bond strength in methyl iodide is 55 kcal.
Ethyl Iodide.— The slope of E4 for the completely reported run at 260° is &3/fc4 = 7.7 and the intercept is fc2 = 5.18 X 10⁶ (mole/cc.)-1 sec.-1. The summarized data of all the 260° runs gave fc3/ft4 = 10 and k 2 = 6.80 X 10⁶ (mole/cc.)-1 sec.-1.
In calculating from the summarized data for 250, 260 and 270°, the variation in [l /(I2)1/2]av over all runs at each temperature was too small to allow h to be determined. From extrapolation using k i = A i exp( —52,000/ R T ) of the value of h = 1 X 10⁻⁴ sec.-1 obtained from the 290° data, the values of /ci(l/(I2)1/2) at these lower temperatures were less than 3% of k 2K r>. The variation of fciU/ChV^av over all runs at a given temperature was less than 1.3% of At thesetemperatures, then, equation E7 was used to determine k-s/kn and k 2.
Trial values fc3/fc4 = 6, 8, 10, 12 and k b/ k t = 0, 0.05, 0.1 were used in E7; k 6/ k 4 could not be determined and the best values of /c3//c4 were
Temp., °C. ks/ki250 > 1 2 16260 10,12270 8,10280 6 ,8
At 290°, the variation in [l /(I2)1/2]av was sufficiently large to obtain the rough value h = 1 X 10⁻⁴ from equation E6 and good fits to E6 were obtained with h / k i = 6 or 8 and 7c5/fc4 = 0.05 or 0.1. Considering the results from all temperatures we take fc3/fc4 = 8 ± 2, independent of temperature, and k i/ k & = 0.
The values of k h based on the 290° value, are in column 3 of Table II. For the 290 and 300° data, k 2Kr> and k 2 were calculated for each run from E6 using fc3/fc4 = 8, h / k i = 0 and the appropriate value of k i. The fc2s from individual runs show no trend over a twenty-fold change in concentration of either reactant at 280, 290 and 300°. The mean values and the probable errors in k 2 are given in Table II.
The values of RHSE6 at 250, 260, 270 and 280° in Table II are means, the individual values for each run having been calculated from E7 using k%/ki = 8, k i/ k i = 0. The small corrections ki (1 /(I2)I/2) were applied to RHSE6 to obtain the mean values given in columns 5 and 6. The uncertainty in k 2 arising from uncertainty in the other constants (mainly fc3/fc4) is about 15-20%.
(16) Only three runs were made, and the data are insufficient for a determination of kz/ki.
Fig. 1.— Determination of the activation energies of reaction 2.
T able IIE thyl Iodide, fa/fet = 8, k6/k, = 0
Temp.,°C.
RHSEG, (mole/ cc.) -1>'2 sec.-1
104 kifsec.“1
H U(L)1,!>,
(mole/cc.)ktKn,
-1/ 2 sec.
1 0 8 fc2,
(mole/cc. ) -1 sec.“1
250 0.307 0 .0 3 “ 0.005 0.302 4 .85 ± 0 .5260 .503 .07“ .011 .492 5 .78 ± .4270 .947 .18“ .031 .916 7 .86 ± .3280 1.87 .43“ .12 1.75 11.20 ± .2290 1 .0 2.87 C
O 00 H- QO
300 2 .3 “ 5.00 18.3 ± 1 . 1“ Extrapolated from ki at 290°.
The Arrhenius equation for k 2, plotted in Fig. 1, is log fe = 13.62 - 16,700/4.575?
If we assume E?, = 0, then H(R-I) = E 2 + D - (I-I) and the C-I bond strength in ethyl iodide is 52 kcal.
n-Propyl Iodide.— In these runs, the variations in initial concentrations of propyl iodide were less than 20% and in almost every run (RI) < (HI). Since the variation in fci[l/(I2]1/2)av over all the runs at a given temperature was small compared to k iK n , equation E7 was used in analyzing the data.
The concentration range over which these runs were made was too small to allow fc3//c4 and k - J k t to be separately evaluated, but the calculations show that on the basis of the above mechanism, the rates in this system differ significantly from those in the methyl iodide and ethyl, iodide systems. Thus, if we let /c3//c4 = 8 in E7 at each of the five
726 John H. Sullivan Vol. 65
temperatures, the values of A;5/fc4 which fit the data best are 0.5, 0.9, 0.9, 0.9 and ~1.5 at 260, 270, 280, 290 and 300°. If we take k-0/ k i = 0 in E7, the best values of fc3/fc4 are then 3, 3, 2, 3 and 3 at these temperatures. The data are also satisfied by suitable pairs of values for which, roughly, fc3/fc4 ~ 3 “b 5 k 3/ k x.
Rate constants fc2 were calculated using yt3//c4 = 3, k 6/ k i = 0 in equation E7, and are given in TableIII. The values of RHSE6 are averages taken over all runs at a given temperature. In calculating the small quantities, fc/l/iR)’/2), the values of k x at each temperature were taken to be equal to those for ethyl iodide. The values of fc2 are averages over all the runs at each temperature.
T able IIIw-Pkopyl Iodide, = 3, ,5/ ,4 = 0
Temp.,°C.
RHSE6,(mole/CC.)-!/2sec._1
104 ki,a sec.
*i<i/ (Di'/s), (mole/cc.) '
k?Kv, "1/ 2 sec._I
IO"6 ki, (mole/cc.) 1
sec.~1260 0.296 0.07 0.013 0.283 3.32 ± 0.1270 0.569 .18 .030 .539 4.62 ± .2280 1.00 .43 .080 .92 5.9 ± .5290 2.00 1.0 .18 1.82 8 .7 ± .1300 3.45 2.3 .44 3.01 11.1 ± .2“ Taken equal to the ethyl iodide values.
When fc3/fc4 = 8, fc5/fc4 = 1 are used in E7 to calculate fc2, the values are about 30% higher than those in Table III. The assumption of a likely value for k x does not affect the determination of fc3/fc4 and fc5/fc4 since all runs had the same average values of (I2); different k x s merely change fc2 slightly.
The activation energy for (2) is: if fc3/fc4 = 3, E 2 = 19.3 kcal.; if fc3/fc4 = 8, fc5/fc4 = 1, then E 2 =18.0 kcal. Taking E s = 0 the C-I bond strength in n-CsHyl is then 53-54 kcal.
DiscussionMethyl and Ethyl Iodide.—The mechanism sug
gested here explains some of the qualitative observation made by Ogg; (1) the reaction was usually “abnormally slow” at the start of the reaction; (2) this effect was enhanced by large excess of HI; and (3) values of f c b were constant in the 10-50% completion range for each run. On the basis of the present mechanism we see from E5 that f c b is a function of concentrations and can be calculated as a function of the extent of reaction from our values of k x, fc2, k 3/ k x and fc5/fc4. Such calculations (with fc3/fc4 = 8.5, fc5/fc4 = 0.03 to obtain precise agreement with Ogg’s fcbs) were made for two C2H6I 300° runs, run 31b with a high value of (HI)/(RI), and run 29b with a low value of (HI)/ (Rl). In a given run Ogg determined f c b S from the extents of reaction in the time intervals f2 — tx where i2 is a running variable and tx is the time for 10% completion. Our calculated values corresponding to these clearly show the apparent rate ( i.e ., fcb) to be low at the start, and this effect to be enhanced by excess H I; the average taken over the 10-50% completion range was for each run equal to the f c b reported by Ogg.
It should be mentioned that Ogg’s data are so extensive that*, treatment of the p r im a r y data would give much more precise values of the con
stants f c i , f c 2 , fc3/fc4 and fc6/fc4 and also, very likely, the small differences in the activation energies E 3- E i for both the methyl and ethyl iodide systems.
n-Propyl Iodide.—The differences between the calculated rate ratios in the propyl iodide system and those in the methyl and ethyl iodide systems may be real, or the result of a different mechanism in the n-propyl iodide system.
Such a mechanism could occur by the isomerization of the propyl radical, R, to the secondary radical, sR.17 The subsequent reactions 3, 4, 5 of the radical R would then be accompanied by the similar reactions, 3', 4', 5' of sR. In determining the kinetics we may consider that a fraction / of the total number of reactions 2 give sR and a fraction 1 — / give R. The data are not sufficiently extensive to obtain an unequivocal value of / but it is possible to show from these and other literature data that: (1) f ^ 1, i .e ., the radical R does not isomerize in a time short compared to its reaction half-life in this system; and (2) if we consider that the rate constant ratios for the n- propyl radical should be equal to those for methyl and ethyl radicals, fc3/fc4 = 8, fc6/fc4 ~ 0, the n - propyl iodide data then can be explained if 10 to 20% of the propyl radicals isomerized to secondary propyl before reaction with iodine or hydrogen iodide.
With isomerization, the products of (4') and (5') would be the same as those of (4) and (5), but reaction 3' would produce sec-propyl iodide, sRI, which then would react further with iodine atoms by (2')
sR + I2 — ^ sRI + I (3 ')I + sRI — s- sR + I2 (2 ')
Holmes and Maccoll18 have shown that (2') is fast even with trace amounts of iodine at 214 and 236°. At Ogg’s higher temperature runs the rate of (2') would be faster by a factor of (I)28o°/(I)22o° = [A d - (I2) 1/j at 2 8 0 ° ] / [ A d (I2)1/! at 220°]; the ratio of the two dissociation constants is 10, and Ogg’s iodine concentrations were larger than the trace amounts of Holmes and Maccoll by at least a factor of 2, so that the rate of (2') at 280° would be at least a factor of 20 greater than (2). If every R isomerized before reacting with iodine reaction (3') would be nullified by (2') and the inhibition of the over-all reaction by iodine molecules would be absent. Since the over-all reaction is inhibited to at least an extent corresponding to fc3/fc4 = 3, the half life for isomerization cannot be short compared to the time between formation of R by (2) and reaction of Rby(3).
Assuming that the ratios fc3/fc4 and fcs/fc4 for the propyl radical should be equal to those for the ethyl radical and that the apparent differences in rates arise from isomerization, we may calculate what fraction / of the R radicals isomerized to sR and reacted by (3'), (4') and (5'). Taking fc5/fc4 = 0 and also k 6'/ k i ' = 0, a steady-state treatment with d(R)/df = 0, d(sR)/df = 0, d(sRI)/df == 0, gives the rate equation
(17) D. P. Stevenson, Trans. Faraday Soc., 49, 867 (1953), has given evidence that S-C3H7 radicals are present in the mass spectrum of n- hexane.
(18) J, L. Holmes and A, Maccoll, Proc, Chem, Soc., June (1957).
T hermal R eactions of H ydrogen Iodide with Alkyl Iodides 727May, 19(51
d(I)2/d i = [fa(RI) +*2(I)(RI)][(1 - / ) / ( i + Hh)/u m )) + f ]
When this rate is equated to E2 and k h is considered a time average of a function of the concentrationsh 'K D = fcb [[(H I)/(I2)'A]av +
| [(Is)1/*]«] / [ 1 + / | [ (I * ) /(H I )]„ ]
The data fit this equation at each temperature for /c3//c4 = 8 and / = 0.1 to 0.2.
If radical isomerization did not occur and if the ratios of rate constants for R are kz/k4 = 8, k 6/ k 4 = 1, the rate equations E3 and E8, from which these figures were obtained, may be incorrect. Since the rate of (5) is now appreciable, it is necessary to derive rate equations taking into account the reactions of the C3H6I radical subsequent to reaction 5.
The most probable reaction of the C3H6I radical would be bimolecular reactions with hydrogen iodide, «-propyl iodide or iodine, or a unimolecular decomposition
CsHJ — > C3H5 + I (7)The rate equation derived on the assumption
that C3H6I reacted only with hydrogen iodideCsH6I + HI — ^ 71-C3H7I + I (8)
is E3; in this case the values fc3//c4 = 8, k 6/ k 4 1 are correctly calculated. This type of reaction has been suggested as a step in the isomerization of n-propyl to s-propyl iodide.19 The exchange reaction with n-propyl iodide
C3H6I + C3H7I — > C3H7I + C3H6Idoes not affect the rate expression.
The rate of reaction of C3H6I with iodine is very likely slow compared to the rate of (7). Ogg20 has shown that the data of Arnold and Kistiakowsky 21 on the thermal decomposition of di-iodoethane can be fitted by a mechanism in which the rate of the analogous reaction C2H4I + I2 -*• C2H4I2 + I was less than 1.4 X 10~4 for the rate of the unimolecular decomposition of C2H4I.
If, in Ogg’s runs, reaction 7 had predominated over (8), the propylene was not a stable product since there was no increase in pressure during the
(19) C. E. McCauley, W. H. Hamill and R. R. Williams, Jr., J. Am. Chem. Soc., 76, 6263 (1954).
(20) R. A. O g g , Jr., ibid., 68, 607 (1936).(21) L. B. Arnold, Jr., and G. B. Kistiakowsky, J. Chem. Phys., 1,
166 (1933).
reaction. In the pyrolysis of s-propyl22 and 71- propyl 23 iodide at these temperatures, propylene is a stable product and does not react with either iodine or the alkyl iodide. The propylene, if formed, then reacted with hydrogen iodide
C3H6 I T HI — > s-C3H7 -f- I (9)
Similar reactions have been proposed to explain the photoisomerization of 7i-propyl iodide to s-propyl iodide19 and the photoisomerization of n-propyl iodide in the presence of hydrogen iodide.24 The subsequent reactions of s-C3H7I are then of interest. Since reaction (2') is fast compared to (2), a stationary state concentration of s-C3H7I would have been formed. Using the steady state conditions d(sRI)/df = 0, d(C3H6)/df = 0, d(sR)/di = 0, d(R) /di = 0, the rate equation is, very closely
d(I2)/d i = [fa(RI) + fe(I)(RI)] fc4(H I) + 3fe(RI) fe( I2) + fa(HI) + fc(R I)
or, in using Ogg’s summarized data to obtain rate constants
W K t , = fcb(HI)a [ 1 + s I W I'5 I— (R I) J a
, h r i M^ h L(RI)
[(hd 'A U 3 +]J/
h f(HI)-|h L(RI)_| av
These equations, when we take fc3/fc4 = 8, agree with the experimental data for /c6/fc4 = 0.15, 0.25, 0.25, 0.25 and 0.4 at 260, 270, 280, 290 and 300°. If we take k 6/lc4 ~ 0 then k s/ k 4 = 3 is in agreement with the data at each temperature. These ratios apply if no isomerization took place and if the rate of reaction 7 was greater than the rate of (8).
In summary, the kinetics of the 7i-propyl iodide system differs significantly from the kinetics of the methyl and ethyl iodide systems. Either the ratio k z /k i for «-propyl iodide is about one-third that for ethyl iodide and methyl iodide or the ratio k 6/ k 4 for 77-propyl iodide is much larger than that for methyl and ethyl iodide. If these ratios for all three alkyl iodides are about equal, the data for 77- propyl iodide are in agreement with a mechanism in which 10-20% of the 77-propyl radicals isomerized to s-propyl radicals before reacting.
(22) Reference 13. Also J. L. Jones and R. A. Ogg, Jr., J. Am. Chem. Soc., 59, 1939 (1937); J. V. S. Glass and C. N. Hinshelwood, J. Chem. Soc., 1817 (1929).
(23) J. L. Jones and R. A. Ogg, Jr., J. Am. Chem. Soc., 59, 1931 (1937).
(24) C. E. McCauley and G. J. Hilsdorf, ibid., 80, 5101 (1958).
¥ ** ^u H u m t B i J f u f i m j j i i i t n f n f f f n
f m n n j f j u m n m i u«
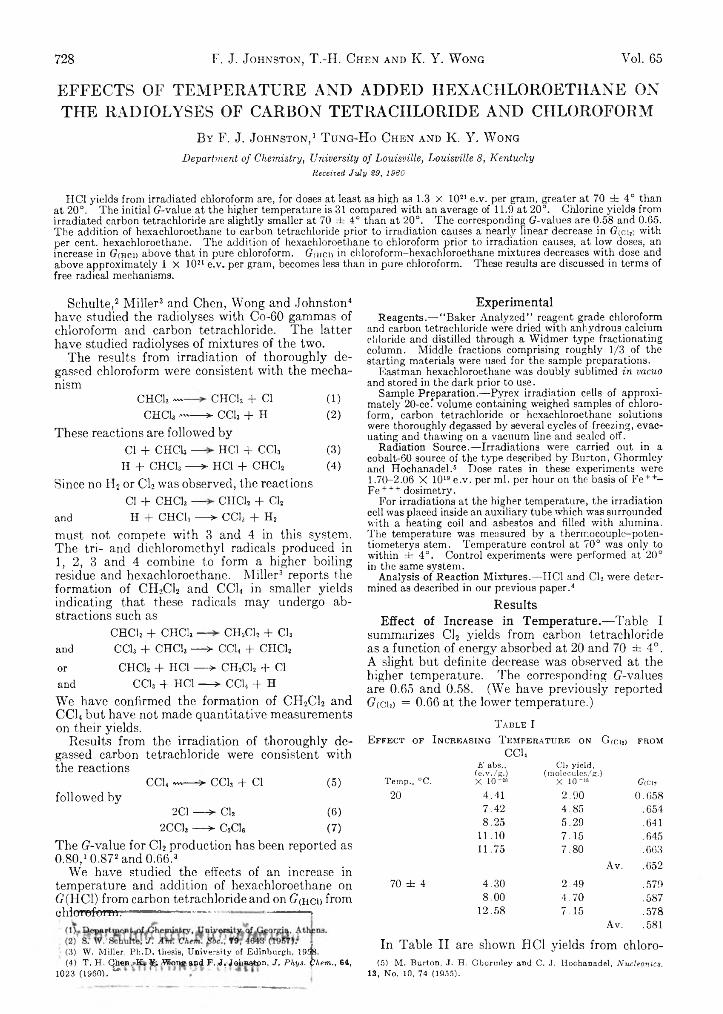
728 F. J. Johnston, T.-H. Chen and K. Y. W ong Vol. 65
E F F E C T S O F T E M P E R A T U R E A N D A D D E D H E X A C I I L O R O E T H A N E O N
T H E R A D I O L Y S E S O F C A R B O N T E T R A C H L O R I D E A N D C H L O R O F O R M
By F. J. J o h n st o n , 1 T u n g -H o C h e n a n d K. Y. W ong
Department of Chemistry, University of Louisville, Louisville 8, Kentucky Received July 29, 1960
HCl yields from irradiated chloroform are, for doses at least as high as 1.3 X 10²¹ e.v. per gram, greater at 70 ± 4° than at 20°. The initial G-value at the higher temperature is 31 compared with an average of 11.9 at 20°. Chlorine yields from irradiated carbon tetrachloride are slightly smaller at 70 ± 4° than at 20°. The corresponding G-values are 0.58 and 0.65. The addition of hexachloroethane to carbon tetrachloride prior to irradiation causes a nearly linear decrease in G<cm with per cent, hexachloroethane. The addition of hexachloroethane to chloroform prior to irradiation causes, at low doses, an increase in Goici) above that in pure chloroform. G(ncm in chloroform-hexachloroethane mixtures decreases with dose and above approximately 1 X 10²¹ e.v. per gram, becomes less than in pure chloroform. These results are discussed in terms of free radical mechanisms.
Schulte,2 Miller3 and Chen, Wong and Johnston4 have studied the radiolyses with Co-60 gammas of chloroform and carbon tetrachloride. The latter have studied radiolyses of mixtures of the two.
The results from irradiation of thoroughly degassed chloroform were consistent with the mechanism
C H C h --------CHC12 + Cl (1)CHCls--------> CC13 + H (2)
These reactions are followed byCl + CHCb — HCl + CCls (3)
H + CHCls — ^ HCl + CHCb (4)Since no H2 or CI2 was observed, the reactions
Cl + CHCls — ClIGb + Cl2 and H + CHCls — ^ CC13 + H2must not compete with 3 and 4 in this system. The tri- and dichloromothyl radicals produced in 1, 2, 3 and 4 combine to form a higher boiling residue and hexachloroethane. Miller3 reports the formation of CH2CI2 and CCh in smaller yields indicating that these radicals may undergo abstractions such as
CHCh + CHCh — CH2C12 + Cl3and CC13 + CHCI3 — > CC14 + CHC12or CHCh + HCl — -> CH2C12 + Cland CCI, + HCl - - > CCI4 + HWe have confirmed the formation of CH2C12 and CCh but have not made quantitative measurements on their yields.
Results from the irradiation of thoroughly degassed carbon tetrachloride were consistent with the reactions
CCh - — =- CCls + Cl (5)followed by
2Cl — ^ Ch (6)2CC1, — > C2C16 (7)
The (7-value for Cl2 production has been reported as 0.80,10.872 and 0.66.3
We have studied the effects of an increase in temperature and addition of hexachloroethane on (?(HC1) from carbon tetrachloride and on (?<hci) from chlrrrofermy.- ■—■»—•- ■■■-——*-— ■ ......... .. >
» (3) W. Miller, Ph.D. thesis, University of Edinburgh, 19£§L(4) T. H. qben.?K »|fe«oi® w d F.JfJohnafcpn, J. Phys. them., 64,
1023 (1960).** ,
ExperimentalReagents.— “ Baker Analyzed” reagent grade chloroform
and carbon tetrachloride were dried with anhydrous calcium chloride and distilled through a Widmer type fractionating column. Middle fractions comprising roughly 1/3 of the starting materials were used for the sample preparations.
Eastman hexachloroethane was doubly sublimed in vacuo and stored in the dark prior to use.
Sample Preparation.— Pyrex irradiation cells of approximately 20-ccT volume containing weighed samples of chloroform, carbon tetrachloride or hexachloroethane solutions were thoroughly degassed by several cycles of freezing, evacuating and thawing on a vacuum line and sealed off.
Radiation Source.— Irradiations were carried out in a cobalt-60 source of the type described by Burton, Ghormley and Hochanadel.6 Dose rates in these experiments were 1.70-2.06 X 10¹⁹ e.v. per ml. per hour on the basis of Fe + +- Fe + + + dosimetry.
For irradiations at the higher temperature, the irradiation cell was placed inside an auxiliary tube which was surrounded with a heating coil and asbestos and filled with alumina. The temperature was measured by a t-hermocouple-poten- tiometerys stem. Temperature control at 70° was only to within ± 4°. Control experiments were performed at 20° in the same system.
Analysis of Reaction Mixtures.—HCl and Cl2 were determined as described in our previous paper.4
ResultsEffect of Increase in Temperature.—Table I
summarizes CI2 yields from carbon tetrachloride as a function of energy absorbed at 20 and 70 ± 4 ° . A slight but definite decrease was observed at the higher temperature. The corresponding (7-values are 0.65 and 0.58. (We have previously reported (7(Ch) = 0.66 at the lower temperature.)
T able IE ffect of I ncreasing T em perature on G(ci2) from
CCh
Temp., °C.
E abs., (e.v./g.) X 10-2»
Cla yield, (molecules/g.)
X 10 " 18 G(Ci,20 4.41 2.90 0.658
7.42 4.85 .6548.25 5.29 .641
11.10 7.15 .64511.75 7.80 .663
Av. .65270 ± 4 4.30 2.49 .579
8.00 4.70 .58712.58 7.15 .578
Av. .581
In Table II are shown HCl yields from chloro-(5) M. Burton, J. H. Ghormley and C. J. Hochanadel, Nucleonics,
13, No. 10, 74 (1955).
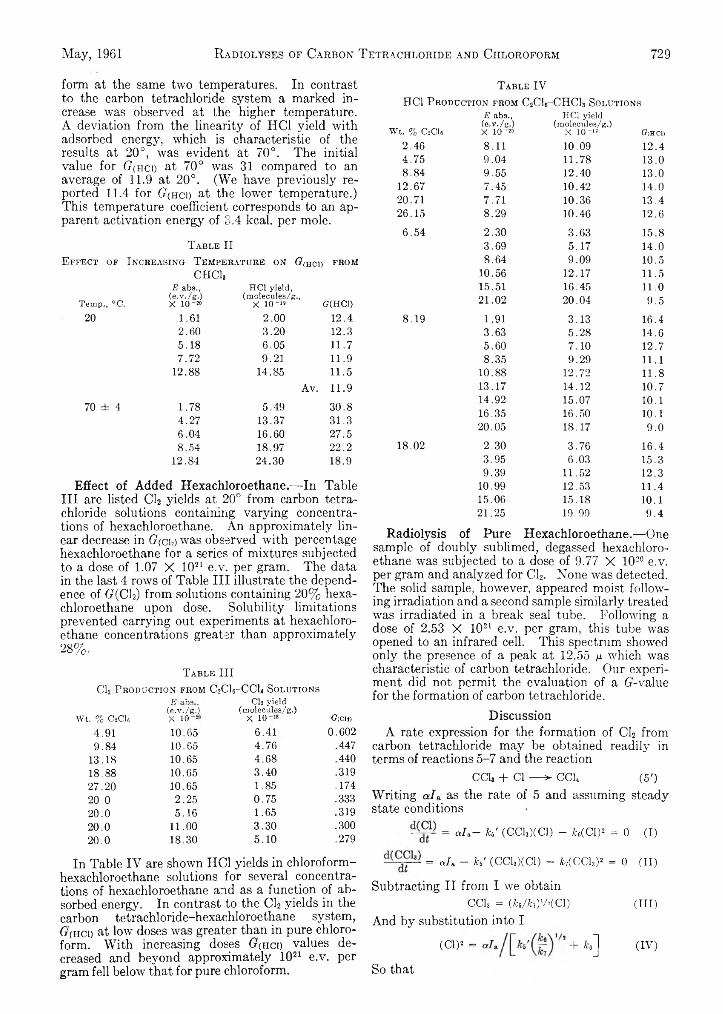
May, 1961 R adiolyses of Carbon T etrachloride and Chloroform 729
form at the same two temperatures. In contrast to the carbon tetrachloride system a marked increase was observed at the higher temperature. A deviation from the linearity of HC1 yield with adsorbed energy, which is characteristic of the results at 20°, was evident at 70°. The initial value for (7(hcd at 70° was 31 compared to an average of 11.9 at 20°. (We have previously reported 11.4 for (?(hci) at the lower temperature.) This temperature coefficient corresponds to an apparent activation energy of 3.4 kcal. per mole.
T a ble II
E ffect of I ncreasing T emperature on C?(hci) from
CHCls
Temp., °C.
E abs., (e.v./g.) X 10 -»
HC1 yield, (molecules/g.,
X IO"*9 G(HC1)20 1.61 2.00 12.4
2.60 3.20 12.35.18 6.05 11.77.72 9.21 11.9
12.88 14.85 11.5Av. 11.9
70 ± 4 1.78 5.49 30.84.27 13.37 31.36.04 16.60 27.58.54 18.97 22.2
12.84 24.30 18.9
Effect of Added Hexachloroethane.— In TableIII are listed Cl2 yields at 20° from carbon tetrachloride solutions containing varying concentrations of hexachloroethane. An approximately linear decrease in G(Ch) was observed with percentage hexachloroethane for a series of mixtures subjected to a dose of 1.07 X 10²¹ e.v. per gram. The data in the last 4 rows of Table III illustrate the dependence of G(Ck) from solutions containing 20% hexachloroethane upon dose. Solubility limitations prevented carrying out experiments at hexachloroethane concentrations greater than approximately 28%.
T able III
Cl2 Production from C2Cl6-CCh Solutions
wt. % CiCl«E abs.,
(e.v./ g.) X 10
CL yield (molecules/g.)x 10 G(Cii)
4.91 10.65 6.41 0.6029.84 10.65 4.76 .447
13.18 10.65 4.68 .44018.88 10.65 3.40 .31927.20 10.65 1.85 .17420.0 2.25 0.75 .33320.0 5.16 1.65 .31920.0 11.00 3.30 .30020.0 18.30 5.10 .279
In Table IV are shown HC1 yields in chloroform- hexachloroethane solutions for several concentrations of hexachloroethane and as a function of absorbed energy. In contrast to the Cl2 yields in the carbon tetrachloride-hexachloroethane system, Gthci) at low doses was greater than in pure chloroform. With increasing doses (t(hcd values decreased and beyond approximately 1021 e.v. per gram fell below that for pure chloroform.
T able IV
HC1 P roduction from C2Cl6-CHCl3 Solutions
Wt. % C2CI8
E abs., (e.v./g.)X 10-2»
HCl yield (molecules/g.)
X 10“ls G(hci)2.46 8.11 10.09 12.44.75 9.04 11.78 13.08.84 9.55 12.40 13.0
12.67 7.45 10.42 14.020.71 7.71 10.36 13.426.15 8.29 10.46 12.66.54 2.30 3.63 15.8
3.69 5.17 14.08.64 9.09 10.5
10.56 12.17 11.515.51 16.45 11.021.02 20.04 9.5
8.19 1.91 3.13 16.43.63 5.28 14.65.60 7.10 12.78.35 9.29 11.1
10.88 12.72 11.813.17 14.12 10.714.92 15.07 10.116.35 16.50 10.120.05 18.17 9.0
18.02 2.30 3.76 16.43.95 6.03 15.39.39 11.52 12.3
10.99 12.53 11.415.06 15.18 10.121.25 19.99 9.4
Radiolysis of Pure Hexachloroethane.-—Onesample of doubly sublimed, degassed hexachloroethane was subjected to a dose of 9.77 X 10²⁰ e.v. per gram and analyzed for Cl2. None was detected. The solid sample, however, appeared moist following irradiation and a second sample similarly treated was irradiated in a break seal tube. Following a dose of 2.53 X 10²¹ e.v. per gram, this tube was opened to an infrared cell. This spectrum showed only the presence of a peak at 12.55 /i which was characteristic of carbon tetrachloride. Our experiment did not permit the evaluation of a (7-value for the formation of carbon tetrachloride.
DiscussionA rate expression for the formation of Cl2 from
carbon tetrachloride may be obtained readily in terms of reactions 5-7 and the reaction
CC13 + Cl — > CC14 (5 ')Writing o il& as the rate of 5 and assuming steady state conditions
= a h - h ' (CChXCl) - 7c6(CI)2 = 0 (I)
= a h - h ' (CClsXCl) - H C C h Y = 0 (II)
Subtracting II from I we obtainCCh = ( W A C l ) (H I)
And by substitution into I
(Cl)* = + *•] (IV)
So that
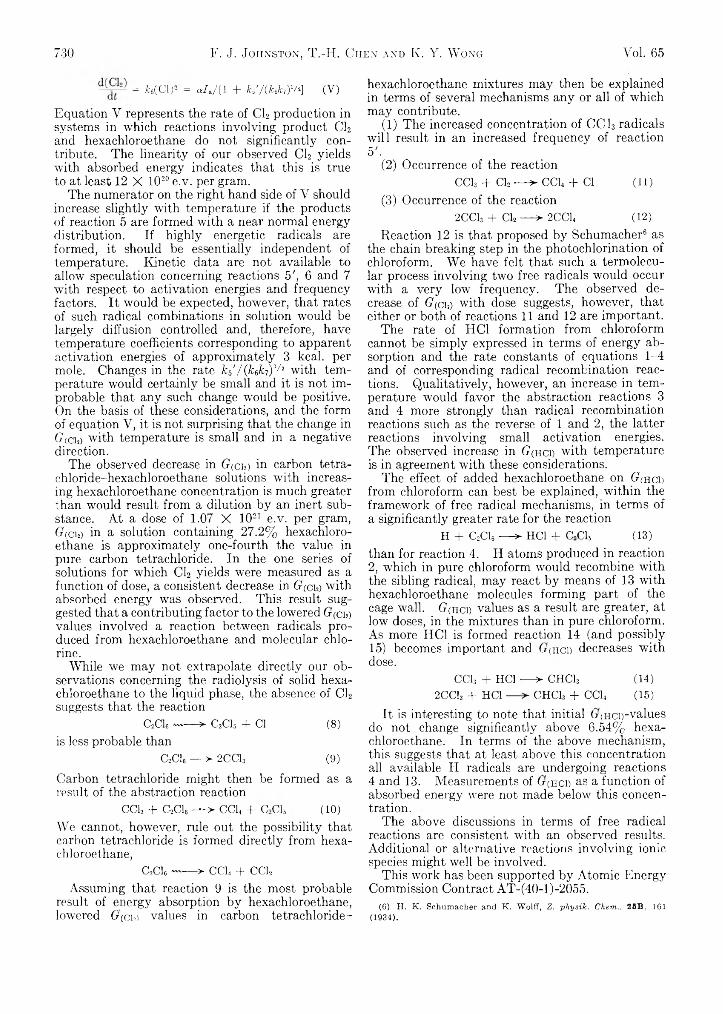
730 F. J. Johnston, T.-H. Chen and K. Y. W ong Vol. 65
- H C l ) - = c J J [l + f e 'A W 2’] (V)
Equation Y represents the rate of Cl2 production in systems in which reactions involving product Cl2 and hexachloroethane do not significantly contribute. The linearity of our observed Cl2 yields with absorbed energy indicates that this is true to at least 12 X 1020 e.v. per gram.
The numerator on the right hand side of V should increase slightly with temperature if the products of reaction 5 are formed with a near normal energy distribution. If highly energetic radicals are formed, it should be essentially independent of temperature. Kinetic data are not available to allow speculation concerning reactions 5', 6 and 7 with respect to activation energies and frequency factors. It would be expected, however, that rates of such radical combinations in solution would be largely diffusion controlled and, therefore, have temperature coefficients corresponding to apparent activation energies of approximately 3 kcal. per mole. Changes in the rate k 6' / ( k ^ ) 1 with temperature would certainly be small and it is not improbable that any such change would be positive. On the basis of these considerations, and the form of equation Y, it is not surprising that the change in (7 (a,) with temperature is small and in a negative direction.
The observed decrease in G(ck) in carbon tetra- chloride-hexachloroethane solutions with increasing hexachloroethane concentration is much greater than would result from a dilution by an inert substance. At a dose of 1.07 X 10²¹ e.v. per gram, G(cn) in a solution containing 27.2% hexachloroethane is approximately one-fourth the value in pure carbon tetrachloride. In the one series of solutions for which Cl2 yields were measured as a function of dose, a consistent decrease in G(Ch) with absorbed energy was observed. This result suggested that a contributing factor to the lowered G(ci2) values involved a reaction between radicals produced from hexachloroethane and molecular chlorine.
While we may not extrapolate directly our observations concerning the radiolysis of solid hexachloroethane to the liquid phase, the absence of Cl2 suggests that the reaction
C2C16 - — > C2C15 + Cl (8)is less probable than
C2C16 — > 2CC13 (9)
Carbon tetrachloride might then be formed as a result of the abstraction reaction
CC13 + C2C16 — >- CC14 + CoCU (10)We cannot, however, rule out the possibility that carbon tetrachloride is formed directly from hexachloroethane,
C2C16 ---------- CC14 + CC12Assuming that reaction 9 is the most probable
result of energy absorption by hexachloroethane, lowered Grow values in carbon tetrachloride-
hexachloroethane mixtures may then be explained in terms of several mechanisms any or all of which may contribute.
(1) The increased concentration of CC13 radicals will result in an increased frequency of reaction 5'.
(2) Occurrence of the reactionCC13 + Cl2 — >- CC14 + Cl (11)
(3) Occurrence of the reaction2CCI3 + Cl2 — =► 2CC14 (12)
Reaction 12 is that proposed by Schumacher6 as the chain breaking step in the photochlorination of chloroform. We have felt that such a termolecu- lar process involving two free radicals would occur with a very low frequency. The observed decrease of G(cu) with dose suggests, however, that either or both of reactions 11 and 12 are important.
The rate of HC1 formation from chloroform cannot be simply expressed in terms of energy absorption and the rate constants of equations 1-4 and of corresponding radical recombination reactions. Qualitatively, however, an increase in temperature would favor the abstraction reactions 3 and 4 more strongly than radical recombination reactions such as the reverse of 1 and 2, the latter reactions involving small activation energies. The observed increase in G(hci) with temperature is in agreement with these considerations.
The effect of added hexachloroethane on Gchcd from chloroform can best be explained, within the framework of free radical mechanisms, in terms of a significantly greater rate for the reaction
H + C2C16 — > HC1 + C.CI5 (13)than for reaction 4. H atoms produced in reaction 2, which in pure chloroform would recombine with the sibling radical, may react by means of 13 with hexachloroethane molecules forming part of the cage wall. G(hci) values as a result are greater, at low doses, in the mixtures than in pure chloroform. As more HC1 is formed reaction 14 (and possibly 15) becomes important and (rqici) decreases with dose.
CC13 + HC1 — > CHCls (14)2CC13 + HC1---- CHC13 + CCh (15)
It is interesting to note that initial (j(HCi)-values do not change significantly above 6.54% hexachloroethane. In terms of the above mechanism, this suggests that at least above this concentration all available 11 radicals are undergoing reactions 4 and 13. Measurements of (t(hcd as a function of absorbed energy were not made below this concentration.
The above discussions in terms of free radical reactions are consistent with an observed results. Additional or alternative reactions involving ionic species might well be involved.
This work has been supported by Atomic Energy Commission Contract AT-(40-l)-2055.
(6) H. K. Schumacher and K. Wolff, Z. physik. Chem., 25B, 161 (1934).

T H E V A P O R I Z A T I O N B E H A V I O R A N D T H E R M O D Y N A M I C S T A B I L I T Y O F
Z I R C O N I U M C A R B I D E A T H I G H T E M P E R A T U R E 1
B y B . D. P o llo ck
Atomics International, A Division of North American Aviation, Inc., Canoga Park, CaliforniaReceived August 11, i960
May, 19G1 Vaporization and T hermodynamic Stability of Zirconium Carbide 731
The vaporization behavior of zirconium carbide was studied in the temperature range 2620 to 2747°K. by means of the- Knudsen and Langmuir techniques in order to investigate the nature of the vaporization process and to determine the high temperature stability of the compound. At 2675°K., the standard free energy of formation was found to be —38.9 (± 1 .5 ) kcal. Agreement of the results of the two methods leads to the conclusions that accommodation coefficients must have been near unity and that molecular carbide species were not of major importance. B’ree energy functions were also estimated and used to derive a heat of formation, A//°29a = —47.7 ± 5.C kcal.
IntroductionPrevious work on the determination of the ther
modynamic properties of zirconium carbide was carried out by Mah and Boyle,2 by Krikorian,3 by Prescott,4 by Kutsev, Ormont and Epelbaum,6 and by Fujishiro and Gokcen.6 Mah and Boyle measured the heat of combustion of ZrC from which they derived the value —44.1 ± 1.5 kcal. for the heat of formation at 298 °K. Krikorian, in a review of available data for the carbides, estimated A<S°29s to be —2.7 ± 1.0 e.u. and also suggested that an estimate of Cp mighc be made by assuming that the difference between the heat capacities of ZrC and ZrN is equal to that between TiC and TiN. This assumption is based on the similarity of the crystal structures of the compounds. Such an estimate was made by the use of Coughlin and King’s data for ZrN7 and Naylor’s data for TiC and TiN,8 and was used to calculate the free energy functions for ZrC— (F°T - H °m ) / T = - ( H »T - H 0m )/ T +
(S«t - S”298) + S»298 (1)The entropy of ZrC, /SYs, was taken as 7.8 ± 0.5 and was estimated in the same manner as C p by use of Kelley’s entropies for the compounds.9 The change of free energy function for the reaction
Zr(s,l) + C( graph.) = ZrC (2)
were also calculated, using Stull and Sinke’s data for the elements.10 The free energy functions thus calculated are presented in Table I, and in combination with Mah and Boyle’s heat of formation, yield —38.5 and —35.5 kcal. for the standard
(1) This work was carried out as part of Contract AT-ll-l-GEN-8 with the United States Atomic Energy Commission.
(2) Alla D. Mah and B. J. Boyle J. Am. Chem. Soc., 77, 6512 (1955).
(3) O. H. Krikorian, “ High Temperature Studies; 11. Thermodynamic Properties of the Carbides,” UCRL 2888 (1955) (Ph.D. Thesis).
(4) C. H. Prescott, Jr., J. Am. Chem. Soc., 48, 2534 (1926).(5) V. S. Kutsev, B. C. Ormont and V. A. Epelbaum, Doklady
A had. Nauk SSSR, 104, 567 (1955).(6) S. Fujishiro and N. A. Gokcen, “Thermodynamic Properties of
Zirconium Carbide at High Temperature,” presented at the International Symposium on the Physical Cnemistry of Process Metallurgy, April 27-May 1, 1959.
(7) J. P. Coughlin and E. G. King, J. Am. Chem. Soc., 72, 2262 (1950).
(8) B. F. Naylor, ibid., 68, 370 (1949).(9) K. K. Kelley, “Contributions to the Data on Theoretical Metal
lurgy. XI. Entropies of Inorganic Substances,” Bur. Mines Bulletin 477, 1950.
(10) D. R. Stull and G. C. Sinke “Thermodynamic Properties of the Elements,” American Chemical Society, Washington, D. C., 1956.
free energy of formation of ZrC at 2000 and 2600 °K., respectively.
T able IF ree E n ergy F unctions
— (F°T — H°298) — (AF°T — A H q298)1T Tmp., °C. (for ZrC) Zr + C = ZrC
400 8.2 -2 .8600 9.8 -2 .8800 11.4 -2 .7
:ooo 13.2 -2 .51200 14.7 -2 .61400 16.1 -2 .71600 17.4 -2 .71800 18.5 -2 .82000 19.6 -2 .82200 20.6 -2 .82400 21.6 -3 .12600 22.8 -3 .32800 23.3 -3 .4
Prescott measured pressures of CO over Zr02, graphite and ZrC in the temperature range 1880 to 2015°K. If his data for the reaction
ZrOo + 3C = ZrC + 2CO (3)are combined with Coughlin’s data for the oxides11 the average standard free energy of formation in the range 1880 to 2015°K. is found to be —40.9 kcal. A o--plot, using a mean AC p equal to 6 cal./ mole3K., leads to the value for aA V s equal to — 46.5 kcal. for the carbide.
Kutsev, Ormont and Epelbaum carried out a similar study in the range 1814 to 2020 °K. but obtained pressures approximately half those of Prescott. They used sufficiently large samples to permit making X-ray diffraction examinations and chemical analyses, on the basis of which they concluded that they had been studying the reaction
ZrC>2 + 2.63C = ZrC0.71O0.08 T 1.92CO (4)By making calculations similar to those of Prescott, they derived che value —53.8 kcal. for the heat of formation at 298°K., and also estimated an entropy for the product, <S°298 equal to 7 e.u.
Fujishiro and Gokcen studied the reactionZrC = Zr(g) + C(s) (5)
by measuring effusion rates of zirconium from a graphite Knudsen cell containing the carbide.
(11) J. P. Coughlin, “ Contributions to the Data on Theoretical Metallurgy. XII. Heats and Free Energies of Formation of Inorganic Oxides,” Bur. Mines Bulletin 542, 1954.
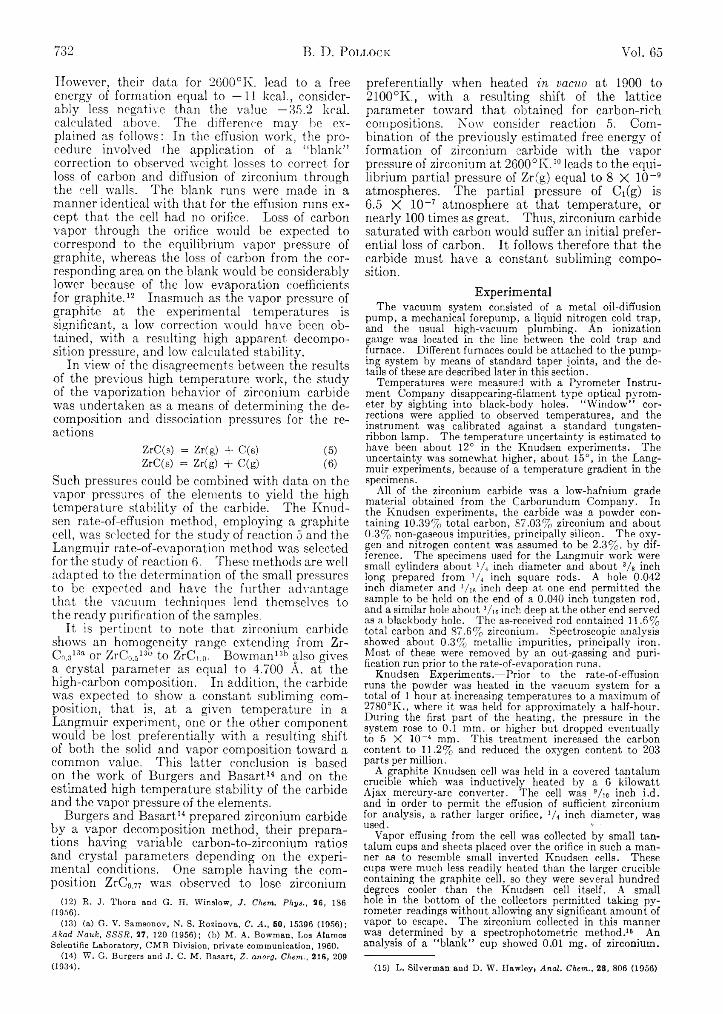
732 B. D. Pollock Vol. 65
However, their data for 2600 °K. lead to a free energy of formation equal to —11 kcal., considerably less negative than the value —35.2 kcal. calculated above. The difference may be explained as follows: In the effusion work, the procedure involved the application of a "blank” correction to observed weight losses to correct for loss of carbon and diffusion of zirconium through the cell walls. The blank runs were made in a manner identical with that for the effusion runs except that the cell had no orifice. Loss of carbon vapor through the orifice would be expected to correspond to the equilibrium vapor pressure of graphite, whereas the loss of carbon from the corresponding area on the blank would be considerably lower because of the low evaporation coefficients for graphite.12 Inasmuch as the vapor pressure of graphite at the experimental temperatures is significant, a low correction would have been obtained, with a resulting high apparent decomposition pressure, and low calculated stability.
In view of the disagreements between the results of the previous high temperature work, the study of the vaporization behavior of zirconium carbide was undertaken as a means of determining the decomposition and dissociation pressures for the reactions
ZrC(s) = Zr( g) + C(s) (5)ZrC(s) = Zr(g) + C(g) (6)
Such pressures could be combined with data on the vapor pressures of the elements to yield the high temperature stability of the carbide. The Knud- sen rate-of-effusion method, employing a graphite cell, was selected for the study of reaction 5 and the Langmuir rate-of-evaporation method was selected for the study of reaction 6. These methods are well adapted to the determination of the small pressures to be expected and have the further advantage that the vacuum techniques lend themselves to the ready purification of the samples.
It is pertinent to note that zirconium carbide shows an homogeneity range extending from Zr- Cn.313a or ZrCo.513b to ZrCi.o- Bowman13b also gives a crystal parameter as equal to 4.700 A. at the high-carbon composition. In addition, the carbide was expected to show a constant subliming composition, that is, at a given temperature in a Langmuir experiment, one or the other component would be lost preferentially with a resulting shift of both the solid and vapor composition toward a common value. This latter conclusion is based on the work of Burgers and Basart14 and on the estimated high temperature stability of the carbide and the vapor pressure of the elements.
Burgers and Basart14 prepared zirconium carbide by a vapor decomposition method, their preparations having variable carbon-to-zirconium ratios and crystal parameters depending on the experimental conditions. One sample having the composition ZrCo.77 was observed to lose zirconium
(12) R. J, Thorn and G. H. Winslow, J. Chem. Phya., 26, 186 (1956).
(13) (a) G. V. Samsonov, N. S. Rozinova, C. A., 50, 15396 (1956); Akad Nauk, SSSR, 27, 120 (1956); (b) M. A. Bowman, Los Alamos Scientific Laboratory, CMB Division, private communication, 1960.
(14) W. G. Burgers and J. C. M. Basart, Z. anorg. Chem., 216, 209 (1934).
preferentially when heated i n vacuo at 1900 to 2100°K., with a resulting shift of the lattice parameter toward that obtained for carbon-rich compositions. Now consider reaction 5. Combination of the previously estimated free energy of formation of zirconium carbide with the vapor pressure of zirconium at 2600°Iv.10 leads to the equilibrium partial pressure of Zr(g) equal to 8 X 10 ~9 atmospheres. The partial pressure of Ci(g) is6.5 X 10~7 atmosphere at that temperature, or nearly 100 times as great. Thus, zirconium carbide saturated with carbon would suffer an initial preferential loss of carbon. It follows therefore that the carbide must have a constant subliming composition.
ExperimentalThe vacuum system consisted of a metal oil-diffusion
pump, a mechanical forepump, a liquid nitrogen cold trap, and the usual high-vacuum plumbing. An ionization gauge was located in the line between the cold trap and furnace. Different furnaces could be attached to the pumping system by means of standard taper joints, and the details of these are described later in this section.
Temperatures were measured with a Pyrometer Instrument Company disappearing-filament type optical pyrometer by sighting into black-body holes. “ Window” corrections were applied to observed temperatures, and the instrument was calibrated against a standard tungsten- ribbon lamp. The temperature uncertainty is estimated to have been about 12° in the Knudsen experiments. The uncertainty was somewhat higher, about 15D, in the Langmuir experiments, because of a temperature gradient in the specimens.
All of the zirconium carbide was a low-hafnium grade material obtained from the Carborundum Company. In the Knudsen experiments, the carbide was a powder containing 10.39% total carbon, 87.03% zirconium and about 0.3% non-gaseous impurities, principally silicon. The oxygen and nitrogen content was assumed to be 2.3%, by difference. The specimens used for the Langmuir work were small cylinders about 1/ 4 inch diameter and about s/ 8 inch long prepared from V4 inch square rods. A hole 0.042 inch diameter and Vis inch deep at one end permitted the sample to be held on the end of a 0.040 inch tungsten rod, and a similar hole about Vie inch deep at the other end served as a blackbody hole. The as-received rod contained 11.6% total carbon and 87.6% zirconium. Spectroscopic analysis showed about 0.3% metallic impurities, principally iron. Most of these were removed by an out-gassing and purification run prior to the rate-of-evaporation runs.
Knudsen Experiments.— Prior to the rate-of-effusion runs the powder was heated in the vacuum system for a total of 1 hour at increasing temperatures to a maximum of 2780°K., where it was held for approximately a half-hour. During the first part of the heating, the pressure in the system rose to 0.1 mm. or higher but dropped eventually to 5 X 10_4 mm. This treatment increased the carbon content to 11.2% and reduced the oxygen content to 203 parts per million.
A graphite Knudsen cell was held in a covered tantalum crucible which was inductively heated by a 6 kilowatt Ajax_ mercury-arc converter. The cell was 9/ie inch i.d. and in order to permit the effusion of sufficient zirconium for analysis, a rather larger orifice, 1/i inch diameter, was used. *
Vapor effusing from the cell was collected by small tantalum cups and sheets placed over the orifice in such a manner as to resemble small inverted Knudsen cells. These cups were much less readily heated than the larger crucible containing the graphite cell, so they were several hundred degrees cooler than the Knudsen cell itself. A small hole in the bottom of the collectors permitted taking pyrometer readings without allowing any significant amount of vapor to escape. The zirconium collected in this manner was determined by a spectrophotometric method.16 An analysis of a “ blank” cup showed 0.01 mg. of zirconium.
(15) L. Silverman and D. W. Hawley, Anal. Chem., 28, 806 (1958)
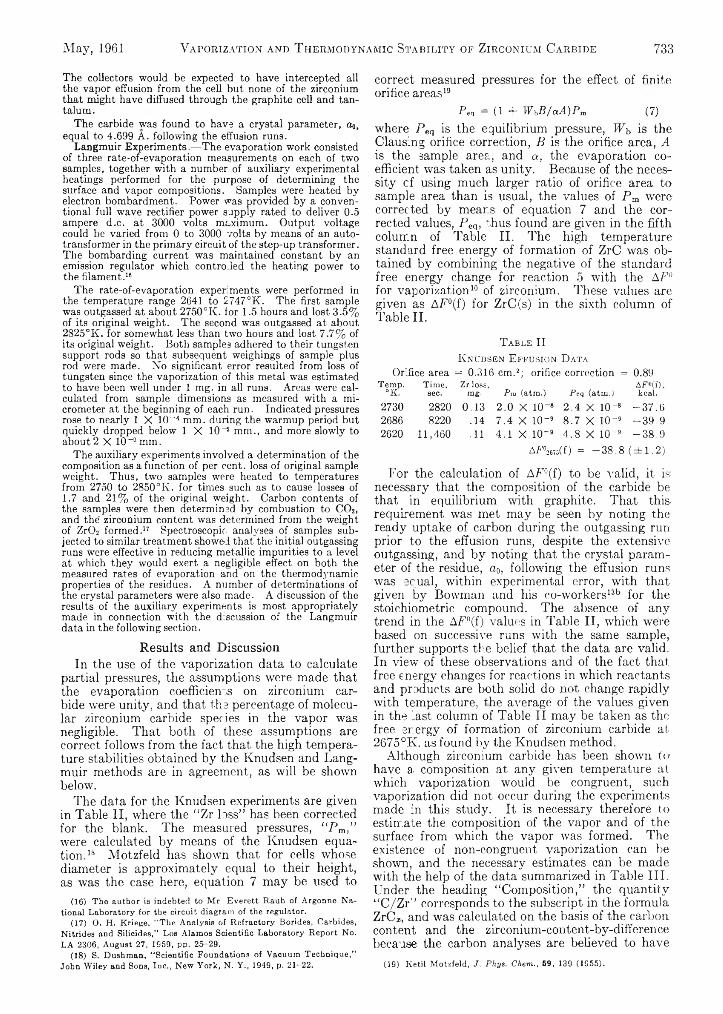
May, 1961 Vaporization and T hermodynamic Stability of Zirconium Carbide 733
The collectors would be expected to have intercepted all the vapor effusion from the cell but none of the zirconium that might have diffused through the graphite cell and tantalum.
The carbide was found to have a crystal parameter, Oo, equal to 4.699 A. following the effusion runs.
Langmuir Experiments.— The evaporation work consisted of three rate-of-evaporation measurements on each of two samples, together with a number of auxiliary experimental heatings performed for the purpose of determining the surface and vapor compositions. Samples were heated by electron bombardment. Power was provided by a conventional full wave rectifier power supply rated to deliver 0.5 ampere d.c. at 3000 volts maximum. Output voltage could be varied from 0 to 3000 volts by means of an autotransformer in the primary circuit of the step-up transformer. The bombarding current was maintained constant by an emission regulator which controlled the heating power to the filament.16
The rate-of-evaporation experiments were performed in the temperature range 2641 to 2747 °K. The first sample was outgassed at about 2750°K. for 1.5 hours and lost 3.5% of its original weight. The second was outgassed at about 2825°K. for somewhat less than two hours and lost 7.7% of its original weight. Both samples adhered to their tungsten support rods so that subsequent weighings of sample plus rod were made. No significant error resulted from loss of tungsten since the vaporization of this metal was estimated to have been well under 1 mg. in all runs. Areas were calculated from sample dimensions as measured with a micrometer at the beginning of each run. Indicated pressures rose to nearly 1 X 10~4 mm. during the warmup period but quickly dropped below 1 X 10”5 mm., and more slowly to about 2 X 10~°mm.
The auxiliary experiments involved a determination of the composition as a function of per cent, loss of original sample weight. Thus, two samples were heated to temperatures from 2750 to 2850°K. for times such as to cause losses of1.7 and 21% of the original weight. Carbon contents of the samples were then determined by combustion to CO2, and the zirconium content was determined from the weight of Zr02 formed.17 Spectroscopic analyses of samples subjected to similar treatment showed that the initial outgassing runs were effective in reducing metallic impurities to a level at which they would exert a negligible effect on both the measured rates of evaporation and on the thermodynamic properties of the residues. A number of determinations of the crystal parameters were also made. A discussion of the results of the auxiliary experiments is most appropriately made in connection with the discussion of the Langmuir data in the following section.
Results and DiscussionIn the use of the vaporization data to calculate
partial pressures, the assumptions were made that the evaporation coefficients on zirconium carbide were unity, and that the percentage of molecular zirconium carbide species in the vapor was negligible. That both of these assumptions are correct follows from the fact that the high temperature stabilities obtained by the Knudsen and Langmuir methods are in agreement, as will be shown below.
The data for the Knudsen experiments are given in Table II, where the “Zr loss” has been corrected for the blank. The measured pressures, “ P m,” were calculated by means of the Knudsen equation.18 Motzfeld has shown that for cells whose diameter is approximately equal to their height, as was the case here, equation 7 may be used to
(16) The author is indebted to Mr Everett Rauh of Argonne National Laboratory for the circuit diagram of the regulator.
(17) O. H. Kriege, “The Analysis of Refractory Borides, Carbides, Nitrides and Silicides,” Los Alamos Scientific Laboratory Report No. LA 2306, August 27, 1959, pp. 25-29.
(18) S. Dushman, “Scientific Foundations of Vacuum Technique,” John Wiley and Sons, Inc., New York, N. Y., 1949, p. 21-22.
correct measured pressures for the effect of finite orifice areas19
Pen = (1 + WbB/aA)Pm (7)where P eq is the equilibrium pressure, W b is the Clausing orifice correction, B is the orifice area, A is the sample area, and a , the evaporation coefficient was taken as unity. Because of the necessity cf using much larger ratio of orifice area to sample area than is usual, the values of P m were corrected by means of equation 7 and the corrected values, Peq, thus found are given in the fifth column of Table II. The high temperature standard free energy of formation of ZrC was obtained by combining the negative of the standard free energy change for reaction 5 with the AF a for vaporization10 of zirconium. These values are given as AP°(f) for ZrC(s) in the sixth column of Table II.
T able IIK ntjdsen E ffusion D ata
Orifice area = 0.316 cm.2; orifice correction = 0.89Temp.
°K.Time,sec.
Zrloss, mg. Pm (atm.) Peq (atm.)
AF*('f),kcal.
2730 2820 0.13 2.0 X 10-* 2 .4 X 10-8 -3 7 .62686 8220 .14 7.4 X IO"9 8.7 X IO“ 9 -3 9 .92620 11,460 .11 4.1 X 10-> 4 .8 X 1 0 -9 -3 8 .9
AF°® (f) = - 3 8 .8 (± 1 .2 )
For the calculation of AP°(f) to be valid, it is necessary that the composition of the carbide be that in equilibrium with graphite. That this, requirement was met may be seen by noting the ready uptake of carbon during the outgassing run prior to the effusion runs, despite the extensive outgassing, and by noting that the crystal parameter of the residue, do, following the effusion runs was equal, within experimental error, with that given by Bowman and his co-workers13b for the stoichiometric compound. The absence of any trend in the AP°(f) values in Table II, which were based on successive runs with the same sample, further supports the belief that the data are valid. In view of these observations and of the fact that free energy changes for reactions in which reactants and products are both solid do not change rapidly with temperature, the average of the values given in the last column of Table II may be taken as the free energy of formation of zirconium carbide at. 2675°K. as found by the Knudsen method.
Although zirconium carbide has been shown to have a. composition at any given temperature at which vaporization would be congruent, such vaporization did not occur during the experiments made in this study. It is necessary therefore to estimate the composition of the vapor and of the surface from which the vapor was formed. The existence of non-congruent vaporization can be shown, and the necessary estimates can be made with the help of the data summarized in Table III. Under the heading “Composition,” the quantity “C/Zr” corresponds to the subscript in the formula ZrCL, and was calculated on the basis of the carbon content and the zirconium-content-by-difference because the carbon analyses are believed to have
(19) Ketil Motzfeld, J. Phys. Chem., 59, 139 (1955).

734 B. D. Pollock Vol. 65
"been more accurate than those of zirconium. The uncertainty in the crystal parameters is estimated to be ±0.001A. The first entry is for stoichiometric ZrC and the second is for the powder used in the Knudsen experiments described above. The other samples are listed in order of increasing weight loss. Samples 2A and 4A are those used in the measurements of the rates of evaporation. The composition and parameter data given were obtained after the samples had undergone the indicated losses. The crystal parameters of the surface layer of samples 5A and 6A were found to be 4.701 A. Comparison with the values for stoichiometric ZrC13b indicates that the atomic ratio, C/Zr, in the surface layers of these two samples must have been very nearly equal to unity; that is, their composition was nearly stoichiometric. The crystal parameter at a point 0.015 inch below the surface was 4.693 A. in sample 5A, and the parameter at oa point 0.011 inch below the surface was 4.696 A. in sample 6A, thus indicating that the bulk of the samples had a lower C/Zr ratio than that of the surfaces. The weight losses which occurred during the evaporation rate measurements on samples 2A and 4A were within the range for samples 5A and 6A, so that the surface layers of the Langmuir specimens must have also been nearly stoichiometric and there must also have been a composition inhomogeneity in these samples. iSuch an inhomogeneity is inconsistent with the existence of congruent vaporization. It is not likely however that diffusion of zirconium through the bulk of the samples would have been rapid enough to have maintained the zirconium in the vapor at a percentage much greater than that in the solid. Accordingly, the average vapor composition was estimated to have been 90% Zr and 10% Ci.
T a b l e I I I
R e su m e o f D a t a U sed to I n f e r t h e S u r f a c e an d V a po r C o m po sitio n s in th e L a n g m u ir E x p e r im e n t s
Loss, as % of initl. Composition
Crystalparam
eterSample wt. % Zr % c C/Zr ao, A.
Stoichiometric ZrC powder in
Knudsen runs
88.37 11. G3 1.00 4.700
after outgas 11.20 0.96after effusion runs > .9 6 4.699
5A 1.7 88.85 11.07 .95 4.7014.693
2 A 14 10.6 .904A 18 90.1 10.25 .876A 21 89. (3 10.34 .88 4.701
4.696The data for the Langmuir experiments are
given in Table IV together with the total rates of evaporation, The total evaporation ratesand the estimated vapor composition were used in calculating the partial pressures of zirconium and carbon, Pzr and P Ct, given in the third and fifth columns of Table V. Tor comparison, the pressures of Zr(g) and Ci(g) in equilibrium with the elements are given in columns four and six. No correction was made for loss of polyatomic carbon, since the C2 and C3 species could be shown to have accounted for less than 4% of the carbon loss. The
approximation was made that the partial pressures P zr and PCl were those in equilibrium with stoichiometric ZrC and the pressures -were then used to calculate the standard free energy change for the inverse of reaction 6 which could then be combined with the standard free energy changes for vaporization of the elements to Zr(g) and Ci(g) to obtain the free energy of formation values for ZrC(s) given in the last column of Table V.
T a b l e I V
R a t e -of-E v a p o r a t io n D a t a fo r t h e L a n g m u ir E x p e r i-
Run Temp., Time,MENTS
Àrea, Wt. loss, (/total,no. °K. sec. cm.2 mg. g./cm.2-sec.
8/17 b 2G73 14,900 2.52 76.5 2.04 X 10⁸/17 c 2671 13,200 2.48 58.1 1.788/17 d 2674 11,880 2.43 62.9 2.188/26 b 2747 7,100 2.34 79.9 4.828/26 c 2641 18,600 2.27 60.3 1.438/26 a 2647 11,600 2 .21 35.9 1.40
T able VR e su m é of C a l c u l a t io n s fo r t h e L a n g m u ir E x p e r i
m en ts
Run Temp.,Pzr
X 1CFP°zr
X 10*Pc,
X 10*P°Cl
X 106AP°(f) for
ZrC(s),no. °K. (All pressures in atm.) kcal.
8/17 b 2673 2.23 1.40 6.0 1.60 - 3 8 .88/17 c 2671 1.94 1.38 6.0 1.57 -4 0 .08/17 d 2674 2.39 1.41 7.3 1.60 - 3 8 .08/26 b 2747 5.4 2.90 16.3 3.90 -3 9 .18/26 c 2641 1.56 1.03 4.8 1.06 - 3 8 .28/26 d 2647 1.51 1 .10 4.7 1.17 -3 9 .5Av. temp. = 2676°Iv. Av. -3 8 .9
( ± 0.6)
The free energy values, AP°(f), are not very sensitive to moderate errors in compositions and Ctotai- For example, if the carbon percentage in the vapor were 9% (or 11%) instead of 10%, the AP°(f) values would be in error by only 0.5 kcal. If the surfaces were ZrCo.%, the free energy values would be 0.6 kcal. less negative than those calculated for the stoichiometric compound.
Reaction with oxygen in the residual gas is estimated to have been no more than 5% of the carbon loss at the lower temperatures. The average of the AP°(f) values in Table V, —38.9 kcal., thus is taken to be the standard free energy of formation of zirconium carbide at 2675 °K. as determined by the Langmuir method in good agreement with the Knudsen result. Accordingly, the average for the two methods, —38.9 kcal., will be taken as the free energy of formation as determined in this study, over-all uncertainty estimated at ±1.5 kcal.
Conclusions and SummaryThe validity of the assumptions concerning
the evaporation coefficients and the absence of molecular zirconium carbide species is a consequence of the fact that the results of the two methods are in agreement. If the evaporation coefficients were less than unity, the calculated A F ’ s would be more negative than the correct value. However, the error in the Knudsen method would be smaller because of the closer approach to the correct zirconium pressure. Thus, for low
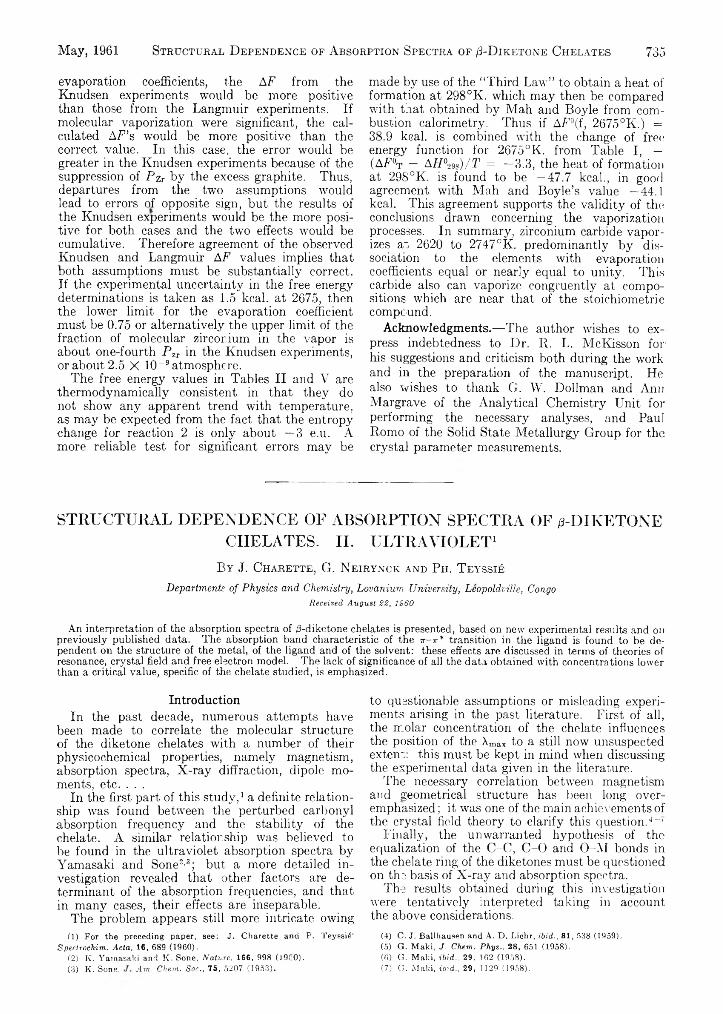
May, 1961 Structural D ependence of Absorption Spectra of /3-Diketone Chelates 735
evaporation coefficients, the A F from the Knudsen experiments would be more positive than those from the Langmuir experiments. If molecular vaporization were significant, the calculated A F ’s would be more positive than the correct value. In this case, the error would be greater in the Knudsen experiments because of the suppression of P zr by the excess graphite. Thus, departures from the two assumptions would lead to errors of opposite sign, but the results of the Knudsen experiments would be the more positive for both cases and the two effects would be cumulative. Therefore agreement of the observed Knudsen and Langmuir AF values implies that both assumptions must be substantially correct. If the experimental uncertainty in the free energy determinations is taken as 1.5 kcal. at 2675, then the lower limit for the evaporation coefficient must be 0.75 or alternatively the upper limit of the fraction of molecular zirconium in the vapor is about one-fourth P ZT in the Knudsen experiments, or about 2.5 X 10⁻⁹ atmosphere.
The free energy values in Tables II and V are thermodynamically consistent in that they do not show any apparent trend with temperature, as may be expected from the fact that the entropy change for reaction 2 is only about —3 e.u. A more reliable test for significant errors may be
made by use of the “Third Law” to obtain a heat of formation at 298 °K. which may then be compared with that obtained by Mah and Boyle from combustion calorimetry. Thus if AF°(f, 2675°K.) =38.9 kcal. is combined with the change of free; energy function for 2675 °K. from Table I, — (A F °t ~ AH °29s)/ T = —3.3, the heat of formation at 298°K. is found to be —47.7 kcal., in good agreement with Mah and Boyle’s value —44.1 kcal. This agreement supports the validity of the conclusions drawn concerning the vaporization processes. In summary, zirconium carbide vaporizes ae 2620 to 2747°K. predominantly by dissociation to the elements with evaporation coefficients equal or nearly equal to unity. This carbide also can vaporize congruently at compositions which are near that of the stoichiometric compound.
Acknowledgments.— The author wishes to express indebtedness to Dr. R. L. McKisson for his suggestions and criticism both during the work and in the preparation of the manuscript. He also wishes to thank G. W. Dollman and Ann Margrave of the Analytical Chemistry Unit for performing the necessary analyses, and Paul Romo of the Solid State Metallurgy Group for the crystal parameter measurements.
S T R U C T U R A L D E P E N D E N C E O F A B S O R P T I O N S P E C T R A O F / 3 - D I K E T O N E
C H E L A T E S . I I . U L T R A V I O L E T 1
B y J. C h a r e t t e , G . N e ir y n c k a n d P h . T e y s sié
Departments of Physics and Chemistry, Lovanium University, Leopoldville, Congo Received August 22, 1960
An interpretation of the absorption spectra of /3-diketone chelates is presented, based on new experimental results and on previously published data. The absorption band characteristic of the ir-w* transition in the ligand is found to be dependent on the structure of the metal, of the ligand and of the solvent: these effects are discussed in terms of theories of resonance, crystal field and free electron model. The lack of significance of all the data obtained with concentrations lower than a critical value, specific of the chelate studied, is emphasized.
IntroductionIn the past decade, numerous attempts have
been made to correlate the molecular structure of the diketone chelates with a number of their physicochemical properties, namely magnetism, absorption spectra, X-ray diffraction, dipole moments, etc. . . .
In the first part of this study,1 a definite relationship was found between the perturbed carbonyl absorption frequency and the stability of the chelate. A similar relationship was believed to be found in the ultraviolet absorption spectra by Yamasaki and Sone2’3; but a more detailed investigation revealed that other factors are determinant of the absorption frequencies, and that in many cases, their effects are inseparable.
The problem appears still more intricate owing(1) For the preceding paper, see: J. Charette and P. Teyssié’
Spectrochim. Acta, 16, 689 (1960).(2) K. Yamasaki and K. Sone, Nature, 166, 998 0950).(3) K. Sone. Am. Chem. Soc., 75, 5207 (1953).
to questionable assumptions or misleading experiments arising in the past literature. First of all, the molar concentration of the chelate influences the position of the Amax to a still now unsuspected extern: this must be kept in mind when discussing the experimental data given in the literature.
The necessary correlation between magnetism and geometrical structure has been long overemphasized ; it was one of the main achievements of the crystal field theory to clarify this question.4'"7
Finally, the unwarranted hypothesis of the equalization of the C-C, C -0 arid O-M bonds in the chelate ring of the diketones must be questioned on the basis of X-ray and absorption spectra.
The results obtained during this investigation were tentatively interpreted taking in account the above considerations.
(4) C. J. Ballhausen and A. D. Liehr, ibid., 81, 538 (1959).(5) G. Maki, J. Chem. Phys., 28, 651 (1958).(6) G. Maki, ibid., 29, 162 (1958).(7) G. Maki, ibid., 29, 1129 (1958).
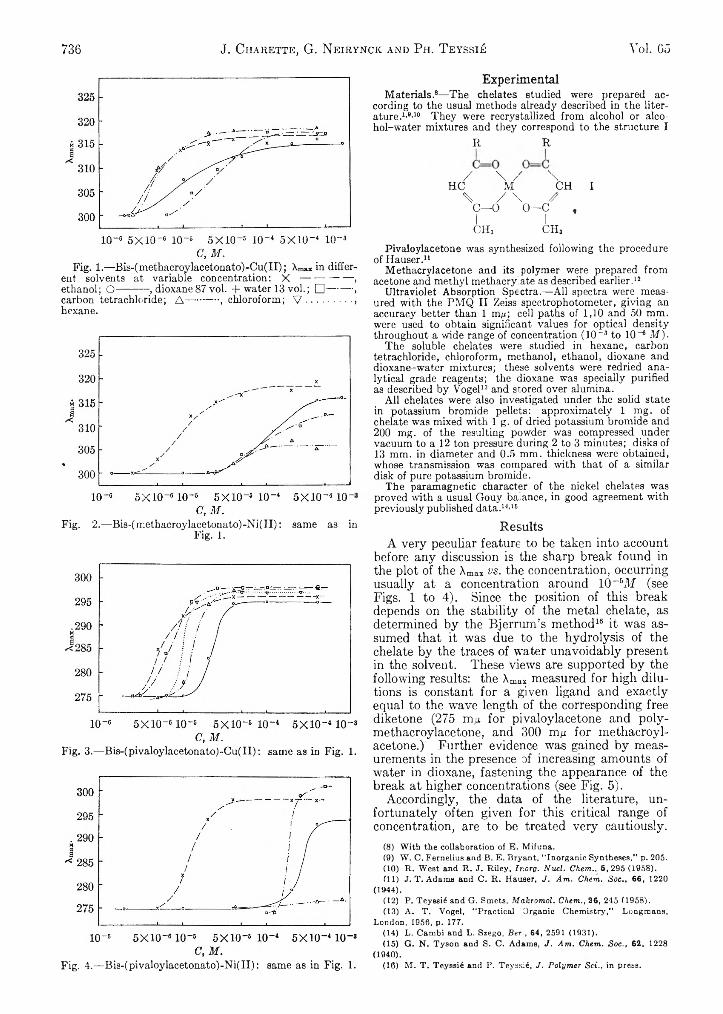
736 J. Charette, G. Neirynck and Ph. T eyssié Vol. 65
ent, solvents at variable concentration: X ---------------- ,éthanol; O ---------- , dioxane87 vol. - f water 13 vol.; □ -------- ,carbon tetrachloride; A — ------ , chloroform; V ..................,hexane.
Fig. 2.— Bis-(ir.ethacroylacetonato)-Ni(JI): same as in Fig. 1.
Fig. 3.— Bis-(pivaloylacetonato)-Cu(II): same as in Fig. 1.
Fig. 4.—Bis-(pivaloylacetonato)-Ni(II): same as in Fig. 1.
ExperimentalMaterials.8— The chelates studied were prepared ac
cording to the usual methods already described in the literature.1’9'10 They were recrystallized from alcohol or alcohol-water mixtures and they correspond to the structure I
R R
/ \ / \HC M CH I
\ / \ /C— 0 0 — c „I !CHa CH3
Pivaloylacetone was synthesized following the procedure of Hauser.11
Methacrylacetone and its polymer were prepared from acetone and methyl methacrylate as described earlier.12
Ultraviolet Absorption Spectra.— All spectra were measured with the PMQ II Zeiss spectrophotometer, giving an accuracy better than 1 m,u; cell paths of 1,10 and 50 mm. were used to obtain significant values for optical density throughout a wide range of concentration (10~3 to 10-6 M ).
The soluble chelates were studied in hexane, carbon tetrachloride, chloroform, methanol, ethanol, dioxane and dioxane-water mixtures; these solvents were redried analytical grade reagents; the dioxane was specially purified as described by Vogel13 and stored over alumina.
All chelates were also investigated under the solid state in potassium bromide pellets: approximately 1 mg. of chelate was mixed with 1 g. of dried potassium bromide and 200 mg. of the resulting powder was compressed under vacuum to a 12 ton pressure during 2 to 3 minutes; disks of 13 mm. in diameter and 0.5 mm. thickness were obtained, whose transmission was compared with that of a similar disk of pure potassium bromide.
The paramagnetic character of the nickel chelates was proved with a usual Gouy balance, in good agreement with previously published data.11’16
ResultsA very peculiar feature to be taken into account
before any discussion is the sharp break found in the plot of the Xmax vs. the concentration, occurring usually at a concentration around 10~6M (see Figs. 1 to 4). Since the position of this break depends on the stability of the metal chelate, as determined by the Bjerrum’s method16 it was assumed that it was due to the hydrolysis of the chelate by the traces of water unavoidably present in the solvent. These views are supported by the following results: the Xmax measured for high dilutions is constant for a given ligand and exactly equal to the wave length of the corresponding free diketone (275 mju for pivaloylacetone and poly- methacroylacetone, and 300 m/x for methacroyl- acetone.) Further evidence was gained by measurements in the presence of increasing amounts of water in dioxane, fastening the appearance of the break at higher concentrations (see Fig. 5).
Accordingly, the data of the literature, unfortunately often given for this critical range of concentration, are to be treated very cautiously.
(8) With the collaboration of E. Mifuna.(9) W. C. Fernelius and B. E. Bryant, “Inorganic Syntheses,” p. 205.(10) R. West and R. J. Riley, Inorg. Nucl. Chem., 5,295 (1958).(11) J. T. Adams and C. R. Hauser, J. Am. Chem. Soc., 66, 1220
(1944).(12) P. Teyssié and G. Smets, Makromol. Chem., 26, 245 (1958).(13) A. T. Vogel, “Practical Organic Chemistry,” Longmans,
London, 1956, p. 177.(14) L. Cambi and L. Szego, Per., 64, 2591 (1931).(15) G. N. Tyson and S. C. Adams, J . Am. Chem. Soc., 62, 1228
(1940).(16) M. T. Teyssié and P. Teyssié, J. Polymer Set., in press.
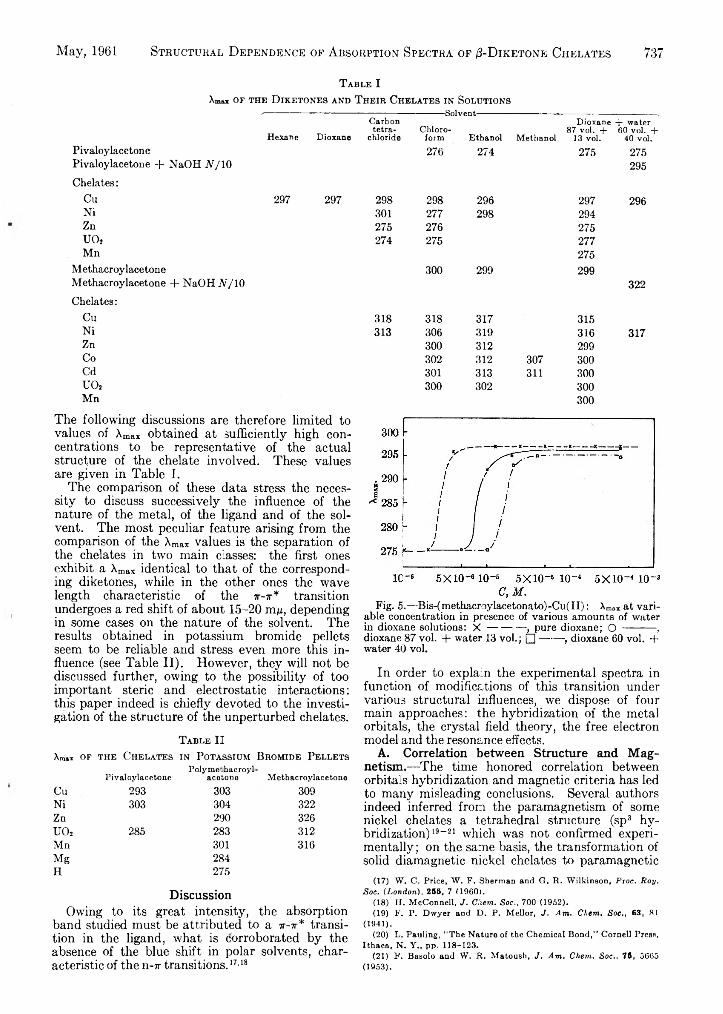
May, 1961 Structural D ependence of A bsorption Spectra of /3-Diketone Chelates 737
T able IXm«x OF THE DlKETONES AND T h E IK CHELATES IN SOLUTIONS
Hexane DioxanePivaloylacetonePivaloylacetone -f- NaOH Ar/10
Chelates:Cu 297 297NiZnUO,Mn
MethacroylacetoneMethacroylacetone + NaOH JV/10Chelates:
CuNiZnCoCdU 02Mn
The following discussions are therefore limited to values of Xmax obtained at sufficiently high concentrations to be representative of the actual structure of the chelate involved. These values are given in Table I.
The comparison of these data stress the necessity to discuss successively the influence of the nature of the metal, of the ligand and of the solvent. The most peculiar feature arising from the comparison of the Xmax values is the separation of the chelates in two main classes: the first ones exhibit a XmaJC identical to that of the corresponding diketones, while in the other ones the wave length characteristic of the x-x* transition undergoes a red shift of about 15-20 mp, depending in some cases on the nature of the solvent. The results obtained in potassium bromide pellets seem to be reliable and stress even more this influence (see Table II). However, they will not be discussed further, owing to the possibility of too important steric and electrostatic interactions: this paper indeed is chiefly devoted to the investigation of the structure of the unperturbed chelates.
T able IIXmax of the C helates in Potassium B romide Pellets
PivaloylacetonePolyme'hacroyl-
acetone MethacroylacetoneCu 293 303 309Ni 303 304 322Zn 290 326U 02 285 283 312Mn 301 316Mg 284H 275
DiscussionOwing to its great intensity, the absorption
band studied must be attributed to a t t - x * transition in the ligand, what is corroborated by the absence of the blue shift in polar solvents, characteristic of the n-7r transitions.17’18
-Solvent-Carbontetra
chlorideChloro
form Ethanol Methanol
Dioxane + water 87 vol. + 60 vol. +
13 vol. 40 vol.276 274 275 275
295
298 298 296 297 296301 277 298 294275 276 275274 275 277
275300 299 299
322
318 318 317 315313 306 319 316 317
300 312 299302 312 307 300301 313 311 300300 302 300
300
Fig. 5.— Bis-(methacroylacetonato)-Cu(II): Xmai at variable concentration in presence of various amounts of waterin dioxane solutions: X ------------ , pure dioxane; O ---------- ,dioxane 87 vol. + water 13 vol.; □ --------, dioxane 60 vol. +water 40 vol.
In order to explain the experimental spectra in function of modifications of this transition under various structural influences, we dispose of four main approaches: the hybridization of the metal orbitals, the crystal field theory, the free electron model and the resonance effects.
A. Correlation between Structure and Magnetism.— The time honored correlation between orbitals hybridization and magnetic criteria has led to many misleading conclusions. Several authors indeed inferred from the paramagnetism of some nickel chelates a tetrahedral structure (sp3 hybridization)19-21 which was not confirmed experimentally; on the same basis, the transformation of solid diamagnetic nickel chelates to paramagnetic
(17) W. C. Price, W. F. Sherman and G. R. Wilkinson, Proc. Roy. Soc. {London), 255, 7 (1960).
(18) H. McConnell, J. Chem. Soc., 700 (1952).(19) F. P. Dwyer and D. P. Mellor, J. Am. Chem. Soc., 63, 81
(1941).(20) L. Pauling, "The Nature of the Chemical Bond,” Cornell Press,
Ithaca, N. Y., pp. 118—123.(21) F. Basolo and W. R. Matoush, J. Am. Chem. Soc., 75, 5665
(1953).
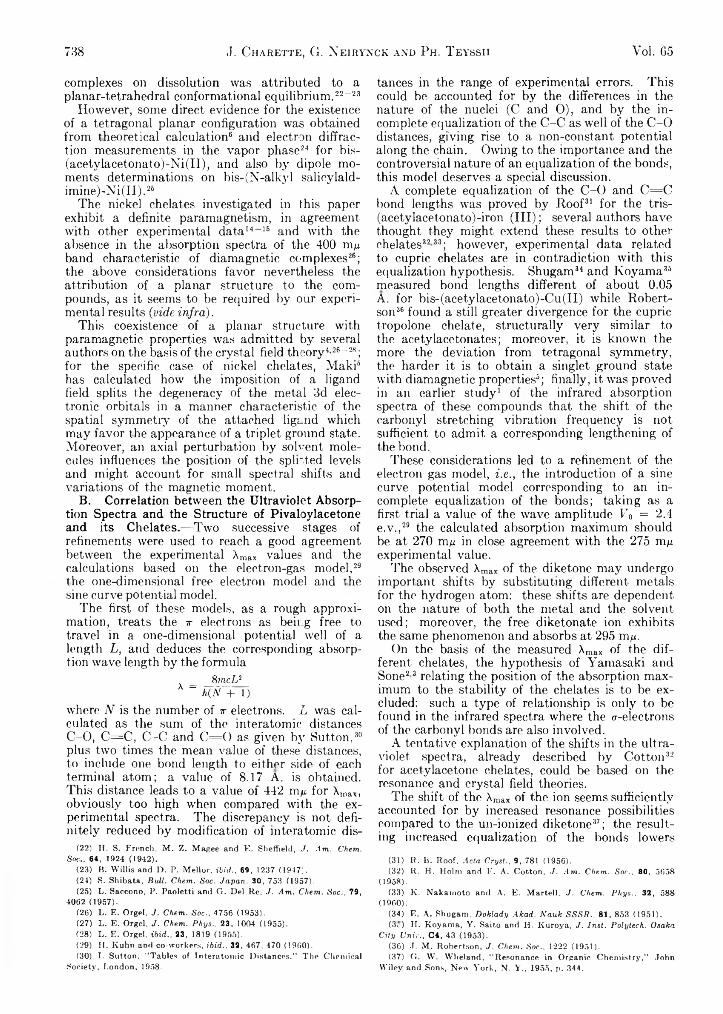
738 J. Charette, G. Neiryxck and Ph. T eyssii Vol. 05
complexes on dissolution was attributed to a planar-tetrahedral conformational equilibrium.22-23
However, some direct evidence for the existence of a tetragonal planar configuration was obtained from theoretical calculation6 and electron diffraction measurements in the vapor phase24 for bis- (acet.ylacetonato)-Ni(II), and also by dipole moments determinations on bis-(N-alkyl salicylald- imine)-Ni(II).26
The nickel chelates investigated in this paper exhibit a definite paramagnetism, in agreement with other experimental data14-15 and with the absence in the absorption spectra of the 400 mu band characteristic of diamagnetic complexes26; the above considerations favor nevertheless the attribution of a planar structure to the compounds, as it seems to be required by our experimental results (vide infra).
This coexistence of a planar structure with paramagnetic properties was admitted by several authors on the basis of the crystal field theory4 26-28; for the specific case of nickel chelates, Maki5 has calculated how the imposition of a ligand field splits the degeneracy of the metal 3d electronic orbitals in a manner characteristic of the spatial symmetry of the attached ligand which may favor the appearance of a triplet ground state. Moreover, an axial perturbation by solvent molecules influences the position of the spirted levels and might account for small spectral shifts and variations of the magnetic moment.
B. Correlation between the Ultraviolet Absorption Spectra and the Structure of Pivaloylacetone and its Chelates.—Two successive stages of refinements were used to reach a good agreement between the experimental Xmax values and the calculations based on the electron-gas model,29 the one-dimensional free electron model and the sine curve pot ential model.
The first of these models, as a rough approximation, treats the x electrons as being free to travel in a one-dimensional potential well of a length L, and deduces the corresponding absorption wave length by the formula
_ 8 mcL2A _ h ( N + 1)
where N is the number of x electrons. L was calculated as the sum of the interatomic distances C-O, C = C , C-C and C = 0 as given by Sutton,30 plus two times the mean value of these distances, to include one bond length to either side of each terminal atom; a value of 8.17 A. is obtained. This distance leads to a value of 442 m/i for Xmax, obviously too high when compared with the experimental spectra. The discrepancy is not definitely reduced by modification of interatomic dis-
(22) H. S. French, M. Z. Magee and E. Sheffield, J. Am. Chem. Soc.., 64, 1924 (1942).
(23) B. Willis and D. P. Mellor, i b i d . , 69, 1237 (1947).(24) S. Shibata, Bull. Chem. Soc. Japan. 30, 753 (1957).(25) L. Saccono, P. Paoletti and G . Del Re, J. Am. Chem. Soc., 79,
4062 (1957).(26) L. E. Orgel, J. Chem. Soc., 4756 (1953).(27) L. E. Orgel, J. Chem. Phys., 23, 1004 (1955).(28) L. E. Orgel, i b i d . , 23, 1819 (1955).(29) II. Kuhn and co-workers, ibid., 32, 467, 470 (19G0).(30) I. Sutton, “ Tables of Interatomic Distances,” The Chemical
Society, London, 1958.
tances in the range of experimental errors. This could be accounted for by the differences in the nature of the nuclei (C and O), and by the incomplete equalization of the C -C as well of the C -0 distances, giving rise to a non-constant potential along the chain. Owing to the importance and the controversial nature of an equalization of the bonds, this model deserves a special discussion.
A complete equalization of the C -0 and C = C bond lengths was proved by Roof31 for the tris- (acetylacetonato)-iron (III); several authors have thought they might extend these results to other chelates3233; however, experimental data related to cupric chelates are in contradiction with this equalization hypothesis. Shugam34 and Koyama35 measured bond lengths different of about 0.05 A. for bis-(acetylacetonato)-Cu(II) while Robertson36 found a still greater divergence for the cupric tropolone chelate, structurally very similar to the acetylacetonates; moreover, it is known the more the deviation from tetragonal symmetry, the harder it is to obtain a singlet .ground state with diamagnetic properties5; finally, it was proved in an earlier study1 of the infrared absorption spectra of these compounds that the shift of the carbonyl stretching vibration frequency is not sufficient to admit a corresponding lengthening of the bond.
These considerations led to a refinement of the electron gas model, i.e., the introduction of a sine curve potential model corresponding to an incomplete equalization of the bonds; taking as a first trial a value of the wave amplitude V0 = 2.4 e.v.,29 the calculated absorption maximum should be at 270 mu in close agreement with the 275 mu experimental value.
The observed Xmax of the diketone may undergo important shifts by substituting different metals for the hydrogen atom: these shifts are dependent on the nature of both the metal and the solvent used; moreover, the free diketonate ion exhibits the same phenomenon and absorbs at 295 mu-
On the basis of the measured Xmax of the different chelates, the hypothesis of Yamasaki and Sone2 3 relating the position of the absorption maximum to the stability of the chelates is to be excluded: such a type of relationship is only to be found in the infrared spectra where the v-electrons of the carbonyl bonds are also involved.
A tentative explanation of the shifts in the ultraviolet spectra, already described by Cotton32 for acetylacetone chelates, could be based on the resonance and crystal field theories.
The shift of the Xmax of the ion seems sufficiently accounted for by increased resonance possibilities compared to the un-ionized diketone37; the resulting increased equalization of the bonds lowers
(31) R. B. Roof, Acta Cryst., 9, 781 (1956).(32) R. H. Holm and F. A. Cotton, ./. Am. Chem. Soc., 80, 5658
(1958).(33) K. Nakatnoto and A. E. Martell, J. Chem. Phys., 32, 588
(1960):(34) E. A. Shugam, Doklady Akad. Nauk SSSR., 81, 853 (1951).(3c) IT. Koyama, Y. Saito and H. Knroya, J. Inst. Polytech. Osaka
City Unit., C4, 43 (1953).(36) .T. M. Robertson, J. Chem. Soc., 1222 (1951).(37) G. W. WKeland, “ Resonance in Organic Chemistry,” John
Wiley and Sons, New York, N. Y., 1955, p. 344.
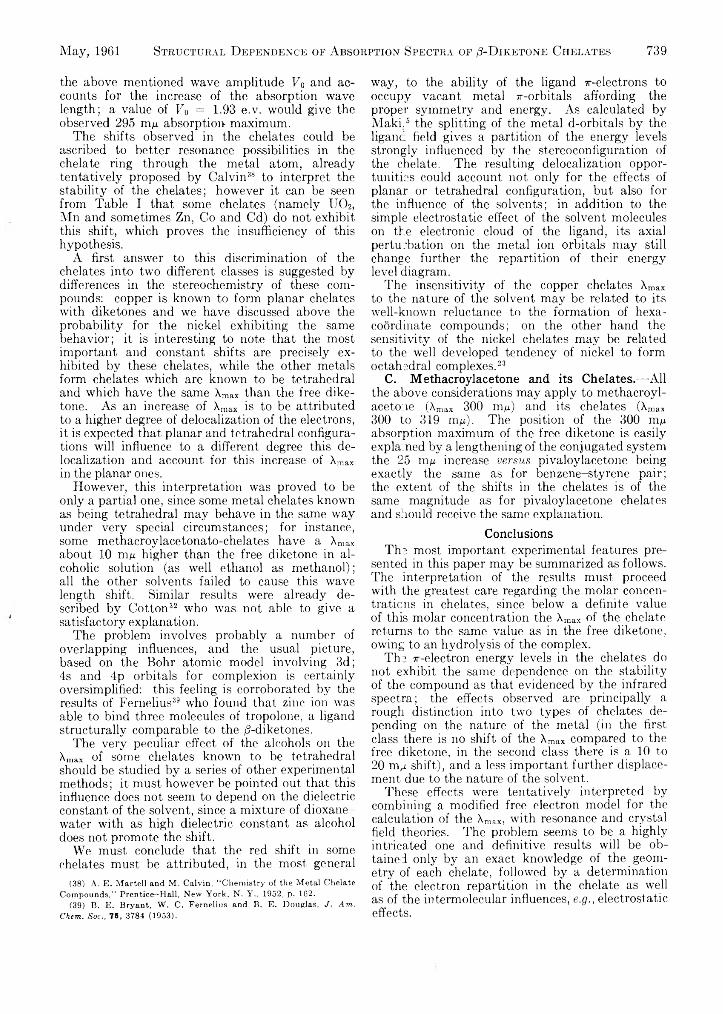
May, 1961 Structural D ependence o f Absorption Spectra o f /3-Diketone Chelates 739
the above mentioned wave amplitude V0 and accounts for the increase of the absorption wave length; a value of Fo = 1.93 e.v. would give the observed 295 m t absorption maximum.
The shifts observed in the chelates could be ascribed to better resonance possibilities in the chelate ring through the metal atom, already tentatively proposed by Calvin38 to interpret the stability of the chelates; however it can be seen from Table I that some chelates (namely UO2, Mn and sometimes Zn, Co and Cd) do not exhibit this shift, which proves the insufficiency of this hypothesis.
A first answer to this discrimination of the chelates into two different classes is suggested by differences in the stereochemistry of these compounds: copper is known to form planar chelates with diketones and we have discussed above the probability for the nickel exhibiting the same behavior; it is interesting to note that the most important and constant shifts are precisely exhibited by these chelates, while the other metals form chelates which are known to be tetrahedral and which have the same Xmax than the free diketone. As an increase of Xmax is to be attributed to a higher degree of delocalization of the electrons, it is expected that planar and tetrahedral configurations will influence to a different degree this de- localization and account for this increase of Xmax in the planar ones.
However, this interpretation was proved to be only a partial one, since some metal chelates known as being tetrahedral may behave in the same way under very special circumstances; for instance, some methacroylacetonato-chelates have a Xmax about 10 m/i higher than the free diketone in alcoholic solution (as well ethanol as methanol); all the other solvents failed to cause this wave length shift. Similar results were already described by Cotton32 who was not able to give a satisfactory explanation.
The problem involves probably a number of overlapping influences, and the usual picture, based on the Bohr atomic model involving 3d; 4s and 4p orbitals for complexion is certainly oversimplified: this feeling is corroborated by the results of Fernelius39 who found that zinc ion was able to bind three molecules of tropolone, a ligand structurally comparable to the /3-diketones.
The very peculiar effect of the alcohols on the Xmax of some chelates known to be tetrahedral should be studied by a series of other experimental methods; it must however be pointed out that this influence does not seem to depend on the dielectric constant of the solvent, since a mixture of dioxane- water with as high dielectric constant as alcohol does not promote the shift.
We must conclude that the red shift in some chelates must be attributed, in the most general
(38) A. E. Martell and M. Calvin, “ Chemistry of the Metal Chelate Compounds,” Prentice-Hall, New York, N. Y., 1952, p. 162.
(39) B. E. Bryant, W. C. Fernelius and B. E. Douglas, J. Am. Chem. Soc., 75, 3784 (1953).
way, to the ability of the ligand 7r-electrons to occupy vacant metal ir-orbitals affording the proper symmetry and energy. As calculated by Maki.6 the splitting of the metal d-orbitals by the liganc field gives a partition of the energy levels strongly influenced by the stereoconfiguration of the chelate. The resulting delocalization opportunities could account not only for the effects of planar or tetrahedral configuration, but also for the influence of the solvents; in addition to the simple electrostatic effect of the solvent molecules on the electronic cloud of the ligand, its axial perturbation on the metal ion orbitals may still change further the repartition of their energy level diagram.
The insensitivity of the copper chelates Xmax to the nature of the solvent may be related to its well-known reluctance to the formation of hexa- coordinate compounds; on the other hand the sensitivity of the nickel chelates may be related to the well developed tendency of nickel to form octahedral complexes.23
C. Methacroylacetone and its Chelates.—Allthe above considerations may apply to methacroylacetone (Xmax 300 mu) and its chelates (Xmax 300 to 319 ni/u). The position of the 300 m,u absorption maximum of the free diketone is easily explained by a lengthening of the conjugated system the 25 mju increase versus pivaloylacetone being exactly the same as for benzene-styrene pair; the extent of the shifts in the chelates is of the same magnitude as for pivaloylacetone chelates and should receive the same explanation.
ConclusionsThe most important experimental features pre
sented in this paper may be summarized as follows. The interpretation of the results must proceed with the greatest care regarding the molar concen- traticns in chelates, since below a definite value of this molar concentration the Xmax of the chelate returns to the same value as in the free diketone, owing to an hydrolysis of the complex.
The 7r-electron energy levels in the chelates do not exhibit the same dependence on the stability of the compound as that evidenced by the infrared spectra; the effects observed are principally a rough distinction into two types of chelates depending on the nature of the metal (in the first class there is no shift of the Xmax compared to the free diketone, in the second class there is a 10 to 20 n v shift), and a less important further displacement due to the nature of the solvent.
These effects were tentatively interpreted by combining a modified free electron model for the calculation of the Xmax, with resonance and crystal field theories. The problem seems to be a highly intrieated one and definitive results will be obtained only by an exact knowledge of the geometry of each chelate, followed by a determination of the electron repartition in the chelate as well as of the intermolecular influences, e.g., electrostatic effects.
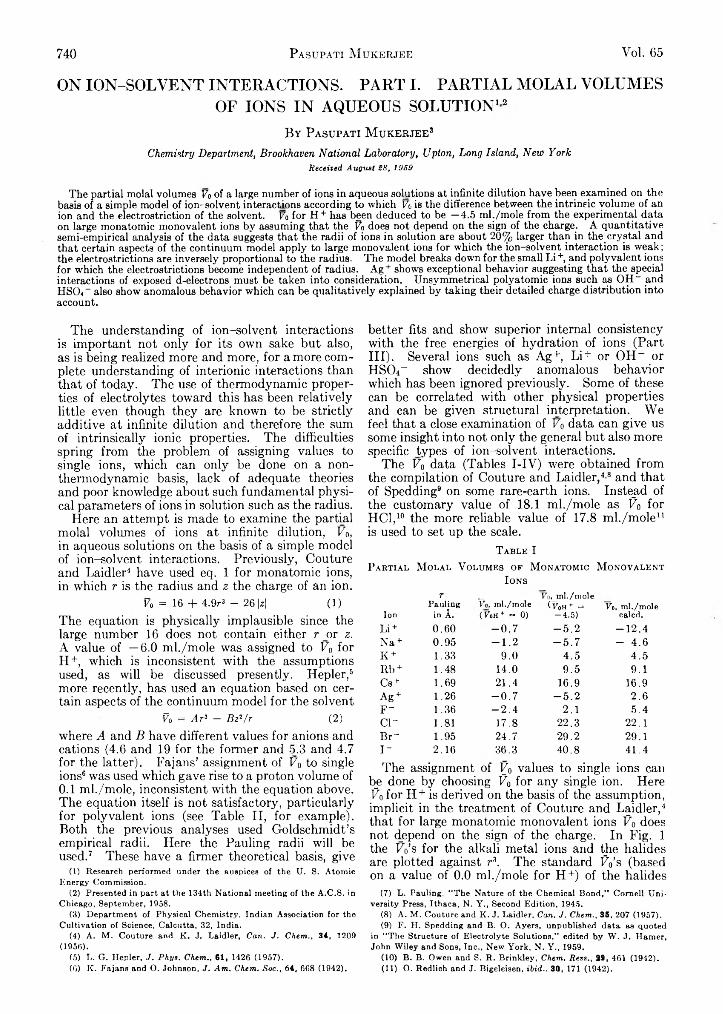
740 Pasupati M ukerjee Vol. 65
O N I O N - S O L Y E N T I N T E R A C T I O N S . P A R T I . P A R T I A L M O L A L V O L U M E S
O F I O N S I N A Q U E O U S S O L U T I O N 12
By Pasupati M ukerjee5Chemistry Department, Brookhaven National Laboratory, Upton, Long Island, New York
Received August 28, 1959
The partial molal volumes Vo of a large number of ions in aqueous solutions at infinite dilution have been examined on the basis of a simple model of ion-solvent interactions according to which Vo is the difference between the intrinsic volume of an ion and the électrostriction of the solvent. Vo for H + has been deduced to be —4.5 ml./mole from the experimental data on large monatomic monovalent ions by assuming that the Vo does not depend on the sign of the charge. A quantitative semi-empirical analysis of the data suggests that the radii of ions in solution are about 20% larger than in the crystal and that certain aspects of the continuum model apply to large monovalent ions for which the ion—solvent interaction is weak; the électrostrictions are inversely proportional to the radius. The model breaks down for the small L i+, and polyvalent ions for which the électrostrictions become independent of radius. A g+ shows exceptional behavior suggesting that the special interactions of exposed d-electrons must be taken into consideration. Unsymmetrieal polyatomic ions such as OH~ and HSO,- also show anomalous behavior which can be qualitatively explained by taking their detailed charge distribution into account.
The understanding of ion-solvent interactions is important not only for its own sake but also, as is being realized more and more, for a more complete understanding of interionic interactions than that of today. The use of thermodynamic properties of electrolytes toward this has been relatively little even though they are known to be strictly additive at infinite dilution and therefore the sum of intrinsically ionic properties. The difficulties spring from the problem of assigning values to single ions, which can only be done on a non- thermodynamic basis, lack of adequate theories and poor knowledge about such fundamental physical parameters of ions in solution such as the radius.
Here an attempt is made to examine the partial molal volumes of ions at infinite dilution, V0, in aqueous solutions on the basis of a simple model of ion-solvent interactions. Previously, Couture and Laidler4 have used eq. 1 for monatomic ions, in which r is the radius and z the charge of an ion.
fo = 16 + 4.9r3 - 26 |z| (1)The equation is physically implausible since the large number 16 does not contain either r or z. A value of —6.0 ml./mole was assigned to V0 for H +, which is inconsistent with the assumptions used, as will be discussed presently. Hepler,6 more recently, has used an equation based on certain aspects of the continuum model for the solvent
Fo = Ar3 - Bz3/r (2)where A and B have different values for anions and cations (4.6 and 19 for the former and 5.3 and 4.7 for the latter). Fajans’ assignment of Vo to single ions6 was used which gave rise to a proton volume of 0.1 ml./mole, inconsistent with the equation above. The equation itself is not satisfactory, particularly for polyvalent ions (see Table II, for example). Both the previous analyses used Goldschmidt’s empirical radii. Here the Pauling radii will be used.7 These have a firmer theoretical basis, give
(1) Research performed under the auspices of the U. S. Atomic Energy Commission.
(2) Presented in part at the 134th National meeting of the A.C.S. in Chicago, September, 1958.
(3) Department of Physical Chemistry, Indian Association for the Cultivation of Science, Calcutta, 32, India.
(4) A. M. Couture and K. J. Laidler, Can. J. Chem., 34, 1209 (1956).
(5) L. G. Hepler, J. Phys. Chem., 6 1 , 1426 (1957).(6) K. Fajans and O. Johnson, J. Am. Chem. Soc., 64, 608 (1942),
better fits and show superior internal consistency with the free energies of hydration of ions (PartIII). Several ions such as Ag+, Li-1- or OH- or HS04~ show decidedly anomalous behavior which has been ignored previously. Some of these can be correlated with other physical properties and can be given structural interpretation. We feel that a close examination of V0 data can give us some insight into not only the general but also more specific types of ion-solvent interactions.
The Fo data (Tables I-IV) were obtained from the compilation of Couture and Laidler,4'8 and that of Spedding9 on some rare-earth ions. Instead of the customary value of 18.1 ml./mole as F 0 for HC1,10 the more reliable value of 17.8 ml./mole11 is used to set up the scale.
T a b l e IP a r t ia l M o l a l V o lu m es o f M o n ato m ic M o n o v a l e n t
I ons
T • _ Fo,_ml./mole
IonPauling
in Â.Vo, ml./mole( VoH + ,= 0)
1 VoH + = -4.5)
Fo, ml./mole calcd.
Li + 0.60 - 0 . 7 - 5 . 2 - 1 2 .4Na + 0.95 - 1 . 2 - 5 . 7 - 4.6K + 1.33 9.0 4.5 4.5Rb + 1.48 14.0 9.5 9.1Cs + 1.69 21.4 16.9 16.9Ag + 1.26 - 0 . 7 - 5 . 2 2.6F - 1.36 - 2 . 4 2.1 5.4c i - 1.81 17.8 22.3 22.1B r - 1.95 24.7 29.2 29.1I - 2.16 36.3 40.8 41.4
The assignment of V0 values to single ions can be done by choosing F 0 for any single ion. Here Fo for H + is derived on the basis of the assumption, implicit in the treatment of Couture and Laidler,4 that for large monatomic monovalent ions F 0 does not depend on the sign of the charge. In Fig. 1 the Fo’s for the alkali metal ions and the halides are plotted against r3. The standard F 0’s (based on a value of 0.0 ml./mole for H+) of the halides
(7) L. Pauling, “ The Nature of the Chemical Bond,” Cornell University Press, Ithaca, N. Y., Second Edition, 1945.
(8) A. M. Couture and K. J. Laidler, Can. J. Chem., 35, 207 (1957).(9) F. H. Spedding and B. O. Ayers, unpublished data as quoted
in “ The Structure of Electrolyte Solutions,” edited by W. J. Hamer, John Wiley and Sons, Inc., New York, N. Y., 1959.
(10) B. B. Owen and S. R. Brinkley, Chem. Revs., 29, 461 (1942).(11) O. Redlich and J. Bigeleisen, ibid.. 30, 171 (1942).
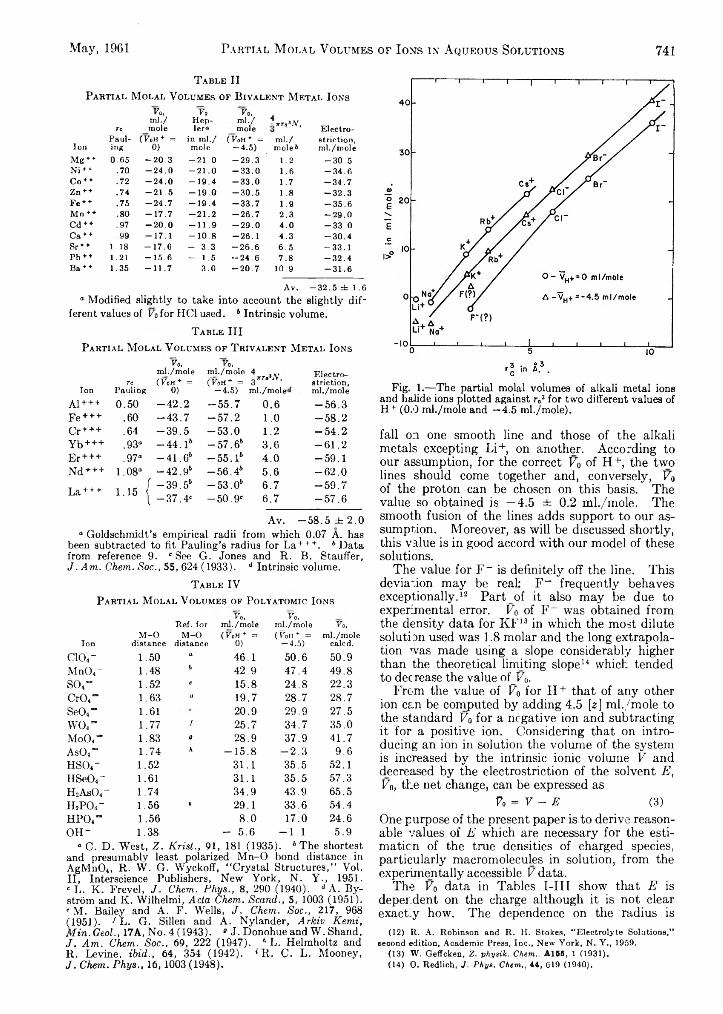
May, 1961 Partial M olal Volumes of Ions in Aqueous Solutions 741
T a b l e I IP a r t ia l M o la l V o lu m es o f B iv a l e n t M e t a l I ons
Vo, Vo Vo,ml./ Hep- m l./ 4-7rra3Y,rc mole 1er« mole Electro-
IonPaul- (VoH+ = in ml./ C VoH + = m l./ striction,ing 0) mole -4 .5 ) mole b ml./mole
Mg + + 0.65 -2 0 .3 -2 1 .0 -2 9 .3 1.2 -3 0 .5Ni + + .70 -2 4 .0 -2 1 .0 -3 3 .0 1.6 -3 4 .6Co + + .72 -2 4 .0 -1 9 .4 -3 3 .0 1.7 -3 4 .7Zn + + .74 -2 1 5 - 1 9 0 -3 0 .5 1.8 -3 2 .3Fe + + .75 -2 4 .7 -1 9 .4 -3 3 .7 1.9 -3 5 .6M n+ + .80 -1 7 .7 -2 1 .2 -2 6 .7 2.3 -2 9 .0Cd + + .97 -2 0 .0 -1 1 .9 -2 9 .0 4.0 - 3 3 0Ca + + .99 -1 7 .1 -1 0 .8 -2 6 .1 4.3 -3 0 .4Sr + + 1.18 -1 7 .6 - 3.3 -2 6 .6 6.5 -3 3 .1P b+ + 1.21 -1 5 .6 - 1.5 -2 4 .6 7.8 -3 2 .4Ba + + 1.35 -1 1 .7 3.0 -2 0 .7 10.9 -3 1 .6
Av. - 3 2 .5 d= 1.6“ Modified slightly to take into account the slightly dif~
ferent values of Vo for HC1 used. ‘ Intrinsic volume.T a b l e III
P a r t ia l M o la l V olu m es o f T r iv a l e n t M e t a l I ons
Vo, Vo,
Ionrc
Pauling
ml./mole(VoH + =
0)
ml./mole (VoH + =
-4.5)xr.LV,
ml./moleElectrostriction,ml./mole
A l+++ 0.50 -4 2 .2 -5 5 .7 0.6 -5 6 .3Fe+++ .60 -4 3 .7 -5 7 .2 1.0 -5 8 .2Cr+++ .64 -3 9 .5 -5 3 .0 1.2 -5 4 .2Y b +++ .93' -4 4 . P - 5 7 . 6‘ 3.6 -6 1 .2E r+++ .97“ - 4 1 . 6‘ - 5 5 . P 4.0 -5 9 .1N d+++ 1.08“ - 4 2 . 9‘ - 5 6 . 4‘ 5.6 -6 2 .0
L a+++ 1.15 j - 3 9 . 5‘ - 5 3 . 0‘ 6.7 -5 9 .7-3 7 .4 ' -5 0 .9 ' 6.7 -5 7 .6
Av. -5 8 .5 ± 2 .0° Goldschmidt’s empirical radii from which 0.07 A. has
been subtracted to fit Pauling’s radius for La + ++. ‘ Datafrom reference 9. 'S ee G. Jones and R. B. Stauffer, J .Am . Chem. Soc., 55, 624 (1933). d Intrinsic volume.
T a b l e IVP a r t ia l M o l a l V o lu m es of P o ly a to m ic I ons
Ref. forV»,
ml./moleVo,
ml./mole Vo,
IonM-0
distanceM-0
distance(VoH + =
0)(VoH + =
- 4 . 5 )ml./mole
caled.C104- 1.50 0 46.1 50.6 50.9M 11O4- 1.48 & 42.9 47.4 49.8SO4" 1.52 c 15.8 24.8 22.3Cr04” 1.63 a 19.7 28.7 28.7Se04“ 1.61 20.9 29.9 27.5WO4“ 1.77 f 25.7 34.7 35.0M0O4” 1.83 a 28.9 37.9 41.7As0 4” 1.74 h -1 5 .8 - 2 .3 9.6HSO4- 1.52 31.1 35.5 52.1HSeCb- 1.61 31.1 35.5 57.3H2ASO4 “ 1.74 34.9 43.9 65.5h 2p o 4- 1.56 % 29.1 33.6 54.4HPO4” 1.56 8.0 17.0 24.6O H " 1.38 - 5.6 - 1 . 1 5.9
» C. D . West, Z. Krist., 91, 181 (1935). ‘ The shortest and presumably least polarized M n -0 bond distance in AgMnO(, R . W. G. Wyckoff, “ Crystal Structures,” Vol. II, Interscience Publishers, New York, N. Y ., 1951. ' L. K . Frevel, J. Chem. Phys., 8, 290 (1940). d A. By- ström and K. Wilhelmi, Acta Chem. Scand., 5, 1003 (1951). ' M. Bailey and A. F. Wells, J. Chem. Soc., 217, 968 (1951). 1 L. G. Sillen and A. Nylander, Arkiv Kemi, Min.Geol., 17A, No. 4 (1943). 1 J. Donohue and W . Shand, J. Am. Chem. Soc., 69, 222 (1947). h L. Helmholtz and R . Levine, ibid., 64, 354 (1942). *R . C. L. Mooney,J. Chem. Phys., 16,1003 (1948).
Fig. 1.— The partial molal volumes of alkali metal ions and halide ions plotted against rt3 for two different values of H + (0.0 ml./mole and —4.5 ml./mole).
fall on one smooth line and those of the alkali metals excepting Li+, on another. According to our assumption, for the correct V0 of H+, the two lines should come together and, conversely, Va of the proton can be chosen on this basis. The value so obtained is —4.5 ± 0.2 ml./mole. The smooth fusion of the lines adds support to our assumption. Moreover, as will be discussed shortly, this value is in good accord with our model of these solutions.
The value for F “ is definitely off the line. This deviation may be real: F~ frequently behavesexceptionally.12 Part of it also may be due to experimental error. Vn of F _ was obtained from the density data for K F13 in which the most dilute solution used was 1.8 molar and the long extrapolation was made using a slope considerably higher than the theoretical limiting slope14 which tended to decrease the value of_F0.
From the value of V0 for H+ that of any other ion can be computed by adding 4.5 [2] ml./mole to the standard V0 for a negative ion and subtracting it for a positive ion. Considering that on introducing an ion in solution the volume of the system is increased by the intrinsic ionic volume V and decreased by the électrostriction of the solvent E, Vo, the net change, can be expressed as
Ÿo = V - E (3)One purpose of the present paper is to derive reasonable values of E which are necessary for the estimation of the true densities of charged species, particularly macromolecules in solution, from the experimentally accessible V data.
The Vo data in Tables I-III show that E is dependent on the charge although it is not clear exactly how. The dependence on the radius is
(12) R. A. Robinson and R. H. Stokes, “ Electrolyte Solutions,” second edition, Academic Press, Inc., New York, N. Y., 1959.
(13) W . Geffcken, Z. physik. Chem., A155, 1 (1931).(14) O. Redlich, J . Phys. Chem., 44, 619 (1940),
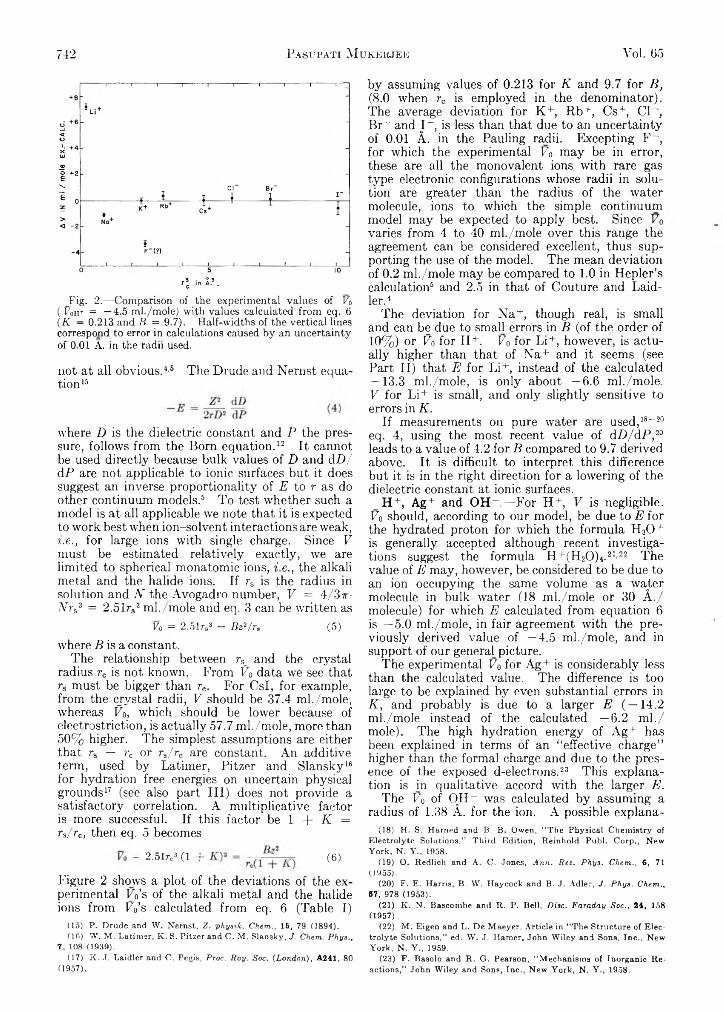
742 Pasupati Mukekjee Vol. 65
_Fig. 2.—-Comparison of the experimental values of Vo ( Foh+ = — 4.5 ml./mole) with values calculated from eq. 6 (K — 0.213 and B = 9.7). Half-widths of the vertical lines correspond to error in calculations caused by an uncertainty of 0.01 A. in the radii used.
n ot a t all ob v io u s .4-6 T h e D ru de and N ernst equat io n 15
where D is the dielectric constant and P the pressure, follows from the Born equation.12 It cannot be used directly because bulk values of D and (ID/ dP are not applicable to ionic surfaces but it does suggest an inverse proportionality of E to r as do other continuum models.5 To test whether such a model is at all applicable we note that it is expected to work best when ion-solvent interactions are weak, i.e., for large ions with single charge. Since V must be estimated relatively exactly, we are limited to spherical monatomic ions, i.e., the alkali metal and the halide ions. If rs is the radius in solution and N the Avogadro number, V = 4 /3 ir- Nrs3 = 2.51ra3 ml./mole and eq. 3 can be written as
Vo = 2.51rs3 - Bz*/rs (5)where B is a constant.
The relationship between rs__ and the crystal radius re is not known. From V0 data we see that rs must be bigger than rc. For Csl, for example, from the crystal radii, V should be 37.4 ml./mole, whereas Vo, which should be lower because of électrostriction, is actually 57.7 ml./mole, more than 50% higher. The simplest assumptions are either that ra — rc or rs/r 0 are constant. An additive term, used by Latimer, Pitzer and Slansky16 for hydration free energies on uncertain physical grounds17 (see also part III) does not provide a satisfactory correlation. A multiplicative factor is more successful. If this factor be 1 + K = rs/rc, then eq. 5 becomes
V.- 2.51r,Ml + K y . ¿ ~ K )<•)
Figure 2 shows a plot of the deviations of the experimental I/n’s of the alkali metal and the halide ions from Fo’s calculated from eq. 6 (Table I)
(15) P. Drude and W. Nernst, Z. physik. Chem., 15, 79 (1894).(1H) W. M . Latimer, K. S. Pitzer and C. M. Slansky, J. Chem. Phys.,
7, 108 (1939).(17) K. J. Laidler and C. Pegis, Proc. Roy. Soc. {London), A241, 80
(1957).
by assuming values of 0.213 for K and 9.7 for B, (8.0 when rc is employed in the denominator). The average deviation for K +, R b+, Cs+, Cl- , Br ~ and I - , is less than that due to an uncertainty of 0.01 A. in the Pauling radii. Excepting F - , for which the experimental Vo may be in error, these are all the monovalent ions with rare gas type electronic configurations whose radii in solution are greater than the radius of the water molecule, ions to which the simple continuum model may be expected to apply best. Since V0 varies from 4 to 40 ml./mole over this range the agreement can be considered excellent, thus supporting the use of the model. The mean deviation of 0.2 ml./mole may be compared to 1.0 in Hepler’s calculation5 and 2.5 in that of Couture and Laidler.4
The deviation for Na+, though real, is small and can be due to small errors in B (of the order of 10%) or Vo for H+. Vo for Li+, however, is actually higher than that of Na+ and it seems (see Part II) that E for Li+, instead of the calculated — 13.3 ml./mole, is only about —6.6 ml./mole. V for Li+ is small, and only slightly sensitive to errors in K.
If measurements on pure water are used,18-20 eq. 4, using the most recent value of dD/dP,20 leads to a value of 4.2 for B compared to 9.7 derived above. It is difficult to interpret this difference but it is in the right direction for a lowering of the dielectric constant at ionic surfaces.
H +, Ag+ and OH- .—For H+, V is negligible. V0 should, according to our model, be due to E for the hydrated proton for which the formula H30 + is generally accepted although recent investigations suggest the formula H+(H20)4.21'22 The value of E may, however, be considered to be due to an ion occupying the same volume as a water molecule in bulk water (18 ml./mole or 30 A ./ molecule) for which E calculated from equation 6 is —5.0 ml./mole, in fair agreement with the previously derived value of —4.5 ml./mole, and in support of our general picture.
The experimental Vo for Ag+ is considerably less than the calculated value. The difference is too large to be explained by even substantial errors in K, and probably is due to a larger E ( — 14.2 ml./mole instead of the calculated —6.2 m l./ mole). The high hydration energy of Ag+ has been explained in terms of an “ effective charge” higher than the formal charge and due to the presence of the exposed d-electrons.23 This explanation is in qualitative accord with the larger E.
The Vo of OH- was calculated by assuming a radius of 1.38 A. for the ion. A possible explana-
(18) H. S. Harned and B. B. Owen, “ The Physical Chemistry of Electrolyte Solutions,” Third Edition, Reinhold Publ. Corp., New York, N. Y., 1958.
(19) O. Redlich and A. C. Jones, Ann. Rev. Phys. Chem., 6, 71(1955).
(20) F. E. Harris, B. W. Haycock and B. J. Adler, J. Phys. Chem., 57, 978 (1953).
(21) K. N. Bascombe and R. P. Bell, Disc. Faraday Soc., 2 4 , 158 (1957).
(22) M. Eigen and L. De Maeyer, Article in “ The Structure of Electrolyte Solutions,” ed. W. J. Hamer, John Wiley and Sons, Inc., New York, N. Y., 1959.
(23) F. Basolo and R. G. Pearson, “ Mechanisms of Inorganic Reactions,” John Wiley and Sons, Inc., New York, N. Y., 1958.
May, 1961 Partial Molal Volumes of Ions in Aqueous Solution 743
tion of the low value of the experimental Fo (Table IV), which applies to many oxyanions (see later), is that here the “ effective charge” is higher than the formal one because of the presence of a hydrogen atom engaged in hydrogen bonding, and containing a small positive charge on itself.
The Significance of K .—The increase of 21% in the radius corresponds to an increase of 78% inV. In view of the smallness of E for the larger ions and their independent confirmation (see partII) this increase in the radius is a very real effect and of great importance wherever ionic sizes in solutions are involved. Qualitatively, the change in the ionic radius from the solid to the solution is in itself not surprising. The electron distribution function for any ion must extend indefinitely and no unique characteristic size can be assigned to an ion without taking into account its environment as well. The crystal radius depends upon the equilibrium between the repulsive and the attractive forces between ions. The former are quantum mechanical in origin and should be substantially the same in the solid and the solution.24 The attractive forces, however, are expected to be weaker in a solution as they are between ions and dipoles. As a consequence, the ions may be expected to be larger in solution. A quantitative formulation of this approach is being attempted.
Benson25 recently has approached this problem from a different point of view in which the size of the ion-cavity in solution is assumed to depend on the equilibrium between the electrical pressure of the Born type and the internal pressure of the cavity itself. He has calculated a value of K of about 0.25, varying only slightly with radius and in approximate agreement with our value.
Finally, an unknown but probably small part of the effective increase in volume undoubtedly is due to the existence of some dead space around each ion which cannot be filled by parts of the water molecules, and is not included in the calculations of V.
Polyvalent Monatomic Ions.— The continuum model breaks down for the small Li+. As might be expected from this eq. 6 does not hold at all for the polyvalent ions, and indeed the E ’s seem to be independent of the radii. Calculating the F ’s by using the formula of eq. 6 E for various ions has been estimated from F0 data and shown in Tables II and III. As the radii change by more than a factor of 2, E remains the same within a small uncertainty in the series of bi- and trivalent ions whose F0’s can, therefore, be represented by eq. 7 and 8, respectively.
7„ = 2.51r„3 (1 + K Y - 32.5 (7)Fo = 2.51t03 (1 + K )s - 58.5 (8)
The calculated E’s are only slightly sensitive to errors in ra because the F ’s are small. However, the use of K derived for monatomic ions gives a more constant value of E in any series and can be supported on this ground and the further ground that about the same value seems to hold for polyatomic ions (see later). This constancy is inde-
(24) R. W. Gurney, “ Ionic Processes in Solution,“ McGraw-Hill Book Co., Inc., New York, N. Y., 1953.
(25) S. W. Benson, unpublished calculations.
pendent of any error in the choice of F0 for II+ and is in accord with Laidler’s analysis although the present values of the électrostrictions are much less. The values are still high and show the strength of ion-solvent interactions, remembering that the molar volume of water is 18 ml. The constant value of E compared to smoothly varying hydration energies in the same series,23 points out the difficulty of correlating various thermodynamic quantities arising from ion-solvent interactions. The effect of exposed d-electrons is relatively much less for bi-valent ions than monovalent ones in hydration energies and is expected to be so for électrostrictions also. There is a slight over-all trend toward higher E ’s for such ions in Tables II and III whose significance is hard to judge because of relatively large experimental errors.
Polyatomic Ions.— The uncertain geometry and the paucity of reliable values of internuclear distances make calculations for polyatomic ions difficult. However, the model and the general ideas advanced for monatomic ions will be shown in this section to be not incompatible with the behavior of many polyatomic ions and no new approach is necessary, such as those used by Couture and Laidler.8 To describe the behavior of oxyanions they use an equation considerably different from the one applied to the monatomic ions which again contains a large number unconnected to the size or the charge of the ions and involves the physically untenable assumption that non-charge bearing ligands such as -OH should occupy no volume in solution.
The F ’s for polyatomic ions are large and must, therefore, be estimated well before we can apply our basic eq. 3. For this the symmetrical tetrahedral M 04~~z type ions seem to be the most tractable. If r be the sum of the M -0 bond distance and the vander Waals radius for oxygen, 1.40 Â., then the volume of the circumscribing sphere is 2.51r3 ml./mole. If the M -0 distance does not vary widely, the volume of the cavity produced by these ions can be assumed on geometrical grounds to be a constant fraction K ' of 2.51r3. Assuming further that the E ’s are the same as for monatomic ions, — 8.0/r for monovalent ones and —32.5 and —58.5 ml./mole for bi- and trivalent ions, respectively, and using a mean value of 0.88 for K ' , the F0 for eight oxyanions have been calculated and compared to experimental values in Table IV. Excepting As()4 % where experimental F0 is lower, the other seven ions show excellent agreement, the mean deviation being 1.7 m l./ mole which is of the order of the experimental error in Fo and corresponds to an average uncertainty of less than 0.03 Â. in the radius for the calculated figures.
To examine whether the value of K ' deduced above is consistent with the apparent increase in volume of monatomic ions in going from the crystal to the solution its value for “ dry” ions is necessary. This has been estimated by making A lb type molecules using the Fisher-Hirschfelder molecular models, enclosing them with a stretched skin of thin rubber to define the shape of the cavity and determining the volume of this cavity by dis-
744 Pasupati Mukerjee Yol. 65
placement of water. The volume was a fraction / of the volume of the circumscribing sphere whose value varied from 0.48 to 0.41 as the ratio of the radius of this sphere to that of A changed from 1.60 to 2.37. This ratio lies between the narrow limits1.8 and 2.0 for all the ions considered in Table IV. In this range the interpolated value of / is 0.45 which shows little dependence on the relative sizes of A and B, thus supporting our assumption of its constancy. The value is moreover considerably less than the value of K ' , consistent with our picture of monatomic ions and indeed the value of / derived from K ' assuming the same increase in volume as in the case of monatomic ions is 0.49, which is comparable to the above value estimated for molecular models. The polyatomic ions considered here thus seem to increase in volume from the solid state to the solution in about the same manner as monatomic ones.
For several unsymmetrical ions such as H M O i “ *, F o’ s have been calculated following the procedure for symmetrical ones. The experimental data (Table IV) indicate considerably larger
E ’s which are, however, lower than those expected for the ions with one more charge: the ions seem to behave as if their effective charge, as far as électrostriction is concerned, is a fraction of a unit higher than their formal charge. The situation is similar to that of OH- and a similar explanation applies. The charge distribution in an ion such as HSO4- may be pictured as
- ( ! + « )
in line with the hydrogen bonding properties of the hydrogen atom. To the solvent, therefore, such ions appear to have a charge of 25 in excess of the formal charge, 8 being the fractional charge on the hydrogen atom.
Acknowledgment.— I am grateful to Mr. R. P. Bell, F.R.S., for helpful discussions and ProfessorS. W. Benson for making some unpublished calculations available.
O N I O N - S O L V E N T I N T E R A C T I O N S . P A R T I I . I N T E R N A L P R E S S U R E
A N D E L E C T R O S T R I C T I O N O F A Q U E O U S S O L U T I O N S O F E L E C T R O L Y T E S 1
By Pasupati M ukerjee2Chemistry Department, Brookhaven National Laboratory, Upton, Long Island, New York
Received August $8, 1959
The électrostrictions in aqueous solutions at infinite dilution of a large number of electrolytes of various complexities and charge types have been estimated from results of high pressure compression studies by Gibson. These have been compared with the results obtained from the analysis of the partial molal volume data of electrolytes in the preceding paper. The agreement is in general fair and tends to improve qualitatively when the directions of the errors in the estimates from compression studies are examined in detail. The assumptions and conclusions in the analysis of partial molal volumes are thus further substantiated.
In the preceding paper3 a semi-empirical analysis has been made of the partial molal volumes of ions in aqueous solution at infinite dilution, Vo, on the basis of a model which assumes that Vo is the difference between the intrinsic volume of the ion in solution and the électrostriction, E, of the solvent. Both contributions were estimated for various ions. The analyses of the V0 data were made on the basis of several assumptions and although fairly satisfactory systematization of the data was possible, it is desirable to obtain some independent evidence for the reliability of the analysis and the various assumptions inherent in it. In this paper an entirely independent method is presented for estimating E ’s in aqueous solutions of ions. For comparison with the previous method the present method has, however, some limitations which will be examined.
In 1888 Tait discovered a simple P -V relation for water4 which was later found by Gibson6-7 to
(1) Research performed under the auspices of the U. S. Atomic Energy Commission.
(2) Department of Physical Chemistry, Indian Association for the Cultivation of Science, Calcutta-32, India.
(3) P. Mukerjee, Part I of this series, J, Phys, Çhem.t 65, 740(1961).
apply accurately to a large number of pure liquids. The Tait equation can be written as
—(FP — Fo) = .C In (1)
where Vp and Vo are the experimental specific volumes of a liquid at pressures P and zero, respectively, and C and B are positive constants. The significance of these constants has been discussed by Gibson and Kincaid.7 B is taken as a measure of the difference between the expansive pressure due to the thermal energy of the molecules and the cohesive pressure arising from the attractive forces between the molecules which are independent of temperature. B, therefore, measures the net cohesive pressure of the liquid.
Gibson has successfully extended the Tait equation to the case of solutions after introducing an additional parameter. This parameter owes its origin to the hypothesis of Tammann8 that the
(4) P. G. Tait, “ Report on Some of the Physical Properties of Fresh Water and of Sea-water,” from the “ Physics and Chemistry of the Voyage of H. M. S. Challenger,” Vol. II, Part IV, S. P. L X I (1888): see also ref. 11.
(5) R, E. Gibson, J. Am. Chem. Soc., 56, 4 (1934).(6) R. E. Gibson, ibid., 57, 284 (1935).(7) R. E. Gibson and J. F. Kincaid, ibid., 60, 511 (1938).
May, 1961 Electrostriction of Aqueous Solutions of Electrolytes 745
solvent in a solution behaves as though it were under an external pressure P e in addition to the atmospheric. Using this hypothesis, Gibson derived the relationship9
F - V = - 1000CB + Pe + P
d (B + Pe) dm (2)
where m is the molal concentration, V is the partial molal volume and V is taken to be the hypothetical molal volume of the pure solute in the liquid state at the temperature and pressure of the experiment. The volume change V — V is, therefore, the change in the volume on mixing this hypothetical pure liquid solute and the solvent.
Since electrolytic solutes at room temperature are solids usually far from their melting points, the quantity V is experimentally inaccessible. It has been suggested that this is the true volume of the solute in solution,9 and can be provisionally identified with the_intrinsic volume of the sojute in our treatment of F0 data.3 The difference V — V, therefore, according to our model, is E. To obtain its value at infinite dilution we must take the limiting case of eq. 2. The term 1000C/B + Pe + P represents the compressibility of the solvent at an external pressure P e + P. At infinite dilution of the solute this can be replaced by the compressibility of pure water, /3, at 1 atmosphere, 45.7 X 10~6 bar-1 at 25°. Equation 2 then reduces to
Fo - V = 0 lim d(B + f e) (3)m — ►O Q771
However, this V0 — V can be strictly called the value of E at infinite dilution only if it arises entirely from changes in the effective pressure Pe and not inB. From the compression data presented by Gibson, assuming B to remain constant Pe can be evaluated easily at various concentrations of electrolyte.6-6 The curves of Pe against m are approximately linear for most electrolytes, especially at low concentrations. The extrapolation to infinite dilution to obtain the limiting slope can be made by graphical means.
In Table I, we have listed the électrostrictions estimated for various electrolytes from the analysis of Vo data,3 using the difference between V0 and the calculated V for monovalent ions and the values — 32.5 and —58.5 ml./mole for bi- and trivalent ions, respectively, and those obtained from compression measurements. The data have been grouped according to the charge type of the electrolytes, namely, 1:1, 2:1 or 1:2 and higher. Electrolytes for which hydrolysis is expected to be extensive have been ignored. For C103_ and N 03~ the values of E in column 5 have been calculated by assuming that their behavior is the same as that of monatomic ions of the same intrinsic volumes. The effect of any asymmetry in the charge distribution of these ions is expected to be small. The estimates of dPe/dm are in good agreement with those made by McDevitt and Long10 for some electrolytes in another connection. The intrinsic
(8) G. Tammann, “ Über die Beziehungen Zwischen den Inneren Kräften und Eigenschaften der Lösungen,” Voss, Leipzig, 1907, p. 36, see also ref. 11.
(9) R. E. Gibson, Am. J. Sei., [5] 35Ä, 49 (1938).(10) W. F. McDevitt and F. A. Long, J. Am. Chem. Soc., 74, 1773
(1952).
volumes estimated for these electrolytes from the Vo data in the previous paper are also shown for comparison.
T a b l e IC o m pa r iso n s o f E l e c tr o st r ic t io n s E stim a t e d from P a r t ia l M o la l V olu m es a n d E f f e c t iv e P r e ssu r e
M e a su r e m e n t s
Electro Charged Pe/dm,bars
Electrostriction, ml./mole From
From From Hepler’s
Intrinsicvol
umes,ml./
lyte type I./mole dPe/dm Vo data eq. moleLiCl 1:1 200 9.2 10.6 16.5 27.5NaCl 270 12.4 13.9 15.3 30.4KC1 200 10.1 10.4 14.0 37.1NaBr 225 10.3 12.5 14.5 37.1KBr 165 7.6 10.1 13.2 43.8CsBr 110 5.1 8.4 12.6 54.8Lil 70 3.2 9.9 14.6 46.1NaOH 540 24.8 22.3 18.3 15.6KCIO; 110 5.1 9 .8 51.1k n o 3 150 6.9 10.1 44.0Li2S04 1:2 800 37 46 60Na2SC4 850 39 51 63Cs2S04 700 32 42 98Na2C 03 650 46 51 47BaCl2 2:1 990 30 41 64MgSO, 2:2 990 46 65 56CeCls 3:1 980 45 72 86Ce2(S 04)3 3:2 3420 157 215 176
DiscussionThe uncertainties in the estimates are hard to
compute and vary with the charge type of the electrolytes. In general the precision of the values in both sets is not expected to be better than 5-10%. However, there are several sources of systematic errors in the compression method. The first arises from the assumed constancy of B. The value of B is high, about 3000 bars at 25°u and since it is a measure of the net cohesive pressure of water arising from the interaction of water molecules, the presence of solutes is expected to lower B merely from a dilution effect because a dissolved solute will break some water-water bonds.12 As a result the estimated Pe and therefore E will be lower than the true values. This effect should be larger for larger ions.
The second important source of error is due to the high concentrations used for the compression measurements. The most dilute solutions used were in the range 0.3-0.6 M. It is well known that V of an electrolyte increases with concentration11 because of a decrease in E caused by interionic interactions. Measurements at high concentrations, therefore, give lower values of E and the long extrapolation to infinite dilution may not account for it entirely, thus giving lower final values. This error will be higher for electrolytes of higher charge type. The variation of V of an electrolyte with concentration C usually can be expressed as
F = Fo + A V C (4)The experimental value of the slope A at moderate
(11) H. S. Harned and B. B. Owen, “ The Physical Chemistry of Electrolytic Solutions,” Third Edition, Reinhold Pubi. Corp., New York, N. Y., 1958.
(12) R. E, Gibson, Sci. Monthly, 46, 103 (1938).
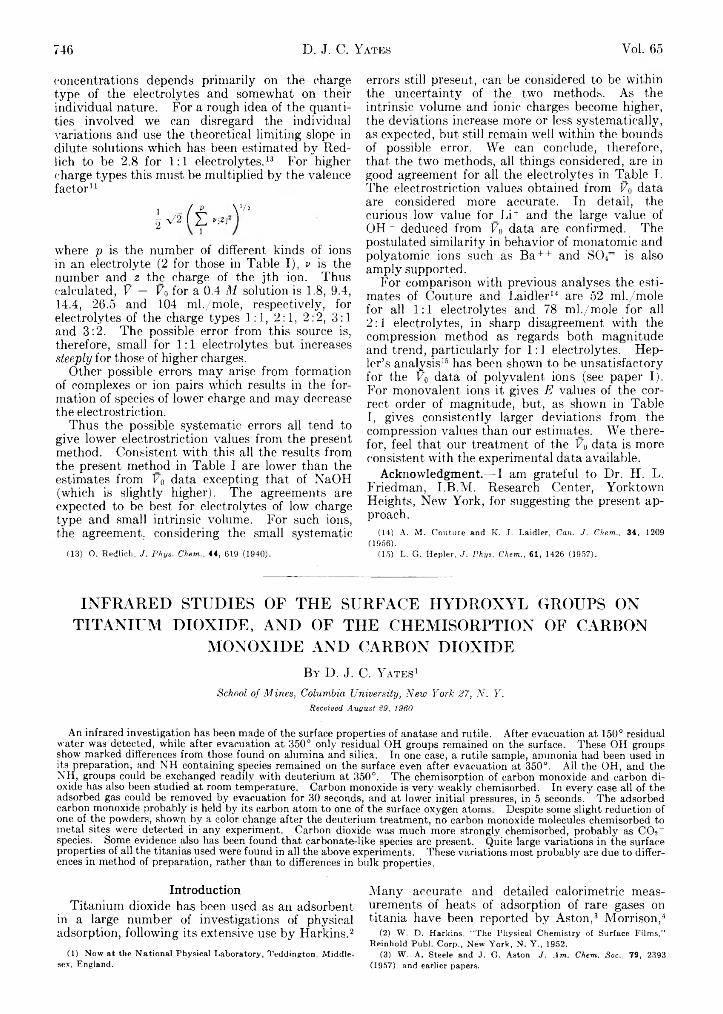
746 D. J. C. Yates Vol. 65
concentrations depends primarily on the charge type of the electrolytes and somewhat on their individual nature. For a rough idea of the quantities involved we can disregard the individual variations and use the theoretical limiting slope in dilute solutions which has been estimated by Red- lich to be 2.8 for 1:1 electrolytes.13 For higher charge types this must be multiplied by the valence factor11
1 _ / p \V*g V 2 i Ç » id
where p is the number of different kinds of ions in an electrolyte (2 for those in Table I), v is the number and_ z the charge of the jth ion. Thus calculated, F — F0 for a 0.4 M solution is 1.8, 9.4,14.4, 26.5 and 104 ml./mole, respectively, for electrolytes of the charge types 1:1, 2:1, 2:2, 3:1 and 3:2. The possible error from this source is, therefore, small for 1:1 electrolytes but increases steeply for those of higher charges.
Other possible errors may arise from formation of complexes or ion pairs which results in the formation of species of lower charge and may decrease the électrostriction.
Thus the possible systematic errors all tend to give lower électrostriction values from the present method. Consistent with this all the results from the present method in Table I are lower than the estimates from F0 data excepting that of NaOH (which is slightly higher). The agreements are expected to be best for electrolytes of low charge type and small intrinsic volume. For such ions, the agreement, considering the small systematic
(13) O. Redïich, J. Phys. Chem., 44, 619 (1940).
errors still present, can be considered to be within the uncertainty of the two methods. As the intrinsic volume and ionic charges become higher, the deviations increase more or less systematically, as expected, but still remain well within the bounds of possible error. We can conclude, therefore, that, the two methods, all things considered, are in good agreement for all the electrolytes in Table I. The électrostriction values obtained from V0 data are considered more accurate. In detail, the curious low value for Li+ and the large value of OH~ deduced from F0 data are confirmed. The postulated similarity in behavior of monatomic and polyatomic ions such as Ba++ and SOf is also amply supported.
For comparison with previous analyses the estimates of Couture and Laidler14 are 52 ml./mole for all 1:1 electrolytes and 78 ml./mole for all 2:1 electrolytes, in sharp disagreement with the compression method as regards both magnitude and trend, particularly for 1:1 electrolytes. Hep- ler’s analysis16 has been shown to be unsatisfactory for the F0 data of polyvalent ions (see paper I). For monovalent ions it gives E values of the correct order of magnitude, but, as shown in Table I, gives consistently larger deviations from the compression values than our estimates. We therefor, feel that our treatment of the F0 data is more consistent with the experimental data available.
Acknowledgment.— I am grateful to Dr. H. L. Friedman, I.B.M. Research Center, Yorktown Heights, New York, for suggesting the present approach.
(14) A. M. Couture and K. J. Laidler, Can. J. Chem., 34, 1209(1956).
(15) L. G. Hepler, J. Phys. Chem., 61, 1426 (1957).
I N F R A R E D S T U D I E S O F T H E S U R F A C E H Y D R O X Y L G R O U P S O N
T I T A N I U M D I O X I D E , A N D O F T H E C H E M I S O R P T I O N O F C A R B O N
M O N O X I D E A N D C A R B O N D I O X I D E
By D. J. C. Y ates1School of Mines, Columbia University, New York %7, N. Y.
Received August 29, 1960
An infrared investigation has been made of the surface properties of anatase and rutile. After evacuation at 150° residual water was detected, while after evacuation at 350° only residual OH groups remained on the surface. These OH groups show marked differences from those found on alumina and silica. In one case, a rutile sample, ammonia had been used in its preparation, and NH containing species remained on the surface even after evacuation at 350°. All the OH, and the NH, groups could be exchanged readily with deuterium at 350°. The chemisorption of carbon monoxide and carbon dioxide has also been studied at room temperature. Carbon monoxide is very weakly chemisorbed. In every case all of the adsorbed gas could be removed by evacuation for 30 seconds, and at lower initial pressures, in 5 seconds. The adsorbed carbon monoxide probably is held by its carbon atom to one of the surface oxygen atoms. Despite some slight reduction of one of the powders, shown by a color change after the deuterium treatment, no carbon monoxide molecules chemisorbed to metal sites were detected in any experiment. Carbon dioxide was much more strongly chemisorbed, probably as COf species. Some evidence also has been found that carbonate-like species are present. Quite large variations in the surface properties of all the titanias used were found in all the above experiments. These variations most probably are due to differences in method of preparation, rather than to differences in bulk properties.
IntroductionTitanium dioxide has been used as an adsorbent
in a large number of investigations of physical adsorption, following its extensive use by Harkins.2
(1) Now at the National Physical Laboratory, Teddington, Middlesex, England.
Many accurate and detailed calorimetric measurements of heats of adsorption of rare gases on titania have been reported by Aston,3 Morrison,4
(2) W. D. Harkins, “ The Physical Chemistry of Surface Films,” Reinhold Publ. Corp., New York, N. Y., 1952.
(3) W. A. Steele and J. G. Aston, J. Am. Chem. Soc., 79, 2393(1957), and earlier papers.
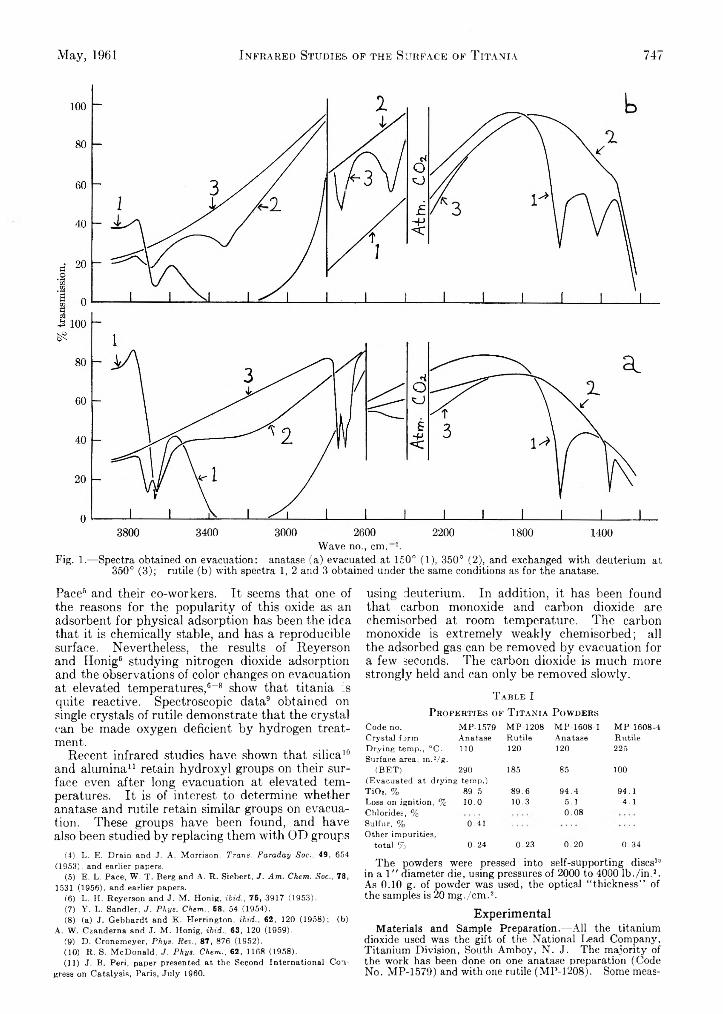
May, 1961 Infrared Studies of the Surface of T itania 747
Wave no., cm. '.Fig. 1.— Spectra obtained on evacuation: anatase (a) evacuated at 150° (1), 350° (2), and exchanged with deuterium at
350° (3); rutile (b) with spectra 1, 2 and 3 obtained under the same conditions as for the anatase.
Pace6 and their co-workers. It seems that one of the reasons for the popularity of this oxide as an adsorbent for physical adsorption has been the idea that it is chemically stable, and has a reproducible surface. Nevertheless, the results of Reyerson and Honig6 studying nitrogen dioxide adsorption and the observations of color changes on evacuation at elevated temperatures,6-8 show that titania is quite reactive. Spectroscopic data9 obtained on single crystals of rutile demonstrate that the crystal can be made oxygen deficient by hydrogen treatment.
Recent infrared studies have shown that silica10 and alumina11 retain hydroxyl groups on their surface even after long evacuation at elevated temperatures. It is of interest to determine whether anatase and rutile retain similar groups on evacuation. These groups have been found, and have also been studied by replacing them with OD groups
(4) L. E. Drain and J. A. Morrison, Trans. Faraday Soc., 49, 654 (1953), and earlier papers.
(5) E. L. Pace, W. T. Berg and A. R. Siebert, J. Am. Chem. Soc., 73, 1531 (1956), and earlier papers.
(6) L. H. Reyerson and J. M. Honig, ibid., 75, 3917 (1953).(7) Y. L. Sandler, J. Phys. Chem., 58, 54 (1954).(8) (a) J. Gebhardt and K. Herrington, ibid., 62, 120 (1958); (b)
A. W. Czanderna and J. M. Honig, ibid., 63, 120 (1959).(9) D. Cronemeyer, Phys. Rev., 87, 876 (1952).(10) R. S. McDonald, J. Phys. Chem., 62, 1168 (1958).(11) J. B. Peri, paper presented at the Second International Con
gress on Catalysis, Paris, July 1960.
using deuterium. In addition, it has been found that carbon monoxide and carbon dioxide are chemisorbed at room temperature. The carbon monoxide is extremely weakly chemisorbed; all the adsorbed gas can be removed by evacuation for a few seconds. The carbon dioxide is much more strongly held and can only be removed slowly.
T a b l e IP r o p e r t ie s o f T it a n ia P o w d e r s
Code no. MP-1579 MP-1208 MP-1608-1 MP-1608-4Crystal form Anatase Rutile Anatase RutileDrying temp., °C. 110 120 120 225Surface area, m.2/g*
(BET) 290 185 85 100(Evacuated at drying temp.)TiOi, % 89.5 89.6 94.4 94.1Loss on ignition, % 10.0 10.3 5.1 4.1Chlorides, % 0.08Sulfur, % 0.41Other impurities,
total % 0.24 0.23 0.20 0.34
The powders were pressed into self-supporting discs1'1 in a 1 " diameter die, using pressures of 2000 to 4000 lb ./in .2. As 0.10 g. of powder was used, the optical “ thickness” of the samples is 20 m g./cm .2.
ExperimentalMaterials and Sample Preparation.— All the titanium
dioxide used was the gift of the National Lead Company, Titanium Division, South Amboy, N. J. The majority of the work has been done on one anatase preparation (Code No. MP-1579) and with one rutile (MP-1208). Some meas-
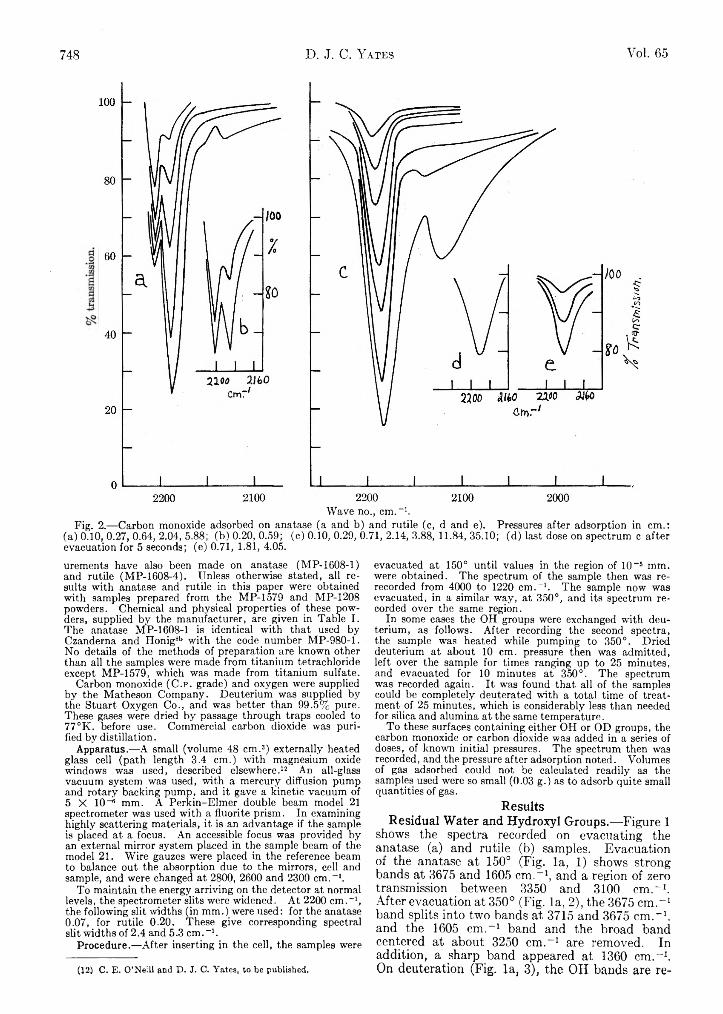
748 D. J. C. Yates Vol. 65
Wave no., cm .-1.Fig. 2.— Carbon monoxide adsorbed on anatase (a and b) and rutile (c, d and e). Pressures after adsorption in cm.:
(a) 0.10, 0.27, 0.64, 2.04, 5.88; (b) 0.20, 0.59; (c) 0.10, 0.29, 0.71, 2.14, 3.88, 11.84, 35.10; (d) last dose on spectrum c after evacuation for 5 seconds; (e) 0.71, 1.81, 4.05.urements have also been made on anatase (MP-1608-1) and rutile (MP-1608-4). Unless otherwise stated, all results with anatase and rutile in this paper were obtained with samples prepared from the MP-1579 and MP-1208 powders. Chemical and physical properties of these powders, supplied by the manufacturer, are given in Table I. The anatase MP-1608-1 is identical with that used by Czanderna and Honig8b with the code number MP-980-1. No details of the methods of preparation are known other than all the samples were made from titanium tetrachloride except MP-1579, which was made from titanium sulfate.
Carbon monoxide (C .p . grade) and oxygen were supplied by the Matheson Company. Deuterium was supplied by the Stuart Oxygen Co., and was better than 99.5% pure. These gases were dried by passage through traps cooled to 77°K. before use. Commercial carbon dioxide was purified by distillation.
Apparatus.— A small (volume 48 cm.3) externally heated glass cell (path length 3.4 cm.) with magnesium oxide windows was used, described elsewhere.12 An all-glass vacuum system was used, with a mercury diffusion pump and rotary backing pump, and it gave a kinetic vacuum of 5 X 10⁻⁶ mm. A Perkin-Elmer double beam model 21 spectrometer was used with a fluorite prism. In examining highly scattering materials, it is an advantage if the sample is placed at a focus. An accessible focus was provided by an external mirror system placed in the sample beam of the model 21. Wire gauzes were placed in the reference beam to balance out the absorption due to the mirrors, cell and sample, and were changed at 2800, 2600 and 2300 cm.-1.
To maintain the energy arriving on the detector at normal levels, the spectrometer slits were widened. At 2200 cm .-1, the following slit widths (in mm.) were used: for the anatase 0.07, for rutile 0.20. These give corresponding spectral slit widths of 2.4 and 5.3 cm .-1.
Procedure.—After inserting in the cell, the samples were
evacuated at 150° until values in the region of 10-5 mm. were obtained. The spectrum of the sample then was rerecorded from 4000 to 1220 cm .-1. The sample now was evacuated, in a similar way, at 350°, and its spectrum recorded over the same region.
In some cases the OH groups were exchanged with deuterium, as follows. After recording the second spectra, the sample was heated while pumping to 350°. Dried deuterium at about 10 cm. pressure then was admitted, left over the sample for times ranging up to 25 minutes, and evacuated for 10 minutes at 350°. The spectrum was recorded again. It was found that all of the samples could be completely deuterated with a total time of treatment of 25 minutes, which is considerably less than needed for silica and alumina at the same temperature.
To these surfaces containing either OH or OD groups, the carbon monoxide or carbon dioxide was added in a series of doses, of known initial pressures. The spectrum then was recorded, and the pressure after adsorption noted. Volumes of gas adsorbed could not be calculated readily as the samples used were so small (0.03 g.) as to adsorb quite small quantities of gas.
ResultsResidual Water and Hydroxyl Groups.— Figure 1
shows the spectra recorded on evacuating the anatase (a) and rutile (b) samples. Evacuation of the anatase at 150° (Fig. la, 1) shows strong bands at 3675 and 1605 cm.-1, and a region of zero transmission between 3350 and 3100 cm.-1. After evacuation at 350° (Fig. la, 2), the 3675 cm.-1 band splits into two bands at 3715 and 3675 cm.-1, and the 1605 cm.-1 band and the broad band centered at about 3250 cm.-1 are removed. In addition, a sharp band appeared at 1360 cm.-1. On deuteration (Fig. la, 3), the OH bands are re(12) C. E. O’Neill and p. J. C. Yates, to be published.
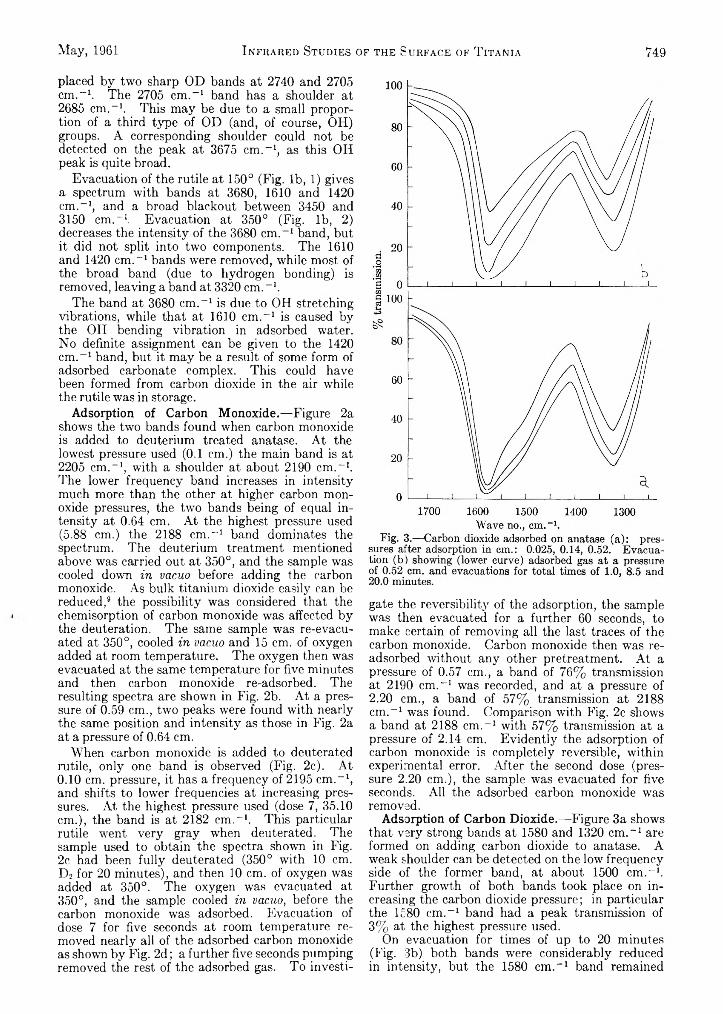
May, 1961 Infrared Studies of the Surface of T itania 749
placed by two sharp OD bands at 2740 and 2705 cm.-1. The 2705 cm.-1 band has a shoulder at 2685 cm.-1. This may be due to a small proportion of a third type of OD (and, of course, OH) groups. A corresponding shoulder could not be detected on the peak at 3675 cm.-1, as this OH peak is quite broad.
Evacuation of the rutile at 150° (Fig. lb, 1) gives a spectrum with bands at 3680, 1610 and 1420 cm.-1, and a broad blackout between 3450 and 3150 cm.-1. Evacuation at 350° (Fig. lb, 2) decreases the intensity of the 3680 cm.-1 band, but it did not split into two components. The 1610 and 1420 cm.-1 bands were removed, while most of the broad band (due to hydrogen bonding) is removed, leaving a band at 3320 cm.-1.
The band at 3680 cm.-1 is due to OH stretching vibrations, while that at 1610 cm.-1 is caused by the OH bending vibration in adsorbed water. No definite assignment can be given to the 1420 cm.-1 band, but it may be a result of some form of adsorbed carbonate complex. This could have been formed from carbon dioxide in the air while the rutile was in storage.
Adsorption of Carbon Monoxide.—Figure 2a shows the two bands found when carbon monoxide is added to deuterium treated anatase. At the lowest pressure used (0.1 cm.) the main band is at 2205 cm.-1, with a shoulder at about 2190 cm.-1. The lower frequency band increases in intensity much more than the other at higher carbon monoxide pressures, the two bands being of equal intensity at 0.64 cm. At the highest pressure used (5.88 cm.) the 2188 cm.-1 band dominates the spectrum. The deuterium treatment mentioned above was carried out at 350°, and the sample was cooled down in vacuo before adding the carbon monoxide. As bulk titanium dioxide easily can be reduced,9 the possibility was considered that the chemisorption of carbon monoxide was affected by the deuteration. The same sample was re-evacuated at 350°, cooled in vacuo and 15 cm. of oxygen added at room temperature. The oxygen then was evacuated at the same temperature for five minutes and then carbon monoxide re-adsorbed. The resulting spectra are shown in Fig. 2b. At a pressure of 0.59 cm., two peaks were found with nearly the same position and intensity as those in Fig. 2a at a pressure of 0.64 cm.
When carbon monoxide is added to deuterated rutile, only one band is observed (Fig. 2c). At 0.10 cm. pressure, it has a frequency of 2195 cm.-1, and shifts to lower frequencies at increasing pressures. At the highest pressure used (dose 7, 35.10 cm.), the band is at 2182 cm.-1. This particular rutile went very gray when deuterated. The sample used to obtain the spectra shown in Fig. 2c had been fully deuterated (350° with 10 cm. D2 for 20 minutes), and then 10 cm. of oxygen was added at 350°. The oxygen was evacuated at 350°, and the sample cooled in vacuo, before the carbon monoxide was adsorbed. Evacuation of dose 7 for five seconds at room temperature removed nearly all of the adsorbed carbon monoxide as shown by Fig. 2d; a further five seconds pumping removed the rest of the adsorbed gas. To investi
gate the reversibility of the adsorption, the sample was then evacuated for a further 60 seconds, to make certain of removing all the last traces of the carbon monoxide. Carbon monoxide then was readsorbed without any other pretreatment. At a pressure of 0.57 cm., a band of 76% transmission at 2190 cm.-1 was recorded, and at a pressure of 2.20 cm., a band of 57% transmission at 2188 cm.-1 was found. Comparison with Fig. 2c shows a band at 2188 cm.-1 with 57% transmission at a pressure of 2.14 cm. Evidently the adsorption of carbon monoxide is completely reversible, within experimental error. After the second dose (pressure 2.20 cm.), the sample was evacuated for five seconds. All the adsorbed carbon monoxide was removed.
Adsorption of Carbon Dioxide.— Figure 3a shows that very strong bands at 1580 and 1320 cm.-1 are formed on adding carbon dioxide to anatase. A weak shoulder can be detected on the low frequency side of the former band, at about 1500 cm.-1. Further growth of both bands took place on increasing the carbon dioxide pressure; in particular the 1580 cm.-1 band had a peak transmission of 3% at the highest pressure used.
On evacuation for times of up to 20 minutes (Fig. 3b) both bands were considerably reduced in intensity, but the 1580 cm.-1 band remained
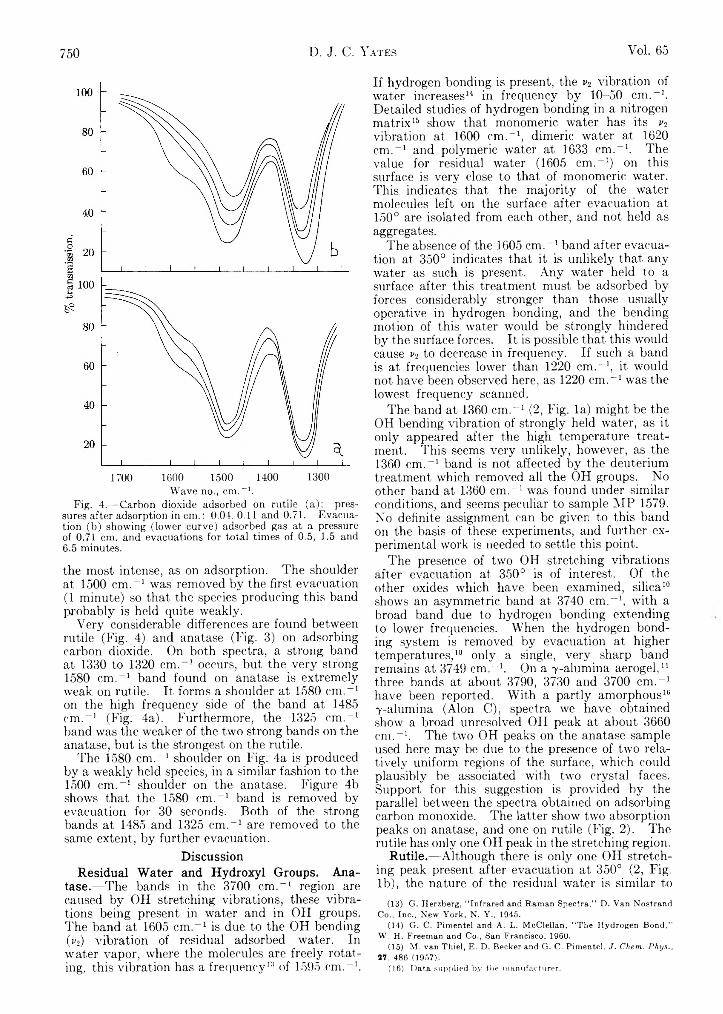
750 D. J. C. Yates Yol. 65
1700 1600 1500 1400 1300Wave no., cm .-1.
Fig. 4.— Carbon dioxide adsorbed on rutile (a): pressures after adsorption in cm .: 0.04, 0.11 and 0.71. Evacuation (b) showing (lower curve) adsorbed gas at a pressure of 0.71 cm. and evacuations for total times of 0.5, 1.5 and 6.5 minutes.
the most intense, as on adsorption. The shoulder at 1500 cm.“ 1 was removed by the first evacuation (1 minute) so that the species producing this band probably is held quite weakly.
Very considerable differences are found between rutile (Fig. 4) and anatase (Fig. 3) on adsorbing carbon dioxide. On both spectra, a strong band at 1330 to 1320 cm.-1 occurs, but the very strong 1580 cm.-1 band found on anatase is extremely weak on rutile. It forms a shoulder at 1580 cm.-1 on the high frequency side of the band at 1485 cm.“ 1 (Fig. 4a). Furthermore, the 1325 cm.“ 1 band was the weaker of the two strong bands on the anatase, but is the strongest on the rutile.
The 1580 cm.“ 1 shoulder on Fig. 4a is produced by a weakly held species, in a similar fashion to the 1500 cm.-1 shoulder on the anatase. Figure 4b shows that the 1580 cm.“ 1 band is removed by evacuation for 30 seconds. Both of the strong bands at 1485 and 1325 cm.“ 1 are removed to the same extent, by further evacuation.
DiscussionResidual Water and Hydroxyl Groups. Ana
tase.—The bands in the 3700 cm.-1 region are caused by OH stretching vibrations, these vibrations being present in water and in OH groups. The band at 1605 cm.“ 1 is due to the OH bending (p2) vibration of residual adsorbed water. In water vapor, where the molecules are freely rotating, this vibration has a frequency13 of 1595 cm.“ 1.
If hydrogen bonding is present, the v2 vibration of water increases14 in frequency by 10-50 cm.“ 1. Detailed studies of hydrogen bonding in a nitrogen matrix16 show that monomeric water has its v2
vibration at 1600 cm.“ 1, dimeric water at 1620 cm.-1 and polymeric water at 1633 cm.-1. The value for residual water (1605 cm.“ 1) on this surface is very close to that of monomeric water. This indicates that the majority of the water molecules left on the surface after evacuation at 150° are isolated from each other, and not held as aggregates.
The absence of the 1605 cm.“ 1 band after evacuation at 350° indicates that it is unlikely that any water as such is present. Any water held to a surface after this treatment must be adsorbed by forces considerably stronger than those usually operative in hydrogen bonding, and the bending motion of this water would be strongly hindered by the surface forces. It is possible that this would cause v2 to decrease in frequency. If such a band is at frequencies lower than 1220 cm.“ 1, it would not have been observed here, as 1220 cm.“ 1 was the lowest frequency scanned.
The band at 1360 cm.“ 1 (2, Fig. la) might be the OH bending vibration of strongly held water, as it only appeared after the high temperature treatment. This seems very unlikely, however, as the 1360 cm.” 1 band is not affected by the deuterium treatment which removed all the OH groups. No other band at 1360 cm.“ 1 was found under similar conditions, and seems peculiar to sample MP 1579. No definite assignment can be given to this band on the basis of these experiments, and further experimental work is needed to settle this point.
The presence of two OH stretching vibrations after evacuation at 350° is of interest. Of the other oxides which have been examined, silica10 shows an asymmetric band at 3740 cm ."1, with a broad band due to hydrogen bonding extending to lower frequencies. When the hydrogen bonding system is removed by evacuation at higher temperatures,10 only a single, very sharp band remains at 3749 cm.“ 1. On a 7-alumina aerogel,11 three bands at about 3790, 3730 and 3700 cm.“ 1 have been reported. With a partly amorphous167-alumina (Alon C), spectra we have obtained show a broad unresolved OH peak at about 3660 cm.“ 1. The two OH peaks on the anatase sample used here may be due to the presence of two relatively uniform regions of the surface, which could plausibly be associated with two crystal faces. Support for this suggestion is provided by the parallel between the spectra obtained on adsorbing carbon monoxide. The latter show two absorption peaks on anatase, and one on rutile (Fig. 2). The rutile has only one OH peak in the stretching region.
Rutile.—Although there is only one OH stretching peak present after evacuation at 350° (2, Fig. lb ), the nature of the residual water is similar to
(13) G. Herzberg, “ Infrared and Raman Spectra,” D. Van Nostrand Co., Inc., New York, N. Y., 1945.
(14) G. C. Pimentel and A. L. McClellan, “ The Hydrogen Bond,” W. H. Freeman and Co., San Francisco, 1960.
(15) M. van Thiel, E. D. Becker and G. C. Pimentel, J. Chem. Phys., 27, 486 (1957).
(16) Data supplied by the manufacturer.
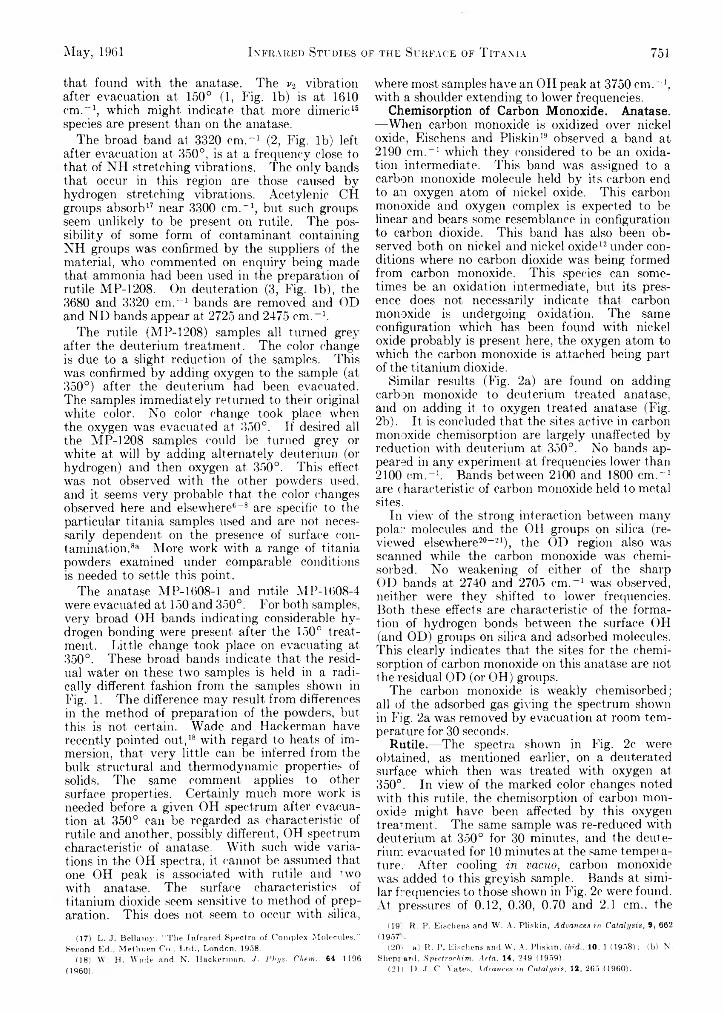
May, 1961 Infrared Studies of the Surface of Titania 751
that found with the anatase. The v2 vibration after evacuation at 150° (1, Fig. lb) is at 1610 cm.-1, which might indicate that more dimeric17 18 species are present than on the anatase.
The broad band at 3320 cm.-1 (2, Fig. lb) left after evacuation at 350°, is at a frequency close to that of NH stretching vibrations. The only bands that occur in this region are those caused by hydrogen stretching vibrations. Acetylenic CH groups absorb17 near 3300 cm.-1, but such groups seem unlikely to be present on rutile. The possibility of some form of contaminant containing NH groups was confirmed by the suppliers of the material, who commented on enquiry being made that ammonia had been used in the preparation of rutile MP-1208. On deuteration (3, Fig. lb), the 3680 and 3320 cm.-1 bands are removed and OD and ND bands appear at 2725 and 2475 cm.-1.
The rutile (MP-1208) samples all turned grey after the deuterium treatment. The color change is due to a slight reduction of the samples. This was confirmed by adding oxygen to the sample (at 350°) after the deuterium had been evacuated. The samples immediately returned to their original white color. No color change took place when the oxygen was evacuated at 350°. If desired all the MP-1208 samples could be turned grey or white at will by adding alternately deuterium (or hydrogen) and then oxygen at 350°. This effect was not observed with the other powders used, and it seems very probable that the color changes observed here and elsewhere6-8 are specific to the particular titania samples used and are not necessarily dependent on the presence of surface contamination. 8a More work with a range of titania powders examined under comparable conditions is needed to settle this point.
The anatase MP-1608-1 and rutile MP-1608-4 were evacuated at 150 and 350°. For both samples, very broad OH bands indicating considerable hydrogen bonding were present after the 150° treatment. Little change took place on evacuating at 350°. These broad bands indicate that the residual water on these two samples is held in a radically different fashion from the samples shown in Fig. 1. The difference may result from differences in the method of preparation of the powders, but this is not certain. Wade and Hackerman have recently pointed out,18 with regard to heats of immersion, that, very little can be inferred from the bulk structural and thermodynamic properties of solids. The same comment applies to other surface properties. Certainly much more work is needed before a given OH spectrum after evacuation at 350° can be regarded as characteristic of rutile and another, possibly different, OH spectrum characteristic of anatase. With such wide variations in the OH spectra, it cannot be assumed that one OH peak is associated with rutile and two with anatase. The surface characteristics of titanium dioxide seem sensitive to method of preparation. This does not seem to occur with silica,
(17) L. J. Bellamy, "The Infrared Spectra of Complex Molecules," Second Ed., Methuen Co.. Ltd., London, 1958.
(18) W. H. Wade and N. Hackerman, ./. Phys. Client., 64, 1196(1960).
where most samples have an OH peak at 3750 cm.-1, with a shoulder extending to lower frequencies.
Chemisorption of Carbon Monoxide. Anatase.— When carbon monoxide is oxidized over nickel oxide, Eischens and Pliskin19 observed a band at 2190 c m .'1 which they considered to be an oxidation intermediate. This band was assigned to a carbon monoxide molecule held by its carbon end to an oxygen atom of nickel oxide. This carbon monoxide and oxygen complex is expected to be linear and bears some resemblance in configuration to carbon dioxide. This band has also been observed both on nickel and nickel oxide12 under conditions where no carbon dioxide was being formed from carbon monoxide. This species can sometimes be an oxidation intermediate, but its presence does not necessarily indicate that carbon monoxide is undergoing oxidation. The same configuration which has been found with nickel oxide probably is present here, the oxygen atom to which the carbon monoxide is attached being part of the titanium dioxide.
Similar results (Fig. 2a) are found on adding- carbon monoxide to deuterium treated anatase, and on adding it to oxygen treated anatase (Fig. 2b). It is concluded that the sites active in carbon monoxide chemisorption are largely unaffected by reduction with deuterium at 350°. No bands appeared in any experiment at frequencies lowrer than 2100 cm.-1. Bands between 2100 and 1800 cm.-1 are characteristic of carbon monoxide held to metal sites.
In view of the strong interaction between many polar molecules and the OH groups on silica (reviewed elsewhere20-21), the OD region also was scanned while the carbon monoxide was chemisorbed. No weakening of either of the sharp OD bands at 2740 and 2705 cm.-1 was observed, neither were they shifted to lower frequencies. Both these effects are characteristic of the formation of hydrogen bonds between the surface OH (and OD) groups on silica and adsorbed molecules. This clearly indicates that the sites for the chemisorption of carbon monoxide on this anatase are not the residual OD (or OH) groups.
The carbon monoxide is w-eakly chemisorbed; all of the adsorbed gas giving the spectrum shown in Fig. 2a was removed by evacuation at room temperature for 30 seconds.
Rutile.—The spectra shown in Fig. 2c were obtained, as mentioned earlier, on a deuterated surface which then was treated with oxygen at 350°. In view of the marked color changes noted with this rutile, the chemisorption of carbon monoxide might have been affected by this oxygen treatment. The same sample was re-reduced with deuterium at 350° for 30 minutes, and the deuterium evacuated for 10 minutes at the same temperature. After cooling in vacuo, carbon monoxide was added to this greyish sample. Bands at similar frequencies to those shown in Fig. 2c were found. At pressures of 0.12, 0.30, 0.70 and 2.1 cm., the
(19; R. P. Eischens and W. A. Pliskin, Advances in Catalysis, 9 , 662 (1957;.
(20; a) R. P. Eischens and W. A. Pliskin, ibid., 10, 1 (1958); (b) N. Sheppard, Spectrochim. Acta, 14, 249 (1959).
(21) D. J. O. Yates, Adrances in Catalysis, 12, 265 (1960).
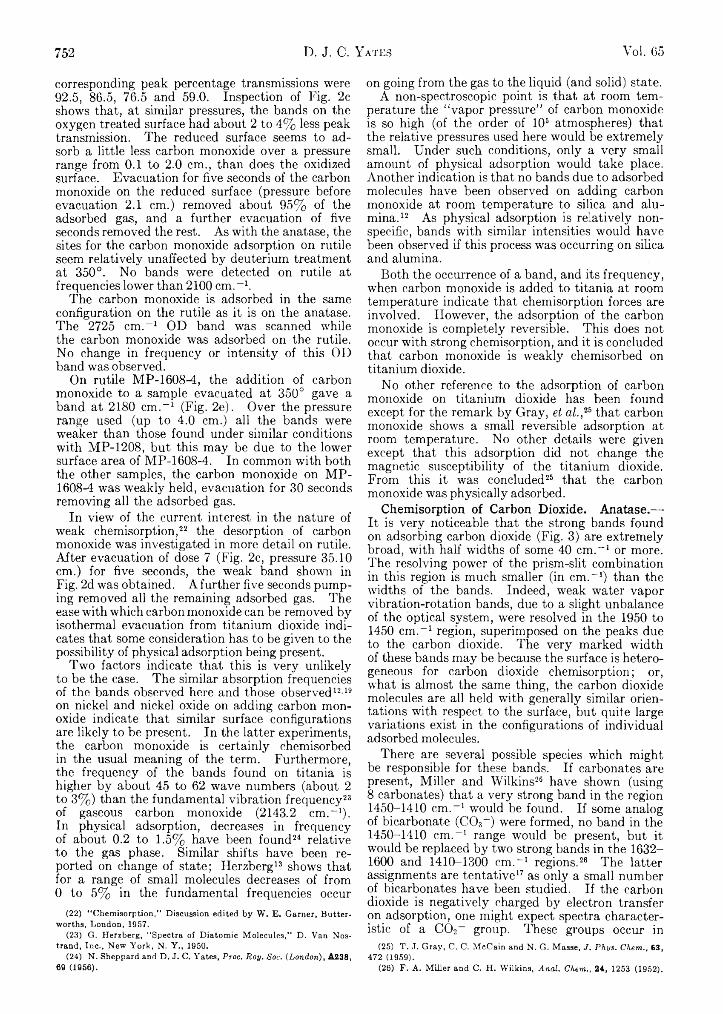
752 D. J. C. Yates Vol. 65
corresponding peak percentage transmissions were92.5, 86.5, 76.5 and 59.0. Inspection of Fig. 2c shows that, at similar pressures, the bands on the oxygen treated surface had about 2 to 4% less peak transmission. The reduced surface seems to adsorb a little less carbon monoxide over a pressure range from 0.1 to 2.0 cm., than does the oxidized surface. Evacuation for five seconds of the carbon monoxide on the reduced surface (pressure before evacuation 2.1 cm.) removed about 95% of the adsorbed gas, and a further evacuation of five seconds removed the rest. As with the anatase, the sites for the carbon monoxide adsorption on rutile seem relatively unaffected by deuterium treatment at 350°. No bands were detected on rutile at frequencies lower than 2100 cm.-1.
The carbon monoxide is adsorbed in the same configuration on the rutile as it is on the anatase. The 2725 cm.-1 OD band was scanned while the carbon monoxide was adsorbed on the rutile. No change in frequency or intensity of this OD band was observed.
On rutile MP-1608-4, the addition of carbon monoxide to a sample evacuated at 350° gave a band at 2180 cm.-1 (Fig. 2e). Over the pressure range used (up to 4.0 cm.) all the bands were weaker than those found under similar conditions with MP-1208, but this may be due to the lower surface area of MP-1608-4. In common with both the other samples, the carbon monoxide on MP- 1608-4 was weakly held, evacuation for 30 seconds removing all the adsorbed gas.
In view of the current interest in the nature of weak chemisorption,22 the desorption of carbon monoxide was investigated in more detail on rutile. After evacuation of dose 7 (Fig. 2c, pressure 35.10 cm.) for five seconds, the weak band shown in Fig. 2d was obtained. A further five seconds pumping removed all the remaining adsorbed gas. The ease with which carbon monoxide can be removed by isothermal evacuation from titanium dioxide indicates that some consideration has to be given to the possibility of physical adsorption being present.
Two factors indicate that this is very unlikely to be the case. The similar absorption frequencies of the bands observed here and those observed12'19 on nickel and nickel oxide on adding carbon monoxide indicate that similar surface configurations are likely to be present. In the latter experiments, the carbon monoxide is certainly chemisorbed in the usual meaning of the term. Furthermore, the frequency of the bands found on titania is higher by about 45 to 62 wave numbers (about 2 to 3%) than the fundamental vibration frequency23 of gaseous carbon monoxide (2143.2 cm.-1). In physical adsorption, decreases in frequency of about 0.2 to 1.5% have been found24 relative to the gas phase. Similar shifts have been reported on change of state; Herzberg13 shows that for a range of small molecules decreases of from 0 to 5% in the fundamental frequencies occur
(22) “ Chemisorption,” Discussion edited by W, E. Garner, Butter- worths, London,1957.
(23) G. Herzberg, “ Spectra of Diatomic Molecules,” D. Van Nostrand, Inc., New York, N. Y., 1950.
(24) N. Sheppard and D. J. C. Yates, Proc. Roy. Soc. {London), A238, 69 (1956).
on going from the gas to the liquid (and solid) state.A non-spectroscopic point is that at room tem
perature the “ vapor pressure” of carbon monoxide is so high (of the order of 106 atmospheres) that the relative pressures used here would be extremely small. Under such conditions, only a very small amount of physical adsorption would take place. Another indication is that no bands due to adsorbed molecules have been observed on adding carbon monoxide at room temperature to silica and alumina.12 As physical adsorption is relatively nonspecific, bands with similar intensities would have been observed if this process was occurring on silica and alumina.
Both the occurrence of a band, and its frequency, when carbon monoxide is added to titania at room temperature indicate that chemisorption forces are involved. However, the adsorption of the carbon monoxide is completely reversible. This does not occur with strong chemisorption, and it is concluded that carbon monoxide is weakly chemisorbed on titanium dioxide.
No other reference to the adsorption of carbon monoxide on titanium dioxide has been found except for the remark by Gray, et al.,2b that carbon monoxide shows a small reversible adsorption at room temperature. No other details were given except that this adsorption did not change the magnetic susceptibility of the titanium dioxide. From this it was concluded25 that the carbon monoxide was physically adsorbed.
Chemisorption of Carbon Dioxide. Anatase.—- It is very noticeable that the strong bands found on adsorbing carbon dioxide (Fig. 3) are extremely broad, with half widths of some 40 cm.-1 or more. The resolving power of the prism-slit combination in this region is much smaller (in cm.-1) than the widths of the bands. Indeed, weak water vapor vibration-rotation bands, due to a slight unbalance of the optical system, were resolved in the 1950 to 1450 cm.-1 region, superimposed on the peaks due to the carbon dioxide. The very marked width of these bands may be because the surface is heterogeneous for carbon dioxide chemisorption; or, what is almost the same thing, the carbon dioxide molecules are all held with generally similar orientations with respect to the surface, but quite large variations exist in the configurations of individual adsorbed molecules.
There are several possible species which might be responsible for these bands. If carbonates are present, Miller and Wilkins26 have shown (using 8 carbonates) that a very strong band in the region 1450-1410 cm.-1 would be found. If some analog of bicarbonate (C03~) were formed, no band in the 1450-1410 cm.-1 range would be present, but it would be replaced by two strong bands in the 1632- 1600 and 1410-1300 cm.-1 regions.26 The latter assignments are tentative17 as only a small number of bicarbonates have been studied. If the carbon dioxide is negatively charged by electron transfer on adsorption, one might expect spectra characteristic of a C 02- group. These groups occur in
(25) T. J. Gray, C. C. McCain and N. G. Masse, J. Phys. Chem., 63, 472 (1959).
(26) F. A. Miller and C. H. Wilkins, Anal. Chem., 24, 1253 (1952).
May, 1961 The Kinetics op the Hydrolysis o f Chlorine 753
ionized carboxylic acids,17 giving strong bands in the regions 1610-1550 cm.-1 (symmetrical vibrations) and 1420-1300 cm.-1 (asymmetrical).
On the anatase, the C 02- species is predominant as the two strong bands at 1580 and 1320 cm.-1 fall well within the usual range for such species. The 1580 cm.-1 band is stronger than the 1320 cm.-1 band, however. The weak shoulder at about 1500 cm.-1 is more difficult to assign; it does not fall into either the C 02- or C 03- region, but is only just outside the region normally assigned to carbonates (1450-1410 cm.-1). It is tentatively suggested that this shoulder is caused by a small proportion of carbonate-like species on the surface.
Rutile.— The width of the bands (Fig. 4) is very similar to that found with anatase, and the significance of this has been discussed in the previous section. The strong band at 1325 cm.-1 and the weak shoulder at 1580 cm.-1 may be due to some type of C 02- species. However, if sufficient of these species are present to form a strong band due to asymmetric stretching vibrations at 1325 cm.-1, it is difficult to account for the weakness of the band at 1580 cm.-1, presumably due to the symmetrical stretching vibrations. It seems very unlikely that the extinction coefficients of these two modes of vibration of the C 02- species could be drastically affected by the surface on which they are adsorbed. The assignment of the bands on the rutile surface is rather uncertain for this reason. The strong band at 1485 cm.-1 shown in Fig. 4a may be caused by a carbonate-like species. Although outside the range normally assigned to
carbonates (1450-1410 cm.-1) this may be because these surface species do not have any strictly comparable analogs in bulk solids. Possibly configurations intermediate between a carboxylate and a carbonate group are present on the surface.
More work is needed before such species, if they exist, can be assigned with certainty. What is certain is that carbon dioxide is strongly adsorbed on the samples of anatase and rutile used here, probably both as C 02- and C 03 species. Nevertheless, wide variations in intensity of the 1580 and 1485 cm.-1 bands occur when anatase and rutile are compared.
In common with the spectra of the residual hydroxyl groups and carbon monoxide, the spectra of the chemisorbed carbon dioxide show clearly that there are quite wide differences in surface properties between the two samples. While this may be due to the different bulk crystal structure of the two oxides, this is unlikely, as very large differences in the spectra of the residual OH groups were found between the anatase and rutile mainly used, and the other samples also studied. The marked differences in surface characteristics shown in all the figures for anatase (MP-1579) and rutile (MP-1208) are likely to be due to variations in their method of manufacture. With titania, at least, it is evident that a great deal of care must be taken in sample selection before the experimental data obtained can bear any relation to surface properties which may be calculated from bulk values of lattice constants, crystal structure, polarizability and so on.
T H E K I N E T I C S O F T H E H Y D R O L Y S I S O F C H L O R I N E . I I . T H E
H Y D R O L Y S I S I N T H E P R E S E N C E O F A C E T A T E
B y A s s a L i f s h i t z a n d B. P e r l m u t t e r - H a y m a n
Department of Physical Chemistry, Hebrew University, Jerusalem, Israel Received August SI, 1930
The hydrolysis of chlorine in the presence of acetate ions has been investigated. The results can be explained by the assumption that the reaction proceeds along three parallel paths: one the same as in pure water, the second involving a reaction between molecular chlorine and acetate ions, and the third involving a reaction between molecular chlorine and hydroxyl ions. In the presence of acetate and acetic acid the second reaction predominates and its rate constant can be determined (k = 5.5& X 102 mole- 1 1. sec.-1). In the presence of acetate alone, the second and third reactions make comparable contributions. The rate constant for the third reaction can only be estimated approximately. In order to contribute to the observed rate, this reaction must be diffusion-controlled.
IntroductionWe have reinvestigated recently1 the kinetics
of the hydrolysis of chlorine in pure water, using the continuous flow method. We concluded that the reaction takes place according to
X2 + H20 HOX + X - + H+ (1)(where X represents the halogen) with no appreciable contribution from a reaction involving the hydroxyl ion
X2 + OH- “ t HOX + X - (2)On the other hand, when investigating the kinetics
(1) A. Lifshitz and B. Perlmutter-Hayman, J. Phys. Chem., 64, 1663 (1960).
of the hydrolysis of bromine2 in phosphate buffer solution we found that the observed rate was compatible with the mechanism
H20 + X2 + A- HOX + X - + HA (3)
where A - represents the buffer anion. The next step in our program of investigating the kinetics of the hydrolysis of the halogens is the study of the hydrolysis of chlorine in buffer solution in order to verify whether mechanism 3 is operative for chlorine. In this paper, the results in the presence cf acetate are reported; the possible correla
(2) A Lifshitz and B. Perlmutter-Hayman, Bull. Research CouncilIsrael, A8, 166 (1959).

754 Assa Lifshitz and B. Perlmutter-Hayman Voi. 65
tion between ka- and the basic strength of A will be discussed in a later paper.
ExperimentalWe again used the continuous flow method, where the
progress of the reaction along the observation tube was measured with the aid of 8 thermistors. The apparatus and experimental procedure are described elsewhere.1'3 The flow velocity was 4.5 to 7.7 cc. sec.“ 1 (140 to 250 cm. sec.-1). Chlorine water was prepared and analyzed as before.1 When the hydrolysis in the presence of acetate only was investigated, the latter was contained in one vessel, and the chlorine solution in the other. Other reagents (acetic acid or inert salt) were divided to equal parts between the two reactant vessels. The concentration of the acetate was checked by adding to a sample a known amount of standard HC1 solution, and carrying out a conductometric titration of the excess HC1, using standard NaOH solution. The temperature was again1 9.5°. The total temperature change AT«, was between ( — 141 to —296) X 10“ 3 (leg.
ResultsInfluence of Ionic Strength.— An experiment was
carried out in the presence of 0.17 N sodium perchlorate. Within the limit of experimental error the rate constant /ch2o (/'i of our previous paper) was identical with that found previously for the reaction in pure water.
Experiments in the Presence of Sodium Acetate, and of Sodium Acetate and Acetic Acid.—Experiments at various initial concentrations of chlorine, sodium acetate and acetic acid were carried out. Details of these experiments are summarized in Table I. In this table, a is the total stoichiometric concentration of chlorine and x<t and Xq are the concentrations of chloride (or hypo- chlorous acid) at time zero and infinity, respectively. The values of x0 were calculated as before1; those of xe were calculated from K :i = Kh/Ka., where Ah is the hydrolysis constant of chlorine (An = 2.23 X 10~4) 41 and A a the dissociation constant of acetic acid (Aa = 1.74 X 10“ 5).5a (An equilibrium of the type of reaction 3 may be assumed to be unaffected by changes of the ionic strength. We therefore used the thermodynamic equilibrium constants for the calculation.)
T a b l e ID e t a il s o f E x p e r im e n t s C a r r ie d O ut in th e P rese n c e
o f A c e t a t e , o r A c e t a te an d A cetic A cid“¿Ac-”X 10~2
[HAc], [Ac a XV .r k* mole 1No. Millimole/1. sec. 1. sec. ~1
i 541 96 69.1 17 3 63 .5 46 5 .802 242 96 .4 35.3 12. 7 34 .6 51 6 .103 129.5 121 39.7 13. 2 39 7 70 6. 504 105 99 35.4 12. 6 35. 1 63 6 805 88 76 49.0 14. 9 48. i 41 6 .906 63 51 5 54.6 15. 2 48. 4 25 6. 657 0 118 54.0 15. 2 53. 8 85 10 008 0 91 ,2 55.8 15. 8 55. 8 52 7 .859 0 66 .5 37.9 13. 3 37 9 55 10 .30
10 0 45 .0 45.6 14. 6 42. 8 24 7 .9011 0 0 60.0“ 15. 6“ 22. 2“ 5.6“
a Mean value1 iof 5 experiments.
(3) E. G il adli, A. I.ifshitz and B. Peirl mutter--Hay man, Bull. Re-search Council Israel, 8A, 75 (1,959).
(4) R. E. Connick and Yuan-tsan Chia, J. Am. Chem. Soc.. 81, 1280 (1959).
(5) R. A. Robinson and R. IT. Stokes, “ Electrolyte Solutions," Buttenvortlis Scientific Publications, London, 1955, (a) p. 490; (b) p. 500.
The values of x were calculated from the measured values of AT from the following considerations. Immediately after mixing, the hydrogen ions present in the chlorine water will be neutralized by the acetate. This causes an initial temperature change A To which is given by the expression
Ar„ = - ( A H J C p)x0
where 6',, is the specific heat of the solution, and AH& is the heat of neutralization of H+ by A c“ (AH& = —0.46 keal. mole-1, calculated from the change of pA a with temperature).6a At time t we have therefore
Cp / _ , A Ha \x = x“ - A H \ A r t + C 7 XV
where AH is the heat, of reaction of reaction 3. Now, AH can be calculated in two ways: (a) it is equal to AHa plus the heat of hydrolysis of chlorine. The latter quantity4 is equal to AHh = 6.55 keal. mole“ 1; (b) it can be calculated from our own experimental data, viz.
Xe — X„
The results of methods (a) and (b) were in reasonable agreement, but method (b) usually yielded a slightly higher result (up to 3%). (Values of Cp between 0.98 to unity were used according to the concentration of the solution.6) The latter value was employed for the calculation of x, in order to get consistent results. (We suspected that the discrepancy might be due to the heat of dilution of the acetate solution; we therefore measured this quantity in our apparatus, but found it negligibly small.)
In column 7 of the table, we report the specific rate with respect to chlorine, defined by the expression
k* — —d In (a — x)/dt (I)
Although this quantity was found to decrease in the course of every run, it gives a useful indication of the reaction rate. The initial values are reported. (The change of k* can be seen from Fig. 1, which is a typical plot of log (a — x) vs. time.) For the sake of comparison, the mean value of k* for 5 experiments carried out in the absence of acetate1 is also included (last row).
Column 8 is explained in the next section.Discussion
When the last row of Table I is compared with all the others, it becomes clear immediately that sodium acetate has a considerable accelerating influence on the rate of hydrolysis of chlorine. The fact that sodium perchlorate has no such influence shows that the effect of the acetate is not an “ inert salt effect.” We shall therefore assume that reaction 1 remains completely unaffected by the presence of acetate, and that in addition a reaction takes place whose rate depends on the acetate concentration. If we tentatively assume that this reaction is reaction 3, we get the rate equation
(9) “ Handbook of Chemistry and Physics,” Chemical RubberPublishing Co., 35th Edition, 1954, p. 2105.
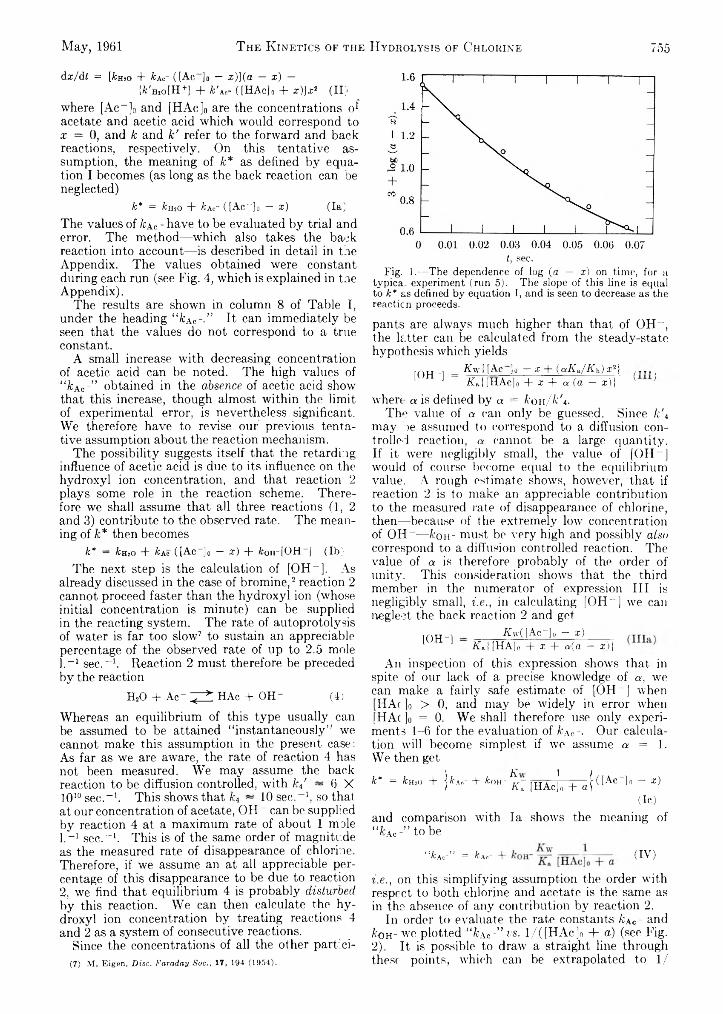
May, 1961 The K inetics of the Hydrolysis of Chlorine 755
dx/dt = [¿mo + ¿Ac- ([Ac ]0 — x)\{a — x) —[fcW H + J + h \ c- ([HAc]„ + x )]x2 (II)
where [Ac- ]o and [HAc]0 are the concentrations of acetate and acetic acid which would correspond to x = 0, and k and k' refer to the forward and back reactions, respectively. On this tentative assumption, the meaning of k* as defined by equation I becomes (as long as the back reaction can be neglected)
k* = kuto + &ac- ([Ac~]o — x) (la)The values of /cac - have to be evaluated by trial and error. The method—which also takes the back reaction into account—is described in detail in the Appendix. The values obtained were constant during each run (see Fig. 4, which is explained in the Appendix).
The results are shown in column 8 of Table I, under the heading “ k\c-.” It can immediately be seen that the values do not correspond to a true constant.
A small increase with decreasing concentration of acetic acid can be noted. The high values of “ kAc~” obtained in the absence of acetic acid show that this increase, though almost within the limit of experimental error, is nevertheless significant. We therefore have to revise our previous tentative assumption about the reaction mechanism.
The possibility suggests itself that the retarding influence of acetic acid is due to its influence on the hydroxyl ion concentration, and that reaction 2 plays some role in the reaction scheme. Therefore we shall assume that all three reactions (1, 2 and 3) contribute to the observed rate. The meaning of k* then becomes
k* — &H20 + Fac ( I A c—] 0 — x) + &oh-[O H - ] (lb )The next step is the calculation of [OH- ]. As
already discussed in the case of bromine,2 reaction 2 cannot proceed faster than the hydroxyl ion (whose initial concentration is minute) can be supplied in the reacting system. The rate of autoprotolysis of water is far too slow7 to sustain an appreciable percentage of the observed rate of up to 2.5 mole 1.-1 sec.-1. Reaction 2 must therefore be preceded by the reaction
H20 + A c - ^ H A c + O H - (4)
Whereas an equilibrium of this type usually can be assumed to be attained “ instantaneously” we cannot make this assumption in the present case: As far as we are aware, the rate of reaction 4 has not been measured. We may assume the back reaction to be diffusion controlled, with /c4' ~ 6 X 10¹⁰ sec.-1. This shows that /c4 ~ 10 sec.-1, so that at our concentration of acetate, OH - can be supplied by reaction 4 at a maximum rate of about 1 mole1. -1 sec.-1. This is of the same order of magnitude as the measured rate of disappearance of chlorine. Therefore, if we assume an at all appreciable percentage of this disappearance to be due to reaction2, we find that equilibrium 4 is probably disturbed by this reaction. We can then calculate the hydroxyl ion concentration by treating reactions 4 and 2 as a system of consecutive reactions.
Since the concentrations of all the other partici-(7) M. Eigen, Disc. Faraday Soc., 17, 194 (1954).
t, sec.Fig. 1.— The dependence of log (a — x) on time, for a
typica. experiment (run 5). The slope of this line is equal to k* as defined by equation I, and is seen to decrease as the reaction proceeds.
pants are always much higher than that of OH- , the latter can be calculated from the steady-state hypothesis which yields
[OH- ] Aw|[Ac ]o — x + (aKe./Kh) x 2} / tt, . A a[[HAc]0 + x + a (a - x)} ( j
where a is defined by a = kon/k\.The value of a can only be guessed. Since lc\
may oe assumed to correspond to a diffusion controlled reaction, a cannot be a large quantity. If it were negligibly small, the value of [OH- ] would of course become equal to the equilibrium value. A rough estimate shows, however, that if reaction 2 is to make an appreciable contribution to the measured rate of disappearance of chlorine, then—because of the extremely low concentration of OH- — fcoH- must be very high and possibly also correspond to a diffusion controlled reaction. The value of a is therefore probably of the order of unity. This consideration shows that the third member in the numerator of expression III is negligibly small, i.e., in calculating [OH- ] we can neglect the back reaction 2 and get
[OH- ] Kw([Ac ]0 - x) Ka|[HA]c + X + « (a - X ) }
An inspection of this expression shows that in spite of our lack of a precise knowledge of a, we can make a fairty safe estimate of [OH- ] when [HAc]o > 0, and may be widely in error when [HAcJo = 0. We shall therefore use only experiments 1-6 for the evaluation of kAc -. Our calculation will become simplest if we assume a = 1. We then get
t 2a ■ 1 )k* = knro + ] * * . - + * o h - t f ; [H A c ]o + 4 ([A c~]o ~ æ)
(le)and comparison with la shows the meaning of"¿Ac-” to be
“ ¿Ac-” = kAc~ + (IV)
i.e., on this simplifying assumption the order wdth respect to both chlorine and acetate is the same as in the absence of any contribution by reaction 2.
In order to evaluate the rate constants kAc- and kon- we plotted “ kAc-” vs. l/([HAc]n + a) (see Fig.2). It is possible to draw a straight line through these points, which can be extrapolated to 1/
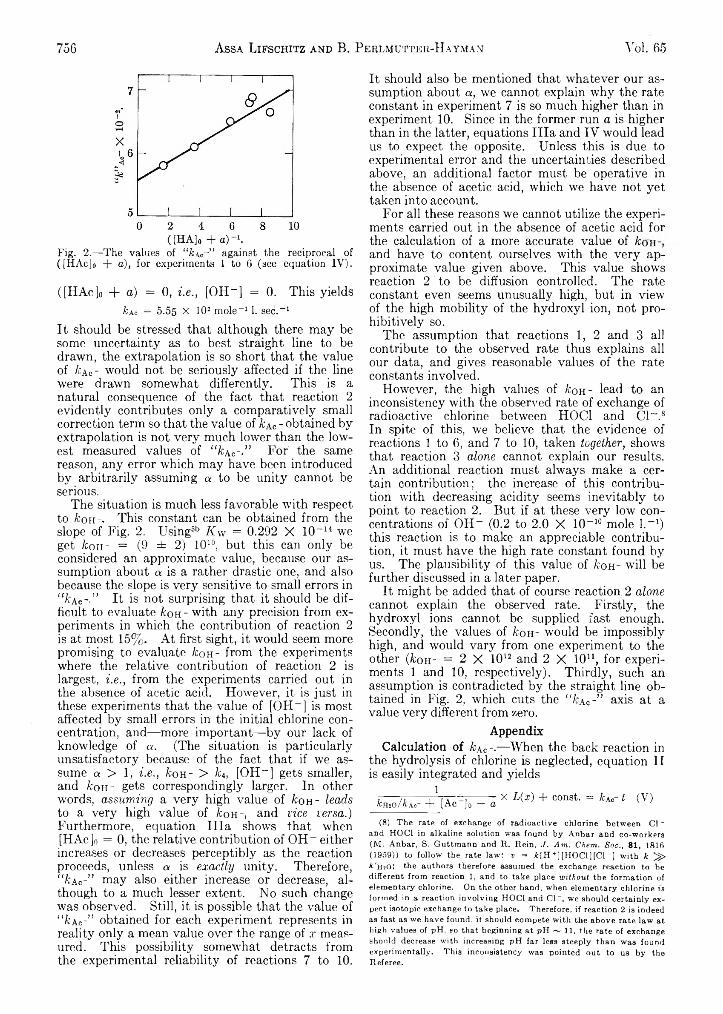
756 Assa Lifschitz and B. Perlmutter-IIayman Vol. 65
Fig. 2.— The values of “ A\c~” against the reciprocal of ([HAc]o + a), for experiments 1 to 6 (see equation IV).
([HAc]o + a) = 0, i.e., [OH- ] = 0. This yields A as = 5.55 X 10² mole- 1 1. sec.-1
It should be stressed that although there may be some uncertainty as to best straight line to be drawn, the extrapolation is so short that the value of /cao- would not be seriously affected if the line were drawn somewhat differently. This is a natural consequence of the fact that reaction 2 evidently contributes only a comparatively small correction term so that the value of ¿Ac - obtained by extrapolation is not very much lower than the lowest measured values of “ Aac--” For' the same reason, any error which may have been introduced by arbitrarily assuming a to be unity cannot be serious.
The situation is much less favorable with respect to Ao h -. This constant can be obtained from the slope of Fig. 2. Using5b Aw = 0.292 X 10⁻¹⁴ we get Aoh - = (9 ± 2) 1010 *, but this can only be considered an approximate value, because our assumption about a is a rather drastic one, and also because the slope is very sensitive to small errors in “ /cao--” It is not surprising that it should be difficult to evaluate Ao h - with any precision from experiments in which the contribution of reaction 2 is at most 15%. At first sight, it would seem more promising to evaluate Ao h - from the experiments where the relative contribution of reaction 2 is largest, i.e., from the experiments carried out in the absence of acetic acid. However, it is just in these experiments that the value of [OH- ] is most affected by small errors in the initial chlorine concentration, and—more important—by our lack of knowledge of a. (The situation is particularly unsatisfactory because of the fact that if we assume a > 1, i.e., Ao h - > A4, [OH- ] gets smaller, and Ao h - gets correspondingly larger. In other words, assuming a very high value of Aon- leads to a very high value of Ao h -, and vice versa.) Furthermore, equation I lia shows that when [HAc]0 = 0, the relative contribution of OH - either increases or decreases perceptibly as the reaction proceeds, unless a is exactly unity. Therefore, “ fcAo -” may also either increase or decrease, although to a much lesser extent. No such change was observed. Still, it is possible that the value of “ AAc-” obtained for each experiment represents in reality only a mean value over the range of .r measured. This possibility somewhat detracts from the experimental reliability of reactions 7 to 10.
It should also be mentioned that whatever our assumption about a, we cannot explain why the rate constant in experiment 7 is so much higher than in experiment 10. Since in the former run a is higher than in the latter, equations I lia and IY would lead us to expect the opposite. Unless this is due to experimental error and the uncertainties described above, an additional factor must be operative in the absence of acetic acid, which we have not yet taken into account.
For all these reasons we cannot utilize the experiments carried out in the absence of acetic acid for the calculation of a more accurate value of Aon and have to content ourselves with the very approximate value given above. This value shows reaction 2 to be diffusion controlled. The rate constant even seems unusually high, but in view of the high mobility of the hydroxyl ion, not prohibitively so.
The assumption that reactions 1, 2 and 3 all contribute to the observed rate thus explains all our data, and gives reasonable values of the rate constants involved.
However, the high values of Ao h - lead to an inconsistency with the observed rate of exchange of radioactive chlorine between HOC1 and Cl- .8 * In spite of this, we believe that the evidence of reactions 1 to 6, and 7 to 10, taken together, shows that reaction 3 alone cannot explain our results. An additional reaction must always make a certain contribution; the increase of this contribution with decreasing acidity seems inevitably to point to reaction 2. But if at these very low concentrations of OH- (0.2 to 2.0 X 10⁻¹⁰ mole l.-1) this reaction is to make an appreciable contribution, it must have the high rate constant found by us. The plausibility of this value of Ao h - will be further discussed in a later paper.
It might be added that of course reaction 2 alone cannot explain the observed rate. Firstly, the hydroxyl ions cannot be supplied fast enough. Secondly, the values of Ao h - would be impossibly high, and would vary from one experiment to the other (Ao h - = 2 X 10¹² and 2 X 10u, for experiments I and 10, respectively). Thirdly, such an assumption is contradicted by the straight line obtained in Fig. 2, which cuts the “ 1cac-” axis at a value very different from zero.
AppendixCalculation of Aac --—-When the back reaction in
the hydrolysis of chlorine is neglected, equation II is easily integrated and yields
,------n-------1 \ T - Ui---------x L(x) + const. = AA<r t (V)Ahso/Aac- + [Ac ]0 — a 1 '
(8) The rate of exchange of radioactive chlorine between Cl~ and HO Cl in alkaline solution was found by Anbar and co-workers(M. Anbar, S. Guttmann and It. Rein, J. Am. Chem. Soc., 81, 1816(1959)) to follow the rate law: v =* fc[H+][HOCl][Cl- ] with k ^ >k,'H2O; the authors therefore assumed the exchange reaction to be different from reaction 1, and to take place without the formation of elementary chlorine. On the other hand, when elementary chlorine is formed in a reaction involving HOC! and C l- , we should certainly expect isotopic exchange to take place% Therefore, if reaction 2 is indeed as fast as we have found, it should compete with the above rate law at high values of pH, so that beginning at pH ~ 11, the rate of exchange should decrease with increasing pH far less steeply than was found experimentally. This inconsistency was pointed out to us by the Referee.
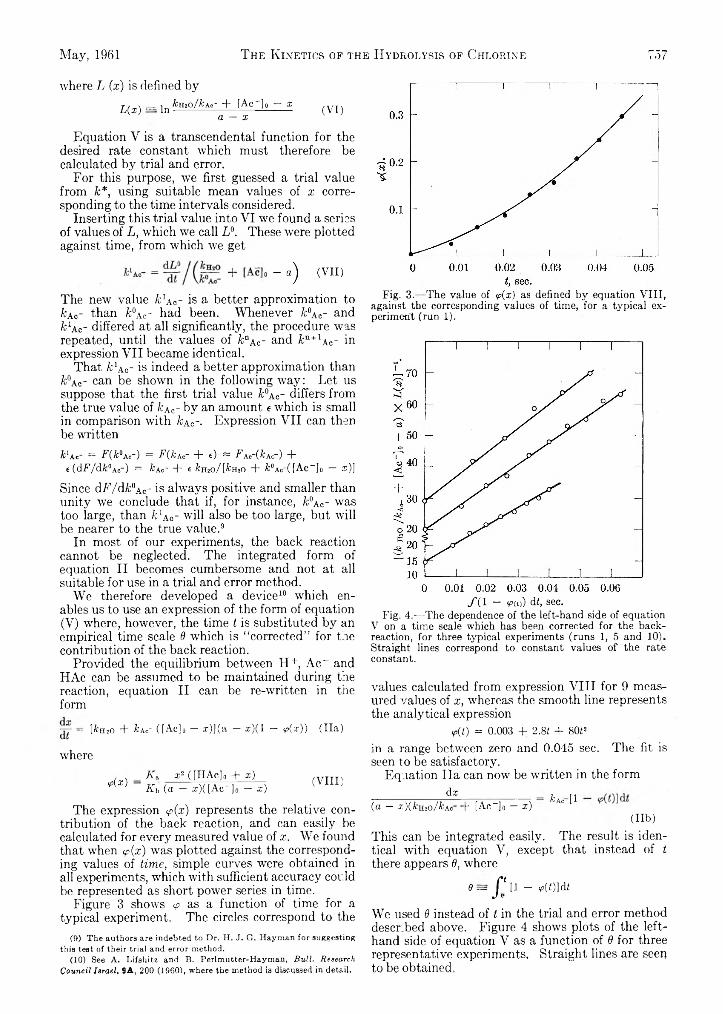
The Kinetics of the Hydrolysis of Chlorine 757
where L (x) is defined byL(x) = In kmo/k^ + iAc~]o ~ ^ ( V I)
a — x
Equation V is a transcendental function for the desired rate constant which must therefore be calculated by trial and error.
For this purpose, we first guessed a trial value from k*, using suitable mean values of x corresponding to the time intervals considered.
Inserting this trial value into VI we found a series of values of L, which we call L°. These were plotted against time, from which we get
^ - “ ) (T,I>The new value fcAc- is a better approximation to 7cac- than k°ac- had been. Whenever fc°a c- and fcJAC- differed at all significantly, the procedure was repeated, until the values of kna c- and kn + 1 a c - in expression VII became identical.
That fc^o- is indeed a better approximation than k°Ac- can be shown in the following way: Let us suppose that the first trial value k°A<r differs from the true value of 7ca0- by an amount e which is small in comparison with &a c- . Expression VII can then be writtenk1 Ac- = F(k°A<r) = FfiCAc- + «) “ FAc-(kAc-) + t(dF/dk°Ao-) = kAo- + e io io /l fc io + k°A<r( [Ac“ ]o — a)]
Since dF/dk°AC- is always positive and smaller than unity we conclude that if, for instance, k°a c - was too large, than kl&0- will also be too large, but will be nearer to the true value.9
In most of our experiments, the back reaction cannot be neglected. The integrated form of equation II becomes cumbersome and not at all suitable for use in a trial and error method.
We therefore developed a device10 which enables us to use an expression of the form of equation(V) where, however, the time t is substituted by an empirical time scale 9 which is “ corrected” for the contribution of the back reaction.
Provided the equilibrium between H+, A c“ and HAc can be assumed to be maintained during the reaction, equation II can be re-written in the form
= [kmo + kAc~ ( [Ac]0 - ar)](a - z ) ( l - <p(x)) (Ha)
where
May, 1961
, , Aa Xs ( [HAc]o + x) ‘Ax> K h (a - a:)([Ac-]o - x)
(VIII)
The expression <p(x) represents the relative contribution of the back reaction, and can easily be calculated for every measured value of x. We found that when <p(x) was plotted against the corresponding values of time, simple curves were obtained in all experiments, which with sufficient accuracy could be represented as short power series in time.
Figure 3 shows <p as a function of time for a typical experiment. The circles correspond to the
(9) The authors are indebted to Dr. H. J. G. Hayman for suggesting this test of their trial and error method.
(10) See A. Lifshitz and B. Perlmutter-Hayman, Bull. Research Council Jsrael, 9A, 200 (I960), where the method is discussed in detail»
Fig. 3.:—The value of <p(x) as defined by equation VIII, against the corresponding values of time, for a typical experiment (run 1).
f { 1 — vm) di, sec.Fig. 4.— The dependence of the left-hand side of equation
V on a time scale which has been corrected for the back- reaction, for three typical experiments (runs 1, 5 and 10). Straight lines correspond to constant values o f the rate constant.
values calculated from expression VIII for 9 measured values of x, whereas the smooth line represents the analytical expression
v,(t) = 0.003 + 2.81 + 80i2in a range between zero and 0.045 sec. The fit is seen to be satisfactory.
Equation Ha can now be written in the formdfc
(a — x )(fcH2o/&Ac b [Ac- ]» — x) ^Ac ^(U b)
This can be integrated easily. The result is identical with equation V, except that instead of t there appears d, where
0 = f * [1 - rfOldt
We used 9 instead of t in the trial and error method described above. Figure 4 shows plots of the left- hand side of equation V as a function of 6 for three representative experiments. Straight lines are seep to be obtained.
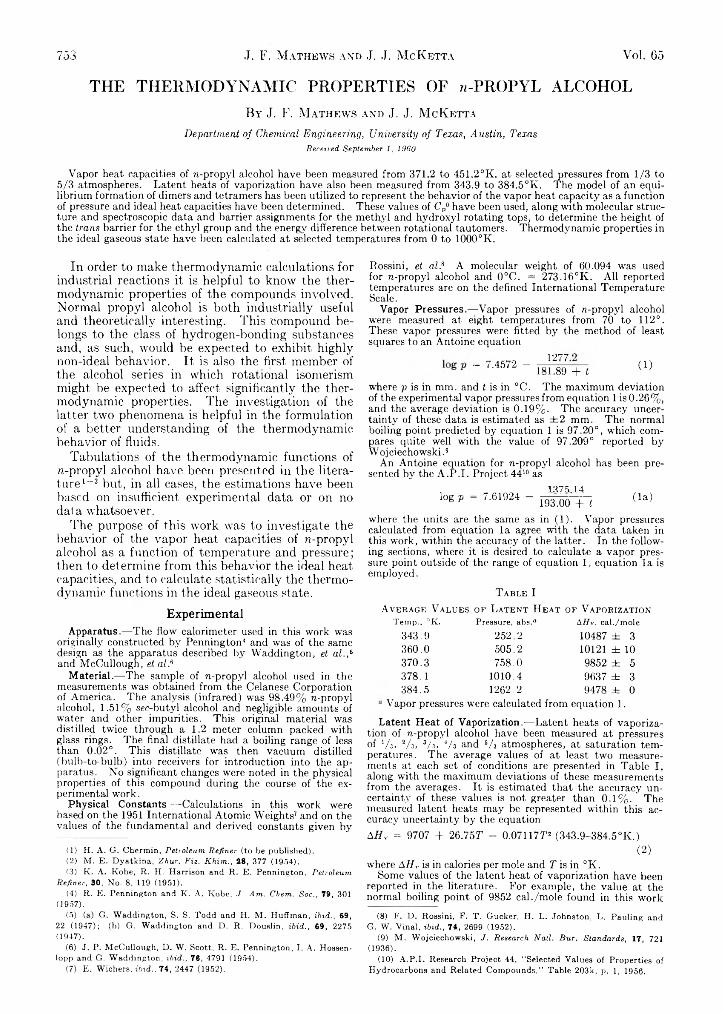
753 J. F. Mathews and J. J. McKetta Vol. 65
T H E T H E R M O D Y N A M I C P R O P E R T I E S O F » - P R O P Y L A L C O H O L
By J. F. Mathews and J. J. M cK etta
Department of Chemical Engineering, University of Texas, Austin, TexasReceived, September 1, 1960
Vapor heat capacities of ra-propyl alcohol have been measured from 371.2 to 451.2°K. at selected pressures from 1/3 to 5/3 atmospheres. Latent heats of vaporization have also been measured from 343.9 to 384.5 °K. The model of an equilibrium formation of dimers and tetramers has been utilized to represent the behavior of the vapor heat capacity as a function of pressure and ideal heat capacities have been determined. These values of Cp° have been used, along with molecular structure and spectroscopic data and barrier assignments for the method and hydroxyl rotating tops, to determine the height of the trans barrier for the ethyl group and the energy difference between rotational tautomers. Thermodynamic properties in the ideal gaseous state have been calculated at selected temperatures from 0 to 1000°K.
In order to make thermodynamic calculations for industrial reactions it is helpful to know the thermodynamic properties of the compounds involved. Normal propyl alcohol is both industrially useful and theoretically interesting. This compound belongs to the class of hydrogen-bonding substances and, as such, would be expected to exhibit highly non-ideal behavior. It is also the first member of the alcohol series in which rotational isomerism might be expected to affect significantly the thermodynamic properties. The investigation of the latter two phenomena is helpful in the formulation of a better understanding of the thermodynamic- behavior of fluids.
Tabulations of the thermodynamic functions of n-propyl alcohol have been presented in the literature1“ 3 but, in all cases, the estimations have been based on insufficient experimental data or on no data whatsoever.
The purpose of this work was to investigate the behavior of the vapor heat capacities of /¡-propyl alcohol as a function of temperature and pressure; then to determine from this behavior the ideal heat capacities, and to calculate statistically the thermodynamic functions in the ideal gaseous state.
ExperimentalApparatus.— The flow calorimeter used in this work was
originally constructed by Pennington4 5 and was of the same design as the apparatus described by Waddington, et al.? and McCullough, et al.6
Material.— The sample of ra-propyl alcohol used in the measurements was obtained from the Celanese Corporation of America. The analysis (infrared) was 98.49% ra-propyl alcohol, 1.51% sec-butyl alcohol and negligible amounts of water and other impurities. This original material was distilled twice through a 1.2 meter column packed with glass rings. The final distillate had a boiling range of less than 0.02°. This distillate was then vacuum distilled (bulb-to-bulb) into receivers for introduction into the apparatus. No significant changes were noted in the physical properties of this compound during the course of the experimental work.
Physical Constants.— Calculations in this work were based on the 1951 International Atomic Weights7 and on the values of the fundamental and derived constants given by
(1) H. A. G. Chermin, Petroleum Refiner (to be published).(2) M. E. Dyatkina, Zhur. Fiz. Khim., 28, 377 (1954).13) K. A. Kobe, R. H. Harrison and R. E. Pennington, Petroleum
Refiner, 30, No. 8, 119 (1951).(4) R. E. Pennington and K. A. Kobe, .7. Am. Chem. Soc., 79, 301
(1957).(5) (a) G. Waddington, S. S. Todd and H. M. Huffman, ibid., 69,
22 (1947); (b) G. Waddington and D. R. Douslin, ibid., 69, 2275 (1947).
(6) J. P. McCullough, D. W. Scott, R. E. Pennington, I. A. Hossen- iopp and G. Waddington, ibid., 76, 4791 (1954).
(7) E. Wichers, ibid., 74, 2447 (1952).
Rossini, et al? A molecular weight of 60.094 was used for ra-propyl alcohol and 0°C. = 273.16°K. All reported temperatures are on the defined International Temperature Scale.
Vapor Pressures.— Vapor pressures of ra-propyl alcohol were measured at eight temperatures from 70 to 112°. These vapor pressures were fitted by the method of least squares to an Antoine equation
- 7-4“ - ¡ ¡ S r i (1>where p is in mm. and t is in °C. The maximum deviation of the experimental vapor pressures from equation 1 is 0.26%, and the average deviation is 0.19%. The accuracy uncertainty of these data is estimated as ± 2 mm. The normal boiling point predicted by equation 1 is 97.20°, which compares quite well with the value of 97.209° reported by Wojciechowski.9
An Antoine equation for ra-propyl alcohol has been presented by the A .P .I. Project 4410 as
1375 14l0* P = 7-61924 - 1 9 3 1 )0 + ! (U )
where the units are the same as in (1). Vapor pressures calculated from equation la agree with the data taken in this work, within the accuracy of the latter. In the following sections, where it is desired to calculate a vapor pressure point outside of the range of equation 1, equation la is employed.
T able IA verage V alues of L atent H eat of V aporization
Temp., °K. Pressure, absA A77v, cal./mole343.9 252.2 10487 ± 3360.0 505.2 10121 ± 10370.3 758.0 9852 ± 5378.1 1010.4 9637 ± 3384.5 1262,2 9478 ± 0
Vapor pressures were calculated from equation 1.
Latent Heat of Vaporization.— Latent heats of vaporization of ra,-propyl alcohol have been measured at pressures of Vs, 2A, 3/a, 4/ 3 and ‘ A atmospheres, at saturation temperatures. The average values of at least two measurements at each set of conditions are presented in Table I, along with the maximum deviations of these measurements from the averages. It is estimated that the accuracy uncertainty of these values is not greater than 0.1% . The measured latent heats may be represented within this accuracy uncertainty by the equationAHv = 9707 + 26.75T - 0.07117T2 (343.9-384.5°K.)
(2)where A H v is in calories per mole and T is in °K.
Some values of the latent heat of vaporization have been reported in the literature. For example, the value at the normal boiling point of 9852 cal./mole found in this work
(8) F. D. Rossini, F. T. Gucker, H. L. Johnston. L. Pauling and G. W. Vinal, ibid., 74, 2699 (1952).
(9) M. Wojciechowski, J. Research Natl. Bur. Standards, 17, 721 (1936).
(10) A.P.I. Research Project 44, “ Selected Values of Properties of Hydrocarbons and Related Compounds," Table 203k, p. 1, 1956.
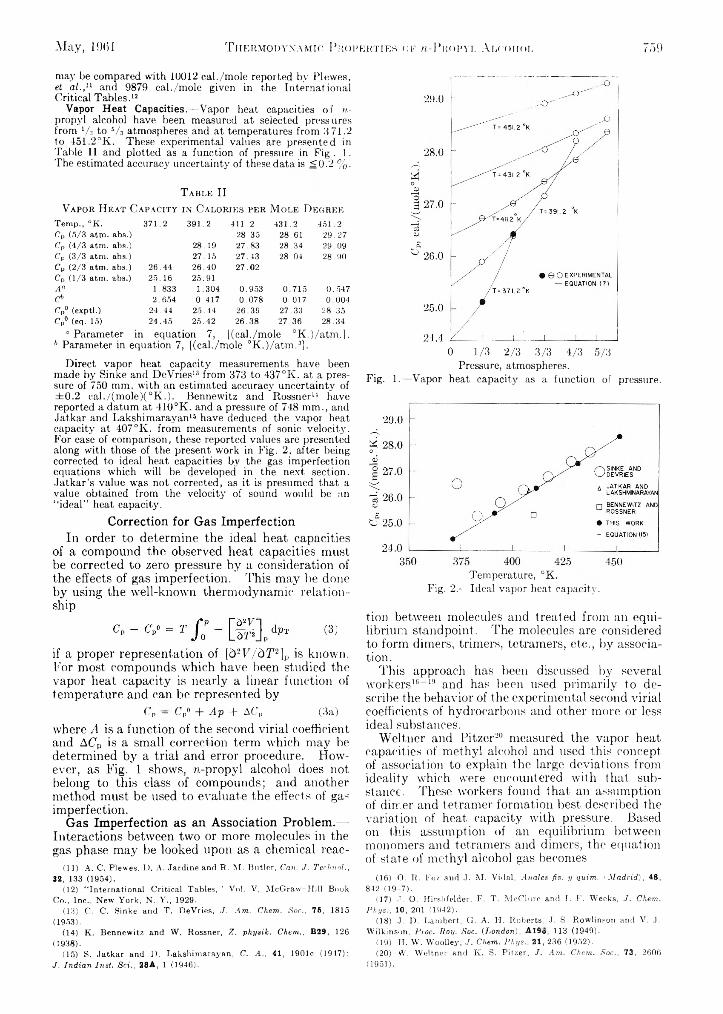
May, 1961 T hermodynamic Properties of «-P ropyl Alcohol 759
may be compared with 10012 cal./mole reported by Plewes, et al.,n and 9879 cal./mole given in the International Critical Tables.12
Vapor Heat Capacities.— Vapor heat capacities o f re- propyl alcohol have been measured at selected pressures from Vs to s/3 atmospheres and at temperatures from .'171.2 to 451.2°K. These experimental values are presented in Table II and plotted as a function of pressure in P ig. 1. The estimated accuracy uncertainty of these data is ¿0 .2 % .
T able IIV apor H eat C apacity in C alories per M ole D egree
Temp,, °K. 371.2 391.2 411.2 431.2 451.2Cp (5/3 atm. abs.) 28.35 28.61 29.27Cp (4/3 atm. abs.) 28.19 27.83 28.34 29.09Cp (3/3 atm. abs.) 27.15 27.43 28.04 28.90Cp (2/3 atm. abs.) 26.44 26.40 27.02Cp (1/3 atm. abs.) 25.16 25.91Aa 1.833 1.304 0.953 0.715 0.547& 2.654 0.417 0.078 0.017 0.004Cp° (exptl.) 24.44 25.44 26.39 27.33 28.35Cp° (eq. 15) 24.45 25.42 26.38 27.36 28.34
“ Parameter in equation 7, [(cal./mole °K .)/atm .]. 6 Parameter in equation 7, [(cal./mole °K .)/atm .3].
Direct vapor heat capacity measurements have been made by Sinke and DeVries13 from 373 to 437°K. at a pressure of 750 mm. with an estimated accuracy uncertainty of ± 0 .2 cal./(m ole)(°K .). Bennewitz and Rossner11 have reported a datum at 410°K. and a pressure of 748 mm., and Jatkar and Lakshimarayan15 have deduced the vapor heat capacity at 407°K. from measurements of sonic velocity. For ease of comparison, these reported values are presented along with those of the present work in Fig. 2, after being corrected to ideal heat capacities by the gas imperfection equations which will be developed in the next section. Jatkar’s value was not corrected, as it is presumed that a value obtained from the velocity of sound would be an “ ideal” heat capacity.
Correction for Gas ImperfectionIn order to determine the ideal heat capacities
of a compound the observed heat capacities must be corrected to zero pressure by a consideration of the effects of gas imperfection. This may be done by using the well-known thermodynamic relationship
if a proper representation of [d2 V/dT2]p is known. For m ost com pounds which have been studied the vapor heat capacity is nearly a linear function of tem perature and can be represented by
C p — C p° 4- A p + ACP (3a)
where A is a function o f the second virial coefficient and A(7P is a small correction term which m ay be determined by a trial and error procedure. H ow ever, as Fig. 1 shows, n-propyl alcohol does not belong to this class o f com pounds; and another m ethod must be used to evaluate the effects of gas im perfection.
Gas Imperfection as an Association Problem.—Interactions between tw o or more molecules in the gas phase m ay be looked upon as a chemical reac-
(11) A. C. Plewes, D. A. Jardine and R. M. Butler, Can. J. Technol., 32, 133 (1954).
(12) “ International Critical Tables,” Vol. V, McGraw-Hill Book Co., Inc., New York, N. Y., 1929.
(13) C. C. Sinke and T. DeVries, J. Am. Chem. Soc., 75, 1815 (1953).
(14) K. Bennewitz and W. Rossner, Z. physik. Chem., B29, 126 (1938).
(15) S. Jatkar and D. Lakshimarayan, C. A., 41, 1901c (1947); J. Indian Inst, Sci., 28A, 1 (1946).
0 1/3 2/3 3/3 4/3 5/3Pressure, atmospheres.
Fig. 1.— Vapor heat capacity as a function of pressure.
Temperature, °K.Fig. 2.— Ideal vapor heat capacity.
tion between molecules and treated from an equilibrium standpoint. The molecules are considered to form dimers, trimers, tetramers, etc., by association.
This approach has been discussed by several workers16" 19 and has been used primarily to describe the behavior of the experimental second virial coefficients of hydrocarbons and other more or less ideal substances.
Weltii er and Pitzer20 measured the vapor heat capacities of methyl alcohol and used this concept of association to explain the large deviations from ideality which were encountered with that substance. These workers found that an assumption of dimer and tetramer formation best described the variation of heat capacity with pressure. Based on this assumption of an equilibrium between monomers and tetramers and dimers, the equation of state of methyl alcohol gas becomes
(16) O. R. Fez and J. M. Vidal, Anales fis. y quim. (Madrid), 48, 842 (1947).
(17) J. O. Hirshfelder, F. T. McClure and I. F. Weeks, J. Chem. Phys., 10, 201 (1942).
(18) J. D. Lambert, G. A. II. Roberts, J. S. Rowlinson and V. J. Wilkinson, Proc. Roy. Soc. {London), A19o, 113 (1949).
(19) H. W. Woolley, J. Chem. Phys., 21, 236 (1952).(20) W. Weltner and K. S, Pitzer, J. Am. Chem. Soc., 73, 2606
(1951),
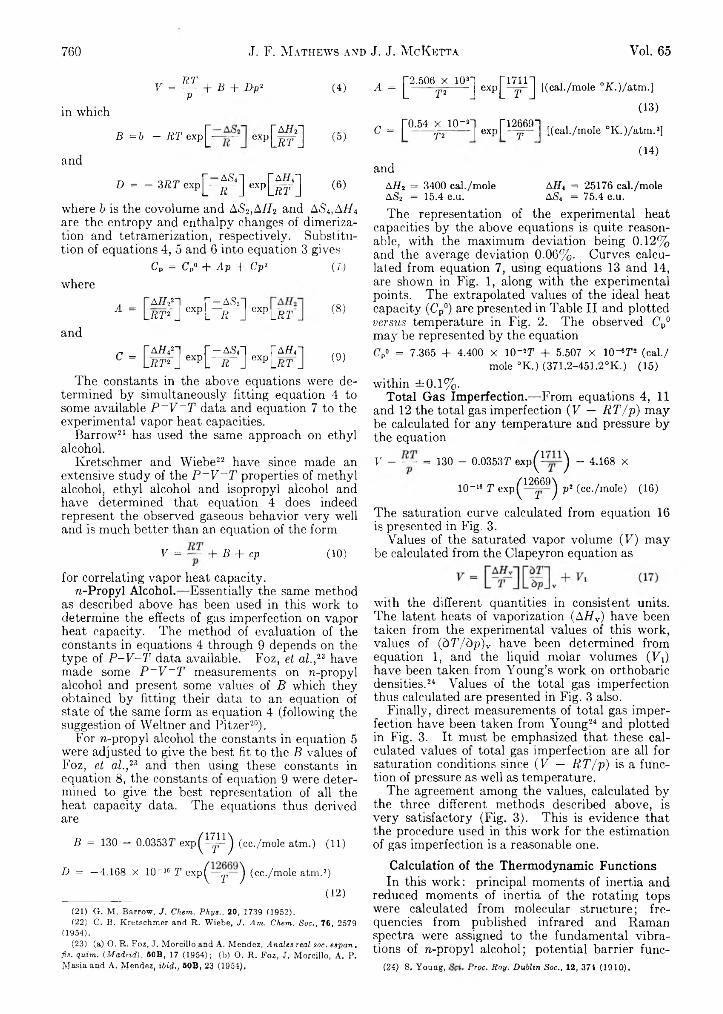
760 J. F. Mathews and J. J. McKetta Vol. 65
TITV = — + B + D p *
Vin which
B = b - R T exp[^— exp [ i ^ J
and
D - - 3 S T « p [ - ^ ] « p [ f f ( ]
(4) A - [ 2-5° y 103] e x p [ i ^ ] [(cal./mole °K.)/atm.]
(13)
(5) c - m1 f 12669"exp| —fjr- j [(cal./mole °K .)/atm .3]
and(14)
(6) AHi = 3400 cal./mole AHt = 25176 cal./moleAiS2 = 15.4 e.u. AjS4 = 75.4 e.u.
where b is the covolume and AS2,AHi and ASitAHi are the entropy and enthalpy changes of dimerization and tetramerization, respectively. Substitution of equations 4, 5 and 6 into equation 3 gives
Cp = Cp° + Ap + Cp3
where. I[A ff2n I |r - A S F 1A = |LRT* J exp L R J exp LRt ]
and„ IfA Í V I 1 !r - A s r i I fA ffr iC = |LRT* J exp L R J exp LRT j
(? )
(8)
(9)
The representation of the experimental heat capacities by the above equations is quite reasonable, with the maximum deviation being 0.12% and the average deviation 0.06%. Curves calculated from equation 7, using equations 13 and 14, are shown in Fig. 1, along with the experimental points. The extrapolated values of the ideal heat capacity (Cp°) are presented in Table II and plotted versus temperature in Fig. 2. The observed Cp° may be represented by the equation C y = 7.365 + 4.400 X 10~*T + 5.507 X lO“ 6! 72 (cal./
mole °K .) (371.2-451.2°K.) (15)The constants in the above equations were de
termined by simultaneously fitting equation 4 to some available P~V~T data and equation 7 to the experimental vapor heat capacities.
Barrow21 has used the same approach on ethyl alcohol.
Kretschmer and Wiebe22 have since made an extensive study of the P~V~T properties of methyl alcohol, ethyl alcohol and isopropyl alcohol and have determined that equation 4 does indeed represent the observed gaseous behavior very well and is much better than an equation of the form
V = ~ + B + cp (10)
for correlating vapor heat capacity.n-Propyl Alcohol.— Essentially the same method
as described above has been used in this work to determine the effects of gas imperfection on vapor heat capacity. The method of evaluation of the constants in equations 4 through 9 depends on the type of P -V -T data available. Foz, et al.,23 have made some P~V~T measurements on n-propyl alcohol and present some values of B which they obtained by fitting their data to an equation of state of the same form as equation 4 (following the suggestion of Weltner and Pitzer20).
For n-propyl alcohol the constants in equation 5 were adjusted to give the best fit to the B values of Foz, et al. , 23 and then using these constants in equation 8, the constants of equation 9 were determined to give the best representation of all the heat capacity data. The equations thus derived are
B = 130 — 0.0353T ex p ^ ^ j4 ^ (ec./mole atm.) (11)
D = —4.168 x 10⁻¹⁶ T exp^—y —^ (cc./m ole atm.3)
______________ (12)(21) G. M. Barrow, J. Chem. Phys., 20, 1739 (19S2).(22) C. B. Kretschmer and R. Wiebe, J. Am. Chem. Soc., 76, 2579
(1954).(23) (a) O. R. Foz, J. Morcillo and A. Mendez, Anales real soc. espan.
fis. quim. {Madrid), 50B, 17 (1954); (b) O. R. Foz, J, Morcillo, A, P, Masía and A, Mendez, ibid,, 50®, 23 (1954),
within ±0.1% .Total Gas Imperfection.— From equations 4, 11
and 12 the total gas imperfection (F — RT/p) may be calculated for any temperature and pressure by the equation
V — — = t30 — 0.0353r e x p ( 4 ~ ) - 4.168 X
10~16 T cxp(^ 69) p2 (cc./mole) (16)
The saturation curve calculated from equation 16 is presented in Fig, 3.
Values of the saturated vapor volume (F) may be calculated from the Clapeyron equation as
with the different quantities in consistent units. The latent heats of vaporization (AHv) have been taken from the experimental values of this work, values of (0T/dp)v have been determined from equation 1, and the liquid molar volumes (F,) have been taken from Young’s work on orthobaric densities.24 Values of the total gas imperfection thus calculated are presented in Fig. 3 also.
Finally, direct measurements of total gas imperfection have been taken from Young24 and plotted in Fig. 3. It must be emphasized that these calculated values of total gas imperfection are all for saturation conditions since (F — RT/p) is a function of pressure as well as temperature.
The agreement among the values, calculated by the three different methods described above, is very satisfactory (Fig. 3). This is evidence that the procedure used in this work for the estimation of gas imperfection is a reasonable one.
Calculation of the Thermodynamic FunctionsIn this work: principal moments of inertia and
reduced moments of inertia of the rotating tops were calculated from molecular structure; frequencies from published infrared and Raman spectra were assigned to the fundamental vibrations of n-propyl alcohol; potential barrier func-
(24) S, Young, Proc. Hoy. Dublin Soc., 12, 374 (1910),

May, 1961 Thermodynamic Properties of r-Propyl Alcohol 761
tions were assumed for two of the rotating tops, and thè parameters of the potential barrier of the third top were adjusted to give the best representation of the experimental ideal vapor heat capacities.
Rotational Tautomerism.—Rotation about the central carbon-to-carbon bond in R-propyl alcohol results in one trans and two skew rotational tautomers. These tautomers would be expected to have different moments of inertia and different normal vibrational frequencies. Pitzer26 has shown that the thermodynamic properties are approximately the same for each tautomer, and thus it is sufficient to make the calculations for only one form. According to Berthelot26 and Golik, et al. , 21 the mcst stable configuration of the R-propyl alcohol molecule is the planar, or trans form. Calculations in this work are based on the trans form.
Moments of Inertia of the R-Propyl Alcohol Molecule.—The product of the principal moments of inertia, and the reduced moments of the rotating tops were calculated using the formalized procedure of Kilpatrick and Pitzer.28
Since a direct determination of bond distances and bond angles in the R-propyl alcohol molecule has not been published, these quantities were estimated from those reported for methyl alcohol, ethyl alcohol and isopropyl alcohol.29 The values used were
Bond lengthsC -H 1.09 Â.C-C 1.54 Á. Bond anglesC -0 1.43 Â. C -O -H 110°O-H 0.96 Á. all others Tetrahedral
The calculated value of the product of the principal moments of inertia of the R-propyl alcohol molecule is 1695 X 10~m g.8 cm.6; and the reduced moments of inertia are 1.26, 4.59 and 16.34 (g. cm.2 X 1040) for the -OH, CH3- and C2H5- tops, respectively.
Fundamental Vibrational Frequencies.— Infrared and Raman spectra reported in the literature30-34 have been used to make the vibrational assignment as shown in Table III. Different designations of the fundamental vibrational modes could of course be made, but the calculation of the thermodynamic properties depends only on the magnitude of the vibrations and is not affected by incorrect designation.
Internal Rotation.— Simple threefold cosine hindering potentials were assumed for the methyl and
(25) K. S. Pitzer, J. Chem. Phys., 14, 239 (1946).(26) 6 . Berthelot, Compt. rend., 231, 1481 (1950).(27) A. Z. Golik, A. F. Skryshevskii and S. D. Ravikovich, C. A., 60,
7534d (1956) [Dopovidi Akad. Nauk, Ukr. R. S. R., 336 (1954)].(28) J. E. Kilpatriek and K. S. Pitzer, J. Chem. Phys., 17, 1064
(1949) .(29) “ Tables of Interatomic Distances and Configuration in Mole
cules and Ions,” Special Publication No. 11, The Chemical Society, London, 1958.
(30) A.P.I. Research Project 44, Catalog of Infrared Spectral Data, Serial No. 427.
(31) W. Braun, D. Spooner and M . Fenske, Ancd. Chem., 22, 1074(1950) .
(32) K. W. F. Kohlrausch, “ Ramanspektren,” Akademische Ver- lagesellschaft Becker and Erler, Kom.-Ges., Leipzig, 1943.
(3.3) E. K. Plyler, J. Research Natl. Bur. Standards, 48, 281 (1952).(34) J. R, Quinan and S. E. Wiberley, Anal, Chem., 26, 1762
(1954).
Fig. 3.— Total gas imperfection for the saturation curve.
hydroxyl rotating tops, and the barrier heights were selected by an inspection of the assignments for these barriers in similar compounds
.—Barrier heights, cal./mole— - C H r -SH -OH3310 16403100 16503300 8003100 800
T a b l e I I IT h e V ib r a t io n a l A ssig n m e n t
Fundamental,cm .-1 Designation
Fundamental, cm. ~l Designation
463 C -C -0 bend 1272 CH2 wag730 CH2 rock 1299 CH2 wag760 C -C -C bend 1341 CH2 twist860 C -C stretch 1381 CH3 sym. bend890 C -C stretch 1393 C -O -H bend971 CH, rock 1450 [2] 2 CH3 bend
1052 CHs rock 1463 and1066 C -0 stretch 1478 2 CH2 bend1103 CH2 rock 2940 [7] C -H stretches1220 CH2 twist 3680 O-H stretch
The potential barrier hindering the ethyl group was assumed to have the same form as the barrier used for 1-propanethiol by Pennington, et al. 36
This barrier has unequal minima and is described by two parameters: Vo, the height of the trans barrier and AEt, the energy difference between the trans and skew rotational tautomers. The contribution of the rotational tautomerism to the thermodynamic properties was calculated by the use of a model of an equilibrium between rotational tautomers.37 Vo and AEt were determined by fitting the calculated ideal vapor heat capacities to the experimentally determined values. The values selected were 2310 cal./mole for F0 and 850 cal./ mole for AEt.
From measurements on the variation of the intensities of Raman lines as a function of temperature, Berthelot26 has deduced the energy difference between the tautomers of liquid R-propyl alcohol
(35) J. P. McCullough, D. W. Scott, H. L . Finke, M . E. Gross, K. D. Williamson, R. E. Pennington, G. Waddington and H. M. Huffman, J. Am. Chem. Soc., 74, 2801 (1952).
(36) R. E. Pennington, D. W. Scott, H. L. Finke, J. P. McCullough, J. F. Messerly, I. A. Hossenlopp and G. Waddington, ibid., 78, 3266 (1956).
(37) K. S. Pitzer, J. Chem. Phys., 5, 473 (1937).
c 2i i6s h *BCeHvSH33C2H6OHaIl-C;H-OH (this work)
762 J. F. Mathews and J. J. McKetta Vol. 65by Parks, et al,,40 was not used to select- the internal rotational parameters. The accuracy of this datum as given by these authors is “ . . . probably accurate to within 1 or 2% . ” A value ofentropy as calculated in this work is compared with that of Parks, et al., in Table IV. The agreement is within the accuracy uncertainty of the latter.
Thermodynamic Functions.— The Cp°, S°, (Hr0 — H0°)/T, and (Ft0 — Ho0) /T functions of normal propyl alcohol in the ideal gaseous state were calculated at selected temperatures from 0-1000°K.
T able V
T hermodynamic P roperties in the I deal G aseous State“
Temp.,°K. Cp«,
cal./mole °K.s°,
cal./mole °K.(#T° - Ho»)/
T,cal./mole °K.
— (Ft0 — Ho»)/ T,
cal./mole °K.-H i» ,
kcal./moleAFf°,
kcal./mole log Kf»0 0 0 0 0 56.35 -5 6 .3 5 Infinite
273.16 19.67 75.86 13.95 61.91 61.51 -4 1 .2 4 32.99298.16 20.82 77.63 14.48 63.11 61.92 -3 9 .3 2 28.82300 20.91 77.75 14.52 63.19 61.95 -3 9 .1 8 28.54400 25.86 84.31 16.74 67.57 63.49 -3 1 .2 9 17.10500 30.51 90.54 19.04 71.50 64.78 -2 3 .0 7 10.08600 34.56 96.44 21.29 75.15 65.82 -1 4 .6 1 5.32700 38.03 102.02 23.43 78.58 66.67 - 6.00 1.87800 41.04 107.29 25.46 81.83 67.31 + 2.72 -0 .7 4900 43.65 112.27 27.32 84.94 67.80 + 11.51 -2 .8 0
1000 45.93 116.98 29.08 87.91 68.11 +20.36 -4 .4 5“ To retain internal consistency some of the values in this table are given to more decimal places than are justified by their
absolute accuracy.
to be 820 ± 120 cal./mole (mean value from —80 to +30°).
The restricted rotator contributions to the thermodynamic properties were taken from the tables of Pitzer and Gwinn38 and from the extension of these tables by Li and Pitzer.39
Comparisons with Experimental Data.— With the information about rotation, vibration, internal rotation, etc., as discussed in the preceding sections, ideal gaseous heat capacities were calculated at temperatures corresponding to the experimental runs. These calculations (and all other calculations of thermodynamic properties in this work) are based on the rigid rotator, harmonic oscillator approximation, with interactions between rotation and vibration and among internal rotations neglected. It is desirable to include a term for the effects of anharmonicity on the thermodynamic properties, but in the present case there are insufficient data for this purpose.
A comparison between the calculated and experimental heat capacities in the ideal gaseous state is shown in Table II. The maximum deviation is 0.14% and the average deviation is 0.06%.The calculated Cp° fit the smoothed values of equation 15 somewhat better, with the maximum deviation being 0.08% and the average 0.06%.
The value of entropy of n-propyl alcohol given(38) K. S. Pitzer and W. D. Gwinn, J. Chem. Phys., 10, 428 (1942)..(39) J. C. M. Li and K. S, Pitzer, Jr., Phys. Chem,, 60, 466
(1956).
and are presented in Table V.The standard heat, standard free energy, and
common logarithm of the equilibrium constant for the formation of n-propyl alcohol by the reaction
GC (graphite) + 4H2 (gas) + * 0 2 (gas) =
1 - C3H,OH (gas) (18)have been computed at selected temperatures from 0 to 1000°K. and are presented in Table V. These functions were calculated by use of the heat of combustion of liquid n-propyl alcohol at 298.16°K. given by Rossini41 (482.15 ± 0.24 kcal./mole), the thermodynamic properties of carbon (graphite), hydrogen (gas) and oxygen (gas) given by Wag- man, et al.i2 and the energy values
A//,°[H 20 (gas)]29s.i6°K. = —57797.9 cal./mole42Aif,°[C02 (gas)].98.i6°K. = —95041.8 cal./mole42A ifv[H20] 298.i6°K. = 10519.5 cal./mole42Ai7v[C3H7OH]21ig.160K. = 11356 cal./mole (eq. 2)
Acknowledgments.—This project was supported by a grant from the Esso Research and Engineering Company. The authors are grateful for this assistance. Mr. Mathews was the Humble Oil and Refining Fellow for one year of this work.
(40) G. S. Parks, K. Iv. Kelley and H. M. Huffman, J. Am. Chem. Soc„ 51, 1969 (1929).
(41) F. D. Rossini, J. Research Natl. Bur. Standards, 13, 189 (1934).
(42) D. D. Wagman, J. E. Kilpatrick, W. J. Taylor, K. S. Pitzer and F, D, Rossini, ibid,, 34, 143 (1945),
T able IV
Ijq u id E ntropy at 298.16°K. in Degree
<S° (calcd.)R In (p )“Gas imperfection'’A S /S (liquid)S (liquid, Third Law)''
C alories per M ole
77.637.18
- 0.04 -3 8 .0 9
46.6846.1 ± 0 .7
“ Vapor pressure at 298.16°K. calculated from equation la . b Calulated from equations 11 and 12. 'L atent heat of vaporization calculated from equation 2. d Parks, et al.40
May, 1961 K inetic Expressions for Competitive Processes in Solution 763
M O R E R I G O R O U S K I N E T I C E X P R E S S I O N S F O R C O M P E T I T I V E
P R O C E S S E S I N S O L U T I O N
B y R i c h a r d M. N c y e s
Department of Chemistry of the University of Oregon, Eugene, Oregon Received September 26, 1660
If the reactivitj' of a molecule depends significantly on the time since its formation, the yields from competitive processes may be influenced in characteristic ways. General equations are set up to describe the competition of unimolecular and bi- molecular processes for a reactive molecule formed singly as in a fluorescence quenching experiment. Approximate solutions developed previously for these equations are satisfactory to within one per cent, or better unless the unimolecular rate constant is greater than 109 sec.-1 and/or the viscosity of the medium is more than 0.1 poise. General equations are also developed for the competition of a bimolecular scavenger reaction with the combination processes when reactive radicals are produced in pairs. Approximate solutions developed previously are satisfactory unless scavenger concentrations are of the order of 1 mole/liter.
IntroductionWhen a reference molecule is formed at random
in a solution containing a normal distribution of molecules capable of reacting with it, the initial probability of reacting per unit of time is the value given by conventional theories of chemical kinetics. If the reference molecule exists for a finite time without reacting, the probability of reaction per unit of time falls and rapidly attains a new value that may be significantly less than the initial one if potential reactants have a high probability of reacting when they encounter each other.
This change in reactivity is associated with a locally depleted concentration of potential reactants. The problem can be treated either with equations for diffusion into an absorbing sink1 or with equations based on the behavior of an isolated pair of molecules.2 We have chosen the latter formulation.
If °k is the rate constant applicable to the initial reactivity and kt is the rate constant at time t after formation of the reference molecule, we have shown previously2 that
h = "k ( l - J'^k(l')dl'J (1)
where t' is a time between 0 and t and where h(t)dt is the probability that a reference molecule and a potential reactant that encountered without reacting at time zero will react with each other between t and t + dt later. We have shown subsequently3 that if diffusive displacements of reactive species are randomly directed regardless of the separation of the species, then
where a is a parameter having dimensions time1/' and
V = f " h(t)dt (3)
Hence, after very short times kt will be a linear function of t~'h as predicted also by the diffusion formulation.1
The time scales involved are too short for direct observation, but the effects of changing reactivity can influence yields of products formed by competitive processes. Two such types of
(1) M. v. Smoluchowski, Z. physik. Chem., 92, 129 (1917).(2) R. M. Noyes, J. Chem. Phys., 22, 1349 (1954).(3) R. M. Noyes, J. Am. Chem, Soc., 78, 5486 (1956).
competition seem to be most important. One involves unimolecular and bimolecular processes of a reactive species formed singly; it can be illustrated by the quenching of fluorescence in solution.4 The other involves bimolecular processes that can compete with the recombination of reactive species formed in pairs; it can be illustrated by the scavenging of free radicals.5
We have previously worked out approximate treatments for the effects of time-dependent, reactivity on quantities measurable in systems undergoing these types of competition. During the preparation of another manuscript,6 we realized that, somewhat more rigorous equations could be set up in order to describe these situations in terms of the model of molecular diffusion on which equation 2 is based. These rigorous solutions do not change the conclusions reached previously by more approximate methods. However, they show somewhat better how the results are influenced by successive levels of approximation, and they show how refinements can be introduced by mathematical or numerical methods if experimental techniques ever justify abandonment of the previous approximations.
Unimolecular Bimolecular CompetitionThe competition of unimolecular and bimolecular
processes has been discussed previously4 for the case of quenching of fluorescence, and we shall retain the same nomenclature. If A* is an excited molecule formed from A by light absorption, the competing processes are
k,A* — » A + hv (4)
fc q
Q - f A * > quenching (5)
The unimolecular rate constant h is independent of the age of A*, but the bimolecular constant kq varies according to equation 1. If h(t) is given by equation 2
fcq = °fcq(l - /S' + /S' erf x) (6)
where
* = §5 V i / t (HP
(4) R. M. Noyes, ibid., 7 9 , 551 (1957).(5) R. M. Noyes, ibid., 7 7 , 2042 (1955).(6) “ Progress in Reaction Kinetics,” edited by G. Porter, Perga
mon Press, London, England, to be published in 1961.
764 R ichard M. Noyes Yol. 65
erf x — — f e~xt Ax (8)\/ir JOLet S be the probability that an A molecule
that was excited at time zero is still excited at timet. Then
- j j f i= htS + kq[Q]S (9)
S = exp — | kit + °fcq( l — |8')[Q]t +
°M'1Q1 J J e r f x d i ' l (10)
The quantity observable experimentally is / , the steady state fluorescence from an illuminated solution. If f ° is the value in the absence of quencher, then we showed previously4 that
/ / / “ = J Q“ h S At (11)
The quantity often reported is the quenching constant, kex, defined by the equation
fc«[Q] = / “/ / - 1 = 1 /J Q” ksS At - 1 (12)
Different levels of approximation are appropriate for the application of these equations to experimental data. Level (1) is to omit the third term in the brackets in equation 10. To this level
k1c 'is - = J kt (13)
where fcq' is the limiting bimolecular rate constant for “ old” excited molecules. To this level of approximation, kex is a true constant independent of concentration of quencher as is usually assumed.
Level (2) is to approximate erf x by 2a/fi't'L so that the third term in equation 10 becomes 4a- °/cq [Q]i1/*. Such an approximation overemphasizes the effect of this term. To this level of approximation, the integral of equation 12 is exactly soluble. The rather complex solution is
k e x [Q] =
where
1 + Jl Q]( i - - 2 V E E L ) exp ( 4M Q 1 V V l + J[ Q] / \! + -7b•7[Ql)
K — a^kq/kt1/*
1
(14)
(15)Except for an unfortunate misprint in equation 22 of the previous reference,4 this result is not significantly different from that equation. Somewhat similar expressions have been derived by Weller.7
Level (3) is to use numerical integration or series methods to obtain a numerical solution exact to the validity of equation 2. Such a solution would be inexact only because of the truly negligible effects of reaction during times less than about 10-15 second.
It is instructive to examine the conditions under which the different levels of approximation are called for. Level (1) neglects the third term in equation 10; this neglect is permissible if
erf x At’ « (1 — p')t (16)
Since erf x can never be greater than unity, this(7) A. Weller, Z. physik. Chem. (Frankfurt), 13, 335 (1957); 15, 438
(1958); Z. Elektrochem., 64, 55 (1960).
approximation will always be valid if /3'<<1. Hence level (1) is always a satisfactory solution unless the quenching reaction is so efficient that there is significant probability of reaction during every encounter of potential reactants.
Even if the quenching reaction is very efficient, level (1) is still a satisfactory approximation unless K is comparable to J in magnitude. Equations 13 and 15 give
K _ akj1/’ .J 1 - / 3' ( ‘
The parameters a and /3' can be related to parameters for diffusive behavior.6 The result is
1 8 (1 + 4 á 7) UJ3'),A (18)where p is the encounter diameter of reactants and D' is the diffusion coefficient for relative motion. The approximation of the last expression in equation 18 assumes °kq » A-wpI)'. This assumption is fairly good for a truly diffusion controlled reaction, and a /( l — /3') will be smaller than this approximation for any less efficient quenching process.
For small molecules, p is a few times 10-8 cm. In ordinary solvents of centipoise viscosity, D ' is of the order of 10 ~6 cm.2/sec. For such conditions, K/J will be 0.01 when k¡ is about 108 sec.-1, and level (1) will be a satisfactory approximation for smaller values of k{. The value of k¡ at which the level (1) approximation begins to fail will vary approximately inversely as the viscosity for more viscous solvents. Data by Bowen and Metcalf8 on the quenching of anthracene fluorescence by carbon tetrabromide illustrate situations where the level (2) approximation is necessary.
Equation 14 overcorrects for the effect of the third term in equation 10. Increasing viscosity and increasing k( make for greater percentage deviations from the predictions of level (1), but these same conditions reduce the importance of the quenching process and also reduce the dependence of fcex on [Q], It is not clear that the approximation of level (3) will be required to describe situations in which the fluorescent intensity is reduced enough to be of experimental interest. Certainly level (2) is satisfactory in solvents of centipoise viscosity unless kt is considerably larger than 109 sec.-1.
Scavenging of Species Formed in PairsThe kinetics of scavenging processes also have
been discussed previously.6 The competing processes are
IL- + R»------ R , (19)
Ro- + S P (20)kr
Ro- + R — > R 2 (21)where the subscript zero designates a species formed in a specific dissociation, and the R in equation 21 indicates a species from a different dissociation.
(8) E. J. Bowea and W. S. Metcalf, Proc. Roy. Soc. (London), 206A, 437 (1951).
May, 1961 K inetic Expressions for Competitive Processes in Solution 765
The rate constants depend on the ages of the reactive radicals, the time dependence being
k, = «k. ( l - J ‘ L(J')dl'^ (22)
kr = °kr ( l - f * hr(i')dt'^ (23)
Let d be the probability that a radical produced with a partner at time zero is still unreacted at time t; it is similar to the S of the previous section. Then
Aa- g j = fc.[S]fl + 2fcr[R]0 +
h/ (6 exp j - 2 J ’J !k. [S] + 2fc[R]l di'| (24)
The factor of two arises in the kt terms because two radicals are destroyed in equation 21 and the rate constant is defined in the conventional manner for the process as written. The exponential term multiplying h/(t) is the probability that neither of the original radicals from the dissociation has reacted with a scavenger or with a radical from a separate dissociation. The hT'(t) function in equation 24 will be the same as K(t) in equation 23 if radicals are formed by thermal dissociation of R2; it will be different if they are formed photo- chemically or by dissociation of a different molecule as in the case of azoisobutyronitrile.
The solution of equation 24 isB = j l - J oV ( i ' ) e - / o l* .f8 ]+ 2 fc [R l)< u 'd i ,|
g - f o (MS] + 2MR]]di' (25)
The quantity accessible experimentally is 4>, the fraction of the radicals produced that react with scavenger by process 20 rather than reacting with other radicals. We can write
h[S]ed t<i> = _ £ ________
/ ; - © d<= J o“ US]0di (26)
Equations 25 and 26 represent a general solution to the problem. As in the previous section, application to experimental data can employ different levels of approximation.
Level (1) is to assume that hT'(t) falls to a negligible value while the exponential terms in equation 25 are still close to unity and also to assume that the rate constants can be replaced by their long-time values ks' and fcr'. This is the approximation for dilute concentrations of scavenger that cannot compete with secondary recombination. At this level of approximation
_ (1 - ff'o)fc.'[S1fcs'[S] + 2fcr'[R] (27)
where /V refers to recombination of Rir radicals from the initial dissociation.
This result could have been written by inspection.
It implies that 4> depends upon the steady-state concentration of radicals. However, if a scavenger is sufficiently efficient that it can compete with secondary recombination at high concentrations, then $ = 1 — fio' over a wide range down to very low scavenger concentrations.
Level (2) is to assume that the rate constants have their long-time values but that the term in brackets in equation 25 attains a limiting value before the exponential term multiplying the brackets has changed much. To this level of approximation, the previous argument6 indicates that the first-order term in a series expansion would replace the 1 — /V in equation 27 by 1 — /V + 2ar- \/27r(,V[S]-l-2fcr'[R ]) where ar is the a parameter for the radical recombination process. The term in [R] will always be negligible compared to the one in [S]. Roy, Williams and Hamill9 obtained a similar type of expression for the concentration dependence of <t>.
Level (3) is to use numerical methods to evaluate 6 as a function of time and then to use the results for a numerical solution of equation 26.
The experimental conditions for different approximation levels can be selected rather easily. The value of k/ cannot be much greater than 1010 liter/mole sec., and [R] will usually be much less than and will probably never be greater than 10 ~7 mole/liter. Then $ = 1 — /V will certainly be valid to better than 1% if k„'[S] > 106 sec.“ 1; it will probably be valid at lower concentrations of scavenger than are required for this inequality. Very low concentrations of a reactive scavenger are needed before the more complicated form of equation 27 must be used.
The approximation of level (2) begins to be significant when arv /8irfca'[S] becomes of the order of 0.01. The parameter ar is given by8
a , =2pr2V ' kD t'
kr (° M 1 +4 : ir p r D r '\2
°kr )
(28)
where pr and D/ refer specifically to the radical recombination. If /V is significant compared to unity, it is hard to assign values to the parameters so that ar is much more than 10-7 secW. The value of k,' cannot be much more than about 1010 l./mole sec. Than [S] must be over 0.01 mole/1. before the approximation of level (2) is necessary.
Subsequent terms in the series expansion of the equations for level (2) will not contribute 0.01 to $ until [S] is of the order of 1 mole/1. and presumably level (3) need not be applied until concentrations of this order are attained.
Acknowledgment.—This work was supported in part by the United States Atomic Energy Commission under Contract AT(45-1)-1310.
(9) J. C. Roy, R. R. Williams, Jr., and W. H. Hamill, J. Am. Chem. Soc., 76. 3274 (1954).
766 D. H. Desty and W. T. Swanton Yol. 65
G A S - L I Q U I D C H R O M A T O G R A P H Y — S O M E S E L E C T I V E S T A T I O N A R Y
P H A S E S F O R H Y D R O C A R B O N S E P A R A T I O N S
By D. H. D esty and W. T. Swanton
The British Petroleum Company Limited, Petroleum Division, BP Research Centre, Chertsey Road, Sunbury-on-ThaniesMiddlesex, England
Received September 22, I960
7,8-Benzoquinoline and certain related compounds at temperatures up to 100° have proved very selective for the separation of close boiling aromatic hydrocarbons, particularly m- and p-xylene. More volatile compounds containing condensed aromatic rings employed at 20° have also been found to be selective for lower boiling paraffin, olefin and naphthene hydrocarbons, especially 2,3-dimethylbutane and 2-methylpentane. Separations achieved are discussed in the light of activity coefficients, derived thermodynamic data and electron polarizabilities of the solutes per unit volume. Selectivities are also compared to the standard liquid, squalane.
IntroductionDespite the rapid development of capillary
columns and the very high efficiencies which they make accessible, selective stationary phases still have an important part to play in gas-liquid chromatography even in the resolution of close boiling hydrocarbon mixtures. For example the separation of m-xylene and p-xylene has been of considerable interest for some time and partial separations of these isomers have been described with various stationary phases in long packed columns1-5 and capillary columns.6 Recently, a remarkable separation of these isomers was reported with a solid absorbent, montmorillonite, treated with a long chain amine.7 Langer, et al.,% have described the use of various tetrahalophthalic esters where the formation of molecular complexes between the solute and solvent molecules causes m-xylene to be eluted first, the reverse of the normal volatility order. In an earlier communication,10 the authors reported that the heterocyclic amine 7,8-benzoquinoline provided a degree of separation of the xylene isomers not previously attained on other stationary phases. As a result of this discovery various condensed ring structures similar to that of 7,8-benzoquinoline were examined and found to separate m- and p-xylene by varying degrees. Though the mechanism of the separation is still obscure, it is possible to relate the degree of separation attained to the shape and structure of the stationary phase molecule and to the nature of the substituent groups.
Some of the compounds employed are much too volatile to be of real use above room temperature and several were examined at 20° for possible selectivities amongst the lower boiling paraffin, olefin and naphthene hydrocarbons and some in-
(1) A. Zlatkis, L. O’Brien and P. R. Scholly, Nature, 181, 1794(1958) .
(2) A. Zlatkis, S. Ling and H. R. Kaufmann, Anal. Chem., 31, [5] 945 (1959).
(3) R. P. W. Scott, unpublished work.(4) J. Bohemen and J. H. Purnell, “ Gas Chromatography,” ed.
D. H. Desty, Butterworths, London, 1958, p. 20.(5) R. P. W. Scott and J. D. Cheshire, Nature, 180, 702 (1957).(6) M. J. E. Golay, ref. 4, 1959, p. 20.(7) M. A. Hughes, D. White and A. L. Roberts, Nature, 184, 1797
(1959) .(8) S. H. Langer, C. Zahn and G. Pantazopolos, Chemistry and In
dustry, 1145 (1958).(9) S. H. Langer, C. Zahn and G. Pantazopolos, J. Chromatog., 3,
154 (1960).(10) D. H. Desty, A. Goldup and W. T. Swanton, Nature, 183, 107
(1959).
teresting results have been obtained. The present paper discusses these results and compares the selectivity of each stationary phase with the standard compound squalane. Solute-solvent interactions and the separations achieved are discussed in the light of derived thermodynamic data and activity coefficients and calculated electron polarizabilities for the solutes in question.
TheoreticalThe Specific Retention Volume, Activity Coef
ficient and the Partial Molar Excess Functions.—The specific retention volume, Vg, defined as the volume of dry gas required to elute a sample, corrected to 0° per g., of stationary phase is given by the equation
G = Fmt PaV 0
» x i x f-t m (i)
whereFm = gas flow rate measured at ambient temp., Tm °K. t = time between air and sample peak maxima w = weight of stationary phase
j = compressibility factor, | [j p . / p ) » -----1JPi = inlet pressurep0 = outlet pressure, assumed here to be barometric
— ----- Dhill = correction for partial pressure of water vaporat Tm °K.
The specific retention volume is related to a partition coefficient, K, defined as the ratio of the weight of solute per unit volume in the liquid phase to that in the gas phase, at infinite dilution, by the equation
where
273K Tp (2)
P — density of stationary phase at the column temp., T°K.
Assuming ideal behavior in the gas phase the partition coefficient may be related to the activity coefficient of the solute in the solvent at infinite dilution, 7o, taking the pure solute liquid as the standard state, by the expression11
K = RTP M y°p 0
where
(3)
(11) P. E. Porter, C. H. Deal and F. H. Stross, J. Am. Chem. Soc.,78, 2999 (1956).
May, 1961 Gas-Liquid Chromatography 767
M = molecular weight of the solventp° = vapor pressure of the solute at the column temp.
T° K.
since K — Yj T p273
V. = 273R Myop» (4)
Thus the activity coefficient may be determined from the specific retention volume without a knowledge of the density of the stationary phase at the operating temperature.
For non-ideal behavior in the gas phase the activity coefficient calculated from equation 3 or 4 represents a hybrid activity coefficient for both liquid and mobile phases. Under these conditions the vapor pressure may be replaced by the fugacity, /, and the true activity coefficient of the solute in the solvent at infinite dilution, yt° is then given by
Ti0273R M V J (5)
The activity coefficient is the measure of departure from solution ideality and may be expressed in terms of the excess partial molar heat, entropy and free energy of solution (Af7sB, A$sE and A(?sE, respectively) by the equations
ÂGsE = AffsE - T a Sse (6)A(jse = RT In 7 ° and (7)
d In 7° AflsEd r I t T 2
The excess partial molar heat of solution (sometimes called the “ heat of mixing” ) can therefore be obtained at infinite dilution from the gradient of a plot of log y° against l/T.
Inserting A//gE and y° in equation 6, A.S'gF; can be obtained readily for any value of T.
The excess partial molar heat of solution can also be obtained from plots of log K vs. l/T or log Vg vs. l/T.11-13 The latter method is preferable since a knowledge of the density variations of the stationary phase with temperature is not required.
From equation 4, taking logarithms and dif-ferentiating w.r.t., T
d In Fg d In 7° ddT dT
butd In 7° AHsE
dT RT2
andd In p° AH,
dT RT2
where AH\ = partial molar latent heat of vaporisation of the solute
d In Vg ( A f f v - A f f s E ) dT RT2
. d In Tg AHv — AHsE■ • d fi/r) ~ r
(12) A. B. Littlewood, C. S. G. Phillips and D. T. Price, J. Chem. Soc., 1480 (1955).
(13) J. R. Anderson and K. H. Napier, Aust. J. Chem., 10, 250(1957).
Therefore a plot of log Vg vs. l/T is practically a straight line since temperature variations of AH\ and A//gE are fairly small. The slope, Z, is given by
„ AHv - AffsE
A similar procedure applied to equation 3 provides
d ln Kd(l ¡T )
A Hv A H s e - RT -R T 2 dp
p d rR
so that a plot of log K vs. l /T is a curve due to the added temperature dependence of the terms RT and RT2(d In p/dT). In some cases the latter term may be small (e.g., for squalane it amounts to ca. 0.3 kcal. over the range 20-100°) and can then be neglected. The gradient, Z, then provides the so- called “ apparent heat of solution,” of Porter, Deal and Stross,11 i.e.
AHv - AHse - RT 2.3 R
The apparent heat of solution can however be obtained more easily from the slope of the plot of log Vg vs. l/T, by subtracting the appropriate value of RT. The disadvantage of determining AHSE from such plots, however, is that A //v must be known fairly accurately since AifsE is usually small by comparison.
ExperimentalApparatus and Materials.— Glass columns (120 cm. long
and 0.4 cm. internal diameter), packed with Celite 545 (Johns Manville Limited), mesh size 72-100 BSS containing approximately 30% w ./w . of the stationary phase were employed in a vapor jacketed gas density meter apparatus similar to that described by Martin.12 13 14
High purity grade nitrogen (British Oxygen Company Limited) containing less than 10 p.p.m. of oxygen was employed as carrier gas and the pressure to the columns controlled by means of a mercury pressure regulator. The outlet pressure was barometric, and the gas flow rate measured by means of a soap bubble flow meter at ambient temperature. For retention volume measurements at 20°, the columns and gas density meter were thermostated to ±0 .05° by circulating water through the jacket from a constant temperature bath.
Higher temperatures were obtained by refluxing vapor through the jacket at atmospheric pressure. For a temperature of 56°, acetone was used as boiler liquid, 65.5° methanol, 78.5° ethanol, 81° cyclohexane, 101° methyl- cyclohexane. Variations in column temperature arising from the fluctuations in boiling point with atmospheric pressure amount to a maximum of ± 0 .5 ° .
The squalane used as the standard compound was Emba- phase quality (M ay and Baker Company Limited). Other stationary phases employed were recrystallized products from Light and Company Limited, with the exception of 7,8-benzoquinoline which was obtained from Gesellschaft fur Teerverwertung m.b.H. of Duisberg-Meiderich. The puritv of each hydrocarbon examined was above 99 mole %•
Procedure.— The column packings were prepared by dissolving a known weight of stationary phase in a suitable volatile solvent. The Celite, previously water washed to remove fines, dried at 300° and rescreened through a 72 mesh sieve to remove lumps, then was added to give 30% by weight of the stationary phase. The resulting slurry was well agitated so that the Celite particles were well covered with solution while the solvent was evaporated in a current of warm dry air. The dry and free flowing packing thus obtained was added a little at a time to the glass
(14) A. J. P. Martin and A. T. James, Biochem. J. (London), 63, 138(1956).
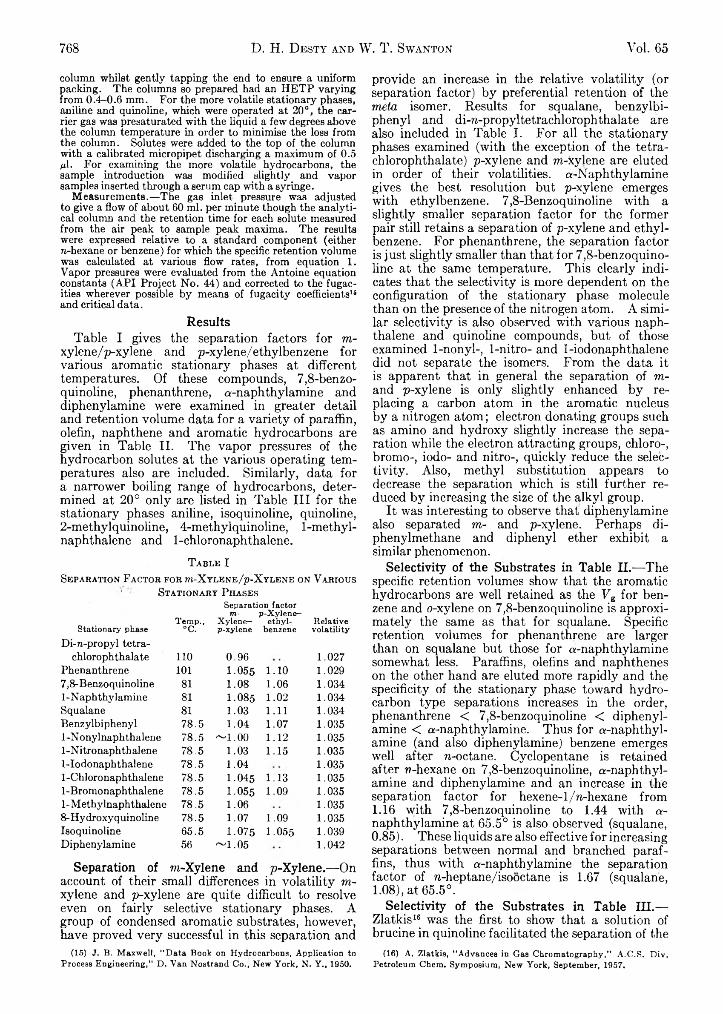
768 D. H. Desty and W. T. Swanton Vol. 65
column whilst gently tapping the end to ensure a uniform packing. The columns so prepared had an HETP varying from 0.<M).6 mm. For the more volatile stationary phases, aniline and quinoline, which were operated at 20°, the carrier gas was presaturated with the liquid a few degrees above the column temperature in order to minimise the loss from the column. Solutes were added to the top of the column with a calibrated micropipet discharging a maximum of 0.5 pi. For examining the more volatile hydrocarbons, the sample introduction was modified slightly and vapor samples inserted through a serum cap with a syringe.
Measurements.— The gas inlet pressure was adjusted to give a flow of about 60 ml. per minute though the analytical column and the retention time for each solute measured from the air peak to sample peak maxima. The results were expressed relative to a standard component (either n-hexane or benzene) for which the specific retention volume was calculated at various flow rates, from equation 1. Vapor pressures were evaluated from the Antoine equation constants (API Project No. 44) and corrected to the fugac- ities wherever possible by means of fugacity coefficients16 and critical data.
ResultsTable I gives the separation factors for m-
xylene/p-xylene and p-xylene/ethylbenzene for various aromatic stationary phases at different temperatures. Of these compounds, 7,8-benzo- quinoline, phenanthrene, a-naphthylamine and diphenylamine were examined in greater detail and retention volume data for a variety of paraffin, olefin, naphthene and aromatic hydrocarbons are given in Table II. The vapor pressures of the hydrocarbon solutes at the various operating temperatures also are included. Similarly, data for a narrower boiling range of hydrocarbons, determined at 20° only are listed in Table III for the stationary phases aniline, isoquinoline, quinoline, 2-methylquinoline, 4-methylquinoline, 1-methyl- naphthalene and 1-chloronaphthalene.
T a b l e ISe p a r a t io n F a c t o r f o r ot- X y l e n e / p - X y l e n e on V a r io u s
' St a t io n a r y P h a se sSeparation factor
m- p-Xylene-Stationary phase
Temp.,°C.
Xylene-p-xylene
ethylbenzene
Relativevolatility
Di-n-propyl tetra- chlorophthalate 110 0.96 1.027
Phenanthrene 101 1.055 1.10 1.0297,8-Benzoquinoline 81 1.08 1.06 1.0341-Naphthylamine 81 1.085 1.02 1.034Squalane 81 1.03 1.11 1.034Benzylbiphenyl 78.5 1.04 1.07 1.0351-N onylnaphthalene 78.5 ~ 1 .0 0 1.12 1.0351-Nitronaphthalene 78.5 1.03 1.15 1.0351-Iodonaphthalene 78.5 1.04 1.0351-Chloronaphthalene 78.5 1.045 1.13 1.0351-Bromonaphthalene 78.5 1.055 1.09 1.0351-Methylnaphthalene 78.5 1.06 1.0358-Hydroxy quinoline 78.5 1.07 1.09 1.035Isoquinoline 65.5 1.075 1.055 1.039Diphenylamine 56 ~ 1 .0 5 1.042
Separation of m-Xylene and p-Xylene.— Onaccount of their small differences in volatility m- xylene and p-xylene are quite difficult to resolve even on fairly selective stationary phases. A group of condensed aromatic substrates, however, have proved very successful in this separation and
(15) J. B„ Maxwell, “ Data Book on Hydrocarbons, Application to Process Engineering,” D, Van Nostrand Co., New York, N. Y ,, 1950.
provide an increase in the relative volatility (or separation factor) by preferential retention of the meta isomer. Results for squalane, benzylbi- phenyl and di-n-propyltetrachlorophthalate are also included in Table I. For all the stationary phases examined (with the exception of the tetra- chlorophthalate) p-xylene and m-xylene are eluted in order of their volatilities. a-Naphthylamine gives the best resolution but p-xylene emerges with ethylbenzene. 7,8-Benzoquinoline with a slightly smaller separation factor for the former pair still retains a separation of p-xylene and ethylbenzene. For phenanthrene, the separation factor is just slightly smaller than that for 7,8-benzoquino- line at the same temperature. This clearly indicates that the selectivity is more dependent on the configuration of the stationary phase molecule than on the presence of the nitrogen atom. A similar selectivity is also observed with various naphthalene and quinoline compounds, but of those examined 1-nonyl-, 1-nitro- and 1-iodonaphthalene did not separate the isomers. From the data it is apparent that in general the separation of m- and p-xylene is only slightly enhanced by replacing a carbon atom in the aromatic nucleus by a nitrogen atom; electron donating groups such as amino and hydroxy slightly increase the separation while the electron attracting groups, chloro-, bromo-, iodo- and nitro-, quickly reduce the selectivity. Also, methyl substitution appears to decrease the separation which is still further reduced by increasing the size of the alkyl group.
It was interesting to observe that diphenylamine also separated to- and p-xylene. Perhaps di- phenylmethane and diphenyl ether exhibit a similar phenomenon.
Selectivity of the Substrates in Table II.— Thespecific retention volumes show that the aromatic hydrocarbons are well retained as the Ve for benzene and o-xylene on 7,8-benzoquinoline is approximately the same as that for squalane. Specific retention volumes for phenanthrene are larger than on squalane but those for a-naphthylamine somewhat less. Paraffins, olefins and naphthenes on the other hand are eluted more rapidly and the specificity of the stationary phase toward hydrocarbon type separations increases in the order, phenanthrene < 7,8-benzoquinoline < diphenylamine < a-naphthylamine. Thus for a-naphthylamine (and also diphenylamine) benzene emerges well after n-octane. Cyclopentane is retained after n-hexane on 7,8-benzoquinoline, a-naphthylamine and diphenylamine and an increase in the separation factor for hexene-1/n-hexane from1.16 with 7,8-benzoquinoline to 1.44 with a- naphthylamine at 65.5° is also observed (squalane, 0.85). These liquids are also effective for increasing separations between normal and branched paraffins, thus with a-naphthylamine the separation factor of n-heptane/isooctane is 1.67 (squalane, 1.08), at 65.5°.
Selectivity of the Substrates in Table III.—Zlatkis16 was the first to show that a solution of brucine in quinoline facilitated the separation of the
(16) A. Zlatkis, “ Advances in Gas Chromatography,” A.C.S. Div„ Petroleum Chem. Symposium, New York, September, 1957,
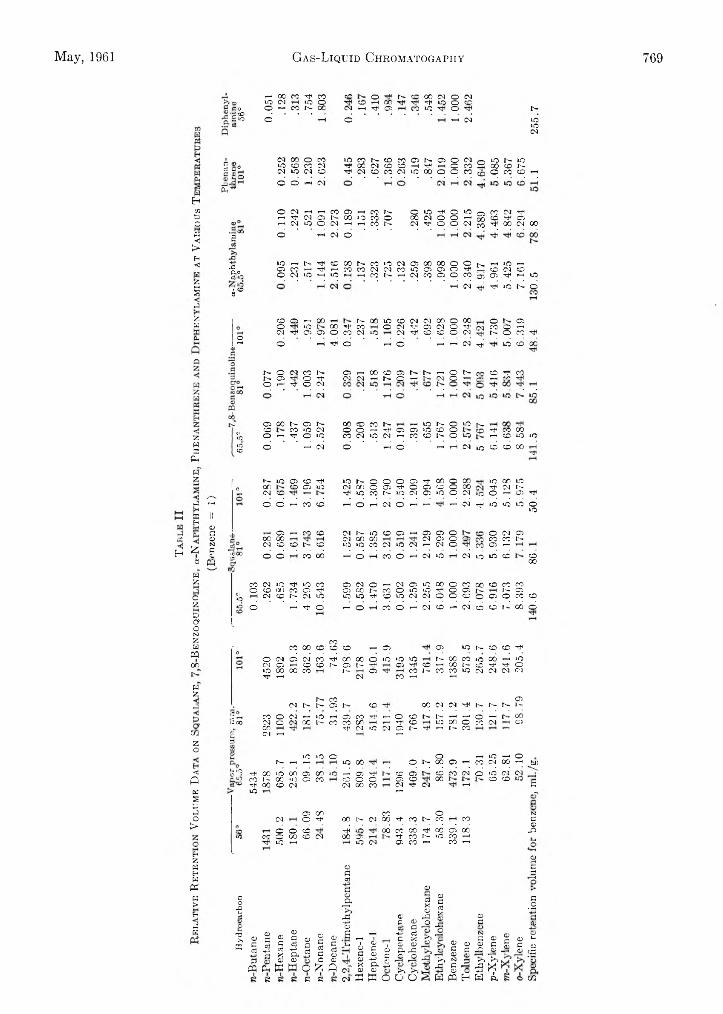
May, 1961 Gas-Liquid Chromatogaphy 769
HCQPOP5<1>H<JZspZwPH
,H CO CO t H CO CO o 1^. CD 00 CM o CMtO CM tO o CO 00 t H ID o CD
C o o T-H CO L - co CM rH Tf< o CO tO o r -• c oS o o O rH CM tO
1CCM
cc3 C °c £©£■**
.IP COa
»Cft®c«iO
i a
CM CO O CO i O C O N O C O O N O O N n i O N i Ot O CD CO CM r } < C O i M O c O H ^ H O M 3 O O 0 N(M l O C l CO ^ C I O C O C I i O C O O O M q O C O C O H
O O iH CM
O N h h c O O h WN OiO^OiOoCOClTtiHT?(MOiNCOOCOO CONOOh ^ co^ Oh C H O C M N h h C O N d ^ O O C l ^ ' I O O C l C OO H Cl O
«5h N ^ © C O N M iP(M03000000n hi O hOf OH^HWMCl dCOi OOi QO^Lc Oi NOOCliPHidHHCONHlMCOQOCOojOC^HiOC l Tt1 > 0 N O
CD © r_i 00 rH N* CO t o CO CM CM 00 O CO o a»o t o 00 Tt< CO o CM t H O i CM O T*l CO O tHCM rJH o i C i o c o CM LO CM t H CD CO o CM L~ o CO
2 © TH Tjn o r H O tH t-H CM TjH I D CD 00
N C C l CO N N 0 3 O ThO 1-t ^ O CM
OHCOOCiNNHONfftCO^CO N N H N O H N N O h q j h CO
«H
0 5 00 N O N CO CO CO N H lO N O iC Ncb CO to CM O o T-H Tf< C i C i tO CD o TH CO CO
z in o T-H Tf3 o to CO CM to CM »-H CO CD I 'r o up T— 1 CD LO to
HK
tnCO o rH CM o - 1 o - 1 CM to CD CD 00
h
HZ L - to C i CD t H to P - o O O C i Tt 00 o 00 to 00 to0 00 CD C i u j CM 0() o C i T t1 o C i CD o 00 T f CM L '-rH CM CD H Tf< to c o t - uo CM C i to o CM to o rH O i t H
»■ iP i-H o O T-H CO CD H o rH CM o rH T---1 rH CM T fl to to to o
toin 1!H ©
pH rH O i rH c o CD CM L - to CD C i rH C i C i o o CM o i© on 00 04 00 Of) CM O i o C i CO CO N
£S3aCL ¡0 0
CM
O
CD
O
CD l>
CO
CD
00
t i i
H
to
o
CO CM
CO
to
o
CM
rH
H
CM
CM
tO
o
CM
CO
to
U1
to
t- h
CD CD$ p -i 00ZWZ CO CM to TfH to CO C i CM o rH CM C i tO 00 o CO 00 CD CO CO
o CD (X) CO O i TfH C i oo L - CO o to to T f CD C l N O iO in CM CD L - CM to to to Th CD to CM CM o o CD o C i O CO CDz to o rH T fi o H o CO o rH CM CD rH CM CD CD t - 00 OpaoNJz COH CO 00 CD CD CD H C i C i to l> - CD CD T f
mo
o CM C i CM CO rH 00 00 o to to tO 1 - 00 CO tO 00 rb to00 CM O i rH CD CD r - C i 1 ^ Tt O i t H CD rH 00 t '- CD TP T f o
to CO 00 CO 1 - C i CO 1 - CO CO to CM CM CM CMTJ3 I-H CM CO r-H t-H
WZ
O iL - COP CM 1> L - C i L - CD 00 CM CM Tt< N r-~ L - 1 -
i s CO o CM rH to H C i CO T ti rH o CD L - L - rH rH O rH l> 00CM O CM 00 1>- CO CO on H+t CD t i i 00 o CO CM ©100 rt« CM to CM C i L - Tt* H 1 - CO rH
¡73 CD CM T-H rH
Zo
to to o o H to H or - rH tH to 00 1 O l> 00 C l tH CO CM 00 rH .W>< S'* TtH 00 >o 00 C i on tO -H C i TH CD C i CD CO CM o tO CM CM
0 o .“ ? CO f r a ) tip C i CO CO o O C i CD 00 CD CD sTF 00 CD CM P i U0 CO CM TjH CM HH to r—
sp
PP C i 00 CO o N3O CM o TH 00 3> CM CXJ T f CO h - CO CO P
>O o CO i 00 CO on t H 00 C i CO
©PC
m co o CXJ CD CM ■C i T f c o l '- to CO tHLO rH to CM <Ji CO tH CO rH
HZ ©
w o pH p pH crt
« p <D >P>Eh
co
rgCS
<v£<rP <V
<DP
c3Xo
rP
opc3X ©
p.2H3
P o "5P O rP p ©
H T3X
w
©Pc3-H
©po3
H-3P
©Pc3X©
©acS
-*HPh©
©Pc3
-P
QPc3PO
<DPc3oCO
BUH1
opo
rH6pDH-3
¿>po+3
H-3 C3P X D O PhLPp o
>>orP
"oo
X>
©pCD«S3
©P©
NP©Pr*
©P©
!>>
©PJD
©P©
©L-O
<g
m Ph w W O ^ i f l cm" X<x> PhD >i to <D rP Po orPH-3 X ©
c £ 6 cm' n W o u u H B B W ¿H m
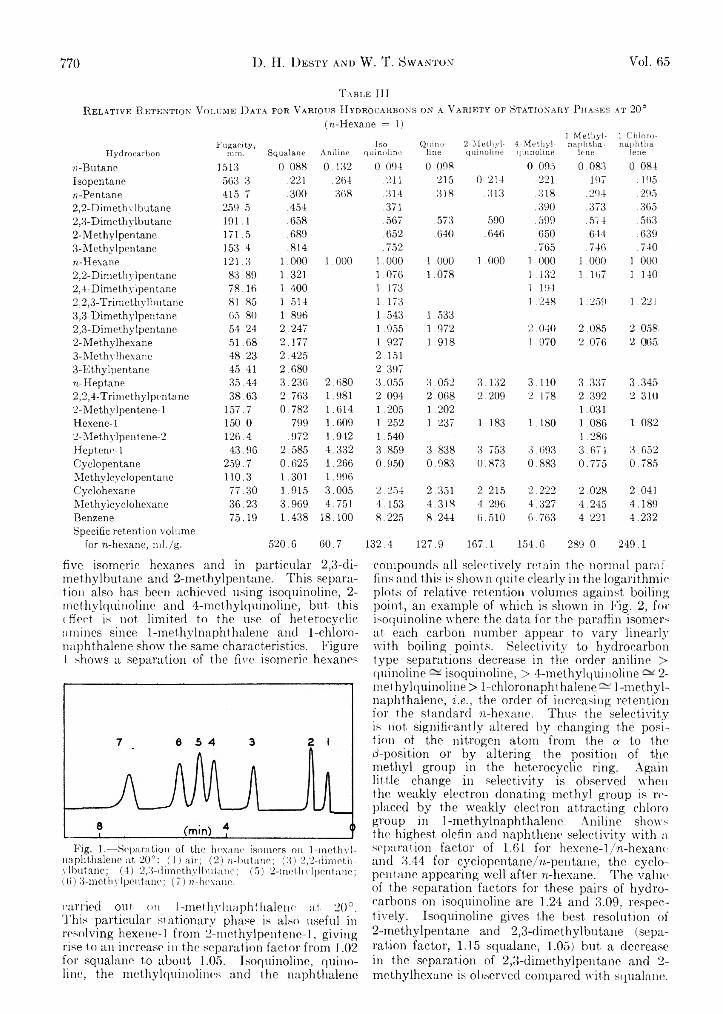
770 D. H. Desty and W. T. 8 wanton Vol. 65
T a b l e I I I
R e l a t iv e R e t e n t io n V o l u m e D a t a f o r V a r io u s H y d r o c a r b o n s o n a V a r ie t y o f St a t io n a r y P h a s e s a t 20°
(n-Hexane = 1)
HydrocarbonFugacity,mm. Squalane Aniline Isoquinoline
Quinoline
2-Methyl-quinoline
4-Methyl-quinoline1-Methyl- naphthalene
l-Chloro-naphtha-lene
«-Butane 1513 0.088 0.132 0.094 0.098 0.095 0.083 0.084Isopentane 563.3 .221 . 264. .211 .215 0.214 .221 .197 . 195«-Pentane 415.7 .300 .368 .314 .318 .313 .318 .294 .2952,2-Dimethylbutane 259.5 .454 .371 .390 .373 .3652,3-Dimethylbutane 191.1 .658 .567 .573 . 590 .599 .574 .5632-Methylpentane 171.5 .689 .652 . 640 .646 .050 . 644 .6393-Methv lpentane 153.4 .814 . 752 .765 . 746 740«-Hexane 121.3 1.000 1.000 1.000 1.000 1 .000 1 .000 1.000 1 .0002,2-Dimethylpentane 83.89 1.321 1.076 1.078 1 .132 1 .167 1.140'2,4-Dimethylpentane 78.16 1.400 1.173 1 .1942,2,3-Trimethylbutane 81.85 1.514 1.173 1 .248 1.259 1 221.3,3-Dimethylpent.ane 65.80 1.896 1.543 1.5332,3-Dimethylpentane 54.24 2.247 1.955 1.972 2.040 2.085 2.0582-Methylhexane 51.68 2.177 1.927 1 .918 1.970 2.076 2.0653-Methylhexane 48.23 2.425 2.1513-Ethylpentane 45.41 2.680 2.397«-Heptane 35.44 3.236 2.680 3.055 3.052 3.132 3.110 3.337 3.3452,2,4-Trimethylpentane 38.63 2.763 1.981 2.094 2.068 2.209 2.178 2.392 2.3102-Methvlpentene-l 157.7 0.782 1.614 1.205 1 .202 1.031Hexene-1 150.0 .799 1.609 1.252 1.237 1 .183 1.180 1.086 1. 0S22-Methylpentene-2 126.4 .972 1.942 1.540 1.286Heptene-1 43.96 2.585 4.332 3.859 3.838 3.753 3.693 3.674 3.652Cyclopentane 259.7 0.625 1.266 0.950 0.983 0.873 0.883 0.775 0.785Methylcyclopentane 110.3 1.301 1.996Cyclohexane 77.30 1.915 3.005 2.254 2.351 2.215 2.222 2.028 2.041Methylcyclohexane 36.23 3.969 4.751 4.153 4.318 4.. 296 4.327 4.245 4.189BenzeneSpecific retention volume
75.19 1.438 18.100 8.225 8.244 6.510 6.763 4.221 4.232
lor n-hexane, ml./g. 520.6 60.7 132.4 127.9 167.1 154.6 289.0 249.1
compounds all selectively retain the normal paraffins and this is shown quite clearly in the logarithmic plots of relative retention volumes against boiling point, an example of which is shown in Fig. 2, for isoquinoline where the data for the paraffin isomers at each carbon number appear to vary linearly with boiling points. Selectivity to hydrocarbon type separations decrease in the order aniline > quinoline — isoquinoline, > 4-methylquinoline — 2- methylquinoline > 1-chloronaphthalene — 1-methyl- naphthalene, i.e., the order of increasing retention for the standard n-hexane. Thus the selectivity is not significantly altered by changing the position of the nitrogen atom from the a to the /3-position or by altering the position of the methyl group in the heterocyclic ring. Again little change in selectivity is observed when the weakly electron donating methyl group is replaced by the weakly electron attracting cbloro group in 1-methylnaphthalene. Aniline shows, the highest olefin and naphthene selectivity with a. separation factor of 1.61 for hexene-1/n-hexane and 3.44 for cyclopentane/n-pentane, the cyclo- pentane appearing well after n-hexane. The value of the separation factors for these pairs of hydrocarbons on isoquinoline are 1.24 and 3.09, respectively. Isoquinoline gives the best resolution of 2-methylpentane and 2,3-dimethylbutane (separation factor, 1.15 squalane, 1.05) but a decrease in the separation of 2,3-dimethylpentane and 2- methylhexane is observed compared with squalane.
five isomeric hexanes and in particular 2,3-dimethylbutane and 2-methylpentane. This separation also has been achieved using isoquinoline, 2- methylquinoline and 4-methylquinoline, but this < fleet is not limited to the use of heterocyclic amines since 1-methylnaphthalene and 1-chloronaphthalene show the same characteristics. Figure 1 shows a separation of the five isomeric hexanes
Fig. 1.—Separation of the hexane isomers on 1-methylnaphthalene at 20°: (1) air; (2) »-butane; (:{) 2,2-dimoth- ylbutanc; (4) 2,3-dimethylbutane; (5) 2-methylpentane; tO) 3-mcthylpontune; (7) «-hexane.
carried out. on 1-methylnaphthalene at 20°. This particular stationary phase is also useful in resolving hexene-1 from 2-methylpentene-l, giving rise to an increase in the separation factor from 1.02 for squalane to about 1.05. Isoquinoline, quinoline, the methylquinolines and the naphthalene
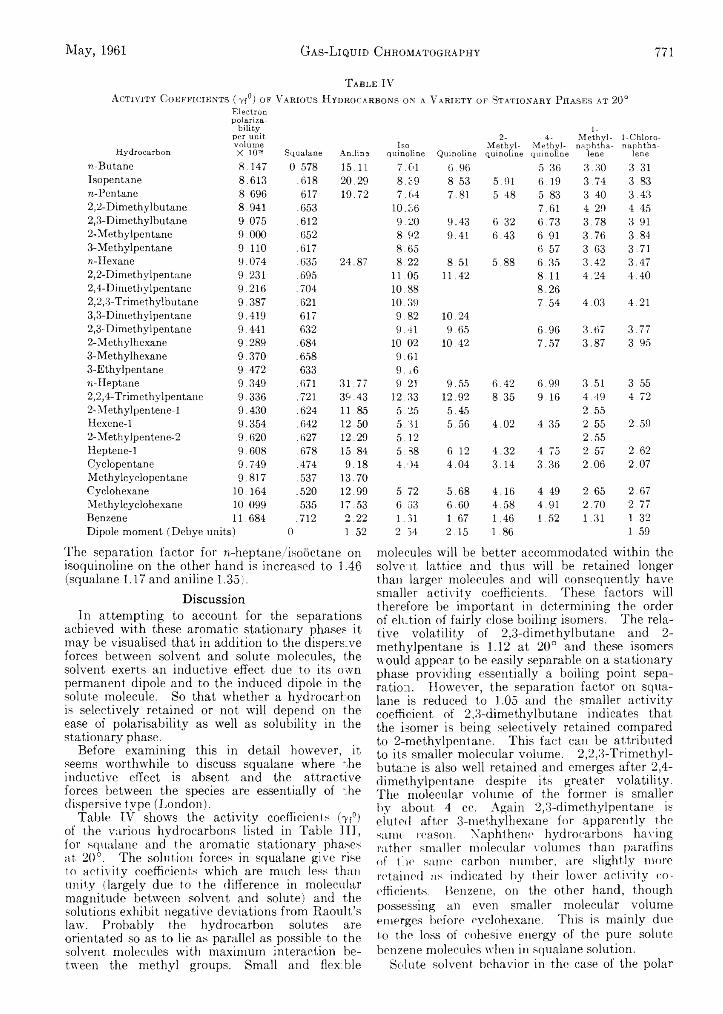
May, 1961 Gas-Liquid Chromatography 771
T a b l e IVA c t iv it y C o e f f ic ie n t s ( y f ° ) o f V a r io u s H y d r o c a r b o n s o n a V a r ie t y o f St a t io n a r y P h a s e s a t 20°
Electron polariza
bility 1-
Hydrocarbonper unit volume X 1026 Squalane Andine
Iso-quinoline Quinoline
2-Methyl-quinoline
4-Methyl-quinoLine
Methyl-naphtha
lene1-Chloro-naphtha-
lenera-Butane 8.147 0.578 15.11 7.01 6.96 5.36 3.30 3.31Isopentane 8.613 .618 20.29 8.39 8.53 5.91 6.19 3.74 3.83n-Pentane 8.696 .617 19.72 7.64 7.81 5.48 5.83 3.40 3.432,2-Dimethylbutane 8.941 .653 10.36 7.61 4.29 4.452,3-D imethylbutane 9.075 .612 9.20 9.43 6.32 6.73 3.78 3.912-Methylpentane 9.000 .652 8.92 9.41 6.43 6.91 3.76 3.843-Methylpentane 9.110 .617 8.65 6.57 3.63 3.71n-Hexane 9.074 .635 24.87 8.22 8.51 5.88 6.35 3.42 3.472,2-Dimethylpentane 9.231 .695 11.05 11.42 8.11 4.24 4.402,4-Dimethylpentane 9.216 .704 10.88 8.262,2,3-Trimethylbutane 9.387 .621 10.39 7.54 4.03 4.213,3-Dimethylpentane 9.419 .617 9.82 10.242,3-Dimethylpentane 9.441 .632 9.41 9.65 6.96 3.67 3.772-Methylhexane 9.289 .684 10.02 10.42 7.57 3.87 3.953-Methylhexane 9.370 .658 9.613-Ethylpentane 9.472 .633 9.16n-Heptane 9.349 .671 31.77 9.21 9.55 6.42 6.99 3.51 3.552,2,4-Trimethylpentane 9.336 .721 39.4.3 12.33 12.92 8.35 9.16 4.49 4.722-Methylpentene-l 9.430 .624 11.85 5.25 5.45 2.55Hexene-1 9.354 .642 12.50 5.31 5.56 4.02 4.35 2.55 2.592-Methylpentene-2 9.620 .627 12.29 5.12 2.55Heptene-1 9.608 .678 15.84 5.38 6.12 4.32 4.75 2.57 2.62Cyclopentane 9.749 .474 9.18 4.04 4.04 3.14 3.36 2.06 2.07Methylcyclopentane 9.817 .537 13.70Cyclohexane 10.164 .520 12.99 5.72 5.68 4.16 4.49 2.65 2.67Methylcyclohexane 10.099 . 535 17.53 6.33 6.60 4.58 4.91 2.70 2.77Benzene 11.684 .712 2.22 1.31 1.67 1.46 1.52 1.31 1.32Dipole moment (Debye units) 0 1.52 2.54 2.15 1.86 1.59
The separation factor for n-heptane/isooctane on isoquinoline on the other hand is increased to 1.46 (squalane 1.17 and aniline 1.35).
DiscussionIn attempting to account for the separations
achieved with these aromatic stationary phases it may be visualised that in addition to the dispersive forces between solvent and solute molecules, the solvent exerts an inductive effect due to its own permanent dipole and to the induced dipole in the solute molecule. So that whether a hydrocarbon is selectively retained or not will depend on the ease of polarisability as well as solubility in the stationary phase.
Before examining this in detail however, it seems worthwhile to discuss squalane where ’die inductive effect is absent and the attractive forces between the species are essentially of the dispersive type (London).
Table IV shows the activity coefficients (yt0) of the various hydrocarbons listed in Table III, for squalane and the aromatic stationary phases at 20°. The solution forces in squalane give rise to activity coefficients which are much less than unity (largely due to the difference in molecular magnitude between solvent and solute) and the solutions exhibit negative deviations from Raoult’s law. Probably the hydrocarbon solutes are orientated so as to lie as parallel as possible to the solvent molecules with maximum interaction between the methyl groups. Small and flexible
molecules will be better accommodated within the solvent lattice and thus will be retained longer than larger molecules and will consequently have smaller activity coefficients. These factors will therefore be important in determining the order of elution of fairly close boiling isomers. The relative volatility of 2,3-dimethylbutane and 2- methylpentane is 1.12 at 20° and these isomers would appear to be easily separable on a stationary phase providing essentially a boiling point separation. However, the separation factor on squalane is reduced to 1.05 and the smaller activity coefficient of 2,3-dimethylbutane indicates that the isomer is being selectively retained compared to 2-methylpentane. This fact can be attributed to its smaller molecular volume. 2,2,3-Trimethyl- butane is also well retained and emerges after 2,4- dimethylpentane despite its greater volatility. The molecular volume of the former is smaller by about 4 cc. Again 2,3-dimethylpentane is eiutod after 3-methylhexane for apparently the same reason. Naphthene hydrocarbons having rather smaller molecular volumes than paraffins of the same carbon number, are slightly more retained as indicated by their lower activity coefficients. Benzene, on the other hand, though possessing an even smaller molecular volume emerges before cyclohexane. This is mainly due to the loss of cohesive energy of the pure solute benzene molecules when in squalane solution.
Solute-solvent behavior in the case of the polar
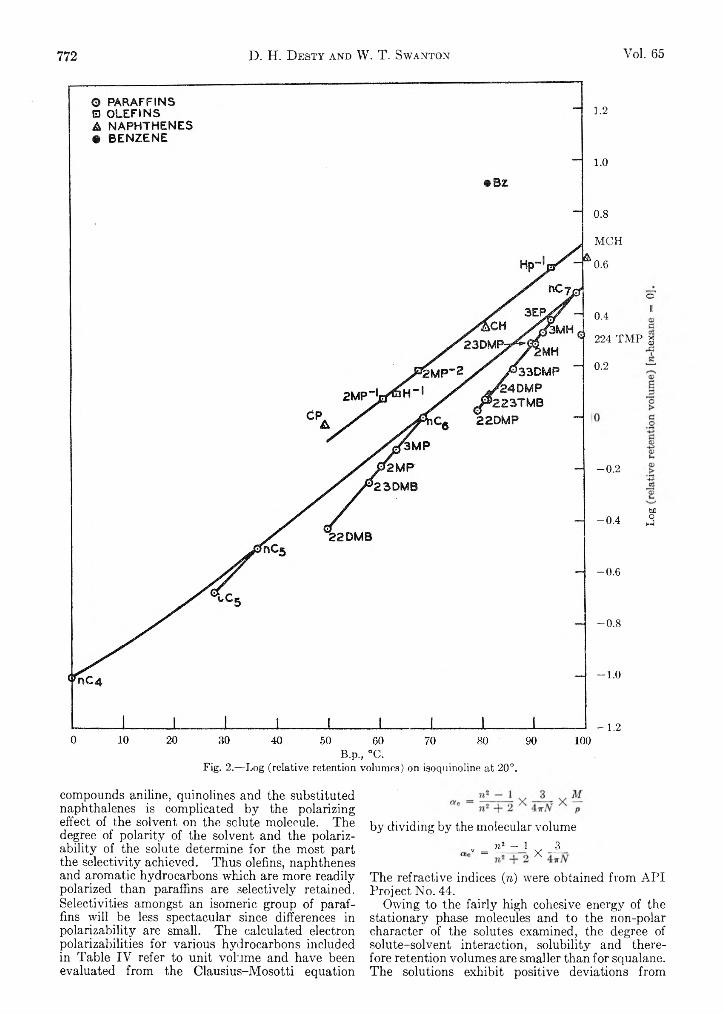
772 D. H. D esty and W. T. Swanton Vol. 65
B.p., °C.Fig. 2.—Log (relative retention volumes) on isoquinoline at 20°.
1.2
1.0
0.8
MCH
0.6
0.4
oII
224 TMP g
0.2 “
-0.2
-0 .45DOhJ
-0.6
-0.8
-1.0
-1.2
compounds aniline, quinolines and the substituted naphthalenes is complicated by the polarizing effect of the solvent on the solute molecule. The degree of polarity of the solvent and the polarizability of the solute determine for the most part the selectivity achieved. Thus olefins, naphthenes and aromatic hydrocarbons which are more readily polarized than paraffins are selectively retained. Selectivities amongst an isomeric group of paraffins will be less spectacular since differences in polarizability are small. The calculated electron polarizabilities for various hydrocarbons included in Table IV refer to unit volume and have been evaluated from the Clausius-Mosotti equation
by dividing by the molecular volume a v = » i n i x J L
The refractive indices (n) were obtained from API Project No. 44.
Owing to the fairly high cohesive energy of the stationary phase molecules and to the non-polar character of the solutes examined, the degree of solute-solvent interaction, solubility and therefore retention volumes are smaller than for squalane. The solutions exhibit positive deviations from
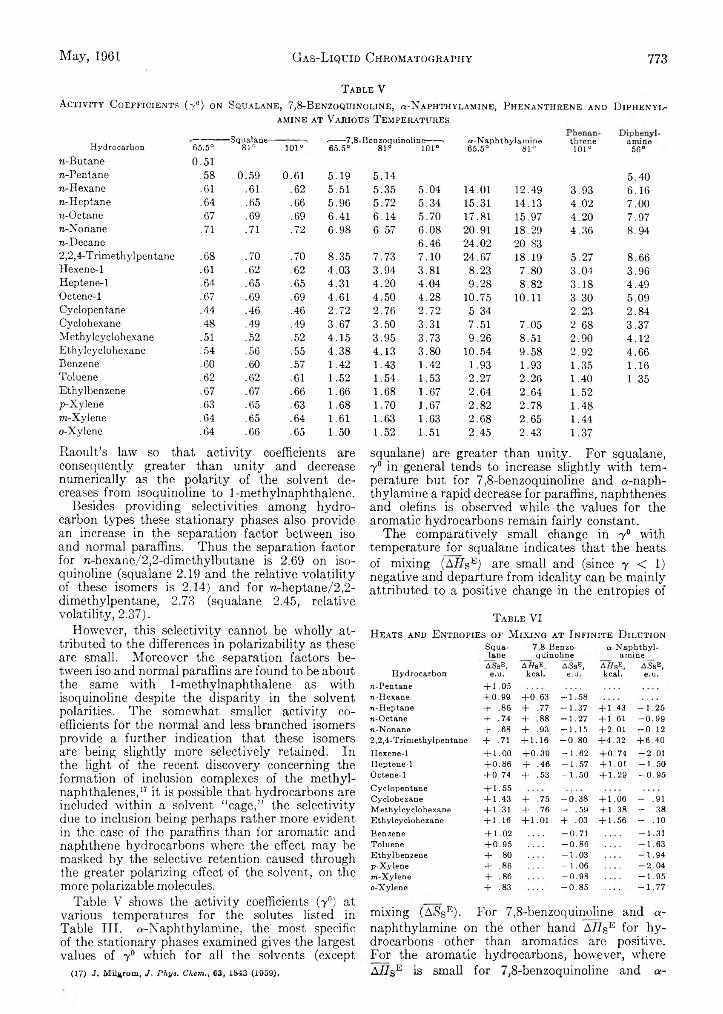
May, 1961 Gas-Liquid Chromatography 773
T a b l e VA c t iv it y C o e f f ic ie n t s ( 7 0) on S q u a l a n e , 7 ,8 -B e n zo q tiin o lin e , « - N a p h t h y l a m in e , P h e n a n t h r e n e an d D ip h e n y l -
a m in e a t V a r io u s T e m p e r a t u r e s
Hydrocarbon----------—Squalane— .----- 7,8-Benzoquimoline------- - a-Napht hylamine threne amine65.5° 81° 101° 65.5° 81° 101° 65.5° 81° 101° 56°
n-Butane 0.51n-Pentane .58 0.59 0.61 5.19 5.14 5.40n-Hexane .61 .61 .62 5.51 5.35 5.04 14.01 12.49 3.93 6.16n-Heptane .64 .65 .66 5.96 5.72 5.34 15.31 14.13 4.02 7.00n-Octane .67 .69 .69 6.41 6.14 5.70 17.81 15.97 4.20 7.97n-Nonane .71 .71 .72 6.98 6.57 6.08 20.91 18.29 4.36 8.94n-Decane 6.46 24.02 20.832,2,4-Trimethylpentane .68 .70 .70 8.35 7.73 7.10 24.67 18.19 5.27 8.66Hexene-1 .61 .62 .62 4.03 3.94 3.81 8.23 7.80 3.04 3.96Heptene-1 .64 .65 .65 4.31 4.20 4.04 9.28 8.82 3.18 4.49Octene-1 .67 .69 .69 4.61 4.50 4.28 10.75 10.11 3.30 5.09Cyelopentane .44 .46 .46 2.72 2.76 2.72 5.34 2.23 2.84Cyclohexane .48 .49 .49 3.67 3.50 3.31 7.51 7.05 2.68 3.37Methylcyclohexane .51 .52 .52 4.15 3.95 3.73 9.26 8.51 2.90 4.12Ethylcyclohexane .54 .56 .55 4.38 4.13 3.80 10.54 9.58 2.92 4.66Benzene .60 .60 .57 1.42 1.43 1.42 1.93 1.93 1.35 1.16Toluene .62 .62 .61 1.52 1.54 1.53 2.27 2.26 1.40 1.35Ethylbenzene .67 .67 .66 1.66 1.68 1.67 2.64 2.64 1.52p-Xylene .63 .65 .63 1.68 1.70 1.67 2.82 2.78 1.48m-Xylene .64 .65 .64 1.61 1.63 1.63 2.68 2.65 1.44o-Xylene .64 .66 .65 1.50 1.52 1.51 2.45 2.43 1.37
Raoult’s law so that activity coefficients are consequently greater than unity and decrease numerically as the polarity of the solvent decreases from isoquinoline to 1-methylnaphthalene.
Besides providing selectivities among hydrocarbon types these stationary phases also provide an increase in the separation factor between iso and normal paraffins. Thus the separation factor for n-hexane/2,2-dimethylbutane is 2.69 on isoquinoline (squalane 2.19 and the relative volatility of these isomers is 2.14) and for n-heptane/2,2- dimethylpentane, 2.73 (squalane 2.45, relative volatility, 2.37).
However, this selectivity cannot be wholly attributed to the differences in polarizability as these are small. Moreover the separation factors between iso and normal paraffins are found to be about the same with 1-methylnaphthalene as with isoquinoline despite the disparity in the solvent polarities. The somewhat smaller activity coefficients for the normal and less branched isomers provide a further indication that these isomers are being slightly more selectively retained. In the light of the recent discovery concerning the formation of inclusion complexes of the methyl- naphthalenes,17 it is possible that hydrocarbons are included within a solvent “ cage,” the selectivity due to inclusion being perhaps rather more evident in the case of the paraffins than for aromatic and naphthene hydrocarbons where the effect may be masked by the selective retention caused through the greater polarizing effect of the solvent, on the more polarizable molecules.
Table V shows the activity coefficients (70) at various temperatures for the solutes listed in Table III. a-Naphthylamine, the most specific of the stationary phases examined gives the largest values of 70 which for all the solvents (except
(17) J. Milurom, J. Phys. Chem., 63, 1843 (1959).
squalane) are greater than unity. For squalane, 7° in general tends to increase slightly with temperature but for 7,8-benzoquinoline and «-naphthyl amine a rapid decrease for paraffins, naphthenes and olefins is observed while the values for the aromatic hydrocarbons remain fairly constant.
The comparatively small change in 70 with temperature for squalane indicates that the heats of mixing (AHse ) are small and (since 7 < 1) negative and departure from ideality can be mainly attributed to a positive change in the entropies of
T a b l e V IH e a t s an d E n t r o p ie s o f M ix in g a t I n f in it e D il u t io n
S q u a ,8 - B e n z o - a - N a p h t h y l la n e q u i n o l i n e a m i n e
A S s E , A H s E, A aS se , A i 7 s E , Â £ s E ,H y d r o c a r b o n e .u . k c a l . e .u . k c a l . e .u .
n - P e n t a n e + 1 .0 5n - H e x a n e + 0 .9 9 + 0 .6 3 -1 5 8n - H e p t a n e + .8 6 + . 7 7 -1 3 7 + 1 . 4 3 - 1 . 2 5n - O c t a n e + . 7 4 + .88 -1 2 7 + 1 . 6 1 - 0 . 9 9n - N o n a n e + .6 8 + .9 3 -1 1 5 + 2 . 0 1 - 0 . 1 22 ,2 ,4 - T r i m e t h y l p e n t a n e + . 7 1 + 1 1 6 -0. 8 0 + 4 . 3 2 + 6 .4 0H e x e n e - 1 + 1 .0 0 + 0 .3 9 -1 6 2 + 0 . 7 4 - 2 . 0 1H e p t e n e - 1 + 0 . 8 6 + .4 6 -1 5 7 + 1 . 0 1 - 1 . 5 0O c t e n e - 1 + 0 . 7 4 + .5 3 -1 5 0 + 1 . 2 9 - 0 . 9 5C y c l o p e n t a n e + 1 .5 5C y c l o h e x a n e + 1 . 4 3 + . 7 5 - 0 3 8 + 1 .0 6 - . 9 1M e t h y l c y c l o h e x a n e + 1 . 3 1 + . 7 6 — 59 + 1 .3 8 - .3 8E t h y l c y c l o h e x a n e + 1 . 1 6 + 1 .01 + 03 + 1 . 5 6 - . 1 0B e n z e n e + 1 . 0 2 -0 7 1 - 1 . 3 1T o l u e n e + 0 . 9 5 -0 86 - 1 . 6 3E t h y l b e n z e n e + .8 0 -1 03 - 1 . 9 4p - X y l e n e + .86 -1 0 6 - 2 . 0 4m - X y l e n e + .86 -0 9 8 - 1 . 9 5o - X y l e n e + .8 3 -0 8 5 - 1 . 7 7
mixing (A$se)- For 7,8-benzoquinoline and a-naphthylamine on the other hand AiZsE for hydrocarbons other than aromatics are positive. For the aromatic hydrocarbons, however, where A //se is small for 7,8-benzoquinoline and <x~
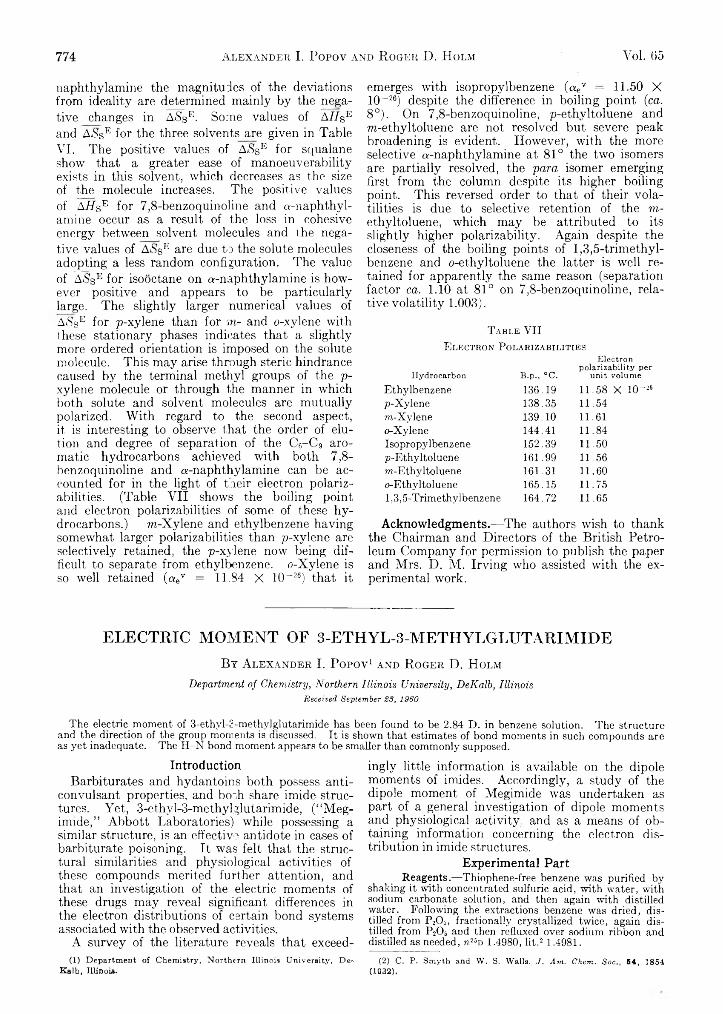
774 Alexander I. Popov and R oger D. Holm Voi. 65
naphthylamine the magnitudes of the deviations from ideality are determined mainly by the negative changes in ASsE. Some values of AHSE and ASse for the three solvents are given in TableVI. The positive values of ASsE for squalane show that a greater ease of manoeuverability exists in this solvent, which decreases as the size of the molecule increases. The positive values of AHsE for 7,8-benzoquinoline and a-naphthyl- amine occur as a result of the loss in cohesive energy between solvent molecules and the negative values of ASsE are due to the solute molecules adopting a less random configuration. The value of A$sE for isooctane on a-naphthylamine is however positive and appears to be particularly large. The slightly larger numerical values of AjSse for p-xylene than for m- and o-xylene with these stationary phases indicates that a slightly more ordered orientation is imposed on the solute molecule. This may arise through steric hindrance caused by the terminal methyl groups of the p- xylene molecule or through the manner in which both solute and solvent molecules are mutually polarized. With regard to the second aspect, it is interesting to observe that the order of elution and degree of separation of the C6-C9 aromatic hydrocarbons achieved with both 7,8- benzoquinoline and a-naphthylamine can be accounted for in the light of their electron polarizabilities. (Table VII shows the boiling point and electron polarizabilities of some of these hydrocarbons.) m-Xylene and ethylbenzene having somewhat larger polarizabilities than p-xylene are selectively retained, the p-xylene now being difficult to separate from ethylbenzene. o-Xylene is so well retained (aev = 11.84 X 1(R26) that it
emerges with isopropylbenzene (aev = 11.50 X 10“"26) despite the difference in boiling point (ca. 8°). On 7,8-benzoquinoline, p-ethvltoluene and m-ethyltoluene are not resolved but severe peak broadening is evident. However, with the more selective a-naphthylamine at 81° the two isomers are partially resolved, the para isomer emerging first from the column despite its higher boiling point. This reversed order to that of their volatilities is due to selective retention of the m- ethyltoluene, which may be attributed to its slightly higher polarizability. Again despite the closeness of the boiling points of 1,3,5-trimethyl- benzene and o-ethyltoluene the latter is well retained for apparently the same reason (separation factor ca. 1.10 at 81° on 7,8-benzoquinoline, relative volatility 1.003).
T a b l e VIIE l e c t r o n P o l a r i z a b i l i t i e s
Electronpolarizability per
Hydrocarbon B.p., °C. unit volumeEthylbenzene 136.19 11.58 X 10^ 26
p-Xylene 138.35 11.54m-Xylene 139.10 11.61o-Xylene 144.41 11.84Isopropylbenzene 152.39 11.50p-Ethyltoluene 161.99 11.56?n-Ethyltoluene 161.31 11.60o-Ethyltoluene 165.15 11.751,3,5-Trimethylbenzene 164.72 11.65
Acknowledgments.— The authors wish to thank the Chairman and Directors of the British Petroleum Company for permission to publish the paper and Mrs. D. M. Irving who assisted with the experimental work.
ELECTRIC MOMENT OF 3-ETHYL-3-METHYLGLUTARIMIDEBt Alexander I. Popov1 and R oger D. H olm
D ep a r tm en t o f C h em istry , N o rth ern I l l in o is U n iversity , D e K a lb , I llin o is Received September 28, 1960
The electric moment of 3-ethyl-2-methylglutarimide has been found to be 2.84 D. in benzene solution. The structure and the direction of the group moments is discussed. It is shown that estimates of bond moments in such compounds are as yet inadequate. The H-N bond moment appears to be smaller than commonly supposed.
IntroductionBarbiturates and hydantoins both possess anti
convulsant properties, and both share imide structures. Yet, 3-ethyl-3-methylglutarimide, (“ Meg- imide,” Abbott Laboratories) while possessing a similar structure, is an effective antidote in cases of barbiturate poisoning. It was felt that the structural similarities and physiological activities of these compounds merited further attention, and that an investigation of the electric moments of these drugs may reveal significant differences in the electron distributions of certain bond systems associated with the observed activities.
A survey of the literature reveals that exceed-(1) Department of Chemistry, Northern Illinois University, De-
Kalb, Illinois.
ingly little information is available on the dipole moments of imides. Accordingly, a study of the dipole moment of Megimide was undertaken as part of a general investigation of dipole moments and physiological activity, and as a means of obtaining information concerning the electron distribution in imide structures.
Experimental PartReagents.—Thiophene-free benzene was purified by
shaking it with concentrated sulfuric acid, with water, with sodium carbonate solution, and then again with distilled water. Following the extractions benzene was dried, distilled from P2Os, fractionally crystallized twice, again distilled from P2O5 and then refluxed over sodium ribbon and distilled as needed, m25d 1.4980, lit. 2 1.4981.
(2) C. P. Smyth and W. S. Walla. ./. Am. Ghent. Soct, 54, 1854 (1932).
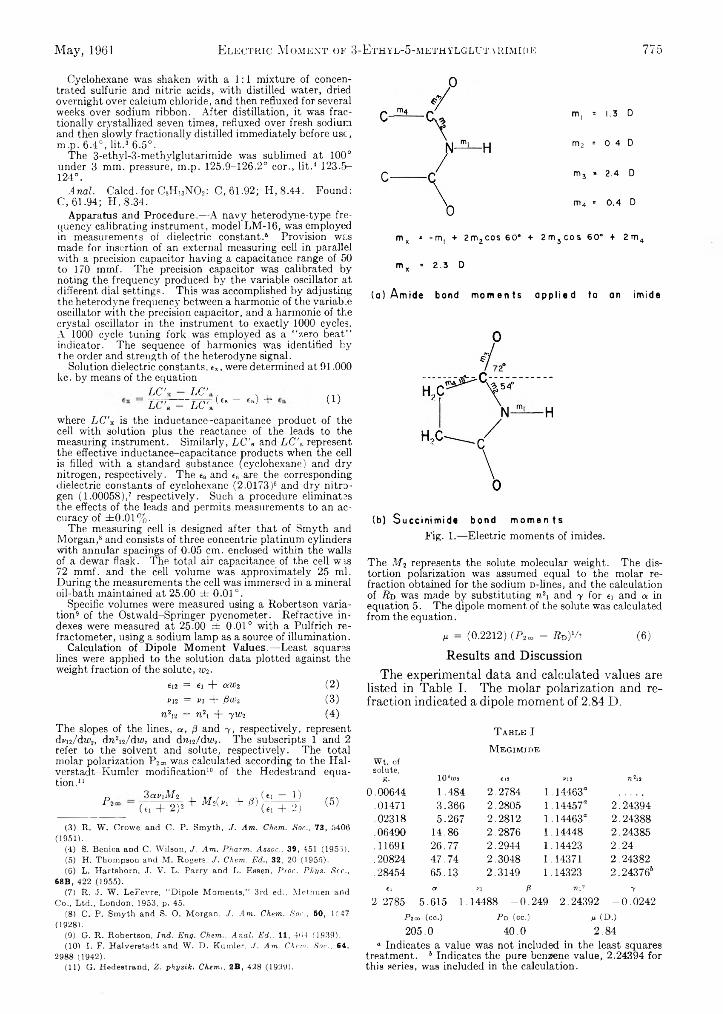
May, 1961 E l e c t r i c M o m e n t o f 3 - E t h y l - 5 - m e t h y l g l u t a i u m i d e 775
Cyclohexane was shaken with a 1 : 1 mixture of concentrated sulfuric and nitric acids, with distilled water, dried overnight over calcium chloride, and then refluxed for several weeks over sodium ribbon. After distillation, it was fractionally crystallized seven times, refluxed over fresh sodium and then slowly fractionally distilled immediately before use,m.p. 6.4°, lit. 3 6.5°.
The 3-ethyl-3-methylglutarimide was sublimed at 100° under 3 mm. pressure, m.p. 125.9-126.2° cor., lit. 4 5 123.5- 124°.
A n a l . Calcd. for C8H 13NO2 : C,61.92; H,8.44. Found: C, 61.94; FI, 8.34.
Apparatus and Procedure.—A navy heterodyne-type frequency calibrating instrument, model LM-16, was employed in measurements of dielectric constant. 6 Provision was made for insertion of an external measuring cell in parallel with a precision capacitor having a capacitance range of 50 to 170 mmf. The precision capacitor was calibrated by noting the frequency produced by the variable oscillator at different dial settings. This was accomplished by adjusting the heterodyne frequency between a harmonic of the variab.e oscillator with the precision capacitor, and a harmonic of the crystal oscillator in the instrument to exactly 1 0 0 0 cycles. A 1000 cycle tuning fork was employed as a “ zero beat” indicator. The sequence of harmonics was identified by the order and strength of the heterodyne signal.
Solution dielectric constants, ex, were determined at 91.000 kc. by means of the equation
L C , L C \L C 's - L C \
(e, — ea) + (1)where L C '* is the inductance-capacitance product of the cell with solution plus the reactance of the leads to the measuring instrument. Similarly, L C 'B and L C 's. represent the effective inductance-capacitance products when the cell is filled with a standard substance (cyclohexane) and dry nitrogen, respectively. The es and ea are the corresponding dielectric constants of cyclohexane (2.0173)6 and dry nitrogen (1.00058),7 respectively. Such a procedure eliminates the effects of the leads and permits measurements to an accuracy of ± 0 .0 1 %.
The measuring cell is designed after that of Smyth and Morgan, 8 and consists of three concentric platinum cylinders with annular spacings of 0.05 cm. enclosed within the walls of a dewar flask. The total air capacitance of the cell was 72 mmf. and the cell volume was approximately 25 ml. During the measurements the cell was immersed in a mineral oil-bath maintained at 25.00 ± 0.01°.
Specific volumes were measured using a Robertson variation9 of the Ostwald-Springer pycnometer. Refractive indexes were measured at 25.00 ± 0.01° with a Pulfrich re- fractometer, using a sodium lamp as a source of illumination.
Calculation of Dipole Moment Values.—Least squares lines were applied to the solution data plotted against the weight fraction of the solute, w 2 .
«12 = 6 1 + aw 2 (2)y i2 = n + fiw-i (3)
n \ i = n \ + yw2 (4)The slopes of the lines, a , p and 7 , respectively, represent dvu/dwz, d n 2u/dw t and d n i2/dw 2. The subscripts 1 and 2 refer to the solvent and solute, respectively. The total molar polarization P2co was calculated according to the Hal- verstadt-Kumler modification10 of the Hedestrand equation. 1 1
Pi 'daviMz(7;t 272+ M%(vi + P)
(ei - 1)(61 + 2) (5)
(3) R. W. Crowe and C. P. Smyth, J. Am. Chcm. Sor., 73, 5406(1951).
(4) S. Benica and C. Wilson, J. Am. Pharm. Assoc., 39, 451 (1953).(5) H. Thompson and M. Rogers, J. Chcm. Ed., 32, 20 (1955).(6) L. Hartshorn, J. V. L. Parry and L. Essen, Proc. Phys. See.,
68B, 422 (1955).(7) R. J. W. LeFevre, “ Dipole Moments,” 3rd ed., Methuen and
Co., Ltd., London, 1953, p. 45.(8) C. P. Smyth and S. O. Morgan, J. Am. Chem. Sor., 50, 1547
(1928).(9) G. R. Robertson, Ind. Eng. Chem., Anal. Ed., 11, 464 (1939),(10) I. F. Halverstadt and W. D. Kumler, ./. Am. Chem. Sor., fi4,
2988 (1942).(11) G. Hedestrand, Z. physik, Chem,, 2B, 428 (1939),
m, = 1.3 D
m2 = 04 D
m3 » 2.4 D
m4 « 0.4 D
mx - -m, + 2m2cos 60” + 2m3cos 60” + 2m4
mx = 2.3 D
(a) Amide bond moments applied to an imide
(b) Succinimide bond momentsFig. 1.—Electric moments of imides.
The M 2 represents the solute molecular weight. The distortion polarization was assumed equal to the molar refraction obtained for the sodium D-lines, and the calculation of R d was made by substituting n 2, and y for ei and a in equation 5. The dipole moment of the solute was calculated from the equation.
p. = (0.2212) (P2ro - RvYA (6)Results and Discussion
The experimental data and calculated values are listed in Table I. The molar polarization and refraction indicated a dipole moment of 2.84 D.
T a b l e IM e g i m i d e
W t . o f s o lu te ,
g- 1 0 4U>2 €12 PI 2 n 2i2
0 . 0 0 6 4 4 1 . 4 8 4 2 . 2 7 8 4 1 . 1 4 4 6 3 “
. 0 1 4 7 1 3 . 3 6 6 2 . 2 8 0 5 1 . 1 4 4 5 7 “ 2 . 2 4 3 9 4
. 0 2 3 1 8 5 . 2 6 7 2 . 2 8 1 2 1 . 1 4 4 6 3 “ 2 . 2 4 3 8 8
. 0 6 4 9 0 1 4 . 8 6 2 . 2 8 7 6 1 . 1 4 4 4 8 2 . 2 4 3 8 5
.1 1 6 9 1 2 6 . 7 7 2 . 2 9 4 4 1 . 1 4 4 2 3 2 . 2 4
. 2 0 8 2 4 4 7 . 7 4 2 . 3 0 4 8 1 . 1 4 3 7 1 2 . 2 4 3 8 2
. 2 8 4 5 4 6 5 . 1 3 2 . 3 1 4 9 1 . 1 4 3 2 3 2 . 2 4 3 7 6 * '
ei a vi /3 72-12 7
2 . 2 7 8 5 5 . 6 1 5 1 . 1 4 4 8 8 - 0 . 2 4 9 2 . 2 4 3 9 2 - 0 . 0 2 4 2
Pi c» ( c c .) P d (cc.) s (D .)
2 0 5 . 0 4 0 . 0 2 . 8 4
4 Indicates a value was not included in the least squares treatment. 6 Indicates the pure benzene value, 2.24394 for this series, was included in the calculation.

776 Alexander I. P opov and R oger D. Holm Vol. 65
From valence-bond considerations the imide portion of this molecule would be expected to possess coplanarity. The imide nitrogen would be in a trigonal sp2 state, with a lone pair of p-electrons available for Tr-bonding with the p-electrons of the carbonyl carbon atoms. The resulting bonding permits delocalization of the p-electrons from the oxygen of one carbonyl through the imide nitrogen to the oxygen of the other carbonyl. Planarity, of course, is essential in such a case, for the stabilizing contribution of the 7r-bonds falls off rapidly as a result of an increasingly out-of-plane orientation for the N -H bond, as the overlap of p-electrons of adjacent atoms is decreased.
Ethyl and methyl substituents in Megimide will probably have little if any effect upon the gross molecular moment. Accordingly, only that portion of the molecule including the carbonyl and the imide portion need be considered when discussing the orientation of the dipole moment. When one assigns to the different bones of the imide those bond moments employed by Bates and Hobbs12 in their study of amides, a total moment of only 2.3 D. is predicted for this molecule (see Fig. la.). Since the experimental value is 2.8 D., it would appear that those moments which prove adequate for amides are no longer adequate in the case of imides. Since no systematic study has been made of the dipole moments of the imides, it is difficult to estimate the magnitudes of the C -N and H -N bond moments. Because of the resonance interaction, the electron density normally due to the lone pair of electrons of the imide nitrogen will be drawn off somewhat and distributed among the other atoms of the two carbonyls. This partial loss of negative charge will leave the nitrogen positively charged to a small degree, resulting in a net reduction of the toi and m2 moments. The extent of this reduction is difficult to estimate, but since the mi and m2 moments are oriented in opposite directions, the reductions will tend to cancel each other somewhat, and the result probably will not differ greatly from the approximation made above.
Assuming that m2 is reduced to approximately 0.3 D. and the values for m3 and given previously are valid, an mi of 0.7 D. is calculated for the H -N bond of Megimide from the 2.8 D. moment observed in this study. This bond moment does not appear unreasonable since the originally assigned value of 1.3 D. was obtained from the H -N bond moment in methylamine.13 The observation that use of this value for the H -N moment leads to reasonable agreement between observed and calculated moments in the amides seems indeed fortuitous. Undoubtedly the actual bond moment is somewhat different, but various compensating estimates of bond moments probably caused the agree-
(12) R. G. Bates and M. E. Hobbs, J. Am. Chem. Soc., 73, 2151 (1951).
(13) C. P. Smyth, ‘ ‘Dielectric Behavior and Structure,” McGraw- Hill Book Co., New York, N. Y., 1955, p. 311.
ment noted by Bates and Hobbs12 for the amides studied.
The only other dipole moment study of imides was performed by Couley and Partington14 in 1936, in which moments of succinimide and phthalimide in dioxane were found to be 1.54 and 2.10 D., respectively. It is of interest to compare the bond moment of H -N in succinimide with that of Megimide. Assuming succinimide to be planar and approximately pentagonal, and using the Megimide bond moments, one may similarly calculate the mi for H -N to be 1.06 D. (see Fig. lb). This moment for H -N is reasonable, but since these measurements were made in dioxane which usually yields moments differing somewhat from those in benzene, sometimes as much as by 0.5 D., no valid conclusions can be drawn from any coincidence between the mi values for Megimide and succinimide. In addition, the 108° bond angles of succinimide undoubtedly reduce the orbital overlap of the C-N bond, and the resulting electron distribution may only remotely resemble that of Megimide. Nevertheless, it is evident that the values are both of a reasonable order.
The 2.10 D. moment of phthalimide was interpreted by the authors13 as an indication of the polarizability of the benzene ring. It is not especially helpful in the case at hand since the effect of the phenylene group is not easily assessed.
Kulkarni15 obtained a moment of 1.10 D. for barbital in dioxane solution using a method in which a calculation of the apparent moment of the barbital is made for each concentration. Her work, however, does not appear applicable to our study, for the assumption of the usual bond moments used in the Megimide and succinimide calculations implies a H -N moment of —0.4 D. if applied directly to barbital. Since it is more likely that the individual bond moments are appreciably altered by the resonance of the system than that the direction of the H -N bond moment is reversed, it appears that conclusions based on the moment reported for barbital are of questionable value in so far as Megimide is concerned. Since a molecule of this type is quite acidic, the question of the extent of ion-pair formation in dioxane arises. Dioxane enhances hydrogen bonding and it is reasonable that solvation of a proton from acidic substances may occur fairly easily. Consequently, the observed moment would be for an equilibrium mixture of ion-pairs and intact barbital molecules. All of these effects serve to render the barbital moment of a doubtful value to this study.
Acknowledgment.—This work was supported by the Research Grant B-1095 from the National Institute of Neurological Diseases and Blindness, Public Health Service. The authors are grateful to Dr. W. Close of the Abbott Laboratories for the Megimide used in this investigation.
(14) E. G. Couley and J. R. Partington, J. Chem. Hoc., 47 (1936).(15) S. B. Kulkarni, J. Indian Chem. Soc., 26,^207 (1949).
ON THE SECOND VIRIAL COEFFICIENT FOR UNCHARGED SPHERICALMACROMOLECULESBy Andrew G. De Rocco
D ep a rtm en t o f C h em istry , U n iversity o f M ich ig a n , A n n A rb or, M ich ig a nReceived September 28, 1960
The second virial coefficient has been calculated for spherical particles obeying an intermolecular potential having the following properties: a hard sphere repulsion and an integrated B ~ s attraction. The results are compared with the theory of Isihara and Koyama and with the data of Krigbaum and Flory on polyisobutylene in benzene. The linearity of A , versus temperature in the region (T / Q ) ~ 1, a result discussed by Isihara and Koyama, was not found in this approach. The general appearance of A , versus temperature, however, was in good agreement with experiment as well as the previous theoretical results. The Flory temperature was found to be independent of molecular weight.
May, 1961 Second V irial Coefficient for Uncharged Spherical M acromolecules 777
IntroductionIn a recent paper Stigter1 has discussed the os
motic pressure and the osmotic coefficient of sucrose and glucose solutions. Treating the cases of spheres and ellipsoids, Stigter computed the second and third virial coefficients in the expansion of the osmotic pressure in terms of powers of the concentration. The intermolecular potential employed was the well-known (m -°°), which for the special case of m = 6 is more often called the Sutherland potential.
Such a potential has been used extensively in the discussion of the equilibrium and transport properties of simple gases. Experience has shown that the values of well depth needed to fit experimental properties, for example, second virial coefficients, are generally much larger than the corresponding values for a Lennard-Jones or (6-12) potential.2 Nonetheless the (6 - “ ) potential has continued to be of theoretical interest largely because it is fairly flexible and does reflect in its attractive component the leading term in the London dispersion energy.
For particles of intermediate and colloidal sizes, numerous attempts have been made to compute the integrated (6-12) potential.3 In all cases two facts stand out: (1) the essential additivity of the dispersion potential leads to an enhanced interaction for larger particles; (2) the integrated repulsion becomes more nearly approximated by a hard sphere cutoff. Qualitatively, these considerations lead us to expect interactions having a range of the order of the particle sizes with a concomitant effect on the virial coefficients.
On the basis of his analysis of the second and third virial coefficients Stigter concluded that the London-van der Waals attraction alone was insufficient to account for the observed osmotic pressures of glucose and sucrose, and suggested, therefore, specific interactions probably due to hydrogen-bonding. It is not unreasonable, con-
(1) D. Stigter, J. Phys. C h e m 64, 118 (I960).(2) It is interesting that surprising agreement can be obtained for a
triangular-well potential if the cutoff is chosen to make the reduced Boyle temperature, Tb* =■ kT/e, conform to the value associated with the (6-12) potential. These results will soon be published.
(3) H. C. Hamaker, Physica, 4, 1058 (1937); M. Atoji and W. N. Lipscomb, J. Chem. Phys., 21, 1480 (1953); A. Isihara and R. Koyama, J. Phys. Soc. Japan, 12, 32 (1957); A. G. De Rocoo, J. Phys. Chem., 62, 890 (1958); C. J. Bouwkamp, Kon. Nederland Ahad. Wetenschap., 50, 1071 (1947); G. J. Thomaes, J. chim. phys., 49, 323 (1952); K . S. Pitzer, J . Am. Chem. Soc., 77, 3427 (1955); J. A. Lambert, A u s t r a l i a n J. Chem., 12, 109 (1959); A. G. De Rocco and W. G. Hoover, P r o c . N a t l . A c a d . S c i 46, 1057 (1960).
sidering the significant role played by hydrogenbonding elsewhere, to suggest such interactions for glucose and sucrose.
In this communication we shall investigate the related problem of the second virial coefficient for the case of an integrated (6-12) potential in the limit of infinite dilution. The results should have relevance to solutions of uncharged spherical macromolecules.
Review of TheoryUsing an appropriately generalized grand parti
tion function McMillan and Mayer,4 and subsequently Kirkwood and Buff,6 were able to derive rigorously an expansion for the osmotic pressure in terms of the concentration which bears a formal resemblance to the virial expansion employed in the theory of imperfect gases. The osmotic pressure can lie written as
j*T = M-'C + A.C* + A3C* + ... (1)
where M is the molecular weight of the solute, C the concentration in grams per unit volume of solution, and the coefficients, A-„ are the virial coefficients. Introducing a generalized distribution function in the coordinates of N particles such that V ~ n F n (1,2,. . ,,N) d ( l ,2,. . ,,AT) is the probability that N specific solute molecules lie in generalized configuration space between (1,2,. . .,N) and (1,2, . . ,,N) + d(l,2,. . ,,N), the second virial coefficient was shown to be
f [F i(l)F,(2) - F,( 1,2)] d(l,2) (2)
(One of the earliest applications of this result to problems of physical interest was made by Zimm,6 and the subsequent literature has been both abundant and varied). In equation 2, Fx(l) and Fi(2) are the distribution functions of single molecules, and F>(1,2) is the pair distribution function: all distribution functions are those of the solute molecules at infinite dilution. It proves convenient to introduce the function g2
{2 \ = F2(l,2) — Fi(l)Fi(2) to measure the interaction of the particles on one another by the difference between the pair distribution function and the corresponding product of singlet distribution functions for the case of independent probabilities. Equation 2 can then be written as
(4) W. G. McMillan and J. E. Mayer, J. Chem. Phys., 13, 276 (1945).
(5) J. G. Kirkwood and F. P. Buff, ibid., 19, 774 (1951).(6) B. H. Zimm, ibid., 14, 104 (1946).
778 Andrew G. D e R occo Vol. 65
A t = - 2V W - f 9* {2 ] d!2! (3)
(Notice that {N} = (1,2,. . .,N)). F( 1,2) can be decomposed into the product of A( l ) , Fi(2) and the appropriate pair correlation function; the latter, in turn, can be approximated by the radial distribution function, neglecting a term OO /v),7 g(r), permitting eq. 3 to be written in the convenient form
A 2 = 2 w N 0M ~ l f ” ;i - g (r )\ r2Ar (4)
where N 0 is the Avogadro number and g(r) is the radial distribution function at infinite dilution for two solute molecules. Next the radial distribution function is approximated by exp[ — ffW], where ¡3 = VkT and W represents the potential of the mean force.8 We wish to consider here spherical particles and we will use for such particles an integrated (6-12) potential, thus preserving central symmetry; this integrated potential will be taken as W.
Consider two spheres of diameters A and A (for convenience set A b A ) having a distance of closest separation d = r - 1/ 2 X (A + A ) , where r is the internuclear separation. Define x = d/D1
and y = A / A so that x measures d in terms of the smaller sphere and y describes the relative size of the two spheres. It is known, then, that W(x,y) can be expressed as9
W ( x ,y ) = - H
W { x , y )
y + ■ y. x 2 + x y + x ' x 2 + x y + x + y
x 2 + x y + x
+
2 Inx 2 + x y ■
— 1 < x < 0x + y. ( x > 0)
(5)In the above equation the range — 1 < x < 0 corresponds to the hard sphere repulsion suggested by a detailed examination of the integrated R ~ 12 term; the expression for x > 0 corresponds to the integrated R~6 term which, it may be noticed, is down four powers of the distance. The quantity H appearing in eq. 5 is a constant containing the atomic density distributions for the two spheres Pi and p2, and the energy and distance scale factors for the interatomic (6-12) potential, viz.
H = 6 P1 P2 e?’o6 (6)
We have previously called H the Hamaker constant.
Introducing w*(x,y) by W(x,y) = —Hw*(x,y) and specializing to spheres of equal size, we get the useful expression
1x ( x + 2 ) + TZ
1(X + l ) 2
+ 2 In x ( x + 2) (x + l )2
(7)
CalculationsCombining the results of the previous section
permits us to write for A 2(7) T. L. Hill, “ Statistical Mechanics,” McGraw-Hill Book Co.,
-New York, N. Y „ 1956, Ch. 6.(8) This is the quantity whose negative gradient represents the
average force felt by a particle in a set of h particles due to a direct interaction with the (ft — 1) others in the subset and an average contribution due to the N — h others.
(9) See, for* example, A. G* De B-oeco, J» Phys, Chem,, 62, 890 (1958).
/ CO_ 1 ( 1 - eu w (* ,l))(l + Ipdz (8 )
where A = 2R0 is the diameter of the sphere. Integrating first from minus one to zero, we obtain
An = k5 ttNuM-Wo3 ^ 1 + 3 J “
(1 — -f- z)2chj (9)
The leading term is exactly the hard-sphere second virial coefficient, a0, and may be combined with A 2, in a fashion analogous to the case in imperfect gas theory, yielding a reduced second virial coefficient A2* = A 2/ao: thus
A 2* = 1 + 3 J*o” (1 - e »B w * {x ,n ) ( 1 + x y d x (10)
The integral of eq. 10 can be accomplished numerically, but below we shall offer a first-order theory for weak interactions in order to gain somewhat more physical insight into the problem. The trouble with a first-order theory, of course, is that upon expansion of the exponential we get an integrand that explodes at the limits of integration. To obviate this annoyance we consider that around the hard core there occurs a well of energy — H extending to x = S, where 8 is a small quantity. Beyond 8 we permit eq. 5 to hold as written. For simplicity we introduce p = (x + 1) = R/2R0
and notice that
A2* = 1 + 3 f * [1 - ef>H/(.p)]p2 dP
f(p) = ; + 21n f 1 - - ) (ID
Dividing the interval 1 ^ o ^ » into two intervals, as suggested above, and also expanding the exponential to first order in /3 for the interval beyond 8 we obtain
A A = e «H + sa(i _ eiiH ) - 3 p H J ” f(p)p2dp ( 1 2 )
Next consider / (p ) : for values of p > 1 (which is assured if 5 is the lowest value of p) it is straightforward enough to show that
f(P) ~ [p2(p2 - i)(2p2 - l ) ] - 1 (13)whence the integral in eq. 12 becomes
P ° dpJs (p2 - l)(2p2 - 1)
Separating by partial fractions results in two standard integrals, so that
m i s (p2 - l ) ( 2 p2 - l ) =3/5J7[coth“ 1 5 - V2 coth“ 1 V2 «] (14)
whereupon A * becomes finallyA 2* = e W + 53( 1 - ef>H) - 3 p H [coth- 1 S - V^coth - 1
V 2 S ] ( 1 5 )
However the fact that f(5) ~ 1 determines 5 to a first approximation from eq. 13 as 1.1825. The standard series expansion for inverse hyperbolic functions can be used to evaluate the term in brackets. The series in \/25 converges fairly rapidly and terms only to 1/7('V/28)7 are needed; for the more slowly converging series in 8 , terms as far as ‘/i3i13 seem desirable. Substituting these
May, 1961 H e a t s os ’ F o r m a t i o n o f U n s t a b l e G a s e o u s H y d r i d e s 779
results into eq. 15 yieldsA2* ~ 1.6535 - 0.6535e/« _ 0.73100 H (16)
DiscussionIf the attractive forces vanish, 0 = 0 and eq.
16 reduces to A 2* = 1, as required for hard spheres. Numerical solution of eq. 16 for the Flory temperature, 0, gives
e = 1.63 ( J ) (17)
so that eq. 16 can be written in the alternative form
A»* ~ 1.6535 - 0.6535 exp|^0.6125 | J + 0.9489 ~ (18)
In the region very near to 0 the graph of ri2* vs. temperature has a positive slope but cannon easily be made strictly linear, in contrast to the result of Isihara and Koyama.3
The behavior of ri2* described above is in general agreement with the data of Krigbaum and Flory13
(10) W. R. Krigbaum and P. J. Flory, J. Am. Chem. Soc., 75, 1775, 5254 (1953).
on polyisobutylene in benzene and with the data of Krigbaum11 on polystyrene in cyclohexane; (from these data we deduce that (H/k) = 182°K. for polyisobutylene in benzene, and (H/k) = 188°K. for polystyrene in cyclohexane, numbers which are at least reasonable). The data cited above fall on or nearly on the curve computed from eq. 18 for the special, reduced case of a0 = 1.
In this treatment, as in the theories, for example, of Flory and Krigbaum12 and of Grimley,13 the Flory temperature does not depend on molecular weight. Isihara and Koyama3 suggest that 0 might depend on molecular weight and cite Krig- baum’s data10 for support; the data of Krigbaum and Flory9 on polyisobutylene in benzene do not exhibit a dependence of 0 on molecular weight.
It would be interesting to examine in detail experimental values of A 2 vs. temperature in the region of the Flory point.
(11) W. R. Krigbaum, ibid., 76, 3758 (1954).(12) P. J. Flory and W. R. Krigbaum, J. Chem. Phys., 18, 1086
(1950); 20, 873 (1952).(13) T. B. Grimley, Proc. Roy. Soc. (London), A212, 339 (1952).
THE HEATS OF FORMATION OF SOME UNSTABLE GASEOUS HYDRIDES1B y Stuart R , Gunn and L eR oy G. Green
U n iversity o f C a lifo rn ia , L a w ren ce R a d ia tio n L a b ora tory , L iverm ore, C a lifo rn ia Received October 24, I960
The heats of explosive decomposition of PH3, P2H4, SiH4, Si2H6, GeH4, Ge2H6, SnH4 and B2H6, either pure or in mixtures with SbH3, have been measured. Heats of formation and thermochemical bond energies are derived.
The success previously attained2 in the determination of the heats of formation of stibine and arsine by use of the explosive decomposition of pure stibine and of mixtures of stibine and arsine suggested that these methods might be generally applicable to measurement of heats of formation of other unstable gaseous hydrides where compound formation in the product system is not a serious problem. For many of these hydrides thermochemical data are either non-existent or of doubtful accuracy.
It was in fact found in this work that hydrides having only slightly positive heats of formation, such as phosphine, could be decomposed to the elements in good yield by explosion in mixtures with stibine; that the decomposition yield, or the minimum ratio of stibine to the second component necessary .to give quantitative decomposition of mixtures, correlated well with the heat of formation; and that compounds such as stannane and diger- mane having heats of formation similar to that of stibine would themselves decompose quantitatively or nearly so upon ignition with a platinum fuse without admixture of stibine or other “ promoter.”
The apparatus and experimental procedures were as previously described2 except as herein specified.
(1) Work was performed under auspices of the IT. S. Atomic Energy Commission.
(2) S. R. Gunn, W. L. Jolly and L, G, Green, J. Phys. Chem., 64, 1334 (1960).
MaterialsThe hydrides were prepared and handled in conventional
vacuum lines, and purified by passage through a sequence of U-traps cooled by slush baths. Vapor pressures were measured in most cases, but the principal criterion of purity was the stoichiometric yield of hydrogen from a weighed sample in the calorimetric decomposition measurements.
Stibine was prepared essentially as previously described. 2 Two runs using 4.0 and 5.0 g. of KBH4 and keeping all other quantities constant each yielded 40 mmoles of SbH3, compared with the 25 previously obtained.
Phosphine was prepared by the reaction of PC13 with LiAlH4 in diethyl ether. Twenty-six mmoles of PC13 was added slowly to 58 mmoles of LiAlH4 in 50 ml. of diethyl ether, the product being slowly swept with nitrogen through traps at —196°. The yield, after purification, was 18 mmoles. The vapor pressure, measured in volumes of both 25 and 580 ml. was 171 mm. at the carbon disulfide melting point (lit.3171 mm.).
Biphosphine was prepared by the neutral hydrolysis of calcium phosphide, essentially according to the procedure of Evers and Street. 4 * The material is quite unstable, decomposing in the liquid phase to a product having_ roughly the composition P2H , 4 the reaction for this composition being
5P2H4 — > 6 PH3 + 2P2H (1)We condensed in a bulb enough phosphine to give a pressure of 2 cm. at room temperature and observed, after warming, a rate of decomposition of about 1% per minute. The reaction did not appear to be autocatalytic on the solids produced since the rate was approximately constant with
(3) R. T. Sanderson, “ Vacuum Manipulation of Volatile Compounds,” John Wiley and Sons, Inc., New York, N. Y., 1948.
(4) E. C. Evers and E. H. Street, Jr., J. Am. Chem, Soc., 78, 5726(1956).
780 Stuart R. Gunn and LeR oy G. Green Vol. 65
time. The experiment was repeated with a clean bulb but transferring the P2H4 through a goldfoil trap and a cold trap to prevent condensation of mercury in the bulb. After warming, the decomposition rate was about 0.1% per minute. When this bulb was shielded from light, the decomposition rate dropped to less than 0.01% per minute. Thus both mercury and light seem to catalyze the decomposition. Accordingly, final purification of the material was done in the dark and the samples were kept free of mercury and handled in the dark.
Vapor pressure measurements of biphosphine are rather imprecise because of the rapid decomposition. The combined data of Evers and Street4 and Royen and Hill5 yield a value of about 200 mm. at 25°, which would correspond to about 1 mmole of gas in our reaction tubes.
Silane was prepared by substantially the same procedure used for phosphine, the yield of purified product relative to SiCb being about the same. The preparation also has been described by Finholt, et a l 6
Disilane was prepared by the reaction of magnesium sili- cide with hydrochloric acid. The disilane fraction produced also contained monochlorosilane or disiloxane; it was treated with LiAlH4 in diethylene glycol and then fractionated.
The germane was prepared in this Laboratory by D. Shriver using the method of Piper and Wilson.7 After standing two years in a blackened flask at room temperature only a small amount of hydrogen had been formed. It was fractionated once.
Digermane was prepared by a procedure similar to that given by Jolly,8 consisting of addition of an alkaline solution of Ge(IV) and NaBH4 to aqueous sulfuric acid. It was found that addition of an antifcaming agent (Dow Polyglycol P-1200) reduced the problem of foaming and improved the yield. The vapor pressure of 5.6 mmoles of purified material measured at 0° in volumes of both 40 and 380 ml. was 236.5 mm.
St.annane was prepared by the slow addition of a solution of 50 mmoles of SnCl4 in 80 ml. of dry diethylene glycol- dimethyl ether to 500 mmoles of LiH and 240 mmoles of LiAlH4 in 140 ml. of the same solvent cooled to —10°, the product being swept through traps by the hydrogen also produced. The yield after purification was 20 mmoles, the product showing a vapor pressure of 17.5 mm. at the carbon disulfide melting point (lit.3 18 mm.). Stannane is quite unstable, the decomposition being autocatalytic on the tin produced. An earlier batch of material, prepared by the method of Finholt, et a l . ,6 decomposed too rapidly to permit accurate calorimetric measurements. Based on our experience with biphosphine, we loaded this material through gold-foil and cold traps to eliminate mercury and handled it in the dark. Neither during the weighing, requiring some 30 minutes, nor during the equilibration period of a similar length of time in the calorimeter before firing was there any evidence of decomposition. The calorimetric reaction vessel contained a platinum fuse, tungsten leads, steel connecting screws, and sharp corners on a Py- rex electrode spacer. Later investigation, however, showed that samples sealed in Pyrex tubes both with and without care to exclude mercury and exposed to room (fluorescent) lighting showed only slight traces of solid deposit in one hour, and very slow acceleration of the decomposition rate for several hours thereafter. Possibly the impurities in the preparation (see “ Results” ) in.iibited the decomposition.
Diborane was from the batch described as preparation C in an earlier paper;9 it contained about 0.2 mole % impurity, probably ethane. After storage for a year at —196° it showed no decomposition and was used without further purification.
ResultsStibine.—Three more runs with pure stibine
gave values for — AE of 34.93, 35.09 and 35.14 kcal. mole-1 with hydrogen yields of 99.91, 100.10 and 100.06% of the theoretical. Combining
(5) P. Royen and K. Hill, Z. anorg. allgem. Chem., 229 , 97 (1936).(6) A. E. Finholt, A. C. Bond, Jr., K. E. Wilzbach and H. I. Schles-
inger, J. Am. Chem. Soc., 69, 2692 (1947).(7) T. S. Piper and M . K. Wilson, J. Inorg. Nticiear Chem., 4, 22
(1957).(8) W. L. Jolly, J. Am. Chem. Soc., 83, 335 (1961).(9) S. R. Gunn and h, G. Green, J. Fhys. Chem., 64, 61 (1960).
these values of — AE with those reported earlier2 (34.99, 34.82 and 34.91), gives an average of 34.98 ± 0.10 and for A#)0, - f 34.68 ± 0.10 kcal. mole-1. This value of AE was used in subtracting the SbH3 heat contribution in all mixed hydride runs.
Phosphine.— Results of the phosphine-stibine runs are given in Table 1.
T a b l e I
H e a t o f D e c o m p o s it io n o f PII3
PH, SbH,PH,
decomposed, g(PH,),-A E (P H 3)
kcal.Run /------millimoles------* % cal. mole
1 0.859 2.901 95.8 1.07 1.302 1.200 2.996 93.2 1.85 1.653 1.327 2.594 81.2 1.89 1.75
The amount of PH3 decomposed is calculatedfrom the total observed hydrogen minus that expected from the stibine. The condensable gas recovered in all runs agreed within 0.003 mmole with the amount of undecomposed phosphine expected from the deficiency in hydrogen. The vapor pressure of this condensable gas from run 3 was checked in several volumes and agreed well with that of pure phosphine; it is thus evident that that portion of the phosphine not decomposed to the elements was unchanged, and AE is calculated by dividing g(PH3) by the amount of PH3 decomposed.
X-Ray diffraction examination of the solid product, transferred in an argon-atmosphere dry box, showed only a normal antimony pattern with the lattice constants unchanged. According to Hansen10 compound formation in the Sb-P system is doubtful and the solid solubility of P in Sb is very low. Upon admission of air to the solid products a white flame appeared briefly; evidently the phosphorus is at least largely of the white form, which is the thermochemical standard state.
A value of —1.6 ± 0.4 is taken for AE and + 1.3 ± 0.4 for A/7f°(PIi3).
Biphosphine.—Results of the biphosphine-stibine runs are given in Table II.
T a b l e I I
H e a t o f D e c o m p o s it io n o f P2H4
RunP2H4 _ > SbH,
/-----millimoles------>P,h 4
decomposed,%
a(PiH.),cal.
- A E- (P,H4).
kcal. mole-1
1 0 . 5 9 9 3.039 95.5 3.43 5.732 .782 2.863 84.4 3.44 4.403 .612 2.029 80.1 3.35 5.474 .584 1.205 5.8 1.96 3.36
The amount of P2H4 decomposed is . calculated from the excess of hydrogen over that contributed by the stibine. AE, however, is calculated by dividing g(P2H4) by the total sample of P2H4, since it is evident that some exothermic heat effect is associated with the biphosphine not decomposed to the elements; it is probable that at least part of this decomposes roughly according to equation 1. That the solid deposit was different from that produced in the phosphine runs was supported by the observation that it flamed more violently upon
(10) M. Hansen, “ Constitution of Binary Alloys,” McGraw-Hill Book Co., Inc., New York, N. Y., 1958.
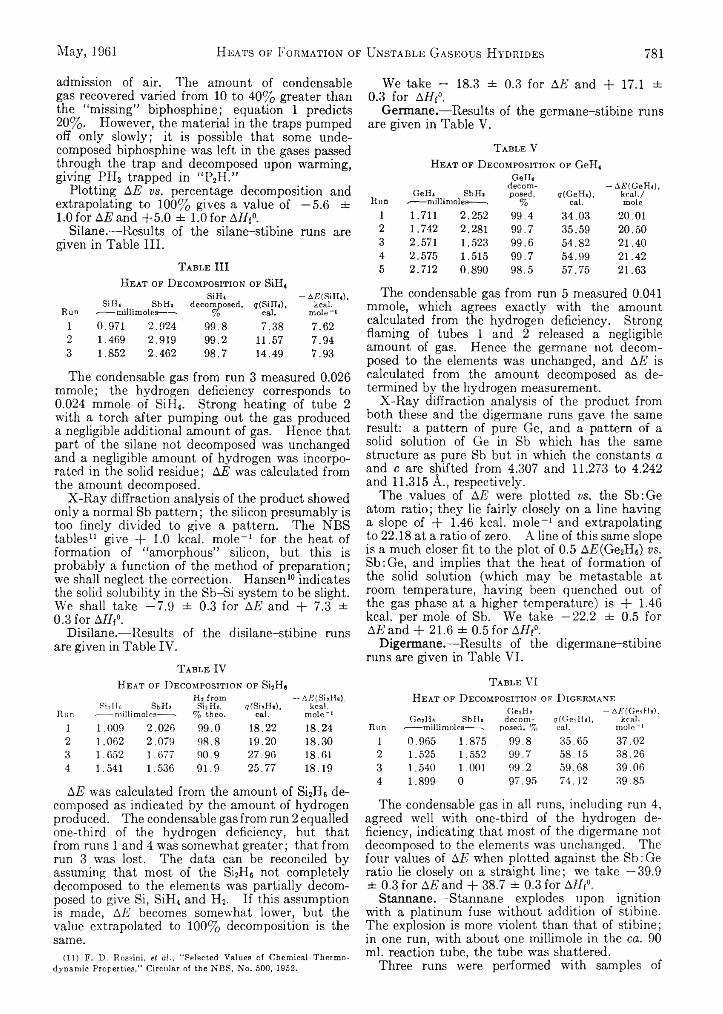
May, 1961 Heats of Formation of Unstable Gaseous Hydrides 781
admission of air. The amount of condensable gas recovered varied from 10 to 40% greater than the “ missing” biphosphine; equation 1 predicts 20%. However, the material in the traps pumped off only slowly; it is possible that some undecomposed biphosphine was left in the gases passed through the trap and decomposed upon warming, giving PIi3 trapped in “ P2H.”
Plotting AE vs. percentage decomposition and extrapolating to 100% gives a value of —5.6 ±1.0 for AE and +5 .0 ± 1.0 for AHf°.
Silane.—Results of the silane-stibine runs are given in Table III.
T a b l e I I IH e a t o f D e co m po sitio n o f S iH ,
Sill. SbH.su n
decomposed,%
«(Sim ),-A tf(S iH 0,
kcal.Run ------millimoles----- - cal. mole-1
1 0.971 2.924 99.8 7.38 7.622 1.469 2.919 99.2 11.57 7.943 1.852 2.462 98.7 14.49 7.93
The condensable gas from run 3 measured 0.026 mmole; the hydrogen deficiency corresponds to 0.024 mmole of SiH4. Strong heating of tube 2 with a torch after pumping out the gas produced a negligible additional amount of gas. Hence that part of the silane not decomposed was unchanged and a negligible amount of hydrogen was incorporated in the solid residue; AE was calculated from the amount decomposed.
X-Ray diffraction analysis of the product showed only a normal Sb pattern; the silicon presumably is too finely divided to give a pattern. The NBS tables11 give + 1.0 kcal. mole-1 for the heat of formation of “ amorphous” silicon, but this is probably a function of the method of preparation; we shall neglect the correction. Hansen10 indicates the solid solubility in the Sb-Si system to be slight. We shall take —7.9 ± 0.3 for AE and + 7.3 ± 0.3 for AHt°.
Disilane.—Results of the disilane-stibine runs are given in Table IV.
T a b l e IVH e a t of D eco m p o sit io n o f Si2H6
RunSi 2 He > SbH*
------millimoles----- 'm fromShH«,
% theo.«(SisHe),
cal.-A#(Si*He),
kcal.mole-1
1 1.009 2.026 99.0 18.22 18.242 1.062 2.079 98.8 19.20 18.303 1.652 1.677 90.9 27.96 18.614 1.541 1.536 91.9 25.77 18.19
AE was calculated from the amount of Si2H6 decomposed as indicated by the amount of hydrogen produced. The condensable gas from run 2 equalled one-third of the hydrogen deficiency, but that from runs 1 and 4 was somewhat greater; that from run 3 was lost. The data can be reconciled by assuming that most of the Si2H6 not completely decomposed to the elements was partially decomposed to give Si, SiH4 and H2. If this assumption is made, AE becomes somewhat lower, but the value extrapolated to 100% decomposition is the same.
(11) F. D. Rossini, et al., “ Selected Values of Chemical Thermodynamic Properties,” Circular of the NBS, No. 500, 1952.
We take — 18.3 ± 0.3 for AE and + 17.1 ± 0.3 for AH{°.
Germane.— Results of the germane-stibine runs are given in Table V.
T a b l e VH e a t o f D e co m po sitio n o f GeH4
RunGeH, SbH,
»■-----millimoles-----»
Gemdecomposed,
%«(GeH<),
cal.-AtfCGeHi),
kcal./mole
1 1.711 2.252 99.4 34.03 20.012 1.742 2.281 99.7 35.59 20.503 2.571 1.523 99.6 54.82 21.404 2.575 1.515 99.7 54.99 21.425 2.712 0.890 98.5 57.75 21.63
The condensable gas from run 5 measured 0.041 mmole, which agrees exactly with the amount calculated from the hydrogen deficiency. Strong flaming of tubes 1 and 2 released a negligible amount of gas. Hence the germane not decomposed to the elements was unchanged, and AE is calculated from the amount decomposed as determined by the hydrogen measurement.
X-Ray diffraction analysis of the product from both these and the digermane runs gave the same result: a pattern of pure Ge, and a pattern of a solid solution of Ge in Sb which has the same structure as pure Sb but in which the constants a and c are shifted from 4.307 and 11.273 to 4.242 and 11.315 A., respectively.
The values of AE were plotted vs. the Sb:Ge atom ratio; they lie fairly closely on a line having a slope of + 1.46 kcal. mole-1 and extrapolating to 22.18 at a ratio of zero. A line of this same slope is a much closer fit to the plot of 0.5 AE(Ge2H6) vs. Sb:Ge, and implies that the heat of formation of the solid solution (which may be metastable at room temperature, having been quenched out of the gas phase at a higher temperature) is + 1.46 kcal. per mole of Sb. We take —22.2 ± 0.5 for AE and + 21.6 ± 0.5 for AH(°.
Digermane.—Results of the digermane-stibine runs are given in Table VI.
T a b l e VIH e a t o f D ecom po sitio n of D ig e r m a n e
R u nG e jH « > SbH*
-------millimoles-------->G esH a
decomposed, %
«(GesH.),cal.
— AFCGesHe), kcal.
mole ~l1 0 . 9 6 5 1 . 8 7 5 . 9 9 . 8 3 5 . 6 5 3 7 . 0 2
2 1 . 5 2 5 1 . 5 5 2 9 9 . 7 5 8 . 1 5 3 8 . 2 6
3 1 . 5 4 0 1 . 0 0 1 9 9 . 2 5 9 . 6 8 3 9 . 0 6
4 1 . 8 9 9 0 9 7 . 9 5 7 4 . 1 2 3 9 . 8 5
The condensable gas in all runs, including run 4, agreed well with one-third of the hydrogen deficiency, indicating that most of the digermane not decomposed to the elements was unchanged. The four values of AE when plotted against the Sb : Ge ratio lie closely on a straight line; we take —39.9 ± 0.3 for AE and + 38.7 ± 0.3 for AHt°.
Stannane.—Stannane explodes upon ignition with a platinum fuse without addition of stibine. The explosion is more violent than that of stibine; in one run, with about one millimole in the ca. 90 ml. reaction tube, the tube was shattered.
Three runs were performed with samples of
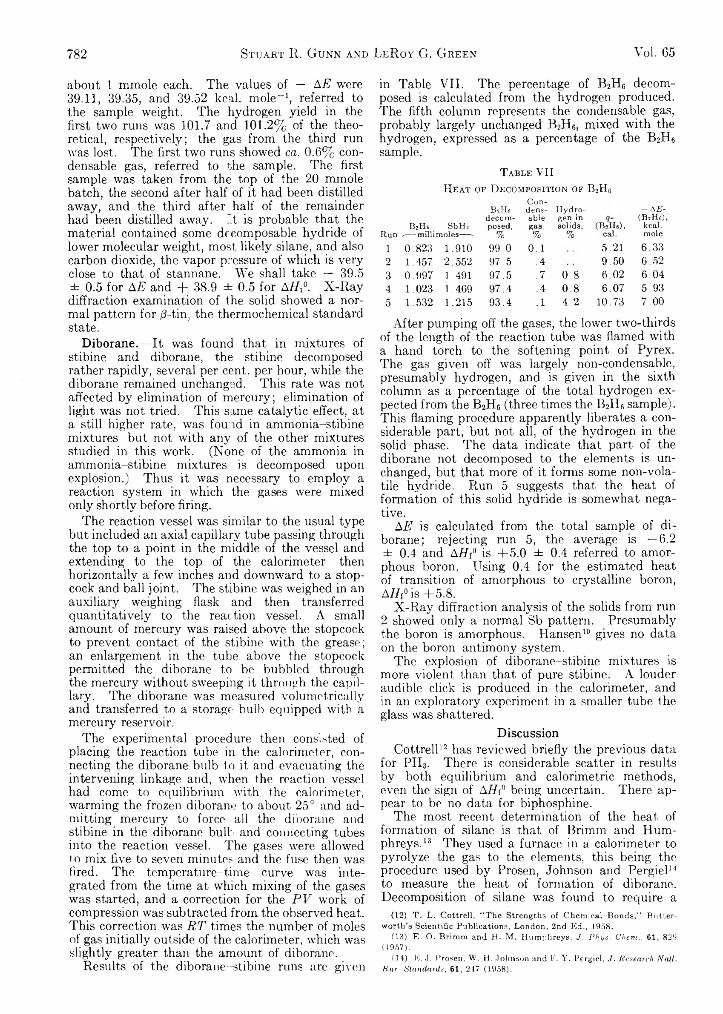
782 Stuart R. Gunn and LeR oy G. Green Vol. 65
about 1 mmole each. The values of — AE were 39.11, 39.35, and 39.52 kcal. mole“ 1, referred to the sample weight. The hydrogen yield in the first two runs was 101.7 and 101.2% of the theoretical, respectively; the gas from the third run was lost. The first two runs showed ca. 0.6% condensable gas, referred to the sample. The first sample was taken from the top of the 20 mmole batch, the second after half of it had been distilled away, and the third after hah of the remainder had been distilled away. It is probable that the material contained some decomposable hydride of lower molecular weight, most likely silane, and also carbon dioxide, the vapor pressure of which is very close to that of stannane. We shall take — 39.5 ± 0.5 for AE and + 38.9 ± 0.5 for AH f. X-Ray diffraction examination of the solid showed a normal pattern for /3-tin, the thermochemical standard state.
Diborane.—It was found that in mixtures of stibine and diborane, the stibine decomposed rather rapidly, several per cent, per hour, while the diborane remained unchanged. This rate was not affected by elimination of mercury; elimination of light was not tried. This same catalytic effect, at a still higher rate, was found in ammonia-stibine mixtures but not with any of the other mixtures studied in this work. (None of the ammonia in ammonia-stibine mixtures is decomposed upon explosion.) Thus it was necessary to employ a reaction system in which the gases were mixed only shortly before firing.
The reaction vessel was similar to the usual type but included an axial capillary tube passing through the top to a point in the middle of the vessel and extending to the top of the calorimeter then horizontally a few inches and downward to a stopcock and ball joint. The stibine was weighed in an auxiliary weighing flask and then transferred quantitatively to the reaction vessel. A small amount of mercury was raised above the stopcock to prevent contact of the stibine with the grease; an enlargement in the tube above the stopcock permitted the diborane to be bubbled through the mercury without sweeping it through the capillary. The diborane was measured volumetrically and transferred to a storage bulb equipped with a mercury reservoir.
The experimental procedure then consisted of placing the reaction tube in the calorimeter, connecting the diborane bulb to it and evacuating the intervening linkage and, when the reaction vessel had come to equilibrium with the calorimeter, warming the frozen diborane to about 25° and admitting mercury to force all the diborane and stibine in the diborane bulb and connecting tubes into the reaction vessel. The gases were allowed to mix five to seven minutes and the fuse then was fired. The temperature-time curve was integrated from the time at which mixing of the gases was started, and a correction for the P V work of compression was subtracted from the observed heat. This correction was RT times the number of moles of gas initially outside of the calorimeter, which was slightly greater than the amount of diborane.
Results of the diborane-stibine runs arc given
in Table VII. The percentage of B2H6 decomposed is calculated from the hydrogen produced. The fifth column represents the condensable gas, probably largely unchanged B2H6, mixed with the hydrogen, expressed as a percentage of the B2H6 sample.
T a b l e VIIH e a t of D ecom po sitio n o f B2H6
Con-
RunB2Hg SbH3
-----millimoles----•
BiHfidecomposed,
%
dens-ablegas,%
Hydrogen in solids,
%(B.He),
cal.
— A E- (B2H6),
kcal, mole
1 0.823 1.910 99.0 0.1 5.21 6.382 1.457 2.552 97.5 .4 9.50 6.523 0.997 1 .491 97.5 .7 0.8 6.02 6.044 1.023 1.409 97.4 .4 0.8 6.07 5.935 1.532 1.215 93.4 .1 4.2 10.73 7.00
After pumping off the gases, the lower two-thirds of the length of the reaction tube was flamed with a hand torch to the softening point of Pyrex. The gas given off was largely non-condensable, presumably hydrogen, and is given in the sixth column as a percentage of the total hydrogen expected from the B2H6 (three times the B2H6 sample). This flaming procedure apparently liberates a considerable part, but not all, of the hydrogen in the solid phase. The data indicate that part of the diborane not decomposed to the elements is unchanged, but that more of it forms some non-volatile hydride. Run 5 suggests that the heat of formation of this solid hydride is somewhat negative.
AE is calculated from the total sample of diborane; rejecting run 5, the average is —6.2 ± 0.4 and AH{° is +5.0 ± 0.4 referred to amorphous boron. Using 0.4 for the estimated heat of transition of amorphous to crystalline boron, Atff°is+5.8.
X-Ray diffraction analysis of the solids from run 2 showed only a normal Sb pattern. Presumably the boron is amorphous. Hansen10 gives no data on the boron-antimony system.
The explosion of diborane-stibine mixtures is more violent than that of pure stibine. A louder audible click is produced in the calorimeter, and in an exploratory experiment in a smaller tube the glass was shattered.
DiscussionCottrell12 has reviewed briefly the previous data
for PH3. There is considerable scatter in results by both equilibrium and calorimetric methods, even the sign of AHf° being uncertain. There appear to be no data for biphosphine.
The most recent determination of the heat of formation of silane is that of Brimm and Humphreys.13 They used a furnace in a calorimeter to pyrolyze the gas to the elements, this being the procedure used by Prosen, Johnson and Pergiel14 to measure the heat of formation of diborane. Decomposition of silane was found to require a
(12) T. L. Cottrell, “ The Strengths of Chemical Bonds,” Butter- worth's Scientific Publications, London, 2nd Ed., 1958.
(13) E. O. Brimm and H. M. Humphreys, J. Phys. Chem., 61, 829 (1957).
(14) 10. J. Prosen, W. H. Johnson and F. Y. Pergiel, J. Research Natl. Bur. ¿Standards, 61, 247 (1958).
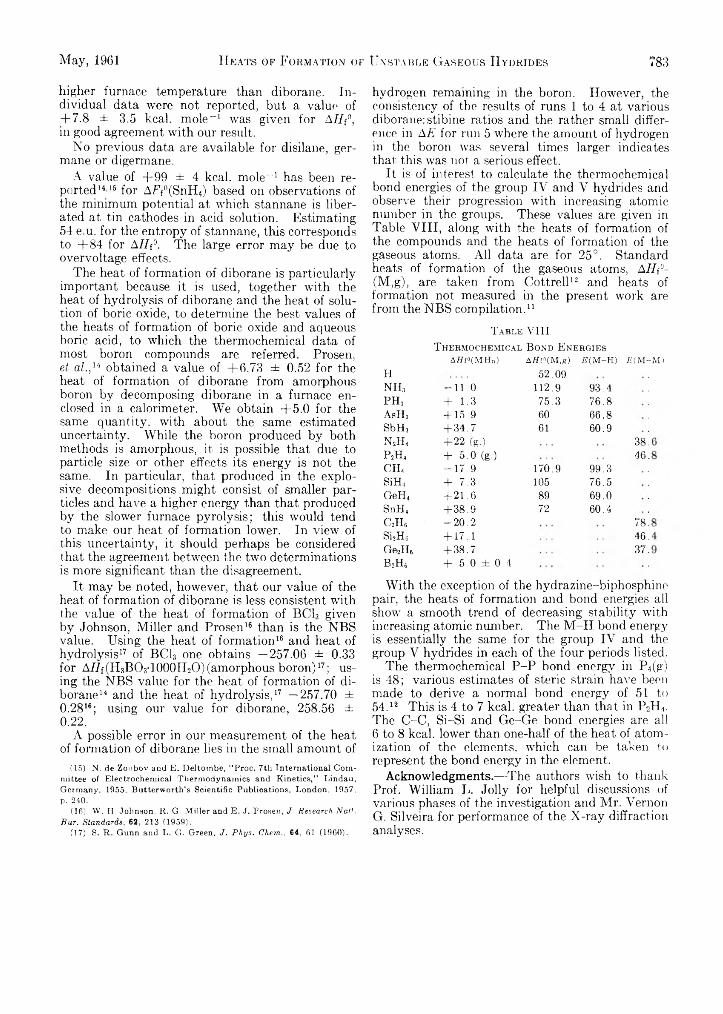
May, 1961 Heats of Formation of Unstable Gaseous Hydrides 783
higher furnace temperature than diborane. Individual data were not reported, but a value of + 7.8 ± 3.5 kcal. mole-1 was given for AHf°, in good agreement with our result.
No previous data are available for disilane, germane or d¡germane.
A value of +99 ± 4 kcal. mole-1 has been reported1416 for AFf°(SnH4) based on observations of the minimum potential at which stannane is liberated at tin cathodes in acid solution. Estimating 54 e.u. for the entropy of stannane, this corresponds to +84 for AHi°. The large error may be due to overvoltage effects.
The heat of formation of diborane is particularly important because it is used, together with the heat of hydrolysis of diborane and the heat of solution of boric oxide, to determine the best values of the heats of formation of boric oxide and aqueous boric acid, to which the thermochemical data of most boron compounds are referred. Prosen, et al.,u obtained a value of +6.73 ± 0.52 for the heat of formation of diborane from amorphous boron by decomposing diborane in a furnace enclosed in a calorimeter. We obtain +5.0 for the same quantity, with about the same estimated uncertainty. While the boron produced by both methods is amorphous, it is possible that due to particle size or other effects its energy is not the same. In particular, that produced in the explosive decompositions might consist of smaller particles and have a higher energy than that produced by the slower furnace pyrolysis; this would tend to make our heat of formation lower. In view of this uncertainty, it should perhaps be considered that the agreement between the two determinations is more significant than the disagreement.
It may be noted, however, that our value of the heat of formation of diborane is less consistent with the value of the heat of formation of BCI3 given by Johnson, Miller and Prosen16 than is the NBS value. Using the heat of formation16 and heat of hydrolysis17 of BC13 one obtains —257.06 ± 0.33 for AHf(H3BO3T000H2O)(amorphous boron)17; using the NBS value for the heat of formation of diborane14 and the heat of hydrolysis,17 —257.70 ± 0.2816; using our value for diborane, 258.56 ± 0.22.
A possible error in our measurement of the heat of formation of diborane lies in the small amount of
(15) N. de Zoubov and B. Deltombe, “ Proc. 7th International Corn* mittee of Electrochemical Thermodynamics and Kinetics," Lindau, Germany, 1955, Butterworth’s Scientific Publications, London, 1957, p. 240.
(16) W. H. Johnson, R. G. Miller and E. J. Prosen, J. Research Natl. Bur. Standards, 62, 213 (1959).
(17) S. It. Gunn and L. G. Green, J. Phys. Chem., 64, 61 (1960).
hydrogen remaining in the boron. However, the consistency of the results of runs 1 to 4 at various diborane: stibine ratios and the rather small difference in AE for run 5 where the amount of hydrogen in the boron was several times larger indicates that this was not a serious effect.
It is of interest to calculate the thermochemical bond energies of the group IV and V hydrides and observe their progression with increasing atomic number in the groups. These values are given in Table VIII, along with the heats of formation of the compounds and the heats of formation of the gaseous atoms. All data are for 25°. Standard heats of formation of the gaseous atoms, AH{°- (M,g), are taken from Cottrell12 and heats of formation not measured in the present work are from the NBS compilation.11
T a b l e V IIIT h e r m o c i-i e m i c a l B o n d E n e r g i e s
A tff»(M H „) A fff°(M ,g) S (M -H ) £ ( M - M )
H 52.09n h 3 — 11. 0 112.9 93 .4p h 3 + 1.3 75.3 76 .8A sH 3 + 15.9 60 6 6 .8SbH3 + 34.7 61 60.9n 2h 4 + 2 2 (g.) 38P Ä + 5 .0 (g.) 46c h 4 - 1 7 .9 170.9 99.3SiH4 + 7 .3 105 76.5GeH4 + 2 1 .6 89 69.0SnH4 + 3 8 .9 72 60.4C2H6 - 2 0 . 2 78Si2H6 + 17.1 46Ge2H6 + 38.7 37B2ÏÏ6 + 5 .0 ± 0 .4
With the exception of the hydrazine-biphosphine pair, the heats of formation and bond energies all show a smooth trend of decreasing stability with increasing atomic number. The M -H bond energy is essentially the same for the group IV and the group V hydrides in each of the four periods listed.
The thermochemical P -P bond energy in P4(g) is 48; various estimates of steric strain have been made to derive a normal bond energy of 51 to54.12 This is 4 to 7 kcal. greater than that in P2H4. The C-C, Si-Si and Ge-Ge bond energies are all 6 to 8 kcal. lower than one-half of the heat of atomization of the elements, which can be taken to represent the bond energy in the element.
Acknowledgments.—The authors wish to thank Prof. William L. Jolly for helpful discussions of various phases of the investigation and Mr. VernonG. Silveira for performance of the X-ray diffraction analyses.
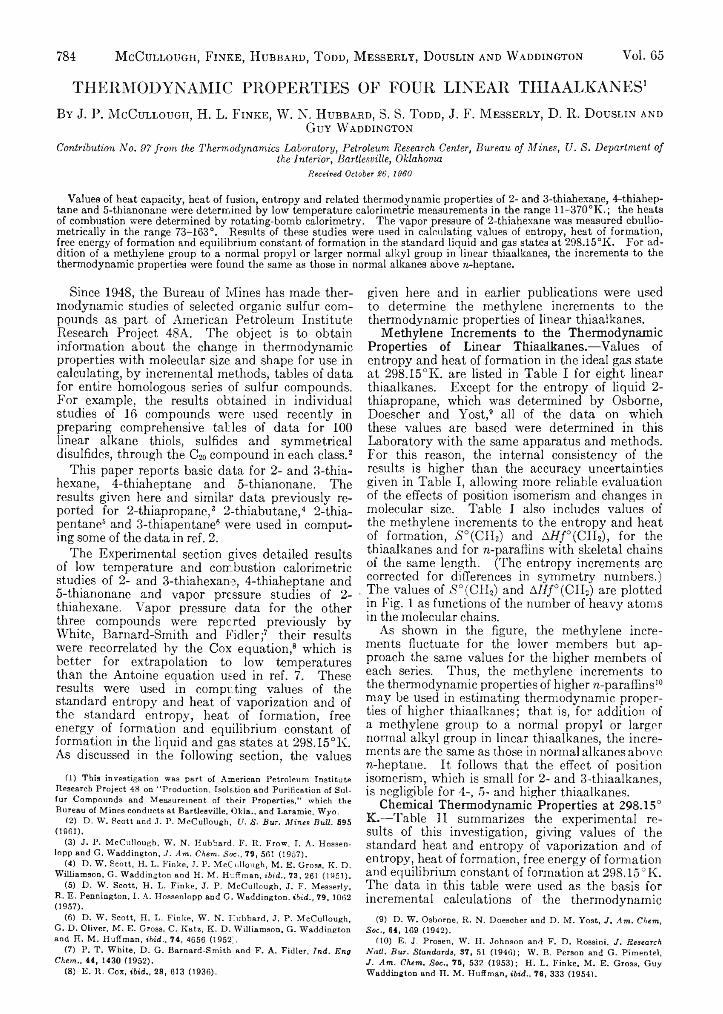
THERMODYNAMIC PROPERTIES OF FOUR LINEAR THIAALKANES1By J. P. M cCullough, H. L. Finke, W. N. Hubbard, S. S. T odd, J. F. M esserly, D. R. D ouslin and
Guy W addington
C ontribu tion N o . 9 7 fr o m the T h erm od yn a m ics L a b ora tory , P etro leu m R esea rch C enter, B u rea u o f M in e s , U . S . D ep a rtm en t o fthe In ter io r , B artlesville, O klahom a
Received October 26, 1960
Values of heat capacity, heat of fusion, entropy and related thermodynamic properties of 2- and 3-thiahexane, 4-thiahep- tane and 5-thianonane were determined by low temperature calorimetric measurements in the range 11-370°K.; the heats of combustion were determined by rotating-bomb calorimetry. The vapor pressure of 2-thiahexane was measured ebullio- metrically in the range 73-163°. Results of these studies were used in calculating values of entropy, heat of formation, free energy of formation and equilibrium constant of formation in the standard liquid and gas states at 298.15°K. For addition of a methylene group to a normal propyl or larger normal alkyl group in linear thiaalkanes, the increments to the thermodynamic properties were found the same as those in normal alkanes above ?j-heptane.
784 M cCullough, Finke, Hubbard, T odd, M esserlt, D ouslin and W addington Vol. 65
Since 1948, the Bureau of Mines has made thermodynamic studies of selected organic sulfur compounds as part of American Petroleum Institute Research Project 48A. The object is to obtain information about the change in thermodynamic properties with molecular size and shape for use in calculating, by incremental methods, tables of data for entire homologous series of sulfur compounds. For example, the results obtained in individual studies of 16 compounds were used recently in preparing comprehensive tables of data for 100 linear alkane thiols, sulfides and symmetrical disulfides, through the C20 compound in each class.2
This paper reports basic data for 2- and 3-thiahexane, 4-thiaheptane and 5-thianonane. The results given here and similar data previously reported for 2-thiapropane,3 2-thiabutane,4 5 2-thia- pentane6 and 3-thiapentane6 were used in computing some of the data in ref. 2.
The Experimental section gives detailed results of low temperature and combustion calorimetric studies of 2- and 3-thiahexane, 4-thiaheptane and5-thianonane and vapor pressure studies of 2- thiahexane. Vapor pressure data for the other three compounds were reported previously by White, Barnard-Smith and Fidler;7 their results were recorrelated by the Cox equation,8 which is better for extrapolation to low temperatures than the Antoine equation used in ref. 7. These results were used in computing values of the standard entropy and heat of vaporization and of the standard entropy, heat of formation, free energy of formation and equilibrium constant of formation in the liquid and gas states at 298.15°K. As discussed in the following section, the values
(1) This investigation was part of American Petroleum Institute Research Project 48 on “ Production, Isolation and Purification of Sulfur Compounds and Measurement of their Properties/' which the Bureau of Mines conducts at Bartlesville, Okla., and Laramie, Wyo.
(2) D. W. Scott and J. P. McCullough, U. S. Bur. M ines Bull. 595 (1961).
(3) J. P. McCullough, W. N. Hubbard. F. R. Frow, I. A. Hossen- lopp and G. Waddington, J. Am. Chem. Soc., 79 , 561 (1957).
(4) D. W. Scott, H. L. Finke, J. P. McCullough, M. E. Gross, K. D. Williamson, G. Waddington and H. M. Huffman, ibid., 73, 261 (1951).
(5) D. W. Scott, H. L. Finke, J. P. McCullough, J. F. Messerly, R. E. Pennington, I. A. Hossenlopp and G. Waddington, ibid., 79 , 1062 (1957).
(6) D. W. Scott, H. L. Finke, W. N. Hubbard, J. P. McCullough, G. D. Oliver, M. E. Gross, C. Katz, K. D. Williamson, G. Waddington and H. M. Huffman, ibid., 7 4 , 4656 (1952;.
(7) P. T. White, D. G. Barnard-Smith and F. A. Fidler, Ind. Eng Chem., 44 , 1430 (1952).
(8 ) E. R. Cox, ibid., 28 , 613 (1936).
given here and in earlier publications were used to determine the methylene increments to the thermodynamic properties of linear thiaalkanes.
Methylene Increments to the Thermodynamic Properties of Linear Thiaalkanes.—Values of entropy and heat of formation in the ideal gas state at 298.15°K. are listed in Table I for eight linear thiaalkanes. Except for the entropy of liquid 2- thiapropane, which was determined by Osborne, Doescher and Yost,9 all of the data on which these values are based were determined in this Laboratory with the same apparatus and methods. For this reason, the internal consistency of the results is higher than the accuracy uncertainties given in Table I, allowing more reliable evaluation of the effects of position isomerism and changes in molecular size. Table I also includes values of the methylene increments to the entropy and heat of formation, *S°(CH2) and Af?/°(CIi2), for the thiaalkanes and for n-paraffins with skeletal chains of the same length. (The entropy increments are corrected for differences in symmetry numbers.) The values of *S'°(CH2) and A/L/°(CH2) are plotted in Fig. 1 as functions of the number of heavy atoms in the molecular chains.
As shown in the figure, the methylene increments fluctuate for the lower members but approach the same values for the higher members of each series. Thus, the methylene increments to the thermodynamic properties of higher n-paraffins10 may be used in estimating thermodynamic properties of higher thiaalkanes; that is, for addition of a methylene group to a normal propyl or larger normal alkyl group in linear thiaalkanes, the increments are the same as those in normal alkanes above n-heptane. It follows that the effect of position isomerism, which is small for 2- and 3-thiaalkanes, is negligible for 4-, 5- and higher thiaalkanes.
Chemical Thermodynamic Properties at 298.15° K.—Table II summarizes the experimental results of this investigation, giving values of the standard heat and entropy of vaporization and of entropy, heat of formation, free energy of formation and equilibrium constant of formation at 298.15°K. The data in this table were used as the basis for incremental calculations of the thermodynamic
(9) D. W. Osborne, R. N. Doescher and D. M. Yost, J. Am . Chem, Soc., 64, 169 (1942).
(10) E. J. Prosen, W. H. Johnson and F. D. Rossini, J . Research Natl. Bur. Standards, 37 , 51 (1946); W. B. Person and G. Pimentel, J. Am. Chem. Soc., 75 , 532 (1953); H. L. Finke, M. E. Gross, Guy Waddington and H. M. Huffman, ibid., 76 , 333 (1954).

May, 1961 T hermodynamic Properties of Linear T hiaalkanes 785
Table IMethylene Increments to the Molal Entropy and Heat of Formation of Linear Thialkanes at 298-15°K.
Compound2-Thiapropane-f
S°298.15,acal. deg.-1
68.32 ± 0 .14
S°(CH 2),bcal. deg.*1 Thiaaikaned n-Paraffin«
AH/°298.I5, ckcal.
-2 4 .3 6 ± 0 .13
kcal.------ -Thiaaikane^ n-Paraffine
2-Thiabutane/ 79.63 ± .16 9.93 9.61 -2 9 .6 4 ± .28 -5 .2 8 -5 .3 32-Thiapentane/ 88.83 ± .18 9.20 9.28 -3 4 .9 3 ± .16 -5 .2 9 -4 .8 53-Thiapentane^ 87.98 ± .18 9.73 9.28 -3 5 .3 4 ± .18 -5 .7 0 -4 .8 52-Thiahexane 98.43 ± .20 9.60 9.43 -3 9 .8 1 ± .21 -4 .8 8 -4 .9 63-Thiahexane 98.82 ± .20 9.46 9.43 -4 0 .3 9 ± .20 -5 .0 5 -4 .9 64-Thiaheptane 107.16 ± ..21 9.72 9.41 -4 5 .3 5 ± .23 -4 .9 6 -4 .9 35-Thianonane 125.69 ± .25 9.26 9.31 -5 5 .3 8 ± .36 -5 .0 2 -4 .9 3
“ The entropy in the ideal gas state and estimated accuracy uncertainty. b The methylene increment to entropy (corrected for symmetry) and heat of formation. c For the reaction: aC(c, graphite) + b/2 H2(g) + l/2S2(g) = CaH&S(g). The indicated uncertainty interval is equal to twice the final “over-all” standard deviation.24 d The increments listed were calculated from data for the following pairs: 2-thiabutane and 2-thiapropane; 2-thiapentane and 2-thiabutane; 3-thia- pentane and 2-thiabutane; 2-thiahexane and 2-thiapentane; 3-thiahexane and 3-thiapentane; 4-thiaheptane and 3-thia- hexane; 5-thianonane and 4-thiaheptane. e Increments for n-paraffins with the same chain length; calculated from results in “Selected Values of Physical and Thermodynamic Properties of Hydrocarbons and Related Substances,” American Petroleum Institute Research Project 44 at the Carnegie Institute of Technology, Carnegie Press, Pittsburgh, 1953. ! Reference 2 and sources cited therein.
Table IISelected Molal Thermodynamic Properties at 298.15°K.
Compound StateA fly0,«
cal.ASv°,a
cal. deg. “ ls ° ,
cal. deg.AHf°, b kcal.
A Ff°, 6 kcal. log Kfb
2-Thiahexane Liq. 9,730 24.94 73.49 -49 .54 -5 .4 6 +4.00Gas 98.43 -39 .81 -3 .1 7 2.32
3-Thiahexane Liq. 9,580 24.84 73.98 -49 .97 -6 .0 4 4.43Gas 98.82 -40 .39 -3 .8 7 2.84
4-Thiaheptane Liq.Gas 10,660 26.31 80.85
107.16-56.01-45 .35
-4 .4 1-1 .6 0
3.231.17
5-Thianonane Liq. 12,750 28.87 96.82 -68 .13 -1 .8 7 1.37Gas 125.69 -55 .38 +2.27 -1 .6 6
° The standard heat and entropy of vaporization. 6 The standard heat, free energy and logarithm of the equilibrium constant of formation for the reaction: a C(c, graphite) + 6/2 H2(g) + l/2S2(g) = CaHiiS(l or g).
properties of the 2-, 3-, 4-, 5- and symmetrical- thiaalkanes through the C2o compound in each class.2
ExperimentalThe apparatus and techniques used for low temperature
calorimetry,11 comparative ebulliometry12 and combustion calorimetry13 have been described. The reported values are based on 1951 International Atomic Weights,14 15 1951 values of fundamental physical constants16 and the relations: 0° = 273.15°K.18'17 and 1 cal. = 4.184 (exactly) joules. Temperature was measured with platinum resistance thermometers calibrated in terms of the International Temperature Scale18 between 90 and 500°K. and the provisional scale19 of the National Bureau of Standards between
(11) H. M. Huffman, Chem. Revs., 4 0 , 1 (1047); H. M. Huffman, S. S. Todd and G. D. Oliver, ./. Am. Chem. Soc., 7 1 , 584 (1940); D. W. Scott, D. R. Douslin, M. E. Gross, G. D. Oliver and H. M. Huffman, ibid., 7 4 , 883 (1952).
(12) G. Waddington, J. W. Knowlton, D. W. Scott, G. D. Oliver, S. S. Todd, W. N. Hubbard, J. C. Smith and H. M. Huffman, ibid., 71, 797 (1949).
(13) W. N. Hubbard, C. Katz and G. Waddington, J. Phys. Chem., 58, 142 (1954).
(14) E. Wichers, J. Am. Chem. Soc., 74, 2447 (1952).(15) F. D. Rossini, F. T. Gucker, Jr., H. L. Johnston, L. Pauling and
G. W. Vinal, ibid., 74, 2699 (1952).(16) H. F. Stimson, Am. J. Phys., 23, 614 (1955).(17) Some of the results originally were computed with constants
and temperatures in terms of the relationship 0° » 273.16°K. Only results affected significantly by the new definition of the absolute temperature scale18 were recalculated. Therefore, numerical inconsistencies, much smaller than the accuracy uncertainty, may be noted in some of the reported data.
(18) H. F. Stimson, J. Research Natl. Bur. Standards, 42, 209 (1949).(19) H. J. Hoge and F. G. Brickwedde, ibid., 22, 351 (1939).
11 and 90°K. All electrical and mass measurements were referred to standard devices calibrated at the National Bureau of Standards.
The samples were prepared at the Laramie (Wyo.) Petroleum Research Center of the Bureau of Mines. The method of purification and useful physical properties of 2- thiahexane, 4-thiaheptane and 5-thianonane have been published,20 and similar information for 3-thiahexane will be published later.
Heat Capacity in the Solid and Liquid States.—Lowtemperature calorimetric measurements were made with 44- to 48-g. samples sealed in a platinum calorimeter with helium (about 3 cm. pressure at room temperature) added to promote thermal equilibration. The observed values of heat capacity, Csatd, are listed in Table III. Above 30°K. the accuracy uncertainty is estimated to be no greater than 0.2%, except in the premelting region.
Each thiaaikane shows a normal sigmoid heat capacity curve in the solid state. The constants of empirical cubic equations selected to represent the heat capacity data in the liquid state are given in Table IV.
Heats of Fusion, Triple Point Temperatures, Cryoscopic Constants and Purity of Samples.—Three measurements of heat of fusion, AH m , of each compound gave the results in Table V. The values of triple point temperature, Jt.p., in Table V were determined from studies of melting temperature, Tobad, as a function of fraction of total sample melted, f . Results of these studies are in Table VI. Table V includes values of the cryoscopic constants,21 a = A H m / jBTt.p.2 and b = 1 /T t.p. —AC m / 2 A H m . The amounts of impurity in the samples, calculated from the results of the melting point studies, are given in Table VI.
(20) J. C. Morris, W, J. Lamim, R. V. Helm, W. E. Haines, G. L Cook and J. S. Ball, J. Chem. Eng. Data, 5, 112 (1960).
(21) A. R. Glasgow, A. J. Streiff and F. D. Rossini, J. Research Natl. Bur. Standards, 35, 355 (1945).

786 M c C u l l o u g h , F i n k e , H u b b a r d , T o d d , M e s s e r l y , D o u s l i n a n d W a d d i n g t o n Vol. 65
T a b l e IIIM o l a l H e a t C a p a c it y o f F o u r T h ia a l k a n e s in C a l .
D e g . -1T, °K.< ATb Csatd c T, °E.n A Tb Csatd o
2-ThiahexaueCrystals 37.12 3.702 7.984
40.98 4.013 9.10311.60 1.567 0.669 45.18 4.408 10.27611.91 1.424 .742 49.83 4.882 11.50313.08 1.379 .956 54.89 5.243 12.79113.40 1.540 1.030 56.44 4.299 13.17714.40 1.269 1.245 61.42 5.656 14.35914.94 1.529 1.375 66.85 5.221 15.53015.71 1.343 1.560 71.92 4.903 16.52216.79 2.172 1.829 77.14 5.557 17.50717.23 1.700 1.947 82.58 5.260 18.50618.83 1.917 2.391 83.02 3.049 18.58119.02 1.881 2.438 86.66 4.233 19.21420.77 1.973 2.950 87.73 5.026 19.39221 .03 2.142 3.016 91.23 4.898 19.91422.71 1.960 3.550 96.36 5.367 20.65523.18 2.164 3.667 1 0 2 .5 6.212 21.47724.90 2.328 4.220 108.25 5.998 22.25325.50 2.494 4.394 114.16 5.815 22.99127.36 2.612 4.972 120.36 6.581 23.76028.38 3.261 5.285 126.84 6.389 24.51030.13 2.928 5.832 133.14 6.224 25.21133.43 3.680 6.860 139.29 6.076 25.871
145 .30 5 .943 26 .525 228 .55 9 .853 44 .713151 18 5 .818 27 .155 238 .35 9 .761 45 .068157 46 4 .916 27 .773 248 .07 9 .675 45 .442162 .72 5 .624 28 .387 257 .70 9 .576 45 .877165 78 6 .247 28 . 742" 267 .23 9 .481 46 . 328
276 .67 9 .385 46 .817Liquid 286 .42 10 .118 47 .356
296 .49 10 .001 47 . 929186. 90 5 .688 43 .881 299 .41 9 985 48 .099187 .11 5 .585 43 .907 309 .34 9 .868 48 .691189 .94 7 .368 43 .919 319 .15 9 .753 49 .328192 .57 5 .659 43 .954 328 .84 9 .633 49 .970193 .61 7 .419 43 .966 338 .42 9 .518 50 .609198 .65 10 .075 44 .032 347 .89 9 .403 51 .261208 .69 10 .006 44 .196 358 .01 10 .822 51 .975218 .66 9 .928 44 .424
3-ThiahexaneCrystals 113 .53 6 . 102 22 .481
119 .25 5 .960 23 .19111 .67 1 .702 0 . 822 119 .54 5 .919 23 .21611 .71 1 .690 .829 125 .13 5 .802 23 .88213 .47 1 .887 1 .189 125 .38 5..762 23 .89613 .49 1 .871 1 .205 131 .21 6 459 24 .56715 28 1 .720 1 .608 131 .32 6 588 24 . 59315 .28 1 .709 1 .614 137 .58 6 .288 25 .28917 .11 1 .950 2 .092 137 .82 6 .410 25 .31417 .11. 1 .959 2 .096 138 .71 4 .631 25 .41619 .09 2 .026 2 .643 141 .34 6 .439 25 . 69319 .11 2 .031 2 .648 143 .36 5 .289 25 .90821 .23 2 .261 3 .272 143 .74 5..453 25 95521 .25 2 .264 3 .281 148 .60 5 .212 26 . 458"23 .56 2 .358 3..98923 .65 2 .589 4 .019 Liquid26 17 2 .870 4 81126 .35 2 .821 4 .869 165 .59 5. 008 43. 10529 .17 3 .146 5 744 171 .58 6. 985 43 10329 .31 3 .109 5 .797 171 .78 10 . 123 43..09132 .49 3 .262 6 .786 1S1 SS 10 .072 43 .14236 .09 3 .930 7 .867 191 .92 10 Oil 43 .23740 .17 4 .241 9 .023 197 .08 10 .177 43 .30744 .52 4 .472 10 .181 201 .89 9..946 43 .40049 .33 5 .139 11 .406 207 .23 10 .122 43 49053 .53 4 .692 12 .411 217 .30 10..037 43 .75054 .65 5 .509 12 .666 227 .30 9 .959 44 ,04358 ,85 5 .952 13 .620 237 .22 9 873 44 .38160. 31 5 .827 13.,938 247 06 9..789 44 76464. 62 5 .595 14..848 257. 28 10. 653 45. 21266. 28 6 .104 15 177 267 89 10. 529 45. 74170. 54 6 .235 15. 978 278. 36 10. 403 46. 29871. 83 4 997 16. 217 288. 26 10. 180 46. 84876. 57 5. 835 17. 069 288. 71 10. 269 46. 88182. 69 6. 416 18. 155 298. 39 10. 072 47. 44588. 93 6. 072 19. 162 308. 40 9. 941 48. 03994. 87 5 .812 20. 018 318. 29 9. 829 48. 65495. 79 5..007 20 135 328. 08 9. 707 49 266
100. 97 6 .396 20. 852 337. 72 9. 547 49. 835101. 04 5 .493 20. 849 347. 24 9. 467 50. 469106. 96 6 .352 21 .643 356. 67 9. 375 51 067107. 33 6 .314 21 685 366 02 9. 268 51 .675113. 20 6..143 22 451
4-ThiaheptaneCrystals 14 . 29 1 503 1.842
14 .34 1 .858 1 .85712 .63 1 .514 1 .381 15 .87 1 .633 2 30012 .79 1 .481 1 .413 16 .14 1.715 2 . 380
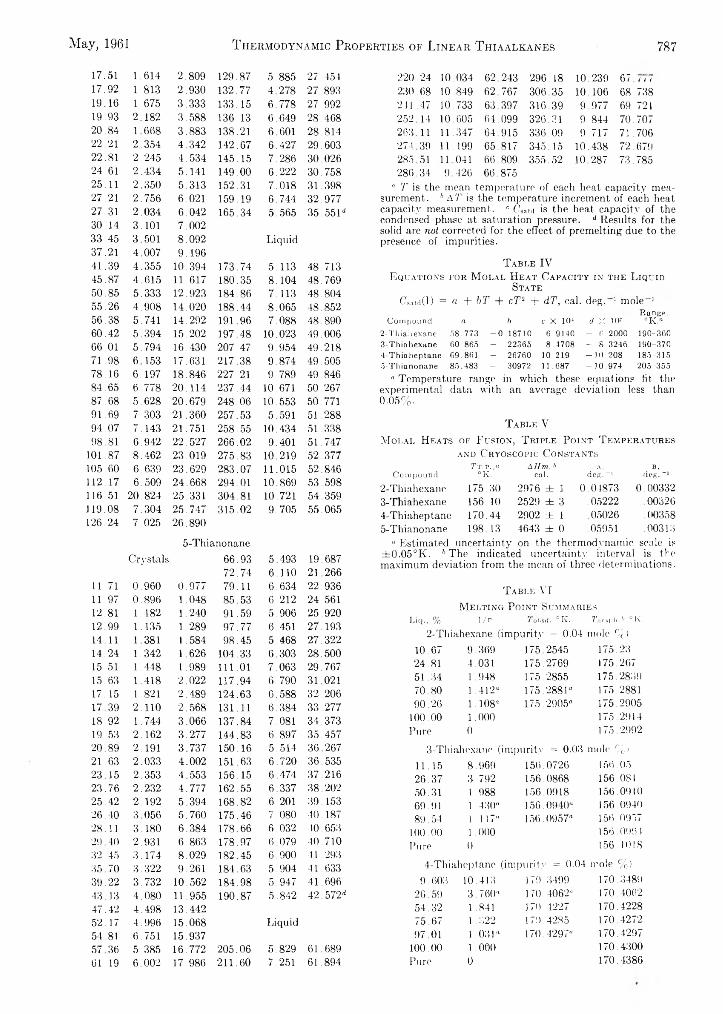
May, 1961 T hermodynamic Properties of Linear T hiaalkanes 787
17..51 1. 614 2.809 129.87 5. 885 27. 45417. 92 1. 813 2.930 132.77 4 278 27. 89319..16 1. 675 3.333 133.15 6 778 27. 99219 .93 2 182 3.588 136.13 6 .649 28. 46820 .84 1 668 3.883 138.21 6 .601 28 .81422 .21 2 354 4.342 142.67 6 .427 29 60322 .81 2 .245 4.534 145.15 7 .286 30 .02624 .61 2 .434 5.141 149.00 6 .222 30 .75825 .11 2..350 5.313 152.31 7 .018 31 .39827 .21 2 .756 6.021 159.19 6 .744 32 .97727 .31 2 .034 6.042 165.34 5 .565 35 .551"30 .14 3 .101 7.00233 .45 3..501 8.092 Liquid37 .21 4,.007 9.19641 .39 4 .355 10.394 173.74 5 .113 48 .71345 .87 4 .615 11.617 180.35 8 .104 48 .76950 .85 5 .333 12.923 184.86 7 .113 48 .80455 .26 4 .908 14.020 188.44 8 .065 48 .85256 .38 5 .741 14.292 191.96 7 .088 48 .89060 .42 5 .394 15.202 197.48 10 .023 49 .00666 .01 5 .794 16.430 207.47 9 .954 49..21871 .98 6 153 17.631 217.38 9 .874 49 .50578 .16 6. 197 18.846 227.21 9. 789 49. 84684 .65 6 .778 20.114 237.44 10 .671 50. 26787 .68 5 .628 20.679 248.06 10 .553 50. 77191 .69 7 .303 21.360 257.53 5 .591 51 .28894 .07 7 .143 21.751 258.55 10 .434 51 .33898 .81 6 .942 22.527 266.02 9 .401 51 .747
101 .87 8 .462 23.019 275.83 10 .219 52 .377105 .60 6 .639 23.629 283.07 11 .015 52 .846112 .17 6 .509 24.668 294.01 10 .869 53 .598116 .51 20 .824 25.331 304.81 10 .721 54 .359119. 08 7 .304 25.747 315.02 9 .705 55 .065126. 24 7..025 26.890
5-ThianonaneC rysta ls 66.93 5 .493 19 .687
72.74 6 .110 21 .26611. 71 0..960 0 .977 79.11 6 .634 22. 93611.97 0 .896 1 .048 85.53 6 .212 24. 56112.81 1 .182 1 .240 91.59 5 .906 25 .92012.99 1 .135 1 .289 97.77 6 .451 27..19314 11 1 381 1 .584 98.45 5 .468 27..32214. 24 1. 342 1 626 104.33 6 303 28. 50015. 51 1 .448 1 .989 111.01 7. 063 29. 76715. 63 1 418 2 .022 117.94 6 .790 31 02117. 15 1 .821 2 .489 124.63 6 ..588 32 .20617 39 2 .110 2 .568 131.11 6 384 33 .27718. 92 1 .744 3 .066 137.84 7 .081 34 .37319 .53 2 .162 3 .277 144.83 6 .897 35 .45720 .89 2 .191 3 .737 150.16 5 .514 36 .26721 .63 2 .033 4 .002 151.63 6 .720 36 .53523 .15 2 .353 4 .553 156.15 6 .474 37 .21623 .76 2 .232 4 .777 162.55 6 .337 38 :20225 .42 2 .192 5 .394 168.82 6 .201 39 .15326 .40 3 056 5 .760 175.46 7 .080 40 .18728 .11 3 .180 6 .384 178.66 6 .032 40 . 65321) 40 2 .931 6 .863 178.97 6 .079 40 .71032. 45 3 .174 8 .029 182.45 6 .900 41 .29335 70 3 .322 9 .261 184.63 5 .904 41 .63339 .22 3 .732 10 .562 184.98 5 .947 41 .69643 .13 4 .080 11 .955 190.87 5 .842 42 . 572"47 .42 4 .498 13 .44252 . 17 4 996 15 .068 Liquid54 81 6 .751 15 .93757 36 5. 385 16 .772 205.06 5. 829 61 689
61. 19 6 ..002 17. 986 211.60 7. 251 61. 894
220 .24 10 .034 62 243 296 .18 10 239 67 7/7230 .68 10 .849 62 767 306 35 10 106 68. 738241 .47 10 .733 63 397 316 39 9 977 69. 721252 14 10 .605 64 099 326. 31 9. 844 70. 707263 11 11 .347 64 915 336. 09 9. 717 71. 706274 39 11 .199 65 817 345. 15 10. 438 72. 67!)285 51 11 .041 66. 809 355. 52 10. 287 73. 785286. 34 9. 426 66. 875
" T is the mean temperature of each heat capacity measurement. b A T is the temperature increment of each heat capacity measurement. ' Osatd is the heat capacity of the condensed phase at saturation pressure. d Results for the solid are not corrected for the effect of premelting due to the presence of impurities.
T a b l e IVE q u a t io n s f o r M o l a l H e a t C a p a c it y in t h e L iq u id
St a t e
CSntd(l) = a + b T + c T a + d T , cal. deg. 1 mole 1
Compound a b c X 10“ d X 10'Range.°K.°
2-Tbiahexane 58.773 -0 .1 8 7 1 0 6.9140 - 6.2000 190-3603-Thiahexane 60.865 - .22365 8.4708 - S 3246 190-3704-Thiaheptane 69.861 - .26760 10.219 -1 0 .2 0 8 185-3155-Thianonane 85.483 - .30972 11.687 -1 0 .9 7 4 205—355
" Temperature range in which these equations tit the experimental data with an average deviation less than 0.05%.
T a b l e VM o l a l H e a t s of F u s io n , T r ip l e P o in t T e m p e r a t u r e s
a n d C r y o s c o p ic C o n s t a n t s
CompoundTt. p.,«
°K .A Hm, f>
cal.A,
deg. _1B,
deg. _12-Tkiahexane 175.30 2976 ± 1 0.04873 0.003323-Thiahexane 156.10 2529 ± 3 .05222 003264-Thiaheptane 170.44 2902 ± 1 .05026 .003585-Thianonane 198.13 4643 ± 0 .05951 .00313
“ Estimated uncertainty on the thermodynamic scale is ±0.05°K . h The indicated uncertainty interval is the maximum deviation from the mean of three determinations.
T a b l e VIM e l t in g P o in t S u m m a r ie s
Liq., % 1/f 7'oi.sd, °K. TVnph.A 0 K.2-Tbiahexane (impurity = 0.04 mole % )
10.67 9.36!) 175 2545 175.2324.81 4.031 175.2769 175.26751.34 1.948 175.2855 175.283970.80 1.412“ 175.2881“ 175.288190.26 1.108“ 175.2905“ 175.2905
100.00 1.000 175.2914Pure 0 175.2992
3-Thiahexane (impurity = 0.03 mole %.)11.15 8.969 156.0726 156.0526.37 3.792 156.0868 156.08150.31 1.988 156.0918 156.091069.91 1.430“ 156.0940“ 156.094089.54 1 .117“ 156.0957“ 156.0957
100.00 1 .000 156.096lPure 0 156.1018
4-Thiaheptane (impurity = 0.04 mole %:)9.603 10.413 170.3499 170.3489
20.59 3.760“ 170.4062“ 170.406254.32 1.841 170,4227 170.422875.67 1.322 17!). 4285 170.427297.01 1.031 “ 170.4297“ 170.4297
100.00 1 000 170.4300Pure Ü 170.4386
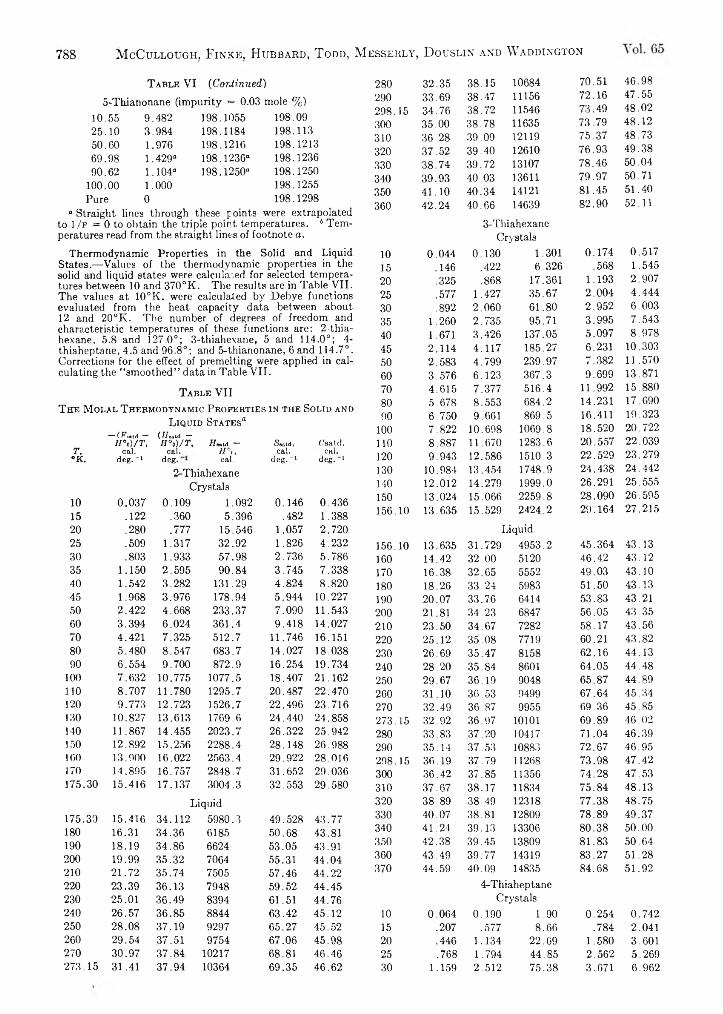
788 M cCullough, Finke, Hubbard, T odd, M esseiily, D ouslin and W addington
T a b l e VI (C o rJ in u ed )
5-Thianonane (impurity = 0.03 mole %)10.55 9.482 198.1055 198.0925.10 3.984 198.1184 198.11350.60 1.976 198.1216 198.121369.98 1.429'’ 198.1236“ 198.123690.62 1.104“ 198.1250“ 198.1250
100.00 1.000 198.1255Pure 0 198.1298
“ Straight lines through these points were extrapolated to 1/ p = 0 to obtain the triple point temperatures. b Temperatures read from the straight lines of footnote o.
Thermodynamic Properties in the Solid and Liquid States.—Values of the thermodynamic properties in the solid and liquid states were calculated for selected temperatures between 10 and 370°K. The results are in Table VII. The values at 10°K. were calculated by Debye functions evaluated from the heat capacity data between about 12 and 20°I\. The number of degrees of freedom and characteristic temperatures of these functions are: 2-thia- hexane, 5.8 and 127.0°; 3-thiahexane, 5 and 114.0°; 4- thiaheptane, 4.5 and 96.8°; and 5-thianonane, 6 and 114.7°. Corrections for the effect of premelting were applied in calculating the “ smoothed” data in Table VII.
T a b l e VIIT h e M o l a l T h e r m o d yn a m ic P r o p e r t ie s in t h e So lid and
L iq u id St a t e s®” (Faatd — (ffsatd —
T,“K.
H°o)/T,cal.
deg.-1
H \ )/ T ,cal.
deg.
iTastd “H°c,cal.
aSsatd,cal.
deg.-1
('said.cal.
deg. ">2-Thiahexane
Crystals10 0.037 0.109 1.092 0.146 0.43615 .122 .360 5.396 .482 1.38820 .280 .777 15.546 1.057 2.72025 .509 1.317 32.92 1.826 4.23230 .803 1.933 57.98 2.736 5.78635 1.150 2.595 90.84 3.745 7.33840 1.542 3.282 131.29 4.824 8.82045 1.968 3.976 178.94 5.944 10.22750 2.422 4.668 233.37 7.090 11.54360 3.394 6.024 361.4 9.418 14.02770 4.421 7.325 512.7 11.746 16.15180 5.480 8.547 683.7 14.027 18.03890 6.554 9.700 872.9 16.254 19.734
100 7.632 10.775 1077.5 18.407 21.162110 8.707 11.780 1295.7 20.487 22.470120 9.773 12.723 1526.7 22.496 23.716130 10.827 13.613 1769.6 24.440 24.858140 11.867 14.455 2023.7 26.322 25.942150 12.892 15.256 2288.4 28.148 26.988160 13.900 16.022 2563.4 29.922 28.016170 14.895 16.757 2848.7 31.652 29.036175.30 15.416 17.137 3004.3 32.553 29.580
Liquid175.30 15.416 34.112 5980.3 49.528 43.77180 16.31 34.36 6185 50.68 43.81190 18.19 34.86 6624 53.05 43.91200 19.99 35.32 7064 55.31 44.04210 21.72 35.74 7505 57.46 44.22220 23.39 36.13 7948 59.52 44.45230 25.01 36.49 8394 61.51 44.76240 26.57 36.85 8844 63.42 45.12250 28.08 37.19 9297 65.27 45.52260 29.54 37.51 9754 67.06 45.98270 30.97 37.84 10217 68.81 46.46273.15 31.41 37.94 10364 69.35 46.62
280 32.35 38.15 10684 70.51 46.98290 33.69 38.47 11156 72.16 47.55298.15 34.76 38.72 11546 73.49 48.02300 35.00 38.78 11635 73.79 48.12310 36.28 39.09 12119 75.37 48.73320 37.52 39.40 12610 76.93 49.38330 38.74 39.72 13107 78.46 50.04340 39.93 40.03 13611 79.97 50.71350 41.10 40.34 14121 81.45 51.40360 42.24 40.66 14639 82.90 52.11
3-ThiahexaneCrystals
10 0.044 0.130 1.301 0.174 0.51715 .146 .422 6.326 .568 1.54520 .325 .868 17.361 1.193 2.90725 .577 1.427 35.67 2.004 4.44430 .892 2.060 61.80 2.952 6.00335 1.260 2.735 95.71 3.995 7.54340 1.671 3.426 137.05 5.097 8.97845 2.114 4.117 185.27 6.231 10.30350 2.583 4.799 239.97 7.382 11.57060 3.576 6.123 367.3 9.699 13.87170 4.615 7.377 516.4 11.992 15.88080 5.678 8.553 684.2 14.231 17.69090 6.750 9.661 869.5 16.411 19.323
100 7.822 10.698 1069.8 18.520 20.722110 8.887 11.670 1283.6 20.557 22.039120 9.943 12.586 1510.3 22.529 23.279130 10.984 13.454 1748.9 24.438 24.442140 12.012 14.279 1999.0 26.291 25.555150 13.024 15.066 2259.8 28.090 26.595156.10 13.635 15.529 2424.2 29.164 27.215
Liquid156.10 13.635 31.729 4953.2 45.364 43.13160 14.42 32.00 5120 46.42 43.12170 16.38 32.65 5552 49.03 43.10180 18.26 33.24 5983 51.50 43.13190 20.07 33.76 6414 53.83 43.21200 21.81 34.23 6847 56.05 43.35210 23.50 34.67 7282 58.17 43.56220 25.12 35.08 7719 60.21 43.82230 26.69 35.47 8158 62.16 44.13240 28.20 35.84 8601 64.05 44.48250 29.67 36.19 9048 65.87 44.89260 31.10 36.53 9499 67.64 45.34270 32.49 36.87 9955 69.36 45.85273.15 32.92 36.97 10101 69.89 46.02280 33.83 37.20 10417 71.04 46.39290 35.14 37.53 10883 72.67 46.95298.15 36.19 37.79 11268 73.98 47.42300 36.42 37.85 11356 74.28 47.53310 37.67 38.17 11834 75.84 48.13320 38.89 38.49 12318 77.38 48.75330 40.07 38.81 12809 78.89 49.37340 41.24 39.13 13306 80.38 50.00350 42.38 39.45 13809 81.83 50.64360 43.49 39.77 14319 83.27 51.28370 44.59 40,09 14835 84.68 51.92
4-ThiaheptaneCrystals
10 0.064 0.190 1.90 0.254 0.74215 .207 .577 8.66 .784 2.04120 .446 1.134 22.69 1.580 3.60125 .768 1.794 44.85 2.562 5.26930 1.159 2.512 75.38 3.671 6.962
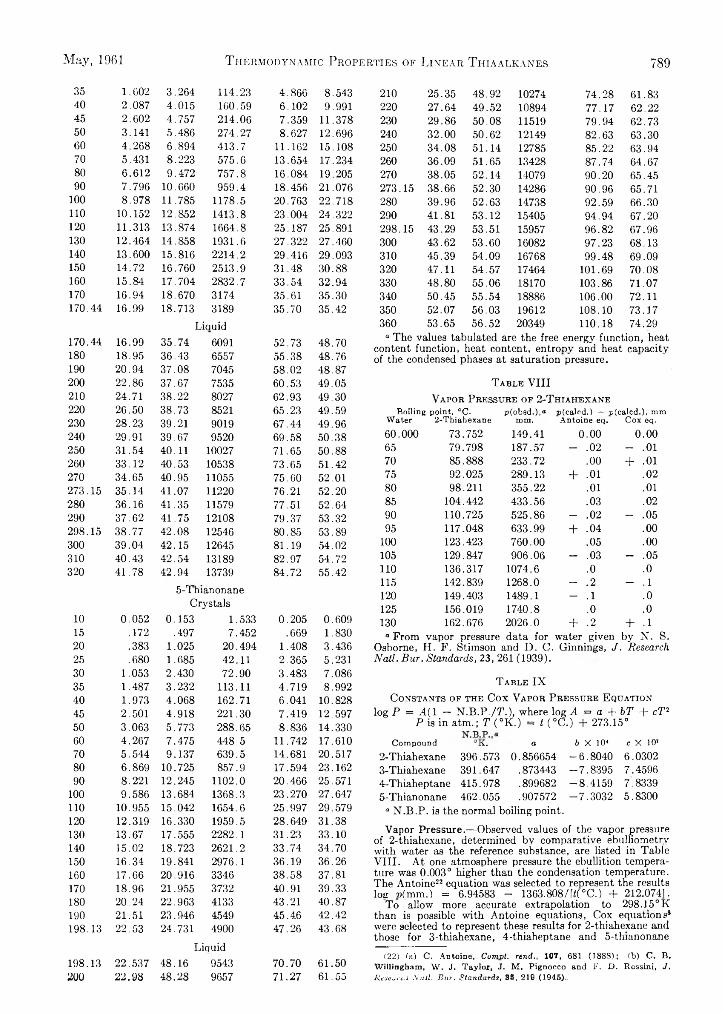
May, 1961 T h e r m o d y n a m i c P r o p e r t i e s o f L i n e a r T h i a a l k a n e s 789
35 1.602 3.264 114.23 4.860 8.543 210 25.35 48.92 10274 74.28 61.8340 2.087 4.015 160.59 6.102 9.991 220 27.64 49.52 10894 77.17 62.2245 2.602 4.757 214.06 7.359 11.378 230 29.86 50.08 11519 79.94 62.7350 3.141 5.486 274.27 8.627 12.696 240 32.00 50.62 12149 82.63 63.3060 4.268 6.894 413.7 11.162 15.108 250 34.08 51.14 12785 85.22 63.9470 5.431 8.223 575.6 13.654 17.234 260 36.09 51.65 13428 87.74 64.6780 6.612 9.472 757.8 16.084 19.205 270 38.05 52.14 14079 90.20 65.4590 7.796 10.660 959.4 18.456 21.076 273. 15 38.66 52.30 14286 90.96 65.71
100 8.978 11.785 1178.5 20.763 22.718 280 39.96 52.63 14738 92.59 66.30110 10.152 12.852 1413.8 23.004 24.322 290 41.81 53.12 15405 94.94 67.20120 11.313 13.874 1664.8 25.187 25.891 298. 15 43.29 53.51 15957 96.82 67.96130 12.464 14.858 1931.6 27.322 27.460 300 43.62 53.60 16082 97.23 68.13140 13.600 15.816 2214.2 29.416 29.093 310 45.39 54.09 16768 99.48 69.09150 14.72 16.760 2513.9 31.48 30.88 320 47.11 54.57 17464 101.69 70.08160 15.84 17.704 2832.7 33.54 32.94 330 48.80 55.06 18170 103.86 71.07170 16.94 18.670 3174 35.61 35.30 340 50.45 55.54 18886 106.00 72.11170.44 16.99 18.713 3189 35.70 35.42 350 52.07 56.03 19612 108.10 73.17
Liauid 360 53.65 56.52 20349 110.18 74.29
170. 44 16.99 35.74 6091 52.73 48.70 a The values tabulated are the free energy function, heat content function, heat content, entronv and heat capacity180 18.95 36.43 6557 55.38 48.76 of the condensed phases at saturation pressure.
190 20.94 37.08 7045 58.02 48.87200 22.86 37.67 7535 60.53 49.05 T a b l e V I I I210 24.71 38.22 8027 62.93 49.30 V a p o r P r e ssu r e o f 2 -T h ia h e x a n e220 26.50 38.73 8521 65.23 49.59 Boiling point, °C. p(obsd.),o ®(calcd.) — nfcalcd.), mm230 28.23 39.21 9019 67.44 49.96 Water 2-Thiahexane mm. Antoine eq. Cox eq.
240 29.91 39.67 9520 69.58 50.38 60.000 73.752 149.41 0.00 0.00250 31.54 40.11 10027 71.65 50.88 65 79.798 187.57 - .02 - .01260 33.12 40.53 10538 73.65 51.42 70 85.888 233.72 .00 + .01270 34.65 40.95 11055 75.60 52.01 75 92.025 289.13 + .01 .02273. 15 35.14 41.07 11220 76.21 52.20 80 98.211 355.22 .01 .01280 36.16 41.35 11579 77.51 52.64 85 104.442 433.56 .03 .02290 37.62 41.75 12108 79.37 53.32 90 110.725 525.86 - .02 - .05298. 15 38.77 42.08 12546 80.85 53.89 95 117.048 633.99 + .04 .00300 39.04 42.15 12645 81.19 54.02 100 123.423 760.00 .05 .00310 40.43 42.54 13189 82.97 54.72 105 129.847 906.06 - .03 - .05320 41.78 42.94 13739 84.72 55.42 110 136.317 1074.6 .0 .0
115 142.839 1268.0 - .2 - .15 -1 hianonane 120 149.403 1489.1 - .1 .0
Crystals 125 156.019 1740.8 .0 .010 0.052 0.153 1.533 0.205 0.609 130 162.676 2026.0 + .2 + .115 .172 .497 7.452 .669 1.830 “ From vapor pressure data for water given by N. S.20 .383 1.025 20.494 1.408 3.436 Osborne, H. F. Stimson and D. C. Ginnings, J . R esea rch25 .680 1.685 42.11 2.365 5.231 N a tl . B u r . S tandards, 23, 261 (1939).30 1.053 2.430 72.90 3.483 7.08635 1.487 3.232 113.11 4.719 8.992 T a b l e I X
40 1.973 4.068 162.71 6.041 10.828 C o n st a n t s o f th e C o x V a p o r P r e s su r e E qu atio n
45 2.501 4.918 221.30 7.419 12.597 log P = A { 1 — N.B.P./T.), where log A = a + b T + c T 250 3.063 5.773 288.65 8.836 14.330 P is in atm. ; T ( 0K.) = t (°C.) + 273.15°60 4.267 7.475 448.5 11.742 17.610 Compound °K. a b X 10« c X 10’70 5.544 9.137 639.5 14.681 20.517 2-Thiahexane 396.573 0.856654 -6 .8040 6.030280 6.869 10.725 857.9 17.594 23.162 3-Thiahexane 391.647 .873443 -7 .8395 7.459690 8.221 12.245 1102.0 20.466 25.571 4-Thiaheptane 415.978 .899682 -8 .4159 7.8339
100 9.586 13.684 1368.3 23.270 27.647 5-Thianonane 462.055 .907572 -7 .3 0 3 2 5.8300110 10.955 15.042 1654.6 25.997 29.579 ° N.B.P. is the normal boiling point.120 12.319 16.330 1959.5 28.649 31.38130 13.67 17.555 2282.1 31.23 33.10 Vapor Pressure.— Observed values of the vapor pressure
of 2-thiahexane, determined by comparative ebulliometrv140 15.02 18.723 2621.2 33.74 34.70 with water as the reference substance, are listed in Table150 16.34 19.841 2976.1 36.19 36.26 V II I . At one atmosphere pressure the ebullition tempera-160 17.66 20.916 3346 38.58 37.81 ture was 0.003° higher than the condensation temperature.170 18.96 21.955 3732 40.91 39.33 The Antoine22 equation was selected to represent the results
log n(mm.) = 6.94583 - 1363.808/W°C.) + 212.0741.180 20.24 22.963 4133 43.21 40.87 To allow more accurate extrapolation to 298.15°K190 21.51 23.946 4549 45.46 42.42 than is possible with Antoine equations, Cox equations8198. 13 22.53 24.731 4900 47.26 43.68 were !selected to represent these results for 2-thiahexane and
those for 3-thiahexane, 4-thiaheptane and 5-thianonaneLiquid
(22) fa) C. Antoine, Conivi. rend., 107, 681 (1888); (b) C. B.198. 13 22.537 48.16 9543 70.70 61.50 Willingham, W . J. Taylor, J. M. Pignocco and F. D. Rossini, J.200 22.98 48.28 9657 71.27 61 . 55 Ii.esej.j-:c'.i Natl. Bur. Standards, 35, 219 (1945).

790 M c C u l l o u g h , F i n k e , H u b b a r d , T o d d , M e s s e r l y , D o u s l i n a n d W a d d i n g t o n Yol. 05
T a b l e XSu m m a r y o f T y p ic a l C o m b u s t io n E x p e r im e n t s "•b
Compound 2-Thiahexane 3-Thiahexane 4-Thiaheptane 5-Thianonane
n(eq. 1) 80 80 9 5 1 2 0
to', g. 0.78177 0.73923 0.75482 0.71331AL, deg. 2.00421 2.00025 2.00094 2.0080'S(calor)( — Ate), cal. -7834.06 -7818.58 -7821.27 -7849.14S(Cont.)( — A ie )/ cal. - 27.62 - 27.59 - 27.66 - 27.64AE\ga, cal. 1.35 1.35 1.35 1.35A E iJ (HNOs + HN02), cal. 11.95 11.93 11.45 11.70AE , cor. to st. states/ cal. 2.53 2.81 2.96 3.67— m " A E c ° / M (auxiliary oil), cal. 424.70 813.78 520.82 749.99— to" A E c°/ M (fuse), cal. 15.81 16.12 16.56 15.43
to' AE c°/ M (compound), cal. -7305.34 -7000.18 -7295.79 -7094.65A E c ° / M (compound), cal. g.-1 -9472.53 -9469.56 -9665.60 -9944.98
a The symbols and abbreviations of this table are those of ref. 23, except as noted. The values of AE c °/ M for the auxiliary oil and fuse are —10,983.7 and —3923 cal. g.-1, respectively. b Auxiliary data: S(Calor.) = 3908.80 cal. deg.-1; V - (bomb) = 0.347 1.; physical properties at 25° for 2-thiahexane, 3-thiahexane, Tthiaheptane and 5-thianonane, respectively— density = 0.83779, 0.83226, 0.83314 and 0.083442 g. ml.-1; (d E / d P )r = -0.0094, -0.0097, -0.0093 and -0.0085 cal. g.-1 atm.-1; cp = 0.461, 0.455, 0.453 and 0.465 cal. deg.-1 g.-1. c S'(Cont.)(L — 25°) + Sf(Cont.)(25° — 0 + Atc) . 41 Items 81-85 inch, 87-91, inch, 93 and 94 of the computation form of ref. 23.
T a b l e XISu m m a r y o f C o m b u s t io n C o l o r im e t r ic R e s u l t s
2-Thiahexane 3-Thiahexane 4-Thiaheptane 5-Thianonane— A E c ° / M ,a cal. g.-1 9472.53 9469.56 9664.90 9944.98
9473.92 9469.96 9663.75 9944.229473.00 9468.09 9664.21 9948.219471.94 9467.06 9665.60 9943.309470.86 9467.21 9665.26 9942.719471.39 9468.34 9666.99 9946.83
9468.469466.819467.60
Mean and std. dev. 9472.27 ± 0 .4 5 9468.12 ± 0.36 9665.12 ± 0.47 9945.04 ± 0.86— Af?c°298.i5,!’ kcal, mole-1 987.12 ± .16 986.69 ± .14 1142.78 ± .18 1454.86 ± .32— Aifc°298.i5,!> kcal, mole-1 989.79 ± .16 989.36 ± .14 1145.74 ± .18 1458.42 ± .32— Aflyo298.i5/ kcal, mole-1 34.12 ± .18 34.55 ± .18 40.59 ± .21 52.71 ± .35— A F f°z n .u ,c kcal, mole-1 4.10 3.52 5.15 7.69log X /238.15C -3 .0 1 -2 .5 8 -3 .7 7 -5 .6 4“ For reaction 1; results of individual experiments are listed. 6 For reaction 1. 5 For reaction 11.
given by White, Barnard-Smith and Fidler.5 The parameters of these equations are in Table IX. Comparisons of observed and calculated vapor pressure for both the Antoine and Cox equations are given in Table VIII for 2- thiahexane. The Cox equations for the other three compounds represent the observed data as well as the Antoine equations in ref. 7.
Heat and Entropy of Vaporization at 298.15°K.—Values of standard heat and entropy of vaporization for the four thiaalkanes were calculated from the Cox equations, the Clapeyron equation and estimated corrections for gas imperfection. The results are in Table II.
Heats of Combustion.—The heats of combustion were determined by rotating-bomb calorimetry; the bomb, laboratory designation Pt-4, and calorimeter have been described.13 The samples were contained in Pyrex ampoules. Ten grams of water was added initially to the bomb, and the air initially present was not removed when the bomb was charged with oxygen t.o 30 atm. total pressure. Each experiment was started at 296.15°K., and the quantities of sulfur compound and auxiliary oil (Sample USBM- P3a, empirical formula CHi.aai) were chosen to produce a temperature rise of 2°. Corrections to standard states23 were applied to the results of all calorimetric experiments. The energy equivalent of the calorimetric system, S(Calor.), was determined by combustion of benzoic acid (National Bureau of Standards Sample 39g certified to evolve 26.4338
(23) W. N. Hubbard, D. W. Scott and G. Waddington, Chapter 5, “ Experimental Thermochemistry,” F. D. Rossini, Editor, Interscience Publishers, Inc., New York, N. Y., 15G, pp» 75—128»
± 0.0026 abs. kj. per gram mass when burned under specified conditions). The calorimetric results for experiments selected as typical for each compound are summarized in Table X . The values of AE c ° / M apply to the idealized combustion reaction ICaHtSa) + (a + 5/4 + 3/2) 0 2(g) + (n -
6/2 + 1)H20(1) = aC02(g) + H2S04toH20(1) (I) The results of all calorimetric experiments are summarized in Table X I. Molal values of the standard change in internal energy, AEc°298.i5, and heat of combustion, AHo°298.i5, with their respective uncertainty intervals,24 are included in Table X I.
Heats of Formation and Related Properties.—Theheat of formation of H2S04-115H20 was redetermined recently in this Laboratory.25 Values of the heat of formation of sulfuric acid at concentrations shown in Table X were calculated by adding appropriate dilution corrections26 to the new value for Ii2S04T15H20. These values, values of the heat of formation of carbon dioxide and water27
(24) “ Uncertainty interval” equal to twice the final “ over-all” standard deviation. See F. D. Rossini and W. E. Deming, J. Wash. Acad. Sci., 2 9 , 416 (1939).
(25) W. D. Good, J. L. Lacina and J. P. McCullough, J. Am. Chem. Soc., 8 2 , 5589 (1960).
(26) F. D. Rossini, D. D. Wagman. W. H. Evans, S. Levine andI. Jaffe, ‘ ‘Selected Values of Chemical Thermodynamic Properties,’ * N.B.S. Circular 500, 1952.
(27) D. D. Wagman, J. E. Kilpatrick, W. J. Taylor, K. S. Pitzet and F» D» Rossini, Research Nath B ut. Standardai 3 4 , 143 (1945),
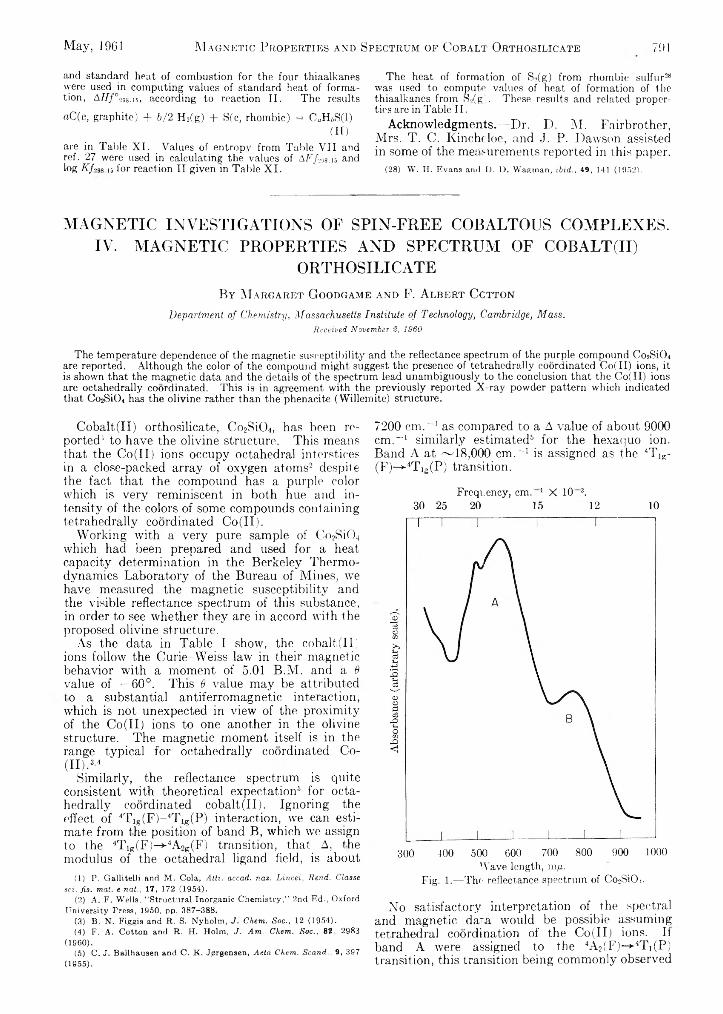
May, 1961 M a g n e t i c P r o p e r t i e s a n d S p e c t r u m o f C o b a l t O r t h o s i l i c a t e 791
and standard heat of combustion for the four thiaalkanes were used in computing values of standard heat of formation, A f f / ° 298.,5, according to reaction II. The results
aC(e, graphite) + 6/2 H2(g) + S(c, rhombic) = CaH&S(l)(II)
are in Table XI. Values of entropy from Table VII and ref. 27 were used in calculating the values of AF/29s.i5 and log K f,g s is for reaction II given in Table XI.
The heat of formation of S2(g) from rhombic sulfur28 was used to compute values of heat of formation of the thiaalkanes from S2(g). These results and related properties are in Table II.
Acknowledgments.— Dr. D. M. Fairbrother, Mrs. T. C. Kincheloe, and J. P. Dawson assisted in some of the measurements reported in this paper.
(28) W. H. Evans and D. D. Wagman, ibid., 49, 141 (1952).
MAGNETIC INVESTIGATIONS OF SPIN-FREE COBALTOUS COMPLEXES.IV. MAGNETIC PROPERTIES AND SPECTRUM OF COBALT(II)
ORTHOSILICATEBy M argaret Goodgame and F. Albert Cctton
D ep a rtm en t o f C h em istry , M a ssa ch u setts In stitu te o f T ech n ology , C am bridge, M a ss .Received November 2, 1960
The temperature dependence of the magnetic susceptibility and the reflectance spectrum of the purple compound Co2Si()4 are reported. Although the color of the compound might suggest the presence of tetrahedrally coordinated Co(II) ions, it is shown that the magnetic data and the details of the spectrum lead unambiguously to the conclusion that the Co(II) ions are octahedrally coordinated. This is in agreement with the previously reported X-ray powder pattern which indicated that Co2Si04 has the olivine rather than the phenacite (Willemite) structure.
Cobalt(II) orthosilicate, Co2Si04, has been reported1 to have the olivine structure. This means that the Co(II) ions occupy octahedral interstices in a close-packed array of oxygen atoms2 despite the fact that the compound has a purple color which is very reminiscent in both hue and intensity of the colors of some compounds containing tetrahedrally coordinated Co (II).
Working with a very pure sample of Co2Si04 which had been prepared and used for a heat capacity determination in the Berkeley Thermodynamics Laboratory of the Bureau of Mines, we have measured the magnetic susceptibility and the visible reflectance spectrum of this substance, in order to see whether they are in accord with the proposed olivine structure.
As the data in Table I show, the cobalt(II) ions follow the Curie-Weiss law in their magnetic behavior with a moment of 5.01 B.M. and a 6
value of —60°. This 8 value may be attributed to a substantial antiferromagnetic interaction, which is not unexpected in view of the proximity of the Co(II) ions to one another in the olivine structure. The magnetic moment itself is in the range typical for octahedrally coordinated Co- (II).3,4
Similarly, the reflectance spectrum is quite consistent with theoretical expectation5 for octahedrally coordinated cobalt(II). Ignoring the effect of 4Tig(F)~4Tig(P) interaction, we can estimate from the position of band B, which we assign to the 4Txg(F)-^4A2g(F) transition, that A, the modulus of the octahedral ligand field, is about
(1) P. Gallitelli and M. Cola, Atti. accad. naz. Lincei, Rend. Classe sci. fis. mat. e nat., 17, 172 (1954).
(2) A. F. Wells, “ Structural Inorganic Chemistry,” 2nd Ed., Oxford University Press, 1950, pp. 387-388.
(3) B. N. Figgis and R. S. Nyholm, J. Chem. Soc., 12 (1954).(4) F. A. Cotton and R. H. Holm, J. Am. Chem. Soc., 82, 2983
(1960).(5) C. J. Ballhausen and Ci K. Jorgensen, Acta Chem. Scand., 9, 397
(1955).
7200 c m v 1 as compared to a A value of about 9000 cm.“ 1 similarly estimated6 for the hexaquo ion. Band A at ~18,000 cm.“ 1 is assigned as the 4T]g- (F)-»-4Tig(P) transition.
Frequency, cm. 1 X 10 3.30 25 20 15 12 10
300 400 500 600 700 800 900 1000Wave length, m p.
Fig. 1.—The reflectance spectrum of Co2Si04.
No satisfactory interpretation of the spectral and magnetic data would be possible assuming tetrahedral coordination of the Co(II) ions. It band A were assigned to the 4A2(F)-*-4Ti(P) transition, this transition being commonly observed
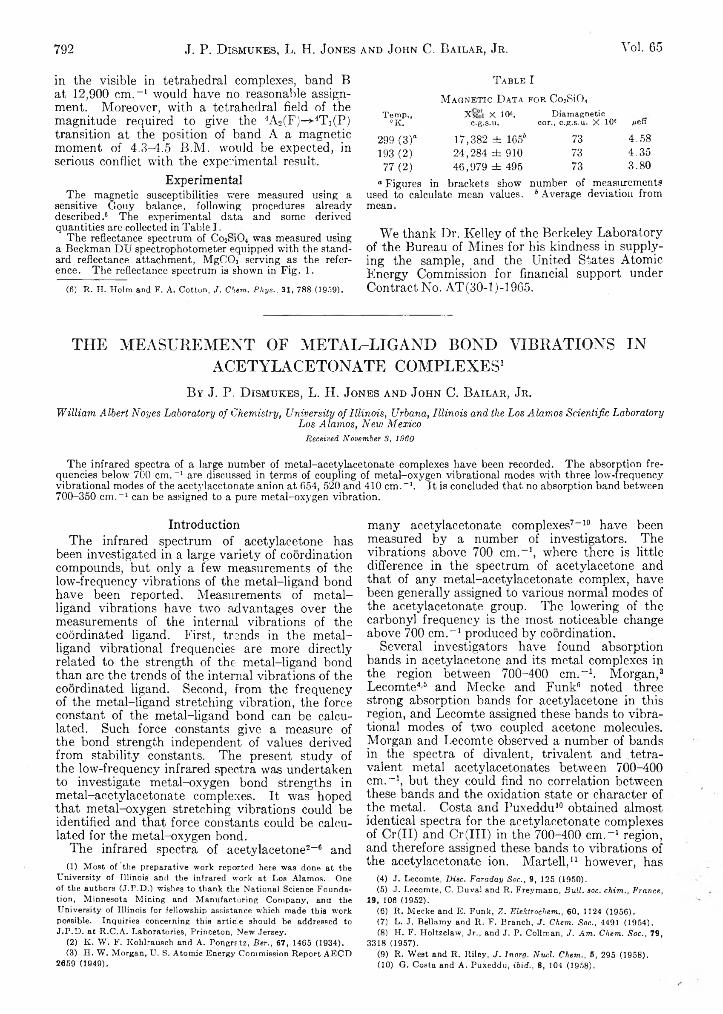
792 J. P. D ismukes, L. H. Jones and John C. Bailar, Jr . Vol. 65
in the visible in tetrahedral complexes, band B at 12,900 cm.-1 would have no reasonable assignment. Moreover, with a tetrahedral field of the magnitude required to give the 4A2(F)->4T i(P) transition at the position of band A a magnetic moment of 4.3-4.5 B.M. would be expected, in serious conflict with the experimental result.
ExperimentalThe magnetic susceptibilities were measured using a
sensitive Gouy balance, following procedures already described.6 The experimental data and some derived quantities are collected in Table I.
The reflectance spectrum of C02S1O4 was measured using a Beckman DU spectrophotometer equipped with the standard reflectance attachment, MgC03 serving as the reference. The reflectance spectrum is shown in Fig. 1.
(6) R. H. Holm and F. A. Cotton, J. Chem. Phys., 31, 788 (1959).
T a b l e I
M a g n e t ic D a t a f o r Co2Si04Temp.,
°K.X m" X 10«,
c.g.s.u.Diamagnetic
cor., c.g.s.u. X 10s eîî
299 (3 )“ 17,382 ± 1655 73 4.58193 (2) 24,284 ± 910 73 4.35
7 7 (2 ) 46,979 ± 495 73 3.80
“ Figures in brackets show number of measurements used to calculate mean values. b Average deviation from mean.
We thank Dr. Kelley of the Berkeley Laboratory of the Bureau of Mines for his kindness in supplying the sample, and the United States Atomic Energy Commission for financial support under Contract No. AT(30-1)-1965.
THE MEASUREMENT OF METAL-LIGAND BOND VIBRATIONS IN ACETYLACETONATE COMPLEXES1
By J. P. D ismukes, L. H. Jones and John C. Bailar, Jr.W illia m A lb er t N o y e s L a b ora tory o f C h em istry , U n iv ersity o f I ll in o is , U rbana , I l l in o is a n d the L o s A la m o s S cien tific L a b ora tory
L o s A la m o s , N ew M e x ic oReceived November S, i960
The infrared spectra of a large number of metal-acetylacetonate complexes have been recorded. The absorption frequencies below 700 cm.-1 are discussed in terms of coupling of metal-oxygen vibrational modes with three low-frequency vibrational modes of the acetylacetonate anion at 654, 520 and 410 cm.-1. It is concluded that no absorption band between 700-350 cm.-1 can be assigned to a pure metal-oxygen vibration.
IntroductionThe infrared spectrum of acetylacetone has
been investigated in a large variety of coordination compounds, but only a few measurements of the low-frequency vibrations of the metal-ligand bond have been reported. Measurements of metal- ligand vibrations have two advantages over the measurements of the internal vibrations of the cobrdinated ligand. First, trends in the metal- ligand vibrational frequencies are more directly related to the strength of the metal-ligand bond than are the trends of the internal vibrations of the coordinated ligand. Second, from the frequency of the metal-ligand stretching vibration, the force constant of the metal-ligand bond can be calculated. Such force constants give a measure of the bond strength independent of values derived from stability constants. The present study of the low-frequency infrared spectra was undertaken to investigate metal-oxygen bond strengths in metal-acetylacetonate complexes. It was hoped that metal-oxygen stretching vibrations could be identified and that force constants could be calculated for the metal-oxygen bond.
The infrared spectra of acetylacetone2-6 and(1) Most of the preparative work reported here was done at the
University of Illinois and the infrared work at Los Alamos. One of the authors (J.P.D.) wishes to thank the National Science Foundation, Minnesota Mining and Manufacturing Company, and the University of Illinois for fellowship assistance which made this work possible. Inquiries concerning this article should be addressed toJ.P.D. at R.C.A. Laboratories, Princeton, New Jersey.
(2) K. W. F, Kohlrausch and A. Pongratz, Ber., 67, 1485 (1934).(3) H. W. Morgan, U. S. Atomic Energy Commission Report AECD
2659 (1949).
many acetylacetonate complexes7-10 have been measured by a number of investigators. The vibrations above 700 cm.-1, where there is little difference in the spectrum of acetylacetone and that of any metal-acetylacetonate complex, have been generally assigned to various normal modes of the acetylacetonate group. The lowering of the carbonyl frequency is the most noticeable change above 700 cm.-1 produced by coordination.
Several investigators have found absorption bands in acetylacetone and its metal complexes in the region between 700-400 cm.-1. Morgan,3 Lecomte4'5 and Mecke and Funk6 noted three strong absorption bands for acetylacetone in this region, and Lecomte assigned these bands to vibrational modes of two coupled acetone molecules. Morgan and Lecomte observed a number of bands in the spectra of divalent, trivalent and tetra- valent metal acetylacetonates between 700-400 cm.-1, but they could find no correlation between these bands and the oxidation state or character of the metal. Costa and Puxeddu10 obtained almost identical spectra for the acetylacetonate complexes of Cr(II) and Cr(III) in the 700-400 cm.-1 region, and therefore assigned these bands to vibrations of the acetylacetonate ion. Martell,11 however, has
(4) J. Lecomte, Disc. Faraday Soc., 9, 125 (1950).(5) J. Lecomte, C. Duval and R. Freymann, Bull. soc. chim., France,
19, 106 (1952).(6) R. Mecke and E. Funk, Z. Elehtrochem., 60, 1124 (1956).(7) L. J. Bellamy and R. F. Branch, J. Chem. Soc., 4491 (1954).(8) LI. F. Holtzclaw, Jr., and J. P. Collman, J. Am. Chem. Soc., 79,
3318 (1957).(9) R. West and R. Riley, J. Inorg. Nucl. Chem., 5, 295 (1958).(10) G, Costa and A, Puxeddu, ibid., 8, 104 (1958).

May, 1961 M etal-Ligand Vibrations in Acetylacetonate Complexes 793
assigned a strong band at 420-460 cm.“ 1 in divalent metal acetylacetonate complexes to a metal- oxygen vibration. At present, there appears to be no general agreement on the origin of the low- frequency infrared absorption bands in metal- acetylacetonate compounds.
Experimentala. Preparation of Compounds.— The compounds used
in these studies were prepared from acetylacetone and the appropriate metal salt by methods reported in the literature. Reference to the method of preparation in each case is given in Table I. Where melting points are reported, these were used to check the purity of the compounds.
T a b l e I
A n a l y t ic a l D a t a o n t h e C o m p l e x e s St u d ie d
Analyses, %Compound Ref.
/-----CarbCalcd.
on----- .Found
<-—Hydrogen—> Calcd. Found
Befacaeh 12 57.95 58.41 6.76 6.96Mn(acac)2 13 47.43 47.28 5.53 5.58Fe(acac)2-HsO 13 44.11 44.02 5.88 5.35Co(acac)2 13 46.69 45.75 5.49 5.54Ni(acac)2 14 46.67 46.52 5.45 5.50Cu(acac)2 13 46.90 46.16 5.36 5.37Cr(acac)3 15 51.52 51.80 6.02 6.40Mn(aeac)3 16 51.20 51.05 5.96 6.17Fe(acac)3 14 50.95 51.18 5.95 6.07Co(acac)3 17 50.50 50.77 5.90 6.10Al(aeac)3 18 55.85 56.05 6.48 6.53Ga(acac)j 19 49.05 49.28 5.72 5.90In(acac)3 19 43.70 43.60 5.13 5.52La(acac)3-H20 20 39.70 39.61 5.06 5.03Ce(acac)3-2H20 20 38.18 38.44 5.27 5.00Nd(acac)3 20 40.82 40.69 4.76 5.02Na(acac) 9 49.20 49.62 5.74 6.14K(aeac) 9 43.50 41.86 5.07 5.51
b. Measurement.—The spectra reported in Table II were observed on a Perkin-Elmer Model 112 Spectrometer equipped with interchangeable LiF, CsBr, and Csl prisms, and on a Perkin-Elmer Model 21 Spectrometer equipped with a NaCl prism. The spectra of the complexes were measured in mineral oil mulls, and where possible also as single crystals and in benzene solution. No significant differences in the spectra were noted for the three methods. The reported frequency values are accurate to better than ± 2 cm.-1. References to the measurements of other investigators are given in Table II along with the spectra of acetylacetone and its metal complexes.
Discussionv The infrared absorptions of all of the metal complexes of acetylacetone above 700 cm.-1 occur at approximately the same frequencies as those of free acetylacetone. The most significant deviation above 700 cm.-1 occurs in the region of the carbonyl absorption. Since it is generally agreed that
(11) A. E. Martell, K. Nakamoto and P. J. McCarthy, Nature, 183, 459 (1959).
(12) A. Arch and R, C. Young, “ Inorganic Syntheses,” McGraw- Hill Book Co., Inc., New York, N. Y., Vol. II, 1946, pp. 17-19.
(13) T. Moeller, “ Inorganic Syntheses,” Yol. V, 1957, pp. 105-113.(14) F. Gach, Monatsh. Cheut., 21, 98 (1900).(15) W, C. Fernelius and J. E. Blanch, “ Inorganic Syntheses,” Vol.
V, pp. 130-131.(16) G. H. Cart-ledge, U. S. Patent 2,556,316, June 12, 1951; C. A
46, 1585 (1952).(17) W. C. Fernelius and B. E. Bryant, “ Inorganic Syntheses,”
Yol. V, pp. 188-189.(48) R. C. Young, “ Inorganic Syntheses,” Vol. II, pp. 25-26.(19) G. T. Morgan, J. Chem. Soc., 1058 (1921).(20) - T. Moeller and W. F. Ulrich, J. Inorg. Nucl. Chem., 2, 164
(1956).
the absorptions above 700 cm.-1 involve mainly internal vibrations of the acetylacetonate group,4’6'7“ 10 discussion of this region of the spectra will be omitted. The spectra of metal acetylacetonate complexes below 700 cm.-1, however, differ markedly from that of acetylacetone. There are more bands in the spectra of the metal complexes, and the absorption bands of acetylacetone apparently are strongly shifted. It is possible, however, to explain the principal features of the absorption below 700 cm.-1 on the basis of the following two assumptions: (1) The three strong low- frequency vibrational modes of the acetylacetonate anion are those of the potassium salt of acetylacetone at’654, 520 and 410 cm.-1 ; and (2) the metal- oxygen vibrational modes interact with the three strong low-frequency modes of the acetylacetonate anion. The splitting of these three peaks into several peaks is caused partly by the coupling of the acetylacetonate vibrations within the complex, and partly by coupling with the metal-oxygen vibrations. It was observed in the sodium and potassium salts of acetylacetone that there are three sharp, intense vibrations in the 700-300 cm.-1 region. Since these vibrations show onljT a slight shift in frequency from the three strong vibrations of the acetylacetone molecule, it is reasonable to assign these three vibrations to an uncoordinated acetylacetonate anion. The frequencies of the potassium salt are chosen for this assignment. It is then possible to arrange the strong absorptions of metal-acetylacetonate chelates in the 700-350 cm.-1 region into three groups, each group being associated with one of the low-frequency absorption bands of the acetylacetonate anion.
In all the complexes there is a split band in the 650-690 cm.-1 region which appears to be associated with the strong 654 cm.“ 1 absorption of the acetylacetonate anion. The upward shift of the 654 crn.“ 1 band shows no apparent correlation to the character of the metal forming the complex. The splitting of this shifted band is no doubt caused by coupling of acetylacetonate vibrations within the complex. For the trivalent rare earth complexes, however, there is no shift in this band from the position in the potassium salt. This lack of interaction reflects the weak complexing nature of rare earth metal ions. A similar effect has been noted for the carbonyl absorption band in rare earth acetylacetonate complexes,9 where there is little lowering compared to that shown by complexes of other trivalent metals. It is evident that the metal-oxygen vibrations in the rare earth complexes do not interact strongly with the 654 cm.“ 1 vibration of the acetylacetonate anion.
In all the metal acetylacetonate complexes, except the beryllium complex, there is a strong absorption band which appears to be associated with the 520 cm.-1 vibration of the acetylacetonate anion. The frequency of this band is shifted upwards upon complexing. The small shift for the rare earth complexes again indicates the weak complexing behavior of the rare earth metal cations. The shift in the 520 cm.“ 1 band of the acetylacetonate anion can be directly related to
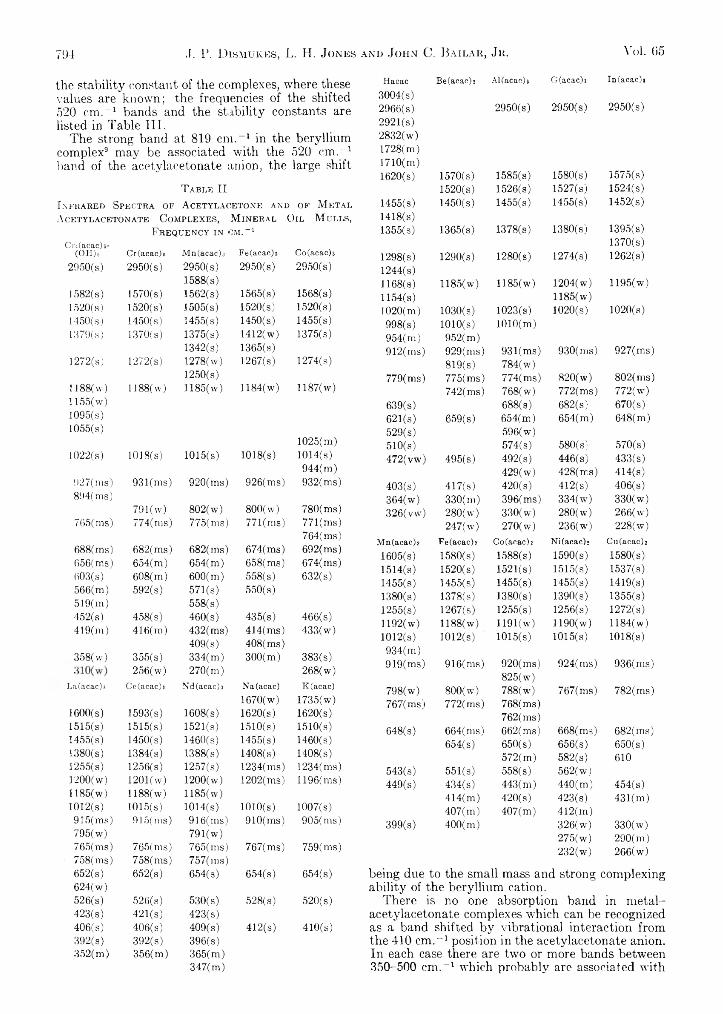
794 J. P. D ismukes, L. H. Jones and John C. Bailar, Jr . Vol. G5
the stability constant of the complexes, where these values are known; the frequencies of the shifted 520 cm v 1 bands and the stability constants are listed in Table III.
The strong band at 819 cm.-1 in the beryllium complex9 may be associated with the 520 cm ."1 band of the acetylacetonate anion, the large shift
T a b l e I II n fr a r e d Sp e c t r a o f A c e t y la c e t o n e an d o f M e t a l A c e t y l a c e t o n a t e C o m p l e x e s , M in e r a l O il M u lls ,
F r e q u e n c y in cm . -1Cn(acac)e-
(OH)i Cr(acac)s Mn(acac)3 Fe(aeao)3 Co(acac)32950(s) 2950(s) 2950(s)
1588(s)2950(s) 2950(s)
1582(s) 1570(s) 1562(s) 1565(a) 1568(a)1520(s) 1520(s) 1505(s) 1520(a) 1520(a)1450(s) 1450(s) 1455(s) 1450(a) 1455(a)1379(h) 1370(s) 1375(b) 1412(w) 1375(a)
1342(s) 1365(a)1272(h) 1272(s) 1278(w)
1250(s)1267(a) 1274(a)
1188(w)1155(w)1095(a)
1188(w) 1185(w) 1184(w) 1187(w)
1055(s)1025(m)
1022(s) lOlS(s) 1015(s) 1018(a) 1014(a)944(m)
!>27(ms) 931(ms) 920(ms) 926(ms) 932(ms)894(ms)
791(w) 802(w) 800(w) 780(ms)765(ms) 774(ms) 775(ms) 771(ms) 771(ms)
764(ms)688(ms) 682(ms) 682(ms) 674(ms) 692(ms)656(ms) 654(m) 654(m) 658(ms) 674(ms)603(a) 608(m) 600(m) 558(s) 632(s)566(m) 592(s) 571(a) 550(a)519(m) 558(s)452(s) 458(s) 460(s) 435(s) 466(a)419(m) 416(m) 432(ms) 414(ms) 433(w)
409(s) 408(ms)358(w) 355(s) 334(m) 300(m) 383(s)
CO 256(w) 270(m) 268(w)
La(acac)3 Ce(acac)3 Nd(acac)3 Na(acac) K(acac)1670(w) 1735(w)
1600(s) 1593(s) 1608(s) 1620(a) 1620(a)1515(s) 1515(s) 1521(a) 1510(a) 1510(a)1455(s) 1450(s) 1460(s) 1455(a) 1460(a)1380(s) 1384(s) 1388(s) 1408(a) 1408(a)1255(s) 1256(s) 1257(a) 1234(ms) 1234(ma)1200(w) 1201(w) 1200(w) 1202(ms) 1196(ms)1185(w) 1188(w) 1185(w)1012(s) 1015(s) 1014(a) 1010(a) 1007(a)915(ms) 915(ms) 916(ms) 910(ms) 905(ms)795(w) 791(w)765(ms) 765(ms) 765(ms) 767(ms) 759(ms)
■ 758(ins) 758(ms) 757(ma)652(s) 652(s) 654(a) 654(s) 654(s)624(w)526(s) 526(a) 530(s) 528(a) 520(s)423(s) 421(s) 423(a)406(s) 406(s) 409(s) 412(a) 410(a)392(a) 392(s) 396(s)352( m ) 356(m) 365(m)
347(m)
Hacac Be(acac)2 Al(acac)* G(acac)s In(acac)i
3004(a)2966(s)2921(a)2832(w)
2950(s) 2950(s) 2950(s)
1728(m)1710(m)1620(a) 1570(a) 1585(a) 1580(a) 1575(a)
1520(a) 1526(a) 1527(a) 1524(a)1455(a)1418(a)
1450(a) 1455(a) 1455(a) 1452(a)
1355(a) 1365(a) 1378(a) 1380(a) 1395(a)1370(a)
1298(a) 1290(a) 1280(a) 1274(a) 1262(a)1244(a)1168(a) 1185(w) 1185(w) 1204(w) 1195(w)1154(a) 1185(w)1020(m) 1030(a) 1023(a) 1020(a) 1020(a)998(s) 1010(a) 1010(m)954(m) 952(m)912(ms) 929(ms) 931(ms) 930(ms) 927(ma)
819(a) 784(w)779(ms) 775(ms) 774(ms) 820(w) 802(ms)
742(ms) 768(w) 772(ms) 772(w)639(s) 688(a) 682(s) 670(a)621(a) 659(s) 654(m) 654(m) 648(m)529(s) 596(w)510(a) 574(s) 580(a) 570(s)472(vw) 495(s) 492(s) 446(s) 433(s)
429(w) 428(rr.s) 414(a)403(a) 417(a) 420(s) 412(a) 406(a)364(w) 330(m) 396(ms) 334(w) 330(w)326(vw) 280(w) 330(w) 280(w) 266(w)
247(w) 270(w) 236(w) 228(w)Mn(acae)2 Fe(acach Co(acac)z Ni(acac); Cu(acac)2
1605(a) 1580(a) 1588(a) 1590(a) 1580(a)1514(a) 1520(a) 1521(a) 1515(a) 1537(a)1455(a) 1455(a) 1455(a) 1455(a) 1419(a)1380(a) 1378(a) 1380(a) 1390(a) 1355(a)1255(a) 1267(a) 1255(a) 1256(a) 1272(a)1192(w) 1188(w) 1191(w) 1190(w) 1184(w)1012(a) 1012(a) 1015(a) 1015(a) 1018(a)934(m)919(ms) 916(ms) 920(ms)
825(w)924(ma) 936(ms)
798(w) 800(w) 788(w) 767(ms) 782(ms)767(ms) 772(ms) 768(ms)
762(ma)648(s) 664(ms) 662(ma) 668(ma) 682(ms)
654(s) 650(a) 656(s) 650(s)572(m) 582(s) 610
543(a) 551(a) 558(a) 562(w)449(a) 434(s) 443(m) 440(m) 454(a)
414(m) 420(s) 423(a) 431(m)407(m) 407(m) 412(m)
399(s) 400(m) 326(w) 330(w)275(w) 290(m)232(w) 266(w)
being due to the small mass and strong c.omplexing ability of the beryllium cation.
There is no one absorption band in metal- acetylacetonate complexes which can be recognized as a band shifted by vibrational interaction from the 410 cm ."1 position in the acetylacetonate anion. In each case there are two or more bands between 350-500 cm.“ 1 which probably are associated with
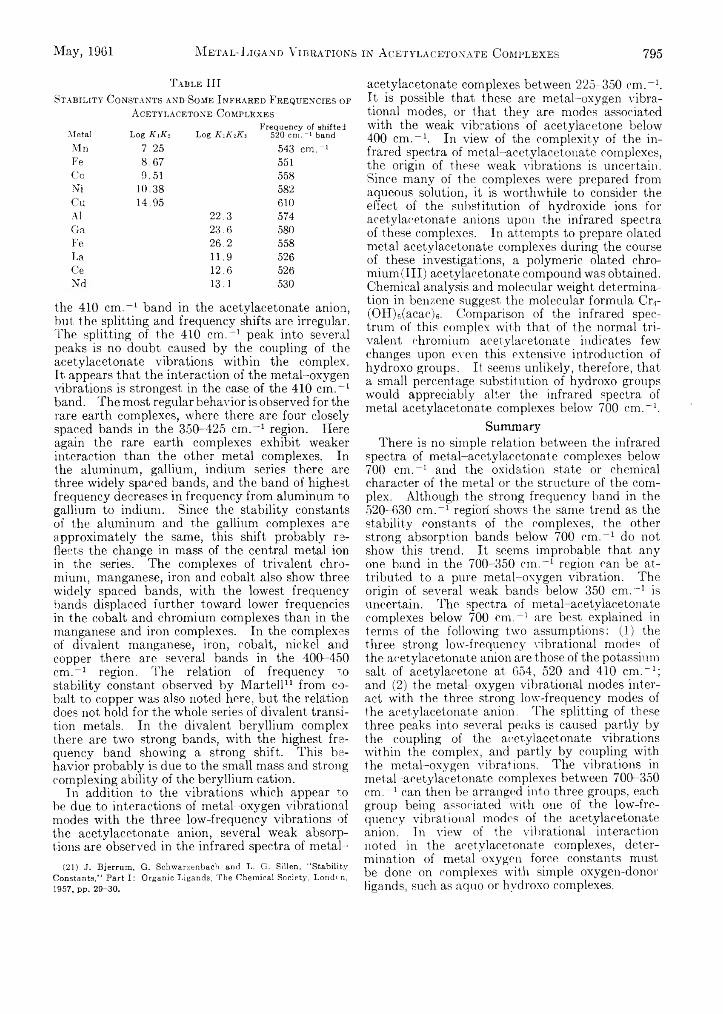
May, 1961 M e t a l - L i g a n d V i b r a t i o n s i n A c e t y l a c e t o n a t e C o m p l e x e s 795
T a b l e IIISt a b il it y C o n st a n t s an d Som e I n f r a r e d F r e q u e n c ie s of
A c e t y l a c e t o n e C o m p l e x e s
Metal Log KiKt Log KiKzKsFrequency of shifted
520 cm. -1 bandMn 7.25 543 cm.” 1Fe 8.67 551Co 9.51 558Ni 10.38 582Cu 14.95 610A1 22.3 574Ga 23.6 580Fe 26.2 558La 11.9 526Ce 12.6 526Nd 13.1 530
the 410 cm.-1 band in the acetylacetonate anion, but the splitting and frequency shifts are irregular. The splitting of the 410 cm.-1 peak into several peaks is no doubt caused by the coupling of the acetylacetonate vibrations within the complex. It appears that the interaction of the metal-oxygen vibrations is strongest in the case of the 410 cm.-1 band. The most regular behavior is observed for the rare earth complexes, where there are four closely spaced bands in the 350-425 cm.-1 region. Here again the rare earth complexes exhibit weaker interaction than the other metal complexes. In the aluminum, gallium, indium series there are three widely spaced bands, and the band of highest frequency decreases in frequency from aluminum to gallium to indium. Since the stability constants of the aluminum and the gallium complexes are approximately the same, this shift probably reflects the change in mass of the central metal ion in the series. The complexes of trivalent chromium, manganese, iron and cobalt also show three widely spaced bands, with the lowest frequency bands displaced further toward lower frequencies in the cobalt and chromium complexes than in the manganese and iron complexes. In the complexes of divalent manganese, iron, cobalt, nickel and copper there are several bands in the 400-450 cm.-1 region. The relation of frequency to stability constant observed by Martell11 from cobalt to copper was also noted here, but the relation does not hold for the whole series of divalent transition metals. In the divalent beryllium complex there are two strong bands, with the highest frequency band showing a strong shift. This behavior probably is due to the small mass and strong complexing ability of the beryllium cation.
In addition to the vibrations which appear to be due to interactions of metal-oxygen vibrational modes with the three low-frequency vibrations of the acetylacetonate anion, several weak absorptions are observed in the infrared spectra of metal-
(21) J. Bjerrum, G. Schwarzenbach and L. G. Sillen, “ Stability Constants,” Part I : Organic Ligands, The Chemical Society, London, 1957, pp. 29-30.
acetylacetonate complexes between 225-350 cm.” 1. It is possible that these are metal-oxygen vibrational modes, or that they are modes associated with the weak vibrations of acetylacetone below 400 cm.” 1. In view of the complexity of the infrared spectra of metal-acetylacetonate complexes, the origin of these weak vibrations is uncertain. Since many of the complexes were prepared from aqueous solution, it is worthwhile to consider the effect of the substitution of hydroxide ions for acetylacetonate anions upon the infrared spectra of these complexes. In attempts to prepare dated metal acetylacetonate complexes during the course of these investigations, a polymeric olated chromium (III) acetylacetonate compound was obtained. Chemical analysis and molecular weight determination in benzene suggest the molecular formula Cr4- (OH)6(acac)6. Comparison of the infrared spectrum of this complex with that of the normal trivalent chromium acetylacetonate indicates few changes upon even this extensive introduction of hydroxo groups. It seems unlikely, therefore, that a small percentage substitution of hydroxo groups would appreciably alter the infrared spectra of metal acetylacetonate complexes below 700 cm.” 1.
SummaryThere is no simple relation between the infrared
spectra of metal-acetylacetonate complexes below 700 cm.” 1 and the oxidation state or chemical character of the metal or the structure of the complex. Although the strong frequency band in the 520-630 cm.” 1 region shows the same trend as the stability constants of the complexes, the other strong absorption bands below 700 cm.“ 1 do not show this trend. It seems improbable that any one band in the 700-350 cm.” 1 region can be attributed to a pure metal-oxygen vibration. The origin of several weak bands below 350 cm.” 1 is uncertain. The spectra of metal-acetylacetonate complexes below 700 cm.-1 are best explained in terms of the following two assumptions: (1) the three strong low-frequency vibrational modes of the acetylacetonate anion are those of the potassium salt of acetylacetone at 654, 520 and 410 cm.” 1; and (2) the metal-oxygen vibrational modes interact with the three strong low-frequency modes of the acetylacetonate anion. The splitting of these three peaks into several peaks is caused partly by the coupling of the acetylacetonate vibrations within the complex, and partly by coupling with the metal-oxygen vibrations. The vibrations in metal-acetylacetonate complexes between 700-350 cm.” 1 can then be arranged into three groups, each group being associated with one of the low-frequency vibrational modes of the acetylacetonate anion. In view of the vibrational interaction noted in the acetylacetonate complexes, determination of metal-oxygen force constants must be done on complexes with simple oxygen-donor ligands, such as aquo or hydroxo complexes.
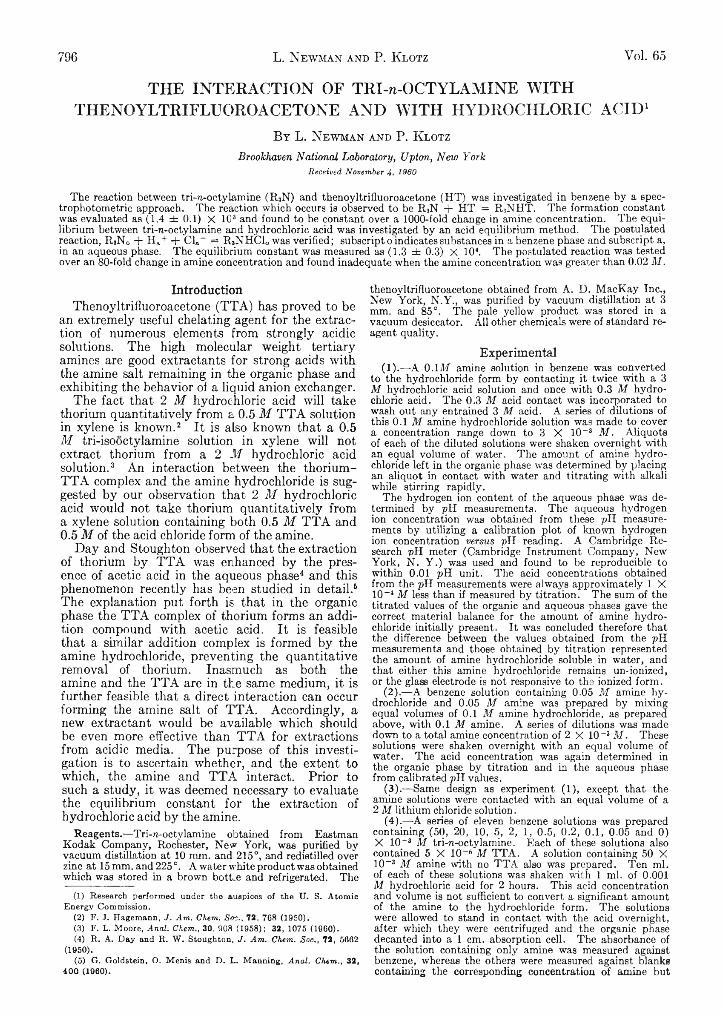
796 L. Newman and P. K lotz Vol. 65
THE INTERACTION OF TRI-n-OCTYLAMINE WITH THENOYLTRIFLUOROACETONE AND WITH HYDROCHLORIC ACID1
By L. Newman and P. K lotz Broolchaven N a tio n a l L a b ora tory , U p ton , N ew Y o rk
Received November 4r i960
The reaction between tri-rc-octylamine (R3N) and thenoyltrifluoroacetone (HT) was investigated in benzene by a spec- trophotometric approach. The reaction which occurs is observed to be R3N + HT = R3NHT. The formation constant was evaluated as (1.4 ± 0.1) X 1C3 and found to be constant over a 1000-fold change in amine concentration. The equilibrium between tri-n-octylamine and hydrochloric acid was investigated by an acid equilibrium method. The postulated reaction, R3N0 + Ha+ + Cla~ = RsNHCi0 was verified; subscript o indicates substances in a benzene phase and subscript a, in an aqueous phase. The equilibrium constant was measured as (1.3 ± 0.3) X 104 5. The postulated reaction was tested over an 80-fold change in amine concentration and found inadequate when the amine concentration was greater than 0.02 M .
IntroductionThenoyltrifluoroacetone (TTA) has proved to be
an extremely useful chelating agent for the extraction of numerous elements from strongly acidic solutions. The high molecular weight tertiary amines are good extractants for strong acids with the amine salt remaining in the organic phase and exhibiting the behavior of a liquid anion exchanger.
The fact that 2 M hydrochloric acid will take thorium quantitatively from a 0.5 M TTA solution in xylene is known.2 It is also known that a 0.5 M tri-isooctylamine solution in xylene will not extract thorium from a 2 M hydrochloric acid solution.3 An interaction between the thorium- TTA complex and the amine hydrochloride is suggested by our observation that 2 M hydrochloric acid would not take thorium quantitatively from a xylene solution containing both 0.5 M TTA and 0.5 M of the acid chloride form of the amine.
Day and Stoughton observed that the extraction of thorium by TTA was enhanced by the presence of acetic acid in the aqueous phase4 and this phenomenon recently has been studied in detail.6 The explanation put forth is that in the organic phase the TTA complex of thorium forms an addition compound with acetic acid. It is feasible that a similar addition complex is formed by the amine hydrochloride, preventing the quantitative removal of thorium. Inasmuch as both the amine and the TTA are in the same medium, it is further feasible that a direct interaction can occur forming the amine salt of TTA. Accordingly, a new extractant would be available which should be even more effective than TTA for extractions from acidic media. The purpose of this investigation is to ascertain whether, and the extent to which, the amine and TTA interact. Prior to such a study, it was deemed necessary to evaluate the equilibrium constant for the extraction of hydrochloric acid by the amine.
Reagents.—Tri-n-octylamine obtained from Eastman Kodak Company, Rochester, New York, was purified by vacuum distillation at 10 mm. and 215°, and redistilled over zinc at 15 mm. and 225°. A water white product was obtained which was stored in a brown bottle and refrigerated. The
(1) Research performed under the auspices of the U. S. Atomic Energy Commission.
(2) F. J. Hagemann, J. Am. Chem. Soc., 72, 768 (1950).(3) F. L. Moore, Anal. Chem., 30, 908 (1958); 32, 1075 (1960).(4) R. A. Day and R. W. Stoughton, J. Am. Chem. S o c . , 72, 5662
(1950).(5) G. Goldstein, O. Menis and D. L. Manning, Anal. Chem., 32,
400 (1960).
thenoyltrifluoroacetone obtained from A. D. MacKay Inc., New York, N.Y., was purified by vacuum distillation at 3 mm. and 85°. The pale yellow product was stored in a vacuum desiccator. All other chemicals were of standard reagent quality.
Experimental(1) .— A 0.1M amine solution in benzene was converted
to the hydrochloride form by contacting it twice with a 3 M hydrochloric acid solution and once with 0.3 M hydrochloric acid. The 0.3 M acid contact was incorporated to wash out any entrained 3 M acid. A series of dilutions of this 0.1 M amine hydrochloride solution was made to cover a concentration range down to 3 X 10 ~3 M. Aliquots of each of the diluted solutions were shaken overnight with an equal volume of water. The amount of amine hydrochloride left in the organic phase was determined by placing an aliquot in contact with water and titrating with alkali while stirring rapidly.
The hydrogen ion content of the aqueous phase was determined by pH measurements. The aqueous hydrogen ion concentration was obtained from these pH measurements by utilizing a calibration plot of known hydrogen ion concentration versus pH reading. A Cambridge Research pH meter (Cambridge Instrument Company, New York, N. Y .) was used and found to be reproducible to within 0.01 pH unit. The acid concentrations obtained from the pH measurements were always approximately 1 X 10~4 M less than if measured by titration. The sum of the titrated values of the organic and aqueous phases gave the correct material balance for the amount of amine hydrochloride initially present. It was concluded therefore that the difference between the values obtained from the pH measurements and those obtained by titration represented the amount of amine hydrochloride soluble in water, and that either this amine hydrochloride remains un-ionized, or the glass electrode is not responsive to the ionized form.
(2) .— A benzene solution containing 0.05 M amine hydrochloride and 0.05 M amine was prepared by mixing equal volumes of 0.1 M amine hydrochloride, as prepared above, with 0.1 M amine. A series of dilutions was made down to a total amine concentration of 2 X 10 ~3 M . These solutions were shaken overnight with an equal volume of water. The acid concentration was again determined in the organic phase by titration and in the aqueous phase from calibrated pH values.
(3 ) .— Same design as experiment (1), except that the amine solutions were contacted with an equal volume of a 2 M lithium chloride solution.
(4) .—A series of eleven benzene solutions was prepared containing (50, 20, 10, 5, 2, 1, 0.5, 0.2, 0.1, 0.05 and 0) X 10 ~3 M tri-n-octylamine. Each of these solutions also contained 5 X 10~6 M TTA. A solution containing 50 X 10-3 M amine with no TTA also was prepared. Ten ml. of each of these solutions was shaken with 1 ml. of 0.001 M hydrochloric acid for 2 hours. This acid concentration and volume is not sufficient to convert a significant amount of the amine to the hydrochloride form. The solutions were allowed to stand in contact with the acid overnight, after which they were centrifuged and the organic phase decanted into a 1 cm. absorption cell. The absorbance of the solution containing only amine was measured against benzene, whereas the others were measured against blanks containing the corresponding concentration of amine but
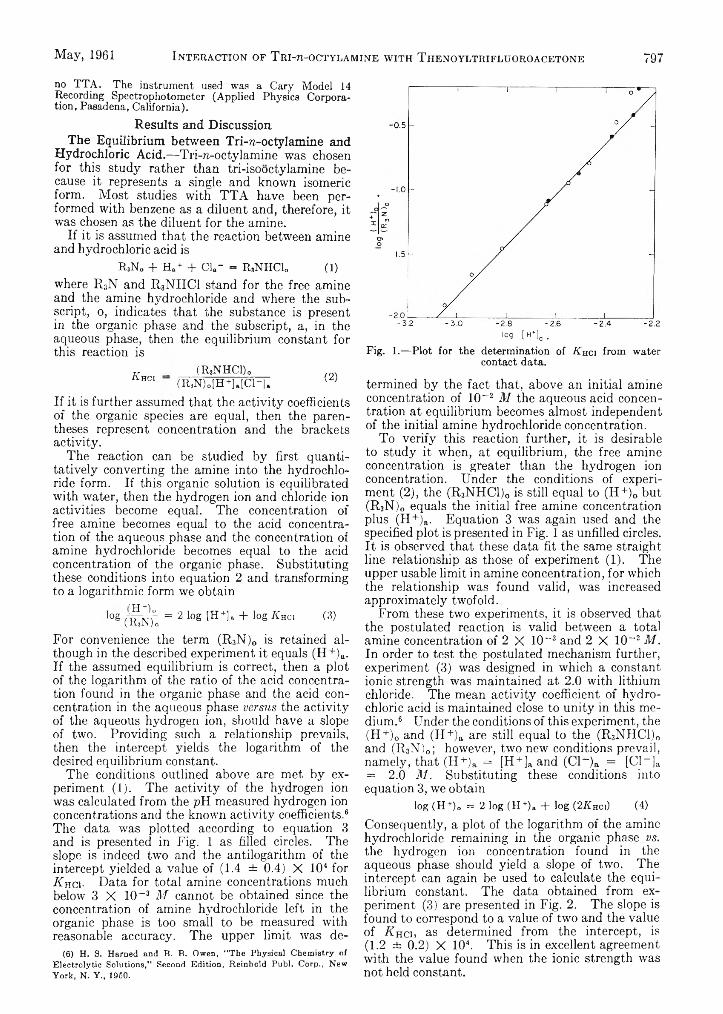
May, 1961 Interaction of T ri-ti-octylamine with T henoyltrifluoroacetone 797
no TTA. The instrument used was a Cary Model 14 Recording Spectrophotometer (Applied Physics Corporation, Pasadena, California).
Results and DiscussionThe Equilibrium between Tri-re-octylamine and
Hydrochloric Acid.— Tri-n-octylamine was chosen for this study rather than tri-isooctylamine because it represents a single and known isomeric form. Most studies with TTA have been performed with benzene as a diluent and, therefore, it was chosen as the diluent for the amine.
If it is assumed that the reaction between amine and hydrochloric acid is
R3N„ + H„+ + C l,- = RsNHClo (1)where R3N and R 3NHC1 stand for the free amine and the amine hydrochloride and where the subscript, o, indicates that the substance is present in the organic phase and the subscript, a, in the aqueous phase, then the equilibrium constant for this reaction is
K HC!(R3NHC1)„
( R sN )o [H + ]a [C l —ja (2)
If it is further assumed that the activity coefficients of the organic species are equal, then the parentheses represent concentration and the brackets activity.
The reaction can be studied by first quantitatively converting the amine into the hydrochloride form. If this organic solution is equilibrated with water, then the hydrogen ion and chloride ion activities become equal. The concentration of free amine becomes equal to the acid concentration of the aqueous phase and the concentration of amine hydrochloride becomes equal to the acid concentration of the organic phase. Substituting these conditions into equation 2 and transforming to a logarithmic form we obtain
losr S f „ = 21og[H+]a + logirHci (3)For convenience the term (R3N)0 is retained although in the described experiment it equals (H+)a. If the assumed equilibrium is correct, then a plot of the logarithm of the ratio of the acid concentration found in the organic phase and the acid concentration in the aqueous phase versus the activity of the aqueous hydrogen ion, should have a slope of two. Providing such a relationship prevails, then the intercept yields the logarithm of the desired equilibrium constant.
The conditions outlined above are met by experiment (1). The activity of the hydrogen ion was calculated from the pH measured hydrogen ion concentrations and the known activity coefficients.6 The data was plotted according to equation 3 and is presented in Fig. 1 as filled circles. The slope is indeed two and the antilogarithm of the intercept yielded a value of (1.4 ± 0.4) X 104 for Knci. Data for total amine concentrations much below 3 X 10~3 M cannot be obtained since the concentration of amine hydrochloride left in the organic phase is too small to be measured with reasonable accuracy. The upper limit was de-
(6) H. S. Hamed and B. B. Owen, “ The Physical Chemistry of Electrolytic Solutions,” Second Edition, Reinhold Publ. Corp., New York, N. Y., 1950.
log (H*]a.Fig. I.— Plot for the determination of -Khci from water
contact data.
termined by the fact that, above an initial amine concentration of 10~2 M the aqueous acid concentration at equilibrium becomes almost independent of the initial amine hydrochloride concentration.
To verify this reaction further, it is desirable to study it when, at equilibrium, the free amine concentration is greater than the hydrogen ion concentration. Under the conditions of experiment (2), the (R3NHC1)0 is still equal to (H+)0 but (R3N)0 equals the initial free amine concentration plus (H+)a. Equation 3 was again used and the specified plot is presented in Fig. 1 as unfilled circles. It is observed that these data fit the same straight line relationship as those of experiment (1). The upper usable limit in amine concentration, for which the relationship was found valid, was increased approximately twofold.
From these two experiments, it is observed that the postulated reaction is valid between a total amine concentration of 2 X 10⁻³ and 2 X 10⁻² M. In order to test the postulated mechanism further, experiment (3) was designed in which a constant ionic strength was maintained at 2.0 with lithium chloride. The mean activity coefficient of hydrochloric acid is maintained close to unity in this medium.6 Under the conditions of this experiment, the ( H + ) 0 and (H + ) a are still equal to the (R3NHC1)0 and (R3N)0; however, two new conditions prevail, namely, that (H+)a = [H+]a and (Cl~)a = [Cl_ ]a = 2.0 M. Substituting these conditions into equation 3, we obtain
log (H+)o = 2 log (H +). + log (2KhcO (4)Consequently, a plot of the logarithm of the amine hydrochloride remaining in the organic phase vs. the hydrogen ion concentration found in the aqueous phase should yield a slope of two. The intercept can again be used to calculate the equilibrium constant. The data obtained from experiment (3) are presented in Fig. 2. The slope is found to correspond to a value of two and the value of R hci, as determined from the intercept, is (1.2 ± 0.2) X 104. This is in excellent agreement with the value found when the ionic strength was not held constant.
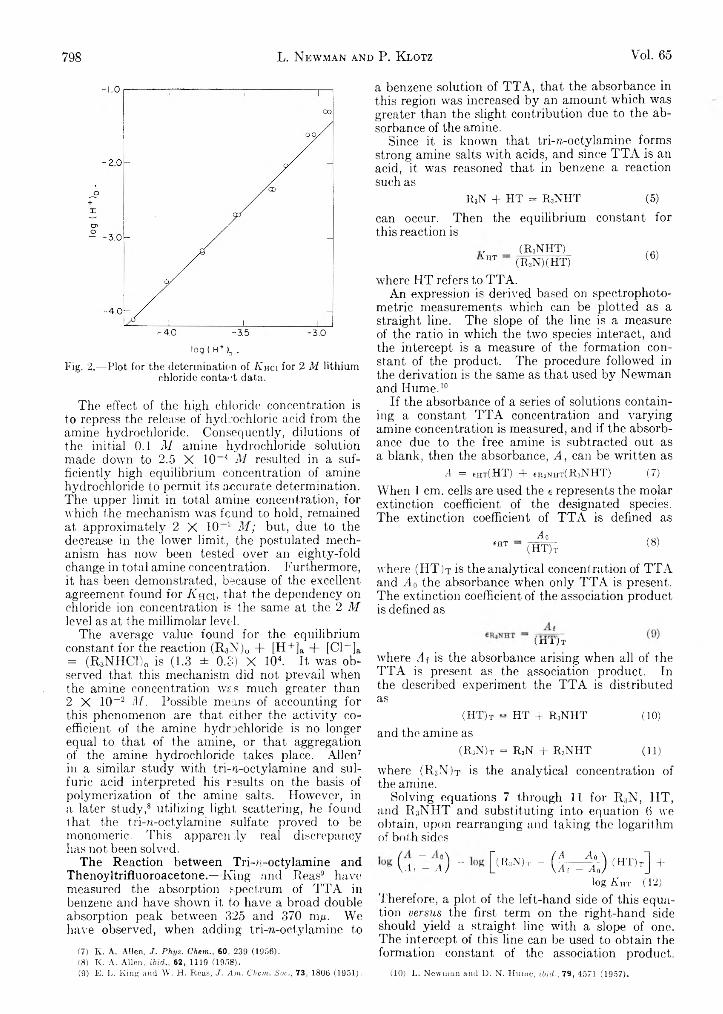
798 L. Newman and P. Klotz Vol. 65
log ( H+ )_, .
Fig. 2.—Plot for the determination of A hci for 2 M lithium chloride contact data.
The effect of the high chloride concentration is to repress the release of hydrochloric acid from the amine hydrochloride. Consequently, dilutions of the initial 0.1 M amine hydrochloride solution made down to 2.5 X 10~4 M resulted in a sufficiently high equilibrium concentration of amine hydrochloride to permit its accurate determination. The upper limit in total amine concentration, for which the mechanism was fcund to hold, remained at approximately 2 X 1 0 M ; but, due to the decrease in the lower limit, the postulated mechanism has now been tested over an eighty-fold change in total amine concentration. Furthermore, it has been demonstrated, because of the excellent agreement found for K hci, that the dependency on chloride ion concentration is the same at the 2 M level as at the millimolar level.
The average value found for the equilibrium constant for the reaction (R3N)0 + [H+]a + [Cl~]a = (R3NHC1)0 is (1.3 ± 0.3) X 104. It was observed that this mechanism did not prevail when the amine concentration was much greater than 2 X 10 ~2 M. Possible means of accounting for this phenomenon are that either the activity coefficient of the amine hydrochloride is no longer equal to that of the amine, or that aggregation of the amine hydrochloride takes place. Allen7 in a similar study with tri-n-octylamine and sulfuric acid interpreted his results on the basis of polymerization of the amine salts. However, in a later study,8 utilizing light scattering, he found that the tri-n-octylamine sulfate proved to be monomeric. This apparently real discrepancy has not been solved.
The Reaction between Tri-n-octylamine and Thenoyltrifluoroacetone.— King and Reas9 have measured the absorption spectrum of TTA in benzene and have shown it to have a broad double absorption peak between 325 and 370 mg. We have observed, when adding tri-n-octylamine to
(7) K. A. Allen, J. Phys. Chem., 60, 239 (1956).(8) K. A. Allen, ib id ., 62, 1119 (1958).(9) E. L. King and W . H. Reas, J. Am. Chem. Soc., 73, 1806 (1951).
a benzene solution of TTA, that the absorbance in this region was increased by an amount which was greater than the slight contribution due to the absorbance of the amine.
Since it is known that tri-n-octylamine forms strong amine salts with acids, and since TTA is an acid, it was reasoned that in benzene a reaction such as
R3N + HT = R3NHT (5)can occur. Then the equilibrium constant for this reaction is
, (R3NHT) ^HT (R,N)(HT) (6)
where HT refers to TTA.An expression is derived based on spectrophoto-
metric measurements which can be plotted as a straight line. The slope of the line is a measure of the ratio in which the two species interact, and the intercept is a measure of the formation constant of the product. The procedure followed in the derivation is the same as that used by Newman and Hume.10
If the absorbance of a series of solutions containing a constant TTA concentration and varying amine concentration is measured, and if the absorbance due to the free amine is subtracted out as a blank, then the absorbance, A, can be written as
A = c h t ( H T ) + eR3N H T (R 3N H T ) ( 7 )
When 1 cm. cells are used the e represents the molar extinction coefficient of the designated species. The extinction coefficient of TTA is defined as
6HT Aa(HT)t
(8)
where (HT)t is the analytical concentration of TTA and A 0 the absorbance when only TTA is present. The extinction coefficient of the association product is defined as
( n l ) i
where A f is the absorbance arising when all of the TTA is present as the association product. In the described experiment the TTA is distributedas
(HT)t = HT + R3NHT (10)and the amine as
(RsN)t = RSN + RjNHT ( 1 1 )
where (R3N)t is the analytical concentration of the amine.
Solving equations 7 through 11 for R3N, IIT, and R3NHT and substituting into equation 6 we obtain, upon rearranging and taking the logarithm of bot h sides
( i f f a ) - [ < ' « ) , - ( f y A ) (HT>d +log K m (12)
Therefore, a plot of the left-hand side of this equation versus the first term on the right-hand side should yield a straight line with a slope of one. The intercept of this line can be used to obtain the formation constant of the association product.
( 1 0 ) L. Newman and D. N. Hume, ibid., 79, 4 5 7 1 ( 1 9 5 7 ) .
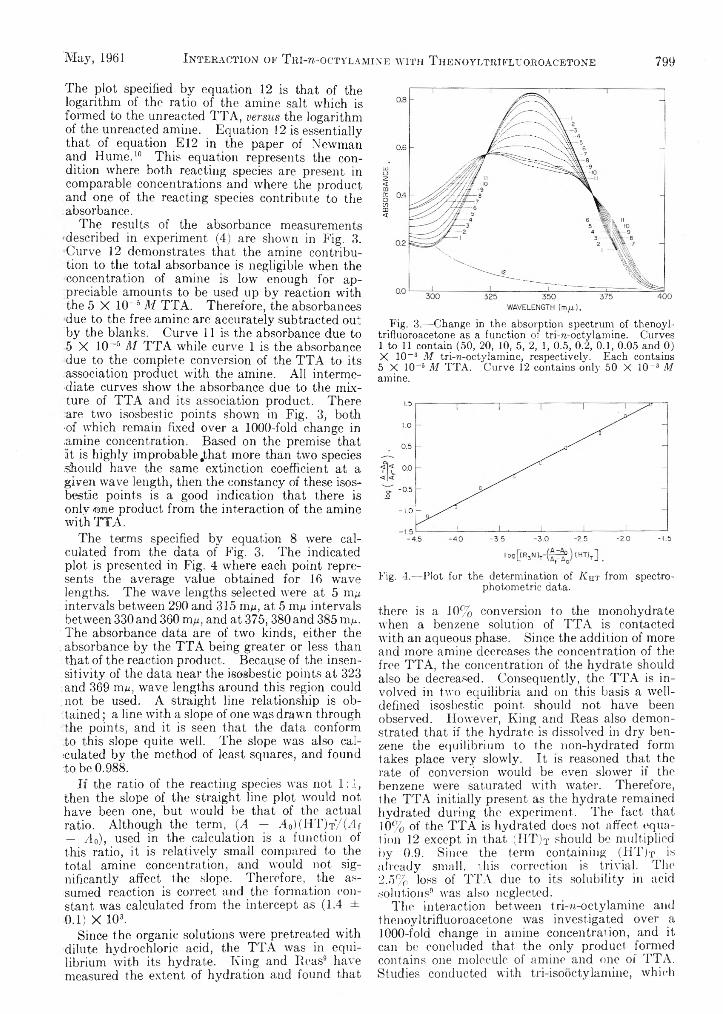
May, 1961 I nteraction of T ri-b-octylamine with T henoyltrIfluoroacetoNe 799
The plot specified by equation 12 is that of the logarithm of the ratio of the amine salt which is formed to the unreacted TTA, versus the logarithm of the unreacted amine. Equation 12 is essentially that of equation E12 in the paper of Newman and Hume.10 This equation represents the condition where both reacting species are present in comparable concentrations and where the product and one of the reacting species contribute to the absorbance.
The results of the absorbance measurements described in experiment (4) are shown in Fig. 3. Curve 12 demonstrates that the amine contribution to the total absorbance is negligible when the concentration of amine is low enough for appreciable amounts to be used up by reaction with the 5 X 10~6 M TTA. Therefore, the absorbances due to the free amine are accurately subtracted out by the blanks. Curve 11 is the absorbance due to 5 X 10 ~6 M TTA while curve 1 is the absorbance due to the complete conversion of the TTA to its association product with the amine. All intermediate curves show the absorbance due to the mixture of TTA and its association product. There are two isosbestic points shown in Fig. 3, both ■of which remain fixed over a 1000-fold change in amine concentration. Based on the premise that at is highly improbable .that more than two species should have the same extinction coefficient at a given wave length, then the constancy of these isos- bestie points is a good indication that there is only one product from the interaction of the amine with TTA.
The terms specified by equation 8 were calculated from the data of Fig. 3. The indicated plot is presented in Fig. 4 where each point represents the average value obtained for 16 wave lengths. The wave lengths selected were at 5 m/i intervals between 290 and 315 my, at 5 my intervals between 330 and 360 my, and at 375, 380 and 385 my.
' The absorbance data are of two kinds, either the absorbance by the TTA being greater or less than that of the reaction product. Because of the insen-
: sitivity of the data near the isosbestic points at 323 ; and 369 my, wave lengths around this region could :not be used. A straight line relationship is obtained ; a line with a slope of one was drawn through the points, and it is seen that the data conform to this slope quite well. The slope was also calculated by the method of least squares, and found to be 0.988.
If the ratio of the reacting species was not 1:1, then the slope of the straight line plot would not have been one, but would be that of the actual ratio. Although the term, {A — Ao)(HT)Ty(rif — A q), used in the calculation is a function of this ratio, it is relatively small compared to the total amine concentration, and would not significantly affect the slope. Therefore, the assumed reaction is correct and the formation constant was calculated from the intercept as (1.4 ± 0.1) X 103.
Since the organic solutions were pretreated with dilute hydrochloric acid, the TTA was in equilibrium with its hydrate. King and Reas9 have measured the extent of hydration and found that
Fig. 3.— Change in the absorption spectrum of thenoyl- trifluoroacetone as a function of tri-n-octylamine. Curves 1 to 11 contain (50, 20, 10, 5, 2, 1, 0.5, 0.2, 0.1, 0.05 and 0) X 10 ~ 3 M tri-w-octylamine, respectively. Each contains 5 X 10⁻⁵ M TTA. Curve 12 contains only 50 X 10~3 M amine.
Fig. 4.— Plot for the determination of Kht from spectro- photometric data.
there is a 10% conversion to the monohydrate when a benzene solution of TTA is contacted with an aqueous phase. Since the addition of more and more amine decreases the concentration of the free TTA, the concentration of the hydrate should also be decreased. Consequently, the TTA is involved in two equilibria and on this basis a well- defined isosbestic point should not have been observed. However, King and Reas also demonstrated that if the hydrate is dissolved in dry benzene the equilibrium to the non-hydrated form takes place very slowly. It is reasoned that the rate of conversion would be even slower if the benzene were saturated with water. Therefore, the TTA initially present as the hydrate remained hydrated during the experiment. The fact that 10% of the TTA is hydrated does not affect equation 12 except in that (HT)x should be multiplied by 0.9. Since the term containing (HT)t is already small, ’his correction is trivial. The 2.5% loss of TTA due to its solubility in acid solutions9 was also neglected.
The interaction between tri-n-octylamine and thenoyltrifluoroacetone was investigated over a 1000-fold change in amine concentration, and it can be concluded that the only product formed contains one molecule of amine and one of TTA. Studies conducted with tri-isooctylamine, which
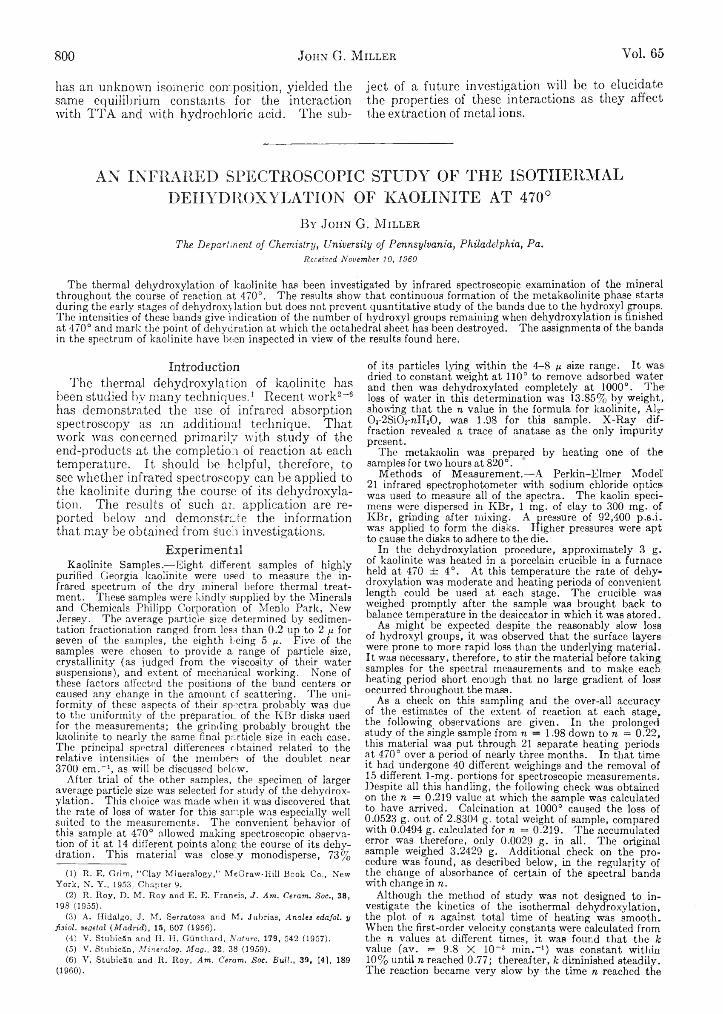
800 John G. M iller Vol. 65
has an unknown isomeric composition, yielded the same equilibrium constants for the interaction with TTA and with hydrochloric acid. The sub
ject of a future investigation will be to elucidate the properties of these interactions as they affect the extraction of metal ions.
AN INFRARED SPECTROSCOPIC STUDY OF THE ISOTHERMAL DEHYDROXYLATION OF KAOLINITE AT 470°
By John G. M iller
T h e D ep a rtm en t o f C hem istry , U n iversity o f P en n sy lv a n ia , P h ila d elp h ia , P a .Received November 10, 1960
The thermal dehydroxylation of kaolinite has been investigated by infrared spectroscopic examination of the mineral throughout the course of reaction at 470°. The results show that continuous formation of the metakaolinite phase starts during the early stages of dehydroxylation but does not prevent quantitative study of the bands due to the hydroxyl groups. The intensities of these bands give indication of the number of hydroxyl groups remaining when dehydroxylation is finished at 470° and mark the point of dehydration at which the octahedral sheet has been destroyed. The assignments of the bands in the spectrum of kaolinite have been inspected in view of the results found here.
IntroductionThe thermal dehydroxylation of kaolinite has
been studied by many techniques.1 Recent work2-6 has demonstrated the use of infrared absorption spectroscopy as an additional technique. That work was concerned primarily with study of the end-products at the completion of reaction at each temperature. It should be helpful, therefore, to see whether infrared spectroscopy can be applied to the kaolinite during the course of its dehydroxylation. The results of such an application are reported below and demonstrate the information that may be obtained from such investigations.
ExperimentalKaolinite Samples.—Eight different samples of highly
purified Georgia kaolinite were used to measure the infrared spectrum of the dry mineral before thermal treatment. These samples were kindly supplied by the Minerals and Chemicals Philipp Corporation of Menlo Park, New Jersey. The average particle size determined by sedimentation fractionation ranged from less than 0.2 up to 2 y for seven of the samples, the eighth being 5 n - Five of the samples were chosen to provide a range of particle size, crystallinity (as judged from the viscosity of their water suspensions), and extent of mechanical working. None of these factors affected the positions of the band centers or caused any change in the amount of scattering. The uniformity of these aspects of their spectra probably was due to the uniformity of the preparation of the KBr disks used for the measurements; the grinding probably brought the kaolinite to nearly the same final particle size in each case. The principal spectral differences obtained related to the relative intensities of the members of the doublet near 3700 cm.-1, as will be discussed below.
After trial of the other samples, the specimen of larger average particle size was selected for study of the dehydroxylation. This choice was made when it was discovered that the rate of loss of water for this sample was especially well suited to the measurements. The convenient behavior of this sample at 470° allowed making spectroscopic observation of it at 14 different points along the course of its dehydration. This material was close_y monodisperse, 73% 1 2 3 4 5 6
(1) R. E. Grim, “ Clay Mineralogy," MeGraw-Hill Book Co., New York, N. Y., 1953, Chapter 9.
(2) R. Roy, D. M. Roy and E. E. Francis, J. Am. Ceram. Soc., 38, 198 (1955).
(3) A. Hidalgo, J. M. Serratosa and M. Jubrias, Anales edafol. y fisiol. vegetal {Madrid), 15, 607 (1956).
(4) V. Stubic&n and H. H. Gunthard, Nature, 179, 542 (1957).(5) V. Stubic&n, Mineralog. Mag., 32, 38 (1959).(6) V. StubicSn and R. Roy, Am. Ceram. Soc. Bull., 39, [41, 189
(1960).
of its particles lying within the 4-8 y size range. It was dried to constant weight at 110° to remove adsorbed water and then was dehydroxylated completely at 1000°. The loss of water in this determination was 13.85% by weight, showing that the n value in the formula for kaolinite, Al2-0 3-2Si0riiH20 , was 1.98 for this sample. X-Ray diffraction revealed a trace of anatase as the only impurity present.
The metakaolin was prepared by heating one of the samples for two hours at 820°.
Methods of Measurement.— A Perkin-Elmer Model'. 21 infrared spectrophotometer with sodium chloride optics was used to measure all of the spectra. The kaolin specimens were dispersed in KBr, 1 mg. of clay to 300 mg. of KBr, grinding after mixing. A pressure of 92,400 p.s.i. was applied to form the disks. Higher pressures were apt to cause the disks to adhere to the die.
In the dehydroxylation procedure, approximately 3 g. of kaolinite was heated in a porcelain crucible in a furnace held at 470 ± 4°. At this temperature the rate of dehydroxylation was moderate and heating periods of convenient length could be used at each stage. The crucible was weighed promptly after the sample was brought back to balance temperature in the desiccator in which it was stored.
As might be expected despite the reasonably slow loss of hydroxyl groups, it was observed that the surface layers were prone to more rapid loss than the underlying material. It was necessary, therefore, to stir the material before taking samples for the spectral measurements and to make each: heating period short enough that no large gradient of loss occurred throughout the mass.
As a check on this sampling and the over-all accuracy of the estimates of the extent of reaction at each stage, the following observations are given. In the prolonged study of the single sample from n — 1.98 down to n = 0.22, this material was put through 21 separate heating periods at 470° over a period of nearly three months. In that time it had undergone 40 different weighings and the removal of 15 different 1-mg. portions for spectroscopic measurements. Despite all this handling, the following check was obtained on the n = 0.219 value at which the sample was calculated to have arrived. Calcination at 1000° caused the loss of 0.0523 g. out of 2.8304 g. total weight of sample, compared with 0.0494 g. calculated for n — 0.219. The accumulated error was therefore, only 0.0029 g. in all. The original sample weighed 3.2429 g. Additional check on the procedure was found, as described below, in the regularity of the change of absorbance of certain of the spectral bands with change in n .
Although the method of study was not designed to investigate the kinetics of the isothermal dehydroxylation, the plot of n against total time of heating was smooth. When the first-order velocity constants were calculated from the n values at different times, it was found that the k value (ay. = 9.8 X 10~3 min.-1) was constant within 10% until n reached 0.77; thereafter, k diminished steadily. The reaction became very slow by the time n reached the
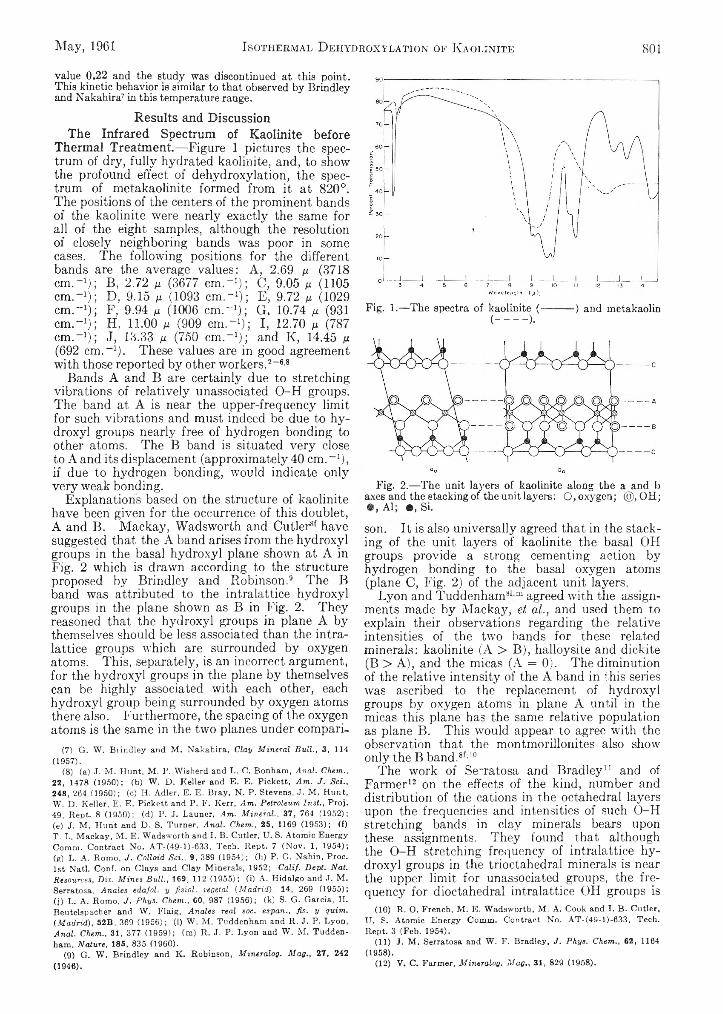
May, 1961 I s o t h e r m a l D e h y d r o x y l a t i o n o f K a o l i n i t e 801
value 0.22 and the study was discontinued at this point. This kinetic behavior is similar to that observed by Brindley and Nakahira7 in this temperature range.
Results and DiscussionThe Infrared Spectrum of Kaolinite before
Thermal Treatment.— Figure 1 pictures the spectrum of dry, fully hydrated kaolinite, and, to show the profound effect of dehydroxylation, the spectrum of metakaolinite formed from it at 820°. The positions of the centers of the prominent bands of the kaolinite were nearly exactly the same for all of the eight samples, although the resolution of closely neighboring bands was poor in some cases. The following positions for the different bands are the average values: A, 2.69 p (3718 cm .-1); B, 2.72 p (3677 cm.“ 1); C, 9.05 p (1105cm .-1); D, 9.15 p (1093 cm .-1); E, 9.72 p (1029cm.“ 1); F, 9.94 p (1006 cm .-1); G, 10.74 p (931cm.“ 1); H, 11.00 p (909 cm .-1); I, 12.70 p (787cm.-1); J, 13.33 p (750 cm.-1); and K, 14.45 p (692 cm.-1). These values are in good agreement with those reported by other workers. 2 _ 6 >8
Bands A and B are certainly due to stretching vibrations of relatively unassociated O-H groups. The band at A is near the upper-frequency limit for such vibrations and must indeed be due to hydroxyl groups nearly free of hydrogen bonding to other atoms. The B band is situated very close to A and its displacement (approximately 40 cm._1), if due to hydrogen bonding, would indicate only very weak bonding.
Explanations based on the structure of kaolinite have been given for the occurrence of this doublet, A and B. Mackay, Wadsworth and Cutler8 1 have suggested that the A band arises from the hydroxyl groups in the basal hydroxyl plane shown at A in Fig. 2 which is drawn according to the structure proposed by Brindley and Robinson . 9 The B band was attributed to the intralattice hydroxyl groups in the plane shown as B in Fig. 2. They reasoned that the hydroxyl groups in plane A by themselves should be less associated than the intralattice groups which are surrounded by oxygen atoms. This, separately, is an incorrect argument, for the hydroxyl groups in the plane by themselves can be highfy associated with each other, each hydroxyl group being surrounded by oxygen atoms there also. Furthermore, the spacing of the oxygen atoms is the same in the two planes under compari-
(7 ) G . W . B i in d le y a n d M . N a k a h ira , Clay Mineral Bull., 3 , 114 (1 9 5 7 ).
(8 ) (a ) J . M . H u n t , M . P . W is h e rd a n d L . C . B o n h a m , Anal. Chem., 2 2 , 1 4 7 8 (1 9 5 0 ) ; (b ) W . D . K e lle r a n d E . E . P ic k e t t , Am. J. Sci., 2 4 8 , 2 6 4 (1 9 5 0 ) ; (c ) I I . A d le r , E . E . B r a y , N . P . S te v e n s , J. M . H u n t , W . D . K e lle r , E . E . P ic k e t t a n d P . F . K e r r , Am. Petroleum Inst., P r o j . 4 9 , K e p t . 8 (1 9 5 0 ) ; (d ) P . J . L a u n e r , Am. Mineral., 37, 7 64 (1 9 5 2 );(e ) J . M . H u n t a n d D . S . T u rn e r , Anal. Chem., 2 5 , 1169 (1 9 5 3 ) ; ( f )T . L . M a c k a y , M . E . W a d s w o r t h a n d I . B . C u t le r , U . S . A t o m ic E n e r g y C o m m . C o n t r a c t N o . A T - ( 4 9 - l ) - 6 3 3 , T e c h . R e p t . 7 (N o v . 1, 1 9 5 4 ) ; (g ) L . A . R o m o , J. Colloid Sci., 9, 3 8 9 (1 9 5 4 ) ; (h ) P . G . N a h in , P r o c . 1 st N a t l . C o n f . o n C la y s a n d C la y M in e r a ls , 1 9 5 2 ; Calif. Dept. Nat. Resources, Div. Mines Bull., 1 69 , 112 (1 9 5 5 ) ; ( i ) A . H id a lg o a n d J . M . S e rra to sa , Anales edafol. y fisiol. vegetal {Madrid), 14, 2 69 (1 9 5 5 ) ; ( j ) L . A . R o m o , J. Phys. Chem., 6 0 , 9 87 (1 9 5 6 ) ; (k ) S . G . G a r c ia , H . B e u te ls p a ch e r a n d W . F la ig , Anales real soc. espan., fis. y quim. {Madrid), 52B, 3 6 9 (1 9 5 6 ) ; (1) W . M . T u d d e n h a m a n d R . J . P . L y o n , Anal. Chem., 31, 3 7 7 (1 9 5 9 ) ; (m ) R . J . P . L y o n a n d W . M . T u d d e n h a m , Nature, 185, 8 3 5 (1 9 6 0 ).
(9 ) G . W . B r in d le y a n d K . R o b in s o n , Mineralog. Mag., 27, 2 42 (1 9 4 6 ).
Fig. 1.— The spectra of kaolinite (---------- ) and metakaolin(----------)■
Fig. 2.— The unit layers of kaolinite along the a and b axes and the stacking of the unit layers: O , oxygen; © , OH;
Al; ®, Si.
son. It is also universally agreed that in the stacking of the unit layers of kaolinite the basal OH groups provide a strong cementing action by hydrogen bonding to the basal oxygen atoms (plane C, Fig. 2 ) of the adjacent unit layers.
Lyon and Tuddenham81™ agreed with the assignments made by Mackay, et al., and used them to explain their observations regarding the relative intensities of the two bands for these related minerals: kaolinite (A > B), halloysite and dickite (B > A), and the micas (A = 0). The diminution of the relative intensity of the A band in this series was ascribed to the replacement of hydroxyl groups by oxygen atoms in plane A until in the micas this plane has the same relative population as plane B. This would appear to agree with the observation that the montmorillonites also show only the B band. 8 1 ' 10
The work of Serratosa and Bradley1 1 and of Farmer1 2 on the effects of the kind, number and distribution of the cations in the octahedral layers upon the frequencies and intensities of such O-H stretching bands in clay minerals bears upon these assignments. They found that although the O-H stretching frequency of intralattice hydroxyl groups in the trioctahedral minerals is near the upper limit for unassociated groups, the frequency for dioctahedral intralattice OH groups is
(1 0 ) R . O . F re n c h , M . E= W a d s w o r t h , M . A . C o o k a n d I . B . C u t le r ,U . S . A t o m ic E n e r g y C o m m . C o n t r a c t N o . A T - (4 9 -1 ) -6 3 3 , T e c h . R e p t . 3 (F e b . 1 9 5 4 ).
(1 1 ) J. M . S e rr a to s a a n d W . F . B r a d le y , J. Phys, Chem., 62, 1164(1 9 5 8 ).
(1 2 ) V. C. F a r m e r , Mineralog. Mag., 31, 8 29 (1 9 5 8 ).
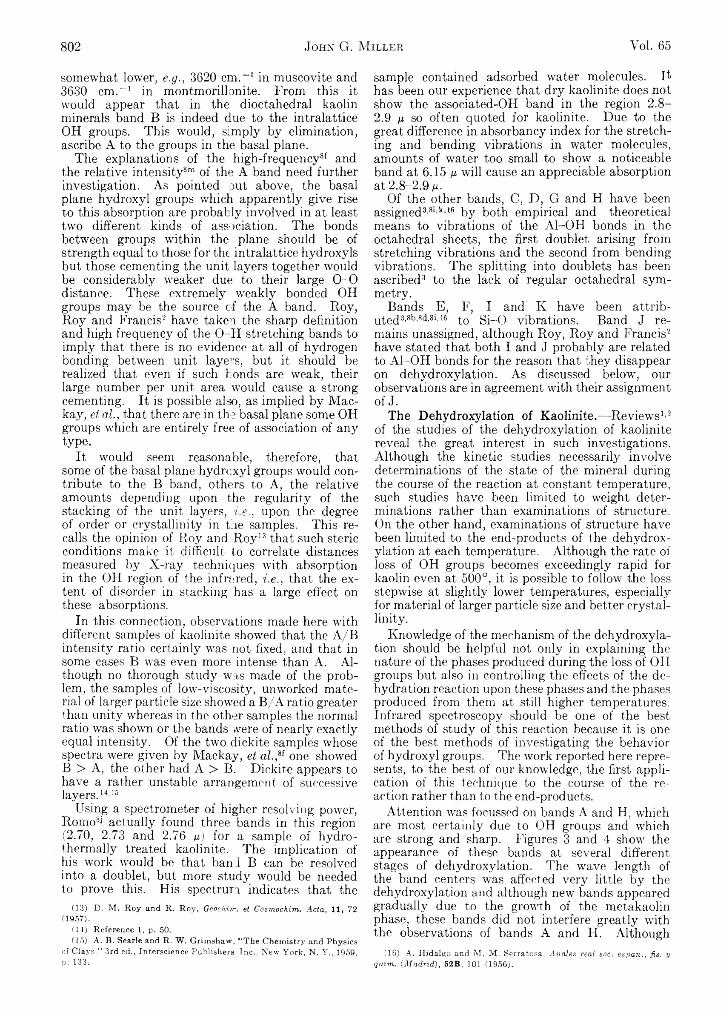
802 J o h n G. M i l l e r Vol. 65
somewhat lower, e .g ., 3620 cm . - 1 in muscovite and 3630 cm . - 1 in montmorillonite. From this it would appear that in the dioctahedral kaolin minerals band B is indeed due to the intralattice OH groups. This would, simply by elimination, ascribe A to the groups in the basal plane.
The explanations of the high-frequency8f and the relative intensity8™ of the A band need further investigation. As pointed out above, the basal plane hydroxyl groups which apparently give rise to this absorption are probably involved in at least two different kinds of association. The bonds between groups within the plane should be of strength equal to those for the intralattice hydroxyls but those cementing the unit layers together would be considerably weaker due to their large 0 - 0
distance. These extremely weakly bonded OH groups may be the source of the A band. Roy, Roy and Francis2 have taken the sharp definition and high frequency of the O-H stretching bands to imply that there is no evidence at all of hydrogen bonding between unit layers, but it should be realized that even if such bonds are weak, their large number per unit area would cause a strong cementing. It is possible also, as implied by Mac- kay, et al., that there are in the basal plane some OH groups which are entirely free of association of any type.
It would seem reasonable, therefore, that some of the basal plane hydroxyl groups would contribute to the B band, others to A, the relative amounts depending upon the regularity of the stacking of the unit layers, i .e ., upon the degree of order or crystallinity in the samples. This recalls the opinion of Roy and Roy 1 3 that such steric conditions make it difficult to correlate distances measured by X-ray techniques with absorption in the OH region of the infrared, i .e . , that the extent of disorder in stacking has a large effect on these absorptions.
In this connection, observations made here with different samples of kaolinite showed that the A /B intensity ratio certainly was not fixed, and that in some cases B was even more intense than A. Although no thorough study was made of the problem, the samples of low-viscosity, unworked material of larger particle size showed a B /A ratio greater than unity whereas in the other samples the normal ratio was shown or the bands were of nearly exactly equal intensity. Of the two dickite samples whose spectra were given by Mackay, et a l . , * 1 one showed B > A, the other had A > B. Dickite appears to have a rather unstable arrangement of successive layers. 1 4 ' 15
Using a spectrometer of higher resolving power, Romo8i actually found three bands in this region (2.70, 2.73 and 2.76 y) for a sample of hydro- thermally treated kaolinite. The implication of his work would be that band B can be resolved into a doublet, but more study would be needed to prove this. His spectrum indicates that the
(1 3 ) D . M . R o y a n d R . R o y , Geochim. et Cosmochim. Acta, 1 1 , 72 (1 9 5 7 ).
(1 4 ) R e fe r e n c e 1 , p . 50.(1 5 ) A . B . S e a rle a n d R . W . G r im sh a w , “ T h e C h e m is try a n d P h y s ic s
o f C la y s ,” 3 rd e d ., In te r s c ie n c e P u b lis h e rs , I n c . , N e w Y o r k , N . Y . , 1959 , p . 133 .
sample contained adsorbed water molecules. It has been our experience that dry kaolinite does not show the associated-OH band in the region 2.8-2.9 n so often quoted for kaolinite. Due to the great difference in absorbancy index for the stretching and bending vibrations in water molecules, amounts of water too small to show a noticeable band at 6.15 ¡x will cause an appreciable absorption at2.8-2.9M-
Of the other bands, C, D, G and H have been assigned3 '8 1 , 1 1 ' 1 6 by both empirical and theoretical means to vibrations of the Al-OH bonds in the octahedral sheets, the first doublet arising from stretching vibrations and the second from bending vibrations. The splitting into doublets has been ascribed3 to the lack of regular octahedral symmetry.
Bands E, F, I and K have been attrib- uted3 '8 b ' 8 d ’8 i ' 16 to S i-0 vibrations. Band J remains unassigned, although Roy, Roy and Francis2
have stated that both I and J probably are related to Al-OH bonds for the reason that they disappear on dehydroxylation. As discussed below, our observations are in agreement with their assignment of J.
The Dehydroxylation of Kaolinite.— Reviews1 ' 2
of the studies of the dehydroxylation of kaolinite reveal the great interest in such investigations. Although the kinetic studies necessarily involve determinations of the state of the mineral during the course of the reaction at constant temperature, such studies have been limited to weight determinations rather than examinations of structure. On the other hand, examinations of structure have been limited to the end-products of the dehydroxylation at each temperature. Although the rate of loss of OH groups becomes exceedingly rapid for kaolin even at 500°, it is possible to follow the loss stepwise at slightly lower temperatures, especially for material of larger particle size and better crystallinity.
Knowledge of the mechanism of the dehydroxylation should be helpful not only in explaining the nature of the phases produced during the loss of OH groups but also in controlling the effects of the dehydration reaction upon these phases and the phases produced from them at still higher temperatures. Infrared spectroscopy should be one of the best methods of study of this reaction because it is one of the best methods of investigating the behavior of hydroxyl groups. The work reported here represents, to the best of our knowledge, the first application of this technique to the course of the reaction rather than to the end-products.
Attention was focussed on bands A and H, which are most certainly due to OH groups and which are strong and sharp. Figures 3 and 4 show the appearance of these bands at several different stages of dehydroxylation. The wave length of the band centers was affected very little by the dehydroxylation and although new bands appeared gradually due to the growth of the metakaolin phase, these bands did not interfere greatly with the observations of bands A and H. Although
(1 6 ) A . H id a lg o a n d M . M . S e rr a to s a , Anales real soc. espan., fis. y quim. (Madrid), 52B, 101 (1 9 5 6 ).
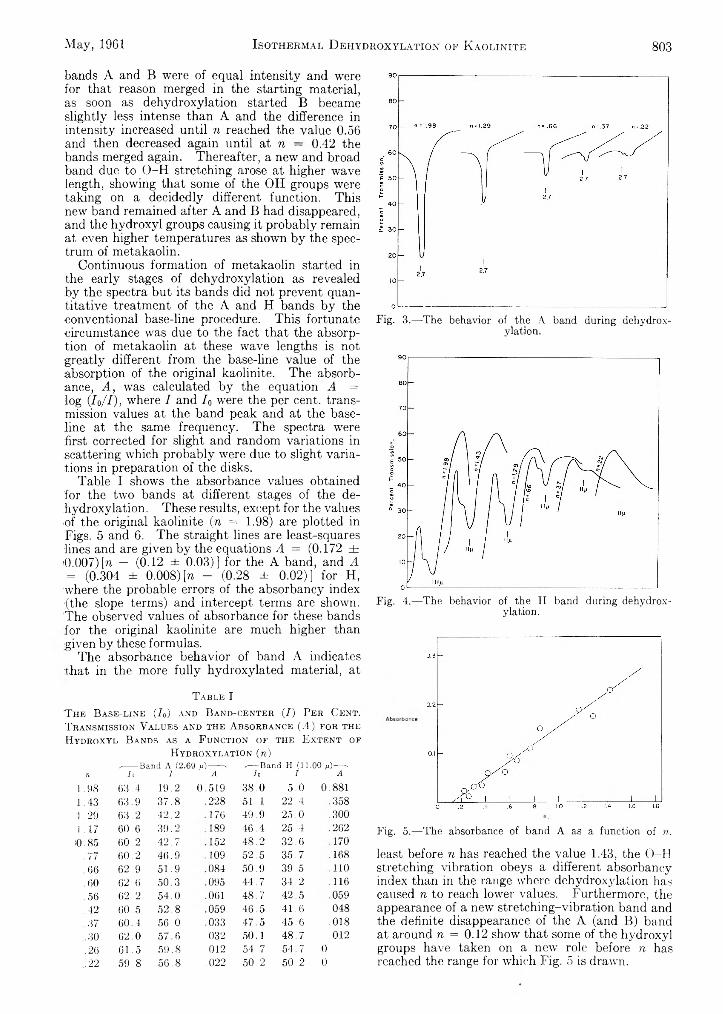
May, 1961 I s o t h e r m a l D e h y d r o x y l a t i o n o f K a o l i n i t e 803
bands A and B were of equal intensity and were for that reason merged in the starting material, as soon as dehydroxylation started B became slightly less intense than A and the difference in intensity increased until n reached the value 0.56 and then decreased again until at n — 0.42 the bands merged again. Thereafter, a new and broad band due to O-H stretching arose at higher wave length, showing that some of the OH groups were taking on a decidedly different function. This new band remained after A and B had disappeared, and the hydroxyl groups causing it probably remain at even higher temperatures as shown by the spectrum of metakaolin.
Continuous formation of metakaolin started in the early stages of dehydroxylation as revealed by the spectra but its bands did not prevent quantitative treatment of the A and H bands by the ■conventional base-line procedure. This fortunate ■circumstance was due to the fact that the absorption of metakaolin at these wave lengths is not greatly different from the base-line value of the absorption of the original kaolinite. The absorbance, A , was calculated by the equation A = log ( I o /I ) , where I and 70 were the per cent, transmission values at the band peak and at the baseline at the same frequency. The spectra were first corrected for slight and random variations in .scattering which probably were due to slight variations in preparation of the disks.
Table I shows the absorbance values obtained for the two bands at different stages of the dehydroxylation. These results, except for the values ■of the original kaolinite (n = 1.98) are plotted in Figs. 5 and 6 . The straight lines are least-squares lines and are given by the equations A = (0.172 ± 0.007) [n — (0 . 1 2 ± 0.03)] for the A band, and A = (0.304 ± 0.008) [n - (0.28 ± 0.02)] for H, where the probable errors of the absorbancy index (the slope terms) and intercept terms are shown. The observed values of absorbance for these bands for the original kaolinite are much higher than given by these formulas.
The absorbance behavior of band A indicates that in the more fully hydroxylated material, at
T a ble I
T he B ase-lin e (J0) and B and-cen ter (I) P er C en t. T ransmission V alu es and the A bsorbance (A) for the H ydroxyl B ands as a F unction of the E xten t of
H ydroxylation (n)-------- Band A (2 .6 9 u )--------. /■— Band H (li.i00 a )----- .
n i 3 l A A l A1.98 63. 4 19. 2 0. 519 38. 0 5 . 0 0 8811.43 63. 9 37. 8 228 51. 1 22 .4 3581.29 63. 2 42. 2 176 49. 9 25 . 0 3001.17 60. 6 39. 2 189 46. 4 25 .4 262
(0.85 60. 2 42. 7 152 48. 2 32 .6 170,77 60. 2 46. 9 109 52. 5 35 .7 168,66 62. 9 51. 9 084 50. 9 39 .5 110,60 62. 6 50. 3 095 44. 7 34 .2 116, 56 62. 2 54. 0 061 48. 7 42 .5 059„42 60. 5 52. 8 059 46. 5 41 .6 .048.37 60 4 56. 0 033 47 5 45 .6 018,30 62 0 57 6 .032 50 1 48 .7 .012.26 61 . 5 59 .8 .012 54 .7 54 . 7 0,22 59 .8 56 .8 .022 50 .2 50 .2 0
Fig. 3.— The behavior of the A band during dehydroxylation.
Fig. 4.— The behavior of the H band during dehydroxylation.
Fig. 5.— The absorbance of band A as a function of n.
least before n has reached the value 1.43, the O-H stretching vibration obeys a different absorbancy index than in the range where dehydroxylation has caused n to reach lower values. Furthermore, the appearance of a new stretching-vibration band and the definite disappearance of the A (and B) band at around n = 0 . 1 2 show that some of the hydroxyl groups have taken on a new role before n has reached the range for which Fig. 5 is drawn.
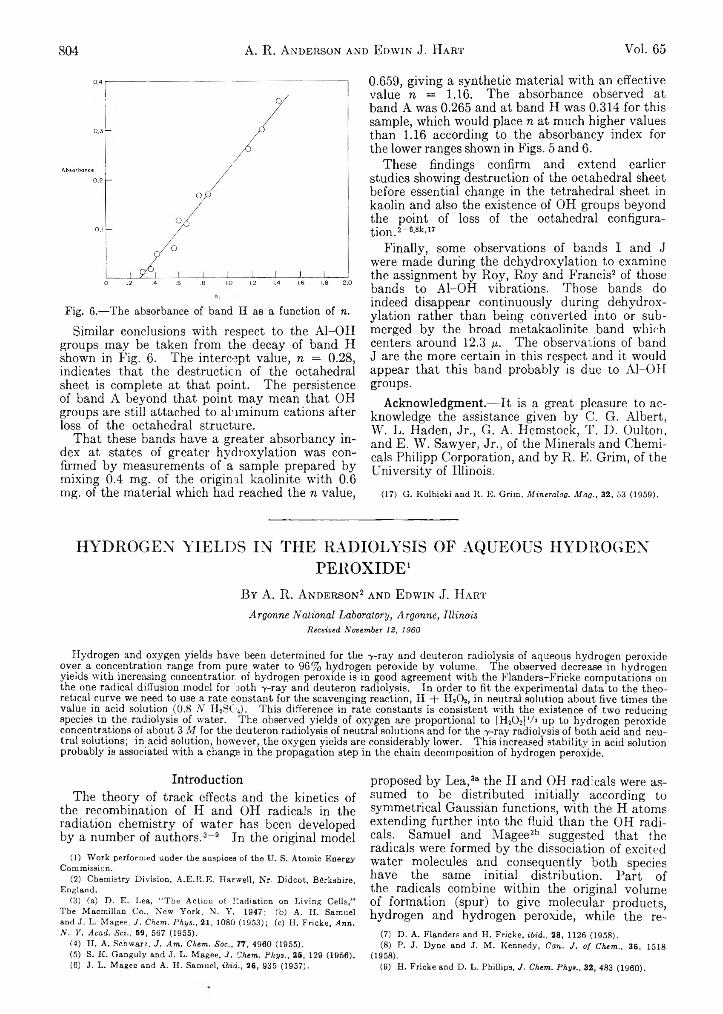
804 A. R. A n d e r s o n a n d E d w i n J. H a r t Vol. 65
Fig. 6.— The absorbance of band H as a function of n.
Similar conclusions with respect to the Al-OH groups may be taken from the decay of band H shown in Fig. 6 . The intercept value, n = 0.28, indicates that the destruction of the octahedral sheet is complete at that point. The persistence of band A beyond that point may mean that OH groups are still attached to aluminum cations after loss of the octahedral structure.
That these bands have a greater absorbancy index at states of greater hydroxylation was confirmed by measurements of a sample prepared by mixing 0.4 mg. of the original kaolinite with 0.6 mg. of the material which had reached the n value,
0.659, giving a synthetic material with an effective value n = 1.16. The absorbance observed at band A was 0.265 and at band H was 0.314 for this sample, which would place n at much higher values than 1.16 according to the absorbancy index for the lower ranges shown in Figs. 5 and 6 .
These findings confirm and extend earlier studies showing destruction of the octahedral sheet before essential change in the tetrahedral sheet in kaolin and also the existence of OH groups beyond the point of loss of the octahedral configuration. 2 _ 6 ’8 k ' 1 7
Finally, some observations of bands I and J were made during the dehydroxylation to examine the assignment by Roy, Roy and Francis2 of those bands to Al-OH vibrations. Those bands do indeed disappear continuously during dehydroxylation rather than being converted into or submerged by the broad metakaolinite band which centers around 12.3 n- The observations of band J are the more certain in this respect and it would appear that this band probably is due to Al-OH groups.
Acknowledgment.— It is a great pleasure to acknowledge the assistance given by C. G. Albert, W. L. Haden, Jr., G. A. Hemstock, T. D. Oulton, and E. W. Sawyer, Jr., of the Minerals and Chemicals Philipp Corporation, and by R. E. Grim, of the University of Illinois.
(1 7 ) G . K u lb ic k i a n d R . E . G r im , Mineralog. Mag., 3 2 , 53 (1 9 5 9 ).
HYDROGEN YIELDS IN THE RADIOLYSIS OF AQUEOUS HYDROGENPEROXIDE1
B y A. R. A nderson2 and E dwin J. H art
Ar gönne National Laboratory, Argonne, Illinois Received November 12, 1960
Hydrogen and oxygen yields have been determined for the 7-ray and deuteron radiolysis of aqueous hydrogen peroxide over a concentration range from pure water to 96% hydrogen peroxide by volume. The observed decrease in hydrogen yields with increasing concentration of hydrogen peroxide is in good agreement with the Flanders-Fricke computations on the one radical diffusion model for ooth 7-ray and deuteron radiolysis. In order to fit the experimental data to the theoretical curve we need to use a rate constant for the scavenging reaction, H + H20 2, in neutral solution about five times the value in acid solution (0.8 N H2S04). This difference in rate constants is consistent with the existence of two reducing species in the radiolysis of water. The observed yields of oxygen are proportional to [H20 2] ‘/ ! up to hydrogen peroxide concentrations of about 3 M for the deuteron radiolysis of neutral solutions and for the 7-ray radiolvsis of both acid and neutral solutions; in acid solution, however, the oxygen yields are considerably lower. This increased stability in acid solution probably is associated with a change in the propagation step in the chain decomposition of hydrogen peroxide.
IntroductionThe theory of track effects and the kinetics of
the recombination of H and OH radicals in the radiation chemistry of water has been developed by a number of authors. 3 - 9 In the original model
(1 ) W o r k p e r fo r m e d u n d e r th e a u sp ice s o f t h e U . S . A t o m ic E n e r g y C o m m is s io n .
(2 ) C h e m is tr y D iv is io n , A .E .R .E . H a rw e ll, N r . D id c o t , B e rk sh ire , E n g la n d .
(3 ) (a ) D . E . L e a , “ T h e A c t io n o f R a d ia t io n o n L iv in g C e lls T h e M a c m illa n C o . , N e w Y o r k , N . Y . 1 9 4 7 ; (b ) A . H . S a m u e l a n d J . L . M a g e e , J. Chem. Phys., 21, 1 08 0 (1 9 5 3 ) ; ( c ) H . F r ic k e , Ann. N . Y. Acad. Sci., 5 9 , 5 6 7 (1 9 5 5 ).
(4 ) H . A . S ch w a rz , J. Am. Chem. Soc., 7 7 , 4 9 6 0 (1 9 5 5 ).(5 ) S . K . G a n g u ly a n d J . L . M a g e e , J. Chem. Phys., 2 5 , 129 (1 9 5 6 ).(6 ) J . L . M a g e e a n d A . H . S a m u e l, ibid., 2 6 , 9 3 5 (1 9 5 7 ).
proposed by Lea,3a the H and OH radicals were assumed to be distributed initially according to symmetrical Gaussian functions, with the H atoms extending further into the fluid than the OH radicals. Samuel and Magee3b suggested that the radicals were formed by the dissociation of excited water molecules and consequently both species have the same initial distribution. Part of the radicals combine within the original volume of formation (spur) to give molecular products, hydrogen and hydrogen peroxide, while the re-
(7 ) D . A . F la n d e r s a n d H . F r ic k e , ibid., 2 8 , 1 1 2 6 (1 9 5 8 ).(8 ) P . J . D y n e a n d J . M . K e n n e d y , Can. J. of Chem., 3 6 , 1518
(1 9 5 8 ).(9 ) H . F r ic k e a n d D . L . P h illip s , J. Chem. Phys., 3 2 , 483 (1 9 6 0 ).
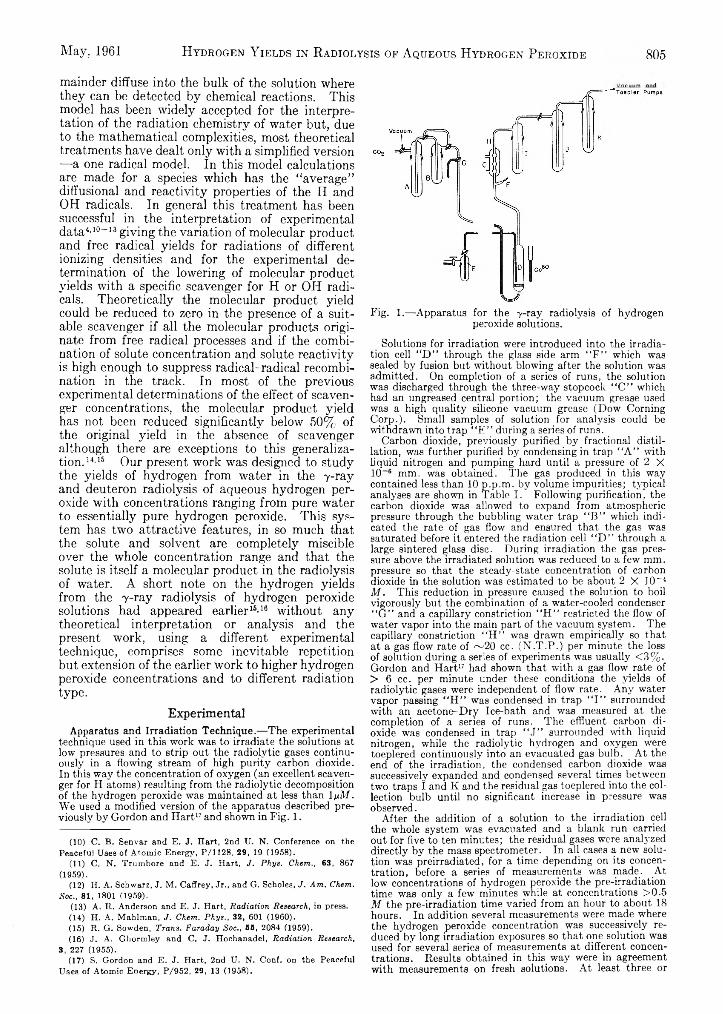
May,. 1961 H y d r o g e n Y i e l d s i n R a d i o l y s i s o p A q u e o u s H y d r o g e n P e r o x i d e 805
mainder diffuse into the bulk of the solution where they can be detected by chemical reactions. This model has been widely accepted for the interpretation of the radiation chemistry of water but, due to the mathematical complexities, most theoretical treatments have dealt only with a simplified version —a one radical model. In this model calculations are made for a species which has the “ average” diffusional and reactivity properties of the H and OH radicals. In general this treatment has been successful in the interpretation of experimental data4 - 1 0 - 1 3 giving the variation of molecular product and free radical yields for radiations of different ionizing densities and for the experimental determination of the lowering of molecular product yields with a specific scavenger for H or OH radicals. Theoretically the molecular product yield could be reduced to zero in the presence of a suitable scavenger if all the molecular products originate from free radical processes and if the combination of solute concentration and solute reactivity is high enough to suppress radical-radical recombination in the track. In most of the previous experimental determinations of the effect of scavenger concentrations, the molecular product yield has not been reduced significantly below 50% of the original yield in the absence of scavenger although there are exceptions to this generalization . 1 4 ’ 1 5 Our present work was designed to study the yields of hydrogen from water in the 7 -ray and deuteron radiolysis of aqueous hydrogen peroxide with concentrations ranging from pure water to essentially pure hydrogen peroxide. This system has two attractive features, in so much that the solute and solvent are completely miscible over the whole concentration range and that the solute is itself a molecular product in the radiolysis of water. A short note on the hydrogen yields from the 7 -ray radiolysis of hydrogen peroxide solutions had appeared earlier1 5 - 1 6 without any theoretical interpretation or analysis and the present work, using a different experimental technique, comprises some inevitable repetition but extension of the earlier work to higher hydrogen peroxide concentrations and to different radiation type.
ExperimentalApparatus and Irradiation Technique.— The experimental
technique used in this work was to irradiate the solutions at low pressures and to strip out the radiolytic gases continuously in a flowing stream of high purity carbon dioxide. In this way the concentration of oxygen (an excellent scavenger for H atoms) resulting from the radiolytic decomposition of the hydrogen peroxide was maintained at less than 1 ¡¿M. We used a modified version of the apparatus described previously by Gordon and Hart17 and shown in Fig. 1. 10 11 12 13 14 15 16 17
(1 0 ) C . B . S e n v a r a n d E . J . H a r t , 2 n d U . N . C o n fe r e n c e o n th e P e a c e fu l U s e s o f A t o m i c E n e r g y , P /1 1 2 8 , 2 9 , 19 (1 9 5 8 ).
(1 1 ) C . N . T r u m b o r e a n d E . J . H a r t , J. Phys. Chem., 6 3 , 867(1 9 5 9 ).
(1 2 ) H . A . S ch w a rz , J . M . C a ffr e y , J r ., a n d G . S ch o le s , J. Am. Chem. Soc., 8 1 , 1801 (1 9 5 9 ).
(1 3 ) A . R . A n d e r s o n a n d E . J . H a r t , Radiation Research, in p re ss .(1 4 ) H . A . M a h lm a n , J . Chem. Phys., 3 2 , 601 (1 9 6 0 ) .(1 5 ) R . G . S o w d e n , Trans. Faraday Soc., 5 5 , 2 0 8 4 (1 9 5 9 ).(1 6 ) J . A . G h o r m le y a n d C . J . H o c h a n a d e l, Radiation Research,
3 , 227 (1 9 5 5 ).(1 7 ) S . G o r d o n a n d E . J . H a r t , 2 n d U . N . C o n f . o n th e P e a c e fu l
U s e s o f A t o m ic E n e r g y , P /9 5 2 , 2 9 , 13 (1 9 5 8 ).
Fig. 1.— Apparatus for the 7-ray radiolysis of hydrogen peroxide solutions.
Solutions for irradiation were introduced into the irradiation cell “ D ” through the glass side arm “ F ” which was sealed by fusion but without blowing after the solution was admitted. On completion of a series of runs, the solution was discharged through the three-way stopcock “ C ” which had an ungreased central portion; the vacuum grease used was a high quality silicone vacuum grease (Dow Corning Corp.). Small samples of solution for analysis could be withdrawn into trap “ E ” during a series of runs.
Carbon dioxide, previously purified by fractional distillation, was further purified by condensing in trap “ A ” with liquid nitrogen and pumping hard until a pressure of 2 X 1 0 mm. was obtained. The gas produced in this way contained less than 10 p.p.m. by volume impurities; typical analyses are shown in Table I. Following purification, the carbon dioxide was allowed to expand from atmospheric pressure through the bubbling water trap “ B ” which indicated the rate of gas flow and ensured that the gas was saturated before it entered the radiation cell “ D ” through a large sintered glass disc. During irradiation the gas pressure above the irradiated solution was reduced to a few mm. pressure so that the steady-state concentration of carbon dioxide in the solution was estimated to be about 2 X 10_4M . This reduction in pressure caused the solution to boil vigorously but the combination of a water-cooled condenser “ G ” and a capillary constriction “ H ” restricted the flow of water vapor into the main part of the vacuum system. The capillary constriction “ H ” was drawn empirically so that at a gas flow rate of ~ 20 cc. (N .T .P .) per minute the loss of solution during a series of experiments was usually < 3 % . Gordon and Hart17 had shown that with a gas flow rate of > 6 cc. per minute under these conditions the yields of radiolytic gases were independent of flow rate. Any water vapor passing " H ” was condensed in trap “ I ” surrounded with an acetone-Dry Ice-bath and was measured at the completion of a series of runs. The effluent carbon dioxide was condensed in trap “ J ” surrounded with liquid nitrogen, while the radiolytic hydrogen and oxygen were toeplered continuously into an evacuated gas bulb. At the end of the irradiation, the condensed carbon dioxide was successively expanded and condensed several times between two traps I and K and the residual gas toeplered into the collection bulb until no significant increase in pressure was observed.
After the addition of a solution to the irradiation cell the whole system was evacuated and a blank run carried out for five to ten minutes; the residual gases were analyzed directly by the mass spectrometer. In all cases a new solution was preirradiated, for a time depending on its concentration, before a series of measurements was made. At low concentrations of hydrogen peroxide the pre-irradiation time was only a few minutes while at concentrations >0.5 M the pre-irradiation time varied from an hour to about 18 hours. In addition several measurements were made where the hydrogen peroxide concentration was successively reduced by long irradiation exposures so that one solution was used for several series of measurements at different concentrations. Results obtained in this_ way were in agreement with measurements on fresh solutions. At least three or
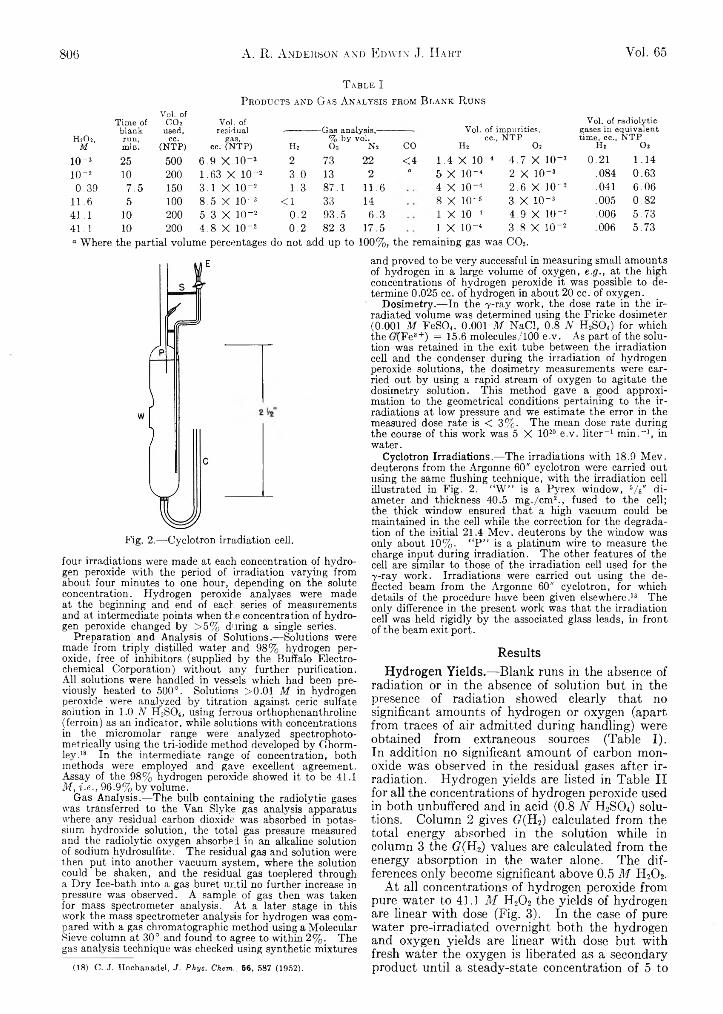
806 A . R,. A n d e r s o n a n d E d w i n J. H a r t Vol. 65
T a b l e IP r o d u c t s a n d G a s A n a l y s i s f r o m B l a n k R u n s
Hî02,T im e o f
b la n k ru n ,
V o l. o f C O 2
u sed , c c .
V o l . o f re s id u a l
gas,,------------- — G a s a n a ly s is ,--------
% b y v o l .V o l . o f im p u r it ie s ,
c c . , N T P
V o l . o f r a d io ly t i c g a s e s in e q u iv a le n t t im e , c c . , N T P
M m in . (N T P ) c c . (N T P ) H2 0 » Ni C O Hi O j H s O ,
10-3 25 500 6.9 X 10⁻³ 2 73 22 <4 1.4 X lO-4 4.7 X 10⁻³ 0.21 1.1410-2 10 200 1.63 X 10⁻² 3.0 13 2 a 5 X 10⁻⁴ 2 X lO-3 .084 0.630.39 7.5 150 3.1 X 10⁻² 1.3 87.1 11.6 4 X 10⁻⁴ 2.6 X 10⁻² .041 6.06
11.6 5 100 8.5 X 10⁻³ <1 33 14 8 X 10⁻⁵ 3 X 10⁻³ .005 0.8241.1 10 200 5.3 X 10⁻² 0.2 93.5 6.3 1 X 10⁻⁴ 4.9 X 10⁻² .006 5.7341.1 10 200 4.8 X 10⁻² 0.2 82.3 17.5 1 X 10⁻⁴ 3.8 X 10“ 2 .006 5.73° Where the partial volume percentages do not add up to 100%, the remaining gas was C 02.
Pig. 2.— Cyclotron irradiation cell.
four irradiations were made at each concentration of hydrogen peroxide with the period of irradiation varying from about four minutes to one hour, depending on the solute concentration. Hydrogen peroxide analyses were made at the beginning and end of each series of measurements and at intermediate points when the concentration of hydrogen peroxide changed by > 5 % during a single series.
Preparation and Analysis of Solutions.— Solutions were made from triply distilled water and 98% hydrogen peroxide, free of inhibitors (supplied by the Buffalo Electrochemical Corporation) without any further purification. All solutions were handled in vessels which had been previously heated to 500°. Solutions >0.01 M in hydrogen peroxide were analyzed by titration against ceric sulfate solution in 1.0 A H2S04, using ferrous orthophenanthroline (ferroin) as an indicator, while solutions with concentrations in the micromolar range were analyzed spectrophoto- metrically using the tri-iodide method developed by Ghorm- lev .18 In the intermediate range of concentration, both methods were employed and gave excellent agreement. Assay of the 98% hydrogen peroxide showed it to be 41.1 M, i.e., 96.9% by volume.
Gas Analysis.— The bulb containing the radiolytic gases was transferred to the Van Slyke gas analysis apparatus where any residual carbon dioxide was absorbed in potassium hydroxide solution, the total gas pressure measured and the radiolytic oxygen absorbed in an alkaline solution of sodium hydrosulfite. The residual gas and solution were then put into another vacuum system, where the solution could be shaken, and the residual gas toeplered through a Dry Ice-bath into a gas buret until no further increase in pressure was observed. A sample of gas then was taken for mass spectrometer analysis. At a later stage in this work the mass spectrometer analysis for hydrogen was compared with a gas chromatographic method using a Molecular Sieve column at 30° and found to agree to within 2% . The gas analysis technique was checked using synthetic mixtures
and proved to be very successful in measuring small amounts of hydrogen in a large volume of oxygen, e.g., at the high concentrations of hydrogen peroxide it was possible to determine 0.025 cc. of hydrogen in about 20 cc. of oxygen.
Dosimetry.— In the y-ray work, the dose rate in the irradiated volume was determined using the Fricke dosimeter (0.001 M FeS04, 0.001 M NaCl, 0.8 N H2S04) for which the (r(Fe8+) = 15.6 molecules/100 e.v. As part of the solution was retained in the exit tube between the irradiation cell and the condenser during the irradiation of hydrogen peroxide solutions, the dosimetry measurements were carried out by using a rapid stream of oxygen to agitate the dosimetry solution. This method gave a good approximation to the geometrical conditions pertaining to the irradiations at low pressure and we estimate the error in the measured dose rate is < 3% . The mean dose rate during the course of this work was 5 X 10²⁰ e.v. liter-1 min.-1, in water.
Cyclotron Irradiations.— The irradiations with 18.9 Mev. deuterons from the Argonne 60" cyclotron were carried out using the same flushing technique, with the irradiation cell illustrated in Fig. 2. “ W ” is a Pyrex window, Vs" diameter and thickness 40.5 m g./cm 2., fused to the cell; the thick window ensured that a high vacuum could be maintained in the cell while the correction for the degradation of the initial 21.4 Mev. deuterons by the window was only about 10%. “ P ” is a platinum wire to measure thecharge input during irradiation. The other features of the cell are similar to those of the irradiation cell used for the y-ray work. Irradiations were carried out using the deflected beam from the Argonne 60" cyclotron, for which details of the procedure have been given elsewhere.13 The only difference in the present work was that the irradiation cell was held rigidly by the associated glass leads, in front of the beam exit port.
ResultsHydrogen Yields.— Blank runs in the absence of
radiation or in the absence of solution but in the presence of radiation showed clearly that no significant amounts of hydrogen or oxygen (apart from traces of air admitted during handling) were obtained from extraneous sources (Table I). In addition no significant amount of carbon monoxide was observed in the residual gases after irradiation. Hydrogen yields are listed in Table II for all the concentrations of hydrogen peroxide used in both unbuffered and in acid (0.8 N H 2SO4) solutions. Column 2 gives C?(H2) calculated from the total energy absorbed in the solution while in column 3 the (?(H2) values are calculated from the energy absorption in the water alone. The differences only become significant above 0.5 M H 20 2.
At all concentrations of hydrogen peroxide from pure water to 41.1 M H2 0 2 the yields of hydrogen are linear with dose (Fig. 3). In the case of pure water pre-irradiated overnight both the hydrogen and oxygen yields are linear with dose but with fresh water the oxygen is liberated as a secondary product until a steady-state concentration of 5 to(18) C. J. Hochanadel, J. Phys. Chem., 56, 587 (1952).
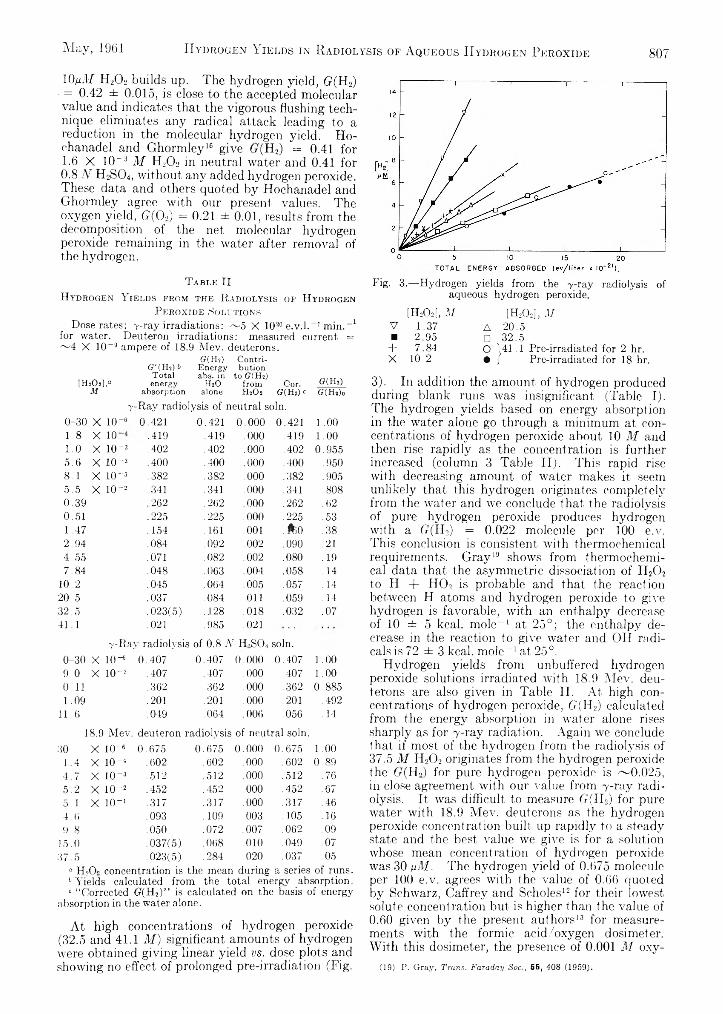
H y d r o g e n Y i e l d s i n R a d i o l y s i s o f A q u e o u s H y d r o g e n P e r o x i d e 807May, 1961
10n M H20 2 builds up. The hydrogen yield, G(H2) - = 0.42 ± 0.015, is close to the accepted molecular value and indicates that the vigorous flushing technique eliminates any radical attack leading to a reduction in the molecular hydrogen yield. Ho- chanadel and Ghormley16 give (r(H2) = 0.41 for 1.6 X 10~ 3 M H 20 2 in neutral water and 0.41 for
0 . 8 A H 2S04, without any added hydrogen peroxide. These data and others quoted by Hochanadel and Ghormley agree with our present values. The oxygen yield, G(0 2) = 0 . 2 1 ± 0 .0 1 , results from the decomposition of the net molecular hydrogen peroxide remaining in the water after removal of the hydrogen.
T a ble I I
H ydrogen Y ields from the R adiolysis of H ydrogen P eroxide Solutions
Dose rates: y - ray irradiations: ~ 5 X 10²⁰ e.v.l.-1 min.-1 for water. Deuteron irradiations: measured current =~ 4 X 10⁻⁹ ampere of 18.9 Mev. deuterons.
[HíOí],0M
G'(H*)&Totalenergy-
absorption
earnEnergy abs. in
HaO alone
Contribution
to G(H2) from H2O2
Cor. G(Hi) 6
G(Ht)<?(&)„
T-Ray radiolysis of neutral soin.0-30 X 10-6 0.421 0.421 0.000 0.421 1.001.8 X 10 .419 .419 .000 .419 1.001.0 X 10-3 .402 .402 .000 .402 0.9555.6 X 10-3 .400 .400 .000 .400 .9508.1 X 10 ~3 .382 .382 .000 .382 .9055.5 X 10~2 .341 .341 .000 .341 .8080.39 .262 .262 .000 .262 .620.51 .225 .225 .000 .225 .531.47 .154 .161 .001 . flfeo .382.94 .084 .092 .002 .090 .214.55 .071 .082 .002 .080 .197.84 .048 .063 .004 .058 .14
10.2 .045 .064 .005 .057 .1420.5 .037 .084 .011 .059 .1432.5 .023(5) .128 .018 .032 .0741.1 .021 . 985 .021
Y-Ra;y radiolysis of 0.8 A; H0SO4soin.0-30 X 10- 6 0.407 0.407 0.000 0.407 1.009.0 X 10~3 .407 .407 .000 .407 1.000.11 .362 .362 .000 .362 0.8851.09 .201 .201 .000 .201 .492
11.6 .049 .064 .006 .056 .14
18.9 Mev. deuteron radiolysis of neutral soin.30 X 10-0 0.675 0.675 0.000 0.675 1.00
1.4 X 10 “ 4 .602 .602 .000 .602 0.894.7 X 10” 3 .512 .512 .000 .512 .765.2 X 10-2 .452 .452 .000 .452 .675.1 X 10“ 1 .317 .317 .000 .317 .464.6 . 093 . 109 .003 . 105 .169.8 .050 .072 .007 .062 .09
15.0 .037(5) .068 .010 ,049 .0737.5 .023(5) .284 .020 .037 .05
“ H2Oo concentration is the mean during a series of runs. b Yields calculated from the total energy absorption.3 “ Corrected (?(H2)” is calculated on the basis of energy
absorption in the water alone.
At high concentrations of hydrogen peroxide (32.5 and 41.1 M ) significant amounts of hydrogen were obtained giving linear yield vs. dose plots and showing no effect of prolonged pre-irradiation (Fig.
Fig. 3.— Hydrogen yields from the y-ray radiolysis of aqueous hydrogen peroxide.
[HAM, M [H A ], MV 1.37 A 20.5■ 2.95 □ 32.5
+ 7.84 O \41.1 Pre-irradiated for 2 hr.X 10.2 • / Pre-irradiated for 18 hr.
3). In addition the amount of hydrogen produced during blank runs was insignificant (Table I). The hydrogen yields based on energy absorption in the water alone go through a minimum at concentrations of hydrogen peroxide about 10 M and then rise rapidly as the concentration is further increased (column 3 Table II). This rapid rise with decreasing amount of water makes it seem unlikely that this hydrogen originates completely from the water and we conclude that, the radiolysis of pure hydrogen peroxide produces hydrogen with a (?(H2) = 0.022 molecule per 100 e.v. This conclusion is consistent with thermochemical requirements. Gray 19 shows from thermochemical data that the asymmetric dissociation of H 20 2
to H + H 0 2 is probable and that the reaction between H atoms and hydrogen peroxide to give hydrogen is favorable, with an enthalpy decrease of 10 ± 5 kcal. mole- 1 at 25°; the enthalpy decrease in the reaction to give water and OH radicals is 72 ± 3 kcal. mole- 1 at 25°.
Hydrogen yields from unbuffered hydrogen peroxide solutions irradiated with 18.9 Mev. deuterons are also given in Table II. At high concentrations of hydrogen peroxide, G(II2) calculated from the energy absorption in water alone rises sharply as for y-ray radiation. Again we conclude that if most of the hydrogen from the radiolysis of37.5 M II20 2 originates from the hydrogen peroxide the Cr(Ho) for pure hydrogen peroxide is ~0.025, in close agreement with our value from y-ray radiolysis. It was difficult to measure G(FI2) for pure water with 18.9 Mev. deuterons as the hydrogen peroxide concentration built up rapidly to a steady state and the best value we give is for a solution whose mean concentration of hydrogen peroxide was 30 fiM . The hydrogen yield of 0.675 molecule per 1 0 0 e.v. agrees with the value of 0 . 6 6 quoted by Schwarz, Caffrey and Scholes1 2 for their lowest solute concent ration but is higher than the value of 0.60 given by the present authors1 3 for measurements with the formic acid/oxygen dosimeter. With this dosimeter, the presence of 0.001 M oxy-
(19) P. Gray, Trans. Faraday Soc., 55, 408 (1959).
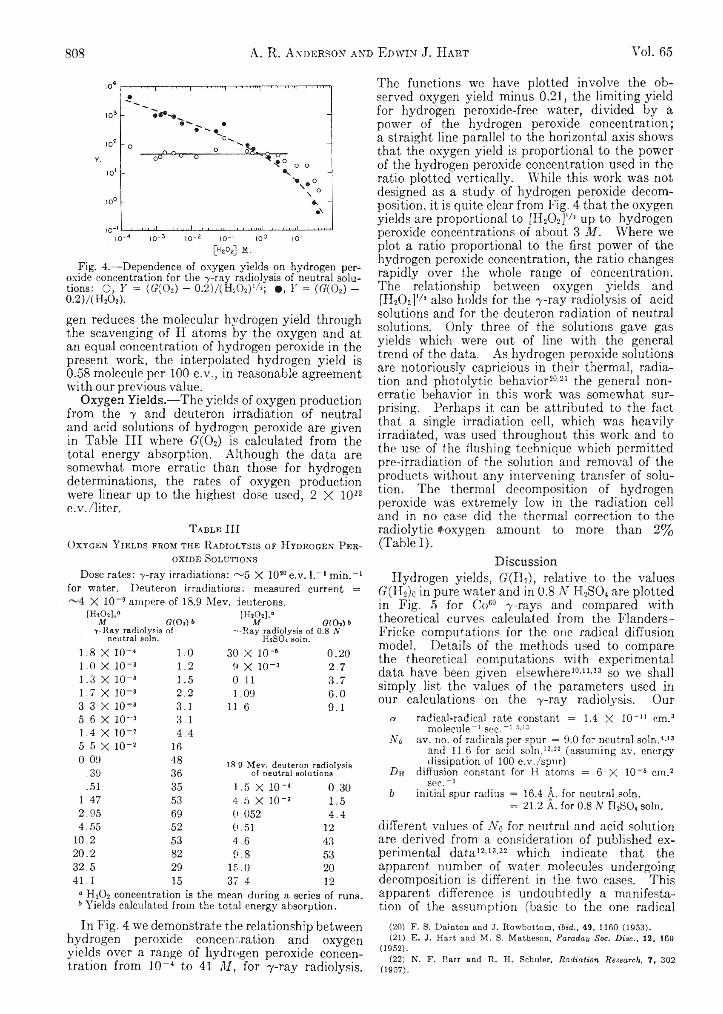
808 A . R. A n d e r s o n a n d E d w i n J. H a r t Vol. 65
Fig. 4.— Dependence of oxygen yields on hydrogen peroxide concentration for the 7-ray radiolysis of neutral solutions: 0 , 7 = (<?(02) - 0.2)/(H iO2)1/ s • , Y = (G(0 2) - 0.2)/( H20 2).
gen reduces the molecular hydrogen yield through the scavenging of H atoms by the oxygen and at an equal concentration of hydrogen peroxide in the present work, the interpolated hydrogen yield is 0.58 molecule per 100 e.v., in reasonable agreement with our previous value.
Oxygen Yields.—The yields of oxygen production from the 7 and deuteron irradiation of neutral and acid solutions of hydrogen peroxide are given in Table III where G (0 2) is calculated from the total energy absorption. Although the data are somewhat more erratic than those for hydrogen determinations, the rates of oxygen production were linear up to the highest dose used, 2 X 10² 2
e.v./liter.T a b l e I I I
O x y g e n Y i e l d s f r o m t h e R a d i o l y s i s o f H y d r o g e n P e r
o x i d e S o l u t i o n s
Dose rates: 7-ray irradiations: ~ 5 X 10²⁰e.v. l .- I min.-1 for water. Deuteron irradiations: measured current =
X 10 9 ampere of 18.9 Mev. deuterons.[HiO*] ® [HîO*],®M G(Ol) b M 0(0,) b
7 - R a y ra d io ly s is o f '• /-R ay ra d io ly s is o f 0 .8 Nn e u tra l s o ln . H 2S O 4 so ln .
1.8 X 10-« 1.0 30 X 10 “• 0.201.0 X 10“ 3 1.2 9 X IO" 3 2.71.3 X 10“ 3 1.5 0.11 3.71.7 X 10“ 3 2.2 1.09 6.03.3 X 10- 3 3.1 11.6 9.15.6 X 10~3 3.11.4 X 10“ 2 4.45.5 X 10“ 2 160.09 48 18.9 M e v . d e u te r o n ra d io ly s is
.39 36 o f n e u tra l s o lu t io n s
.51 35 1.5 x 10⁻⁴ 0.301.47 53 4.5 X 10“ 3 1.52.95 69 0.052 4.44.55 52 0.51 12
10.2 53 4.6 4320.2 82 9.8 5332.5 29 15.0 2041.1 15 37.4 12
a H2O2 concentration is the mean during a series of runs. 6 Yields calculated from the total energy absorption.
In Fig. 4 we demonstrate the relationship between hydrogen peroxide concentration and oxygen yields over a range of hydrogen peroxide concentration from 10- 4 to 41 M , for 7 -ray radiolysis.
The functions we have plotted involve the observed oxygen yield minus 0 .2 1 , the limiting yield for hydrogen peroxide-free water, divided by a power of the hydrogen peroxide concentration; a straight line parallel to the horizontal axis shows that the oxygen yield is proportional to the power of the hydrogen peroxide concentration used in the ratio plotted vertically. While this work was not designed as a study of hydrogen peroxide decomposition, it is quite clear from Fig. 4 that the oxygen yields are proportional to [H2 0 2 ]I/! up to hydrogen peroxide concentrations of about 3 M . Where we plot a ratio proportional to the first power of the hydrogen peroxide concentration, the ratio changes rapidly over the whole range of concentration. The relationship between oxygen yields and [H2 0 2 ] 1 / 2 also holds for the 7 -ray radiolysis of acid solutions and for the deuteron radiation of neutral solutions. Only three of the solutions gave gas yields which were out of line with the general trend of the data. As hydrogen peroxide solutions are notoriously capricious in their thermal, radiation and photolytic behavior20 ’ 2 1 the general nonerratic behavior in this work was somewhat surprising. Perhaps it can be attributed to the fact that a single irradiation cell, which was heavily irradiated, was used throughout this work and to the use of the flushing technique which permitted pre-irradiation of the solution and removal of the products without any intervening transfer of solution. The thermal decomposition of hydrogen peroxide was extremely low in the radiation cell and in no case did the thermal correction to the radiolytic »oxygen amount to more than 2 % (Table I).
DiscussionHydrogen yields, (?(H2), relative to the values
(/(Hi)« in pure water and in 0 . 8 N H 2S0 4 are plotted in Fig. 5 for Co60 7 -rays and compared with theoretical curves calculated from the Flanders- Fricke computations for the one radical diffusion model. Details of the methods used to compare the theoretical computations with experimental data have been given elsewhere 1 0 - u ’ 1 3 so we shall simply list the values of the parameters used in our calculations on the 7 -ray radiolysis. Our
a radical-radical rate constant = 1.4 X 10"u cm.3 molecule“ 1 sec."1 3’13
No av. no. of radicals per spur = 9.0 for neutral soln.4'13 and 11.6 for acid soln.13'22 (assuming av. energy dissipation of 100 e.v. /spur)
D H diffusion constant for H atoms = 6 X 10“ 6 cm.2 sec._1
b initial spur radius = 16.4 A. for neutral soln.= 21.2 A. for 0.8 N H2SO* soln.
different values of N o for neutral and acid solution are derived from a consideration of published experimental data 1 2 ’ 1 3 ’ 2 2 which indicate that the apparent number of water molecules undergoing decomposition is different in the two cases. This apparent difference is undoubtedly a manifestation of the assumption (basic to the one radical
(2 0 ) F . S . D a in t o n a n d J . R o w b o t t o m , ibid., 4 9 , 1 1 6 0 (1 9 5 3 ).(2 1 ) E . J . H a r t a n d M . S . M a th e s o n , Faraday Soc. Disc., 12, 169
(1 9 5 2 ).(2 2 ) N . F . B a r r a n d R . H . S ch u le r , Radiation Research, 7, 3 0 2
(1 9 5 7 ).
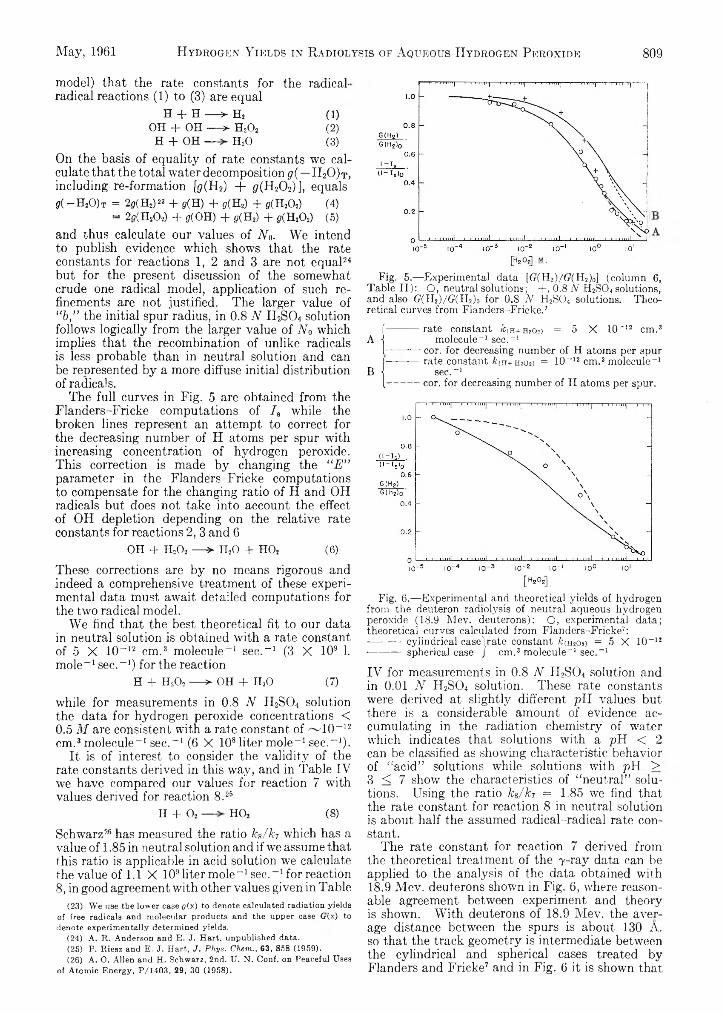
May, 1961 H y d r o g e n Y i e l d s i n R a d i o l y s i s o f A q u e o u s H y d r o g e n P e r o x i d e 809
model) that the rate constants for radical reactions (1) to (3) are equal
the radical-
H + H — > H2 (1)OH + OH — > H20 2 (2 )
H + OH — H20 (3)On the basis of equality of rate constants we calculate that the total water decomposition g ( — H20 )t, including re-formation [gr(H2) + 6f(H2 0 2)], equals g { — H20 )t = 2<7(H2) 23 + ff(H) + g(H2) + g(H202) (4)
= 2<KH20 2) + »(OH) + 9(H2) + ¡/(H20 2) (5)and thus calculate our values of N o. We intend to publish evidence which shows that the rate constants for reactions 1, 2 and 3 are not equal24
but for the present discussion of the somewhat crude one radical model, application of such refinements are not justified. The larger value of “ b ,” the initial spur radius, in 0.8 N H 2S0 4 solution follows logically from the larger value of N o which implies that the recombination of unlike radicals is less probable than in neutral solution and can be represented by a more diffuse initial distribution of radicals.
The full curves in Fig. 5 are obtained from the Flanders-Fricke computations of I„ while the broken lines represent an attempt to correct for the decreasing number of H atoms per spur with increasing concentration of hydrogen peroxide. This correction is made by changing the “ E ” parameter in the Flanders-Fricke computations to compensate for the changing ratio of H and OH radicals but does not take into account the effect of OH depletion depending on the relative rate constants for reactions 2, 3 and 6
OH + H20 2 — > H20 + HO, (6)
These corrections are by no means rigorous and indeed a comprehensive treatment of these experimental data must await detailed computations for the two radical model.
We find that the best theoretical fit to our data in neutral solution is obtained with a rate constant of 5 X 10- 1 2 cm . 3 molecule- 1 sec. - 1 (3 X 10⁹ 1. mole- 1 sec.-1) for the reaction
H + H20 2 — > OH + H20 (7)
while for measurements in 0 . 8 N H 2S0 4 solution the data for hydrogen peroxide concentrations < 0.5 M are consistent with a rate constant of ~ 1 0 - 1 2
cm . 3 molecule- 1 sec. - 1 ( 6 X 10⁸ liter mole- 1 sec.-1).It is of interest to consider the validity of the
rate constants derived in this way, and in Table IV we have compared our values for reaction 7 with values derived for reaction 8 . 26
H + 0 2 — H02 (8)
Schwarz26 has measured the ratio k j k 7 which has a value of 1.85 in neutral solution and if we assume that this ratio is applicable in acid solution we calculate the value of 1.1 X 10⁹ liter mole- 1 sec. - 1 for reaction 8 , in good agreement with other values given in Table
(2 3 ) W e u se t h e lo w e r ca se g(x) t o d e n o te c a lc u la te d r a d ia tio n y ie ld s o f fr e e r a d ica ls a n d m o le c u la r p r o d u c t s a n d th e u p p e r ca se (r (x ) to d e n o te e x p e r im e n ta lly d e te r m in e d y ie ld s .
(2 4 ) A . R . A n d e r s o n a n d E . J . H a r t , u n p u b lis h e d d a ta .(2 5 ) P . R ie s z a n d E . J . H a r t , J. Phys. Chem., 6 3 , 8 5 8 (1 9 5 9 ).(2 6 ) A . O . A l le n a n d H . S ch w a rz , 2 n d . IT. N . C o n f . o n P e a c e fu l U ses
o f A t o m ic E n e r g y , P /1 4 0 3 , 2 9 , 30 (1 9 5 8 ).
Fig. 5.— Experimental data [<7(H2)/<7(H2)o] (column 6, Table II): O, neutral solutions; + , 0.8 A H2S04 solutions, and also (7(H2)/(?(H 2)o for 0.8 N H2S04 solutions. Theoretical curves from Flanders-Fricke.7
f----------rate constant /tiH+mo») = 5 X 10-12 cm.3A i molecule-1 sec.-1
I---------- cor. for decreasing number of H atoms per spur[----------rate constant ¿(h+hsoj) = 10-12 cm.3 molecule-1
B j sec.-1[----------cor. for decreasing number of H atoms per spur.
Fig. 6.—Experimental and theoretical yields of hydrogen from the deuteron radiolysis of neutral aqueous hydrogen peroxide (18.9 Mev. deuterons): O, experimental data;theoretical curves calculated from Flanders-Fricke7:---------- cylindrical case\rate constant k(mo>) = 5 X 10-12■---------- spherical case / cm.3 molecule-1 sec.-1
IV for measurements in 0.8 N H2S0 4 solution and in 0.01 N H 2S0 4 solution. These rate constants were derived at slightly different pH values but there is a considerable amount of evidence accumulating in the radiation chemistry of water which indicates that solutions with a pH < 2 can be classified as showing characteristic behavior of “ acid” solutions while solutions with pH > 3 < 7 show the characteristics of “ neutral” solutions. Using the ratio ks/ k 7 = 1.85 we find that the rate constant for reaction 8 in neutral solution is about half the assumed radical-radical rate constant.
The rate constant for reaction 7 derived from the theoretical treatment of the 7 -ray data can be applied to the analysis of the data obtained with18.9 Mev. deuterons shown in Fig. 6 , where reasonable agreement between experiment and theory is shown. With deuterons of 18.9 Mev. the average distance between the spurs is about 130 A. so that the track geometry is intermediate between the cylindrical and spherical cases treated by Flanders and Fricke7 and in Fig. 6 it is shown that

810 A . R . A n d e r s o n a n d E d w i n J . H a r t Vol. 65
T a b l e IVC o m p a r i s o n o f R a t e C o n s t a n t s
Ref.k(H -f- H2O2),
1. m o le “ 1 s e c . “ 1 A c id N e u tr a l
k(H 4- 02),1. m o l e " 1 s e c . -1
A c id N e u tr a l
Presentwork 6 X 10⁸ 3 X 10⁹ (1.1 X 10⁹)“ (5 .5 X 109)'25 1 X 10911 1.5 X 10911 2 X 10¹⁹
26F (H 4- Os) neutral ß (H 4- H20 2) neutral
3c Assumed radical—radical rate constant = 8 .5 X 109 ° Estimated.
the experimental data lie between the curves calculated for the two cases. The general agreement is good in view of the assumptions in the rather crude one radical model.
The different rate constants which we deduce for reaction 7 in neutral and acid solutions are undoubtedly associated with the two different forms of the “ H” atom which have been postulated in the radiolysis of water. 26 ’ 27 Allen and Schwarz26
formally distinguish the reducing species formed in the radiolysis of water as “ H ” and that formed by the OH oxidation of H 2 as “ H '” but state that the actual identity of the species cannot be established at present. Armstrong, et al . , 27 suggest that the hydrated electron may have a distinctive lifetime in water and shows selective reactivity toward solutes. In addition this idea is supported indirectly by their findings in the radiolysis of liquid ammonia, which has deeper electron traps than water and should show markedly less radiation decomposition. This postulate is confirmed experimentally and they suggest that the smaller decomposition of liquid ammonia is associated with the greater ease of solvation of the electron in that medium. The higher rate constant which we deduce for reaction 7 in neutral solution compared to acid solution is consistent with the idea of two reducing species and leads to the reformulation of reaction 7 in terms of the hypothetical hydrated
Caq 1 ■ H 20 2 — OH O H “ T H20 (7a)
electron. In acid solution this hydrated electron can be destroyed by the reaction to produce a H
eaq“ + H 30 + — >- H 30 + H + H 20 (9)
atom. In neutral solution the solvated electron eaq- may react with the solute as in 7a and in acid solution the hydrogen atom reacts as in 7.
A very good theoretical curve can be calculated to fit the scavenging data for the 7 -ray radiolysis of neutral solutions as a composite function of the two reactions 7 and 7a, each contributing about 50% to the scavenging of H atoms or their precursors. This distribution is based on the assumption that 50% of the reducing species arise from dissociation and the remainder from ionization. The deduced rate constants are about 10-u cm . 8
molecule- 1 sec. - 1 for reaction 7a and about 10- 1 2
(2 7 ) D . A r m s t r o n g , E . C o l lin s o n , F . S . D a in t o n , D . M . D o n a ld s o n , E . H a y o n , N . M ille r a n d J . W e iss , ibid., P /1 5 1 7 , 2 9 , 8 0 (1 9 5 8 ).
cm . 3 molecule- 1 sec. - 1 for the reaction 7. However we feel that such a detailed analysis is not justified from the one radical model and our only present distinction is the difference in reactivity of the H atom or its precursor in acid and neutral solution. We shall present more evidence elsewhere2 4
on this topic from our work on the radiolysis of water at very high dose rates. An interesting feature of the scavenging curve for hydrogen peroxide in acid solution (Fig. 5) is the deviation of the experimental points at hydrogen peroxide concentrations >0.5 M . We attribute this to competition between reactions 7b and 9 for the solvated electron as the hydrogen peroxide concentration is increased.
Oxygen Yields.— Our oxygen yields presented in Fig. 4 indicate that the radiolytic decomposition of hydrogen peroxide is proportional to [H20 2]1/!, up to concentrations of about 3 M . These observations are consistent with earlier data . 2 1 ’ 28
For hydrogen peroxide concentrations up to 1 M , Hart and Matheson2 1 derive the reaction mechanism
H + H20 2 •— H20 + OH (7)OH + H20 2 — > H 02 + H20 (10)
H 02 + H20 2 — > H20 + OH + 0 2 (11)2H 02 4* H20 2 -—->■ 2H20 2 0 2 (12)
Above hydrogen peroxide concentrations of about 3 M , the Hart-Matheson kinetics are no longer followed and C( —0 2) decreases with increasing concentration of hydrogen peroxide. This is probably associated with the decrease in the number of chain initiators (free H atoms or e~) or with increased efficiency of the termination step as the concentration of hydrogen peroxide is increased. Our observations are at variance with the earlier experimental data of Dainton and Row- bottom 20 who found that the decomposition of hydrogen peroxide was proportional to the first power of its concentration over the range from 1
to 18 M . No suitable explanation can be offered for the differences in the experimental data.
The increased radiation stability of hydrogen peroxide in acid solution has been observed previously by Sworski29 and by Ebert and Boag30
for hydrogen peroxide concentrations up to 1 0 - 3
M . We confirm this observation with hydrogen peroxide concentrations from 10- 3 to 11 M . Ebert and Boag suggest that the increased stability is associated with the dissociation of the H 0 2
radical, H 0 2 0 2- + H+. They conclude thatthe H 0 2 radical does not react very efficiently in reaction 1 1 and that the reactive species in neutral water is the 0 2- ion.
Acknowledgments.—The authors are indebted to Chester Plucinski for mass spectrometer analyses and to Dr. H. Fricke for helpful discussions. One of the authors (A.R.A.) wishes to express his thanks to the U.K.A.E.A. for his support on an exchange scheme during the course of this work.
(2 8 ) (a ) E . R . J o h n so n , J . Chem. Phys., 19, 1204 (1 9 5 1 ) ; (b ) H . Fricke, ib id ., 3, 3 6 4 (1 9 3 5 ).
(2 9 ) T . J . S w o rsk i, J. Am. Chem. Soc., 7 6 , 4 6 8 7 (1 9 5 4 ).(3 0 ) M . E b e r t a n d J . W . B o a g , Faraday Soc. Disc., 12, 189 (1 9 5 2 ).
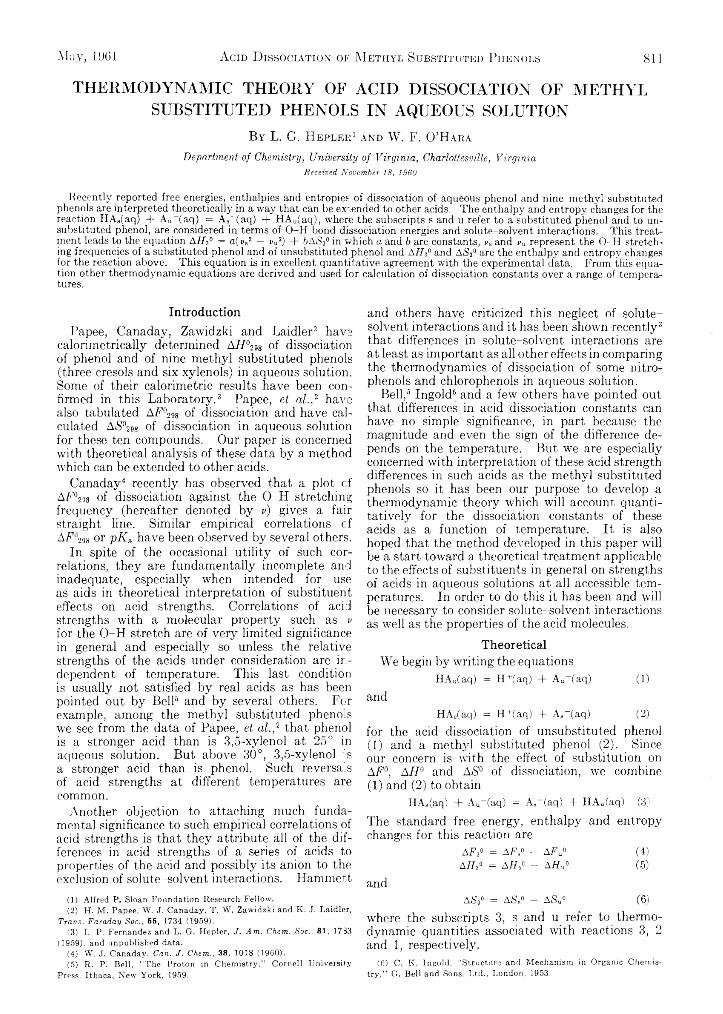
May, 1961 A c id D i s s o c i a t i o n o f M e t h y l S u b s t i t u t e d P h e n o l s 811
THERMODYNAMIC THEORY OF ACID DISSOCIATION OF METHYL SUBSTITUTED PHENOLS IN AQUEOUS SOLUTION
By L. G. H e p l e e 1 a n d W. F. O’Hara
Department of Chemistry, University of Virginia, Charlottesville, Virginia Received November 18, 1960
Recently reported free energies, enthalpies and entropies of dissociation of aqueous phenol and nine methyl substituted phenols are interpreted theoretically in a way that can be expended to other acids. The enthalpy and entropy changes for the reaction HAs(aq) + Au~(aq) = As“ (aq) + HA„(aq), where the subscripts s and u refer to a substituted phenol and to unsubstituted phenol, are considered in terms of O-H bond dissociation energies and solute-solvent interactions. This treatment leads to the equation AH3° = a(j>s2 — vU) + bAS3° in which a and b are constants, vB and vu represent the O-H stretching frequencies of a substituted phenol and of unsubstituted phenol and AH3° and A<S3° are the enthalpy and entropy changes for the reaction above. This equation is in excellent quantitative agreement with the experimental data. From this equation other thermodynamic equations are derived and used for calculation of dissociation constants over a range of temperatures.
IntroductionPapee, Canaday, Zawidzki and Laidler2 havs
calorimetrically determined A H ° 2 98 of dissociation of phenol and of nine methyl substituted phenols (three cresols and six xylenols) in aqueous solution. Some of their calorimetric results have been confirmed in this Laboratory.3 Papee, e t a l.,2 have also tabulated AF° 2 98 of dissociation and have calculated A)S029 8 of dissociation in aqueous solution for these ten compounds. Our paper is concerned with theoretical analysis of these data by a method which can be extended to other acids.
Canaday4 recently has observed that a plot cf AF° 2 9 8 of dissociation against the O-H stretching frequency (hereafter denoted by v) gives a fair straight line. Similar empirical correlations cf AF'^s or p K & have been observed by several others.
In spite of the occasional utility of such correlations, they are fundamentally incomplete and inadequate, especially when intended for use as aids in theoretical interpretation of substituent effects on acid strengths. Correlations of acid strengths with a molecular property such as v for the O-H stretch are of very limited significance in general and especially so unless the relative strengths of the acids under consideration are independent of temperature. This last condition is usually not satisfied by real acids as has been pointed out by Bell8 and by several others. For example, among the methyl substituted phenols we see from the data of Papee, et al. ,2 that phenol is a stronger acid than is 3,5-xylenol at 25° in aqueous solution. But above 30°, 3,5-xylenol is a stronger acid than is phenol. Such reversals of acid strengths at different temperatures are common.
Another objection to attaching much fundamental significance to such empirical correlations of acid strengths is that they attribute all of the differences in acid strengths of a series of acids to properties of the acid and possibly its anion to the exclusion of solute-solvent interactions. Hammett
and others have criticized this neglect of solute- solvent interactions and it has been shown recently3 that differences in solute-solvent interactions are at least as important as all other effects in comparing the thermodynamics of dissociation of some nitro- phenols and chlorophenols in aqueous solution.
Bell,5 Ingold6 and a few others have pointed out that differences in acid dissociation constants can have no simple significance, in part because the magnitude and even the sign of the difference depends on the temperature. But we are especially concerned with interpretation of these acid strength differences in such acids as the methyl substituted phenols so it has been our purpose to develop a thermodynamic theory which will account quantitatively for the dissociation constants of these acids as a function of temperature. It is also hoped that the method developed in this paper will be a start toward a theoretical treatment applicable to the effects of substituents in general on strengths of acids in aqueous solutions at all accessible temperatures. In order to do this it has been and will be necessary to consider solute-solvent interactions as well as the properties of the acid molecules.
TheoreticalWe begin by writing the equations
HAu(aq) = H+(aq) + Au~(aq) (1)and
HA8(aq) = H+(aq) + As-(aq) (2)for the acid dissociation of unsubstituted phenol (1) and a methyl substituted phenol (2). Since our concern is with the effect of substitution on AF °, AH ° and A S 0 of dissociation, we combine (1) and (2) to obtain
HA,(aq) + Au~(aq) = Aa-(aq) + HAu(aq) (3)
The standard free energy, enthalpy and entropy changes for this reaction are
A F 3° = A F s° - A F U» (4)AH3° = AHs0 - A f f u° (5)
and(1 ) A l fr e d P . S lo a n F o u n d a t io n R e s e a r ch F e llo w .(2 ) H . M . P a p e e , W . J . C a n a d a y , T . W . Z a w id z k i a n d K . J . L a id le r ,
Trans. Faraday Soc., 55, 1734 (1 9 5 9 ).(3 ) L . P . F e rn a n d e z a n d L . G . H e p le r , J . Am. Chem. Soc., 81, 1733
(1 9 5 9 ), a n d u n p u b l is h e d d a ta .(4 ) W . J . C a n a d a y , Can. J. Chem., 38, 1 0 1 8 (1 9 6 0 ).(5 ) R . P . B e l l, “ T h e P r o to n in C h e m is t r y ,” C o r n e ll U n iv e rs ity
P ress , I th a c a , N e w Y o r k , 1959.
ASz° = ASs» - AjSu° (6)
where the subscripts 3, s and u refer to thermodynamic quantities associated with reactions 3, 2 and 1, respectively.
(6 ) C . K . I n g o ld , “ S tru c tu re a n d M e c h a n is m in O rg a n ic C h e m is t r y , ” G . B e ll a n d S on s, L t d . , L o n d o n , 1953.
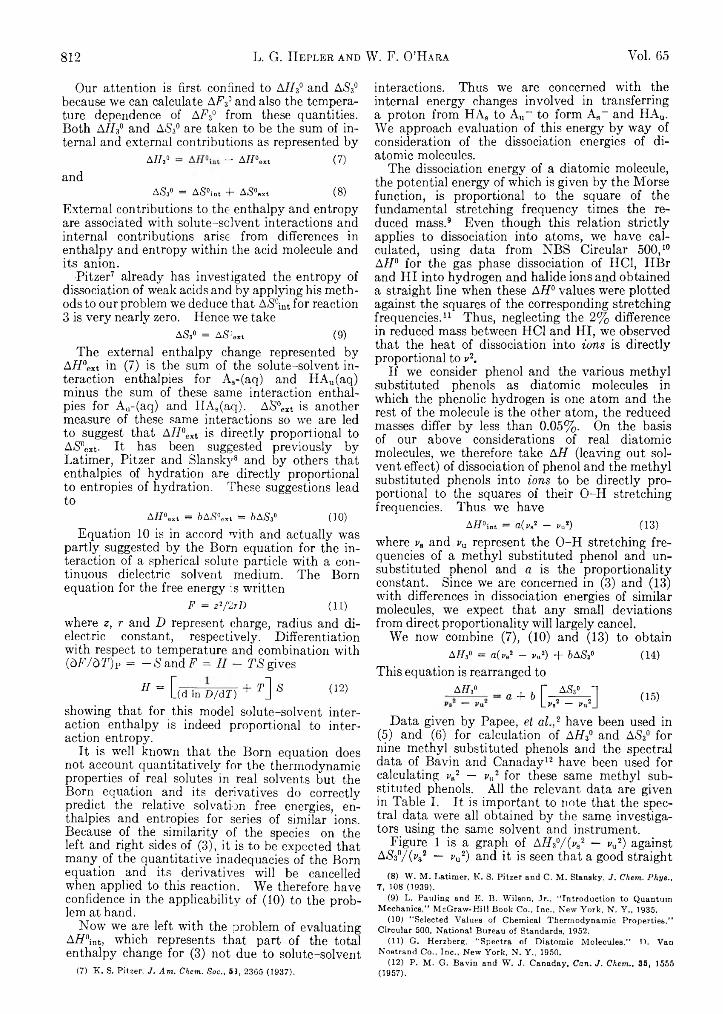
812 L. G. H e p l e r a n d W. F. O ’ H a r a Vol. 65
Our attention is first confined to AH 3a and AS 3° because we can calculate ATV and also the temperature dependence of AE3° from these quantities. Both AH 3° and AS 3° are taken to be the sum of internal and external contributions as represented by
AH,« = - A f f » « , (7 )
andA 1S3 0 = A(S°int 4* A(S°ejit ( 8 )
External contributions to the enthalpy and entropy are associated with solute-sclvent interactions and internal contributions arise from differences in enthalpy and entropy within the acid molecule and its anion.
Pitzer7 already has investigated the entropy of dissociation of weak acids and by applying his methods to our problem we deduce that AiS°int for reaction 3 is very nearly zero. Hence we take
AS,« = A S ’ « * (9 )
The external enthalpy change represented by AH°ext in (7) is the sum of the solute-solvent interaction enthalpies for As-(aq) and HAu(aq) minus the sum of these same interaction enthalpies for Au-(aq) and HAs(aq). AS°ext is another measure of these same interactions so we are led to suggest that A H °ext is directly proportional to A;S0eXt- It has been suggested previously by Latimer, Pitzer and Slanskj’ 8 and by others that enthalpies of hydration are directly proportional to entropies of hydration. These suggestions lead to
A H«ext = bAS%xi = bAS,« (1 0 )
Equation 10 is in accord with and actually was partly suggested by the Born equation for the interaction of a spherical solute particle with a continuous dielectric solvent medium. The Born equation for the free energy is written
F = z2/2rD (11)where z, r and D represent charge, radius and dielectric constant, respectively. Differentiation with respect to temperature and combination with ( d F /b T ) p = —»SandE = H — T S gives
H = [ (d In D/dT) + T ] S (12)showing that for this model solute-solvent interaction enthalpy is indeed proportional to interaction entropy.
It is well known that the Born equation does not account quantitatively for the thermodynamic properties of real solutes in real solvents but the Born equation and its derivatives do correctly predict the relative solvation free energies, enthalpies and entropies for series of similar ions. Because of the similarity of the species on the left and right sides of (3), it is to be expected that many of the quantitative inadequacies of the Born equation and its derivatives will be cancelled when applied to this reaction. We therefore have confidence in the applicability of ( 1 0 ) to the problem at hand.
Now we are left with the problem of evaluating A H °int, which represents that part of the total enthalpy change for (3) not due to solute-solvent
(7) K. s. Pitzer, J. Am. Chem. Soc„ 53, 2363 (1937).
interactions. Thus we are concerned with the internal energy changes involved in transferring a proton from HAS to Au~ to form Ag- and HAU. We approach evaluation of this energy by way of consideration of the dissociation energies of diatomic molecules.
The dissociation energy of a diatomic molecule, the potential energy of which is given by the Morse function, is proportional to the square of the fundamental stretching frequency times the reduced mass. 9 Even though this relation strictly applies to dissociation into atoms, we have calculated, using data from NBS Circular 500,10 AH ° for the gas phase dissociation of HC1, HBr and HI into hydrogen and halide ions and obtained a straight fine when these A H 0 values were plotted against the squares of the corresponding stretching frequencies. 1 1 Thus, neglecting the 2% difference in reduced mass between HC1 and HI, we observed that the heat of dissociation into io n s is directly proportional to v2.
If we consider phenol and the various methyl substituted phenols as diatomic molecules in which the phenolic hydrogen is one atom and the rest of the molecule is the other atom, the reduced masses differ by less than 0.05%. On the basis of our above considerations of real diatomic molecules, we therefore take A H (leaving out solvent effect) of dissociation of phenol and the methyl substituted phenols into ion s to be directly proportional to the squares of their O-H stretching frequencies. Thus we have
A F °in t = a ll ’ s2 — Vn2) (1 3 )
where v„ and va represent the O-H stretching frequencies of a methyl substituted phenol and unsubstituted phenol and a is the proportionality constant. Since we are concerned in (3) and (13) with differences in dissociation energies of similar molecules, we expect that any small deviations from direct proportionality will largely cancel.
We now combine (7), (10) and (13) to obtain AH 3 ° = a(v b2 — Pu2) + bAS,« (1 4 )
This equation is rearranged toAH,« a + 6 r a s 3° -]
Li’s2 — Pu2J (1 5 )
Data given by Papee, et a l . 2 have been used in (5) and (6) for calculation of AH3° and AiS3° for nine methyl substituted phenols and the spectral data of Bavin and Canaday1 2 have been used for calculating vB2 — vn2 for these same methyl substituted phenols. All the relevant data are given in Table I. It is important to note that the spectral data were all obtained by the same investigators using the same solvent and instrument.
Figure 1 is a graph of A H 3°/(vs2 — ru2) against AiS3°/(r s 2 — vu2) and it is seen that a good straight
(8 ) W . M . L a t im e r , K . S . P it z e r a n d C . M . S la n sk y , J. Chem. Phys., 7, 1 08 (1 9 3 9 ).
(9 ) L . P a u l in g a n d E . B . W ils o n , J r ., “ I n t r o d u c t io n t o Q u a n tu m M e c h a n ic s ," M c G r a w -H il l B o o k C o . , I n c . , N e w Y o r k , N . Y . , 193 5 .
(1 0 ) “ S e le c te d V a lu e s o f C h e m ica l T h e r m o d y n a m ic P r o p e r t ie s ," C ir c u la r 5 00 , N a t io n a l B u re a u o f S ta n d a rd s , 195 2 .
(1 1 ) G . H e r z b e r g , “ S p e c tr a o f D ia t o m ic M o le c u le s ,” D . V a n N o s tr a n d C o . , I n c . , N e w Y o r k , N . Y ., 1950 .
(1 2 ) P . M . G . B a v in a n d W . J . C a n a d a y , Can. J. Chem., 35, 1555 (1 9 5 7 ).
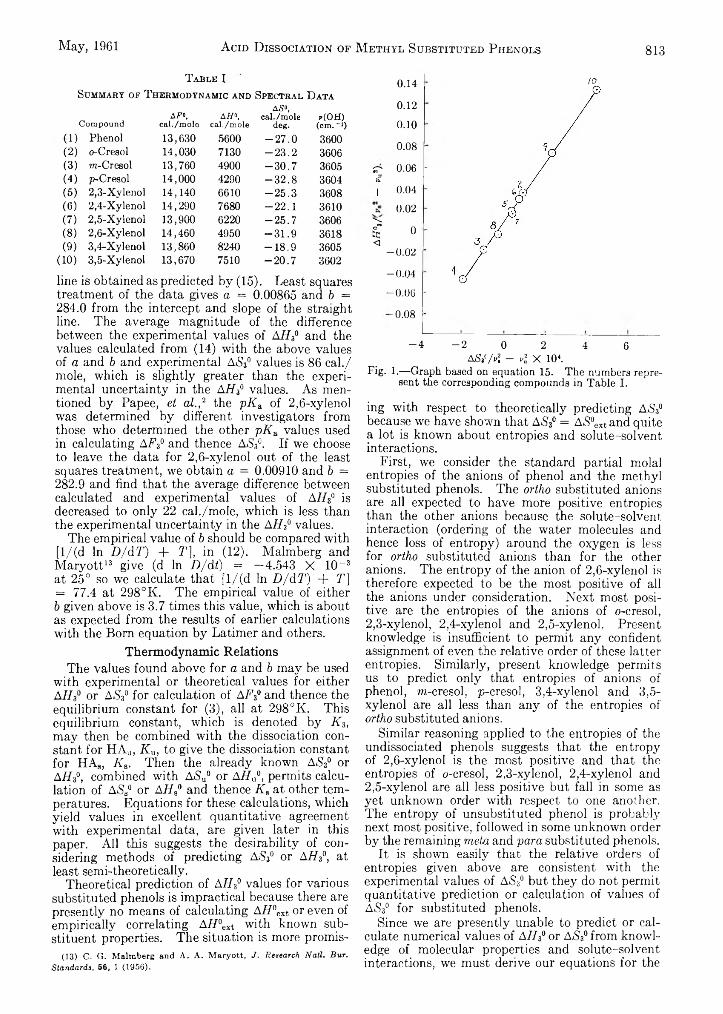
May, 1961 A c i d D i s s o c i a t i o n o f M e t h y l S u b s t i t u t e d P h e n o l s 813
T a b l e I
Su m m a r y o f T h e r m o d y n a m ic a n d Sp e c t r a l D a t a0.14
C o m p o u n dAF°,
c a l . /m o leAH®,
c a l . /m o le
A S »,c a l . /m o le
d e g .» (O H )
(c m . ~l)
0.12
0.10( i ) Phenol 13,630 5600 -2 7 .0 3600 0.08(2) o-Cresol 14,030 7130 - 2 3 .2 3606(3) m-Cresol 13,760 4900 -3 0 .7 3605 »--N 0.06(4) p-Cresol 14,000 4290 -3 2 .8 3604 1?(5) 2,3-Xylenol 14,140 6610 -2 5 .3 3608 1 0.04(6) 2,4-Xylenol 14,290 7680 -2 2 .1 3610 0.02(7) 2,5-Xylenol 13,900 6220 -2 5 .7 3606 \V»
0(8) 2,6-Xylenol 14,460 4950 -3 1 .9 3618©tei
(9) 3,4-Xylenol 13,860 8240 -1 8 .9 3605 <-0 .0 2
(10) 3,5-Xylenol 13,670 7510 -2 0 .7 3602
line is obtained as predicted by (15). Least squares treatment of the data gives a = 0.00865 and b =284.0 from the intercept and slope of the straight line. The average magnitude of the difference between the experimental values of AH3° and the values calculated from (14) with the above values of a and b and experimental AS 3° values is 8 6 cal./ mole, which is slightly greater than the experimental uncertainty in the AH's0 values. As mentioned by Papee, et a l .,2 the p K & of 2,6-xylenol was determined by different investigators from those who determined the other p K a values used in calculating AF 3° and thence A$3°. If we choose to leave the data for 2 ,6 -xylenol out of the least squares treatment, we obtain a = 0.00910 and b =282.9 and find that the average difference between calculated and experimental values of AH3° is decreased to only 2 2 cal./mole, which is less than the experimental uncertainty in the AH3° values.
The empirical value of b should be compared with [l/(d In D / d T ) + T ] , in (12). Malmberg and Maryott1 3 give (d In D /d t ) = —4.543 X 10“ 3
at 25° so we calculate that [1 /(d In D / d T ) + T ] = 77.4 at 298°K. The empirical value of either b given above is 3.7 times this value, which is about as expected from the results of earlier calculations with the Bom equation by Latimer and others.
Thermodynamic RelationsThe values found above for a and b may be used
with experimental or theoretical values for either A H i or ASs° for calculation of A P3° and thence the equilibrium constant for (3), all at 298°K. This equilibrium constant, which is denoted by H3, may then be combined with the dissociation constant for HAU, K u, to give the dissociation constant for HAS, K s. Then the already known AS 3° or A.H30, combined with A SU° or A H u°, permits calculation of AS B° or AH's0 and thence K e at other temperatures. Equations for these calculations, which yield values in excellent quantitative agreement with experimental data, are given later in this paper. All this suggests the desirability of considering methods of predicting A,S'3° or A H 3°, at least semi-theoretically.
Theoretical prediction of AH3° values for various substituted phenols is impractical because there are presently no means of calculating AH°ext or even of empirically correlating AH°cxt with known substituent properties. The situation is more promis-
(13) C. G. Malmberg and A. A. Maryott, J. Research Natl. Bur.Standards, 56, 1 (1956).
-0 .0 4
-0 .0 6 -
-0.08
10
- 4 - 2 0 2 4 6ASf/rt - vl X 104.
Fig. 1.— Graph based on equation 15. The numbers represent the corresponding compounds in Table I.
ing with respect to theoretically predicting A S /' because we have shown that A»S3C = A S °ext and quite a lot is known about entropies and solute-solvent interactions.
First, we consider the standard partial molal entropies of the anions of phenol and the methyl substituted phenols. The ortho substituted anions are all expected to have more positive entropies than the other anions because the solute-solvent interaction (ordering of the water molecules and hence loss of entropy) around the oxygen is less for ortho substituted anions than for the other anions. The entropy of the anion of 2,6-xylenol is therefore expected to be the most positive of all the anions under consideration. Next most positive are the entropies of the anions of o-cresol,2,3-xylenol, 2,4-xylenol and 2,5-xylenol. Present knowledge is insufficient to permit any confident assignment of even the relative order of these latter entropies. Similarly, present knowledge permits us to predict only that entropies of anions of phenol, m-cresol, p-cresol, 3,4-xylenol and 3,5- xylenol are all less than any of the entropies of ortho substituted anions.
Similar reasoning applied to the entropies of the undissociated phenols suggests that the entropy of 2 ,6 -xylenol is the most positive and that the entropies of o-cresol, 2,3-xylenol, 2,4-xylenol and2,5-xylenol are all less positive but fall in some as yet unknown order with respect to one another. The entropy of unsubstituted phenol is probably next most positive, followed in some unknown order by the remaining m eta and para substituted phenols.
It is shown easily that the relative orders of entropies given above are consistent with the experimental values of A<S3° but they do not permit quantitative prediction or calculation of values of AfS3° for substituted phenols.
Since we are presently unable to predict or calculate numerical values of AH3° or A S / from knowledge of molecular properties and solute-solvent interactions, we must derive our equations for the
814 L. G. H e p l e r a n d W. F. O ’ H a r a Voi. 65
equilibrium constant of reaction 3 and the dissociation constants of the various acids in terms of experimentally determined values of ASz° or A H 3°. Of these quantities, only AH 3° can be evaluated experimentally without knowing the equilibrium constant we want to calculate. Therefore we derive thermodynamic; equations for K 3, K s and K u in terms of a, b, vs2. vu2, A H 3° and T .
Combination of (14) withAF3° = AH3° - TASs« (16)
gives
AF3° = AH3o [ l - (ve2 - Vu2) (17)
We also write (17) as
aH3° [ l - + ° j W - vu2) =-R T \ n K s (18) - R T In K s/Ku (19)
Free energies and equilibrium constants, at several temperatures, as calculated from (17), (18) and(19) are in good agreement with the experimental values. 2
The temperature at which A F 3° = 0, K 3 = 1.0 and K s = K u is denoted by T * and is obtained from (17), (18) or (19) as
rp* bAH3°'AH3° — at vu2 — vu1) (20)
Since it is often of interest to compare two substituted acids with each other rather than to compare a substituted acid with the unsubstituted acid, we may generalize our equations by substituting subscripts x and y for subscripts s and u and understanding that x and y refer to any two acids in the series under consideration. In this fashion we obtain
rp* _______ bAH3°AH30' — a( Vx2 — Vy2) (21)
where A H 30' refers to the enthalpy change for the generalized version of reaction 3.
It already has been pointed out that phenol and3,5-xylenol have the same dissociation constant at 30°. Equation 20 gives T * = 303°K. = 30°C. It may be calculated from the data of Papee, et a l.,2 that the dissociation constants of o-cresol and p-cresol are equal at 296°K. Equation 21 gives T * = 297 °K. Similar calculations for other pairs of acids chosen from the phenols under consideration give values of T * in agreement with the temperatures at which dissociation constants are equal as calculated directly from the experimental thermodynamic data. 2 For some pairs of acids T * is out of the range of existence of aqueous solutions and has no physical significance. The dissociation constants of such acids do not become equal to each other at any accessible temperature.
DiscussionThere is one fundamental limitation on the
thermodynamic equations in this paper. We have been forced to consider all enthalpies and entropies to be temperature independent, which is only true if ACP° = 0 for the reactions under consideration. No experimental data are available that permit reliable evaluation of ACP° of dissociation of phenol or any of the methyl substituted phenols and it is certainly pushing the applicability of the Born equation too far to use it for calculation of A(7p0. Since it has been observed many times that values of A C p° of dissociation are all about the same for similar acids (about —35 cal./deg. mole for uncharged acids), we expect that all the unknown values for ACP° of dissociation of the phenols are far from zero but all of the same magnitude. Therefore calculations for reaction 3, or its generalized version, for which Adp0 is small, are reliable over wide ranges of temperature. Calculations for reactions 1 and 2 are reliable only for temperatures close to 25°.
The treatment described in this paper, based on consideration of solute-solvent interactions andO-H stretching frequencies, can be applied to the thermodynamics of dissociation of some carboxylic acids in aqueous solution as is described in a paper in preparation. It also seems likely that this treatment can be satisfactorily applied to the acid dissociation of anilinium ions and similar species. There are, however, restrictions on the applicability of this method to interpretation of the thermodynamics of dissociation of acids. For example, this method cannot be applied without modification to acids with intramolecular hydrogen bonds. One such acid is o-nitrophenol. Further, it is possible that this treatment, although qualitatively satisfactory, may be less quantitatively accurate when applied to acids with highly polar substituents which make the magnitudes of the effects considered here much larger. This possibility cannot be settled at present because there are insufficient thermodynamic and spectral data for such acids to permit an adequate comparison of theory with experiment.
N ote A dded in P roof.— Professor R. Bruce Martin has reminded us that the Born model is not unique in leading to solute-solvent interaction enthalpy proportional to entropy. This led us to investigate the oriented dipole model of Powell and Latimer, J. Chem. Phys., 19, 1139 (1951). We have used their equation for the electrostatic potential energy of interaction with their equation 8 in the same manner that led to equation 12 in this paper. The value deduced by Powell and Latimer for the temperature coefficient terms was then used in calculating a value of 800 for the proportionality constant we have called b.
The actual solute-solvent interactions might be expected to be between the extremes of the oriented dipole model and the Born continuous dielectric model. The value for b deduced in this paper (284) is between the extremes of the continuous dielectric value (77) and the oriented dipole value (800).
Acknowledgment.—We are grateful to the National Science Foundation and the Alfred P. Sloan Foundation for financial support of this and related research.
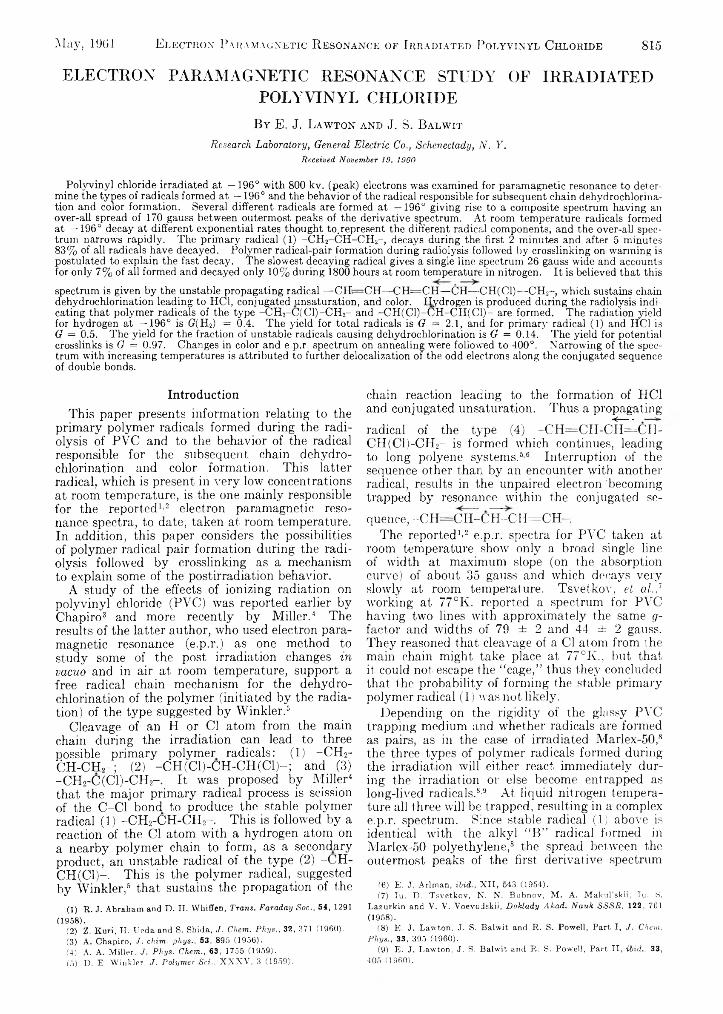
815
ELECTRON PARAMAGNETIC RESONANCE STUDY OF IRRADIATEDPOLYVINYL CHLORIDE
B y E . J. L a w t o n a n d J. S. B a l w it
Research Laboratory, General Electric Co., Schenectady, N. Y.Received November 19, 1960
May, 1901 E l e c t r o n P a r a m a g n e t i c R e s o n a n c e o f I r r a d i a t e d P o l y v i n y l Chloride
Polyvinyl chloride irradiated at —196° with 800 kv. (peak) electrons was examined for paramagnetic resonance to determine the types of radicals formed at —196° and the behavior of the radical responsible for subsequent chain dehydrochlorination and color formation. Several different radicals are formed at —196° giving rise to a composite spectrum having an over-all spread of 170 gauss between outermost peaks of the derivative spectrum. At room temperature radicals formed at —196° decay at different exponential rates thought to. represent the different radical components, and the over-all spectrum narrows rapidly. The primary radical (1) -C H 2-C H -C H 2- , decays during the first 2 minutes and after 5 minutes 83% of all radicals have decayed. Polymer radical-pair formation during radiolysis followed by crosslinking on warming is postulated to explain the fast decay. The slowest decaying radical gives a single line spectrum 26 gauss wide and accounts for only 7% of all formed and decayed only 10% during 1800 hours at room temperature in nitrogen. It is believed that this
spectrum is given by the unstable propagating radical — CHi=CH— C H = C H — CH— CH(C1)— CH2- , which sustains chain dehydrochlorination leading to HC1, conjugated unsaturation, and color. flydrogen is produced during the radiolysis indicating that polymer radicals of the type -C H 2-C(C1)-CH 2- and -CH(C1)-CH -CH (C1)- are formed. The radiation yield for hydrogen at —196° is G(H2) = 0.4. The yield for total radicals is G = 2.1, and for primary radical (1) and HC1 is G = 0.5. The yield for the fraction of unstable radicals causing dehydrochlorination is <7 = 0.14. The yield for potential crosslinks is G = 0.97. Changes in color and e.p.r. spectrum on annealing were followed to 400°. Narrowing of the spectrum with increasing temperatures is attributed to further delocalization of the odd electrons along the conjugated sequence of double bonds.
IntroductionThis paper presents information relating to the
primary polymer radicals formed during the radiolysis of PVC and to the behavior of the radical responsible for the subsequent chain dehydrochlorination and color formation. This latter radical, which is present in very low concentrations at room temperature, is the one mainly responsible for the reported1 2 electron paramagnetic resonance spectra, to date, taken at, room temperature. In addition, this paper considers the possibilities of polymer radical pair formation during the radiolysis followed by crosslinking as a mechanism to explain some of the postirradiation behavior.
A study of the effects of ionizing radiation on polyvinyl chloride (PVC) was reported earlier by Chápiro3 and more recently by Miller. 4 The results of the latter author, who used electron paramagnetic resonance (e.p.r.) as one method to study some of the post irradiation changes in vacuo and in air at room temperature, support a free radical chain mechanism for the dehydrochlorination of the polymer (initiated by the radiation) of the type suggested by AVinkler. 5
Cieavage of an H or Cl atom from the main chain during the irradiation can lead to three possible primary polymer radicals: ( 1 ) -C H 2-CH-CH 2- ; (2) -CH (Cl)-CH -CH (Cl)-; and (3) -C H 2-C(C1)-CH2- It was proposed by Miller4
that the major primary radical process is scission of the C-Cl bond, to produce the stable polymer radical (1) -C H 2-CH-CH2- This is followed by a reaction of the Cl atom with a hydrogen atom on a nearby polymer chain to form, as a secondary product, an unstable radical of the type (2 ) -CH - CH (Cl)-. This is the polymer radical, suggested by Winkler, 6 that sustains the propagation of the
(1) R . J . Abraham and D . H. Whiffen, Trans. Faraday Soc., 5 4 , 1291 (1958).
(2) Z. K uri, H . Ueda and S. Shida, J . Chem. P h y s . , 32, 371 (1960).(3) A. Chápiro, J . chim. phys., 53, 895 (1956).(4) A. A. M ille r, J. Phys. Chem., 63, 1755 (1959).(5 ) D . E . W in k le r , J. Polymer Sci., X X X V , 3 (1 9 5 9 ).
chain reaction leading to the formation of HC1 and conjugated unsaturation. Thus a propagatingradical of the type (4) - C H = C H - c f c c H - CH(C1)-CH2- is formed which continues, leading to long polyene systems. 6 6 Interruption of the sequence other than by an encounter with another radical, results in the unpaired electron becoming trapped by resonance within the conjugated sequence, -T T I -C H -cTTu I I= C H .
The reported1 ' 2 e.p.r. spectra for PVC taken at room temperature show only a broad single line of width at maximum slope (on the absorption curve) of about 35 gauss and which decays very slowly at room temperature. Tsvetkov, et a l.J working at 77 °K. reported a spectrum for PVC having two lines with approximately the same g- factor and widths of 79 ± 2 and 44 ± 2 gauss. They reasoned that cleavage of a Cl atom from the main chain might take place at 77°K., but that it could not escape the “ cage,” thus they concluded that the probability of forming the stable primary polymer radical ( 1 ) was not likely.
Depending on the rigidity of the glassy PVC trapping medium and whether radicals are formed as pairs, as in the case of irradiated Marlex-50,8 the three types of polymer radicals formed during the irradiation will either react immediately during the irradiation or else become entrapped as long-lived radicals. 8 -9 At liquid nitrogen temperature all three will be trapped, resulting in a complex e.p.r. spectrum. Since stable radical (1) above is identical with the alkyl “ B” radical formed in Marlex-50 polyethylene, 8 the spread between the outermost peaks of the first derivative spectrum
(6 ) E . J . A r lm a n , Hid., X I I , 543 (1 9 5 4 ).(7 ) I u . D . T s v e t k o v , N . N . B u b n o v , M . A . M a k u l ’ sk ii, Iu . S.
L a z u r k in a n d V . V . V o e v o d s k ii , Doklady Akad. Nauk SSSR, 122, 761 (1958).
(8 ) E . J . L a w t o n , J. S. B a lw it a n d R . S . P o w e l l , P a r t I , J. Chem. P h y s . , 33, 3 95 (1 9 6 0 ).
(9 ) E . J . L a w t o n , J . S. B a lw it a n d R . S . P o w e l l , P a r t I I , ibid.. 3 3 , 4 0 5 ( I 9 6 0 ) .

816 E, J. L a w t o n a n d J. S. B a l w i t Vol. 65
should be at least 170 gauss, which is considerably wider than that previously reported for PVC.
ExperimentalMaterials.— The polyvinyl chloride was Commercial
Geon 101 powder (B . F. Goodrich Company) which has a glass transition temperature of about 75°.10 The weight average molecular weight, as determined from light scattering measurements on PVC solutions in tetrahydrofuran, was found to be M w = 162,000, which is higher than the value of My, = 103,000 determined by Miller4 from the limiting equivalent viscosity measurement. The light scattering measurements were made at room temperature using filtered solutions of concentration below 1% . The value for the refractive index increment used in calculating M w was dn/dc = 0.1065.11 The samples were used in both powder and film form. Films were hot pressed at 130 0 to a thickness of about 0.010". Samples were outgassed by mild heating and prolonged pumping on a high vacuum system.
Radiation Source.— The samples were irradiated in a nitrogen atmosphere with electrons of 800 K v. (peak) energy from a G. E. resonant-transformer electron beam generator.12'13 Irradiation dose was measured using a special air ionization chamber. Dose is expressed in roentgen units, where 1 roentgen = 83.8 ergs/g. of air. Radiation yields (G-values) are calculated on the basis that the roentgen equivalent to 5.24 X 10¹³ e .v ./g . of air is also the same in this PVC polymer.
Electron Paramagnetic Resonance.— The measurements were made using a standard Varian Model V4500 EPR spectrometer operating at 9400 M e./sec. The measurements were made at low rf-power levels to avoid saturation effects. The procedure followed in making the resonance measurements at liquid nitrogen temperature was similar to that described earlier 3 All samp le transfer operations and e.p.r. measurements were made in a dry nitrogen atmosphere. All spectra shown are first derivative curves.
Hydrogen Evolution.—The gas measurement was made using a demountable stainless-steel irradiation cell having an attached mercury manometer and equipped with a thin (2 mil) stainless-steel window. A one gram sample of PVC powder was sealed in the cell then outgassed by mild heating and several hours pumping. The samples were irradiated to 40 megaroentgens at —170°. Following irradiation the samples were warmed a little above room temperature and allowed to stand for 1 to 2 hours to allow Irydrogen to diffuse out of the powder. The HC1 was condensed in a small side arm during the pressure measurement. The mass spectrograph analysis of the non-condensable fraction showed mainly hydrogen with a small trace of methane.
Gel Determination.— Estimates of radiation-induced crosslinking were made from solubility measurements by determining the minimum dose for gel formation. The outgassed films which were irradiated at liquid nitrogen temperature in a nitrogen atmosphere were enclosed in wire mesh containers and the soluble fraction extracted by suspending the container in a large excess of dimethylform- amide solvent at room temperature for 48 to 72 hours. The container was made from preformed discs of 200 mesh Ni gauze (wire diameter 0.0023 inch) and had a diameter of l-Vs inches. Precautions were taken to exclude oxygen and light during the solubility measurements. Dry nitrogen was bubbled through the solvent for many hours prior to its use and also during the extraction. The"sample preparation and handling were all done in nitrogen. The solubility measurements were started as soon after irradiation as possible (elapsed time about 20 min.) in order to minimize any effect that the presence of unsaturation might have, since conjugated unsaturation increases with time of storage after irradiation. After removing the containers from the solvent, they were vacuum dried at room temperature and the gel fraction determined from the weight loss during extraction.
(1 0 ) P . J . F lo r y , “ P r in c ip le s o f P o ly m e r C h e m is t r y ,” C o r n e ll U n i- v e r s it y P re ss , I t h a c a , N . Y . , 195 3 , p . 52,
(1 1 ) D . L a k e r , J. Polymer Sci., X X V , 1 22 (1 9 5 7 ).(1 2 ) E . J . L a w t o n , Science, 1 1 2 , 4 1 9 (1 9 5 0 ).(1 3 ) E . E . C h a r lto n a n d W . F . W e s t e n d o r p , Gen. Elec. R ev., 44, 6 52
(1 9 4 1 ) .
ResultsTypical E.p.r. Spectrum.— The e.p.r. spectrum
for PVC taken at liquid nitrogen temperature after irradiation to 40 megaroentgens at this temperature is shown in Fig. 1. The spectrum is a composite one made up of several radical components giving rise to a multiplicity of peaks. The reasons for the smearing and lack of definition of the hyperfine structure (especially of the outermost peaks A and B), although not clearly understood, probably can be attributed partly to dipolar broadening and partly to the fact that three different types of radicals are involved. Because of this smearing it was not possible to make a positive identification of the radical types present or to decompose the spectrum—as was done in the case of Marlex-508— to determine the relative numbers of each type present. Instead identification must through necessity be on a qualitative basis. The determination of the total number of radicals present at any given time, however, is on a quantitative basis. Any contribution resulting from the presence of the chlorine atom might be expected to be small1 4 because of its relatively low magnetic moment and nuclear spin of 3/2. The resonance signal for the hot-pressed film sample was the same as that for the sample in its original powder form.
The spread between the outermost peaks A and B of the derivative signal is about 170 gauss. This is the same spacing previously found between corresponding peaks of the alkyl “ B” radical formed in irradiated Marlex-50 polyethylene, 8 which strongly suggests that polymer radical ( 1 ) above is one of the primary polymer radicals formed during the irradiation of PVC.
Changes in Shape of E.p.r. Spectrum with Decay at Room Temperature.—The array of spectra in Fig. 2 shows the changes in hyperfine structure as a function of storage time of a sample at room temperature (in nitrogen) that had been irradiated to 40 megaroentgen at —196°. The e.p.r. measurements were made at liquid nitrogen temperature following each storage period at room temperature. The shape of the spectrum changes rapidly at first, becoming narrower until at the end of 5 minutes radical component ( 1 ) responsible for outer peaks A and B, initially, has completely disappeared. The spectrum continues to narrow but decays more slowly on further storage. The remaining hyperfine structure present in the 5 minute spectrum, presumably due to polymer radicals (2) and (3), disappears leaving but a single line having a width at maximum slope (on the absorption curve) of 26 gauss at the end of about
. 350 hours storage. This spectrum decays very slowly, indeed, the amplitude decreasing only about 1 0 % during 1800 hours additional storage at room temperature. This spectrum is the same as that observed in highly irradiated Marlex-50 which is attributed to a radical trapped by resonance within a conjugated sequence of double bonds. This would correspond to the unstable propagating
(14) D. J. E. Ingram, “ Free Radicals as Studied by Electron SpinResonance,” Butterworths Scientific Publications, London, 1958, p,154.
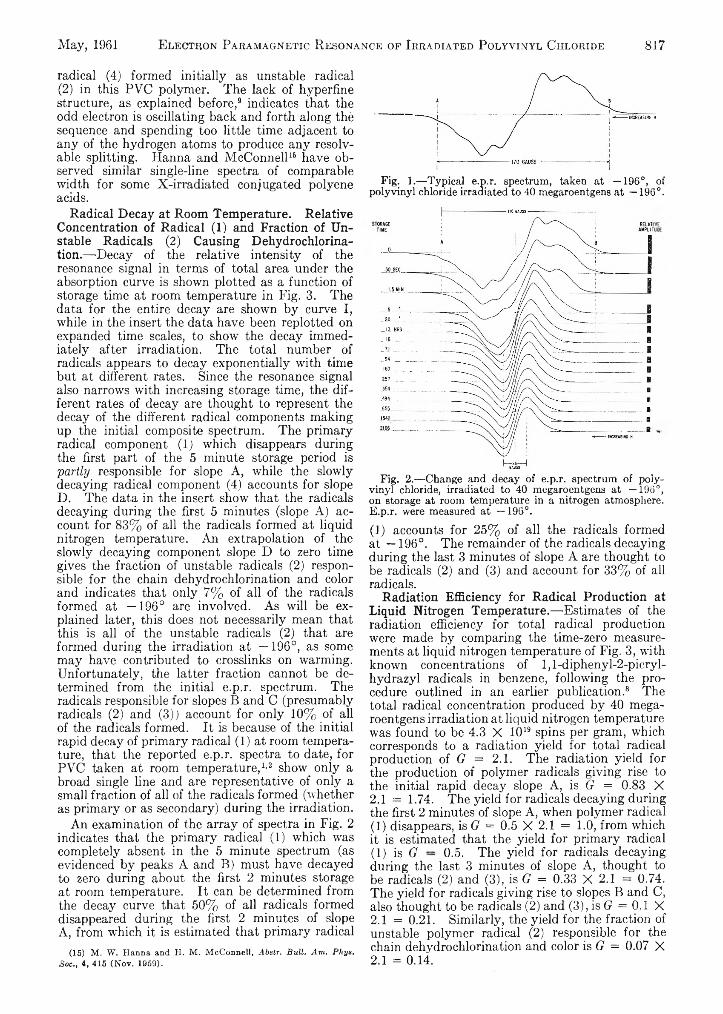
May, 1961 E l e c t r o n P a r a m a g n e t i c R e s o n a n c e o f I r r a d i a t e d P o l y v i n y l C h l o r i d e 817
radical (4) formed initially as unstable radical (2 ) in this PVC polymer. The lack of hyperfine structure, as explained before, 9 indicates that the odd electron is oscillating back and forth along thè sequence and spending too little time adjacent to any of the hydrogen atoms to produce any resolvable splitting. Hanna and McConnell1 5 have observed similar single-line spectra of comparable width for some X-irradiated conjugated polyene acids.
Radical Decay at Room Temperature. Relative Concentration of Radical (1) and Fraction of Unstable Radicals (2) Causing Dehydrochlorination.—Decay of the relative intensity of the resonance signal in terms of total area under the absorption curve is shown plotted as a function of storage time at room temperature in Fig. 3. The data for the entire decay are shown by curve I, while in the insert the data have been replotted on expanded time scales, to show the decay immediately after irradiation. The total number of radicals appears to decay exponentially with time but at different rates. Since the resonance signal also narrows with increasing storage time, the different rates of decay are thought to represent the decay of the different radical components making up the initial composite spectrum. The primary radical component ( 1 ) which disappears during the first part of the 5 minute storage period is partly responsible for slope A, while the slowly decaying radical component (4) accounts for slopeD. The data in the insert show that the radicals decaying during the first 5 minutes (slope A) account for 83% of all the radicals formed at liquid nitrogen temperature. An extrapolation of the slowly decaying component slope D to zero time gives the fraction of unstable radicals (2 ) responsible for the chain dehydrochlorination and color and indicates that only 7% of all of the radicals formed at —196° are involved. As will be explained later, this does not necessarily mean that this is all of the unstable radicals (2 ) that are formed during the irradiation at —196°, as some may have contributed to crosslinks on warming. Unfortunately, the latter fraction cannot be determined from the initial e.p.r. spectrum. The radicals responsible for slopes B and C (presumably radicals (2) and (3)) account for only 10% of all of the radicals formed. It is because of the initial rapid decay of primary radical ( 1 ) at room temperature, that the reported e.p.r. spectra to date, for PVC taken at room temperature, 1 - 2 show only a broad single fine and are representative of only a small fraction of all of the radicals formed (whether as primary or as secondary) during the irradiation.
An examination of the array of spectra in Fig. 2 indicates that the primary radical ( 1 ) which was completely absent in the 5 minute spectrum (as evidenced by peaks A and B) must have decayed to zero during about the first 2 minutes storage at room temperature. It can be determined from the decay curve that 50% of all radicals formed disappeared during the first 2 minutes of slope A, from which it is estimated that primary radical
(1 5 ) M . W . H a n n a a n d H . M . M c C o n n e l l , Abstr. Bull. Am. Phys. Soc., 4, 4 1 5 (N o v . 1 9 5 9 ).
Fig. 1.— Typical e.p.r. spectrum, taken at —196°, of polyvinyl chloride irradiated to 40 megaroentgens at —196°.
Fig. 2.— Change and decay of e.p.r. spectrum of polyvinyl chloride, irradiated to 40 megaroentgens at —196°, on storage at room temperature in a nitrogen atmosphere. E.p.r. were measured at —196°.
(1) accounts for 25% of all the radicals formed at —196°. The remainder of the radicals decaying during the last 3 minutes of slope A are thought to be radicals (2) and (3) and account for 33% of all radicals.
Radiation Efficiency for Radical Production at Liquid Nitrogen Temperature.— Estimates of the radiation efficiency for total radical production were made by comparing the time-zero measurements at liquid nitrogen temperature of Fig. 3, with known concentrations of l,l-diphenyl-2 -picryl- hydrazyl radicals in benzene, following the procedure outlined in an earlier publication . 8 The total radical concentration produced by 40 megaroentgens irradiation at liquid nitrogen temperature was found to be 4.3 X 101 9 spins per gram, which corresponds to a radiation yield for total radical production of G = 2.1. The radiation yield for the production of polymer radicals giving rise to the initial rapid decay slope A, is G = 0.83 X2.1 = 1.74. The yield for radicals decaying during the first 2 minutes of slope A, when polymer radical(1) disappears, is G = 0.5 X 2 . 1 = 1.0, from which it is estimated that the yield for primary radical(1) is G — 0.5. The yield for radicals decaying during the last 3 minutes of slope A, thought to be radicals (2 ) and (3), is G = 0.33 X 2 . 1 = 0.74. The yield for radicals giving rise to slopes B and C, also thought to be radicals (2) and (3), is G = 0.1 X2.1 = 0.21. Similarly, the yield for the fraction of unstable polymer radical (2 ) responsible for the chain dehydrochlorination and color is G = 0.07 X2.1 = 0.14.
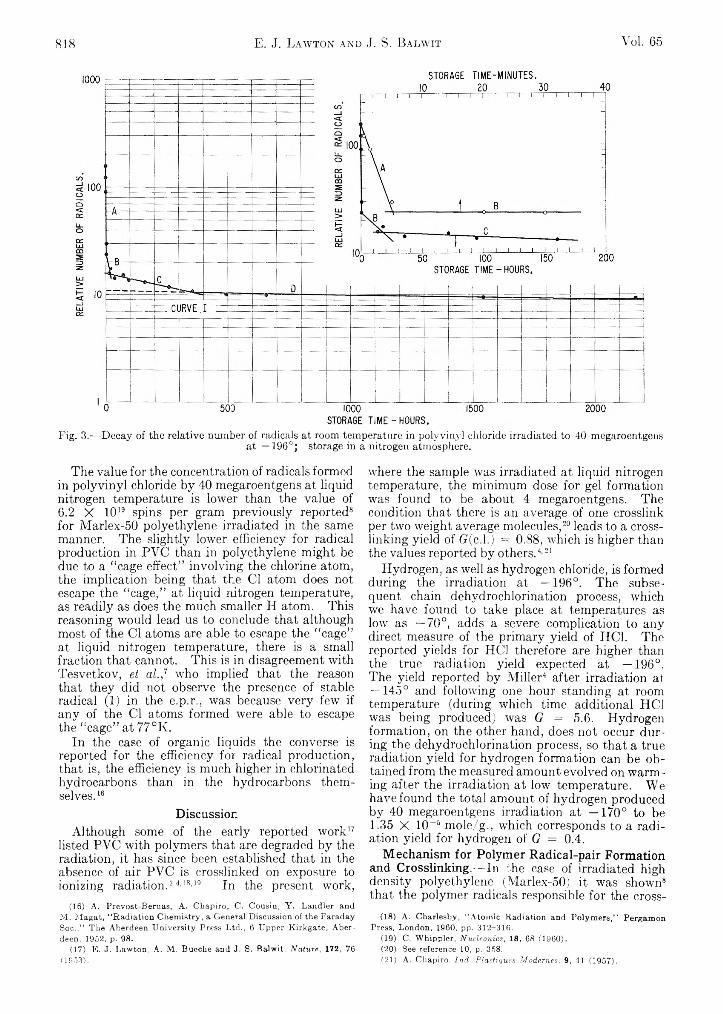
818 E. J. L a w t o n a n d J. S. B a l w i t Yol. 65
Fig. 3.— Decay of the relative number of radicals at room temperature in polyvinyl chloride irradiated to 40 megaroentgensat —196°; storage in a nitrogen atmosphere.
The value for the concentration of radicals formed in polyvinyl chloride by 40 megaroentgens at liquid nitrogen temperature is lower than the value of6.2 X 101 9 spins per gram previously reported8
for Marlex-50 polyethylene irradiated in the same manner. The slightly lower efficiency for radical production in PVC than in polyethylene might be due to a “ cage effect” involving the chlorine atom, the implication being that the Cl atom does not escape the “ cage,” at liquid nitrogen temperature, as readily as does the much smaller H atom. This reasoning would lead us to conclude that although most of the Cl atoms are able to escape the “ cage” at liquid nitrogen temperature, there is a small fraction that cannot. This is in disagreement with Tesvetkov, et a l.,7 who implied that the reason that they did not observe the presence of stable radical ( 1 ) in the e.p.r., was because very few if any of the Cl atoms formed were able to escape the “ cage” at 77°K.
In the case of organic liquids the converse is reported for the efficiency for radical production, that is, the efficiency is much higher in chlorinated hydrocarbons than in the hydrocarbons themselves. 1 6
DiscussionAlthough some of the early reported work 17
listed PVC with polymers that are degraded by the radiation, it has since been established that in the absence of air PVC is crosslinked on exposure to ionizing radiation. 3 -4 1 8 ' 1 9 In the present work,
(1 6 ) A . P r e v o s t -B e r n a s , A . C h á p ir o , C . C o u s in , Y . L a n d le r a n d M . M a g a t , “ R a d ia t io n C h e m is tr y , a G e n e ra l D is cu s s io n o f th e F a r a d a y S o c . , ’ ’ T h e A b e r d e e n U n iv e r s ity P re ss L t d . , 6 U p p e r K ir k g a t e , A b e r d e e n , 195 2 , p . 9 8 .
(1 7 ) E . J . L a w to n , A . M . B u e c h e a n d J. S . B a lw it , Nature, 1 7 2 , 76(1 9 5 3 ).
where the sample was irradiated at liquid nitrogen temperature, the minimum dose for gel formation was found to be about 4 megaroentgens. The condition that there is an average of one crosslink per two weight average molecules, 20 leads to a cross- linking yield of G(c.l.) = 0 .8 8 , which is higher than the values reported by others. 4 2 1
Hydrogen, as well as hydrogen chloride, is formed during the irradiation at —196°. The subsequent chain dehydrochlorination process, which we have found to take place at temperatures as low as —70°, adds a severe complication to any direct measure of the primary yield of HC1. The reported yields for HC1 therefore are higher than the true radiation yield expected at —196°. The yield reported by Miller4 after irradiation at — 145° and following one hour standing at room temperature (during which time additional HC1 was being produced) was G = 5.6. Hydrogen formation, on the other hand, does not occur during the dehydrochlorination process, so that a true radiation yield for hydrogen formation can be obtained from the measured amount evolved on warming after the irradiation at low temperature. We have found the total amount of hydrogen produced by 40 megaroentgens irradiation at —170° to be1.35 X 10~ 6 mole/g., which corresponds to a radiation yield for hydrogen of G = 0.4.
Mechanism for Polymer Radical-pair Formation and Crosslinking.— In the case of irradiated high density polyethylene (Marlex-50) it was shown8
that the polymer radicals responsible for the cross-(1 8 ) A . C h a r le s b y , “ A t o m ic R a d ia t io n a n d P o ly m e r s ,” P e r g a m o n
P ress , L o n d o n , I 9 6 0 , p p . 3 1 2 -3 1 6 .(1 9 ) C . W h ip p ie r , Nxicle-onics, 18, 6 8 (1 9 6 0 ).(2 0 ) S ee re fe re n c e 10, p . 358 .(2 1 ) A . C h a p iro . Ind. Plastiques Modernes, 9, 41 (1 9 5 7 ).

May, 1961 E l e c t r o n P a r a m a g n e t i c R e s o n a n c e o f I r r a d i a t e d P o l y v i n y l C h l o r i d e 819
linking were formed in pairs (at —196°) by the mechanism of C-H scission, as the primary process, followed by hydrogen atom abstraction of a hydrogen atom from an adjacent polymer chain to form the other member of the radical-pair. About one- half of the radiation events resulted in pairs, in which the two radicals of the pair were formed nearly opposite each other. These decayed at a very rapid rate at room temperature. In the remaining radiation events, the two radicals of the pair were formed further apart and these decayed at a much slower rate and at different rates at room temperature. It is proposed that similarly in the case of polyvinyl chloride, polymer radicals are formed as pairs at —196° and that at room temperature these decay to crosslinks at different rates, giving rise to slopes A, B and C of the radical decay curve in Fig. 3. In the case of PVC, however, part of the radical-pairs would be formed by the mechanism of C-Cl scission as the primary event followed by chlorine atom abstraction of a hydrogen atom from a nearby chain, as well as by C-H scission as a primary event with subsequent hydrogen atom abstraction.
In the radical-pair forming process at —196° involving the chlorine atom the radiation reaction
-C H 2-CH(C1)------ " v—>- -C H 2-C H -C H 2- + Cl-(1)
produces radical ( 1 ) as the primary radical of the pair. This is followed by
i----- -CH (C1)-CH -CH (C1)- +Cl- + -C H j-C H (C l)------- (2) HC1
1----- > -C H 2-C(C1)-CH 2- + HC1(3)
to form either the unstable radical (2 ) or stable radical (3) as the secondary member of the radical- pair and a molecule of HC1. Unfortunately, a distinction between radicals (2) and (3) based on the e.p.r. analysis cannot be made because of the smearing present in the initial spectrum. Chemical evidence based on the behavior of radicals in solution4 -2 2 suggests that abstraction of a methylene hydrogen to form radical (2 ) is preferred. When the sample is allowed to warm up the radicals of the pair combine
- c h 2- c h - c h 2- - c h 2- c h - c h 2-(1)+
- (2 ) - or - (3 ) - - ( 2 ) - or - i n
forming crosslinks. Since one molecule of HC1 is formed for each primary polymer radical ( 1 ) formed, the primary yield for HC1 formation is (?(HC1) = G - (Radical (1)) = 0.5. This is also the yield for the potential crosslinks that would be formed by the process involving the chlorine atom. As explained earlier, this is the group of radicals that decayed during the first 2 minute part, of slope A and which accounted for 50% of all radicals formed at — 196°.
The radical-pair forming process involving the hydrogen atom accounts for the remainder of the radicals formed at —196° and which decay during the last 3 minutes of slope A and also during slopes
(2 2 ) C . W a ll in g , “ F re e R a d ic a ls in S o lu t io n ,” J o h n W i le y a n d S on s, I n c . , N e w Y o r k . N . Y . f 1 9 5 7 , p . 3 62 .
B and C at room temperature. In this case the radiation reaction is
-C H 2-CH (C1)--CH ( Cl) -C H -C H ( Cl) - + H-
(2)
-C H 2-C (C 1)-C H ,- + H-(3 )
to form radicals (2) and (3) as p rim a ry radicals of the pair. This is followed by the reaction
-► -C H ( C1)-CH-CH( Cl) + H2H- + -C H 2-CH(C1)------ (2)
-C H 2-C(C1)-CII, + H, (3)
which also forms radicals (2) and (3), but as secondary radicals of the pair. Here again no distinction can be made between primary and secondary radicals based on the e.p.r. The ensuing cross- linking reaction which occurs on warming the sample
- ( 2 ) - or - (3 ) - - (2 ) - or - (3 ) -
- ( 3 ) - o r - (2 ) - - (3 ) - or —(2)—forms crosslinks between different combinations of radicals (2 ) and (3). The yield for potential crosslinks resulting from that part of the radical pairs formed by the process involving the hydrogen atom is equal to one-half of the sum of the yield for the radicals that decay during the last three minutes of slope A and during slopes B and C, or G = (0.74 + 0 .2 1 ) , / 2 = 0.47. Since one molecule of hydrogen is formed for each potential crosslink, the primary yield of hydrogen is (7(H2) = 0.47, which is in good agreement with the value G = 0.4 determined from the gas evolution measurements. The total yield for potential crosslinks determined in this manner is G(Potent. c.l.) = 0.5 + 0.47 = 0.97, which is in good agreement with the value of 0 . 8 8
determined from the gel measurements.The above postulated mechanism of polymer
radical-pair formation and crosslinking implies that in most cases the radicals of the pair are close enough together that, the necessary diffusion of the two radical chain segments required to form the crosslink can take place on warming the sample from liquid nitrogen temperature. In order to account for the small fraction of unstable radicals (2) leading to radical (4), which is responsible for the slowly decaying slope D of the decay curve, it must be further postulated that in the case of some of the pairs involving radical (2 ), the radical is able to undergo chain dehydrochlorination before cross- linking. This would be expected to take place during the initial faster decaying slopes A and B, rather than during slope C where the radical decay requires 200-300 hours. The few radical-pairs decaying during slope C, then, may comprise relatively widely spaced stable radicals (3). The number of these radicals accounts for only 3% of all formed initially. The relatively small concentration compared to radical (4), which at this stage o f the decay is the predominant one present, probably explains why their presence is not readily detected in the e.p.r. spectrum. The fact that color is observed as soon as 5-8 seconds after warming the sample from liquid nitrogen to room
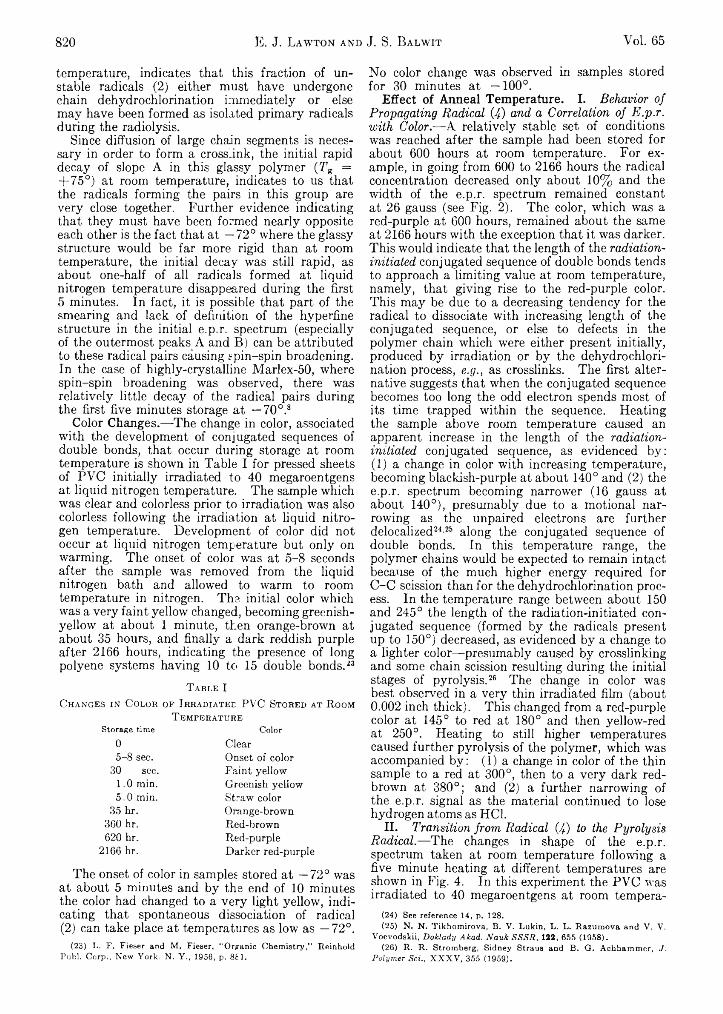
820 E. J. L a w t o n a n d J. S. B a l w i t Vol. 65
temperature, indicates that this fraction of. unstable radicals (2 ) either must have undergone chain dehydrochlorination immediately or else may have been formed as isolated primary radicals during the radiolysis.
Since diffusion of large chain segments is necessary in order to form a crosslink, the initial rapid decay of slope A in this glassy polymer (T g = + 75°) at room temperature, indicates to us that the radicals forming the pairs in this group are very close together. Further evidence indicating that they must have been formed nearly opposite each other is the fact that at —72° where the glassy structure would be far more rigid than at room temperature, the initial decay was still rapid, as about one-half of all radicals formed at liquid nitrogen temperature disappeared during the first 5 minutes. In fact, it is possible that part of the smearing and lack of definition of the hyperfine structure in the initial e.p.r. spectrum (especially of the outermost peaks A and B) can be attributed to these radical pairs causing spin-spin broadening. In the case of highly-crystalline Marlex-50, where spin-spin broadening was observed, there was relatively little decay of the radical pairs during the first five minutes storage at —70°.8
Color Changes.—The change in color, associated with the development of conjugated sequences of double bonds, that occur during storage at room temperature is shown in Table I for pressed sheets of PVC initially irradiated to 40 megaroentgens at liquid nitrogen temperature. The sample which was clear and colorless prior to irradiation was also colorless following the irradiation at liquid nitrogen temperature. Development of color did not occur at liquid nitrogen temperature but only on warming. The onset of color was at 5-8 seconds after the sample was removed from the liquid nitrogen bath and allowed to warm to room temperature in nitrogen. The initial color which was a very faint yellow changed, becoming greenish- yellow at about 1 minute, then orange-brown at about 35 hours, and finally a dark reddish purple after 2166 hours, indicating the presence of long polyene systems having 10 to 15 double bonds. 2 3
T able I
C hanges in C olor of I rradiated PVC Stored at R oom T em perature
S to r a g e t im e C o lo r
05-8 sec.
30 sec.1.0 min.5.0 min.
35 hr.360 hr.620 hr.
2166 hr.
ClearOnset of color Faint yellow Greenish yellow Straw color Orange-brown Red-brown Red-purple Darker red-purple
The onset of color in samples stored at —72° was at about 5 minutes and by the end of 10 minutes the color had changed to a very light yellow, indicating that spontaneous dissociation of radical(2 ) can take place at temperatures as low as —72°.
(2 3 ) L . F . F ie se r a n d M . F ie se r , “ O rg a n ic C h e m is t r y ,” R e in h o ld P u b l . C o r p . , N e w Y o r k . N . Y . , 195 6 , p . 8 6 1 .
No color change was observed in samples stored for 30 minutes at —100°.
Effect of Anneal Temperature. I. B eh avior o f P ropaga tin g R adical (4) and a Correlation o f E .p .r . w ith C olor.—A relatively stable set of conditions was reached after the sample had been stored for about 600 hours at room temperature. For example, in going from 600 to 2166 hours the radical concentration decreased only about 1 0 % and the width of the e.p.r. spectrum remained constant at 26 gauss (see Fig. 2). The color, which was a red-purple at 600 hours, remained about the same at 2166 hours with the exception that it was darker. This would indicate that the length of the radiation - initiated conjugated sequence of double bonds tends to approach a limiting value at room temperature, namely, that giving rise to the red-purple color. This may be due to a decreasing tendency for the radical to dissociate with increasing length of the conjugated sequence, or else to defects in the polymer chain which were either present initially, produced by irradiation or by the dehydrochlorination process, e.g ., as crosslinks. The first alternative suggests that when the conjugated sequence becomes too long the odd electron spends most of its time trapped within the sequence. Heating the sample above room temperature caused an apparent increase in the length of the radiation- initiated conjugated sequence, as evidenced by:( 1 ) a change in color with increasing temperature, becoming blackish-purple at about 140° and (2) the e.p.r. spectrum becoming narrower (16 gauss at about 140°), presumably due to a motional narrowing as the unpaired electrons are further delocalized2 4 ’ 26 along the conjugated sequence of double bonds. In this temperature range, the polymer chains would be expected to remain intact because of the much higher energy required for C -C scission than for the dehydrochlorination process. In the temperature range between about 150 and 245° the length of the radiation-initiated conjugated sequence (formed by the radicals present up to 150°) decreased, as evidenced by a change to a lighter color—presumably caused by crosslinking and some chain scission resulting during the initial stages of pyrolysis. 26 The change in color was best observed in a very thin irradiated film (about 0.002 inch thick). This changed from a red-purple color at 145° to red at 180° and then yellow-red at 250°. Heating to still higher temperatures caused further pyrolysis of the polymer, which was accompanied by: ( 1 ) a change in color of the thin sample to a red at 300°, then to a very dark red- brown at 380°; and (2) a further narrowing of the e.p.r. signal as the material continued to lose hydrogen atoms as HC1.
II. T ran sition fr o m R adical (4 ) to the P y r o ly s is R a dical.— The changes in shape of the e.p.r. spectrum taken at room temperature following a five minute heating at different temperatures are shown in Fig. 4. In this experiment the PVC was irradiated to 40 megaroentgens at room tempera-
(2 4 ) S ee re fe re n c e 14 , p . 128 .(2 5 ) N . N . T ik h o m ir o v a , B . V . L u k in , L . L . R a z u m o v a a n d V . V .
V o e v o d s k ii , Doklady Akad. Nauk SSSR, 122, 6 5 5 (1 9 5 8 ) .(2 6 ) R . R . S tro m b e rg , S id n e y S tra u s a n d B . G . A c h h a m m e r , J.
Polymer Sci., X X X V , 3 5 5 (1 9 5 9 ).
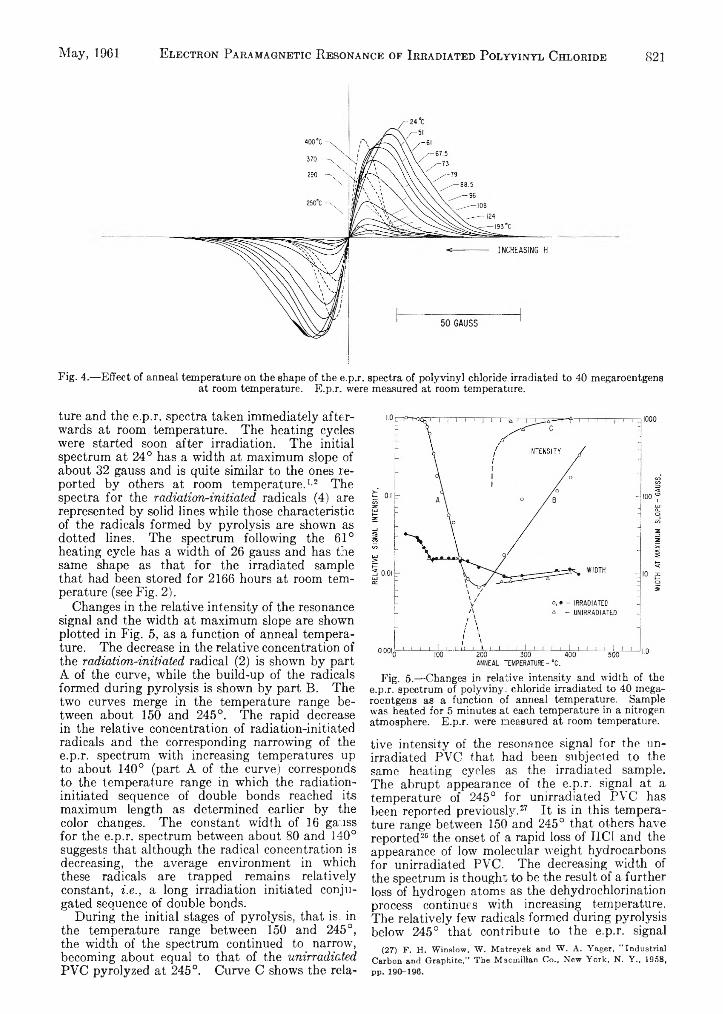
May, 1961 E l e c t r o n P a r a m a g n e t i c R e s o n a n c e o f I r r a d i a t e d P o l y v i n y l C h l o r i d e 821
Fig. 4.— Effect of anneal temperature on the shape of the e.p.r. spectra of polyvinyl chloride irradiated to 40 megaroentgens at room temperature. E.p.r. were measured at room temperature.
ture and the e.p.r. spectra taken immediately afterwards at room temperature. The heating cycles were started soon after irradiation. The initial spectrum at 24° has a width at maximum slope of about 32 gauss and is quite similar to the ones reported by others at room temperature. 1 ’ 2 The spectra for the radiation-initiated radicals (4) are represented by solid lines while those characteristic of the radicals formed by pyrolysis are shown as dotted lines. The spectrum following the 61° heating cycle has a width of 26 gauss and has the same shape as that for the irradiated sample that had been stored for 2166 hours at room temperature (see Fig. 2).
Changes in the relative intensity of the resonance signal and the width at maximum slope are shown plotted in Fig. 5, as a function of anneal temperature. The decrease in the relative concentration of the radiation-initiated radical (2 ) is shown by part A of the curve, while the build-up of the radicals formed during pyrolysis is shown by part B. The two curves merge in the temperature range between about 150 and 245°. The rapid decrease in the relative concentration of radiation-initiated radicals and the corresponding narrowing of the e.p.r. spectrum with increasing temperatures up to about 140° (part A of the curve) corresponds to the temperature range in which the radiation- initiated sequence of double bonds reached its maximum length as determined earlier by the color changes. The constant width of 16 gauss for the e.p.r. spectrum between about 80 and 140° suggests that although the radical concentration is decreasing, the average environment in which these radicals are trapped remains relatively constant, i .e . , a long irradiation initiated conjugated sequence of double bonds.
During the initial stages of pyrolysis, that is, in the temperature range between 150 and 245°, the width of the spectrum continued to narrow, becoming about equal to that of the unirradiated PVC pyrolyzed at 245°. Curve C shows the rela-
Fig. 5.— Changes in relative intensity and width of the e.p.r. spectrum of polyvinyl chloride irradiated to 40 mega- roentgens as a function of anneal temperature. Sample was heated for 5 minutes at each temperature in a nitrogen atmosphere. E.p.r. were measured at room temperature.
tive intensity of the resonance signal for the un- irradiated PVC that had been subjected to the same heating cycles as the irradiated sample. The abrupt appearance of the e.p.r. signal at a temperature of 245° for unirradiated PVC has been reported previously. 27 It is in this temperature range between 150 and 245° that others have reported26 the onset of a rapid loss of HCI and the appearance of low molecular weight hydrocarbons for unirradiated PVC. The decreasing width of the spectrum is thought to be the result of a further loss of hydrogen atoms as the dehydrochlorination process continues with increasing temperature. The relatively few radicals formed during pyrolysis below 245° that contribute to the e.p.r. signal
(2 7 ) F . H . W in s lo w , W . M a t r e y e k a n d W . A . Y a g e r , “ In d u s tr ia l C a r b o n a n d G r a p h it e ,” T h e M a c m illa n C o . , N e w Y o r k , N . Y . , 1 9 5 8 , p p . 1 9 0 -1 9 6 .
822 S . W . M a y e r , T. H. M i l l s , R. C. A l d e n a n d B. B. O w e n s Vol. 65
would result from chain scissions26 and would become trapped within conjugated sequences of double bonds.
The number of pyrolysis-initiated radicals increases in both the irradiated and unirradiated PVC as the temperature is increased above 245°. The width, on the other hand, remains nearly constant and about the same for both, increasing only slightly in going from about 245 to 420°. A nearly constant width of signal has been reported before for unirradiated PVC pyrolyzed between 350 and 450°.26 The nearly constant signal width indicates that the same relatively constant trapping environment prevails in both the irradiated and unirradiated PVC throughout this temperature range. It is within this temperature range, at about 300°, that the dehydrochlorination process is reported to be approximately complete26 and where the weight loss is reported to be relatively
constant between about 300 and 400°.27 Any further narrowing of the e.p.r. spectrum due to the loss of hydrogen from the polymer, therefore, would be expected to be at a much lower rate. Stromberg, et a l .,26 report a nearly constant weight loss of approximately 58% (the weight percentage of HC1 in the polymer) between about 280 and 342°, the volatile products other than HC1 being made up of small hydrocarbon molecules—having five or less carbon units—wdiich are produced at random and their quantity independent of temperature.
Acknowledgments.— The authors are indebted to W. J. Barnes, of this Laboratory, for the light scattering measurements and determination of molecular weight. We also wish to thank Dr. A. A. Miller for the helpful discussions and suggestions concerning this work.
LIQUIDUS CURVES FOR MOLTEN ALKALI METAPHOSPHATE-SULFATESYSTEMS1
By S. W. M ayer, T. H. M ills, R. C. Alden and B. B. Owens Research Department, Atomics International, A Division of North American Aviation, Canoga Park, California
Received November 21, 1960
Liquidus curves for the N aP03-N a2S04, R bP 03-R b 2S04 and R bP 03-N a2S04 systems have been determined by gradient- furnace, visual and thermal analysis techniques. The liquidus curves are compared with those for the LiP03-L i2S04, K P 03-K 2S04 and K P 03-L i2S04 systems. All these alkali metaphosphate-sulfate systems with a common cation are of the single eutectic type, and have constant activation energy for viscous flow. The reciprocal systems, however, form intermediate solid compounds. Results of phosphate chain-length measurements along the N aP03-N a2S04 liquidus are given; they agree, qualitatively, with chain-length estimates based on the freezing-point depression of Na2S04.
IntroductionMolten alkali metaphosphate-sulfate systems
are of particular significance since they provide the basis for potential nuclear reactor fuels. 2 Because molten metaphosphates consist largely of polymers, 3 these systems provide an opportunity to investigate the behavior of molten polymer-salt systems. Bergman and Shclokhovich4 have investigated the LiP0 3-L i2S 0 4 and KPO 3-K 2SO4
systems. It was of interest, therefore, to study the liquidus curves in the NaP0 3-N a 2S0 4 and Rb- P 0 3-R b 2S0 45 systems so that a systematic comparison for the first four cations of the alkali metal group could be made. The RbP0 3-N a 2 S0 4 system was studied also, in order to investigate a reciprocal system ( i . e . , one with no common cation or anion.)
ExperimentalMaterials.— Sodium sulfate, anhydrous reagent grade,
was dried by heating for 24 hours in vacuo (< 1 0 -6 mm.) at 830°. Dry sodium metaphosphate was prepared by heat
(1 ) T h is re se a rch w as p e r fo r m e d u n d e r th e a u sp ice s o f t h e R e s e a r ch D iv is io n o f th e U . S . A t o m ic E n e r g y C o m m is s io n , a n d w a s p r e se n te d in p a r t a t th e A p r i l , 195 9 , M e e t in g o f th e A m e r ic a n C h e m ic a l S o c ie ty .
(2 ) S . W . M a y e r , W . S . G in e ll a n d D . E . M c K e n z ie , Trans. Am. Nuclear Soc., 2 , 126 (1 9 5 9 ).
(3 ) J . R . V a n W a z e r , “ P h o sp h o ru s a n d its C o m p o u n d s ,” V o l I , In te r s c ie n c e P u b lis h e rs , I n c . , N e w Y o r k , N . Y . , 1958 .
(4 ) A . G . B e r g m a n a n d M . L . S h o lo k h D v ich , J. Gen. Chem., U.S.S. R., 2 3 , 107 5 (1 9 5 3 ).
(5 ) T h e s o d iu m a n d ru b id iu m c a t io n s a re im p o r t a n t in th a t th e yh a v e th e lo w e s t th e rm a l n e u tro n c r o s s -s e c t io n a m o n g th e a lk a li m e ta lca t io n s ,
ing N aP03- I 3 in vacuo for seven days at 520°; N aP03- I was made6 from reagent grade NaH2P 04-H20 . Anhydrous rubidium sulfate (obtained from the American Potash and Chemical Corporation), containing less than 0.5% of other cations, was dried by heating in vacuo for two days at 900°. Rubidium metaphosphate was prepared by fusing anhydrous rubidium chloride with the stoichiometric quantity of reagent grade ammonium dihydrogen phosphate for one hour at 770°. The phosphorus content of the R bP 03 was determined and corresponded to 99.6 ± 0.2% R bP 03.
Methods.— Because higher concentrations of N aP03 markedly increased the viscosity of the melts, it was necessary to use three techniques for determining points on the liquidus curves. At relatively low N aP03 concentrations the viscosity was low enough so that thermal arrests corresponding to liquidus points could be detected by the cooling-curve technique. At intermediate concentrations of N aP03, where increasing viscosity led to the disappearance of thermal arrests, a visual technique was used to detect liquidus points on the basis of the first appearance of the solid phase as the melt was cooled slowly. At high N aP 03 concentrations no precipitation or thermal arrests occurred since the viscosity increased during the cooling of the melt until a clear, rigid glass was formed. Accordingly, liquidus points at high N aP03 concentrations were determined by a gradient-furnace technique.7
The thermal arrest procedure8 and gradient-furnace method7 have been described. The standard deviations in the thermal arrest measurements were 0.5° or less. Standard deviations for liquidus points determined after equilibrating for 1, 2 and 3 days in the thermal gradient furnace
(6 ) L . F . A u d r ie th , E d it o r , “ I n o r g a n ic S y n th e s e s ,” V o l . I l l , M c G ra w -H ill B o o k C o . , N e w Y o r k , N . Y . , 195 0 , p , 103.
(7 ) O . H . G r a v e r a n d E . H . H a m ilto n , J. Research Natl. Bur. Standards, 4 4 , 4 9 5 G 9 5 0 ) .
(8 ) S . W . M a y e r , S, J . Y o s im a n d L . E . T o p o l , J. Phys. Chem., 64, 2 38 ( I 9 6 0 ) ,
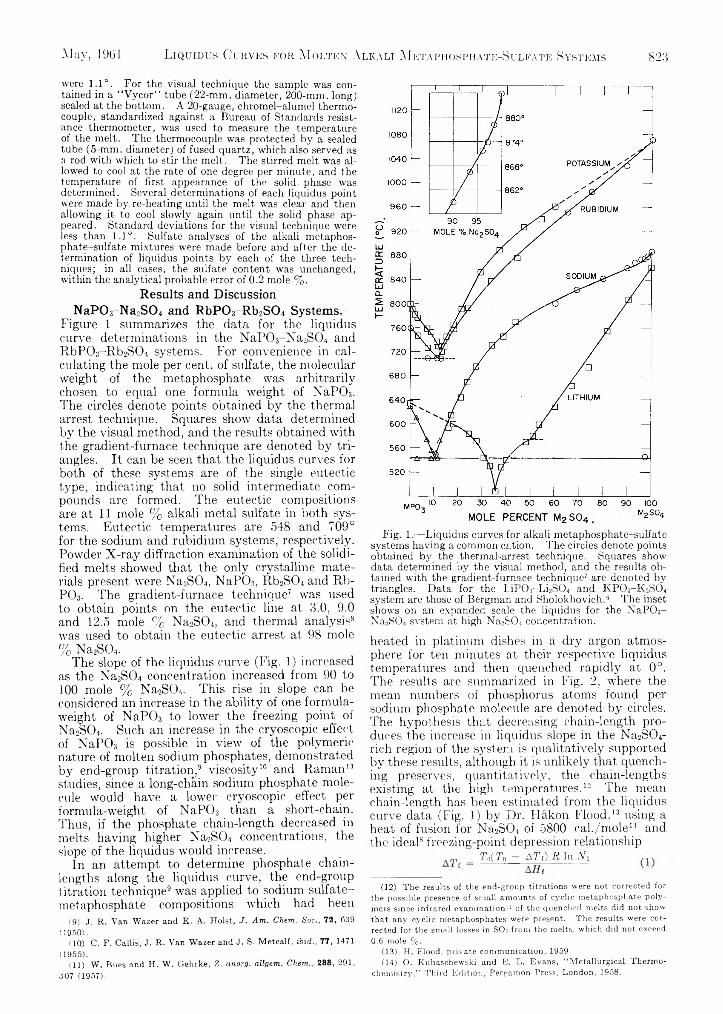
May, 1901 L i q u i d u s C u r v e s f o r M o l t e n A l k a l i M e t a p h o s p h a t e - S u l f a t e S y s t e m s 823
were 1.1°. For the visual technique the sample was contained in a “ Vycor” tube (22-mm. diameter, 200-mm. long) sealed at the bottom. A 20-gauge, chromel-alumel thermocouple, standardized against a Bureau of Standards resistance thermometer, was used to measure the temperature of the melt. The thermocouple was protected by a sealed tube (5-mm. diameter) of fused quartz, which also served as a. rod with which to stir the melt . The stirred melt was allowed to cool at the rate of one degree per minute, and the temperature of first appearance of the solid phase was determined. Several determinations of each liquidus point were made by re-heating until the melt was clear and then allowing it to cool slowly again until the solid phase appeared. Standard deviations for the visual technique were less than 1.1°. Sulfate analyses of the alkali metaphosphate-sulfate mixtures were made before and after the determination of liquidus points by each of the three techniques; in all cases, the sulfate content was unchanged, within the analytical probable error of 0.2 mole % .
Results and DiscussionNaP03-Na2S 04 and RbPO?, Rb2S 04 Systems.—
Figure 1 summarizes the data for the liquidus curve determinations in the NaP0 3-N a 2S0 4 and R bP0 3-R b 2S0 4 systems. For convenience in calculating the mole per cent, of sulfate, the molecular weight of the metaphosphate tvas arbitrarily chosen to equal one formula weight of X aP 03. The circles denote points obtained by the thermal arrest technique. Squares show data determined by the visual method, and the results obtained with the gradient-furnace technique are denoted by triangles. It can be seen that the liquidus curves for both of these systems are of the single eutectic type, indicating that no solid intermediate compounds are formed. The eutectic compositions are at 1 1 mole % alkali metal sulfate in both systems. Eutectic temperatures are 548 and 709° for the sodium and rubidium systems, respectively. Powder X-ray diffraction examination of the solidified melts showed that the only crystalline materials present were Na2S04, NaP03, Rb 2S0 4 and Rb- P 03. The gradient-furnace technique7 was used to obtain points on the eutectic line at 3.0, 9.0 and 12.5 mole % Na2S04, and thermal analysis8
was used to obtain the eutectic arrest at 98 mole % Na2S04.
The slope of the liquidus curve (Fig. 1) increased as the Na2S0 4 concentration increased from 90 to 100 mole % Na2S04. This rise in slope can be considered an increase in the ability of one formula- weight of N aP0 3 to lower the freezing point of Na2S04. Such an increase in the cryoscopic effect of N aP0 3 is possible in view of the polymeric nature of molten sodium phosphates, demonstrated by end-group titration, 9 viscosity1 0 and Raman 1 1
studies, since a long-chain sodium phosphate molecule would have a lower cryoscopic effect per formula-weight of NaP0 3 than a short-chain. Thus, if the phosphate chain-length decreased in melts having higher Na2S0 4 concentrations, the slope of the liquidus would increase.
In an attempt to determine phosphate chain- lengths along the liquidus curve, the end-group titration technique9 was applied to sodium sulfate- metaphosphate compositions which had been
(9 ) J . R . V a n W a z e r a n d K . A . H o ls t , J . Am. Chem.. Soc., 72, 639 (1 9 5 0 ).
(1 0 ) C . F . C a llis , J . R . V a n W a z e r a n d J . S . M e t c a l f , ibid., 77, 1471 (1 9 5 5 ).
(1 1 ) W . B u e s a n d H . W . G e h rk e , Z. anorg. allgem. Chem., 2 8 8 , 2 91 , 3 0 7 (1 9 5 7 ).
Fig. 1.—Liquidus curves for alkali metaphosphate-sulfate systems having a common cation. The circles denote points obtained by the thermal-arrest technique. Squares show data determined by the visual method, and the results obtained with the gradient-furnace technique7 are denoted by triangles. Data for the LiP03-Li2S04 and KPO3-K 2SO4
system are those of Bergman and Sholokhovich.4 The inset shows on an expanded scale the liquidus for the NaP03- NaoSOi system at high Na2S04 concentration.
heated in platinum dishes in a dry argon atmosphere for ten minutes at their respective liquidus temperatures and then quenched rapidly at 0 °. The results are summarized in Fig. 2, where the mean numbers of phosphorus atoms found per sodium phosphate molecule are denoted by circles. The hypothesis that decreasing chain-length produces the increase in liquidus slope in the Na2S04- rich region of the system is qualitatively supported by these results, although it is unlikely that quenching preserves, quantitatively, the chain-lengths existing at the high temperatures. 1 2 The mean chain-length has been estimated from the liquidus curve data (Fig. 1) by Dr. Flakon Flood , 1 3 using a heat of fusion for Na2S0 4 of 5800 cal./mole 1 4 and the ideal8 freezing-point depression relationship
_ To( T o - A Tt ) R In Ah
(1 2 ) T h e re su lts o f t h e e n d -g r o u p t it r a t io n s w e re n o t c o r r e c te d fo r th e p o s s ib le p r e s e n c e o f sm a ll a m o u n ts o f c y c l i c m e ta p h o s p h a te p o ly m e rs s in c e in fra re d e x a m in a t io n 11 o f th e q u e n c h e d m e lts d id n o t sh o w th a t a n y c y c l ic m e ta p h o s p h a te s w e re p r e se n t . T h e re s u lts w e re c o r r e c t e d fo r th e sm a ll losses in SO s fr o m th e m e lts , w h ic h d id n o t e x ce e d 0 .6 m o le % .
(1 3 ) H . F lo o d , p r iv a t e c o m m u n ic a t io n , 1959 .(1 4 ) O . K u b a s c h e w s k i a n d E . L . E v a n s , “ M e t a llu r g ic a l T h e r m o
c h e m is t r y ,” T h ir d E d it io n , P e rg a m o n P re ss , L o n d o n , 195 8 .
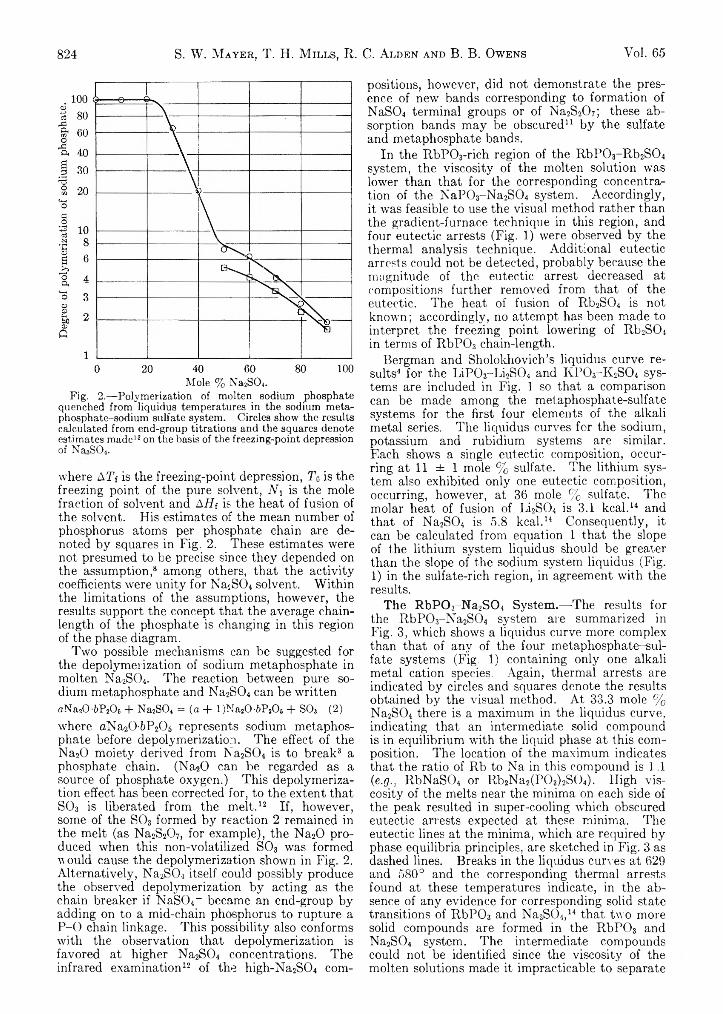
824 S. W. M a y e r , T. H. M i l l s , R. C. A l d e n a n d B. B. O w e n s Vol. 65
0 20 40 60 80 100Mole % Na2SO„.
Fig. 2.— Polymerization of molten sodium phosphate quenched from liquidus temperatures in the sodium metaphosphate-sodium sulfate system. Circles show the results calculated from end-group titrations and the squares denote estimates made13 on the basis of the freezing-point depression of NaoS04.
where A T t is the freezing-point depression, T0 is the freezing point of the pure solvent, N i is the mole fraction of solvent and A H { is the heat of fusion of the solvent. His estimates of the mean number of phosphorus atoms per phosphate chain are denoted by squares in Fig. 2. These estimates were not presumed to be precise since they depended on the assumption, 8 among others, that the activity coefficients were unity for Na2S0 4 solvent. Within the limitations of the assumptions, however, the results support the concept that the average chain- length of the phosphate is changing in this region of the phase diagram.
Two possible mechanisms can be suggested for the depolymerization of sodium metaphosphate in molten Na2SC>4 . The reaction between pure sodium metaphosphate and Na2S0 4 can be written aNa20 '6P 20 6 + Na2S04 = (a + l)N a20-6P20 6 + S03 (2)where aNa2 0 -&P2 C>5 represents sodium metaphosphate before depolymerization. The effect of the Na20 moiety derived from Na2S0 4 is to break3 a phosphate chain. (Na20 can be regarded as a source of phosphate oxygen.) This depolymerization effect has been corrected for, to the extent that S0 3 is liberated from the melt. 1 2 If, however, some of the S0 3 formed by reaction 2 remained in the melt (as Na2S2 C>7 , for example), the Na20 produced when this non-volatilized S0 3 was formed v ould cause the depolymerization shown in Fig. 2. Alternatively, Na2S0 4 itself could possibly produce the observed depolymerization by acting as the chain breaker if NaS04- became an end-group by adding on to a mid-chain phosphorus to rupture a P -0 chain linkage. This possibility also conforms with the observation that depolymerization is favored at higher Na2 S0 4 concentrations. The infrared examination1 2 of the high-Na2S0 4 com
positions, however, did not demonstrate the presence of new bands corresponding to formation of NaS04 terminal groups or of Na2S20 7; these absorption bands may be obscured1 1 by the sulfate and metaphosphate bands.
In the R bP 03-rich region of the RbP 0 3 -R b 2S0 4
system, the viscosity of the molten solution was lower than that for the corresponding concentration of the NaP0 3-N a 2S0 4 system. Accordingly, it was feasible to use the visual method rather than the gradient-furnace technique in this region, and four eutectic arrests (Fig. 1) were observed by the thermal analysis technique. Additional eutectic arrests could not be detected, probably because the magnitude of the eutectic arrest decreased at compositions further removed from that of the eutectic. The heat of fusion of Rb 2S0 4 is not known; accordingly, no attempt has been made to interpret the freezing point lowering of Rb 2S0 4
in terms of R bP0 3 chain-length.Bergman and Sholokhovich’s liquidus curve re
sults4 for the LiP0 3-L i 2S0 4 and K P 0 3-K 2S0 4 systems are included in Fig. 1 so that a comparison can be made among the metaphosphate-sulfate systems for the first four elements of the alkali metal series. The liquidus curves for the sodium, potassium and rubidium systems are similar. Each shows a single eutectic composition, occurring at 11 ± 1 mole % sulfate. The lithium system also exhibited only one eutectic composition, occurring, however, at 36 mole % sulfate. The molar heat of fusion of Li2S0 4 is 3.1 kcal. 1 4 and that of Na2S0 4 is 5.8 kcal. 1 4 Consequently, it can be calculated from equation 1 that the slope of the lithium system liquidus should be greater than the slope of the sodium system liquidus (Fig. 1 ) in the sulfate-rich region, in agreement with the results.
The R bP 03-Na2S 0 4 System.— The results for the R bP0 3-N a 2 S0 4 system are summarized in Fig. 3, which shows a liquidus curve more complex than that of any of the four metaphosphate-sulfate systems (Fig. 1) containing only one alkali metal cation species. Again, thermal arrests are indicated by circles and squares denote the results obtained by the visual method. At 33.3 mole % Na2S0 4 there is a maximum in the liquidus curve, indicating that an intermediate solid compound is in equilibrium with the liquid phase at this composition. The location of the maximum indicates that the ratio of Rb to Na in this compound is 1 .1 (e.gr., RbNaS04 or Rb 2Na2 (P 0 3) 2S04). High viscosity of the melts near the minima on each side of the peak resulted in super-cooling which obscured eutectic arrests expected at these minima. The eutectic lines at the minima, which are required by phase equilibria principles, are sketched in Fig. 3 as dashed lines. Breaks in the liquidus curves at 629 and 580° and the corresponding thermal arrests found at these temperatures indicate, in the absence of any evidence for corresponding solid state transitions of R bP0 3 and Na2S0 4 , 1 4 that two more solid compounds are formed in the R bP 0 3 and Na2S0 4 system. The intermediate compounds could not be identified since the viscosity of the molten solutions made it impracticable to separate
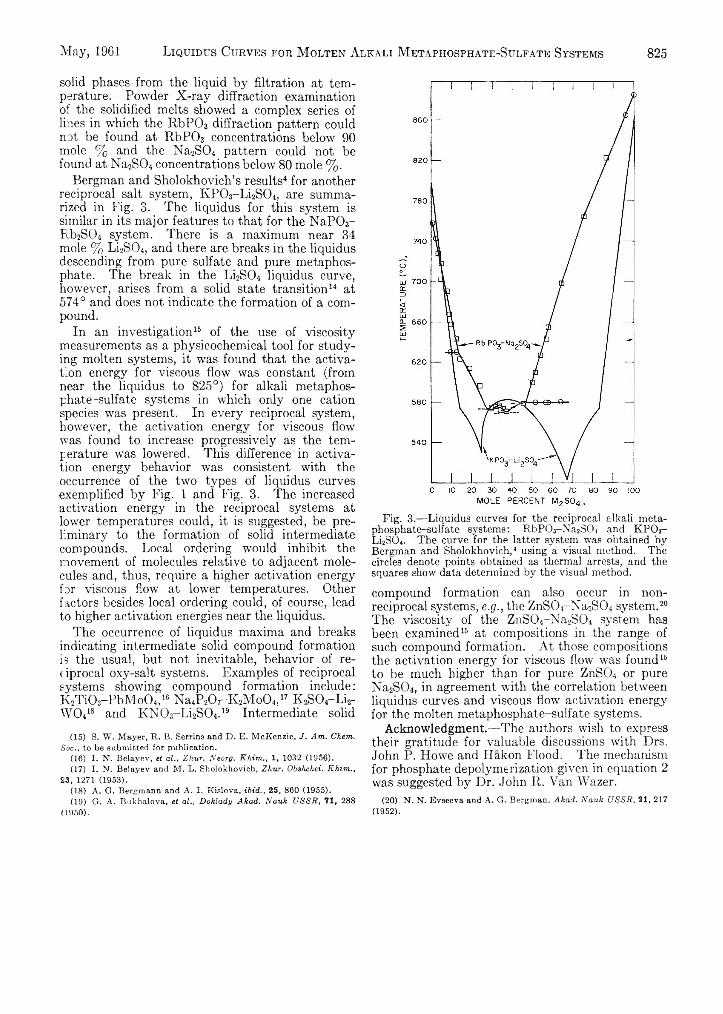
May, 1961 L i q u i d u s C u r v e s f o r M o l t e n A l k a l i M e t a p h o s p h a t e - S u l f a t e S y s t e m s 825
solid phases from the liquid by filtration at temperature. Powder X-ray diffraction examination of the solidified melts showed a complex series of lines in which the R bP 0 3 diffraction pattern could not be found at R bP 0 3 concentrations below 90 mole % and the Na2S0 4 pattern could not be found at Na2S0 4 concentrations below 80 mole % .
Bergman and Sholokhovich’s results4 for another reciprocal salt system, K P 0 3-L i2S04, are summarized in Fig. 3. The liquidus for this system is similar in its major features to that for the NaP03- Rb2S0 4 system. There is a maximum near 34 mole % Li2S04, and there are breaks in the liquidus descending from pure sulfate and pure metaphosphate. The break in the Li2S0 4 liquidus curve, however, arises from a solid state transition1 4 at 574° and does not indicate the formation of a compound.
In an investigation15 1 6 of the use of viscosity measurements as a physicochemical tool for studying molten systems, it was found that the activation energy for viscous flow was constant (from near the liquidus to 825°) for alkali metaphosphate-sulfate systems in which only one cation species was present. In every reciprocal system, however, the activation energy for viscous flow was found to increase progressively as the temperature was lowered. This difference in activation energy behavior was consistent with the occurrence of the two types of liquidus curves exemplified by Fig. 1 and Fig. 3. The increased activation energy in the reciprocal systems at lower temperatures could, it is suggested, be preliminary to the formation of solid intermediate compounds. Local ordering would inhibit the movement of molecules relative to adjacent molecules and, thus, require a higher activation energy for viscous flow at lower temperatures. Other factors besides local ordering could, of course, lead to higher activation energies near the liquidus.
The occurrence of liquidus maxima and breaks indicating intermediate solid compound formation is the usual, but not inevitable, behavior of reciprocal oxy-salt systems. Examples of reciprocal systems showing compound formation include: K 2T i0 3-P bM o0 4 , 1 6 Na4P20r-K 2M o0 4 , 1 7 K ,S0 4-L i2- W 0 4 1 8 and K N 0 3-L i 2S0 4 . 1 9 Intermediate solid
(1 5 ) S . W . M a y e r , R . B . S err in e a n d D . E . M c K e n z ie , J. Am. Chem. Soc., t o b e s u b m it te d f o r p u b l ic a t io n .
(1 6 ) I . N . B e la y e v , et al., Zhur. Neorg. Khim., 1 , 1 03 2 (1 9 5 6 ).(1 7 ) I . N . B e la y e v a n d M . L . S h o lo k h o v ic h , Zhur. Obshchei. Khim.,
2 3 , 1271 (1 9 5 3 ).(1 8 ) A . G . B e r g m a n n a n d A . I . K is lo v a , ibid., 2 5 , 8 6 0 (1 9 5 5 ).(1 9 ) G . A . B u k h a lo v a , et al., Doklady Akad. Nauk USSR, 7 1 , 2 88
(1 9 5 0 ).
Fig. 3.— Liquidus curves for the reciprocal alkali metaphosphate-sulfate systems: RbP0 3-N a2S04 and KPOr-Li2S04. The curve for the latter system was obtained by Bergman and Sholokhovich,4 using a visual method. The circles denote points obtained as thermal arrests, and the squares show data determined by the visual method.
compound formation can also occur in nonreciprocal systems, e .g ., the ZnS04-N a 2S0 4 system. 20
The viscosity of the ZnS04-N a 2S0 4 system has been examined16 at compositions in the range of such compound formation. At those compositions the activation energy for viscous flow was found 16
to be much higher than for pure ZnSC>4 or pure Na2S04, in agreement with the correlation between liquidus curves and viscous flow activation energy for the molten metaphosphate-sulfate systems.
Acknowledgment.—The authors wish to express their gratitude for valuable discussions with Drs. John P. Howe and Hakon Flood. The mechanism for phosphate depolymerization given in equation 2
was suggested by Dr. John R. Van Wazer.(2 0 ) N . N . E v s e e v a a n d A . G . B e r g m a n , Akad. Nauk USSR, 2 1 , 2 17
(1 9 5 2 ).
DETECTION OF METAL ION HYDROLYSIS BY COAGULATION. III.1ALUMINUM2
B y E. M a t i j e v i c , K. G. M a t h a i , R. H. O t t e w i l l 3 a n d M . K e r k e r
Clarkson College o f Technology, Potsdam, New YorkReceived November 28, 1960
Critical coagulation concentrations of aluminum salt solutions for negative silver iodide sols (both aged and in statu nascendi) and for silver bromide sols in statu nascendi were obtained over the pH range from 2 to 10. At pH < 4, the critical coagulation concentration corresponds to that of trivalent counterions indicating the presence of simple hydrated A l+3. In the pH range 4r-7 a tetravalent hydrolysis product is indicated, and at pH >7 a lower, possibly divalent species appears. The neutralization curve of A1(N03)3 titrated with NaOH is consistent with a first hydrolysis product with a Al:OH ratio of 1:2.5. The only complex ion in agreement with these results is Al8(OH)2o4+. At higher pH’s the existence of Al8(OH)222 + and Al8(OH )24 is assumed. Coagulation and electrophoretic measurements show that the hydrolyzed aluminum species reverse the charge of the originally negative silver halide sols, whereas the simple hydrated A l+++ does not.
82G E. M a t i j e v i c , K. G. M a t h a i , R. H. O t t e w i l l a n d M. Kerker Yol. 65
IntroductionDespite very extensive investigations of the
hydrolysis of aluminum salts., the composition of the hydrolyzed aluminum species is still not known with any certainty. A number of methods have been employed including pH measurements, 4 " 10
potentiometric titrations and e.m.f. measurements, 1 1 " 1 8 cryoscopy , 1 1 ' 1 9 ” 2 1 diffusion, 2 2 ' 2 3 ' 26 reaction kinetics, 24 conductivity , 26 light scattering, 2 6
ion exchange27 and coagulation. 28 Based on this work a variety of complex aluminum species, ionic and neutral, mononuclear and polynuclear, have been suggested. In most cases, the procedure was to determine the Al:OH ratio and to deduce the composition of the species from this. Some of the methods followed the change in molecular weight
(1 ) P a r t I I , E . M a t i je v ié , M . B . A b r a m s o n , K . F . S ch u lz a n d M . K e rk e r , J. Phys. Chem., 64, 115 7 (1 9 6 0 ).
(2 ) S u p p o r te d b y t h e O ffice o f O rd n a n c e R e s e a r c h C o n t r a c t N o . D A -O R D -I O .
(3 ) O n le a v e fr o m D e p a r t m e n t o f C o l lo id S c ie n c e , C a m b r id g e , E n g la n d .
(4 ) J . F a u c h e rr e , Bull. soc. chim. Frame, 2 53 (1 9 5 4 ) ; Compt. rend., 2 2 7 , 1367 (1 9 4 8 ).
(5 ) R . K . S ch o f ie ld a n d A . T a y lo r , J. Chem. Soc., 44.45 (1 9 5 4 ).(6 ) T . I t o a n d N . Y u i , Sci. Repts. Tokohu Umv. Ser I, 3 7 , 1 85
(1 9 5 3 ).(7 ) H . G o it e r , Compt. rend., 2 26 , 109 2 (1 9 4 8 ).(8 ) E . C a rr ie re a n d P . F a u r e , Bull, soc chim. France, 9, 8 09 (1 9 4 2 ).(9 ) V . Ó u p r , Collection Czechoslovak Chem. Commun., 1 , 4 6 7 (1 9 2 9 ).(1 0 ) A . J . P o ll in g , J. Chem. Met. Soc. S. Africa, 2 6 , 88 (1 9 2 5 ).(1 1 ) J . K e n t tá m a a , Ann. Acad. Sci. Fennicae, Ser. A, II, N o . 6 7 ,
3 9 p p . (1 9 5 5 ).(1 2 ) C . B r o sse t , G . B ie d e r m a n n a n d L . G . S illó n , Acta Chem. Scand.,
8, 1917 (1 9 5 4 ).(1 3 ) C . B r o sse t , ibid., 6 , 9 1 0 (1 9 5 2 ).(1 4 ) L . L ie p in a a n d A . V a iv a d s , Zhur. Fiz. Khim., 2 7 , 2 1 7 (1 9 5 3 ).(1 5 ) H . T a n a b e a n d F . I la s e g a v a , Ann. Repts. Takeda Research Lab.,
9, 63 (1 9 5 0 ).(1 6 ) W . D . T r e a d w e ll a n d J . E . B o n e r , Helv. Chim. Acta, 1 7 , 7 74
(1 9 3 4 ).(1 7 ) W . D . T r e a d w e ll a n d M . Z ü r ch e r , ibid., 15, 9 80 (1 9 3 2 ).(1 8 ) W . D . T r e a d w e ll a n d O . T . L ie n , ibid., 14, 473 (1 9 3 1 ).(1 9 ) K . F . J a h r a n d A . B r e ch lin , Z. anorg. allgem. Chem., 2 7 0 , 2 5 7
(1 9 5 2 ).(2 0 ) P . S o u c h a y , Bull. soc. chim., France, [V ] 15, 148 (1 9 4 8 ).(2 1 ) H . W . K o h ls c h ü t te r , P . H a n te lm a n n , K . D ie n e r a n d H .
S ch ill in g , Z. anorg. allgem. Chem., 2 4 8 , 319 (1 9 4 1 ).(2 2 ) W . H e u k e s h o v e n a n d A . W in k e l, ibid., 2 1 3 , 1 (1 9 3 3 ).(2 3 ) G . J a n d e r a n d A . W in k e l, ibid., 2 # 0 , 2 5 7 (1 9 3 1 ).(2 4 ) J . N . B r o n s t e d a n d K . V o lq u a r t z , Z, physik. Chem., 134, 97
(1 9 2 8 ).(2 5 ) N . B je r r u m , ibid., 59, 3 5 0 (1 9 0 7 ).(2 6 ) J . K . R u f f a n d S . Y . T y r e e , J. Am. Chem. Soc., 80 , 1523
(1 9 5 8 ).(2 7 ) M . H o n d a , J. Chem. Soc. Japan, Pure Chem. Sect., 7 2 , 5 55
(1 9 5 1 ).(2 8 ) E . M a t i j e v ic a n d B . T e 2 a k , J. Pfys. Chem., 57, 9 51 (1 9 5 3 ).
or number of particles with concentration, but in these cases the results could not be interpreted unambiguously. In all cases the charge of the ionic species was simply computed a p osteriori assuming a certain composition. Thus, for a definite ratio of A1 :OH a number of charged species are possible (e.g ., for the ratio 1:2.5; Al2 (OH)5+1, A14 (OH)102+, Al6 (OH)153+, A18 (OH)204+, etc.). An independent method is then necessary in order to determine the ionic charge.
We have shown previously1 ' 28 that coagulation of lyophobic colloids can be used to determine the actual charge of ionic species in solution. In this work, the critical coagulation concentrations of aluminum salt solutions for negative silver iodide and silver bromide sols were determined over a pH range from 2 - 1 0 and from these data the charge of the aluminum species wTas obtained. This, combined with potentiometric titrations and pH data, led us to unambiguous formulations for the aluminum species in aqueous solutions at various pH’s.
At higher pH values, the reversal o f charge caused by the hydrolyzed aluminum species was investigated utilizing both coagulation and electrophoresis.
Our experiments were performed both with sols in statu n ascendi and aged sols, and good agreement was obtained between the two techniques.
ExperimentalCoagulation of Sols in Statu Nascendi.— Silver iodide
and silver bromide sols in statu nascendi were eoagulated following a procedure described in detail previously.'.29.30
Aged Silver Iodide Sols.— Aged negative silver iodide sols were prepared by a procedure described by Ottewill, et al.31’s2 Five hundred ml. of 2.0 X 10"3 M A gN 03 was added slowly to 500 ml. of 2.0 X 10"3 M K I with vigorous stirring. The resulting sol was aged at 80° for about 15 hours and then diluted with a K I solution in order to obtain a 2.0 X 10~4 M A gl sol in 8.0 X lO "4 M K I. Five ml. of this diluted sol was mixed with 5 ml. of a solution containing the coagulating electrolyte, A1(N03)3, and either H N 03 or NaOH of sufficient quantity to obtain the desired pH. Thus, the final concentrations of aged sols were the same as in the corresponding experiments with sols in statu nascendi. Since the sol concentrations were quite low, the amount of neutral electrolyte was far too small to influence the coagulation effects and, therefore, no dialysis of the sol was carried out. The coagulation measurements were performed as with sols in statu nascendi, that is, by following 29 30 31 32
(2 9 ) E . M a t i je v ié a n d M . K e r k e r , ibid., 6 2 , 1271 (1 9 5 8 ).(3 0 ) B . T e ía k , E . M a t i je v ié a n d K . S ch u lz , ibid., 5 5 , 1 5 5 7 (1 9 5 1 ).(3 1 ) R . H . O t te w ill a n d M . C . R a s t o g i , Trans. Faraday Soc., 56,
8 6 6 (1 9 6 0 ).(3 2 ) R . W . H o r n e a n d R . H . O tte w ill , J. Phot. Sci., 6 , 39 (1 9 5 8 ).
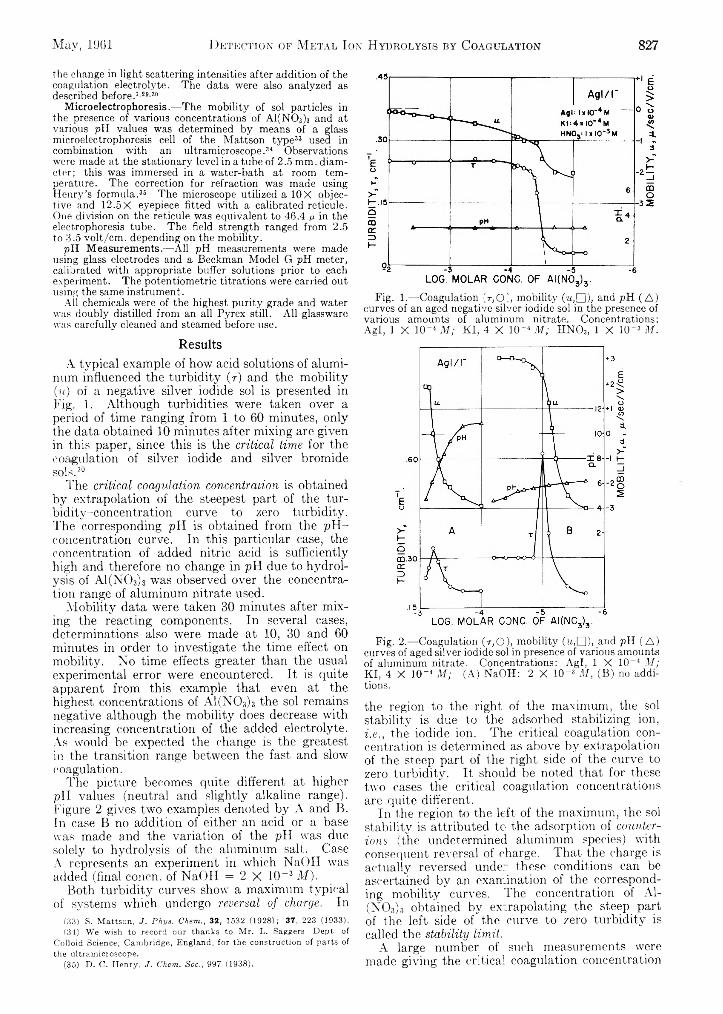
May, 1961 D e t e c t i o n o f M e t a l I o n H y d r o l y s i s b y C o a g u l a t i o n 827
the change in light scattering intensities after addition of the coagulation electrolyte. The data were also analyzed as described before.1'29'30
Microelectrophoresis.— The mobility of sol particles in the presence of various concentrations of A1(N03)3 and at various pH values was determined by means of a glass microelectrophoresis cell of the Mattson type33 used in combination with an ultramicroscope.34 Observations were made at the stationary level in a tube of 2.5 mm. diameter; this was immersed in a water-bath at room temperature. The correction for refraction was made using Henry’s formula.35 The microscope utilized a 10X objective and 12.5X eyepiece fitted with a calibrated reticule. One division on the reticule was equivalent to 46.4 ¡i in the electrophoresis tube. The field strength ranged from 2.5 to 3.5 volt/cm . depending on the mobility.
pH Measurements.— All pH measurements were made using glass electrodes and a Beckman Model G pH meter, calibrated with appropriate buffer solutions prior to each experiment. The potentiometrie titrations were carried out using the same instrument.
Ail chemicals were of the highest purity grade and water was doubly distilled from an all Pyrex still. All glassware was carefully cleaned and steamed before use.
ResultsA typical example of how acid solutions of alumi
num influenced the turbidity (r) and the mobility ( i f ) of a negative silver iodide sol is presented in Fig. 1. Although turbidities were taken over a period of time ranging from 1 to 60 minutes, only the data obtained 1 0 minutes after mixing are given in this paper, since this is the critical tim e for the coagulation of silver iodide and silver bromide sols. 30
The critical coagulation concentration is obtained by extrapolation of the steepest part of the turbidity-concentration curve to zero turbidity. The corresponding pH is obtained from the pH - concentration curve. In this particular case, the concentration of added nitric acid is sufficiently high and therefore no change in pH due to hydrolysis of A 1 (N 0 3) 3 was observed over the concentration range of aluminum nitrate used.
Mobility data were taken 30 minutes after mixing the reacting components. In several cases, determinations also were made at 10, 30 and 60 minutes in order to investigate the time effect on mobility. No time effects greater than the usual experimental error were encountered. It is quite apparent from this example that even at the highest concentrations of A 1 (N 0 3 ) 3 the sol remains negative although the mobility does decrease with increasing concentration of the added electrolyte. As would be expected the change is the greatest in the transition range between the fast and slow coagulation.
The picture becomes quite different at higher pH values (neutral and slightly alkaline range). Figure 2 gives two examples denoted by A and B. In case B no addition of either an acid or a base was made and the variation of the pH was due solely to hydrolysis of the aluminum salt. Case A represents an experiment in which NaOH was added (final concn. of NaOH = 2 X 10“ 3 M ) .
Both turbidity curves show- a maximum typical of systems which undergo reversal o f charge. In
(3 3 ) S. M a t t s o n , J. Phys. Chem., 3 2 , 153 2 (1 9 2 8 ) ; 3 7 , 223 (1 9 3 3 ).(3 4 ) W e w ish t o r e c o r d o u r th a n k s t o M r . L . S a g g e rs , D e p t , o f
C o l lo id S c ie n ce , C a m b r id g e , E n g la n d , f o r th e c o n s t r u c t io n o f p a r ts o f th e u ltr a m ic r o s c o p e .
(3 5 ) D . C . H e n r y , J. Chem. Soc., 9 9 7 (1 9 3 8 ).
Fig. 1 .— Coagulation ( r ,0 ) , m obility ( « , □ ) , and pH (A ) curves of an aged negative silver iodide sol in the presence of various amounts of aluminum nitrate. Concentrations: A gl, 1 X 1 0 “ 1 M ; K I , 4 X 10 ~ 4 M ; H N 0 3, 1 X IQ -3 M .
Fig. 2.— Coagulation (r .O ), mobility ( « , □ ) , and pH ( A ) curves of aged silver iodide sol in presence of various amounts of aluminum nitrate. Concentrations: A gl, 1 X 10 -4 M ; K I, 4 X 1 0 - 4 M ; (A) NaO H: 2 X 10 ~ 3 M , (B ) no additions.
the region to the right of the maximum, the sol stability is due to the adsorbed stabilizing ion, i .e ., the iodide ion. The critical coagulation concentration is determined as above by extrapolation of the steep part of the right side of the curve to zero turbidity. It should be noted that for these two cases the critical coagulation concentrations are quite different.
In the region to the left of the maximum, the sol stability is attributed to the adsorption of counterio n s (the undetermined aluminum species) with consequent reversal of charge. That the charge is actually reversed under these conditions can be ascertained by an examination of the corresponding mobility curves. The concentration of Al- (NO,)„ obtained by extrapolating the steep part of the left side of the curve to zero turbidity is called the stability lim it.
A large number of such measurements were made giving the critical coagulation concentration
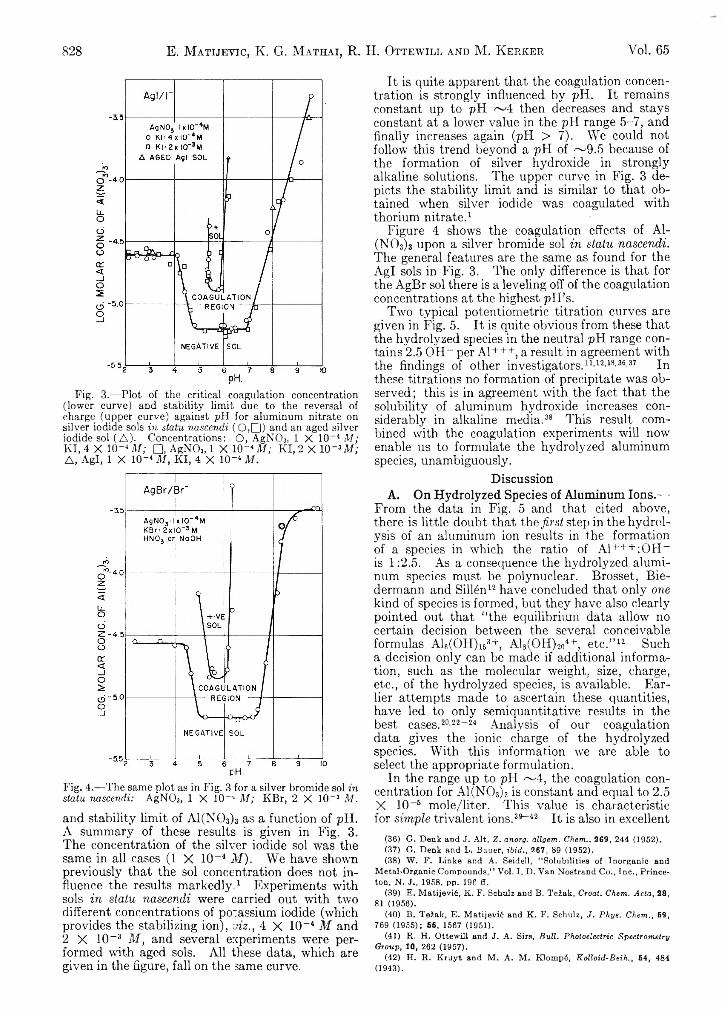
828 E. M a t i j e v i c , K . G. M a t h a i , R . H. O t t e w i l l a n d M . K e r k e r Vol. 65
Fig. 3.-—Plot of the critical coagulation concentration (lower curve) and stability limit due to the reversal of charge (upper curve) against pH for aluminum nitrate on silver iodide sols in statu nascendi ( 0 ,D ) and an aged silver iodide sol ( A) . Concentrations: O, AgN 03, 1 X 10⁻⁴ M ; K I, 4 X 10 ~4 M ; □ , AgN 03, 1 X 10- 4 M ; KI, 2 X 10 “ 3 M ; A , Agl, 1 X 10" 4 M , KI, 4 X 10-* M.
PH.Fig. 4.— The same plot as in Fig. 3 for a silver bromide sol in statu nascendi: AgN 03, 1 X 10“ * M ; KBr, 2 X 10⁻³ M.
and stability limit of A1(N03) 3 as a function of pH. A summary of these results is given in Fig. 3. The concentration of the silver iodide sol was the same in all cases (1 X 10“ 4 M ) . We have shown previously that the sol concentration does not influence the results markedly..1 Experiments with sols in statu n ascendi were carried out with two different concentrations of potassium iodide (which provides the stabilizing ion), viz ., 4 X 10~ 4 M and 2 X 10 “ 3 M , and several experiments were performed with aged sols. All these data, which are given in the figure, fall on the same curve.
It is quite apparent that the coagulation concentration is strongly influenced by pH. It remains constant up to pH ~ 4 then decreases and stays constant at a lower value in the pH range 5-7, and finally increases again (pH > 7). We could not follow this trend beyond a pH of ~ 9 .5 because of the formation of silver hydroxide in strongly alkaline solutions. The upper curve in Fig. 3 depicts the stability limit and is similar to that obtained when silver iodide was coagulated with thorium nitrate. 1
Figure 4 shows the coagulation effects of Al- (N 0 3 ) 3 upon a silver bromide sol in statu nascendi. The general features are the same as found for the Agl sols in Fig. 3. The only difference is that for the AgBr sol there is a leveling off of the coagulation concentrations at the highest pH’s.
Two typical potentiometric titration curves are given in Fig. 5. It is quite obvious from these that the hydrolyzed species in the neutral pH range contains 2.5 OH- per A1+++, a result in agreement with the findings of other investigators. 1 1 ' 1 2 ' 1 8 ’ 3 6 ' 87 In these titrations no formation of precipitate was observed ; this is in agreement with the fact that the solubility of aluminum hydroxide increases considerably in alkaline media. 38 This result combined with the coagulation experiments will now enable us to formulate the hydrolyzed aluminum species, unambiguously.
DiscussionA. On Hydrolyzed Species of Aluminum Ions.—
From the data in Fig. 5 and that cited above, there is little doubt that th e first step in the hydrolysis of an aluminum ion results in the formation of a species in which the ratio of A l+++:OH“ is 1:2.5. As a consequence the hydrolyzed aluminum species must be polynuclear. Brosset, Bie- dermann and SilMn1 2 have concluded that only one kind of species is formed, but they have also clearly pointed out that “ the equilibrium data allow no certain decision between the several conceivable formulas A 1 6 (OH)i63+, Al8 (OH)2o4+, etc . ” 1 2 Such a decision only can be made if additional information, such as the molecular weight, size, charge, etc., of the hydrolyzed species, is available. Earlier attempts made to ascertain these quantities, have led to only semiquantitative results in the best cases. 2 0 ' 2 2 - 2 4 Analysis of our coagulation data gives the ionic charge of the hydrolyzed species. With this information we are able to select the appropriate formulation.
In the range up to pH ~ 4 , the coagulation concentration for A1(N03) 3 is constant and equal to 2.5 X 10“ 6 mole/liter. This value is characteristic for sim p le trivalent ions. 39 “ 4 2 It is also in excellent
(3 6 ) G . D e n k a n d J . A l t , Z. anorg. allgem. Chem., 269, 2 4 4 (1 9 5 2 ).(3 7 ) G . D e n k a n d L . B a u e r , ibid., 267, 89 (1 9 5 2 ).(3 8 ) W . F . L in k e a n d A . S e id e ll, “ S o lu b ilit ie s o f I n o r g a n ic a n d
M e t a l-O r g a n ic C o m p o u n d s , " V o l . I , D . V a n N o s t r a n d C o . , I n c . , P r in c e t o n , N . J ., 1 9 5 8 , p p . 196 ff .
(3 9 ) E . M a t ije v i6 , K . F . S ch u lz a n d B . T e 2 a k , Croat. Chem. Acta, 28, 81 (1 9 5 6 ).
(4 0 ) B . T e £ a k , E . M a t i je v i6 a n d K . F . S ch u lz , J. Phys. Chem., 59, 7 69 (1 9 5 5 ) ; 55, 1567 (1 9 5 1 ).
(4 1 ) R . H . O t te w ill a n d J , A . S irs, Bull. Photoelectric Spectrometry Croup, 10, 2 62 (1 9 5 7 ).
(4 2 ) H . R . K r u y t a n d M . A . M . K lo m p 6 , Kolloid-Beih., 5 4 , 484 (1 9 4 3 ).
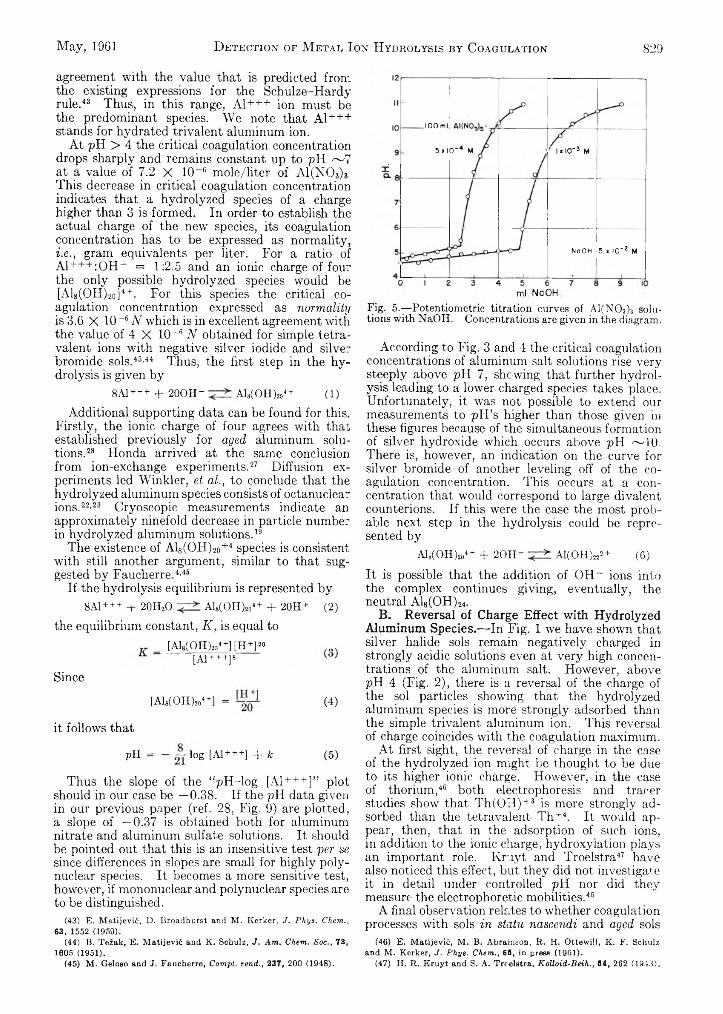
May, 1961 D e t e c t i o n o f M e t a l I o n H y d r o l y s i s b y C o a g u l a t i o n 829
agreement with the value that is predicted from the existing expressions for the Schulze-Hardy rule. 4 3 Thus, in this range, A1+++ ion must be the predominant species. We note that A1+++ stands for hydrated trivalent aluminum ion.
At pH > 4 the critical coagulation concentration drops sharply and remains constant up to pH ~ 7 at a value of 7.2 X 10“ 6 mole/liter of A1(N03 ) 3
This decrease in critical coagulation concentration indicates that a hydrolyzed species of a charge higher than 3 is formed. In order to establish the actual charge of the new species, its coagulation concentration has to be expressed as normality, i .e ., gram equivalents per liter. For a ratio of A l+++:OH~ = 1:2.5 and an ionic charge of four the only possible hydrolyzed species would be [A18(OH)2o]4+. For this species the critical coagulation concentration expressed as n orm ality is 3.6 X 10“ 6 N which is in excellent agreement with the value of 4 X 10“ 6 N obtained for simple tetra- valent ions with negative silver iodide and silver bromide sols. 4 3 ’ 4 4 Thus, the first step in the hydrolysis is given by
8A1+++ + 20OH - A18(OH)204+ (1)
Additional supporting data can be found for this. Firstly, the ionic charge of four agrees with that established previously for aged aluminum solutions. 28 Honda arrived at the same conclusion from ion-exchange experiments. 27 Diffusion experiments led Winkler, et al., to conclude that the hydrolyzed aluminum species consists of octanuclear ions. 2 2 ’ 2 3 Cryoscopic measurements indicate an approximately ninefold decrease in particle number in hydrolyzed aluminum solutions. 19
The existence of Ala(OH) 2 0 + 4 species is consistent with still another argument, similar to that suggested by Faucherre. 4 ’ 45
If the hydrolysis equilibrium is represented by8A1 + + + + 20H2O A18(OH)204+ + 20H+ (2)
the equilibrium constant, K , is equal to_ [Als(OH)204+][H +P° /n\
[AI+++]8
Since
[Ala(OHV+] = (4)
it follows that
pH = — log [A1 + + +] + k (5)
Thus the slope of the “ pH-log [A1+++]” plot should in our case be —0.38. If the pH data given in our previous paper (ref. 28, Fig. 9) are plotted, a slope of —0.37 is obtained both for aluminum nitrate and aluminum sulfate solutions. It should be pointed out that this is an insensitive test per se since differences in slopes are small for highly polynuclear species. It becomes a more sensitive test, however, if mononuclear and polynuclear species are to be distinguished.
(4 3 ) E . M a t ije v i6 , D . B r o a d h u r s t a n d M . K e rk e r , J. Phys. Chem., 63, 1552 (1 9 5 9 ).
(4 4 ) B . T e z a k , E . M a t i j e v i t a n d K . S ch u lz , J . Am. Chem. S oc., 7 3 , 1 60 5 (1 9 5 1 ).
(4 5 ) M . G e lo s o a n d J. F a u c h e rr e , Compt. rend., 237, 2 00 (1 9 4 8 ).
lOOml
5x1
0b5io
____
' I « 1e r 3 M
-
______1_____
NaOH •- 5 x I 0 ' 2 M
ml.NaOH.Fig. 5.— Potentiometrie titration curves of A1(N03)3 solutions with NaOH. Concentrations are given in the diagram.
According to Fig. 3 and 4 the critical coagulation concentrations of aluminum salt solutions rise very steeply above pH 7, showing that further hydrolysis leading to a lower charged species takes place. Unfortunately, it was not possible to extend our measurements to pH’s higher than those given in these figures because of the simultaneous formation of silver hydroxide which occurs above pH -~10. There is, however, an indication on the curve for silver bromide of another leveling off of the coagulation concentration. This occurs at a concentration that would correspond to large divalent counterions. If this were the case the most probable next step in the hydrolysis could be represented by
Al8(OH)2„4 + + 2 0 H - Al(OH)222+ (6)
It is possible that the addition of OH“ ions into the complex continues giving, eventually, the neutral Al8 (OH)24.
B. Reversal of Charge Effect with Hydrolyzed Aluminum Species.— In Fig. 1 we have shown that silver halide sols remain negatively charged in strongly acidic solutions even at very high concentrations of the aluminum salt. However, above pH 4 (Fig. 2), there is a reversal of the charge of the sol particles showing that the hydrolyzed aluminum species is more strongly adsorbed than the simple trivalent aluminum ion. This reversal of charge coincides with the coagulation maximum.
At first sight, the reversal of charge in the case of the hydrolyzed ion might be thought to be due to its higher ionic charge. However, in the case of thorium , 46 both electrophoresis and tracer studies show that Th(OH ) + 3 is more strongly adsorbed than the tetravalent Th+4. It would appear, then, that in the adsorption of such ions, in addition to the ionic charge, hydroxylation plays an important role. Kruyt and Troelstra47 have also noticed this effect, but they did not investigate it in detail under controlled pH nor did they measure the electrophoretic mobilities. 46
A final observation relates to whether coagulation processes with sols in statu n ascendi and aged sols
(4 6 ) E . M a t ije v i6 , M . B . A b ra m s o n , R . H . O t te w ill , K . F . S ch u lz a n d M . K e rk e r , J. Phys. Chem., 6 5 , in press (1 9 6 1 ).
(4 7 ) H . R . K r u y t a n d S . A . T rc-e ls tra , Kolloid-Beih., 54, 2 6 2 (1 9 4 3 ) .
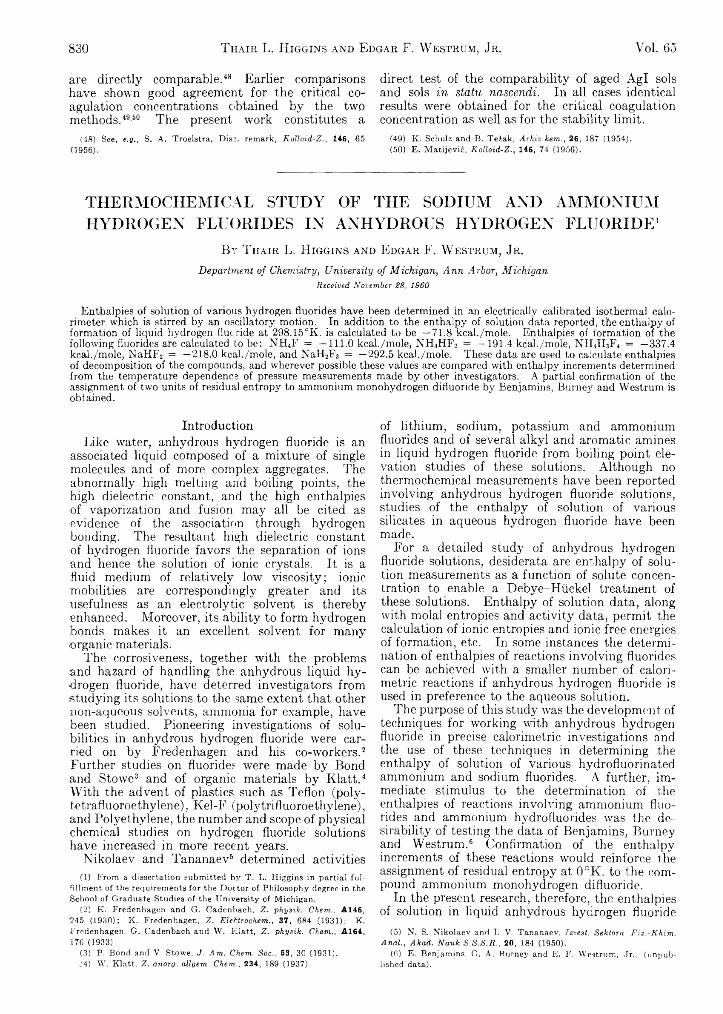
830 T h a i r L. H i g g i n s a n d E d g a r F. W e s t r u m , Jr. Voi. 65
are directly comparable.48 Earlier comparisons have shown good agreement for the critical coagulation concentrations obtained by the two methods.49'50 The present work constitutes a
(4 8 ) S ee , e.g., S . A , T r o e ls t r a , D is o . re m a rk , Kolloid-Z., 1 46 , 6 5 (1 9 5 6 ).
direct test of the comparability of aged Agl sols and sols in statu nascendi. In all cases identical results were obtained for the critical coagulation concentration as well as for the stability limit.
(4 9 ) K . S ch u lz a n d B . T e 2 a k , Arhiv hem., 2 6 , 1 87 (1 9 5 4 ).(5 0 ) E . M a t i je v ic , Kolloid-Z., 1 46 , 74 (1 9 5 6 ).
THERMOCHEMICAL STUDY OF THE SODIUM AND AMMONIUM HYDROGEN FLUORIDES IN ANHYDROUS HYDROGEN FLUORIDE1
B y T hair L. H iggins and E dgar F. W estrum, Jr.Department of Chemistry, University of Michigan, Ann Arbor, Michigan
Received November 28, 1960
Enthalpies of solution of various hydrogen fluorides have been determined in an electrically calibrated isothermal calorimeter which is stirred by an oscillatory motion. In addition to the enthalpy of solution data reported, the enthalpy of formation of liquid hydrogen flucride at 298.15°K. is calculated to be —71.8 kcal./mole. Enthalpies of formation of the following fluorides are calculated to be: NH4F = —111.0 kcal./mole, NH4HF2 = — 191.4 kcal./mole, NH4H3F4 = —337.4 kcal./mole, NaHF2 = —218.0 kcal./mole, and NaH2F3 = —292.5 kcal./mole. These data are used to calculate enthalpies of decomposition of the compounds, and wherever possible these values are compared with enthalpy increments determined from the temperature dependence of pressure measurements made by other investigators. A partial confirmation of the assignment of two units of residual entropy to ammonium monohydrogen difluoride by Benjamins, Burne}1' and Westrum is obtained.
IntroductionLike water, anhydrous hydrogen fluoride is an
associated liquid composed of a mixture of single molecules and of more complex aggregates. The abnormally high melting and boiling points, the high dielectric constant, and the high enthalpies of vaporization and fusion may all be cited as evidence of the association through hydrogen bonding. The resultant high dielectric constant of hydrogen fluoride favors the separation of ions and hence the solution of ionic crystals. It is a fluid medium of relatively low viscosity; ionic mobilities are correspondingly greater and its usefulness as an electrolytic solvent is thereby enhanced. Moreover, its ability to form hydrogen bonds makes it an excellent solvent for many organic materials.
The corrosiveness, together with the problems and hazard of handling the anhydrous liquid hydrogen fluoride, have deterred investigators from studying its solutions to the same extent that other non-aqueous solvents, ammonia for example, have been studied. Pioneering investigations of solubilities in anhydrous hydrogen fluoride were carried on by Fredenhagen and his co-workers.2 Further studies on fluorides were made by Bond and Stowe3 and of organic materials by Klatt.4 With the advent of plastics such as Teflon (poly- t-etrafluoroethylene), Kel-F (polytrifluoroethylene), and Polyethylene, the number and scope of physical chemical studies on hydrogen fluoride solutions have increased in more recent years.
Nikolaev and Tananaev6 determined activities(1 ) F r o m a d is se r ta t io n s u b m it t e d b y T . L . H ig g in s in p a r t ia l fu l
fi llm e n t o f th e re q u ire m e n ts f o r th e D o c t o r o f P h ilo s o p h y d e g re e in th e ¡S ch o o l o f G ra d u a te S tu d ie s o f th e U n iv e r s ity o f M ic h ig a n .
(2 ) K . F re d e n h a g e n a n d G . C a d e n b a c h , Z. physik. Chem., A 1 4 6 , "245 (1 9 3 0 ) ; K . F re d e n h a g e n , Z. Elektrochem., 3 7 , 6 84 (1 9 3 1 ); K . F re d e n h a g e n , G . C a d e n b a c h a n d W . E la t t , Z. physik. Chem., A 1 6 4 , 1 7 6 (1 9 3 3 ).
(3 ) P . B o n d a n d V . S to w e , J. Am. Chem. Soc., 5 3 , 3 0 (1 9 3 1 ).v(4 ) W . K la t t , Z. anorg. allgem. Chem., 2 3 4 , 189 (1 9 3 7 ).
of lithium, sodium, potassium and ammonium fluorides and of several alkyl and aromatic amines in liquid hydrogen fluoride from boiling point elevation studies of these solutions. Although no thermochemical measurements have been reported involving anhydrous hydrogen fluoride solutions, studies of the enthalpy of solution of various silicates in aqueous hydrogen fluoride have been made.
For a detailed study of anhydrous hydrogen fluoride solutions, desiderata are enthalpy of solution measurements as a function of solute concentration to enable a Debye-Hiickel treatment of these solutions. Enthalpy of solution data, along with molal entropies and activity data, permit the calculation of ionic entropies and ionic free energies of formation, etc. In some instances the determination of enthalpies of reactions involving fluorides can be achieved with a smaller number of calorimetric reactions if anhydrous hydrogen fluoride is used in preference to the aqueous solution.
The purpose of this study was the development of techniques for working with anhydrous hydrogen fluoride in precise calorimetric investigations and the use of these techniques in determining the enthalpy of solution of various hydrofluorinated ammonium and sodium fluorides. A further, immediate stimulus to the determination of the enthalpies of reactions involving ammonium fluorides and ammonium hydrofluorides was the desirability of testing the data of Benjamins, Burney and Westrum.6 Confirmation of the enthalpy increments of these reactions would reinforce the assignment of residual entropy at 0°K. to the compound ammonium monohydrogen difluoride.
In the present research, therefore, the enthalpies of solution in liquid anhydrous hydrogen fluoride
(5 ) N . S. N ik o la e v a n d I . V . T a n a n a e v , Tzvest. Sektora Fiz.-Khim. Anal., Akad. Nauk S.S.S.R., 2 0 , 184 (1 9 5 0 ).
(6 ) E . B e n ja m in s , G . A . B u r n e y a n d E . F . W e s tr u m , J r ., (u n p u b lish e d d a ta ) .
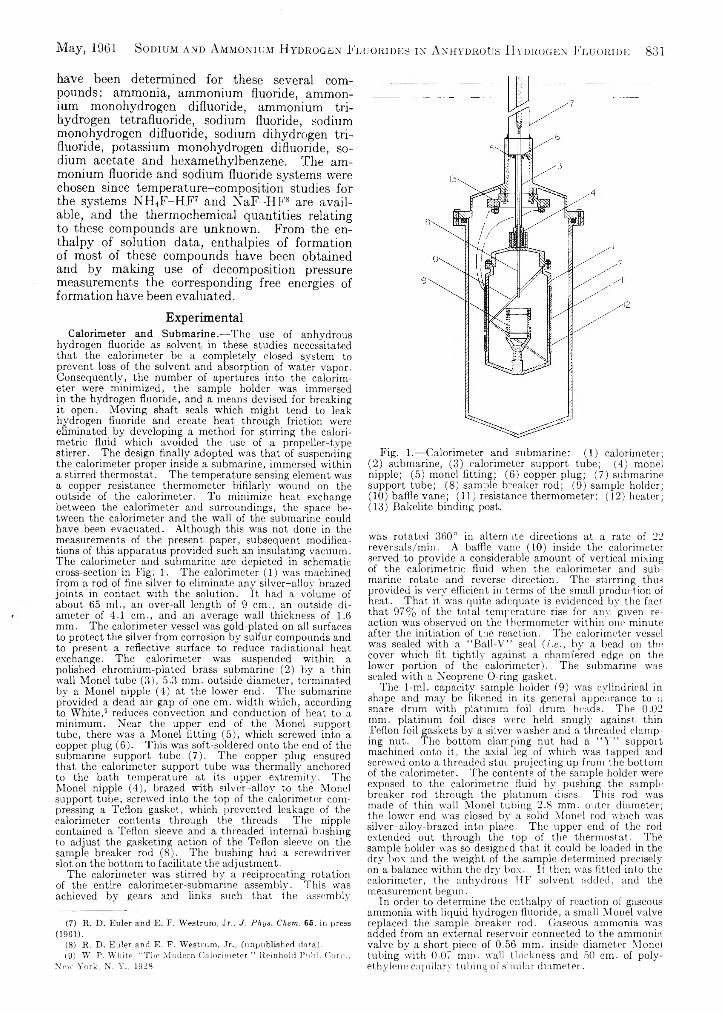
May, 1961 S o d i u m a n d A m m o n i u m H y d r o g e n F l u o r i d e s i n A n h y d r o u s H y d r o g e n F l u o r i d e 831
have been determined for these several compounds: ammonia, ammonium fluoride, ammonium monohydrogen difluoride, ammonium trihydrogen tetrafluoride, sodium fluoride, sodium monohydrogen difluoride, sodium dihydrogen trifluoride, potassium monohydrogen difluoride, sodium acetate and hexamethylbenzene. The ammonium fluoride and sodium fluoride systems were chosen since temperature-composition studies for the systems NH 4F-H F 7 8 and NaF-HFs are available, and the thermochemical quantities relating to these compounds are unknown. From the enthalpy of solution data, enthalpies of formation of most of these compounds have been obtained and by making use of decomposition pressure measurements the corresponding free energies of formation have been evaluated.
ExperimentalCalorimeter and Submarine.— The use of anhydrous
hydrogen fluoride as solvent in these studies necessitated that the calorimeter be a completely closed system to prevent loss of the solvent and absorption of water vapor. Consequently, the number of apertures into the calorimeter were minimized, the sample holder was immersed in the hydrogen fluoride, and a means devised for breaking it open. Moving shaft seals which might tend to leak hydrogen fluoride and create heat through friction were eliminated by developing a method for stirring the calorimetric fluid which avoided the use of a propeller-type stirrer. The design finally adopted was that of suspending the calorimeter proper inside a submarine, immersed within a stirred thermostat. The temperature sensing element was a copper resistance thermometer bifilarly wound on the outside of the calorimeter. To minimize heat exchange between the calorimeter and surroundings, the space between the calorimeter and the wall of the submarine could have been evacuated. Although this was not done in the measurements of the present paper, subsequent modifications of this apparatus provided such an insulating vacuum. The calorimeter and submarine are depicted in schematic cross-section in Fig. 1. The calorimeter (1) was machined from a rod of fine silver to eliminate any silver-alloy brazed joints in contact with the solution. It had a volume of about 65 ml., an over-all length of 9 cm., an outside diameter of 4.1 cm., and an average wall thickness of 1.6 mm. The calorimeter vessel was gold-plated on all surfaces to protect the silver from corrosion by sulfur compounds and to present a reflective surface to reduce radiational heat exchange. The calorimeter was suspended within a polished chromium-plated brass submarine (2) by a thin wall Monel tube (3), 5.3 mm. outside diameter, terminated by a Monel nipple (4) at the lower end. The submarine provided a dead air gap of one cm. width which, according to White,9 reduces convection and conduction of heat to a minimum. Near the upper end of the Monel support tube, there was a Monel fitting (5), which screwed into a copper plug (6). This was soft-soldered onto the end of the submarine support tube (7). The copper plug ensured that the calorimeter support tube was thermally anchored to the bath temperature at its upper extremity. The Monel nipple (4), brazed with silver-alloy to the Monel support tube, screwed into the top of the calorimeter compressing a Teflon gasket, which prevented leakage of the calorimeter contents through the threads. The nipple contained a Teflon sleeve and a threaded internal bushing to adjust the gasketing action of the Teflon sleeve on the sample breaker rod (8). The bushing had a screwdriver slot on the bottom to facilitate the adjustment.
The calorimeter was stirred by a reciprocating rotation of the entire calorimeter-submarine assembly. This was achieved by gears and links such that the assembly
(7 ) R . D . E u le r a n d E . F . W e s tr u m , J r ., J. Phys. Chem. 6 5 , in press (1 9 6 1 ).
(8 ) R . D . E u le r a n d E . F . W e s tr u m , J r ., (u n p u b lis h e d d a ta ) .(9 ) W . P . W h ite , ‘ ‘ T h e M o d e r n C a lo r im e te r ,” R e in h o ld P u b l. O o r p .,
N e w Y o r k , N . Y . f 1928.
Fig. 1.— Calorimeter and submarine: (1) calorimeter;(2) submarine, (3) calorimeter support tube; (4) monel nipple; (5) monel fitting; (6) copper plug; (7) submarine support tube; (8) sample breaker rod; (9) sample holder; (10) baffle vane; (11) resistance thermometer: (12) heater; (13) Bakelite binding post.
was rotated 360° in alternate directions at a rate of 22 reversals/min. A baffle vane (10) inside the calorimeter served to provide a considerable amount of vertical mixing of the calorimetric fluid when the calorimeter and submarine rotate and reverse direction. The stirrring thus provided is very efficient in terms of the small production of heat. That it was quite adequate is evidenced by the fact that 97% of the total temperature rise for any given reaction was observed on the thermometer within one minute after the initiation of the reaction. The calorimeter vessel was sealed with a “ Ball-V” seal (i.e., by a bead on the cover which fit tightly against a chamfered edge on the lower portion of the calorimeter). The submarine was sealed with a Neoprene O-ring gasket.
The 1-ml. capacity sample holder (9) was cylindrical in shape and may be likened in its general appearance to a snare drum with platinum foil drum heads. The 0.02 mm. platinum foil discs were held snugly against thin Teflon foil gaskets by a silver v'asher and a threaded clamping nut. The bottom clamping nut had a “ Y ” suppoit machined onto it, the axial leg of which was tapped and screwed onto a threaded stud projecting up from the bottom of the calorimeter. The contents of the sample holder were exposed to the calorimetric fluid by pushing the sample breaker rod through the platinum discs. This rod was made of thin wall Monel tubing 2.S mm. outer diameter; the lower end was closed by a solid Monel rod which was silver-alloy-brazed into place. The upper end of the rod extended out through the top of the thermostat. The sample holder vans so designed that it could be loaded in the dry box and the weight of the sample determined precisely on a balance within the dry box. It then was fitted into the calorimeter, the anhydrous HF solvent added, and the measurement begun.
In order to determine the enthalpy of reaction of gaseous ammonia with liquid hydrogen fluoride, a small Monel valve replaced the sample breaker rod. Gaseous ammonia was added from an external reservoir connected to the ammonia valve by a short piece of 0.56 mm. inside, diameter Monel tubing with 0.07 mm. wall thickness and 50 cm. of polyethylene capillary tubing of similar diameter.
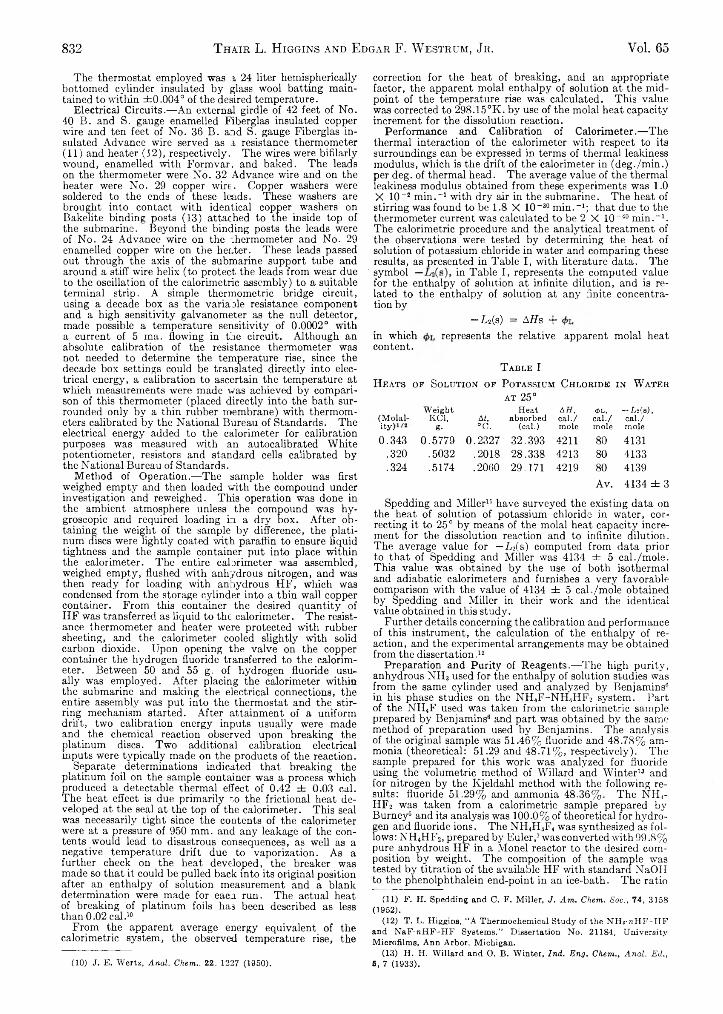
832 T h a i r L. H i g g i n s a n d E d g a r F. W e s t r u m , J r . Yol. 65
The thermostat employed was a 24 liter hemispherically bottomed cylinder insulated by glass wool batting maintained to within ±0.004° of the desired temperature.
Electrical Circuits.— An external girdle of 42 feet of No. 40 B. and S. gauge enamelled Fiberglas insulated copper wire and ten feet of No. 36 B. and S. gauge Fiberglas insulated Advance wire served as a resistance thermometer (11) and heater (12), respectively. The wires were bifilarly wound, enamelled with Formvar, and baked. The leads on the thermometer were No. 32 Advance wire and on the heater were No. 29 copper wire. Copper washers were soldered to the ends of these leads. These washers are brought into contact with identical copper washers on Bakelite binding posts (13) attached to the inside top of the submarine. Beyond the binding posts the leads were of No. 24 Advance wire on the thermometer and No. 29 enamelled copper wire on the heater. These leads passed out through the axis of the submarine support tube and around a stiff wire helix (to protect the leads from wear due to the oscillation of the calorimetric assembly) to a suitable terminal strip. A simple thermometric bridge circuit, using a decade box as the variaole resistance component and a high sensitivity galvanometer as the null detector, made possible a temperature sensitivity of 0.0002° with a current of 5 ma. flowing in the circuit. Although an absolute calibration of the resistance thermometer was not needed to determine the temperature rise, since the decade box settings could be translated directly into electrical energy, a calibration to ascertain the temperature at which measurements were made was achieved by comparison of this thermometer (placed directly into the bath surrounded only by a thin rubber membrane) with thermometers calibrated by the National Bureau of Standards. The electrical energy added to the calorimeter for calibration purposes was measured with an autocalibrated White potentiometer, resistors and standard cells calibrated by the National Bureau of Standards.
Method of Operation.— The sample holder was first weighed empty and then loaded with the compound under investigation and reweighed. This operation was done in the ambient atmosphere unless the compound was hygroscopic and required loading in a dry box. After obtaining the weight of the sample by difference, the platinum discs were lightly coated with paraffin to ensure Squid tightness and the sample container put into place within the calorimeter. The entire calorimeter was assembled, weighed empty, flushed with anhydrous nitrogen, and was then ready for loading with anhydrous HF, which was condensed from the storage cylinder into a thin wall copper container. From this container the desired quantity of HF was transferred as liquid to the calorimeter. The resistance thermometer and heater were protected with rubber sheeting, and the calorimeter cooled slightly with solid carbon dioxide. Upon opening the valve on the copper container the hydrogen fluoride transferred to the calorimeter. Between 50 and 55 g. of hydrogen fluoride usually was employed. After placing the calorimeter within the submarine and making the electrical connections, the entire assembly was put into the thermostat and the stirring mechanism started. After attainment of a uniform drift, two calibration energy inputs usually were made and the chemical reaction observed upon breaking the platinum discs. Two additional calibration electrical inputs were typically made on the products of the reaction.
Separate determinations indicated that breaking the platinum foil on the sample container was a process which produced a detectable thermal effect of 0.42 ± 0.03 cal. The heat effect is due primarily to the frictional heat developed at the seal at the top of the calorimeter. This seal was necessarily tight since the contents of the calorimeter were at a pressure of 950 mm. and any leakage of the contents would lead to disastrous consequences, as well as a negative temperature drift due to vaporization. As a further check on the heat developed, the breaker was made so that it could be pulled back into its original position after an enthalpy of solution measurement and a blank determination were made for eacn run. The actual heat of breaking of platinum foils has been described as less than 0.02 cal.10
From the apparent average energy equivalent of the calorimetric system, the observed temperature rise, the
(1 0 ) J . E . W e r tz , Anal. Chem., 22, 1227 (1 9 5 0 ).
correction for the heat of breaking, and an appropriate factor, the apparent molal enthalpy of solution at the midpoint of the temperature rise was calculated. This value was corrected to 298.15°K. by use of the molal heat capacity increment for the dissolution reaction.
Performance and Calibration of Calorimeter.— The thermal interaction of the calorimeter with respect to its surroundings can be expressed in terms of thermal leakiness modulus, which is the drift of the calorimeter in (deg./min.) per deg. of thermal head. The average value of the thermal leakiness modulus obtained from these experiments was 1.0 X 10⁻² min.-1 with dry air in the submarine. The heat of stirring was found to be 1.8 X 10 ~30 min.-1; that due to the thermometer current was calculated to be 2 X 10-40 min.-1. The calorimetric procedure and the analytical treatment of the observations were tested by determining the heat of solution of potassium chloride in water and comparing these results, as presented in Table I, with literature data. The symbol in Table I, represents the computed valuefor the enthalpy of solution at infinite dilution, and is related to the enthalpy of solution at any finite concentration by
—Ls(s) = AHs -f*in which represents the relative apparent molal heat content.
Table IHeats of Solution of Potassium Chloride in W ater
at 25°
( M o la l i t y )
W e ig h tK C 1 ,
g-At,°c.
H e a ta b s o r b e d
(c a l . )
A H ,c a l . /m o le
0L,c a l . /m o le
-Lit, s ) , c a l . / m o le
0.343 0.5779 0.2327 32.393 4211 80 4131.320 .5032 .2018 28.338 4213 80 4133.324 .5174 .2060 29.171 4219 80 4139
Av. 4134 ± 3
Spedding and Miller11 have surveyed the existing data on the heat of solution of potassium chloride in water, correcting it to 25° by means of the molal heat capacity increment for the dissolution reaction and to infinite dilution. The average value for —Li{s) computed from data prior to that of Spedding and Miller was 4134 ± 5 cal./mole. This value was obtained by the use of both isothermal and adiabatic calorimeters and furnishes a very favorable comparison with the value of 4134 ± 5 cal./mole obtained by Spedding and Miller in their work and the identical value obtained in this study.
Further details concerning the calibration and performance of this instrument, the calculation of the enthalpy of reaction, and the experimental arrangements may be obtained from the dissertation.12
Preparation and Purity of Reagents.— The high purity, anhydrous NHS used for the enthalpy of solution studies was from the same cylinder used and analyzed by Benjamins6 in his phase studies on the NH4F-N H 4HF2 system. Part of the NH4F used was taken from the calorimetric sample prepared by Benjamins8 and part was obtained by the same method of preparation used by Benjamins. The analysis of the original sample was 51.46% fluoride and 48.78% ammonia (theoretical: 51.29 and 48.71%, respectively). The sample prepared for this work was analyzed for fluoride using the volumetric method of Willard and Winter13 and for nitrogen by the Kjeldahl method with the following results: fluoride 51.29% and ammonia 48.36%. The NH4- HF2 was taken from a calorimetric sample prepared by Burney6 and its analysis was 100.0% of theoretical for hydrogen and fluoride ions. The NH4H3F4 was synthesized as follows : NH4HF2, prepared by Euler,7 was converted with 99.8% pure anhydrous HF in a Monel reactor to the desired composition by weight. The composition of the sample was tested by titration of the available HF with standard NaOH to the phenolphthalein end-point in an ice-bath. The ratio
(1 1 ) F . H . S p e d d in g a n d C . F . M i lle r , J. Am. Chem. Soc., 7 4 , 3 1 5 8 (1 9 5 2 ).
(1 2 ) T . L . H ig g in s , “ A T h e r m o e h e m ic a l S t u d y o f t h e N H a - n H F -H F a n d N a F * « .H F -H F S y s te m s ,” D is s e r ta t io n N o . 2 1 1 8 4 , U n iv e r s it y M ic r o film s , A n n A r b o r , M ic h ig a n .
(1 3 ) H . H . W i l la r d a n d O . B . W in te r , Ind. Eng. Chem., Anal. Ed., 5, 7 (1 9 3 3 ).
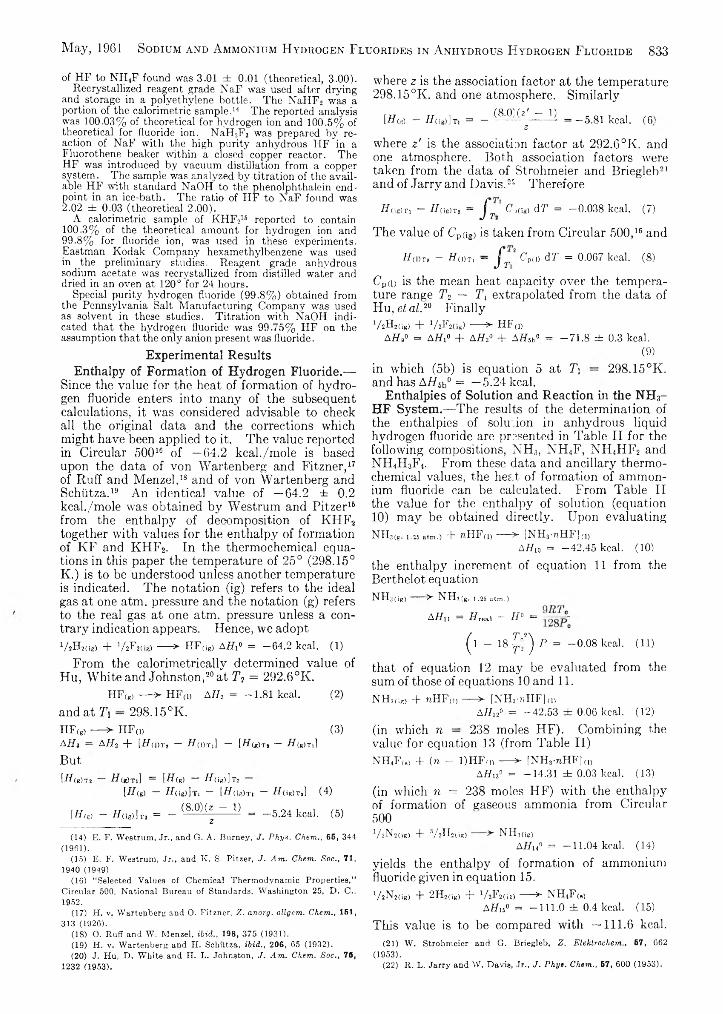
May, 1961 Sodium and Ammonium Hydrogen Fluorides in Anhydrous Hydrogen Fluoride 833
of H F to N H 4F found was 3 .01 ± 0 .01 (theoretical, 3 .0 0 ) .Recrystallized reagent grade N a F was used after drying
and storage in a polyethylene b ottle . T h e N a H F 2 was a portion of the calorimetric sam ple.14 15 T h e reported analysis was 1 0 0 .0 3 % of theoretical for hydrogen ion and 1 0 0 .5 % of theoretical for fluoride ion. N a H 2F 3 was prepared b y reaction of N a F w ith the high purity anhydrous 1IF in a Fluorothene beaker within a closed copper reactor. T he H F was introduced b y vacuum distillation from a copper system . T he sam ple was analyzed b y titration of the available H F w ith standard N a O H to the phenolphthalein endpoint in an ice-bath. T h e ratio of H F to N a F found was 2 .02 ± 0 .0 3 (theoretical 2 .0 0 ) .
A calorimetric sam ple of K H F 216 reported to contain 1 0 0 .3 % of the theoretical am ount for hydrogen ion and 9 9 .8 % for fluoride ion, was used in these experiments. Eastm an K od ak C om pany hexam ethylbenzene was used in the preliminary studies. R eagent grade anhydrous sodium acetate was recrystallized from distilled water and dried in an oven at 120 ° for 24 hours.
Special purity hydrogen fluoride ( 9 9 .8 % ) obtained from the Pennsylvania Salt M anufacturing C om pany w'as used as solvent in these studies. T itration with N a O H indicated that the hydrogen fluoride was 9 9 .7 5 % H F on the assumption th a t the only anion present was fluoride.
Experimental ResultsEnthalpy of Formation of Hydrogen Fluoride.—
Since the value for the heat of formation of hydrogen fluoride enters into many of the subsequent calculations, it was considered advisable to check all the original data and the corrections which might have been applied to it. The value reported in Circular 50018 of —64.2 kcal./mole is based upon the data of von Wartenberg and Fitzner,17 of Ruff and Menzel,18 and of von Wartenberg and Schiitza.19 An identical value of —64.2 ± 0.2 kcal./mole was obtained by Westrum and Pitzer16 from the enthalpy of decomposition of KHF2 together with values for the enthalpy of formation of KF and KHF2. In the thermochemical equations in this paper the temperature of 25° (298.15° K.) is to be understood unless another temperature is indicated. The notation (ig) refers to the ideal gas at one atm. pressure and the notation (g) refers to the real gas at one atm. pressure unless a contrary indication appears. Hence, we adoptV .H ,(W + 1 / 2F2;i.;) — > HF(ig) Alh° = —64.2 kcal. (1)
From the calorimetrically determined value of Hu, White and Johnston,20 at T? = 292.6°K.
H F (g) •— >- H F(i) A H 2 = - 1 . 8 1 kcal. (2)
and at T\ — 298.15°K.H F (g) — ^ H F (1) (3)A H 3 — AH, -j- [H(dtj — TAdt,] — [F7(g)Ti — H(g)Til
But[H (k)T2 H ( r)Ti ] = [H(g) #<ig)]T2
l-ff(g) — H (ig)3 Ti — [ff( ie )T i — H(ig) T2] (4)
[H<g) - H aah , = - (8 ,0 )(^ ~ l) = - 5 . 2 4 kcal. (5)
(14) E. F. Westrum, Jr., and G. A. Burney, J. Phys. Chem., 65, 344 (1961).
(15) E. F. Westrum, Jr., and K. S. Pitzer, J. Am. Chem. Soc., 71, 1940 (1949).
(16) “Selected Values of Chemical Thermodynamic Properties,’ ' Circular 500, National Bureau of Standards, Washington 25, D. C., 1952.
(17) H. v. Wartenberg and O. Fitzner, Z. anorg. allgem. Chem., 151, 313 (1926).
(18) O. Ruff and W. Menzel, ibid., 198, 375 (1931).(19) Ii. v. Wartenberg and H. Schiitza, ibid., 206, 65 (1932).(20) J. Hu, D. White and H. L. Johnston, J. Am. Chem. Soc., 75,
1232 (1953).
where z is the association factor at the temperature 298.15°K. and one atmosphere. Similarly
[ffdO - H(ig)It, = - (8 ,0 )(z ,~ 1}- = -5 .8 1 kcal. (61z
where z' is the association factor at 292.6°K. and one atmosphere. Both association factors were taken from the data of Strohmeier and Briegleb21 and of Jarry and Davis.22 Therefore
H;ie)Ti — H(¡E)T2 = j " T C%ig) dT = —0.038 kcal. (7)
The value of Cp«g) is taken from Circular 500,16 and
ff (i)T , — Ham — J'y, Cpd) dT = 0.067 kcal. (8)
CP(i) is the mean heat capacity over the temperature range T 2 — T , extrapolated from the data of Hu, e t a l .20 Finally ViWcis) + VJF«i.) -— > HF(d
A if»0 = A Hi0 + A H3° + AHsb0 = -7 1 .8 ± 0.3 kcal.(9)
in which (5b) is equation 5 at T\ — 298.15°K. and has AH5b° = —5.24 kcal.
Enthalpies of Solution and Reaction in the NH3- HF System.—The results of the determination of the enthalpies of solution in anhydrous liquid hydrogen fluoride are presented in Table II for the following compositions, NH8, NH4F, NH4IIF2 and NH4H3F4. From these data and ancillary thermochemical values, the heat of formation of ammonium fluoride can be calculated. From Table II the value for the enthalpy of solution (equation10) may be obtained directly. Upon evaluatingN H 3(8, 1.25 atm.) + w H F (l) ------> [N H 3-??.HF] (1)
AHw = -42 .45 kcal. (10)the enthalpy increment of equation II from the Berthelot equationN H 3(ig) ^ N H j(g , 1.25 ntm.)
AHn = Ureal - H° =
( l - 18 ipQ P = -0 .0 8 kcal. (11)
that of equation 12 may be evaluated from the sum of those of equations 10 and 11.N H , m + n H F (i) — > [ N H r n H F ] , , )
A //i2° = -42 .53 ± 0.06 kcal. (12)(in which n — 238 moles HF). Combining the value for equation 13 (from Table II)NHiF|t) + (n - l)HFti) — > [NH,-nHF]a,
Affu1 = -14.31 ± 0.03 kcal. (13)(in which n = 238 moles HF) with the enthalpy of formation of gaseous ammonia from Circular 500V iN id g ) + Vails;ig) > NHa(ig)
AHU« = -11 .04 kcal. (14)yields the enthalpy of formation of ammonium fluoride given in equation 15.V sN 2(ig) + 2 H 2(ig) + 1/ 2F 2(iJ) — > N H 4F (,)
AH,5° = -111 .0 ± 0.4 kcal. (1.5)This value is to be compared with —111.6 kcal.
(21) W. Strohmeier and G . Briegleb, Z. Elektrochem., 57, 662 (1953).
(22) R . L. Jarry and W . Davis, Jr., J . Phys. Chem., 57, 600 (1953).
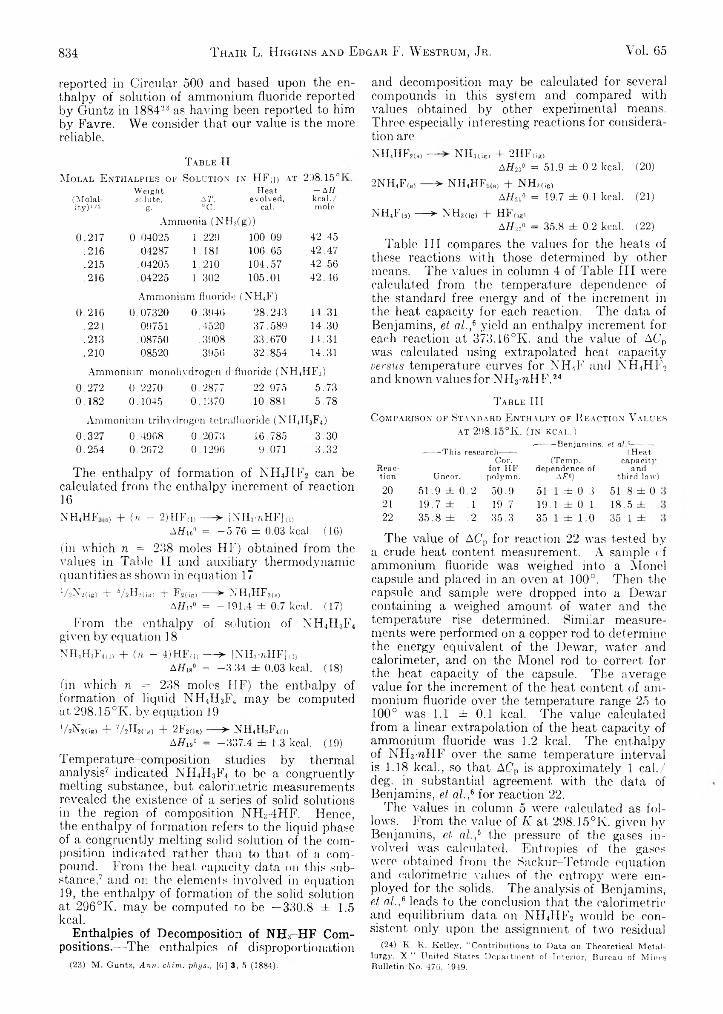
834 T hair L. H iggins and Edgar F. W estrum, Jr. Vol. 65
reported in Circular 500 and based upon the enthalpy of solution of ammonium fluoride reported by Guntz in 188423 as having been reported to him by Favre. We consider that our value is the more reliable.
T a b l e I I
M o l a l E n t h a l p ie s o f S o l u t io n in HF(i) a t 2:18.15°Weight Heat -AH
(M olal solute, A T, evolved, kcal./ity)'« g- °C. cal. mole
Ammonia (NH3(g))0.217 0.04025 1.229 100.09 42.45
.216 .04287 1.181 106.65 42.47
.215 .04205 1.210 104.57 42.56
.216 .04225 1.302 105.01 42.46
Ammonium fluorid'e (NH4F)0.216 0.07320 0 3946 28.243 14.31
.224 .09751 .4520 37.589 14.30
.213 .08750 .3908 33.670 14.31
.210 .08520 . 3956 32.854 14.31
Ammonium monohydrogen d fluoride (NH 4HF2)0.272 0.2270 0.2877 22.975 5.730.182 0.1045 0.1370 10.881 5.78
Ammonium trihydrogen tetrafluoride (NH4H3F4)0.327 0.4968 0.2073 16.785 3.300.254 0.2672 0.1296 9.071 3.32
The enthalpy of formation of ¡\'H4II Is can be calculated from the enthalpy increment of reaction 16NH4HFo(a) + ( n - 2)HF(1) — > [NH3-nHF](1)
Affie0 = -5 .7 6 ± 0.03 kcal. (16)(in which n = 238 moles HF) obtained from the values in Table II and auxiliary thermodynamic quantities as shown in equation 17VdShcig, + y 2H2(il0 + F2(iSi — > NH4HF2(s)
AH,7« = -191 .4 ± 0.7 kcal. (17)From the enthalpy of solution of NH4H3F4
given by equation 18N H JbFw ) + (n - 4)HF(d -----^ [NH.r »HF] (1)
AHls° = -3 .3 4 ± 0.03 kcal. (18)(in which n = 238 moles HF) the enthalpy of formation of liquid NH4H3IC may be computed at 298.15°Iv. by equation 19lAN2(ig) + VdAc-io + 2F2(ie) — > NBuBTFid)
AH,»* = -337 .4 ± 1.3 kcal. (19)Temperature-composition studies by thermal analysis7 indicated NH4H3F4 to be a congruently melting substance, but calorimetric measurements revealed the existence of a series of solid solutions in the region of composition NH34HF. Hence, the enthalpy of formation refers to the liquid phase of a congruently melting solid solution of the composition indicated rather than to that of a compound. From the heat capacity data on this substance,7 and on the. elements involved in equation 19, the enthalpy of formation of the solid solution at 296°K. may be computed to be —330.8 ± 1 .5 kcal.
Enthalpies of Decomposition of NHs HF Compositions.—The enthalpies of disproportionation
(23) M . Guntz, A n n . chim . \?hys., [0] 3, 5 (1884).
and decomposition may be calculated for several compounds in this system and compared with values obtained by other experimental means. Three especially interesting reactions for consideration areNH4HF2(b) — NHjii,,, + 2HF(iS)
AHa* = 51.9 ± 0.2 kcal. (20) 2NH4F(s) — ^ NH4HF.w + NHs(ie)
AHn° = 19.7 ± 0.1 kcal. (21) N H ,F (S) — > N H 3(i6) + H F ( igi
A Hu* = 35.8 ± 0.2 kcal. (22)Table III compares the values for the heats of
these reactions with those determined by other means. The values in column 4 of Table III were calculated from the temperature dependence of the standard free energy and of the increment in the heat capacity for each reaction. The data of Benjamins, et a l ,,6 yield an enthalpy increment for each reaction at 373.16°K. and the value of AC’P was calculated using extrapolated heat capacity versu s temperature curves for NH4F and NH4H1<\ and known values for NH3-reHF.24
T a b l e I I I
C o m p a r is o n o f S t a n d a r d E n t h a l p y o f R e a c t io n V a l u e s a t 298.1o°K. ( in k c a l .)
---------Benjamins, et al.6--------- -------- This research-------- (Heat
Reaction Uncor.
Cor. for HF
polymn.
(Temp, dependence of
AF°)
capacityand
third law)20 51.9 ± 0 2 50.9 51.1 db 0.3 51,8 ± 0.21 19.7 ± . 1 19.7 19.1 ± 0.1 18.5 ± .22 35.8 ± .2 35.3 35.1 ± 1.0 35.1 ± .
The value of AC'p for reaction 22 was tested by a crude heat content measurement. A sample of ammonium fluoride was weighed into a Monel capsule and placed in an oven at 100°. Then the capsule and sample were dropped into a Dewar containing a weighed amount of water and the temperature rise determined. Similar measurements were performed on a copper rod to determine the energy equivalent of the Dewar, water and calorimeter, and on the Monel rod to correct for the heat capacity of the capsule. The average value for the increment of the heat content of ammonium fluoride over the temperature range 25 to 100° was 1.1 ± 0.1 kcal. The value calculated from a linear extrapolation of the heat capacity of ammonium fluoride was 1.2 kcal. The enthalpy of NH3-nHF over the same temperature interval is 1.18 kcal., so that A C P is approximately 1 cal./ deg. in substantial agreement with the data of Benjamins, et a l . ,6 for reaction 22.
The values in column 5 were calculated as follows. From the value of K at 298.15°K. given by Benjamins, et a l . ,6 the pressure of the gases involved was calculated. Entropies of the gases were obtained from the Sackur-Tetrode equation and calorimetric values of the entropy were employed for the solids. The analysis of Benjamins, et a l . 6 leads to the conclusion that the calorimetric and equilibrium data on NH4HF2 would be consistent only upon the assignment of two residual
(24) K. K. Kelley, “ Contributions to Data on Theoretical Metallurgy, X ,” United States Department of Interior, Bureau of Mini'sBulletin No. 470, 1949.
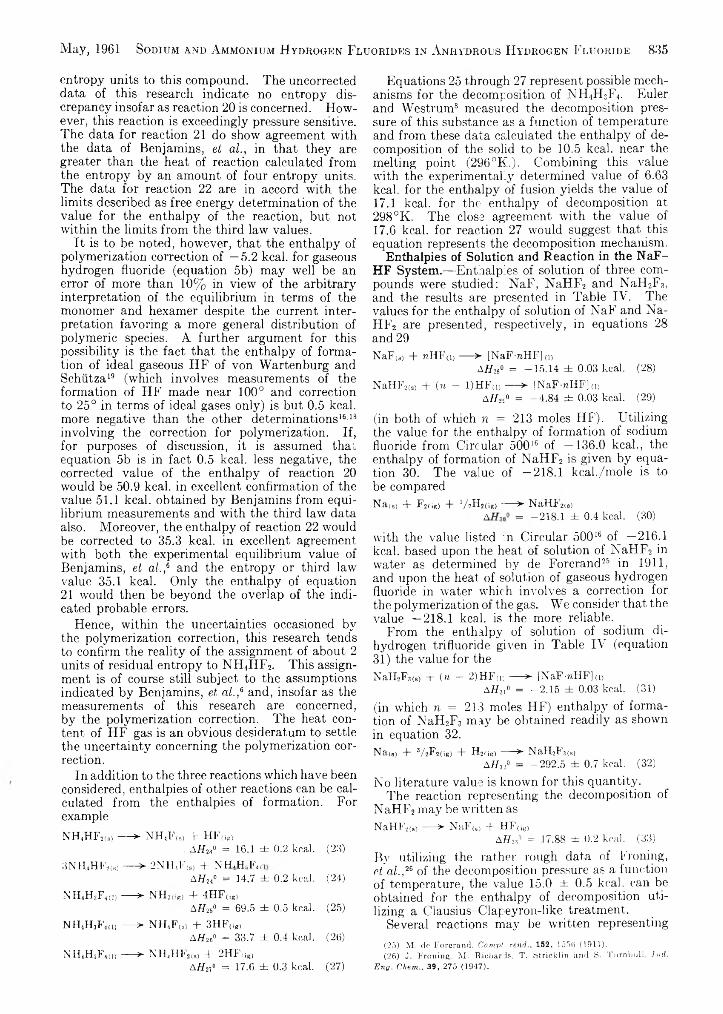
May, 1961 Sodium and Ammonium Hydrogen Fluorides in Anhydrous Hydrogen Fluoride 835
entropy units to this compound. The uncorrected data of this research indicate no entropy discrepancy insofar as reaction 20 is concerned. However, this reaction is exceedingly pressure sensitive. The data for reaction 21 do show agreement with the data of Benjamins, et a l. , in that they are greater than the heat of reaction calculated from the entropy by an amount of four entropy units. The data for reaction 22 are in accord with the limits described as free energy determination of the value for the enthalpy of the reaction, but not within the limits from the third law values.
It is to be noted, however, that the enthalpy of polymerization correction of —5.2 kcal. for gaseous hydrogen fluoride (equation 5b) may well be an error of more than 10% in view of the arbitrary interpretation of the equilibrium in terms of the monomer and hexamer despite the current interpretation favoring a more general distribution of polymeric species. A further argument for this possibility is the fact that the enthalpy of formation of ideal gaseous HF of von Wartenburg and Schutza19 (which involves measurements of the formation of HF made near 100° and correction to 25° in terms of ideal gases only) is but 0.5 kcal. more negative than the other determinations16'18 involving the correction for polymerization. If, for purposes of discussion, it is assumed that equation 5b is in fact 0.5 kcal. less negative, the corrected value of the enthalpy of reaction 20 would be 50.9 kcal. in excellent confirmation of the value 51.1 kcal. obtained by Benjamins from equilibrium measurements and with the third law data also. Moreover, the enthalpy of reaction 22 would be corrected to 35.3 kcal. in excellent agreement with both the experimental equilibrium value of Benjamins, et a l . ,6 and the entropy or third law value 35.1 kcal. Only the enthalpy of equation 21 would then be beyond the overlap of the indicated probable errors.
Hence, within the uncertainties occasioned by the polymerization correction, this research tends to confirm the reality of the assignment of about 2 units of residual entropy to NH4HF2. This assignment is of course still subject to the assumptions indicated by Benjamins, et a l . ,6 and, insofar as the measurements of this research are concerned, by the polymerization correction. The heat content of HF gas is an obvious desideratum to settle the uncertainty concerning the polymerization correction.
In addition to the three reactions which have been considered, enthalpies of other reactions can be calculated from the enthalpies of formation. For exampleNH4HF2(s> — > NHAA) + HF(iR)
AHn° = 16.1 ± 0.2 kcal. (23) ;5N H iH K 2(s) — > 2 N H iF (s ) + N H .H : K ,:
AI/240 = 14.7 ± 0.2 kcal. (24) NH4H3F40) — > NHj(lg) + 4HF(ig)
A Hr,6 = 69.5 ± 0.5 kcal. (25) N H 4H 3F4(„ — > N H 4F ,,) + 3H F (ig ,
A # 260 = 33.7 ± 0.4 kcal. (26) NU4H3F4U) — > NH4HF2(S) + 2HF,ie)
A li21» = 17.6 ± 0.3 kcal. (27)
Equations 25 through 27 represent possible mechanisms for the decomposition of NH4H3F4. Euler and Westrum8 measured the decomposition pressure of this substance as a function of temperature and from these data calculated the enthalpy of decomposition of the solid to be 10.5 kcal. near the melting point (296°K.). Combining this value with the experimentally determined value of 6.63 kcal. for the enthalpy of fusion yields the value of17.1 kcal. for the enthalpy of decomposition at 298 °K. The close agreement with the value of17.6 kcal. for reaction 27 would suggest that this equation represents the decomposition mechanism.
Enthalpies of Solution and Reaction in the NaF- HF System.—Enthalpies of solution of three compounds were studied: NaF, NaHF2 and NaH2F3, and the results are presented in Table IV. The values for the enthalpy of solution of NaF and Na- HF2 are presented, respectively, in equations 28 and 29NaF(s) + nHFy) — > [NaF-nHF] a>
AHw° = -15 .14 ± 0.03 kcal. (28) NaHF2(5) + (n - l)HF(i) — > [NaF-raHF](i)
A f f 2£° = -4 .8 4 ± 0.03 kcal. (29)
(in both of which n = 213 moles HF). Utilizing the value for the enthalpy of formation of sodium fluoride from Circular 50016 of —136.0 kcal., the enthalpy of formation of NaHF2 is given by equation 30. The value of —218.1 kcal./mole is to be comparedNa;sj + F2iig) + 1/ 2H2(ig) -----> NaHF2(S)
A = -218.1 ± 0.4 kcal. (30)
with the value listed :n Circular 50016 of — 216.1 kcal. based upon the heat of solution of NaHF2 in water as determined by de Forcrand26 in 1911, and upon the heat of solution of gaseous hydrogen fluoride in water which involves a correction for the polymerization of the gas. We consider that the value —218.1 kcal. is the more reliable.
From the enthalpy of solution of sodium dihydrogen trifluoride given in Table IV (equation 31) the value for the NaH2F3<S) + ( n - 2)H Fa; — ^ [NaF-nHF] <»
Aff31° = -2 .1 5 ± 0.03 kcal. (31)(in which n = 213 moles HF) enthalpy of formation of NaH2F3 may be obtained readily as shown in equation 32.Na<S) + 3AF2(i8, + H2fiE) — > NaHjFjis)
AH320 = -292.5 ± 0.7 kcal. (32)No literature value is known for this quantity.
The reaction representing the decomposition of NaHF2 may be written asNaHF2W — > NaF(e) + H F(ie,
AflA" = 17.88 ± 0.2 kcal. (33)By utilizing the rather rough data of Froning, et a l . , 26 of the decomposition pressure as a function of temperature, the value 15.0 ± 0.5 kcal. can be obtained for the enthalpy of decomposition utilizing a Clausius-Clapeyron-like treatment.
Several reactions may be written representing(25) M . de Forcrand, Compt. rend., 152, 1556 (1911).(26) J. Froning, M . Richards, T. Stricklin and S. Turnbull, 1 nd.
Eng. Chem,, 39, 275 (1947).
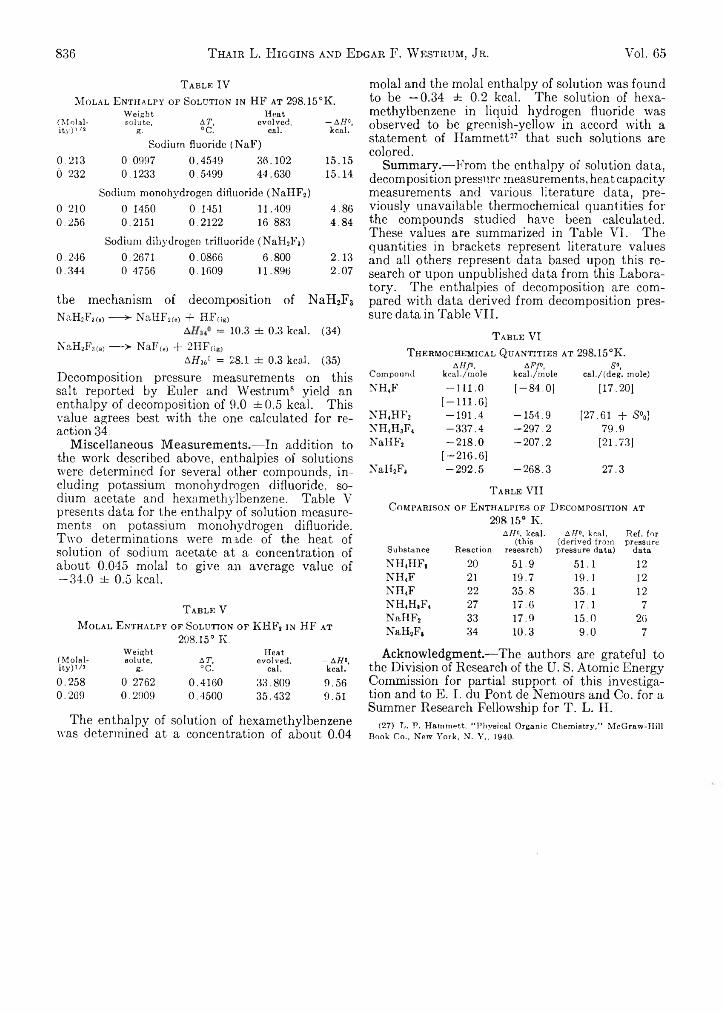
836 T hair L. Higgins and Edgar F. W estrum, Jr. Vol. 65
T a b l e IVM o l a l E n t h a l p y o f S o l u t i o n i n H F a t 2 9 8 . 1 5 ° K .
Weight Heat(Molal- solute, AT, evolved, —AH0,ity)1 /2 g. °C. cal. kcal.
Sodium fluoride (NaF)0.213 0.0997 0.4549 36.102 15.156.232 0.1233 0.5499 44.630 15.14
Sodium monohydrogen difluoride (NaHF2)0.210 0.1450 0.1451 11.409 4.860.256 0.2151 0.2122 16.883 4.84
Sodium dihydrogen trifluoride (NaH2F3)0.246 0.2671 0.0866 6.800 2.130.344 0.4756 0.1609 11.896 2.07
the mechanism of decomposition of NaH2F3 N a H 2F 3( ,) — —>■ N a H F 2(a) - f - H F ( i g)
A = 10.3 ± 0.3 kcal. (34) N a H 2F 3(B) — > N a F ( o ) + 2 H F ( i S.)
AH3i° = 28.1 ± 0.3 kcal. (35)Decomposition pressure measurements on this salt reported by Euler and Westrum8 yield an enthalpy of decomposition of 9.0 ±0 .5 kcal. This value agrees best with the one calculated for reaction 34.
Miscellaneous Measurements.— In addition to the work described above, enthalpies of solutions were determined for several other compounds, including potassium monohydrogen difluoride, sodium acetate and hexamethylbenzene. Table V presents data for the enthalpy of solution measurements on potassium monohydrogen difluoride. Two determinations were made of the heat of solution of sodium acetate at a concentration of about 0.045 molal to give an average value of — 34.0 ± 0.5 kcal.
T a b l e VM o l a l E n t h a l p y o f S o l u t i o n o f K H F 2 i n H F a t
2 9 8 . 1 5 ° K .
(Molality) 1/2Weightsolute,
g-AT,°c.
Heatevolved,
cal.- A H°, kcal.
0.258 0.2762 0.4160 33.809 9.560.269 0.2909 0.4500 35.432 9.51
The enthalpy of solution of hexamethylbenzene was determined at a concentration of about 0.04
molal and the molal enthalpy of solution was found to be —0.34 ± 0.2 kcal. The solution of hexamethylbenzene in liquid hydrogen fluoride was observed to be greenish-yellow in accord with a statement of Hammett27 that such solutions are colored.
Summary.— From the enthalpy of solution data, decomposition pressure measurements, heat capacity measurements and various literature data, previously unavailable thermo chemical quantities for the compounds studied have been calculated. These values are summarized in Table VI. The quantities in brackets represent literature values and all others represent data based upon this research or upon unpublished data from this Laboratory. The enthalpies of decomposition are compared with data derived from decomposition pressure data in Table VII.
T a b l e VIT h e r m o c h e m i c a l Q u a n t i t i e s a t 298.15°K.
CompoundA HP,
kcal./moleA Ff>,
kcal./moleS°,
cal./(deg. mole)NH4F -1 1 1 .0 [-8 4 .0 ] [17.20]
n h 4h f 2[-1 1 1 .6 ]-1 9 1 .4 -1 5 4 .9 [27.61 + S°ol
n h 4h 3f 4 -3 3 7 .4 -2 9 7 .2 79.9NallFj -2 1 8 .0 -2 0 7 .2 [21.73]
NaII2Fj[-2 1 6 .6 ]-2 9 2 .5 -2 6 8 .3 27.3
T a b l e VIIC o m p a r i s o n o f E n t h a l p i e s o f D e c o m p o s i t i o n a t
298 15° K.
S u b s ta n c e R e a c t io n
A H°, k c a l . (th is
re se a rch )
A V ° , k ca l. (d e r iv e d fr o m p re ssu re d a ta )
R e f . f o r p re ssu re
d a ta
n h 4h f , 2 0 5 1 . 9 5 1 . 1 1 2
n h 4f 2 1 1 9 . 7 1 9 . 1 1 2
n h 4f 2 2 3 5 . 8 3 5 . 1 1 2
n h 4h ,f 4 2 7 1 7 . 6 1 7 . 1 7
NaHF, 33 1 7 . 9 1 5 . 0 2 6
NaH2Ft 3 4 1 0 . 3 9 . 0 7
Acknowledgment.— The authors are grateful to the Division of Research of the U. S. Atomic Energy Commission for partial support of this investigation and to E. I. du Pont de Nemours and Co. for a Summer Research Fellowship for T. L. H.
(27) L. P. Hammett, “Physical Organic Chemistry,” McGraw-Hill Book Co., New York, N. Y., 1940.
May, 1961 Structure and Dénaturation of Hemeproteins 837
THE STUDY OF THE STRUCTURE AND DENATURATION OF HEME-PROTEINS BY NUCLEAR MAGNETIC RELAXATION
B y Pi . L u m r y , H . M a t s u m i y a ,
School of Chemistry, University of Minnesota, Minneapolis, Minnesota
F . A . B o v e y a n d
Central Research Department, Minnesota Mining and Manufacturing Company, St. Paul, Minnesota
A . K o w a l s k y
Department of Physiological Chemistry, School of Medicine, University of Minnesota, Minneapolis, MinnesotaReceived December 2, 1960
The molar relaxivitiea toward water protons of the ferric and ferrous forms of simple heme-c omplexes, myoglobin and hemoglobin have been determined by the direct method. An analysis of the data is given which demonstrates that the controlling correlation time for relaxation by heme-proteins and ferrous heme-complexes is the spin-lattice relaxation time of the iron ions. The experiments thus provide information about this time and about ligand-field effects which influence it. They do not directly measure the position of the iron ions in the protein. The use of relaxivities to provide information about protein denaturation is discussed with sample data. A simple solution for relaxation in a two phase system following saturation is given to demonstrate the use of the methods of chemical-relaxation spectroscopy for nuclear-relaxation problems.
Because of the large size of the electron magneton, paramagnetic substances are very effective in accelerating transitions among nuclear spin states. This effect is readily measured in the longitudinal relaxation time, T x, and in the transverse relaxation time, T 2, and has been exploited to provide information about rates of ligand exchange and electron exchange in complex ions as well as in other useful and interesting ways.1 In principle, the method might be applied to heme proteins to provide information about the position of the paramagnetic iron ions in these compounds, the extent of protein hydration, the spin-lattice relaxation time for the spin vector of the ion and the rates of exchange of protein-bound water molecules. In addition, studies of this sort can provide information about the denaturation of proteins. Although the subject has been investigated by Davidson and co-workers,2 by Wishnia,3 and by the present authors,4 * its development is thus far somewhat crude, partly because of inadequacies in the theory but largely because of a lack of suitable experimental data. Previous work has been confined to ferric forms of hemoglobin and myoglobin. In this paper, results on the ferrous forms of these proteins and on reduced hemin will be presented, together with new data for the ferric compounds. It is not yet possible to offer an unequivocal and quantitative interpretation of these results; nevertheless, even at this stage, some interesting deductions can be drawn, not only concerning the compounds studied, but also concerning the power of the method.
ExperimentalThe values of T, for water protons under the influence of
the paramagnetic substances were measured by the direct(1) “High Resolution Nuclear Magnetic Resonance," by J. A.
Pople, W. G. Schneider and H. J. Bernstein, McGraw-Hill Book Co., Toronto, 1952, chapter 9; J. E. Wertz, Ann. Rev. Phys. Chem., 9, 93 (1958).
(2) N. Davidson and R. Gold, Biochim. Biophys. Acta, 26, 370 (1957); H. Kon and N. Davidson, J. Molecular Biol., 1, 190 (1959).
(3) A. Wishnia, J. Chem. Phye., 32, 871 (1960).(4) F. A. Bovey and R. Lumry, Discussions of the Faraday Society,
“Energy Transfer with Special Reference to Biological Systems,”1960. p. 247.
method (method I of Bloembergen, et al.r‘ ), using a Varian V-4300-2 40.00 M e./sec. spectrometer and Brush recorder. The samples were first saturated by using high r.f. power for 5-10 sec.; the power then was reduced quickly to levels corresponding to only slight saturation. Ti values were estimated from the slopes of semilog plots of the regrowth of the water proton signal, and were reproducible within ± 5 % .
Horse hemo lobin was prepared by three recrystallizations from aqueous ethanol; human hemoglobin was recrystallized twice by a modification of Drabkin’s salt method which will be described elsewhere.8 Hemin was prepared by the method of Matsumiya and Lumry,8 and reduced with KBH4 or with hydrogen using Pd-on-charcoal. The data for native protein solutions are presented in Table I.
TheoryRelaxation depends on the magnitude of the
magnitude of the magnetic dipoles, their number, the distance from these to the measuring protons, and the relative motion of the magnetic dipoles. Since spontaneous transitions among nuclear spin states occur very infrequently, all transitions which are observed are induced only by those magnetic fields at the measuring nuclei which vary at the resonant frequency. In treating the problem thus presented, Bloembergen, Purcell and Pound6 analyzed the several forms of relative motion of the magnetic dipoles, i .e . , rotational and translational motion, by Fourier analysis to determine the amplitude of the resonant component thus generated for various values of the parameters. The general expression for longitudinal relaxation has been modified by Solomon7 and extended to include a scalar term suggested by Bloembergen.8 The latter term need not concern us here, since for ferric compounds it is small and for ferrous compounds, although we have none of the information necessary to determine its importance, its presence can have but a minor influence on the arguments presented below.
For our present purposes we may express the longitudinal relaxation rate constant as9
(5) N. Bloembergen, E. M. Purcell and R. V. Pound, Phys. Rev., 73, 679 (1948).
(6) H. Matsumiya, to be published.(7) I. Solomon, P h ys . R et., 99, 559 (1955).(8) N. Bloembergen, J. Chem. P h ys., 27, 572 (1957).
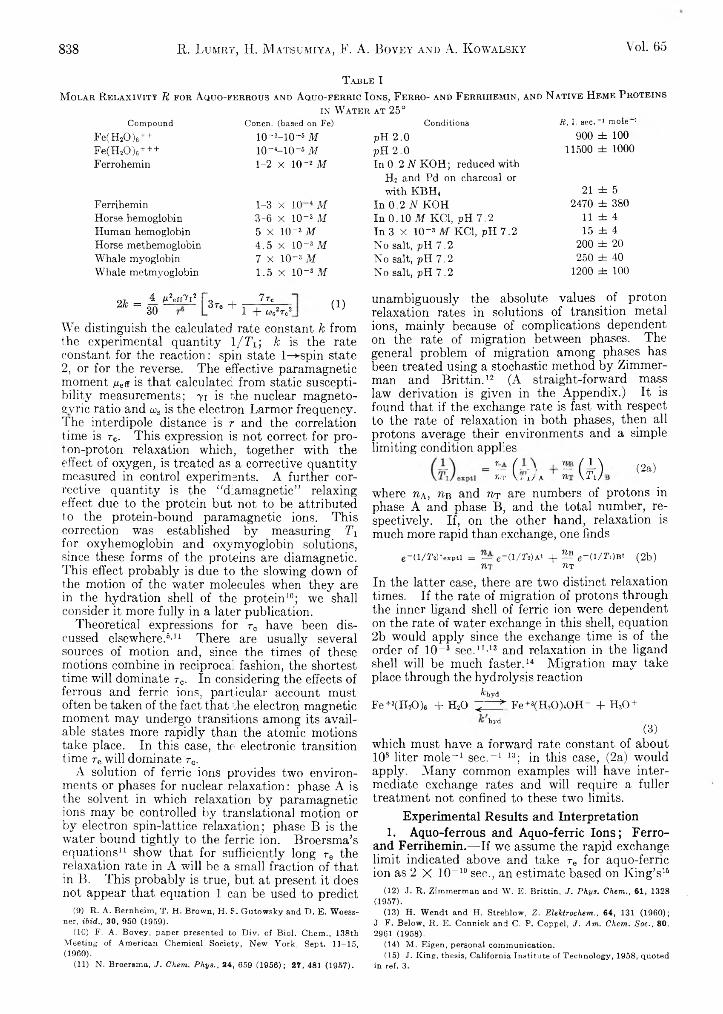
838 R. Lumrt, H. M atsumiya, F. A. Bovey and A. K owalsky Vol. 65
T a b l e I
M o l a r R e l a x i v i t y R f o r A q u o - f e r r o u s a n d A q u o - f e r r i c I o n s , F e r r o - a n d F e r r i h e m i n , a n d N a t i v e H e m e P r o t e i n s
i n W a t e r a t 2 5 “Compound
Fe(H20 ) 6++Fe(H20 ) 6+++Ferrohemin
Ferrihemin Horse hemoglobin Human hemoglobin Horse methemoglobin Whale myoglobin Whale metmyoglobin
Concn. (based on Fe) Conditions R, 1. sec. -> mole 1
10-3-10~6 M pH 2.0 900 ± 10010-4~10-6 M pH 2.0 11500 ± 10001-2 x 10~2 M In 0.2 N K O H ; reduced with
H2 and Pd on charcoal orwith KBH4 21 ± 5
1-3 x I d M In 0.2 IV KOH 2470 ± 3803-6 x IO-3 M In 0.10 M KC1, pH 7.2 11 ± 45 X IO-3 M In 3 x 10⁻³ M KC1, pH 7.2 15 ± 44.5 X IO-3 M No salt, pH 7.2 200 ± 207 X IO-3 M No salt, pH 7.2 250 ± 401.5 x IO-3 M No salt, pH 7.2 1200 ± 100
M2effTl2+
7 T01 + Ws2T02 (1)
We distinguish the calculated rate constant k from the experimental quantity l/7\ ; k is the rate constant for the reaction: spin state l-*-spin state 2, or for the reverse. The effective paramagnetic moment pes is that calculated from static susceptibility measurements; 71 is the nuclear magneto- gvric ratio and wa is the electron Larmor frequency. The interdipole distance is r and the correlation time is re. This expression is not correct for proton-proton relaxation which, together with the effect of oxygen, is treated as a corrective quantity measured in control experiments. A further corrective quantity is the “diamagnetic” relaxing effect due to the protein but not to be attributed to the protein-bound paramagnetic ions. This correction was established by measuring T i for oxyhemoglobin and oxymyoglobin solutions, since these forms of the proteins are diamagnetic. This effect probably is due to the slowing down of the motion of the water molecules when they are in the hydration shell of the protein10; we shall consider it more fully in a later publication.
Theoretical expressions for tc have been discussed elsewhere.6’11 There are usually several sources of motion and, since the times of these motions combine in reciprocal fashion, the shortest time will dominate r0. In considering the effects of ferrous and ferric ions, particular account must often be taken of the fact that the electron magnetic moment may undergo transitions among its available states more rapidly than the atomic motions take place. In this case, the electronic transition time re will dominate r0.
A solution of ferric ions provides two environments or phases for nuclear relaxation: phase A is the solvent in which relaxation by paramagnetic ions may be controlled by translational motion or by electron spin-lattice relaxation; phase B is the water bound tightly to the ferric ion. Broersma’s equations11 show that for sufficiently long re the relaxation rate in A will be a small fraction of that in B. This probably is true, but at present it does not appear that equation 1 can be used to predict
(9) R. A. Bernheim, T. H. Brown, H. 8. Gutowsky and D. E. Woess- ner, ibid., 30, 950 (1959).
(10) F. A. Bovey, paper presented to Div. of Biol. Chem., 138th Meeting of American Chemical Society, New York, Sept. 11-15,(1960).
(11) N. Broersma, J. Chem. Phys., 24, 659 (1956); 27, 481 (196?).
unambiguously the absolute values of proton relaxation rates in solutions of transition metal ions, mainly because of complications dependent on the rate of migration between phases. The general problem of migration among phases has been treated using a stochastic method by Zimmerman and Brittin.12 (A straight-forward mass law derivation is given in the Appendix.) It is found that if the exchange rate is fast with respect to the rate of relaxation in both phases, then all protons average their environments and a simple limiting condition applies
( r X „ , r % G X + %(i).(2‘>where nA, u b and tit are numbers of protons in phase A and phase B, and the total number, respectively. If, on the other hand, relaxation is much more rapid than exchange, one finds
e-u/rjtexpti = — e-d /r^A t + ^ e-d /ri)B t (2b) n T TlT
In the latter case, there are two distinct relaxation times. If the rate of migration of protons through the inner ligand shell of ferric ion were dependent on the rate of water exchange in this shell, equation 2b would apply since the exchange time is of the order of 10-3 sec.11'13 and relaxation in the ligand shell will be much faster.14 Migration may take place through the hydrolysis reaction
&hydF e«(H 20 )6 + H20 y -----^ F e + y n m O H - + H30 +
hyd(3)
which must have a forward rate constant of about 108 liter mole-1 sec.-1 13; in this case, (2a) would apply. Many common examples will have intermediate exchange rates and will require a fuller treatment not confined to these two limits.
Experimental Results and Interpretation 1. Aquo-ferrous and Aquo-ferric Ions; Ferro-
and Ferrihemin.— If we assume the rapid exchange limit indicated above and take re for aquo-ferric ion as 2 X 10⁻¹⁰ sec., an estimate based on King’s16
(12) J. R. Zimmerman and W. E. Brittin, J. Phys. Chem., 61, 1328 (1957).
(13) H. Wendt and H. Strehlow, Z. Elektrochem., 64, 131 (1960); J. F. Below, R. E. Connick and C. P. Coppel, J. Am. Chem. Soc., 80, 2961 (1958).
(14) M. Eigen, personal communication.(15) J. King, thesis, California Institute of Technology, 1958, quoted
in ref. 3.
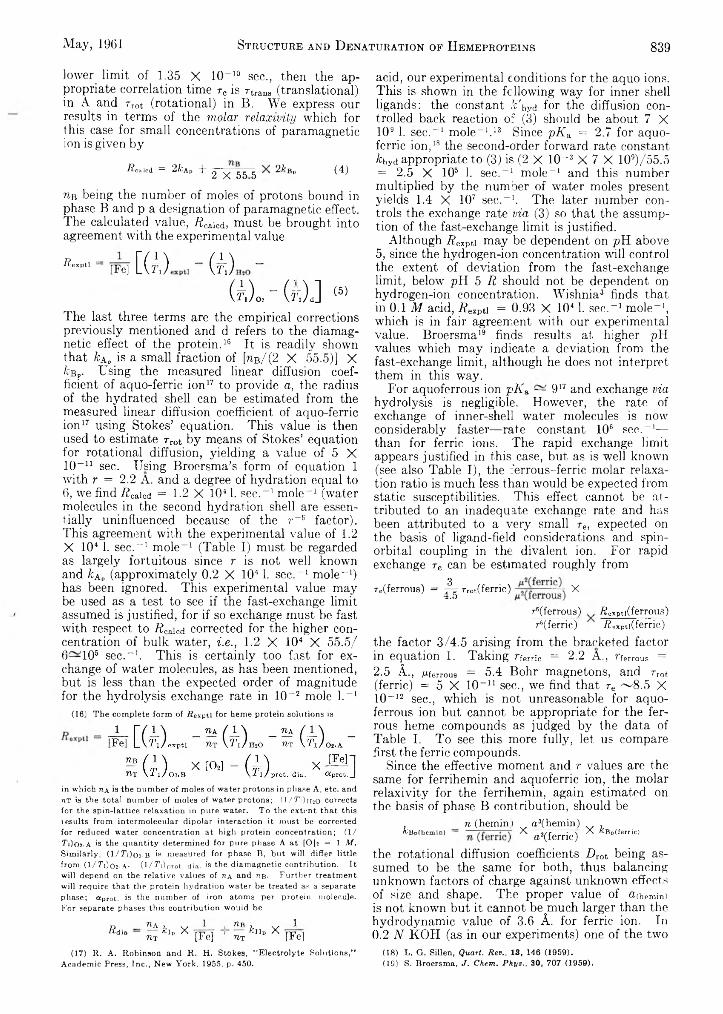
May, 1961 Structure and D énaturation op Hemeproteins 839
lower limit of 1.35 X 10⁻¹⁰ sec., then the appropriate correlation time r? is Ttrana (translational) in A and rrot (rotational) in B. We express our results in terms of the m o la r r e la x iv ity which for this case for small concentrations of paramagnetic ion is given by
licaicd = 2kAp + 2 x 55 5 ^ Bo (4)
nB being the number of moles of protons bound in phase B and p a designation of paramagnetic effect. The calculated value, i f c a ic d , must be brought into agreement with the experimental value
R,exptl [Fe] [ ( A ) , (W -( A k - G O J (5)
The last three terms are the empirical corrections previously mentioned and d refers to the diamagnetic effect of the protein.16 It is readily shown that &ap is a small fraction of [n s / (2 X 55.5)] X /cBp. Using the measured linear diffusion coefficient of aquo-ferric ion17 to provide a, the radius of the hydrated shell can be estimated from the measured linear diffusion coefficient of aquo-ferric ion17 using Stokes’ equation. This value is then used to estimate rrot by means of Stokes’ equation for rotational diffusion, yielding a value of 5 X 10-11 sec. Using Broersma’s form of equation 1 with r = 2 .2 A . and a degree of hydration equal to 6, we find i2Caiod = 1.2 X 1041. sec.-1 mole-1 (water molecules in the second hydration shell are essentially uninfluenced because of the r-6 factor). This agreement with the experimental value of 1.2 X 1041. sec.-1 mole-1 (Table I) must be regarded as largely fortuitous since r is not well known and &Ap (approximately 0.2 X 1041. sec.-1 mole-1) has been ignored. This experimental value may be used as a test to see if the fast-exchange limit assumed is justified, for if so exchange must be fast with respect to Acaicd corrected for the higher concentration of bulk water, i .e ., 1.2 X 104 X 55.5/6—105 sec.-1. This is certainly too fast for exchange of water molecules, as has been mentioned, but is less than the expected order of magnitude for the hydrolysis exchange rate in 10-2 mole l.-1
(16) The complete form of i^exptl for heme protein solutions is
in which riA is the number of moles of water protons in phase A, etc. and ? n is the total number o f moles of water protons; ( I /T O h^O corrects for the spin-lattice relaxation in pure water. To the extent that this Jesuits from intermoleeular dipolar interaction it must be corrected for reduced water concentration at high protein concentration; (1 / TO02.A is the quantity determined for pure phase A at [0]2 = 1 M . Similarly, (1/T i)o2.B is measured for phase B, but will differ little from (1/ T i) o2.A. (l/TO prot. dia. is the diamagnetic contribution. It will depend on the relative values of wa and k b . Further treatment will require that the protein hydration water be treated as a separate phase; «prot. is the number of iron atoms per protein molecule. For separate phases this contribution would be
D « a , . , 1 I r iB 7 . , 1r dia rClp X r 771-1 1 IIp X r-rr' im [re] tit ITeJ(17) R. A. Robinson and R . H. Stokes, “ Electrolyte Solutions,"
Academic Press, Inc., New York, 1955, p. 450.
acid, our experimental conditions for the aquo ions. This is shown in the following way for inner shell ligands: the constant ft'hyd for the diffusion controlled back reaction of (3) should be about 7 X 10⁹ 1. sec.-1 mole-1.13 Since pAa = 2.7 for aquo- ferric ion,18 the second-order forward rate constant &hyd appropriate to (3) is (2 X 10-3 X 7 X 109)/55.5 = 2.5 X 10“ 1. sec.-1 mole-1 and this number multiplied by the number of water moles present yields 1.4 X 10⁷ sec.-1. The later number controls the exchange rate v ia (3) so that the assumption of the fast-exchange limit is justified.
Although Tfexpti may be dependent on pH above 5, since the hydrogen-ion concentration will control the extent of deviation from the fast-exchange limit, below pH 5 R should not be dependent on hydrogen-ion concentration. Wishnia3 finds that in 0.1 M acid, R expti = 0.93 X 10⁴ 1. sec.-1 mole-1, which is in fair agreement with our experimental value. Broersma19 finds results at higher pH values which may indicate a deviation from the fast-exchange limit, although he does not interpret them in this way.
For aquoferrous ion pAa — 917 and exchange v ia hydrolysis is negligible. However, the rate of exchange of inner-shell water molecules is now considerably faster—rate constant 106 sec.-1— than for ferric ions. The rapid exchange limit appears justified in this case, but as is well known (see also Table I), the ferrous-ferric molar relaxation ratio is much less than would be expected from static susceptibilities. This effect cannot be attributed to an inadequate exchange rate and has been attributed to a very small re, expected on the basis of ligand-field considerations and spin- orbit.al coupling in the divalent ion. For rapid exchange re can be estimated roughly from
Te(ferrous) = f g rrot(ferric) X
r6(ferrous) fie^pti(ferrous) r6(ferric) i?expti(ferric)
the factor 3/4.5 arising from the bracketed factor in equation 1. Taking rferric = 2.2 A., rferrous =2.5 A., /iferrous = 5.4 Bohr magnetons, and rrot (ferric) = 5 X 10-11 sec., we find that r e ~8 .5 X 10-12 sec., which is not unreasonable for aquoferrous ion but cannot be appropriate for the ferrous heme compounds as judged by the data of Table I. To see this more fully, let us compare first the ferric compounds.
Since the effective moment and r values are the same for ferrihemin and aquoferric ion, the molar relaxivity for the ferrihemin, again estimated on the basis of phase B contribution, should be
, n (hemini o 3(hemin) s, ,ABp(hemin) - X a 3(fe r r ic ) X «Bp(ferric)
the rotational diffusion coefficients Drot being assumed to be the same for both, thus balancing unknown factors of charge against unknown effects of size and shape. The proper value of a(hemin) is not known but it cannot be^much larger than the hydrodynamic value of 3.6 A. for ferric ion. In 0.2 N KOH (as in our experiments) one of the two
(18) L, G . Sillen, Quart. Rev., 1 3 , 146 (1959).(19) S. Broersma, J. Chem. Phys., 30, 707 (1959).
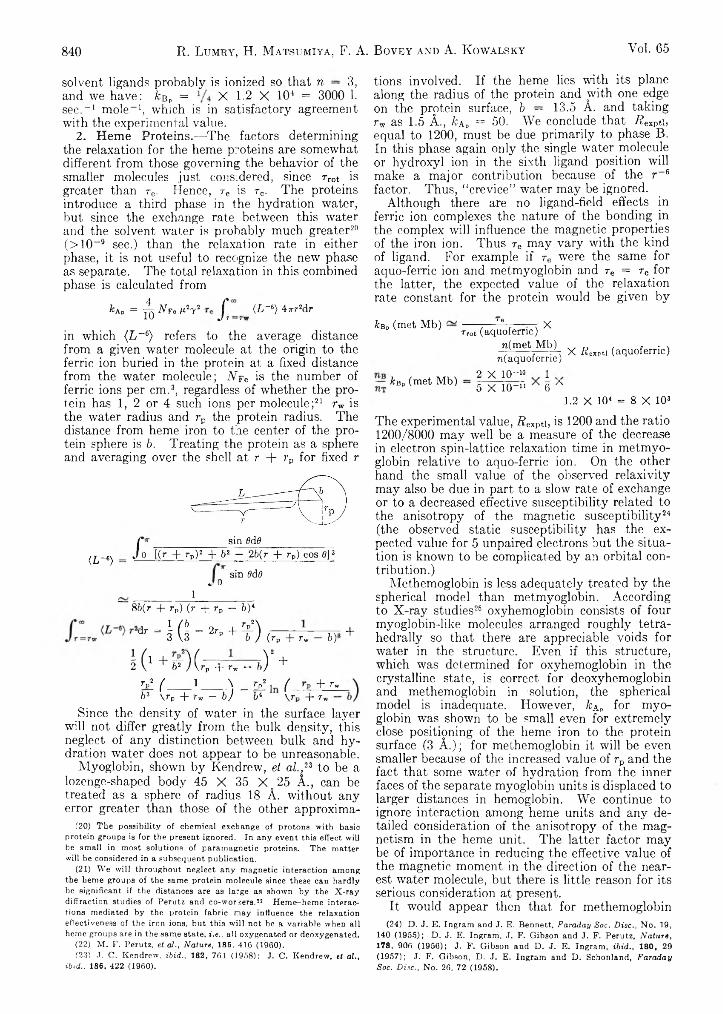
840 R. Lumry, H. M atsumiya, F. A. Bovey and A. K owalsky Vol. 65
solvent ligands probably is ionized so that n — 3, and we have: fcBP = X 1.2 X 104 = 3000 1. sec.“ 1 mole-1, which is in satisfactory agreement with the experimental value.
2. Heme Proteins.—The factors determining the relaxation for the heme proteins are somewhat different from those governing the behavior of the smaller molecules just considered, since rrot is greater than re. Hence, re is r0. The proteins introduce a third phase in the hydration water, but since the exchange rate between this water and the solvent water is probably much greater20 (>10~9 sec.) than the relaxation rate in either phase, it is not useful to recognize the new phase as separate. The total relaxation in this combined phase is calculated from
fcAp = ^ Nv<> mV J (L~s) 4irr2dr
in which (L~6) refers to the average distance from a given water molecule at the origin to the ferric ion buried in the protein at a fixed distance from the water molecule; Wpe is the number of ferric ions per cm.3, regardless of whether the protein has 1, 2 or 4 such ions per molecule;21 rw is the water radius and r p the protein radius. The distance from heme iron to the center of the protein sphere is b. Treating the protein as a sphere and averaging over the shell at r + rp for fixed r
<IV> f. sin 8d&0 [(r + rp)2 + b2 — 2b(r + rp) cos 6]3
/ sin 8dS0
18b(r + r„) (r + rp — 6)4
(rp “b Vwd' - H i - *■ • + ¥ )
! ( 1 + v )C7+w V +V ( 1 \ _ V (b3 \rp + rw — b ) bl \r
by +
+ rw+ r„
Since the density of water in the surface layer will not differ greatly from the bulk density, this neglect of any distinction between bulk and hydration water does not appear to be unreasonable.
Myoglobin, shown by Kendrew, et a l . ,n to be a lozenge-shaped body 45 X 35 X 25 A., can be treated as a sphere of radius 18 A. without any error greater than those of the other approxima-
(20) The possibility of chemical exchange of protons with basic protein groups is for the present ignored. In any event this effect will be small in most solutions of paramagnetic proteins. The matter will be considered in a subsequent publication.
(21) We will throughout neglect any magnetic interaction among the heme groups of the same protein molecule since these can hardly be significant if the distances are as large as shown by the X-ray diffraction studies of Perutz and co-workers.22 Heme-heme interactions mediated by the protein fabric nay influence the relaxation effectiveness of the iron ions, but this will not be a variable when all heme groups are in the sarpe state, i.e., all oxygenated or deoxygenated.
(22) M. F. Perutz, et ah, Nature, 185, 416 (1960).(23) J. C. Kendrew, ibid., 182, 764 (1958); J. C. Kendrew, et al.,
ibid., 186, 422 (1960).
tions involved. If the heme lies with its plane along the radius of the protein and with one edge on the protein surface, b — 13.5 A. and taking rw as 1.5 A., k ad = 50. We conclude that i2expta, equal to 1200, must be due primarily to phase B. In this phase again only the single water molecule or hydroxyl ion in the sixth ligand position will make a major contribution because of the r-6 factor. Thus, “crevice” water may be ignored.
Although there are no ligand-field effects in ferric ion complexes the nature of the bonding in the complex will influence the magnetic properties of the iron ion. Thus re may vary with the kind of ligand. For example if re were the same for aquo-ferric ion and metmyoglobin and re = r0 for the latter, the expected value of the relaxation rate constant for the protein would be given by
kbp (met M b) — ______ 11 xTrot (aquoferrie)
n(met Mb) n(aquoferric) X Rcxvti (aquoferrie)
— kvP (met M b) 2 X IQ"“ 15 X 10"11 6 ^
1.2 X 104 = 8 X 10³
The experimental value, R expti, is 1200 and the ratio 1200/8000 may well be a measure of the decrease in electron spin-lattice relaxation time in metmyoglobin relative to aquo-ferric ion. On the other hand the small value of the observed relaxivity may also be due in part to a slow rate of exchange or to a decreased effective susceptibility related to the anisotropy of the magnetic susceptibility24 (the observed static susceptibility has the expected value for 5 unpaired electrons but the situation is known to be complicated by an orbital contribution.)
Methemoglobin is less adequately treated by the spherical model than metmyoglobin. According to X-ray studies26 oxyhemoglobin consists of four myoglobin-like molecules arranged roughly tetra- hedrally so that there are appreciable voids for water in the structure. Even if this structure, which was determined for oxyhemoglobin in the crystalline state, is correct for deoxyhemoglobin and methemoglobin in solution, the spherical model is inadequate. However, /cap for myoglobin was shown to be small even for extremely close positioning of the heme iron to the protein surface (3 A.); for methemoglobin it will be even smaller because of the increased value of rp and the fact that some water of hydration from the inner faces of the separate myoglobin units is displaced to larger distances in hemoglobin. We continue to ignore interaction among heme units and any detailed consideration of the anisotropy of the magnetism in the heme unit. The latter factor may be of importance in reducing the effective value of the magnetic moment in the direction of the nearest water molecule, but there is little reason for its serious consideration at present.
It would appear then that for methemoglobin(24) D. J. E. Ingram and J. E. Bennett, Faraday Soc. Disc., No. 19,
140 (1955); D. J. E. Ingram, J. F. Gibson and J. F. Perutz, Nature, 178, 906 (1956); J. F. Gibson and D. J. E. Ingram, ibid., 180, 29 (1957); J. F. Gibson, D. J. E. Ingram and D. Schonland, Faraday Soc. Disc., No. 26, 72 (1958).
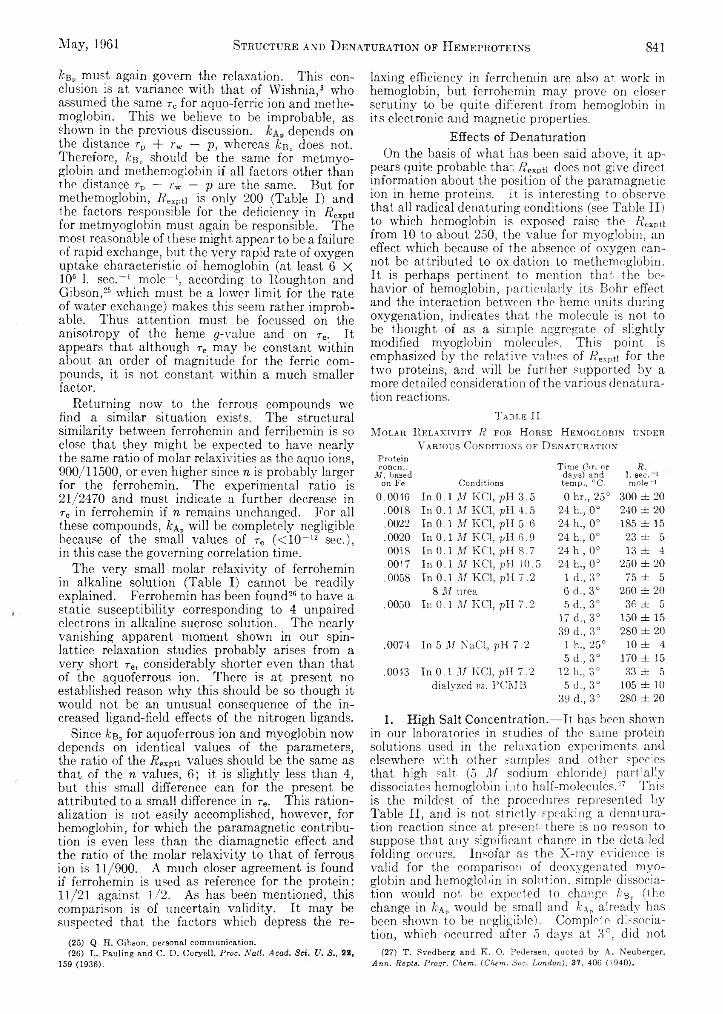
May, 1961 Structure and D énaturation of Hemeproteins 841
kBp must again govern the relaxation. This conclusion is at variance with that of Wishnia,3 who assumed the same rc for aquo-ferric ion and methe- moglobin. This we believe to be improbable, as shown in the previous discussion. depends on the distance r p + rw — p , whereas /¿b„ does not. Therefore, k bp should be the same for metmyo- globin and methemoglobin if all factors other than the distance rp — rw — p are the same. But for methemoglobin, R expti is only 200 (Table I) and the factors responsible for the deficiency in R expti for metmyoglobin must again be responsible. The most reasonable of these might appear to be a failure of rapid exchange, but the very rapid rate of oxygen uptake characteristic of hemoglobin (at least 6 X 10⁶ 1. sec.-1 mole-1, according to Roughton and Gibson,26 which must be a lower limit for the rate of water exchange) makes this seem rather improbable. Thus attention must be focussed on the anisotropy of the heme 0-value and on re. It appears that although re may be constant within about an order of magnitude for the ferric compounds, it is not constant within a much smaller factor.
Returning now to the ferrous compounds we find a similar situation exists. The structural similarity between ferrohemin and ferrihemin is so close that they might be expected to have nearly the same ratio of molar relaxivities as the aquo ions, 900/11500, or even higher since n is probably larger for the ferrohemin. The experimental ratio is 21/2470 and must indicate a further decrease in tc in ferrohemin if n remains unchanged. For all these compounds, /ca„ will be completely negligible because of the small values of re (< 10-12 sec.), in this case the governing correlation time.
The very small molar relaxivity of ferrohemin in alkaline solution (Table I) cannot be readily explained. Ferrohemin has been found26 to have a static susceptibility corresponding to 4 unpaired electrons in alkaline sucrose solution. The nearly vanishing apparent moment shown in our spin- lattice relaxation studies probably arises from a very short re, considerably shorter even than that of the aquoferrous ion. There is at present no established reason why this should be so though it would not be an unusual consequence of the increased ligand-field effects of the nitrogen ligands.
Since /cbp for aquoferrous ion and myoglobin now depends on identical values of the parameters, the ratio of the 72expti values should be the same as that of the n values, 6 ; it is slightly less than 4, but this small difference can for the present be attributed to a small difference in re. This rationalization is not easily accomplished, however, for hemoglobin, for which the paramagnetic contribution is even less than the diamagnetic effect and the ratio of the molar relaxivity to that of ferrous ion is 11/900. A much closer agreement is found if ferrohemin is used as reference for the protein: 11/21 against 1/ 2. As has been mentioned, this comparison is of uncertain validity. It may be suspected that the factors which depress the re-
(25) Q. H. Gibson, personal communication.(26) L. Pauling and C. D. Coryell, Proc. Natl. Acad. Set. U. S., 22,
159 (1936).
laxing efficiency in ferrehemin are also at work in hemoglobin, but ferrohemin may prove on closer scrutiny to be quite different from hemoglobin in its electronic and magnetic properties.
Effects of DenaturationOn the basis of what has been said above, it ap
pears quite probable that /?expt.i does not give direct information about the position of the paramagnetic ion in heme proteins. It is interesting to observe that all radical denaturing conditions (see Table II) to which hemoglobin is exposed raise the i?exPti from 10 to about 250, the value for myoglobin, an effect which because of the absence of oxygen cannot be attributed to oxidation to methemoglobin. It is perhaps pertinent to mention that the behavior of hemoglobin, particularly its Bohr effect and the interaction between the heme units during oxygenation, indicates that the molecule is not to be thought of as a simple aggregate of slightly modified myoglobin molecules. This point is emphasized by the relative values of i?expti for the two proteins, and will be further supported by a more detailed consideration of the various denaturation reactions.
TA3LE IIM olar R e la x iv it y R for H orse H emoglobin under
V arious C onditions of D énaturationProtein concn.,
M, based on Fe ConditionsTime (hr. or days) and temp., °C.
R.1. see. 1 mole-10.0046 In 0.1 M KC1, pH 3.5 0 hr., 25° 300 ± 20
.0018 In 0.1 M KO, pH 4.5 24 h., 0° 240 ± 20
.0022 In 0.1 M KO, pH 5.6 24 h., 0° 185 ± 15
.0020 In 0.1 M KC1, pH 6.9 24 h., 0° 23 ± 5
.0018 In 0.1 M KO, pH 8.7 24 h., 0° 13 ± 4
.0017 In 0.1 M KC1, pH 10.5 24 h., 0° 250 ± 20
.0058 In 0.1 M KO, pH 7.2 1 d., 3° 75 ± 58 M urea 6 d., 3° 260 ± 20
.0050 In 0.1 M KO, pH 7.2 5 d., 3° 36 ± 517 d., 3° 150 ± 1539 d., 3° 280 ± 20
.0074 In 5 M NaCl, pH 7.2 1 h., 25° 10 ± 45 d., 3° 170 ± 15
.0043 In 0.1 M KC1, pH 7.2 12 h., 3° 33 ± 5dialyzed vs. PCMB 5 d., 3° 105 ± 10
39 d., 3° 280 ± 201. High Salt Concentration.-—It has been shown
in our laboratories in studies of the same protein solutions used in the relaxation experiments and elsewhere with other samples and other species that high salt (5 M sodium chloride) partially dissociates hemoglobin into half-molecules.27 This is the mildest of the procedures represented by Table II, and is not strictly speaking a denaturation reaction since at present there is no reason to suppose that any significant change in the detailed folding occurs. Insofar as the X-ray evidence is valid for the comparison of deoxygenated myoglobin and hemoglobin in solution, simple dissociation would not be expected to change /rep (the change in k a„ would be small and 1cap already has been shown to be negligible). Complete dissociation, which occurred after 5 days at 3°, did not
(27) T. Svedberg and K. O. Pedersen, quoted by A. Neuberger,Ann. Repts. Progr. Chem. (Chem. Soc. London), 37, 406 (1940).

842 E,. Lumry, II. M atsumiya, P. A. Bovey and A. Iyowalsky Vol. Go
give the full myoglobin value but the full effect did occur in 0.1 M KC1 at pH 7.2 after a rather long time. Sedimentation studies demonstrated that dissociation into half molecules occurred and though the evidence for oxidation was negative other changes could have taken place.
2. 8 M Urea.—The effect of 8 M urea is to cause separation into half molecules plus some unfolding of the hemoglobin molecule,28 but it produced no higher value cf R expti at any time lhan that of myoglobin, although the heme might perhaps have been expected to have been released from the crevice position. Is is possible that even after partial unfolding the heme iron is held at the fifth ligand position by a nitrogen atom in such a way that the Fe-N distance is the same as in myoglobin, thus giving it the re and g properties of myoglobin. The simplest interpretation for this situation would be that the Fe-N distance in myoglobin is the same as she equilibrium Fe-N distance when free imidazole is bound to free heme. A similar explanation may account for the results obtained using the sulfhydryl reagent p-chloromer- curibenzoate, PCMB, which is known to produce marked alterations in heme-heme interactions.29 However, the full effect in these studies occurred only after 39 days at 3° and may be due to other forms of denaturation.
3. Hydrogen Ion Concentration.—The effects of hydrogen-ion concentration are also somewhat remarkable since they appear to indicate a stability of hemoglobin only in the very narrow mid-range of pH values. A pH of 3.5 is known to produce drastic changes in the conformation of the protein, to make available a number of ionized groups, and undoubtedly to produce alterations of some pAV values by a change in electrostatic factors.30 The gross changes in the protein are in any case similar to those produced by urea, and again lead to a structure having magnetic properties similar to those of myoglobin. At pH 10.5, extensive protein rearrangements probably also occur.31 The Aexpti may be somewhat higher than expected if OH- rather than H20 should occupy the sixth coordination position.
The effect of pH 5.6 is somewhat surprising, since there appear to be no clear indications of instability at this pH.
ConclusionsAlthough little in the way of positive conclusions
can be. reached by these preliminary studies, the deductions which have been made would appear to be a reliable interpretation of nuclear magnetic resonance relaxation studies at the present time. The arguments given to interpret the molar re- laxivities have been carefully chosen to avoid the use of equation 1, except in those instances where its application seems quite unequivocal. Com-
(28) J. T . Simko, Jr., Ph.D . Thesis, Princeton XJniv., 1956; F. Haurowitz, “ The Proteins,” H. Neurath and K. Bailey, eds., Academic Press, New York, N. Y ., 1953, p.
(29) A. F. Riggs and R. A. Walbaeh, J. Qen. Physiol., 39, 585 (1956).
(30) J. Steinhardt and E. M . Zaiser, Advances in Protein Chem., 10, 152 (1955).
(31) IT. Hasselradt and J. Vinograd, Proc. Natl. Acad. Sci., 45, 12 (1959).
parisons among compounds have been used wherever possible and the arguments themselves are not in general sensitive to more than the magnitude of the parameters. Since molar relaxivities for the proteins are in every case considerably less than calculated from the suitable forms of (1) (as given by Broersma11 or derived in this paper), the arguments do not turn on the numerical validity of (1). The most important parameter is re, given by King16 for aquo-ferric ion. It should be noted, however, that a choice of this number ten-fold greater than King’s minimum, 1.35 X 1(U10 sec., does not influence the argument.
The most interesting conclusions from this discussion appear to be the following:
a. The relative distance of the protein-bound heme iron from the hydration or bulk-phase water other than that in the sixth ligand position appears to have little influence on the molar relaxation. Hence, studies of these proteins by n.m.r. relaxation give little direct information about heme position and protein hydration.
b. The molar relaxivity appears to measure the magnetic and thus the electronic properties of the heme group itself and these in turn are closely associated with ligand distances and environment which the protein provides for this group. If, as is quite possible, these properties are involved directly or in a parallel way with heme-heme interaction, nuclear relaxation studies may be of value in elucidating the mechanism of this long-puzzling phenomenon. Their application in this connection wall be discussed in a forthcoming paper. An additional use of the method appears to be the study of electron-spin lattice relaxation times in compounds of ferrous iron.
Acknowledgment.— In addition to the support provided by Minnesota Mining and Manufacturing Company, the Office of Naval Research provided much of the fund which made this work possible (Contract Nonr 710 (15) with the University of Minnesota). One of us (R. L.) is indebted to Dr. Manfred Eigen for helpful discussions and to the National Science Foundation for fellowship support during the period when this paper was written. Partial support also was provided by Public Health Research Grant A-2316.
AppendixZimmerman and Brit.tin12 employed a stochastic
method to obtain solutions for the multiple-phase relaxation problem. Most chemists will find a straight-forward mass-law approach to this problem more familiar and in some cases more useful, since the mass-law method has been used extensively in chemical-relaxation spectroscopy and there is now an abundant literature of special solutions.32 Because the maximum perturbation of the magnetization possible in ordinary nuclear relaxation experiments is very small, the methods of irreversible thermodynamics are also appropriate for this problem.33
The mass-law procedure can be illustrated for a two-phase system using a measuring nucleus with two spin-states
(32) M. Eigen, Z. Blektrochem., 64, 115 (1960).( 3 3 ) J. Meixner, Kolloid-Z., 134, 3 ( 1 9 5 3 ) .
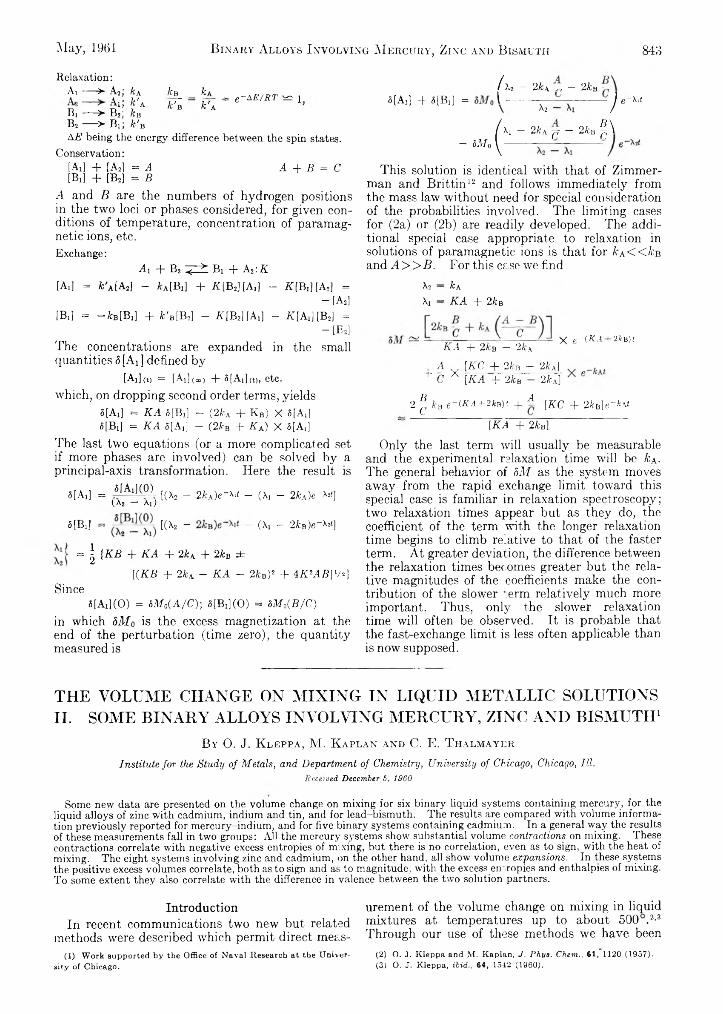
May, 1961 Binary Alloys Involving M ercury, Zinc and Bismuth 843
Relaxation:
= e-A E/RT ^ 1Ai ---- > As', k\ ka_ _ hi.
n 2 41’ Y A k 'B k ’KBi — > B2; &B B2 — > ■ Bij k 'bAE being the energy difference between the spin states.
Conservation:[Ai] + [AJ = 4 A + B = C[Bx] + [Bd = B
A and B are the numbers of hydrogen positions in the two loci or phases considered, for given conditions of temperature, concentration of paramagnetic ions, etc.Exchange:
A i + B2 Z^±: Bi + A s ' .K
[A,] = fc'xlAd - fcA[B,] + A [B 2][A,] - K [B :][A2] =— [Ad
[B,] = — fcB[Bi] + fc'E[B2] - A [B 2][Ad - A [A,] [B2] =- [B2]
The concentrations are expanded in the small quantities 5 [Ar] defined by
[Ai]<t) = [Ai](t») + S[Ad(t), etc. which, on dropping second order terms, yields
8[Ai] = K A 5[Bi] — (2&a + Kb) X 5[Ai]«[Bi] = K A 6[Ai] — (21‘b + K a ) X 8[Afi
The last two equations (or a more complicated set if more phases are involved) can be solved by a principal-axis transformation. Here the result is
«[Ai] = 1 E M 9 ) [(Xi _ 2kA) e - ^ - (Xi - 2k.A)e-^t]{ A 2 — Al )
a[Bl] = [(Xs _ - (h - 2fcs)e-^]
= \ { K B + K A + 2kA + 2kB ±
[ {KB + 2ka - KA - 2kBy + « C A B ] 1/*)Since
MAffiO) = òMo(A/Cy, 5[B ,](0) = 8M0(B/C)
in which SM o is the excess magnetization at the end of the perturbation (time zero), the quantity measured is
/ x2 - 2kA >, - 2 kB8[Afi + 5[Bi] = l ----------X2 -------- - J e ~ M
A i - 2ka jr - 2kB f \
- sM ° { —This solution is identical with that, of Zimmer
man and Brittin12 and follows immediately from the mass law without need for special consideration of the probabilities involved. The limiting cases for (2a) or (2b) are readily developed. The additional special case appropriate to relaxation in solutions of paramagnetic ions is that for fcA<<&B and A > > B . For this case we find
X2 — &AAi — KA T 2k b
KA + 2kB - 2kaX g—(RA 2kB)t
A P + M , ] ^ C A [KA + 2kB - 2Aa]
2 ^ k B e~(KA+2kB)t + 4 [KC + 2 k B] e - k A t
~ [KA + 2 M
Only the last term will usually be measurable and the experimental relaxation time will be k \ . The general behavior of S M as the system moves away from the rapid exchange limit toward this special case is familiar in relaxation spectroscopy; two relaxation times appear but as they do, the coefficient of the term with the longer relaxation time begins to climb relative to that of the faster term. At greater deviation, the difference between the relaxation times becomes greater but the relative magnitudes of the coefficients make the contribution of the slower term relatively much more important. Thus, only the slower relaxation time will often be observed. It is probable that the fast-exchange limit is less often applicable than is now supposed.
THE VOLUME CHANGE ON MIXING IN LIQUID METALLIC SOLUTIONS II. SOME BINARY ALLOYS INVOLVING MERCURY, ZINC AND BISMUTH1
By 0. J. K l e p p a , M. K a p l a n a n d C. E. T h a l m a y e r
Institute for the Study of Metals, and Department of Chemistry, University of Chicago, Chicago, III.Received December 5, 1960
Some new data are presented on the volume change on mixing for six binary liquid systems containing mercury, for the liquid alloys of zinc with cadmium, indium and tin, and for lead-bismuth. The results are compared with volume information previously reported for mercury-indium, and for five binary systems containing cadmium. In a general way the results of these measurements fall in two groups: All the mercury systems show substantial volume contractions on mixing. These contractions correlate with negative excess entropies of mixing, but there is no correlation, even as to sign, with the heat of mixing. The eight systems involving zinc and cadmium, on the other hand, all show volume expansions. In these systems the positive excess volumes correlate, both as to sign and as to magnitude, with the excess entropies and enthalpies of mixing. To some extent they also correlate with the difference in valence between the two solution partners.
Introduction urement of the volume change on mixing in liquidIn recent communications two new but related mixtures at temperatures up to about 500 A 3
methods were described which permit direct meas- Through our use of these methods we have been(1) Work supported by the Office of Naval Research at the Univer- (2) O. J. Kleppa and M. Kaplan, J. Phys. Chem., 61, 1120 (1957).
sity of Chicago. (3) O. J. Kleppa, ibid., 64, 1542 (1960).

844 0 . J. Kleppa, M. K aplan and C. E. Thalmayer Vol. 65
Fig. 1.— Molar integral volume change on mixing (at 158°) and heat of mixing (at 150°) in mercury-zinc and mercury- cadmium alloys. (Heat data from ref. 5.)
Fig. 2.— Molar integral volume change on mixing (158°) and heat of mixing (at 150°) in mercury-thallium alloys. Broken hue gives volume change at 30° calculated from the density work of Richards and Daniels.7 (Heat data from ref. 5.)
able to report new volume data for the low-melting system mercury-indium,2 for five systems involving cadmium3 and for lead-tin.4 In the present communication we report excess volume data for six mercury systems (measured at 158°), for three zinc systems (at 450°) and for lead-bismuth (at 350°). As a result of these investigations we now have detailed excess volume information for a
total of 17 different binary metallic mixtures. This information certainly is more extensive and reliable than any similar set of data contained in the published literature. Nevertheless, we do not believe that our sample is sufficiently representative to permit us to make well-founded predictions regarding volume relations in other liquid alloy systems. This is so because the systems covered in our studies are drawn in the main from the alloys formed by group IIB metals (Zn,Cd,Hg). There is reason to believe that in certain respects these divalent metals are atypical (see below).
For all the systems covered in the present series of investigations we have already reported heat of mixing data.5 6 For most of them there is available in the published literature also a certain amount of free energy information, obtained by e.m.f., phase diagram and vapor pressure methods. By comparing these free energies with the heats of mixing we are able to calculate corresponding excess entropies. However, it should be kept in mind that this entropy information usually is somewhat less reliable than the corresponding heat and volume data.
It is well known that most recent work on solution theory has little or no application in the field of metallic solutions. This is due largely to the failure, in the metallic state, of the central force pair interaction approximation. For this reason we are unable to compare our excess quantities with realistic theoretical values. We believe, nevertheless, that a search for experimental correlations among the various thermodynamic excess functions is of considerable interest. The existence of such correlations may serve as a useful guide for future theoretical work in the field of metallic solutions.
ExperimentalThe experimental methods used in the present work were
described in some detail in our earlier communications. No important changes in technique or procedure were adopted in the present work. Thus the mercury alloys were studied at 158*(±0.1°) in an oil thermostat of conventional design. The mixing process was carried out in U-shaped cells, and volume change on mixing was determined through the displacement of the surface of an inert liquid (mineral oil) in a calibrated capillary.2
The four “ high-melting” systems were studied in argon- filled U-cells immersed in a large, well insulated salt bath.3 In these experiments the volume change on mixing was “ transmitted” through a small bore “ lead” to a capillary measuring device at room temperature. A simple gas law correction was applied to derive the actual volume change from the apparent volume change observed at room temperature.
In most amalgam experiments we used about 0.1-0.2 g. atom of metal in each run. For the higher melting systems the corresponding figure was 0.8-1.0 g. atom. It is believed that in both cases the reported excess volume data are correct to about ±0 .01 cm.11, i.e., to 0.1% or better of the molar volumes.
The base metals used in the present work were all stock metals of 99.9 + % purity. The mercury was of triply distilled commercial quality. Before use all solid metals were precast in the form of ’ A" rods. In the experiments involving solid metals plus mercury it is particularly important that the solid be free from internal voids, since such voids would give rise to systematic errors. In order to obtain sound solid samples we discarded the top part of each cast rod.
(4) O. J. Kleppa, in “Physical Chemistry in Process Metallurgy” (to be published by A.l.M.E. 1961).
(5) (a) O. J. Kleppa, Acta Met., 6, 225 (1958); (b) ibid., 8, 435(1960).
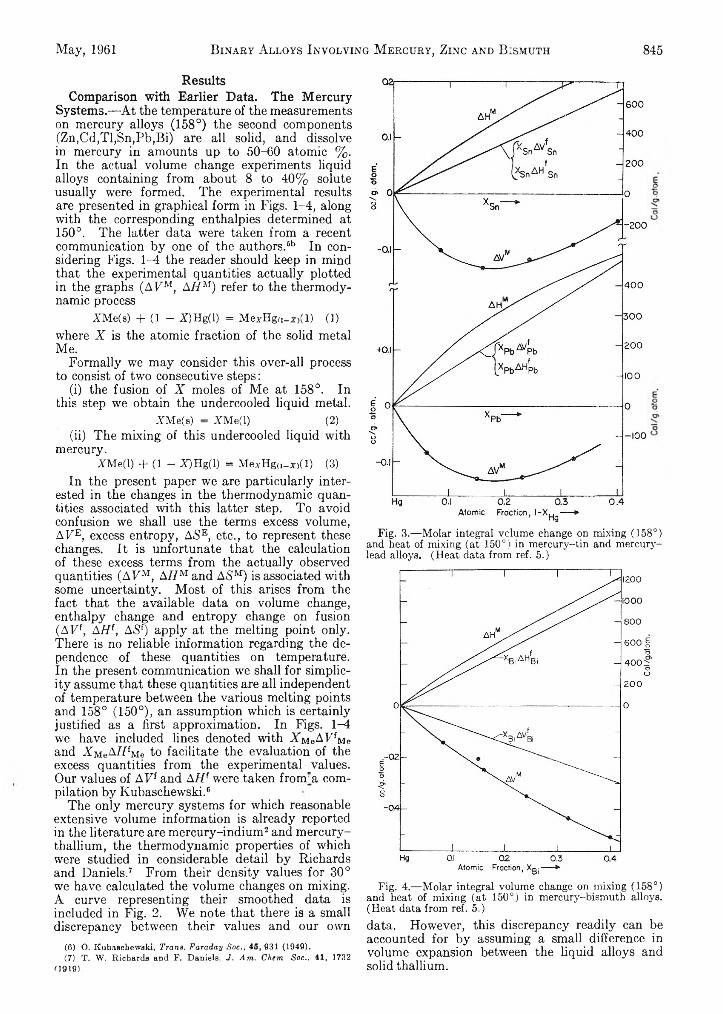
May, 1961 Binary Alloys Involving M ercury, Zinc and Bismuth 845
ResultsComparison with Earlier Data. The Mercury
Systems.—-At the temperature of the measurements on mercury alloys (158°) the second components (Zn,Cd,Tl,Sn,Pb,Bi) are all solid, and dissolve in mercury in amounts up to 50-60 atomic %. In the actual volume change experiments liquid alloys containing from about 8 to 40% solute usually were formed. The experimental results are presented in graphical form in Figs. 1-4, along with the corresponding enthalpies determined at 150°. The latter data were taken from a recent communication by one of the authors.61* In considering Figs. 1-4 the reader should keep in mind that the experimental quantities actually plotted in the graphs (AFM, AH M) refer to the thermodynamic process
XMe(s) + (1 - X)H g(l) = M e*H g(1-x )( l ) (1)where X is the atomic fraction of the solid metal Me.
Formally we may consider this over-all process to consist of two consecutive steps:
(i) the fusion of X moles of Me at 158°. In this step we obtain the undercooled liquid metal.
IM e(a) = XM e(l) (2)(ii) The mixing of this undercooled liquid with
mercury.XM e(l) + (1 - X)H g(l) = MexH g „_x )(l) (3)
In the present paper we are particularly interested in the changes in the thermodynamic quantities associated with this latter step. To avoid confusion we shall use the terms excess volume, AFE, excess entropy, AiS'E, etc., to represent these changes. It is unfortunate that the calculation of these excess terms from the actually observed quantities (AFM, A //M and A»S'M) is associated with some uncertainty. Most of this arises from the fact that the available data on volume change, enthalpy change and entropy change on fusion (AFf, AH {, A»Sf) apply at the melting point only. There is no reliable information regarding the dependence of these quantities on temperature. In the present communication we shall for simplicity assume that these quantities are all independent of temperature between the various melting points and 158° (150°), an assumption which is certainly justified as a first approximation. In Figs. 1-4 we have included lines denoted with X MeAFfMe and XMeAiffMe to facilitate the evaluation of the excess quantities from the experimental values. Our values of AFf and A //f were taken from'a compilation by Kubaschewski.6
The only mercury systems for which reasonable extensive volume information is already reported in the literature are mercury-indium2 and mercury- thallium, the thermodynamic properties of which were studied in considerable detail by Richards and Daniels.7 From their density values for 30° we have calculated the volume changes on mixing. A curve representing their smoothed data is included in Fig. 2. We note that there is a small discrepancy between their values and our own
(6) O, Kubaschewski, Trans. Faraday Soc., 45, 931 (1949).(7) T. W. Richards and F. Daniels, J. Am. Chem Soc., 41, 1732
fl919).
Fig. 3.— Molar integral volume change on mixing (158°) and heat of mixing (at 150°) in mercury-tin and mercury- lead alloys. (Heat data from ref. 5.)
Fig. 4.— Molar integral volume change on mixing (158°) and heat of mixing (at 150°) in mercury-bismuth alloys. (Heat data from ref. 5.)data. However, this discrepancy readily can be accounted for by assuming a small difference in volume expansion between the liquid alloys and solid thallium.
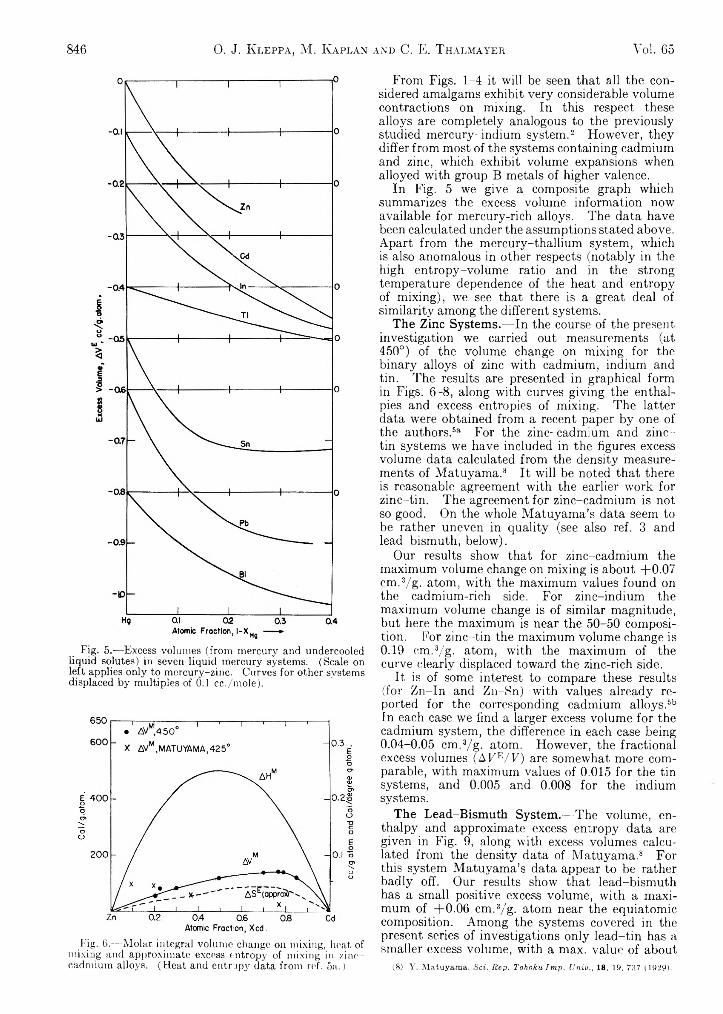
846 0. J. K leppa, M. K aplan and C. E. T halmayer Vol. 65
Fig. 5.-—Excess volumes (from mercury and undercooled liquid solutes) in seven liquid mercury systems. (Scale on left applies only to mercury-zinc. Curves for other systems displaced by multiples of 0.1 cc./mole).
Fig. 6.— Molar integral volume change on mixing, heat of mixing and approximate excess entropy of mixing in zinc- cadmium alloys. (Heat and entropy data from ref. 5a.)
From Figs. 1-4 it will be seen that all the considered amalgams exhibit very considerable volume contractions on mixing. In this respect these alloys are completely analogous to the previously studied mercury-indium system.2 However, they differ from most of the systems containing cadmium and zinc, which exhibit volume expansions when alloyed with group B metals of higher valence.
In Fig. 5 we give a composite graph which summarizes the excess volume information now available for mercury-rich alloys. The data have been calculated under the assumptions stated above. Apart from the mercury-thallium system, which is also anomalous in other respects (notably in the high entropy-volume ratio and in the strong temperature dependence of the heat and entropy of mixing), we see that there is a great deal of similarity among the different systems.
The Zinc Systems.— In the course of the present investigation we carried out measurements (at 450°) of the volume change on mixing for the binary alloys of zinc with cadmium, indium and tin. The results are presented in graphical form in Figs. 6-8, along with curves giving the enthalpies and excess entropies of mixing. The latter data were obtained from a recent paper by one of the authors.511 For the zinc-cadmium and zinc- tin systems we have included in the figures excess volume data calculated from the density measurements of Matuyama.8 It will be noted that there is reasonable agreement with the earlier work for zinc-tin. The agreement for zinc-cadmium is not so good. On the whole Matuyama’s data seem to be rather uneven in quality (see also ref. 3 and lead-bismuth, below).
Our results show that for zinc-cadmium the maximum volume change on mixing is about +0.07 cm.3/g. atom, with the maximum values found on the cadmium-rich side. For zinc-indium the maximum volume change is of similar magnitude, but here the maximum is near the 50-50 composition. For zinc-tin the maximum volume change is 0.19 em.3/g. atom, with the maximum of the curve clearly displaced toward the zinc-rich side.
It is of some interest to compare these results (for Zn-In and Zn-Sn) with values already reported for the corresponding cadmium alloys.5b In each case we find a larger excess volume for the cadmium system, the difference in each case being 0.04-0.05 cm.3/g. atom. However, the fractional excess volumes (AFE/F) are somewhat more comparable, with maximum values of 0.015 for the tin systems, and 0.005 and 0.008 for the indium systems.
The Lead-Bismuth System.— The volume, enthalpy and approximate excess entropy data are given in Fig. 9, along with excess volumes calculated from the density data of Matuyama.8 For tills system Matuyama’s data appear to be rather badly off. Our results show that lead-bismuth has a small positive excess volume, with a maximum of +0.06 cm.3/g. atom near the equiatomic composition. Among the systems covered in the present series of investigations only lead-tin has a smaller excess volume, with a max. value of about
(8) Y. Matuyama, Sci. Rep. Tohoku Imp. Univ., 18, 19, 787 (1929).
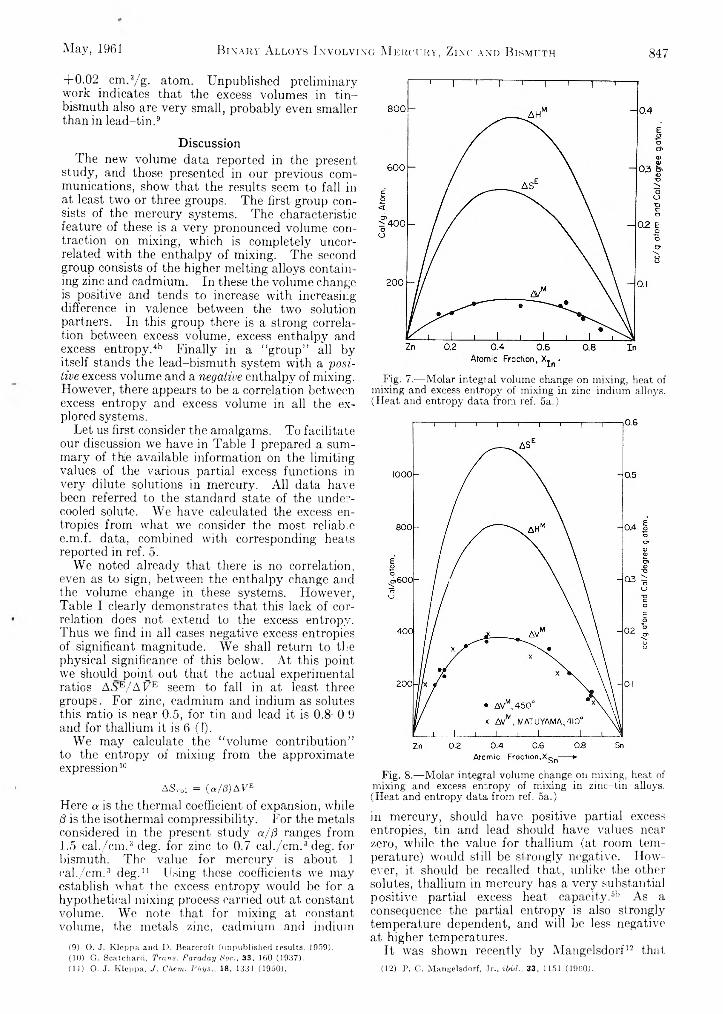
May, 1961 B i n a r y A l l o y s I n v o l v i n g M e r c u r y , Z i n c a n d B i s m u t h 847
+0.02 cm.3/g. atom. Unpublished preliminary work indicates that the excess volumes in tin- bismuth also are very small, probably even smaller than in lead-tin.9
DiscussionThe new volume data reported in the present
study, and those presented in our previous communications, show that the results seem to fall in at least two or three groups. The first group consists of the mercury systems. The characteristic feature of these is a very pronounced volume contraction on mixing, which is completely uncorrelated with the enthalpy of mixing. The second group consists of the higher melting alloys containing zinc and cadmium. In these the volume change is positive and tends to increase with increasing difference in valence between the two solution partners. In this group there is a strong correlation between excess volume, excess enthalpy and excess entropy.4b Finally in a “group” all by itself stands the lead-bismuth system with a p o s itive excess volume and a n egative enthalpy of mixing. However, there appears to be a correlation between excess entropy and excess volume in all the explored systems.
Let us first consider the amalgams. To facilitate our discussion we have in Table I prepared a summary of the available information on the limiting values of the various partial excess functions in very dilute solutions in mercury. All data have been referred to the standard state of the undercooled solute. We have calculated the excess entropies from what we consider the most reliable e.m.f. data, combined with corresponding heats reported in ref. 5.
We noted already that there is no correlation, even as to sign, between the enthalpy change and the volume change in these systems. However, Table I clearly demonstrates that this lack of correlation does not extend to the excess entropy. Thus we find in all cases negative excess entropies of significant magnitude. We shall return to the physical significance of this below. At this point we should point, out that the actual experimental ratios A.SE/A F E seem to fall in at least three groups. For zinc, cadmium and indium as solutes this ratio is near 0.5, for tin and lead it is 0.8-0.9 and for thallium it is 6(1).
We may calculate the “volume contribution” to the entropy of mixing from the approximate expression10
AS,-»! = («//3)AFEHere a is the thermal coefficient of expansion, while (3 is the isothermal compressibility. For the metals considered in the present study a//3 ranges from1.5 cal./cm.3 deg. for zinc to 0.7 cal./cm.3 deg. for bismuth. The value for mercury is about 1 cal./cm.3 deg.11 Using these coefficients we may establish what the excess entropy would be for a hypothetical mixing process carried out at constant volume. We note that for mixing at constant volume, the metals zinc, cadmium and indium
(9) O. J. Kleppa and D. Bearcroft (unpublished results, 1959).(10) G. Scatchard, Trans. Faraday Soc., 33, 160 (1937).ill) O. J. Kleppa, J. Chem. Phys., 18, 1331 (1950).
Fig. 7.— Molar integral volume change on mixing, heat of mixing and excess entropy of mixing in zinc-indium allo3's. (Heat and entropy data from ref. 5a.)
Fig. 8.— Molar integral volume change on mixing, heat of mixing and excess eniropy of mixing in zinc-tin alloys. (Heat and entropy data from ref. 5a.)
in mercury, should have positive partial excess entropies, tin and lead should have values near zero, while the value for thallium (at room temperature) would still be strongly negative. However, it should be recalled that, unlike the other solutes, thallium in mercury has a very substantial positive partial excess heat capacity.5b As a consequence the partial entropy is also strongly temperature dependent, and will be less negative at higher temperatures.
It was shown recently by Mangelsdorf12 that(12) P. C. Mangelsdorf, Jr., ibid., 33, 1151 (1900).
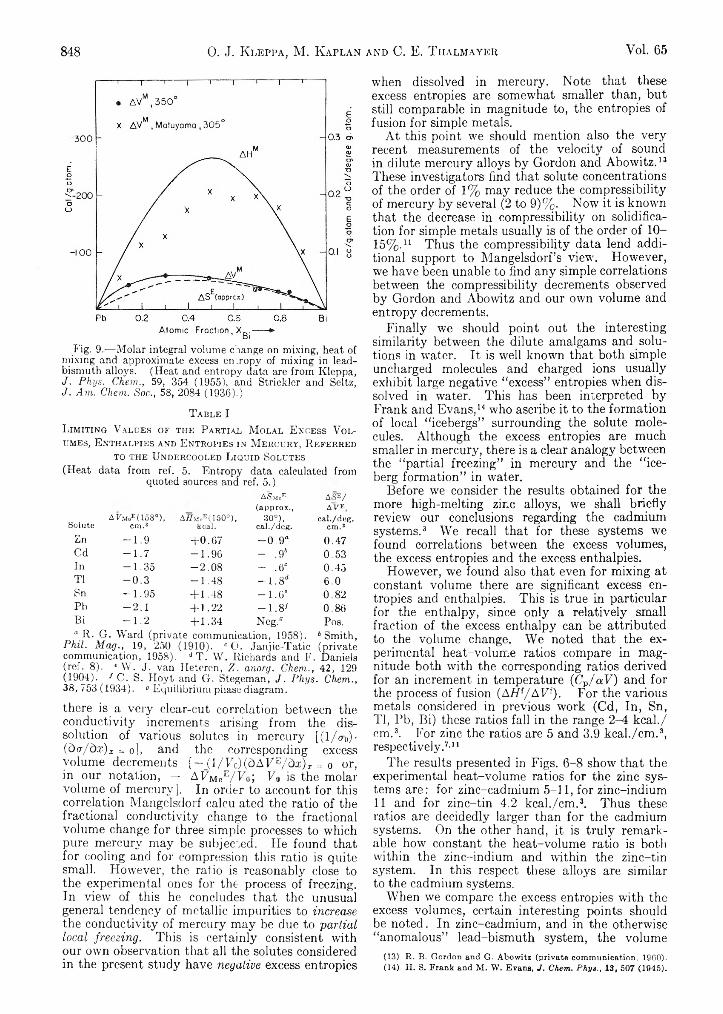
848 0. J. K leppa, M. K aplan and C. E. T halmayer Vol. 65
Fig. 9.— Molar integral volume change on mixing, heat of mixing and approximate excess entropy of mixing in lead- bismuth alloys. (Heat and entropy data are from Kleppa, J. Phys. Chem., 59, 354 (1955), and Stricklor and Seitz, J. Am. Chem. Soc., 58, 2084 (1936).)
T able IL im iting V alues op the Partial M olal E xcess V olumes, E nthalpies and E ntropies in M ercury , R eferred
to the U ndercooled Liquid Solutes (Heat data from ref. 5. Entropy data calculated from
quoted sources and ref. 5.)
SoluteA Vmoe(I58°),
cm.3A //MeE(150°),
kcal.
A&MeE(approx.,
30°),cal./deg.
ASE/A7E,
cal./deg.cm.3
Zn - 1 . 9 + 0 .67 - 0 .9 ° 0.47Cd - 1 . 7 -1 .9 6 - .9* 0.53In -1 .3 5 -2 .0 8 - .6C 0.45Tl - 0 . 3 -1 .4 8 - 1 . 8 “ 6.0Sn -1 .9 5 + 1 .48 - 1 . 6 ' 0.82Pb - 2 . 1 + 1 .22 - 1 . 8 7 0.86Bi - 1 . 2 + 1.34 Neg." Pos.“ R . G. Ward (private communication, 1958).
Phil. Mag., 19, 250 (1910). c O. Janjic-Tatic communication, 1958). d T . W . Richards and F.
b Smith, (private
. Daniels(ref. 8). e W. J. van Heteren, Z. anorg. Chem., 42, 129 (1904). / C. S. Hoyt and G. Stegeman, J . Phys. Chem., 38, 753 (1934). » Equilibrium phase diagram.
there is a very clear-cut correlation between the conductivity increments arising from the dissolution of various solutes in mercury [(l/oo)- (do-/da:)* = o], and the corresponding excess volume decrements [-_ (l/F c)(dAFE/da;)* = 0 or, in our notation, — AFMeE/Fo; F0 is the molar volume of mercury]. In order to account for this correlation Mangelsdorf calculated the ratio of the fractional conductivity change to the fractional volume change for three simple processes to which pure mercury may be subjected. He found that for cooling and for compression this ratio is quite small. However, the ratio is reasonably close to the experimental ones for the process of freezing. In view of this he concludes that the unusual general tendency of metallic impurities to in crea se the conductivity of mercury may be due to p a r t ia l lo ca l fre e z in g . This is certainly consistent with our own observation that all the solutes considered in the present study have n egative excess entropies
-when dissolved in mercury. Note that these excess entropies are somewhat smaller than, but still comparable in magnitude to, the entropies of fusion for simple metals.
At this point we should mention also the very recent measurements of the velocity of sound in dilute mercury alloys by Gordon and Abowitz.13 These investigators find that solute concentrations of the order of 1% may reduce the compressibility of mercury by several (2 to 9)%. Now it is known that the decrease in compressibility on solidification for simple metals usually is of the order of 10- 15%.11 Thus the compressibility data lend additional support to Mangelsdorf’s viewr. However, we have been unable to find any simple correlations between the compressibility decrements observed by Gordon and Abowitz and our owm volume and entropy decrements.
Finally we should point out the interesting similarity between the dilute amalgams and solutions in wrater. It is well known that both simple uncharged molecules and charged ions usually exhibit large negative “excess” entropies when dissolved in water. This has been interpreted by Frank and Evans,14 who ascribe it to the formation of local “icebergs” surrounding the solute molecules. Although the excess entropies are much smaller in mercury, there is a clear analogy between the “partial freezing” in mercury and the “iceberg formation” in water.
Before we consider the results obtained for the more high-melting zinc alloys, we shall briefly review our conclusions regarding the cadmium systems.3 We recall that for these systems we found correlations between the excess volumes, the excess entropies and the excess enthalpies.
However, we found also that even for mixing at constant volume there are significant excess entropies and enthalpies. This is true in particular for the enthalpy, since only a relatively small fraction of the excess enthalpy can be attributed to the volume change. We noted that the experimental heat-volume ratios compare in magnitude both with the corresponding ratios derived for an increment in temperature (Cp/aF ) and for the process of fusion (AHf/A F f). For the various metals considered in previous work (Cd, In, Sn, Tl, Pb, Bi) these ratios fall in the range 2 - 4 keal./ cm.3. For zinc the ratios are 5 and 3.9 kcal./cm.3, respectively.7-11
The results presented in Figs. 6-8 show that the experimental heat-volume ratios for the zinc systems are: for zinc-cadmium 5-11, for zinc-indium 11 and for zinc-tin 4.2 kcal./cm.3. Thus these ratios are decidedly larger than for the cadmium systems. On the other hand, it is truly remarkable how constant the heat-volume ratio is both within the zinc-indium and within the zinc-tin system. In this respect these alloys are similar to the cadmium systems.
When we compare the excess entropies with the excess volumes, certain interesting points should be noted. In zinc-cadmium, and in the otherwise “anomalous” lead-bismuth system, the volume
(13) R. B. Gordon and G. Abowitz (private communication, 1960).(14) H. S. Frank and M. W. Evans, J. Chem. Phya., 13, 507 (1945).
May, 1961 Thermodynamic Functions of Some Phosphorus Compounds 849
changes on mixing are small and positive, and correlate with equally small positive excess entropies. Although the entropy data for these two systems are uncertain, the entropy-volume ratios probably are of the order of 1 cal./cm.3 deg. Thus the volume change accounts for most of the excess entropy.
For zinc-tin and zinc-indium, on the other hand, the experimental entropy-volume ratios are quite large, about 3.0 and 3.6 cal./cm.3 deg., respectively. These values should be compared with values of the order of 1.5 cal./cm.3 deg. for the cadmium systems. We accordingly find that while in the alloys of cadmium with metals of higher valence the volume changes account for some 70% of the excess entropies at constant pressure, the corresponding percentages in the two zinc systems are less than 50%. In both types of system there are significant entropy contributions which cannot be attributed to the volume change. Clearly these contributions are particularly important
in the zinc systems, which show the largest excess entropies.
In a previous communication we have suggested that the correlations between excess thermodynamic quantities and valence difference which characterize the liquid alloys of zinc and cadmium, may be due, at least in part, to departures from “free” electron behavior in these two divalent metals.16 We believe, for example, that the nonzero excess entropies at constant volume may have a relation to the details of the electronic structure of zinc and cadmium. Conceivably they may arise from a non-linear dependence of the electronic heat capacity on composition in the various alloy systems. Unfortunately our understanding of the details of the electronic structure of liquid metals is still rather unsatisfactory. Therefore, more firmly founded conclusions regarding these problems must await further investigations.
(15) O. J. Kleppa and C. E. Thalrnayer, J. Phys. Chem., 63, 1953 (1959).
THERMODYNAMIC FUNCTIONS OF SOME PHOSPHORUS COMPOUNDSB y R o b e r t L. P o t t e r a n d V in c e n t N . D i St e f a n o
American Cyanamid Company, Stamford, Connecticut Received December 10, 1960
The thermodynamic functions of P(g), Pî(g), PN(g), PO(g), PC(g), PF3(g), PH3(g) and Pi(g) have been computed from spectroscopic data according to statistical mechanical formulas. Heats of formation of these compounds have also been selected so that the complete thermodynamic properties cf these compounds are available.
IntroductionThe high temperature thermodynamic proper
ties of phosphorus compounds are a necessary prerequisite for any study of high temperature equilibrium involving phosphorus as a component. Tables of thermodynamic functions for some of the compounds reported here have been published but not with the accuracy or internal consistency strived for herein over the temperature range of 273.15 to 5000 °K. Because many of the compounds have important excited electronic states, and at the same time significantly low dissociation energies, it is difficult to interpolate on the functions. Therefore they have been reported at even 100° intervals.
Functions for P(g), (g = gas) have been given by Stevenson and Yost1 and appear also in a summary by Farr.2 These were computed with I.C.T. constants and extend only to 1500°K. Gordon3 also has calculated functions for P(g) but the internal energy levels were lumped together in an effort to simplify the calculations. Functions for P2(g) also have been reported by Gordon3; however the fundamental constants have changed since his work. Functions for PN(g) also have been given by Gordon,3 and a few at widely spaced intervals by McCallum and Leifer.4
(1) D. P. Stevenson and D. M. Yost, J . Chem. Phys., 9, 403 (1941)*(2) T. D. Farr, “ Phosphorus, Properties of the Elements and Some of
Its Compounds,” Tenn. Valley Auth., Wilson Dam, Ala., 1950, Chem. Eng. Report No. 8 (U. S. Govt. Printing Office, Washington 25, D. C.).
(3) J. S. Gordon, WADC, Technical Rept. No. 57/33 (1957).(4) K. J. McCallum and E. Leifer, J. Chem. Phys., 8, 505 (1940).
For PO(g) tables have been published by Gordon3 but without inclusion of all the excited states, and the same is true of PC(g). For PH3(g), PF3(g) and P4(g) functions have been reported up to 1500°K. by Stevenson and Yost,1 Farr2 and more recently on PH3 by Sundaram, Suszek and Cleveland,6 and on PF3 by Wilson and Polo.6
The spectral data for these compounds have been selected carefully and with the latest values of the fundamental constants, thermodynamic functions have been calculated to 5000°K.
CalculationsThe fundamental constants were taken from
Wichers,7 and Dumond and Cohen.8 The entropy constant was taken as —2.31540 which compares with —2.31533 used by Potter.9 The translational contributions for P(g) were calculated according to the standard formulas, while the contributions due to the internal levels were evaluated by directly summing over the first eight internal energy levels. The energy levels and multiplicities for P(g) were taken from Moore.10
For P2(g), the translational contributions were(5) S. Sundaram, F. Suszek and F. F. Cleveland, ibid., 32, 251
(1960).(6) M. K. Wilson and S. R. Polo, ibid., 20, 1716 (1952).(7) E. Wichers, J. Am. Chem. Soc., 80, 4129 (1958).(8) J. W. M. Dumond and E. R. Cohen, “ Handbook of Physics,”
Chapter 10, E. U. Condon and H. O. Odishaw, Editors, McGraw-Hill Book Co., Inc., New York, N. Y., 1958.
(9) R. L. Potter, J. Chem. Phys., 31, 1100 (1959).(10) C. E. Moore, “Atomic Energy Levels, I, II, III,” Natl. Bur.
Standards Circ. 647, U. S. Govt. Printing Office, Washington 25, D. C.
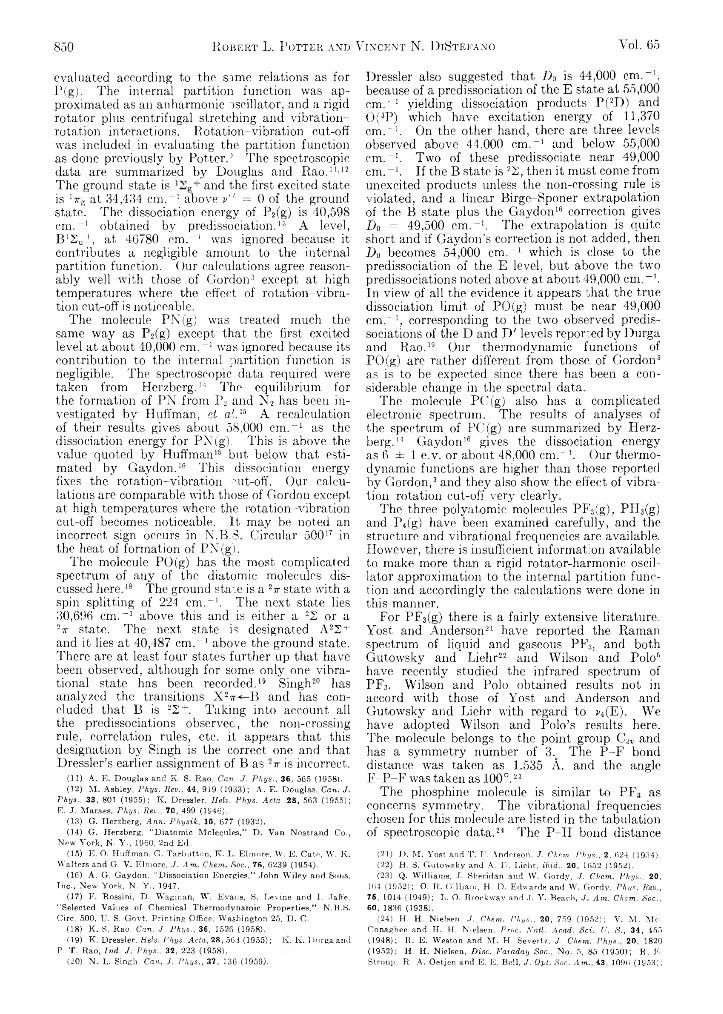
850 R obert L. Potter and Vincent N. D iStefano Vol. 65
evaluated according to the same relations as for P(g). The internal partition function was approximated as an anharmonic oscillator, and a rigid rotator plus centrifugal stretching and vibration- rotation interactions. Rotation-vibration cut-off was included in evaluating the partition function as done previously by Potter.5 The spectroscopic data are summarized by Douglas and Rao.11,12 The ground state is and the first excited state is 1 Tg at 34,434 cm r1 above v " = 0 of the ground state. The dissociation energy of P2(g) is 40,598 cm r1 obtained by predissociation.13 A level, IP2U+, at 46780 cm ."1 was ignored because it contributes a negligible amount to the internal partition function. Our calculations agree reasonably well with those of Gordon3 except at high temperatures where the effect of rotation-vibration cut-off is noticeable.
The molecule PN(g) was treated much the same way as P2(g) except that the first excited level at about 40,000 cm ."1 was ignored because its contribution to the internal partition function is negligible. The spectroscopic data required were taken from Herzberg.14 The equilibrium for the formation of PN from P2 and N2 has been investigated by Huffman, et a ',.15 A recalculation of their results gives about 58,000 cm."1 as the dissociation energy for PN(g). This is above the value quoted by Huffman15 but below that estimated by Gaydon.16 This dissociation energy fixes the rotation-vibration cut-off. Our calculations are comparable with those of Gordon except at high temperatures where the rotation-vibration cut-off becomes noticeable. It may be noted an incorrect sign occurs in N.B.S. Circular 50017 in the heat of formation of PN (g).
The molecule PO(g) has the most complicated spectrum of any of the diatomic molecules discussed here.18 The ground state is a V state with a spin splitting of 224 cm ."1. The next state lies 30,696 cm ."1 above this and is either a 22 or a 27r state. The next state is designated A22 + and it lies at 40,487 cm."1 above the ground state. There are at least four states further up that have been observed, although for some only one vibrational state has been recorded.19 Singh20 has analyzed the transitions X 2tt- -B and has concluded that B is 22+. Taking into account all the predissociations observed, the non-crossing rule, correlation rules, etc. it appears that this designation by Singh is the correct one and that Dressler’s earlier assignment of B as 27t is incorrect.
(11) A . E. Douglas and K . S- Rao, Can, J. P h ys., 36, 565 (1958).(12) M . Ashley, P h ys. Rev., 44, 919 (1933); A . E. Douglas, Can. J.
P hys., 33, 801 (1955); K . Dressier, Helv. P h ys. Acta, 28, 563 (1955); E. J. Maraes, P h ys. Rev., 70, 499 (1946).
(13) G. Herzberg, Ann. P h ysik , 15, 677 (1932).(14) G. Herzberg, “ Diatomic Molecules,” D. Van Nostrand Co.,
New York, N. Y-, 1960, 2nd Ed.(15) E. O. Huffman, G. Tarbutton, Iv. L. Elmore, W . E. Cate, W . K.
Walters and G. V. Elmore, J. Am. Chem. Soc., 76, 6239 (1954).(16) A. G. Gaydon, “ Dissociation Energies,” John W iley and Sons,
Inc., New York, N. Y ., 1947.(17) F. Rossini, D. Wagman, W. Evans, S. Levine and I. Jaffe,
“ Selected Values of Chemical Thermodynamic Properties,” N.B.S. Circ. 500, U. S. Govt. Printing Office, Washington 25, D. C.
(18) K . S. Rao, Can. J. P h ys., 36, 1526 (1958).(19) K . Dressier, Helv. P h ys. Acta, 28, 563 (1955); I\. K . Durga and
P. T. Rao, Ind. J. P h ys., 32, 223 (1958).(20) N. L. Singh, Can. J. P h ys., 37, 136 (1959).
Dressier also suggested that D 0 is 44,000 cm ."1, because of a predissociation of the E state at 55,000 cm."1 yielding dissociation products P(2D) and 0 (3P) which have excitation energy of 11,370 cm ."1. On the other hand, there are three levels observed above 44,000 cm ."1 and below 55,000 cm."1. Two of these predissociate near 49,000 cm._1. If the B state is 22, then it must come from unexcited products unless the non-crossing rule is violated, and a linear Birge-Sponer extrapolation of the B state plus the Gaydon16 correction gives Do = 49,500 cm."1. The extrapolation is quite short and if Gaydon’s correction is not added, then D 0 becomes 54,000 cm.“ 1 which is close to the predissociation of the E level, but above the two predissociations noted above at about 49,000 cm ."1. In view of all the evidence it appears that the true dissociation limit of PO(g) must be near 49,000 cm ."1, corresponding to the two observed predissociations of the D and D' levels reported by Durga and Rao.19 Our thermodynamic functions of PO(g) are rather different from those of Gordon3 as is to be expected since there has been a considerable change in the spectral data.
The molecule PC(g) also has a complicated electronic spectrum. The results of analyses of the spectrum of PC(g) are summarized by Herzberg.14 Gaydon16 gives the dissociation energy as 6 ± 1 e.v. or about 48,000 cm."1. Our thermodynamic functions are higher than those reported by Gordon,3 and they also show the effect of vibration-rotation cut-off very clearly.
The three polyatomic molecules PF3(g), PH3(g) and P4(g) have been examined carefully, and the structure and vibrational frequencies are available. However, there is insufficient information available to make more than a rigid rotator-harmonic oscillator approximation to the internal partition function and accordingly the calculations were done in this manner.
For PF3(g) there is a fairly extensive literature. Yost and Anderson21 have reported the Raman spectrum of liquid and gaseous PF3, and both Gutowsky and Liehr22 and Wilson and Polo6 have recently studied the infrared spectrum of PF3. Wilson and Polo obtained results not in accord with those of Yost and Anderson and Gutowsky and Liehr with regard to r4(E). We have adopted Wilson and Polo's results here. The molecule belongs to the point group C3v and has a symmetry number of 3.o The P-F bond distance was taken as 1.535 A. and the angle F-P-F was taken as 100°.23
The phosphine molecule is similar to PF3 as concerns symmetry. The vibrational frequencies chosen for this molecule are listed in the tabulation of spectroscopic data.24 The P-H bond distance
(21) D. M . Yost and T . F. Anderson, J. Chem. Phys., 2, 624 (1934).(22) H. S. Gutowsky and A. D. Liehr, ibid., 20, 1652 (1952).(23) Q. Williams, J. Sheridan and W. Gordy, J. Chem. Phys., 20,
164 (1952); O. R. Gilliam, H. D. Edwards and W . Gordy, Phys. Rev., 75, 1014 (1949); L. O. Brockway and J. Y . Beach, J. Am . Chem. Soc., 60, 1836 (1938).
(24) H. H. Nielsen, ./. Chem. Phys., 20, 759 (1952); V. M . Me- Oonaghee and H. H. Nielsen, Proc. Natl. Acad. Sci. U. S., 34, 455(1948); R . E. Weston and M . H. Severtz, J. Chem. Phys., 20, 1820 (1952); H. H. Nielsen, Disc. Faraday Soc., No. 5, 85 (1950); R . E. Stroup, R. A . Oetjen and E. E. Bell, J. Opt. Soc. Am ., 43, 1096 (1953);
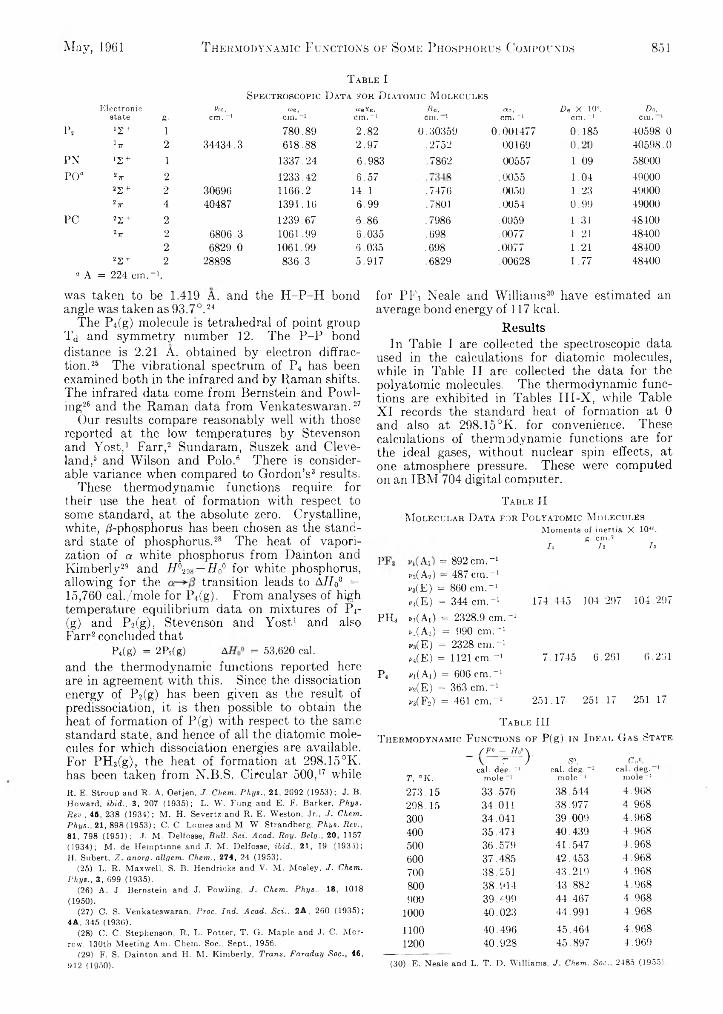
T a b l e IS p e c t r o s c o p i c D a t a f o r D i a t o m i c M o l e c u l e s
May, 1961 T hermodynamic Functions of Some Phosphorus Compounds 851
E le c t r o n ic 00, cue, coeXe, Be, « 3 , D e X 1 0 \ D o ,state g- cm. -1 cm.-1 cm._1 cm. 1 cm. _1 cm. _1 cm. 1Pi 12 + 1 780.89 2.82 0.30359 0.001477 0.185 40598.0
17T 2 3 4 4 3 4 .3 618.88 2.97 .2752 .00169O0 40598.0
PN Js+ 1 1337.24 6.983 .7862 .00557 1.09 58000POa V 2 1233.42 6.57 00 . 0055 1.04 49000
22 + 2 30696 1166.2 14.1 .7476 .0050 1.23 49000V 4 40487 1391.16 6.99 .7801 .0054 0.99 49000
PC 22 + 2 1239.67 6.86 .7986 .0059 1.31 484002ir 2 6806.3 1061.99 6.035 .698 .0077 1.21 48400
2 6829.0 1061.99 6.035 .698 .0077 1.21 4840022 + 2 28898 836.3 5.917 .6829 .00628 1.77 48400
“ A = 224 cm.“1.was taken to be 1.419 A. and the H-P-H bond angle was taken as 93.7°.24
The P4(g) molecule is tetrahedral of point group Td and symmetry number 12. The P-P bond distance is 2.21 A. obtained by electron diffraction.25 The vibrational spectrum of P,t has been examined both in the infrared and by Raman shifts. The infrared data come from Bernstein and Powl- ing26 and the Raman data from Venkateswaran. 27
Our results compare reasonably well with those reported at the low'- temperatures by Stevenson and Yost,1 Farr,2 Sundaram, Suszek and Cleveland,5 and Wilson and Polo.6 There is considerable variance when compared to Gordon’s3 results.
These thermodynamic functions require for their use the heat of formation with respect to some standard, at the absolute zero. Crystalline, white, /3-phosphorus has been chosen as the standard state of phosphorus.28 The heat of vaporization of a white phosphorus from Dainton and Kimberly29 and H ° 29S — H 0° for white phosphorus, allowing for the transition leads to AH 0° =15,760 cal./mole for P4(g). From analyses of high temperature equilibrium data on mixtures of P4- (g) and P2(g), Stevenson and Yost1 and also Farr2 concluded that
P4(g) = 2P2(g) A = 53,620 cal. and the thermodynamic functions reported here are in agreement with this. Since the dissociation energy of P2(g) has been given as the result of predissociation, it is then possible to obtain the heat of formation of P(g) with respect to the same standard state, and hence of all the diatomic molecules for which dissociation energies are available. For PH3(g), the heat of formation at 298.15°K. has been taken from N.B.S. Circular 500,17 whileR. E. Stroup and R. A. Oetjen, J. Chem. Phys., 21, 2092 (1953); J. B. Howard, ibid., 3, 207 (1935); L. W. Fung and E. F. Barker, Phys. Rev., 45, 238 (1934); M. H. Severtz and R. E. Weston, Jr., J. Chem. Phys., 21, 898 (1953); C. C. Lomes and M. W. Strandberg, Phys. Rev., 81, 798 (1951); J. M. Delfosse, Bull. Sci. Acad. Roy. Bely., 20, 1157 (1934); M. de Hemptinne and J. M. Delfosse, ibid., 21, 19 (1935);H. Subert, Z. anorg. allgem. Chem., 274, 24 (1953).
(25) L. R. Maxwell, S. B. Hendricks and V. M. Mosley, J. Chem. Phys., 3, 699 (1935).
(26) A. J. Bernstein and J. Powling, J. Chem. Phys., 18, 1018 (1950).
(27) C. S. Venkateswaran, Proc. Ind. Acad. Sci., 2A, 260 (1935); 4A, 345 (1936).
(28) C. C. Stephenson, R. L. Potter, T. G. Maple and J. C. Morrow, 130th Meeting Am. Chem. Soc., Sept., 1956.
(29) F. S. Dainton and H. M. Kimberly, Trans. Faraday Soc., 46, 912 (1950).
for PI1\ Neale and Williams30 have estimated an average bond energy of 117 kcal.
ResultsIn Table I are collected the spectroscopic data
used in the calculations for diatomic molecules, while in Table II are collected the data for the polyatomic molecules. The thermodynamic functions are exhibited in Tables III-X, while Table XI records the standard heat of formation at 0 and also at 298.15°K. for convenience. These calculations of thermodynamic functions are for the ideal gases, without nuclear spin effects, at one atmosphere pressure. These were computed on an IBM 704 digital computer.
T able IIM o l e c u l a r D a t a f o r P o l y a t o m i c M o l e c u l e s
M o m e n t s o f in e r tia X 10 43, g . c m .2
n i 2 Iz
II<?Ph 8 9 2 c m . - 1
v%( A 2 ) — 4 8 7 c m . -1
- 8 ( E ) = 8 6 0 c m . - *
- 4 ( E ) = 3 4 4 c m . - 1 1 7 4 . 4 4 5 1 0 4 . 2 9 7 1 0 4 . 2 9 7
PH» - i ( A , ) = 2 3 2 8 .9 c m . -1
- . ( A 2) = 9 9 0 c m . - 1
»8(E) = 2 3 2 8 c m . - 1
- 4 ( E ) = 1 1 2 1 c m . - 1 7 . 1 7 4 5 6 . 2 6 1 6 . 2 '. i l
P, - i ( A , ) = 6 0 6 c m . - 1
- a ( E ) = 3 6 3 c m . “ 1
- 3 ( F 2) = 4 6 1 c m . - 1 2 5 1 . 1 7 2 5 1 . 1 7 2 5 1 . 1 7
T a b l e IIIT h e r m o d y n a m i c F u n c t i o n s o f P(g) i n I d e a l G a s S t a t e
/ F ° - Ho°\V 7 ) ’ S», CpO,
c a l . d e g . _1 ca l. d eg . 1 c a l . d e g . 1T, ° K . m o le 1 m o l e -1 m o le _1
2 7 3 . 1 5 3 3 . 5 7 6 3 8 . 5 4 4 4 . 9 6 8
2 9 8 . 1 5 3 4 . 0 1 1 3 8 . 9 7 7 4 . 9 6 8
3 0 0 3 4 . 0 4 1 . 3 9 . 0 0 9 4 . 9 6 8
4 0 0 3 5 . 4 7 1 4 0 . 4 3 9 4 . 9 6 8
5 0 0 3 6 . 5 7 9 4 1 . 5 4 7 4 . 9 6 8
6 0 0 3 7 . 4 8 5 4 2 . 4 5 3 4 . 9 6 8
7 0 0 3 8 . 2 5 1 4 3 . 2 1 9 4 . 9 6 8
8 0 0 3 8 . 9 1 4 4 3 . 8 8 2 4 . 9 6 8
9 0 0 3 9 . 4 9 9 4 4 . 4 6 7 4 . 9 6 8
1 0 0 0 4 0 . 0 2 3 4 4 . 9 9 1 4 . 9 6 8
1 1 0 0 4 0 . 4 9 6 4 5 . 4 6 4 4 . 9 6 8
1 2 0 0 40.928 45.897 4.969(3 0 ) E . N e a le a n d L . T . D . W ill ia m s , J. Chem. So c ., 2 4 8 5 (1 9 5 5 ).
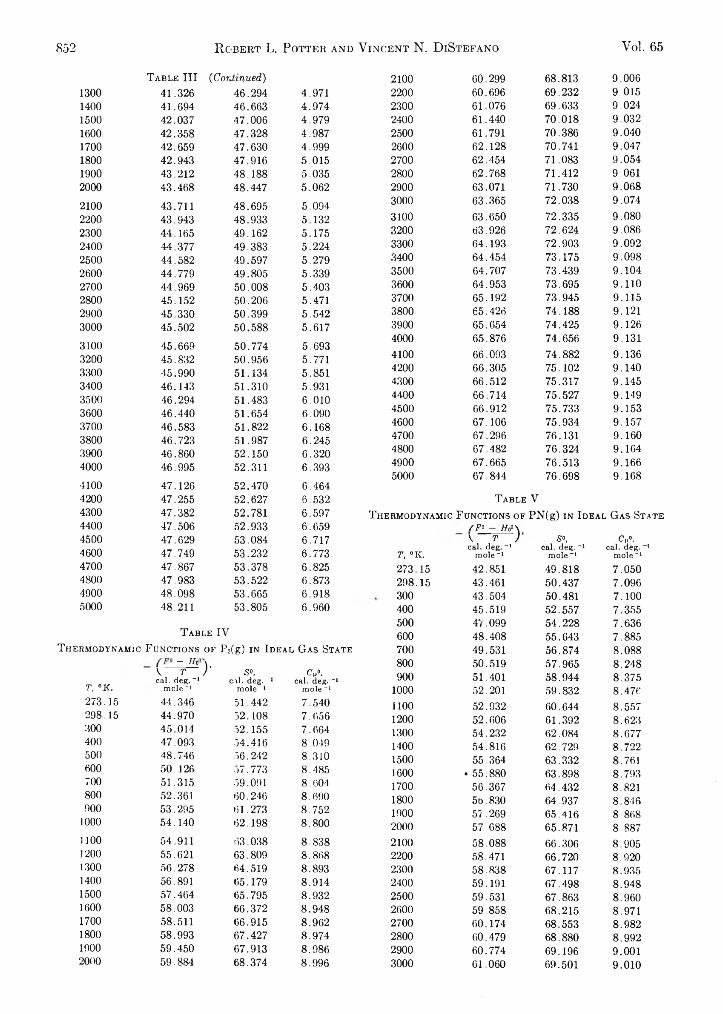
852 R obert L. Potter and Vincent N. D iStefano Vol. 65
T able III ('Continued) 2100 60.299 68.813 9.0061300 41.326 46.294 4.971 2200 60.696 69.232 9.0151400 41.694 46.663 4.974 2300 61.076 69.633 9.0241500 42.037 47.006 4.979 2400 61.440 70.018 9.0321600 42.358 47.328 4.987 2500 61.791 70.386 9.0401700 42.659 47.630 4.999 2600 62.128 70.741 9.0471800 42.943 47.916 5.015 2700 62.454 71.083 9.0541900 43.212 48.188 5.035 2800 62.768 71.412 9.0612000 43.468 48.447 5.062 2900 63.071 71.730 9.068
2100 43.711 48.695 5.094 3000 63.365 72.038 9.074
2200 43.943 48.933 5.132 3100 63.650 72.335 9.0802300 44.165 49.162 5.175 3200 63.926 72.624 9.0862400 44.377 49.383 5.224 3300 64.193 72.903 9.0922500 44.582 49.597 5.279 3400 64.454 73.175 9.0982600 44.779 49.805 5.339 3500 64.707 73.439 9.1042700 44.969 50.008 5.403 3600 64.953 73.695 9.1102800 45.152 50.206 5.471 3700 65.192 73.945 9.1152900 45.330 50.399 5.542 3800 65.426 74.188 9.12130003100
45.502 50.58850.774
5.617 39004000
65.65465.876
74.42574.656
9.1269.131
45.669 5.6933200 45.832 50.956 5.771 4100 66.093 74.882 9.1363300 45.990 51.134 5.851 4200 66.305 75.102 9.1403400 46.143 51.310 5.931 4300 66.512 75.317 9.1453500 46.294 51.483 6.010 4400 66.714 75.527 9.1493600 46.440 51.654 6.090 4500 66.912 75.733 9.1533700 46.583 51.822 6.168 4600 67.106 75.934 9.1573800 46.723 51.987 6.245 4700 67.296 76.131 9.1603900 46.860 52.150 6.320 4800 67.482 76.324 9.1644000 46.995 52.311 6.393 4900 67.665 76.513 9.166
5000 67.844 76.698 9.1684100 47.126 52.470 6.4644200 47.255 52.627 6.532 T able V4300 47.382 52.781 6.597 T hermodynamic F unctions of PN(g) in I deal G as State4400 47.506 52.933 6.659 /F« - Ho«\4500 47.629 53.084 6.717 \ T ) s°, Cp»,
cal. deg. 1 mole-14600 47.749 53.232 6.773 T, °K.
cal. deg.-1 mole-1
cal. deg.-1 mole -1
4700 47.867 53.378 6.825 273.15 42.851 49.818 7.0504800 47.983 53.522 6.873 298.15 43.461 50.437 7.0964900 48.098 53.665 6.918 300 43.504 50.481 7.1005000 48.211 53.805 6.960 400 45.519 52.557 7.355
500 47.099 54.228 7.636T able IV 600 48.408 55.643 7.885
T hermodynamic F unctions of P2(g) in I deal G as State 700 49.531 56.874 8.088- Ho
) ’ So,cal. deg. -1
Cpo,cal. deg. -1
800 50.519 57.965 8.248
T, °K.V T ,cal. deg.-1 900 51.401 58.944 8.375
mole -1 mole-1 mole -1 1000 52.201 59.832 8.476273.15 44.346 51.442 7.540 1100 52.932 60.644 8.557298.15 44.970 52.108 7.656 1200 52.606 61.392 8.623300 45.014 52.155 7.664 1300 54.232 62.084 8.677400 47.093 54.416 8.049 1400 54.816 62.729 8.722500 48.746 56.242 8.310 1500 55.364 63.332 8.761600 50.126 .57.773 8.485 1600 • 55.880 63.898 8.793700 51.315 .59.091 8.604 1700 56.367 64.432 8.821800 52.361 60.246 8.690 1800 5b.830 64.937 8.846900 53.295 61.273 8.752 1900 57.269 65.416 8.8681000 54.140 62.198 8.800 2000 57.688 65.871 8.887
1100 54.911 63.038 8.838 2100 58.088 66.306 8.9051200 55.621 63.809 8.868 2200 58.471 66.720 8.9201300 56.278 64.519 8.893 2300 58.838 67.117 8.9351400 56.891 65.179 8.914 2400 59.191 67.498 8.9481500 57.464 65.795 8.932 2500 59.531 67.863 8.9601600 58.003 66.372 8.948 2600 59.858 68.215 8.9711700 58.511 66.915 8.962 2700 60.174 68.553 8.9821800 58.993 67.427 8.974 2800 60.479 68.880 8.9921900 59.450 67.913 8.986 2900 60.774 69.196 9.0012000 59.884 68.374 8.996 3000 61.060 69.501 9.010
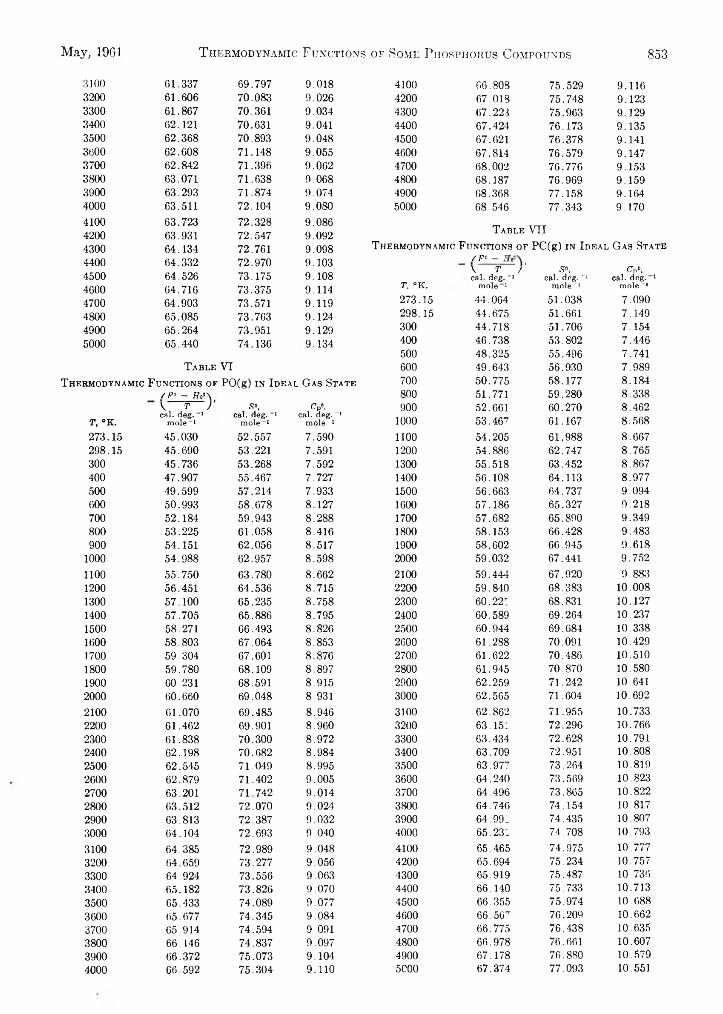
May, 1961 T hermodynamic Functions of Some Phosphorus Compounds 853
3 1 0 0 6 1 . 3 3 7 6 9 . 7 9 7 9 . 0 1 8
3 2 0 0 6 1 . 6 0 6 7 0 . 0 8 3 9 . 0 2 6
3 3 0 0 6 1 . 8 6 7 7 0 . 3 6 1 9 . 0 3 4
3 4 0 0 6 2 . 1 2 1 7 0 . 6 3 1 9 . 0 4 1
3 5 0 0 6 2 . 3 6 8 7 0 . 8 9 3 9 . 0 4 8
3 6 0 0 6 2 . 6 0 8 7 1 . 1 4 8 9 . 0 5 5
3 7 0 0 6 2 . 8 4 2 7 1 . 3 9 6 9 . 0 6 2
3 8 0 0 6 3 . 0 7 1 7 1 . 6 3 8 9 . 0 6 8
3 9 0 0 6 3 . 2 9 3 7 1 . 8 7 4 9 . 0 7 4
4 0 0 0 6 3 . 5 1 1 7 2 . 1 0 4 9 . 0 8 0
4 1 0 0 6 3 . 7 2 3 7 2 . 3 2 8 9 . 0 8 6
4 2 0 0 6 3 . 9 3 1 7 2 . 5 4 7 9 . 0 9 2
4 3 0 0 6 4 . 1 3 4 7 2 . 7 6 1 9 . 0 9 8
4 4 0 0 6 4 . 3 3 2 7 2 . 9 7 0 9 . 1 0 3
4 5 0 0 6 4 . 5 2 6 7 3 . 1 7 5 9 . 1 0 8
4 6 0 0 6 4 . 7 1 6 7 3 . 3 7 5 9 . 1 1 4
4 7 0 0 6 4 . 9 0 3 7 3 . 5 7 1 9 . 1 1 9
4 8 0 0 6 5 . 0 8 5 7 3 . 7 6 3 9 . 1 2 4
4 9 0 0 6 5 . 2 6 4 7 3 . 9 5 1 9 . 1 2 9
5 0 0 0 6 5 . 4 4 0 7 4 . 1 3 6 9 . 1 3 4
T able V I
T hermodynamic F unctions of PO(g) in Ideal G as State/ F » - tfo °\
T , ° K .
V T ) c a l . d e g . “ 1
m o le -1
s°,cal. d e g . -1
m o le -1
CV,c a l . d e g . -1
m o le - I
2 7 3 . 1 5 4 5 . 0 3 0 5 2 . 5 5 7 7 . 5 9 0
2 9 8 . 1 5 4 5 . 6 9 0 5 3 . 2 2 1 7 . 5 9 1
3 0 0 4 5 . 7 3 6 5 3 . 2 6 8 7 . 5 9 2
4 0 0 4 7 . 9 0 7 5 5 . 4 6 7 7 . 7 2 7
5 0 0 4 9 . 5 9 9 5 7 . 2 1 4 7 . 9 3 3
6 0 0 5 0 . 9 9 3 5 8 . 6 7 8 8 . 1 2 7
7 0 0 5 2 . 1 8 4 5 9 . 9 4 3 8 . 2 8 8
8 0 0 5 3 . 2 2 5 6 1 . 0 5 8 8 . 4 1 6
9 0 0 5 4 . 1 5 1 6 2 . 0 5 6 8 . 5 1 7
1 0 0 0 5 4 . 9 8 8 6 2 . 9 5 7 8 . 5 9 8
1 1 0 0 5 5 . 7 5 0 6 3 . 7 8 0 8 . 6 6 2
1 2 0 0 5 6 . 4 5 1 6 4 . 5 3 6 8 . 7 1 5
1 3 0 0 5 7 . 1 0 0 6 5 . 2 3 5 8 . 7 5 8
1 4 0 0 5 7 . 7 0 5 6 5 . 8 8 6 8 . 7 9 5
1 5 0 0 5 8 . 2 7 1 6 6 . 4 9 3 8 . 8 2 6
1 6 0 0 5 8 . 8 0 3 6 7 . 0 6 4 8 . 8 5 3
1 7 0 0 5 9 . 3 0 4 6 7 . 6 0 1 8 . 8 7 6
1 8 0 0 5 9 . 7 8 0 6 8 . 1 0 9 8 . 8 9 7
1 9 0 0 6 0 . 2 3 1 6 8 . 5 9 1 8 . 9 1 5
2 0 0 0 6 0 . 6 6 0 6 9 . 0 4 8 8 . 9 3 1
2 1 0 0 6 1 . 0 7 0 6 9 . 4 8 5 8 . 9 4 6
2 2 0 0 6 1 . 4 6 2 6 9 . 9 0 1 8 . 9 6 0
2 3 0 0 6 1 . 8 3 8 7 0 . 3 0 0 8 . 9 7 2
2 4 0 0 6 2 . 1 9 8 7 0 . 6 8 2 8 . 9 8 4
2 5 0 0 6 2 . 5 4 5 7 1 . 0 4 9 8 . 9 9 5
2 6 0 0 6 2 . 8 7 9 7 1 . 4 0 2 9 . 0 0 5
2 7 0 0 6 3 . 2 0 1 7 1 . 7 4 2 9 . 0 1 4
2 8 0 0 6 3 . 5 1 2 7 2 . 0 7 0 9 . 0 2 4
2 9 0 0 6 3 . 8 1 3 7 2 . 3 8 7 9 . 0 3 2
3 0 0 0 6 4 . 1 0 4 7 2 . 6 9 3 9 . 0 4 0
3 1 0 0 6 4 . 3 8 5 7 2 . 9 8 9 9 . 0 4 8
3 2 0 0 6 4 . 6 5 9 7 3 . 2 7 7 9 . 0 5 6
3 3 0 0 6 4 . 9 2 4 7 3 . 5 5 6 9 . 0 6 3
3 1 0 0 6 5 . 1 8 2 7 3 . 8 2 6 9 . 0 7 0
3 5 0 0 6 5 . 4 3 3 7 4 . 0 8 9 9 . 0 7 7
3 6 0 0 6 5 . 6 7 7 7 4 . 3 4 5 9 . 0 8 4
3 7 0 0 6 5 . 9 1 4 7 4 . 5 9 4 9 . 0 9 1
3 8 0 0 6 6 . 1 4 6 7 4 . 8 3 7 9 . 0 9 7
3 9 0 0 6 6 . 3 7 2 7 5 . 0 7 3 9 . 1 0 4
4 0 0 0 6 6 . 5 9 2 7 5 . 3 0 4 9 . 1 1 0
4100 66.808 75.529 9.1164200 67.018 75.748 9.1234300 67.223 75.963 9.1294400 67.424 76.173 9.1354500 67.621 76.378 9.1414600 67.814 76.579 9.1474700 68.002 76.776 9.1534800 68.187 76.969 9.1594900 68.368 77.158 9.1645000 68.546 77.343 9.170
T able VIIT hermodynamic F unctions of PC(g) in I deal G as State
/F° -
T, °K.V T / ’cal. deg. _l
mole“1
s°,cal. deg. -1
mole-1
CPo,cal. deg. 1
mole -1273.15 44.064 51.038 7.090298.15 44.675 51.661 7.149300 44.718 51.706 7.154400 46.738 53.802 7.446500 48.325 55.496 7.741600 49.643 56.930 7.989700 50.775 58.177 8.184800 51.771 59.280 8.338900 52.661 60.270 8.462
1000 53.467 61.167 8.5681100 54.205 61.988 8.6671200 54.886 62.747 8.7651300 55.518 63.452 8.8671400 56.108 64.113 8.9771500 56.663 64.737 9.0941600 57.186 65.327 9.2181700 57.682 65.890 9.3491800 58.153 66.428 9.4831900 58.602 66.945 9.6182000 59.032 67.441 9.7522100 59.444 67.920 9.8832200 59.840 68.383 10.0082300 60.221 68.831 10.1272400 60.589 69.264 10.2372500 60.944 69.684 10.3382600 61.288 70.091 10.4292700 61.622 70.486 10.5102800 61.945 70.870 10.5802900 62.259 71.242 10.6413000 62.565 71.604 10.6923100 62.862 71.955 10.7333200 63.151 72.296 10.7663300 63.434 72.628 10.7913400 63.709 72.951 10.8083500 63.977 73.264 10.8193600 64.240 73.569 10.8233700 64.496 73.865 10.8223800 64.746 74.154 10.8173900 64.991 74.435 10.8074000 65.231 74.708 10.7934100 65.465 74.975 10.7774200 65.694 75.234 10.7574300 65.919 75.487 10.7364400 66.140 75.733 10.7134500 66.355 75.974 10.6884600 66.567 76.209 10.6624700 66.775 76.438 10.6354800 66.978 76.661 10.6074900 67.178 76.880 10.5795000 67.374 77.093 10.551
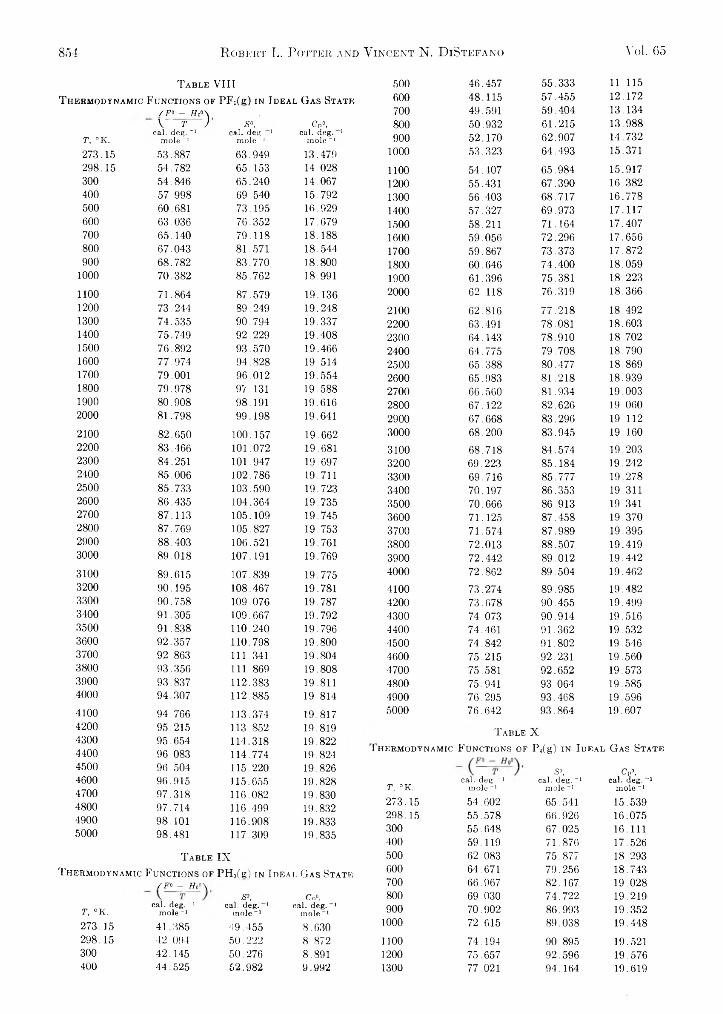
854 Robert L. Potter and V incent N. D iStefano Voi. G5
T able VIII Oo1C 46.457 55.333 11.115T hermodynamic F unctions of PF;(g) in I deal G as State 600 48.115 57.455 12.172
/ F° — Ho*\ 700 49.591 59.404 13.134V T ) S°, Cp°, 800 50.932 61.215 13.988
T, °K. cal. deg. -1 mole-1
cal. deg. 1 mole -1
cal. deg. 1 mole -1 900 52.170 62.907 14.732
273.15 53.887 63.949 13.479 1000 53.323 64.493 15.371298.15 54.782 65.153 14.028 1100 54.407 65.984 15.917300 54.846 65.240 14.067 1200 55.431 67.390 16.382400 57.998 69.540 15.792 1300 56.403 68.717 16.778500 60.681 73.195 16.929 1400 57.327 69.973 17.117600 63.036 76.352 17.679 1500 58.211 71.164 17.407700 65.140 79.118 18.188 1600 59.056 72.296 17.656800 67.043 81.571 18.544 1700 59.867 73.373 17.872900 68.782 83.770 18.800 1800 60.646 74.400 18.059
1000 70.382 85.762 18.991 1900 61.396 75.381 18.2231100 71.864 87.579 19.136 2000 62.118 76.319 18.3661200 73.244 89.249 19.248 2100 62.816 77.218 18.4921300 74.535 90.794 19.337 2200 63.491 78.081 18.6031400 75.749 92.229 19.408 2300 64.143 78.910 18.7021500 76.892 93.570 19.466 2400 64.775 79.708 18.7901600 77.974 94.828 19.514 2500 65.388 80.477 18.8691700 79.001 96.012 19.554 2600 65.983 81.218 18.9391800 79.978 97.131 19.588 2700 66.560 81.934 19.0031900 80.908 98.1.91 19.616 2800 67.122 82.626 19.0602000 81.798 99.198 19.641 2900 67.668 83.296 19.1122100 82.650 100.157 19.662 3000 68.200 83.945 19.1602200 83.466 101.072 19.681 3100 68.718 84.574 19.2032300 84.251 101.947 19.697 3200 69.223 85.184 19.2422400 85.006 102.786 19.711 3300 69.716 85.777 19.2782500 85.733 103.590 19.723 3400 70.197 86.353 19.3112600 86.435 104.364 19.735 3500 70.666 86.913 19.3412700 87.113 105.109 19.745 3600 71.125 87.458 19.3702800 87.769 105.827 19.753 3700 71.574 87.989 19.3952900 88.403 106.521 19.761 3800 72.013 88.507 19.4193000 89.018 107.191 19.769 3900 72.442 89.012 19.4423100 89.615 107.839 19.775 4000 72.862 89.504 19.4623200 90.195 108.467 19.781 4100 73.274 89.985 19.4823300 90.758 109.076 19.787 4200 73.678 90.455 19.4993400 91.305 109.667 19.792 4300 74.073 90.914 19.5163500 91.838 110.240 19.796 4400 74.461 91.362 19.5323600 92.357 110.798 19.800 4500 74.842 91.802 19.5463700 92.863 111.341 19.804 4600 75.215 92.231 19.5603800 93.356 111.869 19.808 4700 75.581 92.652 19.5733900 93.837 112.383 19.811 4800 75.941 93.064 19.5854000 94.307 112.885 19.814 4900 76.295 93.468 19.5964100 94,766 113.374 19.817 5000 76.642 93.864 19.6074200 95.215 113.852 19.819 T able X4300 95.654 114 318 19 8224400 96.083 114.774 19.824 1HERMODYNAMIC FUNCTIONS OF P4(g) in I deal G as State
4500 96.504 115.220 19.826 s°, <V,cal. deg.-1
mole-14600 96.915 115.655 19.828 T, °K.
cal. deg. -1 mole-1
cal. deg. -1 mole-14700 97.318 116.082 19.830
4800 97.714 116.499 19.832 273.15 54.602 65.541 15.5394900 98.101 116.908' 19.833 298.15 55.578 66.926 16.0755000 98.481 117.309 19.835 300 55.648 67.025 16.111
400 59.119 71.876 17.526T able IX 500 62.083 75.877 18.293
T hermodynamic F unctions of PH3(g) in I d eai. G as State600 64.671 79.256 18.743
/F° - Ho°\ 700 66.967 82.167 19.028S°, Co0, 800 69.030 74.722 19.219
T, °K.cal. deg. -I
mole -1cal. deg. 1 cal. deg.-1
mole-1 mole-1 900 70.902 86.993 19.352273.15 41.385 49.455 8.630 1000 72.615 89.038 19.448298.15 42.094 50.222 8.872 1100 74.194 90 895 19.521300 42.145 50.276 8.891 1200 75.657 92.596 19.576400 44.525 62.982 9.992 1300 77.021 94.164 19.619
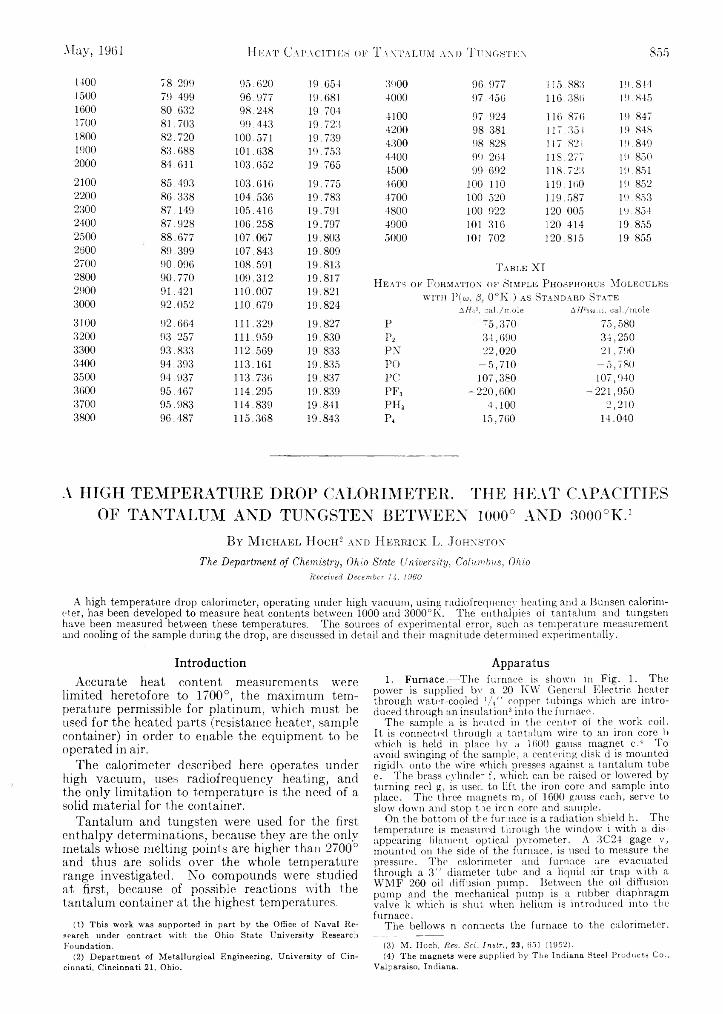
May, 1961 Heat Capacities of T antalum and T ungsten 855
1400 78.299 95.620 19.654 3900 96 977 115.883 19.8441500 79.499 96.977 19.681 4000 97 450 116.386 19.8451600 80.632 98.248 19.704 4100 97 924 116.876 19.8471700 81.703 99.443 19.723 4200 98 381 117.354 19.8481800 82.720 100.571 19.739 4300 98 828 117.821 1 !). 8491900 83.688 101.638 19.753 4400 99 264 118,277 19.8502000 84.611 103.652 19.765 4500 99 692 118.723 19.8512100 85.493 103.616 19.775 4600 100 110 119.160 19.8522200 86.338 104.536 19.783 4700 100 520 119.587 19.8532300 87.149 105.416 19.791 4800 100 922 120.005 19.8542400 87.928 106.258 19.797 4900 101 316 120.414 19.85525002600
88.67789.399
107.067107.843
19.80319.809
5000 101 702 120.815 19.855
2700 90.096 108.591 19.813 T able X I28002900
90.77091.421
109.312110.007
19.81719.821
Heats of Formation of Simple Phosphorus M olecules with Pico. 8. 0°K ) as Standard State3000 92.052 110.679 19.824 A H o°, ?al./rr.ole A//°298.i5, cal./mole
3100 92.664 111.329 19.827 P ■5,370 75,5803200 93.257 111.959 19.830 P2 34,690 34,2503300 93.833 112.569 19.833 PN 22,020 21,7903400 94.393 113.161 19.835 PO -5 ,7 1 0 — 5,7803500 94.937 113.736 19.837 PC 107,380 107,9403600 95.467 114.295 19.839 p f 3 -220 ,600 -221 ,9503700 95.983 114.839 19.841 p h 3 4,100 2,2103800 96.487 115.368 19.843 P< 15,760 14,040
A HIGH TEMPERATURE DROP CALORIMETER. THE HEAT CAPACITIES OF TANTALUM AND TUNGSTEN BETWEEN 1000° AND 3000°K.1
B y M ic h a e l H o c h 2 a n d H e r r ic k L . J o h n s t o n
The Department of Chemistry, Ohio State University, Columbus, OhioReceived December 14, 1960
A high temperature drop calorimeter, operating under high vacuum, using radiofrequency heating and a Bunsen calorimeter, has been developed to measure heat contents between 1000 and 3000°K. The enthalpies of tantalum and tungsten have been measured between these temperatures. The sources of experimental error, such as temperature measurement and cooling of the sample during the drop, are discussed in detail and their magnitude determined experimentally.
IntroductionAccurate heat content measurements were
limited heretofore to 1700°, the maximum temperature permissible for platinum, which must be used for the heated parts (resistance heater, sample container) in order to enable the equipment to be operated in air.
The calorimeter described here operates under high vacuum, uses radiofrequency heating, and the only limitation to temperature is the need of a solid material for the container.
Tantalum and tungsten were used for the first enthalpy determinations, because they are the only metals whose melting points are higher than 2700° and thus are solids over the whole temperature range investigated. No compounds were studied at first, because of possible reactions with the tantalum container at the highest temperatures.
(1) This work was supported in part by the Office of Naval Research under contract with the Ohio State University Research Foundation.
(2) Department of Metallurgical Engineering, University of Cincinnati, Cincinnati 21, Ohio.
Apparatus1. Furnace.—The furnace is shown in Fig. 1. The
power is supplied by a 20 KW General Electric heater through water-cooled l/t" copper tubings which are introduced through an insulation3 into the furnace.
The sample a is heated in the center of the work coil. It is connected through a tantalum wire to an iron core b which is held in place by a lfiOO gauss magnet e.4 To avoid swinging of the sample, a centering disk d is mounted rigidly onto the wire which presses against a tantalum tube e. The brass cylinder f, which can be raised or lowered by turning reel g, is user, to lift the iron core and sample into place. The three magnets m, of 1600 gauss each, serve to slow down and stop the iron core and sample.
On the bottom of the furnace is a radiation shield h. The temperature is measured through the window i with a disappearing filament optical pyrometer. A 3C24 gage v, mounted on the side of the furnace, is used to measure the pressure. The calorimeter and furnace are evacuated through a 3 " diameter tube and a liquid air trap with a WMF 260 oil diffusion pump. Between the oil diffusion pump and the mechanical pump is a rubber diaphragm valve k which is shut when helium is introduced into tiie furnace.
The bellows n connects the furnace to the calorimeter.
(3) M. Hoch, Rev. Sei. Instr., 23, 651 (1952).(4) The magnets were supplied by The Indiana Steel Products Co.,
Valparaiso, Indiana.
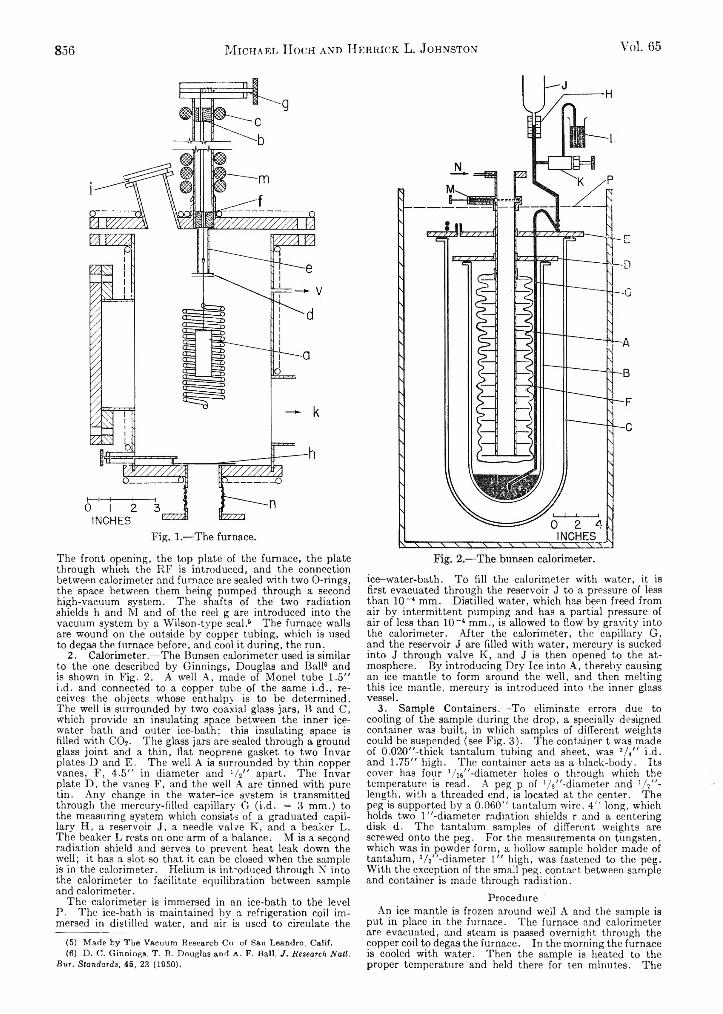
856 M ichael Hoch and Herrick L. Johnston Vol. 65
The front opening, the top plate of the furnace, the plate through which the RF is introduced, and the connection between calorimeter and furnace are sealed with two O-rings, the space between them being pumped through a second high-vacuum system. The shafts of the two radiation shields h and M and of the reel g are introduced into the vacuum system by a Wilson-type seal.5 6 The furnace walls are wound on the outside by copper tubing, which is used to degas the furnace before, and cool it during, the run.
2. Calorimeter.—The Bunsen calorimeter used is similar to the one described by Ginnings, Douglas and Ball6 and is shown in Fig. 2. A well A, made of Monel tube 1.5" i.d. and connected to a copper tube of the same i.d., receives the objects whose enthalpy is to be determined. The well is surrounded by two coaxial glass jars, B and C, which provide an insulating space between the inner ice- water bath and outer ice-bath; this insulating space is filled with C 02. The glass jars are sealed through a ground glass joint and a thin, flat neoprene gasket to two Invar plates D and E. The well A is surrounded by thin copper vanes, F, 4 .5 " in diameter and 'A " apart. The Invar plate D , the vanes F, and the well A are tinned with pure tin. Any change in the water-ice system is transmitted through the mercury-filled capillary G (i.d. = 3 mm.) to the measuring system which consists of a graduated capillary H, a reservoir J, a needle valve K, and a beaker L. The beaker L rests on one arm of a balance. M is a second radiation shield and serves to prevent heat leak down the well; it has a slot so that it can be closed when the sample is in the calorimeter. Helium is introduced through N into the calorimeter to facilitate equilibration between sample and calorimeter.
The calorimeter is immersed in an ice-bath to the levelP. The ice-bath is maintained by a refrigeration coil immersed in distilled water, and air is used to circulate the
(5) Made by The Vacuum Research Co. of San Leandro, Calif.(6) D. C. Ginnings, T. B. Douglas and A. F. Ball, J. Research Natl.
Bur. Standards, 45, 23 (1950).
ice-water-bath. To fill the calorimeter with water, it is first evacuated through the reservoir J to a pressure of less than 10 ~4 mm. Distilled water, which has been freed from air by intermittent pumping and has a partial pressure of air of less than 10~4 mm., is allowed to flow by gravity into the calorimeter. After the calorimeter, the capillary G, and the reservoir J are filled with water, mercury is sucked into J through valve K , and J is then opened to the atmosphere. By introducing Dry Ice into A, thereby causing an ice mantle to form around the well, and then melting this ice mantle, mercury is introduced into the inner glass vessel.
3. Sample Containers.— To eliminate errors due to cooling of the sample during the drop, a specially designed container was built, in which samples of different weights could be suspended (see Fig. 3). The container t was made of 0.020"-thick tantalum tubing and sheet, was V / ' i.d. and 1.75" high. The container acts as a black-body. Its cover has four ‘ /«"-diam eter holes o through which the temperature is read. A peg p of //¡"-diameter and !/ 2" - length, with a threaded end, is located at the center. The peg is supported by a 0.060" tantalum wire, 4 " long, which holds two 1 "-diameter radiation shields r and a centering disk d. The tantalum samples of different weights are screwed onto the peg. For the measurements on tungsten, which was in powder form, a hollow sample holder made of tantalum, 1/ a"-diameter 1 " high, was fastened to the peg. With the exception of the small peg, contact between sample and container is made through radiation.
ProcedureAn ice mantle is frozen around well A and the sample is
put in place in the furnace. The furnace and calorimeter are evacuated, and steam is passed overnight through the copper coil to degas the furnace. In the morning the furnace is cooled with water. Then the sample is heated to the proper temperature and held there for ten minutes. The

May, 1961 H eat Capacities of Tantalum and Tungsten 857
T a b l e IH e a t C o n t e n t o f T a n t a l u m
Runno. i, °C.
Mass of mercury for sample® 1 2 3 4
Mass of4-3
mercury : 4-2
for 1 g. of substance, 4-1 3-2
caled, from 3-1
samples2-1 Av.
EnthalpyHo1,
cal./g.1 1089 44.56 59.58 78.36 99.78 0.5971 0.6006 0.6009 0.6114 0.6034 0.5936 0.6012 38.866 1205 49.41 66.00 87.00 110.85 .6648 .6735 .6686 .6837 .6710 .6556 .6697 43.292 1375 56.58 75.71 99.78 127.22 .7649 .7736 .7687 .7837 .7712 .7560 .7698 49.767 1572 64.96 87.08 114.77 146.45 .8830 .8916 .8868 .9016 .8892 .8742 .8878 57.393 1798 74.68 100.28 132.22 168.84 1.0207 1.0296 1.0247 1.0400 1.0272 1.0117 1.0257 66.308 1975 82.36 110.74 146.05 186.62 1.1308 1.1395 1.1346 1.1497 1.1370 1.1216 1.1356 73.404 2152 90.10 121.30 160.04 204.60 1.2421 1.2510 1.2460 1.2614 1.2485 1.2358 1.2467 80.589 2235 93.76 126.30 168.26 213.12 1.2504 1.3038 1.2989 1.3662 1.3300 1.2860 1.3060 84.425 2375 99.95 134.76 177.89 227.58 1.3850 1.3939 1.3889 1.4043 1.3914 1.3757 1.3899 89.84
10 2574 109.22 146.92 194.03 248.37 1.5147 1.5235 1.5143 1.5339 1.5140 1.4899 1.5151 97.9311 2666 112.96 152.58 201.55 258.07 1.5754 1.5842 1.5790 1.5944 1.5815 1.5657 1.5801 102.13“ Weight of container = 50.277 g. Weight of sample: 1 = 30.488; 2 = 55.792; 3 = 86.505; 4 = 122.381.
T a b l e IIH e a t C o n t e n t o f T u n g s t e n
Runno. t, "C.
Mass of mercury for sample® 1 2 3 4
Mass of mercury for 1 g. of substance, 4-3 4-2 4-1 3-2
caled, from samples 3-1 2-1 Av.
Enthalpy Hol, cal./g.
1 1109 27.32 29.87 32.04 34.12 0.5938 0.5863 0.6061 0.5794 0.6117 0.6422 0.6033 39.006 1223 30.27 32.93 35.44 37.68 .6395 .6553 .6605 .6702 .6700 .6699 .6609 42.722 1397 34.38 37.43 40.28 42.90 .7479 .7546 .7594 .7610 .7646 .7681 .7609 49.187 1612 39.22 42.95 46.33 49.30 .8478 .8760 .8985 .9025 .9214 .9393 .8976 58.023 1813 44.63 48.67 52.55 56.09 1.0106 1.0236 1.0215 1.0360 1.0264 1.0174 1.0226 66.108 2022 50.00 54.25 58.55 62.69 1.1818 1.1643 1.1311 1.1482 1.1081 1.0703 1.1340 73.304 2150 53.02 57.87 62.54 66.74 1.1990 1.2236 1.2470 1.2470 1.2338 1.2214 1.2246 79.169 2422 59.65 65.24 70.55 75.38 1.3788 1.3988 1.4021 1.4179 1.4126 1.4077 1.4030 90.695 2496 62.20 68.09 73.52 78.59 1.4473 1.4485 1.4609 1.4499 1.4671 1.4833 1.4595 94.34
10 2620 64.49 70.67 76.19 81.66 1.5615 1.5161 1.5304 1.4740 1.5163 1.5563 1.5258 98.62a Weight of container and sample holder = = 11.219.
51.796 g. Amount of tungsten in sample: 1 = 0 g .; 2 = 3.971; 3 = 7.716;
rate of heat leak of the calorimeter is then observed and the beaker is weighed. By opening the shields h and M and pulling magnet c ; the sample is dropped into the calorimeter. Shield M is then closed. After five minutes the mechanical pump is shut off by closing valve k. One- tenth mm. of helium is introduced into the furnace and calorimeter through N . After about 30 minutes, the equilibrium is complete, as the rate of mercury intake drops to the leak rate level. Another leak rate is taken and the mercury in the beaker weighed. The sample is lifted into position with the reel g, is held with the magnet c, and the brass lifter f then is lowered. The sample is heated again and another point is taken.
The calorimeter can absorb about 100,000 cal. With the largest sample used, five runs could be made on the same ice bath, i.e., without opening the system.
MaterialsFour tantalum samples of 99.9% purity by Fansteel
assay were used. Their weights were 122.391, 86.505, 55.792 and 30.488 g. for samples 4, 3, 2 and 1, respectively.
The tungsten was in powder form, was obtained from Callite Tungsten Corporation, and had a purity of 99.8%. The container and sample holder were made of tantalum, the purity of which was 99.8% by Fansteel assay.
Before making the runs, each sample and the container were degassed at 2150° for 2 hours. During this degassing each gram of tantalum lost 1 mg. and each gram of tungsten lost 5 mg. This indicates that the greatest part of the impurities volatilized during this preliminary treatment.
ResultsThe runs were carried out by heating the samples
to a certain setting of the oscillator and reading the temperature. For the same oscillator setting, the temperatures read for the four samples of each substance were not equal, but had a spread of about 2% of the temperature. To calculate the heat content of the various samples at the same tempera-
0 .5 I 2INCHES
Fig. 3.— Sample container.
ture, the average of these four temperatures was taken, and the heat content of the samples was linearly interpolated to that temperature. The only correction applied to the data was the heat leak, which is less than 0.2% of the smallest heat content measured.
Table I gives the data for tantalum and Table II
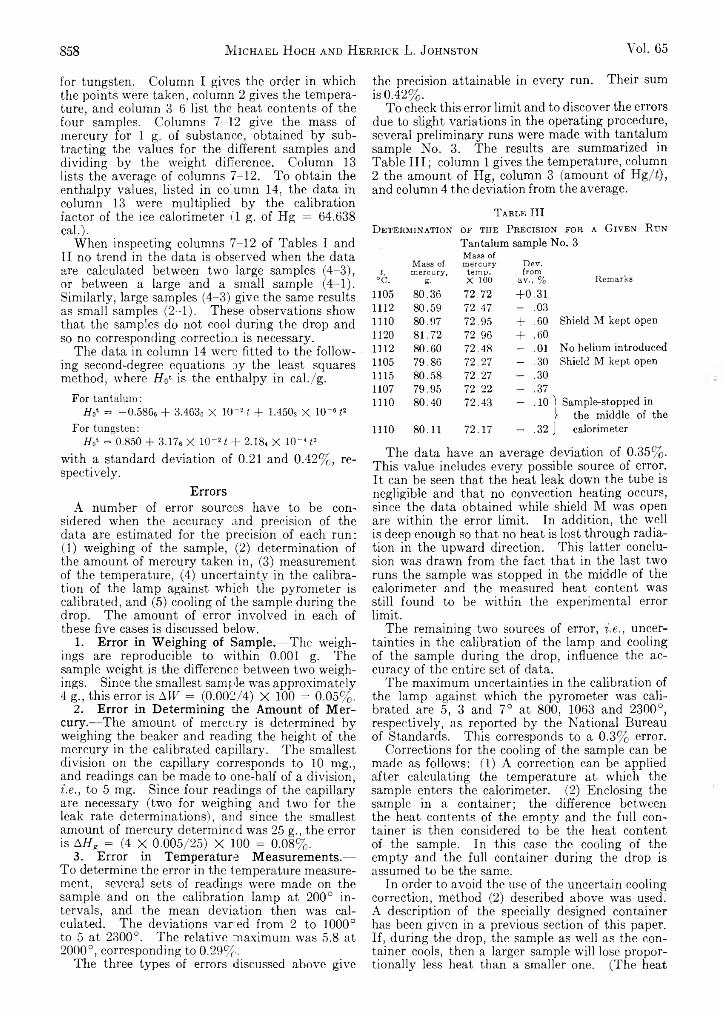
858 M ichael Hoch and Herbick L. Johnston Vol. 65
for tungsten. Column I gives the order in which the points were taken, column 2 gives the temperature, and column 3-6 list the heat contents of the four samples. Columns 7-12 give the mass of mercury for 1 g. of substance, obtained by subtracting the values for the different samples and dividing by the weight difference. Column 13 lists the average of columns 7-12. To obtain the enthalpy values, listed in column 14, the data in column 13 were multiplied by the calibration factor of the ice calorimeter (1 g. of Hg = 64.638 cal.).
When inspecting columns 7-12 of Tables I and II no trend in the data is observed when the data are calculated between two large samples (4-3), or between a large and a small sample (4-1). Similarly, large samples (4-3) give the same results as small samples (2-1). These observations show that the samples do not cool during the drop and so no corresponding correction is necessary.
The data in column 14 were fitted to the following second-degree equations by the least squares method, where H 0t is the enthalpy in cal./g.
For tantalum:H o * = —0.5866 + 3.463» X 10~ H + 1.450s X 10“® i2
For tungsten:ffo* = 0.850 + 3.17« X 10-2Z + 2.184 X 10~4i2
with a standard deviation of 0.21 and 0.42%, respectively.
ErrorsA number of error sources have to be con
sidered when the accuracy and precision of the data are estimated for the precision of each run:(1) weighing of the sample, (2) determination of the amount of mercury taken in, (3) measurement of the temperature, (4) uncertainty in the calibration of the lamp against which the pyrometer is calibrated, and (5) cooling of the sample during the drop. The amount of error involved in each of these five cases is discussed below.
1. Error in Weighing of Sample.— The weighings are reproducible to within 0.001 g. The sample weight is the difference between two weighings. Since the smallest sample was approximately 4 g., this error is ATT = (0.002/4) X 100 = 0.05%.
2. Error in Determining the Amount of Mercury.—The amount of mercury is determined by weighing the beaker and reading the height of the mercury in the calibrated capillary. The smallest division on the capillary corresponds to 10 mg., and readings can be made to one-half of a division, i .e ., to 5 mg. Since four readings of the capillary are necessary (two for weighing and two for the leak rate determinations), and since the smallest amount of mercury determined was 25 g., the error is AH e = (4 X 0.005/25) X 100 = 0.08%.
3. Error in Temperature Measurements.— To determine the error in the temperature measurement, several sets of readings were made on the sample and on the calibration lamp at 200° intervals, and the mean deviation then was calculated. The deviations varied from 2 to 1000° to 5 at 2300°. The relative maximum was 5.8 at 2000°, corresponding to 0.29%.
The three types of errors discussed above give
the precision attainable in every run. Their sum is 0.42%.
To check this error limit and to discover the errors due to slight variations in the operating procedure, several preliminary runs were made with tantalum sample No. 3. The results are summarized in Table III; column 1 gives the temperature, column 2 the amount of Hg, column 3 (amount of Hg/ t ) , and column 4 the deviation from the average.
T able IIID eterm ination of the Precision for a G iv e n R ijn
Tantalum sample No. 3
t,Mass of mercury,
Mass of mercury temp.
Dev.from
Remarks°C. g. x 100 av., %1105 8 0 .3 6 7 2 .7 2 + 0 .3 11112 8 0 .5 9 7 2 .4 7 - .031110 8 0 .97 7 2 .95 + .60 Shield M kept open1120 8 1 .7 2 7 2 .9 6 + .601112 8 0 .6 0 7 2 .4 8 - .01 No helium introduced1105 7 9 .8 6 7 2 .2 7 - .30 Shield M kept open1115 8 0 .5 8 7 2 .27 - .301107 7 9 .9 5 7 2 .2 2 - .371110 8 0 .4 0 7 2 .4 3 - .10 1I Sample-stopped in
1110 8 0 .11 7 2 .1 7 - .32 J) the middle of the
calorimeter
The data have an average deviation of 0.35%. This value includes every possible source of error. It can be seen that the heat leak down the tube is negligible and that no convection heating occurs, since the data obtained while shield M was open are within the error limit. In addition, the well is deep enough so that no heat is lost through radiation in the upward direction. This latter conclusion was drawn from the fact that in the last two runs the sample was stopped in the middle of the calorimeter and the measured heat content was still found to be within the experimental error limit.
The remaining two sources of error, i .e . , uncertainties in the calibration of the lamp and cooling of the sample during the drop, influence the accuracy of the entire set of data.
The maximum uncertainties in the calibration of the lamp against which the pyrometer was calibrated are 5, 3 and 7° at 800, 1063 and 2300°, respectively, as reported by the National Bureau of Standards. This corresponds to a 0.3% error.
Corrections for the cooling of the sample can be made as follows: (1) A correction can be applied after calculating the temperature at which the sample enters the calorimeter. (2) Enclosing the sample in a container; the difference between the heat contents of the empty and the full container is then considered to be the heat content of the sample. In this case the cooling of the empty and the full container during the drop is assumed to be the same.
In order to avoid the use of the uncertain cooling correction, method (2) described above was used. A description of the specially designed container has been given in a previous section of this paper. If, during the drop, the sample as well as the container cools, then a larger sample will lose proportionally less heat than a smaller one. (The heat
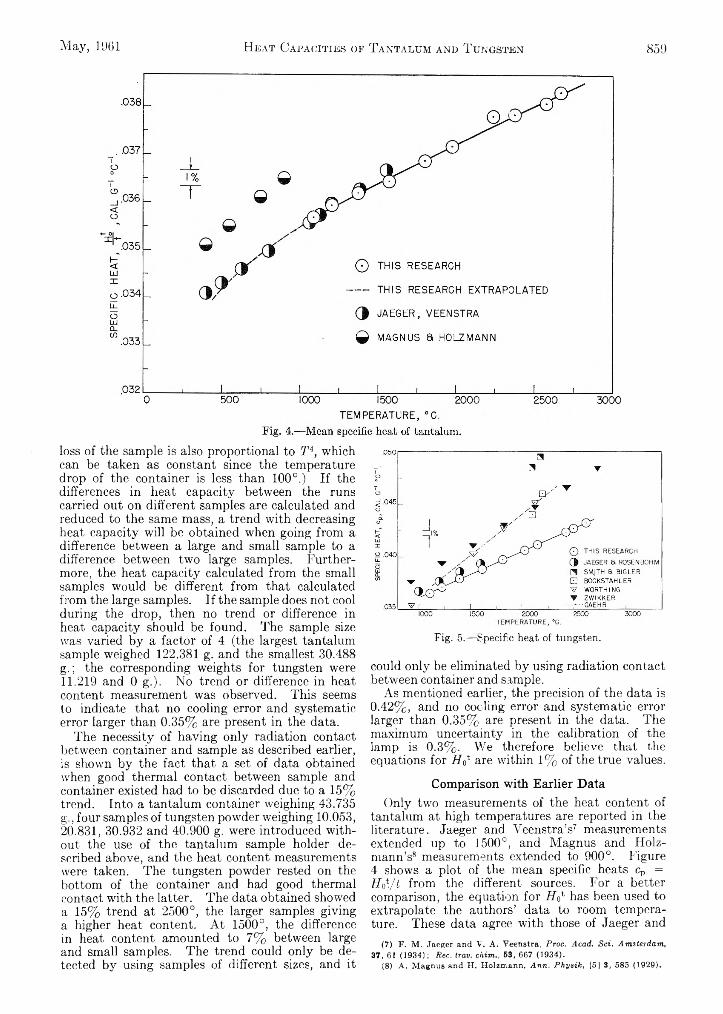
May, 1%1 H eat Capacities of Tantalum and Tungsten 859
loss of the sample is also proportional to T i , which can be taken as constant since the temperature drop of the container is less than 100°.) If the differences in heat capacity between the runs carried out on different samples are calculated and reduced to the same mass, a trend with decreasing heat capacity will be obtained when going from a difference between a large and small sample to a difference between two large samples. Furthermore, the heat capacity calculated from the small samples would be different from that calculated from the large samples. If the sample does not cool during the drop, then no trend or difference in heat capacity should be found. The sample size was varied by a factor of 4 (the largest tantalum sample weighed 122.381 g. and the smallest 30.488 g.; the corresponding weights for tungsten were11.219 and 0 g.). No trend or difference in heat content measurement was observed. This seems to indicate that no cooling error and systematic error larger than 0.35% are present in the data.
The necessity of having only radiation contact between container and sample as described earlier, is shown by the fact that a set of data obtained when good thermal contact between sample and container existed had to be discarded due to a 15% trend. Into a tantalum container weighing 43.735 g., four samples of tungsten powder weighing 10.053, 20.831, 30.932 and 40.900 g. were introduced without the use of the tantalum sample holder described above, and the heat content measurements were taken. The tungsten powder rested on the bottom of the container and had good thermal contact with the latter. The data obtained showed a 15% trend at 2500°, the larger samples giving a higher heat content. At 1500°, the difference in heat content amounted to 7% between large and small samples. The trend could only be detected by using samples of different sizes, and it
Fig. 5.— Specific heat of tungsten.
could only be eliminated by using radiation contact between container and sample.
As mentioned earlier, the precision of the data is 0.42%, and no coding error and systematic error larger than 0.35% are present in the data. The maximum uncertainty in the calibration of the lamp is 0.3%. We therefore believe that the equations for H 01 are within 1% of the true values.
Comparison with Earlier DataOnly two measurements of the heat content of
tantalum at high temperatures are reported in the literature. Jaeger and Veenstra’s7 measurements extended up to 1500°, and Magnus and Holz- mann’s8 measurements extended to 900°. Figure 4 shows a plot of the mean specific heats cp = H oV t from the different sources. For a better comparison, the equation for H al has been used to extrapolate the authors’ data to room temperature. These data agree with those of Jaeger and
(7) F. M. Jaeger and V. A. Yeenstra, Proc. Acad. Sci. Amsterdam, 37, 61 (1934); Ree. trav. chim., 63, 667 (1934).
(8) A . Magnus and H. Holzmann, Ann. Physik* (6J 3, 585 (1929).
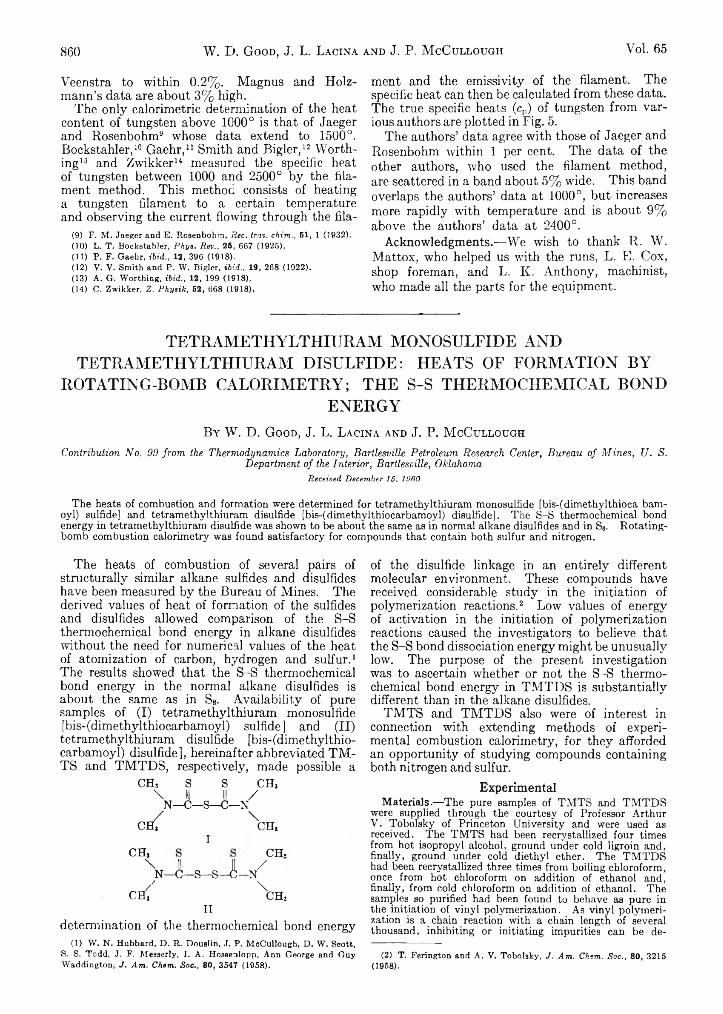
860 W. D. Good, J. L. Lacina and J. P. M cCullough Voi. 65
Veenstra to within 0.2%. Magnus and Holz- mann’s data are about 3% high.
The only calorimetric determination of the heat content of tungsten above 1000° is that of Jaeger and Rosenbohm9 whose data extend to 1500°. Bockstahler,10 Gaehr,11 Smith and Bigler,12 Worthing13 and Zwikker14 measured the specific heat of tungsten between 1000 and 2500° by the filament method. This method consists of heating a tungsten filament to a certain temperature and observing the current flowing through the fila-
(9) F. M. Jaeger and E. Rosenbohm, Rec. trav. chim., 51, 1 (1932).(10) L. T. Bockstahler, Phys. Rev., 26, 667 (1925).(11) P. F. Gaehr, Hid., 12, 396 (1918).(12) V. V. Smith and P. W. Bigler, ibid., 19, 268 (1922).(13) A. G. Worthing, ibid., 12, 199 (1918).(14) C. Zwikker, Z. Physik, 52, 668 (1918).
ment and the emissivity of the filament. The specific heat can then be calculated from these data. The true specific heats (cp) of tungsten from various authors are plotted in Fig. 5.
The authors’ data agree with those of Jaeger and Rosenbohm within 1 per cent. The data of the other authors, who used the filament method, are scattered in a band about 5% wide. This band overlaps the authors’ data at 1000°, but increases more rapidly with temperature and is about 9% above the authors’ data at 2400°.
Acknowledgments.—We wish to thank R. W. Mattox, who helped us with the runs, L. E. Cox, shop foreman, and L. K. Anthony, machinist, who made all the parts for the equipment.
TETRAMETHYLTHIURAM MONOSULFIDE AND TETRAMETHYLTHIURAM DISULFIDE: HEATS OF FORMATION BY
ROTATING-BOMB CALORIMETRY ; THE S-S THERMOCHEMICAL BONDENERGY
B y W. D. G o o d , J. L. L a c in a a n d J. P. M cC u l l o u g h
Contribution No. 99 from the Thermodynamics Laboratory, Bartlesville Petroleum Research Center, Bureau of Mines, U. S.Department of the Interior, Bartlesville, Oklahoma
Received December 15, 1960
The heats of combustion and formation were determined for tetramethylthiuram monosulfide [bis-(dimethylthioca bam- oyl) sulfide] and tetramethylthiuram disulfide [bis-(dimethylthiocarbamoyl) disulfide]. The S-S thermochemical bond energy in tetramethylthiuram disulfide was shown to be about the same as in normal alkane disulfides and in Sg. Rotating- bomb combustion calorimetry was found satisfactory for compounds that contain both sulfur and nitrogen.
The heats of combustion of several pairs of structurally similar alkane sulfides and disulfides have been measured by the Bureau of Mines. The derived values of heat of formation of the sulfides and disulfides allowed comparison of the S-S thermochemical bond energy in alkane disulfides without the need for numerical values of the heat of atomization of carbon, hydrogen and sulfur.1 The results showed that the S-S thermochemical bond energy in the normal alkane disulfides is about the same as in S8. Availability of pure samples of (I) tetramethylthiuram monosulfide [bis-(dimethylthiocarbamoyl) sulfide] and (II) tetramethylthiuram disulfide [bis-(dimethylthio- carbamoyl) disulfide], hereinafter abbreviated TM- TS and TMTDS, respectively, made possible a
C H 3 S SVJU4C H 'f
C H 3/
— N \
CHjI
C H 3
V < U - s J VC H .
CBh"\
C H 3II
determination of the thermochemical bond energy(1) W. N. Hubbard, D„ R. Doualin, J. P. McCullough, D. W. Scott,
S. S. Todd, J. F. Messerly, I. A. Hosseulopp, Ann George and Guy Waddington, J. Am. Chem. Soc., 80, 3547 (1958).
of the disulfide linkage in an entirely different molecular environment. These compounds have received considerable study in the initiation of polymerization reactions.2 Low values of energy of activation in the initiation of polymerization reactions caused the investigators to believe that the S-S bond dissociation energy might be unusually low. The purpose of the present investigation was to ascertain whether or not the S-S thermochemical bond energy in TMTDS is substantially different than in the alkane disulfides.
TMTS and TMTDS also were of interest in connection with extending methods of experimental combustion calorimetry, for they afforded an opportunity of studying compounds containing both nitrogen and sulfur.
ExperimentalMaterials.— The pure samples of TM TS and TM TDS
were supplied through the courtesy of Professor ArthurV. Tobolsky of Princeton University and were used as received. The TM TS had been recrystallized four times from hot isopropyl alcohol, ground under cold ligroin and, finally, ground under cold diethyl ether. The TM TDS had been recrystallized three times from boiling chloroform, once from hot chloroform on addition of ethanol and, finally, from cold chloroform on addition of ethanol. The samples so purified had been found to behave as pure in the initiation of vinyl polymerization. As vinyl polymerization is a chain reaction with a chain length of several thousand, inhibiting or initiating impurities can be de-
(2) T. Ferington and A. V. Tobolsky, J. Am. Chem. Soc., 80, 3215 (1958).
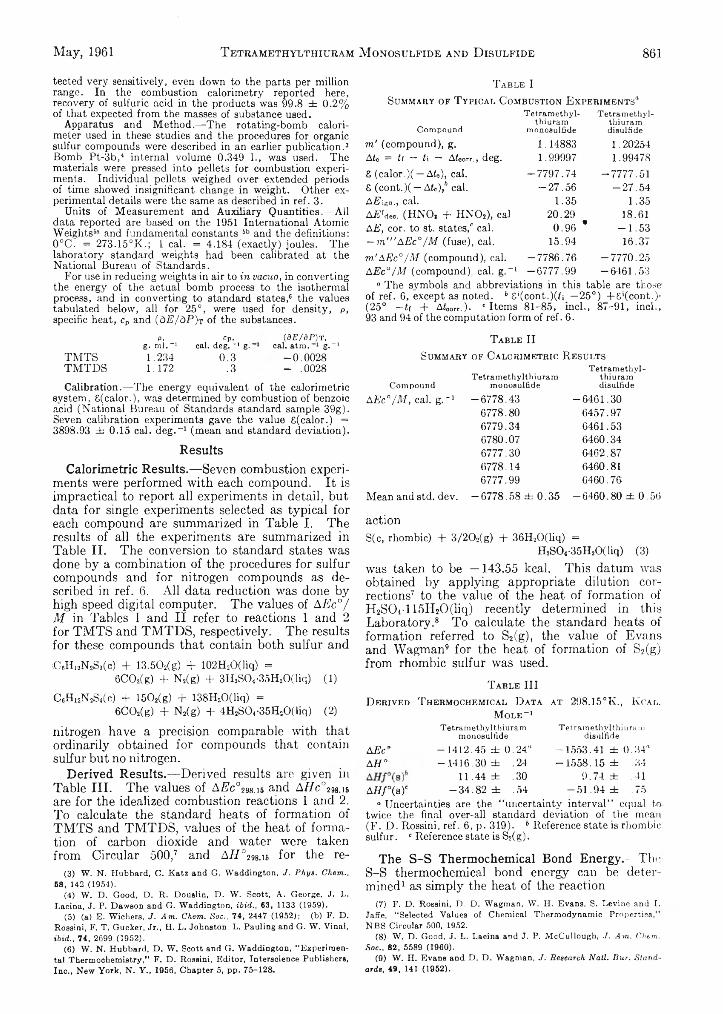
May, 1961 T etramethylthiuram M onosulfide and D isulfide 861
tected very sensitively, even down to the parts per million range. In the combustion calorimetry reported here, recovery of sulfuric acid in the products was 99.8 ± 0.2% of that expected from the masses of substance used.
Apparatus and Method.— The rotating-bomb calorimeter used in these studies and the procedures for organic sulfur compounds were described in an earlier publication.3 Bomb Pt-3b,4 internal volume 0.349 1., was used. The materials were pressed into pellets for combustion experiments. Individual pellets weighed over extended periods of time showed insignificant change in weight. Other experimental details were the same as described in ref. 3.
Units of Measurement and Auxiliary Quantities.— All data reported are based on the 1951 International Atomic Weights63 and fundamental constants 5b and the definitions: 0°C. = 273.15°K.; 1 cal. = 4.184 (exactly) joules. The laboratory standard weights had been calibrated at the National Bureau of Standards.
For use in reducing weights in air to in vacuo, in converting the energy of the actual bomb process to the isothermal process, and in converting to standard states,® the values tabulated below, all for 25°, were used for density, p, specific heat, cp and (dE/dP)t of the substances.
T able ISummary of T ypical C ombustion E xper im ents“
CompoundTetramethyl
thiurammonosulfide
Tetramethylthiuramdisulfide
m' (compound), g. 1.14883 1 .20254Aio = íf — t\ — Aícorr., deg. 1 .99997 1 .99478S (calor. )( — Aio), cal. - 7 7 9 7 .7 4 -7 7 7 7 .5 1S (cont.)( — Aie),6 cal. - 2 7 . 5 6 - 2 7 . 5 4AE¡gu., cal. 1 .3 5 1 .3 5AEU«,. (HNO, + H N 02), cal. 2 0 .2 9 18 .61A E, cor. to st. states,' cal. 0 .9 6 * - 1 . 5 3—m '"AEc°/M (fuse), cal. 1 5 ,94 16 .37m'AEc°/M (compound), cal. - 7 7 8 6 .7 6 - 7 7 7 0 .2 5AEc°/M (compound), cal. g.-1 - 6 7 7 7 .9 9 - 6 4 6 1 .5 3
° The symbols and abbreviations in this table are those' of ref. 6, except as noted. b S*(cont.)(b —25°) -t-S‘(cont.)- (25° —if + Ai,,,,,-,-.). 'Item s 81-85, inch, 87-91, inch, 93 and 94 of the computation form of ref. 6.
p , Cp, (dE/dP) T,g. mi.-1 cal. deg. -1 g . c a l . a t m . g . -1
TM TS 1.234 0.3 -0 .0 0 2 8TM TDS 1.172 .3 - .0028
Calibration.— The energy equivalent of the calorimetric system, S(calor.), was determined by combustion of benzoic acid (National Bureau of Standards standard sample 39g). Seven calibration experiments gave the value S(calor.) = 3898.93 ± 0.15 cal. deg.-1 (mean and standard deviation).
ResultsCalorimetric Results.— Seven combustion experi
ments were performed with each compound. It is impractical to report all experiments in detail, but data for single experiments selected as typical for each compound are summarized in Table I. The results of all the experiments are summarized in Table II. The conversion to standard states was done by a combination of the procedures for sulfur compounds and for nitrogen compounds as described in ref. 6. All data reduction was done by high speed digital computer. The values of AE c ° / M in Tables I and II refer to reactions 1 and 2 for TMTS and TMTDS, respectively. The results for these compounds that contain both sulfur and€ 6H12N2S3(c) + 13.502(g) + 102H2O(liq) =
6C02(g) + Ns(g) + 3H2S04 -35H20( liq) (1)
C 6H12N2S4(c) + 150i(g) + 138H20(liq) =6C02(g) + N*(g) + 4H2S0r35H 20(liq) (2)
nitrogen have a precision comparable with that ordinarily obtained for compounds that contain sulfur but no nitrogen.
Derived Results.— Derived results are given in Table III. The values of A/ic°398.i5 and A/7c°2MJ6 are for the idealized combustion reactions 1 and 2. To calculate the standard heats of formation of TMTS and TMTDS, values of the heat of formation of carbon dioxide and water were taken from Circular 500,7 and Af7°298.i6 for the re-
(3) W. N. Hubbard, C. Katz and G. Waddington, J. Phys. Chem., 68, 142 (1954).
(4) W. D. Good, D. R. Douslin, D. W. Scott, A. George, J. L. Lacina, J. P. Dawson and G. Waddington, ibid., 63, 1133 (1959).
(5) (a) E. Wichers, J. Am. Chem. Soc., 74, 2447 (1952); (b) F. D.Rossini, F„ T. Gucker, Jr., H. L. Johnston, L. Pauling and G. W. Vinal, ibid., 74, 2699 (1952).
(6) W. N. Hubbard, D. W. Scott and G. Waddington, “Experimental Thermochemistry,” F. D. Rossini, Editor, Interscience Publishers, Inc., New York, N. Y., 1956, Chapter 5, pp. 75-128.
T able IISummary of C alorimetric R esults
CompoundAEc°/M, cal. g ._1
Mean and std. dev.
Tetramethylthiurammonosulfide
-6778 .436778.806779.346780.076777.306778.146777.99
-67 78 .5 8 ± 0 .3 5
Tetramethylthiuramdisulfide
-6461 .306457.970461.536460.346462.876460.8!6460.76
-64 60 .8 0 ± 0 .5 6
actionS(c, rhombic) + 3 /2 0 2(g) + 36H20(liq) =
H2S04-35H20(liq) (3)was taken to be —143.55 kcal. This datum was obtained by applying appropriate dilution corrections7 to the value of the heat of formation of H2S04-115H20(liq) recently determined in this Laboratory.8 To calculate the standard heats of formation referred to S*(g), the value of Evans and Wagman9 for the heat of formation of S2(g) from rhombic sulfur was used.
T able IIID erived T hermochemical D ata at 29 8 .15 °K ., K cal .
M o l e -1Tetramethylthiuram
monosulfide-1412 .45 =fc 0.24.a -14 16 .3 0 ± .24
11.44 ± .30-3 4 .8 2 ± .54
“ Uncertainties are the “ uncertainty interval” equal to twice the final over-all standard deviation of the mean (F. D . Rossini, ref. 6, p. 319). b Reference state is rhombic: sulfur. ' Reference state is S2(g ).
AEc°A H °
A fl f (s ) ‘
Tetramethylthiuramdisulfide
-1553 .41 ± 0.34“ -15 58 .1 5 ± .34
9.74 ± .41-5 1 .9 4 ± .75
The S-S Thermochemical Bond Energy.—TheS-S thermochemical bond energy can be determined1 as simply the heat of the reaction
(7) F. D. Rossini, D. D. Wagman, W. H. Evans, S. Levine a n d I. Jaffe, “Selected Values of Chemical Thermodynamic Properties, NBS Circular 500, 1952.
(8) W. D. Good, J. L. Lacina and J. P. McCullough, .7. Am. Chem. S o c ., 82, 5589 (1960).
(9) W. H. Evans and D. D. Wagman, J. Research Natl. Bur. Standards, 49, 141 (1952).
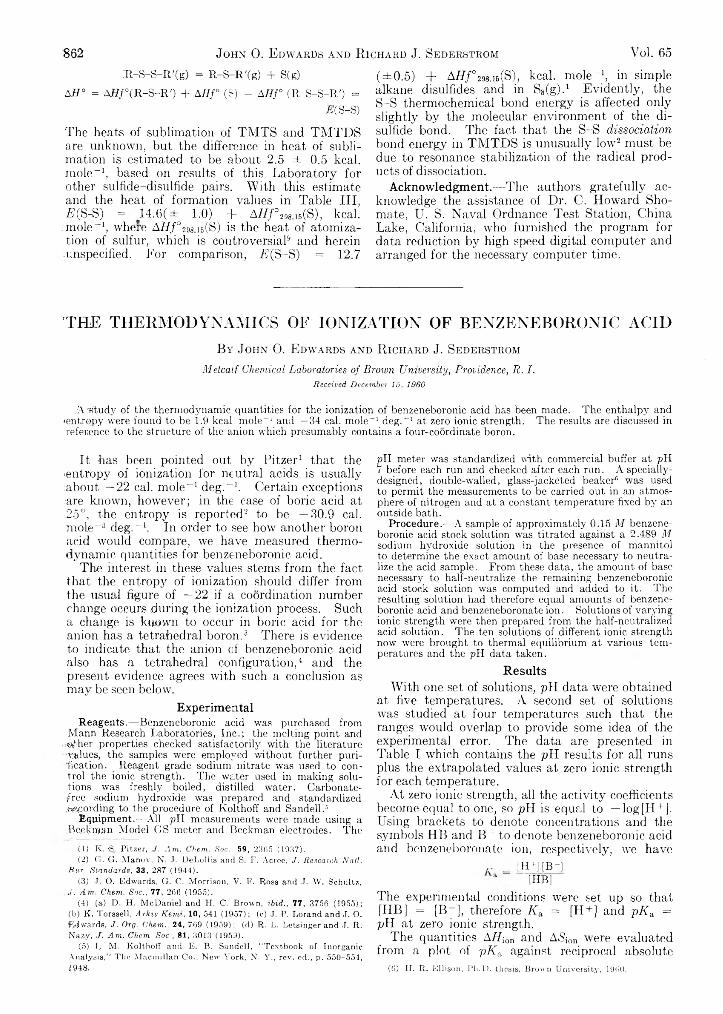
862 John 0 . Edwards and R ichard J. Sederstrom Vol. 65fR -S -S -R '(g) = R -S -R '(g ) + S(g)
AH° = A J ? /° ( R -S -R ') + AHf° (£) - AHf° ( R - S - S - R ') =
E(S-S)
The heats of sublimation of TMTS and TMTDS are unknown, but the difference in heat of sublimation is estimated to be about 2.5 ± 0.5 kcal. mole"1, based on results of this Laboratory for other sulfide-disulfide pairs. With this estimate and the heat of formation values in Table III, E ( S-S) = M .6(± 1.0) + AH/°298.16(S), kcal. mole"1, where A H f ° 2SSA6(S) is the heat of atomization of sulfur, which is controversial9 and herein unspecified. For comparison, I?(S-S) = 12.7
(±0.5) + A H f ° 298.15(S), kcal. mole"1, in simple alkane disulfides and in Ss(g).1 Evidently, the S-S thermochemical bond energy is affected only slightly by the molecular environment of the disulfide bond. The fact that the S-S d isso c ia tio n bond energy in TMTDS is unusually low2 must be due to resonance stabilization of the radical products of dissociation.
Acknowledgment.—The authors gratefully acknowledge the assistance of Dr. C. Howard Sho- mate, U. S. Naval Ordnance Test Station, China Lake, California, who furnished the program for data reduction by high speed digital computer and arranged for the necessary computer time.
THE THERMODYNAMICS OF IONIZATION OF BENZENEBORONIC ACIDB y J oh n 0 . E d w a r d s a n d R ic h a r d J. Se d e r st r o m
Metcalf Chemical Laboratories of Broom University, Providence, R. I.Received December 15, 1960
.A -study of the thermodynamic quantities for the ionization of benzeneboronic acid has been made. The enthalpy and (entropy were found to be 1.9 kcal. m ole"1 and —34 cal. m ole"1 deg.“ 1 at zero ionic strength. The results are discussed in reference to the structure of the anion which presumably contains a four-coordinate boron.
It has been pointed out by Pitzer1 that the ■entropy of ionization for neutral acids is usually about —22 cal. mole"1 deg."1. Certain exceptions are known, however; in the case of boric acid at :25o, the entropy is reported3 to be —30.9 cal. mole"1 deg."1. In order to see how another boron .acid would compare, we have measured thermodynamic quantities for benzeneboronic acid.
The interest in these values stems from the fact that the entropy of ionization should differ from the usual figure of —22 if a coordination number change occurs during the ionization process. Such a change is known to occur in boric acid for the anion has a tetrahedral boron.3 There is evidence to indicate that the anion of benzeneboronic acid also has a tetrahedral configuration,4 5 and the present evidence agrees with such a conclusion as may be seen below.
ExperimentalReagents.— Benzeneboronic acid was purchased from
Mann Research Laboratories, Inc.; the melting point and íOÍher properties checked satisfactorily with the literature values, the samples were employed without further purification. Reagent grade sodium nitrate was used to control the ionic strength. The water used in making solutions was freshly boiled, distilled water. Carbonate- ifree sodium hydroxide was prepared and standardized .-»iCpording to the procedure of Kolthoff and Sandell.6 *
Equipment.—All pH measurements were made using a Beckman Model GS meter and Beckman electrodes. The
(1) K. -S. Pitzer, J. Am. Chem. Soc., 59, 2365 (1937).(2) G. G. Manov, N. J. DeLollis and S. F. Acree, J. Research Nall.
Bur. Standards, 33, 287 (1944).(3) J. O. Edwards, G. C. Morrison, V. F, Ross and J. W. Schultz,
J. Am. Chem. Soc., 77, 266 (1955).(4) (a) D. H. McDaniel and H. C. Brown, ibid., 77, 3756 (1955);
((b) K. Torssell, Arkiv Kemi, 10, 541 (1957); (c) J. P. Lorand and J. O. f54wards, J. Org. Chem., 24, 769 (1959); (d) R. L. Letsinger and J. R. N$?3y, J. Am. Chem Soc , 81, 3013 (1959).
(5) !.. M. Kolthoff and E. B. Sandell, “Textbook of InorganicAnalysis,” The Macmillan Co., New York, N. Y., rev. cd., p. 550-554,¿948.
pH meter was standardized with commercial buffer at pH 7 before each run and checked after each run. A specially- designed, double-walled, glass-jacketed beaker6 was used to permit the measurements to be carried out in an atmosphere of nitrogen and at a constant temperature fixed by an outside bath.
Procedure.— A sample of approximately 0.15 M benzene- boronic acid stock solution was titrated against a 2.489 M sodium hydroxide solution in the presence of mannitol to determine the exact amount of base necessary to neutralize the acid sample. From these data, the amount of base necessary to half-neutralize the remaining benzeneboronic acid stock solution was computed and added to it. The resulting solution had therefore equal amounts of benzeneboronic acid and benzeneboronate ion. Solutions of varying ionic strength were then prepared from the half-neutralized acid solution. The ten solutions of different ionic strength now were brought to thermal equilibrium at various temperatures and the pH data taken.
ResultsWith one set of solutions, pH data were obtained
at five temperatures. A second set of solutions was studied at four temperatures such that the ranges would overlap to provide some idea of the experimental error. The data are presented in Table I which contains the pH results for all runs plus the extrapolated values at zero ionic strength for each temperature.
At zero ionic strength, all the activity coefficients become equal to one, so pH is equal to — log[H+]. Using brackets to denote concentrations and the symbols HB and B " to denote benzeneboronic acid and benzeneboronate ion, respectively, we have
,, [11+] [B —][HB]
The experimental conditions were set up so that [HB] = [B~], therefore Ra = [H+] and p K & = pH at zero ionic strength.
The quantities A E \ 0VL and Arifon were evaluated from a plot of pRa against reciprocal absolute
(0) H. R. Ellison, Ph.D. thesis, Brown U Diversity, I960.
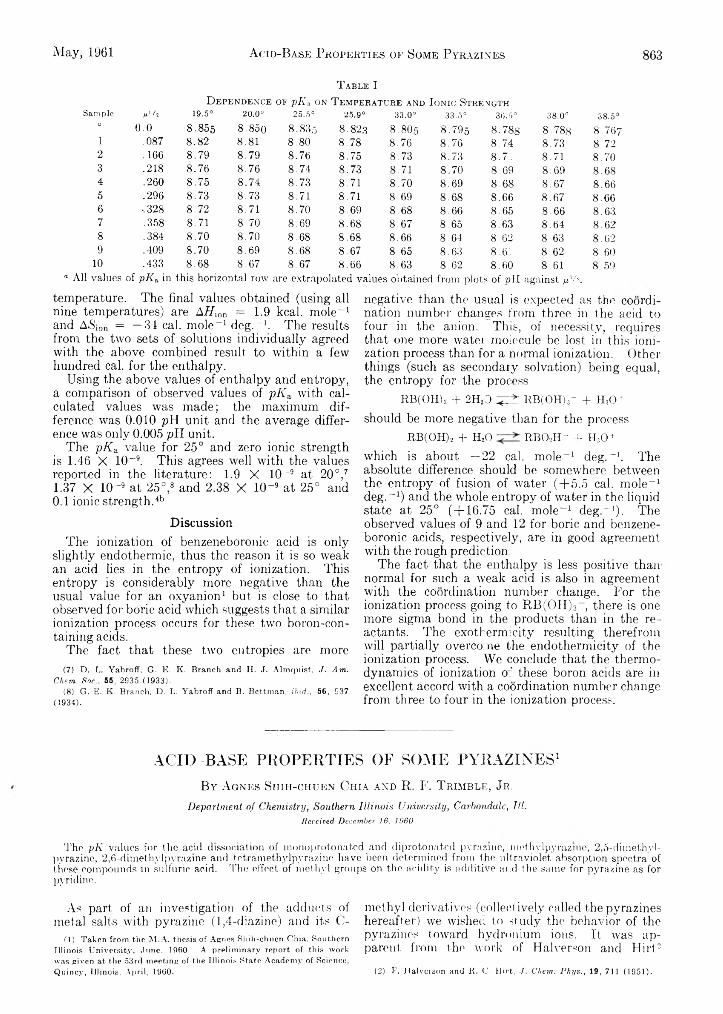
May, 1961 Acid-Base Properties of Some Pyrazines 863
T able I
D ependence of -pKa on T emperature and I onic StrengthSample /DO 19.5° 2 0 .0 ° 25.5° 25.9° 33.0° 33.5° 30.5° 38.0° 38.5*
a 0.0 8.855 8.850 8.835 8.823 8 . 8 O5 8.795 8.788 8.788 8.7671 .087 8.82 8.81 8.80 8.78 8.76 8.76 8.74 8.73 8.722 .166 8.79 8.79 8.76 8.75 8.73 8.73 8.71 8.71 8.703 .218 8.76 8.76 8.74 8.73 8.71 8.70 S. 69 8.69 8.684 .260 8.75 8.74 8.73 8.71 8.70 8.69 8.68 8.67 8.665 .296 8.73 8.73 8.71 8.71 8.69 8.68 8.66 8.67 8.666 -.328 8.72 8.71 8.70 8.69 8.68 8.66 8.65 8.66 8.63.7 .358 8.71 8.70 8.69 8.68 8.67 8.65 8.63 8.64 8.628 .384 8.70 8.70 8.68 8.68 8.66 8.64 8.62 8.63 8.629 .409 8.70 8.69 8.68 8.67 8.65 8.63 8.61 8.62 8.60
10 .433 8.68 8.67 8.67 8.66 8.63 8.62 8.60 8.61 8.59“ All values of pK h in this horizontal row are extrapolated values obtained from plots of pH against ¡tV*.
temperature. The final values obtained (using all nine temperatures) are A H lon = 1.9 kcal. mole*-1 and AiSion = —34 cal. mole-1 deg.-1. The results from the two sets of solutions individually agreed with the above combined result to within a few hundred cal. for the enthalpy.
Using the above values of enthalpy and entropy, a comparison of observed values of p K a with calculated values was made; the maximum difference was 0.010 pH unit and the average difference was only 0.005 pH unit.
The pAa value for 25° and zero ionic strength is 1.46 X 10⁻⁹. This agrees well with the values reported in the literature: 1.9 X 10⁻⁹ at 20°,71.37 X 10-9 at 25°,8 and 2.38 X 10⁻⁹ at 25° and 0.1 ionic strength.4b
DiscussionThe ionization of benzeneboronic acid is only
slightly endothermic, thus the reason it is so weak an acid lies in the entropy of ionization. This entropy is considerably more negative than the usual value for an oxyanion1 but is close to that observed for boric acid which suggests that a similar ionization process occurs for these two boron-containing acids.
The fact that these two entropies are more(7) D. L. Yabroff, G. E. K. Branch and H. J. Almquist, J. Am.
Chem. Soc., 55, 2935 (1933).(8 ) G. E. K. Branch, D. L. Yabroff and B. Bettman, ibid., 56, 937
(1934).
negative than the usual is expected as the coordination number changes from three in the acid to four in the anion. This, of necessity, requires that one more water moiecule be lost in this ionization process than for a normal ionization. Other things (such as secondary solvation) being equal, the entropy for the process
RB(OH)2 + 2HaO ^ ± 1 RB(OH)3- + H ,0+
should be more negative than for the process RB(OH)2 + H20 R B 02H - + H30 +
which is about —22 cal. mole-1 deg.-1. The absolute difference should be somewhere between the entropy of fusion of water (+5.5 cal. mole-1 deg.-1) and the whole entropy of water in the liquid state at 25° (+16.75 cal. mole-1 deg.-1). The observed values of 9 and 12 for boric and benzeneboronic acids, respectively, are in good agreement with the rough prediction.
The fact that the enthalpy is less positive than normal for such a weak acid is also in agreement with the coordination number change. For the ionization process going to RB(OH)3- , there is one more sigma bond in the products than in the reactants. The exothermic-ity resulting therefrom will partially overcome the endothermicity of the ionization process. We conclude that the thermodynamics of ionization o’ these boron acids are in excellent accord with a coordination number change from three to four in the ionization process.
ACID-BASE PROPERTIES OF SOME PYRAZINES1B y A g n e s S h ih - c h u e n C h ia a n d R . F . T r im b l e , J r .
Department of Chemistry, Southern Illinois University, Carhonclule, lit.Received December 16, 1060
The pK values for the acid dissociation of monoprotonated and diprotonated pyrazine, metliylpyrazme, 2,5-dimethvl- pyrazine, 2,6-dimethvlpyrazine and t.otramethylpyrazine have been determined from the ultraviolet absorption spectra of these compounds in sulfuric acid. The effect of methyl groups on the acidity is additive ar.d the same for pyrazine as forpyridine.
As part of an investigation of the adducts of metal salts with pyrazine (1,4-diazine) and its C -
(1) Taken from the M.A. thesis of Agnes Shih-chuen Chia, Southern Illinois University, June, 1960. A preliminary report of this work was given at the 53rd meeting of the Illinois State Academy of Science, Quincy, Illinois, April, 1960.
methyl derivatives (collectively called the pyrazines hereafter) we wished to study the behavior of the pyrazines toward hydronium ions. It was apparent. from the work of Halverson and Hirt2
(2) F. Halverson and R. O. Hirt, ./. Chem. Phys., 19, 711 (1951).
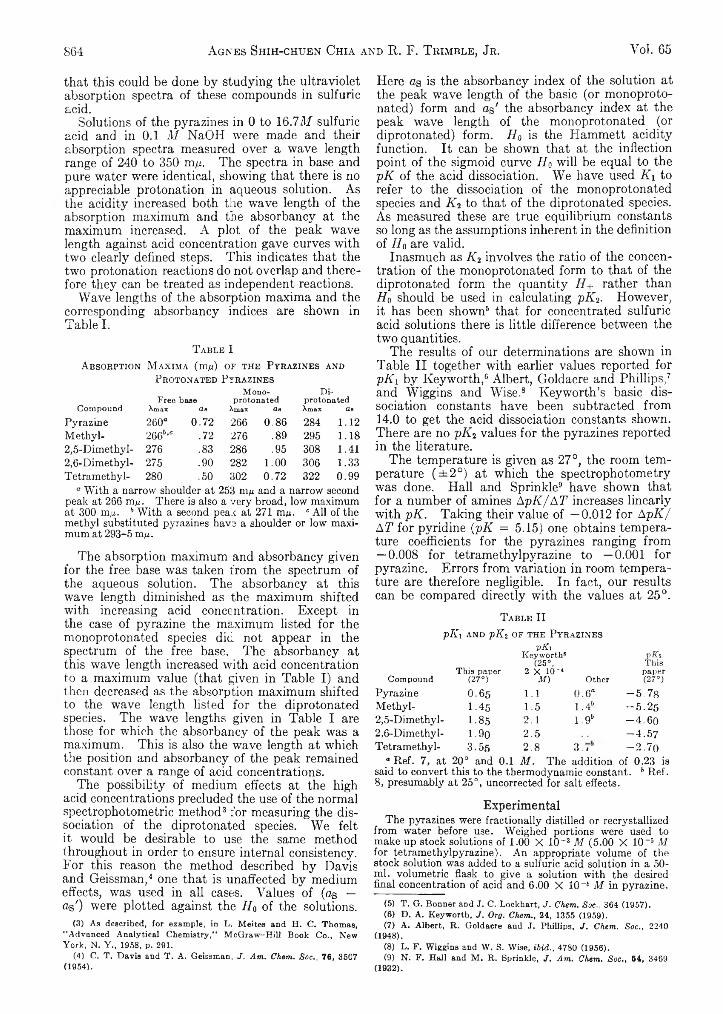
864 Agnes Shih-chuen Chia and R. F. Thimble, Je. Vol. 65
that this could be done by studying the ultraviolet absorption spectra of these compounds in sulfuric acid.
Solutions of the pyrazines in 0 to 16.7M sulfuric acid and in 0.1 M NaOH were made and their absorption spectra measured over a wave length range of 240 to 350 m¡x. The spectra in base and pure water were identical, showing that there is no appreciable protonation in aqueous solution. As the acidity increased both the wave length of the absorption maximum and the absorbancy at the maximum increased. A plot of the peak wave length against acid concentration gave curves with two clearly defined steps. This indicates that the two protonation reactions do not overlap and therefore they can be treated as independent reactions.
Wave lengths of the absorption maxima and the corresponding absorbancy indices are shown in Table I.
T able I
A bsorption M a xim a (m^) of the P yrazines and Protonated Pyrazines
Mono- Di~
CompoundFree base
Xmax <2 sprotonated
Xmax dBprotonated Xmax ds
Pyrazine 260“ 0.72 266 0.86 284 1.12Methyl- 266I’•', .72 276 .89 295 1.182,5-Dimethyl- 276 .83 286 .95 308 1.412,6-Dimethyl- 275 .90 282 1.00 306 1.33Tetramethyl- 280 .50 302 0.72 322 0.99
° With a narrow shoulder at 253 mju and a narrow second peak at 266 mp. There is also a very broad, low maximum at 300 mju. h With a second peak at 271 m,u. c All of the methyl substituted pyrazines have a shoulder or low maximum at 293-5 mil.
The absorption maximum and absorbancy given for the free base was taken from the spectrum of the aqueous solution. The absorbancy at this wave length diminished as the maximum shifted with increasing acid concentration. Except in the case of pyrazine the maximum listed for the monoprotonated species did not appear in the spectrum of the free base. The absorbancy at this wave length increased with acid concentration to a maximum value (that given in Table I) and then decreased as the absorption maximum shifted to the wave length listed for the diprotonated species. The wave lengths given in Table I are those for which the absorbancy of the peak was a maximum. This is also the wave length at which the position and absorbancy of the peak remained constant over a range of acid concentrations.
The possibility of medium effects at the high acid concentrations precluded the use of the normal spectrophotometric method3 for measuring the dissociation of the diprotonated species. We felt it would be desirable to use the same method throughout in order to ensure internal consistency. For this reason the method described by Davis and Geissman,4 one that is unaffected by medium effects, was used in all cases. Values of (as — as') were plotted against the IIa of the solutions.
(3) As described, for example, in L. Meites and H. C. Thomas, ‘ ‘Advanced Analytical Chemistry,” McGraw-Hill Book Co., New York, N. Y., 1958, p. 291.
(4) C. T. Davis and T. A. Geissman, J. Am. Chem. Soc., 76, 3507(1954).
Here as is the absorbancy index of the solution at the peak wave length of the basic (or monoprotonated) form and as' the absorbancy index at the peak wave length of the monoprotonated (or diprotonated) form. H 0 is the Hammett acidity function. It can be shown that at the inflection point of the sigmoid curve H a will be equal to the p K of the acid dissociation. We have used K i to refer to the dissociation of the monoprotonated species and K 2 to that of the diprotonated species. As measured these are true equilibrium constants so long as the assumptions inherent in the definition of H o are valid.
Inasmuch as K 2 involves the ratio of the concentration of the monoprotonated form to that of the diprotonated form the quantity H + rather than H 0 should be used in calculating p K 2. However, it has been shown5 that for concentrated sulfuric acid solutions there is little difference between the two quantities.
The results of our determinations are shown in Table II together with earlier values reported for p K \ by Keyworth,6 Albert, Goldacre and Phillips,7 and Wiggins and Wise.8 Keyworth’s basic dissociation constants have been subtracted from14.0 to get the acid dissociation constants shown. There are no p K 2 values for the pyrazines reported in the literature.
The temperature is given as 27°, the room temperature (±2° ) at which the spectrophotometry was done. Hall and Sprinkle9 have shown that for a number of amines A p K / A T increases linearly with p K . Taking their value of —0.012 for A p K / A T for pyridine (p K = 5.15) one obtains temperature coefficients for the pyrazines ranging from — 0.008 for tetramethylpyrazine to —0.001 for pyrazine. Errors from variation in room temperature are therefore negligible. In fact, our results can be compared directly with the values at 25°.
T a ble II
p I C i AND - p K i OF THE PYRAZINES
CompoundThis paper
(27°)
P it iKeyworth8
(25°,2 X IO “ *
M) Other
pKzT h is
paper(27°)
Pyrazine 0.65 1 . 1 0 . 6 ° - 5 . 7 sMethyl- 1.45 1.5 1.4" - 5 .2 52,5-Dimethyl- 1.85 2 . 1 1,96 - 4 .6 02,6-Dimethyl- 1 . 9 0 2.5 -4 .5 7Tetramethyl- 3 5 5 2.8 qO . i - 2 .7 o
“ Ref. 7, at 20° and 0.1 M . The addition of 0.23 is said to convert this to the thermodynamic constant. b Ref. 8, presumably at 25°, uncorrected for salt effects.
ExperimentalThe pyrazines were fractionally distilled or recrystallized
from water before use. Weighed portions were used to make up stock solutions of 1.00 X 10~3 M (5.00 X 10~5 M for tetramethylpyrazine). An appropriate volume of the stock solution was added to a sulfuric acid solution in a 50- ml. volumetric flask to give a solution with the desired final concentration of acid and 6.00 X 10~E M in pyrazine.
(5) T. G. Bonner aDd J. C. Lockhart, J. Chem. Soc., 364 (1957).(6) D. A. Keyworth, J. Org. Chem., 24, 1355 (1959).(7) A. Albert, R. Goldacre and J. Phillips, J. Chem. Soc., 2240
(1948).(8) L . F. Wiggins and W. S. Wise, ibid., 4780 (1956).(9) N. F. Hall and M. R. Sprinkle, J. Am. Chem. Soc., 54, 3469
(1932).
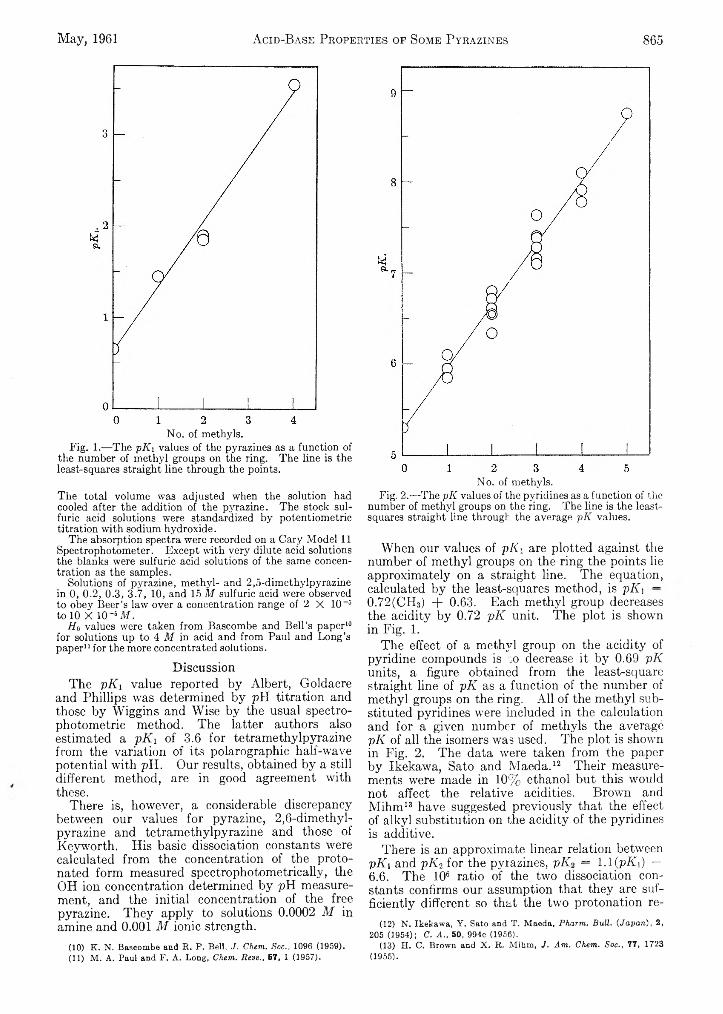
May, 1961 Acid-Base Properties of Some Pyrazines 865
No. of methyls.Fig. 1.—The p K i values of the pyrazines as a function of
the number of methyl groups on the ring. The line is the least-squares straight line through the points.
The total volume was adjusted when the solution had cooled after the addition of the pyrazine. The stock sulfuric acid solutions were standardized by potentiometric titration with sodium hydroxide.
The absorption spectra were recorded on a Cary Model 11 Spectrophotometer. Except with very dilute acid solutions the blanks were sulfuric acid solutions of the same concentration as the samples.
Solutions of pyrazine, methyl- and 2,5-dimethylpyrazine in 0, 0.2, 0.3, 3.7, 10, and 15 M sulfuric acid were observed to obey Beer’s law over a concentration range of 2 X 10~6 to 10 X 10~6M .
Ho values were taken from Bascombe and Bell’s paper10 for solutions up to 4 M in acid and from Paul and Long’s paper11 for the more concentrated solutions.
DiscussionThe j)K\ value reported by Albert, Goldacre
and Phillips was determined by pH titration and those by Wiggins and Wise by the usual spectro- photometric method. The latter authors also estimated a p K i of 3.6 for tetramethylpyrazine from the variation of its polarographic half-wave potential with pH. Our results, obtained by a still different method, are in good agreement with these.
There is, however, a considerable discrepancy between our values for pyrazine, 2,6-dimethyl- pyrazine and tetramethylpyrazine and those of Keyworth. His basic dissociation constants were calculated from the concentration of the proto- nated form measured spectrophotometrically, the OH ion concentration determined by pH measurement, and the initial concentration of the free pyrazine. They apply to solutions 0.0002 M in amine and 0.001 M ionic strength.
(10) K . N. Bascombe and R . P. Bell, J. Chem. Soc., 1096 (1959).(11) M . A. Paul and F. A. Long, Chem. Revs., 57, 1 (1957).
No. of methyls.Fig. 2.-—The p K values of the pyridines as a function of the
number of methyl groups on the ring. The line is the least- squares straight line through the average p K values.
When our values of p K i are plotted against the number of methyl groups on the ring the points lie approximately on a straight line. The equation, calculated by the least-squares method, is p K i — 0.72(CH8) + 0.63. Each methyl group decreases the acidity by 0.72 p K unit. The plot is shown in Fig. 1.
The effect of a methyl group on the acidity of pyridine compounds is to decrease it by 0.69 p K units, a figure obtained from the least-square straight line of p K as a function of the number of methyl groups on the ring. All of the methyl substituted pyridines were included in the calculation and for a given number of methyls the average p K of all the isomers was used. The plot is shown in Fig. 2. The data were taken from the paper by Ikekawa, Sato and M aeda.12 Their measurements were made in 10% ethanol but this would not affect the relative acidities. Browm and M ihm 13 have suggested previously that the effect of alkyl substitution on the acidity of the pyridines is additive.
There is an approximate linear relation between p K i and pK-i for the pyrazines, pK-> — 1.1 (p K i) —6.6. The 106 ratio of the two dissociation constants confirms our assumption that they are sufficiently different so that the two protonation re-
(12) N . Ikekawa, Y . Sato and T . Maeda, Pharm. Bull, (Japan), 2, 205 (1954); C. A . , 50, 994e (1956).
(13) H , C. Brown and X . R„ Mihro, J . Am, Chem. Soc., 77, 1723(1955).

866 C. H. Brubaker, Jr., and T. E. Haas Yol. 65
actions can be treated separately.It appears from our data that trimethylpyrazine
would have a p K j of 2.8 and a pK% of —3.5.Acknowledgments.— This work was supported
by the Graduate Council of Southern Illinois University. We are also indebted to the Wyandotte Chemicals Corporation for generous samples of the pyrazines used.
THE ACTIVITY COEFFICIENTS OF AQUEOUS SOLUTIONS OF TRIS-(ETHYLENEDIAMINE)-COBALT(III) PERCHLORATE
By C. H. B r u b a k e r , Jr ., a n d T. E. H a a s
Kedzie Chemical Laboratory, Michigan State University, East Lansing, MichiganReceived December 17, 1960
Activity and osmotic coefficients of solutions of Co(en)3(C104)3 have been determined at 25° by isopiestic comparison with KC1 solutions. Measurements have been made from about 0.04 to 0.5404 m (saturation). This salt is similar in behavior to other complex 3-1 salts, but some differences are found.
In a series of recent papers,1 we have given the activity coefficients of a dozen complexes, which were high charge electrolytes (1-2, 3-1, 1-3, 3-2,1-4 and 4-1). To complete the 3-1 series, we now have determined the activity coefficients of tris- (ethylenediamine)-cobalt(III) perchlorate, Co(en)3- (C104) 3.
ExperimentalThe apparatus and experimental procedure are those
previously described.1 Co(en)3Cl= was prepared by the procedure in “ Inorganic Syntheses.” 2 Co(en)3(C104)3 then was prepared by quantitative metathesis between the chloride and an AgC104 solution, as had been done for the tris-(propylenediamine)-cobalt(III) perchlorate and other perchlorates we have studied.3 The salt was recrystallized three times from demineralized, distilled water and the hydrate, thus obtained, was dried at 100° until the anhydrous form was obtained.
Results and DiscussionIn Table I are shown the experimental molalities
and osmotic coefficients. The maximum concentration of 0.5404 m is for the saturated solution.
(1 ÓJ calc. 0. i 676sm(f) O' m x*’ ÌÌI ~ / '¿Liil (A0)smoothcdA )
The notation is that of Harned and Owen4 5 and (A<f>) smoothed was determined by the method of Scatchard and Prentiss.6 In order to obtain the best agreement with experiment (Table I), & was taken as 4.7 A. and B = 1.35. The B is positive and d is somewhat larger than for Co(en)3Cl3 or Co(pn)3(C104)3, which were 3.4 and 3.5, respectively. It was possible to fit the data for lower concentrations with & = 4.0 and B = 0.9, but only up to m = 0.2 and then the fit was also poorer below 0.08 m. Thus the higher & seems preferable.
Activity coefficients were calculated by the method of Smith,6 i.e.
In — 2.303sm(n \/m 1 + A'm x/m
„ , Cm Addire , . ,— E m T I -------- T A <f>
Jo m(2)
up to m = 0.2755 and then were obtained from m = 0.2755 to saturation by graphical integration of
I sopiestic M olalities,
T able I
Observed and C alculated O s-
1 mIn 7 * = - ( 1 -
J 0-2755
Cm<p) — 2 1
J 0.2755( 1 — <t>) ds/m/\'m
(3)motic C oefficients of Co(en)3(C I0 4)3
m 4» obsd.at 24.978 ± 0.005°
calod. T able I I
0.04258 0 .7342 0.7342 Smoothed A ctivity and Osmotic C oefficients fo
.05223 .7 16 3 .7 156 Co(en)3(C 10 4)3 at 24.978 ± 0.005°
.08421 . 6624 .6779 rn a» 7±
.12 18 . 6392 .6392 0 .0 1 0 .8 179 0 .528
.1474 .6272 . 6272 .03 . 7305 .39 1
.1879 .5980 .5993 .05 .7 116 .3 3 1
.1902 .5991 .5980 .08 .6678 .277
.2678 . 5641 .5633 .10 .6514 .252
. 2755 . 5601 . 5607 .20 .5936 .18 5
. 3474 .5430 . 2755 .5601 .15 7
.5404" .4992 .30 .5557 .15 3" Saturated solution. to . 5280 . 1 38
It was possible to calculate the osmotic coefficients up to 0.2755 m by using the equation
(1) For the most recent, see K . O. Groves, J. L. D ye and C. H. Brubaker, Jr., J. Am. Chem. Soc., 82, 4:445 (1960). This work was supported by a grant from the National Science Foundation.
''2) J. B. Work, “ Inorganic Syntheses,” Yol. II, ed. by W . C. Fernelius, M cGraw-Hill Book Co., New York, N. Y., 1946, p. 221.
(3) R. A . W ynveen, J. L. Dye and C. IE Brubaker, Jr., J. Am. Chem. Soc., 82, 4441 (1960).
.50 .5005 .125
.5404" .4992 .121° Saturated solution.
(4) H. S. Harned and B. B. Owen, “ The Physical Chemistry of Electrolyte Solutions,” 3rd Ed., Reinhold Publ. Corp,, New York, N. Y., 1958.
(5) G. Scatchard and S. S. Prentiss, J. Am. Chem. Soc., 55, 4355 (1933).
(6) R . P. Smith, ibid., 61, 500 (1939).
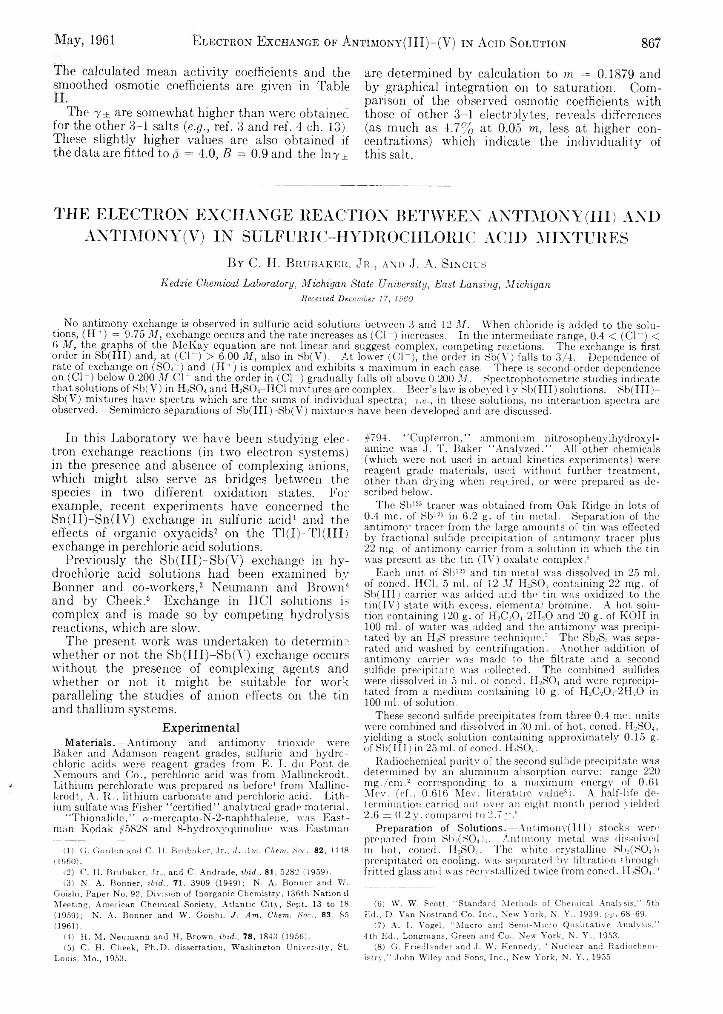
May, 1961 86?Electron Exchange of Antîmony(III)-(V) in A cid Solution
The calculated mean activity coefficients and the smoothed osmotic coefficients are given in Table
The y ± are somewhat higher than were obtained for the other 3-1 salts (e.g., ref. 3 and ref. 4 ch. 13). These slightly higher values are also obtained if the data are fitted to d = 4.0, B = 0.9 and the lny±
are determined by calculation to to = 0.1879 and by graphical integration on to saturation. Comparison of the observed osmotic coefficients with those of other 3-1 electrolytes, reveals differences (as much as 4.7% at 0.05 to, less at higher concentrations) which indicate the individuality of this salt.
THE ELECTRON EXCHANGE REACTION BETWEEN ANTIMONY (HI) AND ANTIMONY(V) IN SULFURIC-HYDROCHLORIC ACID MIXTURES
B y C. H. B r u b a k e r , J r ., a n d J. A. S in c iu s
K edzie Chemical Laboratory, M ichigan State University, East Lansing, M ichigan Received December 17, 1960
No antimony exchange is observed in sulfuric acid solutions between 3 and 12 M . When chloride is added to the solutions, (H+) = 9.75 M , exchange occurs and the rate increases as (C l“ ) increases. In the intermediate range, 0.4 < (C l- ) < 6 M , the graphs of the McKay equation are not linear and suggest complex, competing reactions. The exchange is first order in Sb(III) and, at (C l- ) > 6.00 M , also in Sb(V). At lower (C l- ), the order in Sb(V) falls to 3/4. Dependence of rate of exchange on (S 04~) and (HA) is complex and exhibits a maximum in each case. There is second-order dependence on (C l- ) below 0.200 M C l- and the order in (C l- ) gradually falls off above 0.200 M . Spectrophotometrie studies indicate that solutions of Sb(V) in H2S04 and H2S04-HC1 mixtures are complex. Beer’s law is obeyed by Sb(III) solutions. S b (III)- Sb(V) mixtures have spectra which are the sums of individual spectra; i.e., in these solutions, no interaction spectra are observed. Semimicro separations of Sb(III)-Sb(V) mixtures have been developed and are discussed.
In this Laboratory we have been studying electron exchange reactions (in two electron systems) in the presence and absence of complexing anions, which might also serve as bridges between the species in two different oxidation states. For example, recent experiments have concerned the Sn(II)-Sn(IV ) exchange in sulfuric acid1 and the effects of organic oxyaeids2 on the T1(I)—T1 (III) exchange in perchloric acid solutions.
Previously the Sb(III)-S b (V ) exchange in hydrochloric acid solutions had been examined by Bonner and co-workers,3 Neumann and Brown4 5 and by Cheek.6 Exchange in HC1 solutions is complex and is made so by competing hydrolysis reactions, which are slow.
The present work was undertaken to determine whether or not the S b (III)-S b (V ) exchange occurs without the presence of complexing agents and whether or not it might be suitable for work paralleling the studies of anion effects on the tin and thallium systems.
ExperimentalMaterials.—Antimony and antimony trioxide were
Baker and Adamson reagent grades, sulfuric and hydrochloric acids were reagent grades from E. I. du Pont de Nemours and Co., perchloric acid wras from Mallinckrodt. Lithium perchlorate was prepared as before1 from Mallinckrodt, A. R ., lithium carbonate and perchloric acid. Lithium sulfate was Fisher “ certified” analytical grade material.
“ Thionalide,” a-mercapto-N-2-naphthalene, was Eastman Kodak #5828 and 8-hydroxyquinoline was Eastman
(1) G. Gordon and C. H. Brubaker, Jr., ./. Am. Chem. Sac., 82, 44.18(1960) .
(2) C. II. Brubaker, Jr., and C. Andrade, ibid., 81, 5282 (1959).(3) N. A. Bonner, ibid., 71, 3909 (1949); N. A. Bonner and W.
Goishi, Paper No. 92, Division of Inorganic Chemistry, 136th National Meeting, American Chemical Society, Atlantic City, Sept. 13 to 18 (1959); N. A. Bonner and W. Goishi, J. Am. Chem. Soc., 83, 85(1961) .
(4) H. M . Neumann and H. Brown, ibid., 78, 1843 (1956).(5) C. H. Cheek, Ph.D . dissertation, Washington University, St.
Louis, M o., 1953.
#794. “ Cupferron,” ammonium nitrosophenylliydroxyl- amine was J. T. Baker “ Analyzed.” All other chemicals (which were not used in actual kinetics experiments) were reagent grade materials, used without further treatment, other than drying when required, or were prepared as described below.
The Sb125 tracer was obtained from Oak Ridge in lots of 0.4 me. of Sb125 in 6.2 g. of tin metal. Separation of the antimony tracer from the large amounts of tin was effected by fractional sulfide precipitation of antimony tracer plus 22 mg. of antimony carrier from a solution in which the tin was present as the tin (IV) oxalate complex.6
Each unit of Sb125 and tin metal was dissolved in 25 ml. of coned. HC1, 5 ml. of 12 M H»S04 containing 22 mg. of Sb(III) carrier was added and the tin was oxidized to the tin(IV) state with excess, elemental bromine. A hot solution containing 120 g. of H2C20 4-2H20 and 20 g. of KOH in 100 ml. of water was added and the antimony was precipitated by an H2S pressure technique.7 The Sb2S3 was separated and washed by centrifugation. Another addition of antimony carrier was made to the filtrate and a second sulfide precipitate was collected. The combined sulfides were dissolved in 5 ml. of coned. H2S04 and were reprecipitated from a medium containing 10 g. of H2C20 4-2H20 in 100 ml. of solution.
These second sulfide precipitates from three 0.4 me. units were combined and dissolved in 30 ml. of hot, coned. H2S04, yielding a stock solution containing approximately 0.15 g. of Sb(III) in 25 ml. of coned. H2S04.
Radiochemical purity of the second sulfide precipitate was determined by an aluminum absorption curve: range 220 m g./cm .2 corresponding to a maximum energy of 0.61 Mev. (c f., 0.616 Mev. literature value8). A half-life determination carried out over an eight month period yielded2.6 ± 0.2 y. compared to 2.7 y*
Preparation of Solutions.—Antimony(lII) stocks were prepared from Sbj(S04)». Antimony metal was dissolved in hot, coned. ILS04. The white crystalline Sb2(S04)3 precipitated on cooling, was separated by filtration through fritted glass and was reerystallized twice from coned. H2S04.9
(6 ) W. W. Scott, “ Standard Methods of Chemical Analysis,” 5th Ed., D . Van Nostrand Co. Inc., New York, N. Y ., 1939, pp. 68-69.
(7) A. I. Vogel, “ Macro and Semi-Micro Qualitative Analysis,” 4th Ed., Longmans, Green and Co., New York, N. Y ., 1953.
(8 ) G. Friedlander and J. W . Kennedy, “ Nuclear and Radiochem istry,” John W iley and Sons, Inc., New York, N. Y . , 1955.
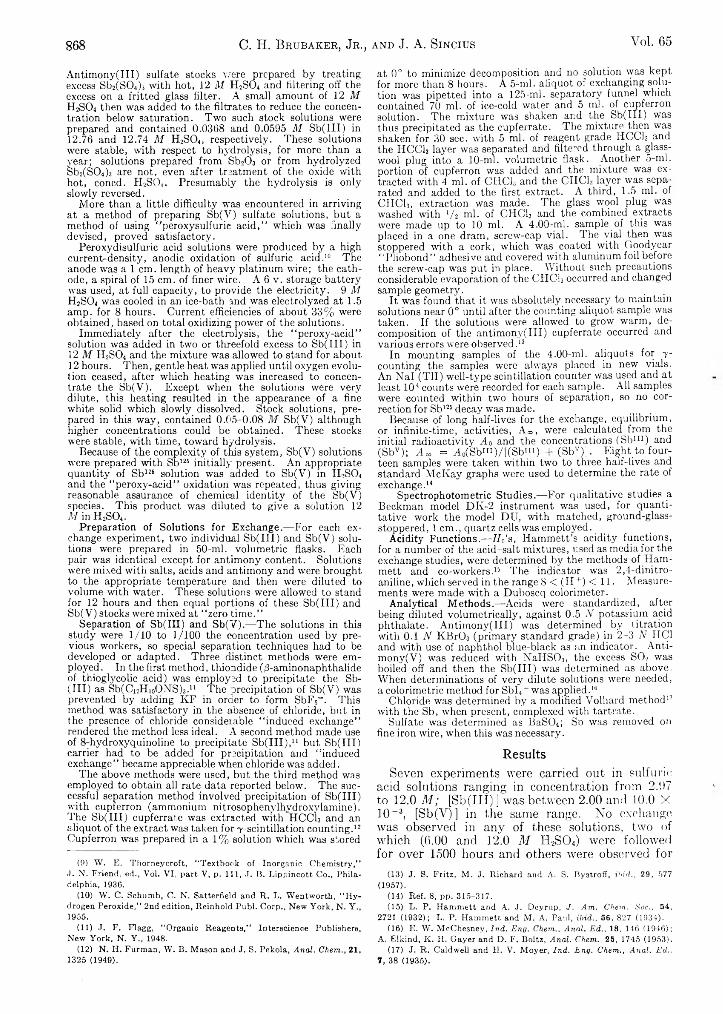
868 C. H. Brubaker, Jr., and J. A. Sincius Vol. 65
Antimony(III) sulfate stocks were prepared by treating excess Sb2(S04)3 with hot, 12 M H2S04 and filtering off the excess on a fritted glass filter. A small amount of 12 M H2S04 then was added to the filtrates to reduce the concentration below saturation. Two such stock solutions were prepared and contained 0.0368 and 0.0595 M Sb(III) in 12.76 and 12.74 M H2S04, respectively. These solutions were stable, with respect to hydrolysis, for more than a year; solutions prepared from Sb20 3 or from hydrolyzed Sb2(S04)3 are not, even after treatment of the oxide with hot, coned. H2S04. Presumably the hydrolysis is only slowly reversed.
More than a little difficulty was encountered in arriving at a method of preparing Sb(V) sulfate solutions, but a method of using “ peroxysulfurie acid,” -which was finally devised, proved satisfactory.
Peroxydisulfuric acid solutions were produced by a high current-density, anodic oxidation of sulfuric acid.9 10 The anode was a 1 cm. length of heavy platinum wire; the cathode, a spiral of 15 cm. of finer wire. A 6 v. storage battery was used, at full capacity, to provide the electricity. 9 M H2S04 was cooled in an ice-bath and was electrolyzed at 1.5 amp. for 8 hours. Current efficiencies of about 33% were obtained, based on total oxidizing power of the solutions.
Immediately after the electrolysis, the “ peroxy-acid” solution was added in two or threefold excess to Sb(III) in 12 M H2S04 and the mixture was allowed to stand for about 12 hours. Then, gentle heat was applied until oxygen evolution ceased, after which heating was increased to concentrate the Sb(V). Except when the solutions were very dilute, this heating resulted in the appearance of a fine white solid which slowly dissolved. Stock solutions, prepared in this way, contained 0.05-0.08 M Sb(V) although higher concentrations could be obtained. These stocks were stable, with time, toward hydrolysis.
Because of the complexity of this system, Sb(V) solutions were prepared with Sb126 initially present. An appropriate quantity of Sb126 solution was added to Sb(V) in II2S04 and the “ peroxy-acid” oxidation was repeated, thus giving reasonable assurance of chemical identity of the Sb(V) species. This product was diluted to give a solution 12 M in H2S04 .
Preparation of Solutions for Exchange.— For each exchange experiment, two individual Sb(III) and Sb(V) solutions were prepared in 50-ml. volumetric flasks. Each pair was identical except for antimony content. Solutions were mixed with salts, acids and antimony and were brought to the appropriate temperature and then -were diluted to volume with water. These solutions were allowed to stand for 12 hours and then equal portions of these Sb(III) and Sb(V) stocks were mixed at “ zero time.”
Separation of Sb(III) and Sb(V).— The solutions in this study were 1/10 to 1/100 the concentration used by previous workers, so special separation techniques had to be developed or adapted. Three distinct methods were employed . In the first method, thiondide (/3-aminonaphthalide of thioglycolic acid) was employed to precipitate the Sb-(III) as Sb(Ci2Hi0ONS)3.u The precipitation of Sb(V) was prevented by adding KF in order to form SbF6- . This method was satisfactory in the absence of chloride, but in the presence of chloride considerable “ induced exchange” rendered the method less ideal. A second method made use of 8-hydroxyquinoline to precipitate Sb(III),11 but Sb(III) carrier had to be added for precipitation and “ induced exchange” became appreciable when chloride was added.
The above methods were used, but the third method was employed to obtain all rate data reported below. The successful separation method involved precipitation of Sb(III) with cupferron (ammonium nitrosophenylhvdroxylamine). The Sb(III) cupferrat.e was extracted with HCCls and an aliquot of the extract was taken for 7-scintillation counting.12 Cupferron was prepared in a 1% solution which was stored
(9) W. E. Thorneyeroft, “Textbook of Inorganic Chemistry,” J. N. Friend, ed., Vol. VI, part V, p. I ll , J. B. Lippincott Co., Philadelphia, 1936.
(10) W. C. Schumb, C. N. Satterfield and R. L. Wentworth, “ Hydrogen Peroxide,” 2nd edition, Reinhold Publ. Corp., New York, N. Y., 1955.
(11) J. F. Flagg, “Organic Reagents,” Interscience Publishers, New York, N. Y., 1948.
(12) N. II. Furman, W. B. Mason and J. S. Pekola, Anal. Chem., 21,1325 (1949).
at 0 ° to minimize decomposition and no solution was kept for more than 8 hours. A 5-ml. aliquot or exchanging solution was pipetted into a 125-m l. separatory funnel which contained 70 ml. of ice-cold water and 5 ml. of cupferron solution. The mixture was shaken and the S b (III) was thus precipitated as the cupferrate. The mixture then was shaken for 30 sec. with 5 ml. of reagent grade H CC 13 and the H CC 13 layer was separated and filtered through a glass- wool plug into a 10-ml. volumetric flask. Another 5-ml. portion of cupferron was added and the mixture was extracted with 4 ml. of CHCls and the CIICls layer was separated and added to the first extract. A third, 1 .5 ml. of C IIC I3 , extraction was made. The glass wool plug was washed with V 2 ml. of CM Cl,3 and the combined extracts were made up to 10 ml. A 4.00-ml. sample of this was placed in a one dram, screw-cap vial. The vial then was stoppered with a cork, which was coated with Goodyear "Pliobond” adhesive and covered with aluminum foil before the screw-cap was put in place. Without such precautions considerable evaporation of the C IIC 13 occurred and changed sample geometry.
It was found that it was absolutely necessary to maintain solutions near 0 ° until after the counting aliquot sample was taken. I f the solutions were allowed to grow warm , decomposition of the antimony(I I I ) cupferrate occurred and various errors were observed . 13
In mounting samples of the 4.00-ml. aliquots for 7 - counting the samples were always placed in new vials. An N a l (T il) well-type scintillation counter was used and at least 1 0 4 counts were recorded for each sample. All samples were counted within two hours of separation, so no correction for Sb 125 decay was made.
Because of long half-lives for the exchange, equilibrium, or infinite-time, activities, A ra, were calculated from the initial radioactivity Ao and the concentrations (Sbm ) and (Sbv ); A c= = A 0(S b m )/[(Sb 'u ) + (Sbv );. E ight to fourteen samples were taken within two to three^half-lives and standard M cK ay graphs were used to determine the rate of exchange . 14
Spectrophotometric Studies.— For qualitative studies a Beckman model D K -2 instrument was used, for quantitative work the model D U, with matched, ground-glass- stoppered, 1 cm ., quartz cells was employed.
Acidity Functions.— H 0 's, Ham m ett’s acidity functions, for a number of the acid-salt mixtures, used as media for the exchange studies, were determined by the methods of H am mett and co-workers . 15 The indicator was 2,4-dinitro- aniline, which served in the range 8 < (H +) < 1 1 . M easurements were made with a Duboscq colorimeter.
Analytical Methods.—Acids were standardized, after being diluted volum etrically, against 0.5 A potassium acid phthalate. A ntim ony(III) was determined^ by titration with 0 .1 N K B r 0 3 (prim ary standard grade) in 2 -3 N HC1 and with use of naphthol blue-black as an indicator. Anti- mony(V) was reduced with N aH S0 3, the excess SO? was boiled off and then the S b (III) was determined as above. When determinations of very dilute solutions were needed, a colorimetric method for Sb l4~ was applied . 10
Chloride was determined by a modified Volhard method17
with the Sb, when present, complexed with tartrate.Sulfate was determined as B a S 0 4; Sb was removed on
fine iron wire, when this was necessary.
ResultsSeven experiments were carried out in sulfuric
acid solutions ranging in concentration from 2.07 to 12.0 M ; [Sb(III) ] was between 2.00 and 10.0 X 10⁻³, [Sb(V)] in the same range. No exchange was observed in any of these solutions, two of which (6.00 and 12.0 M Ii2S04) were followed for over 1500 hours and others were observed for
(13) J. S. Fritz, M. J. Richard and A, S. Bystroff, ibid., 29, 577 (1957).
(14) Ref. 8, pp. 315-317.(15) L. P. Hammett and A. J. Deyrup, J. Am. Chem. Soc., 54,
2721 (1932); L. P. Hammett and M. A. Paul, ibid., 56, 827 (1934).(16) E. W. McChesney, lnd. Eng. Chem., Anal. Ed., 18, 146 (1946);
A. Elkind, K. H. Gayer and D. F. Boltz, Anal. Chem., 25, 1745 (1953).(17) J. R. Caldwell and H. V. Moyer, lnd. Eng. Chem., Anal. Ed..
7, 38 (1935).
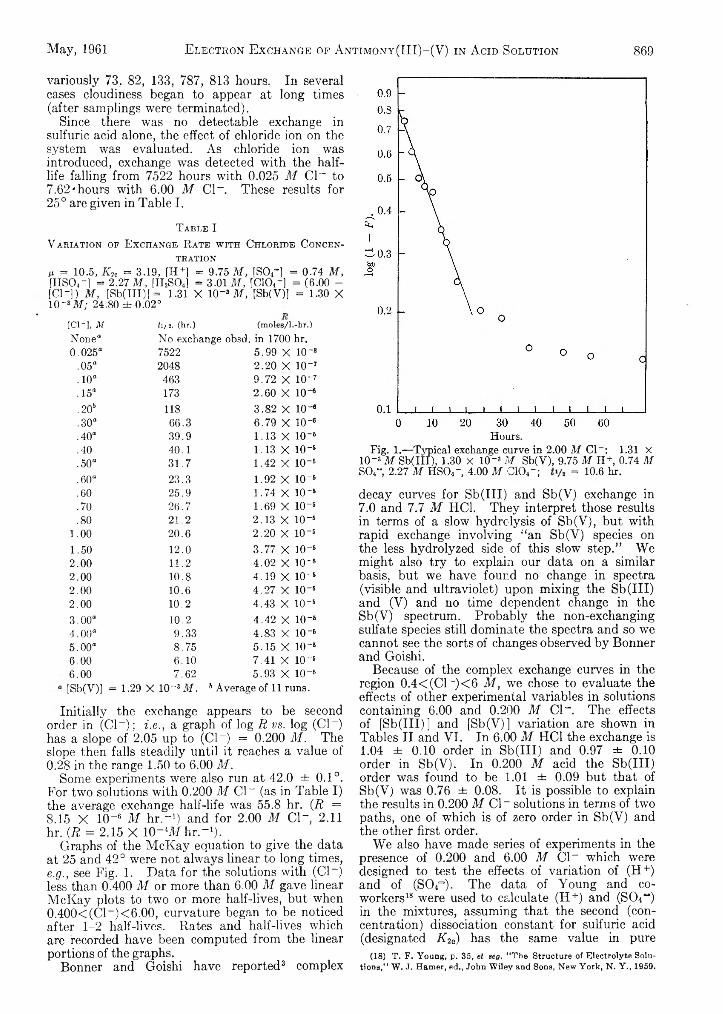
May, 1961 Electron Exchange of Antimont(III)-(V) in Acid Solution 869
variously 73. 82, 133, 787, 813 hours. In several cases cloudiness began to appear at long times (after samplings were terminated).
Since there was no detectable exchange in sulfuric acid alone, the effect of chloride ion on the system was evaluated. As chloride ion was introduced, exchange was detected with the half- life falling from 7522 hours with 0.025 M C l" to 7.62'hours with 6.00 M C l- . These results for 25° are given in Table I.
T able IV ariation of E xc h an g e R ate w it h C hloride C oncen
tration
p = 10.5, IClc = 3.19, [H+] = 9.75 M, [SOr] = 0.74 M, [HS04-] = 2.27 M, [H2SO„] = 3.01 M, [CIO,- ] = (6.00 - [Cl- ]) M, tSb(III)[ = 1.31 X 10-s M, [Sb(V)J = 1.30 X 10_s M; 24.80 ± 0 .0 2 °
[C1-], M ti/ 2, (hr.) (moles/l.-hr.)None“ No exchange obsd. in 1700 hr.0.025“ 7522 5.99 X 10⁻⁸
.05“ 2048 2.20 X 10~7
.10“ 463 9.72 X 10⁻⁷
.15“ 173 2.60 X 10"«,205 118 3.82 X 10-*.30“ 66.3 6.79 X IO”*.40“ 39.9 1.13 X 10~5.40 40.1 1.13 X 10"5.50“ 31.7 1.42 X 10-5.60“ 23.3 1.92 X 10-6.60 25.9 1.74 X 10-6.70 2 6 .7 1.69 X 10-6.80 21.2 2.13 X 10⁻⁵
1.00 20.6 2.20 X 10-61.50 12.0 3.77 X 10-62.00 11.2 4.02 X 10-62.00 10.8 4.19 X 10-52.00 10.6 4.27 X 10-52.00 10.2 4.43 X 10~53.00“ 10.2 4.42 X 10-54 .0 0 “ 9.33 4.83 X 10-65.00“ 8.75 5.15 X 10-56.00 6.10 7.41 X 10~56.00 7 .6 2 5.93 X 10⁻⁶[Sb(V)l = 1.29 X 10⁻³ iff. 6 Average of 11 runs.
Initially the exchange appears to be second order in (C l- ) ; i.e ., a graph of log R vs. log (C l- ) has a slope of 2.05 up to (C l- ) = 0.200 M . The slope then falls steadily until it reaches a value of 0.28 in the range 1.50 to 6.00 M .
Some experiments were also run at 42.0 ± 0.1°. For two solutions with 0.200 M C l- (as in Table I) the average exchange half-life was 55.8 hr. (R =8.15 X 10⁻⁶ M hr.-1) and for 2.00 M C l- , 2.11 hr. (R = 2.15 X 10- 4M h r .-1).
Graphs of the M cK ay equation to give the data at 25 and 42° were not always linear to long times, e.g., see Fig. 1. Data for the solutions with (C l- ) less than 0.400 M or more than 6.00 M gave linear M cK ay plots to two or more half-lives, but when 0.400<(C l- )<6.00, curvature began to be noticed after 1-2 half-lives. Rates and half-lives which are recorded have been computed from the linear portions of the graphs.
Bonner and Goishi have reported3 complex
Fig. 1.— Typical exchange curve in 2.00 M C l- : 1.31 X 10⁻³ M Sb(III), 1.30 X 10⁻³ M Sb(V), 9.75 M H+, 0.74 M S04- 2.27 M HSO4- , 4.00 M CIO«“ ; = 10.6 hr.
decay curves for Sb(III) and Sb(V) exchange in7.0 and 7.7 M HC1. They interpret those results in terms of a slow hydrolysis of Sb(V), but with rapid exchange involving “ an Sb(V) species on the less hydrolyzed side of this slow step.” We might also try to explain our data on a similar basis, but we have found no change in spectra (visible and ultraviolet) upon mixing the Sb(III) and (V) and no time dependent change in the Sb(V) spectrum. Probably the non-exchanging sulfate species still dominate the spectra and so we cannot see the sorts of changes observed by Bonner and Goishi.
Because of the complex exchange curves in the region 0 .4< (C l- )< 6 M , we chose to evaluate the effects of other experimental variables in solutions containing 6.00 and 0.200 M C l- . The effects of [Sb(III) ] and fSb(V)] variation are shown in Tables II and VI. In 6.00 M HC1 the exchange is1.04 ± 0.10 order in Sb(III) and 0.97 ± 0.10 order in Sb(V). In 0.200 M acid the Sb(III) order was found to be 1.01 ± 0.09 but that of Sb(V) was 0.76 ± 0.08. It is possible to explain the results in 0.200 M C l- solutions in terms of two paths, one of which is of zero order in Sb(V) and the other first order.
W e also have made series of experiments in the presence of 0.200 and 6.00 M C l- which were designed to test the effects of variation of (H +) and of (SO4“ ). The data of Young and coworkers18 were used to calculate (H +) and (S 04") in the mixtures, assuming that the second (concentration) dissociation constant for sulfuric acid (designated K 2e) has the same value in pure
(18) T. F. Young, p. 35, et seg. “The Structure of Electrolyte Solutions,’ * W. J. Hamer, ed., John Wiley and Sons, New York, N. Y., 1959.
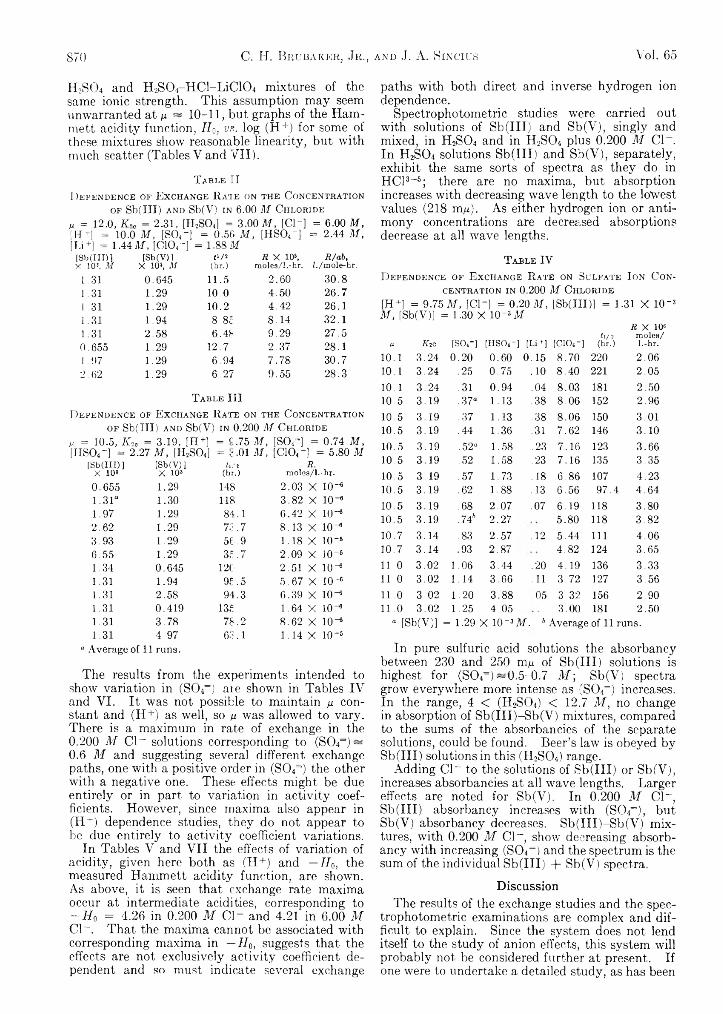
870 C. H. Brubaker, Jr., and J. A. Sincius Vol. 65
H2S 0 4 and H 2S 0 4-H C l-L iC 104 mixtures of the same ionic strength. This assumption may seem unwarranted at ¡x ~ 10-11, but graphs of the Hammett acidity function, H 0, vs. log (H+) for some of these mixtures show reasonable linearity, but with much scatter (Tables V and V II).
T able IID ependence of E xchange R ate on the C oncentration
of Sb(III) and Sb(V) in 6.00 M C hloride ju = 12.0, X ,c = 2.31, [H2S04] = 3.00 M , [Cl~] = 6.00 M , [ ID] = 10.0 M, [S04-] = 0.56 M, [HSO4-] = 2.44 M, [Li+] = 1.44 M, [CIO4-] = 1.88 M
[Sb(IID] X 10s, M
[Sb(V)l X 10s, M
n /2(hr.)
R X 10s,raoles/l.-hr.
R/ab,Z./mole-hr.
1 .31 0 .6 45 11 .5 2 .6 0 3 0 .81 .31 1 .2 9 1 0 .0 4 .5 0 2 6 .71.31 1.29 1 0 . 2 4 .4 2 2 6 .11.31 1.94 8.85 8 .1 4 3 2 .11 31 2 .5 8 6 .4 8 9 .2 9 2 7 .50 .6 55 1.29 12 .7 2 .3 7 28 .11 .97 1 .29 6 .9 4 7 .7 8 3 0 .72 .6 2 1 .2 9 6 .2 7 9 .5 5 2 8 .3
T able IIID ependence of E xchange R ate on the C oncentration
of Sb(III) and Sb(V) in 0.200 M C hloride m = 10.5, JvVc = 3.19, [H+] = c .75 m , [S04“ ] = 0 .74 M, [HSO4-] = 2.27 M, [H2S04] = c .01 M, [C104-] = 5.80 M
[Sb(iri)] [Sb(V)] h : 2 R,X 10* X 10* (hr.) moles/l.-hr.0.655 1.29 148 2.03 X 10-*1.31° 1.30 118 3.82 X 10"«1.97 1.29 84.1 6.42 X 10-*2.62 1.29 73.7 8.13 X 10-83.93 1.29 5 6 .9 1.18 X IO- 56.55 1.29 35.7 2.09 X 10“61.34 0.645 120 2.51 X 10“61.31 1.94 95.5 5.67 X 10-«1.31 2.58 94.3 6.39 X 10“«1.31 0.419 135 1.64 X 10“61.31 3.78 78.2 8.62 X 10“«1.31 4.97 63.1 1.14 X IQ“5
a Average of 11 runs.
The results from the experiments intended to show variation in (S 04“ j aie shown in Tables IV and VI. It was not possible to maintain a constant and (H +) as well, so a was allowed to vary. There is a maximum in rate of exchange in the 0.200 M C l- solutions corresponding to (S 04” ) ~ 0.6 M and suggesting several different exchange paths, one with a positive order in (S 04=) the other with a negative one. These effects might be due entirely or in part to variation in activity coefficients. However, since maxima also appear in (H+) dependence studies, they do not appear to he due entirely to activity coefficient variations.
In Tables V and V II the effects of variation of acidity, given here both as (H+) and — U 0, the measured Hammett acidity function, are shown. As above, it is seen that exchange rate maxima occur at intermediate acidities, corresponding to - H 0 = 4.26 in 0.200 M C l- and 4.21 in 6.00 M C l- . That the maxima cannot be associated with corresponding maxima in — H 0, suggests that the effects are not exclusively activity coefficient dependent and so must indicate several exchange
paths with both direct and inverse hydrogen ion dependence.
Spectrophotometric studies were carried out with solutions of Sb(III) and Sb(V), singly and mixed, in H2S 0 4 and in H2S 0 4 plus 0.200 M C l- . In H2S 0 4 solutions Sb(III) and Sb(V), separately, exhibit the same sorts of spectra as they do in HC13-8; there are no maxima, but absorption increases with decreasing wave length to the lotvest values (218 m/u). As either hydrogen ion or antimony concentrations are decreased absorptions decrease at all wave lengths.
T able IVD ependence of E xchange R ate on Sulfate I on C on
centration in 0.200 M C hloride
[H+] = 9.75 M, [Cl- ] = 0.20 M, [Sb(III)] = 1.31 X 10" 3 M, tSb(V)] = 1.30 X 10 ~3 Iff
e K2 0 [SO4-] [HSOr-I [LD] [CIO4-]¿1/ 2
(hr.)R X 106
moles/ i.-hr.
1 0 .1 3 .2 4 0 . 2 0 0 .6 0 0 .1 5 8 .7 0 220 2 .0 61 0 .1 3 .2 4 .25 0 .7 5 .1 0 8 .4 0 221 2 .0 51 0 .1 3 .2 4 .31 0 .9 4 .04 8 .0 3 181 2 .5 010 .5 3 .1 9 .37 “ 1 .13 .38 8 .0 6 152 2 .9 610 .5 3 .1 9 .37 1.13 .38 8 .0 6 150 3 .0 110 .5 3 .1 9 .44 1.36 .31 7 .6 2 146 3 .1 010 .5 3 .1 9 .52 “ 1 .58 .23 7 .1 6 123 3 .6 610.5 3 .1 9 .52 1.58 .23 7 .1 6 135 3 .3 510 .5 3 .1 9 .57 1.73 .18 6 . 8 6 107 4 .2 310 .5 3 .1 9 .62 1 .8 8 .13 6 .5 6 9 7 .4 4 .6 410 .5 3 .1 9 .6 8 2 .0 7 .07 6 .1 9 118 3 .8 010 .5 3 .1 9 . 746 2 .2 7 5 .8 0 118 3 .8 210 .7 3 .1 4 .83 2 .5 7 .1 2 5 .4 4 111 4 .0 610 .7 3 .1 4 .93 2 .8 7 4 .8 2 124 3 .6 51 1 .0 3 .0 2 1.06 3 .4 4 .2 0 4 .1 9 136 3 .3 311.0 3 .0 2 1 .1 4 3 .6 6 .11 3 .7 2 127 3 .5 611.0 3 .0 2 1.20 3 .8 8 .05 3 .3 2 156 2 .9 01 1 . 0 3 .0 2 1.25 4 .0 5 3 .0 0 181 2 .5 0
“ [Sb(V)] = 1.29 X lO “ 3 M. bAverage of 11 runs.
In pure sulfuric acid solutions the absorbancy between 230 and 250 mu of Sb (III) solutions is highest for (S 04=) ~ 0 .5-0.7 M ; Sb(V) spectra grow everywhere more intense as (S 04=) increases. In the range, 4 < (II2S 0 4) < 12.7 M , no change in absorption of S b (III)-Sb(V ) mixtures, compared to the sums of the absorbancies of the separate solutions, could be found. Beer’s law is obeyed by Sb(III) solutions in this (H2S 0 4) range.
Adding C l- to the solutions of Sb(III) or Sb(V), increases absorbancies at all wave lengths. Larger effects are noted for Sb(V). In 0.200 M Cl~, Sb(III) absorbancy increases with (S 04” ), but Sb(V) absorbancy decreases. S b(III)-S b(V ) mixtures, with 0.200 M C l- , show decreasing absorbancy with increasing (S 04=) and the spectrum is the sum of the individual Sb(III) + Sb(V) spectra.
DiscussionThe results of the exchange studies and the spec
trophotometric examinations are complex and difficult to explain. Since the system does not lend itself to the study of anion effects, this system will probably not be considered further at present. If one were to undertake a detailed study, as has been
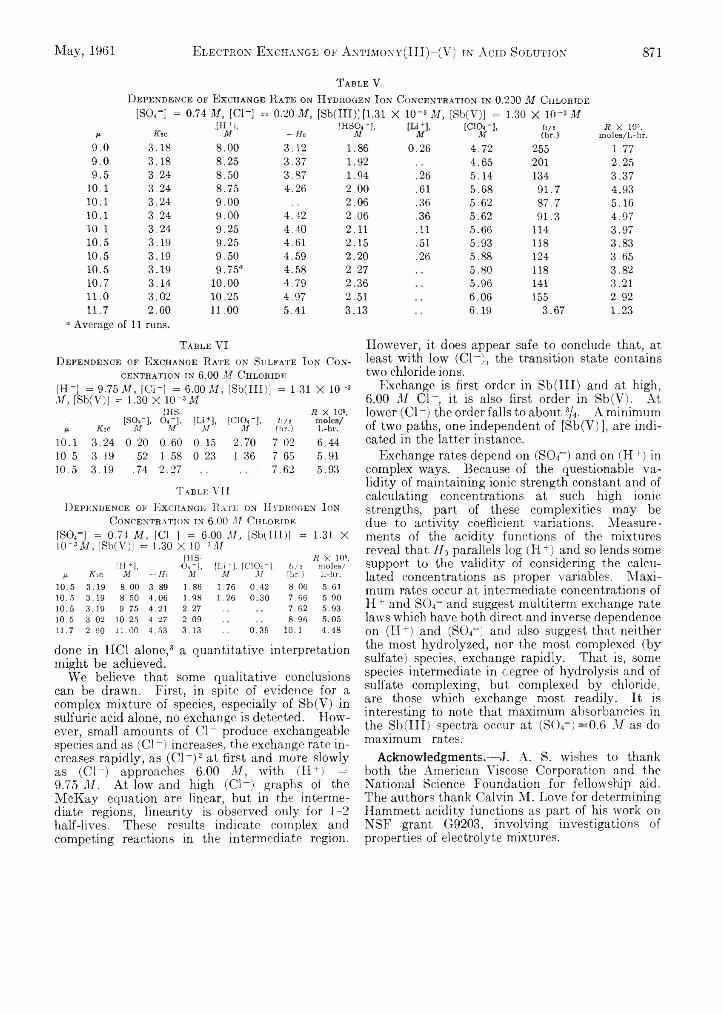
May, 1961 Electron Exchange of Antimony(III)-(V) in Acid Solution 871
T a b l e VD ependence op E xchange R ate on H ydrogen I on C oncentration in 0.2D0 M Chloride
[S04-] = 0.74 M, [C1-] = 0.20 M, [Sb(III)] [1.31 X 10~3 M, [Sb(V)] = 1.30 X 1 C M
i* K t c[H + i,
M - H o[HSO4-],
M M[CIO.-],
Mtl/2(hr.)
R X 108, moles/l.-hr.
9 . 0 3 .1 8 8 . 0 0 3 .1 2 1 . 8 6 0 .2 6 4 .7 2 255 1 .7 79 . 0 3 .1 8 8 .2 5 3 .3 7 1 .9 2 4 .6 5 201 2 .2 59 . 5 3 .2 4 8 .5 0 3 .8 7 1 .9 4 .26 5 .1 4 134 3 .3 7
1 0 .1 3 .2 4 8 .7 5 4 .2 6 2 . 0 0 .61 5 .6 8 9 1 .7 4 .9 31 0 .1 3 .2 4 9 .0 0 2 .0 6 .36 5 .6 2 8 7 .7 5 .1 61 0 .1 3 .2 4 9 .0 0 4 .4 2 2 .0 6 .36 5 .6 2 9 1 .3 4 .9 71 0 .1 3 .2 4 9 .2 5 4 .4 0 2 . 1 1 .11 5 .6 6 114 3 .9 71 0 .5 3 .1 9 9 .2 5 4 .6 1 2 .1 5 .51 5 .9 3 118 3 .8 310 .5 3 .1 9 9 .5 0 4 .5 9 2 . 2 0 .26 5 .8 8 124 3 .6 510 .5 3 .1 9 9 .7 5 “ 4 .5 8 2 .2 7 5 .8 0 118 3 .8 210 .7 3 .1 4 1 0 . 0 0 4 .7 9 2 .3 6 5 .9 6 141 3 .2 11 1 . 0 3 .0 2 10 .25 4 .9 7 2 .5 1 6 .0 6 155 2 .9 21 1 .7 2 .6 0 11.00 5 .4 1 3 .1 3 6 .1 9 3 .6 7 1 .2 3
a Average of 11 runs.
T able V I
D ependence of E xchange R ate on Sulfate I on C oncentration in 6.00 M C hloride
[H+] = 9.75 M, [C1-] = 6.00 M, [Sb(III)] = 1.31 X 10~3 M, [Sb(V)] = 1.30 X 10~3M
K 2C[Sor],
M
[HS-O4-],
M[Li+],
M[CIO. -],
ilit l/2(hr.)
R X 10S, moles/ l.-hr.
1 0 .1 3 .2 4 0 . 2 0 0 .6 0 0 .1 5 2 .7 0 7 .0 2 6 .4 41 0 .5 3 .1 9 .52 1 .5 8 0 .2 3 1.36 7 .6 5 5 .9 110 .5 3 .1 9 .74 2 .2 7 7 .6 2 5 .9 3
T able VIID ependence op E xchan g e R ate on H ydrogen I on
C oncentration in 6.00 M Chloride
[SO,"] = 0.74 M, [CD] = 6.00 M, [Sballi)] = 1.31 X 10-* Ai, [Sb(V)] = 1.30 X 10 ~3 M
K 2C[H +],
M - H o
[HS-O4 -],
M[Li+],
M[CIO4- 3,
Mtl/2
(hr.)
R X 105, m oles/ l.-hr.
10.5 3.19 8 . 0 0 3.89 1 . 8 6 1.76 0.42 8.06 5.6110.5 3.19 8.50 4.06 1.98 1.26 0 .30 7.66 5.9010.5 3.19 9.75 4.21 2.27 7.62 5.9310.5 3.02 10.25 4.27 2.09 8.96 5.0511.7 2.60 1 1 . 0 0 4.53 3.13 0.39 1 0 . 1 4 .48
done in HC1 alone,3 a quantitative interpretation might be achieved.
W e believe that some qualitative conclusions can be drawn. First, in spite of evidence for a complex mixture of species, especially of Sb(V) in sulfuric acid alone, no exchange is detected. However, small amounts of C l- produce exchangeable species and as (C l- ) increases, the exchange rate increases rapidly, as (C l - )2 at first, and more slowly as (C l- ) approaches 6.00 M , with (H+) =9.75 M . At low and high (C l- ) graphs of the M cK ay equation are linear, but in the intermediate regions, linearity is observed only for 1-2 half-lives. These results indicate complex and competing reactions in the intermediate region.
However, it does appear safe to conclude that, at least with low (C l- ), the transition state contains two chloride ions.
Exchange is first order in Sb(III) and at high,6.00 M C l- , it is also first order in Sb(V). At lower (C l- ) the order falls to about 3h. A minimum of two paths, one independent of [Sb(V)], are indicated in the latter instance.
Exchange rates depend on (S O c) and on (H+) in complex ways. Because of the questionable validity of maintaining ionic strength constant and of calculating concentrations at such high ionic strengths, part of these complexities may be due to activity coefficient variations. Measurements of the acidity functions of the mixtures reveal that H 0 parallels log (H+) and so lends some support to the validity of considering the calculated concentrations as proper variables. Maximum rates occur at intermediate concentrations of H + and S O c and suggest multiterm exchange rate laws which have both direct and inverse dependence on (H+) and (SO4” ) and also suggest that neither the most hydrolyzed, nor the most complexed (by sulfate) species, exchange rapidly. That is, some species intermediate in degree of hydrolysis and of sulfate complexing, but complexed by chloride, are those which exchange most readily. It is interesting to note that maximum absorbancies in the Sb(III) spectra occur at (SC>4=)~ 0 .6 M as do maximum rates.
Acknowledgments.— J. A. S. wishes to thank both the American Viscose Corporation and the National Science Foundation for fellowship aid. The authors thank Calvin M. Love for determining Hammett acidity functions as part of his work on NSF grant G9203, involving investigations of properties of electrolyte mixtures.

872 M edini K anta Pal and M axwell Schubert Vol. 65
ULTRACENTRIFUGAL SEPARATION OF THE METACHROMATIC COMPOUND OF AIETHYLENE BLUE AND CHONDROITIN SULFATE1
B y M e d i n i K a n t a P a l 2 a n d M a x w e l l S c h u b e r t
Department of Medicine, the Study Group on Aging, and the Study Group for Rheumatic Diseases, New York University Schoolof Medicine, New York, New York
Received December 20, 1960
It has been found that by centrifuging at values of g over 50,000, metachromatic solutions of methylene blue and chondroi- tin sulfate generally yield a blue sediment. The supernatant solution has an orthochromatic spectrum with a single peak at 665 mp. Subtraction of this orthochromatic spectrum from the solution spectrum before centrifuging gives a difference spectrum which has a single peak at 570 m,u. This seems to be the spectrum of the metachromatic compound sedimented. The material in the original metachromatic solution has thus been resolved by centrifuging into two components, one purely orthochromatic, one purely metachromatic. This resolution has been studied over a range of chondroitin sulfate and sodium chloride concentrations. Direct analysis of the sediment shows it contains one equivalent of chondroitin sulfate per mole of dye, though deposited from solutions with as many as twenty equivalents of chondroitin sulfate per mole of dye. The experiments suggest that in metachromatic solutions containing excess polyelectrolyte the dye cations are not uniformly distributed over all available anionic sites of the polyelectrolyte molecules but saturate some of the polyelectrolyte molecules leaving the rest almost free of dye cations. Crystal violet behaves similarly while methyl green, a structurally related but non-metachromatic dye, gives no such sediments and no difference spectrum.
Metachromatic staining of animal tissues is due to the presence in these tissues of polyanionic substances, generally polysaccharides. The subject has been reviewed.3'4 5 Studies in solutions of heparin, chondroitin sulfate or hyaluronate containing methylene blue have given evidence that dye cations are bound to some extent with the polyanions. Such evidence has been reported in experiments on equilibrium dialysis,6 measurements of electrical conductance,6 and in the effects of the dyes on the viscosity of solutions of appropriate polyelectrolytes.7 Perhaps more direct evidence of the binding of dye and chromotrope has been afforded by a few cases in which precipitates consisting of both dye and chromotrope separate from solution. Examples of direct precipitation from solution were observed by Michaelis and Granick8 in solutions concentrated with respect to dye and dilute with respect to chromotrope. Mukherjee and Mysels9 found an insoluble red product was formed consisting of pinacyanol and lauryl sulfate when the dye and detergent were mixed in certain ratios. Sylven10 pointed out that appearance of micellar aggregates and precipitates in vitro often made difficult the interpretation of spectrophotometric data.
The evidence cited suggests that production of a metachromatic color in solution may depend on the formation in solution of a compound of dye and chromotrope which generally does not precipitate. Since the metachromatic dyes are cationic and the chromotropes are anionic, it is simplest to assume the formation in solution of a salt that
(1) This work has been supported by United States Public Health Service Grants H-3173 (C3) for the Multidisciplinary Study of Aging, and A28(C8) from the National Institute of Arthritis and Metabolic Diseases.
(2) Fellow of the Study Group on Aging.(3) J. W. Kelly, in “Protoplasmatologia, Handbuch der Protoplas-
maforschung,” ed. L. V. Heilbrunn and F. Weber, Springer-Verlag, Vienna, 1956, Vol. 2, Section D 2.
(4 ) M. Schubert and D. Hamerman, J, Histochem. Cytochem., 4, 159(1956).
(5) A. Levine and M. Schubert, J . Am. Chem. Soc., 74, 5702 (1952).(6) M. Schubert and A. Levine, ibid., 75, 5842 (1953).(7) M, K. Pal and S. Basu, Makromol. Chem., 27, 69 (1958).(8) L. Michaelis and S. Granick, J. Am. Chem. Soc., 67, 1212 (1945).(9) P. Mukherjee and K. Mysels, ibid.., 77, 2937 (1955).(10) B. Sylven, Quart. J. Microscop. Sci., 95, 327 (1954).
is at least in part undissociated. This idea agrees with the known behavior of polyelectrolytes as weak electrolytes, even their sodium salts acting as if 50% undissociated. Precipitability from solution of such partially dissociated salts would depend on factors such as dye concentration, chromotrope to dye ratio, and ionic strength. Even under conditions where no spontaneous precipitation occurs, sedimentation may be induced at high centrifugal fields as was found by Mukherjee and Mysels9 working with micellar detergents. The present work is based on the finding that in solutions containing methylene blue and chondroitin sulfate under conditions where a metachromatic color is produced and yet no sedimentation occurs at low centrifugal fields (1000 X g), a rapid sedimentation may take place at higher centrifugal fields (50,000 X g) accompanied by removal of the metachromatic color from the solution leaving it orthochromatic.
ExperimentalA sample of pure methylene blue was recrystallized from
hot 0.1 M HC1 by chilling. After washing with cold ethanol and ether it was dried in vacuo. Measurements of absorbancy of solutions were made with a Beckman model DU spectrophotometer using cells with light paths 10 cm., 1 cm. 1 mm. or 0.1 mm. as required. Insertion of rectangular quartz blocks into the 1 cm. cell gave the shorter light paths. All absorbancy values are given for 1 cm. light, path.
The parent proteinpolysaccharide of chondroitin sulfate was prepared in the form of its potassium salt from bovine nasal cartilage by the method recently described.11 It has a period weight of 680, a charge equivalent weight of 340, and it will be referred to as PP-L. Chondroitin sulfate as its potassium salt was prepared from PP-L by degradation with 0.2 M KOH as described.11 Its period weight is 606 and its charge equivalent weight is 303. In experiments where PP-L or chondroitin sulfate is varied it is sometimes convenient to plot data against the ratio of equivalents of the polyelectrolyte to equivalents of dye. This ratio will be called the equivalence ratio (e.r.).
Centrifugation at values of g over 1000 X g was done with a Spinco model L ultracentrifuge. Values of g reported are those calculated to the center of the centrifuge cups. Methylene blue, PP-L, or chondroitin sulfate in solution in water or with sodium chloride up to 0.1 M as used in this work gave no visible sedimeDt when centrifuged at 100,000 X g for an hour.
(Il) B. R. Gerber, E. C. Franklin and M. Schubert, J. Biol. Chem., 235, 2870 (1960).
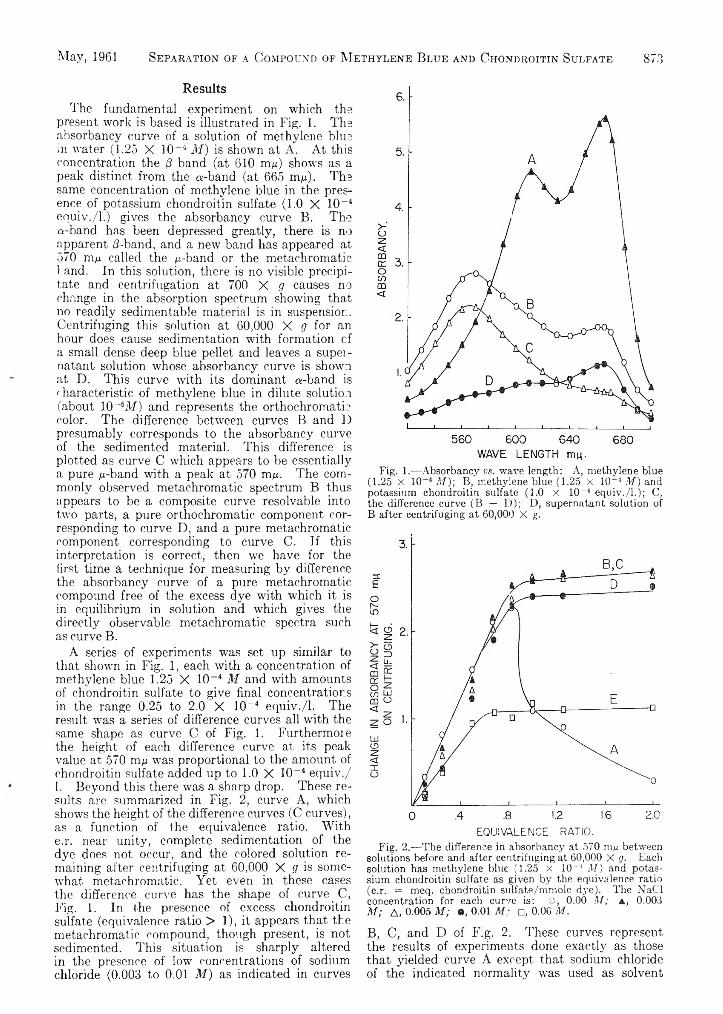
May, 1961 Separation of a Compound of M ethylene Blue and Chondroitin Sulfate 87.3
ResultsThe fundamental experiment on which the
present work is based is illustrated in Fig. 1. The absorbancy curve of a solution of methylene blue m water (1.25 X 10⁻⁴ M ) is shown at A. At this concentration the /3 band (at 610 m/i) shows as a peak distinct from the a-band (at 665 m/i). The same concentration of methylene blue in the presence of potassium chondroitin sulfate (1.0 X 10⁻⁴ equiv./l.) gives the absorbancy curve B. The a-band has been depressed greatly, there is no apparent d-band, and a new band has appeared at 570 ui/j. called the /¿-band or the metachromatic band. In this solution, there is no visible precipitate and centrifugation at 700 X g causes no change in the absorption spectrum showing that no readily sedimentable material is in suspension. Centrifuging this solution at 60,000 X Q for an hour does cause sedimentation with formation cf a small dense deep blue pellet and leaves a supei- natant solution whose absorbancy curve is shown at D. This curve with its dominant a-band is ( haracteristic of methylene blue in dilute solution (about 10 ~6M ) and represents the orthochromatic color. The difference between curves B and D presumably corresponds to the absorbancy curve of the sedimented material. This difference is plotted as curve C which appears to be essentially a pure /¿-band with a peak at 570 m/t. The commonly observed metachromatic spectrum B thus appears to be a composite curve resolvable into two parts, a pure orthochromatic component corresponding to curve D, and a pure metachromatic component corresponding to curve C. If this interpretation is correct, then we have for the first time a technique for measuring by difference the absorbancy curve of a pure metachromatic compound free of the excess dye with which it is in equilibrium in solution and which gives the directly observable metachromatic spectra such as curveB.
A series of experiments was set up similar to that shown in Fig. 1, each with a concentration of methylene blue 1.25 X 10~4 M and with amounts of chondroitin sulfate to give final concentrations in the range 0.25 to 2.0 X 10⁻⁴ equiv./l. The result was a series of difference curves all with the same shape as curve C of Fig. 1. Furthermore the height of each difference curve at its peak value at 570 m,u was proportional to the amount of chondroitin sulfate added up to 1.0 X 10⁻⁴ equiv./ 1. Beyond this there was a sharp drop. These results are summarized in Fig. 2, curve A, which shows the height of the difference curves (C curves’), as a function of the equivalence ratio. With e.r. near unity, complete sedimentation of the dye does not occur, and the colored solution remaining after centrifuging at 60,000 X g is somewhat metachromatic. Yet even in these cases the difference curve has the shape of curve C, Fig. 1. In the presence of excess chondroitin sulfate (equivalence ratio > 1), it appears that the metachromatic compound, though present, is not sedimented. This situation is sharply altered in the presence of low concentrations of sodium chloride (0.003 to 0.01 M ) as indicated in curves
Fig. 1.-—Absorbancy as. wave length: A, methylene blue (1.25 X 1 0 M ); B, methylene blue (1.25 X 10⁻⁴ M ) and potassium chondroitin sulfate (1.0 X 10~4 equiv./l.); C, the difference curve (B — D ); D, supernatant solution of B after centrifuging at 60,000 X g.
EQUIVALENCE RATIO.Fig. 2.—The difference in absorbancy at 570 m/t between
solutions before and after centrifuging at 60,000 X g. Each solution has methylene blue (1.25 X 10“ 4 M ) and potassium chondroitin sulfate as given by the equivalence ratio (e.r. = meq. chondroitin suifate/mmole dye). The NaCl concentration for each curve is: O, 0.00 M ; a , 0.003M ; A, 0.005 M ; 9, 0.01 M : □, 0.06 M.
B, C, and D of Fig. 2. These curves represent the results of experiments done exactly as those that yielded curve A except that sodium chloride of the indicated normality was used as solvent
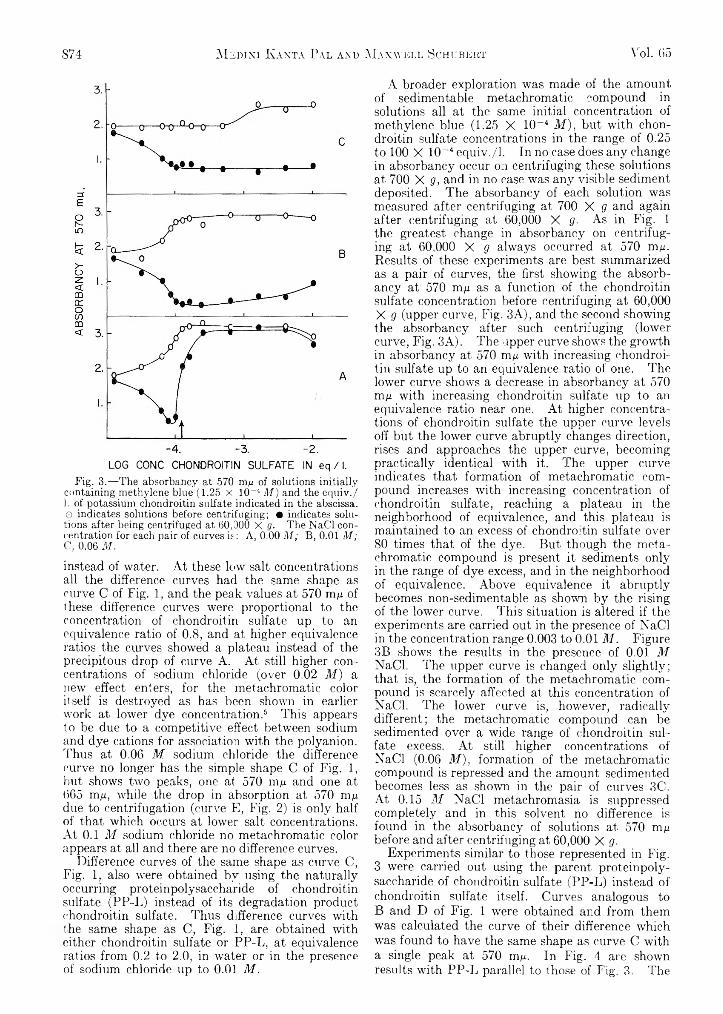
874 M edini K anta Pal and M axwell Schubekt Vol. 05
LOG CONC CHONDROITIN SULFATE IN eq / 1.Fig. 3.—The absorbancy at 570 m/x of solutions initially
containing methylene blue (1.25 X 10~4 M ) and the equiv./ 1. of potassium chondroitin sulfate indicated in the abscissa, o indicates solutions before centrifuging; • indicates solutions after being centrifuged at 60,000 X g. The NaCl concentration for each pair of curves is: A, 0.00 M ; B, 0.01 M ; C, 0.06 M.
instead of water. At these low salt concentrations all the difference curves had the same shape as curve C of Fig. 1, and the peak values at 570 m/x of these difference curves were proportional to the concentration of chondroitin sulfate up to an equivalence ratio of 0.8, and at higher equivalence ratios the curves showed a plateau instead of the precipitous drop of curve A. At still higher concentrations of sodium chloride (over 0.02 M ) a new effect enters, for the metachromatic color itself is destroyed as has been shown in earlier work at lower dye concentration.6 This appears to be due to a competitive effect between sodium and dye cations for association with the polyanion. Thus at 0.06 M sodium chloride the difference curve no longer has the simple shape C of Fig. 1, but shows two peaks, one at 570 m/x and one at 665 m/x, while the drop in absorption at 570 m/x due to centrifugation (curve E, Fig. 2) is only half of that which occurs at lower salt concentrations. At 0.1 M sodium chloride no metachromatic color appears at all and there are no difference curves.
Difference curves of the same shape as curve C, Fig. 1, also were obtained by using the naturally occurring proteinpolysaccharide of chondroitin sulfate (PP-L) instead of its degradation product chondroitin sulfate. Thus difference curves with the same shape as C, Fig. 1, are obtained with either chondroitin sulfate or PP-L, at equivalence ratios from 0.2 to 2.0, in water or in the presence of sodium chloride up to 0.01 M .
A broader exploration was made of the amount of sedimentable metachromatic compound in solutions all at the same initial concentration of methylene blue (1.25 X 10“ 4 M ), but with chondroitin sulfate concentrations in the range of 0.25 to 100 X 10-4 equiv./I. In no case does any change in absorbancy occur on centrifuging these solutions at 700 X g, and in no case was any visible sediment deposited. The absorbancy of each solution was measured after centrifuging at 700 X g and again after centrifuging at 60,000 X g ■ As in Fig. 1 the greatest change in absorbancy on centrifuging at 60,000 X g always occurred at 570 m/x. Results of these experiments are best summarized as a pair of curves, the first showing the absorbancy at 570 m/x as a function of the chondroitin sulfate concentration before centrifuging at 60,000 X g (upper curve, Fig. 3A), and the second showing the absorbancy after such centrifuging (lower curve, Fig. 3A). The upper curve shows the growth in absorbancy at 570 m/x with increasing chondroitin sulfate up to an equivalence ratio of one. The lower curve shows a decrease in absorbancy at 570 m/x with increasing chondroitin sulfate up to an equivalence ratio near one. At higher concentrations of chondroitin sulfate the upper curve levels off but the lower curve abruptly changes direction, rises and approaches the upper curve, becoming practically identical with it. The upper curve indicates that formation of metachromatic compound increases with increasing concentration of chondroitin sulfate, reaching a plateau in the neighborhood of equivalence, and this plateau is maintained to an excess of chondroitin sulfate over 80 times that of the dye. But though the meta- chromatic compound is present it sediments only in the range of dye excess, and in the neighborhood of equivalence. Above equivalence it abruptly becomes non-sedimentable as shown by the rising of the lower curve. This situation is altered if the experiments are carried out in the presence of NaCl in the concentration range 0.003 to 0.01 M . Figure 3B shows the results in the presence of 0.01 M NaCl. The upper curve is changed only slightly; that is, the formation of the metachromatic compound is scarcely affected at this concentration of NaCl. The lower curve is, however, radically different; the metachromatic compound can be sedimented over a wide range of chondroitin sulfate excess. At still higher concentrations of NaCl (0.06 M ), formation of the metachromatic compound is repressed and the amount sedimented becomes less as shown in the pair of curves 3C. At 0.15 ilf NaCl metachromasia is suppressed completely and in this solvent no difference is found in the absorbancy of solutions at 570 m/x before and after centrifuging at 60,000 X g.
Experiments similar to those represented in Fig. 3 ■were carried out using the parent proteinpolysaccharide of chondroitin sulfate (PP-L) instead of chondroitin sulfate itself. Curves analogous to B and D of Fig. 1 were obtained and from them was calculated the curve of their difference which ■was found to have the same shape as curve C with a single peak at 570 m/x. In Fig. 4 are shown results with PP-L parallel to those of Fig. 3. The
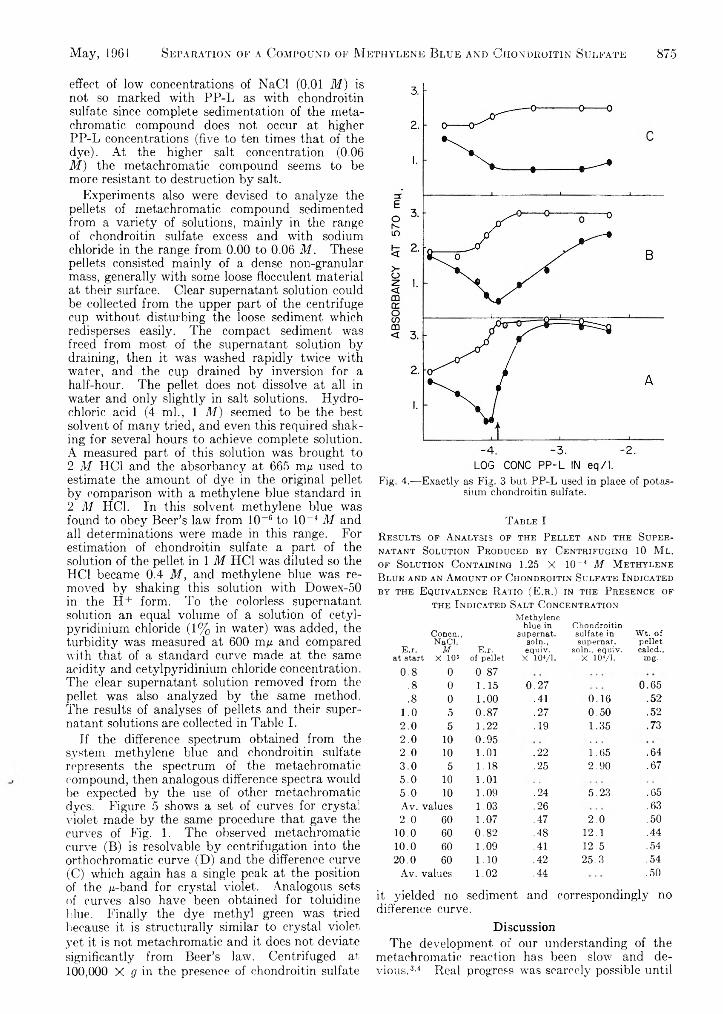
May, 1961 Separation of a Compound of M ethylene Blue and Chondroitin Sulfate 875
effect of low concentrations of NaCl (0.01 M ) is not so marked with PP-L as with chondroitin sulfate since complete sedimentation of the meta- chromatic compound does not occur at higher PP-L concentrations (five to ten times that of the dye). At the higher salt concentration (0.06 M ) the metachromatic compound seems to be more resistant to destruction by salt.
Experiments also were devised to analyze the pellets of metachromatic compound sedimented from a variety of solutions, mainly in the range of chondroitin sulfate excess and with sodium chloride in the range from 0.00 to 0.06 M . These pellets consisted mainly of a dense non-granular mass, generally with some loose flocculent material at their surface. Clear supernatant solution could be collected from the upper part of the centrifuge cup without disturbing the loose sediment which redisperses easily. The compact sediment was freed from most of the supernatant solution by draining, then it was washed rapidly twice with water, and the cup drained by inversion for a half-hour. The pellet does not dissolve at all in water and only slightly in salt solutions. Hydrochloric acid (4 ml., 1 M ) seemed to be the best solvent of many tried, and even this required shaking for several hours to achieve complete solution. A measured part of this solution was brought to 2 M HC1 and the absorbancy at 665 m/i used to estimate the amount of dye in the original pellet by comparison with a methylene blue standard in 2 M HC1. In this solvent methylene blue was found to obey Beer’s law from 10-6 to 1.0“ 4 M and all determinations were made in this range. For estimation of chondroitin sulfate a part of the solution of the pellet in 1 M HC1 was diluted so the HC1 became 0.4 M , and methylene blue was removed by shaking this solution with Dowex-50 in the H + form. To the colorless supernatant solution an equal volume of a solution of cetyl- pyridinium chloride (1% in water) was added, the turbidity was measured at 600 m/i and compared with that of a standard curve made at the same acidity and cetylpyridinium chloride concentration. The clear supernatant solution removed from the pellet was also analyzed by the same method. The results of analyses of pellets and their supernatant solutions are collected in Table I.
If the difference spectrum obtained from the system methylene blue and chondroitin sulfate represents the spectrum of the metachromatic compound, then analogous difference spectra would be expected by the use of other metachromatic dyes. Figure 5 shows a set of curves for crystal violet made by the same procedure that gave the curves of Fig. 1. The observed metachromatic curve (B) is resolvable by centrifugation into the orthochromatic curve (D) and the difference curve(C) which again has a single peak at the position of the ¿¿-band for crystal violet. Analogous sets of curves also have been obtained for toluidine blue. Finally the dye methyl green was tried because it is structurally similar to crystal violet yet it is not metachromatic and it does not deviate significantly from Beer’s law. Centrifuged at.100,000 X g in the presence of chondroitin sulfate
Fig. 4.-—Exactly as Fig. 3 but PP-L used in place of potassium chondroitin sulfate.
T able I
R esults of A nalysis of the Pellet and the Supern atant Solution Produced by Centrifuging 10 M l . of Solution C ontaining 1.25 X 10~4 M M eth ylene B lue and an A mount of Chondroitin Sulfate I ndicated by the E quivalence R atio (E .r .) in the Presence of
the I ndicated Salt C oncentrationMethylene
E.r. at start
Concn.,NaCI,
MX HU
E.r.of pellet
blue in supernat.
soin., equiv.
x ioyi.
Chondroitin sulfate in supernat.
soin., equiv.x ioyi.
Wt. of pellet calcd.,
mg.0.8 0 0.87
.8 0 1.15 0.27 0.65
.8 0 1.00 .41 0.16 .521.0 5 0.87 .27 0.50 .522.0 5 1.22 .19 1.35 .732.0 10 0.952.0 10 1.01 .22 1.65 .643.0 5 1.18 .25 2.90 .675.0 10 1.015.0 10 1.09 .24 5.23 .65Av. values 1.03 .26 .632.0 60 1.07 .47 2.0 .50
10.0 60 0.82 .48 12.1 .4410.0 60 1.09 .41 12.5 .5420.0 60 1.10 .42 25.3 .54
Av. values 1.02 .44 .50
it. yielded no sediment and correspondingly no difference curve.
DiscussionThe development of our understanding of the
metachromatic reaction has been slow and devious.3’4 Real progress vras scarcely possible until
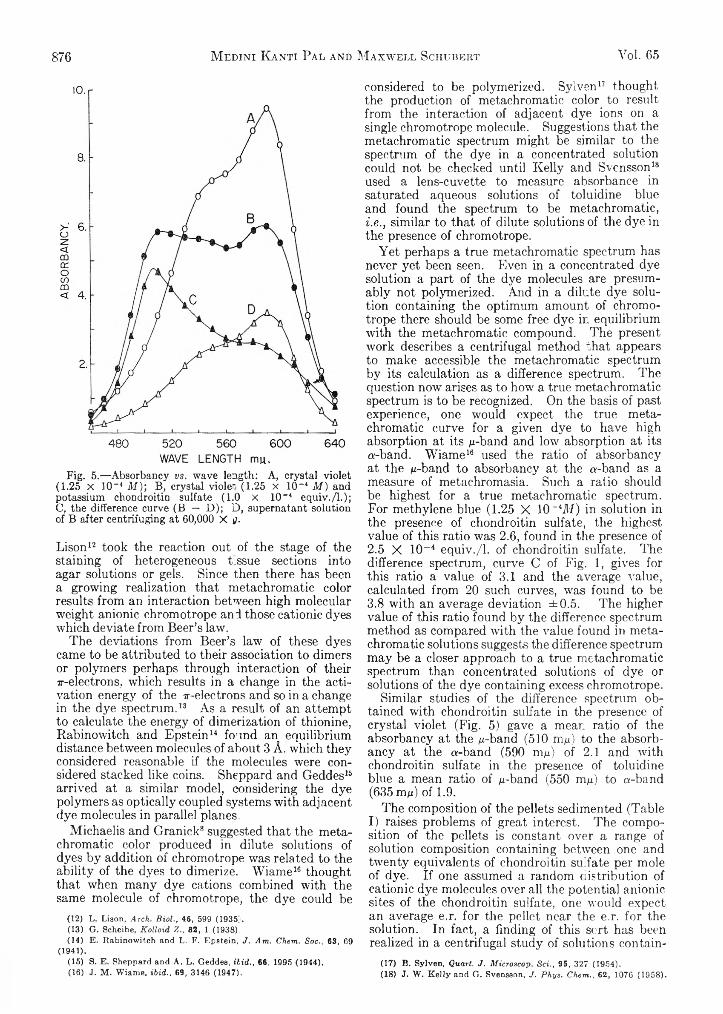
876 M edini K anti Pal and M axwell Schubert Vol. 65
Pig. 5.— Absorbancy vs. wave length: A, crystal violet (1.25 X 10"4 M ); B, crystal viole" (1.25 X 10"4 M ) and potassium chondroitin sulfate (1.0 x 10"4 equiv./l.); C, the difference curve (B — D ); D, supernatant solution of B after centrifuging at 60,000 X g.
Lison12 took the reaction out of the stage of the staining of heterogeneous tissue sections into agar solutions or gels. Since then there has been a growing realization that metachromatic color results from an interaction between high molecular weight anionic chromotrope and those cationic dyes which deviate from Beer’s law.
The deviations from Beer’s law of these dyes came to be attributed to their association to dimers or polymers perhaps through interaction of their 7r-elcctrons, which results in a change in the activation energy of the ^--electrons and so in a change in the dye spectrum.13 As a result of an attempt to calculate the energy of dimerization of thionine, Rabinowitch and Epstein14 found an equilibrium distance between molecules of about 3 A. which they considered reasonable if the molecules were considered stacked like coins. Sheppard and Geddes15 arrived at a similar model, considering the dye polymers as optically coupled systems with adjacent dye molecules in parallel planes.
Michaelis and Granick8 suggested that the metachromatic color produced in dilute solutions of dyes by addition of chromotrope was related to the ability of the dyes to dimerize. Wiame16 thought that when many dye cations combined with the same molecule of chromotrope, the dye could be
(12) L. Liaon, Arch. Biol., 46, 599 (1935;.(13) G. Scheibe, Kolloid Z., 82, 1 (1938).(14) E. Rabinowitch and L. F. Epstein, J. Am. Chem. Soc., 63, 69
(1941).(15) S. E. Sheppard and A. L. Geddes, Hid., 66, 1995 (1944),(16) J. M. Wiame, i b i d . , 69, 3146 (1947).
considered to be polymerized. Sylven17 thought the production of metachromatic color to result from the interaction of adjacent dye ions on a single chromotrope molecule. Suggestions that the metachromatic spectrum might be similar to the spectrum of the dye in a concentrated solution could not be checked until Kelly and Svensson18 used a lens-cuvette to measure absorbance in saturated aqueous solutions of toluidine blue and found the spectrum to be metachromatic, i.e ., similar to that of dilute solutions of the dye in the presence of chromotrope.
Yet perhaps a true metachromatic spectrum has never yet been seen. Even in a concentrated dye solution a part of the dye molecules are presumably not polymerized. And in a dilute dye solution containing the optimum amount of chromotrope there should be some free dye in equilibrium with the metachromatic compound. The present work describes a centrifugal method that appears to make accessible the metachromatic spectrum by its calculation as a difference spectrum. The question now arises as to how a true metachromatic spectrum is to be recognized. On the basis of past experience, one would expect the true metachromatic curve for a given dye to have high absorption at its /¿-band and low absorption at its a-band. Wiame16 used the ratio of absorbancy at the /t-band to absorbancy at the a-band as a measure of metachromasia. Such a ratio should be highest for a true metachromatic spectrum. For methylene blue (1.25 X 10~4Af) in solution in the presence of chondroitin sulfate, the highest value of this ratio was 2.6, found in the presence of2.5 X 10-4 equiv./l. of chondroitin sulfate. The difference spectrum, curve C of Fig. 1, gives for this ratio a value of 3.1 and the average value, calculated from 20 such curves, was found to be3.8 with an average deviation ±0 .5 . The higher value of this ratio found by the difference spectrum method as compared with the value found in metachromatic solutions suggests the difference spectrum may be a closer approach to a true metachromatic spectrum than concentrated solutions of dye or solutions of the dye containing excess chromotrope.
Similar studies of the difference spectrum obtained with chondroitin sulfate in the presence of crystal violet (Fig. 5) gave a mean ratio of the absorbancy at the /¿-band (510 m/j.) to the absorbancy at the a-band (590 m/l) of 2.1 and with chondroitin sulfate in the presence of toluidine blue a mean ratio of /¿-band (550 m/t) to a-band (635 m^) of 1.9.
The composition of the pellets sedimented (Table I) raises problems of great interest. The composition of the pellets is constant over a range of solution composition containing between one and twenty equivalents of chondroitin sulfate per mole of dye. If one assumed a random distribution of cationic dye molecules over all the potential anionic sites of the chondroitin sulfate, one would expect an average e.r. for the pellet near the e.r. for the solution. In fact, a finding of this sort has been realized in a centrifugal study of solutions contain-
(17) B. Sylven, Quart. J. Microscop. Sci., 95, 327 (1954).(18) J. W. Kelly and G. Svensson, J. Phys. Chem., 62, 1076 (1958).
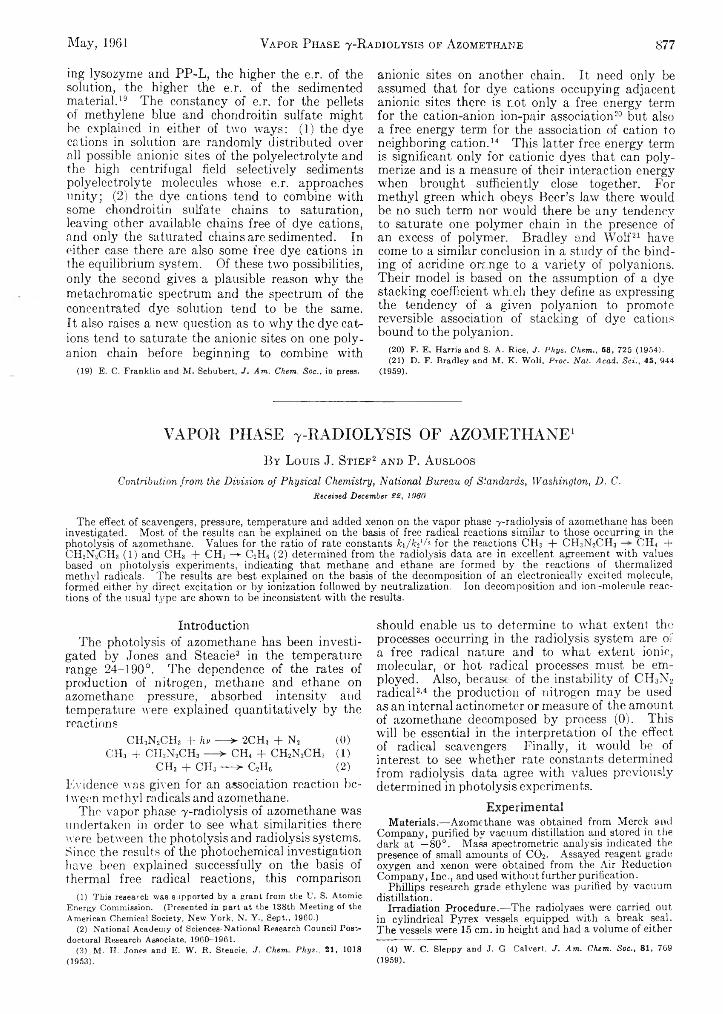
May, 1961 Vapor Phase 7-Radiolysis of Azomethane 877
ing lysozyme and PP-L, the higher the e.r. of the solution, the higher the e.r. of the sedimented material. 19 The constancy of e.r. for the pellets of methylene blue and chondroitin sulfate might he explained in either of two -ways: (1) the dye cations in solution are randomly distributed over all possible anionic sites of the polyelectrolyte and the high centrifugal field selectively sediments polyelectrolyte molecules whose e.r. approaches unity; (2 ) the dye cations tend to combine with some chondroitin sulfate chains to saturation, leaving other available chains free of dye cations, and only the saturated chains are sedimented. In either case there are also some free dye cations in the equilibrium system. Of these two possibilities, only the second gives a plausible reason why the metachromatic spectrum and the spectrum of the concentrated dye solution tend to be the same. It also raises a new question as to why the dye cations tend to saturate the anionic sites on one polyanion chain before beginning to combine with
(19) E. C. Franklin and M. Schubert, J . Am. Chem. Soc., in press.
anionic sites on another chain. It need only be assumed that for dye cations occupying adjacent anionic sites there is not only a free energy term for the cation-anion ion-pair association20 but also a free energy term for the association of cation to neighboring cation . 14 This latter free energy term is significant only for cationic dyes that can polymerize and is a measure of their interaction energy when brought sufficiently close together. For methyl green which obeys Beer’s law there would be no such term nor would there be any tendency to saturate one polymer chain in the presence of an excess of polymer. Bradley and W olf21 have come to a similar conclusion in a study of the binding of acridine orange to a variety of polyanions. Their model is based on the assumption of a dye stacking coefficient which they define as expressing the tendency of a given polyanion to promote reversible association of stacking of dye cations bound to the polyanion.
(20) F. E. Harris and S. A. Rice, J. Phys. Chem., 58, 725 (1954).(21) D. F. Bradley and M. K. Wolf, Proc. Nat. Acad. Sci., 45, 944
(1959).
VAPOR PHASE t-RADIOLYSIS OF AZOMETHANE1B y L o u is J. S t i e f 2 a n d P. A u s l o o s
Contribution from the Division of Physical Chemistry, National Bureau of Standards, Washington, D. C.Received December 22, 1960
The effect of scavengers, pressure, temperature and added xenon on the vapor phase 7-radiolysis of azomethane has been investigated. Most of the results can be explained on the basis of free radical reactions similar to those occurring in the photolysis of azomethane. Values for the ratio of rate constants fci/fe’A for the reactions CH3 + CH3N2CH3 — CH4 + CH2NjCH3 (1) and CH;i + CH3 —► C2H6 (2) determined from the radiolysis data are in excellent, agreement with values based on photolysis experiments, indicating that methane and ethane are formed by the reactions of thermalized methyl radicals. The results are best explained on the basis of the decomposition of an electronically excited molecule, formed either by direct excitation or by ionization followed by neutralization. Ion decomposition and ion-molecule reactions of the usual type are shown to be inconsistent with the results.
IntroductionThe photolysis of azomethane has been investi
gated by Jones and Steacie3 in the temperature range 24-190°. The dependence of the rates of production of nitrogen, methane and ethane on azomethane pressure, absorbed intensity and temperature were explained quantitatively by the reactions
CH3N2CH3 + hv — >■ 2CH3 + N2 (0) CH3 + CH3N2CH3 — ^ CH4 + CH2N2CH3 (1)
CH3 + CH3 — > C2H6 (2)Evidence was given for an association reaction bc- 1 ween methyl radicals and azomethane.
The vapor phase y-radiolysis of azomethane was undertaken in order to see what similarities there wore between the photolysis and radiolysis systems. Since the results of the photochemical investigation have been explained successfully on the basis of thermal free radical reactions, this comparison
(1) This research was supported by a grant from the U. S. Atomic Energy Commission. (Presented in part at the 138th Meeting of the American Chemical Society, New York, N. Y., Sept., 1960.)
(2) National Academy of Seiences-National Research Council Pos> doctoral Research Associate, 1960-1961.
(3) M. H. Jones and E. W. R. Steacie, J. Chem. Phys., 21, 1018 (1953).
should enable us to determine to what extent the processes occurring in the radiolysis system are of a free radical nature and to what extent ionic, molecular, or hot radical processes must be employed. Also, because of the instability of C II3N2 radical3-4 the production of nitrogen may be used as an internal actinometcr or measure of the amount of azomethane decomposed by process (0). This will be essential in the interpretation of the effect of radical scavengers. Finally, it would be of interest to see whether rate constants determined from radiolysis data agree with values previously determined in photolysis experiments.
ExperimentalMaterials.— Azomethane was obtained from Merck and
Company, purified by vacuum distillation and stored in the dark at —80°. Mass spectrometric analysis indicated the presence of small amounts of C 02. Assayed reagent grade oxygen and xenon were obtained from the Air Reduction Company, Inc., and used without further purification.
Phillips research grade ethylene was purified by vacuum distillation.
Irradiation Procedure.— The radiolyses were carried out in cylindrical Pyrex vessels equipped with a break seal. The vessels were 15 cm. in height and had a volume of either
(4) W. C. Sleppy and J. G Calvert, J. Am. Chem. Soc., 81, 769(1959).
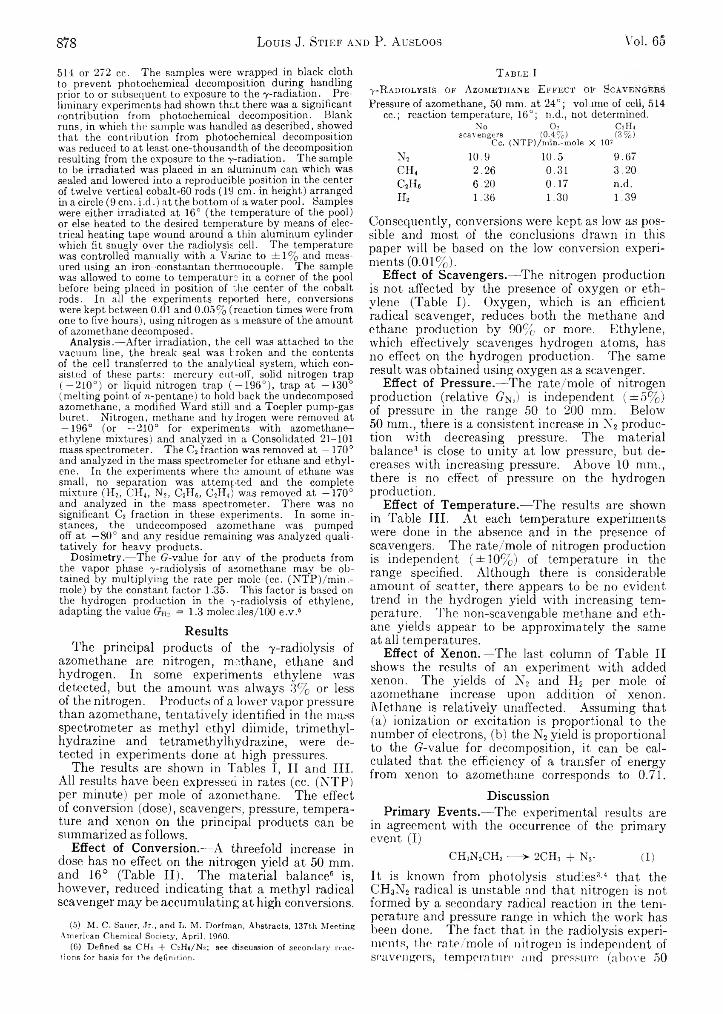
878 Louis J. Stief and P. Ausloos Vol. 65
514 or 272 cc. The samples were wrapped in black cloth to prevent photochemical decomposition during handling prior to or subsequent to exposure to the 7-radiation. Preliminary experiments had shown that there was a significant contribution from photochemical decomposition. Blank runs, in which the sample was handled as described, showed that the contribution from photochemical decomposition was reduced to at least one-thousandth of the decomposition resulting from the exposure to the 7-radiation. The sample to be irradiated was placed in an aluminum can which was sealed and lowered into a reproducible position in the center of twelve vertical cobalt-60 rods (19 cm. in height) arranged in a circle (9 cm. i.d.) at the bottom of a water pool. Samples were either irradiated at 16° (the temperature of the pool) or else heated to the desired temperature by means of electrical heating tape wound around a thin aluminum cylinder which fit snugly over the radiolysis cell. The temperature was controlled manually with a Variac to ± 1% and measured using an iron-constantan thermocouple. The sample was allowed to come to temperature in a comer of the pool before being placed in position of the center of the cobalt rods. In all the experiments reported here, conversions were kept between 0.01 and 0.05% (reaction times were from one to five hours), using nitrogen as a measure of the amount of azomethane decomposed.
Analysis.—After irradiation, the cell was attached to the vacuum line, the break seal was broken and the contents of the cell transferred to the analytical system, which consisted of these parts: mercury cut-off, solid nitrogen trap ( —210°) or liquid nitrogen trap ( — 196°), trap at —130° (melting point of 71-pentane) to hold back the undecomposed azomethane, a modified Ward still and a Toepler pump-gas buret. Nitrogen, methane and hydrogen were removed at — 196° (or —210° for experiments with azomethane- ethylene mixtures) and analyzed in a Consolidated 21-101 mass spectrometer. The C2 fraction was removed at —170° and analyzed in the mass spectrometer for ethane and ethylene. In the experiments where the amount of ethane was small, no separation was attempted and the complete mixture (H2, CH4, N2, C2H6, C2H4) was removed at —170° and analyzed in the mass spectrometer. There was no significant C3 fraction in these experiments. In some instances, the undecomposed azomethane was pumped off at —80° and any residue remaining was analyzed qualitatively for heavy products.
Dosimetry.— The G-value for any of the products from the vapor phase 7-radiolysis of azomethane may be obtained by multiplying the rate per mole (cc. (N TP)/m in.- mole) by the constant factor 1.35. This factor is based on the hydrogen production in the 7-radiolysis of ethylene, adapting the value Cm, = 1.3 molecules/100 e .v .5 6 *
ResultsThe principal products of the 7 -radiolysis of
azomethane are nitrogen, methane, ethane and hydrogen. In some experiments ethylene was detected, but the amount was always 3% or less of the nitrogen. Products of a lower vapor pressure than azomethane, tentatively identified in the mass spectrometer as methyl ethyl diimide, trimethyl- hydrazine and tetramethylhydrazine, were detected in experiments done at high pressures.
The results are shown in Tables X, II and III. All results have been expressed in rates (cc. (NTP) per minute) per mole of azomethane. The effect of conversion (dose), scavengers, pressure, temperature and xenon on the principal products can be summarized as follows.
Effect of Conversion.— A threefold increase in dose has no effect on the nitrogen yield at 50 mm. and 16° (Table II). The material balance6 is, however, reduced indicating that a methyl radical scavenger may be accumulating at high conversions.
(5) M. C. Sauer, .Tr., and L. M. Dorfman, Abstracts, 137th Meeting American Chemical Society, April, 1960.
(6) Defined as CH4 + C2H6/N 2 ; see discussion of secondary reactions for basis for the definition.
T able I7-R adiolysis or Azomethane Effect OF Scavengers Pressure of azomethane, 50 mm. at 24°; volume of cell, 514
cc.; reaction temperature, 16°; h.d., not determined.No O2 C2H4
scavengers (0.4%) (3%)Cc. (NTP)/mm.-mole X 10=
N2 10.9 10.5 9.67c h 4 2.26 0.31 3.20c 2h „ 6.20 0.17 n.d.h 2 1.36 1.30 1.39
Consequently, conversions were kept as low as possible and most of the conclusions drawn in this paper will be based on the low conversion experiments (0 .0 1 % ).
Effect of Scavengers.— The nitrogen production is not affected by the presence of oxygen or ethylene (Table I). Oxygen, which is an efficient radical scavenger, reduces both the methane and ethane production by 90% or more. Ethylene, which effectively scavenges hydrogen atoms, has no effect on the hydrogen production. The same result was obtained using oxygen as a scavenger.
Effect of Pressure.— The rate/mole of nitrogen production (relative 0% ) is independent ( ± 5 % ) of pressure in the range 50 to 200 mm. Below 50 mm., there is a consistent increase in N2 production with decreasing pressure. The material balance3 is close to unity at low pressure, but decreases with increasing pressure. Above 10 mm., there is no effect of pressure on the hydrogen production.
Effect of Temperature.— The results are shown in Table III. At each temperature experiments were done in the absence and in the presence of scavengers. The rate/mole of nitrogen production is independent ( ± 10% ) of temperature in the range specified. Although there is considerable amount of scatter, there appears to be no evident trend in the hydrogen yield with increasing temperature. The non-scavengable methane and ethane yields appear to be approximately the same at all temperatures.
Effect of Xenon.— The last column of Table II shows the results of an experiment with added xenon. The yields of N 2 and H2 per mole of azomethane increase upon addition of xenon. Methane is relatively unaffected. Assuming that(a) ionization or excitation is proportional to the number of electrons, (b) the N2 yield is proportional to the G-value for decomposition, it can be calculated that the efficiency of a transfer of energy from xenon to azomethane corresponds to 0.71.
DiscussionPrimary Events.— The experimental results are
in agreement with the occurrence of the primary event (I)
CH3N2CH3 — >- 2CH3 + N2- (I)
It is known from photolysis studies8'4 that the CH 3N 2 radical is unstable and that nitrogen is not formed by a secondary radical reaction in the temperature and pressure range in which the work has been done. The fact that in the radiolysis experiments, the rate/mole of nitrogen is independent of scavengers, temperature and pressure (above 50
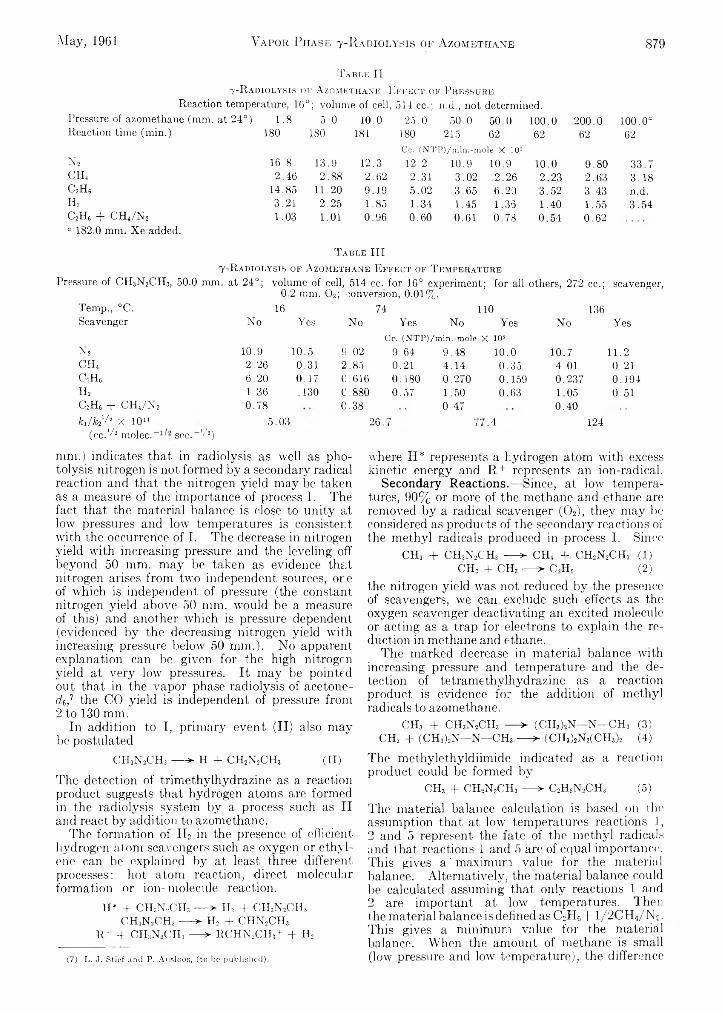
May, 1961 V a p o r P h a s e 7 - R a d i o l y s i s o f A z o m e t h a n e 879
Table II7 - R a d i o l y s i s o f A z o m e t h a n e E f f e c t o f P r e s s u r e
Reaction temperature, 10°; volume of cell, 514 cc.; n.d., not determined.Pressure of azomethane (mm. at 24°) 1.8 5.0 10.0 25.0 50.0 50.0 100.0 200.0 100.0“Reaction time (min.) 180 ISO 181 180 215 62
Cc. (NTP)/rain.-mole X 10262 62 62
n 2 16.8 13.9 12.3 1 2 . 2 10.9 10.9 10.0 9.80 33.7c h 4 2.46 2.88 2.62 2.31 3.02 2.26 2.23 2.63 3.18c2h6 14.85 11.20 9.19 5.02 3.65 6.20 3.52 3.43 n.d.IT 3.21 2.25 1.85 1.34 1.45 1.33 1.40 1.55 3.54C2H6 + ch4/ n 2“ 182.0 mm. Xe added.
1.03 1.01 0.96 0.60 0.61 0.78 0.54 0.62
T a b l e III7 - R a d i o l y s i s o f A z o m e t h a n e E f f e c t o f T e m p e r a t u r e
Pressure of CITN2CH3, 50.0 mm. at 24°; volume of cell, 514 cc. for 16° experiment; for all others, 272 cc.; scavenger,0.2 mm. 0 2; conversion, 0.01%.
Temp., °C. Scavenger No
16Yes No
74Yes No
110Yes No
136Yes
Ns 10.9 10.5 9.02Cc. (NTP)/min.-mole X 102
9.64 9.48 10.0 10.7 11.2CIT 2.26 0.31 2.85 0 . 2 1 4.14 0.35 4.01 0.21CsH6 6.20 0.17 €.616 0.180 0.270 0.159 0.237 0.194h 2 1.36 .130 €.880 0.57 1.50 0.63 1.05 0.51c2h6 + c h 4/ n 2 0.78 C .38 0.47 0.40T/feI/! x 1011 5.03 26.7 77.4 124
(ccA2 rnolec. sec. I/'1)
mm.) indicates that in radiolysis as well as photolysis nitrogen is not formed by a secondary radical reaction and that the nitrogen yield may be taken as a measure of the importance of process I. The fact that the material balance is close to unity at low pressures and low temperatures is consistent with the occurrence of I. The decrease in nitrogen yield with increasing pressure and the leveling off beyond 50 mm. may be taken as evidence that nitrogen arises from two independent sources, one of which is independent of pressure (the constant nitrogen yield above 50 mm. would be a measure of this) and another which is pressure dependent (evidenced by the decreasing nitrogen yield with increasing pressure below 50 mm.). No apparent explanation can be given for the high nitrogen yield at very low pressures. It may be pointed out that in the vapor phase radiolysis of acetone- de,1 the CO yield is independent of pressure from 2 to 130 mm.
In addition to I, primary event (II) also may be postulated
CH3N,CH3 — > H + CH2N2CH3 (II)The detection of trimethylhydrazine as a reaction product suggests that hydrogen atoms are formed in the radiolvsis system by a process such as II and react by addition to azomethane.
The formation of H2 in the presence of efficient hydrogen atom scavengers such as oxygen or ethylene can be explained by at least three different processes; hot atom reaction, direct molecular formation or ion-molecule reaction.
H* + CHsNjCHs — > IT + CH2N2CH3 CHsN,CH3 — > H2 + CHN2CH3
R+ + CH3N,CH3 — > RCHN2CH3+ + IT 7
where H* represents a hydrogen atom with excess kinetic energy and R + represents an ion-radical.
Secondary Reactions.— Since, at low temperatures, 90% or more of the methane and ethane are removed by a radical scavenger (0 2), they may be considered as products of the secondary reactions of the methyl radicals produced in process I. Since
CH3 + CH3N2CH3 — >- CH4 + CH2N2CH3 (1) CH3 + CH3 — > C2H6 (2)
the nitrogen yield was not reduced by the presence of scavengers, we can exclude such effects as the oxygen scavenger deactivating an excited molecule or acting as a trap for electrons to explain the reduction in methane and ethane.
The marked decrease in material balance with increasing pressure and temperature and the detection of tetramethylhydrazine as a reaction product is evidence for the addition of methyl radicals to azomethane.
CHs + CH3N2CH3 — > (CH3)2N—N—CH3 (3) CH3 + (CH3)2N—N—CH3 — > (CH3)2N2(CH3)2 (4)
The methylethyldiimide indicated as a reaction product could be formed by
CH3 + CH2N2CH3 — > C2H5N,CH3 (5)The material balance calculation is based on the assumption that at low temperatures reactions .1, 2 and 5 represent the fate of the methyl radicals and that reactions 1 and 5 are of equal importance. This gives a 'm axim um value for the material balance. Alternatively, the material balance could lie calculated assuming that only reactions 1 and 2 are important at low temperatures. Then the material balance is defined as C2H6+ I / 2CH 4/N«. This gives a minimum value for the material balance. When the amount of methane is small (low pressure and low temperature), the difference(7) L. J. Stief and P. Ausloos, (to be published).

880 Louis J. Stief and P. Ausloos Vol. 65
in magnitude between the two expressions is small. The occurrence of all these methyl radical reactions has been postulated in the photolysis of azomethane.3 It has to be pointed out that the occurrence of process II would lower the material balance. The fact that at low pressure the material balance is close to unity indicates that II is relatively unimportant.
Assuming a steady-state concentration of methyl radicals, it may be shown that
_____ R em _____ _ ki¿ W /2[CH3N2CH3| ~ k2'A
where R is the rate of formation of the substance indicated. The ratio fci//c21/! at various temperatures has been calculated (Table III) according to the above equation8 using the values for rate/mole
J o / CC.1/ » ____\ = /icrT X 1.11 X IO“ 16fcj‘7* Vmolec.'A sec.1 V R C2H/ rA [CH3N2CH3] V.
of methane and ethane corrected at each temperature for the methane and ethane not removed by scavengers. It is interesting to note that the non- scavengable methane and ethane yields are approximately independent of temperature. This gives support to the identification of the non- scavengable methane and ethane as products of hot radical, molecular or ion-molecule reactions. In Fig. 1, a plot of log &i//c2I/2 as a function of l/ T is shown on the same graph with the Arrhenius plots obtained by Jones and Steacie1 and by Ausloos and Steacie9 in the photolysis of azomethane. The excellent agreement obtained makes it evident that the rates of the reactions of the methyl radicals
where R' is rate/mole in units cc.(NTP)/min.-mole and [CHjNsCHsj indicates concentration of azomethane in moles/cc.
(8) In terms of rate/mole, this equation becomes(9) P. Ausloos and E. W. R. Steacie, Can. J. Chem., 33, 47 (1955).
are the same in the radiolysis and the photolysis systems. That is, methane and ethane are mostly formed by the reactions of thermal methyl radicals. The fact that in the xenon experiment the ratio CH4/N 2 is considerably lower than in the run done in the absence of xenon, is consistent with this interpretation. Addition of xenon leads to a higher steady-state concentration of the methyl radicals, which favors radical-radical reactions such as (2).
ConclusionsThe CH3N 2CH3+ ion which is presumably
formed in the radiolysis of azomethane may take part in one or more of these processes
Decomposition CH3N2CH3 + ■ > fragments (A)Reaction CH3N2CH3+ + CH3N2CH3 — »- products
(B)Neutralization CH3N2CH3 + + e — ^ CH3N2CH3* (C)Mass 15 is by far the major peak in the mass spectrometer cracking pattern of azomethane.10
m/e Rei. int. m/e Rei. int.13 3.12 29 1.8014 9.98 30 2.6815 100 42 5.5716 1.20 43 34.126 1.62 57 1.5227 12.8 58 12.928 28.5
This would indicate that if the parent ion decomposes, it may do so primarily by the over-all process
CH3N2CH3+ — > CH3 + N2 + CH3+The results presented in this paper, however, indicate that at low temperatures and pressures:(a) The material balance is close to unity, (b) Methane and ethane formed in the presence of oxygen account for 3% or 2% of the nitrogen,(c) Values of the ratio of rate constants fci/fc2'/! agree very closely with the ones deduced from photolysis data. From this it may be concluded that only thermalized neutral methyl radicals undergo reaction. This seems to exclude step A unless we assume that CH3+ undergoes neutralization and subsequent deactivation rather than taking part in an ion-molecule reaction. It is, however, unlikely that such a highly excited methyl radical would be thermalized before reacting.
It is equally difficult to explain the results presented in this paper by step B. In view of what is known about ion-molecule reaction occurring in the mass spectrometer, we may expect that the hydrogen transfer reaction11 may be the most important reaction which CH3N 2CH3+ can undergo.CH3N2CH3+ + CH3N2CH3 — ^ CH3N2CH4+ + CH,N»CH,This reaction step, however, is not consistent with the results. It will, first of all, lead to a material balance which is considerably less than unity because of the subsequent occurrence of reaction5. It will, however, be even more difficult to give an explanation for the disappearance of C II3-
(10) Cracking pattern of CH3N2CH3 (Consolidated 21-101, 70 v., 50 n amp.). Only peaks contributing more than 1% of the 15 peak are given.
(11) D. P. Stevenson and D. O. Schissler, J. Chem. Phys., 23, 1353 (1955).
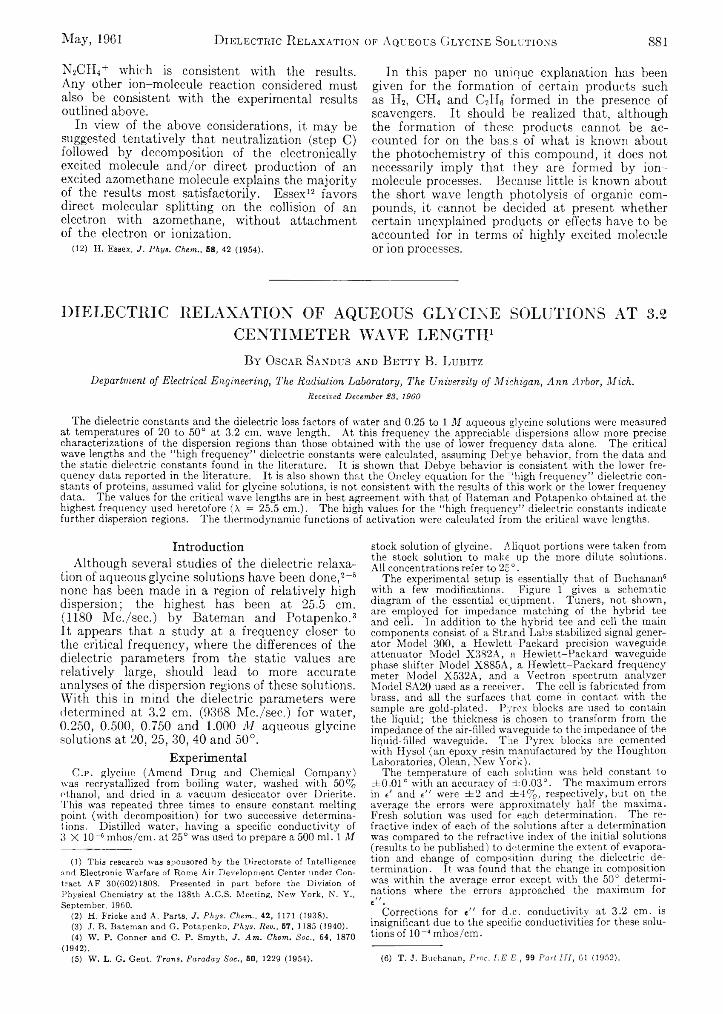
May, 1961 D ielectric R elaxation of Aqueous Glycine Solutions 881
N 2CH4+ which is consistent with the results. Any other ion-molecule reaction considered must also be consistent with the experimental results outlined above.
In view of the above considerations, it may be suggested tentatively that neutralization (step C) followed by decomposition of the electronically excited molecule and/or direct production of an excited azomethane molecule explains the majority of the results most satisfactorily. Essex12 favors direct molecular splitting on the collision of an electron with azomethane, without attachment of the electron or ionization.
(12) H. Essex, J. Phys. Chem., 58, 42 (1954).
In this paper no unique explanation has been given for the formation of certain products such as H2, CH 4 and CiHe formed in the presence of scavengers. It should be realized that, although the formation of these products cannot be accounted for on the basis of what is known about the photochemistry of this compound, it does not necessarily imply that they are formed by ion- molecule processes. Because little is known about the short wave length photolysis of organic compounds, it cannot be decided at present whether certain unexplained products or effects have to be accounted for in terms of highly excited molecule or ion processes.
DIELECTRIC RELAXATION OF AQUEOUS GLYCINE SOLUTIONS AT 3.2CENTIMETER WAVE LENGTH1 2
B y O s c a r S a n d u s a n d B e t t y B . L u b it z
Department of Electrical Engineering, The Radiation Laboratory, The University of Michigan, Ann Arbor, Mich.Received December 23, 1960
The dielectric constants and the dielectric loss factors of water and 0.25 to 1 M aqueous glycine solutions were measured at temperatures of 20 to 50° at 3.2 cm. wave length. At this frequency the appreciable dispersions allow more precise characterizations of the dispersion regions than those obtained with the use of lower frequency data alone. The critical wave lengths and the “high frequency” dielectric constants were calculated, assuming Debye behavior, from the data and the static dielectric constants found in the literature. It is shown that Debye behavior is consistent with the lower frequency data reported in the literature. It is also shown that the Oncley equation for the ‘high frequency” dielectric constants of proteins, assumed valid for glycine solutions, is not consistent with the results of this work or the lower frequency data. The values for the critical wave lengths are in best agreement with that of Bateman and Potapenko obtained at the highest frequency used heretofore (X = 25.5 cm.). The high values for the “high frequency” dielectric constants indicate further dispersion regions. The thermodynamic functions of activation were calculated from the critical wave lengths.
IntroductionAlthough several studies of the dielectric relaxa
tion of aqueous glycine solutions have been done,2-6 none has been made in a region of relatively high dispersion; the highest has been at 25.5 cm. (1180 M e./sec.) by Bateman and Potapenko. 3 4 5 It appears that a study at a frequency closer to the critical frequency, where the differences of the dielectric parameters from the static values are relatively large, should lead to more accurate analyses of the dispersion regions of these solutions. With this in mind the dielectric parameters were determined at 3.2 cm. (9368 M e./sec.) for water, 0.250, 0.500, 0.750 and 1.000 M aqueous glycine solutions at 20, 25, 30, 40 and 50°.
ExperimentalC .p . glycine (Amend Drug and Chemical Company)
was recrystallized from boiling water, washed with 50% ethanol, and dried in a vacuum desiccator over Drierite. This was repeated three times to ensure constant melting point (with decomposition) for two successive determinations. Distilled water, having a specific conductivity of 3 X 10⁻⁶ mhos/cm. at 25° was used to prepare a 500 ml. 1 M
(1) This research was sponsored by the Directorate of Intelligence and Electronic Warfare of Rome Air Development Center under Contract AF 30(602)1808. Presented in part before the Division of Physical Chemistry at the 138th A.C.S. Meeting, New York, N. Y., September, 1960.
(2) H. Fricke and A. Parts, J. Phys. Chem., 42, 1171 (1938).(3) J. B. Bateman and G. Potapenko, Phys. Rev., 57, 1185 (1940).(4) W. P. Conner and C. P. Smyth, J. Am. Chem. Soc., 64, 1870
(1942).(5) W. L. G. Gent, Trans. Faraday Soc., 50, 1229 (1954).
stock solution of glycine. Aliquot portions were taken from the stock solution to make up the more dilute solutions. All concentrations refer to 2E ° .
The experimental setup is essentially that of Buchanan6 with a few modifications. Figure 1 gives a schematic diagram of the essential equipment. Tuners, not shown, are employed for impedance matching of the hybrid tee and cell. In addition to the hybrid tee and cell the main components consist of a Strand Labs stabilized signal generator Model 300, a Hewlett-Packard precision waveguide attenuator Model X382A, a Hewlett-Packard waveguide phase shifter Model X885A, a Hewlett-Packard frequency meter Model X532A, and a Vectron spectrum analyzer Model SA20 used as a receiver. The cell is fabricated from brass, and all the surfaces that come in contact with the sample are gold-plated. Pyrex blocks are used to contain the liquid; the thickness is chosen to transform from the impedance of the air-filled waveguide to the impedance of the liquid-filled waveguide. The Pyrex blocks are cemented with Hysol (an epoxy resin manufactured by the Houghton Laboratories, Olean, New York).
The temperature of each solution was held constant to ±0.010 with an accuracy of ±0.03°. The maximum errors in t and t " were ±2 and ±4% , respectively, but on the average the errors were approximately half the maxima. Fresh solution was used for each determination. The refractive index of each of the solutions after a determination was compared to the refractive index of the initial solutions (results to be published) to determine the extent of evaporation and change of composition during the dielectric determination. It was found that the change in composition was within the average error except with the 50° determinations where the errors approached the maximum for e " .
Corrections for e" for d.c. conductivity at 3.2 cm. is insignificant due to the specific conductivities for these solutions of 10 -i mhos/cm.
(6) T. J. Buchanan, Frac. I.E.E., 99 Part IH, 01 (1952).
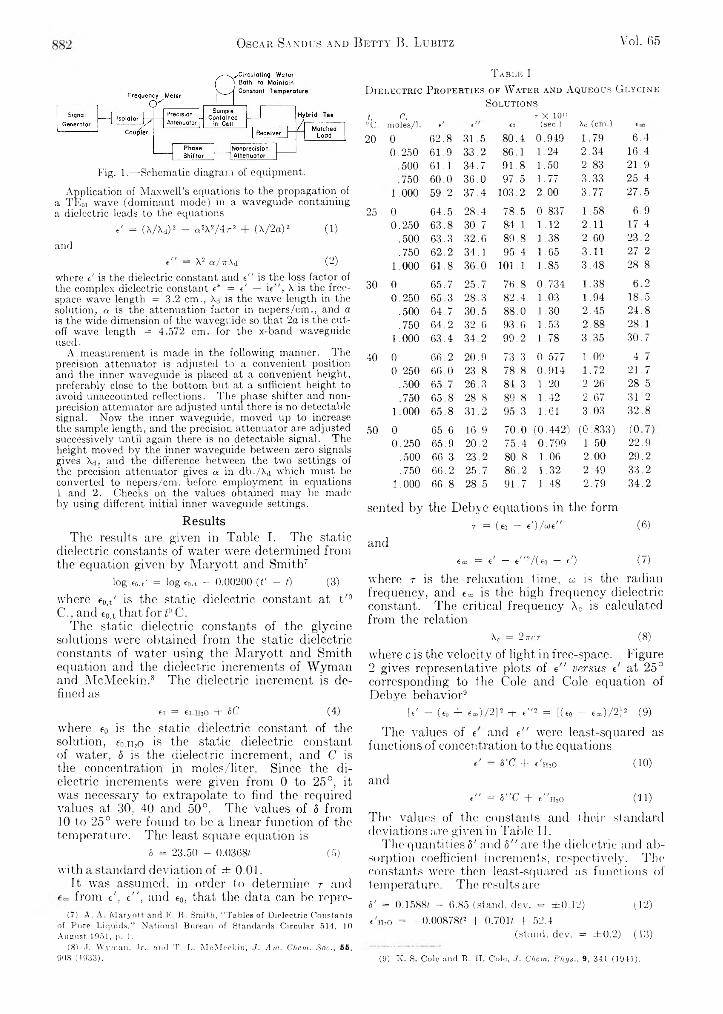
Oscar Sandus and Betty B. Ltjbitz Vol. G5
Fig. 1.—Schematic diagram of equipment.Application of Maxwell’s equations to the propagation of
a TEoi wave (dominant mode) in a waveguide containing a dielectric leads to the equations
t' = (\ /A d) 2 - a 2X2/4 u 2 + (A /2 a )2 (1)
ande" — X2 a / 7rAd (2)
where e' is the dielectric constant and e " is the loss factor of the com plex dielectric constant e* = d — i e " , X is the free- space w ave length = 3 .2 c m ., Xd is the w ave length in the solution, a is the attenuation factor in n ep ers/cm ., and a is the wide dimension of the waveguide so th a t 2a is the cutoff w ave length = 4 .5 7 2 cm . for the x-band waveguide used.
A measurement is made in the following manner. The precision attenuator is adjusted to a convenient position and the inner waveguide is placed at a convenient height, preferably close to the bottom but at a sufficient height to avoid unaccounted reflections. The phase shifter and nonprecision attenuator are adjusted until there is no detectable signal. Now the inner waveguide, moved up to increase the sample length, and the precision attenuator are adjusted successively until again there is no detectable signal. The height moved by the inner -waveguide between zero signals gives Xa, and the difference between the two settings of the precision attenuator gives a in db./Xd which must be converted to nepers/cm. before employment in equations 1 and 2. Checks on the values obtained may be made by using different initial inner waveguide settings.
ResultsThe results are given in Table I. The static
dielectric constants of water were determined from the equation given by Maryott and Smith7
log e0,t' = log «o.t — 0.00200 (/' — /) (3)where e0,t' is the static dielectric constant at t'°C., and e0,t that fori°C .
The static dielectric constants of the glycine solutions were obtained from the static dielectric constants of water using the M aryott and Smith equation and the dielectric increments of Wyman and McMeekin.8 The dielectric increment is defined as
to = to.HsO + SC (4)where e0 is the static dielectric constant of the solution, io,Hso is the static dielectric constant of water, 8 is the dielectric increment, and C is the concentration in moles/liter. Since the dielectric increments were given from 0 to 25°, it was necessary to extrapolate to find the required values at 30, 40 and 50°. The values of 8 from 10 to 25° were found to be a linear function of the temperature. The least square equation is
5 = 23 .50 - 0 .0368 / (5)
with a standard deviation of ± 0.01.It was assumed, in order to determine r and from e', e " , and e0, that the data can be repre-
(7) A. A. Maryott and E. R. Smith, “Tables of Dielectric Constants of Pure Liquids,” National Bureau of Standards Circular 514, 10 August 1951, p. 1.
(8) J. Wyman, .Tr., and T. L. McMeekin, J. Am. Chcm. Soc., 55, 90S (1933).
T a b l e I
D i e l e c t r i c P r o p e r t i e s o p W a t e r a n d A q u e o u s G l y c i n e
S o l u t i o n s
f, c. T X IO “Xc ( c m . )" C . m o le s / 1 . e/ e' €0 (s e c . ) e<
2 0 0 6 2 . 8 3 1 . 5 8 0 . 4. 0 . 9 4 9 1 . 7 9 6 . 4
0 . 2 5 0 6 1 . 9 3 3 . 2 8 6 . 1 l . 2 4 2 . 3 4 1 6 . 4
5 0 0 6 1 . 1 3 4 . 7 9 1 . 8 l . 5 0 2 . 8 3 2 1 . 9
7 5 0 6 0 . 0 3 6 . 0 9 7 . 5 l . 7 7 3 . 3 3 2 5 . 4
1 . 0 0 0 5 9 . 2 3 7 . 4 1 0 3 . 2 2 . 0 0 3 . 7 7 2 7 . 5
2 5 0 6 4 . 5 2 8 4 7 8 . 5 0 . 8 3 7 1 . 5 8 6 . 9
0 . 2 5 0 6 3 . 8 3 0 . 7 8 4 . 1 1 . 1 2 2 . 1 1 1 7 . 4
. 5 0 0 6 3 . . 3 3 2 . 6 8 9 . 8 1 . 3 8 2 . 6 0 2 3 2
. 7 5 0 6 2 2 3 4 . 1 9 5 . 4 1 . 6 5 3 . 1 1 2 7 . 2
1 . 0 0 0 6 1 . 8 3 6 0 1 0 1 . 1 1 . . 8 5 3 . 4 8 2 8 . 8
3 0 0 6 5 . 7 2 5 . 7 7 6 . 8 0 . 7 3 4 1 . 3 8 6 2
0 . 2 5 0 6 5 3 2 8 . 3 8 2 4 1 . 0 3 1 . 9 4 1 8 . 5
. 5 0 0 6 4 . 7 3 0 . 5 8 8 . 0 1 . 3 0 2 . 4 5 2 4 . 8
. 7 5 0 6 4 . . 2 3 2 . 6 9 3 . 6 1 . 5 3 2 . 8 8 2 8 . 1
1 . 0 0 0 6 3 . 4 3 4 2 9 9 . 2 1 . 7 8 3 . 3 5 3 0 . 7
4 0 0 6 6 2 2 0 . 9 7 3 .3 0 . 5 7 7 1 . 0 9 4 . 7
0 . 2 5 0 6 6 0 2 3 . 8 7 8 . 8 0 . 9 1 4 1 . 7 2 21 . 7
. 5 0 0 6 5 . 7 2 6 . 3 8 4 . 3 1 . 2 0 2 . 2 6 2 8 . 5
. 7 5 0 6 5 . 8 2 8 .8 8 9 . 8 1 . 4 2 2 . 6 7 31 .21 .000 6 5 .8 3 1 2 9 5 3 1.61 3 . 0 3 3 2 .8
5 0 0 65 .6 1 6 .9 7 0 .0 (0 . 4 4 2 ) ( 0 . 8 3 3 ) (00 . 2 5 0 6 5 .9 2 0 .2 7 5 .4 0 . 7 9 9 1 . 5 0 22 .9
. 5 0 0 66 .3 2 3 2 8 0 .8 1 . 0 6 2 . 0 0 2 9 .2
. 7 5 0 66 .2 2 5 .7 8 6 .2 1 . 3 2 2 . 4 9 33 .21 .000 66 .8 2 8 .5 9 1 .7 1 . 4 8 2 . 7 9 3 4 .2
sen ted by the Debye equations in the formr = (eo - d ) / » d ' (6)
andCco = d — e "2/(«o — d) (7)
where r is the relaxation time, eo is the radian frequency, and e«, is the high frequency dielectric constant. The critical frequency Xc is calculated from the relation
Xc = 2 TT(‘T (8)
where c is the velocity of light in free-space. Figure 2 gives representative plots of e " versus t at 25° corresponding to the Cole and Cole equation of Debye behavior9
[d - (e„ + €») /2 ]2 + d '2 = [(eo - e=»)/2]2 (9)
The values of t and e" were least-squared as functions of concentration to the equations
e' = 5 'C + e'mo (10)and
e" = S "C + e"nsO (11)
The values of the constants and their standard deviations are given in Table II.
The quantities 8' and 8 " are the dielectric and absorption coefficient increments, respectively. The constants were then least-squared as functions of temperature. The results areS' — 0.1588/ — 6.85 (stand, dev. = ±0.12) (12)e'mo = —O.OOS78/2 + 0.701/ + 52.4
(stand, dev. = ± 0 .2 ) (13)
(9) K. S. Cole and R. H. Cole, J. Chcm. Phys., 9, 341 (1941).

May, 1961 88.3D ielecTrîc R elaxation of Aqueous Glycine Solutions
T a b l e II
L e a s t S q i i a b e s C o n s t a n t s o f t h e « ' a n d e " E q u a t i o n s
t. S t a n d . S t a n d ."C. s' €±20 dev. S " €//H20 dev.
20 - 3 . 6 4 6 2 .8 ± 0 . 0 2 5 .8 4 3 1 .6 ± 0 . 125 - 2 . 8 0 6 4 .5 ± .2 7 .4 4 2 8 .6 ± .2
■ 30 - 2 . 2 8 6 5 .8 ± .1 8 .5 2 2 6 .0 ± .3■ 40 - 0 . 4 0 6 6 .1 ± .1 1 0 .2 4 2 1 .1 ± .150 1 .0 8 6 5 .6 ± .2 1 1 .4 8 1 7 .2 ± .2
5 " = -0 .0 0 3 6 8 3 « 2 + 0.4415t - 1.43(stand, dev. = ± 0 .1 0 ) (14)
log e Hso — — 0.00882f 4 - 1.677(stand, dev. of e "H 20 = ± 0 .1 ) (15)
The values for A0 were least-squared as a function 'of concentration to the equation
Xc = y hO + 5x0 C (16)‘The constants are given in Table III.
T a b l e I I I
L e a s t S q u a r e s C o n s t a n t s o f t h e X c E q u a t i o n
, ° G . X l-120 Y eS ta n d ,
d e v . , cm .
2 0 1 . 8 2 1 . 9 8 ± 0 . 0 3
2 5 1 . 6 2 1 . 9 2 ± . 0 5
: .30 1 . 4 2 1 . 9 5 ± . 0 4
■ 4 0 1 . 1 9 1 . 9 3 ± , 0 9
. 5 0 1 . 1 1 1 . 7 4 ± . 0 6
The thermodynamic functions of activation are given by equations10
A F* = RT In [\ckT/2wch\ (17)
AH* d In (XCT) d ( l /T )
(18)
AS* AH* - A F*(19)T
where AF * is the free energy of activation, A H * is the enthalpy of activation, AS* is the entropy of activation, k is the Boltzmann constant, T is the absolute temperature, h is the Planck constant, and R is the gas constant. A FI*, assumed independent of temperature, was determined from the slopes of the least-squared linear equations of log Xc T vs. 1/T. The results of the thermodynamic functions of activation are given in Table IY .
DiscussionThe values of e' and e", r and Ac (except at 50°)
for water are in good agreement with the results of Buchanan6 and Hasted and El Sabeh.11 The determination of water served not only as a base for the glycine solutions, but also as a check on the operation of the equipment. The values of r and A0 for water at 50° are not in particularly good agreement with the literature values due to the small difference of eo — e' in equation 6 at this temperature. The values of e» for water are even in poorer agreement since not only does an error occur because of the eB — e' difference, but also the error in e" is enhanced by squaring and the difference between the two terms of equation 7
( 1 0 ) S . G l a s s t o n e , K . L a i d l e r a n d H . E y r i n g , “ T h e T h e o r y o f R a t e
P r o c e s s e s , ' * M c G r a w - H i l l B o o k C o . , N e w Y o r k , N . Y . , 1 9 4 1 .
( 1 1 ) J. B . H a s t e d a n d S . H . M . E l S a b e h , Trans. Faraday Soc., 4 9,
1 0 0 3 ( 1 9 5 3 ) .
Fig. 2 .— Dielectric relaxation of aqueous glycine solutions at 2 5 °
T a b l e I V
T h e r m o d y n a m i c F u n c t i o n s o f A c t i v a t i o n o f A q u e o u s
G l y c i n e S o l u t i o n s
c ,m o l e s / 1 . t. °c.
A F*.k c a l . / m o l e
AH*.k c a l . / m o l e
A S * ,c a l . / m o l e d o ;
0(H,O) 20 2.36 3.94 5.3925 2.34 5.3730 2.31 5.3840 2.26 5.3650
0.250 20 2.52 1.92 -2 .0 525 2.51 -1 .9 830 2.51 -1 .9 540 2.54 - 1 .9 850 2.56 -1 .9 8
0.500 20 2.63 1.46 -3 .9 925 2.64 -3 .9 630 2.65 -3 .9 340 2.71 -3 .9 950 2.74 -3 .9 6
0.750 20 2.73 0.83 -6 .4 825 2.74 -6 .4 130 2.75 -6 .3 340 2.82 -6 .3 550 2.88 -6 .3 4
1.000 20 2.80 1.23 -5 .3 625 2.81 — 5.3030 2.84 -5 .3 140 2.89 -5 .3 050 2.95 -5 .3 2
is small. These circumstances are so aggravated at 50° that is quite inaccurate. For the foregoing reasons the values of r, A0, and e« for water at 50° are not used in calculations. The situation is quite different for the glycine solutions where large differences between the dielectric parameters occur. This should lead to fairly accurate results.
When a protein is dissolved in water, the general relationship between t and e " with frequency is shown in Fig. 3.12 The low-frequency dispersion region is due primarily to the protein, while the high-frequency dispersion region is due primarily to the water since the relaxation time for the protein is several orders of magnitude larger than that for water. With the assumptions that the “ high- frequency” dielectric constant of the low-frequency dispersion region, in Fig. 3, is due largely to the contribution of the solvent molecules and that the
( 1 2 ) J . L . O n c l e y , i n E . J . C o h n a n d J . T . E d s a l l , “ P r o t e i n s , A m i n o
A c i d s a n d P e p t i d e s , ” R e i n h o l d F u b l . C o r p . , N e w Y o r k , N . Y . , 1 9 4 3 ,
C h a p t e r 2 2 .

884 Oscar Sandus and Betty B. Lubitz Vol. 65
Fig. 3.-—General relationship of «' and «" with frequency for an aqueous protein solution.12
Fig. 4.— Dielectric relaxation of 1 M aqueous glycine; a.21.5°; b, 20°.
volume occupied by the protein has an equal to unity, Oncley12 obtains an equation for «„ in Fig. 3 as
VC= eo.mo — ( «01H20 — 1) jqq-q (20)
where V is the volume in cc. displaced by one mole of anhydrous protein, usually approximated by the partial molal volume of the protein. Shaw, Jansen and Lineweaver13 have shown that equation 20 holds for /3-lactoglobulin in aqueous glycine, solutions. However, the assumption that is constant with frequency until onset of the high-frequency dispersion region has been shown to be incorrect for hemoglobin by Schwan.14 Grant15 further discusses the lack of agreement between the low-frequency region and high-frequency region extrapolations to e co.
The relaxation times of aqueous glycine solutions are not much greater than that of water. This could cause some significant differences in
(13) T. M. Shaw, E. F. Janaen and H. Lineweaver, J. Chem. Phys., 12, 439 (1944).
(14) H. P. Schwan, in C. A. Tobias and J. H. Lawrence, “Advances in Biological and Medical Physics,” Academic Press, New* York, N. Y., 1957, Vol. 5.
(15) E. H. Grant, Phys. Medicine and Biology, 2, 17 (1957).
dispersion behavior compared to those of protein solutions. Nevertheless, equation 20, or the same underlying assumptions, has been used to calculate €■» in order to determine the relaxation times of aqueous glycine solutions, for example, by Oncley,12 Conner and Smyth4 and Gent.5 Equation 20 shows that e« for aqueous glycine solutions should be slightly less than the static dielectric constant of water; = 75.0 for a 1M glycine solution compared to an e0 for water of78.5 at 25°. The results of this work together with others at lower frequencies are in disagreement with the dispersion of aqueous glycine solutions characterized by equation 20. This is shown in Fig. 4a where e " is plotted against e' for a 1 M glycine solution at 21.5°. The static dielectric constant and the point from this work are calculated from the least-squared equations. The intermediate point is taken from Gent.5 Gent’s point is in good agreement with the results of Debye behavior determined from the other two points. The three points cannot be fitted to a semicircle whose center is appreciably below the e'-axis, indicating little if any distribution of relaxation times. Figure 4b shows that the results of Bateman and Potapenko3 are also in essential agreement with Debye behavior determined from the other two points. Since the data of Bateman and Potapenko are fragmentary, it is assumed that the temperature of their work is at 20° since the value of the static dielectric increment they use is the value at this temperature. In addition, it is assumed that their values of the dielectric and absorption coefficient increments at 25.5 cm. are based on the static values for water rather than the values of e' and e " of water at the frequency and temperature of measurement. The latter give results that are too high, and are not consistent with the values of Wyman and McMeekin.
The critical wave lengths of 8.6 cm. at 21° determined by Fricke and Parts,2 9.4 cm. at 25° by Conner and Smyth,4 and 15.8 cm. at 21.5° by Gent6 are much higher than those reported in this work. The value of 4.9 cm. at 20° determined by Bateman and Potapenko3 is in best agreement. Extrapolation of the data in this work indicates that a value of 4.9 cm. at 20° is reached at about1.6 M glycine.
Since the critical wave lengths are linear functions of the concentration for each temperature, an increment in \c per mole over that of water may be defined by equation 16 and designated 5xc- Values of S\c for different temperatures are listed in Table III. It is noticed that these values of 5xo are essentially constant with temperature, except at 50°. If the value at 50°, which is not as accurate as the others, is omitted, an average value of (¡a,, of 1.95 cm. is obtained. This value corresponds to an increment in r per mole, designated by St and defined by an equation similar to equation 16, of 1.04 X 10-u sec.
The high values for e„ obtained in this vTork indicate further dispersion regions at high frequencies. These may be due, essentially, to “ free” w’ater.
The positive value for the entropy of activation
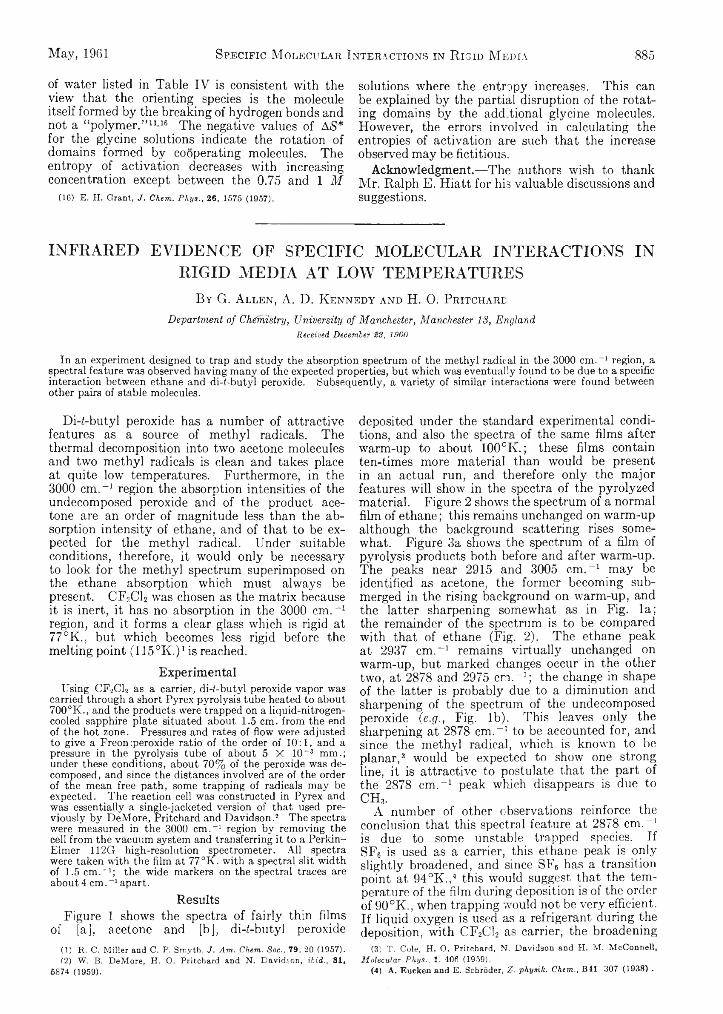
May, 1961 Specific M olecular Interactions in R igid M edia 885
of water listed in Table IV is consistent with the view that the orienting species is the molecule itself formed by the breaking of hydrogen bonds and not a “ polymer.” 11'16 The negative values of AS* for the glycine solutions indicate the rotation of domains formed by cooperating molecules. The entropy of activation decreases with increasing concentration except between the 0.75 and 1 M
(16) E. H. Grant, J. Chem. Phys., 26, 1575 (1957).
solutions where the entropy increases. This can be explained by the partial disruption of the rotating domains by the additional glycine molecules. However, the errors involved in calculating the entropies of activation are such that the increase observed may be fictitious.
Acknowledgment.— The authors wish to thank Mr. Ralph E. Hiatt for his valuable discussions and suggestions.
INFRARED EVIDENCE OF SPECIFIC MOLECULAR INTERACTIONS IN RIGID MEDIA AT LOW TEMPERATURES
By G. A l l e n , A. D. K e n n e d y a n d H. 0 . P r it c h a r d
Department of Chemistry, University of Manchester, Manchester 13, England Received December 28, 1960
In an experiment designed to trap and study the absorption spectrum of the methyl radical in the 3000 cm .-1 region, a spectral feature was observed having many of the expected properties, but which was eventually found to be due to a specific interaction between ethane and di-f-butyl peroxide. Subsequently, a variety of similar interactions were found between other pairs of stable molecules.
Di-f-butyl peroxide has a number of attractive features as a source of methyl radicals. The thermal decomposition into two acetone molecules and two methyl radicals is clean and takes place at quite low temperatures. Furthermore, in the 3000 cm .-1 region the absorption intensities of the undecomposed peroxide and of the product acetone are an order of magnitude less than the absorption intensity of ethane, and of that to be expected for the methyl radical. Under suitable conditions, therefore, it would only be necessary to look for the methyl spectrum superimposed on the ethane absorption which must always be present. CF2C12 was chosen as the matrix because it is inert, it has no absorption in the 3000 c m . '1 region, and it forms a clear glass which is rigid at 77°K., but which becomes less rigid before the melting point (115°K .) 1 is reached.
ExperimentalUsing CF2C12 as a carrier, di-f-butyl peroxide vapor was
carried through a short Pyrex pyrolysis tube heated to about 700°K., and the products were trapped on a liquid-nitrogen- cooled sapphire plate situated about 1.5 cm. from the end of the hot zone. Pressures and rates of flow were adjusted to give a Freon :peroxide ratio of the order of 10:1, and a pressure in the pyrolysis tube of about 5 X 10 “ 3 mm.; under these conditions, about 70% of the peroxide was decomposed, and since the distances involved are of the order of the mean free path, some trapping of radicals may be expected. The reaction cell was constructed in Pyrex and was essentially a single-jacketed version of that used previously by DeMore, Pritchard and Davidson.2 The spectra were measured in the 3000 cm .-1 region by removing the cell from the vacuum system and transferring it to a Perkin- Elmer 112G high-resolution spectrometer. All spectra were taken with the film at 77 °K . with a spectral slit width of 1.5 cm .-1; the wide markers on the spectral traces are about 4 cm .-1 apart.
ResultsFigure 1 shows the spectra of fairly thin films
of [aj, acetone and [b], di-f-butyl peroxide(1) R. C. Miller and C. P. Smyth, J. Am. Chem. Soc., 79, 20 (1957).(2) W. B. DeMore, H. O. Pritchard and N. Davidson, ibid., 31,
6874 (1959).
deposited under the standard experimental conditions, and also the spectra of the same films after warm-up to about 100 cIv.; these films contain ten-times more material than would be present in an actual run, and therefore only the major features will show in the spectra of the pyrolyzed material. Figure 2 shows the spectrum of a normal film of ethane; this remains unchanged on warm-up although the background scattering rises somewhat. Figure 3a shows the spectrum of a film of pyrolysis products both before and after warm-up. The peaks near 2915 and 3005 cm .-1 may be identified as acetone, the former becoming submerged in the rising background on warm-up, and the latter sharpening somewhat as in Fig. la ; the remainder of the spectrum is to be compared with that of ethane (Fig. 2). The ethane peak at 2937 cm .-1 remains virtually unchanged on warm-up, but marked changes occur in the other two, at 2878 and 2975 cm .-1 ; the change in shape of the latter is probably due to a diminution and sharpening of the spectrum of the undecomposed peroxide (e.g., Fig. lb ). This leaves only the sharpening at 2878 cm .-1 to be accounted for, and since the methyl radical, which is known to be planar,3 would be expected to show one strong line, it is attractive to postulate that the part of the 2878 cm .-1 peak which disappears is due to CH 3.
A number of other observations reinforce the conclusion that this spectral feature at 2878 cm .-1 is due to some unstable trapped species. If SF6 is used as a carrier, this ethane peak is only slightly broadened, and since SF6 has a transition point at 94°K .,4 this would suggest that the temperature of the film during deposition is of the order of 90°K ., when trapping would not be very efficient. I f liquid oxygen is used as a refrigerant during the deposition, with CF2C12 as carrier, the broadening
(3) T. Cole, H. O. Pritchard, N. Davidson and H. M. McConnell,Molecular Phys., 1, 406 (1959).
(4) A. Eucken and E. Schroder, Z. physik. Chem., B41 307 (1938) .

886 G. Allen, A D. K ennedy and H. 0. Pritchard Yol. 65
2850 2900 2950 3000 2850 2900 2950 3000 (a). (b).
Cm.-1.Fig. 1.— (a) Acetone film (below, before warm-up; above,
after warm-up), (b) Di-i-butyl peroxide film (below, before warm-up; above, after warm-up).
Fig. 2.'—Ethane film before warm-up (unchanged after warm-up).
is absent, as would be expected since the deposition temperature would now be rather over 100°K., i.e ., approximately that attained during warm-up. Furthermore, if oxygen (a well-known methyl radical scavenger) is added to the carrier gas, the broadening is absent. Finally, in Fig. 3b is shown a pair of spectra from the following experiment. The film was laid down using liquid nitrogen as the refrigerant: the liquid nitrogen was then replaced by liquid oxygen, thus raising the film to 90 °K . and enabling a substantial quantity of ethane to be pumped out of the film. The maximum of the peak in question is now moved from 2878 to 2882 cm .-1 but, on warm-up, it reverts to the normal ethane peak at 2878 cm .-1, making the assignment of the 2882 cm .-1 peak to methyl a most attractive proposition.
It was found however, that (apart from the acetone peaks) spectra identical to those shown
(a). (b).Cm.-1.
Fig. 3.-—Products of pyrolysis of di-f-butyl peroxide: (a) normal experiment (below, before warm-up; above, after warm-up); (b) after pumping away ethane (below, before warm-up; above, after warm-up).
in Fig. 3 could be obtained by depositing mixtures of peroxide and ethane in a CF2C12 matrix. The above observations then can only be interpreted to mean that there is some specific interaction between the peroxide and the ethane which disappears on warm-up; furthermore, ethane molecules subject to this interaction are less readily pumped away and apparently, therefore, more tightly bound in the peroxide-CF2Cl2 matrix. The explanation of the effect of oxygen added to the carrier gas is that it so accelerates the decomposition of the peroxide that none reaches the cold surface.
A subsequent search showed a great variety of similar interactions. For example, di-i-butyl peroxide appeared to interact similarly with ethylene and ¿rans-dichloroethylene (giving new lines or shoulders which disappeared on warming to about 100°K.) but not with propane. The same sort of behavior occurred between ethane and acetone or ¿-butyl alcohol (but not ¿-butyl chloride). It also was observed between ¿r<ros-dichloroethylene and acetone or ¿-butyl alcohol (but not ¿-butyl chloride); the interaction with acetone did not, however, disappear below the melting point of CF2C12.
Our main conclusion is that there are many of these weak interactions between stable molecules, which are observable in the infrared, and which could very easily be mistaken for the spectra of free radicals. It is therefore most unsafe to rely on infrared evidence for the existence of a trapped radical unless simultaneous corroboration is obtained by some other means, e.g^ electron-spin resonance or visible spectroscopy;
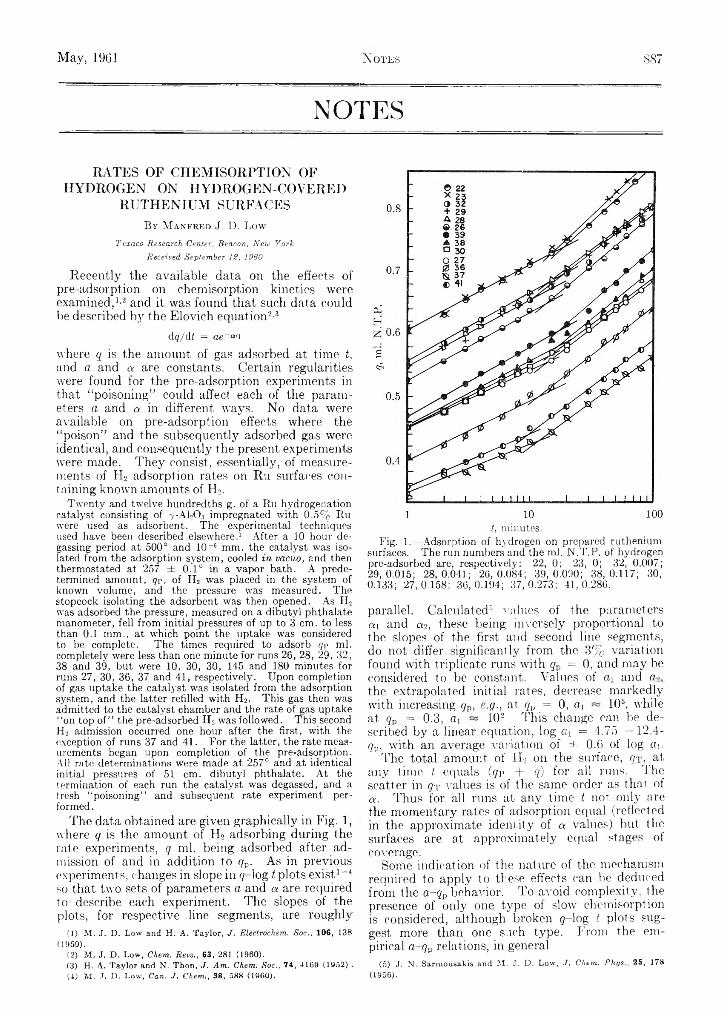
May, 1961 ÍS OTES SS7
NOTESRATES OF CH EM ISORPTION OF
H YD RO G E N ON H YD RO G EN -CO VERED R U TH E N IU M SURFACES
B y M a n f r e d J. D . L o w
Texaco Research Center, Beacon, New York Received September 12, 1960
Recently the available data on the effects of pre-adsorption on chemisorption kinetics were examined,1'2 and it was found that such data could be described b}7 the Elovich equation2'3
Aq/At = ae~aci
where q is the amount of gas adsorbed at time t, and a and a are constants. Certain regularities were found for the pre-adsorption experiments in that “ poisoning” could affect each of the parameters a and a in different ways. No data were available on pre-adsorption effects where the “ poison” and the subsequently adsorbed gas were identical, and consequently the present experiments were made. They consist, essentially, of measurements of H2 adsorption rates on Ru surfaces containing known amounts of H2.
Twenty and twelve hundredths g. of a Ru hydrogenation catalyst consisting of 7 -AI2O3 impregnated with 0.5% Ru were used as adsorbent. The experimental techniques used have been described elsewhere.1 After a 10 hour degassing period at 500° and 10~6 mm. the catalyst was isolated from the adsorption system, cooled in vacuo, and then thermostated at 257 ± 0.1° in a vapor bath. A predetermined amount, qv, of H2 was placed in the system of known volume, and the pressure was measured. The stopcock isolating the adsorbent was then opened. As H-2 was adsorbed the pressure, measured on a dibutyl phthalate manometer, fell from initial pressures of up to 3 cm. to less than 0.1 mm., at which point the uptake was considered to be complete. The times required to adsorb <?p ml. completely were less than one minute for runs 26, 28, 29, 32, 38 and 39, but were 10, 30, 30, 145 and 180 minutes for runs 27, 30, 36, 37 and 41, respectively. Upon completion of gas uptake the catalyst was isolated from the adsorption system, and the latter refilled with H2. This gas then was admitted to the catalyst chamber and the rate of gas uptake “ on top o f” the pre-adsorbed H2 was followed. This second H2 admission occurred one hour after the first, with the exception of runs 37 and 41. For the latter, the rate measurements began upon completion of the pre-adsorption. All rate determinations were made at 257° and at identical initial pressures of 51 cm. dibutyl phthalate. At the termination of each run the catalyst was degassed, and a fresh “ poisoning” and subsequent rate experiment performed .
The data obtained are given graphically in Fig. 1, where q is the amount of H2 adsorbing during therate experiments, q ml. being adsorbed after admission of and in addition to gp. As in previous experiments, changes in slope in g-log t plots exist1-4 so that two sets of parameters a and a are required to describe each experiment. The slopes of the plots, for respective line segments, are roughly
( 1 ) M . J . D . L o w a n d H. A . T a y l o r , J. Electrochem. Soc., 1 0 6 , 1 3 S
( 1 9 5 9 ) .
( 2 ) M . J . D . L o w , Chem. Revs., 6 3 , 2 8 1 ( 1 9 6 0 ) .
( 3 ) H . A . T a y l o r a n d N . T h o n , J. Am. Chem. Soc., 74, 1 1 6 9 ( 1 9 5 2 ) .
(4) M . J, D. Low, Can. J , Chem,, 38, 588 (I960).
t, minutes.Fig. 1.— Adsorption of hydrogen on prepared ruthenium
surfaces. The run numbers and the ml. N.T.P. of hydrogen pre-adsorbed are, respectively: 22, 0; 23, 0; 32, 0.007; 29,0.015; 28,0.041; 26,0.084; 39,0.090; 38,0.117; 30, 0.133; 27,0.158; 36,0.194; 37,0.273; 41,0.286.
parallel. Calculated6 values of the parameters aq and a2, these being inversely proportional to the slopes of the first and second line segments, do not differ significantly from the 3% variation found with triplicate runs with gp = 0, and may be considered to be constant. Values of cii and a>, the extrapolated initial rates, decrease markedly with increasing qp, e.g., at qv = 0, cq ~ 10°, while at gp = 0.3, ai ~ io2 This change can be described by a linear equation, log aq = 4.75 —12.4- gp, with an average variation of ± 0.6 of log a,.
The total amount of H2 on the surface, gT, at any time t equals (gp + q) for all runs. The scatter in g-r values is of the same order as that of a. Thus for all runs at any time t not only are the momentary rates of adsorption equal (reflected in the approximate identity of a values) but the surfaces are at approximately equal stages of coverage.
Some indication of the nature of the mechanism required to apply to these effects can be deduced from the a,-qp behavior. To avoid complexity, the presence of only one type of slow chemisorption is considered, although broken g-log t plots suggest more than one such type. From the empirical a-r/p relations, in general
( 5 ) J . N . S a r m o u s a k i s a n d M . J. D . L o w , J. Chem. Phys., 25, 1 7 8
( 1 9 5 6 ) .
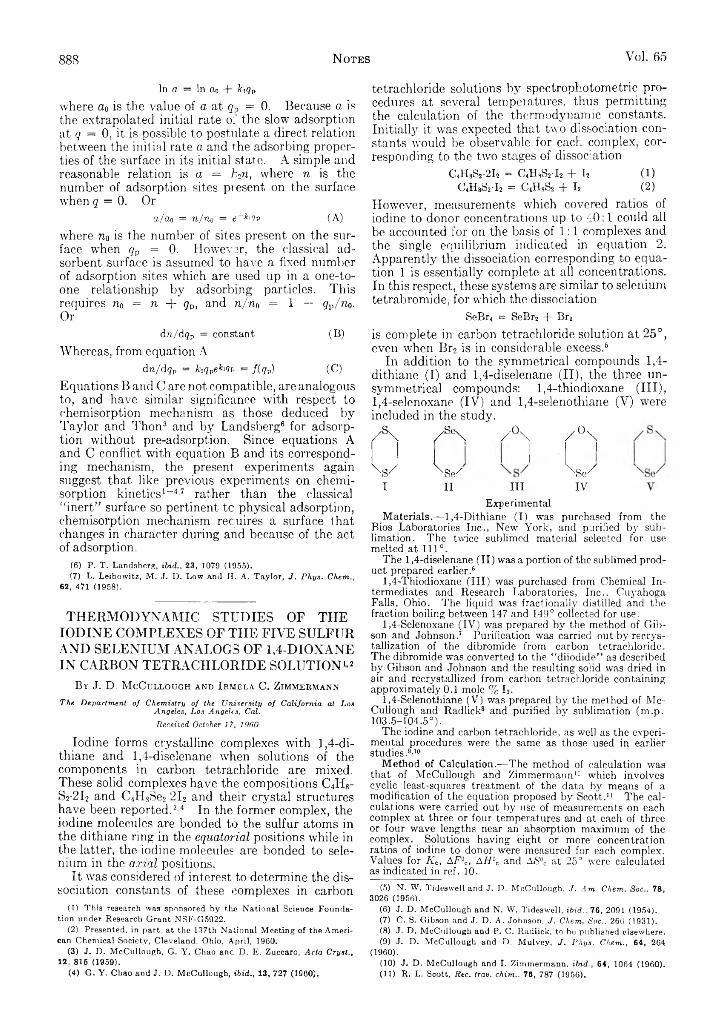
888 Notes Vol. 65
In a — In ao + k,qv
where a0 is the value of a at qp = 0. Because a is the extrapolated initial rate o: the slow adsorption at q = 0, it is possible to postulate a direct relation between the initial rate a and the adsorbing properties of the surface in its initial state. A simple and reasonable relation is a = k2n, where n is the number of adsorption sites present on the surface when q = 0. Or
a/ao = n/n0 = <3- L<jp (A)
where n0 is the number of sites present on the surface when qp = 0. However, the classical adsorbent surface is assumed to have a fixed number of adsorption sites which are used up in a one-to- one relationship by adsorbing particles. This requires n0 = n + gD, and n/ru, = 1 — qp/n0. Or
dn/dqp = constant (B)'Whereas, from equation A
dn/dqp = hqpe <ir. = f (qp) (C)Equations B and C are not compatible, are analogous to, and have similar significance with respect to chemisorption mechanism as those deduced by Taylor and Thon3 and by Landsberg5 6 for adsorption without pre-adsorption. Since equations A and C conflict with equation B and its corresponding mechanism, the present experiments again suggest that like previous experiments on chemisorption kinetics1-4’7 rather than the classical “ inert” surface so pertinent tc physical adsorption, chemisorption mechanism requires a surface that changes in character during and because of the act of adsorption.
(6) P. T. Landsberg, ibid., 23, 1079 (1955).(7) L. Leibowitz, M. J. D. Low and II. A. Taylor, J. Phys. Chem.,
62, 471 (1958).
TH E R M O D Y N A M IC STUDIES OF TH E IO D IN E COM PLEXES OF TH E FIVE SULFUR AN D SELEN IUM ANALOGS OF 1,4-DIOXANE IN CARBON TE TRA C H LO R ID E SOLUTION12
By J. D. M cC ullough and I rmela C. Z immermann
The Department of Chemistry of the University of California at Los Angeles, Los Angeles, Cal.Received October 17, 1960
Iodine forms crystalline complexes with 1,4-di- thiane and 1,4-diselenane when solutions of the components in carbon tetrachloride are mixed. These solid complexes have the compositions C4H8- S2-2I2 and C4H8Se2-2I2 and their crystal structures have been reported.3'4 In the former complex, the iodine molecules are bonded to the sulfur atoms in the dithiane ring in the equatorial positions while in the latter, the iodine molecules are bonded to selenium in the a x ia l positions.
It was considered of interest to determine the dissociation constants of these complexes in carbon
(1) This research was sponsored by the National Science Foundation under Research Grant NSF-G5922.
(2) Presented, in part, at the 137th National Meeting of the American Chemical Society, Cleveland, Ohio, April, 1960.
(3) J. D. McCullough, G. Y. Chao and D. E. Zuccaro, Acta Cryst., 12, 815 (1959).
(4) G. Y. Chao and J. D. McCullough, ibid., 13, 727 (1960).
tetrachloride solutions by spectrophotometric procedures at several temperatures, thus permitting the calculation of the thermodynamic constants. Initially'- it was expected that two dissociation constants would be observable for each complex, corresponding to the two stages of dissociation
C4HgS2-2I2 = CAbSî'L —f- T2 (1)CJLSi'L = C,HsS2 + I2 (2)
However, measurements which covered ratios of iodine to donor concentrations up to 40:1 could all be accounted for on the basis of 1:1 complexes and the single equilibrium indicated in equation 2. Apparently the dissociation corresponding to equation 1 is essentially complete at all concentrations. In this respect, these systems are similar to selenium tetrabromide, for which the dissociation
SeBr4 = SeBr2 + Br2is complete in carbon tetrachloride solution at 25°, even when Br2 is in considerable excess.6
In addition to the symmetrical compounds 1,4- dithiane (I) and 1,4-diselenane (II), the three un- symmetrical compounds: 1,4-thiodioxane (III),1,4-selenoxane (IV) and 1,4-selenothiane (V) were included in the study.
/ \ / Se\ / ° \
/“
O\_
\ 3 / ^ S e / ^ S e/ ’I II III IV
ExperimentalMaterials.— 1,4-Dithiane (I) was purchased from the
Bios Laboratories Inc., New York, and purified by sublimation. The twice sublimed material selected for use melted at 111°.
The 1,4-diselenane (II) was a portion of the sublimed product prepared earlier.6
1.4- Thiodioxane (III) was purchased from Chemical Intermediates and Research Laboratories, Inc., Cuyahoga Falls, Ohio. The liquid was fractionally distilled and the fraction boiling between 147 and 149° collected for use.
1.4- Selenoxane (IV) was prepared by the method of Gibson and Johnson.7 Purification was carried out by recrystallization of the dibromide from carbon tetrachloride. The dibromide was converted to the “ diiodide” as described by Gibson and Johnson and the resulting solid was dried in air and recrystallized from carbon tetrachloride containing approximately 0.1 mole % I2.
1.4- Selenothiane (V ) was prepared by the method of McCullough and Radlick8 and purified by sublimation (m.p. 103.5-104.5°).
The iodine and carbon tetrachloride, as well as the experimental procedures were the same as those used in earlier studies.9'10
Method of Calculation.— The method of calculation was that of McCullough and Zimmermann10 which involves cyclic least-squares treatment of the data by means of a modification of the equation proposed by Scott.11 The calculations were carried out by use of measurements on each complex at three or four temperatures and at each of three or four wave lengths near an absorption maximum of the complex. Solutions having eight or more concentration ratios of iodine to donor were measured for each complex. Values for K c, AF°c, AH°C and AS°c at 25° were calculated as indicated in ref. 10.
(5) N. W. Tideswell and J. D. McCullough, J. Am. Chem. Soc., 78, 3026 (1956).
(6) J. D. McCullough and N. W. Tideswell, ibid., 76, 2091 (1954).(7) C. S. Gibson and J. D. A. Johnson, J. Chem. Soc., 266 (1931).(8) J. D. McCullough and P. C. Radlick, to be published elsewhere.(9) J. D. McCullough and D. Mulvey, J. Phys. Chem., 64, 264
(1960).(10) J. D. McCullough and I. Zimmermann, if r i d 64, 1064 (1960).(11) R. L. Scott, Rec. trav. chim., 75, 787 (1956).
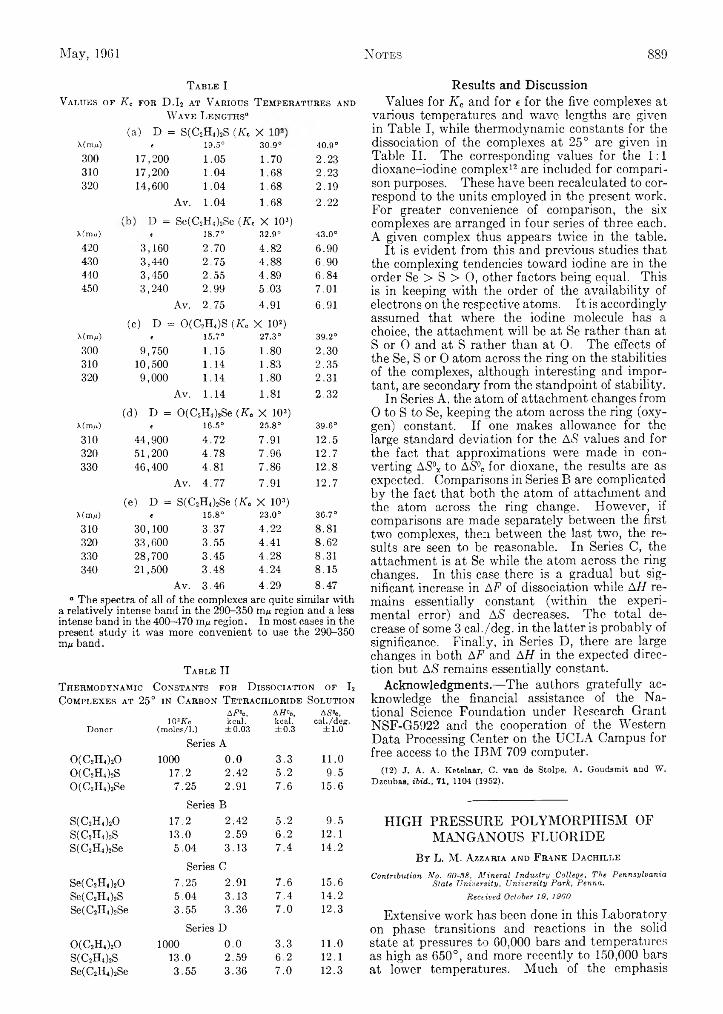
May, 1961 N otes 889
T able IV alues of K c for D .I 2 at V arious T em peratures and
W ave Lengths“
( a ) D == S(C2H4)2S ( N o
oX
\(m/*) 6 19.5° 30.9° 40.9°300 17,200 1.05 1.70 2.23310 17,200 1.04 1.68 2.23320 14,600 1.04 1.68 2.19
Av. 1.04 1.68 2.22
c? Ö II Se(C2H4)2Se (Kc X 103)X (m/j) e 18.7° 32.9° 43.0°420 3,160 2.70 4.82 6.90430 3,440 2.75 4.88 6.90440 3,450 2.55 4.89 6.84450 3,240 2.99 5.03 7.01
Av. 2.75 4.91 6.91
(c) D == 0 (C 2H4)S ( K c X 102)M m ri € 15.7° 27.3° 39.2°300 9,750 1.15 1.80 2.30310 10,500 1.14 1.83 2.35320 9,000 1.14 1.80 2.31
Av. 1.14 1.81 2.32
(d) D = 0 (C 2H4)2Se (K c X 103)Mm/*) e 16.5° 25.8° 39.6°310 44,900 4.72 7.91 12.5320 51,200 4.78 7.96 12.7330 46,400 4.81 7.86 12.8
Av. 4.77 7.91 12.7
(e) D = S(C2H4)2Se (Kc X 103)Mm/*) « 15.8° 23.0° 36.7°310 30,100 3.37 4.22 8.81320 33,600 3.55 4.41 8.62330 28,700 3.45 4.28 8.31340 21,500 3.48 4.24 8.15
Av. 3.46 4.29 8.47“ The spectra of all of the complexes are quite similar with
a relatively intense band in the 290-350 m/* region and a less intense band in the 400-470 mji region. In most cases in the present study it was more convenient to use the 290-350 mn band.
T able IIT herm odynam ic C onstants for D issociation of I2 C om plexes at 25° in C arbon T etrachloride Solution
Donor10 *Kc
(moles/1.)
AF°c, kcal. ±0.03
AH°o,kcal.±0.3
AS0*), cal./deg.
±1.0Series A
0 (C 2H4)20 1000 0.0 3.3 11.00 (C 2H4)2S 17.2 2.42 5.2 9.50 (C 2H4)2Se 7.25 2.91 7.6 15.6
Series BS(C2H4)20 17.2 2.42 5.2 9.5S(C2H4)2S 13.0 2.59 6.2 12.1S(C2H4)2Se 5.04 3.13 7.4 14.2
Series CSe(C2H4)20 7.25 2.91 7.6 15.6Se(C2H4)2S 5.04 3.13 7.4 14.2Se(C2H4)2Se 3.55 3.36 7.0 12.3
Series D0 (C 2H4)20 1000 0.0 3.3 11.0S(C2H4)2S 13.0 2.59 6.2 12.1Se(C2IL)2Se 3.55 3.36 7.0 12.3
Results and DiscussionValues for K c and for e for the five complexes at
various temperatures and wave lengths are given in Table I, while thermodynamic constants for the dissociation of the complexes at 25° are given in Table II. The corresponding values for the 1:1 dioxane-iodine complex12 are included for comparison purposes. These have been recalculated to correspond to the units employed in the present work. For greater convenience of comparison, the six complexes are arranged in four series of three each. A given complex thus appears twice in the table.
It is evident from this and previous studies that the complexing tendencies toward iodine are in the order Se > S > O, other factors being equal. This is in keeping with the order of the availability of electrons on the respective atoms. It is accordingly assumed that where the iodine molecule has a choice, the attachment will be at Se rather than at S or O and at S rather than at O. The effects of the Se, S or O atom across the ring on the stabilities of the complexes, although interesting and important, are secondary from the standpoint of stability.
In Series A, the atom of attachment changes from 0 to S to Se, keeping the atom across the ring (oxygen) constant. If one makes allowance for the large standard deviation for the AS values and for the fact that approximations were made in converting A S \ to AS°C for dioxane, the results are as expected. Comparisons in Series B are complicated by the fact that both the atom of attachment and the atom across the ring change. However, if comparisons are made separately between the first two complexes, then between the last two, the results are seen to be reasonable. In Series C, the attachment is at Se while the atom across the ring changes. In this case there is a gradual but significant increase in AF of dissociation while A H remains essentially constant (within the experimental error) and AS decreases. The total decrease of some 3 cal./deg. in the latter is probably of significance. Finally, in Series D, there are large changes in both AF and A H in the expected direction but AS remains essentially constant.
Acknowledgments.— The authors gratefully acknowledge the financial assistance of the National Science Foundation under Research Grant NSF-G5922 and the cooperation of the Western Data Processing Center on the UCLA Campus for free access to the IB M 709 computer.
(12) J. A. A. Ketelaar, C. van de Stolpe, A. Goudsmit and W. Dzcubas, ibid., 71, 1104 (1952).
H IG H PRESSURE PO LYM O RPH ISM OF M ANGANOUS FLUO RIDE
By L. M. A zzaria and F r ank D achille
Contribution No. 60-88, Mineral Industry College, The Pennsylvania State University, University Park, Penna.
Received October 19, 1960
Extensive work has been done in this Laboratory on phase transitions and reactions in the solid state at pressures to 60,000 bars and temperatures as high as 650°, and more recently to 150,000 bars at lower temperatures. Much of the emphasis
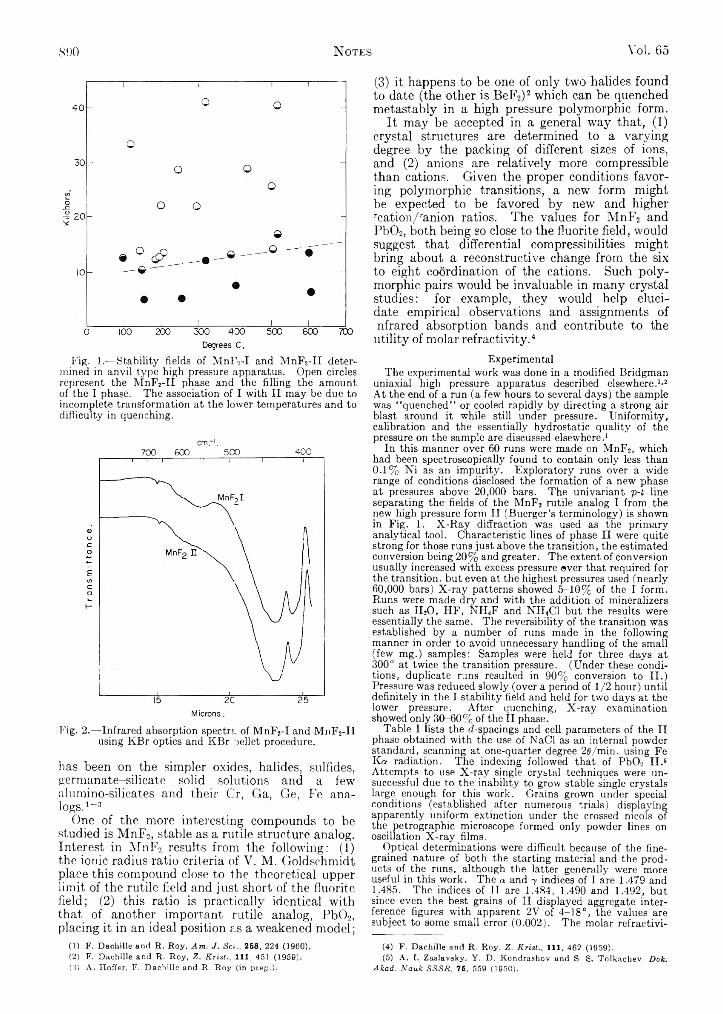
890 N otes Vol. 65
Fig. 1.— Stability fields of MnF2-I and MnF2-II determined in anvil type high pressure apparatus. Open circles represent the MnF2-II phase and the filling the amount of the I phase. The association of I with II may be due to incomplete transformation at the lower temperatures and to difficulty in quenching.
cmr1.700 600 500 400
Fig. 2.— Infrared absorption spectra of MnF2-I and MnF2-II using KBr optics and KBr pellet procedure.
has been on the simpler oxides, halides, sulfides, germanate-silicate solid solutions and a few alumino-silicates and their Cr, Ga, Ge, Fe analogs.1-3
One of the more interesting compounds to be studied is M nF2, stable as a rutile structure analog. Interest in M nF2 results from the following: (1) the ionic radius ratio criteria of V. M. Goldschmidt place this compound close to the theoretical upper limit of the rutile field and just short of the fluorite field; (2) this ratio is practically identical with that of another important rutile analog, P b 0 2, placing it in an ideal position as a weakened m odel;
(1) F. Dachille and R. Roy, Am. J. Sci., 258, 224 (1960),(2) F. Dachille and R. Roy, Z. Krist., I l l , 451 (1959);(3) A, Hoffer, F. Dachille and R. Roy (in prep.);
(3) it happens to be one of only two halides found to date (the other is BeF2) 2 which can be quenched metastably in a high pressure polymorphic form.
It may be accepted in a general way that, (1) crystal structures are determined to a varying degree by the packing of different sizes of ions, and (2) anions are relatively more compressible than cations. Given the proper conditions favoring polymorphic transitions, a new form might be expected to be favored by new and higher rcation /ranion ratios. The values for M nF2 and P b 0 2, both being so close to the fluorite field, would suggest that differential compressibilities might bring about a reconstructive change from the six to eight coordination of the cations. Such polymorphic pairs would be invaluable in many crystal studies: for example, they would help elucidate empirical observations and assignments of nfrared absorption bands and contribute to the
utility of molar refractivity.4Experimental
The experimental work was done in a modified Bridgman uniaxial high pressure apparatus described elsewhere.1’2 At the end of a run (a few hours to several days) the sample was “ quenched” or cooled rapidly by directing a strong air blast around it while still under pressure. Uniformity, calibration and the essentially hydrostatic quality of the pressure on the sample are discussed elsewhere.1
In this manner over 60 runs were made on MnF2, which had been spectroscopically found to contain only less than 0.1% Ni as an impurity. Exploratory runs over a wide range of conditions disclosed the formation of a new phase at pressures above 20,000 bars. The univariant p-t line separating the fields of the MnF2 rutile analog I from the new high pressure form II (Buerger’s terminology) is shown in Fig. 1. X -R ay diffraction was used as the primary analytical tool. Characteristic lines of phase II were quite strong for those runs just above the transition, the estimated conversion being 20% and greater. The extent of conversion usually increased with excess pressure aver that required for the transition, but even at the highest pressures used (nearly 60,000 bars) X-ray patterns showed 5-10% of the I form. Runs were made dry and with the addition of mineralizers such as H20 , HF, NH4F and N IR O but the results were essentially the same. The reversibility of the transition was established by a number of runs made in the following manner in order to avoid unnecessary handling of the small (few mg.) samples: Samples were held for three days at 300° at twice the transition pressure. (Under these conditions, duplicate runs resulted in 90% conversion to II.) Pressure was reduced slowly (over a period of 1/2 hour) until definitely in the I stability field and held for two days at the lower pressure. After quenching, X-ray examination showed only 30-60% of the II phase.
Table I fists the d-spaeings and cell parameters of the II phase obtained with the use of NaCl as an internal powder standard, scanning at one-quarter degree 20/min. using Fe Ka radiation. The indexing followed that of P b02 II .5 Attempts to use X-ray single crystal techniques were unsuccessful due to the inability to grow stable single crystals large enough for this work. Grains grown under special conditions (established after numerous trials) displaying apparently uniform extinction under the crossed nicofs of the petrographic microscope formed only powder lines on oscillation X-ray films.
Optical determinations were difficult because of the finegrained nature of both the starting material and the products of the runs, although the latter generally were more useful in this work. The a and y indices of I are 1.479 and 1.485. The indices of II are 1.484, 1.490 and 1.492, but since even the best grains of II displayed aggregate interference figures with apparent 2V of 4-18°, the values are subject to some small error (0.002). The molar refractivi-
(4) F. Dachille and R. Roy, Z. Krist., I l l , 462 (1959).(5) A. I. Zaslavsky, Y. D. Kondrashov and S. S. Tolkachev, Dok.
Akad. Nauk SSSR, 75, 559 (1950).
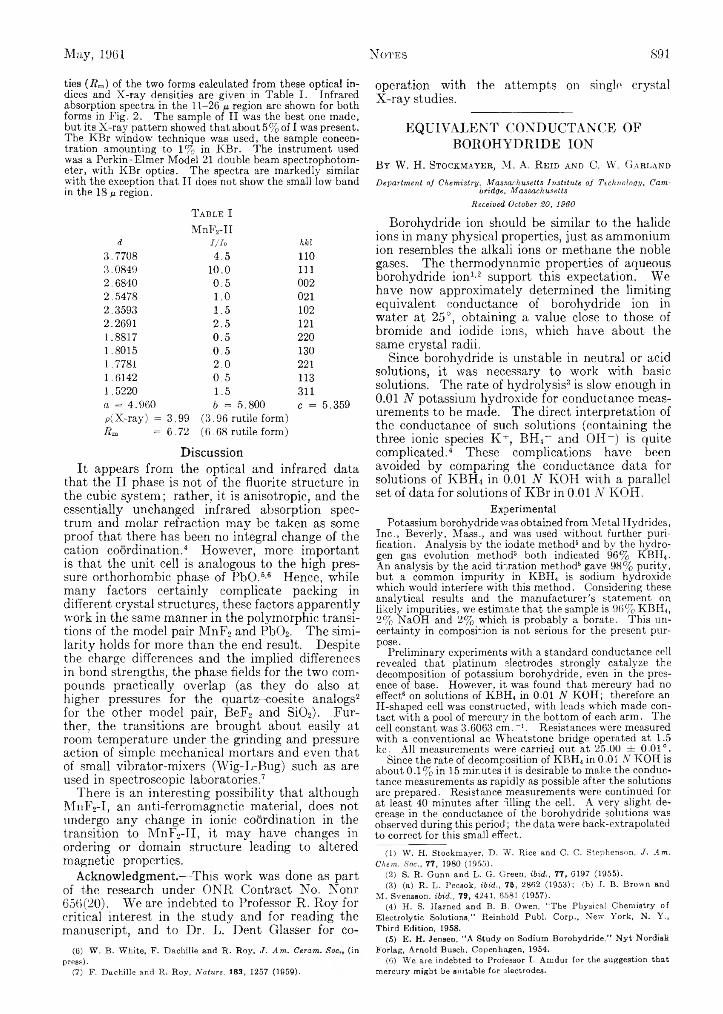
May, 1961 N otes S91
ties (Rm) of the two forms calculated from these optical indices and X-ray densities are given in Table I. Infrared absorption spectra in the 11-26 region are shown for both forms in Fig. 2. The sample of II was the best one made, but its X-ray pattern showed that about 5% of I was present. The KBr window technique was used, the sample concentration amounting to 1% in KBr. The instrument used was a Perkin-Elmer Model 21 double beam spectrophotometer, with KBr optics. The spectra are markedly similar with the exception that II does not show the small low band in the 18 n region.
T able I MnF2-II
d I/Ia hkl3.7708 4.5 1103.0849 10.0 1112.6840 0.5 0022.5478 1.0 0212.3593 1.5 1022.2691 2.5 1211.8817 0.5 2201.8015 0.5 1301.7781 2.0 2211.6142 0.5 1131.5220 1.5 311a = 4.960 b = 5.800 c = 5.359p(X-ray) = 3.99 (3.96 rutile form)Rm = 6.72 (6.68 rutile form )
DiscussionIt appears from the optical and infrared data
that the II phase is not of the fluorite structure in the cubic system; rather, it is anisotropic, and the essentially unchanged infrared absorption spectrum and molar refraction may be taken as some proof that there has been no integral change of the cation coordination.4 However, more important is that the unit cell is analogous to the high pressure orthorhombic phase of PbO.6'6 Hence, while many factors certainly complicate packing in different crystal structures, these factors apparently work in the same manner in the polymorphic transitions of the model pair M nF2 and P b 0 2. The similarity holds for more than the end result. Despite the charge differences and the implied differences in bond strengths, the phase fields for the two compounds practically overlap (as they do also at higher pressures for the quartz-coesite analogs2 for the other model pair, BeF2 and S i02). Further, the transitions are brought about easily at room temperature under the grinding and pressure action of simple mechanical mortars and even that of small vibrator-mixers (Wig-L-Bug) such as are used in spectroscopic laboratories.7
There is an interesting possibility that although MnF2-I, an anti-ferromagnetic material, does not undergo any change in ionic coordination in the transition to M nF2-II, it may have changes in ordering or domain structure leading to altered magnetic properties.
Acknowledgment.— This work was done as part of the research under ONR Contract No. Nonr 656(20). We are indebted to Professor R . R oy for critical interest in the study and for reading the manuscript, and to Dr. L. Dent Glasser for co-
(6) W. B. White, F. Dachille and R. Roy, J. Am. Ceram. S o c (in press).
(7) F. Dachille and R» Roy, Nature, 183, 1257 (1959).
operation with the attempts on single crystal X -ray studies.
EQUIVALENT CONDUCTANCE OF BOROHYDRIDE ION
B y W. H. Stockm ayer , M. A, R eid and C. W. Garland
Department of Chemistry, Massachusetts Institute of Technology, Cambridge, Massachusetts
Received October 20, 1960
Borohydride ion should be similar to the halide ions in many physical properties, just as ammonium ion resembles the alkali ions or methane the noble gases. The thermodynamic properties of aqueous borohydride ion1’2 support this expectation. We have now approximately determined the limiting equivalent conductance of borohydride ion in water at 25°, obtaining a value close to those of bromide and iodide ions, which have about the same crystal radii.
Since borohydride is unstable in neutral or acid solutions, it was necessary to work with basic solutions. The rate of hydrolysis8 is slow enough in 0.01 N potassium hydroxide for conductance measurements to be made. The direct interpretation of the conductance of such solutions (containing the three ionic species K +, BHy and OH- ) is quite complicated.4 These complications have been avoided by comparing the conductance data for solutions of KBH4 in 0.01 N KOH with a parallel set of data for solutions of KBr in 0.01 N KOH.
ExperimentalPotassium borohydride was obtained from Metal Hydrides,
Inc., Beverly, Mass., and was used without further purification. Analysis by the iodate method5 and by the hydrogen gas evolution method5 both indicated 96% KBH4. An analysis by the acid tkration method5 gave 98% purity, but a common impurity in KBH4 is sodium hydroxide which would interfere with this method. Considering these analytical results and the manufacturer’s statement on likely impurities, we estimate that the sample is 96% KBH4, 2% NaOFI and 2% which is probably a borate. This uncertainty in composition is not serious for the present purpose.
Preliminary experiments with a standard conductance cell revealed that platinum electrodes strongly catalyze the decomposition of potassium borohydride, even in the presence of base. However, it was found that mercury had no effect6 on solutions of KBH4 in 0.01 N KOH; therefore an H-shaped cell was constructed, with leads which made contact with a pool of mercury in the bottom of each arm. The cell constant was 3.6063 cm .-1. Resistances were measured with a conventional ac Wheatstone bridge operated at 1.5 kc. All measurements were carried out at 25.00 ± 0.01°.
Since the rate of decomposition of KBH4 in 0.01 N KOH is about 0.1% in 15 minutes it is desirable to make the conductance measurements as rapidly as possible after the solutions are prepared. Resistance measurements were continued for at least 40 minutes after rilling the cell. A very slight decrease in the conductance of the borohydride solutions was observed during this period; the data were back-extrapolated to correct for this small effect.
(1) W. H. Stockmayer, D. W . Rice and C. G. S t e p h e n s o n , J. Am. Chem. Soc., 77, 1980 ( 1 9 5 5 ) .
(2) S. R. Gunn and L. G. Green, ibid., 77, 6197 (1955).(3) (a) R. L. Pecsok, ibid., 75, 2862 (1953); (b) J. B. Brown and
M . Svensson, ibid., 79, 4241, 6 5 8 1 (1957).(4) H. S. Ilarned and B. B. Owen, “The Physical Chemistry of
Electrolytic Solutions,” Reinhold Publ. Corp., New York, N. Y., Third Edition, 1958.
(5) E. H. Jensen, "A Study on Sodium Borohydride,” Nyt Nordisk Forlag, Arnold Busch, Copenhagen, 1954.
(6) We are indebted to Professor I. Amdur for the suggestion that mercury might be suitable for electrodes.

892 N otes Vol. 65
Results and DiscussionThe results of conductance measurements on
solutions of IvBH4 dissolved in 0.0118 N potassium hydroxide are given in Table I ; parallel results on solutions of KBr dissolved in the same standardized potassium hydroxide are shown in Table II. In both cases, “ apparent” equivalent conductances were calculated from the expression
A = 1000(1, - L,)/c' (1)where c ' is the concentration of K B H 4 or KBr in equivalents per liter, L the specific conductance of the mixed electrolyte and La that of the pure KOH solution. The conductance measurements presented in Table II were made several weeks after those shown in Table I, and this may explain the
T able IC onductance of KBH 4 in 0.0118 N KOHc' 103L O "P 1 £■< A(KBH()
0 3.07 00.0206 5.87 2.80 136.0
.0500 9.72 6.55 133.1
.1000 15.92 12.85 128.5
.1500 21.85 18.78 125.2
T able IIC onductance of KBr in 0.0118 N KOH
c' 103L 10»(L - Lo) A(KBr)0 3.03 00.0190 5.58 2.55 133.9
.0485 9.41 6.38 131.6
.0969 15.50 12.47 128.6
.1544 22.48 19.45 125.9T a ble III
Smoothed D ifferences in E quivalent C onductancec A(KBH4) A(K3r) AAo'
0.0306 136.2 133.8 2.5.0625 133.0 131.4 1.7.1056 129.0 128.8 0.2.1600 125.2 126.1 - 1 . 0
slight difference in the L0 values. Any small change in the hydroxide concentration can be ignored, however, in computing the total ionic concentration,c. A plot of these apparent equivalent conductances versus the square root of -he total ionic concentration gives a smooth curve, but the limiting law cannot be expected to apply to data in the concentration range studied. Indeed, the accepted value of A0 for potassium bromide is 151.7 and this value cannot be obtained by conventional extrapolation of the data in Table II.
Moreover, these solutions of K B II4 and K Br cannot be treated as single electrolytes since there is a third ionic species (OH- ) present in appreciable concentration. The Onsager theory predicts4 variations from the Kohlrausch principle of independent ionic mobilities for solutions containing ions of the same sign and very different mobilities. Experiments by Longsworth,7 for example, show an effect of the order of 2.5% in mixed solutions of HC1 and KC1; and our equivalent conductance values in Table II are from 1.5 to 3% lower than the values for pure KBr at the same total ionic concentration. However, if the mobilities of the borohydride and
(7) L. G. Longsworth, J. Am. Chem. Soc., 52, 1897 (1930).
bromide ion are quite similar the equivalent conductances of the K B H 4 and K Br solutions should be affected in almost exactly the same way by the presence of KOH. Thus a treatment of the data based on the differences, Akbh4 — Akbo should permit an extrapolation to infinite dilution. If w e apply the Shedlovsky equation4
A „ ' = f -+ . g * V c = Ao + Bc + _ (2 )
to solutions of two different electrolytes, 1 and 2, we obtain
AA„' = ------= AA° + (A B )c + . . . (3)
where AA = A2 — Ai and both A2 and At are values at the same temperature and at the same concentration in a given solvent. A plot of AA0' against c should be linear8 at sufficiently low concentration and the intercept will give9 the difference between the limiting equivalent conductances at infinite dilution. The value4 of a * for water at 25.0° is 0.229.
In effect, eq. 3 permits one to obtain a fair A0 value from data at relatively high concentrations (say 0.02 to 0.2 N ) if data are available for another similar solute at both high and low concentrations. A test of this method with literature data for potassium chloride and potassium nitrate gives AA0 to within 0.2 unit of the accepted value. Values of Akbh4 and AKBr read from smooth curves of the apparent equivalent conductance against cI/! are given in Table III together with the quantities AA</. A plot of AA0' against c is linear as predicted by eq. 3 and has an intercept of 3.3 — 0.2. Using the known value of A0 for potassium bromide, we obtain 155.0 as the equivalent conductance of potassium borohydride at infinite dilution. However, this value is too high because of the hydroxide impurity in the sample. We finally take A0 for K B H 4 as 153, with an estimated uncertainty from all sources of ± 3. Thus Ao for the borohydride ion at 25° is 80 ± 3 ohm -1 cm .2 equiv.-1, which may be compared to the values 76.4, 78.2 and 76.9 for Cl ", Br~ and I - , respectively.
(8) We consciously ignore the very small known term in c In c. Cf. the work of Fuoas and Onsager described in reference 4, pp. 264- 271.
(9) This statement i3 not exact, but since the equations for three-ion systems are known (reference 4, pp. 114-117) it would be entirely feasible, though tedious, to estimate the small error involved. The precision of our results seems not to justify the labor. It can be shown that linear extrapolation to zero total concentration c is the most nearly correct procedure for eliminating the B terms.
LONG RAN G E A TT R A C TIV E PO TENTIALS FRO M M OLECULAR BEAM STUDIES ON
TH E SYSTEM S IC,N2(g) AN D K Cl,N 2(g )4B y R ichard C. Sciioonmaker2
Columbia Radiation Laboratory, Department of Physics, Columbia University, New York, New York
Received October 24, 1960
The molecular beam technique is well suited to determinations of total cross sections for scattering of beam molecules by dilute gases.3 The introduction of velocity selection for the beam molecules facilitates a determination of the de
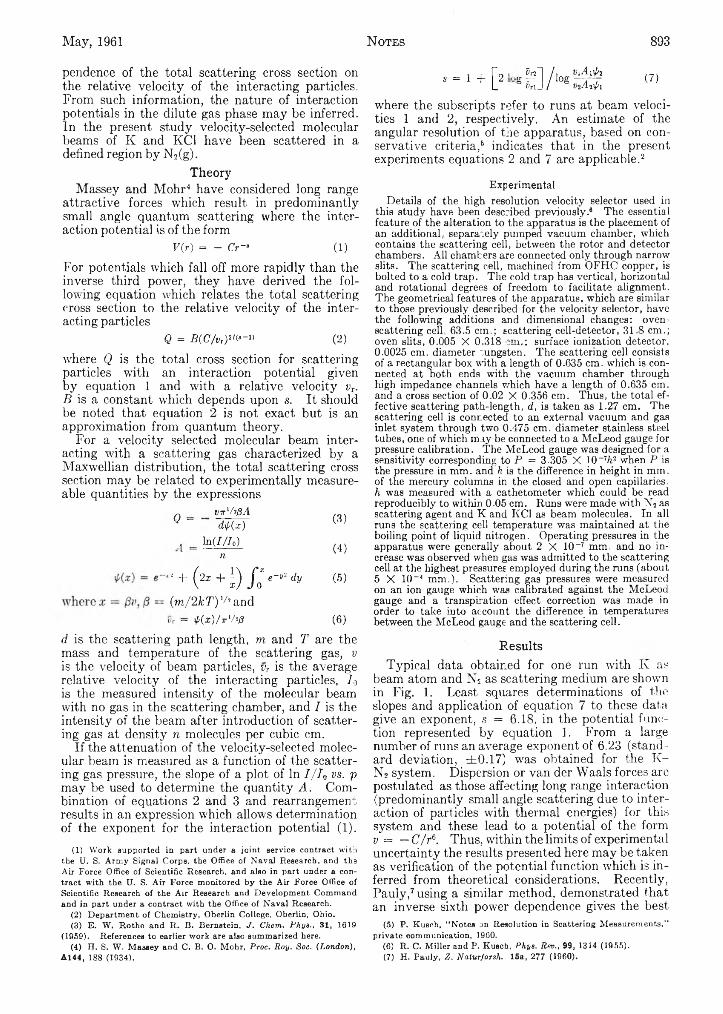
May, 1961 Notes 893
pendence of the total scattering cross section on the relative velocity of the interacting particles. From such information, the nature of interaction potentials in the dilute gas phase may be inferred. In the present study velocity-selected molecular beams of K and KC1 have been scattered in a defined region by N 2(g).
TheoryMassey and M ohr4 have considered long range
attractive forces which result in predominantly small angle quantum scattering where the interaction potential is of the form
V{r) = - Cr-• (1)
For potentials which fall off more rapidly than the inverse third power, they have derived the following equation which relates the total scattering cross section to the relative velocity of the interacting particles
Q = B (C > ,)»'<■-» (2)
where Q is the total cross section for scattering particles with an interaction potential given by equation 1 and with a relative velocity vr. B is a constant which depends upon s. It should be noted that equation 2 is not exact but is an approximation from quantum theory.
For a velocity selected molecular beam interacting with a scattering gas characterized by a Maxwellian distribution, the total scattering cross section may be related to experimentally measure- able quantities by the expressions
„ vwVtßAV ~ # ( z ) (3)
t M i / h )n (4)
■, + { i x + ï ) S l r " dt (5)
( m / 2 k T ) 1/5 and Vr — tp(x)/ir'/*ß (6)
d is the scattering path length, m and T are the mass and temperature of the scattering gas, v is the velocity of beam particles, vt is the average relative velocity of the interacting particles, 70 is the measured intensity of the molecular beam with no gas in the scattering chamber, and I is the intensity of the beam after introduction of scattering gas at density n molecules per cubic cm.
If the attenuation of the velocity-selected molecular beam is measured as a function of the scattering gas pressure, the slope of a plot of In 7 /70 vs. p may be used to determine the quantity A . Combination of equations 2 and 3 and rearrangement results in an expression which allows determination of the exponent for the interaction potential (1). 1 2 3 4
(1) Work supported in part under a joint service contract with the U. S. Army Signal Corps, the Office of Naval Research, and the Air Force Office of Scientific Research, and also in part under a contract with the U. S. Air Force monitored by the Air Force Office of Scientific Research of the Air Research and Development Command and in part under a contract with the Office of Naval Research.
(2) Department of Chemistry, Oberlin College, Oberlin, Ohio.(3) B. W. Rothe and R. B. Bernstein, J, Chem. Pkys., 31, 1619
(1959). References to earlier work are also summarized here.(4) H. S. W. Massey and C. B. 0 . Mohr, Proc. Roy. Soc. (London),
A144, 188 (1934).
-*+[*•■« a/-& <7>where the subscripts refer to runs at beam velocities 1 and 2, respectively. An estimate of the angular resolution of the apparatus, based on conservative criteria,6 indicates that in the present experiments equations 2 and 7 are applicable.2
ExperimentalDetails of the high resolution velocity selector used in
this study have been described previously.® The essential feature of the alteration to the apparatus is the placement of an additional, separately pumped vacuum chamber, which contains the scattering cell, between the rotor and detector chambers. All chambers are connected only through narrow slits. The scattering cell, machined from OFHC copper, is bolted to a cold trap. The cold trap has vertical, horizontal and rotational degrees of freedom to facilitate alignment. The geometrical features of the apparatus, which are similar to those previously described for the velocity selector, have the following additions and dimensional changes: ovenscattering cell, 63.5 cm.; scattering cell-detector, 31.8 cm.; oven slits, 0.005 X 0.318 cm.; surface ionization detector, 0.0025 cm. diameter tungsten. The scattering cell consists of a rectangular box with a length of 0.635 cm. which is connected at both ends with the vacuum chamber through high impedance channels which have a length of 0.635 cm. and a cross section of 0.02 X 0.356 cm. Thus, the total effective scattering path-length, d, is taken as 1.27 cm. The scattering cell is connected to an external vacuum and gas inlet system through two 0.475 cm. diameter stainless steel tubes, one of which may be connected to a McLeod gauge for pressure calibration. The McLeod gauge was designed for a sensitivity corresponding to P = 3.305 X 10_,/i2 when P is the pressure in mm. and h is the difference in height in mm. of the mercury columns in the closed and open capillaries. h was measured with a cathetometer which could be read reproducibly to within 0.05 cm. Runs were made with N2 as scattering agent and K and KC1 as beam molecules. In all runs the scattering cell temperature was maintained at the boiling point of liquid nitrogen. Operating pressures in the apparatus were generally about 2 X 10 ~7 mm. and no increase was observed when gas was admitted to the scattering cell at the highest pressures employed during the runs (about 5 X 10~4 mm.). Scattering gas pressures were measured on an ion gauge which was calibrated against the McLeod gauge and a transpiration effect correction was made in order to take into account the difference in temperatures between the McLeod gauge and the scattering cell.
ResultsTypical data obtained for one run with Iv as
beam atom and N£ as scattering medium are shown in Fig. 1. Least squares determinations of the slopes and application of equation 7 to these data give an exponent, s = 6.18, in the potential function represented by equation 1. From a large number of runs an average exponent of 6.23 (standard deviation, ±0 .17) was obtained for the K - N 2 system. Dispersion or van der Waals forces are postulated as those affecting long range interaction (predominantly small angle scattering due to interaction of particles with thermal energies) for this system and these lead to a potential of the form v = — C / r 6. Thus, within the limits of experimental uncertainty the results presented here may be taken as verification of the potential function which is inferred from theoretical considerations. Recently, Pauly,7 using a similar method, demonstrated that an inverse sixth power dependence gives the best
(5) P. Kusch, "Notes on Resolution in Scattering Measurements," private communication, 1960.
(6) R. C. Miller and P. Kusch, Phys. Rev., 99, 1314 (1955).(7) H. Pauly, Z. Naturforsh.. 15a, 277 (1960).
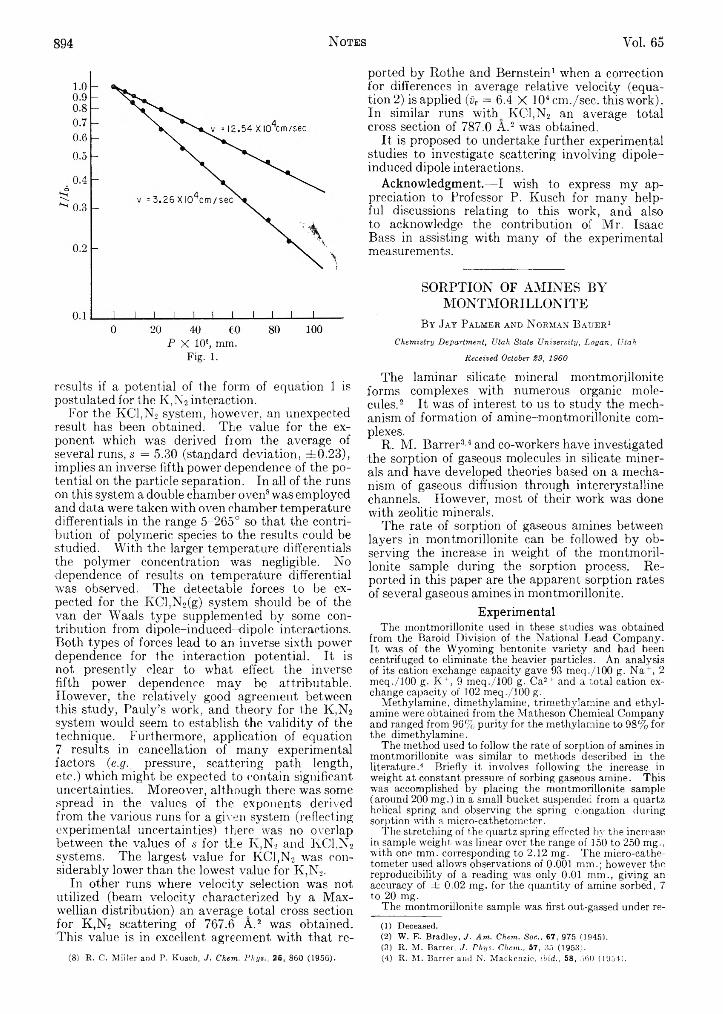
894 Notes Vol. 65
P X 106, mm.Fig. 1.
results if a potential of the form of equation 1 is postulated for the K ,N 2 interaction.
For the KC1,N2 system, however, an unexpected result has been obtained. The value for the exponent which was derived from the average of several runs, s = 5.30 (standard deviation, ±0 .23 ), implies an inverse fifth power dependence of the potential on the particle separation. In all of the runs on this system a double chamber oven8 was employed and data were taken with oven chamber temperature differentials in the range 5-265° so that the contribution of polymeric species to the results could be studied. W ith the larger temperature differentials the polymer concentration was negligible. No dependence of results on temperature differential was observed. The detectable forces to be expected for the IvCl,N2(g) system should be of the van der Waals type supplemented by some contribution from dipole-induced-dipole interactions. Both types of forces lead to an inverse sixth power dependence for the interaction potential. It is not presently clear to what effect the inverse fifth power dependence may be attributable. However, the relatively good agreement between this study, Pauly’s work, and theory for the K ,N 2 system would seem to establish the validity of the technique. Furthermore, application of equation 7 results in cancellation of many experimental factors (e .g . pressure, scattering path length, etc.) which might be expected to contain significant uncertainties. Moreover, although there was some spread in the values of the exponents derived from the various runs for a given system (reflecting experimental uncertainties) there was no overlap between the values of s for the Iy,N2 and KC1,N2 systems. The largest value for KC1,N2 was considerably lower than the lowrest value for K ,N 2.
In other runs where velocity selection was not utilized (beam velocity characterized by a Maxwellian distribution) an average total cross section for K ,N 2 scattering of 767.6 A .2 was obtained. This value is in excellent agreement with that re
ported by Rothe and Bernstein1 when a correction for differences in average relative velocity (equation 2) is applied (9r = 6.4 X 104cm ./sec. this work). In similar runs with KC1,N2 an average total cross section of 787.0 A .2 was obtained.
It is proposed to undertake further experimental studies to investigate scattering involving dipole- induced dipole interactions.
Acknowledgment.— I wish to express m y appreciation to Professor P. Kusch for many helpful discussions relating to this work, and also to acknowledge the contribution of Mr. Isaac Bass in assisting with many of the experimental measurements.
SORPTION OF AM INES B Y M O N TM O RILLO N ITE
B y Ja y Palm er and N orman B a u e r 1
Chemistry Department, Utah State University, Logan, Utah Received October 29, 1960
The laminar silicate mineral montmorillonite forms complexes with numerous organic molecules.2 It was of interest to us to study the mechanism of formation of amine-montmorillonite complexes.
R. M. Barrer3'4 and co-workers have investigated the sorption of gaseous molecules in silicate minerals and have developed theories based on a mechanism of gaseous diffusion through intercrystalline channels. However, most of their work was done with zeolitic minerals.
The rate of sorption of gaseous amines between layers in montmorillonite can be followed by observing the increase in weight of the montmorillonite sample during the sorption process. Reported in this paper are the apparent sorption rates of several gaseous amines in montmorillonite.
ExperimentalThe montmorillonite used in these studies was obtained
from the Baroid Division of the National Lead Company. It was of the Wyoming bentonite variety and had been centrifuged to eliminate the heavier particles. An analysis of its cation exchange capacity gave 93 meq./lOO g. N a+, 2 meq./lOO g. K +, 9 meq./lOO g. Ca2 + and a total cation exchange capacity of 102 meq./lOO g.
Methylamine, dimethylamine, trimethylamine and ethyl- amine were obtained from the Matheson Chemical Company and ranged from 96% purity for the methylamine to 98% for the dimethylamine.
The method used to follow the rate of sorption of amines in montmorillonite was similar to methods described in the literature.4 Briefly it involves following the increase in weight at constant pressure of sorbing gaseous amine. This was accomplished by placing the montmorillonite sample (around 200 mg.) in a small bucket suspended from a quartz helical spring and observing the spring elongation during sorption with a micro-cathetometer.
The stretching of the quartz spring effected by the increase in sample weight was linear over the range of 150 to 250 mg., with one mm. corresponding to 2.12 mg. The micro-cathetometer used allows observations of 0.001 mm.; however the reproducibility of a reading was only 0.01 mm., giving an accuracy of ± 0.02 mg. for the quantity of amine sorbed, 7 to 20 mg.
The montmorillonite sample was first out-gassed under re- 1 2 3 4(1) Deceased.(2) W. E. Bradley, J. Am. Chem. Soc., 67, 975 (1945).(3) R. M. Barrer, J. Phys. Chem., 57, 35 (1953).(4) R. M. Barrer and N. Mackenzie, ibid., 58, 560 (1954).(8) R. C. Miller and P. Kusch, J. Chem. Phys., 25, 860 (1956).
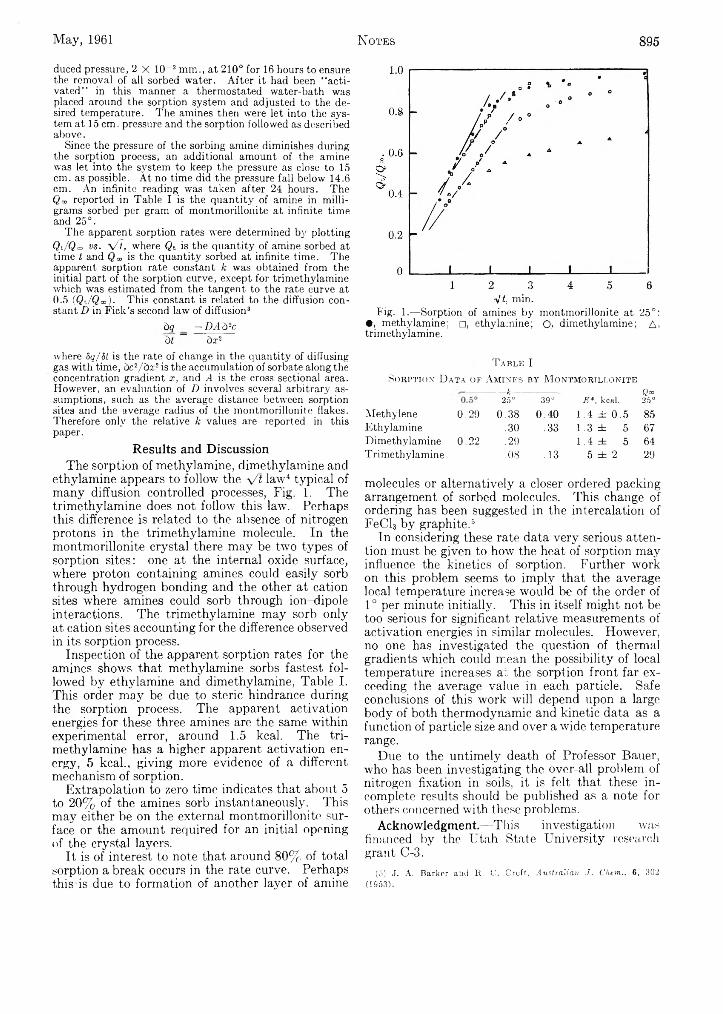
May, 1961 N otes 895
duced pressure, 2 X 10⁻² mm., at 210° for 16 hours to ensure the removal of all sorbed water. After it had been “ activated” in this manner a thermostated water-bath was placed around the sorption system and adjusted to the desired temperature. The amines then were let into the system at 15 cm. pressure and the sorption followed as described above.
Since the pressure of the sorbing amine diminishes during the sorption process, an additional amount of the amine was let into the system to keep the pressure as close to 15 cm. as possible. At no time did the pressure fall below 14.6 cm. An infinite reading was taken after 24 hours. The Qa, reported in Table I is the quantity of amine in milligrams sorbed per gram of montmorillonite at infinite time and 25°.
The apparent sorption rates were determined by plotting Qt/Q™ vs. V7, where Qt is the quantity of amine sorbed at time t and Q „ is the quantity sorbed at infinite time. The apparent sorption rate constant k was obtained from the initial part of the sorption curve, except for trimethylamine which was estimated from the tangent to the rate curve at 0.5 (Qt/Qco). This constant is related to the diffusion constant D in Fields second law of diffusion3
dq _ — DAZ)2c5f dx2
where Sq/St is the rate of change in the quantity of diffusing gas with time, dc2/dx2 is the accumulation of sorbate along the concentration gradient x, and A is the cross sectional area. However, an evaluation of D involves several arbitrary assumptions, such as the average distance between sorption sites and the average radius of the montmorillonite flakes. Therefore only the relative k values are reported in this paper.
Results and DiscussionThe sorption of methylamine, dimethylamine and
ethylamine appears to follow the \/t law4 typical of many diffusion controlled processes, Fig. 1. The trimethylamine does not follow this law. Perhaps this difference is related to the absence of nitrogen protons in the trimethylamine molecule. In the montmorillonite crystal there may be two types of sorption sites: one at the internal oxide surface, where proton containing amines could easily sorb through hydrogen bonding and the other at cation sites where amines could sorb through ion-dipole interactions. The trimethylamine may sorb only at cation sites accounting for the difference observed in its sorption process.
Inspection of the apparent sorption rates for the amines shows that methylamine sorbs fastest followed by ethylamine and dimethylamine, Table I. This order may be due to steric hindrance during the sorption process. The apparent activation energies for these three amines are the same within experimental error, around 1.5 kcal. The trimethylamine has a higher apparent activation energy, 5 kcal., giving more evidence of a different mechanism of sorption.
Extrapolation to zero time indicates that about 5 to 20% of the amines sorb instantaneously. This may either be on the external montmorillonite surface or the amount required for an initial opening of the crystal layers.
It is of interest to note that around 80%. of total sorption a break occurs in the rate curve. Perhaps this is due to formation of another layer of amine
Fig. 1.— Sorption of amines by montmorillonite at 25°: ®, methylamine; □, ethylamine; O, dimethylamine; A, trimethylamine.
T a b l e I
S o r p t i o n D a t a o f A m i n e s b y M o n t m o r i l l o n i t e
---------k--------2 5 ° 3 9 ° E*, kcal.
Qa>25°
Methylene 0.29 0.38 0.40 1.4 ± 0.5 85Ethylamine .30 .33 1.3 ± .5 67Dimethylamine 0.22 .29 1.4 ± .5 64Trimethylamine .08 .13 5 ± 2 29
molecules or alternatively a closer ordered packing arrangement of sorbed molecules. This change of ordering has been suggested in the intercalation of FeCl3 by graphite.5
In considering these rate data very serious attention must be given to how the heat of sorption may influence the kinetics of sorption. Further work on this problem seems to imply that the average local temperature increase would be of the order of 1 ° per minute initially. This in itself might not be too serious for significant relative measurements of activation energies in similar molecules. However, no one has investigated the question of thermal gradients which could mean the possibility of local temperature increases at the sorption front far exceeding the average value in each particle. Safe conclusions of this work will depend upon a large body of both thermodynamic and kinetic data as a function of particle size and over a wide temperature range.
Due to the untimely death of Professor Bauer, who has been investigating the over-all problem of nitrogen fixation in soils, it is felt that these incomplete results should be published as a note for others concerned with these problems.
Acknowledgment.—This investigation was financed by the Utah State University research grant C-3.
( 5 ) J . A . B a r k e r a n d R . C . C r o f t , Australian J. Chem., 6 , 3 0 2
( 1 9 5 3 ) .
896 Communication to the Editor Vol. 65
COMMUNICATION TO THE EDITORM EASU REM EN T OF TH E T A C T IC IT Y OF
SY N D IO TACTIC PO LY -(M E TH Y L M E TH A C R YL ATE ) B Y TH E GEL M E L TIN G
PO IN TS ir :
M ost of the quantitative methods for determining the tacticity of stereoregular poly-(methyl methacrylate)1 depend on nearest-neighbor interactions and, therefore, except in special cases,2 measure the fraction of monomer placements which may be in one tactic configuration or another. This is the case with two of the more useful methods thus far described, high-resolution n.m.r.2 and infrared spectroscopy.1’3'4 Since complete steric control of polymerization probably never is attained with methyl methacrylate, it is also of importance to learn the average length of the stereoregular sequences, and the distribution of these sequence lengths. We report here a new method, specific to poly-(methyl methacrylate), which we believe gives a relative measure of average syndiotactic sequence length.
This method is based on the observation that when a solution of iso tactic poly-(methyl methacrylate) in a solvent such as dimethylformamide is mixed with a solution of syndiotactic poly-(methyl methacrylate) in the same solvent, a rigid continuous gel is formed rapidly. If this gel is heated, it will melt sharply to a clear solution. This gel melting point is (1) reproducible to ± 0 .5 °, (2) only slightly affected by changes in the original polymer concentration from about 1 zo 9% by wt. or by changes in the ratio of isotactic to syndiotactic polymer from about 1:4 to 4 :1 by wt., (3) independent of the mo_de of preparation of the iso tactic polymer if it has M v > ca. 100.000, (4) only slightly affected by the molecular weight of the syndiotactic polymer if it has M v > ca. 50-100,000, (5) m arkedly dependent on the tem perature o f polym erization o f the syndiotactic polym er. Both n.m.r. and infrared spectroscopy have established that the fraction of syndiotactic placements increases with decreasing temperature of polymerization.
(1) T. G. Fox, B. S. Garrett, W. E. Goode, S. Gratch, J. F. Kincaid» A. Spell and J. D. Stroupe, J. Am. Chem. Soc., 80, 1768 (1958).
(2) F. A. Bovey and G. V. D. Tiers, J. Polymer Sci., 44, 173 (1960).(3) U. Baumann, H. Schreiber and K. Tessmar, Makromol. Chem.,
36, 81 (1959).(4) W. E. Goode, F. H. Owens, R. P. Fellmann, W. H. Snyder and
J. E. Moore, J. Polymer Sci., 46, 317 (1960).
Standard conditions therefore can be established so that the gel melting point becomes entirely a function of some element of tacticity of the syndiotactic poly-(methyl methacrylate).
A single isotactic poly-(methyl methacrylate) sample was used as the isotactic component of all gels. Gels were prepared with equal weights of various syndiotactic polymers in dimethylformamide at a total concentration of 5% by wt. The isotactic polymer4 was prepared by initiation with phenylmagnesium bromide in toluene at 3°, and had M v = 130,000; the syndiotactic polymers5 6 7 were prepared by free radical initiation at various constant temperatures from —50° to + 140°. The gel melting points were measured by determining the temperature at which the gel, contained in the tip of a 1-ml. pipet inserted into a snug-fitting test- tube, flowed readily from the tip. Some results areg iven :
Temp, ofpolymerization, °C. M , X 10s Gel melting point.
- 5 0 8.0 92.7- 3 0 19.0 87.5
0 11.5 76.560 25.1 60.0
140 5.7 43.5Gornick6 has applied the Flory theory of co
polymer crystallization1 to partially tactic systems, and concludes that for a polymer chain containing blocks of crystallizable sequences the equilibrium melting point will be primarily dependent on the lengths of the crystallizable blocks, and only secondarily on the concentration of the blocks within the chain. W e believe that the gel formation described here involves a linearly ordered array of short, stiff syndiotactic helical sequences with longer isotactic helical sequences, and that the “ crystallite” dimensions, and hence melting points, depend mainly on the syndiotactic sequence lengths These gels give type III X -ray diffraction patterns1 which disappear at very near the melting points of the gels
W arren H . W atan abe R esearch L aboratories C harles F. R yanR ohm and H aas C om pany Paul C . F leischer , Jr .B ristol, Pen n sylvan ia B. S. G arrett
Received March 10, 1961(5) T. G. Fox, W. E. Goode, S. Gratch, C. M. Huggett, J. F. Kin
caid, A. Spell, and J. D. Stroupe, ibid., 31, 173 (1958).(6) F. Gornick, Ph.D. Thesis, University of Pennsylvania, June,
1959.(7) P. J. Flory, Trans. Faraday Soc., 51, 848 (1955).
N u m b e r 23 in
A d v a n c e s i n C h e m i s t r y S e r ie s
e d i t e d b y t h e s t a f f o f
A C S A p p l i e d P u b l i c a t i o n s
METAL-ORGANICCOMPOUNDS
The papers presented in this volume represent contributions to the first ACS symposium devoted to the increasingly important area of metal-organic compounds. Leading off the symposium is Henry Gilman of Iowa State College who comes nearest to being the one individual most closely associated with metal-organic compounds in the world of chemistry today.
This area of metal-organic compounds has already attained immense commercial stature. As the knowledge of molecular architecture improves, the combination of metals with organic molecules seems to offer possible solutions to many problems in metal extraction purification, in formulation of heat-resistant polymers, in propellant systems, surface coatings, agricultural chemicals, and chemical synthesis.
Beginning with three summary papers surveying the three classes of metal-organic compounds, the symposium proceeds to a more detailed consideration of the manufacture, properties, and uses of the metal-organic compounds of 14 of the metals in the 31 papers which comprise the balance of the symposium.
3 7 1 p a g e s C l o t h B o u n d $ 5 .7 5
O rd er from:
S p e c ia l I s s u e s S a le s D e p a r t m e n t
A m e r i c a n C h e m i c a l S o c i e t y
1 1 5 5 S i x t e e n t h S t r e e t , N . W .
W a s h i n g t o n 6 , D . C .

NONMILITARYDEFENSE
CHEMICAL AND BIOLOGICAL DEFENSES IN PERSPECTIVE
Num ber 26 inAdvances in Chem istry Series
edited by the Staff o f ACS Applied Publications
Complete text of the Symposium which received international attention when presented at the ACS National Meeting in Cleveland, Ohio. The book documents why chemical and biological weapons now must be regarded as nearly on a par with nuclear weapons and stresses what defenses should be in the hands of every citizen for his personal protection and why a protected citizenry will be a major factor in preventing such agents ever being used. The book includes a point by point comparison between chemical, biological, and nuclear weapons; a detailed description of the chemical and biological threat; the medical problems involved in protecting citizens; the individual and collective protection for individuals, companies, institutions, and communities; a detailed discussion of chemical and biological early warning and detection problems; the research still needed to protect individuals from these agents; and detailed, nontechnical discussions of why individuals should be aware of such threats and what they can do about it.
107 pages— paper bound— $2.00 per copy
bulk rates on request
order fr o m :
Special Issues SalesA m e r i c a n C h e m ic a l S o c ie t y1155 16th Street, N.W. Washington 6, D. C.
An important synthesis of theory
ISOTOPE EFFECTS
on REACTION RATES
LARS MELANDER,Nobei Institute of Chemistry,
Stockholm
This authoritative volume serves as an introduction to and theoretical survey of the field of kinetic isotope effects, with emphasis on principles.
Based on the theory of absolute reaction rates, current formulas for the prediction of kinetic isotope effects from molecular data are developed. Their interrelationships and the various underlying steps of approximation are indicated. The problems encountered in the evaluation of isotope effects from experimental data are discussed; the most important relationships are diagrammed.
Simple reactions are used to illustrate the general degree of agreement that may be expected between empirical and predicted isotope effects. Using examples taken from the literature, the evaluation of the experimental data for a given case as well as the application of different formulas for the prediction is worked out in detail. In several instances, prediction methods other than those used by the original authors are tried and the results are compared and discussed. The problems involved in the use of kinetic isotope effects for the investigation of several-step reaction mechanisms are also presented. 1960. 181 pages. $6‘ 'An outstanding feature is the correlation of information obtained by the study of isotope effects with the general body of knowledge on reaction mechanism in organic systems—J a c o b B i g e l -
e i s e n , Brookhaven National Laboratory.
A volume in a series of monographs--------------------------- --------
Modern Concepts in ChemistryPrepared under the editorship o f BRYCE CRAWFORD, Jr., Dean o f the Graduate School and Professor o f Chemistry, University o f Minnesota;W. D. McELROY, Chairman, Department o f Biology and Director, Mc- Collum-Pratt Institute, Johns Hopkins University; and CHARLES C. PRICE, Director, John Harrison Laboratory o f Chemistry, University of Pennsylvania.
,SOTO<*
*5**
• Discusses the probable future Importance of a new line of investigation on isotope effect in isotope exchange.
e Emphasis is on principles.• Important relationships are illustrated by clear,
simple diagrams.
Order direct from:
THE RONALD PRESS COMPANY1 5 E a s t 2 6 t h S t ., N e w Y o r k 1 0