EVIDENCE REPORT No 65 - CiteSeerX
97
IDS EVIDENCE REPORT No 65 Reducing Hunger and Undernutrition Mapping Value Chains for Nutrient-Dense Foods in Nigeria Ewan Robinson, Ndidi Nwuneli, Spencer Henson and John Humphrey March 2014
-
Upload
khangminh22 -
Category
Documents
-
view
0 -
download
0
Transcript of EVIDENCE REPORT No 65 - CiteSeerX

IDSEVIDENCE REPORTNo 65
Reducing Hunger and Undernutrition
Mapping Value Chains for Nutrient-Dense Foods in Nigeria
Ewan Robinson, Ndidi Nwuneli, Spencer Henson and John Humphrey
March 2014

MAPPING VALUE CHAINS FOR NUTRIENT-DENSE FOODS IN NIGERIA
Ewan Robinsona, Ndidi Nwunelib, Spencer Hensona and John Humphreya
a Institute of Development Studiesb Sahel Capital Partners and Advisory, Ltd
March 2014
This is an Open Access publication distributed under the terms of the Creative Commons Attribution License, which permits unrestricted use, distribution, and reproduction in any medium, provided the original author and source are clearly credited.
First published by the Institute of Development Studies in March 2014© Institute of Development Studies/Sahel Capital Partners and Advisory, Ltd 2014
IDS is a charitable company limited by guarantee and registered in England (No. 877338).
The IDS programme on Strengthening Evidence-based Policy works across seven key themes. Each theme works with partner institutions to co-construct policy-relevant knowledge and engage in policy-influencing processes. This material has been developed under the Reducing Hunger and Undernutrition theme.
The development of this material has been led by the Institute of Development Studies and Sahel Capital Partners and Advisory who jointly hold the copyright.
Input was provided by the Global Alliance for Improved Nutrition and Sahel Capital Partners and Advisory. Professor Isaac O. Akinyele, University of Ibadan and Santiago Ripoll, University of Sussex contributed to the text.
The material has been funded by UK aid from the UK Government, however the views expressed do not necessarily reflect the UK Government’s official policies.
AG Level 2 Output ID: 3
1
Contents
Acronyms 4
Executive summary 5
PART I: Background 8
1 Introduction and overview 9 1.1 Project goal and context 9 1.2 The value chain approach to linking agriculture and nutrition 9 1.3 Methods 11
2 Undernutrition in Nigeria 12
PART II: Mapping value chains for selected nutrient-dense food products 14
3 Scoping exercise: Selecting high-potential product types 15
4 Cowpea 17 4.1 Cowpea products 18 4.2 Nutrient content 18 4.3 Consumers and food acceptability 19 4.4 Business interest 20 4.5 Production and supply chain 21 4.6 Pricing 25 4.7 Processing 26 4.8 Distribution 26 4.9 Value chain barriers and potential responses 27
5 Soya 31 5.1 Soya products 33 5.2 Nutrient content 33 5.3 Consumers and food acceptability 34 5.4 Business interest 35 5.5 Production and supply chain 36 5.6 Processing 39 5.7 Distribution 40 5.8 Value chain barriers and potential responses 41
6 Complementary foods 46 6.1 Nutrient content 47 6.2 Product pricing 47 6.3 Consumer acceptability and use 50 6.4 Business interest 50 6.5 Supply chains 53 6.6 Processing of complementary foods 54 6.7 Distribution channels 55 6.8 Value chain barriers and potential responses 57
7 Conclusion 61 7.1 Cowpea products 61 7.2 Soya products 61 7.3 Complementary food products 62

2
Annex A: List of informants 64
Annex B: Commodities examined in scoping exercise 66
Annex C: Product scores 69
Annex D: Undernutrition in Nigeria 70
Annex E: Cowpea figures 83
Annex F: Soya figures 85
Annex G: Complementary food figures 87
References 89
Boxes Box 1.1 Key elements of the value chain approach 10 Box 1.2 Characteristics for assessing foods’ potential for nutrition 10 Box 4.1 Cowpea flour produced by Lisabi Mills 21 Box 4.2 Food safety risks and cowpea storage 23 Box 4.3 Slow uptake of improved storage bags 23 Box 4.4 Business involvement in producing improved storage bags 24 Box 4.5 Key development and research actors involved in cowpea value chains 30 Box 5.1 Storage and transport of soya 37 Box 5.2 Impact of pricing and seasonality on soya in Nigeria 39 Box 5.3 Soya imports and government policy 42 Box 5.4 Key development and research actors engaged in soya value chains 45 Box 6.1 Development of soy-ogi 51 Box 6.2 Supply of micronutrient premix in Nigeria 54 Box 6.3 Retail channels for complementary food products 56
Figures Figure 4.1 Key actors in the cowpea supply chain 22 Figure 4.2 Retail prices for cowpea in Kano State, 2004–06 25 Figure 5.1 Soya value chain map showing approximate number of actors and
quantity of product 38 Figure 5.2 Comparison between Nigeria (local) and world soyabean prices 39 Figure D1 Trends in nutritional status of children under 5 years, at the national
level 71 Figure D2 Prevalence of malnutrition by urban/rural location and region 71 Figure D3 Rates of stunting in Nigerian states (children under 5 years) 72 Figure D4 Rates of underweight in Nigerian states (children under 5 years) 72 Figure D5 Prevalence of malnutrition by size of habitation 73
Tables Table 4.1 Cowpea products available in Nigeria 18 Table 4.2 Quantities of cowpeas consumed in different locations in Kano State 19 Table 4.3 Target consumer groups and regions for commercial cowpea products
in Nigeria 20 Table 4.4 Actors in the cowpea value chain, the relative market power they hold
and the services they provide 24 Table 4.5 Comparison of prices for cowpea flour products 26

3
Table 4.6 Distribution channels for cowpea products and the consumer groups reached by these channels 27
Table 5.1 Soya products available in Nigeria 32 Table 5.2 Use of soya produced in Nigeria 2007–08 34 Table 5.3 Target consumer groups and regions for commercial soya production in
Nigeria 35 Table 5.4 Soya products, scale of production and product differentiation 36 Table 5.5 Price comparison between soya products and other substitute products 40 Table 5.6 Distribution channels for soya product and the consumer groups they
reach 41 Table 5.7 Extent to which commercial soya products address key challenges 43 Table 6.1 Products commonly used for complementary feeding in Nigeria 48 Table 6.2 Composition of home-fortified weaning foods, compared to commercial
brand Nestlé Cerelac 49 Table 6.3 Required amounts (in grams) of home-fortified weaning foods that would
need to be eaten for infants (7–12 months) to meet their dietary requirements 49
Table 6.4 Comparison of prices for complementary food products and brands 49 Table 6.5 Target consumer groups and regions for weaning mix products in
Nigeria 51 Table 6.6 Market shares of multinational corporations selling complementary food
and infant formula products in Nigeria 53 Table 6.7 Summary of business involvement in complementary food products 54 Table 6.8 Processing procedure for complementary food products and scale of
production 55 Table 6.9 Distribution channels for complementary food products and consumer
groups 56 Table 6.10 Extent to which complementary food products have potential to address
the key challenges 58 Table C1 Mean product scores and value chain issues identified 69 Table C2 Detailed product scores from scoping exercise 69 Table D1 Disparities in undernutrition indicators across social groups 73 Table D2 Main food items by region 77 Table D3 Percentage of children aged 6–23 months receiving various food types 80 Table E1 Businesses involved in production of cowpea products and qualities
used to differentiate products 83 Table E2 Comparison of wholesale and retail prices during high and low season
for different varieties of cowpea in markets in Lagos (2013) 83 Table E3 Costs incurred by wholesalers transporting cowpeas for sale in Lagos
markets 84 Table F1 Companies involved in soya products in Nigeria 85 Table F2 Price variation in soy products during 2012 86 Table F3 Processing procedures for soya products and scale of production 86 Table G1 Characterisation of businesses identified in market study 87 Table G2 Description of large Nigerian food manufacturers making
complementary foods 87 Table G3 Supply chains for complementary food products 88 Table G4 Location of large Nigerian manufacturers and presence in three urban
areas 88

4
Acronyms
ABU Ahmadu Bello University CFT Confined Field Trials CBS corn soya blend DFID UK Department for International Development FIIRO Federal Institute of Industrial Research, Oshodi FMARD NIGERIA Federal Ministry of Agriculture and Rural Development FMCG fast-moving consumer goods GAIN Global Alliance for Improved Nutrition IAR Institute for Agricultural Research ICRISAT International Crops Research Institute for the Semi-Arid-Tropics IITA International Institute of Tropical Agriculture IRIN Integrated Regional Information Networks MARKETS Maximizing Agricultural Revenue and Key Enterprises in Targeted Sites MICS Multiple Indicator Cluster Survey NAFDAC National Agency for Food and Drug Administration and Control NDHS Nigeria Demographic and Health Survey NIHORT National Horticultural Research Institute NIRSAL Nigerian Incentive-based Risk Sharing Agricultural Lending PEPFAR President’s Emergency Plan for Aids Relief PICS Purdue Improved Crop Storage RUTF ready-to-use food USAID United States Agency for International Development USDA United States Department of Agriculture WHO World Health Organization WISHH World Initiative for Soy in Human Health

5
Executive summary
This report details the findings of an analysis of value chains for several nutrient-dense foods in Nigeria. It assesses the potential of a number of products to contribute to reducing undernutrition in Nigeria. It identifies key barriers that restrict these products’ impact and identifies options for development agencies, public–private partnerships and others to respond. Value chain analysis has major advantages for food-based approaches to tackling undernutrition, because it highlights where particular actors, activities and markets can serve as leverage points to address barriers to nutrient-dense foods. This report is complemented by a case study of the experiences of two businesses in producing nutrient-dense products, and by an analysis of current policy and recommendations. Although this report lays out options for strengthening each of the commodities examined, the policy report makes broader recommendations on how government, donor agencies, businesses and partnerships can enhance the contribution of food markets to reducing undernutrition in Nigeria.
Chronic undernutrition is a critical problem in Nigeria, with rates of stunting and underweight alarmingly high and little progress over the last decade. There are major disparities in nutrition outcomes between the wealthy and poor, between the north and south, and between urban and rural areas. Micronutrient deficiencies are widespread across social groups. Vitamin A deficiency, for example, contributes to 25 per cent of child and maternal deaths. Drivers of undernutrition include poverty, low access to health services and behavioural factors. Exclusive breastfeeding and proper complementary feeding are very poorly practised. The magnitude of the challenge means that scaling up and improving direct nutrition interventions is an urgent priority. Food and diet-related factors also appear to play a major role, although definitive evidence is not available. In parallel to direct nutrition interventions, efforts are needed to improve the functioning of food value chains and provide access to nutrient-dense foods to the urban and rural poor.
As part of efforts to strengthen the role of food systems in nutrition, this report assesses a set of agricultural commodities and foods that have the potential to provide sources of nutrients to poor populations. After an initial scoping of 12 commodities, the report focuses on three foods based on their high potential in this area. These focal foods are: cowpea, soya and complementary foods. These products are already attracting interest from a variety of businesses and development actors. In some cases, actors are interested in investing in these product types in order to improve nutrition outcomes.
The report maps current value chains for the focal products, concentrating on whether they meet a set of key criteria: availability, affordability, acceptability and nutritional quality. The report examines in detail each stage of the value chains for these products: production and supply, wholesale, processing, distribution/retail and consumer groups. The report analyses the key constraints facing these foods and identifies potential responses, areas of risk and requirements for evidence. The main findings are as follows:
Cowpea products. As the most widely consumed legume in Nigeria, cowpeas currently make a major contribution to the nutrition of poor populations. Markets for cowpea products are dominated by the informal sector, and the majority of products are produced by small-scale businesses and sold locally. Few formal sector businesses have invested in cowpea products, and there is limited innovation in value-added products. The value of cowpea foods is that they are readily acceptable to diverse populations, widely available across the country and can be distinguished from less nutritious alternatives. However, affordability and availability of cowpea is constrained by substantial supply-side problems. Cowpea prices undergo large seasonal fluctuations, linked to the susceptibility of grains to degradation and low use of improved storage technologies. Although simple, safe and low-cost technologies

6
are available in the form of improved storage bags, these have yet to be taken up in the wholesale and transport stages of the value chain. Exacerbating these problems, existing preservation techniques make use of pesticides that create risks of toxic contamination. Options to address these supply-side challenges include the following:
● Incentivise the use of safe storage technologies by farmers, transporters and wholesalers.
● Leverage the position of wholesalers, who occupy a position of dominance in the market for cowpeas.
Another key area for intervention in cowpea value chains is to promote business innovation in cowpea products, including the following options:
● Incentivise production of easy-to-prepare products to reduce the burden of processing cowpeas for households and street food vendors.
● Improve the business climate and encourage partnerships between businesses and research organisations.
Soya products. Soya is an unparalleled source of protein, and its use in processed and traditional foods in Nigeria has expanded rapidly. It has the potential to be an affordable source of high-quality protein for the poor. Soya products have attracted considerable interest from both informal and formal businesses. The majority of formal businesses, however, produce animal feed or cooking oil, not food for human consumption. Furthermore, most formal businesses use imported whole or pre-processed soya, rather than domestic soya. While major agricultural development programmes are currently investing in soya production, impacts are unlikely in the short term. Soya foods face a number of important challenges: on the supply side, demand far exceeds supply, and production costs in Nigeria are well above international prices. In the informal sector, consumption is limited by the high costs and time required to prepare soya foods in a manner that makes them acceptable to consumers. Responses to the challenges facing soya could include the following:
● Upgrade localised soya value chains dominated by informal processors through the provision of business training and coordination. This strategy gets around several of the constraints to national soya markets and reaches populations in northern Nigeria. However, scalability may be limited.
● Increase awareness, acceptability and demand for products, and coordinate business efforts with public health nutrition campaigns.
● Promote fortification of common convenience foods with a simple soya-based ingredient, which could reach many urban populations. Key to these efforts would be establishing distribution channels that can reach informal retailers and food vendors.
● Partner with leading multinationals to leverage their wide-reaching national distribution systems.
Complementary food products. Complementary food products have very high potential to address undernutrition; they target infants at a crucial period for nutrition and have already attracted interest from informal processors and small businesses, as well as a small set of larger manufacturers. Past initiatives have successfully built manufacturing capacity for fortified complementary foods, but were not able to generate sustainable business models selling to consumers. Doing so will require assuring that consumers are aware of and trust the nutrition quality of these products, and that they are sold at a price that is affordable to the poor. Options include:

7
● Coordinate product promotion with public health campaigns, drawing on examples from other countries.
● Work with businesses at multiple scales: upgrade small-scale, informal processors, build the commercial and marketing capacity of a selected domestic manufacturer or target market leading firms with national distribution networks.
● Develop an institutional structure that can guarantee the nutritional content of products and communicate this to consumers. Examples can be drawn from private-led certification systems in other countries. However, given the complexity and risks of the business and governance environments in Nigeria, this approach will require investments in institution building and long-term commitment.
● If certification is deemed to be unfeasible, a lower-risk strategy is to target consumers directly by encouraging home fortification of traditional complementary foods.
This report is complemented by a forthcoming business case study and a policy analysis report. These accompanying reports provide a more in-depth analysis of the incentives faced by particular businesses and of the current policy landscape, respectively. The policy report will be of particular interest to government, donors and public–private partnerships. It examines policy and programmatic approaches for addressing the overarching constraints on developing markets for nutrient-dense foods. It reviews experience in implementing relevant policies in Nigeria, including national fortification, non-profit procurement and distribution and social marketing campaigns. It builds on the evidence in this report and recommends feasible actions for enhancing markets for nutrient-dense foods in Nigeria.

8
PART I: Background
This report presents the outcomes and findings of value chain mapping of nutrient-dense food products in Nigeria. This work was carried out by the Institute of Development Studies (IDS) and Sahel Capital Partners and Advisory, as part of the IDS Accountable Grant, funded by the Department for International Development (DFID). These efforts are part of the ‘Strengthening Agri-food Value Chains for Nutrition’ workstream of the ‘Accelerating Progress in Reducing Hunger and Undernutrition’ theme.
This report is intended to inform policy actors seeking to promote nutrient-dense foods in Nigeria, and in particular those related to cowpeas, soya and complementary food products. The report examines the potential to create incentives that would enable the private sector and public–private partnerships to develop, produce and distribute foods that contribute to reducing undernutrition. For such initiatives to be successful, the private sector’s involvement has to be both sustainable in business terms and successful in generating nutritional impacts. The report systematically outlines evidence on the focal value chains and identifies opportunities and key barriers to enhancing these foods’ nutritional impact.
The present report proceeds as follows: the introduction provides a summary of the project and value chain approach and the methods used to gather evidence. The remainder of the report provides a country study of value chains for a number of nutrient-dense foods in Nigeria. Section 2 briefly reviews the undernutrition situation in Nigeria, highlighting key micronutrient deficiencies and the role of food-based approaches for addressing these problems. Sections 3–6 are a systematic mapping of value chains for the three focus product types: cowpea, soya and complementary foods. These sections provide a rationale for why these products were selected and present evidence to allow assessment of these products’ potential. At the end of each section, areas where particular products have potential to make a greater contribution to reducing undernutrition are identified. The barriers that must be overcome to unlock this potential are highlighted, and potential responses for strengthening these value chains are outlined. These responses will be built upon in the forthcoming report on policy guidelines.

9
1 Introduction and overview
1.1 Project goal and context
The goal of the Strengthening Agri-food Value Chains for Nutrition project is to help reduce undernutrition by contributing to evidence-based policy on ‘nutrition-sensitive’ development. In particular, the project identifies opportunities for various actors to improve and leverage private sector involvement in providing nutrient-dense foods. The project as a whole contributes to these outcomes through three sets of activities, outlined in three sets of country reports:
1. Value chain mapping to assess the potential of particular products for addressing undernutrition for poor and vulnerable population groups, focusing on those that reach populations located off-farm and products that have strong potential to be marketed by businesses on an ongoing basis.
2. Case studies of businesses that have invested in nutritious foods, in order to learn lessons about what works, provide contextual understanding of the perspectives of business and inform policy efforts to enhance the role of the private sector in providing nutritious foods.
3. Policy guidelines that outline key actions that donors, government, non-governmental organisations (NGOs) and the private sector can take to address barriers to making the identified foods accessible and affordable to undernourished population groups.
The present report is the first of these outputs for Nigeria. Nigeria is the second of three focus countries (the other two are Ghana and Tanzania). Once the country studies are completed, a set of overarching policy guidelines will synthesise the lessons learned.
1.2 The value chain approach to linking agriculture and
nutrition
A number of development agencies have set objectives to enhance the link between agriculture and nutrition, as part of strategies to tackle persistent global undernutrition (DFID 2009). The logic is to focus on ‘nutrition-sensitive’ development approaches to take place alongside direct interventions in nutrition, such as management of acute malnutrition and micronutrient supplementation (DFID 2011). But pursuing a goal of nutrition-sensitive agriculture can entail different courses for policy and programmatic action. There are multiple pathways through which agricultural production can lead to improvements in nutrition status (World Bank Agriculture and Rural Development Department 2007). Evidence shows that simply improving farm production and incomes is not sufficient to address undernutrition, especially key micronutrient deficiencies (DFID 2012). There are different approaches for enhancing the link between agriculture and nutrition. A number of reviews and policy guidelines have been published on a set of approaches that can be termed ‘pre-farmgate’ (e.g. Herforth 2012). For the purposes of this report, it is sufficient to note that the pre-farmgate approach focuses on increasing consumption of nutrient-dense foods by the farming households and communities that grow them.1 By remaining on-farm, these approaches therefore have limited reliance on markets to deliver foods. A second approach, termed post-farmgate, seeks to link agricultural production with populations beyond on-farm consumption, both in rural or urban areas. Given that undernutrition affects a wide range of populations off-farms, value chain approaches are a crucial component of the agriculture–nutrition link.
1 For a detailed explanation of pre- and post-farmgate approaches, see Henson, Humphrey and McClafferty (2013).

10
The analysis in this report employs a value chain approach to identify opportunities for providing nutrient-dense foods to populations affected by undernutrition. Box 1.1 highlights the key characteristics of a value chain approach. While the pre-farmgate approach begins with a set of interventions into agricultural production, and then seeks to maximise their impacts on nutrition, the value chain approach takes a different starting point. It begins with the populations affected by food-driven undernutrition, and then identifies value chains that can deliver relevant foods to these populations.
Box 1.1 Key elements of the value chain approach
A value chain is constituted by a sequence of agents (people, companies, etc.) and activities. The advantages of a value chain approach come not in elaborating all actors and relationships, but in identifying those of greatest significance. The advantages of the approach for understanding how to strengthen the delivery of important goods to the poor include:
● identifying the different activities and agents required to bring products to market; ● recognising that what happens at one point in the chain has consequences for
activities and agents at other points; ● paying attention to the output of the chain, including the qualities delivered and the
populations reached; ● highlighting the importance of flows that link actors, including exchanging goods and
payments, but also flows of information, provision or credit and imposition of standards;
● enabling the incentives and limitations faced by private sector actors, including how they capture value control actions at other stages;
● helping identify at which point in the chain, and with which actors, policy interventions can be most effective at improving the functioning of markets.
Four general conditions are necessary for particular foods to contribute to reducing undernutrition: the foods in question must be available, affordable, acceptable and of high nutritional quality. In addition, consumers need to be able to assess the nutritional quality of these foods and make informed purchasing decisions, and businesses must be able to capture the value of investments in nutrition. These conditions are the starting point for assessing the potential of value chains. They are outlined in Box 1.2 and discussed in greater detail in Policy Guidelines: Enhancing Markets for Nutrient-Dense Foods in Ghana (Anim-Somuah et al. 2013a).
Box 1.2 Characteristics for assessing foods’ potential for nutrition
● Nutritional quality. Does the product contain vitamins and protein needed to address undernutrition, especially vitamin A and iron deficiencies among the populations most vulnerable to undernutrition (pregnant and lactating women, infants between six months and two years)?
● Availability. Is the product available in regions affected by undernutrition, and can key populations access the product in locations that are convenient to them?
● Affordability. Is the product available at a price that could be affordable to poor consumers?
● Acceptability. Is there evidence that consumers (especially poor or vulnerable populations) want to consume this product? Is it part of existing diets?
● Integrity and signalling. Can consumers reliably assess the nutritional quality of the product? Can businesses capture a price premium to reflect nutritional value?
Source: Adapted from Hawkes and Ruel (2011: 2).
11
1.3 Methods
The framework used in this report builds on an existing tool designed to facilitate private sector involvement in nutrition-sensitive agriculture (Henson, Humphrey and McClafferty 2013). The tool was restructured and expanded to systematically assess challenges and opportunities for private sector involvement in specific value chains, and to contribute to the development of broader policy guidelines.
Evidence-gathering occurred in two stages: first, a rapid scoping exercise of 13 potential value chains was carried out using desk research and expert interviews. From these commodities, three were selected for in-depth mapping (Section 3 describes the selection methodology), including extensive literature reviews, stakeholder interviews and site visits to wholesale and retail markets. The team met with a total of 32 informants (Annex A), including researchers in universities and institutes, staff in NGOs and donor agencies, civil servants, managers in small and medium-sized food processing businesses, and commodity traders. It should be noted that, due to security risks and resource limitations, field research was only conducted in the South-West zone of the country. However, desk research and expert interviews were used wherever possible to assess conditions in other zones.

12
2 Undernutrition in Nigeria
This section briefly introduces the evidence on rates of undernutrition in Nigeria, especially for children under two years. A more complete overview of this evidence is provided in Annex D. Rates of poverty and acute and chronic undernutrition in Nigeria are alarmingly high and have remained stagnant for the past several years. Between 1999 and 2008, national rates of underweight and stunting in children under the age of three hovered around 25 per cent and 40 per cent, respectively. There are major disparities in nutrition outcomes between the wealthy and poor, between regions of the country and between urban and rural areas. The stunting rate among the poorest 20 per cent of the population is double that among the richest; stunting in some northern states is 50 per cent higher than in the south; and rates in rural areas are 50 per cent higher than in urban areas. In particular, the states in the North-East and North-West suffer the greatest burden of food insecurity and malnutrition. However, rates of micronutrient deficiencies in vitamin A, iron and zinc are high country-wide, especially among the poorest households and particularly among children under five and pregnant women. As the body of global nutrition research has shown, pregnant women and children under the age of two are especially vulnerable to the lifelong negative health impacts of undernutrition. In Nigeria, the use of proper infant feeding and care practices remains very low, with only 13 per cent of infants exclusively breastfed until the age of six months in 2008, a decrease from 17 per cent in 2003; while only 30 per cent of infants receive proper complementary feeding from 6 to 24 months in accordance with the World Health Organization (WHO) Infant and Young Child Feeding Practices.
Micronutrient deficiencies exact a very high toll on human health in Nigeria, with vitamin A deficiency contributing to 25 per cent of child and maternal deaths nationally. Anaemia rates are very high among pregnant women and infants, contributing to almost 20 per cent of maternal deaths, in part driven by lack of access to iron-rich foods. Zinc deficiency is also widespread, linked to lack of access to animal products and diets heavy in phytate-containing cereals and tubers. While salt iodisation programmes have been very successful in Nigeria, and cover the vast majority of households, iodine deficiencies prevail, especially in the north.
Although a majority of Nigerians have sufficiently diverse diets as measured by the number of food groups eaten, consumption of nutrient-dense foods remains insufficient, especially for the poor. Further, over 15 per cent of the population does not have access to a diverse diet, relying overwhelmingly on nutrient-poor cereals or tubers. The main driver of dietary diversity is income, followed by education and family size. In urban areas, there is evidence of a dietary transition and increasing consumption of processed foods and foods high in sugars and salts; this is reflected in growing levels of obesity in some areas, although the overall rate remains low (10 per cent).
Infant care and feeding practices in Nigeria are inadequate for nearly all social groups, and many infants do not get sufficient nutrients from complementary foods, especially among the poor and in the north. Despite progress on timely introduction of complementary foods, only 55 per cent of infants receive complementary foods from a sufficient diversity of food groups, and most complementary feeding diets are dominated by grains. Forty-two per cent of infants are fed fruits and vegetables rich in beta-carotene (the precursor of vitamin A) while approximately 50 per cent are fed meat, fish or eggs. The proportion of children fed foods rich in iron increases with wealth status, from 37 per cent among children in the poorest 20 per cent of households to 81 per cent among children in the richest 20 per cent.
Overall, available data show that undernutrition and micronutrient deficiencies in Nigeria are most severe for the social groups who are least well served by food markets: the poorest people, and those in small towns and rural areas. However, undernutrition – and in particular chronic undernutrition indicated by stunting – remains alarmingly high among children even

13
in higher-income groups, large cities and the relatively more developed South-West states. Even as direct nutrition interventions are scaled up to reach the poorest and most remote populations, parallel efforts are needed to improve the functioning of food value chains that reach the urban poor – and wherever possible the rural poor – in order to address rates of undernutrition above 30 per cent.
This report focuses on food-based approaches to addressing undernutrition, and locates these alongside strategies to address the other drivers of nutrition outcomes, such as access to health services, clean water and sanitation. No studies are available analysing the relative importance of food and dietary factors compared to other drivers of undernutrition in Nigeria at the national level. Available research indicates that wealth status explains the majority of socioeconomic inequality in nutrition outcomes, while health care, maternal education, proper sanitation, breastfeeding and regional differences also play important roles. Despite this gap in the evidence, data showing the prevalence of micronutrient deficiencies, insufficient consumption of nutrient-dense foods and the major growth setbacks experienced by infants during the weaning period suggest a crucial role for increasing the provision of nutrient-dense foods, especially to women and children in the 1,000 days group. In the South-West zone of Nigeria in particular, improving the quality of complementary foods to increase consumption of vitamin A and iron and providing iron-rich foods to young women and pregnant mothers – alongside efforts to improve breastfeeding and complementary feeding practices – appear to be crucial elements of a strategy for tackling undernutrition.

14
PART II: Mapping value chains for selected
nutrient-dense food products
The remainder of this report details the key value chain stages and actors for a set of food products that have potential for reducing undernutrition in Nigeria. As described above, evidence-gathering for this report took place in two stages: an initial scoping exercise followed by detailed value chain mapping of three product types. Part II first outlines the findings of the scoping exercise, which covered commodities that have attracted interest from development agencies, NGOs and the private sector. Based on a rapid assessment, these products were ranked for their potential to reduce undernutrition. Due to the limited time and resources available, two were then selected for detailed value chain mapping: cowpea and soya. In addition, a third type, complementary foods, was selected. Complementary foods are being examined in each of the three country studies conducted under the Strengthening Agri-Food Value Chains for Nutrition project, due to their critical importance for young child nutrition, and strong market presence in case study countries. It should be noted that, while mapping of cowpea and soya value chains included field visits and interviews, mapping of complementary foods was based on Sahel Capital’s existing expertise on this market, as part of developing a previous report for Global Alliance for Improved Nutrition (GAIN) (Sahel Capital Partners and Advisory 2012b).
After explaining the scoring and selection process, the remainder of Part II describes the value chains of the focal product types, disaggregating them to particular actors, processes and supply and distribution systems. It characterises the nutritional qualities, consumer populations, supply chains, processing stages, distribution channels and levels of business interest for each product. The aim of mapping these value chains is to allow for evidence-based assessment of opportunities for intervention to enhance the role of these food value chains in addressing undernutrition.

15
3 Scoping exercise: Selecting high-potential
product types
The scoping exercise focused on 12 food types identified through a desk review of scientific and grey literature. These foods were selected because they are seen as having high potential to address undernutrition among key groups in Nigeria.2 These product types are described in Annex B. Rapid assessment of the value chains for these products was carried out with the purpose of identifying two high-potential commodities for detailed value chain mapping. Foods were assessed against the key criteria that need to be achieved for a particular food to contribute to reducing undernutrition (see Box 1.2, in Section 1.2).
To provide clarity and transparency in the selection of high-priority products, the authors conducted a scoring exercise based on the evidence and stakeholder perspectives collected. Individual products were scored according to how well they addressed each of the conditions in the value chain framework. The criterion of availability was not included in the scoring, since reliable information was not available for most products. In addition, the scoring assessed the extent of current business interest in the product, which is a key indicator of the commercial viability and sustainability of future initiatives. Using a scoring approach allows the products to be ranked according to their average scores and also assessed on individual criteria. While the scoring does not constitute a systematic evaluation, it helps organise the input collected from stakeholder interviews and desk research and provides clarity on the reasoning that underlies selection. In addition to the scoring, investigators considered other information, especially related to the potential for uptake around particular commodities, in selecting the focal product types.
Annex C shows the overall scores for the top-ranked product types and identifies the key value chain challenges faced by each of these products. The overall scoring produced the following ranking for products: (1) tie between cowpea and soya products, (3) dried fish and crayfish and (4) tie between green leafy vegetables and poultry (Table C1). This section provides a narrative explanation of what factors underlie this ranking. Table C2 disaggregates products’ scores among the six criteria. The top-ranked products, cowpea and soya, were scored highly because both products are good sources of protein (although soya is superior) and are generally affordable and acceptable to poor and vulnerable consumers (although cowpea is more affordable). While cowpea can easily be distinguished from alternative products, soya faces signalling issues when it is incorporated as a fortificant in processed foods. There is much greater business interest in soya, compared to cowpeas; while both products have attracted interest from development actors and government. Dried fish and crayfish are an excellent source of protein and key micronutrients. They are widely acceptable to diverse populations and are relatively affordable compared to other sources of animal protein. In addition, they face few signalling issues due to their flavour. However, these products have attracted little interest from business or development actors. Green leafy vegetables have high levels of micronutrients such as iron and are generally acceptable and affordable to poor populations (although availability varies widely across agro-ecological zones). They face few signalling issues but have attracted very little business or development actor interest, probably linked to problems with processing, preservation and marketing. Finally, poultry was scored high as a good source of animal protein and is seen as an aspirational food by many populations. However, affordability for the poor is very low, and poultry faces food safety issues. Although business interest is very high, interest from development actors is low, linked to low affordability.
2 The commodities reviewed were bio-fortified cassava, cowpea, dried fish and crayfish, groundnuts, green leafy vegetables, millet, okra, orange-fleshed sweet potato, plantation, poultry, sorghum and soya.

16
After establishing a set of top-ranking products, the potential of the value chain mapping to contribute to policy and programmatic action was considered. The scoping exercise identified where public–private partnerships, development agencies and NGOs were investing to upgrade value chains and enhance distribution to key populations. These efforts were seen as opportunities to respond to demand for evidence and assure uptake of the value chain analysis. Of the top-scored products, investments and interest from government and donors are focused in particular on soya.3 However, in general these efforts focus on increasing production and yields and linking farmers to markets, but not on nutrition, downstream issues and distribution. Similarly for cowpea, substantial research programmes continue to invest in increasing yields and pest-resistance.4 Research has also examined the potential for increasing nutrient content and reducing post-harvest losses; however, the majority of investment has not focused on downstream issues or nutrition. Poultry, dried fish and crayfish and leafy green vegetables have attracted substantially less interest from development actors. The exception is fish production, which is a target value chain in the Agricultural Transformation Agenda. However, demand for evidence to enhance the nutrition impact of these value chains is limited. The scoping exercise indicated that cowpea and soya – in addition to scoring highly against the value chain criteria – had substantial potential for evidence uptake in ongoing programmes and policies.
Although complementary foods were selected in advance of the scoring process, their potential for evidence uptake was examined. There is an extensive record of interest by development actors and programmes aiming to enhance the potential of complementary foods for nutrition. In addition to programmes focused on infant and young child feeding, and government-funded research, organisations including UNICEF, the United States Agency for International Development (USAID), GAIN, Catholic Relief Services, the Clinton Foundation, Helen Keller, Médecins Sans Frontières and Pathfinder International have invested in this area. Programmes have focused on nutrition education, food fortification and the distribution of ready-to-use food (RUTF) products (Sahel Capital Partners and Advisory 2012b). More recently, Africare, the Federal Ministry of Health and the Federal Ministry of Agriculture and Rural Development (FMARD) have been exploring the linkages between agriculture and nutrition and are actively encouraging large private sector players such as Flour Mills, Honeywell and Dangote to consider introducing nutrient-rich products for the mass market.
Cowpea, soya and complementary foods were selected for detailed value chain mapping in stage 2. This was based on which products best met the conditions for addressing undernutrition and on consideration of potential for uptake in policies and programmes. As will be shown in the sections that follow, particular products in these value chains have the potential to address key micronutrient deficiencies and to be available, acceptable and affordable to the populations who need them. Business interest exists – in the formal and informal sectors – in both types of product. Furthermore, key development actors, including GAIN and its partners, are interested in these product types, stimulating present demand for evidence on how to strengthen these value chains to reduce undernutrition.
3 Development programmes related to soya include the Ministry of Agriculture Agricultural Transformation Agenda, USAID-funded Markets II and DFID-funded Propcom Mai-karfi, as well as a number of research programmes (see Section 5 on Soya for details). 4 Programmes relevant to cowpea include extensive research by the International Institute of Tropical Agriculture (IITA) and USAID-funded crop breeding and research programmes. See Section 4 on Cowpeas for details.

17
4 Cowpea
Cowpea is the cheapest and most widely consumed legume in Nigeria; almost all Nigerians eat cowpea foods on a regular basis. Cowpeas are a good source of protein and feature in a wide variety of traditional foods and dishes. In this sense, cowpea already serves as an important contribution to the nutrition of poor populations. It has 22–32 per cent protein on a dry weight basis, and it also contains key micronutrients including folates and iron.
Nigeria is the world’s largest producer of cowpea, and production of cowpeas doubled from 1990 to 2005. Growth has come from cultivating larger areas, while yields have remained fairly stagnant. Consumption levels are high and far outstrip production. This makes Nigeria the largest global importer of cowpeas. There are a wide range of cowpea varieties grown in Nigeria, with different properties for cultivation, storage, preparation and taste. However, their uses in food products are largely similar, and their differences have little effect on nutritional potential.
The vast majority of cowpea foods are eaten in the home in the form of simply processed foods, usually prepared in the home using purchased cowpeas. In many urban centres, cowpea products are also widely sold as street foods. A relatively small number of formal sector businesses process cowpea commercially. Essentially the only product produced in the formal sector is cowpea flour, which is sold in supermarkets and open-air markets. Although there is limited innovation in packaged cowpea products, a number of food processing companies have developed nutrient-fortified cowpea flour. Strong demand for cowpea foods and their use as street food may present potential for developing new, convenient cowpea products.
Informal sector actors dominate cowpea markets and sell to a broad spectrum of Nigerian consumers. In contrast, formal sector processors of cowpea flour target primarily upper-income groups and institutional buyers such as hotels and caterers. The cowpea value chain is concentrated at the wholesale stage, where a relatively small number of actors channel the majority of supplies.
Despite their widespread consumption, the nutritional impacts of cowpea products are constrained by a number of factors. Although more affordable than alternative protein sources, cowpeas undergo wide seasonal price fluctuations, limiting consumption by the poorest. Low yields and high transportation costs also reduces affordability, especially in urban areas in the south. High prices are also the result of major problems with storage of cowpeas, which are highly susceptible to pests and degradation. Thus far, despite low-cost innovations such as Purdue Improved Crop Storage bags, improved storage techniques are not widely adopted in Nigeria. Most critically, existing preservation techniques using pesticides are creating a toxic hazard in some cowpea supplies. Difficulty in digesting cowpeas also restrains consumption, in particular for children. Low levels of investment by formal sector food processors may be linked to perception that selling to low-income consumers cannot be profitable and to difficulty in securing reliable and high-quality supplies.
Options for responding to these challenges include addressing barriers to the adoption of improved storage technologies by farmers, transporters and wholesalers. These might include working closely with wholesalers, who wield significant leverage, as well as developing coordination across the value chain, by fostering sustained relationships between processors and wholesalers, and between wholesalers and farmers. Finally, a partnership approach with food processors could encourage the introduction of new products targeting low-income consumers, including products fortified with micronutrients.

18
4.1 Cowpea products
The most commonly consumed cowpea product is the boiled cowpea, often served with rice, maize, tubers or bread (see Table 4.1). This is generally regarded as a food eaten by the poor. Cowpea is also used to produce a wide range of Nigerian dishes, dumplings and snacks, including moin-moin, ekuru and dan wake (variously steamed or boiled dumplings), soup (gbegiri) and kosaï/akara (deep-fried fritters). These foods are commonly prepared at home or purchased as street food.
Cowpea is also milled commercially to produce flour, which is sold in supermarkets and open-air markets. A number of medium- and large-scale food processing companies have developed nutrient fortified cowpea flour, including Ayoola Foods Ltd, Lisabi Foods, Endys Flour Mills, U-Best Industries and Ranks West Nig. Limited.
Table 4.1 Cowpea products available in Nigeria
Product Description
Basic cowpea product
Boiled cowpeas The most widely consumed form of cowpea. Simply boiled and seasoned. Served alongside a variety of other foods including rice, maize, tubers, groundnut dishes or salads, depending on the region. Boiled cowpeas are used in traditional soups (such as gbegiri) and dishes (such as kulu wake).
Simply-processed dishes
Various cowpea dumplings (moin-moin, ekuru, dan wake)
Various steamed or boiled dumpling made from cowpea flour are eaten across Nigeria. Ekuru and moin-moin are similar steamed dumplings. Moin-moin often incorporates seasoning, vegetables or meat. Dan wake is a boiled dumpling incorporating powdered baobab leaf and wheat flour. Dumplings are eaten as side dishes, accompanied by a starch or a soup. An advantage of these dishes is they are simple and quick to prepare.
Akara (south) Kosaï (north)
Fritters made by deep frying a batter of decorticated milled cowpeas. Widely eaten for breakfast or as a snack throughout Nigeria.
Processed products
Cowpea flour A number of small medium and large Nigerian companies mill cowpeas into flour and package it for sale. Commercial flour is often used in making moin-moin and akara.
Fortified cowpea flour Several companies produce cowpea flour fortified with micronutrients. This is the only form in which cowpea has been fortified in Nigeria.
Dan wake mix (garin dan wake)
A mix of equal parts cassava, sorghum and cowpea flour produced in Kano and sold in open markets and supermarkets.
Potential products
Canned moin-moin Moin-moin packaged into cans for immediate consumption.
Dry akara The Federal Institute of Industrial Research recently developed akara with reduced moisture content to improve shelf life.
4.2 Nutrient content
Cowpea is sometimes known as naman talaka (‘poor man’s meat’) in Hausa language, indicating its status as a low-cost source of protein. Cowpea grains contain an average of 24 per cent protein and 62 per cent soluble carbohydrates. They are rich in thiamine, folates and iron, and also contain zinc, potassium, magnesium, riboflavin, vitamin B6 and calcium, as well as the amino acids lysine and tryptophan. Nutrient-density varies among cowpea varieties in Nigeria, and some varieties have been highlighted as especially good sources of micronutrients (Boukar et al. 2011a; Boukar et al. 2011b).
19
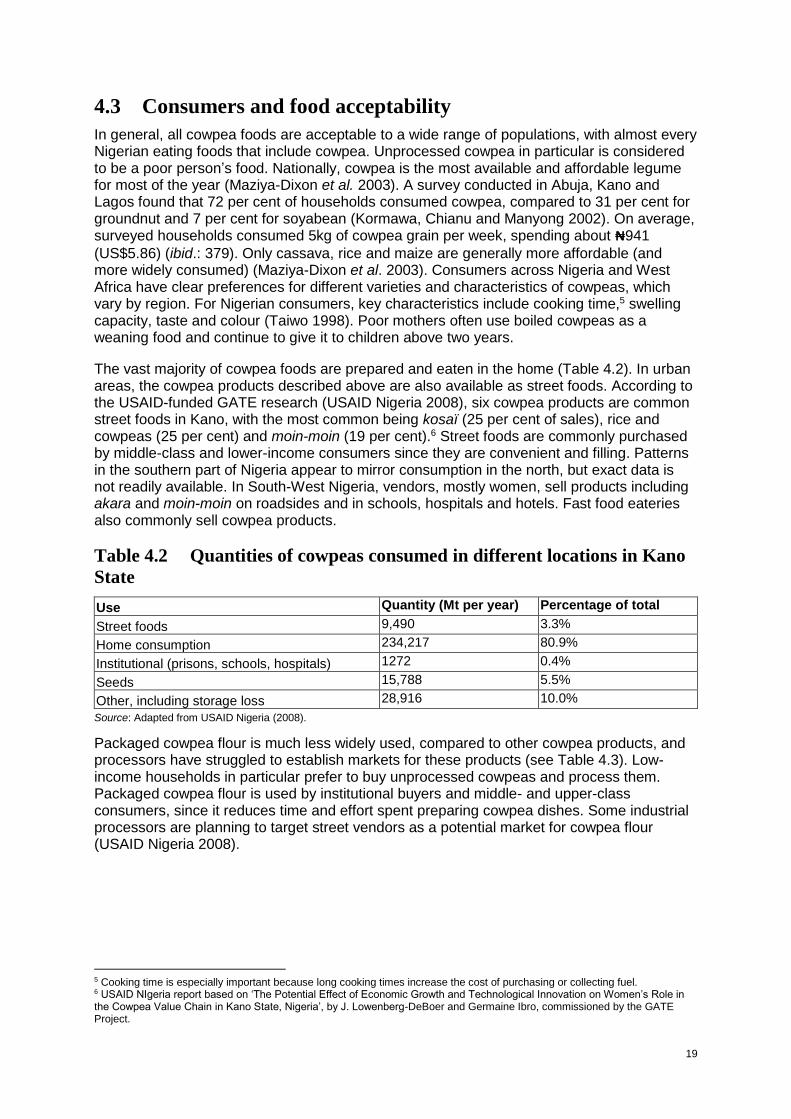
4.3 Consumers and food acceptability
In general, all cowpea foods are acceptable to a wide range of populations, with almost every Nigerian eating foods that include cowpea. Unprocessed cowpea in particular is considered to be a poor person’s food. Nationally, cowpea is the most available and affordable legume for most of the year (Maziya-Dixon et al. 2003). A survey conducted in Abuja, Kano and Lagos found that 72 per cent of households consumed cowpea, compared to 31 per cent for groundnut and 7 per cent for soyabean (Kormawa, Chianu and Manyong 2002). On average, surveyed households consumed 5kg of cowpea grain per week, spending about ₦941
(US$5.86) (ibid.: 379). Only cassava, rice and maize are generally more affordable (and more widely consumed) (Maziya-Dixon et al. 2003). Consumers across Nigeria and West Africa have clear preferences for different varieties and characteristics of cowpeas, which vary by region. For Nigerian consumers, key characteristics include cooking time,5 swelling capacity, taste and colour (Taiwo 1998). Poor mothers often use boiled cowpeas as a weaning food and continue to give it to children above two years.
The vast majority of cowpea foods are prepared and eaten in the home (Table 4.2). In urban areas, the cowpea products described above are also available as street foods. According to the USAID-funded GATE research (USAID Nigeria 2008), six cowpea products are common street foods in Kano, with the most common being kosaï (25 per cent of sales), rice and cowpeas (25 per cent) and moin-moin (19 per cent).6 Street foods are commonly purchased by middle-class and lower-income consumers since they are convenient and filling. Patterns in the southern part of Nigeria appear to mirror consumption in the north, but exact data is not readily available. In South-West Nigeria, vendors, mostly women, sell products including akara and moin-moin on roadsides and in schools, hospitals and hotels. Fast food eateries also commonly sell cowpea products.
Table 4.2 Quantities of cowpeas consumed in different locations in Kano
State
Use Quantity (Mt per year) Percentage of total
Street foods 9,490 3.3%
Home consumption 234,217 80.9%
Institutional (prisons, schools, hospitals) 1272 0.4%
Seeds 15,788 5.5%
Other, including storage loss 28,916 10.0%
Source: Adapted from USAID Nigeria (2008).
Packaged cowpea flour is much less widely used, compared to other cowpea products, and processors have struggled to establish markets for these products (see Table 4.3). Low-income households in particular prefer to buy unprocessed cowpeas and process them. Packaged cowpea flour is used by institutional buyers and middle- and upper-class consumers, since it reduces time and effort spent preparing cowpea dishes. Some industrial processors are planning to target street vendors as a potential market for cowpea flour (USAID Nigeria 2008).
5 Cooking time is especially important because long cooking times increase the cost of purchasing or collecting fuel. 6 USAID NIgeria report based on ‘The Potential Effect of Economic Growth and Technological Innovation on Women’s Role in the Cowpea Value Chain in Kano State, Nigeria’, by J. Lowenberg-DeBoer and Germaine Ibro, commissioned by the GATE Project.

20
Table 4.3 Target consumer groups and regions for commercial cowpea
products in Nigeria
Product Consumed by children under two?
Consumed by the poor?
Consumed by the middle class?
Region of consumption
Boiled cowpea dishes Yes Yes Yes Throughout Nigeria
Dumplings, moin-moin Yes Yes Yes Variously throughout Nigeria
Akara, kosaï Yes Yes Yes Throughout Nigeria
Fortified cowpea flour No No Yes Urban, south, export
Dan wake mix Yes Yes Yes Northern Nigeria
Source: Field research.
4.4 Business interest
With simply processed cowpea foods being so widely consumed, there is substantial involvement from businesses across Nigeria in producing cowpea products. The vast majority of these businesses operate in the informal economy, often at a very local scale. There is limited segmentation of the market according to which consumers are targeted; foods sold in more highly capitalised restaurants and fast food venues target middle- and upper-class consumers. Street vendors target lower-income consumers, although wealthier groups also consume street foods.
Industrial processing of cowpeas in Nigeria is mostly small scale, and the products involved are relatively simple, limited to cowpea flour and flour mixes. Formal sector processors in the South-West are food companies and flour mills that produce flour for sale to targeted groups such as fast food companies, boarding schools, supermarkets and homes. Other products have been suggested at various times, including canned cowpeas and canned traditional foods, but these have not attracted sustained business interest.
In addition to processors, businesses are also involved in agricultural inputs and storing, transporting and wholesaling cowpea. Examples of businesses involved at these upstream stages are listed in Section 4.5.
Companies identified as part of research:
Ayoola Foods Nigeria Limited, located in Lagos State, has a large factory. Its product range includes fortified cowpea flour and whole cowpeas packaged in sachets.
Lisabi Mills has a medium-sized factory in Lagos. Its product range includes fortified cowpea flour. It is the first Nigerian company to invest in food fortification.
Ranks West Nigeria is a medium-sized company located in Lagos and established in 2005. It produces cowpea flour.
Endy Beans Flour is a small food processing company in Lagos. It produces fortified cowpea flour.
Q-Best Agro-processing Enterprises is a small company located in Lagos. It produces cowpea flour, among other products.
Stapro Industries Nig. Limited is a medium-scale food processing company in Lagos. It produces cowpea flour and a range of other processed food products.
Yusol International Foods is a large international company located in the United States. It produces Ola-Ola cowpea flour, which is imported into Nigeria.

21
Box 4.1 Cowpea flour produced by Lisabi Mills
Lisabi Mills Nigeria Limited is the oldest indigenous food processing company in Nigeria, and it pioneered the introduction of micronutrient fortification. It manufactures a wide range of convenience foods and states that it is one of the two largest producers of cowpea flour in the country.
The company sources whole cowpeas from northern Nigeria and the Republic of Niger. Processing is semi-automated and includes destoning, dehulling, decortication, drying and milling, after which vitamins and other micronutrients are added. Lisabi cowpea flour has a shelf life of six months to one year.
Lisabi cowpea flour is packaged in 500g packs, sold at ₦250. Lisabi distributes mainly in the South-West zone, and targets the product towards fast food restaurants, boarding schools and middle-class households.
Lisabi Mills faces a number of challenges in its cowpea business:
● Low awareness of its product, and scepticism about packaged cowpea flour among some consumers;
● High moisture content (above 10 per cent) in cowpea supplies; ● High transportation costs for supplies from northern Nigeria; ● Intense competition from a wide range of processors; ● Distribution challenges, which make it difficult to reach low-income areas and regions
beyond the South-West.
Source: Interviews with Lisabi Mills staff. For further information on the company and its experiences marketing fortified foods in Nigeria, see the accompanying Case Study (Nwuneli et al. 2014).
4.5 Production and supply chain
Cowpeas consumed in Nigeria are both produced domestically and imported, and Nigeria is both the largest producer and importer of cowpeas. Most cowpea production is in northern states, especially Kano, Katsina, Kaduna, Bauchi, Borno, Adamawa and Taraba. Annual production of cowpea has more than doubled from about 1.3 million metric tons reported in the early 1990s to about 5 million metric tons in 2012.7 Most of this increase is due to an expansion in the cowpea area (USAID Nigeria 2008). Although research institutes such as the International Institute of Tropical Agriculture (IITA) have developed and released a number of improved varieties, average yields have not increased (Kormawa et al. 2002). Models have predicted that growth in cowpea consumption is outpacing production and reliance on imports will increase (ibid.).
All cowpea products in Nigeria are sourced from the same supply chain system, including both industrial and informal processors (see Figure 4.1). This system functions similarly to other bulk agricultural commodities in West Africa, and involves complex networks of intermediaries. In-depth research has revealed that this system is effective for sourcing cowpeas over long distances and making them available in urban markets, although costs are high at key points, notably transport (Adejobi and Ayinde 2005). The first link in the chain is farmers selling (generally small volumes) to commission agents. These agents charge a fee to facilitate contact between farmers or rural assemblers and large wholesalers based in major urban markets in the north.8 Wholesalers store cowpeas and sell in large quantities to retailers and to itinerant transporters who transport cowpeas from the north to major markets in the south, including Ibadan, Lagos and Onitsha. Wholesalers and processors in the south cannot access farmers directly due to distance and cultural barriers, although some southern wholesalers use trusted suppliers who they pay in advance for sourcing (Sahel Capital, communication). In contrast, processors in the north are able to buy directly from farmers and
7 FAOSTAT, http://faostat3.fao.org/faostat-gateway/go/to/download/Q/QC/E. 8 Dawanau Market in Kano is the largest cowpea market in the world, with storage capacity exceeding 200,000 metric tons. Merchants from Dawanau Market finance buyers throughout Nigeria and neighbouring countries (Mishili et al. 2007).

22
rural assemblers. According to Adejobi and Ayinde (2005), in both northern and southern markets a small number of large wholesalers control the market and sell to large numbers of small retailers and processors. The commission agents are also powerful because they link buyers to producers.
Figure 4.1 Key actors in the cowpea supply chain
Source: Adapted from Musa (2003) and Ibro et al. (2008).
The various actors in the cowpea value chain provide different services to enable the functioning of markets. They also have vastly different levels of power over the value chain, as a function of their wealth and their ability to control key market functions. These functions are summarised in Table 4.4. According to Adejobi and Ayinde (2005), particularly powerful are large wholesalers based in the north, who control the link between farmers and retailers/consumers, and traders’ associations, which control access to markets. These wholesalers provide crucial services that give them power compared to other actors. They provide credit both to farmers in exchange for a guarantee of exclusive purchasing and to smaller wholesalers and retailers. This is especially important because banks in Nigeria do not provide credit to these actors. Credit provision is based on mutual trust and is enforced by traditional market associations; collateral is rarely provided.
Storage is a key function in the cowpea value chain. Like credit provision, storage is performed primarily by wholesalers, who purchase cowpeas when prices are low and resell when prices rise after the harvest (see Section 4.6 on Pricing). Storage is a crucial problem for cowpeas, since the grains are highly subject to pests, particularly beetles known as bruchid weevils (Callosobruchus maculatus). When stored using traditional methods, over 80 per cent of grains were damaged after eight months (Caswell 1984, cited in Murdock et al. 1997). A market survey in Northern Ghana found that 15–94 per cent of cowpea grains were damaged (Golob 1993, cited in Adam and Baidoo 2008). In response, various value chain actors use preservation techniques. In addition to reducing the quantity of supplies, consumer surveys have found that even a small number of beetles significantly decreases the price consumers are willing to pay (Mishili et al. 2007). In response, merchants commonly sort cowpea supplies to remove grains damaged by beetles (ibid.). A 1991 survey showed

23
that approximately 50 per cent of respondents used traditional preservation techniques such as camphor, pepper, gamaline or ashes (Taiwo 1998). Many farmers, transporters and wholesalers place chemical deterrents/pesticides in storage sacks but these compounds can have negative effects on human health (see Box 4.2). In addition, several projects have recently sought to promote the use of improved storage sacks that prevent weevil infestation (see Box 4.3).
Box 4.2 Food safety risks and cowpea storage
Cowpeas are highly susceptible to post-harvest losses due to bruchid weevil infestation. Although traditional preservation techniques exist, farmers and merchants have recently begun using pesticides such as Phostoxin, Force Toxin and Actellic dust to prevent infestation. However, these compounds can have serious negative health consequences if ingested by humans. Reports indicate pesticides are often used incorrectly, including pesticides intended for field application being placed in storage containers.
Recent news articles and statements by the National Agency for Food and Drug Administration and Control (NAFDAC) have reported on deaths associated with consumption of pesticide-contaminated cowpeas (Shaibu 2008; IRIN 2008). Reports indicate that NAFDAC has made efforts to ban certain pesticides and sanctions market actors who use products incorrectly. Research institutions including the Nigerian Stored Produce Research Institute and the IITA have sought to train farmers and merchants about proper use of chemicals, but field discussions suggest that awareness and compliance are low.
Wholesalers widely claim pesticides do not have negative health effects after cowpeas are washed and cooked. However, in low-income areas, consumers have limited access to water and cowpeas are often not washed sufficiently. Food safety is clearly a major problem for cowpea. Wholesalers and market intermediaries prefer to use pesticides since they are low cost and reduce weevil damage. But consumers are unable to identify whether hazardous pesticides are present when they purchase cowpeas. There is a need for market regulation and/or the introduction of new, safe storage technologies (see Box 4.3).
Box 4.3 Slow uptake of improved storage bags
Simple and safe technology can reduce post-harvest losses of cowpea due to weevil infestation from above 30 per cent to 0.6 per cent. This technology is a three-layer polyethylene bag developed by researchers at Purdue University, USA, and trademarked as Purdue Improved Crop Storage (PICS) bags. In 2008 the Bill and Melinda Gates Foundation funded a project aiming to achieve 50 per cent use of PICS bags in West Africa by 2012. The technology allows farmers to store cowpeas until the peak season, when they can be sold at higher prices. It could also reduce the use of toxic pesticides for storage.
Nigeria is the first country in Africa where PICS bags are being produced locally (see Box 4.4). Uptake has been slow, although demand for bags is now increasing. Government agricultural agencies, working with development partners and the PICS manufacturer, have undertaken aggressive outreach to convince farmers to use the bags. The main limitation is that farmers do not receive a premium price for cowpeas in PICS bags. As a result, they use the bags to store seeds, but not to package grains for sale. Cowpea wholesalers prefer to use chemical deterrents, because these are cheaper. Wholesalers also aim to reduce farmers’ use of PICS bags, since if farmers were able to store until the peak season, this would cut into their profits.
Currently, several new manufacturers intend to begin producing PICS bags. This competition may reduce the cost of bags, but ensuring the quality and efficacy of the products will be a key challenge. The primary challenge remains to create incentives to use PICS bags throughout the value chain.

24
Table 4.4 Actors in the cowpea value chain, the relative market power
they hold and the services they provide
Value chain actor Number and market power Services provided
Commission agents Many Moderately powerful
Broker for wholesalers and producers
Northern wholesalers Few Very powerful
Credit to farmers and retailers Storage
Itinerant traders Unknown Transport
Southern-based wholesalers Few Powerful
Storage
Retailers Many Weak
Credit to consumers
Trader associations One per market; Powerful – control market access
Conflict mediation Market coordination Mediate with government
Industrial processors Few Unknown
Processing
Informal processors Many Weak
State and local government N/A Market infrastructure Taxation
Source: Adapted from Adejobi and Ayinde (2005).
Box 4.4 Business involvement in producing improved storage bags
Lela Agro Industries Nigeria Limited is currently the sole producer of PICS bags in Nigeria. The company was selected to produce the bags because it had the lowest manufacturing cost and was interested in developing a distribution system. The bags are available in 300-piece bales, priced between US$1.60 and US$2.50, depending on the region (Baributsa et al. 2010). According to its managing director, Lela Agro intends to manufacture more than one million PICS bags in 2013 and plans to expand production to above 1.5 million bags in 2014 (Purdue University 2013). Lela Agro originally provided stock on consignment, but this method was abused and there was widespread non-payment. As a result, Lela Agro switched to cash-and-carry in 2009.
Challenges faced by Lela Agro
● Competition from new manufacturers. Lela Agro holds that the competitors are infringing its patent.
● The company’s distribution network has lagged behind increasing demand. The company may need to establish regional distribution centres so bags are supplied more rapidly.
● Transport costs are high, and it is difficult to deliver large bales in remote areas where the roads are poor.

25
4.6 Pricing
Most of the varieties of cowpea are available all year round although prices are higher during the growing seasons due to limited availability. Prices of wholesale cowpeas are subject to large seasonal variations, partly related to high transportation costs and the difficulty of storage. A survey of cowpea prices in Kano State indicates that peak prices during the growing season (April–August) can be double the low price during the harvest periods (October–December). The prices and timing of peak price varies substantially from year to year (Fig. 4.2). In Lagos, prices are substantially higher than in northern markets. High season prices in 2013 ranged from ₦160 to ₦250 for 850g, depending on the variety. The
timing of peak prices also varies between varieties; honey beans are abundant between January and May, Niger variety is abundant between September and October, and other varieties are available between November and December.
Transportation costs are high for supplying cowpeas to the south, although they vary depending on a variety and origin of supplies. In addition to transport costs, land levies and boundary payments must be made to traditional authorities in production zones, and fees must also be paid in markets (Annex E, Table E3).
Figure 4.2 Retail prices for cowpea in Kano State, 2004–06
Source: Kano State Agricultural Development Programme.
Retail prices for cowpea flour products vary widely (see Table 4.5). In general, products that are fortified (according to claims made on product packaging) are sold at higher prices. However, the price gap is small for a number of products (Endys, Lisabi Mills, Ranks West) when compared to home-processed cowpea flour. In these cases, it may be availability in locales where poor consumers can access them, rather than affordability, that restricts purchasing by low-income groups.

26
Table 4.5 Comparison of prices for cowpea flour products
Companies and products Fortification Package sizes Price (₦) Price (₦/kg)
Raw, whole cowpeas None 850g 160–200 188–235
Home-processed cowpea flour (dry-milled)9
None 680g (derived from 850g whole cowpeas)
310–400 456–58810
Endys Bean flour Vitamins A, B1, B2, B6, B12, C, D and unspecified minerals
1kg 465 465
Lisabi Mills Vitamins A, B1, B2, B3 and iron
500g 250 500
Ranks West Nig. Ltd. None 900g 450 500
Ayoola Foods Limited Unspecified vitamins 450g 250 556
Q-Best Agro-processing Enterprises
None 1kg 650 650
Convenient Home Foods and Beverages – dan wake mix11
None 1kg 220 220
4.7 Processing
The vast majority of cowpea products are processed using simple and traditional methods, with cowpeas processed by hand in many rural areas, and small mechanical mills present in almost every urban market. Even among formal sector businesses, processing is limited to milling techniques to produce cowpea flour.
Informal sector milling involves mechanically milling wet, dehulled cowpeas, using plate mills powered by gasoline or diesel. Millers are reluctant to mill dry cowpeas because this requires disassembling and cleaning the mill beforehand. For this reason dry milling is more expensive: wet milling can cost as little as ₦50–70 per 850g whole cowpeas, while dry milling
costs as much as ₦150–200 for the same quantity. Prices increase during periods of fuel
scarcity. Consumers generally prefer wet-milled cowpeas, since the process maintains organoleptic properties. Dry milling, although it can produce higher-quality flour with longer shelf life, must be done carefully to maintain the desired properties.
For cowpea flour produced by larger, formal enterprises, more sophisticated machinery is often used, including dehuller, aspirator, hammer mill with cyclone and packaging and weighing machines. The stages are semi-automated. The end product has a shelf life between six months and one year. Commercial processors use white and brown varieties of cowpea because of their size and high flour yield.
4.8 Distribution
Home consumption appears to be the most common channel for consuming cowpeas, with street food a distant second (see Table 4.2). Detailed evidence on the structure of these distribution channels is scarce. Processors of cowpea products use four standard distribution models to reach consumers: street food vendors, restaurants and fast food companies, institutional providers (such as schools or hospitals) and supermarkets.
9 The cost of home-processed flour shown here is based on the more expensive dry milling process. Home-processed flour can be produced even more cheaply using the conventional wet milling method (see Section 4.7 on Processing). 10 The price shown here assumes a grain yield of 80 per cent when whole cowpeas are milled into flour. Yields may be lower under real market conditions. 11 Dan wake mix incorporates cheaper ingredients including cassava flour, making it lower cost. It cannot be directly compared with cowpea flour products.

27
All of the prepared cowpea foods described in this section are sold as street food, with the exception of traditional northern dumplings, which are more commonly eaten at home. Local studies have reported that there are a very large number of vendors (the vast majority are women) involved in retailing street foods. Demand for these foods is high, but profitability is low due to intense competition and low barriers to entry.
Anecdotal evidence suggests that informal distribution channels, especially through open markets and roadside vendors, along with institutional channels tend to reach poor consumers (as well as some middle class). Supermarkets, established restaurants and fast food menus target middle- and upper-income consumers (Table 4.6).
Table 4.6 Distribution channels for cowpea products and the consumer
groups reached by these channels
Product Distribution channel Target consumers
Boiled cowpea dishes Markets, roadside vendors, small restaurants, schools, hospitals
Poor Some middle class Dumplings
Akara, kosaï
Moin-moin Roadside vendors, fast food outlets, hotels Poor Middle class
Cowpea flour Supermarkets, open markets, used by fast food venues Middle class
Dan wake mix (garin dan wake)
Open markets and supermarkets Poor Middle class
Source: Sahel Capital and Advisory (2012b).
4.9 Value chain barriers and potential responses
Cowpea products have substantial potential for contributing to reducing undernutrition in Nigeria. Cowpeas are at present the most widely consumed legume and already reach a substantial portion of the population affected by undernutrition. They are rich in protein and several important micronutrients. Furthermore, cowpea foods do not suffer the major drawbacks of many other products associated with guaranteeing and signalling their nutritional content to consumers. Cowpea foods can easily be distinguished from alternatives by consumers. The key challenge for cowpea is to make products more consistently affordable to poor consumers and to develop ways to enhance their nutritional content, especially if they are to be used in foods for infants. Increasing the affordability of cowpea products will involve addressing underlying problems at the stages of production, transport and storage. There may also be opportunities to promote innovative product types that are more acceptable to consumers.
4.9.1 Barriers facing cowpea products
● Yields of cowpeas have lagged behind potential, leading to rising imports. Although total cowpea production in Nigeria has increased in the past few decades, this has been driven by increasing cultivation area, not rising yields. If this trend continues, higher imports from neighbouring countries will be needed to meet growing consumer demand. In the extreme, this could lead to rising prices. Factors underlying poor yields include the high cost of inputs for cowpea production, limited use of improved seeds, infestation by pests, drought and irregular rainfall and inconsistent government policies, especially on input subsidies and incentives.
● Large seasonal price fluctuations reduce the affordability of cowpeas for the poor. The price of cowpeas during the high season can be as much as double that during the low season. Although cowpeas are overall the most affordable protein source in most of the country, during the high season they are not

28
affordable to poor populations, who thus cannot access sufficient protein. Lack of adequate storage facilities contributes to these fluctuations, creating cycles of gluts and high prices. Improving use of storage technologies along the value chain, including on-farm facilities, transportation and storage facilities in markets would help address this constraint.
● The high cost of transportation is a major barrier to supplying processors and consumers. For markets in the south of the country, cowpeas are transported long distances. Poor road infrastructure and the need to pay fees and bribes to security agents make transport relatively expensive and slow.
● Cowpeas can be difficult to digest, especially for children. Mothers are aware of this, and this reduces the use of cowpea products as food for children and infants. Proper processing may allow cowpea foods to be more digestible.
● Cowpea products are subject to degradation during storage. Cowpea’s vulnerability to pests is the primary constraint to effective storage of cowpea grains in Nigeria (Akinkurolere, Adedire and Odeyemi 2006). Weevils can destroy supplies in a matter of weeks if not stored in proper conditions. This creates negative knock-on effects when actors use unsafe storage techniques.
● Widely used storage techniques create major food safety risks. Value chain actors use pesticides to reduce weevil damage, but these chemicals persist throughout the value chain and have caused poisoning and even death in people eating cowpea. There are safe and effective storage solutions in Nigeria (i.e. PICS bags). However, thus far these alternatives are not being taken up by value chain intermediaries.
● There is little investment by formal sector businesses. Thus far, medium- and large-scale processors have limited their activities to producing packaged cowpeas or cowpea flour. Although other products have been suggested, they are not currently being produced. This may be linked to the limited acceptance of the packaged products among wholesalers, retailers and consumers, linked to their belief that home-processed cowpea is better, and their fears that processors incorporate other cheaper flours. The practice of mislabelling may indeed be widespread, as there are few standards in the industry, low barriers to entry and limited brand loyalty.
4.9.2 Options for strengthening value chains
Efforts are under way to address broader constraints on agricultural production in Nigeria. Through its Agricultural Transformation Agenda, the Federal Ministry of Agriculture is proposing to support industrialisation of agriculture and food processing with a suite of policy measures including import restrictions and promotion of clusters of industries focused on particular crops. In parallel, donors have sponsored programmes aiming to increase yields and promote upgrading along the value chains for various crops. However, cowpea has thus far not been identified as a priority crop. A review of the many initiatives in this area is beyond the scope of this report. The role of agricultural policy and promoting nutrient-dense foods will be examined in the policy guidelines that accompany this report. The list that follows outlines a number of more targeted measures that could help address the specific challenges identified above.
● Promote use of low-cost improved storage by farmers and wholesalers. Improved storage bags are already produced in Nigeria but are not used throughout the value chain. Future interventions need to investigate in detail the incentives faced by farmers and wholesalers, in order to understand the reasons why this technology is not used. This research should identify options for improving incentives. At present, wholesalers wield significant influence and provide key services in value chains. Government or donor programmes

29
could encourage wholesalers to provide improved bags to farmers as part of their credit services and to guarantee a price premium for cowpeas sold in improved bags. Agro-processers and bulk retailers could be encouraged to offer favourable prices to wholesalers for properly stored cowpeas.
● Foster coordinated supply chains. There is limited coordination between food processors and upstream actors including wholesalers and farmers. Lack of coordination inhibits the provision of incentives (see Box 4.3) that could improve the quality and reliability of cowpea supplies. Government or donor initiatives could support the development of relationships between processors and wholesalers, and between wholesalers and farmers, including trials of new technologies and practices. Reliable and low-cost supplies of cowpeas could incentivise processors to invest more in this market. The key challenge in coordinating supply chains has been both enforcing contracts and providing incentives for farmers.
● Encourage development of products targeting vulnerable groups. As discussed, there is limited innovation in cowpea products. Programmes should assess the potential for new products that are specifically targeted to groups vulnerable to undernutrition (especially infants and young children). These could build on existing familiarity with cowpea products, while addressing acceptability concerns for children associated with poor digestibility. There are already successful cowpea products fortified with micronutrients. New products could also address the problems with the shelf life of cowpea, through use of sealed packaging and processing techniques. These efforts would need to be coordinated with nutrition-focused programmes, especially behaviour-change communications initiatives focused on infant feeding.
● Increase awareness among businesses of opportunities and foster innovative ideas. Limited innovation in cowpea products, and limited uptake of existing technologies. Product innovation can be fostered by forging links between research institutions such as the Federal Institute of Industrial Research, Oshodi (FIIRO) – which have developed innovative products – and food processors and other value chain actors. Product innovation challenge funds could target joint applications including research institutions and private companies.
● Improve business environment for nutritious foods. The high costs and barriers faced by businesses in Nigeria are well known. These barriers include inability to access finance, complex and shifting regulations and lack of expertise and technical capacity. These constraints are not unique to cowpea value chains. But they deter businesses from taking risks in pursuing innovative products more broadly. Government and donor agencies can enhance business interests in nutritious foods (including processed cowpea products) by creating robust business support structures, facilitating access to finance for expansion, providing business training and working with public agencies to simplify business registration and product certification.

30
Box 4.5 Key development and research actors involved in cowpea
value chains
● Institute for Agricultural Research (IAR) of the Ahmadu Bello University (ABU) Zaria is engaged in Confined Field Trials (CFT) of insect-resistant transgenic cowpea granted by the Federal Government of Nigeria.
● International Institute for Tropical Agriculture (IITA) is engaged in a breeding programme that focuses on identifying additional sources of resistance to pests and diseases, combating parasitic weeds, improving drought tolerance and adaptation to low soil fertility. IITA hopes to establish a foundation for further genetic improvement in cowpea and increase production and achieve desired grain size, seed coat texture and colour. Efforts are being made to increase the level of micronutrients and enhance protein in the grains of cowpea. The IITA genebank holds the world’s largest and most diverse collection of cowpeas, with 15,122 unique samples from 88 countries, representing 70 per cent of African cultivars and nearly half of global diversity.
● USAID-funded Maximizing Agricultural Revenue and Key Enterprises in Targeted Sites (MARKETS II) developed a value chain development programme with a focus on cassava, cocoa, cowpea, fish, maize, rice, sesame and sorghum.
● The Gates Foundation has invested in PICS bags. These bags can help farmers mitigate the effects of regular price swings, enabling them to hold on to their harvest until periods of cowpea scarcity, which can increase their cowpea income by approximately 90 per cent annually. Lela Agro, a well-established agro-input supplier, is currently the main supplier of PICS in northern Nigeria.
● Federal Institute of Industrial Research, Oshodi (FIIRO) has designed and fabricated complete process line machinery and equipment for cowpea flour production available at micro, small and medium scales. It has also developed recipes for products with cowpea and other nutritious food.

31
5 Soya
Soyabeans (Glycine max) are an unparalleled source of protein, containing twice as much protein as beef or poultry at one-fifth the price, while being the only vegetable that contains a complete set of amino acids. They also contain beneficial phytochemicals such as isoflavones. For these reasons, soya is a leading ingredient in processed nutritional foods worldwide, and has featured in products aimed at addressing acute malnutrition in Nigeria (New Nigerian Foundation/Development Associates 2007).
Soya production in Nigeria has expanded rapidly in the past few decades; however, it lags far beyond demand by the industrial sector, especially for use in oils and animal feeds. For these reasons, the market is split, with as much as 40 per cent of domestic soya production consumed by the small farmers that produce it, while many large manufacturers use cheaper imported soya. Like supply chains, processing of soya products in Nigeria is divided between small-scale, informal production and large industry. Soya is readily used in the production of soya milk, soya cake and the fortification of carbohydrate-based staple foods. Small-scale processors widely produce traditional foods and dishes derived from soya (especially in the north). In parallel, medium and large manufacturers make a wide variety of domestically produced and imported processed foods that incorporate soya. These formal sector products largely target middle- and upper-income consumers in urban areas.
Soya has strong potential due to its consumption by key populations affected by undernutrition. It is considered to be a ‘poor person’s food’, especially in the northern zones. Surveys of urban consumers have found that awareness and consumption of soya foods were higher among low- and middle-income consumers than among the wealthiest groups. Meanwhile, the largest group of consumers seem to be rural soya-producing households themselves. Soya is also a key ingredient in fortified weaning food products – including products in both the formal and informal sectors.
This potential notwithstanding, soya faces substantial barriers to a wider nutritional impact. First and foremost, the large gap between the price of Nigeria-produced soya and the international price means that, in the near term, the formal sector manufacturing will rely on imported soya. The exception to this is Nestlé Nigeria, which sources Nigerian soya for a number of its products. Larger formal sector soya processors are targeting upper-income consumers and selling products at high prices that are unaffordable to the poor. In the informal sector, consumption is limited by the high costs and time required to prepare soya foods – especially compared to starch-based convenience foods. Furthermore, acceptability of soya foods is limited due to their pungent odour and indigestibility; acceptability is especially a problem for young children. Because of its reputation as poor person’s food, urban households with access to other foods may prefer these to soya.
There are multiple options to respond to these challenges. Agricultural development programmes are investing in increasing soya yields and reducing the cost of production in Nigeria, but widespread impacts are unlikely in the short term. In parallel, nutrition-focused interventions could seek to promote awareness of and demand for soya foods throughout existing behaviour-change communications and campaigns. In urban areas where convenience is a barrier, a public–private partnership could seek to promote fortification of convenience foods using a simple soya flour or similar product; key would be establishing low-cost distribution channels that reach informal retailers. Another option is to upgrade localised soya value chains by working with informal processors and retailers in zones of production. If nationwide reach is imperative, partnerships need to target market leading multinationals, which are the only actors with well-developed distribution systems and whose products are consumed by the broadest spectrum of populations.

32
Table 5.1 Soya products available in Nigeria
Product Description
Basic soya products
Whole soyabeans Whole soyabeans are dried, roasted and cooked for a long period of time to soften. This is mostly consumed by low/middle income households and sold via open markets.
Soya flour Used as ingredient in baked goods, soy-ogi, cereal mixes and other products. Consumed by low/middle income households via open markets.
Soya protein isolates Made from defatted soya flour, it has a neutral flavour and is more digestible than soya flours. Soya protein isolates are imported and used as additives by major multinationals in a large number of foods, including seasonings and weaning foods listed below.
Informal market products
Local soya milk Produced by small-scale informal processors and sold in open markets and small eateries. Also used for feeding infants and young children.
Soy-wara (similar to tofu) Snack consumed by low/middle income households via open markets.
Commercial-scale products
Soya vegetable oil Manufactured on an industrial scale. Mostly consumed by middle-income households. Sold in open markets and supermarkets.
Corn soya blend (CSB) Mixes of maize and soya fortified with essential vitamins and minerals. Although similar mixes are available in domestic markets, this product is primarily formulated specifically to address acute malnutrition, and is purchased and distributed by public agencies and development programmes.
Commercial soya milk Packaged soya milk products are typically imported already fully processed or semi-processed and repackaged in Nigeria. It is generally consumed by higher income households, sold in supermarkets, etc.
Seasonings
Local seasonings (i.e. soya dawadawa)
Traditional seasonings made from fermented soya produced by small informal processors. Consumed by low/middle income households and sold in open-air markets.
Commercial seasonings Industrially produced seasonings similar to those consumed in many other countries. The market leader is Nestlé Maggi. These are consumed by virtually every household and sold in all retail outlets. Imported soy sauce is also available.
Soy weaning foods*
Commercial weaning foods*
Industrially produced weaning foods are both manufactured locally and imported. They are widely available in urban areas throughout the country.
Soy-ogi* (also known as soya ogi)
Soy-ogi is a fermented sour corn pap or porridge widely used as a breakfast food and weaning food among millions of Yorubas in the western states of Nigeria. Made by soaking, blending, sieving the liquid from the solid contents, which is eventually boiled and consumed as pap. The locally made ones are readily sold via open-air markets.
New products
Soy-musa A new product that blends soya with plantain flour, which is being developed by the National Horticultural Research Institute (NIHORT) in Ibadan.
*Soya-based weaning foods and soy-ogi are discussed in detail in Section 6 on complementary foods. They are not discussed in the remainder of this section.

33
5.1 Soya products
Soya in Nigeria is primarily consumed as unprocessed or simply processed products. The grains are used in the production of soya milk, soya cake, dawadawa (seasoning), cheese and soya soup, and the fortification of local carbohydrates. The most commonly eaten products are soya flour used for bread and other confectioneries. Farmers and low-income rural populations consume locally cultivated soya, while the urban and wealthier households consume imported soya milk and local products that use soya flour in their production process, such as bouillon cubes, vegetable oil, breakfast cereals and weaning foods. The poultry-feed millers and food, paint, pharmaceutical and confectionery industries in Nigeria also use soya in various forms.
Numerous other soya products have been developed by Nigerian research institutions, including soy-garri, soy-kunun, soya bread, soy-tuwo, soy-lafun (Okoruwa 2011). However, many of these products have seen little uptake into commercial production (ibid.). The products featured in Table 5.1 include only those with evidence of current production at substantial scale.
In addition to soya-based foods for human consumption, much of the soya in Nigeria is used for animal feed or industrial uses.
● Animal consumption. Soya cake/feed is primarily derived from the residue of processed beans used for making soya oil and is used for animal feed because of its high protein content. The soyabean plant’s leaves and husk are also used for animal feed. The rapid growth of the poultry industry in recent years has led to increased demand for soya.
● Industrial uses. Soya oil is used in the manufacture of adhesives and fertilisers and is widely used for the industrial production of antibiotics (Agwu et al. 2009). Other industrial uses include the local paint, cosmetics and soap making industries (Nicely and David 2011), glycerine, printing inks, greases, lubricants, waterproofing materials, oil cloth, linoleum, putty, resins, insecticides and disinfectants. Soya lecithin is an important product that is used by the food, cosmetics, pharmaceuticals, paint and plastic industries (Agwu et al. 2009).
These uses are not examined in this report.
5.2 Nutrient content
Soya has been described as among the best plant sources of protein, with 44g crude protein content per 100g. It is one of the few plant foods that provide a complete protein source, containing all eight essential amino acids. They are useful sources of folate, vitamin E, magnesium, potassium, iron, copper, phosphorus and manganese. They also contain large amounts of biotin, the A and B vitamins, vitamin K, thiamine, iodine, calcium and folic acid. (Agwu et al. 2009). In addition, soya contains phytochemicals that may contribute to bone health and reduce risk of cardiovascular disease, and it is also suitable for diabetics (ibid.). Because of its nutritional qualities, low cost and availability on global markets, soya is a central ingredient in many nutritional programmes.
One study compared the nutritional status of children in three villages in northern Nigeria whose residents consumed soya. One village had significantly higher nutrition outcomes than the two other villages. This difference was attributed to the consumption of soya (Owolabi et al. 1996). Another study conducted in the Southern Guinea savannah found that children in communities that planted soyabeans were more likely to be in households with higher incomes and to have better nutrition indicators (Sanginga et al. 1999).

34
5.3 Consumers and food acceptability
Soya was not originally part of traditional foods in Nigeria. Although introduced at the beginning of the twentieth century, cultivation of soya expanded rapidly during the 1960s. Nigerians were also exposed to soya in corn-soya blend products imported from the USA as part of the Food for Peace programme (Shurtleff and Aoyagi 2009). Nigeria is the largest producer of soya in Africa, and consumption of soya has risen over time. Nonetheless, consumption and acceptability of soya foods varies by product and differs between the zones of the country. Anecdotal evidence suggests that soya is more widely consumed in the north, where it is cheaper, more varieties are available and it is incorporated into a variety of foods.
In general, soya is widely accepted in foods with sophisticated processing (as this reduces the negative traits associated with odour and digestibility of soya). In many areas in the north, soya has been integrated into a number of traditional foods and seasonings, including wara and dawadawa. Soya is widely used by nursing mothers and is used as an additive for weaning food. In urban areas, soya oil and soya milk are widely available.
Overall, use in industrial-scale food processing makes up only a small portion of soya produced in Nigeria. More than half of production is used in making soya oil and animal feed. About 41 per cent is probably consumed directly by farmers (Nicely and David 2011), mostly in simply processed forms (Table 5.2).
Table 5.2 Use of soya produced in Nigeria 2007–08
Soya use in 2007–08 Quantity (metric ton) Percentage of total
Crush + full fat soy 255,000 53
Industrial food use 29,000 6
Direct human consumption + seed + residuals 200,000 41
Source: Nicely and David (2011).
A small-scale survey conducted in four cities found that middle- and lower-income groups were more likely to be aware of soya (overall 91 per cent of respondents were aware) and more likely to consume it (overall 66 per cent consumed soya) (Research International Nigeria 2007). The survey also found that levels of consumption were much higher outside Lagos (the survey included cities located in the south and north) (ibid.). The form in which soya was consumed also varied; in Lagos and Abuja, soya was most likely to be consumed as an additive to a food or beverage, while in Kano, soya was most likely to be consumed as a stand-alone meal. The most common reason given for consuming soya was that it had high nutritional value; the second most common reason was low cost. Because this is a small survey and was conducted only in urban areas, these results should only be considered as indicative. Those who did not consumed soya indicated that the biggest barriers were lack of availability and poor taste (Research International Nigeria 2007).
During field research for this project, consumers also voiced other reasons why they did not consume soya:
● Soya requires a long time to cook, which increases its cost due to the amount of cooking fuel that must be used.
● Soya has a pungent odour, which is especially unpleasant for children. Several processing companies have attempted to address this problem.
● Soya is difficult for some people to digest and may cause bloating and flatulence.
● Soya oil causes more foaming during cooking, compared to other vegetable oils, which creates risks of causing fires when cooking over kerosene stoves or firewood.

35
Table 5.3 Target consumer groups and regions for commercial soya
production in Nigeria
Product Consumed by children under two?
Consumed by the poor?
Consumed by the middle class?
Region of consumption
Soya flour Yes Yes Yes Throughout Nigeria
Soy-wara No Yes Limited Northern region mainly
Soya oil Limited No Yes Throughout Nigeria
Soya-based seasoning
No Yes Yes Throughout Nigeria
Soya milk Yes Yes Yes Throughout Nigeria
Corn-soya blend Yes Yes (especially via relief efforts)
Limited Areas targeted by food aid and malnutrition interventions
Source: Field research, 2013.
5.4 Business interest
There is growing business interest in soya products in Nigeria, although most interest is focused on processing for soya cooking oil or animal feed. Business investment in local production of value-added soya foods is still limited, and a number of businesses import value-added soya, rather than producing it locally. Eight large processors in Nigeria account for nearly 60 per cent of total soya-processing capacity (Hartwich et al. 2010). However, the soya processing industry is operating at 40 per cent below installed capacity, largely due to difficulties in sourcing high-quality soya. A 2007 scoping study identified five categories of commercial consumers for soyabean in Nigeria. These include oil mills (10), feed mills (18), flour mills (3), infant food (5) and instant food (10) industries (Omotayo et al. 2007).
Companies engaged in soya include the following (and see Table 5.4):
● Vegetable oil: a wide range of companies have invested in substantial processing capacity for soya oil. Companies such as Grand Cereals and Zok Oil appear to be growing their market share in the vegetable oil market. However, processors complain about difficulty in obtaining sufficient local stock.
● Soya milk: Chi Foods packages soya milk in Nigeria, using imported soya, while a number of companies import soya milk. Soya milk is also made by a large number of informal businesses and sold in local markets.
● Soya protein isolates: this product is imported from China and the USA for use in processed foods. It is not produced domestically.
● Soya flour: a few small-scale food processing companies such as Castor Foods, Spectra Foods and AACE Foods process soya flour. They sell directly to institutional buyers and also into consumer markets.
● Corn-soya blends: this product is processed both locally (household level) and imported. Local products are produced by informal businesses and available in open markets. Packaged products are imported from foreign companies (e.g. Insta-Pro International, Ethiopia) and are sold via formal markets and institutional buyers.
● Many other soya products are produced on an artisanal scale by informal businesses, including soy-ogi, soya dawadawa, soya tofu, soya flour, etc.

36
Table 5.4 Soya products, scale of production and product differentiation
Product Current scale of production
Qualities used to differentiate product
Businesses
Soy-ogi Informal processors At-home production
Low cost via informal markets
FIIRO plans to develop commercially for medium and large manufacturers
Commercial weaning foods
Multinational processors Large processors
Branding, packaging, convenience, hygiene, high price
Nestlé Nigeria SMA Nutritional (Pfizer Wyeth Nutrition, USA)
Seasoning Large processor Branding, packaging quality
Nestlé Nigeria Plc
Soya milk Large processor Convenience, packaging, hygiene
Chi Foods Ltd, Nigeria Golden Effect Ventures, Nigeria
Soya snacks Medium-sized processors
Hygiene, low cost, quality, taste
Spectra Foods, Nigeria
Soya oil Large processor Cost, product quality, packaging
Grand Cereals Limited, Jos Zok oil Nig. Ltd Sunola Nig. Ltd
Soya flour Large and small processors
Cost, product quality, colour, texture, packaging
Grand Cereals Limited Addy & Co. Nig. Ltd Ann’s Baker Confectionaries Best Soya Food Industries Candor Foods Spectra Foods AACE Foods
Source: Field survey, 2013.
5.5 Production and supply chain
5.5.1 Production and imports
Soyabean production has steadily increased in the past few years reaching 500,000 MT in 2011/12. However, industrial demand for soya, estimated at 1bn tons per year, far outstrips the supply (Boateng 2012). Manufacturers such as Nestlé Foods Nigeria Plc, Grand Cereals and a number of small and medium enterprises require large quantities of soya to meet production requirements; on occasions, this demand has not been met by domestic supply.
Low domestic production is associated with scarcity and problems with the supply of agricultural inputs, lack of credit for farmers, lack of storage facilities and poor infrastructure (New Nigeria Foundation/Development Associates 2007). Low yields and the low price of imported soya mean that maize is a more profitable cash crop for small-scale farmers. Many farmers therefore produce small quantities of soya to fertilise their fields, as well as for home consumption, but do not scale up production. These problems limit the capacity of the domestic markets in meeting the industrial demand for soyabean. Industrial consumers have responded by importing soya. Domestically produced soyabean is often more expensive and of lower quality than imported soya (Omotayo et al. 2007).
Soya is cultivated in at least 15 states in Nigeria across the middle belt and north, with pockets of cultivation in the South-West. Benue, Niger and Kaduna are the dominant soya producing states. Soya is cultivated largely on smallholder farms with 1–2 hectares (National Bureau of Statistics 2010). National Bureau of Statistics data show that the average yield in Nigeria is 1.2MT/ha. The Ministry of Agriculture posits that, under ideal conditions, yields in Nigeria have the potential to reach 2.0MT/ha (Ministry of Agriculture 2011).
There are many varieties of soya cultivated and processed in Nigeria, although many of these are not widely available. Of the three varieties common in markets in the South-West,

37
two varieties (from the states of Kaduna/Zaria and Benue, respectively) are used for human foods and flour; the third is used primarily for animal feed and oils. Varieties promoted by Nigerian research institutions (IITA, International Crops Research Institute for the Semi-Arid-Tropics – ICRISAT) were not found in South-West markets, and are rarely available to smallholder farmers. The primary source of soya seeds for smallholders is either their own recycled seeds or other farmers’ saved seeds retailed in the local market.
There have been attempts to set up contract farming arrangements between soya processors and farmers. However, many of these are not functional, because farmers are unable to supply sufficient quantities to match demand from soya mills. There is indication that manufacturers have struggled to work with large numbers of small-scale soya farmers, who are not part of farmers’ organisations (Hartwich et al. 2010).
5.5.2 Aggregation, storage and transport
Marketing of domestically produced soyabean is dominated by wholesale market exchanges. Wholesalers are crucial intermediaries between farmers and soya processors; there are very few cases where processors have direct relationships with farmers (Hartwich et al. 2010). In general, the value chain is highly concentrated at the level of wholesalers, who wield important influence and provide key services. Wholesalers buy large quantities of soya at harvest time and store for resale throughout the year. They employ local buying agents who purchase soya directly from farmers or in rural markets, usually pre-financing the agents to make purchases and paying a commission on every bag. Wholesalers therefore influence the quantities purchased and prices paid. Figure 5.1 further outlines the movement of soyabean across the value chain.
Box 5.1 Storage and transport of soya
Well-dried soya (less than 10 per cent moisture content) can be stored for up to three years. As a result, there are relatively minimal challenges associated with soya storage. Soya is less susceptible to weevils and other pests, relative to cowpea. However, the improved storage bags discussed in the cowpea section can also be used for storing soyabeans. The costs of transporting soya from northern Nigeria to the south are high, although not unsimilar to other products.
Value chain coordination efforts, including contract farming, have been attempted in Nigeria, but have largely failed (Hartwich et al. 2010). A few fast-moving consumer goods (FMCG) companies such as Nestlé, Grand Cereals and AACE Foods source from farmer clusters directly, and provide them with market information and standards for grading and packaging the soya. For examples, Nestlé currently sources its products from over 4,000 trained farmers (Eazee 2012). Research and academic institutions such as IITA and IAR have invested in soya research and supporting farmers to improve their yields.
One outcome of this value chain structure is that there is little differentiation between high-quality and low-quality soya supplies that could drive market segmentation. Industrial soya-crushing facilities in Nigeria have struggled to source domestic soya of sufficient quality to make high-quality edible oil (Hartwich et al. 2010: 76).

38
Figure 5.1 Soya value chain map showing approximate number of actors
and quantity of product
Note: the diagram does not capture the full number of actors or quantities of supply flows. Source: Adapted from Boateng (2012). Dotted arrows indicate supply flows not included by Boateng, but deduced based on other sources and fieldwork.
5.5.3 Pricing
According to the US Department of Agriculture (USDA), Nigeria has been steadily importing soya meal and occasionally soyabeans since 1999, primarily from Argentina and the USA. Local manufacturers estimated that in 2011, soya imports were approximately 100,000MT for soyabeans, 100,000MT for soya meal and 80,000MT for layer feed (USDA 2012). Imports of value-added soya products, including soya lecithin and soya meal have also increased steadily since 2000 (Research International Nigeria 2007). Following the removal of the import ban on crude vegetable oils in 2008, US-based soya processors were considering further opportunities to export to Nigeria (Nicely and David 2011).
Reliance on imports relates to the much higher cost of Nigerian soya, compared to international market prices (Figure 5.2), as well as the reliability of local supplies. The growing demand for imports indicates that imported soya is still substantially cheaper than local soya.
There has been a major increase in the price of soya over the last decade (except for a precipitous drop in 2009). Prices also vary seasonally, with a difference of approximately 20–30 per cent between the high and low price. In October, immediately after the harvest, farmgate prices are ₦60–100 per kg, compared to ₦110–150 in the planting season in June.
Prices in Kaduna and Katsina can reach as high as ₦250 per kg. Fluctuations in farmgate
prices in turn create fluctuations in soya-based products (see Annex F, Table F2).

39
Figure 5.2 Comparison between Nigeria (local) and world soyabean prices
Source: Data from Boateng (2012); FAO (2013); Sahel Capital research.
Box 5.2 Impact of pricing and seasonality on soya in Nigeria
Due to poor production techniques, limited inputs – including improved seeds, fertiliser and water, lack of storage facilities, and pest and diseases, Nigeria continues to experience low yields relative to its global counterparts. As a result Nigerian soya is relatively uncompetitive.
Couple this with issues of seasonality, when prices rise by 20–30 per cent during the off season, and companies are often compelled to import their soya requirements. A 100kg bag of soya in the South-
West market was sold for ₦10,500 in the on season, compared to ₦12,000–15,000 in the off season
(Sahel Capital 2012a). This instability in soya price due to seasonality has compelled many companies to depend on imports. For example, Golden Effect Ventures Nigeria Limited imports powdered soya milk that it manufactures under contract in China. This situation seems unlikely to change in the current policy environment. Table F2 in Annex F shows price fluctuations of soya products.
5.6 Processing
Processing of soya is divided between home processing/small-scale processors and a number of industrial-scale manufacturing operations. Household processors are mostly small operators or micro-processors who obtain soyabeans from their personal farms and open markets. Small-scale processors make soya milk, wara, dawadawa, soy-ogi and flour. Most components of the processing are completed in the home, but grinding is usually done by small-scale local millers. It costs approximately ₦80–100 to wet mill and ₦200–300 to dry mill
soya (1.28kg); these costs have increased with rising fuel prices. Local processing of soya milk provides an example of costing: from 1kg soya (costing ₦100/US$0.62), processors can
obtain ₦300 worth of soya milk. This milk is packaged in polythene bags and sold at ₦100
(US$0.62) per 25cl.
Processing and preparing soya foods is costly and labour intensive. For households and small producers, it costs two or three times as much in money and time to prepare a soya meal, compared to other grains and cereals.12 This includes the cost of grinding the soya, the amount of water required, kerosene, gas or firewood used and the time spent in preparation.
12 Information based on field interviews with consumers in Lagos and a focus group conducted with FIIRO staff.

40
As a result, many low-income households avoid soya and instead opt for convenience foods such as noodles, rice, garri or semovita.
Nigeria also has substantial industrial capacity for soya processing; soya crushing capacity is estimated at approximately 600,000MT per year. There are more than 80 soya processing centres (see Section 5.4 Business Interest). Most commercial processors use semi-automated processing – with substantial labour inputs – because of the inadequate power supply, high cost of operation and challenges associated with sourcing equipment. Smaller-scale local processors use more labour-intensive methods. For some products, including soya-ogi and dawadawa, industrial processing techniques have been developed but are not yet practised commercially.
A key role for processing is in overcoming the problems of soya’s pungent odour, difficulty associated with digestion and tendency to foam during cooking. A few processing companies have successfully overcome these problems via flavouring and proper refining. However, they have been unable to market their products to consumers on this basis, with little ability to advertise (Amusa, Ashaye and Oladapo 2005). Businesses that employ more sophisticated processing technologies include Grand Cereals, Zok Oil and Nestlé Nigeria. Most multinational companies in Nigeria do not process their soya locally. Instead, they import finished goods. Nestlé Nigeria is a notable exception to this trend.
Processing requirements mean that production costs for some soya products are higher than for some substitute products (Table 5.5). In interview, a manager at Grand Cereals stated that the high cost of soya oil was due to required micronutrient fortification as well as purification of the soya oil to avoid congelation and foaming.
Table 5.5 Price comparison between soya products and other substitute
products
Product type
Soya products Substitute products
Quantity Price (₦) Quantity Price (₦)
Breakfast meal
Grand vita 900g 500 Oatmeal 500g 450
Processed milk
Chi Soy milk 1L 260 Nutri milk by Cway Nig.
550ml 100
Organic soya milk (imported)
950ml 640 Viju milk 550ml 100
Ogi Soy-ogi by FIIRO
100g 100–200 (est.)
Maize ogi (informal)
per wrap (weight varies)
20–100
Soya oil Grand Cereal soya oil (fortified)
3.75L 2,2200 Gino vegetable oil 4L 1,650
Source: Field research, 2013.
5.7 Distribution
Information is scarce on distribution channels for processed soya products (with the exception of soya-containing weaning foods, see Section 6). In general, distribution channels for soya products are fragmented and poorly organised. There appear to be five main models for distribution to end consumers (and see Table 5.6):
● Soya products from the informal sector are sold close to where they are produced, in open markets or from the home, and often sold directly by producer.

41
● Soya products from medium and large industry are purchased by local wholesalers, who distribute the products through local distribution networks, primarily reaching small shops and open markets.
● Institutional buyers, including hospitals, schools, prisons and large bakeries, purchase some products (e.g. soya flour, soya milk) directly from processors.
● Government and aid agencies purchase products targeted at malnutrition (especially corn-soya blends) and distribute these through public channels to areas affected by malnutrition.
● Multinationals with manufacturing in Nigeria (principally Nestlé Nigeria) have the widest distribution network, with some low-cost products reaching small shops and roadside sellers across the country, as well as selling to supermarkets.
Table 5.6 Distribution channels for soya product and the consumer
groups they reach
Product Distribution channel Buyers/consumers
Soya oil Markets, supermarkets Middle and upper class
Soya flour Direct delivery to institutional buyers Institutional buyers (e.g. bakeries) FMCGs
Soy wara Markets, roadside vendors Low-income Middle class
Cereal-soya mix (breakfast food)
Markets, supermarkets Some middle and upper class, institutional buyers
Soya milk (simply processed)
Markets, roadside vendors Markets, direct delivery
Low-income, middle class
Soya milk (industrial) Markets, supermarkets, direct delivery Middle and upper class, institutional buyers
Soya dawadawa Markets Low-income, some others
Commercial seasoning Markets, roadside vendors Low-income, middle class, upper class
Soya protein isolates Direct delivery Processors
Source: Field survey, 2013.
5.8 Value chain barriers and potential responses
Soya has great potential to be incorporated into a diverse range of foods and can produce products of very high nutritional value. For these reasons, it is widely used in nutritional supplementation worldwide. Consumption of soya in Nigeria seems to have increased in the past few decades, and it features in a range of traditional and processed foods. This indicates the potential for soya to achieve acceptability with consumers. Yet soya also faces major barriers to playing a larger role in the diets of Nigerians most affected by undernutrition. The key challenges facing soya products are outlined in Section 5.8.1. Notably, at present there are strong incentives for food processors to use imported soya, or to import pre-processed foods, rather than using domestic supplies. As has been pointed out, the market for soya products is split between simply processed products manufactured on a small scale and industrial-scale manufactured products. These product classes circulate through very different value chains and encounter different sets of barriers. Key barriers to small-scale soya products are their low acceptability with consumers, limited availability and the expense of time and money needed to prepare them. For the industrial soya sector, the key challenge is reducing costs and reaching poor consumers. At present, Nigerian businesses are wary of investing in soya products, and the products they do produce are marketed at prices unaffordable to the poor and distributed through channels that prevent

42
them reaching low-income groups. After outlining these challenges, this section briefly reviews several options for increasing the potential of soya (see Table 5.7).
5.8.1 Barriers facing soya products
● Nigerian soya is uncompetitive relative to imports. Low yields, high costs of production and transport and inconsistent supplies mean that formal sector food processors prefer to import soyabeans or pre-processed soya. Federal policy initiatives aim to increase yields and production levels for soya, and foster its use in processed foods. However, given the wide gap between the price of Nigerian soya and international prices, the feasibility of such initiatives is unclear. Certainly, in the short to medium term, commercial processors will continue to use imported soya. However, there may be opportunities to promote small-scale processing in the zones of soya production. Small-scale processors may have advantages in accessing low-cost domestic soya and achieving lower costs of production.
● Competing industrial demands for soya are growing. So long as it is protected by an import ban, the poultry sector in Nigeria will continue to require growing quantities of high-protein animal feed. Use in soya vegetable oil may also remain strong. Strong industrial demand may lead to increasing domestic prices, and make soya more expensive as a protein source for people.
Box 5.3 Soya imports and government policy
Approximately 50 per cent of the soya consumed in Nigeria is imported. Refined vegetable oils and fats are banned from Nigeria, although linseed, castor and olive oils and crude vegetable oil are not (H.S. Code 1507.1000 – 1516.2000.29). Imported soyabeans and soya products attract a 10–35 per cent duty, depending on the product. Whole soyabeans and soya meal, cake or flour has a 10 per cent duty; soya oil has a 35 per cent duty; other imported products have a 20 per cent duty. With Nigerian soyabeans almost twice the international price, these duties do not deter imports.
Fostering domestic soya production may require a combination of protective policies alongside reducing costs on farm and in transport. At present, farmers may have few incentives to increase production of soya beyond household and local requirements.
● Commercial soya products are not affordable due to the costs of distribution.
The cost of establishing distribution networks is very high, especially for those that reach low-income and rural areas. This requires investment in logistics, delivery vans and warehouses. Businesses have little guarantee they will be able to recover these investments. As a result, most formal sector manufacturers sell through supermarkets or via business-to-business sales, at prices that are not affordable to the poor. While many poor consumers eat soya products, they overwhelmingly purchase them on informal markets. The exception to this trend is Nestlé Nigeria, which sells some products that target the broad base of Nigerian consumers (e.g. Maggi cubes).
● Preparation of soya foods is costly and time-consuming. In total, preparing soya foods can cost households two or three times as much time and money, compared to alternative convenience foods. This may especially discourage the poor and urban consumers who are ‘time poor’ due to long working hours and commuting times. Prepared soya foods available in informal markets are cheaper than commercially-produced soya foods but are still more expensive than convenience foods.
● Soya products have low acceptance with consumers, unless they are processed correctly. Simply processed soya has a strong odour, is difficult to digest and is time-consuming and expensive to prepare. For this reason, some consumers avoid it. A few Nigerian businesses have capability to

43
process soya to overcome these challenges, but these products have yet to see major commercial success, and they are not targeted at the poor. There is higher consumption among lactating women and children because soya is often introduced in pre-natal classes as a weaning food. However, as children grow, many mothers discard soya because children will not eat it without adding large quantities of sugar.
● Soya foods are generally considered to be ‘poor person’s food’. Social pressures may mitigate against eating soya foods, especially among the urban poor. Eating soya is considered a sign of poverty, indicating that one cannot afford meat or alternative foods. Thus, aspirational pressures reduce consumers’ willingness to eat soya.
● The policy environment for soya is inconsistent. The Agriculture Transformation Agenda and Nigerian Incentive-based Risk Sharing Agricultural Lending (NIRSAL) have identified soya as a priority value chain for public support. Historically, government agencies and donors have been inconsistent in supporting programmes focused on soya. Programmes have often been defunded following handover from donors to government or changes of administration. Soya has not benefited from policies mandating its use (for example, the cassava bread programme, which requires substituting 20 per cent cassava in bread).
Table 5.7 Extent to which commercial soya products address key
challenges
Product Sufficient micro-nutrients
Targets women and children
Widely available
Consumer acceptance
Potential for reaching the poor
Soya oil x x x
Soya flour x x
Soy-wara x x x
Corn-soya blend (commercial) x x x x
Soya milk (simply processed) x x x
Soya milk (industrial) x x x
Soya dawadawa x x x
Commercial seasonings x x x x
5.8.2 Options for strengthening value chains
The challenges outlined in the previous subsection relate to the broader policy landscape for agricultural production, trade and food regulation in Nigeria. As was the case for cowpeas, the broader changes necessary to address these underlying factors are beyond the scope of this report. (Broader policy changes will be considered in the forthcoming policy guidelines.) Instead, the focus here is on more targeted measures involving various businesses, public agencies, development actors and partnerships.
● Upgrade localised, small-scale processors in regions of soya production. In many soya-producing areas, consumers already eat a variety of soya foods, and small processors sell these foods. Working in the region of production overcomes some of the key constraints, including the high cost of domestic soya, and builds on areas where soya foods are already widely acceptable. It would also target regions with high undernutrition. Interventions could include capacity building and business training for small-scale processors to help them upgrade their production, increase the nutrient content of their products and market these products’ nutritional value to consumers. Low-cost

44
processing technologies could be introduced and piloted. Clearly, the scalability of this approach is limited. It has the advantage, however, of requiring few changes to the current configuration of soya value chains, and thus entails fewer risks. This approach already has some interest from federal and state public agencies.
● Promote fortification of ‘convenience foods’ with a simple soya product. Urban consumers have a preference for easy-to-prepare foods (garri, bread). Interventions could incentivise bakers, processors and retailers to incorporate soya. Doing so would require developing a low-cost, highly acceptable and reliable soya input (e.g. soya flour) that could be distributed to these food processors. The intervention would need to partner with manufacturers with access to technology to overcome the pungent taste and poor digestibility of soya. Programmes could either engage processors with distribution capability across the zones of the country (e.g. Grand Cereals) or work with a number of regional businesses. The programme could build on existing business-to-business sales, targeting large bakeries, etc. It would be in line with the policy priorities for soya value chains in the Agricultural Transformation Agenda. It could be modelled on experience from the Cassava Bread Initiative, which mandates substitution of cassava in bread flour.
● Build distribution systems to reach informal retailers. Key to widespread acceptance of soya products will be distributing to open-air markets and retail channels through which poor consumers access food – and doing so at a very low cost. Interventions could promote links between Nigerian manufacturers and large-scale distributors that provision informal retailers. These distributors have tended not to carry products that are made in Nigeria. The connection between domestic manufacturers and large distributors is untested, and further examination is required of the risks of this strategy.
● Seek to partner with multinationals with Nigeria-wide distribution networks. Multinationals have many more resources and technical expertise than other market players. Market leaders such as Nestlé Nigeria, Flour Mills, Dangote and Promasidor have nationwide distribution networks. They also span low and higher income groups. For example, Nestlé has demonstrated an interest in upgrading the nutritional value of its product line, including introducing iron fortification in Maggi in West Africa. It also has well-established domestic supply chains for soya. Development partners might contribute value-added to a partnership with a multinational by encouraging changes in product formulation, nutritional messages in advertising or partnering to develop products targeting bottom of the pyramid markets. The federal government already engages with some multinationals on domestic sourcing.
● Promote soya foods through public awareness campaigns. Public agencies and donors already implement behaviour-change communication focused on nutrition and infant feeding. These programmes could incorporate specific messages on soya foods. These efforts could complement the options outlined above by focusing on particular regions or promoting improved soya flour product. The risk of this approach is that, at present, there is limited evidence about the effectiveness of awareness campaigns at influencing decisions about purchasing and eating nutritious foods.

45
Box 5.4 Key development and research actors engaged in soya value
chains
● The International Institute for Tropical Agriculture (IITA) undertakes plant breeding to enhance pest resistance, yields and consumer acceptability.
● The Institute of Agriculture Research and Training undertakes breeding to improve storage, yield, and cultivation.
● International Crops Research Institute for the Semi-Arid Tropics undertakes breeding for pest resistance.
● Maximizing Agricultural Revenue and Key Enterprises in Targeted Sites (MARKETS II): value chain development programme including soya.
● World Initiative for Soy in Human Health promotes use of US soya in relief programmes. WISHH is active in Nigeria in training workshops and awareness.
● Federal Institute of Industrial Research: Development of nutritious products, including soy-ogi.

46
6 Complementary foods
A diverse set of complementary food products is available in urban and rural areas in Nigeria. These foods target infants after weaning13 and must be consumed properly and alongside breastmilk in order to support healthy growth in children. As discussed above, rates of proper infant feeding are alarmingly low in Nigeria, and rates of exclusive breastfeeding are especially low. But even for children over six months feeding practices are inadequate and most children do not receive a sufficiently diverse and nutrient-dense diet of complementary foods. Indeed, children suffer major setbacks in nutrition status beginning at six months (Federal Republic of Nigeria, UNPF and UNICEF 2011: 166). Therefore, enhancing complementary foods is a key strategy to addressing child undernutrition (World Bank 2009).
In general, the majority of weaning children in Nigeria are fed traditional weaning foods made from unsupplemented tubers or cereals (Maziya-Dixon et al. 2003; Nnam 2000). These traditional complementary foods do not contain sufficient protein or micronutrient levels to support healthy infant development (Akinrele and Edwards 1971; Ijarotimi and Ogunsemore 2006). They need to be fortified with micronutrient premixes and other nutrient-dense ingredients. There are a large number of products and private sector actors in the marketplace for complementary foods, and this creates a complex and opaque environment for consumer decision-making. Central to enhancing the contribution of these products to reducing undernutrition will be the introduction of measures to guarantee that products are nutritionally adequate and to identify these products to consumers.
During the last 50 years, researchers have developed a wide range of potential complementary food products in Nigeria (see Table 6.1). The Federal Institute of Industrial Research pioneered work in this area, developing a maize porridge fortified with soyabean flour known as soy-ogi (Akinrele and Edwards 1971). Today, a large number of small businesses and kitchen enterprises produce weaning mixes and complementary food products across Nigeria. Soya-based products and maize-based custard products are especially common. A small number of larger Nigerian businesses have also produced weaning mixes on an industrial scale; but thus far these products have failed to achieve consumer markets (Sahel Capital Partners and Advisory 2012b). Overall, the most widely consumed complementary foods – especially among the poor – appear to be unfortified traditional foods processed at home or in informal markets. The formal market is overwhelmingly dominated by international brands, especially those produced by the Nigerian franchises of multinational corporations (e.g. Nestlé, FrieslandCampina) (Euromonitor International 2012).
Achieving sufficient nutrient levels in cereal-based complementary foods requires fortification with micronutrients or nutrient-dense inputs. Traditional complementary foods, often in the form of porridges or ‘pap’, provide insufficient energy, protein, fat and micronutrients to support child development and health; consumption of these foods has been linked with poor nutritional status (Akinrele and Edwards 1971; Gegios et al. 2010). A number of mixes containing various cereals, legumes and tubers have been shown to be nutritionally adequate complementary foods, with some even containing levels of protein superior to major commercial brands (Nnam 2000). Yet without careful formulation or fortification with micronutrients, these mixes can fail to provide sufficient vitamin A, iron or zinc (Agbon, Oguntona and Mayaki 2009). The major international brand products in Nigeria generally meet international guidelines for nutrition content (Al-Othman, Khan and Al-Kanhal 1997), provided they are consumed in the recommended quantities, prepared under hygienic circumstances and form part of a diverse diet.
13 These foods are also often eaten by adults as breakfast foods or after illness.

47
Affordability and perception of product quality are key. Major brand complementary food products are not affordable to the majority of the Nigerian population. Although some locally-manufactured products are available at much lower prices, consumers prefer to purchase international brands, even when they cannot afford sufficient quantities to support children’s health. When poor households spend limited budgets on insufficient quantities of international brands – in place of cheaper, nutritionally adequate local alternatives – this contributes to child undernutrition. Consumers’ preference for international brands is linked to the perception that domestically produced products are lower quality. In addition, multinationals are the only businesses with truly national distribution networks, so their products are more widely available. Currently, Nestlé Nigeria is beginning to market infant foods in smaller package sizes (Euromonitor International 2012); however, these are still unaffordable to poor consumers. Enhancing consumer trust of domestic products is therefore a key priority.
Demonstrating quality to consumers requires guaranteeing nutritional content and signalling it to consumers. Consumers do not have access to information to assess the nutritional quality of complementary food products. Evidence from a similarly structured weaning food market in Ghana shows that nutrient content can differ dramatically between otherwise similar products; thus choosing a product that is nutritionally adequate is difficult for consumers (Masters, Kuwornu and Sarpong 2011). In Nigeria, some weaning mixes have been shown to provide adequate levels of protein, fat and micronutrients (Agbon et al. 2009; Nnam 2000). Others have insufficient nutritional value. This problem compounds consumer perceptions that imported and multinational products are higher quality. Creating mechanisms to signal nutritional quality is key to promoting affordable and healthy complementary food products. However, establishing good governance of these systems will clearly pose a major challenge.
6.1 Nutrient content
Food composition studies indicate that some Nigerian weaning foods, when properly prepared, can contain adequate levels of protein, as well as many micronutrients (Ijarotimi and Ogunsemore 2006). Some foods (those incorporating crayfish or cowpeas) can attain protein content superior to multinational brand commercial products (Table 6.2). While a number of the mixes contain sufficient iron, none contain sufficient vitamin A (Ijarotimi and Ogunsemore 2006) (see Table 6.3). However, no evidence is available on the nutrient content of products in the form in which they are retailed or prepared in homes. Evidence from Ghana shows that – even when the constituent ingredients are relatively similar – the nutrient content of commercial weaning mixes can vary dramatically (Masters et al. 2011).
6.2 Product pricing
The prices of complementary food products vary widely. Products purchased in open markets and prepared at home are, unsurprisingly, much cheaper than packaged alternatives. Among packaged products, those available from small and local businesses tended to be cheaper than those from large Nigerian businesses with established brand names. International brand products were the most expensive, although Nigerian-produced versions of these products were much cheaper than imports. In a market survey in Lagos, custard was observed to be the most affordable packaged product (Sahel Capital Partners and Advisory 2012b). This evidence indicates that it is possible to produce nutritionally adequate weaning foods in Nigeria at a low cost (Ijarotimi and Ogunsemore 2006). It does not, however, indicate whether marketing these products could constitute a viable business model under market conditions.

48
Table 6.1 Products commonly used for complementary feeding in Nigeria
Traditional weaning foods
Traditional weaning foods based on cereals or tubers (including pap, ogi/akamu, agidi/eko, alama, etc.)
Unfortified paps and porridges based on tubers or cereals are the most widely used weaning foods in Nigeria. Most are produced at home or may be purchased from roadside vendors.
Weaning mixes and other cereals14
Informal sector mixes, e.g. soy-ogi and similar mixes
A wide variety of locally produced weaning mixes are available in informal markets, especially in urban areas. These are produced by small enterprises and individuals, using various ingredients and formulas. They commonly include maize, sorghum and/or cassava along with soya, cowpea and/or groundnut. Their quality and nutritional adequacy varies substantially.
Formal sector mixes A small set of formal sector enterprises produce weaning mix products. Often, these mixes are only a small portion of their total business. Formal sector mixes are more likely to be packaged and labelled. They are sold in open markets, local shops and small supermarkets. Distribution is often limited in cities and areas near the production facility. Quality and nutritional adequacy may also vary.
Micronutrient-fortified mixes Dala Foods and Grand Cereals, both large Nigerian firms, produced micronutrient-fortified cereal mixes for sale to donor-funded projects. Both products were mixed cereals fortified with soyabean flour and micronutrient premix. Donors distributed these products for free to vulnerable populations. However, after donor purchasing ended, both companies stopped producing these products because they were unable to secure a market with consumers. The companies are interested in establishing marketing channels for these products.
International brand weaning foods The most widely available packaged weaning mixes in Nigeria are those manufactured by international brands. The clear market leader is Nestlé Cerelac. Consumers, even those in lower income groups, strongly prefer international brand products to those made by smaller Nigerian businesses due to concerns about quality. However, the international brand products are not affordable to the poor.
Other products
Custard Custard powder, based on maize starch, often with added sweeteners, thickeners and flavouring, is widely used as weaning food in Nigeria. These weaning foods are preferred because they are very easy to prepare. Custard products are produced by many formal sector businesses. Unfortified, it is not nutritionally adequate for infants. Some large producers (e.g. Lisabi Mills) produce custard fortified with micronutrients.
Micronutrient-fortified sprinkles Micronutrient powders have been distributed by NGOs and agencies in communities affected by malnutrition and the north of Nigeria. Bio-Organics, a fortification company, customises and supplies vitamin and mineral premixes to the Nigerian food, beverage and animal industries and has recently introduced a sprinkles product called Enrich, generally intended to be mixed with semi-solid food. GAIN is partnering with Bio-Organics and has expressed interest in developing commercial channels for marketing micronutrient sprinkles.
14 In addition to products that are purposefully marketed as weaning foods and infant foods, it is reported that other products not marketed as infant foods are also commonly used as complementary foods. These include various breakfast cereals and other cereal and porridge products.

49
Table 6.2 Composition of home-fortified weaning foods, compared to
commercial brand Nestlé Cerelac
Ingredient Milk-ogi Crayfish-ogi Soy-ogi Soy-moinmoin Cooked beans Cerelaca
Energy (kcal) 408.2 438.7 333.0 377.3 330.4 412.6
Moisture (g) 5.5 2.7 8.9 7.8 12.6 2.5
Protein (g) 16.9 22.1 10.8 30.4 24.4 15.0
Carbohydrate (g) 65.7 61.5 61.5 42.5 52.2 67.9
Fat (g) 8.6 11.6 5.0 9.6 2.0 9.0
Ash (g) 1.7 1.1 11.6 6.3 3.3 3.30
Crude fibre (g) 1.6 1.0 2.2 3.5 4.2 2.30
Source: Ijarotimi and Ogunsemore (2006).
Table 6.3 Required amounts (in grams) of home-fortified weaning foods
that would need to be eaten for infants (7–12 months) to meet their dietary
requirements
Nutrient Recommended daily allowance
Milk ogi Crayfish ogi Soy-ogi Soy-moin-moin Cooked beans
Energy (kcal) 820 201 187 246 217 248
Protein (g) 11 65 50 102 36 45
Fat (g) 30 349 259 625 313 1,500
Iron (mg) 11 262 275 112 63 59
Vitamin A (IU) 500 3,225 N/A N/A 1,333 100
Calcium (mg) 270 101 1,144 299 119 1,227
Note: A high number indicates that it would be difficult for the product to provide an adequate quantity of the specified nutrient. Source: Ijarotimi and Ogunsemore (2006).
Table 6.4 Comparison of prices for complementary food products and
brands
Product Business type Size (g) Low price High price Average price per 100g
Custard powders Small scale 500 300 550 85
FrieslandCampina Frisco Gold
Multinational 400 700 1300 250
Nestlé Cerelac Multinational 50 60 75 135
Nestlé Nutrend Multinational 400 350 500 106
Tiger Brands Purity Imported 250 800 870 334
Soy-ogi Informal 500 61*
Pap Informal Handful 50 100 50
*Estimated production cost. The cost of producing home-made soy-ogi was estimated by Ijarotimi and Ogunsemore (2006). This figure was converted to 2012 prices, using the annual average of the FAO Consumer Food Price Index, http://faostat.fao.org/site/351/default.aspx. Source: Ijarotimi and Ogunsemore (2006); Sahel Capital Partners and Advisory (2012b).

50
6.3 Consumer acceptability and use
In general, complementary food products have high acceptability among consumers in Nigeria; the challenge is in making the nutritionally adequate products available and affordable to poor consumers. Sparse and conflicting evidence makes it difficult to fully assess the acceptability of various products, although there are reports that some products are less tolerated by infants, including those based on soya flour.
Evidence on the availability and use of various complementary foods is sparse, and limited to national-level food consumption surveys and small-scale studies of particular regions or urban areas. This evidence suggests that, at the national level, consumption of packaged and formal-sector complementary food products appears to be very low. In the Nigeria Demographic and Health Survey (NDHS) 24-hour recall data, only 8–9 per cent15 of children had eaten fortified baby foods (National Population Commission 2009). In contrast, 77–81 per cent had eaten non-fortified cereal foods.
The types of products that are available and used varies hugely between urban and rural areas, even within the South-West zone of the country. In urban areas, it appears that more households prepare fortified weaning mixes at home or purchase packaged products; in contrast, in rural areas the majority use unfortified traditional weaning foods. One small-scale study surveyed 384 mothers in an urban and a rural area in Osun State (Ogunba 2012). In the urban area, the most commonly used complementary foods were tinned food (78 per cent of respondents) and Nestlé Golden Morn (72 per cent), while in the rural area it was amala, yam porridge (67 per cent), rice (66 per cent) or tea (81 per cent). While 27 per cent of urban mothers reported using packaged weaning foods, only 3 per cent of rural mothers used such products (ibid.). Urban mothers reported valuing packaged products for their easy preparation and nutrient content. For the majority of rural mothers (82 per cent) packaged products were too expensive (ibid.). Very few women, especially in the rural area, were aware of home-fortified complementary food types. However, once women were aware of formulations, the vast majority reported that they adopted them (ibid.).
Similar to rural–urban differences, access to nutritionally adequate complementary foods differs sharply across wealth groups. Middle-class and wealthy consumers tend to use international brands of complementary foods and even prefer imported products to the Nigeria-produced versions of the same product (Sahel Capital Partners and Advisory 2012b). Evidence suggests that poor consumers also purchase them but are unable to afford sufficient quantities. This is reflected in the fact that the leading international brand products are the most widely available weaning mixes, even in rural areas (ibid.).
6.4 Business interest
There is substantial business interest in complementary foods among multinational corporations and small- and medium-scale food processors alike. In contrast, interest among large Nigerian manufacturers has been limited to where there has been support from donor initiatives (Sahel Capital Partners and Advisory 2012b: 10). The exception is custard powder, which has attracted investment from several Nigerian manufacturers. Understanding the composition of this marketplace should inform efforts to improve the accessibility of nutritious complementary foods, in order to assure that initiatives become commercially sustainable.
6.4.1 Informal businesses
There is no documented information on informal business involvement in complementary foods in Nigeria. Anecdotal observation, however, indicates that there are large numbers of individuals and small businesses (often run by women) selling either prepared foods that are
15 The NDHS reports these figures for breastfeeding (7.5 per cent) and non-breastfeeding (9.3 per cent) children.

51
used as complementary foods, or weaning mixes for home preparation (soya flour is common, especially in Lagos).
Box 6.1 Development of soy-ogi
The Federal Institute of Industrial Research (FIIRO) developed a formula for soy-ogi, a mix of soya flour with a traditional thick porridge made from fermented maize. This was one of several products aiming to help contribute to reducing undernutrition. Early studies (Akinrele and Edwards 1971; Oke 1967) identified serious nutritional inadequacies in conventional pap. FIIRO research found that, when fortified with 30 per cent heat-treated whole soya flour, the protein efficiency ratio of pap increased threefold, making the protein usability almost equal to that of casein. Clinical trials indicated that the end product (soy-ogi) was effective in combating disorders such as protein malnutrition (kwashiorkor) (Akinrele and Edwards 1971), while composition studies showed that it provided a complete protein food, and compared nutritionally and economically with milk-based weaning foods.
Prior to 1969, Cadbury’s (Nigeria) Ltd. did an acceptance study of soy-ogi based on 600 consumer tests and found that, except for its container, it was preferred to other products: a commercial dried cow’s milk (Lactogen), a filled milk preparation (SMA), and plain ogi. In 1970 the Nigerian Federal Ministry of Industries published a detailed report on soy-ogi, citing the palatability study and stating that soy-ogi could be produced at one-third the cost of branded infant foods.
However, despite these promising results, progress on commercialising soy-ogi has stalled. Currently, no large business explicitly produces products under the name soy-ogi. (Although a number of the mixes cited above include soya and may have similar formulations.) FIIRO has developed the brand and is seeking to enable Nigerian processors to develop packaged soy-ogi. There have been concerns about microbiological contamination of soy-ogi products (and ogi more generally). However, a variety of products resembling soy-ogi were found in market surveys, produced on a local scale by small, informal sector businesses. These products targeted middle-class consumers. In this sense, the development of soy-ogi has successfully created business models providing this product to consumers through informal markets.
Table 6.5 Target consumer groups and regions for weaning mix products
in Nigeria
Product Consumed by children under 2?
Consumed by women?
Consumed by the poor?
Consumed by the middle class?
Region of consumption
Traditional foods/pap
Yes Limited Yes Yes Throughout Nigeria
Informal sector mixes
Yes Limited Yes Unknown Unknown
Formal sector mixes
Yes Limited No Yes Urban, primarily southern zones, especially Lagos
Micronutrient-fortified mixes
Yes Limited N/A N/A Not under production
International brands
Yes Limited Yes (but quantities insufficient)
Yes Throughout Nigeria
Custard powders
Yes Limited Yes Yes Widespread in urban areas
6.4.2 Formal sector businesses
In its market research, Sahel Capital identified 61 Nigerian companies making food products targeted at children and mothers, of which 53 made products that could be used as complementary foods (Sahel Capital Partners and Advisory 2012b). Most of these were

52
small-scale processors with fewer than five employees and had been in operation for less than five years. Several large Nigerian companies were identified, with total production across their product lines estimated at 2,000MT (ibid.). But nutritious foods tended to be relatively unimportant components of their product range, accounting for less than 10 per cent of sales (ibid.). The exception was Lisabi Mills, a Lagos-based business that generates most of its sales from custard-based products. The largest Nigerian manufacturer identified was Grand Cereals, which produces roughly 25,000MT of maize and cereal flours annually, although its core business is edible oils and animal feed. About 10 per cent of Grand Cereals’ flour business is from Richfil, a fortified maize-wheat-soya flour product (Sahel Capital Partners and Advisory 2012b).
In the past, two manufacturers produced fortified cereal products specifically designed for use as complementary foods. These were Dala Foods (the product was ACTION Meal) and Grand Cereals (the product was GrandVita). Both products were developed with funding from USAID and the United States President’s Emergency Plan for Aids Relief (PEPFAR), and were sold for distribution by public and non-profit agencies. Dala Foods produced 135MT of ACTION Meal between September 2009 and February 2012, while Grand Cereals produced 137MT of GrandVita between November 2009 and December 2010 (Sahel Capital Partners and Advisory 2012b). Neither business has thus far developed commercial markets for these products. Grand Cereals has stated that it is working on new formulations of its product.
At the time of market research (2012), none of the large Nigerian firms identified were actively marketing products as complementary foods. Instead, they produced fortified cereal products that could be consumed by infants or adults (Sahel Capital Partners and Advisory 2012b). Although these products are not promoted as infant foods, it is plausible that consumers do in fact use them for complementary feeding.
6.4.3 Multinational corporations
The market study found that multinational corporations dominated the market for complementary food, at least within the formal sector. Over 95 per cent of products identified were either imported or produced by multinationals with operations in Nigeria (Sahel Capital Partners and Advisory 2012b: 9). Collectively, multinational brands accounted for over 12,800MT of sales volumes and ₦26.9 billion (~US$170 million) in revenue in 2011 (Sahel
Capital Partners and Advisory 2012b). According to a 2011 Euromonitor Report, Nestlé Nigeria Plc has the largest market share with 50.6 per cent based on retail sales value, followed by FrieslandCampina WAMCO with a 12.3 per cent share (Euromonitor International 2012). Nestlé’s dominant position is driven by its extensive distribution network and broad range of products (Cerelac, Nutren, Golden Morn, Nan) (Sahel Capital Partners and Advisory 2012b: 9). The multinational products primarily target middle-class consumers, with high prices, conspicuous branding and larger package sizes. There is some indication these businesses are looking for ways to sell to lower-income consumers: Nestlé Nigeria introduced a 50-gram size Cerelac in 2010, priced at ₦60, although sales were slow during
the first year of production (Euromonitor International 2012). It was predicted that sales would increase over time, and that other manufacturers would also begin to produce in sachets formats (ibid.).

53
Table 6.6 Market shares of multinational corporations selling
complementary food and infant formula products in Nigeria16
Baby Food Market Share Market Share Mix (based on retail value)
Company Naira (billions)
2011
Nestle Nigeria Plc 13.6 50.6% Cerelac (39.1%), Nutren (9.2%), Nan (2.3%)
FrieslandCampina WAMCO 3.3 12.3% Friso (12.0%), Peak (0.3%)
Tiger Brands 0.9 3.2% Purity (3.2%)
Wyeth (Pfizer) 0.7 2.6% SMA (2.6%)
Abbott Laboratories 0.4 1.4% Similac (0.5%)
Pioneer Food Group 0.3 1.3% Pro Nutro (1.3%)
Danone, Groupe 0.3 1.3% Cow & Gate (1.3%)
Promasidor 0.2 0.8% Cowbell (0.8%)
Beech-Nut Nutrition 0.1 0.2% Beech-Nut (0.2%)
Others 7.1 26.3% Comprised primarily of imports
Total 26.9 100%
Source: Sahel Capital Partners and Advisory (2012b), from Euromonitor International (2012).
6.5 Supply chains
Most complementary foods in Nigeria source inputs through conventional wholesalers and markets. Conventional transport and wholesale systems do not provide traceability and create problems for improving supply quality, including reducing aflatoxin contamination. In addition to agricultural commodities, the supply chain for micronutrient premix is important to production of nutritionally adequate complementary food products. Premix supplies in Nigeria are examined in Box 6.2.
Complementary foods use many different formulations derived from basic agricultural commodities: the key ingredients tend to be maize, wheat, rice and/or millet, along with soyabean, cowpea and/or groundnut. The majority of small- and medium-sized processors source these commodities by purchasing them in whole unprocessed form from urban wholesalers. In rural areas, many complementary foods are produced from crops grown by the household. Other commodities commonly used to fortify complementary foods include crayfish powder and milk powder.
There are a handful of focused supply chains among manufacturers. Nestlé Nigeria has established a bespoke traceable supply chain for several commodities used in its products. The company stated that it sourced over 75 per cent of its raw materials (including soya) from Nigerian farmers (Adedoyin 2010), while the figure for maize supplies was 100 per cent (Nestlé 2011). The company highlighted Cerelac-Maize and Nutrend as products that use local ingredients (Nestlé Nigeria Plc 2011). Nestlé also imports some ingredients, including milk powder. Nestlé Nigeria has recently made efforts to establish greater controls at upstream stages of the value chain. Through its Grains Quality Improvement Project, Nestlé is working with the International Institute of Tropical Agriculture to train and encourage farmers to adopt improved storage for maize in order to reduce aflatoxin contamination levels by 60 per cent in its locally sourced grains. As of 2010, the project had driven 30,000 farmers to supply grain that met the company’s quality standards. Little information is available on the monitoring system used to enforce the standards. Using this system, Nestlé Nigeria meets its corporate traceability requirements. The system comes at a substantial cost, which is incorporated into the high price of products.
16 Note that only Nestlé Nigeria and FrieslandCampina WAMCO have production facilities in Nigeria.

54
Table 6.7 Summary of business involvement in complementary food
products
Product Number of businesses identified17
Businesses involved Product differentiation
Traditional foods/pap
Not covered Micro-processors and street food vendors selling pre-prepared product
Low cost Convenient location
Informal sector mixes
Not covered Micro and small scale Low cost Convenient location
Formal sector mixes
26 small-scale (producing soya flour products)
Small and medium scale Hygienic packaging Low cost Product quality
Micronutrient-fortified mixes
2 large Dala Foods Grand Cereals
Nutritional quality Meets international standards18 Instant preparation
International brands
2 manufacturing in Nigeria 6 importing
Nestlé Nigeria FrieslandCampina-WAMCO (other brands have limited market share)
Instant preparation Premium quality Convenient location Hygienic and attractive packaging Micronutrient-fortified
Custard powders
2 large 1 medium 22 small
Lisabi Mills Chi Limited Amsel Limited Small and medium scale
Convenience Taste Hygienic packaging Micronutrient-fortified (Lisabi Mills product)
Box 6.2 Supply of micronutrient premix in Nigeria
Micronutrient premixes are blends of compounds containing micronutrients in forms that are bio-available and can be easily incorporated into processed food products. Premixes are inputs to many fortified products, used to achieve recommended levels of micronutrients. Micronutrient fortification is especially crucial for complementary food mixes. In Nigeria there are two distinct channels for the supply of premixes for the fortification of foods: local companies and imports from multinational producers. The major private sector suppliers of premixes and micronutrients are DSM Nutritional Products (South Africa), Nycomed Pharmaceuticals and Fortitec (Europe) and BDL, Hexagon and Piramal (India). Nigerian producers are Bio-Organics and BSF. The main consumers of micronutrient premixes are Nestlé Nigeria Ltd, major flour mills and vegetable oil processors, and other large (mostly multinational) food manufacturers. Bio-Organics is the foremost producer of premixes in Nigeria. Benue State has partnered with Bio-Organics to combat micronutrient deficiencies in parts of Nigeria with the use of the micronutrient premix powder. GAIN also partners with Bio-Organics.
6.6 Processing of complementary foods
The technologies involved in processing weaning mixes are simple, widely available and similar to those used in processing many other common Nigerian cereal foods. The process involves sorting and grading, roasting and milling the grains (see Table 6.8). For some traditional weaning foods, grains are sprouted before milling and/or fermented after milling to decrease their viscosity. Many individuals operate as micro-processors of complementary food products. These enterprises often process and package weaning mixes in private homes, relying on private grain millers and/or roasters located in urban markets. Medium-
17 Figures are from the survey of products available in Lagos, Anambra and Kano (Sahel Capital Partners and Advisory 2012b). 18 Meeting international standards was crucial for these products, since they were intended for distribution by development agencies.

55
scale processors tend to have small factories with their own milling, roasting, mixing and packaging equipment.
Only a small number of weaning mix products are instant, requiring only limited preparation. These are produced by multinationals (Nestlé, FrieslandCampina, etc.) or large Nigerian businesses (Dala Foods, Grand Cereals). Custard powder has the advantage of being an instant product.
Table 6.8 Processing procedure for complementary food products and
scale of production
Product Scale of production Processing
Traditional foods/pap Small or micro Sorting, sprouting, milling, fermentation, mixing, cooking
Informal sector mixes Small or micro Sorting, milling, roasting, mixing, packaging by hand
Formal sector mixes Small to medium, industrial Sorting, milling, roasting, mixing, packaging
Micronutrient-fortified mixes Large industrial Sorting, milling, roasting, mixing, extrusion, packaging
International brands (Nestlé Cerelac)
Very large industrial Sorting, milling, roasting, mixing, extrusion, packaging
Custard powders Large industrial, some small
Sorting, fermentation, separation, drying, blending, packaging
6.7 Distribution channels
The distribution channels used for complementary foods have important consequences for their availability and affordability, and for how quality is signalled to consumers. Available complementary food products use several different distribution models, with many weaning mix products distributed by informal retailers, while international brands are retailed through small shops and supermarkets. Evidence on the coverage of distribution networks for different products is scarce; and there is almost no evidence on the availability of weaning mixes produced in the informal sector. Availability varies widely among complementary food products. The fact that traditional weaning foods are widely consumed across the country (Maziya-Dixon et al. 2003) suggests they are available in informal markets throughout the country.
The market research study discussed above incorporated a survey of nutritious packaged products19 in small shops and supermarkets (Sahel Capital Partners and Advisory 2012b). This study provides an indication of the distribution networks for small, medium and large manufacturers. The study found a much greater density of businesses with products available in two cities in the southern zones of the country: Lagos (35 producers) and Anambra (19 producers), compared to Kano, a city in the north (two producers). The vast majority of businesses identified were small-scale and distributed products within their local area. Even among large Nigerian-owned manufacturers, the survey found that only a few had multi-state or national coverage. The three companies with the broadest networks were Ayoola Foods, which distributed widely in the South-West; Dala Foods, which distributed across the north and exported to neighbouring Niger; and Grand Cereals, which had distribution depots country-wide.20 The only businesses with truly country-wide distribution networks were multinationals, in particular Nestlé Nigeria and FrieslandCampina WAMCO.
19 In this survey, Sahel Capital Advisory defined nutritious packaged food as high energy protein supplements, fortified baby portages, fortified beverages and ready-to-use therapeutic foods, as well as custard powder, cowpea flour and soyabean flour. 20 However, Grand Cereals focuses on edible oils and animal feed, rather than nutritious foods.

56
The survey found these products commonly in almost all the shops visited (Sahel Capital Partners and Advisory 2012b).
Box 6.3 Retail channels for complementary food products
Home production. In rural areas, women produce mixes at home, using household-produced or locally available inputs (Ogunba 2012).
Informal retail. The majority of consumers still purchase food products in informal markets. Many complementary foods are purchased as raw commodities or flours in open markets and prepared in homes. In a slightly longer chain, individuals and micro-enterprises purchase commodities, mill them and produce weaning mixes for sale in local markets, near health centres or in neighbourhoods. Market sellers and shops also may sell packaged weaning mixes made by nearby manufacturers (both formal and informal). There is little detailed information on these distribution channels.
Small shops and groceries. In urban areas, many small shops and the majority of small (local) supermarkets sell packaged complementary food products. The dominant multinational brands (in particular Nestlé Cerelac) have the largest number of distributors and are able to reach these small shops in most urban areas. Small shops may also sell mixes and custards made by Nigerian manufacturers.
Supermarkets are small but rapidly growing in the Nigerian food retail sector, retailing 3.4 per cent of formal sector infant foods in 2011 (Euromonitor International 2012). This channel serves wealthy and upper-middle-class consumers. These supermarkets have a much higher degree of control over their supply chains. They sell international brands and are unique in being able to source a wide variety of imported brands.
Direct marketing is used to a limited extent for business-to-business sales, which target institutional buyers and new product introductions.
Non-commercial distribution. Several public and non-profit agencies have distributed complementary foods in Nigeria. They use their own transport and distribution systems target vulnerable populations in regions affected by severe malnutrition, and the north in particular. USAID funded Nigerian manufacturers Dala Foods and Grand Cereals to produce for public distribution. The School Feeding Programme might have represented another channel, but it was closed in 2006 in all but one state (Osun).
Potential products and channels
Retail through community networks. Although there appear to be no efforts under way in Nigeria, donor-funded programmes in a number of other countries have trialled distribution using community-level retailers who sell products on commission and provide educational and promotional messages to consumers. At time of writing, no organisation has expressed interest in developing this channel.
Table 6.9 Distribution channels for complementary food products and
consumer groups
Product Distribution channel Target consumers
Traditional foods/pap Informal retailers, markets, street food vendors
Poor, Lower income
Informal sector mixes Informal retailers, markets Lower income, Middle class
Formal sector mixes Small shops Middle class
Micronutrient-fortified mixes Public and agency distribution systems
Very poor and malnourished
International brands (Nestlé Cerelac)
Small shops, supermarkets Lower income, middle class
Custard powders Small shops, markets, supermarkets
Lower income, middle class

57
6.8 Value chain barriers and potential responses
Complementary food products in Nigeria have high potential to address undernutrition among children between six months and two years old. In addition to targeting a vulnerable population, these products are acceptable to consumers, available in most cities and attract business interest from micro-enterprises, large Nigerian manufacturers and multinational corporations alike. The key to enhancing their impact on nutrition is to strengthen low-cost Nigerian products by creating frameworks that guarantee their nutritional quality and build trust among consumers. Achieving this will require long-term programmes that shift consumer perceptions about the quality of Nigeria-produced products. The efforts should build on established value chains that reach poor and vulnerable populations. Strengthening Nigerian products must be accompanied by continued efforts to improve infant feeding practices, in particular exclusive breastfeeding and correct and adequate complementary feeding.
6.8.1 Barriers facing complementary food products
Although complementary food products currently make a contribution to child nutrition in Nigeria, a number of barriers restrict their potential, in particular by reducing the affordability of these products. These barriers are described below; the extent to which current products address these barriers is outlined in Table 6.10.
● Many complementary food products do not deliver sufficient nutrient content to support infant health and development. Fortification with micronutrients or other nutrient-dense products is required.
● Lack of mechanisms to signal nutritional value to consumers contributes to the low nutrient levels of complementary foods. In general consumers cannot differentiate between these products based on their nutritional value, whether the products are manufactured in the formal sector or by small informal processors. This discourages businesses from investing in more nutritious products.
● Most formal sector businesses do not produce products that are affordable for the poor. This includes both large Nigerian manufacturers and multinationals. They compete on premium product quality rather than low price. Both multinationals such as Nestlé Nigeria and domestic manufacturers are trying to reach lower-income consumers by distributing their products in small packet sizes. However, in general, even when sold in small quantities, these products are still more expensive than informal sector weaning mixes.
● Aflatoxin contamination affects complementary foods, especially those using maize or groundnut ingredients. This is especially concerning since these products target infants who are at greatest risk of negative health and development impacts from aflatoxin. At present, the only strategy available to Nigerian businesses for assuring safe aflatoxin levels is to exclude maize and groundnuts from the product. Currently, there is little pressure to reduce aflatoxin because consumer awareness is low. Nestlé West and Central Africa has an objective to reduce aflatoxin in its supplies by 60 per cent by introducing new production and storage practices on farms where it sources.
● The sector is difficult to regulate due to the large number of small businesses. Strategies to enhance the nutrition value of complementary foods include introducing certification programmes and building the capacity and knowledge of businesses. However, implementing these strategies is difficult because the vast majority of Nigerian manufacturers are small, and thus outside the reach of regulatory agencies. At present, the complexity and high cost of product

58
registration and certification processes makes it difficult for small businesses to comply with standards.21
Table 6.10 Extent to which complementary food products have potential to
address the key challenges
Product Sufficient micronutrients
Targets women and infants
Targets the poor
Safe aflatoxin levels?
How is nutritional value signalled?
Traditional foods/pap
Some products, when fortified correctly
x x No evidence† Individual trust between producer and consumer
Informal sector mixes
Some products x x No evidence† Individual trust between producer and consumer
Formal sector mixes
Some products x No evidence† High product quality, packaging
Micronutrient-fortified mixes
x x x No evidence Distribution by donor projects
International brands
x x x* High brand value, packaging, nutrition label
Custard powders
No evidence x x No evidence of risk if maize-based
High product quality, nutrition label
* Based on claims made on product labels. † It may be possible to reduce aflatoxin levels by excluding commodities that are most affected by aflatoxin contamination, particularly groundnut and maize.
6.8.2 Options for strengthening value chains
The key to enhancing the potential of complementary food products to address undernutrition is to tackle the current lack of signalling of the nutritional quality of these products, and to create incentives for businesses to market products with adequate nutrient content. Addressing the signalling challenge would help to make nutrient-dense products more affordable by providing cheaper alternatives to international brand products. It is estimated that nutritionally adequate weaning mix products can be marketed at half the price of international brands (Akinrele and Edwards 1971). However, business plans must be developed in order to assess the viability of models selling at a price that is affordable to low-income consumers. Addressing signalling issues for complementary foods would also contribute to ongoing efforts by public agencies, NGOs and development agencies to promote appropriate feeding practices. These efforts can also contribute to addressing complementary food challenges by creating awareness and demand for products.
Donor agencies and public–private partnerships have options for how to engage with businesses in the complementary foods market; further investigation will be needed to determine whether the best opportunities lie in partnering with large businesses in the formal sector or building the capacity of small and informal enterprises. Policy engagement is critical to addressing value chain signalling challenges for complementary foods, and indeed for other types of foods. The following list outlines several options for development agencies, NGOs and public–private partnerships. These issues are discussed in greater detail in the forthcoming policy guidelines (Robinson et al. forthcoming, 2014).
● Develop a certification scheme to guarantee nutrition quality to consumers. This would incentivise investment in upgrading nutrition quality. Such a scheme would require two components: (1) a system to get product
21 It costs on average, ₦53,000 per product to register in compliance with regulations, excluding paperwork and product analysis. In total, it costs approximately ₦150,000 per product. This amount is prohibitive for most small and medium-sized enterprises.

59
certification and ensure products meet both safety and nutritional standards; and (2) a way to signal to consumers using a certification logo. Similar programmes have been recommended for complementary food markets in Ghana (see Masters et al. 2011). It has been suggested that such a programme could be piloted through a public–private partnership focused on a single urban area, which would allow comparative evaluation of its effectiveness at improving market organisation and product quality. (For further details on the options for structuring such a certification scheme, see Anim-Somuah et al. 2013; Masters et al. 2011.)
● Provide purchase guarantees and facilitate transition to retail products. This option has been attempted at scale in Nigeria, through the USAID and PEPFAR-funded initiatives. These programmes have proven effective in building up technical capacity to manufacture products and scale. However, they have failed to transition into viable models where products are retailed to consumers. Transitional support might seek to facilitate product innovation in order to address consumer preferences, which rarely align with the requirements of public distribution. This approach involves identifying particular key businesses and investing intensively in their capacity. For more details, see the accompanying Case Study (Nwuneli et al. 2014). In addition, parallel investments are needed to increase consumer awareness and demand for fortified products.
● Coordinate product development and promotion with public health nutrition campaigns. Non-profit and government agencies can coordinate their nutrition education campaigns and messages with marketing of particular nutrient-fortified food products. Coordination can have dual benefits for increasing demand for products while also promoting appropriate infant care practices. There are very few examples of such coordination in Nigeria. In late 2013, a partnership involving GAIN, the government of Benue State and manufacturer Bio-Organics is trialling this approach through a pilot scheme for distributing micronutrient sprinkles.
● Enhance the capacity of small-scale processors to upgrade the nutritional quality of weaning mixes. Small processors are present in open markets in urban areas. However, their products vary widely in nutritional content. Public programmes could organise weaning mix manufacturers into business associations and provide business and technical training, emphasising the importance of producing products that are nutritionally adequate. The association could use a ‘name and shame’ approach to pressure members to produce high quality products. This approach has the advantage of drawing on relationships of trust between low-income consumers and small entrepreneurs, and it would be complementary to a nutrition certification scheme.
● Advocate for market leaders to pursue a ‘bottom of the pyramid’ business model. Nestlé is the market leader for complementary foods in Nigeria and has the most comprehensive distribution network. It has trialled small packet sizes, demonstrating an interest in marketing to consumers in lower income brackets. However, its products remain too expensive for many of the poor. Working with Nestlé to develop a low-cost complementary food product could leverage the company’s distribution system and increase affordability. The product might incorporate novel formulations (substituting for high-cost ingredients), low-cost packaging and new marketing messages that target poor consumers.
● Where other approaches are unfeasible promote home-fortification. As identified above, lack of signalling is a major barrier in complementary food markets. Creating market governance systems that overcome this problem will be institutionally complex, especially in the difficult business and government

60
environment in Nigeria. Ensuring consistent monitoring and enforcement across the loosely organised market for complementary foods will be difficult. For these reasons, policy actors may judge that addressing the signalling problem in private markets is too expensive and complex. An alternative approach is to promote consumption of products whose value consumers can already assess easily, especially raw commodities available through local informal markets. Public programmes could encourage consumers to undertake their own fortification of cereal/tuber foods with readily available ingredients (soya flour, cowpeas, crayfish) for making infant foods. The challenges in implementing this option will be motivating behavioural change, especially given the time required to process foods in the home.
61
7 Conclusion
This report has analysed the value chains for three types of foods (cowpea, soya and complementary food products) in order to provide an initial assessment of their potential for addressing undernutrition in Nigeria. The report identifies challenges facing efforts to promote the production and consumption of these products and potential responses to these challenges. Since cowpea, soya and complementary foods were selected through a scoping exercise, they represent a subset of products with particularly high potential for achieving the criteria of availability, affordability, acceptability and nutrition quality. The purpose of this analysis is to inform programmes and partnerships aiming to promote the consumption of nutrient-dense foods and the development of new products. To this end, the report highlights possible ways to respond to the current challenges, as well as the risks these responses entail. However, a rigorous assessment of the feasibility of these options is beyond the scope of this report. Before pursuing any option or promoting a particular product type, a business case will be needed, including risk assessment and costing. It is hoped the evidence presented here can contribute input and recommendations to the choice and design of interventions.
Key findings for each of the product types are reviewed below.
7.1 Cowpea products
As the most widely consumed legume, cowpeas already make a substantial contribution to the nutrition of the poor in Nigeria. The provision of cowpea products is dominated by the informal sector. Few formal sector businesses have invested in cowpea products, and there is limited innovation in value-added products. The advantage of these foods is that they are readily acceptable to diverse populations and can generally be distinguished from less nutritious alternatives. However, affordability and availability of cowpea is constrained by substantial supply-side constraints. Cowpea prices undergo large seasonal fluctuations, linked to high vulnerability to pests and low use of improved storage. Existing preservation techniques using pesticides create the risk of toxic contamination. Although simple, safe and low-cost technologies are available (e.g. PICS bags), they have not been taken up throughout the value chain. Responses to these supply-side challenges should:
● First, understand the incentives facing farmers, wholesalers and transporters to use/not use improved storage.
● Develop programmes to enhance incentives where they are lacking. ● Leverage the position of wholesalers, who occupy a position of dominance in
the market. ● In order to improve the climate for innovation, programmes should aim to
improve the business climate and encourage partnerships between businesses and research organisations.
7.2 Soya products
Soya is an unparalleled source of protein, and its use in processed and traditional foods in Nigeria has been expanding. It has potential to be an affordable source of high-quality protein for the poor. Soya products have attracted considerable interest from both informal and formal sector businesses. The majority of formal businesses, however, focus on manufacturing animal feed or cooking oil, or import soya whole or pre-processed. Soya foods face a number of important challenges: on the supply side, demand far exceeds production, and production costs are well above international prices. In the informal sector, consumption is limited by the time required to prepare soya foods in a manner that makes them acceptable to consumers. While major agricultural development programmes are investing in

62
soya production, impacts are unlikely in the short term. Responses to the challenges facing soya include the following:
● Increase awareness, acceptability and demand for products, in coordination with nutrition communications and campaigns.
● Quick wins may be found in promoting existing soya value chains in the informal sector in northern Nigeria. These products are already acceptable and reach populations in a key region. Programmes could provide business training and facilitate organisation of the informal sector.
● There may be opportunities to promote fortification of common convenience foods with a simple soya-based ingredient in urban areas. This would require establishing distribution channels that can reach informal retailers.
● Since market-leading multinationals are the only businesses with well-developed national distribution systems, they may be key partners for efforts aiming at national impact.
7.3 Complementary food products
Complementary food products have very high potential to address undernutrition; they target infants at a crucial period for nutrition and have already attracted interest from many informal processors, as well as a small set of formal sector businesses. Past initiatives have successfully built manufacturing capacity for fortified complementary foods but were not able to generate sustainable business models selling to consumers. Bridging this gap requires assuring that consumers are aware of and trust the nutrition quality of these products, and that they are sold at a price that is affordable to the poor. Options include:
● Coordinating product promotion with public health campaigns, drawing on examples from other countries;
● Targeting different levels: upgrade small-scale, informal processors, seek to build the capacity of a domestic manufacturer and transition it to a viable business model or target market leaders with national distribution networks;
● Promoting home fortification, if effective certification cannot be enforced in practice. Increase consumers’ knowledge of how to improve the nutritional quality of well-known complementary foods using locally available ingredients.
Further cross-cutting challenges affect the broader environment for nutrient-dense foods. These broader challenges, described below, are examined in detail in the accompanying policy guidelines (Robinson et al. forthcoming, 2014).
● Targeting poor consumers through the private sector. Developing a viable commercial business selling nutrient-dense food products to bottom of the pyramid consumers is a challenge across the products examined in this report. Businesses struggle to achieve price points affordable to low-income consumers, linked to the costs of distribution and signalling nutritional quality. The policy challenge is to enable businesses to target the poor and ensure products reach populations affected by undernutrition, especially those in rural areas.
● Nutrition awareness is low. Awareness of nutritional needs is generally low in Nigeria, as is awareness of foods containing essential nutrients. This is especially true for low-income groups. Low awareness means that nutrition is often not taken into consideration in purchasing decisions, and that there are few incentives for businesses to produce nutrient-dense foods. Policy approaches to awareness can include both public and private sector mechanisms for communicating messages to consumers.
● Assuring nutritional quality through value chain integrity and signalling. This report has shown that the lack of mechanisms to guarantee nutritional quality

63
and to signal this to consumers leads to low nutritional quality. This is a problem that faces nutrient-dense foods and food safety in many countries. A body of evidence shows that assuring access to accurate information about product quality and safety is key to the efficient operation of markets (Dranove and Jin 2010), and that consumers face major barriers to acquiring accurate information about certain product traits, including nutrient content and levels of contamination with harmful substances. A variety of policy approaches can address the problem of signalling nutritional quality; the most appropriate approach depends on the characteristics of the value chain in question. In Nigeria, options include formal certification schemes, franchising to increase control over retailers and upgrading capacity among businesses in the informal sector to meet and enforce standards.
The forthcoming policy guidelines complement the analysis in this report, outlining the implications of the current policy environment in Nigeria for value chain approaches to nutrition, reviewing experience with policy interventions to promote nutrient-dense foods and recommending approaches for tackling the major challenges in Nigeria.

64
Annex A: List of informants
Cowpea informants
Name Contact details Role
Mama Toyin Mile 12 Market, Lagos State Wholesaler
Iya Lekan Mile 12 Market, Lagos State Wholesaler
Mr Rasheed Mile 12 Market, Lagos State Wholesaler
Mr Chukwudi James Mile 12 Market, Lagos State Wholesaler
Mr Samuel Cowpea retailer, Ketu market, Lagos Retailer
Mr Shex Ladipo, M.D. Lisabi Mills Mr Ajayi Ayoola, Human Resource & Admin. Manager, Lisabi Mills Mr Tunde Ojo, General Manager, Lisabi Mills
Lisabi Mills (Nigeria) Limited 378 Ikorodu Road, Maryland, Ikeja, Lagos
Food processor
Alhaji Musbahudeen Alawode
Bodija Market, Ibadan, Oyo State Retailer
Mrs Alayande Bodija Market, Ibadan, Oyo State Primary processor of cowpea
Mrs Ajayi Cowpea consumer
Mrs Fabunmi Cowpea consumer
Mr Ogunlana O. Cowpea consumer
Dr Christian Fatokun International Institute of Tropical Agriculture (IITA), Ibadan, Nigeria
Scientist and breeder
Dr Ousmane Boukar International Institute of Tropical Agriculture (IITA), Ibadan
Scientist and breeder
Mr Yaya Convenient Home Foods and Beverages Limited, Kano Municipal, Kano
Processor
Mr Hassan Fawaz Managing Director, Lela Agro Industries Limited, Kano
Storage bag (PICS) manufacturer

65
Soya informants
Name Address Role
Dr (Mrs) F.O. Oladunmoye
Federal Institute of Industrial Research (FIIRO)
Food Technologist
Dr (Mrs) B.O. Oyedoyin Federal Institute of Industrial Research (FIIRO)
Director, Industrial Linkage Division
Dr (Mrs) B.O. Oluwole Federal Institute of Industrial Research (FIIRO)
Director, Food and Analytical Services Department
Mr Sadiq Babatunde Grand Cereals Nig. Ltd Business Development Manager
Abdul Kareem Mile 12 Market, Lagos Wholesaler
Mr John J.J. Mile 12 Market, Lagos Wholesaler
Mr Emeka Alapere, Ketu, Lagos Retailer
Mr John Ikosi, Ketu, Lagos Wholesaler/retailer
Mama Isa Mile 12 Market, Lagos Wholesaler/retailer
Mr B.C. Nneji Golden Effect Ventures Nigeria Limited
Chairman/Chief Executive Officer (CEO)
Mrs Olubunmi Olatunde New Nigerian Foundation Senior Programme Manager
Prof. Femi Ajibola New Nigerian Foundation Managing Director
Mama Isale-eko 1/3 Oyesiku, Alapere, Ketu Pap (ogi) street vendor
Iya Ologi 7 Ijan Otun Street, Alapere, Ketu Street miller
Dr C. Fatokun IITA, Ibadan Agronomist/Snr breeder
Ms Blessing Ebano supermarket, Lekki, Lagos Head of business unit

66
Annex B: Commodities examined in scoping
exercise
Bio-fortified cassava is a new and promising intervention for addressing vitamin A deficiency in Nigeria. It has high concentrations of beta-carotene (pro-vitamin A) which makes it yellow in colour. This cassava variety is relatively new and not widely available. In fact, development actors such as Harvest Plus are focused on generating awareness about
bio-fortified cassava especially among resource-poor farmers; however, this crop is still only in the initial phases of field distribution, and it is unclear whether farmers will take it on widely. Garri is the major product from bio-fortified cassava and customers cannot easily differentiate between the bio-fortified garri and yellow garri because they are both yellow.
Cowpea is most commonly eaten as boiled cowpea in Nigeria either as whole beans or in mixture with cereals (rice, maize and bread), tubers (yam, cocoyam, sweet potato) and plantain seasoned with pepper and palm oil. The grains contain high levels of protein, and vitamins and minerals. Processed cowpea products in the north include kosaï, dan wake and kulu wake while in the south it is processed into moin-moin, akara, ekuru and gbegiri. These products are consumed as street foods, in boarding schools, hospitals, prisons, household consumption and sold in open markets. Few companies are engaged in cowpea processing into flour. The key challenges facing cowpea consumers in Nigeria include storage, effect of fungi, pricing and seasonality; a few research institutes and NGOs are working to address these issues.
Dried fish/crayfish are consumed on a daily basis in soups and stews by low-income families across Nigeria. They have significant protein, phosphorus, calcium, vitamin A and micronutrients such as iron and iodine. Dried fish is sold in pieces and mounds in local markets and crayfish is sold in mounds or using measurements such as bowls and buckets. It is widely available and relatively affordable. Despite high levels of crayfish production and dried fish consumption in Nigeria, the industry is relatively fragmented and unorganised. These challenges are difficult to address due to fragmented value chains.
Groundnuts are eaten and enjoyed by all classes of people and in all regions in Nigeria. They contain high-quality edible oils, easily digestible protein and carbohydrates. Boiled or roasted groundnuts are widely accepted as a common snack. Roasted groundnuts can be consumed on their own or soaked in water with garri, eaten with garden egg (Solanum melongena), biscuits or in any other desired form. Some tribes in Nigeria blend groundnuts and use them to make soup. In the eastern part of Nigeria it is blended into ose oji, a thick paste with pepper and salt and eaten with garden egg. In the west and in the north it is used to make kuli kuli, a hard biscuit-like snack also used with garri. Groundnut and its products are mainly supplied to consumers through street vendors and open markets. Groundnut oil, which is used for cooking, is extracted and processed from groundnut. There have been a few initiatives from the government and other actors focused on increasing production and developing a traceable value chain and also reducing aflatoxin levels.
Leafy vegetables have high levels of essential micronutrients and are very useful for the maintenance of health and the prevention and treatment of various diseases. Amaranthus spp. (green amaranthus) and Telfairia occidentalis (fluted pumpkin) are predominantly eaten by all ethnic groups in Nigeria, while Talinum spp. (waterleaf) is eaten by selected ethnic groups in Nigeria, especially communities in Cross River State. Leafy vegetables are consumed almost every day and many rural households have a home garden with vegetables. They are used for soups, stews, porridges and relishes which accompany carbohydrate staples. The value chain for leafy vegetables in Nigeria is underdeveloped. Only a few companies are engaged in vegetable processing, packaging and distribution.
67
Millet contains high levels of proteins, iron and other essential nutrients. In Nigeria, 78 per cent of millet produced is consumed at the household level, 20 per cent is used for fermented drinks and other uses while 2 per cent is used as livestock feed. It is processed into flour (tuwo, fura), pap (ogi, akamu), drinks (kunu zaaki) and dessert (dan wake), which are sold mainly through informal channels. A major challenge is the low yields as a result of limited use of pesticides and fertiliser, poor production and harvesting techniques and poor usage of improved seeds. Development actors and donor institutes are engaged in a number of programmes to support millet production and develop the value chain.
Okra is one of the most widely consumed vegetables in Nigeria. It is a rich source of dietary fibre, vitamins and minerals. It is consumed by all classes of people as soups and sauces. There are a few cottage industries involved in the drying of okra on a very small scale. Sadly, there is minimal value addition to okra and a limited interest in okra from the development community.
Orange-fleshed sweet potato is limited across Nigeria, with a greater presence in the north. It is a good source of pro-vitamin A. It is boiled, fried or roasted and is also cooked together with cowpea and other root and tuber crops to make yam pottage. It is prepared in the home or purchased from roadside food processors. Orange-fleshed sweet potato is not very popular especially in the open markets and has not attracted substantial business interest although there have been efforts by research institutes and development agencies to promote the cultivation and consumption of this staple in Nigeria.
Plantain is consumed boiled or fried with other staples such as rice and beans in homes. It is a rich source of energy, vitamin and minerals, especially iron. It is fondly consumed by most Nigerians as a roasted ripe plantain delicacy called boli, which is sold by roadside vendors, and a fried unripe plantain snack called ipekere (chips), which is packaged and sold in supermarkets and on the roadside. Plantain flour is packaged and sold in supermarkets as a highly nutritional alternative to garri and other fufu products, suitable for consumers with diabetes. In Nigeria, all stages of plantain (from immature to overripe) are used as a source of food in one form or the other. Plantain chips and flour production is a highly profitable business in Nigeria and a lot of companies are engaged in the production.
Poultry sub-sector is the most commercialised of all Nigeria’s agricultural sub-sectors. It is an important source of animal protein and the main products are meat and egg. Low-income Nigerians cannot afford to consume these products because they are extremely expensive. The poultry industry has been faced with bird flu issues in the recent past but the Nigerian government has invested significant funds to combat this. The Nigerian private sector is actively engaged in the poultry industry, but there is limited engagement from development actors.
Sorghum is a traditional food in northern Nigeria and is consumed in fermented forms mainly as ogi, burukutu and pito (brewed) from malted sorghum. It is an excellent source of starch and protein. Sorghum flour has been incorporated in wheat flours at various levels to produce cakes, cookies and bread, and sorghum malt is being used wholly or partly as a substitute for barley in the production of non-alcoholic malt drinks in Nigeria. It is one of the priority crops of the Nigerian government’s Agricultural Transformation Agenda. In addition, new hybrid seeds are under development by research institutes.
Soyabean is a good source of plant protein and other essential minerals. The Nigerian formal soyabean processing sector has an installed capacity exceeding 700,000 tons per annum with the main products being soyabean oil and the high protein cake that is usually used as an ingredient in poultry feed. Many food processing companies are engaged in the production of soyabean products that are available in open markets and supermarkets. Popular products include soya milk, soy-vita, soya flour, soy-ogi, soy-garri, dawadawa while soya biscuits and confectionery are under development. The major challenges faced by

68
consumers in Nigeria are the long preparation time and repulsive smell of soyabean. However, there is growing interest from firms and NGOs to develop a high-quality value chain for soyabean in Nigeria.

69
Annex C: Product scores
Table C1 Mean product scores and value chain issues identified
Product Mean score Value chain/policy issues Notes
Cowpea 2.4 Post-harvest losses; few processed products
Soya 2.4 Signalling issues when used to fortify products
Dried fish and crayfish 2.3 Preservation; food safety
Green leafy vegetables 2.2 Preservation
Poultry 2.2 Preservation; food safety
Bio-fortified cassava 2.1 Uptake unclear; potential signalling issues
Recently released; few data under real market conditions
Sorghum 2.1 Signalling issues when fortified
Okra 2.0 Preservation
Orange-fleshed sweet potato
2.0 Acceptability limited to a few regions
Groundnuts 1.9 Food safety
Plantain 1.6
Millet 1.4 Signalling issues when fortified
Table C2 Detailed product scores from scoping exercise
Product Mean score
Nutritional quality
Afford-ability
Accept-ability
Signalling issues
Business interest
Development actor interest
Bio-fortified cassava 2.1 2.5 2.0 2.0 1.0 3.0
Cowpea 2.4 2.5 3.0 2.5 2.5 2.0 2.0
Dried fish and crayfish 2.3 3.0 2.0 3.0 3.0 2.0 1.0
Green leafy vegetables 2.2 2.5 2.5 3.0 3.0 1.0 1.0
Groundnuts 1.9 2.5 2.5 2.5 2.0 1.0 1.0
Millet 1.4 1.5 2.0 2.0 1.0 1.0 1.0
Okra 2.0 2.5 2.5 3.0 2.0 1.0 1.0
Orange-fleshed sweet potato
2.0 3.0 1.0 1.0 3.0 1.0 3.0
Plantain 1.6 1.5 1.5 3.0 1.0 1.5 1.0
Poultry 2.2 3.0 1.0 3.0 2.0 3.0 1.0
Sorghum 2.1 1.5 2.5 3.0 1.0 2.0 2.5
Soya 2.4 3.0 2.5 2.5 1.5 2.5 2.5

70
Annex D: Undernutrition in Nigeria
D1 Nutrition status and trends
Despite consistent economic growth rates above 6 per cent in the past decade and the elaboration of national policy frameworks explicitly aiming to reduce undernutrition in Nigeria, a growing majority of the country’s population live in poverty. According to the National Bureau of Statistics, 69 per cent of Nigerians lived below the national poverty line in 2010, an increase since 2004, when the rate was 54 per cent. The proportion of people living on less than one dollar a day is 52 per cent in urban areas, and 66 per cent in rural areas (UNDP 2009). There are major regional inequalities, and rates of poverty are above 75 per cent in some states in the north of the country.
Poverty and undernutrition are very closely linked, and this is borne out in trends in acute and chronic undernutrition in Nigeria. In parallel to worsening poverty, both acute and chronic undernutrition among children under five are severe, and there have been few improvements in the past decade. In the latest Nigeria Demographic and Health Survey (NDHS) (National Population Commission 2009), national rates for the key indicators of nutrition status were as follows:
● Stunting (low height for age) prevalence was 41 per cent, with 23 per cent severely stunted. Stunting is a measure of chronic malnutrition.
● Underweight (low weight for age) prevalence was 23 per cent, with 9 per cent severely underweight. Underweight is a measure for chronic and acute malnutrition.
● Wasting (low weight for height) prevalence was 13.9 per cent, with 7 per cent severely wasted. Wasting is associated with acute malnutrition; it represents a critical failure to receive adequate calories, proteins and micronutrients.
Since 2003, there has been little change in rates of stunting and underweight, while wasting has increased slightly (Figure D1). In parallel, levels of overweight have increased substantially. Obesity among adults reaches 25 per cent in some urban areas in the southern region (see Ekpenyong et al. 2012), but rates remain low at the national level. Although the so-called ‘double burden’ of under- and overnutrition is a growing public health concern (Oganah and Nwabah 2009), this report focuses on levels of undernutrition, and in particular on chronic deficiencies in protein and key micronutrients. It is noted that micronutrient deficiencies can occur alongside obesity.
D1.1 Regional differences in nutrition status
There are major regional disparities in nutritional status in Nigeria, with the northern regions generally having much higher rates of undernutrition, linked to persistent food insecurity. This inequality derives from high rates of poverty, low access to services, high reliance on agricultural livelihoods and the history of underdevelopment in the north. However, rates of stunting are alarmingly high (above 30 per cent) even in the southern regions, and the regional averages hide very large inequalities among populations within regions. Inequalities in nutrition status within regions tend to be higher than inequalities between regions (Omilola 2010).
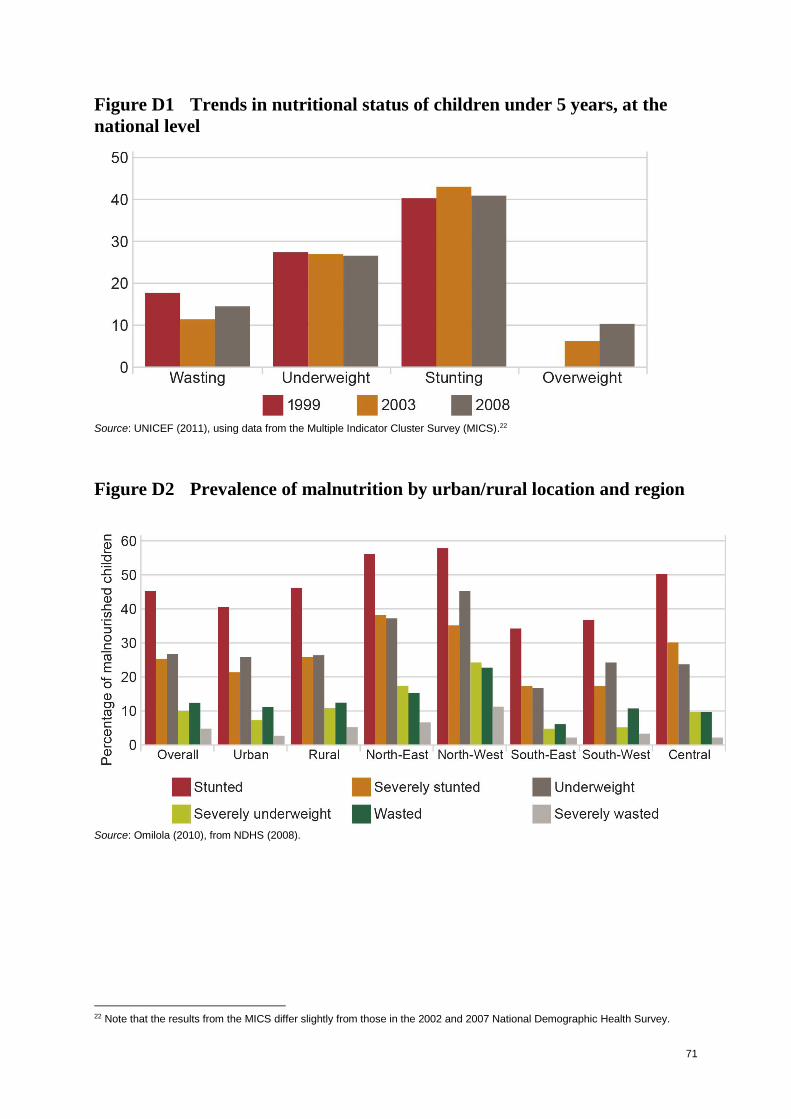
71
Figure D1 Trends in nutritional status of children under 5 years, at the
national level
Source: UNICEF (2011), using data from the Multiple Indicator Cluster Survey (MICS).22
Figure D2 Prevalence of malnutrition by urban/rural location and region
Source: Omilola (2010), from NDHS (2008).
22 Note that the results from the MICS differ slightly from those in the 2002 and 2007 National Demographic Health Survey.

72
Figure D3 Rates of stunting in Nigerian states (children under 5 years)
Source: Nigeria National Bureau of Statistics.23
Figure D4 Rates of underweight in Nigerian states (children under 5
years)
Source: Nigeria National Bureau of Statistics.24
23 http://nigeria.prognoz.com/Map.aspx. 24 http://nigeria.prognoz.com/Map.aspx.

73
D1.2 Disparities across social groups
Children in poor families are substantially more likely to be stunted, wasted or underweight than those in wealthier households (Table D1). In the NDHS 2008, the rate of stunting in the poorest wealth quintile (52 per cent) is more than twice that in the wealthiest quintile (24 per cent). Meanwhile, the rate of underweight in the poorest quintile (35 per cent) is more than three times that in the wealthiest quintile (10 per cent). However, chronic undernutrition is prevalent even among wealthier households; in all but the top quintile, stunting rates remain above 30 per cent. These data suggest that household income has a major impact on nutrition status of children, with wealthy households having low rates of underweight, in particular. However, non-wealth factors clearly also contribute to chronic undernutrition, since stunting rates are high even in wealthier households (see further analysis in Section D5.
Table D1 Disparities in undernutrition indicators across social groups
Indicator Residence Wealth quintile
Urban Rural 1 2 3 4 5
Stunting 31 45 52 49 42 34 24
Underweight 16 27 35 29 22 17 10
Source: UNICEF (2011), using NDHS (2008).
In addition to disparities among wealth groups, there are major nutrition inequalities between and within urban and rural areas. Undernutrition is consistently more prevalent in rural areas, although it remains severe in urban areas (Table D1). Overall, 45 per cent of children in rural areas are stunted, while 31 per cent are stunted in urban areas. However, when urban and rural areas are categorised by the size of habitation, it becomes clear that rates of undernutrition – and stunting in particular – are just as high in small cities and towns as in the countryside (Figure D5). Furthermore, across all groups and settings, infants and children become more likely to be stunted as they grow older; this trend points to the importance of proper infant feeding practices and sufficient dietary diversity after the age of six months (Ajieroh 2009).
Figure D5 Prevalence of malnutrition by size of habitation
Source: Omilola (2010), from NDHS (2008).

74
D2 Micronutrient deficiencies
Undernutrition in the form of deficiencies in key micronutrients remains widespread, especially in the period from conception to a child’s second birthday (the so-called 1,000 days period). Deficiencies in vitamin A, iron, iodine and zinc are major nutritional challenges in Nigeria.
D2.1 Vitamin A deficiency
Vitamin A deficiency is extremely widespread in Nigeria, contributing to 25 per cent of infant, child, and maternal deaths, reducing resistance to disease (Akinyele 2009). Vitamin A is an essential micronutrient necessary for the normal functioning of the eyes, resistance to diseases and proper functioning of the immune system.
Nationally, 24.8 per cent of children under five suffer from mild vitamin A deficiency, while 4.7 per cent suffer from severe deficiency (Akinyele 2009). There are marked regional differences; while children in the three northern geopolitical zones suffer from the highest rates of marginal-level deficiency, rates of clinical deficiency are highest in the South-South geopolitical zone (ibid.: 34). Overall rates of deficiency were above 20 per cent in all geopolitical zones except the South-East. In contrast to trends for overall nutritional status, rates of vitamin A deficiency are similar in rural, peri-urban and urban areas (23, 25 and 23 per cent, respectively) (ibid.: 34). Vitamin A deficiency – unlike other deficiencies – is negatively correlated with livelihoods, suggesting the importance of factors related to income (Legg Kormawa et al. 2001).
Vitamin A supplementation is an important strategy for combating deficiencies in young children. One in four children aged 6 months to 5 years received vitamin A supplements in the six months preceding the 2008 NDHS (National Population Commission 2009). There are large disparities in coverage across regions, with far higher coverage in the South than the North, and substantial variation even within the North. For example, Katsina State achieved 80 per cent coverage, compared to only 17 per cent in Sokoto State (UNICEF 2012). Rural and rural–urban disparities were also marked; one in three urban children received supplementation, compared with one in five rural children. Mothers’ level of education was a crucial factor: while only 14 per cent of children of mothers with no education received supplementation, the rate was 49 per cent for children whose mothers have more than secondary education. Household income status had a similar effect, with 13 per cent of children receiving supplements in the lowest wealth quintile, compared to 44 per cent in the highest wealth quintile (National Population Commission 2009).
D2.2 Iron deficiency
Iron deficiencies among pregnant women and young children appear to be alarmingly high in Nigeria, and social disparities mirror those for overall nutritional status. Although direct data on deficiencies in iron consumption are not available, rates of anaemia are used as a proxy indicator.25 Current rates of anaemia among preschool-aged children and pregnant women are 76 per cent and 67 per cent, respectively (World Bank 2008) while the prevalence of iron deficiency anaemia is estimated to be 20 to 40 per cent in adult females, 20 to 25 per cent in children and 10 per cent in adult males (Akinyele 2009).
In the 2003 Nigeria Food Consumption and Nutrition Survey, 27.5 per cent of children under five were found to be iron deficient, with 8.1 per cent having depleted iron stores (Maziya-Dixon et al. 2003: 32). Rates of iron deficiency in mothers and pregnant women were 24.3 per cent and 35.3 per cent, respectively (ibid.). Regionally, the rates of iron deficiency in
25 Deficiency in dietary iron is only one factor in anaemia; others include deficiencies in folate and vitamin B12, and parasitic diseases including malaria and hookworm. In sub-Saharan Africa, iron and folate deficiencies are estimated to be the most common causes of anaemia in pregnant women (Vanderjagt et al. 2007).

75
children were highest in the North-East (29 per cent) and North-West (22 per cent), and lowest in the South-West (3 per cent) (Akinyele 2009). In contrast to the pattern for overall nutrition status, the prevalence of iron deficiency in children was higher in urban areas (with the rates of 24, 28 and 33 per cent in rural, peri-urban and urban areas, respectively) (ibid.).
Iron supplementation for pregnant women and young children is one strategy to combat iron deficiencies. At present, supplementation has insufficient coverage in Nigeria. In 2008, only 15 per cent of women in Nigeria took iron supplements for 90 days or more, while 44 per cent did not take any supplements at all. Only 16 per cent of children had received iron supplements in the week preceding the 2008 NDHS. There are substantial regional disparities; while 11 per cent of women did not take any iron supplements during their pregnancy in the South-West, this figure is 68 per cent in the North-West. Children in southern zones (where rates ranged from 16 to 49 per cent) were much more likely to receive iron supplements than children in the north (with a range of 3 to 7 per cent). Children in wealthier households and those whose mothers had higher levels of education were more likely to receive supplements. In addition to supplementation, eating foods rich in bioavailable iron is crucial to addressing anaemia, especially in pregnant women. (Other important strategies include deworming and combating malaria in areas of high infection.)
D2.3 Iodine deficiency
Iodine deficiency has major negative health and development consequences in Nigeria; it was estimated that if 2008 levels of deficiency continued, over 9 million children born between 2009 and 2015 would suffer from mental impairments (Akinyele 2009). In 2003, 14 per cent of children were mildly iodine deficient, 8 per cent moderately deficient and 4 per cent severely deficient (ibid.). In addition, over 20 per cent of the Nigerian population suffers from goitre, the most severe form of iodine deficiency (ibid: 38). It is noteworthy that, while deficiencies are widespread, nearly 30 per cent of children had a possible excess intake of iodine, which can lead to adverse consequences (Maziya-Dixon et al. 2003). Iodine deficiency is most common in the South-West and North-Central zones and the extreme north (Legg et al. 2001). Unlike with vitamin A, the correlation between iodine and incomes is weak or absent, it is often more related to diets and other environmental factors (ibid.).
Universal salt iodisation in Nigeria has been remarkably successful in reducing rates of iodine deficiency. According to the World Bank, 97 per cent of households consume iodised salt (World Bank 2008). The NDHS 2008 found that nationally 3 per cent of households used salt with no iodine content, 45 per cent used salt with inadequate content and 52 per cent used salt with adequate content. It is estimated that the number of people affected by goitre fell from 40 million in 1992 to less than 11 million in 1999 (UNICEF 2005). Far less improvement occurred in some western areas where cassava represents the major staple food, since some varieties of cassava can inhibit the utilisation of dietary iodine in the body (ibid.). The coverage of salt iodisation also varies among zones (National Population Commission 2009).
D2.4 Zinc deficiency
Zinc deficiency is prevalent in Nigeria, especially among pregnant women and in the middle savannah belt of the country. Zinc deficiency can cause growth retardation and can lead to lifelong impairments in immune function (Caulfield and Black 2004). In 2003 zinc deficiency was reported as 20 per cent for children under five, 28 per cent for mothers, and 44 per cent for pregnant women (Maziya-Dixon et al. 2003). Rates were highest in the moist savannah zone (37 per cent), intermediate in the dry savannah (26 per cent) and lowest in the humid forest (6 per cent) (ibid.). Deficiency was higher (26 per cent) in rural areas than in urban or peri-urban areas (17 per cent) (ibid.). Evidence indicates that supplementing pregnant women with zinc is unlikely to be sufficient to reduce the risk of low birth weight (ACC/SCN 2001). There is evidence that zinc deficiency in children with bouts of diarrhoea are at risk of

76
death if not treated properly; while parallel food-based strategies are also key to addressing zinc deficiencies among vulnerable groups.
D3 Diet
Diets in Nigeria are dominated by staple foods such as cereals, roots and tubers, although more than 80 per cent of households consume what are considered to be adequately diverse diets, based on the number of food groups they include. However, there are major problems in the diets of key groups. First, poor households are unable to access sufficiently diverse diets, contributing to micronutrient deficiencies. Second, consumption of foods rich in key micronutrients is insufficient, especially in some regions. Finally, there are major problems in the diets of infants, including very low levels of exclusive breastfeeding and proper complementary feeding.
D3.1 Dietary components
Diets vary substantially across the zones and ethnic groups in Nigeria, with people in the northern zones generally eating more cereals and less diverse diets overall, while in the south, people eat more starchy tubers and access a greater diversity of foods. Detailing the diets of different groups is beyond the scope of this report; broad regional trends are summarised in Table D2. This section briefly summarises available evidence on the consumption of micronutrient-rich foods and on the social drivers of adequately diverse diets. It focuses on diets in the South-West zone.
Across Nigeria, the diets of poor populations are predominantly based on starchy staples and are low in animal foods, fruits and vegetables. They are also high in phytates, which inhibit the absorption of micronutrients. In one 24-hour recall survey conducted in six states spanning the north, central and southern regions, the main food groups were: cereal/grains (92 per cent), roots and tubers (59 per cent), legumes and nuts (63.5 per cent), fish (57.1 per cent), vegetables (48 per cent) and meat (33 per cent) (Ajani 2010). In the two states in the South-West zone, Osun and Kwara, consumption of roots/tubers (87 per cent), beta-carotene-rich vegetables (65 per cent) and legumes (81 per cent) was higher than the national average; while consumption levels were lower for other (non-leafy) vegetables (19 and 28 per cent in Kwara and Osun, respectively) and milk products (17 and 19 per cent in Kwara and Osun, respectively). Consumption of nutrient-dense foods differs substantially among wealth groups; for example, while the wealthiest and poorest groups had similar consumption of vegetable protein, wealthier groups were able to consume protein-rich animal foods more frequently, with more than 90 per cent consuming animal foods more than two times per week in the wealthiest quintile, compared to just over 60 per cent in the poorest quintile (Kuku-Shittu et al. 2013: 26).
The 2003 Nigeria Food Consumption and Nutrition Survey asked consumers what foods were available and affordable in their area. Households in the southern humid forest zone reported that the most available staples were cassava (18 per cent), rice (16 per cent), yam (12 per cent) and maize (9 per cent) (Maziya-Dixon et al. 2003). The most available and affordable sources of protein were cowpea, soyabean and groundnut; while the most available and affordable non-staple foods were meat, non-leafy vegetables and leafy vegetables (Maziya-Dixon et al. 2003). In urban areas, bread and processed foods are also commonly consumed (Lawal and Olukemi 2010), although in the 2003 Survey these products were considered less available and affordable (Maziya-Dixon et al. 2003: 12). Akinyele (2009) noted that, nationally, prices for several staples (rice, yam), animal foods and fruits and vegetables had generally increased in the preceding six years, although in the South-West the prices of some foods (beans, garri and maize) had decreased.
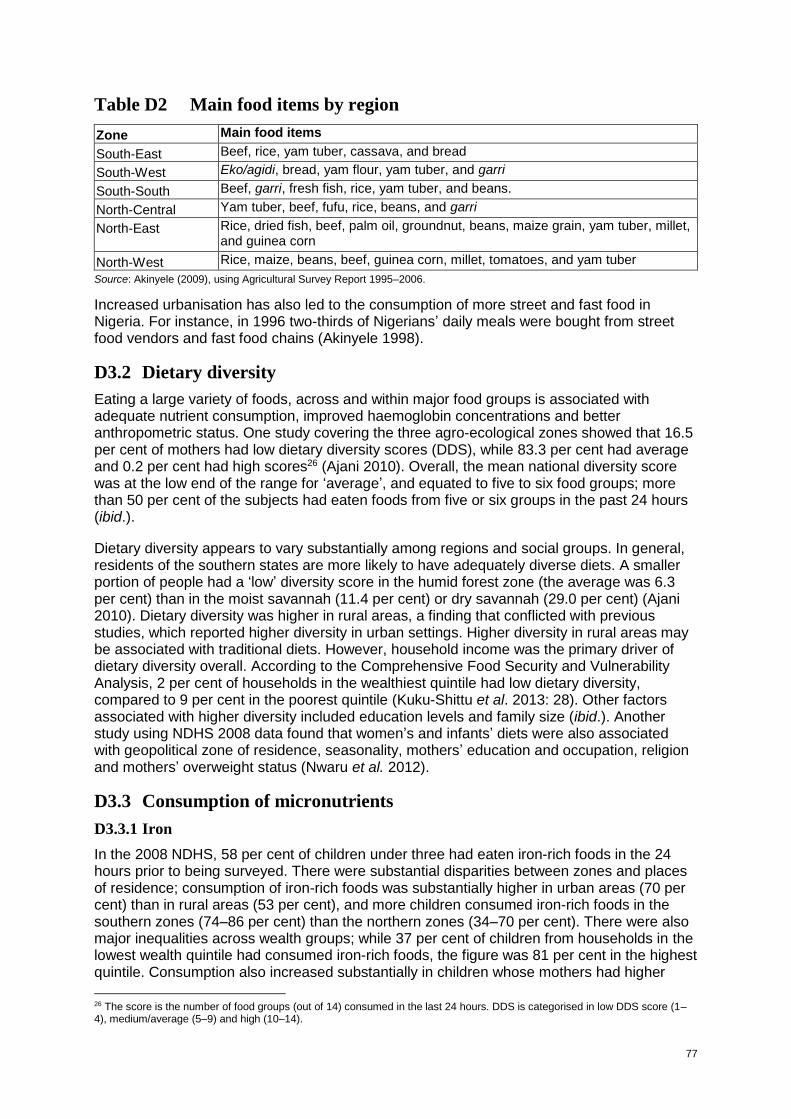
77
Table D2 Main food items by region
Zone Main food items
South-East Beef, rice, yam tuber, cassava, and bread
South-West Eko/agidi, bread, yam flour, yam tuber, and garri
South-South Beef, garri, fresh fish, rice, yam tuber, and beans.
North-Central Yam tuber, beef, fufu, rice, beans, and garri
North-East Rice, dried fish, beef, palm oil, groundnut, beans, maize grain, yam tuber, millet, and guinea corn
North-West Rice, maize, beans, beef, guinea corn, millet, tomatoes, and yam tuber
Source: Akinyele (2009), using Agricultural Survey Report 1995–2006.
Increased urbanisation has also led to the consumption of more street and fast food in Nigeria. For instance, in 1996 two-thirds of Nigerians’ daily meals were bought from street food vendors and fast food chains (Akinyele 1998).
D3.2 Dietary diversity
Eating a large variety of foods, across and within major food groups is associated with adequate nutrient consumption, improved haemoglobin concentrations and better anthropometric status. One study covering the three agro-ecological zones showed that 16.5 per cent of mothers had low dietary diversity scores (DDS), while 83.3 per cent had average and 0.2 per cent had high scores26 (Ajani 2010). Overall, the mean national diversity score was at the low end of the range for ‘average’, and equated to five to six food groups; more than 50 per cent of the subjects had eaten foods from five or six groups in the past 24 hours (ibid.).
Dietary diversity appears to vary substantially among regions and social groups. In general, residents of the southern states are more likely to have adequately diverse diets. A smaller portion of people had a ‘low’ diversity score in the humid forest zone (the average was 6.3 per cent) than in the moist savannah (11.4 per cent) or dry savannah (29.0 per cent) (Ajani 2010). Dietary diversity was higher in rural areas, a finding that conflicted with previous studies, which reported higher diversity in urban settings. Higher diversity in rural areas may be associated with traditional diets. However, household income was the primary driver of dietary diversity overall. According to the Comprehensive Food Security and Vulnerability Analysis, 2 per cent of households in the wealthiest quintile had low dietary diversity, compared to 9 per cent in the poorest quintile (Kuku-Shittu et al. 2013: 28). Other factors associated with higher diversity included education levels and family size (ibid.). Another study using NDHS 2008 data found that women’s and infants’ diets were also associated with geopolitical zone of residence, seasonality, mothers’ education and occupation, religion and mothers’ overweight status (Nwaru et al. 2012).
D3.3 Consumption of micronutrients
D3.3.1 Iron
In the 2008 NDHS, 58 per cent of children under three had eaten iron-rich foods in the 24 hours prior to being surveyed. There were substantial disparities between zones and places of residence; consumption of iron-rich foods was substantially higher in urban areas (70 per cent) than in rural areas (53 per cent), and more children consumed iron-rich foods in the southern zones (74–86 per cent) than the northern zones (34–70 per cent). There were also major inequalities across wealth groups; while 37 per cent of children from households in the lowest wealth quintile had consumed iron-rich foods, the figure was 81 per cent in the highest quintile. Consumption also increased substantially in children whose mothers had higher
26 The score is the number of food groups (out of 14) consumed in the last 24 hours. DDS is categorised in low DDS score (1–4), medium/average (5–9) and high (10–14).

78
levels of education. More older children had also consumed iron-rich foods. Vanderjagt et al. (2007) point out that iron deficiencies in the northern states are further exacerbated due to heavy reliance on grains such as millet and sorghum, which contain high levels of phytates that interfere with uptake of iron and other trace minerals.
Among mothers, similar trends were observed, although mothers in general were more likely than infants to have consumed iron-rich foods. Overall, 69 per cent of mothers had consumed such foods during the 24 hour recall period. Again, there were major disparities among zones, wealth quintiles and differing levels of education. In particular, women in the North-East and North-West zones were substantially less likely to have consumed iron-rich foods, compared to those in the other regions.
D3.3.2 Vitamin A
The NDHS 2008 indicates that overall, 70 per cent of children under three had eaten vitamin A-rich foods in the 24-hour recall period. As with iron, there were substantial regional disparities, with proportions lower in the northern zones (54–77 per cent) than in the south (81–88 per cent). Similarly, children in urban areas (76 per cent) were more likely to have consumed vitamin A-rich foods than those in rural areas (67 per cent). There were also inequalities among wealth groups, although not as pronounced as those for iron: 56 per cent of children in the poorest quintile had consumed vitamin A-rich foods, while in the wealthiest quintile this figure was 83 per cent. As with iron, children whose mothers had higher levels of education were more likely to have consumed vitamin A, although the difference was less pronounced.
Among mothers, 84 per cent had eaten foods rich in vitamin A nationally. Mothers in urban areas (90 per cent) were more likely to consume these foods than those in rural areas (82 per cent), although again the difference was less than that for iron. Disparities remained between the North-East (74 per cent) and North-West (73 per cent) compared to the rest of the country (91–96 per cent). Among wealth groups, 73 per cent of mothers in the poorest quintile had consumed vitamin A-rich foods, compared to 94 per cent in the wealthiest quintile. Consumption of vitamin A-rich foods increased with mother’s level of education.
D3.3.3 Zinc
National data on consumption of zinc-rich foods are not available. One study (Onianwa et al. 2001) estimated zinc consumption among different wealth groups in the city of Ibadan in the South-West zone. The study measured zinc content in various foods and conducted a small survey of household food consumption patterns. Dietary zinc intake was estimated to be above the recommended daily allowance of 15mg per day for all three of the wealth groups for which diets were estimated. However, the study noted that these levels might be inadequate due to high phytate content in foods.
D3.3.4 Iodine
National data on consumption of iodine in foods are not available. As was noted above, there is high coverage of salt iodisation. Varying incidence of goitre in eastern Nigeria has been attributed to cassava, while the Nigerian Society for Endocrinology and Metabolism has blamed diets poor in seafoods for the high incidence of goitre in upland eastern and western zones (Muanya 2009).

79
D4 Infant feeding practices
D4.1 Exclusive breastfeeding
Infant feeding practices contribute crucially to the nutritional status of young children. WHO and UNICEF recommend exclusive breastfeeding for the first six months of life, and that children are given solid or semi-solid complementary foods alongside continued breastfeeding until at least two years. This period represents part of the window of opportunity to reduce child stunting (Black, Allen, Bhutta, Caulfield, de Onis, Ezzati, Mathers and Rivera 2008). Levels of exclusive breastfeeding are very low in Nigeria, according to the 2008 NDHS. Only 13 per cent of infants under six months have been exclusively breastfed, and this proportion is decreasing over time, falling from 17 per cent in 2003 to 13 per cent in 2008. Overall, most infants continue to receive breastmilk; the median duration of breastfeeding was nearly 18 months. However, the duration of breastfeeding was substantially lower in the southern zones (14–16 months), among higher wealth quintiles and for infants whose mothers had higher education.
Crucial problems with infant feeding practices in Nigeria include widely practised prelacteal feeding (giving infants other liquids before their mother’s milk begins to flow) and the introduction of foods other than breastmilk before six months. Prelacteal feeding is especially widespread; 54 per cent of infants received other liquids prior to receiving breastmilk in 2008, with the most common liquid being water. Prelacteal feeding prevents early initiation of breastfeeding,27 reduces the frequency of breastfeeding and exposes the baby to the risk of infection. Premature introduction of other foods and liquids prior to six months was also widespread, with the most common product used being plain water. Other foods given to infants aged 4–5 months included foods made from grains (41 per cent), liquids other than water or milk (41 per cent), fresh, tinned or powdered milk (22 per cent) and infant formula (11 per cent). The proportion of infants prematurely receiving complementary foods increased substantially from 2003 to 2008.
D4.2 Proper complementary feeding
The transition period between 6 and 23 months of age is a second crucial stage in children’s development. Children of this age should receive appropriate complementary foods, in addition to breastmilk. In Nigeria, only 30 per cent of children in this age range are fed appropriately according to WHO guidelines on Infant and Young Child Feeding Practices (National Population Commission 2009). There have been modest improvements in complementary feeding practices; the proportion of children aged 6–9 months who receive timely introduction of complementary foods increased from 2003 to 2008. Overall, 55 per cent of children received foods from a sufficient diversity of food groups, while 50 per cent were fed at least the minimum number of times.
There were substantial disparities in the use of appropriate infant feeding practices, although zonal differences were less pronounced than for other dietary indicators. The portion of infants appropriately fed ranged from 26 per cent in the North-West to 37 per cent in the South-South. However, in the North-East and North-West zones children were more likely to be fed at least the minimum number of times (59 and 47 per cent, respectively) but less likely to receive a sufficient diversity of foods (46 and 41 per cent, respectively), compared to those in the South-West (where 43 per cent were fed the minimum number of times, and 69 per cent had adequate dietary diversity). Across social groups, more infants were properly fed among wealthier households and when mothers had higher levels of education. Wealth disparities, however, were less pronounced than for other indicators: with the proportion of infants receiving proper feeding ranging from 27 in the lowest quintile to 32 per cent in the wealthiest. Mothers’ levels of education were more important, with the proportion of infants
27 Infant feeding practices specify that breastfeeding should be initiated within 30 minutes to 1 hour after childbirth.

80
receiving proper feeding ranging from 27 per cent for mothers with no education to 40 per cent for mothers with higher than secondary education.
D4.3 Infant diets and micronutrient intake
According to 24-hour recall data in the NDHS 2008, the foods consumed by infants aged 6–23 months consisted mostly of grains, with over 75 per cent of children receiving grain-based foods (Table D3). In addition, a majority of non-breastfeeding children also received iron-rich animal products (meat, fish, poultry or eggs) and beta-carotene-rich fruits or vegetables. There were major disparities in infants’ consumption of nutrient-dense foods across zones and social groups. Urban children (70 per cent) were more likely than rural children (53 per cent) to receive iron-rich foods. Regionally, the proportion of children who consumed iron-rich foods ranges from 41 per cent in the North-East to 86 per cent in the South-South. The proportion of children fed iron-rich foods increased with wealth status, from 37 per cent among children in households in the lowest wealth quintile to 81 per cent among children in households in the highest wealth quintile. Infants whose mothers had higher levels of education were also much more likely to be fed iron-rich foods, with 39 per cent eating these foods in the no education group and 84 per cent in the group with higher than secondary education.
Table D3 Percentage of children aged 6–23 months receiving various food
types
Solid food groups Percentage of breastfeeding children
Percentage of non-breastfeeding children
Fortified baby foods 7.5 9.3
Other food made from grains (excluding fortified baby foods)
76.6 81.2
Fruits and vegetables rich in vitamin A 41.6 62.0
Other fruits and vegetables 20.2 37.7
Food made from roots and tubers 24.5 40.9
Food made from legumes and nuts 29.6 38.6
Meat, fish, poultry and eggs 46.2 77.9
Dairy products 15.1 17.5
Source: Adapted from National Population Commission (2009).
Two in three children aged 6–35 months consumed foods rich in vitamin A, including meats, fish, poultry, eggs, pumpkin, yellow squash, carrots, orange sweet potatoes, dark green leafy vegetables, mango, papaya and palm nuts. Urban children (76 per cent) were more likely to consume foods rich in vitamin A than rural children (67 per cent). Children living in southern regions (81 per cent to 88 per cent) were more likely to consume these foods than children in the northern regions (54 per cent to 77 per cent). Similar to iron consumption, infants whose mothers had higher levels of education and those in wealthier households were also more likely to consume vitamin A-rich foods. Animal products are the most common sources of zinc; patterns of consumption of these foods are similar to those of iron. However, soya-pap weaning food (a grain-based food fortified with soya) achieves the desired levels of zinc (although most traditional weaning foods do not) (Ogbonnaya et al. 2012).
Small-scale studies in the South-West zone showed that children of weaning age consumed more cereals and roots and tubers than any other type of food. In Osun State, the most popular food item consumed was amala (yam-based flour), followed by eba (solid paste made from fermented and fried cassava), yam and fufu (cassava-based flour) (Ogunba 2010). Liquid pap was the most consumed cereal, followed by rice and bread in the rural setting. Processed breakfast cereals, ready-to-cook foods (such as Indomie noodles), and fortified liquid pap were the foods mostly consumed in urban settings (ibid.). The

81
consumption of protein-rich foods of plant or animal origin was low, with only cow’s milk consumed by at least 50 per cent of children (ibid.). Fewer than 30 per cent of children consumed legume-based foods and fewer than 50 per cent of children in the study group consumed meat, eggs, or fish. Results were similar in a study conducted in neighbouring Ondo State, where children’s diets were dominated by carbohydrate-based foods low in protein, minerals and vitamins (Ijarotimi and Ogunsemore 2006). Carbohydrate-based diets low in key nutrients are a particular concern for young children; one study found that consuming cassava as a central part of the diet increased the risk of deficiency in zinc, iron and vitamin A in children 3–5 years (Gegios et al. 2010).
D5 Drivers of undernutrition
As outlined in the UNICEF framework (Black et al. 2008), consumption of sufficient quantity and quality of food is necessary but not sufficient to ensure adequate nutrition. This report focuses on the food-based drivers of undernutrition, but these must be examined alongside other proximate drivers, including disease burden, access to water, sanitation and health services and infant care practices. In Nigeria, there is little evidence showing the relative importance of food and diet compared to the other drivers of undernutrition.
Two studies compare drivers of nutrition status at a national level; however, because they used different sub-samples and focused on different outcome variables these studies cannot be compared. In the first study, Uthman (2009) used data from NDHS 2003 to calculate the relative contributions of various factors to inequalities in undernutrition outcomes.28 However, this study does not include food and diet as a separate driver. The author finds that wealth was the most important factor, accounting for 31 per cent of socioeconomic inequality in undernutrition outcomes. Other important contributors were the overall use of health care services (18 per cent); level of maternal education (13 per cent); proper sanitation (11 per cent), breastfeeding duration (8 per cent), regional variables (8 per cent) and residency in urban/rural areas (5 per cent) (Uthman 2009). Higher contributions indicate that a given factor was both associated with higher risk of stunting and also more prevalent in poorer households; or associated with lower risk of stunting and also more prevalent in wealthier households. According to the author, the contribution of wealth status represents its direct contribution to inequality, while ‘the remainder is the wealth-related inequality in malnutrition through other factors’. (Uthman 2009: 362). The study concludes that poverty is the most important factor driving undernutrition in Nigeria.
The large contribution of use of health services shows that those with low access to health services were more likely both to suffer from undernutrition and to be from poorer wealth quintiles, controlling for other factors. The cost of care and transportation and lower awareness about important health behaviours probably contribute to low use of health services by the poor. Although zone and place of residence were significant in their contributions to inequality in nutrition outcomes, they were less important than the household-level variables: access to health services, use of health services, mother’s education, sanitation and breastfeeding. However, it should be noted that households in the most affected zones are also less likely to have access to health services, education and proper sanitation. Overall, the study does not assess the effect of access to nutritious foods, and food-related drivers are captured within the wealth status variable.
In the second study, Ajieroh (2009) assessed three groups of drivers (socioeconomic status, child and infant care, and access to health and sanitation) to determine which are significant in each zone, agro-ecological region and urban/rural setting. The author found that the effect of household economic status was consistently significant across these places, although the magnitude of the effect was small. The variable with the greatest impact on reducing child
28 The outcome variables used in this analysis were height-for-age a-score (degree of stunting) and membership in the five NDHS-determined wealth quintiles (Uthman 2009).

82
malnutrition was higher levels of maternal education; this was especially true in the northern zones. Even after controlling for income, children were more likely to be stunted when the household was primarily engaged in agriculture, especially in the southern zones, and in the northern zones children were much less likely to be stunted when their mother had a source of income. Overall, the significant drivers of undernutrition differed between urban and rural settings, with the only driver significant in both being household wealth status. Like Uthman, Ajieroh did not consider consumption of food as a separate driver; the effects of access to nutritious foods are probably captured under socioeconomic status, as well as the variables relating to household head livelihood and mother’s education and income. Ultimately, neither of the modelling studies allows the impacts of food-related drivers of undernutrition to be compared with others.
D5.1 The role of food-based approaches
Clearly, the absence of research decomposing the role of access to and consumption of nutritious foods in driving nutrition outcomes in Nigeria is a major gap. In the absence of such evidence, no firm conclusions can be drawn, although similar research in Ghana suggests that access to nutritious food can be an important driver (Van de Poel, Hosseinpoor and Jehu-Appiah 2007). In Nigeria, data showing the prevalence of micronutrient deficiencies, especially iron-related anaemia and rapid deterioration of nutrition status in infants during the weaning period suggests a key role for food-based approaches in reducing undernutrition. These approaches can contribute to addressing drivers linked to inadequate diversity of diets, low consumption of key micronutrients (especially iron, vitamin A and zinc), insufficient nutrient content of complementary foods and poor infant feeding practices. In general, these problems are worst in rural areas in the northern zones, but they also affect urban and wealthier populations. The remainder of this report focuses on the potential of selected food types to address the specific undernutrition challenges of micronutrient deficiencies, especially in vitamin A and iron, and especially for women of child-bearing age and young children.

83
Annex E: Cowpea figures
Table E1 Businesses involved in production of cowpea products and
qualities used to differentiate products
Product Businesses involved Product differentiation
Boiled cowpea dishes Dumplings Akara, kosaï
Micro-processors Informal sector retailers Small restaurants
Low cost, convenience, taste, appearance, hygiene
Moin-moin Micro-processors (i.e. individuals) Informal sector retailers (roadside vendors) Caterers e.g. No Leftovers Nig. Ltd Fast food companies e.g. Mr Biggs, Chicken Republic, Tantalizers, Mama Cass
Convenience, taste, appearance, low cost, hygiene
Cowpea flour Nigerian processors including: Ayoola Foods Nigeria Limited (large processor) Lisabi Mills (large processor) Endy’s Beans flour (mid-sized) Q-Best Agro-processing Enterprise (mid-sized) Ranks West Nigeria Ltd (mid-sized) Stapro Industries Nig. Ltd (mid-sized)
Convenience, high quality, packaging, high price, fortification
Dan wake flour Convenient Home Foods and Beverages Limited Convenience, high quality
Table E2 Comparison of wholesale and retail prices during high and low
season for different varieties of cowpea in markets in Lagos (2013)
Variety Wholesale prices per bag (₦1,000s) Retail prices per bag (₦1,000s)
Lowest price Highest price Lowest price Highest price
Maiduguri 13.5 24.0 17.0 26.0
Gombe 10.5 19.0 15.0 21.0
Niger 9.5 18.0 13.0 19.0
Honey 9.0 14.0 11.0 16.0
White Iron beans 11.0 19.5 17.0 22.0
White purchisco 10.0 17.0 15.0 20.0
Olo 1 8.0 12.0 10.0 13.0
Source: Sahel Capital field research.

84
Table E3 Costs incurred by wholesalers transporting cowpeas for sale in
Lagos markets
Variety Transportation
cost/bag (₦) Loading charges,
cost/bag (₦) Unloading charges
Market revenue
Boundary payment
Land levy (‘Ilada’)
Maiduguri 1,300 280 ₦50–60
bag/variety
₦30/bag ₦20
bag/boundary for two boundaries
₦40/bag
Gombe 1,300 100
White varieties 1,300 100
Niger 600 60
Honey 600 60
Olo 1 600 60
Source: Sahel Capital field research.

85
Annex F: Soya figures
Table F1 Companies involved in soya products in Nigeria
Company Volume required29 (tonnes/day)
Sourcing Uses of soy
Grand Cereals and Oil Mills Limited
150 Domestic Edible oils, soya meal, soya cake, fortified weaning food (no longer in production)
Fortune Oil Mills Kano 100 Imported Edible oil
Sunseed Nigeria PLC Zaria
70 Imported Edible oil
JOF Ideal Family Farm, Owo, Ondo
43 Imported Edible oil, soya meal
Yakasai Oil Mills Kano 1–3 Unclear Sells crude oil to Grand Cereals Sells soya cake to poultry feed manufacturers
AACE Foods, Ogun 1 Local Soya flour for FMCGs, institutional buyers Soya-maize blend
Nestlé Nigeria, Ogun Unclear Domestic Products include Maggi, breakfast cereals, baby foods. Examples: Golden Morn is a cereal product made from maize (70%) and soya (30%). Nutrend is weaning food product made from maize and dehulled soya.
Spectra Foods, Lagos (not active)
Unclear Local Instant soya and soya-maize products
Willmerc (La Cussion), Lagos
Unclear Unclear Feed mill and oil mill
Candor Foods, Lagos 1 Local Soya flour, livestock feed
Slabmark Ltd Unclear Imported Edible oil, soya meal, food products
New Products
Vitamilk Not available Imported Soya milk drink manufactured in Thailand and imported into Nigeria.
CHI Ltd. (Tropical General Investment)
Not available Imported Soya milk packaged in Nigeria.
Golden Effect Ventures
Not available Imported Powdered soya milk contract manufactured in China for the Nigerian market.
New Age Beverage Not available Imported Soya milk manufactured in Nigeria. (product name: Soy Good)
Moreson Nigeria Limited
Not available Imported Food industry (Cerolina, a mix of soya and wheat middling)
Source: Omotayo et al. 2007 and field research.
29 Volume data is from 2007.
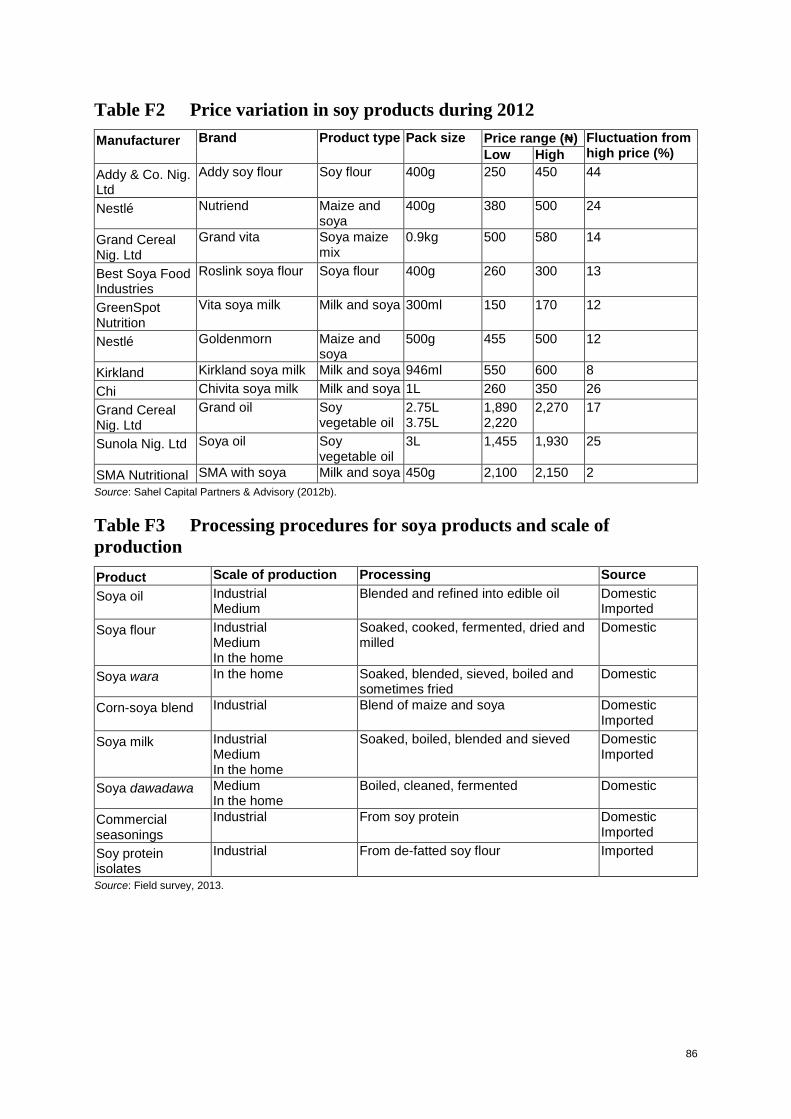
86
Table F2 Price variation in soy products during 2012
Manufacturer Brand Product type Pack size Price range (₦) Fluctuation from high price (%) Low High
Addy & Co. Nig. Ltd
Addy soy flour Soy flour 400g 250 450 44
Nestlé Nutriend Maize and soya
400g 380 500 24
Grand Cereal Nig. Ltd
Grand vita Soya maize mix
0.9kg 500 580 14
Best Soya Food Industries
Roslink soya flour Soya flour 400g 260 300 13
GreenSpot Nutrition
Vita soya milk Milk and soya 300ml 150 170 12
Nestlé Goldenmorn Maize and soya
500g 455 500 12
Kirkland Kirkland soya milk Milk and soya 946ml 550 600 8
Chi Chivita soya milk Milk and soya 1L 260 350 26
Grand Cereal Nig. Ltd
Grand oil Soy vegetable oil
2.75L 3.75L
1,890 2,220
2,270 17
Sunola Nig. Ltd Soya oil Soy vegetable oil
3L 1,455 1,930 25
SMA Nutritional SMA with soya Milk and soya 450g 2,100 2,150 2
Source: Sahel Capital Partners & Advisory (2012b).
Table F3 Processing procedures for soya products and scale of
production
Product Scale of production Processing Source
Soya oil Industrial Medium
Blended and refined into edible oil Domestic Imported
Soya flour Industrial Medium In the home
Soaked, cooked, fermented, dried and milled
Domestic
Soya wara In the home Soaked, blended, sieved, boiled and sometimes fried
Domestic
Corn-soya blend Industrial Blend of maize and soya Domestic Imported
Soya milk Industrial Medium In the home
Soaked, boiled, blended and sieved Domestic Imported
Soya dawadawa Medium In the home
Boiled, cleaned, fermented Domestic
Commercial seasonings
Industrial From soy protein Domestic Imported
Soy protein isolates
Industrial From de-fatted soy flour Imported
Source: Field survey, 2013.

87
Annex G: Complementary food figures
Table G1 Characterisation of businesses identified in market study
Company mix Total Factory location
Anambra Kano Lagos Other
# Indigenous companies 61 19 2 35 5
Established <5 years 46 16 1 25 4
5–10 years 7 2 0 5 0
>10 years 8 1 1 5 1
Size Small 53 19 1 29 4
Medium 4 0 1 3 0
Large 4 0 0 3 1
Employees <11 52 18 1 29 4
11–50 3 1 0 2 0
>50 2 0 1 4 1
# Products <3 52 19 0 29 4
4–5 1 0 0 1 0
>5 8 0 2 5 1
Source: Sahel Capital Partners and Advisory (2012b).
Table G2 Description of large Nigerian food manufacturers making
complementary foods
Company Key characteristics Core products Products used as complementary foods30
Ayoola Foods
Strong distribution network Well established
Staple flours (cassava, fufu, garri, yam) Palm oil Spices and flavourings
none
Dala Foods
Distributed widely in north Produced fortified CFP under USAID programme
Instant mixed cereals (kurun tsamiya, millet) Instant fruit drinks
ACTION Meal*,†
Lisabi Mills
Fortifies a range of its products (custard, cowpea flour) Distributes mainly in South-West
Staple flours* (wheat, yam, cowpea) Custard powder* Packaged cereals*
Custard powder*
Grand Cereals
Strong distribution network Large manufacturing capacity Produced fortified CFP under USAID programme In discussions to produce RUTF under licence
Vegetable oils Animal feeds Maize and cereal flours Industrial materials
GrandVita*,† Maize-wheat-soya cereal*
* fortified product † no longer in production Source: Sahel Capital Partners and Advisory (2012b).
30 The products listed here include cereals that are likely to be used as complementary foods, even if they are not sold and promoted as targeting infants from six months.

88
Table G3 Supply chains for complementary food products
Product Agricultural commodities Source Traceable supply chain?
Traditional foods/pap Maize, sorghum, yam, cassava, wheat, rice and/or cowpea
Informal markets Some imports (soyabean, wheat, rice) Rural self-provision
No
Informal sector mixes Maize/sorghum, cassava/wheat/rice and soyabean/cowpea/groundnut
Informal and wholesale markets, some imports
No
Formal sector mixes Maize/sorghum/, cassava/wheat/rice and soyabean/cowpea/groundnut
Wholesale markets, some imports
No
Micronutrient-fortified mixes
Maize, wheat, soyabean, micronutrient premix Maize, sorghum, soyabean, groundnut, micronutrient premix
Farmer clusters, wholesalers
No
International brands (Nestlé Cerelac)
Maize/wheat/ rice, milk/soya, sugar, palm oil, micronutrient premix, flavouring
Farmer clusters, aggregators and imports
Yes
Custard powders Various, including: maize starch, sweeteners, flavouring, skim milk powder, micronutrient premix (some brands)
Aggregators, wholesale markets and imports
No
Table G4 Location of large Nigerian manufacturers and presence in three
urban areas
Manufacturer Location Size Product range Anambra Lagos Kano
1 Amsel Limited Isolo, Lagos Medium Corn flour, custard, Malt-Vita, baking powder, icing sugar, honey, cocoa
X
2 Ayoola Foods Ltd
Ipaja, Lagos Large Beans flour, plantain flour, cassava flour, yam flour
X X X
3 Dala Foods Nigeria Ltd
Kano Large Tamarin Millet cereal X
4 Bejide Industries Ltd
Iju Ishaga, Lagos
Medium Soya meal, plantain flour, yam flour, ground rice
X
5 Grand Cereals Ltd
Jos, Plateau Large Cereals, edible oils, animal feed
X X X
6 Lisabi Mills Nig. Ltd
Maryland, Lagos
Large Beans flour, cereal, yam flour, wheat flour, custard powder, cocoa drink
X
7 Ranks West Nig. Ltd
Oshodi-Isolo, Lagos
Medium Bean flour, plaintain flour X
8 Vital Products Ltd
Lagos Large Baby puree, energy drinks, juices, dairy, tomato paste and ketchup, spices
X
Source: Sahel Capital Partners and Advisory (2012b).

89
References
ACC/SCN (2001) What Works? A Review of the Efficacy and Effectiveness of Nutrition Interventions, L. Allen and S. Gillespie (eds), Administrative Committee Coordination, Sub Committee on Nutrition, Geneva, in collaboration with Asian Development Bank, Manila: Asian Development Bank
Adam, J. and Baidoo, P.K. (2008) ‘Susceptibility of Five Cowpea (Vigna Unguiculata) Varieties to Attack by Callosobruchus Maculatus (Fab.) [Coleoptera: Bruchidae]’, Journal of Ghana Science Association 10.2: 85–92
Adedoyin, A. (2010) Q3’ 2010 Earning Release for Nestle Nigeria Plc, report of Vetiva Capital Management, 26 October 2010, www.naijalowa.com/wp-content/uploads/downloads/2010/11/Vetiva-Research-Nestle-Nigeria-Plc-Q3-2010-Earnings-Release.pdf (accessed 22 January 2014)
Adejobi, A.O. and Ayinde, I.A. (2005) ‘Market Institutions for Cowpea in Maiduguri and Abeokuta’, in G. Porter, F. Lyon and The Nigerian Marketing Network, Investigations on Building a Food Marketing Policy Evidence Base in Nigeria, Nigerian Marketing Network: 142–163
Agbon, C.A.; Oguntona, C.R.B. and Mayaki, T.F. (2009) ‘Micronutrient Content of Traditional Complementary Foods’, The Forum for Family and Consumer Issues 14.2
Agwu, A.E.; Ellah, J.; Ekweagwu, E. and Iwuchukwu, J.C. (2009) ‘Consumption Patterns and Intra-Household Roles in the Production, Processing and Marketing of Soyabeans in the Northern Agricultural Zone of Benue State, Nigeria’, African Journal of Biotechnology 8.4: 605–13
Ajani, S. (2010) ‘An Assessment of Dietary Diversity in Six Nigerian States’, African Journal of Biomedical Research, 13 September: 161–67
Ajieroh, V. (2009) A Quantitative Analysis of Determinants of Child and Maternal Malnutrition in Nigeria, Nigeria Strategy Support Programme, Background Paper NSSP10, Abuja, Nigeria: International Food Policy Research Institute
Akinkurolere, R.O.; Adedire, C.O. and Odeyemi, O.O. (2006) Laboratory Evaluation of the Toxic Properties Of Forest Anchomanes, Anchomanes difformis against Pulse Beetle Callosobruchus maculatus (Coleoptera: Bruchidae)’, Insect Science 13.1: 25–29
Akinrele, I.A. and Edwards, C.C. (1971) ‘An Assessment of the Nutritive Value of a Maize-Soya Mixture, “‘Ogi”, as a Weaning Food in Nigeria’, British Journal of Nutrition 26.2: 177–85
Akinyele, I.O. (2009) Ensuring Food and Nutrition Security in Rural Nigeria: An Assessment of the Challenges, Information Needs, and Analytical Capacity, IFPRI Nigeria Strategy Support Programme, Background Paper, Abuja: International Food Policy Research Institute
–– (1998) ‘Street Foods and their Contribution to the Food Security and Nutritional Status of Nigerians. West African’, Journal of Foods and Nutrition 1.1: 6–20
Al-Othman, A.M.; Khan, M.A. and Al-Kanhal, M.A. (1997) ‘Nutritional Evaluation of Some Commercial Baby Foods Consumed in Saudi Arabia’, International Journal of Food Sciences and Nutrition 48.4: 229–36
Amusa, N.A.; Ashaye, O.A. and Oladapo, M.O. (2005) ‘Microbiological Quality of Ogi and Soy-Ogi a Nigerian Fermented Cereal Porridge Widely Consumed and Notable Weaning Food in Southern Nigeria’, Journal of Food, Agriculture and Environment 3.2: 81–83
90
Anim-Somuah, H.; Henson, S.; Humphrey, J. and Robinson, E. (2013a) Policy Guidelines: Enhancing Markets for Nutrient-Dense Foods in Ghana, IDS Evidence Report 28, Brighton: IDS
–– (2013b). Strengthening Agri-Food Value Chains for Nutrition: Mapping Value Chains for Nutrient-Dense Foods in Ghana, IDS Evidence Report 2, Brighton: IDS
Baributsa, D.; Lowenberg-DeBoer, J.; Murdock, L. and Moussa, B. (2010) ‘Profitable Chemical-Free Cowpea Storage Technology for Smallholder Farmers in Africa: Opportunities and Challenges’, 10th International Working Conference on Stored Product Protection: 1046–52
Black, R.E.; Allen, L.H.; Bhutta, Z.A.; Caulfield, L.E.; de Onis, M.; Ezzati, M.; Mathers, C. and Rivera, J. (2008) ‘Maternal and Child Undernutrition: Global and Regional Exposures and Health Consequences’, The Lancet, 371.9608: 243–60
Boateng, Isaac (2012), Soybean Value Chain in Nigeria. A report submitted to Department for International Development (DFID) by Propcom Mai-Karfi Nigeria.
Boukar, O.; Massawe, F.; Muranaka, S.; Franco, J.; Maziya-Dixon, B.; Singh, B., and Fatokun, C. (2011a) ‘Evaluation Of Cowpea Germplasm Lines for Protein and Mineral Concentrations In Grains’, Plant Genetic Resources 9.4: 515–22
Boukar, O.; Muranaka, S.; Franco, J. and Fatokun C. (2011b) Protein and Mineral Composition in Grains of Elite Cowpea Lines, Ibadan, Nigeria: International Institute of Tropical Agriculture
Caulfield, L.E. and Black, R.E. (2004) ‘Zinc Deficiency’, in M. Ezzati, A.D. Lopez, A. Rodgers and C.J.L. Murray (eds), Comparative Quantification of Health Risks: Global and Regional Burden of Diseases Attributable to Selected Major Risk Factors, Basel, Switzerland: World Health Organization
DFID (2012) An Update of ‘The Neglected Crisis of Undernutrition: Evidence for Action’, London: Department for International Development
–– (2011) Scaling Up Nutrition: The UK’s Position Paper on Undernutrition, London: Department for International Development
–– (2009) The Neglected Crisis of Undernutrition: Evidence for Action, London: Department for International Development
Dranove, D. and Jin, G. (2010) ‘Quality Disclosure and Certification: Theory and Practice’, Journal of Economic Literature 48.4: 935–63
Eazee, L. (2012) ‘We have Trained 4,000 Farmers through UNAAB – Nestle Boss’, Daily Independent, www.dailyindependentnig.com/2012/06/we-have-trained-4000-farmers-through-unaab-nestle-boss (accessed 22 January 2014)
Ekpenyong, C.; Udokang, N.; Akpan, E. and Samson, T. (2012) ‘Double Burden, Non-Communicable Diseases and Risk Factor Evaluation in Sub-Saharan Africa: The Nigerian Experience’, European Journal of Sustainable Development 1.2: 249–70
Euromonitor International (2012) Baby Food in Nigeria, Euromonitor International
Federal Republic of Nigeria, National Bureau of Statistics; UNPF Population Fund and UNICEF (2011) Nigeria: Multiple Indicator Cluster Survey 2011, Abuja: National Bureau of Statistics

91
FAO (2013) Food and Agriculture Organization, Economic and Social Development Statistics Division, www.fao.org/es/esc/prices (accessed 24 January 2014)
Gegios, A.; Amthor, R.; Maziya-Dixon, B.; Egesi, C.; Mallowa, S.; Nungo, R.; Gichuki, S.; Mbanaso, A. and Manary, M.J. (2010) ‘Children Consuming Cassava as a Staple Food are at Risk for Inadequate Zinc, Iron, and Vitamin A Intake’, Plant Foods for Human Nutrition 65.1: 64–70
Golob, P. (1993) ‘Phosphine: A Fumigant for Small-Scale Application in Northern Ghana’, NRJ Report No. 4.
Hartwich, F.; Devlin, J.; Kormawa, P.; Bisallah, I.D.; Odufote, B.O. and Polycarp, I.M. (2010) Unleashing Agricultural Development in Nigeria through Value Chain Financing, Geneva: United Nations Industrial Development Organization
Hawkes, C. and Ruel, M.T. (2011) ‘Value Chains for Nutrition’, in S. Fan (ed.), Leveraging Agriculture for Improving Nutrition, Washington DC: International Food Policy Research Institute
Henson, S.; Humphrey, J. and McClafferty, B. (2013) Nutritious Agriculture by Design: A Tool for Program Planning, GAIN-IDS Discussion Paper, Geneva: Global Alliance for Improved Nutrition
Herforth, A. (2012) Guiding Principles for Linking Agriculture and Nutrition: Synthesis from 10 Development Institutions, Rome: Food and Agriculture Organization
Ibro, G.; Seydou, Ramatou; Saley, Kaka; Everhart-Valentin, Kira; Fulton, Joan; Lowenberg-DeBoer, J. and Otoo, Miriam (2008) ‘Testing the Market Potential for a New Value-Added Cowpea Product to Improve the Well-Being of Women Entrepreneurs in West Africa’, paper presented at the Association for International Agricultural and Extension Education Annual Conference, EARTH University, Costa Rica, 10–15 March 2008
Ijarotimi, O. and Ogunsemore, M. (2006) ‘Weaning Foods and their Impact on Child-Feeding Practices among Low-Income Nigerian Mothers’, Food Nutrition Bulletin 27.4: 327–34
IRIN (2008) ‘NIGERIA: Toxic Grain Threatens Food Security’, 15 May 2008, IRIN Humanitarian News and Analysis, www.irinnews.org/printreport.aspx?reportid=78242 (accessed 22 January 2014)
Kormawa, P.M.; Chianu, J.N. and Manyong, V.M. (2002) ‘Cowpea Demand and Supply Patterns in West Africa: The Case of Nigeria’, in C. Fatokum, S. Tarawali, B.B. Singh, O. Kormawa and M. Tamo (eds), Challenges and Opportunities for Enhancing Sustainable Cowpea Production, Ibadan, Nigeria: International Institute for Tropical Agriculture: 376–86
Kuku-Shittu, O.; Mathiassen, A.; Wadhwa, A.; Myles, L. and Ajibola, A. (2013) Comprehensive Food Security and Vulnerability Analysis: Nigeria, Washington DC: International Food Policy Research Institute
Lawal, B.O. and Olukemi, S.F. (2010) ‘Determinants of Nutritional Status in Children in Farming Households in Oyo State, Nigeria’, African Journal of Food Agriculture Nutrition and Development 10.10: 4236–53
Legg, C.; Kormawa, P.; Maziya-Dixon, B.; Okechukwu, R. and Alabi, T. (2001) Mapping Livelihoods and Nutrition in Nigeria using Data from the National Rural Livelihoods Survey and the National Food Consumption and Nutrition Survey, Ibadan, Nigeria: International Institute for Tropical Agriculture

92
Masters, W.A.; Kuwornu, J. and Sarpong, D. (2011) Improving Child Nutrition through Quality Certification of Infant Foods: Scoping Study for a Randomized Trial in Ghana, London: International Growth Centre
Maziya-Dixon, B.; Akinyele, I.O.; Oguntona, E.B.; Nokoe, S.; Sanusi, R.A. and Harris, E. (2003) Nigeria Food Consumption and Nutrition Survey, Ibadan: International Institute of Tropical Agriculture
Ministry of Agriculture (2011) Plan for the Maize-Soybean Transformation in Nigeria, http://unaab.edu.ng/attachments/Maize Final Report.pdf (accessed 22 January 2014)
Mishili, F.J.; Fulton, J.; Chergna, A. and Lowenberg-DeBoer, J. (2007) Consumer Preferences for Quality Characteristics along the Cowpea Value Chain, West Lafayette, IN: Dept. of Agricultural Economics, Purdue University
Muanya, C. (2009) ‘Why Goitre Thrives in Southern Nigeria, by Experts’, 5 October 2009, http://newsnigeria.onlinenigeria.com/templates/default.aspx?a=8701&template=print-article.htm (accessed 22 January 2014)
Murdock, L.; Shade, R.; Kitch, L.; Ntoukam, G.; Lowenberg-DeBoer, J.; Heusing, J.; Moar, W.; Chambliss, O.; Endondo, C. and Wolfson, J. (1997) ‘Postharvest Storage of Cowpea in Sub-Saharan Africa’, in B. Singh, D.M. Raj, K. Dashiell and L. Jackai (eds), Advances In Cowpea Research, Ibadan, Nigeria: International Institute of Tropical Agriculture
Musa, Sehu (2003) ‘Marketing of Cowpea in Nigeria: Econometric Studies of Quality Factors and Market Integration’, unpublished PhD dissertation, Abubakar Tafawa Balewa University, Department of Agricultural Economics and Extension
National Bureau of Statistics/Federal Ministry of Agriculture and Rural Development (2010) Collaborative Survey on National Agriculture Sample Survey (NASS) Report, Lagos: New Nigeria Foundation
National Population Commission (2009) Nigeria Demographic and Health Survey, Abuja, Nigeria: National Population Commission
Nestlé (2011) Nestlé’s Commitment to Africa: The Grains Quality Improvement Project, Vevey, Switzerland: Nestlé SA
Nestlé Nigeria Plc (2011) Nestlé Manufacturing Operations in Nigeria: A Profile, Lagos: Nestlé Nigeria Plc
New Nigeria Foundation/Development Associates (2007) Final Report on the Soya Value Chain Baseline Survey, PrOpCom Monograph Series 32, Lagos: New Nigeria Foundation
Nicely, R. and David, M. (2011) Soy Beans and Products: Assessments of Commodity and Trade Issues. Global Agricultural Information Network Report, Lagos: US Department of Agriculture, Foreign Agricultural Service
Nnam, N.M. (2000) ‘Chemical Evaluation of Multimixes Formulated from some Local Staples for Use as Complementary Foods in Nigeria’, Plant Foods for Human Nutrition 55.3: 255–63
Nwaru, B.I.; Onyeka, I.N.; Ndiokwelu, C.; Esangbedo, D.O.; Ngwu, E.K. and Okolo, S.N. (2012) ‘Maternal and Child Dietary Patterns and their Determinants in Nigeria’, Maternal & Child Nutrition 1–14
Nwuneli, N.; Robinson, E.; Humphrey, J. and Henson, S. (2014) The Role of Businesses in Providing Nutrient-Rich Foods for the Poor. Two Case Studies in Nigeria, IDS Evidence Report 64, Brighton: IDS

93
Oganah, B. and Nwabah, N. (2009) ‘Nutrition Transition and its Consequences: Implications for the Nigerian Child’, International Journal of Home Economics 2.2: 20–31
Ogbonnaya, Joy A.; Ketiku, A.O.; Mojekwu, C.N.; Mojekwu, J.N. and Ogbonnaya, J.A. (2012) ‘Energy, Iron and Zinc Densities of Commonly Consumed Traditional Complementary Foods in Nigeria’, British Journal of Applied Science & Technology 2.1: 48–57
Ogunba, B.O. (2012) ‘Adoption of Enriched Local Complementary Food in Osun State: Combating Micronutrient Deficiency in the First Two Years of Life’, African Research Review 6.1: 171–83
Ogunba, B.O. (2010) ‘Diet Diversity in Complementary Feeding and Nutritional Status of Children Aged 0 to 24 Months in Osun State, Nigeria: A Comparison of the Urban and Rural Communities’, ICAN: Infant, Child, & Adolescent Nutrition 2.6: 330–35
Oke, O.L. (1967) ‘Chemical Studies on the Nigerian Foodstuff “Ogi”‘, Food Technology 21.2: 98–100
Okoruwa, A.E. (2011) ‘Sourcing and Utilization of High Quality Protein in Nigerian Food Products: Issues, Challenges and Opportunities’, paper presented at the USDA-hosted seminar ‘High-Quality Proteins: The Missing Link in Development?’, Lagos, 8 March 2011
Omilola, B. (2010) Patterns and Trends of Child and Maternal Nutrition Inequalities in Nigeria, IFPRI Discussion Paper 968, Washington DC: International Food Policy Research Institute
Omotayo, A.M.; Olowe, V.I.O.; Fabusoro, E.; Babajide, J. M.; Ojo, D.K. and Adegbite, D.A. (2007) Commercial Demand for Soybean in Nigeria, Report of a Survey commissioned by PrOpCom, PrOpCom Monograph Series No. 29, Abeokuta, Nigeria: Agricultural Media Resources and Extension Centre (AMREC) University of Agriculture
Onianwa, P.; Adeyemo, A.; Idowu, O. and Ogabiela, E. (2001) ‘Copper and Zinc Contents of Nigerian Foods and Estimates of the Adult Dietary Intakes’, Food Chemistry 72.1: 89–95
Owolabi, A.O.; Mac-Inegite, J.O.; Olowoniyan, F.O. and Chindo, H.O. (1996) ‘A Comparative Study of the Nutritional Status of Children in Villages in Northern Nigeria Using and not Using Soya Beans’, Public Health Nutrition 17.1
Purdue University (2013) ‘Nigerian Company Licenses Purdue Crop Storage System that Deters Insects’, Research Foundation News, 4 September 2013, http://www.purdue.edu/newsroom/releases/2013/Q3/nigerian-company-licenses-purdue-crop-storage-system-that-deters-insects.html (accessed 22 January 2014)
Research International Nigeria (2007) Market Trends and Business Opportunities for Delivering Improved Nutrition: Soya, Ibadan, Nigeria: World Initiative for Soy in Human Health
Robinson, E.; Akinyele, I.O.; Humphrey, J. and Henson, S. (forthcoming, 2014) Policy Options to Enhance Markets for Nutrient-Dense Foods in Nigeria, IDS Evidence Report, Brighton: IDS
Sahel Capital Partners and Advisory (2012a) An Assessment of the Soya Value Chain in Nigeria: Africare Inc. Soya Value Chain Baseline Survey (2007), PrOpCom (a DFID agricultural programme)
Sahel Capital Partners and Advisory (2012b) ‘Market Research Study Nutritious Foods for Mothers and Children, Nigeria’, unpublished: Lagos: Sahel Capital Partners and Advisory

94
Sanginga, P.C.; Adesina, A.A.; Manyong, V.M.; Otite, O. and Dashiell, K.E. (1999) Social Impact of Soybean in Nigeria’s Southern Guinea Savanna, Ibadan, Nigeria: International Institute of Tropical Agriculture
Shaibu, I. (2008) ‘30 Agrochemical Products Banned in Nigeria After Deaths’, Organic Consumers Asociation, Vanguard, Nigeria, 14 May 2008, www.organicconsumers.org/articles/article_12416.cfm (accessed 21 March 2014)
Shurtleff, W. and Aoyagi, A. (2009) History of Soybeans and Soy Foods in Africa (1857–2009): Extensively Annotated Bibliography and Sourcebook, Lafayette CA: SoyInfo Center
Taiwo, K.A. (1998) ‘The Potential of Cowpea as Human Food in Nigeria’, Technovation 18.6–7: 469–81
UNDP (2009) Human Development Report Nigeria 2008–2009, Abuja: Development Programme
UNICEF (2012) Summary Findings of Cross-Sectional Nutrition Survey Northern Nigeria, February 2012, Ibadan: UNICEF, 1–4
UNICEF (2011) ‘Overview of Nutritional Status of Nigerians’, presentation given at seminar ‘High Quality Proteins: the Missing Link in Development’, Lagos, Nigeria, 8 March 2011
–– (2005) Universal Salt Iodization Process, Successes and Lessons, Abuja: UNICEF Nigeria
USAID Nigeria (2008) A Study of the Cowpea Value Chain in Kano State, Nigeria, from a Pro-Poor and Gender Perspective, Washington DC: USAID, www.nigeriamarkets.org/files/GATE_Cowpeas_Final%5B1%5D.pdf (accessed 22 January 2014)
USDA (2012) Oilseeds: World Market and Trade May 2012, United States Department of Agriculture, Economics, Statistics, and Market Information System, http://usda.mannlib.cornell.edu/MannUsda/viewDocumentInfo.do?documentID=1490 (accessed 22 January 2014)
Uthman, O. (2009) ‘Decomposing Socio-Economic Inequality in Childhood Malnutrition in Nigeria’, Maternal & Child Nutrition 5.4: 358–367
Van de Poel, E.; Hosseinpoor, A.R. and Jehu-Appiah, C. (2007) ‘Malnutrition and the Disproportional Burden on the Poor: The Case of Ghana’, International Journal for Equity in Health 6.21: 1–12
Vanderjagt, D.J.; Brock, H.S.; Melah, G.S.; El-Nafaty, A.U.; Crossey, M.J. and Glew, R.H. (2007) ‘Nutritional Factors Associated with Anaemia in Pregnant Women in Northern Nigeria’, Journal of Health, Population, and Nutrition 25.1: 75–81
World Bank (2009) Nutrition at a Glance: Ghana, Washington DC: World Bank
World Bank (2008) Nigeria: Nutrition at a Glance, Ibadan, Nigeria: World Bank
World Bank Agriculture and Rural Development Department (2007) From Agriculture to Nutrition: Pathways, Synergies and Outcomes, Washington DC: World Bank