The Journal of Physical Chemistry 1975 Volume.79 No.17
148
^ volume 79 AUGUST 14, 1975 NUMBER 17 JPCHAx THE JOURNAL OF •cm ' 11 ~ '4Ss? CHEMICAL SOCIETY
-
Upload
khangminh22 -
Category
Documents
-
view
4 -
download
0
Transcript of The Journal of Physical Chemistry 1975 Volume.79 No.17

^ v o l u m e 7 9 A U G U S T 14, 1 9 7 5 N U M B E R 17
JPCHAx
T H E J O U R N A L O F
•cm' 11 ~ '4Ss?
C H E M I C A L S O C I E T Y
T H E J O U R N A L OF
P H Y S I C A L C H E M I S T R Y
BRYCE CRAWFORD, Jr., Editor STEPHEN PRAGER, Associate EditorROBERT W. CARR, Jr., FREDERIC A. VAN-CATLEDGE, Assistant Editors
EDITORIAL BOARD: C. A. ANGELE (1973-1977), F. C. ANSON (1974-1978),V. A. BLOOMFIELD (1974-1978), J. R. BOLTON (1971-1975), L. M. DORFMAN (1974-1978), H. L. FRIEDMAN (1975-1979), E. J. HART (1975-1979), W. J. KAUZMANN (1974-1978),R. L. KAY (1972-1976), D. W. McCLURE (1974-1978), R. M. NOYES (1973-1977),J. A. POPLE (1971-1975), B. S. RABINOVITCH (1971-1975), S. A. RICE (1969-1975),F. S. ROWLAND (1973-1977), R. L. SCOTT (1973-1977), A. SILBERBERG (1971-1975),J. B. STOTHERS (1974-1978), W. A. ZISMAN (1972-1976)
AMERICAN CHEMICAL SOCIETY, 1155 Sixteenth St., N.W., Washington, D C. 20036
Books and Journals D ivision
D. H. MICHAEL BOWEN Director
CHARLFIS R. BERTSCH Head, Editorial Processing Department BACIL GUILEY Head, Graphics and Production Department SELDON W. TERRANT Head, Research and Development Department
© C opyright, 1975, by th e American Chemical Society. P u b lished biweekly by the American Chemical Society a t 20th and N ortham pton Sts., Easton, Pa. 18042. Second-class postage paid a t W ashington, D.C., and a t additional m ailing offices.
All m anuscripts should be sen t to The Journal o f P hysical C hem istry, D epartm ent of Chem istry, University of M innesota, M inneapolis, M inn. 55455.
A dditions and Corrections are published once yearly in the final issue. See Volume 78, N um ber 26 for the proper form.
E xtensive or unusual a lterations in an article a fter it has been set in typ e are made at th e au th o r’s expense, and it is understood th a t by requesting such a lterations the au thor agrees to defray the cost thereof.
The Am erican Chemical Society and the E ditor of The Journal o f P hysical C hem istry assum e no responsibility for the sta tem ents and opinions advanced by contributors.
Correspondence regarding accepted copy, proofs, and reprin ts should be directed to E ditorial Processing D epartm ent, American Chemical Society, 20th and N ortham pton Sts., E aston, Pa. 18042. D epartm ent Head: CHARLES R. Be r t SOH. Associate D epartm ent Head: MARIANNE C. BROGAN, A ssistant Editors: CELIA B.McFarland , Joseph E. Yurvati.
Advertising Office: Centcom , Ltd., 50 W. S ta te St., W estport, Conn. 06880.
Business and Subscription Information
Send all new and renewal subscriptions w ith p a ym en t to: Office of the Controller, 1155 16th S treet, N.W., W ashington. D C. 20936. Subscriptions should be renewed prom ptly to avoid c break in your series. All correspondence and telephone calls regarding
changes of address, claims for missing issues, subscription service, the sta tu s of records, and accounts should be d irected to M anager, M em bership and Subscription Services, American Chemical Society, P.O. Box 3337, Columbus, Ohio 43210. Telephone (614) 421- 7230. For microfiche service, contact ACS M icrofiche Service, 1155 16t.h St. N.W., W ashington, D.C. 20036. Telephone (202) 872-4444.
On changes of address, include both old and new addresses w ith ZIP code num bers, accompanied by m ailing label from a recent issue. Allow four weeks for change to become effective.
Claims for m issing num bers will not be allowed (1) if loss was due to failure of notice of change in address to be received before the date specified, (2) if received more th an sixty days from date of issue plus tim e norm ally required for postal delivery of journal and claim, or (3) if the reason for the claim is “ issue missing from files.”
Subscription rates (hard copy or microfiche) in 1975: $20.00 for 1 year to ACS m embers; $80.00 to nonm em bers. E x tra postage $4.50 in Canada and PUAS, $5.00 o ther foreign. Supplem entary m aterial (on microfiche only) available on subscription basis, 1975 rates: $15.00 in U.S., $19.00 in Canada and PUAS, $20.00 e lsewhere. All microfiche airm ailed to non-U.S. addresses; air freight ra tes for hard-copy subscriptions available on request.
Single copies for current year: $4.00. R ates for back issues from Volume 56 to date are available from the Special Issues Sales D epartm en t, 1155 Sixteenth St., N.W., W ashington, D.C. 20036.
Subscriptions to this and the o ther ACS periodical publications are available on microfilm. For inform ation on microfilm write Special Issues Sales D epartm ent at the address above.
Notice to Authors last printed .r. the issue of July 3, 1975
T H E J O U R N A L O F
P H Y S I C A L C H E M I S T R YV o l u m e 79 , N u m b e r 1 7 A u g u s t 1 4 , 1 9 7 5
JPCHAx 79(17) 1749-1890 (1975)
ISSN 0022-3654
Analytical Results for First-Order Kinetics in Flow Tube Reactors with Wall ReactionsPaul J. Qgren 1749
Rates of Reaction of Hydrogen Atoms with Silane and GermaneK wang Yul Choo, Peter P . Gaspar,* and A. P . Wolf 1752
Reaction of Hydrogen Atoms with ThiiraneT. Yokota, M. G. Ahmed, I. Safarik , O. P . Strausz,* and H. E. Gunning 1758
Rate Constants for the Reaction of OH Radicals with a Series of Aromatic HydrocarbonsD . A. Hansen, R. Atkinson, and J . N. P itts, Jr.* 1763
Reaction of -OH with Benzoic Acid. Isomer Distribution in the Radical Intermediates. George W. Klein, K ishan B hatia, V. M adhavan, and Robert H. Schuler* 1767
Polarographic and Optical Pulse Radiolysis Study of the Radicals Formed by OH Attack on Imidazole and Related Compounds in Aqueous Solutions
K. M. B ansal and R. M. Sellers* 1775
Combination and Disproportionation of Allylic Radicals at Low TemperaturesRalph Klein* and Richard D. Kelley 1780
Thermodynamics of the Reaction of Ammonia and Sulfur Dioxide in the Presence of Water VaporRonald Landreth, Rosa G. de Pena, and Julian Heicklen* 1785
Electronic Excitation Transfer between the Same Kind of Excited Molecules in Rigid Solvents under High-Density Excitation with Lasers
N obuaki Nakashim a, Yuji Kume, and Noboru M ataga* 1788
Structure, Energetics, and Dynamics of Small Water ClustersJohn C. O w icki, Lester L. Shipm an, and Harold A. Scheraga* 1794
Influence of a First Hydrogen Bond on the Formation of a Second One by Alkyl- orDialkylammonium Ions M. CL H aulait and P. L. Hu.vskens* 1812
Apparent and Partial Molar Polarizations in Solutions and the Halverstadt-Kumler andHedestrand Equations..............................................................................W illiam J. Taylor 1817
Calculation of the Elementary Graph of the Fourth Virial Coefficient of a Dilute Ionic SolutionM. Dixon* and P. Hutchinson 1820
Expansion of the McDevit and Long Theory of Nonelectrolyte Activity Coefficients to aConsideration of Concentrated Aqueous Electrolyte Solutions ..................... R. F. Cross 1822
Voltammetry of Rhodium-1,10-Phenanthroline ComplexesGregory Kew, Kenneth H anck, and Keith DeArmond* 1828
Oxygen Adducts of Cobalt(II)-Ethylenediamine Complexes in X- and Y-Tvpe ZeolitesR. F. Howe and J. H. Lunsford* 1836
Molecular Diffusion and Proton Exchange in Methanol Adsorbed by a Sodium and a HydrogenY Zeolite...............................................................................P. Salvador and J. J . Fripiat* 1842
Infrared Spectra of Matrix Isolated Disulfur Monoxide IsotopesAlfred G. Hopkins, Francis P. D aly, and Chris W. Brown* 1849
f Y v jT ' - ' f P « ■)***■?1A
Raman Spectroscopic Studies of Binary Systems. II. Effect of Temperature upon Molecular Association in the Ammonia-Hexadeuteriobenzene System
. John H. Roberts* and Bertin de B ettign ies 1852
Electron Spin Resonance Spectra of Certain Fluorohydride Radicals of Phosphorus, Arsenic, andAntimony...............................................A. J. Colussi, J . R. Morton,* and K. F. Preston 1855
Electron Spin Resonance Study on the Structure of Radical Pairs in Irradiated OrientedPolyethylene Takashi Fujimura* and N aoyuki Tam ura 1859
Molecular Orbital Calculations on the Nitrogen Nuclear Spin-Spin Coupling ConstantsShin ichi N agata,* Tokio Yam abe, Kim ihiko Hirao, and K enichi Fukui 1863
Nuclear Magnetic Resonance Investigation of Cobalt(III) Outer-Sphere Complexes in AqueousSolutions.................................................. K. L. Craighead, P. Jones, and R. G. Bryant* 1868
Crystal Structures of Hydrated and Dehydrated Divalent-Copper-Exchanged FaujasiteI. E. M axwell* and J. J. de Boer 1874*
Polar Tensors and Effective Charges of B ^ C O ............ A. B. M. S. B assi and Roy E. Bruns* 1880
Soret Coefficient of 1 N Lithium Iod ide ......................................................D ouglas R. C aldw ell 1882Pressure Dependence of Thermal and Fickian Diffusion in 0.1 N Sodium Chloride
D ouglas F. C aldwell 1885
A Relationship between Hydroxyl Proton Chemical Shifts and Torsional Frequencies in SomeOrtho-Substituted Phenol Derivatives............................................................. Ted Schaefer 1888
■ Supplementary material for this paper is available separately, in photocopy or microfiche form. Ordering information is given in the paper.
* In papers with more than one author, the asterisk indicates the name whom inquiries about the paper should be addressed.
AUTHOR INDEX
Ahmed, M. G., 1758 Atkinson, R., 1763
Bansal, K. M., 1775 Bassi, A. B. M. S..
1880Bhatia, K., 1757 Brown, C. W., 1849 Bruns, R. E., 1880 Bryant, R. G., 1868
Caldwell, D.R., 1882, 1885
Choo, K. Y„ 1752 Colussi, A. J., 1855 Craighead, K. L., 1868 Cross, R. F., 1822
Daly, F. P„ 1849 DeArmond, K., 1828 de Bettignies, B., 1852
de Boer, J. J., 1874 dePena, R. G., 1785 Dixon, M., 1820
Fripiat, J. J., 1842 Fujimura, T., 1859 Fukui, K., 1863
Gaspar, P. P., 1752 Gunning, H. E., 1758
Hanck, K., 1828 Hansen, D. A., 1763 Haulait, M. Cl., 1812 Heicklen, J., 1785 Hirao, K., 1863 Hopkins, A. G., 1849 Howe, R. F., 1836 Hutchinson, P., 1820 Huyskens, P. L., 1812
Jones, P., 1868
Kelley, R. D„ 1780 Kew, G., 1828 Klein, G. W., 1767 Klein, R., 1780 Kume, Y., 1788
Landreth, R., 1785 Lunsford, J. H., 1836
Madhavan, V., 1767 Mataga, N., 1788 Maxwell, I. E., 1874 Morton, J. R., 1855
Nagata, S., 1863 Nakashima, N., 1788
Ogren, P. J., 1749 Owicki, J. C., 1794
of the author to
Pitts, J. N., Jr., 1763 Preston, K. F., 1855
Roberts, J. H., 1852
Safarik, L, 1758 Salvador, P., 1842 Schaefer, T., 1888 Scheraga, H. A., 1794 Schuler, R. H., 1767 Sellers, R. M., 1775 Shipman, L. L., 1794 Strausz, O. P., 1758
Tamura, N., 1859 Taylor, W. J., 1817
Wolf, A. P., 1752
Yamabe, T., 1863 Yokota, T„ 1758
2Â The Journal o f Physical Chemistry, Voi. 79, No. 17, 1975

T H E J O U R N A L O F
P H Y S I C A L C H E M I S T R YRegistered in U. S. P atent Office © Copyright, 1975, by the Am erican Chemical Society
VOLUME 79, NUMBER 17 AUGUST 14, 1975
Analytical Results for First-Order Kinetics in Flow Tube Reactors with Wall Reactions
Paul J. OgrenDepartment of Chemistry, Central College, Pella, Iowa 50219 (Received January 13, 1975)
An analysis of chemical reaction in a flow system is presented. The analysis is confined to cases of Poiseuille flow, with first-order gas-phase and wall reactions, and with negligible axial diffusion; these conditions permit exact solutions to be obtained. Particular attention is given to results for systems with nearly constant radial concentration, a condition of considerable experimental importance. A convenient method is outlined for correcting observed rate constants for the combined effects of wall reactions and small radial concentration gradients. Applications of the exact solutions agree well with the conclusions of previous workers.
IntroductionFlow tube reactors are commonly used for the study of
fast gas-phase reactions. For simple interpretation, conditions are normally employed which give minimum viscous pressure drop, axial diffusion and wall reaction, and maximum radial diffusion. Such conditions, discussed in some detail by Kaufman,1 allow the system to be treated as one with all fluid elements moving with the bulk velocity v with no radial concentration gradients. In this “ideal” case the concentration of a species disappearing by a first-order reaction is governed at any position z along the tube by the original concentration and the equation dc/dz = — kc/v, where k may include both bulk and wall reaction terms.
For many experimental systems, viscous pressure drop and axial diffusion can often be minimized; however, tube size and diffusion or pressure conditions chosen to give nearly uniform radial concentrations also increase the relative importance of wall reactions. In typical experimental studies, apparent rate constants are examined as a function of pressure to separate wall rate terms from bulk rate terms. At the increasingly higher pressures which increase the relative importance of bulk rate processes, however, appreciable radial concentration gradients may develop due to the decrease in molecular diffusion. In such circumstances, the main portion of the flowing gas, which is eventually studied at a downstream detection point, becomes increasingly “insulated” from the wall reaction and the observed rate may be less than the sum of wall and bulk reaction rates.
Some who have dealt fairly recently with the general problem of corrections to “ideal” flow behavior have suc-
eessfully used approximate analytical solutions to a restricted continuity equation to describe effects of viscous pressure drop, axial diffusion, and slip flow on observed axial decay constants.1-3 The effect of wall reactions on radial concentration gradients has been evaluated approximately by Kaufman,1 but the determination of nonideal effects of wall reactions and incomplete radial mixing on axial decay has thus far required numerical analysis.4 5 The primary contribution of the present work is to demonstrate that the restricted continuity equation used by others can be solved exactly for first-order reactions. These solutions are then used to examine nonideal effects of incomplete radial mixing and wall reactions on first-order rate processes in the absence of other complications. The analytical approach taken also provides some useful insight into the effects of initial and boundary conditions on apparent reaction parameters under fairly general flow conditions.
Theory and D iscussionGeneral Development. The treatment here is restricted
to Poiseuille flow; the development follows closely the notation of Poirier and Carr5 and is primarily aimed at evaluating wall effects on observed first-order kinetics in the absence of axial diffusion. The continuity equation for a flowing system at constant pressure and temperature with a small amount of component c undergoing experimental first-order reaction is
L \R o/ J dz L r nr nr <iz-J kc (1)
The general boundary conditions are c = co(r) at z = 0; c =
1749

17S0 Paul J. Ogren
0 at 2 = a>; and —D{ac/ar) = k^c at r = R, the radius of the cylinder.9 We first assume that conditions making the axial gradient term negligible can be chosen.1 Equation 1 may then be written in dimensionless form as
a8 _ 1 a s8( 1 — ul ) — = a -----u ------ 9
d \ U d l l d l l(2)
where X = kz/vo, 8 = c/co(0), 8 = 8o(u) at X = 0, u = r/R, a = D/kR2. Setting 8 = k J kR the wall condition may be written as
* — *<>au a (3)
This restricted equation is separable;2’3 assuming 8(u, X) = h(\)f(u) one finds that:
— — = — 6 or h = hoe~bx (4)h a\
anda sf — u — au au
1 - 6a
fu + — fua
3 (5)
where 6 is a positive number. Letting d = 1/a, (5) is first solved by noting that the trial solution esu2g(u) eliminates the u3 term when s = lh Jb /a . Equation 5 then may be reduced to an equation for g:
ug" + (4su2 + 1 )g' + (4s + 4s2 - d)ug = 0 (6)g(u) may now be solved by the method of infinite series, assuming
g(u) = £ anunn=0
After sotne rearrangement and collection of coefficients of like powers of u, the following recursion formula is found:
4 (n — l)s + 4s2 — d&n 9 2 (7)
The ratio test shows this series to be convergent for 0 < it < 1 for finite s and d. Only the even terms of the series satisfy (6), and thus g{u) has been determined in principle except for the initial constant oo10
Calling g(u) = G(u) when ao = 1, we now have the exact solution to (2):
8(X,u) = Ase~bxesu2G(u) (8)and the general solution
0(X,u) = £ A se bxesu2G(u) (9)hi
where s values are chosen to meet the wall boundary condition (3) and the As are to be determined from initial conditions at X = 0. The first few terms of G(u) are given in
G(u) = 1 - p + y - d j M2 +
T (12s + 4s2 — d)(4s + 4s2 — d)~|L 64 \ U (10)
where y = (4s2 — d)/4s. (This result can be verified by expansion of the exponential term in a 1/(1 + x) power series, followed by integration of each term in the integrand using the Cauchy integral formula,6 and a term-by-term comparison with (10).) In practice, however, it was much easier tc work with the series (10) than with (11).
Boundary Condition at the Wall. Writing f(u ) = esu2G(u), the boundary equation (3) may be written as:
2sG(l) + G'(l) + -G (1 ) = 0 (12)a
This effectively becomes a condition on s, or, in turn, on b, as will now be shown. Further treatment is restricted to reasonably large values of a, a condition approaching the desired behavior mentioned in the beginning, except for wall reaction. The first few terms of G'(u) are given in
w - [ 4, + 4f - rf] u +
[12s + 4s2 — d][4s + 4s2 — d]------------------------ ------------------ iC — . . . (13116
When (10) and (13) are both evaluated at u = 1, (12) is seen to become essentially a power series in s (already shown to be convergent). Solution of (12) then amounts to finding the roots of (12) as a polynomial equation in s. Dealing first with a very simple case, suppose d = 0 and a is very large (e.g., 1000). s is of order (l/n )1/2 and d is of order 1/a. Keeping only the terms of lowest order in 1/a and substituting (10) and (13) into (12), we have
—s ----s2 + - = 0 (14)2 2
Keeping only the two lowest order terms, s2 = d/2 = 6/4 and thus 6 = 2. Putting this into eq 4 gives exactly the result expected for the “ideal” case discussed originally since the bulk velocity = Vo/2 for cylindrical laminar flow. An inclusion of nonzero p in the above treatment gives the ideal result
6 = 2(1 + 2d) or 6 exp = k + 2k J R (15)a result obtained earlier by Kaufman.1
One may proceed beyond these initial results both analytically and numerically. Equation 12 may be written as
\2 a/ \2 a/ 24d^_P d +16 4a
4a (16)
a result which includes explicitly all terms of order 1/a, (l/a)3/2, and (1/a)2. Equation 16 may be developed to give
6 — 6o~vT/a (6 — 6o) j +
i f —(562 - 24 - 96d + 286 + 24d6)l + . . . = 0 (17) aL96 Jwhere bo = 2(1 + 2d), the “ideal” result. If the 1/a term is dropped, one obtains
For suitably low values of s it is also possible to show that (10) becomes
G(u) =sin 7 1(7 / 2 + 1/2) Ç°°x (t/2 t -1/2> e-25uV(i+x)dx (ix)
7r Jo 1 + x
and6 = 60 (18)
6 = 4a (19)uas the first two 6 roots satisfying (12). Keeping the 1/a term and assuming a root near 6q of the form
The Journal of Physical Chemistry, Vol. 79, No. 17, 1975

First-Order Kinetics in Flow Tube Reactors 1751
, , , / 1 \ 1/2 1 b = bo + p ( - ) +q~\ a / a
one can show that p = 0 and so (16) becomes
- = (5b02 - 24 - 960 + 28fc0 + 24£60) (20)a 96akeeping only terms in 1/a.
If (60 — b)/bo = F is the relative fractional difference between b and the “ideal” bo value, then it can be shown that
^¿-¿(7b°+w+D t2i>which can be reexpressed as
0 5450 = 2.18F« - 0.318 - (22)
b oEquation 22 may be interpreted as defining a and 0
values which produce a certain fractional error F in b relative to b 0.
To obtain more accurate results corresponding to (22) one must deal with the obvious fact that each power of s appears an infinite number of times in the series forms (10) and (13). It was thus convenient to use an IBM 1130 computer to collect coefficients of s in eq 12 for a large number of terms in G(u) and G'(u). The roots of the resulting polynomial in s were then computed. Representative results of these calculations are shown in Table I.
It should be noted that the top three entries in Table I correspond to an F value of 0.001 for the lowest b root, illustrating the fact that the program was designed to find a and 8 values corresponding to a given F for comparison with (22). The slope of a 0 vs. a plot for the top three entries corresponds fairly well to (22) but the intercept at a = 0 does not. This occurs because (17) converges rather slowly, especially at low a values, so that the approximations leading to (22) are somewhat inadequate.
Similar calculations are presented in a different manner in Figure 1, where 0 and a values corresponding to a fixed value of F are plotted for several F values. The plots shown are roughly linear and are approximated by the equation
0 « 2.4F« (23)
As F increases, the slopes gradually increase from the 2.2F value of (22).
TABLE I:
8 = 0 8 = 2 0 = 4
Q II to « = 836 a = 1742bn = 2 b 0 = 10 'h = 18b = 1.998 /> = 9.99 b = 17.982
= 541 = 21,500 = 44,700
fi = 0 0 = 1 8 = 0a = .23 a = 1.18 a = .10’>„ = 2 bo = 6 K = 2TTOOr—<II h = 4.52 b = 1.69
= 7.9 = 36.6 = 4.25
Figure 1. Deviations of b (and hence /cexp) from ideality as a function of a and 0 .
leads to F * 0.03. few was not measured, but a value larger than 0.4 cm sec-1 would be reasonable for this reaction and could account in part for the significant 60% drop in measured rate observed at high pressures.7
In cases where (24) implies a major correction, 0 and a may be used to determine a better correction from Figure 1. If kw = 0, then (24) does not apply, but Figure 1 may again be used to estimate errors due solely to decreased radial diffusion.
ApplicationsEquation 23 may be used to evaluate F for experimental
conditions and thus provide either a quantitative assurance that radial effects are negligible or a basis for correcting experimental axial decay values, b, for “nonideal” radial and wall effects. Making use of the relations given in (2), (23) may be arranged to yield
F ~ kwR/2.4D (24)
Recent data of Howard and Evenson7 on the reaction of OH + NO + He —► HONO + He may be used to illustrate the application of (24). Assuming an (NO) concentration of about 10 X 1013 molecules cm-3, one can estimate kw * 0.4 cm sec-1; with D ~ 200 cm2 sec-1 for OH in 4 Torr of He,5 and a flow tube radius of about 1 cm, F ~ 0.001, implying a negligible deviation from ideal flow behavior in this case. Furthermore, a is sufficiently large (ca. 200) that effects of higher s roots can be ignored (see below). For their study of CO + OH -*■ CO2 + H in 30 Torr of Ar, use of the same kw
Further RemarksTable I shows that low a values give more than one rea
sonably low value of b, whereas high o values generally yield one low value b ~ bo and other much higher b values. Reference to (9) suggests that all these solutions should be combined in such a way as to meet the initial concentration conditions at X = 0.12 The point of greatest interest here is that the high b terms of (9) will quickly drop out as X increases, leaving only the low b values, a phenomenon also discussed elsewhere.8 No special problems arise, then, if only one low b value is present, but if two distinct low values are present, further errors may be introduced. In practice, if a > 0.1, one can assume that only the lowest b term will contribute to observed decay along most of the tube, and the corrections of Figure 1 can be safely applied.
As a decreases, the initial radial concentration profile at X = 0 will have an increasing effect on the observed kinetics. If a = 0, for example, eq 2 is easily solved: 0 = t)0 exp[—X/(l - u2)], and decay constants for the cylindrical
The Journal of Physical Chemistry, Vol. 79, No. 17, 1975
1752 Choo, Gaspar, and Wolf
shells will vary from 1 to «°. Although this suggests in general that initial conditions will have a great deal to do with the contributions of the various terms in (9), Poirier and Carr have shown for first-order reaction that choice of a constant initial radial concentration together with a technique which observes a cross section of the reaction tube minimizes such problems, even with very small a.5 Their numerical calculations for small a of log 6 vs. A typically show some initial curvature followed by linear behavior over most of the A range examined. The linear region suggests dominance by the lowest b root, and it is of some interest to note that the /3 = 0, a = 0.10, b — 1.69 system of Table I is in excellent agreement with the final slopes calculated for these /3 and a parameters by Poirier and Carr.
The right side of (24) is very close to Kaufman’s result for radial concentration gradients for slight deviations from “ideal” flow,1 and (24) therefore clearly supports the usual assumption that a concentration gradient of 1% or less produces negligible effects on observed kinetics. Furthermore, it may be noted that the a2c/az2 term of (1) may be treated as a perturbation of the exact solutions of (2), leading to the result
( > c o r r = b ( l - - ^ f 5) (25)
The treatment and result correspond to those of Kaufman.1 Equation 25 will not be valid for large b values, however, first because (25) is based on the assumption that c(r) is nearly constant, and more importantly because d2c/sz2 will not be small for very large b values.
Finally, if slip flow is included, the 1 — u2 term of (2) becomes e — u2, where « = 1 + 2.76 (Ai/PR).3 The subsequent
analyses are similar to those given here, with slight modification of the results for (10) and (13). Equation 15 becomes, for example, kexp = + 2kw/R), as expectedfor the ideal slip flow case. More refined calculations, such as those leading to Table I or Figure 1, must be done separately for each new € value, however.
Acknowledgment. Much of the initial work on this problem was carried out in the Advanced Study Fellowship Program of the National Center for Atmospheric Research. Helpful discussions with Dr. Eric Allen and Dr. Geert Moortgat are gratefully acknowledged.
R eferen ces and N otes(1) F. Kaufman in "P rogress in Reaction K ine tics", G. Porter, Ed., Vol. 1,
Pergamon Press, New York, N.Y., 1961, pp 11-13 .(2) R. W. Huggins and J. H, Cahn, J . Appl. Phys., 38, 180 (1967).(3) R. C. Bolden, R. S. Hemsworth, M. J. Shaw, and N. D. Twiddy, J, Phys.
B, Atom. Mol. Phys.. 3, 45 (1970).(4) R. E. W alker, Phys. Fluids, 4, 1211 (1961).(5) R. V. Poirier and R. W. Carr, Jr., J. Phys. Chem., 75, 1593 (1971).(6) R. V. Churchill, "Com plex Variables and App lica tions", 2nd ed,
McGraw-Hill, New York, N.Y., 1960, pp 168-171.(7) C. J. Howard and K. M. Evenson, J. Chem. Phys., 61, 1943 (1974).(8) E. E. Ferguson, F. C. Fehsenfeld, and A. L. S chm eltekopf, Adv. At. Mol.
Phys., 5 ,1 (1969).(9) k „ o f this notation system is used throughout th is paper and is equal to
the k w o f Kaufm an's paper1 multiplied by R / 2 .
(10) As u —► 0, 4 su2 + 1 —*■ 1 and (6) becom es arbitrarily close to a Bessel equation. This im plies that the second general solution will be a logarithm ic function o f u near u = 0. The singularity o f this solution at u = 0 m akes it o f no physical Interest.
(11) Since a is assumed to be large here, this b value will also be large, and several term s which have been dropped will in fa c t be significant. Equation 19 is therefore only likely to be a crude approxim ation fo r this high b value (cf. Table I).
(12) Although this can be done, It should be noted that a suffic iently high b value can m ake the a2c /a z2 term of (1) im portant re lative to the radial term s. As this would invalidate (2) and subsequent developm ent, the higher b values may only be of qualitative interest.
Rates of Reaction of Hydrogen Atoms with Silane and Germane1
Kwang Yul Choo, Peter P. Gaspar,* and A. P. WolfDepartments o f Chemistry, Brookhaven National Laboratory, Upton, New York 11973, and Washington University, Saint Louis, Missouri 63130 (Received March 5, 1973; Revised Manuscript Received May 2, 1975)
Publication costs assisted by the United States Energy Research and Development Administration
The rates of reaction of hydrogen atoms with silane, germane, and (for comparison) ethylene have been determined at 20 Torr in a discharge flow system. The apparent bimolecular rate constants are 8.5 X 10-12,4.3 X 10-1°, and 3.5 X 10⁻¹³ cm3 molecule-1 sec-1, respectively, which are substantially larger than previously reported values. Activation energies were calculated by the empirical methods of Johnston (BEBO) and Spirin and compared with the values estimated from the experimental rate constants. The experimentally estimated values are lower than those predicted by the BEBO method, suggesting that the activated complex for reaction of hydrogen atoms with silane and germane may differ from the simple linear model for hydrogen atom transfer.
IntroductionReactions of hydrogen atoms with various hydrocarbons
have been studied for many years.2 However no direct ki
* To whom correspondence should be addressed at Washington University.
netic study of reactions of atomic hydrogen with the methane analogs silane and germane has been published until recently.3
Recently reactions of hydrogen atoms,4 methyl radical,5 and trifluoromethyl radical6 with silicon and germanium hydrides and alkylsilanes have been reported. The results
The Journal o f Physical Chemistry, Vol. 79, No. 17, 1975
Reaction of Hydrogen Atoms with Silane and Germane 1753
indicate that compounds of silicon usually react more rapidly than their carbon analogs, principally due to the lower activation energy of the silicon reaction. Hot tritium reactions with silane and methylsilanes have also been studied.7 The Si-C bond was found to be more reactive than the C-C bond and Si-H more reactive than C-H. In 1966 Niki and Mains8 first suggested that the reaction rate of atomic hydrogen with silane might be greater than that of the reaction with ethylene. It was observed that added ethylene, which was known to be a good scavenger of atomic hydrogen in hydrocarbon reaction systems, affected neither the yield nor the isotopic ratio (H2:HD:D2) of molecular hydrogen produced in the mercury-photosensitized decomposition of SiH4-SiD4 mixtures.
We have studied the absolute rates of reaction of hydrogen atoms with silane, germane, and ethylene in order to shed new light on the reactivity of Si-H and Ge-H bonds and in order to assess the usefulness of ethylene as a radical scavenger in silane and germane. In order to assist in the interpretation of our results, estimates have been made of the activation energy for hydrogen abstraction, following the procedure used by Strausz, Gunning, and cowork-gj.g 3a,5b,6b
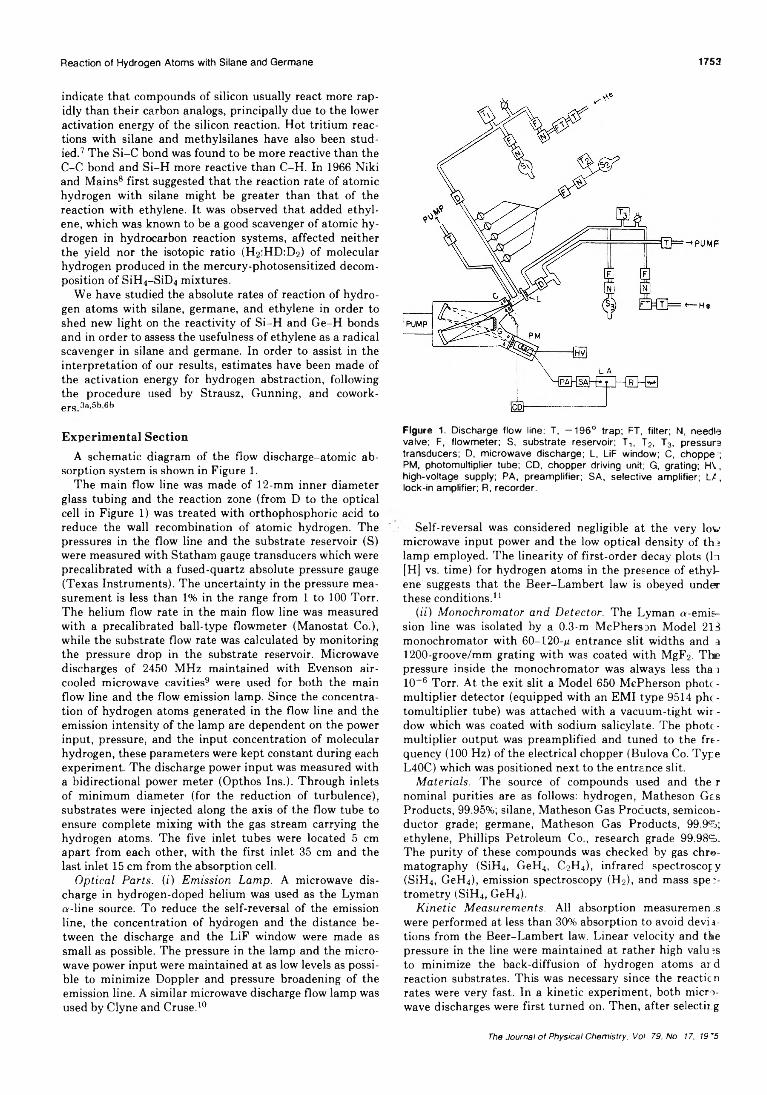
E xperim ental S ectionA schematic diagram of the flow discharge-atomic ab
sorption system is shown in Figure 1.The main flow line was made of 12-mm inner diameter
glass tubing and the reaction zone (from D to the optical cell in Figure 1) was treated with orthophosphoric acid to reduce the wall recombination of atomic hydrogen. The pressures in the flow line and the substrate reservoir (S) were measured with Statham gauge transducers which were precalibrated with a fused-quartz absolute pressure gauge (Texas Instruments). The uncertainty in the pressure measurement is less than 1% in the range from 1 to 100 Torr. The helium flow rate in the main flow line was measured with a precalibrated ball-type flowmeter (Manostat Co.), while the substrate flow rate was calculated by monitoring the pressure drop in the substrate reservoir. Microwave discharges of 2450 MHz maintained with Evenson aircooled microwave cavities9 were used for both the main flow line and the flow emission lamp. Since the concentration of hydrogen atoms generated in the flow line and the emission intensity of the lamp are dependent on the power input, pressure, and the input concentration of molecular hydrogen, these parameters were kept constant during each experiment. The discharge power input was measured with a bidirectional power meter (Opthos Ins.). Through inlets of minimum diameter (for the reduction of turbulence), substrates were injected along the axis of the flow tube to ensure complete mixing with the gas stream carrying the hydrogen atoms. The five inlet tubes were located 5 cm apart from each other, with the first inlet 35 cm and the last inlet 15 cm from the absorption cell.
Optical Parts. (i) Emission Lamp. A microwave discharge in hydrogen-doped helium was used as the Lyman a-line source. To reduce the self-reversal of the emission line, the concentration of hydrogen and the distance between the discharge and the LiF window were made as small as possible. The pressure in the lamp and the micro- wave power input were maintained at as low levels as possible to minimize Doppler and pressure broadening of the emission line. A similar microwave discharge flow lamp was used by Clyne and Cruse.10
Figure 1. Discharge flow line: T, —196° trap; FT, filter; N, needle valve; F, flowmeter; S, substrate reservoir; T,, T2, T3, pressure transducers; D, microwave discharge; L, LiF window; C, choppe ; PM, photomultiplier tube; CD, chopper driving unit; G, grating; HV, high-voltage supply; PA, preamplifier; SA, selective amplifier; L£, lock-in amplifier; R, recorder.
Self-reversal was considered negligible at the very low microwave input power and the low optical density of tho lamp employed. The linearity of first-order decay plots (In[H] vs. time) for hydrogen atoms in the presence of ethylene suggests that the Beer-Lambert law is obeyed under these conditions.11
(it) Monochromator and Detector. The Lyman a-emis- sion line was isolated by a 0.3-m McPherson Model 213 monochromator with 60-120-a entrance slit widths and a 1200-groove/mm grating with was coated with MgF2. The pressure inside the monochromator was always less than 10~6 Torr. At the exit slit a Model 650 McPherson photc - multiplier detector (equipped with an EMI type 9514 phc- tomultiplier tube) was attached with a vacuum-tight wir - dow which was coated with sodium salicylate. The photomultiplier output was preamplified and tuned to the frequency (100 Hz) of the electrical chopper (Bulova Co. Type L40C) which was positioned next to the entrance slit.
Materials. The source of compounds used and the r nominal purities are as follows: hydrogen, Matheson Gas Products, 99.95%; silane, Matheson Gas Products, semiconductor grade; germane, Matheson Gas Products, 99.9%; ethylene, Phillips Petroleum Co., research grade 99.98%. The purity of these compounds was checked by gas chromatography (SiH4, GeH4, C2H4), infrared spectroscopy (SiH4, GeH4), emission spectroscopy (H2), and mass spectrometry (SiH4, GeH4).
Kinetic Measurements. All absorption measurement were performed at less than 30% absorption to avoid deviations from the Beer-Lambert law. Linear velocity and the pressure in the line were maintained at rather high values to minimize the back-diffusion of hydrogen atoms ard reaction substrates. This was necessary since the reacticn rates were very fast. In a kinetic experiment, both micro- wave discharges were first turned on. Then, after selecting
The Journal of Physical Chemistry, Voi. 79, No. 17, 19*5
1754 Choo, Gaspar, and Wolf
the Lyman «-emission line by manually rotating the grating with the proper slit width set (usually between 60 and 120 fx) to give maximum signal intensity, the detector electronics were adjusted to give full scale on the recorder (I0) for the unattenuated emission line. Hydrogen was then slowly added into the helium stream of the main flow line (the H2 input concentration was less than 0.1% in the helium stream) until the transmitted light intensity (I) was reduced to about 70-80% of that of the original light intensity (i.e., (To — I)/I0 a: 20 or 30%) by atomic absorption due to hydrogen atoms produced by the dissociation of H2. Next the desired capillary inlet was opened and the flow of substrate was slowly increased until a noticeable change in the atomic absorption was observed. This procedure was repeated for all the other capillary inlets and with various substrate concentrations in randomly chosen order. The substrate flow rate was determined by monitoring the pressure drop with exactly the same flow rate and pressure in the main flow line at the end of each kinetic experiment.
If we assume the flow is laminar and neglect diffusion of hydrogen atoms into helium,12 the disappearance of the hydrogen atom can be written
H + RH ^ H2 + R
H + wall %H2
so-d[H]/dt = [H] f/zb[RH] + kw\ (1)
Under the condition that [RH] is almost constant during the reaction, eq 1 has the solution
In [H] - In [H]oo = -j*b[RH] + K \t (2)where [H]oo is the concentration of hydrogen atoms at substrate injection point, t = x/V, x is the distance between injection and the detection point, and V is the linear velocity of helium flow.
However, for an observation point at which [H] is measured fixed with respect to the point at which hydrogen atoms are generated, the loss of hydrogen atoms due to wall reaction is independent of substrate concentration and we may write13
In [H] - In [H]0 = -feb[RH]f = ~kohBdt (3)where [H]o is the concentration of hydrogen atoms at detection point at zero substrate concentration. The relative concentration of atomic hydrogen can be obtained from the Beer-Lambert law
[H] = (l/fcaI) In (Io/I) (4)where ka is the absorption coefficient, l is the effective optical path length, Iq is the intensity of the transmitted emission line without attenuation by atomic hydrogen, and / is the intensity of the transmitted line with atomic hydrogen in the optical path. Since ka and l are constant under our experimental conditions, eq 3 and 4 indicate that a plot of In jin (Io/I)} vs. t should give a straight line with slope obsd, and then feb can be obtained from the slope of the
&obsd vs. [RH] plot.In jin (I0/I )) = In jin (I0/I)]o ~ kohadt (5)
If the silyl or germyl radicals formed by hydrogen abstraction reacted principally by recombination with hydrogen atoms, as has been suggested for similar systems,4®
TABLE I: Input Param eters for Calculation of A ctivation Energies
P a ra m e te r Value Ref
Bond d ist, ASi-H 1.48 aGe-H 1.53 aH-H 0.74 h
Bond en e rg ies (£), k ca l/m o lSiH3-H 98.3 cGeH3-H 90.2 cH-H 109.4 b
Bond energy index (p)Si-H 1.004 dGe-H 0.937 dH-H 1.041 d
F orce const x 105, dyn/cmSi-H 2.9 aGe-H 2.6 aH-H 5.7 c
M orse p a ra m e te r (/3)Si-H 1.414 fGe-H 1.46 f
R efractive index (P)H 1.02 gSi 9.06 gGe 11.08 gC 2.08 g
Fundam ental s t r vib, c m '1Si-H 2190 hGe-H 2110 hH-H 4395 i
“ G. Thyagarajan. H. Herranz, and F. F. Cleveland, J. Mol. Spectrosc., 7, 154 (1961); E. B. Wilson, Jr., J. C. Decius, and P. C. Cross, “Molecular Vibrations”, McGraw-Hill, New York, N.Y., 1955. 6 Reference 14.c Reference 22. “ Calculated using the relationship p - 0.26 In (E iS/E x )/(R x - fiis) (see ref 14). Ex and Ex are the Lennard-Jones parameters for the noble gas equivalents of the Si-H (Ar-He) and Ge-H (Kr-He) bonds, and EiS and Els are the bond energy and bond length, respectively. The subscript X refers to the noble gas equivalent and the subscript IS to the Si-H and Ge-H bonds. e C. L. Kibby and R. E. Weston, Jr., J. Chem. Phys., 49, 4825 (1968). t Calculated using the relationship j3 = 1.2177 X 10⁷ we(/i/ £ 3 s ) 1 / 2 (see G. Herzberg, “Spectra of Diatomic Molecules” , Van Nostrand-Reinhold, Princeton, N.J., 1950). we is the fundamental vibrational stretching frequency for the Si-H or Ge-H bond, /j is the reduced mass of SiH3-H or GeH3 -H, and £ 3* is equivalent to Eis of footnote d. * S. S. Batsanov, “Refractometry and Chemical Structure”, translated by P. P. Sutton, Consultants Bureau, New York, N.Y., 1961. h K. Venkateswarlu and S. Sun- daram, J. Chem. Phys., 23, 2365 (1955), and ref 15. ‘ T. Schimanonchi, Natl. Stand. Ref. Data Ser., Natl. Bur. Stand., No. 6.
then the overall stoichiometry would be 2H + RH —► H2 + RH and a stoichiometry correction would need to be applied to obtain feb from kob8d-
C alculation o f A ctivation E nergiesCalculations were carried out according to the bond en
ergy bond order (BEBO) method of Johnston14'15 and the empirical method of Spirin.16 Input parameters for the calculations are given in Table I. Properties of activated complexes calculated by the BEBO method are given in Table
The Journal o f Physical Chemistry, Vol. 79, No. 17, 1975

Reaction of Hydrogen Atoms with Silane and Germane 1755
TABLE II: Properties of A ctivated Complexes Calculated by the BEBO Method
P ro p e rty “ H3S i-H " -H H3Ge—H --H
0.75 0.88»2f 0.25 0.12Rif, A 1.56 1.56R2f, A 1.10 1.29F u f x 105, dyn/cm 2.04 2.33F 22f x 105, dyn/cm -0.12 -0 .2 6P 12f x 105, dyn/cm 0.83 0.36F 0f x 1011, e rg /ra d ia n 0.063 0.046r3f, c m '1 1369 1642rbf, c m '1 588 448vf, cm"1 1303/ 904.2/a Symbols defined in ref 14.
TABLE III: Calculated and Observed (Estim ated from Experim ent) A ctivation Energies for the R eaction H + RH — H2 + R (R = CH3, S iH 3, GeH3)
Estd or£„(BEBO),'1 -E„(Spirin), determ ined
R eaction kca l/m o l k ca l/m o l by expt“
H + CH4 — ► l l 6 12.8 11.8'h 2 + c h 3
H + SiH4 — * 8.5(98.3) 4.3CH2 + SiH3 6.5(94.3) 3.7 <3.8'
4.6(88.31 2.7H + GeH4---- ► 5.2 2.7 <1.5'
H 2 + G eH ;J
a E stim ated from the experim entally determ ined ra te constants a t 300°K and assum ed frequency factor log A = 14 + 1.4 = 15.4 cm 3 m o h 1 sec-1 . * Reference 14. c Niki and M ains8 have obtained 0.5 kcal/m ol, bu t th is value seems to have been estim ated from therm ochem ically determ ined S i-H bond dissociation energy ( = 78 kcal/m ol). d W ithout including tunneling correction. Values in parentheses are the bond dissociation energies (S i-H ) used in the calculation (including zero-point energy). e Reference 17a.
II, and activation energies, in Table III. Activation energies calculated with Spirin’s equation, also given in Table III, agreed well with the values estimated from experiment.
R esu lts
Figure 2 shows the kinetic plots of In [H] vs. t for two concentrations of SiH4 and one of GeH4. The linearity indicates that pseudo-first-order conditions prevailed under our experimental conditions. In GeH4 + H reactions, however, In [H] vs. t plots gave slight upward curvature at longer reaction times. The reaction of hydrogen atoms with germane is so rapid that only a very low concentration of germane is required for a rapid decrease in hydrogen atom concentration. At these low germane concentrations partial depletion of germane during reaction leads to a diminished rate of disappearance of hydrogen atoms. This deviation from first-order decay could be avoided if one used shorter reaction times and could detect very small changes in atomic hydrogen concentration. The practical constraint on the use of shorter reaction times is the maximum flow rate attainable by the available pumping speed. The minimum detectable concentration of hydrogen atoms is limited by the optical path length of the absorption cell and the
Figure 2. In [H] vs. f (the slope is kobsd) for GeH4 and SiH4: • , [SIH4] = 0.5 X 10¹³ molecules/cm3; O, [SiH4] = 1.0 X 10¹³ molecules/cm3; ■ , [GeH4] = 3 .1 X 1011 molecules/cm3.
Figure 3. kobsb vs. [SIH4]; slope Is kbim(H + SiH4—► ).
stability of the light source and the detector circuitry. The hydrogen atom concentration is estimated to be 101 1—1012 molecules/cm3 under the present experimental conditions. Sensitivity could be increased by multiple reflectance techniques. In the germane experiments the linear portion (first part) of the kinetic plot is utilized for rate measurements. As a consequence the error in the rate constant of the GeH4 + H reaction may be slightly greater than that of the silane reaction. Figure 3 shows a plot fe0bsd vs. [SiH4], whose linearity indicates that the reaction is first order with respect to SiH4. This linear dependence of the observed first-order rate constant for disappearance of hydrogen atoms on the silane concentration demonstrates that pseudo-first-order conditions prevail. Table IV includes the conditions for the rate measurement of the H + SiH4 reaction as well as the rate constants.
The poisoning of the glass wall with orthophosphoric
The Journal of Physical Chemistry, Vol. 79, No. 17, 1975

1756 Choo, Gaspar, and Wolf
TABLE IV: Data for the Measurement of fcbim(H + SiH4) at 300°K, 20 Torr, and 1010 cm/see Linear Velocity0
10-12LSiH4]m ole -
c u le s /c m 3 ^obadJ SeC
10"12[SiH4],m ole-
c u le s /c m 3 obsd? SeC
2.4 15.6 ± 4 5.2 61 ± 43.8 20.4 ± 4 9.7 88 ± 5, 74 ± 54.5 33 ± 4, 39 ± 4 15.0 120 ± 5, 122 ± 55.0 24 ± 4, 35 ± 4
0 &bim = '(8.5 ± 0.7) x 10' 12 cm3 molecule-1 sec-1, with nostoichiometric correction applied. b These error limits are the standard deviations of the slope of the In [(/o//)] vs. t plots. Since values of ie„bsd for separate experiments differ by a greater amount, systematic errors obviouslv contribute to the total error which is ca. ±40%.
acid was essential since without wall coating only about 10- 20% of the hydrogen atoms reached the absorption cell compared to the number which survived to that point when the wall was coated.
The experimentally determined rate constants along with reported values from the literature are shown in TableV. All the rate constants at 300° K taken from the literature were calculated from the most recently reported values of activation energies and frequency factors. To facilitate comparison of these results we measured the rate of reaction for the well-studied system H + C2H4 under the same conditions as H + SiH4 and H + GeH4.
Table III compares activation energies, estimated from the experimental rate constants by assuming a maximum frequency factor log A = 15.4 cm3 mol-1 sec-1,17 with values calculated by the BEBO and Spirin methods.
DiscussionThe reaction rates of hydrogen atoms with silane and
germane are both faster than that for H + CH4 and even faster than the well-known hydrogen atom scavenging reaction H + C2H4 at room temperature. Although Niki and Mains8 have questioned the scavenging ability of ethylene for hydrogen atoms in silane, the failure to observe this scavenging effect has been interpreted as indicating the absence of hydrogen atoms in the reaction system. Obi et al. used ethylene scavenger to search for the possible formation of H atoms in the photolysis of CH3SiD3.3b The hydrogen isotopic product ratio (i.e., HD:H2) was not altered by the presence of ethylene, a finding which was believed to preclude the formation of H atoms in the reaction pathway. These workers reported that the rate of addition of deuterium atoms to C2D4 is 5.5 times the rate of reaction with CH3SiD3. In the thermal decomposition of GeH4 + D2 mixtures, Taylor and coworkers18 based their suggestion of GeH4 -* GeH2 + H2 as the primary step upon the observation that no HD was found in the reaction product. This interpretation rests on the assumption that H + D2 (ft = 0.2 X 10” 15 cm3 molecule-1 sec-1)19 is faster than H + GeH4. Since H + GeH4 is in fact much faster than H + D2, D2 could not give any HD even if the decomposition of germane did produce hydrogen atoms. Rousseau and Mains have suggested a very rapid reaction of hydrogen atoms (which they believed to be hot) with germane to explain the
TABLE V: Rate Constants of Hydrogen-Transfer Reactions of Group 4 Hydrides at 300°K
ReactionRate const,
cm 3 m olecule"1 s e c '1 Ref
H + CH4 — ► H2 +c h 3
3.2 x 10"18 a
H + SiH4 — ► H2 + SiH3
H + GeH4 — ► H2 +
(8.5 ± 0.7) x 10"12/ This work
GeH3 (4.3 ± 0.3) x 10"10/ This w orkCH3- + CH4 — -
CH4 + c h 35.0 x 10"23 b
CH3- + SiH4 — ► CH4 + SiH3
9.0 x 10"18 c
C F 3 + SiH4 — ► C F 3H + SiH3
1.1 x 10"16 d
H + C,H4 — *c 2h 6*
(3.5 ± 0.1) x 10"13/ (20 T o rr)
(5.26 ± 0.13) x 10"13 (20 T o rr)
This w ork
e
° References 17a and b. 6 F, S. Dainton, K. J. Ivin, and F. Wilkinson, Trans. Faraday Soc., 55, 929 (1959); G. A. Creak. F. S. Dain- ton, and K. J. Ivin, ibid., 58, 326 (1962). c Reference 5b. Reference 6b.e M. J. Kurylo, N. C. Peterson, and W. Braun, J. Chem. Phys., 53, 2776 (1970). t The error limits are the standard deviations of the slope of the &obsd vs. concentration plots. The estimated total errors are ±50%.
lack of scavenging of hydrogen atoms by proplylene in the mercury-sensitized decomposition of germane.43
Recently Glasgow et al.3a reported the relative rate constant &(D + C2D4)/&(D + SiH4) = 1.2 in the photolysis of a C2D4-SiH4 mixture at —130° in the liquid phase. From our experimental values fe(H + SiH4) = (8.5 ± 0.7) X 10-12 cm3 molecule-1 sec-1 and &(H + C2H4) = 3.5 ± 0.1 X 10⁻¹³ cm3 molecule-1 sec-1 we obtain fe(H + C2H4)/fe(H + SiH4) = 0.04 at 300°K and 20 Torr. Therefore, ethylene appears to be a very poor scavenger for hydrogen atoms in gaseous silane.
The experimentally determined rate constants for reactions of hydrogen atoms with silane and germane respectively are difficult to reconcile with the model for hydrogen atom transfer used to calculate the energy of activation by the BEBO method of Johnston.14 This semiempirical method usually gives energies of activation within 2 kcal/ mol of experimental values.14 In the H + SiH4 reaction the activation energy estimated from the experimental rate constant is 4.7 kcal/mol less (3.8 vs. 8.5) than that calculated by the BEBO method. The calculated value is however very sensitive to the SiH bond strength employed as an input parameter. A change in this parameter of 10% will change the calculated activation energy by more than 30%, since it also changes the p and d parameters. fJ(Si-H) =98.2 kcal/mol (including zero-point energy) has given most satisfactory agreement between experimental E& (7.0 and6.0 kcal/mol) and calculated E& (8.2 and 6.9 kcal/mol) for the reactions of methyl radicals with silane and disilane, respectively.511
This bond dissociation energy has been notoriously controversial.20 The values of Steele and Stone,21 Z)(SiH3-H) = 94 ± 3 kcal/mol, and Saalfeld and Svec,22 95.2 kcal/mol, both obtained from electron-impact experiments, are gen
The Journal of Physical Chemistry, Vol. 79, No. 17, 1975

Reaction of Hydrogen Atoms with Silane and Germane 1757
erally accepted in place of the average bond dissociation energy, 76.8 kcal/mol.23 We have used the electron-impact value,22 although this method often overestimates the bond dissociation energy. Even if the bond energy input parameter is reduced from 98.2 to 88.2 kcal/mol the BEBO calculation still gives an energy of activation (4.6 kcal/mol) 0.8 kcal/mol higher than estimated. The estimate uses the log of that Arrhenius preexponential factor for hydrogen abstraction from methane, increased by 10%. Therefore the activation energies estimated from experiment can be regarded as a maximum for the hydrogen atom transfer model. The assumed preexponential factor is near the upper limit for bimolecular reactions.24
A recent modification of the BEBO calculation has predicted lower activation energies for hydrogen-transfer reactions than is normally obtained.25
While it can be argued that the discrepancies between the BEBO activation energy and the values estimated from the H + SiH4 and H + GeH4 experiments are due to inaccuracies in the input parameters for the BEBO calculation, the differences may have another, more interesting origin.
The model used for the BEBO calculation is a linear activated complex H—H—R. Should the activated complex be nonlinear, or should a tunneling correction be significant, the discrepancies might be removed. In related systems, tunneling corrections as great as 2 kcal/mol have been calculated.14
A more interesting possibility is that the overall reaction H + MH4 —'► H2 + MH3 involves an intermediate adduct MH5.26 This has been suggested recently by Glasgow, 01- brich, and Potzinger,3® who have employed isotopic labeling experiments and quantum chemical calculations to explore for an intermediate adduct. The neutral radical SiHs was found to be at least 3.6 eV lower in energy than H + SiH4. Therefore the addition of hydrogen atoms to silane and germane must be seriously considered as an explanation for the failure of a hydrogen atom transfer model to predict correctly the reaction rate for hydrogen atoms with silane and germane. The adduct radicals need not be stable, and the suggestion that SiHs is long-lived has been withdrawn.3“5
Further speculation about the activation energy for reactions of hydrogen atoms with silane and germane is pointless until the temperature dependence of the rate constant is determined experimentally. It should be noted that in contrast to the BEBO activation energies, the Spirin equation gives values in reasonable agreement with the estimates based on experiments.
The absolute rate constant determined in this work for the reaction of hydrogen atoms with silane is more than an order of magnitude greater than the value published by Obi, Sandhu, Gunning, and Strausz3® ((8.5 ± 0.7) X 10-12 vs. 1.9 X 10⁻¹³ cm3 molecule-1 sec-1)27 for the reaction of deuterium atoms with silane. Recently a value of (3.0 ± 1.0) X 10~13 cm3 molecule-1 sec-1 has been reported for the rate constant for D + SiH4.3e A large isotope effect in H + SiH4 vs. D + SiH4 may contribute to the apparent discrepancy, and application of a stoichiometric correction would decrease our rate constant by 50%. A lower limit of 2.2 X 10⁻¹³ cm3 molecule-1 sec-1 has been reported for the rate constant for H + SiH4.3c
In summary, it has been found that the reactions of hydrogen atoms with silane and germane are very rapid, the rate constants being 1 and 3 orders of magnitude greater, respectively, than that for addition of hydrogen atoms to
ethylene. The activation energies calculated by the BEBO method are higher than the values estimated from experiment, the discrepancies giving rise to some questions about the applicability of a linear hydrogen atom transfer model for the activated complexes in these systems.
References and Notes(1 ) T h is w o rk w a s c a r r ie d o u t a t th e B ro o k h a v e n N a tio n a l L a b o r a to r y u n d e r
th e a u s p i c e s o f t h e U. S . A to m ic E n e rg y C o m m is s io n . P a r tia l s u p p o r t f ro m s p e c i a l r e s e a r c h s u p p o r t a g r e e m e n t A T (1 1 -1 ) -1 7 1 3 is g ra te fu lly a c k n o w le d g e d . T h is is t e c h n ic a l R e p o r t N o. C O O - 1 7 1 3 -3 7 .
(2 ) (a) A. F . T r o tm a n -D ic k e n s o n a n d G. S . M ilne, Natl. Stand. Ref. Data Ser.. Natl. Bur. Stand., No. 9 (1 9 6 7 ); (b) B. A. T h ru s h , Prog. React. Kinet., 3 , 6 3 (1 9 6 5 ).
(3) (a ) D u rin g th e p r e p a r a t io n o f th is a r t i c le th e r e s u l ts o f p h o to c h e m ic a lc o m p e t i t io n e x p e r im e n t s g iv in g th e r e la t iv e r a t e o f r e a c t io n o f h y d ro g e n a to m s w ith e th y le n e a s 1 .2 a n d 1.88 t im e s t h a t w ith s i l a n e h a v e b e e n p u b lis h e d : L. C . G la s g o w , G. O lb r ic h , a n d P . P o tz in g e r , Chem. Phys.Lett., 14, 4 6 6 (1 9 7 2 ); K . O bi, H. S . S a n d h u . H. E . G u n n in g , a n d O . P . S t r a u s z , J. Phys. Chem., 76, 3 9 1 1 (1 9 7 2 ) . (b) A k i n e t c i s o to p e e f f e c t In th e r e a c t io n s D + CH 3SiH 3 a n d D + C H 3S O 3 h a s a l s o b e e n e s t im a te d In a p h o to c h e m ic a l e x p e r im e n t : K. O bi, A. C le m e n t , H. E. G ru n n ln g ,a n d O . P. S t r a u s z , J . Am. Chem. Soc., 91, 1 6 2 2 (1 9 6 9 ) . (c) G. K. M o o rt- g a t , P h .D . T h e s is , U n iv e rs ity o f D e tro it; Diss. Abstr. Int. B, 31, 1 8 7 9 (1 9 7 0 ). (d) J . H o n g , P h D. T h e s is , U n iv e rs ity o f D e t r o t , 1 9 7 2 . (e ) D. Mi- h e lc ic , P P o tz in g e r , a n d R . N. S c h in d le r , Ber. Bunserges. Phys. Chem., 78, 8 2 (1 9 7 4 ) . (f) P . P o tz in g e r , L. C . G la s g o w , a n d B. R e im a n , Z. Natur- forsch., Tell A, 29, 4 9 3 (1 9 7 4 ) .
(4) (a) Y. R o u s s e a u a n d G. J . M a in s , J. Phys. Chem., 70, 3 1 5 8 (1 9 6 6 ); (b) M . A. C o n t in e a n u , D. M ic h e lc ic , a n d R . N. S c h in d le r , Ber. Bunsenges. Phys. Chem., 75, 4 2 6 (1 9 7 1 ) ; (c ) T. L. P o llo c k , H. S . S a n d h u , A. J o d h a n , a n d O . P . S t r a u s z , J. Am. Chem. Soc., 95, 1 0 1 7 (1 9 7 3 ).
(5) (a ) E. R . M o rris a n d J . C . J . T h y n n e , J. Phys. Chem., 7 3 , 3 2 9 4 (1 9 6 9 ); (b)O . P . S t r a u s z , E. J a k u b o w s k i, H. S . S a n d h u , a n d H. E. G u n n in g , J. Chem. Phys., 51, 5 5 2 (1 9 6 9 ).
(6) (a ) E. R . M o rris a n d J . C . J . T h y n n e , Trans. Faraday Soc., 66, 1 8 3 (1 9 7 0 ); (b) E . J a k u b o w s k i , H . S . S a n d h u , H. E . G u n n in g , a n d O . P . S t r a u s z , J. Chem. Phys., 52, 4 2 4 2 (1 9 7 0 ) .
(7 ) (a ) G. C e tln i, O . G a m b in o , M. C a s tlg lio n i, a n d P. V o lp e , J. Chem. Phys., 4 6 , 8 9 (1 9 6 7 ); (b) S . H. D an ie l a n d Y. N. T a n g , J. Phys. Chem., 7 3 , 4 3 7 8( 1 9 6 9 ) ; (c ) J . W itk in a n d R . W o lfg a n g , ibid., 72, 2 6 3 1 (1 9 6 8 ); (d) T . T o m i- n a g a , A. H o s a k a , a n d F . S . R o w la n d , ibid., 73, 4 6 5 (1 9 6 9 ).
(8) H. Niki a n d G. J . M a in s , J . Phys. Chem., 68 , 3 0 4 (1 9 6 4 ) .(9 ) F . C . F e h s e n fe ld , K. M. E v e n s o n , a n d H. P . B ro id a , Rev. Sci. Instrum.,
3 6 , 2 9 4 ( 1 9 6 5 ) .(1 0 ) M. A. A. C ly n e a n d H. W . C r u s e , Trans. Faraday Soc., 6 7 , 2 8 6 9 (1 9 7 3 ).(1 1 ) S tric tly , t h e lin e a rity o f t h e In [H ] v s . t im e p lo ts d e m o n s t r a t e s th e r e la
t io n s h ip log (f/fo) = —r([H ] t jy w h e r e 7 n e e d n o t b e un ity ; s e e R . J . D o n o v a n , D. H u sa in , a n d L. J . K irsc h , Trans. Faraday Soc., 66, 2 5 5 1( 1 9 7 0 ) .
(1 2 ) If o n e c o n s id e r s d iffu s io n , k obsd(diff) = /cobsd(1 + k0bSaD/\/2), w h e r e D is th e d iffu s io n c o e f f ic ie n t o f a n H a to m in to H e a n d V is l in e a r v e lo c ity . A t th e p r e s s u r e a n d lin e a r f low r a t e e m p lo y e d in e x p e r im e n ts , kob^DM « 0 .1 ; s e e J . V . M ic h a e l a n d R. E. W e s to n , J r . , J. Chem. Phys., 45, 3 6 3 2 ( 1 9 6 6 ) .
(1 3 ) (a ) A. A. W e s te n b e r g a n d N. d e H a a s , J. Chem. Phys., 4 6 , 4 9 0 (1 9 6 7 ); (b) M. A. A. C ly n e a n d B. A. T h ru s h , Proc. R. Soc. London, Ser. A, 275, 5 4 4 (1 9 6 1 ).
(1 4 ) H. S . J o h n s to n , " G a s P h a s e R e a c t io n R a te T h e o r y ” , R o n a ld P r e s s , N ew Y ork , N .Y ., 1 9 6 5 .
(1 5 ) N. L. A rth u r a n d J . A. M cD o n e ll, J. Chem. Phys., 5 6 , 3 1 0 0 (1 9 7 3 ) .(1 6 ) Y u. L. S p irin , Puss. J. Phys. Chem. [Engl. Transi.), 36, 6 3 6 (1 9 6 2 ); Zh.
Fiz. Khim, 36, 1 2 0 2 ( 1 9 6 2 ) .(1 7 ) S in c e log A for th e a n a lo g o u s r e a c t io n H + C H 4 is 14 c m 3 m o l - 1 s e c - 1
( s e e (a) M. J . K urylo a n d R. B. T im m o n s , J. Chem. Phys., 5 0 , 5 0 7 6 (1 9 6 9 ) ; (b ) R . W . W a lk e r , J. Chem. Soc. A, 2 3 9 1 (1 9 6 8 )) a n d th e r e a c t io n s C H 3 + S iH 4 a n d C F 3 + SIH 4 b o th h a v e f r e q u e n c y f a c t o r s s im ila r to t h o s e o f C H 3 + C H 4 a n d C F 3 + C H 4 ( s e e r e f 5 a n d 6 ), w e a s s u m e d th a t t h e f r e q u e n c y f a c to r fo r t h e r e a c t io n H + SIH4 o r H + G eH 4 Is o f t h e s a m e m a g n i tu d e a s t h a t fo r t h e H + C H 4 r e a c t io n i s e e a ls o r e f 14 , p 2 2 1 ) . T h e r e f o r e w e c h o s e log A(H + S iH 4) = lo g A(H + C H 4) ± 1 0 % < 1 5 .4 c m 3 m o l - 1 s e c - 1 .
(1 8 ) P . J . F e n s h a m , K. T a m a ru , M. B o u d a r t, a n d H. T a y lo r, J. Phys. Chem., 59, 8 0 6 ( 1 9 5 5 ) .
(1 9 ) J . C . P o lan y i, J. Chem. Phys., 2 3 , 1 5 0 5 (1 9 5 5 ) .(2 0 ) (a ) J . H. P u rn e ll a n d R. W a lsh , Proc. R. Soc. London, Ser. A, 293, 5 4 3
(1 9 6 6 ); (b) M. A. R ing , M. J . P u e n te s , a n d H. E. O 'N e a l , J . Am. Chem. Soc., 92, 4 8 4 5 (1 9 7 0 ).
(2 1 ) (a ) W . C . S t e e l e a n d F. G. A. S to n e , J. Am. Chem. Soc., 84, 3 5 9 9 (1 9 6 2 ); (b) W . C . S t e e l e , L. D. N ic h o ls , a n d F. G. A. S to n e , ibid., 84, 4 4 4 1 (1 9 6 2 ).
(2 2 ) F . E. S a a lf e ld a n d H. J . S v e c , J. Phys. Chem., 7 0 , 1 7 5 3 (1 9 6 6 ) .(2 3 ) S . R. G u n n a n d L. G. F r e e n , J . Phys. Chem., 65, 7 7 9 (1 9 6 1 ) .(2 4 ) S , W . B e n s o n , " T h e F o u n d a tio n o f C h e m ic a l K in e tic s " , M cG raw -H ill,
N e w Y ork , N .Y ., 1 9 6 0 .(25) N. L. A rth u r, K. F. D o n c h l, a n d J . A. M cD o n ell, J . Chem. Phys., 6 2 , 1585
(1975). (Note A d d e d in Pr o of: T h is m o d if ic a t io n lo w e r s th e c a lc u la te d
The Journal of Physical Chemistry, Vol. 79, No. 17. 1975
1758 Strausz et al.
activation energy for hydrogen atom transfer from SiH4 and GeH4 to H by 3.2 and 3.1 kcal/mol, respectively, for Si-H and Ge-H bond energies of 98.3 and 90.2 kcal/mol, respectively. The generality of this new potential function remains however to be established.)
(26) That hydrogen atoms may add to silane giving SiH5 was suggested toP.P.G. by the late Professor Richard Wolfgang in 1970.
(27) The relative rate of hydrogen abstraction from silane by deuterium atoms compared with the rate of addition of deuterium atoms to perdeu- terioethylene obtained by Obi et al.3a has been combined with our absolute value for addition of hydrogen atoms to ethylene for the purpose of comparing the absolute rate of hydrogen abstraction deduced by Obi et al. with our own.
Reaction of Hydrogen Atoms with Thiirane
T. Yokota, M. G. Ahmed, I. Safarik, O. P. Strausz,* and H. E. GunningDepartment of Chemistry and Hydrocarbon Research Center, University of Alberta, Edmonton, Alberta, Canada (Received December 3, 1974)
Publication costs assisted by the University of Alberta
Hydrogen atoms, produced from the mercury photosensitization of H2, react with thiirane to yield ethylene and hydrogen sulfide as the only retrievable products with quantum yields of 2.46 and 0.40, respectively, at room temperature. The sole primary reaction occurring is sulfur atom abstraction, H + C2H4S —*■ HS + C2H4 (1). The rate coefficient of reaction 1 was determined in competition with the reaction H + H2S —► H2 + HS to have the value k\ = (5.7 ± 0.7) X 1013 exp((—1944 ± 175)/RT) cm3 mol-1 sec-1. It is shown that at room temperature 41% of the HS radicals undergo disproportionation, 2HS —>■ H2S + S(3P), while the rest are scavenged by mercury atoms, Hg + SH + M —»• %(HgSH)2 + M, and perhaps the S2 7 and HS3_7 radicals present in the system. The relative importance of disproportionation decreases with increasing temperature.
The desulfurization of thiiranes in the liquid phase by nucleophilic reagents such as tertiary phosphines,2 tertiary phosphites,3 alkyl lithium, and aryl lithium4 has been reported. More recently studies on radical reactions in the gas phase with thiiranes also appeared. Desulfurization has been shown to occur upon attack by S(3P), S(XD2)5, carbon atoms,6 and excited triplet state thiiranes.7 In the case of the tert-butoxy radical + methylthiirane system,8 hydrogen abstraction was the only observable reaction.
The reactions of methyl radicals with thiirane, methylthiirane, and dimethylthiirane have been reported in recent studies from this laboratory.9 In all three cases there are two primary steps which occur parallel and in competition: hydrogen abstraction and sulfur abstraction. The latter is unique in that it is the first known example of a reaction wherein a divalent atom in a bridgehead position is abstracted by a monovalent radical. All desulfurization reactions feature a high degree of stereospecificity and probably occur in a single step, concerted process.
In order to ascertain whether the desulfurization reaction is common to other monovalent radicals the reaction of hydrogen atoms with thiirane was examined. The results are presented in this article.
E xperim ental Section
The apparatus, general vacuum, and analytical techniques were similar to those employed in previous studies.9,10
Hydrogen atoms were produced by the mercury photo- sensitization of H2. The light source was a low-pressure Hg resonance lamp equipped with a 253.7-nm interference filter and a collimating quartz lens. The cylindrical quartz reaction cell (5 X 10 cm) was enclosed in an aluminum
block furnace and connected to a circulatory system having a total volume of 510 cm3. Circulation was effected by a fan type, magnetically driven pump.
Pressures of thiirane and hydrogen sulfide were always very much smaller than that of hydrogen in order to avoid direct or Hg sensitized decomposition.
Light intensities, as in the previous study of the H + COS reaction,10 were determined by propane and nitrous oxide actinometry. The mean value of the absorbed intensity was about 0.03 ^einstein min-1.
The reaction mixtures consisting of H2 + C2H4S or H2 + H2S + C2H4S were equilibrated by circulation for 20 min prior to irradiation. After each experiment the cell window was thoroughly baked. At the conclusion of irradiation the excess hydrogen was pumped off through traps cooled with liquid nitrogen and solid nitrogen. Ethylene and hydrogen sulfide were distilled from the reaction mixture at —130°. In the runs with added hydrogen sulfide, ethylene was distilled at —161°. The yields of C2H4 and H2S were determined by gas chromatography on a 6-ft silica gel column at 90° using He as carrier.
The upper limit of the reaction temperature, 150°, was determined by the thermal decomposition of thiirane.
Materials in general were the best grades available commercially. Hydrogen (Matheson, 99.999%) was used without purification. Hydrogen sulfide (Matheson) was purified by distillation at —130° and degassing at —196°. Thiirane (Aldrich, 99%) was distilled at -78° and degassed at —130°. It was stored in the dark at —78°.
R esu lts and D iscussion
The HgCPiHHg*) photosensitization of hydrogen and thiirane mixtures leads to the formation of C2H4, H2S, and
The Journal of Physical Chemistry, Vol. 79, No. 17, 1975
Reaction of Hydrogen Atoms with Thiirane 1759
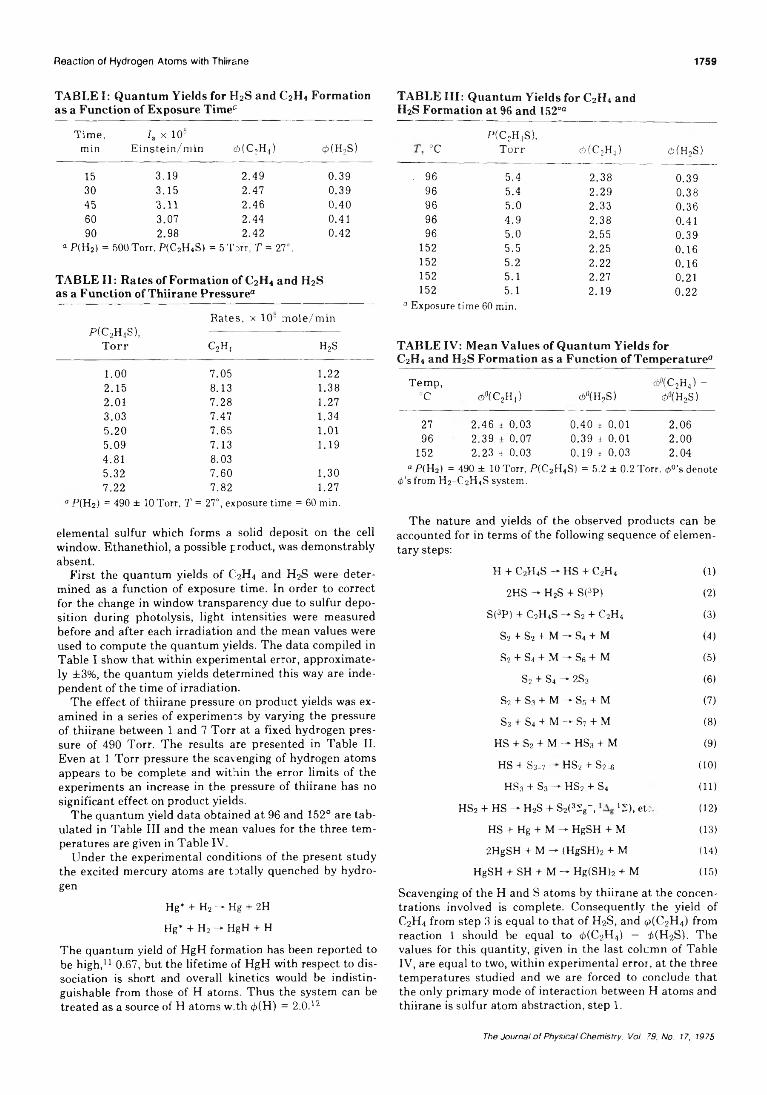
TABLE I: Quantum Yields for H 2 S and C2 H 4 Form ation as a Function of Exposure Tim ec
Time,min
fa X 1 0 8
E inste in /m in d>(C2 H4) 0(H 2S)
15 3.19 2.49 0.3930 3.15 2.47 0.3945 3.11 2.46 0.4060 3.07 2.44 0.4190 2.98 2.42 0.42
“ P (H 2) = 500T orr, P(C 2H 4S) = 5 Torr, T = 27°.
TABLE II: R ates of Form ation of C2 H4 and H2S as a Function of Thiirane Pressure“
P (C 2H4S),T o rr
Rates, x 1 0 s m ole /m in
C2 H, H2S
1 . 0 0 7.05 1 . 2 2
2.15 8.13 1.382 . 0 1 7.28 1.273.03 7.47 1.345.20 7.65 1 . 0 1
5.09 7.13 1.194.81 8.035.32 7.60 1.307.22 7.82 1.27
a P(H2) = 490 ± 10 Torr, T = 27°, exposure time = 60 min.
elem ental sulfur which forms a solid deposit on the cell window. E thanethio l, a possible product, was dem onstrably absent.
F irs t the quantum yields of C2 H 4 and H 2 S were determ ined as a function of exposure tim e. In order to correct for the change in window transparency due to sulfur deposition during photolysis, light intensities were m easured before and after each irradiation and the mean values were used to com pute the quantum yields. T he data compiled in Table I show th a t w ithin experim ental error, approxim ately ±3%, the quantum yields determ ined th is way are independen t of the tim e of irradiation.
T he effect of th iirane pressure on product yields was exam ined in a series of experim ents by varying the pressure of th iirane between 1 and 7 T orr a t a fixed hydrogen p ressure of 490 Torr. The results are presented in Table II. Even a t 1 T o rr pressure the scavenging of hydrogen atom s appears to be com plete and w ithin the error lim its of the experim ents an increase in the pressure of th iirane has no significant effect on product yields.
T he quantum yield d a ta obtained a t 96 and 152° are ta b ulated in T able III and the mean values for the three tem peratures are given in T able IV.
U nder the experim ental conditions of the present study the excited m ercury atom s are totally quenched by hydrogen
Hg* + H 2 — Hg + 2H
Hg* + H 2 - HgH + H
T he quantum yield of HgH form ation has been reported to be high , 1 1 0.67, but the lifetim e of HgH with respect to d issociation is short and overall kinetics would be ind istin guishable from those of H atoms. T hus the system can be trea ted as a source of H atom s w:th 0 (H) = 2.O. 1 2
TABLE III: Quantum Y ields for C2 H4 and H2S Form ation at 96 and 152°°
P{ C 2H4S),
o o T o rr ci>(C2H4) 6 (H,S)
96 5.4 2.38 0.3996 5.4 2.29 0.3896 5.0 2.33 0.3696 4.9 2.38 0.4196 5.0 2.55 0.39
152 5.5 2.25 0.16152 5.2 2.22 0.16152 5.1 2.27 0 . 2 1
152 5.1 2.19 0 . 2 2
a Exposure time 60 min.
TABLE IV: M ean V alues of Quantum Y ields for C 2 H 4 and H2S Form ation as a Function of Tem perature“
Temp, <b°(C2H4) -°C d>°(C2H4) 0>°(H2S) d>°(H2 S)
27 2.46 ± 0.03 0.40 ± 0.01 2.0696 2.39 ± 0.07 0.39 ± 0.01 2 . 0 0
152 2.23 ± 0.03 0.19 ± 0 .03 2.04“ P( H2) = 490 ± 10 Torr, P(C2 H4 S) = 5.2 ± 0.2 Torr. 0 °’s denote
0’s from H 2-C 2H 4S system .
T he nature and yields of the observed products can be accounted for in term s of the following sequence of elemen-ta ry steps:
H + C2H 4S — HS + C2H 4 (1 )
2 HS - H2S + S(3P) (2 )
S(3 P) + C2 H4S - S2 + C2H 4 (3)
S2 4- S2 4- M -*• S4 4- M (4)
S2 4- S4 4- M —**■ Sg 4- M (5)
S2 4- S4 —► 2 S3 (6 )
S2 4- S3 4- M —► S5 4- M (7)
S 3 4- S4 4- M “ *• S7 4* M (8 )
HS + S2 + M -► HS3 + M (9)
HS 4- S3_7 ~ H S 2 4- S2- 6 (1 0 )
HS3 4- S3 —*• HS2 4- S4 (1 1 )
HS2 + HS — H2S + S2 (3 2g- , >2), et: (1 2 )
HS + Hg + M -► HgSH + M (13)
2HgSH + M — (HgSH) 2 + M (14)
HgSH + SH + M — Hg(SH)2 + M (15)
Scavenging of the H and S atom s by th iirane a t the concentrations involved is complete. Consequently the yield of C2 H 4 from step 3 is equal to th a t of H 2 S, and <p(C2 H 4) from reaction 1 should be equal to 0 (C2 H 4) — 0 (H 2 S). The values for this quantity , given in the last column of Table IV, are equal to two, w ithin experim ental error, a t the three tem peratures studied and we are forced to conclude th a t the only prim ary mode of interaction between H atom s and th iirane is sulfur atom abstraction, step 1 .
The Journal of Physical Chemistry, Vol. 79, No. 17, 1975

1760 Strausz et al.
TABLE V: R ate of C2 H 4 Form ation as a Function of P (H 2 S )/P (C 2 H 4 S)a
T. C P(H2). T o rrP(C2H,S),
T o rrP(H2S),
T o rrP(H2S)/P(C2H,S) 10"i; m ol/m in rt(C2H,) V
27 485 4.33 1.05 0.242 7.25 2.36 0.513474 3.02 1.02 0.300 7.37 2.40 0.503502 4.89 4.89 1.00 6.77 2.21 0.556487 3.00 3.02 1.00 6.42 2.09 0.595505 2.89 5.63 1.95 5.72 1.87 0.685490 3.05 5.97 1.96 5.82 1.90 0.671
96 488 3.07 0.998 0.325 7.23 2.36 0.508496 2.97 2.89 0.973 6.30 2.05 0.602458 3.02 3.07 1.02 6.67 2.17 0.562424 3.00 3.10 1.03 6.43 2.10 0.585486 3.00 5.97 1.99 5.68 1.85 0.685441 2.77 5.91 2.13 5.77 1.88 0.671
152 496 3.10 0.95 0.306 6.63 2.16 0.508498 2.94 0.97 0.330 6.38 2.08 0.529503 2.41 0.88 0.365 6.58 2.14 0.513497 3.43 3.00 0.875 6.20 2.02 0.546476 3.02 3.00 0.993 5.69 1.85 0.602499 3.00 3.20 1.07 5.98 1.95 0.568505 3.05 5.86 1.92 5.22 1.70 0.662504 3.02 5.99 1.98 5.28 1.72 0.654499 2.89 5.89 2.04 5.13 1.67 0.676
a Exposure tim e, 60 min.
With regard to reaction 2, a recent study of the photolysis of hydrogen sulfide established a quantum yield value of unity for hydrogen production13 suggesting that the only important mode of interaction between two sulfhydril radicals is disproportionation into S + H2S and that hydrogen or H2S2 are not produced in significant yields. The present results shed additional light on the fate of the HS radical the two plausible scavengers of which are the sulfur or sulfhydril radicals and mercury atoms according to the scheme indicated by reactions 9-15. Mercurous sulfhydride is a poorly characterized compound the synthesis of which has been reported14'15 in 1928 from the reaction of solid mercurous chloride with liquid hydrogen sulfide. In the interpretation of the present results cognizance must be taken of the data obtained in recent studies on the photolysis of hydrogen sulfide13 in the presence and absence of mercury. The mercury free photolysis gave a quantum yield value of unity for both hydrogen formation and hydrogen sulfide disappearance the latter determined from the yield of solid, elemental sulfur. In the presence of mercury vapor, however, while the yield of hydrogen remained unaffected, the yield of sulfur in the solid film which coated the cell wall increased by 19-29%. This yield increase in the sulfur content of the solid is attributed to the formation of (HgSH>2 and perhaps Hg(SH)2 via reactions 13-15. Therefore, we conclude that the principal scavengers of the sulfhydril radical in the present system are the mercury atoms. If scavenging by the sulfur or sulfhydril radicals occurs at all it must be via complexing with thiirane, C2H4S- SH, C2H4S-Sx, C2H4S-3xH, since the pure hydrogen sulfide system where Sx radicals are also present, scavenging is inefficient. The presence of small concentrations of the HS2 radical in flash photolyzed hydrogen sulfide and the production of S2(!A„) in the self-disproportionation reactions of HS2
2HS2 —*■ H 2S 2 + S2(* Ag) (16)
and its cross disproportionation, step 12, have been demonstrated in previous flash spectroscopic studies.16 Also, the presence of small concentrations of H2S2 in flashed H2S was detected earlier by kinetic mass spectrometric techniques.17 The detection of small concentrations of H2S2 and presumably of all higher polysulfides by conventional analytical techniques is exceedingly difficult and unreliable owing to their well-known tendency to undergo surface decomposition to yield H2S and elemental sulfur.
It is interesting to note that the relative rates of scavenging and disproportionation of the HS radical are temperature dependent and scavenging becomes more important with increasing temperature. This may be due to a slight increase in the mercury vapor concentration at elevated temperatures.
Reaction 3 is very rapid, its rate coefficient being 1.7-2.7 X 1013 cm3 mol-1 sec-1.5’18
In order to determine the rate coefficient of reaction 1, competitive studies were carried out with added H2S, in which the ratio of H2S to thiirane pressure was varied between 0.2 and 2 at a constant hydrogen pressure of 500 Torr. The ethylene yields obtained at 27, 96, and 152° are given in Table V.
Steady-state treatment of the competing reactions 1 and H + H 2S -* H 2 + H S (17)
leads to the following kinetic expression:
As the yield of HS per hydrogen atom produced is unaffected by the H2S to C2H4S ratios, the value of 7 can be obtained from the measured yield of C2H4 and the H2S yields <t>°(H2S), from the H2-C2H4S system.
From the plots of 7 vs. P(H2S)/P(C2H4S), shown in Figure 1, it can be seen that eq I is obeyed and the slope and
The Journal of Physical Chemistry, Vol. 79, No. 17, 1975

Reaction of Hydrogen Atoms with Thiirane 1761
intercept values obtained by least mean square treatment of the data are given in Table VI. Plotting the logarithm of k \/kn values against 1/T, Figure 2, the activation energy difference and A factor ratio of reactions 17 and 1 are found to have the values: E\ — E n = 235 ± 115 cal mol-1 and 7.3 ± 1.2, respectively. If Braun and coworkers’19 values of = 1709 cal mol' 1 and A17 = 7.78 X 1012 cm3 mol' 1 sec' 1 are accepted,20 then for the Arrhenius parameters of reaction 1 we obtaink i = (5.7 ± 0.7) X 1013 exp((—1944 ±
llh)/RT) cm3 mol“ 1 sec“ 1
These values appear to be reasonable when compared to those of other, similar reactions, which are compiled in Table VII. The entropies of activation given in Table VII were obtained by the method of Benson.21 To calculate the entropy of the H—Sd activated complex we start with the
TABLE VI: Slopes and Intercepts from 7
vs. P (H 2 S )/P (C 2 H4 S) Plots
T , JC Slope, k \ i / ï h \ Intercept
27 0.101 ± 0.006 0.478 ± 0.00896 0.0942 ± 0.0082 0.485 ± 0.011
152 0.0899 ± 0.0051 0.485 ± 0.007
S3 molecule. If the C2u symmetry is retained there will be a contribution of R In 2 from spin only, because the increase in the moments of inertia is negligible:
S°t = S°(Sd) + 1.4 euand the entropy of activationASp1 = S°(SC) + 1.4 - S°(S3) - S°(H) =
1.4 - 27.4 = -26.0 euor, by transformation to the standard state of 1 M
ASc* = ASp1 - RAn - (An)R In (RT) = -17.6 euThis value differs from the experimentally obtained entropy of activation by 6.3 eu. The difference can be assigned to the contribution from the degenerate bending modes of the new H—S bond corresponding to a vibrational frequency of 125 cm“1 which seems to indicate a rather loose structure for the activated complex.
If the C2t symmetry is lost in the activated complex, as is probably the case,9 another R In 2 term must be added to estimate the absolute S °% = S° (S3) + 2.8 eu, and the entropy of activation ASp1 = 2.8 — 27.4 = —24.6 eu or ASc1 = — 16.2 eu. The difference from the experimental entropy of activation is now only 4.9 eu indicating somewhat stiffer H—S bending modes with frequencies of about 200 cm“1.
( 1 / T ) x l 0 3
Figure 2. Arrhenius plot for S abstraction from ethylene episulfide by H atoms.
TABLE VII: Arrhenius Param eters and Entropies of Activation
ReactionA f . cm ’’
m o l'1 s e c ' 1E t .
kcal m o l '1 .3,1. eu RefA r, cm 1
m o l'1 s e c ' 1'E r , kcal
m o l'1a s ; ,
eu
V Z i *CH; + S ^ CH;iS + 7.08 x 10ll! 6.7 -24 .6 (C2„) 10 8.65 x 10:l 18.5 -28.8
CjH,f
CH-, + COS CH^S 3.80 x 10¹¹ 11.35 -21.3 10 3.34 x 101" 9.65 -26.1
+ O O
CHj + HjS CH, 4 5.00 x 101” 2.9 -25.3 25 3.94 x 10“ 16.0 -21.2HS
\ / _ l *H ^ S V HS 4 C,H, 5.66 x 101' 1.9 -11.3 (C2ll) This 2.78 x 10u 26.8 -21.9
fH + COS HS + 9.10 x 10¹² 3.9 -15 .0
work11 3.17 x 101" 15.3 -26.2
CO fH 4 H2S HS t H2 7.77 x 10¹² 1.7 -15.3 18 4.0 x 10¹² 15.0 -16.6
The Journal of Physical Chemistry, Voi. 79, No. 17. 1975
1762 Strausz et al.
The Arrhenius parameters and activation entropies for the reverse of the reactions listed in Table VII were also calculated and are presented in the last three columns of Table VII.
As was noted before, all the known desulfurization reactions of thiiranes feature a high degree of stereospecificity from which it has been inferred that they proceed via single step, concerted reactions. The CH3 and H reactions with thiiranes are further characterized by the complete absence of the addition products, the thio ether and thiol radicals, C H 3S C H 2C H 2 and H S C H 2C H 2, respectively. It is likely that in the H + C 2H 4S system the initial interaction involves the nonbonding 3p orbital of the S atom
leading to a symmetrical transition state. The potential energy of activation for a symmetrical pull of the sulfur using a modified form of the oond energy-bond order method,9’22 was found to be 4 kcal/mol if the sulfur atom is assumed to be transferred in its lowest lying (XD2) state or zero if the transfer is in the (3P2) ground state. In agreement with the earlier results on the CH3 + COS and CH3 + S3 systems9 the experimental value lies close to the arithmetic mean of the computed limits.
In conclusion it should be noted that the analogous deoxygenation reactions whh oxirane have not been observed; hydrogen atoms,23 CH3,24 and CF325 radicals react with oxirane by hydrogen abstraction although energetically, oxygen abstraction would be more favorable. This difference between the chemical behavior of oxiranes and thiiranes has been interpreted9 as being due to the higher value of the activation energy for the deoxygenation of oxiranes as compared to desulfurization of thiiranes. The higher activation energy in turn is a consequence of the somewhat lower exothermicity, more stringent obeyance of spin conservation in the reaction, and the higher value of the excitation energy of the XD2 state of the oxygen than sulfur atom.
Acknowledgments. The authors thank the National Research Council of Canada for financial support and Dr.E.M. Lown for helpful discussions.
References and Notes(1) Author to whom correspondences should be addressed.(2) B. Denney and M. J. Boskin, J. Am. Chem. Soc., 82, 4736 (1960); R. E.
Davis, J. Org. Chem., 23, 1767 (1958).(3) R. D. Schuetz and R. L. Jakobs, J. Org. Chem., 23, 1799 (1958).(4) N. P. Neureiter and F. G. Bordwell, J. Am. Chem. Soc., 81, 578 (1958);
F. G. Bordwell, H. M. Anderson, and B. Pitt, ibid., 76, 1082 (1954).(5) R. J. Donovan, D. Husain, R. W. Fair, O. P. Strausz, and H. E. Gunning,
Trans. Faraday Soc., 66, 1635 (1970); O. P. Strausz, W. B. O'Callag- han, E. M. Lown, and H. E. Gunning, J. Am. Chem. Soc., 93, 559 (1971); J. Connor, A. Van Roodselaar, R. W. Fair, and O. P. Strausz, J. Am. Chem. Soc., 93, 560 (1971).
(6) J. H. Plonka and P. S. Skeil, Chem. Commun., 1108 (1970); K. J. Kla- bunde and P. S. Skeil, J. Am. Chem. Soc., 93, 3807 (1971).
(7) E. M. Lown, H. S. Sandhu, H. E. Gunning, and O. P. Strausz, J. Am. Chem. Soc., 90, 7164 (1968).
(8) E. Sabatino, Ph.D. Thesis, University of Connecticut, 1963.(9) E. Jakubowski, M. G. Ahmed, E. M. Lown, H. S. Sandhu, R. K. Gosavi,
and O. P. Strausz, J. Am. Chem. Soc., 94, 4094 (1972).(10) S. Tsunashima, T. Yokota, I. Safarik, H. E. Gunning, and O. P. Strausz,
J. Phys. Chem., submitted for publication.(11) A. B. Callear and J. C. McGurk, J. Chem. Soc., Faraday Trans. 2, 68,
289 (1972); A. B. Callear and P. M. Wood, ibid., 68, 302 (1972).(12) T. L. Pollock, E. J. Jakubowski, H. E. Gunning, and O. P. Strausz, Can. J
Chem., 47, 3474 (1969).(13) S. Tsunashima and O. P. Strausz, to be submitted for publication.(14) A. W. Ralston and J. A. Wilkinson, J. Am. Chem. Soc.. 50, 258 (1928).(15) Gmelins Handbuch der Anorganischen Chemie, Vol. 34, 8th ed, Verlag
Chemie, Weinheim/Bengstr., Germany, 1968, p 954.(16) O. P. Strausz, R. J. Donovan, and M. de Sorgo, Ber. Bunsenges. Phys
Chem., 72, 253(1968).(17) O. P. Strausz, S. C. Barton, and W. K. Duholke, to be submitted for pub
lication.(18) R. B. Klemm and D. D. Davis, Int. J. Chem. Kinet., 5, 149 (1973); O. P.
Strausz and A. van Roodselaar, unpublished results.(19) M. J. Kurylo, N. C. Peterson, and W. Braun, J. Chem. Phys., 54, 943
(1971) .(20) Other rate constant measurements for reaction 14 include: B. de B.
Darwent, R. L. Wadlinger, and M. J, Allard, J. Phys. Chem., 71, 2346 (1967); A. A. Westenberg and N. de Haas, J. Chem. Phys., 40, 707 (1969); D. Mihelcic and R. N. Schindler, Ber. Bunsenges. Phys. Chem., 74, 1280 (1970); H. Rommel and H. I. Shiff, Int. J. Chem. Kinet., 4, 547(1972) .
(21) S. W. Benson, "Thermochemical Kinetics", Wiley, New York, NY 1968.
(22) S. W. Mayer, J. Phys. Chem., 73, 3941 (1969).(23) W. R. Trost, B. de B. Darwent, and E. W. Steacie, J. Chem. Phys 16
353 (1948).(24) R. Gomer and W. A. Noyes, Jr., J. Am. Chem. Soc., 72, 101 (1950); M.
K. Phibbs and B. de B. Darwent, Can. J. Res. Sect. B, 28, 395 (1950).(25) S. H. Jones and E. Whittle, Can. J. Chem., 48, 3601 (1970).(26) N. Imai and O. Toyama, Bull. Chem. Soc. Jpn., 33, 652 (1960).
The Journal of Physical Chemistry, Vol. 79, No. 17, 1975
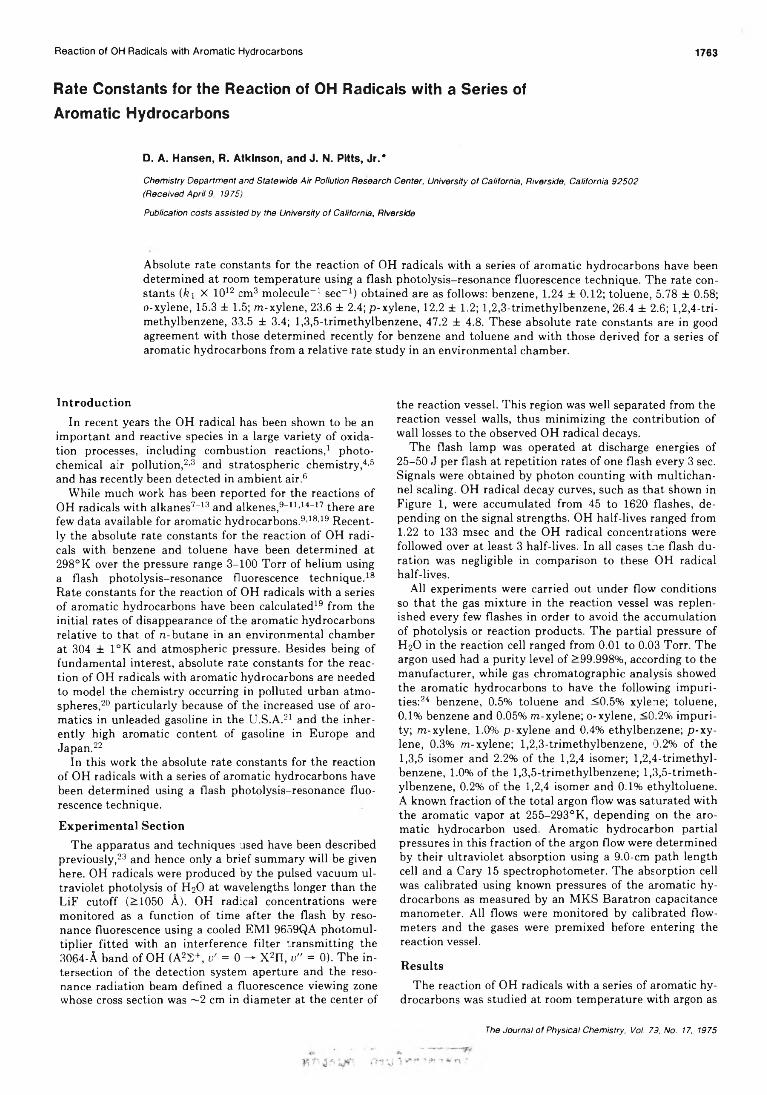
Reaction of OH Radicals with Aromatic Hydrocarbons 1763
Rate Constants for the Reaction of OH Radicals with a Series of Aromatic Hydrocarbons
D. A. Hansen, R. Atkinson, and J. N. Pitts, Jr.*Chemistry Department and Statewide Air Pollution Research Center, University of California, Riverside, California 92502 (Received April 9, 1975)
Publication costs assisted by the University of California, Riverside
Absolute rate constants for the reaction of OH radicals with a series of aromatic hydrocarbons have been determined at room temperature using a flash photolysis-resonance fluorescence technique. The rate constants ( ii X 1012 cm3 molecule-1 sec-1) obtained are as follows: benzene, 1.24 ± 0.12; toluene, 5.78 ± 0.58;o-xylene, 15.3 ± 1.5; m-xylene, 23.6 ± 2.4; p-xylene, 12.2 ± 1.2; 1,2,3-trimethylbenzene, 26.4 ± 2.6; 1,2,4-tri- methylbenzene, 33.5 ± 3.4; 1,3,5-trimethylbenzene, 47.2 ± 4.8. These absolute rate constants are in good agreement with those determined recently for benzene and toluene and with those derived for a series of aromatic hydrocarbons from a relative rate study in an environmental chamber.
IntroductionIn recent years the OH radical has been shown to be an
important and reactive species in a large variety of oxidation processes, including combustion reactions,1 photochemical air pollution,2’3 and stratospheric chemistry,4’5 and has recently been detected in ambient air.6
While much work has been reported for the reactions of OH radicals with alkanes7-13 and alkenes,9-11’14-17 there are few data available for aromatic hydrocarbons.9’18'19 Recently the absolute rate constants for the reaction of OH radicals with benzene and toluene have been determined at 298° K over the pressure range 3-100 Torr of helium using a flash photolysis-resonance fluorescence technique.18 Rate constants for the reaction of OH radicals with a series of aromatic hydrocarbons have been calculated19 from the initial rates of disappearance of the aromatic hydrocarbons relative to that of n-butane in an environmental chamber at 304 ± 1°K and atmospheric pressure. Besides being of fundamental interest, absolute rate constants for the reaction of OH radicals with aromatic hydrocarbons are needed to model the chemistry occurring in polluted urban atmospheres,20 particularly because of the increased use of aromatics in unleaded gasoline in the U.S.A.21 and the inherently high aromatic content of gasoline in Europe and Japan.22
In this work the absolute rate constants for the reaction of OH radicals with a series of aromatic hydrocarbons have been determined using a flash photolysis-resonance fluorescence technique.E xperim ental Section
The apparatus and techniques used have been described previously,23 and hence only a brief summary will be given here. OH radicals were produced by the pulsed vacuum ultraviolet photolysis of H2O at wavelengths longer than the LiF cutoff (>1050 A). OH radical concentrations were monitored as a function of time after the flash by resonance fluorescence using a cooled EMI 9659QA photomultiplier fitted with an interference filter transmitting the 3064-A band of OH (A22 +, u' = 0 — X2II, v" = 0). The intersection of the detection system aperture and the resonance radiation beam defined a fluorescence viewing zone whose cross section was ~2 cm in diameter at the center of
the reaction vessel. This region was well separated from the reaction vessel walls, thus minimizing the contribution of wall losses to the observed OH radical decays.
The flash lamp was operated at discharge energies of 25-50 J per flash at repetition rates of one flash every 3 sec. Signals were obtained by photon counting with multichannel scaling. OH radical decay curves, such as that shown in Figure 1, were accumulated from 45 to 1620 flashes, depending on the signal strengths. OH half-lives ranged from 1.22 to 133 msec and the OH radical concentrations were followed over at least 3 half-lives. In all cases the flash duration was negligible in comparison to these OH radical half-lives.
All experiments were carried out under flow conditions so that the gas mixture in the reaction vessel was replenished every few flashes in order to avoid the accumulation of photolysis or reaction products. The partial pressure of H2O in the reaction cell ranged from 0.01 to 0.03 Torr. The argon used had a purity level of >99.998%, according to the manufacturer, while gas chromatographic analysis showed the aromatic hydrocarbons to have the following impurities:24 benzene, 0.5% toluene and <0.5% xylene; toluene, 0.1% benzene and 0.05% m-xylene; o-xylene, <0.2% impurity; m-xylene, 1.0% p-xylene and 0.4% ethylbenzene; p-xylene, 0.3% m-xylene; 1,2,3-trimethylbenzene, 0.2% of the1,3,5 isomer and 2.2% of the 1,2,4 isomer; 1,2,4-trimethyl- benzene, 1.0% of the 1,3,5-trimethylbenzene; 1,3,5-trimethylbenzene, 0.2% of the 1,2,4 isomer and 0.1% ethyltoluene. A known fraction of the total argon flow was saturated with the aromatic vapor at 255-293°K, depending on the aromatic hydrocarbon used. Aromatic hydrocarbon partial pressures in this fraction of the argon flow were determined by their ultraviolet absorption using a 9.0-cm path length cell and a Cary 15 spectrophotometer. The absorption cell was calibrated using known pressures of the aromatic hydrocarbons as measured by an MKS Baratron capacitance manometer. All flows were monitored by calibrated flowmeters and the gases were premixed before entering the reaction vessel.
R esu ltsThe reaction of OH radicals with a series of aromatic hy
drocarbons was studied at room temperature with argon as
The Journal of Physical Chemistry, Vol. 79, No. 17, 1975

1764 Hansen, Atkinson, and Pitts
Figure 1. Time dependence of the OH resonance fluorescence signal intensity accumulatec from 377 flashes of an H2O (0.010 Torr)- toluene (0.00145 Torr)-a-gon (99.7 Torr) mixture with a multichannel scaler channel width of 100 psec and a flash energy of 50 J per flash.
the diluent gas. Under the experimental conditions used, the decay of the OH radical concentration, [OH], is given by the integrated rate expression
[OH]0/[OH] = S0/S = exp[(fco + fei[aromatic])(f - to)](I)
where [OH]o and [OH] are the concentrations of OH at times to and t, respectively, So and S are the corresponding resonance fluorescence intensities, ko is the first-order rate constant for removal of OH in the absence of added reactant (primarily attributed to diffusion out of the viewing zone and to reaction with impurities), and ki is the rate constant for the reaction
OH + arom atic -* products (1)
In all experiments exponential decays of the resonance fluorescence signal were observed and the measured decay rate, defined as R = (t — to)-1 In (So/S), was found to depend linearly on the concentration of added reactants. The decay rates obtained from OH radical decay curves such as shown in Figure 1 typically had error limits of ±2-3%. Equation I was thus obeyed and rate constants k\ were accordingly derived from the slopes of plots of the decay rate R against the reactant concentration. In the absence of added reactant, the OH radical decay rates, R = k0, ranged from 5.2 to 10.3 sec-1 and were similar to those reported previously23 from this laboratory.
Figures 2-4 show plots of the OH radical decay rate against the aromatic hydrocarbon concentration for the aromatic hydrocarbons studied at a total pressure of ~100 Torr, while Table I gives the rate constants k\ obtained from such plots. For benzene and toluene, total pressures were varied over the ranges 50-600 and 100-620 Torr, respectively. Within the experimental errors, no dependence of the rate constants k\ on total pressure was observed over these pressure ranges, and hence rate constants k\ for the other aromatic hydrocarbons were determined at ~100 Torr total pressure only. In all cases, a variation of a factor of 2 in the flash energy (from 25 to 50 J per flash) produced no change in the rate constant within the experimental errors, indicating that secondary reactions were negligible under these conditions.
Figure 2. Plots of OH decay rate against aromatic concentration for benzene and toluene; total pressure ~100 Torr of argon.
Figure 3. Plots of OH decay rate against aromatic concentration for m-xylene, p-xylene, and 1,2,4-trimethylbenzene; total pressure ~100 Torr of argon.
600rI.3.5.-TRIMETHYLBENZENE
Figure 4. Plots of OH decay rate against aromatic concentration for o-xylene, 1,2,3-trimethylbenzene, and 1,3,5-trimethylbenzene; total pressure ~100 Torr of argon.
DiscussionThe initial OH radical concentration after the photolysis
flash can be estimated from the flash energies and H20 concentrations used and from previous work13-25 to be ~10n molecules cm-3. From these initial OH radical concentrations and the aromatic hydrocarbon concentrations
The Journal of Physical Chemistry, Vol. 79, No. 17, 1975

Reaction of OH Radicals with Aromatic Hydrocarbons 1765
TABLE I: R ate Constants k i for the R eaction of OH R adicals w ith a Series of Arom atic Hydrocarbons
/<■,, c m 3 m o le c u le "1 s e c " 'T o ta l p r e s s u r e , -------------------------------------------------------------------
A r o m a tic h y d ro c a rb o n T e m p , °C T o r r a •>
Benzene 24.8 ± 0.5 50.4 ± 0.4 (1.28 ± 0.04) X 10-1224.3 ± 0.4 100.0 ± 0.2 (1.22 ± 0.06) X lO"12 (1.24 ± 0.12) X 10"1224.5 ± 0.5 199.9 ± 0.6 (1.20 ± 0.06) X 10"1224.6 ± 0.3 600.0 ± 0.4 (1.24 ± 0.11) X 10"12
Toluene 25.0 ± 0.5 99.7 ± 0.3 (5.90 ± 0.16) X 10"1224.6 ± 0.2 249.7 ± 0.6 (5.69 ± 0.27) X 10"12 (5.78 ± 0.58) X lO"1224.7 ± 0.5 618.6 ± 0.5 (5.75 ± 0.16) X lO"'2
o-Xylene 24.8 ± 0.2 101.3 ± 0.2 (1.53 ± 0.15) X 10"11m -Xylene 24.1 ± 0.5 99.9 ± 0.3 (2.36 ± 0.24) X 10 "11p-Xylene 24.1 ± 0.6 99.6 ± 0.3 (1.22 ± 0.12) X 10-111,2 ,3-T rim ethylbenzene 23.9 ± 0 .4 99.9 ± 0.3 (2.64 ± 0.26) X 10"111,2 ,4-T rim ethylbenzene 23.7 ± 0.6 100.3 ± 0.3 (3.35 ± 0.34) X 10"111,3,5 -T rim ethy lbenzene 23.9 ± 0.3 100.4 ± 0.3 (4.72 ± 0.48) X 10"11a E rror lim its are the least-squares s tan d ard deviations of plots such as those shown in Figures 2-4. 6 E rror lim its shown are the estim ated
overall error lim its which include the least-squares stan d ard deviations as well as estim ated accuracy lim its of o ther param eters such as total pressure and arom atic concentrations.
TABLE II: Comparison of Room Tem perature Rate Constants, ki, for the Reaction of OH R adicals with Arom atic Hydrocarbons from the Present Work w ith Literature V alues and w ith the Room Temperature Rate Constants for the Reaction of 0 ( 3P) Atom s w ith Arom atic Hydrocarbons
0 ( 3P ) a to mk x 1013,
OH r a d ic a l c m 3 m o le -A’, x 1 0 12, c m 3 m o le c u le "1 s e c "1 c u le "1 s e c "1
A ro m a tic h y d ro c a rb o n T h is w o rk “ R e f 196 R e f I 8C R e f 9" R e f 24
B e n z e n e T o lu e n e o -X y le n e m -X y le n e p -X y le n e1 .2 .3 - T r im e th y lb e n z e n e1 .2 .4 - T r im e th y lb e n z e n e1 .3 .5 - T r im e th y lb e n z e n e
1.24 ± 0.12 5.78 ± 0.58
15.3 ± 1.5 23.6 ± 2.4 12.2 ± 1.226.4 ± 2.633.5 ±3.4 47.2 ± 4.8
<3.84.2 ± 1.5
12.8 ± 3.823.2 ± 1.712.3 ± 2.5 23 ± 533 ± 5 51.5 ± 6.5
1.59 ± 0.12 6.11 ± 0.40
0.24 ± 0.033 0.75 ± 0.075
) 1.74 ± 0.18■ 18.7 3.52 ± 0.35
) 1.81 ± 0.1811.5 ± 1.2 10.0 ± 1.0 2r7.9 ± 3.3
° Total pressure >50 Torr (Ar). 8 T otal pressure 1 atm of air: rates relative to OH + n-bu tane placed on an absolute basis using the rate constant for OH + n-bu tane as 3.0 x 10“ 12 cm3 m olecule - 1 sec 18 10-12 ' T o ta l pressure 100 Torr (He). d T otal pressure ~ 1 Torr (He), m ixture of isomers.
used it can be estimated that errors in the measured rate constants due to the reaction of OH radicals with reaction products would be typically <5-10%, using an assumed rate constant of 10-10 cm3 molecule-1 sec-1 for the reaction of OH radicals with all reaction products. This conclusion is substantiated by the good linearity of the plots shown in Figures 2-4 for variations of factors of 3-9 in the aromatic hydrocarbon concentrations. Similarly, the reaction of OH radicals with reactant impurities can be calculated to cause errors in the measured rate constants of <5%.
Table I shows that the rate constants ki for benzene and toluene are, within experimental error, independent of the total pressure of argon over the ranges 50-600 Torr for benzene and 100-620 Torr for toluene. This is in agreement with the recent data of Davis and coworkers,18 who observed a pressure dependence of k\ for benzene and toluene in the range 3-100 Torr of helium but concluded from Lindemann plots that the rate constants measured at 100 Torr were essentially the high-pressure limiting values.
Table II gives a comparison of the present rate constants k\ with the available literature values. It can be seen that the present rate constants k\ are in good agreement with the absolute rate data of Davis and coworkers18 (also obtained using a flash photolysis-resonance fluorescence technique) and in excellent agreement with the rate constants derived from the relative rate study of Doyle et al.19 The latter workers monitored the rates of disappearance of a series of aromatic hydrocarbons and n-butane in the early stages of an irradiated NO^-hydrocarbon-air mixture in an environmental chamber and assumed that this hydrocarbon loss was due to reaction with OH radicals. The relative rate constants were placed on an absolute basis using a rate constant for the reaction of OH with n-fcutane of 3.0 X 10⁻¹² cm3 molecule-1 sec-1 derived from the literature.8“10'12 It thus appears that this relative rate technique using an environmental chamber may be used to determine reliable OH radical rate constants for a variety of other reactants. The present values of k\ for the xylenes deter
The Journal of Physical Chemistry, Voi. 79, No. 17, 1975

1766 Hansen, Atkinson, and Pitts
mined at ~100 Torr total pressure of argon are also consistent with that determined by Morris and Niki9 for a mixture of isomers using a discharge flow technique at ~1 Torr total pressure of helium.
Table II also gives the rate constants for the reaction of 0(3P) atoms with the aromatic hydrocarbons determined using a modulation phase-shift technique.24 It can be seen that the OH radical rate constants show the same trend with degree and position of alkylation as for 0(3P) atom reactions demonstrating the electrophilic character of the OH radical. This suggests19 that in the reaction of OH radicals with aromatic hydrocarbons, the major reaction path is that of addition to the aromatic ring, in agreement with the conclusions reached by Davis and coworkers18 from the pressure dependence of the rate constants for benzene and toluene over the range 3-100 Torr of helium. The mechanism and products for the reaction of OH radicals with aromatic hydrocarbons are presently unknown, but it may be speculated that the aromatic ring undergoes substantial cleavage following addition of the OH radical with subsequent production of a variety of long-chain organics. This would be similar to the reaction of 0(3P) atoms26-29 and 0 330-31 with aromatic hydrocarbons where a large amount of ring cleavage is observed to occur. However, OH radicals are much more reactive than 0(3P) atoms toward these aromatic hydrocarbons and hence, as previously discussed,1819 the more reactive aromatic hydrocarbons should contribute significantly to the formation of photochemical air pollutants.
Acknowledgment. The authors are grateful to Drs. A. C. Lloyd and J. L. Sprung for helpful discussions and gratefully acknowledge the financial support of NSF Grant GP-38053X.
References and Notes(1) R. R. Baker, R. R. Baldwin, and R. W. Walker, Symp. (Int.) Combust.,
Proc., 13, 291 (1971).(2) J. Heicklen, K. Westberg, and N. Cohen, Report No. 115-69, Center for
Air Environmental Studies, 1969.(3) D. H. Stedman, E. D. Morris, Jr., E. E. Daby, H. Niki, and B. Weinstock,
paper presented at the 160th National Meeting of the American Chemical Society, Chicago, III., Sept 14-18, 1970.
(4) D. D. Davis, Can. J. Chem., 52, 1405 (1974).(5) M. B. McElroy, S. C. Wofsy, J. E. Penner, and J. C. McConnell, J.
Atmos. Sei., 31, 287 (1974).(6) C. C. Wang and L. I. Davis, Jr., Phys. Rev. Lett., 32, 349 (1974).(7) N. R. Greiner, J. Chem. Phys., 46, 2795, 3389 (1967).(8) N. R. Greiner, J. Chem. Phys., 53, 1070 (1970).(9) E. D. Morris, Jr., and H. Niki, J. Phys. Chem., 75, 3640 (1971).
(10) R. A. Gorse and D. H. Volman, J. Photochem., 1, 1 (1972); 3, 115(1974) .
(11) J. N. Bradley, W. Hack, K. Hoyermann, and H. Gg. Wagner, j. Chem. Soc., Faraday Trans. 1, 69, 1889 (1973).
(12) F. Stuhl, Z. Naturforsch., Teil A, 28, 1383 (1974).(13) D. D. Davis, S. Fischer, and R. Schiff, J. Chem. Phys., 61, 2213 (1974).(14) N. R. Greiner, J. Chem. Phys., 53, 1284 (1970).(15) E. D. Morris, Jr., D. H. Stedman, and H. Niki, J. Am. Chem. Soc., 93,
3570 (1971).(16) I. W. M. Smith and R. Zellner, J. Chem. Soc., Faraday Trans. 2, 69,
1617(1973).(17) F. Stuhl, Ber. Bunsenges. Phys. Chem., 77, 674 (1973).(18) D. D. Davis, W. Bollinger, and S. Fischer, J. Phys. Chem., 79, 293
(1975) .(19) G. J. Doyle, A. C. Lloyd, K. R. Darnall, A. M. Winer, and J. N. Pitts, Jr.,
Environ. Sei. Technoi., 9, 237 (1975).(20) M. C. Dodge, Report EPA-R4-73-010, Environmental Protection Agency,
Washington, D. C., 1973.(21) J. M. Heuss, G. J. Nebel, and B. A. D'Alleva, Environ. Sei. Technoi., 8,
641 (1974).(22) J. Kondo and H. Akimoto, Adv. Environ. Sei. Technoi., in press.(23) R. Atkinson, D. A. Hansen, and J. N. Pitts, Jr„ J. Chem. Phys., 62, 3284
(1975).(24) R. Atkinson and J. N. Pitts, Jr., J. Phys. Chem., 78, 1780 (1974).(25) F. Stuhl and H. Niki, J. Chem. Phys., 57, 3671 (1972).(26) G. Boocock and R. J. Cvetanovic, Can. J. Chem., 39, 2436 (1961).(27) G. R. H. Jones and R. J. Cvetanovic, Can. J. Chem., 39, 2444 (1961).(28) R. A. Bonanno, P. Kim, J. H. Lee, and R. B. Timmons, J. Chem. Phys.,
57, 1377 (1972).(29) J. S. Gaffney, R. Atkinson, and J. N. Pitts, Jr., to be submitted for publi
cation.(30) K. Nojima, K. Fukaya, S. Fukai, and S. Kanno, Chemosphere, 5, 247
(1974).(31) C. T. Pate, R. Atkinson, and J. N. Pitts, Jr., to be submitted for publica
tion.
The Journal of Physical Chemistry, Vol. 79, No. 17, 1975

Reaction of -OH with Benzoic Acid 1767
Reaction of *OH with Benzoic Acid. Isomer Distribution in the Radical Intermediates1
George W. Klein, Kishan Bhatia, V. Madhavan, and Robert H. Schuler*Radiation Research Laboratories and Department of Chemistry, Mellon Institute of Science, Carnegie-Mellon University, Pittsburgh, Pennsylvania 15213 (Received February 28, 1975)
Publication costs assisted by the U.S. Energy Research and Development Administration and Carnegie-Mellon University
Products of the reaction of radiation-produced OH radicals with benzoic acid under conditions where the intermediate hydroxycyclohexadienyl radicals are quantitatively oxidized to hydroxybenzoic acids have been examined by liquid chromatographic methods. In N20-saturated 1 nxM benzoic acid solutions containing 0.5 mM ferricyanide as the radical oxidant the initial radiation chemical yields of o-, m-, and p- hydroxybenzoic acids are 1.7, 2.3, and 1.2, respectively. Decarboxylation contributes an additional phenol yield of 0.4 to give a total product yield of 5.6 which accounts for essentially all of the OH radicals produced in this system. Material balance considerations show that no major product is unaccounted for. Reaction at the various ortho, meta, and para positions is very nearly statistical (k (ortho):/? (meta):fc(para) = 0.7:0.9:1 per position). ESR experiments show a similar ratio of radical concentrations at steady state so that there can be little selectivity in the second-order radical combination processes. Because of the high reactivities of the phenolic products toward OH radicals, secondary reactions become important at very low conversions (a 10% reduction in yield occurs at a conversion of only 5%). The initially produced hydroxybenzoic acids are, however, not consumed to any important extent in the secondary processes so that the resultant phenoxyl radicals must, in this mixed-radical system, be reduced back to the original products rather than being oxidized further. A detailed model is described which allows one to use numerical integration methods to take the competitive effects of the secondary processes into account and to describe the course of the reaction quite well up to conversions of ~25%. The present study serves to illustrate the application of spectrophotometric and radiotracer approaches in liquid chromatographic investigations of the radiation chemistry of dilute aqueous solutions.
The reaction of OH radicals with benzoic acid has been examined in numerous pulse radiolysis,2 ESR,3>4 and radiation chemical studies5 7 which show quite conclusively that the principal reaction is addition to the ring to form car- boxylated hydroxycyclohexadienyl radicals. At question are the quantitative aspects of this addition, particularly with respect to possible interferences from secondary reactions, and the relative importance for OH attack at each of the ring positions. From observations during steady-state ESR studies Eiben and Fessenden3 have concluded that to a first approximation addition at the meta and para positions of the benzoate anion occurs statistically with addition at the ortho position being only ~50% as great. In a brief report on radiation chemical studies in acidic solutions in which ferricyanide was used to oxidize the intermediate carboxylated hydroxycyclohexadienyl radicals to the corresponding phenols, Volkert and Schulte-Frohlinde5 found that at high ferricyanide concentrations the three isomers were produced very nearly statistically. However they also reported a complicated dependence on ferricyanide concentration which indicates that secondary processes are important. Mathews and Sangster6 have examined the radiolysis of solutions of carboxyl-labeled benzoic acid and have found yields of 0.5-1 for hydroxyl-induced decarboxylation which occurs at least partially via postirradiation effects. We have reexamined the products resulting from the addition of radiation-produced OH radicals to benzoate anion taking advantage of recent developments in liquid chromatography8 to study the dose dependences in some detail. It is found that, as for hydroxycyclohexadienyl radical itself,9 the intermediate radicals produced in this system are quantitatively oxidized by ferricyanide. Material balance considerations show that even though secondary
reactions become important at low conversions, the initially produced hydroxybenzoic acids are, for the most part, not oxidized further. Detailed kinetic treatment allows one to extract the initial yields from the data even 'hough it is clear that the observed yields are significantly affected by the secondary processes. One is, of course, interested in the relative yields of the initial products so that one can describe the relative frequency for attack of OH at each of the ring positions. Because these studies on a relatively simple system have been used to explore the potentialities and limitations of spectrophotometric and radiochemical detection methods in the application of high-pressure liquid chromatography to aqueous radiation chemistry, the experimental approaches are described here in some detail.
Experimental SectionMaterials and Irradiations. Water was triply distilled,
including distillation from basic permanganate and acid dichromate solutions. Solutions containing the cesired concentrations of benzoic acid and potassium ferricyanide were purged of oxygen and saturated with NT) by bubbling in the irradiation cell for 20-30 min. All solutions were buffered at pH 7 with 2 mM phosphate buffer.
For the 14C tracer experiments both carboxyl- and ring- labeled benzoic acid were measured (New England Nuclear Co.; specific activities respectively of 18 and 3.3 Ci/mol). Blank chromatographic experiments showed that the carboxyl-labeled material was free of any detectable radiochemical impurity. The ring-labeled sample had a small amount of impurity that eluted with m-hydroxybenzoic acid and had to be corrected for in the actual experiments. In order to conserve the total amount of activity these samples were diluted with inactive material to give specific ac
The Journal of Physical Chemistry, Vol. 79, No. 17, 1975

1768 Klein, Bhatia, Madhavan, and Schuler
tivities of ~2 Ci/mol. The solute concentrations (mostly 0.7 or 1.0 mM) were determined from the known content of active material (measured chromatographically) and inactive material (measured by weight) and the radiochemical sensitivities determined in terms of these concentrations. Usually 1.6 ml of the sample was irradiated so that the individual experiments required ~3 ¿¿Ci of activity. At low solute concentrations the sensitivity can be improved somewhat by using samples of higher specific activities. At higher concentrations (>10~3 M) a limitation is usually imposed by the total amount of activity one is willing to consign to an experiment which, for practical purposes, means dilution with inactive material.
Irradiations were carried out in 60Co sources at absorbed dose rates of 6.4 X 10¹⁷ or 4.5 X 10¹⁶ eV g_1 min-1 as determined by Fricke dosimetry. Doses ranged from 1017 to 3 X 10¹⁸ eV/g.
Chromatographic Separation. The characteristics of the high-pressure liquid chromatograph used in these laboratories for the analysis of irradiated aqueous solutions have been previously described.8,10 Chromatographic resolution of benzoic acid and the three hydroxybenzoic acids is possible11 but only with considerable difficulty and only under conditions where the peaks are broadened and the sensitivity suffers. In particular it is difficult to separate m-hy- droxybenzoic acid from both benzoic acid and its para isomer and this problem is accentuated by the fact that the meta isomer has relatively low absorption in the accessible uv region. In the present study a different separation system was used to examine each of the products. All employed either a 1- or 2-m column (2.2-mm i.d.) of “ZIPAX” strong anion-exchange resin (Du Pont No. 820960005). p- Hydroxybenzoic acid was eluted in front of the benzoic acid and separated from all other components using 20 mM acetic acid-acetate buffer at pH 4.2 containing 0.5 mM perchlorate (system A) as the eluent (the meta isomer is eluted with the benzoic acid). The m- and p-hydroxybenzoic acids were eluted together after the benzoic acid peak using 20 mM borate buffer at pH 9.2 containing 10 mM nitrate (system B) (phenol is eluted with the benzoic acid). Separation of the meta isomer from the other components could be obtained by using 0.1 M sodium acetate at pH 7.2 (system C) as the eluent. The separation is, however, poor and the chromatographic peak considerably wider than in the other analyses so the sensitivity is reduced accordingly. With all three systems the ortho isomer (salicylic acid) was retained on the column for a long period but could be eluted rapidly and in a reasonably narrow peak by adding a high concentration of perchlorate or nitrate. In the spectrophotometric studies this component was eluted using 20 mM acetate-2.5 mM perchlorate at pH 4.2 (system D). In the radiochemical experiments, after the other isomers had been eluted, 14 mM perchlorate was added to system A or 80 mM nitrate was added to system B. Flow rates of 1 ml/min were used in the optical studies and 0.2 ml/min in the radiochemical studies.
It was found that the column characteristics changed as the experiments progressed because of the accumulation of relatively large amounts of ferricyanide on the column. After the source of this difficulty was recognized it was found that the columns could be regenerated by eluting the ferricyanide with 0.5 M nitrate at pH 3.
Spectrophotometric Detection. In the present study the 254-nm fixed-wavelength detector used in previous investigations8,9 has been replaced with a Varian 635m spectro
photometer equipped with 8-^1 cells (10-mm path length). This detector has a somewhat lower signal-to-noise ratio than the previously used fixed-wavelength detector (with a time constant of 1 sec the short-term noise level corresponded to an absorbance of ~10~4; see Figure 1) but permits selection of an optimum analytical wavelength and allows one optically to resolve overlapping components that have significantly different absorption spectra.12,13 In the present study one is fortunate in that the meta isomer absorbs in the region of 300 nm where its para isomer and benzoic acid have no significant absorption, p- Hydroxybenzoic acid was analyzed at 250 nm using eluting system A and the ortho isomer at 300 nm using system D. As is illustrated in Figure 1 using system C the meta isomer is best examined at 285 nm where the sensitivity is optimum and, because of the combined chromatographic and optical resolution, there is essentially no interference from the benzoic acid or the para isomer. The advantages available in the spectrophotometric approach over one using a mercury resonance line detector (254 nm) are very apparent in Figure 1. The meta isomer can also be examined at 300 nm using system A where this component is eluted along with the benzoic acid but can be examined because the latter does not absorb significantly at concentrations of 10-3 M or less. System B cannot be used because the basic form of the para isomer absorbs significantly at the high pH of the eluent. Phenol was examined at 270 nm.
The sensitivity of the apparatus for each of these components was calibrated with known samples (50 ¡xM) containing also benzoic acid, ferricyanide, and buffer at the concentrations of the experiment. The presence of 2 mM ferricyanide in the sample has a small effect on the peak shapes and resultant sensitivities so it is important that calibrations be done with samples similar to those produced by the irradiations. At the very low concentration in these references samples the hydroxybenzoic acids are slowly oxidized so that freshly prepared solutions are required. With the above systems the analytical sensitivity (in units of absorbance at the chromatographic peak) was 0.0022/juM for p-hydroxybenzoic acid, 0.0001/^M for the meta isomer, 0.0002//xAf for the ortho isomer, 0.0005/¿¿M for phenol, and 0.00006/iiM for benzoic acid. Sample injection was via a 0.18-ml loop, as previously described.8 In general peak height reproducibility was quite good (of the order of a few percent) so that the overall analytical reliability is largely limited by problems of calibration in the detector noise level.
Radiochemical Experiments. Radiotracer experiments possess the obvious advantage that the sensitivities of all labeled products are known a priori in terms of the sensitivity of the starting material. After passing through an auxiliary optical detector the column effluent was monitored with a 1-ml flow-through scintillation cell packed with cerium-activated lithium glass scintillator beads (Packard Instrument Co.). Counting was with a Packard “Tri-Carb” coincidence scintillation spectrometer. Although the large sample volume (~0.4 ml) of this cell limited the overall chromatographic resolution, such a large volume was necessary in order to achieve reasonable counting rates. Little mixing occurred with the cell since the peaks were broadened only by the cell volume and no spurious “tailing” occurred. A relatively low flow rate was used (0.2 ml/min) so that the residence time of the sample within the counter volume was ~2 min. Preliminary experiments with anthracene as the scintillator showed it to be unsuitable
The Journal of Physical Chemistry, Voi. 79, No. 17, 1975

Reaction of -OH with Benzoic Acid 1769
Inject A B
Figure 1. Chromatograms of 1 m/W benzoic acid solution containing 0.5 mM ferricyanide irradiated to a dose of 3.2 X 10¹⁸ eV/g as detected at 250, 285, and 300 nm. Elution is done with 0.1 M acetate at pH 7.2. Benzoic acid (800 nM) and p-hydroxybenzoic acid (41 tiM) are eluted at A. m-Hydroxybenzoic acid (69 pA4) is eluted at B (elution time 13 min).
because of background increases resulting from retention of active material on the anthracene. Use of glass scintillator beads avoids memory effects almost completely (the counting level recovers to within 50 cpm of normal 10 min after passage of a benzoic acid peak of 100,000 cpm). Occasionally small increases in the background level did occur but it was found that the counting cell could be cleaned rapidly by flushing it with a detergent solution.
In order to improve the counting rates, the volume of the loop injector was increased to 0.38 ml but this increase had little effect on the peak widths. With the glass scintillator 14C counting efficiency was only ~10% and the background rather high (>200 cpm). These values impose a fundamental detectability limit of ~ 10~9 Ci for chromatographic peaks that have a reasonable width (~2 ml or 5 times the sample volume). Using a specific activity of 20 Ci/mol a practical detectability limit of ~10-7 M can be readily attained in this type of experiment. By collecting samples and counting them internally in a scintillation solution this limit can be extended by about 2 orders of magnitude provided the components can be adequately resolved chroma- tographically. In the present experiments the specific activities used were an order of magnitude lower than above and the sensitivities reduced accordingly. The concentration of each of the products was determined by comparing the activity under a chromatographic peak with that in the benzoic acid peak of an unirradiated sample of known concentration and, in general, should be accurate to of the order of a few percent with a detectability limit of about 1V.M. Maximum counting rates were <100,000 cpm so that coincidence losses were less than a few percent (coincidence losses were measured to be 10% at 500,000 cpm). For the on-line measurements the total count will vary inversely with the flow rate so that it is important to maintain constant flow rates, particularly where differences are to be ex
amined. In any one experiment the flow was set and not disturbed during the course of the experiment (including the examination of the reference solution). For the experiments where material balance was examined in detail the complete benzoic acid peaks of the initial and irradiated samples were collected, the total samples weighed, and aliquots counted internally in a liquid scintillator (“Hand- fluor”; Mallinckrodt Chemical Works). Total activities measured in this way do not involve any consideration of flow and in any one set of experiments were reproducible to ~ 1% so that the yield for consumption of benzoic acid can be determined to ~5% in the region of 25% conversion.
Pulse Radiolysis and ESR Experiments. Pulse radiolytic determinations of the rate for reaction of OH with m-hy- droxybenzoic acid and for the oxidation of the intermediate hydroxycyclohexadienyl radicals by ferricyanide were carried out using the computer-controlled pulse radiolysis apparatus described by Patterson and Lilie.14 ESR studies of the relative steady-state concentrations for each of the intermediate radicals were carried out by the in situ radioly- sis-ESR methods described by Eiben and Fessenden.3
ResultsAs expected the principal products produced in the pres
ence of ferricyanide are the hydroxybenzoic acids. This aspect is illustrated very well by the radiochromatograms of Figure 2. Since the sensitivity for each of the tagged products is identical with that of the starting material, in these chromatograms one can see directly the importance of each group of products and be virtually certain that no others are produced in any appreciable yield. In the absence of ferricyanide the yields of the hydroxybenzoic acids are low and a melange of additional unidentified products is produced as is illustrated in Figure 3.
It is seen in Figure 2b that, in addition to the hydroxybenzoic acids, a significant fraction of the product activity (~10%) from the carboxyl-labeled benzoic acid is eluted with little or no retention (peak A). This activity represents, to a large extent, bicarbonate produced by decarboxylation. With ring-labeled material this peak (cf. Figure 2a) is very much smaller (~2%) and, since any CO2 will be unlabeled, must be attributed to organic products (e.g., hy- droquinone) which are very likely produced in secondary reactions. Using eluting system A the yield of phenol from the ring-labeled material accounts for only 7% of the activity. One also sees a small peak (peak D from Figure la) just in front of the salicylic acid which amounts to 2-3% of the product and must contain both a ring and a carboxyl group since it is observed with both types of label. Presumably this product is produced in secondary reactions but because of the low yield cannot be followed in any detail. Increasing the nitrate or perchlorate concentration in the eluent does not wash any additional activity off the column so that one can be quite sure that compounds of greater retention volumes are not produced to any significant extent.
Material Balance. The uniform detection sensitivity for each of the products makes these radiochemical experiments ideal for considerations of material balance. In general it was found that within experimental error the total activity in the product chromatogram was equal to the activity in the benzoic acid peak in a parallel chromatogram of the starting sample so that no important component is being missed. Data for two experiments with carboxyl-labeled material taken at a dose sufficient to consume ~25% of the benzoic acid are given in Table I. The loss in activity
The Journal of Physical Chemistry, Vol. 79, No. 17, 1975

1770 Klein, Bhatia, Madhavan, and Schuler
TABLE I: Illustrative Radiochemical Experiments and Material Balance0
Expt A6 Expt B
A ctivityc Concn, p M A ctiv ity1 Concn. ¡ J .M
Collected sam plesIn itial soin 1.092.782 720 1.159,996 720Irrad ia te d soin Benzoic acid consumed
823.508 543177 (24.6%)
845,524 525195 (27.1%)
On line countingInitial soln 412.720'* 720 452.585c 720Irrad ia ted soln 307.336 536 340,028 541Benzoic acid consumed (105.384) 184 (25.5%) (112.457) 179(24.9%)
Peak A 11.673 21 13.732 22in - + ¡i -Hydroxybenzoic acid 62,470 109 65,840 105o -Hydroxybenzoic acid 32,008 56 33.385 53Peak D 1.685 3 2,032 3
Total products 107,836 189(26.2%) 114,989 183 (25.4%)a D uplicate sam ples containing 0.72 m M carboxyl-labeled benzoic acid. 2 m M phosphate buffer, and 2 mM ferricyanide as oxidant. Ir
radiations were a t a dose of 3.2 x 10¹⁸ eV/g. Elution was with a n itra te borate system . A priori calculation based on integration of eq 7 with G(OH) = 5.6 indicates th a t consum ption of benzoic acid should be 199 m M or 27.6% at this dose. b Experim ent illustra ted in Figure 2b and c. c For collected sam ples the to ta l activities (in cpm) were determ ined from m easurem ents in a liquid sc in tilla tor on 500->il aliquots of the collected sam ples (volume —5 ml as determ ined by weight). On-line activ ities represent the integrated count (corrected for background) obtained for a sam ple residence tim e of ~ 2 min and will be inversely dependent on the flow rate. Slight differences in activ ities reflect day to day variations in counting efficiencies and flow rates. d Relative specific activities calculated from these values were used in determ ining the concentrations in the subsequent da ta .
Insect A 3 C Eluent D EChange
Figure 2. Radiochromatograms of (a) 0.64 mM ring-labeled benzoic acid solution and (b) 0.72 mM carboxyl-labeled benzoic acid solution containing 2 mM ferricyanide and saturated with N20. Both were irradiated to a dose of 3.2 X 10¹⁸ eV/g; part (c) is the blank for (b). Eluent was initially 20 mM borate-10 mM nitrate at pH 9.2; nitrate is increased to 80 mM at the point marked for eluent change. A is the point at which unretained components will pass through the detector (H C O 3 - , hydroquinone). Peak B is benzoic acid (and phenol) sensitivity decreased by a factor of 10; note that this peak is 25% smaller in (b) than in (c). Peak C is unresolved m- and p-hydroxybenzoic acid and peak E the o-hydroxybenzoic acid. Peak D is very likely a dihy- droxybenzoic acid produced in a secondary reaction. Increasing the nitrate to 0.5 M showed very little additional activity so that there can be no significant products with greater retention volumes. Entire chromatogram takes ~160 min.
in the benzoic acid fraction is essentially completely accounted for by the activities observed in the three major product peaks. These data show very clearly that even though the product hydroxybenzoic acids must be attacked
XlO
Inject A 8 C Eluent D EChange
Figure 3. Radiochromatogram of 1.28 mM ring-labeled benzoic acid irradiated to a dose of 1.9 X 10,B eV/g; no ferricyanide present. Peaks A, B, C, and E are as in Figure 2. D is a false peak that arises because of a pile up of activity after the eluent change. Note that peaks C and E are considerably smaller than in Figure 2 and account for only about one-third of the total activity eluted after the benzoic acid. Peak A contains ~10% of the product activity and is much larger than observed for the ring-labeled material in the presence of ferricyanide (see Figure 2a).
to a significant extent at the conversion levels involved in these experiments these products are not, for the most part, oxidized further to carboxyl-labeled secondary products (which would presumably fall elsewhere in the chromatogram). Small amounts of additional products are, indeed, formed (~5%) but they account for only a small fraction of the secondary reactions that must be occurring.
Dependence of Yield on Dose. The dose dependence for each of the components measured in the radiochemical experiments is illustrated by the solid symbols in Figure 4. It is seen that the yields fall off considerably at doses sufficient to convert a significant fraction of the benzoic acid to product and that in the region of 25% conversion the total yield is only 3.5. The ratio of the yields of 0- and p-hydroxybenzoic acids from the relative activities in their respec-
The Journal of Physical Chemistry, Voi. 79, No. 17, 1975
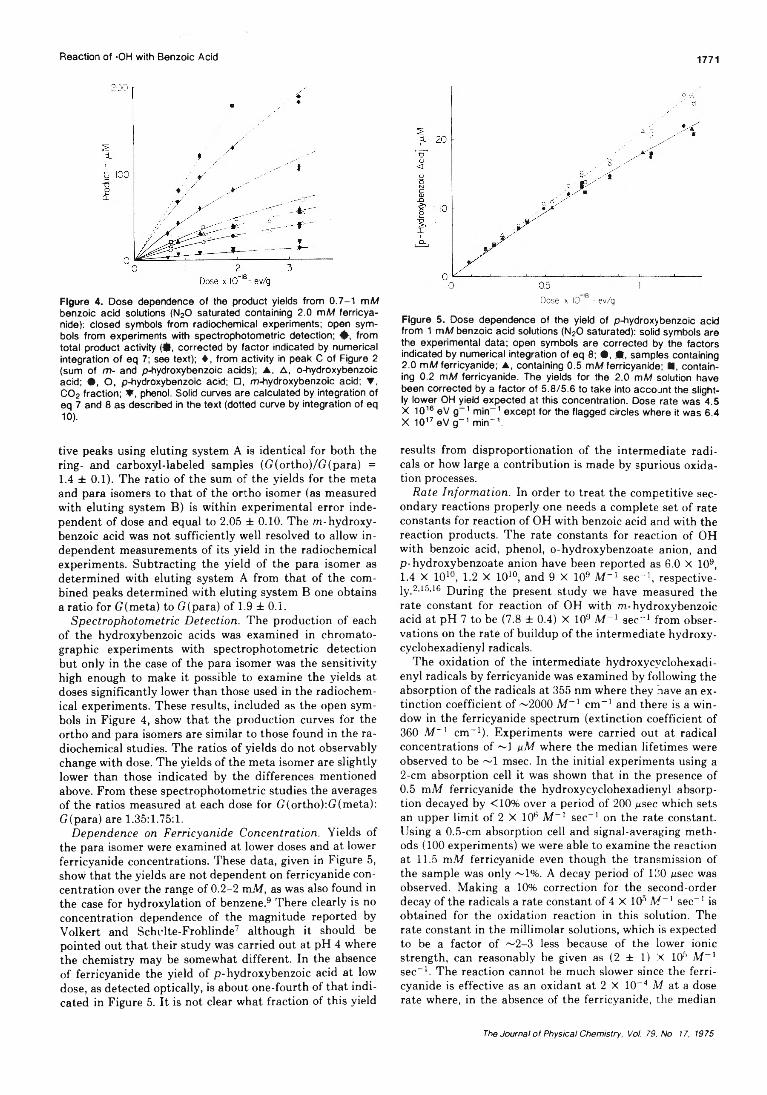
Reaction of -OH with Benzoic Acid 1771
Figure 4. Dose dependence of the product yields from 0.7-1 m/W benzoic acid solutions (N20 saturated containing 2.0 m/W ferricya- nide): closed symbols from radiochemical experiments; open symbols from experiments with spectrophotometric detection; +, from total product activity (♦ , corrected by factor indicated by numerical integration of eq 7; see text); ♦ , from activity in peak C of Figure 2 (sum of m- and p-hydroxybenzoic acids); ▲ , A, o-hydroxybenzoic acid; • , O, p-hydroxybenzoic acid; □, m-hydroxybenzoic acid; ▼ , C02 fraction; ♦ , phenol. Solid curves are calculated by integration of eq 7 and 8 as described in the text (dotted curve by integration of eq 10).
tive peaks using eluting system A is identical for both the ring- and carboxyl-labeled samples (G(ortho)/G(para) =1.4 ± 0.1). The ratio of the sum of the yields for the meta and para isomers to that of the ortho isomer (as measured with eluting system B) is within experimental error independent of dose and equal to 2.05 ± 0.10. The m-hydroxybenzoic acid was not sufficiently well resolved to allow independent measurements of its yield in the radiochemical experiments. Subtracting the yield of the para isomer as determined with eluting system A from that of the combined peaks determined with eluting system B one obtains a ratio for G(meta) to G(para) of 1.9 ± 0.1.
Spectrophotometric Detection. The production of each of the hydroxybenzoic acids was examined in chromatographic experiments with spectrophotometric detection but only in the case of the para isomer was the sensitivity high enough to make it possible to examine the yields at doses significantly lower than those used in the radiochemical experiments. These results, included as the open symbols in Figure 4, show that the production curves for the ortho and para isomers are similar to those found in the radiochemical studies. The ratios of yields do not observably change with dose. The yields of the meta isomer are slightly lower than those indicated by the differences mentioned above. From these spectrophotometric studies the averages of the ratios measured at each dose for G(ortho):G(meta): G(para) are 1.35:1.75:1.
Dependence on Ferricyanide Concentration. Yields of the para isomer were examined at lower doses and at lower ferricyanide concentrations. These data, given in Figure 5, show that the yields are not dependent on ferricyanide concentration over the range of 0.2-2 mM, as was also found in the case for hydroxylation of benzene.9 There clearly is no concentration dependence of the magnitude reported by Volkert and Schvlte-Frohlinde7 although it should be pointed out that their study was carried out at pH 4 where the chemistry may be somewhat different. In the absence of ferricyanide the yield of p-hydroxybenzoic acid at low dose, as detected optically, is about one-fourth of that indicated in Figure 5. It is not clear what fraction of this yield
Dose x 10 18 - ev/g
Figure 5. Dose dependence of the yield of p-hydroxybenzoic acid from 1 m/W benzoic acid solutions (N20 saturated): solid symbols are the experimental data; open symbols are corrected by the factors indicated by numerical integration of eq 8; • , it, samples containing 2.0 m/W ferricyanide; ▲ , containing 0.5 m/W ferricyanide; ■ , containing 0.2 m/W ferricyanide. The yields for the 2.0 m/W solution have been corrected by a factor of 5.8/5.6 to take into account the slightly lower OH yield expected at this concentration. Dose rate was 4.5 X 10¹⁶ eV g-1 min-1 except for the flagged circles where it was 6.4 X 10¹⁷ eV g-1 min-1.
results from disproportionation of the intermediate radicals or how large a contribution is made by spurious oxidation processes.
Rate Information. In order to treat the competitive secondary reactions properly one needs a complete set of rate constants for reaction of OH with benzoic acid and with the reaction products. The rate constants for reaction of OH with benzoic acid, phenol, o-hydroxybenzoate anion, and p-hydroxy benzoate anion have been reported as 6.0 X 109,1.4 X 1010, 1.2 X 10¹⁰, and 9 X 10⁹ M-1 sec-1, respectively 2,15,16 During the present study we have measured the rate constant for reaction of OH with m-hydroxybenzoic acid at pH 7 to be (7.8 ± 0.4) X 109 M-1 sec-1 from observations on the rate of buildup of the intermediate hydroxy- cyclohexadienyl radicals.
The oxidation of the intermediate hydroxycyclohexadi- enyl radicals by ferricyanide was examined by following the absorption of the radicals at 355 nm where they have an extinction coefficient of ~2000 M-1 cm-1 and there is a window in the ferricyanide spectrum (extinction coefficient of 360 M-1 cm-1). Experiments were carried out at radical concentrations of ~1 /¿M where the median lifetimes were observed to be ~1 msec. In the initial experiments using a 2-cm absorption cell it was shown that in the presence of 0.5 mM ferricyanide the hydroxycyclohexadienyl absorption decayed by < 10% over a period of 200 nsec which sets an upper limit of 2 X 10⁶ M~l sec-1 on the rate constant. Using a 0.5-cm absorption cell and signal-averaging methods (100 experiments) we were able to examine the reaction at 11.5 mJW ferricyanide even though the transmission of the sample was only ~1%. A decay period of 130 /¿sec was observed. Making a 10% correction for the second-order decay of the radicals a rate constant of 4 X 10° M-1 sec-1 is obtained for the oxidation reaction in this solution. The rate constant in the millimolar solutions, which is expected to be a factor of ~2-3 less because of the lower ionic strength, can reasonably be given as (2 ± 1) X 105 M-1 sec-1. The reaction cannot be much slower since the ferricyanide is effective as an oxidant at 2 X 10⁻⁴ M at a dose rate where, in the absence of the ferricyanide, the median
The Journal of Physical Chemistry, Vol. 79, No. 17, 1975

1772 Klein, Bhatia, Madhavan, and Schuler
radical lifetime is ~0.1 sec. With a rate constant of 2 X 10⁵ M ~l sec-1 for the oxidation the reaction period is 0.02 sec and the radicals are not permitted to build up to a concentration where second-order recombination plays a significant role. At dose rates only somewhat higher than those used here complications from second-order reactions between radicals should set in and one can expect a dependence of the yields on the ferricyanide concentration. It is clear that in studies with chemically produced OH radicals,e.g., in the hydroxylation of aromatic systems using Fenton’s reagent, ferricyanide will not be effective as a radical oxidant unless one is careful to maintain the radical production rate less than ~ 10-3 M lsec.
ESR Experiments. Eiben and Fessenden3 have given an ESR spectrum observed during the irradiation of benzoic acid solutions which shows that at steady state all of the isomeric carboxyl-substituted hydroxycyclohexadienyl radicals are present at comparable concentrations. They have commented that the observed relative intensities indicate that the meta and para adducts are produced at similar rates (per position available) and the ortho adduct is produced at about half the rate. We have repeated their experiment to examine in slightly greater detail the region 20 G above the spectral center where lines from each of the three radicals appear adjacent to each other. This study was carried out at pH 13 where the splitting by the OH proton is eliminated by exchange but the radical identity is maintained. Modulation conditions were adjusted so that slight differences in line width would not affect the relative intensities. The spectrum given in Figure 6 shows that the steady-state concentrations of radicals produced by OH addition at the ortho, meta, and para positions are in the ratios 1.4:1.8:1. Since essentially identical relative production rates are indicated by the present product studies, it is clear that there is very little selectivity in the second-order processes that control the steady state in the ESR experiments. It is perhaps a little surprising that the hydroxycyclohexadienyl radicals carboxylated at the 1 or 3 positions are not observed in somewhat higher relative intensities (since in more highly carboxylated cyclohexadienyl radicals substitution at the positions of high spin density does tend to interfere with the recombination processes4) but apparently the effects of a single substitution are not sufficient to produce an observable difference.
K in etic A nalysis and In itia l Y ieldsThe initial yield of hydroxy radicals expected for an
N20-saturated solution 1 mM in benzoic acid and 2 mM in ferricyanide is 5.6.17 The total product yield of ~4.7 observed at a dose of 1018 eV/g is reasonably in accord with this value but it is quite clear from the pronounced curvature of the data of Figure 4 that secondary processes are coming into play at even lower doses. This strong dependence of yield on dose is expected since, as indicated above, the rate constants for reaction of OH with the products are all somewhat greater than for reaction with benzoic acid. Proceeding iteratively one can estimate appropriate corrections to the data from preliminary calculations based on integration of the kinetic expressions that describe the competitive effects of the buildup of product, apply these corrections to the experimental data to determine the initial yields, and then refine the calculations to obtain more accurate values. In practice for solutions ~1 mM in benzoic acid and doses less than ~1018 eV/g the corrections are small (<20%) and insensitive to the kinetic details so that
Figure 6. ESR spectrum observed during the irradiation of a Im M benzoic acid solution at pH 13 in the region of ~20 G above the spectral center. The three lines represent unit intensity lines of the radical produced by OH addition at the meta and ortho positions and a doubly intense line of the isomer produced by addition at the para position (see Figure 7 in ref 3). If addition occurs statistically, all three lines should be equally intense. The relative intensities are estimated to be 0.7, 0.9, and 1 for the ortho, meta, and para adducts.
only one iteration is necessary. The calculated corrections depend on the relative values of the rate constants involved but it is believed that these are known sufficiently well that the possible errors cannot be more than a few percent (a 20% uncertainty in the relative rate constants introduces an uncertainty of only 3% in the correction at a dose of 2 X 10¹⁸ eV/g).
The reaction of prime interest is, of course, that of the OH radicals produced from the water
[1 0G(OH )D / 1 I f N
H20 ------------------ * • OH (1)
with the benzoic acid
•OH + C gH5C 0 2- — - • C eH5(0H )C02- (2)
where the production rate of OH radicals (10G(OH)D/tIV) is given by OH yield (G(OH) in radicals/100 eV) and the dose rate D/t in eV g-1 sec-1 (N is Avogadro’s number). The stoichiometry involved in the subsequent oxidation of the hydroxycyclohexadienyl radicals can be represented by
C 6H5(OH)C02-- + Fe(CN)e3’ ^
H 0 C eH4C 0 2- + Fe(CN)64' + H+ (3a)¡¡(-co2>
-------- *- C 6H5OH + Fe(CN)64- + C 0 2 (3b)
The hydroxybenzoic acids and phenol produced in reaction 3 will, as they build up, compete more and more for the OH radicals. It is known that in the presence of millimolar phosphate buffer the initial adduct of OH to phenol eliminates water with a period ~25 usee to form phenoxyl radical15 so that phenoxyl and the carboxyl-substituted phenoxyl radicals are expected to be the important intermediate produced in the secondary processes
•OH + HOC6H4CO,- «0 C eH4C 0 2" + H ,0 (4a)
• OH + C GH5OH • O C6H5 + H ,0 (4b)
Some decarboxylation is also expected and should be accompanied by reduction of ferricyanide
The Journal of Physical Chemistry, Vol. 79, No. 17, 1975

Reaction of -OH with Benzoic Acid 1773
&3•OH + HOCeH4C 0 2- (+Fe(CN)63-) —
C6H4(OH), + COz (+Fe(CN)fi4' ) (5)
but the fractional contribution of this reaction, ~ k 3/k2, is expected to be small (<10%). Phenoxyl radicals are strong oxidizing agents so that it seems likely that they will either oxidize the intermediate hydroxycyclohexadienyl radicals or the ferrocyanide and, as a result, be converted back to the hydroxybenzoic acids. The initial products will, therefore, not be destroyed by the secondary reactions (as is indicated experimentally by the almost complete absence of more highly oxidized products (see Figure 2)). It is known that OH radicals react very rapidly with ferrocyanide
k,•OH + Fe(CN)64- —► OH- + Fe(CN)63" (6)
(&4 = 1.1 X 10¹⁰ M_1 sec-1)21 so that this product will also cause appreciable interference with reaction 2. The carbox- ylated cyclohexadienyl radicals produced from H atoms are expected to be oxidized to benzoic acid and should not directly affect reaction 2 nor contribute to the organic products.22
According to the above, the differential equation which describes the consumption of benzoic acid as a function of dose (D) is_d[S] =
d D10G(OH) 1 , 7>
N fe2([Sl0 - [S]) kt [FeiCNyTi1 *i[S] [S]
where [S]o and [S] are the initial and instantaneous benzoic acid concentrations, k 2 is the average rate constant applicable to the reaction of OH with the organic products, and ki is the rate constant for reaction of OH with ferrocyanide. Peroxide will also build up in this system but its reaction with OH is so slow (~107 M-1 sec-1)23 that no significant removal of OH will occur at small conversions of the benzoic acid. The production of the individual hydroxybenzoic acids (Pi) should be given quite well by
d[P,] d D
d[S] d D
_ fei lPjN*i [s] ) [s]
(8)where /( i) is the fractional yield for production of a particular isomer. The second term in eq 8 corrects for any decarboxylation that occurs and presumably is small so that one does not expect any large change in the isomer distribution with increased dose. For phenol /( i) is replaced in eq 8 by / ( —CO2) and the second term will, of course, be absent. Calculation of the dose dependence of the ferricyanide concentration requires correction for the reoxidation of the ferrocyanide by reaction 6 and for the additional reduction of ferricyanide that accompanies the secondary decarboxylation reactions. Ferrocyanide will also be produced by the oxidation of the H atom adducts.d|Fe(CN)R4-l
d Dd[S] d D )(' ft,, [Fe(CN)fiJ-
[S]
1 - 2 k2 [s]1 0 G (H )
N (9)
The production of CO2 should be given by
Numerical integration of the above set of differential equations was carried out on a Hewlett-Packard 9830 calculator with the average value of k2/ki (appropriately weighted according to the relative yield of products) taken as 1.65, ks/ki as 2.9, and kz/k2 as 0.07. These calculations show that for doses up to ~1018 eV/g the principal complications result from removal of OH radicals by reaction with the organic products and with ferrocyanide. Decarboxylation of the hydroxybenzoic acids reduces the yield of these products slightly in the region of 3 X 10¹⁸ eV/g and contributes somewhat to the CO2 production (compare the dotted line and lowest solid curve in Figure 4). At still higher doses the second-order reactions between phenoxyl radicals can be expected to lead to partial consumption of the products24 but more detailed knowledge of the steady-state concentrations of each of the intermediates is required to take these reactions into account quantitatively.
If the radiochemical measurements for total product formation from the carboxyl-labeled material are corrected for the expected loss in the secondary processes, then, as indicated by the dashed curve in Figure 4, one finds a linear increase with dose up to ~2 X 10¹⁸ eV/g. A slight (~5%) decrease is observed in the region ~3 X 10¹⁸ eV/g which can be attributed to reactions not adequately accounted for by the above equations. The initial yield for production of products (and consumption of benzoic acid) from the three points at the lowest doses is 5.7 in excellent agreement with the expected yield of 5.6.17 Turning the calculation around, if we assume an OH yield of 5.6, then the dose dependence for the consumption of benzoic acid (the integral of eq 7) is given by the uppermost solid line of Figure 4. Within a possible error of ~5% (from dosimetry, analysis and interpretation) it is seen that all of the OH radicals are accounted for. In the radiochemical measurements the initial product distribution is broken down to 62% for the sum of the m- and p-hydroxybenzoic acids and 30% for the o-hydroxy- benzoic acid. The curves in Figure 4 for these components are calculated from eq 8 using these fractions. The contribution of the para isomer, as measured radiochemically, is 21% leaving 42% of the activity to be assigned to the meta isomer. Unfortunately this latter product could not be sufficiently well resolved from the other components to make an accurate radiochemical measurement practical. From the overall fit of the curves to the data ratios of 1.43:1.95:1 for G(ortho):G(meta):G(para) are indicated by the radiochemical measurements. Measurements of phenol production from the ring-labeled material show it represents ~7% of the total expected product. Because of possible contributions from secondary processes the production of CO2 from the carboxyl-labeled material is more difficult to interpret but an initial fractional yield of decarboxylation in the range of 7-10% is indicated.
The spectrophotometric measurements of the production of the o-, m-, and p-hydroxybenzoic acids reported in Figure 4 can be fitted quite well by integration of eq 8 with fractional contributions of 30, 37, and 21%. The fractional yields of the ortho and para isomers are in good agreement with those measured radiochemically. The fractional yield of the meta isomer (37%) is somewhat lower than indicated
The Journal of Physical Chemistry, Vol. 79, No. 17, 1975

1774 Klein, Bhatia, M a d h a va n , a n d S c h u le r
by the difference noted above in the radiochemical experiments (41%).
The higher analytical sensitivity in the spectrophotomet- ric determination of p-hydroxybenzoic acid allows measurements at doses in the range of 1017-1018 eV/g where the corrections are less than 20% and can be made very accurately. The experimental data in Figure 5 (solid symbols) have been approximately corrected (open symbols) to give a linearized plot with a slope corresponding to an initial yield of 1.22 for the formation of p-hydroxybenzoic acid. At these doses the only important complication is the loss of OH radicals in reactions 4 and 6 so that interpretive difficulties are at a minimum and the uncertainty in the initial yield can reasonably be estimated as ±0.05. This initial yield (1.22) is, in fact, 21.0% of the expected OH yield of 5.817 in agreement with the fractional production determined in the radiochemical experiments at higher doses.
The individual initial yield of the o-hydroxybenzoic acid, as indicated by the above yield for the para isomer and the ratios determined in the spectrophotometric and radiochemical experiments, is 1.7 (±0.1). The spectrophotometric measurements give an initial yield of 2.2 for the meta isomer while the radiochemical measurements indicate a slightly higher value of 2.4 so that this yield can be reasonably given as 2.3 ± 0.2. In the initial stages, the three isomeric hydroxybenzoic acids, therefore, account for a total yield of 5.2 ± 0.3 or 90 ± 5% of the OH reactions. Decarboxylation accounts for a yield of 0.4 ± 0.1 (7 ± 2%) or most of the remainder. It, of course, does not seem likely that in the absence of complications other reaction paths will be open to the OH radicals. It is indeed comforting that essentially all of the expected radical intermediates can be converted to well-defined products.
SummaryIn summary these studies show that at low production
rates (<10-6 M/sec) the hydroxycyclohexadienyl radicals produced in the reaction of OH radicals with benzoic acid are quantitatively oxidized to phenolic products with ferri- cyanide at concentrations as low as 2 X 10“4 M. The measured oxidation rate is low (2 X 10⁵ M~l sec-1) so that complications can be expected at low ferricyanide concentrations and high radical production rates. The individual initial yields of the 0-, m-, and p-hydroxybenzoic acids produced in N20-saturated solutions are 1.7, 2.3, and 1.2 with decarboxylation contributing an additional yield of 0.4. Secondary reactions involving attack of OH on the products are clearly very important, even at low conversions, but these secondary reactions do not lead to further oxidation of the products. Finally, the ratios of the product
yields are very similar to the ratios of the precursor radicals observed at steady state so that there can be little selectivity in the second-order reactions removing these radicals in the latter instance.
Acknowledgment. The authors wish to thank Dr. P. Neta for valuable discussions on the rate constants for reaction of intermediates with the various materials present in the systems studied here.
References and Notes(1) Supported in part by the U.S. Energy Research and Development Ad
ministration.(2) P. Neta and L. M. Dorfman, Adv. Chem. Ser., No. 81, 222 (1968).(3) K. Eiben and R. W. Fessenden, J. Phys. Chem., 75, 1186 (1971).(4) K. Eiben and R. H. Schuler, J. Chem. Phys., 62, 3093 (1975).(5) I. Loeff and A. J. Swallow, J. Phys. Chem., 68, 2470 (1964).(6) R. W. Mathews and D. F. Sangster, J . Phys. Chem., 69, 1938 (1965).(7) O. Volkert and D. Schulte-Frohlinde, Tetrahedron Lett., 17, 2151 (1968).
See this paper for reference to other earlier studies.(8) See K. Bhatia and R. H. Schuler, J. Phys. Chem., 77, 1356 (1973), for
an illustrative example of the application of high-pressure liquid chromatography to studies of the radiation chemistry of aqueous systems.
(9) K. Bhatia and R. H. Schuler, J. Phys. Chem., 78, 2335 (1974).(10) K. Bhatia, Anal. Chem., 45, 1344 (1973). In the spectrophotometric
studies reported here the pump has been replaced with a Waters Associates Model 6000 digitally controlled chromatographic pump.
(11) U. Kramer and K. Bhatia, J. Chromatogr., 89, 348 (1974).(12) This technique has recently been used in a recent study of the radiation-
induced oxidation of nitrobenzenes: K. Bhatia, J. Phys. Chem., 79, 1032(1975).
(13) Extinction coefficients of benzoic acid and the o-, m-, and p-hydroxybenzoic acids are (at pH 7) 920, 500, 1000, and 12,000 M~' cm-1 at 250 nm and <1, 3700, 900, and <10 M~' cm-1 at 300 nm. The extinction coefficient of m-hydroxybenzoic acid is 2200 M-1 cm-1 at 285 nm. Phenol was detected at 270 nm where its extinction coefficient is 1500 M“ 1 cm-1.
(14) L. K. Patterson and J. Lilie, Int. J. Radiat. Phys. Chem., 6, 129 (1974).(15) E. J. Land and M. Ebert, Trans. Faraday Soc., 63, 1181 (1967).(16) C. S. Amphlett, G. E. Adams, and B. D. Michael, Adv. Chem. Ser., No.
81, 231 (1968).(17) From the reported rate constants18*20 it is estimated that for solutes
containing 1 mM benzoic acid and 0.5 and 2.0 mM ferricyanide, 5 and 14% of the hydrated electrons, respectively, do not react with the N20. The OH yields will, therefore, be 0.2 and 0.4 unit lower than the yield of 6.0 expected for N20-saturated water.
(18) J. P. Keene, Radiat. Res., 22, 1 (1964).(19) M. Anbar and E. J. Hart, J. Phys. Chem., 69, 973 (1965).(20) S. Gordon, E. J. Hart, M. S. Matheson, J. Rabani, and J. K. Thomas, J.
Am. Chem. Soc., 85, 1375 (1963).(21) J. Rabani and M. S. Matheson, J. Am. Chem. Soc., 86, 3175 (1964).(22) The studies of C. L. Brett and V. Gold, J. Chem. Soc., Perkin Trans. 2,
1437 (1973), with tritium atoms make it clear that the hydrogen atom adducts of aromatics can be readily oxidized back to the starting materials.
(23) H. A. Schwarz, J. Phys. Chem., 66, 255 (1962).(24) During the course of these studies it has been shown that N20-saturat-
ed p-hydroxybenzoic acid, when irradiated by itself in the presence of ferricyanide, is consumed with a G » 3 . The products have not, as yet, been identified. In the present instance reducing entities produced by the reaction of OH with benzoic acid dominate the products up to 25 % conversion so that it is reasonable that pher-oxyl radicals will be reduced back to the hydroxybenzoic acids at low conversions. At high conversions, however, phenoxyl radicals will dominate the intermediates and loss of product can be expected.
The Journal of Physical Chemistry, Vol. 79, No. 17, 1975

Pulse Radiolysis of Imidazoles 1775
Polarographie and Optical Pulse Radiolysis Study of the Radicals Formed by OH Attack on Imidazole and Related Compounds in Aqueous Solutions
K. M. Bansal1 and R. M. Sellers*2Hahn-Meitner-lnstitut für Kernforschung Berlin GmbH, Bereich Strahlenchemie, 1 Berlin 39, West Germany (Received December 6, 1974) Publication costs assisted by Hahn-Meitner-lnstitut für Kernforschung Berlin GmbH
Polarographic and optical pulse radiolysis studies of the radicals formed by OH attack on imidazole, 1- methylimidazole, 2-methylimidazole, and histidine have been performed. The absorption spectra of the radicals are characterized by peaks as 300 ± 15 and 390 ± 10 nm. The pKa values of the radicals, measured from the pH dependence of the spectra, are ca. 1-2 units below those of the corresponding parent compound. At high pH’s (>11) a first-order, pH-dependent decay was observed with imidazole, 2-methylimida- zole, and histidine, and is attributed to a water elimination reaction. The principal features of the polaro- grams are (i) a flat cathodic wave at potentials more negative than 0 V for the protonated radicals and (ii) for the unprotonated radicals a steep anodic wave extending up to ca. —0.5 V followed by a flatter cathodic wave. The polarographic data at high pH’s (>11) are consistent with the rearrangement reaction observed in the optical experiments.
The imidazole ring is an important functional group in many biochemicals. It is widely distributed in nature as part of the histidine residue, and as such is an important constituent, for instance, of the active center of enzymes such as ribonuclease.3 It also occurs, fused to aromatic rings, in compounds such as the purines and benzimidazoles, while metronidazole (l-/3-hydroxyethyl-2-methyl-5- nitroimidazole), because of its low toxicity, has found some application as a radiosensitizer of anoxic cells.4 Much interest in radiation chemistry and biology has focussed on inactivation studies of biochemicals, and radiation effects on tissue, and it is clearly relevant to these to find out how the primary radiation produced radicals in water, eaq~, OH, and H, react with the individual constituents of these macromolecules. Much work has been done on this, although compounds containing the imidazole ring have received little attention. We report here a study using polarographic and optical pulse radiolysis techniques on the radicals formed by OH attack on imidazole, 1-methylimidazole, 2- methylimidazole, and histidine which indicate (i) that they have absorption maxima at 300 ± 15 and 390 ± 10 nm, (ii) that the pica’s of the radicals are ca. 1-2 pH units less than those of the corresponding parent compounds, and (iii) that in alkaline solutions (pH >11) a water elimination reaction occurs. Some preliminary results with imidazole have been reported elsewhere.5
E xperim ental S ectionApparatus. Optical pulse radiolysis experiments were
carried out using 0.5-5.0-^sec pulses of 1.6-MeV electrons from a Van de Graaff accelerator. The optical system consisted of a 450-W xenon lamp, a 1.5-cm path length cell, a Zeiss MQ4 III prism monochromator, and an EMI 9558 QB photomultiplier. Other details were as described elsewhere.6“8 Dosimetry was performed using aerated 10~2 M CNS-, taking G((CNS)2~) = 2.8 and «475((CNS)2-) as 7600 M_1 cm-1.
The polarographic pulse radiolysis experiments were performed using 20-nsec pulses of 12-MeV electrons from a linear accelerator. The polarographic circuit consisted of a hanging mercury drop electrode (surface area 0.02 cm2),
the solution containing 0.35 M Na2S04 as the supporting electrolyte, a mercury pool 8 mm from the drop as the second electrode, the potential supply, and a working resistance of 20 ohms. All potentials were measured vs. the saturated calomel electrode (SCE). Other details have been described elsewhere.9,10
4C------ N:!Il II
Materials. Imidazole (Fluka), 2-methylimidazole (Sigma), and histidine (Merck) were used as received. 1- Methylimidazole (Fluka) was purified by distillation under reduced pressure. Other chemicals were of AR grade and were used without further purification. The pH of the solutions was adjusted by addition of NaOH or HC104. All experiments were performed at 20 ± 2°.
R esu lts and D iscussionOptical Measurements. Spectra and pKa Determina
tions. The spectra of the radicals produced by OH attack on imidazole and its derivatives were measured by the pulse radiolysis of N20-saturated solutions containing 10~;i M of the imidazoles. Under these conditions >95% of the hydrated electrons react with the N2Q to give OH radicals, and these react with the imidazoles with t\/o < 1 gsec. In each case the spectra of the radicals formed have absorption maxima near 300 and 390 nm (Figure 1, Table I), and there is evidence for a further band at <240 nm. With increasing pH the 300-nm peak becomes more strongly absorbing and that at 390 nm less strong (with the exception of 2-methylimidazole). From the effect of pH on these absorptions, titration curves could be measured (Figure 1) and from the midpoints of which the pKa values listed in Table II were found. For 1-methyl- and 2-methylimidazole the oscillograms showed a small spike immediately after the pulse at pH’s a little above the pK„ of the parent and a rapid build-up at pH’s a little below. This behavior is due to the presence at the end of the pulse of a nonequilibrium mixture of protonated and unprotonated radicals. Approximate values for the pKa’s could be obtained by making
The Journal of Physical Chemistry, Voi. 79, No. 17, 1975
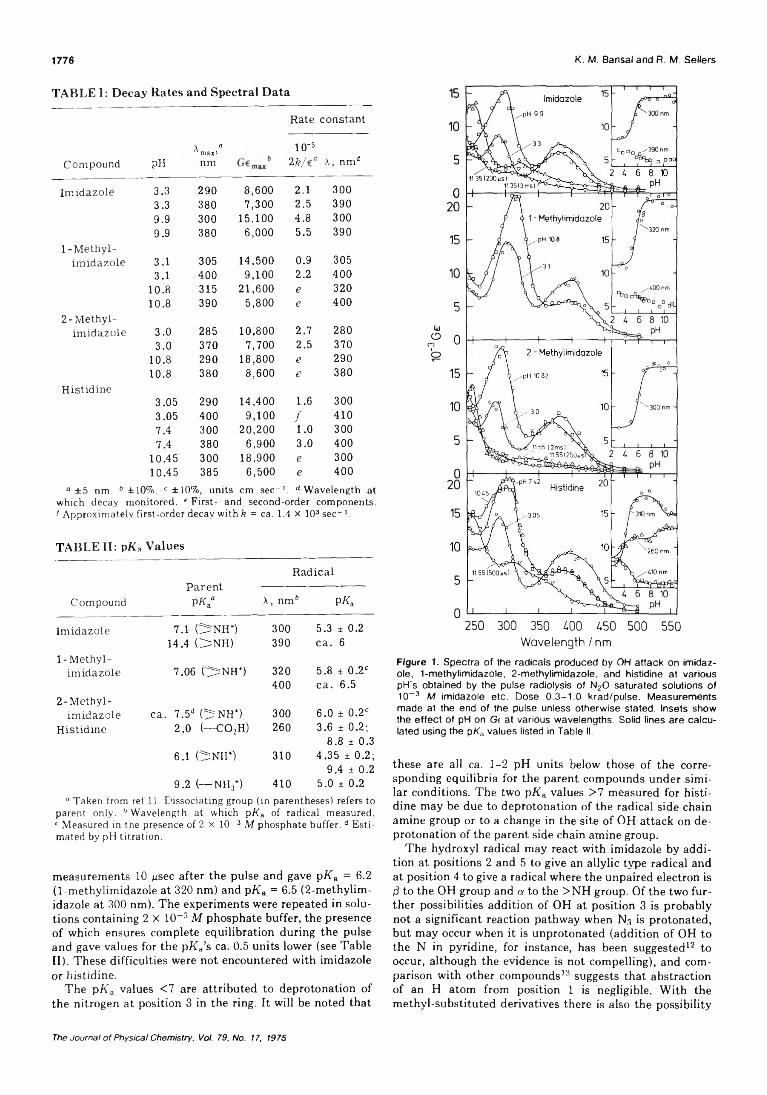
1776 K. M. Bansal and R. M. Seders
TABLE I: Decay Rates and Spectral Data
Compound PH
\ a vmax’nm
Rate constant
10"52 k / X, nm‘
Imidazole 3.3 290 8,600 2.1 3003.3 380 7,300 2.5 3909.9 300 15,100 4.8 3009.9 380 6,000 5.5 390
1-M ethyl-imidazole 3.1 305 14.500 0.9 305
3.1 400 9,100 2.2 40010.8 315 21,600 e 32010.8 390 5,800 e 400
2 -M ethyl-im idazole 3.0 285 10,800 2.7 280
3.0 370 7,700 2.5 37010.8 290 18,800 e 29010.8 380 8,600 e 380
Histidine3.05 290 14,400 1.6 3003.05 400 9,100 / 4107.4 300 20,200 1.0 3007.4 380 6,900 3.0 400
10.45 300 18,900 e 30010.45 385 6,500 e 400
0 ±5 nm. b ±10%. c ±10%, units cm see-1 . d Wavelength atwhich decay monitored. e First- and second-order components.f Approximately first-order decay with k = ca. 1.4 x 10³ sec-1.
TABLE II: pKa Values
RadicalParent
Compound p i c X, nm6 pwa
Imidazole 7.1 C ^ m r ) 300 5.3 ± 0.214.4 O N H ) 390 ca . 6
1 - Methyl-im idazole 7.06 r > N H +) 320
4005.8 ± 0 .2e ca . 6.5
2-M ethyl-imidazole ca . 7.5* C 5N H +). 300 6.0 ± 0 .2e
Histidine 2.0 (— C 0 2H) 260 3.6 ± 0.2; 8.8 ± 0.3
6.1 (5:NH*) 310 4.35 ± 0.2; 9.4 ± 0.2
9.2 (—-NH3+) 410 5.0 ± 0.2a Taken from ref 11. D issociating group (in parentheses) refers to
parent only. " W avelength a t which pKa of radical m easured. c M easured in the presence of 2 x 10~3 M phosphate buffer. d E stim ated by pH titra tion .
measurements 10 /nsec after the pulse and gave pKa = 6.2 (1-methylimidazole at 320 nm) and pK& = 6.5 (2-methylim- idazole at 300 nm). The experiments were repeated in solutions containing 2 X 10⁻³ M phosphate buffer, the presence of which ensures complete equilibration during the pulse and gave values for the pXa’s ca. 0.5 units lower (see TableII). These difficulties were not encountered with imidazole or histidine.
The pKa values <7 are attributed to deprotonation of the nitrogen at position 3 in the ring. It will be noted that
250 300 350 ¿00 ¿50 500 550 Wavelength / nm
Figure 1. Spectra of the radicals produced by OH attack on imidazole, 1-methylimidazole, 2-methylimldazole, and histidine at various pH's obtained by the pulse radiolysis of N20 saturated solutions of 10-3 M imidazole etc. Dose 0.3-1.0 krad/pulse. Measurements made at the end of the pulse unless otherwise stated. Insets show the effect of pH on Gc at various wavelengths. Solid lines are calculated using the pKa values listed in Table II.
these are all ca. 1-2 pH units below those of the corresponding equilibria for the parent compounds under similar conditions. The two pKa values >7 measured for histidine may be due to deprotonation of the radical side chain amine group or to a change in the site of OH attack on deprotonation of the parent side chain amine group.
The hydroxyl radical may react with imidazole by addition at positions 2 and 5 to give an allylic type radical and at position 4 to give a radical where the unpaired electron is /3 to the OH group and a to the >NH group. Of the two further possibilities addition of OH at position 3 is probably not a significant reaction pathway when Ns is protonated, but may occur when it is unprotonated (addition of OH to the N in pyridine, for instance, has been suggested12 to occur, although the evidence is not compelling), and comparison with other compounds13 suggests that abstraction of an H atom from position 1 is negligible. With the methyl-substituted derivatives there is also the possibility
The Journal o f Physical Chemistry, Voi. 79, No. 17, 1975

Pulse Radiolysis of Imidazoles 1777
of H abstraction from the methyl group and with histidine from the side chain. In view of the complexities it is not possible to assign particular structures to the absorptions and pKa values measured. With histidine the pKas measured at 260, 310, and 410 nm differ significantly from one another (Table II), and we conclude that at least three different radicals are formed in this case. For imidazole and1-methylimidazole the uncertainty of the pKa values measured at 390 and 400 nm, respectively, is too great to permit any definite statement about the number of radicals formed in either case. The marked similarity of the absorption spectra from all four compounds studied is, however, to be noted. Samuni and Neta14 have unequivocably shown, using the in situ ESR radiclysis technique, that OH + imidazole gives rise, at least in part, to the 5-hydroxyim- idazolyl radical.
It has also been found that there is 84% electron transfer from the OH adducts of imidazole to menaquinone (pH6.9) ,15 88% from the histidine radicals to menaquinone (pH6.9) ,15 and 93% from the histidine radicals to 1,4-benzoqui- none (pH 7.7).16 The ca. 10% of the radicals which do not react in the histidine case can probably be identified with attack at the side chain. For imidazole it is expected that all the possible radicals would transfer to menaquinone. One possible explanation why 16% do not is that another reaction pathway, e.g., addition of the OH adducts to the quinones, might be important.
Optical Measurements. Kinetics. At pH <10 the first half-life for the decay of the radicals was inversely dependent on dose. The rate constants (2k/t) shown in Table I were measured from plots of reciprocal optical density vs. time, which were linear over ca. two half-lives; at longer times some deviation from linearity was observed. These results are consistent with radical-radical reactions.
At higher pH’s the decay of the radicals became first order (with the exception of 1 -methylimidazole), and an absorption rising toward shorter wavelengths remained after this first-order decay was complete. Rate constants for this decay were determined from plots of In (Dt — D„) vs. time, where is the optical density of the absorption remaining after the decay was complete. Some difficulty was experienced with the histidine radical due to the concomitant decay of this second absorption at 300 nm (but not at 390 nm; apparently the long-lived absorption is due to two different species). Values of feobsd were determined at various pH’s and are shown in Table III. Plots of kobsd“ 1 vs. [OH- ]-1 give a straight line with an intercept (Figure2), and indicate a rate law of the following form:
w 1 = a[OH-]-' + b (1)We ascribe this decay to a base-catalyzed water elimination reaction (taking the example of the 5-hydroxy adduct):
OH OH
where the process labeled k& is rate determining. In sup-
TABLE III: Kinetic Data for Rearrangement Reaction
Compound pH 10"4 obsd> se c "1“
Im idazo le11.1511.3511.5811.7512.0012.2012.38
2 -M e th y l- im idazo le
11.2211.4011.6211.8512.0712.32
H istid ine11.5511.7812.0512.27
300 nm 390 nmh 2.0h 2.6
3.2 4.04.5 6.27.0 7.99.4 11.5
13.5 17290 nm 380 nm
1.1 1.31.5 1.72.5 2.63.35 3.85.3 5.68.1 8.1
390 nm1.31.63.63.9
“ ±10%. Solutions contained 10-3 M of the imidazole and were saturated with N20 . Dose ca. 500 rads/pulse.
[O H - ] " 1 / M ’ 1
Figure 2. P lo t o f ko0sd~ ' v s . [ O H - ] - 1 f o r h is t id in e a t 3 9 0 n m ( l in e 1),
2 - m e t h y l im id a z o le a t 2 9 0 (2 ) a n d 3 8 0 n m (3 ) , a n d im id a z o le a t 3 0 0 (4 ) , 3 9 0 (5 ) , a n d 2 6 0 n m (6 ) .
port of this are the following observations: (i) the polaro- graphic experiments described below, (ii) Samuni and Neta’s14 experiments using the in situ ESR radiolysis technique indicate that at pH >11 the reaction of OH with imidazole and 2-methylimidazole yields radicals such as I, where the unpaired electron is delocalized over the whole imidazolyl ring, (iii) No first-order decay was observed with1 - methylimidazole. In this case there is no ionizable hydrogen atom attached to Ni and a rearrangement reaction is not possible.
It seems unlikely that the deprotonation equilibrium involves the hydroxyl group rather than the >NH group since the rate-determining step would then involve either0 2- or OH“ elimination (e.g., via a cyclic four-centered transition state), both of which are likely to have large activation energies. There is evidence from in situ ESR radiolysis experiments14 that the hydroxyl group of the 2-hy- droxyimidazolyl-4,5-dicarboxylate radical ionizes with pK„ = 12. It is noteworthy, however, that this radical undergoes no detectable water elimination reaction.14
The Journal o f Physical Chemistry, Voi. 79, No. 17, 1975
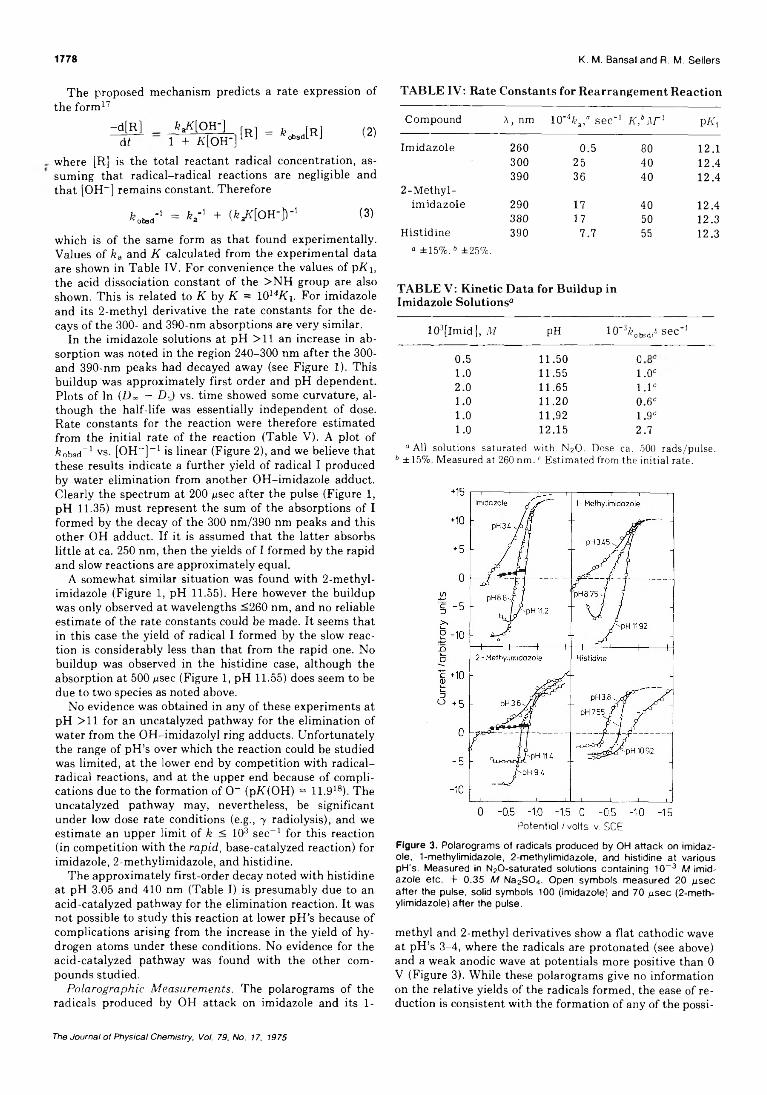
1778 K. M. Bansal and R. M. Seilers
The proposed mechanism predicts a rate expression of the form17
-d[R] d t
fe^ [O H -]1 + A[OH '] [ R ] = fecbsd[R ] (2)
where [R] is the total reactant radical concentration, assuming that radical-radical reactions are negligible and that [OH- ] remains constant. Therefore
w 1 - V 1 + (^ [O H -])- ' (3)
which is of the same form as that found experimentally. Values of ka and K calculated from the experimental data are shown in Table IV. For convenience the values of pKi, the acid dissociation constant of the >NH group are also shown. This is related to K by K = IQ14K\. For imidazole and its 2-methyl derivative the rate constants for the decays of the 300- and 390-nm absorptions are very similar.
In the imidazole solutions at pH >11 an increase in absorption was noted in the region 240-300 nm after the 300- and 390-nm peaks had decayed away (see Figure 1). This buildup was approximately first order and pH dependent. Plots of In (Do» — D-) vs. time showed some curvature, although the half-life was essentially independent of dose. Rate constants for the reaction were therefore estimated from the initial rate of the reaction (Table V). A plot of kobsd- 1 vs- [OH- ]-1 is linear (Figure 2), and we believe that these results indicate a further yield of radical I produced by water elimination from another OH-imidazole adduct. Clearly the spectrum at 200 /¿sec after the pulse (Figure 1, pH 11.35) must represent the sum of the absorptions of I formed by the decay of the 300 nm/390 nm peaks and this other OH adduct. If it is assumed that the latter absorbs little at ca. 250 nm, then the yields of I formed by the rapid and slow reactions are approximately equal.
A somewhat similar situation was found with 2-methyl- imidazole (Figure 1, pH 11.55). Here however the buildup was only observed at wavelengths <260 nm, and no reliable estimate of the rate constants could be made. It seems that in this case the yield of radical I formed by the slow reaction is considerably less than that from the rapid one. No buildup was observed in the histidine case, although the absorption at 500 /¿sec (Figure 1 , pH 11.55) does seem to be due to two species as noted above.
No evidence was obtained in any of these experiments at pH >11 for an uncatalyzed pathway for the elimination of water from the OH-imidazolyl ring adducts. Unfortunately the range of pH’s over which the reaction could be studied was limited, at the lower end by competition with radical- radical reactions, and at the upper end because of complications due to the formation of O- (pK(OH) = 11.918). The uncatalyzed pathway may, nevertheless, be significant under low dose rate conditions (e.g., y radiolysis), and we estimate an upper limit of k < 103 sec-1 for this reaction (in competition with the rapid, base-catalyzed reaction) for imidazole, 2-methylimidazole, and histidine.
The approximately first-order decay noted with histidine at pH 3.05 and 410 nm (Table I) is presumably due to an acid-catalyzed pathway for the elimination reaction. It was not possible to study this reaction at lower pH’s because of complications arising from the increase in the yield of hydrogen atoms under these conditions. No evidence for the acid-catalyzed pathway was found with the other compounds studied.
Pnlarographic Measurements. The polarograms of the radicals produced by OH attack on imidazole and its 1-
T A B L E I V : R ate C on stan ts for R earran gem en t R ea c tio n
Com pound X, nm 10"4&a,“ s e c '1 K ,b x r 1 PA',
Im id azo le 260 0.5 80 12.1300 25 40 12.4
2 -M eth y l-390 36 40 12.4
im id azo le 290 17 40 12.4380 17 50 12.3
H is tid in e 390 7.7 55 12.3“ ±15% .6 ±25%.
T A B L E V : K in etic D a ta for B u ild u p in Im id azo le S o lu tio n s“
103[lm id ], ¿V/ PH 10' 3 oted.6 s e c ’1
0.5 11.50 O CO
1 .0 11.55 1.0C2.0 11.65 l . l c1.0 11.20 0 .6C1.0 11.92 1.9C1.0 12.15 2.7
“ All solutions saturated with N2O. Dose ca. 500 rads/pulse. 6 ±15%. Measured at 260 nm. c Estimated from the initial rate.
Potential / volts v. SCEFigure 3. P o la r o g r a m s o f r a d ic a l s p r o d u c e d b y O H a t t a c k o n im id a z
o le , 1 - m e t h y l im id a z o le , 2 - m e t h y l im id a z o le , a n d h is t id in e a t v a r io u s p H 's . M e a s u r e d in N 20 - s a t u r a t e d s o lu t io n s c o n t a in i n g 1 0 - 3 M im id
a z o le e t c . + 0 . 3 5 M N a 2S 0 4 , O p e n s y m b o ls m e a s u r e d 2 0 /¿ s e c
a f t e r t h e p u ls e , s o l id s y m b o ls 1 0 0 ( im id a z o le ) a n d 7 0 /¿ s e c ( 2 - m e t h y l im id a z o le ) a f t e r t h e p u ls e .
methyl and 2-methyl derivatives show a flat cathodic wave at pH’s 3-4, where the radicals are protonated (see above) and a weak anodic wave at potentials more positive than 0 V (Figure 3). While these polarograms give no information on the relative yields of the radicals formed, the ease of reduction is consistent with the formation of any of the possi-
The Journal of Physical Chemistry, Voi. 79, No. 17, 1975

Pulse Radiolysis of Imidazoles 1779
Im id a z o le
- 0 .5 V
p H 8 .5
- 0 . 5 V
p H 11.2
1 - M e th y l im id a z o le
- 0 . 4 V
p H 8 .7 5
- 0 . 4 V
p H 11.92
2 - M e th y l im id a z o le
- 0 . 5 V
p H 9 .4
- 0 . 5 V
p H 11.8
* FJIiP*-
' ,1
H is t id in e
- 0 . 5 V
p H 10.92
- 0 . 5 V
p H 11.92
Figure 4. E f f e c t o f a lk a l i o n p o la r o g r a p h ic c u r r e n t v s . t im e c u r v e s . M e a s u r e d in N 20 - s a t u r a t e d s o lu t io n s c o n t a in in g 1 0 3 M im id a z o le
e t c . + 0 .3 5 M N a 2S 0 4 .
ble OH adducts. For the 2-hydroxy adduct the cathodic reaction is particularly favorable because of the positive charge on N3 (4). With the 4- and 5-hydroxy adducts the
unpaired electron is (3 to the hydroxyl group so that the reduction probably involves elimination of OH- and may be catalyzed by H+ as has been suggested19’20 to occur with other ¿¡-alcohol radicals (5). The reduction of the 5-hydroxy adduct may also be favorable because of the proximity of the >N+-H group (6). With histidine the oxidation wave, extends to —0.4 V.
In alkaline solutions (pH 7-10) where the radicals are unprotonated a steep anodic wave extending up to ca. —0.5 V, immediately followed by a somewhat flatter cathodic wave, was found (Figure 3). These polarograms correspond to the case of competitive oxidation and reduction of the radicals where the rates of the oxidation and reduction are comparable over a narrow potential range.20 21 The ease of oxidation is attributed to canonical contributions such as that of form III to structure II (7) (similar reactions can be
OH OH OH
II III +H+ (7)
written for the other adducts). A mechanism of this type has been proposed for the electrode oxidation of the OH adducts of furan and pyrrole.20
At higher pH’s (>11) the oscillograms for imidazole and 2-methylimidazole showed, at potentials of ca. —0.5 V, an oxidation at times shortly after the pulse, and reduction at longer times (see Figure 4; for comparison typical oscillograms at the same potentials but at less alkaline pH’s are shown). With histidine the oxidation current falls rapidly to zero, but no reduction signal was observed, and with 1 - methylimidazole the oscillograms were similar to those at lower pH’s. These changes of oxidation to reduction are due to the transformation of one radical to another with different electrochemical properties and have been observed in a number of other systems.5’22 No reliable kinetic data for these processes can be obtained from the polarographic measurements, but the timescale of the changes are of the same magnitude as the first-order reactions observed optically (see Table III). The latter has been interpreted in terms of a base-catalyzed water elimination reaction and the polarographic data are in accord with this. Radical IV produced in the rearrangement reaction is expected to be easily reduced (8) as was found (Figure 3).
IV
Acknowledgment. We thank Professor A. Henglein for many helpful discussions.
R e fe r e n c e s and N o te s
(1 ) R a d ia t io n R e s e a rc h L a b o ra to r ie s , C e n te r to r S p e c ia l S tu d ie s a n d D e p a r tm e n t o f C h e m is try , M e llo n In s t itu te o f S c ie n c e , C a rn e g ie -M e llo n U n iv e rs ity , P it ts b u rg h , P a. 1 5 2 1 3 .
(2 ) A d d re s s c o r re s p o n d e n c e to th is a u th o r a t th e M a te r ia ls D v is io n . C e n tra l E le c tr ic i ty G e n e ra tin g B o a rd , B e rk e le y N u c le a r L a b o ra to r ie s , B e rk e le y , G lo u c e s te r s h ir e G L 1 3 9 P B , E n g la n d .
(3 ) A . M . C re s t f le ld , W . H . S te in , a n d S . M o o re , J . Biol. Chem.. 2 3 8 , 2 4 1 3 , 2 4 2 1 (1 9 6 3 ).
(4 ) (a ) J . L . F o s te r a n d R. L . W ills o n , Brit. J. Radiol, 46, 2 3 4 (1 9 7 3 ); (b ) A .
The Journal of Physical Chemistry. Vol. 79. No. 17, 1975

1780 Ralph Klein and Richard D. Kelley
C . B e g g , P. W . S h e ld o n , a n d J . L . F o s te r , ibid., 4 7 , 3 9 9 (1 9 7 4 ) ; (c ) J . C . A s q u ith , J . L F o s te r , R . L . W ills o n , R . Ing s , a n d J . A . M c F a d z e a n , ibid., 4 7 , 4 7 4 ( 1 9 7 4 ) .
(5 ) K . M . B a n s a l a n d R . M . S e l le r s in “ F a s t P ro c e s s e s in R a d ia t io n C h e m is t r y a n d B io lo g y ” , G . E. A d a m s , E. M , F ie ld e n , a n d B . D . M ic h a e l, E d ., W i le y , L o n d o n , 1 9 7 5 , p 2 5 9 .
(6 ) A . H e n g le in , Allg. Prakt, Chem., 1 7 , 2 9 5 (1 9 6 6 ).(7 ) G . B e c k , D is s e r ta t io n , T .U . B e r lin , 1 9 6 8 .(8 ) A . H e n g le in , W . S c h n a b e l, a n d J . W e n d e n b u rg , "E in fü h ru n g in d ie
S tr a h le n c h e m ie ” , V e r la g C h e m ie , W e in h e im , W . G e rm a n y , 1 9 6 9 .(9 ) M . G rä tz e l, A . H e n g le in , J . L ilie , a n d M . S c h e f f le r , Ber. Bunsenges. Phys.
Chem., 7 6 , 6 7 (1 9 7 2 ) .(1 0 ) M . G rä tz e l a n d A . H e n g le in , Ber. Bunsenges. Phys. Chem., 7 7 , 2 (1 9 7 3 ) .(1 1 ) (a ) Chem. Soc. Spec. Pub!., No. 1 7 (1 9 6 4 ) ; (b ) ibid, N o . 2 5 (1 9 7 1 ).(1 2 ) B . C e rc e k a n d M . E b e r t , Trans Faraday Soc., 6 3 , 1 6 8 7 (1 9 6 7 ) .(1 3 ) E .g ., (a ) E. H a y o n , T . Ib a ta , N . N . L ic h t ln , a n d M . S im ic , J. Am. Chem.
Soc., 9 2 , 3 8 9 8 (1 9 7 0 ) ; 9 3 , 5 3 8 8 (1 9 7 1 ) ; (b ) M . S im ic , P. N e ta , a n d E. H a y o n , ibid., 9 2 , 4 7 6 3 (1 9 7 0 ) ; (c ) E. H a y o n a n d M . S im ic , ibid., 9 3 , 6 7 8 1 (1 9 7 1 ) .
(1 4 ) A . S a m u n i a n d P. N e ta , J. Phys. Chem., 7 7 , 1 6 2 9 (1 9 7 3 ).(1 5 ) P. S . R a o a n d E. H a y o n , Biochim. Biophys. Acta, 2 9 2 , 5 1 6 (1 9 7 3 ) .(1 6 ) M . S im ic a n d E . H a y o n , Biochem. Biophys. Res. Commun., 5 0 , 3 6 4
(1 9 7 3 ).(1 7 ) R . P. B e ll, " T h e P ro to n in C h e m is t ry ” , M e th u e n , L o n d o n , 1 9 5 9 , p 1 3 3 .(1 8 ) J . R a b a n i a n d M . S . M a th e s o n , J. Phys. Chem., 7 0 , 7 61 (1 9 6 6 ).(1 9 ) K . M . B a n s a l, A . H e n g le in , E. J a n a ta , a n d R . M . S e lle rs , Ber. Bunsenges.
Phys. Chem., 7 7 , 1 1 3 9 (1 9 7 3 ) .(2 0 ) K . M . B a n s a l, A . H e n g le in , a n d R . M . S e l le r s , Ber. Bunsenges. Phys.
Chem., 7 8 , 5 6 9 (1 9 7 4 ).(2 1 ) K . M . B a n s a l a n d A . H e n g le in , J. Phys. Chem., 7 8 , 1 6 0 (1 9 7 4 ).(2 2 ) K . M . B a n s a l, M . G rä tz e l, A . H e n g le in , a n d E. J a n a ta , J. Phys. Chem.,
7 7 , 1 3 ( 1 9 7 3 ) .
Combination and Disproportionation of Allylic Radicals at Low Temperatures
Ralph Klein* and Richard D. Kelley
Physical Chemistry Division, National Bureau of Standards, Washington, D.C. 20234 (Received November 1, 1974; Revised Manuscript Received May 12, 1975)
Publication costs assisted by the National Bureau of Standards
The disproportionation-combination ratio for several allylic type radicals has been measured in the condensed phase at 90 K. Pairs of allylic radicals react exclusively by combination, with no disproportionation found within the limits of the analytical technique. Cross combination and disproportionation occurs between an allylic radical and an alkyl radical. In the cross disproportionation, the allylic radical acts exclusively as a hydrogen donor. This effect is attributed to the delocalization of the free spin, the hydrogen acceptor function being completely inhibited. Because of this, two allylic type radicals (or any radicals in which the density of the free spin is sufficiently delocalized) can only combine. The contribution of the resonant components of the allylic radicals to the combination products is found to be greatly dependent on steric effects.
In tro d u ctio n
Reactions at low temperatures in a condensed phase are relatively simple because high activation energy paths are eliminated, while enthalpy developed in the reaction processes is efficiently dissipated. Advantage was taken of low temperature techniques to observe a series of alkyl radical cross disproportionation reactions.1 In an extension of that work we consider here allylic radicals to determine the effect of the resonance structure on their combination and disproportionation reactions and contrast them with non- resonant radicals in this regard.
A convenient method for preparation of radicals is the hydrogen atom addition to an appropriate olefin.2 The condensed olefin, either with or without a diluent such as propane, is present as a layer on the bottom of a flask immersed in a refrigerant such as liquid oxygen. Hydrogen atoms are produced by thermally dissociating molecular hydrogen on a heated tungsten filament. The atoms bombard the condensed layer and react with the olefin by addition to form radicals. These diffuse away from the surface, where they are formed, and undergo radical-radical reactions.3
To prepare allylic radicals, conjugated dienes are used. Thus, H atom addition to 1,3-butadiene gives the methylal-
lyl radical. Higher homologs may possess isomers of the cis and trans variety. These are useful for assessing rotation in the allylic radical by way of the diene-radical-product path. A substantial activation energy barrier for rotation exists, one estimate being 70 kJ/mol.4 Sustman and Trill,5 using a flow system and ESR spectroscopy, found a value of 34-42 kJ/mol for an allyl radical containing CN and isobutyl groups. Doering and Beasley6 gave 75 kJ/mol for the cis-trans isomerization of some hexatrienes via the allylic radical. Rotation of allylic radicals, as evidenced by a cis- trans isomerization, would not be expected to be observed in the low-temperature region. The preparation of the allylic radicals at low temperatures, as noted, is through hydrogen atom addition to a diene. The exothermicity of the process is approximately 209 kJ/mol and consideration must be given to the question of whether or not configuration is retained. We give here the results of several observations that are pertinent.
A further purpose of this paper is to determine some of the disproportionation-combination characteristics of allylic radical : particularly in the low temperature region. Nelsen and Bartlett7 first pointed out the striking difference between' cumyl radicals and ferf-butyl radicals in their disproportionation-combination reactions. Cumyl radicals combine to an extent of 94% at 20° whereas tert-
The Journal of Physical Chemistry, Vol. 79, No. 17, 1975

Combination a n d Disproportionation of Allylic Radicals 1781
butyl radicals combine to an extent of only 20%. Nelsen and Bartlett suggested that the anomolous behavior with regard to the low disproportionation rate may be associated with the benzylic delocalization of the free electron. They also noted, however, that a lowering of the combination rate might have also been expected on this basis and no prediction could have been made. Engel and Bishop8 reported that for the methylallyl radical, there was less than 2% disproportionation relative to combination. James and Kambanis9 found that the ratio of combination to disproportionation for the radical pair allyl and cyclohexadienyl is 91 to 9, confirming the propensity of allyl type radicals to favor combination. Al-Sader and Crawford10 showed that in the interaction of allyl radicals, 1,5-hexadiene is produced with only a trace of propene. Again, the major, if not exclusive, process is combination.
Previous work has shown that there is a temperature effect in the disproportionation-combination ratio15 for alkyl radicals,3 lower temperatures favoring disproportionation. For sec-propyl radicals, for example, k j k c = 0.6 at 300 K and k(i/kc = 5.5 at 90 K. Disproportionation for the allylic radicals would, by analogy, be enhanced at low temperatures, and it might be expected that disproportionation would be observed.
E x p e r im e n ta l S ec tio n
Experimental details of the low-temperature technique have been published previously.1 Following the reaction, the film is warmed and transferred to the inlet of a gas chromatograph. Analysis of the entire film, typically 0.5 X 10⁻³ mol, was accomplished by chromatographically separating the mixture into three fractions: (1 ) diluent; (2) reactant and disproportionation products; and (3) radical dimer products. A squalane column was used for the initial separation. A 10 m, 20%, 3,3'-oxydipropionitrile (saturated with AgN03) column was used at 25° for the analysis of the second fraction, while a 4-m version of this column was used at 35° for the third fraction. Standard samples were used wherever possible to verify that these procedures yield accurate quantitative results.
R e su lts
Ally lie-Ally lie Radical Reactions. H atom addition to1,3-butadiene at a concentration of 0.3% in propane at 90 K yields the methylallyl radical
It will be shown that the alternate reaction-I- H —*■ (2)
is negligible. If both disproportionation and combination reactions of these radicals occur, C4 and Cg compounds would be produced. A precise indication of the amount of disproportionation is available through the C4 analysis. Disproportionation of methylallyl would necessarily yield 1-butene or 2-butene. Neither of these compounds was detected in the reaction products following the H-atom addition to 1,3-butadiene. The product analysis from a typical experiment is given in Table I. The distribution of the Cg diene products (given in Table V) indicates that the only radical present in this system is methylally' and therefore that reaction 2 is not significant. Consideration of the absence of four carbon products and the equivalence of Cs diene with the depleted reactant requires us to conclude
T A B L E I: P rod u ct A n a ly s is from M eth y la lly l + M eth y la lly l a t 90 K
Product mol x 109
«-C< H101- c4h8 > <12- C4H8 )1,2-C4H6 <1A(1,3-C4H6)“ 160 ± 5%C8H14 156
a A(1,3-C,iH6) is the 1,3-butadiene depleted by reaction with H atoms. The quantity indicated represents approximately 10% conversion.
that greater than 99% of the reaction of methylallyl with methylallyl at 90 K is by way of combination.
In another example, the radical 1,3-dimethylallyl
was prepared by the H atom addition to as-1 ,3-pentadiene diluted to 0.3% with propane at 90 K. Disproportionation of these radicals would yield 1 - and 2-pentenes. These compounds were not detected in the products within the limits of the chromatographic technique. The quantity of C10 diene observed indicates that the Ci0 dimer to pentene ratio exceeds 100.
The disproportionation-combination reactions of alkyl radicals show steric effects for branched chain radicals markedly favoring disproportionation. The k j k v ratio for isobutyl at 90 K is approximately 500. Whether the effect of branching is applicable to allylic radicals was determined with
INot only is this radical branched, but there are seven “donor” hydrogens associated with each of the “free spin” carbons. These characteristics should be especially favorable to disproportionation. The preparation of I was by H atom addition to 2,4-dimethyl-l,3-pentadiene in a 0.1% solution in propane at 90 K. The reactions of the allylic radicals were followed by the formation of the Cu dimers and the diminution of the parent olefin. More than 99% of the reaction is combination. Table II summarizes the disproportionation-combination data for these allylic radicals. Included are related data for radicals derived from unconjugated dienes and a C5 olefin. The 4-penten-2-yl radical and the 2-pentyl radical were generated at 90 K in propane films by the H atom addition to 1,4-pentadiene and 1 -pentene, respectively.1 The disproportionation to combination ratio for 4-penten-2-yl is given by the product ratio, 1- C5HX0/C10H18 while that of 2-pentyl is given by n-CgHio/ CioH22- In both cases, these product ratios were found to be constant, within 5%, for a series of six runs with each radical. The difference between the allylic and these nonallylic radicals is striking. Clearly, a generalization may be adduced, that allylic—allylic radical reactions are exclusively combination, and that disproportionation does not occur.
Allylic-Alkyl Radical Reactions. The question arises as to whether or not the absence of disproportionation is characteristic of allylic radical reactions in general or only in those reactions where both radicals are allylic. The results
The Journal of Physical Chemistry. Voi. 79, No. 17, 1975

1782 Ralph Klein and Richard D. Kelley
T A B L E II: A u tod isp rop ortion a tion -C om b in ation R a tio s a t 90 K for S ev era l A lly lic and A lk y l R a d ica ls“
R ad ica l
<0.01<0.01
<0.01
7.6
6.4a The radicals are produced by the H atom addition to an ap
propriate olefin or diolefin highly diluted in propane. See text for experimental details of these measurements.
of James and Troughton11 show that disproportionation for an allylic radical occurs provided it reacts with an alkyl radical. The reaction between allyl and ethyl at 410 K showed 85% combination, and 15% disproportionation. 73% of the disproportionation involved allyl as the H atom acceptor and 27% as the donor radical. These experiments were done in the temperature range 137-175°. The preparation of ethyl and allyl radicals involved photolysis of a mixture of diethyl ketone and diallyl at 3130 Â. Conclusions with regard to disproportionation between ethyl and allyl depend on the assumption that propylene and aliéné arise exclusively from disproportionation of ethyl and allyl. The complexity of the generating system would dictate caution in this regard, however.
We have investigated the alkyl-allyl type radical-radical reaction of 2-butyl with 1,3-dimethylaIlyl. The reactions were at 90 K and the radicals were generated by exposure to gas phase atomic hydrogen of a condensed phase consisting of cis-1,3-pentadiene, cts-2-butene, and propane in a ratio of 10:1:3000. Hydrogen atom addition generates 1,3- dimethylallyl and 2-butyl. These react via biradical encounters. The 1,3-pentadiene is in considerable excess of the cis-2-butene so there will be an excess of 1,3-dimethy- lallyl over 2-butyl. Auto 2-butyl reactions are hence minimized. The experimental results are shown in Table III. Several significant conclusions may be drawn. The absence of 3,4-dimethylhexane shows that 2-butyl-2-butyl reactions are negligible. Thus, essentially all 2-butyl radicals react by cross disproportionating or cross combining with the dominant radical, 1,3-dimethylallyl. The cross disproportionation reactions possible are
C—C—C—C — - C = C —C—C + C—C = C —C—C — ► C = C —C ~ C + C = C —C—C—C
—* C—C=C—C + C—C=C—C—C—- c—c=c—c + c=c—c—c—c
c—c—c—c + c=c—c= =c—c(cis)
c—c—c—c + c=c—c=c—c(trans)
c—c—c—c + c—C = C = C —C
(3)
(4)(5)
(6)
(7)Previously it was noted that when 2-butene was formed from 2-butyl in reactions at 90 K where 2-butyl acted as a
T A B L E III: P rod u cts from th e R eaction of and a t 90 K a
P ro d u c t R e la tiv e y ield
w-C4H10 25i -c4h8 <0.5t - 2 -C 4H8 <0.5i ”1,3 ~C5H8 <0.12,3 -C 5H8 <0.13,4 -D im ethy lhexane <0.1
25
C 10 d iene 4,000a Film composition CaH^cis-l.S-CsHg :a's-2-C4H8 = 3000:10:1.
T A B L E IV : P rod u ct A n a ly s is from 1 ,3 -D im eth y la lly l + 2 -M eth y l-2 -b u ty l a t 90 K
P ro d u c t R e la tiv e y ield
2 -M ethylbutane 1.02 -M ethyl -1 -bu tene <0.01i l -P e n ta n e ]1 -P en ten e > <0 .022 -P en ten e^c 10h 20 1.7C iqR i 8 250
hydrogen donor, the 2-butene was 98% trans.3 The advantage of using cis-2-butene as the 2-butyl source is that products are distinguishable from reactants. For the reaction between 1,3-dimethylallyl and 2-butyl, the ratio n- C4HI0/(1-C4H8 + trans-2-C4H8) is greater than 25. The ratio n-butane/4,5-dimethyl-2-heptene, a measure of feaa/- k c where the k ’s refer to the cross radical process, is equal to 1 ± 0.2. Where butene is formed in the cross disproportionation, equal amounts of 2-pentene (reactions 3 and 4) must be produced. The ratio of n-butane/2-pentene = 100. The small amount of C4 monoolefin products found were extraneous to the cross disproportionation reaction and probably arose from a small amount of 2-butyl + 2-butyl reaction.
In a similar manner we investigated the cross-disproportionation of 2-methyl-2-butyl with 1,3-dimethylallyl (in great excess). The reaction products from one run are indicated in Table IV. The reaction produced 2-methylbutane (from the reaction analogous to (5)). However, 2-methyl-l- butene, 2-pentene, and 1-pentene (from reactions analogous to (3) and (4)) were not detected. Thus, the 1,3-dimethylallyl radical reacts by cross disproportionation in the same way with both of these alkyl radicals. The outstanding feature, and the point to be emphasized, is that in the cross disproportionation reaction of the allylic radical, the radical acts only as a hydrogen donor. Because allylic type radicals cannot function as hydrogen acceptors, in al- lylic—allylic radical reactions only combination is possible.
Rotation about a C—C bond in an allylic radical moiety presents a 40 to 80 kJ/mol activation barrier. Rotation at low temperatures, for example 90 K, would not be expected. However, in a sequential reaction series, where the initial preparative step is highly exothermic, uncertainty exists as to the retention of configuration. Information in this
The Journal o f Physical Chemistry, Voi. 79, No. 17, 1975

Combination and Disproportionation of Allylic Radicals 1783
T A B L E V: C om bination P ro d u cts o f M eth y la lly l R a d ica ls a t 90 K
% total dimer
Product 90 K" 398 K6
Meso 8.4 ± 0.15 M )Rac 7.5 ± 0.16 M. j'
Trans 43.5 ± 0.53 28.71Cis <0.1 18.4 j
Trans, trans 40.5 ± 0.63 12.2 jCis, trans 0.22 ± 0.03 17.5 >
Cis, cis <0.1 6.1 )° Source of the methylallyl radicals is the H atom addition to 1,3-C4H8 (0.3% in propane a t 90 K). The uncertainty is one a for 14 deter
minations in which the conversion was varied by more than 10-fold. The gc analysis was accomplished with a 4-m 20% 3,3'-oxydipropio- nitrile (saturated with AgNOa) column. * R. J. Crawford, J. Hamelin, and B. Strehlke, J A m . Chem . Soc., 93, 3810 (1971).
regard can be obtained from the data in Table 111 in which the products of the H atom addition to cis- 1,3-pentadiene (in large excess) and cis-2-butene are given. In the cross disproportionation of 1,3-dimethylallyl with 2-butyl, 1,3- dimethylallyl acts exclusively as the hydrogen donor, and the 1,3-pentadiene is re-formed. Rotation in the allylic radical would result in the formation of trans- 1,3-pentadiene. In the experiments where the 1,3-dimethylallyl radical was in excess, butane formation indicated that a cross disproportionation reaction had occurred, but no trace of trans-1.3- pentadiene was found. The sensitivity of the analysis was such that 1 part of irons-1,3-pentadiene out of 250 parts of n- butane would have been detected. Clearly, the exothermic heat of H atom addition to the 1 position of cis-1.3- pentadiene is dissipated to the condensed phase sufficiently rapidly that the energy equivalent to the rotation barrier is not accumulated at the 3 position.
The cross combination of 2-propyl with the methylallyl radical is interesting because there is a secondary as well as a primary carbon in the methylallyl radical capable of combination with the free spin carbon of the 2-propyl radical:
mers to be HH-16, HT-30, and TT-54. The TT dimer, showing the least steric hindrance for the approach of the two carbon atoms to be bonded, is highly favored.
D iscu ss io n
The unusual features of reactions of allylic radicals is that, in the reaction of an allylic radical pair, combination is essentially quantitative. Disproportionation can occur between an allylic radical and alkyl radical, but the former functions only as a hydrogen donor. The fact that the allylic radical is not a hydrogen acceptor implies that an allylic- allylic radical interaction can only be of the combination type. James and Suart,14 in studies of disproportionation reactions of the cyclohexadienyl radical and methyl, ethyl, 2-propyl, and isobutyl radicals, noted that the cyclohexadienyl radical did not accept a hydrogen atom. The explanation proposed by them was based on energetic grounds. If the cyclohexadienyl radical acted as a hydrogen acceptor, in which case cyclohexadiene either in the 1,3 or 1,4 configuration is formed, a considerable fraction of the stabilization energy of 104 kJ/mol would be lost compared to the
A BThe radicals were prepared by exposing an equimolar mixture of propene and 1,3-butadiene in propane (olefin concentration 1%) at 90 K to H atoms in the gas phase. The reaction products, 3,4-dimethyl-1-pentene and 5-methyl- 2-hexene (B + 2-propyl), were measured in several runs in which the conversion of the reactants varied considerably. The ratio 5-methyl-2-hexene to 3,4-dimethyl-l-pentene was found to be 4 and constant for conversions up to 10%. Favoring of B in the cross combination with sec-propyl over that of A by a factor of 4 may be explained on the basis of steric hindrance. Engel and Bishop8 considered an analogous problem involving the autocombination of un- symmetrical allylic radicals. They noted that neither relative spin densities nor product stabilities were determining factors for the combination distribution. Steric effects seemed to be the most likely explanation for their results on the combination of 1,1-dimethylallyl radicals. With the tertiary carbon of the 1,1-dimethylallyl radical designated as the H (head) end and the terminal allylic carbon as the T (tail) end, Engel and Bishop found the distribution of di
—* (10)
situation where cyclohexadienyl is the hydrogen donor and benzene results. Since, as we have shown, allylic radicals also react in this manner, i.e., they function exclusively as the donor radical in cross disproportionation reactions with alkyl radicals, the resonance energy suggestion is not convincing. The enthalpy change in the cross-disproportionation reactions 8-10 of the 1,3-dimethylallyl and the 2-butyl radicals are (AHg)298K = —230 kJ/mol; (AH9)298K = —243 kJ/mol, (Ai/io)298K = —251 kJ/mol.16 Our observation is that reaction 10 predominates while reactions 8 and 9 occur, if at all, to a negligible extent. It is unlikely that the course of these highly exothermic reactions would be deter-
The Journal o f Physical Chemistry, VoI. 79, No. 17, 1975

17 8 4 Ralph Klein and Richard D. Kelley
mined by differences of a few percent in the total enthalpy change. In fact, the autodisproportionation reaction of the 2-butyl radical producing I-C4H8 and n-C4Hio [AH298K = -229 kJ/mol] is favored over that producing i-2-C4Hi0 [AH298K = —280 kJ/mol], If the overall exothermicity were controlling, the opposite result would be found.
Disproportionation of two alkyl radicals is characterized by a near zero activation energy and hence is mechanistically unrelated to hydrogen abstraction reactions where a 25 to 40 kJ/mol activation energy is usual. The “head to tail” transition complex has been widely accepted as a basis for consideration of the disproportionation reaction. The transfer of hydrogen in a disproportionation reaction is concerted. The p electron of the free radical carbon interacts with the C-H a bond, the acceptor radical changing from sp2 to sp3 hybridization. The donor radical simultaneously develops the ir bond characteristic of the olefin. Al- lylic radicals, as we have shown, do not disproportionate with other allylic radicals, and when disproportionating with alkyl radicals, function exclusively as hydrogen donors. Their activity as hydrogen acceptors is absent. It is suggested that this characteristic is attributable to the electron delocalization in the allylic radical. The free electron has a probability of % of being associated with an end carbon of the allylic radical grouping. This contrasts with a probability of 1 for the appropriate alkyl radical carbon. The smaller effective charge density on the carbon available as a potential acceptor in allylic type radicals inhibits the interaction with the u C-H bond of the counterradical so that allylic type radicals (or resonance type radicals in general where the free electron density is reduced) no longer function as H atom acceptors in disproportionation. The donor effectiveness of the allylic radical is unaffected by these considerations.
Table VI shows the disproportionation-combination ratio of 2-butyl with dimethylallyl and of 2-methyl-2-butyl with dimethylallyl, though they differ by a factor of 2, are nevertheless both considerably lower than that of alkyl- alkyl radical ratios. The lowest k j k c ratio found for alkyl radicals under cryogenic conditions is that of 2-propyl-2- propyl with a value of 5.5. The value for 2-butyl + 2-butyl is 9.5 and for 2-methyl-2-butyl + 2-methyl-2-butyl is 1500. The cross reactions of allylic radicals with alkyl radicals favor combination relative to alkyl with alkyl reactions. This is true even considering the absence of H atom transfer to the allylic radical which would account for only a factor of about 2. The notably low value of the k j k c ratio for cross allylic-alkyl radical reactions could be accounted for by assuming that the H atom transfer to the alkyl radical is inhibited. The rationale for such an assumption is not evident. It is more likely that the combination reaction is favored with respect to H atom transfer to the alkyl radical because the delocalization of the free electron in the allylic radical furnishes two reactive centers for combination.
Data for the k j k c ratio for several pertinent radical pairs may be seen in Table II. The absence of disproportionation between allylic radicals, and the favoring of combination in cross reactions between allylic and alkyl radicals, has been noted. The autodisproportionation-combination of 4-pentene-2-yl, with k j k c = 7.6, shows clearly that the presence of a simple olefinic bond in the radical has no effect on the k j k c ratio, the value of 7.6 being “normal” for alkyl radicals. The values of 9.5, 35, and 1500 for
T A B L E VI: D isp rop ortion a tion -C om b in ation R a tio s“
R eactio n k jkc
CI
CÇCC +
c c c c +
cIc c c c
CioHjo
CCCC +
1.7 ± 0.2
— *• C 9H 18 1.0 ± 0 .2“ In the condensed phase at 90 K. The k A/k 0 values are derived
from the data given on Tables III and IV.
the pairs (2-butyl, 2-butyl), (2-butyl, 2-methyl-2-butyl), and (2-methyl-2-butyl, 2-methyl-2-butyl) show clearly that there is no simple relationship among the k j k c ratios (for example, that the cross reaction ratio is the geometric mean between the two autoreaction ratios). In the three pairs (dimethylallyl, dimethylallyl), (dimethylallyl, 2- butyl), and (2-butyl, 2-butyl), the k j k c ratios are '-0, 1, and 9.5, respectively.
S u m m a ry
Allylic radicals are found to react in a remarkably different manner than alkyl radicals. Low temperature reactions of pairs of allylic radicals occur by combination, with no disproportionation observed. In contrast, alkyl radicals react predominantly by disproportionation. However, cross disproportionation as well as combination with alkyl radicals can occur. In the cross disproportionation between an allyl and an alkyl radical, the allylic radical acts exclusively as a hydrogen donor. This effect is attributed to the inhibition of the hydrogen acceptor function by the delocalization of the free spin. Because of this, two allylic type radicals (or any radicals in which the density of the free spin is sufficiently delocalized) can only combine. The contribution of the resonant components of the allylic radicals to the combination products is greatly dependent on steric effects.
R e fe r e n c e s and N o te s
(1 ) R . D . K e l le y a n d R . K le in , J. Phys. Chem., 7 8 , 1 5 8 6 (1 9 7 4 ).(2 ) R. K le in a n d M . D . S c h e e r , J. Phys. Chem., 6 2 , 1 0 1 1 (1 9 5 8 ).(3 ) R . K le in , M . D . S c h e e r , a n d R . D . K e lle y , J. Phys. Chem., 6 8 , 5 9 8
(1 9 6 4 ) .(4 ) D . M . G o ld e n , Int J. Chem. Kinet., 1 , 1 2 7 (1 9 6 9 ) .(5 ) R . S u s tm a n a n d H. T r ill, J. Am. Chem. Soc., 9 6 , 4 3 4 3 (1 9 7 4 ).(6 ) W . v o n E. D o e r in g a n d G . H. B e a s le y , Tetrahedron, 2 9 , 2 2 3 1 (1 9 7 3 ) .(7 ) S . F . N e ls o n a n d P. D . B a r t le t t , J. Am. Chem. Soc., 8 8 , 1 3 7 (1 9 6 6 ) .(8 ) P. S . E n g e l a n d D . J . B is h o p , J. Am. Chem. Soc., 9 4 , 2 1 4 8 (1 9 7 2 ).(9 ) D . G . L . J a m e s a n d S . M . K a m b a n is , Trans. Faraday Soc., 6 6 , 2 0 8 1
(1 9 6 9 ) .(1 0 ) B . H . A l-S a d e r a n d R . J . C ra w fo rd , Can. J. Chem., 4 8 , 2 7 4 5 (1 9 7 0 ).(1 1 ) D . G . L . J a m e s a n d G . E. T ro u g h to n , Trans. Faraday Soc., 6 2 , 1 4 5
(1 9 6 6 ) .(1 2 ) R . J . C ra w fo rd , J . H a m e lin , a n d B . S tre h lk e , J. Am. Chem. Soc., 9 3 ,
3 8 1 0 ( 1 9 7 1 ) .(1 3 ) J . C . A s to n , G . S z a s y , H . W . W o o le y , a n d F . G . B r ic k w e d d e , J. Chem.
Phys., 1 4 , 6 7 (1 9 4 6 ).(1 4 ) D . G . L . J a m e s a n d R . D . S u a rt , Trans. Faraday Soc., 6 4 , 2 7 3 5 (1 9 6 8 ).(1 5 ) T h e ra t io ka/kc is d e f in e d a s th e ra t io o f th e s u m o f th e ra te c o n s ta n ts
o f th e p o s s ib le d is p ro p o r t io n a t io n re a c t io n s to t h a t o f th e p o s s ib le c o m b in a t io n re a c t io n s .
(1 6 ) A lth o u g h A H g 0K w ill d if fe r f r o m A H 29sk . th e la t te r v a lu e s n e v e r th e le s s g iv e a v a lid in d ic a t io n o f th e re la t iv e o rd e r in g fo r th e th r e e re a c t io n s .
The Journal of Physical Chemistry, Vol. 79, No. 17, 1975

Reaction of Ammonia and Sulfur Dioxide 1785
Thermodynamics of the Reaction of Ammonia and Sulfur Dioxide in the Presence of Water Vapor1
Ronald Landreth, Rosa G. de Pena, and Julian Heicklen*
Departments of Chemistry and Meteorology and Center for Air Environment Studies, The Pennsylvania State University, University Park, Pennsylvania 16802 (Received August 22, 1974; Revised Manuscript Received May 27, 1975)
Publication costs assisted by the Environmental Protection Agency
The reaction of NH3, S02, and H20 vapor to produce particulate matter was examined at 14, 24, 35, and 44°. At the three highest temperatures a white solid is produced consisting of two NH3 molecules, one S02 molecule, and one H20 molecule. Infrared studies have shown the solid to be (NH4)2S03. Thus the reaction is 2NH3(g) + S02(g) + H20(g) (NH4)2S03(s). The enthalpy and entropy of the reaction are -53 kcal/mol and -113 cal/(mol deg), respectively. There is about ±20% uncertainty in both values, so that the data are consistent with the enthalpy of -60.9 kcal/mol for the normal solid form of (NH4)2S03. A* 14°, there is less H20 in the solid, and presumably some (NH4)2S20s is produced.
In tro d u ctio n
Due to the presence of ammonium sulfate in the atmosphere and the strong desire to determine how it is formed,2 the reaction of ammonia, sulfur dioxide, and water vapor is of importance. The reaction of S02 and NH3 under anhydrous conditions has been reported previousl y _2a,3,4 rphg history of the water reaction is closely related to that of the anhydrous reaction and was reviewed by Scott et al.2a Friend et al.5 could not produce particles in a similar experiment but their gas pressures were much smaller than used in the other investigations.
Neither the chemical structures nor the thermodynamics of the adducts are precisely known. McLaren et al.4 have reported a AH of reaction of —34 kcal/mol for the reaction of S02 and NH3 in wet nitrogen and —45 kcal/mol in 0 2. No temperature ranges for the experiments were stated. Scargill6 identified two products from the NH3-S 02-H20 reaction as (NH4)2S03 and (NH4)2S20 5 using chemical analysis and infrared spectroscopy. The dissociation constants of both compounds were measured by a transpiration method from 273 to 298°K. The values found for AS and AH for the two sublimations were 152.2 cal/(mol deg) and 64.8 kcal/mol, respectively, for (NH4)2S03 and 191.7 cal/(mol deg) and 81.0 kcal/mol, respectively, for (NH4)2S20 5.
In this paper, we have examined the reactions from 14 to 44° between S02, NH3, and H20 vapor in N2. The stoichiometry and thermodynamic functions are reported.
E x p er im en ta l S ec tio n
The reaction was carried out :n a 2.9-1. cylindrical cell 149 cm long and 5 cm in diameter. The cell was capped at each end by a quartz window. Along the length of the interior of the cell was a narrow tube with holes every 10 cm through which the gases entered no allow thorough mixing. Temperature regulation was made with a constant-temperature water bath surrounding the cell.
During the experiments S02 absorption at 3340 Â was monitored photometrically. The 3340-Â radiation was from
* To whom correspondence should be addressed at the D epartm ent of Chemistry, The Pennsylvania State University.
a Hanovia Utility 30620 Hg lamp which had been passed through a Jarrell-Ash 82-410 monochromator set at 3340 A. The light beam was split and half of it passed through the reaction vessel to a RCA 935 phototube; the other half impinged directly on a second RCA 935 phototube. When the reaction vessel was empty, the signals from the two beams were balanced by a Wheatstone bridge. Thus with S02 in the cell the difference in beam signals was a direct measure of the S02 pressure.
The S02 and NH3 gases were from the Matheson Co. and the N2 gas was from Phillip and Sons Inc. Before use, the N2 was passed through a trap packed with glass wool at —196° to remove water and impurities. Both S02 and NH3 were twice purified by distillation from —98 to —196°. Sometimes further distillation was performed from —98 to —130°. Distilled water was used after being degassed at various temperatures from —10 to —196°. The gases were handled in a mercury and grease-free vacuum line containing Teflon stopcocks with Viton “O” rings. The vacuum line could be evacuated to less than 1 X 10~4 Torr.
The gases were introduced into the cell and the experiments performed as follows. Water was the first gas introduced and was allowed to stand for 5 min to obtain a constant-pressure reading. A known prepared mixture of S02, NH3, and N2 (the pressures of S02 and NH3 were below the point at which they react in the absence of H20 3) was added in increments to the water in the cell. All gas pressures were read on a calibrated National Research Corp. 820 alphatron vacuum guage.
After each incremental addition of the S02-NH3-N 2 mixture, the S02 absorption increased and then remained constant if particles were not produced. Ultimately the reactant pressures became sufficiently high so that particles were produced and the S02 absorption decreased slowly over a period of a few minutes after the sharp increase accompanying the incremental addition. This peak was taken as the nucleation pressure. Then the contents of the cell were expanded by 4.5% into a small evacuated volume connected by a stopcock to the reaction vessel. If the particles sublimed to restore the S02 pressure, then the expansion was repeated until the S02 pressure coulc not be restored. At this point all of the solid had just sublimed, and the NH3 and H20 pressures could be computed from their
The Journal o f Physical Chemistry, Vol. 79 No. 17, 1975

1786 Landreth, de Pena, and Heicklen
initial pressures and the expansion factor. These pressures were taken as the equilibrium vapor pressures.
When N2 was used as a diluent, the ratio of its pressure to that of SO2 varied from 77 to 292 and to that of NH3 from 81 to 146. Reactions without nitrogen were done in a similar manner as above except that water was not necessarily added first. The order of addition of the reactants did not affect the results.
ResultsWhen S02, NH3, and H2O gases were mixed, a white
solid was produced instantly if the gas pressures were sufficiently high. The reaction was reversible and when the gas pressures were reduced, the solid sublimed back to its gaseous reactants. When N2 was used as a diluent there was a slight delay and a noticeable slowing of the reaction.
Gas pressures could be measured to within 7-10% accuracy. To be sure that the reaction was not affected by the monitoring light, runs were done with the light off using it only to make a measurement. The results were the same as with continuous monitoring.
The pressures of SO2 and H2O in equilibrium with the solid at 24° are shown graphically in log-log plots in Figure 1 for three mixture ratios of [S02]/[NH3], The plots are linear, and as the ratio is lowered, the lines lie successively lower. The results in N2 are the same as without it. All the plots of SO2 pressure vs. H2O pressures are linear and can be fitted with a line of slope
The equilibrium pressures of SO2 and H2O at 14, 24, 35, and 44° are shown graphically in log-log plots in Figure 2 for a 1:1 ratio of [S02]/[NH3], As the temperature is lowered, so are the points on the plot. At the three higher temperatures, the points can be fitted to a line of slope — However, at 14° the plot cannot be fitted to a line of slope —% but is best fitted by a line of slope —
The supersaturation ratio needed for particle nucleation (i.e., the absorbance of SO2 needed to form particles divided by the absorbance of SO2 at equilibrium) was obtained in each experiment. A plot of this ratio vs. H2O pressure in any series showed considerable scatter. For some of the series there was no trend in the data. For other series, there may have been a slight downward trend as the H2O vapor pressure was raised. However the scatter was sufficiently large so that this trend may not have been meaningful. The average values for the six series of runs are tabulated in Table I. There is considerable scatter, but no obvious trend in the data. The average value for the six series is 1.50 ± 0.10.
DiscussionThe heterogeneous equilibrium under study is
xNH3(g) + S02(g) + yH20(g) ^ (NH3)*S02(H20)y (1)The equilibrium expression is
K = 1 /[NH3]x [S02] [H20]y (2)
where K is the equilibrium constant at a given temperature. Equation 2 can be rearranged to give
log [S02] = -x log [NH3] - y log [H20] - log K (3)
If [H20] is held constant, a log-log plot of [S02] vs. [NH3] will give a plot of slope —x. Such a plot is shown in Figure 3 for [H20] = 1 Torr. The [S02] values were taken from Figure 1, and [NH3] was computed from the known value of
SYMBOL [ s o j / [ n h J n 2
A 2 .62 PRESENT
O 1.0 0 PRESENT
□ 0 .3 3 3 PRESENT
• 1.0 0 ABSENT
1.0-
0.1 -
0.01_______ ,____ ,___1 .................................... 1 ................................... 10.01 0.1 1.0 10.0
[ h , o ] , t o r r
Figure 1. log-log plots of the vapor pressures of S 0 2 vs. the final H20 pressure in equilibrium with the solid at 2.62:1, 1:1, and 1:3 mixtures of S 0 2 and NH3 at 24°. * 4
; SYMBOL TEMP, °C n 2
❖ 14 PRESENTO 24 PRESENT
- • 24 ABSENTA 35 PRESENTD 4 4 PRESENT
[ h 20 ] , TORR
Figure 2. log-log plots of the vapor pressures of S 0 2 vs. the final H20 pressure in equilibrium with the solid at 14, 24, 35, and 44°. A 1:1 ratio of [ S 0 2] to [NH3] was used in all reactions.
the [S02]/[NH3] ratio. The plot is linear with a slope of —2; thus x = 2.
Now if we consider those series of runs with [S02]/[NH3] = 1 .00, then eq 2 can be rearranged to
loe [sod - T h t ï ^ Ü ï t l i t i O l (4)
The log-log plots of [S02] vs. [H20] shown in Figure 2 have slopes -% at 24, 35, and 44° and at 14°. Thus y - 1 at
The Journal of Physical Chemistry, Voi. 79, No. 17, 1975

Reaction of Ammonia and Sulfur Dioxide 1 7 8 7
TABLE I: A v era g e V a lu es o f the S u p er sa tu ra tio n R atios N eed ed for N u cléa tion
T A B L E II: E q u ilib rium C on stan ts for the R eaction2NH3(g) + SOz(g) + H20(g) ±± (NH3)2S 0 2-H20(s)a
[ s o 21 / [ n h 3 ] T e m p , ° C S u p e r s a t n r a t i o T e m p , ° C K, T o r r " 4 1 0 " 1 2 Ä , a t m " 4
1 . 0 0 1 4 1 . 5 1 2 4 ± 1 4 6 0 1 5 4
2 . 6 2 2 4 1 . 3 9 3 5 ± 1 2 5 . 5 8 . 5 1
1 . 0 0 2 4 1 . 6 2 4 4 ± 1 1 . 5 4 0 . 5 1
0 . 3 3 2 4 1 . 6 3 a I n K ( a t m - 4 ) = A S/R - A H /R T ; AS = — 1 1 3 c a l / ( m o l d e g ) ;
1 . 0 0 3 5 1 . 3 3 AH = - 5 3 k c a l / m o l .
1 . 0 0 4 4 1 . 5 4
A v 1 . 5 0 ± 0 . 1 0
Figure 3. log-log plot of [ S 0 2] vs. [NH3] in equilibrium with 1 Torr of H20 and the solid at 24°.
the three highest temperatures and lk at the lowest temperature.
The formula of the solid at 24° and above is (NH3)2S02- H20. Prom the intercepts of the plots in Figure 2, the equilibrium constants can be evaluated, and they are listed in Table II.
The equilibrium constants in Table II are plotted on the van’t Hoff plot, Figure 4, since
lnff(atm_4) = A S/R — AH/RT (5)A straight line can be drawn reasonably through the points. The slope gives AH = -53 kcal/mol and the intercept gives AS = -113 cal/(mol deg), both with an uncertainty of about ±20%. Our value of AH is considerably lower than the value of —34 kcal/mol reported by McLaren et al.,4 and our thermodynamic functions are somewhat higher than those of Scargill.6 Also shown in Figure 4 is the plot based on Scargill’s thermodynamic functions. It can be seen that, in spite of the differences in thermodynamic functions, which are quite inaccurate because of the small temperature ranges involved, the equilibrium constants from the two studies are in excellent agreement.
Infrared measurements in our laboratory have shown that the solid (NH3)2S02-H20 is (NH4)2S03.7 The enthalpy of formation of this compound is known to be —211.6 kcal/ mol.8 For the gases the enthalpies of formation, AH°29s (kcal/mol), are:9 NH3, -10.970; H20, -57.798; S02, -70.947. Thus the enthalpy for the reaction
2 N H 3 ( g ) + S 0 2( g ) + H 20 ( g ) ( N H 4 ) 2S 0 3 ( s )
is —60.9 kcal/mol, a value intermediate to those found here
Figure 4. Semilog plot of the equilibrium constant K vs. the reciprocal temperature for the reaction 2NH3(g) + S 0 2(g) + H20(g) <= (NH3)2S 0 2-H20(s).
0.3 r
0.1 -r (NH4)2 SC^dhis Work, Extrapoloted)
(NH4)2 S205 (Scargill) ❖
/■ '(NH4)2SC>3 (Scorgil
0.01 0.10 5.0Ih2o I, torr
Figure 5. Comparison of 14° data for a 1:1 mixture of S 0 2 and NH3 with the equilibrium vapor pressure curves expected for (NH4)2S 0 3 and (NH4)2S 20 5 from Scargill6 and for (NH4)2S 0 3 extrapolated from the higher temperature data of this study.
and those found by Scargill,6 but within the uncertainty limits of both measurements.
The formula for the solid at 14° is not established. The data are replotted in Figure 5 along with the expected lines
The Journal of Physical Chemistry, Vol. 79, No. 17, 1975

1788 Nakashima, Kume, and Mataga
for (NH4)2S03 and (NH4)2S2C)5 from Scarf ill’s results and the extrapolated plot from our higher temp nature data for (NH4)2S03. The solid formed should correspond to that with the lowest equilibrium vapor press are. The data, though badly scattered, can conform to eitl er our extrapolated plot for (NH4)2S03 or Scargill’s plot ior (NH4)2S205. Probably both compounds are present and this may account for the scatter. Scargill’s plot for (N.!r.4)2S03 appears to lie too low to be consistent with the data
Acknowledgment. The authors wish to thank Drs. K. Olszyna and L. Stockburger for their assistance. This work
was supported by the Environmental Protection Agency through Grant No. 800874, for which we are grateful.
References and Notes(1 ) C A E S R e p o r t N o . 3 6 9 -7 4 .(2 ) (a ) W . D . S c o t t , D . L a m b , a n d D . D u ffy , J. Atmos. Sei.. 26, 7 2 7 (1 9 6 9 ); (b )
C . S . K a in g , D . S ta u ffe r , a n d V . A . M o h n e n , Nature (London), Phys. Sei., 244, 5 3 (1 9 7 3 ).
(3 ) R . L a n d re th , R . G. d e P e n a , a n d J . H e ic k le n , J. Phys. Chem., 7 8 , 1 3 7 8 (1 9 7 4 ).
(4 ) E. M c L a re n , A . J . Y e n c h a , J . M . K u s h n ir , a n d V . K . M o h n e n , Tellus, 2 6 , 1 (1 9 7 4 ) .
(5 ) J . P. F r ie n d , R. L e ite r , a n d M . T r ic h o n , J. Atmos. Sei., 3 0 , 4 6 5 (1 9 7 3 ).(6 ) D . S c a rg ii l, J. Chem. Soc. A, 2 4 6 1 (1 9 7 1 ).(7 ) I. C . H is a ts u n e a n d J . H e ic k le n , u n p u b lis h e d re s u lts , 1 9 7 4 .(8 ) Nat. B u r . Stand. (U.S.), Tech. Note, No. 2 7 0 -3 (1 9 6 8 ) .(9 ) " J A N A F T h e rm o c h e m ic a l T a b le s ” , D o w C h e m ic a l C o ., M id la n d , M ic h .,
1 9 6 6 .
Electronic Excitation Transfer h stween the Same Kind of Excited Molecules in Rigid Solvents under High-Density Excitation with Lasers
Nobuaki Nakashima, Yuji t ime, and Noboru Malaga*
Department of Chemistry, Faculty cf Engineering Science, Osaka University, Toyonaka, Osaka, Japan (Received November 1, 1974; Revh ed Manuscript Received June 3, 1975)
By means of high-density axcitation with a Q-switched ruby laser, the electronic excitation transfer between excited pyrenes in tl e fluorescent state (S4 + Si —1► So + Sn) and that between excited perdeuterio- phenanthrenes in the phos ahorescent state (T4 + T4 -*■ So + Tn) in rigid solvents at 77°K have been observed by directly measuring the luminescence decay curves. Comparing the theoretical decay functions derived in the present worl- with the experimental ones, it has been proved that the excitation transfers in these systems are due to Forster’s dipole-dipole coupling mechanism.
In tro d u ctio n
Bimolecular quenching of fluorescence due to the interaction between excited aromatic molecules was first found by Tolstoi and Abramov1 as well as by Be-groan et al.2 It has been confirmed by many other inve i ligations3-6 following the above ones that this phenomenon is occurring in general under high-density excitation.
This bimolecular quenching seems to consist of the following two processes: (1) mutual approach of excited molecules to a distance where they can interact vith each other; (2) an actual quenching process due to the interaction between the excited molecules. However, in nany cases, including the excited molecules in solution and excitons in crystals, the actual quenching process is masked by the rapid “bimolecular collision”. The bimobcular collision process has been confirmed for many cases, and its rate constant has been determined. Such a stud / has proved to be a powerful mean especially for the investigation on the diffusion of excitons in crystals.4
As for the mechanisms of the actual quenching process, Abramov1 has insisted that the overlapping between the Sn *— Si absorption and Si —* So fluorescence bands is essential for the quenching process to occur. Babenco et al.5 as well as Kobayashi and Nagakura6 have also insisted that
the quenching occurs owing to the electronic excitation transfer between the excited states due to the Forster mechanism.7 However, there has been no direct experimental proof for that so far as we know.
In order to elucidate the mechanism of this bimolecular interaction, we have derived decay functions of excited states for the systems fixed in rigid solvents assuming the excitation transfer between excited states due to Forster’s very weak interaction mechanism of the dipole-dipole coupling7 and have compared them with observed decay curves of excited molecules fixed in rigid organic solvents at 77°K under high-density excitation with a Q-switched ruby laser. We have proved that the mechanism of the bimolecular quenching in these excited molecules is Forster’s dipole- dipole coupling.
E x p er im en ta l P ro ced u re
The second harmonic of a Q-switched ruby laser was used for exciting the rigid solution. The ruby laser system was the same one as used before.8-9 Its maximum output at 3472 Á was 2 X 10¹⁷ photons/pulse and the pulse width was ca. 15 nsec. Fluorescence decay curves were observed by using a Nalumi R21 monochromator, an RCA 1P28 photomultiplier, and a Tektronix 585A oscilloscope. The re
The Journal of Physical Chemistry, Voi. 79, No. 17, 1975

Electronic Excitation Transfer between Excited Molecules 17 8 9
sponse time of the detecting system was ca. 5 nsec. For the measurement of phosphorescence decay curves, an HTV R213 photomultiplier with an amplifier was used and the decay curves were recorded on a X-Y recorder. The response time of this system was ca. 0.25 sec. The exciting light pulse was focused or. the surface of the sample cell which is made of two glass tubes whose optical thickness was ca. 0.1 mm, so that only the fluorescent light from the part of the cell under high-density excitation was monitored. As it will be described later in detail, we have confirmed that if one uses a cell with optical thickness larger than 0.1 mm, the effects of the fluorescence reabsorption due to the Sn ■«— Si or Tn ■*— Ti transitions are not negligibly small.
Pyrene was chromatographed on activated alumina using n-hexane for elution. Chromatographed pyrene was sublimated under vacuum. Nakarai’s 1,12-benzperylene containing 0.02% perylene and Merck’s perdeuteriophenan- threne containing ca. 2.5% anthracene were used without further purification. Since the fluorescence decay time of perylene is much shorter than that of 1 ,12-benzperylene and also the phosphorescence decay of anthracene is very much faster than that of perdeuteriophenanthrene, the existence of these impurities does not affect the results of the luminescence decay function measurements to be described. Methylcyclohexane (Wako, Spectrograde), dibutyl ether (Merck, Spectrograde), methanol (Wako, analytical grade reagent), and ethanol (Wako, analytical grade reagent) were used without further purification. Decaline was Wako analytical grade reagent and distilled under reduced pressure before use. All sample solutions were deaerated by freeze-pump-thaw cycles.
R e su lts and D iscu ss io n
a. Luminescence Decay Functions in the Presence of Excitation Transfer between Excited Molecules. The decay function of the excited molecules fixed in a rigid solvent in the presence of excitation transfer of the type D(Si) + A(S0) - D(S0) + A(Sj) or D(T,) + A(S0) - D(S0) + A(Si), due to the dipole-dipole interaction, is given by eq I7-10 assuming that D is excited at t = 0 by a light flash with duration much shorter than the decay time of the excited state.
P(t) = exp ( - ^ - 2i ( ;~ )1/2) (1)
Here to is the lifetime of excited D in the absence of the energy acceptor A, £ is a function of the acceptor concentration, i.e„ £ = CA/CA°, Ca ° = 4.77 X K T 10 n2/(K2<pDU)1/2 mol/1. and fi = Jo" [/dW^a^)/’?4] di. K2 is the average value of the square of orientation factor between transition dipoles of energy donor and acceptor, respectively.10 When molecules are fixed but in a random orientation state, the value 0.475 is usually used, n is the refractive index of solvent, 4>d is the fluorescence quantum yield of D, and ft is the so-called overlap integral between the donor fluorescence spectra and acceptor absorption spectra.
On the other hand, for the excitation transfer of the type Si + Si — So + Sn or Ti + Ti — S0 + Tn, between the same kind of molecules fixed in the rigid solvent, we can derive easily the decay function of eq 2, where we must take into consideration the fact that the energy acceptors are also decaying in the same way as the energy donors. Namely, the decay function may be written as
PIT) = exp ( - Í - ) Nf f f)exPr - ( ^ ' ) 6^ ] (2)
where NgPit) is the number of the excited molecules at the delay time t from the exciting pulse, Ru is the distance between excited molecules, and Ro is the critical transfer distance where the rate of the excitation transfer becomes the same as the rate of the decay of the excited state. Taking average of P(t) over the statistical distribution of molecules in a way similar to that for the derivation of eq l ,7 one obtains
P(F) = e x p [-^ - -2 £ P (t ) (™ )1/2] (3)
In the above derivation, it is assumed that the molecules excited to the Sn state return very rapidly tc the Si state. This assumption seems to be quite reasonable since the relaxation time of Sn —*■ Si internal conversion may certainly be much smaller compared to the decay times we are measuring in this work. Throughout this paper, we are assuming that the molecules excited to Sn or Tn by the excitation transfer or fluorescence reabsorption return very rapidly to Si or Ti, respectively. The validity of this assumption may be demonstrated in section b by analyzing the observed results with equations derived under this assumption. Another possible type of excitation transfer due to the dipole- dipole interaction between the excited molecules of the same kind may be Si + Tx —► So + Tn. In this case, the decay function of the Si state can be obtained by the procedure similar to that for the derivation of eq 3.
P(f) = exp [ - — - 2 ^ ( t ) } 1 (4)
Here <f>st is the quantum yield of the Ti state formation, t p
is the decay time of the Ti state, and it is assumed that the Ti state is formed from the relaxed Si state (fluorescent state). The Si -*■ Ti excitation transfer between the same kind of molecules has been confirmed in the case of crystals under steady excitation.5'11
In the case of the rapid diffusion of excited molecules in solution or rapid diffusion of excitons in crystals, the Si —► Si or Ti —*• Ti excitation transfer becomes a diffusion-controlled bimolecular process. The decay function in this case may be given by
1/P(f) = (1 + Cat07 ) exp(t/r0) - Catoy (5)where 7 is the rate constant of the bimolecular process.1-6 The decay function seems to be rather complicated when the thermal diffusion is possible but is not so rapid as in the above case, i.e., when the rate of diffusion is comparable with that of excitation transfer. In the case of the Si —* So transfer (D(Si) + A(S0) -* D(S0) + A(Sj)) due to the Forster mechanism, an appropriate decay function can be derived even for such a complicated case, and it can reproduce the experimental observation satisfactorily.12 In the case of the excitation transfer between excited molecules, we can derive also such a decay function. However, it seems to be rather difficult to get a clear-cut conclusion by comparing such a complicated formula with experimental observations for the intermediate case.
b. Luminescence Decay Functions in the Presence of Reabsorption Effects. Actually, we are observing the luminescence decay curve instead of the decay function itself.
The Journal of Physical Chemistry, Voi. 79, No. 17, 1975
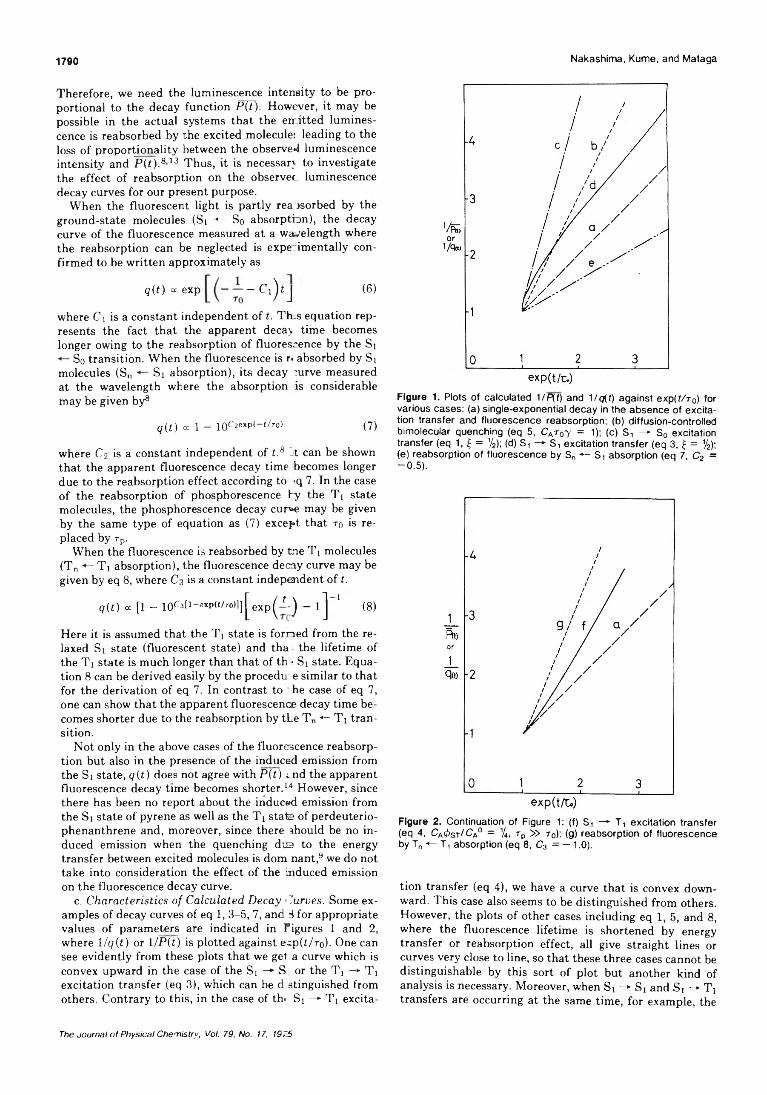
17 9 0 Nakashima, Kume, and Mataga
Therefore, we need the luminescence intensity to be proportional to the decay function P(i). However, it may be possible in the actual systems that the emitted luminescence is reabsorbed by the excited molecules leading to the loss of proportionality between the observed luminescence intensity and P(i).813 Thus, it is necessary to investigate the effect of reabsorption on the observed luminescence decay curves for our present purpose.
When the fluorescent light is partly rea jsorbed by the ground-state molecules (Si •*— So absorption), the decay curve of the fluorescence measured at a wavelength where the reabsorption can be neglected is experimentally confirmed to be written approximately as
q(t) cc exp - C^jt J (6)
where Ci is a constant independent of t. Tins equation represents the fact that the apparent decay time becomes longer owing to the reabsorption of fluorescence by the Si
So transition. When the fluorescence is r. absorbed by Si molecules (Sn Si absorption), its decay curve measured at the wavelength where the absorption is considerable may be given by8
q(t) ce 1 — ioc2e*P<—t/T°> (7)
where C2 is a constant independent of f.8 Jt can be shown that the apparent fluorescence decay time becomes longer due to the reabsorption effect according to -q 7. In the case of the reabsorption of phosphorescence by the Ti state molecules, the phosphorescence decay curve may be given by the same type of equation as (7) except that to is replaced by t p .
When the fluorescence is reabsorbed by tne Ti molecules (Tn Ti absorption), the fluorescence decay curve may be given by eq 8, where C3 is a constant independent of t.
q(t) oc [1 - loCsU-expU/Totlj exp - -J - l j 1 (8)
Here it is assumed that the Ti state is formed from the relaxed Si state (fluorescent state) and tha the lifetime of the Ti state is much longer than that of th-. Si state. Equation 8 can be derived easily by the procedu e similar to that for the derivation of eq 7. In contrast to he case of eq 7, one can show that the apparent fluorescence decay time becomes shorter due to the reabsorption by the Tn ■*- Ti transition.
Not only in the above cases of the fluorescence reabsorption but also in the presence of the induced emission from the Si state, q{t) does not agree with Pit) end the apparent fluorescence decay time becomes shorter.1-4 However, since there has been no report about thé induced emission from the Si state of pyrene as well as the T! state of perdeuterio- phenanthrene and, moreover, since there should be no induced emission when the quenching dus to the energy transfer between excited molecules is dom nant,9 we do not take into consideration the effect of the induced emission on the fluorescence decay curve.
c. Characteristics of Calculated Decay Curves. Some examples of decay curves of eq 1, 3-5, 7, and 3 for appropriate values of parameters are indicated in Figures 1 and 2, where 1 /q{t) or 1 /P(t) is plotted against esp(i/r0). One can see evidently from these plots that we get a curve which is convex upward in the case of the Si —► S or the Ti —► Ti excitation transfer (eq 3), which can be d stinguished from others. Contrary to this, in the case of th. Si —► Ti excita-
Figure 1. Plots of calculated 1/P(f) and 1/g(f) against exp(f/T0) for various cases: (a) single-exponential decay in the absence of excitation transfer and fluorescence reabsorption; (b) diffusion-controlled bimolecular quenching (eq 5, C Ar 07 = 1); (c) S , — S 0 excitation transfer (eq 1, £ = 1/2); (d) S , —► S , excitation transfer (eq 3, £ = 1/2); (e) reabsorption of fluorescence by S n * - S , absorption (eq 7, C2 = -0 .5 ).
Figure 2. Continuation of Figure 1: (f) S , — T i excitation transfer (eq 4, C 4>s y / C a ° = %, t p » r 0); (g) reabsorption of fluorescence by Tn ■*— Tt absorption (eq 8, C3 = — 1.0).
tion transfer (eq 4), we have a curve that is convex downward. This case also seems to be distinguished from others. However, the plots of other cases including eq 1, 5, and 8, where the fluorescence lifetime is shortened by energy transfer or reabsorption effect, all give straight lines or curves very close to line, so that these three cases cannot be distinguishable by this sort of plot but another kind of analysis is necessary. Moreover, when Si — Si and Si — Tx transfers are occurring at the same time, for example, the
The Journal of Physical Chemistry, Voi. 79, No. 17, 19.25

Electronic Excitation Transfer between Excited Molecules 1791
plot of 1 /P(t) or l/q(t) vs. exp(i/r0) may give a straight line or a curve very close to the line. Accordingly, when one obtains a straight line in this sort of plot for the system in rigid solvent, it is rather difficult to get any definite conclusion about the mechanisms of interactions in the excited state.
d. Results of Measurements of Excitation Transfer between Excited Molecules. The possible existence of Ti —*■ Ti excitation transfer due to the dipole-dipole interaction was already demonstrated in the case of perdeuteriophe- nanthrene in solid solution by measuring the dependence of the phosphorescence yield upon the triplet concentration.15 Therefore, we have examined first whether the phosphorescence decay curve of perdeuteriophenanthrene under high-density excitation in a rigid solvent can be reproduced by eq 3.
For the measurement of Ti —>- Ti excitation transfer, perdeuteriophenanthrene was dissolved in a methylcyclo- hexane-decaline 1:1 mixture. The phosphorescence decay curve of 10-4 M solution at 77°K under low-density excitation was a single-exponential type and the decay time was ca. 12.1 sec. The phosphorescence decay curve of the 10_1 M solution under high-density excitation is not exponential. The plot of the reciprocal of phosphorescence intensity against exp (i/ t o ) is quite similar to the theoretical curve of eq 3, as one can see from Figure 3.
For the measurement of the Si -*• Si excitation transfer we have examined the pyrene-toluene system as well as the pyrene-dibutyl ether (DBE) system. Under low-density excitation with reduced intensity of laser light, both of these systems showed single exponential decay. In the case of 10-4 M solution at 77°K, the fluorescence decay time was determined as follows: to = 346 ±19 nsec in toluene and to = 456 ± 17 nsec in DBE. The fluorescence decay times of 10_1 M solutions in toluene and DBE under low-density excitation were the same as those of 10“4 M solutions, respectively. Therefore, the fluorescence reabsorption effect by the ground-state molecules (eq 6) can be neglected in the case of the pyrene solutions.
Fluorescence decay curves of 10~x M solutions under high-density excitation are not exponential. As it is indicated in Figures 4 and 5, the plot of the reciprocal of fluorescence intensity against exp(f/To) shows the characteristics of eq 3. In the case of Figure 4, however, the discrepancy between the experimental values and predicted ones with eq 3 becomes larger at later stages of the decay. Possible explanations for this result will be given later.
e. Analysis of Experimental Results. 1. Elimination of Reabsorption Effects. We have actually confirmed that eq 7 and 8 can reproduce very well the observed reabsorption effects in the case of 1,12-benzperylene as shown in Figure6. Fluorescence decay curves were measured at 77°K with the sample cell which was made of a 4-mm i.d. quartz tube. They were single-exponential types ( t o » 160 nsec) at all wavelengths under low-density excitation. Even under high-density excitation, they were single-exponential types at 407 nm where Sn «- Si and Tn — Ti absorption16 intensities were relatively weak. However, the fluorescence observed at the peak of the Sn Si absorption spectrum (420 nm)16 and at the peak of the Tn — T, absorption spectrum (455 nm)16 under high-density excitation exhibited characteristic decay curves in agreement with those calculated by eq 7 and 8, respectively. Thus, the reabsorption effect is directly demonstrated when the optical thickness is not very small. However, as we have pointed out already, the reab-
Figure 3. Plot of the reciprocal of observed phosphorescence intensity, M\t), against exp(f/To) for the perdeuteriophenanthrene-meth- ylcyclohexane-decaline system under high-density excitation: experimental values obtained by averaging several observations; the horizontal and vertical lines indicate the magnitudes of the standard deviations due to t 0 and 1 /<f), respectively; — , theoretical curve(eq 3, £ = 0.28) showing the best fit to the observed va lues;-------,single-exponential curve.
Figure 4. Plot of the reciprocal of observed fluorescence intensity, 1 /<f), against exp(f/r0) for the pyrene-toluene system under high- denslty excitation: -cj>r experimental values obtained by averaging several observations; the meanings of horizontal and vertical lines are the same a s those in Figure 3, respectively. Theoretical curves(eq 3): — , £ = 0 . 6 ; ........., £ = 0.75 (upper one) and £ = 0.45(lower one). The curve with £ = 0.6 show s the best fit to the experimental values;------ single exponential curve.
sorption effect becomes negligibly small if we use a cell with an optical thickness of 0.1 mm. We have used the 0.1- mm cell for the measurement of excitation transfer throughout the present work. One should note here that the decay functions of eq 7 and 8 should depend on the wavelength where the fluorescence is observed, while those of eq 1, 3, 4, and 5 should not show such a wavelength dependence. Thus, it has been confirmed that one can eliminate the reabsorption effects by employing the 0.1-mm cell.
2. Ti —1► Ti Excitation Transfer. Since the phosphorescence spectrum of perdeuteriophenanthrene overlaps strongly with its Tn •*— Ti absorption spectrum, the probability of the Ti —► Tt excitation transfer by the Forster
The Journal of Physical Chemistry, Vol. 79, No. 17, 1975

1792 Nakashima, Kume, and Mataga
Figure 5. Plot of the reciprocal of observed fluorescence intensity, 1//(f), against exp(f/r0) for the pyrene-DBE system under high-den- sity excitation: O, experimental values; the possible errors seem to be a s large a s those in Figure 4; — , theoretical curve (eq 3, £ = 0.45) showing the best fit to the observed values;------ , single-exponential curve.
Figure 6. Wavelength dependence of reabsorption effects in the case of 1,12-benzperylene, 7 X 10~3 M in a mixed solvent of toluene-ether-ethanol (2:2:1 by volume), at 77°K. Observed fluorescence decay curves: A , at 420 nm; X , at 407 nm; O, at 455 nm. Calculated decay curves (— ): (a) eq 7; (b) single-exponential curve; (c) eq 8. The experimental values in this figure contain possible errors a s large a s those in Figure 4.
mechanism seems to be fairly large.15 According to the estimation by Kellogg,15 the value of Q between the phosphorescence and the Tn «— Ti absorption spectra is 2.2 X 10“12 and Ca° is 1.7 X 10~3 M.
In the present work, we have confirmed the Tj —*■ Ti excitation transfer due to dipole-dipole interaction by directly measuring the phosphorescence decay curves under high-density excitation. As indicated in Figure 3, the agreement between the experimental values and the theoretical decay curve calculated with £ = 0.28 is quite satisfactory, which is a direct proof that the Ti — Ti excitation transfer occurs by the Forster’s dipole-dipole coupling mechanism.
3. S i —«■ Si Excitation Transfer. Fluorescence spectra and Sn Si and Tn <— Ti absorption spectra of pyrene are shown in Figure 7. The experimental values of the longer
Figure 7. Fluorescence, S n *- S t absorption (es ), and Tn «— T-, absorption (ey) spectra of pyrene: — , fluorescence spectra;.........S n•*— S t absorption spectra (a) measured by Post et al.17 and (b) measured by Nakato et al.;18-----------, T„ ■ *- T i absorption spectra.20
wavelength band in the Sn •«- Si spectra were taken from the measurement by Post et al.17 (e (at 470 nm) =¿1.6 X 10⁴ ± 10%) and the experimental values of the shorter wavelength band were taken from the measurement by Nakato et al.18 The extinction coefficient of the shorter wavelength band was adjusted so as to agree with the result of Post et al. at its long-wavelength edge. There is another experimental measurement of the extinction coefficient of the longer wavelength band by Muller et al.19 According to their result, ((at 450 nm) is =¿3.6 X 10³ ± 30%. The Tn •*- Ti absorption spectra were taken from the measurement by Heinzelmann et al.20 With these spectra, we can evaluate the critical transfer distance Ro and the critical concentration Ca°, as indicated in Table I. There are no experimental values of the fluorescence quantum yield 4>i) of pyrene in toluene as well as in DBE at 77°K which are necessary for the evaluations of Table I. However, 4>r> in ethanol at 77°K is obtained to be 0.91,21 and 0.8-0.95 in PMMA.22'23 In view of these experimental values, we have assumed the value 0.9 for our systems.
In Table I, not only the Ro and Ca° values for Si —<• Si and Si —*• Ti transfers but also those for the Sx * S0 transfer as well as the transfer from pyrene Si to perylene So22 are shown for the purpose of comparison. One can see that the Si —► So transfer between pyrenes can occur rather difficultly just as one can surmise it easily from the fact that the Si So absorption intensity of pyrene is very small. However, the Si —► Sj transfer can occur much more easily than the Si —» So transfer. The critical distance of Si —► Si transfer is rather close to that of pyrene(Si) » perylene (So) transfer. We can see also that the values of 0 and Ro for the Si —*■ Ti transfer between pyrenes are as large as those of the Si —>• Si transfer, respectively. However, since the fluorescence yield of pyrene at 77°K is ca. 0.9, the concentration of triplet pyrene molecules acting as energy acceptors is quite small. Moreover, when the Si —► Si transfer is occurring, the yield of the triplet molecules will be further decreased. Thus, the effect of the Si -»■ Tj transfer on the observed fluorescence decay curves may be negligibly small. Actually, the experimental result plotted in Figure 5 shows clearly that the Si — Si transfer is predominating. The result in Figure 4, however, does not satisfy eq 3 at the later stages of the decay. Presumably, the quantum yield of the triplet-state formation, 0st, in toluene might be larger than that in DBE, since the fluorescence lifetime in toluene is shorter than that in DBE. The Si -»■ Ti energy transfer to the accumulated triplets might be occurring at the later stages of the decay in toluene. Nevertheless, the plot at the
The Journal o f Physical Chemistry, Vol. 79, No. 17, 1975

Electronic Excitation Transfer between Excited Molecules 17 9 3
T A B L E I: V a lu es o f P a ra m eters R elevan t to the E xcita tion T ran sfers from th e S i S ta te o f P yren edue to F orster ’s M ech an ism
A ccep to r n R „ k 1 0 2 C A ° , m
P e ry le n e (S0)Ia 3.4 x HT14 37 0.87P y re n e (S0)n <2 x 10 '11 <10 >32P y re n e (S4)I! (0.9, 4.0) x 1 0 -" 111 30, 4 0 ,n 1.5, 0 .7 UIP y re n e (T ,)n 3.4 x IO’14 39 0.77
a The following values were used for calculation of Ro: (I) inPMMA at 77°K, K 2 = 0.475, 0 D = 0.95, n = 1.5; (II) in DEE at 77°K, K 2 = 0.475, <jio = 0.90, n = 1.4; (III) two different values are due to the use of the different values1719 of extinction coefficient of the longer wavelength band in the S„ * Si spectra.
early stage of the decay clearly shows the curve characteristic of eq 3, which seems to be an evidence that Si -*■ Si transfer is predominating.
Since the samples are subjected to high-density excitation, one might argue that there occurs the local heating of the solution due to the radiationless degradation leading to the shortening of the decay time. However, according to our estimation, the extent of the temperature raising by such a mechanism is smaller than 3-4°. Accordingly, it may not affect the fluorescence decay time in the rigid solvent at 77°K.23 One might argue also that the sample solution may be partly destroyed by some nonlinear photochemical reaction, and excitation transfer from the Si state pyrene to the ground-state reaction product may bring about the shortening of the fluorescence decay time. However, if this is the case, the plots in Figures 4 and 5 must be straight lines as indicated in Figure 1 for the Si -» S0 transfer. Thus, in both toluene and DBE solutions at 77°K, the Si
Si transfer by the Forster mechanism occurs predominantly between excited pyrenes.
R e fe r e n c e s and N o te s
(1 ) N. A . T o ls to i a n d A . P. A b ra m o v , Sov. Phys.— Solid State (Engl. Transi)9, 2 5 5 (1 9 6 7 ) ; 9, 1 5 1 6 (1 9 6 8 ).
(2 ) A . B e rg m a n , M . L e v in e , a n d J . J o r tn e r , Phys. Rev. Lett., 1 0 , 5 9 3 (1 9 6 7 ).(3 ) C . R . G o ld s c h m id t , Y . T o m k ie w lc z , a n d I. B . B e r lm a n , Chem. Phys. Lett.,
2 , 5 2 0 (1 9 6 8 ) ; H. M a s u h a ra a n d N . M a ta g a , ibid., 7 , 4 1 7 (1 9 7 0 ).(4 ) A . In o u e , K . Y o s h ih a ra , a n d S . N a g a k u ra , Bull. Chem. Soc. Jpn 45,
1 9 7 3 (1 9 7 2 ).(5 ) S. D . B a b e n k o , V . A . B e n d e rs k i i, V . I. G o l 'd a n s k ii, A . G. L a v ru s h k o , a n d
V . P. T y c h in s k ii, Chem. Phys. Lett., 8 , 5 9 8 (1 9 7 1 ) ; Phys. Status Solidi B 45, 91 (1 9 7 1 ).
(6 ) T . K o b a y a s h i a n d S . N a g a k u ra , Mol. Phys., 23, 1 2 1 1 (1 9 7 2 ) ; 24, 6 9 5(1 9 7 2 ) .
(7 ) Th . F o rs te r , A n n . Phys. (Leipzig), 2 , 5 5 (1 9 4 8 ); Z . Naturtorsch., 4a, 3 2 1 (1 9 4 9 ).
(8 ) H . M a s u h a ra a n d N . M a ta g a , Chem. Phys. Lett., 6 , 6 0 8 (1 9 7 0 ) ; Bull. Chem. Soc. Jpn., 45, 4 3 (1 9 7 2 ).
(9 ) N . N a k a s h im a , N . M a ta g a , C . Y a m a n a k a , R . Ide , a n d S . M is u m i, Chem Phys. Lett., 1 8 , 3 8 6 (1 9 7 3 ).
(1 0 ) R . G. B e n n e tt , J. Chem. Phys., 41, 3 0 3 7 (1 9 6 4 ); R . G. B e n n e t t a n d R . E. K e llo g , Prog. React. Kinet., 4, 2 1 5 (1 9 6 7 ).
(1 1 ) V . E rn , J . L. S a in t-C la ir , M . S c h o tt, a n d G . D e la c o te , Chem. Phys. Lett.,10, 2 8 7 (1 9 7 1 ) ; J . F o u rn y , M. S c h o t t , a n d G . D e la c o te , ibid., 20, 5 5 9(1 9 7 3 ) .
(1 2 ) M . T o m u ra , E. Is h ig u ro , a n d N. M a ta g a , J. Phys. Soc. Jpn., 22, 1 1 1 7(1 9 6 7 ); 25, 1 4 3 9 (1 9 6 8 ); M . Y o k o ta a n d O . T a n im o tc , ibid., 22, 7 7 9(1 9 6 7 ) ; N . M a ta g a a n d T . K u b o ta , “ M o le c u la r In te ra c t io n s a n d E le c tr o n ic S p e c t r a ” , M a rc e l-D e k k e r , N e w Y o rk , N .Y ., 1 9 7 0 .
(1 3 ) G . P o r te r a n d M . R . T o p p , Proc. R. Soc. London, Ser. A, 3 1 5 , 1 68 (1 9 7 0 ).
(1 4 ) H . L e s s in g , E. L ip p e r t , a n d W . R a p p , Chem. Phys. Lett., 7 , 2 4 7 (1 9 7 0 ) .(1 5 ) R . E. K e llo g g , J. Chem. Phys., 4 1 , 3 0 4 6 (1 9 6 4 ).(1 6 ) D . L a v a le tte r , C . J . W e rk h o v e n , D . B e b e la a r , J. L a n g e la a r , a n d J . D . W .
V a n V o o rs t , Chem. Phys. Lett., 9, 2 3 0 ¡1 9 7 1 ).(1 7 ) M . F. M . P o s t, J , L a n g e la a r , a n d J . D . W . V a n V o o rs t , Chem. Phys. Lett.,
10, 4 6 8 (1 9 7 1 ).(1 8 ) Y . N a k a to , N . Y a m a m o to , a n d H . T s u b o m u ra , Chem. Phys. Lett., 2 , 5 7
(1 9 6 8 ) .(1 9 ) A . M u lle r a n d U . S o m m e r , Ber. Bunsenges. Phys. Chem., 7 3 , 8 1 9
(1 9 6 9 ) .(2 0 ) W . H e in z e lm a n n a n d H . L a b h a r t , Chem. Phys. Lett., 4, 2 0 (1 9 6 9 ).(2 1 ) J . L a n g e la a r , R . P. H . R e t ts c h n ic k , a n d G . J . H o ijt in k , J. Chem. Phys.,
54, 1 (1 9 7 1 ).(2 2 ) N . M a ta g a , H. O b a s h i, a n d T. O k a d a , Chem. Phys. Lett., 1 , 1 3 3 (1 9 6 7 ) '
J. Phys. Chem., 7 3 , 3 7 0 (1 9 6 9 ).(2 3 ) J . L . K ro p p , W . R. D a w s o n , a n d M . W . W in d s o r , J. Phys. Chem., 73,
1 7 4 7 (1 9 6 9 ).
The Journal of Physical Chemistry, Voi. T9, No. 17, 1975

1794 J. C. Owicki, L. L. Shipman, and H. A. Scheraga
Structure, Energetics, and Dynamics of Small Water Clusters1-2
John C. Owicki,3® Lester L. Shipman,3b and Harold A. Scheraga*
Department of Chemistry, Cornell University, Ithaca, New York 14853 (Received March 24, 1975)
The empirical potential using electrons and nuclei (EPEN) has been applied to a study of water clusters containing from two to five molecules. Cluster structures corresponding to potential energy minima have been characterized structurally and energetically. Among dimers and trimers, the only minimum-energy structures (on the six- and twelve-dimensional potential energy surfaces, respectively) that have been found are the trans near-linear dimer (TNLD) and the cyclic trimer. The cyclic dimer and open trimer are not potential-energy minima. In contrast, many local minimum-energy tetramers and pentamers exist. The most stable of these are cage-like structures which owe their low potential energy to the formation of a large number of highly strained hydrogen bonds. No open tetramer or pentamer structures have been found which are minima on their 18- and 24-dimensional respective potential energy surfaces. For the dimer and trimer, transition states for the interconversion between superimposable or enantiomeric minimum-energy structures are discussed along with their effects on the dynamics of these systems. An approximate statistical mechanical calculation of the thermodynamics of water cluster association equilibria in the gas phase is presented and analyzed. Selected water clusters obtained with other published empirical potentials are analyzed; also, the implications of the EPEN results for the structures of bulk liquid water, water surfaces, and droplet nuclei are discussed.
I. IntroductionLiquid water continues to be the subject of intense re
search effort because of its importance in biological, chemical, and physical systems as well as its great theoretical importance as an example of a liquid with strong noncentral intermolecular forces.
In a previous paper,4 we studied the structure, energetics, and dynamics of the water dimer by using the Ship- man-Scheraga (SS) empirical effective pair potential for water.5 Our ultimate interests in this laboratory are not, however, in water per se, but in the hydration of biologically important macromolecules. Thus, it is appropriate to our goals to use an empirical potential for water interactions which is compatible with similar potentials for other molecules. In this way, knowledge of the pure liquid at the molecular level can be applied readily to the study of aqueous solutions. During attempts to derive a family of compatible pair potentials in th;s laboratory, it was found that the overlap repulsion model chosen for the SS potential did not generalize easily to intramolecular (conformational) potentials for other molecules in which it was necessary to reproduce energy barriers for internal rotations about single bonds. However, an extension of the approach used to derive the SS potentia., viz., the empirical potential using electrons and nuclei (EPEN), has been developed recently and does meet the compatibility criterion.6 In this paper we have applied EPEN to the study of water clusters containing from two to five molecules. In addition to the ultimate applicability of these results to the problem of hydration in aqueous solutions, they are also relevant to studies of nu- cleation in aerosols and to other atmospheric problems.
Several pair potentials for water have been published recently.5’7"12 We have generated and compared the minimum-energy dimers and trimers predicted by these potentials to determine how much of a consensus has been reached regarding the structures of small water clusters and to give a preliminary evaluation of the relative usefulness of the various potentials.
II. B r ie f D e sc r ip t io n o f E P E N
EPEN6 may be thought of in terms of the localized molecular orbital theory view of the water molecule. Its electrostatic component consists of point charges representing the nuclei, lone pair electrons, and bonding electron pairs of the molecule as depicted in Figure 1. An attractive R~e term acts between oxygen nuclei, and exponential repulsions act between electron pairs. The complete potential of interaction for N water molecules is, thus
N ( 7 7 ZbZlU= £ £ £ 332.0719^ +
i<i l*=i i=i fki
£ £ A exp (-B rmn) - CE^-6! (1)m = l n~\ J
where U is the potential energy in kilocalories/mole; R,j is the 0 , - 0 j distance in A units; rki is the distance in A units between point charges k on molecule i and l on molecule j; rmn is the distance in A units between electron pairs m on molecule i and n on molecule j; Zk and zi are the point charges in atomic units; A, B, and C are parameters for the exp 6 part of the potential. The experimental infrared and microwave monomer geometry13 is used. Values for point- charge coordinates and parameters6 are presented in Table I. It should be noted that the zero of potential energy corresponds to infinite separation of all molecules. Since each molecule is treated as a rigid body, no intramolecular degrees of freedom are considered.
III. P ro ced u res
Minima on the EPEN energy hypersurface of aggregates of water molecules were located with the aid of computerized function minimization algorithms, and the resulting minimum-energy structures were characterized.
Starting points for the minimizations were selected by constructing hydrogen-bonded molecular models and by considering the results of other theoretical studies.414“16 The choice of starting points also was influenced by the
The Journal of Physical Chemistry, Voi. 79, No. 17, 1975
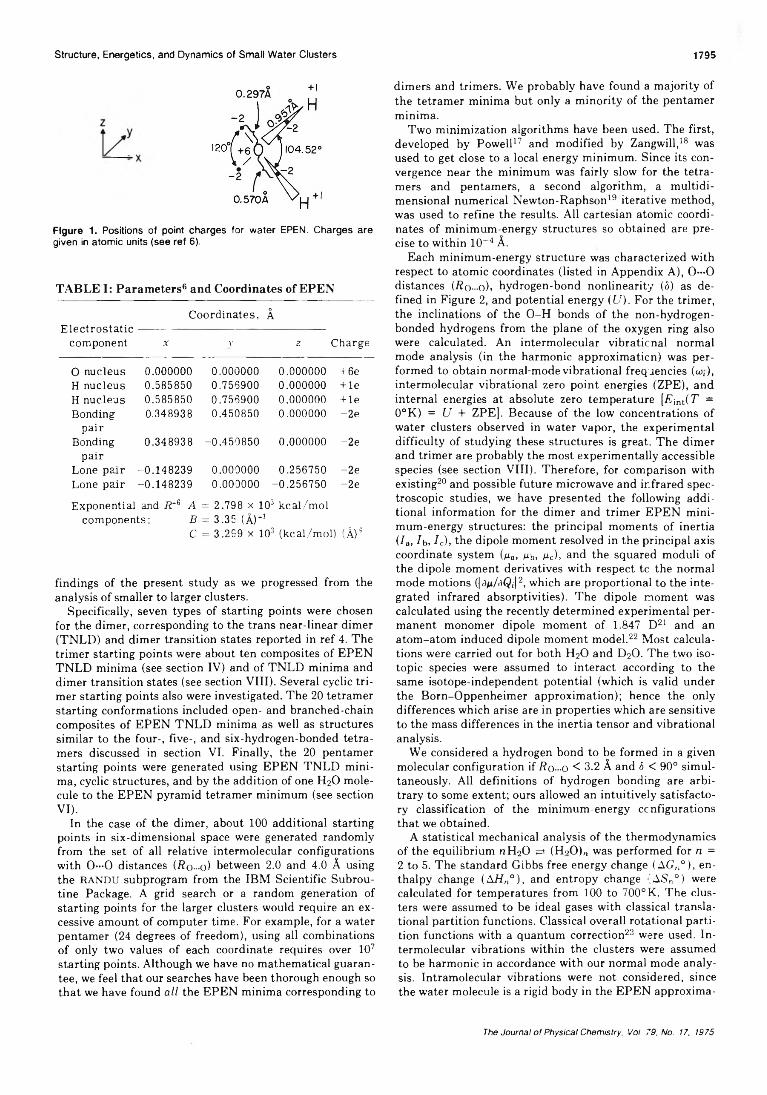
Structure, Energetics, and Dynamics of Small Water Clusters 17 9 5
Figure 1. Positions of point charges for water EPEN. Charges are given In atomic units (see ref 6).
T A B L E I: P a ra m eters 6 and C oord inates o f E P E N
C o o rd in a te s , ÀE l e c t r o s t a t i c -----------------------------------------------------
com ponen t x y z C harge
O n u c leu s 0.000000 0.000000 0.000000 +6eH n u c leu s 0.585850 0.756900 0.000000 + leH n u c leu s 0.585850 -0 .756900 0.000000 + leBonding 0.348938 0.450850 0.000000 -2 e
p a irBonding 0.348938 -0 .450850 0.000000 -2 e
p a irLone p a ir -0 .148239 0.000000 0.256750 -2 eLone p a ir -0 .148239 0.000000 -0 .256750 -2 e
E xponen tia l and R~e A = 2.798 x 10³ k c a l/m o l com ponen ts: B = 3.35 (A)"1
C = 3.2S9 x 103 (k ca l/m o l) (A)6
findings of the present study as we progressed from the analysis of smaller to larger clusters.
Specifically, seven types of starting points were chosen for the dimer, corresponding to the trans near-linear dimer (TNLD) and dimer transition states reported in ref 4. The trimer starting points were about ten composites of EPEN TNLD minima (see section IV) and of TNLD minima and dimer transition states (see section VIII). Several cyclic trimer starting points also were investigated. The 20 tetramer starting conformations included open- and branched-chain composites of EPEN TNLD minima as well as structures similar to the four-, five-, and six-hydrogen-bonded tetra- mers discussed in section VI. Finally, the 20 pentamer starting points were generated using EPEN TNLD minima, cyclic structures, and by the addition of one H2O molecule to the EPEN pyramid tetramer minimum (see section VI).
In the case of the dimer, about 100 additional starting points in six-dimensional space were generated randomly from the set of all relative intermolecular configurations with O—O distances (fio~o) between 2.0 and 4.0 A using the RANDU subprogram from the IBM Scientific Subroutine Package. A grid search or a random generation of starting points for the larger clusters would require an excessive amount of computer time. For example, for a water pentamer (24 degrees of freedom), using all combinations of only two values of each coordinate requires over 107 starting points. Although we have no mathematical guarantee, we feel that our searches have been thorough enough so that we have found all the EPEN minima corresponding to
dimers and trimers. We probably have found a majority of the tetramer minima but only a minority of the pentamer minima.
Two minimization algorithms have been used. The first, developed by Powell17 and modified by Zangwill,18 was used to get close to a local energy minimum. Since its convergence near the minimum was fairly slow for the tetra- mers and pentamers, a second algorithm, a multidimensional numerical Newton-Raphson19 iterative method, was used to refine the results. All cartesian atomic coordinates of minimum-energy structures so obtained are precise to within 10~4 A.
Each minimum-energy structure was characterized with respect to atomic coordinates (listed in Appendix A), 0 —0 distances (Ro-o), hydrogen-bond nonlinearity (5) as defined in Figure 2, and potential energy (U). For the trimer, the inclinations of the O-H bonds of the non-hydrogen- bonded hydrogens from the plane of the oxygen ring also were calculated. An intermolecular vibrational normal mode analysis (in the harmonic approximaticn) was performed to obtain normal-mode vibrational frequencies (co,), intermolecular vibrational zero point energies (ZPE), and internal energies at absolute zero temperature [E\nt(T = 0°K) = U + ZPE]. Because of the low concentrations of water clusters observed in water vapor, the experimental difficulty of studying these structures is great. The dimer and trimer are probably the most experimentally accessible species (see section VIII). Therefore, for comparison with existing20 and possible future microwave and infrared spectroscopic studies, we have presented the following additional information for the dimer and trimer EPEN minimum-energy structures: the principal moments of inertia (7a, Ib, Ic), the dipole moment resolved in the principal axis coordinate system (na, /ub, He), and the squared moduli of the dipole moment derivatives with respect tc the normal mode motions (|5ji/aQ;|2, which are proportional to the integrated infrared absorptivities). The dipole moment was calculated using the recently determined experimental permanent monomer dipole moment of 1.847 D21 and an atom-atom induced dipole moment model.22 Most calculations were carried out for both H2O and D2O. The two isotopic species were assumed to interact according to the same isotope-independent potential (which is valid under the Born-Oppenheimer approximation); hence the only differences which arise are in properties which are sensitive to the mass differences in the inertia tensor and vibrational analysis.
We considered a hydrogen bond to be formed in a given molecular configuration if Ro-o < 3.2 A and 5 < 90° simultaneously. All definitions of hydrogen bonding are arbitrary to some extent; ours allowed an intuitively satisfactory classification of the minimum-energy configurations that we obtained.
A statistical mechanical analysis of the thermodynamics of the equilibrium ni^O 5=> (HoO),, was performed for n = 2 to 5. The standard Gibbs free energy change (AG,,0), enthalpy change (AHn°), and entropy change (ASn°) were calculated for temperatures from 100 to 700°K. The clusters were assumed to be ideal gases with classical translational partition functions. Classical overall rotational partition functions with a quantum correction23 were used. Intermolecular vibrations within the clusters were assumed to be harmonic in accordance with our normal mode analysis. Intramolecular vibrations were not considered, since the water molecule is a rigid body in the EPEN approxima
The Journal of Physical Chemistry, Voi. 79, No. 17, 1975

1796 J. C. Owicki, L. L. Shipman, and H. A. Scheraga
tion.24 The partition functions and thermodynamic expressions are derived in Appendix B.
By using the Newton-Raphson technique to search for points of zero potential energy gradient rather than minima, we easily located saddle points on the six-dimensional dimer and twelve-dimensional trimer potential energy surfaces. These structures, which represent transition states for the interconversions between minimum-energy structures (see section VIII), were characterized in much the same way as were the minimum-energy structures.
Calculations performed with the empirical potentials described below were similar to those carried out with the EPEN, though they generally were limited to dimers and trimers.
(1) Shipman-Scheraga (SS) Potential.5 The coulombic component of the SS potential has seven point charges placed similarly to those in the EPEN. An exponential repulsion and an R~6 attraction act between H20 molecular centers of mass. The parameters of the potential were set during the derivation of the potential to achieve the best fit to a variety of gas-phase and crystal data.
(2) Analytical Fit to Hcrtree-Fock (AFHF) Potential.1 ’8 This potential has three electrostatic point charges: two (positive) are placed on hydrogen nuclei, with the third (negative) on the molecular Co axis. Exponential repulsions act between pairs of atoms. Since the potential was derived to fit the Hartree-Fock water dimer potential energy surface (without correlation effects), there is no R~6 dispersion term. The second parameterization8 of the AFHF potential was used in our calculations.
(3) Ben-Naim~Stillinger (BNS) Potential.9’10 Two positive (hydrogen nuclei) and two negative (lone pairs) point charges are placed at the vertices of a regular tetrahedron. A polynomial “switching function” reduces the coulombic potential for small 0 —0 distances. A Lennard-Jones 12-6 potential acts between oxygen nuclei centered in the point charge tetrahedron. The BNS potential was derived to fit water vapor second virial coefficient data classically. The revised version10 used here is equal to the original9 BNS potential multiplied by 1.06, a change introduced10 to strengthen the potential slightly. The positions of energy minima are the same for the two versions, but energies obtained with the revised potential are equal to 1.06 times the energies for the same configurations calculated with the original potential. Intermolecular vibrational energy levels and frequencies are likewise multiplied by (1.06)1/2.
(4) ST2 Potential.11 This potential is very similar to the BNS potential, the most important difference being that the lone-pair point charges are moved closer25® to the oxygen nucleus, reducing the excessively high librational frequencies calculated with the BNS potential.25’26
(5) Weissmann-Blum (WB) Potential,12 The coulombic component of this potential is similar to those of the SS and EPEN potentials except that the lone-pair and bonding-electron point charge positions were adjusted to fit the CNDO/2 electron distribution for HoO. An exponential repulsive term acting between oxygen nuclei was adjusted so that the trans linear dimer equilibrium Ro-o was 2.76 A as in ice R.
IV. EPEN DimerOnly one minimum-energy dimer was found on the six
dimensional EPEN potential energy surface. This structure, which is pictured in Figure 2, has a symmetry plane (and belongs to the point group Cs) and a single hydrogen
Figure 2. Structure of TNLD.
bond. The hydrogen bond is nearly linear, and the remaining hydrogens are trans to each other across iz. We have termed this structure the trans near-linear dimer (TNLD), the same name given to the very similar dimer found in our previous study4 with the SS potential. The TNLD is characterized further in Tables II and III. Figure 3 depicts the intermolecular vibrational normal mode motions approximately, and Figure 4 is a graphical presentation of the integrated infrared absorptivity data from Table III. Figure 5 shows the dependence of U on Ro-o for configurations like the TNLD.
Dyke and Muenter,20 using molecular beam microwave spectroscopy, have published an experimental structure for the dimer (see Table II) with which the EPEN TNLD is in substantial agreement. The deviations of the calculated angular variables 6 and <5 (as defined in Figure 2) from experiment are less than experimental error. The theoretical value of R0...o is about 3% smaller than the experimental value. Part of this discrepancy may arise from the fact that the theoretical value refers to the structure at the potential-energy minimum while the experimental one is a quantum-mechanical average on the structure in its vibrational ground state. Our calculations agree with the experimental20 finding that the water dimer is very close to being an accidental symmetric top (for the theoretical H20 TNLD, I J I b = 1.0009). Alternatively, the asymmetry parameter27 k = —0.99994, indicating that the EPEN TNLD is an almost perfect prolate top (k = —1).
The 10% disagreement between the calculated and experimental20 values of ¿¿a arises more from approximations in the dipole-moment model22 that we have used than from structural disagreements between the calculated and experimental TNLD’s. This can be seen clearly if we use the experimental TNLD structure from Table II to calculate Ma, obtaining 2.37 D. This is very close to the value calculated for the EPEN TNLD (2.35 D), but it is about 9% below the experimentally determined value (2.601 D). The major approximation in the dipole-moment model22 is the assumption that the induced dipole moment is produced by charges and scalar, first-order, bulk polarizabilities centered on the atomic nuclei.
It should be noted that we have used a value of the static polarizability, a, which includes only the electronic polarizability of water (a = 1.444 X 10⁻²⁴ cm3).28 Nir et al.29 have found that, for water, there are important contributions to a from intra- and intermolecular motions. These effects, which previously have been neglected, respectively contribute an additional 0.16 X 10~24 and 2.34 X 10⁻²⁴ cm3 to a, for a total of 3.95 X 10~24 cm3. In our calculations of the dipole moments of minimum-energy water clusters in the absence of external fields, it might be valid to include the
The Journal of Physical Chemistry, Vol. 79, No. 17, 1975

Structure, Energetics, and Dynamics of Small Water Clusters 1757
{X N3 TOto ri X o O a v; J, ” IE <5 o
§ OÏ -Ì X' 'C ,-- TOo P 3 s-O 3 ¡3
5’ : **2 . 4 o »a s* x 3n 2 ^ «>« 2 to r*ZZ' fD TO» ’S 3 ^
•a SSL • n o-o 3 » ~2. 2 03 3-3 3 3 23 rt> 2 3s * 5
P3 *1
% § ° 3 3 > §> 5" JT* ta a
03 3d,^ o r » < &> > 35- 3 ’3" TO3” ^ CD<<
¿™ ~ 3 3I ? ? ? ?3 ? 2 § ^ai <n io ^o' 73 5» 733 O 3 i ' O» S ’ O' s^ 2 r+ a ®3- b“ <T> ^, O- £T. g S- 03E' fis ra tc rt 1 F ® ■8 ¿ ? ^
S ^3 73 a> <t> 3 ►*<-t- h*'I
a- 3“att> ,03O cn ^ Sr+ CD ^ »-IS '5 305 *L o ®?r O ST
o <<3 C^ > S' N '3 , M f f l ^C — oa h g-S i f f £ = “ 1 1
§ 1 j 5 o S - c* 0303 7303O" <— —03 .03 Û3 <0
ï X B 3 tfl cc‘ 3 ' 03‘ O II73 03 _i73 03 C , 03 33 •3 S' PVQ- o os NS 3 .S S. os os r J
- O) X. -,33 03 .oi 3 ^ 03
~/3§ 5. S' ErD-. 7 o> o>
S s 'S '5<7 _ 2. 03£ 5 ? f &? -§ " « 3+ S g I
crO »■ 03 03 Ç O ^ no *5’ £. 51 3 2.
03 0373 X0> 0)O 0303 0)oo 373 rt-
- o3I! 3 2
03 3 CLto O ^ 03® 3 S.’SS' sI »^ 3 B II m TO10’S P*>g ifto g! rII 3- o
H fl) (D ,un C cr03 O ü-rtP ~ B' ^TO n03
cr g*03 O 03 <T>2. a¡3 03 2 . 8 73 2SL73 ^ 3
W r+ CD
® ►§
o<*5' o4 w■' g *
P.£-
03 tQ. !, J3’ <
. ? !5* os o 03 o E. w ^ x a os S. or ~ x »55' rr w =~ 03 t« ^ 03
cr 3 tr a'" 03
o>H ? 3
03
3 ^ 51 — P ^O 3 ’-
2 . a <>< n s s S a^ w O> ^ a 3 o =-03 ¿j* 3» O ^3 ^ g 'g 3 I < § S s-S£ 3 °TO rr i-i
03 _ ^ 73
A g
^ i r
H. g 5.D- H. D p * -03 fi3 <rf- _ - TrjŸ S '^ O'O » » 2 - 5 - S h S s , , g- o
(TO “■ 3 ~^ 3 M = ÇO 0i D 2O3 h - (Ç 03 ®
S, W C B.-.j 03 ° hi03 CL O O 22 -■ rf c Mf6 3 o ” Z<TD C3 _2 H ® H3 “ " I , ZI s ? ? 63 2 a 3 . oO 3 3 ?. ->g » a s . 3
H* ° °O H-
O OIf
< TO “ B ^3 09CT o i H>-s 03 3 £T. 5CD rt- *-> cr O-O (< o
a xto COO O
o- 0» ï £ »Oi« Z" rC, D« 3 a £' n 3H SZ - o
p Bo -a’
ËS.s r
CO 00 O0 IN3
COp 02 O gcn h.
COP crȤ SOO H-
H ^3 - 03
3 -* CL 73 -h S-» 3o ro>-3 n>Z-3 r sO g . y s- ^ £. S' B
z ° r « a ? 3 s 'G- O)œ ifi o O
a CD > CD Ma z H -d aCD a M
a Z
Jn A l Jn ci,o 00 00 cn “4 4L05 CD 00 05 4LCO CO CO 1- CO COt—* -J l-t CD CO *4lOO CO h-4 CJl 00 4Lto CO to ht ht ht
00 CO 4L -4 COCJl o CJl —J ht CO
h* CÌ9 cL CÌ9 CÌ900 h-t -o 05 ►CL oCO 05 CO CO 00 o
tS3 l l ¿9 l ¿902 o 4L Ht o *051—1 CD CD ht cn htCO CO CO CO to to“Cl -o OO O 00 COCJl 05 CJl O cn CO
4L CJl CJl CO “4 0500 4L ht 00 CD hto -o 00 o CD CD
o o to CO toCD o ht 4L “4 CO
CO to to CO to toro CJ1 Cl ht 4L co05 CO CO CH CO CO4L 4L 4L 4L 4L 4LCO 00 00 Ht -4 cnCO to o *"■* O ht“J -o “4 00 ->4 «4o l- 4 CJl 4L 4L 05CD CO CD to 4L ’-4CO ~J 05 ht 05CO OO CO CO 00 00ht I—4 05 05 CO “4CO 4L -4 CO CD COo CD OO CD CO en
<1 -o ~4 OO «4 “4h-t h-t 05 4L 4L 05h-*- 4L ht 4L CJl OO4L to 4L CO CD COCO 00 CO CD OO 00h-t to -*4 05 4L “4CO O CO CD O CO4l 4L 4L to 05 05CO CO to to ht to02 05 “4 CO -4 CO02 CO CO CD CO cn
to to 30 CO ht CO05 05 —4 OO -4 COCJl CO t-t 05 to cn
CO CO CO to h* to05 05 «4 00 ~4 CO4L CO ht en CO 4L
O o O O O Ao o o O h-* Oo o o o OOo o p o O Oo o o o Ht Oo o o o *“* o
i i ¿ o O oto t-t Ht ¿L o oCJl CO 05 cn o o
i ¿ i O o ACO co to cn o o4L CO 05 CO o “4
O
CS3hjM
o ^9 J5 -? H
?0o
nsrpport-«2.N*Prt-5 ’PO>-bHp-©o©rt-o ’£.ppaMx73©B©prt-E-53©nCfi
X3 Cr
g CD og 03 ”3 03©P’ CD^ ©
© 5£, s- S- g § 5 £- M 3S3 h O
CJl 4-
> >
a » 2S-iS 3- 3 D
3- <SJ. ©o <*3 <
° 3JZ. 03% 73s aTO °
? 32 - c3 ^a >© 1©
a q a^ w & ¿*
o pG ir o' a
§ cr &a o 3 nft- QO P p O' 3 CD © © 3o o.3 ^
i l l3 O CL ^ 3 ©S> ° ¡ .Ì ^ crCB ft 1r t 3 - »O © ET.
Q 3 » w © a M 3 7>V Sl73 3“ » S’
3 O 0u ^ » "T _ 73^ » O0x3 2 .0 ° 3oc © 05* £ £ g 5-<<3 oT 3' rt- • 3S a a1 s f(T © 3 © 2 Ç § -«
3 oTo **3 3■ © o: a ri^ 3■ Cl P © V- • 2. 3< c p 2r t M-
2. 3T 3© 2.S:g 83 S K-. Ï 3 3e £ . 5
3 3,P O MO" CL ■§ © «. I 3 H^ - 0 3“ 5‘ -• ®3; 2 «3
I s i© D CLP ©2- cr 3 cr << 2a © 2g 03 cl
p P3
• CLH*5‘sr o03 ’ ©
O U a ^a ^ gcr es _© r-H 3”3 K (T3O-
CD
to
>
_ 3O' _ CD O % 3T3 M (Îa g »W <* ■
ocr
©p
a p
cr ao3 73 Q, *—' P D©
ht ht Ht 4L enCD 05 © CO © ©00 CO © 02 CO
ht ht H_i CO 4L->4 ht 02 CO -4 CO05 to 4L 4L cnCO O p en p pen b CO cn © 4LCD CO en 4L to htht p © p r htCD o b 02 CO COht CJl © © © enht ht ht 4L ©-4 05 00 © CJl COCO CO CO 02 *-*
Ht CO 4LCO 4L —4 “4 CO 00to CJl CJl -O to -4CO O Ht © p p4L cn *4l en b ©05 CO 4L © co COht © Ht p p htCO to © b to ¡_i05 CO © ~4 to ~4ht H-t ht H_L CO CJlO to 02 ht ht COen “4 ht 02 © ~4
h* to CO“4 © en 00 CO 0205 CO O -4 “4 02
p p © 4L ht COCO 05 “4 CO © b4L 00 02 CO 02 CO
ht p p p M htCO to CO 4l b -OCO ht to © © COH* to to CO 02 02CO 02 ht “4 4L CJl05 © CO en © ©
H_t to ht 4L 4LCD © © © ©ht CJl 02 CO © htCO O © CO CO pO © © CJl CO “405 to to © CO ©h- p ht p ht CO05 b ht -4 CJl COCO CO CO 4L ©h* CO ht CO OO “4ht CO CO Ht CO •O05 -4 cn 02 ht en
to ht CO 02 cnC0 4L “4 CO 02 cnCO 4L 02 -4 © ©CO O p CO 4L p4L ht b 4L ht PCO en CO ht © toht O p ht P htCO o -4 *4L htCO CO to 4L 02 en
CO CO CO en 02CD ht 02 00 -4 COCO en 02 “4 02 CO
ht CO to 4L CJl05 en CJl ht ht ht“4 ; to © CO en 4LCO O O en p p4L ht CO CO 4L 02to -4 02 -4 ©ht O p CO Ht H*“4 o © b CO 4Len © “4 ht 4L -4
E I ? 8. ©
^ ■<
« CO3 ^© 3
® o 2 . cr5 gE- pp* ° o ,3 1
f=CD
«O
"PCD■e
■pCD
•O
■PCD-C
"PCD«e
■pCD
>7373►3OXBprt-©
whjWa
CDCD
>TtJa
CD
to
aaCD
3a
H>arH
H2 !ra
©•I3o©“©c_p*►t
O“>-iprtO*P£-
o
oQ-©•t©<oc©p©
ppa
©w.>1prt©CL
*P-t©a>O“CDO»173rt<*
The Journal of Physical Chemistry, Voi. 79, No. 17, 1975

17 98 J. C. Owicki, L. L. Shipman, and H. A. Scheraga
' Ar
^ H\ H\0 0 0I , I f . IHr VH
6 0 0hI V V
I 2 3
H\ A H \A 0 0 01 1 CP
H H
¿ V C u H4 5 6
Figure 3. Intermolecular normal-mode vibrations of the TNLD. Modes numbered a s in Table III.
ui , cm
Figure 4. Approximate integrated infrared spectra for the H2O TNLD’s produced with various ootentials and for the EPEN H20 cyclic trimer. The positions of absorption lines are determined by an intermolecular vibrational normal-mode analysis. The line heights are proportional to the calculated integrated absorptivities of the modes. This is a plot of data in Table III, and the normal modes are numbered as in Table III.
small intramolecular increment to a, but the large intermolecular contribution should not be included. This exclusion follows from the fact that EPEN already explicitly takes into account the effects of interactions of the molecular charge distributions on relative molecular orientations. Indeed, a calculation of Ma for the experimental geometry
Figure 5. Variation of U with R0...0 for the EPEN TNLD. For each value of Ro-o, 8 and 5 are varied to minimize U, with Cs symmetry maintained
TNLD using the full Nir et al. a gives a result 16% above that of experiment.
The above analysis leads to three conclusions. First, the dipole moments that we have calculated using the atom- atom induced-dipole-moment model22 should not be expected to agree precisely with experimentally determined values (i.e., to closer than about 10%). Second, a similar statement is true about the integrated infrared absorptivities, which we have calculated using the same dipole-moment model. Third, within the model, the dipole moments of the experimental and EPEN TNLD structures agree very closely.
The EPEN results also can be compared with those of extended basis set ab initio calculations. The most recent ab initio water dimer study (and one of the best yet with respect to the quality of the basis set) is that of Popkie et al.7 This is the same calculation used in deriving the AFHF potential.
The accuracy of the ab initio results, which are given in Table II, must be viewed in the light of two factors. First, because of the time-consuming nature of the computer calculations, a complete minimization (in six dimensions) was not performed. For example, the hydrogen bond was constrained to be linear. Second, 6 was reported only to the nearest 10°. Popkie et al.7 noted that, because of the flatness of the potential energy vs. 8 curve, greater precision was beyond the limits of accuracy of their basis set. This flatness can be seen in Figure 4 of ref 7 or, for EPEN, in Figure 6 of this paper. In spite of these limitations, the ab initio dimer structure in Table II should be fairly close to the minimum on the six-dimensional Hartree-Fock potential energy surface.
The ab initio dimer potential energy (U) is algebraically greater than that for the EPEN TNLD. This is understandable, because the ab initio result does not include sta-
The Journal of Physical Chemistry, Vol. 79, No. 17, 1975

Structure, Energetics, and Dynamics of Small Water Clusters
Figure 6. Variation of U with 8 for the EPEN TNLD. For each value of 8, R0...o and 5 are varied to minimize U, with Cs symmetry maintained.
bilizing correlation effects (estimated conservatively by Popkie et al.7 at 0.3-0.5 kcal/mol of dimer). The 4% disagreement in if? o -o between EPEN and ab initio also would be reduced by the inclusion of correlation effects, which would tend to contract the hydrogen bond. The biggest discrepancy between the results of the two techniques is in the calculated values of 8. The small dependence of the potential energy on 8 near the minimum makes the equilibrium value of 8 difficult to predict, and, in any event, such disagreements are of comparatively small energetic consequence.
There exist few direct experimental measurements or ab initio calculations of the water dimer intermolecular vibration normal mode frequencies or absorptivities with which to compare the EPEN results from Table III and Figure 4. Dyke and Muenter30 have obtained a preliminary value of about 145 cm-1 for both the H2O and D2O hydrogen-bond stretching vibrational frequencies. The EPEN results for normal mode 4 (168 cm-1 for H2O, 162 cm-1 for D20) are in good agreement with experiment considering the approximations made to deduce the frequencies from experimental data and the fact that mode 4 is not a completely pure hydrogen-bond stretch.
We note three additional vibrational results here.(1) The vibrations are strongly quantum mechanical.31
The lowest normal mode frequency for the EPEN H2O TNLD corresponds to a thermal excitation temperature of 141°K, the highest to 853°K. The equivalent values for D2O are 102 and 611°K. Thus, the two highest modes of both H2O and D2O are virtually unexcited at room temperature. Because of the quantum-mechanical nature of the vibrations, the use of classical statistical mechanics to compute the virial coefficient, or of classical mechanics in molecular-dynamics studies of water, may possibly introduce errors or artifacts.
(2) Analysis of the normal mode eigenvectors reveals that there is little coupling between motions of the centers of mass of the individual water molecules and rotations (li- brations) about their centers of mass. This results in a relatively pure hydrogen-bond stretch mode (mode 4 in TableIII) and five modes which are essentially hydrogen-bond bending motions of various types. The hydrogen-bond stretch mode, being primarily translational, is predicted to be only weakly infrared active (see Table III). Charge transfer between molecules, which is predicted by ab initio studies,7 would increase the integrated absorptivity32-33 over our calculated value.
(3) Although Figure 4 does not take into account such effects as line width broadening, anharmonicity, and vibrational overtones, it should be a rough representation of the integrated infrared spectrum of the dimer in the intermolecular vibrational region. The EPEN results suggest that the greatest intermolecular dimer infrared absorption should occur in the region of 100-200 cm-1 for H20 and 50-150 cm-1 for D20.
V. E P E N T r im er
Ab initio calculations1415 have been performed to determine the relative stability of open and cyclic water trimers (as in Figure 7). These studies have been inconclusive because of the prohibitive computational expense of performing a complete minimization on the twelve-dimensional trimer potential energy surface. Empirical potentials, much less expensive to evaluate, greatly reduce this problem. Indeed, Kistenmacher et al.8 recently have published a fully minimized cyclic trimer structure obtained with the AFHF potential. They concluded that configurations similar to the open trimer were of higher potential energy than the cyclic trimer, though they did not perform a minimization in all twelve degrees of freedom for the open structure to prove this conclusively.
Calculations with EPEN have shown that there is only one stable trimer on the twelve-dimensional potential-energy surface. That structure is the cyclic trimer pictured in Figure 7b and characterized in Table IV. We have found no minimum corresponding to an open structure such as in Figure 7a, nor are there minima for the analogous open structures in which the middle molecule accepts or donates two hydrogens in the hydrogen bonds formed with the end molecules. It is not surprising that the open trimer in Figure 7a is not at a potential-energy minimum, since cycliza- tion involves the completion of a hydrogen bond that already is weakly formed between the end molecules.
These results, together with those of Kistenmacher et al.,8 provide the strongest evidence to date that the cyclic structure is the only important water trimer. They also suggest that, at least in small systems, compact (cyclic) configurations with a large number of bent hydrogen bonds are more stable than open configurations with fewer but less-strained hydrogen bonds. This is borne out by our results for water tetramers and pentamers in sections VI andVII.
There are no published experimentally determined water trimer or larger cluster structures. However, Dyke and Muenter34 have obtained evidence that trimers and higher water clusters are only very slightly polar or are nonpolar, which is more consistent with cyclic than with open structures.
The EPEN cyclic trimer intermolecular vibrational normal-mode frequencies (Table V and Figure 4) span ap-
1799
The Journal of Physical Chemistry, Voi. 79, No. 17, 1975

1800 J. C. Owicki, L. L. Shipman, and H. A. Scheraga
Figure 7. (a) Hypothetical open trimer, (b) EPEN cyclic trimer.
T A B L E IV: C h aracter istics o f E P E N C yclic Trim er«
Q uantity h 2o D ,0
U -1 4 .8 1 -1 4 .8 1Z PE 5.36 4.06E in t( T = 0°K) -9 .4 5 -1 0 .7 54 77.94 89.31h 79.44 90.814 153.90 173.68
m | 1.10 1.10Ma 0.06 0.06Ms 0.12 0.16
Me -1 .0 8 -1 .0 8
. . .o 2 = 2.89 6 (0 ,—H—0 2) = 286
OoCDIIT—415
ÄOJ...C3 = 2.91
* 0 3. . . 0l ~ ^
ô (0 2-H — 0 3) = 30 a(2) = 57ô(o 3- h — o ,) = 27 a(3) = 57
a Quantities defined as in Table II and molecules numbered as in Figure 7b. 0 Deviation of hydrogen bond from linearity, in degrees. c Inclination of non-hydrogen-bonded hydrogen from plane of ring, measured in degrees as the dihedral angle between the H2O or D2O molecular plane and the plane of the 0 - 0 - 0 ring.
proximately the same range as those for the EPEN TNLD. The trimer frequencies are, on the average, somewhat higher than are those of the dimer, even though the trimer hydrogen bonds individually are weaker. This probably reflects the greater orientational constraint to librations imposed by a cyclic structure with two hydrogen bonds per molecule rather than one, as in the dimer. That is, if only one O-H is hydrogen bonded, the molecule can rotate about that O-H axis without breaking the hydrogen bond. However, if the molecule participates in two or more hydrogen bonds, rotation about any axis must break at least one hydrogen bond.
The cyclic trimer has no symmetry, and the translational and librational modes of the constituent molecules are highly coupled in the normal modes. The normal modes
T A B L E V : E P E N C yclic T rim er In term olecu lar N orm al-M ode V ib ra tion a l F req u en c ies and In teg ra ted In frared A b sorp tiv ities0
C 2O) 3 (020)3
Mode6 CO; lap /S Q il'2 coi |3p./8Q j|2
1 720 0.26 519 0.162 556 7.80 409 4.443 438 4.12 321 2.344 362 1.91 268 1.085 345 1.36 256 0.406 331 1.38 248 0.707 207 0.22 191 0.038 192 0.28 149 0.399 170 2.45 135 1.50
10 164 3.08 127 0.9311 135 0.02 111 0.0812 131 0.07 110 0.65
a Quantities defined as in Table III. b Modes numbered in orderof decreasing frequency. Unlike in Table III, no correspondencebetween like-numbered H20 and D20 normal-mode eigenvectors isimplied here.
therefore cannot be described as concisely as those of the TNLD. We note, however, that the modes which are predominantly librations tend to be higher in frequency than those which are predominantly hindered translations.
V I. E P E N T e tra m ers
Ab initio potential energy minimization studies of water tetramers14,15 have, of necessity, consisted of incomplete energy minimizations carried out on structures of high symmetry, in which all intermolecular degrees of freedom were not allowed to vary independently. The potential energies of open tetramers (analogous to the open trimer in Figure 7a) have been calculated but without energy minimization.14’15 The primary conclusion drawn from those studies is that cyclic structures probably are more stable than open structures. Kistenmacher et al.8 using the AFHF potential and more complete energy minimizations have reached the same conclusion.
Our energy minimizations on the 18-dimensional EPEN water tetramer potential energy surface confirm this conclusion. Furthermore, they extend it as follows. (1) There probably are no minimum-energy open tetramers on the complete potential energy surface. (2) There are at least nine unique tetramer minima (not counting enantiomers).(3) These minima consist of cyclic tetramers (with four hydrogen bonds connecting the four molecules into a ring) as well as more complex structures having five or six hydrogen bonds. Three representative tetramers (the pyramid, S 4 symmetry cyclic, and asymmetric cyclic tetramers) are pictured in Figure 8 and characterized in Table VI. The potential energy of the pyramid is lowest, that of the S 4 cyclic is next, and the asymmetric cyclic lies in the middle of the range of energies of the nine tetramer minima.
There are several ways to form cyclic tetramers. For example, there can be zero, one, or two water molecules which donate two hydrogens to the hydrogen-bond ring system. The S4 cyclic tetramer and asymmetric cyclic tetramers belong to the first and second of these classes, respectively.
The pyramid tetramer, the global minimum-energy structure, has the most highly strained (nonlinear) hydro-
The Journal of Physical Chemistry, Vol. 79, No. 17, 1975
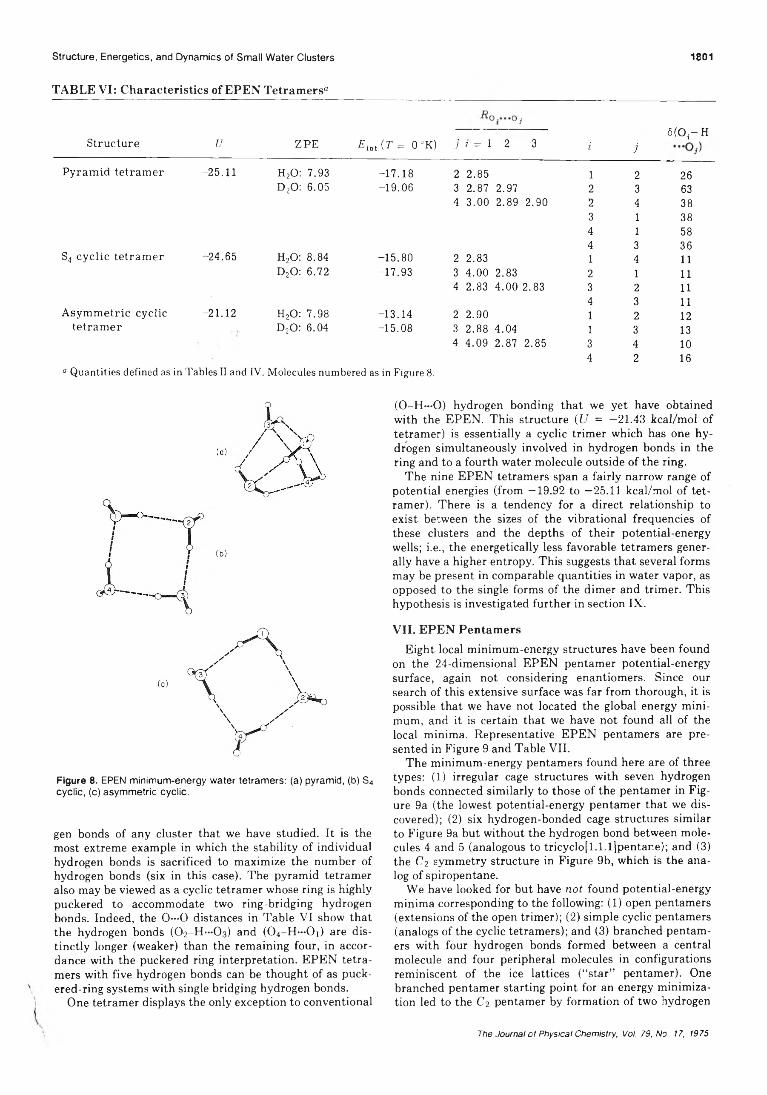
Structure, Energetics, and Dynamics of Small Water Clusters 1801
T A B L E V I: C ha rac te ris tics o f E P E N Te tram ers"
j
5(0 r HStructure U ZPE Em (T= 0 °K) 7 7 = 1 2 3 i j
Pyramid tetramer -25.11 H20: 7.93 -17.18 2 2.85 1 2 26DjO: 6.05 -19.06 3 2.87 2.97 2 3 63
4 3.00 2.89 2.90 2 4 383 1 384 1 584 3 36
S4 cyclic tetramer -24.65 HzO: 8.84 -15.80 2 2.83 1 4 11D20: 6.72 -17.93 3 4.00 2.83 2 1 11
4 2.83 4.00 2.83 3 2 114 3 11
Asymmetric cyclic -21.12 H20: 7.98 -13.14 2 2.90 1 2 12tetramer DjO: 6.04 -15.08 3 2.88 4.04 1 3 13
4 4.09 2.87 2.85 3 4 104 2 16
“ Quantities defined as in Tables II and IV. Molecules numbered as in Figure 8.
Figure 8. EPEN minimum-energy water tetramers: (a) pyramid, (b) S 4 cyclic, (c) asymmetric cyclic.
gen bonds of any cluster that we have studied. It is the most extreme example in which the stability of individual hydrogen bonds is sacrificed to maximize the number of hydrogen bonds (six in this case). The pyramid tetramer also may be viewed as a cyclic tetramer whose ring is highly puckered to accommodate two ring-bridging hydrogen bonds. Indeed, the 0 —0 distances in Table VI show that the hydrogen bonds (O2-H—O3) and (O4-H—O1) are distinctly longer (weaker) than the remaining four, in accordance with the puckered ring interpretation. EPEN tetramers with five hydrogen bonds can be thought of as puckered-ring systems with single bridging hydrogen bonds.
One tetramer displays the only exception to conventional
(0-H—O) hydrogen bonding that we yet have obtained with the EPEN. This structure (U = —21.43 kcal/mol of tetramer) is essentially a cyclic trimer which has one hydrogen simultaneously involved in hydrogen bonds in the ring and to a fourth water molecule outside of the ring.
The nine EPEN tetramers span a fairly narrow range of potential energies (from —19.92 to —25.11 kcal/mol of tetramer). There is a tendency for a direct relationship to exist between the sizes of the vibrational frequencies of these clusters and the depths of their potential-energy wells; i.e., the energetically less favorable tetramers generally have a higher entropy. This suggests that several forms may be present in comparable quantities in water vapor, as opposed to the single forms of the dimer and trimer. This hypothesis is investigated further in section IX.
VII. EPEN PentamersEight local minimum-energy structures have been found
on the 24-dimensional EPEN pentamer potential-energy surface, again not considering enantiomers. Since our search of this extensive surface was far from thorough, it is possible that we have not located the global energy minimum, and it is certain that we have not found all of the local minima. Representative EPEN pentamers are presented in Figure 9 and Table VII.
The minimum-energy pentamers found here are of three types: (1 ) irregular cage structures with seven hydrogen bonds connected similarly to those of the pentamer in Figure 9a (the lowest potential-energy pentamer that we discovered); (2) six hydrogen-bonded cage structures similar to Figure 9a but without the hydrogen bond between molecules 4 and 5 (analogous to tricyclo[l.l.l]pentar_e); and (3) the C'i symmetry structure in Figure 9b, which is the analog of spiropentane.
We have looked for but have not found potential-energy minima corresponding to the following: (1 ) open pentamers (extensions of the open trimer); (2) simple cyclic pentamers (analogs of the cyclic tetramers); and (3) branched pentamers with four hydrogen bonds formed between a central molecule and four peripheral molecules in configurations reminiscent of the ice lattices (“star” pentamer). One branched pentamer starting point for an energy minimization led to the C2 pentamer by formation of two hydrogen
The Journal of Physical Chemistry, Voi. 79, No. 17, 1975

1802 J. C. Owicki, L. L. Shipman, and H. A. Scheraga
Ro j - ■ • o .. -------------------- ------------ - S (O j- H
T A B L E V I I : C ha rac te ris tics o f E P E N Pentam ers“
Structure U ZPE Eint(T= 0 °K) j7 = l 2 3 4 7 j ” ’Oj)
Cage pentamer -35.51 H20: 11.26 -24.25 2 2.81 l 2 13D20: 8.61 -26.91 3 3.62 2.81 2 3 16
4 2.88 4.09 2.87 3 4 285 2.85 4.09 2.89 2.97 3 5 41
4 1 374 5 585 1 29
C2 pentamer -29.41 H20: 10.06 -19.35 2 2.90 1 3 27D20: 7.66 -21.74 3 2.87 2.91 1 5 27
4 2.90 5.66 5.32 2 1 275 2.87 5.32 5.03 2.91 3 2 32
4 1 275 4 32
a Quantities defined as in Tables II and IV, Molecules numbered as in Figure 9.
Figure 9. EPEN minimum-energy water pentamers: (a) cage, (b) C2.
bonds between peripheral molecules. In other words, these particular structures are not minima on the 24-dimensional EPEN potential-energy surface.
The pentamers that we studied are even closer together in potential energy than are the tetramers. The C2 structure is the least stable (U = —29.41 kcal/mol of pentamer), and the other seven minima all fall between —34.90 and —35.51 kcal/mol. The pentamer hydrogen bonds are generally less strained than are those of the pyramid tetramer.
V III. T r a n sit io n S ta te s
As discussed in ref 4 and Appendix B, there are eight minima on the six-dimensional water dimer EPEN surface, corresponding to superimposable TNLD’s. This multiplicity is related to the CiU symmetry of the water molecule and physically corresponds to the eight ways of producing a hydrogen bond between two molecules with artificially labeled hydrogen nuclei and lone-pair electrons. Similarly,
there exist 96 isoenergetic cyclic trimer minima (of the type shown in Figure 7b) on the twelve-dimensional water trimer EPEN surface. Since the cyclic trimer is chiral, it occurs in 48 enantiomeric pairs. We now proceed to a discussion of the transition states and barriers to the interconversions among these structures.
Dimers. The five types of EPEN trimer transition states found here are pictured in Figure 10. They are the cyclic dimer (CD), planar linear dimer (PLD), perpendicular plane bifurcated dimer (PePBD), parallel plane bifurcated dimer (PaPBD), and perpendicular plane opposed dimer (PePOD).
The positive PePOD potential energy (U = +0.06 kcal/ mol) represents a high barrier to dimer interconversion and implies that the water dimer classically would dissociate (U = 0.00 kcal/mol) rather than pass through this transition state. We therefore have dropped the PePOD from further consideration. We likewise have eliminated the PaPBD because it is an energetically high-lying (U = —3.13 kcal/mol) transition state connecting other transition states and should not be important for dimer interconversions.
The CD, PLD, and PePBD are characterized in Table VIII with respect to R o - o , their energetics, and their normal mode vibrational frequencies for both H2O and D2O. We have reported fewer than six frequencies because one normal mode (two in the PLD and PePBD) is a transition coordinate rather than a bound vibrational mode. In other words, it is a coordinate for which the transition state is a point of unstable equilibrium on the six-dimensional potential energy surface. The most important result presented in Table VIII is that the barriers to the interconversions of dimers are small. At 0°K, as indicated by E ¡nt, the barriers are at most a few tenths of a kilocalorie/mole; the PLD barrier for H2O (but not D2O) is essentially zero. Moreover, since the transition-state normal-mode vibrational frequencies tend to be lower than those for the TNLD, the interconversion barriers should decrease with increasing temperature. In fact, a statistical-mechanical analysis (as in section IX, but treating the transition motions as monomer rotations instead of translations) of the “equilibrium” TNLD <=> PLD suggests that the PLD should predominate over the TNLD at temperatures above 0°K. Though such a treatment is at best of dubious validity, it illustrates clearly the importance of considering the
The Journal of Physical Chemistry, Vol. 79, No. 17, 1975

Structure, Energetics, and Dynamics of Small Water Clusters 1803
T A B L E V I I I : C ha rac te riza tion o f E P E N D im e r T ra n s itio n S tates“
Properties Cyclic dimer Planar linear dimerPerpendicular
plane bifurcated dimer
R o - . - o 2.91U -4 .48Z P E 1.65 1.25£ int ( T = 0 °K) -2 .83 -3 .23E in t(T = 0 "K) - £ inl ( T = 0.17 0.38
0°K) of TNLDWi 438 312a>2 300 221co3 185 160W4 148 121"5 83 60
° Quantities defined as in Tables II and III.
3 .00 2.90-4 .13 -4 .08
1.13 0.87 1.37 1.05-3 .0 0 -3 .2 6 -2 .71 -3 .03
0.00 0.35 0.29 0.58
288 208 306 234275 200 302 220146 139 208 147
81 59 140 133
C D P e P B D
P L D
Figure 10. EPEN water dimer transition states. For an explanation of the nomenclature, see section VIII. For those molecules for which only a single hydrogen Is shown, a second hydrogen lies directly behind the one shown, and its position Is determined by reflecting the pictured hydrogen through the plane of the paper.
curvature of the potential energy surface as well as the depths of its minima.
Though it is contrary to intuition to have a transition state more stable than a minimum-energy structure of lower potential energy, this actually is quite acceptable physically if the dimer is viewed as a quantum system having a higher probability density in a region of very low curvature of the potential than it has in a region of slightly lower potential energy but of higher curvature. In fact, however, the PLD structure is incompatible with the experimental observation20 that the b and c principal moments of inertia of the water dimer cannot differ from each other by more than a few tenths of a percent (for the PLD, the difference as computed from the coordinates in Appen
dix A is 2.2%). We must conclude that either the EPEN or our harmonic analysis produces transition states whose potential energies or calculated potential energy surface curvatures are slightly too low relative to those of the TNLD.
Since interconversion involves primarily hydrogen motions, the combination of the low mass and low transition- state barriers makes it likely that there is substantial quantum mechanical tunneling between potential-energy wells. At high temperatures (certainly in the supercritical region) there should be significant population of excited vibrational states lying above the barriers. Viewed classically, the dimer then interconverts freely among the eight potential energy minima. From a quantum-mechanical point of view, these effects increase the symmetry of the dimer so that the dimer can be classified under the permutation-inversion group35 isomorphic to the DAh point group36 rather than under the Cs point group to which the rigid nontunneling model of the TNLD belongs.
As discussed in Appendix B, the presence of the many isoenergetic minima does not in itself affect the entropy of the cluster. However, the additional fact, that the barriers to interconversion are low, should lead to an entropic increase and an enthalpic stabilization because of a decrease in the spacing of excited vibrational levels.
The conclusions that we have reached about the water dimer transition states are in general agreement with those from our earlier SS potential water dimer study,4 and we direct the reader there for a fuller discussion of the interconversion process. Dyke and Muenter20 have found evidence of tunneling and large-amplitude proton motions in the water dimer, and our conclusion that interconversion is rapid is in accord with their observations.
Trimers. The energetically most stable transition state for the interconversions of cyclic trimers that we have found is that pictured in Figure 11 and characterized in Table IX. While the cyclic trimer has its three non-hydro- gen-bonded hydrogens arranged one on one side of the oxygen ring and two on the other, the transition state has one on each side with the third approximately in the plane of the ring. It thus represents a transition state for the interconversion of enantiomers by the flipping of a non-hydrogen-bonded hydrogen from one side of the oxygen ring to the other.
Reference to Table IX shows that the potential energy of the transition state is 0.62 kcal/mol higher than that of the cyclic trimer minimum. However, if one includes the effects of vibrational zero-point energy, the energy difference
The Journal of Physical Chemistry, Vol. 79, No. 17, 1975

1804 J. C. Owi'cki, L. L. Shipman, and H. A. Scheraga
U Z P E E m ( T = 0 °K) N o rm a l-m o d e fre q u e n c ie s
T A B L E IX : C h a rac te riza tion o f the C yc lic T r im e r T ra n s itio n S ta te“
h 2o -14 .1 9 4.70
d 2o -1 4 .19 3.56
= 2.87 ß o 2" - 0 3 = 2.97 7?o3” -oj = 2.89
-9 .49 668 558163 184
-10 .63 484 408158 139
6 { 0 ,-H —0 2) = 23 ô (Oj -H * "0 3) = 25 5 (O j-H —Ot) = 44
450 328 292 214144 137 115331 240 216 187125 113 91
o;(l) = 62 a (2) = 65 £*(3) = 6
a Quantities defined as in Tables II, III, and IV. Molecules numbered as in Figure 11.
Figure 11. EPEN cyclic trimer transition state.
(Eint, T = 0°K) drops to 0.12 kcal/mol for D20. For H20, the internal energy at 0°K corresponding to the transition state actually is computed to be 0.04 kcal/mol lower than that of the cyclic trimer minimum. Since discriminations of energy as small as this are beyond the accuracy of our model, it would be rash to assert that what we have termed the cyclic trimer transition state really is the most stable form of the trimer at 0°K. One can conclude that the trimer exists in a cyclic form but that the time-averaged positions of the nuclei, particularly those hydrogens not involved in hydrogen bonds, are somewhat in doubt. That is, there are large-amplitude motions even at 0°K. As in the case of the dimer, tunneling between the cyclic trimer minima probably is important on a rotational time scale.
As noted above, the entropy of the trimer is increased by the presence of low-energy barriers for the interconversions between minima. Therefore, it is of interest to note (by examination of molecular models) that not all 96 minima on the twelve-dimensional EPEN trimer potential-energy surface are interconnected by the transition states described above. The minima can be divided into 16 groups of six each in which only members of a group can be intercon- verted by a succession of such low-energy paths. Passage between groups requires the interchange of hydrogens on one of the water molecules (i.e., a net 180° rotation about the molecular C2 axis) or the interchange of water molecules and, therefore, the rupture and re-formation of a hydrogen bond. The barrier to this process should be at least several kilocalories/mole of trimer; thus it should occur much more slowly than the interconversion of enantiomers.
Although we have not analyzed transition states for larger clusters, it seems likely that interconversion barriers will be higher for the more rigid, highly coordinated structures than for the dimer and trimer.
IX . V a p o r -P h a se A sso c ia tio n E q u ilib r ia
With the EPEN theoretical results so far presented, we are in a position to carry out an approximate statistical- mechanical calculation of thè thermodynamics of the gas- phase water cluster association equilibria
nH20 ^ (H20)„ (2)where (H20)„ is any of the seven water clusters that we have described. Other statistical-mechanical treatments of the dimer equilibrium have been reported by Bolander et al.37 and by Braun and Leidecker.32 Our statistical-mechanical model is of rigid-rotor clusters which execute small-amplitude harmonic vibrations about the EPEN minima. The straightforward derivation of the standard free energy, enthalpy, and entropy changes (AGn°, AHn°, and ASn°) for reaction 2 with this model is given in Appendix B.
It should be noted that reaction 2 pertains to a single type of nmer structure (e.g., the pyramid tetramer) rather than to all varieties of nmer (e.g., pyramid tetramer, S4 cyclic tetramer, etc.). If all varieties were included, the computed entropy change probably (but not necessarily) would be larger, and the computed enthalpy change would be a Boltzmann-weighted mean of the enthalpy changes of the various nmer structures.
The calculated values for these thermodynamic functions in the temperature range 100-700°K for all H20 and D20 clusters treated in this study are presented in TableX. The H20 data are plotted in Figures 12-14. The general features of these results are similar to those of most association equilibria. A i f „ ° is negative, reflecting the potential- energetic stability of the cluster, and ASn° is also negative, primarily reflecting the conversion of free translational and rotational degrees of freedom in the monomers to relatively restricted vibrational modes in the cluster. The temperature dependence of AHn° and ASn° can be explained generally in terms of the population of the excited vibrational states with increasing temperature.
From Figure 12 it is apparent that, in the temperature range studied, and at normal pressures, water vapor is composed primarily of monomers. From calculations of equilibrium concentrations using AGn° and Kn, dimers are present in much smaller amounts, and higher clusters represent only a minute fraction of the total. It might seem that the equilibrium concentration of small clusters relative to monomers should be high at low temperatures (AGn° < 0), but this is illusory because of the low equilibrium water vapor pressure there (P « 1 atm), which favors dissociation; i.e., the vapor pressure is much lower than the standard-state value of 1 atm, to which AGn° applies.
Any analysis of tetramer contributions to water vapor
The Journal of Physical Chemistry, Voi. 79, No. 17, 1975

Structure, Energetics, and Dynamics of Small Water Clusters 180S
T A B L E X : W a te r C luste r A ssocia tion E q u ilib r iu m Therm odynam ic Functions
A G Y---------------------------------------- - A # Y -A S0,.*
T - ------------------------------------------------------------------------------------------------------------------------------
C lu s te r S pecies 100°K 400°K 700°K 100°K 400°K 700°K 100°K 400°K 700°K
E P E N TNLD h 2o -1 .53 4.65 10.31d 2o -1 .8 9 4.52 10.23
E P E N cyclic h 2o -5 .8 2 9.29 23.48t r im e r d 2o -6 .61 9.00 23.31
E P E N p y ram id h 2o :-1 1 .0 5 13.54 36.74te t r a m e r d 2o -1 2 .2 1 13.11 36.48
E P E N S4 cy c lic h 2o . - -9 .9 0 14.13 37.05te t r a m e r d 2o -11 .3 1 13.56 36.71
E P E N a sy m m e tr ic h 2o -7 .43 15.19 36.49cy c lic te t r a m e r d 2o -8 .6 7 14.71 36.20
E P E N cage h 2o -15 .73 18.09 50.29p e n ta m e r d 2q . -1 7 .4 6 17.42 49.88
E PE N C 2 p e n ta h 2o -1 1 .07 20.75 50.63m e r d 2o - -1 2 .5 8 20.17 50.28
E xptl d im e r" h 20 3.41 8.78E xp tl t r im e r " h 2o 6.93 17.34E xptl te tra m e r" •h 20 9.49 24.79“ Units: kcal/mol of cluster. " Units: cal/deg/m ol of cluster. c AH¡
range of 150-450°.38
Temperature , °K
Figure 12. Plot of standard free energy change AG„° iper mole of rimer) vs. temperature for gas-phase EPEN water cluster association equilibria. Dashed lines are experimental results from ref 38.
should take into account the fact that many different tetra- mer structures are present. The same is true for pentamers and, presumably, for higher structures.
For T = 373°K, P = 1 atm, we have used our results to calculate the equilibrium mole fractions of H2O found in the various types of EPEN clusters reported in this paper. We have found the following distribution: monomer, 0.991;
3.57 3.28 2.32 20.4 19.8 18.14.09 3.53 2.47 22.0 20.1 18.2
10.71 10.37 8.50 48.9 49.2 45.711.87 10.92 8.83 52.6 49.8 45.919.05 18.49 15.67 79.9 80.1 74.920.75 19.29 16.15 85.4 81.0 75.217.61 17.45 14.84 77.1 78.9 74.119.58 18.49 15.49 82.7 80.1 74.614.79 14.29 11.54 73.6 73.7 68.616.55 15.18 12.09 78.8 74.7 69.026.66 26.24 22.64 109.3 lio.e 104.229.12 27.49 23.41 116.6 112.3 104.721.51 20.57 16.80 104.4 103.3 96.323.69 21.64 17.46 111.1 104." 96.8
3.75 3.75 17.9 17.96.95 6.95 34.7 34.7
10.91 10.91 51.0 51.0and AS,° assumed constant throughout experimental temperature
Figure 13. Plot of standard enthalpy change A Hn° (per mole of nmer) vs. temperature for gas-phase EPEN water cluster association equilibria. Dashed lines are experimental results from ref 38.
TNLD, 9 X 10~3; cyclic trimer, 6 X 10~5; tetramers (each type), ~10~7 to 10~6; pentamers (each type), ~10-10 to 10“8.
Three experimental techniques have been employed to elucidate the thermodynamics of water clusters (usually the dimer) in water vapor. They are (1) the analysis of PVT data for nonideality,38’39 (2) the study of the pressure dependence of the speed of sound in water vapor,40 (3) the study of the temperature dependence of water vapor absorptions in the far infrared (7-30 cm-1),41 which have been attributed to AK = 1 dimer rotational transitions.42
Results have varied widely. For example, experimental estimates of AH 2 ° range from —3.75 kcal/rr.ol39 to -12
The Journal of Physics! Chemistry, Vol. 79, No. 17, 1975

1806 J. C. Owicki, L L. Shipman, and H. A. Scheraga
Figure 14. Plot of standard entropy change A Sn° (per mole of nmer) vs. temperature for gas-phase EPEN water cluster association equilibria. Dashed lines are experimental results from ref 38.
keal/mol.40 The most complete and, probably, the most accurate study is that of Kell and McLaurin,38 in which water vapor virial coefficient data are analyzed by assuming that nonideality results from water cluster association equilibria. These results for the dimer, trimer, and tetramer are presented in Table X and Figures 12-14.43 In analyzing their accuracy, one must consider both experimental error in' the virial coefficient determination and approximations in the theoretical model which translates virial coefficient data into association equilibrium constants. The most important of these approximations probably is the use of a somewhat arbitrary temperature-independent hard-sphere excluded volume to describe the effects of intermolecular interactions which are not productive of clusters. Taking these uncertainties into account, we estimate the uncertainty in the experimental AG2° at less than 1 kcal/mol. That in AG30 may be as great as 2 kcal/mol, and that in AG4° should be somewhat higher. Also, it should be noted that the experimental quantities refer to tetramers as a group, and thus technically are not directly comparable to the calculations for any one of our single tetramer equilibria.
We turn now to a comparison of our EPEN theoretical results with the experimental results. The agreement is good considering the accuracy of the experimentally derived data and the fact that our theoretical calculations have made no use of experimental data on water clusters. Our values of AGn° are somewhat too positive, while A//„° and ASn° (except for the TNLD) are significantly too negative. These deviations may be caused by approximations either in EPEN itself and/or in our statistical-mechanical analysis. In making this comparison, it should be recalled that reaction 2 applies to a single nmer species, while the experimental results are for a mixture of nmers for a givenn. This is not important for n = 2 and 3, since we believe that the TNLD and cyclic trimer are the only dimer and trimer minima. For n > 3, however, many different types of nmers should be present. Since we have not found and characterized all of these, our results are difficult to compare with experiment.
One important cause of the deviations of our results from experiment is our use of a rigid-rotor, harmonic-oscillator model in a system where anharmonicity and quantum-mechanical tunneling between potential-energy minima probably are important. The neglect of anharmonicity in this model leads to an overprediction of the separation of vibrational energy levels, which is consistent with the observed discrepancies between calculated and experimental thermodynamic properties. Bolander et al.37 tried to overcome this limitation, partially, for the dimer by assuming free rotation about the hydrogen bond. While, in our case, this procedure might improve the agreement between calculations and experimental data somewhat, it is neither readily applicable to cyclic clusters nor (according to our calculations) physically valid. In section VIII, we discussed the energetically most feasible dimer interconversions or large- amplitude internal motions. Rather than hydrogen-bond torsions, they are complicated combinations of monomer rotations and translations which are difficult to treat except in the classical limit, and our calculations suggest that the system is far from classical.
Kell et al.44 have determined the D2O vapor virial coefficients as functions of temperature. Using an analysis similar to that in ref 38, they calculated that, near 600°K, A A / / 20 = A//20h2o — A7/2°d2o = 0.02 kcal/mol and AAS2° = A S 2°h 2o — AS2°D20 = —0.03 cal/mol deg. Our EPEN-calculated values (at 600° K) are somewhat larger: 0.17 kcal/mol and +0.14 cal/mol deg, respectively.
In this paper, as in ref 32 and 37, the standard approximations of quantum mechanics (e.g., the separation of internal variables and the harmonic-oscillator assumption) have been employed. It should be emphasized that these provide only a very crude representation of the real system, which is extraordinarily complex and difficult to treat accurately.
X. Comparison of Water Pair PotentialsTables II and III and Figure 4 present the results of our
dimer calculations with the water pair potentials listed in section III. The purpose of the following discussion is a comparison of these results with experimental water dimer data and a discussion of the areas of consensus about the water dimer structure and energetics.
Reference to Table II shows that the AFHF value of Ro-o is correct within experimental error;45-46 those predicted by the EPEN, SS, and ST2 potentials are somewhat too small, and the BNS and WB values are much too small. The latter two are approximately the same Ro-o that is found for ice Ih,47 which is not characteristic of the dimer. The agreements between theoretical and experimental values of 7b and Ic parallel those for Ro-o, since the quantities are related closely. The dimers formed with all of the potentials conform to the experimental finding that the dimer is almost an accidental symmetric top.
The values of 6 predicted by the EPEN, ST2, and BNS potentials are correct within experimental error. The WB result is marginal, and the SS and AFHF predictions are definitely wrong. All of the potentials correctly predict that the hydrogen bond is linear to within 10°.
The theoretical results for in Table II reflect both the dimer structure computed with each potential and our di- pole-moment model. As was discussed in section IV, all of our calculated TNLD dipole moments are about 10% too low. Therefore, the seemingly excellent agreement of the BNS and WB Ma’s with experiment is due largely to a can-
The Journal o f Physical Chemistry, Vol. 79, No. 17, 1975
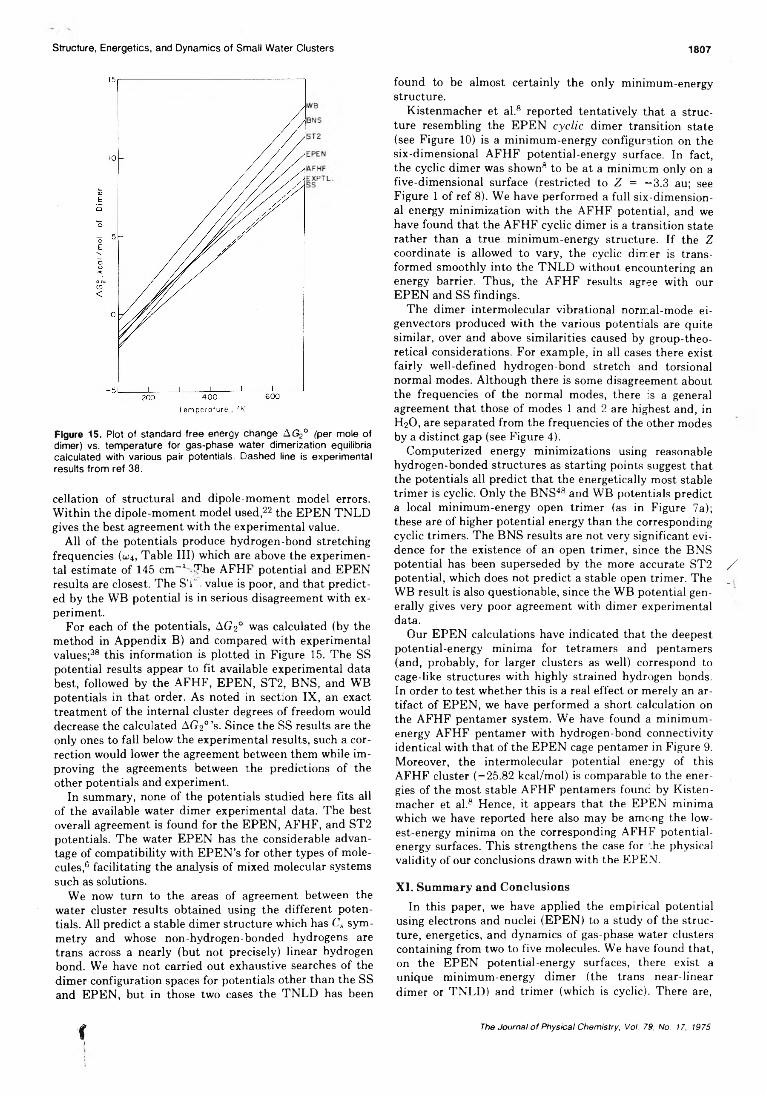
Structure, Energetics, and Dynamics of Small Water Clusters
Figure 15. Plot of standard free energy change A G2° (per mole of dimer) vs. temperature for gas-phase water dimerization equilibria calculated with various pair potentials. Dashed line is experimental results from ref 38.
cellation of structural and dipole-moment model errors. Within the dipole-moment model used,22 the EPEN TNLD gives the best agreement with the experimental value.
All of the potentials produce hydrogen-bond stretching frequencies (0)4, Table III) which are above the experimental estimate of 145 cm-1 »The AFHF potential and EPEN results are closest. The ST . value is poor, and that predicted by the WB potential is in serious disagreement with experiment.
For each of the potentials, AG2° was calculated (by the method in Appendix B) and compared with experimental values;38 this information is plotted in Figure 15. The SS potential results appear to fit available experimental data best, followed by the AFHF, EPEN, ST2, BNS, and WB potentials in that order. As noted in section IX, an exact treatment of the internal cluster degrees of freedom would decrease the calculated AG 2° ’s. Since the SS results are the only ones to fall below the experimental results, such a correction would lower the agreement between them while improving the agreements between the predictions of the other potentials and experiment.
In summary, none of the potentials studied here fits all of the available water dimer experimental data. The best overall agreement is found for the EPEN, AFHF, and ST2 potentials. The water EPEN has the considerable advantage of compatibility with EPEN’s for other types of molecules,6 facilitating the analysis of mixed molecular systems such as solutions.
We now turn to the areas of agreement between the water cluster results obtained using the different potentials. All predict a stable dimer structure which has Cs symmetry and whose non-hydrogen-bonded hydrogens are trans across a nearly (but not precisely) linear hydrogen bond. We have not carried out exhaustive searches of the dimer configuration spaces for potentials other than the SS and EPEN, but in those two cases the TNLD has been
found to be almost certainly the only minimum-energy structure.
Kistenmacher et al.8 reported tentatively that a structure resembling the EPEN cyclic dimer transition state (see Figure 10) is a minimum-energy configuration on the six-dimensional AFHF potential-energy surface. In fact, the cyclic dimer was shown8 to be at a minimum only on a five-dimensional surface (restricted to Z = -3.3 au; see Figure 1 of ref 8). We have performed a full six-dimensional energy minimization with the AFHF potential, and we have found that the AFHF cyclic dimer is a transition state rather than a true minimum-energy structure. If the Z coordinate is allowed to vary, the cyclic dimer is transformed smoothly into the TNLD without encountering an energy barrier. Thus, the AFHF results agree with our EPEN and SS findings.
The dimer intermolecular vibrational normal-mode eigenvectors produced with the various potentials are quite similar, over and above similarities caused by group-theoretical considerations. For example, in all cases there exist fairly well-defined hydrogen-bond stretch and torsional normal modes. Although there is some disagreement about the frequencies of the normal modes, there is a general agreement that those of modes 1 and 2 are highest and, in H2O, are separated from the frequencies of the other modes by a distinct gap (see Figure 4).
Computerized energy minimizations using reasonable hydrogen-bonded structures as starting points suggest that the potentials all predict that the energetically most stable trimer is cyclic. Only the BNS48 and WB potentials predict a local minimum-energy open trimer (as in Figure 7a); these are of higher potential energy than the corresponding cyclic trimers. The BNS results are not very significant evidence for the existence of an open trimer, since the BNS potential has been superseded by the more accurate ST2 / potential, which does not predict a stable open trimer. The _ WB result is also questionable, since the WB potential generally gives very poor agreement with dimer experimental data.
Our EPEN calculations have indicated that the deepest potential-energy minima for tetramers and pentamers (and, probably, for larger clusters as well) correspond to cage-like structures with highly strained hydrogen bonds.In order to test whether this is a real effect or merely an artifact of EPEN, we have performed a short calculation on the AFHF pentamer system. We have found a minimum- energy AFHF pentamer with hydrogen-bond connectivity identical with that of the EPEN cage pentamer in Figure 9. Moreover, the intermolecular potential energy of this AFHF cluster (—25.82 kcal/mol) is comparable to the energies of the most stable AFHF pentamers found by Kistenmacher et al.8 Hence, it appears that the EPEN minima which we have reported here also may be among the low- est-energy minima on the corresponding AFHF potential- energy surfaces. This strengthens the case for rhe physical validity of our conclusions drawn with the EPEN.
XI. Summary and ConclusionsIn this paper, we have applied the empirical potential
using electrons and nuclei (EPEN) to a study of the structure, energetics, and dynamics of gas-phase water clusters containing from two to five molecules. We have found that, on the EPEN potential-energy surfaces, there exist a unique minimum-energy dimer (the trans near-linear dimer or TNLD) and trimer (which is cyclic). There are,
18 0 7
fThe Journal o f Physical Chemistry, Voi. 79, No. 17, 1975

1808 J. C. Owicki, L. L, Shipman, and H. A, Scheraga
however, many local minimum-energy tetramers and pen- tamers. The presence of multiple minima of comparable energies probably is true for larger clusters as well, and is of great entropic importance to the formation of such structures.49
The calculated intermolecular potential energy per mole of water monomers in our clusters (—U/n in Figure 16) is far below the value for an infinite cluster, represented by the experimental lattice energy of ice Ih.50 This happens because, in ice (as opposed to smaller clusters), complete hydrogen bonding, energetically stable hydrogen bonding geometries, and favorable non-nearest-neighbor interactions are allowed simultaneously. A major conclusion of this study is that hydrogen bonding in smaller water clusters often is significantly distorted from the tetrahedral linear hydrogen bonds found in ice.
Nor are our results characteristic of bulk liquid water, which may have local C2u symmetry.51 Using a cluster model, Lentz et al.25b have shown that there are strong, ori- entationally dependent interactions between clusters in liquid water. We would expect these interactions to stabilize more regular, tetrahedrally coordinated structures than those which we have obtained for the gas phase. .
Instead, our findings are more applicable at surfaces or at interfaces between an aqueous phase and another without hydrogen-bonding capability. This is related closely to the question of solvent structural changes due to hydro- phobic interactions. The EPEN formalism now is being used in our laboratory to investigate this subject.
Our results also have important implications for atmospheric processes such as the water-vapor association equilibrium and water droplet nucleation. Daee et al.52 have developed a molecular theory of homogeneous nucleation in water based on a statistical-mechanical analysis of cla- thrate-like water clusters. We suggest that, in view of the present results, it would be profitable to explore a model in which there are many compact, irregular structures for a given cluster size. These should be more characteristic of the true water prenucleation clusters than the clathrate forms.
We have confirmed and extended our earlier study of water cluster transition states4 in which we predicted low barriers for interconversions among potential-energy minima and attendant quantum-mechanical tunneling.
An approximate statistical-mechanical treatment of the gas-phase water association equilibrium has been carried out with results which are in moderate agreement with experimental data.
Finally, we have analyzed the water dimer and trimer structures produced by a variety of water pair potentials. Among these, the EPEN, AFHF,7-8 and ST211 potentials generally give the best results in comparison to experiment. All of the potentials predict essentially the same type of minimum-energy dimer, and they are unanimous in their prediction that the lowest minimum-energy trimer is cyclic.
Acknowledgments. We wish to thank Drs. John S. Muenter and Benjamin A. Widom for helpful discussions of this work.
Appendix AThis Appendix lists the cartesian coordinates (in A) of
the oxygen and hydrogen atoms of the water molecules in the EPEN water clusters described in the text of this
2 3 4 5n,molecules In cluster (ICE I h)
Figure 16. Intermolecular potential energy per water molecule (—U/n) for EPEN clusters plotted vs. number of molecules (n) per cluster. At the right is the limit for infinite n (the experimental ice K, lattice energy50).
paper. In each cluster, one molecule has the following coordinates:
Atom X Y Z
O 0.0000 0.0000 0.0000H 0.5859 0.7569 0.0000H 0.5859 -0.7569 0.0000
The coordinates of the additional molecules in the various clusters are listed in Table XI.
Appendix BWater vapor is assumed to be a mixture of water mono
mers and clusters whose partial pressures are governed by relations such as
KnnH20 — (H20)„ (Bl)
Kn = P J P ? (B2)where Pi and Pn are the partial pressures of the monomer and timer, respectively, and Kn is the pressure equilibrium constant for the reaction. It should be noted that (H20)n pertains to a single timer structure rather than to all varieties of timers. Thus, for example, we will have separate equilibria for the pyramid tetramer and S4 cyclic tetramer.
For a water timer, each point on the (6ti - 6)-dimensional potential-energy surface is a member of a set of ti!(2") points corresponding to superimposable structures. These may be viewed as the ti! permutations of the ti water molecules, multiplied by the 2" permutations of the hydrogen nuclei generated by 180° rotations of the individual molecules about their C2 symmetry axes. In cases where a molecular symmetry axis is also a symmetry element of the cluster, some of these points in the cluster configurational space are degenerate. For example, there are only four distinct PePBD points on the six-dimensional dimer potential-energy surface instead of eight [= 2!(22)]. Finally, if a configuration is chiral, there exists an additional set of nl(2n) enantiomeric configurations. In this case, there are a total of n!(2n+1) isoenergetic configurations in two enantiomeric classes, each formed of n!(2n) superimposable structures.
It might seem that the existence of all these minima would lead to a great entropic contribution, but such is not the case. In statistical-mechanical theory, configurations
The Journal of Physical Chemistry, Vol. 79, No. 17, 1975X

Structure, Energetics, and Dynamics of Small Water Clusters 1809
TABLE XI:
C oordinates
C luster Atom X Y Z
TNLD O -1.3582 - 0 . 0 0 0 0 2.5388H -0.9484 - 0 . 0 0 0 0 1.6739H -2.2984 - 0 . 0 0 0 0 2.3590
Cyclic 0 -0.9133 1.3245 2.4000tr im e r H -0.8172 0.6634 1.7145
H -1.8087 1.6471 2.29860 1.2666 2.4683 0.8821H 0.5710 2.3609 1.5308H 2.0720 2.5067 1.3979
P yram id 0 0.9960 2.6613 0.1749te tra m e r H 0.6119 2.9116 1.0151
H 0.3319 2.8978 -0.47260 -1.4456 1.8533 1.6556H -2.0377 1.6890 2.3895H -1.0673 0.9970 1.45590 -1.5092 2.2932 -1.2091H -1.8834 2.2544 -0.3290H -1.3152 1.3818 -1.4278
S4 cyclic 0 0.2282 2.9513 2.6969te tra m e r H 0.6901 2.8652 3.5308
H -0.3780 2.2107 2.6807O -1.3385 0.6079 2.4210H -0.9294 0.2909 1.6157H -2.2613 0.7206 2.1931O 1.6536 2.2734 0.3452H 1.2649 2.5740 1.1666H 1.5286 3.0037 -0.2608
A sym m etric O 2.0523 2.0431 -0.1368cyclic H 2.0079 2.7649 0.4902te tra m e r H 2.0040 2.4663 -0.9939
O 2.0716 -1.9940 -0.1446H 2.8151 -1.3925 -0.1851H 2.0767 -2.4394 -0.9918O 4.0863 0.0181 -0.1623H 3.5352 0.7982 -0.0998H 4.5726 0 . 0 0 1 2 0.6619
corresponding to the interchange of identical particles (here, water molecules or hydrogen nuclei) cannot be counted twice in the partition function. For a given type of cluster, then, we may develop the partition function in one of two equivalent ways. Either we may consider all n!(2") superimposable structures and then divide the partition function by n!(2n) to correct for overcounting, or we may treat only one of the configurations and not divide by n!(2n). In this paper we have used the latter procedure. In the case of a chiral structure, this produces a partition function for only one member of the enantiomeric pair. Since we have chosen to treat both members together in the development below, we have added a multiplicative factor (Qi,9) to the partition function to account for the effects of chirality.
We now present a derivation of the statistical thermodynamics of reaction B1 based upon our EPEN results and
C oordinates
C luster Atom X Y Z
Cage O 1.3890 2.4393 -0.1214pentam er H 0.5633 2.9175 -0.1971
H 1.8148 2.8160 0.6486O -1.2489 3.3942 -0.2215H -1.5951 2.9479 -0.9943H -1.6142 2.9102 0.5190O -2.2141 1.2225 1.3850H -1.4441 0.6589 1.3097H -2.7960 0.9289 0.6841O -2.1527 1 . 0 1 1 0 -1.5749H -1.3507 0.5464 -1.3358H -2.3798 0 . 6 6 8 6 -2.4394
C2 O -0.6344 1.1938 2.5635pentam er H -0.5935 0.5731 1.8360
H -1.5511 1.4675 2.5942O 1.3832 2.3768 0.8251H 0.8373 2.2617 1.6030H 1.1679 3.2541 0.5085O -0.6344 -1.1938 -2.5635H -1.5511 -1.4675 -2.5942H -0.5935 -0.5731 -1.8360O 1.3832 -2.3768 -0.8251H 1.1679 -3.2541 -0.5085H 0.8373 -2.2617 -1.6030
CD O 0.3515 2.2096 1.8615tran sitio n H -0.2344 1.4527 1.8615sta te H -0.2344 2.9665 1.8615
PePBD O -2.8958 0 . 0 0 0 0 0 . 0 0 0 0
tran sitio n H -2.3099 0 . 0 0 0 0 0.7569sta te H -2.3099 0 . 0 0 0 0 -0.7569
PLD O -2,8799 -0.8439 0 . 0 0 0 0
tran sitio n H -3.4407 -0.0683 0 . 0 0 0 0
sta te H -1.9884 -0.4955 0 . 0 0 0 0
Cyclic O -0.9442 0.7945 2.5946tr im e r H -0.8119 0.3450 1.7599transition H -1.8183 1.1782 2.5245sta te O 1.3367 2.1922 1.4989
H 0.6383 1.8945 2.0819H 1.8260 2.8310 2.0173
making use of standard statistical-mechanics theory.53 Although reaction B1 refers to H20, our results will apply equally well to D20.
Choosing a standard state of 1 atm pressure (P°) for each component, we obtain the standard Gibbs free energy change for reaction B1 as
AG„° = G n° ~ nGi° = - R T In K n (B3)
Expression B3 can be related to the cluster molecular partition function qt (i = 1 , n) under the assumption of ideal- gas behavior between clusters by
Gi° = - R T In — j (i = 1, n) (B4)
We assume that tj, is expressible as a product of independent partition functions from translational (<?,.t), rotational
The Journal of Physical Chemistry, Vol. 79, No. 17, 1975

1810 J. C. Owicki, L. L. Shipman, and H. A. Scheraga
(qi r), and v ibrational (g;,v) degrees of freedom, as well as term s involving the dep th of the interm olecular potential- energy m inim um (qi,p) and the existence of enantiom orphic form s of th e s truc tu re (g;,s):
Qi — Qi,tQitrQi,vQi,pQi,s (B5)
qi t is the classical translational partition function
where A; is th e therm al wavelength of species i and m, is the corresponding mass.
qir is th e classical rigid-rotor partition function m ultiplied by the S tripp-K irkw ood quantum correction : 2 3
q,,T = (<7;,r)class j l + j^2(0r,a + 0r ,b + ^r,c) “
^r,a^r,b ^r.b^r.c ^r,c^r,a j |0r,c fir,a &r,b J J
whereir1/2 / r 3 y / 2
(<7i,r)class ( „ „ „ )&i ' ^r,a^r,b^r,c^
and! _ h 2 _ 24,26 am u À deg'r J = 8 x 2W j " Tj
j = a, b, c
0tj is the rotational excitation tem peratu re for ro tation about the j principal inertial axis with inertial m om ent Ij (j = a, b, c). <r, is the rotational sym m etry num ber.
The classical rotational partition function is valid where 6J T « 1. We have used the quantum correction 2 3 to im prove the low -tem perature accuracy, prim arily because of th e high ro tational excitation tem peratures of the m onom er (flr,a = 39° K). The quantum correction is ~4% of (<?i,r)ciass for the m onom er a t 100°K, and it is insignificant for n > 2 a t or above this tem perature . In the calculations, we have used cluster principal inertial m om ents obtained for the E P E N structures; the m onom er principal m om ents have been given by Benedict e t a l . 1 3
q,_v is obtained by assuming th a t the cluster executes sm all-am plitude harm onic vibrations about the potential- energy minimum. The vibrational partition function is th en a product of harm onic-oscillator partition functions for the various interm olecular norm al-m ode vibrations.
= n :---- ZT~Jt (B8)j 1 — e
where
1.439coy cm deg
j = 1 ,2,.. ., (6 i - 6 )
(>v] is the vibrational excitation tem peratu re for the y'th norm al mode, which has a v ibrational frequency of coy, in wave num bers. This vibrational model is of questionable validity, as is discussed in sections V III and IX of this paper.
We have neglected intram olecular vibrations under the assum ption th a t they are not affected significantly in the association reaction. This introduces a sm all error, bu t it is a necessary assum ption within the E P E N rigid-monomer theoretical framework.
ryIiP is in troduced to com pensate for the fact th a t, in ql v,
energy levels are measured with reference to the bottom of the intermolecular potential energy well rather than with respect to isolated, noninteracting molecules:
qi. P = e~u‘/RT (B9)Here Ui is the EPEN intermolecular potential energy of interaction as reported in the text of this paper for the various water clusters.
qi.a is an entropic factor having the value 1 unless species i exists as a pair of enantiomers (is chiral), in which case q i.s = 2. Of the clusters presented in this paper, all except the monomer, TNLD, and C2 pentamer are chiral.
It should be noted that qijV = q\ p = 1 for the monomer.Once AGn° is known as a function of temperature, the
standard enthalpy change AHn° and entropy change ASn° can be obtained analytically or numerically from relations such as
n A Q 0A Sn° = ------ - 2 - ; A H n° = A G n° + T A S n° (BIO)
a T P
N o t e Ad d e d IN P r o o f : In a recent study of correlation effects in hydrogen-bonding systems, Diercksen et al.54 have found that the inclusion of configurational interaction (Cl) in ab initio SCF calculations on the water dimer reduces the minimum-energy value of R 0-0 from 3.00 A, as obtained without Cl, to 2.92 A. This is about 0.06 A lower than the experimental (quantum-mechanical average) value20 of 2.98 A. As noted in section IV, differences between such average and minimum-energy quantities are to be expected and may be due to anharmonicity in the effective hydrogen-bond stretching potential. This decrease in the calculated value of R o - o reduces the difference between the calculated values of Rq- o for the EPEN and ab initio minimum-energy water dimers to 1.4%. Diercksen et al. also found 8 = 42.4° and U = —6.05 kcal/mol for the SCF-CI dimer; 6 was constrained to be zero.
In another recent paper, Curtiss and Pople55 have performed a theoretical (ab initio SCF) intra- and intermolecular vibrational normal-mode analysis on the water dimer using a 4-31G basis set. They obtained the following H2O intermolecular normal-mode vibrational frequencies (with the approximately corresponding mode numbers from Table III of this paper): 536 cm-1 (1), 452 cm-1 (2), 204 cm" 1 (4), 185 cm“ 1 (3), 118 cm“ 1 (5, 6), 81 cm“ 1 (5, 6). These results agree with those of the better empirical potentials in Table III in several respects. In particular, there are two high-frequency librations and a fairly well-defined hydrogen-bond stretch, and the remaining modes have frequencies below 300 cm-1. The authors reported that, with an improved basis set (6-31G*, which gave a much more accurate structural and energetic description of the dimer), the hydrogen-bond stretching normal mode dropped to about 170 cm-1. Similar variations might be expected for the other frequencies.
References and Notes(1) This work was supported by research grants from the National Institute
of General Medical Sciences of the National Institutes of Health, U.S. Public Health Service (GM-14312), and from the National Science Foundation (BMS71-00872 A04).
(2) Part of this work was presented before the Division of Physical Chemistry at the 169th National Meeting of the American Chemical Society, Philadelphia, Pa., April, 1975, Abstracts, Phys. 137.
(3) (a) NSF Predoctoral Fellow, 1968-1969 and 1972-1974; NIH Trainee, 1974-1975. (b) NIH Postdoctoral Fellow, 1972-1974.
(4) L. L. Shipman, J. C. Owicki, and H. A. Scheraga, J. Phys. Chem 78, 2055(1974).
(5) L. L. Shipman and H. A. Scheraga, J. Phys. Chem., 78, 909 (1974).
The Journal of Physical Chemistry, Voi. 79, No. 17, 1975

Structure, Energetics, and Dynamics of Small Water Clusters 1811
(6) (a) L. L. Shipman, A. W. Burgess, and H. A. Scheraga, Proc. Nat. Acad. Sci. U.S.A., 72, 543 (1975); (b) A. W. Burgess, L. L Shipman, and H. A. Scheraga, ibid., 72, 854 (1975).
(7) H. Popkie, H. Kistenmacher, and E. Clementi, J. Chem. Phys., 59, 1325 (1973).
(8) H. Kistenmacher, G. C. Lie, H. Popkie, and E. Clementi, J. Chem. Phys., 61, 546 (1974).
(9) A. Ben-Naim and F. H. Stillinger, Jr., in "Structure and Transport Processes in Water and Aqueous Solutions", R. A. Horne, Ed., Wiley, New York, N.Y , 1972, p 295.
(10) A. Rahman and F. H. Stillinger, Jr., J. Chem. Phys., 55, 3336 (1971).(11) F. H. Stillinger, Jr., and A. Rahman, J. Chem. Phys., 60, 1545 (1974).(12) M. Weismann and L. Blum, Trans. Faraday Soc., 64, 2605 (1968).(13) W. S. Benedict, N. Gailar, and E. F. Flyer, J. Chem. Phys., 24, 1139
(1956).(14) B. R. Lentz and H. A. Scheraga, J. Chem. Phys., 58, 5296 (1973); 61,
3493 (1974).(15) J. Del Bene and J. A. Pople, J. Chem. Phys., 52, 4858 (1970).(16) D. Hankins, J. W. Moskowitz, and F. H. Stillinger, Jr., J. Chem. Phys.,
53, 4544(1970).(17) M. J. D. Powell, Comput. J., 7, 155 (1964).(18) W. I. Zangwlll, Comput. J., 10, 293 (1967).(19) J. Raphson, "Analysis Equationum Universalis", 1690, cited by T. Cajori
in "A History of Mathematics", McMillan, New York, N.Y., 1919, p 203.(20) T. R. Dyke and J. S. Muenter, J. Chem. Phys., 60, 2929 (1974).(21) S. A. Clough, Y. Beers, G. P. Klein, and S. Rothman, J. Chem. Phys.,
59,2254(1973).(22) L. L. Shipman and H. A. Scheraga, J. Phys. Chem., 79, 380 (1975).(23) K. F. Stripp and J. G. Kirkwood, J. Chem. Phys., 19, 1131 (1951).(24) For a discussion of the approximations made in the derivation of EPEN,
see ref 6.(25) (a) B. R. Lentz, A. T. Hagler, and H. A Scheraga, J. Phys. Chem., 78,
1844 (1974); (b) ibid., 78, 1531 (1974).(26) 0. Weres and S. A. Rice, J. Am. Chem. Soc., 94, 8983 (1972).(27) k is defined as (2(,- ' - /a_1 - < f1K(4-1 ~ k~')- See, e.g., J. C. Davis,
Jr., "Advanced Physical Chemistry", Ronald Press, New York, N.Y., 1965, p 324.
(28) J. B. Hasted in “Water, a Comprehensive Treatise”, Vol. 1, F. Franks, Ed., Plenum Press, New York, N.Y., 1972, p 257.
(29) S. Nir, S. Adams, and R. Rein, J. Chem. Phys., 59, 3341 (1973).(30) J. S. Muenter, private communication. These were calculated in the har
monic approximation from spectroscopic determinations of DJf the centrifugal distortion constant. The water dimer was taken to be a pair of point molecules to evaluate the hydrogen-bond stretching force constant.
(31) This fact has been noted before. See, e.g., ref 4 and 5.
(32) C. Braun and H. Leidecker, J. Chem. Phys., 61, 3104 (1974).(33) K. Morokuma and J. R. Winlck, J. Chem. Phys., 52, 1301 (1970).(34) T. R. Dyke and J. S. Muenter, J. Chem. Phys., 57, 5011 (1972).(35) H. C. Longuet-Higgins, Mol. Phys., 8, 445 (1963).(36) This analysis has been carried out by Dyke and Muenter In ref 20 to an
alyze the tunneling splitting of the dimer rotational energy levels.(37) R. W. Bolander, J. L. Kassner, Jr., and J. T. Zung, J. Chem. Phys., 5 0 ,
4402(1969).(38) G. S. Kell and G. E. McLaurin, J. Chem. Phys., 51, 4345 (1969).(39) G. S. Kell, G. E. McLaurin, and E. Whalley, J. Chem. Phys., 48, 3805
(1968).(40) G. E. Ashwell, P. A. Eggett, R. Emery, and H. A. Gebbie, Nature (Lon
don), 2 4 7 , 196 (1974).(41) H. A. Gebbie, W. J. Burroughs, J. Chamberlain, J. E. Harries, and R. G.
Jones, Nature (London), 2 2 1 , 143 (1969).(42) A. A. Viktorova and S. A. Zhevakin, Sov. Phys. Dokl. (Engl. Trans.), 11,
1059(1967).(43) In comparing thermodynamic quantities in this paper to those in ref 38,
it should be noted that ours refer to the equilibrium nfHiO) ¡=î (H2O),, while those in ref 38 refer to the sequential polymerization equilibria (HîOin-! + H2O j=s (H20)„. The experimental data in Table X and Figures 12-14 have been transformed to refer to our equilibria.
(44) G. S. Kell, G. E. McLaurin, and E. Whalley, J . Chem. Phys., 4 9 , 2834 (1968).
(45) Kistenmacher et al.46 have added a term to the AFHF potential to account for electron correlation effects. With this modification, flo~o decreases slightly to 2.97 A. The changes in the dimer structure are small, and U becomes only 0.26 kcal/mol more negative (by our calculation).
(46) H. Kistenmacher, H. Popkie, E. Clementi, and R. O. Watts, IBM Research Report No. RJ 1335, San Jose, Calif., Jan 20, 1974. See also F.F. Abraham, J. Chem. Phys., 61, 1221 (1974).
(47) D. Eisenberg and W. Kauzmann, "The Structure and Properties of Water", Oxford University Press, New York, N.Y., 1969, p 71.
(48) This structure also has been found by Lentz et al.25*(49) This has been noted previously by Kistenmacher et al.8(50) E. Whalley in "Physics and Chemistry of Ice", E. Whalley, S. Jones, and
J. W. Gold, Ed., Royal Society of Canada, 1973, p 73.(51) G. E. Walrafen in "Water, a Comprehensive Treatise”. Vol. 1, F.
Franks, Ed., Plenum Press, New York, N.Y., 1972, p 170.(52) M. Daee, L. H. Lund, P. L. M. Plummer, J. L. Kassner, Jr., and B. N.
Hale, J. Colloid Interface Sci., 3 9 , 65 (1972).(53) T. L. Hill, "An Introduction to Statistical Thermodynamics", Addison-
Wesley, Reading, Mass., 1960.(54) G. H. Diercksen, W. P. Kraemer, and B. O. Roos, Theor. Chim. Acta,
38, 249 (1975).(55) L. A. Curtiss and J. A. Pople, J. Mol. Spectrosc., 5 5 , 1 (1975).
The Journal of Physical Chemistry, Vol. 79, No. 17, 1976

1812 M . Cl. Haulait and P. L. Huyskens
Influence of a First Hydrogen Bond on the Formation of a Second One by Alkyl- or Dialkylammonium Ions
M. Cl. Haulait and P. L. Huyskens*Laboratorium voor Fysicochemie en Stralingschemie, Universiteit te Leuven, Celestijnenlaan 200-F, 3030 Heverlee, Belgium (Received March 10, 1975)
Publication costs assisted by KUL and F.C.F.O (Belgium)
From conductim etric m easurem ents, the dissociation constants Kd of dialkyl- and monoalkylam m onium picrates and dialkylam m onium perchlorates, brom ides, and chlorides in n itrobenzene were determ ined in the presence of various am ounts of basic ligands such as pyridine and aliphatic am ines. From these data, it was possible to show th a t the solvation of the ion pairs is effective and to estim ate th e values of k\+ and &2 +, the equilibrium constants for the successive additions of ligand molecules to the cation, and of K i, the addition constan t for the ion pair. I t appears th a t k\+ > K \ > &2+. A first hydrogen bond between the ca tion and a ligand molecule decreases thus more the proton donor ability of the second N -H link than the firs t hydrogen bond between the cation and the anion. This can be explained by a greater stretching of the first N -H link in the form er case. This stretching is rela ted to the difference between th e two m inim a of the curve of the po tential energy of the proton of the first bond. This stretching is the greatest in th e case of a sym m etrical hydrogen bond as in R 2 H N H +—N H R 2 and is less im portan t in the ion pairs considered here. T he pertu rbation of the proton donor ability of the second N -H link by the form ation of a f irs t hydrogen bond seems thus to depend more on covalent th an on electrostatic effects.
IntroductionPositive ions with N -H links are able to form hydrogen
bonded complexes with basic molecules such as pyridine or aliphatic amines.
W itschonke and K raus 1 and G ilkerson 2 -3 ascribed the large increase of the conductivity of solutions of mono-, di-, and trialkylam m onium salts when basic ligands are added to the solutions to the form ation of such hydrogen bonds, whereas in the case of the tetraalkylam m onium salts these substances practically do not affect the conductivity.
The occurrence of these hydrogen bonds has been d irectly dem onstrated by v ibrational spectroscopy4 and fu rthe rmore NM R m easurem ents perform ed by Clem ents and W ood5 showed th a t in the case of the pyridine the lone pair of electrons of the nitrogen atom and no t the 1r system acts as proton acceptor.
In the case of monoalkyl- and dialkylam m onium salts, the form ation of higher complexes m ust be considered.
As a m a tte r of fact, a cation, such as R N H 3 +, which bears several sites can bind several ligand molecules L. In the presence of the ligand L, the solution can in principle conta in , besides uncom plexed cations R N H 3 +, complexes ions of the types R N H 3 +L, R N H 3 +L2, and R N H 3 +L3. T he form ation of such complexed ions of higher stoichiom etry was considered by several au thors . 6 “ 8
At the same tim e, however, solvation of the paren t ion pair R N H 3 +X “ can then occur and the possibility of form ation of the neu tra l complexes R N H 3 +X “ L and R N H 3 +X “ L 2 m ust be considered.
T he solvation of these different species has an effect upon the conductivity of the solutions. The form ation of a hydrogen bond between the cation and the ligand increases the num ber of types of conducting species b u t reduces their m obility as a consequence of the increase of their size. On the other hand, th e solvation of the ion pair tends to strengthen the stability of the nondissociated and thus nonconducting species and disfavors the conductivity.
Our experim ental approach is based upon the determ ination of the dependence of the electric conductivity of the solutions of the ionophore R N H 3 +X~ on the concentration of free ligand. From these data, it was possible not only to show th a t the solvation of the ion pairs by the ligand is effective b u t also to estim ate the values of the various equ ilibrium constants.
T he ionophores were diethylam m onium perchlorate (E t2 N H 2 C 1 0 4 ), diethylam m onium picrate (E t2 N H 2 Pi), diethylam m onium brom ide (E t2 N H 2 Br), d iethylam m onium chloride (E t2 N H 2 Cl), dibutylam m onium picrate (Bu2 N H 2 Pi), and butylam m onium picrate (BuN H 3 Pi).
T he ligands were 3,4-dim ethylpyridine (3,4-lutidine), di- butylam ine (Bu2 NH), and butylam ine (BuN H 2).
I t was im portan t to choose a solvent which should no t be too com petitive with the ligands in the ir interaction with the acidic sites of the cations and the ion pairs. Among the solvents generally used for a conductim etric study, we have selected nitrobenzene (NB), a dipolar aprotic solvent (D = 34.82).
All experim ents were perform ed a t 25 ± 0.1°.
Experimental Section
A. Materials. N itrobenzene was a F luka puriss product and was distilled from activated alum ina under reduced pressure. The specific conductance was then 5 X 10“ 9
ohm - 1 cm-1.Butylam ine, dibutylam ine, and 3,4-dim ethylpyridine
were F luka products and were distilled under reduced pressure just prior to use.
The specific conductance of solvent containing basic ligands (for instance, 3 X 10“ 8 ohm - 1 cm “ 1 for a 0.2 M solution of 3,4-dim ethylpyridine in nitrobenzene) was above th a t of pure solvent b u t was always less than 1 % of the m easured conductance of the m ost d ilu te sa lt solutions. In each case, the specific conductance of the solvent was sub
The Journal of Physical Chemistry, Vol. 79, No. 17, 1975
Influence of a Hydrogen Bond on Molécula' Reactivity 1813
tracted from th a t of the salt solution to obtain the specific conductance due to the salt.
The partia lly substitu ted am m onium picrates were p repared by interaction of picric acid w ith the corresponding amine in m ethanol. Butylam m onium p icrate was recrystallized from m ethanol. D ibutylam m onium picrate and diethylam m onium picrate were recrystallized from ether a t the tem pera tu re of Dry Ice. T riethylam m onium picrate was recrystallized from a benzene-m ethanol m ixture.
D iethylam m onium perchlorate was obtained from 70% perchloric acid and diethylam ine in ethanol. The salt was recrystallized from ethanol a t the tem peratu re of Dry Ice.
D iethylam m onium bromide was prepared by neu tra lizatio n of an aqueous solution of hydrobrom ic acid with d iethylam ine. T he solution was evaporated and the sa lt was recrystallized from a d ichloroethane-m ethanol mixture.
D iethylam m onium chloride was an E astm an Kodak product recrystallized from a d ichloroethane-m ethanol m ixture.
B. Measurements. E lectrical conductances were m easured w ith a Wayne K err universal bridge B 221 having a frequency of 1592 Hz. T h e conductance cells were of the Philips type with parallel platinum electrodes.
In these conditions, th e equivalent conductances, A, were m easured with a precision of about 1 %.
The dielectric constants were determ ined with a W.T.W. DM01 dipolm eter.
MethodIn a previous work, Macau, Lam berts, and H uyskens9
have proposed a general relation between the specific conductiv ity of the solutions and the concentration of free ligand, which is a generalization of the equation proposed by G ilkerson . 2 1 0 , 1 1
T he overall dissociation constant, K a, of the ionophore is defined as
K a = ([ions]2/± 2)/[ion pairs] ( 1 )
where [ions] is the to tal concentration of the various positive ions and [ion pairs] is the to tal concentration of the nondissociated ionophores.
In the absence of ligands, the dissociation constant will be noted K a°-
L et us consider the more general case of a m onoalkyl ca tion with th ree acidic sites. In the presence of a basic ligand which is not able to bind the anions to any appreciable exten t, the equilibrium s which are to be considered are the following: (a) for the ions
kl +RNH3+ + L RNH3+L (2)
RNH3+L + L % RNH3+L2 (3)
RNH3+L2 + L f= RNH3+L3 (4)
(b) for the ion pairs
RNH3X + L RNH3XL (5)
r n h 3x l + l S RNH3XL2 (6)
U nder these circumstances the ratio R = K a/Ka° m ust obey the following relation:
TABLE I: Equivalent Conductance of the Solutions as a Function of the Formal Concentration C of the Salt Et2NH2 Pi in the Presence of 0.1 Mol of3,4-Lutidine in Nitrobenzene
C , 10'4 MA, ohm '1 cm 2 m o l '1 C, 10"1 M
A, ohm'1 cm 2 m o l'1
0.000 30.00 4.544 19.55(caled)
0.738 25.79 5.845 18.351.092 24.90 7.550 17.121.545 23.88 8.475 16.59
R ^ ~ = ( l + kx+L + kx+k2+L 2 +
k S k 2+k 3+L 3) / ( l + K XL + K J < 2L 2) (7)where k x+, k 2+, and k 3+ are the equilibrium constants for the successive additions of ligand molecules L to the cation and K i and K 2 are the addition constants for the ion pair, the la tte r always possessing one site less than the corresponding cation.
A sim ilar relation has been previously used for the study of the solvation of the anions by an acidic ligand . 1 2
T he dissociation constan t K a* in a given m edium can be com puted from the conductivity d a ta using the m ethod of Fuoss and K raus : 1 3
F (z )/A = 1/A0 + A C /± 2 /A 0 2 K d*F(z) (8 )
where F(z) is the Fuoss function 1 4 and f± 2 is calculated from the Debye-Hiickel theory. C is the formal concentration of the ionophore.
I t is necessary to know the value of A0 to calculate K a* from the slope of F (z)/A plo tted vs. CA/±2 /F ( z ).
In the case of dibutyl-, diethyl-, and m onobutylam m o- nium picrates and of diethylam m onium perchlorate, the value of the lim iting molar conductivity Ao which appears in eq 8 can be easily com puted by th e extrapolation of the A vs. C l / 2 curves. A t the lowest concentrations used in this study, the dissociation of the salts is indeed strong enough to allow an accurate extrapolation. An example is given in Table I. The obtained values of Ao vary however with the concentration L of the added ligand, owing to the effect of the solvation on the mean m obility of the conducting species.
In the case of diethylam m onium brom ide and of d ie th ylam m onium chloride, the dissociation constants become too low to allow the foregoing extrapolation. H ere the value of Ao was estim ated on the basis of the K ohlrausch’s equation:
Ao = Ao+ + Ao- (9)
using for Xo+ the value com puted from Ao for th e picrate a t the same ligand concentration (A0~ for the picrate ion in n itrobenzene was taken as 16 ohm - 1 cm 2 m ol-11 ). The Ao~ values of Br~ and Cl- were taken from the literature: A0~ (Br~) = 21.60 ohm - 1 cm 2 m ol- 1 and Ao" (Cl~) = 2 2 . 2 0
ohm - 1 cm 2 mol- 1 . 1
In order to com pare the values of R a t different ligand concentrations, it is very im portan t th a t the K a values refer to a medium having the same dielectric constant. T he d ielectric constant D of the solutions were therefore d e termined and all the K a values were reduced to the reference
The Journal of Physical Chemistry, Vol. 79, No. 17, 1975

1814 M. Cl. Haulait and P. L. Huyskens
log K d = log K d* + B(l/D* — 1/34.82) (10)
T he value of th e factor B was com puted from m easurem ents of Kd* for solutions of E t3N H P i in m ixtures of ben zene and nitrobenzene having a known dielectric constant. T h is value, nam ely 56, was taken as being approxim atively th e sam e for the o ther systems.
Results and DiscussionT he values of Kd and R for the various salts studied in
th e n itrobenzene-ligand solvent system s are listed in Table II.
R is p lo tted vs. the form al concentration of ligand L in Figures 1 and 2. These graphs show in all cases a downward curvature. This negative curvature is clearly dem onstrated in the last colum n of Table II by th e variation of the (R - 1 )/L ratio w ith the concentration of the ligand L.
T his allows us to conclude t h a t t h e s o l v a t io n o f t h e io n p a i r b y t h e l ig a n d occurs to a n o n n e g l ig ib l e e x t e n t . Since all the higher term s appearing in the num erator of eq 7 are positive, only th e term s of the denom inator which correspond to the solvated ion pairs can bring about a decrease of th e slope of the R vs. L curve.
The relative im portance of the solvation constants are given by the com putation of the first and the second derivatives of expression 7 a t the origin:
R0' = kl+ - K 1 (11)
R0" = 2\kr{k2+ - K j) + K l (K1 - K 2)\ (12)
T he fact th a t th e R vs. L curves show a positive slope dem onstrates th a t the first com plexation of the ion is stronger th a n th a t of the ion pair (kx+ > K i). T he decrease of the slope w ith increasing L shows th a t the constan t K\ for the solvation of the ion pair is greater than the constan t k2+ corresponding to the addition of a second ligand molecule to the free cation (while the difference K i — K 2 m ust be positive).
T he existence of th is second solvation of th e free cation (k2+) can be m ade evident by the variation of the quantity (R — 1 )/L vs. R according to
(R — 1)/L = ki+ — RKi + ki+k2+ L (13)
T his variation is not linear and the last term of th is expression m ay not be neglected (Figure 3).
From the graphs of Figures 1 and 2, it is possible to estim ate which values of kx+, k2+ and K j, in the expression
R = (1 + kx+L + kx+k2+L 2 ) / ( l + K XL ) (14)
will be in best agreem ent with our experim ental values. I t is not necessary to take the constants fe3+ and K 2 into account for the system s including diethylam m onium and di- butylam m onium ions w ith only two sites on the free cation and one site on the ion pair. For m onobutylam m onium pic- rate , these constants are supposed to be negligible.
T he values of the constants kx+, k2+, and K i are listed in T able III for the system s studied in nitrobenzene.
As expected, the values of k ¡ + and k2+ for the solvation of a given cation are independent of the natu re of the anion and rem ain constan t w ithin the lim its of the experim ental errors.
T he solvation constan t of the ion pair, K i, is system atically sm aller th an kx+. T he solvation of the ion pair implies
value of the dielectric constant of pure nitrobenzene [D =34.82) using the equation
TABLE II: Conductance Parameters in Nitrobenzene at 25°
Ao>ohm-1
L , 1CT2 M
9cmm o l '1 K d, M R
lR - 1 ) /L , AT1
Cation BuNH3+; Anion Picrate; Ligand BuNH2 0.00 32.90 1.52 x 10'4 1.000.25 32.80 2.36 x 10'4 1.56 2240.50 32.80 3.05 x 10 '4 2.01 2021.00 32.60 4.21 x 10 '4 2.77 1772.00 32.20 5.92 x 10 '4 3.89 1453.00 32.00 7.41 x 10'4 4.87 1295.00 31.60 9.33 x 10'4 6.14 1037.00 31.30 11.65 x 10'4 7.66 958.00 31.20 12.40 x 10'4 8.16 89.5
10.00 31.10 14.40 x 10'4 9.48 84.815.00 30.80 18.82 x 10'4 12.38 75.920.00 30.60 . 23.27 x 10'4 15.31 71.5
i Cation B u2NH2+; Anion Picrate; Ligand Bu2NH 0.00 30.40 1.56 x l O ' 4 1.001.00 30.30 1.77 x 10'4 1.13 132.10 30.20 1.92 x 10'4 1.23 113.94 30.00 2.25 x 10'4 1.44 11.26.00 29.80 2.55 x 10'4 1.63 10.58.00 29.60 2.78 x 10'4 1.78 9.89.60 29.50 2.97 x 10'4 1.90 9.4
l Cation Et2NH2+; Anion Perchlorate; 0.00 40.55 2.17 x l O ' 3
Ligand 3,4-Lutidine 1.00
2.00 37.05 3.46 x 10'3 1.60 30.04.00 36.05 4.54 x 10'3 2.09 27.25.97 35.65 5.51 x 10'3 2.54 25.77.95 35.35 6.10 x 10'3 2.81 22.8
10.00 35.15 6.64 x 10'3 3.06 20.615.00 34.75 8.20 x 10'3 3.78 18.520.00 34.35 9.90 x 10'3 4.56 17.8
1 Cation Et2NH2+; Anion Picrate; Ligand 3 ,4- 0.00 35.40 1.65 x 10 4 1.00
Lutidine
2.00 31.90 2.96 x 10'4 1.79 39.56.04 30.50 4.83 x 10'4 2.93 31.9
10.00 30.00 6.34 x 10'4 3.84 28.415.00 29.60 8.18 x 10'4 4.96 26.419.80 29.20 9.77 x 10'4 5.92 24.8
Cation Et2NH2+; Anion Bromide; Ligand 3,4- 0.00 41.00 6.90 x 10‘6 1.00
-Lutidine
2.00 37.50 13.52 x 10'6 1.96 48.04.00 36.50 18.89 x 10'6 2.74 43.56.00 36.10 23.52 x 10'6 3.41 39.88.08 35.80 28.23 x 10'6 4.09 38.2
10.10 35.60 32.14 x 10'6 4.66 36.215.10 35.20 43.17 x 10'6 6.26 34.820.10 34.80 56.65 x 10'6 8.21 35.0
Cation Et2NH2+; Anion Chloride; Ligand 3,4- 0.00 41.60 3 . 8 0 x 1 0 ' 7 1.00
Lutidine
2.00 38.10 9.03 x 10 '7 2.38 69.04.00 37.10 12.44 x 10 '7 3.27 56.76.00 36.70 17.44 x 10 '7 4.59 59.6
10.00 36.20 24.85 x 10 '7 6.54 55.415.10 35.80 36.96 x 10 '7 9.73 57.922.00 35.20 53.24 x 10 '7 14.01 58.6
The Journal o f Physical Chemistry, Vol. 79, No. 17, 1975

Influence of a Hydrogen Bond on Molecular Reactivity 1815
Figure 1. Graph of ft — Kd/Kd° vs. concentration of added ligand: (A) BuNH3PI with BuNH2 in nitrobenzene; (B) Bu2NH2Pi with Bu2NH In nitrobenzene.
____i___ i___ :___ i___ i____i____i___ i i i0 2 « 6 8 tO 12 U 16 18 20
Figure 2. Graph of ft vs. concentration of added 3,4-lutidine for (A) Et2NH2CI, (B) Et2NH2Br, (C) Et2NH2Pi, and (D) Et2NH2CI04 in nitrobenzene.
the form ation of a hydrogen bond between the second N -H link of the cation and the ligand molecule, the first N -H link of the cation being included in the cation-anion hydrogen bond. I t can be observed in Table III th a t as the bond between th e anion and the cation becomes stronger (E t2 N H 2 +C l- > E t 2 N H 2 +B r- > E t2 N H 2 +Pi~ > E t 2 N H 2 +C 1 0 4 _), the ratio Ki/ki+ becomes smaller.
This leads to the conclusion th a t the hydrogen bond between the anion and the cation clearly disfavors the pro-
Figure 3. Graph of (ft — 1 )/L vs. ft for BuNH3Pi in the presence of BuNH2 in nitrobenzene.
TA BLE I II ; Complexation Constants (M ~ ') in Nitrobenzene
Cation Anion Ligand V *1
B uNH3+ Picrate BuNH2 279 ± 10 10 ± 1 50 ± 2Bu2NH2* P icrate Bu2NH 16.5 ±0.5 0.5 4 ±
0.2Et2NH2+ P e r
chlorate3,4-
Lutidine60 ± 2 5.1 ± 0.6 2 2 .7±
2Et,NH2+ Picrate 3,4-
Lutidine61 ±2 5± 3.5 16.5±
2Et2NH2* Bromide 3 ,4-
Lutidine61 ±2 5 ± 3.5 11±1
Et2NH2+Chloride 3,4-Lutidine
62 ±2 5.2 ± 0.6 5.5 ± 0.7
ton donor properties of the second N - H group of the cation.
However, it appears th a t if the first an ion-cation hydrogen bond decreases the acidity of the other N -H groups, th is effect is even more im portan t when the first hydrogen bond is a cation-pyrid ine or a cation-am ine bond. In th is case, the reduction of the constan t fc2+ as com pared with k\+ is still stronger.
These results appear a t a first sight as ra th e r unexpected. Indeed, the presence of a negative ion near the cation in the ion pair m ust have an unfavorable effect upon the a t traction between the cation and the dipole of the ligand molecule (Figure 4a). Such an effect m ust be sm aller when the first entity bound to the cation is no more an ion b u t only a polar en tity (Figure 4b).
On the other hand, the first hydrogen bond is much stronger in the cation-anion bond than in the cation-ligand bond.
From these two facts, it could a priori be assum ed th a t the perturbations brought about in the acidic character of the second N -H link of the cation should be more im porta n t when the first N -H link is bound to an anion.
Our results prove th a t th is supposition is not correct. T he opposite effect was indeed observed.
The Journal of Physical Chemistry, Vol. 79, No. 17. 1975

1816 M, Cl. Haulait and P. L. Huyskens
Figure 4. Interaction between a ligand molecule and the second N-H link of the cation: (a) the first N-H link Is bound to an anion; (b) the first N-H link is bound to a ligand molecule.
This can be explained by the inheren t p roperties of the firs t hydrogen bonds form ed by the cation. All these hydrogen bonds increase th e N -H d istance w ith respect to the N -H distance in th e free cation. I t can be estim ated, in first approxim ation, th a t a greater N -H distance in the first group induces a greater charge density around the n itrogen atom and th u s induces a greater pertu rba tion in the acidic character of th e other N -H groups.
In recen t works W ood et al. have stud ied th e vibrational spectra of complex hydrogen bonded cations of the type (B iH B 2 )+ where B i and B 2 may be identical or d ifferent m onofunctional bases. For th e hom oconjugated complex M e3 N H +—N M e 3 , these au thors find a vs band w ith a single broad m axim um a t 2100 cm - 1 . 1 6 For th e heteroconjugated com plex M e3 N H +—N C 5 H £ th e vs band appears a t significantly higher wave num bers w ith m axim a a t 2650 and 2450 cm - 1 . 1 6 We can thus conclude th a t the N -H distance is greater in th e hom oconjugated bond. A sim ilar observation is m ade by W ood in the case of the complex ions of trie th - ylenediam ine where for th e complex T E D H +-T E D the va lies a t 2 2 0 0 cm - 1 whereas for the hydrogen bond between TED H + and another cation, the m axim um of va appears a t 2500 cm - 1 . 1 7 In th e cation (B iH B 2)+ th e N -H distance d epends th u s on the difference of the pK values of the bases B i and B 2 and is m axim al in the case of the hom oconjugation.
As we consider the distance N -H in the first hydrogen bond between th e cations RNH,3 + or R 2 N H 2 + and the basic ligands, th is distance will be greater in th e case of hom oconjugation. T he pertu rbation of th e acidic character of a second N -H group will th u 3 be the greatest in th is case.
Effectively the constan t &2 + is more reduced as com pared w ith ki+ in the com plexation of the cation w ith the another aliphatic am ine th an w ith the pyridine.
If sufficient long tim e scales are considered, the po ten tia l
energy curves of the proton show two m inim a the vertical distance of which depends on th e difference in pK a b e tween the donor and the acceptor. The distance N - H in this first hydrogen bond and the perturbation brought about in the other sites, is thus related to the vertical difference between the two minima of the potential energy curve of the proton.
T hus it can be considered th a t, although the an ion -cation hydrogen bond in the ion pair is very strong, th e vertical difference between the two po ten tia l m inim a of the proton is im portant. As a consequence, the d istance N -H is sm aller as com pared w ith th e d istance N -H in th e cation- am ine hydrogen bond and th e pertu rb a tio n of th e acidity of the second N -H group is also more reduced.
This is confirm ed if we consider the four last-m entioned system s of T able III including the sam e cation E t2 N H 2 + b u t different anions. T he distance betw een the two m inim a of the po ten tia l energy curve of the p ro ton increases w ith the acidity of the conjugated acid of the anion. This will th u s be more im portan t in the case of the perchlorate th an in th e case of the chloride and the reduction of K\ com pared to k\+, due to th e hydrogen bond form ed by th e c a tion w ith the anion, will increase according to the sequence: CIO4 - < P i“ < Br~ < Cl“ .
T he effect of the first hydrogen bond upon th e form ation of a second one depends th u s more on covalent th a n onelectrostatic effects.
Acknowledgment. T he au thors wish to express the ir thanks to Professor J. L. Wood for his in teresting suggestions.
References and Notes(1) C. R. Witschonke and C. A. Kraus, J. Am. Chem. Soc., 69, 2472 (1947).(2) E. K. Ralph, III, and W. R. Gilkerson, J. Am. Chem. Soc., 86, 4783
(1964).(3) H. W. Aitken and W. R. Gilkerson, J. Am. Chem. Soc., 95, 8551 (1973).(4) R. Clements, F. N. Masri, and J. L. Wood, Chem. Commun., 1530
(1971).(5) R. Clements and J. L. Wood, J. Mol. Struct., 17, 265 (1973).(6) M. L. Junker and W. R. Gilkerson, J. Am. Chem. Soc., 97, 493 (1975).(7) Z. Pawlak, Rocz. Chem. Ann. Soc. Chim. Polon., 47, 347 (1973).(8) D. J. Pirson and P. L. Huyskens, J. Solution Chem., 3, 515 (1974).(9) J. Macau, L. Lamberts, and P. Huyskens, Bull. Soc. Chim. Fr., 2387
(1971).(10) W. R. Gilkerson and J. B. Ezell, J. Am. Chem. Soc., 89, 808 (1967).(11) H. B. Flora, II, and W. R. Gilkerson, J. Am. Chem. Soc., 92, 3273
(1970).(12) D. J. Pirson and P. L. Huyskens, J. Solution Chem., 3, 503 (1974).(13) R. M. Fuoss and C. A. Kraus, J. Am. Chem. Soc., 55, 476, 2387 (1933).(14) R. M. Fuoss and F. Accascina, "Electrolytic Conductance”, Inter
science, New York, N.Y., 1959.(15) F. N. Masri and J. L. Wood, J. Mol. Struct., 14, 217 (1972).(16) F. N. Masri and J. L. Wood, J. Mol. Struct., 14, 201 (1972).(17) R. L. Dean and J. L. Wood, J. Mol. Struct., 26, 237 (1975).
The Journal o f Physical Chemistry, Vol. 79, No. 17, 1975
Apparent and Partial Molar Polarizations in Solutions 1817
Apparent and Partial Molar Polarizations in Solutions and the Halverstadt-Kumler and Hedestrand Equations
William J. Taylor
Department of Chemistry, Ohio State University, Columbus, Ohio 43210 (Received February 18, 1975) Publication costs assisted by the Ohio State University
H edestrand and H alverstad t and K um ler have developed m ethods for the extrapolation of the m olar polarization of a dilute solution of a polar molecule in a nonpolar solvent, to obtain the apparent m olar polarization of the solute a t infinite dilution, P 2„. The precise significance of these extrapolated values has, however, rem ained unclear; thus, one recognized au thority in the field has claimed th a t they are in error when the m olar polarization of the solvent varies with concentration. This question is reexamined from the viewpoint of partial m olar polarizations, and it is dem onstrated th a t the preceding m ethods of extrapolation yield the partial m olar polarization of the solute a t infinite d ilution, P 2 °, a quan tity which has an unam biguous theoretical in terpretation . T he calculation of the dipole m om ent of the solute molecule from P 2° is also discussed.
IntroductionIn the determ ination of dipole m om ents from m easure
m ents of dielectric constants of d ilute solutions of polar molecules in nonpolar solvents it is custom ary to use Debye’s equation 1 ” 3
P = (tS:~ ) v = N lP l + N iP 2 ( 1 )
H ere c is the dielectric constant of the solution, and N\ and N 2 are the mole fractions of solvent and solute, respectively. T he molar polarization and molar volume of the solution are denoted by P and V, respectively , 4 while Pi and P 2
denote the m olar polarizations of solvent and solute in the solution, which are not rigorously defined in the standard discussions. For dilute solutions it is usual to set Pi equal to P i° , the m olar polarization of pure solvent (at the same tem perature), and then to solve eq 1 for P 2
P 2a = (P - N\Pi ° )/N2 = P.° + [(P - Pi°)/N2] (2)
This is generally regarded as sim ply a useful approxim ation; however, in the present discussion we wish to em phasize th a t P 2a as given by eq 2 is a well-defined quantity , the apparent molar polarization of the solute a t mole fraction N 2 , in the sense in which “apparen t” is used in the therm odynam ics of binary solutions . 5 In general, P 2a is a function of IV2, and m ay vary m arkedly with iV2 over the range N 2 = 0 to TVo = l ; 6 the two m ost obvious causes of th is are polarization of the solvent in the neighborhood of a solute m olecule by the dipole field of the la tte r (the so-called solvent effect7), and the dipole-dipole (and other) interactions between solute molecules which may affect their orientation polarization (especially). The effects of so lu te-solute in te raction can be elim inated by making m easurem ents a t several values of N 2 in the low-concentration range and ex trapolating to N 2 = 0 to obtain P 2 a ° . 8 However, a direct extrapolation of P 2a vs. N 2 is inaccurate, because of the m arked increase in the relative errors of m easured values of P 2a as N 2 —- 0. Extrapolation procedures which appear to overcome this difficulty have been given by H edestran d , 9 and by H alverstadt and K um ler , 1 0 -1 1 and are widely used. On the other hand, S m ith 1 2 -1 3 has claimed th a t all
procedures for the extrapolation of P 2a to N 2 = 0 which are based on eq 2 give incorrect results to the degree th a t Px varies w ith N 2, and to the au tho r’s knowledge no refutation of S m ith’s proof of th is has appeared heretofore in the literature.
In the present article the significance of extrapolated values of P 2a is reconsidered from the viewpoint of the theory of partial molar properties. I t was suggested many years ago by Orr and B u tler 1 4 th a t the proper measure of the contribution of an individual species to the polarization of a solution is the partial molar polarization, Pj, of this species in the given solution. These authors proposed the application of the graphical method of intercepts for the calculation of P\ and P2 in a binary solution, b u t did not develop analytical expressions for these quantities. The m ethod of intercepts was applied in th is context by Goss , 1 5
b u t so far as the w riter has been able to determ ine there has been no further application of the concept of partial m olar properties in connection with polarization of solutions; the term is not even m entioned in the standard m onographs in this field , 2 -3 -1 6 1 8 and S m ith 1 2 -1 3 has stated th a t the concept is not meaningful when applied to the polarization of solutions.
In the next section we form ulate the essential equations for the partial molar polarizations of solvent and solute, and the relation of the la tte r to the apparent molar polarization, P 2a, of the solute defined by eq 2. Fokowing this we consider the extrapolation of P2a to N 2 = 0 , and show th a t (in the absence of experim ental error) the m ethods of H edestrand, and of H alverstad t and Kumler, yield the true partial molar polarization of the solute a t infinite dilution, or P 2°, regardless of the extent to which Pi varies with N 2. We also po in t out the source of the errors in S m ith ’s criticisms of the preceding extrapolation m ethods, and of the m ethod of intercepts. Finally, we discuss the solvent effect, and the calculation of the dipole m om ent from P2°.
Partial Molar and Apparent PolarizationsLet P and V represent the total polarization and volume,
respectively, of a solution containing Hi moles of species 1 , and n 2 moles of species 2 ; although it will be convenient in the present context to refer to these two species as the sol-
The Journal of Physical Chemistry, Vot 79. No. 17, 1975

1818 William J. Taylor
vent and solute, respectively, all the equations in the present section are valid formally over the entire range N2 = 0 to N2 = 1 , given the assumed functional dependence of the polarization, P, on e and V'L19 The partial molar polarizations, Pi = (dP/drii)n2 and P2 = (dP/dn2)ni, are calculated by partial differentiation of the equation20
p ’ ( ^ ) v ,3)It will be convenient to regard the dielectric constant, e, as a function of IV2 = n2/(ni + n2), and to denote df/d/V2 by a = a(N2). Also required are the relations (aN2/sni)n2 = —iV2/(rzi + n2) and (aAt2/an2)ni = N\/(n\ + n2). We obtain in this way
vent. On the other hand, the partial molar polarization of solute in its standard state at N2 = 0, as obtained from eq 4b is
P 2O v 2° +3a°
(«1 ° + 2 ) 2
Vi° (8 )
Here ei° is the dielectric constant of pure solvent, and a° is the limiting value of de/dN2 at N2 = 0 . The two terms on the right-hand side of eq 8 represent the contributions to P2° of changes in volume and dielectric constant, respectively, when 1 mol of solute is added to an indefinitely large quantity of solvent.
We show next that P 2a approaches P2° as N2 —► 0. Substitution of P = P i + N2(P2 — P i) in eq 2 yields
Pi = (-----V i----------——— N2V (4a)
P2 = ( V2 + 3a „ NiV (4b)\e + 2/ (i + 2)2
where Vi and V2 are partial molar volumes, and V = V/(n\ + n2) is the molar volume of the solution.
It follows from the definition of Pi and P2 that dP = P\ dni + P 2 dn2, and by integration of this equation at a fixed mole ratio, n2/n\ = constant, that P = rciPi + n^ 2.21 Equations 4a and 4b are seen to be consistent with the last equation, or the alternative form P = N\P\ + N2P2; thus, the use of partial molar polarizations eliminates the need for the usual assumption, implicit in eq 1 , that the polarizations of the two species are additive.
On taking the differential of the relation P = n\P\ + n2P2, and comparing with dP = P 1 dni + P2 dn2, one obtains ni dPi + n2 dP2 = 0, which is the analog of the Gibbs-Duhem equation for partial molar polarizations; it will be convenient for subsequent use to rewrite this in the form
Ni(dPi/dW2) + N2(dP2/dN2) = 0 (5)
The method of intercepts suggested by Orr and Butler14 for the determination of P 1 and P2 for general values of N2 is based on the equations
Pi - P - N2(dP/dN2) (6a)
P 2 = P + (1 — N2)(dP/dN2) (6b)
These relations are derived by eliminating first P2, and then Pi, from P = N 1P 1 + N2P2 and the equation obtained from it by differentiation (with the use also of eq 5), i.e., dP/dN‘2 — P2 — Pi- The claim of Smith22 that the intercept method yields erroneous results for Pi and P2 is not valid, because he overlooked the identity represented by eq 5; the existence of this important relation is a further persuasive argument for the use of partial molar polarizations.
Alternatively, P2 may be calculated from values of P2a, as defined by eq 2. On multiplying eq 2 by n2 and rearranging one obtains P = in + n2)P = n\P\° + n2P2a; partial differentiation with respect to n2, and use of the equation preceding eq 4a, then yields
P2 = p 2a + -V2( l - i V 2)(dP2a/dAf2) (7)
Limit of Infinite DilutionAs N2 —*• 0, Vi and V approach Vi°, the molar volume of
pure solvent, while V2 approaches V2°, the partial molar volume of solute in its standard state.8 Hence, in the limit eq 4a yields Pi = P i0, the molar polarization of pure sol
P2a = P2 + ( ~ ^ ) ( P l - P l ° ) 0 )
In the limit N2 = 0, eq 9 becomes
P2a° = P2° + (dPi/dW2)° (10)
which is equivalent to the result obtained by a different argument by Smith.23 However, in view of eq 5, (dP\/ dN2)° = 0, and therefore (contrary to the assertion of Smith)
P2a° = P20 (IDthis result may also be obtained from eq 7.24
Since the methods of Hedestrand,9 and of Halverstadt and Kumler,10 are based on the extrapolation of P2a to N 2 = 0, they must yield P2° if the extrapolation is carried out correctly. We now show explicitly that their equations for P2a° are equivalent to eq 8 for P2°. Both procedures involve the extrapolation of dielectric constant, t, for the solution to obtain the value ei° for pure solvent.25 In addition, Halverstadt and Kumler extrapolate the specific volume, v = V/{M\Ni + M2N2) to TV2 = 0 (the molecular weights of solvent and solute are denoted by M1 and M2, respectively), and their result is expressed in terms of the value of du/dN2 for N2 = 0. Differentiation of the relation V = N 1 V1 + N2V2 with respect to N2, and use of the Gibbs-Duhem type equation (or analog of eq 5 for partial molar volumes), yields dV/diV2 = V2 — Substitution of this result in dv/dN2, and passage to the limit N2 = 0, then yields (dv/dN2)° = (V2° - M2n°)/Mh where n ° = Vi0/ Mi is the specific volume of pure solvent; rearrangement of this result gives
V2° = M2v1° + M iidv/dW a ) 0 (12)
Halverstadt and Kumler’s equation10 for P2a° is identical (except for notation) with the result obtained by substitution of eq 12 for V2° in eq 8. Substitution of p = 1/v, and Pi° = 1 /^1°, in the preceding derivation, where p and pi0 are the densities of solution and pure solvent, respectively, has the effect of replacing eq 12 by
V2° = [M2Pl° - M 1 (dp/dA 1 2 ) ° ] /(p 1 0 ) 2 (13)
Hedestrand’s equation9 for P2a° is obtained by substitution of eq 13 for V2° in eq 8. This confirms that both extrapolation procedures yield a value for P2a° which is equal to P2°, in accord with eq 1 1 , and removes any ambiguity regarding the interpretation of such extrapolated values of the apparent molar polarization.26
Solvent Effect and Calculation of Dipole Moment By definition P2° is the change in the polarization of an
The Journal of Physical Chemistry, Voi. 79, No. 17, 1975

Apparent and Partial Molar Polarizations in Solutions 1819
indefinitely large quantity of pure solvent when 1 mol of solute is added to it (at constant temperature and pressure). Under these conditions, as remarked in the Introduction, dipole-dipole (and other) interactions between solute molecules are absent. Any remaining difference between the polarization of the molecules in solution and in the gas phase (at the' same temperature and zero density) is then due solely to the interactions between separated solute molecules and surrounding solvent molecules. This solvent effect1 may be expressed as the difference between the apparent dipole moment of a solute molecule in the infinitely dilute solution, or hs°, and the t"ue permanent dipole moment of an isolated solute molecule, Hg, as obtained from measurements on the gas phase. We make the usual assumption that this difference represents the mean vector sum of the moments induced in the solvent molecules by the dipole field of a typical solute molecule. We assume, further, that the symmetry of the molecule and its environment is sufficiently great so that this induced moment is colinear with the permanent moment of the solute molecule, so that we need consider only the scalar value, hu of the induced moment; then
Hs° = Hg + Mi (14)The value of Hi is susceptible to approximate theoretical
estimation on the basis of certain plausible models for the solute molecule and surrounding solvent.27 Since the dipole field at each point in space is proportional to Hg, the induced moment is given by an expression of the form
m = Ah g (15)
where A is a factor which depends on the shape of the molecule, the location and orientation of the point dipole in the molecule, and the polarizability and number density of solvent molecules. For the present discussion we do not need to be concerned with the detailed dependence of A on these factors; we merely remark that Higasi28 has shown that if the dipole is at the center of an ellipsoid of revolution, and directed along the symmetry axis, A is negative for prolate ellipsoids, positive for oblate ellipsoids, and zero for spherical molecules. Combination of eq 14 and 15 yields29
Hg — (1 + A)~lHs° (16)
On the assumption that the moments, Hi, induced in the solvent by the fields of the solute dipoles follow the rotation of the latter, the total orientation polarization of an infinitely dilute solution of 1 mol of polar solute in a nonpolar solvent is given by Debye’s formula, (4irlV/3)(/u2/ 3kT), with h set equal to h ° of eq 14 (here N is Avogadro’s number, k is Boltzmann’s constant, and T is the absolute temperature). However this orientation polarization is also equal to P2° ~ P-id, where P2d is the distortion (or deformation) polarization for 1 mol of solute (equal to the sum of the electronic and atomic polarizations), which may be estimated from the molar refraction of the pure solute.30’31 It follows that
HS° = l(9kT/4*N)(P2° - P2d)]1/2 (17)
Finally, Hg is obtained from eq 16 and 17, provided an estimate of A is available.32
DiscussionThe continuing importance that chemists and chemical
physicists attach to molecular dipole moments is indicated
by the fact that the comprehensive tabulation by McClellan33 lists values for over 11,000 compounds published in the period 1962-1971, compared with 6500 for the preceding four decades. Molecular dipole moments are frequently useful in deciding between alternative structures or conformed, in estimating bond or group moments, and as a check on calculated molecular wave functions. McClellan lists more than 60 experimental methods for the determination of dipole moments. Although many of these are of minor importance, some (e.g., molecular beam, electron resonance, and microwave methods) are capable of considerably greater accuracy than is obtainable from measurements of dielectric constants of dilute solutions of polar molecules, and have the important advantage of yielding values for individual vibronic states. Nevertheless, an inspection of McClellan’s tables shows that the great majority of reported dipole moments (especially for molecules which cannot be studied in the gas phase) are still obtained from measurements of dielectric constants of dilute solutions. The values given in McClelland’s tables for the latter method are values of h $ ° calculated from eq 17; i.e., no corrections for the solvent effect are included. The analysis given in the present article does not require any change in these values, since we have merely shown that the extrapolated solute polarization commonly denoted by P2® is equal to the partial molar polarization'of solute at infinite dilution, P2°. However, it is felt that this clarifies the theoretical significance of the extrapolated values, since P2° is rigorously defined.
Finally, we remark that the analysis in the present article is easily adapted to use of mass (or weight) fractions as concentration variables, in place of the mole fractions adopted here. The use of mass fractions was advocated by Sugden,34 and is preferred by many workers in the field. To convert to a mass basis, set Mi = M2 = 1 (unit mass); then n 1 and n2 become the masses, and N 1 and N2 the mass fractions of solvent and solute, respectively. All molar, apparent molar, and partial molar quantities are replaced by corresponding specific quantities; for example, P2° of eq 8 becomes the partial specific polarization of solute in its standard state of infinite dilution.
References and Notes(1) P. Debye, "Polar Molecules”, Chemical Catalog Company, New York,
N.Y., 1929, p 45.(2) C. P. Smyth, “Dielectric Behavior and Structure”, McGraw-Hill, New
York, N.Y., 1955, p 18.(3) J. W. Smith, “Electric Dipole Moments”, Butterworths, London, 1955, p
52.(4) The molar polarization is frequently denoted by [P]; however, for con
sistency we denote all molar quantities with a tilde (except the partial molar quantities to be Introduced subsequently, which are denoted by the conventional bar).
(5) G. N. Lewis and M. Randall, “Thermodynamics and the Free Energy of Chemical Substances", McGraw-Hill, New York, N.Y., 1923, p 35.
(6) See ref 1, Figures 14 and 15, where (as Is usual) P2a Is denoted by P2.(7) See ref 2, p 40, for a definition of “solvent effect”.(8) The extrapolated value at infinite dilution is commonly denoted by P2„
or „P2; since the spirit of the present discussion is that of the thermodynamic treatment of dilute solutions (and we will not be concerned with the pure solute), we define the standard state of the solute to be that of infinite dilution and distinguish quantities associated with It by the conventional superscript (°).
(9) G. Hedestrand, Z. Phys. Cherrt. B , 2, 428 (1929), eq 8.(10) I. F. Halverstadt and W. D. Kumler, J. Am. Chem. Soc., 64, 2988
(1942), eq 5.(11) Halverstadt and Kumler10 do not give a derivation of their equation; for a
derivation of this equation, as well as a more explicit derivation of the Hedestrand equation,9 see ref 3, pp 54-55.
(12) J. W. Smith, Sci. Prog., 36, 483 (1948).(13) J. W. Smith, Trans. Faraday Soc., 48, 802 (1952).(14) W. J. C. Orr and J. A. V. Butler, Nature (London), 130, 930 (1932).
The Journal of Physical Chemistry, Vol. 79, No. 17, 1975

1820 M. Dixon and P. Hutchinson
(15) F. R. Goss, J. Chem. Soc. 19"5 (1937); 752 (1940).(16) H. Fröhlich, “Theory of Dielectrics”, 2nd ed, Oxford University Press,
London, 1958.(17) N. E. Hill, W. E. Vaughan, A. H. Price, and M. Davies, "Dielectric Proper
ties and Molecular Behaviour”, Van Nostrand-Relnhold, London, 1969.(18) C. J. F. Böttcher, "Theory of Electric Polarization", 2nd ed, Elsevier,
Amsterdam, 1973 (material In Chapter 9 of the 1952 edition which Is relevant to the present discussion is omitted in the second edition).
(19) For concentrated solutions o- polar solvents the Clausius-Mosotti expression for the "cavity” field acting on a polar solute molecule is inaccurate and Debye’s equation must be modified (ref 2, pp 19-39; ref 3, pp 145-159).
(20) All derivatives in the present article refer to conditions of constant temperature and pressure; since the quantity conventionally referred to as the molar polarization is in fact 4rr/3 times the molar polarizability, it Is not necessary to specify constant electric field strength (in the absence of saturation effects).
(21) This result depends, of course, on the fact that partial molar properties are intensive; alternatively, it -nay be regarded as an application of Euler's theorem to the function P, which is homogeneous and of first degree in the mole numbers n, and n2.
(22) See ref 13, eq 6.1 and following two equations.(23) See ref 13, eg 5.2.(24) The result (dP1/d/V2)/v2=o = 0 follows from eq 5 only if (dP2/dW2)W2. 0 is
finite. Lewis and Randall (ref 5, pp 44, 45J have pointed out that there are two types of partial molar properties, G,: those like partial molar volume and enthalpy for which (¡Gi/3N)u=0 is finite and those like partial molar entropy and free energy (or chemical potential) for which the magnitude of this derivative approaches infinity as N/ - * 0. It is clear from eq 4 and the known behavior of e that partial molar polarizations behave in this respect in essentially the same way as partial molar vol
umes and are thus of the first type. Similar considerations apply to the derivation of eq 11 from eq 7.
(25) See ref 10 for a discussion of the advantages of using an extrapolated value for fi°, rather than a value measured for a sample of pure solvent.
(26) The analysis leading to eq 12 and 13 for V2° (which appear to be new) makes it clear that the volumetric aspects of Halverstadt and Kumler’s and Hedestrand's procedures represent particular methods for obtaining the partial molar volume of the solute at Infinite dilution, l/2°. One advantage of eq 8 for P2°, relative to the equations of these authors, is that l/2° may also be determined by other procedures (see, for example, ref 5, pp 36-40).
(27) For reviews of methods for calculation of the inductive solvent effect see ref 2, pp 39-51, and ref 3, pp 133-143. The most useful and widely used formulas are probably those due to Higasi28 (eq 6.16 of ref 3 contains misprints; see eq 18 of Higasi's paper or eq 18.28, p 44 of ref 2).
(28) K. Higasi, Sci. Pap. Inst. Phys. Chem. Res. (Jpn.), 28, 284 (1936).(29) For typical observed values of the ratio p.s°/pg, see ref 2, Table 18.1, or
ref 3, Table 12.(30) Reference 2, Chapter 14.(31) R. J. W. Le Fevre, "Dipole Moments”, 2nd ed, Methuen, London, 1948,
pp 10-13.(32) It might be asked why pg cannot £>e computed directly from aQ equation
similar to eq 17 but with P2° - P2d replaced by P2° — P, — P2d, where Pi = (4irA//3)( i2/3kT) is the polarization of the solvent induced by 1 mol of solute molecules, at Infinite dilution. However, this procedure would be Inconsistent with the additivity of dipole moments implied by eq 14.
(33) A. L. McClellan, "Tables of Experimental Dipole Moments”, Vol. 1, W. H. Freeman, San Francisco, Calif., 1963; Vol. 2, Rahara Enterprises, El Cerrito, Calif., 1974.
(34) S. Sugden, Trans. Faraday Soc., 30, 720 (1934).
Calculation of the Elementary Graph of the Fourth Virial Coefficient of a Dilute Ionic Solution
M. Dixon*CECAM, Bâtiment 506, Orsay, France
and P. HutchinsonTheoretical Physics Division, Atomic Energy Research Establishment, Harwell, Oxfordshire, United Kingdom (Received January 23, 1975)
From the M ayer function f(r;; ) = e x p ( - r i;) /r„ the elem entary graph, 0 , is calculated by num erical q u ad ra tu re in Fourier transform space. The value 0 = 43.091 is obtained.
Friedm an and K rishnan 1 have studied the models for the mixing of ionic solutions w ithin the M cM illan-M ayer2
theory. They have calculated the excess free energy and the enthalpy mixing coefficients, g\ and hi, from the cluster expansions using an approxim ate fourth virial coefficient and from the hypernevted chain approxim ation which assumes a zero value for all elem entary graphs. For the charge types studied experim entally 3 (BaCl2 -N aC l and N a 2 S 0 4 -N aC l) the coefficients g\ and h{ depend on the th ird and the fourth virial coefficients even in the limiting law region. The cluster theory calculation of the lim iting law behavior of gi and h\ is reasonably consistent with the HNC calculations for higher concentrations b u t the calculated hi function agrees neither in sign nor in m agnitude w ith the experim ental data. These contradictions m ight be
*To whom correspondence should be addressed a t the D ep artm en t of Physics, T he University, Reading, U.K.
resolved if the contribution from the elem entary graph to the fourth virial coefficient was significantly larger than the approxim ate value.
The M ayer function corresponding to a d ilute electrolyte in the M cM illan-M ayer theory is f(rq) = exp(— rlJ)/rlJ which is infinite a t rt] = 0 ; we take the Debye length as unity. Although the elem entary graph is finite, it cannot be evaluated analytically, and the singularity a t the origin, a lthough integrable, makes the direct evaluation intractable. However, the Fourier transform of f(rl;) yields a function which decays slowly and is everywhere finite, i.e.
t(k) = J i( r )e ikr dr = 4ir/(l + k2) = x----— (1)and
Hr) = (1/27t f j i (k )e- ikrAk = x---------~x (2)with
Mk) = 1 6(r) = (l/2ir)3 J e ' ikrdk (3)
The Journal o f Physical Chemistry, Vol. 79, No. 17, 1975

Fourth Virial Coefficient of a Dilute Ionic Solution 1821
Then TABLE Ia
— E l(r 1 2 )
ex p{-
= / d r 3 / d r 4 f ( r 13 ) f ( r 14)f(r 2 3 ) / ( r 2 4 ) /( r34) (4a)
= (l/27r)15/ d r 3/ d r 4/ / / j / f l [d* tf (*,)] xC = 1
-i[ki ( r 3 - r t) + fe2(y i - r 4) + fe3 ( r 2 - r 3) +
M n “ ^ 2 ) + M»'4 “ ^ 3 ) 1} (4b)5
= ( 1 / 2 tr)15/ / / / / - * 3 -
^rnax N P Tr>
-rLmax M K5 0 . 2 6 1 2 8 8 . 0 4 3 . 1 0 7
4 7 . 1 2 1 5 0 1 0 . 0 4 3 . 0 4 8
4 0 . 2 1 2 8 1 0 . 0 4 3 . 0 2 3
3 9 . 2 7 1 5 0 1 2 . 0 4 3 . 0 1 0
3 3 . 5 1 2 8 1 2 . 0 4 2 . 9 7 0
6 2 . 8 3 2 0 0 1 0 . 0 4 3 . 0 7 3
3 3 . 5 1 6 0 1 5 . 0 4 2 . 9 6 9
5 9 . 9 5 2 2 9 1 2 . 0 4 3 . 0 6 3 5 5 . 1 4 4
5 0 . 2 7 1 9 2 1 2 . 0 4 3 . 0 4 8
a 2max i s c u t o f f i n r e c i p r o c a l s p a c e • Rmax d e f i n e d a s i n t h e s t e p
l e n g t h i n r e c i p r o c a l s p a c e = rr/Rmax ■ N P T i s n u m b e r o f q u a d r a t u r e
points.
&5)ô(-&2 + &4 + * 5) e x p l - i i - f e j r j + &2y i +
^3r 2 - *4^)1 (4c)T hus
E,(£) = J"E1(r12)efftr|2dr12 (5a)5
= (1 / 2 . f / / / / / n dfei f(/fei)6(fe3 - +t= 1
k2)ô(ki + - k 2)à(ki - h3 - k5) (5fc)
(1 /2 tt)s (5c)
andx x
= (1 /2tt)6 j V ^ i - / / / dr2dr3dr4 x
f ( r 1 2 ) f ( r i 3 ) f ( r 1 4 ) f( r 2 3 ) f ( r 2 4 ) f ( r34) (6 )
Dixon and H utchinson 4 used bo th these relationships to check the accuracy of these calculations for potentials of the form r~m where 4 < m < 25 and found extrem ely good agreem ent for the independent paths of calculation. In the calculations perform ed here the topological relationship perm its the calculation of B. Following H enderson and O den 5 we can perform the angular integrations using the orthogonality relationships of associated Legendre polynomials and reduce the nine-dim ensional integral to a three- dimensional one, i.e.
— 647r3 E / / / fe12f( fe l )fe22f( fe2) ^ 3 2f( fe3) X1=0
A l(kuk 2)Al(khk2)Al(k2,k3)dkxdk2dki (7)w hereA,(k„kj) =
[(21 + D/2] I P,(cos 0„)(sin 0{j)i(k{j)d6u (8) do
T he Fourier transform s were carried out using the fast Fourier transform algorithm with removal of the aliased peaks using 1024 m esh points. T he interpolations were carried out using cubic splines and the num erical quadrature followed Sim pson’s rules with the function values tab u la ted a t the necessary points and the accuracy on the integrals for Ai(ki,kj) of 10-5 .
Although i(k) decays slowly and in fact appears in the integrand as
where the num erators arise from the rem aining integration over spatial variables, the function fii(fe) decays through m ore than four decades in the spatia l range used.
The results of these calculations are given in T able I. I t is clear from the calculations th a t a conflict is arising between th e need to pack m any points in the region of m axim um variation of t(k ) which occurs a t small k and the need to take a satisfactory account of the slowly decaying tail. H aga6 has m ade an estim ate of the value of th is graph of 51.164 which seems to be in fair agreem ent w ith the values obtained here. T he values of the graph calculated w ith the sam e k max = 33.5 appeared to be independent of w hether a step length of 7r/ 1 2 or ir/15 was used. T his suggested th a t the step length of tt/ 1 2 was sufficient to represen t the function a t low k so th a t step length was used in the la ter calculations. E xtrapolation against (l / k max)m yields a lim iting value of 43.091 for m = 2.5 b u t it was too tim e consuming to perform the calculation with more th an 229 quadrature points. In order to provide a check of th e calculation, we used the relationship
= 4 7 7 / 7 A 'd r = 477 / 7 '2E 1( ? - ) d r (9a)
= 4 t7 / r 2d r 3 J E {{k)e-ikrdk (9b)
This way both □ and B were calculated from the same graph. However B can be obtained accurately by an independen t path and has a value of 55.1227 in com parison with the present calculation which yields 55.144. Consequently it may be assum ed th a t B = 43.091 is a good estim ate of the graph. However th is value does not produce sufficient change in either g, or hi predicted by F riedm an and Krish- nan to make them com patible w ith the experim ental re su lts.7
Acknowledgments. I t is a pleasure to th an k Professor H. L. F riedm an for suggesting th is project and for discussions during its im plem entation. We are grateful to the SRC for financial support and to CECAM for facilities.
References and Notes(1) H. L. Friedman and C. V. Krishnan, J. Phys. Chem., 78, 1927 (1974).(2) W. G. McMillan and J. E. Mayer, J. Chem. Phys., 13, 276 (1945).(3) R. R. Cassel and R. H. Wood, J. Phys. Chem., 78, 1924 (1974).(4) M. Dixon and P. Hutchinson, unpublished work.(5) D. Henderson and L. Oden, Mol. Phys., 10, 405 (1965); J. A. Barker and
J. J. Monaghan, J. Chem. Phys., 36, 2564 (1962).(6) E. Haga, J. Phys. Soc. Jpn., 8, 714 (1953).(7) H. L Friedman, private communication.
The Journal of Physical Chemistry, Voi. 79, No. 17, 1975

1822 R. F. Cross
Expansion of the McDevit and Long Theory of Nonelectrolyte Activity Coefficients to a Consideration of Concentrated Aqueous Electrolyte Solutions
R. F. Cross*University of Melbourne, Parkville, Victoria, Australia, 3052 and The Swinburne College of Technology, Ha wthorn, Victoria, Australia, 3122 (Received November 25, 1974; Revised Manuscript Received May 19, 1975)
T he M cDevit and Long theory of nonelectrolyte activity coefficients in aqueous sa lt solutions has previously been developed only in its lim iting form. In th is paper the theory is expanded to a consideration of concen trated aqueous electrolyte solutions and is applied to the solutions of several nonpolar nonelectrolytes for which experim ental d a ta exist in the literatu re and for which a com parison can also be m ade w ith calculations based upon the statistical mechanical description of hard-sphere fluids. The a lte rn a te approaches are found to have sim ilar success in prediction.
Introduction
T he addition of a salt to a solution of a nonelectrolyte brings about a change in the activity coefficient of the nonelectrolyte and hence a change in its solubility. A knowledge and understanding of nonelectrolyte activity coefficients is therefore fundam ental to any study of sa lt effects upon chemical or electrochem ical processes. Bockris and R eddy 1 have pointed out the im portance of bo th salting out (increase in nonelectrolyte activity coefficient and decrease in solubility) in m any established processes in the chemical industry and Tiepel and G ubbins2 have referred to the problem of the salting out of oxidant and fuels in the developm ent of new electrochemical power sources. The m agnitudes of activity coefficients of nonelectrolytes in salt solutions are therefore of very great in terest on both p rac tical and theoretical grounds.
In this paper th e M cDevit and Long theory of nonelectrolyte activity coefficients in aqueous sa lt solutions (previously only presented for determ inations in lim iting small concentrations of electrolyte) is expanded so th a t it may be applied to solutions of concentrated electrolyte solutions. Some calculations are done on systems containing nonpolar nonelectrolytes and the results com pared with experim ent and with calculations based upon the statistical mechanics of hard-sphere fluids.
Early a ttem p ts to calculate activity coefficients were based upon electrostatics (Debye and M cAulay , 3 Debye4) and generally failed to account for the high specificity of activity coefficients, both with respect to the nonelectrolyte and the salt. Subsequent developm ents of electrostatic theories were largely extensions or reform ulations of the earlier theories. The exceptions being the work of Bockris, Bowler-Reed, and K itchener , 5 and of Conway, Desnoyers, and S m ith . 6 The former developm ent5 was significant in th a t the role of specific interactions was first recognized. N onelectrolyte activity coefficients were described as a balance between electrostatic salting out and salting in due to dispersion force interactions between the salt and the nonelectrolyte. Consequently the theory was able to predict the common form of salting in which previous electrostatic theories had failed to do. However, the order of m agnitude of calculated activity coefficients was not correct. In contra s t to previous electrostatic treatm ents, Conway, Des-
* Address corresponder.ee to th is au thor a t T he Sw inburne College of Technology, H aw thorn, Victoria, Australia, 3122.
noyers, and Smith6 retained the later terms in the series expansion of the exponential energy term of the Debye theory. In addition, they allowed for the effect of ionic hydration upon the dielectric decrement. As the authors point out, previous electrostatic theories had enjoyed success that was perhaps unwarranted in view of the compensatory effects of neglect of hydration and of consideration of only the initial term of the series expansion. Unfortunately, this meant that the sounder theoretical treatment of Conway et al. was to yield little improvement in the prediction of nonelectrolyte activity coefficients in salt solutions.
In 1952, M cDevit and Long7 published the ir theory, which was a correlation between the nonelectrolyte activity coefficient and the limiting values of bulk properties of the nonelectrolyte and of the salt solution a t infinite dilution. Hence it was only possible to calculate the lim iting values of the activity coefficient. However, the theory was able to pred ic t (i) the wide spread of salt effects observed, (ii) the low salting out of L i+ and H + and the correct cation and anion sequences (except in some cases where the effects of some salts are very similar) and, (iii) salting in where it was observed. For very small nonelectrolyte molecules (O 2 , H 2 ) the calculated sa lt effect was generally of the correct m agnitude. However, for larger molecules the calculated sa lt effect was two to three tim es too large . 7 , 9 - 1 2 M any criticism s of the theory have been based upon th is discrepancy, a d iscrepancy which can be accounted for by a correction factor allowing for the nonzero distance of closest approach of ion and nonelectrolyte in solution . 7 O ther criticisms of the M cDevit and Long approach have been to the usage of the somewhat nebulous intrinsic volume of the salt (the molar volume of the liquid salt a t solution tem perature) and to the inability of the theory (as presented) to calculate salt effects as a function of electrolyte concentration. This la tter shortcom ing is rectified below. In addition, A ltshuller and Everson 1 1 have questioned the form of the McDevit and Long correction factor. However, w ith the exception of the ir activity coefficient data in solutions of iodide salts, the validity of which has been questioned in o ther places , 1 3
the ir data on ethyl acetate support the form of the correction factor proposed by McDevit and Long. As well, Mast- erton and o thers 1 4 , 1 5 have brought forward experim ental d a ta th a t seem difficult to correlate w ith the M cDevit and Long theory. The significance of these results is uncertain as the subsidiary therm odynam ic d a ta necessary for a quantita tive te st are not available.
The Journal o f Physical Chemistry, Voi 79, No. 17, 1975

Nonelectrolyte Activity Coefficients in Salt Solutions 1823
The m ost recen t approach to the calculation of nonelectrolyte activity coefficients in sa lt solutions is based upon the exact form ulation of the sta tistica l m echanics of hard- sphere flu ids,16a,b in which particles obey a pairwise add itive potential. As developed18'"* (largely) by P iero tti and applied by Shoor and G ubbins , 1 7 the solubility of a nonpolar gas in a fluid is calculated by the “scaled particle theo ry” (S P T h) from the sum m ation of the G ibb’s free energy term s associated w ith the change of the phase of the solute, the creation of a cavity in fluid (gh) and the solute-solvent in teractions ( g B), w ater d ipole-solute induced-dipole, and all dispersion interactions being considered in g s .
g h is determ ined directly from the hard-sphere statistical m echanics. T his raises th ree difficulties, (i) T he assum ption th a t all particles in solution have a “hard core” or, in o ther words, th a t the p lacem ent of a particle in a cavity of a given size in the solution does no t a lter the natu re of the cavity. A part from the problem posed in the selection of the correct hard-sphere diam eters (to which the theory is understandib ly sensitive), there is th e question of whether the particle placed in th e created cavity can impose specific orientational restrictions upon neighboring particles in solution. In view of the highly polar natu re of w ater and our curren t p ic ture of solute-solvent in teractions , 1 8 th e answer to this question m ust be yes . 1 9 (ii) A related difficulty arises from the assum ption th a t particles obey a pairwise additive potential. T his seems m ost unlikely in aqueous solu tions . 2 0 (iii) The approxim ation of a uniform d istribu tion of particles in solution is likely to break down for large nonpolar solutes or bulky ions and also for polar solutes. In ad dition, (iv) the approxim ation is m ade th a t g s = e s (the in te rna l energy contribution to g a ) . According to P iero tti this is reasonable, b u t Shoor and G ubbins have pointed out th a t while the pva term m ay safely be discarded a t norm al pressures, the approxim ation th a t Tss « es is also likely to become less reasonable as the size of solute particles in crease.
Shoor and G ubbins have found very good agreem ent between experim ent and theory for several nonpolar gases in concentrated KOH solutions, while other S P T h calculations2 1 ’ 2 2 upon nonpolar solutes in aqueous solutions contain ing small ion salts have been less successful. In each study, agreem ent between experim ent and theory can be seen to noticably deteriorate with the increasing size of the solute or ion. Also as expected, the choice of the “correct” or appropriate ancilliary d a ta is a recurren t problem in these and sim ilar calculations . 2 ’ 1 7 ’ 2 1 - 2 3
A further developm ent based upon the sta tistica l m echanics of hard-sphere fluids has been presented by Tiepel and G ubbins . 2 4 ’ 2 The equations developed in th is “p e rtu rbation theory” are sim ilar to those of the S P T h b u t are free from approxim ation iv of the P iero tti approach since a Taylor series expansion is made about th e H elm holtz free energy of a fluid m ixture of hard spheres. Also, a tem perature-dependen t expression is used for th e hard-sphere d iam eters of th e particles. Calculated values of activity coefficients of nonpolar solutes are generally in good agreem ent w ith experim ent and are slightly b e tte r than S P T h es tim ates, although subject to sim ilar lim itations w ith respect to the size and polarity of solutes.
T h eo ryMcDevit and Longs’ expression for the activity coeffi
cien t of a nonelectrolyte in a sa lt solution a t lim iting, small concentrations of bo th nonelectrolyte and salt are based
upon a T aylor’s expansion of the H elm holtz free energy of the solution around Vo = nwV w + nsV a. V w is the m olar volume of w ater and V s th e m olar volume of pure liquid sa lt a t th e tem peratu re of the solution. The H elm holtz free energy after mixing the liquid sa lt and w ater is
M V , + a v i = A l i y + ( i i )
'/,(§,) (A V I* + U ‘A
A V m +T , V = V
r,v=v0 3 !d P(A F ”) J + . . .
T , V = V
AVm = n a(<j>s — Va) and is the volume change upon mixing, 4>s being the ap p aren t m olar volume of the salt. M cDevit and Long then introduce the iden tity (dA/AV)r = —p and the isotherm al com pressibility (0 = — ( l/V )(d W d p ) 7 -), thus obtaining an expression in p , 1/0V and differentials of 1 /0V w ith respect to V. An expression, analogous to the one thus obtained, b u t allowing for the in troduction of an additional volume of nonelectrolyte (Vn) is then d ifferentia ted w ith respect to Vn a t constan t T and p. In the case of vanishingly small am ounts of th e nonelectrolyte, since (dG /dV )r,p = (dA/dVOr.p + p, the resu ltan t expression is
lim ( # )v„- o V d y„ ) t, p 0 V
A F ‘
r d ( m i (a f Y r d 2 m iL d P \0 V ) J r 2 L d P 2 W / J
d 3 / 1 ( A P m) J d F 3 \ / H 7 J T 24
( A P m) 3
+ • • • (1 )
T he first derivative of 1/0V w ith respect to V m ay be expressed in term s of cs as follows:
dd p 0 L dP
+T
L f - J L / M l dc , V L dcs \B ) J TdV
As d c s/ d P - - c J V
ddV m
S im ila r ly
( 2 )
( i ^ 1 ( 2 d T \ 1
\0V ) r ” V 3 h + 4Cs _dcs <0 / .+
T
c v ' Â
1------1
H |CQ.
(3)
If we assume, as Long and M cDevit did, th a t a neu tra l non electrolyte occupies the same m olar volume when infinitely d ilute in a salt solution (Vn°°) as when both the nonelectrolyte and salt are infinitely d ilu te (Vn" ’"), Vn = n nV/n" = rcnVn“ ’°°. This assum ption is n o t correct, bu t reference to Table II (for example) shows th a t the error in troduced in th is approxim ation is only of the order of a few percent. The left hand side of eq 1 m ay then be w ritten as
lim 2.303 R TV “’°°v n (log /a) I
where fn is the mole fraction activity coefficient o f the non- electrolyte. We may com pensate for the approxim ation m entioned above by writing the left hand side of eq 1 as
limn n - 0
2.303RTV.”
( lo g /n) |
The Journal of Physical Chemistry, Voi. 79, No. 17, 1975

1824 R. F. Cross
Using th is expression in eq 1, com bining eq 1-3, replacing A Vm w ith n s(0s - Vs), and rearranging
lim [log / J =
!dc. Q Ï
V.~cs{V3 - <Ps) I 1 -c s
r 1 +2.303 R T ( 0 2 U
c 2 r 2 d / Ia 6 j + C sd cs \l3 ) +
2 d 2
Cs d c s 2 ( i ) ]( - <P ) 2 “ s' . } (4)
Gibson2 5 has expressed the isotherm al com pressibility (8) of a sa lt solution a t any externally applied pressure (P) and 25° in term s of the in ternal pressure of th a t solution (P e). W here x\ and x2 are the weight fractions of w ater and salt respectively, p is th e density of the solution, and va is the specific volume of th e solid salt, the relationship is
0 P j; 0.13337*1 d r5d P
I j lP f(296.2 + P e + P
T he pressures are expressed in M N m ~2. As d c 3/d P is neg ligibly sm all . 2 6
1 296.2 + P„ + P13 ~ 0 .13337*,p
and from Gibson2 5 -2 6
P = L c 1c 3
where L is a constant. Also
x, = cxM j p
where M i is th e molecular weight of water.
1 0 3pM,
(5)
(6 )
(7)
( 8 )
and according to R oot , 2 7 th e density of certain aqueous sa lt solutions may be expressed as
p = p 0 + kics + k,cs3n (9)
where k\ and k2 are constants and po is the density of water. From eq 5-9, a t atm ospheric pressure
7.50
J i md cs \ 0 /
-, = 7.50
0.2963LPo + % - 10-3 Ms) cs + c s 3 / 2 '
0.2963(V + % k 7c j n )
i f .M.
( 1 0 )
(Po + kiCs + k2Ca3 / i ) 2 iv t j JM,
( 1 1 )k 4 = V — 10~3 M S, where M s is the molecular weight of the salt.
d2dc 2
________ 2 . 2 2 2
(Po + k4cs + k2cs3/y x
2(ki + 3/ , k , c sU2) 3k,Po + V s + &2 cs3/2 4 c s 1 /2
( 1 2 )
Values of 1/0, (d /dcs)(l/0 ), and (d 2/d c s2 )(l/0 ) calculated from eq 10-12 are given in T able I for solutions of NaCl a t several concentrations. A plot of (p — po)/cs vs. cs1/2 is lin ear, giving k\ = 5.75 X 10~ 2 and k2 = —2.60 X 10⁻³ . From Gibson , 2 5 L = 0.567 bar M ~ 2 for NaCl solutions. Even for quite large values of es, the term s involving the derivatives of 1/0 in eq 4 will be negligible with respect to those involving 1 / 0 , thus yielding th e final expression:
TABLE I: Relative Magnitudes of Terms Involving the Isothermal Compressibility (0)
c Nacl>mol dm"3
1/0, 103 J"1 dm3
(d/dc3) (1/0), 103 J"1 dm6 mol”1
(d2/dcs2) (1/0), 103 J"1
dm9 mol-2
1 2440 0.244 0.004432 2700 0.247 0.003273 2990 0.250 0.002834 3290 0.253 0.002615 3560 0.255 0.00250
h m [log A ] ~ “ 2 .3 0 3 R T P * X
1 - y s (Vs - 4>s) ^ C~ f ( V s - cp3)2 - . • • (13)
If r is the radius of the average ion presen t in solution and r n is the van der W aals radius of the nonelectrolyte, correcting eq 13 for the distance of closest approach of ion and nonelectrolyte will yield:
rr + rn
(14)
As the various param eters in eq 5-9 are of sim ilar m agnitude for the other alkali halides and for th e alkali hydroxides, eq 13 and 14 will also hold true in these cases.
ResultsThe systems chosen with which to te s t the above equa
tions have been restricted to those for which com parison may be m ade w ith both m easured values of th e activity coefficients and estim ates made according to the calculations based upon hard-sphere fluid statistical mechanics. A fu rther lim itation arises due to the ancilliary therm odynam ic d a ta required.
In the M cDevk and Long(M cDL) approach, th e m ost troublesom e param eter is the intrinsic volume, Vs. Values vary appreciably, according to the m ethod of estim ation, and the (Vs - 0 S) term is typically only 10 to 25% of the m agnitude of its com ponent term s so th a t a 1 0 % variation in Vs may well lead to a 100% variation in log /„ . Hence considerable care is necessary in choosing values of Vs. Figure 1 shows several sets of V9 d a ta for a range of salts. T he scale on the abscissa was arranged by plo tting th e d a ta of Scott ( # ) 2 8 vs. itself and then labeling these positions on the abscissa with the sa lt concerned. C ertainly the nature of th is p lo t will vary according to the se t of Vs values chosen to se t up th is scale, bu t for the salts considered in th is paper there is no significant variation. S co tt’s d a ta were chosen in view of the fairly com plete range of alkali halide salts contained, the absence of extreme V8 values, and the inclusion of Vs values for CsCl th a t are derived th e true structu re of the sc lid salt, as well as from the hypothetical rock sa lt structure. Vs from L unden 2 9 in the case of NaCICU and NaNOs and from M cDevit and Long7 in the case of KOH (assuming additivity of ionic contributions) have also been plotted against themselves. Choosing the d a ta estim ated by Scott (Cl) 2 8 using a d ifferent method,
[ , o g / J = t - x
1 - | s OG - <p s) - % (vs - <PS) 2
The Journal of Physical Chemistry, Vol. 79, No. 17, 1975
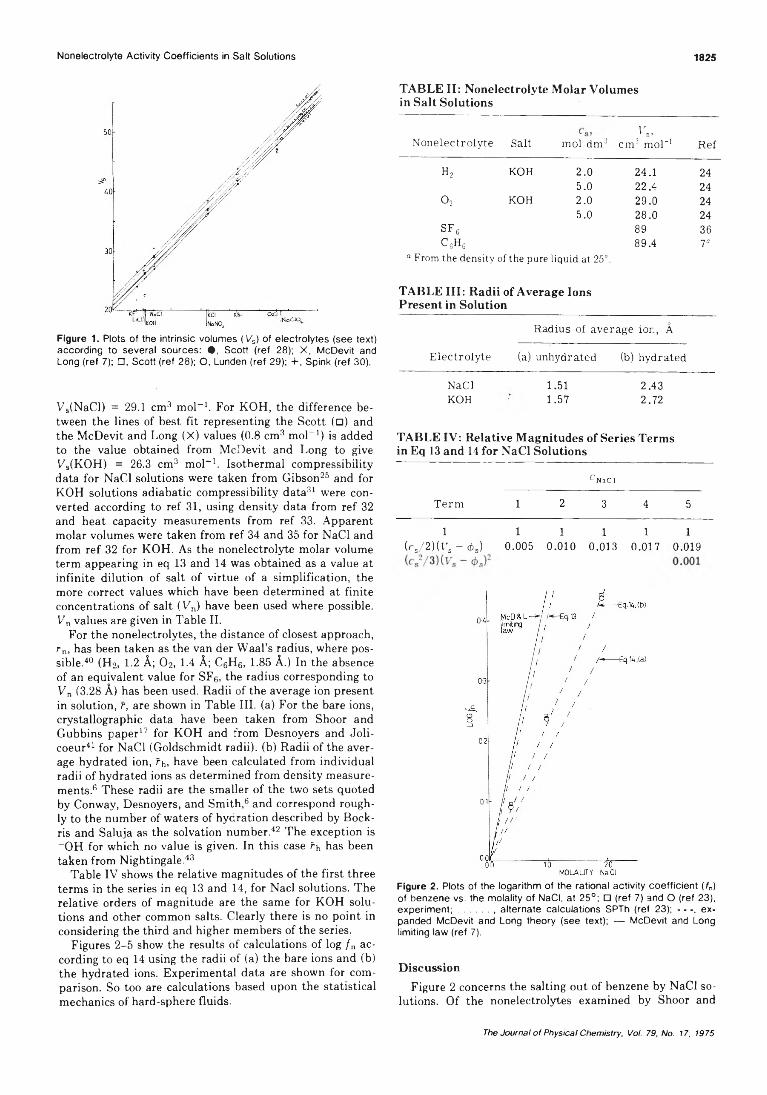
Nonelectrolyte Activity Coefficients in Salt Solutions 1825
Figure 1. Plots of the intrinsic volumes (l/s) of electrolytes (see text) according to several sources: • , Scott (ref 28); X, McDevit and Long (ref 7); □ , Scott (ref 28); O, Lunden (ref 29); +, Spink (ref 30).
Vs(NaCl) = 29.1 cm 3 m ol-1. For KOH, the difference between th e lines of best fit representing the Scott (□) and the M cDevit and Long (X) values (0.8 cm 3 mol-1 ) is added to the value obtained from M cDevit and Long to give V9(KOH) = 26.3 cm 3 mol-1 . Isotherm al com pressibility data for NaCl solutions were taken from Gibson2 5 and for KOH solutions adiabatic com pressibility d a ta 3 1 were converted according to ref 31, using density data from ref 32 and h ea t capacity m easurem ents from ref 33. A pparent molar volumes were taken from ref 34 and 35 for NaCl and from ref 32 for KOH. As the nonelectrolyte molar volume term appearing in eq 13 and 14 was obtained as a value a t infinite dilution of salt of virtue of a sim plification, the more correct values which have been determ ined a t finite concentrations of sa lt (Vn) have been used where possible. V n values are given in Table II.
For the nonelectrolytes, the distance of closest approach, r n, has been taken as the van der W aal’s radius, where possible . 4 0 (H2, 1.2 A; O2 , 1.4 A; CeHe, 1.85 A.) In the absence of an equivalent value for SFg, the radius corresponding to Vn (3.28 A) has been used. Radii of the average ion present in solution, r, are shown in Table III. (a) For the bare ions, crystallographic data have been taken from Shoor and Gubbins pap e r 1 7 for KOH and from Desnoyers and Joli- coeur4 1 for N aCl (Goldschm idt radii), (b) Radii of the average hydrated ion, rh, have been calculated from individual radii of hydrated ions as determ ined from density m easurem ents .6 These radii are the sm aller of the two sets quoted by Conway, Desnoyers, and S m ith , 6 and correspond roughly to the num ber of waters of hydration described by Bock- ris and Saluja as the solvation num ber . 4 2 The exception is - OH for which no value is given. In th is case fh has been taken from N ightingale .4 3
Table IV shows the relative m agnitudes of the first three term s in the series in eq 13 and 14, for Nacl solutions. The relative orders of m agnitude are the same for KOH solutions and other common salts. Clearly there is no point in considering the th ird and higher m embers of the series.
Figures 2-5 show the results of calculations of log / n according to eq 14 using the radii of (a) the bare ions and (b) the hydrated ions. Experim ental d a ta are shown for com parison. So too are calculations based upon the statistical mechanics of hard-sphere fluids.
TABLE II: Nonelectrolyte Molar Volumes in Salt Solutions
vn,Nonelectrolyte Salt mol dm3 cm3 mol"1 Ref
h 2 KOH 2.0 24.1 245.0 22.4 24
O j KOH 2.0 29.0 245.0 28.0 24
s f g 89 36c 6h g 89.4 V
“ From the density of the pure liquid at 25°.
TABLE III: Radii of Average Ions Present in Solution
Radius of average ion, A
Electrolyte (a) unhydrated (b) hydrated
NaCI 1.51 2.43KOH 1.57 2.72
TABLE IV: Relative Magnitudes of Series Termsin Eq 13 and 14 for NaCI Solutions
c N a C l
Term 1 2 3 4 5
1 1 1 1 1 1
(<rs/ 2 ) ( r s - ós) 0.005 0.010 0.013 0.017 0.019
Figure 2. Plots of the logarithm of the rational activity coefficient (fn) of benzene vs. the molality of NaCI, at 25°; □ (ref 7) and O (ref 23), experiment;........., alternate calculations SPTh (ref 23); — , expanded McDevit and Long theory (see text); — McDevit and Long limiting law (ref 7).
DiscussionFigure 2 concerns the salting out of benzene by NaCI so
lutions. Of the nonelectrolytes examined by Shoor and
The Journal o f Physical Chemistry, Voi. 79, No. 17, 1975

1826 R. F. Cross
molality koh
Figure 3. Plots of the logarithm of the rational activity coefficient (fnj of hydrogen vs. molality of KOH, at 25°: — O— , experiment (ref 1 7 );...........SPTh (ref 17);------ , expanded McDevit and Long theory (see text).
Figure 4. Plots of the logarithm of the rational activity coefficient (fn) of oxygen vs. molality of KOH, at 25°: — O— , experiment (ref 17);..........SPTh (ref 17); +— +, theory of Conway, Desnoyers, andSmith (ref 2); H------ h theory of Debye and McAulay (ref 2);----- ,expanded McDevit and Long theory (see text); — McDevit and Long limiting law (ref 7).
G ubbins 1 7 in KOH solutions, H 2 , O2 , and SF 6 were chosen in view of the accurate V n data available (Figures 3-5).
In Figures 2 and 4 (the benzene-N aC l and O2-K O H , respectively) the p lo t corresponding to McDL lim iting expression7 for the salting constan t (fes) is shown. For these systems, the difference between the lim iting expression and eq 13 is no t as great as m ay be expected in either case as the increases in es and the series term s and the decrease in f3 largely offset the decrease in (Vs — <j>s). The sensitivity of th e theory to the value of </>„ is shown in Figure 4 by the bars on the McDevit and Long plots. In th is example, where strong salting out occurs, and (V 9 — 4>a) is consequently large, a variation of only 1 cm 3 mol- 1 (4%) in the value of Va (26.3 cm 3 mol-1) still gives rise to the 11% change seen in log fn. N onetheless, for an uncorrected estim ate of ks giving rise to log fn values about th e same as those due to the Debye and McAulay theory, Tiepel and
Figure 5. Plots of the logarithm of the rational activity coefficient (fn) of SFe vs. molality of KOH, at 25°: — O— , experiment (ref 17);.........theory of Tiepel and Gubbins (ref 2);------ expanded McDevitand Long theory (see text).
G ubbins2 would have needed to use Vs 12 cm 3 m ol- 1 for KOH. Such a value seems m ost unreasonable in view of the d a ta available in the literature: 21.7 cm 3 m ol- 1 ,4 4 24.2 cm 3
mol- 1 (15°),28 and 25.5 cm 3 mol- 1 . 7
Estim ates of the salt effect of KOH on O 2 calculated by Tiepel and G ubbins2 according to electrostatic theories (of Debye and McAulay and of Conway, Desnoyers, and Sm ith) have also been included in F igure 4. Clearly the electrostatic theories are least accurate in prediction, the Debye and McAulay approach being least accurate a t all sa lt concentrations while the theory of Conway, Desnoyers, and Sm ith breaks down com pletely a t m oderately high sa lt concentrations.
As w ith estim ates of ks for small nonelectrolytes in solutions of salts from which strong salting out occurs ,8 Figures 2-5 tend to indicate th a t there is no m arked difference between the sa lt effects calculated for small and large nonelectrolytes according to the M cDevit and Long approach.
I t is obvious th a t estim ates of log /„ using eq 13 are consistently too high for the systems exam ined, as is com m only the experience in applications of th e McDL lim iting expression for ks. E quation 14, (a) used in conjunction with the radii of the unhydrated ions (crystallographic radii) lead to consistently low estim ates whereas (b) the use of hydrated radii to define the distance of closest approach to ions give use to values of log / n th a t are interm ediate in m agnitude and are generally in good quan tita tive agreem ent w ith experim ent. Indeed, in the case of the H 2-K O H system agreem ent w ith experim ent is far better th an the S P T h estim ate although for O2-K O H the reverse is true. For CeHe-NaCl and SF 6-K O H , S P T h and eq 14, (b) give alm ost identical and good estim ates. (The S P T h calculation for SF 6-K O H 1 7 is not shown in F igure 5 bu t is v irtua lly identical w ith eq 14 (b). Tiepel and Gubbins calculation according to their “pertu rbation theory ” 2 is shown in F igure 5 and is less successful in th is case.) Generally, it ap pears th a t the expanded M cDL approach m ay give rise to good estim ates of the activity coefficients of nonpolar nonelectrolytes in salt solutions, when corrected using the radii of hydrated ions5 0 and the van der W aal’s radius of the nonelectrolyte to define the distance of closest approach.
Salting in systems have also been exam ined by Tiepel and G ubbins , 2 b u t w ithout success. k3 is generally found to become less negative with increasing size of the alkane and sometim es also with increasing size of the tetraalkylam m o-
The Journal o f Physical Chemistry, Vol. 79, No. 17, 1975

Nonelectrolyte Activity Coefficients In Salt Solutions
nium ion present in solution; the opposite of that observedexperimentally. In fact, the theory predicts salting out forn-butane in solutions of (n-C4HlO)4NBr. The system examined most closely was methane in (CH3)4NBr solutions.Tiepel and Gubbins have calculated a value of k. accordingto the McDL limiting expression which is an order of magnitude ~ger than observed experimentally. Even alloWingfor a larger than usual uncertainty in V. for this salt, literature eJ>.,46,47 Vn,24 and (348 data for this system at the finitesalt concentrations considered indicate that their estimateis probably too small~ ~~tever assumptions ar~ madewith respect to distances ofCloeest approach,eq 13 and 14seems incapable of dealing with this system. However, thisparticular system appears to be atypical inasmuch as otherMcDL applications to salting in7•10 yield k. only 2-3 timestoo large, and consistently so. Taking r«CH3)4N+) = 2.70A49 and r(Br-) = 2.23 As gives f(CH3)4NBr) = 2.49 A.With the van der Waal's radius for benzene = 1.85 A,40 f/(F+ r n) = 0.573 and the experimental value of k. for this system (approximately one-half k. calculated by the McDLlimiting expression) is well within the range of the corrected McDL approach. For benzene in solutions of the largerquaternary ammonium salts, the discrepancy is about 3and the larger cations would lead to larger correction factors not smaller as required. Nevertheless, with the largeuncertainty in V. for these systems and the differences inexperimental salting constants7,l0 the McDL approachseems still to be reasonable. In addition, the radii of quaternary ammonium cations referred to in ref 41 give rise tomolar volumes that seem to be more compatible with effective volumes occupied than with distances of closest approach. Setting r«CH3)4N+) = 2.70 A,the volume occupied by this ion is 85 cm3 (g ion)-l according to eq 11 of ref49. V. for the same ion is 73 cm3 (g ion)-l as calculatedfromeq 6 of ref 41. The intrinsic volume (V.) takes in someof the free space between the ion and the solvent molecules.This indicates that distances of closest approach to thebulky R.N+ ions may be less than the radii indicated in ref41 and the correction factors subsequently smaller as required.
It may be concluded that, for nonpolar nonelectrolytes insolutions of small ions, the McDL approach and the SPTh(and related calculations) appear to be similarly accurate inpredicting the nonelectrolyte activity coefficients. In solutions of large ion salts the McDL approach seems superiorat this time. Of the SPTh, and particularly the more recentdevelopments based upon the statistical mechanics ofhard-sphere fluids, it must be said that this more fundamental approach has considerable appeal, especially inview of the success of the theories in some systems and theability of the theory to calculate actual solubilities and awide range of other thermodynamic properties. However,in the systems where it has been less successful and for systems involving polar molecules, the assumptions uponwhich the theories have operated until now lire likely to beinvalid. In these cases, the theories may require modification to the point of complexity at which their usefulnessmay be largely lost. Meanwhile, the McDL approach mayprove to be a useful tool. This approach has considerableappeal for two reasons. First, the treatment requires no assumption!labout the molecular distribution of particles insolution or the precise mathematical description of interactions between particles. It is based upon observable thermodynamic bulk properties. Hence it is likely that this approach may be equally successful for polar nonelectrolytes.
1827
This will be the subject of a later communication. Secondly, the final equations ofthe expanded McDL approach aresuch that once a single nonelectrolyte-salt solution systemhas been considered, application to further nonelectrolytesin solutions of the same salt requires only knowledge of themolar volumes of the nonelectrolytes (and van der Waalsradii for nonpolar nonelectrolytes). The major difficulty ofthe McDevit and Long approach lies in the assignment ofvalues of the intrinsic volume.
Acknowledgment. The author wishes to thank Dr. E.H.Bode and The Swinburne College of Technology for thegrant of partial release during which time some of this workwas carried out.
References and Notes
(1) J. O'M. Bockrls and A. K. N. Reddy, "Modem Electrochemistry", Vol. 1,Plenum Press, New York, N.Y., 1970, P 164.
(2) E. W. T1epel and K. E. Gubbins, Ind. Eng. Chem., Fundsm., 12, 18(1973).
(3) P. Debye and J. McAulay, Phys. Z., 28, 22 (1925).(4) P. Debye, Z. Phys. Chem., 130,56 (1927).(5) J. O'M. Bockrls, J. Bowler-Reed, and J. A. Kltchener, Trans. Faraday
Soc., 47, 184 (1951).(6) B. E. Conway, J. E. Desnoyers, and A. C. Smith, PhIl. Trans. R. Soc.,
London, Ser. A, 258. (1074),389 (1964).(7) W. F. McDevlt and F. A. Long, J. Am. Chem. Soc., 74, 1773 (1952).(8) F. A. Long and W. F. McDevlt, Chem. Rev., 51, 119 (1952).(9) J. L. Lui and T. C. Huang, Sci. Slnlca, 10,700 (1961).
(10) N. C. Deno and C. H. Spink, J. Phys. Chem., 87, 1347 (1983).(11) A. P. Altshuller and H. E. Everson, J. Am. Chem. Soc., 75, 4823 (1953).(12) W. L. Masterton and T. P. Lee, J. Phys. Chem., 74, 1776 (1970).(13) S. Glasstone and A. Pound, J. Chem. Soc., 127,2660 (1925).(14) W. L. Masterton and R. N. Schwartz, J. Phys. Chem., 88, 1546 (1965).(15) W. L. Masterton, T. P. Lee, and R. L. Boyington, J. P"Iys. Chem., 73,
2761 (1969).(16) (a) H. Reiss, H. L. Frlsh, and J. L. Lebowitz, J. Chern. Phys., 31, 369
(1959); (b) H. Reiss, H. L. Frlsh, E. Helfand and J. L. Le:>owltz, ibid., 32,119 (1960); (c) R. A. Pierotti, J. Phys. Chem., 87,1840 (1963); (d) S. W.Mayer, J. Chem. Phys., 38, 1805 (1963); (e) R. A. Pierotti, J. Phys.Chem., 89, 281 (1965); (f) J. L. Lebowitz, E. Helfand, and E. Praestgaard, J. Chem. Phys., 43, 774 (1965).
(17) S. K. Shoor and K. E. Gubbins, J. Phys. Chem.• 73, 498 (1969).(18) See, for example, H. S. Frank and M. W. Evans, J. Chem. Phys., 13,
507 (1945). .(19) F. H. StiHInger, J. Solution Chern., 2,141 (1973),(20) H. S. Frank, Z. Phys. Chem. (Leipzig), 228, 364 (1965).(21) M. Lucas, Bun. Soc. Chlm. Fr., 2994 (1969).(22) W. L. Masterton and T. P. Lee, J. Phys. Chern.• 74,1776 (1970).(23) Y. L. Tlen, M. Y. Schrier, and E. E. Schrier, J. Phys. Chern., 78, 165
(1974).(24) E. W. Tlepel and K. E. Gubbins, J. Phys. Chem., 78, 3044 (1972).(25) R. E. Gibson, J. Am. Chem. Soc.• 57, 284 (1935).(26) R. E. Gibson, J. Am. Chem. Soc., 58, 4 (1934).(27) W. C. Root, J. Am. Chem. Soc., 55, 850 (1933).(28) A. F. Scott, J. Phys. Chem., 35, 3379 (1931).(29) B. Lunden, Z. Phys. Chem. (Leipzig), 192,345 (1943).(30) C. H. Spink, Ph.D. Thesis, Pennsylvania State Unlv~, 1962.(31) D. S. Allam and W. H. Lee, J. Chem. Soc. A, 5 (1966).(32) G. Akerlof and P. Bender,. J. Am. Chem. Soc., 83, 1085 (1941).(33) L. V. Puhkov, T. A. Baranova, and M. E. Lapidus, J. Appl. Chem. ussr,
43,463 (1970).(34) W. Geffcken, Z. Phys. Chem. A, 155, 1 (1931).(35) F. Vaslow, J. Phys. Chem., 70, 2286 (1966). . _(36) Reference 37 gives a value of 101 emS fqr the pertlal molar volume (II)
of SF8 In cyclohexane at 25°. However, V for nonpolar solutes Is usually less In water than in hydrocarbon solvents.sa An alternate value of\IlSF8) = 77.7 cm3 mol-1 may be obtained from the density of pure Uquld SF8 at -50.5°.39 As a larger volume would be occupied by SF8 at25° an averaged value of the two (89 cm3 mol-') has been taken. .
(37) R. G. Unford and J. H. Hildebrand, Trans. Faraday Soc., 85, 1470(1969).
(36) R. Battlno and H. L. Clever, Chem. Rev., 88, 395 (1966).(39) "Handbook of Chemistry and Physics", 51st ed, The Chemlcel Rubber
Co., Cleveland, Ohio, 1970-1971.(40) F. A. Cotton and G. Wilkinson, "Advanced Inorganic Chemistry", 1st ed,
Intersclence, New York, N.Y., 1962, P 104.(41) J. E. Desnoyers and C. Jolicoeur In "Modern Aspects :>f Electrochemis
try", Vol. 5, J. O'M. Bockrls and B. E. Conway, Ed., Pt9num Press, Ne1lllYork, N.Y., 1969.
(42) J. O'M. Bockrls and P. P. S. Saluja, J. Phys, Chern., 78, 2140 (1972).(43) E. R. Nightingale, J. Pflys. Chem., 83, 138 (1959).(44) J. Pavoda, J. Chern. Phys., 40, 691 (1964).(45) J. O'M. Bockrls and P. P. S. Saluja, J. Electrochem. Soc., 119, 106C
(1972).
The Journal of Physical Chemistry, Vol. 79, No. 17, 1975'

1828 Kew, Hanck, and DeArmond
(46) Y. W. Wen and S. Saito, J. Phys. Chem., 68, 2639 (1964).(47) H. E. Wirth, J. Phys. Chem., 71, 2922 (1967).(48) S. Schiavo, B. Scrosati, and A. Tommasini, Ric. Sci., 37, 219 (1967).(49) W. L Masterton, D. Eolocofsky, and T. P. Lee, J. Phys. Chem., 75,
2809 (1971).(50) The question of “What is the radius of an ion in solution?”, is a vexed
one; and not only because of the difficulty of precise definition and the uncertainty of the exact meaning of any value calculated from experimental data, or otherwise. There is also the problem of selecting the
value that is most appropriate for a particular application. In the present context, the distance of closest approach of a nonpolar nonelectrolyte to an ion seems best defined in terms of the size of an ion plus the very small number of tightly bound water molecules which could be described as "having lost their own degrees of translation freedom and have those of the ion".45 Bockris and Saluja42,45 define this number of water molecules of the solvation number of an ion. A set of radii of hydrated ions approximately corresponding to this extent of hydration have been used.
Voltammetry of Rhodium-1,10-Phenanthroline Complexes
Gregory Kew, Kenneth Hanck, and Keith DeArmond*Department of Chemistry, North Carolina State University, Raleigh, North Carolina 27607 (Received February 5, 1975)
Cyclic voltam m etry d a ta have been obtained for the tris- and bis(l,10-phenanthroline) (phen) complexes of rhodium (III) in acetonitrile. The basic reaction sequence involves four one-electron transfers and is analogous to th a t reported earlier for rhodium (III)—2,2,-bipyridyl (bpy) complexes. T he firs t two-electron transfers are followed by chemical reactions; the rate of these reactions is considerably slower than in the bpy complexes. The th ird and fourth reduction steps occur through both a soluble and an adsorbed p a th way. A ddition of an electron to either [Rh(bpy)2 (phen)]3+ or [R h(bpy)(phen)2]3+ appears preferentially to involve the phen ligand. The role of delocalization in the electrochem istry of rhod ium (III)- and rutheni- um (II)-d iim ine complexes is also discussed.
IntroductionElectrochem ical reduction of [Rh(bpy)3 ]3+ occurs by an
ECEC mechanism in which two successive one-electron transfers appear under a single peak a t voltam m etric scan rates below approxim ately 1-2 V/sec. Higher scan rates resu lt in separation of the two reduction processes due to d ifferences in kinetic influence of the reactions following each one-electron reduction . 1 The reduction of [Rh(bpy)s]3+ in acetonitrile (AN) is thus unique since the (bpy ) 3 complexes of a num ber of other first and second transition series m e tals in acetonitrile undergo relatively straightforw ard successive one-electron transfers through the first th ree to five reduction steps . 2 (More complex behavior is found in aqueous solution 3 and a t very negative potentials in nonaqueous solvents.4)
Luminescence data for tris(b identate)rhodium (III) complexes of both 2 ,2 '-bipyridine and 1 ,1 0 -phenanthroline imply relative independence of each b iden tate ligand from others presen t . 5 V oltam m etric m easurem ents on the tris-, bis-, and m ono(bipyridine)rhodium (III) complexes seem consistent w ith such an in te rp re ta tion . 1 D eterm ination of the reduction mechanisms of [Rh(phen)s]3+, [R h(phen)2- (bpy)]3+, and [Rh(bpy)2 (phen)]3+ can furnish answers to the following questions, (a) W hat is the nature of the p rim ary reductan t orbital for these complexes? (b) Is the reduction mechanism determ ined for [Rh(bpy)3 ]3+ a prototype for rhodium (III)-tris(d iim ine) complexes in acetonitrile?
Experimental SectionMaterials. T he acetonitrile (Fisher reagent grade and
E astm an Spectro Grade) and tetraethylam m onium p er
chlorate (TEA P) used as a base electrolyte (Eastm an W hite Label) were fu rther purified and dried by m ethods reported previously . 1 The complexes were synthesized using RhCl3 *3 H 2 0 (Engelhard Industries), 2,2'-bipyridine (Aldrich Chemical Co.), and 1,10-phenanthroline (Aldrich Chemical Co.). All three were used as received. P reparation and chemical and spectral analysis of all Rh(III) complexes used in th is study have been described elsewhere . 5 ’6 Com plexes containing Rh in lower valence sta tes were obtained by m ethods paralleling those used for the analogous com plexes involving bpy . 7
Techniques. T he apparatus employed was identical w ith th a t reported in a preceding study w ith the exception th a t a P rinceton Applied Research (PAR) M odel 173 Potentios- ta t/G alvanosta t, employing positive feedback iR com pensation, was used instead of a PAR M odel 174 Polarographic Analyzer . 1 All potentials reported are vs. an aqueous sa tu ra ted calomel electrode (SCE) connected to the electrochemical cell by a large-diam eter agar-4% KC1 salt bridge im m ersed in AN. Liquid-junction potentials were not d eterm ined. V oltam m etric peaks were reproduced w ithin ± 1 0
mV. All complexes were dissolved in AN which also contained TEA P as a base electrolyte (0.10 M in TEA P).
Several phenom ena involving adsorption and p recip itation of reduced species on the surface of th e p latinum test electrode were noted in the cyclic voltam m etry of phen- containing R h(III) complexes. For consistent observation of these phenom ena extrem e care m ust be taken to exclude oxygen. T he electrochem ical cell was enclosed in a well- flushed, dry glove bag; the te st solution was deaerated for a m inim um of 60 min with 99.995% pure nitrogen which had been passed through a Ridox oxygen-removal catalyst and an AN scrubbing tower.
The Journal o f Physical Chemistry, Voi. 79, No. 17, 1975

R h o d iu m - 1 , 1 0 - P h e n a n t h r o l in e C o m p le x e s 1829
The p la tinum working electrode m ust be reproducibly cleaned and conditioned prior to each scan if reproducible voltam m ogram s are to be obtained. Two conditioning procedures were used. The first will be designated procedure A and the second procedure B. In procedure A the P t working electrode was immersed in concentrated n itric acid a t room tem peratu re for 1 - 2 m in and then rinsed in deionized w ater for a sim ilar period. A fter rem oval from w ater and drying, the electrode was im m ersed in a blank solution of AN-,0.10 M TE A P for 1-2 min. The solvent was allowed to evaporate from the electrode upon rem oval from the blank solution. The electrode was then installed in th e electrochem ical cell and conditioned by applying a po ten tia l of —0.4 V vs. SCE for 15-30 sec un til the cathodic cu rren t had decayed to a constant value. The po ten tia l was removed, th e te st solution stirred vigorously and allowed to become quiescent, th e initial po ten tia l applied to the cell, and the recorded scan started a few seconds later. P rocedure B is the same as A except prior to removing the po ten tia l of —0.4 V, several (10-15) cyclic scans of the te st solution were perform ed at a scan rate of ca. 30 V/sec. P rocedure A yields a P t surface which reproducibly exhibits adsorption phenom ena. P rocedure B yields a P t electrode whose su rface activity has been greatly reduced by the adsorp tion- desorption which occurs during the conditioning scans.
Results and DiscussionRedox couples observed for the complex ions are desig
nated by Rom an num erals I-IV , increasing tow ard more negative potentials. For some complexes certain num erals are om itted from the series to em phasize better and to designate uniform ly electron transfers though t to involve identical species. In other instances waves which appear to arise from overlap of waves due to two d istinct processes are designated by a sum of rom an num erals, e.g., I + II.
Voltammetry of Rhnl-phen Complexes. Cyclic voltam mogram s of [Rh(phen)3 ]3+ are seen in Figures 1-3. T he re lationship between various waves m ay be seen by altering the tim e a t which po ten tia l scan was reversed while holding scan ra te constan t (Figure 1). Figure 2 illustrates all waves due to nonadsorbed species in the same poten tia l range as in F igure 1. F igure 3a shows the effect of varying scan rate when the po tential range covered is sim ilar to th a t in F igure lb . Figure 3 b -f illustrates the effect of varying scan ra te over a constan t potential range. D ata from Figures 1-3 are found in Table I.
T he cyclic voltammogram s for [Rh(phen)2 Cl2 ]+ shown in Figures 4-6 are exactly analogous to those for the tris species in Figures 1-3, respectively. Com parisons and discussion are found below and corresponding data are found in T able II.
A redox couple appearing a t E i / 2 = +0.9 V vs. aqueous SCE for [Rh(phen)2 Cl2]+ has not been exam ined in detail as p a r t of th e presen t study since the tr is species do not u n dergo a parallel electron transfer. Some d a ta are presented in Table II where th is process is designated “0” ra th e r th an where the series of couples designated by rom an numerals.
An aqueous suspension of [R h(phen)2 Cl2 ]C 1 0 4 was tre a ted with N aB H 4 yielding a black solid which was isolated and dried. The solid was redissolved in A N-0.10 M TE A P and a cyclic voltam m ogram obtained (Figure 7a). F igure 7b was obtained from an AN solution initially containing [Rh(phen)2 Cl2]+ to which a small quan tity of solid N aB H 4
was added. (See Table III.)To ascertain the role of m ono(phenanthroline) com-
Figure 1. Cyclic voltammograms of [Rh(phen)3]3+, 5 90 X 10~4 A4; v = 0.10 V/sec; electrode conditioning A.
Figure 2. Cyclic voltammograms of [Rh(phen)3]3+, 4.90 X 10 4 A4; v = 0.10 V/sec; electrode conditioning B.
plexes in the electron-transfer sequence of the bis- and tris- (phenanthroline) complexes, (phenH )[R h(phen)C l4 j was synthesized by literatu re m ethods . 615 Synthesis, purifica
r n e Journal of Physical Chemistry, Voi. 79, No. 17, 1975

1830 Kew, Hanck, and DeArmond
TA B LE I: E x am p les of V a ria tio n in Ev w ith C hange in v fo r [R h(phen )3]3+ a'b
V ( £ , e ) l t e p j i ( - £ p c ) n ( - E p c ) n i - P ( ■ F p a )m -R p e l i l i ( £ p a ) n i ( • E p c ) lV -R (Evc\v (Epa) i v
A. 5.90 x 10‘4M (F igure le ) c0 . 1 0 0 0.791 0.727 0.963 1.407 1.105 1.490 1.573 1.635
B. 4.50 x 10"4M (F igure 2c)c0 . 1 0 0 0.787 0.710 0.930 1.452 1.373 1.670 1.540
C. 5.90 x 10 '4M (F igure 3b-f)d0.147 0.780 0.720 0.966 1.406 1.114 1.491 1.581 1.633 1.5810.987 0.788 0.724 0.999 1.465 1.116 1.553? 1.553? 1.649 1.6029.39 0.797 0.711 1.030 1.255 1.507 1.679 1.597
31.6 0.799 0.699 1.062 1.228 1.214 1.538 1 . 6 8 8 1.57489.2 0.826 0.697 1.108 1.297 1.234 1.598 1.698 1.548
a Results for complex in 0.10 MTEAP-AN solutions at a Pt electrode. 6 v in V/sec; Ev in -V vs. aqueous SCE. c Data obtained with PAR 174 potentiostat; no positive iR compensation.d Data obtained with PAR 173 potentiostat; positive iR compensation.
Figure 3. Cyclic voltammograms of [Rh(phen)3]3+ as a function of voltage sweep rate, 5.90 X 10~4 M; electrode conditioning A.
tion, and voltam m etry of th is complex in polar solvents were ham pered by the facile ligand-exchange reaction resulting in the bis species [R h(phen)2 Cl2 ]+. Indeed, under the experim ental conditions of th is study, the voltam m etries of AN solutions to which the solid m ono(phenanthro- line) com pound was added were essentially identical w ith those of the [Rh(phen)2 Cl2 ]+ species, therefore it was concluded th a t the m ono(phenanthroline) species did not contribu te to the voltam m ogram s of the other phen complexes.Electron-Transfer Sequence for E > — 1 . 1 V. [_Epa —
Epcli = 64 mV (at v = 0.10 V/sec) for [Rh(phen)3 ]3+ (Figure la ), so it appears th a t redox couple I is electrochem ical- ly reversible b u t is followed by a slow chemical reaction. T he presence of a following reaction is shown by a m arked decrease in (ipa)i w ith increasing elapsed tim e before poten tia l scan reversal (e.g., Figure le). Since the m ain s tructu ral difference between [Rh(phen)3]3+ and [Rh(phen)2 Cl2 ]+ is the additional phen ligand of the tris
b.
com pound and since voltam m ogram s of the bis and tris complexes differ only by lack of a d iscrete redox couple of E 1 / 2 = -0 .7 5 V in the bis case, the chemical reaction following reduction I is probably substitu tion of one or more solvent molecules for a phen ligand. T he rate constan t of the following reaction was found to be 0 . 1 2 ± 0.04 sec- 1
using a m ethod 8 based on variation of (ipc/ ipa) w ith sweep rate.
[£(p/2 )c ~ A’pclii = 58 mV (at v = 0.10 V/sec) for [R h(phen)3]3+; no corresponding oxidation wave is d e tec table a t scan rates up to 200 V/sec. Redox couple II therefore appears to involve one electron and to be followed by a very fast chemical reaction. No oxidation wave m ay be observed corresponding to the least negative reduction for
The Journal of Physical Chemistry, Voi. 79, No. 17, 1975
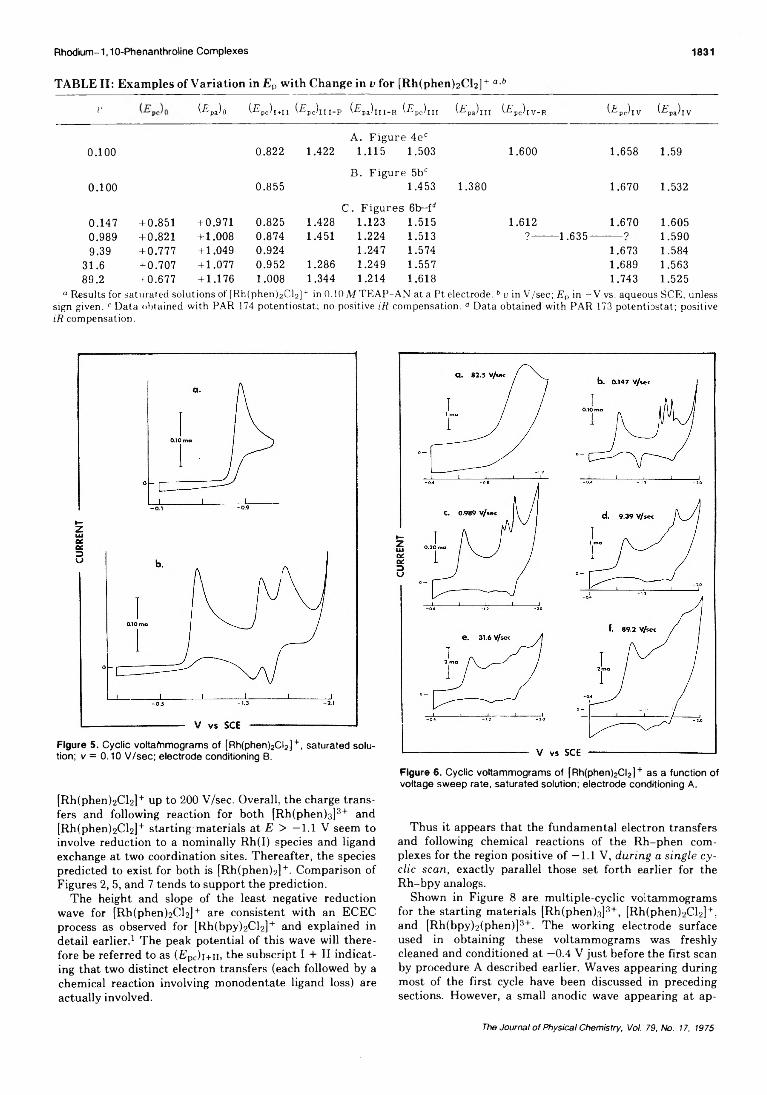
Rhodium-1,10-Phenanthroline Complexes 1831
TABLE II: E x am p les of V a ria tio n in E v w ith C hange in v for [R h(phen)2 C l2 ]+ a,t
2' (£Pa)o (Epc)i+ii (Epc)iii-:P (£pJlll-R (-EpJlU (Epa)lII (■EpJlV-R (■Epe) IV (•Epa) IV
A . F ig u r e 4 e c0 .1 0 0 0 .822 1.422 1 .1 1 5 1 .503 1 .600 1.658 1.59
B . F ig u r e 5bc0 .1 0 0 0 .8 5 5 1 .453 1 .3 8 0 1 .6 7 0 1.532
C . F ig u r e s 6b—f40 .1 4 7 + 0 .8 5 1 + 0 .971 0 .8 2 5 1.428 1 .1 2 3 1 .515 1 .612 1 .6 7 0 1.6050 .989 + 0 .8 2 1 + 1 .0 0 8 0 .874 1.451 1 .224 1 .513 ? ------- 1 . 6 3 5 - ? 1 .5 9 09.39 + 0 .7 7 7 + 1 .0 4 9 0 .924 1 .2 4 7 1 .574 1.673 1 .584
31 .6 + 0 .7 0 7 + 1 .0 7 7 0 .9 5 2 1.286 1 .249 1 .557 1.689 1.56389 .2 + 0 .677 + 1.176 1 .0 0 8 1.344 1.214 1 .618 1.743 1 .525
° Results for sa tu rated solutions of [R h(phen)2Cl2]+ in 0 .10M T E A P -A N a t a P t electrode. b v in V/sec; E p in - V vs. aqueous SCE, unless sign given. c D a ta obtained w ith PAR 174 po ten tiosta t; no positive iR com pensation. d D ata obtained w ith PAR 173 po ten tiostat; positive iR com pensation.
Figure 5. Cyclic voltafnmograms of [Rh(phen)2Cl2]+, saturated solution; v = 0.10 V/sec; electrode conditioning B.
[R h(phen)2 Cl2 ]+ up to 200 V/sec. Overall, the charge tra n s fers and following reaction for bo th [Rh(phen)3 ]3+ and [Rh(phen)2 Cl2]+ sta rting m aterials a t E > —1.1 V seem to involve reduction to a nom inally Rh(I) species and ligand exchange a t two coordination sites. T hereafter, the species predicted to exist for bo th is [Rh(phen)2]+. Com parison of Figures 2, 5, and 7 tends to support the prediction.
T he height and slope of the least negative reduction wave for [R h(phen)2 Cl2]+ are consistent w ith an ECEC process as observed for [Rh(bpy)2 Cl2]+ and explained in detail earlier . 1 The peak potential of th is wave will th e refore be referred to as (E pc)i+ii, the subscrip t I + II ind icating th a t two distinct electron transfers (each followed by a chemical reaction involving m onodentate ligand loss) are actually involved.
Figure 6. Cyclic voltammograms of [Rh(phen)2CI2]+ as a function of voltage sweep rate, saturated solution; electrode conditioning A.
T hus it appears th a t the fundam ental electron transfers and following chemical reactions of the R h -p h en com plexes for the region positive of —1.1 V, during a single cyclic scan, exactly parallel those se t fo rth earlier for the R h-b p y analogs.
Shown in Figure 8 are m ultiple-cyclic voltam m ogram s for the sta rting m aterials [Rh(phen)3 ]3+, [Rh(phen)2 Cl2]+, and [Rh(bpy)2 (phen)]3+. The working electrode surface used in obtaining these voltam m ogram s was freshly cleaned and conditioned a t —0.4 V ju s t before the first scan by procedure A described earlier. W aves appearing during m ost of the first cycle have been discussed in preceding sections. However, a sm all anodic wave appearing a t ap-
The Journal of Physical Chemistry, Vol. 79, No. 17, 1975
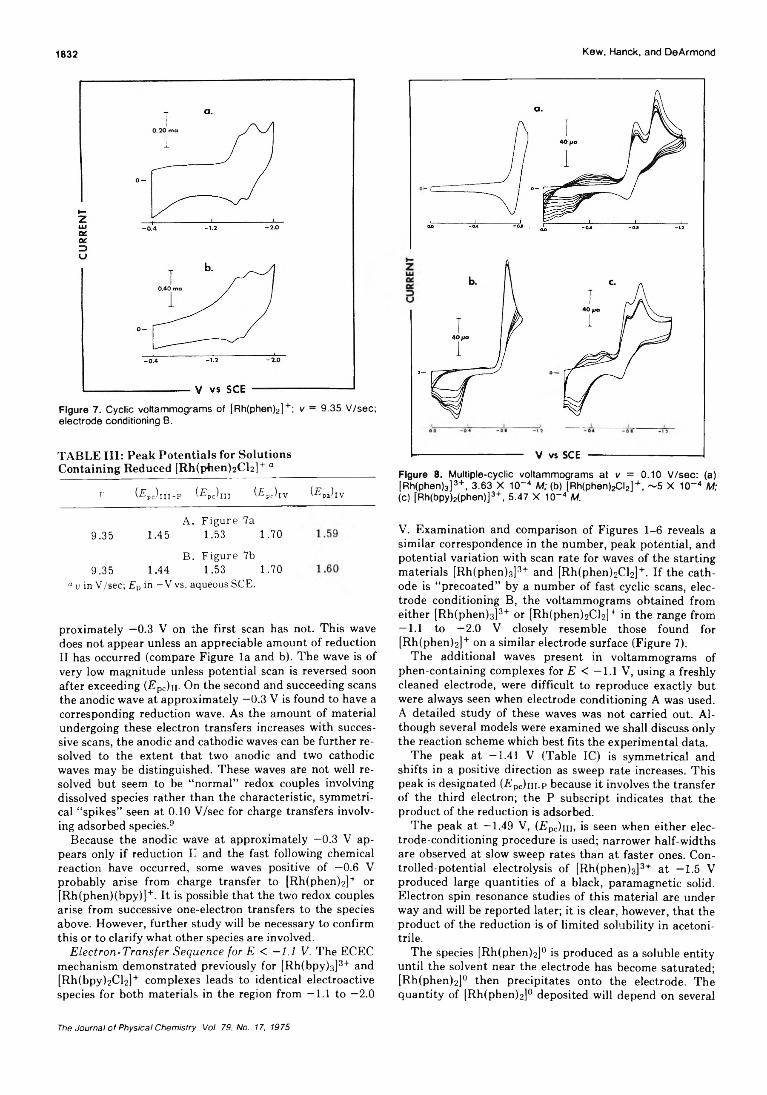
1832 Kew, Hanck, and DeArmond
Figure 7. Cyclic voltammograms of [Rh(phen)2]+; v = 9.35 V/sec; electrode conditioning B.
TABLE III: Peak Potentials for Solutions Containing Reduced [Rh(phen)2Cl2]+ °
r (Epchn-p (-EpJni (£pc)iv (Eva)lV
-------------------------- V vs SCE ---------------------------
Figure 8. Multiple-cyclic voltammograms at v = 0.10 V/sec: (a) [Rh(phen)3]3+, 3.63 X 1CT4 M; (b) [Rh(phen)2CI2]+, ~5 X 10~4 M; (c) [Rh(bpy)2(phen)]3+, 5.47 X 10⁻⁴ M.
A. F igure 7a9.35 1.45 1.53 1.70
B. F igure 7b9.35 1.44 1.53 1.70
“ u in V/sec; Ep in -V vs. aqueous SCE.
proxim ately —0.3 V on the first scan has not. This wave does no t appear unless an appreciable am ount of reduction II has occurred (compare Figure la and b). T he wave is of very low m agnitude unless potential scan is reversed soon after exceeding CEpc)ii. On the second and succeeding scans the anodic wave a t approxim ately —0.3 V is found to have a corresponding reduction wave. As the am ount of m aterial undergoing these electron transfers increases w ith successive scans, the anodic and cathodic waves can be further re solved to the extent th a t two anodic and two cathodic waves may be distinguished. These waves are not well resolved b u t seem to be “norm al” redox couples involving dissolved species rather than the characteristic, sym m etrical “spikes” seen a t 0.10 V/sec for charge transfers involving adsorbed species . 9
Because the anodic wave a t approxim ately —0.3 V ap pears only if reduction II and the fast following chemical reaction have occurred, some waves positive of —0.6 V probably arise from charge transfer to [R h(phen)2 ]+ or [R h(phen)(bpy)]+. I t is possible th a t the two redox couples arise from successive one-electron transfers to the species above. However, further study will be necessary to confirm th is or to clarify w hat other species are involved.
Electron-Transfer Sequence for E < — 1.1 V. The ECEC m echanism dem onstrated previously for [Rh(bpy)a]3+ and [Rh(bpy)2 Cl2]+ complexes leads to identical electroactive species for both m aterials in the region from —1 . 1 to —2 . 0
V. Exam ination and com parison of Figures 1-6 reveals a sim ilar correspondence in the num ber, peak potential, and po ten tia l variation w ith scan rate for waves of the starting m aterials [Rh(phen)a]3+ and [Rh(phen)2 Cl2]+. If the ca th ode is “precoated” by a num ber of fast cyclic scans, electrode conditioning B, the voltammogram s obtained from either [Rh(phen)3 ]3+ or [Rh(phen)2 Cl2]+ in the range from — 1.1 to —2.0 V closely resem ble those found for [Rh(phen)2]+ on a sim ilar electrode surface (Figure 7).
T he additional waves present in voltam m ogram s of phen-containing complexes for E < —1.1 V, using a freshly cleaned electrode, were difficult to reproduce exactly bu t were always seen when electrode conditioning A was used. A detailed study of these waves was no t carried out. Although several models were exam ined we shall discuss only the reaction scheme which best fits the experim ental data.
T he peak a t —1.41 V (Table IC) is sym m etrical and shifts in a positive direction as sweep ra te increases. This peak is designated (jEpc)iii-p because it involves the transfer of the th ird electron; the P subscript indicates th a t the product of the reduction is adsorbed.
The peak a t —1.49 V, CEpc)m, is seen when either electrode-conditioning procedure is used; narrower half-w idths are observed a t slow sweep rates than a t faster ones. Con- tro lled-potential electrolysis of [R h(phen)3]3+ a t —1.5 V produced large quantities of a black, param agnetic solid. E lectron spin resonance studies of th is m aterial are under way and will be reported later; it is clear, however, th a t the product of the reduction is of lim ited solubility in acetonitrile.
The species [Rh(phen)2]° is produced as a soluble entity un til the solvent near the electrode has become saturated; [Rh(phen)2]° then precipitates onto the electrode. The quan tity of [Rh(phen)2]° deposited will depend on several
The Journal of Physical Chemistry, Voi. 79, No. 17, 1975

Rhodium-1,10-Phenanthroline Complexes 1833
factors including the rate of nucleation, m agnitude of the solubility product, and the rate a t which [Rh(phen)2 ]° d iffuses into th e bulk of solution.
The spike a t —1.53 V, CEpc)iv -r , is observed only a t slow sweep rates. Its potential is too positive to involve an a d sorbed Rh(0) species. We have in te rp re ted th is peak to be the fu rth e r reduction of the insoluble fraction of [Rh(phen)2 ]° produced a t 1.5 V. At sweep rates greater than ~ 1 V/sec an insignificant am ount of [Rh(phen)2 ]° p re cip itates onto th e electrode; consequently the peak a t —1.58 V disappears.
T h e peak a t —1.64 V, (E pc)iv, is seen when either electrode conditioning is used; i t results from the reduction of soluble [R h(phen)2]Cl to [R h(phen)2]~.
F u rth e r reduction of adsorbed [Rh(phen)2 ]° is no t observed prior to the reduction of the supporting electrolyte. T he strength of the interaction between [Rh(phen)2 ]° and the P t electrode suggests th e presence of a chemical bond between the electrode and the complex. T he ease of reduction to [Rh(phen)2]~ is [Rh(phen)2 ]°insoi > LRh(phen)2]°soi » [R h(phen)2 ]°ads-
A reaction sequence sum m arizing the behavior of [Rh(phen)2]+ is shown as follows (abbreviations: sol, soluble; insol, insoluble; ads, adsorbed).
[Rh(phen)2]+ + e_ ^ [R h(phen)2]°ads (Epc)lii-P = -1 .4 1 V
[Rh(phen)2]+ + e~ ^ [R h(phen)2]°soi (t?pc)ni = -1 .4 9 V
[R h(phen)2]°aoi =- [R h(phen)2]0insoi
[R h(phen)2]°insoi + e~ ^ [R h(phen)2]~ ( £ po)i v-r = -1 .5 8 V
[R h(phen)2]°soi + e~ ^ [R h(phen)2]_ (Epc)iv = -1 .6 4 V
For bo th [Rh(phen)3]3+ and [R h(phen)2 Cl2]+, th e corresponding series of oxidations are less clearly resolved than the reductions in th is region. T he peaks a t —1.58 and —0.72 V are seen when either electrode conditioning is used and resu lt from the oxidation of [Rh(phen)2]- to [R h(phen)2]° and the oxidation of a R h(II) species (probably [Rh- (phen)2 (AN)2]2+) to a R h(III) species (probably [Rh- (phen)2 (AN)2]3+). The sharp oxidation peak observed a t — 1.11 V (Figures 1-4) has a shape and sweep rate dependence consistent w ith the oxidation of [R h(phen)2]°ads to [Rh(phen)2]+; th e fact th a t the “desorption” of [Rh- (phen)2]°ada occurs nearly 0.5 V positive of the “adsorptio n ” peak a ttes ts to the strength of the P t-[R h (p h en )2]° interaction.
Voltammetry of Mixed-Ligand Complexes. Two modes of behavior seem possible for the m ixed-ligand tris com plexes. First, th e presence of a relatively independent phen ligand in a tris complex containing bo th bpy and phen could lead to preferential electron transfer to phen only, a t an electrode potential characteristic of [Rh(phen)3 ]3+. A second possibility is th a t a com bination of factors such as ionic charge and geom etry m ight give reduction peak poten tia ls showing a gradual sh ift from those of [Rh(bpy)3 ]3+ to those of [Rh(phen)3]3+ with increase in the ratio of phen to bpy. Peak overlaps m ight produce a sim ilar result. F u rther, a trip ly charged ion in a high dielectric constan t solvent such as AN should carry along a substan tia l “solvation sphere” tending to m oderate the influence of d isparate ligands.
Cyclic voltammogram s of the ions [Rh(phen)2 (bpy)]3+, [Rh(bpy)2 (phen)]3+ and [Rh(bpy)3]3+ are seen in Figure 9. B oth the tris(bipyridine)- and tris(phenanthroline)rhodi- um (III) complexes undergo essentially the same reduction
sequence on a cyclic voltam m etry tim e scale so the overall resem blance of voltam m ogram s for [R h(phen)2 (bpy)]3+ is no t surprising. (£ pc)i and ( £ pc)n prove to be largely independen t of the ratio of phen to bpy. T h a t is, so long as one or more phen ligands are p resent, (Epc): and (E pc)n values are essentially identical w ith those of [R h(phenl3]3+. D ata illustrating th is point have been collected in T able IV. T hus the am ount of in teraction of each 1,10-phenanthro- line ligand w ith other ligands containing large ring system s seems to be small.
Recall th a t only phen-containing complexes exhibit strong adsorption-type phenom ena, though adsorption processes are not directly known to affect reduction waves I and II. T he rate of ionic ro tation in the vicinity of the p la tinum electrode surface is expected to be high relative to d if fusion rate of the ions to the electrode. C onsequently the ions are easily able to assume an orientation placing any phen ligands presen t closest to the electrode before charge transfer occurs. A “driving force” for th is could be lowered system free energy when ions are weakly adsorbed on the platinum surface. A less negative po ten tia l is required for reduction of phen-containing complexes, b u t in the absence of any adsorption th is should no t favor o rientations with phen closest to the electrode over those w ith bpy closest. In sum m ary, preferential electron transfer to largely independen t phen ligands indirectly suggests weak adsorption ph enom ena m ay be involved in redox couple I.
In teraction between th e p la tinum surface anc phen may be localized in the bond between the 5 and 6 positions of
The Journal of Physical Chemistry, Vol. 79, No. 17, 1975

1834 K e w , H a n c k , a n d D e A r m o n d
TABLE IV: £ p for Redox Couples I and II of Tris, Mixed-Ligand Complexes“ 6
MolarityIon x 104 U U r (£pa)t (T?ec)ii
[Rh (phen), (bpy) ]3+ 4.53 0.785 0.711 0.932[Rh (bpy K (phen) ]3+ 5.47 0.795 0.715 0.937[Rh(phen):!]:i+ 4.90 0.793 0.720 0.932a R esults for complex ions in 0.10 M T EA P-A N solutions a t a P t
electrode. 6 u = 0.10 V /sec; E v in - V vs. aqueous SCE.
the 1 ,1 0 -phenanthroline ring system in accordance w ith one of the previously described general models for adsorption of doubly bonded system s on p la tinum . 1 1 Independent studies have suggested the 5-6 position bond m ay act more like an isolated double bond 1 2 th a n would norm ally be expected for such an arom atic fused-ring system.
Waves for nonadsorbed species seen in the region —1.3 to —2.0 V vs. SCE are, w ithin experim ental error, identical for th e ions resulting from reduction of all four tris R h(III) complexes. Differences between the highest unfilled o rb itals of [Rh(phen)2]+, [Rh(bpy)2]+, and probably[Rh(phen)(bpy)]+, insofar as is reflected in E p values, would thus appear minimal.
A question not answered in the presen t study is whether the natu re of the bonding is such th a t electron transfer to a phen in [Rh(phen)2 (bpy)]3+ or [Rh(bpy)2 (phen)]3+ leads to loss of phen preferentially in the following chemical reaction. T he other alternative would be th a t the ratio of free phen to free bpy in solution after prolonged electrolysis was identical w ith the ratio in the starting complex.
Summary of Reaction SequenceT he reactions undergone by the phen-containing com
plexes discussed herein appear to parallel those found for rhodium -bipyrid ine complexes, except th a t additional waves resulting from the strong adsorption and lim ited solubility of [R h(phen)2]° are seen for phen-containing complexes. For clarity and ease of reference a sum m ary of the reactions proposed for phen-containing complexes is found in Figure 10.
Kinetic InformationNonadsorbed Species. The forward rate constan t kf of
the chemical reaction following electron transfer I was calculated for th ree of the four tris complexes considered in these studies using a m ethod outlined by Nicholson . 8 The results are shown in Table V. For phen-containing tris species, an anodic peak is exhibited on scan reversal after reduction wave I, a t 0.10 V/sec. The transfer of an electron from the cathode to an ion in solution is electrochemically reversible under these conditions. At scan rates above ap proxim ately 1 V/sec, the heterogeneous electron transfer to [Rh(phen)3 ]3+ becomes irreversible, as evidenced by [E(p/2)c - E pc]i > 70-75 mV. Consequently, the conditions assum ed in Nicholson’s calculations are not met. A ttem pts to calculate k{ a t increasing scan rates greater than 1 V/sec yield steadily increasing values, e.g., kf = 0 . 1 2 sec- 1 a t 0 . 1 0
V/sec, while “k(” = 1C sec- 1 a t approxim ately 10 V/sec, “ fef” = 20 sec“ 1 a t approxim ately 30 V/sec, and “k ” = 70 sec “ 1 a t approxim ately 90 V/sec.
Since no anodic peak can be observed for couple I of [Rh(bpy)a]3+ unless v > 1 V/sec, difficulties were an ticipated. A lthough it is qualitatively obvious th a t the fol-
BIS
lRh(phen^C l3J
(I) le
Rb(phen)3ClJ
¡Rhjphen^Ct * Cl
(II) le‘
[Rh(phen)2CI
[Rh(phen)J -Cl"
(III)le"
1e'
1e"
(m-p)
(IV) le-
[Rh(phen)J sol
TRIS
[Rh(phen)J
le' (I)
2 +|Rh(phen)
V
jRh phenj Y ■ phen
le- (II)I (i+n)-
(RhfphenW]
jRhipheny * Y
le an)
[Rh(phen)j“ mso| jRh(phen) ja d s [Rh(phen)2] |imso|
le- (IV)
¡Rh(phen)j;o|
Figure 10. Summary of proposed reactions for phen-containing bis and tris species.
TABLE V: Rate Constants for Tris Rh(III) Starting Materials0,6
ks, c m /se c
Ion (kt)u se c " 1 III IV
[Rh(phen)3]3i 0.12 ± 0.04 0.22 ± 0.05 0.15 ± 0.04[Rh(phen),(bpy)]3+ 0.14 ± 0.01 c 0.13 ± 0.04[Rh(bpy),(phen)]:J+ 0.16 ± 0.01 c 0.18 ± 0.04[Rh(bpy)Ji+ c 0.14 ± 0.04 0.079 ± 0 .0 4
“ D ata derived from solutions of concentration (5 ± 1) x lO^4 M. b Values presented are an average of a t least three indiv idual calculations. c Oxidation peak poorly defined.
lowing chemical reaction for [Rh(bpy)3]3+ is m uch faster th a n th a t for the phen analog, the values obtained for kf of [Rh(bpy)s]3+ a t v > 9 V/sec closely parallel those a t the sam e scan rates for [R h(phen)3]3+; i.e., neither se t of d a ta is valid due to irreversible charge transfer a t v > 1 V/sec.
Heterogeneous rate constants obtained on the four tris species considered in these studies are also given in Table V. Several gaps are found for the phen-containing com plexes due to the lack of a resolvable oxidation peak for various couples, a problem discussed earlier. Those values which are presented for phen-containing complexes should be viewed w ith caution since th e possibility of some contribution from adsorbed species cannot be com pletely ruled out.
No ks data are presented for couple III-P since it presum ably arises from an adsorbed species and therefore does not fulfill the theoretical criteria on which N icholson’s calculations8 0 were based. Similarly, d a ta on couple I are excluded because the following chemical reaction can affect
The Journal o f Physical Chemistry, Vol. 79, No. 17, 1975

Rhodium-1,10-Phenanthroline Complexes 1835
apparen t E p’s in a complex way, particularly in view of the small potential separation from redox couple II.
Adsorbed Species. A num ber of theoretical relationships have been developed between the po ten tia l a t which charge transfer occurs for a dissolved species and the potential re quired for charge transfer to occur when the same species is adsorbed on an electrode . 9 , 1 0 In general, the potential d ifference m ay be related to the free energy of adsorption and hence to an equilibrium constan t for the adsorption process. T h e assum ptions involved in calculating a potential- dependen t param eter, a, and the poten tia l-independent isotherm constant, K', are as follows: (a) the adsorption wave and desorption wave under consideration arise from a one-electron charge transfer to strongly adsorbed product of a preceding reduction; (b) th e po ten tia l scan rate is slow w ith respect to the poten tia l-independent adsorption rate constant, ka\ and desorption rate constant, kd' (K' = k^/ ka'); (c) the concentration of reduced species a t the electrode surface during charge transfer to adsorbed species is adequately described by the Langm uir isotherm.
The phen-containing complexes of th is study undergo a series of reactions leading to a species which is adsorbed on a platinum surface and which reduces a t po ten tia ls sufficiently d ifferent from the nonadsorbed species to produce two peaks; however, for satisfaction of assum ptions (b) and (c), and “desorption peak” ought to appear a t th e sam e poten tia l as th e “adsorption peak”. In fact the peaks are greatly separated; therefore we have concluded th a t the models developed by Shain and coworkers9 , 1 0 are no t applicable to the adsorption phenom ena of [Rh(phen)2 ]°. The P t-[R h (p h en ) 2 ]° interaction, although very strong, does not inhibit electron transfer as evidenced by the experim ents with electrode conditioning B.
Redox Orbitals and Delocalization. Analogous com plexes involving two different, though related ligands, such as phen and bpy, are norm ally expected to show some d ifferences in the energies of lowest unfilled molecular energy levels, and hence in E p values, which are to some ex ten t a m easure of these energies. However, d a ta recently reported for reduction of the ions [Ru(bpy)3 ]2+ and [Ru(phen)3]2+ in acetonitrile4 illustrate lim its to the generalization. For the bpy complex, ( £ pc)n = -1 .517 V and (E pc)m = -1 .764 V vs. SCE while for the starting m aterial [R u(phen)3 ]2+, C E P c ) n = -1 .5 4 V and (E pc)m = -1 .8 4 V. The difference in E pc between successive electron transfers, AE pc = ( £ pc)n — ( £ pc)m, is 0.247 V for the bpy species and 0.30 V for the phen. W hile great significance should no t be a ttrib u ted to a variation of approxim ately 50 mV, in light of the num ber of m easurem ents involved in determ ining these quantities and the possible experim ental error in each, the variation between the bpy and phen complexes seems in a reverse d irection from norm al expectations. Normally, increased de- localization of molecular orbitals into which an electron is transferred leads to a less negative half-wave po tential and E pc for the process . 1 3 Considering only the relative size of the conjugated ring system , norm al expectation is th a t a tris(phenanthroline) complex ought to be less localized th an a tris(bipyridine) complex, implying the corresponding electron transfers ought to be observed a t less negative potentials for the phen complex. This is the reverse of the observed trend for the Ru(II) complexes. T he reversal is probably due to solvation energy contributions due to identical charges on two different-sized ions.
Vlcek 1 3 has generalized th a t in a m etal complex ion the more localized the redox orbital, the m ore negative the poten tia l required to add an electron. F urther, he noted th a t differences in successive E° values for successive electron transfers depend only slightly upon substitu tion on the ligand and th a t th is difference becomes sm aller w ith increasing delocalization of the redox orbital.
T he Ru complexes do not undergo substan tia l b iden tate ligand loss a t potentials positive of approxim ately —1.9 V implying th a t the redox orbitals for the first two electron transfers are predom inantly ligand localized. Consequently, com parison of the redox orbitals of [Ru(bpy)3 ]+ and [R u(phen)3 ]+ to those of [Rh(bpy)2 ]+ and [R h(phen)2 ]+, re spectively, seems appropriate. The relative effect on E pc of substitu ting phen for bpy on the two different m etal centers should be sim ilar. For the ions [Rh(phen)2 ]n+ size- charge differences, and hence solvation effects, should be reduced by roughly one-third relative to the corresponding differences between Ru tris analogs. Differences in degree of delocalization, based only on size of ring system, should also be reduced by a sim ilar am ount. Both effects should lead to more nearly identical half-wave potentials for [Rh(bpy)2 ]n+ and [Rh(phen)2 ]n+ th an was seen for [Ru- (bpy)3]m+ vs. [R u(phen)3]m+.
Now if the E \/2 for charge transfer leading from + 1 - to0 -charged species is designated E 1 /2 1 and th a t for charge transfer leading from 0 to - 1 is called E 1 /2 2, then AE 1 /2 1 , 2
represents the difference m entioned above.Arranged in order of AE 1 /2 1 , 2 corresponding to increas
ing delocalization, we find [R u(phen)3]',+ < [Ru(bpy)3],I+ = [Rh(bpy)2 ]n+ = [R h(phen)3]n+. A lternatively there is less difference in energies of redox orbitals accom modating successively transferred electrons in the four-coordinate Rh complexes than in the six-coordinate Ru tris complexes. Only differences between identically charged ions are being considered so solvation energy differences should depend only on size differences.
So far as ligand substitu tion is concerned, [Rh(bpy)2 ]n+ and [R h(phenl2]'1+ appear so delocalized th a t “substitu tio n ” of -C H = C H - between the 6 positions of the rings of 2 ,2 '-bipyridine to “form ” phen produces no observable shift in AE i/21,2.
R e fe re n c e s an d N otes
(1) G. Kew, K. DeArmond, and K, Hanck, J. Phys. Chem., 78, 727 (1974).(2) (a) N. Tanaka and Y. Sato, Inorg. Nucl. Chem. Lett., 2 , 359 (1966); (b)
ibid., 4 , 487 (1968); (c) Eiectrochim. Acta, 13, 335 (1968); (d) Bull. Chem. Soc. Jpn, 41 , 2059 (1968); (e) ibid., 41 , 2064 (1968); (f) ibid., 42, 1021 (1969).
(3) (a) D. M. Soignet and L. G. Hargis, Inorg. Chem., 11, 23*9 (1972); (b) ibid., 11, 2921 (1972); (c) B. V. Tucker, J. M. Fitzgerald, L. G. Hargis, and L. B. Rogers, J. Electroanal. Chem., 13, 400 (1967); (d) B. R. Baker and B. Dev Mehta, inorg. Chem., 4, 848 (1965); (e) R. D. Gillard, J. A. Osborn, and G. Wilkinson, J. Chem. Soc., 4107 (1965); (f) A. A. Vlcek, Nature (London), 189, 393 (1961).
(4) N. E. Tokel-Takvoryan, R. E. Hemingway, and A. J. Bard, J. Am. Chem. Soc , 95, 6582(1973).
(5) W. Halper and M. K. DeArmond, J. Lumin., 5, 225 (1972).(6) (a) M. K. DeArmond and J. E. Hillis, J. Chem. Phys., 54 , 2247 (1971); (b)
G. C. Kulasingam, W. R. McWhinnie and J. D. Miller, J. Chem Soc. A, 521 (1969).
(7) B. Martin, W. R. McWhinnie, and G. M. Waind, J. Inorg. Nucl. Chem., 23, 207 (1961).
(8) (a) R. S. Nicholson, Anal. Chem., 38, 1406 (1966); (b) ibid., 37, 1351 (1965).
(9) R. H. Wopschall and I. Shain, Anal. Chem., 39, 1514 (1967).(10) M H. Hulbert and I. Shain, Anal. Chem., 42, 162 (1970).(11) R. F. Lane and A. T. Hubbard, J. Phys. Chem., 77, 1401 (1973).(12) K. DeArmond and W. Halper, J. Phys. Chem., 75, 3230 (1971).(13) A. A. Vlcek, Proc. Int. Coni. Coord. Chem., 14, 220 (1972).
The Journal of Physical Chemistry, Voi. 79, No. 17, 1975

1836 R. F. Howe and J. H. Lunsford
Oxygen Adducts of Cobalt(ll)-Ethylenediamine Complexes in X- and Y-Type Zeolites
R. F. Howe and J. H. Lunsford*Chemistry Department, Texas A&M University, College Station, Texas 77843 (Received March 14, 1975)
Publication costs assisted by the National Science Foundation
T he form ation of param agnetic oxygen adducts in cobalt-exchanged X- and Y -type zeolites containing a d sorbed ethylenediam ine is described. In frared and gravim etric adsorption m easurem ents were used to characterize the adsorbed ethylenediam ine. In both X and Y zeolites the low-spin [Coln (en)2 0 2~]2+ adduct is form ed in the large cavities and is stable in the presence of 0 2 up to 70°. The E P R param eters of this add u c t are sim ilar to those of analogous adducts form ed in solution. A second 0 2- species, formed only in Y- type zeolites and only in the presence of Co(en)32+, shows no 59Co hyperfine structure . T he changes in the infrared spectra accom panying form ation of this species suggest it is form ed by electron transfer from an ethylenediam ine ligand.
T ransition m etal cations exchanged into the faujasite- type zeolites X and Y 1 are capable of forming well-defined com plexes w ith added ligands w ithin the large cavities of the zeolite fram ework . 2 - 5 We have recently stud ied by electron param agnetic resonance (EPR) the form ation of oxygen adducts of cobalt(II)-am ine complexes in zeolite Y, w ith am m onia, m ethylam ine, and n-propylam ine as ligands . 6 T he cobalt am ine complexes bind oxygen reversibly in the zeolite, b u t the 1 : 1 adducts formed are not stable in the presence of oxygen above —78°. M onomeric 1 : 1 cobalt oxygen adducts have been stabilized in solution by using macrocyclic polydentate ligands . 7 We describe in th is paper an investigation of oxygen adducts form ed in cobalt(II)- exchanged X and Y zeolites w ith ethylenediam ine as the ligand. Our objective has been to form 1:1 oxygen adducts which are sufficiently stable for the reactivity of the bound oxygen to be investigated a t room tem perature or above.
Experimental SectionTwo Con-Y zeolites w ith differing cobalt contents were
prepared from a Linde NaY zeolite (Lot No. 13544-76) by conventional ion exchange; these are designated Coio.sNaY and Coo.rsNaY, where the subscripts indicate the num ber of cobalt ions present per un it cell. A Coi2.5CaY zeolite was prepared by exhaustive exchange (to greater than 90%) of NaY with calcium, followed by cobalt exchange. A Co2iN aX zeolite was prepared from Linde N aX (Lot No. M-1330837). E thylenediam ine (Eastm an Kodak) was dried by several distillations over m olecular sieve and outgassed by repeated freeze-pum ping prior to use. D euterated ethylenediam ine was prepared following the m ethod of Sabatini and Califano . 8 E thylenediam ine hydrochloride was exchanged with D20 (99%), dried, and heated with CaO to generate the ethylenediam ine. The infrared spectrum of th e deu terated m aterial showed th a t it contained approxim ately 60% ND2, 30% NHD, and 10% N H 2. Oxygen and oxygen enriched to 44% in 170 and 55% in 180 were used as supplied.
Zeolite samples were dehydrated by heating to 400° in increm ents of 100°/hr under a vacuum of 10~ 5 Torr. In the E P R experim ents, powdered samples were transferred to a quartz side arm prior to recording the spectra. For the in frared experim ents, self-supporting wafers (5-10 mg cm-2 ) were trea ted in situ in an infrared cell as described elsew here . 9
E P R spectra were recorded a t —196 or +25° using Var- ian E 6 S and V4502 spectrom eters for X -band (9.1 GHz) and Q -band (35 GHz) m easurem ents, respectively. T he g values were m easured using a 2 ,2 -diphenyl-l-picrylhydraz- yl (D PPH ) standard (g = 2.0036). Spin concentrations were calculated by num erical double in tegration of the recorded derivative spectra and com parison w ith a phosphorus-doped silicon standard of known spin concentration; the uncertain ty in the spin concentration m easurem ents is estim ated to be ±30%. S im ulated E P R spectra were calculated using the com puter program SIM 13.6 Infrared spectra were recorded on a Beckm an IR-9 spectrophotom eter operating in the double-beam transm ittance mode, w ith spectra l slit w idths of 3-4 cm - 1 over the range 1200-2500 cm - 1
and 6 - 8 cm - 1 above 2500 cm-1 . The spectrophotom eter was purged w ith dry air to remove atm ospheric water vapor, b u t absorption by atm ospheric C 0 2 obscured the re gion 2300-2400 cm-1 .
G ravim etric adsorption experim ents were carried out by suspending known weights of zeolite in a quartz bucket from a previously calibrated quartz spring and following changes in the extension of the spring with a cathetom eter. W eight changes could be determ ined to w ithin ±0.2 mg.
ResultsE P R Spectra. Two param agnetic oxygen species were
observed when oxygen was added to CoNaY zeolites containing adsorbed ethylenediam ine. Adsorption of excess ethylenediam ine vapor a t 25° by adding successive doses un til no fu rther uptake was observed, followed im m ediately by exposure to oxygen (20 Torr), gave the spectrum shown in Figure 1(a). This consists of two overlapping signals: an axially sym m etric signal (I) showing no hyperfine structure and two shoulders arising from a second signal (II). Exposure to a high pressure of oxygen (>100 Torr) e n hanced signal I relative to signal II. T he two signals could be separated by prolonged evacuation a t 25°, which re moved signal II while leaving signal I reduced in intensity (Figure 1 (b)). Signal I was com pletely destroyed only on outgassing a t 100° for 1 hr. Subsequent reexposure to oxygen restored both signals, b u t w ith the intensity of signal II considerably enhanced (Figure 1(c)). If the zeolite was out- gassed a t 2 0 0 ° for 1 hr after adsorption of excess ethylenediam ine and then exposed to oxygen a t 25°, only signal II was observed (Figure 2). After outgassing a t 300°, signal II
The Journal of Physical Chemistry, Vol. 79, No. 17, 1975

Oxygen Adducts of Cobalt(ll)-Ethylenediamine Complexes 1837
Figure 1. EPR spectra (X band) of CoNaY zeolite containing adsorbed ethylenediamine after addition of oxygen: (a) 0 2 added immediately after adsorption of ethylenediamine; (b) evacuated, 25°, 24 hr; (c) outgassed, 100°, 1 hr, and further oxygen added.
Figure 2. EPR spectra: (a) CoNaY containing adsorbed ethylenediamine outgassed at 200°, then exposed to 0 2 (X band); (b) computer simulation of (a); (c) Q-band spectrum of (a).
was again observed on addition of oxygen, b u t w ith a much reduced intensity , and no signals a t all could be detected on addition of oxygen after outgassing a t 400°. Identical behavior was observed if the am ount of ethylenediam ine
initially added was much less th an th a t required for complete adsorption, except th a t the signal intensities were correspondingly reduced.
Both signals were stable in the presence of oxygen a t 25° and unchanged on recording a t —196°. We found th a t signal II was stable in oxygen up to 75° b u t was slowly re duced in in tensity on heating above th a t tem perature. M aximum intensities of signal I were obtained by exposing the zeolites to 760 T orr of oxygen after adsorption of excess ethylenediam ine; these corresponded to spin concentrations of approxim ately 0.1 and 0.025 per un it cell in Coio.sNaY and Coo.vsNaY, respectively. M aximum in tensities of signal II were obtained by adsorbing ethylenediam ine a t 25°, outgassing a t 200° for 1 hr, and then exposing the sam ple to about 50 T orr of oxygen a t 25°. H igher oxygen pressures gave no in tensity increase, and the m axim um intensities corresponded to spin concentrations of about 5.0 and 1.0 per u n it cell in Coio.sNaY and Coo.vsNaY.
Figure 3(a) shows signal I form ed with oxygen enriched in 1 7 0 . This shows one set of six lines centered on g x , a second much weaker se t of 1 1 lines also centered on g ± , and a th ird se t of six lines, only partially resolved, centered on g\\. Also shown (Figure 3(b)) is a spectrum calculated with the param eters extracted from the experim ental spectrum , assuming axial symm etry. T he E P R param eters of signals I and II are sum m arized in T able I. Figure 3(c) shows signal II formed with the 1 7 0-enriched oxygen. The 170 hyperfine structure in this case overlaps severely with th a t due to 5 9 Co, and the 170 lines, ap a rt from poorly resolved shoulders a t the outer edges of the spectrum , cannot be unam biguously identified. T he com plexity of the spectrum p re vents satisfactory com puter sim ulation.
Signals I and II were also observed from the C oi2.5CaY zeolite; substitu tion of Ca2+ for N a+ caused no change in th e E P R param eters of bo th signals. In the Co^iNaX zeolite, only signal II was observed, w ith the same param eters as in the Y-type zeolites. Exposure to oxygen im m ediately after adsorption of ethylenediam ine gave a very weak signal, and a m aximum intensity was observed, as before, by outgassing a t 200° for 1 hr before adm itting oxygen. U nder no conditions have we observed signal I in X -type zeolites.
Blank experim ents were carried out w ith a NaY zeolite containing adsorbed ethylenediam ine, b u t no E PR signals were detected after exposure to oxygen. Likewise, signals I and II were not observed on exposure to oxygen of CoNaY or CoNaX which did no t contain adsorbed ethylenediamine.
Infrared Spectra. Zeolite sam ples dehydrated a t 400° were transparen t to infrared radiation above about 1 2 0 0
cm-1 . T he spectrum of ethylenediam ine adsorbed in a NaY zeolite is shown in Figure 4(a). (The frequencies of a d sorbed ethylenediam ine are sum m arized in Table II.) O u tgassing a t 2 0 0 ° drastically reduced the in tensity of all the ethylenediam ine bands, and after 1 h r a t 300° no bands rem ained in the spectrum . Adsorption of ethylenediam ine into Coio.sNaY gave a sim ilar spectrum , bu t w ith a num ber of additional bands between 1200 and 1400 cm - 1 (Figure 4(b)). As discussed below, these additional bands are a t tribu ted to ethylenediam ine coordinated to cobalt. O utgassing a t 2 0 0 ° for 1 h r caused only a slight reduction in in tensity of the coordinated ethylenediam ine bands. The band a t 1333 cm - 1 was shifted to 1326 cm -1 , and several new bands began to appear as shoulders on the original bands (Figure 5(a)). Outgassing a t 300° enhanced these new bands, while fu rther reducing the original bands (Figure 5(b)), and after 1 hr a t 400° the coordinated ethylene-
The Journal of Physical Chemistry, Vol. 79, No. 17, 1975

1838 R. F. Howe and J. H. Lunsford
------- >100G
TA B LE I: E P R P a ra m e te rs of C>2 ~ Species in Zeolites
o2-form ed in g u S y y g x r A a
Co(en)3NaY 2 . 1 0 2 2 . 0 0 0 2 . 0 0 0 13.5 0 ( 1 7O) 72(signal I)
NaY 6 2.113 2.007 2 . 0 0 2
NaY® 2.074 2.007 2 . 0 0 2
CaY® 2.046 2 . 0 1 1 2 . 0 0 2
Co(en)2NaY 2.084 1.998® 1.992 2 0 10® (59Co) 13(signalII)
Co(CH3- 2.075 2 .0 1 0 ® 1.999 2 1 12® (5 9Co) 1 2
NH ^N aY"° Estimated uncertainties: ±0.002 in g values; ±1 G in A values.
6 Reference 12. Reference 13. d Reference 6 . e Estimated from computer simulation.
diam ine bands were com pletely removed (Figure 5(c)). Identical spectra were obtained as a function of the out- gassing tem peratu re after adsorption of ethylenediam ine in the Co2 iN aX zeolite.
Admission of oxygen (760 Torr) following adsorption of excess ethylenediam ine in Coio.sNaY caused im m ediate changes in the infrared spectrum , as shown in F igure 4(c). T he bands due to coordinated ethylenediam ine between 1200 and 1400 cm - 1 were substan tia lly reduced in intensi-
Figure 4. Infrared spectra of adsorbed ethylenediamine: (a) adsorbed in NaV at 25°; (b) adsorbed in CoNaY at 25°; (c) exposed to 760 Torr of 0 2; (d) outgassed, 100°, 1 hr.
Figure 5. Infrared spectra of ethylenediamine adsorbed in CoNaY, outgassed: (a) 200°, 1 hr; (b) 300°, 1 hr; (c) 400°, 1 hr.
ty, and a new band appeared a t 1380 cm -1. Above 2000 cm-1 , a new band appeared as a shoulder a t abou t 2450 cm-1 , while a decrease in transm ittance between 3000 and 3200 cm - 1 suggested the appearance of one or more new bands in th is region. Removal of the oxygen by evacuation a t 25° caused no change in the spectrum , b u t a fte r outgass- ing a t 1 0 0 ° for 1 h r the new bands were com pletely re moved and the coordinated ethylenediam ine bands restored. S ubsequent reexposure to oxygen caused th e same changes to occur, b u t to a lesser extent. Exposure to oxygen after outgassing a t 2 0 0 ° for 1 h r caused no change in the spectrum . T he spectrum of Co2 iN aX containing adsorbed ethylenediam ine was unchanged on exposure to oxygen.
T he same experim ents were carried ou t using partially deu terated ethylenediam ine. F igure 6 (b) shows th e spectrum of Coio.sNaY after adsorption of deu tera ted ethylenediam ine a t 25°. Exposure to oxygen gave the spectrum
The Journal o f Physical Chemistry, Vol. 79, No. 17, 1975
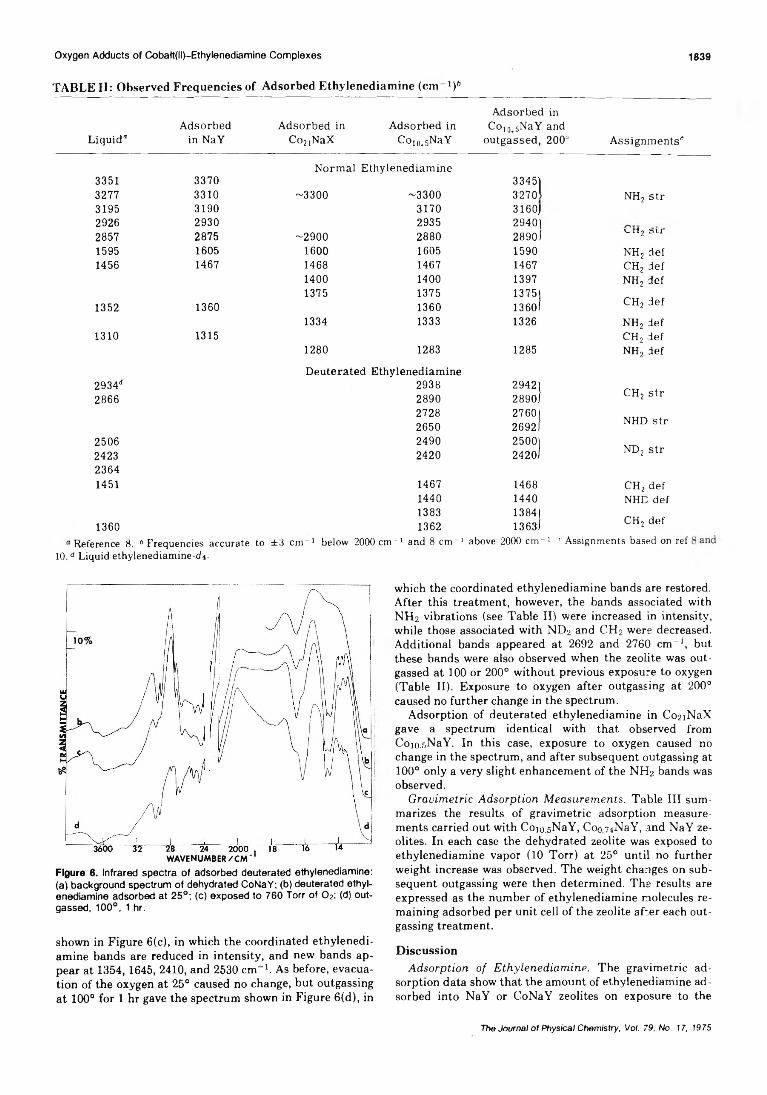
Oxygen Adducts of Cobalt(ll)-Ethylenedlamine Complexes 1839
TABLE II: Observed Frequencies of Adsorbed Ethylenediamine (cm ^
Liquid0
Adsorbed in NaY
A dsorbed in Co2)NaX
A dsorbed in Coio.sNaY
Adsorbed in Co10-5NaY and
outgassed, 2 0 0 ° A ssignm ents0
N orm al Ethylenediam ine3351 3370 3345)3277 3310 -3300 -3300 3270) NHj s t r3195 3190 3170 3160)2926 2930 2935 2940)2857 2875 -2900 2880 2890) '»✓ it 2 £5 tl
1595 1605 1600 1605 1590 NH2 def1456 1467 1468 1467 1467 CH2 def
1400 1400 1397 NH2 def1375 1375 1375)
1352 1360 1360 1360) CH2 def
1334 1333 1326 NH2 def1310 1315 CH2 def
1280 1283 1285 NH2 def
D euterated Ethylenediam ine2934" 2938 2942)2866 2890 2890) CH2 s t r
2728 2760)2650 2692) NHD s tr
2506 2490 2500)2423 2420 2420/ ND2 s t r
23641451 1467 1468 CH2 def
1440 1440 NHD def1383 1384)
1360 1362 1363) CH2 def
Reference 8 . 6 Frequencies accurate to ±3 cm 1 below 2000 cm " 1 and 8 cm " 1 above 2000 cm-1. ‘ Assignments based on ref10. d L iquid ethylenediam ine-di.
Figure 6. Infrared spectra of adsorbed deuterated ethylenediamine: (a) background spectrum of dehydrated CoNaY; (b) deuterated ethylenediamine adsorbed at 25°; (c) exposed to 760 Torr of O2; (d) out- gassed, 100°, 1 hr.
shown in F igure 6 (c), in which the coordinated ethylenediam ine bands are reduced in intensity , and new bands ap pear a t 1354, 1645, 2410, and 2530 cm-1 . As before, evacuation of the oxygen a t 25° caused no change, b u t outgassing a t 100° for 1 hr gave the spectrum shown in F igure 6 (d), in
which the coordinated ethylenediam ine bands are restored. A fter this trea tm en t, however, the bands associated with N H 2 v ibrations (see Table II) were increased in intensity, while those associated with N D 2 and CH 2 were decreased. A dditional bands appeared a t 2692 and 2760 cm -1 , but these bands were also observed when the zeolite was out- gassed a t 1 0 0 or 2 0 0 ° w ithout previous exposure to oxygen (Table II). Exposure to oxygen after outgassing a t 200° caused no further change in the spectrum .
Adsorption of deuterated ethylenediam ine in Co2 iNaX gave a spectrum identical with th a t observed from Coio.fjNaY. In th is case, exposure to oxygen caused no change in the spectrum , and after subsequent outgassing at 1 0 0 ° only a very slight enhancem ent of the N H 2 bands was observed.
Gravimetric Adsorption Measurements. T able III sum marizes the results of gravim etric adsorption m easurem ents carried out with Coio.sNaY, CocmNaY, and NaY zeolites. In each case the dehydrated zeolite was exposed to ethylenediam ine vapor (10 Torr) a t 25° un til no further weight increase was observed. The weight changes on subsequent outgassing were then determ ined. The results are expressed as the num ber of ethylenediam ine molecules rem aining adsorbed per un it cell of the zeolite after each o u tgassing treatm ent.
DiscussionAdsorption of Ethylenediamine. T he gravim etric ad
sorption d a ta show th a t the am ount of ethylenediam ine adsorbed into NaY or CoNaY zeolites on exposure to the
The Journal of Physical Chemistry, Vol. 79. No. 17, 1975

1840 R. F. Howe and J. H. Lunsford
TA B LE I I I : E th y lè n ed ia m in e A dso rp tionD a ta (m o lecu les/ u n it cell“)
T rea tm en tC o I0.5
NaYC °0.HNaY NaY
A dsorbed at 25° 64.5 6 6 . 0 63.5O utgassed at 25°, 12 hr 55.5 58.0 54.0O utgassed a t 100° 1 hr 44.5 46.5 42.0O utgassed at 200°, 1 h r 23.5 12.5 5.5O utgassed a t 300°, 1 h r 16.5 1 . 0 bO utgassed at 400°, 1 hr 7.5 b b
a ±2 m oiecu les/un it cell. b Less th an 1.0 m olecu le /un it cell.
vapor a t 25° is independen t of the cation-exchange level and is approxim ately equal to the am ount of liquid ethyl- enediam ine required to fill com pletely the zeolite void volum e of 0.36 cm 3 g “ 1 . 1 The v ibrational frequencies of ethyl- enediam ine adsorbed in NaY are close to those reported for liquid ethylenediam ine (Table II). In the CoNaY and CoNaX zeolites these same ethylenediam ine bands are observed, plus additional bands between 1200 and 1400 cm - 1
which are characteristic of C H 2 and N H 2 deform ation vibrations of ethylenediam ine coordinated to transition m etal ions . 1 0 X -R ay diffraction studies have shown th a t m ost of the divalent cations in dehydrated faujasite zeolites reside w ithin the sodalite cages and hexagonal prism s , 1 1
which are inaccessible to ethylenediam ine. On adsorption of ethylenediam ine, m igration of cobalt ions tow ard or into the large cavities of the zeolite structu re evidently occurs.
W e can distinguish between the N H 2 and CH 2 bands of coordinated ethylenediam ine from the observed frequency shifts when N H 2 is replaced by ND 2 or NHD. T he bands a t 1283, 1333, and 1400 cm-1 , which are shifted below 1200 cm -1 , m ust be due to N H 2 deform ation modes, whereas the 1360- and 1375-cm“ 1 bands are no t significantly affected by deu teration and, so, m ust be due to CH 2 deform ation modes. Our assignm ents of the bands above 1400 cm - 1 in the spectra of adsorbed ethylenediam ine follow those of Powell and S heppard 1 0 and of S abatin i and Califano . 8
Above 2000 cm -1 , the spectrum of deu terated ethylenediam ine adsorbed in CoNaY shows, in addition to the expected d N D 2) and r(C H 2) bands, bands a t 2650 and 2728 cm - 1
which we tentatively assign to stretching modes of the N H D group coordinated to cobalt, although these occur between 2400 and 2500 cm - 1 in the free molecule. T he a lte rnative assignm ent of these bands to OD groups form ed by exchange w ith zeolite OH groups seems unlikely, since such bands would be broadened through in teraction w ith ethy lenediam ine molecules, as are th e bands due to the residual OH groups rem aining in the zeolite after dehydration a t 400°.
The num ber of ethylenediam ine molecules coordinated to cobalt afte r adsorption of the vapor a t 25° cannot be d e term ined from the infrared spectrum above 1200 cm -1 . In the presence of excess ethylenediam ine, however, the tris complex, Co(en)3 2+, should be th e preferred form. T he s ta bility constants a t 30° in aqueous solution are 5 X 101 0 for Co(en)22+ and 7 X 101 3 for Co(en ) 3 2 + . 1 2 A fter outgassing a t 2 0 0 ° for 1 hr, m ost of the ethylenediam ine is rem oved from NaY. The am ount rem aining coordinated to cobalt in Coio.sNaY is slightly less than 2 m olecules/cobalt ion. (This figure is obtained by subtracting the am ount rem aining in N aY from the to ta l am ount rem aining in Coio.sNaY after outgassing a t 200°.) T he gravim etric d a ta are no t suffi
ciently accurate for the cobaltrethylenediam ine ra tio in the low-exchanged CocmNaY zeolite to be reliably determ ined.
T he infrared spectra of ethylenediam ine coordinated to cobalt in Coio.sNaY and Co2iN aX afte r outgassing a t 200° are no t identical w ith those observed initially. W ith e th y lenediam ine, the N H 2 deform ation band a t 1333 cm “ 1 is shifted to 1326 cm “ 1 on outgassing a t 200°, and with d e u te ra ted ethylenediam ine, the N H D stretch ing bands a t 2650 and 2728 cm “ 1 are shifted to 2692 and 2760 cm “ 1, re spectively. We conclude from the gravim etric and infrared evidence th a t the bis complex Co(en)22+ is form ed in the cobalt-exchanged zeolites on outgassing a t 2 0 0 °.
All of the adsorbed ethylenediam ine is rem oved from NaY afte r outgassing above 200°, as shown by both the gravim etric and infrared experim ents. In Coio.sNaY, on the other hand, a significant am ount of adsorbed m aterial is re ta ined afte r outgassing a t 400°. The in frared spectra show th a t the bands due to ethylenediam ine coordinated to cobalt are alm ost com pletely removed afte r 1 h r a t 300°, accom panied by the appearance of a series of new bands b e tween 1 2 0 0 and 1600 cm “ 1 and above 3000 cm“ 1. We a t tr ib u te these changes to decom position of ethylenediam ine ligands. We have not investigated the n a tu re of the decom position products in any detail, b u t th e new bands due to these products begin to appear in the spectrum after o u tgassing a t tem peratu res as low as 200°. T he com plexity of the spectra recorded afte r outgassing a t high tem peratures suggests th a t th e decom position sequence is no t simple. T he same decom position products were apparen tly form ed in the Co2iN aX zeolite.Formation of Oxygen Adducts. T he E P R signal I, ob
served only in the cobalt-exchanged Y -type zeolites, is due to a species containing two equivalent oxygen atom s. T his is evident from the spectrum obtained using oxygen-17. A singly labeled superoxide ion with two equivalent oxygens would give six lines of approxim ately equal in tensity for each principal direction. A doubly labeled species with equivalent atom s would be characterized by eleven lines for each principal direction. T he observed spectrum shows a se t of six lines and a set of eleven lines, w ith bo th centered on gx, and a se t of six lines centered on g\. T he se t of eleven lines centered on g|| due to 1 7 0 1 7 0 cannot be resolved in the experim ental spectrum b u t is included in the computer-sim ulated spectrum , which agrees well w ith th a t observed. Analysis of the 170 hyperfine sp litting constants (Table I) in the usual m anner indicates th a t the unpaired electron is greater than 90% localized on a 2 p 7r* orbital of0 2. No 59Co hyperfine splitting is observed in signal I, so th a t the oxygen m ust not be bonded to cobalt. T he g values of signal I resemble, b u t do no t exactly equal, those of 0 2~ form ed in NaY zeolites by uv or 7 irrad ia tion . 1 3 ’ 1 4 T h e 0 2“ in NaY is believed to be in teracting w ith N a+ cations, since replacem ent of N a+ by Ca2+ causes a large change in the value of f e . 1 4 T he g values of signal I are identical however, in bo th Coio.sNaY and C oi2 .5 CaY, so th a t stab ilization of the 0 2“ on N a+ or Ca2+ seems unlikely.
T here seems to be a correlation between the appearance of signal I and the changes in the infrared spectrum of ad sorbed ethylenediam ine on exposure to oxygen. Signal I and the changes in the infrared spectra are observed only in Y -type zeolites and only in the presence of Co(en)3 2+. Signal I is com pletely destroyed and the original infrared spectrum restored afte r outgassing a t 100°. T he changes in the infrared spectra, a reduction in the in tensity of the coordinated ethylenediam ine bands and the appearance of
The Journal of Physical Chemistry, Vol. 79, No. 17, 1975

Oxygen Adducts of Cobalt(ll)-Ethylenediamine Complexes 1841
new bands, imply that oxidation of ethylenediamine ligands is occurring on exposure to oxygen. Oxidation of ethylenediamine coordinated to Ru(II)15 or Pt(IV)16 in solution has been reported to give imine groups
CH— NH\./
=NHM
CH=
CH=
CH=
=NH\/
=NH:m
The coordinated imine group is expected to give infrared bands (above 1200 cm-1) around 3300-3400 cm-1 (=N —H stretch), 3000-3100 cm-1 (=C—H stretch), 1600 cm-1 (C=N stretch), 1400 cm-1 (=C—H deformation), and 1200 cm-1 (=N —H deformation).16 The new bands appearing below 2000 cm-1 when oxygen is added to ethylenediamine adsorbed in Coio.sNaY are consistent with the formation of imine groups. With ethylenediamine, the single new band at 1380 cm-1 may be assigned to the —C—H deformation mode, while the intense NH2 deformation band at 1600 cm-1 obscures the expected C=N stretch band. With deuterated ethylenediamine, the = C —H deformation band occurs at 1354 cm-1, and the C=N stretch is observed at 1645 cm-1. Above 2000 cm-1, the predicted imine bands cannot be clearly distinguished from those due to ethylenediamine, although obvious changes occur in the spectra in the expected regions, e.g., between 3000 and 3100 cm-1, and in the case of deuterated ethylenediamine, between 2400 and 2500 cm-1. The band appearing as a shoulder at about 2450 cm-1 with ethylenediamine (Figure 4(c)) is in the region characteristic of N+—H stretching vibrations, raising the possibility that the imine group carries a positive charge and should be formulated as -CH=NH2+. However, we have not observed the corresponding N+—D band with deuterated ethylenediamine. The observed enhancement of the NH2 bands in the spectrum of deuterated ethylenediamine after exposure to oxygen and subsequent outgassing at 100° supports the proposed imine structure. Loss of protons from both carbon and nitrogen on addition of oxygen provides a mechanism for intramolecular exchange. The protons removed from coordinated ethylenediamine probably protonate surrounding ethylenediamine molecules, but on outgassing at 100° this process is reversed.
We suggest that formation of the 0 2~ species responsible for the EPR signal I occurs through transfer of an electron from a coordinated ethylenediamine ligand to oxygen. This occurs only with the tris complex Co(en)32+ and only in the Y-type zeolites. Zeolites X and Y have the same framework structure and differ only in the silicon to aluminum ratio.1 The higher aluminum content of zeolite X results in a higher density of exchangeable cations within the zeolite structure, but it is not clear why this should inhibit the electron transfer from ethylenediamine to oxygen. No EPR studies have been reported of 0 2” formation in X-type zeolites. Electron transfer from the ligand does not occur with Co(en)22+, since in this case direct interaction of oxygen with Co2+ can take place giving rise to signal II.
The EPR signal II closely resembles the signals observed previously from other cobalt-amine-oxygen adducts formed in CoNaY zeolites.6 Two sets of eight 59Co hyper- fine lines can be identified in the observed spectrum, implying axial symmetry. The Q-band spectrum (Figure 2(c)) shows clearly, however, that the g tensor is nonaxial, although the gxx and gyy components are not well enough resolved for their values to be accurately determined. As
with the ammonia-, methylamine-, and n-propylamine- oxygen adducts,6 the observed X-band spectrum of the eth- ylenediamine-cobalt-oxygen adduct could not be satisfactorily computer simulated unless nonaxial symmetry was assumed. Figure 2(b) shows a typical computed spectrum, with the parameters given in Table I. The positions of the maxima and minima are correctly predicted; the lack of complete agreement with the experimental spectrum is probably due to the line width associated with gyy being greater than that associated with gxx, which cannot be allowed for by our computer program.
The observed 59Co hyperfine coupling constants for signal II are in the range 10-20 G, comparable to those reported for other cobalt(II)-oxygen adducts.6’7 Comparison of the experimental coupling constants with the values of 1350 G17 and —156 G18 calculated for an unpaired electron in a pure s or 3d orbital, respectively, on 59Co2+ indicates that the unpaired electron is only about 3% localized on Co2+ orbitals. We may conclude that the electron is mostly localized on the oxygen, since no 14N hyperfine interaction with the ligands is observed; i.e., the oxygen adduct should be formulated as Co3+0 2~. Drago19 has recently suggested that the observation of reduced 59Co hyperfir.e constants alone is not sufficient evidence for the 0 2~ formulation. Definitive evidence for 0 2~ should come from 170 hyperfine coupling constants. If the unpaired electron is located in an oxygen 2ptr* molecular orbital, the 170 hyperfine tensor is expected to have a large anisotropic component. Van- sant and Lunsford20 observed 170 hyperfine splitting in a cobalt-ammonia-oxygen adduct in a CoNaY zeolite and concluded that the unpaired electron was about 90% localized in a 2p7r* molecular orbital. The 170 hyperfine lines in signal II are not sufficiently well resolved for an accurate analysis to be carried out. Nevertheless, the outermost 170 lines are seen to be separated by approximately 80 G (Figure 3(c)) and are up to 400 G removed from the center of the signal. Hyperfine splittings of this magnitude, when compared to the isotropic 170 coupling constant of 21.6 G observed for a cobalt-oxygen adduct in solution,21 imply the existence of a large anisotropic component consistent with the 0 2~ formulation for the cobalt-ethylenediamine- oxygen adduct.
A maximum intensity of signal II is observed when oxygen is added to a zeolite containing mostly Co(en)22+. Accordingly, we suggest the following structure for the cobalt- ethylenediamine-oxygen adduct
where the sixth coordination site is occupied by an oxide ion of the zeolite lattice. The observed nonaxial g tensor is consistent with a nonlinear Co-0-0 structure. The suggested structure is similar to those of 1:1 cobalt-oxygen adducts formed in solution, in which the in-plane ligand is a Schiff base22 or porphyrin23 and the sixth coordination site is occupied by a coordinating base such as pyridine.
The remarkable stability of the [Co(en)20 2]2+ adduct in X and Y zeolites compared with the analogous adducts formed with ammonia, methylamine, and n-propylamine, is probably a consequence of the coordination to the zeolite
The Journal of Physical Chemistry, Vol. 79, No. 17, 1975

18 4 2 P. Salvador and J. J. Fripiat
lattice. In particular, no dimerization to form a 1:2 adduct is observed, although dimeric ethylenediamine-cobalt-oxy- gen adducts are readily formed in solution,24 and a dimeric ethylenediamine adduct should be no larger than the me- thylamine-cobalt-oxygen dimer which can form in the large cavities of CoNaY zeolites at room temperature.6
Acknowledgments. This research was supported by the National Science Foundation (Grant GP-43041X).
R eferen ces and N o tes(1) D. W. Breck, J. Chem. Educ., 41, 678 (1964).(2) E. F. Vansant and J. H. Lunsford, J. Phys. Chem., 76, 2860 (1972).(3) E. F. Vansant and J. FI. Lunsford, J. Chem. Soc., Faraday Trans. 2, 69,
1028 (1973).(4) I D Mikheiken, O. I. Brotikovskü, G. M. Zhidomirov, and V. B. Kazanskii,
Kinet. Catal. (Engl. Transi.), 12, 1279 (1971).(5) I. R. Leith and FI. F. Leach, Proc. R. Soc. London, Ser. A, 330, 247
(1972).(6) R. F. Howe and J. H. Lunsford, J. Am. Chem. Soc., in press.
(7 ) R . G . W ilk in s , Adv. Chem. Ser., No. 100, 1 11 (1 9 7 1 ), a n d re fe r e n c e s th e re in .
(8 ) A . S a b a tin i a n d S . C a lifa n o , Spectrochim. Acta, 1 6 , 6 7 7 (1 9 6 0 ).(9 ) J . W . J e rm y n , T . J . J o h n s o n , E . F . V a n s a n t , a n d J . H . L u n s fo rd , J. Phys.
Chem., 77, 2 9 6 4 (1 9 7 3 ) .(1 0 ) D . B . P o w e ll a n d N . S h e p p a rd , Spectrochim. Acta, 1 7 , 6 8 (1 9 6 1 ).(1 1 ) J . V . S m ith , Adv. Chem. Ser., No. 102, 4 0 1 (1 9 7 1 ) ; P. G a lle z o t, V . B e n
T a a r it , a n d B . Im e lik , J. Catal., 26, 2 9 5 (1 9 7 2 ) .(1 2 ) A . E. M a r te l l a n d M . C a lv in , “ C h e m is t ry o f th e M e ta l C h e la te C o m
p o u n d s " , P re n t ic e -H a ll, N e w Y o rk , N .Y ., 1 9 5 2 .(1 3 ) P. H . K a s a i, J. Chem. Phys., 4 3 , 3 3 2 2 (1 9 6 5 ) .(1 4 ) K . M . W a n g a n d J . H . L u n s fo rd , J. Phys. Chem., 7 4 , 1 5 1 2 (1 9 7 0 ).(1 5 ) B . C . L a n e , J . E. L e s te r , a n d F . B a s o lo , Chem. Commun., 1 6 1 8 (1 9 71 ).(1 6 ) Y . N . K u k u s h k in a n d Y . S . V a rs h a v s k i i , Russ. J. Inorg. Chem. (Engl.
Transi.), 11 , 1 9 3 (1 9 6 6 ).(1 7 ) B . R . M c G a rv e y , J. Phys. Chem., 7 1 , 51 (1 9 6 7 ) .(1 8 ) B . A . G o o d m a n a n d J . B . R a y n o r , Adv. Inorg. Chem. Radiochem., 13,
1 3 5 (1 9 7 0 ) .(1 9 ) B . S . T o v ro g a n d R . S . D ra g o , J. Am. Chem. Soc., 9 6 , 6 7 6 5 (1 9 7 4 ).(2 0 ) E. F . V a n s a n t a n d J . H . L u n s fo rd , Adv. Chem. Ser., No. 12 1, 4 41
(1 9 7 3 ) .(2 1 ) E . M e la m u d , B . L . S ilv e r , a n d Z . D o ri, J. Am. Chem. Soc., 9 6 , 4 6 8 9
(1 9 7 4 ) .(2 2 ) S e e , f o r e x a m p le , B . M . H o f fm a n , D . L . D ie m e n te , a n d F. B a s o lo , J. Am.
Chem. Soc., 9 2 , 6 1 ( 1 9 7 0 ) .(2 3 ) S e e , f o r e x a m p le , F . A . W a lk e r , J. Magn. Reson.. 1 5 , 2 0 1 (1 9 7 4 ).(2 4 ) P. B ijl a n d G . D e V r ie s , J. Chem. Soc., Dalton Trans., 3 0 3 (1 9 7 2 ).
Molecular Diffusion and Proton Exchange in Methanol Adsorbed by a Sodium
and a Hydrogen Y Zeolite
P. Salvador1 and J. J. Fripiat*
Laboratoire de Physico-Chimie Minérale, Louvaln-la-Neuve, Belgium, and CRSOCI-CNRS, 45045 Orleans-Cedex, France (Received February 24, 1975)
The pulse magnetic resonance technique and infrared spectroscopy have been used to study the behavior of CH3OD and CD3OH occluded at the maximum capacity or at one-third of the full loading in either the sodium Y zeolite or the decationated Y zeolite. In the Na zeolite the diffusion coefficients derived from the diffusional correlation time are in good agreement with similar results reported for other molecules in a similar situation. The behavior of methanol in the zeolitic cage is that of a viscous liquid composed of various “polymeric” units. The broad OH band observed for methanol in this situation is in favor of this model. The spin-lattice proton relaxation rate is mainly contributed by this diffusional motion. In the decationated zeolite the spin-lattice relaxation rate is apparently contributed by a proton-exchange process only. The infrared spectra indicate that methanol interacts with the lattice OH by strong hydrogen bonding. The adsorbed methanol behaves as a vehicle bearing the lattice proton within the zeolitic cage. The proton-exchange process does not appear as being first order. The reason for this special behavior of methanol occluded in the decationated sieve is probably the similarity between the pK a of the lattice OH (pK a = —6) and that of CH30H2+ (pK a = —4.5).
Introduction
The adsorption of methanol on cation-exchanged and decationated zeolites has been studied by Geodakyan, Kiselev, and Lygin2a by infrared spectroscopy.
The perturbation of the hydroxyl groups of methanol is determined, at a low filling factor, not only by the effect of exchangeable cations but also by the additional effect of the oxygen framework. Relative to the hydroxyl stretching band in the liquid, the hydrogen bond is weaker. Possibly, hydrogen bonds are formed by the interaction of the meth-
* To whom correspondence should be addressed at CRSOCI- CNRS.
anol hydroxyl with the negatively charged oxygen atoms of the zeolite framework. At a higher filling degree, an additional vibration band similar to that in crystalline methanol is observed. The latter is not subject to the direct influence of the exchangeable cations.
In the spectra of methanol adsorbed by decationated zeolites, it is clear that strong hydrogen bonds are formed with the surface hydroxyl groups. This observation, particularly stressed by Bosacek et al.,2b is not surprising in view of the strong proton-donor character of those surface OH groups. Their pK& values are in the range of -6 (±2) according to recent measurements by Sempels and Rouxhet.3
Cruz et al.4’5 have shown that methanol is an interesting
The Journal o f Physical Chemistry, Vol. 79, No. 17, 1975

Molecular Diffusion and Proton Exchange in Methanol 18 43
molecule for studying molecular motions and proton exchange by pulse nuclear magnetic resonance in the adsorbed state. By an adequate choice of hydrogenated and deuterated systems, it is indeed possible to make a distinction between different kinds of relaxation mechanisms. Particularly interesting has been, for methanol adsorbed on silica gel, the distinction between molecular diffusion, the tumbling of the adsorbed species, and the proton exchange with surface silanols and between adsorbed species according to the mechanisms
X-OH + CH3OH - CH3OH24- + X-O- (I)CH3OH2+ + CH3OH — CH3OH + CH3OH2+ (II)
Because of well-marked differences between the adsorption processes of methanol in zeolites and on silica gel it was interesting to repeat a similar study for a Na and a de- cationated Y zeolite.
In silica gel the pKa of the surface hydroxyls is between +7 and + 8. In presence of a proton acceptor (A) characterized by a pXa on the order of or higher than that of silica gel, Noller et al.6 have explained a continuous absorption by assuming that the protons detached from the SiOH groups and captured by the proton acceptor AH+ are tunneling in the AH+—A bonds. This interpretation is based on the findings of Zundel et al.,7’8 who have shown that hydrogen bonds with symmetrical or almost symmetrical double-minimum potential wells are about 2 orders of magnitude more polarizable than electron systems, causing a continuity of energy level shifts and therefore a continuous absorption.
The pffa of CH3OH2+ is about -4.5.® This is near the pKa of the surface OH in decationated zeolite.
From the pKa of XOH and CH3OH2+ and by combining reactions I and II it may be easily shown that if [CH3OH]/ [XOH] = 1 the ratio [CH3OH2+]/[XOH] is 1.2 in the zeolite and about 10-6 on the silica gel surface. The activity coefficients are neglected but the orders of magnitude are sufficiently separated to initiate a very different behavior.
In decationated zeolites, the influence of the proton exchange is thus expected to determine the relaxation mechanism. On the contrary, in the sodium sample it should be comparable with that observed for various other occluded liquids. Resing9 has made a comparison between the diffusion coefficients computed from the correlation times measured for various adsorbed materials such as H20, SF6, CeHio, and CeH6.
The magnetic nuclear resonance study should be completed by some infrared investigation, especially for the decationated sample, in order to check the stability of the hy- droxylated lattice in the presence of methanol. It has been indeed pointed out by Bosacek et al.2b that some of the OH groups enter a chemical reaction with methanol, forming firmly bound methoxyl groups. The initial value of isosteric heat of adsorption of methanol by a sodium X sieve obtained by Avgul et al.10 is rather large, indicating a strong interaction.
Hence, this paper aims to define the behavior of methanol occluded in Na-Y and H-Y near-faujasite molecular sieves, the main tool being the proton pulse NMR spectroscopy.
ProceduresMaterials. The Na sieve was prepared in the laboratory
by Lerot.11 The chemical composition for the dehydrated
samp! was Na64Al6sSii22 0 384- Si:A1 = 1.86 is in the domain of a Y near-faujasite. By repeated contacts with a 1 iV NH4CI solution at room temperature, the sodium sieve was converted into a NH4 sample at the extent of about 86%. The decationated sample was obtained by the so-called “thin” bed thermal treatment12 of the NH4 zeolite under the same conditons as those described for the ir study. The chemical analysis of the decationated sample showed the composition HssNagAUsSi^sC^. For this chemical composition, at full loading of the sieve the [CH3OH]/[XOH] ratio is 15 whereas [CH3OH2+]/[XOH] m 1.
The sodium and decationated samples will be called Na-Y and H-Y, respectively. The iron content is of the order of 100 ppm.
Adsorption Isotherms. Merck spectroscopy grade CH3OH was used. Isotherms were obtained with a volumetric adsorption apparatus. The equilibrium pressures were measured within ±0.05 Torr with a mercury manometer and an accurate cathetometer. Below 10-2 Torr, a McLeod gauge was used.
Before any adsorption, the samples were dehydrated or decationated in the adsorption apparatus. The adsorption isotherms, the heats of adsorption, and the diffusion coefficients obtained from isothermal desorption will be discussed elsewhere.12
The full loading was derived through the Dubinin equation and it was found equal to 7.5 X 10⁻³ mol/g for Na-Y and to 10 X 10~3 mol/g for H-Y at 20°,
The reason for this difference is perhaps that methanol has access to the cage inside the cuboctahedron in H-Y but not in Na-Y because the Na cations block the pathway to inside these structure elements.
Infrared Spectroscopy. Na or NH4 zeolites were pressed into thin wafers of 5-10 mg/cm2 average thickness, under a pressure of about 2 kg/cm2. These Na zeolite wafers were pretreated in a quartz ir cell at 450°, under a residual pressure of 10-6 Torr, for 24 hr. NH4 zeolite wafers were decationated in the following way. First the system was evacuated at room temperature under a residual pressure of 10~6 Torr for 24 hr, and then it was heated under vacuum at 2°/min up to 350°; this temperature was maintained for 12 hr.
CH3OH and CH3OD spectroscopic grade reagents were used. Ir spectra were always recorded at room temperature. The methanol filling degree, expressed relative to the full loading that can be occluded within the zeolite, was the variable parameter for these experiments. When required, surface deuteration was obtained as described in the next section.
The spectra were recorded with a Beckman IR 12 spectrometer. In all cases the spectral line width was negligible with respect to the width of the vibrational bands of the adsorbed material.
NMR Experiments. Samples were pretreated under the conditions used for the ir experiments. Pretreatments were carried out in Pyrex tubes (15-mm i.d.) placed horizontally in a furnace in such a way that the thickness of the powder bed on the wall was less than 3 mm.
After the pretreatment, the sample was cooled and brought into contact with methanol vapor. The quantity of methanol adsorbed was measured volumetrically. The tube was then sealed and placed in the NMR probe. CH3OH, CH3OD, and CD3OH spectroscopic grade reagents were degassed before use by repeated freezing and thawing.
When deuterated samples were required, a few Torr of
The Journal of Physical Chemistry. Voi. 79, No. 17, 1975

ibso
rban
ce1844 P. Salvador and J. J. Fripiat
Figure 1. Evolution of the OH stretching region of H-Y upon adsorption of CH3OH: a, decatlonated zeolite (see text); b, adsorption at 200° for 5 min under a relative pressure P/Po = 1 followed by out- gassing at 200° till P < 10-6 Torr; c, further outgassing for 14 hr at 200°.
CfiDg vapor was introduced into the cell containing the de- cationated sample, while heating at about 150-200°.14 After a few minutes the vapor was pumped off. The procedure was repeated several times. Afterward the sample was again outgassed at 200° for several hours.
The 60-MHz proton pulse NMR measurements were performed with a modified Briiker BKR 302 spectrometer fitted with Tektronic 162 and 163 pulse generators, monitored by an electronic time counter. The 90° pulse duration was of the order of 20 X 10-6 sec and the magnetic field heterogeneity within the sample was between 30 and 40 X 10~3 G. In order to increase the signal to noise ratio, a Ni- colet 1072 time averager was used.
The proton longitudinal relaxation time ( T l p ) was obtained by a 90°-90° pulse sequence.
The spin-spin relaxation time (T2P) was derived from the free induction signal following a 90° pulse. When the resonance line was sufficiently narrow (T2p > 2 X 10³ sec), T2 was also obtained from the decay of the spin-echo signal following a 90°-180° pulse sequence.
All T2 values were corrected for the inhomogeneity of the magnetic field. T 2 was obtained either from the characteristic exponential decay for a lorentzian line as generally observed for the decationated samples or from the slope of log {M±/M0) vs. t2 (sec2) in the case of the gaussian line as has been usual for the sodium sieves. In those cases where
Figure 2. Evolution of the OH and OD stretching regions of H-Y upon adsorption of CH3OH: a, decationated and partially deuterated zeolite; b, adsorption of CH3OH at 25° and P /P 0 = 1 followed by out- gassing at 120° for 30 min till P < 10-5 Torr; C, further outgassing at 200° for 30 min.
two clear exponential decays were observed in the signal, the short T 2 was corrected graphically for the long component.
All J 11 values have been measured at two different time intervals on the signal. In the case of two exponential decays, these time intervals were in the same range of values as the two T2’s. A single Tx was obtained in all cases. Ti and T2 measurements at different temperatures were performed by means of the NMR probe described by Vannice et al.15
Ir Experimental Results and DiscussionThe typical doublet of the lattice OH stretching vibra
tion in H-Y is shown in Figure la, the two bands being observed at 3670 and 3565 cm-1, respectively. Spectrum b was obtained after exposing the decationated sample at 200° for 5 min to 30 Torr of methanol vapor followed by outgassing for 5 min under a residual pressure of 10~e Torr.
The high-frequency OH stretching is no more observable but the low-frequency component may be on the left-hand side of a broad band containing also the OH stretching bands of CH3OH. CH3 antisymmetrical and symmetrical
The Journal of Physical Chemistry, Vol. 79, No. 17, 1975

ab
so
rba
nc
eMolecular Diffusion and Proton Exchange in Methanol 1845
Figure 3. Isotopic exchange between H-Y and CH3OD: a, two-thirds filling with CH30 D at room temperature: b, outgassing at room temperature for 12 hr till P < 10“ 5 Torr; c, outgassing at 45°; d, out- gassing at 100°; e, outgassing at 280° (for 12 hr at each temperature).
stretches contribute to the bands between 3000 and 2800 cm“1. After outgassing at 200° for 14 hr under a residual pressure of 10“6 Torr, the initial doublet, though less intense, is clearly visible as well as a weak contribution in the CH region. In the methanol OH stretching region, the base line has the same profile as in the outgassed decationated sample. Therefore it must be concluded that at 200° some méthoxylation occurs and that some lattice OH groups are involved in this reaction.
In Figure 2a, the OH and OD stretching regions of a partially deuterated H-Y sample are shown. As the absorption coefficient of an OD stretching is usually about 50% that of the corresponding OH stretch, it may be concluded that deuteration has occurred to a large extent. When exposed to 80 Torr of CH3OH at room temperature and outgassed at 120° for 30 min under a residual pressure of 10-6 Torr, the sample does not contain any more OD groups (Figure 2b). Some méthoxylation has occurred as suggested by a residual absorption in the CH stretching region which is not removed by outgassing at 200° for 30 min.
Since the removal of the physically adsorbed CH3OH cannot be achieved completely below 200° and since at this temperature methanol reacts with the lattice OH, as shown
Figure 4. OD stretching band of CH 3OD adsorbed by Na-Y. Degree of filling: a, 0.03; b, 0.06; c, 0.17; d, 0.45.
in Figure 1, the residual CH stretching band shown in Figure 2c may result from the reaction occurring during the outgassing treatment. It must be also concluded that the isotopic OD OH exchange occurs very rapidly at room temperature.
This is also clearly visible in Figure 3. Spectrum a is obtained for a filling degree of 70%, the samples being initially hydroxylated and the adsorbate being CH3OD. So, by contact at room temperature the exchange has been achieved since both the OH and OD stretching regions are very well defined on both sides of the CH stretching region.
After outgassing at room temperature for 12 hr the high- frequency OH stretch at 3670 cm-1 and the corresponding OD stretch at 2700 cm“ 1 as well as the CH stretching become clearly observable (spectrum b). After outgassing at 45 and 100° (spectra c and d, respectively), the resolution is still better and the low-frequency OH and OD bands are clearly observed. Finally after outgassing at 280° (spectrum e) the residual CH stretching band is present.
Also, in agreement with the observation made on the change in intensity of the OH stretching bands upon physical adsorption of rare gases,16 it is clear that the OH groups in the supercage and their corresponding high-frequency stretching band are strongly affected by methanol. Because of the superimposition with the methanol OH bands, the behavior of the OH inside the cuboctahedron and hexagonal prisms giving rise to the low-frequency stretch is ambiguous. According to the methanol content at full loading in H-Y, physically adsorbed methanol should also interact with these OH’s. Examination of the absorbance in the region of the low-frequency OH stretch suggests that no interaction occurs. However isotopic exchange involves both kinds of OH.
The strong interaction between the high-frequency OH and methanol suggests of course that a strong hydrogen bond is formed between CH3OH and the lattice OH in the
The Journal of Physical Chemistry, Vol. 79, No. 17, 1975

(se
c)
18 4 6 P. Salvador and J. J. Fripiat
Figure 5. Variation of the spin-lattice (7*,) and spin-spin ( T2) relaxation times with respect to *000/ T (°K_1) at two filling degrees for C D 3OH in H-Y. The variation observed for 7i in absence of methanol is from ref 20.
supercage. The isotopic exchange with the low-frequency OH could occur through the OH in the supercage.
As far as the adsorption of methanol by the sodium sieve is concerned, the main feature is the development of a strong absorption in the OH region with increasing filling degree. However, the shape of the band is almost the same at low as at high methanol content. This suggests that the intermolecular interactions are not very sensitive to the methanol content, in agreement with the observations reported by Cruz et al.17
Pulse NMR ResultsThe spin-lattice (Tj) and spin-spin (T2) relaxation
times measured between +80 and —160° are shown in Figure 5 and Figures 6 and 7 for the H-Y and Na-Y sieves, respectively. Obviously the relaxation mechanism does not depend appreciably on the filling degree of the cage, but an important distinction between the sodium and the deca- tionated sample appears clear.
Let us consider first Figures 6 and 7 where the proton relaxation times of either CD3OH or CH3OD in the Na sieve are compared. In this case no proton exchange with the lattice should occur. However two T2 values are observed when CD3OH is used as adsorbate. According to Cruz et al.4 the short T2 should be assigned to proton exchange between CD3OH molecules and the surface. Actually the so
Figure 6. Variation of T-, and T2 for CH3OD (• ) and C D 3OH (■ ) in Na-Y at full loading of the zeolite cage.
dium sieve contains some silanol groups18 on the broken bonds at the cleavage faces of the microcrystal and also at some hydrolyzed cationic sites. These OH groups can be responsible for the exchange process. However, this contribution to T] is small because of the very small number of surface protons available, and the main contribution to the spin-lattice relaxation mechanism could be assigned to a diffusional motion.
The solid lines in Figures 6 and 7 have been computed assuming a distribution of correlation times for the diffusion motion. The fraction of molecules in the “mobile” phase f m, as defined by Resing,19 is shown in enclosure in both of these figures. Because of some contribution Tip_1 of the paramagnetic impurities4’20
T r 1 = T ld~! + Tip- 1 (1)where Tm-1 is the contribution of the diffusional motion to the observed relaxation rate T j-1.
For a normalized distribution function P(t) of the correlation times r
P(r)dr = r 1* -172 exp[-(Z/d2)]dZ (2)where /3 is the spreading coefficient of the distribution function and
Z = In (r/rm) (3)rm being the average correlation time. Then
The Journal of Physical Chemistry, Vol. 79, No. 17, 1975

(sec
)Molecular Diffusion and Proton Exchange in Methanol 1847
Figure 7. Variation of 7", and T7 for CD 3OH in Na-Y at one-third of the maximum content.
_ . 2 S2 C°° rw , T “ T , 4o>T 1 JT Id = " I P(t) ”2"2 + î' . A 2 2 dr3 a) Jo Ll + co2t2 1 +
T2d- 1= 7 2- f TCP(r)rdr f m *70
/m=JTp(t) dT
(4)
(5)
rc = T2,rigid = (rr/2S2)1/2 (for a gaussian line), S2 being the second moment.
The details of these calculations for adsorbed methanol have been given previously,4 and they will not be repeated here. As may be shown in Figures 6 and 7, a reasonably good fit is obtained between the experimental and theoretical curves using the parameters shown in Table I. Hd is the average activation enthalpy for diffusion. A diffusion coefficient (D) can be deduced from rm since
Tm = T 0 exp (HJRT) D = <(2>/6r
(6)(7)
If the average quadratic jump distance (l2) is independent of the filling degree, the diffusion coefficients shown in Figure 8 are obtained. Other diffusion coefficients reported by Resing et al.9 for various molecules are indicated for the sake of comparison. The agreement with the present results seems acceptable. In particular, the activation enthalpy and the influence of the filling degree are in line with
TABLE I: Best Fitting Parameters Used in Eq. 4 and 5 for the Diffusion of CH3OD and CD3OH in Na-Y
Filling degree
% 1
H a, kcal/m ol 3.9 4.4ß 3.0 2.5t u. 1 0 ' 12 sec 1.71 1.94S 2, 109 radian2 / s e c 2 5.8 9.2T2 ,ruid. f 0 " 3 sec -1 .65 -1 .3
Figure 8. Comparison of the diffusion coefficients obta ned for methanol at two degrees of filling with similar data reviewed by Resing .9
the observations reported for water and benzene. Again, as shown earlier for silica gel,4 methanol appears to behave intermediately between these two molecular species.
In the decationated sieve, because of the rapid exchange between the methanol OH (or OD) and the structural OD or OH, the spin-lattice relaxation rate may be to a large extent contributed by proton jumps if the jump frequency is in the appropriate range with respect to the proton resonance frequency.
This seems to be the case for the spin-spin relaxation time which is near the short T2 observed for the sodium system. As is shown clearly in Figure 5, T1 does not evolute with respect to temperature as does the spin-lattice relaxation time found in the sodium sieve.
Because of the absence of an observable minimum in T 1 and the uncertainty on T2 r¡g¡d and therefore on the second moment, it is impossible to take into account a distribution of relaxation times; therefore the activation energy (£) obtained from the slope of T\ might be appreciably lower than the actual value. The parameters in Table II have been used to compute the solid lines in Figure 5.
For a filling degree equal to unity, the correlation time intercepts T2 when it reaches the value of T2,rigid- For the lower degree of filling, the variation of T2 is unusually rapid at about 266° K.
As compared with the parameters shown in Table I, however, E is appreciably smaller than H¿ and to is noticeably longer.
On the basis of a unimolecular reaction or first-order kinetics to is expected to be in the range 10_12- 10-,:l sec. This was the case for the proton-exchange process observed
The Journal of Physical Chemistry, Vol. 79. No 17. 1975

18 4 8 P. Salvador and J. J. Fripiat
TABLE II: Best Fitting Parameters for the Proton- Exchange Process in the CD3OH H-Y System
Filling degree
Vs 1
E . kcal/mol 2.4 2.7To* sec 26 4.7S2, 1CT radian2/sec‘ ~10 ~2.7To, rigid, IO’5 sec ? O ~2.0
• t1
__sil»«T *O)* 0i / j /r Qb"
-f----» /
1 / /
e=o /i/ * /* y
; / 1’ i »i
/ » / i / »' i/
»t / %/
_a__!
2 3 4 5 6 7 8
Figure 9. Variation ot the correlation time ruling the spin-lattice relaxation time in H-Y unloaded and partially (two-thirds) or totally filled with CD3OH. For silica gel data see ref 5.
for methanol adsorbed on silica gel. Here, in presence of a more acidic surface, and thus of a higher concentration in protonated species, the 4 orders of magnitude increase observed for ro suggests a different mechanism, perhaps a bi- molecular process.
The correlation time shown in Figure 9 on the left-hand side is that observed by Mestdag et al.20 for a proton jumping from one oxygen to another in a decationated Y sieve. The activation energy is then 19 kcal/mol. The correlation time for the proton-exchange process observed for CD3OH at the monolayer coverage for a silica gel is also shown in Figure 9 as an example for a weakly acidic surface.
The H-Y-methanol system should be considered as constituted by a pool of protons belonging either to the lattice OH or to CD3OH and involved in a fast-exchange process relayed by CD30H2+ in high concentration. In other words in the decationated sieve, the methanol molecule may be considered as a vehicle that transports the lattice acidic
TABLE III: Diffusion Coefficient (cm2 sec x) Obtained from the Desorption Rate12 at Full Cage for Na-Y and H-Y
Temp, °C Na-Y H-Y
55 1.15 y 1(T6 2.2 x HT6115 5 x 1CT6 1.3 x 1er5225 4.6 x 10‘r' 5.4 x HT5
protons within the cage. The relaxation mechanism is therefore entirely different from that observed in the sodium sieve.
Would a diffusional motion contribute appreciably to the relaxation mechanism in the decationated sieve, then in agreement with similar observations reported for silica gel,4 a single T 1 containing the superimposition of the exchange and of the diffusion contributions should be obtained. Hence the experimental results should be comparable with those reported in Figures 6 and 7 with a broader minimum for T 1.
Because of strong hydrogen bonding between methanol and lattice hydroxyls, some of the occluded species should have a rather low diffusion coefficient. However since at full loading the ratio [CH3OH + CH30H2+]/[0 H] in the supercage is of the order of 10, the average diffusion coefficient should not differ so much from that obtained for methanol in Na-Y. This is supported by the diffusion coefficients obtained from isothermal desorption processes for both kinds of sieves, as shown in Table III. Obviously they are close to each other and in reasonable agreement with the extrapolated values shown in Figure 8.
The lack of an appreciable diffusional contribution to the observed spin-lattice relaxation rates T-¡ for the CD3OH-H-Y system can be accounted for if the three following conditions are fulfilled.
T i - ^ T r ’exch+Tid-’ + Tip-1 (8)
If the associated correlation times rexch and are such that Texch » Td and if the T iexch and T m minima occur at two very different temperatures, 7 ’ i _ l eXch should dominate T in the temperature domain where the experimental T 1 and T2 data are collected.
(b) If the second moment modulated by the proton-exchange process (see reactions I and II) is higher than that modulated by the straight molecular diffusion of CD3OH, T'i-1txch > T id '1; this is acceptable in view of the large CD3OH2'1 concentration. In CD30H2+ the proton-proton distance is of the order of 1.6 Â whereas the H-H distance in CH3OD is about 1.8 Â.
(c) If the molecular diffusion in H-Y is effected by a peculiarly broad distribution of correlation times, Tid_1min should decrease and the minimum itself should be very shallow. As said before, strong hydrogen bonding with the lattice OH groups and perhaps also the presence of methanol in both the sodalite and the zeolitic cages could be at the origin of this spreading of the distribution function.
Therefore the particular conditions19 that produce sometimes a T2 minimum in systems where a proton exchange occurs between two phases are not obeyed and the assumption that the CD3OH-H-Y system behaves a single pool of protons may well be accounted for by the obvious difference between the relaxation mechanisms observed for methanol occluded in Na-Y and H-Y.
Resing21 has analyzed recently the exchange between
The Journal o f Physical Chemistry, Vol. 79, No. 17, 1975

Ir Spectra of Matrix Isolated Dlsulfur Monoxide Isotopes 1849
chemisorbed and physisorbed molecules and, in particular, the proton exchange between adsorbed water and the OH groups originating from a very limited hydrolysis of the Na-X near-faujasite zeolite. At two-thirds of the maximum water content, the proton lifetime in the OH group is 2 X 10⁻⁴ sec at room temperature. Here the correlation time assigned to the proton jumps is 4.6 X 10⁻⁷ sec at room temperature and full loading. The jump frequency in the CD3OH-H-Y pool of protons is thus about 1000 times larger than in the system studied in Resing. Since the hydrolysis of Na-X does not generate lattice OH groups with the high acidity22 characterizing those shown by the OH stretching bands in Figures 1-3, this difference is not surprising.
C onclusions(1) In the Na-Y sieve, the proton relaxation mechanism
of adsorbed methanol is ruled by a diffusional motion. The diffusion coefficient at full loading is about half that measured at one-third filling. These coefficients are in the right order of magnitude as compared with those reported for other adsorbed species.
(2) In the decationated sieve, the proton relaxation mechanism of adsorbed CD3OH is probably ruled by a proton exchange with the acid surface OH groups. The proton- exchange process does not appear to be first order.
Acknowledgments. Many thanks are due to W. E. E. Stone and to P. G. Rouxhet for stimulating discussions.
The help of W. E. E. Stone in the experimental part of this work has been deeply appreciated by P.S.
R eferen ces and N otes
(1) On leave of absence from the CSIC on a Juan March fellowship.(2) (a) K. T. Geodakya, A. V. Kiselev, and V. I. Lygln, Russ. J. Phys. Chem.
(Engl. Transi.), 41, 227 (1967); (b) V. Bosacek and Z. Tvarutzkova, Collect. Czech. Chem. Commun., 36, 551 (1971).
(3) P. G. Rouxhet and R. E. Sempels, Trans. Faraday Soc., 70, 2021 (1974).
(4) M. I. Cruz, W. E. E. Stone, and J. J, Fripiat, J. Phys. Chem., 76, 3078(1972) .
(5) S. J. Seymour, M. I. Cruz, and J. J. Fripiat, J. Phys. Chem., 77, 2847(1973) .
(6) H. Noller, B. Mayerbock, and G. Zundel, Surf. Sei., 33, 82 (1972).(7) E. G. Weidemann and G. Zundel, Z. Naturforsch., Teil A, 28, 236 (1973),(8) R, Janoschek, E. G. Weideman, H. Pfeiffer, and G. Zundel, J. Am.
Chem. Soc., 94, 2387 (1972).(9) H. A. Resing and I. S. Murday, Adv. Chem. Ser., No. 121, 414 (1973).
(10) N. N. Avgul, A. G. Bezuz, and 0. M. Dzhigit, Adv. Chem. Ser., No 102 184(1971).
(11) L. Lerot, Ph D. Thesis, University of Louvain, 1974.(12) P. Salvador et al., unpublished data.(13) G. T. Kern, Adv. Chem. Ser., No. 121, 219 (1973).(14) P, Jacobs, personnal communication.(15) M. A. Vannlce, M. Boudart, and J. J. Fripiat, J. Catal., 17, 359 (1970).(16) J. L. Wite, A. N. Jelly, J. M. Andre, and J. J. Fripiat, Trans. Faraday Soc.,
63, 461 (1967).(17) M. I. Cruz, J. Andre, K. Verdinne, and J. J. Fripiat, An. Quim., 69, 895
(1973).(18) P. A. Jacobs and J. B. Uytterhoeven, J. Chem. Soc., Faraday Trans 1,
69, 373 (1973).(19) H. A. Resing, Adv. Mol. Relaxation Processes, 1, 109 (1967).(20) M. M. Mestdag, W. E. E. Stone, and J. J. Fripiat, submitted for publica
tion in Trans. Faraday Soc.(21) H. A. Resing, J. Phys. Chem., 78, 1279 (1974).(22) H. A. Resing, personal communication.
infrared Spectra of Matrix Isolated Disulfur Monoxide Isotopes
Alfred 6 . Hopkins, Francis P. Daly, and Chris W. Brown*
Department o f Chemistry, University o f Rhode Island, Kingston, Rhode Island 02881 (Received February 10, 1975)
Publication costs assisted by the Petroleum Research Fund
Infrared spectra of natural abundance and isotopically enriched S2O matrix isolated in Ar have been measured. The vibrational bands of 32S2160 , 32S2180 , 34S2160 , 34S32S160, and 32S34S160 have been assigned, and the observed frequencies of these isotopes used to calculate the harmonic force constants of S2O.
IntroductionThe species S2O has been found to be stable for short pe
riods of time in the gas phase at low pressures, and it is thought to be an important species in photochemical, combustion, and electrical discharge reactions of sulfur and oxygen. Schenk and Steudel1 have shown that S2O is one of the products formed from the very reactive SO species (reacting with itself), and that S20 is a good indicator for the prior existence of SO. In early work,2'3 S20 was incorrectly identified SO or (SO)2. Later, Myer and coworkers4’5 correctly identified S20 by mass and infrared spectroscopy.
Several years ago we initiated a program to measure vibrational spectra of all of the sulfur oxides6’7 and of small sulfur species.6’8’9 Since S20 is one of the more important sulfur oxides, we have measured the infrared spectra of
most of its isotopic species isolated in inert gas matrices, and determined its harmonic force constants.
E xperim ental SectionInfrared spectra were measured on a Perkin-Elmer
Model 521 infrared spectrometer, which was calibrated with water vapor and polyethylene.10 S20 was prepared by passing S02-Ar mixtures through either a radiofrequency (<200 W at 10 MHz) or a microwave (<60 W at 2450 MHz) electrodeless discharge. The “hot” gaseous mixture was condensed onto a Csl substrate in a Cryotip cell at 20° K;11 the discharge region and the substrate were separated by a pinhole (0.8 to 3.5 mm in diameter). The gas was deposited at the rate of 3-6 mmol/hr.
S02 (Matheson) was vacuum distilled several times prior
The Journal of Physical Chemistry, Vol. 79, No. 17. 1975
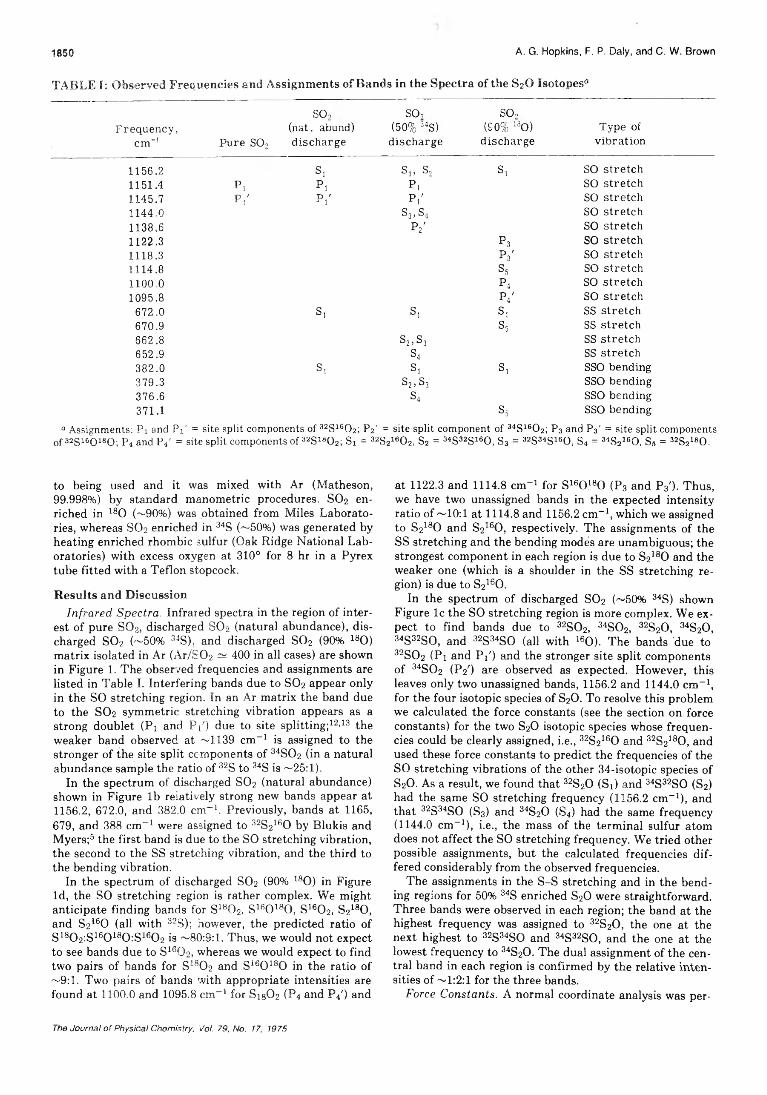
18 50 A. G. Hopkins, F. P. Daly, and C. W. Brown
TABLET: Observed Frequencies and Assignments of Bands in the Spectra of the S20 isotopes0
Frequency,cm"’ Pure SO,
SO,(nat. abund) discharge
so,(50% 34S)discharge
SO,(so% 130)
dischargeType of
vibration
1156.2 s, S], s. s, SO stretch1151.4 Pi P, P. SO stretch1145.7 Pi' Pi' P / SO stretch1144.0 S3 j s4 SO stretch1138.6 P2' SO stretch1122.3 P3 SO stretch1118.3 P3' SO stretch1114.8 S5 SO stretch1100.0 P4 SO stretch1095.8 p4' SO stretch672.0 S, S, Si SS stretch670.9 S5 SS stretch662.8 S2, S3 SS stretch652.9 S4 SS stretch382.0 Si S, S, SSO bending379.3 S2,S3 SSO bending376.6 S4 SSO bending371.1 S5 SSO bending
a Assignments: Pi and Pi' = site split components of 32S1602; P2' = site split component of 34S1602; P3 and P3' = site split components 0f 32gi6oi8Q; p4 and Pi' = site split components of 32S1802; Si = 32S2160 2, S2 = 34S32S160, S3 = 32S34S160, S4 = 34S2160 , S5 = 32S2180.
to being used and it was mixed with Ar (Matheson, 99.998%) by standard manometric procedures. S02 enriched in 180 (~90%) was obtained from Miles Laboratories, whereas SO2 enriched in 34S (<~50%) was generated by heating enriched rhombic sulfur (Oak Ridge National Laboratories) with excess oxygen at 310° for 8 hr in a Pyrex tube fitted with a Teflon stopcock.
Results and DiscussionInfrared Spectra. Infrared spectra in the region of inter
est of pure SO2, discharged S02 (natural abundance), discharged S02 (~50% 34S), and discharged S02 (90% 180) matrix isolated in Ar (Ar/S02 ^ 400 in all cases) are shown in Figure 1. The observed frequencies and assignments are listed in Table I. Interfering bands due to S02 appear only in the SO stretching region. In an Ar matrix the band due to the S02 symmetric stretching vibration appears as a strong doublet (Pi and Pi') due to site splitting;12’13 the weaker band observed at ~1139 cm-1 is assigned to the stronger of the site split components of 34S02 (in a natural abundance sample the ratio of 32S to 34S is ~25:1).
In the spectrum of discharged S02 (natural abundance) shown in Figure lb relatively strong new bands appear at1156.2, 672.0, and 382.0 cm“1. Previously, bands at 1165, 679, and 388 cm“ 1 were assigned to 32S2160 by Blukis and Myers;5 the first band is due to the SO stretching vibration, the second to the SS stretching vibration, and the third to the bending vibration.
In the spectrum of discharged S02 (90% 180) in Figure Id, the SO stretching region is rather complex. We might anticipate finding bands for S180 2, S160 180, Sle0 2, S2180, and S2160 (all with 32S); however, the predicted ratio of S180 2:S160 180:S160 2 is ~80:9:1. Thus, we would not expect to see bands due to S160 2, whereas we would expect to find two pairs of bands for S180 2 and S160 180 in the ratio of ~9:1. Two pairs of bands with appropriate intensities are found at 1100.0 and 1095.8 cm-1 for Sis02 (P4 and P4') and
at 1122.3 and 1114.8 cm“1 for S160 180 (P3 and P3'). Thus, we have two unassigned bands in the expected intensity ratio of ■—'10:1 at 1114.8 and 1156.2 cm“1, which we assigned to S2lsO and S2160, respectively. The assignments of the SS stretching and the bending modes are unambiguous; the strongest component in each region is due to S2180 and the weaker one (which is a shoulder in the SS stretching region) is due to S2lsO.
In the spectrum of discharged S02 (~50% 34S) shown Figure lc the SO stretching region is more complex. We expect to find bands due to 32S02, 34S02, 32S20, 34S20, 34S32SO, and 32S34SO (all with 160). The bands due to 32S02 (Pi and P f) and the stronger site split components of 34S02 (P20 are observed as expected. However, this leaves only two unassigned bands, 1156.2 and 1144.0 cm“1, for the four isotopic species of S20. To resolve this problem we calculated the force constants (see the section on force constants) for the two S20 isotopic species whose frequencies could be clearly assigned, i.e., 32S2160 and 32S2180, and used these force constants to predict the frequencies of the SO stretching vibrations of the other 34-isotopic species of S20. As a result, we found that 32S20 (Si) and 34S32SO (S2) had the same SO stretching frequency (1156.2 cm“1), and that 32S34SO (S3) and 34S20 (S4) had the same frequency (1144.0 cm“1), i.e., the mass of the terminal sulfur atom does not affect the SO stretching frequency. We tried other possible assignments, but the calculated frequencies differed considerably from the observed frequencies.
The assignments in the S-S stretching and in the bending regions for 50% 34S enriched S20 were straightforward. Three bands were observed in each region; the band at the highest frequency was assigned to 32S20, the one at the next highest to 32S34SO and 34S32SO, and the one at the lowest frequency to 34S20. The dual assignment of the central band in each region is confirmed by the relative intensities of ~ 1:2:1 for the three bands.
Force Constants. A normal coordinate analysis was per-
The Journal o f Physical Chemistry, Voi. 79, No. 17, 1975

Ir Spectra of Matrix Isolated Disulfur Monoxide Isotopes 1851
Figure 1. Infrared spectra of pure S 0 2 (natural abundance), S 0 2 (natural abundance) discharge products, S 0 2 (5 0 % 34S) discharge products, and S 0 2 (9 0 % 180) discharge products, isolated in Ar matrices (A r/S02 a; 400 in al! cases).
formed using the Wilson FG matrix method and the force constant adjustment computer program written by Schachtschneider.14 The following geometrical parameters were used in the calculations:15 rso = 1.4594 A, r9S = 1.8845 A, and Zs90 = 118.08°. The three valence bond force constants for the squared terms in the potential energy expression (Kso, Ksa, and K a) and the three for the cross terms (Kso,ss, Kso,m and K8S,a) were used in the analysis; the resulting force constants obtained using all five isotopes of S20 are given in Table II. The observed and calculated frequencies are given in Table III. The average error in frequency for the 15 frequencies is 0.2 cm-1 or 0.03%, which strongly supports the reliability of the assignments.
ConclusionsAlthough assigning the bands of the isotopic species of
S20 was not extraordinarily difficult, the process was much easier after we completed the normal coordinate analysis on the vibrations of 32S16Q and 32S2180 , i.e., on the vibrations of the isotopes that could be assigned with a degree of certainty. This adds support to the use of normal coordinate analysis in assigning the vibrational bands of simple molecules. Knowledge of the force constants of S2O should now make it possible to assign the vibrational bands of other lower oxides of sulfur.
TABLE II: Force Constants for S2O Calculated Using Frequencies from Five Isotopes
Force constant2 7
Kso 8.249 0,002■so,ss 0.151 0.004
Kso, a -0.013 0.005Kss 4.430 0.002KSs,a 0.242 0.002Ka 1.408 0.001
a Units: Kao, K33, and Kso,as in mdynes/A; Kso,., and Kss,, inmdynes/radian; and K, in mdynes A/radian2
TABLE III: Observed and Calculated Frequencies for the Isotopes of S20
CalcdObsd frequency
Isotope frequency, cm' 1 cm-1
32s216o 1156.2 1156.4672.2 672.3382.0 382.1
32s218o 1114.8 1114.6670.9 670.6371.1 370.5
34s216o 1144.0 1144.0652.9 653.1376.6 376.8
32s34s 16o 1144.0 1144.1662.8 662.8379.3 379.4
34s32s 16o 1156.2 1156.2662.8 662.8379.3 379.4
Acknowledment. Acknowledgment is made to the donors of the Petroleum Research Fund, administered by the American Chemical Society, for support of this research. Two of us (A.G.H. and F.P.D.) gratefully acknowledge fi- éÉ nancial aid in the form of NDEA Title IV Fellowships.
References and Notes(1) P. W. Schenk and R. Steudei in “Inorganic Sulfur Chemistry”, G. Nick
less, Ed., Elsevier, New York, N. Y., 1988, pp 367-418.(2) P. W. Schenk, Z . Anorg. Allg. Cham., 211, 150 (1953'; Chem. Z „ 67,
273(1943).(3) A. V. Jones, J. Chem. Phys., 18, 1268 (1950).(4) D. J. Meschi and R. J. Myers, J. Am. Cham. Sac., 78, 6220 (1956); J.
Mol. Spectrosc., 3, 405 (1959).(5) U. Biukis and R. J. Myers, J. Phys. C h e m ., 69, 1154 (1965).(6) A. G. Hopkins, S.-Y. Tang, and C. W. Brown, J. Am. Chem. Soc., 95,
3486(1971).(7) A. G. Hopkins and C. W. Brown, J. Chem. Phys., 62, 25" 1 (1975).(8) R. E. Barletta and C. W. Brown, J. Phys. Chem., 75, 4059 (1971).(S) A. G. Hopkins and C. W. Brown, J. Chem. Phys., 62, 1598 (1975).
(10) E. K. Plyler, A. Danti, L. R. Blaine, and E. D. Tidwell. J. Res. Natl. Bur. Stand., 64, 1 (1960).
(11) Cryotip cell, Model AC-2L-110, Air Products and Chemicals, Inc.(12) J. W. Hastle, R. Hauge, and J. L Margrave, J. Inorg. Nuci Chem., 31,
281 (1969).(13) D. E. Milligan and M. E. Jacox, J. Chem. Phys., 55, 1003 (1971).(14) J. H. Schachtschneider, “Vibrational Analysis of Polyatomic Molecules
VI", Shell Development Co., Emeryville, Calif., 1964.(15) E. Tlemann, J. Hoeft, F. J. Lovas, and D. R. Johnson, J. Chem. Phys.,
60, 5000 (1974).
The Journal of Physical Chemistry, Vol. 79, No. 17, 1975
1852 J. H. Roberts and 8 . de Bettignies
Raman Spectroscopic Studies of Binary Systems. II. Effect of Temperature upon Molecular Association in the Ammonia-Hexadeuteriobenzene System
John H. R o b e rts *
Laboratoire des métaux alcalins dans l ’ammoniac liquide, Equipe de recherche associée au C.N.R.S, Faculté libre des Sciences et Hautes Etudes Industrielles, 59 046 Lille, France
and Bertin de Bettignies
Service de Spectrochimie Infrarouge et Raman C.N.R.S. Section de Lille, Université des Sciences et Techniques de Lille B.P. 36, 59 650 Villeneuve d'Ascq, France (Received January 6, 1975)
The Raman spectra of some binary solutions of ammonia and hexadeuteriobenzene have been measured as a function of temperature. It appears that, when the temperature decreases, molecular association increases between ammonia molecules. Further a liquid-liquid phase separation has been observed. In the lower benzene-rich phase, when benzene solidifies as a glassy solid, the spectrum of the N-H stretching region becomes similar to the spectrum of pure liquid ammonia. At temperatures lower than 200°K the observed spectrum is like that of pure solid ammonia.
Spectroscopic studies of molecular association in hydrogen-bonded solvents have shown that similar changes in the degree of association, whether caused by the addition of an electrolyte or simply by a change in temperature, modify the solvent spectra.1’2 Near-infrared3 and Raman4 studies of association in liquid ammonia have also emphasized the necessity of consistency in the interpretation of temperature and concentration studies. The previous paper in this series examined changes in the state of molecular association of ammonia molecules in the ammonia-hexadeut- eriobenzene system as a function of composition.5 In this study we have examined the system as a function of temperature, and it will be shown that the results of the two studies support a unified interpretation for the aggregation phenomena exhibited by this system. Aggregation phenomena have been studied in the case of metal-ammonia binary system above and below the critical temperature of liquid-liquid demixtion.6-10 It would be fruitful to compare the respective interactions of ammonia, which is a polar liquid, with benzene, a nonpolar liquid, or with solvated alkali metals.
Although ammonia and hexadeuteriobenzene (or benzene) are miscible at room temperature, we have found that at some lower temperature, which depends upon the composition of the sample, a liquid-liquid phase separation occurs. At a slightly lower temperature, benzene starts solidifying from the lower benzene-rich phase. It is in equilibrium with an ammonia-rich phase which seems to be partly included in the solid and which remains liquid until considerably lower temperatures. The Raman spectra in the N-H stretching region are drastically modified when the benzene is solidified. These results will be discussed in terms of the state of aggregation of the ammonia molecules in the homogeneous liquid solutions and in the liquid in equilibrium with solid benzene.
Experimental SectionAll the spectra reported here were recorded from the
* Address correspondence to this author at the Department of Chemistry, University of Texas at Austin, Austin, Tex. 78712.
lower part of the samples (benzene-rich phase). The details of sample preparation have been described previously, as have the spectrometer, laser, and data accumulation system.5 For this study a cryostat was used for temperatures below ambient and a furnace was used for temperatures above ambient.11 With this system, the temperature can be followed continuously. Minimal variation of temperature occurs during the recording of a spectrum since the rapid scanning monochromator requires about 10 sec, at low speed, to record the spectrum in the N-H stretching region (3100-3450 cm-1). For spectra requiring multiple scans with data accumulation no significant temperature variation was noticed and the reported temperatures are accurate to ± 1° with variations during the experiments less than 0.5°.
ResultsFigure 1 shows the evolution of the spectrum for a sam
ple of mole ratio 1 NH3:1.3 C De over the temperature range 268-198°K. In Figure 2, a set of spectra is shown for a sample with a mole ratio 1.5 NH3:1 C6D6 over the temperature range 338-200° K. It must be kept in mind that hexadeuteriobenzene freezes at 278°K and liquid ammonia at 195°K and the various mixtures appear to be solid at different temperatures between these two extremes. Three characteristics types of spectra have been obtained which correspond to the physical state of the sample. At higher temperatures, the spectra are characteristic of liquid mixtures, and at the lowest temperature, of ammonia in the solid state. Spectra in the intermediate temperature region (b, c, and d in Figure 1 and e, f, and g in Figure 2) differ considerably from both the spectra for the liquid solutions and the lowest temperature solids. The temperature range of this intermediate region varies with the composition of the sample, but in all cases studied the lower limit is about 195°K. In this intermediate temperature region, the samples appear to be white glassy solids. In experiments in which the temperature of the samples was lowered gradually, a liquid-liquid phase separation occurred. As the temperature was lowered further, benzene solidified from the benzene-rich phase into a glassy white solid. Other experi-
The Journal of Physical Chemistry, Vol. 79, No. 17, 1975

Raman Spectroscopic Studies of Binary Systems 1853
Figure 1. Experimental spectra of the N -H stretching region for a sample of mole ratio 1 NH3:1.3 C 6D 6: (a) liquid 268°K; (b-d) intermediate range (b) 263°K, (c) 225°K, (d) 206°K; (e) solid 198°K. The 3213- and 3301-cm -1 lines result from the Fermi resonance between the p-[ and 2vt vibrations. Decomposition of the envelop by resol program5 yields v' at 3260 cm -1 .
Figure 2. Experimental spectra of the N -H stretching region for a sample of mole ratio 1.5 NH3:1 C 3D 6 liquid (a) 338°K, (b) 297°K, (c) 273°K, (d) 251°K intermediate state (e) 244°K, (f) 228°K, (g) 205°K; solid (h) 200°K. The assignments are the same as in Figure 1.
merits are now being planned to obtain Raman spectra of both phases in the liquid-liquid and liquid-solid equilibrium in an effort to gain more insight into the aggregation processes involved in the phase separation. Figure 3 shows the experimental frequency shifts of i>\ of ammonia for sev-
3300 -
3280 •
Î* 3260
• •• •«# © O•S
------ 1-------- 1--------1-------- 1_____ i_____298 273 248 223 198
T e m p e r a t u r e ( ° K )
Figure 3. Experimental frequency shifts of 3301-cm - 1 band of ammonia as a function of temperature: (O) 1 NH3:1.3 C 6D 6; (• ) 1.5 NH3:1 C 6D6; ( + ) 3 N H 3:1 C eD 6.
eral samples as a function of temperature. The assignments used here are in agreement with the majority of other workers in this field, as previously discussed.5 The question of assignment for v\ and 2o4, the bands in Fermi resonance, as a function of temperature will be considered in detail in the Discussion section.
For the sample with mole ratio 1.5 NH3T CeDg the halfwidths increase from 18 to 48 cm-1 for the 3213-cm-1 band and from 24 to 42 cm-1 for the 3301-cm_1 band, as the temperature decrease in relative intensity of both v', the symmetric stretch of associated ammonia molecules with Cs symmetry, and 03 the asymmetric stretch of ammonia as the temperature of the liquid solutions is lowered. Spectra in the N-H stretching region of all the low temperature solid samples below 195° K were identical with that of solid ammonia.
D iscussionIn spectroscopic studies of hydrogen-bonded liquid sys
tems it has often been shown that the changes in the X-H stretching region of the spectrum can be attributed to changes in the degree of hydrogen bonding.12’13 If a mixture model for a liquid system is valid the changes in the spectrum should be consistent whether the perturbation to the hydrogen-bonded structure is caused by the addition of an electrolyte, dilution with a strongly interacting liquid, dilution with a noninteracting liquid, or with changes in temperature. The expectation that the extent of hydrogen bonding in liquid ammonia should increase as the temperature is lowered is borne out by the results of this study. In Figures 1 and 2 it is clear that v increases in relative intensity as the temperature decreases, and, thus, it is evident that unassociated ammonia molecules with C u symmetry are being converted into associated ammonia molecules with Cs symmetry. The increase in the relative intensity of 1*3, Figures 1 and 2, as the temperature decreases is in agreement with this interpretation as are the frequency shifts of the N-H stretching modes to lower frequency and the increase in the half-widths of v\ and 2<q Figure 3.
The previous paper in this series examined the behavior of the ammonia-hexadeuteriobenzene system as a function of concentration.5 The results of this temperature study are in agreement with the concentration study, i.e., similar changes in the Raman spectrum are observed when the ammonia structure is subjected to stresses, arising from differ
The Journal of Physical Chemistry, Vol. 79, No. 17, 1975

18 5 4 J. H. Roberts and B. de Bettignies
ent sources, which are relieved by similar changes in the extent of hydrogen bonding.
Another phenomenon which affects the Raman spectrum in the N-H stretching region is the Fermi resonance interaction between v\ and 2j>4 of ammonia molecules with C3u symmetry. Fermi resonance can occur in a molecule when an overtone or a combination and a fundamental have nearly the same frequency and are both of the same symmetry species.14 There is then a mixing of the two states and the overtone, which would normally have negligible intensity in the Raman spectrum, is said to borrow intensity from the fundamental so that the intensities of the two bands in the spectrum are more nearly equal. Also, the observed bands are shifted, one to higher frequency and one to lower frequency, from the frequency where the accidental degeneracy occurs.14 The separation between the two bands, and thus their positions, varies as the separation of the unperturbed levels varies. Since there is a mixing of the two states the experimentally observed bands cannot rigorously be labeled vi and 2 vA since both of the observed bands are a mixture of the two vibrations. In a first approximation, it can be said that the more intense of the two bands in Fermi resonance is composed to a greater extent of in, since the fundamental supplies the intensity observed in both bands. In the case of liquid ammonia there is a reversal in position of the more intense band as the temperature is lowered, and so assignments of the two bands based upon their preponderant character should be reversed for high and low temperature.15
When the symmetry of the ammonia molecule is lowered from C3u to Cs, as is the case for ammonia molecules with an N-H group involved in a hydrogen bond, the degeneracy of v\ is lifted and the energy levels of the two bands are separated considerably. Although these bands have not yet been observed in the Raman spectra of liquid ammonia, probably due to a much reduced intensity in comparison to the already weak ¡>4 of ammonia with C3v symmetry, their separation may be such that Fermi resonance is no longer possible. A calculation of the frequency expected for iq in the absence of any perturbation yields 3260 cm-1.15 This result and the observation of the polarized band at 3260 cm-1, which is due to associated ammonia molecules, suggest that in ammonia molecules with Cs symmetry Fermi resonance may not occur.
Raman spectra for ammonia molecules, such as those reported here, Figure 1 and 2, for the intermediate temperature range are characterized by two features. The halfwidths of the bands are much greater than for the homogeneous solutions at higher temperature and when the tem
perature is lowered they tend to the characteristic values of pure liquid ammonia. The relative intensity of v3 is much greater than in the homogeneous solution and also greater than in pure liquid ammonia at the same temperature. The later difference seems to decrease with decreasing temperature. All these properties are well interpreted if, in the intermediate range of temperature, a very dilute solution of benzene in ammonia is in equilibrium with solid benzene. The fact that spectra for all samples below 195°K are identical with pure solid ammonia strongly suggests that these solid mixtures must be viewed as being dispersions of aggregates of solid ammonia in a benzene matrix.
It may be asked if the intermediate range spectra might be indicative of the formation of weak hydrogen-bonded complexes. The phase separation and the close resem- blence of the spectra below 195°K to that of pure solid ammonia would seem to rule out complex formation, and preliminary studies on the ammonia-carbon tetrachloride system have shown that similar phenomena occur in this system.16 Further work now in progress on these systems may yield a better understanding of the aggregation process that occurs immediately before the liquid-liquid phase separation and of the phase diagram of the system.
Acknowledgments. We wish to thank Professor G. Lep- outre for his helpful discussion, and the National Science Foundation and The Centre National de la Recherche Scientifique for the Exchange of Scientists grant to J.H.R.
References and Notes(1) J. D. Worley and I. M. Klotz, J. Chem. Phys., 45, 2868 (1966).(2) G. E. Walrafen, J. Chem. Phys., 52, 4176 (1970).(3) J. H. Roberts and J. J. Lagowski in “ Electrons in Fluids, the Nature of
Metal-Ammonia Solutions” , J. Jortner and N. R. Kestner Ed., Springer- Verlag, Berlin, 1973.
(4) A. T. Lemley, J. H. Roberts, K. R. Plowman, and J. J. Lagowski, J. Phys. Chem., 77, 2185 (1973).
(5) J. H. Roberts and B. de Bettignies, J. Phys. Chem., 78, 2106 (1974).(6) G. Lepoutre and J. P. Lelieur in “ Metal-Ammonia Solutions, Colloque
Weyl II” , J. J. Lagowski and M. J. Sienko, Ed., Butterworths, London, 1970.
(7) G. Lepoutre in ref 3. p 181.(8) M. J. Sienko and P. Chieux in ref 6, p 339.(9) P. Chieux, Phys. Lett. A, 48, 493 (1974).
(10) B. L. Smith and W. H. Koehler in ref 3, p 145; M. G. De Backer, P. F. Rusch, B. De Bettignies, and G. Lepoutre, ref 3, p 161; P. F. Rusch and J. J. Lagowski, ref 3, p 169.
(11) B. De Bettignies, These 3eme Cycle, Lille, 1971.(12) G. C. Pimentel and A. L. Me. Clellan, “ The Hydrogen Bond” , W. H. Free
man, San Francisco, Calif., 1960.(13) “ Hydrogen-Bonded Solvent Systems", A. K. Covington and P. Jones,
Ed., Taylor and Francis, London, 1968.(14) G. Herzberg, “ Molecular Spectra and Molecular Structure” , Vol. II, Van
Nostrand, Princeton. N.J., 1962.(15) B. de Bettignies and F. Wallart, C. R. Acad. Sci., Paris, 271, 640 (1970).(16) J. H. Roberts and B. de Bettignies, unpublished results.
The Journal o f Physical Chemistry, Vol. 79, No. 17, 1975

ESR Spectra of P, As, and Sb Fluorohydride Radicals 1855
Electron Spin Resonance Spectra of Certain Fluorohydride Radicals of Phosphorus, Arsenic, and Antimony13
A. J. Colussi,1b J. R. Morton,* and K. F. Preston
Division o f Chemistry, National Research Council o f Canada, Ottawa K 1A 0R9, Canada (Received December 16, 1974)
Publication costs assisted by the National Research Council o f Canada
Isotropic ESR spectra of a series of phosphorus fluorohydride radicals PH„F4_„, where n = 0-4, have been observed in 7 -irradiated solid solutions of PF3, PF2H, and PH3 in neopentane or SF6. The spectra of AsH3F and SbH3F are also reported. The hyperfine interactions of these radicals are consistent with a totally symmetric semioccupied orbital in a framework possessing either C2,, or C, symmetry. The relative merits of Hückel and INDO molecular orbital calculations in predicting the various observed trends are discussed.
IntroductionThe existence of free radicals derived from tetravalent
phosphorus (phosphoranyl radicals) is now well established.2-7 These radicals have attracted considerable interest among both ESR spectroscopists and theoreticians because of their unusual structure. Thus, the spectra of both PF44 and PH45 show, in addition to a large 31P hyperfine interaction, interactions with two pairs of equivalent ligand nuclei, indicating trigonal bipyramidal geometries for both species. Since all phosphoranyl radicals (and a number of isoelectronic radicals) may be regarded as derivatives of one or other of these species, there is good reason to believe that all radicals of tetracoordinated phosphorus have trigonal bipyramidal structures. This is borne out by ESR hyperfine interaction measurements for radicals such as ROPH3,2a PC14,6 P0C13- ,7 and SOF3.8
While there remains little doubt concerning the molecular geometry of these radicals, their electronic structure is still a subject of debate. Higuchi, in his theoretical study9 of PF4, was able to account for the experimental data with either the valence-bond or molecular orbital approach by assuming phosphorus 3d orbital participation. Hiickel and INDO MO calculations for PF4 and PH4, on the other hand, reproduce the experimental hyperfine measurements with a minimal basis set of s and p orbitals only.3 Furthermore, a number of additional features brought out by recent studies of derivatives of PH42a and PF43-7 are more readily explained in terms of MO theory. For example, the greater stability of apically substituted derivatives of PH4 and PF4 is consistent with the charge-density distributions predicted by INDO MO calculations. Moreover, the effect of increasing electronegativity of RO in ROPF3 radicals3 upon the various hyperfine interactions is readily accounted for in terms of a semioccupied orbital which is an antibonding, three-center (Rundle10) MO involving the phosphorus atom and the two apical ligands.
In this paper we present hyperfine interaction measurements for some simple phosphoranyl radicals PHnF4_„ (where n = 0-4) and for the related species AsH3F and SbH3F. The data show trends consistent with a simple MO description of the semioccupied orbital, in which d orbital participation is ignored.E xperim ental Section
Samples of SFg, neopentane, or neopentane-di2 were
doped with approximately 5% PF3, PH3, or PF2H by mixing appropriate proportions of the two gases, followed by condensation of the mixture into an ESR sample tube. The samples were irradiated at —196° with 7 rays from a 9000- Ci fi0Co source, and their ESR spectra examined at —170° with a Varian E-12 spectrometer.3
PF3 and SFg were obtained from Ozark-Mahoning Inc., Tulsa, Okla., the PH3 was a gift from the Defence Research Board Laboratories, Ottawa; AsH3 was obtained from Ma- theson Gas Products Inc., East Rutherford, N.J.; PF2H was prepared by the method of Rudolph and Schiller;11 a sample of antimony metal enriched to 99% in the isotope 123Sb was obtained from Oak Ridge National Laboratory, Oak Ridge, Tenn., and was used to prepare 123SbH3. --
R esu lts
A. Phosphorus-Centered Radicals. An irradiated sample of SFfi containing a few percent PF3 exhibits the powerful ESR spectrum attributed by Fessenden and Schuler4 to the radical PF4. The g factor and hyperfine data (Table I) were obtained by exact diagonalization of the appropriate spin matrix under the assumption that all hyperfine interactions had the same (positive) sign. As Fessenden has shown,13 this combination leads to a much smaller standard deviation in the spectral parameters than any other. Our data for PF4-SF6 are in virtually exact agreement with those of Fessenden,13 but differ substantially from those of Nelson, Jackel, and Gordy.14 These authors generated an anisotropic spectrum of PF4 in a PF3 matrix at 4°K. The discrepancy between their data and ours could be a matrix or a temperature effect, but is probably an artifact resulting from the inherent difficulties of interpreting anisotropic spectra.
Irradiation of a matrix consisting of 5% PH3 in neopentane enabled us to detect the spectrum of PH4 at —170°.5 Its four protons are equivalent in pairs—apical and equatorial. Exact analyses of the data show unequivocally that the signs of the 31P hyperfine interaction and that of the two apical protons are the same (positive). The results of these calculations appear in Table I.
In addition to the two prototype radicals PF4 and PH4 we were also able to generate and detect (Table I) certain other radicals in the series PH„F4_„. For example, after irradiation of a matrix of PH3 in SF6 we detected a spectrum attributable to PH3F. A very interesting result was the de-
The Journal of Physical Chemistry, Vol. 79, No. 17, 1975

18 56 A. J. Colussi, J. R. Morton, and K. F. Preston
TABLE I: ESR D ataa for Certain PH„F4 Radicals
R adical g value31P h fs ,6
GA pical h fs ,6
GEquatorial
hfs, G
P Fi 2.0009 1322.0 293.5 59.5P F 3Heqc 2.0016 1030.8 225.2(F) 38.5 (F)
PFiHe, 2.0020 1027.3 226.8 (F)
38.5 (H) 5.9 (D)
35.0 (F)
PH:iF ap 2.0032 721.3 347.2 (F)
35.0 (H) 5.1 (D)
12.6 (H)
P H ,c 2.0030 519.3130.1 (H) 198.7 (H) 6.0 (H)
30.2 (D)a Errors are ±2 in last significant figure given.
Not r e s (D) b Shown to have
the same sign by best-fit procedures.13 c In neopentane; others inS F 6.
pf4
Figure 1. The M(/31) = 0.5 transition of PF3Heq observed in 5 % PF2H in S F 6 at approximately 9.1 GHz. The hyperfine interactions of the 1H and 19F equatorial ligands are accidentally equal in this radical.
tection in both PF3-neopentane and PF2H-SF6 of a spectrum which appeared to be that of PF2H2 (i.e., the hyperfine pattern indicated two pairs of apparently equivalent ligands (Figure 1)). However, deuteration studies with both PF3-neopentane-di2 and PF2D-SFg revealed that the radical possessed only one equatorial proton, whose hyperfine interaction happened to be the same as that of the equatorial fluorine nucleus. The species was thus identified as PF3Heq; its parameters in both neopentane and SF3 are given in Table I. Unfortunately, we have not been able as yet to obtain an ESR spectrum of the radical PF2H2.
B. Radicals AsH3F and SbH3F. Irradiation of a matrix consisting of ~5% AsH3 in SFg at —196° resulted in the formation of the radical AsH3F. Its ESR spectrum at —170° consisted of 16 7.7-G, 1:2:1 triplets, of which four (the M(/a.s) = —0.5 transition) were obscured by the radicals SF5 and SFr~. The spectral parameters (g, hyperfine interactions) were determined by computerized diagonalization of the appropriate spin matrix, a process which clearly demonstrated that the signs of the 75As, 19F, and apical proton hyperfine interactions were all positive. Table II shows the average values of several independent determinations of these parameters.
Irradiation of an SFg matrix containing dissolved SbH3 enabled us to detect the ESR spectrum of SbH;)F at —170°. In this case, however, analysis of the spectrum was complicated by the following factors: (a) the existence of two mag-
TABLE II: ESR Param eters of P H 3F, A sH 3F, and SbH3F R adicals“
R adical g value
C entral atom hfs, G
A pical h fs , G
Equatorial hfs, G
3tPH3F 2.0032 721.3 347.2 (F) 130.1 (H)
12.6 (H)
75AsH3F 2.0093 860.7 300.7 (F) 167.5 (H;
7.7 (H)
123SbH3F 2.0158 1048.9 233.8 (F) 178.7 (H)
Not r e s (H)
“ Errors are ±2 in last significant figure given.
6.2 6.4 6.6 kG
Figure 2. The M(/,23) = — 3.5 transition of SbH3F enriched to 9 9 % in the isotope 123Sb(/ = 3.5).
netic isotopes of antimony (121Sb, 57.2-5%, I = 2.5 and 12 !Sb, 42.75%, / = 3.5) and (b) the anticipation of exceedingly large hyperfine interactions for both isotopes. The combined effect of these two factors led us to anticipate that for m SbH3F, only the M (Il2\) = -2.5 transition would be accessible but that for 123SbH3F both the M (/i23) = —3.5 and —2.5 transitions would be accessible. We therefore prepared SbH3 from a sample of antimony enriched to 99% in the isotope 123Sb. The M (/i23) = —3.5 (Figure 2) transition was analyzed to yield for the apical 19F and 'H hyperfine interactions the values 234 and 178 G, respectively. The equation
a = (2H - 2)/(27 + 1 - H) (1)enables one to calculate the hyperfine interaction (a) of a nucleus (spin I) from the transition at highest field (H), if both a and H are expressed in units of v/g&: where v is the microwave frequency and /3 = 1.399611 MHz/G. At 9146 MHz, this transition occurred at 6402 G, yielding (assuming g ~ 2.0000 in eq 1) a provisional value for a123 of 1038G. Unfortunately, the M (/123) = -2.5 transition was obscured by the powerful spectra of SF5 and SF6~ in the g = 2 region, and so accurate values of the g factor and hence the antimony hyperfine interactions could only be obtained
The Journal of Physical Chemistry, Voi. 79, No. 17, 1975

ESR Spectra of P, As, and Sb Fluorohydride Radicals 1857
with the aid of the “forbidden” transition 14, —4) |3, —3)(low-field, |-F, M(F)) quantum numbers) of 123SbH3F. This transition, for which a = (2H + 2)/(8 + H) in units of v/gfi, occurred at 1138 G and, combined with the M il) = —3.5 transition, yielded g = 2.0158, aias = 1049 G. Using this g value we calculated a value for a m of 1929 G from the M{Ii-2i ) = —2.5 transition observed at 6961 G in natural SbH3. The ratio of the observed hyperfine interactions, a i‘2i/n i23 = 1.839, was in close agreement with the ratio of the magnetogyric ratios (1.847).
The proton and fluoron hyperfine interactions in SbH3F were assigned (Table II) on the basis of the line-width variation apparent (Figure 2) in the spectrum. The larger hyperfine interaction is clearly associated with considerable anisotropy, and was therefore assigned to the fluorine nucleus. Assuming this interaction to be positive (as in AsH3F), a greater (or lesser) width is expected for the low- field (M/(Fap) = 0.5) pair of lines if the inner product of the anisotropic g and 19F hyperfine tensors is positive (or negative).15 This product is likely to be larger for the apical fluorine atom than for the apical proton, because of the expected large contribution of F(2p) orbitals to the semioccu- pied orbital.
D iscussionIt has been well established by ESR spectroscopy that all
of the radicals whose spectra we shall be discussing possess ground states which are totally symmetric in either C2,, or C, symmetry. In the former case the four ligands are equivalent in pairs, the pair subtending the smaller angle at the central atom being called the equatorial ligands, the other pair being called apical. It follows from the totally symmetric ground-state of these radicals that the orbital occupied by the unpaired electron can possess considerable central- atom ns character, a fact which accounts for the dominant feature of all the spectra: the exceedingly large central- atom hyperfine interaction. In addition, of course, the semioccupied orbital contains contributions from various ligand atomic orbitals (ns, or appropriate combinations of np). The data in Table I demonstrate that successive replacement of F atoms by H atoms in PF4 results in a monotonic decrease in the 31P hyperfine interaction, a trend consistent with the antibonding nature of the half-filled orbital in these radicals. The pronounced effect of equatorial substitution, however, is somewhat surprising since it presumably implies that the description of the semioccupied orbital as a Rundle orbital3'7 is not entirely adequate.
We have suggested elsewhere3 that in the radicals ROSF4 and ROPF3 the contribution to the semioccupied orbital by the fluorine atom trans to RO consisted primarily of F(2p) atomic orbitals. The total contribution of F(2s) including polarization effects was demonstrably small. Increasing the electronegativity in R caused the trans 19F hyperfine interaction to decrease, an effect which we tentatively ascribed to a decrease in the polarizibility factor Q f m f (he., operating on the F(2p) contribution) rather than due to a decrease in any direct F(2s) participation. In the present case, however, very different conditions obtain: the apical H(ls) contribution to the semioccupied orbital in PH4 is approximately 40%, and there can be no contribution from p orbitals on hydrogen. Therefore, the decrease in the trans proton hyperfine interaction on substitution of a more electronegative fluorine atom or tert-butoxy2a ligand for an apical proton can only be due to a decrease in the contribution of the apical proton Is orbital to the
semioccupied orbital. Such a direct effect may also be operative in ROSF4 and ROPF3, although it is impossible to determine the relative importance of the two mechanisms.
The 75As hyperfine interaction in AsH3F can be compared with those of certain other arsenic-centered radicals. The general trends discussed above for phosphoranyl radicals are apparent. The largest ,5As hyperfine interaction occurs for the radical AsF4 (1576 G16), and the smallest for As(C6H5)4 (541 G17). The effect of an electronegative ligand in the apical position is apparent from the value for As(CeH5)3OC(CH3)3 (666 G18); two apical feri-butoxy ligands increase the 75As interaction still further, to 792 G.18
We turn now to a brief discussion of the effects on the spin-density distribution of a change in the central-atom electronegativity along a series such as PH3F, AsH3F, and SbH3F (the radicals PF4 and AsF4 have been discussed elsewhere16). For this purpose we need a reliable factor to relate the central-atom hyperfine interaction to its valence s spin density. For want of a better method, and with certain reservations,19 we identify unit valence s spin density on the central atom (M) with the factor ( 8 i r / 3 ) 7 e7M >/'2 (0 ) as calculated from Froese’s wave function.20 For the nuclei 31P(3s), 75As(4s), and 123Sb(5s) the values 3638, 3393, and 3266 G, respectively, were obtained. From these figures and the corresponding hyperfine interactions (Table II) the contribution of central-atom ns character to the semioccupied orbital may be calculated to be approximately 0.32 in the case of SbH3F, 0.25 for AsH3F, and 0.20 for PH3F. This decrease in central-atom s character with increasing electronegativity at that atom is due to the antibonding nature of the semioccupied orbital. As is also evident from Table II, the spin released from the central atom upon increasing its electronegativity reappears as increasing F(2pff) or F(2s) contributions to the semioccupied orbital. This effect (and the concomitant reduction in the Hap hyperfine interaction) is probably due to the weakly Hap—F bonding nature of the semioccupied orbital.
M olecular O rbital C alcu lations
We have carried out molecular orbital calculations on the phosphorus-centered radicals listed in Table I. The INDO I iK = 1) parameterization,21 with a minimal basis set of valence s and p atomic orbitals, was used. As has been mentioned elsewhere,3 the minimum energy configuration of both PH4 and PF4 is predicted by the INDO I method to have neither D^h (square planar) nor Td (tetrahedral), but C2U symmetry. This, in itself, is gratifying agreement with the experimental observations. The INDO method furthermore predicts that the observed radicals PF3Heq and PH3Fap are more stable by several kilocalories per mole than their conformers PF3Hap and PH3Fap, respectively. On the other hand, however, the INDO approximation reproduces only the grossest features of the spin-density distributions. For the purposes of comparing atomic spin densities with experimental hyperfine interactions we use as conversion factors the parameter ( 8 i r / 3 ) 7 e 7 M ' i ' n s 2 ( 0 ) , which may be calculated from Froese’s wave function20 to be 3 6 3 8
G for 31P and 1 7 , 1 0 0 G for 19F. For protons we use the factor 5 0 7 G. In Table III the calculated 31P, 19F, and !H hyperfine interactions are given for the radicals PF4, PF3Heq, PH3Fap, and PH4.
It will be seen that the experimental trend in the 31P hyperfine interactions down the series of radicals is not adequately reproduced by the INDO method. However, much better overall agreement with experiment was obtained not
The Journal of Physical Chemistry, Vol. 79, No. 17. 1975

1858 A. J. Colussi, J. R. Morton, and K. F. Preston
TABLE III: Calculated Values of 31P, 19F, and 1H Hyperfine Interactions“ in Certain Phosphorus Fluorohydrides
Equatorial31P Apical ligands ligands
Radical Hückel INDO HUckel INDO HUckel INDO
PF4 1464 569 243 71 41 4PF3Heq 1300 609 232 79 33 (F) 5
30 (H) 11PH3Fap 1045 506 438 (F) 201 26 24
32 (H) 31ph 4 930 674 155 245 2 2
“ Values (gauss) obtained by multiplying atomic spin densitiesby 507 G PH) , 17,100 G (19F), or 3638 G (31P).
only for 31P, but also for 'H and 19F interactions by using the Hiickel-level spin densities corresponding to the INDO-optimized geometries.
Note Added in Proof: Very recently K. Sogabe (J. Sci. Hiroshima Univ., Ser. A, 39, 225 (1975)) reported an intense spectrum of PF3Hap, detected in 7 -irradiated PF2H-SF6 mixtures. In spite of many attempts to generate this spectrum under a variety of experimental conditions, we have been unable to do so. We wish to emphasize, however, that NMR analyses obtained both before and after 7
irradiation clearly indicated that our samples of PF2H in SFe contained PF2H and no detectable amounts of other phosphorus fluorides.
Acknowledgments. We thank Dr. K. Sogabe for a preprint of the above-mentioned article and Dr. S. K. Brown- stein for NMR spectra.
References and Notes(1) (a) NRCC No. 14768. (b) NRCC Postdoctorate Fellow 1974.(2) (a) P. J. Krusic, W. Mahler, and J. K. Kochi, J. Am. Chem. Soc., 94,
6033 (1972); (b) D. Griller and B. P. Roberts, J. Chem. Soc., Perkin Trans. 2, 1339 (1973).
(3) A. J. Colussi, J. R. Morton, and K. F. Preston, J. Phys. Chem., 79, 651 (1975).
(4) R. W. Fessenden and R. H. Schuler, J. Chem. Phys., 45, 1845 (1966).(5) A. J. Colussi, J. R. Morton, and K, F. Preston, J. Chem. Phys., 62, 2004
(1975).(6) G. F. Kokoszka and F. E. Brinkman, J. Am. Chem. Soc., 92, 1199
(1970).(7) T. Gillbro and F. Williams, J. Am. Chem. Soc., 96, 5032 (1974).(8) J. R. Morton and K. F. Preston, J. Chem. Phys., 58, 2657 (1973).(9) J. Higuchi, J. Chem. Phys., 50, 1001 (1969).
(10) R. E. Rundle, Sun. Prog. Chem., 1, 81 (1963).(11) R. W. Rudolph and H. W. Schiller, J. Am. Chem. Soc., 90, 3581 (1968).(12) W. L. Jolly and J. E. Drake, Inorg. Synth., 7, 34 (1963).(13) R. W. Fessenden, J. Magn. Resonance, 1, 277 (1969).(14) W. Nelson, G. Jackel, and W. Gordy, J. Chem. Phys., 72, 4572 (1970).(15) A. Fludson and G. R. Luckhurst, Chem. Rev., 69, 191 (1969).(16) A. J. Colussi, J. R. Morion, and K. F. Preston, Chem. Phys. Lett., 30,
317 (1975).(17) S. A. Fieldhouse, FI. C. Starkie, and M. C. R. Symons, Chem Phys
Lett., 23, 508(1973).(18) E. Furimsky, J. A. Floward, and J. R. Morton, J. Am. Chem. Soc 95,
6574 11973).(19) J. FI. Mackey and D. E. Wood, J. Chem. Phys., 52, 4914 (1970).(20) C. Froese, J. Chem. Phys., 45, 1417 (1966).(21) A. R. Gregory, J. Chem. Phys., 60, 3713 (1974).
The Journal o f Physical Chemistry, Vol. 79, No. 17, 1975

Radical Pairs in Irradiated Oriented Polyethylene 1859
Electron Spin Resonance Study on the Structure of Radical Pairs in Irradiated Oriented Polyethylene
Takashi Fujimura* and Naoyukf Tamura
Takasaki Radiation Chemistry Research Establishment, Japan Atomic Energy Research Institute, Takasaki, Gunma-ken, Japan (Received January 10, 1975)
Publication costs assisted by the Japan Atomic Energy Research Institute
A well-resolved AMs = 1 ESR spectrum due to radical pairs was observed in oriented polyethylene irradiated at 77°K; this spectrum is ascribed to the pair of alkyl radicals. The change of the fine splitting with the angle between the magnetic field and the draw direction reveals that the radical pairs produced are intrachain type rather than interchain type. When the magnetic field is parallel to the chain axis, the maximum fine splitting, 371 G, is obtained. This splitting is due to interactions between members of the radical pair; interspin distance is calculated to be 5.31 A. The concentration of the paired radicals giving the observed AMS = 1 spectrum is about 0.3% of that of the total radicals. On warming the sample above 77°K, the intensity of the AMa = 1 spectrum due to the radical pair decreases faster than that of the AMS = 2 spectrum. Some evidence was also found for the existence of other types of radical pairs in irradiated polyethylene.
IntroductionThe pairwise trapping of radicals has been reported in
many organic substances irradiated at low temperatures by detecting the electron spin resonance (ESR) signals due to the AM8 = 1 transition,1’2 and interest has greatly increased in the study of their structure and correlation with radiation chemical reactions.2
The pairwise trapping of radicals in irradiated polymers has been found by detecting the ESR signals of AMS = 2.3’4 Iwasaki, Ichikawa, and Ohmori4 obtained the AMs = 2 spectra due to radical pairs in irradiated polyethylene and other polymers and found the existence of radical pairs in the polymers irradiated at 77°K. The AMS = 1 spectrum of radical pairs in polymers has not been clearly obtained. The failure to observe the AMS = 1 spectrum has been attributed to the presumption that the paired radicals have not a specific distance in the case of polymers because of the complicated structure of polymers.4 It is difficult, however, to obtain reliable information about the structure and behavior of radical pairs from the AMS = 2 spectrum only.
We considered that the AMS = 1 spectrum of radical pairs should be clearly observed in the polymeric system, if some regularity is given in the system. On the basis of this idea, we have previously obtained the AMs = 1 spectrum with hyperfine structure due to radical pairs trapped in a single-crystal mat of polyethylene irradiated at 77°K.5 Furthermore, using an oriented polyethylene, we have succeeded in obtaining the well-resolved AMs = 1 spectrum due to radical pairs.6 Here, details of the structure and of the thermal decay of radical pairs in irradiated oriented polyethylene will be reported.
Experim ental SectionSamples used are high-density polyethylene, Sholex
6050, purified with boiling xylene. A sheet of thickness 0.5 mm was formed by compression molding at 180°, quenched in ice water, and then cut into strips 3 cm wide. The strips were drawn at 60°, until an elongation of about 1000% was obtained. Good orientation of the c axis in this sample was
obtained; the width at half-maximum of the angular distribution as measured from the [002] X-ray reflection is within 7°.
Irradiations were performed in vacuo at 77°K with a Cockcroft-Walton type of electron beam which provides a dosage of 15 Mrads. The energy of the electrons was 2 MeV and the current 500 ft A; the dose rate was about 0.16 Mrads/sec. Some experiments were carried out with 60Co y rays to a dosage of 15 Mrads; the dose rate was 0.7 Mrads/ hr. The spurious ESR signal from the irradiated quartz ampoule was eliminated by heating the ampoule while the sample was cooled in liquid nitrogen at the opposite end of the ampoule. ESR measurements were made at 77°K with Varian V-4502 X-band spectrometer. Some measurements were made with Varian E-4 spectrometer.
R esu lts
The AMS = 1 spectrum obtained with drawn polyethylene irradiated in vacuo at 77°K with electrons is shown in Figure 1, when the magnetic field is parallel to the draw direction or the chain axis of polyethylene. Well-resolved multiplets are obviously observed on both sides of the main sextet spectrum; the sextet comes from the isolated alkyl radicals -CH2-CH-CH2-. The outer multiplets consist of eleven lines as estimated later. The separation between the two eleven lines is 371 G and the hyperfine splitting of the eleven lines is 17 G, which is half of the value, 33.5 G, of the main sextet. When the sample was irradiated with 7 rays, the spectrum of the same shape and intensity was observed.
The spectrum changes with the angle 7 between the magnetic field and the draw direction as shown in Figure 2. A remarkable change of the outer spectrum is observed even at the small change of angle 7 . When the magnetic field is perpendicular to the draw direction, the outer spectrum is hardly observed (see Figure 2d). The change of the main sextet spectrum is well explained by the change of a-H coupling of the alkyl radicals as already reported.7
The observed angular dependence of the fine splitting is
The Journal of Physical Chemistry, Vo.’. 79, No. 17, 1975

1860 Takashi Fujimura and Naoyuki Tamura
Figure 1. The AA4S = 1 spectrum in drawn polyethylene Irradiated at 77°K. Magnetic field Is parallel to the draw direction or chain axis of polyethylene. Outer parts of the spectrum are recorded at Increasedgain (200X).
indicated by open circles in Figure 3. When the angle 7 is changed from zero, Hie fine splitting decreases. At about 20° it becomes difficult to determine the spectral position, since the spectrum is smeared out and its height decreases rapidly.
The AMS = 2 spectra are also obtained at g » 4 with the same sample as shown in Figure 4. When the magnetic field is parallel to the draw direction, the spectrum was estimated to consist of eleven lines with hyperfine splitting of 17 G which is the same as that of the AMS = 1 outer spectrum. When the magnetic field is perpendicular to the draw direction, a well-resolved spectrum was not obtained. These results reveal that the outer parts of the AMs = 1 spectra undoubtedly come from radical pairs. The intensity ratio of the outer spectrum due to radical pairs to the main sextet due to isolated radicals is 3 X 10~3. The anisotropy of the AMS = 2 spectrum can be explained by the anisotropy of hyperfine splitting in the isolated alkyl radical.
The radical pairs are less stable than the isolated radicals at 77° K. On warming of the sample, the radical pairs decay rapidly as shown in Figure 5, where the intensities of the AMS = 2 and AMS = 1 spectra due to the paired radicals are plotted against the temperature of heat treatment. Heat treatment of the sample was carried out by warming the sample irradiated at 77°K to the given temperature for 5 min and then cooling it back to 77°K for the measurement. It can be seen that both AMS = 1 and AMS = 2 spectra begin to decay at about 130°K. However, the decay amount of the AMs = 2 spectrum is smaller than that of the AMS = 1 spectrum. Around 200°K the AMS = 1 spectrum decays faster than the AMS = 2 spectrum. It is observed that the AMS = 2 spectrum still remains at the temperature where the AMs = 1 spectrum has almost decayed. The AMs = 1 spectrum due to the isolated radical does not decay even at 150°K. The decay curve of the AMs = 1 spectrum due to isolated radicals as well as that of the AMS = 2 spectrum due to radical pairs in powder sample will be shown elsewhere.
Discussion
Type of Radicals Composing a Radical Pair. The fol
lowing three types of radicals can be presumed for radical pairs in the irradiated polyethylene.
H H
H H H H H
chain scission type -C--- C-! IH H
H HI • I
chain end type -C— C— C— H
H H H
In the AMS = 2 spectrum, when the magnetic field is parallel to the draw axis, the observed intensity ratio of the central seven lines is 1:2.3:4.3:5.3:4.4:2.4:1. In the AMS = 1 spectrum (Figure 1) due to radical pairs, the intensity ratio of the central seven lines of the lower field spectrum is 1: 2.5:4.4:5.2:4.4:2.8:1.8 and that of the higher field spectrum is 1.4:2.6:4.3:5.1:4.4:2.5:1. These results are in good agreement with 1:2.67:4.67:5.60:4.67:2.67:1, which is the theoretical intensity ratio of the central seven lines in eleven lines. Since an eleven-line spectrum comes from ten equally coupled protons, the radical pairs giving the AMS = 1 and AMS = 2 spectra are presumed to consist of the main chain type. The spectral intensity ratios calculated for the radical pairs of chain-scission and chain-end types do not agree with that of the observed spectra.
Structure of Radical Pairs for the Observed Spectrum. In the AMS = 1 spectrum a fine splitting, d, due to radical pair can be expressed as follows, if the point dipole approximation is valid1
d = 3g/3(l — 3 cos2 0)/2r3 (1)where g is the g tensor, (3 is the Bohr magneton, and 0 is the angle between the magnetic field H0 and the vector r connecting two radicals of a radical pair.
In order to calculate the theoretical angular dependence of the fine splitting in the oriented sample, a coordinate system is fixed in the sample as shown in Figure 6. The z axis of this coordinate frame is taken to be along the draw axis, and the magnetic field defines the yz plane. The vector r is defined by angles 8 and ct> in this frame, and 7 is the angle between H0 and the draw axis. In this frame, angle 0 is expressed by
cos 0 = sin 6 sin <f> sin 7 — cos 6 cos 7 (2)Various types of radical pairs can be postulated for the
main-chain alkyl radicals by use of the crystallographic data of polyethylene. Since the crystal lattice constants of drawn polyethylene at 77°K are not known, they were estimated by multiplying the lattice constants of powdered polyethylene at 77°K8 by the ratio of the lattice constants of the 10 times drawn polyethylene to those of an undrawn one at room temperature.9 The estimated constants are a = 7.184 A, b = 4.909 A, and c = 2.547 A. Figure 7 shows the crystal structure of drawn polyethylene with the estimated lattice constants at 77°K. The values of r and 8 can be cal-
The Journal of Physical Chemistry, Vol. 79, No. 17, 1975

Radical Pairs in Irradiated Oriented Polyethylene 1861
Figure 2. Angular dependence of the A M S = 1 spectra in drawn polyethylene Irradiated at 77°K. The angle y between magnetic field H and draw direction is (a) 0°, (b) 10°, (c) 15°, and (d) 90°.
culated for various sets of radical pairs by using this constant. When the values of r and 8 are substituted in eq 1 and 2, the corresponding d values are calculated. Four d values near the observed value, 371 G, are selected as shown in Table I. It is found that the radical pairs of the interchain type C0-C7 0, which is the radical pair produced between Co and C7 0 carbon atoms (see Figure 7), and Co- C8,-i and the intrachain type C0-C4 have values relatively close to those observed. However, these intercarbon distances are not so different that the structure of the radical pair cannot be decided only from this comparison.
In order to decide the structure of radical pairs, the angular dependence of the fine splitting should be considered. By using eq 1 and 2, the calculated angular dependences of fine splittings are obtained as shown in Figure 3 for three types of radical pairs selected above. The calculated curve obtained with the radical pairs C0-C4 of the intrachain- type agrees relatively well with the observed result. However, the curves with interchain radical pairs Co-C7,o and C0-C8-1 differ with the observed result. The calculated curves of other radical pairs were also examined; they are far from agreement with the observed result.
These results suggest that the observed spectrum of the radical pairs is attributed to the intrachain radical pair C0-C4 (0° intrachain type) where the vector connecting two
radicals is parallel to the chain axis. The difference between the observed d value, 371 G, and the calculated d value, 419 G, may be explained by the following consideration. Since the spin densities at the a carbons of two alkyl radicals which compose a radical pair are smaller than 1, the interaction between two radicals is expected to be reduced10 and the observed d value may be smaller than the calculated value.
Other Types of Radical Pairs. It was presumed that the observed spectrum of radical pairs in irradiated drawn polyethylene is attributed to the 0° intrachain type. However, there are some evidences suggesting the existence of other types of radical pairs. When the sample irradiated at 77°K is heated, the AMs = 1 spectrum due to radical pairs decays faster than the AMs = 2 spectrum as shown in Figure 5. The intensity of the AMs = 2 spectrum reflects all radical pairs present in the sample, while the intensity of the AMS = 1 spectrum reflects the radical pair which is presumed to be the 0° intrachain type. This fact suggests the existence of different types of radical pairs from the observed type.
The presence of other types of radical pairs is also suggested by the following results. Figure 8 shows the intensity of AMS = 2 spectrum vs. the angle between H0 and the chain axis. It is noticed that the intensity is almost inde-
The Journal of Physical Chemistry, Vol. 79, No. 17, 1975
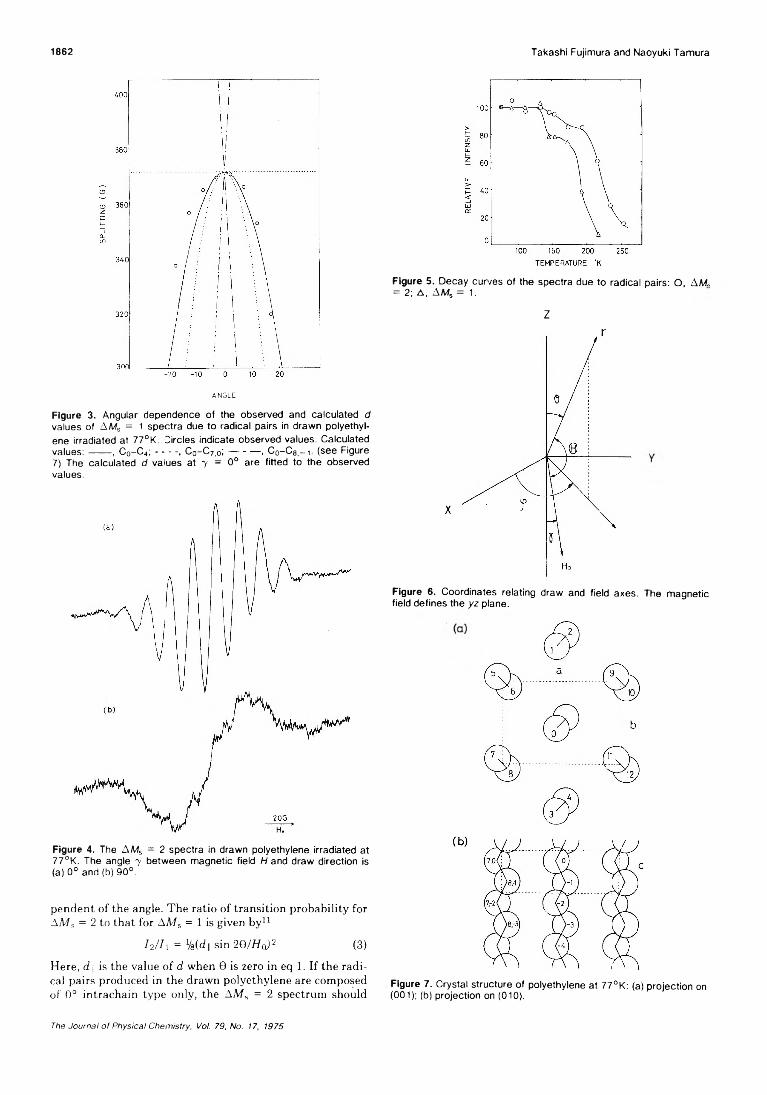
1862 Takashi Fujimura and Naoyuki Tamura
ANGLE
Figure 3. Angular dependence of the observed and calculated d values of AMS = 1 spectra due to radical pairs in drawn polyethylene irradiated at 77°K. Circles indicate observed values. Calculatedvalues:------ , C 0- C 4; -------, C 0- C 7,0; --------- , C 0- C 8,_i. (see Figure7) The calculated d values at 7 = 0° are fitted to the observed values.
Figure 4. The A M S = 2 spectra in drawn polyethylene Irradiated at 77°K. The angle 7 between magnetic field H and draw direction is(a) 0° and (b) 90°.
pendent of the angle. The ratio of transition probability for AMs = 2 to that for AMs = 1 is given by11
/ 2//1 = Vs(cf|| sin 2O/ / /0; 2 (3)Here, d ¡1 is the value of d when 0 is zero in eq 1. If the radical pairs produced in the drawn polyethylene are composed of 0° intrachain type only, the AMs = 2 spectrum should
Figure 5. Decay curves of the spectra due to radical pairs: O, AM. = 2; A, AMS = 1.
Z
Figure 6. Coordinates relating draw and field axes. The magnetic field defines the yz plane.
Figure 7. Crystal structure of polyethylene at 77°K: (a) projection on (001); (b) projection on (010).
The Journal o f Physical Chemistry, Vol. 79, No. 17, 1975

Nitrogen Nuclear Spin-Spin Coupling Constants 1863
TABLE I: Intercarbon and Interspin D istances and ¿V alu es for the R adical P airs Selected
Type of Inter-selected Intercarbon rj a _ uobsd spinradical distance, calcd» calcd? distancpairs A Cos 6 G G A
Co-Cs.o 4.70 0 265 106 4.21Co- ^7,0 4.03 0 421 -50 4.21C0~C8,-1 4.06 0.313 290 81 3.75C0-C 4 5.10 1 419 -48 5.31“ Observed d value is 371 G.
too 6----------------- o
in
LU
0 10 20 30 40 50 60 70 80 90
DIRECTION OF MAGNETIC FIELD
Figure 8. Intensity of the AMs = 2 spectrum vs. the angle y between magnetic field and z axis.
not be observed when 7 is zero, since in this case 9 becomes 0° and / 2//1 equals zero. Actually, however, the spectrum is observed. This result suggests the existence of the other types of radical pairs, where the vector connecting two radicals is neither 0° nor 90° to the chain axis.
Although the existence of interchain radical pairs is suggested, the problem is that they do not give distinct AMs = 1 spectra. In the drawn polyethylene used here, the chain axes are well oriented, but there is disorder in the interchain directions because of the presence of the amorphous or the defective crystalline regions. This situation presumably causes a rather broad distribution of the d values, which smears out the AMs = 1 spectra of interchain paired radicals. In the case of intrachain radical pairs, however, the distance between paired radicals is fixed through the covalent bond, and thus a distinct spectrum is obtained if the sample has a good orientation of chains.
In our recent investigation with the single crystal of n- eicosane, several interchain radical pairs have been observed, while the radical pairs of the intrachain type such as C0-C4 in the drawn polyethylene have not been clearly observed.12 This observation may support the existence of the interchain radical pairs presumed in polyethylene.
Acknowledgment. We wish to thank Mr. N. Hayakawa, Mr. T. Seguchi, and Dr. I. Kuriyama for valuable discussions and Mr. O. Yoda for X-ray diffraction measurements.
References and Notes(1) Y. Kurita, J. Chem. Phys., 41, 3926 (1964).(2) Ya. S. Lebedev, Radiat. E ft, 1, 213 (1969).(3) M. Iwasaki and T. Ichikawa, J. Chem. Phys., 46, 2851 (1967).(4) M. Iwasaki, T. Ichikawa, and T. Ohmori, J. Chem. Phys., 50, 1984
(1969).(5) T. Fujlmura, N. Hayakawa, and N. Tamura, Rep. Prog. Polym. Phys.
Jpn., 1 4 ,5 57 (1971).(6) T. Fujimura and N. Tamura, J. Polym. Sci., Polym. Lett. Ed., 10, 469
(1972).(7) A. G. Kiselev, M. A. Mokulskll, and Yu. S. Lazurkln, Vysckomol. Soedin.,
2, 1678 (1960).(8) P. R. Swan, J. Polym. Sci., 56, 403 (1962).(9) W. Gienz, N. Morosoff, and A. Peterlin, J. Polym. Sci., Polym. Lett. Ed.,
9, 211 (1971).(10) A. Dulcic and J. N. Herak, Mol. Phys., 26, 605 (1973).(11) Y. Kurita, Nippon Kagaku Zasshi, 85, 833 (1964).(12) T. Fujimura and N. Tamura, unpublished results.
Molecular Orbital Calculations on the Nitrogen Nuclear Spin-Spin Coupling Constants
Shinichi Nagata,* Tokio Yamabe, Kimihiko Hirao, and Kenichi Fukui
Department o f Hydrocarbon Chemistry, Faculty o f Engineering, Kyoto University, Sakyo-ku, Kyoto, Japan (Received November 11, 1974; Revised Manuscript Received June 2, 1975)
Nuclear spin-spin coupling constants between 15N and 13C or 'H were calculated by means of the “sum- over-states” perturbation and the “finite perturbation” methods using the INDO MO’s. For J (13C, 15N) coupling constants, we discuss the difference of the contributions from three kinds of mechanisms, FC, SD, and OB terms. The significant effect of lone-pair orientation is demonstrated not only for 2J ( 15N-C-'H) couplings in imines and oximes but also for 2J ( 170 -C -xH) in protonated formaldehyde.
Introduction
Experimental data of indirect spin-spin coupling constants have recently been reported on many kinds of molecules containing XH, 13C, 15N, 19F, 31P, etc. The coupling constant reflects the magnitude of spin-spin interaction between two coupled nuclei in a molecule and then provides valuable structural and stereochemical information
as well as insights into the nature and distribution of bonding electrons. Especially, it is very interesting and noticeable from the point of view of molecular structure determination that the coupling constants are markedly affected by the orientation of the lone-pair electrons of the nitrogen atom in the coupling between the 15N nucleus and other ones.1 Lehn and coworkers2 showed experimentally that
The Journal o f Physical Chemistry, Vol. 79, No. 17, 1975

18 6 4 Nagata, Yamabe, Hirao, and Fukui
the V (15N, JH) couplings of protons cis and trans to the nitrogen lone pair in formaldoxime were considerably different not only in magnitude but also in their signs. Since the advent of this finding, similar observations have been made with respect to a large number of compounds containing nitrogen atom, e.g., cis- and trans-acetaldoxime,2 aziridine,3 iV-nitrosodimethylamine,4 quinoline,5 oxaziridine,6 iV-al- doimine,7 etc. In addition, in order to make clear the effect of lone-pair orientation, there have appeared a large number of experimental investigations concerning the change of N-H coupling constants in both the sign and the magnitude brought about by the protonation to the nitrogen lone pair.2 Furthermore, from several experimental results of the coupling constants between 15N and 13C nuclei, Binsch and coworkers8 proposed the following empirical equation for the relation between the 15N -13C coupling constant and the product of the s characters of the nitrogen and the carbon orbitals forming the a bond, assuming a predominance of the Fermi contact term: S^Sc = 80[1J (15N -13C)]. Large deviations, however, were noted particularly for those compounds with a multiple bond between nitrogen and carbon atoms. Such a phenomenon was attributed to the low-lying excited states or the effects of contributions to the total coupling mechanism from the orbital term.
On the other hand, the theory of the indirect spin-spin coupling of nuclei is based on the consideration of three types of interactions which was formulated by Ramsey,9 i.e., Fermi contact (FC), spin-dipolar (SD), and orbital (OB) interactions. Applications of the formula, using a wave function obtained in LCAO form from MO theory, were made by McConnell10 and later by Pople and San- try.u Furthermore, a new approach to the problem of evaluating nuclear spin coupling constants has recently been made by Pople et al., i.e., the “finite perturbation theory”.12 Until now, among the three sorts of interactions mentioned above, the FC term was found to be predominant in the case of the proton couplings by Ramsey and Purcell9 and in most of later theoretical studies.10 This term, however, was found not always dominant for the couplings between nuclear pairs other than protons.13 There have been far fewer theoretical studies concerning the coupling constants between the 15N nucleus and other ones in comparison with those of the 1H or 13C coupling constants. For example, Maciel et al.14 calculated the J ( 13C, 15N) coupling constants (only the FC term considered) using a finite perturbation method within INDO approximation and concluded that the calculation did not satisfactorily reproduce the C-N coupling constant, whereas the C-C and the C-H couplings were well explained. Further, Lichter et al.15 have recently studied the geometrical dependences of 13C-16N coupling constants of various oximes by the same manner. On the other hand, there have appeared a few theoretical investigations16 of the coupling constants between 15N and XH nuclei by the finite perturbation method employing both CNDO/2 and INDO wave functions and they pointed out the difference of two N-H coupling constants, probably induced by the effect of lone-pair orientation, without further detailed theoretical interpretations.
In this paper, we have used the “sum-over-states” perturbation approach within the INDO framework to estimate the order of magnitude of the above-mentioned three components of the nuclear spin coupling constants between ,r’N and I3C in several molecules. Furthermore, we discuss the 15N—C—1H coupling constants of a molecule, CH2=NH, in comparison with those of CH2= +OH in
order to evaluate clearly the nitrogen or oxygen lone-pair effect upon the magnitude of these coupling constants by the finite perturbation method.
Results and DiscussionAt first, we tried to carry out the calculation of the cou
pling constants between 15N and 13C or XH by using both the “sum-over-states” perturbation and the “finite perturbation” methods within the INDO approximation,17 respectively. Computational details were described ear- lier.1213e The values of sa2(0) and sb2(0), the valence s-or- bital electron densities of atom A and atom B, used for present calculation are the same as the previous ones of Pople et al.12 Further, the following values of (r~3},- for the calculation by the “sum-over-states” perturbation were used: 1.430 for carbon and 2.472 for nitrogen atoms. The equilibrium geometries of CH2=NH and CH2= +OH were taken from ab initio calculations18 and others were cited from Sutton’s table.19
(1) C—N Coupling. The calculated C—N coupling constants are summarized in Table I together with the values of C—C coupling constants for the sake of comparison. The calculated values of both J ( 13C, 13C) and J (13C, 15N) are somewhat lower than experimental ones. It may be attributed to the larger values of transition energy X-3AK; ■ overestimated by the INDO approximation. But the relative magnitude of calculated values of both J (13C, 13C) and J ( 13C, 15N) is parallel with observed ones. Moreover, by a careful examination of this table, some characteristic features are revealed. First, in the C—C, C=C, and C=C coupling constants, the FC term is dominant, consistent with results of Pople et al.,14 which took only the FC term into account and pointed out a monotonic relationship between PScsc2 and J ( 13C, 13C) (PScSc is the carbon 2s-carbon 2s element of the first-crder density matrix). Second, the investigation of the C—N coupling constant in terms of the three kinds of contributions is of interest. The observed values of C—N coupling constants including the sign have been reported for methylamine, acetonitrile, and methyl isocyanide only as shown in Table II. The calculated values of negative ’J ( 13C—l0N) of methylamine and methyl isocyanide, negative 1J ( 13C = 15N) of acetonitrile, and positive 2J ( 13C—C = 15N) of acetonitrile are in agreement with the experimental evidences. Speaking from the result of the present calculation, the coupling constants for 1J ( 13C = 15N) are predicted to be positive, inconsistent with results of Pople et al.,14 who took into account only the FC term. As w:ll be seen in the later discussion, the OB term plays a more important role than the FC term in this case. Thus, these may be reasonable and reliable enough to permit discussion of the difference of the contributions of C—N, C=N, and C=N coupling constants.
On the one-bond coupling constant, 1J ( 13C—15N), it is easily seen from Table I that the FC term is dominant and that the less important SD term cancels out the OB term. For 1J ( 13C = 15N) and 1J ( 13C = 15N), however, the OB and SD terms appear to make significant contributions as well as the FC term. This result explains well the previous experimental and theoretical results7'19 that the coupling constants of J ( 13C = 15N) and J ( 13C = 16N) clearly fall far off the straight line when, as usual, only the contribution from the FC term is taken into account. Thus, it is worthwhile to note that the main difference between C—C and C—N coupling mechanisms is the nonnegligible contributions of the OB and SD terms in C==N and C=N coupling
The Journal of Physical Chemistry, Vol. 79, No. 17, 1975

Nitrogen Nuclear Spin-Spin Coupling Constants 18 65
TABLE I: Calculated Coupling Constants h/(13C, TABLE III: Calculated Coupling Constants, J{13C,13C) and 1J ( 13C, 15N)e 15N), for Pyridine and Pyridinium Ion6
FC SD OB T o ta l E xptl P y rid in e P y rid in iu m ion
h 3c *— *n h 2 -5 .2 7 -0 .5 5 + 0.89 -4 .9 3 —4.5'H3C*— *C H / +14.01 + 1.19 -1 .8 7 + 13.33 +34.6'h2c * = * n h +6.58 -1 .9 0 + 12.04 + 16.72h 2c *==*c h / +45.16 + 2.95 -1 1 .3 4 + 36.77 + 67.2H3C— C*==N* + 5.01 -5 .0 4 -1 .0 2 -1 .0 5 -17 .5 'H C *=*C H <i + 119.05 +9.19 + 12.53 + 140.77 + 170.6'
“ L. Paolillo and E, D. Becker, J. Magn. Resort., 3, 200 (1970). b D. M. Graham and C. E. Molloway, Can. J. Chem., 41, 2114 (1963) . c W. McFarlane, Mol. Phys., 10, 603 (1966). d C-C coupling constants were already obtained from the same method as ours by H. Nakatsuji, I. Morishima, H. Kato, and T. Yonezawa, Bull. Chem. Soc. Jpn., 44, 2010 (1971). e Calculations carried out by means of the “sum-over-states” perturbation method.
TABLE II: Calculated Coupling Constants, </(13C, 15N), for Single, Double, and Triple Bonds'*
C aled E xptl
H C*—*NH. -4 .9 3 -4 .5H,C*—*NH, -7 .2 5 ! < 8 1
Ph\/ C _<N\H CH:l
7.1 Ia
C“ =*NH OH
+ 16.18 2.96 0
H H+ 16.72
HC\HC OH
+30.16
♦ / " H X H
-7 .11
CHfssN -1 .0 5 + 2.26
-17.5" (V (13C = 15N)) + 3 .0 6 (2J (13C— C = ,5N))
OH )N==C + 17.98 —4.72
9.1 c ('j P N s ^C)) - 1 0 . 7C 0 j (13C— !lsN))
0 See ref 7. 6 W. McFarlane, Mol. Phys., 10, 603 (1966).r W. M cFarlane, J. Chem. Soc. A, 1660 (1967). d Calculations carried out by means of the “sum-over-states” perturbation method.
constants. Moreover, the examination of the electronic parts demonstrates that the FC term of 1 J ( 13C—15N) and V (13C = 15N) and the OB term of 1J ( 13C = 15N) come mainly from n —► 7r* or n -♦ cr* term. This result also indicates the significance of the nitrogen lone pair to the coupling mechanism.
So we carried out calculations for pyridine and pyridinium ion in order to clarify the change of C—N coupling constants according to the protonation to the nitrogen lone pair. The calculated results are shown in Table III and Figure 1. For these compounds, we have only the experimental C—N coupling constants without the sign information. The calculated result, however, seems to reflect correctly the following trend which is found in the experimental absolute value; for one-bond coupling a large negative contribution is induced, accompanied by the change of sign by protonation, and two-bond and three-bond couplings have small negative values. It is easily seen from Table III that, experimentally as well as theoretically, one-bond coupling
Caled Exptl“ Caled Exptl
'J i13 C, 15n ) + 13.55 0.45 -1 1 .5 9 112.02j 0 3 c , 15n ) -1 .5 7 2.4 | -0 .2 3 | 2.13j (13c , 15N) -7 .4 0 3.61 -9 .6 4 15.3a R. L. Lichter and J. D. Roberts, -J. Am. Chem. Soc., 93. 5218
(1971). 6 Calculations carried out by means of the “ sum-over- states” perturbation method.
1 2 3 1 2 3
(Number o f bonds.)
Figure 1. The change of the contributions from three mechanisms due to the difference of number of bonds for pyridine and pyridiniumion.
is most strongly affected by protonation. This may indicate that the protonation to the nitrogen lone pair in pyridine induces a partial single-bond character in the C=N bond, which is a small effect in two- or three-bond coupling cases. Moreover, it is easily seen from Figure 1 that there exists a large difference in the relative importance of tine three contributions, FC, SD, and OB terms, between pyridine and pyridinium ion. This may be attributed to the difference of one-, two-, and three-bond couplings discussed above; for two- and three-bond couplings there seems to be little change of each contribution caused by protonation, while for the one-bond coupling the OB term makes a significant contribution for pyridine and the FC term has a strongly negative value for pyridinium ion. This result may also correspond to the partial single-bond character of the directly connected double bond introduced by protonation.
The Journal of Physical Chemistry, Vol. 79, No. 17, 1975

a E
(eV
)1666 Nagata, Yamabe, Hirao, and Fukui
TABLE IV: Net Charge Densities of Ha and Hb Atoms of Methylenimine
Ha Lb Ha Hb
6 = 0° 0.9453 1.0724 0=70° 1.0336 1.00140 = 30° 1.0295 1.0543 0 = 90° 0.9966 0.97700 = 55° 1.0411 1.0216
Figure 2. Total energy of methylenimine and protonated formaldehyde for angle variation of 8.
(2) N—H Coupling. The information for J ( 15N, ’H) coupling constants including their sign has recently been obtained in regard to several kinds of molecules by means of double-resonance experiments in comparison with those of J(13C, 15N). We are interested in the experimental result that the lone-pair orientation has a significant effect on the sign and magnitude of coupling constants for oxime compounds. Then, we investigated the geometrical dependence of the two 2J ( 15N—C—XH) coupling constants, syn and anti with respect to the N—H bond, to make clear the lone- pair effect. As a typical and simple model of oximes, we took up the virtual molecule methylenimine. According to the previous study cf the ab initio calculation18® for this compound, the geometry minimizing the total energy was predicted as
First, we calculated the 2J ( 15N—C—1H) coupling constants by the use of this geometry, which gave 1.17 Hz for
angle (6)
Figure 3. Calculated coupling constants, 2J(15N - C - 1H) and 2J(170 - C - 1H), for angle variations of 8.
2J(15N_C—!Ha) and -14.35 Hz for 2j(i5N_ c _ i H B). This result is consistent with the observed values for for- maldoxime (2.68 and —13.88 Hz). Then, we tried to calculate them by varying the angle 8 = HaCX only (CX is the line in the C=N direction). It may be reasonable from the following point of view that the nitrogen lone pair and hydrogen atom of the N—H bond may affect the two C—H bonds. The result of total energy as shown in Figure 2 demonstrates that it is most stable at 8 = 55°, which seems in accord with the microwave data20 for formaldoxime; HaCX = 58° 14' and HBCX = 64° 21'.
Recently, a calculated result was reported on methylenimine, using a 4-31G Gaussian basis set.21 The optimized equilibrium geometry is not only completely opposite to the relative magnitude of the two HCX angles experimentally obtained for formaldoxime, but also it is inconsistent with the values of N—H coupling constants (—13.13 and —8.85 Hz), if we employed these geometrical values.
Now, we calculated the coupling constants ZJ (1SN—C— 'H) for geometries with various HaCX angles. The calculated results are shown in Figure 3, which demonstrates that the coupling constants 2J ( 15N—C—XH) are very sensitive for a variation of angle 8. For the conformer (6 = 55°) predicted by minimization of the INDO total energy, the difference between two coupling constants becomes considerably larger than that of 8 = 59° and is much more consistent with the experimental result of formaldoxime.
Next, we calculated the 2J ( 170 —C—XH) coupling constant of protonated formaldehyde by the same manner, because this molecule is identical with methylenimine from the point of view in making clearer the lone-pair effect although the coupling constant 2J ( 170, XH) has not been
The J o u rn a l o f P h ys ica l C hem is try , Vol. 79, No. 17, 1975

Nitrogen Nuclear Spin-Spin Coupling Constants 18 6 7
TABLE V: Calculated Coupling Constants (Hz)J (13C, XH) and J ( XH, H) of Protonated Formaldehyde6
Ha Hc^ c = < +
_________________ Hb_ _____________ ___
Calcd Exptl" Calcd Exptl“
J(C-Ha) +179.03 +198.4 j(HA-HB) +12.83 +21.7J(C-Hb) +188.56 +209.8 j(HA-Hc) +4.04 +9.0J(C—Hc) -11.03 -8.7 J(Hb-Hc) +17.47 +19.0a A. M. White and G. A. Olah, J. Am. Chem. Soc., 91, 2943
(1969 . 6 Calculations carried out by means of the "finite” perturbation method.
found out experimentally. The result obtained by changing the angle 8 is shown in Figure 3, which suggests that 2J ( 170 —C—1H) coupling constant has a quite similar trend compared to V (15N—C—1H). This may be the proof that there exists the same effect of lone-pair orientation for two-bond coupling constants in these molecules. The total energy of this molecule for the angle variation, however, was minimized at 8 = 60°, which implies the symmetrical geometry concerning to the C = 0 line. This result obtained from INDO approximation is in good agreement with the ab initio calculation18*5 and may be reasonable from the following trend that the electron cloud of the cationic lone pair of the oxygen atom in protonated formaldehyde is not so extended as the neutral one, i.e., nitrogen atom in methylenimine. The reliability of the present calculation seems to be indicated in Table V, where calculated coupling constants, J ( 13C, *H) and J(*H, XH), of protonated formaldehyde are in good agreement with experimental ones including both the sign and magnitude.
ConclusionIn the case of coupling constants between 15N and 13C,
the SD and OB terms are found theoretically to make a significant contribution in addition to the FC term, especially in multiple bonds. Moreover, in the protonation to the nitrogen lone pair it was demonstrated that one-bond coupling is most strongly affected and that two- and three- bond couplings do not make so remarkable a change.
On the other hand, the large difference between 2J ( 15N-C-1Ha) and 2J ( ’5N-C-1Hb) was attributed to the indirect effect of the nitrogen lone-pair orientation. A similar trend was also found in the case of protonated formal
dehyde. Furthermore, these couplings are very sensitive to a variation of angle 8; that is, 2J ( 15N-C-1Ha) and 2J (170 - C-xHa) increase, and 2J (15N-C-1F b) and 2J ( 170-C -1Hb) decrease as the angle 8 becomes small.
Acknowledgments. The authors wish to thank ProfessorH. Kato and Dr. S. Inagaki for their helpful discussions and suggestions. We express our appreciation to the Computer Center of Kyoto University for the use of the FACOM 230-75 computer.
References and Notes(1) T. Axenrod, "Nitrogen NMR” , G. Webb and M. Witanowski. Ed., Plenum
Press, New York, N.Y., 1972, p 261; E. W. Randall and D. G. Gillies, Prog. Nucl. Magn. Rason. Spectrosc., 119 (1971).
(2) J. P. Klntzinger and J. M. Lehn, Chem. Commun., 660 (1967); D. Cré- paux and J. M. Lehn, Mol. Phys., 14, 547 (1968); D. Crépaux, J. M. Lehn, and R. R. Dean, ibid., 16, 225 (1969).
(3) M. Ohtsuru and K. Tori, Tetrahedron Lett., 4043 (1970); M. Ohtsuru, K. Tori, J. M. Lehn, and R. Seher, J. Am. Chem. Soc., 91, 1187 (1969).
(4) T. Axenrod and P. S. Pregosln, Chem. Commun., 702 (1968).(5) R. L. Llchter and J. D. Roberts, Spectrochim. Acta, Part A, 26, 1813
(1970); K. Tori, M. Ohtsuru, K. Aono, Y. Kawazoe, and M. Ohnlshl, J Am. Chem. Soc., 89, 2765 (1967).
(6) W. B. Jennings, D. R. Boyd, C. G. Watson, E. D. Becker, R. B. Bradley, and D. M, Jerina, J. Am. Chem. Soc., 94, 8501 (1972).
(7) H. J. C. Yeh, H. Ziffer, D. M. Jerina, and D. R. Boyd, J. Am. Chem Soc 95, 2741 (1973).
(8) G. Binsch, J. B. Lambert, B. W. Roberts, and J. D. Rooerts, J. Am. Chem. Soc., 86, 5564 (1964).
(9) N. F. Ramsey and E. M. Purcell, Phys. Rev., 85, 143 (1952); N. F. Ramsey, ibid., 91, 903 (1953).
(10) FI. M. McConnell, J. Chem. Phys., 24, 460 (1956); M. Karplus, ibid., 30, 11 (1956); Fl. S. Gutowsky, M. Karplus, and D. M. Grant, ioid., 31, 1278 (1959); M. J. Stephens, Proc. R. Soc. London, Ser. A, 243, 274 (1957).
(11) J. A. Pople and D. P. Santry, Mol. Phys., 8, 1 (1964).(12) J. A. Pople, J. W. Mclver, Jr., and N. S. Ostlund, J. Chem. Phys., 49,
2960,2965(1968).(13) (a) J. A. Pople, Mol. Phys., 1, 216 (1958); (b) J. N. Murrell, P. E. Ste
phenson, and G. T. Jones, ibid., 12, 265 (1967); (c) FI. Nakatsujl, H. Kato, I. Morishima, and T. Yonezawa, Chem. Phys. Lett., 4, 607 (1970); (d) A. C. Blizzard and D. P. Santry, J. Chem. Phys., 55, 950 (1971); (e)K. Flirao, H. Nakatsuji, H. Kato, and T. Yonezawa, J. Am Chem. Soc., 94, 4078 (1972); (f) K. Hlrao, FI. Nakatsuji, and FI. Kato ibid., 95, 31 (1973).
(14) G. E. Maclel, J. W. Mclver, Jr., N. S. Ostlund, and J. A. Pople, J. Am Chem. Soc., 92, 4151, 4497, 4506 (1970).
(15) R. L. Llchter, D. E. Dorman, and R. Wasyllshen, J. Am. Chem. Soc., 96, 930 (1974).
(16) (a) M. S. GÎopInathan and P. T. Narashlmhan, Mol. Phys., 22, 473 (1970); (b) R. Wasyllshen and T. Schaefer, Can. J. Chem., 50, 2989 (1972).
(17) J. A. Pople, D. L. Beveridge, and D. A. Dobosh, J. Chem. Phys., 47, 2026(1967).
(18) (a) For CH2=NFI, J. M. Lehn, B. Munsch, and P. Millie, Theor. Chim. Acta, 16, 351 (1970); (b) for CH2= +OH, P. Ros, J. Chem. Phys.. 49, 4903 (1968).
(19) Chem. Soc., Spec. Publ., No. 11 (1958); Suppl., No. 18 (1965).(20) I. N. Levin, J. Chem. Phys., 38, 2326 (1963).(21) R. Macaulay, L. A. Burnelle, and C. Sandorfy, Theor. Chim. Acta, 29, 1
(1973).
The Journal of Physical Chemistry, Vol. 79, No. 17, 1975
1868 K. L. Craighead, P. Jones, and R, G. Bryant
Nuclear Magnetic Resonance Investigation of Cobalt(lll) Outer-Sphere Complexes in Aqueous Solutions
K. L. Craighead, P. Jones, and R. G. Bryant*
Department of Chemistry, University o f Minnesota, Minneapolis, Minnesota 55455 (Received October 31, 1974; Revised Manuscript Received May 15, 1975)
Publication costs assisted by the National Institutes o f Health
Nuclear magnetic resonance relaxation time measurements are reported for nuclei participating in weak outer-sphere complexes of cobalt(III) complex ions. The data are analyzed in terms of outer-sphere association constants and line broadening parameters. Analysis of the relaxation times in the outer-sphere complexes is made with the aid of measurements on model systems to evaluate some of the several contributions to the relaxation rates. It is concluded that the solvent-solute interaction of halide ions in outer- sphere association with tris(diamine) chelates of cobalt(III) is significantly perturbed. Within experimental errors, both optical and NMR methods gave the same values for equilibrium constants.
IntroductionThe existence of ion pairs or outer-sphere metal com
plexes is often postulated to explain data from a variety of experiments ranging from thermodynamic measurements1 on electrolyte solutions to kinetic measurements on inorganic2 reactions. Nevertheless relatively little detailed information has been presented concerning ion pair structure or other physical properties in aqueous solutions. Experimental difficulties in the study of outer-sphere complexes are accute in aqueous solutions. Reports of outer-sphere association constants between simple inorganic anions and complex cations have differed significantly if different measuring techniques are used in the same or different laboratories.3 For example, the suggestion based on NMR experiments that hydrophobic substituents such as alkyl groups on one ion will promote ion association4 is not supported by conductance or spectrophotometric results.3 It might be suggested that these discrepancies are associated with the selective detection of different ion pair structures by different physical techniques. However, assuming that equilibrium thermodynamics may be applied, Orgel and Mulliken5 have shown that even if a large number of structurally different 1:1 ion pairs are formed, analysis of the data from any experiment should yield the same value for the apparent 1:1 association constant. The observed equilibrium constant will be the sum of equilibrium constants for the formation of each structural type. According to this analysis each physical technique should yield the same equilibrium constant even if some structural types of 1:1 complex have a negligible extinction coefficient or its equivalent for a particular measurement. On the other hand, if the equilibrium under study is complicated by additional weak associations due to presumably passive electrolyte ions, such as perchlorate ion, Johansson6 has pointed out that different types of measurement may lead to different results depending on the experimental details.
The present investigation was undertaken to examine the equilibrium constants and structural properties of the outer-sphere complexes of various cobalt(III) amine complexes in water using both broad line NMR and optical methods.
E xp erim en tal Section
Spectrophotometric equilibrium measurements were made on a Cary 14 spectrophotometer using a short path- length cell so that the same metal complex concentrations could be used in NMR measurements. The cell was calibrated at 545 nm using potassium permanganate in 1 M sulfuric acid by comparison with a standard 1.00-cm cell and by comparison with Lingane and Collat’s7 value for the extinction coefficient of 2.31 M~l cm-1. Temperature was controlled at 25.0 or 30.0°.
NMR spectra were recorded on a Varian DP-60 NMR spectrometer employing methods described previously.8 Samples were contained in 15-mm o.d. test tubes. For bromine measurements temperature was controlled with a Varian variable temperature controller because 81Br line widths are very sensitive to small changes in temperature. In all experiments the radiofrequency power was adjusted to be below saturation. For the broadest bromine lines where derivative spectra were obtained, the modulation amplitude was adjusted to obtain negligible modulation broadening. Line widths were measured as the full-width at half-height of the absorption mode signal. For the derivative signals line widths were measured between extrema and corrected to the absorption mode width by multiplying by 1.732. In all cases the magnetic field was calibrated from side band separations.
59Co chemical shift measurements were made using16-mm sample tubes with standard 5-mm thin walled NMR tubes containing the reference solution placed coaxially inside.
35C1 measurements of Tip were made using the adiabatic half passage experiments.9 The field was swept off resonance with a 100 to 200 mA current placed on the probe helmholtz coils on top of the audiomodulation. The transient signal taken from the PAR Model 121 lock-in detector was accumulated on a Varian C-1024 CAT or recorded directly on a Midwestern Instruments LCRII oscillographic recorder. Tip values were extrapolated to zero Hi. The response of this configuration was measured to be 0.05 sec for a modulation frequency of 500 Hz and was not determined by the lock-in amplifier time constant.
The Journal o f Physical Chemistry, Vol. 79, No. 17, 1975
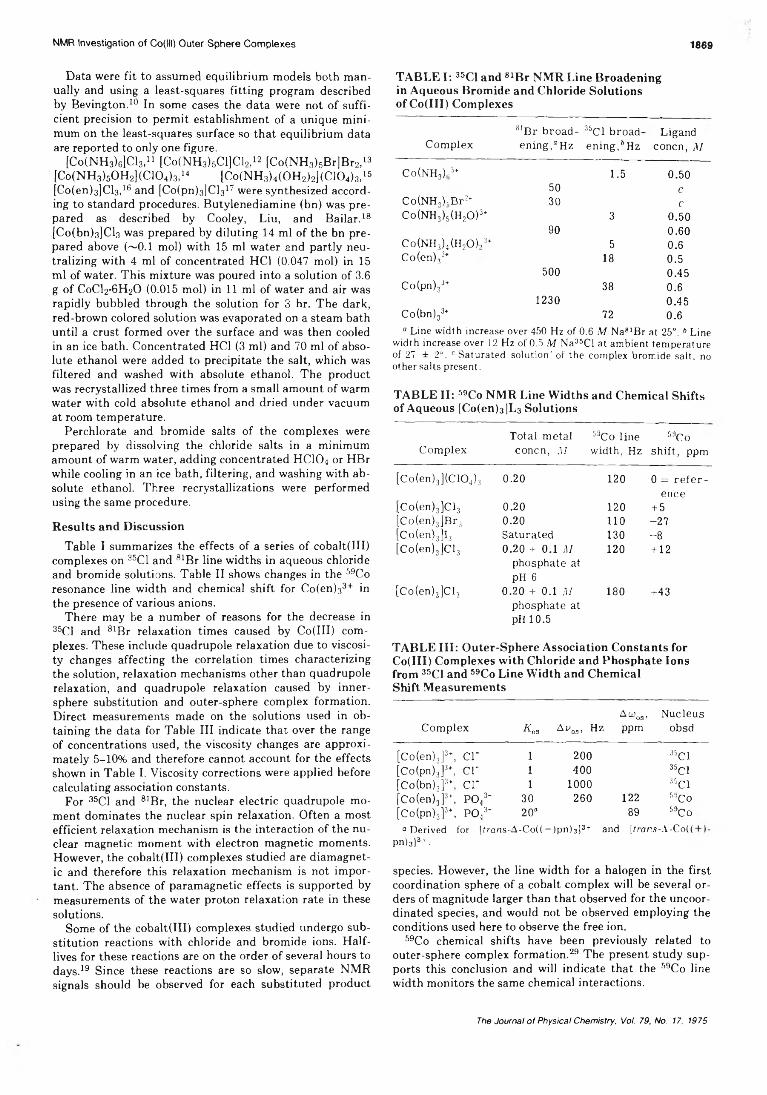
NMR Investigation of Co(lll) Outer Sphere Complexes 1869
Data were fit to assumed equilibrium models both manually and using a least-squares fitting program described by Bevington.10 In some cases the data were not of sufficient precision to permit establishment of a unique minimum on the least-squares surface so that equilibrium data are reported to only one figure.
[CoCNHglelCls,11 [Co(NH3)5Cl]Cl2,12 [Co(NH3)5Br]Br2,13 [Co(NH3)6OH2](C104)3,14 [Co(NH3)4(OH2)2](C104)3,16[Co(en)3]Cl3,16 and [Co(pn)3]Cl317 were synthesized according to standard procedures. Butylenediamine (bn) was prepared as described by Cooley, Liu, and Bailar.18 [Co(bn)3]Cl3 was prepared by diluting 14 ml of the bn prepared above (~0.1 mol) with 15 ml water and partly neutralizing with 4 ml of concentrated HC1 (0.047 mol) in 15 ml of water. This mixture was poured into a solution of 3.6 g of CoC12*6H20 (0.015 mol) in 11 ml of water and air was rapidly bubbled through the solution for 3 hr. The dark, red-brown colored solution was evaporated on a steam bath until a crust formed over the surface and was then cooled in an ice bath. Concentrated HC1 (3 ml) and 70 ml of absolute ethanol were added to precipitate the salt, which was filtered and washed with absolute ethanol. The product was recrystallized three times from a small amount of warm water with cold absolute ethanol and dried under vacuum at room temperature.
Perchlorate and bromide salts of the complexes were prepared by dissolving the chloride salts in a minimum amount of warm water, adding concentrated HC104 or HBr while cooling in an ice bath, filtering, and washing with absolute ethanol. Three recrystallizations were performed using the same procedure.
R esu lts and D iscussion
Table I summarizes the effects of a series of eobalt(III) complexes on 35C1 and 81Br line widths in aqueous chloride and bromide solutions. Table II shows changes in the 59Co resonance line width and chemical shift for Co(en)33+ in the presence of various anions.
There may be a number of reasons for the decrease in 35C1 and 81Br relaxation times caused by Co(III) complexes. These include quadrupole relaxation due to viscosity changes affecting the correlation times characterizing the solution, relaxation mechanisms other than quadrupole relaxation, and quadrupole relaxation caused by inner- sphere substitution and outer-sphere complex formation. Direct measurements made on the solutions used in obtaining the data for Table III indicate that over the range of concentrations used, the viscosity changes are approximately 5-10% and therefore cannot account for the effects shown in Table I. Viscosity corrections were applied before calculating association constants.
For 35C1 and 81Br, the nuclear electric quadrupole moment dominates the nuclear spin relaxation. Often a most efficient relaxation mechanism is the interaction of the nuclear magnetic moment with electron magnetic moments. However, the cobalt(III) complexes studied are diamagnetic and therefore this relaxation mechanism is not important. The absence of paramagnetic effects is supported by measurements of the water proton relaxation rate in these solutions.
Some of the cobalt(III) complexes studied undergo substitution reactions with chloride and bromide ions. Half- lives for these reactions are on the order of several hours to days.19 Since these reactions are so slow, separate NMR signals should be observed for each substituted product
TABLE I: 35C1 and 81Br NM R Line Broadening in Aqueous Bromide and Chloride Solutions of Co(III) Complexes
Com plex81Br broaden ing ,0 Hz
35C1 broad en in g ,6Hz
Ligand concn, 71/
Co(NH3) > 1.5 0.5050 c
Co(NH3)r,Br2* 30 cCo(NH3)5(H2O P 3 0.50
90 0.60Co(NH3)4(H20 ) , 3+ 5 0.6Co(en)33+ 18 0.5
500 0.45Co(pn)33+ 38 0.6
1230 0.45Co(bn)33+ 72 0.6“ Line width increase over 450 Hz of 0.6 M Na81Br at 25°. 6 Line
width increase over 12 Hz of 0.5 M Na35Cl at ambient temperature of 27 ± 2 ° . c Saturated solution' of the complex bromide salt, no other salts present.
TABLE II: 59Co NM R Line W idths and Chemical Shifts of Aqueous [Co(en)3]L3 Solutions
Total m etal 53Co line 59CoCom plex concn, M width, Hz sh ift, ppm
[Co(en)3](C104):j 0.20 120 0 = r e fe r -ence
[Co(en)3]Cl3 0.20 120 + 5[Co(en)3]Br3 0.20 110 -2 7[Co(en)3]l3 Saturated 130 - 8[Co(en)3]Cl3 0.20 + 0.1 M 120 + 12
phosphate at pH 6
[Co(en)3]Cl3 0.20 + 0.1 M 180 +43phosphate at pH 10.5
TABLE III: O uter-Sphere Association C onstants for Co(III) Complexes w ith Chloride and Phosphate Ionsfrom 35C1 and 59Co Line Width and ChemicalShift M easurem ents
A“ os , N ucleusComplex *03 ^ OS > Hz ppm obsd
[Co(en)3]3*,, c r 1 200 35C1[Co(pn)3]3*, c r 1 400 35C1[Co(bn)3]3+,, c r 1 1000 35c i[Co(en)3]3+,, po 43- 30 260 122 5!)Co[Co(pn)3]3+,, PO.,3' 20° 89 5!)Coa Derived for [frans- A-Co(( - )p n )3)3 + and [trar.s-A-Co((
pn)3]3+ ■
species. However, the line width for a halogen in the first coordination sphere of a cobalt complex will be several orders of magnitude larger than that observed for the uncoordinated species, and would not be observed employing the conditions used here to observe the free ion.
59Co chemical shifts have been previously related to outer-sphere complex formation.29 The present study supports this conclusion and will indicate that the 59Co line width monitors the same chemical interactions.
The Journal o f Physical Chemistry, Voi. 79, No. 17, 1975

1870 K. L. Craighead, P. Jones, and R. G. Bryant
Assuming then that these relaxation time and chemical shift changes can be attributed to outer-sphere complex formation, it is possible to determine outer-sphere association constants from these effects. The equilibrium constant, Kos, for the association of a cation M and an anion L to form an outer-sphere complex (or ion pair), X, can be measured from the concentration dependence of a physical property of either the cation or the anion. Exchange of either partner between free sites and ion pair sites is expected to be diffusion controlled20 and therefore very fast compared with NMR shifts or line widths. In this case the observed NMR line width and chemical shift for a nucleus exchanging rapidly between free and ion pair sites will be a weighted average of the values for each site in solution.21 If a property of the metal complex is measured, the line width, chemical shift, or optical density, represented by “>obsd, >s given by
k'obsd(M) - [X] [X]
(M) + (M) ^ (1)
where cof and an, are the observables for the free and bound sites, respectively, [X] is the ion pair concentration, and (M) is the total metal concentration. By combining eq 1 with the expression for Kos
= [X]/[M][L] (2)the following equation is obtained:
/ i os(M)wobsd2 - {X03(MKwb + w{) + X M(wb - ojf) +
wb - wt}o)0b3d + {Xog[L]wb(a)b - w£) + X os(M')cubwf +
u)h0Jt - wf2} = 0 (3)
If changes in [L] are negligible during the experiment, the concentration dependence of the observable becomes
obsd u t + ■ft'oJL]a>b 1 + K j h ] (4)
Similarly, if a property of the anion is measured, eq 3 is replaced by
X0J LK sd 2 - {AjLKyb + v t ) + K os( M ) ( v b - V f) +” i'fKbsd + { X J M K K - vi) + X jL j iv 'f +
vbvt “ i' i2} = 0, (5)where in, and v{ are the values of the observable for the anion in the outer-sphere complex and free in solution, respectively. This may be reduced to
obsd Vf + 1 + X0S|L] (6)
if outer-sphere complex concentration is small compared with total ligand concentration. For many of the cases shown in Tables I ar.d II it was not possible to determine ion pair association constants, either because the complex solubility is too low or because the effects are too small to observe changes outside experimental error as a function of ligand concentration. Formation constants that were determined by fitting the concentration dependence of NMR and optical data to one of the eq 1-6 are shown in Table III. Examples of the data and calculated curves are shown in Figures 1-3. For the chloride ion pairs the approximate expression yields the same results as the more exact equations; however, for the phosphate experiments eq 3 is necessary.
°0 0 5 1.0 15 20P[cn m
Figure 1. 35CI NMR line width vs. chloride ion concentration tor 0.15 M [Co(pn)3] Cl3 at ambient temperature.
Figure 2. Absorbance at 261 nm and 25.0° for 0.10 M [Co(pn)3l- (C I04)3 vs. [ c r ] , ‘ '
Figure 3. 59Co chemical shift and line width for 0.10 M [Co(en)3] Cl3 vs. phosphate concentration at pH 13.5 and ambient temperature. Shift reference is saturated [Co(en)3](CI04)3.
Although the error in measuring NMR line widths in these experiments is 5% or less, the concentration range available for the study of the equilibria involved is small. The precision and accuracy of the derived equilibrium constants is therefore limited. The optical methods did in general give slightly different values for the equilibrium constants. However, large values of the reduced x2 statistic for the NMR data make it impossible to conclude that the NMR results for outer-sphere complex association constants disagree with the somewhat more precise optical experiments.
The J o u rn a l o f P h y s ic a l C hem is try , Vof. 79, No. 17, 1975
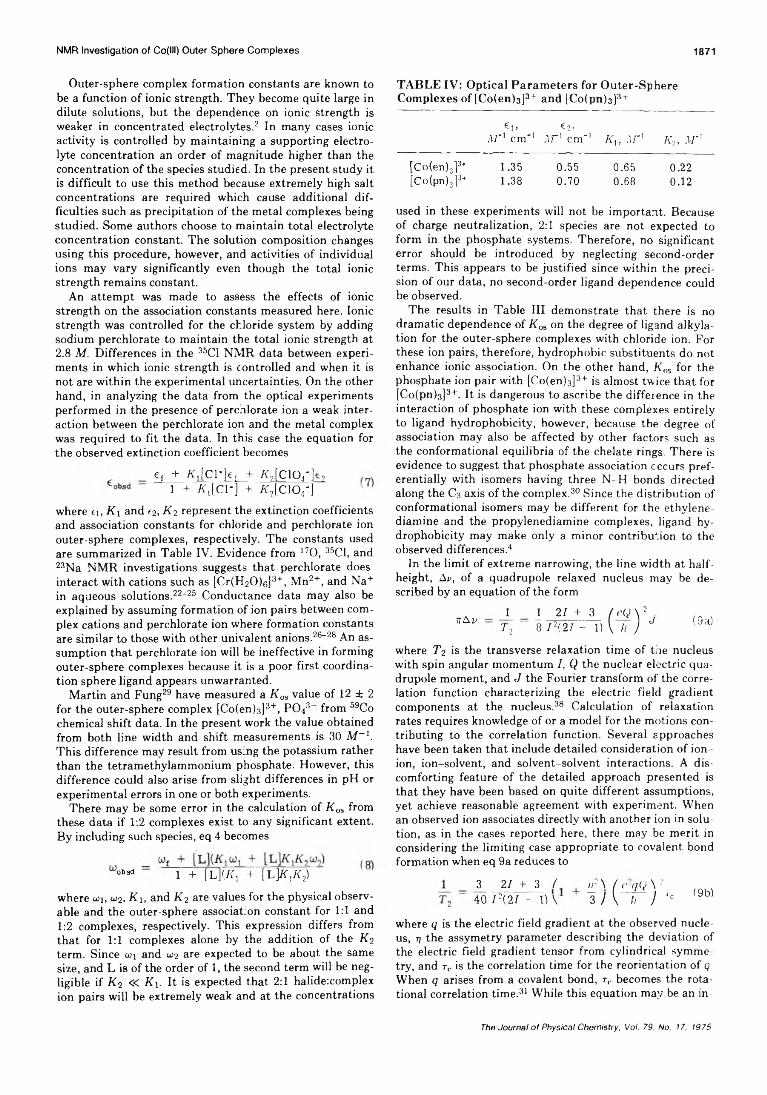
NMR Investigation of Co(lll) Outer Sphere Complexes 1871
Outer-sphere complex formation constants are known to be a function of ionic strength. They become quite large in dilute solutions, but the dependence on ionic strength is weaker in concentrated electrolytes.2 In many cases ionic activity is controlled by maintaining a supporting electrolyte concentration an order of magnitude higher than the concentration of the species studied. In the present study it is difficult to use this method because extremely high salt concentrations are required which cause additional difficulties such as precipitation of the metal complexes being studied. Some authors choose to maintain total electrolyte concentration constant. The solution composition changes using this procedure, however, and activities of individual ions may vary significantly even though the total ionic strength remains constant.
An attempt was made to assess the effects of ionic strength on the association constants measured here. Ionic strength was controlled for the chloride system by adding sodium perchlorate to maintain the total ionic strength at2.8 M. Differences in the 35C1 NMR data between experiments in which ionic strength is controlled and when it is not are within the experimental uncertainties. On the other hand, in analyzing the data from the optical experiments performed in the presence of percnlorate ion a weak interaction between the perchlorate ion and the metal complex was required to fit the data. In this case the equation for the observed extinction coefficient becomes
ef + RjCl-Je, + K , [ClCVlt,1 + RtlCl-] + K 2 c ic v ]
where ei, K\ and 62, K 2 represent the extinction coefficients and association constants for chloride and perchlorate ion outer-sphere complexes, respectively. The constants used are summarized in Table IV. Evidence from 170, 35Cl, and 23Na NMR investigations suggests that perchlorate does interact with cations such as [Cr(H20)e]3+, Mn2+, and Na+ in aqueous solutions.22"25 Conductance data may also be explained by assuming formation of ion pairs between complex cations and perchlorate ion where formation constants are similar to those with other univalent anions.26"28 An assumption that perchlorate ion will be ineffective in forming outer-sphere complexes because it is a poor first coordination sphere ligand appears unwarranted.
Martin and Fung29 have measured a Koa value of 12 ± 2 for the outer-sphere complex [Co(en)3]3+, PO43"" from 59Co chemical shift data. In the present work the value obtained from both line width and shift measurements is 30 M~l. This difference may result from using the potassium rather than the tetramethylammonium phosphate. However, this difference could also arise from slight differences in pH or experimental errors in one or both experiments.
There may be some error in the calculation of Koa from these data if 1:2 complexes exist to any significant extent. By including such species, eq 4 becomes
°bsd “ 1 + [L](/ft + [L]K^K2)
where o>\, <*>2, K x, and K2 are values for the physical observable and the outer-sphere association constant for 1:1 and 1:2 complexes, respectively. This expression differs from that for 1:1 complexes alone by the addition of the K2 term. Since on and 0J2 are expected to be about the same size, and L is of the order of 1, the second term will be negligible if K2 « K\. It is expected that 2:1 halide:complex ion pairs will be extremely weak and at the concentrations
TABLE IV: Optical Parameters for Outer-Sphere Complexes of [Co(en>3]3+ and [Co(pn)s]3+
el> e2-AT1 cm' 1 Af1 cm' 1 Ku A/ '1 K2, A/ '1
[Co(en)J* 1.35 0.55 0.65 0.22[Co(pn)3j3+ 1.38 0.70 0.68 0.12
used in these experiments will not be important. Because of charge neutralization, 2:1 species are not expected to form in the phosphate systems. Therefore, no significant error should be introduced by neglecting second-order terms. This appears to be justified since within the precision of our data, no second-order ligand dependence could be observed.
The results in Table III demonstrate that there is no dramatic dependence of Kos on the degree of ligand alkylation for the outer-sphere complexes with chloride ion. For these ion pairs, therefore, hydrophobic substituents do not enhance ionic association. On the other hand, Kos for the phosphate ion pair with [Co(en)3]3+ is almost twice that for [Co(pn)s]3+. It is dangerous to ascribe the difference in the interaction of phosphate ion with these complexes entirely to ligand hydrophobicity, however, because the degree of association may also be affected by other factors such as the conformational equilibria of the chelate rings. There is evidence to suggest that phosphate association occurs preferentially with isomers having three N-H bonds directed along the C3 axis of the complex.30 Since the distribution of conformational isomers may be different for the ethylene- diamine and the propylenediamine complexes, ligand hydrophobicity may make only a minor contribution to the observed differences.4
In the limit of extreme narrowing, the line width at halfheight, An, of a quadrupole relaxed nucleus may be described by an equation of the form
ttAu 1 1 21 + 3 (eQ y-T2 “ 8 / 2(2/ - 1) \ h ) J (9a)
where T2 is the transverse relaxation time of the nucleus with spin angular momentum I, Q the nuclear electric quadrupole moment, and J the Fourier transform of the correlation function characterizing the electric field gradient components at the nucleus.38 Calculation of relaxation rates requires knowledge of or a model for the motions contributing to the correlation function. Several approaches have been taken that include detailed consideration of ion- ion, ion-solvent, and solvent-solvent interactions. A discomforting feature of the detailed approach presented is that they have been based on quite different assumptions, yet achieve reasonable agreement with experiment. When an observed ion associates directly with another ion in solution, as in the cases reported here, there may be merit in considering the limiting case appropriate to covalent bond formation when eq 9a reduces to
3 2 7 + 3 / y \ ( e~qQ \ 2 _40 /=(2/ - 1 )\ 3 J \ ti ) ‘c ( 9b)
where q is the electric field gradient at the observed nucleus, 7) the assymetry parameter describing the deviation of the electric field gradient tensor from cylindrical symmetry, and rc is the correlation time for the reorientation of q. When q arises from a covalent bond, rc becomes the rotational correlation time.31 While this equation may be an in
The Journal of Physical Chemistry, Voi. 79, No. 17, 1975

1872 K. L. Craighead, P. Jones, and R. G. Bryant
complete description in the case at hand, it displays explicitly two major variables, namely, the magnitude of the electric perturbation and its time dependence.
Association constants for the series of outer-sphere complexes [Co(en)3]3+, Cl- to [Co(bn)3]3+, Cl" are essentially the same. However, the line width of chloride ion in the outer-sphere complex changes by about a factor of 10 over the series. For example, the line width of the chlorine resonance for chloride ion associated with [Co(bn)3]3+ is almost two orders of magnitude larger than that of the free chloride ion line width of the control solutions. This dramatic alteration in relaxation time may reflect changes in either the average electric environment of the chlorine nucleus or its time dependence.
Rotational correlation times of transition metal complexes such as [Cr(H20)e]3+ are about 4 X 10-11 sec.32 Correlation times for ions such as chloride are difficult to define. These must be associated with molecular events such as rotation or solute collisions with solvent which are not likely to differ from 40 psec by more than a factor of 10.33 If chloride ion association with the transition metal complexes were sufficiently strong so that the two species rotated as a unit, the chloride ion could experience a change in correlation time for the quadrupole interaction on the order of a factor of 10 or less. The maximum 35C1 line width expected for the outer-sphere complex site assuming only the extreme correlation time changes would be approximately 150 Hz or less. These crude estimates suggest that the observed changes in Avoa have major contributions from changes in the field gradient factors of eq 9. This conclusion is consistent with earlier deductions drawn from similar studies of the alkyl ammonium ion-halide interactions in water.34-37
Factors which may account for electric field gradient changes have been discussed by several authors and several approaches to the question based on very different assumptions have been shown to be capable of accounting for the magnitudes of the effects encountered in aqueous solutions.38 0 For example, electric gradients may be generated by fluctuations in the electric field caused by the rotational or vibrational motion of water dipoles adjacent to the ion or by the large pulse of electric assymmetry generated when a colliding molecule or ion recoils from the repulsive part of the pair potential. It also seems possible that temporary defects in the solvation of an anion or cation could contribute significantly to the relaxation.
In the present case of halide ion relaxation, electric fields at the anion nucleus in the outer-sphere complex generated by the presence of the adjacent tripositive cation could be significant. However, calculation of the field gradient from the adjacent ion shows that this contribution to the relaxation rate is small.42 The magnitude of such a gradient should be inversely proportional to the size of the cation, but the data show the opposite trend. In some cases where outer-sphere complexes have been reported by other methods3 for the ions listed in Table I, very small effects are observed in the halide NMR spectrum. These observations suggest that the electrostatic contribution to the field gradient expected from the cation is not a dominant factor in determining the total relaxation rate of the anion in the outer-sphere complex.
Concentrations of the solutions studied were high by the standards of electrolyte theory.27 However, in a solution 0.1 M in [Co(en)3]Cl3 and 1.5 M in NaCl, there are on the average slightly more than 16 water molecules available to sol
vent each ion. This is certainly sufficient to provide complete solvation in the sense of a first hydration level with water remaining for higher order interactions. Therefore insufficient primary solvation of the separate ions does not explain the observations.
In light of these considerations solvation sphere perturbations by associated cations remain as the most probable source of electric field gradient changes around halide ions in outer-sphere complexes. This idea has been advanced previously in discussions of halide relaxation in the presence of alkyl ammonium ions34 36 and recently criticized.37 In order to obtain information about structural details of the outer-sphere complex from halide NMR line broadening parameters, it is necessary to determine the contributions of various structural types of outer-sphere complexes to the observed line width parameters. The values of Ait, shown in Table III are expected to be weighted averages taken over a number of cation associated sites in solution. Thus
= ¿ P , An; (10)¿=1
where n is the number of outer-sphere structures, and Pi the probability that the nucleus will be found at a site with line width Av,.
Ion pairs are often divided into classes based on the presumed degree of solvent interaction with the associated ions. A direct interaction between cation and anion with no intervening solvent molecules is classified as a contact ion pair.41 Solvent-shared ion pairs have one solvent molecule between the ions that is common to both solvation spheres. In solvent-separated ion pairs, the primary solvation of the cation and anion remains essentially complete in the associated product.
To assess the relative contributions of different structures to an observed line width, model systems were chosen to approximate the various types of ion pairs. The effects of first solvation sphere changes on the 35C1 relaxation of chloride ion such as would be provided by contact ion pair formation can be approximated from the relaxation time changes upon introducing other solvent molecules. For lithium chloride in methanol-water mixtures, the 35C1 line width is directly proportional to methanol mole fraction and increases from 12 Hz in pure water to 180 Hz in pure methanol as shown in Figure 4. This change is small compared with a 1000-Hz line width calculated for the [Co(bn)3]3+, Cl” ion pair. However, a relatively small effect from methanol is not surprising if methanol is considered as methyl-water. This result shows that even this subtle change in the first solvation sphere of chloride ion will produce large changes in the 35C1 relaxation time.
A quadrupole-relaxed nucleus with an intact first coordination sphere provides a model for a solvent-shared or solvent-separated ion pair. Two such ions were selected to assess these effects: [Cl(en)3]3+ and CIO4”. In the first case, relaxation time changes due to the presence of various outer-sphere ligands were measured for the 59Co resonance of [Co(en)3]3+ and the results are listed in Table II. Except for the phosphate outer-sphere complex, no appreciable effect on the 59Co line width is observed in the presence of these anions. Chloride, bromide, and iodide ions produce no more effect than the more weakly associated perchlorate ion. A it, calculated for the phosphate ion pair is 260 Hz, which is only a factor of two larger than the line width of the uncomplexed ion. Separate measurements of the cobalt
The Journal o f Physical Chemistry, Vol. 79, N o. 17, 1975

NMR Investigation of Co(lll) Outer Sphere Complexes 1873
2 0 0 4
Ü 150
100
5 0
Q 25 0 5 0 0 7 5 100M o le F r a c t io n M e th a n o l
Figure 4. 35CI NMR line width vs. mole traction of methanol in 1.0 M lithium chloride solutions in water-methanol.
TABLE V: 35C1 Tip in Sodium Perchlorate Solutions
[N aC lO j,M Solvent Other ions presen t T sec
2.2 H ,0 0.253.7 H ,0 0.257.5 h 2o 0.1415 h 20 0.093.5 Acetone 0.011
(0.025)62.2 H20 0.1 XI [Co(en)3]-
(C104)30.26 (0.25)1
2.2 HjO 0.1 M [Co(pn)3J- (C104)3
0.20 (0.25)'
a Estimated error is 10%. 6 Corrected for viscosity.
complex rotational correlation time demonstrate that the correlation time changes by at least a factor of two when the phosphate ion is associated. Therefore, no change in the field gradient term is required to explain the change in the 59Co line width.42 It is critical to note that placement of a highly charged ion in the second coordination sphere of the cobalt complex appears to make a negligible contribution to the 59Co relaxation rate. This suggests that electrostatic effects are very efficiently attenuated by the symmetric and covalent first coordination sphere.
To the extent that the rigid tetrahedral arrangement of oxygen atoms in perchlorate ion resembles the nearest neighbor structure of chloride ion, measurements of 35C1 in perchlorate ion should reflect the importance of second coordination sphere effects in chloride ion relaxation. The 35C1 relaxation time of perchlorate ion is expected to be long because in perfect tetrahedral symmetry the quadru- pole contribution to relaxation would vanish. The 35C1 relaxation time may be determined by measuring T ip,9 which is equal to T2 in the limit of very small Hi and in the absence of any slow processes in solution. Tip measurements summarized in Table V show that T2 for 36C1 in 2.2 M NaCICU is 0.25 sec, giving a line width of about 1 Hz in aqueous solution. Increasing NaC104 concentration and the addition of [Co(en)3]3+ and [Co(pn)3]3+ do not produce any measurable effect on the 35C1 T ip when viscosity corrections are made. This result is in agreement with the expectation that second coordination sphere perturbations should have small effects on the perchlorate 35C1 relaxation time, however, it is inconclusive since the outer-sphere complexes are weak.
A more drastic change in the presumed second coordination sphere of perchlorate ion occurs if it is placed in a non- aqueous solvent such as acetone. For 3 M NaClO.i in acetone, the 35C1 line width of the absorption mode signal is 28 Hz. After viscosity corrections, this corresponds to a relaxation time of 0.025 sec, which is ten times shorter than the T2 value measured in aqueous solution. To the extent that perchlorate is a useful model, these results conflict with those from the 59Co measurements. A possibly critical difference between these two systems is that perchlorate ion is four coordinate and cobalt six coordinate. It may be that neither model is an accurate representation of aqueous chloride ion. Even with the large change in the perchlorate ion relaxation time attending the introduction of acetone, the relaxation rates are small compared with these observed for chloride ion in association with complex cations where perturbations of the primary hydration is possible.
Therefore we suggest that the changes observed in the chloride ion relaxation times are due primarily to perturbations of the first hydration sphere.
Assuming that association constants are similar for all outer-sphere complexes of the trivalent cations with a given anion, which is supported by the Kos values determined here, the differences in halide line widths can be attributed to different effects on the primary solvation spheres of the associated anions. The effects increase in the order [Co(NH3)6]3+ < [Co(NH3)5OH2]3+ < [Co(N-H3)4(OH2)2]3+ « [Co(en)3]3+ < [Co(pn)3]3+ < [Co(bn)3]3+. It is tempting to suggest detailed models based on these results; however, these experiments by themselves do not provide compelling evidence to support them. The ligands in [Co(en)3]3+, [Co(pn)3]3+, and [Co(bn)3]3+ are increasingly hydrophobic and Avoa values for chloride ions associated with these complexes increase in the same order. The effects of alkyl groups on the structure of water have been investigated extensively, particularly in the case of tetraalk- ylammonium salts. Collectively this work indicates that the alkyl groups do affect the nature of water in their vicinity including that in hydration domains of other ions. The extension of this conclusion to suggest that alkyl groups coordinated to metals such as in the diamine series should alter the water structure in the solvation domain of an associated outer-sphere ligand such as chloride ion is supported by the present work.
Acknowledgment. This work was supported by The Merck Company, The Research Corporation, The Graduate School, and The Chemistry Department, University of Minnesota, and the National Institutes of Health, GM 19719.
Helpful discussions with Professors Harold Friedman and H. G. Hertz are gratefully acknowledged.References and Notes(1) R. A. Robinson and R. H. Stokes, ‘'Electrolyte Solutions", Butterworths,
London, 1959.(2) F. A. Posey and H. Taube, J. Am. Chem. Soc.. 75, 1463 (1953).(3) M. T. Beck, Coord. Chem. Rev., 3, 91 (1968).(4) T. R. Stengle and C. H. Langford, J. Phys. Chem., 69, 3299 (1965).(5) L. E. Orgel and R. S. Mulliken, J. Am. Chem. Soc., 79, 4839 (1957).(6) L. Johansson, Coord. Chem. Rev., 12, 241 (1974).(7) J. J. Lingane and J. W. Collat, Anal. Chem., 22, 166 (1950).(8) R. G. Bryant, Y. Legler, and M. Han, Biochemistry, 11, 3846 (1972).(9) I. Solomon, C. R. Acad. Sci., 92, 248 (1959).
(10) P. R. Bevington, "Data Reduction and Error Analysis for the Physical Sciences”, McGraw-Hill, New York, N.Y., 1969.
(11) L. E. Conroy and R. S. Tobias, "General Chemistry Laboratory Operations”, Macmillan, New York, N.Y., 1965, p 150.
(12) G. G. Schlessinger, Inorg. Syn., 9, 160 (1967).
The Journal of Physical Chemistry, Vol. 79, No 17, 1975
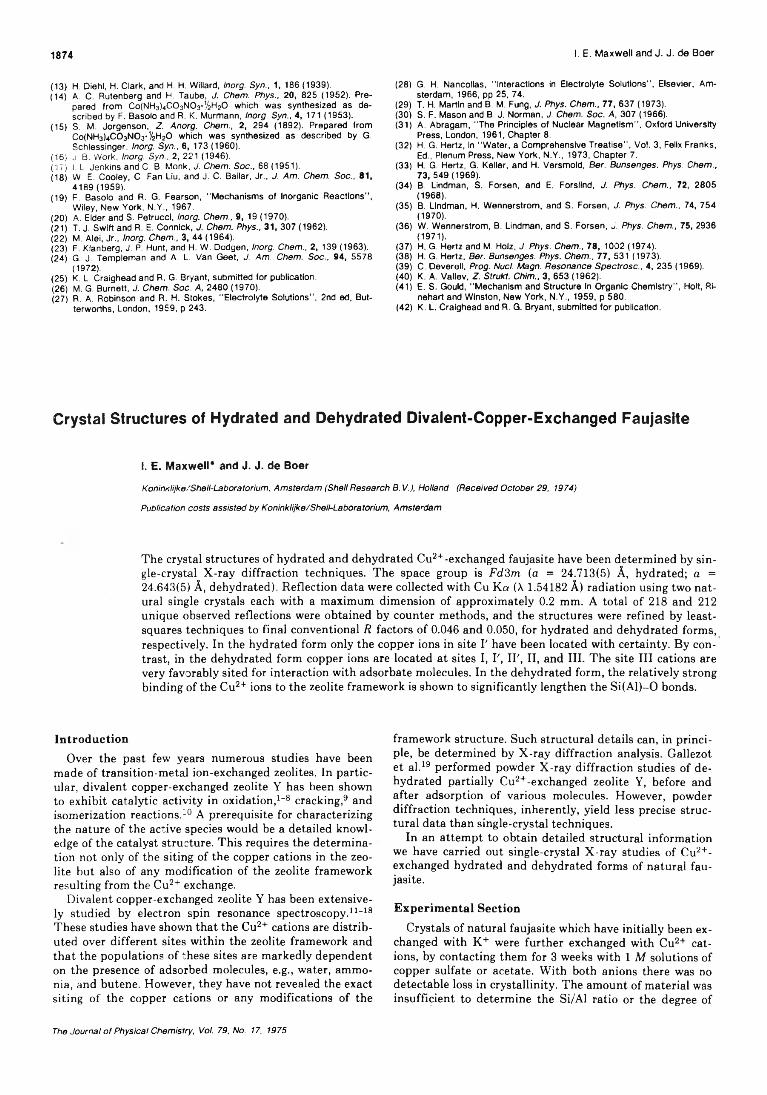
1874 I. E. Maxwell and J. J. de Boer
(13) H. Diehl, H. Clark, and H. H. Willard, Inorg. Syn., 1, 186 (1939).(14) A. C. Rutenberg and H. Taube, J. Chem. Phys., 20, 825 (1952). Pre
pared from Co(NH3)4C03N03-y2H20 which was synthesized as described by F. Basolo and R. K. Murmann, Inorg. Syn., 4, 171 (1953).
(15) S. M. Jorgenson, Z Anorg. Chem., 2, 294 (1892). Prepared from Co(NH3)4C03N03-y2H20 which was synthesized as described by G. Schlessinger, Inorg. Syn., 6, 173 (1960).
(1 6 ) J . B. W o rk , Inorg. Syn.. 2 , 221 (1946).(1 7 ) i. L. Jenkins and C. B. Monk, J. Chem. Soc., 68 (1951).(18) W. E. Cooley, C. Fan Liu, and J. C. Bailar, Jr., J. Am. Chem. Soc., 81,
4189 (1959).(19) F. Basolo and R. G. Pearson, “Mechanisms of Inorganic Reactions",
Wiley, New York, N.Y., 1967.(20) A. Elder and S. Petrucoi, Inorg. Chem., 9 , 19 (1970).(21) T. J. Swift and R. E. Connick, J. Chem. Phys., 31, 307 (1962).(22) M. Alei, Jr., Inorg. Chem., 3, 44 (1964).(23) F. Klanberg, J. P. Flunt, and FI. W. Dodgen, Inorg. Chem., 2, 139 (1963).(24) G. J. Templeman and A. L. Van Geet, J. Am. Chem. Soc., 94, 5578
(1972).(25) K. L. Craighead and R. G. Bryant, submitted for publication.(26) M. G. Burnett, J. Chem Soc. A, 2480 (1970).(27) R. A. Robinson and R. H. Stokes, “Electrolyte Solutions”, 2nd ed, But
terworths, London, 1959, p 243.
(28) G. H. Nancollas, "Interactions in Electrolyte Solutions", Elsevier, Amsterdam, 1966, pp 25, 74.
(29) T. H. Martin and B. M. Fung, J. Phys. Chem., 77, 637 (1973).(30) S. F. Mason and B. J. Norman, J. Chem. Soc. A, 307 (1966).(31) A. Abragam, "The Principles of Nuclear Magnetism", Oxford University
Press, London, 1961, Chapter 8.(32) Fl. G. Hertz, in "Water, a Comprehensive Treatise", Vol. 3, Felix Franks,
Ed., Plenum Press, New York, N.Y., 1973, Chapter 7.(33) H G. Hertz, G, Keller, and H. Versmold, Ber. Bunsenges. Phys. Chem.,
73,549(1969).(34) B. Lindman, S. Forsen, and E. Forslind, J. Phys. Chem., 72, 2805
(1968).(35) B. Lindman, H. Wennerstrom, and S. Forsen, J. Phys. C-hem., 74, 754
(1970) .(36) W. Wennerstrom, B. Lindman, and S, Forsen, J. Phys. Chem., 75, 2936
(1971) .(37) H. G. Hertz and M. Holz, J. Phys. Chem., 7 8 , 1002 (1974).(38) H. G. Hertz, Ber. Bunsenges. Phys. Chem., 77, 531 (1973).(39) C. Deverell, Prog. Nucl. Magn. Resonance Spectrosc., 4, 235 (1969).(40) K. A. Valiev, Z Strukt. Chim., 3, 653 (1962).(41) E. S. Gould, "Mechanism and Structure In Organic Chemistry”, Holt, Ri
nehart and Winston, New York, N.Y., 1959, p 580.(42) K. L. Craighead and R. G. Bryant, submitted for publication.
Crystal Structures of Hydrated and Dehydrated Divalent-Copper-Exchanged Faujasite
I. E. Maxwell* and J. J. de Boer
Koninklljke/Shell-Laboratorium, Amsterdam (Shell Research B. V.), Holland (Received October 29, 1974)
Publication costs assisted by Koninklijke/Shell-Laboratorium, Amsterdam
The crystal structures of hydrated and dehydrated Cu2+-exchanged faujasite have been determined by single-crystal X-ray diffraction techniques. The space group is FdSm (a = 24.713(5) A, hydrated; a = 24.643(5) A, dehydrated). Reflection data were collected with Cu Ka (X 1.54182 A) radiation using two natural single crystals each with a maximum dimension of approximately 0.2 mm. A total of 218 and 212 unique observed reflections were obtained by counter methods, and the structures were refined by least- squares techniques to final conventional R factors of 0.046 and 0.050, for hydrated and dehydrated forms, respectively. In the hydrated form only the copper ions in site I' have been located with certainty. By contrast, in the dehydrated form copper ions are located at sites I, I', IT, II, and III. The site III cations are very favorably sited for interaction with adsorbate molecules. In the dehydrated form, the relatively strong binding of the Cu2+ ions to the zeolite framework is shown to significantly lengthen the Si(Al)—0 bonds.
IntroductionOver the past few years numerous studies have been
made of transition-metal ion-exchanged zeolites. In particular, divalent copper-exchanged zeolite Y has been shown to exhibit catalytic activity in oxidation,1' 8 cracking,9 and isomerization reactions.10 A prerequisite for characterizing the nature of the active species would be a detailed knowledge of the catalyst structure. This requires the determination not only of the siting of the copper cations in the zeolite but also of any modification of the zeolite framework resulting from the Cu2+ exchange.
Divalent copper-exchanged zeolite Y has been extensively studied by electron spin resonance spectroscopy.11' 18 These studies have shown that the Cu2+ cations are distributed over different sites within the zeolite framework and that the populations of these sites are markedly dependent on the presence of adsorbed molecules, e.g., water, ammonia, and butene. However, they have not revealed the exact siting of the copper cations or any modifications of the
framework structure. Such structural details can, in principle, be determined by X-ray diffraction analysis. Gallezot et al.19 performed powder X-ray diffraction studies of dehydrated partially Cu2+-exchanged zeolite Y, before and after adsorption of various molecules. However, powder diffraction techniques, inherently, yield less precise structural data than single-crystal techniques.
In an attempt to obtain detailed structural information we have carried out single-crystal X-ray studies of Cu2+- exchanged hydrated and dehydrated forms of natural faujasite.
Experimental SectionCrystals of natural faujasite which have initially been ex
changed with K+ were further exchanged with Cu2+ cations, by contacting them for 3 weeks with 1 M solutions of copper sulfate or acetate. With both anions there was no detectable loss in crystallinity. The amount of material was insufficient to determine the Si/Al ratio or the degree of
The Journal o f Physical Chemistry, Vol. 79, No. 17, 1975

Crystal Structures of Divalent-Cu-Exchanged Faujasite 1875
Cu2+ exchange by chemical analysis. However, the Si/Al ratio could be estimated from the unit cell constant of the original, hydrated K+-exchanged form.
To our knowledge ion-exchange isotherms have only been published for the Cu2+/Na+-X system.20 Nevertheless, these show that the selectivity is very much in favor of Cu2+ ions in the zeolite surface and that 100% exchange can be readily achieved. The Cu2+/Na+-Y ion-exchange system would not be expected to be markedly different, thus we would expect to have achieved close to 100% Cu2+ exchange of the faujasite crystals.
Mortier and Bosmans21 carried out powder X-ray analyses of four hydrated K+-exchanged synthetic zeolites, types X and Y, with different Si/Al ratios. As shown in Figure 1, the relationship between the unit cell constants and the number of cations per unit cell is approximately linear. Using this graph and the measured cell constant for our sample of K+-exchanged natural faujasite (a = 24.761(5) A), we find a unit cell formula of K56(A102)s6(Si02)i36- XH2O and thus a Si/Al ratio of 2.42. This is in good agreement with the Si/Al ratio for natural faujasite reported by Baur22 (Si/Al = 2.31). Data collection of the hydrated form was carried out by simply mounting a suitable single crystal on a glass fibre. For the dehydrated form a crystal was firmly wedged inside a thin-walled Lindeman glass capillary. The crystal was then heated at 150° for 20 hr while the capillary was evacuated to 10~3 Pa (= 10~5 Torr). Both crystals (each with maximum dimensions of approximately 0.2 X 0.1 X 0.1 mm) were aligned about [110] and then placed on a Nonius three-circle automatic diffractometer equipped with scintillation counter and pulse-height discriminator. Least-squares cell refinement based on 6, —6 {6 < 15°) values measured for several reflections with Cu Ka radiation (X 1.54182 A) gave the following lattice parameters: hydrated, a = 24.713(5) A; dehydrated a = 24.643(5)A.
For both forms six equivalent data sets were collected, using Ni-filtered Cu Ka radiation (0 < 50°). The 6 — 26 scan method was used with a scanning speed of 0.6°/min (in 6) and a scan range of 0.7°. Backgrounds were measured for half of the scan time on each side of the reflection. Control reflections monitored at regular intervals showed no significant variations in intensity, for both crystals, during data collection. Initial standard deviations in observed structure factors were calculated from counting statistics, but these were later found to be inadequate. Lorentz, polarization, and ¡¿¡-dependent absorption corrections (aCuK„ = 5.2 m m '1) were applied, that latter by means of a sem- iempirical method as described by Furnas.23 The ¡^-dependent absorption corrections were obtained by averaging the measurements from several reflections of the type hhO. The variation with 6 was found to be negligible and the ^-dependent absorption correction was neglected. The data were then scaled and averaged to yield 218 and 212 unique reflections with estimated conventional R factors of 0.03 and 0.04 for hydrated and dehydrated crystals, respectively.
S tructu re D eterm inationFull matrix least-squares refinements were initially car
ried out on the basis of the framework parameters for natural faujasite.24 Copper cations and water molecules were located from a series of difference Fourier syntheses and included in subsequent cycles of refinement. Parameters with high correlation coefficients, such as occupancy and temperature factors, were varied separately in alternating cy-
CUBIC UNIT CELL CONSTANT, o( I N 2 I
Figure 1. Plot of cubic unit cell constant against number of cations per unit cell for hydrated K+-exchanged X and Y zeolites.
cles. Scattering factors for the ions Cu2+, O ', Si2+, and Al3+ were used throughout the refinements.25 In both structures, the agreement between observed and calculated structure factors was poor for the 111 reflection. This was also true for the 220 reflection of the hydrated form (vide infra). These reflections were therefore removed in the final stages of the refinements. The maximum peaks on final difference Fourier syntheses were approximately 0.1 e/A3 in both structures. Most of these were either diffuse or at chemically unacceptable locations. There was no evidence of significant anisotropic thermal motion of framework atoms from difference syntheses. In view of this and of the rather limited amount of reflection data, anisotropic refinement was not attempted.
Plots of ((Fa — Fc)2), in ranges of sin 0/X, at early stages in the refinement of both structures, revealed that the initial weighting scheme based on counting statistics was unsatisfactory. The estimated standard deviations were accordingly modified such that for 0 < sin 6/\ < 0 2062 A-1, <j(F0) = 9.10, hydrated; and 5.63, dehydrated; for 0.2062 < sin 0/A < 0.2598 A-1, <r(F0) = 5.46, hydrated; 4.10 dehydrated; and for sin 6/\ > 0.2598 A-1, ¡r(F0) = 3.51 hydrated; and 4.10 dehydrated.
The final residuals were R\, 0.046 and 0.050, and i?2, 0.042 and 0.049, for hydrated and dehydrated structures, respectively (where R\ = 2||Fo| — |Fc||/2|Fo|, R2 = [2a>(|Fo| ~ |Fc))2/2ai|Fo| 2]1/2 and u = a~2(F0). Final values for the error in an observation of unit weight were 0.96 (hydrated) and 1.00 (dehydrated). The refined positional, occupancy, and temperature factors are given in Table I. Listings of observed and calculated structure factors (Tables II andIII) are available elsewhere.26
D iscussionThe sitings of cations and water molecules in hydrated
and dehydrated divalent-copper-exchanged faujasite, as determined from the X-ray analyses, are compared in Table IV. Assignments have been made on the basis of the cation-H20 framework distances (see Table V). In some instances it was difficult to make a clear distinction between water molecules and cations (e.g., OW{2), OW(6), OW(7) hydrated form and OW dehydrated form). In these cases the observed electron density could be due either to copper ions that are very weakly bound to the framework (and therefore presumably strongly bound to water) or to strongly bound water molecules.
Copper cations are evidently rather mobile and mainly bound to water molecules in the hydrated form. Only 6.3(2)
The Journal of Physical Chemistry, Vol. 79, No. 17, 1975

1876 I. E. Maxwell and J. J. de Boer
TABLE I: Positional, Thermal, and Occupancy Parameters for Hydrated and Dehydrated Divalent-Copper-Exchanged Faujasite
OccupancyAtom Position“ factor6 X r Z B. À2
(Si,Al) 1S 2 (i) 1.0(a) Hydrated
0.0362(1) 0.3037(1) 0.1247(1) 1.42(8)0 (1) £6(h) 1.0 0 —0.1062(4) 0.1062(4) 2.9(2)0 (2) S6(g) 1.0 0.0033(5) -0.1431(31 0.0033(5) 2.7(2)0(3) £6(g) 1.0 0.0761(5) -0.0329(3) 0.0761(5) 2.6(2)0(4) S6(g) 1.0 0.0717(4) 0.3224(3) 0.0717(4) 2.2(2)Cu(I') 32 (e) 0.196(7) 0.071(1) 0.071(1) 0.071(1) 3.6(3)0W(1) 32 (e) 0.84(4) 0.082(1) 0.168(1) 0.082(1) 3.5(4)0 W(2) S2(e) 0.70(4) 0.016(2) -0.266(2) 0.016(2) 5.9(7)OW(3) 8(a) 0 .10(1) 1/8 1/8 1/8 0.1(9)0W(4) 192 (i) 0.16(2) 0.173(3) -0.197(3) 0.048(3) 11.4(1.9)0W(5) 192(i) 0.16(2) 0.075(3) -0.201(3) 0.109(3) 10.1(2.0)0 W(6) 96 (g) 0.18(3) 0.031(6) 0.427(4) 0.031(6) 10.8(2.3)OW(7) 96 (g) 0 .12(2) 0.006(6) 0.386(4) 0.006(6) 5.7(2.1)
(Si, Al) 192(i) 1.0(b) Dehydrated 0.0359(1) 0.3038(1) 0.125(1) 1.67(8)
0 (1) 96 (h) 1.0 0 -0.1062(5) 0.1062(5) 3.6(2)0 (2) 96(g) 1.0 0.0030(6) -0.1432(4) 0.0030(6) 4.3(2)0(3) 96 (g) 1.0 0.0737(5) -0.0317(4) 0.0737(5) 3.9(2)0(4) 96 (g) 1.0 0.0733(5) 0.3209(4) 0.0733(5) 3.0(2)Cu(l) 16(c) 0.095(13) 0 0 0 8 .2(2 .0)Cu(I'A) 32 (e) 0.355(7) 0.0401(7) 0.0401(7) 0.0401(7) 3.3(2)Cu(l'B) 32(e) 0.086(9) 0.073(5) 0.073(5) 0.073(5) 8.9(1.6)Cu(ll') 32 (e) 0.025(5) 0.047(7) 0.203(7) 0.047(7) 0 .0(1.8)Cu(lIA) 32(e) 0.118(6) 0.031(2) 0.219(2) 0.031(2) 1.1(4)Cu(lIB) 32(e) 0.048(5) 0.006(4) 0.244(4) 0.006(4) 0.6(1.0)Cu(lII) 192 (i) 0.017(3) 0.017(3) 0.418(3) 0.084(3) 3.2(1.7)OW 32(e) 0.166(26) 0.013(6) -0.263(6) 0.013(6) 2.5(1.9)
“ Origin a t center (3m). 6 S tandard deviations in un its of the least significant digits of the corresponding param eter are given in p a ren theses in all tables.
cations per unit cell could be located at site I' inside the so- dalite cage. (The site nomenclature is as follows: site I, center of hexagonal prism; site II, six-membered ring face of sodalite cage on the supercage side; site T and IF lie on the other sides of the six-membered rings, opposite sites I and II, respectively, inside the sodalite cage.) Moreover, these cations are only relatively weakly bonded to the zeolite framework: Cu(I')-0(3) = 2.58(3) A (cf., rcu2+ + ro2~ = 2.09 A). Water molecules are located at site IF [OW(l)], the center of the sodalite cage [OW(3)], and inside the supercage [OW(4)-OW(7)].
In marked contrast to the hydrated form, in the dehydrated form almost all the copper ions (25.1 per unit cell (puc) vs. 28 puc for complete exchange) have been located. The cations are distributed over several different sites, although site I', as in the hydrated form, is clearly favored with a total of 14.2 cations puc. Most of the cations at this site are strongly bound to the zeolite framework [Cu(FA)- 0(3) = 2.12(1) A] and a smaller number of cations are less firmly bound [Cu(I'B)-0(3) = 2.56(1) A] and are therefore presumably interacting with residual water (see Figure 2). A similar cation-framework coordination geometry exists at the single six-membered ring which faces onto the supercage (site II). Copper ions, Cu(II') and Cu(IIA), are strongly bound to the zeolite framework [Cu(IF)-0(2) = 2.29(9) A; Cu(IIA)-0(2) = 2.22(1) A] and a smaller number of cations that are less strongly bound to the framework appear
Figure 2. Perspective view showing the coordination of Cu(l), Cu(l'A), and Cu(l'B) cations to the hexagonal prism in dehydrated divalent- copper-exchanged faujasite (see ref 30).
to be interacting with residual water in the supercage [Cu(IIB)-0(2) = 2.51(10) A, see Figure 3],
More interestingly, copper cations, Cu(III), have been unequivocably located inside the supercage (sites other than site II). The site has no crystallographic symmetry and the cation coordination to the framework oxygen atoms is most unusual (see Figure 4). These cations are located at the edges of the four-membered rings formed by the 0(1) and 0(4) oxygen atoms. The bonding of the copper ions to these oxygen atoms is very unsymmetrical, the
The Journal o f Physical Chemistry, Voi. 79, No. 17, 1975

Crystal Structures of Divalent-Cu-Exchanged Faujasite 1877
TABLE IV : Comparison of S itings of Cations and W ater M olecules in Hydrated and D ehydrated D ivalent-C opper-Exchanged Faujasite
Hydrated Dehydrated
Atom Coordinates3No. per unit cell Atom Coordinates
No. per unit cell
Inside Cu(I) 0“ 1.5(2)dense Cu(I'A) 0.0401(7)“ 11.4(2)cage (Cu(I') 0.071(1)“ 6.3(2) Cu(I'B) 0.073(5)“ 2.8(3)structure |0W(3) 0.125“ 3.2(3)
low(i) 0.168(1)“ 26.9(1.3)Cu(II') 0.203(7)“ 0.8(2)
Inside Cu(IIA) 0.219(2)“ 3.8(2)or on the Cu(IIB) 0.244(4)“ 1.5(2)periphery of OW(2) 0.266(2)“ 22.4(1.3) OW 0.263(6)“ 5.3(8)supercage If 0.173(3) 31(4)structure OW(4) -0.197(3)
I[ 0.048(3)
[ 0.075(3)OW(5) -0.201(3) 31(4)
l 0.109(3)OW(6) |f 0.031(6)
0.427(4) 17(3) Cu(III) (0.017(3) 10.418(3)
1 0.031(6) (0.084(3)OW(7)
i( 0.006(6)
0.386(4)l 0.006(6)
12(2)
Total Cu2+ 6.3 25.1located
Total H20 143.5 5.3located
a Coordinates belong to set 32(e), x = y = z.
TABLE V: Cation-W ater Fram ework D istances (A) for Hydrated and Dehydrated Divalent-Copper-Exchanged F aujasite
Atoms Distance Atoms Distance
(a) HydratedCu(I')-0(3) 2.58(3) OW(4)-0(l) 3.03(6)Cu(I')-0(2) 3.15(2) 0W(4)-0(4) 3.14(7)Cu(I')-OW(3) 2.31(5) OW(5)-0(1) 3.00(7)Cu(I')-OW(l) 2.42(4) 0W(5)-0(2) 3.47(7)OW(l)-0(2) 3.06(4) 0W(6)-0(4) 2.94(13)OW(l)-0(3) 3.64(5) 0W(6)-O(l) 3.38(10)0W(2)-O(2) 3.08(6) OW(7)-0(4) 2.79(18)0W(2)-0(4) 3.37(6) OW(7)-0(l) 3.50(14)
(b) DehydratedCu(I)-0(3) 2.68(2) Cu(IIA)-0(2) 2.22(1)Cu(I)-0(2) 3.53(2) Cu(IIA)-0(4) 2.92(1)Cu(I'A)-0(3) 2.12(1) Cu(IIB)-0(2) 2.51(10)Cu(I'A)-0(2) 2.95(1) Cu(IIB)-0(4) 3.03(6)Cu(I'B)-0(3) 2.56(1) Cu(m)-o(i) 2.16(7)Cu(I'B)-0(2) 3.15(2) Cu(III)-0(4) 2.77(7)Cu(II')-0(2) 2.29(9) OW-0 (2) 2.99(9)Cu(II')-0(4) 3.05(10) OW-0(4) 3.35(9)
interaction with 0(1), Cu(III)-0(l) = 2.16(7) A, beingmuch stronger than with 0(4), Cu(III)-(4) = 2.77(7) A. The short Cu(III)-0(l) distance means that the assignment of this electron density to a copper cation is unequivocal since
Cu ni')
Figure 3. Perspective view showing the coordination of Cu(ll'), Cu(IIA), and Cu(IIB) cations to the single six-membered ring in dehydrated divalent-copper-exchanged faujasite (see ref 30).
such a close approach to framework oxygen ions is not possible for residual water molecules on unexchanged K+ ions. Noteworthy is the water molecule, OW(6), which in the hydrated form is also located in the vicinity of the Cu(III) cation but more distant from the framework as expected (i.e., 0W(6)-0(4), 2.94(13) A, 0W(6)-0(1), 3.38(10) A).
To our knowledge there are no other published X-ray data on cations (other than site II type) that have been located inside the supercage and are bound to the framework. However, there has been considerable speculation as to the most probable siting of these so-called site III type cations.
Conventionally most authors27 have supposed that site III type cations are located at the center of the square faces of the sodalite unit, which is in contrast to the present results. Further studies will be necessary to determine whether this observed site is specific to Cu2+ cations or whether it is also occupied by other divalent and monovalent cations. Olson24 has referred to unpublished X-ray
The Journal of Physical Chemistry, Vol 79, No. 17, 1975

1878 I. E. Maxwell and J. J. de Boer
FRONT VIEW SIDE VIEWFigure 4. Perspective views of Cu2+ cations coordinated to the oxygen atoms at the edges of the four-membered rings in the supercages of dehydrated divalent-copper-exchanged faujasite (see ref 30).
data on dehydrated NaX, where Na+ ions were also located at the edges of the square faces. This suggests that this site may be generally occupied irrespective of the type of cation (cf., sites I, I', II, and II'). The lack of symmetry together with the low occupancy factors have clearly been responsible for the previous difficulties in locating site III type cations by X-ray analysis.
As previously mentioned, the Cu(III) cations are almost exclusively bonded to the bridging hexagonal prism oxygen atoms, 0(1). These cations are therefore located at a position in the supercage which is highly accessible to adsorbed molecules, namely, at the entrances to the large cavities (see Figure 5). Cations at site II, however, which are also accessible to adsorbed molecules, are partially shielded from adsorbent molecules by the six-membered ring oxygen atoms. Thus site ill Cu2+ cations would appear to be the most favorably sited to interact with adsorbent molecules and are therefore likely to be the catalytically most active sites. Interestingly, this site is remarkably similar to the proposed siting or protons in hydrogen faujasite. From X-ray studies, Olson and Dempsey28 concluded on the basis of Si (Al)—0 bond distances that the most reactive protons in hydrogen faujasite were also attached to the bridging oxygens, 0 (1). of the hexagonal prism.
As indicated in Table VI the Si(Al)—0 distances in the dehydrated form show a marked variation whereas those in the hydrated form remain equal (within 1 estimated standard deviation). This difference can be related to the interaction between framework oxygen atoms and the copper cations. In the hydrated form there are no strong cation - framework interactions, the closest approach being that of Cu(I')-0(3) = 2.58(3) A. However, for the dehydrated form there are several rather strong interactions between various copper cations and oxygen atoms. In Figure 6 the Si(Al)-0 distances for the dehydrated form are plotted against the percentage of each type of oxygen atom in close contact with a copper cation (these values are less than 100% due to partial occupancy of sites by cations). Clearly, there is an approximately linear relationship between these two quantities. By extrapolation it can be seen that for 100% involvement of oxygen atoms in bonding with copper cations the Si(Al)-0 bond distance is lengthened to 1.69 A (cf.,1.63 A for 0% divalent copper-oxygen bonding), indicating
Figure 5. Perspective view showing the siting of Cu2+ cations at the pore entrance to the supercage in dehydrated divalent-copper-ex- changed faujasite (see ref 30).
TABLE VI: Fram ework D istances (A) and Bond A ngles (degrees) for Hydrated and Dehydrated D ivalent-Copper-Exchanged Faujsite
Atoms Hydrated Dehydrated
(Si.Al)-O(l) 1.644(6) 1.628(7)(Si, Al)—0(2) 1.643(5) 1.640(5)(Si, Al)—0(3) 1.647(4) 1.661(5)(Si, Al)-0(4) 1.644(5) 1.629(5)Mean value 1.645 1.640(Si, Al)-O(l)-<Si, Al) 138.5(1.0) 138.3(1.2)(Si, Al)—0(2)—(Si, Al) 146.0(7) 144.8(8)(S1,A1)-0(3HS1.A1) 141.8(6) 137.9(7)(Si,Al)-0(4)~(Si,Al) 140.5(7) 145.3(8)Mean value 141.7 141.60( 1)—0(2) 2.702(14) 2.696(16)0( 1)—0(3) 2.714(13) 2.696(17)0(l)-O(4) 2.648(5) 2.655(5)0(2) -0(3) 2.669(8) 2.649(9)0(2)-0(4) 2.667(6) 2.650(8)0(3) -0(4) 2.710(16) 2.717(18)Mean value 2.685 2.6770(lHSi,Al)-0(2) 110.6(7) 111.2(8)0(1)—(Si,Al)—0(3) 111.1(6) 110.1(8)0(1)—(Si, Al)—0(4) 107.3(6) 109.2(7)0(2)—(Si,Al )--0(3) 108.4(6) 106.7(7)0(2)-(Si,Al)~0(4) 108.4(6) 108.3(6)0(3HSi,Al) -0(4) 110.9(8) 111.3(9)Mean value 109.5 109.5
a decrease in bond order. Similar effects were reported by Olson24 for dehydrated Mi2+ faujasite and dehydrated CaX and SrX zeolites.28
This decrease in Si(Al)—O bond order in dehydrated divalent copper-exchanged faujasite might explain some of the results obtained in oxygen mobility studies of zeoliteY.29 These studies showed that the activation energy for oxygen exchange with the lattice decreased markedly on exchanging Na+ for Cu2+ cations (NaY, Eexch = 45 kcal/ mol; Cu2+Y, 2?exch = 23 kcal/mol). Evidently, the oxygen bonding to the lattice is weakened in the presence of Cu2+ cations, as is seen from the X-ray results. Unfortunately, X-ray structural data on dehydrated NaY are not available
The Journal o f Physical Chemistry, Vol. 79, No. 17, 1975

Crystal Structures of Divalent-Cu-Exchanged Faujasite 1879
PERCENTAGE OF EACH OXYGEN ATOM IN CLOSE CONTACT WITH A COPPER ION
St (Al)-O BONO DISTANCE, XFigure 6. Plot of Si(AI)—O bond distance against the percentage of each oxygen atom in close contact with a copper ion in dehydrated divalent-copper-exchanged faujasite.
for comparison. However, it would seem that exchangeable cations, particularly those with a high polarizing power, can have a pronounced influence on the chemical bonding within the zeolite framework itself.
The present X-ray study cannot be directly compared with the powder diffraction studies of Gallezot et al.20 since the copper-exchange levels and dehydration temperatures (150° present study, 500° Gallezot et al.20) are different. Nevertheless, the distributions of Cu2+ cations over sites I and I' are surprisingly similar (site I, 1.5(2) puc, 3.2; site T, 11.4(2), 11.1(2); for the present study and that by Gallezot et al.20 respectively). This would seem to emphasize the strong preference of Cu2+ cations for site I'. By contrast, in dehydrated nickel(II)-exchanged faujasite (and zeolite Y) Ni2+ cations are preferentially located inside the hexagonal prisms at site I. This difference in site preference between two cations of such similar ionic radii (^ ¡2+ = 0.72, rcu2+ = 0.69 A) would appear to be related to preferred coordination geometries (octahedral coordination for site I and trigonal coordination for site I') as determined by the different electronic properties of the cations.
Supplementary Material Available. Listings of observed
and calculated structure factor amplitudes (Tables II andIII) will appear following these pages in the microfilm edition of this volume of the journal. Photocopies of the supplementary material from this paper only or microfiche (105 X 148 mm, 24X reduction, negatives) containing all of the supplementary material for the papers in this issue may be obtained from the Journals Department, American Chemical Society, 1155 16th St., N.W., Washington, D.C. 20036. Remit check or money order for $4.00 for photocopy or $2.50 for microfiche, referring to code number JPC-75- 1874.
R eferen ces and N otes(1) I. Mochida, S. Hayata, A. Kato, and T. Selyama, J . C a ta l. , 15, 314
(1969).(2) I. Mochida, S. Hayata, A. Kato, and T. Seiyama, J . C a ta l. , 23, 31 (1971).(3) I. Mochida, T. Jitsumatsu, A. Kato, and T. Seiyama, B u ll. C h e m . S o c .
J p n .. 44, 2595 (1971).(4) C. Naccache and Y. BenTaarit, J . C a ta l. , 22, 171 (1971).(5) S. Roginskii, O. V. Altshuler, O. M. Vinogradova, V. A. Seleznev, and I.
L. Tsitovskaya, D o k l. A k a d . N a u k . S S S R , 196, 872 (1970).(6) G. K. Boreskov, N. N. Bobrov, N. G. Maksimov, V. F. Anufrienko, K. G.
lone, and N. A. Shestakova, D o k l. A k a d . N a u k . S S S R , 201, 887 (1971),(7) I. Mochida, S. Hayata, A. Kato, and T. Seiyama, B u ll. C h e m . S o c . Jpn.,
44,2282(1971).(8) O. V. Altshuler, I. L. Tsitovskaya, O. M. Vinogradova, and V. A. Sel
eznev, Izv . A k a d . N a u k . S S S R , 2145 (1972).(9) K. Tsutsumi, S. Fuji, and H. Takahashi, J . C a ta l. , 24, 146 (1972).
(10) C. Dimitrov and H. F. Leach, J . C a ta l. , 14, 336 (1969).(11) A. Nicula, D. Stamires, and J. Turkevich, J . C h e m . P h y s ., 42, 3684
(1965).(12) J. T. Richardson, J . C a ta l. . 9, 178 (1967).(13) H. B. Slot and J. L. Verbeek, J . C a ta l. , 12, 216 (1968).(14) C. Naccache and Y. Ben Taarit, C h e m . P h y s . L e t t . , 11, 11 (1971).(15) J Turkevich, Y. Ono, and J. Soria, J. C a ta l. , 25, 44 (1972).(16) I. R. Leith and H. F. Leach, P ro c . R . S o c . , S e r . A , 330, 247 (1972).(17) E. F. Vansant and J. H. Lunsford, J . P h y s . C h e m ., 76, 2860 (1972).(18) C. Naccache, M. Che, and Y. Ben Taarit, C h e m . P h y s . L e t t . , 13, 109
(1972).(19) P Gallezot, Y. Ben Taarit, and B. Imelik, J. C a ta l. . 26, 295 (1972).(20) F. Wolf, D. Ceacareanu, and K. Pilchowski, Z . P h y s . C h e m . (L e ip z ig ) ,
252, 50 (1973).(21) W. J. Mortier and H. J. Bosnians, J . P h y s . C h e m ., 75, 3327 (1971).(22) W. H. Baur, A m . M in e ra l, 49, 697 (1964).(23) T. C. Furnas, "Single Crystal Orienter Instruction Manual", General Elec
tric Company, Milwaukee, Wise., 1957.(24) D. H. Olson, J . P h ys . C h e m ., 72, 4366 (1968).(25) "International Tables for X-ray Crystallography”, Vol. II, Kynoch Press,
Birmingham, England, 1969.(26) See paragraph at end of text regarding supplementary material.(27) J. V. Smith, A d v . C h e m . S e r ., No. 101, 171 (1971).(28) D. H. Olson and E. Dempsey, J . C a ta l. , 13, 221 (1969).(29) G. V. Antoshin, Kh. M. Minachev, E. N. Sevastjanov, D. A. Kondratjev,
and C. Z. Newy, A d v . C h e m . S e r ., No. 101, 514 (1971).(30) Because of partial occupancy of sites by Cu2+ ions and repulsive forc
es, simultaneous occupancy of Cu2+ ion sites shown in Figures 2-5 is not expected.
The Journal of Physical Chemistry, Vol. 79, No. 17, 1975

1880 A. B. M. S. Bassi and Roy E. Bruns
Polar Tensors and Effective Charges of Br2CO
A. B. M. S. Bassi and Roy E. Bruns*
In s t itu to d e Q u ím ic a , U n iv e rs id a d e E s ta d u a l d e C a m p in a s , C a m p in a s , S P , B ra z i l (R e c e iv e d F e b r u a ry 2 4 , 1 9 7 5 )
P u b lic a t io n c o s ts a s s is te d b y F u n d a c a o d e A m p a r o á P e s q u is a d o E s ta d o d e S a o P a u lo
Polar tensors and effective charges of Br2CO have been calculated and the recently reported sign ambiguity for the Bi symmetry dipole moment derivatives has been confirmed. Small changes in the values of the dipole moment derivatives of CI2CS, due to a sign ambiguity in earlier treatments, are also reported. The effective charges of Br2CO are compared with those calculated for other X2CY (X = F, Cl; Y = 0, S) molecules.
Recently, Prasad and Singh1 have pointed out a sign ambiguity in the dipole moment derivatives of the Bi symmetry species of Br2C0 .2 Using the polar tensor formalism3'4 and the effective charges4’5 of the X2CY molecules (X = F, Cl, Br; Y = 0, S) we have been able to affirm the conclusions of Prasad and Singh for Br2C0 and to ascertain that a sign ambiguity also exists in the Bi symmetry species of C12CS.6 As the polar tensor and effective charge values of the X2CY molecules” are of interest in their own right the previously unreported values for Br2C0 are presented in this report.
The atomic polar tensor (for atom a) is composed of the derivatives of the molecular dipole moment with respect to the atomic cartesian coordinates
/ 3/>x/a* a zp jdy* ^px/ d z \Px'a) = d p j d x a a p j d y a dpy/ a z a (1)
\dp2/dxa * p j a v 0 dpjdza )
The polar tensor for the X2CY molecules is defined as a juxtaposition of its atomic polar tensors
Px = (P*,c)| p*<Y>lPxlXt)| p*<X2)) (21The values of P * are calculated directly using the matrix equation
P* = PqL-’UDM172 + Pp5M1/2 (3)The first term in eq 3 represents purely vibrational contributions to P x. The P q matrix is of dimension 3(3N — 6) and contains values of apm/dQt (m = x, y, or 2; t = 1, 2 . . . , 3N — 6) which are evaluated directly from the infrared intensities.4 The signs of the elements of the P q matrix are those suggested on the basis of semiempirical CNDO molecular orbital investigations.8 The matrices L_1, U, and D M 1/2 = B are the standard coordinate transformation matrices involved in the evaluation of the force fields of molecules. The second term in eq 3 expresses the rotational contribution to P x and has been described previously.4 The values of P * are determined in part by the signs of the elements in P q and P „ (those of the latter matrix being specified by the sign of the equilibrium dipole moment). Previous analysis of infrared intensity data was hampered by the lack of an analytical expression which clearly indicates the effect of the different sign choices for the equilibrium moment and the dp/sQi on the values of the dipole moment derivatives with respect to the symmetry coordinates, a p / a S j .
A knowledge of the polar tensor values leads to a
straightforward determination of the effective charge values,4 of atom a
£a2 = TR[Pxt“ ,(PI (“V ] = (9 p /9 * a) 2 +(9 p /9 y J 2 + (9p /9 z y (4)
Here, TR[Px(a)(Px(“))'] represents the trace of the matrix product of the atomic polar tensor with its transpose. The effective charges are of special interest as they can, in principle, be determined from the intensity sum of all the fundamental bands of a molecule
= Nn/3c2- j f ka2/m u - « 1 (5)k U=l >
In this equation ma represents the mass of atom a, Q corresponds to a rotational correction which depends on the equilibrium dipole moment and the principal moments of inertia of the molecule, and Ak is the experimental infrared intensity of the kth fundamental band.
The polar tensor and effective charge values of the X2CY molecules (X = F, Cl; Y = 0, S) have been shown7 to be related by the empirical equations
PI(“i )(Cl2CO) - P / ^ F j C O ) =
P ^ M d jC S ) - PxlV (F 2CS) (6)and
?Bi(C12CO) - ?a2(F 2CO) = ^ 3(C12CS) - ?c4(F 2CS) (7)
where a4 = 013 = Cl and <22 = <24 = F, oq = <22 = 0 and 03 = <24 = S, or <21 = a2 = <23 = «4 = C. A knowledge of the atomic polar tensors and effective charges of Br2C0 leads to a prediction of the vibrational intensity parameters of Br2CS through equations similar to (6) and (7) if they can be extended to the bromine substituents.
The polar tensor values for Br2C0, corresponding to the preferred sign choice of Prasad and Singh1 are presented in Table I. The atomic cartesian coordinates are defined in Figure 1. The sign ambiguity can be described as follows. As the two normal coordinates of Bi symmetry, Q4 and Q5, produce dipole moment changes in the x direction a reversal of the signs of dpx/dQ4 and dpx/dQ5 as well as a sign change for the equilibrium moment results in a change of all the signs for the first row elements of the atomic polar tensors. Elements contained in the other rows are not affected. This corresponds to a change in the dp/dSj values of the Bj symmetry species. As the rotational contributions to Px in eq 3 are large for Br2CO (up to 0.10 e) the values of
The Journal o f Physical Chemistry, Voi. 79, No. 17, 1975

Polar Tensors and Effective Charges of Br2C0 1881
TABLE I: P olar Tensor of B r2CO (e)“ 6
P (C ) p ( O ) P ( B r j )c.Y * X * r
1.58 ± 0.04 0.0 0.0 -0 .83 ± 0.02 0.0 0.0 -0 .37 ± 0.01 0.0 -0 .0 6 ± 0.020.0 0 10 ± 0.01 0.0 0.0 -0 .17 ± 0.02 0.0 0.0 0.04 ± 0.02 0.00.0 0.0 1.40 ± 0.10 0.0 0.0 -1 .10 ± 0 .03 -0 .19 ± 0.04 0.0 -0 .15 ± 0.03a T h e values of the polar tensor elements are multiples of the electronic charge, e. 1 D A -1 = 0.2082 e = 3.335 x 10' 20 C. b The L ^ 1 matrix
used in th e calculation of these polar tensors is from ref 2. The U matrix and cartesian coordinate system correspond to those of ref 8 . The above p o la r tensors correspond to a sign choice of dp/dQi > 0 for i = 3, 5 and dp/dQi < 0 for i = 1, 2, 4, 6 . In ref 8 dp/dQi was chosen to be positive an d dp/dQ$ was given a negative sign. c The diagonal polar tensor elements for Br2 (see Figure 1) are equal to those of Brj. The off- diagonal elements of Br2 have the same magnitudes but opposite signs to those of Bri.
Z
Y
ap/dSj which are now preferred (corresponding to the —t sign combination for ap^/aQi and apx/aQr:„ respectively) are markedly different from those chosen previously.8 As Prasad and Singh1 have pointed out, the electronic distortions for the various vibrational displacements deduced from the recalculated values of the ap/aSj are more consistent with those found for F2CO and Cl2CO. All of the polar tensor elements in Table I with the exception of apy/aysr have the same signs as their corresponding elements in the tensors for the latter molecules. This element has values of —0.11, 0.00 and 0.04 e for F, Cl, and Br, respectively. These values are expected to become more positive for the heavier atoms.
For CI2CS there is only a sign change in the rotational term of eq 3. As the experimental dipole moment (0.28 D) of CI2CS is larger than the recently measured value of 0.08 D9 for F2CS the chlorine atoms appear to be situated at the positive end of the dipole (+C12CS~). This sense of the moment has been predicted by CNDO calculations10 and was used in our calculation of the polar tensor of C12CS.7 Table II gives the values of the ap/aSj of the Bi symmetry species corresponding to this polar tensor along with the original values.6 Because the rotational contributions are small the differences in magnitudes are less than 0.04 e. The sense of the dipole moment of F2CS is not of importance in the calculation of dipole moment derivatives, as the rotational contributions are smaller than the experimental errors arising in the vibrational analysis.
The effective charges of Br2CO evaluated from eq 4 are compared with those for the other X2CY molecules in Table III. The decrease in the carbon effective charge with substitution of Br for Cl is 0.42 e strikingly similar to the decreases in ¿c on substitution of Cl for F (0.35, X2CO; 0.41, X2CS). The corresponding increases in £0 are 0.23 and 0.12 e. The value of ¿¡Br (0.45 e) is about one-half of the
TABLE II: R ecalculated V alues of the dp/dSj for C12CS (B i Sym m etry) from the Experim ental In ten sities of Ref 6“
Signs Of 3/>/3 <J4
and 3/>/3Q5
Ref 6 v a lu es R eca lcu la ted v a lu es
3/>,/3S4 d p J d S r d p J a S i a p J d S i
+ + -0 .95 + 0.08 -0 .95 + 0.15___b + 0.97 -0.14 +0.95 - 0 . 1 0
+ - -1 .05 -0.03 -1 .07 +0.02— 4 . + 1.07 -0 .03 + 1.08 +0.04
a Units of e. b Preferred set of signs for the dp/dQt. The (--) signchoice, dp /dQ i and dp/dQ 5 both negative, was also chosen pre-viously in ref 10 .
TABLE III: Experim ental Effectives Charges ofF 2 CO, F2CS, CI2 CO, CI2 CS, and B r2CO
X,CYs c
tS Y ts x
F,CO 2.88 ± 0.06 1.04 ± 0.03 1.05 ± 0.02CUCO 2.53 ± 0.09 1.16 ± 0.04 0.86 ± 0.03Br2CO 2.11 ± 0.10 1.39 ± 0.04 0.45 ± 0.04FnCS 2.43 ± 0.06 0.65 ± 0.03 1.06 ± 0.03c u e s 2.02 ± 0.09 0.78 ± 0.04 0.87 ± 0.04Bi’jCS“ (1.66 ± 0.22) (1.00 ± 0.10) (0.46 ± 0.10)
“ Values of Br2CS evaluated using an equation analogous to (7), and the effective charges of F2CS and F2CO. Effective charge values of Br2CS using the values of C12CS and Cl2CO are verv similar (1.60, 1.01, and 0.47 e).
value of ¿ci (0.86 e) in Cl2CO. As the effective charges of F and Cl are both invariant to substitution of oxygen for sulfur we might tentatively predict a bromine effective charge for Br2CS extremely close to the one found for Br2CO. This is borne out by the estimation of the effective charges of Br2CS, also listed in Table III, when Br2CO and Br2CS are substituted in eq 7 for CI2CO and C12CS. The effective charge of carbon which is seen to decrease by 0.41 e upon substitution of Cl for F in the thionyl halides is calculated to decrease by a similar amount, 0.36 e, when Cl is replaced by Br.
These effective charge values of Br2CO emphasize the previous observation7 that this parameter reflects the electronegativities of atoms in molecules. The effective charges of the halogens decrease as does their electronegativities for the heavier atoms. The oxygen effective charges increase and those of carbon decrease with substitution of the less electronegative halogens. It is worth noting that ¿c in Cl2CO and F2CS have similar magnitudes as does this parameter in Br2CO and C12CS. A knowledge of the rela
The Journal of Physical Chemistry, Voi. 79, No. 17, 1975
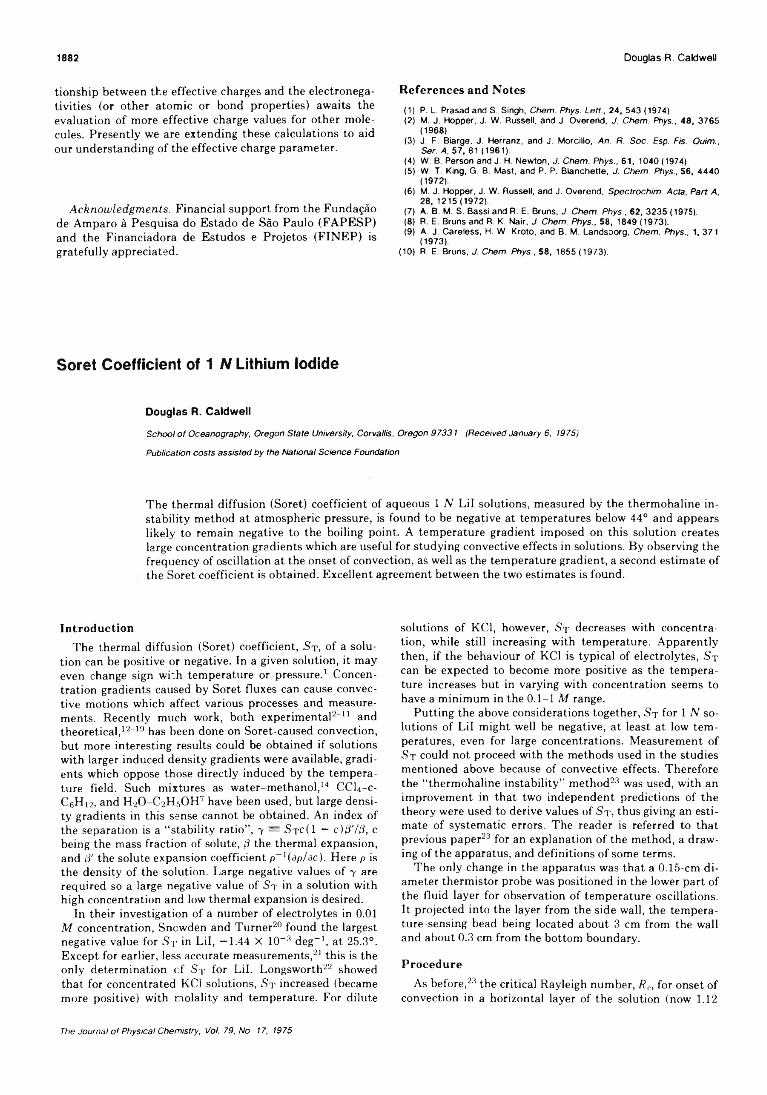
1882 Douglas R. Caldwell
tionship between the effective charges and the electronegativities (or other atomic or bond properties) awaits the evaluation of more effective charge values for other molecules. Presently we are extending these calculations to aid our understanding of the effective charge parameter.
Acknowledgments. Financial support from the Fundaçâo de Amparo à Pesquisa do Estado de Sâo Paulo (FAPESP) and the Financiadora de Estudos e Projetos (FINEP) is gratefully appreciated.
Soret Coefficient of 1 N Lithium Iodide
R eferen ces and N otes(1) P. L. Prasad and S. Singh, Chem. Phys. Lett., 24, 543 (1974).(2) M. J. Hopper, J. W. Russell, and J. Overend, J. Chem. Phys., 48, 3765
(1968).(3) J. F. Biarge, J. Herranz, and J. Morcillo, An. R. Soc. Esp. Fis. Ouim.,
Ser.A, 57,81 (1961).(4) W. B. Person and J. H. Newton, J. Chem. Phys., 61, 1040 (1974).(5) W. T. King, G. B. Mast, and P. P. Blanchette, J. Chem. Phys., 56, 4440
(1972) .(6) M. J. Hopper, J. W. Russell, and J. Overend, Spectrochim. Acta, Part A,
28, 1215 (1972).(7) A. B. M. S. Bassi and R. E. Bruns, J. Chem. Phys., 62, 3235 (1975).(8) R. E. Bruns and R. K. Nair, J. Chem. Phys., 58, 1849 (1973).(9) A. J. Careless, H. W. Kroto, and B. M. Landsoorg, Chem. Phys., 1, 371
(1973) .(10) R. E. Bruns, J. Chem. Phys., 58, 1855 (1973).
Douglas R. Caldwell
School of Oceanography, Oregon State University, Corvallis, Oregon 97331 (Received January 6, 1975)
Publication costs assisted by the National Science Foundation
The thermal diffusion (Soret) coefficient of aqueous 1 N Lil solutions, measured by the thermohaline instability method at atmospheric pressure, is found to be negative at temperatures below 44° and appears likely to remain negative to the boiling point. A temperature gradient imposed on this solution creates large concentration gradients which are useful for studying convective effects in solutions. By observing the frequency of oscillation at the onset of convection, as well as the temperature gradient, a second estimate of the Soret coefficient is obtained. Excellent agreement between the two estimates is found.
IntroductionThe thermal diffusion (Soret) coefficient, St, of a solu
tion can be positive or negative. In a given solution, it may even change sign with temperature or pressure.1 Concentration gradients caused by Soret fluxes can cause convective motions which affect various processes and measurements. Recently much work, both experimental2-11 and theoretical,12-19 has been done on Soret-caused convection, but more interesting results could be obtained if solutions with larger induced density gradients were available, gradients which oppose those directly induced by the temperature field. Such mixtures as water-methanol,14 CCU-c- C6H12, and H2O-C2H5OH7 have been used, but large density gradients in this sense cannot be obtained. An index of the separation is a “stability ratio”, 7 == S t c (1 — c)/3V/3, c being the mass fraction of solute, /3 the thermal expansion, and fi' the solute expansion coefficient p- 1(<3p/3c). Here p is the density of the solution. Large negative values of 7 are required so a large negative value of St in a solution with high concentration and low thermal expansion is desired.
In their investigation of a number of electrolytes in 0.01 M concentration, Snowden and Turner20 found the largest negative value for S t in Lil, —1.44 X 10⁻³ deg-1, at 25.3°. Except for earlier, less accurate measurements,21 this is the only determination cf St for Lil. Longsworth22 showed that for concentrated KC1 solutions, St increased (became more positive) with molality and temperature. For dilute
solutions of KC1, however, St decreases with concentration, while still increasing with temperature. Apparently then, if the behaviour of KC1 is typical of electrolytes, St can be expected to become more positive as the temperature increases but in varying with concentration seems to have a minimum in the 0.1-1 M range.
Putting the above considerations together, St for 1 N solutions of Lil might well be negative, at least at low temperatures, even for large concentrations. Measurement of St could not proceed with the methods used in the studies mentioned above because of convective effects. Therefore the “thermohaline instability” method23 was used, with an improvement in that two independent predictions of the theory were used to derive values of St, thus giving an estimate of systematic errors. The reader is referred to that previous paper23 for an explanation of the method, a drawing of the apparatus, and definitions of some terms.
The only change in the apparatus was that a 0.15-cm diameter thermistor probe was positioned in the lower part of the fluid layer for observation of temperature oscillations. It projected into the layer from the side wall, the temperature-sensing bead being located about 3 cm from the wall and about 0.3 cm from the bottom boundary.
P rocedure
As before,23 the critical Rayleigh number, Rc, for onset of convection in a horizontal layer of the solution (now 1.12
The Journal of Physical Chemistry, Voi. 79, No. 17, 1975
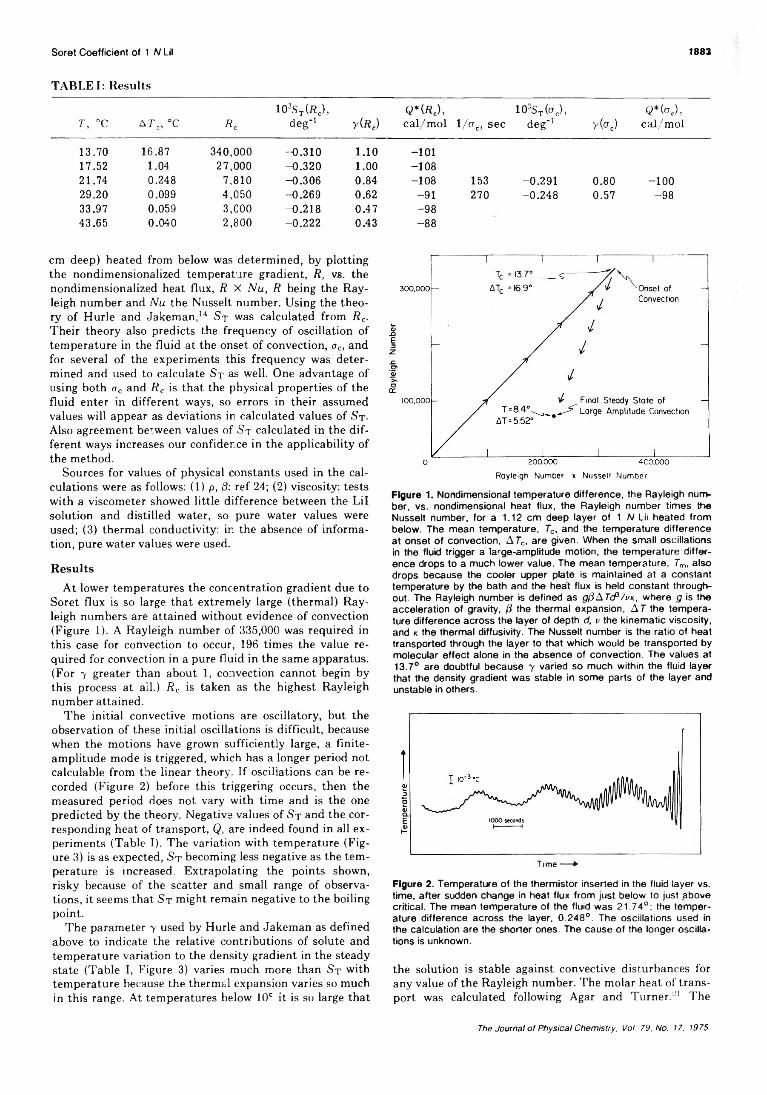
Soret Coefficient of 1 N Lil 1883
TABLE I: R esults
T, °C A Tc, °C Rc103Sx(Rc),
deg' 1 y(RjQ*(Rj,cal/mol l/crc, sec
103ST(trc),deg' 1 y(<7c)
Q*(oc),cal/mol
13.70 16.87 340,000 -0.310 1.10 -10117.52 1.04 27,000 -0.320 1.00 -10821.74 0.248 7,810 -0.306 0.84 -108 153 -0.291 0.80 -10029.20 0.099 4,050 -0.269 0.62 -91 270 -0.248 0.57 -9833.97 0.059 3,C00 -0.218 0.47 -9843.65 0.040 2,800 - 0.222 0.43 -88
cm deep) heated from below was determined, by plotting the nondimensionalized temperature gradient, R, vs. the nondimensionalized heat flux, R X Nu, R being the Rayleigh number and Nu the Nusselt number. Using the theory of Hurle and Jakeman,14 St was calculated from Rc. Their theory also predicts the frequency of oscillation of temperature in the fluid at the onset of convection, <rc, and for several of the experiments this frequency was determined and used to calculate St as well. One advantage of using both <rc and Rc is that the physical properties of the fluid enter in different ways, so errors in their assumed values will appear as deviations in calculated values of St. Also agreement between values of St calculated in the different ways increases our confidence in the applicability of the method.
Sources for values of physical constants used in the calculations were as follows: (1) p, ft: ref 24; (2) viscosity: tests with a viscometer showed little difference between the Lil solution and distilled water, so pure water values were used; (3) thermal conductivity: in the absence of information, pure water values were used.
ResultsAt lower temperatures the concentration gradient due to
Soret flux is so large that extremely large (thermal) Rayleigh numbers are attained without evidence of convection (Figure 1). A Rayleigh number of 335,000 was required in this case for convection to occur, 196 times the value required for convection in a pure fluid in the same apparatus. (For 7 greater than about 1, convection cannot begin by this process at all.) Rc is taken as the highest Rayleigh number attained.
The initial convective motions are oscillatory, but the observation of these initial oscillations is difficult, because when the motions have grown sufficiently large, a finite- amplitude mode is triggered, which has a longer period not calculable from the linear theory. If oscillations can be recorded (Figure 2) before this triggering occurs, then the measured period does not vary with time and is the one predicted by the theory. Negative values of St and the corresponding heat of transport, Q, are indeed found in all experiments (Table I). The variation with temperature (Figure 3) is as expected, St becoming less negative as the temperature is increased. Extrapolating the points shown, risky because of the scatter and small range of observations, it seems that St might remain negative to the boiling point.
The parameter y used by Hurle and Jakeman as defined above to indicate the relative contributions of solute and temperature variation to the density gradient in the steady state (Table I, Figure 3) varies much more than St with temperature because the thermal expansion varies so much in this range. At temperatures below 10° it is so large that
R oyleiqh N um ber x N u sse ll N u m b e r
Figure 1. Nondimensional temperature difference, the Rayleigh number, vs. nondimensional heat flux, the Rayleigh number times the Nusselt number, for a 1.12 cm deep layer of 1 N Lii heated from below. The mean temperature, Tc, and the temperature difference at onset of convection, A Tc, are given. When the small oscillations in the fluid trigger a large-amplitude motion, the temperature difference drops to a much lower value. The mean temperature, Tm, also drops because the cooler upper plate is maintained at a constant temperature by the bath and the heat flux is held constant throughout. The Rayleigh number is defined as gftATcP/uK, where g is the acceleration of gravity, ft the thermal expansion, A T the temperature difference across the layer of depth d, v the kinematic viscosity, and k the thermal diffusivity. The Nusselt number is the ratio of heat transported through the layer to that which would be transported by molecular effect alone in the absence of convection. The values at 13.7° are doubtful because y varied so much within the fluid layer that the density gradient was stable in some parts of the layer and unstable in others.
Figure 2. Temperature of the thermistor inserted in the fluid layer vs. time, after sudden change in heat flux from just below to just above critical. The mean temperature of the fluid was 21.74°; the temperature difference across the layer, 0.248°. The oscillations used in the calculation are the shorter ones. The cause of the longer oscillations is unknown.
the solution is stable against convective disturbances tor any value of the Rayleigh number. The molar heat of transport was calculated following Agar and Turner.21 The
The Journal of Physical Chemistry, Voi. 79, No. 17. 1975

1884 Douglas R. Caldwell
with vertical position in the fluid, then the values calculated from Rc can be fit by the formula
ST = 10~3(—0.391 (±0.029) + 0.0042 (±0.0004)T) deg“ 1
with a least-squares error of 0.020, T being the temperature in degrees Celsius. The numbers in parentheses are the estimated errors of the fit. Extrapolating to higher temperatures, St does not become positive until T = 104°.
Acknowledgments. Financial support was provided by the Physical Oceanography Section of the National Science Foundation under Grants GA23336 and DES74-17968.
R eferen ces and N otes
Figure 3. Soret coefficient, St, and stability parameter, 7 , vs. mean temperature T. Symbols: • , value calculated from the critical Rayleigh number: O, value calculated from period of thermal oscillation at onset of convection.
values are much lower than those observed in dilute solutions.20
The values of St calculated from <rc (Figure 3) are just a bit less negative than the ones derived from Rc■ The average discrepancy is less than 6%.
If the point at 13.7° is ignored, as it might well be because the temperature difference in this case is so great that the density gradient varies from stable to unstable
(1) D. R. Caldwell, Deep-Sea Res. Oceanogr. Abstr., 21, 369-376 (1974).(2) D. T. J. Hurle, Philos. Mag., 13, 305-310 (1966).(3) J. C. Legros, W. A. Van Hook, and G. Thomaes, Chem. Phys. Lett., 1,
696-701 (1968).(4) J. C. Legros, W. A. Van Hook, and G. Thomaes, Chem. Phys. Lett., 2,
249-251 (1968).(5) J. C. Legros, W. A. Van Hook, and G. Thomaes, Chem. Phys. Lett., 2,
251-252(1968).(6) E. J. Harp and D. T. J. Hurke, Philos. Mag., 17, 1033-1038 (1968).(7) J. C. Legros, D. Rasse, and G. Thomaes, Chem. Phys. Lett., 4, 632-634
(1970) .(8) D. R. Caldwell, J. Fluid Mech., 42, 161-175 (1970).(9) J. K. Platten and G. Chavepayer, Phys. Lett. A, 40, 287-288 (1972).
(10) D. T. J. Hurle and E. Jakeman, Phys. Lett. A, 43, 127-129 (1973).(11) D. R. Caldwell, J. Fluid Mech., 64, 347-367 (1974).(12) D. T. J. Hurle and E. Jakeman, Phys. Fluids, 12, 2704-2705 (1969).(13) M. G. Velarde and R. S. Schecter, Chem. Phys. Lett., 12, 312-315
(1971) .(14) D T. J. Hurle and E. Jakeman, J. Fluid Mech., 47, 667-687 (1971).(15) R. S. Schecter, I Prlgoglne, and J. R. Hamm, Phys. Fluids, 15, 379-386
(1972) .(16) J. C. Legros, J. K. Platten, and P. G. Poty, Phys. Fluids, 15, 1383-1390
(1972) .(17) J. K. Platten and G. Chavepeyer, Phys. Fluids, 15, 1555-1557 (1972).(18) M. G. Velarde and R. S. Schecter, Phys. Fluids, 15, 1707-1714 (1972).(19) J. C. Legros, P. Poty, and G. Thomaes, Physica (Utrecht), 64, 481-496
(1973) .(20) P. N. Snowden and J. C. R. Turner, Trans. Faraday Soc., 56, 1409-
1418 (1960).(21) J. N. Agar and J. C. R. Turner, Proc. R. Soc. London, Ser. A, 255,
307-330 (1960).(22) L. G. Longsworth, J. Phys. Chem., 61, 1557-1562 (1957).(23) D. R. Caldwell, J. Phys. Chem., 77, 2004-2008 (1973).(24) "International Critical Tables", McGraw-Hill, New York, N.Y.
The Journal of Physical Chemistry, Voi. 79, No. 17, 1975

Pressure Dependence of Diffusion in 0.1 N NaCI 1885
Pressure Dependence of Thermal and Fickian Diffusion in 0.1 N Sodium Chloride
Douglas R. Caldwell
School of Oceanography, Oregon State University, Corvallis, Oregon 97331 (Received January 23, 1975)
Publication costs assisted by the National Science Foundation
A nonlinear dependence of the Soret coefficient on pressure in a 0.1 N NaCI solution at 17.65° is found in conductance cell experiments. The pressure dependence of the isothermal solute diffusivity at 11.24° in the same solution is not large enough to be measurable within the limits of the procedures used. It is 50% probable that the pressure coefficient of the solute diffusivity lies between + 1.0 and —1.8%/kbar.
IntroductionIn the past few years, sharp thermal gradients have been
found in the oceans at various depths which indicate the presence of layers of sea water in which heat and salt may be transported by molecular diffusion, rather than turbulent diffusion.1 Laboratory experiments in solutions have shown that layering is inherent in the process of thermal convection, and again diffusive interfaces are found.2 For the first time, the molecular transport properties of salt solutions were seen to be significant to the study of the ocean, and work was undertaken to measure them. Thermal and Fickian diffusion coefficients were measured in NaCI solutions as the beginning of a program of defining these quantities in the complicated solution that is sea water.3'4 In these studies, the pressure dependence is quite important because of the high pressures found in the ocean depths.
To the resolution of these first experiments the pressure dependence of the thermal diffusion (Soret) coefficient was taken to be linear and the Fickian diffusivity was taken to be independent of pressure. To see if nonlinearity in the pressure dependence of St and a nonzero pressure dependence of D were masked by the restricted pressure range and the scatter in the above-mentioned measurements, further, more careful experiments were undertaken, with the pressure range extended to 0.96 kbar.
Sodium chloride was chosen as the solution to study because of the fact that its properties, especially electrical conductivity, are fairly well-known and because of its importance in ocean waters. A somewhat lower concentration was used than before in order to decrease the effect of polarization impedances at the electrodes. The chosen value of the mean temperature, Tm, of 17.65°, with a temperature difference, AT, across the cell of 8.9°, gives the highest pressure derivative of St for which St remains negative throughout the cell at all pressures. At lower temperatures positive Soret diffusion would cause convection in the sample. A smaller value of AT could not be used because of the limitation in precision of the conductivity measurement, 1CT6.
A total of 114 measurements of St and D were made, over 1 year, each measurement consuming 2 days. Long waits of weeks were required for the polarization layers to reach equilibrium after pressure changes. Several experimental difficulties were encountered, including the leveling of the cell in its position inside the pressure bomb, the time required for thermal gradients to come to equilibrium, and the changes in the polarization layers at the electrodes with pressure.
A pparatus and Procedures
No significant changes were made in the cell, pressure system, bath, or electrical system since their previous descriptions in the literature,3,4 so only a brief description is given here. The cell itself, operating on the conductivity ratio principle, is patterned after that used by Snowdon and Turner,5 with some improvements and a modernized electronic system which allows more precise measurement of the ratio with less heat dissipated in the sample, even with samples of relatively high conductivity.
The sample is contained in a cylindrical cavity 1.27 cm high and 1.27 cm in diameter and is confined between horizontal-plate platinized-platinum electrodes (Figure 1). A part of the sample in horizontal hole drilled in the confining acrylic material constitutes an electrical tap located approximately at the vertical halfway point. The turns ratio of a variable autotransformer completing an ac bridge with the cell, when adjusted for null with a phase-sensitive detector, gives a measure of the ratio of electrical conductance across the bottom half of the sample to that across the whole.
When a vertical temperature gradient is imposed, from above, the movement of solute downward can be tracked with the turns ratio, X. When the heat is first applied, the conductance ratio change is caused mainly by the change of conductivity with temperature. After thermal equilibrium is reached, further changes in X are caused by solute movement. From this latter change St can be calculated, with correction for the initial period of temperature change. The time required for the salt to complete its migration can be used to calculate D.4 5
In practice, more consistent results are obtained by making the measurements after the heat is turned off and extrapolating backward to obtain the concentration variation accompanying a temperature gradient, this gradient having been applied long enough for diffusive equilibrium to be reached. The mean temperature is taken to be the average of the temperatures at the end plates, 17.65°, for the St measurement. (The value of D obtained by this procedure is the isothermal diffusion coefficient, at the bath temperature, 11.24°.) The temperature gradient in these experiments decayed with an e-folding time of about 8 min. The total change in X caused by temperature change was 0.027, so it takes 82 min for the temperature effect on X to be reduced to the 10~6 level, the degree of precision in X. Therefore, the first measurement of X used in calculations was taken 100 min after the heat was turned off. The e-folding time for solute motion was about 300 min, so plenty of time
The Journal of Physical Chemistry, Vol. 79, No. 17, 1975

1886 Douglas R. Caldwell
K
Figure 1. The diffusion cell. Top: The measured diffusion takes place in the solution contained in the cylindrical space (a) In the Plexiglas plate (b). The filling hole (c), 0.08-cm diameter, leads from the diffusion area to a cylinder (d) and piston (a) which allow for compression and expansion. Diametrically opposite Is a smaller hole leading to a platinum wire (f). Platinum sheets (0.012 cm thick) extend past the O rings (g) at the top and bottom of plate (b). The platinum sheets are insulated by thin (0.012-in.) Mylar sheets from the top aluminum plate (h) and the bottom aluminum plate (i). Plate (h) is heated by Ev- anohm wire pressed into spiral grooves in the Delrin Insulator (j). Thermal contact with tie inside surfaces of the pressure bomb (k) is provided by aluminum plates (i) and (I). The device is hung from the bomb lid by screws, sc thermal contact with the bottom of the bomb Is made certain by a copper plate (m) which is free to slide relative to plate (i). The space at the sides of the device is used for electrical connectors (not shown) mounted on the bomb lid. Transformer oil is used as the hydraulic fluid. Bottom: Plan view of plate (b).
remained to follow the changes in X caused by solute migration.
The heat was turned off first thing in the morning and periodic readings were made all day with a final one the following morning. Then the heat was turned on again; since 99% of the solute motion took place in 24 hr, another run could be made the next day.
Snowdon and Turner5 avoided the initial period of thermal change by turning the heat on with their cell upside- down, letting convection mix the solution while thermal equilibrium was being reached, and then inverting it suddenly and monitoring the establishment of the solute gradient after convection had died out, only a few minutes. The wait was then only for the thermal profile within the sample, rather than throughout the apparatus, to come to equilibrium. Our apparatus weighs over 100 kg and works well only in a water bath, so inverting it was not seriously considered.
Figure 2. Soret coefficient, ST, and solute diffusivity, D, vs. tilt of cell in a 0.1 N NaCI solution at 5.2° mean temperature and 0.538-kbar pressure. The cell had already been “ leveled” in the orthogonal direction. The zero for the tilt axis on this plot represents the initial guess.
Characteristic of this type of cell is its sensitivity to leveling.6 This presented a particular difficulty with the pressure system because of the difficulty in “carrying” a level from the cell surfaces to some surface external to the bomb where a level could be placed. The best procedure was found to be “letting the apparatus level itself’, that is, making experimental runs with various settings of the leveling screws on the base of the bath to find the setting for which the highest value of St was obtained (Figure 2). This is assumed to be the level setting; deviations are assumed to cause convection which reduces the apparent value of St- Great deviations from the optimum position are required to affect the measurement of D. This procedure was carried out at several pressures, but no significant difference was found in the “level” position; apparently pressurization does not affect the leveling of the cell.
The only experimental parameter of concern is X. It is limited in precision to 10-6 because of the electrical noise level in our laboratory even though a lock-in system is used for signal detection. A change in conductance of this amount corresponds to a temperature variation across the cell of less than 10-4 °, the reason a great deal of work went into building a temperature bath which regulates to this precision. The thermal shielding of the pressure bomb also helps keep out stray gradients.
Three readings were used in the calculations, taken at 100 min, at approximately 600 min, and at about 1400 min. The ratio of these times to the e-folding time is 0.33, 2.0, and 4.67. Relative values of the change in X due to concentration, in terms of the initial concentration are 0.720, 0.135, and 0.009. An error of 10-6 in the 600-min time causes an error of approximately 1.2% in D, errors in the other readings being less significant. An error of 10-6 in the 1400-min reading caused the major error in St, about 2%. Other readings confirmed the exponential character of the decay of the concentration gradient.
The Journal of Physical Chemistry, Vol. 79, No. 17, 1975

Pressure Dependence of Diffusion in 0.1 N NaCI 1887
Figure 3. Measured values of ST vs. pressure in 0.1 N NaCI at 17.65° mean temperature.
P ressu re D ependence o f th e S oret C oefficientFor an assessment of the linearity of the pressure depen
dence of St at 17.65° 81 data points were used (Figure 3). All runs in which the cell was tilted more than 20 min of arc relative to the “level” position were rejected. Linear and quadratic least-squares fits were made, with the results (St in deg-1, P in kilobars)
ST(P) = 10-3(0.568 + 1.682P) a = 0.0857 ST(P) = 10-3(0.512 + 2.313P - 0.686P2) a = 0.0645
The F value calculated from the values of <x, the standard deviations of the errors, is 64, significant beyond doubt; the probability of exceeding F = 12 for this many degrees of freedom is 0.001 for purely statistical variations. It is quite possible that there is some physical reason for a change in behavior at about 0.75 kbar and that one continuous curve is not appropriate. More data, particularly at higher pressures, would be required to make a meaningful assessment of this possibility. Thus, the dependence of St on pressure is not linear. This nonlinearity did not show up in the previously reported experiments because of their lesser pressure range.
P ressu re D ependence o f D iffu siv ityIn previous experiments3 we were unable to define the
pressure dependence of D, more than to say that aD/aP lies between +4 X 10- 7 and +38 X 10- 7 cm2 sec-1 kbar-1, in 0.5 N NaCI. This conclusion resulted from an analysis of 51 measurements at a wide range of temperatures. In the experiments presently described, 104 measurements taken over a larger pressure range (Figure 4) at 11.24°, do not show any obvious positive pressure coefficient. (The temperature appropriate to the diffusivity measurement is 11.24°, the temperature of the isothermal cell with no heat flux imposed.)
Figure 4. Measured values of D vs. pressure in 0.1 N NaCI at 11.24°.
TABLE I: S ta tistics o f Salt D iffusivity D ata
P r e s su rerange
Samplesize
Stddev
Skewness
K ur-to sis Mean
Std e r r o r
in mean
Atm only 17 0.057 0.15 2 . 0 0 1.1949 0.0138>Atm and
< 0 . 6
kbar
31 0.024 0.43 2.59 1.1435 0.0044
> 0 . 6
kbar55 0.018 -0.14 2.75 1.1415 0.0024
For analysis the data were divided into three classes by pressure (Table I). At atmospheric pressure the data show a different character than at higher pressures. The mean is larger by more than 3 times its standard error and the standard deviation is 2.4 times larger than that of either of the other two classes. These discrepancies might be caused by air bubbles in the cell, which are very difficult to eliminate even though the sample is loaded into the cell under vacuum. The error in X caused by a bubble moving vertically from one half of the cell to the other is approximately given by 4 times the ratio of the bubble volume to the cell volume. Thus an error greater than 10-5 in X is caused by such a movement of a 0.02-cm diameter bubble. This change in X could cause a 10% error in D, larger than the scatter observed at atmospheric pressure. At the lowest pressure above atmospheric, 0.11 kbar, the volume of a bubble would be reduced by a factor of 100, so its effect would be lessened by that factor and would be insignificant.
If the atmospheric pressure data are ignored and the remaining two classes, above and below 0.6 kbar, considered, no significant difference is seen (Table I). These two sets are quite similar, their means differing by less than the standard error in either mean. So no significant trend with pressure has been found.
If the assumption is made that the pressure dependence is linear, further analysis of these data reveals that there is a 50% probability that D~l(aD/aP) lies between —1.8%/ kbar and + 1.0%/kbar. The viscosity of electrolytic solutions displays a complicated behavior with pressure, first decreasing as pressure is raised and then increasing again. To see if any such behavior could be present in D, a quadratic function was fitted by the method of least squares to all data for pressure above atmospheric. The standard deviation of deviations of the data relative to this function was 0.02016, which must be compared to a standard deviation of the data itself, relative to its mean, of 0.02018. The F test shows the difference to be insignificant.
The Journal of Physical Chemistry, Vol. 79 No. 17, 1975
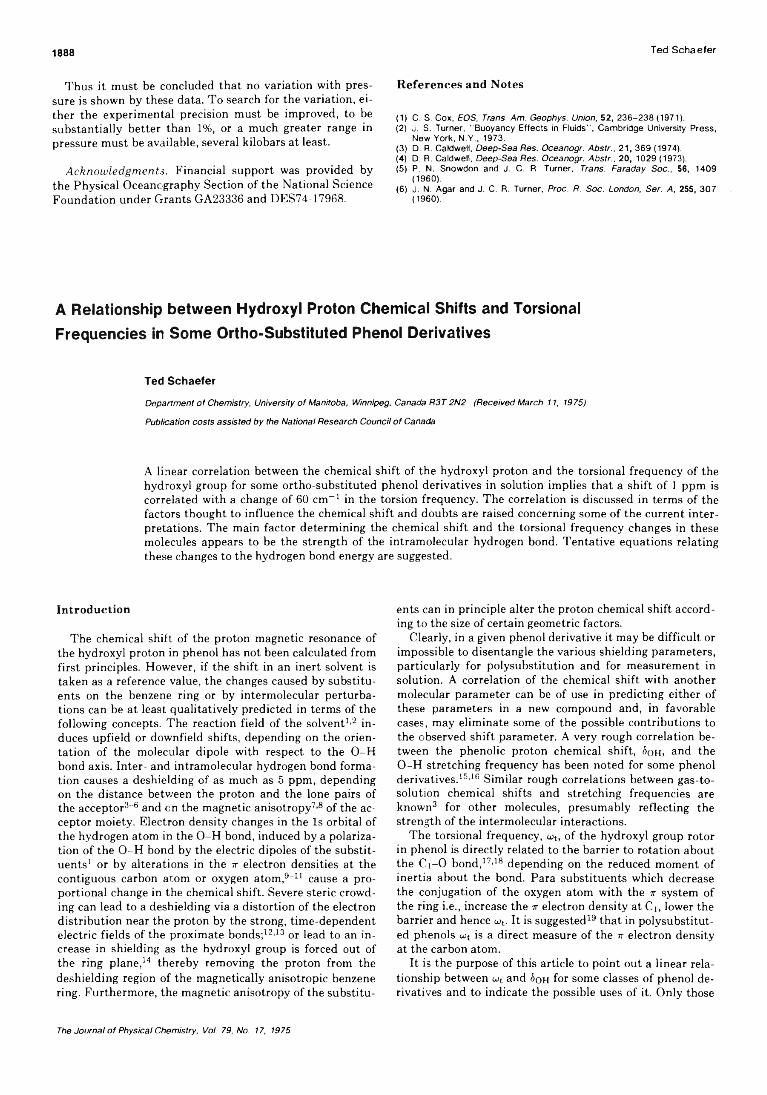
1888 Ted Schaefer
Thus it must be concluded that no variation with pressure is shown by these data. To search for the variation, either the experimental precision must be improved, to be substantially better than 1%, or a much greater range in pressure must be available, several kilobars at least.
Acknowledgments. Financial support was provided by the Physical Oceanography Section of the National Science Foundation under Grants GA23336 and DES74-17968.
R eferen ces and N otes
(1) C. S. Cox, EOS, Trans. Am. Geophys. Union, 52, 236-238 (1971).(2) J. S. Turner, "Buoyancy Effects in Fluids”, Cambridge University Press,
New York, N.Y., 1973.(3) D. R. Caldwell, Deep-Sea Res. Oceanogr. Abstr., 21, 369 (1974).(4) D. R. Caldwell, Deep-Sea Res. Oceanogr. Abstr., 20, 1029 (1973).(5) P. N. Snowdon and J. C. R. Turner, Trans. Faraday Soc., 56, 1409
(1960).(6) J. N. Agar and J. C. R. Turner, Proc. R. Soc. London, Ser. A, 255, 307
(1960).
A Relationship between Hydroxyl Proton Chemical Shifts and Torsional Frequencies in Some Ortho-Substituted Phenol Derivatives
Ted Schaefer
Department of Chemistry, University of Manitoba, Winnipeg, Canada R3T 2N2 (Received March 11, 1975)
Publication costs assisted by the National Research Council of Canada
A linear correlation between the chemical shift of the hydroxyl proton and the torsional frequency of the hydroxyl group for some ortho-substituted phenol derivatives in solution implies that a shift of 1 ppm is correlated with a change of 60 cm-1 in the torsion frequency. The correlation is discussed in terms of the factors thought to influence the chemical shift and doubts are raised concerning some of the current interpretations. The main factor determining the chemical shift and the torsional frequency changes in these molecules appears to be the strength of the intramolecular hydrogen bond. Tentative equations relating these changes to the hydrogen bond energy are suggested.
Introduction
The chemical shift of the proton magnetic resonance of the hydroxyl proton in phenol has not been calculated from first principles. However, if the shift in an inert solvent is taken as a reference value, the changes caused by substituents on the benzene ring or by intermolecular perturbations can be at least qualitatively predicted in terms of the following concepts. The reaction field of the solvent1’2 induces upfield or downfield shifts, depending on the orientation of the molecular dipole with respect to the O-H bond axis. Inter- and intramolecular hydrogen bond formation causes a deshielding of as much as 5 ppm, depending on the distance between the proton and the lone pairs of the acceptor3“6 and cn the magnetic anisotropy7 8 of the acceptor moiety. Electron density changes in the Is orbital of the hydrogen atom in the O-H bond, induced by a polarization of the O-H bond by the electric dipoles of the substituents1 or by alterations in the ir electron densities at the contiguous carbon atom or oxygen atom,9“11 cause a proportional change in the chemical shift. Severe steric crowding can lead to a deshielding via a distortion of the electron distribution near the proton by the strong, time-dependent electric fields of the proximate bonds;12’13 or lead to an increase in shielding as the hydroxyl group is forced out of the ring plane,14 thereby removing the proton from the deshielding region of the magnetically anisotropic benzene ring. Furthermore, the magnetic anisotropy of the substitu
ents can in principle alter the proton chemical shift according to the size of certain geometric factors.
Clearly, in a given phenol derivative it may be difficult or impossible to disentangle the various shielding parameters, particularly for polysubstitution and for measurement in solution. A correlation of the chemical shift with another molecular parameter can be of use in predicting either of these parameters in a new compound and, in favorable cases, may eliminate some of the possible contributions to the observed shift parameter. A very rough correlation between the phenolic proton chemical shift, ¿oh, and the O-H stretching frequency has been noted for some phenol derivatives.15’16 Similar rough correlations between gas-to- solution chemical shifts and stretching frequencies are known3 for other molecules, presumably reflecting the strength of the intermolecular interactions.
The torsional frequency, o)t, of the hydroxyl group rotor in phenol is directly related to the barrier to rotation about the Ci-0 bond,17’18 depending on the reduced moment of inertia about the bond. Para substituents which decrease the conjugation of the oxygen atom with the ir system of the ring i.e., increase the ir electron density at Ci, lower the barrier and hence u>t. It is suggested19 that in polysubstitut- ed phenols o>t is a direct measure of the ir electron density at the carbon atom.
It is the purpose of this article to point out a linear relationship between o>t and ¿oh for some classes of phenol derivatives and to indicate the possible uses of it. Only those
The Journal o f Physical Chemistry, Voi. 79, No. 17, 1975
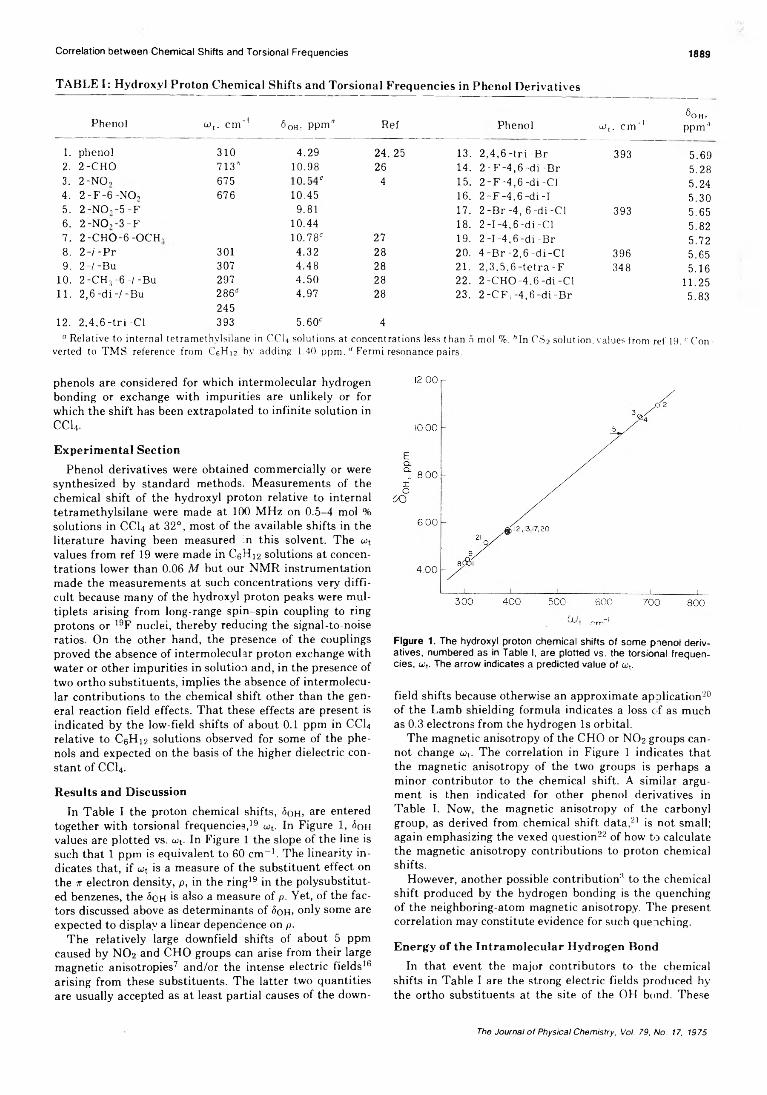
Correlation between Chemical Shifts and Torsional Frequencies 1889
TABLE I: Hydroxyl Proton Chemical Shifts and Torsional Frequencies in Phenol Derivatives
Phenol LOt. cm -1 5oh- ppm" Ref Phenol uj,. c m '1ÖOH,ppm'1
1. phenol 310 4.29 24. 25 13. 2.4,6 - tr i -Br 393 5.692. 2 -CHO 713* 10.98 26 14. 2 -F -4 ,6 -d i-B r 5.283. 2 -NO, 675
tjmo
4 15. 2 -F -4 ,6 -di -Cl 5.244. 2 -F -6 -N O , 676 10.45 16. 2 -F -4 ,6 -d i- I 5.305. 2-NO ,-5 -F 9.81 17. 2 -B r -4, 6 -d i-Cl 393 5.656. 2 -NO ,- 3 - F 10.44 18. 2 - I -4 ,6 -d i-Cl 5.827. 2 -CHO-6 -OCH, 10.78c 27 19. 2 -I -4,6 -di -Br 5.728. 2-?'-Pr 301 4.32 28 20. 4 -B r -2,6 -di-C l 396 5.659. 2-1 -Bu 307 4.48 28 21. 2 ,3 .5 ,6 -te tra -F 348 5.16
10. 2 -CH3 -6 -/-B u 297 4.50 28 22. 2 -CHO-4,6 -di -Cl 11.2511. 2 ,6 -d i-/-B u 286" 4.97 28 23. 2-CF;, -4 ,6 -d i-B r 5.83
24512. 2,4.6 - tr i -Cl 393 5.60c 4
a Relative to internal tetram ethv lsilane in CCL solutions at concentrations less than 5 mol %. ftIn CS2 solution, values from ref 19. c Con - verted to T M S reference from CeHi2 by adding 1.40 ppm . d Fermi resonance pairs.
phenols are considered for which intermolecular hydrogen bonding or exchange with impurities are unlikely or for which the shift has been extrapolated to infinite solution inCC14.
E xperim ental SectionPhenol derivatives were obtained commercially or were
synthesized by standard methods. Measurements of the chemical shift of the hydroxyl proton relative to internal tetramethylsilane were made at 100 MHz on 0.5-4 mol % solutions in CCI4 at 32°, most of the available shifts in the literature having been measured m this solvent. The wt values from ref 19 were made in C(;H12 solutions at concentrations lower than 0.06 M but our NMR instrumentation made the measurements at such concentrations very difficult because many of the hydroxyl proton peaks were multiplets arising from long-range spin-spin coupling to ring protons or 19F nuclei, thereby reducing the signal-to-noise ratios. On the other hand, the presence of the couplings proved the absence of intermolecular proton exchange with water or other impurities in solution and, in the presence of two ortho substituents, implies the absence of intermolecular contributions to the chemical shift other than the general reaction field effects. That these effects are present is indicated by the low-field shifts of about 0.1 ppm in CCI4 relative to CeH12 solutions observed for some of the phenols and expected on the basis of the higher dielectric constant of CCI4.
R esu lts and D iscussion
In Table I the proton chemical shifts, <5oh, are entered together with torsional frequencies,19 ojt. In Figure 1, ¿oh values are plotted vs. oit. In Figure 1 the slope of the line is such that 1 ppm is equivalent to 60 cm-1. The linearity indicates that, if ait is a measure of the substituent effect on the it electron density, p, in the ring19 in the polysubstitut- ed benzenes, the 5qh is also a measure of p. Yet, of the factors discussed above as determinants of <5oh, only some are expected to display a linear dependence on p.
The relatively large downfield shifts of about 5 ppm caused by NO2 and CHO groups can arise from their large magnetic anisotropies7 and/or the intense electric fields16 arising from these substituents. The latter two quantities are usually accepted as at least partial causes of the down-
Flgure 1. The hydroxyl proton chemical shifts of some pnenol derivatives, numbered as in Table I, are plotted vs. the torsional frequencies, a;,. The arrow indicates a predicted value of cot.
field shifts because otherwise an approximate application20 of the Lamb shielding formula indicates a loss of as much as 0.3 electrons from the hydrogen Is orbital.
The magnetic anisotropy of the CHO or N02 groups cannot change ojt. The correlation in Figure 1 indicates that the magnetic anisotropy of the two groups is perhaps a minor contributor to the chemical shift. A similar argument is then indicated for other phenol derivatives in Table I. Now, the magnetic anisotropy of the carbonyl group, as derived from chemical shift data,21 is not small; again emphasizing the vexed question22 of how to calculate the magnetic anisotropy contributions to proton chemical shifts.
However, another possible contribution2 to the chemical shift produced by the hydrogen bonding is the quenching of the neighboring-atom magnetic anisotropy. The present correlation may constitute evidence for such quenching.
E nergy o f the Intram olecular H ydrogen BondIn that event the major contributors to the chemical
shifts in Table I are the strong electric fields produced by the ortho substituents at the site of the OH bond. These
The Journal of Physical Chemistry, Vol. 79, No. 17, 1975

1890 Ted Schaefer
fields deform the electron distribution about the proton and decrease the proton shielding. Rather involved but approximate calculations16 of electric field effects on the chemical shift of the hydroxyl proton in intermolecularly hydrogen bonded phenol predict a very nearly linear relationship between the chemical shift and the energy of the hydrogen bond. It can be written as
A5 = -0.4 ± 0.2 + E (1)where A<5 is given in parts per million relative to phenol and E in kilocalories/mole. It is uncertain whether this equation is correct for intramolecular bonds, but it may allow an estimate of their energy. If so, the correlation in Figure 1 implies (1 ppm being equivalent to 60 cm-1)
0.017Aout = -0.4 ± 0.2 + E (2)
where Acot is in (centimeter)-1 relative to phenol.As a check on eq 2 the value of oh in the hydrogen bond
ed form of o-fluorophenol,19 366 cm-1, yields 1.3s ± 0.2 kcal/mol for the energy of the hydrogen bond, compared to —1.44 ± 0.12 kcal/mol found for the enthalpy of formation from a full analysis of the far-infrared spectrum.19 The agreement is encouraging.
The energy of the intramolecular bonds in chelated phenols such as compounds 2, 3, and 4 in Table I have never been directly determined.23 Equations 1 and 2 predict the hydrogen bond energy of compound 2 as 7.2 ± 0.2 kcal/mol.
The ortho-disubstituted halophenols in Table I are predicted to have hydrogen bond energies of less than 2 kcal/ mol. Only one chemical shift is measured for each compound because rapid conversion from 1 to 2 occurs. Appar- 1
1 2
ently only one ojt value is available for compounds 13, 17, 20, and 21 and the predicted energies must therefore be considered as mean values for I and 2. Nevertheless, the predicted energies are reasonable in view of the enthalpies found for the ortho halophenols,19 all less than 2 kcal/mol.
It is very probable, therefore, that for ortho-substituted phenols both <5oh and o)t are mainly a measure of the strength of the intramolecular hydrogen bond. However, when the ortho substituents are not hydrogen bond acceptors, eq 1 and 2 will not apply. For example, strong intramolecular repulsive interactions12 will deshield the hydroxyl proton and are probably the cause of the deviation of ¿ o h by about 1.5 ppm to low field of the correlation line in
Figure 1 for 2,6-di-tert-butylphenol (compound 11). These deviations become smaller as the size of the ortho alkyl substituents decreases (compounds 8, 9, and 10 in Table I).
Practical Considerations¿ o h can be severely altered by intermolecular proton ex
change with impurities in solute or solvent or by intermolecular association and, in studies of intramolecular hydrogen bond formation in mono-ortho-substituted phenols, e.g., the correlation may serve as a check that the observed shift does not contain unwanted contributions. Alternatively, the observed shift may allow an assignment of the torsional band in the sometimes very complex far-infrared spectrum.
Acknowledgments. I am grateful to Dr. J. B. Rowbotham for help with the measurements and to a referee for most helpful comments. This work was supported by the National Research Council of Canada.
References and Notes(1) A. D. Buckingham, Can. J. Chem., 38, 300 (1960).(2) A. D. Buckingham, T. Schaefer, and W. G. Schneider, J. Chem. Phys.,
32, 1227(1960).(3) W. G. Schneider, H. J. Bernstein, and J. A. Pople, J. Chem. Phys., 28,
601 (1958).(4) L. W. Reeves, E. A. Allen, and K. O, Stromme, Can. J. Chem., 38, 1249
(1960).(5) A. L. Porte, H. S. Gutowsky, and I. M. Hunsberger, J. Am. Chem. Soc.,
82, 5057 (1960).(6) J. C. Davis, Jr., and K. K. Deb, Adv. Magn. Resonance, 4, 201 (1970).(7) H. M. McConnell, J. Chem. Phys., 27, 226 (1957).(8) J. A. Pople, Proc. Roy Soc. {London), Ser. A, 239, 550 (1957).(9) G. Fraenkel, R. E. Carter, A. MacLachlan, and J. H. Richards, J. Am.
Chem. Soc., 82, 5846 (1960).(10) T. Schaefer and W. G. Schneider, Can. J. Chem., 41, 966 (1963).(11) G. K. Hamer, I. R. Peat, and W. F. Reynolds, Can. J. Chem., 51, 897
(1973) .(12) T. Schaefer, W. F. Reynolds, and T. Yonemoto, Can. J. Chem., 41,
2969(1963).(13) N. Boden, J. W. Emsley, J. Feeney, and L. H. Sutcliffe, Mol. Phys., 8,
133(1964).(14) J. A. Pople, J. Chem. Phys., 24, 1111 (1956).(15) E. A. Allan and L. W. Reeves, J. Phys. Chem., 66, 613 (1962).(16) I. Granacher, Helv. Phys. Acta, 34, 272 (1961).(17) L, Radom, W. J. Hehre, J, A. Pople, G. L. Carlson, and W. G. Fateley, J.
Chem. Soc., Chem. Commun., 308 (1972).(18) A, S. Manocha, G. L. Carlson, and W. G. Fateley, J. Phys. Chem. 77,
2094 (1973).(19) W. G. Fateley, G. L. Carlson, and F. F. Bentley, J. Phys. Chem., 79, 199
(1975).(20) J. A. Pople, W. G. Schneider, and H. J. Bernstein, "High-Resolution Nu
clear Magnetic Resonance", Mc-Graw-Hill, New York, N.Y., 1959.(21) J. W. ApSimon and H. Bierbeck, Can. J. Chem., 49, 1328 (1971).(22) W. T. Raynes, Chem. Soc. Spec. Pub!., 1, 1 (1972); 2, 1 (1973); 3, 3
(1974) .(23) U. Koelle and S. Forsén, Acta Chem. Scand. Sect. A, 28, 531 (1974).(24) T. Gramstad and E. D. Becker, J. Mol. Struct., 5, 253 (1970).(25) M. Nakano, N. I. Nakano, and T. Higuchi, J. Phys. Chem., 71, 3954
(1967).(26) G. Pala, Nature {London), 204, 1190 (1964).(27) S. Forsén and R. A. Hoffman, J. Mol. Spectrosc., 20, 168 (1966).(28) B. G. Somers and H. S. Gutowsky, J. Am. Chem. Soc., 85, 3065 (1963).
The Journal o f Physical Chemistry, Voi. 79, No. 17, 1975

New concepts new techniques new interpretations
. . . together with valuable reports on classical areas
They are all waiting for you between the covers of our well-balanced JOURNAL OF PHYSICAL CHEMISTRY. Whatever your particular Interest in physical chemistry, you’ll find the JOURNAL'S broad range of experimental and theoretical research reports are relevant and beneficial to your work. Each biweekly Issue brings you an average of 30 authoritative, comprehensive reports on fundamental aspects of atomic and molecular phenomena, as well as timely notes, communications and reports plus the proceedings of selected symposia.Join your fellow physical chemists who rely on JPC as an excellent biweekly source of data in both new and classical areas. Just complete and return the form to start your own subscription.
another ACS service
Journal ofPhysicalChemistry1975
The Journal of Physical Chemistry American Chemical Society1155 Sixteenth Street, N.W.Washington, D.C. 20036Yes, I would like to receive the JOURNAL OF PFIYSICAL CHEMISTRY at the one-year rate checked below:
ACS Member One-Year Rate* NonmemberBill me □ Bill company □Air freight rates available on request.
Name
US.□ S20.00□ $80.00
Canada * *□ $24.50□ S84.50
LatinAmerica**□ $24.50□ $84.50
Offre-Nations**□ $25 00□ S85.00
Payment enclosed □
StreetHome □Business □
City State ZipJournal su b sc r ip t io n s start on January '75
‘ NOTE Subscrip t ions at ACS member *ates are for persona! use only. “ Payment must be made in U.S. currency, by internat ional money order, UNESCO coupons, U.S. bank draft, or order through your book dealer.

Nonequilibrium Systems In Natural Water ChemistryA D V A N C E S IN C H E M I S T R Y S E R I E S No. 1 0 6
Thirteen papers from a symposium by the Division of Water, Air, and Waste Chemistry of the American Chemical Society, chaired by J . D. Hem .
Which is more important: efficient exploitation of our natural resources or a stable ecosystem? W hat is the relationship between a wide variety of life forms and a healthy environment? W hat do geology and ground- water flow patterns have to do with the chemical composition of water? How may one predict when a lake will reach equilibrium or tell how long it has supported life?
This volume features:
• principles of water pollution control• methods of analysis for dissolved chemicals• mathematical models• discussion of stratified lakes• chemical processes in a carbonate aquifer• decomposition and racemization of amino acids
342 pages with index Cloth (1971) $11.00Postpaid in U.S. and Canada; plus 40 cents elsewhere. Set of L.C. cards with library orders upon request.
O t h e r b o o k s in t h e A D V A N C E S IN C H E M I S T R Y S E R I E S o n w a t e r c h e m i s t r y i nc l ude :
No. 105 Anaerob ic B io log ica l Treatm ent ProcessesNine papers survey the state of the art of this natural process for waste treatment, with three papers on methane fermentation, others on process control and design. Considers volatile acid formation, toxicity, synergism, antagonism, pH control, heavy metals, light metal cations.196 pages with index Cloth (1971) $9.00
No. 79 Adsorption from Aqueous SolutionFifteen papers discuss thermodynamic and kinetic aspects of adsorption phenomena and the results of studies on a variety of adsorbate-adsorbent systems.212 pages with index Cloth (1968) $10.00
No. 73 Trace Inorganics in W aterResearch reports; analytical developments including atomic absorption, flame emission, and neutron activation; and broad reviews, such as effects of trace inorganics on the ice-water system and the role of hydrous manganese and iron oxides on fixing metals in soils and sediments.396 pages with index Cloth (1968) $12.50
No. 67 Equilibrium Concepts in Natural W ater System s$ixteen papers represent the collaboration of aquatic chemists, analytical chemists, geologists, oceanographers, limnologists, and sanitary engineers, working with simplified models to produce fruitful generalizations and valuable insights into the factors that control the chemistry of natural systems.344 pages with index Cloth (1967) $11.00
No. 38 Saline W ater Conversion— IIFourteen papers from two symposia; includes recovery of minerals from sea water, minimizing scale formation, wiped thinfilm distillation, diffusion still, solar flash evaporation, osmosis, electrodialysis (3 paper), research in Israel, hydrate process.199 pages Paper (1963) $8.00
No. 27 Saline W ater ConversionThermodynamics of desalting, solvent extraction, freezing, centrifugal phase barrier recompression distillation, multistage flash evaporation, ion exchange, osmosis, and electrochemical demineralization.246 pages Paper (1960) $9.00
Order from: Specia l Issues Sales, Am erican Chem ica l Society 1155 Sixteenth St., N.W., W ash ington, D.C. 20036 *
*1(1 £10 ?r.<o