Physical fitness of elite women's rugby union players ... - CORE
132
PHYSICAL FITNESS OF ELITE WOMEN'S RUGBY UNION PLAYERS OVER A COMPETITION SEASON NCEBA MZIMKULU HENE A full thesis submitted in fulfillment of the requirements for the degree MA (Sport, Recreation and Exercise Science) in the Department of Sport, Recreation and Exercise Science University of the Western Cape Supervisor: Dr S. Bassett February 2011 brought to you by CORE View metadata, citation and similar papers at core.ac.uk provided by UWC Theses and Dissertations
-
Upload
khangminh22 -
Category
Documents
-
view
0 -
download
0
Transcript of Physical fitness of elite women's rugby union players ... - CORE

PHYSICAL FITNESS OF ELITE WOMEN'S RUGBY UNION PLAYERS OVER A
COMPETITION SEASON
NCEBA MZIMKULU HENE
A full thesis submitted in fulfillment of the requirements for the degree
MA (Sport, Recreation and Exercise Science)
in the Department of Sport, Recreation and Exercise Science
University of the Western Cape
Supervisor: Dr S. Bassett
February 2011
brought to you by COREView metadata, citation and similar papers at core.ac.uk
provided by UWC Theses and Dissertations

ii
DECLARATION
I hereby declare that “Seasonal variations in the physical fitness of Elite Women’s Rugby
Union Players” is my own work, that it has not been submitted before for any other degree in
any other university, and that the sources I have used have been indicated and acknowledged
as complete references.
Nceba Mzimkulu Hene February 2011
Signed:
iii
ACKNOWLEDGMENTS
I would like to acknowledge the support of the South African Rugby Union and Management
of the Women’s National Rugby Team, especially Mahlubi Puzi who has provided me with a
platform to grow as a Biokineticist. Not many professionals get an opportunity to work with a
National team from inception and to fulfill their childhood dream of representing their country
at a World Cup.
The players have not only had a profound effect on me as a professional but also as a man
hence it was only fitting that I conducted my research study on this group of players. I admire
their passion for the game, as not many people have the drive to pursue and live their passion
despite being stigmatised by their own community.
I would also like to express my sincere gratitude to Dr Sue Bassett for her valuable guidance
and input in putting together this thesis. In addition to Prof Madsen (statistician) and
Lungiswa Tsolekile (proof reader) for their contribution towards the completion of this study.
Finally, I would to like to thank my parents (Peter and Bongiwe) for their continuous love and
sacrifices they have made in order for me to a great childhood and education.

iv
ABSTRACT
The primary aim of this study was to investigate the changes in physical fitness characteristics
of elite women’s rugby union players over the duration of the season. Thirty two elite female
rugby players who were identified as members of the South African Rugby Union High
Performance Squad were assessed on three separate occasions (pre-season, mid-season and
post-season) throughout the competition season. The players were sub-divided into two
positional categories consisting of 17 forwards and 15 backs. On all testing occasions, players
underwent anthropometric (stature, body mass and sum of 7 skinfolds) and physical
performance measurements (sit-and-reach, vertical jump, 10m and 40m speed, 1 RM bench
press; pull-ups;1 min push-ups and multi-stage shuttle run test). A two–factor analysis of
variance evaluated differences in the physical fitness variables between and within playing
positions over the competition season.
There were statistical differences (p < 0.01) between positional groups, as forwards had a
greater body mass, higher sum of skinfolds and larger body fat percentage than backs. In
terms of explosive leg power, maximum speed (40m sprint times), muscular and aerobic
endurance, backs obtained superior performance values. In contrast, no significant differences
were detected between forwards and backs in terms of stature, flexibility, acceleration (10m
sprint times) and upper body strength (1 RM bench press and pull-ups).

v
In both positional groups, no significant changes were determined in the sum of skinfolds,
vertical jump height, 1 RM bench press, 1 min push-ups and multi-stage shuttle run test scores
between pre-season and mid-season. Whereas, sprint times (10m and 40m) significantly
decreased for both forwards and backs, regardless of the significant decrease in percent body
fat during the same time period. Although a significant increase in speed was observed, there
were no significant changes in the other physical fitness characteristics measured. Based on
the results achieved, further studies are required to determine the appropriate training stimulus
to enhance the physical fitness characteristics of elite women’s rugby union players during the
early phase of the season without compromising speed.

vi
TABLE OF CONTENTS
PAGE
DECLARATION ........................................................................................................................ II
ACKNOWLEDGMENTS ........................................................................................................ III
ABSTRACT ............................................................................................................................. IV
TABLE OF CONTENTS ......................................................................................................... VI
LIST OF TABLES ................................................................................................................... XI
LIST OF FIGURES ................................................................................................................. XII
CHAPTER ONE : STATEMENT OF THE PROBLEM ........................................................... 1
1.1 INTRODUCTION ........................................................................................................... 1
1.2 STATEMENT OF THE PROBLEM ............................................................................... 5
1.3 AIM AND OBJECTIVES ............................................................................................... 6
1.4 RESEARCH HYPOTHESIS ........................................................................................... 7
1.5 SIGNIFICANCE OF THE STUDY ................................................................................ 8
1.6 LIMITATIONS OF THE STUDY .................................................................................. 8
1.7 SCOPE OF THE STUDY ............................................................................................... 9
1.8 TERMINOLOGY .......................................................................................................... 10
CHAPTER TWO : REVIEW OF RELATED LITERATURE ................................................ 13
2.1 INTRODUCTION ......................................................................................................... 13
2.2 WOMEN’S RUGBY UNION ....................................................................................... 13
2.2.1 Women’s Club Rugby ....................................................................................... 14
2.2.2 Provincial Women’s Rugby .............................................................................. 16
2.2.3 International Women’s Rugby .......................................................................... 17

vii
2.3 PHYSIOLOGICAL DEMANDS OF RUGBY COMPETITION ................................. 17
2.3.1 Movement Patterns ........................................................................................... 19
2.3.2 Work-to-Rest Ratios ....................................................................................... 200
2.3.3 Distance Covered and Velocity ........................................................................ 21
2.4 PHYSICAL FITNESS OF A RUGBY PLAYER ......................................................... 22
2.4.1 Body Mass ...................................................................................................... 223
2.4.2 Stature ............................................................................................................... 24
2.4.3 Sum of Skinfolds............................................................................................... 24
2.4.4 Speed ................................................................................................................. 26
2.4.5 Agility ............................................................................................................... 30
2.4.6 Muscle Strength and Power ............................................................................ 311
2.4.7 Muscle Endurance ............................................................................................. 34
2.4.8 Aerobic Endurance ............................................................................................ 36
2.4.9 Anaerobic Endurance ........................................................................................ 38
2.5 CHANGES IN PHYSICAL FITNESS OF OVER A COMPETITION SEASON ....... 40
2.5.1 Body Composition ............................................................................................ 41
2.5.2 Speed ................................................................................................................. 41
2.5.3 Muscle Strength ................................................................................................ 42
2.5.4 Aerobic Fitness ................................................................................................. 42
2.6 SUMMARY .................................................................................................................. 43
CHAPTER THREE : METHODS AND PROCEDURES ....................................................... 44
3.1 INTRODUCTION ......................................................................................................... 44
3.2 RESEARCH DESIGN ................................................................................................... 44
3.3 PARTICIPANTS ........................................................................................................... 44

viii
3.4 ASSESSMENT SCHEDULE ........................................................................................ 45
3.5 DATA COLLECTION .................................................................................................. 46
3.6 TESTING PROTOCOL ................................................................................................ 46
3.6.1 Stature ............................................................................................................... 47
3.6.2 Body Mass ........................................................................................................ 48
3.6.3 Skinfolds ........................................................................................................... 48
3.6.4 Flexibility .......................................................................................................... 50
3.6.5 Power ................................................................................................................ 51
3.6.6 Speed ................................................................................................................. 52
3.6.7 Muscle Strength Test ........................................................................................ 52
3.6.8 Muscle Endurance Test ..................................................................................... 53
3.6.9 Maximal Aerobic Power ................................................................................... 54
3.7 STATISTICAL ANALYSIS ......................................................................................... 55
3.8 ETHICAL CONSIDERATIONS .................................................................................. 56
CHAPTER FOUR: RESULTS ................................................................................................. 57
4.1 INTRODUCTION ......................................................................................................... 57
4.2 ANTHROPOMETRIC MEASUREMENTS ................................................................. 57
4.2.1 Stature ............................................................................................................... 57
4.2.2 Body Mass ........................................................................................................ 59
4.2.3 Sum of Skinfolds............................................................................................... 59
4.2.4 Percentage Body Fat ......................................................................................... 62
4.3 PHYSICAL PERFORMANCE CHARACTERISTICS ................................................ 62
4.3.1 Flexibility .......................................................................................................... 62
4.3.2 Muscle Power .................................................................................................... 65
ix
4.3.3 Speed ................................................................................................................. 65
4.3.4 Muscle Strength ................................................................................................ 68
4.3.5 Muscle Endurance ............................................................................................. 74
4.3.6 Aerobic Endurance ............................................................................................ 74
CHAPTER 5 : DISCUSSION, CONCLUSION AND RECOMMENDATIONS ................... 77
5.1 INTRODUCTION ......................................................................................................... 77
5.2 ANTHROPOMETRIC CHARACTERISTICS ............................................................. 77
5.2.1 Stature ............................................................................................................... 77
5.2.2 Body Mass ........................................................................................................ 78
5.2.3 Sum of Skinfolds............................................................................................... 79
5.2.4 Percentage Body Fat ......................................................................................... 81
5.3 PHYSICAL PERFORMANCE CHARACTERISTICS ................................................ 82
5.3.1 Flexibility .......................................................................................................... 82
5.3.2 Muscular Power ................................................................................................ 83
5.3.3 Speed ................................................................................................................. 85
5.3.4 Muscle Strength ................................................................................................ 86
5.3.5 Muscle Endurance ............................................................................................. 89
5.3.6 Aerobic Endurance ............................................................................................ 90
5.4 SUMMARY ................................................................................................................. 92
5.5 CONCLUSIONS ........................................................................................................... 95
5.6 RECOMMENDATIONS FOR FURTHER RESEARCH ............................................. 96
REFERENCES ......................................................................................................................... 98

x
APPENDIX A – PARTICIPATION INFORMATION QUESTIONNIARE ........................ 113
APPENDIX B – CONSENT FORM ...................................................................................... 115
APPENDIX C – PHYSICAL FITNESS DATA CAPTURING SHEET ............................... 116
APPENDIX D – PHYSICAL FITNESS DATA .................................................................... 118

xi
LIST OF TABLES
PAGE
Table I: Body Mass (kg) of female rugby player ..................................................................... 25
Table II: Stature (cm) of female rugby players ........................................................................ 27
Table III: Comparison of 10m and 40m sprint times among elite female sports athletes ........ 29
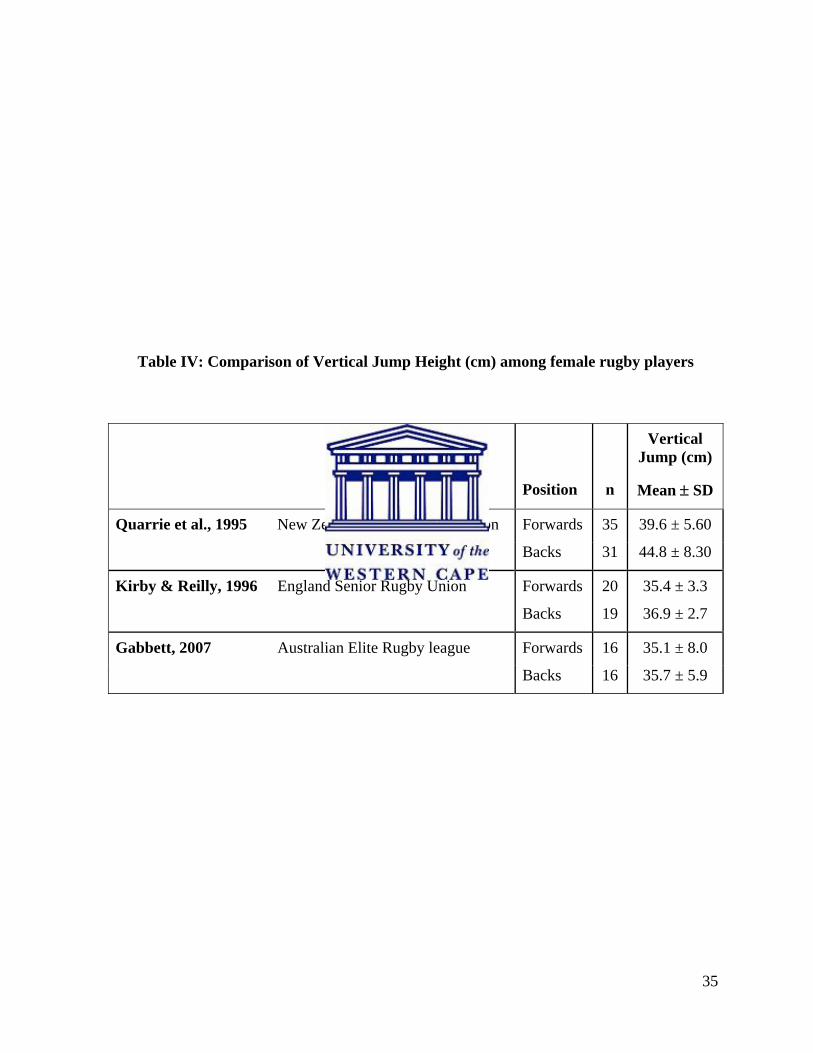
Table IV: Comparison of Vertical Jump Height (cm) among female rugby players ............... 35

xii
LIST OF FIGURES
PAGE
Figure 1: Map of South African Women’s Club Rugby .......................................................... 15
Figure 2: Mean stature (cm) by position over the three test sessions ....................................... 58
Figure 3: Mean body mass (kg) by position over the three test sessions ................................. 60
Figure 4: Mean sum of seven skinfolds (mm) by position over three testing sessions ............ 61
Figure 5: Mean percentage body fat (%) by position over the three testing sessions .............. 63
Figure 6: Mean sit and reach (cm) by position over the three testing sessions ........................ 64
Figure 7: Mean vertical jump (cm) by position over the three testing sessions ....................... 66
Figure 8: Mean 10m speed (sec) by position over the three test sessions ................................ 67
Figure 9: Mean 40m speed (sec) by position over the three test sessions ................................ 69
Figure 10: Mean Absolute Bench Press (kg) by position over the three test sessions ............. 70
Figure 11: Mean ratio scaled Bench Press by position over the three test sessions ................. 72
Figure 12: Mean number of pull-ups by position over the three test sessions ......................... 73
Figure 13: Mean number of push-ups by position over the three test sessions ........................ 75
Figure 14: Mean predicted VO2 max (mlkg-1min-1) by position over the .............................. 76

1
CHAPTER ONE
STATEMENT OF THE PROBLEM
1.1 INTRODUCTION
Female participation in rugby has been described as that of a ‘domestic worker’ (Chandler &
Nauright, 1999; Thompson, 1988). The role of females in rugby has been one of doing endless
chores for their sons and husbands such as - transporting them to games and practices,
cleaning their rugby gear, preparing meals and attending to their injured bodies and egos.
Hence, the role of women within the rugby sphere has been traditionally one of provision
rather than as an active participant (Haynes & Miller, 2001).
Over the past two decades, rugby union has grown unexpectedly as a female participative
sport throughout Australia, Great Britain, Canada, USA, New Zealand and many other
Western and Asian countries. Chu, Leberman, Howe, and Bachor (2003), identified the prime
reason for women participation in a male dominant sport, as being the physical nature and
love for the sport.
With the emergence of structured international competitions, women’s rugby has also
increasingly found its way into the limelight as matches have been played at rugby
“fortresses” such as Murrayfield (Scotland); Twickenham (England) and Ellis Park (South
Africa) as curtain raisers to International Men’s rugby matches. With the 2009 Women’s
Rugby World Cup and 2009 Rugby World Cup Sevens (Men and Women) being broadcasted
2
live on pay TV channels, this has provided women with the platform to showcase their talent
to a global audience.
In 2000, when South African Rugby Union (SARU), the custodians of the game in South Africa
accepted women’s rugby into the rugby fraternity, there were less than 10 clubs playing on a
social basis in the middle class communities. At present, rugby is being played in 143 rugby
clubs throughout South Africa, with 15 129 registered players within towns, suburbs and rural
districts (International Rugby Board, n.d). In 2003, SARU launched the Inter-Provincial
League, where games were played once a month. Such domestic competitions serve to provide a
pathway for players to develop physical and technical skills so as to cope with the physical
demands at international level (Duthie, 2006).
Rugby is a field-based team sport, eliciting a variety of physiological responses as a result of
repeated high-intensity sprints and high frequency of contact (Duthie, Pyne, & Hooper, 2003).
Time-motion analysis is an objective and yet non-invasive method of quantifying the demands
of rugby and for providing information that is applicable in the designing of physical
conditioning and testing programmes (Deutsch, Kearney & Rehrer, 2007). Of interest to
coaches is the difference in movement patterns between forwards and backs in competitive
rugby (Deutsch, Kearney, & Rehrer, 2002; Deutsch, Maw, Jenkins & Reaburn, 1998). In
rugby, high intensity activity accounts for 12-14% of game time for the forwards and 4.5-6%
for backs (Deutsch et al., 2007; Duthie et al., 2003). This difference between backs and
forwards was largely as result of the greater involvement of forwards in static exertion
(rucking, mauling and scrummaging) and higher sprinting efforts by the backs (Deutsch et al.,
3
2007). Static exertion requires great strength, while intense running involves acceleration and
maximal speed and when performed over an extended duration or repeatedly, both static
exertion and sprinting will require muscle and aerobic endurance. Detailed analysis of the
occurrences of these activities, will assists coaches to prepare highly effective training
sessions and sport scientist to develop specific physiologic tests to examine the preparedness
for competition (Deutsch et al., 1998, 2007).
Competitive success in male rugby union is related to anthropometric profiles (Duthie, Pyne,
Hopkins, Livingstone, & Hooper, 2006a; Hawes & Sovak, 1994) and physical capacities of
players such as strength (Mayes & Nutall, 1995; Quarrie & Wilson, 2000; Tong & Wood,
1995), speed (Duthie et al., 2003; Quarrie, Handcock, Waller, Chalmers, Toomey, & Wilson,
1995) muscular power (Carlson, Carter, Patterson, Petti, Orfanos & Noffal, 1994; Deutsch,
Kearney, & Rehrer, 2002) and aerobic fitness (Deutsch et al., 1998; McLean, 1992; Scott,
Roe, Coats & Piepoli, 2003). Hence, scientifically evaluating players with regards to the
anthropometric and physical characteristics plays an integral role in monitoring and
developing these physical fitness components among modern rugby players (Du Plessis,
2007). A number of studies have investigated the physical fitness characteristics of sub-elite
and elite female rugby union players (Kirby & Reilly, 1993; Quarrie, Handcock, Waller,
Chalmers, Toomey & Wilson, 1995). There is however, presently a lack of information on the
characteristics on contemporary elite female rugby union players. These studies have
suggested that, as in men’s rugby, female players are most often selected for positions based
on their anthropometric and physical characteristics.

4
Rugby union players have a diverse range of physical attributes, and a distinct physique will
naturally orient a player towards a particular position over others (Quarrie, Handcock,
Toomey & Waller, 1996). Backs players for whom sprinting is important for attacking and
cover defending, have a lean physique unlike forwards who are heavier, taller, and have a
greater proportion of body fat as the physique is more suitable for dominating scrums, tackles,
rucks and mauls (Rienzi, Reilly & Malkin, 1999). In addition, forwards also demonstrate
greater absolute power and strength so as to defend as well as retain turn over possession.
When body mass is taken into account, there is a reversal of these results (Duthie et al., 2003).
In the professional era, playing rugby is virtually a year-round endeavor. The capacity of elite
players to acquire and maintain a good level of physiological fitness during pre-season and in-
season, respectively, has become paramount (Caldwell & Peters, 2009). Studies conducted on
male rugby players (Duthie et al., 2006a; Gabbett, 2005b; Tong & Mayes, 1995) show that the
greatest improvement in strength, flexibility, aerobic fitness and reduction in skinfold
thickness occur in the earlier stages of the season before returning to baseline values or being
maintained during the competition. Reduction in muscular power and maximal aerobic power
and increase skinfold thickness may also occur towards the end of the rugby season due to low
training loads and high match loads and injury rates (Gabbett, 2005a). However, with
women’s rugby being an amateur sport, fitness may either increase or decrease in some
players over a season due to level of competition and quality of training sessions or social
circumstances.

5
From the time men’s rugby union became professional worldwide in 1995, the science
examining the sport and its participants has developed rapidly to meet the increased demand
for knowledge of the requirements of the game and the characteristics of players (Nicholas,
1997). As a result of the physical demands of the game, the anthropometric and physical
characteristics of elite players have become highly developed. However, little is known about
the optimal way to enhance physical fitness in female rugby players, and to what extent
aerobic power, speed, muscle strength and power should be trained during the competition
season. The finding of different magnitude of changes in physical fitness during the season in
elite female rugby players will have important implications for team selection and
highlighting the need to determine the appropriate training strategy and periodisation required
to elicit improvements in physical fitness in elite team sports (Granados, Izquierdo, Ibáñez,
Ruesta, & Gorostiaga, 2008).
The aim of this study is to establish descriptive data for elite South African women’s rugby
union players and to determine the changes in anthropometric and physical characteristics of
the players within a competition season.
1.2 STATEMENT OF THE PROBLEM
As far as it can be ascertained, no study published has monitored the physical fitness levels of
women’s rugby union player throughout a competitive season. Several studies have described
the anthropometric and physical characteristics of women’s rugby union players; however all
of these studies have been limited to a single fitness testing session performed either at pre-
season, mid-season or post-season.
6
Hence, the purpose of this study is to monitor the changes in physical fitness characteristics of
elite women’s rugby union players over the duration of a competitive season. The data could
be used by the coaching staff, sport scientists and medical practitioners to determine the
effectiveness of intervention programs in the attainment or maintenance of fitness levels
throughout the season.
1.3 AIM AND OBJECTIVES
The aim of this study was to assess the physical fitness of elite senior women’s rugby union
players over a competition season. In order to meet the primary aim of this study, the
following objectives are relevant:
To investigate seasonal variations in physical fitness of an elite women’s rugby union
player during a competition season between pre-season, mid-season and post-season.
To identify which of the following anthropometric and physical characteristics are
significantly different between forwards and backs, of an elite South African women’s
rugby union player during a competition season:
o anthropometric measures such as:
stature
body mass
skinfold
percentage body fat
o physical measures such as
flexibility
vertical jump

7
10 and 40 m speed
1 RM bench press
pull-ups
1 minute push-ups
aerobic power
1.4 RESEARCH HYPOTHESIS
For this study, it was hypothesised that:
There will be a significant improvement in the body mass, sum of seven skinfolds,
percentage body fat, flexibility, vertical jump, 10m and 40m speed, 1- RM bench
press, pull-ups, 1 minute push-ups and predicted maximum oxygen uptake between
pre-season, mid-season and post-season.
There will be no significant change in the body mass, sum of seven skinfolds,
percentage body fat, flexibility, vertical jump, 10m and 40m speed, 1- RM bench
press, pull-ups, 1 minute push-ups and predicted maximum oxygen uptake between
mid-season and post-season.
There will be a significant difference between the forwards and backs for the
following physical fitness characteristics: body mass, sum of seven skinfolds,
percentage body fat, flexibility, vertical jump, 10m and 40m speed, 1- RM bench
press, pull-ups,1 minute push-ups and predicted maximum oxygen uptake.
8
1.5 SIGNIFICANCE OF THE STUDY
Rugby union is a contact team sport played by both sub-elite and elite male and female
competitors. The increase in women’s participation in competitive games is reflected in the
growing popularity of Women’s Rugby Union (Kirby & Reilly, 1993). The acceptance of the
women’s rugby by SARU, culminated in the participation of the Springbok Women’s Team in
the 2006 Women’s Rugby World Cup. Up to now there has been little attention given to the
women’s game in South Africa by researchers, unlike men’s rugby in which has been studied
by various research groups (Duthie et al., 2003).
According to Holmyard and Hazeldine (1993), the seasonal nature of rugby union imposes
varied physical stresses on the player which may compromise their physical development.
With this mind, the scientific investigation on physical testing of these fitness qualities will
attempt to assist in the monitoring of a players physical fitness during the season.
Furthermore, the knowledge generated in this study will assist in the development of
intervention programs for women’s rugby union players. From a practical perspective, such
research could be utilised by coaches in structuring periodised plans so as to facilitate
effective training to improve individual and team performance. In addition, it may provide
conditioning coaches with realistic performance guidelines based on the different phases on
the competition season.
1.6 LIMITATIONS OF THE STUDY
The sample size of this study is relatively small however it is comparable to anthropometric
and physical studies for women’s rugby players in club, provincial and international level

9
(Gabbett, 2007; Quarrie et al., 1995; Kirby & Reilly, 1993). In an attempt to obtain a
homogenous sample size of senior elite women’s rugby union players, only participants that
have been selected for the SARU high performance squad will be studied. Although it may
have been advantageous to include a greater sample size, the researcher deems it more
important to study a representative sample of elite women’s rugby players.
1.7 SCOPE OF THE STUDY
The sample consisted of 32 elite female rugby players who were identified as members of the
South African Rugby Union High Performance Squad for the 2010 Women’s Rugby World
Cup. The players’ ages ranged from 19 to 37 years and were defined as “elite” because the
majority of these players have international playing experience.
The participants were assessed on three separate occasions throughout the 2009 competition
season. The first data collection process took place in May, pre-season, then in July, mid-
season and in October, post season. All physical assessments were conducted on the first day
of the national training camps after medical assessments were done on each player by the
medical staff. All measurements and assessments were done in-doors so as to limit any
interference from environmental conditions. On all testing occasions, the fitness testing
protocol was specifically completed in the following order: stature, body mass; skinfolds; sit
and reach; vertical jump; speed; bench press; pull-ups, push-ups and multi-stage shuttle run so
as to increase reliability and accuracy.

10
1.8 TERMINOLOGY
Forwards: Classified as players numbered 1 to 8 and referred to as
“ball winners” (Duthie et al., 2003). Within the
forwards, players 1 to 3 are referred to as the “front
row”, while 1 to 5 are commonly known as the “tight 5”.
The “second row” is formed by the locks (players 4 and
5). The “loose forwards” are players 6 to 8, and also
referred as the “back row”.
Backs: Classified as players numbered 9 to 15 and referred to as
“ball carriers” (Duthie et al., 2003). Within the backs,
“half backs” players 9 to 10, while 9 to 13 are commonly
known as the “inside backs”. The “midfield backs”
(centers) are 12 and 13, and “outside backs” are 11, 14
and 15.
Physical fitness: Defined in this study as a combination of anthropometric
and physical performance characteristics.
Anthropometric characteristics: Defined as the measurement of the dimensions of the
human body (Maud & Foster, 2006) and for this study,
measurements of stature, weight and skinfolds to
determine body composition.
11
Physical performance characteristics: Defined in this study as the outcome of measurements
of the following fitness components: muscle strength
and endurance, anaerobic and aerobic endurance,
flexibility, speed, and power.
Scrum: The scrum is a way to restart play after a minor
infringement or a stoppage. A scrum is formed in the
field of play when eight players from each team, bound
together in three rows for each team, close up with their
opponents so that the heads of the front rows are
interlocked. This creates a tunnel into which a scrum
half throws in the ball so that front row players can
compete for possession by hooking the ball with either
of their feet (SA Rugby, 2007).
Maul: A maul occurs when a player carrying the ball is held by
one or more opponents, and one or more of the ball
carrier’s team mates bind on the ball carrier. A maul
therefore consists of at least three players, all on their
feet; the ball carrier and one player from each team. All
the players involved must be caught in or bound to the
maul and must be on their feet and moving towards a
goal line (SA Rugby, 2007).
12
Ruck: A ruck is a phase of play where one or more players
from each team, who are on their feet, in physical
contact, close around the ball on the ground (SA Rugby,
2007).
Line-out: It is a way to restart play, after the ball has gone into
touch, with a throw-in between two lines of players (SA
Rugby, 2007).

13
CHAPTER TWO
REVIEW OF RELATED LITERATURE
2.1 INTRODUCTION
Rugby is a collision-based sport, which historically has been a male preserve. Success in the
sport is extremely reliant upon the player’s possessing an adequate level of strength, power,
speed, endurance and as well as technical and tactical acumen. With the rapid growth in
women’s rugby, this chapter first explores the history of women’s rugby and its competitive
development in South Africa. The demands of rugby competition are described in terms of
activity patterns so as to gain insight into the positional demands in rugby union. Thereafter,
specific physical fitness characteristics are described in this chapter, which have shown to
influence sporting performance. Finally, season changes in fitness over the course of the
season as well as monitoring methodology used during training will be discussed.
2.2 WOMEN’S RUGBY UNION
South Africa is a country whereby rugby has a following of about ten million in a population
of 44 million and played by both men and women at club, provincial and national level (SA
Rugby, n.d.). In the 1990’s, women’s rugby in South Africa emerged in Johannesburg and
Pretoria, with when it was played predominately by middle class females who had enough
time and resources to establish teams. These players encountered gender stereotypes on a
regular basis from some rugby men, although rugby in South Africa was founded on the

14
principle of a non-racial, non-political and democratic rugby community, so as to ensure the
leveling of the playing fields on and off the field (SA Rugby, n.d.).
2.2.1 Women’s Club Rugby
When the South African Rugby Union (SARU) accepted women’s rugby into its fold in 2000,
there were less than 10 clubs which were mainly situated at the Blue Bulls, Golden Lions and
Falcons rugby union. Women’s rugby achieved success in the early period and experienced an
exponential growth due to SARU initiated campaigns through the Provinces to establish club
rugby so as to dispel the stereotypes born of misconceptions about the sport. The recruitment
drive resulted in the affiliation of 65 clubs in July 2001 and on National Women’s Day (9
August 2001) the programme was officially launched in Pretoria. At the end of 2001, there
were 91 clubs throughout the country which further increased to 123 by March 2002, with
Eastern Province and Border region showing remarkably growth especially in the under-
privileged communities. With the increasing numbers and competitiveness, women’s rugby
was now an established female sport in South Africa.
Women’s rugby playing numbers declined between 2003 and 2006, as women faced the
daunting task of managing clubs, raising funds and yet playing. In addition, senior players
who had aspiration of representing the National Team retired after realising that they were not
meeting the selection criteria.
After a few years of struggling for survival, rugby is now being played in over 143 amateur
clubs (Figure 1). This resurgence in the women’s games is due to an initiative by Mahlubi Puzi

15
LEOPARDS
No of Women’s Clubs: 7No of Women Rugby Players: 360
GRIQUAS
No of Women’s Clubs: 5No of Women Rugby Players: 104
FREE STATE
No of Women’s Clubs: 3No of Women Rugby Players:78
MPUMALANGA
No of Women’s Clubs: 3No of Women Rugby Players: 70
GOLDEN LIONS
No of Women’s Clubs: 4No of Women Rugby Players: 37
GRIFFONS
No of Women’s Clubs: 4No of Women Rugby Players: 480
NATAL SHARKS
No of Women’s Clubs: 4No of Women Rugby Players: 400
VALKE
No of Women’s Clubs: 3No of Women Rugby Players: 27
WESTERN PROV
No of Women’s Clubs: 8No of Women Rugby Players: 240
BOLAND
No of Women’s Clubs: 8No of Women Rugby Players: 280
BORDER BULLDOGS
No of Women’s Clubs: 52No of Women Rugby Players: 1300
MIGHTY ELEPHANTS
No of Women’s Clubs: 19No of Women Rugby Players: 360
SWD EAGLES
No of Women’s Clubs: 8No of Women Rugby Players: 160
BLUE BULLS
No of Women’s Clubs: 6No of Women Rugby Players: 219
Total No of Players in Schools, Clubs & Women Rugby Players
397 373
Figure 1: Map of South African Women’s Club Rugby
(International Rugby Board, n.d)

16
Puzi, the South African Rugby Game Development Manager to attract young girls to the game
through men’s youth club so as makes the clubs more sustainable. Currently they are 15129
amateur female rugby players, comprising of 7167 senior female players, 4143 teen female
players and 3819 pre-teen female players (International Rugby Board, n.d)
2.2.2 Provincial Women’s Rugby
In August 2002, SARU staged the inaugural Inter-Provincial Tournament to give opportunity
to a greater number of players to play representative rugby. This culminated in Falcons
winning against Natal in a closely contested match on National Women’s Day (09 August
2002). SARU then launched the Inter-Provincial League in 2003. In New Zealand, provincial
rugby has been played since 1980 (Chester, Palenski, & McMillian, 1998), even though it was
only accepted by the New Zealand Rugby Football Union in 1992 (Chu, Leberman, Howe, &
Bachor, 2003). In South Africa, Provincial rugby is played once a month with the other three
weeks dedicated to club rugby. Provincial games are played either in communities or as
curtain raisers to provincial men’s games in major stadiums so as to promote the game to a
broader spectator base.
Blue Bulls and Eastern Province are the leading Provincial rugby teams as they both secured
four and three consecutive Inter-Provincial titles between 2003-2006 and 2007-2009,
respectively (SA Rugby, 2009).
17
2.2.3 International Women’s Rugby
Men’s Rugby Union has been an international sport since 1871, when England and Scotland
contested the first international match (Quarrie & Hopkins, 2007). In the United States, the
senior, U23 and U19 women’s national team began participating in 1987, 1999 and 2002,
respectively (Chase, 2006). The South African Women’s Rugby team, commonly known as
the Springbok Women’s Team, played their inaugural test matches against Wales at the
Adcock Stadium in Port Elizabeth and at Securicor Loftus Stadium in Pretoria in 2004,
followed by a reciprocation outbound tour to Wales and England in 2005 whereby the team
won its first international game against Wales (SA Rugby, 2005). The Springbok Women’s
team won their first home game and test series in June 2006 against Netherlands (SA Rugby,
2006).
In 2006, at the third official 2006 International Rugby Board Women’s Rugby World Cup in
Canada, South Africa participated as the Confederation of Africa Rugby (CAR)
representative. The first recognised Women’s Rugby World Cup was hosted by The
Netherlands Rugby Board in 1998, which was won by New Zealand, who are the current
three-time defending World Cup champions. Prior to this, World Tournaments were staged in
Wales and Scotland in 1991 and 1994 respectively.
2.3 PHYSIOLOGICAL DEMANDS OF RUGBY COMPETITION
Rugby is typical of many team sports, with a range of work intensities, durations and recovery
periods (McLean, 1992). Researchers have used measurements of physiological parameters

18
such as heart rate (Deutsch et al., 1998), blood lactate concentration (Deutsch et al., 1998;
McLean, 1992); blood glucose (Jardine, Wiggins, Myburgh, & Noakes, 1988), muscle
glycogen (Jardine et al., 1988) and haematological parameters (Banfi, Del Fabbro, Mauri,
Corsi, & Melegati, 2006) to establish the physiological response to rugby. Due to the
frequency of physical contact during competition, to collect blood samples poses logistical
difficulty for researchers and players. Hence time-motional analysis is preferred, as it provides
a non-invasive and yet effective method of quantifying the demands of rugby and also
provides conceptual frame work for specific physical preparation of players (Deutsch, et al.,
2002; Deutsch et al., 2007; Duthie et al., 2003; McLean, 1992; Roberts, Trewartha, Higgitt,
El-Abd, & Stokes, 2008).
In rugby, time-motion analysis has been used extensively to establish movement patterns
(Deutsch et al., 1998; Deutsch et al., 2002; Deutsch et al., 2007), distance covered and average
velocities (Deutsch et al., 2002; Deutsch et al., 2007; Duthie et al., 2003; McLean, 1992;
Roberts et al., 2008), levels of exertion and work to rest ratios (Deutsch et al., 1998; Deutsch
et al., 2007; Duthie, Pyne, & Hooper, 2005; McLean, 1992) in order to quantify the time spent
in different activities at different levels of competition and between positional groups (Duthie
et al., 2003).
Hence, a detailed understanding of positional demands is necessary to inform the development
of more position specific norms so as to match players to particular positions and for the
implementation of training programs specific to the physical positional demands.

19
2.3.1 Movement Patterns
Time-motion studies have revealed that the 85% of the match is spent on low intensity
activities (standing, walking, jogging and utility movements) and 15% in high intensity
activities (cruising, sprinting, scrummaging, rucking, mauling, and tackling) (Duthie, 2007;
Deutsch et al., 2007). These findings support the notion that rugby is of interment nature
whereby short bouts of high intensity are interspersed with long periods of low intensity
activity.
Studies of rugby union players reveal that forwards spent significantly more time in the high
intensity phase than backs, because of their greater involvement in rucking, mauling and
scrummaging (Deutsch et al., 2002; Duthie et al., 2003; Duthie et al., 2005). These findings
were supported by a recent study by Deutsch et al., (2007) and Roberts et al., (2008), whereby
forwards spent 12-14% total match time performing high intensity work, while corresponding
value for backs were 4.5-6%. These findings reaffirm the notion that static and dynamic
movements such as rucking, mauling, tackling are critical components in the game of rugby
for forwards. Of high intensity activity, backs spend approximately two to three times more
sprinting than forwards irrespective of playing conditions (Deutsch et al., 1998; Deutsch et al.,
2007; Roberts et al., 2008).
Movement analysis of elite male junior and senior internationals indicate that front row
forwards spend more time standing still, with the trend for this time to decrease as one moves
outwards among the different positional groups (Deutsch et al., 1998; Deutsch et al., 2007;
Roberts et al., 2008). This breakdown of movement suggests that players carrying a greater

20
body mass passively recovery around the ruck area after an intense activity. The percentage of
time spent walking reported for U-19 players (front forwards 14.7%, back row forwards 16%,
inside backs 27.5%; outside backs 27%) was similar to Super 12 players (Deutsch et al.,
1998). Conversely, there is greater use of jogging by forwards when compared with backs
which suggests forwards continuously follow the ball to breakdowns given the proximity to
the contest (Deutsch et al., 1998; Roberts et al., 2008).
2.3.2 Work-to-Rest Ratios
Across all rugby playing positions, players are required to repeatedly reproduce maximal
sprints of short duration, interspersed with brief recovery periods over the duration of a match.
Hence, work-to-rest ratios provide an objective means of quantifying the physiological
requirement of an activity (Duthie et al., 2003). Work and rest periods have been defined as
those when a player is involved in high intensity activities (running, sprinting, rucking,
mauling or scrumming) and in low intensity activities (standing, walking, jogging and
shuffling sideways or backwards) respectively (McLean, 1992). Work-to-rest ratios are
calculated by comparing the mean duration of work periods against the mean duration of rest
periods (Deutsch et al., 2002; Duthie et al., 2003; McLean, 1992). High-intensity efforts can
sometimes follow each other in effort to retain possession, resulting in increased work-to-rest
ratios and players having insufficient time for the replenishment of creatine phosphate stores
between high intensity efforts, and thus a considerable reliance on anaerobic glycolysis during
these subsequent work periods (Deutsch et al., 1998; Deutsch et al., 2007). This results in the
need for longer periods of recovery between high intensity efforts (Meir, Newton, Curtis,
Fardell, & Butler, 2001).
21
Analysis of work-to-rest periods in U-19 Australia male rugby players showed that forwards
(1:1.4) maintained a higher work-to-rest ratio than backs (1:2.7) with the loose forwards
(1:1.2) working more continuously than inside backs (1:3.6 ) (Deutsch et al., 1998). Similarly,
McLean (1992) reported that most work-to-rest ratios during international match-play were in
the range of 1:1 to 1:9 for backs and forwards combined which is the same with U-19
Australian players when positions are combined. These are considerably higher than the
estimated mean work-to-rest ratios of 1:7.4 and 1:21.8 reported for New Zealand Super 12
forwards and backs respectively (Deutsch et al., 2007). The prolonged rest periods at the
senior elite level of rugby union reflects the increase number of stoppages due to injuries, goal
kicking and stringent refereeing. This in contrast, to the junior level, in which rest periods are
short and work rates are higher (Deutsch et al., 1998), which suggests a less structured,
continuous style of rugby in U-19 level compared to senior level.
2.3.3 Distance Covered and Velocity
Estimation on the distance covered during the course of a match indicates that backs cover
more distance than forwards (Deutsch et al., 1998; Roberts et al., 2008). The total distance
covered by both forwards (5581m) and backs (6127m) during a 80 minute rugby match at the
elite level (Roberts et al., 2008) is in line with U19 age group level of forwards (4240m) and
backs (5640m) during a 70 min match (Deutsch et al., 1998). The difference in total distance
traveled by backs and forwards is attributed to a greater walking distance by backs (2351 vs.
1928 m) and as result of high intensity running (448 vs. 298m) (Roberts et al., 2008).
Sprinting data show that outside backs (280 ± 185 m) sprint significantly greater total
distances than inside backs (124 ± 78 m), tight forwards (144 ± 189 m ) and loose forwards

22
(192 ± 203 m) (Roberts et al., 2008). The greater sprints performed by outside backs
reinforces the generally accepted notion that as “finishers” they require a superior sprinting
ability then other positional groups.
Furthermore, male forwards and backs achieved speeds in excess of 90% maximal velocity
(Vmax) at 7.5ms-1 and 8.5 ms-1 , respectively (Duthie, Pyne, Marsh, & Hooper, 2006b). For
forwards, many sprints commence from a standing start and typically lasted 2.5 seconds in
which they covered a distance of 15m (Duthie et al., 2006b). This illustrates that conditioning
coaches should train forwards from a standing position and test them preferably over ten
meter splits (0 to 10 m and 10 to 20m), which can be classified as acceleration. When starting
from a jogging speed, elite rugby union backs achieved 100% of Vmax in which they covered
approximately 40m within five seconds. Hence, the assessment of speed for backs should
include 0 to 10m and 30-40m sprint training from standing and moving starts as this will
assess their acceleration and ability to attain speeds in excess of 90% of Vmax.
2.4 PHYSICAL FITNESS OF A RUGBY PLAYER
Rugby union is a high contact, dynamic sport in which athletes requires high levels of
physical fitness, which is a composite of aerobic and anaerobic endurance, muscle strength
and power, speed, agility and body composition. For this review, the anthropometric and
physical performance characteristics will be compartmentalized in sections for ease of
discussion.
23
2.4.1 Body Mass
There has been a marked increase in the body mass of rugby players following the
introduction of professionalism due to selection pressure towards physiques that best match
the requirements of the sport (Quarrie & Hopkins, 2007). The 1999 Rugby World Cup lends
support to this conception as the most successful teams had greater mass in the forwards
(Duthie at al., 2006). A greater body mass confers an advantage in the contact phases of the
sport, because of the great momentum players are able to generate (Quarrie & Hopkins, 2007).
An increased focus on weight training and usage of nutritional supplements may also have
contributed to the increase changes in body mass (Duthie et al., 2003).
Numerous studies have shown that there is a distinction between forwards and backs with
respect to body mass of elite (Duthie et al., 2006; Meir & Halliday, 2005; Quarrie & Hopkins,
2007), amateur (Maud, 1983; Quarrie et al., 1995), adolescent (Deutsch et al., 1998; Durandt
et al., 2006) and female rugby players (Gabbett, 2007; Kirby & Reilly, 1993; Quarrie et al.,
1995; Schick, Molloy, & Wiley, 2008). Amongst the 2006 Women’s Rugby Union players,
the forwards (80.17 ± 10.10 kg) were significantly heavier that the backs (68.03 ± 10.10 kg)
which is comparable to elite women’s rugby league forwards and backs (74.5 ± 12.5 kg vs.
64.7 ± 7.6 kg) (Gabbett, 2007; Schick et al., 2008) (Table I). Differences in body mass have
also been observed within the forwards and backs between U/16 and U/18 South African
rugby union players (Durandt et al., 2006). Sixteen year old players weighing significantly
less than the 18-year-old players (76.5 ± 8.2 vs. 84.9 ± 8.3 kg) with the props being the
heaviest and scrumhalves the lightest in both age groups .

24
2.4.2 Stature
There is a clear distinction in stature (standing height) between male forwards and backs at
junior (Durandt et al., 2006) and professional level (Duthie et al., 2003). Interestingly, a data
analysis of New Zealand Rugby Players between 1972 and 2004 shows, that forwards have
become slightly shorter whereas backline players have become taller (Quarrie & Hopkins,
2007). It has been speculated that the decrease in stature of the forwards coincides with the
introduction of the law permitting lineout jumpers to be supported in the lineout as this law
allows good lifters to overcome slight disadvantages in the stature of the jumper.
In contrast to male players, numerous studies have demonstrated that senior and school girl’s
forwards and backs have similar stature (Table II) (Kirby & Reilly, 1993; Quarrie et al., 1995;
Sedlock, Fitzgerald, & Knowlton, 1988). Recent literature has shown that both elite women’s
rugby union forwards are significantly taller than backs (Schick et al., 2008). It would appear
that players in the forwards need to be tall to contest aerial possession of the ball in line-outs.
2.4.3 Sum of Skinfolds
The majority of anthropometric assessments of rugby players have involved quantifying the
body fat levels (Duthie et al., 2003). The calculation of percentage body fat is problematic,
due to limitations in establishing percentage body from estimates of body density and skinfold
measurements (Martin, Ross, Drinkwater, & Clarys, 1985) and the measurement error of
different methods and prediction equations (Duthie et al., 2006a). Given these concerns, it is

25
Table I: Body Mass (kg) of female rugby player
Body Mass (kg)
Mean SD
Forwards Backs
Gabbett (2007) Elite Rugby league 75.5 ± 12.5 64.7 ± 7.6
Schick, Molloy & Willey (2008) Elite Rugby Union 80.2 ± 10.1 68.0 ± 7.5
Quarie et al., (1995) Senior New Zealand 75.6 61.4
Kirby & Reilly (1993) Senior England 68.9 ± 6.6 60.8 ± 5.7
Williams (1984) Club United States 68.9 ± 6.1 60.7 ± 5.9
Sedlock, Fitzgerald, & Knowlton (1988)
Club 69.2 ± 9.3 54.1 ± 6.8
26
now common practice to monitor sum of skinfolds in elite rugby players in preference to
estimating percentage body fat, as it can be used to monitor changes in peripheral fat stores
over time (Jenkins & Reaburn, 2000).
The skinfold thickness is reported to significantly higher in forwards than backs for male
professional rugby union players (forwards: 84 ± 19 mm vs. backs: 60 ± 13mm), and elite
female rugby league player (forwards: 141 ± 37.2 mm vs. backs: 114.8 ± 20.2 mm) (Duthie,
2006; Gabbett, 2007). It has been suggested that the higher percentage body fat in forwards
may serves as protective buffer in contact situations or impact injuries (Bell, 1973), however,
to date no conclusive evidence exists to support or refute this claim. The lower body fat values
of the backs are a reflection of the higher speed requirements of these players. Body fat values
for male backs are said to be similar to other team sports such as field hockey, soccer and
touch rugby (Duthie, Pyne & Hooper, 2003). Excessive body fat should be avoided as it has
shown to have negative impact on performance for two main reasons, First, Newton’s second
law (a = F/m) specifies that increases in fat mass (m) without an increase in muscle force (F)
will reduce acceleration (a). Second, displacement of additional fat mass requires extra
energy, which increases the relative physical cost of exercise (Duthie, 2006).
2.4.4 Speed
Speed is a component of fitness that is often assessed by sport scientist to indicate athletic
ability (Logan, Fornasiero, Abernethy, & Lynch, 2000). Speed is the ability to cover distances
in as short a time as possible and represents the maximum capabilities of an athlete in a

27
Table II: Stature (cm) of female rugby players
Stature (cm)
Mean SD
Forwards Backs
Gabbett (2007) Elite Rugby league 169.0 ± 6.6 166.1 ± 5.4
Schick, Molloy & Willey (2008) Elite Rugby Union 172.0 ± 6.7 165.6 ± 5.9
Quarie et al., (1995) Senior New Zealand 166.7 164.1
Kirby & Reilly (1993) Elite Rugby Union 168.5 ± 7.9 165.5 ± 3.9
Williams (1984) Club 166.0 ± 5.4 164.9 ± 5.4
Sedlock, Fitzgerald, & Knowlton (1988)
Club 166.4 ± 4.6 162.2 ± 5.6

28
straight line (Baker & Nance, 1999). The ability to sprint is undeniable an important fitness
component for rugby union (Nicholas, 1997). In rugby, sprints vary in terms of change of
direction, methods of carrying the ball, and strategies to avoid contact with the opposition
(Duthie et al., 2006b). Collectively, these factors make sprinting in rugby different from
straight-line track line sprinting (Sayers, 2000). Despite these differences, elite rugby union
coaches and conditioning staff still strive for their players to be able run quickly in a straight
line (Duthie et al., 2003).
Speed consists of a number of components, all of which are independent qualities; namely
acceleration, maximum speed and speed-endurance (Cronin & Hansen, 2005). Assessment of
elite rugby players’ speed has traditionally involved testing over a range of distances (10 to
100m) from both a standing and moving start (Duthie et al., 2006b; Carlson et al., 1994;
Quarrie et al., 1995; Quarrie et al., 1996). Time motion studies have suggested that
acceleration (0-10m) and to a lesser extent, maximal velocities (30-40m) are important
qualities of sprinting for elite rugby players (Duthie et al., 2006b; Duthie et al., 2003). Sprint
comparison among elite female sport athletes reported that Touch rugby players are fastest in
acceleration and speed endurance (Table III).
Considering the importance of assessing and developing acceleration qualities of rugby
players, coaches and conditioning staff need to be aware of the critical differences between
track and rugby running techniques. Correct track sprinting technique is not ideal in rugby, as
players need to change direction, carry a ball and prepare for contact (Sayers, 2000). Rugby
players must sprint with low foot elevation and emphasis on fast feet or cadence rather than

29
Table III: Comparison of 10m and 40m sprint times among elite sportswomen
Seconds
Mean SD
10-m sprint 40-m sprint
Gabbett (2007) Rugby League 2.00 ± 0.11 6.46 ± 0.36
Tumilty (2000) Soccer 1.87 ± 0.07 Not reported
Lawrence & Polgaze (2000) Hockey 1.98 ± 0.07 6.04 ± 0.22
O'Connor (1997) Touch Rugby 1.82 ± 0.09 5.71 ± 0.22

30
stride length like a track sprinter (Duthie et al., 2003). Rugby players tend to run with a
closed, slightly slouched upper body posture with a significantly forward lean (to drive hard
and protect possession) with the foot landing forward of the centre of gravity (to brace for
impact or provide breaking force for change in direction), as compared to track athletes who
run more upright and with feet landing under the centre of gravity (Sayers, 2000). Attacking
players often have to sprint while carrying a ball which has the potential to reduce their arm
drive, an important characteristic of sprinting. A study has shown that players can sprint
fastest without the ball, while running with the ball under one arm is slower and running with
the ball in both hands is the slowest (Grant et al., 2003). The negative effect of slowing down
while holding the ball in both hands, has to be weighed up against the advantages of being
able to distribute the ball more efficiently when the need arises.
2.4.5 Agility
At present, there is no consensus among sport scientists for a clear definition of agility,
although most practitioners classify agility as any movement involving rapid change(s) of
direction (Bloomfield, Ackland & Elliot, 1994). In a more recent publication by Sheppard and
Young (2006), agility is defined as a rapid, whole body, change of direction or speed in
response to a sport specific stimulus.
Several researchers have advocated the use of agility tests on rugby union players such as
Illinois agility run (Durandt et al., 2006), 505 test (Ellis et al., 2000), Agility run (Quarrie et
al., 1995) and T-test (van Gent & Spamer, 2005). Although these studies reflect the time
difference within positional groups (backs and forwards), there is no significant difference

31
between age groups (Durandt et al., 2006) and playing levels (Quarrie et al., 1995). If a test
cannot discriminate between higher and lower performers within a sport, its utility in detecting
training-induced changes is questionable (Gabbett, Kelly, & Sheppard, 2008). In addition,
these tests are limited as the change of direction relies on preplanned movements which are
not practical in a sport such as rugby. Furthermore, the aerobic and anaerobic test procedures
that will be described in the upcoming paragraphs both involve a component of agility as they
comprise several sharp turns within the tests.
While the majority of agility research has been devoted to preplanned change of direction
speed tests, a study reported that during a Super 12 game, 16% of all the sprints involved a
change of direction of which the forwards had 15% per game which is significantly greater
than backs (6 ± 3.2%) (Duthie et al., 2006b). In this investigation, the ability of rugby player
to respond to game specific stimulus has been demonstrated.
2.4.6 Muscle Strength and Power
Strength is defined as the ability to overcome or resist very high levels of force, especially
against large external resistances, such as the body weight of opposing players (Baker,
2001b). Power is defined as the ability to generate high levels of force quickly (strength x
speed or the speed at which strength can be manifested) (Baker, 2001b). Strength and power
have been reported as important physical qualities necessary for successful participation in
rugby union player, as is not only necessary to be strong to effectively tackle, push or pull
opponents or resisting high level of forces during scrums, rucks and mauls but also to generate
these high levels of strength with speed (Hrysomallis, 2010; Meir et al., 2001). Hence
muscular power and strength are regularly evaluated by strength and conditioning staff and are

32
deemed important components of physical fitness by players and coaching staff (Crewther,
Gill, Weatherby, & Lowe, 2009).
Testing of rugby players has greatly increased during the past decade, principally due to the
increased professionalism in the sport and the consequent determination to improve player
talent identification and performance level (Baker, 2001b). Numerous studies have examined
the upper body strength of male rugby union players at various competitive levels and age
groups (Du Plessis, 2007; Durandt et al., 2006; van Gent & Spamer, 2005; Crewther et al.,
2009), however there is presently limited published information on the leg strength levels of
elite rugby union players (Duthie et al., 2003). Strength test such as the one or three repetition
maximum bench press, bench pull up test, pull-up test, grip strength and leg strength tests
have been used to profile the strength characteristics in various rugby populations.
Crewther et al., (2009), reported significant differences in one repetition maximum (1 RM)
box squat (197.7 ± 25.5 kg vs. 181.9 ±16.8 kg) and bench press (143.6 ± 10.9 kg vs.130.6
±17.9 kg) strength in forwards and back respectively at elite level. These findings are in line
with previous research on international rugby union players (Cometti, Pousson, Bernardin, &
Brullebaut, 1992). The positional difference in muscular strength can be partially explained by
the larger body mass of forwards, and may also reflect the muscular adaptation which occurs
as a function of the strength requirements of forwards to enable them to withstand and
transmit the forces applied whilst scrumming (Quarrie & Wilson, 2000).
33
Durandt et al., (2006) indicate that a 16 year old (77.1 ± 11.8 kg) male elite rugby player
lifted less weight than a 18 year-old male (95.3 ± 16.7 kg) in the 1 RM bench press test for
upper body strength. The greater strength in 18 year olds was attributed to maturation, training
discrepancies or a combination of the two (Durandt et al., 2006). Significant differences were
also reported by Mayes and Nuttall (1995) between senior and U21 male Welsh Rugby Union
players regarding their three- repetition maximum bench press of 98.7± 13.7 kg and 83.1 ±
14.4 kg respectively. These findings may be attributed, in part to neural adaptations that occur
with long-term periodised strength training of professional rugby players (Baker, 2001a). It
appears that rugby players require a high degree of muscularity combined with exceptional
levels of upper and lower body strength however no study has investigated the muscular
strength of female rugby players. The evaluation of strength could assist in the development of
scientific knowledge in rugby union.
Power expression on rugby union players has been assessed by measures of vertical jump
height (Carlson et al., 1994; Maud, 1983; Quarrie et al., 1995; Quarrie & Wilson, 2000; Tong
& Mayes, 1995), squat jump and bench throw (Crewther et al., 2009). Investigations have
commonly used the vertical jump test instead of the squat jump to assess muscular leg power
as it equipment is portable and can be used on the appropriate surfaces. Research indicates
that backs generally produce a superior vertical jump performance compared with forwards
(Maud, 1983; Rigg & Reilly, 1988), while surprisingly, vertical jumping performance
decreased as playing level increased. This is similar to a previous study on New Zealand
senior female rugby union forwards players (Quarrie et al., 1995). However, it is contrast to
studies by Kirby & Reilly (1996) and Gabbett (2007) on elite women’s rugby union and

34
league players, respectively whereby no significant positional differences were found for the
vertical jump test (Table IV). Such comparisons may be erroneous given the changes in
vertical jump assessment over this period (e.g. chalk board versus Vertec) (Duthie et al.,
2003).
Recently, Crewther et al., (2009) reported, that the absolute expression of squat jump and
bench throw peak power was greater for the forwards than the backs when assessing lower
and upper body muscle power respectively. After normalizing the power results using ratio
scaling (power/body mass), the backs revealed superior performance in these tests, which is
consistent with previous research in rugby union players (Maud, 1983). Ratio scaling has been
criticised as it assumes a linear relationship between body size and performance, thereby
penalizing heavier individuals and showing bias towards lighter individuals (Atkins, 2004;
Jaric, Mirkov, & Markovic, 2005). There was no performance difference between the backs
and forwards after allometric scaling using either the proposed or the derived exponents. The
present study did have limitations, as scaling power values for body mass, using either the
ratio or allometric methods, did not account for body composition differences between
individual players (e.g. fat mass, muscle mass) (Crewther et al., 2009) and the regional
distribution of body and muscle mass, which can vary between forwards and backs (Bell,
Evans, Cobner, & Eston, 2005).
2.4.7 Muscle Endurance
Muscle endurance is dependent on the muscle being able to contract repetitively without
developing fatigue. A combination of muscle strength, metabolic characteristics and local
35
Table IV: Comparison of Vertical Jump Height (cm) among female rugby players
Position n
Vertical Jump (cm)
Mean SD
Quarrie et al., 1995 New Zealand Senior Rugby Union Forwards 35 39.6 ± 5.60
Backs 31 44.8 ± 8.30
Kirby & Reilly, 1996 England Senior Rugby Union Forwards 20 35.4 ± 3.3
Backs 19 36.9 ± 2.7
Gabbett, 2007 Australian Elite Rugby league Forwards 16 35.1 ± 8.0
Backs 16 35.7 ± 5.9
36
circulation in the muscle influence the endurance characteristics (Lambert, 2009). Rugby
researchers have predominately assessed abdominal and upper body muscle endurance via the
1 minute sit-up and push-up test respectively (Durandt et al., 2006; Maud, 1983). A study on
South African U16 and U18 elite male junior rugby players showed that 18 year old players
completed more pushups (52 ± 15) than the 16-year-old players (41 ± 12) however no
significant differences between playing position were demonstrated (Durandt et al., 2006).
Although tests are performed within a group of players and descriptive analysis are provided,
there are concerns over their standardization, reliability and validity (Duthie et al., 2003).
2.4.8 Aerobic Endurance
The trend towards more expansive game plans with constant recycling of possession and a
decrease in set plays in Super 12 and international matches has placed greater aerobic
endurance demands upon modern rugby players as compared to those of the era before
professionalism (Scott et al., 2003). Aerobic endurance, also referred to as cardiovascular
endurance or aerobic fitness, refers to the collective ability of the cardiovascular system to
adjust to the physiological stress of exercise (Lambert, 2009). Cardiovascular fitness is usually
measured in a laboratory or field setting. The most frequently employed laboratory protocols
for assessing a rugby player’s maximum oxygen consumption (VO2max), are progressive,
incremental exercise tests to exhaustion on either a treadmill or cycle ergometer (Scott et al.,
2003). An athlete’s VO2max can be expressed either in absolute (liters per minute (lmin-1)
when power output is important or relative to body mass per minute (mlkg-1min-1) for
activities where body mass should be considered (Duthie et al., 2003). Given the large body
mass variation between backs and forwards, it suggested that researchers present these ratios

37
to allow accurate comparison (Duthie et al., 2003). Recent research examining the difference
using modified Bruce protocol on a treadmill showed that the maximum oxygen uptake was
higher in backs (48.3 ± 2.1 mlkg-1min-1 ) than forwards (41.2 ± 2.7 mlkg-1min-1 ) yet no
significant difference in the exercise duration (Scott et al., 2003). This reaffirms the research
finding that backs have superior oxygen uptake when expressed relative to body mass and that
forwards have superior absolute VO2max values as compared to backs (Maud, 1983; Jardine et
al., 1988).
Hawley and Burke (1988) reported a significant negative correlation between maximum
oxygen uptake and time for continuous aerobic endurance tests such as the 3 km run test. This
was attributed to pace setting, as athletes will often start too quickly, and consequently
experience fatigue prematurely during the late stages of the test, hence the athlete’s true
aerobic capacity would be underestimated (Hawley & Burke, 1988). In addition, rugby players
discipline does not require participants to run uphill or at the same pace. Hence, both
laboratory and sustained running tests of VO2max are unsuitable for assessing the aerobic
power of rugby players.
Ruby Union and Rugby League are sports which demand a high level of aerobic fitness, with
players covering an average distance of 5.5 to 7 km during the course of game (Roberts et al.,
2008). However, in these sports, players change both the pace and direction of running, and
have to accelerate from a standing or walking start many times during a match (Hawley &
Burke, 1998). For this reason, the multi-stage shuttle run test is widely used to predict aerobic
fitness in a field setting. Kirby and Reilly (1993) reported mean VO2max values of 43.8 and
38
47.3 mL/kg/min for elite women’s rugby union forwards and backs respectively. The
estimated maximum oxygen uptake is similar to those of Senior New Zealand Women’s
Rugby Union forwards and backs of 44.75 and 54.48 mL/kg/min respectively (Quarrie et al.,
1995). Interestingly, elite touch rugby union players had superior aerobic power at 50.3
ml/kg/min. A limitation of the multi-stage shuttle run test is that it provides no confirmation
that maximum effort was given by the athlete (Duthie et al., 2003; Scott et al., 2003).
2.4.9 Anaerobic Endurance
A rugby match entails intermittent exercise with varying intensity, from all-out sprints to
static pauses, high power outputs in accelerating into a sprint, jumping for the ball, or in
winning possession of the ball in line-outs or scrums or in intercepting passes (Rienzi et al.,
1999). Hence, a rugby player is required to continually produce short bursts of high intensity
work with minimal loss of power (Nicholas, 1997). Exercise performance in sports that
involve short bursts of intense exercise, such as sprinting or jumping, rely predominantly on
the phosphagen and glycolytic energy system. Players rarely get sufficient time to recover
completely and achieve full synthesis of the creatine phosphate (Spencer, Bishop, Dawson, &
Goodman, 2005). Hence, the ability of the players to continue to produce high intensity
efforts depends on the efficiency of the removal substance produced in the sprint, which
inhibits peak performance (Wadley & Le Rossignol, 1998).
Laboratory research on the anaerobic performance of rugby players have largely focused on
cycle ergometry or treadmill sprinting of short (<10 seconds) to moderate (30 to 40 seconds)
duration to quantify players abilities (Maud, 1983; Quarrie & Wilson, 2000; Rigg & Reilly,

39
1988; Ueno, Watai, & Ishii, 1988). Forwards produce higher absolute peak and mean power
outputs across a range of 7 to 40 seconds in comparison with backs (Maud, 1983; Rigg &
Reilly, 1988; Ueno et al., 1988). When these results are expressed relative to bodyweight, the
results are similar or slightly favour the backs over the forwards (Maud, 1983). Although the
cycle ergometer is the most commonly used laboratory procedure for estimating an athlete’s
anaerobic power, most individuals may not have access to facilities or expertise to undertake
such a test.
A more practical test may involve repeated sprint ability (Duthie et al., 2003). The repeated
effort test protocol measures the ability of the players to resist fatigue while enduring similar
demands, with respect to time and distance of sprint, as experienced in a game situation
(Jenkins & Reaburn, 2000). Numerous exercise protocols have been use to investigate repeat
sprint ability with differences in sprint duration (6 to 10 seconds), number of sprint repetitions
(10 to 15), distance (30 to 40m) and recovery duration (30 to 60 seconds) (Dawson,
Fitzsimmons, & Ward, 1993; Spencer et al., 2005). For repeat sprint ability to be relevant to
performance in field-based team sports, the test variables need to be specific to the movement
patterns (Spencer et al., 2005).
The five meter repeat sprint test (5-m RSP) measures the ability to resist fatigue during
repeated short bouts of sprinting and was designed to test match-related fitness in a number of
sports characterized by intermittent short duration high intensity bouts of activity, including
rugby, field hockey, soccer and Gaelic football (Durandt, Tee, Prim, & Lambert, 2006).
Hence, analysis of factors that influence the performance in the 5-m RSP have practical
40
implication for players, coaches and sport scientists. The 5-m multiple shuttle repeat sprint
test (5-m RST) adopted by Welsh Rugby Union and modified by the Sport Science Institute of
South Africa is used to determine player’s match-related fitness (Boddington, Lambert,
Gibson, & Noakes, 2001). The test consists of six 30 seconds repeat sprint bouts, interspersed
with 35 seconds rest period. The participants performed 6 repeat shuttles of this protocol with
a 35-second rest between bouts. The peak distance (greatest distance covered during a 30s
shuttle), total distance (the total distance covered during the 6 x 30s shuttles), delta distance
(the difference between the longest and shortest shuttle distance and fatigue index are
recorded (Boddington et al., 2001). Factors determining success in the 5-m RST are
multifaceted, and performance is best predicted by a combination of factors including body
mass, strength and aerobic fitness. To cover a total distance in excess of 750m for the 5-m
RST requires good basic speed, the ability to run at a pace and accelerate, and excellent
aerobic system for a rapid recovery between runs (Hawley & Burke, 1998). Even though
deemed important by rugby researchers, there is limited normative data on rugby players.
2.5 CHANGES IN PHYSICAL FITNESS OF OVER A COMPETITION SEASON
Professional athletes perform concurrent physical and technical training throughout the season
in an attempt to elicit gains in many physical attributes required for optimal performance
(Argus, Gill, Keogh, Hopkins & Beaven, 2009).. Physical fitness can provide a coach and the
sport scientist with an objective and reproducible means of assessing an athlete/players
training status, physical strengths and performance capabilities (O'Gorman, Hunter,
McDonnacha, & Kirwan, 2000). Information gathered from these tests can assist the coaching

41
staff with regards to selection and making appropriate adjustments to an individual’s training
program.
2.5.1 Body Composition
In team sports such as rugby, hockey and soccer, body composition plays is an important role
in individual performance because excess body fat may influence speed, power and
endurance. A number of investigations suggest that females participating in team sports report
desirable changes in body composition (reduction in percentage body fat or skinfold thickness
and or increase in lean muscle mass) during rigorous pre-season conditioning (Astorino, Tam,
Rietschel, Johnson & Freedman, 2004; Clark, Reed, Crouse & Armstrong, 2003) primarily
due to a high training volume (Burke, Gollan, & Read, 1986). During a competition season,
players experience a minimal change in body composition (Granados, et al., 2008) as training
emphasis is on tactical preparation for the upcoming match and conditioning sessions are
predominately of a high intensity but for a short duration (Burke et al., 1986).
2.5.2 Speed
A study by Holmyard and Hazeldine (1993) on international rugby players showed that the
greatest improvements in sprint performance occurred during the pre-season and the first half
of the competition. No additional studies on professional rugby players were found to support
the above findings. This is in contrast to a study done on junior and senior rugby league
players whereby there was no significant change in 10m and 40m times after a 14 week pre-
season training program (Gabbett, 2006). The progressive increase in training volume and

42
insufficient rest prior to the sprint test could be the contributing factors for the non-positive
result.
2.5.3 Muscle Strength
An investigation by Granados et al. (2004) on the changes in upper and lower body strength
during a female competitive field hockey season, reported no changes in upper and lower
body strength, although the athletes were stronger during pre-season and in-season compared
with post-season. This is consistent with findings by Baker (2001b), whereby professional
rugby league players maintained upper and lower body strength in both elite and amateur
rugby league players throughout a competition season. It has been suggested that a lack of
strength gains in experienced athletes could be due to their greater strength training
background (Baker, 2001b; Baker & Newton, 2006), concurrent training (Kraemer et al.,
2004) and a decrease in resistance training volume (Argus et al., 2009; Koutedakis, 1995)
2.5.4 Aerobic Fitness
National male rugby players may exhibit significant increase in aerobic fitness during the
preparatory phase of the season (Holmyard & Hazeldine, 1993; Gabbett, 2005a; Tong &
Mayes, 1995) and no significant changes in aerobic power in the later part of the season
(Holmyard & Hazeldine, 1993; Gabbett, 2005a). However, it has also been suggested the there
is no significant change in aerobic fitness of college female field hockey players over the
entire season Astorino et al., (2004). The improvement in the aerobic endurance of National

43
male rugby players may be associated with greater training volume during field conditioning
sessions. the greater conditioning volume (Gabbett, 2005a).
2.6 SUMMARY
Traditionally, the game of rugby union has been a male dominated sport. Acceptance of the
female game by the International Rugby Board (IRB) has resulted in the emergence of a
structured international competition being the World Cup. Rugby union is a contact sport in
which players requires high levels of physical fitness which is a composite of aerobic and
anaerobic endurance, muscle strength and power, speed and agility.With rugby union
increasingly being played year round, a greater emphasis has being placed on the development
and maintenance of physical fitness levels. Much research has been conducted with male
rugby players, but very little with females. Therefore, the aim of this study is to contribute the
knowledge of coaches by describing anthropometric and physical characteristics of an elite
women’s rugby union within a competition season.

44
CHAPTER THREE
METHODS AND PROCEDURES
3.1 INTRODUCTION
This chapter will outline the practicalities of the research employed and also discusses the
research inventories and tests utilised to determine the outcome of this research study. Hence,
the chapter commences with a detailed explanation of the research design adopted and of the
participants recruited, then an explanation of the testing period, the description of the data
collection process and procedures of each assessment included in the fitness test battery. The
chapter concludes by describing the ethical aspects to be considered, as well as the statistical
analysis to be used to analyse the data.
3.2 RESEARCH DESIGN
A quantitative approach was used in this study with the specific nature of the research being
descriptive and comparative. The study was classified as descriptive as it aimed to achieve
insight into the physical fitness of elite women’s rugby players in South Africa over a
competitive season.
3.3 PARTICIPANTS
For the purpose of this study, 32 female rugby players selected for the South African Rugby
High Performance Programme were recruited. These players were selected from the 2008
Inter-provincial competition by National Selectors appointed by the South African Rugby

45
Union. The players were sub-divided into the following positional categories: 17 forwards
(five props, two hookers, four locks, six loose forwards) and 15 backs (nine inside backs and
six outside backs). The forwards ages ranged from 19 to 37 years, while backs ages ranged
from 19 to 34 years.
3.4 ASSESSMENT SCHEDULE
The 32 week season was from April 2009 to November 2009 and consisted of pre-season
(from week 1 to 12) and in-season (from weeks 13 to 32) consisting of Provincial games and a
four week overseas tour.
During the season, the participants were tested on the following three occasions:
The first test (T1) in May 2009, was performed two weeks after the beginning of
the competition season.
The second test (T2) in July 2009, was performed at the middle of the competition
season.
The third test (T3) in November 2009, was performed two weeks after the end of
the Interprovincial League Finals, at which 20 of the players participated.
All the players involved in the study followed individual training programs based on the
demands of their specific playing position.

46
3.5 DATA COLLECTION
The collection of physical fitness data occurred on three assessment periods during the season
(pre-season, mid-season and post-season), of which coincided with the National training
camps. All of the players were assessed on each test on the first day of each training camp.
On arrival at the training camp, players completed a detailed medical questionnaire and had a
full medical examination by the team sport physician and musculo-skeletal screening by the
physiotherapist. Players with medical conditions were excluded from participating in the
physical assessment. Participants were familiarized with the testing protocol, although they
had already been tested on several occasions for training program prescription purposes.
The participants were confirmed by the South African Institute for Drug Free Sport as not
having taken any exogenous anabolic-androgenic steroids or other drugs or substances that
could affect physical performance or hormonal balance. During the data collection process,
assistants were used to help administer the testing .All of the assistants were qualified
Biokineticist and also trained by the researcher prior to assisting in the physical evaluations.
3.6 TESTING PROTOCOL
The testing protocol consisted of anthropometric and physical measurements which were
performed in the following order:
Anthropometric measurements
Stature
47
Body mass
Skinfolds (biceps, triceps, subscapular, suprailiac, medial calf, front thigh and
abdominal)
Physical measurements
Flexibility (Sit and reach)
Muscle Power (Vertical jump)
Speed (10m and 40m sprint)
Muscle strength test (1 RM Bench Press)
Muscle endurance tests (pull-ups and 1 min push-ups)
Aerobic endurance (Multi-stage shuttle run)
For measurements to be made as quickly and efficiently as possible, the participants were
requested to present themselves in shorts, sports bra and without shoes for ease of access to all
measurement sites.
3.6.1 Stature
The stature of each player was measured to the nearest 0.1 centimeter using a stadiometer
(Seca Model 708, Seca Germany). The free standing technique was used for measuring stature
as reported by Norton, Marfell-Jones, Whittingham, Kerk, Carter, Saddington, & Gore (2000).
The player stood with her feet together and heels, buttocks, and upper part of the back
touching the stadiometer. The head was in a Frankfort plane whereby the orbital was placed in
the horizontal plane with the tragion. The participant was instructed to look straight ahead,
48
breathe in and stand as tall as possible then the platform of the stadiometer was lowered until
it made firm contact with the vertex (top of the head).
3.6.2 Body Mass
Body mass was measured using a calibrated scale (Seca Model 708, Seca Hamburg, Germany)
with accuracy to the nearest 0.1 kg. The players were weighed on a scale located on a hard
and level surface. Participants were requested to remove their footwear and stand erect and
still on the scale until the measurement was recorded.
3.6.3 Skinfolds
As an estimate of adiposity, skinfold thickness was measured at seven sites using a Harpenden
skinfold calipers. The biceps, triceps, subscapular, suprailiac, medial calf, front thigh and
abdominal were the sites selected (Ross & Marfell-Jones, 1991).
The skinfold-caliper reading was the measurement of the compressed thickness of a double
layer of skin and the underlying subcutaneous tissue, which is assumed to be adipose tissue.
The skinfold thickness was measured by grasping a fold of skin and the underlying
subcutaneous tissue between the thumb and forefinger, 1 - 2 cm above the site that is to be
measured. The fold was pulled away from the underlying muscle and the jaws of the calipers
are placed on either side of the site, at a depth of approximately 1 cm. The skinfold was held
firmly throughout the application of the caliper and the reading was taken when the needle
became steady after the full pressure of the caliper jaws had been applied. The calipers were

49
held at 90 degrees to the surface of the skinfold site at all times. All measurements were
recorded on the player's right side, irrespective of their dominant side. All measurements,
according to specification, were taken three times, unless the first two measurements were the
same. The median value was used if three measurements were taken. A complete data set was
obtained before repeating the measurements for the second and the third time.
Thereafter, body fat was estimated as the sum of seven skinfolds (mm) and as a percentage of
body mass according to Durnin and Womersley (1974). Body fat determination from skinfolds
has a reliability ranging between 0.70 and 0.90 (American College of Sports Medicine, 2000).
The exact positioning of each skinfold site was according to the procedures described by Ross
and Marfell-Jones (1991).
Biceps: The caliper was applied 1cm distally from the vertical fold raised by the
tester’s left thumb and index finger, at the marked mid-acromiale-radiale line on the
anterior surface of the participant’s right arm.
Triceps: The caliper was applied 1 cm distally from the vertical fold raised by the
tester’s left thumb and index finger, at the marked mid-acromiale-radiale line on the
posterior surface of the participant’s right arm.
Subscapular: The caliper was applied 1 cm distally from the skin fold raised by the
tester’s left thumb and index finger, in a position oblique to the inferior angle of the
participant’s scapula along the natural fold.
Suprailiac: The caliper was applied 1cm anteriorly from the oblique skin fold raised
by the tester’s left thumb and index finger, at the intersection of the border of the
50
participant’s ilium (a horizontal line projected from the iliac crest mark) and a line
from the spinale to the anterior axillary border (armpit). The fold follows the natural
fold lines running medially downwards at about a 45° angle from horizontal.
Medial Calf: The caliper was applied 1cm distally to the left thumb and index finger,
raising a vertical fold on the relaxed medial right calf at the estimated level of the
greatest circumference.
Front Thigh: The caliper was applied 1 cm distally to the skin fold raised by the
tester’s left thumb and index finger, on the anterior surface of the participant’s right
thigh, along the long axis of the femur, with the leg is flexed at 90° at the knee by
placing the foot on a box. The mid-thigh position for this measure was measured as
halfway between the inguinal crease and the mid-point of the anterior patella. In those
participants where the fold was difficult to raise, the calipers were pushed to the
muscle level and slightly retracted with the participant assisting by supporting the
underside of the leg.
Abdominal: The caliper was applied 1 cm inferiorly to the vertical fold raised by the
tester’s left thumb and index finger, on the participant’s right side 5 cm lateral to, and
at the level of, the omphalion (midpoint of the navel).
3.6.4 Flexibility
Sit-and-reach test
The purpose of test was to determine the joint range of motion and flexibility of the muscles
around the hip joint using a sit and reach box with the “zero” point being 26 cm. The sit-and-
reach test was performed according to Ellis et al. (2000). A participant sat on the floor with

51
knees extended (straight), and bare feet against the vertical edge of the sit-and-reach box. The
participant then flexed (bent) at the hip and reached forward, with one hand placed over the
top of the other with palms facing down, fingertips overlapping and elbows straight. The
participant was encouraged to lean forward as far as possible, sliding her hands along the ruler
of the sit and reach box, exhaling gently as she moved. Full stretch was held for at least 2
seconds to avoid the effect of bouncing. The furthest reach of the middle fingertips was
recorded. The best of three attempts was recorded to the nearest 0.5 cm. The sit-and-reach test
has a test-retest reliability of 0.89 (Johnson & Nelson, 1979).
3.6.5 Power
Vertical Jump
Explosive leg power was tested using the Vertec Jump Tester (Sports Imports, Columbus,
OH). Vertical jump height was measured according to Logan et al. (2000). Participants were
requested to stand with feet flat on the ground, extend their dominant arm and hand against the
wall for the tester to measure the distance from the floor to the fingertips of the outstretched
dominant arm. Thereafter each participant was instructed to jump as high as possible using a
vertical countermovement with an arm swing and touch the highest vane possible of the
Vertec Jump tester with their dominant arm. The depth and speed of knee flexion during the
countermovement was self-determined. The take-off was from two feet, with no preparatory
steps or shuffling. Vertical jump height was calculated as the difference between the standing
reach height and the highest vane touched during the jump from three attempts. Vertical jump
height was measured to the nearest half inch on the Vertec and then converted to centimeters.
52
3.6.6 Speed
10m and 40m speed
The acceleration and maximum velocity of players over 10 meters and 40 metres, respectively
was evaluated using an electronic sprint timer with photo-electric sensors (Newtest Oy, Oulu,
Finland). The speed test was measured according to Durandt et al. (2006). Players underwent
a 10 minute standardised warm-up (which consisted of low intensity running, a standardized
stretching routine, some moderate to high intensity striding and acceleration sprints) to
familarise themselves with the intensity of the test. An electronic sprint timer was set at chest
height and positioned at 10m and 40m intervals from the start line. The starting position was
standardized for all players. The players started in a two point crouch position and with the
front foot approximately 30cm from the start line, after which they sprinted maximally for
40m through the sensors, with the fastest 10m and 40m times for each player being recorded.
Each player completed two maximal efforts separated by a 5-10 minute recovery period. They
were instructed to run as quickly as possible over 40m distance and to not slow down before
the finish line. Running velocity was measured to the nearest 0.01s, with the fastest 20m and
40m times from the two trials being recorded as their sprint scores.
3.6.7 Muscle Strength Test
1 RM bench press
The 1RM bench press test is a standard test of upper body strength. The test reflects the
maximum load that an individual can press once from the chest (Durandt et al., 2006). The
player lay supine on the bench press machine with feet on the bench with hips and shoulders
in contact with the bench. The player started the test by lowering the 20 kg Olympic bar in a

53
controlled manner to the center of the chest, touching the chest lightly and then extending
upwards until the arms were in a fully locked position. A lift was disqualified if the player
raised her buttocks off the bench during the movement, bounced the bar of their chest,
extended her arms unevenly, or if the spotter had to assist the lifter.
A light warm-up set of 10 repetitions was performed using the 20 kg Olympic bar prior to
testing. This was followed by 6-8 repetitions at approximately 30-40% of the estimated 1RM,
based on the player’s previous resistance training experience. A 2-minute stretching routine
for the shoulders and chest was completed; thereafter six repetitions at 60% of the estimated
1RM were performed. The player was required to rest for 3-4 minutes before attempting their
1RM. If the 1RM was successful, the resistance was increased by 2.5% to 5% increments after
a 5 minute rest period before attempting the next bench press. The final weight lifted
successfully was recorded as the absolute 1RM in kilograms, and the relative bench press was
calculated as 1RM/ (body weight). It has been demonstrated that the test-retest reliability of 1
RM measurements amongst experienced male and female lifters ranges from 0.92 to 0.98
(Logan et al., 2000).
3.6.8 Muscle Endurance Test
Underhand pull-ups
The pull-up test is widely used to assess body mass-related dynamic upper body muscular
endurance. The underhand pull-up test was performed according to Durandt et al. (2006). An
underhand grip was used with hands placed 10-15 cm apart. The player started from a hanging
position (arms fully extended). The player’s chin was required to reach above and touch the

54
bar on the ascent with arms fully extending (straightening) on the descent. A repetition was
not considered valid if these requirements were not fulfilled. Being a maximal effort test, the
player continued until she could no longer lift her chin to the bar. The maximal amount of
valid pull-ups completed was from an extended arm position to where the chin touches the bar
and back down. The reliability of the pull-up test is 0.95 (Vanderburgh & Edmonds, 1997).
1 min push-up
The player assumed a prone position with her hands on the floor, shoulder width apart, elbows
fully extended and a training cone placed below the chest. Keeping the back and body straight,
the player descended until her chin touched the training cone and then ascend until elbows are
fully extended (straightened). If the player did not adhere to these specifications, the repetition
was not counted. The test was scored as the number of push-up correctly performed in one
minute. Players were allowed to rest within the one minute period, in the extended arm
position. The number of push-ups performed in one minute was recorded as their score
(Jackson, Fromme, Plitt, & Mercer, 1994).
3.6.9 Maximal Aerobic Power
Multiple stage shuttle run test
The purpose of the test is to estimate the aerobic endurance. The progressive multistage
shuttle run was based on the protocol of Léger and Lambert (1982). Players were required to
run back and forth on a 20m marked floor according to the pace determined by a pre-recorded
sound signal. If they failed to complete the 20m distance in the required time for two
consecutive laps they were withdrawn from the test. Players were allowed to voluntarily

55
withdraw from the test if they are unable to maintain the required pace. The score was
recorded as the number of the last completed lap and the maximal aerobic power was then
predicted (Léger & Lambert, 1982). The reliability and validity of measurement for the
multistage fitness test is 0.95 and 0.90, respectively (Léger & Lambert, 1982).
3.7 STATISTICAL ANALYSIS
Descriptive statistics was used to analyse the test results and were expressed as means and
standard deviations. Double entry was used to ensure accuracy of the data entry.
The main aim of this study was to determine whether there were differences in the physical
condition (as measured by several different variables) of women (high-level) rugby players at
three different points in the season: pre-season, mid-season, and post-season. A secondary
aim was to know if there were differences between playing positions with regards to physical
fitness. Hence, statistically, the model that was used for analysis was a two-factor analysis of
variance (ANOVA) with one factor (position) being a between-participants factor with two
levels and the second factor (test or time) being a within-participants factor with three levels.
The responses within participants were dependent and the dependency was modeled using an
unstructured correlation model.
The software SAS v9 (SAS Institute Inc., Cary, NC, USA) was used for analysis. Specifically
the MIXED procedure was used for the analysis. An interaction term for Position and Test
was included in the model. Pairwise comparisons were done using Least Squares Means.
Due to the large number of tests being conducted, a more stringent level of significance of

56
0.01 was used rather than 0.05. For each outcome variable the residuals from the analysis of
variance model were examined for outliers. Standardized residuals greater than 2.5 were
noted and the analysis was re-run with outliers excluded. In most cases the results were not
noticeably different when the outliers were excluded. The residuals were approximately
normally distributed.
3.8 ETHICAL CONSIDERATIONS
Ethical clearance and permission was sought from the CHS and Senate Research Committees
of the University of the Western Cape, The South African Rugby Union, and 2009-2010
Springbok women’s rugby squad coaching and technical staff.
On arrival at the training camp, the participants and coaching staff were given an information
package detailing the procedures, expectations and benefits for participating in the study
(Appendix A). Prior to the fitness testing, players received a verbal briefing on the nature and
content of the research (Appendix A). A written consent from each player was requested
(Appendix B) and they were informed of their right to withdraw at any time from the study
without prejudice. They were given the assurance that all data gathered in the data sheet
(Appendix C) during their participation in the research study would be kept confidential and
that their names will not be used in any publication that may arise from this research. Each
participant had access to their own physical fitness results for their personal development.

57
CHAPTER FOUR
RESULTS
4.1 INTRODUCTION
This chapter describes the positional physical fitness results at each of the three testing periods
over the competitive season. Measurement results of the tests are reported in terms of the
mean scores achieved at each of the three different testing periods in the season. The
descriptive data for the sub groupings (forwards and backs) at the three testing sessions are all
contained in a table in Appendix D. The results depicting comparisons and changes for the
positional groups over the competition season are displayed graphically. In addition, this
chapter highlights the significant changes within the forwards and backs during the
experimental period.
4.2 ANTHROPOMETRIC MEASUREMENTS
The anthropometric measurements conducted during the study consisted of body mass and
body composition expressed as the sum of seven skinfolds, from which percentage body fat
was calculated.
4.2.1 Stature
The positional stature results of the forwards and backs for the three testing sessions are
outlined in Figure 2. There were no significant differences or changes in stature between or
within the positional groups during three testing sessions. Although not statistically significant

58
Pre-s
easo
n
Mid
-sea
son
Post-s
easo
n
020406080
100120140160180200
ForwardsBacks
Sta
ture
(cm
)
* significant at p < 0.01
Figure 2: Mean Stature (cm) by position over the three test sessions
59
the descriptive analysis indicated that forwards (164.9 ± 6.68 cm) in comparison were taller
than backs (160.1 ± 6.39 cm).
4.2.2 Body Mass
The body mass comparisons between positional groups as well as changes within each
position are presented in Figure 3. These data indicate that for each testing session, forwards
had a significantly higher body mass than backs (p<0.01). The highest body mass for backs
(62.97 ± 5.96 kg) and forwards (79.51 ± 14.19 kg) were reported at pre-season and post-
season, respectively. There was a significant decrease (p <0.01) in body mass within the backs
from pre-season to midseason, whilst no changes were observed from mid-season to post-
season. However, there were no significant changes in body mass within forwards throughout
the season.
4.2.3 Sum of Skinfolds
The data for the sum of the seven skinfolds between forwards and backs, and the mean score
progressions within forwards and backs are reflected in Figure 4. The measured difference in
skinfold thickness between forwards and backs in pre-season and mid-season, was 35.8 mm
and 42.0 mm, respectively (p<0.01). No significant differences were observed between backs
and forwards at the end of the season. Within the forwards, skinfold thickness increased
significantly between pre-season and the end of the season (p<0.01), but no significant
differences were reported from mid-season onwards. With respect to the backs, no significant
changes were noted throughout the competition season.

60
Pre-s
easo
n
Mid
-sea
son
Post-s
easo
n
0
20
40
60
80
100ForwardsBacks*
Bo
dy
Mas
s (k
g)
* significant at p < 0.01
Figure 3: Mean body mass (kg) by position over the three test sessions

61
Pre-s
easo
n
Mid
-sea
son
Post-s
easo
n
020406080
100120140160180200
ForwardsBacks
*
Su
m o
f sk
info
lds
(mm
)
* significant at p < 0.01
Figure 4: Mean sum of seven skinfolds (mm) by position over three testing sessions
62
4.2.4 Percentage Body Fat
The positional body fat percentage results for the three testing sessions are outlined in Figure
5. Forwards had a greater body fat percentage than backs at pre-season (p<0.01) and mid-
season (p<0.01) but no meaningful differences were reported post-season. Within backs,
percentage body fat decreased significantly (p<0.01) by 1.6% from pre-season (26.11 ± 3.81
%) to mid-season (23.81 ± 3.28 %) and increased by 2.9% (p< 0.01) from mid-season (23.81
± 3.28 %) to post-season (27.33 ± 2.76 %). In addition, significant decreases (p<0.01) of
2.24% from pre-season (30.81 ± 4.56 %) to mid-season (29.10 ± 5.60 %), and of 1.76 % from
pre-season (30.81 ± 4.56 %) to post-season (29.24 ± 2.93) were observed within the forwards
4.3 PHYSICAL PERFORMANCE CHARACTERISTICS
The physical performance characteristics tests included flexibility, explosive leg power, speed
(10m and 40m), upper strength (measured by means of bench press and pull-up tests), upper
body muscular endurance and aerobic endurance.
4.3.1 Flexibility
Sit-and-Reach Test
The mean scores illustrated in Figure 6 represent the changes within positions and over the
competition season. The sit-and-reach test did not show any significant differences in
flexibility between or within backs and forwards throughout the experimental period.

63
Pre-s
easo
n
Mid
-sea
son
Post-s
easo
n
0
5
10
15
20
25
30
35
40ForwardsBacks
e
**
**
Per
cen
tag
e B
od
y F
at (
%)
* significant at p < 0.01
Figure 5: Mean percentage body fat (%) by position over the three testing sessions
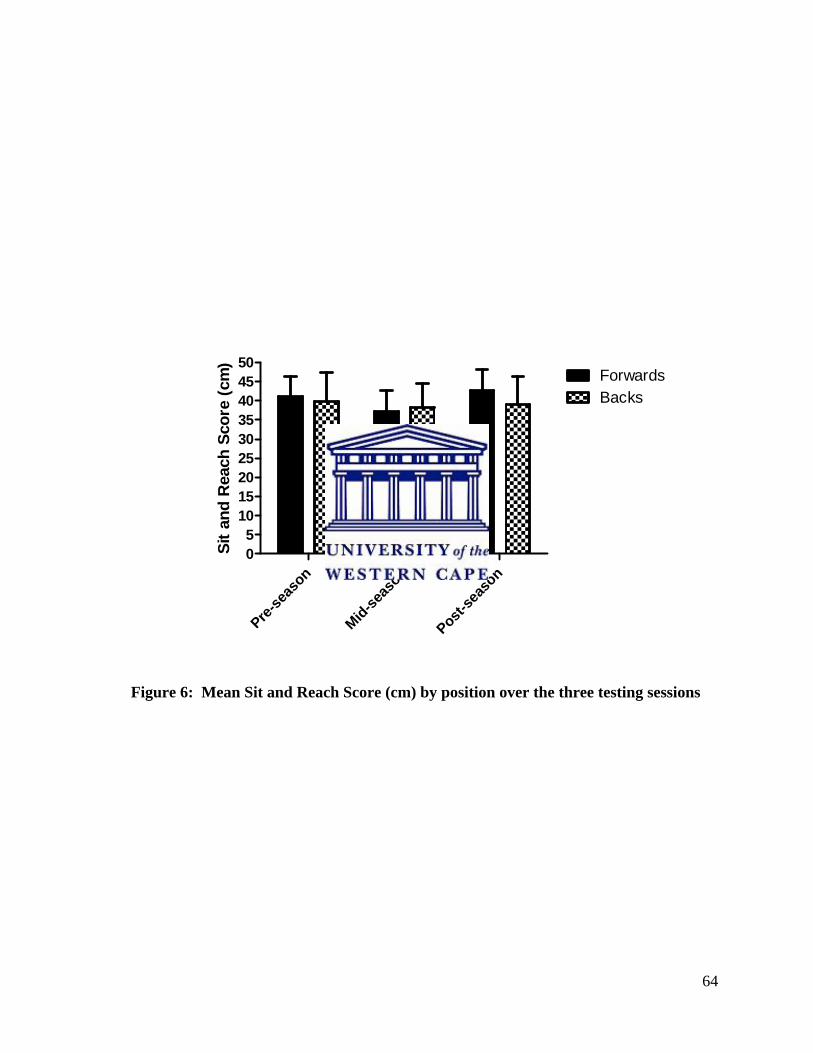
64
Pre-s
easo
n
Mid
-sea
son
Post-s
easo
n
05
101520253035404550
ForwardsBacks
Sit
an
d R
each
Sco
re (
cm)
Figure 6: Mean Sit and Reach Score (cm) by position over the three testing sessions

65
Within forwards, there was a small decrease of 3.94 cm from pre-season to mid-season and a
small increase of 5.45 cm from mid-season to post-season, with greatest flexibility being
observed at post-season.
4.3.2 Muscle Power
Vertical Jump
The vertical jump results for each testing session between and within positional groups are
shown in Figure 7. The results indicate that backs produced a significantly (p<0.01) superior
vertical jump performance compared with forwards at pre-season (44.35 ± 5.06 cm vs. 37.50
± 5.36 cm), mid-season (44.60 ± 5.23 cm vs. 38.40 ± 5.03 cm) and post-season (46.25 ± 2.92
cm vs. 39.25 ± 5.69 cm). Although the explosive leg power results were not significantly
different within forwards and backs, there were progressive increases in vertical jumping
height throughout competitive season for both positional groups.
4.3.3 Speed
10m sprint
The 10-metre sprint times achieved at the three testing sessions are depicted in Figure 8.
Although backs were faster than forwards throughout the season, the difference was
significant (p<0.01) at pre-season and with the fastest sprint times recorded during post-
season testing. Both positional groups were significantly slower in mid-season than in pre-
season and significantly faster at end of the season than mid-season. In addition, forwards
sprint times at the end of the season were significantly faster than pre-season.
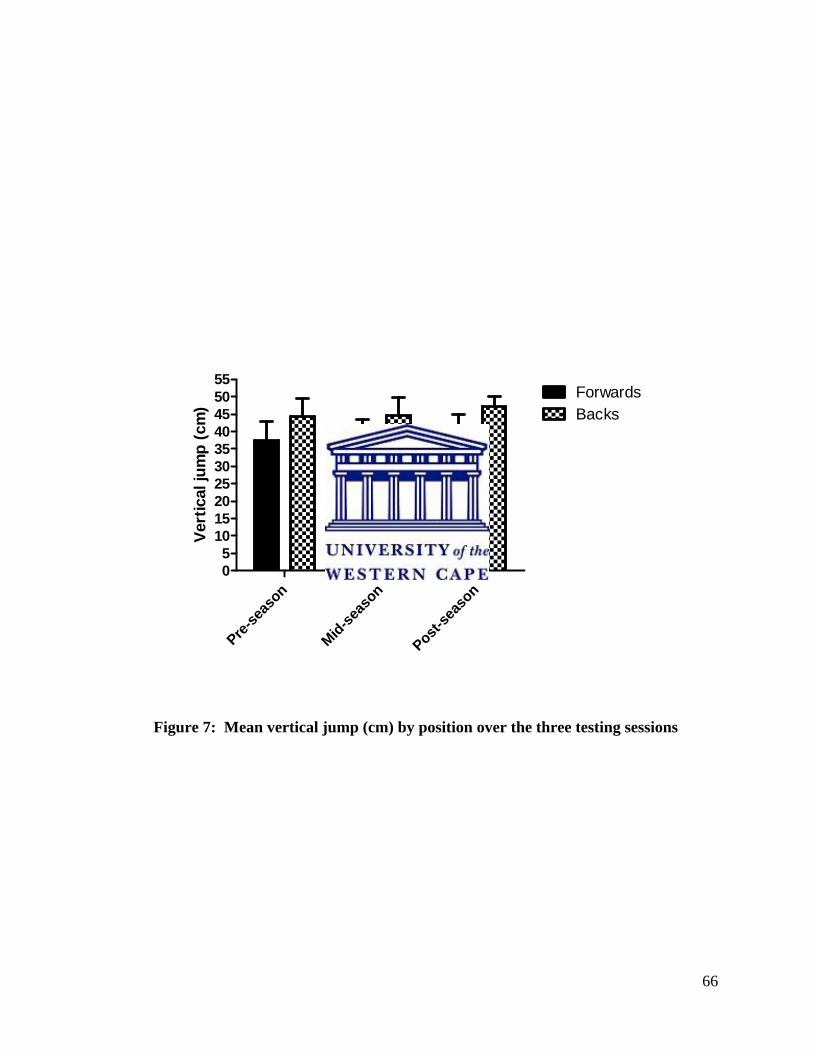
66
Pre-s
easo
n
Mid
-sea
son
Post-s
easo
n
05
10152025303540455055
ForwardsBacks
Ver
tica
l ju
mp
(cm
)
Figure 7: Mean vertical jump (cm) by position over the three testing sessions

67
Pre-s
easo
n
Mid
-sea
son
Post-s
easo
n
0.00.20.40.60.81.01.21.41.61.82.02.22.4
ForwardsBacks
a
* * ** *
10m
sp
eed
(se
c)
* significant at p < 0.01
Figure 8: Mean 10m speed (sec) by position over the three test sessions

68
40m sprint
The mean 40m sprint results for forwards and backs for the three testing sessions during the
study are depicted in Figure 9. Unlike the 10m sprint times, the backs were significantly
faster than forwards over 40m throughout the season. As in the 10m sprint, backs are
significantly slower (p<0.01) at mid-season as compared pre-season (6.13 ± 0.78 sec vs.5.96 ±
0.19 sec), then significantly faster (p<0.01) from mid-season to post-season (6.13 ± 0.78 sec
vs. 5.90 ± 0.07 sec,). The forwards, maximum sprint times were non-significant between pre-
season (6.51 ± 0.31 s) and mid-season (6.63 ± 0.16 s) but then a significant improvement
(p<0.01) was seen from mid-season (6.63 ± 0.16 s) to post-season (6.41 ± 0.29 s) and when
comparing pre-season and post-season sprint times.
4.3.4 Muscle Strength
The bench press and pull-up test were conducted to examine the upper body strength
characteristics of the participants at the three testing sessions over the competitive season. The
1-RM bench press measurements were used to investigate differences in absolute and ratio
scaled strength.
Absolute Strength Results
Displayed graphically in Figure 10 are changes in 1-RM bench press data according to
positional groups. There was no significant difference between forwards and backs at any
period throughout the season.

69
Pre-s
easo
n
Mid
-sea
son
Post-s
easo
n
0
1
2
3
4
5
6
7 ForwardsBacks
40m
sp
eed
(se
c)
** *
*
* significant at p < 0.01
Figure 9: Mean 40m speed (sec) by position over the three test sessions
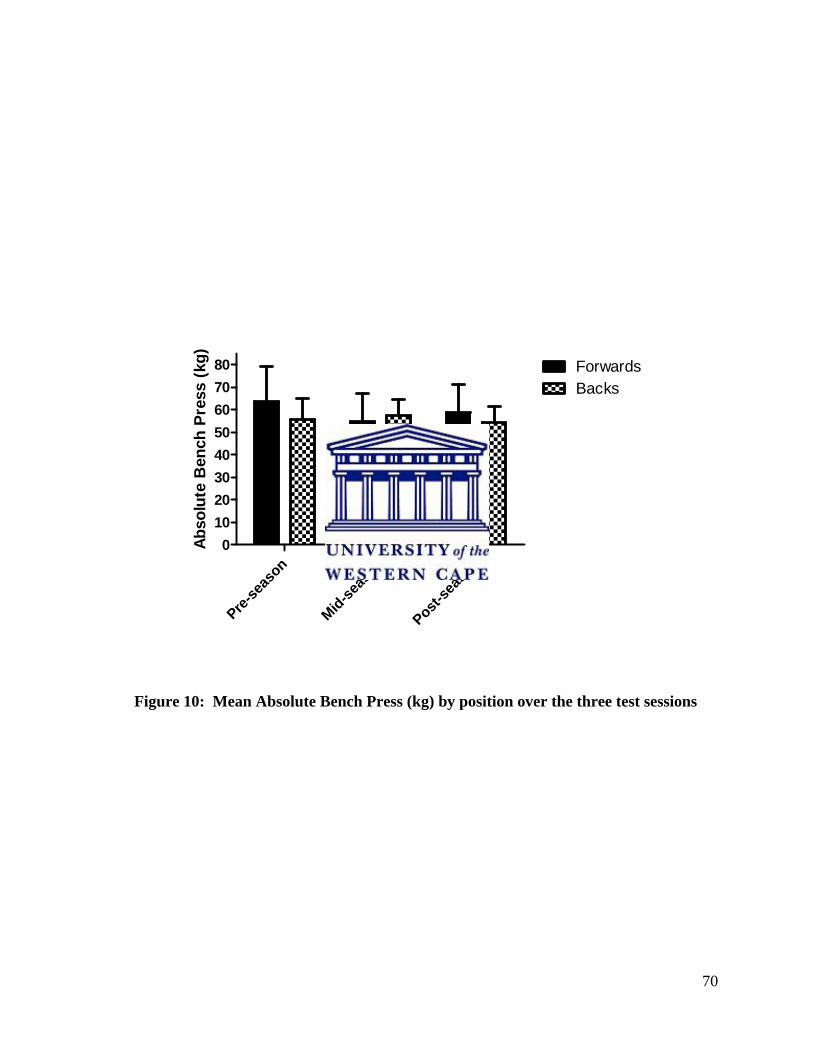
70
Pre-s
easo
n
Mid
-sea
son
Post-s
easo
n
0
10
20
30
40
50
60
70
80 ForwardsBacks
Ab
solu
te B
ench
Pre
ss (
kg)
Figure 10: Mean Absolute Bench Press (kg) by position over the three test sessions

71
No difference was apparent within positional groups from pre-season to post-season.
However, the backs and forwards were strongest at mid-season (57.33 ± 7.04 kg) and pre-
season (63.57 ± 15.86 kg), respectively.
Ratio scaled strength
When normalizing the 1-RM strength results using ratio scaling, significant differences
(p<0.05) between backs and forwards (0.91 ± 0.14 vs. 0.71 ± 0.18) were only observed in
mid-season. As with absolute strength, no significant changes were observed in the scaled
strength ratio within positional groups from the start to the end of the competition season
(Figure 11).
Pull-ups
Mean pull-up testing results are presented in Figure 12. As with the 1-RM bench press test,
non-significant differences were observed between forwards and backs at all three testing
periods. On the exclusion of large residuals (same participant at pre-season and mid-season,
which performed 12 and 13 pull ups, respectively), the analysis identified a significant
difference (p<0.01) between forwards and backs at pre-season, mid-season and post-season.
Within the backs, a significant increase in the number of completed pull-ups were observed
from pre-season to mid-season and between pre-season and post-season (p<0.01). No
significant difference was noted within forwards and even when the analysis was re-run with
outliers excluded during the experimental period.
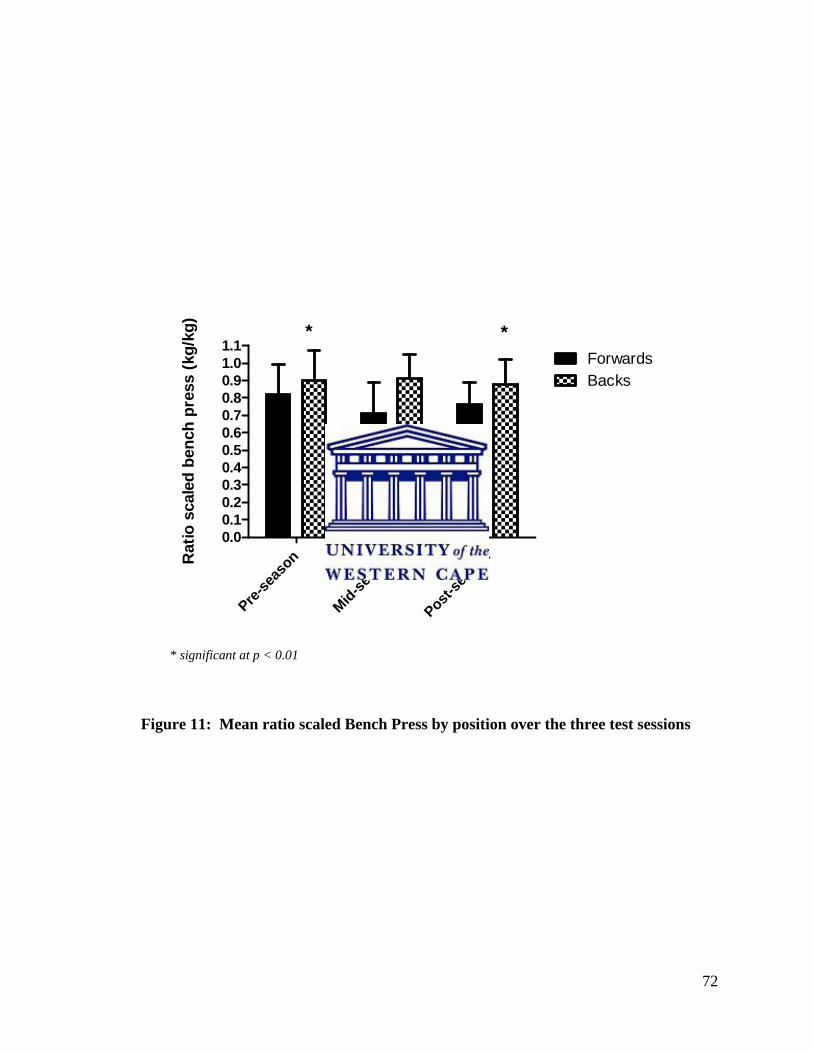
72
Pre-s
easo
n
Mid
-sea
son
Post-s
easo
n
0.00.10.20.30.40.50.60.70.80.91.01.1
ForwardsBacks
Rat
io s
cale
d b
ench
pre
ss (
kg/k
g)
* *
* significant at p < 0.01
Figure 11: Mean ratio scaled Bench Press by position over the three test sessions
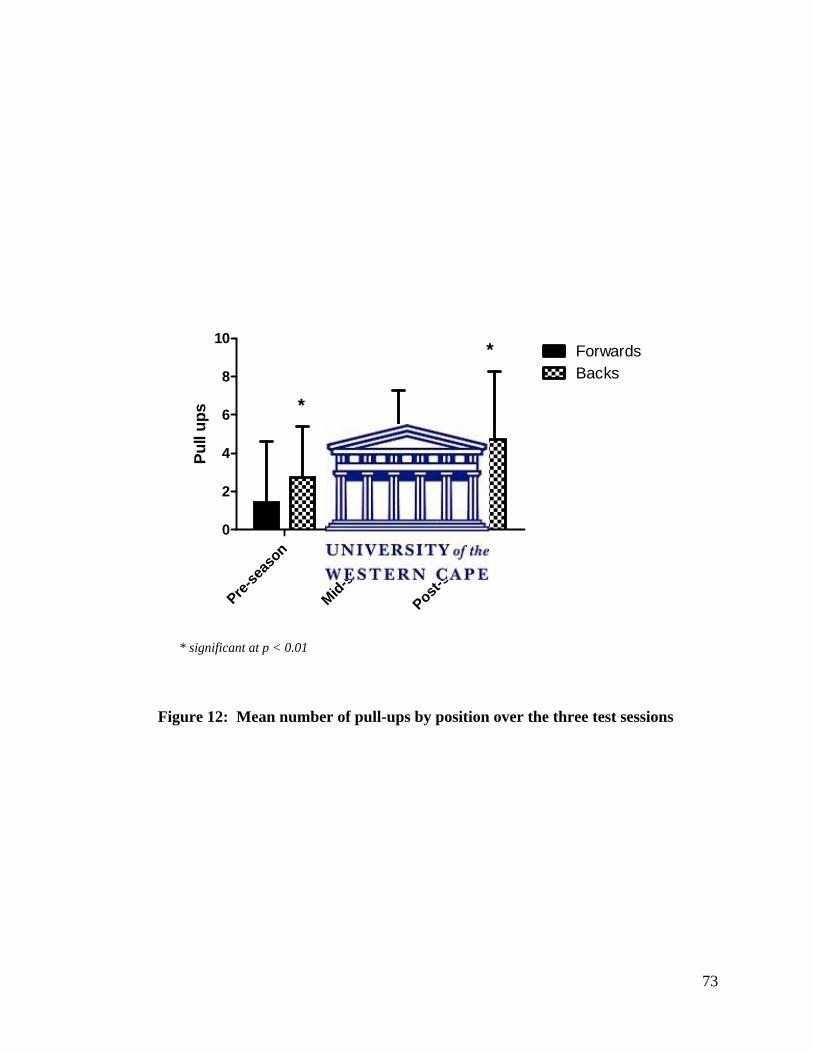
73
Pre-s
easo
n
Mid
-sea
son
Post-s
easo
n
0
2
4
6
8
10ForwardsBacks
Pu
ll u
ps *
*
* significant at p < 0.01
Figure 12: Mean number of pull-ups by position over the three test sessions

74
4.3.5 Muscle Endurance
1 minute push-ups
The 1 minute push-up test data illustrated in Figure 13 indicate that backs completed a greater
number of push-ups at all three testing sessions but with significant positional difference only
observed at the pre-season. Significant improvements in upper body muscle endurance for
both backs and forwards were reported between pre-season and mid-season and as well as pre-
season and post-season (p < 0.01).
4.3.6 Aerobic Endurance
Multi-Stage shuttle run
Figure 14 depicts the changes in aerobic endurance within each positional group. Backs
achieved a significantly (p<0.01) higher aerobic endurance score when compared to forwards
at mid-season ( 45.28 ± 3.4 mlkg-1min-1 vs. 37.76 ± 6.29 mlkg-1min-1) and end-of-season
testing (46.03 ± 2.21 mlkg-1min-1 vs. 40.58 ± 4.79 mlkg-1min-1), and with the mean highest
VO2max score at pre-season for both backs (46.49 ± 4.75 mlkg-1min-1) and forwards (41.12 ±
9.28 mlkg-1min-1). An assessment of the forwards aerobic endurance over the course of the
season, showed a marginal decrease from pre-season to mid-season then a significant
improvement from mid-season to the end of season (p<0.01). In contrast, no significant
differences were observed within backs throughout the season.

75
Pre-s
easo
n
Mid
-sea
son
Post-s
easo
n
0
10
20
30
40
50ForwardsBacks
Pu
sh-u
ps
*
**
*
* significant at p < 0.01
Figure 2: Mean number of push-ups by position over the three test sessions

76
Pre-s
easo
n
Mid
-sea
son
Post-s
eason
05
10152025303540455055
Forwards
Backs
*
Pre
dic
ted
VO
2 m
ax
(ml/
kg
/min
)
* significant at p < 0.01
Figure 3: Mean predicted VO2 max (mlkg-1min-1) by position over the three test sessions

77
CHAPTER 5
DISCUSSION, CONCLUSION AND RECOMMENDATIONS
5.1 Introduction
This chapter will include a discussion of the changes in physical fitness characteristics of the
South African Elite women’s rugby players over a competition season. A two-factor analysis
of variance (ANOVA) is used to examine differences in anthropometric and physical
characteristics between and within playing positions over the competition season with data
derived from forwards and backs at pre-season, mid-season and post-season. Where
applicable, possible explanations are provided to offer insight as to why some variables are
statistically significant (p<0.01), while others are not. Conclusions will be drawn in
accordance with the aims and findings then recommendations are made for further research.
5.2 ANTHROPOMETRIC CHARACTERISTICS
The anthropometric measurements assessed were body mass, percentage body fat, and sum of
skinfolds at the three testing sessions over the duration of the competition season.
5.2.1 Stature
The stature of the South African women’s rugby union players was shorter than those reported
in senior club and international female rugby union players (Kirby & Reilly, 1993; Quarie et

78
al., 1995; Schick et al., 2008). However, in contrast to the patterns observed by Schick et al.,
2008, but consistent with the findings of several other anthropometric studies (Kirby & Reilly,
1993; Quarrie et al., 1995; Sedlock et al., 1988), there was no significant difference in stature
between forwards and backs.
5.2.2 Body Mass
The results obtained from the study show that forwards are significantly (p<0.01) heavier than
backs. These current findings concur with previous observations on elite, amateur and
adolescent male and females rugby players that demonstrated that rugby forwards possess
greater body mass than backs at various playing levels (Durandt et al., 2006; Duthie et al.,
2006a; Gabbett, 2007; Kirby & Reilly, 1993; Meir & Halliday, 2005; Quarrie & Hopkins,
2007; Quarrie et al., 1995; Schick et al., 2008). The difference in body mass may be accounted
for by skeletal factors, since forwards have a greater limb girths and bone diameters (Kirby &
Reilly, 1993; Quarrie et al., 1995).
The introduction of professionalism and law changes in rugby union led to an increased
emphasis on body mass as a greater body mass confers an advantage in the contact phases due
to greater momentum players are able to generate (Quarrie & Hopkins, 2007). When
comparing the participants positional body mass to other relevant literature, SA elite women’s
forwards had similar body mass to their international counterparts (Schick et al., 2006) which
is the equivalence of a U16 SA male rugby hooker (Durandt et al., 2006). However, the South
African Elite Women’s backs weighed less than the teams at the 2006 Women’s Rugby World

79
Cup (Schick et al., 2006). Attention to nutrition and increased focus on weight training may
assist to make changes in body mass so overcome possible disadvantages in contact phases.
When comparing body mass across the season, the backs’ body mass decreased significantly
(p<0.01) by 1.5 kg from pre-season to mid-season and then returned to pre-season weight by
post-season testing, whilst the forwards showed minimal, non-significant fluctuations in body
mass over the competitive season. Body mass is likely to change during the course of a
competitive season as a result of periodised training, injury breaks, habitual patterns such as
diet and drinking which may lead to energy imbalances thus resulting in weight loss or gain
(Burke et al., 1986). The decrease in body mass for the backs during the pre-season could be
due to caloric restriction in combination with high levels of aerobic and anaerobic endurance
and resistance training performed during this period coupled with training matches. In general,
rugby players with lower skinfold typically have an increased body mass as a result of heavy
training loads whilst players with higher skinfolds often exhibit a decrease in body mass
(Reilly & Doran, 2001). Hence, researchers and conditioning coaches’ need the collective
measurement of body mass and skinfolds in determining the influence of body composition
change in strength based sports such as rugby.
5.2.3 Sum of Skinfolds
In the current study, forwards had a substantially greater skinfold thickness than backs in pre-
season and mid-season but no marked difference at post-season. This greater sum of skinfolds

80
in forwards is reflected as additional body fat which may serve as a protective buffer in
contact and collision situations (Duthie, 2006).
Body fat values for the backs are similar to other team sports such as field hockey, soccer and
touch rugby (Duthie, Pyne & Hooper, 2003). When comparing the skinfold thickness to other
female team sport players, the SA elite female rugby backs (106.66 ± 19.12 mm), have a
greater sum of 7 skinfold thickness in comparison with soccer (95.9 ± 23.0 mm) (Tumility,
2000), hockey (68.2 ± 13.6 mm) (Lawrence & Polgaze, 2000) and touch rugby players (71.3 ±
11.85 mm) (O’Connor, 1997), but lower sum of skinfold values when compared with
international female rugby league backs (114.8 ± 20.2 mm) (Gabbett, 2007). Reilly and Doran
(2001), indicated that where extra mass consists of fat rather than lean tissue, the power-to-
weight ratio is reduced, energy expenditure during movement is increased, horizontal and
vertical acceleration are diminished which suggests that the South African backs could benefit
from a loss of subscanteous fat, thereby improving their power and speed which can have a
positively influence on outcomes during closely contested matches.
In rugby, desirable changes in body composition (increases in lean mass and/or decrease in
skinfolds) occur primarily during preparation of competition when training volume is high
(Duthie et al., 2006a; Holmyard & Hazeldine, 1993; Gabbett, 2005a, 2005b; Tong & Mayes,
1995). Furthermore, skinfold thickness and or lean mass was maintained throughout the
competitive phase of the season when training loads were reduced, match loads and injuries
were at their highest (Gabbett, 2005a; Duthie et al., 2006a). Despite a significant decrease
(p<0.01) in body mass at the beginning of the season, there was no variation in the backs
81
skinfold thickness throughout the season. With the greater mobility of rugby players
associated with body fat levels and higher lean muscle mass (Olds, 2001), sport nutrition
counseling and direction supervision of training will be most beneficial to the players.
With respect to the forwards, although skinfold thickness decreased throughout the season, it
was only significant when a comparison was made between pre-season and post-season
testing. The decrease in skinfold thickness (from 137.40 ± 30.08 mm to 116.84 ± 20.01 mm)
may be attributed to the players perhaps starting the season with higher than optimal skinfold
values as a result of inactivity or low levels of physical activity during the off-season and then
undergoing high levels of aerobic, anaerobic, position specific skills (scrumming and mauling)
and weight training combined with calorie restriction diet during the season.
5.2.4 Percentage Body Fat
Several researchers have reported that forwards generally posses greater estimated percentage
body values than backs (Duthie, et al., 2003). As expected, this research revealed that
forwards carry a higher percentage of body fat than backs. Whilst additional body fat may
serve as a protective buffer from injury, excess body fat acts as “dead weight” thus adversely
affecting the player’s work rate and speed (Duthie et al., 2003). The percentage body fat of SA
elite women rugby union backs and forwards was calculated to be 23.81 ± 3.28 % and 29.10 ±
5.6 %, respectively. These values are higher to those reported for England female rugby union
backs (21.2 ± 1.7 %) and forwards (26.11 ± 4.56 %) at the same testing period (Kirby &
Reilly, 1996). A likely explanation for the lower percentage body fat measurement amongst

82
English female rugby players is that their bodies are placed under greater physical demands
during the season as they have a structured and highly competitive international and domestic
season. As a result of the high physical demands and greater preparation time (off-season and
pre-season) for regular competition, their muscular skeletal structures are more highly
developed.
For both positional groups, percentage body fat decreased significant between pre-season and
mid-season. At post-season, the percentage body fat increased significantly whilst no
significant changes were reported for the forwards. These findings are in agreement with a
study (Gabbett, 2005a) of senior rugby league players whereby percentage body fat decreased
during the pre-season period. In the current study, the loss in body fat may also have been a
result of the frequency of high level aerobic, anaerobic and muscle strength training
performed during pre-season.
5.3 PHYSICAL PERFORMANCE CHARACTERISTICS
5.3.1 Flexibility
Sit-and- Reach test
Testing the combined flexibility of erector spinae, external rotators of the hips, hamstrings and
gastrocnemii muscles has been an integral part of health-related and sport specific assessments
for many decades (Holt, Pelham & Burke, 1999). Many exercises designed to increase
strength and aerobic capacity tend to decrease the flexibility of the erector spinae and
hamstring musculature hence less than ideal flexibility in these muscles may increase the

83
likelihood of injury during a training session or competition (Holt, Pelham & Burke, 1999).
On the other hand, it has been suggested that highly extensible muscles, which do not possess
the necessary coordination and stability, may lead to joint dislocations and ligament strain
(Cowan, Jones, Tomlinson, Robinson & Polly, 1988).
Changes in flexibility occur after stretching exercises and flexibility training is used in the
warm-up before training or competition (Lambert, 2009). There were no statistically
significant changes in flexibility over the competition season within each positional group
although there was a non-significant decrease of 3.94 cm and non-significant increase of 5.45
cm during mid-season and post-season, respectively. As tightness in any of the muscle groups
may contribute to the limitation of movements whilst measuring sit-and-reach flexibility (Holt
et al., 1999). It is difficult to explain the practical but non-significant change in flexibility
throughout the season as the players as stretching was an integral component of the recovery
sessions. Further research, need to utilise protocols that will separately assess the four muscle
groups involved, as this will enable the strength and conditioning coach to get a better
understanding of the exercises or work load that may result in the limitation the muscles range
of movement.
5.3.2 Muscular Power
The vertical jump has been used extensively as a measure of explosive leg power in contact
sports as it is highly related to dynamic performance activities such acceleration and breaking
tackles (Nicholas, 1997). The vertical jump height reported for participants of this study
84
(forwards = 38.5 ± 5.03 cm; backs = 44.8 ± 8.30 cm), is higher than elite Australian female
rugby league forwards (35.1 ± 8.0 cm) and backs (35.7 ± 5.9 cm) (Gabbett, 2007) and
equivalent to senior New Zealand female rugby players (forwards = 39.6 ± 5.60 cm; backs =
44.8 ± 8.30 cm) (Quarrie et al., 1995) which suggests that the players have satisfactory
explosive leg power to compete internationally.
In the current study, although there were no significant differences between positional groups
in the vertical jumping height results, the current data indicated that the backs obtained higher
mean vertical jump displacement values than the forwards. This is similar to a previous study
on elite Australian female rugby league players (Gabbett, 2007) whereby no significant
positional differences were found for the vertical jump test using the Vertec height measuring
device. This pattern of results differs from the findings of a previous research studies (Maud,
1983; Rigg & Reilly, 1988) whereby backs generally produce a superior vertical jump
performance compared with forwards when assessed using the chalk board or wall measuring
tape. Hence, such comparisons may not be valid and reliable as the vertical jump assessment
did not use standardised methods over this period (e.g. chalk board versus Vertec) (Duthie et
al., 2003).
Based on this study, there were no changes in vertical jump performance over the course of
the season for both forwards and backs. It has been suggested that to enhance vertical
jumping ability, one needs to implement a well-designed training program that includes short
plyometric sessions as part of the strength and conditioning program (Hoff, Kemi & Helgaud,
2005). The relatively modest change in jumping height within the participants of this study

85
can be possibly attributed to a greater focus on gym based lower body resistance and lack of
plyometric training.
5.3.3 Speed
Speed is integral to successful performance in various contact football codes such as
Australian rules, rugby league and rugby union (Baker & Nance, 1999; Deutsch, et al., 2002;
Sayers, 2000) as it is potentially decisive in determining the outcome of a game (Duthie et al.,
2006). However, due to different starting techniques (standing or kneeling), sprint distance
(10, 30, 40, 60 m), positional groups and demographics (gender and age), it proved difficult to
compare the speed of the participants to other rugby research studies.
10 m sprint
In the present study, the acceleration capabilities of forwards and backs were assessed over a
10m distance. The current 10m sprint results revealed that backs were faster than backs during
the three testing sessions although a significant difference was only found in preseason. These
results are contrary to previous research (Duthie et al., 2003) that backs have a superior
sprinting ability than forwards. With good running speed over short distances fundamental to
success (Duthie et al., 2006), the strength and conditioning staff should develop sprint training
programs with greater emphasis on acceleration from a standing start.

86
Sprint times over 10m, for both forwards and backs were significantly slower in mid-season
than in pre-season and significantly faster at the end of the season than in mid-season. These
findings are contrary to previous research on senior (Gabbett, 2005a) and junior (Gabbett,
2005b) rugby league players, whereby the times remained relatively unchanged throughout
the season. The improvement in speed during the second half of the season can be attributed to
an increased amount of time devoted towards developing acceleration qualities for all
positions from various starting positions.
40 m sprint
At all three testing sessions, backs were faster than forwards over 40m. The faster maximum
sprint times are to be expected as backs have greater space in which to run thus achieving
higher speeds than do forwards during a game, who are closer to the opposition (Duthie et al.,
2006). Over the competition season, similar results were observed for both positional groups
as in the 10m sprint.
5.3.4 Muscle Strength
Upper body strength is important to sporting codes such as rugby union, rugby league and
Australian football, which all involve contact and collision during play (Hrysomallis, 2010).
As rugby union involves the upper body in both pushing and pulling activities, it is important
that these movements are replicated when assessing players. The bench press and pull-ups

87
provide a good measure of the upper body strength, both in terms of absolute and relative
strength.
Absolute strength
Forwards generally have high levels of upper body strength when compared with the backs, as
they are required to perform optimally in scrumming, rucking and mauling. Data from the
present study revealed no significant difference in 1RM bench press between forwards and
backs at any stage of the competitive season. These findings are unexpected as backs
traditionally distribute possession of the ball won by forwards, which requires high level of
strength. Thus, it appears that the upper body strength of these forwards is not optimally
developed for their positional demands.
The goal for a pre-season and in-season conditioning program is to maximise muscular fitness
before the competition season and maintaining the pre-season gains, respectively
(Hrysomallis, 2010). In this research, the 1RM bench press surprisingly remained constant for
both backs and forwards throughout the season despite the players being prescribed a specific
periodised strength and conditioning program. Although this study did not research the
training program per se, the unchanged strength results could possibly be due to a lack of
direct supervision of a strength coach on daily basis during gym training. This notion is
supported by Coutts, Murphy and Dascombe (2004) that direct supervision of resistance
training in athlete’s results in increased strength gains compared with unsupervised training.

88
Strength and conditioning coaches may provide support to the athlete in the form of technique
analysis, motivation, goal setting and psychological reinforcement during training.
Ratio Scaled Strength
It is common practice to normalise strength performance by dividing the absolute strength
outcome variable by body mass, to account for differences in body size in rugby (Atkins,
2004; Crewther et al., 2009). Research has shown that when expressing strength using
absolute values, forwards are significantly stronger than backs (Duthie et al., 2003). However,
when accounting for differences in body mass using ratio scaling the performance favours the
lighter backs (Atkins, 2004; Crewther et al., 2009). During pre-season and off-season testing,
the absolute expression of strength was greater for the significantly heavier forwards, but after
ratio scaling these performance measures favoured the significantly lighter backs throughout
the season, with a significant difference being noted at mid-season (backs = 0.91 ± 0.14;
forwards = 0.71 ± 0.18).
Pull-ups
The pull-up is often called a test of arm and shoulder strength and is used to assess the muscle
strength of the elbow flexors and shoulder extensors (Jenkins & Reaburn, 2000). Pull-up
performance is largely influenced by body size, as individuals with larger body mass are
expected to complete fewer pull-ups (Vanderburg & Edmonds, 1997). Contrary to these
findings, this research noted no significant difference between forwards and backs for pull-up
scores. However, with the exclusion of large residuals (same participant at pre-season and

89
mid-season, which performed 12 and 13 pull ups, respectively), backs completed greater
number pull-ups compared with forwards as a result of a significantly small body size.
The number of pull-ups completed by the backs from pre-season (2.74 ± 2.66) to mid-season
(4.2 ± 3.08) increased then remained constant from mid-season to post-season (4.73 ± 3.52).
In addition, the forwards shoulder and arm strength remained constant throughout the season
(pre-season = 1.43 ± 3.2; mid-season = 1.69 ± 3.66, post-season = 0.58 ± 0.99). As in the 1
RM bench press, there were no significant improvements in pull-up strength for both
positional groups throughout the season. With upper body strength being important for
success in rugby (Hrysomallis, 2010; Meir et al., 2001), the lack of improvement in muscular
strength in the preparatory phase, is of concern, as it may limit the participants ability to
successfully challenge and overcome their opponents during contact phases (Meir et al.,
2001).
5.3.5 Muscle Endurance
Push-ups
Rugby players, especially forwards are required to repeatedly wrestle for ball possession
hence rugby researchers have predominately used the 1 minute push-up to assess a player’s
ability to sustain continuous muscle activity. In the current study, the backs completed a
greater number of push-ups at all three testing sessions but with a significant difference only
being observed at pre-season testing. Given that forwards in this study have a significantly

90
greater percentage body fat than backs, it is to be expected that they would perform fewer
push-ups as excess body fat has been shown to hinder one’s ability to continuously perform
muscle movements (Gabbett et al., 2008).
For both positional groups, there was a significant (p<0.01) incremental increase in upper
body muscle endurance over the three testing sessions with peak scores being achieved at
post-season for both backs (36.27 ± 11.43) and forwards (26.33 ± 10.22). These results are to
be expected, as a muscle endurance base is needed to allow repeated work efforts during
matches throughout the season.
5.3.6 Aerobic Endurance
Multi-Stage shuttle run
Although researches have clearly established the anaerobic nature of rugby union, it is also
clear that a well-developed cardio-respiratory fitness level is the cornerstone of success in any
physically dynamic sport such as rugby (Williams, Reid & Coutts, 1973). In the present
investigation, backs exhibited a higher predicted maximum oxygen uptake than forwards. This
is supported by previous researchers who have reported that backs typically possess greater
levels of endurance fitness than forwards (Quarrie et al., 1995, 1996; Gabbett, 2007). The
greater body mass and percentage body fat of the forwards is likely to be the reason for the
lower aerobic fitness. The different forward and aerobic fitness profiles, lends support to the
concept of position specific aerobic exercise program (Scott et al., 2003).

91
A reasonably high aerobic fitness level is important for the ability to sustain high intensity,
intermittent exercise bouts so as to aid the recovery between repeated periods of ball retention
and repeated recycling off the ball (Evans, 1973). The estimated maximum oxygen uptake of
the backs (46.49 ± 4.75 mlkg-1min-1) and forwards (41.12 ± 9.28 mlkg-1min-1) of this study
were lower than those of the Senior New Zealand Union forwards and backs (44.75 and 54.48
mlkg-1min-1 respectively) (Quarrie et al., 1995). The lower aerobic fitness values of the elite
South African women players has the potential to limit their ability to recover quickly
between high intensity efforts during a match thus having an adverse effect on skill execution
level in game defining moments such as scoring or preventing the opposition from scoring.
With skills-based games been used to develop the skill and fitness of rugby players (Gabbett
et al., 2008), the conditioning staff should focus more on skill-based conditioning games over
traditional interval training to enhance aerobic fitness.
For most elite rugby research studies, an increased aerobic fitness was reported at pre-season
(Holmyard & Hazeldine, 1993; Gabbett, 2005a; Tong & Mayes, 1995) with a decrease being
observed towards the end of the season (Gabbett, 2005a). The significant improvements in
fitness in the early stages of the season have been attributed to the high training loads
experience during this period (Gabbett, 2005a), while reductions in aerobic fitness as the
season progressed may be due to lower training loads and higher match loads and injury rates
during this period (Gabbett, et al., 2008). In contrast to these studies, there were no changes in
aerobic fitness over the entire season for backs, whilst improvements in aerobic endurance for
forwards were witnessed from mid-season onwards. Based on these findings, it seems that the
92
highest training loads were conducted in-season rather than during the general preparatory
phase of the season.
5.4 SUMMARY
Thirty two elite female rugby players who were members of the South African Rugby Union
High Performance Squad for the 2010 Women’s Rugby World Cup were assessed on three
separate occasions (pre-season, mid-season and post-season) during the 2009 competition
season. The players were sub-divided into two positional categories consisting of 17 forwards
and 15 backs. On all testing occasions, the fitness testing protocol was specifically completed
in the following order: stature, body mass, skinfolds, sit and reach, vertical jump, speed, bench
press, pull-ups, push-ups and multi-stage shuttle run. The aim of this study was to assess the
physical fitness of elite women’s rugby union players over a competition season.
For this study, it was hypothesised that there would be significant positional difference in
stature, body composition, explosive leg power, speed, upper body muscular strength,
muscular and aerobic endurance. This hypothesis was supported in that body composition
varied according to position as the forwards had a greater body mass, higher sum of skinfolds
and larger body fat percentage than the backs. In terms of explosive leg power, maximum
speed (0-40m), muscular and aerobic endurance, backs obtained superior performance values.
The current data reinforces the pronounced difference in physical fitness of the forwards and
backs as forwards as spend greater time in physical contact with the opposition while the
backs spend more time running, allowing them to cover greater distances. Players within
93
these two broad positional groups have different tasks during specific phases of the game
therefore further research is required to evaluate the differences between the positional
categories of the female rugby players within forwards and backs.
There was not significant difference in 1 RM bench press and pull-up strength between the
two positional groups. These results are unexpected given that rugby performance requires
high levels of muscular strength particular in scrums, rucks and mauls, hence forwards should
possess greater strength than backs. The lack of strength amongst forwards may suggest that
the strength and conditioning coach should prescribe a strength program with an additional
number of specific upper body sessions and greater stimulus (intensity and frequency)
throughout the season for forwards. A study to determine the contribution of different strength
training stimulus to strength performance during a competitive season may provide an in-
depth understanding of the strength variations needed for enhanced strength amongst female
rugby players.
It was hypothesised that there would be a significant improvement in the physical fitness
characteristics between pre-season and mid-season. During the first half of the season,
improved body composition (loss in body mass and body fat percentage) and increased upper
body strength (pull-ups) were reported for backs. In addition, forwards data reflected a
constant skinfold thickness, body mass and pull-ups during the same period.

94
The current finding of non-significant differences in explosive leg power, aerobic and
muscular endurance, bench press strength and flexibility during the preparatory phase is
counter to the theory that endurance, strength and power may be easily developed during off-
season and pre-season training periods. Due to a lack of empirical research, the variety of
physical fitness characteristics and exact training stimulus required by women rugby union
players is unclear. Coaches traditionally use a combination of speed, agility, muscular power
and aerobic conditioning to improve the player physical fitness.
During pre-season training, sprint times are either expected to improve (Holmyard &
Hazeldine, 1993) or maintained (Gabbett, 2006). It is also noteworthy that sprint times for
both positional groups significantly decreased between pre-season and mid-season. With
speed being a decisive factor in winning games, the strength and conditioning coach needs to
implement sprint training programmes that comprises a combination of plyometrics, sprint
loading ( e.g. weighted sledge towing) and resistance training as it has shown to increase
running velocity.
The results support the researchers’ hypothesis in that body mass, sum of skinfolds, flexibility,
explosive leg strength, upper body muscular strength (bench press and pull-ups) and
endurance remained constant between mid-season and post-season. In addition, there were no
changes in percentage body fat and aerobic endurance within forwards and backs,
respectively. This may indicate that they had reached their maximal physical fitness by mid-
season. While an increase in training volume may lead to improvement or maintenance in

95
physical fitness, it may also be accompanied by an increase in the number and incidences of
injuries sustained by players (Gabbett, 2004).
It is not entirely clear why sprint performance significantly improved for both positional
groups whereas an increase in percentage body fat and aerobic endurance was observed for
backs and forwards, respectively. Further research on the effects of concurrent training on the
maintenance or improvement of power in female rugby players would increase our
understanding of the changes in physical fitness during a lengthy competition season.
5.5 CONCLUSIONS
It was hypothesised that there would be a significant difference between the forwards and
backs physical fitness. The current study reinforces scientific evidence that there is a
distinction between the forwards and backs with respect to anthropometric and physical
performance characteristics. The forward players had a greater body mass, higher sum of
skinfolds and larger body fat percentage whereas backs demonstrated superior leg power and
speed. With forward and backs spending greater time in physical contact and sprinting,
respectively, during a game, this gives support to the concept of position-specific strength and
conditioning programs.
The results of the present study suggest that there may have been a limited improvement in
physical fitness between pre-season and mid-season within forwards and backs as it was
96
hypothesised there would be a significant improvement physical fitness. Of the measured
physical fitness characteristics, there was significant improvement in anthropometric
characteristics and no significant changes in 1 RM bench press, pull-ups, vertical jump height,
push-ups and predicted aerobic power. However, a significant decrease in sprint times over
the same period. Based on these findings, when developing training programs for elite
women’s rugby union players, strength and conditioning staff should consider incorporating
skills based conditioning games with an additional resistance training session.
It was hypothesised that the improved physical fitness levels during the pre-season would be
maintained as the season progresses. The data supports the researcher’s finding in that the
physical fitness characteristics remained constant. However, the sprint significantly increased
for both positional groups. The importance of the coaches ensuring that player’s fitness levels
are maintained whilst on-field performance is not compromised are reinforced by these
results.
5.6 RECOMMENDATIONS FOR FURTHER RESEARCH
Based on the experience gained and findings from the present study, further research to
determine physical fitness requirements between forwards ( front row, locks and loose
forwards) and between backs (inside and outside backs) at female U/16, U/20 and senior level
would assist in the development of normative data in order to facilitate talent selection and
development.

97
The current study has described the changes in physical fitness of elite women’s rugby union
players during a season. With a greater number of international games being played, a study
quantifying the training and match loads and injury rates for comparison with the physical
fitness changes during a season could assist coaches the designing of physical fitness training
programs and or modifying the current testing protocol.

98
REFERENCES
American College of Sports Medicine (2000). ACSM’s guideline for exercise testing and
prescription (sixth edition). Philadelphia, Lippincott Williams & Wilkins.
Argus, C.K., Gill, N.D., Keogh, J.W.L., Hopkins,W.G., and Beavan, C.M. (2009). Changes in
strength, power, and steroid hormones during a professional rugby union competition.
Journal of Strength & Conditioning Research, 23(5), 1583-1592.
Astorino, T.A., Tam, P.A., Rietschel, J.C., Johnson,S.M., and Freedman, T.P. (2009).
Changes in physical fitness parameters during a competitive hockey season. Journal of
Strength & Conditioning Research, 18(5), 850-854.
Atkins, S.J. (2004). Normalizing expressions of strength in elite rugby league players. Journal
of Strength & Conditioning Research, 18(1), 53-58.
Baker, D.G. and Newton, R.U. (2006). Adaptations in upper-body maximal strength and
power output resulting from long-term resistance training in experienced strength-power
athletes. Journal of Strength & Conditioning Research, 20(3), 541-546.
Baker, D. (2001a). Comparison of upper-body strength and power between professional and
college-aged rugby league players. Journal of Strength & Conditioning Research, 15(1),
30-35.
Baker, D. (2001b). The effects of an in-season of concurrent training on the maintenance of
maximal strength and power in professional and college-aged rugby league football
players. Journal of Strength & Conditioning Research, 15(2), 172-177.

99
Baker, D. and Nance, S. (1999). The relation between running speed and measures of strength
and power in professional rugby league players. Journal of Strength and Conditioning
Research, 13(3), 230-235.
Banfi, G., Del Fabbro, M., Mauri, C., Corsi, M.M., and Melegati, G. (2006). Haematological
parameters in elite rugby players during a competitive season. Clinical and Laboratory
Haematology, 28(3), 183-188.
Bell, W. (1973). Anthropometry of young adult college rugby players in Wales. British
Journal of Sports Medicine, 7(1), 298-299.
Bell, W., Evans, W.D., Cobner, D.M., and Eston, R.G. (2005). The regional placement of
bone mineral mass, fat mass, and lean soft tissue mass in young adult rugby union
players. Ergonomics, 48(11-14), 1462-1472.
Boddington, M.K., Lambert, M.I., Gibson, S., and Noakes, T.D. (2001). Reliability of a 5-m
multiple shuttle test. Journal of Sports Sciences, 19(3), 223-228.
Burke, L.M., Gollan, R.A., and Read, R.S.D. (1986). Seasonal changes in body composition
in Australian rules footballers. British Journal of Sports Medicine, 20(2), 69-71.
Caldwell, B.P., and Peters, D.M. (2009). Seasonal Variation in physiological fitness of a semi-
professional soccer team. Journal of Strength and Conditioning Research, 25(5), 1370-
1377.
Carlson, B.R., Carter, J.E., Patterson, P., Petti, K., Orfanos, S.M., and Noffal, G.J. (1994).
Physique and motor performance characteristics of US national rugby players. Journal of
Sports Sciences, 12(4), 403-412.

100
Chandler, T.J.L. and Nauright, J. (1999). Making the rugby world: Race, gender, commerce
London ; Frank Cass.
Chase, L.F. (2006). (Un)disciplined bodies: A foucauldian analysis of women's rugby.
Sociology of Sport Journal, 23(3), 229-247.
Chester, R., Palenski, R., and McMillian, N. (1998). The encyclopedia of New Zealand rugby.
Auckland: Hodder Moa Becket.
Chu, M.M.L., Leberman, S.I., Howe, B.L., and Bachor, D.G. (2003). The black ferns: The
experiences of New Zealand's elite women rugby players. Journal of Sport Behavior,
26(2), 109.
Clark, M., Reed, D.B., Crouse, S.F., Armstrong, R.B. (2003). Pre- and Post-Season dietary
intake, body composition and performance indices of NCAA Division 1 female soccer
players. International Journal of Sport Nutrition Exercise Metabolism, 13(3), 303-319.
Cometti, G., Pousson, M., Bernardin, M., and Brullebaut, J.L. (1992). Assessment of the
strength qualities of an international rugby squad. In, Rodano, R. (ed.) et al., ISBS '92
proceedings of the 10th Symposium of the Iinternational Society of Biomechanics in
Sports June 1992, Milan, Italy, 323-326.
Coutts, A.J., Murphy, A.J., and Dascombe, B.J. (2004). Effect of direct supervision of a
strength coach on measures of muscular strength and power in young rugby league
players. Journal of Strength & Conditioning Research, 18(2), 316-323.

101
Crewther, B.T., Gill, N., Weatherby, R.P., and Lowe, L.T. (2009). A comparison of ratio &
allometric scaling methods for normalizing power & strength in elite rugby union players.
Journal of Sport Sciences, 23(14), 1575-1580.
Cronin, J.B. and Hansen, K.T. (2005). Strength and power predictors of sports speed. Journal
of Strength and Conditioning Research, 19(2), 349-357.
Dawson, B., Fitzsimmons, M., and Ward, D. (1993). The relationship of repeated sprint ability
to aerobic power and performance measures of an aerobic work capacity and power.
Australian Journal of Science & Medicine in Sport, 25(4), 88-93.
Deutsch, M.U., Kearney, G.A., and Rehrer, N.J. (2007). Time-motion analysis of professional
rugby union players during match-play. Journal of Sports Sciences, 25(4), 461-472.
Deutsch, M.U., Kearney, G.A., and Rehrer, N.J. (2002). A comparison of competition work
rates in elite club and 'super 12' rugby. In Spinks, W. (ed.), Science and Football IV,
London,UK: Routledge. p.160-166.
Deutsch, M.U., Maw, G.J., Jenkins, D., and Reaburn, P. (1998). Heart rate, blood lactate and
kinematic data of elite colts (under-19) rugby union players during competition. Journal
of Sports Sciences, 16(6), 561-570.
Du Plessis, D.J. (2007). Comparative characteristics of elite New Zealand and South African
U/16 rugby players with reference to game-specific skills, physical abilities and
anthropometric data. [Online] Retrieved 26 November, 2009 from
http://upetd.up.ac.za/thesis/available/etd-04302008-085932/unrestricted/dissertation.pdf
102
Durandt, J., du Toit, S., Borrensen, J., Butler, T., Masimla, H., Jakoet, I., and Lambert, M..
(2006). Fitness and body composition profiling of elite junior South African rugby
players. South African Journal of Sports Medicine, 10(3), 38-45.
Durandt, J., Tee, J.C., Prim, S.K., and Lambert, M.I. (2006). Physical fitness components
associated with performance in a multiple-sprint test. International Journal of Sports
Physiology and Performance, 1(2), 150-160.
Durnin, J.V.G.A. and Womersley, J. (1994). Body fat assessed from total body density and its
estimation from skinfold thickness: measurements on 481 men and women aged from 16
to 72 years. British Journal of Nutrition, 32: 77-97.
Duthie, G.M., Pyne, D.B., Hopkins, W.G., Livingstone, S., and Hooper, S.L. (2006a).
Anthropometry profiles of elite rugby players: Quantifying changes in lean mass. British
Journal of Sports Medicine, 40(3), 202-207.
Duthie, G.M., Pyne, D.B., Marsh, D.J., and Hooper, S.L. (2006b). Sprint patterns in rugby
union players during competition. Journal of Strength and Conditioning Research, 20(1),
208-214.
Duthie, G., Pyne, D., and Hooper, S. (2003). Applied physiology and game analysis of rugby
union. Sports Medicine, 33(13), 973-991.
Duthie, G., Pyne, D., and Hooper, S. (2005). Time motion analysis of 2001 and 2002 Super 12
rugby. Journal of Sports Sciences, 23(5), 523-530.
Duthie, G.M. (2006). A framework for the physical development of elite rugby union players.
International Journal of Sports Physiology and Performance, 1(1), 2-13.
103
Ellis, L., Gastin, P., Lawrence, S., Savage, B., Sheales, A., Stapff, A., Tumility, D., Quinn,
S.W. and Young, W. (2000). Protocols for the Physiological Assessment of Team Sport
Players. In C.J. Gore (Ed.), Physiological tests for elite athletes. Champaign, IL: Human
Kinetics. p. 128-144.
Evans, E.G., (1973). Basic fitness testing of rugby football players. British Journal of Sports
Medicine, 7, 384-387.
Gabbett, T.J. (2007). Physiological and anthropometric characteristics of elite women rugby
league players. Journal of Strength & Conditioning Research, 21(3), 875-881.
Gabbett, T.J., Kelly, J.N., and Sheppard, J.M. (2008). Speed, change of direction speed, and
reactive agility of rugby league players. Journal of Strength & Conditioning Research,
22(1), 174-181.
Gabbett, T.J. (2006). Performance changes following a field conditioning program in junior
and senior rugby league players. Journal of Strength and Conditioning Research, 20(1),
215-221.
Gabbett, T.J. (2005a). Changes in physiological and anthropometric characteristics of rugby
league players during a competitive season. Journal of Strength & Conditioning
Research, 19(2), 400-408.
Gabbett, T.J. (2005b). Physiological and anthropometric characteristics of junior rugby league
players over a competitive season. The Journal of Strength & Conditioning Research,
19(4), 764-771. [Online] Retrieved from http://journals.lww.com/nsca-
jscr/Abstract/2005/11000/Physiological_and_Anthropometric_Characteristics.7.aspx

104
Granados, C., Izquierdo, M., Ibáñez, J., Ruesta, M., and Gorostiaga, E. M. (2008). Effects of
an entire season on physical fitness in elite female handball players. Medicine and
Science in Sports and Exercise, 40(2), 351-361.
Grant, S.J., Oommen, G., McColl, G., Taylor, J., Watkins, L., Friel, N., Watt, I., and Mclean,
D.A. (2003). The effect of ball carrying method on sprint speed in rugby union football
players. Journal of Sports Sciences, 21(12), 1009-1015.
Hawes, M.R., and Sovak, D. (1994). Morphological prototypes, assessment and change in
elite athletes. Journal of Sports Sciences, 12(3), 235-242.
Hawley, J.A., and Burke, L.M. (1998). Peak performance: Training and nutritional strategies
for sport. Sydney, Australia: Allen and Unwin.
Haynes, J. and Miller, J. (2001). Women playing rugby, an 'old boys game': Beyond the social
expectations.[Online] Retrieved 11/26/2009, 2009, from
http://www.aare.edu.au/01pap/mil01183.htm
Hoff, J., Kemi, O.J., and Helgerud, J. (2005). Strength and endurance differences between
elite and junior elite hockey players: Allometric scaling of strength measurement to body
size. European Journal of Applied Physiology, 102, 739-745.
Holt, L.E., Pelham, T.W., and Burke, D.G. (1999). Modification to the standard sit and reach
flexibility protocol. Journal of Athletic Training, 34(1), 43-47.
Holmyard, D.J. and Hazeldine, R.J. (1993). Seasonal variations in the anthropometric and
physiological characteristics of international rugby union players. In T. Reilly (Ed.),
Science and football (2nd Ed.). London: E & FN Spon.

105
Hrysomallis, C. (2010). Upper body strength and power changes during a football season.
Journal of Strength and Conditioning Research, 24(2), 557-559.
International Rugby Board. (n.d). SA rugby union. [Online] Retrieved 12 October, 2009 from
http://www.irb.com/unions/union=11000034/index.html
Jackson, A.W., Fromme, C., Plitt, H., and Mercer, J. (1994). Reliability and validity of a
1-minute push-up test for young adults. Research Quarterly for Exercise in Sport,
65(Suppl.), A57-A58.
Jardine, M.A., Wiggins, T.M., Myburgh, K.H., and Noakes, T.D. (1988). Physiological
characteristics of rugby players including muscle glycogen content and muscle fibre
composition. South African Medical Journal, 73(9), 529-532.
Jaric, S., Mirkov, D., and Markovic, G. (2005). Normalizing physical performance tests for
body size: A proposal for standardization. Journal of Strength & Conditioning Research,
19(2), 467-474.
Jenkins, D. and Reaburn, P. (2000). Protocols for the physiological assessment of rugby union
players. In C.J Core (Ed.), Physiological tests for elite athletes (pp. 327-333).
Champaign, IL: Human Kinetics.
Johnson, B.L. and Nelson, J.K (1969). Practical measurements for evaluation in Physical
Education. Minneopilis: Burgess Publishing.
Kirby, W.J. and Reilly, T. (1993). Anthropometric and fitness profiles of elite female rugby
union players. In T. Reilly (Ed.), Science and football (2nd Ed.). London, UK: E. & F.N.
Spon. p. 27-30.

106
Koutedakis, Y. (1995). Seasonal variation in fitness parameters in competitive athletes. Sports
Medicine, 19(6), 373-392.
Kraemer, W.J., French, D.N., Paxton, N.J., Hakkinen, K., Volek, J.S., Sebastianelli, W. J.,
Putukian, M , Newton, R.U., Rubin, M.R., Gomez, A.L., Vescovi, J., Ratamess, N.A.,
Fleck, S.J., Lynch,J.M., and Knuttgen, H.G (2004). Changes in exercise performance and
hormonal concentrations over a big ten soccer season in starters and nonstarters. Journal
of Strength and Conditioning Research, 18(1), 121-128.
Lambert, M.I. (2009.). Aspects of physical conditioning for rugby. [Online] Retrieved 11
November, 2009 from http://www.sarugby.co.za/boksmart/pdf/BokSmart%20-
%20Aspects%20of%20physical%20conditioning%20for%20rugby.pdf
Lawrence, S., and Polgaze, T. (2000). Protocols for the physiological assessment of male and
female field hockey players. In C.J. Gore (Ed.), Physiological tests for elite athletes.
Champaign, IL: Human Kinetics. p. 302-310.
Léger, L.A. and Lambert, J. (1982). A maximal multistage 20- m shuttle run test to predict
VO2max. European Journal of Applied Physiology and Occupational Physiology. 49:1-2
Logan, P., Fornasiero, D., Abernethy, P., and Lynch, K. (2000). Protocols for the assessment
of isoinertial strength. In C.J. Gore (Ed.), Physiological tests for elite athletes.
Champaign, IL: Human Kinetics. p. 200-221.
Martin, A.D., Ross, W.D., Drinkwater, D.T., and Clarys, J.P. (1985). Prediction of body fat by
skinfold caliper: Assumptions and cadaver evidence. International Journal of Obesity, 9
Suppl 1, 31-39.

107
Maud, P.J. (1983). Physiological and anthropometric parameters that describe a rugby union
team. British Journal of Sports Medicine, 17(1), 16-23.
Maud, P.J. and Foster, C. (2006). Physiological assessment of human fitness (2nd ed.)
Champaign, Ill.; Human Kinetics, 2006.
Mayes, R. and Nuttall, F.E. (1995). A comparison of the physiological characteristics of
senior and under 21 elite rugby union players. Journal of Sports Sciences, 13, 13-14.
McLean, D.A. (1992). Analysis of the physical demands of international rugby union. Journal
of Sports Sciences, 10(3), 285-296.
Meir, R.A. and Halliday, A.J. (2005). Pre- and post-game body mass changes during an
international rugby tournament: A practical perspective. Journal of Strength and
Conditioning Research, 19(3), 713-716.
Meir, R., Newton, R., Curtis, E., Fardell, M., and Butler, B. (2001). Physical fitness qualities
of professional rugby league football players: Determination of positional differences.
Journal of Strength & Conditioning Research, 15(4), 450-458.
Nicholas, C.W. (1997). Anthropometric and physiological characteristics of rugby union
football players. Sports Medicine, 23(6), 375-396.
Norton, K.M., Marfell-Jones, N., Whittingham, D., Kerk, L.,Carter, K. Saddington, and Gore,
C. Anthropometric assessment protocols. In: Physiological Tests for Elite Athletes. C.J.
Gore, ed. Champaign, IL: Human Kinetics, 2000. pp. 66–85.
O'Connor, D. (1997). Profile of elite female touch football players. In Reilly T, Bangsbo J, &
Hughes, M. (Ed.), Science and football (3rd Ed.). London, UK: E. and F.N. Spon. p. 7-10.
108
O'Gorman, D., Hunter, A., McDonnacha, C., and Kirwan, P. (2000). Validity of field tests for
evaluating endurance capacity in competitive and international-level sports participants.
Journal of Strength & Conditioning Research, 14(1), 62-67.
Olds, T. (2001). The evolution of physique in male rugby union players in the twentieth
century. Journal of Sports Science, 19, 253-262
Quarrie, K.L. and Hopkins, W.G. (2007). Changes in player characteristics and match
activities in Bledisloe Cup rugby union from 1972 to 2004. Journal of Sports Sciences,
25(8), 895-903.
Quarrie, K.L. and Wilson, B.D. (2000). Force production in the rugby union scrum. Journal of
Sports Sciences, 18(4), 237-246.
Quarrie , K.L., Handcock, P., Waller, A.E., Chalmers, D.J., Toomey, M.J., and Wilson, B.D.
(1995). The New Zealand rugby injury and performance project. III. anthropometric and
physical performance characteristics of players. British Journal of Sports Medicine,
29(4), 263-270.
Quarrie, K.L., Handcock, P., Toomey, M.J., and Waller, A.E. (1996). The New Zealand rugby
injury and performance project. IV. anthropometric and physical performance
comparisons between positional categories of senior A rugby players. British Journal of
Sports Medicine, 30(1), 53-56.
Reilly, J and Doran, D. (2001). Science and Gaelic football: A review. Journal of Sports
Sciences, 19(3), 183-193.

109
Rienzi, E., Reilly, T., and Malkin, C. (1999). Investigation of anthropometric and work-rate
profiles of rugby sevens players. Journal of Sports Medicine & Physical Fitness, 39(2),
160-164.
Rigg, P. and Reilly, T. (1988). A fitness profile and anthropometric analysis of first and
second class rugby union players. In T. Reilly, A. Lees, K. Davids & W.J Murphy (Ed.),
Science and football (1st Ed.). London, UK: E. and F.N. Spon. p. 194-199.
Roberts, S.P., Trewartha, G., Higgitt, R.J., El-Abd, J., and Stokes, K.A. (2008). The physical
demands of elite English rugby union. Journal of Sports Sciences, 26(8), 825-833.
Ross, W.D., and Marfell-Jones M.J. (1991). Kinanthropometry. In: MacDougall JD, Wenger
HA, Green HJ, eds. Physiological Testing of the High-Performance Athlete. Champaign,
IL, USA: Human Kinetics Books. 223-308.
SA Rugby (2009). EP confident of retaining the crown. [Online] Retrieved 11 November,
2009 from: http://www.sarugby.co.za/newsarticle.aspx?newsid=318113&leagueid=&fix
turescatid=6,16,24,25,26&resultscatid=6,16,24,25,26&vidcatid=&piccat=&statscatid=6&
statsteam= SouthAfrica&newscat='sarugby/womens','sarugby/womeninternational',
'sarugby/ womenpr (TRUNCATED)
SA Rugby (2007). SA Rugby Referees: Laws. [Online] Retrieved 17 May, 2010 from
http://www.sareferees.co.za/laws/laws
SA Rugby (2006). Springbok women defeat Netherlands. [Online] Retrieved 11 November,
2009 from: http://www.sarugby.co.za/press.aspx?page=4&leagueid=&fixturescatid=6,16,
24,25,26&resultscatid=6,16,24,25,26&vidcatid=&piccat=&statscatid=6&statsteam=Sout

110
h%20Africa&newscat='sarugby/womens','sarugby/womeninternational','sarugby/womenp
rovincial','sarugby/womenworldcup'
SA Rugby. (2005). SA Women win first overseas Test. [Online] Retrieved 11 November, 2009
from http://www.sarugby.co.za/newsarticle.aspx?newsid=145224&leagueid=&fixtures
catid=6,16,24,25,26&resultscatid=6,16,24,25,26&vidcatid=&piccat=&statscatid=6&statst
eam=South%20Africa&newscat='sarugby/womens','sarugby/womeninternational','sarugb
y/womenprovincial','sarugby/womenworldcup'
SA Rugby. (n.d.). Rugby in South Africa. [Online] Retrieved 11 November, 2009 from
http://www.sarugby.co.za/content.aspx?contentid=19255&statsteam=South%20Africa&st
atscatid=2
Sayers, M. (2000). Running techniques for field sport players. Sports Coach, 23(1), 26-27.
Schick, D. M., Molloy, M. G., and Wiley, J. P. (2008). Injuries during the 2006 women's
rugby World Cup. British Journal of Sports Medicine, 42(6), 447-451.
Scott, A.C., Roe, N., Coats, A.J., and Piepoli, M.F. (2003). Aerobic exercise physiology in a
professional rugby union team. International Journal of Cardiology, 87(2-3), 173-177.
Sedlock, D.A., Fitzgerald, P.I., and Knowlton, R.G. (1988). Body composition and
performance characteristics of collegiate women rugby players. Research Quarterly for
Exercise and Sport, 59, 78-82.
Sheppard, J. and Young, W. (2006). Agility literature review: Classifications, training and
testing. Journal of Sports Sciences, 24(9), 919-932.

111
Spencer, M., Bishop, D., Dawson, B., and Goodman, C. (2005). Physiological and metabolic
responses of repeated-sprint activities: Specific to field-based team sports. Sports
Medicine, 35(12), 1025-1044.
Thompson, S. M. (1988). Challenging the hegemony: New Zealand women's opposition to
rugby and the reproduction of a capitalist patriarchy. International Review for the
Sociology of Sport, 23(3), 205-212.
Tong, R.J. and Mayes, R. (1995). The effect of pre-season training on the physiological
characteristics of international rugby union players. In T. Reilly, J. Bangsbo, M. Hughes
(Ed.), Science and football III: Proceedings of the third world congress of science and
football (3rd ed., pp. 98). London: E & FN Spon.
Tong, R.J., and Wood, G.L. (1995). A comparison of upper body strength in collegiate rugby
union players. (abstract). Journal of Sports Sciences, 13(6), 507-508.
Tumilty, D. (2000). Protocols for the physiological assessment of male and female soccer
players. In C.J. Gore (Ed.), Physiological tests for elite athletes. Champaign: IL: 2000. p.
356-362.
Ueno, Y., Watai, E., and Ishii, K. (1988). Aerobic and anaerobic power of football players. In
T. Reilly, A. Lees, K. Davids & W.J Murphy (Ed.), Science and football (I Ed.). London,
UK: E. and F.N. Spon. p. 201-205.
Vanderburg, P.M., and Edmonds, T. (1997). The effect of experimental alterations in excess
mass on pull-up performance in fit young men. Journal of Strength and Conditioning
Research. 11(4): 230-233.

112
Van Gent, M.M. and Spamer, E.J. (2005). Comparisons of positional groups in terms of
anthropometric, rugby-specific skills, physical and motor components among U13, U16,
U18 and U19 elite rugby players. Kinesiology, 37(1), 50-63.
Wadley, G. and Le Rossignol, P. (1998). The relationship between repeated sprint ability and
the aerobic and anaerobic energy systems. Journal of Science & Medicine in Sport, 1(2),
100-110.
Williams, C., Reid, R., and Coutts, R. (1973). Observations on the aerobic power of university
rugby players and professional soccer players. British Journal of Sports Medicine, 7, 390-
391.

113
APPENDIX A
PARTICIPATION INFORMATION QUESTIONNIARE
Faculty of Community and Health Sciences
Department of Sport, Recreation, and Exercise Science
PARTICIPITANT INFORMATION PACKAGE
Project description
This testing is being conducted as part of my postgraduate studies at University of the Western Cape
(UWC) and preparation for the 2010 Women’s Rugby World Cup. The purpose of this research is to
establish the fitness profile of an elite women’s rugby union player in South Africa. A second aim is to
determine the changes in anthropometric characteristics, muscle power, speed and strength over a
competitive season. This research is being conducted with full support and cooperation of the South
African Rugby Union, however your decision to participate in the study is entirely voluntary.
Participant involvement
If you choose to participate in the study, you will be involved in continuous testing session throughout
the World Cup campaign involving fitness testing of your individual body composition (Body Mass,
Stature and 7 sum of skinfold), speed, muscle power, upper strength and endurance and aerobic
endurance. The duration of the testing session will be approximately 3 hours for the entire squad.
Expected Outcomes
I expect to complete a Masters thesis for examination. In addition, publish the finding of various
aspects of this research in a number of journals and publications, only after the 2010 Women’s Rugby

114
World Cup. You will not be identifiable as an individual in any of the publication arising from the
research.
Benefits of the Participants
Your involvement in this project may increase your improve your fitness profile thus potentially
improving your performance. You will have access to your anthropometric and physical measurements
and this will contribute to current understanding of physical fitness characteristics required for an elite
women’s rugby player in South Africa.
Risk and Discomfort
Every effort will be made to minimise discomfort and risk associated with all testing procedures.
Confidentiality
All information obtained from the testing will be treated confidentially and only the research team and
South African Rugby Union will have access to the data collected. Your name will not be used and
will no way be identifiable in any publication that arises from this research.
Voluntary Participation
Your decision to participate in the study is entirely voluntary, and you can withdraw anytime without
comment or penalty. Your decision to participate will in no way influence you present and/or future
involvement with the South African Women’s National Rugby Team.
Enquiries
For any enquires or further information regarding this research study please contact
Researcher: Nceba Hene
University of the Western Cape
Private Bag X17, Belville 7535
Cell: 083 5787 410
Email: [email protected]

115
APPENDIX B
CONSENT FORM
Faculty of Community and Health Sciences
Department of Sport, Recreation, and Exercise Science
Private Bag X17, Bellville 7535, South Africa
Tel: +27 21-9592350, Fax: 27 21-959368
CONSENT FORM
Title of Research Project: Seasonal variations in the physical fitness of elite women’s rugby union
players
I ………………………………………………………. (Print full name and surname) hereby consent
to voluntarily participate in the activities of the research. The study has been described to me in
language that I understand and my questions about the study have been answered. I understand that my
identity will not be disclosed and that I may withdraw from the study without giving a reason at any
time and this will not negatively affect me in any way.
Signed at ………………………… on this .…………… day of ..…… 20………
Participants Signature ………………………..… Witness ……………………….
Should you have any questions regarding this study or wish to report any problems you have
experienced related to the study, please contact the supervisor and the head of department:
Head of Department: Dr S Bassett Telephone: (021)959-2273
University of the Western Cape Fax: (021)959- 3688
Private Bag X17, Belville 7535 E-mail: [email protected]

116
APPENDIX C
PHYSICAL FITNESS DATA CAPTURING SHEET
1. ANTHROPOMETRY
NAME:
SPORT: POSITION:
GENDER: DOB: AGE:
STATURE (cm): WEIGHT (kg):
SKINFOLDS (mm)
Tricep
Biceps
Subscapular
Suprailiac
Calf
mid thigh
Abdominal
2. EXPLOSIVE POWER: Vertical Jump
Reaching height(cm) Jumping height 1(cm) Jumping height 2(cm) Diff(cm)

117
3.SPEED AND ACCELARATION
10 m (sec) 40m sec)
Attempt 1
Attempt 2
4. MUSCLE STRENGHT
kg kg/kg BW
1 -RM Bench Press
5. MUSCLE ENDURANCE
Pull ups Push ups(1 min)
6. AEROBIC ASSESSSMENT : Multi stage shuttle run
Shuttle Stage Level
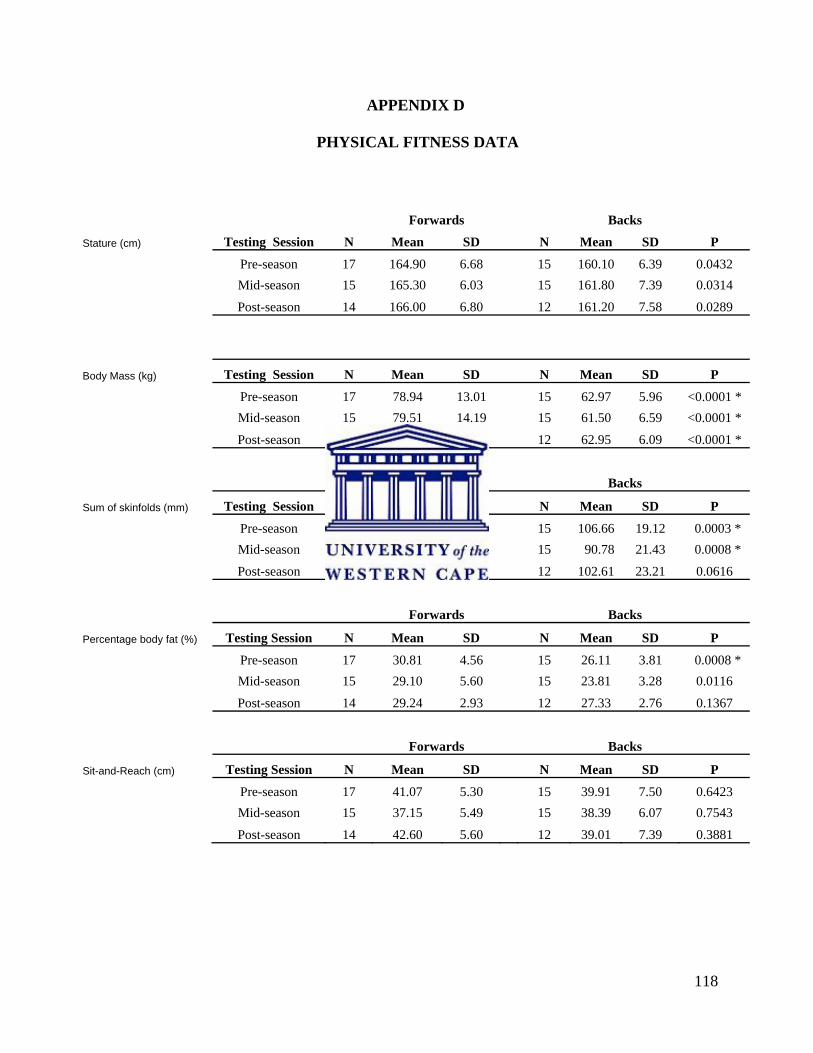
118
APPENDIX D
PHYSICAL FITNESS DATA
Forwards Backs
Stature (cm) Testing Session N Mean SD N Mean SD P
Pre-season 17 164.90 6.68 15 160.10 6.39 0.0432
Mid-season 15 165.30 6.03 15 161.80 7.39 0.0314
Post-season 14 166.00 6.80 12 161.20 7.58 0.0289
Body Mass (kg) Testing Session N Mean SD N Mean SD P
Pre-season 17 78.94 13.01 15 62.97 5.96 <0.0001 *
Mid-season 15 79.51 14.19 15 61.50 6.59 <0.0001 *
Post-season 14 78.39 11.51 12 62.95 6.09 <0.0001 *
Forwards Backs
Sum of skinfolds (mm) Testing Session N Mean SD N Mean SD P
Pre-season 17 137.40 30.08 15 106.66 19.12 0.0003 *
Mid-season 15 134.32 50.31 15 90.78 21.43 0.0008 *
Post-season 14 116.84 20.01 12 102.61 23.21 0.0616
Forwards Backs
Percentage body fat (%) Testing Session N Mean SD N Mean SD P
Pre-season 17 30.81 4.56 15 26.11 3.81 0.0008 *
Mid-season 15 29.10 5.60 15 23.81 3.28 0.0116
Post-season 14 29.24 2.93 12 27.33 2.76 0.1367
Forwards Backs
Sit-and-Reach (cm) Testing Session N Mean SD N Mean SD P
Pre-season 17 41.07 5.30 15 39.91 7.50 0.6423
Mid-season 15 37.15 5.49 15 38.39 6.07 0.7543
Post-season 14 42.60 5.60 12 39.01 7.39 0.3881
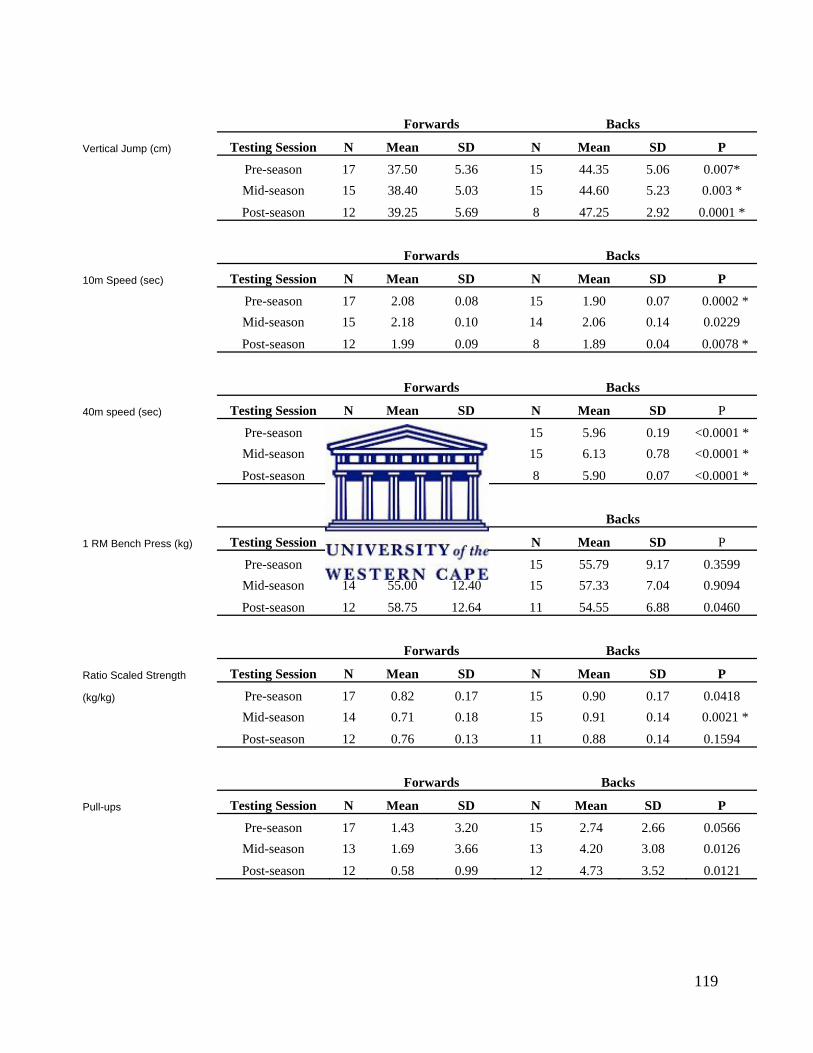
119
Forwards Backs
Vertical Jump (cm) Testing Session N Mean SD N Mean SD P
Pre-season 17 37.50 5.36 15 44.35 5.06 0.007*
Mid-season 15 38.40 5.03 15 44.60 5.23 0.003 *
Post-season 12 39.25 5.69 8 47.25 2.92 0.0001 *
Forwards Backs
10m Speed (sec) Testing Session N Mean SD N Mean SD P
Pre-season 17 2.08 0.08 15 1.90 0.07 0.0002 *
Mid-season 15 2.18 0.10 14 2.06 0.14 0.0229
Post-season 12 1.99 0.09 8 1.89 0.04 0.0078 *
Forwards Backs
40m speed (sec) Testing Session N Mean SD N Mean SD P
Pre-season 17 6.51 0.31 15 5.96 0.19 <0.0001 *
Mid-season 15 6.63 0.16 15 6.13 0.78 <0.0001 *
Post-season 12 6.41 0.29 8 5.90 0.07 <0.0001 *
Forwards Backs
1 RM Bench Press (kg) Testing Session N Mean SD N Mean SD P
Pre-season 17 63.57 15.86 15 55.79 9.17 0.3599
Mid-season 14 55.00 12.40 15 57.33 7.04 0.9094
Post-season 12 58.75 12.64 11 54.55 6.88 0.0460
Forwards Backs
Ratio Scaled Strength Testing Session N Mean SD N Mean SD P
(kg/kg) Pre-season 17 0.82 0.17 15 0.90 0.17 0.0418
Mid-season 14 0.71 0.18 15 0.91 0.14 0.0021 *
Post-season 12 0.76 0.13 11 0.88 0.14 0.1594
Forwards Backs
Pull-ups Testing Session N Mean SD N Mean SD P
Pre-season 17 1.43 3.20 15 2.74 2.66 0.0566
Mid-season 13 1.69 3.66 13 4.20 3.08 0.0126
Post-season 12 0.58 0.99 12 4.73 3.52 0.0121

120
Forwards Backs
Push-ups Testing Session N Mean SD N Mean SD P
Pre-season 17 16.46 8.71 15 24.83 9.47 0.0020*
Mid-season 13 25.31 11.68 15 35.27 12.28 0.0160
Post-season 12 26.33 10.22 11 36.27 11.43 0.0425
Estimated aerobic Forwards Backs
power (ml.kg-1min-1 ) Testing Session N Mean SD N Mean SD P
Pre-season 17 41.12 9.28 15 46.49 4.75 0.0276
Mid-season 14 37.76 6.29 14 45.28 3.40 <0.0001*
Post-season 11 40.58 4.79 8 46.03 2.21 0.0014 *