Ground reaction forces and throwing performance in elite and novice players in two types of handball...
7
Journal of Human Kinetics volume 40/2014, 49-55 DOI: 10.2478/hukin-2014-0006 49 Section I – Kinesiology 1 - Sport Biomechanics Lab-Department of Sport Medicine & Biology of Exercise, Faculty of Physical Education & Sports Science, National & Kapodistrian University of Athens, Greece. 2 - Department of Sport Games, Faculty of Physical Education & Sports Science, National & Kapodistrian University of Athens, Greece. . Authors submitted their contribution of the article to the editorial board. Accepted for printing in Journal of Human Kinetics vol. 40/2014 on March 2014. Ground Reaction Forces and Throwing Performance in Elite and Novice Players in Two Types of Handball Shot by Elissavet Rousanoglou 1 , Konstantinos Noutsos 2 , Ioannis Bayios 2 , Konstantinos Boudolos 1 The purpose of this study was to examine the differences in the ground reaction force (GRF) patterns between elite and novice players during two types of handball shots, as well as the relationships between throwing performance and the GRF variables. Ball velocity and throwing accuracy were measured during jump shots and 3-step shots performed by 15 elite and 15 novice players. The GRF pattern was recorded for the vertical and the anterior-posterior GRF components (Kistler forceplate type-9281, 750Hz). One-way ANOVA was used for the group differences and the Pearson coefficient for the correlation between throwing performance and GRF variables (SPSS 21.0, p 0.05). The elite players performed better in both types of shot. Both groups developed consistent and similar GRF patterns, except for the novices’ inconsistent Fz pattern in the 3-step shot. The GRF variables differed significantly between groups in the 3-step shot (p 0.05). Significant correlations were found only for ball velocity and predominantly for the novice players during the 3-step shot (p 0.05). The results possibly highlight a shortage in the novice ability to effectively reduce their forward momentum so as to provide a stable base of support for the momentum transfer up the kinetic chain, a situation that may predispose athletes to injury. Key words: braking force, postural control, jump shot, drive leg, injury prevention, handball. Introduction Throwing performance in handball is typically evaluated with ball velocity and throwing accuracy (Bayios et al., 2001; García et al., 2013; Gorostiaga et al., 2005; van den Tillaar and Ettema, 2006; Wagner et al., 2011; Wagner et al., 2012). Based on the premise that the lower extremity drives the upper extremity’s motor pattern (Wagner et al., 2011; Zattara and Bouisset, 1998), throwing performance may be considered as the final outcome of an efficient kinetic chain. Previously, it has been reported that there is a significant relationship between ball velocity and the ground reaction forces (GRF) of the drive leg during softball pitching (Oliver and Plummer, 2011), as well as to the time to peak the vertical and braking GRFs during baseball (Elliot et al., 1988) and softball pitching (Guido and Werner, 2012). Similarly, MacWilliams et al. (1998) reported a significant relationship between linear wrist velocity and vertical, braking and resultant GRFs during baseball pitching. MacWilliams et al. (1998) did not measure ball velocity in all their subjects but they reported a high correlation of wrist and ball velocities for a single subject. Handball is a well-studied activity; however, there appears to be a lack of information about the GRFs developed during handball shots, as well as their relationship with throwing performance. The GRFs reported for baseball (Elliot et al., 1988; MacWilliams et al., 1998) and softball
Transcript of Ground reaction forces and throwing performance in elite and novice players in two types of handball...
Journal of Human Kinetics volume 40/2014, 49-55 DOI: 10.2478/hukin-2014-0006 49 Section I – Kinesiology
1 - Sport Biomechanics Lab-Department of Sport Medicine & Biology of Exercise, Faculty of Physical Education & Sports Science,
National & Kapodistrian University of Athens, Greece. 2 - Department of Sport Games, Faculty of Physical Education & Sports Science, National & Kapodistrian University of Athens,
Greece.
.
Authors submitted their contribution of the article to the editorial board.
Accepted for printing in Journal of Human Kinetics vol. 40/2014 on March 2014.
Ground Reaction Forces and Throwing Performance in Elite and
Novice Players in Two Types of Handball Shot
by
Elissavet Rousanoglou1, Konstantinos Noutsos2, Ioannis Bayios2,
Konstantinos Boudolos1
The purpose of this study was to examine the differences in the ground reaction force (GRF) patterns between
elite and novice players during two types of handball shots, as well as the relationships between throwing performance
and the GRF variables. Ball velocity and throwing accuracy were measured during jump shots and 3-step shots
performed by 15 elite and 15 novice players. The GRF pattern was recorded for the vertical and the anterior-posterior
GRF components (Kistler forceplate type-9281, 750Hz). One-way ANOVA was used for the group differences and the
Pearson coefficient for the correlation between throwing performance and GRF variables (SPSS 21.0, p 0.05). The
elite players performed better in both types of shot. Both groups developed consistent and similar GRF patterns, except
for the novices’ inconsistent Fz pattern in the 3-step shot. The GRF variables differed significantly between groups in
the 3-step shot (p 0.05). Significant correlations were found only for ball velocity and predominantly for the novice
players during the 3-step shot (p 0.05). The results possibly highlight a shortage in the novice ability to effectively
reduce their forward momentum so as to provide a stable base of support for the momentum transfer up the kinetic
chain, a situation that may predispose athletes to injury.
Key words: braking force, postural control, jump shot, drive leg, injury prevention, handball.
Introduction Throwing performance in handball is
typically evaluated with ball velocity and
throwing accuracy (Bayios et al., 2001; García et
al., 2013; Gorostiaga et al., 2005; van den Tillaar
and Ettema, 2006; Wagner et al., 2011; Wagner et
al., 2012). Based on the premise that the lower
extremity drives the upper extremity’s motor
pattern (Wagner et al., 2011; Zattara and Bouisset,
1998), throwing performance may be considered
as the final outcome of an efficient kinetic chain.
Previously, it has been reported that there is a
significant relationship between ball velocity and
the ground reaction forces (GRF) of the drive leg
during softball pitching (Oliver and Plummer,
2011), as well as to the time to peak the vertical
and braking GRFs during baseball (Elliot et al.,
1988) and softball pitching (Guido and Werner,
2012). Similarly, MacWilliams et al. (1998)
reported a significant relationship between linear
wrist velocity and vertical, braking and resultant
GRFs during baseball pitching. MacWilliams et al.
(1998) did not measure ball velocity in all their
subjects but they reported a high correlation of
wrist and ball velocities for a single subject.
Handball is a well-studied activity; however,
there appears to be a lack of information about the
GRFs developed during handball shots, as well as
their relationship with throwing performance.
The GRFs reported for baseball (Elliot et
al., 1988; MacWilliams et al., 1998) and softball
50 Ground reaction forces and throwing performance in elite and novice players in two types of handball shot
Journal of Human Kinetics volume 40/2014 http://www.johk.pl
pitchers (Guido and Werner, 2012; Oliver and
Plummer, 2011) are considered to be large enough
to predispose to injury (Oliver and Plummer,
2011). With the high risk of injury in handball
(Junge et al., 2006), information about the GRFs
developed during handball shots is warranted.
The most frequent shots in handball are the jump
shot (JS) and the 3-step shot (3SS). Their
fundamental difference is that the upper
extremity’s throwing movement is executed in the
aerial phase for the JS whereas in ground contact
for the 3SS (Wagner et al., 2011). As seen in
throwing activities that are similar to 3SS, such as
the javelin throwing (Whiting et al., 1991) and the
baseball pitching (MacWilliams et al., 1998;
Matsuo et al., 2001), the braking action of the
drive leg is essential to provide a stable base of
support for the transfer of momentum through
the pelvis and trunk to the throwing arm. Thus, it
may be assumed that the relationship between the
GRFs and throwing performance is greater in the
3SS than in the JS.
The purpose of this study was to examine
the differences of the GRF pattern developed by
elite and novice players during the handball JS
and 3SS, as well as the relationship between the
GRF pattern variables and the throwing
performance variables (ball velocity and throwing
accuracy).
Material and Methods
Participants
The elite group (EG) included 15 males
among the best scorers in the 1st division of the
Handball National League with a training
experience of 12.3 3.0 years (age: 24.9 2.9 years,
body height: 181.3 6.3 cm, body mass: 83.1 5.3
kg). The novice group (NG) included 15 male
students of physical education and sport science
who had completed a handball course (4 months,
3 hours per week) (age: 21.7 0.9 years, body
height: 181.7 5.5 cm, body mass: 77.1 6.4 kg).
All participants were free of medical problems or
pain for at least the past 6 months. All subjects
signed an informed consent form that described
the testing procedure in detail. The work reported
was approved by the institutional review board
and conformed to the principles outlined in the
Declaration of Helsinki.
Procedures
A 15-min warm-up was allowed for each
participant including general and shoulder-
specific mobility exercises, as well as stretching
exercises and familiarization with the protocol.
Participants were instructed to complete five trials
from the 7 m penalty line for both the JS and 3SS
using a standard official ball (0.44 kg, 58.1 cm).
Participants were allowed 1 min rest between
trials. Τhe trial with the greatest ball velocity was
selected for further analysis. If the ball velocity
was the same in two or more trials, the one with
the best throwing accuracy was selected.
The ball velocity was measured by an
innovative electronic device described in detail by
Bayios et al. (2001). Briefly, the device consisted of
a laser beam emitter and an electronic system
laser beam infrared detectors, which were
connected to a digital pulse counter. The ball
interrupted the laser beam at a distance of 1.5 m
after the penalty line. The ball velocity, which was
calculated by multiplying the beam interruption
time by the ball’s diameter, was expressed in
meters per second (m/s).
The accuracy of the shot was measured by
an innovative electronic device described in detail
by Bayios et al. (1998). Briefly, the device
consisted of a Π-shaped tabloid surface that was
attached firmly to the inner side of a handball
goal post. The tabloid surface included a net of
light-emitting diodes (LEDs) (target hit pointers)
that were interwoven with a net of metal strips
(hit point detectors). The hit point detectors
transferred the coordinates of the actual hit point
to the central unit with 1 mm accuracy. Throwing
accuracy was defined by the difference between
the coordinates of the target and the actual hit
point. The player initiated his trial when the
target-pointer lit up (randomly via an electronic
programmer). Trials in which the tabloid surface
was not hit were rejected and additional trials
were conducted until a total of five successful
shots were achieved.
GRFs were recorded when the drive leg
landed on the forceplate (60 x 40 cm, Kistler type –
9281, 750 Hz mounted flush with the floor at the 7
m penalty position, Bioware software Kistler). The
GRF data were filtered (10 Hz low pass
Butterworth filter, Bioware software Kistler). The
GRF variables inserted for analysis were the
contact time (tcontact) expressed in milliseconds
(ms), the peak vertical (Fzmax) and anterior-
posterior (Fymax) GRF components expressed as a
by Elissavet Rousanoglou et al. 51
© Editorial Committee of Journal of Human Kinetics
multiple of body weight (BW), the time to peak
Fzmax and Fymax (tFzmax and tFymax, respectively)
expressed in milliseconds and as a percentage of
tcontact (% tcontact) and the vertical and anterior-
posterior impulses (Fzimpulse and Fyimpulse,
respectively) expressed in BWs units.
Statistical Analysis
One-way ANOVA was used to test the
group differences (EG versus NG) in the GRF
pattern variables (tcontact, Fzmax, Fymax, Fzimpulse,
Fyimpulse, tFzmax, tFymax) and the throwing
performance variables (ball velocity and throwing
accuracy) separately for each type of shot. The
Pearson Coefficient of Correlation was used to
test the significance of the relationships between
the GRF and the throwing performance variables
in the EG and NG separately for each type of the
shot. The level of significance was set at p ≤ 0.05
for all statistical tests (SPSS 21.0).
Results
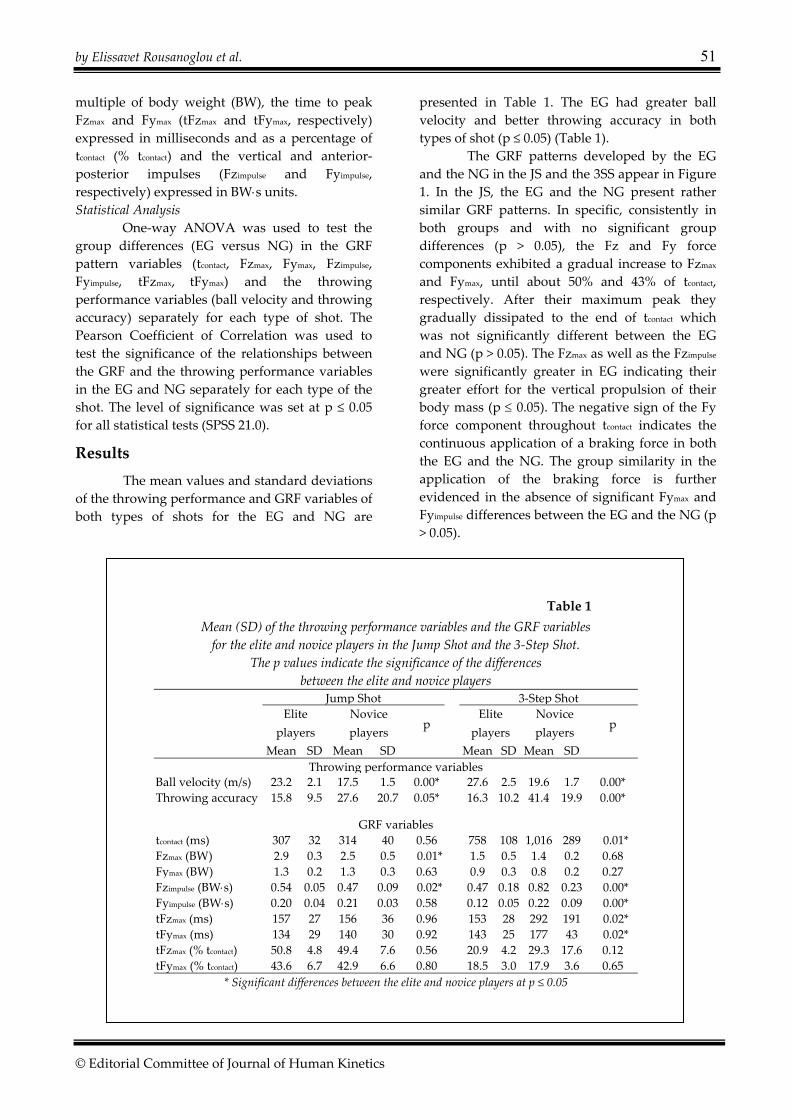
The mean values and standard deviations
of the throwing performance and GRF variables of
both types of shots for the EG and NG are
presented in Table 1. The EG had greater ball
velocity and better throwing accuracy in both
types of shot (p ≤ 0.05) (Table 1).
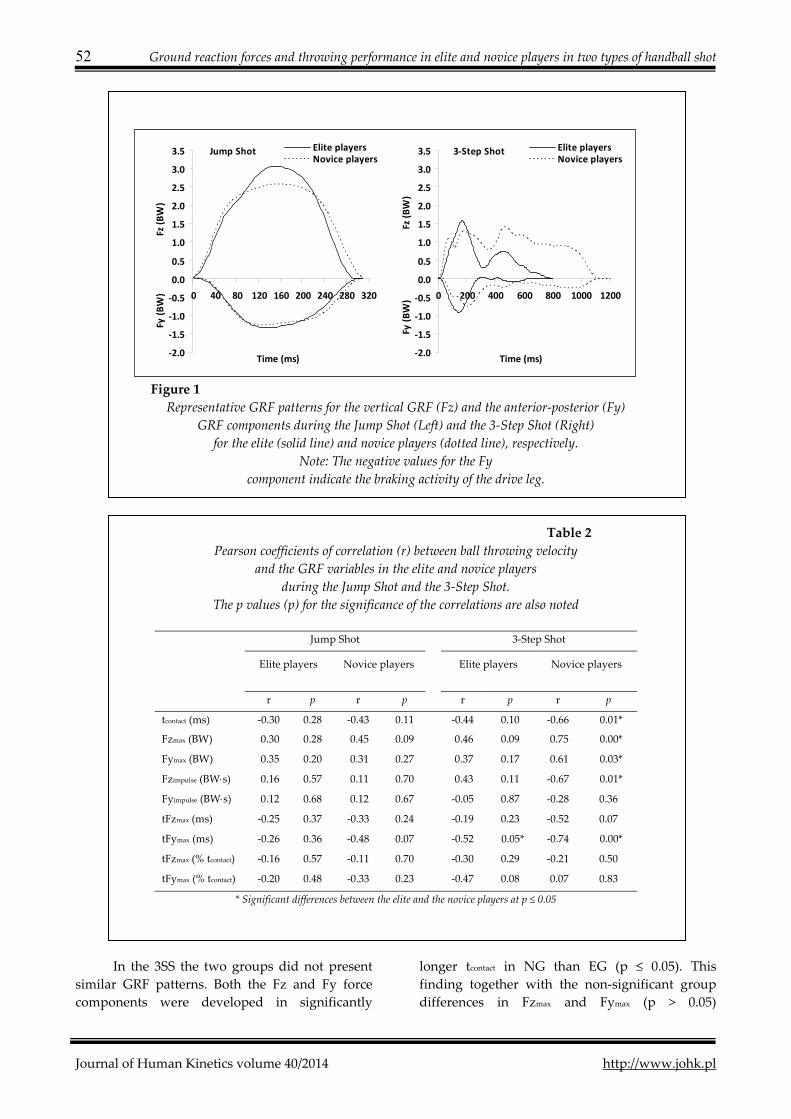
The GRF patterns developed by the EG
and the NG in the JS and the 3SS appear in Figure
1. In the JS, the EG and the NG present rather
similar GRF patterns. In specific, consistently in
both groups and with no significant group
differences (p > 0.05), the Fz and Fy force
components exhibited a gradual increase to Fzmax
and Fymax, until about 50% and 43% of tcontact,
respectively. After their maximum peak they
gradually dissipated to the end of tcontact which
was not significantly different between the EG
and NG (p > 0.05). The Fzmax as well as the Fzimpulse
were significantly greater in EG indicating their
greater effort for the vertical propulsion of their
body mass (p 0.05). The negative sign of the Fy
force component throughout tcontact indicates the
continuous application of a braking force in both
the EG and the NG. The group similarity in the
application of the braking force is further
evidenced in the absence of significant Fymax and
Fyimpulse differences between the EG and the NG (p
> 0.05).
Table 1
Mean (SD) of the throwing performance variables and the GRF variables
for the elite and novice players in the Jump Shot and the 3-Step Shot.
The p values indicate the significance of the differences
between the elite and novice players
Jump Shot 3-Step Shot
Elite
players
Novice
players p
Elite
players
Novice
players p
Mean SD Mean SD Mean SD Mean SD
Throwing performance variablesBall velocity (m/s) 23.2 2.1 17.5 1.5 0.00* 27.6 2.5 19.6 1.7 0.00*
Throwing accuracy 15.8 9.5 27.6 20.7 0.05* 16.3 10.2 41.4 19.9 0.00*
GRF variables
tcontact (ms) 307 32 314 40 0.56 758 108 1,016 289 0.01*
Fzmax (BW) 2.9 0.3 2.5 0.5 0.01* 1.5 0.5 1.4 0.2 0.68
Fymax (BW) 1.3 0.2 1.3 0.3 0.63 0.9 0.3 0.8 0.2 0.27
Fzimpulse (BWs) 0.54 0.05 0.47 0.09 0.02* 0.47 0.18 0.82 0.23 0.00*
Fyimpulse (BWs) 0.20 0.04 0.21 0.03 0.58 0.12 0.05 0.22 0.09 0.00*
tFzmax (ms) 157 27 156 36 0.96 153 28 292 191 0.02*
tFymax (ms) 134 29 140 30 0.92 143 25 177 43 0.02*
tFzmax (% tcontact) 50.8 4.8 49.4 7.6 0.56 20.9 4.2 29.3 17.6 0.12
tFymax (% tcontact) 43.6 6.7 42.9 6.6 0.80 18.5 3.0 17.9 3.6 0.65
* Significant differences between the elite and novice players at p ≤ 0.05
52 Ground reaction forces and throwing performance in elite and novice players in two types of handball shot
Journal of Human Kinetics volume 40/2014 http://www.johk.pl
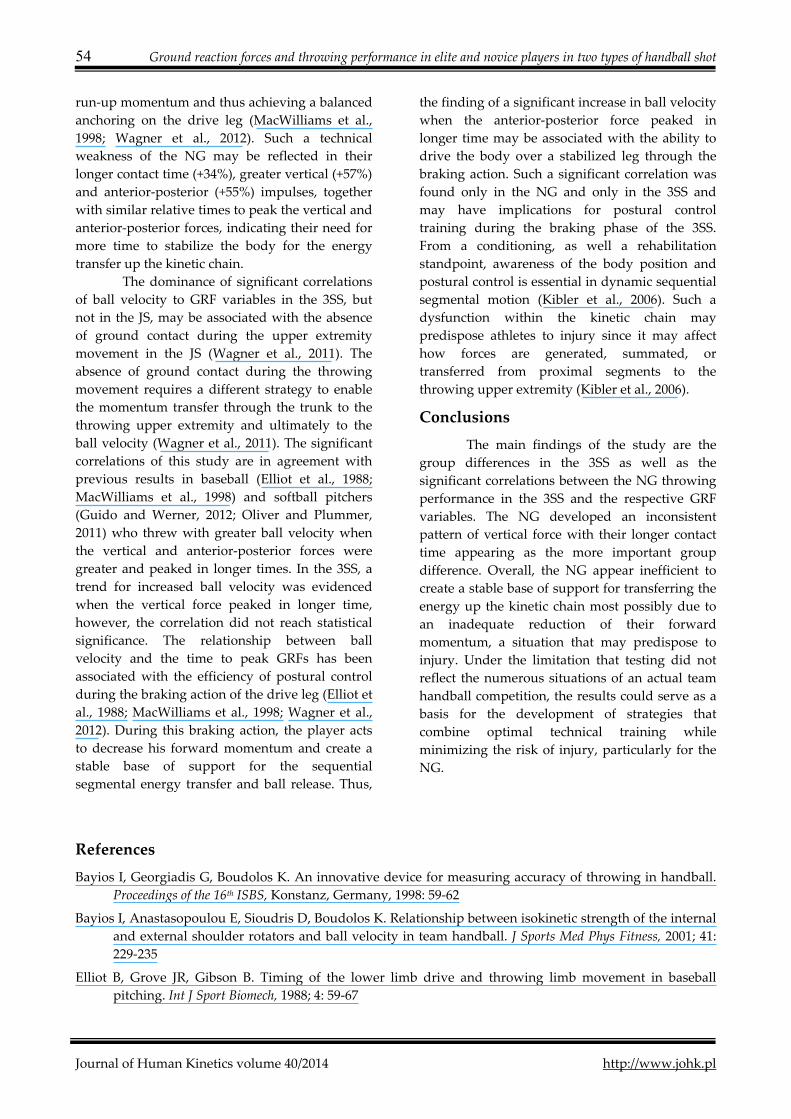
Figure 1
Representative GRF patterns for the vertical GRF (Fz) and the anterior-posterior (Fy)
GRF components during the Jump Shot (Left) and the 3-Step Shot (Right)
for the elite (solid line) and novice players (dotted line), respectively.
Note: The negative values for the Fy
component indicate the braking activity of the drive leg.
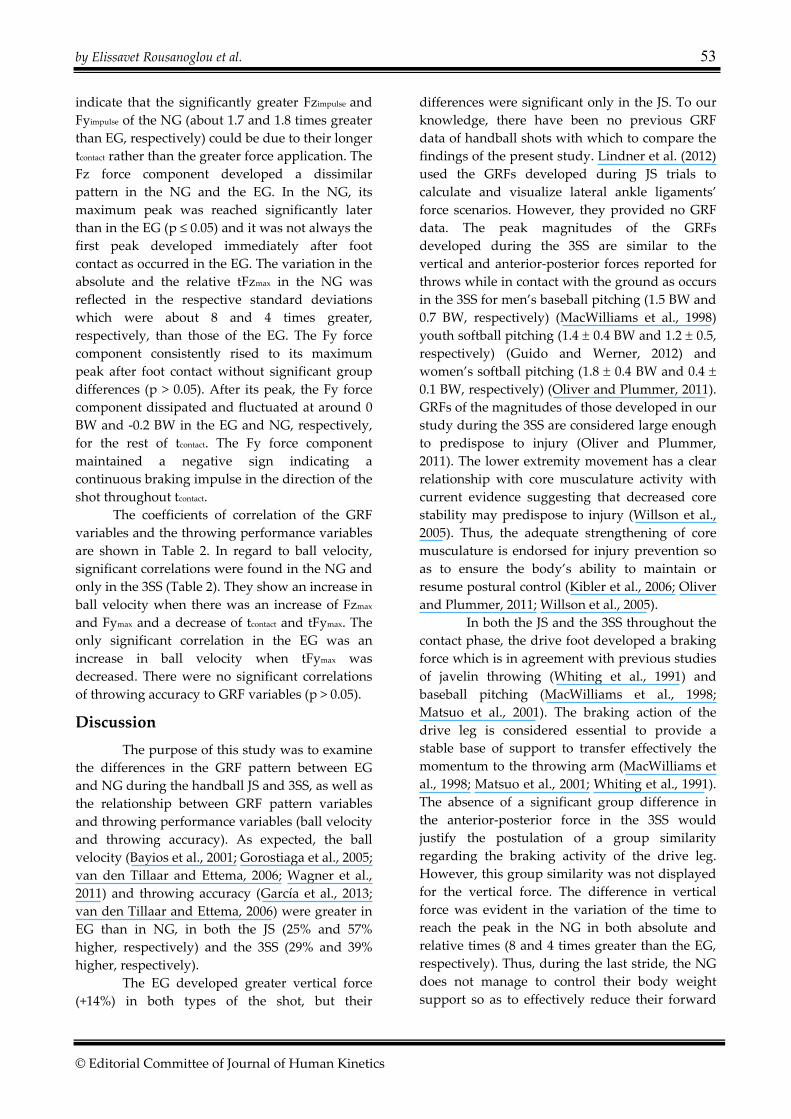
Table 2
Pearson coefficients of correlation (r) between ball throwing velocity
and the GRF variables in the elite and novice players
during the Jump Shot and the 3-Step Shot.
The p values (p) for the significance of the correlations are also noted
Jump Shot 3-Step Shot
Elite players Novice players Elite players Novice players
r p r p r p r p
tcontact (ms) -0.30 0.28 -0.43 0.11 -0.44 0.10 -0.66 0.01*
Fzmax (BW) 0.30 0.28 0.45 0.09 0.46 0.09 0.75 0.00*
Fymax (BW) 0.35 0.20 0.31 0.27 0.37 0.17 0.61 0.03*
Fzimpulse (BWs) 0.16 0.57 0.11 0.70 0.43 0.11 -0.67 0.01*
Fyimpulse (BWs) 0.12 0.68 0.12 0.67 -0.05 0.87 -0.28 0.36
tFzmax (ms) -0.25 0.37 -0.33 0.24 -0.19 0.23 -0.52 0.07
tFymax (ms) -0.26 0.36 -0.48 0.07 -0.52 0.05* -0.74 0.00*
tFzmax (% tcontact) -0.16 0.57 -0.11 0.70 -0.30 0.29 -0.21 0.50
tFymax (% tcontact) -0.20 0.48 -0.33 0.23 -0.47 0.08 0.07 0.83
* Significant differences between the elite and the novice players at p ≤ 0.05
In the 3SS the two groups did not present
similar GRF patterns. Both the Fz and Fy force
components were developed in significantly
longer tcontact in NG than EG (p ≤ 0.05). This
finding together with the non-significant group
differences in Fzmax and Fymax (p > 0.05)
Jump Shot
-2.0
-1.5
-1.0
-0.5
0.0
0.5
1.0
1.5
2.0
2.5
3.0
3.5
0 40 80 120 160 200 240 280 320
Time (ms)
Fy (
BW
)
Fz
(BW
)Elite playersNovice players
3-Step Shot
-2.0
-1.5
-1.0
-0.5
0.0
0.5
1.0
1.5
2.0
2.5
3.0
3.5
0 200 400 600 800 1000 1200
Time (ms)
Fy (
BW
)
Fz
(BW
)
Elite playersNovice players
by Elissavet Rousanoglou et al. 53
© Editorial Committee of Journal of Human Kinetics
indicate that the significantly greater Fzimpulse and
Fyimpulse of the NG (about 1.7 and 1.8 times greater
than EG, respectively) could be due to their longer
tcontact rather than the greater force application. The
Fz force component developed a dissimilar
pattern in the NG and the EG. In the NG, its
maximum peak was reached significantly later
than in the EG (p ≤ 0.05) and it was not always the
first peak developed immediately after foot
contact as occurred in the EG. The variation in the
absolute and the relative tFzmax in the NG was
reflected in the respective standard deviations
which were about 8 and 4 times greater,
respectively, than those of the EG. The Fy force
component consistently rised to its maximum
peak after foot contact without significant group
differences (p > 0.05). After its peak, the Fy force
component dissipated and fluctuated at around 0
BW and -0.2 BW in the EG and NG, respectively,
for the rest of tcontact. The Fy force component
maintained a negative sign indicating a
continuous braking impulse in the direction of the
shot throughout tcontact.
The coefficients of correlation of the GRF
variables and the throwing performance variables
are shown in Table 2. In regard to ball velocity,
significant correlations were found in the NG and
only in the 3SS (Table 2). They show an increase in
ball velocity when there was an increase of Fzmax
and Fymax and a decrease of tcontact and tFymax. The
only significant correlation in the EG was an
increase in ball velocity when tFymax was
decreased. There were no significant correlations
of throwing accuracy to GRF variables (p > 0.05).
Discussion
The purpose of this study was to examine
the differences in the GRF pattern between EG
and NG during the handball JS and 3SS, as well as
the relationship between GRF pattern variables
and throwing performance variables (ball velocity
and throwing accuracy). As expected, the ball
velocity (Bayios et al., 2001; Gorostiaga et al., 2005;
van den Tillaar and Ettema, 2006; Wagner et al.,
2011) and throwing accuracy (García et al., 2013;
van den Tillaar and Ettema, 2006) were greater in
EG than in NG, in both the JS (25% and 57%
higher, respectively) and the 3SS (29% and 39%
higher, respectively).
The EG developed greater vertical force
(+14%) in both types of the shot, but their
differences were significant only in the JS. To our
knowledge, there have been no previous GRF
data of handball shots with which to compare the
findings of the present study. Lindner et al. (2012)
used the GRFs developed during JS trials to
calculate and visualize lateral ankle ligaments’
force scenarios. However, they provided no GRF
data. The peak magnitudes of the GRFs
developed during the 3SS are similar to the
vertical and anterior-posterior forces reported for
throws while in contact with the ground as occurs
in the 3SS for men’s baseball pitching (1.5 BW and
0.7 BW, respectively) (MacWilliams et al., 1998)
youth softball pitching (1.4 0.4 BW and 1.2 0.5,
respectively) (Guido and Werner, 2012) and
women’s softball pitching (1.8 0.4 BW and 0.4
0.1 BW, respectively) (Oliver and Plummer, 2011).
GRFs of the magnitudes of those developed in our
study during the 3SS are considered large enough
to predispose to injury (Oliver and Plummer,
2011). The lower extremity movement has a clear
relationship with core musculature activity with
current evidence suggesting that decreased core
stability may predispose to injury (Willson et al.,
2005). Thus, the adequate strengthening of core
musculature is endorsed for injury prevention so
as to ensure the body’s ability to maintain or
resume postural control (Kibler et al., 2006; Oliver
and Plummer, 2011; Willson et al., 2005).
In both the JS and the 3SS throughout the
contact phase, the drive foot developed a braking
force which is in agreement with previous studies
of javelin throwing (Whiting et al., 1991) and
baseball pitching (MacWilliams et al., 1998;
Matsuo et al., 2001). The braking action of the
drive leg is considered essential to provide a
stable base of support to transfer effectively the
momentum to the throwing arm (MacWilliams et
al., 1998; Matsuo et al., 2001; Whiting et al., 1991).
The absence of a significant group difference in
the anterior-posterior force in the 3SS would
justify the postulation of a group similarity
regarding the braking activity of the drive leg.
However, this group similarity was not displayed
for the vertical force. The difference in vertical
force was evident in the variation of the time to
reach the peak in the NG in both absolute and
relative times (8 and 4 times greater than the EG,
respectively). Thus, during the last stride, the NG
does not manage to control their body weight
support so as to effectively reduce their forward
54 Ground reaction forces and throwing performance in elite and novice players in two types of handball shot
Journal of Human Kinetics volume 40/2014 http://www.johk.pl
run-up momentum and thus achieving a balanced
anchoring on the drive leg (MacWilliams et al.,
1998; Wagner et al., 2012). Such a technical
weakness of the NG may be reflected in their
longer contact time (+34%), greater vertical (+57%)
and anterior-posterior (+55%) impulses, together
with similar relative times to peak the vertical and
anterior-posterior forces, indicating their need for
more time to stabilize the body for the energy
transfer up the kinetic chain.
The dominance of significant correlations
of ball velocity to GRF variables in the 3SS, but
not in the JS, may be associated with the absence
of ground contact during the upper extremity
movement in the JS (Wagner et al., 2011). The
absence of ground contact during the throwing
movement requires a different strategy to enable
the momentum transfer through the trunk to the
throwing upper extremity and ultimately to the
ball velocity (Wagner et al., 2011). The significant
correlations of this study are in agreement with
previous results in baseball (Elliot et al., 1988;
MacWilliams et al., 1998) and softball pitchers
(Guido and Werner, 2012; Oliver and Plummer,
2011) who threw with greater ball velocity when
the vertical and anterior-posterior forces were
greater and peaked in longer times. In the 3SS, a
trend for increased ball velocity was evidenced
when the vertical force peaked in longer time,
however, the correlation did not reach statistical
significance. The relationship between ball
velocity and the time to peak GRFs has been
associated with the efficiency of postural control
during the braking action of the drive leg (Elliot et
al., 1988; MacWilliams et al., 1998; Wagner et al.,
2012). During this braking action, the player acts
to decrease his forward momentum and create a
stable base of support for the sequential
segmental energy transfer and ball release. Thus,
the finding of a significant increase in ball velocity
when the anterior-posterior force peaked in
longer time may be associated with the ability to
drive the body over a stabilized leg through the
braking action. Such a significant correlation was
found only in the NG and only in the 3SS and
may have implications for postural control
training during the braking phase of the 3SS.
From a conditioning, as well a rehabilitation
standpoint, awareness of the body position and
postural control is essential in dynamic sequential
segmental motion (Kibler et al., 2006). Such a
dysfunction within the kinetic chain may
predispose athletes to injury since it may affect
how forces are generated, summated, or
transferred from proximal segments to the
throwing upper extremity (Kibler et al., 2006).
Conclusions
The main findings of the study are the
group differences in the 3SS as well as the
significant correlations between the NG throwing
performance in the 3SS and the respective GRF
variables. The NG developed an inconsistent
pattern of vertical force with their longer contact
time appearing as the more important group
difference. Overall, the NG appear inefficient to
create a stable base of support for transferring the
energy up the kinetic chain most possibly due to
an inadequate reduction of their forward
momentum, a situation that may predispose to
injury. Under the limitation that testing did not
reflect the numerous situations of an actual team
handball competition, the results could serve as a
basis for the development of strategies that
combine optimal technical training while
minimizing the risk of injury, particularly for the
NG.
References
Bayios I, Georgiadis G, Boudolos K. An innovative device for measuring accuracy of throwing in handball.
Proceedings of the 16th ISBS, Konstanz, Germany, 1998: 59-62
Bayios I, Anastasopoulou E, Sioudris D, Boudolos K. Relationship between isokinetic strength of the internal
and external shoulder rotators and ball velocity in team handball. J Sports Med Phys Fitness, 2001; 41:
229-235
Elliot B, Grove JR, Gibson B. Timing of the lower limb drive and throwing limb movement in baseball
pitching. Int J Sport Biomech, 1988; 4: 59-67
by Elissavet Rousanoglou et al. 55
© Editorial Committee of Journal of Human Kinetics
García JA, Sabido R, Barbado D, Moreno FJ. Analysis of the relation between throwing speed and throwing
accuracy in team-handball according to instruction. Eur J Sport Sci, 2013; 13: 149-154
Gorostiaga EM, Granados C, Ibanez J, Izquierdo M. Differences in physical fitness and throwing velocity
among elite and amateur male handball players. Int J Sports Med, 2005; 26: 225-232
Guido JA Jr, Werner SL. Lower-extremity ground reaction forces in collegiate baseball pitchers. J Strength
Cond Res, 2012; 26: 1782-1785
Junge A, Langevoort G, Pipe A, Peytavin A, Wong F, Mountjoy M, Beltrami G, Terrell R, Holzgraefe M,
Charles R, Dvorak J. Injuries in team sport tournaments during the 2004 Olympic Games. Am J Sports
Med, 2006; 34: 565-576
Kibler WB, Press J, Sciascia A. The role of core stability in athletic function. Sports Med, 2006; 36: 189-198
Lindner M, Kotschwar A, Zsoldos RR, Groesel M, Peham C. The jump shot - a biomechanical analysis
focused on lateral ankle ligaments. J Biomech, 2012; 45: 202-206
MacWilliams BA, Choi T, Perezous MK, Chao EY, Mcfarland EG. Characteristic ground-reaction forces in
baseball pitching. Am J Sports Med, 1998; 26: 66-71
Matsuo T, Escamilla RF, Fleisig GS, Barrentine SW, Andrews JR. Comparison of kinematic and temporal
parameters between different pitch velocity groups. J Appl Biomech, 2001; 17: 1-13
Oliver GD, Plummer H. Ground reaction forces, kinematics, and muscle activations during the windmill
softball pitch. J Sports Sci, 2011; 29: 1071-1077
van den Tillaar R, Ettema G. A comparison between novices and experts of the velocity-accuracy trade-off in
overarm throwing. Percept Mot Skills, 2006; 103: 503-514
Wagner H, Pfusterschmied J, von Duvillard S, Müller E. Performance and kinematics of various throwing
techniques in team-handball. J Sports Sci Med, 2011; 10: 73-80
Wagner H, Pfusterschmied J, von Duvillard S, Müller E. Skill-dependent proximal-to-distal sequence in
team-handball throwing. J Sports Sci, 2012; 30: 21-29
Whiting WC, Gregor RJ, Halushka M. Body segment and release parameter contributions to new-rules
javelin throwing. Int J Sport Biomech, 1991; 7: 111-124
Willson JD, Dougherty CP, Ireland ML, Davis IM. Core stability and its relationship to lower extremity
function and injury. J Am Acad Orthop Surg, 2005; 13: 316-325
Zattara M, Bouisset S. Posturo-kinetic organization during the early phase of voluntary upper limb
movement. 1. Normal subjects. J Neurol Neurosurg Psychiatry, 1998; 51: 956-965
Corresponding author:
Elissavet Rousanoglou
Biomechanics Lab-Department of Sport Medicine & Biology of Exercise,
Faculty of Physical Education & Sports Science, National & Kapodistrian University of Athens, Greece
Ethnikis Antistasis 41, Daphne, 172-37, Athens, Greece
Phone and Fax: 00302107276090
E-mail: [email protected]