The Journal of Physical Chemistry 1973 Vol.77 No.21
100
VOLUME OCTOBER 11, 1973 / n u m b e r 21 7 7 JPCHAx T H E JOURNAL OF
-
Upload
khangminh22 -
Category
Documents
-
view
2 -
download
0
Transcript of The Journal of Physical Chemistry 1973 Vol.77 No.21

V O L U M E O C T O B E R 1 1 , 1 9 7 3 / n u m b e r 2 17 7
JP C H A x
T H E J O U R N A L O F

T H E J O U R N A L OF
C H E M I S T R YP H Y S I C A L
BRYCE CRAWFORD, Jr., Editor STEPHEN PRAGER, Associate EditorROBERT W. CARR, Jr., FREDERIC A. VAN-CATLEDGE, Assistant Editors
EDITORIAL BOARD: A. O. ALLEN (1970-1974), C. A. ANGELL (1973-1977),J. R. BOLTON (1971-1975), M. FIXMAN (1970-1974). H. S. FRANK (1970-1974),R R HENTZ (1972-1976), J. R. HUIZENGA (1969-1973), W. J. KAIIZMANN (1969-1973),R. L. KAY (1972-1976), W. R. KRIGBAUM (1969-1973), W. J. MOORE (1969-1973),R. M. NOYES (1973-1977), J. A. POPLE (1971-1975), B. S. RABINOVITCH (1971-1975),H. REISS (1970-1974), S. A. RICE (1969-1975), F. S. ROWLAND (1973-1977),R. L. SCOTT (1973-1977), W. A. ZISMAN (1972-1976)
AMERICAN CHEMICAL SOCIETY, 11.5.5 S i x t e e n t h S t . , N . W . , W a s h i n g t o n . 1). C. 20 0 3 6
Books and Journals Division
JOHN K CRUM DirectorRUTH REYNARD Assistant to the Director
CHARLES R. BERTSCH Head, Editorial Processing Department D. H. MICHAEL BOWEN Head, Journals Department BACIL GUILEY Head, Graphics and Production Department SELDON W. TERRANT Head, Research and Development Department
©Copyright, 1973, by the American Chemical Society. Published biweekly by the American Chemical Society at 20th and Northampton Sts,, Easton, Pa. 18042. Second-class postage paid at Washington, D. C., and at additional mailing offices.
All manuscripts should be sent to The Journal of Physical Chemistry, Department of Chemistry. University of Minnesota. Minneapolis, Minn. 55455.
Additions and Corrections are published once yearly in the final issue. See Volume 76, Number 26 fer the proper form.
Extensive or unusual alterations in an article after it has been set in type are made at the author's expense, and it is understood that by requesting such alterations the author agrees to defray the cost thereof.
The American Chemical Society and the Editor of The Journal of Physical Chemistry assume no responsibility for the statements and opinions advanced by contributors.
Correspondence regarding accepted copy, proofs, and reprints should be directed to Editorial Processing Department, American Chemical Society, 20th and Northampton Sts., Easton, Pa. 18042. Head: C h a r i . e s R. B e r t s c h . Assistant Editor: E d w a r d A.
B o r g e r . Editorial Assistant: J o s e p h E. Y u r v a t i .
Advertising Office: Centcom, Ltd., 142 East Avenue, Norwalk,Conn. 06851.
Business and Subscription InformationSend all new and renewal subscriptions with payment to: Office
of the Controller, 1155 16th Street. N.W.. Washington, D. C. 2O056. Subscriptions should be renewed promptly to avoid a break in your series. All correspondence and telephone calls regarding changes of
address, claims for missing issues, subscription service, the status of records, and accounts should be directed to Manager, Membership and Subscription Services, American Chemical Society, P.O. Box 3337, Columbus, Ohio 43210. 'telephone (614) 421 -7230.
On changes of address, include both old and new addresses with ZIP code numbers, accompanied by mailing label from a recent issue. Allow four weeks for change to become effective.
Claims for missing numbers will not be allowed (1) if loss was due to failure of notice of change in address to be received before the date specified, (2) if received more than sixty days from date of issue plus time normally required for postal delivery of journal and claim, or (3) if the reason for the claim is “ issue missing from files.”
Subscription rates (1973): members of the American Chemical Society, $20.00 for 1 year; to nonmembers, $60.00 for 1 year. Those interested in becoming members should write to (he Admissions Department, American Chemical Society. 1155 Sixteenth St., N.W., Washington, 1). C. 20036. Postage to Canada and countries in the Pan-American Union, $5.00; all other countries, $6.00. Single copies for current year: $3.00. Rates for back issues from Volume 56 to date are available from the Special Issues Sales Department, 1155 Sixteenth St., N.W., Washington, D. C. 20036.
Subscriptions to this and the other ACS periodical publications r.-e evaillb1? on microfilm. Supplementary material not printed in 1 hi-" journal is now available in microfiche form on a current subscription basis. For information on microfilm or microfiche subscriptions, write Special Issues Sales Department at the address above.
Notice to Authors last printed in the issue of June 21, 1 9 7 3

T H E J O U R N A L O F
PHYS I CAL C H E M I S T R YVolume 77, Number 21 October 11, 1973
JPCHAx 77(21) 2493-2586 (1973) ISSN 0022-3654
HF and DF Infrared Chemiluminescence and Energy Partitioning from the Reactions of Fluorine Atoms with C6-Cio Cycloalkanes and Propane-d6 ...............K. C. Kim and D. W. Setser*
Trajectory Studies of Abstraction Reactions. Fluorine Atoms with Substituted Methanes andDeuterium Atoms with Chloroiodide . . R. L. Johnson, K. C. Kim, and D. W. Setser*
The Reaction of Nitrogen Dioxide with Ozone . C. H. Wu, E. D. Morris, Jr.,* and H. Niki
Kinetics of Gas-Phase Reactions of Ozone with Some Olefins. . D. H. Stedman, C. H. Wu,* and H. Niki
An Investigation of Photochemically Induced Reactions in a Chlorine-Ozone System at —10.5 and 0 .0 ° ................................................................. Richard W. Davidson and Dale G. Williams*
Ionic Photodissociation of Weak Charge-Transfer Complexes. Donor Acetonitrile and Acceptor Tetracyanoethylene and Iodine Katsumi Kimura,* Yohji Achiba, and Shunji Katsumata
Electron Scavenging by Bromobenzene in the Radiolysis of Hydrocarbon SolutionsMasayuki Tanaka and Kenji Fueki*
Electron Reactions in Aqueous Concentrated Acid Solutions. O. I. Micic, V. Markovic, and D. Nikolic
The Interaction between Halide Ions and Amphiphilic Organic Cations in Aqueous SolutionsStudied by Nuclear Quadrupole Relaxation . . . . Goran Lindblom* and Bjorn Lindman
Matrix Isolation Studies on the Gallium-Indium-Oxygen System. Infrared Spectra andStructures of Molecular Ga20, ln20 , and InOGa . . A. J. Hinchcliffe and J. S. Ogden*
Formation Constants for Aniline-Tetracyanoethylene Charge-Transfer Complexes. . P. G. Farrell* and Phi-Nga Ngo
A Quantum Mechanical Treatment of Bond and Molecular Polarizabilities of Some Substituted Hydrocarbons with Ring and Chain Structures
Nitish K. Sanyal,* Parvez Ahmad, and L. Dixit
Location of Nickel Ions in Y Zeolites. II. Influence of Various Reagents Adsorption on NickelPositions............................................................. P. Gallezot, Y. Ben Taarit, and B. Imelik*
A Semiempirical Study of Hydrogen Bonding in the Diaquohydrogen Ion, H502 +. . George R. Anderson* and George J. Jiang
The Complex Solubility of Silver Bromide in Ethanol-Water, Methanol-Water, Acetone-Water, and Dioxane-Water Mixtures . Keith P. Anderson, Eliot A. Butler, and Earl M. Woolley*
Diffusion Coefficients of Tetrabutylammonium Halides in Water at 25°Hyoungman Kim,* Arnold Revzin, and Louis J. Gosting
Surface Studies of the Adsorption of Sulfur-Containing Gases at 423°K on Porous Adsorbents.I. The Adsorption of Hydrogen Sulfide, Methanethiol. Ethanethiol, and Dimethyl Sulfide on Silica G e ls .............................................................................R. W. Glass* and R. A. Ross
Surface Studies of the Adsorption of Sulfur- Containing Gases at 423 °K on Porous Adsorbents.II. The Adsorption of Hydrogen Sulfide, Methanethiol, Ethanethiol, and Dimethyl Sulfide on y-A lum ina.............................................................................R. W. Glass* and R. A. Ross
miiQYliT
4
1 4
2493
2499
2507
2511
2515
2520
2524
2527
2531
2537
2545 ■
2552
2556 ■
2560 ■
2564 ■
2567
2571 ■
2576
1 A

Correlation of Homogeneous Self-Exchange and Electrochemical Rate Data. Further Evidence for Anomalously Low Recrganizational Barriers in Electron Transfer Reactions of Cobalt Complexes
. John F. Endicott, Ronald R. Schroeder,* Dale H. Chidester, and Donald R. Ferrier 2579
Excited-State Chemistry of Indigoid Dyes. III. The Interaction of Indigo and Thioindigo with Tin(IV) Tetraphenyltetrahydroporphyrin Triplets: the Photosensitized Isomerization of Thioindigo...................George M. Wyman,* Bizhan M. Zarnegar, and David G. Whitten 2584
■ Supplementary material for this paper is available separately, in photocopy or microfiche form. Ordering information is given in the paper.
* In papers with more than one author, the asterisk indicates the name of the author to whom inquiries about the paper should be addressed.
AUTHOR INDEX
Achiba, Y., 2520 Ahmad, P., 2552 Anderson, G. R., 2560 Anderson, K. P., 2564
Ben Taarit, Y., 2556 Butler, E. A., 2564
Chidester, D. H „ 2579
Davidson, R. W., 2515 Dixit, L„ 2552
Endicott, J. F., 2579
Farrell, P. G., 2545 Ferrier, D. R., 2579 Fueki, K.,2524
Gallezot, B., 2556 Glass, R. W „ 2571, 2576 Gosting, L. J., 2567
Hinchcliffe, A. J., 2537
Imelik, B., 2556
Jiang, G. J., 2560 Johnson, R. L., 2499
Katsumata, S., 2520 Kim, H., 2567 Kim, K. C„ 2493, 2499 Kimura, K., 2520
Lindblom, G., 2531
Lindman, B., 2531
Markovic, V., 2527 Micie, O. I., 2527 Morris, E. D., Jr., 2507
Ngô, P.-N., 2545 Niki'H., 2507, 2511 Nikolic, D., 2527
Ogden, J. S., 2537
Revzin, A.. 2567 Ross, R. A., 2571, 2576
Sanyal, N. K., 2552 Schroeder, R. R., 2579 Setser, D. W., 2493, 2499 Stedman, D. H., 2511
Tanaka, M., 2524
Whitten, D. G., 2584 Williams, D. G., 2515 Woolley, E. M., 2564 Wu, C. H„ 2507, 2511 Wyman, G. M., 2584
Zarnegar, B. M., 2584

T H E J O U R N A L O F
P H Y S I C A L C H E M I S T R YRegistered in U. S. Patent Office © Copyright, 1973, by the American Chemical Society
V O L U M E 77, N U M B E R 21 O C T O B E R 11, 1973
HF and DF Infrared Chemiluminescence and Energy Partitioning from the Reactions of Fluorine Atoms with C6-C10 Cycloalkanes and Propane-cf6
K. C. Kim and D. W. Setser*
Department of Chemistry, Kansas State University, Manhattan, Kansas 6 6 5 0 6 ( R e c e i v e d April 24, 1 9 7 3 )
The infrared emission from the HF and DF products from the reactions of F atoms with cyclohexane, cy- clohexane-di2 , cycloheptane, cyclooctane and cyclodecane has been studied. The initial product HF relative vibrational populations, N 1:N2:N3:Ni , are: CsH^ = 0.28:0.56:0.18:trace, C6D1 2 =0.08:0.32:0.43:0.17, C7Hi4 = 0.25:0.54:0.20:0.01, C8Hi6 = 0.27:0.50:0.20:0.02, and C1 0H20 =0.26:0.54:0.20:0.01. The mean fractional conversion of the available energy to vibrational energy of HF by these reactions (50%) is lower than for reactions with typical primary C-H bonds (60%). In order to provide reference data for reaction with a noncyclic secondary C-H bond, HF and DF overtone emission from F + CD3CH2 CD3 was studied. The relative vibrational populations are N 2:N3 = 0.62:0.38 for HF and N 2:N3:N4 = 0.37:0.41:0.23 for DF. A very small HF, u' = 4 population was observed from the cyclic alkanes but not from CD3CH2CD3 , which is consistent with the difference in bond energies. Although the steady-state HF rotational populations are partially relaxed, an estimate of the initial rotational distributions suggests that ~ 7% of the available energy was partitioned as HF rotational energy for the reaction of fluorine atoms with cyclic alkanes.
IntroductionIn preceding papers, 1 -2 the results of the HF infrared
chemiluminescence from the F atom abstraction reactions with polyatomic hydride molecules were reported. Relative rate constants for formation of HF in individual vibrational quantum states and information about the general nature of energy partitioning patterns were obtained. The importance of thermochemistry, differing mass combinations, variable bond types, substituent effects, and other factors have been discussed.
We report here the HF infrared chemiluminescence arising from the reaction of F atoms with secondary C-H bonds of C6-C10 cyclic alkanes3 and CD3CH2CD3. The results from CH3CD2CH3 and previously published1 data from reactions with other primary C-H bonds are used for reference. The bond energy of the secondary C-H bonds is ~ 6 kcal moD 1 lower than the bond energies of primary C-H bonds, and this change could affect the energy partitioning. If the claim1 -2 -4 that these F atom abstraction reactions populate vibrational-rotational levels up to the thermochemical limit is valid, then the lowered C-H bond energy should be evident from the highest observed HF level. Furthermore, a comparison between the secondary C-H bonds of cyclic and aliphatic alkanes should illus
trate the consequences of the cyclic radical reorganization energy3 and possibly other factors upon the HF vibrational and rotational populations.
Reactions of F atoms with polyatomic deuteride molecules have not previously been studied by the chemiluminescence technique. Although the DF fundamental spectrum falls in the region where the sensitivity of the lead sulfide detector is declining very rapidly, the enhanced sensitivity in the overtone region compensates somewhat for the smaller Einstein coefficients, relative to HF, and the slower reaction rates, relative to F + HR. Since the spacing of the vibration-rotational energy levels for DF are smaller than for HF, the DF results from F + C-C6D12, CD4, and CD3CH2CD3 provide a check for the relative rate constants and the energy partitioning patterns of the F + c-C6Hi2, CH4, and CH3CD2CH3 reactions.
The experiments were carried out in a fast flow apparatus1 -2 with the walls of the reaction vessel cooled to liquid nitrogen temperature. 6 The absence of vibrational relaxation was tested by varying reagent flow rate, background pressure, and F atom source. For some conditions, the degree of rotational relaxation could be altered and tentative estimates can be placed on the fractional conversion of the total energy into HF rotational energy.
2493

2494 K. C. Kim and D. W. Setser
Experimental SectionApparatus and Techniques. All cyclic alkanes were pur
chased from Columbia Organic Chemicals Co. Cyclic CeDi2 was obtained from Stohler Isotope Chemicals with the specified isotopic purity of 99.5%. CD3CH2CD3 was prepared from CD3COCD3 according to the standard LiAlHU reduction followed by chlorination of the resulting2-propanol-(i6 and hydrolysis of the Grignard reagent. Mass spectral analysis showed greater than 98% isotopic and chemical purity. CD4 and CH3CD2CH3 were obtained from Merck Laboratory Chemicals.
The main features of the apparatus have been described previously.1 The cold-walled (77°K) reactor was pumped through a liquid nitrogen trap by a 6-in. diffusion pump and a 500-1./min mechanical pump. The systems of gas inlets, pressure measuring devices, the optics, monochromator, and PbS detector were functionally the same as that used in the previous work.1 The detector signal was amplified by a PAR Model HR-8 lock-in amplifier and PAR Model BZ-1 chopper, which was operated at 600 Hz.
Fluorine atoms were produced by microwave discharge of SF6 or CF4 in a quartz tube. The discharged CF4 or SF6 was mixed with reagent via a concentric mixing arrangement; the central quartz tube (0.8 mm i.d.) was 1 cm longer than the outer tube. A typical flow for SFg or CF4 was ~ 4 ¿¿mol/sec. Typical flows of reagents were 2-6 iimol/sec. In addition to concentric mixing, a nozzle geometry in which the F atom flow was crossed with the flow of the substrate was tried. For the latter geometry, the tips of the two nozzles were ~ 4 cm apart.
The reagents were introduced to the vacuum line from a reagent flask after thorough degassing. The vapor pressure of the cyclic alkanes at room temperature was used as the back pressure and the flow was monitored with a Gilmont flowmeter. The operating pressure, measured at the bottom of the reactor under stabilized flow conditions, was1-2 X 10"4 Torr for typical experimental conditions. The actual density of the gas mixture in the mixing and emission zone undoubtedly is higher than indicated by the static pressure measurement.
The entire optical system was purged continuously before and during the experiment with dry nitrogen to minimize the absorption by atmospheric water. Emission from vibrationally excited HF„ j was recorded in the fundamental (0.4-mm slit) and overtone (2.0-mm slit) spectral region for most substrates. Typical sets of HF and DF spectra are shown in Figure 1 (F + c-CgHig) and Figure 2 (F + C-C6D12).
Data Treatment. Population analyses were made by computer simulation2 of the observed spectra. The transition probabilities were calculated by the methods of Heaps and Herzberg6a and Herman-Wallis6b for the first term in the dipole moment expansion, with the spectroscopic constants of Mann, et a l1 The detector response in the frequency range of interest was calibrated with a Barnes Engineering black body source. The line positions were calculated using the Herzberg expression. These positions were confirmed subsequently with the more accurate Dunham expression. It is necessary to use the latter for populations involving J levels higher than those observed in this work. An approximate set of initial populations and the detector response are entered intothe program which calculates line positions and intensities which then are combined according to a triangular peak shape. The rotational populations of each vibrational level are normalized. Thus the relative vibrational popu-
F . c-C gH ,g — - HF'(V.J) * c -C q H-0
5870 74X1 7990
WAVENUMBER, IV
Figure 1. Fundamental and overtone spectra from F + cyc looctane at 1 0 " 4 Torr. The fundamental and overtone spectra were taken with slit w idths of 0.4 and 2 mm, respectively. The feature at 6950 c m " 1 is the R transitions from 4 to 2. The apparent feature at 6590 cm " 1 was not assigned (see te x t) .
F » c-CgD^2_"C)F (V,J)7C-C6 D11
PCP) R(DÑT ' RO) Rfl )
2 ! ' ' ' ' ' FÑo¡ roT ' ^1 u 5 4 3 2 1 P(0) fW 2 5 4 5 6
5 0 5 0 5 3 10 _ 5 5 7 0 5 8 3 0
W AVEN UM BER CM ~
Figure 2. Fundamental and overtone spectra from F + cyc lo hexane-chi.
lations and the shapes of the rotational distribution for each vibrational level are varied until the experimental spectrum is reproduced. The computer simulation was carried out for both the fundamental and the first overtone spectra.
The vibration-rotation populations for HF(u = 1, 2 and 3) were assigned by fitting the fundamental spectra. For the u = 2 and 3, the overtone data served as a check on the vibrational and rotational population assignments. For the higher vibrational states (u > 4) the fundamental emission falls in the region where the PbS detector sensitivity declines rapidly. However, the relative detector response in the overtone region for the higher levels is increasing and the small v' = 4 populations from the C7- C10 compounds are based on comparison of the v'. = 4 and 3 bands in the overtone spectra. The relative DF populations are based primarily upon analysis of the overtone spectra, except for DF(u = 1 and 2) from F + C6Di2.
We experienced considerable difficulty in obtaining a good calibration for our spectrometer in the 7500-8100- cm" 1 region because the response declines in this region and the black body intensity also is low. The lack of confidence in the calibration curve prevented us from using the HF overtone spectra to the fullest advantage. Although the v = 2 and 3 population ratios deduced from the fundamental spectrum frequently did not match that
The Journal of Physical Chemistry. Vol. 77. No. 21, 1973

HF and DF Infrared Chem ilum inescence 2495
TABLE I: Sum m ary of Energy Partition ing
Init ial v i b r a t i o n a l 0 p o p u l a t i o n
E t , k c a lCompound V = 1 v = 2 v = 3 v = 4 D° 0 (C-H) mol “ 1 b %EVC
c-C8H12 0.28 0.56 0.16 <0.005 94.0d 41.4 50c-C6D12 0.08 0.32 0.43 0.17 96.8 40.2 54C-C7H -\ 4 0.25 0.54 0.20 0.01 91.0d 44.4 49c-C8 H t 5 0.27 0.50 0.20 0.02 91.0d 44.4 48c-C ioH2o 0.26 0.54 0.20 0.01 91 ,0d 44.4 49CD3CH2CD3(HF) 0.62 0.38 93.0« 42.4 —
CD3CH2CD3(DF) 0.37 0.41 0.23 99.6« 37.8 —
CH3CD2CH3(HF) (<0.24)® 0.50 0.26 96.8« 39.0 > 5 7 hc d 4 (0.05)® 0.29 0.56 0.10 104.91 33.2 65h
“ T h e s t e a d y - s t a t e p o p u l a t i o n s o b t a i n e d f r o m t h e s p e c t r a l a n a l y s i s w e r e c o r r e c t e d f o r r a d i a t i v e d e c a y u s i n g a 0 . 2 - m s e c r e s i d e n c e t i m e f o r H F . N o
c o r r e c t i o n s w e r e m a d e f o r D F b e c a u s e t h e r a d i a t i v e l i f e t i m e is s u f f i c i e n t l y l o n g t h a t r a d i a t i v e d e c a y i s u n i m p o r t a n t . T h e s u m s o f t h e p o p u l a t i o n s a r e n o r m a l i z e d t o u n it y . 0 E t = D “ 0 ( H r F ) - D ° 0 ( H - R ) + £ J; E° Is t h e t h r e s h o l d e n e r g y f o r r e a c t i o n . T h e v a l u e 9 u s e d f o r D ° 0 ( H - F ) w a s 1 3 5 . 4 k c a l m o l - ' ; E° f o r t h e s e c o n d a r y C - H b o n d s w a s a s s u m e d t o b e z e r o ; f o r CH410 a n d CH3CD2CH311 v a l u e s o f 1 . 1 a n d 0 . 4 k c a l m o l - 1 w e r e u s e d . 0 % E V = ( S ’ / . i / V , £ , : / E T ) X 1 0 0 ; t h e p o p u l a t i o n o f t h e v = o l e v e l is a s s u m e d t o b e n e g l i g i b l e . T h e £ , ' s f o r J = 0 a r e 1 1 . 3 2 ( 8 . 3 1 ) , 2 2 . 1 4 ( 1 6 . 3 5 ) , 3 2 . 4 9 ( 2 4 . 1 4 ) , 4 2 . 3 8 ( 3 1 . 6 5 ) , a n d
5 2 . 1 0 ( 3 8 . 9 8 ) k c a l f o r v — 1 , 2, 3 , 4 , a n d 5 o f H F ( C F ) . 0 R e f e r e n c e 3 c . 0 R e f e r e n c e 1 2 . ! R e f e r e n c e 1 3 . ® E s t i m a t e d b y e x t r a p o l a t i o n o f F i g u r e 5 . h T h e % E „ p r e v i o u s l y f o u n d f o r C H 4 a n d C 2 H 6 a r e 6 1 a n d 6 2 % , r e s p e c t i v e l y .
from the overtone spectra, the data are not of sufficient reliability to test the ratios of transition probabilities8 for the Au = 1 and Au = 2 transitions. The disparity in the v' = 2 and 3 population ratios from the Av = 1 and Au = 2 spectra was similar to the variation from different experiments. As already stated the v = 1, 2, and 3 HF populations are based on the fundamental spectra, except for the experiments with CD3CH2CD3 and CH3CD2CH3.
The thermochemistry and relative vibrational populations (the sum of the relative populations are normalized to unity) are summarized in Table I. We previously1’2 have argued that these populations are the original relative vibrational populations produced by the reactions. An additional and even more compelling argument is that the same vibrational populations were obtained for differing degrees of rotational relaxation for the F + c-CbHi6 reaction (see Figure 3). An estimate of the random experimental error in the relative populations was given in our earlier report.1 The use of both the overtone and fundamental spectra, the improvement in our simulation techniques (primarily the addition of a Calcomp plotter to the Computer Center), and a more systematic approach to the assignment of rotational populations reduced our random error (see Table II of ref 1) by approximately a factor of 2. The most uncertain portion of our assignment is the population of the high J levels of v = 1. The emission is intrinsically weak because of low populations and low Einstein coefficients and this is compounded by overlapping of the P lines and low sensitivity2 for the R lines.
F + c-CsH12 and c-C§Di2- The F + c-C6Hi2 reaction was used in previous work1 as a reference reaction. In the present study data from CgHi2 at somewhat lower pressure and with C-C6D12 were obtained.8 Since the vibrational-rotational spacings for DF are considerably smaller than those for HF, obviously a larger number of levels are populated and the spectrum contains more overlapped lines. The relative DF vibrational-rotational populations for v' = 2, 3, and 4 were based on analysis of the overtone spectrum and the relative population for v = 1 and 2 was obtained from the fundamental spectrum.
The exoergicity from F + C-C6D12 (40.2 kcal mol-1 ) is lower than that from F + C-C6H12 (41.4 kcal mol-1 ) because of zero point energy changes. These amounts of energy are sufficient to populate DF(J' = 6 of v' = 5 and HF(J' = 12 of v' = 3); however, DF emission from v' = 5
F igure 3. Relative rotational populations (v = 1, •; v = 2, ■; v = 3, ▲) from F + c-C8hl16. The d istribution for each vibrational level is normalized to unity. The top set of d istributions, which shows less rotational relaxation, was obtained at 1 X 10 -4 Torr with SF6 as the F atom source, and the lower one was recorded at 7 X 10 -4 Torr using CF4 as the F atom source. The steady- state distributions shown here at 10 -4 Torr are preferred over the F + C6H12 data of Figure 7, ref 1, as being representative of sec-C -H bonds under 1 X 10 - 4 Torr operating conditions.
was not detected. The highest observed DF level was J' - 12 of v' = 4 (35.9 kcal mol-1 ). The highest identified HF level in the fundamental spectrum was J' = 8 of v' = 3 (36.2 kcal mol-1 ), but the overtone spectra suggested a trace of emission from HF(u' = 4), which would require utilization of the thermal energy of the collision.
Figure 4 shows the relative vibrational populations for F + c-CgHi2 and F + c-CgD^ (scaled to fit the HF distribution at DF(u = 3) plotted on a continuous energy scale. Within the experimental error the DF vibrational distribution fits that for HF. The low DF(u = 1) relative population supports the assignment of a negligible population to the HF(u = 0) level. The DF(u = 2 and 3) levels pro-
The Journal of Physical Chemistry, Vol. 77, No. 21, 1973

2496 K. C. Kim and D. W. Setser
Figure 4. Relative vibrational populations from F 4- c-C6H12 (O) and F + c-C6D 12 ( • ) • The DF distribution was scaled to fit the HF distribution at v(DF) = 3. Also shown are the HF populations from F + CH3CD2CH3 (□ ) combined with the DF populations from F + CD3CH2CD3 (■ ) . The dotted vertica l lines ind icate the potential energy released by the reactions.
vide useful intermediate points between the widely spaced HF levels.
F + C-C7H14, c-C8tfi6, and c- C ioH 2o. The fundamental spectra13 from all of these reactions were nearly identical with that shown in Figure 1 for F + c-CgHi6 . The rotational distributions (1 X 10' 4 Torr) shown in Figure 3 were derived from this fundamental spectrum, and they should be taken as representative steady-state populations for these three reactions (and C6H1 2 ). According to Figure 3, the steady-state rotational distributions of v = 1 and 3 are less extended than v = 2. This might have been expected for v = 3 but not for v = 1. Considerable study was put into simulating the 2 - 1 and 1 - 0 emission bands but we could find no evidence to support higher populations of the observed rotational states or any indication of emission from higher J levels. The low population for v = 1, J = 4 is an artifact of absorption by water and is probably exaggerated. The populations (1 0 '4 Torr) of Figure 3 are used in the Discussion section to estimate initial rotational distributions.
The effect of increasing pressure from 6 X 10' 5 to ~10 ' 3 Torr on the rotational populations was tested using CF4 as the F atom source. Extensive rotational relaxation was found at ~10 ' 3 Torr, see Figure 3; however, the relative vibrational populations from the two sets of data shown in Figure 3 were the same. Two different types of nozzle geometry also were tested using c-CgHi6 as the reagent. Under our best experimental conditions (<10~ 4 Torr static background pressure) no consistent differences in the total intensity or in the extent of the rotational relaxation were observed between the concentric and crossed nozzle arrangements for the same F atom source. However, rotational relaxation was more extensive with CF4 than with SF6 . This is attributable to the higher background pressure corresponding to increased gas phase collisional deactivation by CF4, since it is not fully condensable at 77°K.
Simulation of the overtone spectrum of Figure 1 , using the rotational distribution of Figure 3, required the addition of a significant HF(u = 4) population. The feature of the spectrum responsible for this is apparent at ~6950 cm- 1 . Careful examination of high-intensity fundamental spectra showed the presence of weak emission peaks in the 4-3 transition region (3200-3600 cm '1) which confirm
F • CD3 — DF(V.J) * CD3
4 - 2 3 -1 2 - 0—i I I
W A V E N U M B E R CM.
Figure 5. F + CD4 overtone spectra at 5 X 1 0 '4 Torr. The solid and dashed lines indicate experim ental and sim ulated spectra, respectively. The simulated spectrum is displaced downward for c larity of presentation.
the presence of HF(u = 4). From the overtone data, J = 4 of v = 4 (43.4 kcal m ol'1) was estimated to be the highest level; the highest level from v = 3 was J = 10.
Experiments were done to vary the total emission intensity in order to test for the possibility that energy pooling, 2HF(u = 3) —► HF(u = 4) + HF(p = 2), might contribute to the observed emission from high v levels. However, no correlation of the 4-2 emission with total emission intensity was found.
The feature at 6590 cm' 1 in the overtone spectrum of Figure 1 remains unexplained. It was observed in some, but not all, of the F + c-CgHi6 experiments but was absent from the F + C-C7H14 or C-C10H20 spectra. It is not assignable, in a reasonable way, to emission from HF.
F + C D 3C H 2C D 3, C H 3C D 2C H 3, and CD4. For these compounds the available quantities of material permitted the scanning of only one or two overtone spectra. The results are thus less complete and less reliable. The main point of these experiments was to provide information to confirm trends expected from other results, and the data are of sufficient quality for this purpose. The spectrum and simulation from F + CD4 are shown in Figure 5 for reference.
The F + CD3CH2CD3 reaction was studied in order to compare results from cyclic and aliphatic s e c -C-H bonds. The bond energy, D°o(H-CH(CD3)2), is about 2 kcal higher than for cycloheptane and about 1 kcal less than for cyclohexane. Therefore, differences in HF populations arising from thermochemical effects should be minimal. The relative HF(l> = 3) population from CD3CH2CD3 ( N 3/ N 2 = 0.63) is considerably higher than that from cyclic alkanes, { N 3/ N 2 = 0.37), but there was no evidence for a significant i> = 4 population. Although information on the HF(u = 1) relative population is lacking, based upon the significantly higher v = 3 relative population, the fractional conversion into vibration energy is estimated to be higher than that for cyclic alkanes.
The HF results from F + CH3CD2CH3 and the DF results from F + CD3CH2CD3 provide another set of populations for a “typical” primary C-H bond. The combined results are plotted in Figure 4 with HF(u = 2) population set to 0.8 and DF(u = 3) scaled to fit the line connecting HF(e = 2) and HF(o = 3). If the HF(n = 1 ) population is estimated by extrapolation of Figure 4, % E V can be assigned as >57%. The very similar HF(i> = 2; v = 3) population ratio from the primary and secondary positions of CD3CH2CD3 and CH3CD2CH3 strongly suggests that % E V is less for the secondary position because E T is larger.
The Journal of Physical Chemistry, Vol. 77, No. 21, 1973

HF and DF Infrared Chemiluminescence 2497
Figure 6. The relative vibrational populations from F + CD4, • , and F + CH4 , 1 - 1 3 O. The DF d istribution was scaled to obtain an approximate m atch to the HF d istribution at the DF(v = 3) point. The vertica l dotted line indicates the available potential energy.
The F + CH4 data14 shown in Figure 6 were obtained at 4 X 10_ 4 Torr and are in agreement with our previous study.1 As with cyclohexane, the DF population distribution from CD4 matches the HF distribution from CH4. The highest DF rotational level from the spectral simulation of the F + CD4 overtone spectrum was J = 5 of v = 4 (35.3 kcal/mol). The v = 1, 2, 3 relative vibrational populations from F + C2H6 have been reported as 0.14:0.50:0.36; this distribution was confirmed for both conditions of Figure 3 in the present study. The variation in %EV and the N2/N3 ratio can be compared for CH4 (61%, 5.0), C2H6 (62%, 1.4), CH3CD2CH3 (>57%, 1.9), and C(CH3)4 (56%, 4.1). The abrupt change in N2/N3 for CH4 and C2H6 probably can be attributed to the difference in C-H bond energies.15
DiscussionComparison of Results from Primary and Secondary
C-H Bonds. The vibrational (HF) energy distributions from the F + c-Cg-Cio reactions are all similar and constitute a set of data for these secondary C-H bonds. One of the most prominent features is that the fractional conversion of the available energy to vibrational energy is ~50% as compared to 60% for most primary C-H bonds. The ring strain energies for C7-C 1C cyclic alkanes are sizeable, and the difference in strain energy between a molecule and its cyclic radical may be significant because a carbon atom undergoes a rearrangement from sp3 to sp2 configuration, which generally increases the strain. Since the duration of the abstraction reactions proceeding by the direct15 mechanism is of the order of 10“ 14 sec, the radical fragments do not have sufficient time to rearrange to their equilibrium configurations and this radical distortion energy is not freely available to the HF+ fragment (t indicates an HF fragment as it initially is born, subsequent interactions15 with the R group may modify this initial energy distribution before it becomes an HF product). Cyclohexane, in its most stable conformation, is nearly strain free while the ring strain energies for C7-C 10 cyclic alkanes are 4-10 kcal relative to cyclohexane. Therefore, the change in ring strain energy from the molecular configuration to the cyclic radical configuration should be larger for c-CeHi2 than for the rest of the cy- clanes. This may explain the energy defect observed for c-C6Hi2 (and C6Di 2).
The distribution from F + CD3CH2CD3 provides results from a noncyclic secondary C-H bond for reference. Additional data would be desirable; however, the overtone
spectrum indicated that iV3/N 2 was considerably higher than that from the cyclic alkanes, which suggests that the change in ring strain energy contributes to the distortion energy of the cyclic radicals, which affects the energy released to the HF product.
The HF vibrational distribution pattern from the primary and secondary bonds in propane were virtually identical, in spite of the availability of 4 kcal mol“ 1 more energy for abstraction from the secondary position. Thus, a smaller fraction of energy was partitioned to HF vibrational energy from secondary C-H bonds than from primary C-H bonds. This conclusion from an intramolecular comparison agrees with conclusions from intermolecular comparisons. This reduced %EV is somewhat surprising since the saddle point might be expected to occur at somewhat greater H-F distances for secondary C-H bonds. According to a three-body simulation15 of the F + HR reactions, moving the thermochemical limit from 2 kcal in excess of the v = 3 limit to 7 kcal mol“ 1 in excess greatly enhanced the relative HF(u = 3) yield. Further calculations are needed to check for the effect of advancing the thermochemical limit from 7 kcal mol“ 1 in excess up to the v = 4 limit (10 kcal mol-1 in excess). If the trend can be extrapolated, then an explanation of the reduction in %EV is required. The simplest point of view is that the additional energy is not available to the HF on the time scale of the reaction. Stated in another way, the radical distortion energy (which we assume to be released late in the reaction) is larger for isopropyl than for n-pro- pyl radicals. According to this view, the difference in secondary and primary C-H bond energies16 is largely the difference in the radical distortion energies.
Except for cyclohexane, the highest observed HF vibrational-rotational level does closely correspond to that permitted by the available energy. This total energy release to HF for a small fraction of the events is not too surprising considering the complexity of some trajectories for transfer of H from R to F, even for the three-body approximation.15 Although emission from HF(u = 3) corresponded closely with the thermochemical limit, no HF(u = 4) emission was observed from the F + CD3CH2CD3 reaction even though there is just enough energy. In contrast, the excess potential energy for (u = 4) from F + CD4 is ~0.5 kcal mol-1 ; it is even less for HF(u = 3) from F + CH4, but emission is observed from both of these levels. Evidently abstraction from primary C-H bonds tends to favor higher HF vibrational levels than does abstraction from secondary C-H bonds. Formation of u = 4 from C7, Cg, and C10 but not from CD3CH2CD3 may be a consequence of the slightly higher bond energy for the latter.
Estimation of Rotational Energy Partitioning. Rotational relaxation was not fully arrested in these experiments, but there are indications of a secondary maxima in the distribution around J = 5-8 in Figure 3. If one assumes that the original distributions peak at intermediate J and assigns the contour of high J levels as the remnant of the unrelaxed population, then an estimate of the original populations can be made with the aid of simulated steady-state populations according to a preassigned relaxation model.2 17 The model that was used for the down transitions was of the form P, . j = Ngj exp [-(£ , - Ej)/ RT] with T = 200° and N = 0.3. The details of the model are not particularly important, as long as the basic forms of the transition probabilities are not changed; i.e., if the total inelastic cross section is reduced, then a larger Z is required to fit the same degree of relaxation. For these
The Journal of Physical Chemistry, Vol. 77, No. 21, 1973

2498 K. C. Kim and D. W. Setser
Figure 7. Comparison of experimental low pressure HF(v = 2) data of Figure 4 and computed (---- ) steady-state rotational distributions, which were obtained from the original (—) distribution and the mean number of collisions, Z, for the rotational relaxation model specified in the text. The average energy of the initial distribution was 1256 cm-1.
calculations an equilibrium distribution of collision timeg was used; hence, the designation of Z for the average number of collisions before observation.
The agreement between the simulated (for Z ~ 15) and experimental population for v = 2 is reasonable as shown in Figure 7. The initial population is not, however, unique. For example, an initial distribution shifted upward by one J unit and broadened ((E) = 1540 cm-1 as contrasted to 1256 cm -1 in Figure 7) gave only a slightly less satisfactory fit for Z = 25. If the assumption regarding a “ symmetric” form for the original population is valid, the estimated distribution of Figure 7 should be a reasonable one. Applying the same model and the same Z to the v = 1 and 3 levels, gives distributions of the same general form as that of Figure 7, but with average energies of 1032 and 920 cm "1, respectively. For these distributions the fraction of energy released to rotation is 7% for the CgHi6 thermochemistry. Based upon other symmetric type distributions which are compatible with the data, the range for %Er probably extends from 6 to 9%. According to this analysis there is no inverse correlation of EH with v. This appears to be a general feature of F + hydrocarbon reactions and is quite different from the Cl + HI or F + HC1 reactions,53’18 which have similar dynamical features. Although this is the most obvious interpretation of the data, some reservation should be maintained because, as already explained, the high J transitions of u = 1 are difficult to observe with our detection system. On the other hand, the steady-state rotational population, obtained in our apparatus from F + HC1, which is known18 to favor high J levels, differs significantly from that of Figure 3. This strongly suggests that our estimates for the hydrocarbon reactions are, at least, qualitatively valid.
ConclusionsFor the reactions of F atoms with C6-C 10 cyclic alkanes,
49% of the energy is partitioned as vibrational energy and ~7% as rotational energy of the HF product. From a less
detailed study of CD3CH2CD3, the fraction of HF vibrational energy appeared to be somewhat larger than for the cyclic alkanes, although still lower than for reaction with primary C-H bonds. The reduced fraction of energy released to HF from the secondary C-H bonds relative to primary bonds suggests that all of the energy is not accessible to the HFf on the time scale for separation of HF from the R fragment. One explanation is that the radical distortion energy (which is released late in the course of the reaction) may be larger for secondary radicals (isopropyl) than for primary radicals («-propyl). Our data do not permit a distinction to be made between the normal view (n-alkylation leads to a stabilization of the free radical center) and a more recent suggestion16 (greater strain in the molecule state with increasing alkylation) as to the origin of the difference of bond energies in primary and secondary CH bonds, because energy release from either effect would occur slower than the time for the initial15 transfer of H to the attacking F atom. Better data, especially of the rotational distributions, and a greater understanding of how secondary and complex encounters15 between the HFf and R fragment may influence the hydrogen fluoride vibrational and rotational distributions are needed before simple interpretations are accepted with any degree of confidence. Nevertheless, the HF energy partitioning patterns are not only of interest in themselves but may provide insight concerning the origin of energy differences in molecules and radicals.
Acknowledgments. We thank Dr. Denis Bogan for permission to show the F + C8Hi6 data, which were obtained with CF4 as the atom source, and to quote his results from the F + C2H6 reaction. This work was supported by the National Science Foundation (NSF-27536X).
References and Notes
( 1 ) H. W . C h a n g a n d D . W . S e t s e r , J. Chem. Phys.. 5 8 , 2 2 9 8 ( 1 9 7 3 ) .(2 ) W . H. D u e w e r a n d D . W . S e t s e r , J. Chem. Phys., 5 8 , 2 3 1 0 ( 1 9 7 3 ) .(3 ) ( a ) J . D . C o s , Tetrahedron, 1 9 , 1 1 7 5 ( 1 9 6 3 ) ; (b ) K . B . W i b e r g , J.
Amer. Chem. Soc., 87, 1 0 7 0 ( 1 9 6 5 ) ; ( c ) K . C . F e r g u s o n a n d E. W h i t t l e , Trans. Faraday Soc., 6 7 , 2 6 2 0 ( 1 9 7 1 ) .
(4) ( a ) J . C . P o l a n y i a n d K. B . W o o d a l l , J. Chem. Phys., 5 7 , 1 5 7 4 ( 1 9 7 2 ) ; (b ) J . C . P o l a n y i a n d D . C . T a r d y , ibid., 5 1 , 5 7 1 7 ( 1 9 6 9 ) .
( 5 ) ( a ) K . G . A n l a u f , D . S . H o r n e , R . G . M c D o n a l d , J . C . P o l a n y i , a n d K . B. W o o d a l l , J. Chem. Phys., 5 7 , 1 5 4 7 ( 1 9 7 2 ) ; (b) D. H. M a y -
l o t t e , J . C. P o l a n y i , a n d K . B. W o o d a l l , ibid., 5 7 , 1 5 6 1 ( 1 9 7 2 ) .(6 ) ( a ) H. S . H e a p s a n d G . H e r z b e r g , Z. Phys., 1 3 3 , 4 8 ( 1 9 5 2 ) ; (b ) R.
C . H e r m a n a n d R . F. W a l l i s , J. Chem. Phys., 2 3 , 6 3 7 ( 1 9 5 5 ) .( 7 ) ( a ) D . E. M a n n , B. A . T h r u s h , D . R. L i d e , J r . , J . J . B a l l , a n d N . A c -
q u i s t a , J. Chem. Phys., 3 4 , 4 2 0 ( 1 9 6 1 ) ; (b ) R. N . S p a n b a u e r a n d K . N a r a h a r i R a o , J. Mol. Spectrosc.. 1 6 , 1 0 0 ( 1 9 6 5 ) .
(8 ) T h e v a l u e s o f t h e H F t r a n s i t i o n p r o b a b i l i t i e s u s e d f o r a n a l y s i s o f t h e d a t a a r e A 01 = 1 8 3 , A,2. = 3 3 0 , A 23 = 4 4 5 , A34 = 5 3 6 a n d A 02 = 2 2 . 8 , A , 3 = 6 2 . 9 , A 24 = 1 1 6 . 1 s e c - 1 . F o r D F t h e v a l u e s a r e A 0 1 = 7 2 . 6 , A t2 = 1 3 4 , A 23 = 1 8 7 , A 3 4 = 2 3 2 a n d A 02 = 9 . 1 , A , 3 =
2 5 . 6 , A 24 = 4 8 . 7 , A 35 = 7 6 . 9 s e c - 1 . T h e d a t a o f R. L. S p e l l i c y , R.E. M e r e d i t h a n d F . G . S m i t h , J. Chem. Phys., 5 7 , 5 1 1 9 ( 1 9 7 2 ) ,
w e r e u s e d t o s c a l e t h e r e l a t i v e v a l u e s t o a b s o l u t e q u a n t i t i e s .(9 ) W . A . C h u p k a a n d J . B e r k o w i t z , J. Chem. Phys., 5 4 , 5 1 2 6 ( 1 9 7 1 ).
( 1 0 ) J . W a r n a t z , H. G . W a g n e r , a n d C . Z e t s c h , Ber. Bungenges. Phys. Chem., 7 4 , 5 8 5 ( 1 9 7 0 ) ; 7 5 , 1 1 9 ( 1 9 7 1 ) .
( 1 1 ) ( a ) R. F o o n a n d G . P. R e i d , Trans. Faraday Soc., 6 7 , 3 5 1 5 ( 1 9 7 1 ) ; (b ) R. F . W a l k e r a n d M . A . A . C l y n e , p r i v a t e c o m m u n i c a t i o n , 1 9 7 2 .
( 1 2 ) J . A . K e r r , Chem. Rev., 6 6 , 4 6 5 ( 1 9 6 6 ) .( 1 3 ) B . d e B . D a r w e n t , “ B o n d D i s s o c i a t i o n E n e r g i e s in S i m p l e M o l e
c u l e s , ” N S R D S - N B S - 3 1 , U . S . G o v e r n m e n t P r i n t i n g O f f i c e , W a s h i n g t o n , D . C . , 1 9 7 0 .
( 1 4 ) K . C . K i m , P h . D . T h e s i s , K a n s a s S t a t e U n i v e r s i t y , 1 9 7 3 .( 1 5 ) R. L. J o h n s o n , K. C . K i m , a n d D . W . S e t s e r , J. Phys. Chem., 7 7 ,
2 4 9 9 ( 1 9 7 3 ) .
( 1 6 ) C . R u c h a r t , Angew. Chem., Int. Ed. Engl., 9 , 3 8 0 ( 1 9 7 0 ) .
( 1 7 ) J . C . P o l a n y i a n d K . B . W o o d a l l , J. Chem. Phys., 5 6 , 1 5 6 3 ( 1 9 7 2 ) .( 1 8 ) A . M . G . D i n g , L. J . K i r s c h , D . S . P e r r y , J . C . P o l a n y i , a n d J . L.
S c h r e i b e r , Discuss. Faraday Soc., in p r e s s .
The Journal of Physical Chemistry, Vol. 17, No. 21, 1973

Tra jectory Studies of Abstraction Reactions 2499
Trajectory Studies of Abstraction Reactions. Fluorine Atoms with Substituted Methanes and Deuterium Atoms with Chloroiodide
R. L. Johnson, K. C. Kim, and D. W. Setser*
Department of Chemistry, Kansas State University, Manhattan, Kansas 66506 (Received April 24, 1973)
Classical three-body trajectory calculations with LEPS potential surfaces have been done for F + HR —>- FH + R type reactions. The mass and other properties of the R body were adjusted to closely simulate the reaction with CH4 and CH3Br (or CH2CI2). The objective was to provide computed results, within the three-body approximation, which could be compared to experimental energy partitioning patterns for these two reactions and fcr reactions with CH3F, CH3OD, CH3CI, CH3I, and CH3HgCH3. The general pattern, i.e., release of ~60% of the energy as vibrational energy of HF, is reproduced by the LEPS surface. The computed results show only a small mass effect which appears as a slight broadening of the vibrational distribution. The calculations suggest that the HF(u = 3) population is qiiite sensitive to the thermochemistry, if the thermochemical limit is close to the HF(u = 3) energy. A significant fraction of the trajectories show complex (indirect) trajectories and also delayed secondary encounters. This feature is emphasized by the central light atom and suggests that care should be exercised in using the three- body approximation for hydrogen atom abstraction reactions. In the course of development of the trajectory computer program, calculations were done for the D + C1I reaction with an LEPS surface. Good agreement is found with experimental data for the DI channel, but the potential surface for the DC1 channel needs improvement.
I. Introduction
Reactions of fluorine atoms with hydrogen-containing molecules are fast and exothermic; consequently, the HF and other products may be produced with nonequilibrium energy state distributions. These distributions, being a clue to the fundamental dynamics, are being studied by infrared emission spectroscopy,1-5 laser techniques,6’7 and molecular beam experiments.8-9 The present classical trajectory computations are concerned with providing a reference point for F + HR —* HF + R type reactions within a three-body approximation and a London-Eyring -Po- lanyi-Sato (LEPS) surface. The impetus was to correlate our experimental data1-3 with the dominant features of the potential function. Classical trajectory calculations10 for F + H2 with a LEPS potential encompass most of the features of this reaction. The reactions of interest here, however, are not strictly of the A + BC type because six atoms are involved. Nevertheless, we have used the simple A + BC model, which emphasizes the F-H and H-R interactions, in an attempt to isolate the major features such as mass effects, changes of thermochemistry, and general energy partitioning pattern for the F + H-C —* FH + C reaction in which the mass of the carbon atom is adjusted to fit the total mass of CH3 and CH2Br (or CHC12). Four LEPS surfaces were investigated with a total of 2609 trajectories. No consideration was given to the spin multiplet (2Pi /2, 2P3/2) problem10d'e of fluorine atoms.
The D + C1I reaction was simulated during the course of the development of the computer program because the execution time for the trajectory of the lighter atom was shorter than for the F atom reactions. In addition we were interested in more fundamental points such as (i) having a different type of mass combination as a reference point and (ii) checking whether the measured11 translational and angular distributions could be reproduced by a LEPS surface with low directionality. These computed results
are only briefly described since our main interest is with the F + H-R systems.
The HF infrared chemiluminescence experiments have been described1-3 and only the results for F + CH4, CH3F, CH3CI, CH3Br, CH3I, and CH3HgCH3 will be given here. Our best efforts for CH-dCD-i) are reported in the preceding paper.33 The complete data for CH3OD will be reported later.3c The vibrational-rotational populations reported here for CH3C1 and CH3Br are derived from new data12 obtained at somewhat lower pressures than the previously reported results;23 however, the relative vibrational populations are the same as reported earlier.2 We have argued that for most reagents vibrational relaxation has been arrested, but that rotational relaxation is only partially arrested.
The original HF product vibrational populations are summarized in Table I and an example of the steady state rotational distribution in shown in Figure 1. Although the %Ev is virtually constant, except for CH3HgCH3, the shapes of the distributions do change, especially the N2/N3 ratio. The steady-state rotational populations for all these reagents are similar to that of Figure 1, except for CH3OD,3c which has larger populations in the higher levels for all three vibrational states. There is evidence for a residue of the original rotational distribution in Figure1. If the original HF product distribution is assumed to be “ symmetric,” the data can be interpreted in the same way as the CgHi6 data were treated in the preceding paper33 and very similar “ initial” rotational populations could be obtained. At the present time we cannot discount the possibility of a significant formation rate into low J levels; however, it appears that < 10% of the energy is partitioning as rotational energy of HF. Another result, which is not quantitatively established but appears correct, is the lack of an inverse correlation of rotational excitation with diminishing vibrational level.
Although the F + CH2C12 and CHC13 reactions have been studied,23 the data appear to be affected by secon-
The Journal of Physical Chemistry, Voi 77, No. 21, 1973

2500 R. L. Johnson, K. C. Kim, and D. W. Setser
TABLE I: Relative HF Vibrational Populations
ReagentD°0 (H-R) ,c ' kcal mol- 1
Initial population“ (Ev).kcal
mol- 1 %Evbv = 1 v = 2 v = 3
c h 4 102.5d 0.22 0.65 0.13 21.1 62c h 3f 101.3d 0.17 0.61 0.21 22.2 64c h 3ci 99.4d 0.25 0.39 0.39 24.1 65CH3Br 100.5d 0.23 0.42 0.35 23.3 65CH3I 102.1d 0.26 0.46 0.29 22.5 66CH3OD 9 7 .0e 0.27 0.43 0.31 22.6 58(CFRRFIg 100.5t 0.41 0.45 0.11 18.2 51
“ Corrected for radiative decay using a 0 .2 -msec residence time; for our earlier work 0.3 msec was used. 6 Calculated from 0 WiD/Fa X 1 0 0 and assuming that the relative population of v = 0 is negligible. £a was calculated from D°o(F-H) - D°o(H-R) + fro- The threshold energy was taken as 1.1 kcal mol- 1 for CH4 and 0.8 kcal mol- 1 for the other reagents. c The highest observed rotational level from H F (v = 3) correlated closely with the available energy, Ea. In particular, emission was found from higher J levels for CH5Br and CH3CI than for CH3I and CH3 F, which supports the claim that the bond energies for C H 3I and CH3 F are higher than for CH3Br or CH3CI. However, from the highest observed J levels, D(H-CH2 l) ~ D ( H - C H jF ) rather than being 2 kcal mol- ' higher. In order to make more firm distinctions about the bond energies from the highest observed level, more care would have to be made in regard to regulating the temperature of the reagents and discharged SF6 and in identification of a cutoff, rather than a gradual decline, in the populations of the high rotational levels of HF(v = 3), d S. Furuyama, D. M. Golden, and S. W. Benson, J. A m e r . C h e m . S o c . . 91 7564 (1969). e (i) F. R. Cruickshank and S. W. Benson, J. P h y s . C h e m - . 7 3 , 733 (1969). (II) Z. B. Afassi and D. M. Golden, ibid., 7 6 , 3314 (1972). ' Calculated from £ 0 = 0.8 kcal mol-1 , D°(HF) = 135.4 kcal mol- 1 and the highest observed rotational level of HF (v = 3).
dary reactions or other complications, and these results will not be included in the present discussion. Reactions which compete with H abstraction are not expected for C H 4, CH3F, or CH 3C l;9a however, Br, I,9b and D abstraction probably are important for C H 3Br, CH3I, and CH3OD. A displacement reaction with C H 3H gCH 3 probably can not be ruled out.
II. Computation MethodsA. Equation of Motion. Of the various three-dimension
al models1 3 1 4 used for three-particle systems, our model is most like the one described by Karplus, Porter, and Sharma. 13 Of the nine coordinates, only the six which describe relative motion are of interest. Three of these, Qi, Q2, and Q3, were used to locate atom A from the center of mass (cm) of BC, and the remaining three, Q4, Q5 , and ( ? 6, were used to locate atom B with respect to C. The resulting classical Hamiltonian (eq 1 ) is easily understood in terms of the kinetic energy of A and BC, the kinetic energy of B and C, and the potential energy of the system.
H = (2 M A_BCr l( P f + P21 2 + P32) +
(2M b_c r '(P 42 + P52 + P62) + V(Q b...,Qe) (1)
M A-BC
Mu
m„(mh + mc)
m„ + mb + mc mbmc
mh + 171 uIntegration of the equations of motion (eq 2 and 3) was
done with a modified Hamming’s fourth order predictor- corrector algorithm. 1 5 To debug the computer program and to ensure that the time interval for integration was small enough, the constancy of the Hamiltonian and the total cm angular momentum were checked in every trajectory. Also, for selected trajectories integration was done both in the forward and backward directions to make sure
Figure 1. The experimental steady state rotational distributions from F + CH3I forv = 1 (•), v = 2 (■ ), and v = 3 (A).
that the initial conditions would be regenerated from the final values of the coordinates and momenta.
dP,d t
ÒH ____ y^òV à rjÒQ, ¿-lò rJ ÒQ,
(2)
(3)dQ, d H dt ~ dp,
B. Potential Functions. The basic LEPS potential form, 16 eq 4-6, was used with c4 = C2 = c3
Q) 1 Q2 1 Qiv +1 + Cj 1 + c2
+ 1 + e.a2J a32
.d + Cl)2 a + cja fi.2
2 ( 1 + c3)2
(1 + cx)(l + c2) (1 + c2)(l + c3)
(1 + C3X1 ]11
(4)Qi + a .
1 + c,
£>,iexp[-2|0,(r,Qi ~ a, =
1 — c,
y |exp[ - 2 ß,(r,
r,°)] — 2 exp[—/?,(r, - r,°)]| (5)
r,°)] + 2 exp[—6,(r: - r,°)]i (6 )
The spectroscopic data for the HF, C1I, DC1, and DI system are readily available. 1 7 Our selection for D(H-F) is in agreement with the most recent determination. 18 For the pseudodiatomic molecules, H-Ri5 and F-R15, the data were estimated from the bond energies, bond distances, and frequencies of CH4 and CH3F. In the scheme for generating the spectroscopic parameters, first the value of D e for H-Rlg was set at 110 kcal/mol in accordance with the H-CH3 bond energy at 0°K and the zero point energies of CH4 and CH3. The value of D e for F-R15 was set at 90 kcal/mol. This value, which is several kcal/mol lower than D(F-C), was chosen to block the channel for the F-Ria product. If this was not done, the kinematics for the H + LH combination favor the H -H product rather than the desired H -L product. 1 6 The coe and weXe values were then adjusted to fit the c(H-CH3) = 3000 cm- 1 and u(F-CH3) = 1100 cm- 1 stretching frequencies. 1 9 The r° values of H-R and F-R were set equal to the H-CH3 and F-CH3 bond lengths of 1.09 and 1.39 A. These values also were used to calculate the rotational constants for the v = 0
levels. The Morse parameter, fi, for H-R15 and F-Rls was calculated using the standard expression. 1 9 Surfaces 1 and2 differ only in the choice of c in eq 4. For 3 D(H-R) was lowered by 5 kcal mol- 1 but the /3 values of 1 and 2 were
The Journal of Physical Chemistry, Voi. 17. No. 21, 1973

Tra jectory Studies of Abstraction Reactions 2501
TABLE II: S p ectro scop ic and LEPS Param eters
Surface I nteraction
De.kcal/mol 0 , A -1 Re,a A c
X i T1 141 2.2123 0.9168 0.155
1 H-R 110 1.8801 1.09 0.155F-R 90 2.2259 1.39 0.155H-F 141 2.2123 0.9168 0.18
2 H-R 110 1.8801 1.09 0.18F-R 90 2.2259 1.39 0.18
Ll_IX
141 2.2123 0.9168 0.183
ccIX
105 1.8801 1.09 0.18F-R 90 2.2259 1.39 0.18H-F 141 2.2123 0.9168 0.18
4 H-R 110 1.9302 1.09 0.18F-R 90 3.0231 1.39 0.18D-CI 106.5 1.8617 1.27462 0.173
5 Cl-I 50.15 1.8513 2.3207 0.173D-l 73.89 1.7437 1.6091 0.173
Interaction <j)e, cm 1 ueXe, c m -1 Be, cm- 1 ae, cm~1
X I Tl 4138.33 89.652 20.9548 0.7939
H — R15 3127.1 63.542 15.369 0.4683h - r 83 3127.1 63.542 14.582 0.4437F -R ,5 1119.9 9.961 1.047* 0.0122*f - r83 1119.9 9.961 0.5671* 0.0055*D-CI 2144.77 26.92 5.44839 0.11226Cl-I 384.293 1.501 0.114146 0.000536D-l 1640.14 20.16 3.2840 0.06142
0 The r° in eq 5 and 6 is the same as the Re of this table. * These Be and af values were obtained by solving simultaneously the relationship So = Be - ctp/2 and the relationship among ae, Be, we and u>eXe as given in ref 19. For the Rb3 case, the rotational constants were altered to account for the increase in mass over the ft15 species.
retained. The ¡3 values for 4 were adjusted to fit R^; everything else was the same as for surface 2.
The F + HR surfaces decrease in repulsive character in the order they are numbered. The general nature of these surfaces in the collinear configuration is shown in Figure 2 for surface 4 and the parameters describing the saddle points of the collinear geometry are summarized in TableII. As the surfaces become less “ repulsive,” the saddle point moves to larger Ri* values; tne barrier energy, Vc*, decreases; and the directionality of surfaces decreases, as is evidenced by the decrease in the bending force constants / 3 3 and / 4 4 . 2 0 The calculated absolute rate theory activation energies, Ea, are in the proper range for this series of reactions.21 (See Table III.)
Three methods (see Table IV) were used to classify the surfaces according to “ attractive,” “ mixed,” and “ repulsive” categories.10’15’20 Method a is the primitive rectli- near method. Method b, which utilizes the minimum energy path, provides a measure of the mixed energy release, which is very important for the F + HR mass combination. Although (a) and (b) are based upon collinear geometry, method c used the actual three-dimensional trajectories. The %(A + M)zt was calculated by 100AV/ (De-i — De2) where AV is the change in the potential energy from (R\ — i?2 = R20) to the point at which R1first reaches Ri°; %Rzt was taken as 100 - %(A + M )3t- The values vary from one trajectory to another, and an average over 5-10 trajectories was taken for Table IV. Since the trajectories are begun with zero point energy, the R2 coordinate and, hence, the potential energy is not
0.51---------- ---------------1------------ 1------------ ._______ _i_0.5 1.0 '.5 2.0 2.5 3.0
R: = rH-F. AFigure 2. Contour plot of the potential energy for collinear geometry on surface 4. The dotted lines show the rectlinear method for assigning “ attractive” and “ repulsive” character. The location of the barrier (0.06 kcal mol-1 ) is indicated by the J.
constant even at R1 = <*>. For obtaining %(A + M)zt the initial potential energy was taken as the minimum value associated with the zero point energy of oscillation. The values for %(A + M)zt on surfaces 1-4 were consistently greater than the corresponding values from the minimum path method. This difference arises because (c) includes the mass effect on the mixed energy release. However, for both (b) and (c) the %(A + M) does slowly increase in the series 1-4.
C. Initial and Final Conditions. The manner in which initial values were assigned to Qi, Q2, Q3, Pi, P2, and P3 parallels that of Karplus, Porter, and Sharma, except that p, the initial distance of A from the cm of BC, was constant, and averaging over the phase angles of BC was done in a different way. The impact parameter, b, was selected in two ways. In the calculations for the total cross section, it was selected randomly in even intervals up to the maximum value that gave reaction, bmax; but in the calculations for energy distributions the random selection was weighted by b which means that b = bmax(RN) 112. In all instances RN denotes a random number from 0 to 1. Limited resources required the use of a fixed relative velocity; see footnote 1 of Table V. The initial values of Q4, Q5, Q6, P4, P5, and P6 were first selected with BC aligned along the z axis. In this orientation the only nonzero coordinate is Qq which has the value of r2- The value for r2 can be obtained by assigning values to the vibrational and rotational quantum numbers, u and J, and the phase of the BC Morse oscillator. For these calculations v was set at zero, but J was selected by (RN) = exp[— J(J + l)B L,/kT]. The procedure that was used to incorporate the phase angle is given by r2 = rm + ra sin A, where rm is the midpoint between the maximum and minimum CTP’s of the appropriate Morse oscillator, ra is the amplitude from the midpoint, and A, the phase angle, is given by 2tr(RN). Initial values for the momenta in this preliminary orientation can be generated by the selection of one more condition besides v, J, and A. This condition was taken as the angle between the x axis and the component of linear momentum perpendicular to the BC molecular axis (z axis). This angle was selected in a manner analogous to that for the phase angle. The remaining two initial conditions were used to randomize the orientation of BC by rotation
The Journal of Physical Chemistry, Vol. IT, No. 21, 1973

2502 R. L. Johnson, K. C. Kim, and D. W, Setser
TABLE I I I : Su rface P rope rties fo r L inear “ A c tiva ted C om p lex ” C on figu ra tion0
Surface 1 Surface 2 Surface 3 Surface 4 Surface 5
F - H - R ,5
ccIXILiceIXILL F - H - R ,5 f- h- r83 F - H - R ,5 F - H - R 83 D-CI-I D-I-CI
f t , 6 * 1.657 1.931 2.024 2.411 3.456 3.607f i 26 * 1.102 1.093 1.092 1.090 2.321 2.321Vcb* 0.935 0.206 0.163 0.055 0.028 0.033
tu* -0 .06 6 -0 .014 -0.011 -0.0028 -0 .00094 -0 .00102f22* 4.83 5.16 4.96 5.56 2.34 2.34
f l 2 * 0.275 0.068 0.47 0.0058 0.0011 0.0016f33*> ^44 0.0168 0.0052 0.0037 0.00021 0.00007 0.00003¡ / , * 135i 55i 41 i 48 i 36i 23i 18i 28i 30iv 2 * 2776 3016 2935 2968 2889 3168 3085 380 380V 3 * . V i * 260 137 136 114 113 30 30 30 30E o c 1.22 0.48 0.36 0.30 0.18 0.24 0.13 0.11 0.11F d 1.52 1.02 0.91 0.89 0.79 1.05 0.93 0.91 0.92
a Internuclear distances are in A; energies in kcal/mol; force constants in mdyn/A and mdyn-A/rad2; and frequencies in cm "'. b ft, is the F-H coordinate, ft2 is the H-R coordinate, and the asterisk denotes the values of the coordinates and other properties at the saddle points. c The threshold energy, which is Vc* plus zero point energy difference. d The absolute rate theory activation energy.
TABLE IV : C lass ifica tion o f Surfaces
a b c%
Sur- (A +System face %Aj_ % ft^ %Am % M m %Rm M)3t %R3t
( 1 ) F + HR,5 1 5 95 31 21 48 74 26HF + R,s 2 16 84 42 16 42 82 18
3 21 79 45 14 41 86 144 35 65 61 6 33 90 10
(2) F + HR83 — 2 16 84 42 16 42 84 16HF + R83 3 21 79 45 14 41 89 11
4 35 65 61 6 33 91 9(3) D + Cll —
DCI + I 5 69 31 70 9 21 68 32(4) o + o T
Dl + Cl 5 59 41 55 21 24 49 51
0 Rectilinear method in which %Ax = 100Em/AD where Em is themaximum decrease in potential energy along the entry line R2 — R2° and AD = D i — D2; %R±- = 100 - %A_l. 6 Minimum path method in which %A.n = 100£2/AD where E2 is the decrease in potential energy along the minimum path from ft, ~ a, to the classical turning point (CTP) of ft2; %Mm = E21/AD where £ 2 1 is the energy decrease from the CTP of fl2 to the CTP of R,; %Rm = 100 - Am - %Mm; the CTP’s for HR, HF, CM , DCI, and Dl were taken as 1.21, 1.01, 2.38, 1.36, and 1.70 A, respectively. c Estimated from three dimension trajectories (explained in text). The variation in %(A + Arf)3t was small (< ±3% ) for the F + HR trajectories for a given surface; however, for D + Cll the deviation from the mean was large and values as high as 63% and as low as 22% were found for the Dl channel.
of 8 about the y axis and <p about the 2 axis.22 The angles 8 and <f> were chosen by cos 8 = 2(RN) - 1 and 4> = 2w(RN).
Resolving the final results into the desired energy quantities was accomplished by first separating out the relative translational energy. The remaining energy was partitioned between the rotation and vibration of the diatomic molecule by first calculating the J which corresponds to the classical angular momentum of the diatomic molecule and then iterating on u until the quantum vibrational and rotational energy expression equaled the classical Hamiltonian.
III. Calculated ResultsA. F + HR. Since our main objective was to obtain re
sults which could be compared with the experimental
ENERGY IN KCAL / MOLE
Figure 3. Energy partitioning pattern from F + H R 1 5 on surface 2. Note that the size of the interval changes from 1 kca l/m o l-1 for the translational distribution to 2 kca l/m o l-1 for the vibrational distribution. The bar graph is for the total vibrational energy, including the zero point energy of HF. The heavy dotted lines result from reducing (see text) the vibrational distribution to the quantized vibrational levels (v = 0, 1, 2, 3). This graph summarizes the results of 32 reactive trajectories from 300 attempts.
energy partitioning data, only enough reactive trajectories were collected to represent the energy pattern. Except for surface 4, the statistics were not sufficient for correlation of one calculated result with another. The calculated results are summarized in Figures 3-6 and in TableV. The least amount of effort was done with surface 1 because the reaction probability was low. Even for an initial relative velocity corresponding to 5.0 kcal mol-1 , the small number of reactions (14 out of 270 attempts) on surface 1 may make the results of Table V subject to statistical uncertainty.
All surfaces released a very high fraction, ~90%, of the available energy to Ev + Er, as a consequence of the low directionality and high degree of mixed energy release. A very noticeable aspect is the constancy of the fraction of available energy appearing as HF vibrational energy from F + HR15. Figures 3-5 do show that the distributions change more than is suggested by the %Ev and, in fact, N3/N2 is fairly sensitive to the potential surface. In par-
The Journal of Physical Chemistry, Voi. IT, No. 21, 1972

Trajectory Studies of Abstraction Reactions 2503
TABLE V: Average Energies (kca l/m ol) and Average CM Scattering Angles (degs)
System Surface0 Fc avail Et (%Et) Ev (%Ev) Er (°/oEr ) m
F + HR15 —>■ 1 41.3 4.9 (12) 29.7 (72) 6.7 (16) 125HF + R 15 2 38.8 3.2 ( 8) 30.3 (78) 5.3 (14) 79
3 43.7 3.9 ( 9) 33.3 (76) 6.5 (15) 814 38.7 4.9 (13) 27.4 (71) 6.4 (16) 69
F + HR83 —» 2 38.6 4.5 (12) 26.1 (68) 8.0 (20) 85HF + R83 3 43.9 3.8 ( 9) 34.4 (78) 5.7 (13) 72
D + CM —*■4 38.8 4.7 (12) 26.1 (67) 8.0 (21) 69
DCI + ID + Cll - *
5 67.4 15.1 (23) 37.9 (56) 14.4 (21) 99
Dl + Cl 5 34.8 12.2 (35) 10.1 (29) 12.5 (36) 98
a The number of reactive trajectories is specified ir the Figures 3-6 and 10, except for surface 1 (14/270) and HR8 3 on surfaces 2 ( 2 1 /360) and 3(27/ 439). b The available energy (kcal/mol), is the initial energy (E> + Ev + Er ) + Del - De_2, ET was fixed at 2.5 kcal for surfaces 2, 3, arid 4, and ET was fixed at 5.0 kcal for surface 1. E r varied between 0.7 and 0.9 kcal and Ev was 4.4 kcai, which is in the H-R zero point energy, for calculations on surfaces 1. 2, 3 and 4. E t was set at 9.9 kcal; E r was 0.6 kcal, and Ev was 0.5 kcal for surface 5. c The CM scattering angle is defined relative to the extension of the relative velocity vector of the atom; i.e.. 0° is forward scattering of HF. These average angles are not weighted by a (sin 9) _ 1 factor. d The reaction cross sections were 8.0 and 7.2 A2 for the DCI and Dl channels, respectively.
ENERGY IN KCAL MOLE
FRACTION OF AVAILABLE ENERGY
Figure 4. Energy partitioning pattern from F + HR15 on surface 3. This graph represents the results of 31 reactive tra jecto ries from a total of 505 attempts. See Figure 3 for further description.
ENERGY IN KCAL/MOLE
FRACTION OF AVAILABLE ENERGY
Figure 6. Energy partitioning pattern from F + HR83 on surface 4. This graph represents 93 reactive tra jecto ries from a total of 405 attempts. See Figure 3 for fu rther description.
ENERGY IN KCAL/MOLE
FRACTION OF AVAILABLE ENERGY
Figure 5. Energy partitioning pattern from F + HR15 on surface 4. This graph represents 51 reactive tra jec to ries from a total of 330 attempts. See Figure 3 for further description.
ticular the greater available potential energy for surface(e) gave a dramatic increase in N3/N2, for both HR15 and HR83. The %Ai or %(A + M )3i classification of the sur
faces would imply that the %Ev should increase more than what was found. This failue of %Ev to increase with increasing %(A + M) character of the surface has been attributed to multiple encounters in the trajectory.16 As we shall see this is a plausible explanation for F + HR systems too. Although the statistics are not adequate to show good correlation between Ev, Er and Et, the results from surface 4 were sufficient to definitely establish that high Ev correlates with low E r and vice versa. This also is apparent from the relatively small spread in the translational energy distributions shown in Figures 3-6.
A comparison of the effects of changing the mass from R15 to R83 on surface 4 (Figures 3 and 6) shows that the % E V declined slightly and % E r increased slightly. A similar result was found for surface 2. However, for surface 3 there was virtually no change in %EV with mass. This may be a consequence of poor statistics or it may be real. In any event, the main conclusion is that the mass effect is quite minor for the energy partitioning. One might have anticipated that increasing the mass of R would lower the degree of mixed energy release (lower %EV) for a given potential surface because the greater mixed energy release occurs for M A 2> Mc and M b large.20 Apparently the variation in mixed energy release for changing of Me from 15
The Journal of Physical Chemistry, Voi. 77, No. 21. 1973

2504 R. L. Johnson, K. C. Kim, and D. W. Setser
Figure 7. Plot of internuclear distances and total potential ener-. gy during the course of reaction. This is an example of a complex (indirect) trajectory.
Figure 8 . Plot of internuclear distances and total potential energy during the course of reaction. This is an example of a simple (direct) primary encounter followed by a delayed secondary encounter. This secondary encounter had the effect of removing vibrational energy from HFt-
to 83 is small, as also is indicated by the %(A + M)st values of Table IV. In a three-body simulation of the K + IR (R = CH3, C2H5, C3H7, C4H9) reaction, the mass effect on % £V(KI) also was found to be negligible.23
Definitions of direct, complex (indirect), primary and secondary encounters have been reported20'24>25 and descriptive terms, defined by the types of forces acting between the products, have been applied to the secondary encounters.23-26 Inspection of our trajectory plots suggested three classifications for reactive encounters of F + HR. These are (i) simple (direct), (ii) complex (indirect), see Figure 7, and (iii) delayed secondary encounter, see Figure 8. The latter group are identified by a distinct time period after the transfer of H to F during which H begins to separate from R, but another encounter subsequently results as a consequence of the rotation of HF^ (the dagger denotes an HF which has been formed but has not yet escaped from the influence of the R group) which brings the H back to the vicinity of R. In most cases the primary encounter for type iii was simple (direct); however, in a few instances a delayed secondary encounter occurred after a complex (indirect) interaction. For type iii interactions the usual result of the secondary encounter was a lowering of the amplitude of HFt oscillation, see Figure 8, although
E v i p , k c a l / m o l e
Figure 9. Plot of vibrational excitation of HF vs. the initial impact parameter for F + HRb3 on surface 4. The available energy is marked in the lower right-hand corner. A plot of E r v s . b also showed no correlation; this should be self-evident from the above and the statement of inverse correlation of Ey and Er .
in a few instances, Ev was increased by the secondary encounter. The appearance of type ii trajectories varied a great deal. That shown in Figure 7 is a fairly extreme case; in many instances the R Hr distance goes through only one complete cycle of motion after R Hf first becomes < R h r . Typical interaction times are 2-5 X 10~14 sec for complex type trajectories; the time for transfer of H from R to F in the primary encounter is 0.5-1 X 10-14 sec. From visual inspection of plots such as Figures 7 and 8 it appeared that complex trajectories often were associated with approach of F along the H-R molecular axis (but not necessarily with small impact parameters), whereas the direct trajectories tended to have a large component of motion perpendicular to the H-R axis. About one-half of the reactive trajectories appeared to be complex. Of the remaining one-half, 50% showed evidence for delayed secondary encounters. There also appears to be some enhancement of (ii) and (iii) with Rg3 relative to Ri5. Since surfaces 2, 3, and 4 partition a high fraction of energy to rotational energy, the delayed secondary encounters may be over emphasized. Reference 25 should be consulted for additional discussion of complex encounters in the Cl + HI reaction.
The extent to which the vibrational distributions are dependent on impact parameter is indicated by Figure 9. Although the uppermost range of b contributed slightly more to the higher range of Ev , the vibrational distribution is not strongly dependent on the impact parameter. In contrast the cm scattering angle of HF, relative to the extension of the initial direction of F, definitely tended to decrease (more forward scattering) at large b. For example, with F + HRg3 on surface 4, the average scattering angles for b in the ranges 0 - 0 . 2 , 1 . 0 - 1 . 2, and 2 . 0 - 2 . 2 A
were 161°, 103", and 45°, respectively. Throughout the whole range of b complex trajectories occurred; however, they did not disturb this correlation and the relative breadth of the angular distribution was more a consequence of relative values of b than an effect of complex trajectories. The average scattering angles are given in Table V.
B. D + ClI System. The calculated results, which were done with an initial translational energy of 9.9 kcal mol“ 1 for ease of comparison with experimental data, are summarized in Figures 10 and 11 and in Table V. The potential surface is relatively attractive and has low direction-
The Journal of Physical Chemistry, Vol. 71, No. 21, 1973

Trajectory Studies of Abstraction Reactions 2505
TRANSLATIONAL ENERGY KC A L/m OLE
- rACM ON OE AVAILABLE ENERGY
Figure 10. Translational energy distribution from D + Cll —*■ Dl + Cl, surface 5. This graph represents 121 reactive trajectories giving Dl from a total of 1020 attempts.
Figure 11. Distribution of scattering angles for D + Cll —► Dl + Cl (solid line) and DCI + I (dashed line); the average angles are 98 and 99°, respectively. If these distributions are weighted by (sin d)~ 1 for comparison of in-plane experimental scattering measurements the average angles are 107 and 115°, respectively.
ality; the characteristics of the potential surface at the barriers of both channels are virtually identical. The three methods of classifying the surface give similar results, as would be expected because the L + H -H mass combination given rise to very little mixed energy-release. This absence of mixed energy release for L + H -H (implying an approximate perpendicular path across the potential surface) is the essence of the phenomenon termed the light atom anomaly by Polanyi.20 This has the result that a smaller portion of the energy is released as vibrational energy and more as relative translational energy (see also ref 25). The amount of energy released as rotational energy of Dl and DCI is, however, quite high. In contrast to the F + HR trajectories, no complex encounters were observed, which is a consequence of the different relative masses and the higher initial translational energy. Some trajectories did show delayed secondary encounters, but this was a small fraction which correlated with those trajectories giving forward scattering. In spite of the higher initial relative translational energy, the duration of the primary encounter was much longer, ~ 5 X 10“ 13 sec, for release of the potential energy in the D + Cll trajectories
relative to F + HR. This, of course, is a consequence of the slow separation of the heavy masses of Cl and I. The average scattering angles for formation of Dl from groups of trajectories with impact parameters centered at b value = 1.0, 1.4, 2.0, and 2.9 À were 108, 114, 96, and 98°. Thus the scattering angle correlates only very weakly with impact parameter for D + Cll.
V. Discussion
A. F + H R Reactions. Our primary objective was to obtain calculated three-body results which might provide insight for interpreting the experimental energy partitioning results for thè polyatomic F + HR systems. The %ET values will not be discussed because the experimental difference between the available energy — (Ev plus E K) is the relative translational energy plus the internal energy of the R fragment. The most significant general aspects of the calculations are: (a) the mixed energy release aspect for this type of mass combination, 25 (b) the very short time period 1-0.5 x 10“ 14 sec, for the transfer of H from R to F in the primary encounter, (c) increasing the mass of R from 15 to 83 had a minor effect upon the energy partitioning, (d) minor changes in the thermochemistry did not affect %EV, but, of course, the vibrational distribution was changed, (e) the high probability for multiple encounters in the trajectories. We now wish to use the calculated results, the experimental data, and other intuitive guidelines in examining the validity of the three-body model.
Since the %Ey was found not to be particularly sensitive to the three body surface and since reasonable agreement between the experimental (~62%) and the calculated results ( — 70% ) were obtained for %Ev, this suggests that a three-body approximation is not too bad for that aspect of the data. However, the large fraction of the reactive trajectories which showed complex behavior and delayed secondary encounters suggests (even for other less attractive surfaces) that representing groups like CH3 or CH2I by a single atom of equivalent mass must introduce serious approximations relative to the real potential surface and the dynamics on the real surface. Two problems immediately come to mind. The first, which we already have emphasized, 2 is the release of the energy of the R fragment when it relaxes from the geometry in the molecule to the equilibrium geometry of the free radical and the transfer of energy to and from the HFt and the R during the complex (indirect) encounter. The second is the greater likelihood of delayed secondary encounters for the complete representation of the R fragment.
In the present computations treating R as an atom meant, for the most part, that in the secondary encounter incipient HFt vibrational and rotational energy was converted into relative translational energy of HF and R. Treating R more exactly would mean that instead of swinging around and interacting with an atom, the H-Ft would be interacting with a group, e.g., CH3 or CH2I. This would seem especially important for larger groups, such as CH2 (CHs)3 , or groups which interact at long range, either attractively or repulsively, with HFt (the f denotes the initially formed HF before it has escaped from the influence of the R group). An experimental observation3® which may illustrate the effects of delayed secondary encounters is the slight, but systematic, decline in %Ev (HF) in the series F + C2H6 , CH3CD2CH3 , (CH3 )4C.
If the period (~ 5 X 10“ 1 4 sec) of the bending vibration of CH3 is taken as a measure of the necessary time for CH3 to change from tetrahedral to planar geometry, this
The Journal of Physical Chemistry, Voi. IT, No. 21, 1973

2506 R. L. Johnson, K. C. Kim, and D, W. Setser
corresponds to the interaction times of the more involved of the complex trajectories but is much longer than the characteristic tim e for transfer of H from R to F in the primary encounter. The surprising fact that the highest observed HF level usually is very close to that permitted by the H -R bond energy (see footnote c of Table I) may be a consequence of the small fraction of complex-type encounters which permit the radical distortion energy to reach the H F t product. For radicals with larger distortion energies, such as resonance stabilized radicals or even cyclohexyl radicals,33 the highest observed level m ay be less than that perm itted by the bond energy because of the slow release of the radical distortion energy. (The radical distortion energies of CH2X radicals has been estim ated2-27 as ~5 kcal m ol- 1 .) For mass combinations which lead to a longer tim e for the transfer of B from C to A, the radical distortion energy of C m ay be more readily available to A B t even for direct interactions. M ass com binations which lead to longer total interaction times presum ably enhance this effect, as well as the transfer of energy from A B t back to the C group. A four-body (A + B C D —► AB + CD) sim ulation28 of the K + IC2H5 reaction with an attractive surface, which showed both direct and complex-type collision trajectories, provided some support for the reasoning because a substantial increase in the energy of the CD fragment was found for complex- type trajectories. The duration of the com plex-type interaction appears to be significantly longer (~ 10 from the published example) for K + IC2 relative to F + HR15.
An important result of the calculations was the increase in N 3 / N 2 for lowering of D (H -R ) by 5 kcal m ol- 1 , which is rem arkably sim ilar to what is found experim entally (see Table I). This sensitivity of the three-body calculation to the available energy further emphasizes the importance of the radical distortion energy and its mechanism for release during the course of the reaction; i.e., in the extreme case the radical distortion energy would not be available to H F t.
The effects from changing the mass from 15 to 83 were minor (for a three-body surface), but the nature of the effect was to broaden the vibrational energy distribution with a slight drop in % E V . Such a tendency may be in the data but it easily could be overshadowed by other unknown effects. Since the mass ratio of (C H 3)2Hg to CH3I is only 1.6, it is very unlikely that the difference between the two vibrational distributions arises from a mass effect since other reagents with larger mass differences show lesser changes in % E V or in the distributions. The decline in the N 3 / N 2 ratio with increasing com plexity of hydrocarbon, but with the same bond energy, i.e., C2H6, CH3CD2CH3, and C (C H s)4 previously has been noted. However, for that series the N 1 / N 2 ratio does not change significantly, which is in strong contrast to CH3I and CH 3H gCH 3. The low % E V and high population of N y for CH 3-H gC H 3 m ay be related to the linear geometry, heavy central mass and relatively low rotational moment of CH2HgCH3, which may give more delayed secondary encounters than CH2I.
The most interesting (or troublesome) feature is the disparity between the calculated (— 15%) and experimental (< 10%) values of % E R . Furthermore the calculations show a fairly strong inverse correlation between E v and E R, which is not found experimentally. For the other well studied exam ple25 of mixed energy release (Cl + HI), both the calculated and experimental results show the inverse correlation but the calculations also tended to over
estimate the correlation. We suspect that the interactions between HFt and the polyatomic R fragment are an important aspect of the rotational energy distributions. Attempts to refine the three-body F-H-C potential do not seem worthwhile without insight into the nature of the many-body problem.24 Additional theoretical and experimental work on the rotational energy partitioning by F + HCX3 reactions is needed.
B. D + ICl. The results for the DI channel (see Table V and Figures 10 and 11) are in reasonable agreement with experimental data,11 which show sidewise peaking with Et — 10 kcal mol-1 . For this type of mass combination the scattering angle is not so dependent upon b (as was the case for the F + HR systems) as the angle of the “ activated” configuration. Such a dependence is, of course, due to the low mass of the deuterium atom. The average angle of the “ activated” configuration for both channels was essentially the scattering angle, ~100°; however, weighting the calculated scattering angle distributions by sin 0-1 does increase the difference between the average values; i.e. (6cm)m = 107° and (0cm>Dci = 115°. This fits' the DI results adequately, but for DC1 the angle needs to be increased to ~150°. Also, the calculated cross section for DC1 (8.0 A2) was too large relative to DI (7.2 A2) because the experimental ratio favors DI by a factor of at least 3-4. To bring the DC1 results into better agreement with experiment, this channel must be made more “ repulsive.” The changes must be made without significantly altering the DI channel since it needs only minor improvements. Making the DC1 channel more repulsive would correct both the cross section and the scattering angle inadequacies. As the repulsive character is increased, the barrier would “ move in” and become higher,15 and secondly, this change in barrier position would increase the directionality. These effects can be seen in Table III by a comparison of Ry*, Vc*, and / 33 and fa- The most important conclusion is that relatively good agreement with the DI channel was obtained without a deliberate attempt to construct a surface which favored strongly bent configuration. However, the surface which would, in fact, give good agreement with the data has the properties that a greater degree of collinear geometry is required for D -C l-I relative to D-I-Cl, which is in agreement with the analysis of ref11.
Acknowledgments. We are grateful for the support provided by the National Science Foundation (G.P. 27536 X) and by the Kansas State University Computing Center.
References and Notes(1) H. W. Chang, D. W. Setser, and M. J. Perona, J. Phys. Chem., 75,
2070 (1971).(2) (a) H. W. Chang and D. W. Setser, J. Chem. Phys.. 58, 2298
(1973); (b) W. H. Duewer and D. W. Setser, ibid., 58, 2310 (1973).(3) (a) K. C7Kim and D. W. Setser, J. Phys. Chem., 77, 2493 (1973);
(b) K. C. Kim and D. W. Setser, J. Chem. Phys., submitted; (c) K.C. Kim and D. W. Setser, J. Phys. Chem., to be submitted.
(4) J. C. Polanyi and K. B. Woodall, J. Chem. Phys., 57, 1587 (1972).(5) N. Jonathan, C. M. Melliar-Smith, and D. H. Slater, M o l. Phys., 20,
93(1971).(6 ) J. H. Parker and G. C. Pimentel, J. Chem. Phys., 48, 5273 (1968).(7) M.C. Lin and W. H. Green, J. Chem. Phys., 53,3383 (1970).(8 ) (a) T. P. Schafer, P. E. Siska, J. M. Parson, F. P. Tully, Y. C.
Wong, and Y. T. Lee, J. Chem. Phys , 53, 3385 (1970); (b) J. M.Parsons and Y. T. Lee, ibid., 56, 4655 (1972).
(9) (a) C. E. Kolb and M. Kaufman, J. Phys. Chem., 76, 947 (1972); (b) J. W. Bozzelli and M. Kaufman, ibid, 77, 1748 (1973).
(10) (a) J. T. Muckerman, J. Chem. Phys., 56, 2997, 3191 (1972); (b) R. L. Jaffe and J. B. Anderson, ibid., 54, 2224 (1971); (c) R. L. Wilkens, ibid., 57, 912 (1972); (d) J. T. Muckerman and M. D. Newton, ibid., 56, 3191 (1972); (e) D. G. Truhlar, ibid., 56, 3189 (1972).
The Journal 0/ Physical Chemistry, Vol. 77, No. 21, 1973

Reaction of N02 with O3 2507
(11) J. D. McDonald, P. R. LeBreton, Y. T. Lee, and D. R. Hershbach, J . C h e m . P h y s ., 56, 769 (1972).
(12) K. C. Kim, Ph.D. Thesis, Kansas State University, Manhattan, Kan. 1973.
(13) K. Karplus, R. N. Porter, and R. D. Siarma, J . C h e m . P h y s ., 43 , 3529 (1965).
(14) D. L. Bunker, M e th o d s C o m p u t. P h y s ., 10 , 287 (1971).(15) (a) A. Ralston and H. S. Wilt, “Mathematical Methods for Digital
Computers," Wiley-lnterscience, New York, N. Y. (1960); (b) A. Ralston, M T A C , 1 6 , 431 (1962).
(16) P. J. Kuntz, E. M. Nemeth, J. C. Polanyi, S. D. Rosner, and C. E. Young, J . C h e m . P h y s ., 44, 1168 (1966).
(17) (a) The data for the various F + HR systems were taken from “JANAF Thermochemical Tables” (U. S. Government Printing Office). (b) The data for the diatomic pairs of the D + ICI system were taken from B. Rosen, "Selected Constants Spectroscopic Data Relative to Diatomic Molecules," -’ergamon Press, New York, N. Y., 1970.
(18) W. A. Chupka and J. Berkowitz, J . C h e m . P h y s ., 54, 5126 (1971).(19) G. Herzberg, “ Molecular Spectra and Molecular Structure. I. Spec
tra of Diatomic Molecules," Van Nostrand, Princeton, N. J., 1950,pp 108, 1 0 1 .
(20) J. C. Polanyi, A c c o u n ts C h e m . R e s ., 5, 161 (1972).(21) (a) R. Foon and N. S. McAskll, T ra n s . F a r a d a y S o c . , 65, 3005
(1969); R. Foon and G. P. Reid, ib id . , 6 7 , 3515 (1971); (b) R. F. Walker and M. A. A. Clyne, University of London, Queen Mary College, private communication, 1972.
(22) L. M. Raff, private communication.(23) L. M. Raff and M. Karplus, J. C h e m . P h y s ., 44, 1212 (1966).(24) D. L. Bunker and M . C . Pattengil, J . C h e m . P h y s . , 53, 3041 (1970).(25) C. A. Parr, J. C. Polanyi, and W. H. Wong, J . C h e m . P h y s ., 58, 5
(1973).(26) B. A. Hodgson and J. C. Polanyi, J . C h e m . P h y s ., 55, 4745 (1971).(27) D. L. McFadden, E. A. McCullough, Jr., F. Kalos, and J. Ross, J.
C h e m . P h y s ., 5 9 , 121 (1973).(28) L. M. Raff, J. C h e m . P h y s ., 44, 1202 (1966); 50, 2276 (1969).
The Reaction of Nitrogen Dioxide with Ozone
C. H. Wu, E. D.Morris, J r.,* and H. Niki
S c ie n t i f ic R e s e a r c h S ta f f , F o r d M o to r C o m p a n y , D e a rb o rn , M ic h ig a n 4 8 1 2 1 ( R e c e iv e d A p r i l 6 . 1 9 7 3 )
P u b l ic a t io n c o s ts a s s is te d b y th e F o r d M o to r C o m p a n y
T he mechanism and rate constant of the reaction NO2 + 0 3 » NO3 + O2 were investigated at the parts- per-million concentration level. A chemiluminescent detection method was used to monitor the decay of O3 in excess NO2. From these data a rate constant of 4.4 X 10⁻¹⁷ cm 3 m olecule-1 sec-1 at 26° was determined with an uncertainty of ± 15%. Long-path infrared was used to measure the overall stoichiom etry (ANO2/AO3). Since the primary reaction is rapidly followed by NO2 + NO3 p± N2O5, the observed stoichiom etry ranged from 1.65 to 2.00.
The reaction of N 0 2 with 0 3 plays an im portant role in photochemical smog and acts as a sink for both N 0 2 andO3.1 The mechanism proposed2 for this reaction is
NO, + 0 3 — ► N0 3 + 0 2 (1)
NO, + N0 3 3= t N20 5 (2)
In the atmosphere, N2O5 is subsequently removed by reactions involving water and solid surfaces.3
In 1922, W ulf, Daniels, and Karrer4 measured the stoichiometry (ANO2/AO3) of this reaction by titrating NO2 with O3 until the brown color of NO2 disappeared. From the initial concentration of NO2 (10-50 Torr) and the amount of O3 added, they concluded that two molecules of N 0 2 were consumed for every molecule of O3. A few of their data points gave results significantly less than 2, but they were attributed to a faulty ozone analysis.
The most extensive kinetic data on this reaction are those of Johnston and Y o st.2 They followed the concentration of NO2 by its absorption at 4400-4800 A in a stopped flow reactor. The ozone concentration during the reaction was determined assuming a stoichiometry of 2. From the decay of O3, they report a rate constant at 21° of 6.1 X 10⁻¹⁷ cm 3 m olecule-1 sec-1 with a standard deviation of 10% over the range of 1 to 10 Torr initial concentrations. An activation energy of 7.0 ± 0.6 kcal/m ol was obtained over the temperature range of 13 to 29°.
Ford, Doyle, and Endow5 measured the rate of the NO2 + O3 reaction in a 50-1. stirred-flow reactor using concentrations in the ppm range. (Throughout this paper the unit ppm refers to 760 Torr at 25° so that 1 ppm = 2.45 x 10¹³ m olecules/cm 3.) Ozone was determined in s i t u by an ultraviolet photometric method, while NO2 was measured at the exit of the reactor by a continuous wet chemical method. The analysis of their data is based in the m echanism (1)—(2) which requires a stoichiometry of 2. However, the stoichiometry calculated from the N 0 2 and O3 concentrations given in this paper range from 0.9 to 4.8. Although the individual determinations scatter over a factor of 4, these authors derived an average rate constant of3.3 X 10-17 cm 3 m olecule-1 sec- 1 . This is in reasonable agreement with the value of Johnston and Yost obtained at m uch higher concentrations.
Scott, Preston, Andersen, and Quick8 monitored the decay of NO2 produced by the flash photolysis of 0 3 in N2O. From their high-pressure data (>400 Torr), they estim ated fei as 1.3 X 10⁻¹⁷ cm3 m olecule-1 sec- 1 . Experiments performed at 100 Torr yield a value for k y some 5-6 times smaller. This suggests the mechanism for the formation of N 0 2 even at higher pressures is not entirely correct.
In a recent paper from this laboratory, Stedm an and N iki7 used a chemiluminescent detector to follow the
The Journal of Physical Chemistry, Voi. 17, No. 21, 1973

2508 C. H. Wu, E. D. Morris, Jr., and H. Niki
first-order decay of small amounts of O3 (0.1- 0.01 ppm) in the presence of 1-8 ppm of NO2. Under these conditions a rate constant can be determined on the assumption that O3 is consumed only in the primary step. They reported a rate constant for ky of 6.5 X 10 17 cm3 m olecu le1 sec“ 1. This was based on rather preliminary data and the uncertainties in their rate constant judged to be ±50%.
Thus there is considerable uncertainty in the reported rate constant for the reaction of NO2 with O3. In addition, no mechanistic studies have been done under the conditions which were used for kinetic measurements. In the present work, more extensive kinetic data have been gathered using chemiluminescent detection of ozone to obtain a more precise rate constant. Experiments were also performed to investigate the reaction mechanism using long- path infrared spectroscopy.
Experimental SectionThe kinetics and mechanism of the NO2-O 3 reaction
were studied in the ppm range using two experimental methods. The kinetics was studied sc, atmospheric pressure in N2 in a 45-1. Pyrex bell jar. The jar was sealed to a Teflon-coated stainless steel base plate which was connected to a mechanical pump through a 1-in. line and a liquid nitrogen cooled trap. The reactor was evacuated below 10“ 3 Torr for a minimum of 30 min between runs. The leak rate under vacuum was less than 10“ 3 Torr/min.
Nitrogen dioxide was prepared by adding excess oxygen to prepurified NO. The NO2 was then frozen out and excess O2 was pumped off. The NO content was less than 0.1%. Ozone was prepared by passing high-purity oxygen through a silent discharge ozonizer. As a precaution, the O2 was first passed through heated CuO to remove hydrocarbon impurities. The O3 produced was trapped in silica gel at —78° and excess O2 was pumped off. The purity of the ozone was found to be 98 ± 2% by decomposing a small portion and measuring the pressure rise. Ozone could be stored in the cold trap for up to a week without significant decomposition. Ultrahigh-purity nitrogen (<1 ppm CH4) was used as a diluent gas without further purification.
Reactant mixtures of NO2 and O3 at ppm levels were prepared by first filling calibrated volumes (10-60 cm3) with a few Torr of reaptant. This pressure was measured with a Pace Wiancko transducer which had been calibrated against an oil manometer. The reactants were then flushed with diluent nitrogen through a multiperforated Pyrex inlet tube into the reactor. A thermistor with a1-sec time response indicated that the temperature during the kinetic measurements was 26 ± 1°.
Analyses of NO, NO2, and O3 were made with chemiluminescent detectors which have been described in detail previously.8-9 The noise level of these detectors was equivalent to 3 ppb with a 1-sec time constant. The NO detector was calibrated using a standard mixture of NO in nitrogen. The NO2 was analyzed using an NO instrument equipped with a molybdenum impregnated carbon tube which quantitatively (>99%) reduces NO2 to NO. This detector thus responds to the sum of NO + NO2. In a mixture of NO and NO2, NO2 can be obtained by subtracting NO. The NO2 and O3 detectors were calibrated relative to the NO detector using an NO titration method based on the reaction
0 :, + NO — *■ NO, + 0 2All of these calibrations were cross checked against known
concentrations prepared in the bell jar by the standard volume method described earlier. The results agreed within ± 2%.
It was noted that the molybdenum carbon convertor was also sensitive to other oxides of nitrogen such as N2O5 and HNO3. Since these are known products of the reaction under investigation, the decay of NO2 could not be measured during the course of the reaction. Therefore, all experiments were performed in NO2 excess with continuous monitoring of O3.
Long-path (40 m) infrared spectrometry was used to monitor the reactants and product of the NO2-O3 reaction. The reaction cell was constructed of glass except for the mirror supports which were coated with Teflon. This cell was routinely conditioned with ozone. Under these conditions either O3 or N 02 alone in the cell was stable for several hours. Ozone was prepared by passing dried oxygen through a silent discharge ozonizer directly into the 70-1. Pyrex reaction vessel. NO2 was prepared by adding 760 Torr of oxygen to 10-20 Torr of purified NO in a standard volume.
The infrared absorption coefficient of NO2 was calibrated at 1600 and 1620 cm “ 1 by introducing known concentrations of NO2 into the reaction cell. The ozone absorption at 1060 cm “ 1 was calibrated relative to NO2 by introducing ozone into the cell and taking its spectrum. Excess NO (NO2 free) was then added to convert all the O3 into NO2 via reaction 5. Measurement of the resulting NO2 then gave the concentration of ozone initially present. The O2 and NO concentrations were low enough so that the termolecular reaction NO + NO + O2 —*• 2NO2 was too slow to interfere with the calibration. Since the infrared peaks of NO2 and O3 were pressure sensitive, care was taken to make calibrations and measurements at the same pressure.
Measurements of the stoichiometry (ANO2/AO3) were performed by adding ozonized oxygen to the evacuated cell until the desired concentration (as indicated by ir) was reached. A known quantity of NO2 was then added together with argon to bring the total pressure in the reactor to 400 Torr. The infrared spectrometer was set at either 1620 or 1060 cm “ 1 to monitor whichever species was present in excess. When the reaction was complete, as indicated by a stable ir signal, a measurement was made of the concentration remaining. The stoichiometry was determined by combining this with the initial concentrations. The analytical sensitivity was adequate to detect 1 ppm of NO2 or O3. However, concentrations of 5-25 ppm were used to obtain good accuracy for the stoichiometric measurements.
ResultsMechanism. The overall stoichiometry of reactions 1
and 2 was measured under conditions of both NO2 excess and O3 excess. Initial concentrations were chosen so that either N02 or O3 was completely consumed within several minutes. The results of these measurements are shown in Table I for a variety of initial conditions. In the case of ozone excess, ANO2/AO3 = 1.88; for the NO2 excess condition ANO2/AO3 = 1.68. The maximum error in these measurements is estimated to be ±0.15. The stoichiometry observed under O3 excess conditions was consistently greater than in the NO2 excess case. This remained true for three independent sets of calibrations and experiments. Since the error limits overlap, it could not be de-
The Journal of Physical Chemistry, Vol. 77, No. 21, 1973

Reaction ot N 02 with 0 3 2509
TABLE 1: Stoichiometry Measured in O3 Excess and in N 02 Excess0
[Osjinitia! [Osjfinal [NOalinitial [N02]final a n o 2/ a o 3
17.7 11.7 12 0 2.0018.4 5.5 24 0 2.0310.5 7.1 6 0 1.7711.4 5.6 10 0 1.7318.1 11.5 12 0 1.8211.6 8.2 6 0 1.7716.7 10.8 12 0 2.0315.8 5.3 20 0 1.9117.3 11.7 10 0 1.7921.2 9.1 24 0 1.9816.8 4.0 24 0 1.8817.4 6.9 20 0 1.9113.9 5.3 16 0 1.85 •
Av 1.88 ± 0.15
7.4 0 20 7.7 1.677.8 0 20 7.1 1.659.5 0 24 7.5 1.739.6 0 24 7.6 1.716.8 . 0 20 9.0 1.625.1 0 18 9.3 1.684.9 0 15 6.9 1.633.8 0 15 8.8 1.638.2 0 24 10.0 1.716.5 0 24 12.7 1.74
° C oncentrations in p p m units ( = 2 .4 5 X 1 0 13 m o le c u le s /c m 3).
termined whether this is due to a real effect or a systematic error. Additional experiments were performed to determine the effect of total pressure of argon diluent. Data taken at 100, 400, or 750 Torr under NO2 excess conditions gave the same stoichiometry.
Dinitrogen pentoxide was observed as a product in the infrared at 1240 cm-1 but is not stable in this system and decayed to HNO3 with a 20-30-min half-life.3 If the absorption cross section for N2O5 determined by Cramerossa and Johnston10 is used here, 10 ppm of NO2 + excess 03 initially produces 4.9 ppm of N2O5. This absorption cross section is dependent on total pressure and optical resolution. Since an effort was made to use similar experimental conditions here, the quantitative measurement of N205 should not be greatly in error. Therefore, N2O5 is the major nitrogen-containing product.
Kinetics. Prior to investigating the reaction of NO2 with O3, the decay of O3 alone in pure nitrogen was measured in the bell jar system. Depending on the wall conditions, decay rates of 0.002-0.025 min“ 1 were observed for initial O3 of 0.05 to 1.0 ppm. The lower rates were obtained after the vessel had been exposed to higher concentrations of ozone for an extended period. Therefore a standard procedure was adopted of treating the vessel overnight with 10 ppm of O3 in N2. This procedure gave a decay rate between 0.003 and 0.005 min“ 1 and was used for all experiments except where stated otherwise. This rate is insignificant compared to that observed when 1-10 ppm N02 has been added.
When enough N02 is present so that [NO2]/[O3] > 30, a pseudo-first-order decay of O3 was observed. Figure 1 shows typical plots of In [0 3] vs. time for several different N02 concentrations between 1 and 10 ppm. The depen-
Av 1.68 ± 0.15
Figure 1. Logarithmic decays of ozone at various initial N 02 concentrations. [NC>2]o / [03 ]o > 30.
dence of the 0 3 decay slope, d In [0 3]/dt, is shown as a function of [NO2] in Figure 2, curve A. This plot is linear with a zero intercept. From the slope a bimolecular rate constant of 4.3 X 10“ 17 cm3 molecule“ 1 sec“ 1 was determined. The experimental precision of the slope measurements in these experiments was better than ± 0.2 in the same units. To check the effect of wall treatment on the rate constant, a second set of experiments were carried out by replacing the 0 3 pretreatment of the vessel with
The Journal ot Physical Chemistry, Vol. 77, No. 21, 1973

2510 C. H. Wu, E. D. Morris, Jr., and H. Niki
Figure 2 . Decay of ozone as a function of [N 02]o for the wall conditions: A, = O3 treatment; B, = N 02 treatment; C, = evacuation only.
NO2 pretreatment. Ozone again exhibited first-order decay at various NO2 concentrations. A plot of d In [03]/df vs. [NO2] for data taken under these conditions is given in Figure 2, curve B. This line has a slope corresponding to a rate constant of 4.5 X ICO17 cm3 molecule-1 sec-1 and a small positive intercept. This slope is slightly greater than that found with 03-treated walls but is within experimental uncertainty. To study the wall effect further, kinetic data were obtained after subjecting the vessel to overnight pumping. When these data are plotted in the form d In[0 3]/dt vs. [NO2] (Figure 2, curve C), the slope gives a rate constant of 4.9 X 10⁻¹⁷ cm3 molecule-1 sec-1 . This value is greater than that observed with either O3 or NO2 pretreatment.
The dependence of the 0 3 decay rate on the initial ozone concentration was investigated at a fixed [N02]o = 4.9 ppm. In this experiment [O3]o was varied from 0.1 to1.0 ppm. When [N02] 2> [03], d In [03]/]dt vs. time is linear with a constant slope as shown in Figure 3. At higher 0 3 concentrations, these plots become curved as shown in this figure. The points are experimental data taken from the continuous recording of the ozone detector. The lines are from a computer analysis using reactions 1 and 2 (stoichiometry = 2) and a rate constant for ki = 4.4 X 10⁻¹⁷ cm3 molecule-1 sec-1 . The experimental data do not start at time zero since it requires 1-2 min to fill the cell. Accordingly, the time scale of the experimental points has been shifted to take this into account. The calculation gives an excellent fit to all the data including those at the higher 0 3 concentrations where N 02 is no longer in large excess. A number of calculations were performed assuming various stoichiometries between 1.0 and2.0. The data show a good fit to calculations with a stoichiometry between 1.7 and 2.0. Below 1.7 the calculation exhibits significant deviation from the experimental data. These results are in agreement with the stoichiometric determinations made in the long-path infrared cell.
DiscussionIn all previous studies of this reaction the mechanism
( l ) - (2) and the corresponding stoichiometric value of 2 were assumed in the data analysis. Before proceeding to kinetic measurements, we wished to confirm the validity of this mechanism at the ppm concentration level. The stoichiometry measured in the long-path infrared cell was
Figure 3. Concentration vs. time profiles of ozone at various initial concentrations with fixed [ N0 2] o = 4.9 ppm. The points are experimental data while the lines are computed results using reactions 1 and 2 and Ar-i = 4.4 X 10⁻¹⁷ cm 3 molecules-1 sec- 1.
1.88 ± 0.15 with ozone excess and 1.68 ± 0.15 for NO2 excess. It was not possible to determine whether this difference was caused by a change in mechanism or by a systematic error in the experiments. A similar stoichiometric value could be inferred from 0 3 decay in nonpseudo-first- order conditions. These measurements thus indicate the reaction is proceeding largely via the proposed mechanism. However, the measured stoichiometries tend to indicate other reactions may be occurring to reduce the ratio of ANO2/A O 3 below 2.0 as predicted by the simple mechanism.
The following reactions can be incorporated into the mechanism
N03 + NO, — ► NO + NO, + O, (3)NO + N03 — ► 2NO, (4)
NO + 0 3 — *- NO, + O, (5)The overall stoichiometry is reduced by competition of reaction 3 with reaction 2. The NO formed in reaction 3 can react either via reaction 4 or 5. A computer integration of the mechanism (1)—(5) was carried out using rate constants suggested by Johnston.11 The predicted stoichiometry is 1.95.
In addition, an alternative path for reaction 1NO, + 0 3 — ► 202 + NO (6)
cannot be ruled out entirely. If this reaction is occurring, it would have a strong effect on the stoichiometry. For example, if k\/k% = 20 the overall stoichiometry is calculated to be 1.76.
The present stoichiometric data indicate the reaction proceeds greater than 90% via mechanism (1)—(2) at ppm concentrations. This is supported by the observation of an N2O5 yield approximately one-half the initial N 0 2. A stoichiometry of 2.0 is an upper limit. Several possible minor reactions tend to reduce this value under the present experimental conditions.
The Journal of Physical Chemistry, Voi. 77, No. 21, 1973

Kinetics of Gas-Phase Reactions of Ozone with Olefins 2511
The equation for O3 decay has been demonstrated in this study to be d[Os]/dt = -fe[N02][C>3] from the decay of O3 and the dependence on NO2 where k = 4.4 X 10⁻¹⁷ cm3 molecule-1 sec-1 . The scatter in the individual determinations is less than 5%. Possible systematic errors in the rate constant could result from the absolute calibration of reactant concentrations. The NO and NO2 calibrations were based on a standard mixture of NO which was analyzed independently by two laboratories reporting results within =1=4%. The absolute calibration of ozone is not necessary for the rate constant determination. However, the calibration was done for purposes of cross checking and investigation of the second-order region. The temperature of the reaction mixture was monitored and found to be 26 =1= 1°, which results in a maximum error of 3% assuming 7 kcal/mol for the activation energy. The stoichiometric value does not affect the rate constant derived from O3 decay unless reactions such as (6) which consume extra ozone are occurring. In that case the rate constant measured here would be too large by the fraction k /k-y. However, this ratio is not likely to be greater than 0.05. The rate constant obtained from results in the “ untreated” reactor is larger than that obtained with either O3 or NO2 treatment. This is likely a major cause of the larger value reported by Stedman and Niki. Based on these considerations, the overall uncertainty in the rate constant is estimated to be ±15%.
The present value of k1 = 4.4 ± 0.6 x 10⁻¹⁷ cm3 molecule-1 sec-1 is larger than that determined by Ford, et al. , 5 and that estimated by Scott, et al. 6 However, both of these studies exhibited large uncertainty. Johnston and Yost report a rate constant of 6.1 ± 0.6 X 10⁻¹⁷ cm3 mol
ecule-1 sec-1 at 21°.2 Using the reported activation energy of 7.0 ± 0.6 kcal/mole, their value at 25° is 7.2 ± 1 x 10-17. The rate constant derived in the present work is somewhat smaller than this. However in view of the vastly different experimental conditions used in their work, this should be considered in good agreement with the present value.
After the completion of this work another report of ky appeared. Ghormley, Ellsworth, and Hochandel12 observed the decay of N02 produced in the flash photolysis of O3 in N2O. Due to an error in their rate equation, the rate constant as printed is incorrect. With the proper kinetic equation, their data yield a value of 3.2 x 10⁻¹⁷ cm3 molecule-1 sec-1 for fci.13
References and Notes(1 ) H. N ik i, E. E. D aby, and B. W ein sto ck , Advan. Chem. Ser. No. 113,
16 (1 9 7 2 ).(2) H. S. Johnston and D. M . Yost, J. Chem. Phys., 17 , 3 86 (1 9 4 9 ).(3) E. D. M orris, J r., and H. N ik i, J. Phys. Chem., 7 7 , 1929 (1 9 7 3 ).(4) O. R. W ult, F. D an ie ls , and S. K arrer, J. Amer. Chem. Soc., 44,
2 39 8 (1 9 2 2 ).(5) H. W , Ford, G. J. D oyle, and N . Endow , J. Chem. Phys., 26, 1336
(1 9 5 7 ).(6 ) P. M . Scott, K. F. Preston, R. J. A ndersen, and L. M. Q u ick, Can.
J. Chem., 49, 1808 (1 9 7 1 ).(7 ) D . H. S tedm an and H . N ik i, "K inetics and M ech an ism for the Pho
tolysis of N O 2 in A ir," Ford M otor C o., S c ien tific R esearch Staff R eport Jan 17, 1973 .
(8) D. H. S tedm an , E. E. D aby, F. Stuhl, and H. N ik i, J. A ir Pollut. Contr. Ass., 2 2 , 2 60 (1 9 7 2 ).
(9) L. P. B reitenbach and M . She le f, J. A ir Pollut. Contr. Ass., 23, 128 (1 9 7 3 ).
(1 0 ) F. C ram aro ssa and H. S. Johnston, J. Chem. Phys., 43, 727 (1 9 6 5 ).
(11) H. S. Johnston, "P ro je c t C lean A ir," U niversity of C aliforn ia , 1970.(12) J. A. G horm ley, R. L. Ellsw orth, and C. J. H ochandel, J. Phys.
Chem., 77, 1341 (1 9 7 3 ).(1 3 ) Private com m unication .
Kinetics of Gas-Phase Reactions of Ozone with Some Olefins
D. H. Stedm an, C. H. W u,* and H. N ik i
Scientific Research Staff, Ford Motor Company, Dearborn, Michigan 48121 (Received February 22, 1973)
Publication costs assisted by the Ford Motor Company
Gas-phase reactions of ozone with ethylene, propylene, trans-2-butene, and 1-hexene were studied at 299 ± 2°K using a 45-1. static reactor and low reactant concentrations (~mTorr) at 760 Torr total pressure. Ozone was analyzed by the NO/O3 chemiluminescence method, while hydrocarbons were monitored by gas chromatography. The kinetics was studied in both hydrocarbon and ozone excess conditions in the presence and absence of O2. Absolute values of the second-order rate constant were determined to be 1.55 ± 0.15, 12.5 ± 1, 275 ± 23, and 11 ± 1.5 X 10⁻¹⁸ cm3 molecule-1 sec-1 for ethylene, propylene, trans-2-butene, and 1-hexene, respectively. For propylene and frans-2-butene, a stoichiometry of unity was observed in both nitrogen and air diluents.
Introduction
Ozonolysis of simple olefins plays a key role in the formation of photochemical smog.1’2 As a result, the kinetics of the gas-phase reactions of ozone with olefins has been the subject of numerous studies.3-9 The available kinetic data on ethylene, propylene, tran.s-2-butene, and 1-hexene
are summarized in Table I. Most of the studies listed here were carried out at low reactant concentrations (~mTorr) in air near atmospheric pressure. While the rate constants for 1-hexene show a general agreement, there is considerable discrepancy in rate constants and stoichiometries for the other olefins. In particular, an order of magnitude variation exists among the reported values for tmns-2 -bu-
The Journal of Physical Chemistry, Voi. 77, No. 21, 1973

2512 D. H. Stedman, C. H. Wu, and H. Niki
TABLE I: Summary of Previous Kinetic Studies on Gas-Phase Ozonolysis of Ethylene, Propylene, frans-2-Butene, and 1- Hexene
Initial concn, mTorrStoichiometry,A [H C !/A [0 3]
Rate constant (ambi ent temp), 1018 X
cm3 m olecule-1 sec-[HC]o [O3]0 Torr 1 Ref
— (2 -3 ) X 103 — (3 -5 ) X 102
E thylene
- 1 5 0 - 6 5 0 (A ir) 1 .9 -3 .2 3.0 ± 1 .3 “ 3
~ 15 - 1 5 - 7 6 0 (A ir) 0.9 1 .3“ 4
- 6 - 2 - 7 6 0 (A ir) 1.6 2.6 ± 0 .4 “ 7
— (2 -4 ) X 104 - ( 0 . 3 - 2 ) X 104 - 5 0 - 5 0 0 <02) 4 .0 “ 8
- 2 . 4 X 10⁴ — 4 X 10³ - 1 0 0 ( 0 2) 1 .4 -2 .0 2 .6“ 9
— 2 .4 X 104 - 4 X 10³ - 1 0 0 (N 2) 1 2d 9
- 8 - 1 6 - 0 . 8
P ropylene
- 7 6 0 (A ir) 6 .2 “ 3
- 3 0 - 8 - 7 6 0 (A ir) 1.06 8 .0 ft 4
- ( 2 - 4 ) X 104 — (0 .3 -2 ) X 104 - 5 0 - 5 0 0 ( 0 2) 11.2 d 8
- 2 . 4 X 10⁴ - 4 X 10³ - 1 0 0 ( 0 2) 1 ,4 -2 .0 10 .6 “ 9
- 2 . 4 X 10⁴ - 4 X 10³ - 1 0 0 (N2) 1 9 .2 “ 9
fra n s -2 -B u te n e
- 7 6 0 (A ir) 166“ 1 ,6
- 0 . 2 - 0 . 3 - 7 6 0 (A ir) 1.5 430“ 7
— (2 -4 ) X 104 — (0 .3 -2 ) X 104 - 5 0 - 5 0 0 ( 0 2) 38 “ 8
— 2 .4 X 104 - 4 X 10³ - 1 0 0 ( 0 2) 1 .4 -2 .0 35“ 9
- 2 . 4 X 10⁴ — 4 X 10³ - 1 0 0 (N2) 1 21“ 9
- 0 . 8 - 8 - 0 . 8 - 8
1 -H exene
- 7 6 0 (A ir) 1 .6 -2 .5 9.0 ± 0 .2 “ 3- 7 6 0 (A ir) 1 0 .0 “ 4
- 0 . 8 - 3 0 - 0 . 2 - 6 0 - 7 6 0 (A ir) 9 .21 5
- 7 6 0 (A ir) 1 1 1 .0 “ 1 ,6
- 0 . 6 5 - 0 . 5 - 7 6 0 (A ir) 1.8 11.0 ± 0 .2 “ 7
- ( 2 - 4 ) X 104 — (0 .3 -2 ) X 104 - 5 0 - 5 0 0 ( 0 2) d 8
— 2 .4 X 104 - 4 X 10³ - 1 0 0 ( 0 2) 1 .4 -2 d 9
- 2 . 4 X 10⁴ — 4 X 10³ - 1 0 0 (N2) 1 d 9
a 0 3 and olefins analyses by ir. h 0 3 and olefins analyses by long-path lr. c 0 3 analysis by iodometrlc method and olefins by gas-liquid chromatography. d Relative rate method, products analyses by gas-liquid chromatography, rate constants normalized to 1-hexene = 10.2 X 10⁻¹⁸ cm3 m olecule-1 se c -1 .
0 3 analysis by iodometric method. 1 0 3 analysis by iodometric and by converting 0 3 to N 02 and measuring N 02 equivalent.
tene. Although the observed stoichiometry, A[HC]/A[C>3], is unity with nitrogen diluent,9 it varies between 1 and 3 in the presence of oxygen.3-4-7-9 The present study was undertaken in an effort to resolve these uncertainties. Ozone was analyzed by the NO/O3 chemiluminescence method and olefins by gas chromatography. The rate constants and stoichiometries were examined at several oxygen concentrations and various initial reactant ratios.
Experimental SectionOzonolysis was carried out in a 45-1. Pyrex bell jar with
a Teflon-coated stainless steel base. The reactor could be evacuated to below 1 mTorr with a mechanical pump and a liquid nitrogen trap. The leak rate was less than 1 mTorr min-1 upon isolation from the pumping system.
Pure ozone was prepared by condensing ozonized oxygen in a silica gel trap at 195°K and pumping off oxygen. The purity of ozone was checked by decomposing a sample in a Pyrex bulb ( —100 cm3) with a tesla coil and measuring the pressure change. The observed purity was 98 ± 3%. The research grade olefins (Phillips) were vacuum distilled prior to use. Nitrogen (American Cryogenics, ul- trahigh purity, stated O2 impurity <10 ppm) and oxygen (Matheson, ultrahigh purity) were used as received.
Reactant mixtures of ozone and olefin in the ppm concentration range (1 ppm = 2.45 X 10¹³ molecules cm-3 at 760 Torr 298°K) were prepared by first filling calibrated
volumes to the desired pressures. The contents of these were then flushed into the evacuated bell jar with diluent gases to a total pressure of 760 Torr. The individual reactant pressures up to 20 Torr in the calibrated volumes were measured by a pressure transducer (Pace Wiancko, CD25) which had been calibrated against an oil manometer. The reactant concentrations in the gas mixtures thus prepared can be reproduced better than ±3%. The temperature of the gas mixture was 26 ± 2° during kinetic measurements.
Ozone was continuously sampled from the reactor using a capillary probe (flow rate — 35 cm3 min-1 ) and was analyzed by an NO/O3 chemiluminescence detector.10 The overall response time of the instrument is less than 1 sec. The ozone concentration was calibrated by titration with NO of known concentration.10 Linearity of the signal vs. concentration was checked from 10-3 to 102 ppm using an exponential dilution method.11 Olefins were analyzed gas chromatographically using a flame ionization detector and a stainless steel column (% in. x 12 ft) packed with DC 200 on chromosorb W. The reaction mixture was sampled into a 0.2-cm3 loop and introduced to the column using a Carle minivolume valve. Olefin concentrations were calibrated by preparing known concentrations in the bell jar by the standard pressure-volume technique mentioned above. The lower limit of the detection sensitivity was about 10-3 ppm.
The Journal of Physical Chemistry, Voi. 77, No. 21, 1973

Kinetics of Gas-Phase Reactions of Ozone with Olefins 2513
Results
In this study, the second-order rate constants for ozone- olefin reactions were determined mainly from the measurements of ozone decay rate in excess olefins using
d In [0 3] di - A[HC] 0 ( 1 )
According to this equation, the exponential decay of ozone, d In [0 3 ]/df, is proportional to the initial hydrocarbon concentration, [HC]o, and is independent of the ozone concentration, [O3]. These kinetic relationships were examined extensively in the presence and absence of the molecular oxygen. For propylene and tran s-2-butene, the rate constants were also checked by measurements of olefin decay rate in excess ozone concentration.
The comparison of the rate constants obtained by the two methods, i.e ., hydrocarbon and ozone excess conditions, gives measurements of stoichiometry. In addition, the stoichiometric data, A[HC]/A[0 3 ], were obtained from the decays of both reactants in near equimolar mixtures.
1-H exen e and E th ylen e. The rate constant for 1-hexene was measured to determine if the chemiluminescence method gives a result consistent with previous studies. Figure 1 shows the exponential decay of ozone at several1-hexene concentrations. The slopes of these lines are plotted against 1-hexene concentration in Figure 2. The filled circles designate values obtained in air ([O2] = 2 x 1 0 5 ppm), and the open circles designate values obtained in N2 . These kinetic data obtained over the range of [HC] from 1 to 16 ppm are well represented by eq 1 and are not affected by the presence of molecular oxygen. From the slope of the line in Figure 2, a rate constant for 1-hexene was determined to be 1.10 ± 0.15 x 10- 1 7 cm3 molecule- 1
sec-1 . This value is in good agreement with those of the previous studies listed in Table I. The overall uncertainties assigned to the rate constants in this work were estimated from the precision of the first-order decay slopes and from the accuracy of the olefin concentrations prepared. Figure 2 also shows the kinetic data for ethylene over the range from 5 to 55 ppm. The derived rate constant is 1.55 ± 0.15 X 10- 1 8 cm3 molecule- 1 sec-1 . Although only one run was made in N2 the result appears to be independent of the presence of O2 . Stoichiometric data were not obtained for these two olefins.
P ropylene. The first-order decay rate of ozone was measured as a function of propylene concentration (1-16 ppm) at three oxygen levels, i.e ., [O2] < 10, 2 X 10⁵, and 8.5 X 10® ppm. The results are shown in Figure 3. These data were obtained over a period of several months to check for possible random errors associated with the measurements. The O2 effect is not discernible in this figure. Thus a rate constant of 1.25 ± 0.1 X 10- 1 7 cm3 molecule- 1 sec- 1 was derived from the combined data. Another set of runs was made to determine the rate constant from the decay of propylene in excess ozone (1-12 ppm). The first-order decay was observed both in the presence and absence ofO2. The slopes are plotted against O3 concentration in Figure 4. The line drawn in this figure was taken from Figure 3 for comparison. The consistency in rate constants derived from both sets of data suggests that the stoichiometry, A[HC]/A[03], is unity under these conditions. In addition, the stoichiometry was measured directly from the decays of both propylene and ozone in near stoichiometric mixtures, the results of which are given in Table IIA. The data indicate that the stoichiometry is unity and is independent of the O2 concentration.
Figure 1. First-order decays of ozone in various 1-hexene concentrations at 299°K, 760 Torr of air ([0 2] = 2 X 10⁵ ppm), [1-hexene] (ppm) = • , 0; ▲, 1.6; ■ , 3.3; O, 7.8; A 15.7.
Figure 2. First-order decay rate of ozone as a function of excess concentration of 1-hexene (circles) and ethylene (triangle) at 299°K and 760 Torr total pressure, [O2] (ppm): O, A , <10; • , A, 2 X 10⁵.
Figure 3. First-order decay rate of ozone as a function of excess propylene concentration at 299°K and 760 Torr total pressure, [0 2] (ppm): O, <10; # , 2 X 10⁵; ▲, 8.5 X 10s.
tran s-2-B u ten e. The rate of ozone removal in excess trorcs-2 -butene was studied at relatively low concentrations since trans-2 -butene reacts with ozone at a much faster rate than do the terminal olefins. The first-order decay rates of ozone both in N2 and in air are plotted in Figure 5 as a function of fnms-2-butene concentrations from 0.2 to 3 ppm. The data show a linear relationship and the rate constant derived from the slope is 2.75 ± 0.23
The Journal of Physical Chemistry, Vol. 77, No. 21, 1973

2514 D. H. Stedman, C. H. Wu, and H. Niki
Figure 4. First-order decay rate of propylene as a function of excess ozone concentration at 299°K and 760 Torr total pressure, [0 2] (ppm): O, <10; • , 2 X 10⁵.
Figure 5. First-order decay rate of ozone as a function of excess frans-2-butene concentration at 299°K and 760 Torr total pressure, [0 2] (ppm): O, <10; • , 2 X 10⁵.
TABLE II: Stoichiometric Data of the Ozonolysis of Propylene and frans-2-Butene
Diluentat 760 Torr
103 ]o.ppm
[HC],ppm
A [0 ?],ppm
A[HC],ppm
A [H C ]/A [0 3]
A. P ropylene
A ir 1.45 2.5 0.29 0.31 1.07A ir 5.7 0.77 0.35 0.33 0.94n 2 12.2 0.48 0.5 0.45 0.9n 2 1.62 2.72 0.52 0.62 1.19A ir 1.63 0.33 0.07 0.07 1.0n 2 2.0 0.84 0.12 0.13
Av1.081.03
± 0.1 ( t r )a
B. fra n s -2 -B u te n e
A ir 1.05 0.49 0.36 0.39 1.08A ir 0.23 0.74 0.13 0.12 0.92n 2 1.0 0.43 0.33 0.38 1.15n 2 0.80 0.40 0.35 0.39 1.11n 2 0.96 0.2 0.18 0.19 1.05
Av 1.06± 0.06 (ct) ‘
a a is standard deviation.
X 10-16 cm3 molecule-1 sec-1 . The first-order decay of frans-2-butene in excess ozone was also measured in order to compare the rate constants obtained by the two meth
ods and to check the stoichiometry. With [C>3]o = 0.6 and 0.74 ppm in N2, the decay rates of frans-2-butene were 0.26 and 0.32 min-1, respectively. With [Os]o = 0.82 ppm in air, the decay rate was 0.32 min-1 . These results give the same rate constant within experimental error as shown in Figure 5 for O3 decay in excess trans-2-butene. Therefore, a stoichiometry is unity for this reaction. The A[HC]/A[03] ratio was further studied in near equimolar mixtures of ozone and fran.s-2-butene in N2 and in air. These results are shown in Table IIB. Again the stoichiometry for this reaction is unity and independent of oxygen concentration.
Discussion
Linear plots shown in Figures 1-5 demonstrate that the reactions of ozone with simple olefins are first order with respect to both reactants under the present experimental conditions. For propylene and trans-2-butene, the stoichiometry was shown to be unity both by equal decrements of the reactants (Table II) and by identical rate constants for O3 decay in excess [HC] and olefin decay in excess[0 3] (Figures 3, 4, and 5). In addition, all the kinetic data were independent of [02]. Therefore, the results strongly suggest that the rate constants obtained thereby can be assigned to the primary ozonolysis steps of these olefins.
The present results are in general agreement with those obtained by previous workers using long-path ir analysis.4-6 It was pointed out5 that the iodometric method for ozone analysis may be susceptible to the interference from oxidant products. Therefore, part of the results3-7 indicating stoichiometries greater than 1 may be due to such effect.
Vrbaski and Cvetanovic,8 and Wei and Cvetanovic worked at much higher concentrations using competitive product analysis. Their results showed first-order reaction with respect to hydrocarbon and unit stoichiometry in the presence of N2. However, their stoichiometry of 1.4-2.0 in the presence of 0 2, the effect of 0 2 on the relative rate constants, and the low rate constant for frans-2-butene do not agree with the low-concentration studies. The source of these differences is not clear, although it has been suggested4 that zwitterions formed by the initial reaction O3 + RCH = CHR — adduct — RHC+OO- + RCHO may react further with olefins at high concentrations but undergo unimolecular decomposition at lower concentrations. In order to resolve these differences, it is desirable to carry out time-resolved analysis of both reactants and products at both high and low reactant concentrations. Such an attempt is currently underway in this laboratory using a flow system coupled to a quadrupole mass detector.
References and Notes(1 ) P. A. Leighton, "P ho to chem istry of Air P ollution," A ca d e m ic Press,
N ew Y o rk , N. Y „ 1961.(2 ) H. N ik i, E. E. D aby, and B. W ein sto ck , A d v a n . C h e m . S e r . , N o. 113,
16 (1 9 7 2 ).(3) R. D. C ad le and C. S chadt, J . A m e r . C h e m . S o c . , 74 , 6 0 0 2 (1 9 5 2 ).(4) P. L. H anst, E. R. S tephens, W . E. S cott, and R. C. D oerr, "A tm o
spheric O zo n e -O le fin R eaction s ," Th e Franklin Institu te , Philadelphia, Pa., 1958 .
(5) B. E. S a ltzm ann and N. G ilbert, In d . E n g . C h e m ., 51, 1415 (1 9 5 9 ).(6) E. A. S chuck, G . J. D oyle, and N. Endow , Report N o. 3 1 , A ir P ollu
tion Foundation, San M arino , C alif., 1960 .(7) J. J. Bufalini and A. P. A ltshuller, C a n . J . C h e m ., 4 3 , 2 2 4 3 (1 9 6 5 ).(8) T. V rbaski and R. J. C vetanovic, C a n . J . C h e m ., 38 , 1053 , 1063
(1 9 6 0 ).(9) Y . K. W ei and R. J. C vetanovic , C a n . J . C h e m ., 4 1 ,9 1 3 (1 9 6 3 ) .
(10) D. H. S tedm an , E. E. D aby, F. Stuhl, and H. N ik i, J . A i r P o llu t . C o n tr . A s s . , 22 , 2 60 (1 9 7 2 ),
(1 1 ) A. Fontijn , A. J. S abadell, and R. J. R onco, A n a l. C h e m . , 4 2 , 575 (1 9 7 0 ).
The Journal of Physical Chemistry, Vol. 77, No. 21, 1973

Photochemically Induced Reactions in a Chlorine-Ozone System 2515
An Investigation of Photochemically Induced Reactions in a Chlorine-Ozone System at —10.5 and 0 .0°1
Richard W. Davidson and Dale G. Williams*
T h e In s t i t u t e o f P a p e r C h e m is t r y , A p p le to n , W is c o n s in 5 4 9 1 1 ( R e c e iv e d F e b r u a r y 2 1 , 1 9 7 3 )
The reactions of the system were induced by light of wavelength 365-366.5 npi. The products of the system were removed from the reactor and dissolved in water. The water solution was tested for the ionic chlorine species chloride, hypochlorite, chlorite, chlorate, and perchlorate. Dichlorine heptoxide was found to be the only stable chlorine oxide product of the reaction. The formation of dichlorine heptoxide was studied with respect to the light intensity, reactant concentration, presence of diluents, temperature, and total pressure. The observed data and information already in the literature were used to develop a reaction mechanism which was based on the formation of a proposed chlorine atom-ozone complex. Analysis of the mechanism showed that it adhered to the observed data and the use of certain known rate constants allowed the attainment of several rate constants concerning the formation of the chlorine atom-ozone complex.
IntroductionSystems containing chlorine oxides are very complex, as
indicated in reviews by Mellor,2 Farrar,3 Schmeisser and Brandle,4 and Eachus.5 The photochemically induced reactions in a chlorine-ozone system can involve most of the known chlorine oxides: chlorine monoxide (CIO), chlorine dioxide (CIO2), chlorine peroxide (ClOO), chlorine trioxide (CIO3), dichlorine dioxide (CI2O2), dichlorine hexoxide (CI2O6), and dichlorine heptoxide (CI2O7). The last published work describing the system appeared in 1934 and was authored by Norrish and Neville.6 Others who directly studied the photochemical system were Weigert,7 Bonhoeffer,8 Bodenstein, et ai.,9 Bodenstein and Schumacher,10 Allmand and Spinks,11 13 Heidt, et al. , 14 and Byms and Rollefson.15 17 All of this early work used pressure measurement to study the breakdown of ozone to oxygen. The pressure increase was used to establish rates of ozone decomposition and quantum yields despite the evidence for the formation of the higher chlorine oxides, dichlorine hexoxide, and dichlorine heptoxide, which would cause a net decrease in pressure.
The reaction mechanisms proposed by these earlier workers appear somewhat in doubt in light of more recent studies of the photolysis of chlorine in the presence of oxygen18 and knowledge gained in the past 40 years. In order to improve our understanding of the reaction mechanism, the present study focused on the system in light of the chlorine oxide products formed. Wet analytical techniques were used to measure the amounts of ionic chlorine species formed when the chlorine oxide products of the reaction were dissolved in water.Experimental Section
Apparatus. The reactor was made from a Pyrex “ Double-Tough” Drainline Straight Tee (Mooney Brothers Corp., Minneapolis, Minn.) with an inside diameter of 2 in. Pyrex plates were fused to the ends of the straight- through portion. The other opening was fitted with a Teflon manifold which had appropriate taps fcr entrance and exit of gases and liquids and insertion of a thermocouple. The volume of the reactor was 611.6 ± 0.1 ml. The overall inside length was 8.0 in. Chromatronix tubing (Chroma-
tronix, Inc., Berkeley, Calif.) and Hamilton, Kel-F lined valves (Hamilton Co., Inc., Whittier, Calif.) were used in all tubing configurations. The oxygen and chlorine used in the study were Matheson Research grade gases, 99.99% and 99.965%, respectively. Helium (Matheson High Purity grade), when used as a diluent, was first passed through a liquid nitrogen gas trap. The ozone was prepared before each use in an apparatus similar to that described by Griggs and Kaye.19 The reactor was evacuated using a vacuum pump with appropriate traps to prevent contamination of the oil. Initially, the temperature inside the reactor was monitored using a Kel-F coated copper-con- stantan thermocouple. This was eliminated when no heating effect due to the light beam was observed.
The reactor was immersed in a 2.5-gal temperature control bath fitted with double windows to allow passage of the activating light beam without frost buildup. The bath fluid was a 40% by volume solution of ethylene glycol in water which was kept at a constant specific gravity and was cleaned after each experimental run by passing it through activated charcoal and then through a 0.45-upi Millipore filter (Millipore Filter Corp., Bedford, Mass.). Circulation of the fluid was achieved with a Teel submersible pump (Dayton Electric Mfg., Chicago, 111.). Cooling of the bath was achieved through a compressor, appropriate cooling coil, and expansion valve. Temperature control was maintained by the addition of heat through knife heaters using a Precision electronic relay control box in conjunction with a Precision Micro-set differential range thermoregulator ±0.005°F, —35 to +500°F. All metal parts except the stainless steel knife heaters were coated with epoxy to prevent corrosion. Pressure was measured through the use of a calibrated Pace Model P7D differential-type pressure transducer (Whittaker Corp., North Hollywood, Calif.).
The light source was a Hanovia (Engelhard Hanovia, Inc., Newark, N. J.) 673A-10 500-W medium pressure mercury arc lamp used in conjunction with a Hanovia 20651-1 550-W ballast system. The lamp was mounted in an appropriate light housing and cooled by forced air circulation. The optical train consisted of the standard elements with a Corning (Corning Glass Works, Corning, N.
The Journal ot Physical Chemistry, Voi. 77, No. 21, 1973

2516 Richard W. Davidson and Dale G. Williams
Y.) combination filter designed to pass light of wavelength 365 mu (C.S. number 7-83). A light intensity in the order of 3.0 X 10¹⁵ quanta/sec was achieved with the optical train; however, the light beam entering the reactor was divergent. The concentration of chlorine in the system was maintained at a concentration of 8.82 X 10 3 mol/1., which ensured complete absorption of the incident light before the divergent beam reached the walls of the reactor.
Light intensity measurements were made using the potassium ferrioxalate system originally studied by Parker20 and Hatchard and Parker21 and recommended by Calvert and Pitts.22 The procedures for the preparation and use of the actinometer system were taken from Calvert and Pitts.22
Procedures. The experimental procedures included three parts: (1) the initial procedures which consisted of starting up the equipment, preparing the ozone, calibrating the pressure transducer, and measuring the light intensity; (2) the reaction procedures which consisted of introducing the reactant gases to the reactor, initiating the reaction, monitoring the reaction, and terminating the reaction; and (3) recovery of products procedures which consisted of removing the chlorine oxides from the reactor by either dissolving them in carbon tetrachloride or purging with helium, dissolving the products in water, rinsing the reactor with water, and drying the reactor.23
The water solutions of chlorine and reaction products were analyzed using colorimetric techniques for hypochlorite (CIO- ), chlorite (CIO2- ), chlorate (CIO3- ), perchlorate (CIO4- ), and chloride (Cl- ). Ozone was stripped from the solutions by purging with He during removal from the reactor. The chlorine was trapped in 0.1 N NaOH solution. The procedures used for the determination of hypochlorite, chlorite, and chloride were taken from the work of Chen.24 The procedure used for determination of total chlorite and chlorate was a modified form of that given by Chen.24 The modification was used to destroy hypochlorite in the sample as described in ref 23. The procedure used for determination of perchlorate was a modified form of that given by Trautwein and Guyon.26 The modification was used to destroy hypochlorite, chlorite, and chlorate in the sample as described in ref 23.
Results and DiscussionFour of the five ionic chlorine species tested for in the
analysis of the solutions were found. Chlorite was not found in any measurable quantities. The chloride, hypochlorite, and traces of chlorate found were products of the unreacted chlorine. The only ionic chlorine species found in abundance which could be attributed to a chlorine oxide product of the reaction was perchlorate. The perchlorate found was attributed to the hydrolysis of dichlorine heptoxide (CI2O7). The presence of dichlorine hexox- ide (CLOe) was considered negligible since it would hydrolyze to equal quantities of chlorate and perchlorate. Therefore, the following results will be based on the formation of dichlorine heptoxide as the only measurable product of the reaction system.
The apparent absence of detectable amounts of dichlorine hexoxide, which is a red liquid in the temperature range used, is a contradiction of the existing literature6’13’15-17 on systems with comparable reactant concentrations and light intensities; however, the temperatures were 20-30°. A possible explanation for this is that the earlier workers may in fact have had abundant formation
Figure 1. Relationship between light intensity absorbed and product formed at 0° and 10-hr reaction time with helium as the diluent.
of dichlorine heptoxide but it was colored red by a small amount of dichlorine hexoxide. The literature indicates that no quantitative methods were used to determine the amounts of dichlorine hexoxide and dichlorine heptoxide present.
In the system under study, approximately 90% of the light was absorbed in the first 2 in. of the reactor. Therefore, a reaction zone was considered that included the first 3 in. of the reactor with a diameter of 2 in., giving a volume of 155 ml. The rate of formation of the product dichlorine heptoxide is based on this volume. The concentration of chlorine atoms produced is also based on this volume, as is the concentration of short-lived intermediates. The concentrations of the reactants, chlorine and ozone, the diluents, helium and oxygen, and long-lived intermediates and products are based on the volume of the entire reactor. Diffusion calculations indicate that the concentration of the reactants would not be depleted in the reaction zone.
Results of Experimental Runs. All experimental runs, except where noted, were done with equimolar concentrations of ozone, chlorine, and helium, 9.15 ± 0.05 X 10⁻³ M at -10.5° and 8.82 ± 0.05 x 10- 3M at0°.
A number of experimental runs were made using varying light intensities at the same initial reactant concentration and temperature. The results showed a direct proportionality between amount of light absorbed in the system and the amount of product formed as shown in Figure 1. Because of this direct proportionality, all of the data could be corrected to the same light intensity base of3.05 X 1018 quanta/sec.
The data presented in Figure 2 show the results of experimental runs made at two different temperatures. It is seen from these data that there is no temperature dependence over the temperature range examined. The data also show that there is a very long constant rate period
The Journal of Physical Chemistry, Voi. 77, No. 21, 1973

Photochemically Induced Reactions in a Chlorine-Ozone System 2517
TABLE 1: Effect of He and 0 2 as Diluent and of No Diluent at 0.0° for 10-Hr Runs
No.of
runs
Moles of reactant added (103)CI2O7 formed,
mol X 104
Rate of formation Of CI2O7.
m o l/l. sec
Quantum yield of formation
of CI2O70 3 C I 2 He 0 2
2 5 .3 9 5.38 _ _ 0.73 ± 0 .07 1.31 ± 0.13 0.405 5.41 5.38 5.36 — 0.65 ± 0 .07 1.16 ± 0 .13 0.362 5.40 5 .38 — 5.45 0.61 ± 0 .07 1.09 ± 0.13 0.33
TABLE II: Pressure and Concentration Changes in the Reactor during Different Reaction Times at 0.0° and the Same Initial Reactant Concentrations
Time of reaction, hr
4 7 10 15 20 2 6
Change In pressure, mm -0 .6 7 0.40 1.76 1.90 6.75 5.20Change in total mol X 104 -0 .2 4 0.14 0.63 0.68 2.42 1.87C I2O 7 formed, mol X 104 0.35 0.48 0.65 1.14 1.60 1.86
despite qualitative evidence that the concentration of ozone was reduced significantly at 20 hr of reaction time.These data, however, cannot show the presence or absence of an induction period under about 1 hr.
The previous data were taken using helium as a diluent.The data presented in Table I show the effect of the re- -gmoval of helium and also the replacement of helium with 3oxygen for 10-hr runs at 0.0°. The quantities of product |formed are significantly different at the 80% confidence 6level. Both helium and oxygen retard the formation of di- gchlorine heptoxide with the latter being more effective. |
Norrish and Neville6 found no effect on the decomposi- °tion of ozone due to introduction of nitrogen and carbon gdioxide. It is apparent that the effect of introduction of ghelium in this study is small so that the pressure mea- clsurements used by them to follow the reaction may not have been sensitive enough to show a small effect due to nitrogen and carbon dioxide.
The effect of the variation of ozone on the production of dichlorine heptoxide at a constant amount of chlorine,8.83 X 10“ 3 M, and different amounts of helium to give a constant total pressure of 450 mm is shown in the data given in Figure 3. At low concentrations of ozone (less than 3.0 x 10~3 M) there is a greater than zero order relationship with respect to ozone, but as the amount of ozone increases the relationship approaches one of zero order.
During the course of the reaction, a small pressure rise was encountered. This was attributed to the decomposition of ozone to oxygen. However, since preliminary experiments showed that there was negligible thermal and photochemical decomposition of ozone in the absence of chlorine, the decomposition of ozone to oxygen in the reaction system must involve chlorine or some of the chlorine oxides formed. The data given in Table II indicate that the increase in total moles in the system, under most conditions, was less than the moles of dichlorine heptoxide formed. These observations have been interpreted to mean that the formation of the final product, dichlorine heptoxide, is accomplished through reactions which give no net change in total moles. The increase in pressure has then been assumed to be due to side reactions which cause breakdown of chlorine oxides to chlorine and oxygen or to direct decomposition of ozone catalyzed by chlorine atoms or reactive chlorine oxides. To further confuse the pressure measurement data, a net decrease in total moles was encountered during early stages of the reaction (first 4
Figure 2. Motes of dichlorine heptoxide formed vs. time at — 10.5 and 0.0° with helium as the diluent.
hr). This was believed to be due to reaction of dichlorine heptoxide with water absorbed on the surface of the reactor, accounting for the observed formation of a white film.
The quantum yield of CI2O7 production has been shown to be fairly constant over a period of a run and unaffected by the temperature as shown by the data listed in Table III. The effect of diluent on the quantum yield is shown by the data in Table I. The direct proportionality between dichlorine heptoxide formation and light intensity also points out that the quantum yield of CI2O7 production is independent of light intensity.
Because the concentration of ozone at the end of a reaction was not measured, the rate and quantum yield of ozone decomposition was estimated based on the amount of dichlorine heptoxide formed and the pressure rise in the system. These estimates showed that the quantum yield of ozone decomposition for the O3-CI3, C>3-C l2-He, and
The Journal of Physical Chemistry, Vol. 71, No. 21, 1973

2518 Richard W. Davidson and Dale G. Williams
TABLE I I I : Q uantum Y ie ld o f C I2O 7 Fo rm a tion at - 1 0 .5 and 0.0°
Temp, °C
Time of reaction,
hr
Moles of Quantum yield CI2O7 formed of CI2O7
X 104 formation
- 1 0 . 5 4 . 0 0.31 0.428 . 0 0.61 0.42
14.0 1.18 0.4620.0 1.48 0.4126.0 1.77 0.37
A V 0.42
0 .0 4.0 0.36 0.497.0 0.48 0.38
10.0 0 .65 0.3615.0 1.14 0.4220.0 1.60 0.4426 .0 1.86 0.40
Av 0.42
O3-CI2-O 2 systems were 3.82, 2.72, and 3.06, respectively.These quantum yields are within the magnitude expected for the system based on the data of earlier workers.6 4 3
The preceding results on the formation of dichlorine heptoxide have been interpreted as follows.
1 . The lack of temperature dependence, the magnitude of the quantum yield, and the direct proportionality between product formation and light intensity indicates that dichlorine heptoxide is formed in a nonchain stepwise manner. Since no high-energy atoms are produced in the photodissociation of chlorine, 18 the reactions leading to dichlorine heptoxide formation must have low activation energies.
2. The slight decrease of dichlorine heptoxide formation due to introduction of diluent is due to increased recombination of chlorine atoms because of the additional third bodies. Although decomposition of simple radicals, deactivation of “hot” radicals, and lower diffusion rates may be factors they are considered to be of minor importance.
3. The quantum yield of dichlorine heptoxide formation of 0.3 to 0.4 indicates certain reactions in the system that lead to inefficient use of the chlorine atoms formed. This again has been attributed to chlorine atom recombination.
4. The rather low pressure increase in the system indicates the net mole change in the reaction is essentially zero. Thus, every mole of ozone used in forming CI2O7
produces one mole of O2 .5. The relationship of dichlorine heptoxide formation
with ozone concentration indicates an approach to a zero- order relationship. This interpretation is supported further by the observation of a rather long constant rate portion of the product us. time curve in spite of decreasing ozone concentration.
6 . With no, or relatively short, induction period, there is little time delay in building up the equilibrium concentrations of necessary intermediates for stepwise formation of product indicating that these intermediates are shortlived.
Development of a Reaction Mechanism. The reaction mechanism has been developed based on the observations of the earlier workers and those of the present study. The major points that must be adhered to are the following:(1 ) the mechanism must account for a change in the light intensity relationship for ozone decomposition from one
proportional to light intensity at relatively high concentrations of ozone, chlorine, and oxygen to one approaching an / 0 5 relationship when the concentrations of chlorine and oxygen are low;12 43 (2) the mechanism must account for the chain breakdown of ozone when the chlorine and oxygen concentrations are low and a zero-order relationship with respect to ozone when the concentrations of chlorine and ozygen are high;12-13 (3) dichlorine heptoxide must be formed in a stepwise nonchain process; (4) reactions must be occurring that lead to recombination of chlorine atoms; and (5) formation of dichlorine heptoxide is accomplished with no net change in moles in the system.
The first step in the proposed mechanism is the formation of chlorine atoms due to absorption of a quantum of lightCl2(l2 g+) + k * — ► C12(37t0+u) — - Cl(2P 3/2) + Cl(2P 1/2)
(1)For the interest of simplicity, the chlorine atoms formed will be considered to be identical despite the small energy difference between the singlet and triplet states, 2.52 kcal/mol, and will be represented by the symbol Cl.
The second step in the mechanism is the proposed formation of a chlorine atom-ozone complex which is stabilized by a third-body collision
Cl + 0 3 + M — > CIOOO + M (2)
This is similar in nature to the formation of chlorine peroxide (ClOO) when a chlorine atom and oxygen come together.18 The third body would be those species in reasonably high concentrations, such as chlorine, ozone, helium, and oxygen. Under conditions where the total pressure is so low that the chlorine atom-ozone complex would not experience a stabilizing third body collision, it could decompose as
Cl + Os — »► CIOOO* — *► CIO + 0 2 (3)
leading to a chain decomposition of ozone with CIO as the chain carrier6
CIO + 0 3 — ► Cl + 202 (4)
The third step in the mechanism is the formation of chlorine dioxide
CIOOO + 0 3 — *► C102 + 202 (5)The chlorine dioxide quickly reacts to form chlorine trioxide
CIO, + 0 3 — *- C103 + 0 2 (6)
which is a common preparative method for chlorine trioxide. The reaction of chlorine monoxide and ozone is not a major source of chlorine dioxide formation since the reaction of eq 4 is favored thermodynamically26 and since increased oxygen concentrations inhibit dichlorine heptoxide formation (see Table I) even though the CIO concentration would be increased.18
The final step in the mechanism is the reaction of chlorine trioxide with ozone to form a complex, which is stabilized by the distribution of the collision energy over many bonds, followed by reaction with another chlorine trioxide molecule with the net reaction27
2C103 + 03 — ► C120 7 + O, (7)
A very similar sequence of reactions, involving the production of chlorine tetroxide15 rather than the complex,
The Journal of Physical Chemistry, Vol. 77, No. 21, 1973

Photochemically Induced Reactions in a Chlorine-Ozone System 2519
TABLE IV: Estimated Rate Constants for the Indicated Reaction of Eq 2
Reaction“ Rate constant
Cl + 0 3 + 0 2 -«-CIOOO + 0 2 5.0 X 10⁴ l.2/m o l2 secCl + 0 3 + He —*■ CIOOO + He <1.0 X 10² l.2/m o l2 secCl + 0 3 + M' —► CIOOO + M' 2.2 X 10⁴ l.2/m o l2 sec
a M' Is the sum of the chlorine and ozone concentrations when their ratio is one.
was discounted because of the evidence for the very short life of the former. Several other routes for the formation of dichlorine heptoxide have been suggested28"31 and were discarded as explained in ref 23.
Of the many side reactions possible, only the following were considered as reasonable:23 (1) the recombination of chlorine atoms
and2C1 + M — ► CL + M
Clwall y2ci2
(8)
(9)
where M are the high concentration species oxygen,18 chlorine, and helium, and (2) the breakdown of chlorinemonoxide to chlorine and oxygen18
CIO + CIO — ■* Cl + ClOO (1 0 )
Cl + ClOO — CIO + CIO (11 )
andCl + ClOO — >- CL + 0 2 (1 2 )
To summarize: product formation is through reactions 1, 2, and 5-7; ozone decomposition is by reactions 3-7; and side reactions are reactions 8- 12.
Using the steady-state assumption for Cl, CIO, ClOO, CIO2, CIOOO, and CIO3 the following rate expressions result
d[C(j2° 7] = AklOjM]/2B (13)
and
_ = [A / B ]i(7/2)^ [0 3][M] + k3[03]\ + * 4[C10][0 3]dt ' (14)
where A = 2/abs + fe4[C10][0 3] and B = &2[03][M] + 2- fes[Cl][M] + kg. When the third bodies oxygen and helium are absent and the chlorine concentration is low, there is very little dichlorine heptoxide formation so that the rate of ozone loss reduces to an labs0 5 relationship through the chlorine monoxide concentration which is consistent with the literature. When the third bodies oxygen and helium are present and the chlorine concentration is high, as in the present study, reactions 3 and 4 are negligible. Both rate expressions become directly proportional to 7abs- This is consistent with the observed direct proportionality of product concentration and independence of quantum yield with light intensity. The rate of dichlorine heptoxide formation would also go from first order with respect to ozone at very low ozone concentrations to that approaching zero order at high concentrations, which is consistent with the observed data.
Using the data obtained in the present study and the rate expression for product formation, eq 13, estimates of the rate constants for the reactions represented by eq 2 were made by a trial and error procedure.23 The results
X<_)a
-------------1_______ I________ I________ I0 5 10 15 20
OZONE ADDED, m o le s /lite r ( I0 3)
Figure 3. Moles of dlchlorine heptoxide formed vs. moles per liter of ozone added for 10-hr runs at 0.0° for 8.83 mol/l. of chlorine at a total pressure of 450 mm established by the addition of helium.
are presented in Table IV. The rate constant for He is negligible compared to O2 or NT. The rate constants for k% and kg required to make these calculations were estimated from the literature and are as follows: when M is chlorine, helium, and oxygen, the contributions to ks are 2.0 x 10¹⁰, 4.25 x 10⁹, and 2.05 x 10¹¹ l.2/m ol2 sec, respectively;18-32 kg is 0.93 sec" 1 using the surface recombination coefficient equation given by Herron34 and reasonable values of the necessary parameters.23-33 It is of interest to note that although oxygen is a good third body for the chlorine atom-ozone complex it is also a very good third body for chlorine atom recombination.
The integrated form of the dichlorine heptoxide rate of formation equation under the conditions represented in Figure 2 is given in the figure. A reasonable agreement with the observed data is evident. In addition, the quantum yields calculated from the integrated equation were in reasonable agreement with the observed data.
ConclusionsThe only chlorine oxide product of the reaction system
was found to be dichlorine heptoxide, in contradiction to that reported in the literature. It is proposed that this product is formed through a stepwise nonchain series of reactions involving ozone and a number of intermediate chlorine oxides. The key to the mechanism is the formation of a chlorine atom-ozone complex, CIOOO. which can be stabilized by a third body allowing further stepwise formation of dichlorine heptoxide.
The development of rate expressions from the mechanism shows that the mechanism accounts for essentially all of the experimental evidence that has been established about the system. The mechanism also indicates that third bodies can both speed up and slow down the formation of dichlorine heptoxide, increasing it by increasing the chlorine atom-ozone complex concentration and decreasing it by lowering the chlorine atom concentration through chlorine atom recombination reactions. In either case, chlorine and ozone, and oxygen were shown to be very effective third bodies while helium was shown to be much less effective.
The Journal of Physical Chemistry, Voi. 77. No. 21, 1973

2520 K. Kimura, Y. Achiba, and S. Katsumata
Acknowledgments. The authors wish to express their appreciation to other members of the Ph.D. Advisory Com m ittee, Drs. R. H. A talla and G. A. Nicholls, for their many helpful discussions during the course of this research. R. W. D. acknowledges with thanks the fellowship support from The Institute of Paper Chemistry.
References and Notes(1) A portion of a thesis submitted by R. W. Davidson in partial fulfill
ment of the requirements of The Institute of Paper Chemistry for the degree of Doctor of Philosophy from Lawrence University, Appleton, Wise., June 1972. Present address Is S. D. Warren Co., Westbrook, Me.
(2) Mellor's “Comprehensive Treatise on Inorganic and Theoretical Chemistry," Suppl. II, Part I, Longmans, Green and Co., New York, N. Y., 1956, p 1153.
(3) R. L. Farrar, Jr., “Safe Handling of Chlorine Trifluoride and the Chemistry of the Chlorine Oxides and Oxyfluorides,” AEC Research and Development Report, K-1416, 1960, p 33.
(4) M. Schmeisser and K. Brandle, A d v a n . In o r g . C h e m . R a d io c h e m . , 5, 41 (1963).
(5) R. S. Eachus, L e ic e s t e r C h e m . R e v ., 10, 29 (1969).(6 ) R. G. W. Norrish and G. H. J. Neville, J. C h e m . S o c . , 1864 (1934).(7) F. Weigert, A n n . P h y s ., 24, 243 (1907).(8 ) K. F. Bonhoeffer, Z. P h y s ., 13 , 94 (1923).(9) M. Bodenstein, P. Harteck, and E. Padelt, Z. A n o rg . A l lg . C h e m .,
147, 233 (1925).(10) M. Bodenstein and H. J. Schumacher, Z. P h y s . C h e m ., B5, 233
(1929).(11) A. J. Allmand and J. W. T. Spinks, N a tu r e ( L o n d o n ) , 124, 651
(1929).(12) A.J. Allmand and J. W. T. Spinks, J. C h e m . S o c ., 1652 (1931),
(13) A.J. Allmand and J. W. T. Spinks, J . C h e m . S o c . , 599 (1932).(14) L. J. Heldt, G. B. Kistlakowsky, and G. S. Forbes, J. A m e r . C h e m .
S o c .. 55, 223 (1933).(15) G. K. Rollefson and A. C. Byrns, J. A m e r . C h e m . S o c . , 56, 364
(1934).(16) A. C. Byrns and G. K. Rollefson, J . A m e r . C h e m . S o c . , 56, 1250
(1934).(17) A. C. Byrns and G. K. Rollefson, J. A m e r . C h e m . S o c . , 5 6 , 2245
(1934).(18) H. S. Johnston, E. D. Morris, Jr., and J. Van den Bogaerde, J.
A m e r . C h e m . S o c . , 91, 7712 (1969).(19) M. Griggs and S. Kaye, R e v . S e i. In s t r u m . , 39, 1685 (1968).(20) C. A. Parker, P ro c . R o y . S o c ., S e r . A , 220, 104 (1953).(21) C. G. Hatchard and C. A. Parker, P ro c . R o y . S o c . , S e r . A . 235, 518
(1956) .(22) J. G. Calvert and J. N. Pitts, "Photochemistry," Wiley, New York,
N. Y., 1966, p899.(23) R. W. Davidson, Doctor's Dissertation, The Institute of Paper
Chemistry, Appleton, Wis., 1972, p 208.(24) T.-h. Chen, A n a l. C h e m ., 39 , 804 (1967).(25) N. L. Trautwein and J. C. Guyon, A n a l. C h e m ., 40, 639 (1968).(26) "JANAF Thermochemical Tables,” U. S. Government Printing Of
fice, U. S. National Bureau of Standards, Washington, D. C., 1965.(27) C. F. Goodeve and A. E. L. Marsh, J. C h e m . S o c .. 1332 (1939).(28) H. J. Schumacher, Z. P h y s . C h e m . ( F r a n k fu r t a m M a in ) , 13, 353
(1957) .(29) A. J. Arvia, W. H. Basualdo, and H. J. Schumacher, Z. A n o rg . A l lg .
C h e m ., 286,58 (1956),(30) J. W. T. Spinks and H. Taube, J. A m e r . C h e m . S o c . . 59 , 1155
(1937).(31) J. W. T. Spinks and H. Taube, C a n . J. R e s ., 15B , 499 (1937).(32) E. Hutton and M. Wright, T ra n s . F a r a d a y S o c . , 61, 78 (1965).(33) P. G. Ashmore, A. J. Parker, and D. E. Sterne, T ra n s . F a r a d a y
S o c ., 6 7 , 3081 (1971).(34) J. T. Herron, J. P h y s . C h e m ., 67, 2864 (1963).
Ionic Photodissociation of Weak Charge-Transfer Complexes. Donor Acetonitrile and Acceptor Tetracyanoethylene and Iodine
Katsumi Kimura,* Yohji Achiba, and Shunji Katsumata
P h y s ic a l C h e m is t r y L a b o ra to r y , I n s t i tu t e o f A p p l ie d E le c t r ic i t y , H o k k a id o U n iv e r s it y , S a p p o r o 0 6 0 , J a p a n ( R e c e iv e d A p r i l 2 4 , 1 9 7 3 )
P u b l ic a t io n c o s ts a s s is te d b y th e I n s t i tu te o t A p p l ie d E le c t r ic i t y , H o k k a id o U n iv e r s i t y
Ionic photodissociations of weak charge-transfer complexes of acetonitrile with tetracyanoethylene (TCNE) and iodine have been studied spectroscopically. From quantitative measurements of spectral intensity, it was found that acetonitrile and TCNE form a 1:1 charge-transfer complex in which acetonitrile works as an electron donor toward TCNE. Flash-irradiation in the charge-transfer band gave rise to a transient species assigned to the TCNE anion. It is concluded therefore that ionic photodissociation takes place via the excited state of the charge-transfer complex. This experimental evidence has revealed the mechanism of the photoinduced anion formation of TCNE in acetonitrile reported by Sofue and Nagakura. The known charge-transfer complex of the donor acetonitrile and the acceptor iodine was also flash-irradiated in solution, and as a result the ionic photodissociation was found to occur forming a transient species attributed to the I2 anion.
IntroductionIt has been reported by Sofue and Nagakura1 that the
photoirradiation of solutions of tetracyanoethylene (TCNE) and tetracyanobenzene (TCNB) in acetonitrile gives rise to the corresponding anion radicals even in the absence of a definite electron donor. No explanation has so far been given for the mechanism of this photoinduced anion formation.
The photoinduced TCNE- formation in ethereal solvents such as tetrahydrofuran (THF) has been studied by several workers.2 7 In our preliminary flash-photolysis work8 of TCNE in dichloromethane solution containing a small amount of acetonitrile, a transient absorption spectrum attributable to TCNE- was obtained. This suggests that the photoinduced anion formation results either from an exciplex which was first proposed by Weller and his
The Journal of Physical Chemistry, Vol. 77, No. 21, 1973

Ionic Photodissociation of Weak Charge-Transfer Complexes 2521
collaborators9 or from the excited state of a charge-transfer (CT) complex of TCNE with acetonitrile. In order to clarify the mechanism of the photoinduced TCNE- formation in acetonitrile, it should first be investigated if TCNE certainly forms a CT complex with acetonitrile in its ground state. According to a spectroscopic study by Popov and Deskin,10 an acetonitrile molecule forms CT complexes with iodine and iodine halides (IC1 and IBr). These complexes seem to be only a few examples in which acetonitrile works as an electron donor.
The present paper is concerned first with evidence of a complex formation between acetonitrile and TCNE and secondly with evidence of the ionic photodissociation of acetonitrile CT complexes with TCNE as well as with iodine. The present work provides typical examples of ionic photodissociation of weak CT complexes of acetonitrile.
Experimental SectionCommercial material of TCNE was purified by vacuum
sublimation. Iodine was sublimed once. Acetonitrile was refluxed over P2O5 for several hours and finally distilled. Dichloromethane and 1,2-dichloroethane were purified by shaking with dilute sulfuric acid (10%), with aqueous alkaline solution (10%), and finally with water and distilled after drying over CaCl2. In order to study electronic absorption of the acetonitrile-TCNE system, a series of solutions were prepared in dichloromethane with the concentration of acetonitrile ranging from 0.15 to 1.00 M and TCNE of about 4.6 x 10- 4 M. Electronic absorption measurements were carried out on a Cary 15 spectrophotometer.
Flash photolysis experiments were performed with an apparatus equipped in our laboratory,11 a quartz cell 12 cm long being used. The duration times of the photolysis- flash and spectro-flash argon lamps were 5.0 and 3.5 ¿¿sec, respectively. Transient absorption spectra were recorded photographically using a Shimazu grating spectrograph, Model GE-100. Solutions used in the present flash experiments were degassed with a freeze-pump-thaw technique except for those used in the study of oxygen effect.
Low-temperature photoirradiations were carried out in acetonitrile rigid matrices at 77°K with a 250-W high- pressure mercury lamp, using a 0.1-cm quartz cell capable of measuring absorption spectra of somewhat opaque matrices, with a neutral filter. The present low-temperature irradiation technique is essentially the same as that used previously.12Results and Discussion
Acetonitrile-TCNE Complex. Electronic absorption spectra of dichloromethane solutions containing about 4.6 X 10- 4 M TCNE and acetonitrile up to 1.0 M are shown in Figure la, from which it is seen that a new broad band appears in the range 320-450 nm by increasing acetonitrile concentration. This band was distinctly observed only in the degassed solutions. Such an absoprtion band has not been reported so far. The change in the intensity of the 320-450-nm band was found to be interpreted in terms of a 1:1 complex between acetonitrile and TCNE by applying the Benesi-Hildebrand method13 and by using the following approximate equation
/[TCNE]/Dct = l/ecA T[CH3CN] + l/eCT (Dwhere DcT and eCT denote the optical density and the molar extinction coefficient, respectively, [TCNE] and [CH3CN] are the concentrations of TCNE and acetoni-
W A V E L E N G T H ( nm )
Figure 1. a, Dependence of the absorption spectra of d ich loromethane solutions containing aceton itrile and TCNE upon the acetonitrile concentration (a ir-free): 1, 4.69 X 10~4 At TCNE; 2, 4.64 X 10“ 4 M TCNE and 0.20 M CH3CN; 3, 4.60 X 10⁻⁴ M TCNE and 0.49 M CH3CN; 4, 4.49 X 10⁻⁴ M TCNE and 0.95 M CH3CN. b, Benesi-H ildebrand plot for the acetonitrile-TC N E complex.
TABLE I: Comparison of Absorption Maxima, Molar Extinction Coefficients,and Equilibrium Constants for Charge-Transfer Complexes of TCNE
^CT max. CCT. I./ kCT.nm mol cm l./mol
Acetonitrile-TCNE 360 55 1.86Ether-TCNE14 335 — 1.54Tetrahydrofuran-TCNE15 318 3125 1.15 ± 0.09D ioxane-TCNE15 350 1859 2.13 ± 0.13
TABLE II: Comparison of Equilibrium Constants forCharge-Transfer Complexes of Acetonitrile
Act , l./mol
Acetonitrile-TCNE 1.86A ce ton trile -IC I10 6.9 ± 0.3A ce to n itrile -IB r10 1.40 :L 0.03A c e to n itr i le -L 10 0.57 :t 0.02
trile, respectively, kCT is the charge-transfer equilibrium constant, and l is the path length. As shown in Figure lb, a plot of i[TCNEJ/DCT u s . 1/[CH3CN] indicates a satisfactory straight line, yielding kCT = 1.86 l./mol at 25° from the slope (1/£CT&Ct ) as well as tCT = 55 l./mol cm from the intercept (1/«CT). This kCT value considerably resembles that for the ether-TCNE complex reported by Merrifield and Phillips14 and those for the tetrahydrofu- ran-TCNE and dioxane-TCNE complexes by Vars, et al. , 15 as shown in Table I, whereas the cCT value of the acetonitrile-TCNE complex is much less than those of the others. The acetonitrile-TCNE complex may be one of rare cases in which the acetonitrile molecule functions as an electron donor. This CT complex belongs to the same category as those found by Popov and Deskin10 between acetonitrile and the halides (I2, IC1, and IBr), their kCr values being shown for comparison in Table II. According to Klaboe,16 these halogen compounds also form stable 1:1 complexes with propionitrile which works as an electron donor toward the halides.
Flash Photolysis of Acetonitrile-TCNE Complex. Sofue and Nagakura1 have reported that flash irradiation of rather concentrated solution of TCNE in acetonitrile gives rise to the long-lived TCNE- species detectable by an ordinary absorption measurement. We carried out the fol-
The Journal of Physical Chemistry, Voi. 17, No. 21, 1973
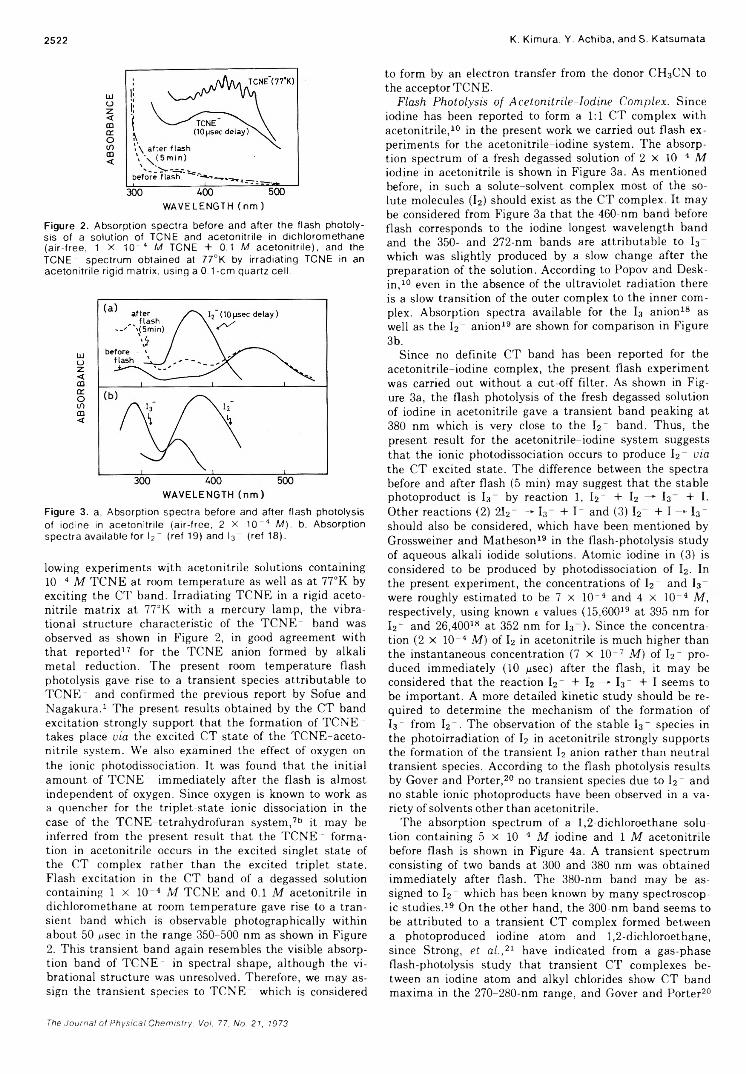
2522 K. Kimura, Y. Achiba, and S. Katsumata
W A V E L E N G T H ( n m )
Figure 2. Absorption spectra before and after the flash photolysis of a solution of TONE and acetonitrile in dichloromethane (air-free, 1 X 1 0 "4 M TCNE + 0.1 M acetonitrile), and the TCNE" spectrum obtained at 77°K by irradiating TCNE in an acetonitrile rigid matrix, using a 0.1-cm quartz cell.
Figure 3. a, Absorption spectra before and after flash photolysis of iodine in acetonitrile (air-free, 2 X 1 0 "4 M). b, Absorption spectra available for l2~ (ref 19) and l3" (ref 18).
lowing experiments with acetonitrile solutions containing 10“ 4 M TCNE at room temperature as well as at 77°K by exciting the CT band. Irradiating TCNE in a rigid acetonitrile matrix at 773K with a mercury lamp, the vibrational structure characteristic of the TCNE- band was observed as shown in Figure 2, in good agreement with that reported17 for the TCNE anion formed by alkali metal reduction. The present room temperature flash photolysis gave rise to a transient species attributable to TCNE" and confirmed the previous report by Sofue and Nagakura.1 The present results obtained by the CT band excitation strongly support that the formation of TCNE" takes place via the excited CT state of the TCNE-aceto- nitrile system. We also examined the effect of oxygen on the ionic photodissociation. It was found that the initial amount of TCNE" immediately after the flash is almost independent of oxygen. Since oxygen is known to work as a quencher for the triplet-state ionic dissociation in the case of the TCNE-tetrahydrofuran system,7b it may be inferred from the present result that the TCNE" formation in acetonitrile occurs in the excited singlet state of the CT complex rather than the excited triplet state. Flash excitation in the CT band of a degassed solution containing 1 X 10 4 M TCNE and 0.1 M acetonitrile in dichloromethane at room temperature gave rise to a transient band which is observable photographically within about 50 ¿¿sec in the range 350-500 nm as shown in Figure2. This transient band again resembles the visible absorption band of TCNE" in spectral shape, although the vibrational structure was unresolved. Therefore, we may assign the transient species to TCNE" which is considered
to form by an electron transfer from the donor CH 3CN to the acceptor TCNE.
Flash Photolysis of Acetonitrile-Iodine Complex. Since iodine has been reported to form a 1:1 CT complex with acetonitrile,10 in the present work we carried out flash experiments for the acetonitrile-iodine system. The absorption spectrum of a fresh degassed solution of 2 X 10" 4 M iodine in acetonitrile is shown in Figure 3a. As mentioned before, in such a solute-solvent complex most of the solute molecules (I2) should exist as the CT complex. It may be considered from Figure 3a that the 460-nm band before flash corresponds to the iodine longest wavelength band and the 350- and 272-nm bands are attributable to I3 which was slightly produced by a slow change after the preparation of the solution. According to Popov and Deskin,10 even in the absence of the ultraviolet radiation there is a slow transition of the outer complex to the inner complex. Absorption spectra available for the I3 anion18 as well as the I2" anion19 are shown for comparison in Figure 3b.
Since no definite CT band has been reported for the acetonitrile-iodine complex, the present flash experiment was carried out without a cut-off filter. As shown in Figure 3a, the flash photolysis of the fresh degassed solution of iodine in acetonitrile gave a transient band peaking at 380 nm which is very close to the I2" band. Thus, the present result for the acetonitrile-iodine system suggests that the ionic photodissociation occurs to produce I2" via the CT excited state. The difference between the spectra before and after flash (5 min) may suggest that the stable photoproduct is I3" by reaction 1, I2" -F I2 — I3 + I. Other reactions (2) 2I2" —► I3" + I" and (3) I2 + I —*• I3" should also be considered, which have been mentioned by Grossweiner and Matheson19 in the flash-photolysis study of aqueous alkali iodide solutions. Atomic iodine in (3) is considered to be produced by photodissociation of I2. In the present experiment, the concentrations of I2" and I3 were roughly estimated to be 7 x 10" 4 and 4 x 10" 4 M, respectively, using known t values (15,60019 at 395 nm for I2" and 26,40018 at 352 nm for I3 ). Since the concentration (2 X 10" 4 M) of I2 in acetonitrile is much higher than the instantaneous concentration (7 X 10" 7 M) of I2" produced immediately (10 /¿sec) after the flash, it may be considered that the reaction I2" + I2 —► I3" + I seems to be important. A more detailed kinetic study should be required to determine the mechanism of the formation of I3" from I2". The observation of the stable I3" species in the photoirradiation of I2 in acetonitrile strongly supports the formation of the transient I2 anion rather than neutral transient species. According to the flash photolysis results by Gover and Porter,20 no transient species due to I2" and no stable ionic photoproducts have been observed in a variety of solvents other than acetonitrile.
The absorption spectrum of a 1,2-dichloroethane solution containing 5 X 10" 4 M iodine and 1 M acetonitrile before flash is shown in Figure 4a. A transient spectrum consisting of two bands at 300 and 380 nm was obtained immediately after flash. The 380-nm band may be assigned to I2" which has been known by many spectroscopic studies.19 On the other hand, the 300-nm band seems to be attributed to a transient CT complex formed between a photoproduced iodine atom and 1,2-dichloroethane, since Strong, et al. , 21 have indicated from a gas-phase flash-photolysis study that transient CT complexes between an iodine atom and alkyl chlorides show CT band maxima in the 270-280-nm range, and Gover and Porter20
The Journal of Physical Chemistry. Vol. 77, No. 21, 1973

Ionic Photodissociation of Weak Charge-Transfer Complexes 2523
300 400 500WAVELENGTH (nm)
Figure 4. Absorption spectra before and after flash photolysis of degassed 1,2-dichloroethane solutions containing (a) 5 X 10⁻⁴ M iodine and 1 M acetonitrile and (b) 5 X 10“ 4 M iodine.
350 400 450 500 550
60Ö 65Ö TOO 75Ö 800WAVELENGTH (nm )
Figure 5. Transient absorption spectra (------- ) obtained immediately after the flash photolysis of (a) TCNB, (b) DCNB, (c) PMDA, and (d) TCNQ in acetonitrile (air-free, about 10 ‘ 4 M)at room temperature, and ordinary absorption spectra (--------•— ) obtained from these compounds by uv irradiation in an acetonitrile matrix a 77°K. For comparison, the absorptionspectra (....... ) available for the anion radicals are shown: (a)TCNB- (ref 23), (b) DCNB- (ref 23), (c) PMDA- (ref 24), and (d) TCNQ- (ref 25).
have also observed CT complexes of iodine atom with a variety of solvents in the flash photolysis of h-
When a 1,2-dichloroethane solution containing 5 X 10⁻⁴ M iodine (without mixing acetonitrile) was flash-irradiated under the same condition, a transient band peaking at 300 nm was observed within 100 psec, but no band due to I2_ , as shown in Figure 4b. Thus, it may be reasonably considered that the 300-nm bands in Figure 4a and b are probably due to the iodine atom-1,2-dichloroethane complex.
Very recently, Fornier, et a l . ,22 have carried out a laser flash photolysis of I2 in hydroxylic solvents and have indi
cated that the transient absorptions in the range 250 to 400 nm are attributed to iodine atom-solvent CT complexes and the 385-nm transient absorption is reassigned to the I2 - radical anion. These results seem to support the present interpretation for the I2- formation in acetonitrile.
Photoinduced Anion Formation of Other Acceptors. Further uv irradiation experiments were carried out with acetonitrile solutions of 1,2,4,5-tetracyanobenzene (TCNB), p-dicyanobenzene (DCNB), pyromellitic dianhydride (PMDA), and tetracyano-p-quinodimethane (TCNQ) at room temperature as well as at 77°K. Transient spectra obtained in the room-temperature flash photolysis of these compounds immediately after the flash are shown by solid curves in Figure 5, in good accord with the absorption spectra of the anions (broken curves) obtained by other workers.23 25 Therefore, the transient species may be attributed to the corresponding anions. (The transient spectrum obtained for TCNQ is not shown in Figure 5 because of somewhat uncertainty in spectral shape. However, its absorption region was very similar to that of the anion.) The low-temperature uv irradiation gave rise to the anion species stable in rigid acetonitrile matrices at 77°K. The absorption spectra of the anions thus obtained are shown b y ------ in Figure 5. All the experimental results obtained here for TCNB, DCNB, PMDA, and TCNQ indicate that photoinduced anion formations take place in acetonitrile at room temperature as well as at 77°K. We consider that these anion formations in acetonitrile proceed via the CT excited states rather than the ex- ciplexes.
References and Notes
(1 ) M . S ofue and S . N ag ak u ra , B u ll. C h e m . S o c . J a p . . 3 8 , 1048 (1 9 6 5 ).(2 ) C . L ag ercran tz and M . Y h lan d , A c fa C h e m . S c a n d . . 16 , 1043 , 1799,
1807 (1 9 6 2 ).(3 ) R. L. W ard , J . C h e m . P h y s ., 3 9 ,8 5 2 (1 9 6 3 ) .(4 ) D . F. Ilten and M . C alvin , J . C h e m . P h y s .. 4 2 , 3 7 6 0 (1 9 6 5 ) .(5 ) F. E. S tew art and E. E isner, M o l. P h y s ., 12 , 173 (1 9 6 7 ) .(6 ) R. T . Keys and W . R. C arp e r, J . C h e m . P h y s .. 47 , 3 6 8 2 (1 9 6 7 ).(7 ) (a ) Y . A ch iba , S . K atsum ata , and K. K im ura, B u ll. C h e m . S o c . J a p . .
4 5 , 1 27 2 (1 9 7 2 ); (b) Y . A ch iba, S. K atsum ata , and K. K im ura, C h e m . P h y s . L e t t . , 13 , 2 1 3 (1 9 7 2 ); (c ) Y . A ch iba and K. K im ura, ib id . , 19 , 45 (1 9 7 3 ) .
(8 ) Presented by Y . A ch iba , S. K atsum ata , and K. K im ura, at th e 24th A nnual M eeting of C h e m ica l S oc ie ty o f Jap an , O saka , 1971 .
(9 ) H. Leonhard t and A . W e ller, Z. P h y s . C h e m . ( F r a n k fu r t a m M a in ) . 2 9 , 2 77 (1 9 6 1 ); B e r . B u n s e n g e s . P h y s . C h e m ., 6 7 , 791 (1 9 6 3 ).
(1 0 ) A . I. Popov and W . A. D esk in , J . A m e r . C h e m . S o c . , 8 0 , 2976(1 9 5 8 ) .
(1 1 ) N . K an am aru and K. K im ura, M o l. P h o to c h e m . . in press.(1 2 ) K. K im ura, K. Y o sh inaga, and H . T sub om ura, J . P h y s . C h e m .. 71 ,
4 4 8 5 (1 9 6 7 ).(1 3 ) H. A. Benesi and J. H. H ildebrand , J . A m e r . C h e m . S o c . . 7 1 , 2 70 3
(1 9 4 9 ).(1 4 ) R. E. M errifie ld and W . D . Phillips, J . A m e r . C h e m . S o c . . 8 0 , 2778
(1 9 5 8 ) .(1 5 ) R. V ars , L. A. Tripp , and L. W . P ickett, J . P h y s . C h e m .. 66 , 1754
(1 9 6 2 ) .(1 6 ) P. K laboe, J . A m e r . C h e m . S o c . . 8 5 , 871 (1 9 6 3 ).(1 7 ) W . D . Phillips, J. C . R ow ell, and S. I. W e lssm an , J. C h e m . P h y s ..
33, 6 26 (1 9 6 0 ).(1 8 ) D . M eyerste in and A . T re ln in , T ra n s . F a r a d a y Soc., 5 9 , 1114
( 1 9 6 3 ) .(1 9 ) For instance, s e e L. I. G rossw ein er and M . S. M ath eso n , J . P h y s .
C h e m .. 6 1 , 1089 (1 9 5 7 ); A. Za lio u s -G itter and A. Tre in in , J . C h e m . P h y s .. 4 2 , 2 01 9 (1 9 6 5 ).
(2 0 ) T. A. G over and G . Porter, P ro c . R o y . S o c . , S e r . A . 2 62 , 476 (1 9 6 1 ) .
(2 1 ) V . A . B rosseau, J. R. B asila , J. F. S m alle y , and R. L. Strong, J. A m e r . C h e m . S o c . , 9 4 , 716 (1 9 7 2 ) , and co n secutive papers.
(2 2 ) P. Forn ier de V io le t, R. B onneau, and J. Joussot-D ub ien , C h e m . P h y s . L e t t . . 19 , 251 (1 9 7 3 ).
(2 3 ) A. Ishitan i and S . N ag ak u ra , T h e o r. C h im . A c ta , 4 , 236 (1 9 6 6 ).(2 4 ) Y . P. P ilette and K. W e iss , J . P h y s . C h e m . . 7 5 , 3 80 5 (1 9 7 1 ).(2 5 ) L. R. M elby, R. J. H ard er, W . R. H ertle r, W . M ah le r, R. E. Benson,
and W . E. M oche l, J . A m e r . C h e m . S o c . . 8 4 , 3 37 6 (1 9 6 2 ).
The Journal of Physical Chemistry, Vol. 77, No. 21, 1973

2524 Masayuki Tanaka and Kenji Fueki
Electron Scavenging by Bromobenzene in the Radiolysis of Hydrocarbon Solutions
Masayuki Tanaka and Kenji Fueki*
D e p a r tm e n t o f S y n th e t ic C h e m is t r y , F a c u lt y o f E n g in e e r in g , N a g o y a U n iv e r s it y , C h ik u s a - k u , N a g o y a , J a p a n
( R e c e iv e d J u n e 14, 1 9 7 3 )
P u b l ic a t io n c o s ts a s s is te d b y N a g o y a U n iv e r s it y
A quantitative study has been made of electron scavenging processes in y-irradiated liquid hydrocarbons: n-pentane, cyclopentane, n-hexane, cyclohexane, 3-methylpentane, 2,3-dimethylbutane, 2,2-dimethylbu- tane, 2,2,4-trimethylpentane, and n-octane. The benzene yield observed upon electron scavenging by bromobenzene in the hydrocarbon solutions can be quantitatively described by an empirical model developed by Schuler and coworkers. The ion-pair yields and the reactivity parameters for electron scavenging were obtained by the analysis of data. The results indicate that the total ion-pair yields in liquid alkanes are about 4 and do not differ very much from the gas-phase values. The ranges of electrons in the hydrocarbons studied were also calculated based on a model in which a simple exponential distribution was assumed for initial electron-positive ion separation distances.
IntroductionIn recent years there has been considerable interest in
the ion-pair yields, the dynamics of electrons, and the reactivity of electrons toward scavengers in the radiolysis of hydrocarbon solutions. A large number of studies on these subjects have been carried out by various experimental methods. These methods may be classified into two categories: physical and chemical methods. Physical methods were applied to measurements of the free-ion yield1-4 and, to a much lesser extent, the total ion-pair yield,5'6 and the mobility of electrons.4-7-11 The physical methods are undoubtedly the useful ones for studies of the free-ion yield and the electron mobility in liquid hydrocarbons. Chemical methods are more common approaches to studies of the total ion-pair yield and the reactivity of electrons in the radiolysis of hydrocarbon solutions. The current status of knowledge on electron scavenging processes in hydrocarbon solutions has been summarized in a recent article.12 Various electron scavengers have been used for the studies of electron scavenging processes in a variety of hydrocarbon solutions. Nitrous oxide is known as one of the most common electron scavengers, which gives nitrogen as a result of electron scavenging processes.13 It has been noted, however, that the nitrogen yields observed at high solute concentrations are too high to give the yields of scavenged electrons and indicate that some additional effects which involve secondary reactions are also present.14-16 A quantitative treatment13 of this subject has recently been made in terms of an empirical model developed by Schuler and coworkers.17 The ion-pair yields in y-irradiated cyclohexane,18-19 n-hexane,19 and 2,2,4-trimethylpentane20 were determined by the quantitative studies of electron scavenging processes in the hydrocarbon solutions of alkyl halides. These studies made it possible to determine with considerable accuracy the yields of free and geminate ions. Perfluorocyclohexane was also used for determination of the ion-pair yields in the radiolysis of cyclohexane solutions.21
In a previous study22 we have shown that bromobenzene can be used as an efficient electron scavenger in the radiolysis of hydrocarbons. In subsequent work23 we have determined the ion-pair yields in liquid methylcyclohexane (MCH) and in glassy MCH and MCH-cyclopentane
The Journal of Physical Chemistry, Vol. 77, No. 21. 1973
mixtures. In the present work we have extended such studies with bromobenzene as an electron scavenger to nine liquid alkanes and have determined the ion-pair yields and the reactivity parameters for electron scavenging in these alkanes. The ion-pair yields obtained are compared with the previously reported values for some of the same alkanes in the gaseous and liquid states. The ranges of electrons in the alkanes studied in this work are also calculated based on a model in which a simple exponential distribution is assumed for initial electron-positive ion separation distances.
Experimental SectionBromobenzene (Nakarai Kagaku research grade) was
distilled and passed through a column of activated alumina. Cyclohexane, n-hexane, cyclopentane, n-pentane, n- octane, 2,2-dimethylbutane, 2,3-dimethylbutane, and2,2,4-trimethylpentane were obtained from Tokyo Kagaku Seiki Co. and 3-methylpentane from Nakarai Kagaku Co. They were the purest commercially available reagents and were purified by passage through a column of activated silica gel.
The samples containing the desired amount of bromobenzene were degassed by freeze-pump-thaw cycles. The samples were sealed off the vacuum line and irradiated at 23° with 60Co 7 rays at a nominal dose rate of 5.1 X 10¹⁹ eV g_1 hr-1 as determined by Fricke dosimeter. The dose absorbed in the samples, 9.6 X 10¹⁸ eV g-1 , was determined by correction for the appropriate electron density differences. Consumption of bromobenzene during y irradiation was less than 5% of its initial amount in the samples. The benzene produced from bromobenzene was measured by a Hitachi K53 gas chromatograph with a flame ionization detector.
Results and DiscussionA fraction of the electrons produced by y irradiation in
liquid hydrocarbons containing bromobenzene are captured by bromobenzene to yield bromide anions and phenyl radicals. The phenyl radical thus produced immediately abstracts a hydrogen atom from a solvent molecule (RH) to form a benzene molecule and a solvent radical( R ) .

Radiolysis of Hydrocarbon Solutions 2525
RH — ► RH+ + e_ (1)C6H5Br + e_ — ► C6H5 + Br" (2)
C6H5 + RH — C6H6 + R (3)
If the benzene is produced from the bromobenzene with unit efficiency in the electron scavenging process, it is anticipated that the concentration dependence of the yield of benzene is well described by17
G(C6H6) - Gn Ggi ^ Gg,a1/2 [C6H5Br]1/2
where Gfl and GRj represent the yields of free and geminate ions, respectively, [CsH5Br] is the concentration of bromobenzene, and a is a parameter which represents the reactivity of the electron toward the solute relative to the recombination processes.
Figure 1 illustrates a plot of [GlCeH^) - Gn]-1 vs. iCeH5Br] 1,2 for 2,3-dimethylbutane, which shows that the data correspond well to the predicted dependence. To avoid complications which might arise from the possible positive charge transfer from the solvent to the solute, the concentration of bromobenzene was limited to about 0.1 M, below which the positive charge transfer is expected to be ineffective compared with electron scavenging as is the case with methylcyclohexane.22 Since it was difficult to reliably measure the free-ion yield by our conventional analytical technique, the values of Gn from Schmidt and Allen1 were used in making the above plots. The geminate-ion yields and the total ion-pair obtained in this way are given in Table I. The estimated standard deviations in Ggi or Gt are about ±0.2 except for cyclopentane, 3-meth- ylpentane, and 2,2,4-trimethylpentane where the standard deviations amount to ±0.3. The values of the parameter a are also given in Table I. The values of a are about the same for most of the alkanes studied, but those for the pentanes are significantly higher.
Ion-Pair Yield. Table II summarizes the total ion-pair yields in the alkanes in the gas and liquid phases. The values of Gt, which are given in Table II as determined by physical methods, were calculated from the corresponding W values.24'26 In gases, the W value can be determined accurately by measurement of the saturation current induced by ionizing radiation. Recently an attempt has been made to determine the W value in liquid alkanes by measurement of the ionization current induced by 60Co 7 rays.6 The data were analyzed by the use of Jaffe’s theory to obtain the W value. The values of Gt obtained in this way are in general agreement with the gas-phase values. It is questionable, however, to interpret the sequence of events in liquids following ionization by 7 rays in terms of Jaffe’s theory which is based on the columnar model of ion recombination, although it may be applicable to such high LET radiation as a rays.
At the present time, chemical methods are more practical and probably more reliable for measurement of the total ion-pair yield in liquids. Various electron scavenging techniques have been used by a number of investigators with a variety of electron scavengers.12 The values of Gt for cyclohexane and n-hexane obtained in the present work are in agreement with the previously reported values18-19 within experimental error. However, our value of Gt for 2,2,4-trimethylpentane is somewhat lower than that in ref 20. This difference in Gt is due to that in GRi between the two studies. The present results indicate that the total ion-pair yields in liquid alkanes at 23° do not
Figure 1. Plot of eq I: bromobenzene solutions in 2,3-dlmethyl- butane.
TABLE I: Ion-Pair Yields and the Reactivity Parameter for Electron Scavenging in 7 -lrradiated Alkane Solutions of Bromobenzene at 23°
C om pound G n a G gl G t tv, M
n - Pentane 0.145 3.7 3.8 23.6Cyclopentane 0.155 3.8 4.0 23.0n-Hexane 0.131 4.0 4.1 12.1Cyclohexane 0.148 4.0 4.1 10.63-Methylpentane 0.146 4.0 4.1 13.52,3-Dimethylbutane 0.192 4.0 4.2 13.72,2-Dimethylbutane 0.304 4.0 4.3 13.42,2,4-Trimethylpentane 0.332 4.1 4.4 13.3n - Octane 0.124 4.1 4.2 12.7
“ R efe ren ce 1.
TABLE II: Comparison of the Total Ion-Pair Yields inGaseous and Liquid Alkanes Irradiated with Different Types of Ionizing Radiation and as Determined by Physical and Chemical Methods
C h em ica l m ethod Physical m ethod
Liquid phase G as phase
7 Rays Rays a Rays
C om pound Ia I I 6 I I I d IV e VS
n-Pentane 3.8 4.38, 4.26/Cyclopentane 4.0 3.94n-Hexane 4.1 3.9 4.0 4.42, 4.27' 3.95Cyclohexane 4.1 3.9, 4.3e 4.5 4.4V 3.993-Methylpentane 4.1 4.382,3-Dimethylbutane 4.2 4.382,2-Dimethylbutane2,2,4-Trimethyl-
4.3 4.37
pentane 4.4 4.8 4.54.371n-Octane 4.2
“ This w ork. b R efe ren ces 18, 19, and 20. 1 R efe ren ce 21 . d R efe ren ce 6 . e R e fe re n c e 2 4 . 1 R e fe re n c e 25. s R e fe re n c e 26 .
differ very much from a value of 4 and the gas-phase values.
Ranges of Electrons. Knowledge of the ranges of electrons is important to an understanding of radiation effects on liquids. Schmidt and Allen1 have calculated the mean thermalization distances of electrons produced by X irradiation in a number of dielectric liquids. In this calcula-
The Journal of Physical Chemistry, Vol. 77, No. 21, 1973

2526 Masayuki Tanaka and Kenji Fueki
TABLE II I : Ranges of Electrons in Liquid Alkanes TABLE IV: Relative Ranges ot Electrons in Liquid Alkanes
Compound 1“
b, Ä
II“ I I I “
n -P e n tan e 65.3 71.5 36C yc lope n tan e 62.2 68.9 77n -H e xane 58.1 67.4 42C yc lohexane 57.5 66.13 -M e th y lp e n ta n e 61.3 69 .6 502 ,3 -D im e th y lb u ta n e 68.5 74.92 ,2 -D im e th y lb u ta n e 92.8 92.02 ,2 ,4 -T rim e th y lp e n ta n e 96.1 95 .0 10277-Octane 54.0 64.2
Ö / Ö H X
Compound 1“ II0 II I“ IV“ V“
7)-Pentane 1.12 1.06 0.86 1.26 1.39C yc lope n tan e 1.07 1.02 1.83 1.22 1.867i-Hexane 1.00 1.00 1.00 1.00 1.00C yc lohe xane 0.99 0.98 0.94 1.173 -M e th y lp e n ta n e 1.06 1.03 1.19 1.032 ,3 -D im e th y lb u ta n e 1.18 1.11 1.042 ,2 -D lm e th y lb u ta n e 1.60 1.37 1.03 2.252 ,2 ,4 -T rim e th y l-
pentane 1.65 1.41 2.43 1.02 2.11n -O ctane 0.93 0.95 1.01
" Calculated from eq II. " References 1. “ Reference 27.
tion they have used the free-ion yields determined by the clearing field method and a total ion-pair yield of 4.3, and assumed a Gaussian "distribution for electron thermaliza- tion distances. Holroyd, Dietrich, and Schwarz27 have determined the ranges of photoinjected electrons in liquid hydrocarbons by measurements of the current efficiency of liquid-filled phototubes and analysis of the data in terms of a diffusion model. Since Holroyd’s work concerns low- energy electrons, their values of electron ranges can not be compared directly to those of Schmidt and Allen. Nevertheless, a correlation is seen between the two sets of values, showing that most of the range of hot electrons is attained while the electron is in the epithermal energy region.28 Recently, Abell and Funabashi29 have shown that a simple exponential distribution of electron thermaliza- tion distances can satisfactorily account for recent experiments on electron scavenging and the effect of electric field strength on free-ion yields in some of alkanes. So we have attempted to calculate the electron ranges in the alkanes studied in the present work by the application of Abell and Funabashi’s treatment.
The values of the parameter 6, which is a measure of the mean range of electrons, were found numerically from eq II.29
47r f e x p ( - r c/r)f(r,b)r2 dr = Gfi/Gt (II) J a
f(r,b) = (C /r2) exp(~r/b)where rc is the Onsager length, rc = e2/tkT, in which the symbols have their usual meanings, and where C is a normalization constant. The reaction radius a was taken to be 5 A.29 The values of b obtained in this manner are shown in Table III along with those of Schmidt and Allen1 and of Holroyd, et al.21 It can be seen in Table III that most of the b values obtained with a simple exponential distribution for electron thermalization distances are somewhat smaller than those obtained with a Gaussian distribution. However, the b values for 2,2-dimethylbu- tane and 2,2,4-trimethylperitane are very close to each other. The b values determined by Holroyd, et ai, appear to be more dispersed from compound to compound than the values of b mentioned above.
At this point, it is interesting to compare the relative b values derived from the Nernst-Einstein relationship with those from Table III. It has been shown that the parameter a is given by
a = k j A (III)where ks is the rate constant for electron scavenging and A is a constant for a given solvent and represents the rate of
“ Calculated from 6(1) In Table III. “ Calculated from 6(11) in Table III. ‘ Calculated from 6(111) in Table III. “ Calculated from eq VI. e Calculated from eq VII. The values of the electron mobility were taken from ref 7.
recombination of geminate electron-positive ion pairs.30 If the Nernst-Einstein relationship applies to the recombination of the geminate ion pairs, A can be expressed as20
A = 3(De + D +)rJb3 (IV)where De and D+ are the diffusion coefficients of the electron and the positive ion, respectively. If the reaction of the electron with a solute is diffusion-controlled and De is much greater than D +, a can be expressed as
a = 4irRb3/3rc (V)
where R is the reaction radius. Taking a constant value of R for different solvents x and y, one obtains
Kby
- (arc)xl- ( « r c ) y j
1/3
(VI)
Recently, Beck and Thomas31 have found that the rate constant for reaction of the electron with biphenyl is proportional to the square root of the electron mobility in several alkanes. If one uses this relationship between the rate constant ks and the mobility g,e of the electron, one gets
6x _ ( a r c ] / p e ) x
by (aTcj/pJy (VII)
Thus, one can calculate the relative values of b from eq VI or VII with known values of a, rc and ^e• The relative b values of electrons in alkanes are given in Table IV as b/ bhx, where 6hx is the b value for n-hexane.
It is seen in Table IV that there is a fairly good correlation between the relative b values calculated from eq VI and those calculated from 6(1) or 6(11) in Table III for n- pentane, cyclopentane, n-hexane, cyclohexane, and 3- methylpentane. However, there is no such correlation for branched alkanes such as 2,3-dimethylbutane, 2,2-di- methylbutane, and 2,2,4-trimethylpentane. For these branched alkanes the relative 6 values calculated from eq VI are much smaller than those calculated from 6(1) or 6(11) in Table III. The use of eq VII gives much larger values of 6 / 6 hx for the branched alkanes and yields a qualitative correlation between the two sets of values, although it also makes the correlation found with eq VI for some of the alkanes worse. It is interesting to note that the relative 6 values calculated from eq VII are in reasonable agreement with those calculated from 6(111) in TableIII.
The Journal of Physical Chemistry, Voi. 77, No. 21, 1973

Electron Reactions In Concentrated Acid Solutions 2527
References and Notes
(1) W. F. Schmidt and A. O. Allen, J. Phys. Chem., 7 2 , 3720 (1968).(2) P. H. Tewarl and G. R. Freeman, J. Chem. Phys.. 49, 4394 (1968).(3) M. G. Robinson, P. G. Fuochi, and G. R. Freeman, Can. J. Chem ,
49, 3657 (1971).(4) P. G. Fuochi and G. R. Freeman, J. Chem. Phys.. 56, 2333 (1972).(5) W. F. Schmidt, Radiai. Res.. 42, 73 (1970).(6) T. Nakayama and M. Kawano, Appt. Phys.. 40, 358 (1971 ).(7) W. F. Schmidt and A. O. Allen, J. Chem. Phys., 52, 4788 (1970).(8) J.-P. Dodelet and G. R. Freeman, Can. J. Chem., 50, 2667 (1972).(9) R. M. Minday, L. D. Schmidt, and H. T. Davis, J. Chem. Phys., 54,
3112 (1971).(10) R. M. Minday, L. D. Schmidt, and H. T. Davis, J. Phys. Chem., 76,
442 (1972).(11) W. F. Schmidt and G. Bakale, Chem. Phys. Lett., 17, 617 (1972).(12) R. H, Schuler and P. P. Infelta, J. Phys. Chem., 76, 3812 (1972).(13) P. P. Infelta and R. H. Schuler, Int. J. Radiât. Phys. Chem., 5, 41
(1973), and the references cited therein.(14) S. Sato, R. Yugeta, K. Shinsaka, and T. Terao, B u ll. Chem. Soc.
Jap.. 39, 156 (1966).(15) J. M. Warman, K.-D. Asmus, and R. H. Schuler, Advan. Chem.
Ser.. N o. 82, 25 (1968).
(16) Y. Flatano, K. Takeuchi, and S. Takao, J. Phys. C h e m ., 77, 586 (1973).
(17) See ref 12 and the references cited therein.(18) J. M. Warman, K.-D. Asmus, and R. H. Schuler, J. Phys. Chem..
7 3 , 931 (1969).(19) J. M. Warman and S. J. Rzad, J . Chem. Phys.. 52, 485 (1970).(20) S. J. Rzad and K. M. Bansal, J. Phys. Chem., 76, 2374 (1972).(21) N. H. Sagert, J. A. Reid, and R. W. Robinson, Can J. Chem.. 47,
2655 (1969).(22) T. Kimura, K. Fueki, and Z. Kuri, Bull. Chem. Soc. Jap., 43, 3090
(1970) .(23) T. Kimura, K. Fueki, and Z. Kuri, Bull. Chem. Soc. Jap.. 44, 2650
(1971) .(24) T. A. Stoneham, D. R. Ethridge, and G. G. Meisels. J. Chem. Phys .
54, 4054 (1971).(25) P. Adler and H. K. Bothe, Z. Naturforsch., 20a, 1700 (1965).(26) L. M. Hunter and R. H. Johnsen, J. Phys. Chem., 71, 3228 (1967).(27) R. A. Flolroyd, B. K. Dietrich, and H. A. Schwarz, J. Phys. Chem.,
76, 3794 (1972).(28) A. Mozumder and J. L. Magee, J. Chem Phys.. 47, 939 (1967).(29) G. C. Abell and K. Funabashi, J. Chem. Phys.. 58, 1079 (1973).(30) S. J. Rzad, P. P. Infelta, J. M. Warman, and R. H. Schuler, J.
Chem. Phys., 52, 3971 (1970).(31) G. Beckand J. K. Thomas, J. Chem. Phys., 57, 3649 (1972).
Electron Reactions in Aqueous Concentrated Acid Solutions
O. I. M ic ic ,* V. M arkov ic , and D. N iko lic
B o r is K id r ic I n s t i tu t e o f N u c le a r S c ie n c e , V in c a , Y u g o s la v ia ( R e c e iv e d D e c e m b e r 12, 1 9 7 2 )
Competition between some organic compounds (glycine, acetic acid, propionic acid, and acetone) and hydronium ion for hydrated electrons in 7 -irradiated aqueous concentrated acid solution has been studied. These compounds show an ability to reduce the initial yield of the hydrated electron without any direct correlation with the corresponding hydrated electron rate constants. The results are discussed taking into account the protonation effects, the time dependence of the rate constants, and the possibility of reaction with a hydrated electron precursor. They support the idea that radiation-produced electrons react before hydration.
Introduction
Hunt, et a/.,1-3 have discovered by pulse radiolysis technique at the picosecond time scale a significant decrease in the hydrated electron yield in the presence of high concentrations of some solutes (acetone, nitrate ion, hydrogen peroxide, glycine, etc.). Known rate constants of these solutes for reactions with eaq~ could not fit the observations, Therefore, they concluded that (i) these solutes react with the precursor of eaq~, so called dry electron (edry~), according to the model suggested by Hamill4-5 and (ii) that the reaction rates of these solutes with eary“ are significantly faster than the corresponding rates of the reactions with eaq - .
Schwarz6 argued against these conclusions pointing out that the time dependence of rate constants for diffusion- controlled reactions and reactions between charged species may be responsible for the observed eaq_ yield decrease.
The experiments of Hunt, et al., were usually performed in the presence of high concentrations of HCIO4. Taking into account protonation of organic compounds at high acidities and expected increase in reactivity toward eaq - due to protonation, Hayon7 also cast some doubts on
these conclusions. He claims that some of the observed decrease in eaq- yield at the end of a 20-psec electron pulse may be due to higher reactivity of protonated organic compounds toward eaq" .
We used the method of steady-state kinetics to investigate this problem from another approach. Solutes with different protonation constants were chosen (glycine, acetone, acetic acid, and propionic acid) and the effect of concentration of the solute and the hydronium ion on the molecular hydrogen yield was studied. These experiments were expected to give more information about the role of protonation and hydration on the possibility of scavenging electrons in aqueous concentrated acid solutions.
Experimental SectionThe organic compounds were AR Merck and were used
without purification. Double distilled HCIO4 was used as supplied by F. Smith Co. Water was triply distilled. The pH of the solutions and the ionic strength were adjusted with HCIO4 and NaCICK, respectively.
Irradiations were carried out in a 60Co gamma source at an absorbed dose rate of the order of 5 krads min-1 . Total absorbed doses were between 1.6 and 8 krads. They were
The Journal of Physical Chemistry, Vol. 77, No. 21, 1973

2528 O. I. M icie, V. M arkovlc, and D. N iko lic
determined by a Fricke dosimeter. Solutions were deaerated on a vacuum line or by bubbling with argon stated to contain about 2 ppm of oxygen, obtained from Tehnogas. Acetone concentration in the solution was determined after this procedure by the volumetric method with iodine.8 All absorbed doses were corrected for variation in solution composition on the basis of corresponding electron densities.
Molecular hydrogen was quantitatively measured by a Perkin-Elmer Model 154L gas chromatograph using a 4-m silica gel column at 50° and argon as the gas carrier.
Results and DiscussionMolecular hydrogen yield, G(H2), was measured as a
function of HCIO4 concentration at varying concentrations of glycine, acetic acid, propionic acid, and acetone. The results are summarized in Figure 1. In the same figure the results obtained in pure HCIO4 solution are presented. All solutions contained 0.1 M ethanol as an H and OH scavenger.
The initial increase of G(H2) can be explained by competition between reactions 1 and 2 where (SH+)aq repre-
Gaq "4" Haq H (1)6aq "4” S Saq (2.1)
eaq- + (SH+)aq SH (2.2)sents the protonated form of the solute S. In the presenceof ethanol
H + C2H5OH —► H, + C2H4OH (3)The yield of hydrogen in this systems is given by
G(H2) = G„, + GH + G(l) (4)where
GII) - G--/[> + m 2 ?)] (5)
and
(So) = (S) + (SHaq+ )
a(l — a ) = (SHaq+/(S ) = A P(Haq"'')
k2 = ak.2.2 + (1 — cv)/e2.i (6)where KP and a are the constant and degree of protonation, respectively.
In Table I, G(l) and k2/k 1 values calculated from experimental results are given. GHz + Gh = 0.7 and Geaq- = 3.2 were used for calculation, except for acetone where published values for Gh2 + Gh5 were taken. In doing that, only results showing the main trend of the curves in Figure 1 are used for the calculations and are presented in Table I.
The product of the reaction 2.1 can to some extent form H2
Figure 1. M o le cu la r hyd roge n yie ld as the fu n c tio n o f H CIO 4 c o n ce n tra tio n at va ry in g so lu te co n ce n tra tio n s : (O ) H CIO 4 ; (A) 0.1 M g lyc ine ; ( □ ) 3 M a ce tic ac id ; ( ■ ) 0 .6 M a ce tone ; ( A ) 3 M p ro p io n ic ac id ; ( • ) 2 M g lyc in e ; ( X ) 4 M g lyc ine .
TABLE I: Values of G (1 ) and k 2/ k .
Solute[S],M
[ H C I O 4 ] , [Haq + ], M M a G (H 2)a <3(1) k2/k ,
G lyc ine 0.1 0.5 0.40 0 . 9 9 3.70 3.00 0.280.1 2.00 1.90 1 . 0 0 3.60 2.90 1.902 2.40 0.42 0 . 9 9 1.73 1.03 0.442 4.00 2.00 1 . 0 0 1.70 1.20 1.704.0 6.00 2.01 0 . 9 9 0.76 26 .153.6 7.3 3.63 0 . 9 9 0.72 159
A ce ton e 0.57 2.0 1.74 0 . 4 5 2.19 1.84 2.280.69 4.0 3.56 0.63 1.75 1.34 7.221.03 0.92 0.68 0.23 1.40 1.09 1,271.03 3.23 2.66 0.55 1.70 1.45 3.10
A c e tic 3 0.50 0.36 0.05 < 2.56 1.86 0.09acid 3 4.00 3.09 0.30 1.90 1.20 1.71
P rop ion ic 3 0.50 0.26 0.08 2.52 1.82 0.07acid 3 4 .00 2.61 0.46 1.80 1.10 1.66
a Experimental values.
Therefore in the Haq+ concentration range from 0.1 to 3 M, reaction 7 did not contribute significantly to measured G(H2). H (or H2) is not formed in reaction 2.2. For example, G(H2) = 0.7 in 2 M glycine at pH 1 (Figure 1).
Another reaction had to be accounted for in these experiments, i.e., the competition of the solute S with ethanol for H atoms
(7)
- H, ( 8 )
The ratio of rate constants k-j/k% is 0.56, 0.88, and 0.60 for glycine, acetic acid, and propionic acid, respectively.9’10 However, in all cases k2.i <C k22 as well as k21 <SC fe i.
.r H2s + h
( 9 )
(10)Glycine, acetic acid, and propionic acid react only
through reaction 911 not influencing eq 4 and 5. Acetone, however, reacts in both ways at comparable rates.12 There-
The Journal of Physical Chemistry, Voi. 77, No. 21, 1973

Electron Reactions in Concentrated Acid Solutions 2529
C,M
Figure 2. Molecular hydrogen yield as the function of acetic acid [ ( • ) a = 0.06; (■ ) a = 0.005] anc proplcnic acid [(X ) a = 0.04; (□ ) a = 0.09; (O) a = 0.13] concentrations: 0.1-0.5 M HCI04.
fore, corresponding corrections in the calculation of G(l) and k2/ki were made by using kg/k3 = 0.068 and k10/k3 =0.035.
Figure 1 and Table I provide unambiguous evidence for incomplete scavenging of eaq~ by Haq+ :n the presence of high concentrations of glycine, acetic acid, propionic acid, and acetone. Furthermore, the “ deficit” in eaq yield increases with increasing solute concentration. These results obtained by steady-state radiolysis are similar to observations made by pulse radiolysis at the picosecond time scale.2-3 The results should be analyzed taking into account protonation effects, time dependence of the rate constants, structural changes of solutions, direct action of radiation on the solute, and the possibility of the reactions with hydrated electron precursor (“ dry” electron).
Time Dependence of the Rate Constants. Schwarz6 has recently drawn attention to the effect of time needed for the formation of concentration gradients for diffusion-controlled reactions if one of the reactants, as it is the case in radiation chemistry, is formed instantaneously in the solution which contains the other reactant homogeneously distributed. As a consequence the apparent rate constants in some time interval after the start of an experiment can be different in comparison with the rate constant measured at some time later. He calculated the k2/k\ values for 0.6-2 M acetone in 0.2-2 M HCIO4, taking into account this time dependence of rate constants. These values were in agreement with the experimental results obtained by Peled and Czapski.13 In this calculation, however, the protonation of acetone14 has not been taken into account. This has two effects: the concentration of Haq + is lower than assumed and consequently k2/ki should be smaller than calculated, then, reaction 2.2 similar to reaction 1 occurs between oppositely charged species and k 2 2 should increase with time.
Under our experimental conditions the rate constants of reactions 1 and 2.2 are time dependent. The k2.\ for acetone is also time dependent. Quantitative analysis of the k2fk\ values given in Table I has not been attempted here. However, all the results obtained indicate that the change of k2fk\ could not be explained by the time dependence of rate constants only. The values of k 2/h\ increase with increasing concentration of glycine at constant Haq + concentration which is opposite tc the effect expect-
5 10
(S0)/(Haq1Figure 3. Compettion between glycine and hydronium ions for hydrated electrons: ( • ) a = 0.30; (O) a = 0.50; (□ ) a: = 0.75; (X ) a = 0.96.
ed, since k2,2 should decrease with increasing concentration. k2fk\ for other solutes changes much more drastically than might be explained by time dependence as both reactions are between species of opposite charge.
This effect is even less applicable to the results given in Figure 2. Here, neither k2 1 nor k2 2 are time dependent. However, significant decrease in G(H2) was observed again.
Protonation. Protonation constants of glycine, acetic acid, propionic acid, and acetone are 223, 0.14, 0.33, and0.47, respectively.14’15 In 0.1-2 M HCIO4 glycine is pro- tonated completely and acetic acid only to about 30%.
The rate constant k2 2 = 3.8 X 10⁹ M -1 sec-1 was obtained from competition data at low glycine concentration at the ionic strength g = 0.5 (Figure 3) and ki = 2.2 X 10¹⁰ M -1 sec^1 (/j. = 0) assuming that the ionic strength effect is the same for both reactions 2.2 and 1. This value is in good agreement with k2 2 = 4 X 10⁹ M ~ 1 sec-1 recently published.16
It is obvious that further increase of k2/k1 at higher glycine concentrations (Table I) cannot be explained by the rate of reaction 2 2.
G(H2) for acetic and propionic acids does not depend on HCIO4 concentrations. This is well illustrated in Figure 2. G(H2) is constant within experimental error from 0.05-0.5 M HCIO4, although in 0.5 M HCIO4 6% of acetic acid and 14% of propionic acid are protonated. k2 2 < 3 x 10⁹ M -1 sec-1 is estimated from these results.
It was not possible to distinguish between reactions 2.1 and 2.2 in the case of acetone. Reaction 2.1 is considered to be diffusion controlled (fe2.i = 7.6 x 10⁹ sec^1)3since acetone is not a spherically symmetrical molecule. Further increase of the rate constant should not be expected, except for the electrostatic interaction factor between ions of opposite charge according to the Debye equation.17 The value of k2,2 = 1.4 x 10¹⁰ M " 1 sec-1 should be taken as the upper limit because of the opposite effect of ionic strength on the rate constant k2 2.
Structural Changes. The rate constants can also be influenced by structural changes of the solution. Here, most important are the changes of dielectric properties, ionic strength, and viscosity. We supposed that the effect of these parameters on the k2 2/ki rate constants ratio is not very significant since both reactions are of the same type.
Direct Radiation Effect. G (l) should be expected to decrease at higher solute concentrations due to direct action
The Journal of Physical Chemistry, Vol. 77, No. 21, 1973

2S30 O. I. Micic, V. Markovic, and D. Nikolic
of radiation on the solute. This was observed in pure HCIO4 solution. This decrease, however, being less than 30% (4 M glycine, for example) could not’ account for the total decrease of (7(1).
Reactions of the Hydrated Electron Precursor. The analysis of different possible explanations for the increase of ki/ki in concentrated solutions have shown that time dependence and protonation could only partially explain the observed increase. Besides, these two effects are obviously deficient in explaining the results of Figure 2. The effect observed with all solutes shows distinct regularities: the incomplete competition between reactions 1 and 2, the plateau of H2 yield above certain HCIO4 concentration (Figure 1), and lowering of this plateau with the increase of solute concentrations. This can be taken as an evidence for the existence of fast reactions, faster than known reactions with hydrated electron, and reactions which could not be affected by HCIO4 concentration.
In similar experiments using pulse radiolysis the transient produced in the reaction of acetic acid with electron has been detected.18 The concentration of this transient at high solute concentration could only be due to the certain limit suppressed by increasing the HCIO4 concentration. This limit was dependent on HCIO4 and acetic acid concentrations in the same way as hydrogen yield here.
These experiments, therefore, support the idea that some solutes react with the precursor of eaq (called the “ dry electron” ) at sufficiently high concentrations. As a consequence, the observed ea(| yields measured either directly, by pulse radiolysis, or indirectly, as in the pres
ent work, decrease significantly and more than can be explained without taking into account dry electron reactions. The results reported here support the possibility of chemical reactions of nonequilibrium electrons.
Acknowledgment. We are indebted to Dr. I. Draganic for some valuable discussions in preparing this manuscript and for continuous interest in this work. Our thanks are due to Mrs. M. Marovic for technical assistance.
References and Notes(1 ) M . J . Bronskill, R. K. W olff, and J. W . H unt, J . C h e m . P h y s ., 5 3 ,
4201 (1 9 7 0 ).(2 ) R. K. W olff, M . J . Bronskill, and J. W . H unt, J . C h e m . P h y s ., 53 ,
4211 (1 9 7 0 ).(3) J. E. A ldrich, M . J . Bronskill, R. K. W olff, and J. W . H unt, J . C h e m .
P h y s .. 5 5 , 5 30 (1 9 7 1 ).(4 ) W . H . H am ill, J . P h y s . C h e m ., 7 3 ,1 3 4 1 (1 9 6 9 ).(5 ) T. S a w a ia n d W . H . H am ill, J . P h y s . C h e m ., 74 , 3 9 1 4 (1 9 7 0 ) .(6) H. A . S ch w arz , J. C h e m . P h y s ., 5 5 , 3 6 4 7 (1 9 7 1 ).(7 ) E. H ayon , N a tu r e (L o n d o n ) , P h y s . S c i . , 2 3 8 , 76 (1 9 7 2 ) .(8 ) I. M . K olthoff and P. J . Elving, “T reatise on A nalytical C hem istry ,"
In tersc ien ce , N ew Y o rk , N . Y ., 1966 , p 189.(9) R. L. W illix and W . M . G arrison, R a d ia t . R e s ., 3 2 , 4 5 2 (1 9 6 7 ) .
(1 0 ) O. I. M ic ic a n d V . M arko v ic , tn t . J . R a d ia t . P h y s . C h e m ., 4 , 43(1 9 7 2 ).
(1 1 ) P. N e ta , R. W . Fessen den , and R. H . S chuler, J . P h y s . C h e m ., 75 , 1655 (1 9 7 1 ).
(1 2 ) P. N e ta , G . R. H o ld ren , and R. H . S chuler, J . P h y s . C h e m ., 75 , 4 49(1 9 7 1 ) .
(1 3 ) E. P eled and G . C zap sk i, J . P h y s . C h e m ., 7 5 , 3 6 2 6 (1 9 7 1 ).(1 4 ) C. F. W ells, T ra n s . F a r a d a y S o c . , 6 3 , 147 (1 9 6 7 ).(1 5 ) R. M . K ee fe r and M . G . R elber, J . A m e r . C h e m . S o c . , 6 3 , 689
(1 9 4 1 ).(1 6 ) F. A. P eter and P. N e ta , J . P h y s . C h e m .. 7 6 , 6 30 (1 9 7 2 ) .(1 7 ) P. D eb ye , T ra n s . E te c t ro c h e m . S o c . , 8 2 , 2 65 (1 9 4 2 ) .(1 8 ) B. C erc e k and O. I. M ic ic , N a tu r e ( L o n d o n ) , P h y s . S c i . , 238, 76
(1 9 7 2 ) .
The Journal of Physical Chemistry, Vol. 77, No. 21, 1973

Interaction between Halide Ions and Am phiphilic Organic Cations 2531
The Interaction between Halide Ions and Amphiphilic Organic Cations in Aqueous Solutions Studied by Nuclear Quadrupole Relaxation
Göran Lindblom* and Björn LindmanD iv is io n o f P h y s ic a l C h e m is t r y 2 , T h e L u n d In s t i t u t e o f T e c h n o lo g y , C h e m ic a l C e n te r , S - 2 2 0 0 7 L u n d 7, S w e d e n
( R e c e iv e d A p r i l 9 , 1 9 7 3 )
P u b l ic a t io n c o s ts a s s is te d b y T h e L u n d I n s t i tu t e o f T e c h n o lo g y
The nuclear quadrupole relaxation rates of 81Br and 35C1- counterions in aqueous solutions of cationic surfactants have been determined as a function of surfactant concentration, temperature, surfactant end group, and the length of the surfactant ion. A moderate increase in the relaxation rates at low concentrations is attributed to an enhanced anion-solvent interaction in the vicinity of the nonpolar groups of the cations. As micellar aggregates form, the counterion relaxation rates increase rapidly. By use of a simple model for micelle formation, critical micelle concentrations are determined from the concentration dependences of the relaxation rates. On the assumption that it is sufficient to consider one type of counterions bound to the micelles, intrinsic relaxation rates of the micellarly bound counterions are calculated. These intrinsic relaxation rates show that halide ions interact more strongly with micelles composed of alkylammonium ions than with those formed by alkyltrimethylammonium ions. The observed relaxation behavior is compared with that expected for various motional processes and it appears that the quadrupole relaxation is affected by the motion of water molecules. Upper limits of the time constants of the motion have been estimated. A smaller relative change in relaxation rate on micelle formation for 35C1 than for 81Br is ascribed to differences in ionic radii. In addition to the changes in counterion binding at the critical micelle concentrations a second change occurs at higher concentrations for some of the surfactants. This change in counterion binding to the micelles occurs at considerably lower concentrations for alkylammonium bromides than for alkyltrimethylammonium bromides.
Introduction
The interaction between anions and positively charged nitrogens is of importance in many biological systems and also in connection with some other phenomena in aqueous colloid solutions such as counterion binding to polycations and micellar catalysis. An important biological situation where this interaction is significant concerns the surfaces of biological membranes. Using proton nmr, Jendrasiak1 was recently able to establish a strong interaction between certain small anions and the choline group for aqueous vesicular solutions of egg yolk lecithin. The binding of anions to nonmetallic proteins occurs via positively charged side chains in the amino acid sequence and it is interesting to note that there may be a close neighborhood of positively charged groups and hydrophobic side chains in the anion binding site of proteins. Thus recent work has shown that for serum albumin the binding sites for hydro- phobic anions contain lysine and arginine as well as apo- lar amino acids.2 5 It may, furthermore, be concluded from nmr studies6’7 on aqueous serum albumin solutions that bromide and chloride ions have binding sites in common with hydrophobic anions such as anionic surfactants.
These and other examples motivate studies aimed at obtaining a better understanding of the mode of interaction between anions and positively charged nitrogens and in particular it would be desirable to establish how this interaction depends on the proximity of other charged, dipolar, or nonpolar groups. A very sensitive way of studying how certain small ions interact with other species in a solution is to study the nuclear quadrupole relaxation rate. We have previously applied this method to studies of the interaction between halide ions and substituted ammo
nium ions which can serve as simple models for anion binding sites in proteins.8~10 These investigations were concerned with the interactions between halide ions and organic cations having alkyl chains so short that the solutions are mainly molecule-disperse. In the present study we have examined aqueous solutions containing substituted ammonium ions with long alkyl chains by 81Br nmr and to some extent by 35C1 nmr. First, the halide quadrupole relaxation data will provide information on how the anion-cation interactions are modified on cation self-association. Secondly, by investigating how the counterion quadrupole relaxation rate varies with the end group of the surfactant, some information on the mode of attachment of counterions to micellar aggregates is obtained. Due to the rather low sensitivity of 81Br and 35C1 nmr, the alkyl chain lengths were in most cases chosen so as to give critical micelle concentrations of the order of 0.1 M. Previously, we have investigated the interaction between bromide ions and a long chain surfactant incorporated in different types of aggregates11 13 (normal and reversed micelles and hexagonal and lamellar mesophases).
Experimental SectionThe 81Br measurements were performed with a Varian
V-4200 nmr spectrometer as described elsewhere.910 The modulation frequency and the modulation amplitude settings were chosen9’10 so that the instrumental broadening was less than 1%. For the bromine signals, the line widths were taken as the distance between maximum and minimum slopes of the nmr absorption curve. In order to improve the stability of the magnetic field a flux stabilizer was used when recording the rather narrow 35C1 nmr sig-
The Journal of Physical Chemistry, Vol. 77, No. 21, 1973

2532 Goran Lindblom and Björn Lindman
n a ls . H ere th e lin e w id th w a s ta k e n as th e w id th at h a lf h e ig h t o f th e a b so r p tio n p e a k . T h e 35C1 n m r s ig n a ls w ere s tu d ie d u sin g a fie ld m o d u la tio n fre q u e n cy o f 4 0 0 H z an d th e first s id e b a n d o f th e a b so rp tio n sig n a l w as reco rd ed . D u e to th e in h o m o g e n e ity o f th e m a g n e tic fie ld th e m e a su red 35C1 lin e w id th s are s lig h tly to o large . F or th e d a ta giv e n in F igu re 4 n o correction for th is in h o m o g e n e ity , w h ich w as d e te r m in e d to be a b o u t 2 p T , h a s b een a p p lie d , w h ereas th e e ffe c t o f th e in h o m o g e n e ity b ro a d e n in g w as e lim in a te d w h en th e q u a n tit ie s g iv en in T a b le II w ere c a lc u la te d . T h e s a m p le te m p e ra tu re w a s 28 ± 2 ° i f n o t o t h erw ise sp e c ifie d . In th e v a ria b le te m p e ra tu re s tu d ie s s a m p le te m p e ra tu re w as co n tro lled b y m e a n s o f a V a r ia n V - 4 5 4 0 in str u m e n t. T h e a c tu a l te m p e ra tu re w as m e a su red w ith a c o p p e r -c o n s ta n ta n th e r m o c o u p le b efo re a n d a fter th e reco rd in g o f e a ch series o f sp ec tra at a g iven te m p e r a
tu re a n d w as fo u n d to b e ac cu ra te w ith in ± 0 . 3 ° . In th e d e te r m in a tio n s o f th e fre q u e n cy d ep e n d e n c e o f th e line w id th s , th e sa m p le te m p e ra tu re w as s ta b iliz e d at 3 2 ° .
D e c y ltr im e th y la m m o n iu m b r o m id e , te tr a d e c y ltr im e th - y la m m o n iu m b r o m id e , c e ty ltr im e th y la m m o n iu m b ro m id e , a n d o c ty ltr im e th y la m m o n iu m ch lo rid e w ere p u r c h a sed fro m T h e B r itish D r u g H o u se s , L t d ., P o o le , E n g la n d . N o n y ltr im e th y la m m o n iu m b r o m id e w as o b ta in e d fro m E a s tm a n K o d a k , R o c h ester , N . Y . N o n y la m m o n iu m b r o m id e , d e c y la m m o n iu m b r o m id e , a n d o c ty la m m o n iu m ch lo rid e w ere p re p a re d b y rea ctio n o f th e ap p ro p ria te a m in e w ith th e h yd ro g en h a lid e . A ll th e a m m o n iu m sa lts w ere re cry sta llized tw ice fro m a c e to n e . T h e a m in e s w ere o b ta in e d fro m F lu k a A G , B u c h s , S w itz e r la n d . D e c y lp y r i- d in iu m b r o m id e w as p re p a re d b y re flu x in g 1 -b ro m o d e c a n e a n d d ry p y r id in e an d re c ry sta lliz in g fro m a c eto n e (cf. re f 1 4 ) . F or so m e o f th e su r fa c ta n ts th e p u rity w a s d e te r m in e d b y titra tio n w ith A gN C >3. T h e p u rity w as fo u n d to be b e tter th a n 9 9 % .
Experimental ResultsF or a n u m b e r o f a m p h ip h ilic a m m o n iu m h a lid e s th e
d ep e n d e n c e o f co u n terio n q u a d r u p o le re la x a tio n ra te on su r fa c ta n t co n c e n tra tio n w as in v e stig a te d in a w id e c o n ce n tra tio n region a t 2 8 ° . T h e sa lts in v e stig a te d w ere: n o n y la m m o n iu m b r o m id e ( N A B ) , d e c y la m m o n iu m b ro m id e ( D A B ) , n o n y ltr im e th y la m m o n iu m b ro m id e ( N T A B ) , d e c y ltr im e th y la m m o n iu m b r o m id e ( D T A B ) , te tr a d e c y ltr im e th y la m m o n iu m b ro m id e ( T T A B ) , h e x a d e - c y ltr im e th y la m m o n iu m b r o m id e ( C T A B ) , d e c y lp y r id i- n iu m b r o m id e ( D P B ) , o c ty la m m o n iu m ch lo rid e ( O A C ) , a n d o c ty ltr im e th y la m m o n iu m ch lo rid e ( O T A C ) .
F o r th e c o m p o u n d s h a v in g u p to te n ca rb o n a to m s in th e lo n g a lk y l c h a in , m e a su r e m e n ts c o u ld b e m a d e w ell b e lo w th e critic a l m ic e lle co n c e n tra tio n (c m c ) . A gen eral o b serv a tio n is th a t b e lo w th e c m c th e c o u n terio n n m r line w id th in creases m o d e ra te ly w ith s u r fa c ta n t co n c e n tra tio n w h erea s in th e h ig h co n c e n tra tio n region th e lin e w id th s in crease m u c h m o re ra p id ly w ith in crea sin g c o n c e n tr a tio n . T h is b e h a v io r is e x e m p lifie d in F ig u re 1 for N A B a n d N T A B . A n in terestin g o b serv a tio n is th a t b e lo w th e c m c greater lin e w id th s are o b ta in e d w ith N T A B th a n w ith N A B , w h erea s a b o v e th e c m c th e reverse b e h a v io r is fo u n d . A co rresp o n d in g d ep e n d e n c e o f co u n terio n n m r line w id th on s u r fa c ta n t e n d group is fo u n d w h en th e re su lts for D T A B are c o m p a re d w ith th o se o b ta in e d for D A B or w h en th e resu lts for O T A C are c o m p a re d w ith th o se for O A C . D P B gives lin e w id th s in te r m e d ia te b e tw ee n th o se o f D T A B a n d D A B at low c o n c e n tra tio n s w h ereas at h igh
"5 to 1.5 2.0 ao
C ,M
Figure 1. The 81Br nmr line width, AB (in mT), as a function of the surfactant concentration for aqueous nonyltrim ethylam m onium bromide (O ) and nonylammonium brom ide ( # ) solutions. Inserted Is shown the low-concentration region. Tem perature28°.
to
.8
.6
.4
.2
Figure 2. The 81 Br nmr line width, AB (in mT), as a function of the inverse surfactant concentration for four a lkyltrim ethylam - monlum bromides. The d ifferent lengths of the carbon chains of the surfactant salts are nonyl ( • ) , decyl (O ), tetradecyl (d), and cetyl (<r). Tem perature 28°.
Figure 3. The 81 Br nmr line width, A B (In mT), as a function of the inverse concentration of nonylamm onium brom ide f # t , decylam m onium brom ide (0), and decylpyrid in lum brom ide (O ). Tem perature 28“ .
c o n c e n tra tio n s it g ives lin e w id th s a b o u t th e sa m e as th o se for D T A B .
In F igu res 2 - 4 w e give th e c o n c e n tra tio n d ep e n d e n c e s o f th e o b serv e d c o u n terio n n m r lin e w id th s for th e d iffe re n t c o m p o u n d s in v e stig a te d . In order to fa c ilia te a c o m p a r i so n w ith a s im p le m o d e l o f m ic e lle fo r m a tio n (see b e lo w ) th e lin e w id th s are g iven as a fu n c tio n o f th e in v erse s u r fa c ta n t c o n c e n tra tio n . T h e te m p e ra tu re d ep e n d e n c e o f th e
The Journal of Physical Chemistry, Vol. 77, No. 21, 1973

Interaction between Halide Ions and Amphiphilic Organic Cations
30
2 4 6 8 10 12 14 16 18c V
Figure 4. The 35CI nmr line width, A S (in juT), as a function of the inverse concentration of octy ltnm ethylam m onium chloride (O ) and octylam m onium ch loride ( • ) . Tem perature 28°.
line w id th w a s in v e stig a te d for a 0 .5 M N A B so lu tio n an d a 1 .0 M N T A B so lu tio n . T h e te m p e ra tu re ran ge stu d ie d w as 3 3 - 7 2 ° . In b o th c a ses th e lin e w id th w as fo u n d to d e crease ra p id ly w ith in crea sin g te m p e ra tu re . A p p a r e n t en ergies o f a c tiv a tio n o f th e re la x a tio n p rocess o b ta in ed from an A rrh en iu s p lo t (F ig u re 4 ) w ere c a lc u la te d to b e 26 ± 2 kJ m o l - 1 a n d 17 ± 2 kJ m o l - 1 for th e N A B a n d N T A B so lu tio n s , re sp e c tiv e ly . (T h e a c c u ra c y o f th e a c t i va tio n en ergies w as e s tim a te d fro m th e a c c u r a c y o f th e m e a su r e m e n ts .) A n in v estig a tio n o f th e fre q u e n cy d e p e n d en c e o f th e lin e w id th for a 1 .5 M N T A B so lu tio n sh ow ed th a t th e lin e w id th w ith in th e e x p e r im e n ta l error is in d e p en d e n t o f th e reso n a n ce fre q u e n cy b e tw ee n 8 a n d 16 M H z .
DiscussionF or 81B r a n d 35C1 w ith sp in q u a n tu m n u m b e r s I = %
th e d o m in a n t n u c le a r m a g n e tic re la x a tio n m e c h a n ism in so lu tio n is d u e to th e in tera ctio n b e tw ee n th e n u clea r e lectric q u a d r u p o le m o m e n t a n d f lu c tu a tin g e lectric field g ra d ie n ts a t th e n u c le u s . U n d e r c o n d itio n s o f ex trem e n arro w in g th e q u a d r u p o le re la x a tio n ra tes for a n u cleu s w ith / = % are g iv en b y 15
H ere 7 \ a n d T 2 are th e lo n g itu d in a l a n d tran sv erse r e la x ation t im e s , r e sp e c tiv e ly , eq is th e largest c o m p o n e n t o f th e e lectric fie ld g ra d ie n t ten so r (th e g ra d ie n t is a ssu m ed to h a v e c y lin d ric a l s y m m e tr y ) ta k e n in its p rin c ip a l axes sy ste m , eQ is th e n u c le a r e lectric q u a d ru p o le m o m e n t , a n d r c is th e co rrela tio n t im e w h ich ch a ra cte rize s th e tim e d e p e n d e n c e o f th e in te r a c tio n . T h e lin e w id th for L o - re n tz ia n -ty p e sig n a ls is g iven b y (in m a g n e tic u n its)
2( 2 )
2(3)
yTz
E q u a tio n 2 refers to th e ca se w here th e lin e w id th is m e a sured b e tw ee n in fle c tio n p o in ts o f th e a b so rp tio n curve (81B r) a n d eq 3 to th e ca se w here th e line w id th is m e a
su red a t h a lf -h e ig h t o f th e a b so rp tio n cu rve (35C 1).In so lu tio n s c o n ta in in g large ag g reg a tes , su ch as m i
ce lles , slow m o tio n a l p ro cesses m a y b e e x p e c te d a n d , th erefore , th e v a lid ity o f th e e x tr e m e n arro w in g c o n d itio n ,
i.e., corc <s 1 , ai b e in g th e L a r m o r p recessio n freq u en cy , m u s t be c a re fu lly e x a m in e d . In th e n o n e x tre m e narrow ing ca se for sp in % n u c le i re la x a tio n is n o n e x p o n e n tia l an d th e n m r sp e c tru m c o n sists o f tw o c o m p o n e n t sig n a ls w ith d ifferen t lin e w id th s . (T h e re la x a tio n o f sp in % n u cle i in th e n o n e x tre m e n arro w in g ca se is tr ea te d in ref 1 6 -1 8 .) T h e narrow p ea k co rresp on d s to 4 0 % o f th e to ta l in ten sity a n d is d ete r m in e d b y m o tio n for w h ich oirc < 1 w hereas th e b ro a d c o m p o n e n t is d e te r m in e d b y slow er m o tio n . I f w t c ~ 1 , T\ ?£ T2 a n d th e lin e w id th va ries w ith th e m a g n e tic fie ld s tr e n g th . T o in v e stig a te w h ich s itu a tio n is a p
p ro p riate in th e p resen t case so m e in v estig a tio n s o f th e sig n a l in te n sity a n d th e fre q u e n c y d e p e n d e n c e o f th e line w id th w ere p er fo rm e d . A s w as d esc rib e d a b o v e , no fre q u e n c y d e p e n d e n c e o f th e lin e w id th for a fa ir ly co n ce n tra ted N T A B or C T A B s o lu tio n 13 c o u ld be d e te c te d . W e a lso m e a su red th e s ig n a l in te n sity o f th e 81B r n m r sig n al for a 0 .5 M C T A B s o lu t io n .13 It w as fo u n d th a t th is sign al h as th e sa m e in teg ra ted in te n sity as th e 81B r s ig n a l from a 0 .5 M N a B r aq u eo u s so lu tio n . F ro m th ese e x p er im e n ta l resu lts it ap p ea rs th a t th ere is no m o tio n w ith utc ~ 1 , w h ich c o n tr ib u te s to th e re la x a tio n ra te an d th a t th e 81B r n m r sig n al c o n ta in s o n ly on e c o m p o n e n t.
T h e o b serv a tio n s a c c o u n te d for a b o v e im p ly th a t th e re la x a tio n is a d e q u a te ly d e sc rib e d b y eq 1 a n d th a t a ll th e tra n sitio n s b e tw ee n th e d iffe re n t n u c le a r sp in sta te s c o n
tr ib u te to th e o b serv e d n m r s ig n a l. W it h severa l ty p e s o f h a lid e b in d in g s ites in th e so lu tio n s eq 1 gives th e line w id th ch a ra c te ristic o f a p a rticu la r s ite w h ereas th e o b se rv a b le re la x a tio n rate w ill b e a c o m p o site o f th e r e la x a tio n b e h a v io r in th e d iffe re n t s ite s . I f th e h a lid e ions are ex ch a n g in g b e tw ee n th e v a rio u s s ites m u c h m o re ra p id ly th a n th e re la x a tio n th e o b serv a b le line w id th is g iven b y
A B ahs = E p A B , (4 )
H ere p , is th e fra c tio n o f h a lid e ion s o c c u p y in g s ites o f ty p e i an d A B t is th e c o rresp o n d in g in trin sic lin e w id th . T h e a p p lic a b ility o f eq 4 w a s, as in ou r p rev io u s stu d ie s , in v estig a te d b y s tu d y in g th e te m p e ra tu re d ep e n d e n c e o f th e line w id th a n d b y a c o m p a riso n o f th e 79B r an d 81B r q u a d ru p o le re la x a tio n ra te s . T h e ra p id d ec re a se in line w id th w ith in crea sin g te m p e ra tu re (see F igu re 5 ) im p lie s th a t eq 4 is v a lid . T h e ra tio A B ( 79B r ) /A B ( 81B r) w as o b
se rv ed to be a b o u t 1 .6 for a 1 .5 M N T A B a n d a 1 .0 M D T A B so lu tio n . T h is v a lu e is close to th a t e x p e c te d for ra p id ex ch a n g e (cf. re f 1 9 ) .
I f w e sta rt b y c o n sid erin g th e e x p e r im e n ta l co u n terio n re la x a tio n d a ta o b ta in e d a t s u b m ic e lla r c o n c e n tra tio n s a str ik in g o b serv a tio n is t h a t th e c o u n te rio n n m r lin e w id th s a lso a t low c o n c e n tra tio n s are m a r k e d ly d e p e n d e n t on su r fa c ta n t c o n c e n tra tio n . T h u s th e h a lid e ion s in tera c t w ith th e ca tio n s even in th e a b sen c e o f m ic e lle fo rm a tio n . It ca n be in ferred fro m th e e x p e r im e n ta l d a ta (for e x a m p le , F igu re 1) th a t th e q u a d ru p o le re la x a tio n o f s l B r a t low c o n c e n tra tio n s is m o re e ffec tiv e for N T A B a n d D T A B th a n for N A B a n d D A B . F ro m ou r p rev io u s stu d ie s 8 1 0 it c a n b e in ferred th a t th is in tera c tio n is n o t an io n -p a ir form a tio n w ith th e n o rm a l m e a n in g o f th is c o n c e p t nor is it n ecessa ry to in v ok e a fo rm a tio n o f so -c a lle d p re -m ic e lla r ag greg ates to e x p la in th ese fin d in g s . T h u s th e sa m e e ffec t is o b ta in e d for c o n sid e r a b ly sm a lle r organ ic ca tio n s w here c a t io n -c a t io n a sso c ia tio n is u n lik e ly to o c c u r .8 ’9 In ste a d , it ap p ea rs th a t th e e x p la n a tio n is th a t th e n on p o la r grou p s e x ert a s tr u c tu re -m a k in g e ffec t on th e w a ter la ttic e a n d th a t p a rt o f th e a n io n s are in co rp o ra ted in to th e m o d -
2533
The Journal of Physical Chemistry, Vol. 77, No. 21, 1973

2534 Goran Lindblom and Björn Lindman
t . c70 60 50 40
F ig u re 5 . The 81 Br nmr line width, AB (in mT), on a logarithm ic scale plotted against the inverse absolute tem perature for 0.5 M nonylamm onium brom ide (O ) and 1.0 M nonyltrim ethylam m oni- um brom ide ( 0 ) .
ified w ater stru ctu re in th e v ic in ity o f th e c a tio n s .8-10 T h e s tr u c tu r e -m a k in g e ffec t in creases w ith in crea sin g s u b s t i tu tio n on th e n itro g en 20-21 an d th is e x p la in s w h y N T A B a n d D T A B so lu tio n s g ive greater lin e w id th s in th e m o le c u le -d isp erse c o n c e n tra tio n region th a n d o N A B an d D A B so lu tio n s .
T h e ra p id in crease in co u n terio n q u a d ru p o le re la x a tio n ra te a b o v e th e c m c ca n be referred to an a tta c h m e n t o f p a r t o f th e c o u n terio n s to th e m ic e lla r ag g reg a tes . (A n e f fe c t o f m ic e lle fo rm a tio n on co u n terio n q u a d ru p o le r e la x a tio n h as b een o b serv e d p rev io u sly for so m e oth er su r fa c
t a n t s .22" 24) It is a p p a r e n t fro m F igu res 1 -4 th a t th e lin e b ro a d e n in g o b ta in e d on m ic e lle fo rm a tio n d ep e n d s to a great e x te n t on th e ca tio n ic group o f th e su r fa c ta n t. I f the d istr ib u tio n o f c o u n terio n s a m o n g th e d iffe re n t b in d in g
s ite s in th e so lu tio n s w ere k n ow n we co u ld b y m e a n s o f eq 4 c a lc u la te th e in trin sic re la x a tio n rate o f th e m ic e lla r ly b o u n d c o u n terio n s . T h is in trin sic re la x a tio n rate co u ld be a u se fu l q u a n tity for o b ta in in g a d eep er in sig h t in to th e m o d e o f a t ta c h m e n t o f c o u n terio n s to m ic e lla r a g greg ates.
F or th e d esc rip tio n o f m ic e lliz a tio n tw o th eories are in cu rren t u se , i.e., th e p se u d o -p h a se se p a ra tio n m o d e l an d th e a p p lic a tio n o f th e la w o f m a ss a c tio n to th e su rfa c ta n t a g g reg a tio n .25-26 F or large ag greg ation n u m b e r s th e tw o m o d e ls g ive th e sa m e re su lts , e x c e p t th a t in th e p resen ce o f co u n terio n d isso c ia tio n a sm a ll d ev ia tio n re su lts . T h e ag greg ation n u m b e r s g iven b y S h in o d a 26 w o u ld im p ly th a t th e p h a se se p a ra tio n a p p ro a ch c o u ld serve as a u se fu l first a p p ro x im a tio n for th e su rfa c ta n ts s tu d ie d in th e p resen t w ork . W e h a v e , th erefore , in order to o b ta in th e q u a d r u p o le re la x a tio n ra tes o f th e m ic e lla r ly b o u n d co u n terio n s e m p lo y e d th is th e o ry . A s w ill be sh ow n b e low , th e o b serv ed c o n c e n tra tio n d e p e n d e n c e s o f th e co u n terio n n m r lin e w id th s agree c lo se ly w ith th a t p re d ic te d b y th e th e o
ry.L e t u s a ssu m e that, in th e m ic e lla r so lu tio n s o n ly tw o
ty p e s o f h a lid e ion s n e e d to be c o n sid ered . O n e corresp o n d s to a free ion , th a t is a h a lid e ion n o t in tera ctin g w ith th e m ic e lles b u t o n ly w ith th e m o n o m e ric ca tio n s . W e w ill refer to th is b y th e su b sc rip t f . (T h e “ fre e ” ion s in th e sen se g iv en here co rresp on d in fa c t to a t le a st tw o ty p e s o f h a lid e io n s, i.e., h a lid e ions n o t in tera c tin g a t all w ith th e s u r fa c ta n t a n d h a lid e ion s in tera ctin g w ith th e n o n a sso c ia ted c a tio n s as d esc rib e d ab o v e for p re m ice lla r c o n c e n tra tio n s . A B f is, th erefore , a w eig h ted av erag e o f th e line w id th s o f th ese tw o ty p e s o f sites w h ich , as d e
scrib ed b e low , w a s ta k e n in to a c c o u n t on c a lc u la tin g A B m fro m A Bobs-) T h e o th er ty p e o f h a lid e ion s w ou ld be th o se a tta c h e d to th e m ic e lle s , w h ich are d en o te d b y th e s u b scr ip t m . E q u a tio n 4 n ow reads if w e in tro d u ce m o la r c o n cen tra tio n s
A B obs = ~ A B m + Cl ^ A B f (5 )
H ere C m is th e co n ce n tra tio n o f m ic e lla r ly b o u n d h a lid e ion s an d C t th e to ta l su r fa c ta n t c o n c e n tr a tio n . A B ( a n d A B m are th e in trin sic lin e w id th s o f th e tw o s ite s . A s s u m in g n ow th a t th e p se u d o -p h a se sep a ra tio n m o d e l a p p lie s an d th a t th e ra tio , o f h a lid e ion s to su r fa c ta n t io n s in th e m ic e lla r a g g reg a tes is in d e p e n d e n t o f co n ce n tra tio n w e have
C m = f3(Ct - C c) (6 )
w here C c is th e critic a l m ic e lle c o n c e n tr a tio n . In sertio n o f eq 6 in to eq 5 y ie ld s
BCABobs = A B f + /3(ABm - A B f) - - ^ ( A B m - AB,) (7)
E q u a tio n 7 h o ld s for so lu tio n s w here Ct > Cc w h ereas b elo w th e c m c A B obs = A B f . S in c e th e c o n c e n tra tio n d e p en d e n ce o f A B r is w eak c o m p a re d to th e d ifferen ce A B m — A B f a n d A B f va ries n ea rly lin early w ith th e in verse s u r fa c ta n t c o n c e n tra tio n ou r s im p le m o d e l sh o u ld give tw o stra ig h t lin es in tersec tin g a t th e c m c if th e o b serv e d line w id th is p lo tte d as a fu n c tio n o f th e in verse to ta l su r fa c
ta n t co n c e n tra tio n .It m a y be in ferred fro m F igu res 2 - 4 th a t eq 7 g ives a
go od ra tio n a liz a tio n o f th e line w id th d a ta in a w ide c o n ce n tra tio n region arou n d th e c m c . (D u e to se n s itiv ity l i m ita tio n s T T A B a n d C T A B cou ld n o t b e s tu d ie d in th e v i c in ity o f th e c m c .) F ro m th e low co n c e n tra tio n in te r se c tio n p o in ts o f th e stra ig h t lin e se g m e n ts in F igu res 2 - 4 th e critic a l m ic e lle c o n c e n tra tio n s w ere o b ta in e d . T h e s e are lis te d in T a b le I to g e th e r w ith c m c d a ta for a lk y la m m o - n iu m h a lid e s ta k e n fro m th e litera tu re . In so m e ca ses w here c m c v a lu e s c o u ld n o t be fo u n d w e m a d e u se o f th e e x p e r im e n ta l a n d th e o re tica l o b serv a tio n th a t th e lo g a r ith m o f th e c m c va ries n ea rly lin e a rly w ith th e n u m b e r o f ca rb o n s in th e h y d ro ca rb o n c h a in .26 A s ca n be seen fro m T a b le I, th ere is g en era lly a good a g re e m en t b e tw ee n th e c m c v a lu e s o b ta in e d fro m th e c o u n terio n q u a d ru p o le re la x a tio n ra tes a n d th o se o b ta in e d b y oth er m e th o d s .
A s h a s been p o in te d o u t earlier , 27 it is n e ce ssa ry w h en d iscu ssin g th e v a ria tio n o f th e c m c w ith th e n a tu re o f th e co u n terio n to ta k e in to a c c o u n t n o t o n ly h o w th e c o u n te r io n s in tera c t w ith th e a sso c ia te d su r fa c ta n t io n s b u t a lso th e in tera ctio n b etw een th e c o u n terio n s a n d th e m o n o m eric s u r fa c ta n t w h ich h as b e e n d e m o n str a te d in th e p resen t w ork. A ls o , th e stron g er in tera ctio n b e tw ee n b r o m id e ion s a n d a lk y ltr im e th y la m m o n iu m ion s b e lo w th e c m c sh o u ld te n d to in crease th e c m c v a lu e s o f a lk y ltr im e th y la m m o n iu m b r o m id e s re la tiv e to th o se o f a lk y la m - m o n iu m b r o m id e s . W e fin d for th e a lk y ltr im e th y la m m o n iu m b ro m id e s h ig h er c m c v a lu es th a n for a lk y la m m o n iu m b r o m id e s b u t , o f cou rse , oth er fa cto rs m a y a lso give rise to th e d ifferen ce b etw een th e tw o ty p e s o f su r fa c ta n ts .
A s m a y b e in ferred fro m F igu res 2 - 4 , b e s id es th e c h a n g e in co u n terio n b in d in g in th e v ic in ity o f th e c m c a p r o n o u n ce d seco n d slop e a ltera tio n is o b served at h ig h er c o n ce n tra tio n s for so m e o f th e su r fa c ta n ts . T h u s d e v ia tio n s fro m th e b e h a v io r p re d icted b y eq 7 b e c o m e v is ib le a t
The Journal of Physical Chemistry, Vol. 77, No. 21, 1973

TABLE I: Critical Micelle Concentrations (cmc) Determined from Plots of Counterion Quadrupole Relaxation Rates against the Inverse Surfactant Concentrations. (See Figures2-4.) Temperature 28°
Interaction between Halide Ions and Amphiphilic Organic Cations
S urfactantC m c,
M Lit. values
NAB 0.13NTAB 0.18 0.14a (30°)DAB 0.047 0.040-0 .054° (DAC, 25°)DTAB 0.074 0.065* (30°), 0.075e (25°)DPB 0.047 0.047dOAC 0.27 0.27,d 0.18° (25°), 0.27e (27°)OTAC 0.25 0.22° (OTAB, 30°)
a P. M u k e rje e and K. J. M ysels, “C ritica l M ic e lle C oncentrations of Aqueous S u rfactan t S ystem s," N a t . S t a n d . R e f . D a t a S e r . , N a t . B u r . S t a n d . . 36 , (1 9 7 1 ) . 0 R. F. Tu ddenh am and A. E. A lexan der, J. Pfiys. C h e m . . 66 , 1839 (1 9 6 2 ). c H. B. K levens, J . P h y s . C o l l o i d C h e m . . 52 , 130 (1 9 4 8 ). d C alcu la ted assum ing a linear relation be tw een the logarithm of the c m c and the nu m b er of carbons in the alkyl chain For D PB the values given In the book by M u k e rje e and M ysels (see footnote a ) w ere used w h ereas for O A C the expression given by Shinoda (ref 26, p 4 3 ) was em ployed. e H. G ustavsson and B. L lndm an, J . C h e r r . S o c . , C h e m . C om - m u n . . 93 (1 9 7 3 ).
a b o u t 0 .9 1 M for N A B , 0 .1 8 M for D A B , 0 .4 8 M for T T A B , a n d a t a b o u t 0 .1 9 M for C T A B . T h e seco n d ch a n ge in c o u n terio n b in d in g su g g e sts th a t a t th e c o n c e n tra tio n s q u o te d a n a lte r a tio n o f th e charge d e n sitie s o f th e m ic e lla r su rfa ces is c o m m e n c in g to ta k e p la c e . A charge d en sity c h a n g e at th e in terfa ce b e tw ee n th e m ic e lles an d th e in term ic e lla r so lu tio n s h o u ld b e c o n n ec te d w ith an a ltered a r ra n g e m e n t o f th e a m p h ip h ilic ion s in th e m ic e lles , w h ich m a y le a d to a c h a n g e in th e sh a p e o f th e m ic e lle s , for e x a m p le fro m sp h erica l or n e a r ly sp h erica l m ic e lles to lo n g e llip so id a l a g g reg a tes . F or C T A B it h as b e e n o b
served b y m e a n s o f o th er e x p e r im e n ta l te c h n iq u e s th a t a d ra stic e lo n g a tio n o f th e m ic e lle s ta k e s p la c e at th e sa m e co n c e n tra tio n as w h ere w e o b serv e th a t th e co u n terio n b in d in g to th e m ic e lle s ch a n g e s (c /. re f 1 3 ) . In a n a lo g y w ith th e C T A B so lu tio n s it se e m s re a so n a b le to p o stu la te a ch a n ge in m ic e lla r fo rm also for N A B , B A B , a n d T T A B a t th e c o n c e n tra tio n s g iven a b o v e . It ap p ea rs th a t for th e sa m e len g th o f th e su r fa c ta n t ion th e c h a n g e in co u n terio n b in d in g to th e m ic e lle s ta k e s p la c e at a c o n sid era b ly low er co n c e n tra tio n for th e a lk y la m m o n iu m b r o m id e s th a n for th e a lk y ltr im e th y la m m o n iu m b r o m id e s .
F rom th e s lo p es o f th e stra ig h t line se g m e n ts in F igu res2 - 4 ju s t ab o v e th e c m c or fro m th e ir in terce p ts w ith th e ord in ate ax is th e q u a n tity /3{ABm - A f i f ) m a y b e c a lc u la ted for th e f ir s t -fo r m e d m ic e lle s {cf. eq 7 ) . T h e s e v a lu es are g iven in T a b le II for th e d iffe re n t su r fa c ta n ts . In order to o b ta in A B m fro m th e se q u a n tit ie s it is n ecessa ry to h av e in fo r m a tio n on /I a n d A B (. S in c e th e lin e -b r o a d e n in g on m ic e lle fo rm a tio n is s u b s ta n tia l, th e error in tro d u ce d b y n e g le c tin g A B { is n o t seriou s in m o s t c a se s . In our c a lcu la tio n s w e to o k , fo llo w in g th e p s e u d o -p h a se se p a ra tio n a p p ro a ch , for A B ( th e v a lu es o b ta in e d w h en th e line w id th s o b serv e d for th e s u b m ic e lla r c o n c e n tra tio n s are e x tra p o la te d to th e c m c . I t is a m o re d e lic a te m a tte r to e s t- m a te (3. O f co u rse , d eg rees o f co u n terio n a sso c ia tio n to m ic elles h a v e b e e n o b ta in e d b y oth er m e th o d s ,28 a n d one p o ssib ility w o u ld be to u se th ese v a lu es d ire c tly . H o w e v e r, it is n ot n e ce ssa r ily tru e th a t th e a sso c ia tio n d egree o b ta in ed b y on e m e th o d is th e sa m e w h ich d e te r m in e s th e m a g n itu d e o f an e n tire ly d iffe re n t e x p e r im e n ta l p a r a m e ter. T h erefo re , in order to g et a t lea st a rou gh e s tim a te o f
2535
TABLE II: Quadrupole Relaxation Parameters for Micellarly Bound 81 Br~ and 3 5 CI~ Ions0
S u rfactan t/S(ABm - ABf), m T
Afím.mT
a s myA B„'>
T max y 'cm1 0 10, secc
NTAB 0.28 0.43 17 0 . 2 7 e
DTAB 0.27 0.39 16 0.25TTABd 0.46 0.60 24 0.38CTABd 0.59 0.77 31 0.50NAB 0.88 1.1 44 0.70DAB 0.88 1.1 44 0.70DPB 0.27 0.38 15 0.24OTAC 0.016 0.031 12 0.27OAC 0.047 0.068 26 0.59
a $ is the ratio be tw een counterions and su rfactan t ions in the m i-celles . 0 was assum ed to be 0 .8 in the calcu la tio n of A B m - A B m is the 81Br or 35CI line w idth ch ara c te riz in g the counterions bound to the m icelles . ABf is the counterion nm r line w idth corresponding to the ions not a ttach ed to the m ice lles . A B f w as taken as the line w idth observed at low concentra tions extrapo la ted to the critica l m ice lle concentration . ABo stands for the 35CI or 81 Br line w idth for the fre e ions. Tcmmax is the upper lim it of the corre lation tim e for the m ice lla rly bound counterions. The calcu la tio ns of the d ifferen t p a ram e te rs (as w ell as the assum ptions m ad e) are described in the text. 6 ABn w as for 81Br determ in ed to 25 and w as for 35CI ta ke n to be 2 .6 pT (R . L. W a rd , B i o c h e m i s t r y , 9 , 2447 (1 9 7 0 )) . c In the calcu lation of r Cm max w e used the corre lation tim es for free ions given by H e rtz .37 d For TTA B and C TA B all the quantities c o rrespond to upper limits s ince m easurem ents could not be perform ed in the vicin ity of the c ritica l m ice lle c oncentra tions . e C oncern ing the absolute value of TCmmax only the first figure is sign ificant.
th e ¡3 v a lu e re le v a n t in th e p resen t s itu a tio n so m e q u a d r u pole re la x a tio n e x p e r im e n ts w ere u n d e r ta k e n . A n o b vio u s w a y to o b ta in /3 w o u ld b e to s tu d y h ow ABobs for th e co u n terio n s is a ffe c te d b y th e a d d itio n of, for e x a m p le , an a lk a li b r o m id e (or a lk a li ch lo rid e) {cf. eq 5 ) . T h e cru cia l p ro b le m is th a t an u n a m b ig u o u s d e te r m in a tio n o f ¡3 from su c h an e x p e r im e n t requires th a t th e sh a p e s o f th e m i ce lles s ta y c o n sta n t. O n th e o th er h a n d , it is o fte n o b serv ed th a t e le ctro ly te a d d itio n m a y in d u ce a tr a n s fo r m a tio n fro m g lo b u la r to ro d -sh a p e d m ic e lle s .28 T h is w ou ld in crease th e line w id th a c co rd in g to ou r re su lts . In order to c ir c u m v e n t th is p ro b le m th e e x p e r im e n ts w ere p er fo rm e d w ith 0 .5 M C T A B so lu tio n s w h ere on ly ro d -sh a p e d m ic e lle s are e x p e c te d . S im p le co n sid era tio n s u sin g eq 5 sh o w th a t if ¡3 <c 1 o n ly sm a ll line w id th ch a n g e s are e x p e c te d on a d d itio n o f a lk a li b r o m id e , w h ereas if ¡3 is close to u n ity th e line w id th sh o u ld d ecrease ra p id ly a n d in su ch a w ay th a t th e ra tio b e tw ee n th e resid u a l lin e w id th a n d th e in itia l lin e w id th is c lose to th e ra tio b e tw ee n th e C T A B c o n c e n tra tio n a n d th e to ta l b ro m id e c o n c e n tra tio n . O u r e x p e r im e n ta l d a ta co n fo rm c lo se ly to th e la tte r s itu a tio n . B y a ssu m in g ¡3 to be 0 .8 th e c a lc u la te d A B m va lu e is w ith in our e x p e r im e n ta l error in d e p e n d e n t o f th e a m o u n t o f N a B r a d d e d (u p to 1 .0 M). T h e sa m e v a lu e has been o b ta in e d b y s tu d ie s u sin g oth er te c h n iq u e s .29-30 It m u st b e n o ted , h ow ever, th a t d u e to th e lim ite d p recisio n or our lin e w id th m e a su r e m e n ts our (3 v a lu e ca n o n ly be ta k en as a rou gh e s tim a te . T h e re is on a d d itio n o f N a B r to a C T A B so lu tio n a m a rk e d in crease in v isc o sity b u t a c co rd in g to ou r s tu d ie s on ly o tro p ic m e so p h a se s 31 th is is n o t e x p ec te d to a ffec t A B m or A B ( s ig n ific a n tly .
U sin g for /3 th e v a lu e 0 .8 w e h av e o b ta in e d th e A B m v a lu e s g iven in T a b le II. ( O f cou rse , ¡3 m a y va ry s lig h tly b e tw ee n th e d iffe re n t su r fa c ta n ts b u t th is is n o t serious for th e p resen t d isc u ss io n .) T o p e r m it a c o m p a riso n b e tw een th e tw o d iffe re n t co u n terio n s w e h a v e in c lu d e d in T a b le II a lso th e ra tio ABm/ABo, A B 0 b e in g th e line w id th co rresp o n d in g to a free h a lid e ion . (A B o w as o b
The Journal of Physical Chemistry, Vol. 77, No. 21. 1973

2536 Goran Undblom and Björn Lindman
ta in e d fro m m e a su r e m e n ts on d ilu te a lk a li h a lid e s o lu t io n s .) A c c o rd in g to eq 1 -3 w e ca n w rite
__ Q t r ^ T cm
w here qm a n d q0 are th e fie ld g ra d ie n ts e x p erien ced b y th e h a lo g e n n u cle i in th e tw o e n v ir o n m e n ts an d r cm a n d r co are th e t im e c o n sta n ts for th e c h a n g e in th e fie ld g ra d ie n ts . O n e c a n see from T a b le II th a t q m2Tcm for a given len g th o f th e lo n g a lk y l c h a in is c o n sid era b ly larger for a l- k y la m m o n iu m h a lid e s th a n for a lk y ltr im e th y la m m o n iu m
h a lid e s or th e a lk y lp y r id in iu m sa lt . T h e d ifferen ce b e tw e en N A B a n d D A B on on e sid e an d N T A B a n d D T A B on th e o th er ca n be u n d ersto o d if th e e n h a n c e d re la x a tio n is d u e , d ire c tly or in d ire c tly , to th e m ic e lla r su rface ch a rg es s in ce for N T A B a n d D T A B th e m e th y l grou p s w ill ca u se th e c o u n terio n s a n d th e ch a rg ed n itro g en s to be fa r th e r a p a rt . E v id e n t ly , th e in tera ctio n c a u sin g re la x a tio n m u s t b e d iffe re n t fro m th a t fo u n d for free orga n ic ca tio n s ( c /. a b o v e a n d re f 8 - 1 0 ) . I f an in co rp oration o f th e c o u n terion s in a w a ter la ttic e s ta b iliz e d b y n o n p o la r grou ps w ere th e ca u se o f th e e n h a n c ed q u a d ru p o le re la x a tio n we w o u ld e x p e c t, d u e to th e m e th y l g rou p s, A B m to b e larger for N T A B a n d D T A B th a n for N A B an d D A B , w h ich is co n trary to o b se r v a tio n . F or D P B e x c e p t for a sh ie ld in g e ffec t a lso a d e lo c a liz a tio n o f th e p o sitiv e ch a rg e over th e p y r id in iu m rin g m a y b e an im p o r ta n t fa c to r in d e te r m in
in g A B m.In order to ch a ra cte rize th e co u n terio n b in d in g in m o re
d e ta il fro m q u a d r u p o le re la x a tio n d a ta it is n e ce ssa ry to e sta b lish w h ich m o tio n is ca u sin g re la x a tio n a n d to a t
te m p t a se p a ra tio n o f th e tw o fa cto rs d e te r m in in g A B m,i.e., qm a n d r cm . W e w ill c o n sid er th e fo rm er p ro b lem first. In a th e o re tica l s tu d y ,32 co u n terio n q u a d ru p o le re la x a tio n ra tes for d iffe re n t ty p e s o f m o tio n a l p ro cesses are given as w ell as p re d ictio n s o f h ow th e q u a d ru p o le r e la x a tio n ra tes d e p e n d on v a rio u s fa c to rs , su c h as m ic e lla r ra d iu s , s o lv e n t iso to p ic e ffec t, m ic e lla r sh a p e a n d su rfa c ta n t c o n c e n tra tio n . A n a p p lic a tio n o f th e se re su lts to th e su r fa c ta n ts s tu d ie d in th e p resen t w ork s tro n g ly in d ica te s th a t w ater m o tio n is ca u sin g re la x a tio n . Im p o r ta n t p o in ts for th is co n c lu sio n are th e fo llo w in g .
(a ) W e r e in te r m ic e lla r co u n terio n ex ch a n g e th e ca u se o f th e tim e v a ria tio n o f th e fie ld gra d ie n ts , th e re la x a tio n rate sh o u ld d ecrease w ith in creasin g m ic e lla r c o n c e n tr a
tio n . In n o ca se h as su c h a d ecrease b e e n ob serv e d .(b ) F or m ic e lla r ro ta tio n , a m p h ip h ile la tera l d iffu sio n
a n d co u n terio n tr a n sla tio n a l m o tio n a lo n g th e a m p h i- p h ile -w a te r in terfa ce r cm sh o u ld b e stro n g ly d e p e n d e n t on ag greg ate cu rv a tu re , b u t w e o b serv e 31 n o or v ery sm a ll re la x a tio n ra te c h a n g e s a t p h a se tra n sitio n s (for e x a m p le , m ic e lla r so lu tio n s — - la m e lla r m e so p h a se ) in su rfa c ta n t sy ste m s .
(c ) F or m ic e lla r ro ta tio n r cm sh o u ld b e p ro p o rtio n a l to th e th ird p ow er o f th e m ic e lla r ra d iu s if w e a ssu m e a c o n s ta n t re sista n ce to w a rd re o rie n ta tio n . A c c o rd in g to o b se r v a tio n ( T a b le II) , for a g iven en d grou p , A B m va ries to a m u c h sm a lle r e x te n t w ith th e le n g th o f lo n g a lk y l ch a in .
(d ) T h e re la tiv e c h a n g e in re la x a tio n rate on s u b s t itu tio n o f h e a v y w a ter for ord in ary w a ter13 is th e sa m e as th a t o b ta in e d for n o n a sso c ia ted h y d r a te d io n s10 -33 an d a lso close to th e iso to p ic e ffec t in w ater v isc o sity 34 an d w ater tr a n sla tio n a l d iffu s io n .34
(e ) T h e en ergy o f a c tiv a tio n o f th e re la x a tio n p ro cess is n e a r ly in d e p e n d e n t o f a g greg ate s h a p e .13
(f) R e la x a tio n rate an d m a c ro sc o p ic v isc o sity (w h ic h sh o u ld b e p r e d o m in a n tly d e te r m in e d b y th e m o tio n o f th e large ag g reg a tes) va ry in a q u ite d iss im ila r w a y w ith th e su r fa c ta n t c o n c e n tr a tio n .13
O u r co n c lu sio n th a t th e m o tio n o f w ater m o le c u le s e f
fec ts th e co u n terio n q u a d ru p o le re la x a tio n in d ic a te s th a t th e c o u n terio n s are h y d ra te d a lso w h en th e y are a tta c h e d to th e m ic e lle s . In a g re e m en t w ith th is it ca n b e n o te d th a t for C T A B d isso lv e d in m o le c u le -d isp e r se fo rm in an organ ic s o lv e n t th e 81B r line w id th is c o n sid e r a b ly greater th a n for m ic e lla r so lu tio n s 11 a n d th a t c o n ta c t io n -p a ir in g is n o t o f great im p o r ta n c e for a q u eo u s so lu tio n s .
U n fo r tu n a te ly , a sep a ra tio n o f th e fie ld g ra d ie n t a n d th e co rrela tio n t im e is, e x c e p t for th e ca se w here cotc is o f th e order o f u n ity (see ref 35 a n d 3 6 ) , d iff ic u lt to a c h iev e w h en , as for m o n o a to m ic io n s, th e re la x a tio n is d u e to in - te rm o le c u la r in tera c tio n s . O n e ca n e n v isa g e th a t th e a t ta c h m e n t o f a c o u n terio n to a m ic e lla r a g greg ate w ou ld be a c c o m p a n ie d b y an in crease in b o th q a n d r c. T h u s for a h y d ra te d ion th e ch a rg ed m ic e lla r su rfa ce w ill d isto rt the h y d ra tio n sp h ere so as to in crease q a t th e sa m e t im e as th e w a ter m o le c u la r m o tio n is re ta rd e d . I t is p ro b a b le th a t b o th qm a n d rcm are greater th a n th e c o rresp o n d in g q u a n tit ie s for a n o n a sso c ia ted ion b u t w e are a t p resen t u n a b le to d ec id e w h eth er e ith er th e fie ld g ra d ie n t or th e co rrelation t im e is m a k in g a m a jo r c o n tr ib u tio n to th e e n h a n c ed c o u n terio n q u a d ru p o le re la x a tio n o b serv e d o n m i ce lle fo rm a tio n . It w as h o p ed th a t th e te m p e ra tu re d e p e n d en c e o f th e lin e w id th s c o u ld be in fo r m a tiv e in th is re sp e c t b u t th e fa c t th a t th e a c tiv a tio n en ergies o f A B m are in th e order C T A B (re f 13) ~ N A B > N T A B is d iff ic u lt to e x p la in . B y a ttr ib u tin g th e w h ole c h a n g e in lin e w id th to a ch a n g e in th e co rrelation t im e an u p p e r lim it for r cm m a y be o b ta in e d . T h e s e u p p er lim its o f rcm are in c lu d e d in T a b le II. In th e c a lc u la tio n s w e u se d for rco th e figu res given b y H e r t z .37
T h e fa c t th a t ABm/AB0 is larger for B r ~ th a n for C l a n d th a t for R b + a n d N a + co u n terio n s th is q u a n tity is an order o f m a g n itu d e sm a lle r 23'24 ca n c e rta in ly b e referred to d ifferen ces in co u n terio n charge d en sitie s w h ich are in th e se q u e n c e N a + > R b + > C D > B r ~ . F o r an ion w ith a h igh ch arge d e n s ity , h y d ra tio n w ater m o le c u la r m o tio n w ill b e less su sc e p tib le to e ffec ts b y th e e lectric fie ld fro m th e m ic e lla r su rfa ce a n d , fu rth erm o re , on a t ta c h m e n t o f a stro n g ly h y d r a te d ion to a m ic e lle th e d e fo r m a tio n o f th e h y d ra tio n sp h ere w ill be sm a lle r th a n for a w ea k ly h y d r a ted ion .
Acknowledgments. W e are in d e b te d to M r . H a k a n W e n n e r str o m for h e lp fu l th e o re tic a l d isc u ssio n s a n d to M r . S v e n A n d e r sso n a n d M r s . A n n ik a R a ih le for te c h n ic a l a ssista n c e .
References and Notes(1 ) G . L. Jen d ras iak , Chem. Phys. Lipids. 9, 133 (1 9 7 2 ).(2 ) J. B. S w aney and I. M. K lotz, Biochemistry. 9, 2 5 7 0 (1 9 7 0 ).(3) L .-O . A ndersson, D issertation , U ppsala , 1971 .(4) A. Jonas and G . W eber, Biochemistry, 10, 1335 (1 9 7 1 ).(5 ) A . Jonas and G . W eber, Biochemistry. 10, 4 4 9 2 (1 9 7 1 ).(6 ) G. G illb erg -L a Fo rce and S. Forsen, Biochem. Biophys. Res. Com-
mun.. 38, 137 (1 9 7 0 ).(7 ) J. A. M agnusson and N. S. M agnusson, J. Amer. Chem. Soc., 94,
5461 (1 9 7 2 ).(8) B. L indm an, S. Forsen, and E. Forslind, J. Phys. Chem.. 7 2 , 2 80 5
(1 9 6 8 ).(9 ) B. L indm an, H. W enn erstro m , and S. Forsen, J. Phys. Chem.. 74,
7 54 (1 9 7 0 ).(10) H. W en n ers tro m , B. Lindm an, and S. Forsen, J. Phys. Chem., 75,
2 9 3 6 (1 9 7 1 ) .
The Journal of Physical Chemistry, Vol. 77, No. 27, 1973

Matrix Isolation Studies on the Gallium-Indium-Oxygen System 253/
(11) G. Lindblom, B. Lindman, and L. Mandell, J. Colloid Interface Sei., 34, 262 (1970).
(12) G. Lindblom and B. Lindman, Mol. Cryst. Liq. Cryst.. 14, 49 (1971).(13) G. Lindblom, B. Lindman, and L. Mandell, J. Colloid Interface Scl.,
42, 400 (1973).(14) W. P. J. Ford, R. H. Ottewill, and H. C. Parreira, J. Colloid Inter
face Scl.. 24, 522 (1966).(15) A. Abragam, "The Principles of Nuclear Magnetism," Clarendon
Press, Oxford, 1961, p 314.(16) H. J. C. Berendsen and H. T. Edzes, presented at the International
Conference on Physicochemical State of Ions and Water in Living Tissues and Model Systems, The New York Academy of Sciences, Jan 1972.
(17) P. S. Hubbard, J. Chem. Phys., 51, 1647 (1969).(18) T. E. Bull, J. Magn. Resonance. 8, 344 (1972).(19) H. G. Hertz, Ber. Bunsenges. Phys. Chem., 65, 36 (1961).(20) M. D. Zeidler in “ Water, a Comprehensive Treatise,” F. Franks,
Ed., Vol. 2, “ Aqueous Solutions of Simple Molecules and Ions,” Plenum Press, New York, N. Y., in press.
(21) W.-Y. Wen in “ Water and Aqueous Solutions. Structure, Thermodynamics, and Transport Processes," R. A. Horne, Ed., Wiley, New York, N. Y., 1972, p 613.
(22) J. C. Eriksson, A . Johansson, and L.-O. Andersson, Acta Chem. Scand., 20, 2301 (1966).
(23) B. Lindman and I. Danielsson, J. Colloid Interface Scl.. 39, 349 (1972).
(24) I. D. Robb, J. Colloid Interface Sei.. 37,521 (1971).
(25) P. H. Elworthy, A. T. Florence, and C. B. Macfarlane, “ Solubilization by Surface-active Agents," Chapman and Hall, London, 1968, p 48.
(26) K. Shinoda, T. Nakagawa, B.-l. Tamamushi, and T. Isemura, “ Colloidal Surfactants," Academic Press, New York, N. Y., 1963.
(27) B. Lindman, Proc. Intern. Congr. Surface Active Agents. 5th. Barcelona. 1088 (1968).
(28) E. W. Anacker in “Surfactant Science Series,” E. Jungermann, Ed., Vol. 4, Marcel Dekker, Inc., New York, N. Y., 1970, p 203.
(29) E. Keh, C. Gavach, and J. Guastalla, C. R. Acad. Sci.. Ser. C. 263, 1488 (1966).
(30) W. K. Mathews, J. W. Larsen, and M. J. Pikal, Tetrahedron Lett.. 6, 513 (1972).
(31) G. Lindblom and B. Lindman, Proc. Intern. Congr. Surface Active Agents, 6th, Zurich, 1972, in press.
(32) H. Wennerstrom, G. Lindblom, and B. Lindman, to be submitted for publication.
(33) M. Eisenstadt and H. L. Friedman, J. Chem. Phys., 44, 1407(1966) .
(34) G. S. Kelly in “ Water, a Comprehensive Treatise," F. Franks, Ed., Vol. 1, Plenum Press, New York, N. Y., 1972, p 363.
(35) T. E. Bull, J. Andrasko, E. Chiancone, and S. Forsén, J. Mol. Biol.. 73, 251 (1973).
(36) J. Andrasko, I. Lindqvist, and T. E. Bull, Chem. Scripts. 2, 93 (1972).
(37) H. G. Hertz, Progr. Nucl. Magn. Resonance Spectrosc.. 3, 159(1967) .
Matrix Isolation Studies on the Gallium-Indium-Oxygen System. Infrared Spectra and
Structures of Molecular Ga20 , ln20 , and InOGa
A. J. Hinchcliffe and J. S. Ogden*
Inorganic Chemistry Laboratory, University of Oxford, Oxford, England (Received June 14. 1973)
W h e n th e v a p o r a b o v e h e a te d g a lliu m o x id e is co n d e n se d in lo w -te m p e ra tu re m a tric e s , tw o ox id e sp ecies are fre q u e n tly p ro d u c ed a n d th ese are id en tified b y in frared sp ec tro sc o p y as G a 2 0 an d a d im e r sp ec ies G a 4C>2 . T h e sa m e m o le c u le s are a lso o b serv ed w h en ox y g en gas is p a sse d over h e a te d g a lliu m a n d th e p ro d u c ts are s im ila r ly iso la te d . T h e co rresp o n d in g in d iu m -o x y g e n sy ste m y ie ld s a n a lo g o u s sp ec ies In 2 0
a n d In 4 0 2 , a n d w h en ox y g en is p a ssed over an a llo y o f g a lliu m a n d in d iu m , severa l n ew m ix e d sp ec ies o f th e gen era l fo rm u la G a ^ I n ^ - jC ^ are id en tified in a d d itio n to th e m ix e d m e ta l su b o x id e I n O G a . In frared b a n d a ss ig n m e n ts are su p p o rted b y d iffu sio n s tu d ie s a n d th e use o f 180 e n r ic h m e n t, an d n o r m a l c o o rd i
n a te a n a ly se s for G a 2 0 a n d In 2 0 y ie ld p rin c ip a l force c o n sta n ts Fg a-O = 3 .6 5 ± 0 .2 m d y n /A a n d F In_0 =3 .1 5 ± 0 .2 5 m d y n /A an d apex a n g les > 1 4 2 ° a n d > 1 3 5 ° , re sp ec tiv e ly . T h e in terp reta tio n o f th ese resu lts is d isc u sse d in th e c o n te x t o f p rev io u s w ork on th ese sy s te m s .
Introduction
T h e v a p o r p h a se o x id es o f g a lliu m a n d in d iu m h av e been s tu d ie d fa ir ly e x te n siv e ly b y m a ss s p e c tr o m e tr y , 1 4
an d it is w ell e s ta b lish e d th a t G a 2 0 a n d In 2 0 are th e im p o rta n t sp ec ies p ro d u c e d on h e a tin g th e so lid o x id es G a 2C>3 or In 20 3 . T h e m o le c u le I n O G a h a s a lso b een rece n tly d e te c te d in th e v a p o r a b o v e h e a te d I n -G a 2 0 3
m ix tu r e s .5
H o w ev er, d e sp ite se v e ra l a t te m p ts to c h a ra cterize th ese sp ecies m o re c o m p le te ly , c o n sid era b le u n c e r ta in ty still re m a in s c o n ce rn in g th e ir v ib ra tio n fre q u e n cie s a n d e q u ilib riu m g e o m etrie s . T h e in itia l h ig h -te m p e r a tu re electro n d iffra ction re su lts in d ic a te d 6 th a t b o th G a 2 0 a n d In 2 0
h a d C 21; stru ctu re s w ith a p ex a n g les o f 140 a n d 1 5 0 ° , re
sp e c tiv e ly , a n d th a t th e G a - 0 a n d I n - 0 b o n d len g th s w ere 1 .8 4 ± 0 .0 1 a n d 2.02 ± 0 .0 1 A . H o w e v e r , a re a ssess m e n t7 o f th e e lectro n d iffra c tio n d a ta , ta k in g in to a c co u n t th e e ffe c t o f p o ss ib le lo w -fre q u e n c y b e n d in g v ib ra tio n s , su g g e ste d th a t b o th th e m o le c u le s w ere lin e a r . T h is c o n clu sio n c o n flic ts w ith a v a p o r p h a se in frared s tu d y 8 on G a 2 0 a n d In 2 0 in w h ich th e s y m m e tr ic a n d a n t is y m m e tric stre tc h in g m o d e s a p p ea r to b e ir a c tiv e in b o th sp ec ies . In an a t te m p t to reso lv e so m e o f th ese d iffic u lt ie s , we h a v e b een stu d y in g th e ir sp ec tra o f th ese sp ec ies tra p p ed at low te m p e ra tu re s in in ert m a tr ic e s , an d a p re lim in a ry rep o rt9 b a se d u p o n 180 iso top e fre q u e n cy sh ifts favo rs a C 2v m o d e l for b o th G a 2 0 an d ln 20 . T h e s e sy s te m s h av e also b e e n s tu d ie d in d e p e n d e n tly b y C a rlso n , et al. , 10 b u t a n u m b e r o f d iffic u lt ie s still re m a in co n cern in g th e in te r
The Journal of Physical Chemistry, Vol. 77, No. 21, 1973

2538 A. J. Hinchcliffe and J. S. Ogden
p re ta tio n o f th e m a tr ix iso la tio n re s u lts .11 T h is p a p e r d e scrib es in d e ta il ou r ir s tu d ie s on m a tr ix -is o la te d G a 2 0 , ln 20 , a n d I n O G a , a n d p re sen ts a d d itio n a l d a ta on th e p o ly m e r iz a tio n o f th e se sp ec ies .
Experimental SectionT h e K n u d s e n fu rn a ce an d lo w -te m p e ra tu re cry o tip u sed
for th e se m a tr ix iso la tio n stu d ie s h av e b e e n d esc rib e d p re v io u s ly .12 In th is w ork, th e v a p o r p h a se o x id es o f g a lliu m a n d in d iu m w ere p ro d u c ed in tw o d is tin c t w a y s . In th e first ty p e o f e x p e r im e n t, so lid sa m p le s o f G a 20.3 or In 2Oa w ere h e a te d to ~ 1 0 5 0 or ~ 9 5 0 ° K , re sp e c tiv e ly , in a lu m in a or ta n ta lu m sa m p le h o ld ers , an d th e v a p o r w a s d e p o s ite d on a co o led C s l w in d o w w ith an e x ce ss o f n itro g en or argo n . T h e a ltern a tiv e p ro cedu re w as to p a ss a reg u la ted flo w o f o x y g en ga s ( ~ 0 .1 m m o l /h r ) over e le m e n ta l g a l
liu m or in d iu m h e a te d to ~ 1 1 0 0 ° K in a q u a rtz tu b e . A t th is te m p e ra tu re , th e v a p o r p ressu res o f g a lliu m a n d in
d iu m are still low ( < 1 0 3 T o r r ) 13 b u t a n y ox id e p ro d u c ed is im m e d ia te ly v a p o rize d , a n d is co n d e n se d w ith th e in ert m a tr ix g a s. T h is m e th o d p ro ved to b e a m o s t c o n v e n ie n t rou te to 180 -la b e lle d c o m p o u n d s .
A n u m b e r o f e x p e r im e n ts w ere a lso ca rried o u t in an a t te m p t to p rep are m ix e d m e ta l o x id es (e.g., I n O G a ) an d th e se in v o lv ed p a ssin g 0 2 ga s ov er h e a te d G a -I n a llo y s or a lte r n a tiv e ly h e a tin g a m ix tu r e o f th e so lid sesq u io x id es . B o th th e se m e th o d s w ere su c c essfu l b u t h a d th e m in o r d isa d v a n ta g e th a t th e c o m p o sitio n o f th e v a p o r slow ly ch a n g e d w ith t im e . A n u m b e r o f a d d itio n a l e x p e r im e n ts w ere a lso carried o u t in w h ich 0 2 ga s w as p a sse d over in d iu m a n d g a lliu m h e a te d separately to ~ 1 1 0 0 ° K in p a r a lle l sa m p le tu b e s a n d th e va p ors c o c o n d e n se d s im u lta n e o u sly w ith th e m a tr ix .
T h e sa m p le s o f G a 20 3 a n d e le m e n ta l g a lliu m a n d in d iu m all h a d a s ta te d p u rity > 9 9 .9 9 % . R e sea rc h grade 160 2 , A r , an d N 2 ga ses w ere o b ta in e d fro m th e B r itish O x y g e n C o m p a n y , a n d 180 -e n r ic h e d o x y g en ga s (9 3 a to m % ) w as su p p lie d b y M ile s L a b o ra to r ie s . T h e n itro g en or argon m a tric es w ere d ep o site d a t ra tes o f 5 - 1 0 m m o l /h r a n d m a tr ix ra tio s w ere va ried fro m an e s tim a te d 1 :3 0 0 to 1 :3 0 0 0 . D u r in g s a m p le d e p o sitio n , th e co o led C s l w in d o w c o u ld be m a in ta in e d at an y fix e d te m p e ra tu re b e tw ee n 15 a n d 2 7 ° K , a n d co n tro lled d iffu sio n e x p e r im e n ts w ere ca r ried ou t in th e te m p e ra tu re ran ge 2 0 - 3 5 ° K . Ir sp ec tra w ere reco rd ed a t 2 0 ° K u sin g a P e r k in -E lm e r 2 2 5 sp e c tro p h o to m e te r , a n d th e fu ll ran ge o f th is in s tru m e n t ( 5 0 0 0 -2 0 0 c m ' 1) w a s a v a ila b le th ro u g h e ffic ie n t d ry air p u rg in g . T h e c a lib ra tio n o f th is in s tru m e n t w as ca rried o u t u sin g s ta n d a rd g a ses , a n d fre q u e n c y re p ro d u c ib ility w a s ro u tin e ly w ith in 0 .1 c m ^ 1.
Results and DiscussionA large n u m b e r o f e x p e r im e n ts w ere ca rried o u t u sin g
b o th argon a n d n itro g en m a tr ic e s , a n d in c o m m o n w ith m o s t o th er m a tr ix iso la tio n s tu d ie s , all ir a b so rp tio n s w ere fo u n d to b e d e p e n d e n t to a s m a ll e x te n t u p o n th e m a tr ix e n v ir o n m e n t. H o w e v e r , sp ec tra l reso lu tio n w as g en era lly su p erior in n itro g en , a n d th e fre q u e n cie s q u o te d in th e te x t b e lo w refer to n itrog en m a tric es u n less oth erw ise s ta te d . F or th e sa m e d eg ree o f iso la tio n , n o s ig n ific a n t d if feren ces w ere o b serv e d b etw een th e sp ec tra o b ta in e d fro m th e M 20 3 v a p o riza tio n s a n d th o se o b ta in e d fro m th e co rre sp o n d in g M - 0 2 sy s te m s . H o w e v e r , v a ry in g th e m a tr ix ra tio or a lter in g th e te m p e ra tu re o f th e co o led C s l w in d o w d u rin g d ep o sitio n d id p ro d u c e s ig n ific a n t ch a n g e s in re la tiv e b a n d in te n s it ie s . T h e s im p le s t sp e c tra w ere a lw a y s
The Journal of Physical Chemistry, Vol. 11, No. 21, 1973
F igu re 1. Ir sp e c tra of g a lliu m ox ides iso la te d in n itrogen m a trice s : (a ) fro m hea ted G a2lb 0 3; m a trix ra tio ~ 1 0 0 0 :1 ; (b) a fte r d iffu s in g sam p le (a) to 32°K ; (c) a fte r p ro longed d e p os ition from hea ted Ga m e ta l /160 2; (d) a fte r pass ing 160 2 + 180 2 gas ove r heated g a lliu m ; p ro d u c ts condensed at 25 “ K.
p ro d u c ed u n d er co n d itio n s o f o p t im u m iso la tio n a t ~ 1 5 ° K , a n d in gen eral sp ec tra b e c a m e m o re c o m p lic a te d as th e m a tr ix ra tio w as d ec rea sed or as th e te m p e ra tu re o f th e C s l w in d o w w as ra ise d .
Gallium Oxides. W h e n th e v a p o r a b o v e h e a te d G a 2C>3
w as c o c o n d e n se d w ith a large ex cess ( ~ 3 0 0 0 :1 ) o f n itro g en a t 1 5 °K , th e ir sp e c tru m sh ow ed o n ly on e p r o m in e n t b a n d a t 8 0 9 .4 c m ' 1, to g e th e r w ith tra c es o f C O , H 20 , a n d C 0 2 . W h e n th e m a trix ra tio w a s re d u ce d to ~ 1 0 0 0 :1 , th is b a n d w as still th e m o s t p ro m in e n t fea tu re in th e s p e c tr u m , b u t
it w as a c c o m p a n ie d b y a d d itio n a l w ea k er fea tu res a t5 9 0 .9 , 4 2 3 .9 , a n d 7 4 9 c m - 1 , a n d a ty p ic a l sp e c tru m o b ta in e d u n d er th e se co n d itio n s is sh ow n in F igu re l a . In argon m a tr ic e s u n d er th e sa m e c o n d itio n s o f iso la tio n , th e m o s t p ro m in e n t b a n d a p p ea re d as a p a r tia lly reso lv ed d o u b le t a t 8 2 1 .7 /8 1 7 .8 c m - 1 , an d th e w ea k er fea tu res w ere o b serv e d a t 5 9 4 .7 , 4 1 6 .0 , a n d 7 6 3 c m " 1 . F igu re l b sh ow s th e sp ec tra l ch a n g e s w h ich ta k e p la c e as a re su lt o f w a rm in g th e d e p o s it sh o w n in F igu re l a to a te m p e ra tu re o f ~ 3 2 ° K , a n d it is e v id e n t th a t th e b a n d s a t 5 9 0 .9 a n d
4 2 3 .9 c m " 1 h a v e in crea sed in in te n s ity a t th e e x p e n se o f th e 8 0 9 .4 - c m " 1 b a n d . A s im ila r e n h a n c e m e n t o f th ese tw o b a n d s w a s o b serv e d w h en low er m a tr ix ra tio s ( 5 0 0 :1 ) w ere u se d , a n d th e re su lts o f severa l s tu d ie s o f th is k in d sh o w th a t th e se tw o b a n d s a t 5 9 0 .9 a n d 4 2 3 .9 c m " 1 w ere a lw a y s p re sen t in a p p r o x im a te ly th e sa m e re la tiv e in te n sity ( ~ 5 : 1 ) w h ich su g g e sts th a t th e y b e lo n g to th e s a m e m o lec u la r sp e c ie s . A s an a ltern a tiv e to low erin g th e m a tr ix ra tio , th e in te n s ity o f th e se tw o b a n d s c o u ld a lso b e in c rea sed b y d e p o s itin g a t a w in d o w te m p e ra tu re o f > 2 4 ° K , b u t u n d er th e se c o n d itio n s , tw o w ea k sa te llite s w ere o b serv ed on th e lo w -fre q u e n c y sid e o f th e 8 0 9 .4 -c m 1 b a n d a t 7 9 3 .7 an d 7 8 3 .5 c m " 1.
E v e n u n d er h ig h re so lu tio n , n o fin e s tru c tu re d u e to g a lliu m iso to p e s co u ld be o b serv e d , b u t th e e ffe c t o f 1 8 0
e n ric h m e n t on th is sy s te m is sh o w n in F igu re I d . In th is e x p e r im e n t, an a p p r o x im a te ly e q u im o la r m ix tu re o f 16 0 2
a n d 180 2 w as p a sse d over h e a te d g a lliu m , an d th e p r o d u c ts co n d e n se d a t ~ 2 5 ° K in a n itro g en m a tr ix ( — 1 5 0 0 :1 ) . T h e h ig h -fre q u e n c y region sh ow s tw o p ro m in e n t b a n d s a t8 0 9 .4 a n d 7 6 8 .5 c m 1, e a c h o f w h ich is a c c o m p a n ie d b y tw o w ea k er s a te llite s a t 7 9 3 .7 a n d 7 8 3 .5 a n d 7 5 3 .6 a n d7 4 4 .2 c m - 1 , r e sp e c tiv e ly . In th e 4 0 0 - 6 0 0 - c m " 1 re g io n , th e sp e c tru m c o n sists b a s ic a lly o f tw o tr ip le ts w ith c o m p o

n en ts a t 5 9 0 .9 , 5 7 5 .0 , a n d 5 6 3 .1 c m 1, a n d 4 2 3 .9 , 4 1 5 .0 , a n d 4 0 5 .3 c m 1.
T h e s e re su lts th erefore in d ic a te th a t th ere are a t le a st tw o d iffe re n t g a lliu m ox id e sp ec ies tr a p p e d in th ese m a tr ice s , a n d th e se h a v e b een id e n tif ie d 11 as G a 2 0 an d G a 4C>2. In c o n tr a st , th e m a ss sp e c tro m e tr ic re su lts1 '3 '4
sh ow th a t th e v a p o r is p r e d o m in a n tly G a 2 0 a n d th a t there is n o e v id e n c e for a n y p o ly m e r ic sp ec ies . O u r b a n d a ssig n m e n ts m u s t th erefore b e d isc u sse d in d e ta il.
Ga2 0. T h e in ten se b a n d a t 8 0 9 .4 c m 1 (F igu re l a ) is a ssig n ed to th e a n tis y m m e tr ic s tr e tc h in g m o d e (v3 ) o f G a 2- 160 . O n ly on e a c c o m p a n y in g b a n d is o b serv ed at 7 6 8 .5 c m 1 in 180 e n r ic h m e n t e x p e r im e n ts , a n d in ou r earlier c o m m u n ic a t io n ,9 it w a s sh o w n th a t th is fre q u e n c y sh ift in d ic a te s a b e n t (C2 V) s tru c tu re w ith an a p e x an gle ~ 1 4 3 ° . T h e tw o re m a in in g fu n d a m e n ta ls o f th is m o le c u le (b o th s y m m e tr y A i ) sh o u ld th erefore b e o b serv e d in th e ir sp e c tru m a n d a lth o u g h th e b e n d in g m o d e v 2 , m ig h t lie b elow th e l im it o f ou r sp e c tro m e te r , on e sh o u ld e x p e c t to see v\ th e s y m m e tr ic G a - 0 s tr e tc h . A n u m b e r o f w eaker fea tu res are p re sen t in F igu re l a , b u t th ese e ith er re m a in u n c h a n g e d or in crease in in te n s ity d u rin g d iffu sio n (F ig ure l b ) w h erea s th e b a n d a t 8 0 9 .4 c m - 1 d ec rea ses in in te n s ity , a n d it is o n ly w h en very large d ep o sits are stu d ie d th a t a se c o n d a b so r p tio n w ith s im ila r d iffu sio n c h a ra c te r istics is o b serv e d .
F igu re l c sh o w s p a rt o f th e ir sp e c tru m o f a large d e p o s it o f g a lliu m o x id es iso la te d in a n itro g en m a trix ( ~ 1 0 0 0 :1 ) . In a d d itio n to th e in ten se b a n d s p re sen t in F igu re l a , a n u m b e r o f w ea k er fea tu res are o b serv e d a t 6 1 8 , 5 4 8 , 5 1 8 , 4 7 2 , 4 4 9 , a n d 3 8 0 c m - 1 . D u r in g d iffu sio n , th e 4 4 9 -c m 1 b a n d in cre a se d in in te n sity , a n d th e 6 1 8 an d 3 8 0 -c m - 1 b a n d s d ec re a se d e x tr e m e ly r a p id ly . T h e o th ers w ere u n a ffe c te d a p a rt fro m th e 4 7 2 -c m “ 1 b a n d , w h ich d e
crea sed in in te n s ity a t a p p r o x im a te ly th e sa m e ra te as th e8 0 9 .4 -c m “ 1 b a n d , a n d th is b a n d is th erefore a ssig n ed as v\ G a 2 0 . T h is 4 7 2 - c m 1 a b so rp tio n w a s a lw a y s p re sen t w h en th e 8 0 9 .4 -c m 1 b a n d w a s very in te n se , b u t its a ss ig n m e n t re m a in s s o m e w h a t te n ta tiv e as it w a s n o t p o ssib le to c o n firm quantitatively t h a t th e in te n s ity ra tio o f th ese tw o fu n d a m e n ta ls r e m a in e d c o n sta n t, a n d n e ith er w a s it p o s s ib le to carry o u t 180 e n r ic h m e n t s tu d ie s on su c h a w ea k fea tu re . N o e v id e n c e c o u ld b e fo u n d for th e b e n d in g fre q u e n c y in th e se sp e c tra , a n d th is v ib ra tio n is th erefore a s su m e d to lie b e lo w 200 c m - 1 .
T h e s e re su lts a n d b a n d a ss ig n m e n ts for G a 2 0 m a y be c o m p a re d w ith th e m a tr ix iso la tio n stu d ie s o f C a r lso n , et al. , 1 0 a n d w ith th e g a s p h a se d a ta o f M a l ’tse v , et al. 8 C a r lson , et al., o b ta in e sse n tia lly th e sa m e v a lu e for 1/3 (T a b leI) b u t th e ir a ss ig n m e n t o f fea tu res a t 5 9 5 .6 an d 4 1 6 .5 c m 1 as vi a n d v 2 h a s b e e n s h o w n 11 to be in co rrect. T h e g a s-p h a se ir sp e c tru m o f G a 2 0 h a s b een reco rd e d 8 u n d er low reso lu tio n a t a te m p e ra tu re o f 1 4 5 0 °K a n d sh ow s tw o a b so rp tio n s (b a n d w id th s ~ 3 0 c m - 1) a t 7 7 0 c m “ 1 a n d 420 c m “ 1. T h e s e h a v e b e e n a ssig n e d as v3 a n d v \ , re sp ec tiv e ly , an d a lth o u g h th e b a n d cen ters are n o t p re cise ly lo c a te d , th e se fre q u e n cie s d iffe r s ig n ific a n tly fro m th e fu n d a m e n ta ls o b serv e d here in a n itro g en m a tr ix .
T h is d iffe re n ce m a y p a r tly b e a c c o u n te d for b y th e o c cu rren ce o f “ h o t b a n d s ” in th e g a s -p h a se s p e c tr u m , w h ich w ou ld b ro a d e n th e a b so rp tio n s on th e lo w -fre q u e n c y sid e a n d th u s s h ift a p p a r e n t b a n d ce n te rs . A n o th e r c o n tr ib u to ry fa cto r c o u ld b e th a t th e v ib ra tio n s o f th e G a 2 0 m o le cu le are ra th er se n sitiv e to th e m a tr ix e n v ir o n m e n t an d m ig h t sh ow a s ig n ific a n t m a tr ix sh ift c o m p a re d w ith th e gas p h a se , a n d th is e x p la n a tio n m ig h t a lso a c c o u n t for th e
Matrix Isolation Studies on the Gallium-Indium-Oxygen System
TABLE I: Ir Frequencies (cm“ 1) and Band Assignments for Matrix Isolated Gallium and Indium Oxides
2539
Argon Nitrogen
(a)“ (b )6 (a)“ (b)° (c )c Assignment
822.6 821.7 808.1 809.4 80 9 .4 v3G a2160 and817.9 817.8 793.7 793.7 sa te llite s
783.5 783.5768.5 v3G a2180 and753.6 sa te llite s744.2
472 V !G a21605 9 5 .6 * 594.7 5 9 0 .4 * 590.9 590.9 G a4,60 2
575.0 G a4160 180563.1 G a4180 2
4 1 6 .5 * 416.0 4 2 5 .8 * 423.9 423.9 G a4160 2415.0 G a4160 l8040 5 .3 G a4180 2
763 749 749 P o lym eric G a -0715 spe c ie s
449 G a - 0 bands548 not ass igned518618380
734.9 721.8 722.4 722.4 v3 ln 2160 and741.3 708.0 708.0 sa te llite s
697.0 697.0684.3 v3 ln 2180
442 v 1 ln 21605 5 5 .1 * 5 5 0 .5 * 550.2 550.2 ln 4160 2
532.0 ln 4160 180522.1 ln 4180 2
4 0 4 .3 * 4 1 2 .6 * 412.2 412.2 ln 4160 2402.8 ln 4160 18039 3 .0 ln 4180 2
579524 ln - 0 bands512 no t assigned491436
a Reference 10. Bands labeled with an asterisk originally assigned as fundamentals of Ga20 or ln20. b This work, 160 species only. c This work, 160 + 180 species. Frequency accuracy In (b) and (c) Is ±0.1 cm “ 1 for 1/3, ± 0 .2 cm “ 1 for M40 2 species, and ±1 cm “ 1 for the remaining absorptions.
rather large frequency shift ( — 1 0 cm-1) observed for 1/3 on passing from a nitrogen to an argon matrix.
I f ou r a ss ig n m e n t o f th e 4 7 2 -c m “ 1 b a n d is correct, its o b serv a tio n p ro v id es a d d itio n a l c o n firm a tio n th a t G a 2 0
h a s C2u s y m m e tr y w h en iso la te d in a n itro g en m a tr ix . H o w e v e r , th is b a n d is very m u c h w ea k er th a n v3, a n d it is im p o r ta n t to e x a m in e m o re c lo se ly th e a ssu m p tio n s w h ich o rig in a lly led to th e e s tim a te o f ~ 1 4 3 ° for th e G a O G a a n g le .
I f on e a ssu m e s th a t th e v ib ra tio n s o f a C2v X Y 2 m o le cu le are c o m p le te ly h a r m o n ic , th e zero -o rd er a n t is y m m e t
ric s tre tc h in g fre q u e n c y cu3 is g iv en b y
4 tr W = (F r - F rr)(nY + 2 p x s in 2 9) (1 )
w here q. refers to a recip roca l m a s s an d 26 is th e Y X Y a p e x a n g le . Fr an d F rr are th e p rin c ip a l a n d in tera ctio n s tretc h in g c o n sta n ts , re sp ec tiv e ly . T h is e q u a tio n in d ic a te s t h a t if C03 is k n ow n for th e tw o iso to p ic m o le c u le s G a 2160
a n d G a 2180 , th e n th e a p e x an g le m a y b e c a lc u la te d via
The Journal of Physical Chemistry, Vol. 71, No. 21, 1973

2540 A. J. Hinchcliffe and J. S. Ogden
co3(160)/ co3(]80)> c ,a + 2 p ( 16Q ) s in 2flT /:
_M c,a + 2p ( lsO ) s in 2# J
T h e s e e x p e r im e n ts , h ow ever, y ie ld a b so rp tio n fre q u e n cies w h ich are unconnected for a n h a rm o n ic ity , a n d it h as b e e n sh o w n th a t if th e o b served fre q u e n c y ra tio i»3( 160 ) / ¡’3( 180 ) is u sed in th e a b o v e e x p re ssio n , th e v a lu e o f 8 o b ta in e d is lower th a n th e tru e v a lu e .14 S u b s titu tio n o f v3 , G a 2160 a n d v3 G a 2180 (T a b le I) in to th is e q u a tio n , u sin g th e a to m ic w eig h ts G a = 6 9 .8 a n d 0 = 1 6 .0 or 1 8 .0 y ie ld s G a O G a = 142° 2 0 ' w ith a tte n d a n t error lim its o f + 6 ° a n d - 4 ° re su ltin g fro m th e e x p e r im e n ta l u n c e r ta in ty ( ± 0 .1 c m - 1 ) in m e a su r in g b a n d c en ters . I f on e a ssu m e s th a t th e o b serv e d G a 20 fre q u e n cy v3 is re la ted to th e co rresp o n d ing zero -ord er fre q u e n c y b y
va = co3( l ~ a )
a n d e s tim a tin g th e a n h a rm o n ic ity co rrection (a)316a 16) to be 1 0 .0 c m - 1 , th en a>3 G a 2160 lies a t 8 1 9 .4 c m - 1 , a n d , a s s u m in g th e D a r lin g -D e n n is o n ru le , 15 th e co rresp on d in g zero -o rd e r fre q u e n c y for G a 2180 lies a t 7 7 7 .5 c m - 1 . T h e v a lu e o f 8 o b ta in e d fro m th is “ c o rrec te d ” zero -ord er fre q u e n c y ra tio is n ow 8 6 ° 5 0 ' an d th is v a lu e is s ig n ific a n tly larger th a n th e e s tim a te o b ta in e d d ire c tly fro m th e o b serv ed fre q u e n cie s . T h is in d ic a te s th a t i f th e a n h a r m o n ic ity co rrection is 1 0 .0 c m - 1 , G a 20 m a y in fa c t h av e an a p e x an g le in th e region o f 1 7 4 ° . D ia to m ic G a O , w h ich a b sorb s a t 7 5 5 .0 c m ' 1 in th e gas p h a s e , 16 h a s a zero -ord er freq u en cy o f 7 6 7 .7 c m - 1 an d th e e s tim a te d 1 0 .0 c m ' 1 co r rectio n a ssu m e d here for G a 20 is th erefore n o t u n r e a so n a b le .
T h e v a lu e o f F r - F rr o b ta in e d fro m eq 1 is 3 .0 6 m d y n / A u sin g th e e x p e r im e n ta lly o b serv ed fre q u e n cie s , a n d a lth o u g h a c o m p le te so lu tio n to th e g en era l v a len c e force fie ld is n o t p o ssib le , so m e a t te m p t m a y b e m a d e to e s ti m a te Fr an d Frr in d e p e n d e n tly b y c o m b in in g th is d a ta w ith v\ a t 4 7 2 c m ' 1 . T h e resu lts o f th is exercise for th e sp ec ies G a 20 , ln 20 a n d I n O G a are se t o u t b e lo w .
G a 40 2. T h e in te n s ity ra tio o f th e tw o b a n d s a t 5 9 0 .9 a n d 4 2 3 .9 c m ' 1 re m a in e d c o n sta n t th ro u g h o u t th ese e x p e r im e n ts , an d b o th b a n d s w ere o b serv ed to in crease in in te n sity d u rin g co n tro lled d iffu sio n at th e ex p en se o f G a 20 (F ig u res l a a n d l b ) . E a c h b a n d g ives rise to a tr ip let stru ctu re in 180 e n r ic h m e n t e x p e r im e n ts , (F ig u re Id ) su g g e stin g th a t tw o e q u iv a le n t a to m s o f o x y g en are in v o lv e d in th e se v ib ra tio n s . B o th b a n d s are th erefore a s s ig n ed to a s im p le d im e r sp ec ies G a 40 2 . I t is s ig n ific a n t th a t b o th th ese b a n d s h a d n e g lig ib le in te n s ity u n d er c o n d itio n s o f o p tim u m iso la tio n , a n d th a t th e ir in ten sity c o u ld b e e n h a n c e d e ith er b y d ec re a sin g th e p ro p o rtio n o f m a trix gas or b y d e p o sitin g a t w in d o w te m p e ra tu re s ab o v e 2 0 °K . T h is sp ec ies is th erefore a lm o s t ce rta in ly fo rm e d b y d iffu sio n d u rin g th e fin ite q u e n c h in g t im e w h en th e m a trix is s till so ft, a n d its id e n tific a tio n as G a 40 2 d oes n ot th erefore c o n flic t w ith th e gas p h a se m a ss sp ec tro m e tr ic d a ta . O n e a d d itio n a l b a n d w as o b serv ed to in crease in in te n s ity on d iffu sio n , a n d th is w a s th e w ea k fea tu re a t 449 c m “ 1. H o w e v e r , th e a ss ig n m e n t o f th is b a n d to G a 40 2 re
m a in s te n ta tiv e , as it c o u ld o n ly be o b serv e d in h e a v y d e p o sits {e.g., F igu re lc ) a n d an in te n sity co rrelation w ith th e tw o p r o m in e n t d im e r b a n d s w as n o t a t te m p te d .
In argon m a tr ic e s , tw o p ro m in e n t b a n d s w ere o b served at 5 9 4 .7 a n d 4 1 6 .0 c m “ 1 an d a lth o u g h n o 180 e n ric h m en t e x p e r im e n ts w ere carried o u t, th ese a lm o s t c e rta in ly co rresp o n d to th e n itro g en m a tr ix a b so rp tio n s d iscu sse d a b o v e . B o th th e n itro g en a n d argon m a tr ix freq u en cies are
in good a g re e m e n t w ith C a r lso n ’s o b se r v a tio n s 10 a n d th e o n ly s ig n ific a n t d ifferen ce b e tw ee n th e tw o se ts o f 160 re s u lts is th a t in h is d iffu sio n e x p e r im e n ts th e se b a n d s decreased in in te n s ity in d iffu sio n in th e sa m e w a y as v3
G a 20 , a n d w ere c o n seq u en tly a ssig n e d as th e v-y a n d ¡/2
fu n d a m e n ta ls o f th is m o le c u le .T h is a n o m a lo u s d iffu sio n b e h a v io r ca n p erh a p s b e a c
co u n te d for if G a 20 is a b le to re a ct ra p id ly w ith G a 40 2 to fo rm h igh er p o ly m e r s in a d d itio n to u n d erg o in g d im e r iz a
tio n . T h e n e t e ffe c t on th e G a 40 2 b a n d in te n sit ie s d u rin g d iffu sio n w ill th e n b e d e te r m in e d b y th e p ro p o rtio n s o f G a 20 a n d G a 40 2 p resen t in th e in it ia l d e p o s it . C a r ls o n ’s sp ec tra sh ow d im e r b a n d s w h ich are c o n sid e r a b ly m o re in ten se th a n th o se o b serv e d in th is w ork , a n d it is p o ss ib le th a t u n d er th e se co n d itio n s , th e p r e d o m in a n t d iffu sio n rea ctio n is G a 20 + G a 40 2 —*■ G a g O s e tc ., ra th e r th a n 2 G a 20 *■ G a 40 2 .
T h e 180 e n r ic h m e n t e x p e r im e n ts in d ic a te fro m s im p le sta tis t ic s th a t tw o e q u iv a le n t o x y g en a to m s are p re sen t, a n d a p o ssib le stru ctu re for th is d im e r m o le c u le is d is
cu ssed b e lo w .Remaining Features. T h re e oth er b a n d s w ere fre q u e n tly
o b served in th e se e x p e r im e n ts , a n d th ese are th e tw o s a t e llites to th e m a in G a 20 p ea k a n d th e ra th er b ro a d fe a tu re a t ~ 7 5 0 c m ' 1. T h e tw o s a te llite s o c cu r a t 7 9 3 .7 a n d7 8 3 .5 c m ' 1 a n d th ese b a n d s w ere a lw a y s p ro d u c ed w h en d ep o sitio n w as ca rried o u t a t w in d o w te m p e ra tu re s in e x cess o f ~ 2 3 ° K . O n d iffu sio n th e 7 9 3 .7 -c m - 1 b a n d d e crea sed in in te n s ity w h ile th e 7 8 3 .5 -c m “ 1 b a n d in cre a se d , b u t b o th th e se c h a n g e s to o k p la c e very m u c h m o re ra p id ly th a n e ith er th e grow th o f th e G a 40 2 b a n d s or th e d ecrease o f th e p rin c ip a l G a 20 b a n d a t 8 0 9 .4 c m - 1 . E a c h o f th e se s a te llite s g a v e rise to o n ly on e a d d itio n a l fea tu re in 180
e n ric h m e n t e x p e r im e n ts (F igu re I d ) a n d th e se b a n d s are a ssig n ed to th e a n tisy m m e tr ic s tre tc h in g m o d e o f G a 20 m o le c u le s tr a p p e d in d iffe re n t m a tr ix e n v ir o n m e n ts . T h is a ss ig n m e n t is su p p o rte d b y th e o b serv a tio n th a t th e fre q u e n c y ra tio s o f th e 160 a n d 180 sa te llite s co rresp on d very close ly w ith th e 8 0 9 .4 /7 6 8 .5 ra tio fo u n d for th e p rin c ip a l G a 216 0 - G a 2180 b a n d s , an d th e d iffu sio n b e h a v io r m a y b e q u a lita t iv e ly u n d ersto o d if on e a c c e p ts th a t s lig h t a n n e a lin g o f a m a tr ix is lik e ly to red u ce th e n u m b e r o f d if feren t tr a p p in g s ite s a v a ila b le . A rg o n m a tr ic e s a p p ea r to sh ow th is m u ltip le site e ffec t to a m u c h larger degree , a n d in c o m m o n w ith C a rlso n , et al, w e w ere n ev er a b le to o b ta in ju s t on e sin g le a b so rp tio n for v3 G a 20 in argo n ( T a b le
I ) .
T h e re m a in in g fea tu re in F igu re l a is a ra th er b r o a d b a n d c e n te re d a t 7 4 9 c m “ 1, a n d th is h a s an 180 c o u n te r p a r t a t 7 1 5 c m - 1 (F igu re I d ) . T h is sp ec ies w as re la tiv e ly m o re in ten se in co n ce n tra te d m a tr ic e s , a n d a lth o u g h it c o u ld b e a ssig n ed to d ia to m ic G a O on th e b a sis o f fr e q u e n c y , w e b e liev e it arises fro m a h ig h er p o ly m e r o f G a 20 . T h e p ro p o rtio n o f G a O in th e v a p o r p h a se is v e ry low , a n d if th is w ere iso la te d in th e m a tr ix as a d ia to m ic m o le c u le , on e w o u ld e x p e c t to see a ra th er sh a rp a b so r p tio n w ith a b a n d w id th c o m p a ra b le to th a t o b serv e d for m o n o m e ric G a 20 .
Indium Oxides. W h e n th e v a p o r a b o v e h e a te d In 20 3
w as co n d e n se d in a n itro g en m a trix ( ~ 2000 : 1 ) a t ~ 20 ° K , an in ten se b a n d w as o b serv e d a t 7 2 2 .4 c m “ 1 to g e th e r w ith tw o w eaker fea tu res a t 5 5 0 .2 a n d 4 1 2 .2 c m “ 1, a n d th e sa m e b a n d s w ere o b serv e d in a n a lo g o u s I n - 0 2 e x p e r im e n ts (F ig u re 2 a ) . D u r in g d iffu sio n , th e tw o w ea k er f e a tu res in crea sed in in ten sity a t th e e x p en se o f th e 7 2 2 .4 - c m " 1 b a n d . T h e fre q u e n cie s o f th e se th ree b a n d s are v e ry
The Journal of Physical Chemistry, Vol. 77, No. 21, 1973

Matrix Isolation Studies on the Gallium-Indium-Oxygen System
Figure 2. Ir sp e c tra o f ind ium ox ides iso la te d in n itrogen m a trice s : (a) fro m heated I n / 160 2; m a trix ra tio ~ 2 0 0 0 :1 ; (b) a fte r passing 160 2 + ,80 2 gas ove r heated ind ium .
close to th o se rep orted b y C a rlso n , et al. , 10 b u t as in th e ca se o f th e g a lliu m ox id e e x p e r im e n ts , C a r lso n ’s d iffu sio n e x p erim e n ts in th is s y s te m d iffer fro m th e re su lts o b ta in e d h ere , a n d th is p o in t is d isc u sse d b e lo w .
A n u m b e r o f v ery w ea k fea tu res are a lso p resen t in F ig ure 2a , n o ta b ly a t 4 4 2 , 4 3 6 , 5 1 2 , 5 2 4 , 4 9 1 , a n d 5 7 9 c m ” 1
an d th e d iffu sio n b e h a v io r o f th e se b a n d s w as s tu d ie d in h e a v y d e p o sits . In p a rtic u la r , it w a s fo u n d th a t th e b a n d a t 442 c m “ 1 d ec re a se d in in te n s ity a t a ra te c o m p a ra b le w ith th a t o b serv ed for th e 7 2 2 .4 -c m ” 1 b a n d , a n d th a t in c o n tra st th e o th er w ea k fea tu res e ith er d isa p p ea re d very ra p id ly or re m a in e d u n c h a n g e d . B y a n a lo g y w ith th e c o r re sp o n d in g g a lliu m ox id e sy s te m , th e 7 2 2 .4 a n d 4 4 2 -c m ” 1 b a n d s are a ssig n ed as th e v3 an d iu fu n d a m e n ta ls o f In 2- 160 , a n d th e b a n d s a t 5 5 0 .2 a n d 4 1 2 .2 c m ” 1 to a d im e r sp ec ies ln 40 2 . T h is a ss ig n m e n t d iffe rs11 fro m th a t su g ge ste d b y C a rlso n , et al., b u t is su p p o rted b y 180 en ric h m e n t e x p e r im e n ts .
F igu re 2b sh ow s a sp e c tru m o f m a tr ix iso la te d in d iu m o x id es o b ta in e d b y p a ssin g 180 en ric h ed o x y g en ga s over h ea ted in d iu m . I t is e v id e n t th a t th e b a n d a t 7 2 2 .4 c m ” 1
is n ow a c c o m p a n ie d b y a sin g le e x tra fea tu re a t 6 8 4 .3 c m ” 1 a n d th a t th is v ib ra tio n th erefore in v o lv e s o n ly one a to m o f o x y g en . In c o n tr a st, th e 5 5 0 .3 a n d 4 1 2 .2 -c m ” 1 b a n d s n ow a p p ea r as c o m p o n e n ts o f tw o tr ip le t p a ttern s in d ic a tin g th a t tw o e q u iv a le n t o x y g en a to m s are in v o lv ed in th ese v ib ra tio n s . D e p o s it io n a t w in d o w te m p e ra tu re s ab o v e 2 0 ° K p ro d u c e s , in a d d itio n , w ea k s a te llite b a n d s on th e lo w -fre q u e n c y s id e o f v3 a t 7 0 8 a n d 6 9 7 c m - 1 w h ich b e h a v e in a s im ila r w a y to th e sa te llite s o b serv ed in th e g a lliu m ox id e s y s te m . T h u s on d iffu sio n , th e 6 9 7 -c m ” 1 c o m p o n e n t grow s ra p id ly in in te n s ity a t th e ex p en se o f th e 7 0 8 -c m ” 1 b a n d .
T h e fre q u e n cie s o b serv e d in th ese in d iu m ox id e e x p e r im e n ts are lis te d in T a b le I, a n d th e ir a ss ig n m e n ts m a y n ow be d isc u sse d .
/ n 20 . M a s s sp e c tro m e tr ic s tu d ie s 1-4 sh ow th a t th e v a p or ab o v e h e a te d In 2C>3 c o n ta in s ln 20 , In , 0 2, a n d In O a n d th a t ln 20 is th e m o s t p r e d o m in a n t sp ec ies . D ia to m ic In O is k n ow n to a b so r b at 6 9 5 .7 c m ” 1 in th e ga s p h a s e ,16 a n d th e in ten se b a n d a t 7 2 2 .4 c m - 1 h as b e e n a ssign ed to v3 In 2 - 160 p r in c ip a lly on th e b a sis o f d iffu sio n stu d ie s a n d 180
en ric h m en t.I f one a ssu m e s th a t th is m o le c u le h as C 2l s y m m e tr y ,
th e n fo llo w in g eq 1 a n d 2 , th e o b serv ed freq u en cies y ie ld
an a p ex an g le o f 135 ° w ith error lim its o f + 1 0 a n d - 8° arisin g d ire c tly fro m th e fre q u e n cy u n c e r ta in ty o f ± 0 .1
c m ” 1 . T h e c o rresp o n d in g v a lu e o f Fr - F rr is 2 .6 6 m d y n /A . A s in th e ca se o f G a 20 , th is a p e x an g le rep resen ts a low er l im it , in v iew o f th e n e g le c t o f a n h a rm o n ic ity , an d th e in c lu sio n o f a m o d e s t a n h a rm o n ic co rrection w ill re su lt in an a p ex an g le m u c h c loser to 1 8 0 °. T h e id e n tific a tio n o f i/i a t 442 c m ” 1 is ra th er less c o n c lu siv e as it w as n o t p o ssib le to o b ta in 180 d a ta , b u t if th is a ss ig n m e n t is correct, ln 20 w o u ld a p p e a r to be n o n lin ea r in n itrogen m a tric e s . T h e g a s -p h a se ir sp e c tru m o f ln 20 8 sh ow s tw o v e ry b ro a d b a n d s c e n tered a t ~ 6 8 0 an d ~ 3 6 0 c m - 1 w h ich are a ssign ed as v3 a n d n , re sp ec tiv e ly . T h is su g g ests a b e n t stru ctu re in th e gas p h a se , a n d if on e con sid ers th a t th e a p p a r e n t cen ters o f th ese b ro a d g a s -p h a se ab so rp tio n s m ig h t b e sh ifte d to low fre q u e n c y as a resu lt o f h o t b a n d s, th e a g re e m en t w ith th e m a tr ix fre q u e n cie s is m o d e ra te ly sa tis fa c to ry .
i h 40 2. T h e tw o b a n d s a t 5 5 0 .2 an d 4 1 2 .2 c m ” 1 w ere o b serv ed to in crease in in te n s ity on d iffu sio n , an d tw o tr ip let p a ttern s are p ro d u c ed on 180 e n r ic h m e n t (F igu re 2 b ) . T h e s e b a n d s th u s p r o b a b ly arise fro m a m o le c u le c o n ta in in g tw o e q u iv a le n t o x y g en a to m s , a n d b y a n a lo g y w ith th e g a lliu m o x id e sy s te m , are a ssig n ed to a d im e r sp ecies ln 40 2. T h e re is n o ev id e n c e fro m m a ss sp e c tro m e tr y th a t a sp ec ies o f th is m o le c u la r w eig h t is p resen t in th e vap or a b o v e h e a te d in d iu m ox id es , b u t th is m o le c u le co u ld re a d ily be fo rm ed d u rin g d ep o sitio n via
21n 20 — *- ln 40 2
a n d th is re a ctio n m a y a lso be re sp o n sib le for th e in ten sity ch a n ges o b serv e d here d u rin g c o n tro lled d iffu sio n .
In th e ir p a r a lle l series o f e x p e r im e n ts , C a rlso n , et al. , 10
assign s im ila r b a n d s a t 5 5 0 .5 a n d 4 1 2 .6 c m ” 1 in n itrogen as fu n d a m e n ta ls o f m o n o m e ric ln 20 ra th er th a n as a b sorp tio n s o f a d im e r , b u t th is a ss ig n m e n t is n o t su p p o rted b y ou r 180 e n r ic h m e n t re su lts .
Other Features. D e p o s it io n a t w in d o w tem p e ra tu re s a b o v e 2 0 °K p ro d u c ed sa te llite b a n d s on th e lo w -fre q u e n cy s id e o f v3 In 2le O a t 7 0 8 a n d 6 9 7 c m ” 1, a n d th e d iffu sio n b e h a v io r o f th e se b a n d s w as v ery s im ila r to th a t ob served for th e c o rresp o n d in g G a 20 sa te llite s . T h e s e b a n d s are a s s ig n ed to ln 20 m o le c u le s tr a p p e d on d iffe re n t m a trix sites (T a b le II).
F in a lly , a n u m b e r o f very w eak fea tu res w ere also o b serv ed in h e a v y d e p o sits , an d th e se are in c lu d e d in T a b leI . A p a r t fro m th e o b serv a tio n th a t th e y all lie in w h a t a p p ea rs to be th e In - 0 s tre tc h in g reg ion , litt le ca n be said a b o u t th e ir a ss ig n m e n t, a n d th e y w ill n o t b e d iscu ssed fu rth er .
Indium-Gallium Oxides. In th e first ty p e o f m ix ed m e ta l e x p e r im e n t, o x y g en ga s w a s p a ssed over an a llo y o f in d iu m a n d g a lliu m h e a te d to ~ 1 1 0 0 ° K a n d th e p ro d u c ts w ere tr a p p e d in n itro g en m a tric es as d esc rib e d earlier. F igu re 3a sh ow s a ty p ic a l sp e c tru m o b ta in e d fro m an in d iu m -r ic h a llo y ( I n :G a = 8 :1 ) in w h ich th e v a p o rs h av e b een co n d e n se d a t 2 5 ° K to a u g m e n t th e p o ly m e r fea tu res. In th e region a b o v e 7 0 0 c m - 1 , th ree stro n g b a n d s are o b serv ed a t 809 '.4 , 7 8 1 .9 , a n d 7 2 2 .4 c m - 1 , to g e th e r w ith a n u m b e r o f w ea k er s a te llite fea tu res . A p a r t fro m th e p r o m in e n t b a n d a t 7 8 1 .9 c m ” 1 a n d its tw o sa te llite s a t 765 an d 757 c m ” 1, all th e o th er a b so rp tio n s in th is region w ere p re v io u sly o b serv e d in th e pure G a - 0 or I n - 0 sy s te m s , an d h av e b een a ssig n ed to G a 20 a n d ln 20 . T h e p ro m in e n t new a b so rp tio n lies a p p ro x im a te ly m id w a y b e tw ee n th e in ten se a n tisy m m e tr ic s tre tc h in g m o d e s in G a 20 an d
2541
The Journal of Physical Chemistry, Voi. 77, No. 21, 1973

2542 A. J. Hinchcliffe and J. S. Ogden
cmFigure 3. Ir sp e c tra o f m ixed g a lliu m -in d iu m ox ides In n itrogen m a trice s : (a) a fte r passing 160 2 gas ove r a heated a lloy w ith ln :G a in the p ro p o rtio n s 8 :1 ; p roduc ts condensed at 25°K ; (b) a fte r passing 160 2 + 1£0 2 gas ove r the sam e a lloy; p roduc ts condensed at 16°K ; (c) a fte r w a rm ing de p o s it (b) at 32°K ; (d) a fte r passing 160 2 gas ove r pu re g a lliu m and ind ium heated in sep a ra te tubes; p ro d u c ts co -conde nsed at 25°K.
TABLE ll: Ir Frequencies (c m '1) Observed for Mixed Indium-Gallium Oxides Isolated in Nitrogen Matrices
InOGa
783 .0 “ 7 8 1 .9 *1 ln ,DOGa and 781 .9 “ ln ,6OGa765 .0* J sa te llite s 742 .3 “ ln 18OGa 757 .0* '
G a jIru -x C ^ M o le cu le s *
Pure In +Alloy composition (ln:G a) pure Ga in
------------------------------------------- separate2:1 8:1 25:1 tubes
Monomer species observed
Tentativeassignments^
Ga20 + I nOGa
Ga20 + InOGa +
ln20ln20 + InOGa
ln20 ± Ga20
G a40 2 590.9 590.9 __ 590.9G a3 I n 0 2 ( I) 554.5 554.5 — —
G a3ln 0 2 (II) 606.5 606.5 — —G a2ln 20 2 (A) 561.4 561.4 — 561.4G a2ln 20 2 (B or 536 536 — —G a2ln 20 2 C) — 584 — —Ga In3 0 2 ( I ) — 543 543 —Ga ln 30 2 (II) — 564 564 —ln 40 2 — 550.2 550.2 550.2
a Reference 10. f tThis work, 160 only. c This work, 160 + 180 species. d Roman numerals indicate the possibility of isomerization in G a3ln02 and Galn302. The isomers A, B, and C of Ga2ln20 2 are discussed in the text. Frequency accuracy, ±0.1 cm -1 for InOGa, ± 0 .2 cm -1 for Ga402 and ln40 2, and ± 0 .5 cm -1 for the remaining bands. The absorptions at 584 and 564 cm -1 were always relatively weak, and the band at 561.4 cm “ 1 was only prominent in the double tube experiments.
In 20 , a n d is a ssig n ed to a co rresp o n d in g v ib ra tio n in the m ix e d m e ta l su b o x id e I n O G a . In th e fre q u e n cy region a s so c ia te d w ith th e m o re in ten se d im e r v ib ra tio n s ( 5 2 5 -6 2 5 c m - 1 ), ln 40 2 a n d G a 40 2 are ob serv e d , b u t severa l a d d itio n a l fea tu res are a lso p resen t a t 6 0 6 .5 , 5 8 4 , 5 6 4 , 5 5 4 .5 , 5 4 3 , a n d 5 3 6 c m ' 1 .
T h e e ffec t o f 180 e n r ic h m e n t on th is sy s te m is sh ow n in F igu re 3 b . In th is p a rtic u la r e x p e r im e n t, in terest h as b een fo cu se d on th e region ab o v e 7 0 0 c m ' 1, a n d th is figure sh ow s a sp e c tru m o b ta in e d after p a ssin g a m ix tu re o f 160 2- 180 2 (4 :5 ) over th e sa m e h e a te d a llo y an d c o n d e n s
in g th e p ro d u c ts a t 1 6 °K . A p ro m in e n t s ix -lin e p a tte r n is p ro d u c ed a t 8 0 9 .4 , 7 8 1 .9 , 7 6 8 .5 , 7 4 2 .3 , 7 2 2 .4 , an d 6 8 4 .3 c m ' 1. A n u m b e r o f v ery w eak fea tu res w ere a lso p re sen t in th e low er fre q u e n c y region . F o u r o f th e c o m p o n e n ts o f th e se x te t are im m e d ia te ly id en tified as th e v3 fu n d a m e n
ta ls o f ln 216 0 , In 2l s O , G a 2160 , a n d G a 2180 ( T a b le I) a n d th e re m a in in g tw o are a ssig n ed to In 16O G a an d In 18O G a . T h is a ss ig n m e n t is su p p o rted b y th e in ten sity ch a n g e s w h ich are o b serv e d on w a rm in g th is d e p o s it to ~ 3 2 ° K . A ll th e c o m p o n e n ts o f th e s e x te t d ec rea se in in te n s ity , a n d in a d d itio n to c o n firm in g th a t th e p a irs o f b a n d s a t 7 2 2 .4 a n d 6 8 4 .3 c m ' 1 ( ln 20 ) , 8 0 9 .4 an d 7 6 8 .5 c m - 1 ( G a 20 ) , 7 8 1 .9 an d 7 4 2 .3 c m ' 1 ( I n O G a ) , d o in d eed b e lo n g to m o le c u le s co n ta in in g on e a to m o f o x y g e n , th is e x p e r im e n t a lso in d ic a te s th a t th e re la tiv e ra tes o f re a c tio n for th e se m o n o m e rs are in th e order l n 20 > G a 20 > In O G a .
O n e cu riou s fea tu re o f th ese e x p e r im e n ts is th a t a l th o u g h in d iu m o x id e is m ore v o la tile th a n g a lliu m o x id e , an 8 :1 ra tio o f I n :G a w as req u ired in order to p ro d u c e th e l n 20 , G a 20 , a n d I n O G a p ea k s in a p p ro x im a te ly th e sa m e re la tiv e in te n s ity . A lth o u g h th e re la tiv e e x tin c tio n c o e ffic ie n ts o f th ese b a n d s are n o t k n o w n , one m ig h t h av e e x p e c te d th a t g a lliu m -r ic h a llo y s w o u ld be req u ired to p r o d u ce th is ty p e o f sp e c tru m . In th e se a llo y e x p e r im e n ts , th e re la tiv e b a n d in ten sities o f G a 20 , I n O G a , an d ln 20 w ere fo u n d to v a ry w ith sp ra y -o n t im e , a n d in it ia l sp e c tra alw a y s sh ow ed re la tiv e ly m o re G a 20 a n d I n O G a . A s th e a llo y g r a d u a lly b e c a m e d e p le te d in g a lliu m , th e l n 20
b a n d b e c a m e re la tiv e ly m o re in ten se , an d th e sp e c tru m sh o w n , for e x a m p le , in F igu re 3 a m ig h t th erefore b e re g a rd ed as th e su p erp o sitio n o f sp ec tra o b ta in e d fro m g a lliu m -r ic h a n d in d iu m -r ic h d ep o sits . In crea sin g th e p ro p o rtio n o f in d iu m in th e origin al a llo y to ~ 2 5 : 1 p ro d u c e d e s se n tia lly l n 20 a n d I n O G a an d very litt le G a 20 , w h ile d e crea sin g th e in d iu m c o n te n t h a d th e reverse e ffe c t . C o rre sp o n d in g in ten sity v a ria tio n s w ere o b serv e d in th e “ d im e r ” reg ion , a n d T a b le II lists th e n in e d is tin c t b a n d s ob served here in p u re 160 e x p e r im e n ts u sin g d iffe re n t a llo y c o m p o sitio n s . A n a t te m p t is m a d e to a ssig n so m e o f th ese b a n d s on th e b a sis o f v a ria tio n s in re la tiv e in ten sity w ith a llo y c o m p o sitio n , a n d so m e stru c tu ra l in fo r m a tio n m a y a lso b e d e d u c e d fro m th e n u m b e r o f d iffe re n t c h e m ica l sp ec ies w h ich a p p ea r to be re p re se n te d .
W h e n 160 2 w as p a ssed over pure in d iu m a n d g a lliu m h e a te d separately in d ifferen t sa m p le h o ld e rs , no I n O G a w as p ro d u c ed , a n d F igu re 3 d sh ow s a ty p ic a l sp e c tru m fro m th is s y s te m . In th is e x p e r im e n t, d e p o sitio n h a s b e e n carried ou t a t 2 5 ° in ord er to e n h a n c e d im e r b a n d in te n s ities a n d h as resu lted in th e fo rm a tio n o f a sm a ll a m o u n t o f “ p o ly m e r ic ” G a 20 a t 749 c m - 1 ( T a b le I) a n d th e a p p e a ra n c e o f sa te llite b a n d s on vs G a 20 a n d v3 ln 20 . T h e u p p e r d im e r region sh ow s b a n d s p re v io u sly a ssig n e d to G a 40 2 an d ln 40 2 an d on e a d d itio n a l p r o m in e n t b a n d at5 6 1 .4 c m ' 1. S in c e G a 20 a n d l n 20 are th e o n ly m o n o m e r sp ec ies p re sen t, th is b a n d is a ssign ed to In 2G a 20 2 .
S ev era l e x p e r im e n ts w ere a lso carried o u t in w h ich m ix tu res o f In 20 3 an d G a 20 3 w ere h e a te d to 9 5 0 -1 0 5 0 ° K a n d th e va p ors co n d e n se d in n itro g en m a tr ic e s . T h e ir sp ec tra o b ta in e d w ere very s im ila r to th o se p ro d u c e d in th e 0 2-a l lo y ty p e o f e x p e r im e n t a n d th e re la tiv e p ro p o rtio n s o f l n 20 , I n O G a , an d G a 20 in th e m a tr ix a g a in d e p e n d e d u p o n th e c o m p o sitio n o f th e o x id e m ix tu r e . T h e tr a p p e d sp ec ies b e h a v e d in a s im ila r w ay on d iffu sio n a n d th ese e x p e r im e n ts w ill n ot th erefore b e d e sc rib e d in d e ta il.
The Journal of Physical Chemistry, Vol. IT, No. 21. 1973

Matrix Isolation Studies on the Gallium- Indium-Oxygen System 2543
TABLE III: Observed and Calculated Molecular Parameters for Ga20, InOGa, and ln20
Vibration frequencies, cm 1
Calculated
MoleculeU D s e r v e j m
N2 matrix I“ I I“
G a2160 vs 809.4 809.4 809.4v 1 472 471.9 472.0v2 — 192.6 75.0
G a2180 Vs 768.5 768.5 768.5
ln 16OGa Vs 781.9 782.1 782.1Vi — 450.0 450.0v2 — 164.5 58.7
ln 18OGa Vs 742.3 742.2 742.2
ln 2160 Vs 7 2 2 .a 722.4 722.4Vi 442 442.0 442.0V2 — 140.2 53.4
ln 21sO Vs 684.3 684.3 684.3
Bond lengths, A Apex angles'
1.84 ± 0 .0 1 * 1.81 ± 0 .0 2c > 1 4 2 °
2.02 ± 0 .0 1 * 1.98 ± 0 .0 3 ° > 1 3 5 °
0 Assuming apex angles of 142, 138, and 135° for Ga20, InOGa, and ln20 , respectively, and force constants (m dyn/A) given by (calculation I and II, respectively): F (r,). 3.45, 3.86; F (r2), 2.89, 3.41; F ( r , r ,). 0.39, 0.80; F (r2r2), 0.23, 0.74; F ( r ,r2), 0.21, 0.67; F ^ / r ,2. 0.19, 0.023; F ^ / V , 0.18, 0.020; F ^ / r , r2. 0.18, 0.018; F r^ /r, 0.0, 0.0. r, refers to rGa-o and r2 refers to r i n_o. ” From electron diffraction, ref 6. c Values derived from this work.
T h e s e re su lts m a y b e c o m p a re d w ith th e re la ted e x p e r im e n ts o f C a rlso n , et al., in w h ich sa m p le s o f G a 2 0 3 m ix e d w ith in d iu m m e ta l w ere v a p o rize d a n d th e p ro d u c ts is o la ted in lo w -te m p e r a tu r e m a tr ic e s . In a d d itio n to sh ow in g a b so rp tio n s a ssig n ed to “ p u re ” in d iu m a n d g a lliu m oxide sp ec ies , th e ir n itro g en m a tr ix sp e c tra sh ow a p ro m in e n t b a n d a t 7 8 3 .0 c m “ 1 an d a w eaker fea tu re a t 5 4 4 .2 c m “ 1, b o th o f w h ich are a ssig n e d to I n O G a . O u r e x p e r im e n ts co n firm th e ir a ss ig n m e n t o f th e 7 8 3 .0 -c m - 1 b a n d , b u t we b eliev e th a t th e ir 5 4 4 .2 -c m “ 1 b a n d sh o u ld b e a ssign ed to a m ix e d m e ta l d im e r as it lies in th e sa m e region o f th e sp e c tru m as th e G a 4 0 2 a n d In 4 0 2 v ib ra tio n s d esc rib ed earlier. A b a n d a t 5 4 3 c m " 1 w as o b serv e d in our in d iu m - rich a llo y e x p e r im e n ts ( T a b le II) .
Force Constant Calculations and Molecular StructuresT h e gen eral v a le n c e force fie ld for a C 2„ tr ia to m ic m o le
cu le X Y 2 c o n ta in s fou r in d e p e n d e n t force c o n s ta n ts 15
2 V = F r( A r „ 2 + Ar&2) + 2 F rrAr„Arb +
F ^ A i ' 2 + 2 F r^ A 4 > { A r a + r b)
an d for n o n lin e a r X Y Z , tw o fu rth er p a r a m e te rs are re q u ired to d esc rib e th e v ib ra tio n s . T h e r e are c lea rly in s u ffic ie n t d a ta fro m th e se e x p e r im e n ts to a t te m p t a u n iq u e so lu tio n for th e th ree sp e c ie s G a 20 , ln 20 , an d In O G a , an d a n u m b e r o f a p p r o x im a tio n s m u st th erefore be m a d e .
G a 2 0 and ln 2 0. I f on e a ssu m e s th a t for th ese C2v m o le cu les, th e s tr e t c h -b e n d in tera ctio n c o n sta n t Fr(bjr is zero, it is th en p o ssib le to so lv e th e se c u la r e q u a tio n s for G a 20 an d ln 20 if on e k n ow s th e th ree fu n d a m e n ta l v ib ra tio n freq u en cies for th e 160 sp ec ies , a n d th e a p e x an g le 26 = <t>. In th ese e x p e r im e n ts , th e a p e x an g le u sed w as o b ta in e d d ire c tly fro m 180 d a ta on v3, an d tw o o f th e fu n d a m e n ta ls o f b o th G a 2 160 a n d In 2 160 h a v e b e e n id e n tifie d . A range o f so lu tio n s is th erefore p o ssib le d e p e n d in g u p on th e p o s ition o f th e (u n o b se rv e d ) b e n d in g m o d e v2 . T h is v ib ra tio n is p re su m e d to lie b e lo w 2 0 0 c m “ 1 for b o th G a 20 a n d ln 20 , a n d T a b le III c o m p a re s th e fre q u e n cie s o b serv e d for G a 20 a n d ln 20 w ith th o se c a lc u la te d a ssu m in g first, th a t th e b e n d in g fre q u e n cie s lie in th e ran ge 1 4 0 -2 0 0 c m - 1 , and se c o n d ly , th a t th e y lie b e lo w 8 0 c m “ 1. A co m p a riso n
m a y th en b e m a d e b etw een th e tw o se ts o f c a lc u la te d force c o n sta n ts .
A s e x p ec te d , th e m o s t s ig n ific a n t d ifferen ce is ob served in F<j)jr2, b u t in c o n tr a st, th e p rin c ip a l m e ta l-o x y g e n str e tc h in g c o n sta n ts are o n ly s lig h tly a ffe c te d . T h is a n a ly sis th erefore su g g e sts th a t an a c c e p ta b le ra n ge o f v a lu es for Fr is F Ga_0 = 3 .6 5 ± 0 .2 m d y n /A a n d F lrt_0 = 3 .1 5 ±0 .2 5 m d y n /A , re sp e c tiv e ly , a n d th a t th e in tera ctio n c o n s ta n ts F rr are a lw ay s p o sit iv e . T h e s e c a lc u la tio n s h ave been m a d e a ssu m in g th a t Fr(jl/r = 0 .0 , b u t even if one a llow s th is p a r a m e te r to a ssu m e fin ite v a lu es in th e range0- 0 .1 m d y n /A , th e a b o v e c o n c lu sio n s re m a in v a lid .
S ev era l e m p iric a l re la tio n sh ip s e x ist b e tw ee n p rin c ip a l s tretc h in g force c o n sta n ts a n d in tern u c lea r d ista n c e s , an d in p a rticu la r th e L a u r ie -H e r s c h b a c h e q u a tio n s 17
r = a — b lo g F r
w here a a n d b are ta b u la te d c o n sta n ts , y ie ld v a lu es o f rc a -o = 1 -81 ± 0 .0 2 a n d r In_0 = 1 .9 8 ± 0 .0 3 A , re sp e c tiv e ly , fro m Fga - o an d F i ^ o T h e s e b o n d len g th e stim a te s c o m p a re fa v o ra b ly w ith th e e lectro n d iffra c tio n d a ta on G a 20 a n d ln 20 in th e v a p o r p h a se a n d are in c lu d e d in T a b le III.
InOGa. F or a n o n lin e a r X Y Z m o le c u le , there is no stra ig h tfo rw a rd m e th o d o f d e te r m in in g th e ap ex an gle , a n d no a t te m p t is m a d e to solve th e secu la r eq u a tio n s for I n O G a d ire c tly . In s te a d , we h a v e a ssu m e d th a t th e ap ex angle in th is m o le c u le lies b e tw ee n th e v a lu e s o b ta in e d for G a 20 a n d ln 20 a n d th a t th e p rin c ip a l force co n sta n ts F Ga_o a n d F In_0 in I n O G a m a y be d ire c tly tran sferred fro m G a 20 an d ln 20 . W it h th ese c o n str a in ts , a n d th e a s su m p tio n th a t s tr e tc h -b e n d in tera c tio n c o n sta n ts are zero, it is p o ss ib le to so lv e for th e in tera ctio n c o n sta n t F (r ir 2) a n d th e b e n d in g c o n sta n t Fc/>/rir2 u sin g th e o b serv ed fre q u e n cie s o f In 16O G a a n d In 18O G a . I f th e a s su m p tio n reg ard in g tr a n sfe ra b ility o f F Ga_0 a n d F ln _0 is v a lid , th e v a lu es o f F (r ir 2) a n d F^/nr2 o b ta in e d sh o u ld be s im ila r to th e co rresp o n d in g p a r a m e te rs in G a 20 and l n 20 . T h e re su lts sh o w n in T a b le III c lea rly sh ow th a t th is is true for b o th se ts o f force c o n sta n t d a ta .
In p ra c tic e , it is u n lik e ly th a t th e p rin c ip a l stre tc h in g c o n sta n ts are e x a c tly tra n sfe ra b le , b u t th e fa c t th a t th e
The Journal of Physical Chemistry, Voi. 77, No. 21, 1973

2544 A. J. Hinchcliffe and J, S. Ogden
v ib ra tio n s o f I n O G a ca n be re p ro d u c ed u sin g p a ra m e te rs d eriv ed e sse n tia lly fro m G a 2 0 an d In 2 0 in d ic a te s th a t th e b o n d in g in all th ese sp ec ies is ra th er s im ila r . T h e s e re su lts m a y a lso b e c o m p a re d w ith th e co rresp o n d in g group I o x id es L i20 , N a 20 , K 20 , a n d C s 20 in w h ich th e m e ta ls are a lso in a fo rm a l o x id a tio n sta te o f + 1 . T h e ir sp ec tra o f all th ese sp ec ies h av e recen tly b een o b ta in e d b y A n d re w s, et al.,is a n d th e y co n clu d e th a t th e a p e x a n g les in th ese m o le c u le s v a ry fro m 180° (L i2 0 ) to ~ 1 4 0 ° (C S 2O ) , an d th a t th e c o rresp o n d in g force c o n sta n ts range fro m 2 .0 to1 .1 m d y n /A , re sp e c tiv e ly . T h e s im ila r ity b e tw ee n th ese tw o se ts o f m o le c u le s se e m s rath er c lose , a n d in c o n tra st to th e co n c lu sio n s re a ch e d b y C a rlso n th ere is n o reason to in v o k e a n y fo rm o f m e t a l -m e t a l b o n d in g in G a 2 0 or In 2 0
to in terp ret th e re su lts d esc rib e d h ere.Dimeric Species. T h e b a n d s b e lo w 625 c m - 1 h ave been
a ssig n e d to d im e r sp ec ies on th e b a sis o f d iffu sio n e x p e r im e n ts a n d th e o b serv a tio n th a t in th e p u re G a - 0 an d In - 0 sy s te m s , 180 e n r ic h m e n t in d ic a te s th e p resen ce o f tw o e q u iv a le n t ox y g en a to m s . N u m e r o u s g e o m etrie s m a y b e co n sid ered w h ich fu lfil th is req u ire m en t b u t w ith the lim ite d e x p e r im e n ta l d a ta a v a ila b le , it is n o t p o ssib le to d ed u ce or ev en co n firm a n y one stru ctu re . H o w e v e r , it is k n o w n 19 th a t m o le c u le s su ch as R,3G e - 0 - G a R 2 re a d ily d im erize to give s tru ctu res b a sed on a fo u r -m e m b e r e d G a 2 0 2
rin g , a n d w e b e liev e th a t th e stru ctu re o f G a 4C>2 is p r o b a
b ly
GaGa— 0 ^ ^ 0 — Ga
GaT h is ty p e o f d im e r stru ctu re is fre q u e n tly fo u n d in th e
s tu d y o f tr ia to m ic s y s te m s 20 a n d if th is is th e stru ctu re a d o p te d b y G a 4 0 2 , on e m ig h t e x p e c t a to ta l o f n in e d im e r -ty p e m o le c u le s G a J h u - j C ^ (x = 0 -4 ) to be p ro d u c e d in e x p e r im e n ts w here m o n o m e ric G a 2 0 , In 2 0 , a n d I n O G a are all p re sen t. O u r e x p e r im e n ts sh ow ( T a b le II) th a t a t le a s t n in e b a n d s are o b served in th e a llo y - 0 2 s y s te m s , a n d th e ir in ten sities a p p ea r to v a ry independently, w h ich in d ic a te s th a t th e y arise fro m d iffe re n t m o le c u la r sp ec ies . T w o o f th ese b a n d s , h ow ever, w ere a lw a y s very w ea k , a n d th eir a ss ig n m e n t re m a in s te n ta tiv e . A n u m b e r o f iso m ers are p o ssib le for th ese m ix e d sp ec ies , a n d in p a r tic u la r , G a 2l n 20 2 c o u ld be
A BGa In
> ----In O o \
^ I n ^ ^In-or
C
In— 0 0 — InG a ^
Iso m ers B a n d C ca n o n ly be p ro d u c ed b y th e d im e r iz a tio n o f In O G a , b u t an a ltern a tiv e rou te to A is a fford ed b y G a 2 0 + l n 20 , a n d th is iso m er is in fa c t th e only m ix e d d im e r w h ich ca n b e fo rm e d in th e d o u b le tu b e e x p e r im e n t (F ig u re 3 d ) . T h e fa c t th a t I n O G a ap p ea rs to re a ct ra th er slow ly in c o n tro lled d iffu sio n e x p e r im e n ts (F igu res 3 b , c) m a y p o ss ib ly e x p la in w h y so m e b a n d s are m o re p r e d o m in a n t th a n oth ers in T a b le II.
D e ta ile d force c o n sta n t c a lc u la tio n s w ere n o t a t te m p te d for an y o f th ese d im e r sp ec ies , b u t th e fre q u e n c y sh ifts o b served for G a 40 2 a n d ln 40 2 on 180 s u b s t itu t io n are c o n s is te n t w ith th e a ss ig n m e n t o f th ese b a n d s as m e t a l -o x y
gen v ib ra tio n s .
ConclusionsT h e s e e x p e r im e n ts sh ow th a t for th e G a - I n - 0 s y s te m s
d esc rib e d h ere , th e s im p le tr ia to m ic m o le c u le s G a 2 0 , ln 20 , a n d I n O G a are th e m o s t im p o r ta n t ox id e sp ec ies fo u n d in lo w -te m p e ra tu re m a tr ic e s , b u t th a t d im e ric sp ec ies w ith th e gen eral fo rm u la G a xIn 4 _ j ;0 2 m a y a lso be p resen t i f iso la tio n is p oor or c o n tro lled d iffu sio n is a l
low ed to ta k e p la c e .It is sh ow n th a t so m e b a n d s p re v io u sly a ssig n e d as fu n
d a m e n ta ls o f G a 20 , l n 20 , a n d I n O G a m u s t b e rea ssig n ed to th ese d im e r m o le c u le s , a n d w ith th e a id o f 180 e n r ic h m e n t , a rev ised n o rm a l co o rd in a te a n a ly sis is p re sen te d for G a 2 0 , In 2 0 , a n d I n O G a . T h e stru ctu res o f th e se m o le cu les are d isc u sse d in th e lig h t o f th is a n a ly s is , a n d w h ile it is n o t p o ssib le to rea ch a firm c o n clu sio n reg ard in g th e v a lu e o f th e a p e x an g le in G a 2 0 or In 2 0 , th e a ss ig n m e n t o f w eak b a n d s a t 4 7 2 an d 4 4 2 c m ' 1 to th e v\ m o d e s in th e se sp ec ies in d ic a te s th a t th e m o le c u le s are b e n t , a n d e stim a te s o f 142 a n d 135° are su g g e ste d as low er lim its .
T h e tw o o x y g en a to m s in th e d im e r sp ec ies G a 40 2 a n d l n 40 2 are sh o w n to b e e q u iv a le n t , a n d a stru ctu re is p ro p o sed for th ese m o le c u le s w h ich is b a se d on a fo u r -m e m - b ered ring.
Acknowledgments. W e g ra te fu lly a c k n o w le d g e th e f i n a n c ia l su p p o rt o f th e S c ie n c e R e sea rch C o u n c il a n d th e C e n tr a l E le c tr ic ity G e n e ra tin g B o a rd for th is w ork.
References and Notes(1) R. P. Burns, J. Chem. Phys.. 44,3307 (1966).(2) R. P. Burns, G. DeMarla, J. Drowart, and M. G. Inghram, J. Chem.
Phys.. 38, 1035 (1963).(3) S. A. Shchukarev, G. A. Semenov, and I. A. Rat’kowski, Russ. J.
Inorg. Chem., 14, 1 (1969).(4) S. A. Shchukarev, G. A. Semenov, and I. A. Rat’kowski, Zh. Prikl.
Khim., 35, 1454 (1962).(5) F. J. Kohl and C. J. Stearns, unpublished observations quoted in ref
10 .
(6) N. G. Rambidi and S. M. Tolmachev, Teplofiz. \/ys. Temp.. 3, 487 (1965).
(7) N. G. Rambidi and Y. S. Ezhov, Zh. Strukt. Khim.. 9, 363 (1968).(8) A. A. Mal’tsev, and V. F. Shevel'kov, Teplofiz. Vys. Temp., 2, 650
(1964).(9) A. J, H inchcliffe and J. S. Ogden, Chem. Commun.. 1053(1969).
(10) D. M. Makowieckl, D. A. Lynch, Jr., and K. D. Carlson, J. Phys. Chem., 75, 1963 (1971).
(11) A. J. H inchcliffe and J. S. Ogden, J. Phys. Chem., 75, 3908 (1971).(12) J. S. Anderson and J. S. Ogden, J. Chem. Phys.. 51,4189 (1969).(13) See, for example, “ Vapor Pressure of the Chemical Elements,” A.
N. Nesmayanov and R. Gary, Ed., Elsevier, New York, N. Y., 1963.(14) M. Allavena, R. Rysnik, D. White, V. Calder, and D. E. Mann, J.
Chem. Phys., 50, 3399 (1969); J. Overend, Ann. Rev. Phys. Chem., 21, 265 (1970).
(15) See, for example, G. Herzberg, “ Molecular Spectra and Molecular Structure,” Vol. II, Van Nostrand, New York, N. Y., 1964, pp 229, 148.
(16) G. Herzberg, “ Molecular Spectra and Molecular S tructure," Vol. I, Van Nostrand, Princeton, N. J., 1959.
(17) D. R. Herschbach and V. W. Laurie, J. Chem. Phys.. 35, 458 (1961).
(18) R. C. Splker and L. Andrews, J. Chem. Phys.. 58, 713 (1973).(19) B. Armer and H. Schmidbaur, Chem. Ber.. 100, 1521 (1967).(20) J. W. Hastie, R. Hauge, and J. L. Margrave In "Spectroscopy In
Inorganic Chemistry," Vol. I, C. N. R. Rao and J. R. Ferraro, Ed., Academic Press, New York, N. Y., 1970.
The Journal of Physical Chemistry, Vol. 77. No. 21, 1973

Aniline-Tetracyanoethylene Charge-Transfer Complexes 2545
Formation Constants for Aniline-Tetracyanoethylene Charge-Transfer Complexes
P. G. Farrell* and Phi-Nga Ngo
Department of Chemistry, McGill University, Montreal 101, Canada (Received May 22, 1973) Publication costs assisted by the National Research Council of Canada
T h e fo rm a tio n c o n sta n ts a n d e x tin c tio n co effic ie n ts for th e c h a rg e -tra n sfe r c o m p le x e s fo rm e d b e tw ee n te tra c y a n o eth y le n e an d v a rio u s a n ilin es h av e been d eterm in e d b y th e u su a l g ra p h ica l m e th o d s a n d b y tw o ite ra tiv e m e th o d s . O n e o f th e la tte r m e th o d s , a “ h il l -c lim b in g ” o p tim iz a tio n p ro ced u re d ev ised b y R o se n b r o c k , h as n o t p re v io u sly b e e n a p p lie d to c h a rg e -tra n sfe r c o m p le x e s . T h e m e th o d s are c o m p a re d in te r m s o f th e fin a l resu lts an d th e R o sen b ro ck te c h n iq u e is sh ow n to be an a ltern a tiv e to th e n o n -lin ea r le a s t-sq u a r e s m e th o d . T h e p ro p erties o f th e tr c o m p le x e s are d iscu sse d .
IntroductionIn stu d ie s o f ch a rg e tran sfer, or ir c o m p le x e s , on e o f th e
m a jo r sou rces o f co n cern h a s b e e n th e d iscrep a n c ies a m o n g p u b lish e d v a lu e s o f th e fo rm a tio n c o n sta n t, K CT, an d th e m o la r e x tin c tio n c o e ffic ie n t, tCT, for a g iven d o n o r -a c c e p to r s y s te m . F or th e sy s te m
K ct
A + D ^ A D
w here A, D, a n d AD are, re sp e c tiv e ly , th e a c c e p to r , d on or, and 1 : 1 c h a rg e -tra n sfe r c o m p le x , sp ec tro sco p ic d e te r m in a tio n s o f K CT a n d cCt are n o r m a lly ca rried o u t w ith th e d on or in large e x c e ss , [D]o » [A]o, or w ith e q u im o la r c o n c e n tra tio n s . In th e p resen ce o f a large e x ce ss o f d on or, if o n ly th e c o m p le x a b so rb s a t th e w a v e le n g th o f m e a su r e m e n t a n d B e e r ’s la w is o b e y e d b y th e c o m p le x , th en th e orig in al B e n e s i -H ild e b r a n d e q u a tio n (eq l ) , 1 or an y o f its a ltern a tiv e fo rm s {e.g., eq 2 a n d 3) , 2 >3 m a y be a p p lie d to
[A ]o / O D = l /( F ^ ct ct[D J o) + l / i c r (D
[ D ] 0[ A ] „ /O D = [D J o / cct + 1 / ( A ' ct£ct) ( 2 Y
OD/([D]o[A]0) = —OD KCT/[A ] 0 + K CTeCT (3) 3
th e e x p e r im e n ta l d a ta . (OD is th e a b so rb a n c e at th e w a v e len g th o f in te r e st .) U n d e r e q u im o la r c o n d itio n s [D]o = n [A ]o , w here n ^ 1, a n d eq 4 m a y be d erived fro m a
[A]0/OD = { n + 1) / ( n t C 7 ) + l/(n^cTecT[- -]o/ (4)c o n sid era tio n o f th e d o n o r -a c c e p to r e q u ilib r iu m sh ow n a b o v e .4 F ro m e a ch o f th e a b o v e eq u a tio n s a lin ear p lo t, w h ich allow s th e e v a u la tio n o f K Ct an d cCt , m a y b e o b ta in e d . H o w e v e r , re su lts o b ta in e d g ra p h ic a lly u sin g a n y o f th ese e q u a tio n s o fte n sh ow an a p p a r e n t d ep e n d e n c e o f K Ct a n d cCT on th e d on o r a n d a c c e p to r co n ce n tra tio n s , although their product remains constant, 5 In so m e s y s te m s , w here [D]o » [A]o, an a p p a r e n t d ep e n d e n c e o f K CT u p o n th e w a v e le n g th o f m e a su r e m e n t h as b een re p o r te d .6 9
N u m e r o u s te n ta tiv e e x p la n a tio n s for th ese a n o m a lie s h av e b een p ro p o sed a n d th ese fa ll in to tw o ca teg o ries . T h e first o f th e se su g g e sts th a t th e p o stu la te d m o d e l, w h ich c o n stitu te s th e b a sis o f th e d e te r m in a tio n , is in e x a c t, e.g., th e n o n o b e y a n c e o f B e e r ’s law b y th e c o m p le x ,7 ' 10 sp ecific so lv a tio n ,1 1 ’12 e tc . T h e seco n d ca tego ry c r itic a lly e x a m ines th e g ra p h ica l m e th o d s , e sp e c ia lly eq 1 , to d eterm in e th e o p tim u m c o n d itio n s for th e ir u se , e.g., e q u im o la r
d on o r a n d a c cep to r c o n c e n tr a tio n s ,4 a sa tu ra tio n fra c tio n 13 o f th e m o s t d ilu te c o m p o n e n t ( = [ A D ] /[ A ] 0 ) b e tw een 0 .2 a n d 0 .8 , e tc . In sp ite o f th e p ro b le m s o f in ter
p re ta tio n o f th e e x p e r im e n ta l d a ta , sp ec tro sc o p ic stu d ies o f 7r c o m p le x e s ( in c lu d in g n m r s tu d ie s ) are still very e x te n siv e ly e m p lo y e d b e c a u se o f th e ir te c h n ic a l s im p lic ity . I t is th erefore so m e w h a t su rp risin g th a t ite ra tiv e te c h n iq u e s h av e n o t b een m o re w id e ly u sed for th e ev a lu a tio n o f K Ct a n d cCT fro m su ch e x p e r im e n ta l d a t a .14"17 R o s - se in sk y an d K e lla w i14 a p p lie d th e n o n -lin e a r lea st-sq u a res ( N L L S ) tr e a tm e n t to p u b lish e d d a ta in a réé v a lu a tio n o f so m e K Ct a n d cCT v a lu e s , an d in so m e sy s te m s fou n d resu lts th a t d iffered c o n sid era b ly fro m th o se o b ta in ed g ra p h ic a lly , b u t th ere h a v e b e e n few oth er a p p lic a tio n s o f th is m e th o d . W it h th e in crea sin g a v a ila b ility o f c o m p u tin g fa c ilities ite ra tiv e te c h n iq u e s m a y be m o re w id e ly u t i liz ed a n d we rep ort here th e a p p lic a tio n o f th e “ h illc lim b in g ” o p tim iz a tio n m e th o d d u e to R o se n b r o c k 18 for th e e v a lu a tio n o f K CT a n d eCT v a lu e s . W e are u n a b le to fin d a n y p rev io u s a p p lic a tio n o f th is m e th o d to ch a rg e- tra n sfe r c o m p le x e s a n d th e e ssen tia l d e ta ils o f th e m e th o d are g iven in A p p e n d ix I .19 T o c o n firm th e a p p lic a b ility o f th e m e th o d , w e h a v e c a lc u la te d K cr a n d eCT for all th e sy ste m s s tu d ie d b y R o sse in sk y , to g e th e r w ith so m e a d d itio n a l sy s te m s w h ich h a d p re v io u sly o n ly b e e n a n a ly ze d b y g ra p h ica l m e th o d s .
T h e R o se n b ro ck m e th o d h a s b e e n a p p lie d here in a s tu d y o f th e c h a rg e -tra n sfe r c o m p le x e s fo rm e d b y an ilin e a n d so m e o f its d er iv a tiv es w ith te tra c y a n o eth y le n e ( T O N E ) . It h as b een su g g e ste d th a t th e irreversib le re a c tio n occu rrin g in th e se s y s te m s p ro ceed s via th e it c o m p le x 20 a n d a c cu ra te v a lu e s o f K CT a n d cCT are th erefore n ecessa ry for th e e v a lu a tio n o f th e k in e tic a n d th e r m o d y n a m ic p a ra m e te rs for th e sy s te m s .
Results(i) TCNE-Aniline System. D ic h lo r o m e th a n e w as u sed
as s o lv e n t for a ll e x p e r im e n ts . T C N E an d a n ilin e u n d ergo an irreversib le rea ctio n in d ic h lo r o m e th a n e , via th e ir c o m p le x , to y ie ld W -tr ic y a n o v in y la n ilin e . T h e rea ctio n has b een s tu d ie d k in e tic a lly a n d th e d e c a y o f th e ir c o m p le x fo llo w s first-o rd e r k in e tic s w h en a n ilin e is in large e x c e s s .20 T h u s , e x tr a p o la tio n o f th e first-o rd e r p lo t to th e t im e o f m ix in g y ie ld s th e a b so rb a n c e d u e to th e it c o m p le x prior to an y re a c tio n . V a lu e s o f K c t , ecT> a n d K c t éCt o b ta in e d u n d er th e c o n d itio n [D]o 3> [A]o a t fou r te m p e r a -
The Journal of Physical Chemistry, Vol. 77, No. 21, 1973

2546 P. G. Farrell and Phi-IMga Ngô
TABLE I: Values of K c y and 6 ct Obtained from both Graphical and Iterative Methods for the Aniline-TCNE Complex in Dichloromethane“
2 ( O D o b s d
Method KCTfCT Kct. M - ' «ct, 1 c m '1Correi. ODcaicd)2 x coeff. 104 Temp, °C
Eq 1 5820 2 .30 ± 0 13 2530 ± 122 0.9990 25.4Eq 2 5800 2.25 ± C.12 2575 ± 168 0.9870Eq 3 5805 2.26 ± 0.12 2570 ± 136 0.9774R osenbrock 5770 2.20 2620 3.87NLLS 5730 2.20 ± 0.13 2622 ± 11 3.86Eq 1 6380 2.50 ± 0.12 2550 ± 103 0 .9992 20.7Eq 2 6320 2 .40 ± 0.12 2630 ± 100 0.9885Eq 3 6311 2.39 ± 0.12 2640 ± 132 0.9807R osenbrock 6340 2.43 2610 4.79NLLS 6320 2 .42 ± 0.15 2619 ± 117 4.76
Eq 1 7080 2.60 ± 0.15 2730 ± 126 0.9990 16.8Eq 2 7112 2.66 ± 0.15 2678 ± 114 0 .9866Eq 3 7081 2.61 ± 0.15 2720 ± 156 0.9763R osenbrock 7120 2.67 2670 4.91NLLS 7120 2.65 ± 0.16 2684 ± 120 4.92Eq 1 7670 3.04 ± 0.19 2525 ± 121 0.9985 15.0Eq 2 7480 2.74 ± 0.18 2730 ± 129 0.9837Eq 3 7497 2.79 ± 0.18 2680 ± 173 0 .9714R osen b ro ck 7420 2.70 2752 5.16NLLS 7550 2.52 ± 0.19 2894 ± 158 4.81
a [A ]0 « [D ]0-
TABLE II: Typical Values of the Equilibrium Constant, Kc t , for Aniline TCNE Charge-Transfer Complex Formation
System (temp, °C) Kctct fC T Kc t A M - ' Kct,0 M - '
A n ilin e -T C N E (25 .4°)Set I 5960 453 ± 95 13.16 ± 2.92 2.25Set II 6130 700 ± 97 8.76 ± 1.30 2.31
[N. A/-2H2¡-A n ilin e -T C N E (25 .4°)Set I 5940 1100 ± 134 5.40 ± 1.03 2 .24S et II 6080 880 ± 96 6.91 ± 1.67 2 .30
A n ilin e -T C N E (2 0 .7°) 6380 1062 ± 368 6.01 ± 2.01 2.41
° Values obtained from eq 4. This equation is derived assuming that [A D j [A ]0 and this is not true in practice when K 2. These data thus reveal in part errors arising from the use of eq 4 and errors arising from working at all times at the upper concentration limit of A. When D0 A0 then [AD] is very small and the errors in the data are maximized. b Derived from values of KCTeCT given by eq 4, assuming <ct = 2650.
TABLE III: Values of the Equilibrium Constant fiCT for the Aniline-TCNE Complex at Various Temperatures“
[ D ]o » [A ]o[Djo = [A ]0 ------------------------------------------------------------------------------------
Temp, °C eq 4 Eq 1 Eq 2 Eq 3 Rosenbrock NLLS Average
25.4 2.30 2.22 2.23 2.23 2.17 2.17 2.22 ± 0 .0320.7 2.41 2.41 2.39 2.40 2.40 2.40 2.40 ± 0.0116.8 2.68 2.69 2.68 2.70 2.70 2.69 ± 0.0115.0 2 .90 2.83 2.83 2.80 2.85 2.84 ± 0 .03
a Based on t e r = 2650.
tu res , b y b o th g ra p h ic a l a n d ite ra tiv e m e th o d s , are g iven A v e ra g e v a lu e s o f K cT d erived b y th e d iffe re n t m e th o d s in T a b le I. A s s u m in g th a t tCT is c o n sta n t w ith in th e e x - a t fou r te m p e ra tu re s are sh ow n in T a b le III. F ro m th e lin -p e r im e n ta l te m p e ra tu re range ( 1 5 .0 -2 5 .4 ° ) , an average v a lu e w a s c a lc u la te d fro m th e re su lts . T h is av erag e v a lu e ( r c t = 2 6 5 0 ± 4 6 ) w as th en u sed to c a lc u la te K CT fro m th e p ro d u c ts K CTeCT.
U n d e r e q u im o la r co n d itio n s th e ir c o m p le x rea cts very s lo w ly a n d th e a b so rb a n c e a t zero t im e m a y b e o b ta in e d b y lin ea r e x tr a p o la tio n o f th e a b so r b a n c e us. t im e cu rve . T a b le II sh ow s ty p ic a l K CT a n d tCT v a lu e s o b ta in e d fro m eq 4 , to g e th e r w ith K CT v a lu e s o b ta in e d a ssu m in g eCT = 2 6 5 0 .
ear va ria tio n o f In K c tM:t us. 1/T th e e n th a lp y o f c o m p le x fo rm a tio n w as e s tim a te d to be - 4 . 2 0 ± 0 .2 6 k ca l m o l - 1 and hence the e n tro p y to be - 1 2 . 5 0 ± 0 .9 0 eu (a t 2 5 .4 ° ) .
A n e x a m in a tio n o f the [A?,A r- 2H 2] -a n i l i n e -T C N E s y s te m sh o w ed no d ifferen ces in th e d eriv ed K CT a n d <CT v a lu e s b etw een th e d e u tera ted a n d p ro tia te d sp ec ies , in d ic a tin g th e a b sen c e o f an y iso to p e e ffe c t u p o n c o m p le x fo r m a tio n .
(it) TCNE-Substituted Aniline Systems. T h e lo n g w a v e len g th a b so rp tio n m a x im a , K cv, an d eCT v a lu e s for
The Journal of Physical Chemistry, Vol. 77, No. 2 1 . 1973

Aniline-Tetracyanoethylene Charge-Transfer Complexes 2547
TABLE IV: Values of Kct and cct Obtained from Both Graphical and Iterative Methods for the Complexes of TCNE with Some AnilineDerivatives in Dichloromethane at 25.4°“
( 0 D o b sd O D c a l c d ) 2 X
Method Kc t ^ct Kc t , M~' €(;t , M 1 cm 1 Correl. coeff. 104
Eq 1 1,840p-Chloroaniline
0.41 ± 0.10 4,500 ± 1070 0.9995Eq 2 1,850 0.50 ± 0.10 3,740 ± 731 0.8595Eq 3 1,848 0.48 ± 0.10 3,850 ± 802 0.8427Rosenbrock 7,636 0.76 10,100 2.59NLLS 6,716 0.0776 ±0 .00 2 6 86,546 ± 1878 21.8
Eq 1 13,600p-M ethylaniline
4.74 ± 0.35 2,875 ± 173 0.9992Eq 2 13,600 4.70 ± 0.31 2,900 ± 193 0.9862Eq 3 13,615 4.83 ± 0.35 2,840 ± 207 0.9767Rosenbrock 13,710 4.98 2,753 0.634NLLS 13,765 5.02 ± 0.39 2,742 ± 158 0.648
Eq 1 20,200p-M ethoxyaniline
12.20 ± 3.57 1,660 ± 396 0.9870Eq 2 19,000 9.25 ± 0.53 2,060 ± 241 0.9436Eq 3 19,100 9.50 ± 1.67 2,010 ± 353 0.8842Rosenbrock 18,493 8.52 2,168 1.98NLLS 18,506 8.54 ± 1.28 2,167 ± 225 1.99
" [Ajo « [D ]0.
th e tr c o m p le x e s fo r m e d b e tw ee n p -c h lo r o a n ilin e , p -to lu i - dine, a n d p -a n is id in e in d ic h lo r o m e th a n e w ere d ete r m in e d at 2 5 .4 ° , a n d th e re su lts are sh ow n in T a b le I V .
DiscussionA c o m p a riso n o f th e re su lts o b ta in e d b y th e d iffe re n t
gra p h ica l m e th o d s a n d th e tw o ite ra tiv e te c h n iq u e s is m a d e in it ia lly , fo llo w ed b y d e ta ile d d iscu ssio n o f th e a n i- l i n e -T C N E sy ste m .
Graphical Methods. W it h large excess o f d on o r, eq 1 -3 have a ll b e e n u sed to e v a lu a te K cT a n d tCT. T h e resu lts d erived fro m on e e q u a tio n m a y b e u se d as a ch e ck a g a in st th ose c o m p u te d fro m th e o th ers a n d e a c h re su lt sh ow s for an ilin e th a t a ll three e q u a tio n s y ie ld very s im ila r v a lu es for K CTtCT w ith in a s y s te m , b u t th a t th e se p a ra te v a lu es are n o t in go od a g re e m e n t. T h is c o n firm s th e c o n c lu sio n s o f o th er w orkers w h o h av e d isc u sse d a t len g th th e in se n sit iv ity o f th e B e n e s i -H ild e b r a n d e q u a tio n to b o th e x p e r im e n ta l errors10 a n d th e ex isten c e o f sp ec ies oth er th a n th e 1 :1 c o m p le x . 6 ’21 T a b le s I an d I V sh o w th a t for a ll sy s te m s th e B e n e s i -H ild e b r a n d e q u a tio n h as th e h ig h est co rrela tio n w h erea s eq 3 h a s th e lo w est. T h is is a lso illu str a te d in F igu res 1 -3 w here p lo ts c o rresp o n d in g to th e th ree e q u a tio n s are sh o w n for th e sa m e set o f d a ta . T h e s e c o n c lu sion s are a lso c o rro b o ra te d b y th e error a n a ly sis sh ow n in A p p e n d ix I I .19 H a m m o n d 22 sh ow ed th a t th e e ffec t o f e x p er im e n ta l errors in crea ses m a r k e d ly for s m a ll K cr v a lu es so th a t an y o f th e a b o v e e q u a tio n s b e c o m e s in a p p lic a b le , in p ra ctic e , for w eak d o n o r -a c c e p to r in tera ctio n s .
F ro m a co m p a riso n o f resu lts o b ta in e d b y b o th o p tic a l a n d n m r stu d ie s , F o ste r4 su g g e ste d th a t th e m o s t c o n s is t e n t K c t v a lu e s for Tr-com plex fo rm a tio n are th o se d erived fro m o p tic a l d a ta w h en [D]o = [A]o. In th e p re sen t s tu d y th is c o n siste n c y h a s n o t b e e n o b serv e d for th e a n i lin e - T C N E s y s te m ( T a b le II) in sp ite o f th e v ery good lin ear d a ta p lo ts o b ta in e d e x p e r im e n ta lly .
Iterative Techniques. T h e re su lts o f T a b le s I a n d IV show th a t th e R o se n b r o c k a n d N L L S m e th o d s y ie ld very close v a lu es o f A CTeCT to g eth er w ith th e sa m e fu n c tio n m in im a , w ith th e e x c e p tio n o f th e p -c h lo r o a n i l in e -T C N E
F ig u r e 1 . G r a p h ic a l e s t im a t io n o f K c t a n d c c t u s in g e q 1 fo r th e a n i l in e - T C N E c o m p le x in d ic h lo r o m e th a n e a t 2 5 . 4 ° , th e d o n o r b e in g in e x c e s s .
s y s te m s . S u c h a g re e m en t is g ra tify in g e sp e c ia lly as the N L L S is an a n a ly tic a l m e th o d w h erea s th e R o se n b r o c k is a d irect sea rch m e th o d , e n tire ly h eu ristic in n a tu re . A l th o u g h in th e p re sen t w ork th e tw o m e th o d s h a v e o n ly b e e n a p p lie d to o p tic a l d a ta o b ta in e d u n d er th e co n d itio n
The Journal of Physical Chemistry, Vol. 77, No. 21, 1973

2548 P. G. Farrell and Phi-Nga Ngo
F ig u re 2 . Graphical estimation of K c r r and £ c t using eq 2 for the in excess.
F ig u re 3. G raphical estimation of Kqt and ecT using eq 2 for the aniline-TCNE complex in d ichlorom ethane at 25.4°, the donor being in excess.
[D]o > [A ]o, th e y m a y a lso be a p p lie d to d a ta o b ta in e d u n d er e q u im o la r co n c e n tra tio n c o n d itio n s .
In ord er to c o m p a re m o re w id e ly th e resu lts o b ta in e d b y b o th th e R o se n b ro c k a n d th e N L L S te c h n iq u e a n u m b e r o f d a ta rep orted in th e lite ra tu re h a s b een re a n a ly z e d .
aniline-TCNE com plex in dichlorom ethane at 25.4°, the donor being
T h e re su lts are rep orted in T a b le V I 19 a n d a c o m p a riso n o f th ese te c h n iq u e s is lim ite d to a c o m p a riso n o f th e fin a l e stim a te s o f K CT a n d eCT- N e ith e r m e th o d req u ires a n y a ssu m p tio n s to b e m a d e in th e a p p ro p ria te e q u a tio n s a l th o u g h in th e d er iv a tio n o f th e y fu n c tio n in th e R o se n
brock p ro g ra m [D ]0 - [A D ] ~ [D ]0 w as a s s u m e d . A s e v i d en c ed b y th e a g re e m e n t in th e re su lts o b ta in e d b y th e tw o m e th o d s , th is a ssu m p tio n w as v a lid . N o su ch a s s u m p
tio n w as m a d e in th e N L L S m e th o d .T h e R o se n b ro c k m e th o d h as th e gen era l a d v a n ta g e ov er
th e N L L S m e th o d in th a t it d oes n o t require a c o m p u ta
tio n o f first d e r iv a tiv e s . F or th e a ssu m e d m o d e l o f a 1 :1 c h a rg e -tra n sfe r c o m p le x th is w o u ld n o t be a p r o b le m , b u t m a y be m o re d iff ic u lt or ev en im p o ssib le in oth er m ore c o m p le x s y s te m s . T h e o b v io u s d isa d v a n ta g e o f th e R o s e n b rock m e th o d is th a t th ere is n o s im p le w a y o f e s tim a tio n o f th e errors in th e c o m p u te d p a ra m e te rs . T h e o n ly in d ic a tio n o f th e fit o f th e e x p e r im e n ta l d a ta to th e m o d e l is th e resu ltin g v a lu e o f th e fu n ctio n m in im u m , y. S ta n d a r d d ev ia tio n s are re a d ily c o m p u te d in th e N L L S m e th o d in a d d itio n to th e fu n c tio n m in im a a n d an e x a m in a tio n o f T a b le V I sh ow s th a t , o f th e 26 sy s te m s s tu d ie d , th e tw o m e th o d s ga ve id en tic a l e s tim a te s o f K ct a n d f CT, w ith in th e lim its o f error o f th e N L L S m e th o d , for 19 o f th e se . F or so m e o f th e re m a in in g sy s te m s , th e N L L S p ro g ra m d id n o t co n verg e w hile th e R o se n b r o c k m e th o d g a v e re su lts w h ich are in good a g re e m en t w ith th o se o b ta in e d by g ra p h ica l m e th o d s (en tries 3 , 7 , a n d 1 5 ) .
A close e x a m in a tio n o f th e d a ta o f th is ta b le sh ow s th a t th e v a lu es o b ta in e d b y th e R o se n b r o c k te c h n iq u e are a l w ays w ith in th e errors e s tim a te d b y th e N L L S m e th o d a n d w e h av e th erefore a ssu m e d th a t th e o b ta in e d v a lu e s are a c c e p ta b le . In all c a ses th e a c c u ra c y o f th e e x p e r im e n ta l d a ta p ro v id es th e l im ita tio n u p o n th e a c cu ra cy o f th e o b ta in e d resu lts an d an in d ic a tio n o f th is is g iven b y th e v a lu e o f th e fu n c tio n m in im u m y.
The Journal of Physical Chemistry, Vol. 77, No. 21, 1973

Aniline-Tetracyanoethylene Charge-Transfer Complexes 2549
TABLE V: Ranges of Saturation Fraction Studied, Wavelengths of Maximum Absorption, Equilibrium Constants, and Molar ExtinctionC o e ff ic ie n t s for th e V a r io u s A n ilin e -- T C N E C h a r g e -T r a n s f e r C o m p le x e s in D ic h lo ro m e th a n e at 2 5 . 4 °
Amine S ^max,CT, nr>1 Av /CçTi M 1 Av fC T pKa“
p-C hloroaniline 0.03-0.08 580 ~ 0 ,5 0 ~ 4 0 0 0 4.07Aniline 0.10-0.32 600 2.22 2650 4.60p-M ethylaniline 0.11-0.30 652 4.85 2820 5.03p-M ethoxyaniline 0.05-0.42 700 9.58 2010 5.40
a Reference 34.
Graphical Methods and Iterative Techniques. T h e re su lts for th e a n i l i n e -T C N E sy ste m u n d er co n d itio n s o f e x cess d on o r sh ow th a t th e g ra p h ic a l m e th o d s a n d th e ite r a tiv e te c h n iq u es all y ie ld very s im ila r v a lu es o f th e p ro d
u c ts , f i CT€cT> a n d a l s ° ° f th e se p a ra te d v a lu e s . T h e fin a l v a lu es o f K Ct w ere c o m p u te d fro m th e p ro d u c ts u sin g th e va lu e o f eCT = 2 6 5 0 . T h e c o n siste n c y b e tw ee n th e K c x v a lu es o b ta in e d b y th is m e th o d is sh o w n in T a b le III.
F ro m th e re su lts o f th e p re sen t s tu d y , th e b e st a n a ly sis o f o p tic a l d a ta for 1 : 1 c o m p le x fo rm a tio n se e m s to b e a c o m b in a tio n o f b o th g ra p h ic a l a n d ite ra tiv e te c h n iq u e s . T h e g ra p h ica l p re se n ta tio n assists in th e d e te c tio n o f s y s
te m a tic errors, e.g.. c u rv a tu re , a n d a lso p ro v id es th e in itia l gu esses n e ed e d for th e ite ra tiv e m e th o d s . I f th e e x p erim e n ta l d a ta are re lia b le th ese la tte r m e th o d s y ie ld go od v a lu es o f K cr cCT, p ro v id ed th a t th e p o stu la te d m o d e l is correct. I t s till h ow ever re m a in s tru e th a t th e lim its o f a c cu racy o f a ll th e m e th o d s are d ete r ta in e d b y th e e x p e r im e n ta l c o n d itio n s . T h is h a s b een e m p h a s iz e d b y oth er w orkers, in p a r tic u la r P erso n 23 w h o e m p h a s iz e d th a t th e eq u ilib r iu m c o n c e n tr a tio n o f th e c h a rg e -tra n sfe r c o m p le x sh ou ld be o f th e sa m e ord er o f m a g n itu d e as th e e q u ilib r iu m co n c e n tra tio n o f th e m o re d ilu te c o m p o n e n t o f th e sy s te m . T h is s a m e p rin c ip le w as e x p ressed b y D e r a n le a u 13
as a fu n c tio n o f th e sa tu ra tio n fra c tio n , s, o f th e m o s t d i lu te c o m p o n e n t ( = [A D ] / [A ]0) - H e su g g e ste d th a t th e th e oretica l m in im u m errors in K CT a n d «Ct w ou ld be o b ta in e d for so lu tio n s w h ere th e sa tu ra tio n fra c tio n lies b e tw een 0 .2 a n d 0 .8 , a n d th a t a s tu d y o f 7 5 % o f th e s a tu r a tio n cu rve is req u ired to sh ow th e co rresp on d en ce b etw een th e e q u a tio n o f th e m o d e l a n d th e e q u a tio n f ittin g th e d a ta .
T h e ra n ges o f sa tu ra tio n fra c tio n s tu d ie d for th e d iffe r en t T C N E -a n i l i n e s y s te m s are sh ow n in T a b le V . A l th o u g h in n o s y s te m b o th th e u p p e r a n d low er lim its are w ith in th e ra n g e su g g e ste d b y D e ra n le a u , th e stron ger co m p le x e s a ll h a v e u p p e r l im its greater th a n 0 .2 . T h e fa i l ure o f th e m e th o d s to p ro v id e a re lia b le v a lu e for K r r for th e p -c h lo r o a n i l in e -T C N E c o m p le x is p ro b a b ly d u e to th e fa c t th a t th e maximum v a lu e o f s for th is c o m p le x w as less th a n 0 .2 . A large v a lu e o f s co rresp o n d s to th e u se o f high don or c o n c e n tr a tio n s , a n d as th is is n o t p o ssib le in a n u m b e r o f sy s te m s for p ra c tic a l rea so n s, su c h as th e l im it ed so lu b ility o f e ith er d o n o r or a c c e p to r , th e fa s t d is a p pea ra n ce o f th e 7r c o m p le x w ith h ig h d on o r co n ce n tra tio n d u e to re a ctio n , e tc ., greater errors in th e d e te r m in e d v a lu es K ct a n d eCT w ill resu lt. O w in g to th e in so lu b ility o f p -c h lo ro a n ilin e in d ic h lo r o m e th a n e , an u p p e r l im it u p on th e c o n c e n tra tio n w h ich m a y b e u se d is e s ta b lish e d . For th is reason th e sa tu ra tio n cu rve c o u ld n o t b e stu d ie d over th e ra n g e w h ic h D e ra n le a u su g g e ste d w o u ld sh ow th e corresp on d en ce b e tw ee n th e m o d e l an d th e d a ta eq u a tio n .
Aniline-TCNE Charge-Transfer Complexes. In T a b le V som e o f th e p ro p erties o f th e c o m p le x e s fo rm e d b e tw ee n T O N E a n d th e a n ilin es u se d are sh o w n . T h e d a ta in d ica te
an in crease in Xmax,CT an d in K cr in go in g fro m th e w eaker to th e stron g er b a ses . In c rea sin g base stren g th is a c c o m p a n ie d b y low erin g o f th e io n iz a tio n p o te n tia l o f th e a m in e , th u s fa v o rin g an in creased e x te n t o f c o m p le x fo rm a tio n . T h e e n th a lp y a n d th e e n tro p y o f ch a rg e -tra n sfe r c o m p le x fo rm a tio n b e tw ee n a n ilin e an d T C N E co m p a re w ell w ith th o se v a lu es for oth er s im ila r a m in e s su ch asIV .N -d im e th y la n ilin e ,24 N -m e t h y la n i lin e ,25 a n d in d o le .26
T h e v a lu es o f X CT a n d eCT for th e a n i l in e -T C N E a n d th e p -c h lo r o a n i l in e -T C N E sy s te m s d iffe r fro m th o se fo u n d by I s a a c s ,27 b u t he d id in d ic a te th a t h is v a lu e s w ere “ n o t o f a n y great a c c u r a c y .” T h e v a lu e for i CT for th e p -m e th o x y - a n i l in e -T C N E c o m p le x is less th a n th a t for th e other c o m p le x e s sh ow n in T a b le V , w h erea s th e reverse sh o u ld b e tru e . A n d re w s a n d K e e fe r 28 o b se r v e d a s im ila r b e h a v ior in io d in e -m e th y lb e n z e n e c o m p le x e s in ca rb o n te tr a ch lo rid e a n d su ch an e ffec t w as a ttr ib u te d b y M u llik e n a n d O rg e l to th e occu rren ce o f c o n ta c t ch a rg e -tra n sfe r w ith in th e s y s t e m .29 T h is w o u ld lea d to a greater a p p a r e n t m o la r e x tin c tio n c o e ffic ie n t, eapp, w h ich is re lated to th e tru e e x tin c tio n c o effic ie n t ec x b y th e ex p ression
- ) (5 )
w here P = a ( e con ta c t A c t ) , a b e in g th e n u m b e r o f p o ssib le c o n ta c t s ite s for th e c o m p o n e n t in ex cess a ro u n d a n y m o lecu le o f th e se c o n d sp ec ies ; ¿contact is th e e x tin c tio n c o e ffic ie n t for th e c o n ta c t c h a rg e -tra n sfe r p ro ce ss . T h e ab ove e q u a tio n im p lie s th a t eapp b e c o m e s in cre a sin g ly greater th a n ec x as K CT d ec rea ses . I f th is e x p la n a tio n a p p lies to th e d a ta in T a b le V it w o u ld im p ly th a t th e tru e ec x v a lu e for th e p -m e t h o x y a n i l in e -T C N E c o m p le x m a y be close to 2 0 10 , w h ereas th o se for th e a n ilin e an d p -m e th y la n ilin e c o m p le x e s sh o u ld be m u c h le ss th a n 2 6 5 0 a n d 2 8 2 0 , re sp e c tiv e ly . A n a lte r n a tiv e p o ss ib ility is th a t m ix in g o f th e c h a rg e -tra n sfe r e x c ite d s ta te w ith e x c ite d s ta te s o f eith er th e d on o r or th e a c c e p to r occu rs, as w a s p ro p o sed b y M u r r e l l .30 T h e lin e a rity o f th e p lo t o f In K c x vs. T - 1 for th e a n i l in e -T C N E sy ste m su g g e sts th a t if e ith er o f th ese p o ssib ilit ie s o c cu r th e y are o f r e la tiv e ly m in o r im p o r ta n c e .
Isotope Effects in Charge-Transfer Complexes. A n e x a m in a tio n o f T a b le II in d ic a te s th a t , w ith in th e e x p e r im e n ta l errors, th ere is n o d ifferen ce b e tw ee n th e e q u ilib r iu m c o n sta n ts a n d m o la r e x tin c tio n c o effic ie n ts o f ch a rg e- tra n sfer c o m p le x e s o f T C N E w ith an ilin e a n d [N,N-2H 2]- a n ilin e , a n d th a t b o th c o m p le x e s h av e id en tic a l a b so r p tio n m a x im a in d ic h lo r o m e th a n e . S u b s t itu t io n o f d e u te r iu m on th e n itro g en a to m th u s h as n o o b se r v a b le e ffect u p o n th e sp e c tro sc o p ic a lly m e a su red p ro p erties o f th e w c o m p le x . P rev io u s s tu d ie s o f th e e ffe c t o f iso to p ic re p la c e m e n t on th e p ro p erties o f ch a rg e -tra n sfe r c o m p le x e s h av e su g g e ste d th a t in d e ed iso top e e ffec ts sh o u ld be ob served . T h u s th e m e th y l d eu tera tio n o f b o th to lu en e a n d m-xy - len e d ecreases th e e q u ilib r iu m c o n sta n t for th e ir c o m p le x es w ith ch lo ra n il b y so m e 7 % . 31 T h is in verse iso top e
The Journal of Physical Chemistry, Vol. 77, No. 27, 1973

2550 P. G. Farrell and Phl-Nga Ngô
pKaFigure 4. Variation of Kc t with pKa of the donor for some aniline-TCNE complexes.
e ffe c t w a s a ssig n ed to a sm a lle r h y p e rc o n ju g a tiv e s ta b ili za tio n b y tr id e u te r io m e th y l th a n b y m e th y l, w h ich is s u f f ic ie n t to o v erco m e th e in d u ctiv e e ffe c t in th e reverse d i rectio n . E m s lie a n d F o ster32 rep orted a v a lu e o f 0 .7 3 at 22° for th e ra tio K CT( D ) / X CT(H ) for c o m p le x e s o f T O N E w ith b e n zen e a n d b en zen e -d 6 - T h is is a s ig n ific a n tly greater a p p a ren t e ffe c t fro m th a t o b served for th e ch lo - ran il c o m p le x e s . I t w as p ro p o sed th a t d e v ia tio n s fro m B e e r ’s la w w ere th e ca u se o f th e a p p a r e n t iso to p e e ffec t a n d th e au th ors q u o te d as su p p o rtin g ev id e n c e th e e q u a l e n th a lp ie s o f fo rm a tio n a n d s im ila r e x c ita tio n en ergies for b o th c o m p le x e s , th e v irtu a lly id e n tic a l io n iz a tio n p o te n t ia ls o f b e n z en e an d b e n z e n e -c ta 33 a n d th e a b sen c e o f an y iso to p e e ffe c t in th e e q u ilib r iu m c o n sta n ts o f th e c o m p lex es o f th ese d on ors w ith 1 ,3 ,5 -tr in itr o b e n z e n e o b ta in ed b y n m r s tu d ie s .34
It is o f in terest to n o te th a t th e p ro d u c ts K CTeCT for b o th th e b e n z en e a n d b e n z e n e -d g -T C N E c o m p le x e s w ere id en tic a l a n d th a t th e a p p a ren t iso to p e e ffe c t m a y arise in th e sep a ra tio n o f th e v a lu es o f K CT a n d eCT. I t w ou ld th erefore be o f in terest to trea t th e d a ta o b ta in e d for th ese c o m p le x e s b y one o f th e iterativ e m e th o d s d iscu sse d ab ove .
V a lu e s o f JVCT( D ) / I f CT(H ) less th a n u n ity are su rprisin g in th e ab o v e sy s te m s w here h y p e rc o n ju g a tio n ca n n o t o c cu r a n d e sp e c ia lly as there is a m p le litera tu re ev id en ce for th e greater in d u c tiv e e ffec t o f d e u te r iu m as co m p a re d to p r o t iu m .35 In te rm s o f e lectro n ic e ffec ts th e tra n sitio n en ergy for th e c o m p le x o f [IV ,iV-2H 2] -a n ilin e w ith T C N E sh o u ld be less an d th e e q u ilib r iu m c o n sta n t greater th a n th o se c o rresp o n d in g to p ro tia ted an ilin e . In th e p resen t sy ste m su ch d ifferen ces m a y w ell e x is t b u t w ere n o t d e te c ta b le b e c a u se th e y fa ll w ith in th e lim its o f e x p e r im e n ta l error.
Z o llin g e r, et al.,36 m ea su red th e p K a o f a n ilin e , 2 ,3 ,4 ,5 ,6 -p e n ta d e u te r io a n ilin e , a n d 2 ,4 ,6 -tr id e u te r io a n ilin e a n d fo u n d re sp ec tiv e ly v a lu es o f 4 .7 1 4 , 4 .7 3 7 , a n d 4 .7 3 1 (in w ater at 2 0 ° , ion ic stren g th = 0 .1 0 ) . T h e s e v a lu e s in d ica te
&pKa d ifferen ces o f + 0 .0 2 3 a n d + 0 .0 1 7 b e tw e e n a n ilin e an d th e p e n ta d e u te r io a n d tr id eu terio d e r iv a tiv e s , r e sp e c t iv e ly . IV -d eu tera tio n sh o u ld h av e a greater p o sitiv e e ffe c t u p o n th e p K a v a lu e for an ilin e th a n sh o u ld rin g d e u te r a - tio n a n d w e h a d p re v io u sly e s tim a te d th is as 5pK a ~ 0 .1 . A t th e low er en d o f th e cu rve o f F igu re 4 th is w o u ld g ive rise to a d ifferen ce in th e X CT v a lu es o n ly m a rg in a lly greater th a n th e e x p e r im e n ta l error. H o w e v e r, th e r e c e n tly rep orted s tu d y o f so lv en t iso to p e e ffec ts on th e p K a v a lu es o f a n ilin iu m ions in aq u eo u s su lfu ric a c id sh ow s th a t p K a( D 2 0 ) - p i f a( H 2 0 ) = 0 .5 6 for a n ilin e an d [N,N- 2H 2] -a n ilin e .37 T h is v a lu e g ives [lV ,A f-2H 2] -a n ilin e a p K a greater th a n th a t o f p -to lu id in e a n d F igu re 4 im p lie s an iso to p e e ffec t a p p ro a c h in g 3 for X Ct ( D ) / K Ct ( H ) . T o g e t h er w ith th e e x p e r im e n ta l la ck o f a n y iso to p e e ffe c t , F igu re 4 im p lie s th a t th e a n ilin es s tu d ie d here are p r e d o m in a n tly 7r ra th er th a n n d on o rs, a n d p K a ch a n g es c a u sed b y N- su b st itu t io n are n o t a c c o m m o d a te d b y th is figu re .
Effect of Solvent on Aniline-TCN E Complexes. In th e ir early w ork on T C N E c o m p le x e s , M e r r ifie ld a n d P h illip s 38 su g g e ste d a c o m p e titiv e c o m p le x fo rm a tio n b e tw ee n T C N E an d th e s o lv e n t d ic h lo r o m e th a n e . T h e y e s t im a te d th a t th e e q u ilib r iu m c o n sta n t K s b e tw ee n T C N E a n d th e s o lv e n t w o u ld be 0 .2 1 in m o le fra c tio n u n its , w ith c h lo r o fo rm as th e sta n d a rd so lv en t. M o r e re c e n tly a v a lu e o f K s = 0 .2 9 M " 1 a t 25° u sin g ca rb o n te tra c h lo rid e as s ta n d a rd h a s b e e n o b ta in e d b y oth er w o rk ers .39 T h is la tte r w ork sh ow s th a t c o m p e titiv e c o m p le x fo rm a tio n b y th e so lv e n t h as n o e ffe c t u p o n th e m o la r e x tin c tio n co e ffic ie n t, b u t th a t th e e q u ilib r iu m c o n sta n t o b ta in e d b y th e B e n e s i -H i l - d eb ra n d tr e a tm e n t is o n ly an a p p a r e n t v a lu e K app, r e la t e d to th e tru e v a lu e by
K Ct = K pp( l + [ S p Q ( 6 )
w here [S]o is th e s o lv e n t co n ce n tra tio n a n d K s is th e e q u ilib r iu m c o n sta n t for th e T C N E -s o lv e n t c o m p le x . In th e p re se n t s tu d y n o a c c o u n t h a s b e e n ta k e n o f c o m p e tit iv e s o lv e n t in tera ctio n w ith T C N E as th e b a sic a n a ly s is is n o t
The Journal of Physical Chemistry, Vol. 77, No. 27, 1973

Aniline-Tetracyanoethylene Charge-Transfer Complexes 2551
a ffec te d b y su c h c o m p e tit io n . F u rth erm o re , th e k in etic a n a ly sis o f th is s y s t e m 19 is n o t a ffe c te d b y so lv e n t c o m p e tit io n for T C N E , if th is o c cu rs . T h e lin e a rity o f th e p lo t o f In K c r i c T vs. T su g g e sts th a t th is process is n eg lig ib le in th e a n i l i n e -T C N E sy s te m .
Experimental SectionMaterials. T h e a m in e s an d T C N E w ere p u rified c o m
m e rc ia l p ro d u c ts , a n ilin e b e in g sto red u n d er n itrog en in a d esic ca to r a t 0 ° after fra c tio n a l d is t illa t io n . D ic h lo r o m e th - ane (F ish er sp ec tro g ra d e ) w as d ried for 1 d a y (C a C U ) a n d d istilled (b p 3 9 .8 ° ) im m e d ia te ly b efore use in to p o ly th en e b o ttle s .
Spectroscopic Measurements. S to c k so lu tio n s o f th e re a c ta n ts w ere p re p a re d im m e d ia te ly b efore u se at th e a p p ro p riate te m p e ra tu re . A liq u o ts o f th ese so lu tio n s w ere ra p id ly m ix e d in sto p p e re d s ilic a a b so r p tio n c e lls (4 0 or 10 m m p a th le n g th ) c o n ta in e d in th e c o n sta n t-te m p e ra tu r e cell h o u sin g o f a B e c k m a n D B sp e c tro p h o to m e te r , th e tim e a t h a lf -a d d itio n b e in g ta k e n as t = 0 . T h e v a ria tio n o f th e a b so rb a n c e a t a c o n sta n t w a v e len g th w a s th e n re co rd ed . T h e te m p e ra tu re in sid e th e rea ctio n cell w as m e a su red b y m e a n s o f a c o p p e r -c o n s ta n ta n th e rm o c o u p le ( ± 0 . 1 ° ) . F or e x p e r im e n ts u sin g large excess o f d on o r (3 0 <[D]o/[A]o < 4 0 0 ) , a series o f runs a t c o n sta n t [TCNEJo an d v a ry in g [D]o w as s tu d ie d a t e a ch te m p e ra tu re , a n d a b so rb a n c e v a lu e s u se d in eq 1 -3 w ere o b ta in e d b y e x tr a p o la tio n to zero t im e . F or th e d e te r m in a tio n s o f K CT a n d eCT u sin g e q u im o la r c o n c e n tr a tio n s , a series o f ru ns w ith c o n sta n t [D]o/[A]o v a lu e s ( ~ 1 ) w ere s tu d ie d . A b so r b a n c e v a lu es for u se in eq 4 w ere a g a in o b ta in e d b y e x tr a p o la tion to zero tim e .
Acknowledgments. W e are g ra tefu l to th e N a tio n a l R e search C o u n c il o f C a n a d a for fin a n c ia l su p p o rt, an d to M c G ill U n iv e r s ity for th e aw ard o f a M c C o n n e ll F e llo w sh ip (to P . N . N . ) .
Supplementary Material Available. A p p e n d ic e s I a n d II an d T a b le V I w ill a p p ea r fo llo w in g th e se p a g es in th e m i cro film ed itio n o f th is v o lu m e o f th e jo u r n a l. P h o to co p ie s o f th e s u p p le m e n ta r y m a te r ia l from th is p a p er o n ly or m i crofich e (1 0 5 X 148 m m , 2 0 x re d u c tio n , n e g a tiv e s) c o n ta in in g all o f th e s u p p le m e n ta r y m a te r ia l for th e p ap ers in th is issu e m a y be o b ta in e d from th e J o u rn a ls D e p a r tm e n t , A m e r ic a n C h e m ic a l S o c ie ty , 1 1 5 5 1 6 th S t ., N .W . , W a s h in g to n , D . C . 2 0 0 3 6 . R e m it ch e ck or m o n e y ord er for $ 3 .0 0
for photocopy or $2.00 for microfiche, referring to code number J P C -7 3 -2 5 4 5 .
References and Notes(1) H. A. Benesi and J. H. Hildebrand, J. Amer. Chem. Soc.. 71, 2703
(1949).(2) R. L. Scott, Red. Trav. Chim. Pays-Bas, 75, 787 (1956).(3) R. Foster, “ Organic Charge-Transfer Complexes,” Academie Press,
London, 1965,p 131.(4) R. Foster and I. C. B. Matheson, Spectrochim. Acta, Part A. 23,
2037 (1967).(5) S. D. Ross and M. M. Labes, J. Amer. Chem. Soc.. 79, 76 (1957).(6) G. D. Johnson and R. E. Bowen, J. Amer. Chem. Soc., 87, 1655
(1965).(7) R. Foster and I. Horman, J. Chem. Soc. B. 171 (1966).(8) H. Kuroda, T. Amano, I. Ikemoto, and H. Akamatu, J. Amer Chem
Soc.. 89, 6056 (1967).(9) T. Matsuo and O. Higuchi, Bull. Chem. Soc. Jap.. 41,518 (1968).
(10) P, H. Emslie, R. Foster, C. A. Fyfe, and I. Horman, Tetrahedron. 21, 2843 (1965).
(11) S. Carter, J. N. Murrell, and E. J. Rosch, J. Chem. Soc., 2048 (1965).
(12) S. Carter, J. Chem. Soc. A. 404 (1968).(13) D. A. Deranleau, J. Amer. Chem. Soc.. 91, 4044 (1969).(14) D. R. Rosseinsky and H. Kellawi, J. Chem. Soc. A. 1207 (1969).(15) P. A. D. de Maine and R. D. Seawright, “ Digital Computer Pro
grams for Physical Chemistry,” Vol. I and II, Macmillan, New York, N. Y., 1963.
(16) K. Conrow, G. D. Johnson, and R. E. Bowen, J. Amer. Chem. Soc.. 86, 1025 (1964).
(17) W. E. Wentworth, W. Hirsch, and E. Chen, J. Phys. Chem.. 71, 218 (1967).
(18) H. H. Rosenbrock, Compt. J.. (3), 175 (1960); H. H. Rosenbrock and C. Storey, "Computational Techniques for Chemical Engineers,” Pergamon Press, London, 1966.
(19) See paragraph at end of paper regarding supplementary material.(20) P. G. Farrell and P. N. Ngô, J. Chem. Soc.. Perkin Trans. 2. 974
(1973).(21) D. W. Tanner and T. C, Bruice, J. Phys. Chem.. 70, 3816 (1966).(22) P. R. Hammond, J. Chem. Soc., 479 (1964).(23) W. B. Person, J. Amer. Chem. Soc., 87, 167 (1965).(24) Z. Rappoport, J. Chem. Soc., 4498 (1963).(25) Z. Rappoport and A. Horowitz, J. Chem. Soc., 1348 (1964).(26) R. Foster and P. Hanson, Tetrahedron, 21,255 (1965).(27) N .S. Isaacs, J. Chem. Soc. B, 1053 (1966).(28) R. M. Keefer and L. J. Andrews, J. Amer. Chem. Soc.. 74, 4500
(1952).(29) L. E. Orgel and R. S. Mulliken, J. Amer. Chem. Soc., 79, 4839
(1957) .(30) J. N. Murrell, J. Amer. Chem. Soc., 81, 5037 (1959).(31) E. A. Halevi and M. Nussim, J. Chem. Soc., 879 (1963).(32) P. H. Emslie and R. Foster, Tetrahedron, 21, 2851 1965).(33) P. G. Wilkinson, J. Chem. Phys.. 24, 917 (1956); Can. J. Phvs., 34,
596 (1956).(34) R. Foster and C. A. Fyfe, Trans. Faraday Soc.. 61, 1626 (1965).(35) E.g., E. A. Halevi, M. Nussim, and A. Ron, J. Chem. Soc.. 866
(1963).(36) C. Bernasconi, W. Koch, and H. Zollinger, Helv. Chim. Acta. 46,
1184 (1963).(37) J. L. Jensen and M. P. Gardner, J. Phys. Chem., 77,1557 (1973).(38) R. E. Merrifleld and W. D. Phillips, J. Amer. Chem. Soc.. 80, 2778
(1958) .(39) R. X. Ewall and A. J. Sonnessa, J. Amer. Chem. Soc.. 92, 2845
(1970).
The Journal of Physical Chemistry, Voi. 77, No. 21, 1973

2552 N. K. Sanyal, P. Ahmad, and L. Dixit
A Quantum Mechanical Treatment of Bond and Molecular Polarizabilities of Some Substituted Hydrocarbons with Ring and Chain Structures
Nitish K. Sanyal,* Parvez Ahmad, and L. DixitDepartment of Physics. University o f Gorakhpur. Gorakhpur. 273001. India (Received September 5, 1972; Revised Manuscript Received May 3. 1973)
T h e o n e -d im e n sio n a l se m ie m p ir ic a l 5 -fu n c tio n p o te n tia l m o d e l o f c h e m ic a l b in d in g , p ro p o sed b y L ip p i n c o tt a n d S tu tm a n , h a s b e e n a p p lie d to c a lc u la te th e average m o le c u la r p o la r iz a b ilit ie s o f so m e s u b s t i tu t e d h y d ro ca rb o n s w ith ring a n d ch a in stru c tu re s . T h e re sid u a l a to m ic p o la r iz a b ility degrees o f fr e e d o m o f th ese m o le c u le s va ry fro m 7 to 5 8 . R e su lts h ave b een d isc u sse d in th e v iew o f a v a ila b le e x p e r im e n ta l v a lu es rep orted b y L e F e v re a n d oth ers.
IntroductionL ip p in c o tt a n d S t u t m a n 1 p ro p o sed th e u se o f a o n e
d im e n sio n a l 5 -fu n c tio n p o te n tia l m o d e l to c a lc u la te th e b o n d a n d m o le c u la r p o la r iz a b ilit ie s o f s im p le sy s te m s . T h e m o d e l h a s b e e n su c c essfu lly a p p lie d to s im p le p o ly a to m ic m o le c u le s b y L ip p in c o tt , et al.,2 N a g a r a ja n ,3 an d S a n y a l, et al.* T h e s e stu d ie s in c lu d e su c h m o le c u la r g e o m etrie s for w h ich th e resid u al a to m ic p o la r iz a b ility d egrees o f fre ed o m (n d f, d efin e d in re f 1 ) is re la tiv e ly sm a ll ( 5 - 1 3 ) . B e ra n a n d K e v a n 5 h av e u se d th is m o d e l to c a lc u la te th e m o le c u la r p o la r iz a b ilit ie s o f flu o ro ca rb o n s, su b s t itu te d flu o ro ca rb o n s, eth ers, esters, k eto n e s , an d a l d e h y d e s . R e c e n tly , P u ra n c h a n d ra an d R a m a m u r th y 6
h a v e e x te n d e d th e u se o f th e 5 -fu n c tio n m o d e l for th e c a lc u la tio n o f m o le c u la r p o la r iz a b ilit ie s o f so m e su b st itu te d b e n z e n e s . In th e p resen t c o m m u n ic a tio n , we h av e e x a m
ined th e a p p lic a b ility o f th e 5 -fu n c tio n p o te n tia l m o d el o f c h e m ic a l b in d in g to re la tiv e ly large orga n ic m o le c u le s w ith ring a n d ch a in stru ctu re s . T h e re su lts h av e b een c o m p a re d w ith k n ow n e x p e r im e n ta l v a lu es o f average m o lec u la r p o la r iz a b ilit ie s .
Polarizability CalculationsT h e gen eral e x p ressio n for m o le c u la r p o la r iz a b ility e x
p ressed in C a rte sia n c o o rd in a te s is g iven by
2 y (Mx),2 + (My)r + (p.-)ra ~ E, - E 0
w h ere
(M i) ; =
e is th e e lectro n ic ch a rg e , i^o is th e g r o u n d -sta te 5 -fu n c tio n w ave fu n c tio n , a n d E d en o te s th e en ergy . E q u a tio n 2 is d iffic u lt to e v a lu a te in gen era l, e x c e p t in th e ca se o f d ia to m ic sy s te m s w here th e ac cu ra te w ave fu n c tio n s give rise to c a lc u la te d p o la r iz a b ilit ie s th a t sh ow re a so n a b le a g ree m e n t w ith th e e x p e r im e n ta l o n e s .7 '8 T o c a lc u la te the m o lecu lar p o la r iz a b ilit ie s for th e gen eral c la ss o f p o ly a to m ic m o le c u le s , L ip p in c o t t a n d S t u tm a n 1 u sed th e s e m ie m p ir i
ca l 5 -fu n c tio n m o d e l o f c h e m ic a l b in d in g .9 ’ 10 T h e 5 -fu n c tion m o d e l w a s o b ta in e d b y re p la cin g th e c o u lo m b p o te n t ia ls in th e S ch ro d in g e r e q u a tio n o f a m o le c u la r sy stem w ith 5 -fu n c tio n p o te n tia ls . T h e m o le c u la r w ave fu n c tio n s are o b ta in e d fro m lin ear c o m b in a tio n s o f a to m ic 5 -fu n c tio n w ave fu n c tio n s .
(1)
(2)
O n th e b a sis o f th e v a ria tio n a l tr e a tm e n t11 f irst in tr o d u c e d b y H y lle r a a s 12 a n d H a s s e , 13 th e xx component of th e p o la r iz a b ility is e x p ressed in th e form
a XI = - x f — (n ~ l ) ( x , - x)(x2 - x ) fa o . „
w here x is th e c o o rd in a te o f a n y on e o f n eq u iv a len c e c la ss o f e le ctro n s w h ich fa lls in th e first e q u iv a len c e c la ss , x is th e average c o o rd in a te o f an y on e o f th ese e le ctro n s, A is th e 5 -fu n c tio n stren g th d e te r m in e d 9 fro m th e red u ced e le c tro n e g a tiv ity o f th e a to m , a n d ao is th e ra d iu s o f th e first B o h r o rb it . S in c e th e 5 -fu n c tio n w ave fu n c tio n d oes n o t a llo w a n y in tera ctio n b etw een th e c o o r d in a te s , (x i - x){x2 — x ) = 0 . T h e m o d e l w ith th e m e a n 5 -fu n c tio n stren g th p re d icts x = 0 , so eq 3 b e c o m e s
O C xx (4 )
or e q u iv a le n tly
t t0 (5)
M o le c u la r p o la r iz a b ility co n sists o f p a r a lle l a n d p e r p e n d icu la r c o m p o n e n ts o f th e c o n stitu e n t b o n d p o la r iz a b ilit ies . T h e b o n d p a ra lle l c o m p o n e n t is o b ta in e d fro m the c o n tr ib u tio n s b y th e b o n d in g a n d n o n b o n d in g e lectro n s o f th e v a len c e sh e ll. T h e co n tr ib u tio n o f b o n d in g e le ctro n s is c a lc u la te d b y u sin g a lin e a r c o m b in a tio n o f a to m ic 5 -fu n c - tio n w ave fu n c tio n s rep resen tin g th e n u c le i in v o lv e d in th e b o n d ; i.e., th e e x p e c ta tio n v a lu e o f e lectro n ic p o sitio n sq u a red (x 2 ) a lo n g th e b o n d axis is c a lc u la te d , a n d th is is u se d to e v a lu a te th e p a ra lle l c o m p o n e n t o f b o n d p o la r iz a b ility a Mb fro m th e eq u a tio n
4 n A „ r-~n« iib = --------- - [ * ] (6 )a o
w h ere
x2 = \ R2 + ;An = (A .A ,)1'2 (7 )
n is th e b o n d order, R is th e in tern u c lea r d ista n c e a t th e e q u ilib r iu m co n fig u ra tio n , an d
C Ba = (n1nlN lN j H( A 1A J m ( 8 )
w here n, a n d N t (i = 1 , 2) rep resen t th e p r in c ip a l q u a n tu m n u m b e r a n d th e n u m b e r o f e lectro n s m a k in g th e c o n -
The Journal of Physical Chemistry, Voi. 77. No. 21, 1973

Bond and Molecular Polarizabilities 2553
tr ib u tio n to th e b in d in g , re sp e c tiv e ly . F or a h etero n u clea r b o n d , a p o la r ity co rrection m u s t b e m a d e in th e p a ra lle l c o m p o n e n t o f th e b o n d in g e lectro n s to a c c o u n t for th e charge d e n sity in tro d u c e d b y th e e le c tro n e g a tiv ity d iffe r ence o f th e a to m s . T h e degree o f p o la r ity p d e fin e d by P a u lin g 14 is g iven as
P = 1 - e~ lM( X t - X 2f (9 )
T h e ch a rg e d e n s ity in th e b o n d region th e n sh o u ld be re la ted to th e p er c e n t c o v a le n t ch a ra cte r , a
a = e~'l/4(X 1 - X 2f (10)
w here Xy a n d X 2 are th e e le c tro n eg a tiv ities o f th e a to m s 1
a n d 2 , re sp e c tiv e ly , on th e P a u lin g 14 sc a le . T h e co rrected v a lu e o f p a ra lle l c o m p o n e n t o f b o n d p o la r iz a b ility is giver.
b y
Æ 'ilp — ^ l l b ^ ’ ( 1 1 )
T h e c o n tr ib u tio n o f n o n b o n d e d e le ctro n s is c a lc u la te d b y e v a lu a tin g th e c o n tr ib u tio n o f e lectro n s in th e v a len c e sh ell o f e a c h a to m n o t in v o lv e d in th e b o n d in g . S u c h c a l
c u la tio n s are m a d e on th e b a sis o f th e L e w is -L a n g m u ir 15-16
o c te t ru le m o d ifie d b y L in n e tt17 in te rm s o f a d o u b le q u a rtet o f e le c tro n s . T h is ca n b e e x p re sse d as
«H» = Z / > j (12)j
w here fj is th e fra c tio n o f th e v a len c e e lectro n s in th e jth a to m n ot in v o lv ed in th e b o n d in g a n d aj is th e a to m ic p o la r iz a b ility o f j t h a to m .
T h e p e r p e n d ic u la r c o m p o n e n t o f th e b o n d p o la r iz a b ility w as o b ta in e d b y an e m p iric a l a p p ro a c h m a d e b y L ip p in co tt an d S t u t m a n ,1 w h ich is exp ressed as
3N - 2 n b2 > i ; = ----JJ----1>, (13)
w here N is th e n u m b e r o f a to m s a n d n b is th e n u m b e r o f b o n d s in th e m o le c u le . T a k in g in to a c c o u n t th e p o la r ity correction , th e su m o f th e p erp en d ic u la r c o m p o n e n ts o f th e b o n d p o la r iz a b ility is g iven as
2>x, = ( 3 i V - (1 4 )
or
Z 2 « ! , = » d f E ^ (15 ), X j
w here nàf = ( 3 N - 2 n b), th e re s id u a l a to m ic p o la r iz a b ility d egrees o f fre e d o m o b ta in a b le fro m th e c o n sid era tio n o f s y m m e tr y a n d g e o m e try o f th e m o le c u la r ty p e .
N o w th e a v erag e m o le c u la r p o la r iz a b ility w ith n o b o n d p olarity co rrection s ca n b e w ritten as
1 f v , v , , 3 N - 2 n ^= g + Ç/,«, + — ^ Ç (16 )
a n d w ith b o n d p o la r ity correction
I [Z«"p, + Z /> , + «dfÇ X ; .
X f J( 1 7 )
E q u a tio n 17 w as u sed in th e p resen t c a lc u la tio n o f average m o le c u la r p o la r iz a b ilit ie s .
Results and DiscussionC a lc u la te d v a lu e s o f m o le c u la r p o la r iz a b ilit ie s (in 1 0 “ 25
c m 3) o f fo r m a m id e , a c e ta m id e , a n d th e m o le c u le s o f ring stru ctu re are g iven in T a b le I. T h e b o n d len g th s w ere
ta k e n fro m th e w ork o f S u tto n .18 A b o n d order o f 2 .5 w as u se d in n itr o g e n -o x y g e n ( N O 2) b o n d s ow in g to th e co ord in a te ch a ra cte ristic o f th e b o n d in g . In order to d iscu ss th e c o m p u te d re su lts , it is w orth w h ile to co n sid er th e c lasses o f m o le c u le s ta c k le d p e r ta in in g to s in g le , d o u b le , a n d tr ip le rings a n d c h a in stru ctu re s in d iv id u a lly .
Single-Ring Molecules. In th is c la ss , th e m o le c u le s e x a m in e d are b e n z a m id e , an ilin e , p -to lu id in e , to lu en e , p - x y le n e , m e s ity le n e , d u ren e , h e x a m e th y lb e n z e n e , p y rid in e , an d h a lo g en , n itro , a n d cy n o d eriv a tiv es o f so m e o f the a b o v e m o le c u le s . T h e n df v a lu e for th ese m o le c u le s has b een ta k e n as 18 e x c e p t in th e ca se o f p y r id in e , w here it is15 . H ere a c o n triv ed b u t ju s tif ie d co n sid era tio n h as been m a d e th a t o n ly n in e b o n d s fo rm in g th e ring are ta k e n into a c c o u n t in th e e v a lu a tio n o f n df o f b e n z e n e (n dr = 3N — 2 n b = 36 - 18 = 18) a n d it is a ssu m e d th a t w h a te v e r s u b stitu tio n s are m a d e on th e b e n z e n e rin g , th e n df v a lu e re m a in s c o n sta n t.
I t is e v id e n t fro m th e re su lts t h a t in m o s t o f th e m o le cu les ou r c a lc u la te d v a lu e s are in re a so n a b le a g re e m en t w ith e x p e r im e n ta l v a lu e s .19- 28 T h e c a lc u la te d v a lu e o f p o la r iz a b ility for to lu e n e (1 2 3 .0 9 1 , see A p p e n d ix ) is in a g re e m en t w ith th e e x p e r im e n ta l v a lu es rep orted by L a n - d o lt -B o r n s te in 19 (1 2 2 .6 ) a n d L e F e v r e 20 (1 1 8 .3 3 ) .
Double-Ring Molecules. M o le c u la r p o la r iz a b ilit ie s o f n a p h th a le n e a n d its d er iv a tiv es h av e b een d isc u sse d here. T h e nds v a lu e o f th is c la ss h a s b een d e te r m in e d on th e sa m e co n sid era tio n s as in th e ca se o f b e n z e n e . In n a p h th a le n e , th ere are 18 a to m s a n d 16 b o n d s (fo rm in g th e rin g) a n d h en ce n df = 54 - 32 = 2 2 . T h e c a lc u la te d va lu e (1 6 3 .9 4 ) o f n a p h th a le n e is in go od a g re e m en t w ith th e e x p e r im e n ta l v a lu e (1 6 4 .6 ) o f L e F e v r e .29 In th e ca se o f d e riv a tiv es , e x p e r im e n ta l v a lu es are n o t a v a ila b le for th e co m p a riso n b u t th e c a lc u la te d v a lu e s se e m to b e rea so n a b ly a c cu ra te .
Triple-Ring Molecules. A n th r a c e n e a n d its d er iv a tiv es b e lo n g to th is c la ss w here th ree b e n z en e rings are fu sed to e a c h oth er . T h e n df v a lu e o f a n th ra c e n e h a s b e e n e v a lu a te d fro m th e fo llo w in g co n sid era tio n s , (a ) O n e b en zen e ring h a s 18 a to m ic p o la r iz a b ility d egrees o f fr e e d o m , (b ) T h e secon d ring fu sed in th e b e n z en e ring co n tr ib u te s on ly fou r to th e n df v a lu e o f th e re su ltin g m o le c u le , as in th e ca se o f n a p h th a le n e .
T h e stru ctu re o f an th ra ce n e sh ow s tw o s id e rings a t ta c h e d b y a th ird m id d le ring. T h e co n tr ib u tio n to th e n df va lu e b y th e tw o s id e rin gs w ill be 3 6 (b y “ a ” ) a n d b y th e m id d le rin g on ly 2 (b y “ b ” ) . H e n c e th e to ta l v a lu e o f ndi for a n th ra ce n e w ill be 3 8 . I t is e v id e n t fro m T a b le I th a t th e c a lc u la te d v a lu es o f m o le c u la r p o la r iz a b ilit ie s o f a n th ra c en e a n d its d e r iv a tiv e s are in re a so n a b le a g re e m en t w ith e x p e r im e n ta l v a lu e s .30 -31
M o le c u la r p o la r iz a b ilit ie s o f p h e n a z in e a n d th ia n th re n e h a v e a lso b e e n c a lc u la te d . T h e stru ctu re s o f th e se m o le c u le s are ___________________
T h e s e stru ctu re s m a y be trea te d as c o n sistin g o f tw o b e n zen e rings a tta c h e d b y tw o n itro g en a n d tw o su lfu r a to m s , re sp ec tiv e ly . H e n c e th e n df v a lu e o f th e se m o le c u le s w ill be 3 6 , th e c o n tr ib u tio n o f tw o b e n zen e rings o n ly . In th e ca se o f p h e n a z in e , th e c a lc u la te d v a lu e (2 3 4 .8 7 ) is in e x c e lle n t a g re e m en t w ith th e e x p e r im e n ta l v a lu e ( 2 3 4 .3 ) .28
Molecules of Chain Structure. T a b le II rep resen ts th e m o le c u la r p o la r iz a b ilit ie s (in 1 0 “ 25 c m 3) o f so m e a lk yl
The Journal of Physical Chemistry, Voi. 77, No. 27, 7973

2554 N. K. Sanyal, P. Ahmad, and L. Dixit
TABLE I: Calculated Values of Molecular Polarizabilities o f S o m e Substituted Hydrocarbons (10 25 cm3)
Molecules 2 a p «.,n Z 2a x obsd Ref
Form am ide 47.599 6.918 54.767 36.428 38.8 21Acetam ide 97.807 6.918 63.254 55.993 53.886 21Benzamide 231.758 6.918 140.818 126.495 127.466 21Aniline 208.667 2.772 143.397 118.346 115.3 22p-F luoroaniline 208.622 7.172 135.296 117.030 115.13 23p-C hloroaniline 231.359 14.869 157.068 134.432 134.96 23p-Brom oaniline 241.484 19.602 165.394 142.160 145.466 23p-lodoaniline 266.665 28.442 176.344 157.150p-N itroan iline 237.351 13.327 135.629 128.769 139.0 23Difluoroaniline 208.577 8.400 129.062 115.346D ichloroaniline 254.052 23.794 169.288 149.044 151.83 24Dibromoaniline 274.301 33.260 185.599 164.387D iiodoaniline 324.663 50.940 207.795 194.466p-Toluidine 245.416 2.972 142.089 130.159 134.666 23Dim ethylaniline 284.314 2.972 141.148 142.812 152.333 24Toluene 224.249 0.000 145.023 123.091 122.6 19
118.33 20p-F luoroto luene 224.270 4.200 136.862 121.755 117.0 25p-Chlorotoluene 246.942 11.897 158.333 139.057 137.0 25p-B rom otoluene 257.067 16.630 166.509 146.735 148.0 25p-lodoto luene 276.262 25.470 177.256' 159.663 171.0 25p-Cyanotoluene 261.317 2.970 147.937 137.402 139.0 25p-N itro to luene 260.507 10.355 136.937 135.926 141.0 25p-Xylene 258.269 0.000 143.478 133.916 137.0 26Mesitylene 300.838 0.000 142.359 147.732 153.76 27Nitromesitylene 324.334 10.355 136.596 157.095DureneHexamethyl-
338.478 0.000 141.512 159.999 174.0 27
benzene 409.803 0.000 140.314 184.700 208.1 27Pyridine 169.444 2.972 121.115 97.843 91.8 28Naphthalene1,5-D ichloro-
307.307 0.000 184.520 163.942 164.6 29
naphthalene 1,5-D initro-
333.211 23.794 209.332 188.779
naphthalene 363.506 20.710 175.162 186.459/3-Naphthol 337.001 3.946 178.476 173.141Anthracene9-Chloro-
435.953 0.000 322.486 252.800 253.6 30
anthracene 470.212 11.897 339.188 273.766 273.466 309,10-D ich loro-
anthracene 496.775 23.794 354.802 291.7909-Brom o-
anthracene 495.033 16.630 349.772 287.144 283.2 309,10-D ibrom o-
anthracene 536.179 33.260 375.706 315.0489-N itro-
anthracene 485.040 10.355 308.045 267.8139,10-D in itro-
anthracene9-Cyano-
509.772 20.710 298.030 276.171
anthracene 474.245 2.972 325.126 267.447 283.2 31Anthraquinone 442.458 7.893 312.103 254.152Anthraldéhyde 487.267 3.946 316.574 269.262Phenazine 396.690 5.944 301.992 234.870 234.3 28Thianthrene 465.768 24.266 343.011 277.682
b r o m id e s , c a lc u la te d w ith th e a id o f th e 5 -fu n c tio n m o d e l, a n d th o se rep o rted b y L e F e v r e , et al.32 T h e nd[ v a lu e s o f th is series h a v e b e e n d e te r m in e d b y th e sa m e re la tio n (n df = 3 N - 2nb), w h ich va ries fro m 7 to 5 8 . C a lc u la te d v a lu es o f s u b s t itu te d n- a lk a n e s sh ow a c o n tin u o u s in crea sin g d e v ia tio n fro m th e L e F e v re v a lu e s . T h is d e v ia tio n in creases reg u la rly b y a p p r o x im a te ly 2 u n its for th e a d d itio n o f e a ch C H 2 g rou p . T h e ca u ses o f th is d isc r e p a n c y are n o t c lea r . I t m a y b e e ith er d u e to th e w ea k n ess o f th is m o d e l to ta k e
in to a c c o u n t th e in creased in tera c tio n w ith le n g th e n in g o f th e h y d ro c a rb o n c h a in or in a ccu ra cies in e x p e r im e n ta l v a lu e s . F u rth er e x p e r im e n ta l w ork is n e ed e d to se ttle th is p o in t .
T a b le III sh o w s th e b o n d p a r a lle l c o m p o n e n t o f p o la r iz a b ilitie s w ith b o n d p o la r ity co rrec tio n s . R e su lts sh o w t h a t th is c o m p o n e n t m a y b e tra n sferred fro m on e m o le c u la r sy s te m to a n o th er h a v in g s im ila r c h e m ic a l b o n d s . In n i - tro a n th ra c e n e , th e v a lu e o f b o n d p a ra lle l c o m p o n e n t for
The Journal of Physical Chemistry, Vol. 77, No. 21, 1973

Bond and Molecular Polarizabilities 2555
TABLE II: Molecular Polarizabilities of Bromine-Substituted n-Alkanes ( 1 0 25 cm3)
«M,Molecules p 2 a n 2 2a obsda
CH3Br 70.128 16.630 74.719 53.826 55.3C2H5Br 108.349 16.630 95.532 73.503 72.8C3H7Br 145.427 16.630 117 .262 93.106 90.7C4H9Br 183.076 16.630 139.338 113.015 108.6C sH uB r 220.720 16.630 161.582 132.978 126.5C6H13Br 258.375 16.630 183.919 152.974 144.4C7H15Br 296.025 16.630 206.314 172.989 162.3C sH ^B r 333.674 16.630 228.747 193.014 180.2CgH-igBr 371.324 16.630 251.206 213.053 198.1C10H21 Br 408.973 16.630 273.684 263.096 216.0Cn H23Br 446.623 16.630 296.177 253.143Ci2H25Br 484.272 16.630 318.681 273.161 251.8C i6H33Br 634.870 16.630 408.766 353.422 323.4Ci8H37Br 710.169 16.630 453.834 393.544 359.2
° Reference 32.
th e C - N b o n d is 1 9 .5 5 a n d in c y a n o a n th r a c e n e th e va lu e for tn e C = N b o n d is 2 1 .8 9 , w h ic h is in ac co rd a n ce w ith th e o b serv a tio n th a t 7r a n d <j e le ctro n s d o n o t c o n tr ib u te e q u a lly to th e b o n d p a r a lle l c o m p o n e n t o f p o la r iz a b ility an d th a t th e c o n tr ib u tio n o f e le ctro n s in th e 7r o rb ita l is less th a n th o se o f th e e le c tro n s in th e a o r b ita l. In d iv id u a l c o n trib u tio n o f th e 7r an d a o r b ita ls to th e p o la r iz a b ility ca n p o ssib ly be e s tim a te d fro m th e c a lc u la tio n s b a sed on m o le cu la r o rb ita l th e o ry . F u rth er in v estig a tio n s ca n on ly provide th is in fo r m a tio n .
T h e e x c e lle n t a g re e m e n t o b ta in e d b e tw ee n th e c a lc u la t ed a n d e x p e r im e n ta l v a lu e s in d ic a te s th e w id e a p p lic a b ili ty o f th e 5 -fu n c tio n m o d e l o f c h e m ic a l b in d in g to c o m p li ca te d m o le c u la r sy s te m s su ch as rin g stru ctu res an d c o m p le x m e ta l c a rb o n y l , 33’34 e tc .
Acknowledgment. T h e a u th o rs are th a n k fu l to P rofessor
D . S h a r m a for h is c o n tin u e d in terest in th e p ro je ct . F in a n c ia l a ss ista n c e rece iv ed b y tw o o f u s (P . A . an d L . D .) fro m th e U n iv e rs ity G r a n ts C o m m is s io n a n d C o u n c il o f S c ie n tific a n d In d u stria l R e sea rc h , N e w D e lh i, in th e form o f research fe llo w sh ip s is g ra te fu lly a c k n o w le d g e d .
AppendixS a m p le c a lc u la tio n s o f b o n d a n d m o le c u la r p o la r iz a b ili
tie s for to lu en e are g iv en here.
C - H = 1 .11 A, ( C - C ) r = 1 .3 9 A, C C = 1 .5 2 Â , A h = 1.0 0 au , A c = 0 .8 4 6 a u , aH = 5 .9 2 X IO“ 25 cm3, ac = 9 .7 8 X 1 0 25
cm3, X H = 2 . 1 , X c = 2 .5 , a n d « df = 18.F or th e C - H b o n d
x2 = 0.337257 X 10⁻¹⁶ cm2( 4 ) (1 ) (0 .9 1 9 7 8 ) (0 .1 1 3 7 4 2 ) „
« lb -----------(p529-------------------------------X 10 c m =
7.9106 X IQ-25 cm3
a .ip = a , ,bff = (7 .9 1 0 6 ) (0 .9 6 0 7 8 9 ) ( 10 2S) =
7 .6 0 0 4 1 7 X 1 0 ~ 25 c m 3For 8 C - H b o n d s
a p = 6 0 .8 0 3 2 X 10 - 2 5 c m 3
F or th e ( C - C ) r b on d
i 2 = 0 .4 9 5 2 1 8 X IO ' 16 c m 2
( 4 ) ( 1 ) ( 0 .8 4 6 ) ( 0 .2 4 5 2 4 1 )«Mb : 0 .5 2 9
X 1 0 - 24 c m 3 =
1 5 .6 8 7 9 X IO - 23 c m 3
« u p = a llb(r = (1 5 .6 8 7 9 )( 1 ) = 1 5 .6 8 7 9 X 10 - 2 5 c m 3
TABLE III: Bond Parallel Component of Polarizabilities (10 25 cm3)
Molecules
OIO
C— C C— H C— N C =N C = 0 N — H N—O
Formamlde 7.208 13.362 16.876 5.076Acetam ide 38.218 7.113 14.036 14.625 4.794Benzamlde 15.031 20.048 7.601 12.123 16.716 4.794Aniline 16.134 7.601 15.724 4.863p-N itroan iline 15.272 7.601 15.307 4.863 11.662p-Tcluid ine 15.948 20.905 7.601 18.045 4.863Toluene 15.688 22.254 7.601p-Cyanotoluene 15.688 22.254 7.601 22.414p-N Itrotoluene 15.688 22.254 7.601 20.081 9.511p-Xylene 16.134 20.964 7.113Mesitylene 16.134 23.423 7.113Nitromesitylene 15.275 21.500 7.113 19.556 9.823Pyridine 15.866 6.902 13.245N apitha lene 15.882 6.6491,5-D initro-
naphthalene 16.589 6.649 13.636 6.182Anthracene 16.092 6.6499-N itroanthracene 16.603 6.649 19.556 9.5119,10-D in itro-
anthracene 16.006 6.649 18.045 10.4719-Cyanoanthracene 16.304 17.526 6.649 21.889Anthraquinone 16.561 6.649 12.454Anthraldéhyde 16.808 19.009 6.649 15.190Phenazine 16.128 5.226 13.460
a Represents the carbon-carbon bond of ring structure.
The Journal of Physical Chemistry, Voi. 77, No. 21, 1973

2556 P. Gallezot, Y. Ben Taarit, and B, Imellk
F or 9 ( C -C ) r b o n d s
a, p = 1 4 1 .1 9 1 1 x 1 0 _ 2 5 c m 3
F or th e C - C b o n d
x 2 = 0 .5 8 9 8 1 8 X 10 16 c m 2
a ,ib( 4 ) ( 1 ) ( 0 .8 4 6 ) ( 0 .3 4 7 8 8 5 )
0 .5 2 91 0 ~ 24 c m 3 =
2 2 .2 5 4 1 X 1 0 ' 25 c m 3
a p = a :ba = ( 2 2 .2 5 4 1 )(1 ) = 2 2 .2 5 4 1 X 1 0 ~ 25 c m 3
T o ta l b o n d p a ra lle l p o la r iz a b ility o f to lu en e is
2 a , IP = 2 2 4 .2 4 8 5 X 10 - 2 5 c m 3
S a Mn = 0
(T h e r e are no n o n b o n d in g e lectro n s in C - H a n d C - C b o n d s .)
= ^ ^ 636-7326> x 1 0 " 25 c m 3 = 1 4 5 .0 2 3 2 x K) - 23 c m 37 9 .0 3
u m g ( 2 a, + 2 a + 2 2 a j_ ) = 1 2 3 .0 9 1 X H H ^ c m 3
References and Notes(1) E. R. Lippincott and J. M. Stutman, J. Phys. Chem., 68, 2926
(1964).(2) E. R. Lippincott, G. Nagarajan, and J. M. Stutman, J. Phys. Chem..
70, 78 (1966).(3) G. Nagarajan, Z. Naturforsch. A, 21,864 (1966).(4) N. K. Sanyal, L. Dixit, and A. N. Pandey, Indian J. Pure Appl. Phys.,
10, 329 (1972).(5) J. A. Beran and L. Kevan, J. Phys. Chem., 73, 3860 (1969).(6) B. Purnachandra Rao and V. Ramamurthy, Curr. Sci., 41, 15
(1972).(7) R. M. Stevens, R. M. Pitzer, and W. N. Lipscomb, J. Chem. Phys.,
38, 550 (1963); R. M. Stevens and W. N. Lipscomb, ibid., 40, 2238 (1964); 41, 184, 3710 (1964).
(8) H. J. Kolker and M. Karplus, J. Chem. Phys., 39, 2011 (1963).(9) E. R. Lippincott and M. O. Dayhoff, Spectrochim. Acta, 16, 807
(1960).(10) A. A. Frost, J. Chem. Phys., 22, 1613 (1954): 23, 985 (1955); 25,
1150, 1154 (1956).(11) J. W. Hirschfelder, C. F. Curtiss, and R. B. Bird, “ Molecular Theory
of Gasses and Liquids," Wiley, New York, N. Y. 1967, pp 942-946.(12) E. A. Hylleraas, Z. Phys.. 65, 209 (1930).(13) H. R. Hasse, Proc. Cambridge Phil Soc., 26. 542 (1930); 27, 66
(1931).(14) L. Pauling, “ The Nature of the Chemical Bono,” Cornell University
Press, Ithaca, N. Y., 1960.(15) G. N. Lewis, J. Amer. Chem. Soc., 38, 762 (1916).(16) I. Langmuir, J. Amer. Chem. Soc., 38, 2221 (1916).(17) J. W. Linnett, J. Amer. Chem. Soc.. 83, 2643 (1961).(18) L. E. Sutton, Chem. Soc. Spec. Publ.. No. 11 (1958); No. 18
(1965).(19) H. H. Landolt and R. Bornstein, “ Zahlenwerte and Functionen," 6
Auflage, 3 Teil, Springer-Verlag, Berlin, 1950, pp 509-517.(20) R. J. W. LeFevre and L. Radom, J. Chem. Soc. 3, 1295 (1967).(21) M. J, Aroney, R. J. W. LeFevre, and A. N. Singh, J. Chem. Soc.,
3179 (1965).(22) M. J. Aroney, R. J. W. LeFevre, L. Radom, and G. L. D. Ritchie, J.
Chem. Soc. B, 507 (1968).(23) M. J, Aroney, K. E. Calderbank, R. J. W. LeFevre, and R. K. Pi-
erens, J. Chem. Soc. B, 561 (1968).(24) R. J. W. LeFevre, L. Radom, and G. L. D. Ritchie, J. Chem. Soc.
B, 913 (1969).(25) M. J. Aroney, K. E. Calderbank, R. J. W. LeFevre, and R. K. Pi-
erens, J. Chem. Soc. B, 159 (1969).(26) K. E. Calderbank, R. J. W. LeFevre, and R. K. Pierens, J. Chem.
Soc. B, 968 (1969).(27) M. J. Aroney, H. H. Huang, R. J. W. LeFevre, and G. L. D. Ritchie,
J. Chem. Soc. B. 416 (1966).(28) J. Hurley and R. J. W. LeFevre, J. Chem. Soc. B. 824 (1967).(29) C. G. LeFevre and R. J. W. LeFevre, J. Chem. Soc., 1641 (1955).(30) R. J. W. LeFevre, L. Radom, and G. L. D. Ritchie, J. Chem. Soc.
B, 775 (1968).(31) P. H. Gore, J. A. Hoskins, R. J. W. LeFevre, L. Radom, and G. L.
D. Ritchie, J. Chem. Soc. B, 227 (1969).(32) C. G. LeFevre, R. J. W. LeFevre, and A. J. Williams, J. Chem.
Soc., 4188 (1965).(33) G. Nagarajan and M. W. Undauer, Phys. Rev. A, 5, 557 (1972).(34) N. K. Sanyal, P. Ahmad, and L. Dixit, paper presented at the First
International Conference on Quantum Chem stry held at Menton, France, July 1973.
Location of Nickel Ions in Y Zeolites. II. Influence of Various Reagents Adsorption on Nickel Positions
P. Gallezot. Y. Ben Taarit, and B. Im elik*
institut de Recherches sur la Catalyse■ CNRS, 69,100 Villeurbanne. France (Received March 22, 1973) Publication costs assisted by the Centre National de la Recherche Scientifique
T h e c ry sta l s tru ctu res o f N i Y zeo lite c o n ta in in g v a rio u s so rb ed p h a se s (NH3, N O , C5HaN, CioH8, C4H8, C2H4, C O ) w ere d e te r m in e d in order to lo c a lize th e N i 2 + io n s. N e ith e r CioHg, C4H8, an d C 2H 4 n or C O ch a n ges th e d istr ib u tio n o f N i 2+ ion s p re v io u sly d e te r m in e d for th e d e h y d ra te d zeo lite . NH3 ca n r e a d ily
e x tr a c t th e ca tio n s fro m th e S i s ite s . O n th e oth er h a n d , N O a n d C5H5N gen erate o n ly a slow m ig ra tio n p ro cess fa v o re d b y th e p resen ce o f re sid u a l w ater m o le c u le s . T h e stru ctu re o f N i - N O c o m p le x is d is cu ssed a n d a m e c h a n is m for th e c a tio n m o tio n is p ro p o sed .
Introduction
In order to u n d e r sta n d th e b e h a v io r a n d c a ta ly tic a c tiv ity o f z eo lites b e tte r , th e p o sitio n s o f th e ca tio n s in th e fram ew ork h ave to b e k n ow n . H o w e v e r , it is n o t su ffic ien t to d e te r m in e th ese p o sitio n s after a g iven p re tr e a tm e n t sin ce th e ca tio n s m a y m ig ra te u n d er th e in flu en c e o f a d
so rb a tes or re a g en ts , as w as sh ow n in a p re v io u s in v e s t ig a tion for c o p p e r -e x c h a n g e d z e o lite s .1 A fte r d e h y d ra tio n , C u 2+ ion s are m a in ly fo u n d in S i- s ites b u t th e y m ig ra te very rea d ily to w a rd th e su p erca g es if large m o le c u le s su ch as p y r id in e , n a p h th a le n e , or b u te n e are a d m it te d in to th e so lid . In p a rt I o f th is w ork ,2 n ick e l ion p o s it io n s w ere d e te rm in e d in Y zeo lite s as a fu n c tio n o f b o th e x c h a n g e level
The Journal of Physical Chemistry, Voi. 77, No. 21, 7973

Location of Nickel Ions In Y Zeolites 2557
an d d eh y d ra tio n te m p e ra tu re . I t w as sh ow n th a t n ick el ion s stro n g ly prefer S i s ite s , w here th e y are stro n g ly co or
d in a ted a n d p r o b a b ly d iff ic u lt to reach b y th e rea gen ts. A s for c o p p e r -e x c h a n g e d zeo lite s , X -r a y a n a ly sis w as used in order to te st th e p o ssib ilitie s o f n ick e l ion m ig ra tio n . T h e in flu en c e o f s m a ll m o le c u le s su ch as NH3, C O , an d N O w h ich ca n en ter th e so d a lite ca g e s , as w ell as larger ones lik e p y rid in e a n d v a rio u s h y d ro c a rb o n s , w as e x a m ined .
Experimental SectionT h e p re p a ra tio n o f th e d e h y d ra te d N i i 4N a 23H 5Y ( s a m
ple A o f p a rt I) w as d esc rib e d in a p rev io u s p a p e r .2 G a ses w ere in tro d u ce d th ro u g h a b r e a k -se a l in to th e g rease -free cell c o n ta in in g th e p re trea te d s a m p le . S p e c ia l care h a s b een ta k e n to dry th e ga ses b efo re a d so rp tio n ; a m m o n ia va p or, ca rb o n m o n o x id e , n itric o x id e , e th y le n e , an d 1 -b u tene w ere tr a p p e d a t liq u id n itro g en te m p e ra tu re on a c tiv a ted m o le c u la r s ieves a n d w a rm e d u p u n til a 1 0 0 -T o rr pressure w as e s ta b lish e d in th e gas lin e . P y r id in e a n d n a p h th a le n e va p ors w ere p re a d so r b e d on a c tiv a te d m o le c u lar sieves b efore in tro d u c tio n in th e a d so rp tio n ce ll. T h e gases w ere k e p t in c o n ta c t w ith th e zeo lite for 12 hr or m ore a t ro o m te m p e ra tu re , th e n ex cess ga s w a s e v a c u a te d for 6 hr a t th e sa m e te m p e ra tu re a n d a resid u a l pressure o f I I P 5 T o r r w as a c h ie v e d . N o a t te m p t h a s b e e n m a d e to d eterm in e th e a m o u n t o f d eso rb e d g a s ; h ow ever, th is tr e a tm e n t re m o v e s m o s t o f th e p h y siso rb e d m o le c u le s b u t lea ves th e m o le c u le s c o m p le x e d w ith th e N i 2+ io n s. T h e trea ted sa m p le s w ere tra n sfered in to c o n n e c te d g la ss c a p illaries a n d se a led o f f fro m th e v a c u u m sy ste m for X -r a y in v estig a tio n . T h e tr e a tm e n t c o n d itio n s a p p lie d to th e in v e stig a ted sa m p le s are lis te d in T a b le I.
X -R a y p ow d er d iffra c tio n p a tte r n s w ere ta k e n w ith f i l tered C u K a ra d ia tio n , u s in g a h ig h -re so lu tio n D e b y e - S ch errer c a m e ra . F ilm s w ere m e a su red w ith a lin e a r c o m p arato r a n d m e a su r e m e n ts w ere co rrected for ra d iu s c a m era a n d f i lm sh rin k a g e errors. C u b ic u n it cell c o n sta n ts w ere o b ta in e d b y a v era g in g th e v a lu e s d eriv ed fro m ten w ell d efin e d d iffra c tio n lin es in th e region 3 0 -4 0 ° d. A c q u isitio n o f line in ten sities a n d th e le a st-sq u a r e s re fin e m e n t p ro g ra m w ere p re v io u sly d e s c r ib e d .1 E a c h o b se r v a tio n w as w eig h te d a t u n ity . T h e sca le fa c to r , th e c o o rd i
n a tes , an d te m p e ra tu re fa cto rs o f fra m ew o rk a to m s h ave b een re fin ed to g e th e r w ith th e co o rd in a te s a n d o c c u p a n c y factors o f e x tra -fr a m e w o rk a to m s . T h e te m p e ra tu re fa c tors o f th e la tte r w ere k e p t a t th e sa m e v a lu e for a ll th e stru ctu res in v e stig a te d ; h ow ever, m a n y tr ia ls h av e p ro ved th a t w h en re fin ed th e se p a ra m e te rs d o n o t d iverge to a b n orm a l lew or h ig h v a lu e s , an d m e a n w h ile it w as a sc er
ta in e d th a t th e o c c u p a n c y fa c to r for m o s t o f th e ca tio n s ites d oes n o t ch a n ge a p p re c ia b ly .
ResultsT h e cry sta l s tru ctu res o f A 3 A M , A 3 N 0 1 , A 3 N 0 2 ,
A 6P Y , A 3 P Y , a n d A 2 P Y w ere d e te r m in e d . N o a tte m p t h as b een m a d e to lo c a te a d so rb e d m o le c u le s an d n ickel ion s in th e su p erca g es .
F or sa m p le s A 6 P Y an d A 3 P Y , sc a tte r in g m a tte r w as o n ly fo u n d on S i , S r , an d S n s ite s . T h e first tw o sites w ere a ssig n ed to N i 2+ ion s a n d th e la s t on e to N a + io n s.
A n a d d itio n a l e lectro n d e n sity p e a k a t x = y = z = 0 .1 6 w as fo u n d in th e so d a lite ca ges o f sa m p le s A 2 P Y an d A 3 A M . It w as a ttr ib u te d to H2O a n d NH3 m o le c u le s , re sp e c tiv e ly .
T h e a ss ig n m e n t o f e x tr a -fr a m e w o rk sp ec ies in A 3 N 0 1 a n d A 3 N 0 2 w as d iff ic u lt b e c a u se a d ifferen ce F ou rier m a p sh ow ed d o u b le S n - p ea k s a t x = y = z = 0 .1 4 a n d 0 .1 6 5 . A s s u m in g th a t th e d o u b le p ea k s are d u e to ox y g en a to m s, th e re fin e m en t re su lte d in a s ig n ific a n t R in d e x decrease fro m 0 .0 7 5 an d 0 .0 8 to 0 .0 6 7 a n d 0 .0 6 3 for sa m p le s A 3 N 0 1 an d A 3 N 0 2 , re sp ec tiv e ly . M o re o v e r , th ese tw o d iffra ctin g sp ec ies are a b o u t 1 .2 A a p a rt w h ich fits th e n itr o g e n -o x y gen d ista n c e occu rrin g in N O re a so n a b ly w ell a n d we th erefore su gg est th a t th ese a to m s b e lo n g to n itric ox ide m o le cu le s .
C r y sta llo g r a p h ic p a r a m e te rs an d listin g s o f stru ctu re fa ctors w ill b e g iven in th e m ic ro film e d it io n o f th e jo u r n a l .3 C u b ic u n it ce ll c o n sta n ts , fin a l R in d e x e s , a n d p o p u la tio n s o f e x tra -fra m e w o rk s ites are given in T a b le II. T a b le III sh o w s th e in te r a to m ic d ista n c e s .
T h e cry sta l s tru ctu res o f A 6 A M , A 6 N O , A 6 C O , A 2 C O , A 6E T , A 2 E T , A 6B U , A 2 B U , A 6N A , a n d A 2 N A w ere n ot d e te r m in e d . T h e p o p u la tio n o f th e h e x a g o n a l p rism s (h p ) w as e s tim a te d fro m th e c h a rt g iv en in p a rt I2 w h ich re la tes th e p o p u la tio n N o f h p to th e c u b ic u n it -c e ll c o n s ta n t a. T h e u se o f th is ch a rt for sa m p le s c o n ta c te d w ith NH3 ( A 6A M ) a n d N O ( A 6 N O ) is q u ite v a lid sin ce th e v a lu es o f N us. a for A 3 A M , A 3 N 0 1 , a n d A 3 N 0 2 are w ell on th e A lin e o f th e c h a rt . (T h e te s t is a lso q u ite s a t is fa c to ry for A 6 P Y , A 3 P Y , a n d A 2 P Y .)
DiscussionF re q u e n t u n referen ced m e n tio n s o f th e re su lts rep orted
in p a r t I o f th is w ork 2 w ill b e m a d e in th e p re sen t d isc u s sion .
Ammonia Adsorption (Sample A3AM). A d so r p tio n o f a m m o n ia on a sa m p le p retrea te d a t 3 0 0 ° in d u c e d a n early to ta l re m o v a l o f th e n ick e l ion s o c c u p y in g th e h p (s ite S i ) . M o s t o f th e u n lo c a te d N i 2 + are p r o b a b ly c o m p le x e d w ith
TABLE I: Treatment Conditions of the Samples
Samples
Dehydrationtemp,“
°C
Nature of adsorbed
gas
Time of contact,6
hr Samples
Dehydrationtemp
°C
Nature of adsorbed
gas
. Time of contact,
hr
A 6AV1 600 n h 3 24 A 3P Y C 300 P yrid ine 72A 3A M C 300 n h 3 24 A 2P Y C 200 P yrid ine 72A6N O 600 NO 12 A6ET 600 E thylene 15A 3 N 0 1 C 300 NO 12 A2ET 200 E thylene 15A 3 N 0 2 C 300 NO 96 A6BU 600 1-B u te ne 15A6CO 600 CO 15 A2BU 200 1-B u tene 15
A2CO 200 CO 15 A 6N A 600 N aph tha lene 15A 6P Y C 600 P yrid ine 72 A 2N A 200 N aph tha le ne 15
“ Before gas adsorption. 6 At room temperature. c Structures entirely determined.
The Journal of Physical Chemistry, Vol. 77, No. 21, 1973
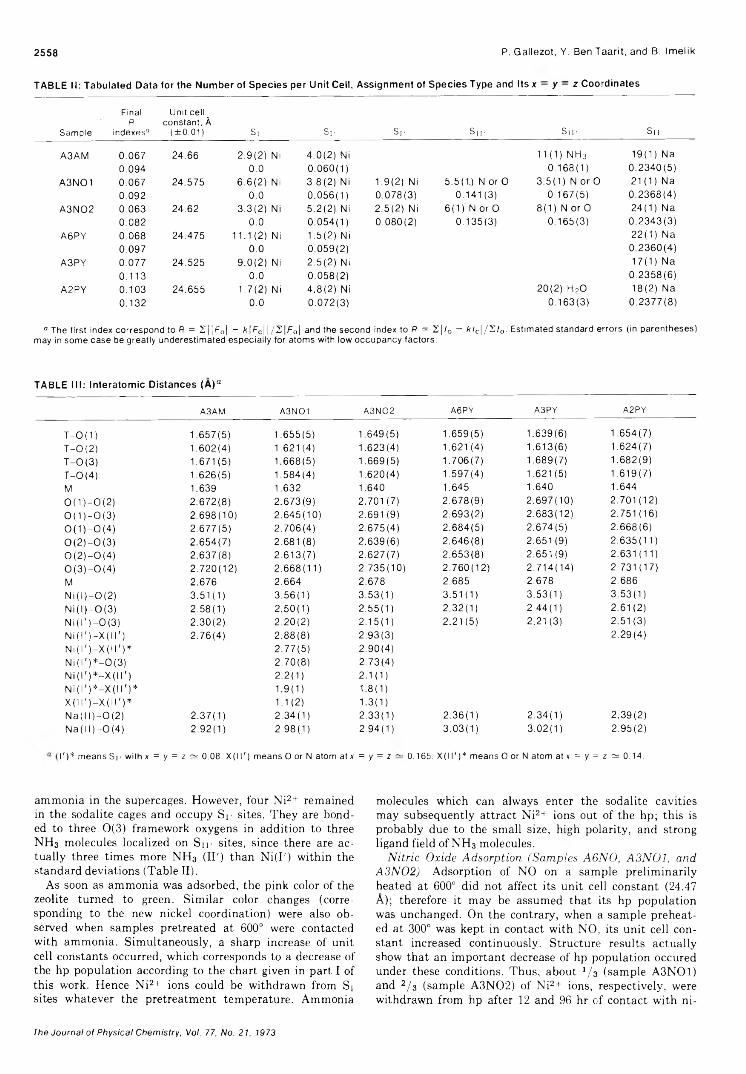
2558 P. Gallezot, Y. Ben Taarit, and B. Imelik
TABLE II: Tabulated Data for the Number of Species per Unit Cell, Assignm ent of Species Type and Its x - y - z Coordinates
Sample
FinalR
indexes“
Unit cell _ constant, Á
(±0.01) Si S r Si- S i i ' S i i - Su
A3AM 0.067 24.66 2 .9 (2 ) Ni 4 .0 (2 ) Ni 11 (1 ) n h 3 19 (1 ) Na0.094 0.0 0 .060(1 ) 0 .1 68 (1 ) 0 .2 3 4 0 (5 )
A 3N 01 0.067 24.575 6 .6 (2 ) Ni 3 .8 (2 ) Ni 1 .9 (2 ) Ni 5.5(1.) N or O 3.5(1.) N o rO 21 (1) Na0.092 0.0 0 .0 56 (1 ) 0 .0 7 8 (3 ) 0.141 (3) 0 .1 67 (5 ) 0 .2 3 6 8 (4 )
A 3 N 0 2 0.063 24.62 3 .3 (2 ) Ni 5 .2 (2 ) Ni 2 .5 (2 ) Ni 6 (1 ) N o rO 8 (1 ) N or O 24 (1 ) N a0.082 0.0 0 .0 54 (1 ) 0 .0 8 0 (2 ) 0 .1 35 (3 ) 0 .1 65 (3 ) 0 .2 3 4 3 (3 )
A6PY 0.068 24.475 11.1 (2) Ni 1 .5 (2 ) Ni 2 2 (1 ) Na0.097 0.0 0 .0 59 (2 ) 0 .2 3 6 0 (4 )
A3PY 0.077 24.525 9 .0 (2 ) Ni 2 .5 (2 ) Ni 17 (1 ) Na0.113 0.0 0 .0 58 (2 ) 0 .2 3 5 8 (6 )
A2PY 0.103 24.655 1 .7 (2 ) Ni 4 .8 (2 ) Ni 20 (2 ) H 20 18 (2 ) Na
0.132 0.0 0 .0 72 (3 ) 0 .1 63 (3 ) 0 .2 3 7 7 (8 )
a The first index correspond to R = Z | |F 0| - k \F c\ | / 2 | F 0| and the second index to f l = 2 | / 0 - k /c | / 2 / 0. Estimated standard errors (in parentheses) may in some case be greatly underestimated especially for atoms with low occupancy factors.
TABLE III: In tera tom ic D istances (A )°
A3AM A3N01 A3N02 A6PY A3PY A2PY
T - 0 (1) 1 .657(5 ) 1 .655(5 ) 1 .649(5 ) 1 .659(5 ) 1 .639(6 ) 1 .6 54 (7 )
T - 0 (2 ) 1 .602(4 ) 1 .621(4 ) 1 .623(4 ) 1 .621(4 ) 1 .613(6 ) 1 .624(7 )
T - 0 (3 ) 1 .671(5 ) 1 .6 68 (5 ) 1 .669(5 ) 1 .706(7 ) 1 .689(7 ) 1 .6 82 (9 )
T - 0 (4) 1 .626(5 ) 1 .584(4 ) 1 .620(4 ) 1 .597(4 ) 1.621(5) 1 .619(7 )
M 1.639 1.632 1.640 1.645 1.640 1.644
0 ( 1 ) —O (2) 2 .6 72 (8 ) 2 .6 73 (9 ) 2 .7 01 (7 ) 2 .6 78 (9 ) 2 .697 (10 ) 2 .7 0 1 (1 2 )
0 ( 1 ) —O (3) 2 .6 98 (10 ) 2 .6 45 (10 ) 2.691 (9) 2 .6 93 (2 ) 2 .683 (12 ) 2 .7 5 1 (1 6 )
0 ( 1 ) —O (4) 2 .6 77 (5 ) 2 .7 0 6 (4 ) 2 .6 75 (4 ) 2 .6 84 (5 ) 2 .674(5 ) 2 .6 6 8 (6 )
0 ( 2 ) - 0 ( 3 ) 2 .6 54 (7 ) 2.681 (8) 2 .6 39 (6 ) 2 .6 46 (8 ) 2 .6 51 (9 ) 2 .6 3 5 (1 1 )0 ( 2 ) - 0 ( 4 ) 2 .637(8 ) 2 .6 1 3 (7 ) 2 .6 27 (7 ) 2 .6 5 3 (8 ) 2 .6 51 (9 ) 2 .6 3 1 (1 1 )
0 ( 3 ) - 0 ( 4 ) 2 .7 20(12 ) 2 .6 6 8 (1 1 ) 2 .7 35 (10 ) 2 .7 60 (12 ) 2 .7 14(14 ) 2 .7 3 1 (1 7 )
M 2.676 2.664 2.678 2.685 2.678 2.686
Ni (1)—O (2) 3 .5 1 (1 ) 3 .5 6 (1 ) 3 .5 3 (1 ) 3 .5 1 (1 ) 3 .5 3 (1 ) 3 .5 3 (1 )
Ni (1) —O (3) 2 .5 8 (1 ) 2 .5 0 (1 ) 2 .5 5 (1 ) 2 .3 2 (1 ) 2 .4 4 (1 ) 2 .6 1 (2 )
N i (1') —O (3) 2 .3 0 (2 ) 2 .2 0 (2 ) 2 .1 5 (1 ) 2 .2 1 (5 ) 2 .2 1 (3 ) 2 .5 1 (3 )
Ni (1 ') —X ( I I ') 2 .76 (4 ) 2 .8 8 (8 ) 2 .9 3 (3 ) 2 .2 9 (4 )Ni (1' ) -X (11 ' ) * 2 .7 7 (5 ) 2 .9 0 (4 )N i (1') * —O (3) 2 .7 0 (8 ) 2 .7 3 (4 )N i ( l ' ) * - X ( l l ' ) 2 .2 (1 ) 2 .1 (1 )N i ( l ' ) * - X ( l 1 ')* 1 .9 (1 ) 1 .8 (1 )X (l l ' ) - X ( l l ' ) * 1 .1 (2 ) 1 .3 (1 )N a (11)—O (2) 2 .37 (1 ) 2 .3 4 (1 ) 2 .3 3 (1 ) 2 .3 6 (1 ) 2 .3 4 (1 ) 2 .3 9 (2 )N a ( l l ) - 0 ( 4 ) 2 .9 2 (1 ) 2 .9 8 (1 ) 2 .9 4 (1 ) 3 .0 3 (1 ) 3 .0 2 (1 ) 2 .9 5 (2 )
1')* means Si- with x = y = z ce 0.08. X ( ll '; ) means O or N atom at x = y = z ~ 0.165. X ( 11')* means O or N atom at < = y = Z ce 0.14.
a m m o n ia in th e su p erca g e s . H o w e v e r , fou r N i 2+ re m a in e d in th e so d a lite cages an d o c c u p y S i- s ite s . T h e y are b o n d ed to th ree 0 ( 3 ) fra m ew o rk o x y g en s in a d d itio n to three N H 3 m o le c u le s lo c a liz e d on Sn> site s , sin ce th ere are a c tu a lly three tim e s m o re N H 3 ( IT ) th a n N i ( I ') w ith in th e sta n d a rd d ev ia tio n s (T a b le II).
A s soo n as a m m o n ia w as a d so rb e d , th e p in k color o f th e zeo lite tu rn ed to green . S im ila r color ch a n g es (corre sp o n d in g to th e n ew n ick el c o o rd in a tio n ) w ere a lso o b
served w h en sa m p le s p re trea te d a t 6 0 0 ° w ere c o n ta c te d w ith a m m o n ia . S im u lta n e o u s ly , a sh arp in crease o f u n it ce ll c o n sta n ts o ccu rred , w h ich co rresp on d s to a d ecrease o f th e h p p o p u la tio n a c co rd in g to th e c h a rt g iven in p a rt I o f th is w ork . H e n c e N i 2+ io n s c o u ld b e w ith d ra w n fro m Si sites w h a te v e r th e p re tr e a tm e n t te m p e ra tu re . A m m o n ia
m o le c u le s w h ich ca n a lw a y s en ter th e so d a lite c a v it ie s m a y s u b se q u e n tly a ttr a c t N i 2+ io n s o u t o f th e h p ; th is is p ro b a b ly d u e to the sm a ll s ize , h ig h p o la r ity , a n d stro n g lig a n d fie ld o f N H 3 m o le c u le s .
Nitric Oxide Adsorption (Samples A6NO, A3N01, and A3N02). A d so rp tio n o f N O on a sa m p le p re lim in a r ily h e a te d a t 6 00 ° d id n o t a ffec t its u n it cell c o n sta n t (2 4 .4 7 A ) ; th erefore it m a y be a ssu m e d th a t its h p p o p u la tio n w as u n c h a n g e d . O n th e co n trary , w h en a s a m p le p r e h e a ted a t 3 0 0 ° w as k e p t in c o n ta c t w ith N O , its u n it ce ll c o n s ta n t in creased c o n tin u o u sly . S tru ctu re re su lts a c tu a lly show th a t an im p o r ta n t d ecrease o f h p p o p u la tio n o c cu red u n d er th ese co n d itio n s . T h u s , a b o u t 1 / 3 ( s a m p le A 3 N 0 1 ) an d 2/ 3 (sa m p le A 3 N 0 2 ) o f N i 2+ io n s, r e sp e c tiv e ly , w ere w ith d ra w n fro m hp after 12 a n d 9 6 hr o f c o n ta c t w ith n i-
The Journal of Physical Chemistry, Vol. 77, No. 21, 1973

Location of Nickel Ions in Y Zeolites 2559
trie o x id e . T h e d isp la c e d ca tio n s m a in ly o c c u p y S i- (0 .0 5 ) and S i- (0 .0 8 ) s ites in th e so d a lite ca g e s . S p (0 .0 5 ) ca tio n s are b o n d e d to th ree 0 ( 3 ) fra m ew o rk o x y g en s b u t rath er far a w a y fro m S n (0 .1 4 ) a n d S i p (0 .1 6 5 ) s ites a ssu m e d to be o c cu p ie d b y N O m o le c u le s . T h e c o o rd in a tio n sc h e m e o f S p (0 .0 8 ) n ick e l ions is q u ite d iffe re n t; in a d d itio n to long range in teraction w ith th ree 0 ( 3 ) fra m ew o rk o x y g en s 2 .7 A a p a rt, th e y are c o o rd in a te d b y th ree n itrog en a n d three oxygen a to m s b e lo n g in g to th ree N O m o le c u le s (there w ere a c tu a lly th ree tim e s m o re S n - (0 .1 4 ) a n d S n - (0 .1 6 5 ) sp ecies th a n S p (0 .0 8 ) n ick e l ions w ith in th e s ta n d a rd e r rors).
T h e S p (0 .0 8 ) N i 2 + ion s are e q u id is ta n t fro m th e tw o S p - s ite s ; th erefore th e N i - N O b o n d s are n o t lin ear b u t have a T -l ik e c o n fig u ra tio n . S tro n g in tera c tio n s are lik ely to occu r b e c a u se o f th e sh o rt (2.0 A) d is ta n c e s in v o lv ed in th ese b o n d s . T h is su g g e sts th a t an N O m o le c u le is b o n d e d to a N i 2+ ion th ro u g h a 7r-e lectro n tra n sfer fro m th e N O m o lecu la r o rb ita l to th e n ick e l 3d o rb ita l. T h e b e h a v io r o f th ese N O lig a n d s is n o t su rp risin g b e ca u se n itric ox id e is k now n as a stro n g e lectro n d on o r a n d th e T b o n d in g sch e m e in w h ich th e tw o a to m s o f th e N O m o le c u le are n early e q u id ista n t fro m th e c a tio n h a s a lrea d y b e e n e n c o u n te re d .4 E sr an d ir sp ec tro sc o p y m e a su r e m e n ts p e r fo rm ed in th is la b o ra to r y 5 a n d e lsew h ere 6 are q u ite c o n sis te n t w ith th e a b o v e re su lts . A n esr s ig n a l a ttr ib u te d to a N i+ ion ap p ea red w h en N O w as a d so rb e d on N i N a Y z e o lite w hile ir sp ec tra ga ve clear in d ic a tio n o f n itrosy l ion fo rm a tio n . T h e se o b serv a tio n s sh ow th a t a N i + N O + c o m p lex is fo rm e d via a 7r-e le ctro n tra n sfer . M o re o v e r , th e esr sign al in ten sity in creased as a fu n c tio n o f th e N O tim e o f c o n ta c t w ith th e z e o lite . T h is m e a n s th a t a larger n u m b e r o f N i 2+ ion s are in crea sin g ly a v a ila b le to rea ct w ith N O in th e so d a lite cages a n d th u s co rrob o ra tes th e tim e d e p e n d en ce o f N i 2+ w ith d ra w a l fro m h p rep orted a b o v e .
H o w e v e r, su b se q u e n t in tera c tio n s b e tw ee n sorb ed N O an d th e zeo lite fra m ew o rk m a y le a d to a fra m ew o rk o x y gen c a p tu re . T h is is su g g e ste d b y th e b r o a d e n in g an d ra p id fa ll o f d iffra c tio n line in ten sities to w a rd large B ra g g a n g les , ob served on th e d iffra c tio n p a tte r n s o f A 3 N 0 1 and A 3 N 0 2 , in d ic a tin g th e p ro b a b le o ccu ren ce o f p o in t d efects in th e zeo lite la tt ic e . S im ila r c o n clu sio n s w ere rea ch ed b y L u n sfo rd , et al.,1 in an in frared s tu d y o f N O d isp ro p o rtio n a tio n on C u Y z eo lite .
Pyridine Adsorption (Samples A6PY, A3PY, and A2PY). T h e S i sites n ick e l p o p u la tio n o f A 6 P Y is a lm o st u n c h a n g e d c o m p a re d w ith th a t o f a 6 0 0 ° tr ea te d s a m p le (Aeoo o f p a rt I ) . O n th e oth er h a n d , 1 an d 1 .6 N i 2 + w ere w ith d ra w n fro m h p a fter p y r id in e a d so rp tio n on sa m p le s p reh eated a t 3 0 0 a n d 200°, re sp ec tiv e ly . W h ile Aeoo is fu lly d e h y d ra te d , A 30o a n d A 200 s till c o n ta in 1 .3 a n d 2 .9 h y d ra te d S i- (0 .0 8 ) N i 2+ io n s. O n e m a y co n clu d e th a t p yrid in e a d so rp tio n d oes n o t a ffe c t th e h p p o p u la tio n o f fu lly d e h y d ra te d sa m p le s w h erea s sm a ll N i 2+ d is p la c e m e n ts m a y occu r w h en w ater traces re m a in in th e so d a lite cages.
Adsorption of Carbon Monoxide, Naphthalene, Ethylene, and Butene. W h a te v e r th e p re tr e a tm e n t te m p e r a ture, C O or C io H g a d so rp tio n on th e zeo lite d oes n o t a f fect its u n it cell c o n sta n t (2 4 .4 7 a n d 2 4 .6 1 5 A for sa m p le s pretreated at 6 0 0 a n d 200°, re sp ec tiv e ly ) a n d it m a y be assu m ed th a t th e h p p o p u la tio n is u n c h a n g e d .
O n th e oth er h a n d , a d m issio n o f C2H4 or C4H8 on to sa m p les p retrea ted a t 6 0 0 an d 200° p ro d u c ed a d ecrease o f a from 2 4 .4 7 to 2 4 .4 4 A a n d fro m 2 4 .6 1 5 to 2 4 .6 0 A, re
sp e c tiv e ly . A c c o rd in g to th e c h a rt th is sh o u ld m e a n an in
crease o f S i sites p o p u la tio n . H o w e v e r , it is n otew orth y th a t : (i) th e se t o f d iffra c tio n lin es in ten sity w as u n c h a n g e d ; (ii) th ese v a ria tio n s o f a w ere a lm o s t q u a n tita tiv e ly rev ersib le u p o n s im p le e v a c u a tio n a t ro om te m p e r a
tu re ; a n d (iii) e th y le n e or b u te n e a d so rp tio n on N a Y z e o lite in d u ces a s im ila r d ecrease o f a a n d w e m a y co n clu d e th a t th e p h e n o m e n o n is n o t sp ec ific to n ick e l io n s. A d d i tio n a l d a ta a n d e x te n siv e d iscu ssio n a b o u t th e in flu en c e o f h y d ro ca rb o n p h y siso rp tio n on N a Y zeo lite w ill be given e lse w h ere .8
R e c e n tly , E g e rto n an d S to n e 9 h a v e sh ow n th a t th e a m o u n t o f C O a d so rb e d on N i 2+ ion s in N i Y zeo lites sh a rp ly in creases o n ly w h en th e e x c h a n g e lev el rise ab ove 4 5 % . T h e se o b serv a tio n s corrob orate th e p revio u s re s u lts ,2-10 in d ica tin g th a t th e fillin g o f h p is lim ite d to ab ou t 12 N i 2 + /u n i t ce ll, b u t th e p re sen t resu lts a lso sh ow th a t th ese ca tio n s re m a in in th eir h id d e n sites on C O a d so rp tio n .
In c o n c lu sio n , C O , C io H 8, C 2H 4 , a n d C 4H 8 are u n a b le to w ith d ra w s ig n ific a n t a m o u n ts o f N i2 + ions fro m th e hp reg a rd less o f th e zeo lite p re tr e a tm e n t te m p e ra tu re .
Mechanism of Ni2+ Ion Migration Out of the hp. F rom th e e x p e r im e n ts p re sen te d in th is p a p er , w e m a y first c o n clu d e th a t th e degree o f d e h y d ra tio n o f N i Y zeo lite is an im p o r ta n t fa cto r for th e m ig ra tio n o f N i 2+ io n s. T h u s , for th e fu lly d e h y d ra te d sieve (Aeoo) th e m ig ra tio n o f n ickel ions o u t o f th e h p ca n occu r on ly u n d er p a rticu la r c o n d itio n s . It se em s th a t o n ly s m a ll , stro n g p o la r m o le c u le s are ab le to rea ct an d w ith d ra w th e ca tio n s fro m S i site s , since all a b so r b a te s te s te d , w ith th e e x c e p tio n o f a m m o n ia , h ave n o e ffec t on th e h p p o p u la tio n . O n th e oth er h an d , w h en so m e w ater m o le c u le s are s till p re sen t (p r o b a b ly 1 - 2
H 2O p er u n it ce ll is su ffic ien t) a d ecrease o f S i p o p u la tio n is o b served after a d so rp tio n o f N O a n d p y rid in e , w h ereas C O , C2H4, C4H8, a n d C io H 8 are c o m p le te ly in effectiv e even in th ese c o n d itio n s . H e n c e , th e steric H indrance is n o t th e p re d o m in a n t fa c to r , sin ce C5H5N is u n lik ely to en ter th e so d a lite c a v it ie s , w h erea s C O , for e x a m p le , is sm a ll en ou g h to p en e tra te th e so d a lite ca g e s . A lth o u g h th e d a ta n ow a v a ila b le are n o t su ffic ie n t to p o stu la te a precise m e c h a n ism o f th e N i 2+ ion m ig ra tio n , th e fo l low in g su gg estion s m a y be m a d e : (i) th e a d so rb a te sh ou ld be ab le to d isp la ce w ater m o le c u le s still a t ta c h e d to N i2+ io n s ; an d (ii) w ater m o le c u le s act as a c a tio n carrier.
W e co n sid er tw o s te p s . F irst , th e a d so rb a te a ttr a c ts anS i- n ick el io n ; H 20 a tta c h e d to th e c a tio n is d isp la c e d b y th e n ew lig a n d a n d a c o m p le x ion is fo rm e d . In a secon d ste p , th e lib era ted w ater m o le c u le s m o v e b a c k c lose to h p an d ex tra c t an N i 2+ fro m th e S i s ite , w h ich in tu rn m a y m ig ra te a n d rea ct w ith o th er a d so rb a te m o le c u le s . T h is p rocess is slow for large size m o le c u le s (p y rid in e ) r e m a in ing in th e su p erca g es b u t m a y b e e n h a n c ed for sm a ll m o le cu les like N O , a b le to en ter th e so d a lite ca g e s . In th is la tte r case th e m ig ra tio n p a th is sh orter, sin ce n ick e l ions m a y b e c o m p le x e d a lrea d y in th e so d a lite c a g e s . O n th e o th er h a n d , C O , C 2H 4, C 4H 8, a n d C 10H S are to o w eak lig a n d s to ex c h a n g e w ith th e w ater co o rd in a te d to n ick el io n s. T h u s th ese m o le c u le s w o u ld rea ct w ith th e d e h y d ra ted n ick el ion s o c c u p y in g th e so d a lite ca g es (for on ly C O ) or su p erca g es b u t th e h y d ra te d N i 2+ a n d th e n u m e rous ca tio n s o c c u p y in g th e h p sh o u ld be o u t o f ran ge .
C o n c lu s io nT h is s tu d y h as sh ow n so m e in terestin g a sp e c ts o f th e
c o o rd in a tio n c h e m istry o f n ick el ion s in th e Y zeo lite h ost
The Journal ot Physical Chemistry, Vol. 77, No. 21, 1973

2560 George R. Anderson and George J. Jiang
la t t ic e . T h u s , th e p a rtic u la r ste re o ch e m istry o f th e c o m p le x fo rm e d b y N i 2+ ion s a n d N O m o le c u le s is o f in terest.
F u rth erm o re , it h a s in d ic a te d th a t th e a c c e ss ib ility o f th e N i 2+ ion s to th e rea gen ts d ep e n d s u p o n th e in itia l ca tio n lo c a tio n , th e resid u a l w ater c o n te n t o f th e zeo lite , an d th e re a g e n t’s a b ility to d isp la c e th e H 2O lig a n d s from th e c a tio n s . T h u s , n ick el ions w h ich o c c u p y th e su p e r ca ges are a lw a y s a v a ila b le p ro v id ed th a t th e y are n o t c o o rd in a ted b y a to o stro n g lig a n d w h ich w ou ld p reven t d ire c t c o n ta c t w ith th e rea gen t.
N ic k e l io n s o c c u p y in g th e so d a lite ca ges m a y b e d ire c tly rea ch ed b y s m a ll m o le c u le s w h ich ca n en ter th e so d a
lite ca ges, b u t th e se ca tio n s w ill h ave to m ig ra te to w a rd th e su p erca g es in ord er to rea ct w ith larger m o le c u le s .
In co n tra st, n ick e l ions o c cu p y in g th e h p ca n n o t be rea ch ed b y an y m o le c u le b u t m a y be w ith d ra w n b y H 2O or N H 3 m o le c u le s . A n io n -tra n sfer p rocess m a y even occu r an d co n tin u e w ith th e h e lp o f th ese m o le c u le s a c tin g as carriers p ro v id ed th a t th ese lig a n d s are ea sily d isp la c e d b y th e rea gen t m o le c u le s .
T h e b eh a v io r o f C u 2 + io n s is very d iffe re n t sin ce th ey m ig ra te rea d ily fro m th e ir in itia l S i- s ites a n d th e n b e co m e a c c e ssib le to th e rea gen ts o c c u p y in g th e su p e r c a g e s .1 C o n sid e rin g th e c a ta ly tic p ro p erties for th e copp er an d n ick e l z eo lites , w e m a y a ssu m e th a t th e a c tiv ity o f C u Y w ill in crease w ith th e co p p er c o n te n t w h ereas N i Y w ill n o t b e ac tiv e u n til th e h ex a g o n a l p rism s are filled u p (aro u n d 12 N i 2 + /u n i t c e ll) .
Acknowledgments. T h e au th ors exp ress th e ir gra titu d e to M r . A . T h e o lie r for h e lp fu l te c h n ic a l a ss ista n c e a n d M r . H . U r b a in for p erfo rm in g th e c h e m ic a l a n a ly sis .
Supplementary Material Available. L is tin g s o f stru ctu re fa cto rs , a to m ic co o rd in a te s , te m p e ra tu re fa c to rs , a n d o c c u p a n c y fa cto rs w ill a p p ea r fo llow in g th ese p ag es in th e m i
cro film ed itio n o f th is v o lu m e o f th e jo u r n a l. P h o to c o p ie s o f th e su p p le m e n ta ry m a te ria l fro m th is p a p er o n ly or m ic ro fich e (10 5 X 148 m m , 2 0 X re d u c tio n , n e g a tiv e s) c o n ta in in g a ll o f th e s u p p le m e n ta ry m a te r ia l for th e p a p e r s in th is issu e m a y be o b ta in e d fro m th e J o u rn a ls D e p a r tm e n t , A m e r ic a n C h e m ic a l S o c ie ty , 1155 16th S t . , N .W . , W a s h in g to n , D . C . 2 0 0 3 6 . R e m it ch eck or m o n e y ord er for $ 3 .0 0 for p h o to c o p y or $ 2.00 for m ic ro fich e , referrin g to code
n u m b e r J P C -7 3 -2 5 5 6 .
R e fe r e n c e s a n d N o t e s
(1 ) P. Gallezot, Y. Ben Taarit, and B. Imelik, J. Catal., 26, 295 (1972).(2) P. Gallezot and B. Imelik, J. Phys. Chem., 77, 652 (1973).(3) See paragraph at end of paper regarding supplementary material.(4) P. R, H. Alderman and P. G. Owston, Nature {London), 178, 1071
(1956).(5) C. Naccache and Y. Ben Taarit, J. Chem. Soc., Faraday Trans. 1.
69, 1475 (1973).(6) P. H. Kasai and R. J. Bishop, J. Amer. Cnem. Soc., 94, 5560
(1972).(7) C. C. Chao and J. H. Lunsford, J. Amer. Chem. Soc., 93, 71
(1971).(8) P. Gallezot and B. Imelik, J. Phys. Chem.. 77, 2364 (1973).(9) T. A. Egerton and F. S. Stone, J. Chem. Soc., Faraday Trans. 1, 69,
22 (1973).(10) E. Dempsey and D. H. Olson, J. Phys. Chem., 74, 305 (1970).
A Semiempirical Study of Hydrogen Bonding in the Diaquohydrogen Ion, H502 +
George R. Anderson* and George J. Jiang
Department of Chemistry. Bowdoin College. Brunswick, Maine 04011 (Received April 9. 1973) Publication costs assisted by the National Science Foundation
T h e d ia q u o h y d ro g e n ion , [H 2O H O H 2] + , is a h y d ro g e n (H ) -b o n d e d sp ec ies o f c o n sid era b le s ta b ility a n d is on e for w h ich b o th e x p e r im e n ta l a n d th eo retica l d a ta are a v a ila b le . In th is s tu d y , H -b o n d in g p ro p erties o f H 50 2+ are c o m p u te d b y m e a n s o f a se m ie m p ir ic a l m o d e l for lin ear H b o n d s rep orted earlier an d th e re su lts are c o m p a re d a n d d isc u sse d . A g r e e m e n t is fo u n d to b e fa v o ra b le p a rticu la rly w ith re sp e c t to v i b ra tio n (in frared ) fre q u e n c ie s . F u rth erm o re , th e m o d e l p o te n tia l en ergy fu n c tio n c o n ta in s se m ie m p ir ic a l p a ra m e te rs w h ich are n o t fo u n d to ch a n ge a p p re c ia b ly fro m one sy ste m (rep o rted earlier , H F 2~ ) to a n oth er ( H 50 2+ ) . T h e s e resu lts su g g est th a t p erh a p s th e m o d e l for H b o n d in g is su ffic ie n tly gen era l to b e a p p lie d to o th er H -b o n d e d sp ec ies for w h ich few er e x p e r im e n ta l d a ta are a v a ila b le .
IntroductionT h e s tu d y o f th e d ia q u o h y d ro g e n ion , H 50 2+ , is p a rt o f
a m o re e x te n d ed s tu d y o f h y d ro g en ( H ) b o n d in g in a s e ries o f c o m p o u n d s for w h ich e x p e r im e n ta l d a ta a n d th e o retica l m o d e l c a lc u la tio n s are rep o rted . T h e b iflu orid e ion , H F 2_ , s tu d y w as rep orted e a r lie r .1 S p e c tro sc o p ic a n d cry sta llo g ra p h ic d a ta to g eth er w ith ab initio M O resu lts o f H F 2~ w ere fit to a se m ie m p ir ic a l m o d e l o f th e H b o n d . N u m e r ic a l p a ra m e te rs o rig in a tin g in th e m o d e l c a lc u la
tion w ere e v a lu a te d , an d g r o u n d -s ta te a n d e x c ite d v ib r a t io n a l-s ta te p ro p erties o f H F 2_ ion w ere c o m p u te d a n d d iscu sse d .
In th e p resen t H s 0 2+ ion s tu d y , w e fo llo w a s im ila r a p p ro ach b eg in n in g w ith a le a st-sq u a r e s f it to rep orted ab initio M O d a ta u sin g a p p ro p ria te e m p iric a l c o n sta n ts a n d th e sa m e three m o d e l p a r a m e te rs ( m, b, a n d g) as b e fo re . T h e se re su lts are fu rth er a n a ly z e d b y c o m p a riso n o f c o m p u te d an d ob served in frared fre q u e n cie s . T h e fin a l c o n -
The Journal of Physical Chemistry, Voi. 77, No. 21, 1973

Hydrogen Bonding in the D iaquohydrogen Ion 2561
e lu sion s su g g est th e p o ss ib ility th a t th e p ro p o sed H -b o n d m o d el m a y be a p p lic a b le to oth er H b o n d e d s y s te m s p e r h ap s w ith o u t s ig n ific a n t ch a n g es in th e th ree m o d e l p a ra m e te rs ; th e y are a b o u t th e sa m e fo r H F 2 _ a n d H 50 2 + . F u rth er s tu d ie s , th erefore , are u n d erw a y to te st a n d e x te n d th e m o d e l c a lc u la tio n s to a v a rie ty o f w ea k er Id- b o n d e d sy s te m s w h ich in c lu d e so m e o f p o ss ib le b io lo g ic a l sig n ific a n c e . B y th is a p p ro a c h , w e h op e e v e n tu a lly to sh ed new lig h t on p o ssib le m e c h a n is tic im p lic a tio n s o f th e H b o n d in areas o f c h e m ic a l d y n a m ic s a n d p ro to n c o n d u c tiv ity in b io lo g ic a l m e m b r a n e s .2
T h e H 50 2 + ion is o b serv ed a n d s tu d ie d in th e ga s p h ase (n a tu ra lly occu rrin g in th e low er io n o sp h ere , 8 0 - 9 0 k m a l titu d e) a n d in c ry sta llin e so lid s w here it ex ists as on e o f a series o f s ta b le p o ly h y d r a te d m in e ra l a c id s . T h e stru ctu re o f H 50 2+ is s im ila r to th a t o f h y d ra z in e w here th e N - N b o n d is re p la c e d b y th e 0 - - H - - - 0 b o n d . In ou r c a l cu la tio n s , w e a ssu m e th a t th e fou r H a to m s a t th e en d s o f th e m o le c u le are u n c o u p le d fro m th e m o tio n o f th e cen tral H a to m a n d th a t th e n e t e ffec t o f th e te rm in a l H a to m s is a s lig h t in crease in th e e ffec tiv e m a ss o f th e tw o ox yg en a to m s , 16 to 18 a m u . A ls o , w e w ill con cern ou rse lv es so le ly w ith th e lin ear m o tio n s o f th e H b o n d , th e tw o c o o rd in a tes th a t m e a su re th e re la tiv e d is p la c e m e n t o f th e
a to m s as g iven p r e v io u s ly .1 B e n d in g a n d to rsio n al m o d e s o f th e H b o n d are a ssu m e d to b e o f lesser im p o rta n ce to th e en ergetics o f H b o n d in g . T h e ju s t i f ic a tion for th ese a p p ro x im a tio n s w ill b e d isc u sse d b e low .
T h e h e a t o f fo rm a tio n o f H 50 2+ fro m H 20 an d H 30 + w as m e a su red in th e ga s p h a se b y m a s s sp e c tro m e tr y a n d rep orted b y K e b a r le , S ea rle s , et al.3 T h e y fou n d A / i ( H 5 0 2 + ) = - 1 5 0 . 6 k J /m o l ( - 3 6 k e a l /m o l ) . T h is is a b o u t % th e en ergy re le a se d w h en w ater is p ro to n a te d , A JT (H 3 0 + ) = - 6 9 0 . 4 k J /m o l ( - 1 6 5 k e a l /m o l ) , a n d it is a b o u t % th e en ergy o f th e stro n g est H b o n d k n ow n A H ( H F 2- ) = —2 4 2 .7 k J /m o le 4 ( — 5 8 k e a l /m o l ) .
A b initio M O c a lc u la tio n s on H 50 2+ are rep orted b y K o llm a n a n d A lle n ,5 K r a e m e r s a n d D ie r c k se n ,6 a n d b y J a n o sch e k , et al.1 K o l lm a n a n d A lle n ’s c a lc u la tio n s agree q u ite w ell w ith m a ss s p e c tro m e tr y d a ta o f K e b a r le , et al. T h e y ca lc u la te an H b o n d en ergy o f — 1 5 4 .4 k J /m o l ( - 3 6 . 9 k e a l /m o l) , a v a lu e w e h av e u sed in ou r c a lc u la tio n s . T h e sh ap e o f th e p o te n tia l su rfa ce n ear th e b o tto m o f th e p o te n tia l “ w e ll” p r o b a b ly is a sh a llo w sin g le m in im u m su r face a lth o u g h J a n o sc h e k , et al.,1 rep ort c a lc u la tio n s w h ich leave so m e d o u b t as to w h eth er th e ir resu lts p re d ic t a s y m m e tr ic d o u b le -m in im u m p o te n tia l su rfa ce or on e h a v
ing a sin g le m in im u m . T h e tw o c a lc u la te d eq u ilib r iu m0 - - - 0 b o n d d is ta n c e s are Re(K A ) = 2 .3 8 A5 a n d .R e (K D ) = 2 .3 9 A.6 w here th e H a to m is on cen ter corre sp o n d in g to th e sin g le p o te n tia l en ergy m in im u m . T h e ca lc u la tio n s o f J a n o sc h e k , et al., o n ly co vered th e ran ge R = 2 .5 0 -2 .8 0 A, w h ich d id n o t in c lu d e an en ergy m in im u m in R.
C r y sta l stru ctu re stu d ie s o f H 5 0 2+ in v o lv in g X -r a y a n d n eu tron d iffra c tio n te c h n iq u e s w ere rev iew ed b y P im e n te l a n d M c C le l la n .8 T h e ev id e n c e c le a r ly sh ow s th e H -b o n d d ista n ce in th is sp ec ies to b e “ s h o r t ,” Ro = 2 .5 1 -2 .4 2 4 A, d ep e n d in g u p o n c ry sta llin e e n v ir o n m e n t. T h e in fra red a n d R a m a n sp ec tra o f d ia q u o h y d ro g e n ion p erch lo ra te , H 50 2+ C 1 0 4 - , h av e a lso b e e n re p o r te d .9-12 T h e y sh o w th a t th e H a b so rp tio n , vh , is b ro a d a n d sh ifte d to 1 7 0 0 -1 9 0 0 c m - 1 .10 *11 T h e sa m e a b so rp tio n m o d e u p o n d eu ter iu m su b stitu tio n , v-q, is n e a r 125 0 or 140 0 c m - 1 ;9 '1 1 th e a ss ig n m e n t is n o t c lea r . T h e 0 - - - 0 v ib ra tio n (i/4) w h ic h is R a m a n a c tiv e occu rs a t 4 1 2 c m - 1 .11
Results and DiscussionFit of the Potential Function. T h e p o te n tia l fu n ctio n o f
th e m o d e l H b o n d w a s g iven in an earlier p a p e r1 for th e sy m m e tr ic H b o n d
V /D = 1 - f ( s ) - f ( f ) + £ ff (s ) f ( i) + F (R)
w here th e c o o rd in a tes s a n d t m e a su re th e lin e a r d is p la c e m e n t o f th e H a to m fro m th e tw o re sp ec tiv e ox y g en a to m s su ch th a t th e to ta l 0 - - - 0 d ista n c e R = s + (; th e d is p la c e m e n t o f th e H -a t o m o ff ce n te r is g iven b y r = (s -t)/2. T h e fu n c tio n s f(s ) a n d f ( t ) are s y m m e tr ic u p o n e x ch a n ge o f c o o rd in a tes a n d are o f th e fo rm
f ( s ) = e x p ) — n(s - seJ 2/2s\
w here n = kese„/D. T h e R-d e p e n d e n t te rm loo ks like
F (R) = C j e x p | - 61? j - C2(R JR '"'
T h e e m p iric a l c o n sta n ts a n d b e s t -f i t p a r a m e te rs are listed in T a b le I .13-16 N o te th a t th e first th ree c o n sta n ts listed (D, fee, a n d se/ s e J are re la ted e n tire ly to th e H 3 0 + sp ec ies ; th e n e x t tw o (V e an d Re) are e m p iric a l c o n sta n ts re latin g to th e H -b o n d e d sp ec ies , H 5 0 2+ ; a n d th e la s t th ree (m, b, a n d g) are c o n sta n ts u se d in th e le a st-sq u a r e s f it to ab initio d a ta . T h e ran ges ov er w h ich th e p a r a m e te rs w ere in d iv id u a lly va ried are as fo llo w s: m v a rie d fro m 1 to 9 w ith m = 6 b e in g the o n ly va lu e a t w h ich a n y le a st-sq u a r e s fit co u ld be a c h ie v e d ; g va ried fro m 0 .1 0 to 1 .0 ; a n d b varied fro m 1 .0 to 1 0 .0 . T h e th ree se ts o f ab initio d a ta w ere first trea te d se p a ra te ly .
J a n o sc h e k , et al.,1 rep orted th e largest n u m b e r o f th e o retica l d a ta p o in ts (2 8 p o in ts ) . Y e t w e w ere u n a b le to m a k e a le a st-sq u a r e s fit d u e to in su ffic ie n t d a ta n ear th e e q u ilib r iu m p o sitio n . F u rth erm o re , w h en u sin g th eir coord in a tes o f p o te n tia l en ergy m in im a a t Re = 2 .4 8 , re = ± 0 .1 6 A (e s t im a te d fro m F igu re 1 2 o f r e f 7 ) , w e c o u ld n ot “ fo rc e ” th e m o d e l to d u p lic a te th e d o u b le m in im a p o te n tia l su rfa ce e x c e p t for large v a lu e s o f th e g p a ra m e te r (g ~ 0 .8 - 0 .9 9 ) . T h is su g g e ste d to u s th a t a d o u b le m in im a p o te n tia l su rfa ce for th e H 50 2+ d a ta w a s o u t o f ran ge o f our m o d e l-f itt in g p ro ced u re . F o llo w in g a su g g e stio n from one o f th e referees, h ow ever, Re w a s ch o sen a t 2 .3 9 A, an d a le a st-sq u a res fit w as o b ta in e d a t g = 0 .6 6 5 , b = 2 .6 0 .
TABLE I: The Spectroscopic and Structural Constants, and Parameters
Ref
Em pirical Constants
Dissociation energy of H3Û +, D 64,013 c m -1 3,13Harmonic force constant of
H30 + , ke 6.134 m D /Â 14,15O -H bond length of H30 + ,S e„ 1.02 Â 16Hydrogen bonding energy, l/e 12,908 c m -1 3Potential energy m inimum, Re 2.39 Â (re = 0) 3,5
Least-square fit param eters m = 6 (for all determ inations)
lr frequencyb 9 Ab initio data agreement
2.568 0.665 KA (ref 5) Good2.680 0.675 KD (ref 6) Good2.60 0.670 Average Best3.80 0.910 KA Poor3.50 0.930 KD Poor3.20 (fixed) 0.680 KD, g fit only Good2.60 0.665 J et al. (ref 7) Good
The Journal of Physical Chemistry, Voi. 77, No. 21, 1973

2562 George R. Anderson and George J. Jiang
F ig u re 1 . P o te n t ia l e n e rg y c o n to u r p lo t o f H 50 2 + a t 5 0 0 - c m ' In te rv a ls u s in g “ b e s t” f it p a r a m e te r s g iv e n in T a b le I. T h e c e n te r c o n to u r is a t V = — 1 2 ,5 0 0 c m - 1 , th e o u te r a t V = — 7 5 0 0 c m ' 1. T h e c ro s s ( + ) n a r k s th e p o te n t ia l m in im u m a t R e = 2 .3 9 0 A. T h e s o lid s tra ig h t lin e s d e p ic t th e p o s it io n s o f th e H a to m b e tw e e n th e c la s s ic a l tu rn in g p o in ts a t th e m in im u m R
v a lu e s in th e fo u r lo w e s t - ly in g H v ib ra t io n a l s ta te s , E 0 + to E , ” .
T h is sh ow ed good a g re e m en t w ith th e fits to th e oth er tw o sets o f d a ta (see fo llo w in g ).
T h e K o llm a n a n d A lle n 5 d a ta se t (11 p o in ts) p ro d u ced tw o le a st-sq u a r e s fits as d id th e K r a e m e r s an d D ie rc k se n 6 d a ta se t (8 p o in ts ) ; see T a b le I. N o t in g a g re e m e n t b e tw een tw o o f th e in d e p e n d e n t d e te r m in a tio n s , w e c o n stru cted a p o te n tia l su rfa ce u sin g th e average v a lu e s o f th e p a ra m e te rs , m = 6 , b = 2 .6 0 , a n d g = 0 .6 7 , a n d th is p o te n tia l su rfa ce is sh ow n in F igu re 1. C o n to u r p lo ts o f th e th ree p o te n tia l su rfa ces in fa c t w ere id e n tic a l w ith in2 - 3 % so th a t w e fe lt w e h ad rea ch ed a re a so n a b le lev el o f re fin e m en t for c o m b in in g all three in d e p e n d e n t d a ta se ts .
T h e p o te n tia l su rfa ce in F igu re 1 h as co n to u r lin es d raw n a t 5 0 0 - c m '1 in terv a ls s ta rtin g a t — 1 2 ,5 0 0 c m ” 1, e n d in g a t - 7 5 0 0 c m - 1 . T h e sin g le m in im u m o f en ergy o f - 1 2 ,9 0 8 c m ” 1, - 1 5 4 . 4 k J /m o l ( - 3 6 . 9 k c a l /m o l ) , is at Re = 2 .3 9 A. S e c tio n s th ro u g h th e p o te n tia l en ergy su rface a t c o n sta n t R sh ow a progression o f cu rves goin g fro m sin gle m in im u m (sm a ll R) to d o u b le m in im a p o te n tia l cu rves (larger R). T h e b o u n d a ry b e tw ee n th ese tw o d o m a in s is a t R = 2 .6 3 A w here th e p o te n tia l cu rve in d eed is a f la t b o t to m e d w ell (see F igu re 2 ) .17
R e tu rn in g to th e seco n d le a st-sq u a r e s fit o f K o llm a n an d A lle n ’s ab initio d a ta se t w here m = 6 , b = 3 .8 0 , a n d g = 0 .9 1 , w e fin d a co rresp on d in g p o te n tia l su rfa ce (F ig ure 3 ) 17 th a t is c lea rly d istin c tiv e fro m th e “ h y b rid ” p o te n tia l su rface sh ow n in F igu re 1. T h e p o te n tia l w ell is m u c h “ f la tte r ” n ear th e b o tto m o f th e w ell a n d th e c e n tral b arrier (to p ro ton m o tio n ) rises to h ig h er p ro m in e n c e for s im ila r R v a lu e s . F or in sta n c e a t R = 2 .4 9 A, a sm a ll barrier (less th a n 150 c m ” 1) se ts in , an d w h en R = 2 .7 9 A th e barrier grow s to ~ 1 2 0 0 c m ” 1. B y v isu a l co m p a riso n w ith a s im ila r d ia g ra m o f K o llm a n a n d A lle n (F igu re 4 o f re f 3 ) , th e p o te n tia l su rfa ce lo o k s v ery s im ila r to th e cu ryes p resen ted b y th e se au th o rs .
T h e seco n d le a st-sq u a r e s fit o f K ra e m e r s an d D ie rc k - se n ’ s d a ta se t (for b = 3 .5 0 a n d g = 0 .9 3 ) is a lso very s im ilar. W e th erefore w ere co n fro n ted w ith e sse n tia lly tw o p o te n tia l su rfa ces for th e H s 0 2 + ion , e a c h fit to an ab initio d a ta b a se . T h is d u a lity p ro b le m w as reso lv ed on th e b a sis o f in frared a b so rp tio n an d R a m a n sp ec tro sco p ic d a ta .
Calculated Vibrational Energies and Spectra of Hs02+. T h e v ib ra tio n a l e ig e n fu n c tio n s a n d e ig e n v a lu es o f th e H
T A B L E I I : C a lc u la te d R e s u lts a n d E x p e r im e n ta l V a lu e s “
This work Experimental
G ro u n d s ta te
m in im u m to r H
G ro u n d s ta te
m in im u m fo r D
Is o to p e s h ift
H a s y m m e tr ic s t re tc h
i>h ' o v e r to n e
v h " o v e r to n e
D a s y m m e tr ic s tre tc h
S y m m e tr ic s tre tc h Is o la te d io n H 3 0 +
R 0 = 2 .4 1 5 ± 0 .0 0 1 Â
R o = 2 .4 0 7 ± 0 .0 0 1 Â
A R 0 = - 0 . 0 0 8 Ä
«H = 1 7 8 3 c m ” 1 ( I r )
v h ' = 3 8 5 0 (R )
v H = 6 0 6 0 ( I r )
c D = 1 2 4 2 ( I r )C 0 -- -0 = 4 8 0 ± 1 2 0 (R )
C } | ( H 30 + ) = 3 2 1 0 (R , Ir )
~ 2 . 4 0 - 2 . 5 0 ' 1
U n o b s e rv e d
U n o b s e rv e d
~ 1 7 0 0 - 1 9 0 0 e
U n o b s e r v e d
U n o b s e r v e d
1 2 5 0 o r 1 4 0 0 e
4 1 2 e
3 2 0 0 “
“ The calculations are based upon the "best" potential surface with parameters given in Table I. Infrared (Ir) and Raman (R) active modes are predicted by symmetry selection rules. h References 7, 8, 16. c Reference 1 1 .“ References 14, 15.
(a n d d e u te r iu m , D ) a to m s w ere c a lc u la te d u sin g th e a p p ro x im a tio n o f “ c la m p e d ” h e a v y n u cle i fo llo w in g th e p ro ced u re o f A n d e r so n a n d L ip p in c o t t .18 F o u r low er v ib r a tio n a l s ta te s w ere c a lc u la te d for a ra n ge o f 0 - - - 0 s e p a ra tio n s fro m 2 .2 to 5 .0 A (F igu re 4 ) .17 F or th e “ h y b rid ” p o te n tia l su rfa ce w here m, = 6 , 6 = 2 .6 0 , a n d g = 0 .6 7 w e o b ta in e d th e fo llo w in g resu lts .
A t large O • • • O se p a ra tio n s , th e first tw o v ib ra tio n a l s ta te s (Eo a n d E i , see ref 1 for n o ta tio n ) are d o u b ly d eg en erate sin ce th e p ro ton m a y b e lo c a liz e d n ear one o x y g en (w a te r m o le c u le ) or th e o th er . T h e se p a ra tio n b e tw een th e sta te s E i — Eo = 3 2 1 0 c m ” 1 at R = °° w as fix e d (b y ke) to co rresp on d to an infrared a b so rp tio n o f H 3 0 + o b served at ~ 3 2 0 0 c m - 1 . B y th e h a rm o n ic o sc illa to r a p p ro x im a tio n , v = (2irc)^1(ke/mp)1'2, a fre q u e n cy c Ho = 3 3 1 6 c m ” 1 is c a lc u la te d . T h e 3 .6 % sh ift in c a lc u la te d fr e q u e n c y sh ow s th a t th e m o d e l p o te n tia l fu n c tio n in c lu d e s a ty p ic a l a n h a rm o n ic d e v ia tio n c h a ra cteristic o f m a n y m o lecu lar sp ec ies b u t n o t d ire c tly o b serv e d in H 3O 1 .
A t sh orter 0 - - - 0 se p a ra tio n s , th e first tw o v ib r a tio n a l s ta te s (see F ig u re 4 ) 17 sp lit w h en H a to m tu n n e llin g b e c o m e s im p o r ta n t: n ear R ~ 3 .1 A for th e u p p e r ( E i ) s ta te an d R ~ 2 .9 A for th e grou n d (Eo) s ta te . T h e d eg en e ra cy is lifte d a n d th e fou r s ta te s are n ow d e sig n a te d b y th e s y m m e tr y ( + a n d — ) o f th e ir resp ec tiv e e ig e n fu n c tio n s , Eo+, E 0” , E i + , E 1 ” . T h e b o tto m “ d ip ” o f e a ch cu rve co r resp on d s to th e 0 - - - 0 sep a ra tio n for w h ich th e en ergy is m in im a l in th e Eo+---Ei~ s ta te s , 2 .4 1 5 , 2 .4 7 0 , 2 .5 2 , an d 2 .5 8 A , re sp ec tiv e ly . T h e g r o u n d -sta te m in im a for th e H a n d D c a lc u la tio n s are g iven in T a b le II . T h e d ifferen ce o f th ese tw o R v a lu e s is th e iso top e s h ift an d is fo u n d to b e n e g a tiv e in th is in sta n c e . F or w eak H b o n d s , th e is o to p e sh ift is e x p e r im e n ta lly a n d th e o r e tic a lly fo u n d to be p o s it iv e .18 F or H 50 2+ n o e x p e r im e n ta l d e te r m in a tio n h as been rep orted .
T h e in frared sp ec tra l a b so rp tio n o f H 50 2 + is c a lc u la te d on th e a ssu m p tio n o f “ v e r tic a l” tra n sitio n s b e tw ee n th e £ o + to E o ” s ta te s at th e p o sitio n o f m in im u m o f en ergy , Ro = 2 .4 1 5 A . T h e ob served H a n d D a s y m m e tr ic stretch d a ta are listed in T a b le II a n d th e c a lc u la tio n is b a sed (a g a in ) u p o n th e “ h y b r id ” p o te n tia l su rfa ce . O n e m a y n o tice th a t th e a g re e m en t is e x c e lle n t an d th a t ou r d e u te r iu m c a lc u la tio n (a t 124 2 c m ” 1) is very close to th e 1 2 5 0 - c m _ 1 o b served a b so rp tio n . T h u s , th e m o d e l c lea rly fa v o rs th e a ss ig n m e n t o f vD to th e 1 2 5 0 -c m ” 1 b a n d over th e 140 0 c m - 1 b a n d w h ich th e au th ors also su g g e ste d as a p o s s ib i l ity .
The Journal of Physical Chemistry, Voi. 77, No. 21, 1973

Hydrogen Bonding in the Diaquohydrogen Ion 2563
T h e oth er p o te n tia l su rfa ces m e n tio n e d a b o v e (b = 3 .5 , g = 0 .9 3 ) p re d ic t in fra red tr a n sit io n s in c o n sid era b le d is a g re e m en t w ith th e o b serv e d v a lu es lis te d in T a b le II. T h e H 5O 2+ a s y m m e tr ic s tre tc h freq u en cies w ere c a lc u la te d to be vH = 107 0 c m - 1 a n d v-q = 6 8 0 c m - 1, a d isc r e p a n c y o f 3 0 - 3 5 % w ith o b serv e d fre q u e n c ie s . T h e re fo re , th is p o te n tia l su rfa ce m a y be a ssu m e d to b e s ig n ific a n tly less d e scrip tiv e o f th e “ tr u e ” H 5O 2+ p o te n tia l su rfa ce for th e H 5 0 2 + C I O 4“ c ry sta llin e so lid .
A n in terestin g c o m p a riso n o f th e o re tica l d a ta w as m a d e ba sed u p on th e p re v io u s s tu d y o f th e H F 2“ io n .1 W e tran sferred tw o o f th e b e s t - f i t p a r a m e te rs (m = 6 , b = 3 .2 0 ) fro m th e H F 2“ ab initio d a ta f it a n d h e ld th ese fixed w hile va ry in g g to m a k e a le a st-sq u a r e s fit u sin g th e K ra e m e r s a n d D ie rc k sen d a ta se t on H 5 0 2 + . T h is ga ve a f it for g ( H 50 2 + ) = 0 .68 c o m p a re d w ith th e b iflu orid e ion resu lts g ( H F 2~ ) = 0 .6 5 . T h e in fra red freq u en cies c a lc u la t ed from th is su rfa ce w ere vh = 1 8 1 0 c m “ 1 a n d i/p = 1246 c m “ 1 . C o m p a re d w ith re su lts in T a b le I I , th e a g re e m en t again is g o o d . W e th erefore m a y s ta te on e im p o r ta n t re su lt of th is in v e stig a tio n b y re co g n iz in g th e v ery close s im ila rity o f p a r a m e te rs (m, b, a n d g) fo u n d in th e a n a ly sis o f tw o e n tire ly d iffe re n t c h e m ic a l sy s te m s , H 5O 2 " a n d H F 2 “ . T h e v a lu e o f m = 6 se e m s to b e fix e d w h ile th e re m a in in g tw o are o n ly ro u g h ly se t over th e range b ~ 2 .6 -3 .2 a n d g 0 .6 4 -0 .6 8 . C a lc u la tio n s on th e fa m ily o f b i h alid e sa lts b e y o n d H F 2“ are cu rre n tly b e in g ca rried o u t on th e b a sis o f th e p o ss ib ility o f tra n sfe ra b le (c o n sta n t) p a ra m e te rs w hen ab initio M O d a ta are u n a v a ila b le .
V ib r a tio n a l ov erto n e tra n sitio n s o f vH are a lso p re d ic te d b y th e m o d e l c a lc u la tio n s as g iven in T a b le II, b u t none as y e t h av e b e e n rep o rted in th e in fra red or b y th e R a m a n te c h n iq u e . S u p p o s in g th a t e x c ita tio n fro m th e grou n d s ta te is so m eh o w in d u c e d t o an y o f v ib r a tio n a l s ta te s (sh ow n in F igu re 4 ) ,17 s u b se q u e n t v ib ra tio n a l re lax ation to th e grou n d sta te m a y lik e ly ca u se o b serv a b le ch a n g es in 0 - - - 0 sep a ra tio n a c co rd in g to m o d e l p re d ic tio n s . T h e ch a n g es o f course are e x p e c te d to b e sh ort liv ed (r ~ 1 0 “ 7 se c ) w ith an expansion o f th e H b o n d d ista n c e fixed b y th e m in im u m o f en ergy o f th e s ta te to w h ich th e s y s te m h a s been e x c ite d . T h is ty p e o f v ib ra tio n a l F r a n c k - C o n d o n e ffec t h as b e e n d isc u sse d p re v io u sly 1 1 8 a n d m a y be on e sou rce o f th e lin e w id th o f th e t<H tra n sitio n .
O n e o f th e ch a ra cte ristic fea tu res o f th e stro n g h y d rogen b o n d is th e h igh a n h a rm o n ic ity o f th e H s tretc h in g v ib r a tion (see T a b le I I ) . T h is ca n be se en fro m th e c a lc u la te d fu n d a m e n ta l, E 0 ~ ~ E o + = ¡ 'h (1 7 8 3 c m - 1 ) a n d its first sy m m e tr y -a llo w e d ov erto n e , Ei~ — Eo+ (6 0 6 0 c m “ 1), a freq u en cy ra tio o f 3 .4 0 w h ich is s im ila r as th e case in b i - floride io n .1 W e w o u ld e x p e c t a lso th a t th e ra tio o f rp/vp in H5 O2 + w ill d e v ia te s ig n ific a n tly fro m th e h a rm o n ic va lu e (1 .3 8 ) . O u r c a lc u la te d ra tio , 1 .4 3 6 , is h igh er th a n the h a rm o n ic v a lu e a n d is close to th e b iflo rid e ion va lu e o f v\\jup ~ 1 .5 0 6 (c a lc d ) an d = 1 .4 2 (o b s d ) .
T h e sy m m e tr ic H 20 ----------- O H 2 s tretc h in g fre q u e n cy isc a lc u la te d fro m force c o n sta n t e v a lu a te d fro m th e c u r v a tu re o f th e grou n d s ta te en ergy (see F ig 4 ) 17 u sin g the h a rm o n ic o sc illa to r a p p ro x im a tio n . T h e c a lc u la te d
0 - 0 stre tch in g fre q u e n c y , 1/0-0 = 4 8 0 ± 120 c m ' 1, is av erag ed over o f six c a lc u la tio n s w ith th e 2 5 % sta n d a rd d ev ia tio n error d u e to th e lim ita tio n s o f th e n u m e ric a l p ro cedu re an d c o m p u te r r o u n d -o ff errors. T h e general a g re e m en t w ith e x p e r im e n ta l v a lu e (4 1 2 c m - 1 ) is good .
T h e lim ita tio n s o f th is lin e a r m o d e l o f H b o n d in g sh o u ld n o t be ov erlo o k ed , h ow ever. T h e first-o rd e r a p p ro x im a tio n s in v o lv in g th e s e p a ra tio n o f m o tio n o f large n u m b e r s o f p a rtic le s (e le c tro n s a n d n u cle i) h av e b een d is cu ssed earlier1 -18 a n d are ce rta in ly a p p a r e n t . P a rticu la rly in H 50 2+ , C h e m o u n i, et al.,12 h a v e n o ted th e stro n g c o u p lin g b e tw ee n th e en d O H b e n d in g v ib ra tio n (1 6 8 0 c m “ 1) an d th e a sy m m e tr ic H v ib ra tio n o f th e b rid ge (1 7 8 0 c m “ 1). T h u s , ou r c o m p a riso n s o f c a lc u la te d a n d ob served freq u en cies to 3 - 4 s ig n ific a n t figu res is p erh a p s n ot too m e a n in g fu l. S till , w e fee l we h a v e o b ta in e d co n sid era b le in sig h t in to th e d y n a m ic s o f th e H b o n d in g b y th e se m i- q u a n tita tiv e co rrelation o f (v ib r a tio n a l) s ta te s a n d b y ro u gh ly a c c o u n tin g for a n u m b e r o f o b serv a b le e ffe c ts .
A c k n o w le d g m e n t. W e are p le a s e d to a c k n o w le d g e th e N a tio n a l S cie n ce F o u n d a tio n (G r a n t N o . G P -3 1 7 25 ) for fin a n c ia l su p p o rt o f th is s tu d y . W e a lso w ish to th a n k D r .E . G . W e id e m a n n for h is h e lp fu l (w ritte n ) c o m m e n ts on
th e le a st-sq u a r e s fit o f th e S C F d a ta .
Supplementary Material Available. F ig u res 2, 3 , an d 4 w ill a p p ea r fo llow in g th ese p a g es in th e m ic ro film ed itio n o f th is v o lu m e o f th e jo u r n a l. P h o to c o p ie s o f th e s u p p le m e n ta ry m a te r ia l fro m th is p a p e r o n ly or m ic ro fich e (105 X 148 m m , 2 0 X re d u c tio n , n e g a tiv e s ) c o n ta in in g all o f th e s u p p le m e n ta ry m a te r ia l for th e p a p ers in th is issu e m a y be o b ta in e d fro m th e J o u rn a ls D e p a r tm e n t , A m e r ic a n C h e m ic a l S o c ie ty , 1 1 5 5 1 6 th S t . , N . W . , W a s h in g to n , D .C ., 2 0 0 3 6 . R e m it ch e ck or m o n e y order for $ 3 .0 0 for p h o to co p y or $ 2 .0 0 for m ic ro fic h e , referrin g to co d e n u m b e r J P C -7 3 -2 5 6 0 .
R e fe r e n c e s a n d N o te s
(1 ) G. J. Jiang and G. R. Anderson, J. Phys. Chem.. 77, 1764 (1973).(2) G. Zundel and E. G. Weidemann, Eur. Biophys. Congr. Proc.. 1st.
43 (1971).(3) P. Kebarle, S. K. Searles, A. Zolla, J. Scarborough, and M. Arshadi,
J. Amer. G hem. Soc , 89, 6393 (1967).(4) T. C. Waddington, Trans. Faraday Soc., 54, 25 (1958).(5) P. A. Kollman and L. C. Allen, J. Amer. Chem. Soc.. 92, 6101
(1970) .(6) W. Kraemers and G. Diercksen, Chem. Phys. Lett.. 5, 463 (1970).(7) R. Janoschek, E. G. Weidemann, H. Pfeiffer, and G. Zundel, J.
Amer. Chem. Soc.. 94, 2387 (1972).(8) G. C. Pimentel and A. L. McClellan, Ann. Rev. Phys. Chem.. 22,
358 (1971).(9) R. Blinc, D. Hadzi, and A. Novak, Z. Elektrochem.. 64. 567 (1960).
(10) R. D. Gillard and G. Wilkinson, J. Chem. Soc.. 1640 (1964).(11) A. C. Pivia and P. A. Giguere, J. Chem. Phys . 52, 355" (1970).(12) E. Chemouni, M. Fournier, J. Ragiere, and J. Potier, J. Chim.
Phys., 67, 517 (1970).(13) M. A. Haney and J. L. Franklin, J. Chem. Phys.. 50, 2028 (1967).(14) R. D. Gillard and G. Wilkinson, J. Chem. Soc.. 1640 (1964).(15) J. T. Mullplaupt and D. F. Hornig, J. Chem. Phys.. 24, "69 (1956).(16) W. C. Hamilton and J. A. Ibers, "Hydrogen Bonding in Solids," W.
A. Benjamin, New York, N. Y., 1968, p 116.(17) See paragraph at end of paper regarding supplementary material.(18) G. R. Anderson and E. R. Lippincott, J. Chem. Phys.. 55, 4077
(1971) .
The Journal of Physical Chemistry. Vol. 77, No. 21, 1973

2564 K. P. Anderson, E. A, Butler, and E. M. Woolley
The Complex Solubility of Silver Bromide in Ethanol-Water, Methanol-Water, Acetone-Water, and Dioxane-Water Mixtures
Keith P. Anderson, Eliot A. Butler, and Earl M. Woolley*
Department of Chemistry, Brigham Young University, Provo, Utah 84602 (Received January 29, 1973)
Publication costs assisted by *he Department of Chemistry, Brigham Young University
R e su lts o f a s tu d y o f th e so lu b ility o f silver b r o m id e a t 2 5 ° as a fu n c tio n o f b r o m id e ion c o n c e n tr a tio n in w ater, in 10, 20 , 3 0 , 40 , a n d 5 0 % b y w eig h t m e th a n o l-w a te r , e th a n o l-w a te r , a c e to n e -w a te r , a n d d io x a n e - w a ter m ix tu r e s , a n d in a 6 0 % b y w eig h t d io x a n e -w a te r m ix tu r e are p re sen te d . T h e s e re su lts w ere o b ta in e d w ith p re v io u sly e s ta b lish e d ra d iotracer te c h n iq u e s th a t are m o d ifie d to in c lu d e sp ec ific ion e le c
tro d e m e a su r e m e n ts . A ll o b serv e d so lu b ilitie s are in terp reted in te rm s o f th e p resen ce o f s ilv er io n s , u n d isso c ia te d silver b r o m id e m o le c u le s , d ib r o m o a rg e n ta te io n s, a n d tr ib ro m o a rg e n ta te io n s . V a lu e s o f th e th e r m o d y n a m ic e q u ilib r iu m c o n sta n ts re la tin g th e a c tiv itie s o f th ese sp ec ies to th e b r o m id e ion a c tiv ity are o b ta in e d b y a le a s > s q u a r e s tr e a tm e n t o f th e so lu b ility d a ta for e a ch so lv e n t m ix tu r e . T h e o b serv e d ch a n g es in th ese e q u ilib r iu m c o n sta n ts are d isc u sse d in te rm s o f e le c tro sta tic s th e o ry , so lv a tio n th e o ry , a n d o th er sp ec ific so lv e n t e ffec ts .
Introduction
T h e w ork rep orted in th is p a p er is a c o n tin u a tio n 1 '2 o f our stu d y o f th e so lu b ilitie s o f s lig h tly so lu b le silver sa lts as fu n c tio n s o f a n io n co n c e n tra tio n in a q u e o u s -n o n a - q u eo u s m ix tu r e s . T h e s o lu b ility o f s ilv er b r o m id e a n d th e v a rio u s e q u ilib r ia in v o lv e d h a v e b een in v e stig a te d in 0 , 10, 2 0 , 3 0 , 4 0 , a n d 5 0 % b y w eig h t e th a n o l-w a te r , m e th a n o l-w a te r , a c e to n e -w a te r , a n d d io x a n e -w a te r m ix tu res a n d in a 6 0 % d io x a n e -w a te r m ix tu re a t b r o m id e ion co n ce n tra tio n s b etw een 1 0 “ 9 a n d 1 0 “ 1 M. A ra d io tra c er te c h
n iq u e d esc rib ed p re v io u sly 2 w as u se d to d e te r m in e to ta l silver co n c e n tra tio n s . S ilv e r ion a c tiv itie s w ere m e a su red w ith an O rion M o d e l 9 4 -1 6 s i lv e r -s u lfid e sp e c ific ion e le c tro d e . O u r p u rp o se w as to d eterm in e q u a n tita tiv e ly th e effec ts o f th e c o m p o sitio n o f th e so lv e n t on th e c o n c e n tr a tio n s a n d e q u ilib r iu m c o n sta n ts o f th e s ilv e r -c o n ta in in g sp ec ies in so lu tio n a n d to in terp ret th ese e ffec ts .
Experimental Section
A ll c h e m ic a ls u se d w ere rea gen t grad e . S o lu tio n s w ere p rep ared fro m d o u b ly d istille d w a ter w h ich h a d a sp ec ific c o n d u c ta n c e < 1 .3 x 1 0 “ 6 o h m - 1 c m - 1 a t 2 5 ° . G a s ch ro m a to g ra p h ic a n a ly sis o f th e fou r organ ic so lv e n ts u sed in so lu tio n p rep a ra tio n s in d ic a te d th e a b se n c e o f w ater ( < 0 . 1 % ) a n d v o la tile organ ic im p u ritie s .
T h e m e th o d o f so lu tio n p re p a ra tio n , e q u ilib r a tio n , an d a n a ly sis h a s b e e n d e s c r ib e d .2 S o lu b ility d e te r m in a tio n s (2 5 ) , e a ch a t a d iffe re n t b r o m id e ion c o n c e n tr a tio n , w ere m a d e in each a q u e o u s -o r g a n ic m ix tu r e . T h e so lu b ility p ro d u c t c o n sta n t, K s, a sso c ia te d silver b r o m id e fo rm a tio n c o n sta n t, K lt a n d th e step w ise b ro m o a r g e n ta te ion fo r m a tio n c o n sta n ts , K 2 a n d K 3, w ere c a lc u la te d u sin g th e m o d ifie d le a st-sq u a r e s m e th o d o f d a ta tr e a tm e n t p re v io u sly o u tlin e d 2 -3 w ith th e in c lu sio n o f an ite ra tiv e p ro ced u re to a v o id u n e q u a l w eig h tin g o f d a ta . T h e n o ta tio n for th e v a rio u s eq u ilib r ia is th e g e n e ra lly a c c e p te d n o ta tion for co n sec u tiv e or ste p w ise c o n sta n ts . T h e m a ss b a lan ce e q u a tio n (e q l a , l b , a n d lc ) for th ese sy s te m s in -
[Agtotail = [ A g + ] + [ A g B r ] + [ A g B r 2~ ] + [ A g B r / - ]
(la)
!-A g t o t a l l
[Agtolal]
K,+
K,K,
[ Br]) !*)2 T0
A
+ K .K .K lB r-] +
K ,K 2K , K l B r ~ ]2
(Tr*)2
D [ B r ~]2
[B r ] ( T i * ) 2+ B + C [ B r ~ ] +
( y * f
(lb)
( lc )
e lu d es p re v io u sly d efin e d a c tiv ity c o e ffic ie n ts .1 A s c a n be seen in eq l b a n d l c , T o*, th e a c tiv ity c o e ffic ie n t o f th e u n ch a rg ed sp ec ies in an y so lv e n t m ix tu r e , is co n stra in e d to b e u n ity . T h is co n stra in t forces th e e ffe c t o f th e so lv e n t to a p p ea r as v a ria tio n s in B v a lu e s . V a lu e s for th e d e n s ities a n d d ie le ctric c o n sta n ts o f th e so lu tio n s w ere o b ta in e d b y in terp o la tio n o f d a ta as rep orted p r e v io u s ly .1 -2 T h e p o
te n tia l d ifferen ce b e tw ee n an O rio n M o d e l 9 4 -1 6 s ilv e r - su lfid e e lectro d e (w h ic h sen ses free silver ion in so lu tio n an d free su lfid e ion w h en silv er ion is a b s e n t) a n d a d o u b le -ju n c tio n c a lo m e l referen ce e lectro d e w a s m e a su red in e a ch e q u ilib r a te d so lu tio n . A n O rio n M o d e l 801 d ig ita l p H m e te r w as u sed to m e a su re th e p o te n tia l d iffe re n ce s . T h e s ilv e r -s u lfid e e le ctro d e w as c a lib ra te d to rea d silv er ion co n ce n tra tio n s b y m e a su r e m e n ts in s ta n d a rd A g N C >3 so lu tio n s o f th e sa m e organ ic so lv en t c o n te n t as th e e q u ilib ra te d sa m p le so lu tio n s . C o rrectio n s for io n ic s tren g th e f fec ts w ere m a d e .
T h e b r o m id e ion co n ce n tra tio n s w ere c a lc u la te d fro m to ta l b r o m id e m a s s -b a la n c e e q u a tio n s . A v a lu e fo r th e s o l u b ility p ro d u c t c o n sta n t for A g B r w as c a lc u la te d fro m th e e le c tro d e -d e te rm in e d silver ion a c tiv ity a n d th e b r o m id e ion a c tiv ity in e a ch o f th e e q u ilib r a te d so lu tio n s . V a lu e s o f K s d e te r m in e d in th is m a n n er agree w ith e a ch o th er w ith an average d e v ia tio n o f on ly a few h u n d re th s o f a lo g u n it so lo n g as th e m a s s -b a la n c e d e te r m in a tio n o f fre e -b ro m id e ion ca n b e m a d e re lia b ly . A t low fre e -b ro m id e ion c o n c e n tra tio n s th e c o n c e n tra tio n s o f o th er b r o m id e -c o n ta in in g sp ec ies are no lon g er n e g lig ib le in th e d e te r m in a tio n o f fre e -b ro m id e io n . F re e -b r o m id e ion c o n c e n tr a tio n s w ere c a lc u la te d in th is lo w -c o n c e n tr a tio n region u sin g v a lu e s o f th e m e a n so lu b ility p ro d u c t c o n sta n t a n d silv er ion a c t iv ities c a lc u la te d fro m se le c tiv e -io n e lectro d e re a d in g s . F re e -
The Journal of Physical Chemistry, Vol. 77, No. 21, 1973

Solubility of AgBr In Aqueous-Nonaqueous Mixtures 256S
b ro m id e ion c o n c e n tra tio n s a n d to ta l s ilv er c o n c e n tr a
tio n s4 w ere u sed to d e te r m in e e q u ilib r iu m c o n sta n ts b y a le a st-sq u a res f it o f th e d a ta to eq l c as d isc u sse d p re v io u s ly .1 2 In th e c a lc u la tio n s it h a s b een a ssu m e d th a t
7 2 * = ( 7 i * ) 4 -
Results and Discussion
T h e log v a lu e s for K 9, Kz, K 2, a n d Kz l is te d in T a b le I w ere c a lc u la te d fro m th e le a st-sq u a r e s so lu b ility cu rves. T h e B te rm o f T a b le I is K zK s/yo* a n d is e q u a l to th e m o la r co n ce n tra tio n o f th e u n d isso c ia te d A g B r sp ec ies in each so lu tio n . T h e v a lu e s o f - l o g B are p lo tte d us. th e re cip rocal o f th e d ie le c tr ic c o n sta n t o f th e so lv en t m ix tu res in F igu res 1 an d 2 . T h e d e v ia tio n o f B fro m its va lu e in pure w ater ap p ea rs to be to o large to b e a ttr ib u te d to e x p e r im e n ta l error. E x a m in a t io n o f F igu re 1 in d ic a te s th a t d ev ia tio n s are p o ss ib ly c a u se d b y s o lv e n t -s o lv e n t in tera c tio n s .5 I f it is su p p o se d th a t th e p ro d u c t K zK s is c o n sta n t in al_ so lv e n t m ix tu r e s , th e n v a r ia tio n s in B (B = K zK s/ 7 0 * ) can b e in terp reted in te rm s o f d ifferen ces b etw een 7 o* a n d 7 0 . w h ere 7 0 is th e a c tiv ity co e ffic ie n t o f th e u n ch arged sp ec ies in w a ter so lv e n t. A n a ssu m e d c o n sta n c y o f KiK* im p lie s th e ch o ice o f a s o lv e n t -in d e p e n d e n t s ta n
dard sta te for th e u n d isso c ia te d A g B r m o le c u le s so th a t v a ria tio n s in th e v a lu e o f Kz w ith so lv e n t c o m p o sitio n re fle ct ch a n g es in th e s u m o f th e s ta n d a rd c h e m ic a l p o te n
tia ls o f A g + a n d B r ~ , w h ile v a ria tio n s in th e v a lu e o f K 2
w ith so lv en t c o m p o sitio n re fle ct ch a n g es in th e d ifferen ce b etw een th e s ta n d a rd c h e m ic a l p o te n tia ls o f B r~ a n d A g B r 2~ . T h e e ffe c t o f h o ld in g K zK s c o n sta n t is to s u b tra c t o u t th e n o n lin e a r e ffe c ts th a t are a p p a r e n tly a sso c iated w ith th e u n c h a rg ed sp e c ie s .5 T h u s p lo ts o f lo g K 2 vs. so lv en t c o m p o sitio n sh o w g re a tly im p ro v e d lin e a rity w h en K i K s is ta k e n to b e c o n sta n t. (S e e F ig u res 1 -3 . ) T h e v a lu es o f log Kz a n d lo g K 2 g iven in T a b le I are th o se c a lc u la ted u sin g th e a s su m p tio n th a t K zK s is a lw a y s e q u a l to its v a lu e in pure w a te r . V a lu e s o f log K 3 lis te d in T a b le I are in d e p e n d e n t o f th is a ssu m p tio n .
T h e v a lu es w e rep ort in T a b le I for pure w ater are in good a g re e m en t w ith v a lu es fro m th e lite ra tu re . T y p ic a l v a lu es o f log K s are — 12.27 ,® - 1 2 . 3 ,7 a n d - 1 2 . 5 4 s c o m p ared to ou r v a lu e o f — 1 2 .4 6 . O u r v a lu e s o f 6 .0 9 for log K 1
an d —6 .3 7 for lo g B in d ic a te th a t th ere is so m e w h a t m ore u n d isso c ia ted A g B r in so lu tio n th a n oth ers h av e o ften su g g e ste d . P rev io u s w orkers h a v e rep orted v a lu e s o f lo g K± o f 4 .23 ,® 4 .1 5 ,9 a n d 5 .0 8 .10 O n th e oth er h a n d , th e v a lu es w e give in T a b le I for log K 2 a n d log Kz in d ic a te th a t we fou n d so m e w h a t s m a lle r a m o u n ts o f A g B r 2 ~ a n d A g B r 32 ~ in so lu tio n th a n h a d b een rep orted p re v io u sly . A m o n g v a lu es rep o rted in th e litera tu re are th e fo llo w in g ; log K 2 '.3.0,® 2 .5 ,7 2 .0 ,8 3 .0 ,9 a n d 3 .4 ;11 log K 3: 1.4,® 1 .2 ,7 an d O .9 .8
T h e r e is m u c h less in th e lite ra tu re on v a lu es o f th e va rio u s e q u ilib r iu m c o n sta n ts in m ix e d so lv e n ts . K r a to h - vil a n d T e z a k 8 rep ort v a lu es o f K s (e s t im a te d ) , K 2, an d Kz in 3 0 % a n d 5 0 % e th a n o l-w a te r , 6 2 % m e th a n o l-w a te r , and in 4 8 .5 % a c e to n e -w a te r th a t are c o n siste n t w ith our resu lts . M o r e re c e n tly it h a s b een rep o rte d 12 th a t log K s b e c o m es m o re n e g a tiv e b y a b o u t 1 .0 b y c h a n g in g from w ater to a 4 0 % a c e to n e -w a te r so lv e n t , w h ich is a lso in a g re e m en t w ith ou r re su lts .
Log Kz (-log K s) vs. l/D data fit straight lines constrained to pass through the water point fairly well. However, There appears to be no way to rationalize the inclusion cf the water points for a straight line fit for log K 2
and log K3 data.
TABLE I: Equilibrium Constants in the Solvent Mixtures“
wt%non-
aqueouscom- Dielectric
ponent constant -L ogK s Log K2 Log K3 -L o g S % SD6
A. Ethanol-Water Mixtures0.00 78.54 12.46 0.45 2.10 5.37 10.69.67 72.99 12.52 1.74 0.70 8.14 16.3
19.86 67.08 12.80 1.87 0.69 6.88 25.234.47 58.37 13.00 2.43 -0 .1 4 6.84 31.942.15 53.66 13.12 2.62 -0 .5 5 6.83 34.754.23 46.66 13.71 2.74 0.34 6.06 28.4
B. Methanol-Water Mixtures9.47 74.36 12.69 1.11 0.60 6.95 13.2
19.84 69.28 12.84 1.88 0.95 6.66 27.634.48 62.19 12.99 1.76 1.00 6.71 19.142.10 58.61 13.22 2.25 -0 .0 8 7.76 37.854.20 52.88 13.50 2.12 0.84 6.31 25.4
C. Acetone-Water Mixtures9.64 73.28 12.52 1.79 0.64 >3.5 22.4
19.80 67.73 12.99 2.03 0.75 3.47 7.234.43 59.17 13.23 2.73 0.40 7.31 21.042.08 54.41 13.47 3.12 0.06 7.65 12.054.15 46.87 13.49 3.72 -0 .5 2 6.92 17.7
D. Dioxane-Water Mixtures8.24 71.28 12.42 0.47 2.47 6.36 32.3
20.47 60.37 12.70 2.26 0.36 6.56 26.528.49 53.24 12.48 2.50 -0 .0 4 6.12 15.340.75 42.33 12.84 3.02 -0 .4 8 5.71 18.148.75 35.25 12.98 3.28 -0 .5 6 6.18 19.960.73 25.24 13.25 3.89 < - 0 .6 6.52 17.5
a The assignment of meaningful values of uncertainties to be associated with our reported values of equilibrium constants Is a difficult problem. The values we report here are given to what we consider to be a “reasonable” number of significant figures. * Relative (percentage) standard deviation of the experimental solubility data from the least-squares calculated solubility curve of eq 1.
T h e slo p es for th e log K 1 ( - l o g K s) vs. l/D curves (T a b le II) a p p ea r to b e in v ersely p ro p o rtio n a l to th e m o la r v o lu m e o f th e orga n ic c o m p o n e n t a n d d ire c tly p ro p o rtio n al to its d ip o le m o m e n t as o b serv e d for A g C l s o lu t io n s .1
M e t h a n o l-w a te r (s lo p e = 175 , m o la r v o lu m e = 4 0 .5 , d i p ole m o m e n t = 1 .7 0 ) is u sed as th e referen ce so lv e n t to c a lc u la te v a lu es o f th e s lo p es for th e o th er so lv en ts in eq 2, 3 , a n d 4 .
175
1 7 5 x S I x tS = 1 2 0 (ethanol) (2 )58.5 1.7040 5 9 «Q
175 X X = 164 (acetone) (3)
405 x (0655)^,, = (32Wasd (dioxane) (4)85.2 1.70
T h e resu lts for e th a n o l- , m e th a n o l- , a n d a c e to n e -w a te r m ix tu res are in go od a g re e m en t w ith th o se rep orted for A g C l so lu tio n s . T h e s lop es d iffer for th e tw o so lu tes , p o s sib ly in d ic a tin g a d ifferen ce in th e ra d ii o f th e ch lorid e an d b r o m id e io n s. A p p a r e n tly th e b r o m id e io n , b ein g so m e w h a t larger th a n th e ch lo rid e ion , is a ffec te d b y both o f th e o x y g en s in d io x a n e ra th er th a n ju s t on e as w a s su g gested b y th e e x p e r im e n ta l re su lts for A g C l .1
I f th e p o in t for w ater as so lv en t is o m itte d , th e p lo ts o f log K 2 an d log Kz us. 1 0 0 /D are a p p ro x im a te ly lin e a r . T h e
The Journal of Physical Chemistry, Voi. 71, No. 21, 1973

2566
Figure 1. Plots of 6b = log B (water) - log 6 (solvent) + 2.00 and 5S = log Ks (water) — log Ks (solvent) accord ing to the Born electrostatic m odel:1 • , solvent = water; O solvent = e thano l-w ate r m ixtures; A , solvent = m ethanol-w ater m ixtures; X, solvent = ace tone-w ater m ixtures.
Figure 2. Plots of 5b = log B (water) — log B (solvent); 5S = log Ka (water) - log Ka (solvent) + 0.60, 63 = log K3 (water) - log K3 (solvent) + 2.50, and 52 = log K2 (solvent) — log K2 (water) + 1.50 according to the Born e lectrosta tic m odel:1 • , solvent = water; □ and ■ , solvent = d loxane-w ater m ixtures.
TABLE II: Slopes of Plots of log K vs. 1 / D (Figures 1-3)
MeOH EtOH Acetone Dioxane
— Log K s an d log K 1 175 120 1 9 1 “ 32Log K 2* 2 5 2 “ 1 8 8 ° 28 3 8 9 “- L o g K 3b 1 6 9 ° 2 7 2 “ 189 7 7 “
“ The 50% point is omitted. b The 0% point is omitted. “ The 10% and 60% points are omitted.
K. P. Anderson, E. A. Butler, and E. M. Woolley
F igure 3. Plots of 52 = log K 2 (solvent) - log K 2 (water) + 2.40 and 53 = log K3 (water) - log K 3 (solvent) accord ing to the Born e lectrosta tic m odel:1 • , solvent = water; O , solvent = e thano l-w ate r m ixtures; A , solvent = m ethano l-w ate r m ixtures; X, solvent = ace tone-w ater m ixtures.
fa c t th a t p o in ts for w ater d o n ot lie on th ese lin es su g g e sts th a t th e a d d itio n o f th e n on 'aq ueous c o m p o n e n t p o ss ib ly ca u ses a d ra stic ch a n ge in so m e p ro p erty o f th e sp ec ies in so lu tio n su ch as so lv a tio n , e ffec tiv e ion ic ra d ii, or e ffec tiv e d ielectric c o n sta n t o f th e so lv en t n ear th e so lu te sp ec ies .
O n e ca n use th e tr e a tm e n t o f M a r s h a ll13 to try to e s t i m a te v a lu es o f th e h y d ra tio n n u m b e r s o f th e several sp ec ies p resen t as w as d on e p re v io u sly w ith A g C l d a t a .1
H o w e v e r, th is a p p ro a c h lea d s to n eg a tiv e v a lu e s for h y d ra tion n u m b e r s for so m e o f th e sp ec ies . It sh o u ld a lso be n o ted th a t th e v a lid ity o f th is a p p ro a c h h a s b e e n c h a llen g ed b y M a th e s o n .14
A cknow ledgm ent. W e are g ra tefu l to th e B r ig h a m Y o u n g U n iv e rs ity R e sea rch D iv is io n a n d to th e N D E A T itle IV F e llo w sh ip p ro gra m for su p p o rt o f p a r t o f th is w ork.
Supplem en tary M aterial A vailable. S o lu b ility d a ta c o n sistin g o f [B r_ ], [A g (to ta l)] , an d ionic stren g th s o f e q u ili b ra ted so lu tio n s w ill a p p ea r fo llo w in g th ese p a g es in th e m ic ro film ed itio n o f th is v o lu m e o f th e jo u r n a l. P h o to co p ies o f th e su p p le m e n ta ry m a te r ia l fro m th is p a p e r on ly or m ic ro fich e (1 0 5 X 148 m m , 20 X re d u c tio n , n e g a tiv e s) co n ta in in g a ll o f th e su p p le m e n ta r y m a te r ia l for th e p a pers in th is issu e m a y be o b ta in e d fro m th e J o u rn a ls D e p a r tm e n t, A m e r ic a n C h e m ic a l S o c ie ty , 115 5 1 6 th S t . ,N .W . , W a s h in g to n , D . C . 2 0 0 3 6 . R e m it ch e ck or m o n e y order for $ 3 .0 0 for p h o to c o p y or $ 2 .0 0 for m ic ro fic h e , re fer ring to code n u m b e r J P C -7 3 -2 5 6 4 .
References and Notes(1) K. P, Anderson, E. A. Butler, and E. M. Woolley, J. Phy.s. C h e m .
75,93(1971).(2) K. P, Anderson, E. A. Butler, D. R. Anderson, and E. M. Woolley, J.
Phys. Chem.. 7 1 , 3566 (1967).(3) (a) K. P. Anderson and R. L, Snow, J. Chem. Educ., 44, 756
The Journal of Physical Chemistry. Vol. 77. No. 21. 1973

Diffusion Coefficients of Tetrabutylammonium Halides in Water
( 1 9 6 7 ) ; (o ) T. P. K o h m a n , ibid.. 4 7 , 6 5 7 ( 1 9 7 0 ) .(4) S e e p a r a g r a p h a t e n d o f p a p e r r e g a r d i n g s u p p l e m e n t a r y m a t e r i a l .
(5) K . P. A n d e r s o n , E. A . B u t l e r , a n d E. M . W o o l l e y , J. Phys. Chem.. 7 1 , 4 5 8 4 ( 1 9 6 7 ) .
(6 ) D . D . W e g m a n , W . H. E v a n s , V . B. P a r k e r , I. H a l o w , S . M . B a i l e y , a n d R. H. S c h u - n m . Nat. Bur. Stand. Tech. Note. N o . 2 7 0 - 3( 1 9 6 8 ) ; N o . 2 7 0 - 4 ( 1 9 6 9 ) .
( 7 ) L. G . S i l l e n a n d A . E. M a r t e l l , " S t a b i l i t y C o n s t a n t s o f M e t a l - I o n C o m p l e x e s , " T h e C h e m i c a l S o c i e t y , L o n d o n , 1 9 6 4 .
(8 ) J . K r a t o h v i l a n d B . T e z a k , Ark. Kemi , 2 6 , 2 4 3 ( 1 S 5 4 ) .
2567
(9) K. B. K a t s l m i r s k i l a n d V . P. V a s M ' e v , " I n s t a b i l i t y C o n s t a n t s o f C o m p l e x C o m p o u n d s , " R u s s i a n T r a n s l a t i o n , C o n s u l t a n t s B u r e a u , N e w
Y o r k , N . Y „ 1 9 6 0 .( 1 0 ) J . K r a t o h v i l , B. T e z a k , a n d V . B. V o u k , Ark. Kemi. 2 6 , 1 9 1 ( 1 9 5 4 ) .( 1 1 ) Ft. A l e x a n d e r , E. C . F . K o , Y . C . M a c , a n d A . J . P a r k e r , J. Amer.
Chem. Soc.. 8 9 , 3 7 0 3 ( 1 9 6 7 ) , in c o n j u n c t i o n w it h d a t a f r o m r e f 6 .
( 1 2 ) C . B a r r a q u é , J. V e d e l , a n d B. T r é m i l l o n , Bull. Soc. Chim Fr.. 3 4 2 1 ( 1 9 6 8 ) .
( 1 3 ) W . L. M a r s h a l l , J . Phys. Chem.. 7 4 , 3 4 6 ( 1 9 7 0 ) .( 1 4 ) R. A . M a t h e s o n , J. Phys. Chem.. 7 3 , 3 6 3 5 ( 1 9 6 9 ) .
Diffusion Coefficients of Tetrabutylammonium Halides in Water at 25°1 2
Hyoungman K im ,* Arnold Revzin,3 and Louis J. Gosting4
Institute for En zy me Research and Department of Chemistry, University of Wisconsin. Madison, Wisconsin 53 706
(Received October 27, 1972; Revised manuscript received June 18. 1973)
Publication costs assisted by the National Institute of Arthritis and Metabolic Diseases
Diffusion coefficients measured with a new optical diffusiometer are reported for tetrabutylammonium halides (BU4NX) in water at 25°. The concentration range studied extended up to 0.6 M for BU4NCI, 0.8 M for Bu4NBr, and 0.06 M for the less soluble BU4NI. The diffusion coefficients for a given concentration decreased with increasing anion size while the mobility terms, which were obtained by dividing the diffusion coefficients by a thermodynamic term, showed the reverse order. Refractive index derivatives were also determined as well as density data from which partial molal volumes were computed.
IntroductionIn recent years, there has been much interest in the
physical chemical properties of tetraalkylammonium halides in aqueous solution. A large number of experimental results on both the equilibrium and the transport behavior of these materials has been published. These results have shown that the larger tetraalkylammonium ions significantly increase the degree of structure among neighboring water molecules. There are also cation-cation as well as cation-anion interactions in solutions of tetrabutyl- and tetraamylammonium salts, although the detailed mode of interaction is not known.
The present study provides another of the fundamental transport properties, the isothermal diffusion coefficients of tetrabutylammonium chloride, bromide, and iodide. It is hoped that these diffusion coefficients can be combined with activity data and with other transport properties such as the conductance and transport numbers, to compute the ionic transport coefficients, which have been described by Miller. 5 The ionic transport coefficients may give better insight into the nature of ionic interactions than either conductivity or diffusion data alone. 6 ' 7
As a by-product of the diffusion experiments, we have also obtained refractive index derivative and density data; from the latter we have computed the partial molal volumes of the tetrabutylammonium halides.
Experimental SectionM aterials. Tetrabutylammonium chloride, bromide,
and iodide were obtained from Eastman Organic Chemicals. Both tetrabutylammonium bromide, Bu4NBr, and
tetrabutylammonium iodide, BU4NI, were re crystallized three or more times from once-distilled acetone. Tetrabutylammonium chloride, BU4NCI, was first dissolved in once-distilled acetone and then was precipitated by adding purified ether. Recrystallization was performed three times. All salts were dried in the vacuum oven for at least 1 week and then were stored in a vacuum desiccator over P2O5. For the highly hygroscopic BU4NCI, the transfer into a weighing bottle was made in a polyethylene glove bag (Instruments for Research and Industry, Cheltenham. Pa.) filled with dry nitrogen gas. The molecular weights used are 277.925 for BU4 NCI, 322.376 for Bu4 NBr, and 369.376 for Bu4NI.
All solutions were prepared with distilled water which had been further purified with a Barnstead water purifier and then saturated with air. The density values used to calculate the air-buoyancy corrections in preparing the solutions were 1.1 for BU4NCI and Bu4NBr, 1.5 for BU4NI, and 8.4 for the metal weights.
D iffusion E xp erim en ts . All diffusion measurements were performed on a new optical diffusiometer, using procedures similar to those used with previous instruments. 8
A detailed description of the new device will be given elsewhere;9 here we shall describe only its main features.
The heart of the instrument is a rigid steel beam, 884 cm in length, to the top of which are bolted accurately- aligned stainless steel dove-tailed ways. All optical components (light source, lens, water bath windows, diffusion cell, cylinder lens, and camera) are firmly supported on the ways. Owing to its heavy weight, the water bath is not supported by the beam but instead is bolted to the floor
The Journal of Physical Chemistry. Voi. 77. No. 21. 1973

2568 H. Kim, A. Revzin, and L. J. Gosting
and ceiling of the laboratory. Watertight seals between the windows and the bath itself are formed with flexible rubber bellows which allow minor movements of the water bath relative to the ways without inducing strains.
Illumination was provided with a GE H-100A4 mercury vapor lamp fitted with a Kodak Wratten 77A filter, which emits light at a wavelength of 5460.7 A (in air). The source slit can be made precisely horizontal or vertical as required. Our experiments were performed using a single main collimating lens of focal length about 145 cm; the optical lever arm, b, was about 309 cm. The cylinder lens is mounted in a special housing which permits it to be swung out of the light path (for Gouy experiments) or into an accurately reproducible position in the light path (for Rayleigh measurements).
Diffusion cells used were the glass and fused quartz Tiselius type and had cell dimensions, a, along the optical axis of about 2.5 cm. The initial boundary between the upper and lower solutions was formed by siphoning through a single stainless steel capillary or a single platinum capillary. For both 5-corrections and the fractional part of the total number of fringes, photographs were taken on Kodak Metallographic glass plates. During free diffusion, 6 to 12 photographs of Gouy fringes were taken on Kodak Spectroscopic IIIG glass plates. One or two Rayleigh photographs were also taken. An unusual property of BU4NCI is that the density of its aqueous solution is less than that of pure water and decreases with increasing concentration. Therefore, the upper solution must be more concentrated than the lower solution, and the Gouy fringes lie a b ove the undeviated slit image in contrast to the usual case.
The measurements of the photographic plates were made with a photoelectric null indicator1 0 ' 1 1 mounted on a Gaertner Model M2001RS-B Toolmakers’ microscope. This microscope is provided with two encoders and each axis position is displayed on a Tyco Digi-Point Readout to the nearest 0.0001 cm. The Digi-Point readout is connected to an IBM No. 29 keypunch through an interface (Instrumentation Systems Center, University of Wisconsin) and the displayed numbers on the Digi-Point Readout were directly punched onto data cards. The calculations were made with a Univac 1108 digital computer at the University of Wisconsin Computation Center.
The temperature of the water bath was measured during diffusion with a mercury-in-glass thermometer which had been calibrated against a platinum resistance thermometer. The temperature of the water bath during diffusion runs was within ±0.005° of 25° and never fluctuated by more than 0.003° during a run.
The density of each solution was measured in triplicate with single-neck pycnometers of volume about 30 ml in a water bath maintained at 25°.
Results and DiscussionTables I, II, and III present the diffusion coefficients
and other data from experiments cn BU4NCI, Bu4NBr, and BU4NI, respectively. In these tables c and C are the mean solute concentrations (the average for the upper and lower starting solutions) expressed in g/ 1 0 0 ml and mol/1 ., respectively, Ac is the initial concentration difference between the upper and lower solutions, J is the total number of fringes, (An/Ac) is the refractive index derivative, and (D)v is the mutual diffusion coefficient for the volume- fixed frame of reference. Also given in Tables I and II are values for the mobility term, i l l , which is expressed by the
Figure 1. D X 105 p l o t t e d a g a i n s t V C f o r t e t r a b u t y l a m m o n i u m
h a l i d e s in w a t e r a t 2 5 ° : O , B U 4 N C I ; A , B u 4 N B r ; □ , B U 4 N I ; • ,
B u 4 N B r b y P e p e l a , S t e e l a n d D u n l o p . 15
following equation. 12
3TI = --------- - --------- = ----------— ---- ----- (1 )1 + C d In y/ d C I + m d In 7 /dm
In eq 1, (D ) 0 is solvent-fixed mutual diffusion coefficient, m is the molality, and y and 7 are the activity coefficients on the molar and molal scales, respectively. Values of [1 + m d In 7 /dtn], evaluated using the molal activity coefficients given by Lindenbaum and Boyd1 3 are also given in Tables I and II. Activity data for BU4NI are not available.
Figure 1 shows the variation of (D)v with n/ C for the three systems studied. The low solubility of BU4NI restricts the concentration range over which we could study this salt. The limiting diffusion coefficients at infinite dilution were calculated using the Nemst equation and they are found to be 0.8205 x 10* 5, 0.8244 x 10*5, and0.8217 X 10* 5 for BU4NCI, Bu4NBr, and BU4NI, respectively. The limiting equivalent conductivities were taken to be1 4 19.31 for BU4NU 76.39 for Cl- , 78.22 for Br~, and 76.98 for I*. The limiting diffusion coefficients for the three salts studied here are equal within about 0.5% because the limiting equivalent conductivities of the anions are very nearly the same.
The filled circles in Figure 1 are the diffusion coefficients of Bu4NBr obtained by Pepela, Steel, and Dunlop1 5
using shearing interference optics. 1 6 It can be seen that results from the shearing diffusiometer and the Gouy method agree within the precision of the former.
The concentration dependence of the density, d, at 25°, is given by the expressions
d = 0.99707 - 5.30 X 10*4c + 4.25 X10*5c3/2 (for Bu4NCl)
d = 0.99707 + 6.44 X 10*4c + 4.34 X10~V/2 (for Bu4NBr)
and
d = 0.99707 + 1.56 X 10*3c (forBu4NI)
where d is expressed in g/ml and c is in g/100 ml. In these expressions, 0.99707 is the rounded value of the density of pure water at 25° while the coefficients of c and c 3'2 were determined by the method of least squares. The average deviation of the measured densities from these functions is less than 0 .0 2 %.
Figure 2 presents the apparent molal volumes, 0V, and the partial molal volumes, V, for BU4NCI and Bu4NBr,
The Journal of Physical Chemistry, Vol. 77, No. 21, 1973

Diffusion Coefficients of Tetrabutylammonium Halides in Water 2569
TABLE I: Experimental Results for Bu4NCI in Water at 25°
c ,
g / 1 0 0ml
C ,m o l / l .
- A c ,g / 1 0 0
m l
( A n / A c ) x 1 o 3,
( g / 1 0 0m l) - 1
( D ) v X 1 0 s , c m 2/ s e c
1 + md l n y / d m
3TI X 1 0 5 ,
c n 2/ s e c
0 .7 2 0 0
1 .1 7 5 82 .4 7 8 0
4 .8 1 2 2
7 .7 2 1 3
‘ 3 .3 7 7 9■ 6 .4 9 1 5
0 .0 2 5 9 00 .0 4 2 3 1
0 .0 8 9 1 6
0 .1 7 3 1 50 ,2 7 7 8 2
0 .4 8 1 3 5
0 .5 9 3 3 8
0 .0 2 6 1 80 .0 4 2 9 7
0 .0 9 1 8 2
0 .1 8 2 9 1
0 .3 0 3 1 60 .5 6 0 9 4
0 .7 1 8 1 8
0 .7 7311.2251
0 .6 5 6 0
0 .7 7 2 7
1 .3 8 7 50 .5 8 7 9
3 .5 8 3 5
5 9 .1 8
9 3 .9 8
5 0 .7 26 0 .4 3
1 0 9 .9 9
47 .512 9 3 .1 4
1 .6 6 7 0
1 .6 7 0 61 .6 8 3 8
1.7031
1 .7 2 6 3
1 .7 5 9 91 .7 8 1 5
0 .7 3 5 30 .7 1 4 2
0 .6 7 0 10 .6 1 9 5
0 .5 7 2 50 .5 0 6 4
0 .4 7 8 7
0 .9 4 30 .9 2 7
0 .9 0 6
0 .8 9 60 .8 8 70 .9 4 4
0 .9 7 9
0 .7 8 00 .7 7 0
0 .7 4 00 .6910 .6 4 5
0 .5 3 60 .4 8 9
TABLE II: Experimental Results for Bu4NBr in Water at 25°
g / 1 0 0 ml
C ,
m o l / l .
A c ,
g / 1 0 0 ml
( A n / A c ) X 1 0 3 ,
( g / 1 0 0 m l) -( D ) v X 1 0 5 ,
c m 2/ s e c
1 + m d i l n ' y / d m
3 t l X 1 0 5 ,
c m 2/ s e c
C.8131 0 .8 1 3 1
1 .6 3 0 9
2 .4 0 3 5 4 .8 2 1 4
9 .1 3 3 6
1 3 .5 2 8 0 1 8 .0 6 4 6 2 2 .5 1 3 4
2 5 .7 8 9 2
0 .0 2 5 2 20 .0 2 5 2 2
0 .0 5 0 5 9
0 .0 7 4 5 5
0 .1 4 9 5 60 .2 8 3 3 2
0 .4 1 9 6 3
0 .5 6 0 3 50 .6 9 8 3 5
0 .7 9 9 9 6
0 .0 2 5 4 9
0 .0 2 5 4 90 .0 5 1 5 2
0 .0 7 6 4 90 .1 5 7 0 3
0 .3 1 0 3 90 .4 8 0 8 7
0 .6 7 4 0 0
0 .8 8 2 8 6
1 .0 5 0 8 3
0 .8 1 9 2
1 .6 2 6 2
0 .7 9 7 9
0 .6 7 8 00 .6 0 4 5
1 .2 6 5 51 .2 6 5 6
1 .2 5 7 5 0 .7 1 6 4
0 .7 0 2 3
5 8 .3 6
1 1 5 .8 85 7 .3 4
4 8 .6 2
4 3 .8 6 9 3 .3 3 9 4 .5 2
9 4 .8 6 5 4 .2 5
5 3 .4 6
1 .5 6 0 01 .5 6 0 4
1 .5 6 5 0
1 .5 7 0 31 .5 8 8 81 .6 1 4 91 .6 3 5 4
1 .6 5 1 81 .6 5 8 2
1 .6 6 6 7
0 .7 2 5 8 “0 .7 2 2 5 “
0 .6 8 6 0
0 .6 5 6 60 .5 8 8 80 .5 0 6 0
0 .4 4 6 8
0 .3 9 8 10 .3 5 4 80 .3 2 7 7
0 .8 9 50 .8 9 5
0 .8 4 50.831
0 .7 9 00 .7 11
0 .6 8 7
0 .6 9 00 .6 8 2
0 .6 6 4
(0 .8 1 2 )*
0 .8 1 2
0 .7 9 00 .7 4 50 .7 1 2
0 .6 5 0
0 .5 7 7
0 .5 2 00 .4 9 4
“ T h e t w o e x p e r i m e n t s a t c = 0 . 8 1 3 1 s h o w e d b e h a v i o r w h i c h i n d i c a t e d a c o n c e n t r a t i o n d e p e n d e n c e o f ( D ) v a n d / o r d n / d c a c r o s s t h e d i f f u s i o n b o u n
d a r y . T h u s t h e v a l u e s g i v e n in t h e " D ” c o l u m n a r e n o t d i f f e r e n t i a l d i f f u s i o n c o e f f i c i e n t s b u t a r e r e d u c e d h e i g h t - a r e a r a t i o s , D a , [L. J. G o s t i n g a n d H. F u j i t a , J. Amer. Chem. Soc., 7 9 , 1 3 5 9 ( 1 9 5 7 | ) . A p l o t o f d a vs. ( A c ) 2 w a s e x t r a p o l a t e d t o A c = 0 t o y i e l d t h e d i f f e r e n t i a l d i f f u s i o n c o e f f i c i e n t o f 0 . 7 2 6 9 X 1 0 ~ 5 c r r 2 / s e c a t t h i s c o n c e n t r a t i o n [ P . J. D u n l o p a n d L. J . G o s t i n g , J . Amer. Chem. Soc.. 7 7 , 5 2 3 8 ( 1 9 5 5 ) J. ° U s i n g t h e d i f f e r e n t i a l d i f f u s i o n c o e f f i c i e n t a b o v e .
TABLE III: Experimental Results for Bu4»JI in Water at 25°
c ,g / 1 0 0
ml
C ,m o l / l .
A c ,
g/100ml
( A n / A c )X 1 0 3 ,( g / 1 0 0 ( 0 ) v X 1 0 5 ,
m l ) - 1 c m 2/ s e c
0 .2 5 7 60 .4 0 6 2
0 .6 3 4 2
0 .7 9810 .9 9 3 2
1 .2 3 9 4
1 .5 8 6 2
2 .1 3 4 9
0 .0 0 6 9 8
0.011000 .0 1 7 1 7
0 .0 2 1 6 0
0 .0 2 6 8 90 .0 3 5 5 50 .0 4 2 9 4
0 .0 5 7 8 0
0 .4 0 6 4
0 .6 0 9 2
0 .6 7 8 8
0 .9 9 4 9
0 .9 2 5 6
1 .4 7 9 90 .7 5 2 20 .7 1 7 2
2 9 .2 0 4 3 .7 7
4 8 .3 0
7 1 .5 8
6 6 .5 0
1 0 6 .5 954 .21 5 1 .7 6
1 .5 6 4 71 .5 6 4 7
1 .5 6 5 6 1 .5 6 6 8
1 .5 6 7 0
1 .5 6 8 6
1 .5 6 9 5 1 .5 7 1 7
0 .7 6 1 3
0 .7 4 4 30 .7 2 5 0
0 .7 1 3 2
0 .6 9 8 0
0 .6 8 2 00 .6 6 3 3
0 .5 3 4 8
calculated from the density values using the equations
1 /1000 + m M(pv = m \
and
V = <pv +
d
1000 - C0,
1000\d 0 )
2000 + c Y cd(/>v
d f c
i cd<ftv
dVC
where M is the molecular weight of the solute and do is the density of pure water. The values of d$v/dv/C were obtained from the slopes of 4>v v s . V C curves. The apparent and partial molal volumes of Bu4NI did not change within the small concentration range studied and the average value obtained is 312.5 ml/mo,. Our </>v and V values check very closely with corresponding results of Wen and Saito17 for Bu4NBr.
Figure 2. A p p a r e n t a n d p a r t i a l m o l a l v o l u m e s j m l / m o l )
B u 4 N C I a n d B u 4N B r p l o t t e d a g a i n s t C : O , <j>v ; • , V ; □ a n d
W e n a n d S a i t o . 16
o f
It is of interest to compare the concentration dependence of the diffusion coefficients of these tetrabutylammonium halides with that of more familiar 1-1 electrolytes such as the chlorides, bromides, and iodides of potassium and sodium. For the latter electrolytes the diffusion coefficients initially decrease, bottom out, and then
The Journal of Physical Chemistry, Vol. 77, No. 21, 1973

2570 H. Kim, A. Revzin, and L. J. Gosting
00 “ ~01 1 02 J 03 ' 04 ' 05 “ ~06 ^ 0 7 ^O B 0.9
Figure 3. 91T X 105 and iJTI (T7/ 170) X 10s plotted against V C : O, 9TI for Bu4NCI; A , 3TC for Bu4NBr; • , yil(v/vo) for Bu4NCI; ▲ , 3Tt (77/ 770) for Bu4NBr.
increase with increasing concentration.18-21 The magnitude of the initial decrease in (jD)v is largest for the chlorides and smallest for the iodides, and at higher concentrations (D)v values for iodides are always larger than those for bromides which, in turn, are larger than those for chlorides. Identical trends are observed for the concentration dependencies of activity coefficients. It is striking that the ordering of diffusion coefficients and of activity coefficients for tetrabutylammonium halides is opposite to that of the “ simple” electrolytes as described above.
The fact that the limiting equivalent conductivities of Cl- , Br- , and I- have nearly identical values is attributed to ionic hydration, with the extent of hydration increasing in the order I- < Br- < Cl- , thus making the sizes of the hydrated anions about the same.22 This hydration effect alone, however, should give an order of activity coefficients opposite to the experimentally found order for both potassium and sodium halides.23-24 To explain this observation, Diamond22 proposed a type of ion pairing “ through the agency of the water molecules,” with the extent of ion-pair formation in the order of NaCl > NaBr > Nal (or KC1 > KBr > KI).
The ordering of the dependence of A on C for tetrabutylammonium halides which has an order opposite to that for the alkali halides has been also explained in terms of ion-pair formation; it was proposed that the extent of ionpairing, unlike to alkali halides, increases with the anion size.13 The conductance data of tetrabutylammonium halides at low concentrations have been discussed in the same terms.14
The interpretation of diffusion data, especially at higher concentrations, is more complicated because (D)v contains both mobility and thermodynamic terms. The mobility term obtained using eq 1 depends on a large number of factors, such as long range Coulombic effects, electrophoretic effects, ion-solvent interactions, viscosity, and ionpairing. It is of interest, however, to note that the 3TC values for both Bu4NC1 and Bu4NBr decrease with increasing concentration while those of other 1-1 electrolyte systems25-26 where ion pairing is relatively well established increase with concentration. The increase in the value of 3k was attributed to the fact that when two ions form an ion pair they offer less resistance to motion.25-27
If tetrabutylammonium halides also form ion pairs as suggested by other studies,13-14 it is clear that some other effect is overcoming the effect by the ion pairing. The most obvious effect is the viscosity and this can be clearly seen in Figure 3 where the values of 3TC and 311 (r//oo) are plotted against C1/2. The values of relative viscosity were calculated using the viscosity coefficients of Desnoyers and Perron.28 They obtained the coefficients from their viscosity data of concentrations of up to 0.3 M and therefore the 3TC (vho) values in Figure 3 are also given up to that concentration. The values of 91t (77/ 1/0) for both Bu4NCl and Bu4NBr increase with concentration and, unlike the values of (D)v, both 2ffl and3E(?//?/o) values of Bu4NBr for a given value of C are larger than the corresponding values of Bu4NCl. These observations are in agreement with the suggestion that tetrabutylammonium halides form ion pairs and that the extent of ion pairing increases with the anion size. However, those observations should not be construed as unambiguous support for the above suggestion because it is not known whether other factors such as the electrophoretic effect, ion-solvent interactions, and cation-cation interactions29-32 affect the mobilities of these electrolytes significantly. As mentioned earlier, a better picture of these aqueous solutions may emerge when the ionic transport coefficients are obtained. It is hoped that other data necessary for the calculation of the ionic transport coefficients will soon be forthcoming.
References and Notes( 1 ) T h i s i n v e s t i g a t i o n w a s s u p p o r t e d in p a r t b y P u b l i c H e a l t h S e r v i c e
R e s e a r c h G r a n t A M - 0 5 1 7 7 f r o m t h e N a t i o n a l I n s t i t u t e o f A r t h r i t is a n d M e t a b o l i c D i s e a s e s .
(2) P o r t i o n s o f t h i s w o r k w e r e s u b m i t t e d b y A . R. t o t h e G r a d u a t e S c h o o l of t h e U n i v e r s i t y o f W i s c o n s i n in p a r t i a l f u l f i l l m e n t o f t h e r e q u i r e m e n t s f o r t h e P h . D . d e g r e e .
(3 ) R e c i p i e n t o f W i s c o n s i n A l u m n i R e s e a r c h F o u n d a t i o n F e l l o w s h i p
( 1 9 6 4 - 1 9 6 5 ) a n d N a t i o n a l I n s t i t u t e s o f H e a t h P r e d o c t o r a l F e l l o w s h i p ( 1 9 6 5 - 1 9 6 9 ) .
(4) D e c e a s e d , M a y 3 1 , 1 9 7 1 . R e c i p i e n t o f P H S R e s e a r c h C a r e e r A w a r d , A M - K 6 - 1 6 J 1 5 .
(5 ) D . G . M il le r , J. Phys. Chem., 7 0 , 2 6 3 9 ( 1 9 6 6 ) .(6 ) M . J . P i k a l , J. Phys. Chem., 75, 6 6 3 ( 1 9 7 1 ) .( 7 ) D . G . M i l l e r a n d M . J . P i k a l , J. Solution Chem., 1 , 1 1 1 ( 1 9 7 2 ) .(8 ) G . R e i n f e l d s a n d L. J . G o s t i n g , J. Phys. Chem., 6 8 , 2 4 6 4 ( 1 9 6 4 ) .(9) L. J . G o s t i n g , H. K i m , M . A . L o e w e n s t e l n , G . R e i n f e l d s , a n d A . R e v
z in , Rev. Sci. Instrum., In p r e s s .( 1 0 ) R. P . W e n d t , P h . D . t h e s i s , U n i v e r s i t y o f W i s c o n s i n , 1 9 6 1 .( 1 1 ) J . G . A l b r i g h t , P h . D . t h e s i s , U n i v e r s i t y o f W i s c o n s i n , 1 9 6 3 .( 1 2 ) E q u a t i o n s 3 3 a n d 3 5 o f r e f 5.( 1 3 ) S . L i n d e n b a u m a n d G . E. B o y d , J. Phys. Chem., 6 8 , 9 1 1 ( 1 9 6 4 ) .( 1 4 ) D . F . E v a n s a n d R. L. K a y , J. Phys. Chem., 7 0 , 3 6 6 ( 1 9 6 6 ) .( 1 5 ) C . N. P e p e l a , B. J . S t e e l , a n d P. J. D u n l o p , J. Amer. Chem. Soc.,
92, 6 7 4 3 ( 1 9 7 0 ) .( 1 6 ) 0 . B r y n g d a h l , Acta Chem. Scand., 1 1 . 1 0 1 7 ( 1 9 5 7 ) .( 1 7 ) W . - Y . W e n a n d S . S a i t o , J. Phys. Chem., 6 8 , 2 6 3 9 ( 1 9 6 4 ) .( 1 8 ) R. H. S t o k e s , J . Amer. Chem. Soc., 72, 2 2 4 3 ( 1 9 5 0 ) .( 1 9 ) P. J . D u n l o p a n d R. H. S t o k e s , J. Amer. Chem. Soc., 7 3 , 5 4 5 6
( 1 9 5 1 ) .( 2 0 ) L J. G o s t i n g , J. Amer. Chem. Soc., 72, 4 4 1 8 ( 1 9 5 0 ) .( 2 1 ) V . V i t a g l i a n o a n d P . A . L y o n s , J. Amer. Chem. Soc., 7 8 , 1 5 4 9
( 1 9 5 6 ) .(2 2 ) R. M . D i a m o n d , J. Amer. Chem. Soc., 8 0 , 4 8 0 8 ( 1 9 5 8 ) .( 2 3 ) R . A . R o b i n s o n a n d R. H. S t o k e s , “ E l e c t r o l y t e S o l u t i o n s , " 2 n d e d ,
r e v i s e d , B u t t e r w o r t h s , L o n d o n , 1 9 6 5 .( 2 4 ) A p p e n d i x 8 . 1 0 o f r e f 2 3 .( 2 5 ) B . F. W i s h a w and R. H. S t o k e s , J. Amer. Chem. Soc., 7 6 , 2 0 6 5
( 1 9 5 4 ) .
( 2 6 ) J . G . A l b r i g h t a n d D . G . M il le r , J. Phys. Chem., 7 6 , 1 8 5 3 ( 1 9 7 2 ) .( 2 7 ) S e e a l s o p a g e 3 0 0 o f r e f 2 3 .
( 2 8 ) J . E. D e s n o y e r s a n d G . P e r r o n , J. Solution Chem., 1 , 1 9 9 ( 1 9 7 2 ) .( 2 9 ) W . - Y . W e n a n d K . N a r a , J. Phys. Chem., 7 1 , 3 9 0 7 ( 1 9 6 7 ) .(3 0 ) R. H. W o o d , e t a / . , J. Phys. Chem., 7 1 , 2 1 4 9 ( 1 9 6 7 ) .( 3 1 ) A . L o S u r d o a n d H. E. W i r t h , J. Phys. Chem., 7 6 , 1 3 3 3 ( 1 9 7 2 ) .( 3 2 ) P . S . R a m a n a t h a n , C . V . K r i s h n a n , a n d H. C . F r i e d m a n n , J. Solu
tion Chem., 1, 2 3 7 ( 1 9 7 2 ) .
The Journal of Physical Chemistry, Vol. 77. No. 21, 1973

Adsorption of Sulfur-Containing Gases 2571
Surface Studies of the Adsorption of Sulfur-Containing Gases at 423°K on Porous Adsorbents. I. The Adsorption of Hydrogen Sulfide, Methanethiol, Ethanethiol, and Dimethyl Sulfide on Silica Gels
R. W. Glass*1 and R. A. Ross
Department of Chemistry, Lakehead University, Thunder Bay, Ontario, Canada (Received February 26, 1973)
Calorimetric heats of adsorption have been determined at coverages up to one-tenth of a monolayer for hydrogen sulfide, methanethiol, ethanethiol, and dimethyl sulfide, adsorbed at 423°K on silica gels of varying surface hydroxyl group concentrations. Adsorption isotherms have been determined and entropies of adsorption calculated to provide additional data on the nature of the adsorbed species. The high values of the initial heats of adsorption of up to 30 kcal mol 1 are associated with surface heterogeneity. Subsequently, at coverages greater than 0.020 ¿tmol m- 2 a similar type of adsorbed species is probably formed by all gases through interactions involving the formation of hydrogen bonds between surface hydroxyl hydrogen atoms and the sulfur atoms of the adsorbate. The differences in heats, entropies, and adsorption capacities for these gases are believed to be related to the magnitude of the inductive effect on the sulfur atom. A decrease in the heat of adsorption and adsorption capacity and an increase in the entropy of the adsorbed species occurred with all gases as the surface hydroxyl group concentration of the silica gels was decreased.
Introduction
This investigation contributes to a series of studies on the adsorption of sulfur-containing gases on various solids. The studies are largely motivated by the possibility of using adsorption or adsorption with catalysis as effective processes for the removal of deleterious sulfur compounds from industrial stack gases.
Although many studies2 - 5 have been reported of the adsorption of specific sulfur-containing gases on solid adsorbents, few have been detailed and very few have included essential thermodynamic measurements. Those studies that have included thermodynamic data were carried out at temperatures near the boiling point of the adsorbate.6-8 Thus while the data were of considerable theoretical importance, their practical value was limited since much higher temperatures are normally encountered when solid adsorbents or catalysts are used to remove sulfur-containing gases from industrial effluents.
Earlier, results were described8 for the adsorption of hydrogen sulfide, methanethiol, ethanethiol, and dimethyl sulfide on silica gels at their respective boiling points. Adsorption-desorption isotherms and isosteric heats of adsorption for surface coverages above one-tenth of a mono- layer were determined. These data showed that hydrogen bonding was involved at low surface coverages and that the heats decreased with increasing surface coverage to values approaching the heat of liquefaction of the respective gases at monolayer completion.
In the present work calorimetric hea::s of adsorption, adsorption isotherms, and entropies of adsorption have been determined for hydrogen sulfide, methanethiol, ethanethiol, and dimethyl sulfide adsorbed at 423°K at coverages up to one-tenth of a monolayer on silica gels of different surface hydroxyl group concentrations.
Experimental Section
Materials. Davison 923 grade silica gel (surface area, 630 m2 g^1; particle size, 75-150 pm) was used as the ad
sorbent. The surface hydroxyl group concentration was varied by heat treatment of the adsorbent for 20 hr at 240, 550, and 700° in a static air atmosphere. Surface hydroxyl group concentrations, surface areas, “ lump” densities by displacement of mercury, and pore size distributions for these heat-treated gels have been given earlier9 and the key data are summarized in Table I.
After heat-treatment the adsorbent was cooled over phosphoric anhydride", transferred to the appropriate apparatus, and then outgassed at 150° overnight at <10~4 Torr.
CP grade hydrogen sulfide (99.7 mol %, Matheson) was drawn, after line flushing, from the cylinder to a trap attached to the apparatus. It was then outgassed at 10~4 Torr and vacuum distilled over trays of phosphoric anhydride. Middle fractions only were used and mass spectro- metric analysis showed these to be >99.9% pure.
Methanethiol (Matheson) had a stated purity of 99.6 mol %. It was drawn, after line flushing, from the cylinder to a .trap attached to the adsorption apparatus. The procedure followed in the purification of hydrogen sulfide was again repeated. Mass spectrometric analysis of the purified gas showed it to be >99.9% H2S.
Ethanethiol, Eastman Kodak Ltd., was shown by mass spectrometric analysis to be at least 99.9% pure. The liquid was obtained in a sealed glass bottle and was transferred by pipet in a nitrogen atmosphere to a removable reservoir. The reservoir was quickly attached to the apparatus and the liquid was thoroughly outgassed and then frozen using a liquid nitrogen trap. The gas was then vacuum distilled over trays of phosphoric anhydride, the first and last fractions being discarded, and was stored at liquid nitrogen temperature. The sample was always outgassed prior to use.
Dimethyl sulfide, Eastman Kodak Ltd., was obtained in a sealed glass bottle. The specification was Standard Grade laboratory reagent, 0.84 g ml-1 at 20°, and on mass spectrometric analysis it was shown to be 99.9% pure. The transferral and purification procedures followed for ethanethiol were repeated here.
The Journal of Physical Chemistry. Vol. 77, No. 21; 1973

2572 R. W. Glass and R. A. Ross
Apparatus and Procedure. Heats of adsorption and adsorption isotherms were determined in an apparatus similar to that described earlier.10 Entropies of adsorption were calculated from the classical thermodynamic equations11 taking the standard state of each gas at 1 atm and ignoring deviations from the ideal gas law. Thus
Ss = Sg - .ff In p - (qst/T) (1)
where Ss is the differential molar entropy of the adsorbed species at temperature T and equilibrium pressure p; Sg is the entropy of the gas and qs, is the isosteric heat of adsorption.
Since differential heats of adsorption were measured experimentally, eq 1 may be rewritten
Ss = SE - R In p - (9d + RT)/T (2)since the differential heat of adsorption, q<j ^ qst - RT.
Thus if values of SK are obtained from the literature and the differential heat of adsorption and the equilibrium pressure are known at a variety of surface coverages, the differential molar entropy of adsorption at these coverages can be calculated.
The experimental entropy values were compared with theoretical values calculated for mobile and immobile layers. In the model of immobile adsorption the atoms are firmly bound to adsorption sites and there are no translational motions perpendicular or parallel to the surface. The only entropy of the adsorbed layer present is that of the differential molar configurational entropy12 which is given by
Ssc = - R In [0/(1 - 0)] (3)where 8 is the degree of surface coverage.
The other extreme model of adsorption is that of an ideal two-dimensional adsorbed surface gas in which the degrees of rotation are retained and there is also the possibility of the adsorbed species moving perpendicular to the surface.13 In this case the differential molar entropy of the species is given by
Ss = S2, + Srot + Svib (4)where S2t is the two-dimensional translational entropy of an adsorbed species and Srot and SVib are the corresponding rotational and vibrational entropies.
S2t for an ideal surface gas may be evaluated12 using the equation
SV = R In M TA + 83.8 (5)where M is the molecular weight of the gas and A is the area occupied per molecule which is a function of the number of molecules adsorbed. Srot and Sv¡b may be obtained from the literature or they can be calculated from the usual statistical thermodynamic equations.14
ResultsHydrogen Sulfide. Heats of adsorption were determined
at 423°K for surface coverages between 0.005 and 0.150 ¿¿mol m* 2 and are shown in Figure 1. At 423°K, 7.5 ¿¿mol m 2 is approximately equivalent to monolayer coverage.8
All adsorbents exhibited relatively high heats at the lowest coverage. At 0.005 ¿¿mol m~2 the 240° gel gave a heat of adsorption of 30.0 kcal m o l '1. The heats then fell rapidly with increasing surface coverage. The heat curves for the 550 and 700° gels were similar but exhibited a more rapid fall in heat for the same increase in surface
Figure 1. V a r ia t io n o f h e a t o f a d s o rp t io n o f h y d ro g e n s u lf id e w ith a m o u n t a d s o rb e d a t 4 2 3 °K o n h e a t- t r e a te d s i l ic a g e ls . H e a t t re a tm e n t a t 2 4 0 ° (O ) , 5 5 0 ° (X ), a n d 7 0 0 ° ( A ) .
TABLE I: Surface Areas, “ Lump” Densities, and Surface Hydroxyl Group Concentrations for Heat-Treated Silica Gels
S u r f a c e O H
g r o u p c o n c n ,Tem p of heat trea tm ent, °C
S urface area, m 2 g ’
"L u m p " density, g e m '3
//m o l of OHm -2
24 0 6 3 0 1 .1 8 2 7 .2
55 0 5 8 0 1 .2 7 5 2 .4
700 4 9 0 1.391 1 .3
coverage, and the “ limiting” heats were reduced to 7.3 kcal mol' 1 for the 550° gel and to 5.8 kcal mol-1 for the 700° gel.
The adsorption isotherms at 423°K for the 240, 550, and 700° gels exhibit the same general features as those obtained for sulfur dioxide on the same materials (Figure 2). The curves were linear and had slopes that decreased with increasing temperature of heat treatment of the sample. However, for a given heat-treatment temperature and a given adsorbate pressure, the amount of gas adsorbed was generally only half of that for sulfur dioxide. Equilibrium times were of the order of 30 min for all points on the isotherm and did not vary significantly with the sample used. Reversibility tests7 showed that the adsorption was reversible for each adsorbent.
Infrared analysis of the gas desorbed from each sample at 423°K showed that no component other than hydrogen sulfide was present. In addition, no trace of free sulfur was detected on chemical analysis of the solid residues.
The variation of the experimental differential molar entropy as a function of surface coverage for adsorptions at 423°K on silica gels is shown in Figure 3. The curves for the 550 and 700° gels were very similar rising rapidly from low entropy values of about 5 cal deg' 1 m o l 1 at 0.010 /¿mol m-2 to relatively constant values of 36.5 and 39.8 cal deg' 1 mol-1 , respectively, at 0.100 pmol m '2. At this coverage the curves for the 550 and 700° gels were 1.0 and4.5 cal deg*1 mol-1 , respectively, higher than that calculated for mobile adsorption. In contrast the curve for the 240° gel was 5.0 cal deg-1 mol*1 below the theoretical curve at 0.130 pmol m*1 having risen from a value of about 25.0 cal deg' 1 mol-1 at 0.010 pmol m *1.
The Journal of Physical Chemistry, Voi. 77, No. 21, 1973

Adsorption of Sulfur-Containing Gases 2573
Figure 2. A d s o r p t i o n i s o t h e r m s f o r h y d r o g e n s u l f i d e a t 4 2 3 ° K o n
h e a t - t r e a t e d s i l i c a g e l s . H e a t t r e a t m e n t a t 2 4 0 ° ( O ) , 5 5 0 ° ( X ) ,
a n d 7 0 0 ° ( A ) .
Methanethiol. There was a tendency for the value of the heats of adsorption15 on all the adsorbents to level out above a coverage of 0.200 ¿¿mol m-2 following the relatively rapid falls between 0.010 and 0.050 ¿¿mol m -2 . The 700° gel exhibited the most rapid fall from 28.0 kcal mol-1 at 0.010 ¿¿mol m~2 to 15.0 kcal mol-1 at 0.050 ¿¿mol m-2 and began to level out toward the lowest heat value determined, about 6.5 kcal mol-1 , at 0.400 ¿¿mol m 2.
Adsorption isotherms for methanethiol15 were determined at 423°K on the three gel samples and the familiar trend of decreasing amounts adsorbed, at a given pressure, with increase in the temperature of heat treatment of the gel was shown by this gas. The isotherms of the 240 and 550° gels were slightly concave to the pressure axis while that of the 700° gel was essentially a straight line. No significant differences in the equilibrium times were observed for the samples. Normally equilibrium was reached in approximately 20 min for adsorbate pressures up to 100 Torr and beyond this increased to 50 min for pressures up to 400 Torr. The adsorption was reversible for each adsorbent.
Infrared analysis of the desorbed products from each of the samples indicated that only methanethiol was present. No elemental sulfur was detected in the solid residues.
The experimental differential molar entropies of adsorption at 423°K15 showed that for the 550 and 700° gels a rapid increase in entropy from about 9.0 cal deg-1 mol-1 at 0.010 ¿¿mol m-2 to 30.0 cal deg-1 mol 1 at 0.025 ¿¿mol m” 2. At higher coverages the entropy of adsorption on the 700° gel began to level out to 51.5 cal deg-1 mol-1 at 0.400 ¿¿mol m-2 , 3 cal deg-1 mol-1 above the theoretical entropy for a mobile adsorbed gas. A rapid increase in entropy was not observed at low surface coverages for the 240° gel, and at coverages above 0.050 /¿mol m-2 the entropy for the 240° gel was 5 cal deg-1 mol-1 less than for the 550° gel.
Ethanethiol. The heat curves were very similar in shape to those for the adsorption of methanethiol on these materials.15 The heats for the 240° gel fell rapidly between0.010 and 0.050 ¿¿mol m-2 from 27.3 to 20.1 kcal mol” 1, respectively, before beginning to level out to around 12.3 kcal mol-1 at 0.400 ¿¿mol m-2 . The 550° gel gave a fairly similar heat curve to that of the 240° gel while the most rapid heat fall occurred with the 700° gel up to about0.100¿¿mol m” 2.
Adsorption isotherms15 for etnanethio. at 423°K were determined up to a pressure of only 150 Torr in order to avoid any problems associated with condensation of the
AMOUNT ADSORBED (¿¿motenC2)
Figure 3. E x p e r i m e n t a l d i f f e r e n t i a l m o l a r e n t r o p y o f h y d r o g e n
s u l f i d e a d s o r b e d a t 4 2 3 ° K o n s i l i c a g e l s . H e a t t r e a t m e n t a t 2 4 0 °
( O ) , 5 5 0 ° ( X ) , a n d 7 0 0 ° ( A ) . C u r v e 1 , m o b i e a d s o r p t i o n ;
c u r v e 2 , i m m o b i l e a d s o r p t i o n .
vapor in the apparatus since at room temperature (23°) the vapor pressure of ethanethiol is 506 Torr.16 However, even within this limited pressure range the familiar trend of decreasing adsorption with increasing temperature of gel heat treatment was observed. Equilibrium times were of the same order throughout any given isotherm but decreased with increasing temperature of sample heat treatment. Thus equilibrium was reached in approximately 60, 45, and 35 min for gels heat-treated at 240, 550, and 700°, respectively. Again the adsorption was reversible for each adsorbent.
Infrared analysis of the gas desorbed from each sample at 423°K showed that ethanethiol was the only component present. Sulfur was not detected on chemical analysis of the solid residues.
The entropy curves for the 240 and 550° gels15 were very similar having entropies which increased rapidly from 29.0 to 50.0 cal deg-1 mol” 1 between 0.010 and 0.200 ¿¿mol m -2, respectively. The entropy curve for the 700° gel also increased rapidly between 0.100 and 0.200 ¿¿mol m” 2 but the curve generally lay at 7 cal deg” 1 mol” 1 above the other two curves and leveled out at 57.2 cal deg” 1 mol” 1, approximately 3 cal deg” 1 mol-1 below the theoretical curve for mobile adsorption.
Dimethyl Sulfide. The magnitude of the heats of adsorption at a given coverage fell with increase in the sample heat-treatment temperature.15 Thus at a coverage of0.010 ¿¿mol m" 2 the heats were 29.1, 21.0, and 18.8 kcal mol-1 for the 240, 550, and 700° gels, respectively. The heats decreased with increasing coverage for all the samples up to a coverage of 0.200 ¿¿mol m ~2 to 17.5, 14.7, and12.3 kcal mol” 1 for the 240, 550, and 700° gels, respectively-
Isotherms for the adsorption of dimethyl sulfide15 at 423°K were determined up to a pressure of 150 Torr for the reasons given above. The isotherms were concave to the pressure axis and the amount of gas adsorbed at a given pressure decreased with increase in the temperature of gel heat treatment in the same manner as that for the
The Journal of Physical Chemistry, Voi. 77, No. 21, 1973

2574 R. W. Glass and R. A. Ross
TABLE II: Summary of Adsorption Data for Hydrogen Sulfide, Methanethiol, Ethanethiol, and Dimethyl Sulfide Adsorbed at 423°K on Heat-Treated Silica Gels
T e m p of h e a t
t r e a t m e n t ,° C A d s o r b a t e
A d s o r p t i o n c a p a c i t y
a t 1 5 0 T o r r ,
¿ t m o l m ~ 2
" L i m i t i n g 1' h e a t o f
a d s o r p t i o n , k c a l m o l - 1
A S ( = S 21 - S s ) a t 0 .4 0 0 / i m o l m - 2 , c a l d e g " 1
m o i " 1
2 4 0 H 2 S 0 . 0 5 9 . 8 5 . 8
c h 3 s h 0 . 2 9 1 1 . 5 1 1 . 5
C 2 H 5 S H 0 . 5 0 1 2 . 3 8 . 6
( C H 3 ) 2S 0 . 5 7 1 7 . 5 2 8 . 0
5 5 0 h 2 s 0 . 0 4 7 . 3 - 2 . 5
c h 3 s h 0 . 2 3 1 0 . 5 5 . 5
c 2 h 5 s h 0 . 4 0 1 1 . 7 8 . 5
( C H 3 ) 2S 0 . 4 8 1 4 . 7 1 5 . 5
7 0 0 h 2 s 0 . 0 3 5 . 8 - 4 . 5
c h 3 s h 0 . 1 5 6 . 5 - 3 . 0
c 2 h 5 s h 0 . 3 2 9 . 7 2 . 9
( C H 3 ) 2S 0 . 4 0 1 2 . 3 9 . 0
other sulfur-containing gases. The equilibration times for all samples were of the same order of magnitude at all points on the isotherms (— 45 min) and did not differ significantly with gel heat-treatment temperature. Again the adsorption was reversible for each adsorbent.
Infrared analysis of the gas desorbed from each sample at 423°K showed that no component other than dimethyl sulfide was present in the sample, and no sulfur was detected in the solid residues.
The entropy curves obtained for adsorption on the 550 and 700° gels15 were similar in shape; however, the values for the 550° gel were approximately 7.0 cal deg-1 mol-1 lower than those of the 700° gel. Much lower entropy values were obtained for adsorption on the 240° gel than for the other two and the values increased over a wider surface coverage range from 4.2 to 30.0 cal deg' 1 mol' 1 at 0.030 and 0.450 pmol m '2, respectively, compared with 42.0 to 48.5 cal deg' 1 mol' 1 at 0.030 and 0.110 pmol m~2, respectively, for the 700° gel.
Table II summarizes the principal data for the adsorption of hydrogen sulfide, methanethiol, ethanethiol, and dimethyl sulfide on heat-treated silica gels.
DiscussionThe adsorption data obtained for each gas on the three
adsorbents follow similar trends, and similar interactions between adsorbate and adsorbent are believed to have taken place.
Other studies of the adsorption of gases on silica surfaces17-18 have shown that surface hydroxyl groups play a very important part in the nature of the adsorbed species. It has been shown17-18 that a fully hydroxylated silica surface has approximately 4.6 OH groups/100 A2 of surface. Since the 240° gel had 4.3 OH groups/100 A2 ( = 7.2 /¿mol of OH m '2) it can be assumed that many adjacent hydroxyl groups are present on this surface. Infrared studies by Kiselev19 have indicated that for adsorbates containing oxygen, two adjacent hydroxyl groups are the most important adsorption sites when there are more than 3.0 OH groups/100 A2, while “ free” surface hydroxyl groups become the more important adsorption site when there are less than 3.0 OH groups/100 A2. Thus “ free” surface hydroxyl groups can be expected to be the most important groups for the 550 and 700° gels.
The magnitudes of the “ limiting” heats of adsorption
are too high to be caused by purely physical interactions and the similar trends of the heats, adsorption capacities, and entropies with variation of the surface hydroxyl group content suggests that there is a specific interaction between the surface hydroxyl groups and the adsorbate molecules, probably of a hydrogen bond nature.
The formation of a hydrogen bond involves a form of charge-transfer process in which charge is displaced from the proton acceptor to the proton donor,20 and for the adsorption of these gases on a largely dehydroxylated (700°) silica gel surface this may be represented by
RiIS— R2
/H
/O
Iwhere R3 = H, CH3, C2H5 and R2 = H, CH3.
The strength of the hydrogen-sulfur hydrogen bond would be expected to be increased by the presence of adjacent hydroxyl groups which enhance the inductive effect on the atom HA shown below. Thus
R,
S— R,y
/Ha
I I
I I
These two types of proposed adsorbed species would be expected to exhibit the following properties. For species II the strength of the S-H hydrogen bond should be greater than that for species I; the entropy of I is expected to be greater than that for II, but the proportion of the entropy increase caused by either rotational or translational restrictions cannot be distinguished; a reduction in the number of surface hydroxyl groups would be expected to decrease the adsorption capacity, and no decomposition of the adsorbate should take place.
These proposed adsorbed species are supported by the heat, isotherm, and entropy data. All of these gases exhibit heats and adsorption capacities which at a given coverage decrease with increase in temperature of heat treatment, and entropies which increase with increase in heat- treatment temperature (see Table II). Further support for this concept of weak hydrogen bonds is obtained from the ready desorption of the gas from all of the adsorbents, the absence of sulfur in the residues, and the absence of any gases other than the adsorbate in the gas desorbed from the adsorbents.
Consider the adsorption of hydrogen sulfide in more detail. In general, it is typical of the other adsorbates, and similar arguments can be made for them.
The high heats of adsorption observed for hydrogen sulfide at 423°K on silica gels heat treated at 240, 550, and 700° at coverages less than 0.030 pmol m '2, approximately one three-hundredth of a monolayer,8 are believed to be due to interactions with a very small number of energeti
The Journal of Physical Chemistry, Voi. IT, No. 21, 1973

Adsorption of Sulfur-Containing Gases 2575
cally heterogeneous sites since subsequently the heats fall so rapidly. For example, with the 240° gel the heats fall from 30.0 to 10.8 kcal mol“ 1 for the small increase in surface coverage from 0.005 to 0.040 /umol m.“ 2, This is a much more rapid fall than that observed for the same coverage range with sulfur dioxide when the heats of adsorption were 22.0 and 16.3 kcal mol" 1 and 0.010 and 0.040 jumol m r2, respectively. It is difficult to define the nature of these heterogeneous sites without further detailed experiments; however, it is possible that contributions to the high initial heats could arise from interactions of the adsorbate with impurities in the adsorbent21 (T i02 = 55 ppm; Zn02, 30 ppm) or possibly by adsorption within the micropores of the adsorbent.22
The values of the “ limiting” heats of adsorption increase with increasing surface hydroxyl group concentration from 5.5 kcal mol“ 1 for a surface possessing 1.3 /rmol of OH (as H20) m-2 to 9.8 kcal mol“ 1 for one with 7.2 ¿¿mol of OH m“ 2. In addition, the adsorption capacity increases in the order 0.058, 0.073, and 0.098 ¿¿mol m“ 2 for surface hydroxyl group concentrations of 1.3, 2,4, and 7.2 jumol of OH m“ 2, respectively. These data are in agreement with the species proposed above.
The values of the experimental differential molar entropies15 are also in accord with this view. For each adsorbent, the extremely rapid increase in the entropy of the adsorbed species from about 5.0 cal deg“ 1 mol“ 1 at 0.010 /rmol m“ 2 to 37.0 cal deg“ 1 mol“ 1 at 0.100 ,umol m“ 2, follows the expected pattern for a surface possessing a small number of very heterogeneous sites.23 The mobility of the adsorbed hydrogen sulfide varies from an essentially immobile state to one that has been described as “ supermobile,” 24 that is when the experimental entropy is greater than that for a theoretical model of a perfect two-dimensional adsorbed gas. This phenomenon has been observed in several cases of physically adsorbed gases13'25 and interpreted to indicate that the vibration replacing the translational {notion perpendicular to the surface is not negligible, as assumed in the calculation, and is beginning to make a significant contribution to the entropy.25 A similar argument may be proposed to explain the present results.
The “ limiting” entropy of the hydrogen sulfide adsorbed on the 2aOc gel is, however, at least 10 cal deg mol“ 1 lower than that of the gas adsorbed on the other heat- treated gels and hence the gas adsorbed is not “ supermobile” or even fully mobile. This is consistent with the value for the heat of adsorption at 0.100 ¿¿mol m-2 of 9.8 kcal mol“ 1 for the 240° gel and in accord with the conclusion that the hydrogen sulfide molecule is held by two or more bonds. For adsorptions on surfaces containing largely isolated hydroxyl groups, i.e., the 550 and 700° gels, the entropy is much greater. Thus as the gel heat-treatment temperature is increased, more isolated hydroxyl groups are present on the surface, and hence the mobility of the adsorbed species at a given coverage should increase with increasing gel heat-treatment temperature. This is observed in practice.
The Effect of Increase in Méthylation of the Adsorbate. Distinct differences are apparent in the values of the “ limiting” heats of adsorption for a given silica gel surface. Thus, for the series hydrogen sulfide, methanethiol, eth- anethiol, and dimethyl sulfide, the heat values are 5.5,7.0, 10.0, and 12.2 kcal mol“ 1, respectively, for the 700° gel, which perhaps reflects the different electronic structures
o f th e m o le c u le s w h ich , in tu r n , in flu en c e th e lik elih o od o f th e fo rm a tio n o f h yd ro g en b o n d s .
I f th e h e a t d a ta are c o m p a re d for e th a n e th io l a n d d i m e th y l su lfid e , it c a n b e se en th a t th e h e a ts o f ad so rp tio n for d im e th y l su lfid e lie 3 to 5 k ca l m o l“ 1 a b o v e th o se for e th a n e th io l for a g iv e n su rfa ce co vera ge . S im ila r d isp la c e m e n ts o f th e h e a t v a lu es o c cu r irresp ective o f th e surface h y d ro x y l group c o n c e n tra tio n . T h e s e re su lts su g g e st th a t steric h in d ra n ce is n o t a p r e d o m in a n t fa c to r in in flu en c in g th e v a lu es o f th e h e a ts sin ce th e larger e th a n e th io l m o le cu le 7 h as a low er h e a t o f a d so rp tio n th a n d im e th y l su lfid e a t a n y g iven h y d ro x y l grou p co n c e n tra tio n on th e silic a gel su rfa ce .
C o n sid e r in g th e d isp o sitio n a n d n a tu re o f th e o rb ita ls in th e m o le c u le s o f m e th a n e th io l, e th a n e th io l, a n d d im e th y l su lfid e , it ca n be o b serv ed th a t as th e in c lu sio n o f th e 3s fu n c tio n in th e b o n d in g o r b ita ls in crea ses th e n th ere is less 3s ch a ra cter a sso c ia te d w ith th e n o n b o n d in g orb ita ls o f su lfu r a n d so th ese m u s t h av e g reater 3p c h a ra c te r th a n in h y d ro g en su lfid e . F u rth er , for th e fo rm a tio n o f a th ird b o n d to su lfu r , th e o p t im u m ou tw a rd e x te n sio n o f a th ird p air o f e lectro n s w o u ld occu r w h en th e y o c c u p y an s p 3 o r b ita l26 an d th is s itu a tio n is a p p ro a c h e d w h en th e b o n d an g le in creases w ith in crea sin g m e th y la tio n o f th e su lfu r a to m (cf. b o n d an g les o f 9 3 .3 , 1 0 0 .3 , 1 0 3 .0 , a n d 1 0 5 .0 ° for h y d rogen su lfid e , m e th a n e th io l, e th a n e th io l, a n d d im e th y l su lfid e , re sp e c tiv e ly ) . T h u s th e b a se s tren g th o f th e m o le cu les in th e series w ill p ro g ressiv ely in crease a lo n g w ith th e a b ility to form b o n d s w ith an e lectro n a c c e p to r ,27
T h e tren d sh ow n b y th e h e a ts o f a d so rp tio n to in crease w ith in creasin g m e th y la tio n o f th e ad so rb a te is co n siste n t w ith th ese p h e n o m e n a sin ce th e b a se stren g th s o f th e a d so rb a tes in crease in th e order ( C H 3) 2S > C 2H 5S H > C H 3S H > H 2S .26
Supplementary Material Available. G r a p h s o f th e h eats o f a d so rp tio n , a d so rp tio n iso th e rm s, a n d d iffe re n tia l m o la r en trop ies o f a d so rp tio n as fu n c tio n s o f su rfa ce coverage h a v e b e e n p lo tte d for each o f th ese ga ses a d so rb e d on th e h e a t-tr e a te d silica g els a n d w ill a p p ea r fo llo w in g th ese p a g es in th e m ic ro film ed itio n o f th is v o lu m e o f th e jo u r n a l. P h o to c o p ie s o f th e su p p le m e n ta r y m a te r ia l fro m th is p a p er on ly or m ic ro fic h e (1 0 5 X 148 m m , 2 0 X re d u c tio n , n e g a tiv e s) c o n ta in in g all o f th e s u p p le m e n ta r y m a te ria l for th e p a p ers in th is issue m a y be o b ta in e d fro m th e J o u rn a ls D e p a r tm e n t , A m e r ic a n C h e m ic a l S o c ie ty , 1155 1 6th S t . , N .W . , W a s h in g to n , D . C . 2 0 0 3 6 . R e m it ch eck or m o n e y order for $ 3 .0 0 for p h o to c o p y or $ 2 .0 0 for m ic ro
fich e , referring to co d e n u m b e r J P C -7 3 -2 5 7 1 .
References and Notes( 1 ) P r e s e n t a d d r e s s , O n t a r i o R e s e a r c h F o u n d a t i o n , S h e r i d a n P a r k ,
C l a r k s o n , O n t a r i o , C a n a d a .
(2) ( a ) E. B. M il le r , Chem. Met. Eng.. 2 3 , 1 1 5 5 , 1 2 1 9 , 1 2 5 1 ( 1 9 2 0 ) ; (b ) G . E. M a p s t o n e . Aust. Chem. Inst. J. Proc.. 1 4 , 6 1 ( 1 9 4 6 ) .
(3 ) W . S t o b e r , Kolloid-Z. Z. Polym.. 1 4 5 , 1 7 ( 1 9 5 6 ) .(4) F. C . B o s t o n , Hydrocarbon Process., 4 3 (8 ), 1 4 1 ( 1 9 6 4 ) .(5) " A p p l i c a b i l i t y o f M e t a l O x i d e s t o t h e D e v e l o p m e n t o f N e w P r o c e s s e s
f o r R e m o v i n g S u l f u r D i o x i d e f r o m F l u e G a s e s , ” V o l . II (8 ), C o n t r a c t P H 8 6 - 6 8 - 6 8 , T r a c o r ( 1 9 6 9 ) .
(6 ) R. A . B e e b e a n d H. D e ll , J. Chem. Phys., 3 9 , 7 4 6 ( 1 9 5 5 ) .( 7 ) W . J. J o n e s a n d R. A . R o s s , J. Chem. Soc. A, 1 0 2 1 ( 1 9 6 7 ) .(8 ) W . J . J o n e s a n d R. A . R o s s , J. Chem. Soc. A, 1 7 8 7 ( 1 9 6 8 ) .(9) R. W . G l a s s a n d R. A . R o s s , Can. J. Chem., 5 0 , 1 2 4 1 ( 1 9 7 2 ) .
( 1 0 ) R. W . G l a s s a n d R. A . R o s s , Can. J. Chem., 4 9 , 2 8 3 2 ( 1 9 7 1 ) .( 1 1 ) D . H. E v e r e t t , Trans. Faraday Soc., 4 6 , 4 5 3 , 9 4 2 , 9 5 7 ( 1 9 5 0 ) .( 1 2 ) A . C l a r k , " T h e T h e o r y o f A d s o r p t i o n a n d C a t a l y s i s , " E. M. L o e b l ,
E d . , A c a d e m i c P r e s s , L o n d o n , 1 9 7 0 .( 1 3 ) J. J . F . S h o l t e n a n d S . K r u y e r . " P h y s i c a l a n d C h e m i c a l A s p e c t s o f
A d s o r b e n t s a n d C a t a l y s t s , ” B. G . L i n s e n , E d . , A c a d e m i c P r e s s ,
L o n d o n , 1 9 7 0 , p 1 4 8 .
The Journal of Physical Chemistry, Vol. 77, No. 21, 1973

2576 R. W. Glass and R. A. Ross
( 1 4 ) C . K e m b a l l , Advan. Calal., 2 , 2 3 7 ( 1 9 5 0 ) .( 1 5 ) S e e p a r a g r a p h a t e n d o f p a p e r r e g a r d i n g s u p p l e m e n t a r y m a t e r i a l .( 1 6 ) " H a n d b o o k o f C h e m i s t r y a n d P h y s i c s , " C h e m i c a l R u b b e r P u b l i s h i n g
C o . , C l e v e l a n d , O h i o , 1 9 7 0 , p F 1 5 6 .( 1 7 ) A . V . K i s e l e v a n d V . I. L y g i n , Kolloid. Zh.. 2 1 , 5 8 1 ( 1 9 5 9 ) .( 1 8 ) J . U y t t e r h o e v e n , M . S l e e x , a n d J . J . F r i p i a t , Bull. Soc. Chlm. Fr., 6 ,
1 8 0 0 ( 1 9 6 5 ) .( 1 9 ) A . V . K i s e l e v , “ S t r u c t u r e a n d P r o p e r t i e s o f P o r o u s M a t e r i a l s , ”
D . H. E v e r e t t a n d F . S . S t o n e , E d . , B u t t e r w o r t h s , L o n d o n , 1 9 5 8 , p
210 .
( 2 0 ) M. L. H a ir , E d . , “ I n f r a r e d S p e c t r o s c o p y of S u r f a c e C h e m i s t r y , ” E d
w a r d A r n o l d , L t d . , L o n d o n , 1 9 6 7 .
( 2 1 ) S . G . A s h , A . V . K i s e l e v , a n d B . V . K u z n e t s o v , Trans. Faraday S o c . ,
6 7 , 3 1 1 8 ( 1 9 7 1 ) .( 2 2 ) E. R o b i n s o n a n d R. A . R o s s , J. Chem. Soc. A, 8 4 ( 1 9 7 0 ) .
( 2 3 ) J . M. T h o m a s a n d W . J. T h o m a s , “ I n t r o d u c t i o n t o t h e P r i n c i p l e s o f H e t e r o g e n e o u s C a t a l y s i s , ” A c a d e m i c P r e s s , L o n d o n , 1 9 6 7 .
( 2 4 ) C . K e m b a l l a n d E. K . R i d e a l , Proc. Roy. Soc., Ser. A, 1 8 7 , 5 3
( 1 9 4 6 ) .( 2 5 ) A . C l a r k a n d V . C . F . H o l m , J. Catal., 2 , 2 1 ( 1 9 6 3 ) .( 2 6 ) A . B . B u r g , " O r g a n i c S u l p h u r C o m p o u n d s , ” N . K h a r a s c h , E d . , P e r -
g a m o n P r e s s , L o n d o n , 1 9 6 1 , p 30 .( 2 7 ) M . L. H a ir , “ I n f r a r e d S p e c t r o s c o p y in S u r f a c e C h e m i s t r y , ” E d w a r d
A r n o l d , L t d . , L o n d o n , 1 9 6 7 .
Surface Studies of the Adsorption of Sulfur-Containing Gases at 423°K on Porous Adsorbents. II. The Adsorption of Hydrogen Sulfide, Methanethiol,Ethanethiol, and Dimethyl Sulfide on 7 -Alumina
R. W. G lass*1 and R. A. Ross
Department of Chemistry, Lakehead University, Thunder Bay, Ontario, Canada (Received February 26, 1973)
Calorimetric heats of adsorption have been determined for hydrogen sulfide, methanethiol, ethanethiol, and dimethyl sulfide adsorbed at 423°K on 7 -alumina at coverages up to 0 = 0.5. Adsorption isotherms have been measured and the entropies of the adsorbed species have been calculated. Heats of adsorption and adsorption capacities at a given coverage increased with increasing méthylation of the adsorbate. A similar type of adsorbed species involving hydrogen-bond type interactions between the sulfur atoms of the adsorbate and hydroxyl hydrogen atoms on the alumina surface is proposed to account for all the results. Differences in heats, entropies, and adsorption capacities among the systems are explained by the increasing inductive effect on the sulfur atoms with increasing méthylation of the adsorbate which results in the formation of stronger hydrogen bonds with the adsorbent.
IntroductionMany different types of adsorbents and catalysts are
used in industry to remove obnoxious sulfur-containing gases from gas streams. X-Alumina either by itself2® or doped with NaOH2b or other compounds is one of the most commonly used materials and yet few data have been reported in the literature on the thermodynamic properties of such systems or on the nature of the adsorbed surface complexes formed.
Studies of the adsorption of sulfur dioxide at relatively elevated temperatures on 7 -alumina have been reported.3 A recent paper4 on the adsorption of hydrogen sulfide, methanethiol, ethanethiol, and dimethyl sulfide at 423°K on heat-treated silica gels has shown that for any given adsorbate the strongest bonds were formed with the adsorbent possessing the highest surface hydroxyl group concentration and that for any given adsorbent the strength of the adsorbate-adsorbent interaction increased with increased electron-donating power of the adsorbate.
In the present work calorimetric heats of adsorption, adsorption isotherms, and entropies of adsorption have been determined for hydrogen sulfide, methanethiol, eth
anethiol, and dimethyl sulfide at 423°K on A-alumina heat-treated to 700°.Experimental Section
Materials. 7 -Alumina was prepared by heating boehm- ite in air at 700° for 20 hr. The boehmite was prepared by a method described earlier.3 The surface area, “ water content,” “ lump” density by displacement of mercury, and pore size distribution data, determined by the nitrogen adsorption method, of the 7 -alumina have been reported3 along with similar data for other samples heat-treated at other temperatures. In brief, the 7 -alumina had a surface area of 160 m2 g” 1, a “ water content” of 18.6 jimol m~2, a “ lump” density of 0.6864 g cm -3, and a mean pore diameter of 35 A.
After heat treatment, the adsorbent was cooled over phosphoric anhydride, transferred to the appropriate apparatus, and then outgassed at 150° overnight at <10- 4 Torr. Hydrogen sulfide, methanethiol, ethanethiol, and dimethyl sulfide were each purified to >99.9% in the manner described earlier.4
Apparatus and Procedure. Heats of adsorption and adsorption isotherms were determined in apparatus similar
The Journal of Physical Chemistry, Vol. 77, No. 21, 1973

Adsorption of Sulfur-Containing Gases 2577
to that described earlier,® and entropies of adsorption calculated from the heat data as before.4
ResultsThe heat curves for hydrogen sulfide, methanethiol,
ethanethiol, and dimethyl sulfide adsorbed at 423°K on 7-alumina are shown in Figure 1. The curves for methanethiol, ethanethiol, and dimethyl sulfide, although similar, were separated from each other by approximately 3.0 kcal mol-1 above a surface coverage of 0.700 /¿mol m 2. For these adsorbates the heats of adsorption tended to level out at a coverage of about 0.700 /¿mol m" 2 after falling relatively rapidly from 0.400 /¿mol m-2 .
The results for hydrogen sulfide adsorption were limited because of the small adsorption capacity of 7 -alumina for this gas (Table I). However, the results that were obtained showed a relatively rapid fall in the heats of adsorption from 31.5 kcal mol-1 at 0.050 /¿mol m-2 to 16.3 kcal mol-1 at 0.340 /¿mol m-2 , and at coverages above this latter value the heats tended to level out to 16.0 kcal mol-1 . For methanethiol, ethanethiol, and dimethyl sulfide the relatively constant heat values at a coverage of1.40 /¿mol m-2 were 16.5, 18.4, and 20.7 kcal mol-1 , respectively.
The adsorption isotherms for hydrogen sulfide, methanethiol, ethanethiol, and dimethyl sulfide at 423°K on X- alumina are shown in Figure 2. All of the isotherms were concave to the pressure axis while the amount of hydrogen sulfide adsorbed was very much smaller than that for the other gases. At a pressure of 150 Torr the amount of gas adsorbed was 0.370, 1.20, 1.51, and 1.72 /¿mol m-2 for hydrogen sulfide, methanethiol, ethanethiol, and dimethyl sulfide, respectively.
Reversibility tests6 showed that approximately 100 /¿g of hydrogen sulfide could not be desorbed from the sample, whereas the adsorption was reversible with the other three gases.
In all cases infrared analysis of the gases desorbed from the 7-alumina samples on completion of the isotherm showed the absence of foreign components. Analyses of the solid residues showed the presence of sulfur on 7 -alumina exposed to hydrogen sulfide at 423°K. Sulfur was not detected on the other residues.
Experimental differential molar entropies of hydrogen sulfide,' methanethiol, ethanethiol, and dimethyl sulfide adsorbed at 423°K on 7-alumina are shown as a function of surface coverage in Figure 3.
TABLE I: Comparison of the Adsorption Characteristics of Hydrogen Sulfide, Methanethiol, Ethanethiol, and Dimethyl Sulfide Adsorbed at 423°K on 7 -Alumina Heat-Treated at 700°
Adsorbate
"Limiting" heat at 1.40 /¿mol m "2, kcal mol" 1
Amount adsorbed at 150 Torr,
¿¿mol nv~2
AS (_= S2, — Ss) at
0.120 ¿¿mol m-2, cal
deg - 1 mol- 1
Hydrogensulfide 16.0° 0.37 10.0“
Methanethiol 16.5 1.20 17.3Ethanethiol 18.4 1.51 25.7Dimethyl
sulfide 20.7 1.72 29.5
a "Limiting" heats and AS values for hydrogen sulfide are quoted for a surface coverage of 0.410 fxmol m-2.
AMOUNT ADSORBED (/imoksrrT2)
Figure 1. Variation of the heats of adsorption with surface coverage for hydrogen sulfide (O ), methanethiol (X ), ethanethiol (A ), and dimethyl sulfide (0 ) adsorbed at 423°K on 7 -alumina heat-treated at 700°.
Figure 2. Adsorption isotherms for hydrogen sulfide (O ), methanethiol (X ), ethanethiol (A ), and dimethyl sulfide (0 ) adsorbed at 423°K on 7 -alumina heat-treated at 700°.
The entropy curves for methanethiol, ethanethiol, and dimethyl sulfide adsorptions were very similar in shape. They exhibited negative entropy values at their lowest coverages followed by a rapid increase in positive entropy values between 0.100 and 0.120 /¿mol m-2 . At this latter coverage the entropy values had leveled off to 29.2, 32.3, and 26.0 cal deg-1 mol-1 for methanethiol, ethanethiol, and dimethyl sulfide, respectively. The entropy curve of hydrogen sulfide was very similar to that of methanethiol up to the maximum surface coverage measured. Table I summarizes the principal adsorption characteristics for all of the gases.
DiscussionRecently4 it was demonstrated that a correlation ap
peared to exist between the heats of adsorption of all of these gases on silica gel and the degree of méthylation of the adsorbate. A similar correlation can be made for 7 - alumina. The heats of adsorption and adsorption capacities increase, and the entropies of adsorption decrease with increasing méthylation of the adsorbate.
The “ water content” of the 7 -alumina is apparently equivalent to two monomolecular layers of water. How-
The Journal of Physical Chemistry, Voi. 17, No. 21, 1973

2578 Ft. W. Glass and R. A. Ross
Figure 3. Experimental differential molar entropies of adsorption for hydrogen sulfide ( O ) , methanethiol (X ), ethanethiol (A) , and dimethyl sulfide ( 0 ) adsorbed at 423°K on 7 -alumina heat- treated at 70 0 °;....... , “ mobile" adsorption entropy values.
ever, it has been shown7 that water molecules that are not desorbed as such during heat-drying up to 300° react to form surface hydroxyl groups. Thus, it can be assumed that after heat treatment for 20 hr at 700° a large proportion of this water is present in the bulk of the adsorbent, while not excluding the possibility that a large number of hydroxyl groups exist on the surface. Thus the surface of the 700° 7 -alumina may be considered to be similar with regard to hydroxyl group distribution to that for silica gel, and similar properties may be expected.
It is pertinent to note that infrared studies of the adsorption of hydrogen sulfide on alumina8 suggest that fairly strong interactions occur involving the formation of hydrogen bonds. A comparison was made of the shifts of the SH stretching frequency to a lower value, and of the HSH bending frequency to a higher value, with the shifts obtained for adsorbed water and it was concluded that a likely representation of adsorbed hydrogen sulfide was
A1/ \
A color change from white to bright violet was noted on adsorption of hydrogen sulfide on the 7 -alumina at room temperature, and it was postulated that this may have been due to dissociation of the hydrogen sulfide molecule or possibly to the formation of some higher polymeric form of sulfur. More recently, further infrared work9 has suggested that decomposition of hydrogen sulfide has taken place on 7 -alumina. This was confirmed in the present work where the residue was pale yellow and chemical tests showed the presence of ~100 pg of sulfur in an unknown state. It should be noted that this amount represents an extremely small fraction of available adsorbent surface and the effect on heat and entropy results can be assumed to be insignificant.
The heats of adsorption of hydrogen sulfide at 423°K fell from 32.5 kcal mol-1 at a coverage of 0.020 //mol m ' 2 to an almost constant value of 16.3 kcal mol' 1 at 0.420 /tmol m '2. These results compare reasonably well with isosteric heats determined for hydrogen sulfide on 7 -alu
mina10 at 573 and 737°K when the values were 25 and 38 kcal mol-1 , respectively, at surface coverages of 0.170 and0.114 nmol m '2. Entropy values calculated subsequently from these latter heats indicated that the mobility of the hydrogen sulfide molecule was highly restricted,10 possibly by reaction as a base at Lewis acid sites on the oxide surface.
While alternative mechanisms have been proposed11-12 to account for infrared investigations on the adsorption of methyl and ethyl alcohols on alumina surfaces at 543°K it is generally agreed11-12 that surface alkoxyl species are formed.
Thus, all of these studies indicate that strong interactions may he expected for the adsorption of hydrogen sulfide, methanethiol, ethanethiol, and dimethyl sulfide on a 7 -alumina heat treated at 700° on which Lewis acid sites are probably present.13
In the present work, no color changes were observed with the residues obtained after the adsorption of methanethiol, ethanethiol, and dimethyl sulfide and no sulfur was detected in the residues. For these gases adsorption on two different types of sites is proposed: (a) adsorption on a relatively high energy Lewis acid site, probably more significant at low surface coverages, and (b) adsorption involving hydrogen bonds between the sulfur and hydroxyl hydrogen atoms, which may predominate at higher surface coverages.
The argument used to account for the results for the adsorption of these gases on silica gels can also be applied plausibly to explain the adsorptions at higher surface coverages on 7 -alumina. Thus the influence of the methyl groups on the inductive effect and hence the strength of the hydrogen bond formed between the sulfur atom and the hydroxyl hydrogen atom should be reflected in the values of the entropy differences (AS) and the heats of adsorption. This is consistent with the results since the AH and AS values are, respectively, 16.0 kcal mol' 1 and 10.0 cal deg-1 mol' 1 for hydrogen sulfide; 16.5 kcal mol' 1 and17.3 cal deg' 1 mol' 1 for methanethiol; 18.4 kcal mol' 1 and 25.7 cal deg' 1 mol' 1 for ethanethiol; and 20.7 kcal mol' 1 and 29.5 cal deg" 1 mol' 1 for dimethyl sulfide. Hence at a given coverage for a given gas, the heats are higher for adsorption on 7-alumina than on silica gel. This feature may be explained by the greater acidity of the hydroxyl hydrogens on alumina14 which would give rise to stronger hydrogen bonds on association with electron donor molecules.References and Notes( 1 ) P r e s e n t a d d r e s s , O n t a r i o R e s e a r c h F o u n d a t i o n , S h e r i d a n P a r k ,
C l a r k s o n , O n t a r i o , C a n a d a .(2) ( a ) S e e , f o r e x a m p l e , W . S t r a u s s , " A i r P o l l u t i o n C o n t r o l , P a r t I , " W .
S t r a u s s , E d . , W i l e y - l n t e r s c i e n c e , N e w Y o r k , N. Y . , 1 9 7 1 ; ( b ) J . I. P a i g e , J . W . T o w n , J . H. R u s s e l l , a n d H. J. K e l l y , U. S. Govt. Res. Develop. Rep., 7 0 ( 2 1 ) , 5 5 ( 1 9 7 0 ) .
(3 ) R. W . G l a s s a n d R. A . R o s s , Can. J. Chem., 5 0 , 2 4 5 1 ( 1 9 7 2 ) .
(4) R. W . G l a s s a n d R. A . R o s s , J. Phys. Chem., 7 7 , 2 5 7 1 ( 1 9 7 3 ) , P a r t I o f t h i s s e r i e s .
( 5 ) R. W . G l a s s a n d R. A . R o s s , Can. J. Chem., 4 9 , 2 8 3 2 ( 1 9 7 1 ) .( 6 ) W . J. J o n e s a n d R . A . R o s s , J. Chem. Soc. A, 1 0 2 1 ( 1 9 6 7 ) .( 7 ) J. B . P e r i a n d R. B. H a n n a n , J. Phys. Chem., 6 4 , 1 5 2 6 ( 1 9 6 0 ) .( 8 ) A , V , D e o , I. G . D a l l a L a n a , a n d H. W . H a b c o o d , J. Catal., 2 1 , 2 7 0
( 1 9 7 1 ) .
( 9 ) T. L. S l a g e r a n d C . H. A m b e r g , Can. J. Chem., 5 0 ( 2 1 ) , 3 4 1 6 ( 1 9 7 1 ) .
( 1 0 ) A . J. d e R o s s e t , C . G . F i n s t r o m , a n d C . J . A d a m s , J. Catal., 1 , 2 3 5 ( 1 9 6 2 ) .
( 1 1 ) R . G . G r e e n l e r , J. Chem. Phys., 3 7 , 2 0 9 4 ( 1 9 6 2 ) .
( 1 2 ) A . V , K i s e l e v a n d V . I. L y g i n , " I n f r a r e d S p e c t r a o f A d s o r b e d S p e c i e s , ” L. H. Li tt le, E d . , A c a d e m i c P r e s s , N e w Y o r k , N . Y . , 1 9 6 6 .
( 1 3 ) J . B . P e r l , J. Phys. Chem., 6 9 , 2 2 0 ( 1 9 6 5 ) .( 1 4 ) M . L. H a ir , E d . , " I n f r a r e d S p e c t r o s c o p y in S u r f a c e C h e m i s t r y , " E d
w a r d A r n o l d L td . , L o n d o n , 1 9 6 7 .
The Journal of Physical Chemistry, Voi. 77. No. 21. 1973

Correlation of Self-Exchange and E lectrochem ical Rate Data 2579
Correlation of Homogeneous Self-Exchange and Electrochemical Rate Data. Further Evidence for Anomalously Low Reorganizational Barriers in Electron Transfer Reactions of Cobalt Complexes13
John F. Endicott, Ronald R, Schroeder,* Dale H. Chidester, and Donald R. Ferrier16
Department of Chemistry, Wayne State University, Detroit, Michigan 48202 (Received October 12, 1971; Revised Manuscript Received August 8, 1973)
Publication costs assisted by the Public Health Service
The staircase voltammetric technique has been applied to the determination of the standard heterogeneous rate constants (ks) for one electron reductions of several coordination complexes. Some of these determinations together with literature data suggest a correlation between k s and the homogeneous selfexchange rate constants (kexch) similar in form to that suggested by Marcus: log feexrn ~ (2.0 ± 0.5) log k s
+ (4.0 ± 1). Contrasting behavior is exhibited by cobalt(III) complexes for which little variation in k s is found for complexes whose self-exchange rates vary by more than a factor 1012. Similar behavior has previously been reported for outer-sphere homogeneous reduction of cobalt(III) complexes. It must be concluded that the reorganizational barriers which are so important in cobalt(III)—(II) self-exchange reactions are not as significant in cross reactions of cobalt complexes.
Owing to their apparent simplicity, electron transfer reactions of coordination complexes have been the subject of many experimental and theoretical studies.2 Although most of the systematic investigations have dealt with homogeneous reactions, the theoretical treatment of Mar- c u s 2a,b,3 SUggests a relationship (1) between the homoge-
(kexch/ Z )^ = k J Z el (1)
neous self-exchange rate constant (e.g., for the Ru- (NH3)63 + -2+ exchange reaction), kexchi the standard (reference to E° for the exchange related couple) heterogeneous rate constant, fes, and the homogeneous and heterogeneous diffusion rates (Z and ZeU respectively). Although Marcus’ arguments have been in the literature for several years, there does not appear to have been any previous attempt to systematically examine the validity of (1) or to examine the possibility that there may be a general empirical correlation between kexch and ka.
The studies reported in the present manuscript were undertaken to complement studies of the outer-sphere electron transfer reactions of cobalt complexes in homogeneous aqueous solutions.'2'4~8 The Marcus-type free energy correlations (2) have not been precisely applicable to ho-
AG12 Ài2 AG12 I (AG12)" T + ~~2 ~ + 4X (2)
mogeneous electron transfer reactions of cobalt complexes.2a~d,4~8 Several studies5"8 have demonstrated that the major discrepancy between (2) and observed behavior arises because reorganizational barrier in cross reactions is much smaller than would be inferred from the usual2a"b relation, X12 = V2(Aii + X22) = %(XCo + a22). Rate parameters from heterogeneous reactions provide a more direct means of examining this anomalous behavior of cobalt complexes.
The present study examines the relationship between fcexch and k s, and is a result of our interests in the energetics of homogeneous, outer-sphere electron transfer
reactions4’7’8 and in the development of convenient and accurate methods for determining standard heterogeneous rate constants.9’ 11
It is to be noted that the widely cited2’ 4-6 12 success in correlating heterogeneous rates of reduction of Co!11(NH3)5X complexes with outer sphere homogeneous reduction rate constants is probably due to the fact that Vlcek12 referred all his heterogeneous rate constants to a common reference potential (since standard potentials, E°, are unknown for these complexes) and variations in the cross reaction rates whether homogeneous or heterogeneous depend strongly on AG\2.
Experimental SectionThree different instrument systems were used to obtain
the staircase voltammetry data.9-11’13 Each system was composed of an electrolysis cell, a potentiostat. a central timing unit, a staircase waveform generator, a current sampler, and a data recording device.
The same cell potentiostat and waveform sources were used with each of the three instrument systems. The cell was of the conventional three electrode type composed of a working electrode (either a hanging mercury drop, a platinum wire, or a slowly dropping mercury electrode), a platinum wire counter electrode, and a saturated calomel reference electrode connected to the cell by a salt bridge and capillary probe. The cell was a 50-mm diameter weighing bottle with a snug-fitting Teflon cap which held the electrodes and the nitrogen gas inlet tube. The potentiostat was an operational amplifier based adder-controller of conventional design and included a voltage follower input to which the reference electrode was connected, a dc voltage source for setting the initial potential, and a precision resistor for current monitoring.
The staircase generator was a binary up-down counter, triggered by the central timing unit. The counter output was connected to a digital to analog converter to produce the staircase waveform. The staircase waveform consisted of 128 steps of 5, 10, or 20 mV amplitude.
The Journal of Physical Chemistry, Voi. 77, No. 21, 1973

2580 J. Endicott, R. Schroeder, D. Chidester, and D. Ferrier
The first instrument system9-11 used for preliminary and qualitative work included a square wave signal generator as the central timer. The differentiated square wave triggered the waveform counter and a delay timer; the delay timer in turn triggered the current sampling by modulating the electron beam of an oscilloscope. The delay timer turned “ on” the beam during each step only at the preselected current sampling time. The voltammogram was recorded using an oscilloscope camera with a Polaroid back using 3000 speed film.
The second instrument system11-13 utilized a transient recorder (Biomation 610, Biomation Inc., Palo Alto, Calif.) as the central timer and as a digital recorder. A delay timer connecting the transient recorder and the waveform counter provided the delay needed for selectable current sampling times. The voltammogram was stored in the transient recorder memory as 128 six-bit binary words. A teletype interfaced to the transient recorder provided a punched paper tape recording of the voltammogram. This tape recording was processed through the university’s IBM 360/67 time-shared system to produce decimal output. Programs stored in the time-shared system were used for signal averaging, peak finding, automatic baseline correction, unit conversion, and plotting.
The third system13 used a minicomputer (JRA-5 spectrum computer, JOEL, Inc., Tokyo, Japan) as the central timer and data gathering device. This system provided up to five current samples per step at five preselected times and was used with the slow dropping mercury electrode. The computer averaged the data from five experiments (one experiment per DME drop) and provide a punched paper tape output identical in form with the previously described system except in provicing eight-bit binary numbers.
Solutions were prepared from reagent grade chemicals using distilled solvents. The cobalt macrocyclic complexes were kindly donated by Dr. D. P. Rillema.14 Other cobalt complexes were prepared by standard literature procedures.15-16 The [Ru(NH3)e](C104)3 used was obtained as the chloride salt from Mathey-Bishop, Malvern, Pa., and recrystallized from perchloric acid. All solutions used in the staircase studies were shown by polarography to contain no significant impurities.
The solutions for voltammetric studies were made up just before use to be approximately millimolar or less in the complex and either 0.05 or 0.1 M in NaClO* or HCIO4.
For each complex, voltammograms were run on solutions containing 0.05 and 0.1 M perchlorate. Voltammograms were recorded using several step times and at least five step to sampling time ratios.9-11-13 The data were used to determine experimental iq values. These were compared with iq values calculated from the theory presented by Ferrier and Schroeder.10 The theoretical ks values giving iq corresponding most closely to the experimental values were chosen. These results are listed in Table I. The measured ks values were corrected for double layer effects using the data of Wroblowa, Kovac, and Bockris for NaCICL.17 For this purpose graphs of the outer Helmholtz plane potential, <f>, us. applied potential (referenced to see) were constructed for several perchlorate concentrations18 (see Figure 1). For each set of voltammograms, run in either 0.05 or 0.1 M perchlorate, a <f> value corresponding to the peak potential was selected and a corrected ks value was calculated. Corrections were made according to eq 3
log kSmrr \ogks +(z — ana)<j>
0059 (3)
where z is the formal charge on the reacting species, a is the transfer coefficient, and na is the number of electrons involved in the rate determining portion of the electron transfer reaction.18-19
Our measurements showed that ana was close to 0.5 for the various reactions studied here and this value was used for all corrections.20 Corrected ks values and the measured values for each complex in each supporting electrolyte are listed in Table I.
Significance of the ks Values. The measured ks values and the corresponding corrected ks values listed in Table I warrant some further discussion in regard to reliability and consistency of the results. From the ks values listed all of the complexes studied would be polarographically reversible, a conclusion consistent with previous observations in this9-11 and other laboratories.21-22 In fact the results given here serve merely to support with quantitative data a trend previously noted for numerous cobalt complexes. The effects of chemical reactions and adsorption on the measured ks values are considered minimal. For the species studied here, cyclic voltammograms taken at moderate scan rates have shown both cathodic and anodic waves indicating that chemical decomposition of the electron transfer products is slow on the relevant experimental time scale.23
Adsorption peaks or other anomalous peaks where observed were sufficiently removed from the normal voltammetric wave to allow its complete characterization via normal means. The trend in peak current with variations in sampling time was entirely consistent with the behavior predicted by the staircase theory.9 -10
For Ru(NHa)63+ the ks value reported is the upper limit measurable by the staircase technique with the apparatus currently available. For cases where a measured ks value was obtained, we feel the values in Table I and II are accurate to within ±30%.
The double layer corrections merit additional comment. Our anticipation of somewhat dissimilar results at the two perchlorate concentrations21 was not entirely satisfied as similar results were generally obtained. Corrections for double layer effects should have reduced any dissimilarities but instead increased them. Thus, the uncorrected results for any one complex seem more consistent than do the corrected values. It should be noted, however, that the
V O L T S vs. S C E
Figure 1. T h e p o te n t ia l a t th e o u te r H e lm h o ltz p la n e , <p, vs. th e a p p lie d p o te n t ia l ( in v o lts vs. s e e ) fo r v a r io u s c o n c e n t r a t io n s o f N a C I0 4 . B a s e d o n th e d a ta p re s e n te d in re f 17.
The Journal of Physical Chemistry, Vol. 77, No. 21, 1973

Correlation of Self-Exchange and Electrochemical Rate Data 2581
TABLE I: Measured and Corrected k a Values for Several Metal Complexes
C o m p l e x “ E l e c t r o l y t e * iq / q ( t h e o r ) , ks’ a kse 0 / k e ,g As c o r r
Co([14]dieneN4)(N H 3) 23+ 0.050 M HCI04 -0 .0 8 1.22 1.22 1.0 2.45 X IO“ 2 0.085 >11.30 1.301.42 1.37
0.10 /w h c io 4 -0 .0 6 1.24 1.23 0.9 2.2 X IO - 2 0.044 >11.33 1.321.41 1.40
Co([14]tetraeneN4)(N H 3) 23+ 0.050 M HCI04 -0 .5 6 1.17 1.18 0.55 1.35 X IO -2 -0 .067 2 X 1 0 -51.24 1.241.29 1.291.37 1.33
0.01 M HCI04 -0 .5 4 1.21 1.21 0.75 1.84 X I O '2 -0 .06 3 4 X I O '51.28 1.291.35 1.351.53 1.42
Co(en)3s+ 0.050 M NaCIO. -0 .4 7 1.27 1.26 1.2 2.94 X I O '2 -0 .043 4 X IO -41.36 1.361.37 1.47
0.10 M NaCIO4 -0 .4 7 1.28 1.30 2.5 6.5 X IO “ 2 -0 .04 3 9 X IÛ - 41.46 1.471.66 1.65
Ru(NH3)s3+ 0.10 A4NaCI04 -0 .21 1.30 1.33 Rev >1 + 0.013 » 11.51 1.541.81 1.851.94 2.45
a F o r c o m p l e x a b b r e v i a t i o n s s e e r e f 2 5 . 6 Al l In H 20 , a t 2 5 ± 0 . 1 °. c V o l t s vs. s e e . d F r o m re f 9, ks' = fcs v / 7:Y “ 'l a / v /D . e C m / s e c . < F r o m F i g u r e
v a l u e s in v o l t s . g U s i n g e q 3.
TABLE II: Standard Heterogeneous Rate Constants for Reduction of Several Coordination Complexes
C o m p l e x “ S o l v e n t * Ep, V e i s , ' ' c m s e c 1 kexch,M ~'sec 1 d
A. C oba lti!II) ComplexesCo([14]aneN4)(C N )2+ AN -1 .1 0.01-0.02Co([14]dieneN4)(C N )2 + AN -1 .1 0.01-0.02Co([14]dieneN4) (NH3) 23+ H20 -0 .0 6 0.023 i o - 9 e
Co([14]dieneN4)CI2+ AN + 0.05 0.005Co([14]dieneN4) Br2+ AN + 0.16 0.005Co([14]tetraeneN4) (NH3)23+ H20 -0 .5 6 0.015 wCo(en)33 + h 2o -0 .4 7 0.040 5 X 1 0 -5Co(EDTA) - h 2o -0 .0 4 0.01-0.02 1 0 -6Co(NH3)63+ 0.5-1.3 X IO “ 3® 3 X 1 0 '12 h
B. Other Metallo ComplexesFe(CN)63- . 4' 10 1 ' 5 X 10²Ru(N I-3)63+.2+ h 2o -0 .21 >1 103 2Fe3+.2 + 5 X IO“ 3 ‘ 41/3 + .2 + 3 X 10 —31 1.0 X 1 0 -2 (1 0 -3)*Eu3 + ,2 + 2 X 1 0 “ 41 1 x 1 0 -4Cr3+.2+ I O '5 ‘ 2 X 10_5(3 X 10- 7:
° F o r l i g a n d a b b r e v i a t i o n s s e e r e f 2 5 . 6 A N = a c e t o n i t r i l e . c P e a k p o t e n t i a l v s . s e e . “ V a l u e s t a k e n f r o m r e f 2 c o r 2 4 e x c e p t a s i n d i c a t e d . e B a s e d o n t h e s e l f - e x c h a n g e r a t e o b s e r v e d f o r i r a r ) s - C o ( [ 1 4 ] d i e n e N 4) ( O H 2) 23 * >2 4 ( r e f 4 d ) . ' B a s e d o n t h e s e l f - e x c h a n g e r a t e o b s e r v e d f o r C o ( [ 1 4 l t e t r a e n e N 4- ( O H 2) 23 + - 2+ . r e f 4 d ) . F r o m t h e r a t e c o n s t a n t f o r t h e R u ( N H 3) e 2+ r e d u c t i o n o f f r a n s - C o ( [ 1 4 ] t e t r a e n e N 4 ( N H 3) 23 + , 4c w e e s t i m a t e t h a t kexCh = 1 0 0- 4 ± 0 -8 M ~ ' s e c " 1 . * R e f e r e n c e 2 5 . h R e f e r e n c e 2 4 . ‘ R e f e r e n c e 1 9 . J T. J . M e y e r a n d H. T a u b e , Inorg. Chem., 7 , 2 3 6 9 ( 1 9 6 8 ) ; G . N a v o n a n d D . M e y e r s t e i n ,
J. Phys. Cherr,., 7 4 , 4 0 6 7 ( 1 9 7 0 ) . * V a l u e s in p a r e n t h e s e s e s t i m a t e d f r o m c r o s s r e a c t i o n s w i t h R u ( N H 3) 6 3+ u s i n g t h e M a r c u s r e l a t i o n , /C12 = ( * 1 1 * 22^ 1 2 -
f , 2) 1/2. S e e r e f 4.
correction applied (eq 3) is in fact an overcorrection for double layer effects, and that the actual ka for each complex lies between the corrected and uncorrected values. It is our opinion, though not supported by existing theories, that the uncorrected values more closely approximate the true k s value than do the corrected ones. Furthermore, considering the similarities in the complexes one would expect them to exhibit some similarities in behavior and
o here again the uncorrected ks values appear to be more reasonable than the corrected ones.
Results and DiscussionValues of the standard heterogeneous rate constant, k a,
for reduction of several cobalt complexes are listed in Table II.25 To facilitate comparisons we have also included, where possible, estimates of the homogeneous self-ex-
The Journal of Physical Chemistry, Voi 71, No. 21, 1973

2582 J. Endicott, R. Schroeder, D. Chidester, and D. Ferrier
LOG ksFigure 2. Correlation of homogeneous self-exchange rate constants with heterogeneous rate constants: circles are data from part B of Table II; squares are entries for cobalt couples (part A, Table II). Compexes included are Co([14]tetraeneN4- (NH3)23+-2+ (I), Co(en)33+ ’2+ (II), Co(EDTA)- ’2- (III), Co- ([14]dieneN4)(NH3)23+-2+ (IV), and Co(NH3)63+l2+ (V). The line is drawn to fit eq 1 assuming Z = 1011 /W” 1 sec-1 and ZeI = 104 cm sec-1 . Solid circles of squares represent values measured in this work, corrected values are indicated by dashed line squares.
change rates for the appropriate cobalt(III)-(II) couples and some similar data previously reported for Co(NH3)63+ and other complexes.26-29
It is a most remarkable observation that the measured values of ks vary by no more than a factor of 102 for a series of cobalt complexes whose homogeneous self-exchange rates vary by a factor of more than 1012. In a way this result might have been anticipated since it is known that many cobalt(III) complexes are polarographieally reversible21'22 whereas the corresponding homogeneous self-ex- change rates are well known to be very slow; e.g., both qualitative observations apply to the Co(en)33+ '2+ and Co(EDTA)- -2- couples. However, the magnitude of the discrepancy has certainly not been commonly recognized. Since there has been so much speculation about the kinetic significance of metal ligand interactions in electron transfer cross reactions, whether the interactions be due to bond strengths,8-30 crystal field strengths,31 or metal ligand stretching in the activated complex,8'32 it is very important to note that ks is relatively independent of the ligands (axial or other) coordinated to cobalt(III). It seems to be a characteristic of both the heterogeneous and homogeneous reactions that the rates of electron transfer reactions of cobalt complexes are very often faster than predicted by the Marcus cross relation (1 or 2).
Despite the anomalous behavior noted for cobalt complexes, such limited information as is available suggests that ks and kexch are reasonably well correlated by (1) for complexes of many other metals (Figure 2); for example, the empirical relation 4 is in reasonable agree-
log^exch = (2.0 ± 0.5) log&s + (4 ± 1) (4)ment with (1) and is a reasonable representation of data for complexes not containing cobalt. In fact if one takes
cognizance of the relatively poor quality of the values of feexch and ks currently available the agreement between(4) and (1) is far better than might have been expected. Such problems as reactant adsorption in the heterogeneous reactions and specific ion effects in the homogeneous reactions may require that empirical relations of type (4) are intrinsically imprecise.
The very large difference in the magnitude of the variations observed in ka and kexch for cobalt complexes suggest some differences in the fundamental physical parameters determining the rates of the two kinds of one electron reductions, heterogeneous and self-exchange. On the other hand, the outer sphere {e.g., with Ru(NH3)62+ or V2+) reduction rates of these same cobalt complexes in homogeneous solution exhibit a similar independence of the cobalt self-exchange rates.8 It seems necessary to conclude that the rate constants for cobalt(III)-(II) self-ex- change reactions are limited by some factor (or factors) which is less significant in heterogeneous or homogeneous cross reactions of cobalt complexes. At the present time it does not appear that there are significant “ spin restrictions” on the cobalt(III)-(II) self-exchange rates.8'33-37 Much of the variation in these self-exchange rates has been rationalized in terms of ligand reorganizational barriers a view that has received much experimental support and has been widely accepted.2-8'28’29'35'38 In the sense that (1), a prediction based on such a theory, is consistent with the experimental correlation (4) of kexch and ka, the present study further corroborates this model. However, we do not find a basis within the context of this model for rationalizing the order observed for self-exchange rates (or standard heterogeneous reduction rates) even of all the complexes not containing cobalt; i.e., the decrease of kexch in the order Fe(CN)63 - ’4- ~ Ru(NH3)e3+’2+ > Fe3+’2+ > V3+.2+ > Eu3+ '2+ > Cr3+ '2+ is extremely difficult to understand only on the basis of the variation in ligand reorganizational barriers.
Despite such reservations the most notable exceptions to reactivity correlations based on (1) or (4) involve reactions of cobalt complexes and these seem most deviant with regard to the reorganizational contributions inferred from cobalt(III)—(II) self-exchange data. It is possible to postulate that self-exchange and cross reaction rate data are intrinsically unrelatable, but this would again be true only in the case of cobalt and would attribute a very unsatisfying complexity and capriciousness to an intrinsically simple class of reactions.
The cobalt(III)-(II) self-exchange reactions do have the relatively unique feature that both the donor and acceptor orbitals are antibonding *eg. Although it is commonly believed2 that the reactant orbital overlap integrals, J'0d0a dr, make a negligible contribution to the reaction energetics, it is also evident that in order for the transmission coefficient * 1, f <Po4>a dr must be greater than someminimum value, y. Since the *eg orbitals are buried within the ligation of the complex ion while the tsg orbitals are not, the condition / <t>r>4>A dr > 7 in effect requires shorter distances of closest approach and different activated complex geometries when the donor and acceptor orbitals are both *eg in character than when both are t2g in character or when only the acceptor orbital is *eg in character. Thus it seems plausible that variations in cobalt(III)-(II) selfexchange rates arise in part from the work required to achieve the S4>d4>a dr > 7 condition as the ligands are changed.
The Journal of Physical Chemistry, Vol. 77, No. 21, 1973

Correlation of Self-Exchange and Electrochemical Rate Data
Acknowledgment. The authors are grateful to Dr. D. P. Rillema for samples of cyclic complexes and for assistance in preparing some of the nonaqueous solutions. One of the authors (J. F. E.) is indebted to Professor J. K. Beattie for some stimulating discussions and for a preliminary report of some of his work.
References and Notes(1) (a) Partial support of this research by the Public Health Service
(Grant No. AM 14391) is gratefully acknowledged, (b) N.D.E.A. Fellow 1967-1969.
(2) For recent reviews see (a) R. A. Marcus, Ann Rev. Phys. Chem., 15, 155 (1969); (b) W. L. Reynolds and R. W. Lumry, "Mechanisms of Electron Transfer," Ronald Press, New York, N. Y„ 1966;(c) A. G. Sykes, Advan. Inorg. Cherr,. Radiochem., 10, 153 (1967);(d) H. Taube, "Electron Transfer Reactions of Complex Ions In Solution." Academic Press, New York, N. Y., 1970; (e) J. E. Earley, Progr. Inorg. Chen., 13, 243 (1970); (f) R. G. Linck, MTP Int. Rev. Sci., Inorg. Chem., Ser. 1, 9, 303 (1971); (g) N. Sutin, Chem. Britain, 8 , 148 (1972).
(3) R. A. Marcus, J. Phys. Chem., 67, 853 (1963).(4) J. F. Endicott and H. Taube, J. Amer. Chem. Soc., 86 , 168 (1964).(5) R. J. Campion, N. Purdie, and N. Sutin, Inorg. Chem., 3, 1091
(1964).(6) J . P. Candlin, J. Halpern, and D. D. Trim, J. Amer. Chem. Soc., 86 ,
109 (1964).(7) R. C. Patel and J. F. Endicott, J. Amer Chem. Soc., 90, 6364 (1968).(8) (a) D. P. Rillema, J. F. Endicott, and R. C. Patel, J. Amer. Chem. Soc., 94, 394 (1972); (b) D. P. Rillema and J. F. Endicott, Inorg. Chem., 11, 2361 (1972); (c) J. Amer. Chem. Soc., 94, 8711
(1972) .(9) D. R. Ferrier, Ph.D Thesis, Wayne State University, 1971.
(10) D. R. Ferrier and R. R. Schroeder, J. Electroanal. Chem., 45, 343(1973) .
(11) D. R. Ferrier, D. H. Chidester, and R. R. Schroeder, J. Electroanal. Chem., 45,361 (1973).(12) (a) A. A. Vlcek, "Advances in the Chemistry of Coordination Com
pounds,” Macmillan, New York, N. Y„ 1961, p 289; (b) Progr. Inorg. Chem., 5, 211 (1963). •(13) D. H. Childester, Ph.D. Thesis, Wayne State University, 1973.(14) D. P. Rillema, J. F. Endicott, and E. Papaconstantinou, Inorg. Chem., 10.1739 (1963).(15) R. Angilici, "Synthesis and Technique of Inorganic Chemistry,” W.
B. Saunders, Philadelphia, Pa., 1969, p 71.(16) F. P. Dwyer, E. Gwarfas, and D. Me'ler, J. Phys. Chem.. 59, 296
(1955).(17) H. Wroblowa, Z. Kovac, and J. O’M. Bockris, Trans. Faraday Soc.,
61, 1523 ('965).(18) P. Delahay, "Double Layer and Electrode Kinetics,” Interscience,
New York, N. Y., 1965.(19) Although eq 3 is the standard correction used to correct measured
rate constants for double layer effects, its application to the data presented here is subject to question. For lack of a more appropriate correction it has been used. The sources of our concern are the nonequilibrium double layer involved in the staircase experiment due to the large overall potential changes and the subsequent concentration changes and reactant mass transfer. We anticipate from
2583
t h e s e c o n s i d e r a t i o n s t h a t e q 3 o v e r c o r r e c t s t h e m e a s u r e d v a l u e s . T h i s o v e r c o r r e c t i o n is p r o b a b l y a m p l i f i e d b y t h e u s e o f t h e f o r m a l c h a r g e s o f t h e r e a c t a n t s w i t h o u t c o n s i d e r i n g io n p a i r i n g , a c t i v i t y e f f e c t s , o r t h e e f f e c t s o f t h e r e a c t a n t o n t h e d o u b l e l a y e r s t r u c t u r e . T h u s , t h e m e a s u r e d a n d c o r r e c t e d r a t e c o n s t a n t s c a n b e c o n s i d e r e d o n l y t o d e f i n e t h e r a n g e w i t h i n w h i c h t h e t r u e v a l u e f a l l s . T h i s r a t h e r l a r g e u n c e r t a i n t y in t h e t r u e r a t e c o n s t a n t v a l u e s d o e s n o t h o w e v e r d e t r a c t f r o m t h e c o n c l u s i o n s g i v e n o r f r o m t h e q u e s t i o n s r a i s e d in t h i s w o r k .
(2 0 ) ( A c t u a l l y ana v a l u e s r a n g i n g b e t w e e n 0 . 4 a n d 0 . 6 w e r e e s t i m a t e d f r o m o u r d a t a ; n o a t t e m p t w a s m a d e t o d e t e r m i n e a m o r e a c c u r a t e an& v a l u e . E v e n a l a r g e u n c e r t a i n t y in an„ h a s l i tt le e f f e c t o n t h e c o r r e c t e d k s v a l u e s e s p e c i a l l y c o n s i d e r i n g t h e l a r g e u n c e r t a i n t y in
z).( 2 1 ) P o l a r o g r a p h i c r e v e r s i b i l i t y is u s u a l l y o b s e r v e d , in t h e p r e s e n c e o f
e x c e s s l i g a n d , f o r t h o s e c o m p l e x e s w h e r e c o b a l t ( 11 ) c o m p l e x f o r m a t i o n c o n s t a n t s a r e f a i r l y l a r g e . F o r e x a m p l e , s e e H. A . L a i t i n e n a n d M . W . G r e i b , J. Amer. Chem. Soc., 7 7 , 5 2 0 1 ( 1 9 5 5 ) .
( 2 2 ) S e e a l s o c o m m e n t s o n t h i s p o i n t in r e f 8 a n d 1 4 .( 2 3 ) R. S . N i c h o l s o n a n d I. S t r a i n , Anal. Chem., 34, 7 0 6 ( 1 S 6 4 ) .( 2 4 ) If d o u b l e l a y e r e f f e c t s a r e to b e s i g n i f i c a n t , t h e n t h e r a t h e r l a r g e
d i f f e r e n c e s in ¡¡> f o r t h e s a m e c o m p l e x a t t h e t w o d i f f e r e n t p e r c h l o r a t e c o n c e n t r a t i o n s h o u l d h a v e c a u s e d m a j o r d i f f e r e n c e s in t h e m e a s u r e d ks v a l u e s .
( 2 5 ) L i g a n d a b b r e v i a t i o n s u s e d in t h i s p a p e r a r e [ 1 4 ] a n e N 4 = 5 , 7 , 7 , 1 2 , 1 4 , 1 4 - h e x a m e t h y l - 1 , 4 , 7 , 1 1 - t e t r a a z a c y c l o t e t r a d e c a n e ;
[ 1 4 ] d i e n e N 4 = 5 , 7 , 7 , 1 2 , 1 4 , 1 4 - h e x a m e t h y l - 1 , 4 , 8 , 1 l - t e t r a a z a c y c l o t e - t r a d e c a - 4 , 1 1 - d i e n e ; [ 1 4 ] t e t r a e n e N 4 = 2 , 3 , 9 , 1 0 - t e t r a m e t h y l - 1 , 4 , 8 , 1 1 - t e t r a a z a c y c l o t e t r a d e c a - 1 , 3 , 8 , 1 0 - t e t r a e n e ; e n = e t h y l e n e - d i a m i n e ; E D T A = e t h y l e n e d i a m i n e t e t r a a c e t a t e .
( 2 6 ) N . T a n a k a a n d R. T a m a m u s h i , Electrochim. Acta. 9 , 9 6 3 ( 1 9 6 4 ) .( 2 7 ) A v a l u e o f k s = 0 . 5 - 3 X 1 0 - 3 c m s e c 7 1 f o r C o ( N H 3 l 63+ h a s b e e n
o b t a i n e d . H. B a r t e l t a n d S . L a n d a z u r y , J. Electroanal. Chem., 22, 1 9 5 ( 1 9 6 9 ) . A v a l u e o f 1 . 3 X 1 0 ~ 3 c m / s e c is a l s o o b t a i n e d f r o m
V l c e k ’s d a t a u s i n g a n £f° o f - 0 . 2 1 1 v s . s e e a n d d i f f u s o n c o e f f i c i e n t o f 7 X 1 0 - 6 c m 2/ s e c .
( 2 8 ) N. S u t i n , Ann. Rev. Nucl. Sci., 12, 2 8 5 ( 1 9 6 2 ) .( 2 9 ) A n u p p e r l i m it o f 3 . 3 X 1 0 " 12 M " 1 s e c - 1 f o r t h e C o ( N H 3) 63 + -2 +
s e l f - e x c h a n g e r a t e h a s b e e n e s t i m a t e d in r e f 4 f r o m d a t a o f D. R. S t r a n k s , Discuss. Faraday Soc., 29, 7 3 ( 1 9 6 0 ) ; N . S . B i r a d a r a n d D. R. S t r a n k s , Trans. Faraday Soc.. 5 8 . 2 9 2 1 ( 1 9 6 3 ) .
(3 0 ) S e e d i s c u s s i o n in r e f 2 c - f a n d C . B i f a n o a n d R. G . L i n c k , J. Amer. Chem. Soc.. 89, 2 9 4 5 ( 1 9 6 7 ) .( 3 1 ) P . B e n s o n a n d A . H a i m , J. Amer. Chem. Soc., 8 7 , 3 8 2 6 ( 1 9 6 5 ) .( 3 2 ) H. D i e b l e r , P. H. D o d e l , a n d H. T a u b e , Inorg. Chem.. 5 , 1 6 8 8
( 1 9 6 6 ) .( 3 3 ) J. K . B e a t t i e , p r i v a t e c o m m u n i c a t i o n , 1 9 7 1 .(3 4 ) R. F a r i n a a n d R. G . W i l k i n s , Inorg. Chem., 7 , 5 1 4 ( 1 9 6 8 ) .( 3 5 ) F o r e x a m p l e , t h e C o ( [ 1 4 ] d i e n e N 4) ( O H 2) 23 + ' 2+ s e l f - e x c h a n g e r a t e
is s l o w ( 1 0 - 7 M " 1 s e c " 1 a t 7 0 ° ) d e s p i t e t h e f a c t t h a t C o ( [ 1 4 ] d i - e n e N 4) ( O H 2) 22+ is p r e d o m i n a n t l y l o w s p i n .36 R e c e n t s t r u c t u r a l s t u d i e s h a v e s h o w n t h a t t h e C o n - O H 2 b o n d l e n g t h s a r e 0 . 5 Â l o n g e r t h a n t h e C o I I ! - O H 2 b o n d l e n g t h s ; M . D . G l i c k , J . K u s z a j , a n d J.F. E n d i c o t t , J. Amer. Chem. Soc., 95, 5 0 9 7 ( 1 9 7 3 ) .
(3 6 ) ( a ) D. D. R i l l e m a , J . F. E n d i c o t t , a n d N. A . D. K a n e - M a g u i r e , J. Chem. Soc., Chem. Commun.. 4 9 5 ( 1 9 7 2 ) ; (b ) m a n u s c r i p t in p r e p
a r a t i o n .( 3 7 ) ( a ) J . T . Y a r d l e y a n d J . K . B e a t t i e , J. Amer. Chem. Soc.. 94, 8 9 2 5
( 1 9 7 2 ) ; (b) J . K . B e a t t i e . N. S u t i n , D. H. T u r n e r , a n d G . W . F ly n n ,
ib id . , 95, 2 0 5 2 ( 1 9 7 3 ) .( 3 8 ) F o r a c o n t r a r y p o i n t o f v i e w s e e H. L. S t y n e s a n d J. A . I b e r s , Inorg. Chem.. 10. 2 3 0 4 ( 1 9 7 1 ) .
The Journal of Physical Chemistry, Vol. 77, Mo. 21, 1973

2584 G. M. Wyman, B. M. Zarnegar, and D. G. Whitten
Excited-State Chemistry of Indigoid Dyes. III. The Interaction of Indigo and Thioindigo with Tin(IV) Tetraphenyltetrahydroporphyrin Triplets: the Photosensitized Isomerization of Thioindigo1
George M. Wyman,* Bizhan M. Zarnegar, and David G. Whitten
Department of Chemistry, University of North Carolina-Chapel Hilf, Chapel Hill, North Carolina (Received February 26, 1973)
Publication costs assisted by the U.S. A r m y Research Office
The photosensitized cis-trans isomerization of thioindigo, using tin(IV) tetraphenyltetrahydroporphyrin (Er = 36.5 kcal) as sensitizer resulted in a photostationary-state concentration of 78% trans isomer. The interaction of the dye (cis or trans) with the sensitizer triplet was found to take place at a slightly lower rate than diffusion-controlled, with the cis isomer reacting a little faster than the trans. The sensitizer triplet was also quenched by indigo and by 6,6'-dimethoxyindigo at somewhat slower rates, but without any detectable trans to cis isomerization.
IntroductionIt has been known for some time that the direct irradia
tion of solutions of indigoid dyes (with the exception of indigo and its ring-substituted derivatives) in inert solvents results in cis-trans isomerization.2 More recently a number of studies have attempted to put this information on a more quantitative basis by developing precise analytical methods for the pairs of isomers3 and by determining the quantum efficiencies of the various competing photochemical and photophysical processes.4 Nonetheless far less is known about the photochemistry of these molecules than of other related conjugated unsaturated compounds. Thus, during the past decade the photosensitized cis- trans isomerization of a number of stilbenes and other conjugated olefins has been investigated in depth:5 these studies have not only extended our knowledge of the particular systems studied, but have also improved our understanding of the mechanism of photochemical reactions in general.
The present work on the attempted photosensitized isomerization of thioindigo (I) (as the prototype of isomer - izable indigoid dyes)4-6 and of indigo (II) and 6,6'- dimethoxyindigo (III) (two indigo dyes that cannot be isomerized by direct irradiation) was undertaken with this dual purpose in mind. utc-Tin(IV) tetraphenyltetrahydroporphyrin was selected as the sensitizer (ET = 36.5 kcal), because its long-wavelength absorption band (at 611 nm) does not overlap with the first absorption bands of I and III (543 and 563 nm, respectively) and only relatively little with that of II (599 nm).
Experimental Section(A) Materials. Thioindigo was a research sample from
the Dupont Co., further purified by recrystallization from chloroform. Indigo and 6,6'-dimethoxyindigo were kindly provided by Professor W. Luettke, University of Goettingen. vie-Tin(IV) tetrahydrotetraphenylporphyrin was prepared according to the method of Whitten, Yan, and Car- roll.7 Spectroscopic grade benzene and Merck “ Uvasol” toluene were used as solvents.
(B) Preparation of Solutions. Solutions of thioindigo in benzene (or toluene) contained in a 50-ml Erlenmeyer flask were irradiated with filtered light from a 300-W projector lamp for 15 min in order to enrich them with re
spect to one or the other isomer prior to mixing with an equal volume of sensitizer solution. Irradiation with Corning Filter No. 3-67 gave a cis-rich solution (ca. 65% cis), while irradiation with Corning Filter No. 5-60 gave a trans-rich solution (95% trans). Sensitizer concentration was adjusted to yield an optical density of 0.95 at 611 nm in a 1-cm cell in the final mixture. Since indigo and 6,6'- dimethoxyindigo exist only as the trans isomers, preirradiation of these solutions was omitted.
In the experiment involving the determination of the quenching rates of the sensitizer triplet by cis and trans I a cis-rich solution was first prepared as above, degassed and flashed. After flashing in vacuo, the solution was exposed to blue light for 15 min (Corning Filter No. 5-60) to convert some of the cis isomer to trans and flashed again. The cis-rich solution was found to contain 56% trans isomer just prior to flashing, while the trans-rich solution contained 78%, as determined spectroscopically.
(C) Photostationary State Measurements. Undegassed solutions (contained in a standard 1-cm absorption cell) were irradiated with filtered light from a 300-W projector lamp for 7 min. (This time period was found to be sufficient to reach the photostationary state.) A Corning No.2-61 or a Jena RG-610 filter was used to cut out all light with \ <595 nm and the light was passed through a rectangular water bath (i.d. 7 cm) to eliminate heat effects.
(D) Flash Photolysis. Flash photolysis was carried out in an apparatus described earlier8 with a decay time of 10 fisec. The light output from the flash was filtered by means of the Jena RG-610 filters. The solutions contained in a cyclindrical quartz cell (length, 10 cm; i.d., 1.5 cm) were degassed prior to flashing. The T -T absorption of the sensitizer was monitored at a suitable wavelength in the 435-460-nm region and lifetimes calculated from the observed decay curves. For the measurements on I, in view of its photosensitivity, the monitoring beam was passed through a monochromator before entering the sample cell.
(E) Absorption Spectra. Absorption spectra were measured on a Cary Model 17 recording spectrophotometer using matched quartz absorption cells.
Results(A) Photostationary-State Measurements. The absorp
tion spectrum characteristic of the photostationary state
The Journal of Physical Chemistry, Vol. 77, No. 21, 1973

Excited-Stale Chemistry of Indigoid Dyes 2585
F igure 1. Absorption spectra of thioindigo in benzene with tin(IV) tetraphenyltetrahydroporphyrin sensitizer. PSS curve represents the photostationary state that is reached either from a trans-rich (t) or a cis-rich (c) starting solution, rradiatior: 7 min, A >595 nm; reference: sensitizer at the same concentration.
TABLE I: T rip le t L ife tim es and Q uench ing Rate C onstan ts in To luene
Sensitizer Quencher Conen, MTobsd. fi sec ( x i o9)
SnIV-THPP “ c is -r ich ” I 8.05 X 10 ~ 6 a 49 2.6bSnIV-THPP "tra n s -rich ” I 8.05 X 10 ~ 6 a 51 2.0eSnIV-THPP ■ II 1.6 X 1 0 '5 45 1.2SnIV-THPP III 2.4 X 1 0 '5 45 0.8SnIV-THPP None 0 446
“ T o t a l c o n c e n t r a t i o n o f I. b C a l c u l a t e d f o r c i s - l . c C a l c u l a t e d f o r trans-l.
composition of I in benzene, starting with either a cis-rich or a trans-rich solution is shown in Figure 1 Substantially the same result was obtained when toluene was used as the solvent. The photostationary-state concentrations were found to be independent of sensitizer concentration over a range involving a tenfold variation of the latter. Under similar conditions dyes II and III exhibited no isomerization, but a slow degradation of both dye and sensitizer could be observed upon prolonged irradiation.
(B) Flash Photolysis. The specific rates of the interactions (7eq) with the sensitizer triplet were estimated by determining the dependence of the triplet lifetimes (r) on the concentration of the dye (quencher).9 The results are tabulated in Table I. The hope to be able to determine the values for cis-I and trans-I accurately was only partially fulfilled. Although precautions had been taken to protect the cis-rich solution from light during the degassing process, considerable isomerization appears to have occurred during the manipulations that were necessary prior to flashing. As a consequence, since the concentrations of the two isomers were not greatly different in the “ cis-rich” and the “ trans-rich” solutions and since, as expected, the respective kQ values appear to be quite similar, the measured lifetimes were found to be almost identical. For this reason, not too much credence should be attached to the second digits of the fcq values for cis-I and trans-I in Table I, although there is little doubt that the specific rate constant of the former is slightly greater than that of the latter.
(C) Determination of Et . The energy level of the sensitizer triplet was determined by observing the weak So —>■ T i transition at 777 nm in methyl iodide solution (ET =36.5 kcal). This absorption also appears (at 774 nm and at a reduced intensity) in toluene solutions of the porphyrin indicating the presence of a “ built-in” heavy atom effect due to the tin atom in this molecule. Unfortunately, neither thioindigo nor the far more soluble 5,5'-di-fert-butyl- thioindigo was found to exhibit S0 —*■ T i absorption in the 650-1000-nm region.
Discussion of ResultsThe observed photosensitized cis-trans isomerization of
I is consistent with the behavior of other conjugated unsaturated compounds.5’10 Under the conditions of the present work direct excitation of the dye could not occur, since the sensitizer was the only species present that could absorb the exciting radiation. The alternative process of energy transfer by a singlet mechanism was also eliminated for every practical purpose, because the singlet energy levels of trans-I and cis-I are considerably higher (by 6.0 and 12.4 kcal, respectively) than that of the sensitizer. Although the Et values for the two dye isomers are not known, the high, almost diffusion-controlled rates found for this process (c/. Table I) attest to the efficient transfer of energy from the sensitizer triplet to both isomers. As a consequence, the S-T splittings in trans-I and, especially in cis-I, must be quite large in order to lower their Et values below that of the sensitizer (Er = 36.5 kcal), since it is well known that only exothermic T -T energy transfer processes take place at such high rates.11
The results indicate that the photochemical cis-trans isomerization of thioindigo can take place via two separate routes: (1) direct isomerization by a singlet mechanism and (2) sensitized isomerization through a triplet intermediate. This is evident from the dramatically different decay ratios found for the two types of processes. In the direct isomerization this ratio was estimated to be 1.22;4 from the present results, if the photostationary composition of 22/78 (cf. Figure 1) is combined with the ratio of the quenching constants from Table I according to eq l 10
, . >-cisdecay ratio = -r-----------— > trans
(cis)pss K ' s (trans)pss k " :ins
( 1 )
(where kr cis and kr trans represent the respective rate constants for the decay of the twisted intermediate to cis and trans products) a decay ratio of 0.37 is obtained for the photosensitized reaction.12’13 Thus it appears that the intermediate in the direct reaction yields slightly more cis isomer than trans, while the intermediate in the sensitized reaction decays to the trans isomer about three times as fast as to the cis. (This is in sharp contrast with what has been observed for the stilbenes, where substantially the same decay ratios have been observed in the direct and the sensitized isomerizations;10 as a consequence there are still some unresolved questions concerning the mechanisms of these reactions.5) The inferred large S-T splittings in thioindigo are also consistent with a duality of mechanisms for the isomerization, since this would be expected to make intersystem crossing slow and therefore probably inefficient and less able to compete with the other deactivating processes of the Sj state. It snould be mentioned in this connection that the thioindigo triplet has recently been detected optically by flash or laser-flash excitation.14
The Journal of Physical Chemistry, Vol. IT, No. 21, 1973

2586 G. M. Wyman, B. M. Zarnegar, and D. G. Whitten
The unique photostability of indigo and its ring-substituted derivatives (in contrast with thioindigo) has recently been attributed to the possibility of an intramolecular proton-transfer in the Si state that is so fast that it takes precedence over the other deactivating processes (fluorescence, twisting, and radiationless decay) normally associated with molecules of this type.15 Inasmuch as the acidity (viz. basicity) characteristics of functional groups in the triplet state frequently more closely resemble the ground state than the Si state,16 it was hoped that trans —* cis isomerization could be brought about by photosensitization, bypassing the Si state. In addition to indigo, its 6,6'-dimethoxy derivative was selected for this purpose, because (1) its long-wavelength absorption band was sufficiently blue-shifted from that of the parent compound to allow the carrying out of a “ clean” photosensitization experiment and (2) by analogy with the corresponding thioindigo compounds the quantum yield of the trans —1► cis conversion might be expected to be enhanced over that of the parent compound.17 On the other hand, indigo offered the advantage that, even in the event of a relatively small S-T splitting, the energy transfer from the sensitizer could still be exothermic.
It is apparent from the data in Table I that the two indigos (II and III) differ little from thioindigo with respect to their behavior toward quenching the sensitizer triplets: the rates of this process, though somewhat slower, are still of the order of 109 M _1 s e c '1. It is possible that the slightly lower values indicate that the triplet energies of the two indigo dyes are closer to that of the sensitizer than are those of cis and trans I; this would correspond to considerably less splitting in the former than in the latter compounds. Although the two indigos appear to be efficient quenchers of the sensitizer triplets, it is remarkable that, in contrast with thioindigo, no isomerization can be detected. While quenching without energy transfer remains a distinct possibility, it is perhaps more reasonable to assume that indigo triplets are formed and that these do not undergo isomerization. It is not clear whether this should be attributed to a proton-transfer similar to that proposed for the Si state;15 this would be consistent with the findings of Godfrey, Porter, and Suppan on p-hydroxy- benzophenone where it was concluded on the basis of chemical evidence that for the CT triplet state of that molecule pK* is substantially the same (= -4 ) as for its Si state.16 Another possibility is that the triplet potential surface of the indigos is altered to favor the trans form
due to hydrogen bonding; such a transoid hydrogen-bonded species would be required to be short-lived and decay only to the trans ground state. In any event indigo derivatives continue to be unique among conjugated unsaturated compounds possessing a central double bond in that they appear to resist both direct and sensitized trans to cis isomerization.
Acknowledgments. The authors are greatly indebted to the Max Planck Institute for Biophysical Chemistry, Gottingen, where most of this work was carried out, for the hospitality extended to two of them (G. M. W. and D.G. W.). It is also a pleasure to thank Professors E. Fischer, A. Weller, and Dr. K.-H. Grellmann for several helpful discussions. Financial support of this research by the Max Planck Society and the U. S. Army Research Office is gratefully acknowledged.
References and Notes( 1 ) T h i s r e s e a r c h w a s c a r r i e d o u t in t h e S p e c t r o s c o p y D e p a r t m e n t o f
t h e M a x P l a n c k I n s t i t u t e f o r B i o p h y s i c a l C h e m i s t r y , G o t t i n g e n , W e s t Germany.
(2) G . M . W y m a n a n d W . R. B r o d e , J. Amer. Chem. Soc., 7 3 , 1 4 8 7 ( 1 9 5 1 ) ; J. W e i n s t e i n a n d G . M . W y m a n , ibid., 7 8 , 4 0 0 7 ( 1 9 5 6 ) ; G . M . W y m a n a n d A . F . Z e n h a u s e r n , J. Org. Chem., 3 0 , 2 3 4 8 ( 1 9 6 5 ) .
(3 ) J. B l a n c a n d D . L. R o s s , J. Phys. Chem., 7 2 , 2 8 1 7 ( 1 9 6 8 ) .(4) G . M . W y m a n a n d B . M . Z a r n e g a r , J. Phys. Chem., 7 7 , 8 3 1 ( 1 9 7 3 ) .
(5 ) C f. D . L. R o s s a n d J . B l a n c in “ T e c h n i q u e s o f C h e m i s t r y , " V o l . 3 , A .
W e i s s b e r g e r , E d . , W i l e y - l n t e r s c i e n c e , N e w Y o r k , N . Y . , 1 9 7 1 , p p 4 7 9 - 4 8 6 , a n d r e f e r e n c e s q u o t e d t h e r e i n .
(6 ) G . M . W y m a n , Chem. Commun., 1 3 3 2 ( 1 9 7 1 ) .( 7 ) D . G . W h i t t e n , J . C . Y a u , a n d F . A . C a r r o l :, J. Amer. Chem. S o c . ,
9 3 , 2 2 9 1 ( 1 9 7 1 ) .(8 ) K . H. G r e l l m a n n , E. H e l l b r o n n e r , P . S e l l e r , a n d A . W e l l e r , J. Amer.
Chem. Soc., 9 0 , 4 2 3 8 ( 1 9 6 8 ) .(9) C . A . P a r k e r , " P h o t o l u m i n e s c e n c e o f S o l u t i o n s , " E l s e v i e r , A m s t e r
d a m , 1 9 6 8 , p 9 3 .( 1 0 ) G . S . H a m m o n d , etal., J. Amer. Chem. Soc., 8 6 , 3 1 9 7 ( 1 9 6 4 ) .( 1 1 ) A . A . L a m o l a in " T e c h n i q u e o f O r g a n i c C h e m i s t r y , " V o l . 1 4 , A .
W e i s s b e r g e r , E d . , I n t e r s c i e n c e , N e w Y o r k , 1 9 6 9 , p p 4 4 - 5 0 .( 1 2 ) T h a t t h i s is a t r u e d e c a y r a t i o Is i n d i c a t e d b y its i n d e p e n d e n c e o f
t h e s e n s i t i z e r c o n c e n t r a t i o n . S u c h a r e s u l t w o u l d n o t b e e x p e c t e d ,
if t h e t r i p l e t d e c a y w e r e t o b e c o m p l i c a t e d b y s e l e c t i v e q u e n c h i n g , e.g., o f a t r a n s o i d t r i p l e t 13 b y t h e s e n s i t i z e r . T h i s s u g g e s t s t h a t t h i o i n d i g o t r i p l e t s d e c a y v e r y r a p i d l y in s o l u t i o n a n d t h a t E t f o r b o t h c i s - a n d t r a n s - l l i e b e l o w t h a t o f t h e s e n s i t i z e r .
( 1 3 ) J. S a l t i e l , J. Amer. Chem. Soc., 9 0 , 6 3 9 4 ( 1 9 6 8 ) ; 8 9 , 1 0 3 6 ( 1 9 6 7 ) .( 1 4 ) Note Added in Proof, ( a ) U s i n g a p u l s e d n i t r o g e n l a s e r ( r = 2 - 3
n s e c ) a s h o r t - l i v e d i n t e r m e d i a t e h a s b e e n d e t e c t e d in s o l u t i o n . (A . S c h o m b u r g , p r i v a t e c o m m u n i c a t i o n ) , (b ) T h i o i n d i g o a n d 5 , 5 ' -d i- f e r f - b u t y l t h i o i n d i g o h a v e r e c e n t l y b e e n f o u n d f o y i e l d t r i p l e t s b y f l a s h e x c i t a t i o n in E P A g l a s s a t - 1 9 6 ° . ( D . S c h u l t e - F r o h l i n d e a n d H. H e r r m a n n , p r i v a t e c o m m u n i c a t i o n ) .
( 1 5 ) G . M . W y m a n a n d B . M . Z a r n e g a r , J. Phys. Chem., 7 7 , 1 2 0 4 ( 1 9 7 3 ) .( 1 6 ) T. S . G o d f r e y , G . P o r t e r , a n d P . S u p p a n , Discuss. Faraday Soc.,
3 9 , 1 9 4 ( 1 9 6 5 ) .( 1 7 ) D . L. R o s s , Appl. Opt., 1 0 , 5 7 1 ( 1 9 7 1 ) .
The Journal of Physical Chemistry, Vol. 77, No. 21, 1973

There’s nothing theoretical about the value of i &ec Process Design and Development
The original papers contained in this quarterly present theoretical anc experimental results relating to the development of processes and process equipment—and the value of our publication is a known quantity to our constant readers. Subjects covered include:
• Empirical or Semi-theoretical correlations of data
• Experimental determinations of design parameters
• Methods of integrating systems analysis and process control into process cesign and development
another ACS service
• Scale-up procedures• Many other experimental proc
ess development techniques.Put us to the test. Complete and return the order form below today.
I&EC Process Design and Development American Chemical Society1155 Sixteenth Street, N.W.Washington, D.C. 20036
Yes, I would like to receive l&EC PROCESS DESIGN AND DEVELOPMENT atthe one-year rate checked below:
ACS Member Personal-Use One-Year Rate
Nonmember
U.S. CanadaLatin
AmericaOther
Nations
Bill me □
Name
□ $ 7.00 □ $10.00 □ $10.00 □ $10.50□ $21.00 □ $24.00 □ $24.00 □ $24.50
Bill company □ Payment enclosed □
H o m e □Street Business □
City State Zip0-73

Do you need a signal averager... or a general purpose computer?
NICOLET NIC-80 DATA SYSTEMSThe new NIC-80 Series data acquisition and processing system combines the benefits of a hard-wired signal averager with the advantages of a general purpose computer. The result is an easy-tc-use data system that permits the scientist to concentrate on his research rather than on electronic data processing.
The NIC-80 Series offers digitizing speeds of up to 10 microseconcs with 12-bit resolution, high resolution timing of up to 1 microsecond, high timing accuracy (100 nanoseconds), 20-bit word length to eliminate double precision programming, easy interface with a wide range of experiments through specialized hardware and software, extensive processing capabnity through available software, flexible control of experimental variables through keyboard entries, continuous display even at high data rates, a broad selection of peripheral equipmert, and the most thorough applications assistance offered anywhere. For ultra-high-speed applications, digitizing speeds of up to 10 nanosec
onds can be achieved with an optional transient recorder.
The NIC-80 Series is presently offered in three different configurations which differ only slightly in hardware design but have a unique software package for each system. For example, the NMR-80 System contains complete programs for Ft nmr work. The MED-80 System is oriented to biomedical applications where the statistical analysis of bioelectric potentials is the task. A third system, called the LAB-80 System is a general purpose laboratory data system designed for use with various spectrometers or other laboratory instruments.
Included in all of the above systems is the hardware for on-line CRT display of incoming data or processed data as well as software for the control of x-y or y-t recorders.
Options and accessories include a high-speed paper tape reader, a disk memory unit, a silent keyboard/ printer, x-y or y-t recorders, a transient recorder, paper tape punch, and magnetic tape interface.
LAB-80 cap ab ilities inc lude:averaging and processing of fast scan infra-red spectrophotometer data for sensitivity improvement, background compensation, and color correction; ultra-high-speed data acquisition (10 nanoseconds sampling interval, via Bioma- tion transient recorder), averaging, and processing of data f rom laser-exci ted f l uor e scence decay studies; averaging and processing of electron paramagnetic resonance spectrometer data; and high-speed acquisition (via transient recorder), averaging and processing of pulsed nmr data.
C a ll o r w r i te to d is c u s s y o u r a v e ra g in g a n d p r o c e s s in g re q u ire m e n ts .
NICOLET INSTRUMENT CORPORATION
5225 Verona Road, Madison, Wisconsin 53711 Phone 608/271-3333 TWX: 910-286-2713
1 4 h.
U j