
The Journal of Physical Chemistry 1963 Vol.67 No.3
190
SA THE JOURNAL OF PHYSICAL CHEMISTRY V olume 67, N umber 3 M arch , 1963 Miriam Milman: The Effect of Benzene Moderator on the (n,7 ) Activated Reactions of Bromine Atoms with Ethyl Bromide...................................................................... 537 F. O. Shuck and H. L. Toor: Diffusion in the Three Com- ponent Liquid System Methyl Alcohol-ra-Propyl Alco- hol-Isobutyl Alcohol ........................................................... 540 V. Kevorkian and R. O. Steiner: Microcalorimetric Stud- ies of the Distribution of Surface Energy in Chemi- sorption .................................................................................. 545 E. F. Zwicker and L. I. Grossweiner: Transient Measure- ments of Photochemical Processes in Dyes. II. The Mechanism of the Photosensitized Oxidation of Aque- ous Phenol by Eosin ............................................................ 549 R. H. Aranow: The Statistical Mechanics of Micelles........ 556 Kang Yang: Pree Radical Reactions Initiated by Ionizing Radiations. III. Paraffin Reactivities in Hydrogen Atom Abstraction Reactions.............................................. 562 T. A. Orofino and Franz Wenger: Dilute Solution Prop- erties of Branched Polymers. Polystyrene Trifunc- tional Star Molecules.......................................................... 566 Richard L. Gustafson and Arthur E. Martell: Hydrolytic Tendencies of Ferric Chelates.......................................... 576 Yukito Murakami and Arthur E. Martell: Catalytic Hy- drolysis of Salicyl Phosphate in the Presence of Cop- per(II) Chelates................................................................... 582 David M. Mohilner and Paul Delahay: Current-Potential Characteristics for Electrode Processes with Specific Adsorption of Reactant and/or Product........................ 588 E. A. Allan and L. W. Reeves: Proton Resonance Stud- ies of orfAo-Substituted Phenols....................................... 591 Barbara A. Thompson and Robert L. Strong: Self-Dif- fusion of Oxygen in Lead Oxide 594 R. D. Oldenkamp and G. Houghton: An Experimental Study of Adsorption Chromatography with a Non- linear Isotherm Using the System Isobutylene-Acti- vated Alumina...................................................................... 597 Reginald Mills: Diffusion Relationships in the System Benzene-Diphenyl at 25° .................................................. 600 Mark Cher: The Liquid Phase Reaction of Methyl Radi- cals with Methanol.............................................................. 605 Isao Matsuzaki and Robert L. Burwell, Jr.: Reaction be- tween 1-Hexene and Hydrogen and Deuterium on Copper-Chromium Oxide Catalyst................................... 608 Thomas W. Lapp and Robert W. Kiser: Carbon-14-Con- taining Compounds Produced by the Pile Neutron Ir- radiation of a-Cyanoacetamide........................................ 612 W. L. Masterton, J. Bianchi, and E. J. Slowinski, Jr.: Surface Tension and Adsorption in Gas-Liquid Sys- tems at Moderate Pressures.............................................. 615 N. W. Gregory: The Condensation Coefficient and the Vaporization Process........................................................... 618 Raymond M. Fuoss and Lars Onsager: The Conductance of Symmetrical Electrolytes. II. The Relaxation Field........................................................................................ 621 Raymond M. Fuoss and Lars Onsager: The Conductance of Symmetrical Electrolytes. III.Electrophoresis.. 628 Richard K. Wolford: Kinetics of the Acid-Catalyzed Hy- drolysis of Acetal in Water-Acetone Solvents at 15, 25, and 35° ................................................................................... 632 W. Keith Hall and J. A. Hassell: Microcatalytic Studies of the Hydrogenation of Ethylene. I. The Promot- ing Effect of Adsorbed Hydrogen on the Catalytic Activity of Metal Surfaces................................................ 636 Robert N. O’Brien and Christine Rosenfield: An Inter- ferometric Determination of Diffusion Constants of Copper(II) Ion in Copper(II)Sulfate Solutions............ 643 Brice G. Hobrock and Robert W. Kiser: Electron Impact Investigations of Sulfur Compounds. II. 3-Methyl- 2-thiabutane, 4-Thia-1-pentene, and 3,4-Dithiahexane 648 Milton Manes: On Thermodynamic Coupling of Chemical Reactions Close to Equilibrium....................................... 651 M. H. Lietzke and R. W. Stoughton: The Second Dis- sociation Constant of Deuteriosulfuric Acid from 25 to 225° ................................................................................... 652 Akio Nakajima and Hiroo Yanagawa: Thermoelasticity and Temperature Variation of Unperturbed Chain Dimension of Polyvinyl Alcohol....................................... 654 Edgar F. Westrum, Jr., and Bruce H. Justice: Thermo- physical Properties of the Lanthanide Oxides. III. Heat Capacities, Thermodynamic Properties, and Some Energy Levels of Dysprosium(ITI), Holmium- (III), and Erbium(III) Oxides.......................................... 659 T. A. Jacobs: Further Shock-Tube Studies by Infrared Emission of the Decomposition of Ammonia................ 665 O. J. Kleppa and S, V. Meschel: Thermochemistry of Anion Mixtures in Simple Fused Salt Systems. I. Solu- tions of Monovalent Chlorides and Bromides in the Corresponding Nitrates...................................................... 668 Richard W. Laity: Diffusion of Ions in an Electric Field... 671 J. P. McCullough, J. F. Messerly, R. T. Moore, and S. S. Todd: Trimethylaluminum: Thermodynamic Func- tions in the Solid and Liquid States, 0~380°K.; Vapor Pressure, Heat of Vaporization, and Entropy in the Ideal Gas State......................... ........................................... 677 D. W. Scott, W. N. Hubbard, J. F. Messerly, S. S. Todd, I. A. Hossenlopp, W. D. Good, D. R. Douslin, and J. P. McCullough: Chemical Thermodynamic Prop- erties and Internal Rotation of Methylpyridines. I. 2-Methylpyridine................................................................. 680 D. W. Scott, W. D. Good, G. B. Guthrie, S. S. Todd, I. A. Hossenlopp, A. G. Osborn, and J. P. McCullough: Chemical Thermodynamic Properties and Internal Rotation of Methylpyridines. II. 3-Methylpyri- dine......................................................................................... 685 L. G. Longsworth: Diffusion in the Water-Methanol Sys- tem and the Walden Product........................................... 689 Peter E. Yankwich and Rudy H. Haschemeyer: Tempera- ture Dependence of the Carbon Isotope Effect in the Decarboxylation ofLiquidFormic Acid .......................... 694 A. S. Dworkin and M. A. Bredig: The Heats of Fusion and Transition of Alkaline Earth and Rare Earth Metal Halides................................................................................... 697 K. N. Marsh, M. Spiro, and M. Selvaratnam: The Trans- ference Numbers of o-Tartaric Acid and the Limiting Equivalent Conductance of the Bitartrate Ion in Water at 25°..................................................................................... 699 Michael A. Greenbaum, R. E. Yates, M. Louis Arm, Mo- hammed Arshadi, Justine Weiher, and Milton Farber: The Thermodynamic and Physical Properties of Beryl- lium Compounds. II. Heat of Formation and En- tropy of Beryllium(I)Fluoride(g)...................................... 703 NOTES Luther E. Erickson and Jay A. Denbo: Formation Con- stants of Weak Complexes: The 1:1 Complexes of Malate with Alkali Metal Cations in Aqueous Solution 707 Howard B. Palmer and Thomas J. Hirt: The Activation Energy for the Pyrolysis of Methane............................. 709 Wasyl S. Hnojewyj and Lloyd H. Reyerson: The Sorp- tion of Water Vapor and the Hydrogen-Deuterium Exchange Effect on Poly-mglutamic Acid ..................... 711 J. A. Wojtowicz, H. B. Urbach, and J. A. Zaslowsky: Ozone Formation at —196°.............................................. 713 F. Martinez, J. A. Wojtowicz, and J. A. Zaslowsky. X-
-
Upload
khangminh22 -
Category
Documents
-
view
4 -
download
0
Transcript of The Journal of Physical Chemistry 1963 Vol.67 No.3
SA
THE JOURNAL OFPHYSICAL CHEMISTRY
V olum e 67, N um ber 3 M arch , 1963
Miriam Milman: The Effect of Benzene Moderator on the (n,7 ) Activated Reactions of Bromine Atoms withEthyl Bromide...................................................................... 537
F. O. Shuck and H. L. Toor: Diffusion in the Three Component Liquid System Methyl Alcohol-ra-Propyl Alco- hol-Isobutyl Alcohol........................................................... 540
V. Kevorkian and R. O. Steiner: Microcalorimetric Studies of the Distribution of Surface Energy in Chemisorption .................................................................................. 545
E. F. Zwicker and L. I. Grossweiner: Transient Measurements of Photochemical Processes in Dyes. II. The Mechanism of the Photosensitized Oxidation of Aqueous Phenol by Eosin............................................................ 549
R. H. Aranow: The Statistical Mechanics of Micelles........ 556Kang Yang: Pree Radical Reactions Initiated by Ionizing
Radiations. III. Paraffin Reactivities in HydrogenAtom Abstraction Reactions.............................................. 562
T. A. Orofino and Franz Wenger: Dilute Solution Properties of Branched Polymers. Polystyrene Trifunctional Star Molecules.......................................................... 566
Richard L. Gustafson and Arthur E. Martell: HydrolyticTendencies of Ferric Chelates.......................................... 576
Yukito Murakami and Arthur E. Martell: Catalytic Hydrolysis of Salicyl Phosphate in the Presence of Cop-per(II) Chelates................................................................... 582
David M. Mohilner and Paul Delahay: Current-Potential Characteristics for Electrode Processes with SpecificAdsorption of Reactant and/or Product........................ 588
E. A. Allan and L. W. Reeves: Proton Resonance Studies of orfAo-Substituted Phenols....................................... 591
Barbara A. Thompson and Robert L. Strong: Self-Diffusion of Oxygen in Lead Oxide 594
R. D. Oldenkamp and G. Houghton: An ExperimentalStudy of Adsorption Chromatography with a Nonlinear Isotherm Using the System Isobutylene-Activated Alumina...................................................................... 597
Reginald M ills: Diffusion Relationships in the SystemBenzene-Diphenyl at 25°.................................................. 600
Mark Cher: The Liquid Phase Reaction of Methyl Radicals with Methanol.............................................................. 605
Isao Matsuzaki and Robert L. Burwell, Jr.: Reaction between 1-Hexene and Hydrogen and Deuterium onCopper-Chromium Oxide Catalyst................................... 608
Thomas W. Lapp and Robert W. Kiser: Carbon-14-Con-taining Compounds Produced by the Pile Neutron Irradiation of a-Cyanoacetamide........................................ 612
W. L. Masterton, J. Bianchi, and E. J. Slowinski, Jr.:Surface Tension and Adsorption in Gas-Liquid Systems at Moderate Pressures.............................................. 615
N. W. Gregory: The Condensation Coefficient and theVaporization Process........................................................... 618
Raymond M. Fuoss and Lars Onsager: The Conductanceof Symmetrical Electrolytes. II. The RelaxationField........................................................................................ 621
Raymond M. Fuoss and Lars Onsager: The Conductanceof Symmetrical Electrolytes. III. Electrophoresis.. 628
Richard K. W olford: Kinetics of the Acid-Catalyzed Hydrolysis of Acetal in Water-Acetone Solvents at 15, 25,and 35°................................................................................... 632
W. Keith Hall and J. A. Hassell: Microcatalytic Studiesof the Hydrogenation of Ethylene. I. The Promoting Effect of Adsorbed Hydrogen on the CatalyticActivity of Metal Surfaces................................................ 636
Robert N. O ’Brien and Christine Rosenfield: An Interferometric Determination of Diffusion Constants ofCopper(II) Ion in Copper(II) Sulfate Solutions............ 643
Brice G. Hobrock and Robert W. K iser: Electron Impact
Investigations of Sulfur Compounds. II. 3-Methyl- 2-thiabutane, 4-Thia-1-pentene, and 3,4-Dithiahexane 648
Milton M anes: On Thermodynamic Coupling of ChemicalReactions Close to Equilibrium....................................... 651
M. H. Lietzke and R. W. Stoughton: The Second Dissociation Constant of Deuteriosulfuric Acid from 25to 225°................................................................................... 652
Akio Nakajima and Hiroo Yanagawa: Thermoelasticity and Temperature Variation of Unperturbed ChainDimension of Polyvinyl Alcohol....................................... 654
Edgar F. Westrum, Jr., and Bruce H. Justice: Thermophysical Properties of the Lanthanide Oxides. III.Heat Capacities, Thermodynamic Properties, and Some Energy Levels of Dysprosium(ITI), Holmium-(III), and Erbium(III) Oxides.......................................... 659
T. A. Jacobs: Further Shock-Tube Studies by InfraredEmission of the Decomposition of Ammonia................ 665
O. J. Kleppa and S, V. Meschel: Thermochemistry of Anion Mixtures in Simple Fused Salt Systems. I. Solutions of Monovalent Chlorides and Bromides in theCorresponding Nitrates...................................................... 668
Richard W. Laity: Diffusion of Ions in an Electric Field. . . 671J. P. McCullough, J. F. Messerly, R. T. Moore, and S. S.
Todd: Trimethylaluminum: Thermodynamic Functions in the Solid and Liquid States, 0~380°K.; Vapor Pressure, Heat of Vaporization, and Entropy in theIdeal Gas State.................................................................... 677
D. W. Scott, W. N. Hubbard, J. F. Messerly, S. S. Todd,I. A. Hossenlopp, W. D. Good, D. R. Douslin, andJ. P. McCullough: Chemical Thermodynamic Properties and Internal Rotation of Methylpyridines. I. 2-Methylpyridine................................................................. 680
D. W. Scott, W. D. Good, G. B. Guthrie, S. S. Todd,I. A. Hossenlopp, A. G. Osborn, and J. P. McCullough: Chemical Thermodynamic Properties and Internal Rotation of Methylpyridines. II. 3-Methylpyri-dine......................................................................................... 685
L. G. Longsworth: Diffusion in the Water-Methanol System and the Walden Product........................................... 689
Peter E. Yankwich and Rudy H. Haschemeyer: Temperature Dependence of the Carbon Isotope Effect in theDecarboxylation of Liquid Formic A cid.......................... 694
A. S. Dworkin and M. A. Bredig: The Heats of Fusion andTransition of Alkaline Earth and Rare Earth MetalHalides................................................................................... 697
K. N. Marsh, M. Spiro, and M. Selvaratnam: The Transference Numbers of o-Tartaric Acid and the Limiting Equivalent Conductance of the Bitartrate Ion in Waterat 25°..................................................................................... 699
Michael A. Greenbaum, R. E. Yates, M. Louis Arm, M ohammed Arshadi, Justine Weiher, and Milton Farber:The Thermodynamic and Physical Properties of Beryllium Compounds. II. Heat of Formation and Entropy of Beryllium(I) Fluoride(g)...................................... 703
NOTESLuther E. Erickson and Jay A. D enbo: Formation Con
stants of Weak Complexes: The 1:1 Complexes ofMalate with Alkali Metal Cations in Aqueous Solution 707
Howard B. Palmer and Thomas J. H irt: The ActivationEnergy for the Pyrolysis of Methane............................. 709
Wasyl S. Hnojewyj and Lloyd H. Reyerson: The Sorption of Water Vapor and the Hydrogen-DeuteriumExchange Effect on Poly-mglutamic Acid..................... 711
J. A. Wojtowicz, H. B. Urbach, and J. A. Zaslowsky:Ozone Formation at —196°.............................................. 713
F. Martinez, J. A. Wojtowicz, and J. A. Zaslowsky. X -
4A
Ray Studies on the Product of the Reaction of AtomicHydrogen and Liquid Ozone............................................. 714
P. Kebarle: The Vinyl + H Split in the Mercury Sensitized Photolysis of Ethylene............................................. 716
Stanley D. Morrett and D. F. Swinehart: The Ionization Constant of 4-Amino-3-methylbenzenesulfonic Acid from 0 to 50° by Means of Electromotive Force Measurements................................................................................ 717
R. K. Boyd, G. W. Downs, J. S. Gow, and C. Horrex: Hydrogen Iodide as Radical Acceptor in the Thermal
Decomposition of Gaseous Organic Iodides................... 719P. B. Hostetler: Complexing of Magnesium with Bi
carbonate ............................................................................... 720John B. Lounsbury : On the Origin of the Dipole Moment
of Tetrazoles......................................................................... 721
COMMUNICATION TO THE EDITOR
Richard W. Laity and Cornelius T. Moynihan : RelativeMobilities of Like-Charged Ions in Fused Salts........... 723
Allan, E. A., 591 Aranow, R. H., 556 Arin, M. L., 703 Arshadi, M., 703
Bianchi, J., 615 Boyd, R. K., 719 Bredig, M. A., 697 Burwell, R. L., Jr., 608
Cher, M., 605
Delahay, P., 588 Denbo, J. A., 707 Douslin, D. R., 680 Downs, G. W., 719 Dworkin, A. S., 697
Erickson, L. E., 707
Farber, M., 703 Fuoss, R. M., 621, 628
Good, W. D., 680, 685
Gow, J. S., 719 Greenbaum, M. A., 703 Gregory, N. W., 618 Grossweiner, L. I., 549 Gustafson, R. L., 576 Guthrie, G. B., 685
Hall, W. K., 636 Haschemeyer, R. H., 694 HasBell, J. A., 636 Hirt, T. J., 709 Hnojewyj, W. S., 711 Hobrock, B. G., 648 Horrex, C., 719 Hossenlopp, I. A., 680,
685Hostetler, P. B., 720 Houghton, G., 597 Hubbard, W. N., 680
Jacobs, T. A., 665 Justice, B. H., 659
Kebarle, P., 716
AUTHOR INDEX
Kevorkian, V., 545 Kiser, R. W , 612, 648 Kleppa, O. J., 668
Laity, R. W., 671, 723 Lapp, T. W., 612 Lietzke, M. H., 652 Longsworth, L. G., 689 Lounsbury, J. B., 721
Manes, M., 651 Marsh, K. N., 699 Martell, A. E., 576, 582 Martinez, F., 714 Masterton, W. L., 615 Matsuzaki, I., 608 McCullough, J. P., 677,
680, 685Meschel, S. V., 668 Messerly, J. F., 677, 680 Müls, R., 600 Milman, M., 537 Mohüner, D. M., 588 Moore, R. T., 677
Morrett, S. D., 717 Moynihan, C. T., 723 Murakami, Y., 582
Nakajima, A., 654
O’Brien, R. N., 643 Oldenkamp, R. D., 597 Onsager, L., 621, 628 Orofino, T. A., 566 Osborn, A. G., 685
Palmer, H. B., 709
Reeves, L. W., 591 Reyerson, L. H., 711 Rosenfield, C., 643
Scott, D. W., 680, 685 Selvaratnam, M., 699 Shuck, F. O., 540 Slowinski, E. J., Jr., 615 Spiro, M., 699
Steiner, R. O., 545 Stoughton, R. W., 652 Strong, R. L., 594 Swinehart, D. F., 717
Thompson, B. A., 594 Todd, S. S., 677, 680, 685 Toor, H. L., 540
Urbach, H. B., 713
Weiher, J., 703 Wenger, F., 566 Westrum, E. F., Jr., 659 Wojtowicz, J. A., 713, 714 Wolford, R. K „ 632
Yanagawa, H., 654 Yang, K., 562 Yankwich, P. E., 694 Yates, R. E., 703
Zaslowsky, J. A., 713, 714 Zwicker, E. F., 549
THE JOURNAL OFPHYSICAL CHEMISTRY
CRegistered in U. S. Patent Office) (© Copyright, 196S, by the American Chemical Society)
V olum e 67, N um ber 3 M arch 15, 1963
T H E E F F E C T O F B E N Z E N E M O D E R A T O R O N T H E ( n , 7 ) A C T I V A T E D R E A C T I O N S
O F B R O M I N E A T O M S W I T H E T H Y L B R O M I D E
B y M i r i a m M i l m a n
Ecole Normale Supérieure, Laboratoire de l’Accélérateur Linéaire B.P. 5, Orsay (Seine et Oise), FranceReceived January 11, 1962
The nature of the chemical reactions following neutron capture in mixtures of ethyl bromide and benzene were studied. After having ascertained the own reactivity of the benzene moderator, it was possible to determine the contribution of “ hot” and “ diffusive” reactions to the yield of organic activity. A tentative description of the nature of reactions following radiative neutron capture in the solid system is proposed.
In troductionA nucleus absorbing a therm al neutron emits the
excess energy in the form of one or more y -ra ys . A s a result of the rad ia tive emission the atom acquires recoil energy, positive charge due to in ternal conversion or Auger electron emission, and also can be le ft in an excited state. Th e activated atom can enter stable chemical com binations after having lost some of its excess energy in successive collisions w ith the surrounding m olecules; the experim ental evidence seems to po in t o u t1 th a t if the m edium is closely packed (liq u id or solid phase) charge and excitation energy also are lost in th is process.
Th e atoms having a k inetic energy higher than the therm al energy of the environm ent are called “ hot atoms” and th e ir chemical reactions are known as “ hot reactions” ; th ey have the fo llow ing characteristic features which distinguish them from the reactions of the same atom at therm al energies: (a) T h e ir yie ld is tem perature independent, (b ) Since th ey take place after o n ly a lim ited num ber of collisions of the recoiling atom , th e ir y ie ld is not affected b y sm all concentrations of scavengers added to remove therm alized free radicals. Th e use of scavengers in the study of the chemical effects of nuclear transform ations helped to give a measure of the y ie ld o f reactions tak ing place in the im m ediate v ic in ity of the capture event and of those taking place fu rth e r aw ay, after the active atom and free radicals start d iffusing (“ diffusive reactions” ) .2 (c) H o t reactions are sensitive to additives (m oderators) th at rem ove the k inetic, v ib ra tio n a l, or electronic energy of the excited species.
(1) M. Milman, Radiochim. Acta, 1, 15 (1962).(2) (a) F. S. Rowland and W. F. Libby, J. Chem. Phys., 21, 1495 (1953);
(b) L. Friedman and W. F. Libby, ibid., 17, 647 (1949); (c) F. Goldhaber, R. S. Chiang, and J. E. Willard, J. Am. Chem. Soc., 73, 2271 (1951); (d) G. Levey and J. E. Willard, ibid., 74, 6161 (1952); (e) M. Milman and P. F. D. Shaw, J. Chem. Soc., 1303 (1957); (f) N. Knight, G. E. Miller, and P. F. D. Shaw, J. Inorg. Nud. Chem., 23, 15 (1961).
Recent studies3 of the hot hydrogen reactions in gaseous hydrocarbons have led to the developm ent of a model th a t was successfully applied to tritiu m and methane reactions moderated b y inert gases, and also was used4 * to estimate the contribution of reactions due to the kinetic energy of hot brom ine and iodine in methane.
Unless inert gases are used as m oderators, the reactions of the hot atom w ith the add itive fu rth e r com plicate the interpretation of the results.
Th e w ork described in th is paper was undertaken to investigate the influence of the addition of benzene m oderator on the organic y ie ld in liq u id and solid e th y l brom ide.
Experim entalMaterials.—Ethyl bromide (chemically pure, Touzard and
Matignon) was purified as described previously.6 The retention (percentage of the total activity in organic combinations) of 32%, now generally admitted for neutron irradiated ethyl bromide in the presence of about 10 ~ 6 molar fraction of bromine, was used as a criterion for the desired purity of the material.
The benzene (Merck p.p.a.) was stored in daylight with elementary bromine for about 30 min., to saturate olefinic impurities. To avoid extensive addition of bromine to benzene this treatment must not be prolonged, and further processing is necessary. After extraction of excess bromine with aqueous bisulfite and drying over magnesium sulfate, the benzene was shaken with successive portions of concentrated sulfuric acid (until the acid remained colorless) followed by extractions with sodium bicarbonate solutions and water. The material was dried over magnesium sulfate, filtered, and distilled in a column (50-cm. length, 1.5-cm. diameter) packed with glass helices. The middle 50% was retained and passed drop wise (directly from the condenser attached to the distillation column) through a chromatographic column (50-cm. length, 1.5-cm. diameter) filled with silica gel (chromatographic grade). The benzene obtained in this way was recrystallized from an ice bath, discarding about 15%.
(3) P. J. Estrup and R. Wolfgang, J. Am. Chem. Soc., 82, 2661, 2665 (I960).
(4) (a) E. P. Rack and A. A. Gordus, J. Chem. Phys., 34, 1855 (1961);(b) J. Phys. Chem., 65, 944 (1961).
537
538 M iriam M ilman Vol. 67
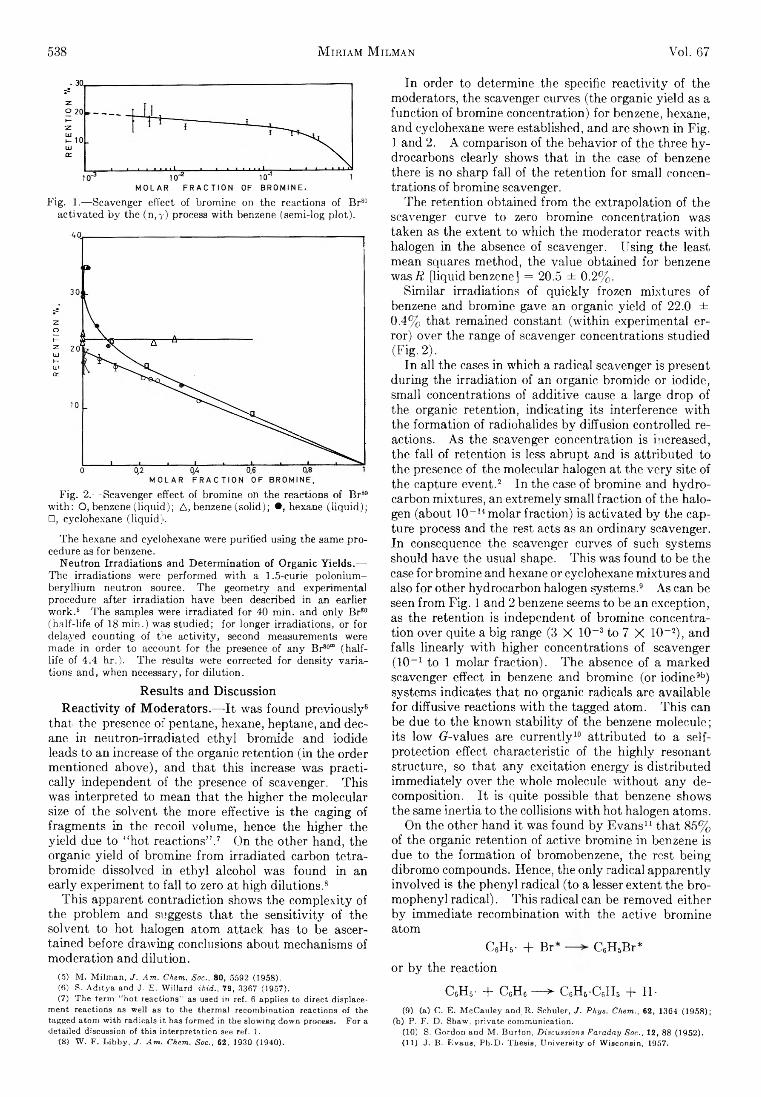
Fig. 1.— Scavenger effect of bromine on the reactions of Br80 activated by the (n ,y) process with benzene (semi-log plot).
Fig. 2.— Scavenger effect of bromine on the reactions of Br80 with: O, benzene (liquid); A, benzene (solid); •, hexane (liquid); □, cyclohexane (liquid).
The hexane and cyclohexane were purified using the same procedure as for benzene.
Neutron Irradiations and Determination of Organic Yields.—The irradiations were performed with a 1.5-curie polonium- beryllium neutron source. The geometry and experimental procedure after irradiation have been described in an earlier work.6 The samples were irradiated for 40 min. and only Br80 (half-life of 18 min.) was studied; for longer irradiations, or for delayed counting of the activity, second measurements were made in order to account for the presence of any Br80“ (half- life of 4.4 hr.). The results were corrected for density variations and, when necessary, for dilution.
Results and D iscussionR e a ctiv ity of M oderators.—It was found previously6
that the presence of pentane, hexane, heptane, and decane in neutron-irradiated ethyl bromide and iodide leads to an increase of the organic retention (in the order mentioned above), and that this increase was practically independent of the presence of scavenger. This was interpreted to mean that the higher the molecular size of the solvent the more effective is the caging of fragments in the recoil volume, hence the higher the yield due to “hot reactions”.7 On the other hand, the organic yield of bromine from irradiated carbon tetra- bromide dissolved in ethyl alcohol was found in an early experiment to fall to zero at high dilutions.8
This apparent contradiction shows the complexity of the problem and suggests that the sensitivity of the solvent to hot halogen atom attack has to be ascertained before drawing conclusions about mechanisms of moderation and dilution.
(5) M. Milman, J. Am. Chem. Soc., 80, 5592 (1958).(6) S. Aditya and J. E. Willard, ibid., 79, 3367 (1957).(7) The term “ hot reactions” as used in ref. 6 applies to direct displace
ment reactions as well as to the thermal recombination reactions of the tagged atom with radicals it has formed in the slowing down process. For a detailed discussion of this interpretation see ref. 1.
(8) W. F. Libby, J. Am, Chem. Soc., 62, 1930 (1940).
In order to determine the specific re a c tiv ity of the m oderators, the scavenger curves (the organic y ie ld as a function of brom ine concentration) for benzene, hexane, and cyclohexane were established, and are shown in F ig . 1 and 2. A comparison of the behavior of the three h y drocarbons clearly shows th at in the case of benzene there is no sharp fa ll of the retention fo r sm all concentrations of brom ine scavenger.
The retention obtained from the extrapolation of the scavenger curve to zero brom ine concentration was taken as the extent to which the m oderator reacts w ith halogen in the absence of scavenger. U sing the least mean squares m ethod, the value obtained fo r benzene was if [liquid benzene] = 20.5 ± 0.2% .
S im ilar irrad ia tions of q u ick ly frozen m ixtures of benzene and brom ine gave an organic yie ld of 22.0 ± 0.4% th at remained constant (w ith in experim ental erro r) over the range of scavenger concentrations studied (F ig . 2).
In a ll the cases in which a radical scavenger is present during the irrad ia tion of an organic brom ide or iodide, sm all concentrations of additive cause a large drop of the organic retention, ind icating its interference w ith the form ation of radiohalides b y diffusion controlled reactions. A s the scavenger concentration is increased, the fa ll of retention is less abrupt and is a ttribu ted to the presence of the m olecular halogen at the ve ry site of the capture event.2 In the case of brom ine and hyd ro carbon m ixtures, an extrem ely sm all fraction of the halogen (about 10-11 m olar fraction) is activated b y the capture process and the rest acts as an o rd in ary scavenger. In consequence the scavenger curves of such systems should have the usual shape. T h is was found to be the case fo r brom ine and hexane or cyclohexane m ixtures and also fo r other hydrocarbon halogen systems.9 A s can be seen from F ig . 1 and 2 benzene seems to be an exception, as the retention is independent of brom ine concentration over quite a b ig range (3 X 10~3 to 7 X 10⁻² ), and fa lls lin e a rly w ith higher concentrations of scavenger (10_1 to 1 m olar fraction ). Th e absence of a m arked scavenger effect in benzene and brom ine (or iodine9b) systems indicates th a t no organic radicals are available fo r diffusive reactions w ith the tagged atom . T h is can be due to the known s ta b ility of the benzene m olecule; its low (7-values are cu rre n tly10 a ttribu ted to a selfprotection effect characteristic of the h ig h ly resonant structure, so th a t any excitation energy is d istributed im m ediately over the whole molecule w ith o u t any decom position. I t is quite possible th a t benzene shows the same inertia to the collisions w ith hot halogen atoms.
On the other hand it was found b y E va n s11 th a t 85% of the organic retention of active brom ine in benzene is due to the form ation of bromobenzene, the rest being dibrom o compounds. Hence, the o n ly radical apparently involved is the phenyl radical (to a lesser extent the b ro - m ophenyl ra d ica l). T h is radical can be rem oved either b y im m ediate recom bination w ith the active brom ine atom
C 6H 6- + Br* C 6H 5Br*
or b y the reaction
C 6H 3- + C 6H 6 — > C cH B'C J I 6 + H -(9) (a) C. E. McCauley and R. Schuler, J. Phys. Chem., 62, 1364 (1958);
(b) P. F. D. Shaw, private communication.(10) S. Gordon and M. Burton, Discussions Faraday Soc., 12, 88 (1952).(11) J. B. Evans, Ph.D. Thesis, University of Wisconsin, 1957.
March, 1963 (11,7) A ctivated R eactions of Bromine Atoms with Ethyl Bromide 539
a type of reaction w ith is known to occur 9b>12 o n ly in arom atic systems. Th e result of the com petition between the tw o reactions would be th a t the phenyl radicals would react to become diphenyl before having a chance to meet the therm alized active brom ine atom .
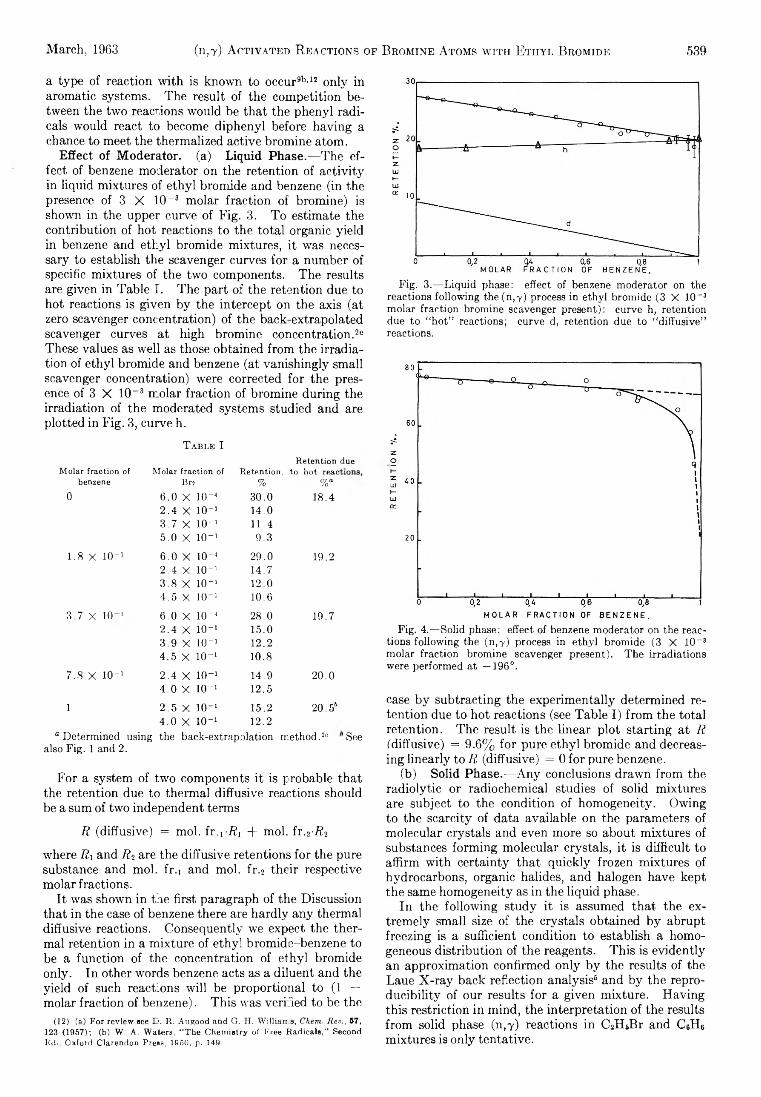
E ffect of M oderator, (a) L iq u id Phase.— Th e effect of benzene m oderator on the retention of a c tiv ity in liqu id m ixtures of e th yl brom ide and benzene (in the presence of 3 X lO -8 m olar fraction of brom ine) is shown in the upper curve of F ig . 3. T o estimate the contribution of hot reactions to the to ta l organic yie ld in benzene and e th y l brom ide m ixtures, it was necessary to establish the scavenger curves fo r a num ber of specific m ixtures of the tw o components. Th e results are given in Table I . The part of the retention due to hot reactions is given b y the intercept on the axis (at zero scavenger concentration) of the back-extrapolated scavenger curves a t high brom ine concentration.26 These values as w e ll as those obtained from the irrad ia tion of e th yl brom ide and benzene (at van ish ingly sm all scavenger concentration) were corrected fo r the presence of 3 X 10~3 m olar fraction of brom ine during the irrad ia tion of the moderated systems studied and are plotted in F ig . 3, curve h.
T a b l e IRetention due
Molar fraction of iMolar fraction of Retention, to hot reacbenzene Br2 % %“
0 6.0 X H X4 30.0 18.42 .4 X 10 "1 14.03 .7 X 10” ’ 11.45.0 X 10“ 1 9.3
1.8 X K X 1 6.0 X 10~4 29.0 19.22 .4 X 10 "1 14.73 .8 X 10-> 12.04.5 X 10“ 1 10.6
3.7 X 10 ' 6 .0 X 10 -4 28.0 19.72 .4 X 1 0 -1 15.03.9 X K X 1 12.24.5 X 1 0 -1 10.8
7.8 X 10“ 1 2.4 X H X 1 14.9 20.04 .0 X 10“ 1 12.5
1 2 .5 X IO“ 1 15.2 20. ö64 .0 X 10“ 1 12.2
0 Determined using the back-extrapolation method.2e 'Seealso Fig. 1 and 2.
F o r a system of tw o components it is probable th at the retention due to therm al diffusive reactions should be a sum of two independent terms
R (d iffusive) = m ol. fr.i-.R i + m ol. f r .2 -.R2
where R i and R 2 are the diffusive retentions fo r the pure substance and m ol. fr .i and m ol. f r .2 th e ir respective m olar fractions.
I t was shown in the first paragraph of the Discussion th a t in the case of benzene there are h a rd ly any therm al diffusive reactions. Consequently we expect the therm al retention in a m ixtu re of e th y l brom ide-benzene to be a function of the concentration of e th yl brom ide o n ly. In other words benzene acts as a d iluent and the yie ld of such reactions w ill be proportional to (1 — m olar fraction of benzene). T h is was verified to be the
(12) (a) For review see D. R. Augood and G. H. Williams, Chem. Rev., 57, 123 (1957); (b) W. A. Waters, “ The Chemistry of Free Radicals,” Second ICdii Oxford Clarendon Press, 1950, p. 149
Fig. 3.— Liquid phase: effect of benzene moderator on thereactions following the(n,Y) process in ethyl bromide (3 X 10~3 molar fraction bromine scavenger present): curve h, retention due to “ hot” reactions; curve d, retention due to “ diffusive” reactions.
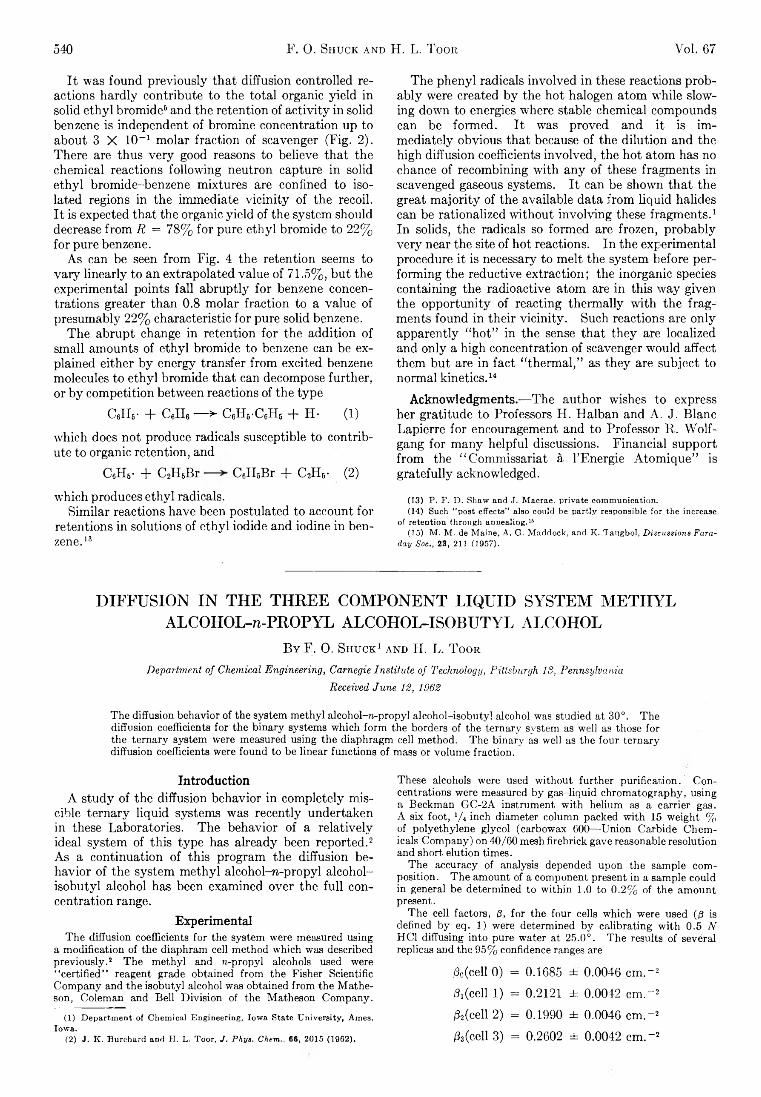
Fig. 4.— Solid phase: effect of benzene moderator on the reactions following the (n,Y) process in ethyl bromide (3 X 10_s molar fraction bromine scavenger present). The irradiations were performed at —196°.
case b y subtracting the experim entally determ ined reten tion due to hot reactions (see Tab le I ) from the to ta l retention. Th e result is the linear p lo t sta rting a t R ("diffusive) = 9.6% fo r pure e th y l brom ide and decreasin g lin e a rly to R (d iffusive) = 0 fo r pure benzene.
(b ) So lid Phase.— A n y conclusions drawn from the ra d io lytic or radiochem ical studies of solid m ixtures are subject to the condition of hom ogeneity. O w ing to the scarcity of data available on the parameters of m olecular crystals and even more so about m ixtures of substances form ing m olecular crystals, it is d ifficu lt to affirm w ith certa in ty th a t q u ick ly frozen m ixtures of hydrocarbons, organic halides, and halogen have kept the same hom ogeneity as in the liq u id phase.
In the fo llow ing study it is assumed th at the extrem ely sm all size of the crystals obtained b y abrupt freezing is a sufficient condition to establish a homogeneous d istribu tion of the reagents. T h is is evidently an approxim ation confirm ed o n ly b y the results of the Laue X -ra y back reflection analysis6 and b y the reprod u c ib ility of our results fo r a given m ixtu re . H a vin g th is restriction in m ind, the in terpretation of the results from solid phase (n ,y ) reactions in C T T B r and CcH6 m ixtures is on ly tentative .
540 F . 0 . S h u c k a n d H. L . T o o r Voi. 67
I t was found previously th a t d iffusion controlled reactions hard ly contribute to the to ta l organic y ie ld in solid e th y l brom ide6 and the retention of a c tiv ity in solid benzene is independent of brom ine concentration up to about 3 X 10” 1 m olar fraction of scavenger (F ig . 2). There are thus ve ry good reasons to believe th a t the chem ical reactions fo llow ing neutron capture in solid e th y l brom ide-benzene m ixtures are confined to isolated regions in the im m ediate v ic in ity of the recoil. I t is expected th a t the organic y ie ld of the system should decrease from R = 78% fo r pure e th y l brom ide to 22% fo r pure benzene.
A s can be seen from F ig . 4 the retention seems to v a ry lin e a rly to an extrapolated value of 71.5%, but the experim ental points fa ll ab ru p tly fo r benzene concentrations greater than 0.8 m olar fraction to a value of presum ably 22% characteristic fo r pure solid benzene.
Th e abrupt change in retention fo r the addition of sm all amounts of e th yl brom ide to benzene can be explained either b y energy transfer from excited benzene molecules to e th y l brom ide th a t can decompose further, or b y com petition between reactions of the type
C ells- + C 6H 6 — ► CeHs-CeHs + H - (1)
w hich does not produce radicals susceptible to contrib ute to organic retention, and
C 6H b- + C 2H 6B r CeHsBr + C 2H 6- (2)
w hich produces e th y l radicals.S im ila r reactions have been postulated to account fo r
retentions in solutions of e th yl iodide and iodine in benzene.18
Th e phenyl radicals involved in these reactions proba b ly were created b y the hot halogen atom w hile slowing down to energies where stable chem ical compounds can be form ed. I t was proved and it is im m ediately obvious th a t because of the d ilu tio n and the high diffusion coefficients involved, the hot atom has no chance of recom bining w ith an y of these fragm ents in scavenged gaseous systems. I t can be shown th a t the great m a jo rity of the available data from liq u id halides can be rationalized w ith ou t in vo lv in g these fragm ents.1 In solids, the radicals so form ed are frozen, probab ly ve ry near the site of hot reactions. In the experim ental procedure it is necessary to m elt the system before perform ing the reductive extraction ; the inorganic species containing the radioactive atom are in th is w ay given the opp ortu n ity of reacting th erm ally w ith the fragm ents found in th e ir v ic in ity . Such reactions are o n ly apparently “ h o t” in the sense th a t th ey are localized and o n ly a h igh concentration of scavenger w ould affect them but are in fact “ therm al,” as th ey are subject to norm al k inetics.14
Acknowledgm ents.— Th e author wishes to express her gratitude to Professors H . H alban and A . J . B lanc Lapierre fo r encouragement and to Professor R . W o lfgang fo r m any helpfu l discussions. F inancia l support from the “ Com m issariat à l ’Energie A tom ique” is g ra te fu lly acknowledged.
(13) P. F. D. Shaw and J. Macrae, private communication.(14) Such “ post effects” also could be partly responsible for the increase
of retention through annealing.16(15) M. M. de Maine, A. G. Maddock, and K. Taugbol, Discussions Fara
day Soc., 23, 211 (1957).
D I F F U S I O N I N T H E T H R E E C O M P O N E N T L I Q U I D S Y S T E M M E T H Y L
A L C O H O L - n - P R O P Y L A L C O H O L - I S O B U T Y L A L C O H O L
B y E. 0 . Sh u c k 1 and H . L . T oor
Department of Chemical Engineering, Carnegie Institute of Technology, Pittsburgh IS, PennsylvaniaReceived June 12, 1962
The diffusion behavior of the system methyl alcohol-n-propyl alcohol-isobuty! alcohol was studied at 30°. The diffusion coefficients for the binary systems which form the borders of the ternary system as well as those for the ternary system were measured using the diaphragm cell method. The binary as well as the four ternary diffusion coefficients were found to be linear functions of mass or volume fraction.
In troductionA study of the diffusion behavior in com pletely m is
cible te rn a ry liq u id system s was recently undertaken in these Laboratories. Th e behavior of a re la tive ly ideal system of th is typ e has already been reported.2 A s a continuation o f th is program the diffusion behavior of the system m ethyl alcohol—n -p ro p yl a lcoh o l- isob u tyl alcohol has been examined over the fu ll concentration range.
Experim entalThe diffusion coefficients for the system were measured using
a modification of the diaphram cell method which was described previously.2 The methyl and n-propyl alcohols used were “ certified” reagent grade obtained from the Fisher Scientific Company and the isobutyl alcohol was obtained from the Mathe- son, Coleman and Bell Division of the Matheson Company.
(1) Department of Chemical Engineering, Iowa State University, Ames, Iowa.
(2) J. K. Burchard and II. L. Toor, J. Phys. Chem., 66, 2015 (1962).
These alcohols were used without further purification. Concentrations were measured by gas-liquid chromatography, using a Beckman GC-2A instrument with helium as a carrier gas. A six foot, y 4 inch diameter column packed with 15 weight % of polyethylene glycol (carbowax 600— Union Carbide Chemicals Company) on 40/60 mesh firebrick gave reasonable resolution and short elution times.
The accuracy of analysis depended upon the sample composition. The amount of a component present in a sample could in general be determined to within 1.0 to 0.2% of the amount present.
The cell factors, p, for the four cells which were used (p is defined by eq. 1) were determined by calibrating with 0.5 N HC1 diffusing into pure water at 25.0°. The results of several replicas and the 95% confidence ranges are
f t (cell 0) = 0.1685 ± 0.0046 c m .-2
f t (cell 1) = 0.2121 ± 0.0042 c m .-2
f t (cell 2) = 0.1990 ± 0.0046 cm .“ 2
f t (cell 3) = 0.2602 ± 0.0042 c m .-»
March, 1963 D iffusion1 int Three Component Liquid System 541B in a ry System s.— Th e m utual diffusion coefficients
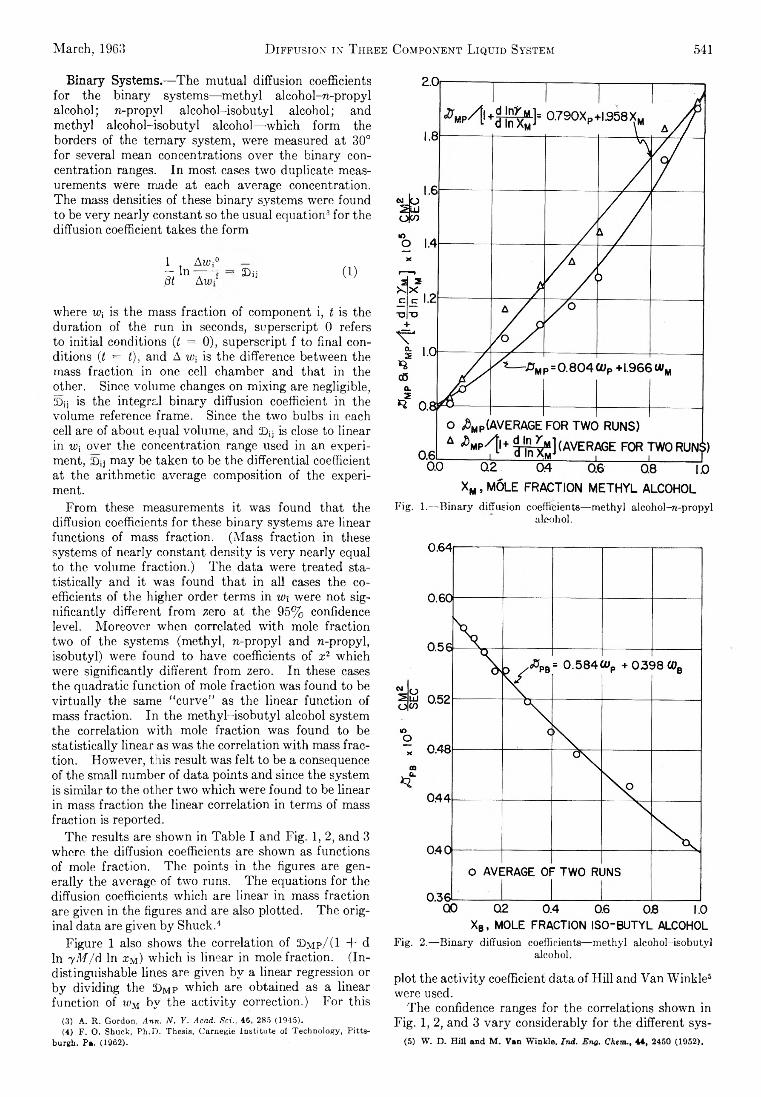
fo r the b in a ry systems— m ethyl alcohol-re -propyl a lcohol; re-propyl a lcoh o l-isob u tyl a lcohol; and m ethyl a lcoh o l-isob u tyl alcohol— -which form the borders of the te rn a ry system , were measured at 30° fo r several mean concentrations over the b in ary concentration ranges. In m ost cases tw o duplicate measurements were made a t each average concentration. The mass densities of these b in a ry systems were found to be v e ry nearly constant so the usual equation3 fo r the diffusion coefficient takes the form
1 , Awi° — In------- fß t Aw*
■ 2D i j (1)
where w; is the mass fraction of component i, t is the duration of the run in seconds, superscript 0 refers to in itia l conditions (t = 0), superscript f to final conditions (t = t), and A w-, is the difference between the mass fraction in one cell chamber and th a t in the other. Since volum e changes on m ixing are negligible, £>ij is the in tegra l b in a ry diffusion coefficient in the volum e reference fram e. Since the tw o bulbs in each cell are of about equal volum e, and ©¡j is close to linear in W[ over the concentration range used in an experiment, 3)ij m ay be taken to be the d ifferentia l coefficient a t the arithm etic average com position of the experiment.
From these measurements it was found th a t the diffusion coefficients fo r these b in a ry systems are linear functions of mass fraction. (M ass fraction in these systems of nearly constant density is v e ry nearly equal to the volum e fraction .) Th e data were treated statis tic a lly and it was found th a t in a ll cases the coefficients of the higher order term s in w , were not sign ifica n tly different from zero at the 95% confidence level. M oreover when correlated w ith mole fraction tw o of the systems (m ethyl, re-propyl and re-propyl, isob u tyl) were found to have coefficients o f x2 w hich were sign ifican tly different from zero. In these cases the quadratic function of mole fraction was found to be v irtu a lly the same “ curve” as the linear function of mass fraction. In the m e th yl-iso b u tyl alcohol system the correlation w ith mole fraction was found to be sta tistica lly linear as was the correlation w ith mass fraction . How ever, th is result was fe lt to be a consequence of the sm all num ber of data points and since the system is sim ilar to the other tw o w hich were found to be linear in mass fraction the linear correlation in term s of mass fraction is reported.
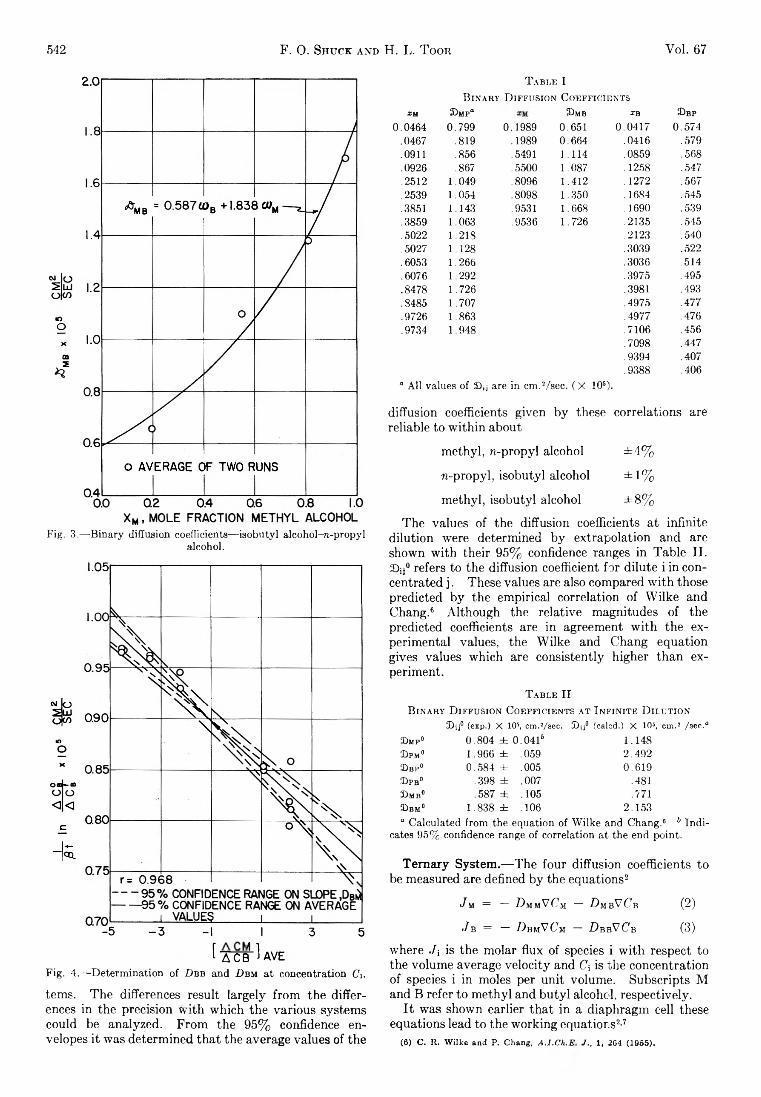
The results are shown in Ta b le I and F ig . 1, 2, and 3 where the diffusion coefficients are shown as functions of mole fraction. The points in the figures are gene ra lly the average of tw o runs. The equations fo r the diffusion coefficients w hich are linear in mass fraction are given in the figures and are also plotted. Th e o rig inal data are given b y Shuck.4
Figure 1 also shows the correlation of £>m p/ (1 + d In yM /d In xM) w hich is linear in mole fraction. (In distinguishable lines are given b y a linear regression or b y d iv id ing the 33m p w hich are obtained as a linear function of wM b y the a c tiv ity correction.) F o r th is
(3) A. R. Gordon, Ann. N. Y. Acad. Sci., 46, 28.5 (1945).(4) F. O. Shuck, Ph.D. Thesis, Carnegie Institute of Technology, Pitts
burgh. Pa. (1962).
Fig. 1.— Binary diffusion coefficients— methyl alcohol-rt-propyl alcohol.
Fig. 2.— Binary diffusion coefficients— methyl alcohol-isobutyl alcohol.
p lot the a c tiv ity coefficient data of H ill and Van W inkle5 were used.
Th e confidence ranges fo r the correlations shown in F ig . 1, 2, and 3 v a ry considerably fo r the different sys-
(5) W. D. Bill and M. Van Winkle, Ind . Eng. Chzm., 44, 2450 (1952).
542 F. 0. Shuck a n d H. L. T oor Vol. 67
Fig. 3.— Binary diffusion coefficients—isobutyl alcohol-re-propyl alcohol.
[■AÏÏï H aVEFig. 4.— Determination of D b b and D bm at concentration CV
terns. Th e differences result la rge ly from the differences in the precision w ith w hich the various systems could be analyzed. F rom the 95% confidence envelopes it was determ ined th a t the average values of the
T a b l e 1B in a r y D if fu sio n C o e f f ic ie n t s
IM £>m f ° £>m b X B S b p
0.0464 0.799 0.1989 0.651 0.0417 0.574.0467 .819 .1989 0.664 .0416 .579.0911 .856 .5491 1.114 .0859 .568.0926 .867 .5500 1.087 . 1258 .5472512 1.049 .8096 1.412 .1272 .567
.2539 1.054 .8098 1.350 .1684 .545
.3851 1.143 .9531 1.668 .1690 .539
.3859 1.063 .9536 1.726 .2135 .545
.5022 1.218 .2123 .540
.5027 1.128 .3039 .522
. 6053 1.266 .3036 .514
.6076 1.292 .3975 .495
.8478 1.726 .3981 .493
.8485 1.707 .4975 .477
.9726 1.863 .4977 .476
.9734 1.948 .7106 .456.7098 .447.9394 .407.9388 .406
“ All values of Sú¡j are in em.2/sec. ( x 105).
diffusion coefficients given b y these correlations are reliable to w ith in about
m ethyl, n -p ro p yl alcohol ± 4 %
n -p ro p yl, isobutyl alcohol ± 1 %
m ethyl, isobutyl alcohol ± 8 %
The values of the diffusion coefficients at in fin ite d ilu tion were determ ined b y extrapolation and are shown w ith th e ir 95% confidence ranges in Table I I . £>ij° refers to the diffusion coefficient fo r d ilu te i in concentrated j . These values are also compared w ith those predicted b y the em pirical correlation of W ilke and Chang.6 A lthough the re la tive m agnitudes of the predicted coefficients are in agreement w ith the experim ental values, the W ilke and Chang equation gives values w hich are consistently h igher than experim ent.
T a b l e IIB in a r y D if f u sio n C o e ff ic ie n t s a t I n f in it e D il u t io n
S ij° (exp.) X 10’ , cm.Vsee. SDjj0 (calod.) X 105, cm.2 /sec.“£>mp° 0.804 ± 0.04T 1.148£)pm° 1.966 ± .059 2.492£ bf° 0.584 ± .005 0.619SDpb° .398 ± .007 .481Dmb° .587 ± .105 .771SDbm° 1.838 ± .106 2.153“ Calculated from the equation of Wilke and Chang.6 6 Indi
cates 95% confidence range of correlation at the end point.
Te rn a ry System .— The four diffusion coefficients to be measured are defined b y the equations2
Jm = — D mmV C m — D mbV C b (2)
< / b = — - D b m V C m — D b b V C b ( 3 )
where Ji is the m olar flu x of species i w ith respect to the volum e average ve lo c ity and C; is the concentration of species i in moles per u n it volum e. Subscripts M and B refer to m ethyl and b u ty l alcohol, respectively.
I t was shown earlier th a t in a diaphragm cell these equations lead to the w ork ing equations2-7
(6) C. R, Wilke and P. Chang, A J .C h .E J ., 1, 204 (1965).
March, 1963 D iffusion in T hree Component Liquid System 543
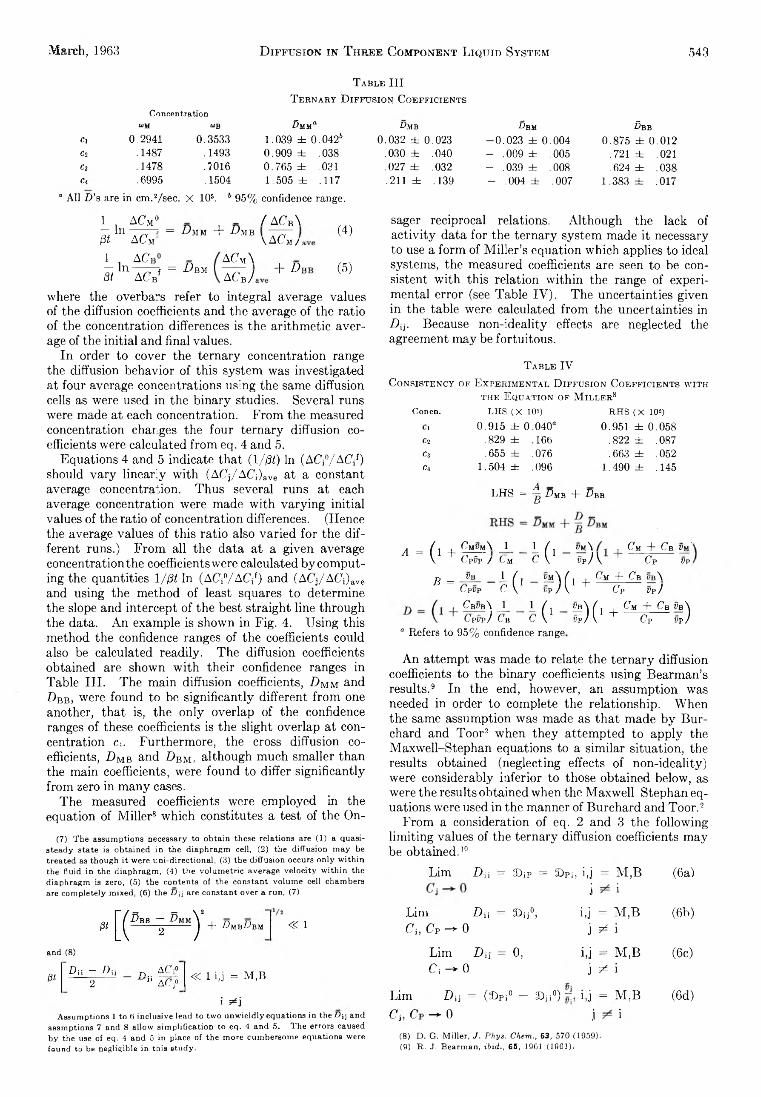
T able I I I
T e r nar y D iffusion C oefficients
Concentration«M OB 5 mm“
Cl 0.2941 0.3533 1.039 ± 0 .042iC2 .1487 .1493 0.909 ± .038Cz .1478 .7016 0.765 ± .031Ca .6995 .1504 1.505 ± .117
“ All D ’s are in cm.2/sec. X 105. 6 95% confidence range.
Dmb 5 bm S bb
0.032 ± 0.023 -0 .0 2 3 ± 0.004 0.875 ± 0.012.030 ± .040 - .009 ± .005 .721 ± .021.027 ± .032 - .039 ± .008 .624 ± .038.21] ± .139 - .004 ± .007 1.383 ± .017
1 ACm°~ In 7~ c = D mm + D mb fit ACm
1 , A Ci — I n — — ßt ACb
f = D b m
ACm \
ACb A
/ A C b \
\ AC m /a
+ D b
(4)
(5)
where the overbars refer to in tegra l average values of the diffusion coefficients and the average of the ra tio of the concentration differences is the arithm etic average of the in itia l and final values.
In order to cover the te rn a ry concentration range the diffusion behavior of th is system was investigated at four average concentrations using the same diffusion cells as were used in the b in a ry studies. Several runs were made at each concentration. From the measured concentration changes the four te rn a ry diffusion coefficients were calculated from eq. 4 and 5.
Equations 4 and 5 indicate th a t (1 /fit) In (ACf/ACf) should v a ry lin e a rly w ith (A C j/A C i)ave at a constant average concentration. Thus several runs at each average concentration were made w ith va ryin g in itia l values of the ra tio of concentration differences. (Hence the average values of th is ra tio also varied fo r the d ifferent runs.) From a ll the data a t a given average concentrationthe coefficients were calculated bycom pu t- ing the quantities 1 /fit In (AC;0/ AC\{) and (A C ,/A C i)ave and using the m ethod of least squares to determ ine the slope and intercept of the best stra igh t line through the data. A n example is shown in F ig . 4. U sing th is m ethod the confidence ranges of the coefficients could also be calculated read ily. Th e diffusion coefficients obtained are shown w ith th e ir confidence ranges in Table I I I . Th e m ain diffusion coefficients, 7) m m and D b b , were found to be sign ifican tly different from one another, th a t is, the o n ly overlap of the confidence ranges of these coefficients is the slight overlap at concentration c4. Furtherm ore, the cross diffusion coefficients, D M b and D b,m , although m uch sm aller than the m ain coefficients, were found to d iffer sign ifican tly from zero in m any cases.
The measured coefficients were em ployed in the equation of M ille r8 w hich constitutes a test of the O n -
(7) The assumptions necessary to obtain these relations are (1) a quasisteady state is obtained in the diaphragm cell, (2) the diffusion may be treated as though it were uni-directional, (3) the diffusion occurs only within the fluid in the diaphragm, (4) the volumetric average velocity within the diaphragm is zero, (5) the contents of the constant volume cell chambers are completely mixed, (6) the D y are constant over a run, (7)
ßt + DmbDbm « 1
and (8)
« 1 i,j = M,B
f ^ iAssumptions 1 to ft inclusive lead to two unwieldly equations in the-Djj and
assmptions 7 and 8 allow simplification to eq. 4 and 5. The errors caused by the use of eq. 4 and 5 in place of the more cumbersome equations were found to be negligible in this study.
ßt Du - Dii r» AC? 2 n AC?
sager reciprocal relations. A lthough the lack of a c tiv ity data fo r the te rn a ry system made it necessary to use a form of M ille r’s equation w hich applies to ideal systems, the measured coefficients are seen to be consistent w ith th is re lation w ith in the range of experim ental error (see Table IV ) . The uncertainties given in the table were calculated from the uncertainties in D jj. Because non -id ea lity effects are neglected the agreement m ay be fortu itous.
T able IVC onsistency of E xper im ental D iffusion C oefficients w ith
the E quation of M iller8Concn. LHS (X 10=) RHS (X IO»)
Ci 0.915 ± 0.040“ 0.951 ± 0.058Cl .829 ± .166 .822 ± .087Cz .655 ± .076 .663 ± .052Ca 1.504 ± .096 1.490 ± . 145
LHS = 4 D ■g ¿ 'mb + D bb
A = ( l +
B =
Cm«m\ 11 (l m\ 1 Cm + Cb v u '
V C p vp.C p ÿ p / C M c V Vp)
V b 1 ('j Wm'> ( ■ +
Cm + Cb pb\Cpvp C \, Vp , C p v p )
CbPb\ 11 (l SbV ( , , Cm + Cb v b \
A + Cp v p )C p vp ) C B c V Vp)“ Refers to 95% confidence range
A n attem pt was made to relate the te rn a ry diffusion coefficients to the b in a ry coefficients using Bearm an’s results.9 In the end, however, an assum ption was needed in order to complete the relationship. W hen the same assumption was made as th a t made b y B u r- chard and T o o r2 when th ey attem pted to app ly the M axw ell-S tephan equations to a sim ilar situation , the results obtained (neglecting effects of n on -id ea lity) were considerably in fe rio r to those obtained below, as were the results obtained when the M axw ell-S tephan equations were used in the manner of B urchard and T o o r.2
From a consideration of eq. 2 and 3 the fo llow ing lim itin g values of the te rn a ry diffusion coefficients m ay be obtained.10
L im D ü = Sûjp = Dpi, i,j = M ,B (6a)i i
L im D ü = D u0, i-j = M ,B (6b)Ci, Cp - 0 j ^ i
L im D i, = 0, i-j = M ,B (6c)Ci — 0 j ^ i
L im D ü = (£>Pi° — 3Dji°) i,j = M ,B (6d)
Oto6" i i
(8) D. G. Miller, J . P h y s . Chew.., 63, 570 (1959).(9) R. J. Bearman, iò id i, 65, 19G1 (1961).
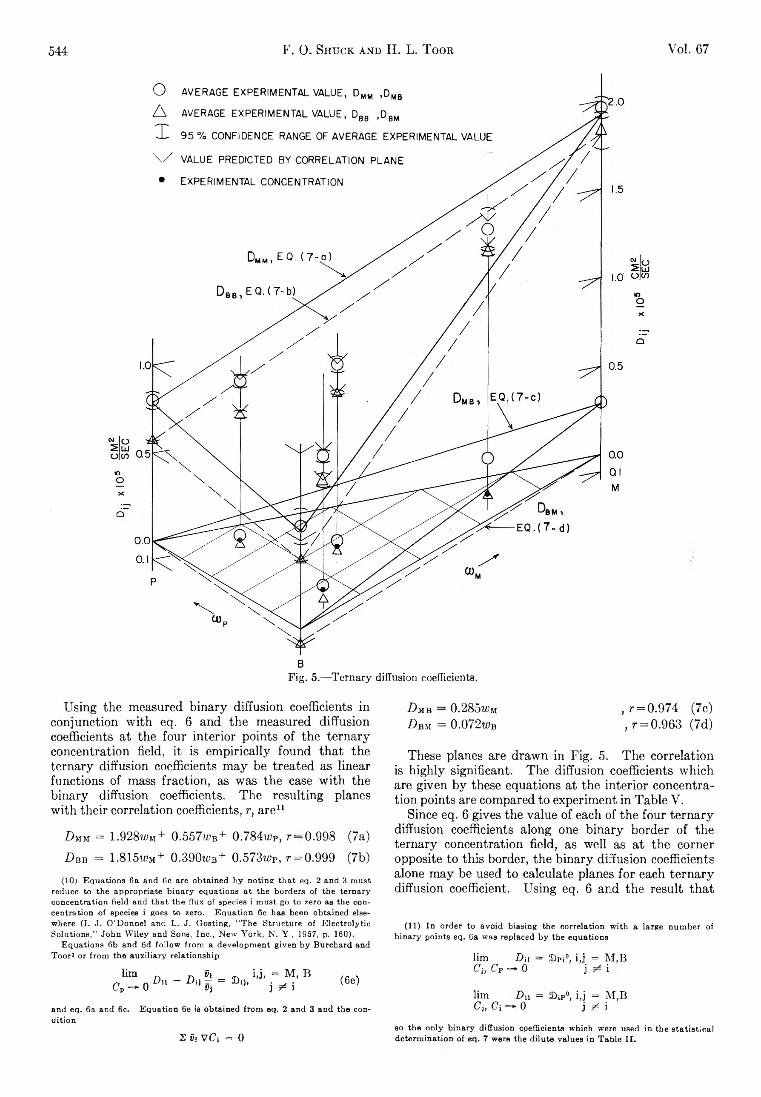
544 F. 0. Shuck and H. L. T oor Vol. 67
0 AVERAGE EXPERIMENTAL VALUE, DMM ,DMB
A AVERAGE EXPERIMENTAL VALUE, Dbb ,Dbm
1 95 % CONFIDENCE RANGE OF AVERAGE EXPERIMENTAL VALUE
\ / VALUE PREDICTED BY CORRELATION PLANE
• EXPERIMENTAL CONCENTRATION
DMm,EQ. (7-q)
Fig. 5.— Ternary diffusion coefficients.
U sing the measured b in a ry diffusion coefficients in conjunction w ith eq. 6 and the measured diffusion coefficients a t the fou r in te rio r points of the te rn a ry concentration field, it is em p irica lly found th a t the te rn a ry diffusion coefficients m ay be treated as linear functions of mass fraction , as was the case w ith the b in a ry diffusion coefficients. Th e resulting planes w ith th e ir correlation coefficients, r, are11
Z> m m = 1.928w m + 0.557w b+ 0.784m>p , r — 0.998 (7a)
D bb = 1.815w m + 0.390wB+ 0.573wP, r = 0.999 (7b)
(10) Equations 6a and 6c are obtained by noting that eq. 2 and 3 must reduce to the appropriate binary equations at the borders of the ternary concentration field and that the flux of species i must go to zero as the concentration of species i goes to zero. Equation 6c has been obtained elsewhere (I. J. O'Donnel and L. J. Gosting, “ The Structure of Electrolytic Solutions,” John Wiley and Sons, Inc., New York, N. Y., 1957, p. 160).
Equations 6b and 6d follow from a development given by Burchard and Toor2 or from the auxiliary relationship
limC p -^ 0 D h — Da jj-1 = ©¡j,
Vii,j, = M, B
î ^ i(6e)
and eq. 6a and 6c. Equation 6e is obtained from eq. 2 and 3 and the condition
2 Vi VCi = 0
Dub — 0.285ifm , r = 0.974 (7c)Dbm = 0.072w>b , r = 0.963 (7d)
These planes are draw n in F ig . 5. Th e corre lation is h ig h ly significant. Th e diffusion coefficients w hich are given b y these equations at the in te rio r concentration points are compared to experim ent in Ta b le V .
Since eq. 6 gives the value of each of the fou r te rn a ry diffusion coefficients along one b in a ry border of the te rn a ry concentration field, as w ell as a t the corner opposite to th is border, the b in a ry diffusion coefficients alone m ay be used to calculate planes fo r each te rn a ry diffusion coefficient. U sing eq. 6 and the result th a t
(11) In order to avoid biasing the correlation with a large number of binary points eq. 6a was replaced by the equations
lim Dn = SDpi0, i,j = M.B Ch CP - 0 j i
lim Du = 2D ip °, i,j = M,B Cj, Ci *■ 0 j ^ i
so the only binary diffusion cpefficients which were used in the statistical determination of eq. 7 were the dilute values in Table II.
March, 1963 D istribution of Surface Energy in Chemisorption 545
T able V
Comparison op Experimental and Calculated T ernary D iffusion Coefficients
Concn. D i f Exptl. Calcd. eq. 7 Calcd. eq. 8
Ci M M 1.039 1.040 1.069MB 0.032 0.084 0.087BM - .023 - .025 - .029BB .875 .874 .887
c2 M M .909 .920 .944 ,MB .030 .042 .044BM - .009 - .011 - .012BB .721 .730 .743
Cs MM .765 .794 .823MB .027 .042 .044BM - .039 - .051 - .057BB .621 .628 .639
c4 MM 1 505 1.550 1.584MB 0.211 0.199 0.207BM -0 .0 0 4 -0 .0 1 1 -0 .0 1 2BB 1.383 1.414 1.433
“ All values of D,, are in cm.2/sec. ( x 105).
the b in a ry diffusion coefficients m ay be taken as linear in w
Da = £>Pi°Wi + T>ij°Wj + 3L>ip0wp, i,j = M ,B (8a)i ^ j
D û = « ¡ (© P i0i,.j = M ,B
i ^ j(8b)
These equations were used w ith the values of the dilute b in a ry diffusion coefficients in Table I I to compute the te rn a ry diffusion coefficients at the in te rio r points of the concentration field. Th e results are given in TableV . The differences between the com puted and measured values are in a ll cases w ith in experim ental error.
I t is interesting to note th a t the diffusion coefficients in th is constant mass density system are also linear functions of volum e fraction . In the to luene-ch loro - benzene-bromobenzene system the m ain diffusion coefficients were reported as linear functions of mole fra ctio n ,2'12 but since th is was a constant m olar density system these coefficients are also linear in volum e fraction . Thus, both systems are described b y eq. 8a13 if w is taken as volum e fraction . T h is g ra tify in g behavior w hich allows fo r estim ation of the te rn a ry coefficients from the d ilu te b in a ry coefficients alone is not to be expected in less therm odynam ically ideal system s.
Acknow ledgm ent.— Th e authors are grateful to the N ationa l Science Foundation fo r its financial support of th is w ork.
(12) The precision of measurement of the cross diffusion coefficients was not great enough to determine the concentration dependence of the cross diffusion coefficients in that system.
(13) The T-C-B system is described by a degenerate form of eq. 8a for in this system S)ij°Ê= oDkj0 so there is only “ one” main diffusion coefficient.
M I C R O C A L O R I M E T R I C S T U D I E S O F T H E D I S T R I B U T I O N O F
S U R F A C E E N E R G Y I N C H E M I S O R P T I O N
B y Y . K e v o r k i a n a n d R . 0 . S t e i n e r
Esso Research & Engineering Co., Process Research Division, Linden, N. J.Received July 5, 196%
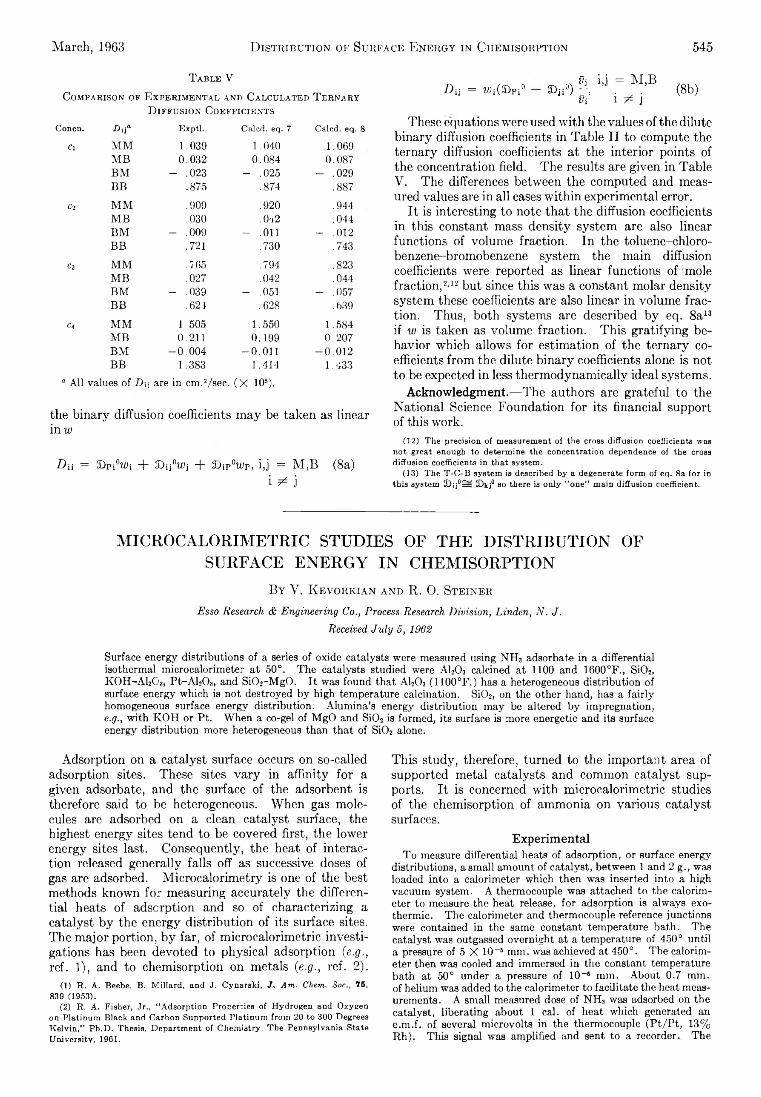
Surface energy distributions of a series of oxide catalysts were measured using NH3 adsorbate in a differential isothermal microcalorimeter at 50°. The catalysts studied were A120 3 calcined at 1100 and 1600°F., Si02, KOH-AlaOn, Pt-AloOa, and SiOj-MgO. It was found that A120 3 (1100°F.) has a heterogeneous distribution of surface energy which is not destroyed by high temperature calcination. Si02, on the other hand, has a fairly homogeneous surface energy distribution. Alumina’s energy distribution may be altered by impregnation, e.g., with KOH or Pt. When a co-gel of MgO and Si02 is formed, its surface is more energetic and its surface energy distribution more heterogeneous than that of Si02 alone.
Adsorption on a cata lyst surface occurs on so-called adsorption sites. These sites v a ry in a ffin ity fo r a given adsorbate, and the surface of the adsorbent is therefore said to be heterogeneous. W hen gas molecules are adsorbed on a clean cata lyst surface, the highest energy sites tend to be covered first, the lower energy sites last. Consequently, the heat of interaction released generally fa lls off as successive doses of gas are adsorbed. M icroca lo rim etry is one of the best methods known fo r m easuring accurately the differentia l heats of adsorption and so of characterizing a cata lyst b y the energy d istribu tion of its surface sites. The m ajor portion , b y far, of m icrocalorim etric in vestigations has been devoted to physical adsorption (e.g., ref. 1), and to chem isorption on m etals (e.g., ref. 2).
(1) R. A. Beebe, B. Millard, and J. Cynarski, J!. Am. Chem. Soc., 75, 839 (1953).
(2) R. A. Fisher, Jr., “ Adsorption Properties of Hydrogen and Oxygen on Platinum Black and Carbon Supported Platinum from 20 to 300 Degrees Kelvin,” Ph.D. Thesis, Department of Chemistry, The Pennsylvania State University. 1961.
T h is study, therefore, turned to the im portant area of supported m etal catalysts and common cata lyst supports. I t is concerned w ith m icrocalorim etric studies of the chem isorption of ammonia on various cata lyst surfaces.
Experim entalTo measure differential heats of adsorption, or surface energy
distributions, a small amount of catalyst, between 1 and 2 g., was loaded into a calorimeter which then was inserted into a high vacuum system. A thermocouple was attached to the calorimeter to measure the heat release, for adsorption is always exothermic. The calorimeter and thermocouple reference junctions were contained in the same constant temperature bath. The catalyst was outgassed overnight at a temperature of 450° until a pressure of 5 X 10“ 6 mm. was achieved at 450°. The calorimeter then was cooled and immersed in the constant temperature bath at 50° under a pressure of 10“ 6 mm. About 0.7 mm. of helium was added to the calorimeter to facilitate the heat measurements. A small measured dose of NHS was adsorbed on the catalyst, liberating about 1 cal. of heat which generated an e.m.f. of several microvolts in the thermocouple (P t/P t, 13% Rh). This signal was amplified and sent to a recorder.. The
Y, K evorkian and R. 0 . Steiner Vol. 67546
Heater
Fig. 2.— Surface energy distribution of alumina (1100°F.).recorder pen followed a straight yertical line when the catalyst and thermocouple reference junction were at the same temperature. The heat of adsorption caused the pen to be deflected sharply away from this equilibrium position. As the catalyst slowly lost the adsorption heat to its surroundings, a cooling curve was traced out by the recorder pen. After thermal equilibrium was re-established, a calibration was made by sending a known amount of electrical energy through a heater wire in the calorimeter, generating another heating-cooling curve. The area under the calibration curve was measured with a plan- imeter and compared to that under the adsorption curve to determine quantitatively the adsorption heat release. The amount of XH , which adsorbed, and caused this heat release, was detem mined by measurement of the equilibrium pressure. This process then wag repeated numerous times by adsorbing mpre small doses until m &pp?#cisbte pari of the surface was covered. In this way, data were obtained which are necessary to calculate the surface energy distribution of the catalyst.
The adsorption system associated with the calorimeter has two high vacuum manifolds which operate over a pressure range of 10~6 to 1 mm. One manifold is used to prepare the adsorbate and the other to outgas the catalyst. A high pressure manifold (10-1 to 103 mm.) is used for measuring BET surface areas of the catalysts.
The constant temperature bath is doubly thermostated and designed to operate over a temperature range of 30-200 ± 0.01°. Sensitive temperature control was achieved in the central bath by use of a helix which contained glycerol. The glycerol either expanded against, or contracted from, a mercury column to achieve the temperature control. Three centrifugal pumps (Eastern Model DH-11) circulated the water of the inner and outer baths to eliminate temperature gradients.
The large bath and two electric furnaces (Hevi-Duty) were mounted on a hydraulic platform which moved on wheels and rails for correct positioning. Special shielding and an isolation transformer were installed to eliminate stray electrical charges which might affect the e.m.f. measurements.
A tray-type calorimeter was specially designed for this study so that it would have a minimum of heat transfer, mass transfer, and diffusional limitations. One already has beeD described3 for use in an adiabatic calorimeter system used for the measurement of specific heats of high polymers. A cut-away side view of the one used in this study is shown in Fig. 1. Seven shallow trays are gold-soldered to a hollow, heavy-walled, central shaft. The entire calorimeter is made of platinum-rhodium (3.5% ) alloy. Inside the shaft is the nichrome heater wire (39.2 ohms resistance), and spot-welded to its side is the thermocouple. The very broad area of contact between the trays and the shaft should result in good heat transfer to the thermocouple. Since the catalyst beds on the trays were only about 2 mm. deep, spurting of the catalyst during outgassing did not occur. Also, diffusional limitations were reduced to a minimum and should not have affected the measured energy distributions because of non-selective adsorption.
Current for the calibration was supplied by a 6-volt storage battery. A standard electric timer, which could be read to ±0 .05 sec., was used to measure the length of the calibration period. Voltage and current were read with a d.c. voltmeter (Weston Model 1) and a d.c. ammeter (Weston Model 1). The thermocouple e.m.f. was amplified by a Beckman d.c. breaker amplifier (Model 14) and recorded on a 0-10 mv. Brown recorder.
Preparation of Adsorbates.— Helium of 99.99% min. purity was phtained from the Matheson Co. Before use, it was passed over activated carbon maintained at liquid nitrogen temperatures. Anhydrous ammonia of 99.99% min. purity also was obtained from the Matheson Co. It was admitted to an evacuated system, liquefied at — 78°, and distilled into a 3-1. storage flask. Prepurified nitrogen was obtained from the Matheson Co. with a purity of 99.996% min. and was used “ as is.”
Preparation of Adsorbents. Alumina.— Adsorptive aluminas were prepared by calcining /3-alumina trihydrate in an atmosphere of dry nitrogen at 1100°F. for 4 hr.— A120 3 (1100°F.)— and at 1600°F. for 8 hr.— A120 3 (1600°F.). These catalysts, like all others investigated, were ground to a small particle size.
Potassium Hydroxide-Alumina.— /3-Alumina trihydrate was treated with a solution containing KOH to provide 5 moles of KOH/100 moles of alumina and calcined at 1100PF.— K 0H -A120 3.
Platinum-Alumina.— A120 3 (1100°F.) was wet with enough of a solution of “ P salt’ ’ (Pt(NH3)2(N 02)2) to deposit 0.3 wt. % Pt. This wet mixture was dried at 250 °F. overnight and finally calcined 1 hr, at 1100°F. Although Debye and Chu4 have shown the deposited platinum to be, highly dispersed, its exact nature (atomic or ionic) is unknown.
Silica.— The silica gel was a pure sample supplied by the Esso Research Laboratories of Baton Rouge, La. It was heated for 3 hr. at 850°F. before shipment.
Silica Magnesia.— This catalyst also was, supplied by the Esso Research. Laboratories of Baton Rouge, La. Sodium silicate was mixed with sulfuric acid solution maintained below 60°F. Powdered Westvaco Co. magnesia then was sprinkled in with rapid stirring to form a stiff co-gel. It was broken up and water washed. The catalyst then was calcined overnight at 1000°F. and for 3 hr. at 1250°F.. The resulting catalyst consisted of 70% silica and 30% magnesia.
Results
Th e catalysts studied, and th e ir B E T surface areas, measured w ith nitrogen adsorbate at liq u id n itrogen tem peratures, are listed in Table I .
(3) A. E. Worthington, P. C. Marx, and M. Dole, Rev. Sci. Instr., 26, 698 (1955).
(4) P. Debye and B. Chu, J . Phys. Chem., 66, 1021 (1962).
March, 1963 D istribution of Surface Energy in Chemisorption 547
T able I
CatalystSurface area,
m.2/g.AI2O 3 (1 1 0 0 °F .) 296Si02 572a i 2o 3 ( i e o o ° F . ) 75K0H-A120 3 250Pt-A l20 3 220Si02-M g 0 536
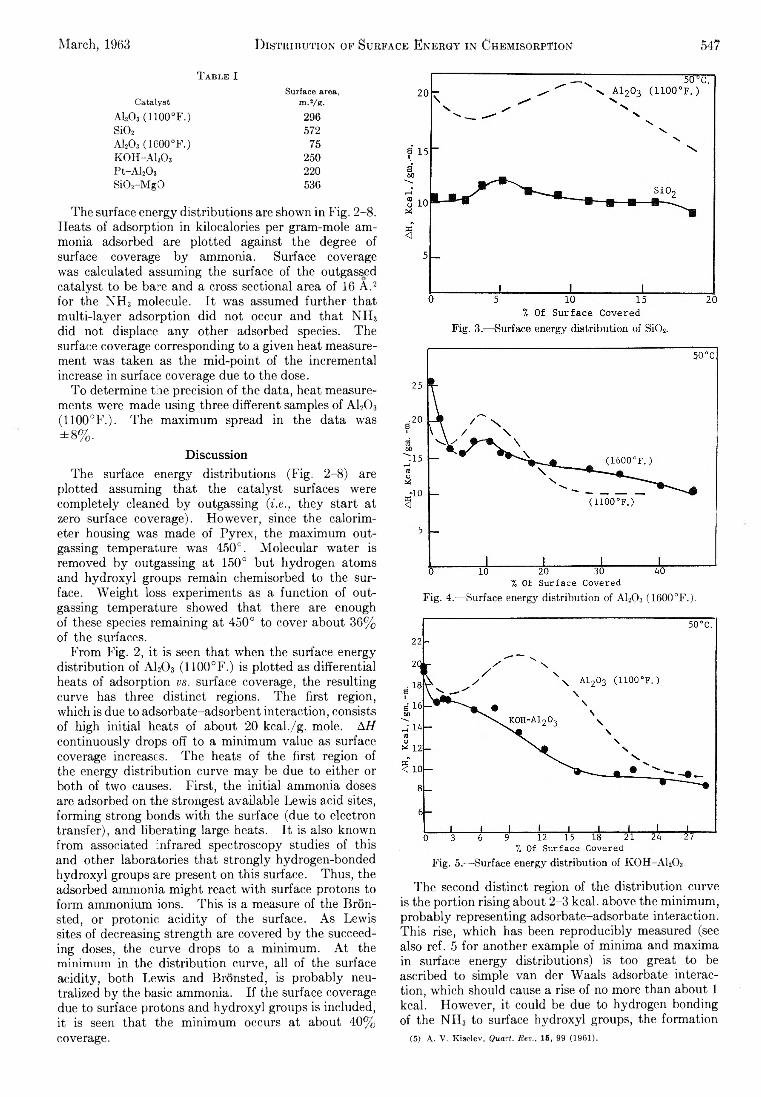
The surface energy d istributions are shown in F ig . 2-8. Heats of adsorption in kilocalories per gram -m ole amm onia adsorbed are p lotted against the degree of surface coverage b y ammonia. Surface coverage was calculated assuming the surface of the outgassed cata lyst to be bare and a cross sectional area of 16 A .2 for the N H 3 molecule. I t was assumed fu rth e r th at m u lti-la ye r adsorption d id not occur and th a t N H :i did not displace any other adsorbed species. The surface coverage corresponding to a given heat measurement was taken as the m id -po in t of the increm ental increase in surface coverage due to the dose.
T o determ ine the precision of the data, heat measurements were made using three different samples of A120 3 (1100°F.). Th e m axim um spread in the data Was ± 8 % .
D iscussionThe surface energy d istributions (F ig . 2-8) are
plotted assuming th a t the cata lyst surfaces were com pletely cleaned b y outgassing (i.e., th ey start at zero surface coverage). H ow ever, since the calorim eter housing was made of P yre x , the m axim um o u t- gassing tem perature was 450c. M olecular w ater is removed b y outgassing a t 150° but hydrogen atoms and h yd ro xy l groups rem ain chemisorbed to the surface. W e igh t loss experim ents as a function of outgassing tem perature showed th a t there are enough of these species rem aining at 450° to cover about 36% of the surfaces.
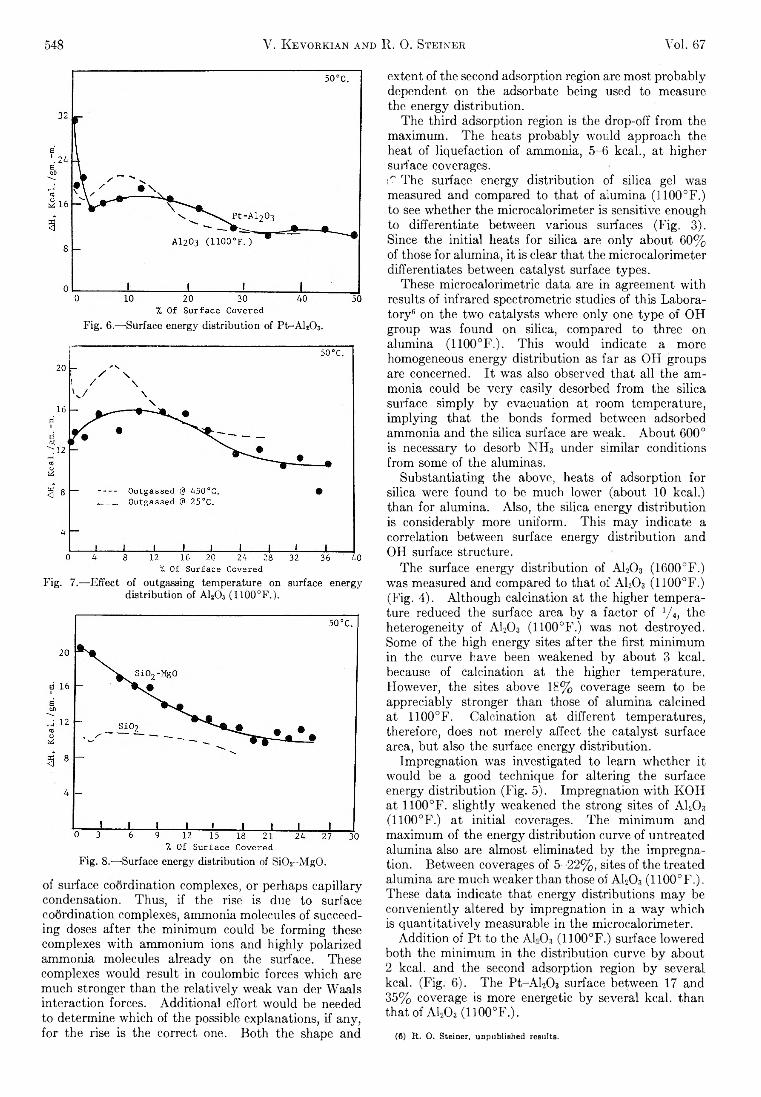
From F ig . 2, it is seen th a t when the surface energy d istribu tion of A120 3 (1100°F.) is p lotted as differential heats of adsorption vs. surface coverage, the resulting curve has three d istinct regions. Th e first region, which is due to adsorbate-adsorbent in teraction, consists of high in itia l heats of about 20 kcal./g. mole. AH continuously drops off to a m inim um value as surface coverage increases. Th e heats of the first region of the energy d istribu tion curve m ay be due to either or both of tw o causes. F irs t, the in itia l ammonia doses are adsorbed on the strongest available Lew is acid sites, form ing strong bonds w ith the surface (due to electron transfer), and libera ting large heats. I t is also known from associated in frared spectroscopy studies of th is and other laboratories th at strong ly hydrogen-bonded h yd ro xy l groups are present on th is surface. Thus, the adsorbed ammonia m ight react w ith surface protons to form ammonium ions. T h is is a measure of the B ro n - sted, or protonic a c id ity of the surface. A s Lewis sites of decreasing strength are covered b y the succeeding doses, the curve drops to a m inim um . A t the m inimum in the d istribu tion curve, a ll of the surface a c id ity, both Lew is and Bronsted, is probab ly neutralized b y the basic ammonia. I f the surface coverage due to surface protons and h yd ro xy l groups is included, it is seen th at the m inim um occurs at about 40% coverage.
Fig. 4.—Surface energy distribution of AI20 3 (1600°F.).
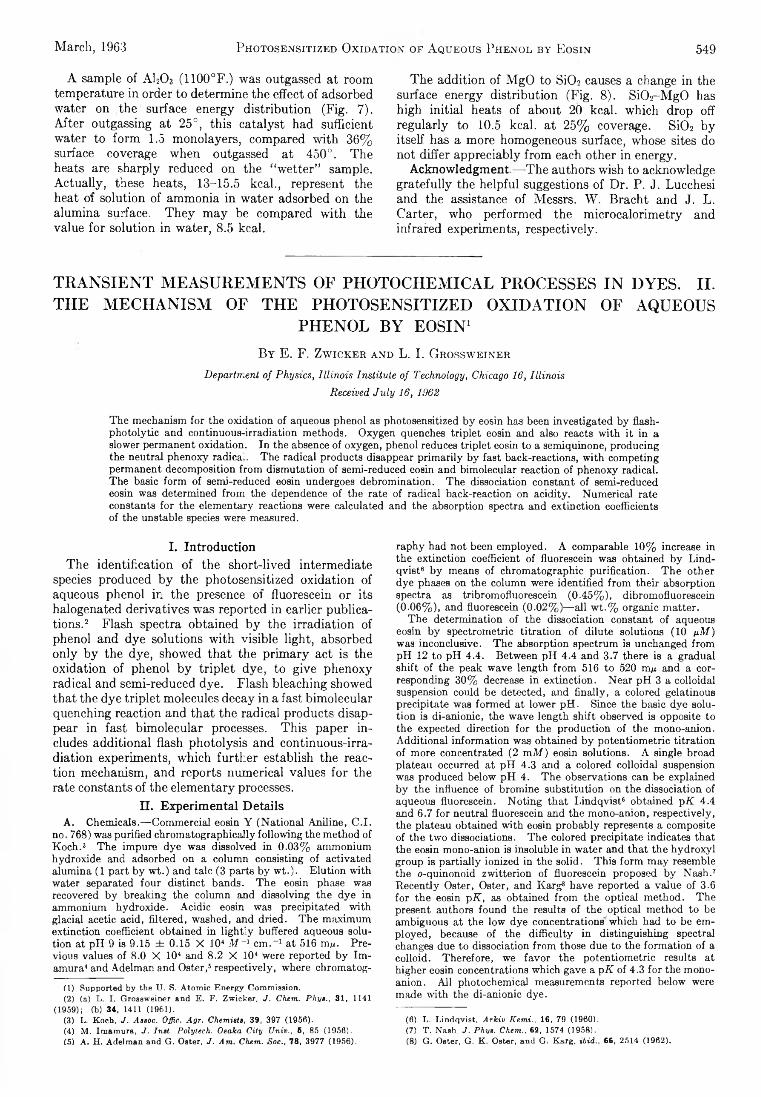
Fig. 5.— Surface energy distribution of K0H -A120 3.
The second d istinct region of the d istribu tion curve is the portion rising about 2-3 kcal. above the m inim um , probab ly representing adsorbate-adsorbate interaction. T h is rise, w hich has been reproducib ly measured (see also ref. 5 fo r another example of m inim a and m axim a in surface energy d istributions) is too great to be ascribed to simple van der W aals adsorbate interaction , w hich should cause a rise of no more than about 1 kcal. H ow ever, it could be due to hydrogen bonding of the N H 3 to surface h yd ro xy l groups, the form ation
(5) A. V. Kiselev, Quart. Rev., 15, 99 (1961).
548 V. Kevorkian and R. 0. Steiner Vol. 67
Fig. 6.—-Surface energy distribution of Pt-A l2C>3.
Fig. 7.— Effect of outgassing temperature on surface energy distribution of A120 3 (1100°F.).
Fig. 8.— Surface energy distribution of Si02-M g0 .
of surface coordination complexes, or perhaps cap illa ry condensation. Thus, if the rise is due to surface coordination complexes, ammonia molecules of succeeding doses after the m inim um could be form ing these complexes w ith ammonium ions and h ig h ly polarized am monia molecules already on the surface. These complexes w ould result in coulom bic forces w hich are m uch stronger than the re la tive ly weak van der W aals in teraction forces. A d d itio n a l effort w ould be needed to determ ine w hich of the possible explanations, if any, fo r the rise is the correct one. B oth the shape and
extent of the second adsorption region are m ost probab ly dependent on the adsorbate being used to measure the energy d istribu tion .
Th e th ird adsorption region is the drop-off from the m axim um . Th e heats probab ly w ould approach the heat of liquefaction of ammonia, 5-6 kca l., a t h igher surface coverages.¡7 The surface energy d istribu tion of silica gel was measured and compared to th a t of alum ina (1100°F.) to see whether the m icrocalorim eter is sensitive enough to differentiate between various surfaces (F ig . 3). Since the in itia l heats fo r silica are o n ly about 60% of those fo r alum ina, it is clear th at the m icrocalorim eter differentiates between cata lyst surface types.
These m icrocalorim etric data are in agreement w ith results of in frared spectrom etric studies of th is Laborato ry 6 on the tw o catalysts where o n ly one typ e of O H group was found on silica, compared to three on alum ina (1100°F.). T h is w ould indicate a more homogeneous energy d istribu tion as fa r as O H groups are concerned. I t was also observed th a t a ll the amm onia could be ve ry easily desorbed from the silica surface sim ply b y evacuation a t room tem perature, im p lyin g th at the bonds form ed between adsorbed ammonia and the silica surface are weak. A b o u t 600° is necessary to desorb N H 3 under sim ilar conditions from some of the alum inas.
Substantiating the above, heats of adsorption fo r silica were found to be much lower (about 1 0 kcal.) than fo r alum ina. A lso , the silica energy d istribu tion is considerably more uniform . Th is m ay indicate a correlation between surface energy d istribu tion and O H surface structure.
Th e surface energy d istribu tion of A120 3 (1600°F.) was measured and compared to th a t of A I2O 3 (1100°F.) (F ig . 4). A lthough calcination at the higher tem perature reduced the surface area b y a factor of V 4, the heterogeneity of A120 3 (1100°F.) was not destroyed. Some of the high energy sites after the firs t m inim um in the curve have been weakened b y about 3 kcal. because of calcination a t the higher tem perature. How ever, the sites above 18% coverage seem to be appreciably stronger than those of alum ina calcined at 1100°F. C alcination at different tem peratures, therefore, does not m erely affect the cata lyst surface area, but also the surface energy d istribu tion .
Im pregnation was investigated to learn w hether it would be a good technique fo r a ltering the surface energy d istribu tion (F ig . 5). Im pregnation w ith K O H at 1100°F. s lig h tly weakened the strong sites of A120 3
(1100°F.) a t in itia l coverages. Th e m inim um and m axim um of the energy d istribu tion curve of untreated alum ina also are almost elim inated b y the im pregnation . Between coverages of 5 -22 % , sites of the treated alum ina are m uch weaker than those of A120 3 (1100°F.). These data indicate th at energy d istribu tions m ay be conveniently altered b y im pregnation in a w a y w hich is q u a n tita tive ly measurable in the m icrocalorim eter.
A d d itio n of P t to the A1,0?, (1100°F.) surface lowered both the m inim um in the d istribu tion curve b y about 2 kcal. and the second adsorption region b y several kcal. (F ig . 6 ). The P t-A L C h surface between 17 and 35% coverage is more energetic b y several kcal. than th at of A I2 O 3 (1100°F.).
(6) R. O. Steiner, unpublished results.
March, 1963 Photosensitized Oxidation of A queous Phenol by Eosin 549
A sample of A120 3 (1100°F.) was outgassed a t room tem perature in order to determ ine the effect of adsorbed water on the surface energy d istribu tion (F ig . 7). A fte r outgassing at 25°, th is cata lyst had sufficient water to form 1.5 m onolayers, compared w ith 36% surface coverage when outgassed a t 450°. The heats are sharply reduced on the “ w etter” sample. A c tu a lly , these heats, 13-15.5 kcal., represent the heat of solution of ammonia in w ater adsorbed on the alum ina surface. T h e y m ay be compared w ith the value fo r solution in w ater, 8.5 kcal.
Th e addition of M gO to SiCb causes a change in the surface energy d istribu tion (F ig . 8). S i0 2-M g O has high in itia l heats of about 20 kcal. which drop off regu la rly to 10.5 kcal. a t 25% coverage. SiCb b y itse lf has a more homogeneous surface, whose sites do not d iffer appreciably from each other in energy.
Acknow ledgm ent— -The authors w ish to acknowledge gra te fu lly the helpful suggestions of D r. P . J . Lucchesi and the assistance of Messrs. W . B racht and J . L . C arter, who perform ed the m icroca lorim etry and infrared experim ents, respectively.
T R A N S I E N T M E A S U R E M E N T S O F P H O T O C H E M I C A L P R O C E S S E S I N D Y E S . I I .
T H E M E C H A N I S M O F T H E P H O T O S E N S I T I Z E D O X I D A T I O N O F A Q U E O U S
P H E N O L B Y E O S I N 1
B y E . F . Z w i c k e r a n d L . I . G r o s s w e i n e r
Department of Physics, Illinois Institute of Technology, Chicago 16, Illinois Received July 16, 1962
The mechanism for the oxidation of aqueous phenol as photosensitized by eosin has been investigated by flash- photolytic and continuous-irradiation methods. Oxygen quenches triplet eosin and also reacts with it in a slower permanent oxidation. In the absence of oxygen, phenol reduces triplet eosin to a semiquinone, producing the neutral phenoxy radical. The radical products disappear primarily by fast back-reactions, with competing permanent decomposition from dismutation of semi-reduced eosin and bimolecular reaction of phenoxy radical.The basic form of semi-reduced eosin undergoes debromination. The dissociation constant of semi-reduced eosin was determined from the dependence of the rate of radical back-reaction on acidity. Numerical rate constants for the elementary reactions were calculated and the absorption spectra and extinction coefficients of the unstable species were measured.
I . In troductionThe identification of the sh ort-lived interm ediate
species produced b y the photosensitized oxidation of aqueous phenol in the presence of fluorescein o r its halogenated derivatives was reported in earlier publications.2 Flash spectra obtained b y the irra d ia tio n of phenol and dye solutions w ith v is ib le lig h t, absorbed o n ly b y the dye, showed th a t the p rim a ry act is the oxidation of phenol b y trip le t dye, to give phenoxy radical and sem i-reduced dye. Flash bleaching showed th a t the dye trip le t molecules decay in a fast bim olecular quenching reaction and th a t the radical products disappear in fast bim olecular processes. T h is paper in cludes additional flash photolysis and continuous-irradiation experim ents, w hich fu rth e r establish the reaction mechanism, and reports num erical values fo r the rate constants of the elem entary processes.
I I . Experim ental D eta ilsA. Chemicals.— Commercial eosin Y (National Aniline, C .I.
no. 768) was purified cbromatographically following the method of Koch.3 The impure dye was dissolved in 0.03% ammonium hydroxide and adsorbed on a column consisting of activated alumina (1 part by wt.) and talc (3 parts by wt.). Elution with water separated four distinct bands. The eosin phase was recovered by breaking the column and dissolving the dye in ammonium hydroxide. Acidic eosin was precipitated with glacial acetic acid, filtered, washed, and dried. The maximum extinction coefficient obtained in lightly buffered aqueous solution at pH 9 is 9.15 ± 0.15 X 10⁴ A f-1 cm .-1 at 516 m i. Previous values of 8.0 X 10⁴ and 8.2 X 10⁴ were reported by Im- amura4 and Adelman and Oster,5 respectively, where chromatog
(1) Supported by the U. S. Atomic Energy Commission.(2) (a) L. I. Grossweiner and E. F. Zwicker, J. Chem. Phys., 31, 1141
(1959); (b) 34, 1411 (1961).(3) L. Koch, J. Assoc. Oflic. Agr. Chemists, 39, 397 (1956).(4) M. Imamura, J. Inst. Polytech. Osaka City Univ., 5, 85 (1956).(5) A. H. Adelman and G. Oster, J. Am. Chem. Soc., 78, 3977 (1956).
raphy had not been employed. A comparable 10% increase in the extinction coefficient of fluorescein was obtained by Lind- qvist6 by means of chromatographic purification. The other dye phases on the column were identified from their absorption spectra as tribromofluorescein (0.45% ), dibromofluorescein (0.06% ), and fluorescein (0.02%)— all w t.% organic matter.
The determination of the dissociation constant of aqueous eosin by spectrometric titration of dilute solutions (10 ¡¡.M) was inconclusive. The absorption spectrum is unchanged from pH 12 to pH 4.4. Between pH 4.4 and 3.7 there is a gradual shift of the peak wave length from 516 to 520 m » and a corresponding 30% decrease in extinction. Near pH 3 a colloidal suspension could be detected, and finally, a colored gelatinous precipitate was formed at lower pH. Since the basic dye solution is di-anionic, the wave length shift observed is opposite to the expected direction for the production of the mono-anion. Additional information was obtained by potentiometric titration of more concentrated (2 m l ) eosin solutions. A single broad plateau occurred at pH 4.3 and a colored colloidal suspension was produced below pH 4. The observations can be explained by the influence of bromine substitution on the dissociation of aqueous fluorescein. Noting that Lindqvist6 obtained pK 4.4 and 6.7 for neutral fluorescein and the mono-anion, respectively, the plateau obtained with eosin probably represents a composite of the two dissociations. The colored precipitate indicates that the eosin mono-anion is insoluble in water and that the hydroxyl group is partially ionized in the solid. This form may resemble the o-quinonoid zwitterion of fluorescein proposed by Nash.7 Recently Oster, Oster, and Karg8 have reported a value of 3.6 for the eosin pK, as obtained from the optical method. The present authors found the results of the optical method to be ambiguous at the low dye concentrations which had to be employed, because of the difficulty in distinguishing spectral changes due to dissociation from those due to the formation of a colloid. Therefore, we favor the potentiometric results at higher eosin concentrations which gave a pK of 4.3 for the monoanion. All photochemical measurements reported below were made with the di-anionic dye.
(6) L. Lindqvist, Arkiv Kemi., 16, 79 (1960).(7) T. Nash, J. Phys. Chem., 62, 1574 (1958).(8) G. Oster, G. K. Oster, and G. Karg, ibid., 66, 2514 (1962).
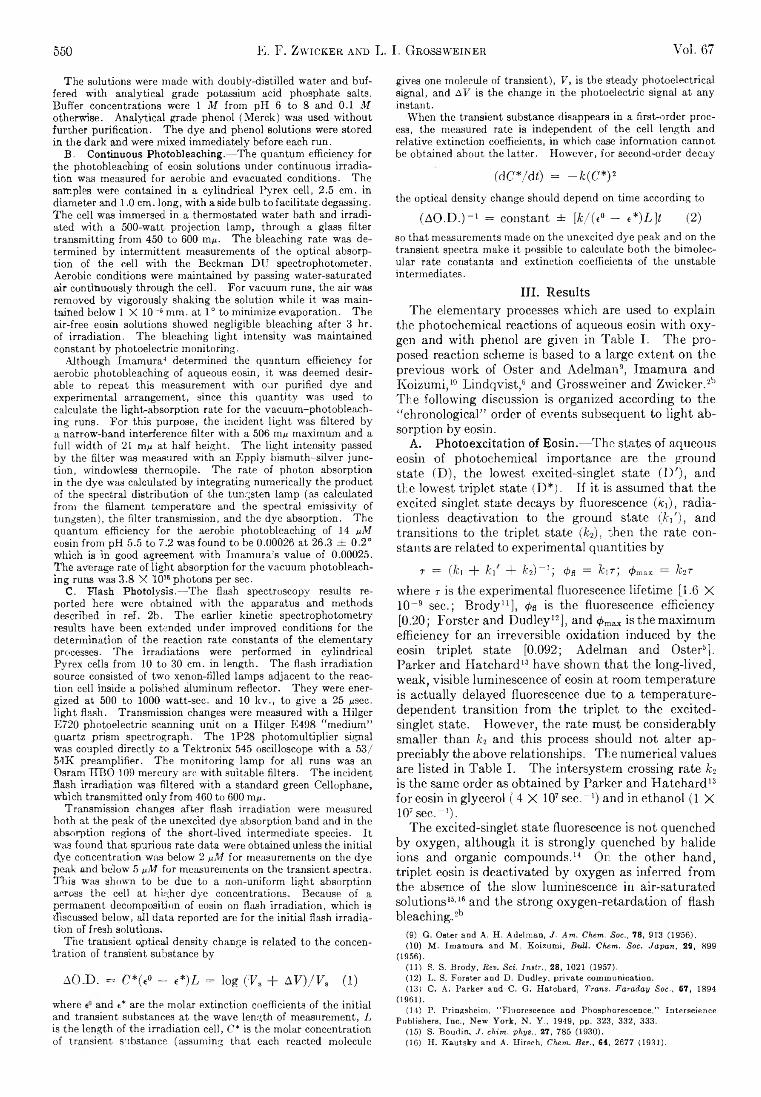
550 E. F. Zwicker and L. I. Grossweiner Vol. 67
The solutions were made with doubty-distilled water and buffered with analytical grade potassium acid phosphate salts. Buffer concentrations were 1 M from pH 6 to 8 and. 0.1 M otherwise. Analytical grade phenol (Merck) was used without further purification. The dye and phenol solutions were stored in the dark and were mixed immediately before each run.
B. Continuous Photobleaching.—The quantum efficiency for the photobleaching of eosin solutions under continuous irradiation was measured for aerobic and evacuated conditions. The samples were contained in a cylindrical Pyrex cell, 2.5 cm. in diameter and 1 .0 cm. long, with a side bulb to facilitate degassing. The cell was immersed in a thermostated water bath and irradiated with a 500-watt projection lamp, through a glass filter transmitting from 450 to 600 mfi. The bleaching rate was determined by intermittent measurements of the optical absorption of the cell with the Beckman DU spectrophotometer. Aerobic conditions were maintained by passing water-saturated air continuously through the cell. For vacuum runs, the air was removed by vigorously shaking the solution while it was maintained below 1 X 10~5 mm. at 1° to minimize evaporation. The air-free eosin solutions showed negligible bleaching after 3 hr. of irradiation. The bleaching light intensity was maintained constant by photoelectric monitoring.
Although Imamura4 determined the quantum efficiency for aerobic photobleaching of aqueous eosin, it was deemed desirable to repeat this measurement with our purified dye and experimental arrangement, since this quantity was used to calculate the light-absorption rate for the vacuum-photobleach- ing runs. For this purpose, the incident light was filtered by a narrow'-band interference filter with a 506 m/i maximum and a full width of 21 npi at half height. The light intensity passed by the filter was measured with an Epply bismuth-silver junction, windowless thermopile. The rate of photon absorption in the dye was calculated by integrating numerically the product of the spectral distribution of the tungsten lamp (as calculated from the filament temperature and the spectral emissivity of tungsten), the filter transmission, and the dye absorption. The quantum efficiency for the aerobic photobleaching of 14 pM eosin from pH 5.5 to 7.2 was found to be 0.00026 at 26.3 ± 0.2° which is in good agreement with Imamura’s value of 0.00025. The average rate of light absorption for the vacuum photobleaching runs was 3.8 X 10w photons per sec.
C. Flash Photolysis.—The flash spectroscopy results reported here were obtained with the apparatus and methods described in ref. 2b. The earlier kinetic spectrophotometry Tesults have been extended under improved conditions for the determination of the reaction rate constants of the elementary processes. The irradiations were performed in cylindrical Pyrex cells from 10 to 30 cm. in length. The flash irradiation source consisted of two xenon-filled lamps adjacent to the reaction cell inside a polished aluminum reflector. They were energized at 500 to 1000 watt-sec. and 10 lev., to give a 25 nsec. light flash. Transmission changes were measured with a Hilger E720 photoelectric scanning unit on a Hilger E498 “ medium” quartz prism spectrograph. The 1P28 photomultiplier signal was coupled directly to a Tektronix 545 oscilloscope with a 53/ 54K preamplifier. The monitoring lamp for all runs was an OsramPTBO 109 mercury arc with suitable filters. The incident flash irradiation was filtered with a standard green Cellophane, which transmitted only from 460 to 600 m^.
Transmission changes after flash irradiation were measured both at the peak of the unexcited dye absorption band and in the absorption regions of the short-lived intermediate species. It was found that spurious rate data were obtained unless the initial dye concentration was below 2 fiM for measurements on the dye peak and below 5 ¡iM for measurements on the transient spectra. This was shown to be due to a non-uniform light absorption across the cell at higher dye concentrations- Because of a permanent decomposition of eosin on flash irradiation, which is discussed below, all data reported are for the initial flash irradiation of fresh solutions.
The transient optical density change is related to the concentration of transient substance by
A O -D . = C*(<0 - e*)L = log CP. + A F )/ F S (1)
where and e* are the molar extinction coefficients of the initial and transient substances at the wave length of measurement, L is the length of the irradiation cell, C* is the molar concentration of transient substance (assuming that each reacted molecule
gives one molecule of transient), F s is the steady photoelectrical signal, and A F is the change in the photoelectric signal at any instant.
When the transient substance disappears in a first-order process, the measured rate is independent of the cell length and relative extinction coefficients, in which case information cannot be obtained about the latter. However, for second-order decay
(dC*/dt) = — fc(C* ) 2
the optical density change should depend on time according to
(A O .D . ) “ 1 = constant ± [k/(t° — e*)L]t (2 )so that measurements made on the unexcited dye peak and on the transient spectra make it possible to calculate both the bimolec- ular rate constants and extinction coefficients of the unstable intermediates.
III. ResultsThe elem entary processes w hich are used to explain
the photochem ical reactions of aqueous eosin w ith o xy gen and w ith phenol are given in Table I . Th e proposed reaction scheme is based to a large extent on the previous w ork of Oster and Adelm an9, Im am ura and K o izu m i, 10 L in d q v is t , 8 and Grossweiner and Z w icker.2b The fo llow ing discussion is organized according to the “ chronological” order of events subsequent to lig h t absorption b y eosin.
A. Photoexcitation of Eosin.— Th e states of aqueous eosin o f photochem ical im portance are the ground state (D ), the lowest excited-singlet state (1 )'), and the lowest trip le t state (D * ). I f it is assumed th a t the excited singlet state decays b y fluorescence (ici), radiationless deactivation to the ground state (k, ') , and transitions to the trip le t state (fc2) , then the rate constants are related to experim ental quantities b y
r = (ki -f- k\ + &2) “ 1; 0 A = k\T; 0 max = k^jwhere r is the experim ental fluorescence lifetim e [1. 6 X 10“ 9 sec.; B ro d y11], bfl is the fluorescence efficiency [0.20; Forster and D u d le y12], and <£max is the m axim um efficiency fo r an irreversible oxidation induced b y the eosin trip le t state [0.092; Adelm an and O ster6]. Parker and H atchard 13 have shown th a t the long-lived , weak, visib le luminescence of eosin at room tem perature is actu a lly delayed fluorescence due to a tem perature- dependent transition from the trip le t to the excited- singlet state. How ever, the rate m ust be considerably sm aller than k2 and th is process should not a lte r appreciably the above relationships. The num erical values are listed in Table I . The intersystem crossing rate fc2
is the same order as obtained b y Parker and H a tch a rd 13
fo r eosin in g lycero l (4 X 10⁷ sec.-1 ) and in ethanol (1 X 1 0 7 sec.-1 ).
The excited-singlet state fluorescence is not quenched b y oxygen, although it is strong ly quenched b y halide ions and organic compounds. 14 O n the other hand, trip le t eosin is deactivated b y oxygen as inferred from the absence of the slow luminescence in air-saturated solutions15- 16 and the strong oxygen-retardation of flash bleaching.2b
(9) G. Oster and A. H. Adelman, J . Am . Chem. Soc., 78, 913 (1956).(10) M. Imamura and M. Koizumi, B u ll. 'Chem. Soc. Ja p a n , 29, 899
(1956).(11) S. S. Brody, Rev. S c i. In str., 28, 1021 (1957).(12) L. S. Forster and D. Dudley, private communication.(13) C. A. Parker and C. G. Hatohard, Trans. F a ra d a y Soc-, 57, 1894
(1961).(14) P. Pringsheim, “ Fluorescence and Phosphorescence,” Interscience
Publishers, Inc., New York, N. Y., 1949, pp. 323, 332, 333.(15) S. Boudin, J . chim. phys., 27, 785 (1930).(16) H. Kautsky and A. Hirsch, Chem. Ber., 64, 2677 (1931).
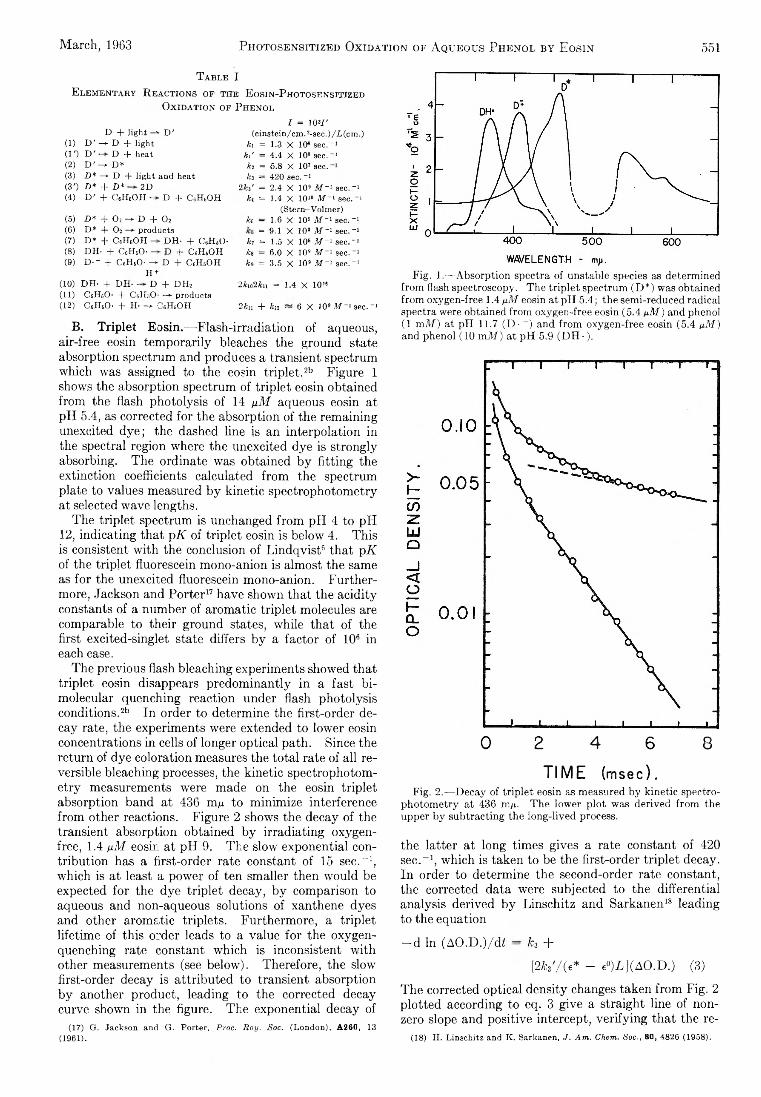
M a r c h , 196 3 Photosensitized Oxidation of A queous Phenol by Eosin 551
T a b l e IE le m e n t a r y R ea c t io n s o p th e E osin -P h oto sen sitized
O x id a t io n o p P h e n o l
I = 10V'(einstein/cm.2-sec.)/I/(cin.)
fa = 1.3 X 10s sec.-i fa' = 4.4 X 10⁸sec.-1 hz = 5.8 X 10⁷ sec. fa - 420 sec. -I
2fa' = 2.4 X 10" .M-i sec.-i kt = 1.4 X 101» Af-i Sec.-i
(Stern-Volmer) fa — 1.6 X 10» M-1 sec. - i
= 9.1 X 10» M-1 sec."1 fa = 1,5 X 10⁵ Hi-1 sec.-1 fa — 6.0 X 10⁹ M~l sec.-1 fa = 3.5 X 10» M ~i sec.- i
D + light - p '(1) D ' —* D -f- light (10 D ' — D + heat(2) D ' —> D*(3) D* —> D + light and heat (30 D* + D* 2D(4) D' + CeH6OH — D H- CsHsOH
(5)(6)(7)(8)(9)
D* -j- O2 — D + O2 D* + O2 —. products D* + CeHeOH DH- + C«HeO-DH- + CeHsO- + C.HsOHD -- + C«H60- — D + CsHsOH
H +(10) DH- + DH- — D 4- D a 2feo2fai = 1.4 X 101®(11) CeHsO- + CVÍÍ.-.O —. products(12) CeHeO- + H- —> CsHeOH 2kn + kn ~ 6 X 10» M -1 sec.-1
B. Triplet Eosin.— Flash -irrad ia tion of aqueous, air-free eosin tem porarily bleaches the ground state absorption spectrum and produces a transient spectrum which was assigned to the eosin trip le t . 213 F igu re 1 shows the absorption spectrum of trip le t eosin obtained from the flash photolysis of 14 ¡xM aqueous eosin at p H 5.4, as corrected fo r the absorption of the rem aining unexcited d ye ; the dashed line is an in terpola tion in the spectral region where the unexcited dye is strong ly absorbing. Th e ordinate was obtained b y fittin g the extinction coefficients calculated from the spectrum plate to values measured b y k inetic spectrophotom etry at selected wave lengths.
The trip le t spectrum is unchanged from p H 4 to p H 12, ind icating th at pK of trip le t eosin is below 4. Th is is consistent w ith the conclusion of L in d q vis t6 th at pK of the trip le t fluorescein m ono-anion is almost the same as fo r the unexcited fluorescein m ono-anion. F u rth ermore, Jackson and P o rte r17 have shown th at the a c id ity constants of a num ber of arom atic trip le t molecules are comparable to th e ir ground states, w hile th a t of the first excited-singlet state differs b y a factor of 1 0 6 in each case.
The previous flash bleaching experim ents showed th at trip le t eosin disappears predom inantly in a fast b i- m olecular quenching reaction under flash photolysis conditions . 211 In order to determ ine the first-o rder decay rate, the experim ents were extended to low er eosin concentrations in cells of longer optical path. Since the return of dye coloration measures the to ta l rate of a ll reversible bleaching processes, the k inetic spectrophotom e try measurements were made on the eosin trip le t absorption band at 436 m ^ to m inim ize interference from other reactions. F igure 2 shows the decay of the transient absorption obtained b y irra d ia tin g oxygen- free, 1.4 tiM eosin at p H 9. Th e slow exponential contrib u tion has a first-o rd e r rate constant of 15 sec.“ 1, w hich is at least a power of ten sm aller then w ould be expected fo r the dye trip le t decay, b y com parison to aqueous and non-aqueous solutions of xanthene dyes and other arom atic trip le ts. Furtherm ore, a trip le t lifetim e of th is order leads to a value fo r the oxygen- quenching rate constant w hich is inconsistent w ith other measurements (see below ). Therefore, the slow first-order decay is a ttribu ted to transient absorption b y another product, leading to the corrected decay curve shown in the figure. Th e exponential decay of
(17) G. Jackson and G. Porter, Proc. Roy. Soc. (London), A260, 13 (1961).
Fig. 1.— Absorption spectra of unstable species as determined from flash spectroscopy. The triplet spectrum (D *) was obtained from oxygen-free 1.4 ¡xM eosin at pH 5.4; the semi-reduced radical spectra were obtained from oxygen-free eosin (5.4 /iM ) and phenol (1 mM) at pH 11.7 (D- “ ) and from oxygen-free eosin (5.4 pM) and phenol (10 mM) at pH 5.9 (D H •).
0 2 4 6 8
T I M E ( m s e c ) .Fig. 2.— Decay of triplet eosin as measured by kinetic spectro
photometry at 436 m*i- The lower plot was derived from the upper by subtracting the long-lived process.
the la tte r at long tim es gives a rate constant of 420 sec.-1 , w hich is taken to be the first-o rder trip le t decay. In order to determ ine the second-order rate constant, the corrected data were subjected to the d ifferentia l analysis derived b y L in sch itz and Sarkanen 18 leading to the equation
— d In (AO .D .)/d< — h +
[2 V /(e* - e «)A ](A O .D .) (3)
The corrected optica l density changes taken from F ig . 2
plotted according to eq. 3 give a stra ight line of nonzero slope and positive intercept, ve rify in g th a t the re -
(18) H. Linschitz and K. Sarkanen, J. Am. Chem. Soc., 80, 4826 (1958).
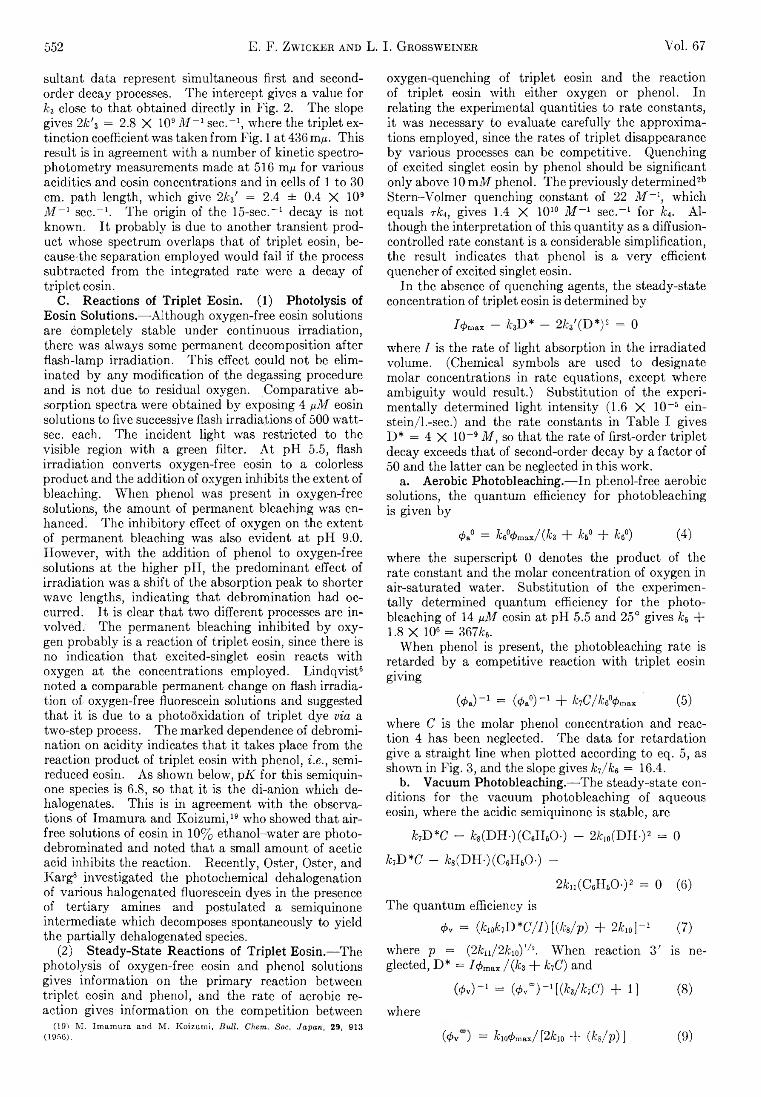
552 E. F. Z wicker and L. I. Grossweiner Yol. 67
sultant data represent simultaneous first and second- order decay processes. The intercept gives a value for h close to that obtained directly in Fig. 2. The slope gives 2k'z = 2.8 X 10⁹ 2I7-1 sec.-1, where the triplet extinction coefficient was taken from Fig. 1 at 436 m/i. This result is in agreement with a number of kinetic spectrophotometry measurements made at 516 m/i for various acidities and eosin concentrations and in cells of 1 to 30 cm. path length, which give 2fc3' = 2.4 ± 0.4 X 10⁹ M -1 sec.-1. The origin of the 15-sec.-1 decay is not known. It probably is due to another transient product whose spectrum overlaps that of triplet eosin, be- cause-the separation employed would fail if the process subtracted from the integrated rate were a decay of triplet eosin.
C. Reactions of Triplet Eosin. (1) Photolysis of Eosin Solutions.— -Although oxygen-free eosin solutions are completely stable under continuous irradiation, there was always some permanent decomposition after flash-lamp irradiation. This effect could not be eliminated by any modification of the degassing procedure and is not due to residual oxygen. Comparative absorption spectra were obtained by exposing 4 ¡iM eosin solutions to five successive flash irradiations of 500 watt- sec. each. The incident light was restricted to the visible region with a green filter. At pH 5.5, flash irradiation converts oxygen-free eosin to a colorless product and the addition of oxygen inhibits the extent of bleaching. When phenol was present in oxygen-free solutions, the amount of permanent bleaching was enhanced. The inhibitory effect of oxygen on the extent of permanent bleaching was also evident at pH 9.0. However, with the addition of phenol to oxygen-free solutions at the higher pH, the predominant effect of irradiation was a shift of the absorption peak to shorter wave lengths, indicating that debromination had occurred. It is clear that two different processes are involved; The permanent bleaching inhibited by oxygen probably is a reaction of triplet eosin, since there is no indication that excited-singlet eosin reacts with oxygen at the concentrations employed. Lindqvist6 noted a comparable permanent change on flash irradiation of oxygen-free fluorescein solutions and suggested that it is due to a photooxidation of triplet dye via a two-step process. The marked dependence of debromination on acidity indicates that it takes place from the reaction product of triplet eosin with phenol, i.e., semi- reduced eosin. As shown below, pK for this semiquin- one species is 6.8, so that it is the di-anion which de- halogenates. This is in agreement with the observations of Imamura and Koizumi,19 who showed that air- free solutions of eosin in 10% ethanol-water are photo- debrominated and noted that a small amount of acetic acid inhibits the reaction. Recently, Oster, Oster, and Karg8 investigated the photochemical dehalogenation of various halogenated fluorescein dyes in the presence of tertiary amines and postulated a semiquinone intermediate which decomposes spontaneously to yield the partially dehalogenated species.
(2) Steady-State Reactions of Triplet Eosin.— The photolysis of oxygen-free eosin and phenol solutions gives information on the primary reaction between triplet eosin and phenol, and the rate of aerobic reaction gives information on the competition between
(19) M. Imamura and M. Koizumi, Bull. Chem. Soc. Japan, 29, 913 (1956).
oxygen-quenching of triplet eosin and the reaction of triplet eosin with either oxygen or phenol. In relating the experimental quantities to rate constants, it was necessary to evaluate carefully the approximations employed, since the rates of triplet disappearance by various processes can be competitive. Quenching of excited singlet eosin by phenol should be significant only above 10 mM phenol. The previously determined211 Stern-Volmer quenching constant of 22 J i -1, which equals rk4, gives 1.4 X 10¹⁰ M _1 sec.-1 for k4. Although the interpretation of this quantity as a diffusion- controlled rate constant is a considerable simplification, the result indicates that phenol is a very efficient quencher of excited singlet eosin.
In the absence of quenching agents, the steady-state concentration of triplet eosin is determined by
7^,,ax - fc3D* - 2fc/(D*Y = 0
where 7 is the rate of light absorption in the irradiated volume. (Chemical symbols are used to designate molar concentrations in rate equations, except where ambiguity would result.) Substitution of the experimentally determined light intensity (1.6 X 10⁻⁶ ein- stein/l.-sec.) and the rate constants in Table I gives D* = 4 X 10⁻⁹ M, so that the rate of first-order triplet decay exceeds that of second-order decay by a factor of 50 and the latter can be neglected in this work.
a. Aerobic Photobleaching.— In phenol-free aerobic solutions, the quantum efficiency for photobleaching is given by
0a° = fcfiVmax/ (&3 + 5° + ks°) (4)
where the superscript 0 denotes the product of the rate constant and the molar concentration of oxygen in air-saturated water. Substitution of the experimentally determined quantum efficiency for the photobleaching of 14 \xM eosin at pH 5.5 and 25° gives h +1.8 X 106 = 367fc6.
When phenol is present, the photobleaching rate is retarded by a competitive reaction with triplet eosin giving
(0a)-1 = (0a0) " 1 + h C / m ma* (5)
where C is the molar phenol concentration and reaction 4 has been neglected. The data for retardation give a straight line when plotted according to eq. 5, as shown in Fig. 3, and the slope gives k7/k& = 16.4.
b. Vacuum Photobleaching.—-The steady-state conditions for the vacuum photobleaching of aqueous eosin, where the acidic semiquinone is stable, are
k7D*C - fc8(D H -)(C 6H 60 -) - 2/cio(DH - ) 2 = 0
k7D*C - /cs(D H -)(C 6H 60 -) -
2fcn(C6H60-)2 = 0 (6)
The quantum efficiency is
0v = (k10k7I)*C /I)m /p) + 2 M -1 (7)
where p = (2kn/2kwy /\ When reaction 3' is neglected, D* = 70max / (h + k7C) and
(0 V) - 1 = (0 V" ) - W / C 7 C ) + 1 ] (8 )
where
(0v ) = 7io0max/ [2/Cio -f- (k$/p) ] (9)
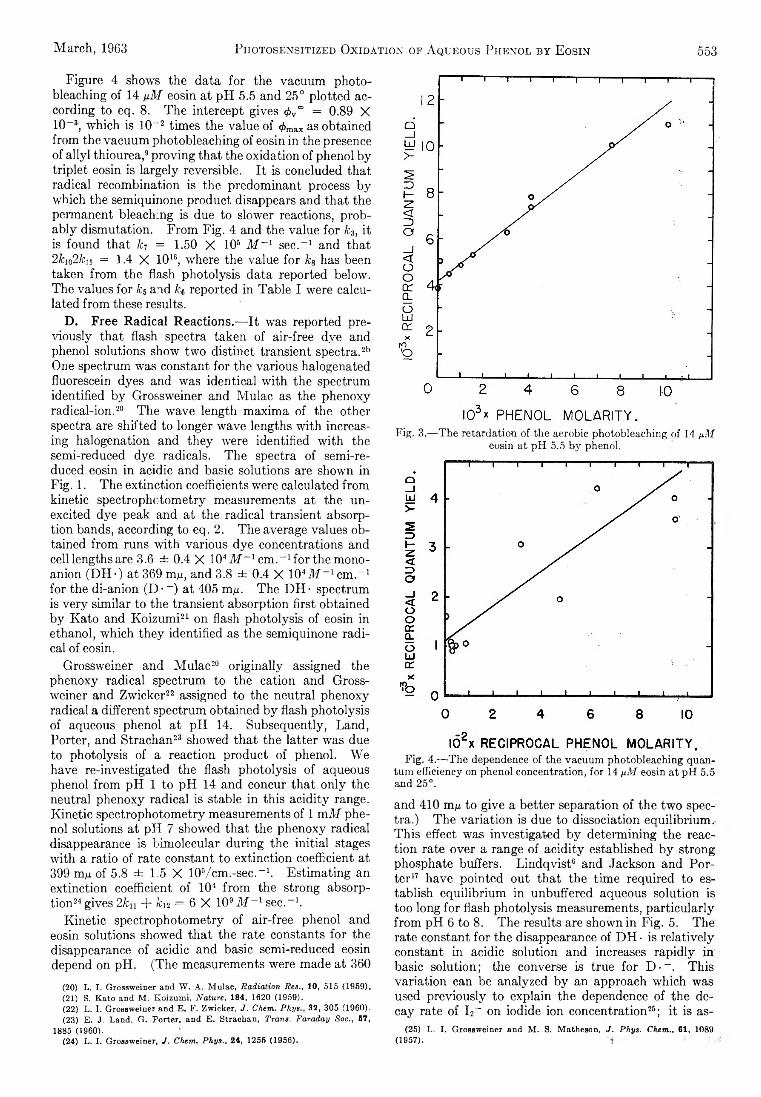
M a r c h , 196 3 Photosensitized Oxidation of A queous Phenol by Eosin 5 5 3
Figure 4 shows the data for the vacuum photo- bleaching of 14 ¡iM eosin at pH 5.5 and 25° plotted according to eq. 8. The intercept gives <£v" = 0.89 X 10⁻³, which is 10~2 times the value of 0max as obtained from the vacuum photobleaching of eosin in the presence of allyl thiourea,9 proving that the oxidation of phenol by triplet eosin is largely reversible. It is concluded that radical recombination is the predominant process by which the semiquinone product disappears and that the permanent bleaching is due to slower reactions, probably dismutation. From Fig. 4 and the value for fc3, it is found that k7 = 1.50 X 10s M ~ l sec.-1 and that 2fc102fc]] = 1.4 X 10¹⁶, where the value for kg has been taken from the flash photolysis data reported below. The values for kg and fc6 reported in Table I were calculated from these results.
D. Free Radical Reactions.— It was reported previously that flash spectra taken of air-free dye and phenol solutions show two distinct transient spectra.2b One spectrum was constant for the various halogenated fluorescein dyes and was identical with the spectrum identified by Grossweiner and Mulac as the phenoxy radical-ion.20 The wave length maxima of the other spectra are shifted to longer wave lengths with increasing halogenation and they were identified with the semi-reduced dye radicals. The spectra of semi-reduced eosin in acidic and basic solutions are shown in Fig. 1. The extinction coefficients were calculated from kinetic spectrophotometry measurements at the unexcited dye peak and at the radical transient absorption bands, according to eq. 2. The average values obtained from runs with various dye concentrations and cell lengths are 3.6 ± 0.4 X 10⁴ M ~ l em u1 for the monoanion (DH-) at 369 m/x, and 3.8 ± 0.4 X 10⁴M - 1 cm.-1 for the di-anion (D • ~) at 405 m/x. The DH • spectrum is very similar to the transient absorption first obtained by Kato and Koizumi21 on flash photolysis of eosin in ethanol, which they identified as the semiquinone radical of eosin.
Grossweiner and Mulac20 originally assigned the phenoxy radical spectrum to the cation and Grossweiner and Zwicker22 assigned to the neutral phenoxy radical a different spectrum obtained by flash photolysis of aqueous phenol at pH 14. Subsequently, Land, Porter, and Strachan23 showed that the latter was due to photolysis of a reaction product of phenol. We have re-investigated the flash photolysis of aqueous phenol from pH 1 to pH 14 and concur that only the neutral phenoxy radical is stable in this acidity range. Kinetic spectrophotometry measurements of 1 vaM phenol solutions at pH 7 showed that the phenoxy radical disappearance is bimolecular during the initial stages with a ratio of rate constant to extinction coefficient at 399 mfi of 5.8 ± 1.5 X 10⁶/cm.-sec.-1. Estimating an extinction coefficient of 104 from the strong absorption24 gives 2kn + ¿ 1 2 = 6 X 10⁹M _1 sec.-1.
Kinetic spectrophotometry of air-free phenol and eosin solutions showed that the rate constants for the disappearance of acidic and basic semi-reduced eosin depend on pH. (The measurements were made at 360
(20) L. I. Grossweiner and W. A. Mulac, Radiation Res., 10, 515 (1959).(21) S. Kato and M. Eoizumi, Nature, 184, 1620 (1959).(22) L. I. Grossweiner and E. F. Zwicker, J. Chem. P h y s 32, 305 (1960).(23) E. J. Land, G. Porter, and E. Strachan, Trans. Faraday Soc., 57,
1885 (1960).(24) L. I. Grossweiner, J. Chem. Phys., 24, 1255 (1956).
Fig. 3.— The retardation of the aerobic photobleaching of 14 yM eosin at pH 5.5 by phenol.
Fig. 4.— The dependence of the vacuum photobleaching quantum efficiency on phenol concentration, for 14 y.M eosin at pH 5.5 and 25°.
and 410 m/t to give a better separation of the tw o spectra .) Th e va ria tion is due to dissociation equ ilibrium . T h is effect was investigated b y determ ining the reactio n rate over a range of a c id ity established b y strong phosphate buffers. L in d q v is t6 and Jackson and P o rte r 17 have pointed out th a t the tim e required to establish equ ilibrium in unbuffered aqueous solution is too long fo r flash photolysis measurements, p a rticu la rly from p H 6 to 8 . Th e results are shown in F ig . 5. The rate constant fo r the disappearance of D H • is re la tive ly constant in acidic solution and increases ra p id ly in basic so lu tion ; the converse is true fo r D -~ . Th is va ria tion can be analyzed b y an approach w hich was used p reviously to explain the dependence of the decay rate of I 2~ on iodide ion concentration26; it is as-
(25) L. I. Grossweiner and M. S. Matheson, J. Phys. Chem., 61, 1089(1957). '
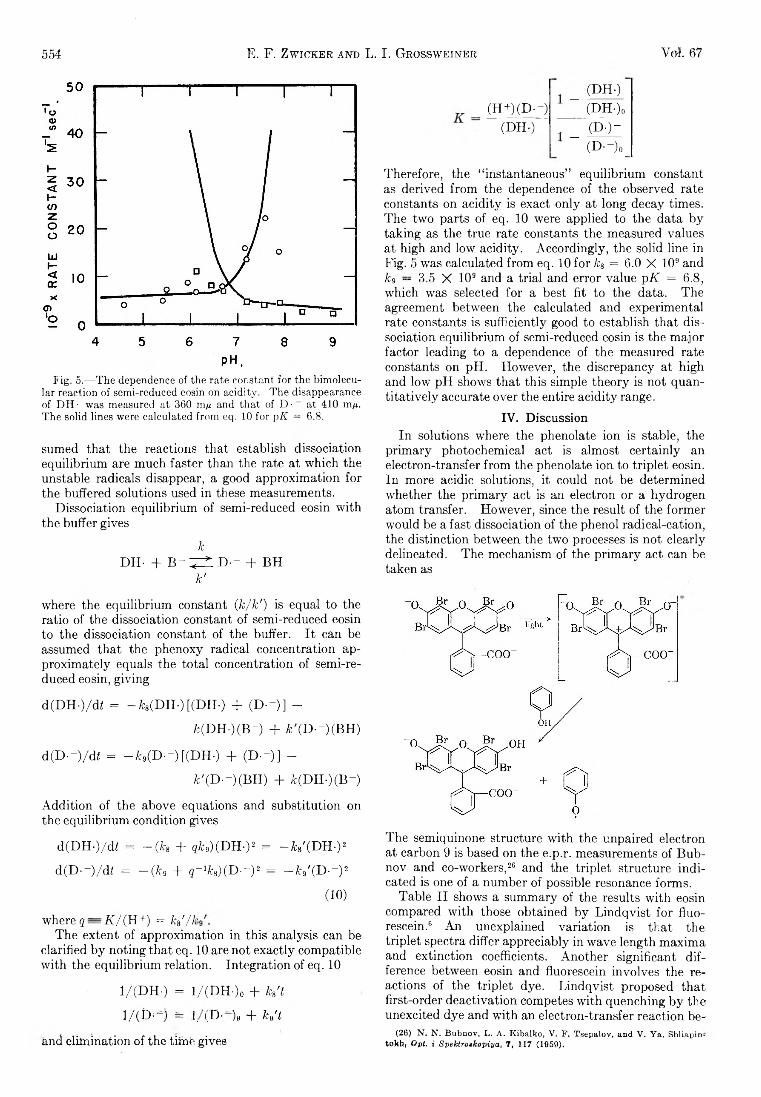
554 E. F. Zwicker and L. I. Grossweinek Voi. 67
Fig. 5.— The dependence of the rate constant for the bimoleeu- lar reaction of semi-reduced eosin on acidity. The disappearance of DH • was measured at 360 m^ and that of D ■ “ at 410 m/i. The solid lines were calculated from eq. 10 for pK — 6 .8 .
sumed that the reactions that establish dissociation equilibrium are much faster than the rate at which the unstable radicals disappear, a good approximation for the buffered solutions used in these measurements.
Dissociation equilibrium of semi-reduced eosin with the buffer gives
kDH- + B - ^ = t D-~ + BH
¥
where the equilibrium constant (k / ¥ ) is equal to the ratio of the dissociation constant of semi-reduced eosin to the dissociation constant of the buffer. It can be assumed that the phenoxy radical concentration approximately equals the total concentration of semi-re- duced eosin, giving
d(DH-)/di = —fcs(DH-) [(DH-) + (D-~)] -
fc(DH-)(B-) + Ad(D--)(BH)
d(D--)/di = -fc,(D--)[(DH.) + (D--)] -
fc'(D--)(BH) + Jfe(DH-)(B-)
Addition of the above equations and substitution on the equilibrium condition gives
d(DH-)/di = ~ (k s + # 9)(DH-)2 = -fe '(D H -)2
d(D--)/df = ~ ( k t + q-'ks)(D --)2 = -W (D -~ y
( 1 0 )
where q = K / ( R +) = k&'/k The extent of approximation in this analysis can be
clarified by noting that eq. 10 are not exactly compatible with the equilibrium relation. Integration of eq. 10
1/(DH-) = 1/(DH-)o + Wt
1/ i iV ) = l. i.D- )„ + h 't
and elimination of the tiihte gives
_ (D H -)_ (H+)(D-~) (DH-)q
(DH-) _ (D-)~(D--)0_
Therefore, the “ instantaneous” equilibrium constant as derived from the dependence of the observed rate constants on acidity is exact only at long decay times. The two parts of eq. 10 were applied to the data by taking as the true rate constants the measured values at high and low acidity. Accordingly, the solid line in Fig. 5 was calculated from eq. 10 for ka = 6.0 X 10⁹ and kg — 3.5 X 10s and a trial and error value pK = 6.8, which was selected for a best fit to the data. The agreement between the calculated and experimental rate constants is sufficiently good to establish that dissociation equilibrium of semi-reduced eosin is the major factor leading to a dependence of the measured rate constants on pH. However, the discrepancy at high and low pH shows that this simple theory is not quantitatively accurate over the entire acidity range.
IV. DiscussionIn solutions where the phenolate ion is stable, the
primary photochemical act is almost certainly an electron-transfer from the phenolate ion to triplet eosin. In more acidic solutions, it could not be determined whether the primary act is an electron or a hydrogen atom transfer. However, since the result of the former would be a fast dissociation of the phenol radical-cation, the distinction between the two processes is not clearly delineated. The mechanism of the primary act can be taken as
The semiquinone structure with the unpaired electron at carbon 9 is based on the e.p.r. measurements of Bubnov and co-workers,26 and the triplet structure indicated is one of a number of possible resonance forms.
Table II shows a summary of the results with eosin compared with those obtained by Lindqvist for fluorescein.6 An unexplained variation is that the triplet spectra differ appreciably in wave length maxima and extinction coefficients. Another significant difference between eosin and fluorescein involves the reactions of the triplet dye. Lindqvist proposed that first-order deactivation competes with quenching by the unexcited dye and with an electron-transfer reaction be-
(26) N. N. Bubnov, L. A. Kibalko, V. F. Tsepalov, and V. Ya. Shliapin- tokfc, Opt. i Spektroakopiya, 1, 117 (1959).
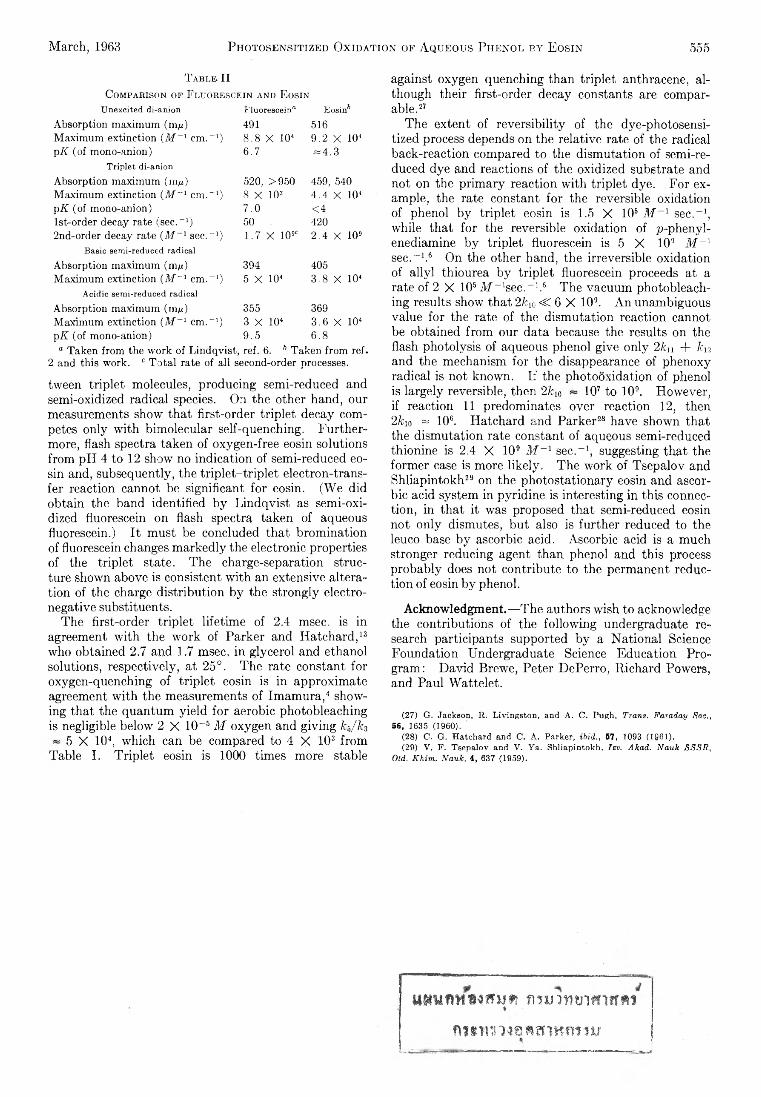
March, 1963 Photosensitized Oxidation of A queous Phenol by Eosin 555
T a b l e I IC om pa riso n o f F l u o r e sc e in an d E osin
Unexcited di-anion Fluorescein0 Eosin6Absorption maximum (m,u) 491 516Maximum extinction (M"- 1 cm .-1) 8 .8 X 104 9.2 X 10⁴pK (of mono-anion) 6.7 « 4 .3
Triplet di-anionAbsorption maximum (m,u) 520, >950 459, 540Maximum extinction (M - 1 cm.-1) 8 X 10³ 4.4 X 10⁴pK (of mono-anion) 7.0 <4lst^order decay rate (sec.-1) 50 4202nd-order decay rate (M - 1 sec.-1) 1.7 X 10⁹C 2.4 X 10⁹
Basic semi-reduced radicalAbsorption maximum (nut) 394 405Maximum extinction (M ~ 1 cm .-1) 5 X 10⁴ 3.8 X 10⁴
Acidic semi-reduced radicalAbsorption maximum (m/i) 355 369Maximum extinction (M - 1 cm.-1) 3 X 10⁴ 3.6 X 10⁴pK (of mono-anion) 9.5 6 .8
° Taken from the work of Lindqvist, ref. 6 . 6 Taken from ref.2 and this work. c Total rate of all second-order processes.
tween trip le t molecules, producing semi-reduced and sem i-oxidized radical species. On the other hand, our measurements show th a t first-o rder trip le t decay competes on ly w ith bim olecular self-quenching. F u rth ermore, flash spectra taken of oxygen-free eosin solutions from p H 4 to 12 show no ind ication of semi-reduced eosin and, subsequently, the tr ip le t-trip le t electron-transfer reaction cannot be significant fo r eosin. (W e did obtain the band identified b y L in d q vis t as sem i-oxidized fluorescein on flash spectra taken of aqueous fluorescein.) I t m ust be concluded th at brom ination of fluorescein changes m arkedly the electronic properties of the trip le t state. Th e charge-separation structure shown above is consistent w ith an extensive alteration of the charge d istribu tion b y the strong ly electronegative substituents.
The first-o rder trip le t lifetim e of 2.4 msec, is in agreement w ith the w ork of Parker and H atchard , 13
who obtained 2.7 and 1.7 msec, in glycero l and ethanol solutions, respectively, a t 25°. Th e rate constant fo r oxygen-quenching of trip le t eosin is in approxim ate agreement w ith the measurements of Im am ura , 4 showing th at the quantum yie ld fo r aerobic photobleaching is negligible below 2 X 10- 6 M oxygen and g iv in g fc6/fc3
~ 5 X 10⁴, w hich can be compared to 4 X 10s from Table I . T rip le t eosin is 1000 tim es more stable
against oxygen quenching than trip le t anthracene, although th e ir first-o rder decay constants are comparable . 27
Th e extent of re ve rs ib ility of the dye-photosensitized process depends on the re la tive rate of the radical back-reaction compared to the dism utation of sem i-reduced dye and reactions of the oxid ized substrate and not on the p rim a ry reaction w ith trip le t dye. F o r example, the rate constant fo r the reversible oxidation of phenol b y trip le t eosin is 1.5 X 10s i f f - 1 sec.-1 , w hile th at fo r the reversible oxidation of p -ph enyl- enediamine b y trip le t fluorescein is 5 X 10⁹ M ~l sec. - 1 . 6 O n the other hand, the irreversible oxidation of a lly l thiourea b y trip le t fluorescein proceeds at a rate of 2 X 10⁶ d f - 1sec. - 1 . 6 Th e vacuum photobleaching results show th a t 2fci0 < 6 X 10⁹. A n unambiguous value fo r the rate of the dism utation reaction cannot be obtained from our data because the results on the flash photolysis of aqueous phenol give o n ly 2 /cn + 7ci2
and the mechanism fo r the disappearance of phenoxy radical is not known. I f the photooxidation of phenol is la rge ly reversible, then 2kw ~ 107 to 109, H ow ever, if reaction 1 1 predom inates over reaction 1 2 , then 2fcio « 106. H atchard and P arke r28 have shown th at the dism utation rate constant of aqueous semi-reduced thionine is 2.4 X 10⁹ i f f - 1 sec.-1 , suggesting th a t the form er case is more lik e ly . Th e w ork of Tsepalov and Sh liapin tokh 29 on the photostationary eosin and ascorbic acid system in p yrid ine is interesting in th is connection , in th a t it was proposed th a t semi-reduced eosin not o n ly disunites, but also is fu rther reduced to the leuco base b y ascorbic acid. Ascorbic acid is a much stronger reducing agent than phenol and th is process probab ly does not contribute to the perm anent reduction of eosin b y phenol.
Acknowledgment.— Th e authors w ish to acknowledge the contributions of the fo llow ing undergraduate research participants supported b y a N ationa l Science Foundation Undergraduate Science Education P ro gram : D a vid Brewe, Peter D ePerro, R ichard Powers, and Paul W atte le t.
(27) G. Jackson, R. Livingston, and A. C. Pugh, Trans. Faraday $0c,, 56, 1635 (1960). '
(28) C. G. Hatchard and C. A. Parker, ibid.r 57, 1093 (1961),(29) V. P. Tsepalov and V. Ya. Shliapintokh, Tzv. Akad. Nauk SSSR>
Otd. Khim. Nauk, 4, 637 (1959).
m u m m m f i m v m m m m i* ■■ ■
n u v u m e n ä i K m u r
556 R. H. A ranow Vol. 67
T H E S T A T I S T I C A L M E C H A N IC S O F M IC E L L E S 1
B y R . H . A r a n o w
RIAS, Baltimore 12, Maryland Received July 23, 1962
A theory of micelle statistics is developed using the extended theory of dilute solutions, the dielectric continuum model of the solvent, and the statistical mechanical treatment of physical clusters at constant pressure, and a connection is made between the mass action approach and the two-phase approach currently in use for examining micelle behavior. Both ionic and non-ionic micelles are treated. A discussion is given for non-ionic micelles of the meaning of averages, fluctuations in size, ideality, and variation of c.m.c. with temperature. A more general theory of micelle statistics is formulated by the elimination of the continuum model of the solvent and the extended theory of dilute solutions. Reich’s model for non-ionic micelles is used to illustrate the theory.
IntroductionM icelles, large clusters of molecules in equilibrium )
are sometimes treated th eoretica lly as a product of the reaction of single molecules to form clusters w ith an associated equilibrium constant. 2 ' 8 Sometimes the m icelles are considered to .b e a different phase and the therm odynam ics of phase equ ilibria is invoked . 4’6 Hoeve and Benson , 6 in a treatm ent w hich can be considered as a sim plification of H ill’s th eory of m olecular clusters of im perfect gases, 7 studied the statistica l mechanics of m icellar systems using the canonical ensemble.
Th e purpose of th is report is to develop a more general theoretical treatm ent of m icelle statistics using H ill’s th eory of physical clusters and the ensemble natura l fo r constant tem perature, pressure and q u a n tity of solvent. Th e more general th eory provides a comm on foundation fo r previous different approaches and reveals the relationship between them as w ell as the source of some of the uncerta in ty underlying the in terp re ta tion of m icelle behavior.
Some of the problem s which arise in the study of m icelles are the m eaning of the tem perature varia tion of the c ritica l m icelle concentration, the effect of in teraction of m icelles upon the d istribu tion of m icelle sizes, the m eaning of “ id e a lity ,” the nature of the spread of m icelle sizes about the average value, and whether or not consideration of a single m icellar size can be used as a basis fo r a theoretical treatm ent of m icelles. W e shall endeavor to answer some of these questions or at least to state the question in a quantita tive m anner. In section I of th is paper we shall present a more general ensemble fo r non-ionic systems using the physical cluster th eory of H ill, the extended th eory of d ilute solutions of Fow ler and Guggenheim , 8 and the assum ption of in com pressib ility. T h is ensemble yie lds inform ation about osm otic pressure and the effect of in teraction of clusters. Th e m eaning of the law of mass action and phase equ ilibrium w ill be stated.
In section I I several useful relationships fo r non-ionic
(1) This research was supported by the United States Air Force through Directorate of Chemical Sciences, Air Force Office of Scientific Research, under Contract Number AF 49(638)-735. Reproduction in whole or in part is permitted for any purpose of the United States Government.
(2) (a) I. Reich, J. Phys. Chem., 60, 257 (1956); (b) D. Stigter, Pec, trav. chim., 73, 593 (1954).
(3) M. J. Void, J. Colloid Sci., 5, 506 (1950).(4) K. Shinoda, Bull. Chem. Soc. Japan, 26, 101 (1953).(5) (a) E. Matijevic and B. A. Pethica, Trans. Faraday Soc., 54, 587
(1958); (b) E. Hutchinson, A. Inaba, and L. G. Baily, Z. physik. Chem., 5,344 (1955); (c) G. Stainsby and A. E. Alexander, Trans. Faraday Soc., 46, 587 (1950); (d) K. Shinoda and E. Hutchinson, J. Phys. Chem., 66, 577 (1962).
(6) C. A. J. Hoeve and G. C. Benson, ibid., 61, 1149 (1957).(7) T. L. Hill, J. Chem. Phys., 23, 617 (1955).(8) R. Fowler and E. A. Guggenheim, “ Statistical Thermodynamics,”
Cambridge, 1956, Chapter VIII, p. 372.
micelles w ill be derived concerning fluctuations in m icelle size and the effect of d im erization on quantities related to the c ritica l m icelle concentration.
In section I I I ionic m icelles w ill be treated using a m odified constant pressure ensemble, the physical cluste r theory of H ill, the continuum m odel of the solvent, and the extended th eory of d ilute solutions.
Suggestions fo r a more general treatm ent of m icellar statistics w ill be discussed in section IV .
In section V calculations fo r an a n a lytica lly tractable m odel proposed b y Reich w ill be presented in order to demonstrate the relationships developed in preceding parts of th is report.
I. Constant Pressure Solution Theory.— In order to develop a more general form al structure fo r studying m icelle systems, we use the ensemble suitable fo r constant pressure, constant tem perature, and constant am ount of solvent w hich H ill considered fo r a constant pressure solution th eo ry . 9 Th e p a rtitio n function fo r th is ensemble is
T(Na, p, T, fiff) = e - ^ / k T =
E An (Na, p, (1 )N p \ 0
where
A n 3 = Z Q(N„ N p, V, T)e-rr/kT v
and Q(Na, Np, V, T) is the canonical ensemble p a rtitio n function. N is the num ber of molecules, ¡x is the chemical potentia l, V is the volum e, p is the pressure, and T is the absolute tem perature. Subscript a refers to the solvent and subscript (3 to the solute. W e re strict our discussion to a b in a ry non-ionic system . Th e leading term , A 0, of the sum in (1) refers to the pure solvent.
Th e extended th eory of d ilu te solutions8 requires th a t the to ta l free energy be the sum of the free energy of the component parts and the p a rtitio n function fo r a b in a ry solution m ust be the product of tw o p a rtitio n functions of the form
Qsolution = Insolvent (T , V - V ff) X
Qsolute (Na, Np, V,T) (2 )
where Qsoiute contains a ll so lu te-solvent in teraction term s and vp is the p a rtia l m olar volum e of a m olecule of solu te . I f both the solvent and solution are regarded as incom pressible and the extended th eory o f d ilu te solutions applies we have
Q(Na, Np = 0, V,T) = Q0(Na, V,T)h{V - V0)(9) T. L. Hill, J. Am. Chem. Soc., 79, 48S5 (1957); J. Chem. Phys., 30, 93
(1959).
March, 1963 Statistical M echanics of M icelles 5 5 7
and
Q(Na, N0, 7 , T) = Q0(Nm V - N„ T) X
5 (7 - [7 0 + N 0 v0])QN0(Nal N 0, V,T) (3)
where 5 is the D ira c 5-function.Substitu ting these relations in to eq. 1 we have
r = £ e-p<-yo+N0v0)/kT q n e^m /kT =A p \ 0
e-pVjkT Q o £ QN0\ » p (4) jvpXo
where Xp is a constant q u a n tity fo r the ensemble and is, b y defin ition , exp (p.0 — pv0)/kT. Le t us introduce the fo llow ing notation
Ms = s(Pp)
Vs = S(V0)
X s = ( X p ) s ( 5 )
Using the methods developed b y H ill in the th eory of m olecular clusters in im perfect gases the p a rtitio n function Q n /3 can be w ritte n in a w ay in w hich the clusters appear e xp lic itly
Q n /3 = 53 Q n (6 )N
where Qw refers to the p a rtitio n function fo r a set of clusters N = Nlt Nt, . . JV S,. . . and the sum m ation is taken over a ll possible sets subject to the restriction
£ sNs = N 0 (7)8 = 1
The product Qnb abnp can then be rew ritten as
Q njs X ^ = £ Qn ( n \SN') (8 )N 8
where the N s is from the set N. Then
53 Q n ,3 x / 0 = 53 Qtx ( n X / .) (9)Np\0 N \ 0 a
where the sum m ation is over a ll cluster sets corresponding to a ll possible values of N0 and the relationship between Q n and Qu is displayed, fo r exam ple, b y
Nn — XpnQooo. • • - i + h n+1(Qm- ■ ■ - i —
Qm- ■ ■Qm■ • -i) + ■ • • ( 1 2 )
W hen the clusters are non-in teracting as in the theory of Hoeve and Benson, o n ly the leading term s appear. The Q’s of the leading term s are the p a rtitio n functions fo r single clusters in the system . Th e in teraction of the cluster w ith the solvent b u t not w ith other clusters is contained in the leading term . W hen the first in ter action term is included, the effect of in teraction of monom er w ith cluster is taken in to account.
Th e set of eq. 1 2 leads to “ law of mass action” equilib rium quotients
Nin _ Q iqq. . . . ” j 2 nQ 2oo- ■ •
Nn Qow • i* l _ Qioo • • •
(n — l)Q ioo-Qm . . . . iQooo • • • l _
(13)
where the first term in Xp accounts fo r in teraction of monomer w ith monomer and w ith the cluster of size
Extension of the developm ent to ideal m ixed m icelles can be made b y considering the clusters themselves to be ideal (perfect) solutions1 1 in te rn a lly at constant tem perature and pressure. Th en the sum m ation in T(Na,p,T,nB,ny) w ould be taken over a ll values of JVp and Ny and then over a ll cluster d istributions N where each d istribu tion corresponds to a particu la r com bination , JVp + Ny. Since no fu rth e r concepts are in tro duced, the methods are essentially the same as we have discussed and the assumptions are equivalent to those of the tw o phase treatm ent b y Shinoda 12 and the mass action treatm ent of M ysels and O tte r , 13 we shall not consider th is topic further.
I I . Applications.— One fu rth e r result of constant pressure solution th eory w hich is useful in m icelle studies is the relationship of the ensemble to osm otic pressure . 9
N o tin g th a t
N jxJp,T ,0) = - k T In Ac (14)
where /¿„(p,T,0 ) is the chem ical potentia l of pure solvent and defining
Qi — Qioo- • • ■
Qi = Qim ■ ■ ■ "T Qoio ■ ■
Q% — Qm - ■ ■ + Quo - • • • + Qooi •. • ( 1 0 )
Th e subscript notation on the rig h t reveals the nature of the d istribu tion . Th e position in the sequence reveals the num ber of particles in the cluster, i.e., s, w hile the num ber in th a t position reveals N s.
Th e equ ilibrium or average num ber of s clusters is obtained b y app lying
N t = Xsò In r
ÒX* ( ID
to eq. 4 using eq. 9. A fte r the d ifferentiation we set X , = Xp®. T h is gives
Ni — Xp Qioo • • • + Xp2 (2 Q 200. . . — Q 1002 • • • ) T . . .
iV j = Xp2Qtio. . . + Xp3((h io• • - Qm■ ■ ■ Qow• • •) 7 . . .
Ma(.P,T, Np) = fia(p,T, TVp) - na(p,T, 0) (15)
we have
M,J(P,T,N0.) 1 , rh r = K t n l ,
(16)
B u t fo r osm otic equ ilibrium between a solution at p,T,N0, and the pure solvent a t p — I I , T, we have
^(P ,T ,N 0) = na(p - 11,7,0) (17)
and
Pa(p,T,0) - na(p - 11,7,0) = (p,T,Np) =
f p - n v<^P',T)dp' (18)
(10) B. D. Flockhart, J. Colloid Sci., 16, 484 (1961).(11) R. Fowler and E. A. Guggenheim, ref. 8, Chap. VIII, p. 353.(12) K. Shinoda, J. Phys. Chern., 58, 541 (1954).(13) K. J. Mysels and R. J. Otter, J. Colloid Sci., 16, 474 (1961).
5 5 8 R . H . A b a n o w V o l . 6 7
U sing the same assumption of incom pressib ility we used to develop the form of r we have the relationships
— Va' _kT kT
Therefore, the ensemble sum has a clear physical in terpretation. W hen the m axim um term m ethod can be used fo r Np and fo r N and micelles do not in teract, the expected result fo r an ideal d ilute solution can be deduced that
UVa = y AL*kT , N a
(2 0 )
where the asterisk denotes values in the m ost probable (m axim um ) d istribu tion . Le t us re tu rn now to the distrib u tio n of average m icelle sizes in order to compare the statistica l treatm ent to a two-phase equilibrium problem . F o r the non-ionic detergent, ignoring cluster interactions we have, le ttin g Q0oo- • -i = Qs
_ s(u.a ~ PVfl) „N* = e — ^ ( 21)
F o r the monomer we compute
Mo = Vvp ~ kT In Q , + kT In Ni (22)
F o r the cluster
sup = spvp — kT In Q s + kT In Ns (23)
A t the m axim um Ns in the d istribu tion , Ns*, where the asterisk denotes the m axim um value
ò In N * òs
= 0
Thus
^ = Pve - kTà In Qs
òs
(24)
(25)
E qu atin g 22 to 25 we have the relationship
Ò In Q.*k T — = _ hT\nQ1 + fc T ln AL (26)
òs
Th e in terpretation of the changes of c.m .c. w ith tem perature is clear fo r the case in eq. 26.
_ / ò In Q ,\ / ò In V (c .m .c .)\\ ÒT Jp.Na.Nf, \ ÒT Jv,Na.Jr0
F o r eq. 27 a sim ilar com putation m ay be made.D eviations of heats of m icellization com puted using
eq. 28 from those found ca lorim etrica lly are sometimes a ttribu ted to n on -idea lity or to d im erization . 10 Equations 1 2 indicate the nature of the term s w hich m ust be considered to include monomer and cluster interactions if these are the source of non -idea lity.
Th e fluctuation of m icelle size about the average of the d istribu tion fo r non-interacting clusters of non-ionic detergents can be related to experim ental observables. U sing the definitions
n = E N. = E V Q S8 8
Nf, = £ sNs = E <8 X / Q s (29)8 S
we compute ò (/ N Np)/ò\p. F o r experim ents where X,? is varied o n ly b y the in troduction of more solute, Qs is not an im p lic it function of Xs as long as the system is s till d ilu te . Th e result is
N ow
àÇS/N,,) = (.g - s)2à In X3 s2
NÑ
— and In X = s
Vf) - PVf)kT
A t o rd in a ry pressures pvp/kT is constant and negligib le. Thus
(s — s)2 _ ò ( l/s)s2 ~ ~ òQip/kT)
A t the critica l m icelle concentration when dim ers have not form ed appreciably Ñ\/V is the critica l m icelle concentration. T h is relationship is com parable to the one used b y Shinoda4 in his treatm ent of the effect of chain length on critica l m icelle concentration. (See section I I I of th is paper.) Shinoda’s energy calculations fo r the m icelle “ phase” clearly are related to the energy changes invo lved in adding or rem oving a molecule from the m ost probable m icelle. T h is relationship displays the reason fo r the success in some calculations of theories w hich postulate o n ly a single m icelle size: o n ly the m ost probable m icelle need be considered in any calculation in vo lv in g chemical potentia l. (V o id 3 has discussed other aspects of th is problem fo r ionic m icelles in term s of the mass action law .) W hen dim ers are appreciably form ed at the c ritica l m icelle concentration, we need o n ly substitute the relationship N/V = c.m .c. = (iV i + 2Ñí)/V to obtain
- kTò In Q s*
òs- k T In Q , +
kT In [(c.m .c.) U — 2Ñí\ (27)
In the o rd in ary m icellar system the a c tiv ity and the average m icelle size change ve ry little above the critica l m icelle concentration; hence, ve ry sensitive measurements would be required to determ ine the fluctuation .
III. Derivation of the Constant Pressure Ensemble for Ionic Detergents.— Developm ent of a com parable cluster th eory fo r ionic detergents is attended b y certa in d ifficu lties w hich are part of the general problem of e lectro lyte th eory. Am ong these d ifficu lties is the necessity of assuring weak in teraction among the members of the statistica l ensemble w hile a llow ing the num ber of molecules of a charged species to v a ry from zero to in fin ity . C le a rly, the condition exists th a t some members of the ensemble w ill have in fin ite charge and in th is case w ill in teract strong ly w ith other members of the ensemble.
In order to avoid these problem s of in teraction we shall assume the restriction of the members of the ensemble to e lectrica lly neutral systems or to systems of some a rb itra ry closeness to electrical n e u tra lity. B y the use of th is restriction we assure the condition th a t the members of a statistica l ensemble be w eakly in te r-
March, 1963 Statistical M echanics of M icelles 559
acting. Th e resultant restricted ensemble is no longer the same as th a t fo r the non-ionic case but is a h yb rid constructed b y the sum over canonical, incom pressible, almost neutral, and neutral ensembles. W hen the fluctuation of charge of the real system about the neutra l po in t is ve ry sm all, the resultant h yb rid ensemble should give a correct representation of properties.
The extended th eory of d ilu te solutions applies o n ly to non-electrolytes. W e find an analog of th is theory, however, in the continuum model of the solvent in an electrolyte system described b y Fow ler and Guggenheim . 14 The statistica l mechanics of the system is studied b y considering the solvent to be a dielectric continuum of d ielectric constant e. The ions which interact are immersed thus in a continuum and the effect of the solvent on the in teraction of the ions is contained in the term e. The effect of the solvent on the ions themselves is assumed constant fo r a ll configurations of the ions. I f we generalize these definitions and require that the effect of the solvent on the potentia l energy due to charge and the effect of the solvent on the potentia l energy of the rem aining part of the ion be separable, then the effect of the solvent on the potential energy due to charge can be treated as constant fo r a ll configurations of the ions w hile the rem aining potentia l energy can be treated ju st as in the case of non-ionic molecules. Th e H elm holtz free energy of a system then can be expressed as
F = Fsolvent (N „ V - E N SV„ T) +in ideal soln. s
X Fs uncharged + F (32)s solute
where s refers to a ll solute species. Th e additional free energy of the e lectro lyte , Fe] w ill be a function of the volum e. Th e assum ption of incom pressib ility w ill again be applied although the assumption of a d d itiv ity of volum e is a poorer assumption fo r e lectro lyte solutions.
Th e use of the continuum m odel fo r e lectro lyte solutions as w ell as the use of the extended th eory of d ilu te solutions fo r non-ion ic solutions obviously is incorrect fo r members of the ensemble where the am ount of solute is of the same order o r m uch greater than the am ount of solvent. H ow ever, fo r systems where NB corresponds to a h igh ly d ilu te system , the contribution of such concentrated members of the ensemble to the ensemble is negligible. Hence, the use of these models fo r concentrated ensemble members has a negligible effect on the averages but is a great convenience m athem atically.
In the derivation th a t follow s, we shall consider on ly one type of solution fo r the sake of s im p lic ity: nam ely, an ionic detergent and un i-un iva len t salt w ith a common ion in aqueous solution. Th e application to other types of systems is obvious.
Io n ic detergents shall be treated as systems where each type of ion is regarded as a different species. The fo llow ing notation shall be used
_ pVor (A Ta,p,T,pp,Py,pv) = Q0e kT X
N p . N y . N r ,
Q(Na,Na,Ny,Nv,V,T ) Xg — pv0) + NyifXy — pvy) + Ni)(flV - f pvv)
kT (33)
where Q0 no longer represents the complete p a rtitio n function of the solvent but rather the p a rtitio n function of the solvent in a solution of discharged ions.
Q(Na,Np,Ny,Nv,V,T) represents the product of the p a rtitio n function of the discharged solute and the additional term , Qel, due to presence of charge. Thus
X Fs (discharged solute) + Fel =S
- k T In Q(Na,Np,Ny,Nv,V,T) (34)
W e use the fo llow ing definitions
Xp = exp (up - pvp)/kT
Xy = exp(,u7 — pvy)JkT
A, = exp(/i, - pvJ/kT (35)
Q(NmNp,Ny,Nv,V,T) = X Q n (36)N
where Qn is the p a rtitio n function fo r the grouping, N , of Np, N<r, iV , molecules in to a particu lar arrangement (set) of various size clusters. Th e sum m ation over N is the sum m ation over a ll possible sets consistent w ith the restriction th a t the to ta l am ount of molecules of /3, 7 and 77 be Np, Ny, and Ar„ respectively.
Le t us decompose the product XpNP XyNy, X„Ni in to a product of term s of the typ e Xps0 A / t A ,8*; w hich correspond to clusters containing sB /3-ions and sT 7 -ions and sn ^-ions. Then the sum m ation in eq. 33 is taken over a ll cluster sets, where the cluster sets range over all values of Np, Ny, N„ but restricted to set values close to electrical n eu tra lity. I f we then define the variable
XSpSyS = X p^X y^X ^
we have the relationship as in eq. 1 1
Nsl ,Sy,Sr} = A,SfiSySr)d In T
dA sPsysr,
(37)
(38)
Thus from the ensemble sum using eq. 36 we can express the properties of the system taking a ll possible clusters into account e xp lic itly . In general, the average num ber of systems Nsp.sy.sr, as derived using eq. 38 w ill be in fin ite series in vo lv in g term s of the type
X ^ X y ^ X ^
where nB > sp, ny > sT, and n , > s,. In particu la r a term of the type
a = solvent species 0 = detergent, iony = detergent counterion and added counterion from a simple
saltj; = ion from simple salt of same charge as detergent ion
The ions a ll are treated as solutes at constant pressure. The ensemble sum as in eq. 4 is
(14) R. Fowler and E. A, Guggenheim, ref. 8, Chap. IX, p. 383.
Xp^Xysy + 1Xvs’>
accounts fo r the in teraction of a cluster (sp sT sv) w ith a single monomer ion of 7 .
W e shall now focus attention on terms of the type Nsp.sy where sB is equal in num ber to sy. The d is tribution of term s of th is type can be represented as ly in g in a plane of the d istribu tion space where the axes cor-
5 6 0 R. H. Aranow Vol. 67
respond to s = = sT and N,B„y. Term s of th istyp e correspond to uncharged clusters and hence in te raction term s w ith other particles and clusters should be re la tive ly sm all, p a rticu la rly in d ilu te solution.
Th us we have approxim ately
Nvsy Qm . . . s? = sy (39)
where the p a rtitio n function Qooo• • .d ,d's7) is the p a rtition function fo r a single cluster of size s3 + sy. I f w'e now differentiate the logarithm of eq. 39 w ith respect to s = Sp = sy, we obtain
d ln NeßSy ds
= ln (\ß\y) +à ln Qqoq. .
ds
Sp = sy = s (40)
In the plane defined b y Nspsy and s, the existence of a m axim um , N*S[iSy, leads to the relationship
ln (XBXy) —ö In Qoqq. .
ds
Th e average num ber of monomer particles is given b y equations of the type
Nlf) = X |8[ Q iooU 3 ) + E A imn\B\ym\ n], A o o o = 0l,m,n
(42)
W hen the interaction term s are assumed negligible, w hich w ould be the case fo r id ea lly d ilu te solution, we have
N iB ~ Quo. . . Op)
Nly^ X y Qm. . .Or) (43)
Com bining eq. 43 and 41 we have the relationship
In XBXy = In NiftNly — In Q 10 0 . . . (10 Qm ■ ■ ■ (l7> =
ö In Qqqq. . ./ ^ r)*
ds Sß -- S-v (44)
T h is result can be compared w ith the two-phase uncharged m icelle model of Shinoda and H utchinson5d which assumes monomer id e a lity.
Define the standard state b y the equations
fas — -pvpY = — kT In Qm -------(1 P5 + kT In 7
(ny - pvy)° = - k T In Q uo .. . . Or) + kT In V (45)
Thus
(ßß ~ pvß)(ßy ~ pvy) = kT In
refers to the positive species and y to the negative species, we have
fa=) = f c T l n ( ^ ) ( y ) + (M±)° (48)
T h is relationship m ay be compared w ith eq. 8 from the paper of Shinoda and H utchinson w hich differs o n ly in the use of mole fraction in place of N/V. O bviou sly, th is difference depends upon the defin ition (45). D e fin ition 45 is used here since it is analogous to the relationship used fo r ideal gases
m( p)k T ^ 0
W e also have the relationship
(49)
fa t ) =-d kT In Qch (8ß>8y)*
ÖSSß — sy s (50)
Since — kT In Qma- ■ ■i(-‘>PSy)*,sp=sy m ay be in te rpreted as the H elm holtz free energy of the m axim um neutral m icellar cluster, the deriva tive w ith respect to s m ay be interpreted as the chemical potentia l of the “ mean” particle which is removed from the m icelle leaving the m icelle in an uncharged state. C a lcu la tion of tem perature changes of a ll these quantities follow s according to the derivation given b y Shinoda and H utchinson. H ow ever, it m ust be observed th a t the m axim um in the d istribu tion m ay be a function of T. Thus, in the in terpretation of the q u a n tity dn±/dT, consideration of the sh ift of the m axim um of the d is tribution cannot be ignored.
W e shall now comment on the com parison of the ensemble to the mass action m odel. F o r uncharged m icelle clusters the mass action quotients derived as fo r eq. 13 should have negligible in teraction term s. These quotients therefore have a constant value and the mass action approach is a good one. F o r charged m icelle clusters, the in teraction term s m ost certa in ly w ill not be negligible and deviations from id e a lity m ay be considerable. A s a first approxim ation to a correct d istribu tion , in teraction w ith gegenion o n ly m igh t be considered. Then we w ould have fo r the d is trib u tion an expression of the form
A V 7 = X „ « V t K W • ■1 (S 7) + E A iky1] (51)l
where the term in brackets represents an effective single cluster p a rtitio n function as a function of gegenion concentration. One m ight also consider a fu lly charged m icelle
Ns? = (Qooo- ■ + E A ImnX7 V A „ " ] (52)
fas + puf,)°(fiy + pvy)° (46)
A t o rd in ary pressures the pv terms are negligible. Thus
w y 3* kT In ( ^ r ) ( ^ r ) + (47)
Th e equation
defines a mean chemical potentia l, ^ • Thus if
W hen term s due to in teraction of m icelle cluster w ith particles and clusters of the same charge as the m icelle m ay be considered negligib le, the term in the brackets m ay be considered independent of /3 and t] and the distrib u tio n becomes
QeS(Xy) (53)
Equations of the type of (23)-(26) m ay also be derived fo r th is case. Estim ation of Qeg(X.y) b y a p a rticu la r model of electrical in teraction leads to the charged phase separation model of Shinoda and H utchinson.
March, 1963 Statistical M echanics of M icelles 561
IV. Improvement of Statistical Treatment—Tw omethods fo r im proving the statistica l treatm ent of m icelles are suggested. E ith e r more and more in teraction term s m ay be included as in eq. 1 2 or the separation of the solvent and solute p a rtitio n functions m ay be abandoned. In the la tte r case the ensemble sum in(4) would take the form
r = « ^ E Q '{N mN p,V „ + N f a T ) X / e (5 4 )Nt3>0
A s we have seen from eq. 13, th is ra tio in the ideal case corresponds to
(61)v i
and then
q s a(5pr + 6(1 — a "1/»))Nb = X / Q , = X / e (62)
where Q' is the canonical ensemble p a rtitio n function fo r the solute and the solvent. A n equation of the type of (9) can s till be w ritte n
Q'(NmNp, F fl + Npvp,T )X ^ = E Qx'(n X *•) (55)N «
but the Q n ' is to be interpreted as the p a rtitio n function fo r a p articu la r arrangem ent of solute molecules and the solvent. W e s till have the relationship
Ns — X5d In r
ò xs(56)
Then since T m ay be w ritte n as
r = e = g t - Q'(Na,0,VB,T ) [ l +
( X g Q ^ V F o + v „ T )
\ Q'(Na,0,V0,T) n
if the sum of the Xg power series term s in the brackets, { }, is less than u n ity , then the inverse of T m ay be expanded in a power series in { }. Thus
L e t us now consider th is problem from the “ two-phase equ ilibrium ” view point.
ò In Ns òs
Then
, , Q i , S0T + 6 ( 1 - S- 1/J) , £S- ‘/> lnXF + --------kT--------+ M Ï
(63)
, Q i , S0T + £ ( 1 -° = lnXF + ---------- W
-v>
3 kT(64)
where s* = smax.
B u t
Then
A T! — XQ i
+ e) 2 v ,kT 3 kT
(65)
A t the critica l m icelle concentration Ni can be considered the to ta l solute. W e also have
1 _ ______________ 1___________
r ~ e ^ p Q ' ( N a,Q,V0,T)U - { } + U 2 + . . . J
(58)
Thus after d ifferentiation as in eq. 56 using eq. 55, changing Xs to Xgs and after collection of term s in Xg" we have fo r example
Nx = Xg + Xg2
where Q'(Na,0,V0,T) = Qo
+ . . . (59)
F o rm a lly the new series m ay be generated from the series in equation 1 2 w ith the substitution, fo r example, Q'ooo- • • i/Qo fo r Qijjo- . .1 . T h is form ulation enables exp lic it account to be taken of specific interactions of the solvent w ith the m icelle (such as h yd ra tio n ). A sim ilar derivation m ay be given fo r the ionic system.
V. Model Calculations.— R eich ’s m odel fo r exp lain ing s ta b ility o: m icelles is based upon a law of mass action treatm ent. 1 Th e equ ilibrium ra tio of concentrations fo r form ation of a m icelle of size s is given b y
IN.]W iY
s[S0T + 6(1 - s~Va)} kT (60)
where So is the entropy change per m olecule when a cluster of size s is form ed from monomer, se is the in te rnal energy change and es2/‘ is the surface energy change.
ò kT InN i
VdT = - So
2 * -< /i- 6S* 'ÒS*
ÒT( 6 6 )
Accord ing to Reich, phase separation (P .S .) occurs when
( 6 + S0T) kT
(67)
where X0 is the value of X when phase separation occurs. Thus, ju st before phase separation
In(e + SoT) ,
kT + r(6 8 )
where eT = X/X0 and r is negative and close to zero. Then
x Q l _ - ( « + StiT)/kT +
F F
and
N,Ì _ gsr ( — (e/kT) «V»
(69)
(70)
W hen t approaches zero the exponential, eST, m ay be expanded in a power series in r and higher terms ignored. Then
Ns 7(1 + s^ e-^ / W °y ‘ (71)
W e can also compute the m axim um value of Ns in term s of t.
562 K ang Y ang Voi. 67
ò In N,= 0 = r — -
ds 3 kT
B u t, as we have seen, t is equivalent to In (X/X0) or
’ Ma - VVp \ [ 9-p ~ pvp
(72)
kT kT(73)
Since the pvB term is negligible and fo r a ll p ractica l purposes constant, we have
M/SkT
(74)
where ppo is the chemical potentia l when phase separation occurs. W e also observe
ò In E N,(75)
I t can be deduced using eq. 71 and replacing the summ ation b y an integration th a t 2 iV s is a linear function
Sof t of the form A + Br where A and B are non-zero coefficients. Thus
B
A s expected, the average value and the m axim um value are quite different. Reich has discussed his model extensively from a mass action view point. W e shall not restate his argum ent. I t has been our purpose to illustra te , using R eich’s m odel, the results w hich are to be obtained when R eich’s m odel is analyzed from the two-phase view point and from the constant tem perature and pressure ensemble view point.
Conclusions.— Th e general statistica l approach contains w ith in it the various models used fo r the study of m icelles and the relationship between these models. Th e nature of the approxim ations invo lved is la id bare. Th e appropriate interaction term s necessary fo r im proving existing theory are displayed in the general distrib u tio n equations fo r Ns.
The basic assumptions of incom pressib ility and addit iv it y of volum es and the assumption of separab ility of p a rtitio n functions used to separate solvent and solute contributions to T are of course inexact. H ow ever, th ey enable us to s im p lify the ensemble sum and do lead to results in accord w ith existing theoretical treatm ents. The separab ility of solvent and solute contributions can be elim inated easily in the form ulation, leading to equations w hich represent an im provem ent over existing treatm ents.
s =
From eq. 72 we have
A T B t(76) Acknowledgment.— The author wishes to express
sincere appreciation and gratitude to D r. Louis W itte n
( i A I ) '
and D r. John G ryd er fo r m any helpfu l and stim ulating discussions and to the Chem ical D irectorate of the A ir
(77) Force Office of Scientific Research fo r th e ir support of\3 kT tJ th is w ork.
F R E E R A D I C A L R E A C T IO N S I N I T I A T E D B Y I O N I Z I N G R A D I A T I O N S .
I I I . P A R A F F I N R E A C T I V I T I E S I N H Y D R O G E N A T O M
A B S T R A C T IO N R E A C T IO N S
B y K a n g Y a n g
Radiation Laboratory, Continental Oil Company, Ponca City, Oklahoma Received July 27, 1962
Rate constants, k = B T in exp( — e/RT), for these reactions H + M —* H2 + R have been determined by investigating the temperature dependence of hydrogen yields in the y-radiolysis of paraffin-propylene systems. Assuming e = 2 .2 kcal./mole for the hydrogen atom addition reaction with propylene, the following e values are estimated: ethane, 8 .6 ; propane, 7.0; «-butane, 6.3; isobutane, 4.7. The LCBO treatment of an assumption that the energy required for isolating two electrons in a bond to be broken from the rest of the cr-electron system plays the decisive role in determining paraffin reactivities leads to the expression: e = £ + N C H y . Here N c h is the number of additional CH bonds formed by the carbon atom that forms the CH bond to be broken. Two constants, £ and y, have these meanings: £ is the activation energy for the hydrogen atom abstraction reaction involving diatomic CH molecules; and y represents the major structural contribution to the reactivity and comes from the fact that the bond to be broken undergoes stabilizing interactions with neighboring CH bonds. Examination of experimental data in the light of the above equation indicates that each such interaction contributes 2.0 kcal./mole to the activation energy, thus reducing the paraffin reactivity about 30-fold at room temperature.
IntroductionS tru ctu ra lly sim ilar compounds often exh ib it m ark
ed ly different reactivities in a series of sim ilar radical reactions . 1 In the case of radical addition reactions w ith carbon-carbon double bonds, th is difference is attrib u ta b le to a difference in the energy, 2 ?loc, required fo r loca lizing a 7r-electron at the reaction center2- 6; thus it is demonstrated th at7
(1) See, for example, M. Szwarc, J. Phys. Chem., 61, 40 (1957).(2) G. W. Wheland, J. Am. Chem. Soc., 64, 900 (1942).(3) C. A. Coulson, J. Chem. Soc., 1435 (1955).
e = aE ioc — b ( E - l )
where e is the activation energy fo r the hydrogen atom addition reactions in gas phase, and tw o constants, a and b, are expressible in term s of param eters characteriz in g potentia l changes involved in these reactions. A ttem pts have been made to extend th is successful localization energy concept to the case of abstraction
(4) J. H. Binks and M. Szwarc, J. Chem. Phys., 30, 1494 (19591.(5) S. Sato and R. J. Cvetanovic, J. Am. Chem. Soc.., 81, 3223 (1959).(6) K. R. Jennings and R. J. Cvetanovic, J. Chem. Phys., 35, 1233 (1961).(7) K. Yang, J. Am. Chem. Soc., 84, 3795 (1962).
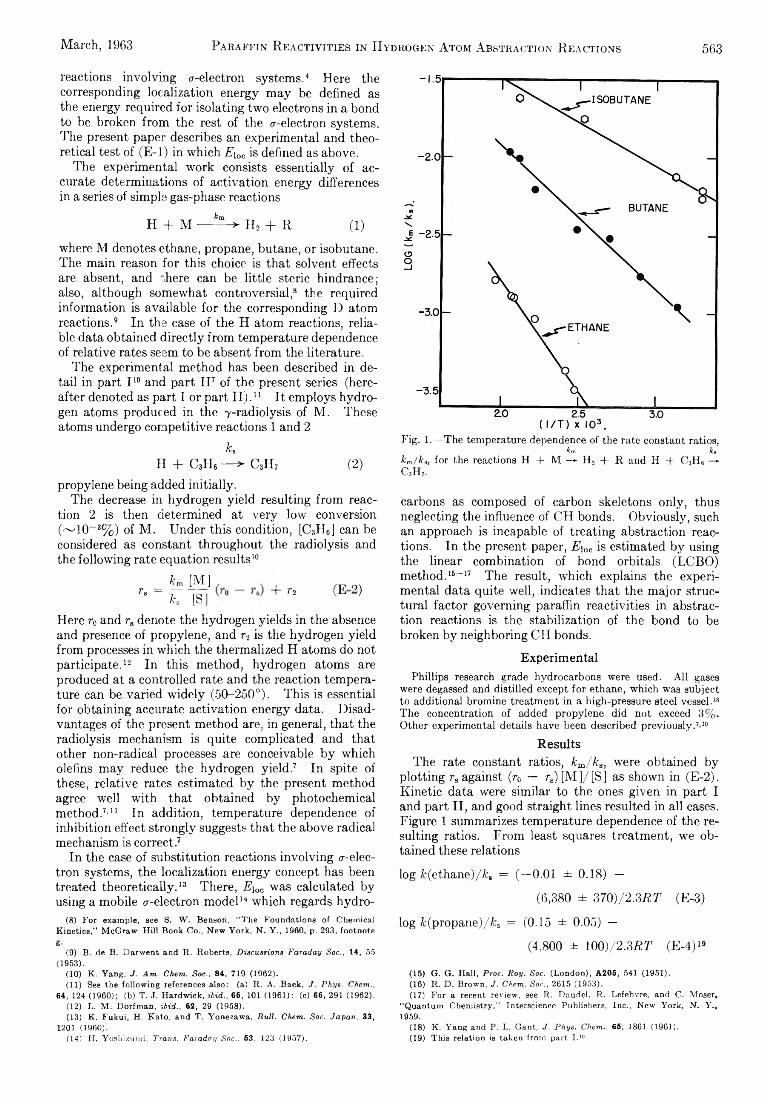
March, 1963 Paraffin R eactivities in Hydrogen Atom A bstraction R eactions 563
reactions in vo lv in g ^-electron system s. 4 Here the corresponding localization energy m ay be defined as the energy required fo r isolating tw o electrons in a bond to be broken from the rest of the e-electron systems. The present paper describes an experim ental and theoretical test of ( E - l) in w hich E\oa is defined as above.
The experim ental w ork consists essentially of accurate determ inations of activa tion energy differences in a series of simple gas-phase reactions
H + M — ^ H 2 + R ( 1 )
where M denotes ethane, propane, butane, or isobutane. The m ain reason fo r th is choice is th at solvent effects are absent, and there can be little steric hindrance; also, although somewhat controversial, 8 the required inform ation is available fo r the corresponding D atom reactions . 9 In the case of the H atom reactions, re lia ble data obtained d ire c tly from tem perature dependence of re lative rates seem to be absent from the literature .
The experim ental m ethod has been described in deta il in part I 10 and part I I 7 of the present series (hereafter denoted as part I or pa rt I I ) . 1 1 I t em ploys hyd ro gen atoms produced in the y-ra d io lys is of M . These atoms undergo com petitive reactions 1 and 2
k.H + C 3H 6 — > C 3H 7 (2)
propylene being added in itia lly .The decrease in hydrogen yie ld resulting from reac
tion 2 is then determ ined at ve ry low conversion (~ 1 0 "3% ) of M . U nder th is condition, [C 3H 6] can be considered as constant throughout the radio lysis and the fo llow ing rate equation results 10
km [M ] ITT Ol’■ ■ ■ ¡ r i s i + r ! ( E ;
Here r0 and rs denote the hydrogen yie lds in the absence and presence of propylene, and r 2 is the hydrogen yie ld from processes in w hich the therm alized H atoms do not participate . 12 In th is m ethod, hydrogen atoms are produced at a controlled rate and the reaction tem perature can be varied w id e ly (50-250°). T h is is essential fo r obtain ing accurate activa tion energy data. D isadvantages of the present m ethod are, in general, th a t the radiolysis mechanism is quite com plicated and that other non-radical processes are conceivable b y which olefins m ay reduce the hydrogen y ie ld .7 In spite of these, re la tive rates estimated b y the present method agree w ell w ith th a t obtained b y photochem ical m ethod .7 1 1 In addition, tem perature dependence of in h ib ition effect strong ly suggests th a t the above radical mechanism is correct.7
In the case of substitu tion reactions in vo lv in g <r-elec- tron systems, the localization energy concept has been treated th eore tica lly . 13 There, Eioc was calculated b y using a m obile <r-electron m odel14 w hich regards h yd ro -
(8) For example, see S. W. Benson, “The Foundations of Chemical Kinetics,” McGraw-Hill Book Co., New York, N. Y., 1960, p. 293, footnote g.
(9) B. de B. Darwent and R. Roberts, Discussions Faraday Soc., 14, 65 (1953).
(10) K. Yang, J . Am. Chem. Soc., 84, 719 (1962).(11) See the following references also: (a) R. A. Back, J. Phys. Chem.,
64, 124 (1960); (b) T. J. Hardwick, ibid., 65, 101 (1961): (c) 66, 291 (1962).(12) L. M. Dorfman, -¿¿>«2., 62, 29 (1958).(13) K. Fukui, H. Kato, and T. Yonezawa, Bull. Chem. Soc. Javan, 33,
1201 (1960).(14) II. Yosliizumi, Trans. Faraday Soc., 53, 123 (1957).
Fig. 1 .— The temperature dependence of the rate constant ratios,km k s
km/k,, for the reactions H + M —*• Hs + R and H + C3H6 —► CSH,.
carbons as composed of carbon skeletons o n ly, thus neglecting the influence of C H bonds. O bviously, such an approach is incapable of trea ting abstraction reactions. In the present paper, EiO0 is estimated b y using the linear com bination of bond orbitals (L C B O ) m ethod . 16 " ' 17 The result, w hich explains the experim ental data quite w ell, indicates th a t the m ajor structu ra l factor governing paraffin reactivities in abstraction reactions is the stab ilization of the bond to be broken b y neighboring C H bonds.
ExperimentalPhillips research grade hydrocarbons were used. All gases
were degassed and distilled except for ethane, which was subject to additional bromine treatment in a high-pressure steel vessel.18 The concentration of added propylene did not exceed 3% . Other experimental details have been described previously.7’10
ResultsTh e rate constant ratios, km/kB, were obtained b y
p lo ttin g rs against (r0 — rs)[M ]/ [S ] as shown in (E -2 ). K in e tic data were sim ilar to the ones given in part I and p a rt I I , and good stra ight lines resulted in a ll cases. Figure 1 summarizes tem perature dependence of the resu lting ratios. From least squares treatm ent, we obtained these relations
log/c(ethane)//cs = ( — 0 . 0 1 ± 0.18) —
(6,380 ± 370)/2.3RT (E -3 )
log 7c(propane)//bS = (0.15 ± 0.05) —
(4,800 ± 100)/2.3Rr (E -4 ) 19
(15) G. G. Hall, Proc. Roy. Soc. (London), A205, 541 (1951).(16) R. D. Brown, J. Chem. S oc., 2615 (1953).(17) For a recent review, see R. Daudel. R. Lefebvre, and C. Moser,
“ Quantum Chemistry,” Interscience Publishers, Inc., New York, N. Y., 1959.
(18) K. Yang and P. L. Gant, J. Phys. Chem., 65, 1861 (1961).(19) This relation is taken from part I.10
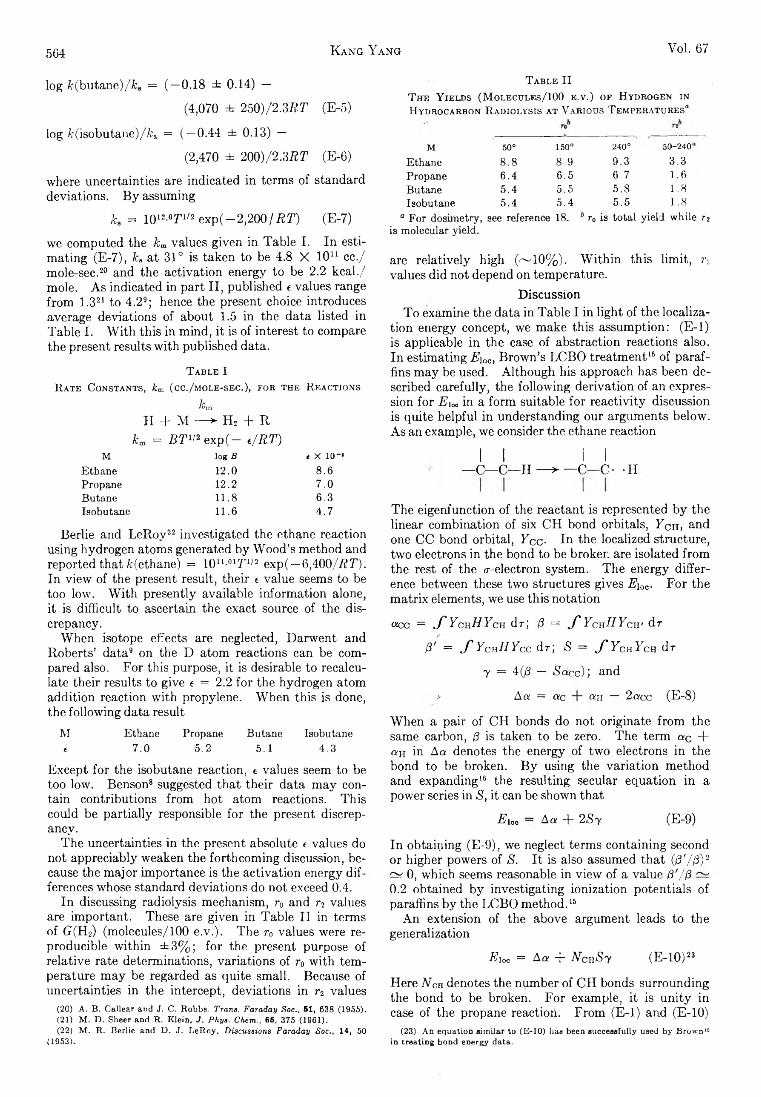
564 K ang Y ang Voi. 67
log fc(butane)/A ;8 = ( — 0.18 ± 0.14) —
(4,070 ± 250)/2.3RT (E -5 )
log fc(isobutane) / & 8 = ( — 0.44 ± 0.13) —
(2,470 ± 200)/2.3RT (E -6 )
where uncertainties are indicated in term s of standard deviations. B y assuming
Jfc. = 101 2 -0Y 1 /2 e xp (-2 ,2 0 0 / i2 r) (E -7 )
we com puted the km values given in Table I . In estim ating (E -7 ), k„ a t 31° is taken to be 4.8 X 101 1 cc./ m ole-sec . 20 and the activa tion energy to be 2 . 2 kcal./ mole. A s indicated in part I I , published e values range from 1.32 1 to 4.29; hence the present choice introduces average deviations of about 1.5 in the data listed in Table I . W ith th is in m ind, it is of interest to compare the present results w ith published data.
T a b l e IR a t e C o n st a n t s , km ( cc . / m o le -s e c .), f o r th e R e a c t io n s
kmH + M — > H 2 + R
km = B T1!2 e xp (— t/RT)M log B t X 10-*
Ethane 1 2 .0 8 .6Propane 1 2 . 2 7.0Butane 1 1 . 8 6.3iBobutane 1 1 . 6 4.7
B erlie and Le R o v 22 investigated the ethane reaction using hydrogen atoms generated b y W ood’s method and reported th at k (ethane) = lO 11-01! 11 exp( — 6,400/RT). In view of the present result, th e ir e value seems to be too low . W ith presently available in form ation alone, it is d ifficu lt to ascertain the exact source of the discrepancy.
W hen isotope effects are neglected, D arw ent and R oberts’ data9 on the D atom reactions can be compared also. F o r th is purpose, it is desirable to recalculate th e ir results to give e = 2 . 2 fo r the hydrogen atom addition reaction w ith propylene. W hen th is is done, the fo llow ing data result
M Ethane Propane Butane Isobutane« 7.0 5 .2 5.1 4.3
Excep t fo r the isobutane reaction, e values seem to be too low . Benson8 suggested th a t th e ir data m ay conta in contributions from hot atom reactions. Th is could be p a rtia lly responsible fo r the present discrepancy.
Th e uncertainties in the present absolute e values do not appreciably weaken the forthcom ing discussion, because the m ajor im portance is the activation energy d ifferences whose standard deviations do not exceed 0.4.
In discussing radiolysis mechanism, r0 and r 2 values are im portant. These are given in Tab le I I in terms of G (H 2) (m olecules/100 e .v .). Th e r0 values were reproducible w ith in ± 3 % ; fo r the present purpose of re la tive rate determ inations, variations of r<> w ith tem perature m ay be regarded as quite sm all. Because of uncertainties in the intercept, deviations in r 2 values
(20) A. B. Callear and J. C. RobbB. Trans. Faraday Soc., 51, 638 (1955).(21) M. D. Sheer and R. Klein, J. Phys. Chem., 65, 375 (1961).(22) M. R. Berlie and D. J. LeRoy, Discussions Faraday Soc., 14, 50
(1953).
T a b l e IIT h e Y ield s (M olecules/100 e .v .) o f H yd r o g e n in H ydrocarbon R adiolysis a t V arious T e m p e r a t u r e s “
M 50° 150° 240° .50-240'
Ethane 8 .8 8.9 9.3 3.3Propane 6.4 6.5 6.7 1 . 6
Butane 5.4 5.5 5.8 1 .8Isobutane 5.4 5.4 5.5 1 .8
“ For dosimetry, see reference 18. 6 r0 is total yield while r2is molecular yield.
are re la tive ly h igh (~ 1 0 % ). W ith in th is lim it, r 2
values d id not depend on tem perature.
D iscussionT o examine the data in Table I in lig h t of the localiza
tion energy concept, we make th is assum ption: ( E - l) is applicable in the case of abstraction reactions also. In estim ating A loo, B row n’s L C B O treatm ent16 of paraffins m ay be used. A lthough his approach has been described carefu lly, the fo llow ing derivation of an expression fo r E ic in a form suitable fo r re a c tiv ity discussion is quite helpful in understanding our argum ents below . A s an exam ple, we consider the ethane reaction
I I I I— C — C — H — *----- C — C • -H
The eigenfunction of the reactant is represented b y the linear com bination of six C H bond orb ita ls, F c h , and one C C bond o rb ita l, Fee - In the localized structure, tw o electrons in the bond to be broker, are isolated from the rest of the e-electron system. Th e energy d iffe rence between these tw o structures gives E\oc. F o r the m a trix elements, we use th is notation
«cc = fY cn H Y cn d r ; /? = P Y csH Y cw d r
13' = fY c n H Y c c d r ; S = P Y chYch d r
7 = 4(8 — Sdcc)] and
>- Act = etc ctn — 2ctec (E -8 )
W hen a pa ir of C H bonds do not originate from the same carbon, /? is taken to be zero. Th e term etc + etH h i Act denotes the energy of tw o electrons in the bond to be broken. B y using the va ria tion m ethod and expanding 16 the resulting secular equation in a power series in S, it can be shown that
E loa — Act -f- 2Sy (E -9 )
In obtain ing (E -9 ), we neglect term s containing second o r higher powers of S. I t is also assumed th a t (dV/3) 2
~ 0, which seems reasonable in view of a value d'//3 ~ 0 . 2 obtained b y investigating ion ization potentials of paraffins b y the L C B O m ethod . 16
A n extension of the above argum ent leads to the generalization
E loe = A* + NcnSy (E -1 0 ) 23
Here NCh denotes the num ber of C H bonds surrounding the bond to be broken. F o r exam ple, it is u n ity in case of the propane reaction. From ( E - l) and (E-10)
(23) An equation similar to (E-10) has been successfully used by Brown16 in treating bond energy data.
March, 1963 Paraffin R eactivities in Hydrogen Atom A bstraction R eactions 565
e — £ + NchV ( E - l l )
where £ = aAa — b, and r? = aSy.The present E\0c is different from bond strength, D, in
tw o respects. F irs t, the term ac + « h in A loc m ay contain a significant contribution from the interaction of tw o electrons in the bond to be broken, w hile th is is not so in the case of D. Secondly, structura l differences between a lk yl radicals in isolated and bound states affect D but not Eioc. F o r these reasons it is quite possible th at Eloc < I). I f these differences are assumed to make a constant contribution to e in a series of sim ilar reactions, then E\oc and D m ay be used interchangeab ly. In th is case, ( E - l) im plies a w ell known and successful expression2 4 - 2 8
« = amD — pm (E-12)
where am and dm are constants. In the present paper, however, it is not necessary to use (E -1 2 ). A s shown below, a correlation of activa tion energy data is achieved w ith ou t using (bond energy data. T h is is w orth em phasizing because, in discussing re la tive rea c tiv ity , the use of (E-12) demands AD values on which available in form ation often contains a large per cent of errors.
According to ( E - l l ) , a stra ight line should result when e in Tab le I is p lotted against A c h - Figure 2 confirms th is prediction. In F ig . 2 o n ly those bonds having the highest reactivities are considered, and the experim ental data are assumed to correspond w ith the reaction in vo lv in g such a bond. A c tu a lly , in the tem perature ranges investigated here, some less reactive bonds are also lik e ly to participate. In view of the lin e a rity shown in F ig . 1, however, uncertainties in e from such sources are not lik e ly to exceed 0.4.
From F ig . 2, we estimate the e value fo r the reaction
H + C H 4 — > Ho + C H 3 (3)
to be 10.3. R ecently Fenim ore and Jones29 investigated th is reaction in a flame and reported th a t fc- (methane) = 2 X 10¹³ e xp (— 11,500/RT). T h is corresponds to an e value of 1 0 , in excellent agreement w ith the present estim ation.
From the data in F ig . 2 , we obtain
£ = 4.7 v = 2.0 (E-13)
W e now examine the physical significances of these tw o constants.
In the case of the reaction
H + 2:-C 4H 10 — > H 2 + ¿ -C J F (4)
A ch = 0; hence e = £. The same relation results when the present theory is applied to the reaction in vo lv in g an isolated C H bond.
H + C H — *■ H 2 + C (5)
Reactions 4 and 5 thus should have about the same activa tio n energy. In such a reaction in vo lv in g three
(24) A. F. Trotman-Dickenson, Discussions Faraday Soc., 10, 111 (1951).(25) A. F. Trotman-Eickenson, “ Gas Kinetics,'’ Butterworths Scientific
Publications, Ltd., London, 1955, p. 199.(26) E. Warburst, Quart. Rev., 5, 44 (1951),(27) R. E. Dodd, J. Chem. Phys., 26, 1353 (1959).(28) K. Otozai, Sci. Papers Osaka Univ., 20 (1951); Bull. Chem. Soc.
Japan, 24, 218, 257, 262 (1951); also see ref. 8, p. 317.(29) C. P. Fenimore and C. W. Jones, J. Phys. Chem., 65, 2200 (1962).
Fig. 2.— Activation energy, e, for the hydrogen atom abstraction reactions as a function of the number, A c h , of additional CH bonds formed by the carbon atom that forms CH bond to be broken.
atoms, E yrin g and his co-workers’ sem i-em pirical m ethod80 can be used to estimate e. H irschfelder8 1 has shown that, when the interactions between tw o outer atoms are neglected, th is m ethod yie lds a simple expression fo r e
« = ^ [2 - 3n - (3(1 - 2n ))1/2] (E-14)
where D is the C H bond strength in an isolated C H bond, and n signifies the ra tio of coulom bic energy to to ta l b inding energy and is usua lly taken to be 0.14. Here, D is different from D (C -H ) in diatom ic molecules, because the effective H am ilton ian in £ is not the same as th at needed in trea ting the C H molecules. F o r the present purpose, it is more appropriate to use Z )(C -H ) (= 94 kcal./m ole33) in isobutane32; then e becomes 5.2, in good agreement w ith the £ value of 4.7 ± 1.5. U n fortu nate ly, e estimated from (E-14) seems to be not better than ± 5 , and the above agreement o n ly in d icates th at the present £ value is not inconsistent w ith the transition state theory.
Th e physical significance of rj is equally clear-cut. I t is the m ajor structura l factor governing the activation energy differences (hence the re la tive re a c tiv ity also)
(30) S. Glasstone, K. J. Laidler, and H. Eyring, “ The Theory of Rate Processes,” McGraw-Hill Book Co., Inc., New York, N. Yl, 1941.
(31) J. Hirschfelder, J . Chem. Phys., 9, 645 (1941).(32) We express Our appreciation for the referee who brought this point
to our attention.(33) T. L. Cottrell, “ The Strength of Chemical Bonds,” Academic Press,
Inc., New York, N. Y., 1954, p. 272.
566 T. A. Obofino and F. W engkk Vol. 67
and comes from a stab ilizing in teraction of neighboring C H bonds w ith the bond to be broken. Equation (E-1 2 ) indicates th at each such interaction contributes2 . 0 to the activa tion energy, thus reducing the paraffin re a c tiv ity about 30-fold at room tem perature.
Acknow ledgm ent.— W e express our appreciation to D r. F . H . D ickey, D r. L . 0 . M organ, and M r. C . L . Hassell for th e ir valuable discussion and to M r. P . L . G ant and M r. J . D . Reedy fo r helping w ith the experim ental w ork.
D I L U T E S O L U T IO N P R O P E R T IE S O F B R A N C H E D P O L Y M E R S .
P O L Y S T Y R E N E T R I F U N C T I O N A L S T A R M O L E C U L E S 1
B y T . A . O k o f i n o a n d F r a n z W e n g e r 2
Mellon Institute, Pittsburgh, Pennsylvania Received July 30, 1962
The results of intrinsic viscosity, second virial coefficient and related thermodynamic measurements on samples of polystyrene trifunctional star molecules are reported. These branched polymers were synthesized by means of a coupling reaction between essentially monodisperse polystyryflithium and l,2,4-tris-(chloromethyl)-benzene. The homogeneity of the materials obtained with regard to molecular weight and functionality was established by fractionation, sedimentation, and absolute molecular weight determinations. Intrinsic viscosities and second virial coefficients in both poor and good solvent media were found to be less for these materials than for linear polystyrenes of comparable molecular weights. The Huggins viscosity constant fc' in good solvents was unaffected by branching; in poor solvent media, an augmentation of k' with branching was noted. The results of these and other dilute solution studies are discussed from the point of view of current theoretical interpretations. An attempt is made to extend them in applicability to more general branched polymer systems.
In troductionThe in terpretation of d ilute solution data obtained
on branched polym er systems to date has been com plicated to va ryin g degrees b y structura l and m olecular w eight heterogeneity present in the samples investigated. A lthough some general conclusions3' 4 concerning the effect of branching have been deduced from the considerable q u a n tity of experim ental data accumulated, the lack of adequate sample characterization has in large part precluded attem pts at quantita tive evaluation of the results.
A general method fo r the controlled synthesis of branched polym ers has recently been outlined b y one of us, 5 the in itia l application of w hich has led to the preparation of polystyrene trifunctiona l star molecules— • branched polym ers formed b y three linear polystyrene chains joined at one end through a common junction . The skeletal structure of these m aterials involves o n ly carbon-carbon linkages, coupling of the three constituent linear chains in each m olecule being achieved through use of a suitable low m olecular w eight arom atic compound. The v irtu a l chemical id e n tity of the branched chains w ith linear polystyrene, together w ith th e ir hom ogeneity in regard to fu n ction a lity and molecu lar w eight, make them id e a lly suited fo r physical measurements, the results of w hich in com parison w ith known properties of th e ir linear counterparts can be attributed unequivocally to the branched nature of the chains.
(1) The results of this investigation were presented at the 141st American Chemical Society National Meeting, March, 1962, Washington, D. C.
(2) Data obtained on earlier branched polymer samples have been reported in previous communications (a) F. Wenger, Discussion Contribution No. 187. Paper A41, International Symposium on Macromolecular Chemistry, July, 1961, Montreal, Canada—see J. Polymer Sci., 67, 481 (1962); (b) T. A. Orofino and F. Wenger, Division of Polymer Chemistry, American Chemical Society, Preprints 3, 274 (1962). These results have since been supplemented through more extensive studies on better characterized materials, data for which are herein reported.
(3) C. D. Thurmond and B. H. Zimm, J. Polymer Sci., 8, 477 (1952).(4) W. H. Stockmayer and M. Fixman, Ann. N. Y. Acad. Sci., 67, 334
(1953).(5) F. Wenger and S.-P. S. Yen, presented at the 141st American Chemical
Society National Meeting, March, 1962, Washington, D. C. (to be published). See also, Division of Polymer Chemistry, American Chemical Society, Preprints 3, 162 (1962).
The p rincipa l aim of the present investigation thus has been to determ ine the d ilute solution properties of the m odel branched structures described and to compare these w ith the corresponding properties of chemica lly identical, linear polym ers of the same m olecular weights. Th e significance of th is undertaking rests d ire c tly upon the degree to which three essentially independent aspects of the investigation can be pursued in an accurate and in te rn a lly consistent m anner. These are ( 1 ) the establishment of the physical constitutions of the branched samples selected fo r study, (2 ) the deta iled investigation of the solution properties of these, and (3) the evaluation o f the corresponding solution properties of th e ir linear counterparts.
In addition to the analyses of p rim ary measurements u tilized to establish the arch itectural structure of the particu lar m aterials selected fo r investigation, the data presented here include the detailed results of osm otic pressure, lig h t scattering, and viscom etric studies as functions of tem perature in both poor and good solvent m edia. In a separate study pursued b y one of us6 the corresponding solution properties of a (reference) linear polystyrene sample have been extensive ly exam ined. Th e results of th a t investigation, coupled w ith other relevant studies carried out on linear polystyrenes in the course of the present pro ject, provide the principa l basis upon w hich the solution properties of the trifu n c tiona l star structures and th e ir linear analogs of the same m olecular w eight are herein compared. A lso , we have included in our presentation a sum m ary o f results obtained on a m ixtu re of star and linear polystyrenes. These data provide a supplem entary measure of the degree to which various d ilu te solution param eters are affected b y branching of the kind here considered.
The results of our investigation are discussed from the p o in t o f view of various prevalent theoretica l developments appropriate to the analysis of branched polym er systems.
(6) T. A. Orofino, Division of Polymer Chemistry, American Chemical Society, Preprints, 2, 161 (1961); T. A. Orofino and J. W. Mickey, Jr., J. Chem. Phy8., 38, in press.
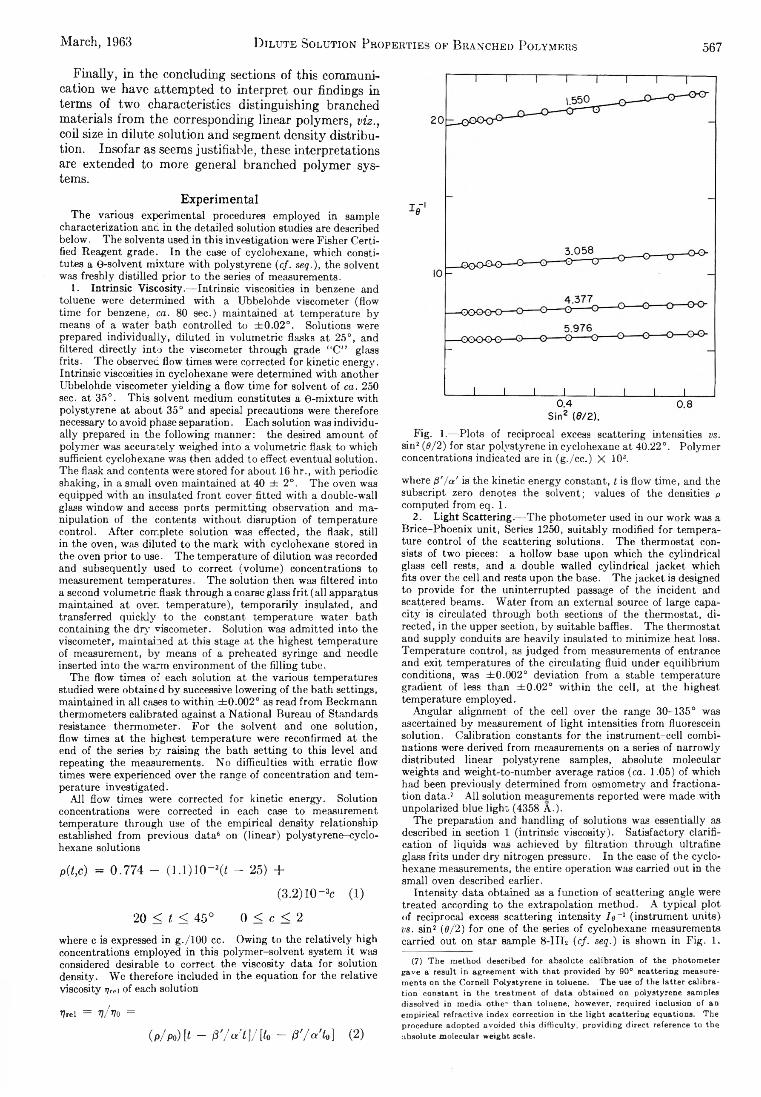
March, 1963 D ilute Solution Properties of Branched Polymers 567
F in a lly , in the concluding sections of th is com munication we have attem pted to in terpret our findings in term s of tw o characteristics distinguishing branched m aterials from the corresponding linear polym ers, viz., coil size in d ilu te solution and segment density d is trib u tion . Insofar as seems justifiab le , these interpretations are extended to more general branched polym er systems.
Experim entalThe various experimental procedures employed in sample
characterization and in the detailed solution studies are described below. The solvents used in this investigation were Fisher Certified Reagent grade. In the case of cyclohexane, which constitutes a O-solvent mixture with polystyrene {cf. seq.), the solvent was freshly distilled prior to the series of measurements.
1 . Intrinsic Viscosity.— Intrinsic viscosities in benzene and toluene were determined with a Ubbelohde viscometer (flow time for benzene, ca. 80 sec.) maintained at temperature by means of a water bath controlled to ±0 .0 2°. Solutions were prepared individually, diluted in volumetric flasks at 25°, and filtered directly into the viscometer through grade “ C” glass frits. The observed flow times were corrected for kinetic energy. Intrinsic viscosities in cyclohexane were determined with another Ubbelohde viscometer yielding a flow time for solvent of ca. 250 sec. at 35°. This solvent medium constitutes a 9-mixture with polystyrene at about 35° and special precautions were therefore necessary to avoid phase separation. Each solution was individually prepared in the following manner: the desired amount of polymer was accurately weighed into a volumetric flask to which sufficient cyclohexane was then added to effect eventual solution. The flask and contents were stored for about 16 hr., with periodic shaking, in a small oven maintained at 40 ± 2°. The oven was equipped with an insulated front cover fitted with a double-wall glass window and access ports permitting observation and manipulation of the contents without disruption of temperature control. After complete solution was effected, the flask, still in the oven, was diluted to the mark with cyclohexane stored in the oven prior to use. The temperature of dilution was recorded and subsequently used to correct (volume) concentrations to measurement temperatures. The solution then was filtered into a second volumetric flask through a coarse glass frit (all apparatus maintained at oven temperature), temporarily insulated, and transferred quickly to the constant temperature water bath containing the dry viscometer. Solution was admitted into the viscometer, maintained at this stage at the highest temperature of measurement, by means of a preheated syringe and needle inserted into the warm environment of the filling tube.
The flow times of each solution at the various temperatures studied were obtained by successive lowering of the bath settings, maintained in all cases to within ±0.002° as read from Beckmann thermometers calibrated against a National Bureau of Standards resistance thermometer. For the solvent and one solution, flow times at the highest temperature were reconfirmed at the end of the series by raising the bath setting to this level and repeating the measurements. No difficulties with erratic flow times were experienced over the range of concentration and temperature investigated.
All flow times were corrected for kinetic energy. Solution concentrations were corrected in each case to measurement temperature through use of the empirical density relationship established from previous data6 on (linear) polystyrene-cyclohexane solutions
p(t,c) = 0.774 - (l.l)1 0 -* (< - 25) +
(3.2)10~3c (1)
20 < t < 45° 0 < c < 2
where c is expressed in g./lOO cc. Owing to the relatively high concentrations employed in this polymer-solvent system it was considered desirable to correct the viscosity data for solution density. We therefore included in the equation for the relative viscosity yrei of each solution
I?rel = V/VO =
(p/p0)[f - P'/a't\/[to - P'/a'to] ( 2 )
Fig. 1 .— Plots of reciprocal excess scattering intensities vs. sin2 {6/2) for star polystyrene in cyclohexane at 40.22°. Polymer concentrations indicated are in (g ./cc.) X 103.
where 0'/a' is the kinetic energy constant, t is flow time, and the subscript zero denotes the solvent; values of the densities p computed from eq. 1 .
2 . Light Scattering. -The photometer used in our work was a Brice-Phoenix unit, Series 1250, suitably modified for temperature control of the scattering solutions. The thermostat consists of two pieces: a hollow base upon which the cylindrical glass cell rests, and a double walled cylindrical jacket which fits over the cell and rests upon the base. The jacket is designed to provide for the uninterrupted passage of the incident and scattered beams. Water from an external source of large capacity is circulated through both sections of the thermostat, directed, in the upper section, by suitable baffles. The thermostat and supply conduits are heavily insulated to minimize heat loss. Temperature control, as judged from measurements of entrance and exit temperatures of the circulating fluid under equilibrium conditions, was ± 0 .0 0 2° deviation from a stable temperature gradient of less than ± 0 .0 2 ° within the cell, at the highest temperature employed.
Angular alignment of the cell over the range 30-135° was ascertained by measurement of light intensities from fluorescein solution. Calibration constants for the instrument-cell combinations were derived from measurements on a series of narrowly distributed linear polystyrene samples, absolute molecular weights and weight-to-number average ratios {ca. 1.05) of which had been previously determined from osmometry and fractionation data.7 All solution measurements reported were made with unpolarized blue light (4358 A.).
The preparation and handling of solutions was essentially as described in section 1 (intrinsic viscosity). Satisfactory clarification of liquids was achieved by filtration through ultrafine glass frits under dry nitrogen pressure. In the case of the cyclohexane measurements, the entire operation was carried out in the small oven described earlier.
Intensity data obtained as a function of scattering angle were treated according to the extrapolation method. A typical plot of reciprocal excess scattering intensity le~ l (instrument units) vs. sin2 {6/2) for one of the series of cyclohexane measurements carried out on star sample 8-III2 (cf. seq.) is shown in Fig. 1 .
(7) The method described for absolute calibration of the photometer gave a result in agreement with that provided by 90° scattering measurements on the Cornell Polystyrene in toluene. The use of the latter calibration constant in the treatment of data obtained on polystyrene samples dissolved in media other than toluene, however, required inclusion of an empirical refractive index correction in the light scattering equations. The procedure adopted avoided this difficulty, providing direct reference to the absolute molecular weight scale.
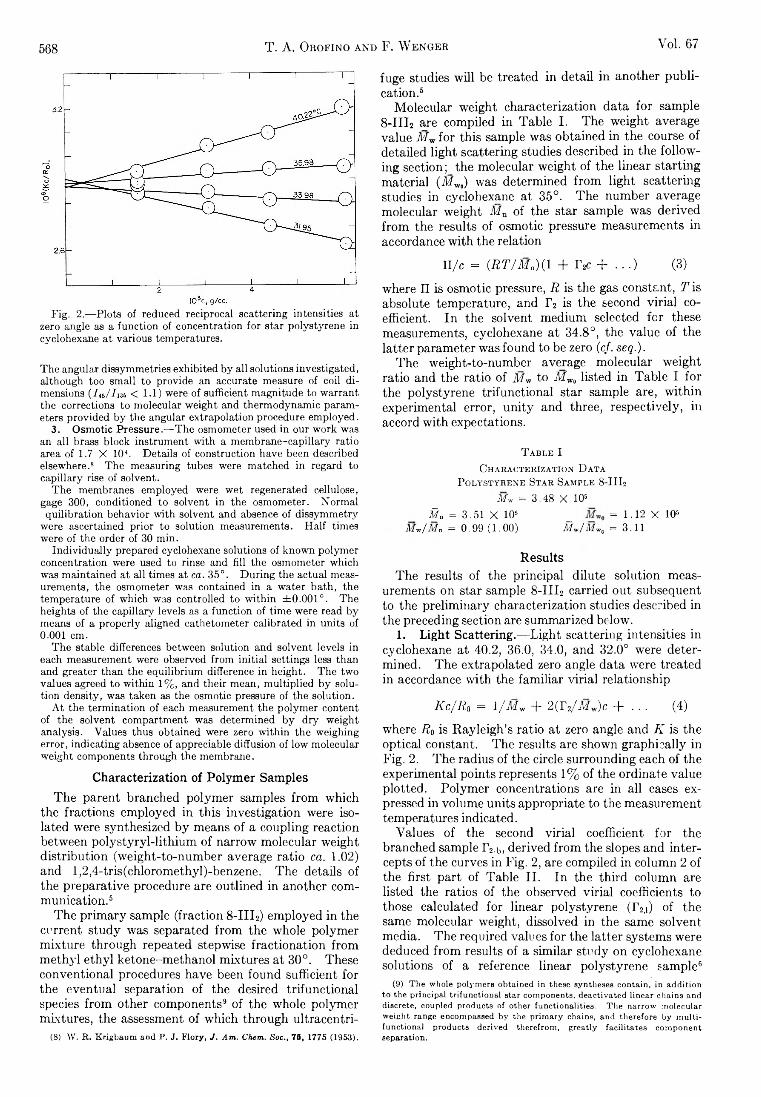
568 T. A. Orofino and F. W enger Voi. 67
Fig. 2.— Plots of reduced reciprocal scattering intensities at zero angle as a function of concentration for star polystyrene in cyclohexane at various temperatures.
The angular dissymmetries exhibited by all solutions investigated, although too small to provide an accurate measure of coil dimensions (A 5//136 < 1 .1 ) were of sufficient magnitude to warrant the corrections to molecular weight and thermodynamic parameters provided by the angular extrapolation procedure employed.
3. Osmotic Pressure.— The osmometer used in our work was an all brass block instrument with a membrane-capillary ratio area of 1.7 X 10⁴. Details of construction have been described elsewhere.8 The measuring tubes were matched in regard to capillary rise of solvent.
The membranes employed were wet regenerated cellulose, gage 300, conditioned to solvent in the osmometer. Normal quilibration behavior with solvent and absence of dissymmetry
were ascertained prior to solution measurements. Half times were of the order of 30 min.
Individually prepared cyclohexane solutions of known polymer concentration were used to rinse and fill the osmometer which was maintained at all times at ca. 35°. During the actual measurements, the osmometer was contained in a water bath, the temperature of which was controlled to within ±0.001°. The heights of the capillary levels as a function of time were read by means of a properly aligned cathetometer calibrated in units of0 .0 0 1 cm.
The stable differences between solution and solvent levels in each measurement were observed from initial settings less than and greater than the equilibrium difference in height. The two values agreed to within 1 %, and their mean, multiplied by solution density, was taken as the osmotic pressure of the solution.
At the termination of each measurement the polymer content of the solvent compartment was determined by dry weight analysis. Values thus obtained were zero within the weighing error, indicating absence of appreciable diffusion of low molecular weight components through the membrane.
Characterization of Polymer SamplesTh e parent branched polym er samples from which
the fractions em ployed in th is investigation were isolated were synthesized b y means of a coupling reaction between p o lys tyry l-lith iu m of narrow m olecular w eight d istribu tion (w eight-to -num ber average ra tio ca. 1 .0 2 ) and l,2 ,4 -tris(chlorom ethyl)-benzene. Th e details of the preparative procedure are outlined in another comm unication . 6
Th e p rim a ry sample (fraction 8 - I I I 2) em ployed in the current study was separated from the whole polym er m ixtu re through repeated stepwise fractionation from m ethyl e th yl ketone-m ethanol m ixtures at 30°. These conventional procedures have been found sufficient fo r the eventual separation of the desired trifunctiona l species from other components9 of the whole polym er m ixtures, the assessment of w hich through u ltracen tri
(8) W. R. Krigbaum and P. J. Flory, J. Am. Chem. Soc., 76, 1775 (1953).
fuge studies w ill be treated in detail in another p u b lication . 6
M olecular w eight characterization data fo r sample8 - I I I 2 are com piled in Table I . The w eight average value M „ fo r th is sample was obtained in the course of detailed lig h t scattering studies described in the fo llow ing section; the m olecular w eight of the linear starting m aterial (M w„) was determ ined from lig h t scattering studies in cyclohexane at 35°. Th e num ber average m olecular w eight Mn of the star sample was derived from the results of osm otic pressure measurements in accordance w ith the relation
n /c = {RT/Mn){l + r 2c + . . . ) (3)
where I I is osm otic pressure, R is the gas constant, T is absolute tem perature, and r 2 is the second v ir ia l coefficient. In the solvent medium selected fc r these measurements, cyclohexane at 34.8°, the value of the la tte r param eter was found to be zero (cf. seq.).
Th e w eight-to-num ber average m olecular w eight ra tio and the ra tio of M „ to M m listed in Ta b le I fo r the polystyrene trifun ction a l star sample are, w ith in experim ental error, u n ity and three, respectively, in accord w ith expectations.
T a b l e IC h a r a c t e r iza t io n D a t a
P o l y s t y r e n e St a r Sa m p le 8-III2
M „ = 3.48 X 10⁵
f „ = 3.51 X 10s _ = 1.12 X 10sMw/Mn = 0.99 (1.00) J i . /M ., = 3.11
ResultsTh e results of the principa l d ilu te solution meas
urements on star sample 8 - I I I 2 carried out subsequent to the p re lim inary characterization studies described in the preceding section are summarized below.
1. Light Scattering.— L ig h t scattering intensities in cyclohexane at 40.2, 36.0, 34.0, and 32.0° were determ ined. The extrapolated zero angle data were treated in accordance w ith the fam ilia r v ir ia l relationship
Kc/Ro = 1 /M „ + 2 ( T 2/ M w)c + . . . (4)
where i ? 0 is R a yle igh ’s ra tio at zero angle and K is the optical constant. The results are shown graph ica lly in F ig . 2. Th e radius of the circle surrounding each of the experim ental points represents 1 % of the ordinate value p lotted . P olym er concentrations are in a ll cases expressed in volum e units appropriate to the measurement tem peratures indicated.
Values of the second v ir ia l coefficient fo r the branched sample r 2,b, derived from the slopes and in te rcepts of the curves in F ig . 2, are com piled in colum n 2 of the first pa rt of Table I I . In the th ird colum n are listed the ratios of the observed v ir ia l coefficients to those calculated fo r linear polystyrene ( r 2il) of the same m olecular w eight, dissolved in the same solvent m edia. Th e required values for the la tte r systems were deduced from results of a sim ilar study on cyclohexane solutions of a reference linear po lystyrene sample6
(9) The whole polymers obtained in these syntheses contain, in addition to the principal trifunctional star components, deactivated linear chains and discrete, coupled products of other functionalities. The narrow molecular weight range encopipassed by the primary chains, and therefore by multifunctional products derived therefrom, greatly facilitates component separation.
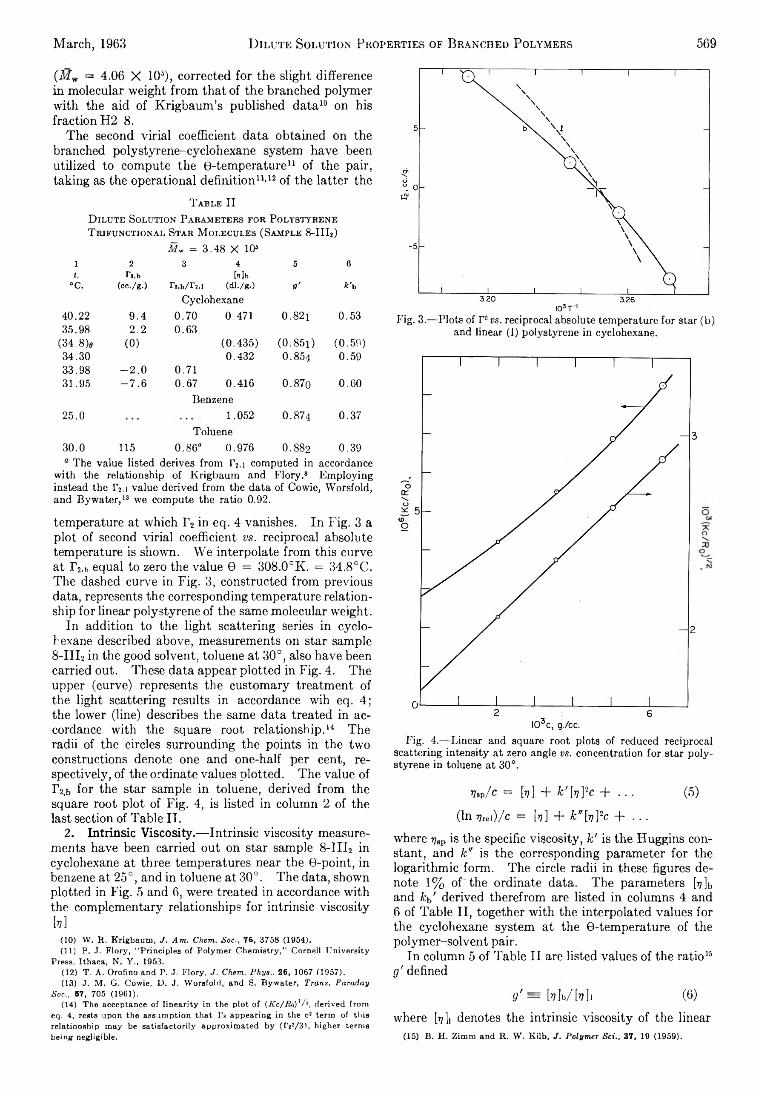
March, 1963 D ilute Solution Properties of Branched Polymers 569
( l f w = 4.06 X 10⁵), corrected fo r the sligh t difference in m olecular w eight from th a t of the branched polym er w ith the aid of K rigbaum ’s published data 10 on his fraction H 2 - 8 .
The second v ir ia l coefficient data obtained on the branched polystyrene-cyclohexane system have been utilized to compute the 9-tem perature 1 1 of the pa ir, taking as the operational de fin ition 1 1 - 12 of the la tte r the
T a b l e I ID il u t e So lu tio n P a r a m e t e r s f o r P o l y s t y r e n e T r if u n c t io n a l St a r M o le c u l e s (S a m p le 8 - I I I2)
# w = 3 .4 8 X 1061 2 3 4 5 6l, r.,b Mb
° c . (cc./g.) r 2,b/r»,i (dl./g.) e' V bCyclohexane
4 0 .2 2 9 .4 0 .7 0 0 .4 7 1 0 .8 2 1 0 .5 33 5 .9 8 2 .2 0 .6 3
(3 4 .8 )9 (0 ) (0 .4 3 5 ) (0 .8 5 1 ) (0 .5 9 )3 4 .3 0 0 .4 3 2 0 .8 5 4 0 .5 93 3 .9 8 - 2 . 0 0 .7 13 1 .9 5 - 7 . 6 0 .6 7 0 .4 1 6 0 ,8 7 o 0 .6 0
Benzene2 5 .0 1 .052 0 .8 7 4 0 .3 7
Toluene3 0 .0 115 0 .8 6 ° 0 .9 7 6 0 .8 8 2 0 .3 9“ The value listed derives from r 2,i computed in accordance
with the relationship of Krigbaum and Flory.8 Employing instead the r2.i value derived from the data of Cowie, Worsfold, and Bywater, 13 we compute the ratio 0.92.
tem perature a t which r 2 in eq. 4 vanishes. In F ig . 3 a p lo t of second v ir ia l coefficient vs. reciprocal absolute tem perature is shown. W e interpolate from th is curve at r 2,b equal to zero the value 9 = 308.0°K. = 34.8°C. The dashed curve in F ig . 3, constructed from previous data, represents the corresponding tem perature re la tion ship fo r linear polystyrene of the same m olecular w eight.
In addition to the lig h t scattering series in cyclo hexane described above, measurements on star sample8 -III* in the good solvent, toluene at 30°, also have been carried out. These data appear plotted in F ig . 4. The upper (curve) represents the custom ary treatm ent of the lig h t scattering results in accordance w ih eq. 4; the lower (line) describes the same data treated in accordance w ith the square root re lationship . 14 The ra d ii of the circles surrounding the points in the tw o constructions denote one and one-half per cent, respectively, of the ordinate values plotted. Th e value of r 2,b fo r the star sample in toluene, derived from the square root p lo t of F ig . 4, is listed in colum n 2 of the last section of Tab le I I .
2. In trin s ic V iscosity.— In trin s ic v iscosity measurements have been carried out on star sample 8 - I I I 2 in cyclohexane a t three tem peratures near the 9 -po in t, in benzene a t 25°, and in toluene at 30°. The data, shown plotted in F ig . 5 and 6 , were treated in accordance w ith the com plem entary relationships fo r in trins ic viscosityM
(10) W. R. Krigbaum, J. Am. Chem. Soc., 76, 3758 (1954).(11) P. J. Flory, “ Principles of Polymer Chemistry," Cornell University
Press, Ithaca, N. Y., 1953.(12) T. A. Orofino and P. J. Flory, J. Chem. Phys., 26, 1067 (1957).(13) J. M. G. Cowie, D. J. Worsfold, and S. Bywater, Trans. Faraday
Soc.., 67, 705 (1961).(14) The acceptance of linearity in the plot of (Kc/Ra)V 2, derived from
eq. 4, rests upon the assumption that Ts appearing in the c2 term of this relationship may be satisfactorily approximated by (ri*/3b higher terms being negligible.
Fig. 3.—Plots of r° vs. reciprocal absolute temperature for star (b) and linear (1) polystyrene in cyclohexane.
Fig. 4.— Linear and square root plots of reduced reciprocal scattering intensity at zero angle vs. concentration for star polystyrene in toluene at 30°.
Vsp/c = [77] + k'[r]]2c + . . . (5)
(In 7?rel)/c = [1 7 ] + fc"[l?]2C + . . .
where J7sp is the specific v iscosity, k' is the H uggins constant, and k" is the corresponding param eter fo r the logarithm ic form . Th e circle ra d ii in these figures denote 1% of the ordinate data. The parameters [17 ]b and kh' derived therefrom are listed in columns 4 and 6 of Table I I , together w ith the interpolated values for the cyclohexane system at the 9-tem perature of the po lym er-so lven t pair.
In colum n 5 of Table I I are listed values of the ra tio 16
g' defined
0 ' = f o ] b/ f o l i (6 )
where [77 ], denotes the in trins ic viscosity of the linear(15) B. H. Zimm and R. W. Kilb, J. Polymer Sci., 37, 19 (1959).
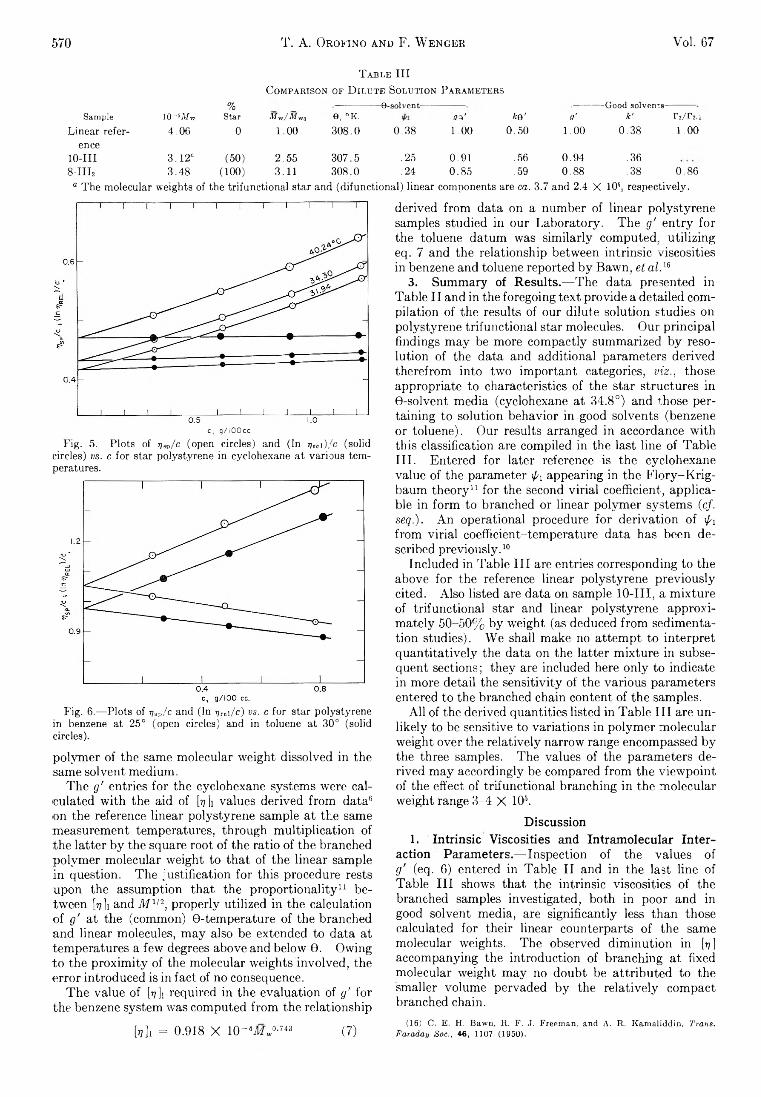
570 T. A. Orofino and F. W enger Vol. 67
T a b l e IIIC o m pa r iso n of D il u t e So lu tio n P a r a m e t e r s
Sample I0 -sitfw%
Star My?/Mw0 0 , °K.— 9-solvent-----
qW ke' q'— Good solvents-
k' r 2/ r 2.iLinear refer- 4.06 0 1 .0 0 308.0 0.38 1 .0 0 0.50 1 .0 0 0.38 1 .0 0
enee10-III 3.12c (50) 2.55 307.5 .25 0.91 .56 0.94 .368-IIL 3.48 ( 10 0 ) 3.11 308.0 .24 0.85 .59 0 .8 8 .38 0 .8 6
a The molecular weights of the trifunctional star and (difunctional) linear components are ca. 3.7 and 2.4 X 10⁵, respectively.
c, g/IOOcc.Fig. 5.— Plots of i)sp/c (open circles) and (In 7jrci)/c (solid
circles) vs. c for star polystyrene in cyclohexane at various temperatures.
Fig. 6 .— Plots of vav/c and (In i;roi/c) vs. c for star polystyrene in benzene at 25° (open circles) and in toluene at 30° (solid circles).
polym er of the same m olecular w eight dissolved in the same solvent medium.
The g' entries fo r the cyclohexane systems were calculated w ith the aid of [i?]i values derived from data6
on the reference linear polystyrene sample at the same measurement tem peratures, through m ultip lica tion of the la tte r b y the square root of the ra tio of the branched po lym er m olecular w eight to th at of the linear sample in question. The ju stifica tion fo r th is procedure rests upon the assumption th a t the p ro p o rtio n a lity 1 1 between [17]i and M 1/2, p roperly u tilized in the calculation o f g' at the (common) 9 -tem perature of the branched and linear molecules, m ay also be extended to data at tem peratures a few degrees above and below 0. O w ing to the p ro x im ity of the m olecular weights involved, the e rro r introduced is in fact of no consequence.
Th e value of [77 ]i required in the evaluation of g' fo r the benzene system was computed from the relationship
[77] 1 = 0.918 X lO ^M J-7*3 (7)
derived from data on a num ber of linear polystyrene samples studied in our Laborato ry. Th e g' e n try fo r the toluene datum was s im ila rly com puted, u tiliz in g eq. 7 and the relationship between in trins ic viscosities in benzene and toluene reported b y Baw n, et al.K
3. Summary of Results.— The data presented in Table I I and in the foregoing te xt provide a detailed comp ila tion of the results of our d ilu te solution studies on polystyrene trifun ction a l star molecules. O ur p rincipa l findings m ay be more com pactly summ arized b y resolu tion of the data and additional parameters derived therefrom in to tw o im portant categories, viz., those appropriate to characteristics of the star structures in 0 -solvent media (cyclohexane at 34.8°) and those perta in ing to solution behavior in good solvents (benzene or toluene). O ur results arranged in accordance w ith th is classification are com piled in the last line of Tab leI I I . Entered fo r la te r reference is the cyclohexane value of the param eter xpi appearing in the F lo r y -K r ig - baum th e o ry 1 1 fo r the second v ir ia l coefficient, applicable in form to branched or linear polym er system s (cf. seq.). A n operational procedure fo r de riva tion of \p\ from v ir ia l coefficient-tem perature data has been described p reviou sly . 10
Included in Table I I I are entries corresponding to the above fo r the reference linear polystyrene previously cited. A lso listed are data on sample 1 0 -III, a m ixtu re of trifunctiona l star and linear polystyrene approxim ately 50-50% b y w eight (as deduced from sedimentation studies). W e shall make no attem pt to in te rp ret q u a n tita tive ly the data on the la tte r m ixtu re in subsequent sections; th ey are included here o n ly to indicate in more detail the se n sitiv ity of the various parameters entered to the branched chain content of the samples.
A ll of the derived quantities listed in Table I I I are unlik e ly to be sensitive to variations in polym er m olecular w eight over the re la tive ly narrow range encompassed b y the three samples. The values of the param eters derived m ay accordingly be compared from the view poin t of the effect of trifun ction a l branching in the m olecular w eight range 3 -4 X 10B.
Discussion1. Intrinsic Viscosities and Intramolecular Inter
action Parameters.— Inspection of the values of g' (eq. 6 ) entered in Table I I and in the last line of Table I I I shows th at the in trins ic viscosities of the branched samples investigated, both in poor and in good solvent m edia, are sign ifican tly less than those calculated fo r th e ir linear counterparts of the same m olecular weights. The observed d im inution in [77] accom panying the in troduction of branching a t fixed m olecular w eight m ay no doubt be a ttribu ted to the sm aller volum e pervaded b y the re la tive ly com pact branched chain.
(16) C. E. H. Bawn, R. F..J. Freeman, and A. R. Kamaliddin, Trans. Faraday Soc.f 46, 1107 (1950).
March, 1963 D ilute Solution Properties of Branched Polymers 571
A n im portant theoretical treatm ent of the viscosity ra tio g' of certain branched polym er systems was presented a few years ago b y Zim m and K ilb . 15 T h e y calculated g' fo r various uniform and irregu la r starshaped molecules obeying random flig h t statistics and, in addition, observed th a t the values obtained could be reasonably w ell approxim ated b y go1/2, the random fligh t (9 -solvent) ra tio of root-m ean-square ra d ii of g y ration of the branched molecules and linear molecules of the same m olecular w eights . 17 Thus, on the basis of th e ir com putations the authors concluded, w ith w hat appears to be a justifiab le generalization, th a t fo r a ll star-shaped molecules the particu la r va rian t of our eq. 6
appropriate to 0 -so lvent m ixtures m ay be e xp lic itly expressed
g& = Me.b/hle.i ^ ffe1/2 (8)F o r the special class of /.(-functional star molecules of uniform branch length, the param eter ge is given b y the expression 17 ’ 18
ge = 3/p - 2/p2 (9)
I t is of interest to note th a t the value of ge ' (0.85) determined in the present investigation is in fa ir agreement w ith either the calculated ra tio (0.90) given b y Zim m and K ilb fo r these trifu n ction a l star structures or, in accordance w ith the approxim ation suggested b y them , the corresponding value of ge112 (0.882) computed from eq. 9. Th e observed discrepancy between the results of experim ent and either of the theoretical predictions, however, is probab ly sign ificant. W e w ould conclude on th is basis th a t in the case of t r ifunctional star molecules the Z im m -K ilb treatm ent somewhat underestimates the effect of branching on viscom etric properties.
The values of ge' listed in Tables I I and I I I fo r the good solvent systems polystyrene-benzene and toluene (0.87-0.88) can be considered to lie in excellent agreement w ith the theoretical q u a n tity gein if, as im plied b y Zim m and K ilb , eq. 8 , unrestricted to 9 -solvent conditions, m ay be extended to good solvent data as w ell. Th e foregoing extension, however, neglects the possib ly im portant influence of re la tive intram olecular expansion of branched and linear polym ers in good solvent media (c/. seq.). W e w ould tend to regard the form al coincidence of g' and ge112 observed in these cases as fortu itous, em phasizing instead the more significant ind ication from our studies, viz., th at g' fo r star structures is augmented b y increase in solvent power of the m edium.
A n alternate theoretical expression fo r g'
g' = [n W M i^ g « * ( 1 0 )
supposedly applicable to a ll branched structures in poor and good solvents, was o rig in a lly proposed a num ber of years ago . 3 ’ 1 1 T h is form ulation follow s b y stra igh tforward generalization of the F lo ry -F o x equation fo r linear polym ers 19
fob = 6 3/2$ (? )3/2/ T f ( 1 1 )
where s2 is the m ean-square radius of gyra tio n of the(17) B. H. Zimm and W. H. Stoekmayer, J . Chem. Phys., 17, 1301
(1949).(18) T. A. Orofi-no, Polymer, 2, 305 (1961).(19) P. J. Flory and T. G Fox, J . Am. Chem. S o c., 73, 1904 (1951).
polym er molecule (not necessarily dissolved in a 9 -so l- vent) and $ is a constant stipulated to be independent of m olecular w eight, solvent and tem perature. The relationship ( 1 1 ) has enjoyed considerable success in correla tin g the v iscosity behavior of linear polym ers; its proposed extension to branched systems m erely involves identification of s2 w ith the mean square radius of the branched m olecule, thus leading to the expression fo r g' given in eq. 10. U n fortu n a te ly, however, the la tte r convenient relationship has not been borne out b y experim ental data obtained on branched systems to date. Th e results of the present measurements are likewise in disagreement w ith eq. 1 0 , as is evident, fo r exam ple, b y com parison of our ge' value w ith f/ e 3 /2 (0 .6 8 6 ) computed from eq. 9.
N otw ithstanding the discrepancies noted, the extension of eq. 1 1 to branched systems involves a m ost reasonable and singu larly a ttractive supposition; nam ely, th a t the in trins ic viscosity of a branched polym er is proportional to some measure of the m olecular volum e. I f we accept the form al a p p lica b ility of eq. 11 to linear polym ers, together w ith its logica l extension to branched systems, fa ilure of the relationship 1 0 to describe adequately experim ental results m ust arise from a dependence of the viscosity constant $ on branching. The la tte r presum ably has its o rig in in the effect of branched structure on the segment density d istribu tion of the polym er coil, affecting the flow behavior of solvent through the m olecule, and thus the relationship between (s2) 1 / 2 and the effective hydrodynam ic radius . 4 20
T h is notion is not new, of course, but we consider it w orthw hile to pursue the argum ent in somewhat more quantitative fashion in the analysis of our v iscosity data.
W e assume th at (1) the in trin s ic v iscos ity of any branched structure m ay be expressed b y an equation of the form ( 1 1 ) w ith the coefficient $ replaced b y F b, now regarded as a function of chain branching. W e assume fu rth e r th a t (2 ) the value of % does not depend on the solvent in w hich a p articu la r branched molecule is dissolved. Thus, as in the case of linear polym ers, augm entation of chain dimensions resulting from segm ent- solvent interactions are assumed to have negligible effect on the p ro p o rtion a lity between (s2) - /2 and h y drodynam ic radius . 2 1 On the basis of assum ption (1) we a rrive a t the revised version 22 of eq. 1 0
g' = ($b/$i)[('se"2)b3/V (i"2)i3/2K«b3/a i3) (12)
= 0e3/2($b/$i)(«b7«i3)where a 3 fo r the branched (b) or linear (1 ) molecule expresses the expansion of m olecular dim ensicns from the random flig h t values, denoted b y the subscript 0 .
W ith assumption (2) we m ay define fo r a given branched molecule dissolved in a non-ideal solvent
M b/h kb = «b3 ^ ( ¡ V /2/( 7 ) b 3/2 (13)(20) F. Bueche, J. Polymer Sci., 41, 549 (1959).(21) Although it is not required in the present application, an additional
approximation might be proposed, namely that (3) $b is constant with respect to systematic variations in a suitable structural parameter characterizing a homologous branched polymer series, which variations do not seriously alter the form of the segment density profile of the molecule. Examples are variations in branch length of p-functional star molecules and variation in backbone length of regular comb polymers (see ref. 18).
(22) G. C. Berry (Thesis, University of Michigan, Ann Arbor, Michigan (I960)) has employed a similar relation in the interpretation of his data on comb-branched polyvinyl acetate.
572 T. A. ÖROFINO AND F. WENGER Vol. 67
where a ll quantities refer to the same polym er molecu lar w eight. Equation 13 is identical in form w ith the corresponding expression fo r linear polym ers . 1 1
A s pointed out earlier, our data on polystyrene star molecules indicate a sligh t increase in the viscosity ra tio g' w ith solvent power of the m edium . In the preceding developm ent leading to eq. 12 and 13 we have a ttribu ted th is varia tion in g' to concom itant variations in the ra tio ab3/a i3- T h is is more d ire ctly evident from inspection of eq. 1 2 in w hich g0 3 /2 and the $ ra tio contained therein are, b y defin ition or assumption , taken to be independent of solvent power.
Values of ab 3 fo r the various branched systems investigated, calculated in accordance w ith eq. 13, are listed in Table IV . W e shall have occasion to refer to these in a subsequent section. A lso listed in Tab le IV are values of the ra tio «b 3/ « ]3, w hich, in accordance w ith eq. 1 2 , m ay be d ire c tly obtained from the equivalent ra tio g'/g& ■ A lthough in a ll cases the expansion factor ra tio departs o n ly s lig h tly from u n ity , it is of interest to note th at the deduced re lative change in coil expansion of the branched polym er in the good solvents benzene and toluene is in the direction indicated b y th e o ry . 23
Th e suppositions involved in the foregoing, provisional in terpretation of our in trins ic viscosity data embodied in the eq. 12 and 13 could be subjected to direct experim ental test. F o r th is purpose lig h t scattering
T a b l e IVI n tr a m o l e c u l a r E x p a n s io n F actor s f o r P o l y st y r e n e
T r if u n c t io n a l St a r M olecu les
Solvent medium«D3
(eq. 13)Cyclohexane, 31.95° 0.956 1 .0 2
33.98 (0.989)34 .8e 1 .0 0 0 1 .0 035.98 (1.018)40.22 1.083 0.97
Toluene, 30.0° 2.24 1.04Benzene, 25.0° 2.42 1.03
ra d ii of gyra tion , coupled w ith [77] values, w ould be required fo r evaluation of 4>b. Because of the lack of sufficient precision otherwise associated w ith determ ination of the form er quantities, such measurements would most p ro fita b ly be confined to w ell characterized star molecule samples of substantia lly h igher m olecular weights than those here considered. In defense of the proposals at the present tim e, we should like to po in t out that mere acceptance of the p rop ortion a lity of [17 ]b to the cube of a coil dim ension, coupled w ith the predictions of the Z im m -K ilb re lation (8 ) w ith w hich our 9 -solvent data are in sem iquantitative accord, unequivoca lly enta il a substantial m odification of $b over l y F o r star molecules th is takes the form <hb ~ $7/ge.
In conclusion of th is section, we m ay make some remarks in regard to the values of the H uggins constant k' (eq. 5) listed in Tables I I and I I I .
O u r viscosity data in the good solvent media benzene and toluene y ie ld values of k' experim entally ind is-
(23) An earlier calculation (a) M. Fixman, J. Chem. Phys., 23, 1656 (1955), of thé initial effect of segment excluded volume on coil dimensions of tetra functional star molecules has led to the conclusion that a is diminished by branching; (b) T. A. Orofino (to be published) recently has revised and extended the development cited to the general class of p-functional star molecules. The results, contrary to the above, support the notion that a is augmented by star branching for all values of p; see also: (c) O. B.Ptitsyh, J . Gen. Chem. U.S.S.R., 29, 396 (1955), and (d) W. R. Krigbaum and Q. A. Trementozzi, J. Polymer Sci., 28, 295 (1958).
tinguishable from those obtained in our Laboratories and reported in the lite ra tu re 1 1 fo r linear polystyrene in the same or comparable m edia. Thus, we have found no ind ication th a t k' in good solvents is sign ifican tly affected b y branching of the type considered here.
O ur v iscosity data obtained in the cyclohexane ©-solvent m ixture y ie ld a value of k' more o r less com parable to those observed6 24 fo r cyclohexane solutions of the linear polym er. Th e value 0.59 listed in Ta b le I I I is, however, s lig h tly larger than the value 0.50 found in our Laboratories fo r the corresponding linear p o ly styrene-cyclohexane system . A lth ough curvature in the rfsp/c vs. c p lots in each case renders specification of k' somewhat uncertain, the difference observed proba b ly is significant, inasmuch as the viscom eter, procedure, and treatm ent of data were identical fo r both the branched and linear systems compared. W e conclude on th is basis th a t fo r polystyrene star m olecules, kr near 0 is augmented b y branching.
2. Second Virial Coefficients and Intermolecular Interaction Parameters.— Th e second v ir ia l coefficient r 2 appearing in eq. 3 fo r the osm otic pressure and in eq. 4 fo r reciprocal lig h t scattering in ten s ity, each of w hich is equally applicable to linear or branched polym ers, is a measure of the extent of interm olecular segm ent- segment interactions in d ilute solution. In recent years several theories re lating r 2 fo r linear polym ers to m olecular w eight, co il size and in teraction param eters have been advanced. Some of these developm ents also have been extended to branched polym er systems, the application of w hich to our relevant d ilute solution data provides the subject m atter of th is section. Values of r 2b obtained in the present studies on branched p o ly mers are listed in Table I I . In the analyses fo llow ing, it w ill be convenient to consider separately the results for the cyclohexane (poor solvent m edia) and the to lu ene (good solvent m edium) systems.
Th e data obtained on sample 8 - I I I 2 in cyclohexane at various tem peratures constitute a lim ited , b u t system atic study of the second v ir ia l coefficient over a narrow range of polym er interactions w hich includes the © -solvent conditions established here. O n th is account, it is of interest to compare our data w ith the predictions of some exact theoretical developm ents applicable over a restricted range of segment excluded volum e. Th e results of the exact treatm ent fo r the second v ir ia l coefficient of branched or linear polym ers4' 26 m ay be expressed in the general form
r 2 = (W 8M /2M o2)(1 + b,z + . . . ) (14)
where M and M 0 are polym er and segment m olecular w eight, respectively, and N is Avoga dro ’s num ber. Th e param eter /3 represents segment excluded volum e, equal to zero fo r © -solvent m ixtures and increasing in value w ith increasing segment in teractions; the param eter z is defined in terms of ¡3 through the relationship
0 = /3(M/M0) 1/2 (3/2x602) !/j (15)
where b0 is the length of one segment. 26
(24) T. G Fox and P. J. Flory, J. Am. Chem. Soc., 73, 1915 (1951).(25) B. H. Zirnm, J. Chem. Phys., 14, 164 (1946).(26) In applications to real systems. Mo and 60 refer to the statistical or
equivalent polymer segment defined in part through the familiar random flight relationship for linear polymers so2 = (M/Mo)(bo2/6). The left- hand side of this equation represents, for any given polymer, a definite, measurable quantity whose value is independent of the foregoing theoretical considerations.
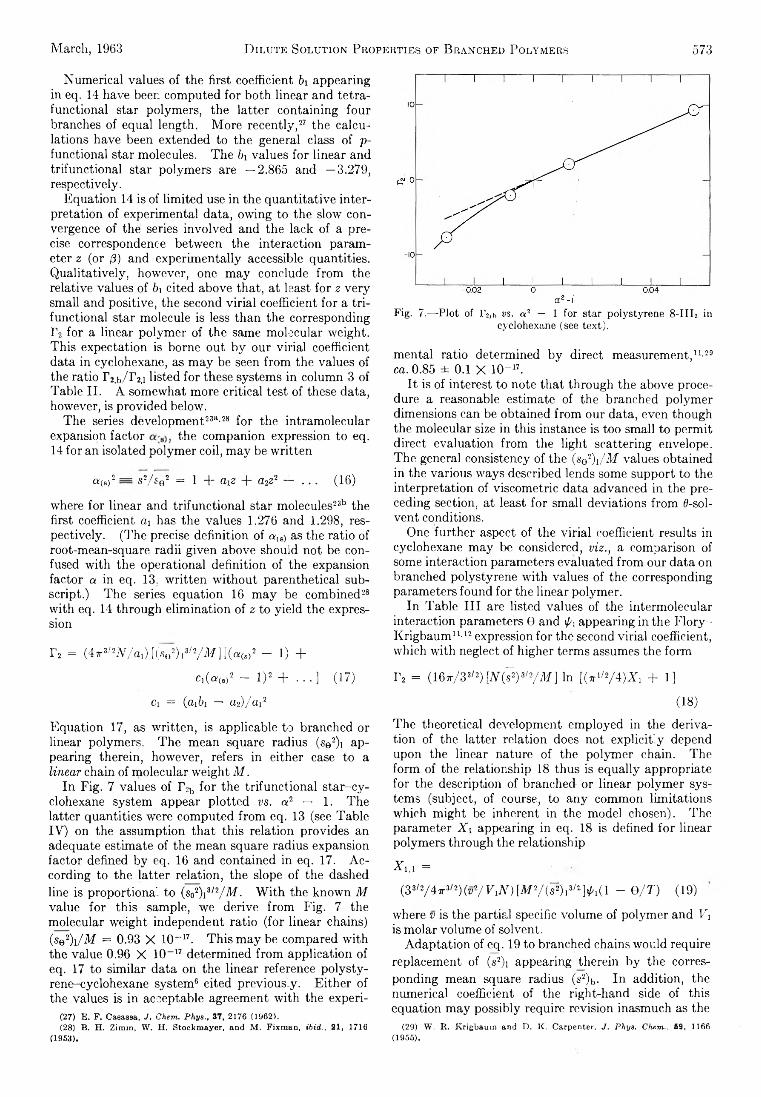
March, 1963 D ilute Solution Properties of Branched Polymers 573
N um erical values of the first coefficient hi appearing in eq. 14 have been computed fo r both linear and te tra - functional star polym ers, the la tte r containing fou r branches of equal length. M ore recen tly , 27 the calculations have been extended to the general class of p- functional star molecules. Th e hi values fo r linear and trifun ction a l star polym ers are — 2.865 and — 3.279, respectively.
Equation 14 is of lim ited use in the q uantita tive in te rpretation of experim ental data, ow ing to the slow convergence of the series involved and the lack of a precise correspondence between the in teraction param eter z (o r j8 ) and experim entally accessible quantities. Q u a lita tive ly , however, one m ay conclude from the re lative values of hi cited above th at, at least fo r z ve ry small and positive, the second v ir ia l coefficient fo r a tr ifunctional star m olecule is less than the corresponding r 2 fo r a linear polym er of the same m olecular w eight. T h is expectation is borne out b y our v ir ia l coefficient data in cyclohexane, as m ay be seen from the values of the ra tio r 2ib/ I\ i listed fo r these systems in colum n 3 of Table I I . A somewhat more critica l test of these data, however, is provided below.
The series developm ent2311' 28 fo r the intram olecular expansion factor the com panion expression to eq. 14 fo r an isolated polym er coil, m ay be w ritte n
a ( s ) 2 = s2/se2 = 1 -f- aiZ + a2z2 — . . . (16)
where fo r linear and trifu n ction a l star m olecules23b the first coefficient a\ has the values 1.276 and 1.298, respective ly. (Th e precise defin ition of a lS) as the ra tio of root-m ean-square ra d ii given above should not be confused w ith the operational defin ition of the expansion factor a in eq. 13, w ritte n w ith ou t parenthetical subscrip t.) Th e series equation 16 m ay be com bined28
w ith eq. 14 through elim ination of z to y ie ld the expression
r 2 = (47r3/W / a 1) [ ( V ) . 3/2/ M ][(a ( s ) 2 - 1) +
Cl(a (8 )2 - l ) 2 + . . . ] (17)
ci = (a A — a2)/ a i2
Equation 17, as w ritte n , is applicable to branched or linear polym ers. Th e mean square radius (se2)i appearing therein, however, refers in either case to a linear chain of m olecular w eight M.
In F ig . 7 values of r 2b fo r the trifun ction a l s ta r-c y clohexane system appear p lotted vs. a 2 — 1. The la tte r quantities were com puted from eq. 13 (see TableIV ) on the assum ption th a t th is re lation provides an adequate estim ate of the mean square radius expansion factor defined b y eq. 16 and contained in eq. 17. A c cording to the la tte r re lation, the slope of the dashed line is proportional to (s02) i3/2/M . W ith the known M value fo r th is sample, we derive from F ig . 7 the m olecular w eight independent ra tio (fo r linear chains) (se2) i/M = 0.93 X 1 0 " 17. T h is m ay be compared w ith the value 0.96 X 10~ 17 determ ined from application of eq. 17 to sim ilar data on the linear reference p o lys ty rene-cyclohexane system 6 cited previously. E ith e r of the values is in acceptable agreement w ith the experi-
(27) E. F. Casassa, J. Chem. Phys., 37, 2176 (1962).(28) B. H. Zimin, W. H. Stockmayer, and M. Fixman, ib id ., 21, 1716
(1953).
Fig. 7.— Plot of r 2,b vs. a 2 — 1 for star polystyrene 8-III2 in cyclohexane (see text).
m ental ra tio determ ined b y d irect measurement, 1 1 ' 29
ca. 0.85 ± 0.1 X 10“ 17.I t is of interest to note th a t through the above proce
dure a reasonable estimate of the branched polym er dimensions can be obtained from our data, even though the m olecular size in th is instance is too sm all to perm it d irect evaluation from the lig h t scattering envelope. The general consistency of the (se2)i/M values obtained in the various w ays described lends some support to the in terpretation of viscom etric data advanced in the preceding section, at least fo r sm all deviations from ^-solvent conditions.
One fu rther aspect of the v ir ia l coefficient results in cyclohexane m ay be considered, viz., a com parison of some interaction parameters evaluated from our data on branched polystyrene w ith values of the corresponding parameters found fo r the linear polym er.
In Table I I I are listed values of the interm olecular in teraction parameters 9 and \pi appearing in the F lo r y - K rigbaum 1 1 - 12 expression fo r the second v ir ia l coefficient, which w ith neglect of h igher term s assumes the form
r 2 = (16tt/ 33/2)[V (7 2) 3/2/ M ] In [(ttiI2/4)X1 + 1]
(18)
Th e theoretical developm ent em ployed in the derivation of the la tte r re lation does not e xp lic itly depend upon the linear nature of the polym er chain. The form of the relationship 18 thus is equally appropriate for the description of branched or linear polym er systems (subject, of course, to any common lim itations which m ight be inherent in the model chosen). The param eter Xi appearing in eq. 18 is defined fo r linear polym ers through the relationship
V i,: =
(3 3/2/47r3/2) (v1/ V iA r) [M:j (s2) i3 /2 Ji/'dl - 0/7 ') (19)
where v is the partia l specific volum e of polym er and Vi is m olar volum e of solvent.
Adaptation of eq. 19 to branched chains would require replacem ent of (s2)i appearing therein b y the corresponding mean square radius (s2)b. In addition, the num erical coefficient of the right-hand side of th is equation m ay possibly require revision inasmuch as the
(29) W. R. Krigbaum and D. K. Carpenter, J. Phys. Chem., 59, 1166 (1955).
574 T. A. Orofino and F. W enger Vol. 67
value of Xi depends upon the d istribu tion of segments about the m olecular center of mass adopted fo r any p articu la r structure.
Th e parameters 0 and pj appearing in eq. 18 and 19, and in the analogous form of the la tte r fo r branched polym ers, are p rim a rily dependent upon segment-solvent interactions. Thus, to a first approxim ation, th e ir m agnitudes should not reflect details of the o ver-a ll m olecular architecture. The values of 0 found for polystyrene-cyclohexane m ixtures (308.0°K.), fo r both branched and linear systems, are in accord w ith th is expectation. W h ile it is conceivable th a t the d isp a rity in values of the param eter pi listed in Table I I I is a ttrib utable to experim ental error, the p o ss ib ility of sign ificant second-order effects of structure cannot be discounted.
W e consider next the single v ir ia l coefficient datum fo r star sample 8 - I I I 2 in the good solvent, toluene at 30°. A n estimate of the value of r 2,b/ r 2|i to be expected for th is system m ay be obtained from the relations 18 and19, w ith suitable revision of the la tte r to take in to account the branched nature of the chains. F o r th is purpose, we m erely replace (s2)i appearing therein b y the corresponding mean square radius of the star molecule (the sole m odification w hich w ould result if, in the analogous deriva tion 4 of X i,b fo r branched chains, the segment density d istribu tion were represented b y a single gaussian function, norm alized to the correct radius of gyra tio n ). W ith the additional, im p lic it assum ption th at 0 and pi appearing in the foregoing relations assume identical values fo r toluene solutions of branched and linear polystyrene, we have
r 2 ,b/ r 2,i = <7e3/2 ( « 3 :3),b/a3(3),,) X
{In [ {^ / 4 )X i ,h + l]}/ {ln [0 r> '* / 4 )X u + 1]}
X lA/XlA = ffe -3/2 ( « 3(s )V * 3Cs),b) (20)
A ll quantities fo r the tw o structures refer of course to the same polym er m olecular w eight. The param eter X i,i m ay be conveniently estim ated through the correspondence
X i.i = 2 ( a 2(s),i - 1 ) ~ 2 [ ( f o ] I/ f o ]e ,1) 3/2 - 1 ] (2 1 )
obtained b y com bination of eq. 19 w ith the F lo ry relationship fo r the expansion factor of linear chains . 30
Th e in trins ic v iscosity ra tio appearing above m ay be computed from data on linear polystyrene cited earlier. We calculate fo r X 14 the value 3 1 1.35. Th e q u a n tity X i ib m ay now be computed from the second of the eq.2 0 , since the other parameters appearing therein can again be deduced from data previously given (e.g., taking fo r “ 3(s),b the in trins ic viscosity ra tio listed in TableIV ) . W e find fo r X i,b the value 1.89. Th e calculated ra tio r 2fb/ r 2ii now follows d ire c tly from the first of the eq. 20. Th e value arrived at in th is m anner, 0.93, stands in good agreement w ith the corresponding ra tio obtained d ire c tly from experim ental data (see last entr y , colum n 3., Table I I , and its footnote). W e conclude th a t the observed d im inution in r 2 w ith branching in good solvents observed in the present study can be sa tis fa cto rily accounted fo r b y straightforw ard exten-
(30) P. J. Flory, J. Chem. Phys., 17, 303 (1949).(31) About the same value may be derived through direct application
of eq. 18 and 19 to pertinent dilute solution data on linear polystyrene- toluene solutions (see ref. 12).
sion of the F lo ry-K rig b a u m theory. A s view ed in th is com parative connection, however, other treatm ents27
a p propria te ly extended to branched system s m ay be equa lly applicable.
Conclusions
W e have presented in th is com m unication the results of pertinent experim ental measurements designed to elucidate some of the d ilu te solution characteristics of polystyrene trifun ction a l star molecules. P a rticu la r emphasis has been directed to com parison of the observed solution properties w ith those of linear molecules of the same chemical com position and polym er m olecula r w eight. W ith an object tow ard extending the app lic a b ility of our results to more general systems, we shall now endeavor to in terpret the various differences and sim ilarities noted in terms of tw o aspects of prim e im portance in the d istinction between linear molecules and any branched structures, viz., coil size and segment density d istribu tion in d ilute solution. I t w ill also be of interest to compare the results of our study w ith some of those reported fo r other branched polym er systems.
One im portant conclusion drawn from the present investigation is, of course, the significant d im inution of [?7 ] accom panying in troduction of trifu n ction a l branching in polystyrene. A considerable am ount of experim ental data3- 2 2 '32 attests to the a p p lica b ility of th is general correspondence in regard to other branched polym ers and th e ir linear analogs. A lth o u gh the decrease in [77] w ith branching at fixed m olecular w eight observed in the present investigation m ay be re a d ily a ttributed to a concom itant reduction in hydrodynam ic volum e of the m olecule, the ra tio of the la tte r to the cube of the radius of gyra tion differs fo r the branched and linear polym ers compared. In th is respect, the significant role of segment density d istribu tion determ ining the ra tio in each case is p a rticu la rly emphasized. On theoretical grounds, the effect of branching is perhaps most clearly illustrated b y the Z im m -K ilb re lationship which requires a substantial m odification in the value of <E> if the F lo ry Fox equation is to be fo rm a lly extended to star polym er systems.
W e have chosen to in terpret our v iscosity results, fo r both poor and good solvent m edia, in accordance w ith a m odified form of the F lo ry -F o x equation in w hich the param eter 4> is regarded as a specific function of chain branching. The adequacy of the assum ption th a t 4>b is independent of the solvent power of the m edium , adopted in subsequent estim ations of the expansion factor a (s),b, cannot be assessed independently from our studies. Values of the la tte r param eter deduced in th is m anner from our cyclohexane data near the 0 -tem perature, however, are consistent w ith the predictions of the exact series developm ents fo r sm all excluded volum e. W e conclude on th is basis th a t the ra tio ( h ]b/ [’?]e,b)1/3J in analogy w ith the corresponding expression fo r linear chains— and to the same degree of approxim ation33— m ay be retained as a sa tisfactory measure of the radius of gyra tio n expansion facto r fo r star molecules. Since the assumptions invo lved in a r-
(32) M. Cantow, G. Meyerhoff, and G. V. Schulz, Makromol. Chem., 49, 1 (1961).
(33) The compatibility of values of the ratio (eQ2)i/M derived from our data on branched and linear polymers in accordance with the exact series treatments is preserved, if, as recently suggested for linear molecules (M. Kurata, H. Yamakawa, and H. Utiyama, Makromol. Chem., 34, 139 (1959)), the ratio [17] / [j; ] © in each case is identified with a ( 8) 2*43.
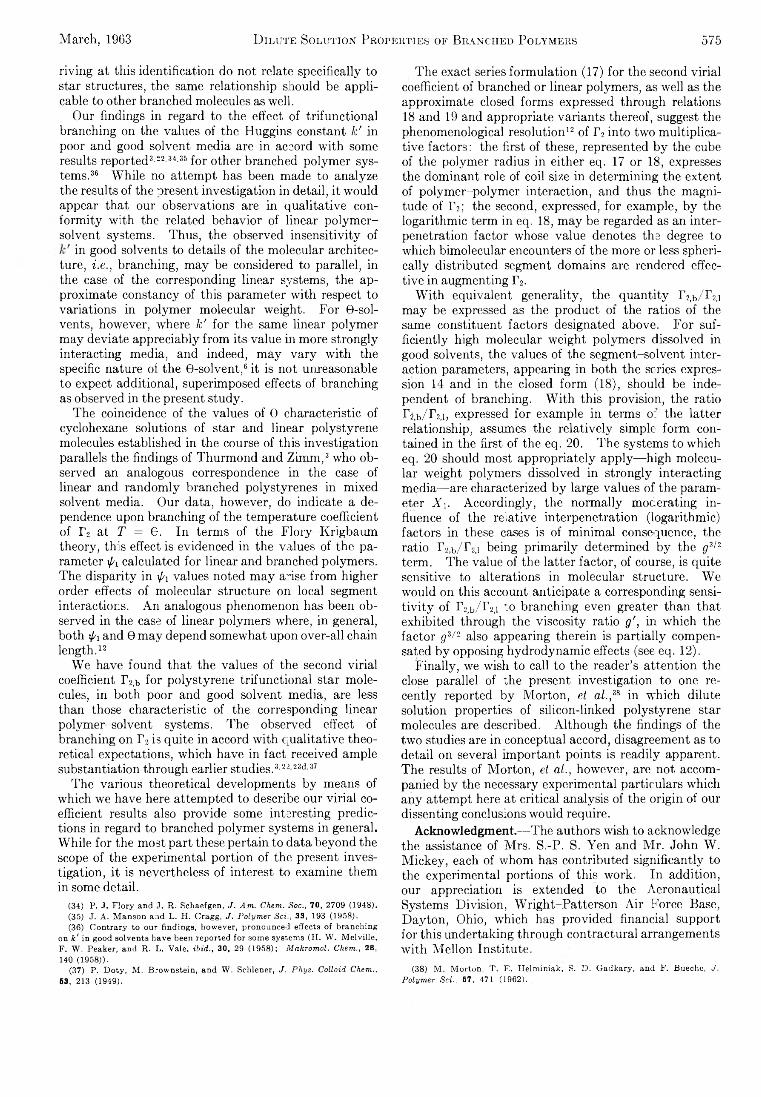
March, 1963 D ilute Solution Properties of Branched Polymers 575
riv in g at th is identification do not relate specifica lly to star structures, the same relationship should be applicable to other branched molecules as w ell.
O ur findings in regard to the effect of trifun ction a l branching on the values of the H uggins constant k' in poor and good solvent media are in accord w ith some results reported 3’ 2 2 ' 34’ 35 fo r other branched polym er system s. 36 W h ile no attem pt has been made to analyze the results of the present investigation in detail, it would appear th at our observations are in q ua lita tive confo rm ity w ith the related behavior of linear p o lym e r- solvent systems. Thus, the observed in se n sitiv ity of
in good solvents to details of the m olecular architecture, i.e., branching, m ay be considered to parallel, in the case of the corresponding linear systems, the approxim ate constancy of th is param eter w ith respect to variations in polym er m olecular w eight. F o r 9-solvents, however, where k' fo r the same linear polym er m ay deviate appreciably from its value in more strong ly in teracting m edia, and indeed, m ay v a ry w ith the specific nature of the 0 -so lven t, 6 it is not unreasonable to expect additional, superimposed effects of branching as observed in the present study.
The coincidence of the values of 0 characteristic of cyclohexane solutions of star and linear polystyrene molecules established in the course of th is investigation parallels the findings of Thurm ond and Z im m , 3 who observed an analogous correspondence in the case of linear and random ly branched polystyrenes in m ixed solvent m edia. O ur data, however, do indicate a dependence upon branching of the tem perature coefficient of I ’2 at T = G. In term s of the F lo ry-K rig b a u m theory, th is effect is evidenced in the values of the param eter \pi calculated fo r linear and branched polym ers. The d isp a rity in xp, values noted m ay arise from higher order effects of m olecular structure on local segment interactions. A n analogous phenomenon has been observed in the case of linear polym ers where, in general, both xpi and 9 m ay depend somewhat upon over-a ll chain length . 12
W e have found th a t the values of the second v ir ia l coefficient F 2,b fo r po lystyrene trifu n ction a l star molecules, in both poor and good solvent m edia, are less than those characteristic of the corresponding linear po lym er-solvent systems. Th e observed effect of branching on F 2 is quite in accord w ith qua lita tive theoretical expectations, w hich have in fact received ample substantiation through earlier studies . 3’ 2 2 ’ 2 3 d ’ 37
Th e various theoretical developm ents b y means of which we have here attem pted to describe our v ir ia l coefficient results also provide some interesting predictions in regard to branched polym er systems in general. W hile fo r the m ost part these pertain to data beyond the scope of the experim ental portion of the present investiga tion , it is nevertheless of interest to examine them in some detail.
(34) P. J. Flory and J. R. Schaefgen, J. Am. Chem. Soc., 70, 2709 (1948).(35) J. A. Manson and L. H. Cragg, J. Polymer Sci., 33, 193 (1958).(36) Contrary to our findings, however, pronounced effects of branching
on k' in good solvents have been reported for some systems (H. W. Melville, F. W. Peaker, and R. L. Vale, ibid., 30, 29 (1958); Makromol. Chem., 28, 140 (1958)).
(37) P. Doty, M. Brownstein, and W. Schlener, J. Phys. Colloid Chem., 53, 213 (1949).
Th e exact series form ulation (17) fo r the second v ir ia l coefficient of branched or linear polym ers, as w ell as the approxim ate closed form s expressed through relations 18 and 19 and appropriate varian ts thereof, suggest the phenom enological resolution 12 of r 2 in to tw o m ultip lica tive facto rs: the first of these, represented b y the cube of the polym er radius in either eq. 17 or 18, expresses the dom inant role of coil size in determ ining the extent of p o lym er-po lym er interaction, and thus the m agnitude of F 2; the second, expressed, fo r exam ple, b y the logarithm ic term in eq. 18, m ay be regarded as an in te rpenetration factor whose value denotes the degree to which bim olecular encounters of the more or less spherica lly d istributed segment domains are rendered effective in augm enting r 2.
W ith equivalent generality, the q u a n tity r 2,b/ T 2il m ay be expressed as the product of the ratios of the same constituent factors designated above. F o r suffic ie n tly high m olecular w eight polym ers dissolved in good solvents, the values of the segm ent-solvent in teraction parameters, appearing in both the series expression 14 and in the closed form (18), should be independent of branching. W ith th is provision, the ra tio r 2|b/ r 2,i, expressed fo r example in term s o: the la tte r relationship, assumes the re la tive ly simple form contained in the first of the eq. 20. Th e systems to w hich eq. 2 0 should m ost appropriate ly app ly— h igh molecula r w eight polym ers dissolved in strong ly in teracting media— are characterized b y large values of the parameter X\. Acco rd in g ly, the norm ally m oderating in fluence of the re la tive interpenetration (logarithm ic) factors in these cases is of m inim al consequence, the ra tio r 2,b/ F 2|1 being p rim a rily determ ined b y the g3 /2
term . The value of the la tte r factor, of course, is quite sensitive to alterations in m olecular structure. W e w ould on th is account anticipate a corresponding sensit iv it y of r 2ib/ r 2il to branching even greater than th at exhib ited through the v iscosity ra tio g', in w hich the factor g3/n~ also appearing therein is p a rtia lly compensated b y opposing hydrodynam ic effects (see eq. 1 2 ).
F in a lly , we w ish to call to the reader’s attention the close parallel of the present investigation to one recently reported b y M orton , et al.,ZH in w hich d ilute solution properties of silicon-linked polystyrene star molecules are described. A lthough the findings of the tw o studies are in conceptual accord, disagreement as to detail on several im portant points is rea d ily apparent. Th e results of M orton , et al., however, are not accompanied b y the necessary experim ental particu lars which any attem pt here at c ritica l analysis of the o rig in of our dissenting conclusions would require.
Acknowledgm ent.— The authors w ish to acknowledge the assistance of M rs. S .-P . S. Yen and M r. John W . M ickey, each of whom has contributed sign ifican tly to the experim ental portions of th is w ork. In addition, our appreciation is extended to the Aeronautical Systems D iv is ion , W righ t-P a tte rso n A ir Force Base, D a yton , Ohio, which has provided financial support for th is undertaking through contractural arrangem ents w ith M ellon In s titu te .
(38) M. Morton, T. E. Helrainiak, S. D. Gadkary, and F. Buechc, J. Polymer Sci., 57, 471 (1962). .
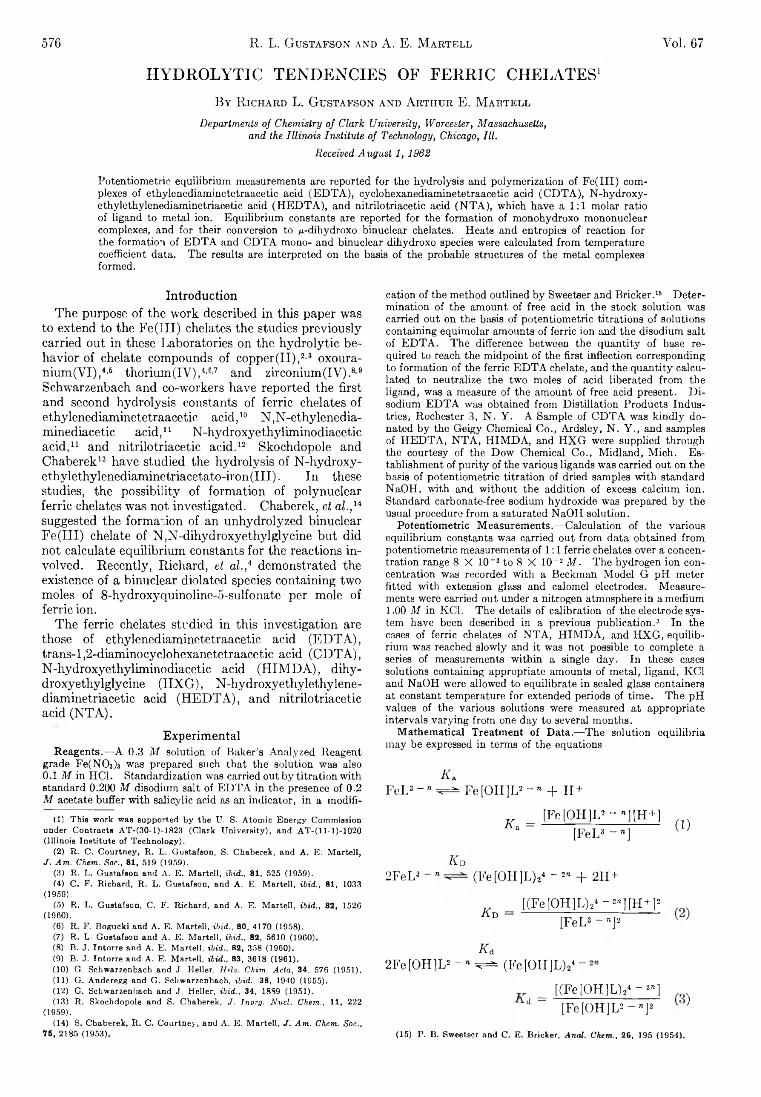
576 R. L. Gustafson and A. E. M artell Vol. 67
H Y D R O L Y T I C T E N D E N C IE S O F F E R R I C C H E L A T E S 1
B y R ic h a r d L . G u s t a f s o n a n d A r t h u r E . M a r t e l l
Departments of Chemistry of Clark University, Worcester, Massachusetts, and the Illinois Institute of Technology, Chicago, III.
Received August 1, 1962
Potentiometrie equilibrium measurements are reported for the hydrolysis and polymerization of Fe(III) complexes of ethylenediaminetetraacetic acid (ED TA), cyclohexanediaminetetraacetic acid (CD TA), N-hydroxy- ethylethylenediaminetriacetic acid (H ED TA), and nitrilotriacetic acid (N TA ), which have a 1:1 molar ratio of ligand to metal ion. Equilibrium constants are reported for the formation of monohydroxo mononuclear complexes, and for their conversion to ¿i-dihydroxo binuclear chelates. Heats and entropies of reaction for the formation of EDTA and CDTA mono- and binuclear dihydroxo species were calculated from temperature coefficient data. The results are interpreted on the basis of the probable structures of the metal complexes formed.
In troductionTh e purpose of the w ork described in th is paper was
to extend to the F e ( I I I ) chelates the studies previously- carried out in these Laboratories on the h yd ro ly tic behavior of chelate compounds of c o p p e r(II) , 2 3 oxoura- n iu m (V I) , 4 ’6 thorium ( IV ) , 4>6'7 and zirconium ( IV ) . 8 9
Schwarzenbach and co-workers have reported the first and second h yd ro lysis constants of fe rric chelates of ethylenediam inetetraacetic acid , 10 N ,N -e th ylened ia - m inediacetic acid , 1 1 N -h yd roxye th ylim inod iace tic acid , 1 1 and n itrilo tria ce tic acid . 12 Skochdopole and Chaberek 13 have studied the hydro lysis of N -h yd ro xy - e th yle th yle n e d ia m in e tria ce ta to -iro n (III). In these studies, the p o ss ib ility of form ation of polynuclear fe rric chelates was not investigated. Chaberek, et al.,u suggested the form ation of an unhydro lyzed binuclear F e ( I I I ) chelate of N ,N -d ih yd ro xye th y lg lyc in e but did not calculate equ ilibrium constants fo r the reactions in vo lved. R ecently, R ichard , et al.,* demonstrated the existence of a binuclear diolated species containing tw o moles of 8 -hydroxyquinoline-5 -sulfonate per mole of fe rric ion.
Th e fe rric chelates studied in th is investigation are those o f ethylenediam inetetraacetic acid (E D T A ), trans-l,2 -diam inocyclohexanetetraacetic acid (C D T A ), N -h yd roxye th ylim inod ia ce tic acid (H IM D A ), d ih y - d ro xye th ylg lyc in e (H X G ) , N -h yd ro xye th yle th ylen e - diam inetriacetic acid (H E D T A ), and n itrilo tria ce tic acid (N T A ).
Experim entalReagents.— A 0.3 M solution of Baker’s Analyzed Reagent
grade Fe(N0 3)3 was prepared such that the solution was also 0.1 M in HC1. Standardization was carried out by titration with standard 0.200 M disodium salt of EDTA in the presence of 0.2 M acetate buffer with salicylic acid as an indicator, in a modifi-
(1) This work was supported by the U. S. Atomic Energy Commission under Contracts A T-(30-1)-1823 (Clark University), and AT-(11-1)-1020 (Illinois Institute of Technology).
(2) R. C. Courtney, R. L. Gustafson, S. Chaberek, and A. E. Martell, J. Am. Chem. Soc., 81, 519 (1959).
(3) R. L„ Gustafson and A. E. Martell, ibid., 81, 525 (1959).(4) C. F. Richard, R. L. Gustafson, and A. E. Martell, ibid., 81, 1033
(1959) .(5) R. L. Gustafson, C. F. Richard, and A. E. Martell, ibid., 82, 1526
(1960) .(6) R. F. Bogucki and A. E. Martell, ibid., 80, 4170 (1958).(7) R. L. Gustafson and A, E. Martell, ibid., 82, 5610 (1960).(8) B. J. Intorre and A. E. Martell, ibid., 82, 358 (1960).(9) B. J. Intorre and A. E. Martell, ibid., 83, 3618 (1961).(10) G. Schwarzenbach and j . Heller, Helv. Chim. Acta, 34, 576 (1951).(11) G. Anderegg and G. Schwarzenbach, ibid., 38, 1940 (1955).(12) G. Schwarzenbach and J. Heller, ibid., 34, 1889 (1951).(13) R. Skochdopole and S. Chaberek, J. Inorg. Nucl. Chem., 11, 222
(1959).(14) S. Chaberek, R. C. Courtney, and A. E. Martell, J. Am. Chem. Soc.,
75, 2185 (1953).
cation of the method outlined by Sweetser and Bricker.16 Determination of the amount of free acid in the stock solution was carried out on the basis of potentiometric titrations of solutions containing equimolar amounts of ferric ion and the disodium salt of EDTA. The difference between the quantity of base required to reach the midpoint of the first inflection corresponding to formation of the ferric EDTA chelate, and the quantity calculated to neutralize the two moles of acid liberated from the ligand, was a measure of the amount of free acid present. D isodium EDTA was obtained from Distillation Products Industries, Rochester 3, N. Y . A Sample of CDTA was kindly donated by the Geigy Chemical Co., Ardsley, N. Y ., and samples of HEDTA, NTA, HIMDA, and H XG were supplied through the courtesy of the Dow Chemical Co., Midland, Mich. Establishment of purity of the various ligands was carried out on the basis of potentiometric titration of dried samples with standard NaOH, with and without the addition of excess calcium ion. Standard carbonate-free sodium hydroxide was prepared by the usual procedure from a saturated NaOH solution.
Potentiometric Measurements.— Calculation of the various equilibrium constants was carried out from data obtained from potentiometric measurements of 1 : 1 ferric chelates over a concentration range 8 X 10⁻³ to 8 X 10⁻² M . The hydrogen ion concentration was recorded with a Beckman Model G pH meter fitted with extension glass and calomel electrodes. Measurements were carried out under a nitrogen atmosphere in a medium 1.00 M in KC1. The details of calibration of the electrode system have been described in a previous publication.3 In the cases of ferric chelates of NTA, H IM DA, and H XG, equilibrium was reached slowly and it was not possible to complete a series of measurements within a single day. In these cases solutions containing appropriate amounts of metal, ligand, KC1 and NaOH were allowed to equilibrate in sealed glass containers at constant temperature for extended periods of time. The pH values of the various solutions were measured at appropriate intervals varying from one day to several months.
Mathematical Treatment of Data.—The solution equilibria may be expressed in terms of the equations
F aF e L 3 - " =5 = ^ F e [O H ]L 2 - n - f H +
T, [F e [O H ]L 2 ~ n][H + ] _K * = [F e L 3 - ] (1)
K a2 FeL 3 - » (F e [O H ]L ) 24 - 2" + 2H+
f ^ [(Fe [O H ]L ) 2 4 ~ 2” ] [H + ] 2
[F e L3 - 73.12
K d2 F e [O H ]L 2 - » ^ (F e [O H ]L ) 24
= [ ( F c [ O H ] L V -» » ]Vd [F e [O H ]L 2 ~ nY j
(15) P. B. Sweetser and C. E. Bricker, Anal. Chem., 26, 195 (1954).
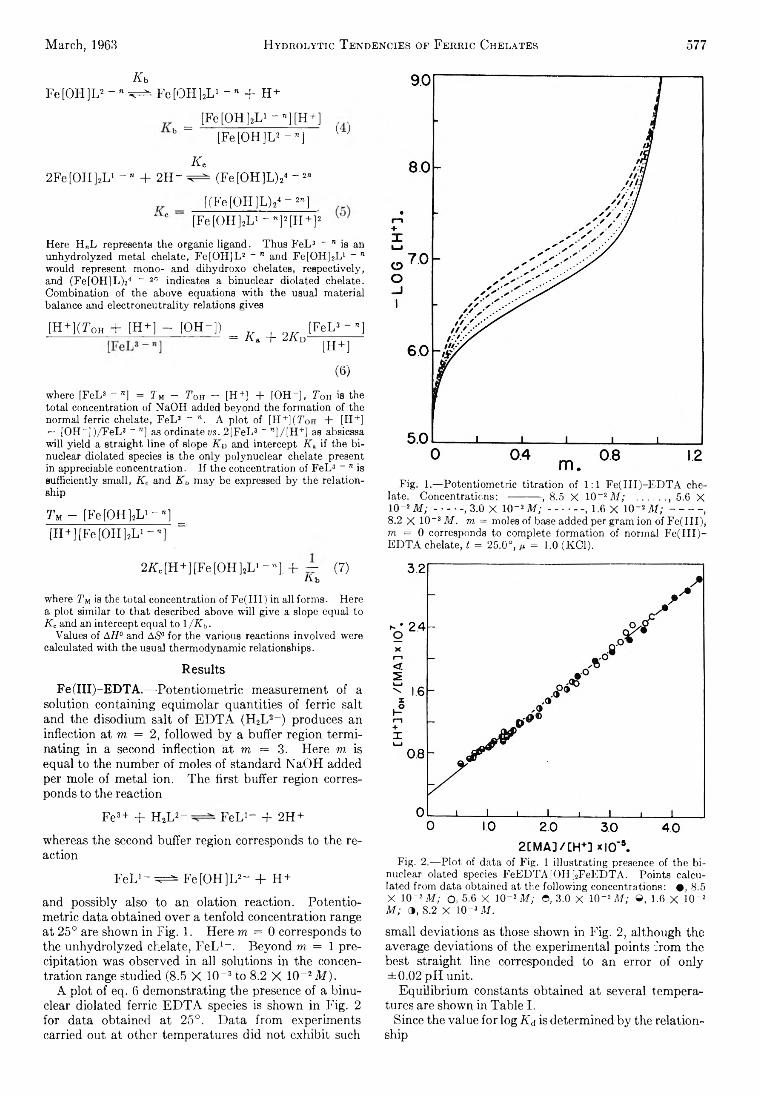
March, 1963 Hydrolytic T endencies of Ferric Chelates 577
K hF e [O H ]L 2 - « ^ F e [O H ]2L 1 - « + H +
= [F e [O H ]2L i~ » ] [H + ] b [F e [O H ]L 2 - n] [ )
K e2 F e [O H ]2L 1 - » + 2H~ ^ (F e [O H ]L ) 24 - 2"
[(Fe [O H ]L ) 24 ~ 27i]" c [F e [O H ]2L 1 - « ] 2 [H + ] 2
Here H„L represents the organic ligand. Thus FeL3 - n is an unhydrolyzed metal chelate, Fe[OH]L2 “ n and FetOHLL1 “ n would represent mono- and dihydroxo chelates, respectively, and (Fe[OH]L )24 ~ 2n indicates a binuclear diolated chelate. Combination of the above equations with the usual material balance and electroneutrality relations gives
[H + ] ( T o h + [H + ] - [O H -]) _ [F e L * -" ]' = Ka + 2Kd [h + ]
(6 )
where [FeL3 " »] = Tu - T0H - [H+] + [OH“ ], Ton is the total concentration of NaOH added beyond the formation of the normal ferric chelate, FeL3 ~ n . A plot of [ H + ] ( T o h + [H +] — [OH“ ])/F eL 3 “ *] as ordinate to. 2 [FeL3 -B ] /[H +] as absicssa will yield a straight line of slope K D and intercept A , if the binuclear diolated species is the only polynuclear chelate present in appreciable concentration. If the concentration of FeL3 - B is sufficiently small, K c and K b may be expressed by the relationship
Tm - [Fe [O H ]2L 4 - ” ] =[H + ][F e [O H ]2L 1 “ "]
2 A c[H + ][F e [O H ]2L 1 ~ ” ] + ~ (7)A b
where Tm is the total concentration of Fe(III) in all forms. Here a plot similar to that described above will give a slope equal to K c and an intercept equal to \/Kh.
Values of Aff° and AS0 for the various reactions involved were calculated with the usual thermodynamic relationships.
ResultsFe(III)-EDTA .— Potentiom etric measurement of a
solution containing equim olar quantities of fe rric salt and the disodium salt of E D T A (H 2L 2~) produces an inflection a t m = 2 , follow ed b y a buffer region term inating in a second in flection at m = 3. Here m is equal to the num ber of moles of standard N a O H added per mole of m etal ion. Th e firs t buffer region corresponds to the reaction
Fe 3+ + H 2L 2“ F e L 1- + 2H+
whereas the second buffer region corresponds to the reaction
F e L > -^ = ± F e [O H ]L 2~ + H +
and possibly also to an o lation reaction. Potentio m etric data obtained over a tenfold concentration range a t 25° are shown in F ig . 1. Here m = 0 corresponds to the unhydrolyzed chelate, F e L 1- . Beyond m = 1 precip itation was observed in a ll solutions in the concentra tion range studied (8.5 X 1 0 -8to 8.2 X 10~2M).
A p lot of eq. 6 dem onstrating the presence of a binuclear diolated ferric E D T A species is shown in F ig . 2 for data obtained at 25°. D ata from experim ents carried out at other tem peratures d id not exh ib it such
Fig. 1.— Potentiometric titration of 1:1 F e(III)-E D T A chelate. Concentrations: ---------- , 8.5 X 10~2 M ; ..........., 5.6 X10“ 2 M;---------, 3.0 X 10 ~*M;----------- , 1.6 X 10 ~ 2 M;---------- ,8.2 X 10~s M. m = moles of base added per gram ion of Fe(III), m = 0 corresponds to complete formation of normal F e(III)- EDTA chelate, t = 25.0°, ya = 1.0 (KC1).
Fig. 2.— Plot of data of Fig. 1 illustrating presence of the binuclear olated species FeEDTA[OH]2FeEDTA. Points calculated from data obtained at the following concentrations: • , 8.5 X 10 “ 2 M ; O, 5.6 X 10~2M ; ©, 3.0 X 10“ 2 ilf; ©, 1.6 X 10“ 2 M ; 3 , 8.2 X 10 “ 3 M.
sm all deviations as those shown in F ig . 2, although the average deviations of the experim ental points from the best stra ight line corresponded to an error of o n ly ±0.02 p H un it.
E q u ilib riu m constants obtained at several temperatures are shown in Table I .
Since the value fo r log K d is determ ined b y the re lationship
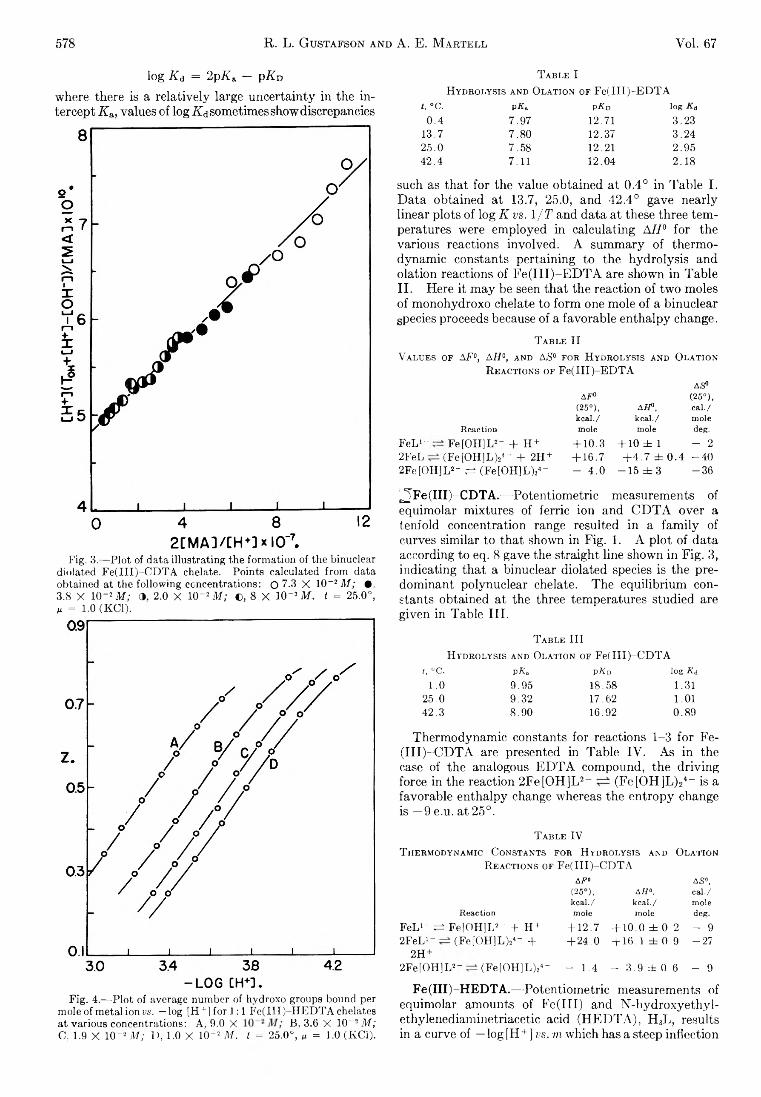
578 R. L. Gustafson and A. E. M artell Vol. 67
log K d = 2pK & — p A V
where there is a re la tive ly large uncerta in ty in the in -
0 4 8 12
2 C M A ]/[H +] * I0 ”7.Fig. 3.— Plot of data illustrating the formation of the binuclear
diolated F e(III)-C D T A chelate. Points calculated from data obtained at the following concentrations: O 7.3 X 10_ 2 l f ; •, 3.8 X 10⁻² M ; 9. 2.0 X 10~2 M ; C, 8 X 10~3 M. I = 25.0°, M = 1 .0 (K C 1).
Fig. 4.— Plot of average number of hydroxo groups bound per mole of metal ion vs. —log [H +] f o r l : l Fe(III)-H ED TA chelates at various concentrations: A, 9.0 X B, 3.6 X 10~2M ;C, 1.9 X 10“ 2 M ; 1), 1.0 X 10⁻² M. t = 25.0°, » = 1.0 (KC1).
T a b l e IH y d b o ly sis an d O la t io n of F e(III)-E D T A
t, "C. P Ï . pKd log Kd0.4 7.97 12.71 3.23
13.7 7.80 12.37 3.2425.0 7.58 1 2 . 2 1 2.9542.4 7.11 12.04 2.18
such as th a t fo r the value obtained at 0.4° in Ta b le I . D a ta obtained at 13.7, 25.0, and 42.4° gave nearly linear plots of log K vs. 1/T and data at these three tem peratures were em ployed in calculating A l l 0 fo r the various reactions involved. A sum m ary o f therm odynam ic constants perta in ing to the h yd ro lysis and o lation reactions of F e ( I I I ) -E D T A are shown in Tab le I I . Here it m ay be seen th a t the reaction of tw o moles of m onohydroxo chelate to form one mole of a binuclear species proceeds because of a favorable enthalpy change.
T a b l e IIV a l u e s of AF°, AH0, an d AS0 f o r H y d r o ly sis an d O la t io n
R e a c t io n s of F e(III)-E D T A
AF°(25°), AH0,
AS0(25°),cal./
kcal./ kcal./ moleReaction mole mole deg.
FeL1- Fe[OH]L2- + H + + 10.3 + 10 ± 1 - 22FeL (Fe[OH]L)24- + 2H + + 16.7 + 4 .7 ± 0 . 4 - 4 02Fe[OH]L2~ ^ (Fe[OH]L)24- - 4 .0 - 1 5 ± 3 - 3 6
jF e ( I I I ) -C D T A .— Potentiom etric measurements of equim olar m ixtures of fe rric ion and C D T A over a tenfold concentration range resulted in a fa m ily of curves sim ilar to th at shown in F ig . 1. A p lo t of data according to eq. 8 gave the stra ight line shown in F ig . 3, ind icating th a t a binuclear diolated species is the predom inant polynuclear chelate. The equ ilibrium constants obtained at the three tem peratures studied are given in Table I I I .
T a b l e IIIH yd r o ly sis and O la t io n of F e(III)-C D TA
t, "C. pA. P-Kd log K d1 . 0 9.95 18.58 1.31
25.0 9.32 17.62 1 . 0 142.3 S.90 16.92 0.89
Therm odynam ic constants for reactions 1-3 fo r Fe -( I I I ) -C D T A are presented in Table IV . A s in the case of the analogous E D T A compound, the d riv in g force in the reaction 2 F e [O H ]L 2_ (F e [O H ]L )24_ is a favorable enthalpy change whereas the entropy change is — 9 e.u. at 25°.
T a b l e IVT h er m o d yn a m ic C o n stants f o r H yd r o ly sis an d O la t io n
R e actio n s of Fe(III)-CD TAA F» AS»,
(25°), A H°, cal./kcal./ kcal./ mole
Reaction mole mole deg.F eL '- ± Fe[OH]L2- + H + + 12.7 + 1 0 .0 ± 0 .2 - 92F eL '- (Fe[OH]L)24- + + 24.0 + 16.1 ± 0.9 - 2 7
2H +2Fe[OH]L2- (Fe[OH]L)24- - 1.4 - 3 .9 =fc 0.6 - 9
F e ( III) -H E D T A .— Potentiom etric measurements of equim olar amounts of F e ( I I I ) and N -h yd ro xye th y l- ethylenediarninetriacetic acid (H E D T A ), H 3L , results in a curve of — lo g[F I+ ] vs. m which has a steep in flection
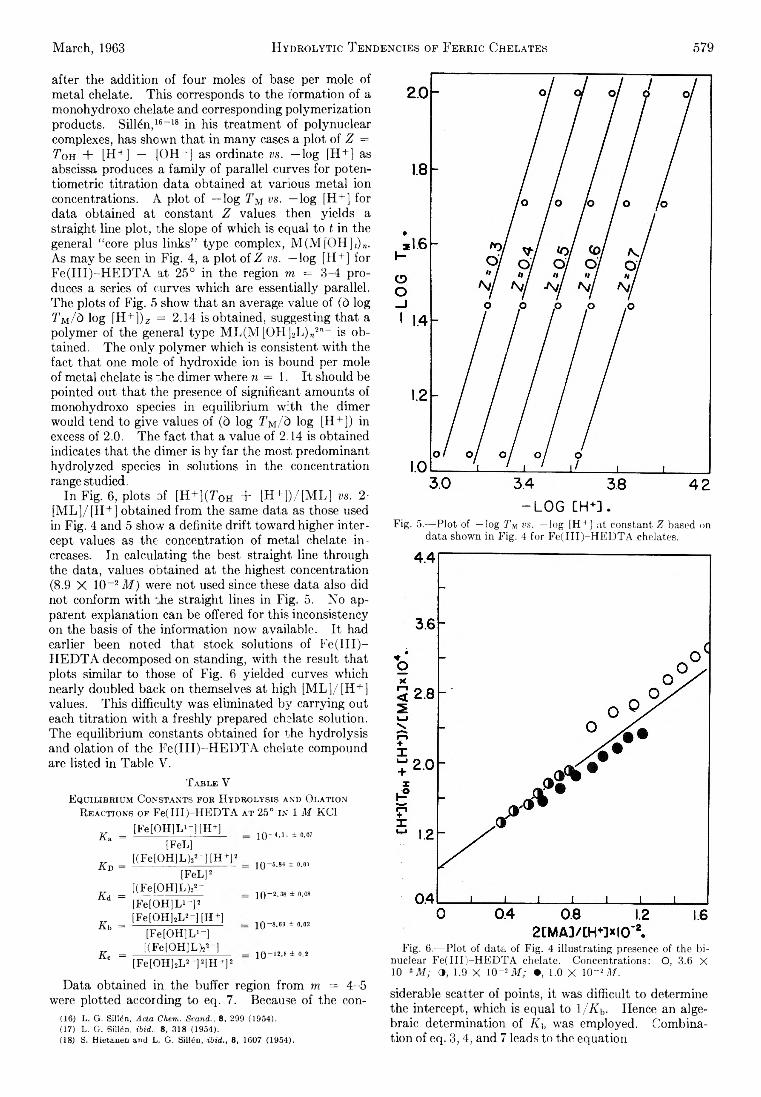
March, 1963 Hydrolytic T endencies of Ferric Chelates 579
after the addition of four moles of base per mole of m etal chelate. T h is corresponds to the form ation of a m onohydroxo chelate and corresponding polym erization products. S ilffin , 1 6 - 1 8 in his treatm ent of polynuclear complexes, has shown th a t in m any cases a p lo t of Z = T oh + [H +] — [O H - ] as ordinate vs. — log [H + ] as abscissa produces a fa m ily o f paralle l curves fo r poten- tiom etric titra tio n data obtained at various m etal ion concentrations. A p lo t of — log Tm v s . — log [H + ] for data obtained at constant Z values then yie lds a stra ight line p lo t, the slope of w hich is equal to t in the general “ core plus lin ks” typ e com plex, M (M [O H ]()n. As m ay be seen in F ig . 4, a p lo t of Z vs. — log [H + ] for F e ( I I I ) -H E D T A at 25° in the region m = 3-4 produces a series of curves w hich are essentially parallel. The plots of F ig . 5 show th at an average value of (d log TM/b log [H + ])z = 2.14 is obtained, suggesting th a t a polym er of the general typ e M L (M [O H ]2 L )„2" - is obtained. The o n ly polym er which is consistent w ith the fact th at one mole of hydroxide ion is bound per mole of m etal chelate is ffie dim er where n = 1. I t should be pointed out th a t the presence of significant amounts of m onohydroxo species in equ ilibrium w ith the dim er would tend to give values of (d log Tm/& log [H + ]) in excess of 2.0. Th e fact th a t a value of 2.14 is obtained indicates th at the dim er is b y fa r the m ost predom inant hydro lyzed species in solutions in the concentration range studied.
In F ig . 6 , plots of [H + ](T o h + [H + ])/ [M L ] vs. 2- [M L ]/ [H + ] obtained from the same data as those used in F ig . 4 and 5 show a definite d rift tow ard higher in te rcept values as the concentration of m etal chelate in creases. In calculating the best stra ight line through the data, values obtained at the highest concentration (8.9 X 10- 2 M) were not used since these data also did not conform w ith ~he stra ight lines in F ig . 5. N o apparent explanation can be offered fo r th is inconsistency on the basis of the in form ation now available. I t had earlier been noted th a t stock solutions of F e ( I I I ) - H E D T A decomposed on standing, w ith the result th at plots sim ilar to those of F ig . 6 yielded curves which nearly doubled back on themselves at h igh [M L ]/ [H +] values. T h is d ifficu lty was elim inated b y carrying out each titra tio n w ith a fresh ly prepared chelate solution. The equ ilibrium constants obtained fo r the hydro lysis and olation of the F e ( I I I ) -H E D T A chelate compound are listed in Ta b le V .
T a bd e VE q u il ib r iu m C o n stan ts f o r H y d r o l y sis and O la t io n
R ea c t io n s o f Fe( III ) -H E D T A a t 25° in 1 M KOI
Xa =
K b =
K i =
K b =
Kc =
[Fe[O H ]H -][H +][FeL]
[(Fe[OHlL)22- ] [H +P[FeL] 2
[(Fe[OH]L)22- [Fe[OH]L1 - ] 2 [Fe[OH]8L2-] [H+]
[Fe[OH]L1-] [(Fe[OH]L)22-]
[Fe[OH]2L 2- ]2[H + ] 2
IQ- 4.11 ± 0.07
10 ~6-84 ± °*01
10-2.38 ± 0.08
10 “8.69 ± 0.02
IQ-Ì 2.S ± 0.2
D ata obtained in the buffer region from m = 4-5 were plotted according to eq. 7. Because of the con-
(16) L. G. Silten, Ada Chem, Stand., 8, 299 (1954).(17) L. G. Silten, ibid.. 8, 318 (1954).(18) S. Hietalien and L. G. SiMn, ibid., 8, 1607 (1954).
- L O G CH+] .Fig. 5.— Plot of —log P m vs. —log [H + ] at constant Z based on
data shown in Fig. 4 for Fe(III)-H ED TA chelates.
Fig. 6 .— Plot of data of Fig. 4 illustrating presence of the bi- nuclear Fe(III)-H ED TA chelate. Concentrations: O, 3.6 X 10- " M ; 9 , 1.9 X 10⁻² M ; •, 1.0 X 10- 2 M.
siderable scatter of points, it was d ifficu lt to determine the intercept, which is equal to 1 /Kh. Hence an algebraic determ ination of A/, was em ployed. Com bination of eq. 3,4, and 7 leads to the equation
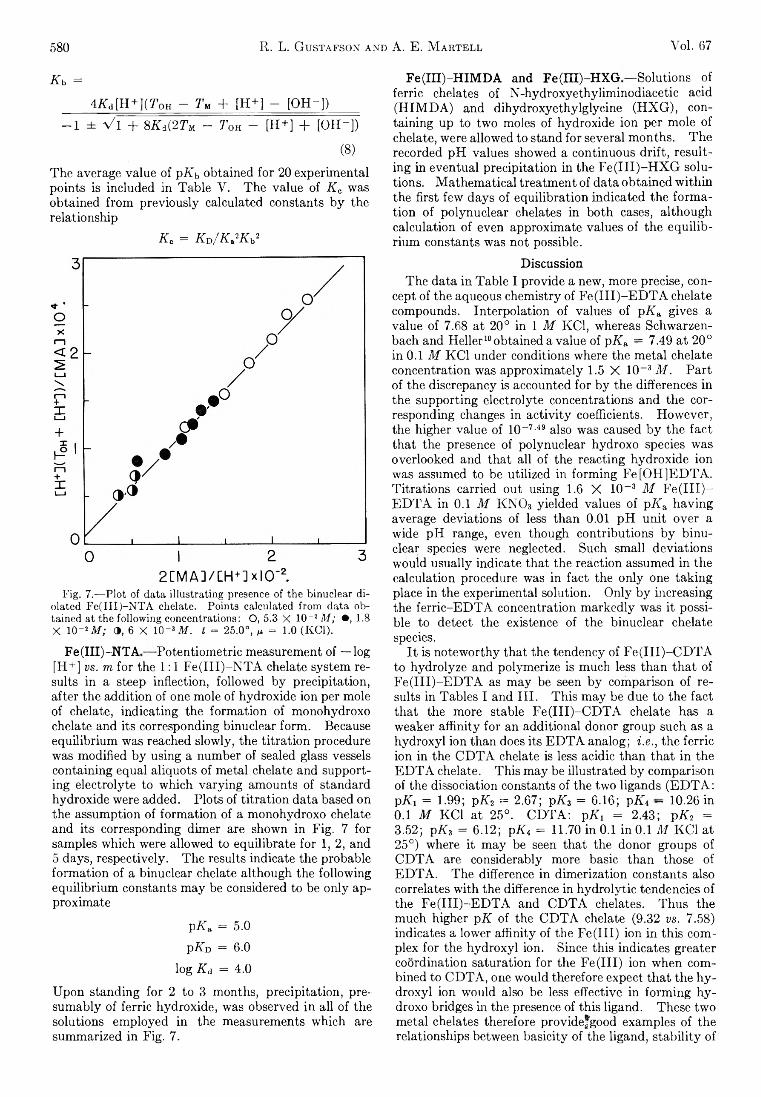
580 R. L. Gustafson and A. E. M artell Vol. 67
K b =
4 X d[H + ](T 0H - Tu + [H + ] - [O H -])
- 1 ± V l + 8Ki(2Tu - Ton - [H + ] + [O H - ])
(8 )
Th e average value of pKb obtained fo r 20 experim ental points is included in Tab le V . Th e value of K c was obtained from previously calculated constants b y the relationship
K a = K u/K^Kh2
2 C M A ] / C H +] x lC T 2.Fig. 7.— Plot of data illustrating presence of the binuclear di-
olated F e(III)-N T A chelate. Points calculated from data obtained at the following concentrations: O, 5.3 X 10_ 2 M ; •, 1.8 X 10“ 2 M ; » , 6 X 10_s M. t = 25.0°, n = 1.0 (KC1).
Fe(III)-NTA Potentiom etric measurement of — log [H + ] vs. m fo r the 1:1 F e ( I I I ) -N T A chelate system results in a steep inflection, followed b y precip itation, after the addition of one mole of hydroxide ion per mole of chelate, ind icating the form ation of m onohydroxo chelate and its corresponding binuclear form . Because equ ilibrium was reached slow ly, the titra tio n procedure was m odified b y using a num ber of sealed glass vessels containing equal aliquots of m etal chelate and supporting e lectro lyte to w hich va ryin g amounts of standard hydroxide were added. P lots of titra tio n data based on the assumption of form ation of a m onohydroxo chelate and its corresponding dim er are shown in F ig . 7 for samples w hich were allowed to equilibrate for 1 , 2 , and 5 days, respectively. Th e results indicate the probable form ation of a binuclear chelate although the fo llow ing equ ilibrium constants m ay be considered to be o n ly approxim ate
p iT a = 5.0
p Ad = 6.0 log K d = 4.0
U pon standing fo r 2 to 3 m onths, p recip itation , presum ably of fe rric hydroxide, was observed in a ll of the solutions em ployed in the measurements w hich are sum m arized in F ig . 7.
Fe(III)-HIMDA and Fe(m )-HXG— Solutions of fe rric chelates of N -h yd roxye th ylim inod iace tic acid (H IM D A ) and d ih yd ro xye th ylg lyc in e (H X G ), conta in ing up to tw o moles of hydroxide ion per mole of chelate, were allowed to stand fo r several m onths. Th e recorded p H values showed a continuous d rift, resu lting in eventual p recip itation in the F e ( I I I ) -H X G solutions. M athem atica l treatm ent of data obtained w ith in the firs t few days of equ ilib ration indicated the form ation o f polynuclear chelates in both cases, although calculation of even approxim ate values of the e q u ilib rium constants was not possible.
DiscussionThe data in Ta b le I provide a new, more precise, con
cept of the aqueous chem istry of F e ( I I I ) -E D T A chelate compounds. In te rpo la tion of values of pKa gives a value of 7.68 at 20° in 1 M KC1, whereas Schwarzen- bach and H e lle r10 obtained a value of p X a = 7.49 a t 20° in 0.1 M KC1 under conditions where the m etal chelate concentration was approxim ately 1.5 X 10~ 3 M . P a rt of the discrepancy is accounted fo r b y the differences in the supporting e lectro lyte concentrations and the corresponding changes in a c tiv ity coefficients. H ow ever, the higher value of 1 0 - 7 -49 also was caused b y the fact th a t the presence of polynuclear hydroxo species was overlooked and th at a ll of the reacting hydroxide ion was assumed to be u tilized in form ing F e [O H ]E D T A . T itra tio n s carried out using 1.6 X 10- 3 M F e ( I I I ) - E D T A in 0.1 M K N 0 3 yielded values of p X a having average deviations of less than 0.01 p H u n it over a w ide p H range, even though contributions b y b inuclear species were neglected. Such sm all deviations w ould usually indicate th at the reaction assumed in the calculation procedure was in fact the o n ly one ta king place in the experim ental solution. O n ly b y increasing the fe rr ic -E D T A concentration m arkedly was it possible to detect the existence of the binuclear chelate species.
I t is notew orthy th at the tendency of F e ( I I I ) -C D T A to hyd ro lyze and polym erize is much less than th a t of F e ( I I I ) -E D T A as m ay be seen b y com parison of results in Tables I and I I I . T h is m ay be due to the fact th at the more stable F e ( I I I ) -C D T A chelate has a weaker a ffin ity fo r an additional donor group such as a h yd ro xy l ion than does its E D T A analog; i.e., the fe rric ion in the C D T A chelate is less acidic than th a t in the E D T A chelate. T h is m ay be illustrated b y com parison of the dissociation constants of the tw o ligands (E D T A : p X i = 1.99; p K-i = 2.67; pK z = 6.16; pK t — 10.26 in 0.1 M KC1 at 25°. C D T A : p X i = 2.43; p X 2 = 3.52; pKa = 6.12; p X 4 = 11.70 in 0.1 in 0.1 M KC1 at 25°) where it m ay be seen th a t the donor groups of C D T A are considerably more basic than those of E D T A . The difference in d im erization constants also correlates w ith the difference in h yd ro ly tic tendencies of the F e ( I I I ) -E D T A and C D T A chelates. Th us the m uch higher pK of the C D T A chelate (9.32 vs. 7.58) indicates a lower a ffin ity of the F e ( I I I ) ion in th is com plex for the h yd ro xy l ion. Since th is indicates greater coordination saturation fo r the F e ( I I I ) ion when combined to C D T A , one would therefore expect th a t the h y d ro xy l ion w ould also be less effective in form ing h y droxo bridges in the presence of th is ligand. These tw o m etal chelates therefore provide^good examples of the relationships between basicity of the ligand, s ta b ility of
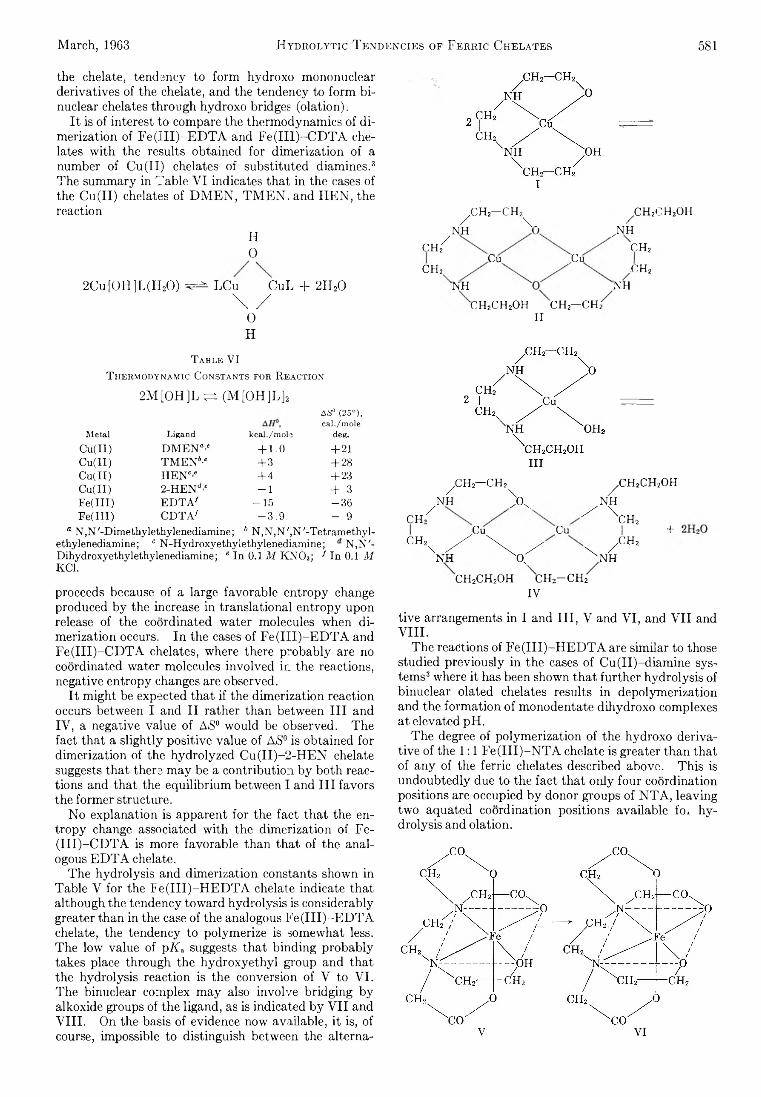
March, 1963 Hydrolytic T endencies of Ferric Chelates 581
the chelate, tendency to form hydroxo m ononuclear derivatives of the chelate, and the tendency to form b i- nuclear chelates through hydroxo bridges (o la tion ).
I t is of interest to compare the therm odynam ics of d im erization of F e ( I I I ) -E D T A and P e ( IIl) - C D T A chelates w ith the results obtained fo r d im erization of a number of C u ( II) chelates of substituted diam ines . 8
The sum m ary in Tab le V I indicates th a t in the cases of the C u ( II) chelates of D M E N , T M E N . and H E N , the reaction
II0
2 C u [0 H ]L (H 20 ) ^ L C u C u L + 2 H 20\ /
OH
T a b l e VIT h e r m o d y n a m ic C o n s t a n t s f o r R e a c t io n
2 M [O H ]L ^ (M [O H ]L ] 2
Metal Ligand kcal./mole
AS0 (25°), cal./mole
deg.Cu(Il) DM EN°* + 1 . 0 + 2 1C u(ll) t m e n 6-> + 3 + 28CuTI) H E N '“ + 4 + 23Cu(II) 2-HEN‘T - 1 + 3Fe(III) ED TA 7 - 1 5 - 3 6Fe(III) CDTA7 - 3 . 9 - 9
° N,N'-Dimethylethylenediamine; 6 N,N,N',N'-Tetramethyl- ethylenediamine; c N-Hydroxyethylethylenediamine; N ,N '- Dihydroxyethylethylenediamine; e In 0.1 M K N 03; 7 In 0.1 M KC 1.
proceeds because of a large favorable entropy change produced b y the increase in translational entropy upon release of the coordinated w ater molecules when d im erization occurs. In the cases of F e ( I I I ) -E D T A and F e ( I I I ) -C D T A chelates, where there probab ly are no coordinated water molecules involved in the reactions, negative entropy changes are observed.
I t m ight be expected th at if the dim erization reaction occurs between I and I I rather than between I I I and IV , a negative value of AS 0 w ould be observed. The fact th at a s lig h tly positive value of AS0 is obtained for dim erization of the hydro lyzed C u (II) -2 -H E N chelate suggests th at there m ay be a contribution b y both reactions and th a t the equilibrium between I and I I I favors the form er structure.
N o explanation is apparent fo r the fact th a t the entro p y change associated w ith the d im erization of Fe -( I I I ) -C D T A is more favorable than th a t of the analogous E D T A chelate.
Th e h yd ro lysis and d im erization constants shown in Table V fo r the F e ( I I I ) -H E D T A chelate indicate that although the tendency tow ard hydro lysis is considerably greater than in the case of the analogous F e ( I I I ) -E D T A chelate, the tendency to polym erize is somewhat less. The low value of p A a suggests th a t b inding probab ly takes place through the h yd ro xye th y l group and th at the hydro lysis reaction is the conversion of V to V I . The binuclear com plex m ay also invo lve b ridg ing b y alkoxide groups of the ligand, as is indicated b y V I I andV I I I . On the basis of evidence now available, it is, of course, impossible to distinguish between the alterna
,CH2— CHZ/ V
NHCH2
c h 2
/Cu .Cu
^ c h 2c h 2o h
JNHCH2
c h 2
NH NH
CHpCHjOH CH2— CH2 II
CH
CH;
,c h 2— c h 2/ \
/ NH / ° x .
^CHaCHzOH
NH^ \ : h 2
Cu Gii 1 +\ / \ / /
NH 0_/ CHz
^ N H
c h 2c h 2o h c h 2- c h 2
IV
tive arrangements in I and I I I , V and V I, and V I I and V I I I .
Th e reactions of F e ( I I I ) -H E D T A are sim ilar to those studied previously in the cases of C u (II)-d ia m in e system s8 where it has been shown th a t fu rther h yd ro lysis of binuclear dated chelates results in depolym erization and the form ation of m onodentate d ihydroxo complexes a t elevated p H .
Th e degree of po lym erization of the hydroxo derivative of the 1:1 F e ( I I I ) -N T A chelate is greater than that of any of the ferric chelates described above. T h is is undoubtedly due to the fact th a t o n ly fou r coordination positions are occupied b y donor groups of N T A , leaving tw o aquated coordination positions available fo* h y dro lysis and o lation.
V
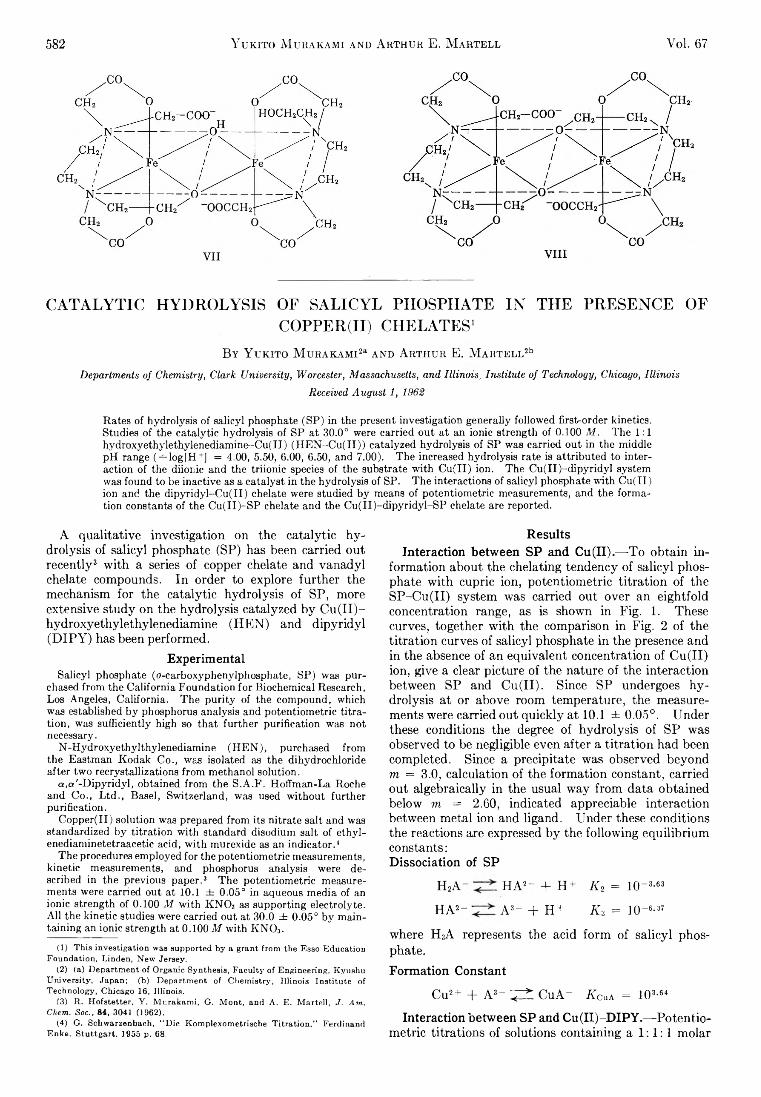
582 Y ukito M urakami and A rthur E. M artell Yol. 67
CATALYTIC HYDROLYSIS OF SALICYL PHOSPHATE IN THE PRESENCE OFCOPPER(II) CHELATES1
B y Y ukito M urakami23 and Arthur E . M artell215 Departments of Chemistry, Clark University, Worcester, Massachusetts, and Illinois, Institute of Technology, Chicago, Illinois
Received August 1, 1962
Rates of hydrolysis of salieyl phosphate (SP) in the present investigation generally followed first-order kinetics. Studies of the catalytic hydrolysis of SP at 30.0° were carried out at an ionic strength of 0.100 M . The 1:1 hydroxyethylethylenediamine-Cu(II) (H EN -C u(II)) catalyzed hydrolysis of SP was carried out in the middle pH range ( —log[H+] = 4.00, 5.50, 6.00, 6.50, and 7.00). The increased hydrolysis rate is attributed to interaction of the diionic and the triionic species of the substrate with Cu(II) ion. The Cu(II)-dipyridyl system was found to be inactive as a catalyst in the hydrolysis of SP. The interactions of salieyl phosphate with Cu(II) ion and the dipyridyl-Cu(II) chelate were studied by means of potentiometric measurements, and the formation constants of the Cu(II)-SP chelate and the Cu(II)-dipyridyl-SP chelate are reported.
A qua lita tive investigation on the ca ta lytic h y dro lysis of sa lieyl phosphate (S P ) has been carried out recently3 w ith a series of copper chelate and vanadyl chelate compounds. In order to explore fu rth e r the mechanism fo r the ca ta lytic h yd ro lysis of SP, more extensive study on the hydro lysis catalyzed b y C u ( I I ) - hydroxyethylethylenediam ine (H E N ) and d ip y rid y l (D IP Y ) has been perform ed.
ExperimentalSalieyl phosphate (o-carboxyphenylphosphate, SP) was pur
chased from the California Foundation for Biochemical Research, Los Angeles, California. The purity of the compound, which was established by phosphorus analysis and potentiometric titration, was sufficiently high so that further purification was not necessary.
N-Hydroxyethylthylenediamine (H EN), purchased from the Eastman Kodak Co., was isolated as the dihydrochloride after two recrystallizations from methanol solution.
a,a '-Dipyridyl, obtained from the S.A.F. Hoffman-La Roche and Co., Ltd., Basel, Switzerland, was used without further purification.
Copper(II) solution was prepared from its nitrate salt and was standardized by titration with standard disodium salt of ethyl- enediaminetetraacetic acid, with murexide as an indicator.4 *
The procedures employed for the potentiometric measurements, kinetic measurements, and phosphorus analysis were described in the previous paper.3 The potentiometric measurements were carried out at 10.1 ± 0.05° in aqueous media of an ionic strength of 0.100 M with KNO3 as supporting electrolyte. All the kinetic studies were carried out at 30.0 ± 0.05° by maintaining an ionic strength at 0.100 M with K N 03.
(1) This investigation was supported by a grant from the Esso Education Foundation, Linden, New Jersey.
(2) (a) Department of Organic Synthesis, Faculty of Engineering, Kyushu University, Japan; (b) Department of Chemistry, Illinois Institute of Technology, Chicago 16, Illinois.
(3) R. Hofstetter, Y. Murakami, G. Mont, and A. E. Martell, J. Am. Chem. Soc., 84, 3041 (1962).
(4) G. Schwarzenbach, “ Die Komplexometrische Titration,” FerdinandEnke. Stuttgart, 1955 p. 68.
ResultsInteraction between SP and Cu(II).— T o obtain in
form ation about the chelating tendency of sa lieyl phosphate w ith cupric ion, potentiom etric titra tio n of the S P -C u (II) system was carried out over an e ightfold concentration range, as is shown in F ig . 1. These curves, together w ith the comparison in F ig . 2 of the titra tio n curves of sa lieyl phosphate in the presence and in the absence of an equivalent concentration of C u ( II) ion, give a clear picture of the nature of the in teraction between SP and C u ( II) . Since SP undergoes h y dro lysis at or above room tem perature, the measurements were carried out q u ick ly at 10.1 ±0.05°. U nder these conditions the degree of h yd ro lysis of SP was observed to be negligible even after a titra tio n had been completed. Since a precipitate was observed beyond m = 3.0, calculation of the form ation constant, carried out a lgebraically in the usual w ay from data obtained below m = 2.60, indicated appreciable in teraction between m etal ion and ligand. U nder these conditions the reactions are expressed b y the fo llow ing equ ilibrium constants:Dissociation of SP
H 2A - H A 2- + H + IC2 = H U 3- 63
H A 2- A 3- + H + Ki = H U 6- 37
where H 3A represents the acid form of sa lie yl phosphate.
Formation Constant
C u 2+ + A 3- ^ C u A - A cua = 103 - 64
Interaction between SP and Cu(II)-DIPY.— Potentio m etric titra tio n s of solutions containing a 1 : 1 : 1 m olar
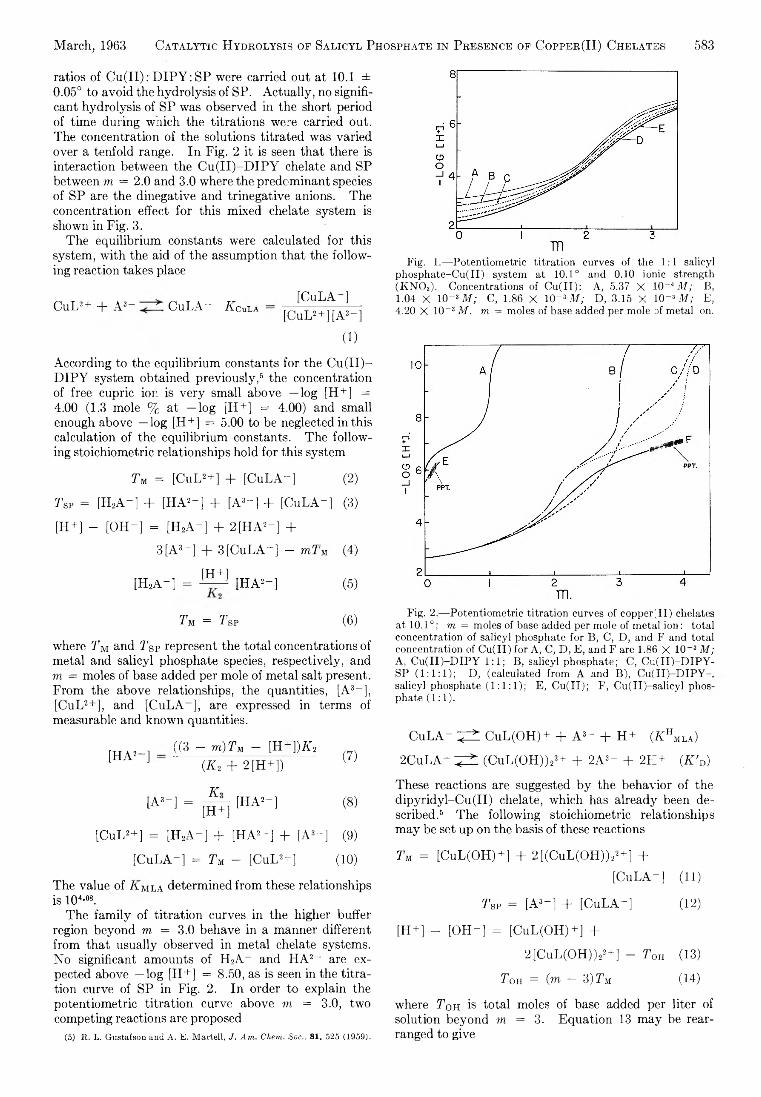
March, 1963 Catalytic Hydrolysis of Salicyl Phosphate in Presence of Copper(II) Chelates 583
ratios of C u ( I I ) : D IP Y : SP were carried out a t 10.1 ± 0.05° to avoid the hyd ro lysis of SP. A c tu a lly , no sign ificant hyd ro lysis of SP was observed in the short period of tim e during w hich the titra tio n s were carried out. The concentration of the solutions titra te d was varied over a tenfold range. In F ig . 2 it is seen th at there is in teraction between the C u ( I I ) -D IP Y chelate and SP between m = 2.0 and 3.0 where the predom inant species of SP are the dinegative and trinegative anions. The concentration effect fo r th is m ixed chelate system is shown in F ig . 3.
Th e equilibrium constants were calculated fo r th is system, w ith the aid of the assumption th a t the fo llow ing reaction takes place
C u L 2+ + A 3" C u L A ~ A cula[C u L A ~ ]
[C u L 2 + ][A 3- ]
( 1 )
According to the equ ilibrium constants fo r the C u ( I I ) - D IP Y system obtained previou sly , 6 the concentration of free cupric ion is ve ry sm all above — log [H +] =4.00 (1.3 mole % at — log [H + ] = 4.00) and sm all enough above — log [H + ] = 5.00 to be neglected in th is calculation of the equ ilibrium constants. Th e fo llow ing stoichiom etric relationships hold fo r th is system
T M = [C u L 2+] + [C u L A -] (2 )
T SP = [H 2A - ] + [H A 2- ] + [A 3“ ] + [C u L A -] (3)
[H + ] - [O H -] = [H 2A - ] + 2 [H A 2- ] +
3 [A 3- ] + 3 [C u L A - ] — toT m (4)
[H + ][H * A -] = [H A 2- ] (5)
T m = Tsv (6 )
where T m and T$p represent the to ta l concentrations of m etal and sa licyl phosphate species, respectively, and m = moles of base added per mole of m etal salt present. From the above relationships, the quantities, [A 3 -], [C u L 2+], and [C u L A - ], are expressed in term s of measurable and known quantities.
[H A 2- ]((3 - m ) T u - [H ~ ])A 2
( A 2 + 2 [H + ])(7)
[A 3- ] = p f q [H A 2- ] (8 )
[C u L 2+] = [H * A -] + [H A 2- ] + [A 3- ] (9)
[C u L A -] = T m - [C u L 2- ] (10)
The value of 7i Mla determ ined from these relationships is 1 0 4-08.
Th e fa m ily of titra tio n curves in the higher buffer region beyond m = 3.0 behave in a m anner different from th at usually observed in m etal chelate systems. N o significant amounts of H 2A _ and H A 2- are expected above — log [H + ] = 8.50, as is seen in the titra tion curve of SP in F ig . 2. In order to explain the potentiom etric titra tio n curve above m = 3.0, two competing reactions are proposed
(5) R. L. Gustafson and A. E. Martell, J . Am . Chem. Soc., 81, 525 (1959).
Fig. 1.— Potentiometric titration curves of the 1:1 salicyl phosphate-Cu(II) system at 10.1° and 0.10 ionic strength (K N 0 3). Concentrations of Cu(II): A, 5.37 X 10~i M ; B, 1.04 X 10 “ 3 M ; C, 1.86 X K) - s M ; D, 3.15 X 10“ 3 At; E, 4.20 X 10~ 3 M. m = moles of base added per mole of metal on.
Fig. 2 .— Potentiometric titration curves of copper(II) chelates at 1 0 .1 °; m = moles of base added per mole of metal ion: total concentration of salicyl phosphate for B, C, D, and F and total concentration of Cu(II) for A, C, D, E, and F are 1.86 X 10- 3 M ; A, C u (II)-D IP Y 1:1; B, salicyl phosphate; C, C u(II)-D IP Y - SP (1 :1 :1 ); D, (calculated from A and B), C u (II)-D IP Y - salicyl phosphate (1 :1 :1 ); E, Cu(II); F, Cu(II)-salicyl phosphate ( 1 : 1 ).
C u L A - ^ C u L (O H ) + + A 3- + H + ( A h mla)
2 C u L A - ^ (C u L (O H ))22+ + 2 A 3“ + 2FI+ (K'n)
These reactions are suggested b y the behavior of the d ip y r id y l-C u (II) chelate, w hich has already been described . 6 Th e fo llow ing stoichiom etric relationships m ay be set up on the basis of these reactions
T m = [C u L (O H )+ ] + 2 [(C u L (O H ))22+] +
[C u L A -] (11)
T sp = [A 3- ] + [C u L A -] ( 1 2 )
[H + ] - [O H -] = [C u L (O H )+ ] +
2 [C u L (O H ))22+] - Ton (13)
Ton = (m - 3 )T M (14)
where T o h is to ta l moles of base added per lite r of solution beyond m = 3. E quation 13 m ay be rearranged to give
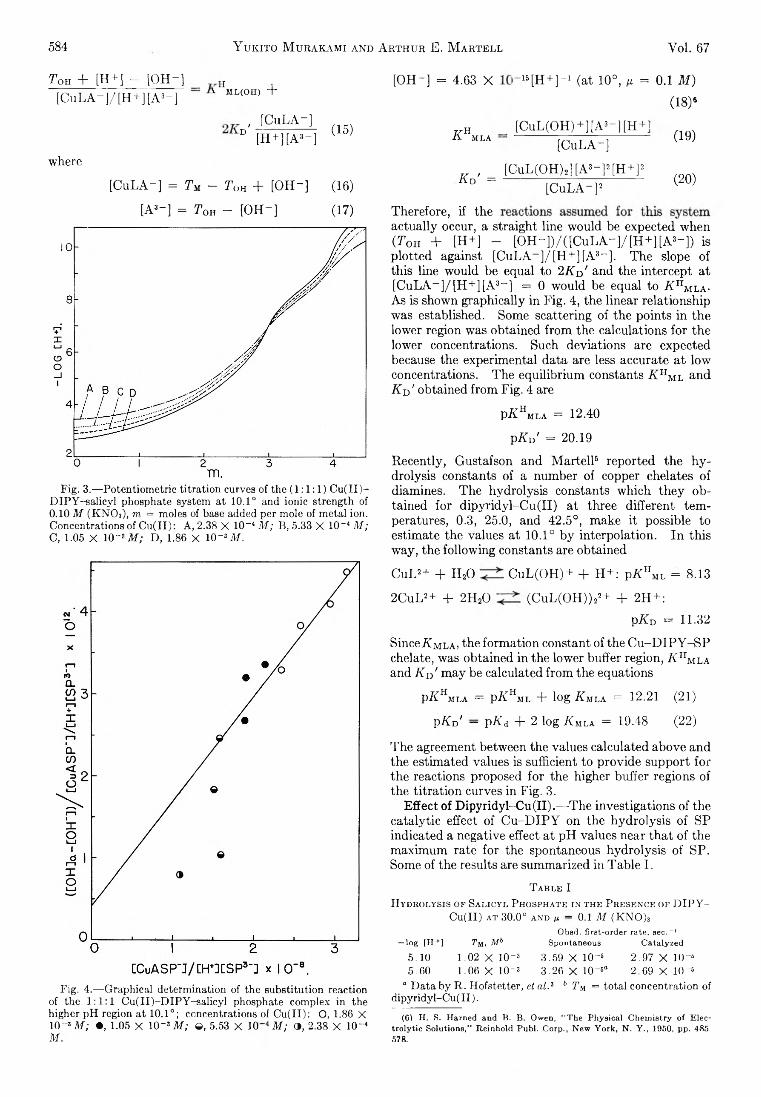
584 Y uicito M urakami and Arthur E. M artell Vol. 67
Ton + [H + ] - [O H -] H [C u L A -]/ [H + ][A 3- ] V ML(0H) +
[O H -] = 4.63 X
, [C u L A -] ° [H + ] [A 3 -]
(15)A H m l a
where
[C u L A -] = Tm - Ton + [O H -] (16) A d' =
[A 3- ] = Ton - [O H -] (17) Therefore, if the
r 1 5 [H + ] - 1 (a t 10°, tx = 0.1 M)
(18)«
[C u L (O H )+] [A 3 -] [H+1[C u L A -]
[C u L (O H ) 2 ] [A 3 - ] 2 [H + ] 2
[C u L A - ] 2
(19)
(2 0 )
Fig. 3.— Potentiometric titration curves of the (1 :1 :1 ) C u (II)- DIPY-salicyl phosphate system at 10.1° and ionic strength of 0.10 M (KNO3), m = moles of base added per mole of metal ion. Concentrations of Cu(II): A, 2.38 X 10~ 4 M ; B, 5.33 X 10 ~4 M ; C, 1.05 X 10~ 3 M ; D, 1.86 X 10~*M.
actu a lly occur, a stra ight line w ould be expected when {Ton + [H + ] - [O H -] )/ ( [C u L A -]/ [H + ][A 3- ] ) is p lotted against [C u L A ~ ] / [H +] [ A 3 - ]. Th e slope of th is line w ould be equal to 2 A D' and the intercept a t [C u L A -]/ [H + ][A 3“ ] = 0 would be equal to A h m l a - A s is shown graph ica lly in F ig . 4, the linear relationship was established. Some scattering of the points in the lower region was obtained from the calculations fo r the lower concentrations. Such deviations are expected because the experim ental data are less accurate a t low concentrations. The equ ilibrium constants A h Ml and A D ' obtained from F ig . 4 are
P-KHm la = 12.40
p A D' = 20.19
R ecently, Gustafson and M a rte ll6 reported the h y dro lysis constants of a num ber of copper chelates of diamines. Th e hydro lysis constants w hich th e y obtained fo r d ip y r id y l-C u (II) at three different tem peratures, 0.3, 25.0, and 42.5°, make it possible to estimate the values at 10.1° b y in terpolation. In th is w ay, the fo llow ing constants are obtained
C u L 2+ + H 20 C u L (O H ) + + H + : p A HML = 8.13
2 C u L2+ + 2H 20 (C u L (O H ))22+ + 2H + :
p A D = 11-32
Since A m l A) the form ation constant of the C u -D IP Y -S P chelate, was obtained in the lower buffer region, A hMla and K n' m ay be calculated from the equations
p A Hmla = p A Hml + lo g A mla = 12.21 (21)
p K b ' — P-Ka + 2 lo g A mla = 19.48 (2 2 )
Th e agreement between the values calculated above and the estimated values is sufficient to provide support fo r the reactions proposed fo r the higher buffer regions of the titra tio n curves in F ig . 3.
Effect of Dipyridyl-Cu(II).— -The investigations of the ca ta lytic effect of C u -D IP Y on the h yd ro lysis of SP indicated a negative effect a t p H values near th a t of the m axim um rate fo r the spontaneous h yd ro lysis of SP. Some of the results are summarized in Ta b le I.
T a b l e IH yd r o l y sis o p Sa l ic y l P h o sph a t e in th e P r e se n c e o p D I P Y -
Cu(II) a t 30 .0° an d n — 0.1 if f (K N O ),Obsd. first-order rate, sec.-1
— log [H +] Tm, Mb Spontaneous Catalyzed5 .1 0 1 . 0 2 X 1 0 " 3 3 .5 9 X 10“ 5 2 .9 7 X 10~55 .6 0 1 .0 6 X 10 -3 3 .2 6 X 1 0 -50 2 .6 9 X I Q -5
Fig. 4.— Graphical determination of the substitution reaction of the 1 :1 :1 Cu(II)-D IPY-salicyl phosphate complex in the higher pH region at 10.1°; concentrations of Cu(II): O, 1.86 X 1(P3 M ; •, 1.05 X 10“ 3 M ; ©, 5.53 X 1 0 M ; O, 2.38 X 10“ 4 M.
“ Data by R . Hofstetter, et al.z b Tm = total concentration of dipyridyl-Cu(II).
(6) H. S. Harned and B. B. Owen, “ The Physical Chemistry of Electrolytic Solutions,” Reinhold Publ. Corp., New York, N. Y., 1950, pp. 485, 578.
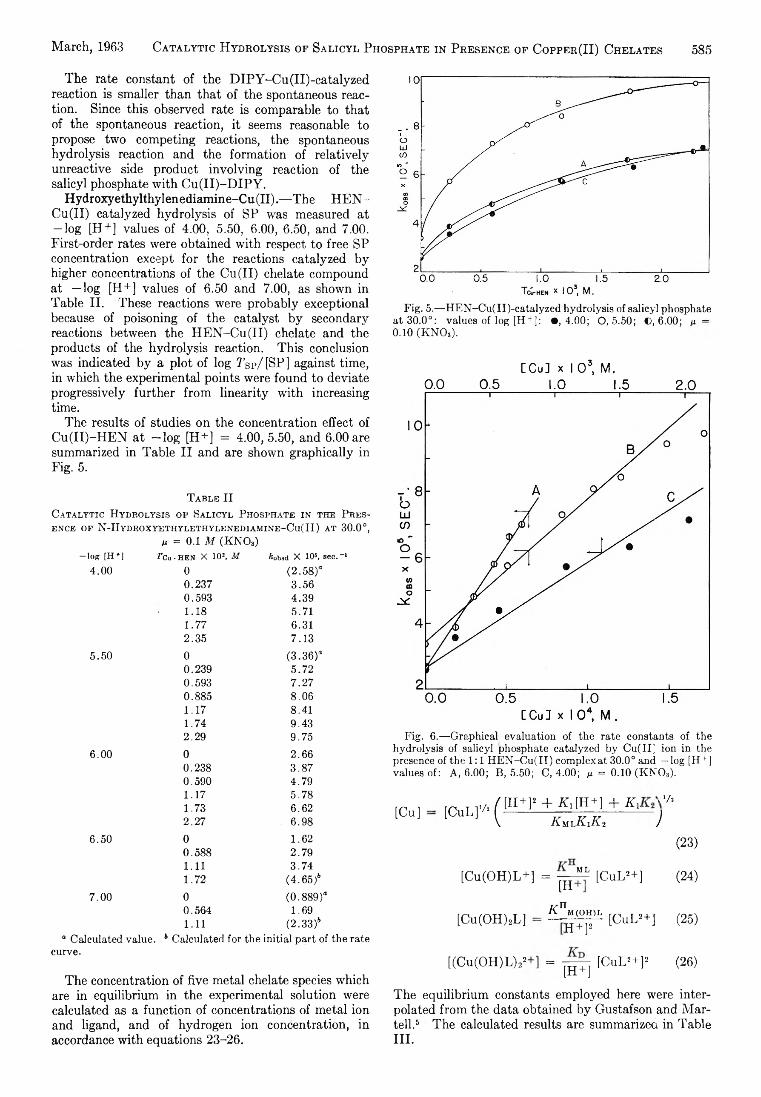
March, 1963 Catalytic Hydrolysis of Salicyl Phosphate in Presence of Copper(II) Chelates 585
The rate constant of the D IP Y -C u (II)-c a ta lyze d reaction is sm aller than th a t of the spontaneous reaction . Since th is observed rate is comparable to th a t of the spontaneous reaction, it seems reasonable to propose tw o com peting reactions, the spontaneous hydro lysis reaction and the form ation of re la tive ly unreactive side product in vo lv in g reaction of the sa licyl phosphate w ith C u ( I I ) -D IP Y .
H yd ro xye th ylth yle n e d ia m in e -C u (II).— Th e H E N - C u ( ll) catalyzed h yd ro lysis of SP was measured at — log [H + ] values of 4.00, 5.50, 6.00, 6.50, and 7.00. P irst-o rd e r rates were obtained w ith respect to free SP concentration except fo r the reactions catalyzed b y higher concentrations of the C u ( II) chelate compound at — log [H + ] values of 6.50 and 7.00, as shown in Tab le I I . These reactions were probab ly exceptional because of poisoning of the cata lyst b y secondary reactions between the H E N -C u ( II) chelate and the products of the hyd ro lysis reaction. T h is conclusion was indicated b y a p lo t of log Ygp/ [SP ] against tim e, in which the experim ental points were found to deviate progressively fu rth e r from lin e a rity w ith increasing tim e.
The results of studies on the concentration effect of C u ( II) -H E N at — log [H + ] = 4.00,5.50, and 6.00 are summarized in Table I I and are shown graph ica lly in F ig . 5.
T a b l e IIC a t a l y t ic H y d r o l y s is o f Sa l ic y l P h o sph a t e in th e P r e s e n ce o f N -H y d r o x y e t h y l e t h y l e n e d ia m in e - C u( I I ) a t 30.0°,
n = 0.1 M (K N 0 3)— log [H+] Tcu. hen X 10s, M £„bsd X 105, sec.-'
4.00 0 (2 .58)“0.237 3.560.593 4.391.18 5.711.77 6.312.35 7.13
5.50 0 (3 .36)“0.239 5.720.593 7.270.885 8.061.17 8.411.74 9.432.29 9.75
6 .0 0 0 2 . 6 60.238 3.870.590 4.791.17 5.781.73 6.622.27 6.98
6.50 0 1.620.588 2.791 . 1 1 3.741.72 (4 .6 5 /
7.00 0 (0.889)“0.564 1.691 . 1 1 (2 .3 3 /
“ Calculated value. * Calculated for the initial part of the ratecurve.
The concentration of five m etal chelate species whichare in equilibrium in the experim ental solution werecalculated as a function of concentrations of m etal ion. and ligand, and of hydrogen ion concentration, in accordance w ith equations 23-26.
Fig. 5.— HEN-Cu(II)-catalyzed hydrolysis of salicyl phosphate at 30.0°: values of log [H + ]: « ,4 .0 0 ; 0 ,5 .5 0 ; C, 6.00; ß — 0 .10 (KNOs).
[C u l X I O 3, M.0.0 0.5 1.0 1.5 2.0
Fig. 6 .— Graphical evaluation of the rate constants of the hydrolysis of salicyl phosphate catalyzed by Cu(II) ion in the presence of the 1:1 H EN -Cu(II) complex at 30.0° and —log [H + ] values of: A, 6.00; B, 5.50; C, 4.00; ¡i = 0.10 (K N 0 3).
[C u ] [C u L ] , /2 ([H + P + Ki [H + ] -F K h , ‘A
[C u (O H )L + ] =
[C u (O H )2L ]
[(C u (O H )L ),*
KuiKrKz )(23)
= p “ 1 [C u L -H (24)
K ”HT , r [cu L* +] (25)
- [H + ] |C“ L ' + I!(26)
Th e equ ilibrium constants employed here were in terpolated from the data obtained b y Gustafson and M a r- te ll. 5 Th e calculated results are summarized in Ta b leI I I .
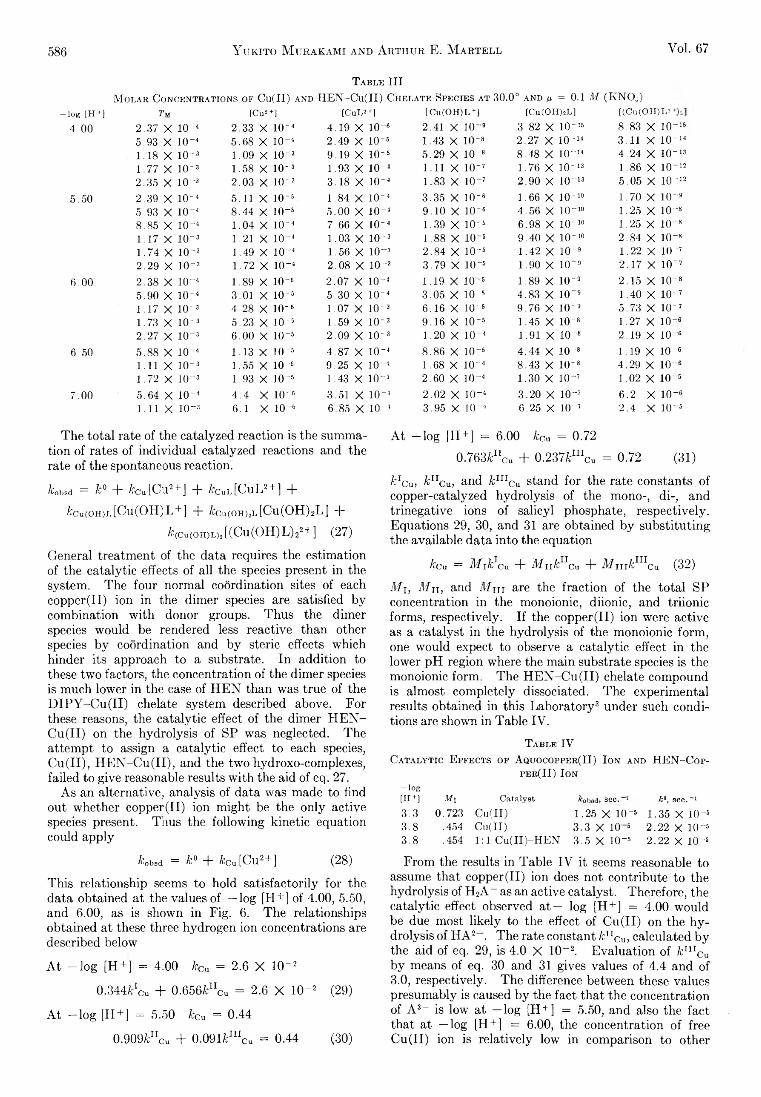
586 Y tjkito M urakami and Arthur E. M artell Vol. 67
T a b l e III
-log [H+l4.00
5.50
6 .0 0
6.50
7.00
M o l a r C o n c e n tr a t io n s o f Cu(II) an d H EN -C u(II) C h e l a t e Sp e c ie s a t 30.0° an d h = 0.1 M (KNO^)T M
2.37 X 10“ 45.93 X 10“ 41.18 X 10“ 3 1.77 X 10“ 3 2.35 X 10~ 3
2.39 X 10“ 45.93 X 10“ 48.85 X IO" 41.17 X 10“ 3 1.74 X 10~ 32.29 X 10“ 3
2.38 X 10~ 45.90 X 10- 41.17 X 10“ 3 1.73 X 10“ 32.27 X 10~ 3
5.88 X 10~ 41 . 1 1 X 1 0 - 3 1.72 X H E 3
5.64 X IO“ 41.11 x 1 0 - 3
[Cu2+]2.33 X 10“ 4 5.68 X IO“ 41.09 X 10~ 31.58 X 10- 32.03 X 10~ 3
5.11 X IO“ 5 8.44 X IO“ 31.04 X IO“ 4 1.21 X 10“ 4 1.49 X 10~ 4 1.72 X IO“ 4
1.89 X 10“ 63.01 X 10“ 54.28 X 10“ 6 5.23 X IO“ 56.00 X IO- 5
1.13 X IO- 51.55 X 10~51.93 X 10~6
4.4 X 10““66.1 X 10-‘
[CuL2+]4.19 X 10“ 6 2.49 X 10~ 69.19 X IO' 51.93 X IO' 43.18 X 10~ 4
1.84 X IO“ 4 5.00 X IO“ 4 7.66 X IO“ 4 1.03 X 10“ 31.56 X 10~ 32.08 X IO- 3
2.07 X IO- 45.30 X IO“ 41.07 X IO- 31.59 X IO“ 32.09 X 10“ 3
4.87 X 10~ 4 9.25 X IO" 41.43 X 10" 3
3.51 X 10“ 46.85 X IO- 4
[Cu(OH)L+]2.41 X 10- 31.43 X IO’ 85.29 X 10~ 81.11 X 10~ 71.83 X IO- 7
3.35 X 10“69.10 X 10" 61.39 X 10“6 1.88 X 10' 52.84 X 10~6 3.79 X 10~8
1.19 X IO- 53.05 X 10 56.16 X IO“69.16 X 10" 61.20 X 10~ 4
8 .8 6 X 10" 5 1.68 X 10“ 42.60 X IO- 4
2.02 X IO- 4 3.95 X 10^ 4
[Cu(OH)2L]3.82 X 10~ 16 2.27 X IO“ 14 8.48 X 10- 141.76 X IO" 132.90 X 10“ 13
1.66 X 10“ 104.56 X 10“ 10 6.98 X 10“ 109.40 X IO" 101.42 X IO“ 31.90 X 10~ 9
1.89 X IO“ 34.83 X 10“ 39.76 X 10“ 9 1.45 X 10“81.91 X 10" 8
4.44 X 10^ 88.43 X 10" 81.30 X IO- 7
3.20 X 10“ 7 6.25 X IO““7
[(Cu(OH)L228 . OO OO X 1 0 --153. 1 1 X 1 0 --144 .24 X 1 0 --131 .86 X 1 0 --12
5 .05 X 10 -12
1 ..70 X 1 0 --91 ..25 X 1 0 --81 ..25 X 10 -82 .84 X 1 0 --81 .2 2 X 10 -72 .17 X 1 0 '"7
2 .15 X 10 -81 .40 X 1 0 -- 75 .73 X 1 0 -- 71 .27 X 1 0 --62 .19 X 1 0 --6
1 . 19 X 1 0 --64. 29 X 10 -61 .02 X 10 -5
6 .2 X 1 0 --62 .4 X 1 0 --5
The to ta l rate of the catalyzed reaction is the summation of rates of in d iv id u a l catalyzed reactions and the rate of the spontaneous reaction.
fcobsd = k° + fccu[Cu2 + ] + /CCul[C uL 2 + ] +
£cu(oh)l [C u (O H )L + ] + /ccu(oh)2l [C u (O H )2L ] +
&(Cu(OH)L)2 [(C u (O H )L )22+] (27)
General treatm ent of the data requires the estim ation of the ca ta lytic effects of a ll the species present in the system. Th e four norm al coordination sites of each co p p e r(II) ion in the dim er species are satisfied b y com bination w ith donor groups. Th us the dim er species w ould be rendered less reactive than other species b y coordination and b y steric effects w hich hinder its approach to a substrate. In addition to these tw o factors, the concentration of the dim er species is m uch low er in the case of H E N than was true of the D IP Y -C u ( I I ) chelate system described above. F o r these reasons, the ca ta lytic effect of the dim er H E N - C u ( II) on the hydro lysis of SP was neglected. The attem pt to assign a ca ta lytic effect to each species, C u ( II) , H E N -C u ( II) , and the tw o hydroxo-com plexes, failed to give reasonable results w ith the aid of eq. 27.
A s an alternative , analysis of data was made to find out whether copper ( I I ) ion m ight be the o n ly active species present. Thus the fo llow ing kinetic equation could app ly
A t - lo g [H + ] = 6.00 fcCa = 0.72
0.763/fcncu + 0.237fcm cu = 0.72 (31)
kxCu, /cITOu, and fcm Cu stand fo r the rate constants of copper-catalyzed hydro lysis of the m ono-, d i-, and trinegative ions of sa licyl phosphate, respectively. Equations 29, 30, and 31 are obtained b y substitu ting the available data in to the equation
/ecu = M i^ c u + Mukllcn + Minkm Cn (32)
Mi, Mu, and M m are the fraction of the to ta l SP concentration in the m onoionic, d iion ic, and triio n ic form s, respectively. I f the copper ( I I ) ion were active as a cata lyst in the hydro lysis of the m onoionic form , one w ould expect to observe a ca ta lytic effect in the lower p H region where the m ain substrate species is the m onoionic form . The H E N -C u ( II) chelate compound is alm ost com pletely dissociated. Th e experim ental results obtained in th is La b o ra to ry3 under such conditions are shown in Table IV .
T a b l e IVC a t a l y t ic E ff e c ts o f A q u o co pper ( I I ) I on a n d H E N -C op-
per(II) I on
— log [H+] Mi Catalyst fcobsd, sec. 1 h°, sec.-I3.3 0.723 Cu(II) 1.25 X 10 —8 1.35 X IO- 33.8 .454 Cu(II) 3.3 X 10 3 2.22 X IO““53.8 .454 1:1 Cu(II)-H EN 3.5 X IO- 5 2.22 X IO- 5
¿obsd = fc° + fccu[Cu2+] (28)
T h is relationship seems to hold sa tisfacto rily fo r the data obtained at the values of — log [H + ] of 4.00, 5.50, and 6.00, as is shown in F ig . 6 . Th e relationships obtained at these three hydrogen ion concentrations are described below
A t — log [H + ] = 4.00 kcu = 2.6 X 10~ 2
0.344/cICu + 0.656fcn cu = 2.6 X 10“ 2 (29)
A t - lo g [H + ] = 5.50 fcCu = 0.44
0.909fcn Cu + 0.091fcin cu = 0.44 (30)
From the results in Table IV it seems reasonable to assume th a t copper ( I I ) ion does not contribute to the hydro lysis of H 2A _ as an active cata lyst. Therefore, the ca ta lytic effect observed a t— log [H + ] = 4.00 w ould be due most lik e ly to the effect of C u ( II) on the h y dro lysis of H A 2 . The rate constant /cTICu, calculated b y the aid of eq. 29, is 4.0 X 10⁻² . E va lu a tion of fcn icu b y means of eq. 30 and 31 gives values of 4.4 and of3.0, respectively. Th e difference between these values presum ably is caused b y the fact th a t the concentration of A 8 - is low at — log [H + ] = 5.50, and also the fact th at at — log [H + ] = 6.00, the concentration of free C u ( II) ion is re la tive ly low in com parison to other
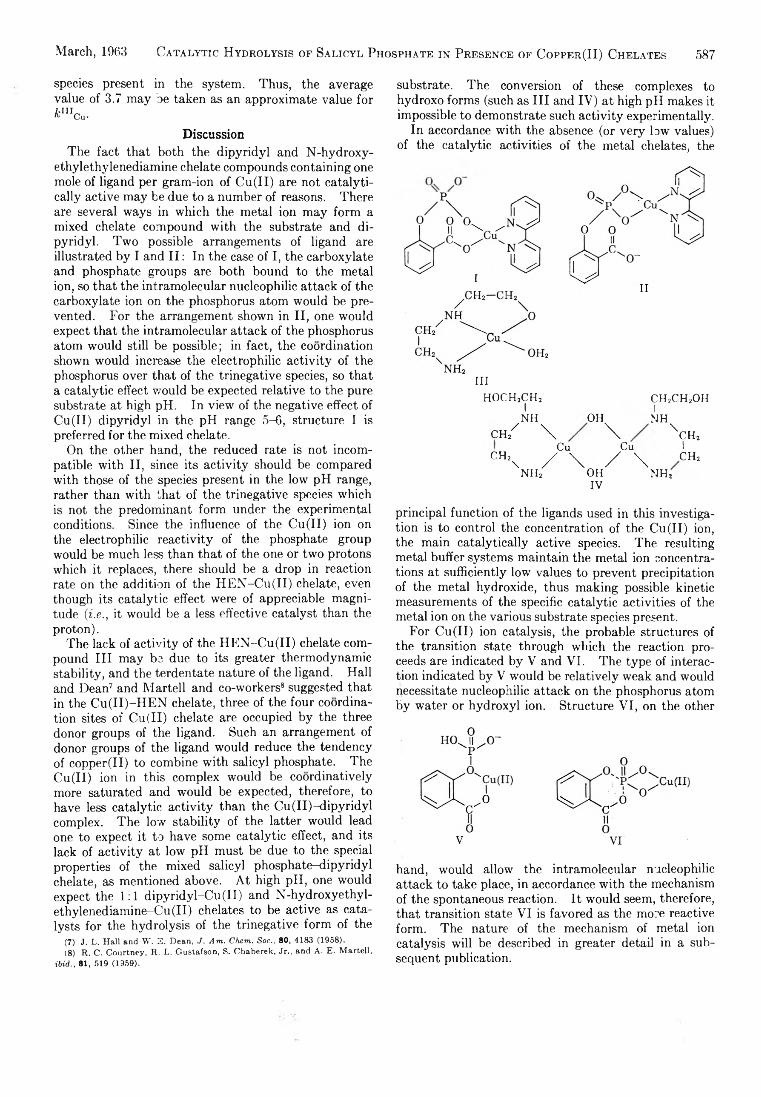
March, 1963 Catalytic Hydrolysis of Salicyl Phosphate in Presence of Copper(II) Chelates 587
species present in the system. Thus, the average value of 3.7 may be taken as an approximate value forfcU I Cu-
DiscussionThe fact that both the dipyridyl and N-hydroxy-
ethylethylenediamine chelate compounds containing one mole of ligand per gram-ion of Cu(II) are not catalyti- cally active may be due to a number of reasons. There are several ways in which the metal ion may form a mixed chelate compound with the substrate and dipyridyl. Two possible arrangements of ligand are illustrated by I and I I : In the case of I, the carboxylate and phosphate groups are both bound to the metal ion, so that the intramolecular nucleophilic attack of the carboxylate ion on the phosphorus atom would be prevented. For the arrangement shown in II, one would expect that the intramolecular attack of the phosphorus atom would still be possible; in fact, the coordination shown would increase the electrophilic activity of the phosphorus over that of the trinegative species, so that a catalytic effect would be expected relative to the pure substrate at high pH. In view of the negative effect of Cu(II) dipyridyl in the pH range 5-6, structure I is preferred for the mixed chelate.
On the other hand, the reduced rate is not incompatible with II, since its activity should be compared with those of the species present in the low pH range, rather than with that of the trinegative species which is not the predominant form under the experimental conditions. Since the influence of the Cu(II) ion on the electrophilic reactivity of the phosphate group would be much less than that of the one or two protons which it replaces, there should be a drop in reaction rate on the addition of the HEN-Cu(II) chelate, even though its catalytic effect were of appreciable magnitude (i.e., it would be a less effective catalyst than the proton).
The lack of activity of the HEN-Cu(II) chelate compound III may be due to its greater thermodynamic stability, and the terdentate nature of the ligand. Hall and Dean7 and Martell and co-workers8 suggested that in the Cu(II)-HEN chelate, three of the four coordination sites of CutII) chelate are occupied by the three donor groups of the ligand. Such an arrangement of donor groups of the ligand would reduce the tendency of copper(II) to combine with salicyl phosphate. The Cu(II) ion in this complex would be coordinatively more saturated and would be expected, therefore, to have less catalytic activity than the Cu(II)-dipyridyl complex. The low stability of the latter would lead one to expect it to have some catalytic effect, and its lack of activity at low pH must be due to the special properties of the mixed salicyl phosphate-dipyridyl chelate, as mentioned above. At high pH, one would expect the 1:1 dipyridyl-Cu(II) and N-hydroxyethyl- ethylenediamine—Cu(II) chelates to be active as catalysts for the hydrolysis of the trinegative form of the
(7) J. L. Hall and W . 3 . Dean, J . Am . Chem. Soc., 80, 4183 (1958).(8) R. C. Courtney, R . L. Gustafson, S. Chaberek, Jr., and A. E. Martell,
ibid., 81, 519 (1959).
substrate. The conversion of these complexes to hydroxo forms (such as III and IV) at high pH makes it impossible to demonstrate such activity experimentally.
In accordance with the absence (or very low values) of the catalytic activities of the metal chelates, the
IIIh o c h 2c h 2
1c h 2c h 2o h
NH OH1
NHc u / \ \ x c h 2
Cu Cu 1
CH\ / V / \c h 2
n h 2 OH n h 2IV
principal function of the ligands used in this investigation is to control the concentration of the Cu(II) ion, the main catalytically active species. The resulting metal buffer systems maintain the metal ion concentrations at sufficiently low values to prevent precipitation of the metal hydroxide, thus making possible kinetic measurements of the specific catalytic activities of the metal ion on the various substrate species present.
For Cu(II) ion catalysis, the probable structures of the transition state through which the reaction proceeds are indicated by V and VI. The type of interaction indicated by V would be relatively weak and would necessitate nucleophilic attack on the phosphorus atom by water or hydroxyl ion. Structure VI, on the other
hand, would allow the intramolecular nucleophilic attack to take place, in accordance with the mechanism of the spontaneous reaction. It would seem, therefore, that transition state VI is favored as the more reactive form. The nature of the mechanism of metal ion catalysis will be described in greater detail in a subsequent publication.
CURRENT-POTENTIAL CHARACTERISTICS FOR ELECTRODE PROCESSES WITH SPECIFIC ADSORPTION OF REACTANT AND/OR PRODUCT
By D avid M. M ohilner1 and Paul D elahay
Coates Chemical IMhoratory, Louisiana Stale University, Baton Rouge■ 8, Louisiana Received August 6, 1962
A general current-potential characteristic is derived for electrode processes controlled by charge transfer kinetics and equilibrium for specific adsorption of reactant and product. The supporting electrolyte is supposed not to be specifically adsorbed. Particular forms of this equation are derived (a) for processes with specific adsorption of a single substance and (b) specific adsorption of a single substance obeying the logarithmic Temkin isotherm. A simple experimental criterion is derived which involves the study of the variations of the apparent exchange current density with ihe activities of reactant and product. Processes with control by charge transfer equilibrium and adsorption kinetics are briefly treated. Experimental and theoretical studies suggested by this work are indicated.
588 David M. M ohilner and Paul D elahay Vol. 67
Current-potential characteristics have been discussed for a number of electrode processes with specific adsorption of reactant and/or product, e.g., hydrogen ion discharge and hydrogen evolution, 2 3 metal deposition. 4
Relaxation methods have also been analyzed for such processes: potentiostatic and galvanostatic methods, 6
faradaic impedance and rectification. 6 The problem is attacked here in a new way by application of recent ideas7 on adsorption kinetics at electrodes and use of Parsons’ treatment of electrode kinetics. 8 A criterion is derived for the detection and, possibly, quantitative study of adsorption. Stoichiometric number and coefficients are assumed to be equal to unity but results can easily be modified when this assumption cannot be made. It is further assumed that the supporting electrolyte is not specifically adsorbed. Mass transfer polarization is not considered.
Control by Adsorption Equilibrium and Charge Transfer Kinetics
General Equation.— We consider the over-all process O* + ne = TP' which is decomposed in the followingconsecutive steps
O2 + S = Ao (1)
Ao -f- ne = A r (2 )
Ar = R 2' + S (3)
There, 0 2 and R 2' of ionic valency z and z', respectively,(1) Postdoctoral fellow, 1960-1962.(2) (a) A detailed review of some aspects of this problem (and also the
influence o f adsorption o f foreign ions) is given b y A. N. Frumkin, “ Advances in Electrochemistry and Electrochemical Engineering,” Vol. 3, P. Delahay, editor, Interscience Division, John W iley and Sons, Inc., New York, N .Y ., in course of publication, (b) See also K . J. Vetter, “ Elektrochemische Kinetik,” Springer-Verlag, Berlin, 1961, pp. 468-474.
(3) (a) For recent work, c/., R . Parsons, Trane. Faraday Soc., 5 4 , 1053(1958). (b) H. Gerischer, Bull. soc. chim. Beiges, 6 7 , 506 (1958). (c)L. Krishtalik, Zh. Fiz. Khim., 3 3 , 1715 (1959); 3 4 , 117 (1960). (d) J. G. N.Thomas, Trans. Faraday Soc., 5 7, 1603 (1961).
(4) For a review, c/., e.g., H. Gerischer, Ann. Rev. Phys. Chem., 12, 227 (1961).
(5) H. Matsuda and P. Delahay, Collection Czechoslov. Chem. Commun., 2 5 , 2977 (1960). It is assumed that adsorption follows £ Langmuir isotherm at equilibrium as in earlier analyses of the faradaic impedance for processes with specific adsorption. This analysis is superseded by that of ref. 6.
(6) M . Senda and P. Delahay, J. Am. Chem. Soc., 6 5 , 1580 (1961). See previous work of other authors therein.
(7) P. Delahay and D. M . Mohilner, J. Phys. Chem., 66, 959 (1962) (Comm unication); J. Am. Chem. Soc., in press. Adsorption of neutral substances is treated but results can readily be transposed to adsorption of ions. It suffices to introduce in the expression for the adsorption exchange rate a Frumkin type of correction for the activity of the adsorbed species in the outer Helmholtz plane.
(8) It. Parsons, Trans. Faraday Soc., 47, 1332 (1951).
are soluble in the electrolyte (possibly R in the electrode,e.g., amalgam electrode); Ao and Ar are the specifically adsorbed forms of 0 2 and R2', S represents the adsorption sites. It is assumed that sites are equally available to either 0 2 and R2\ This formalism is inspired from our previous paper7 on adsorption kinetics. We define the states
I: CP(bulk) + ne(electrode) + S
II: Ao + ne (electrode)
III: A r
IV: R 2' (bulk) + S
The corresponding standard free energies are
G ,° = m o° + ny.,M - + Msn + ^ (4 )
Gn° = fiA0n + AiA0q + WjiteM — nF<j>m (5)
G in 0 = mar " + #uRq (6 )
Giv° = mr° + Ms" + m sq (7)
where the /u°’s are the standard chemical potentials; the /nn’s the charge-independent parts of the standard electrochemical potentials; the nq’s the charge-dependent parts of the standard electrochemical potentials; and <j>M is the inner potential of the electrode referred to the potential in the bulk of the solution. The division of the electrochemical potentials of species Ao, Ar , and S into charge-independent and charge-dependent parts was previously used by us. 7 This division is non- operational but this is immaterial because (a) the current-potential characteristics derived below include only differences of the charge-dependent parts of the electrochemical potentials, and (b) these differences can be determined by experiment. The “electrical” (as opposed to “ neutral” ) parts of the standard free energies are
(G I»)e = —nF<j>M + fxff (8)
(Gu°)e = — nF4(>M + juAoq (9)
(G lII° )e = ßARq (10)
(G i y°)e = /xRq (H)
We now postulate similarly to Parsons8 that the electrical part of the standard free energy of the activated complex (Cr4=0)e is such that
(G+°). - (G n °)e = a l(G m »)e - (G n 6)«] ( 1 2 )
March, 1963 589Current-P otential Characteristics of Electrode Processes
= « [mab9 - (ma09 - nF<f>)}
where a (0 < a < 1) is the transfer coefficient. L ik e wise
(G*°)e - (Gn°), = (a - 1 ) r«7 m °), - (G „°)e] (13)
= ( a — 1 ) [m a r 9 — ( m a o '1 — n F 4 >M ) ]
The standard free energy of a ctiva tion for the forward processes is
AG * 0 = G*° - Gi° (14)
= (AG*°)n - (AG*°)e
= (AG*°)n + (G*°)e - (GF)e
= (AG*°)n + aA G Rq + (1 - a )A G 0q + anF$u
where (AG*°)n is the charge-independent part of AG*0, and AGoq and AG Rq are defined b y
AGoq = MAoq - Msq (15)
AG Rq = marq - Msq (16)
Likew ise, one has fo r the backward process
AG*° = G*° — Giv° = (AG*°)n + «A G Rq + (1 —
a) AG 0q - (1 - a) nF<j>u (17)
The current densities fo r the forw ard and backward reactions are, respectively
7 = nF(kT/h)[exp(— AG4?/RT)]a0as (18)
T = nFQiT/K) [exp( — AG*0/RT) ]aRas (19)
where the ao and aR are the activ ities of 0 2 and IP ' in the bu lk of the solution and as is the a c tiv ity of the sites S ; the other sym bols are as usual. A t equilibrium
7 = 7 = 7a°, where 7a° is the apparent exchange current density (“ apparent1’ because 7a° is an over-a ll qu an tity which does not perta in solely to charge transfer between A o and A R). One has b y analogy w ith the treatm ent of electrode kinetics in the absence of specific adsorption9
7a° = nFk°aol- aanaas e xp [— a (A G Rcl) r/.R71 ]e xp [— (1 —
a)(AG0q)r/RT] (20)
where the standard rate constant kc is
lc° = (kT/h) e xp [— (AG*°)n/72T] e xp [ — amF<j>u/RT]
= (kT/h)exp[ — (AG*°)n/jR T ] e x p [(l — a)nF<t>0M/RT]
(2 1 )
There </>rM is the equilibrium potentia l, <f>0M is the standard potentia l fo r the reaction 0 2 + ne = I P , and (AG 0q)r and (A G Rq)r are the values of AG oq and AGRq at <t>vM■ The current d ensity-po tentia l characteristic ( 7 ^ 0 fo r a net cathodic or anodic current, respectively) is
(9) For a review, cf., e.g., P. Delahay in “ .Advances in Electrochemistry and Electrochemical Engineering,” Vol. 1, P. Delahay, editor, Interscience Division, John Wiley and Sons, Inc., New York, N. Y., 1961, pp. 233-318.
7 = 7a° {exp { — a [A G Rq - (A G Rq) r]/72T} e x p --(1 - a) [AG 0q - (A G 0 q) r]/ £ T } } X {e xp [-omFn/RT] -
e x p [(l — a)nFt)/RT] (2 2 )
where 17 = <j>M — <f>rM is the overvoltage, and AG Rq and AG oq are taken a t <f>M. I t can rea d ily be shownth a t eq. 2 2 reduces to the N ernst equation fo r d>M =, M <f>r
Equation 22 includes the factors (between the second pair of braces) showing the w e ll known dependence of 7 on overvoltage and it should account, together w ith eq. 20 fo r 7a°, fo r the influence of specific adsorption. Ap p lica tion of the general equations 20 and 22 requires the exp lic it form of a g and the knowledge of the va ria tions of AG oq and AG Rq w ith d>M. Ap p lica tion w ill be lim ited here to processes in w hich o n ly one species-— e ith e r, Oz or IT -— is specifically adsorbed and the logarithm ic Tem kin isotherm is obeyed a t equilibrium .
Case of a Single Specifically Adsorbed Substance.— We assume that substance Oz is specifically adsorbed and R z/ is not. States III and IV now are
I I I : R 2' (outer H elm holtz plane) + S
IV : R 2' (bu lk ) + S
The corresponding standard free energies are
G in 0 = MR0 + z'F<j>h + ms” + Msq (23)
Giv° = MR0 + M8n + Msq (24)
where /xr° is the standard chemical potential of R J' and <f>h is the inner potential in the outer Helmholtz plane referred to the inner potential in the bulk of the solution. Equations 10 and 1 1 now become
(Gm°)e = 2'7>h + Msq (25)
(Giv°)e = MSq (26)
and consequently (cf. eq. 1 2 )
(G *°)e - (Gn°)e = « W F ^ + MS9 -
(MA0q - nF<j>M)} (27)
(G *°)e - (G „I°)e = ( « - 1) WF<t>h + MS9 -
( m a 0 q -n 7 > M)] (28)
Hence (cf. eq. 14 and 17)
AG*° = (AG*°)n T (1 — a )A G o q -f-
az'F<j>h + anF(j>u (29)
AG*° = (AG*°)n + (1 - « )A G 0q +
az'F<t>h - ( 1 - a ) nF<f>u (30)
The exchange current density is
7a° = nFkaa0x~a ana as exp [— az'F^f/RT] X
exp[ - ( 1 - a) (AGo^r/RT (31)
where fc° is defined by eq. 2 1 and <£rh is the value of <f>h at cf>rM. It is seen that the effect of non-specific adsorption of Bzl corresponds to a purely electrostatic term of the Frumkin correction type (cf. ref. 10). The I-y characteristic is
7 = 7a° {e xp \ -a z 'F ( / - <hrh)/RT} X
exp{ — (1 - a) [AG 0q - (AGo^hVRT} X
{e xp [ — anFy/RT] — e x p [(l — a) nFrj/RT]} (32)
590 D avid M. M ohilnek and Paul D elahay Vol. 67
Single Specifically Adsorbed Substance Obeying the Logarithmic Temkin Isotherm.— The logarithmic Tern- kin isotherm is10
bV = — AG° — R T In a (33)
where b is a characteristic parameter of the adsorbed substance under given conditions, r the surface concentration, AG° the standard free energy of adsorption, and a the activity in solution for the adsorbed substance. This isotherm represents quite well, as a first approximation, data on adsorption of ions1112 and some organic substances13 on an ideal polarized electrode at constant charge density and provides a convenient starting point in this treatment. One then has
as = exp[- <\b/RT)T] (34)
where X is the coverage parameter introduced by Temkin.10 In view of eq. 33, one has for adsorption equilibrium
as = (a0)- x exp[— X(A Gn + A Gq) /R T ] (35)
where AGn and AGq are the charge-independent and charge-dependent components of the standard free energy of adsorption AG°, respectively. 7a° and the I-?? characteristic are
7a° = nF(k°)'a1-“-XaRa e x p [ - a z 'F ^ h/R T ] X
exp [(a - X + 1) A G fi/R T \ (36)
I = 7a° {exp{-azT [0 h - <t>f]/RT) X
exp [(a - X - 1)(A Gq - A G fi)/R T ]\ X
Jexp[— a nF v/R T ] — exp[(l — a) nF tj/R T ]} (37)
where AGq and A Gy1 correspond to 4>M and <£rm, respectively, and (/c0)' = k° exp(\A G °/R T) (cf. eq. 21). It is seen from eq. 37 that 7a° includes two terms depending on <j>M: the term in <Gh which corresponds to the Frumkin correction for the non-specifically adsorbed substance fP ’, and the term in AG/ 1 resulting from specific adsorption of Oz.
More quantitative data are needed on the dependence of AGfi on 4>M at the present, and only a preliminary conclusion can be reached. Thus, it was shown by Parsons12 that AGq varies linearly with the charge density q for adsorption of Cl~, Br- , and I- on an ideal polarized Hg electrode. As a crude approximation q varies linearly with <f>M not too near the point of zero charge, and consequently the exponential containing AGra in eq. 36 is equivalent to an exponential function of 4>m. The dependence of AG/1 on q for organic substances is more involved but can be determined experimentally. 13
Experimental Criterion for Specific Adsorption.—In addition to the usual methods applied to ideal polarized electrodes for the detection of specific adsorption, eq. 36 supplies a simple criterion based on the measurement of 7a°. One has by analogy with processes without specific adsorption9
(10) M. I. Temkin, Zh. fiz . Khim., 15, 296 (1941). Translation available.(11) D. C. Grahame, J. Am. Chem. Soc., 80, 4201 (1958).(12) (a) R. Parsons, Proc. 2nd Int. Congress Surface Activity, 3, 38 (1957);
(b) R . Parsons, Trans. Faraday Soc., 55, 999 (1959)*(13) D. M. Mohilner, P. Delahay, and T. H. Tidwell, unpublished in=
v estigation*
For a given pair of ao and a-R one has
In the absence of specific adsorption, the left-hand members of eq. 38 and 39 are equal to 1 — a and a, respectively, whereas this is not the case when there is specific adsorption of one reactant. The sum in eq. 40 is equal to 1 in the former case and is comprised between 0 and 1 (0 < X < 1) in the latter case. This provides a simple experimental criterion for detection of specific adsorption. This criterion should not be used without discrimination since other causes than adsorption (complexity of reaction, etc.) may cause the sum of eq. 40 to differ from unity.
Control by Charge Transfer Equilibrium and Adsorption Kinetics
We assume that Rz' is not adsorbed and that O2 is adsorbed according to the logarithmic Temkin isotherm at equilibrium. Further, eq. 1 is supposed to be slow and equilibrium prevails foreq. 2. We consider the states
I: Oz(bulk) + ne(electrode) + S
II: Oz(outer Helmholtz plane) + ne (electrode) + S
III: Ao + ne (electrode)
IV: Rz' (bulk) + S
We proceed as before and postulate that
(GG=°)e — (Gu°)e = p((Gm°)e ~ (Gui°)e] (41a)
(6r=t=°)e — (Giu°)e = (p — 1) [(triii°)e — (Gfl°)e] (41b)
where p is the charge parameter previously introduced7 in the treatment at adsorption kinetics. Thus
7a0 = nF(k°)"ao1~a exp[— (1 — p)zF<t>fi/RT] X
exp[(X - p) A G fi/R T ] (42)with
(fc0)" = (kT /h ) exp[— [A G ^ n /R T ] expIXAG^/TiT] =
ikT /h ) exp[ — (AGy°)n/R T ] exp[AAGn/R ,T ] X
exp [-A G ?/7? T] (43)
where AGt° is the change in standard free energy for the over-all reaction O2 + ne — R 2'. Equation 42 is quite similar to that for the adsorption exchange rate previously derived7 except that the effect of the charge transfer process following adsorption is now included. The 1—n characteristic can be written provided that functions <?>h(<?>M) and AG iipM) are known or can be postulated.
We also considered the general case of control by the kinetics of adsorption and charge transfer but the resulting equations are too involved to be of practical use.
March, 1963 Proton R esonance of orf Ao-Substituted Phenols 591
ConclusionElectrode processes with specific adsorption of react
ant and/or product can be analyzed rather rigorously by the method of this paper. Further progress requires experimental studies on (a) adsorption isotherms, (b)
determination of the standard free energy of adsorption as a function of charge density, and (c) application of the experimental criterion deduced in this paper.
Acknowledgment.— This investigation was supported by the National Science Foundation.
PROTON RESONANCE STUDIES OF ORTHO-SUBSTITUTED PHENOLSBy E. A . A l l a n a n d L. W. R e e v e s
Department of Chemistry, University of British Columbia, Vancouver 8, B. C.Received August 8, 1962
The formation of a cis-trans dimer of orfAo-halo-phenols in dilute solution in CS2 has been studied by n.m.r. Values of the dimerization equilibrium constant are obtained. 1 The temperature dependence of the -O -H chemical shift in 2,6 substituted halo-phenols is interpreted in terms of the asymmetry of the 2-fold internal rotation barrier of the C -O -H group. The ring proton spectra of these compounds have been analyzed and values of chemical shifts and absolute values of coupling constants obtained.
IntroductionIn a recent paper1 the study of intramolecular hy
drogen bonds by proton resonance methods gave quantitative information about the enthalpy of formation of the hydrogen bonds in orfAo-chloro-, bromo-, and iodo- phenol. The changes in chemical shift of the -OH proton on formation of an internal hydrogen bond have been shown to be approximately linearly related to the change in the OH infrared stretching frequency. 4~3
In studies of 2-hydroxybenzophenones similar correlations have been noted.4 Careful work by Gutowsky and co-workers5 has shown that chelated hydrogen bonds in derivatives of phenol, /?-naphthol, and 9- phenanthrol show -OH proton resonances shifted to lower field from the parent compound by an amount proportional to Av (C=0) in the infrared spectra and the bond multiplicity of the C = C bond in the chelate ring. Further work on intermolecular hydrogen bonded association between phenols and solvent molecules has indicated a correlation between hydrogen bond strength and change in chemical shift.6 7
The object of the present work has been to extend conclusions on intramolecular hydrogen bonds in ortho- halo-phenols to include the formation of O-H— O hydrogen bonds at finite concentrations by intermolecular association.1 A study of 2,6-substituted orfAo-halo-phenols also is made and some work on the ring proton resonances in these compounds is included.
ExperimentalSpectra were recorded on a Varian V.4300B high resolution
spectrometer at 40 Me. Small modifications to improve the precision of chemical shift measurements have been described in the previous paper.1 For the work involving ring spectrum analysis, a Varian 60 Me. A-60 analytical spectrometer was used. The chemical shift of the -O H proton at room temperature obtained with this instrument agreed with the results obtained at 40 Me.
2-Fluoro-4,6-diiodo-, 2-chloro-4,6-diiodo-, and 2-bromo-4,6- diiodophenol were prepared according to the procedure of Baker and Kaeding.1 The products were recrystallized several times from ra-heptane. 2-Fluoro-4,6-dibromo- and 2-chloro-4,6-dibro- mophenol were prepared by the method of Raiford and Le Rosen .8
(1) E. A. Allan and L. W. Reeves, J. P h y s . C h e m ., 66, 613 (1962).(2) L. W. Reeves, C a n . J. C h e m ., 38, 748 (1960).(3) L. W. Reeves, E. A. Allan, and K. O. Strtfmme, ibid., 38, 1249 (1960).(4) J. R. Merrill, J. P h y s . C h e m ., 65, 2023 (1961).(5) A. L. Porte, H. S. Gutowsky, and I. M. Hunsberger, J. A m . C h e m .
82, 5057 (1960).(6) L. Granacher, Helv. P h y s . Acta, 34, 272 (1961).(7) A. W. Baker and W. W. Kaeding, J. A m . C h e m . Soc., 81, 5904 (1959).(8) L. C. Raiford and A. L. Le Rosen, ib id ., 66, 2080 (1944).
The remaining substituted phenols used in this work were Eastman Kodak White Label materials further purified by successive recrystallization from redistilled n-hexane. The carbon disulfide was fractionally distilled reagent grade material. A small amount of tetramethylsilane ( ~ 1 % ) was added to serve as an internal reference peak.
ResultsSolutions of the 2,6-substituted halo-phenols were
made up at 2 and 4 mole % in carbon disulfide and sealed in 5 mm. o.d. sample tubes. An independently prepared duplicate set of solutions also was prepared and measured as a check. The -O-H proton resonance in these solutions was measured with respect to tetramethylsilane at temperatures between 0 and 100°. The standard deviation of 10 measurements on each solution varied but was never greater than ±0.5 c.p.s.
The chemical shift of the -OH proton resonance was the same for the 4 and 2 mole % solutions within experimental error. The variation of the chemical shift with respect to cyclohexane at various temperatures is given in graphical form in Fig. 1. The results are given in cycles per second from cyclohexane for comparison with previous results.1 A study of 2,4,6- trichlorophenol in various solvents also was carried out. Values obtained for the -OH proton resonance were — 4.32 p.p.m. in CS2, CC14, and cyclohexane, —4.24 p.p.m. in CHCls, —3.83 p.p.m. in benzene, and —8.94 p.p.m. in acetone. These results show that the -O-H proton is not sufficiently sterically hindered to prevent interaction with solvent.
Analysis of the ring proton spectra in these compounds also was made and these are included in Table I. No spectrum analyzed was more complex than an ABX case.9 A complete summary of these analyses is given in Table I.
DiscussionFormation of cis-trans Dimers.— The data in the
previous paper1 showed that the concentration dependence of the -OH chemical shift in three singly substituted oriAo-halo-phenols was linear from 0-4 mole % between —50 and +100°; and the infinite dilution chemical shift of the -OH proton resonance in these phenols has been used to determine the cis-trans equilibrium constant. At any finite concentration the
(9) J. A . Pop le, W . G . Schneider, and H . J. Bernstein, “ H igh R esolution N uclear M agnetic R eson ance S p ectroscopy ,” M cG ra w -H ill B ook C o ., N ew Y ork , N. Y ., 1959.
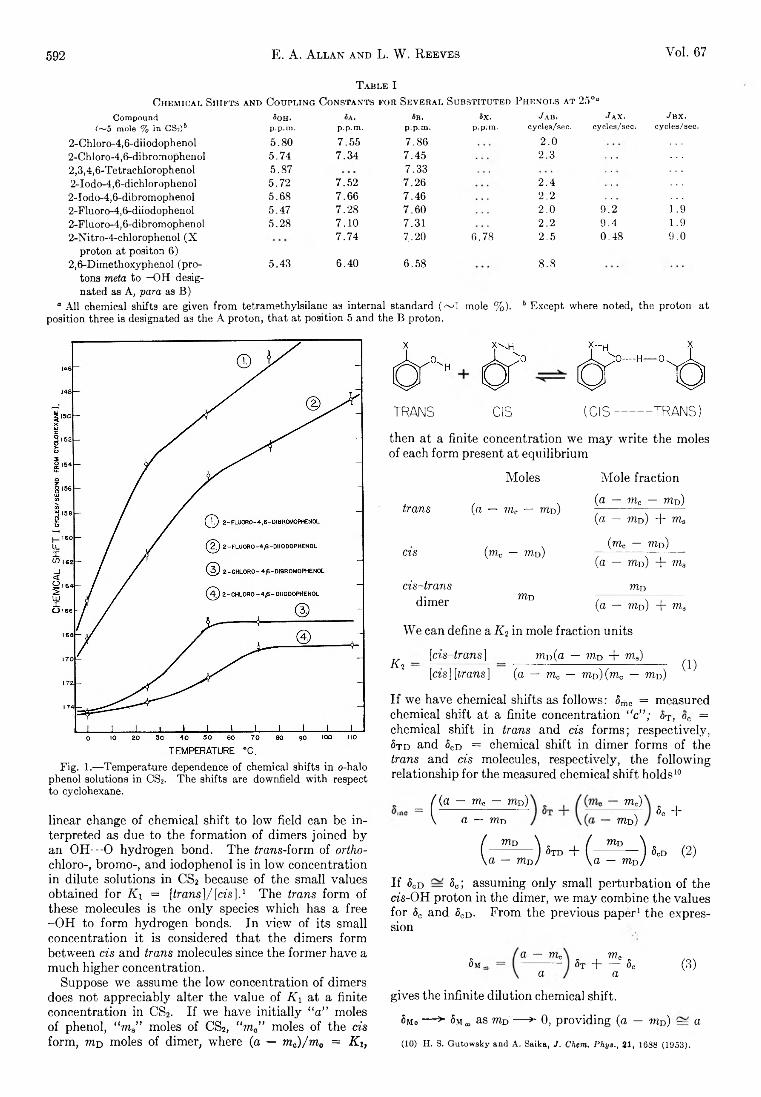
592 E. A. Allan and L. W. R eeves Vol. 67
T a b l e IC h e m ic a l S h ifts an d C o u plin g C o n stan ts f o r S e v e r a l S u b st itu t e d P h eno ls a t 2 5 °“
Compound Soh. Sa, Sb , 5X, J AB. J AX, J BX.(—5 mole % in CSr) p.p.m. p.p.m. p.p.m. p.p.m. cycles/sec. cycles/sec. cycles/sec.
2-Chloro-4,6-diiodophenol 5.80 7.55 7.86 2 . 0
2 -Ch loro-4, S-dibrouiophenol 5.74 7.34 7.45 2.32,3,4,6-Tetrachlorophenol 5.87 7.332-Iodo-4,6-dichlorophenol 5.72 7.52 7.26 2.42-Iodo-4,6-dibromophenol 5.68 7.66 7.46 2 . 2
2-Fluoro-4,6-diiodophenol 5.47 7.28 7.60 2 . 0 9.2 1.92-Fluoro-4,6-dibromophenol 5.28 7.10 7.31 2 . 2 9.4 1.92-Nitro-4-chlorophenol (X
proton at positon 6 )7.74 7.20 6.78 2.5 0.48 9.0
2,6-Dimethoxyphenol (protons meta to -O H designated as A, para as B)
5.43 6.40 6.58 8 . 8
“ All chemical shifts are given from tetramethylsilane as internal standard (~ 1 mole % ). 6 Except where noted, the proton at position three is designated as the A proton, that at position 5 and the B proton.
Fig. 1.-—Temperature dependence of chemical shifts in o-halo phenol solutions in CS2. The shifts are downfield with respect to cyclohexane.
linear change of chem ical sh ift to low field can be in terpreted as due to the form ation of dim ers jo ined b y an 0 H --0 hydrogen bond. Th e trans-form of ortho- chloro-, brom o-, and iodophenol is in low concentration in d ilu te solutions in CS 2 because of the sm all values obtained fo r K\ = [trans]/[cis].1 Th e trans form of these molecules is the o n ly species w hich has a free -O H to form hydrogen bonds. In view of its sm all concentration it is considered th a t the dim ers form between cis and trans molecules since the form er have a m uch h igher concentration.
Suppose we assume the low concentration of dim ers does not appreciably a lte r the value of Ki at a fin ite concentration in CS2. I f we have in it ia lly “ a” moles of phenol, “ ma” moles of CS 2 , “ ma” moles of the cis form , Tod moles of dim er, where (a — mB)/m0 = K\,
TRANS CIS ( C I S ----------- T R A N S)
then at a fin ite concentration we m ay w rite the moles of each form present a t equilibrium
M oles M ole fraction
trans (■a — m0 — mu)(a — toc — mu) (•a — mu) + ma
cis (mc — mu)(mc — mu)
(a — mu) + ms
cis-transdim er mu
mu(a — m0) + m3
W e can define a K 2 in mole fraction units
K .2[cis-trans] [cis] [trans]
mD(a — mu + m3)(a — wic — mD)(m c — tod)
( 1 )
I f we have chemical shifts as fo llow s: 5mo = measured chemical sh ift at a fin ite concentration “ c” ; <5T , o0 = chemical sh ift in trans and cis form s; respectively, 5t d and 5cD = chemical sh ift in dim er form s of the trans and cis molecules, respectively, the fo llo w in g relationship fo r the measured chemical sh ift holds 10
■ ((q — mc — m p)
a — w d
mB)mu)
h +
/ mu \ „ , / mD \ „( ) 5Td + ( ) 5cd (2 )\a — mu) \a — mD)
I f 5cD = 80; assuming o n ly sm all perturbation of the c is -O H proton in the dim er, we m ay combine the values fo r S0 and 5cd - F rom the previous paper1 the expression
8m .a — TOC
a. m 0
8 t H--------8 0a (3)
gives the in fin ite d ilu tion chemical sh ift.
Smo — >■ 8mœ as mu '-— >- 0 , p rovid ing (a — mD) = a
(10) H. S. Gutowsky and A. Saika, J, Chem. Phys., 21, 1688 (1953).
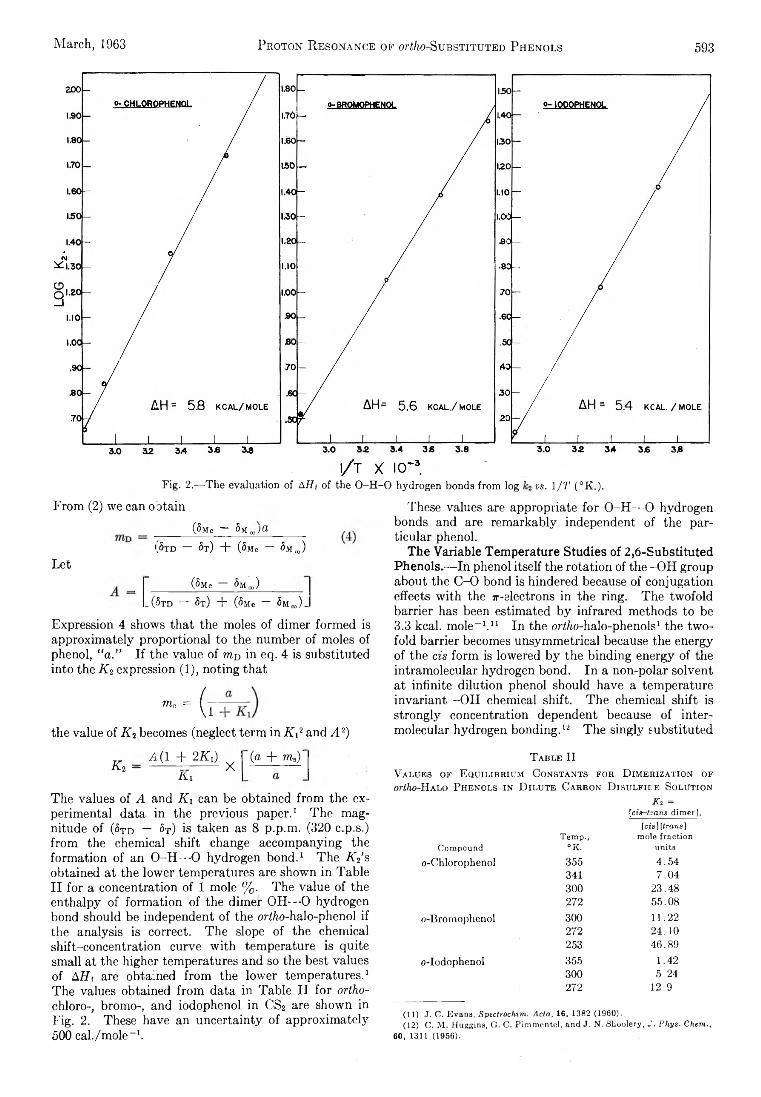
March, 1963 Proton R esonance of ortho-Substituted Phenols 593
Fig. 2.— The evaluation of AH[ of the O -H -O hydrogen bonds from log vs. 1/T (°K .),
From (2) we can obtain
Let_ (8mo — 8m ro)
_ (5 t d — 8t ) + (8mc — 8m„ ) _
Expression 4 shows that the moles of dimer formed is approximately proportional to the number of moles of phenol, “a." If the value of m o in eq. 4 is substituted into the K 2 expression (1), noting that
" • - ( l T k)the value of I i 2 becomes (neglect term in K x2 and A 2)
_______ (8mc — 5m „ j a _______
i,5t d — 8t ) + (5 mc — 8m „ )
(8 mo — 8m œ)
_ (5 t d — 8t ) + (5 mc — 5m „ ) _
These values are appropriate for 0-H---0 hydrogen bonds and are remarkably independent of the particular phenol.
The Variable Temperature Studies of 2,6-Substituted Phenols.— In phenol itself the rotation of the -OH group about the C-0 bond is hindered because of conjugation effects with the x-slectrons in the ring. The twofold barrier has been estimated by infrared methods to be3.3 kcal. mole-1.11 In the orf/io-halo-phenols1 the twofold barrier becomes unsymmetrical because the energy of the cis form is lowered by the binding energy of the intramolecular hydrogen bond. In a non-polar solvent at infinite dilution phenol should have a temperature invariant -OH chemical shift. The chemical shift is strongly concentration dependent because of inter- molecular hydrogen bonding.12 The singly substituted
rr -£(1 + 2IQ wA2 — ~ XA 1
(a + m sy
The values of A and K x can be obtained from the experimental data in the previous paper.1 The magnitude of (5td — 5t ) is taken as 8 p.p.m. (320 c.p.s.) from the chemical shift change accompanying the formation of an 0-H---0 hydrogen bond.1 The AYs obtained at the lower temperatures are shown in Table II for a concentration of 1 mole %. The value of the enthalpy of formation of the dimer OH— 0 hydrogen bond should be independent of the orf/io-halo-phenol if the analysis is correct. The slope of the chemical shift-concentration curve with temperature is quite small at the higher temperatures and so the best values of A / f f are obtained from the lower temperatures.1 The values obtained from data in Table II for ortho- chloro-, bromo-, and iodophenol in CS2 are shown in Fig. 2. These have an uncertainty of approximately 500 cal./mole-1.
T abue IIV a lu e s o f E q u ilib r iu m C o n st a n t s fo r D im e r iza t io n of
ortho-H a lo P h eno ls in D il u t e C a r b o n D is u l f ie e S o lu tio n
Kt. =[cis-trans dimer],
[cis] [irons]Temp., mole fraction
Compound °K. unitso-Chlorophenol 355 4.54
341 7.04300 23.48272 55.08
o-Bromophenol 300 1 1 . 2 2272 24.10253 46.89
o-Iodophenol 355 1.42300 5.24272 12.9
(11) J. C. Evans, Spectrochim. Acta, 16, 1382 (1960).(12) C. M. Huggins, G. C. Pimmentel, and J. N. Shoolery, J. Phys. Chem.,
60, 1311 (1956).
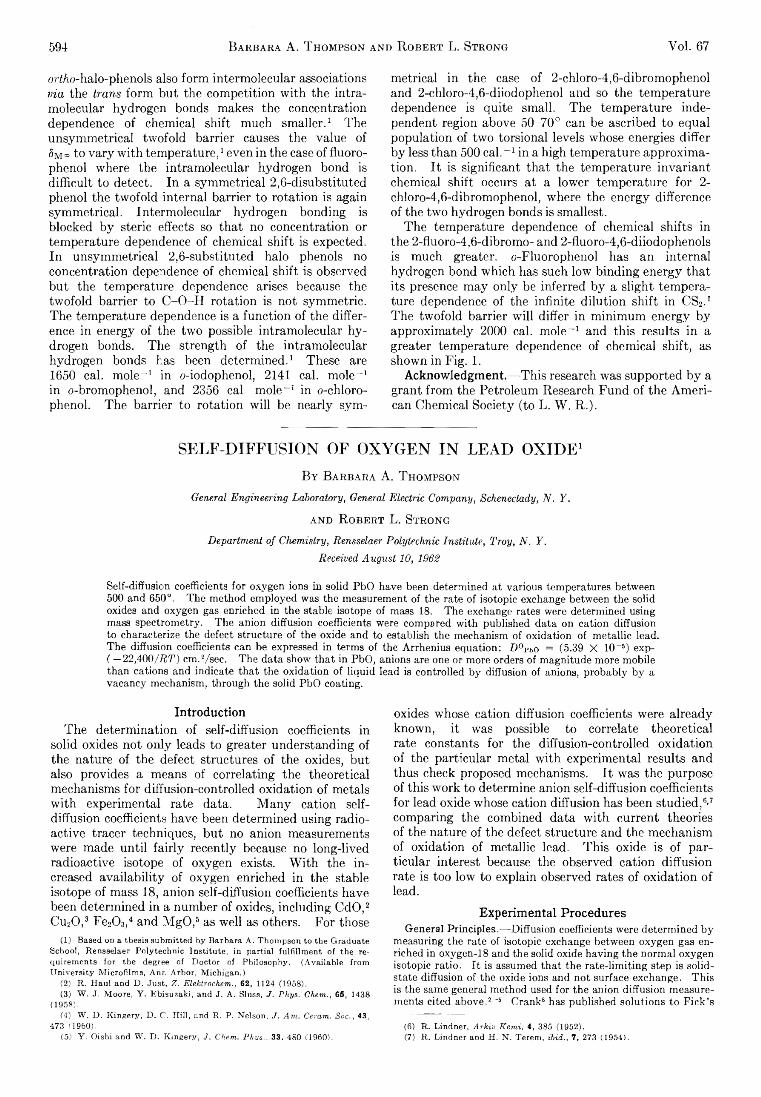
594 Barbara A. T hompson and R obert L. Strong Voi. 67
ortAo-halo-phenols also form interm olecular associations via the trans form but the com petition w ith the in tra m olecular hydrogen bonds makes the concentration dependence of chemical sh ift much sm aller. 1 The unsym m etrical tw ofold barrier causes the value of 5m ™ to v a ry w ith tem perature , 1 even in the case of fluoro- phenol where the intram olecular hydrogen bond is d ifficu lt to detect. In a sym m etrical 2,6-disubstituted phenol the tw ofo ld in ternal barrier to ro ta tion is again sym m etrical. Interm olecular hydrogen bonding is blocked b y steric effects so th at no concentration or tem perature dependence of chemical sh ift is expected. In unsym m etrical 2,6-substituted halo phenols no concentration dependence of chemical sh ift is observed but the tem perature dependence arises because the tw ofold barrier to C -O -H rotation is not sym m etric. Th e tem perature dependence is a function of the d ifference in energy of the tw o possible intram olecular h y drogen bonds. Th e strength of the intram olecular hydrogen bonds has been determ ined . 1 These are 1650 cal. m ole - 1 in o-iodophenol, 2141 cal. m ole - 1
in o-brom ophenol, and 2356 cal. m ole - 1 in o -chloro- phenol. The barrier to ro ta tion w ill be nearly sym
m etrical in the case of 2-chloro-4,6-dibrom ophenol and 2-chloro-4,6-diiodophenol and so the tem perature dependence is quite sm all. The tem perature independent region above 50-70° can be ascribed to equal population of tw o torsional levels whose energies d iffer b y less than 500 cal. - 1 in a high tem perature approxim ation . I t is significant th at the tem perature in va ria n t chemical sh ift occurs at a lower tem perature fo r 2 - chloro-4,6-dibrom ophenol, where the energy difference of the tw o hydrogen bonds is smallest.
Th e tem perature dependence of chem ical sh ifts in the 2-fluoro-4,6 -dibrom o- and 2-fluoro-4,6-diiodophenols is much greater. o-Fluorophenol has an in terna l hydrogen bond w hich has such low b inding energy th at its presence m ay o n ly be inferred b y a s ligh t tem perature dependence of the in fin ite d ilu tion sh ift in C S 2 . 1
Th e tw ofold barrier w ill d iffer in m inim um energy b y approxim ately 2 0 0 0 cal. m ole - 1 and th is results in a greater tem perature dependence of chemical sh ift, as shown in F ig . 1.
Acknowledgment.— T h is research was supported b y a grant from the Petroleum Research Fund of the A m e rican Chem ical Society (to L . W . R .).
SELF-DIFFUSION OF OXYGEN IN LEAD OXIDE1B y B a r b a r a A . T h om pso n
General Engineering Laboratory, General Electric Company, Schenectady, N. Y.
a n d R o b e r t L . St r o n g
Department of Chemistry, Rensselaer Polytechnic Institute, Troy, N. Y.Received August 10, 1962
Self-diffusion coefficients for oxygen ions in solid PbO have been determined at various temperatures between 500 and 650°. The method employed was the measurement of the rate of isotopic exchange between the solid oxides and oxygen gas enriched in the stable isotope of mass 18. The exchange rates were determined using mass spectrometry. The anion diffusion coefficients were compared with published data on cation diffusion to characterize the defect structure of the oxide and to establish the mechanism of oxidation of metallic lead. The diffusion coefficients can be expressed in terms of the Arrhenius equation: D °Pbo = (5.39 X 10⁻⁵) exp- ( — 22,400/i?21) cm.2/sec. The data show that in PbO, anions are one or more orders of magnitude more mobile than cations and indicate that the oxidation of liquid lead is controlled by diffusion of anions, probably by a vacancy mechanism, through the solid PbO coating.
IntroductionTh e determ ination of self-diffusion coefficients in
solid oxides not o n ly leads to greater understanding of the nature of the defect structures of the oxides, but also provides a means of correlating the theoretical mechanisms fo r diffusion-controlled oxidation of metals w ith experim ental rate data. M a n y cation selfd iffusion coefficients have been determ ined using radioactive tracer techniques, b u t no anion measurements were made u n til fa ir ly recently because no long-lived radioactive isotope of oxygen exists. W ith the in creased a va ila b ility of oxygen enriched in the stable isotope of mass 18, anion self-diffusion coefficients have been determ ined in a num ber of oxides, including C d O , 2
C u 20 , 3 Fe 20 3, 4 and M g O , 6 as w ell as others. F o r those(1) Based on a thesis submitted by Barbara A. Thompson to the Graduate
School, Rensselaer Polytechnic Institute, in partial fulfillment of the requirements for the degree of Doctor of Philosophy. (Available from University Microfilms, Ann Arbor, Michigan.)
(2) R. Haul and D. Just, Z. Elektrochem., 62, 1124 (1958).(3) W. J. Moore, Y. Ebisuzaki, and J. A. Sluss, J. Phys. Chem., 65, 1438
(1958).(4) W. D. Kingery, D. C. Hill, and R. P. Nelson, J. Am. Ceram. Soc., 43,
473 (I960).(5) Y. Oishi and W. D. Kingery, J. Chem. Phys.. 33. 480 (1960).
oxides whose cation diffusion coefficients were already known, it was possible to correlate theoretica l rate constants for the diffusion-controlled oxidation of the particu la r m etal w ith experim ental results and thus check proposed mechanisms. I t was the purpose of th is w ork to determ ine anion self-diffusion coefficients fo r lead oxide whose cation diffusion has been studied , 6’ 7
com paring the combined data w ith current theories of the nature of the defect structure and the mechanism of oxidation of m etallic lead. T h is oxide is of particu la r interest because the observed cation d iffusion rate is too low to explain observed rates of oxidation of lead.
Experimental ProceduresG e n e ra l P r in c ip le s .— Diffusion coefficients were determined by
measuring the rate of isotopic exchange between oxygen gas enriched in oxygen-18 and the solid oxide having the normal oxygen isotopic ratio. It is assumed that the rate-limiting step is solid- state diffusion of the oxide ions and not surface exchange. This is the same general method used for the anion diffusion measurements cited above.2~5 Crank8 has published solutions to Fiek’s
(6) R. Lindner, Arkiv Kemi, 4, 385 (1952).(7) R. Lindner and H. N. Terem. ibid., 7, 273 (1954).
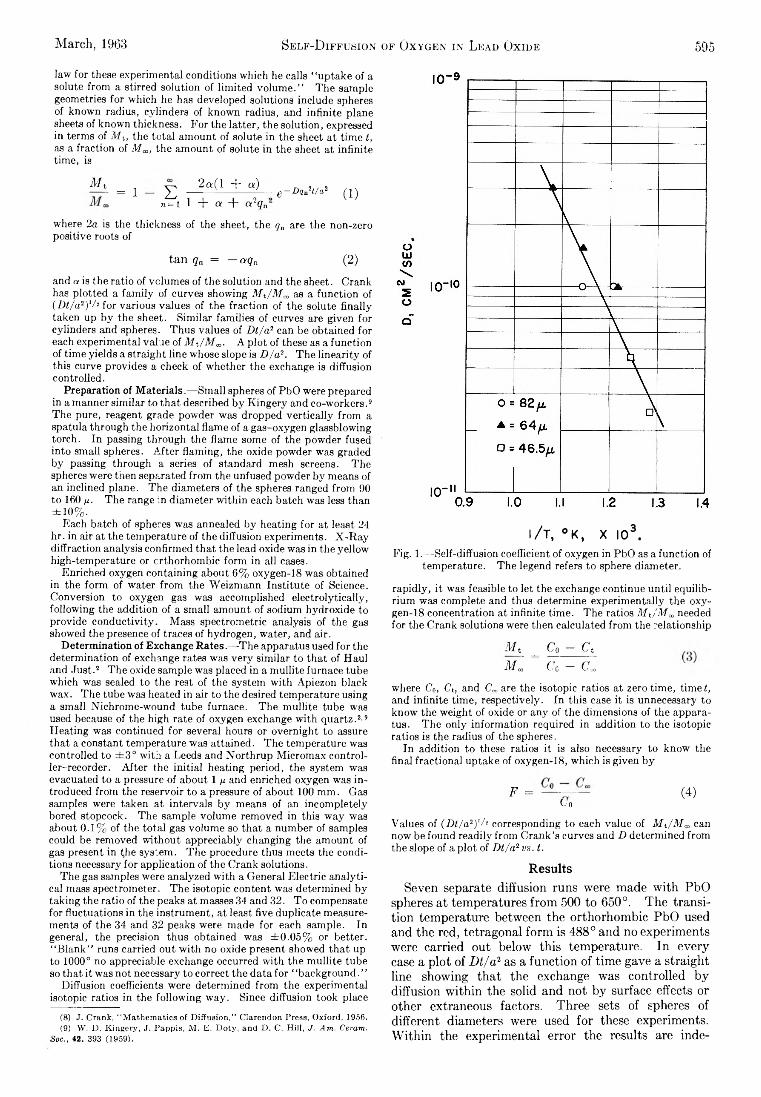
March, 1963 Self-D iffusion of Oxygen in Lead Oxide 595
law for these experimental conditions which he calls “ uptake of a solute from a stirred solution of limited volume.” The sample geometries for which he has developed solutions include spheres of known radius, cylinders of known radius, and infinite plane sheets of known thickness. For the latter, the solution, expressed in terms of M t, the total amount of solute in the sheet at time t, as a fraction of M „, the amount of solute in the sheet at infinite time, is
Mt_= 1 s
2a(l + a)n = i 1 + a + a 2qn‘
g — Dqn2t/a2 ( 1 )
where 2 a is the thickness of the sheet, the qn are the non-zero positive roots of
tan qn = — aqn (2)
and a is the ratio of volumes of the solution and the sheet. Crank has plotted a family of curves showing Mt/Ma as a function of (Dt/a2)'/* for various values of the fraction of the solute finally taken up by the sheet. Similar families of curves are given for cylinders and spheres. Thus values of Dt/a2 can be obtained for each experimental value of Mt/Ma. A plot of these as a function of time yields a straight line whose slope is D/a2. The linearity of this curve provides a check of whether the exchange is diffusion controlled.
Preparation of Materials.— Small spheres of PbO were prepared in a manner similar to that described by Kingery and co-workers.9 The pure, reagent grade powder was dropped vertically from a spatula through the horizontal flame of a gas-oxygen glassblowing torch. In passing through the flame some of the powder fused into small spheres. After flaming, the oxide powder was graded by passing through a series of standard mesh screens. The spheres were then separated from the unfused powder by means of an inclined plane. The diameters of the spheres ranged from 90 to 160 m- The range in diameter within each batch was less than ± 1 0 %.
Each batch of spheres was annealed by heating for at least 24 hr. in air at the temperature of the diffusion experiments. X -Ray diffraction analysis confirmed that the lead oxide was in the yellow high-temperature or crthorhombic form in all cases.
Enriched oxygen containing about 6 % oxygen-18 was obtained in the form of water from the Weizmann Institute of Science. Conversion to oxygen gas was accomplished electrolytically, following the addition of a small amount of sodium hydroxide to provide conductivity. Mass spectrometric analysis of the gas showed the presence of traces of hydrogen, water, and air.
Determination of Exchange Rates.— The apparatus used for the determination of exchange rates was very similar to that of Haul and Just.2 The oxide sample was placed in a mullite furnace tube which was sealed to the rest of the system with Apiezon black wax. The tube was heated in air to the desired temperature using a small Nichrome-wound tube furnace. The mullite tube was used because of the high rate of oxygen exchange with quartz.2'9 Heating was continued for several hours or overnight to assure that a constant temperature was attained. The temperature was controlled to ± 3 ° with a Leeds and Northrup Micromax controller-recorder. After the initial heating period, the system was evacuated to a pressure of about 1 fi and enriched oxygen was introduced from the reservoir to a pressure of about 100 mm. Gas samples were taken at intervals by means of an incompletely bored stopcock. The sample volume removed in this way was about 0 .1 % of the total gas volume so that a number of samples could be removed without appreciably changing the amount of gas present in the system. The procedure thus meets the conditions necessary for application of the Crank solutions.
The gas samples were analyzed with a General Electric analytical mass spectrometer. The isotopic content was determined by taking the ratio of the peaks at masses 34 and 32. To compensate for fluctuations in the instrument, at least five duplicate measurements of the 34 and 32 peaks were made for each sample. In general, the precision thus obtained was ± 0 .0 5 % or better. “ Blank” runs carried out with no oxide present showed that up to 10 0 0° no appreciable exchange occurred with the mullite tube so that it was not necessary to correct the data for “ background. ’ ’
Diffusion coefficients were determined from the experimental isotopic ratios in the following way. Since diffusion took place
(8) J. Crank, “ Mathematics of Diffusion,” Clarendon Press, Oxford, 1956.(9) W. D. Kingery, J. Pappis, M. E. Doty, and D . C. H ill, J. Am. Ceram.
S o c . , 42. 393 (1959).
i/ t, °K , X I03.Fig. 1.— Self-diffusion coefficient of oxygen in PbO as a function of
temperature. The legend refers to sphere diameter.
rapidly, it was feasible to let the exchange continue until equilibrium was complete and thus determine experimentally the oxygen-18 concentration at infinite time. The ratios M J M m needed for the Crank solutions were then calculated from the relationship
Mt_ = C0 - Ct M „ <% - C .
where Co, Ct, and C„ are the isotopic ratios at zero time, time t, and infinite time, respectively. In this case it is unnecessary to know the weight of oxide or any of the dimensions of the apparatus. The only information required in addition to the isotopic ratios is the radius of the spheres.
In addition to these ratios it is also necessary to know the final fractional uptake of oxygen-18, which is given by
F = (4)Go
Values of ( Dt/a2) '/* corresponding to each value of M t/M„ can now be found readily from Crank’s curves and D determined from the slope of a plot of Dt/a2 vs. t.
ResultsSeven separate diffusion runs were made with PbO
spheres at temperatures from 500 to 650°. The transition temperature between the orthorhombic PbO used and the red, tetragonal form is 488° and no experiments were carried out below this temperature. In every case a plot of D t/a 2 as a function of time gave a straight line showing that the exchange was controlled by diffusion within the solid and not by surface effects or other extraneous factors. Three sets of spheres of different diameters were used for these experiments. Within the experimental error the results are inde-
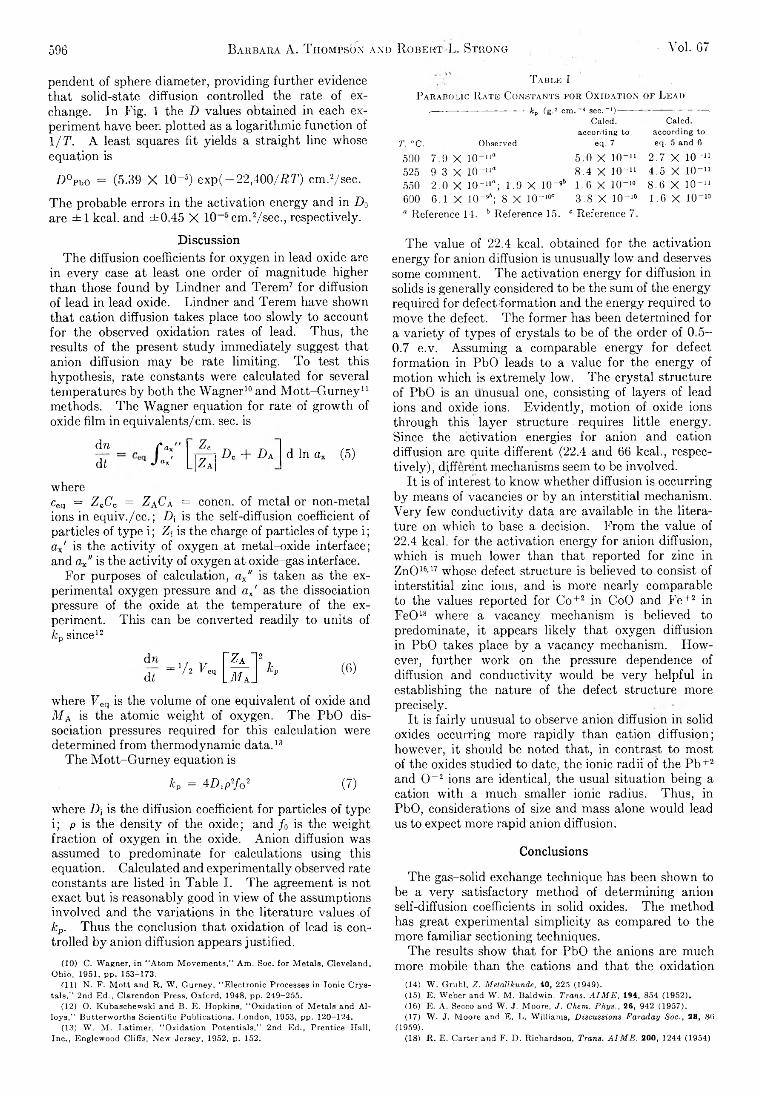
596 Vol. 67Barbara A. T hompsòn and R obert L. Strong
pendent of sphere diameter, providing further evidence that solid-state diffusion controlled the rate of exchange. In Fig. 1 the D values obtained in each experiment have been plotted as a logarithmic function of l/T . A least squares fit yields a straight line whose equation is
D°Pbo = (5.39 X 10⁻⁶) exp ( — 22,400/1? T) cm.2/sec.
The probable errors in the activation energy and in D0 are ± 1 kcal. and ±0.45 X 1 0 cm. 2/sec., respectively.
T able IP a r a b o l ic R a t e C o n s t a n t s f o r O x i d a t i o n o f L e a d
,--------- ------- --------- -—-——kp (g.2 cm .-4 sec.“ O-"—— - — ----- *—-•—•'—•Calcd. Calcd.
according to according toT, °C. Observed eq. 7 eq. 5 and 6500 7.9 X 10“ 11“ 5.0 X 10~u 2.7 X 10~“525 9.3 X 10-” “ 8.4 X 10-“ 4.5 X 10-“550 2.0 X lO-10“; 1.9 X lO“ 96 1.6 X 10⁻¹⁹ 8.6 X 10~“600 6.1 X 1 0 ^ ; 8 X lO -“ “ 3.8 X 10~10 1.6 X 10-““ Reference 14. b Reference 15. c Reference 7.
DiscussionThe diffusion coefficients for oxygen in lead oxide are
in every case at least one order of magnitude higher than those found by Lindner and Terem7 for diffusion of lead in lead oxide. Lindner and Terem have shown that cation diffusion takes place too slowly to account for the observed oxidation rates of lead. Thus, the results of the present study immediately suggest that anion diffusion may be rate limiting. To test this hypothesis, rate constants were calculated for several temperatures by both the Wagner10 and Mott-Gurney1 1
methods. The Wagner equation for rate of growth of oxide film in equivalents/cm. sec. is
dndf
f °xJ a x'
" T A . L N
Dc + Da d In dx (5)
whereceq = ZeCB = Z aCa = concn. of metal or non-metal ions in equiv./cc. ; A is the self-diffusion coefficient of particles of type i; Z, is the charge of particles of type i; a j is the activity of oxygen at metal-oxide interface; and Ox" is the activity of oxygen at oxide-gas interface.
For purposes of calculation, ax" is taken as the experimental oxygen pressure and a j as the dissociation pressure of the oxide at the temperature of the experiment. This can be converted readily to units of fcp since1 2
dn d t = 7 2 Feq (6 )
where F eq is the volume of one equivalent of oxide and M a is the atomic weight of oxygen. The PbO dissociation pressures required for this calculation were determined from thermodynamic data . 13
The Mott-Gurney equation is
K = 4 A p7o2 (7)
where A is the diffusion coefficient for particles of type i; p is the density of the oxide; and / 0 is the weight fraction of oxygen in the oxide. Anion diffusion was assumed to predominate for calculations using this equation. Calculated and experimentally observed rate constants are listed in Table I. The agreement is not exact but is reasonably good in view of the assumptions involved and the variations in the literature values of kp. Thus the conclusion that oxidation of lead is controlled by anion diffusion appears justified.
(10) C. Wagner, in “ Atom Movements,” Am. Soc. for Metals, Cleveland, Ohio, 1951, pp. 153-173.
(11) N. F. Mott and R. W. Gurney, “ Electronic Processes in Ionic Crystals,” 2nd Ed., Clarendon Press, Oxford, 1948, pp. 249-255.
(12) O. Kubaschewski and B. E. Hopkins, “ Oxidation of Metals and Alloys,” Butterworths Scientific Publications, London, 1953, pp. 120-124,
(13) W. M. Latimer, “ Oxidation Potentials,” 2nd Ed., Prentice-Hall, Inc., Englewood Cliffs, New Jersey, 1952, p. 152.
The value of 22.4 kcal. obtained for the activation energy for anion diffusion is unusually low and deserves some comment. The activation energy for diffusion in solids is generally considered to be the sum of the energy required for defect formation and the energy required to move the defect. The former has been determined for a variety of types of crystals to be of the order of 0.5- 0.7 e.v. Assuming a comparable energy for defect formation in PbO leads to a value for the energy of motion which is extremely low. The crystal structure of PbO is an unusual one, consisting of layers of lead ions and oxide ions. Evidently, motion of oxide ions through this layer structure requires little energy. Since the activation energies for anion and cation diffusion are quite different (22.4 and 6 6 kcal., respectively), different mechanisms seem to be involved.
It is of interest to know whether diffusion is occurring by means of vacancies or by an interstitial mechanism. Very few conductivity data are available in the literature on which to base a decision. From the value of 22.4 kcal. for the activation energy for anion diffusion, which is much lower than that reported for zinc in ZnO16 ’ 17 whose defect structure is believed to consist of interstitial zinc ions, and is more nearly comparable to the values reported for Co+ 2 in CoO and Fe+ 2 in FeO18 where a vacancy mechanism is believed to predominate, it appears likely that oxygen diffusion in PbO takes place by a vacancy mechanism. However, further work on the pressure dependence of diffusion and conductivity would be very helpful in establishing the nature of the defect structure more precisely.
It is fairly unusual to observe anion diffusion in solid oxides occurring more rapidly than cation diffusion; however, it should be noted that, in contrast to most of the oxides studied to date, the ionic radii of the P b + 2
and O - 2 ions are identical, the usual situation being a cation with a much smaller ionic radius. Thus, in PbO, considerations of size and mass alone would lead us to expect more rapid anion diffusion.
Conclusions
The gas-solid exchange technique has been shown to be a very satisfactory method of determining anion self-diffusion coefficients in solid oxides. The method has great experimental simplicity as compared to the more familiar sectioning techniques.
The results show that for PbO the anions are much more mobile than the cations and that the oxidation
(14) W. Gruhl, Z . MetaJlkunde, iO, 22.5 (1949).(15) E. Weber and W. M. Baldwin. Trans. AIM E, 194, 854 (1952).(16) E. A. Secco and W. J. Moore, J . Chem. Phys., 26, 942 (1957).(17) W. J. Moore and E. L. Williams, Discussions Faraday S o c . , 28, 86
(1959).(18) R. E. Carter and F. D. Richardson, Trans. A IM E , 200, 1244 (1954)
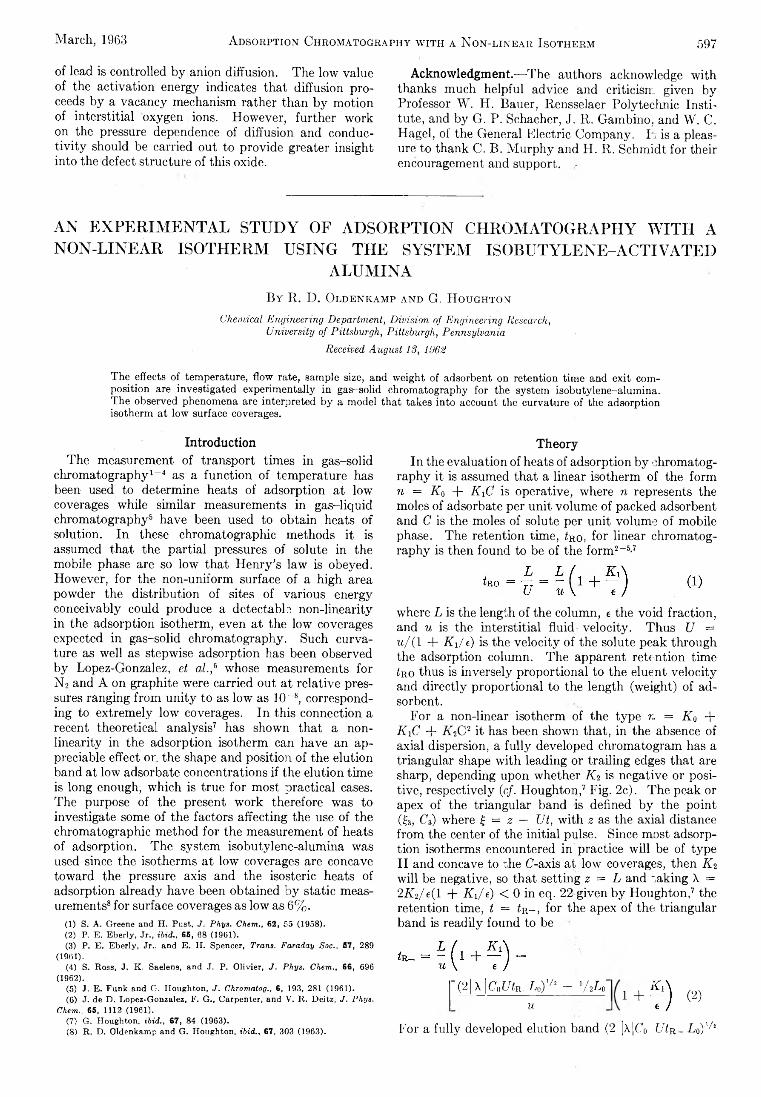
March, 1963 597Adsorption Chromatography with a Non-linear Isotherm
of lead is controlled b y anion diffusion. The low value of the activation energy indicates th at d iffusion proceeds b y a vacancy mechanism rather than b y m otion of in te rs titia l oxygen ions. H ow ever, fu rther w ork on the pressure dependence of d iffusion and conduct iv it y should be carried out to provide greater insight in to the defect structure of th is oxide.
Acknowledgment.— Th e authors acknowledge w ith thanks m uch helpful advice and criticism given b y Professor W . H . Bauer, Rensselaer Polytechn ic In s titu te , and b y G . P . Schacher, J . R . Gam bino. and W . C . H agel, of the General E le ctric Com pany. I is a pleasure to thank C . B . M u rp h y and H . R . Schm idt fo r their encouragement and support. *
AN EXPERIMENTAL STUDY OF ADSORPTION CHROMATOGRAPHY WITH A NON-LINEAR ISOTHERM USING THE SYSTEM ISOBUTYLENE-ACTIVATED
ALUMINAB y R . D . O l d e n k a m p a n d G . H o u g h to n
Chemical Engineering Department, Division of Engineering Research,University of Pittsburgh, Pittsburgh, Pennsylvania
Received August IS, 1962
The effects of temperature, flow rate, sample size, and weight of adsorbent on retention time and exit composition are investigated experimentally in gas-solid chromatography for the system isobutylene-alumina. The observed phenomena are interpreted by a model that takes into account the curvature of the adsorption isotherm at low surface coverages.
IntroductionThe measurement of transport tim es in gas-solid
chrom atography 1 - 4 as a function of tem perature has been used to determ ine heats of adsorption a t low coverages w hile sim ilar measurements in ga s-liq u id chrom atography6 have been used to obtain heats of solution. In these chrom atographic methods it is assumed th a t the p a rtia l pressures of solute in the m obile phase are so low th at H e n ry ’s law is obeyed. How ever, fo r the non-uniform surface of a h igh area powder the d istribu tion of sites of various energy conceivably could produce a detectable n on -lin earity in the adsorption isotherm , even a t the low coverages expected in gas-solid chrom atography. Such curvature as w ell as stepwise adsorption has been observed b y Lopez-Gonzalez, et al. , 6 whose measurements for N 2 and A on graphite were carried out a t re la tive pressures ranging from u n ity to as low as 1 0 -8, corresponding to extrem ely low coverages. In th is connection a recent theoretical analysis7 has shown th at a nonlin e a rity in the adsorption isotherm can have an appreciable effect or. the shape and position of the elution band at low adsorbate concentrations if the e lution tim e is long enough, w hich is true fo r m ost practica l cases. The purpose of the present w ork therefore was to investigate some of the factors affecting the use of the chrom atographic method fo r the measurement of heats of adsorption. Th e system isobutylene-alum ina was used since the isotherm s a t low coverages are concave tow ard the pressure axis and the isosteric heats of adsorption already have been obtained b y static measurements8 fo r surface coverages as low as 6 % .
(1) S. A. Greene and H. Pust, J. Phys. Chem., 62, 55 (1958).(2) P. E. Eberly, Jr., ibid., 65, 68 (1961).(3) P. E. Eberly, Jr.: and E. H. Spencer, Trans. Faraday Soc.t 57, 289
(1961) .(4) S. Ross, J, K. Saelens, and J. P. Olivier, J. Phys. Chem., 66, 696
(1962) .(5) J. E. Funk and G. Houghton, J. Chromatog., 6, 193, 281 (1961).(6) J. de D. Lopez-Gonzalez, F. G., Carpenter, and V. R. Deitz, J. Phys.
Chem., 65, 1112 (1961).(7) G. Houghton, ibid., 67, 84 (1963).(8) R. D. Oldenkamp and G. Houghton, ibid., 67, 303 (1963).
TheoryIn the evaluation of heats of adsorption b y chrom atog
ra p h y it is assumed th a t a linear isotherm of the form n = K q + KiC is operative, where n represents the moles of adsorbate per u n it volum e of packed adsorbent and C is the moles of solute per u n it volum e of m obile phase. The retention tim e, ¡To, fo r linear chrom atogra p h y is then found to be of the form 2 - 6 ’7
where L is the length of the colum n, e the vo id fraction, and u is the in te rs titia l flu id ve lo c ity . Th us U = u/ (1 + Ki/e) is the ve lo c ity o f the solute peak through the adsorption colum n. Th e apparent retention tim e T o thus is inverse ly proportional to the eluent ve lo c ity and d ire c tly proportional to the length (w eight) of adsorbent.
F o r a non-linear isotherm of the type r. = K 0 + KiC + KiC'2 it has been shown th a t, in the absence of axia l dispersion, a fu lly developed chrom atogram has a triangu lar shape w ith leading or tra ilin g edges th a t are sharp, depending upon w hether Ki is negative or positive , respectively (cf. H oughton , 7 F ig . 2 c). Th e peak or apex of the triangu lar band is defined b y the po in t (£3, Cs) where £ = z — Ut, w ith z as the axia l distance from the center of the in itia l pulse. Since m ost adsorption isotherms encountered in practice w ill be of type I I and concave to the C -axis a t low coverages, then Ki w ill be negative, so th a t setting z = L and caking X = 2 A 2/ e (l + Ki/e) < 0 in eq. 22 given b y H oughton ,7 the retention tim e, t = T - , fo r the apex of the triangu lar band is rea d ily found to be
- {2\\\CaUtn-U)'h - u
V 2T 01 + ( 2 )
F o r a fu lly developed elution band (2 |x|C0 t / T - D ' /!
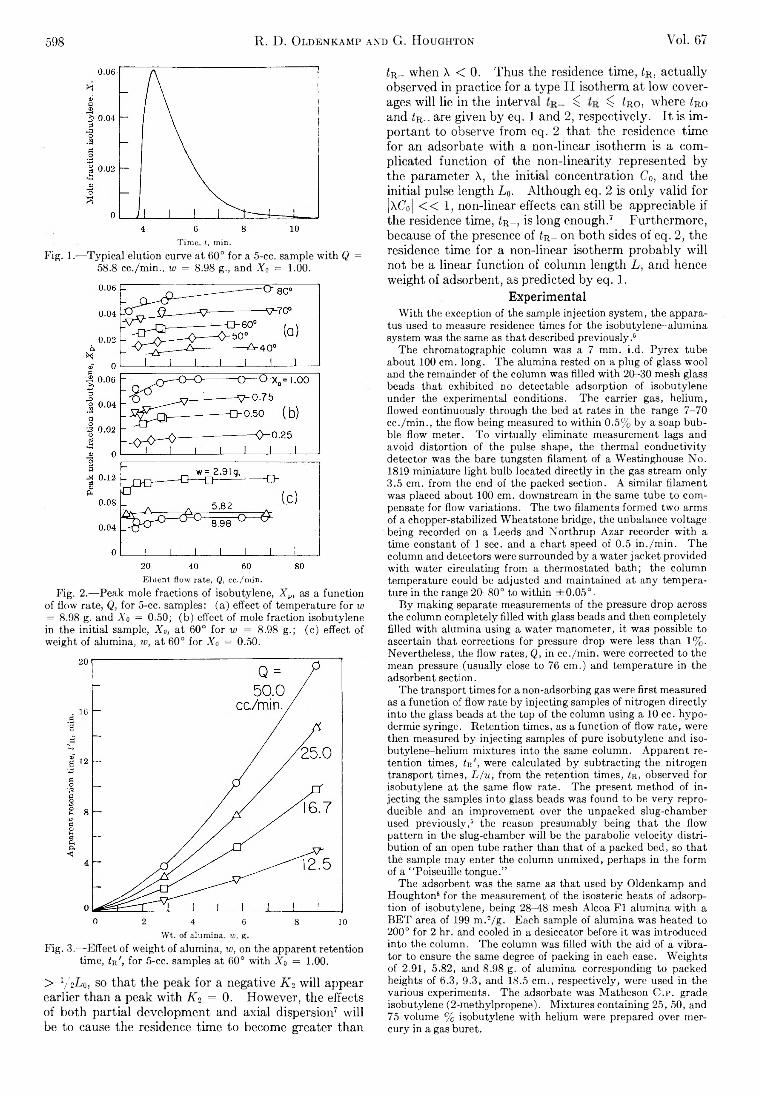
598 R. D . Oldenkamp and G. Houghton Voi. 67
Time, t, min.Fig. 1.— Typical elution curve at 60° for a 5-cc. sample with Q =
58.8 cc./min., to = 8.98 g., and X 0 = 1.00.
Eluent flow rate, Q, cc./min.Fig. 2.— Peak mole fractions of isobutylene, X p, as a function
of flow rate, Q, for 5-cc. samples: (a) effect of temperature for w = 8.98 g. and Xo = 0.50; (b) effect of mole fraction isobutylene in the initial sample, Xo, at 60° for w = 8.98 g.; (c) effect of weight of alumina, w, at 60° for Xo = 0.50.
0 2 4 6 8 10Wt. of alumina, w, g.
Fig. 3.— Effect of weight of alumina, w, on the apparent retention time, tu', for 5-cc. samples at 60° with Xo = 1.00.
> V '2-ko, so th a t the peak fo r a negative K i w ill appear earlier than a peak w ith K 2 = 0. H ow ever, the effects of both p a rtia l developm ent and axia l dispersion7 w ill be to cause the residence tim e to become greater than
iR_ when X < 0. Th us the residence tim e, ¿r , actu a lly observed in practice for a type I I isotherm at low coverages w ill lie in the in te rva l ^ ^ ¿r o , where ¿roand £r _ are given b y eq. 1 and 2, respectively. I t is im portant to observe from eq. 2 th a t the residence tim e fo r an adsorbate w ith a non-linear isotherm is a complicated function of the n on -lin e a rity represented b y the param eter X, the in itia l concentration Co, and the in itia l pulse length L 0- A lth ough eq. 2 is o n ly va lid for [XC0[ « 1 , non-linear effects can s till be appreciable if the residence tim e, iR_, is long enough . 7 Furtherm ore, because of the presence of iR_ on both sides of eq. 2 , the residence tim e fo r a non-linear isotherm probab ly w ill not be a linear function of colum n length L, and hence w eight of adsorbent, as predicted b y eq. 1 .
Experim entalWith the exception of the sample injection system, the appara
tus used to measure residence times for the isobutylene-alumina system was the same as that described previously.6
The chromatographic column was a 7 mm. i.d. Pyrex tube about 100 cm. long. The alumina rested on a plug of glass wool and the remainder of the column was filled with 20-30 mesh glass beads that exhibited no detectable adsorption of isobutylene under the experimental conditions. The carrier gas, helium, flowed continuously through the bed at rates in the range 7-70 cc./m in., the flow being measured to within 0.5% by a soap bubble flow meter. To virtually eliminate measurement lags and avoid distortion of the pulse shape, the thermal conductivity detector was the bare tungsten filament of a Westinghouse No. 1819 miniature light bulb located directly in the gas stream only3.5 cm. from the end of the packed section. A similar filament was placed about 100 cm. downstream in the same tube to compensate for flow variations. The two filaments formed two arms of a chopper-stabilized Wheatstone bridge, the unbalance voltage being recorded on a Leeds and Northrup Azar recorder with a time constant of 1 sec. and a chart speed of 0.5 in./min. The column and detectors were surrounded by a water jacket provided with water circulating from a thermostated bath; the column temperature could be adjusted and maintained at any temperature in the range 20-80° to within ±0 .05°.
By making separate measurements of the pressure drop across the column completely filled with glass beads and then completely filled with alumina using a water manometer, it was possible to ascertain that corrections for pressure drop were less than 1 % . Nevertheless, the flow rates, Q, in cc./m in. were corrected to the mean pressure (usually close to 76 cm.) and temperature in the adsorbent section.
The transport times for a non-adsorbing gas were first measured as a function of flow rate by injecting samples of nitrogen directly into the glass beads at the top of the column using a 10 c c . hypodermic syringe. Retention times, as a function of flow rate, were then measured by injecting samples of pure isobutylene and isobutylene-helium mixtures into the same column. Apparent retention times, tu , were calculated by subtracting the nitrogen transport times, L/u, from the retention times, tu, observed for isobutylene at the same flow rate. The present method of injecting the samples into glass beads was found to be very reproducible and an improvement over the unpacked slug-chamber used previously,6 the reason presumably being that the flow pattern in the slug-chamber will be the parabolic velocity distribution of an open tube rather than that of a packed bed, so that the sample may enter the column unmixed, perhaps in the form of a “ Poiseuille tongue.”
The adsorbent was the same as that used by Oldenkamp and Houghton8 for the measurement of the isosteric heats of adsorption of isobutylene, being 28-48 mesh Alcoa FI alumina with a BET area of 199 m .2/g . Each sample of alumina was heated to 2 0 0° for 2 hr. and cooled in a desiccator before it was introduced into the column. The column was filled with the aid of a vibrator to ensure the same degree of packing in each case. Weights of 2.91, 5.82, and 8.98 g. of alumina corresponding to packed heights of 6.3, 9.3, and 18.5 cm., respectively, were used in the various experiments. The adsorbate was Matheson C.p . grade isobutylene (2-methylpropene). Mixtures containing 25, 50, and 75 volume % isobutylene with helium were prepared over mercury in a gas buret.
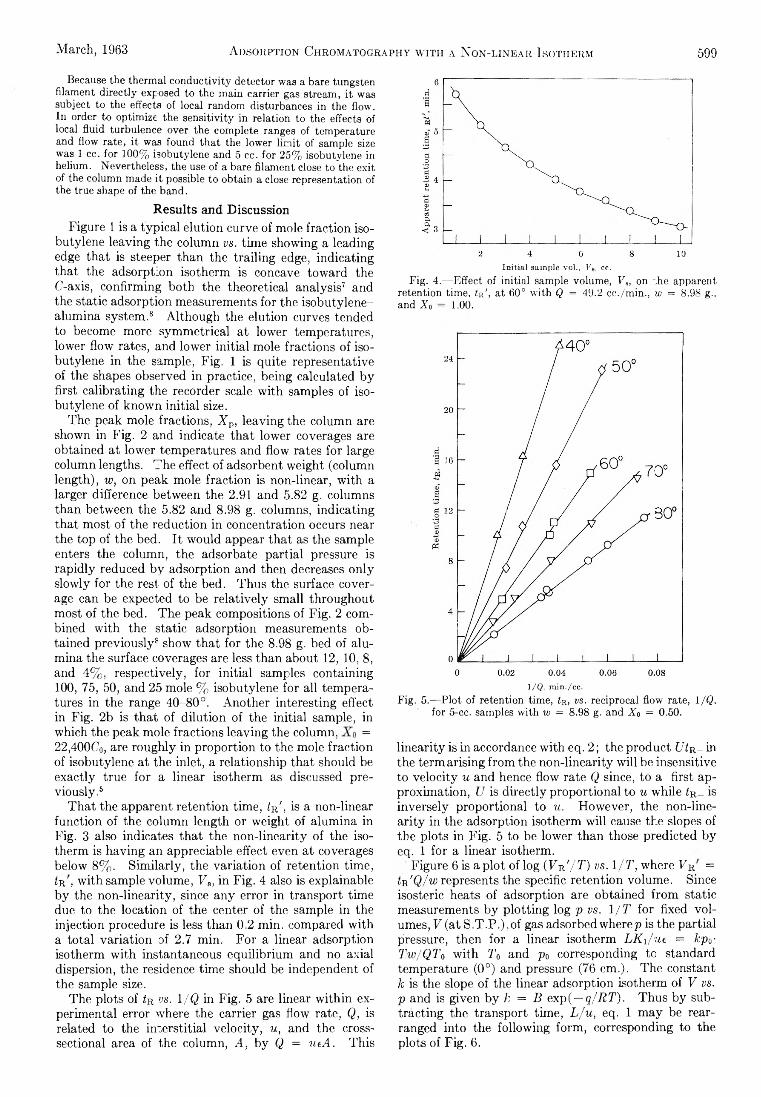
March, 1963 Adsorption Chromatography with a Non-linear Isotherm 599
Because the thermal conductivity detector was a bare tungsten filament directly exposed to the main carrier gas stream, it was subject to the effects of local random disturbances in the flow. In order to optimize the sensitivity in relation to the effects of local fluid turbulence over the complete ranges of temperature and flow rate, it was found that the lower limit of sample size was 1 cc. for 100% isobutylene and 5 cc. for 25% isobutylene in helium. Nevertheless, the use of a bare filament close to the exit of the column made it possible to obtain a close representation of the true shape of the band.
Results and DiscussionFigure 1 is a typ ica l e lution curve of mole fraction iso
butylene leaving the colum n vs. tim e showing a leading edge th at is steeper than the tra ilin g edge, ind icating th at the adsorption isotherm is concave tow ard the C -axis, confirm ing both the theoretical analysis7 and the static adsorption measurements fo r the isobutylene- alum ina system . 8 A lthough the elution curves tended to become more sym m etrical at lower tem peratures, lower flow rates, and lower in itia l mole fractions of isobutylene in the sample, F ig . 1 is quite representative of the shapes observed in practice, being calculated b y first ca librating the recorder scale w ith samples of isobutylene of known in itia l size.
The peak mole fractions, X p, leaving the colum n are shown in F ig . 2 and indicate th a t lower coverages are obtained at lower tem peratures and flow rates fo r large colum n lengths. The effect of adsorbent w eight (colum n length ), w, on peak mole fraction is non-linear, w ith a larger difference between the 2.91 and 5.82 g. columns than between the 5.82 and 8.98 g. columns, ind icating that most of the reduction in concentration occurs near the top of the bed. I t would appear th a t as the sample enters the colum n, the adsorbate partia l pressure is ra p id ly reduced b y adsorption and then decreases o n ly slow ly fo r the rest of the bed. Th us the surface coverage can be expected to be re la tive ly sm all throughout m ost of the bed. Th e peak com positions of F ig . 2 combined w ith the static adsorption measurements obtained p reviou sly8 show th a t fo r the 8.98 g. bed of alum ina the surface coverages are less than about 1 2 , 1 0 , 8 , and 4 % , respectively, fo r in itia l samples containing 100, 75, 50, and 25 mole % isobutylene fo r a ll temperatures in the range 40-80°. Another interesting effect in F ig . 2b is th a t of d ilu tion of the in itia l sample, in which the peak mole fractions leaving the colum n, = 22,400C0, are rough ly in proportion to the mole fraction of isobutylene at the in le t, a relationship th at should be exactly true fo r a linear isotherm as discussed prev io u s ly . 6
T h a t the apparent retention tim e, tn', is a non-linear function of the colum n length or w eight of alum ina in F ig . 3 also indicates th at the n on -lin ea rity of the isotherm is having an appreciable effect even at coverages below 8 % . S im ila rly , the va ria tion of retention tim e, tji, w ith sample volum e, VB, in F ig . 4 also is explainable b y the n on -lin ea rity, since any error in transport tim e due to the location of the center of the sample in the in jection procedure is less than 0 . 2 m in. compared w ith a to ta l va ria tion of 2.7 m in. F o r a linear adsorption isotherm w ith instantaneous equ ilibrium and no axial dispersion, the residence tim e should be independent of the sample size.
The plots of t-R vs. 1/Q in F ig . 5 are linear w ith in experim ental error where the carrier gas flow rate, Q, is related to the in te rs titia l ve lo c ity , u, and the cross- sectional area of the colum n, A, b y Q = ueA. Th is
Initial sample voi., Fs, cc.Fig. 4.— Effect of initial sample volume, Va, on the apparent
retention time, UT, at 60° with Q = 49.2 cc./min., w = 8.98 g., and Xa — 1 .00 .
1/Q, min./cc.Fig. 5.— Plot of retention time, ZR, vs. reciprocal flow rate, 1/Q.
for 5-cc. samples with w = 8.98 g. and Xo = 0.50.
lin e a rity is in accordance w ith eq. 2 ; the product Ufa- in the term arising from the n on -lin e a rity w ill be insensitive to ve lo c ity u and hence flow rate Q since, to a first approxim ation, U is d ire c tly proportional to u w hile Zr _ is inverse ly proportional to u. H ow ever, the non-linea r ity in the adsorption isotherm w ill cause the slopes of the plots in F ig . 5 to be lower than those predicted b y eq. 1 fo r a linear isotherm .
Figure 6 is a p lo t of log (V-r '/T) v s . 1/T, where Vr = tn'Q/w represents the specific retention volum e. Since isosteric heats of adsorption are obtained from static measurements b y p lo ttin g log p vs. 1/T fo r fixed vo lumes, V (a t S .T .P .) ,o f gas adsorbed where p is the partia l pressure, then fo r a linear isotherm LKi/ue = kp0 ■ Tw/QTo w ith T 0 and p0 corresponding to standard tem perature (0°) and pressure (76 cm .). The constant k is the slope of the linear adsorption isotherm of V vs. p and is given b y k = B exp ( — q/RT). Thus b y subtra ctin g the transport tim e, L/u, eq. 1 m ay be rearranged in to the fo llow ing form , corresponding to the plots of F ig . 6 .
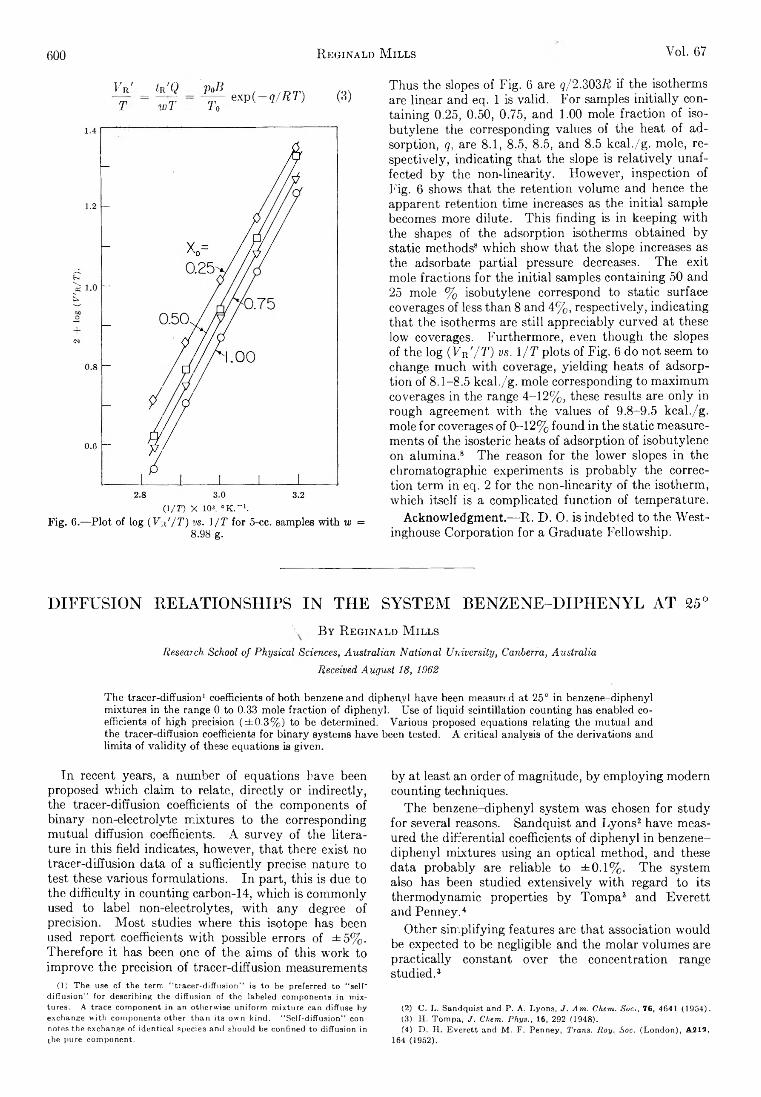
600 R eginald M ills Vol. 67
T V = V Q T wT
PaBTo
exp (-q/R T ) (3)
(I/T) X 103, «K .-1 .Fig. 6 .— Plot of log ( W T) vs. 1/T for 5-cc. samples with w =
8.98 g.
Th us the slopes of F ig . 6 are q/2.30372 if the isotherms are linear and eq. 1 is va lid . F o r samples in it ia lly conta in ing 0.25, 0.50, 0.75, and 1.00 mole fraction of isobutylene the corresponding values of the heat of adsorption, q, are 8.1, 8.5, 8.5, and 8.5 kca l./g . m ole, respectively, ind icating th at the slope is re la tive ly unaffected b y the n on -lin earity. H ow ever, inspection of F ig . 6 shows th at the retention volum e and hence the apparent retention tim e increases as the in itia l sample becomes more d ilu te . T h is find ing is in keeping w ith the shapes of the adsorption isotherms obtained b y static methods8 w hich show th a t the slope increases as the adsorbate p a rtia l pressure decreases. Th e e xit mole fractions fo r the in itia l samples containing 50 and 25 mole % isobutylene correspond to static surface coverages of less than 8 and 4 % , respectively, ind icating th at the isotherms are s till appreciably curved a t these low coverages. Furtherm ore, even though the slopes of the log (Vr '/T) v s . 1/T plots of F ig . 6 do not seem to change m uch w ith coverage, y ie ld in g heats of adsorption of 8 .1-8.5 kcal./g. mole corresponding to m axim um coverages in the range 4 -1 2 % , these results are o n ly in rough agreement w ith the values of 9.8-9.5 kcal./g. mole fo r coverages of 0 - 1 2 % found in the static measurements of the isosteric heats of adsorption of isobutylene on alum ina . 8 The reason fo r the lower slopes in the chrom atographic experim ents is probab ly the correction term in eq. 2 fo r the n on -lin e a rity of the isotherm , w hich itse lf is a com plicated function of tem perature.
Acknowledgment.— R . D . O. is indebted to the W estinghouse Corporation fo r a Graduate Fellow ship.
D IFFU SIO N R ELA T IO N SH IPS IN TH E SY ST EM B E N Z E N E -D IP H E N Y L AT 25°
' B y R e g i n a l d M i l l s
Research School of Physical Sciences, Australian National University, Canberra, Australia
Received August 18, 1962
The tracer-diffusion1 coefficients of both benzene and diphenyl have been measured at 25° in benzene-diphenyl mixtures in the range 0 to 0.33 mole fraction of diphenyl. Use of liquid scintillation counting has enabled coefficients of high precision (± 0 .3 % ) to be determined. Various proposed equations relating the mutual and the tracer-diffusion coefficients for binary systems have been tested. A critical analysis of the derivations and limits of validity of these equations is given.
In recent years, a num ber of equations have been proposed which claim to relate, d ire c tly or in d ire ctly, the tracer-d iffusion coefficients of the components of b inary non-electrolyte m ixtures to the corresponding m utual diffusion coefficients. A survey of the lite ra ture in th is field indicates, however, th at there exist no tracer-d iffusion data of a su fficien tly precise nature to test these various form ulations. In part, th is is due to the d ifficu lty in counting carbon-14, which is com m only used to label non-electrolytes, w ith any degree of precision. M ost studies where th is isotope has been used report coefficients w ith possible errors of ± 5 % .Therefore it has been one of the aims of th is w ork to im prove the precision of tracer-d iffusion measurements
(1) The use of the term “ tracer-diffusion” is to be preferred to “ self- diffusion’ ' for describing the diffusion of the labeled components in mixtures. A trace component in an otherwise uniform mixture can diffuse by exchange with components other than its own kind. “ Self-diffusion” connotes the exchange of identical species and should be confined to diffusion in the pure component.
b y at least an order of m agnitude, b y em ploying modern counting techniques.
Th e benzene-diphenyl system was chosen fo r study fo r several reasons. Sandquist and Lyon s 2 have measured the d ifferentia l coefficients of d iphenyl in benzene- d iphenyl m ixtures using an optica l m ethod, and these data p robab ly are reliable to ± 0 .1 % . Th e system also has been studied extensively w ith regard to its therm odynam ic properties b y Tom pa 8 and E ve re tt and Penney . 4
O ther sim p lifyin g features are th at association w ould be expected to be negligible and the m olar volum es are p ra ctica lly constant over the concentration range studied . 3
(2) C. L. Sandquist and P. A. Lyons, J. Am. Chem. Soc., 76, 4641 (1954).(3) H. Tompa, J. Chem. Phys., 16, 292 (1948).(4) D. H. Everett and M. F. Penney, Trans. Roy. Soc. (London), A212.
164 (1952).
March, 1963 D iffusion R elationships in the System Benzene-D iphenyl 601
Experim entalMaterials.—Analar benzene was used without further purifi
cation in most experiments. A gas chromatographic analysis of this grade of benzene showed that negligible amounts of impurities were present. For some check experiments, however, Analar benzene was fractionated on a column of 17 theoretical plates and only the middle fraction boiling at the range 79.9-80.1° was collected. The diffusion coefficients measured with the purified benzene were indistinguishable, within experimental error, from those employing the Analar solvent. Sandquist and Lyons2 also concluded that for diffusion measurements, rigid purification of materials appears to be unnecessary. B .D .H . laboratory reagent grade diphenyl was finely ground and then thoroughly dried in a vacuum desiccator. Its melting point was 69 ± 0.2°.
Two samples of C14-labeled benzene were used and compared, one from the Radiochemical Centre, Amersham, England, and the other from Tracerlab Inc., Waltham, Mass., U.S.A. Labeled diphenyl was supplied by Merck, Sharpe and Dohme of Canada Ltd., Montreal, Canada.
Diphenyl solutions were made up approximately by weight and a pycnometer then was used to measure their density accurately. The concentrations were determined by interpolation on a large graph of the concentration density function for 25° reported by Sandquist and Lyons.2
d = 0.873141 + 0.024030C - 0.0001 IOO7 C2
Apparatus.— The magnetically stirred diaphragm cell as developed by Stokes6 was used for all measurements. Some modifications to the normal type of cell were necessary, however, due to the high volatility of benzene. The bottom compartment was sealed by a polythene stopper which had a fine capillary drilled through it. This capillary widened at its outer end to take a very small plug of the same material. Withdrawal of this small plug at the end of an experiment did not draw liquid through the diaphragm. The top compartment was closed by a finely-ground glass capillary stopper which could be closed with a' small ground cap. A glass cup was sealed to the lip of the cell socket which was filled with mercury after the stopper was inserted, thus effectively sealing the ground joint to benzene evaporation. Without this precaution, bubbles were liable to appear in the top compartment. The general filling and sampling procedures were essentially similar to those described by Robinson and Stokes.6
Calibration.— The diaphragm cell constant was determined in the normal manner as described in ref. 6 by allowing a solution of 0.5 M KC1 to diffuse into pure water. After diffusion, the concentrations of the cell compartments were determined very precisely by conductance measurements on a Jones bridge. Duplicate values of these constants agreed to within ± 0 .1 % . There is a slight variation -with time, however, due to diaphragm wear and calibrations were made after every eight runs and the constants for individual runs were obtained by interpolation.
Up to this time, it has been assumed that the type of calibration described above should hold for diffusion measurements involving non-aqueous solvents. Our measurements now have confirmed the correctness of this assumption. We have used as a calibrating point the limiting value of the mutual diffusion coefficient of diphenyl in benzene which ought to be identical with the limiting tracer-diffusion coefficient of diphenyl in this solvent. Sandquist and Lyons2 have made very precise measurements of the mutual coefficients for this system using a Gouy diffusiometer and their values in dilute solution extrapolate to give Dab0 = 1.558 X 10⁻⁶ cm.2/sec., which probably is accurate to ± 0 .2 % (A, diphenyl; B, benzene). In this work, using solutions approximately 1.3 X 10 “ 4 M in diphenyl, we have obtained for three runs an average value of 1.554 X 10~6 ± 0.3% for D A*, which is in very good agreement with the mutual value.
Counting Techniques.— Liquid scintillation counting was used because of its precision and high efficiency. The scintillator solution was prepared by dissolving 3 g. of DPO (diphenyloxa- zole) and 0.3 g. of POPOP (l,4-bis-2-[5-phenylaxozolyP-benzene) in 1 1. of benzene. For light pulse collection, an EM I 9514S photomultiplier tube was used in conjunction with a Franklin linear amplifier and a Tracerlab “ Compumatic” scaler.
All power supplies were highly stabilized. Samples were counted in an air-conditioned room and at night, to ensure that fluctuations due to temperature change and from the mains were
(5) R. H. Stokes, J. Am. Chem. Soc., 72, 763 (1950).(6) R. A. Robinson and R. H. Stokes, “ Electrolyte Solutions,” 2nd Ed.,
Butterworths, London, 1959, p. 253.
at a minimum. By these measures and by appropriate settings of the discriminator levels on the linear amplifier, the background rate could be kept to less than 0.5% of the counting rate. Total counts on a given sample were always greater than 106 so that statistical counting error would be expected to be less than ± 0 .1 % .
The glass counting vials used in this technique vary slightly in shape and transparency so that solutions to be compared should be counted in the same vial. In our procedure, 5-ml. aliquots of one of the compartment solutions were transferred with a sili- coned pipet to four counting vials, each of which contained 10 ml. of scintillator solution. Weight checks show that the reproducibility of these volumes was better than ±0 .0 5 % . When a vial had been counted it was immediately emptied, rinsed, refilled with scintillator and solution from the remaining compartment, respectively, and recounted. Errors due to long-term drift in the counting equipment were obviated in this way. Four diffusion coefficients were calculated separately, one from the data for each vial. The high precision gained by these precautions was reflected in the agreement among the four coefficients, the root mean square deviation of which averaged ± 0 .2 % .
ResultsThe results of the tracer-d iffusion measurements
are shown in Table I together w ith other relevant data.
T a b l e IT r a c e r - D i f f u s i o n C o e f f i c i e n t s o f D i p h e n y l a n d B e n z e n e i n
B e n z e n e - D i p h e n y l M i x t u r e s a t 25°D a * ■Db*
C'a , Na Nb X 106, X 105,moles/1. Di Ben cm.2/ cm.2/ D b * v /Diphenyl phenyl zene see. sec. v/vo V0 vo
0 0 1 2.247 1 2.2471.3 X 10 “ 4 —0 - 1 1.554 ~1 1.554
0.4562 0.0419 0.9581 1.440 2.062 1.104 1.590 2.2760.9501 .0901 .9099 1.307 1.911 1.217 1.591 2.3271.980 .2008 .7992 1.091 1.590 1.544 1.685 2.4552.931 .3176 .6824 1.311 1.956 2.5642.996 .3261 .6738 0.890 1.988 1.769
A s stated in the Experim ental section, the average counting error was of the order ± 0 .2 % and as diaphragm cell measurements usually can be reproduced to ± 0 .1 % , the to ta l error is estimated to be ± 0 .3 % . Replicate measurements at the same concentration agreed w ith in th is error.
In Table I I , values fo r the self-diffusion coefficient of benzene w hich have been reported in the lite ra ture are compared w ith the figure obtained in th is study.
T a b l e IIS e l f - d i f f u s i o n C o e f f i c i e n t o f B e n z e n e a t 25°
InvestigatorsDb*
X 106
Estimated
precision,
%Isotope
used MethodGraupner and Winter7 2.15 ± 2 -3 H 2 Diaphragm cellJohnson and Babb8 2.18 ± 6 C 14 CapillaryHiraoka, Osugi, and
Jono9 2.13 ± 3 C H CapillaryRathbun and Babb10 2.21 ± 5 C » CapillaryThis work 2.247 ± 0 .3 C 14 Diaphragm cell
I t w ill be observed th a t our value is considerably higher than those obtained b y other workers, although in one or tw o cases it fa lls w ith in th e ir quoted lim its of error. Th e in terca lib ration of our cells w ith the KC1 diffusion data of Harned and N u tta ll1 1 and G osting 12
(7) K. Graupner and E. R. S. Winter, J. Chem. Soc., 1145 (1952).(8) P. A. Johnson and A. L. Babb, J. Phys. Chem., 60, 14 (1956).(9) H. Hiraoka, J. Osugi, and W. Jono, Rev. Phys. Chem., Ja-pan, 28, 52
(1958 .(10) R. E. Rathbun and A. L. Babb, J. Phys. Chem., 65, 1072 (1961).(11) H. S. Harned and R. L. Nuttall, J. Am. Chem. Soc., 69, 736 (1947);
71, 1460 (1949).(12) L. J. Gosting, ibid., 72, 4418 (1950).
602 R eginald M ills Vol. 67
and the d iphenyl figure of Sandquist and Lyon s 2 would lead one to assume th a t there is no system atic error in our experim ental procedure. Th e on ly other source of e rror w ould be from possible radioactive im purities in the labeled benzene. A s a means of testing th is possib ility, we have obtained labeled benzene from tw o different suppliers on the assumption th a t as these samples were synthesized in d ifferent laboratories, it is u n like ly th a t both would contain the same im purities in the same proportions. Benzene labeled w ith carbon- 14 therefore was obtained from the Radiochem ical Centre, Am ersham , England, and Tracerlab In c., W altham , M ass., U .S .A . D iffusion runs on tw o samples gave
U .K . sample DB* = 2.250 X 10“ 5 cm .2/sec.
ficients, specific fo r in teraction between diffusing molecules. Bearm an’s equations, when restricted to diffusion in regular solutions, take the form
Da*/Db* = Vb/Va (4)
where V i is the partia l m olar volum e of com ponent i, and
Dab = (NbDa* + N aDb*) (5)\d In N aJ
which is identical w ith the H a rtle y -C ra n k extension, eq. 2 .
Lam m ’s general equations cannot be tested d ire c tly experim entally, but he has given an approxim ation 19
which can be used
U .S . sample D b * = 2.245 X 10 5 cm .2/sec.
the results agreeing w ith in the experim ental error of the measurements.
D iscussion
Several equations have been proposed re la ting the processes of m utual and tracer-d iffusion in b in ary non-electro lyte m ixtures. These equations w ill now be listed, tested w ith our data, and then c ritic a lly exam ined. In the derivations of these equations, tw o m ain approaches can be distinguished. One type, characterized b y the treatm ents of H a rtle y and C ra n k 13
and Adam son , 14 adduces a d irect therm odynam ic relationship between the m utual and tracer-d iffusion coefficients. In effect, the m utual coefficient (erroneously termed an “ in trin s ic ” coefficient in the orig ina l derivations) is equated to the tracer coefficient corrected b y an a c tiv ity term . H a rtle y and C ra nk ’s equation is of the form
Dab — RT/NÒ In a a d in V a
N b_ N a \
.(tav cbj? /( 1 )
where aw is a r esistance coefficient, u, being some function of molecula r size and shape. Equation 1 has been extended b y Carm an and Stein , 15 who equate RT/No-av to Da* and so obta in the expression
D a b = (NbD a* + N aDb*) (2)
Adam son’s trea tm e n t14 differed from the above in th at the ra tiona l a c tiv ity term , instead of the concentration- based one, was used to couple the tracer and m utual d iffusion coefficients d ire c tly . T h is m odification gives the fin a l equation
D ab = (4>a D b * + 4>b D a *) ^ (3 )
where is the volum e f raction of component i.Th e other group exem plified b y the derivations of
Bearm an , 16 Lam m , 17 and Adam son and Ira n i18 is based on both m olecular and therm odynam ic approaches. T h e ir m ain characteristic is the use of fric tio n coef-
(13) G. fe. Hartley and J. Crank, Trans. Faraday Soc., 45, 801 (1949).(14) A. W. Adamson, J. Phys. Chem., 58, 514 (1954).(.15) P. C. Cafman and L. H. Stein, Trans. Ffraday Soc., 52, 619 (1956). (161 R. J. Bearman, J. Phys. Chem., 65, 1901 (1961):(17). 0. Lamm, ibid., 51, 1063 (1947).(15) A. W. Adamaoii, Trafid. A IM E -, 219, 158 (I960).
Dab = N aD b*Db*°
Db *° — 4>bDb*/\0 In C b
ò In « b(6 )
where D B*° is the lim itin g tracer coefficient of B in pure A .
Adam son and Ira n i give a sim ilar kind of approxim ation fo r experim ental testing
D ab = (Db* — <£bD b *o??b oA )/ 0 a — — (7)ô In C b
In Table I I I below, the experim ental m utual diffusion coefficients of Sandquist and Lyon s 2 are compared w ith those calculated from eq. 2-7 above. Th e ratios Dr*/Da* also are listed. F igure 1 illustrates graph ica lly the extent of agreement of some of these equations.
T a b l e I I IC'a , Dab , Da b . Dab , Dab , Dab ,
mole/1. obsd.4 eq. 2, 5 eq. 3 eq. 6 eq. 7 Db* /D a*0.5 1.450 1.421 1.439 0.615 1.521 1.451 . 0 1.342 1.301 1.331 .610 1.390 1.451.5 1.242 1 . 2 0 0 1.241 .603 1.309 1.452 . 0 1.147 1.103 1.148 .604 1.205 1.462.5 1.062 1 . 0 2 1 1.066 .584 1.115 1.463.0 0.977 0.940 0.984 .570 1.006 1.46
Tab le I I I shows also th at the ra tio D b */Da * is v ir tu a lly constant over the concentration range measured. I t is notew orthy th at Carm an and Stein’s15 data fo r tracer- diffusion in the e th yl iodide re-butyl iodide system as quoted b y Bearm an20 also show constancy over a sim ilar concentration range. Fu rther, as shown in Table IV , the ratios of V a / V b to D B*/DA* fo r the tw o systems are fa ir ly comparable.
Component Benzene (B) Diphenyl (A) Ethyl iodide (Bi «-Butyl iodide (A ;
T a b l e IV
v89.44 1
149 j 80.51 Ì
113.87 J
Ta Da *Va /Vb Db*/D a * VBDb *
1.67 1.45 1.15
1.41 1.14 1.24
An a lysis of D iffusion Equations.— Before com m enting on the agreement between the experim ental evidence and the above equations, it is proposed to exam ine c ritic a lly the derivations of the la tte r and the lim its of th e ir v a lid ity . There appears to be some confusion in the literature as to the a p p lica b ility of some equations, p a rticu la rly those of the H a rtle y -C ra n k type . B ear-
(19) O. Lamm, Acta Chem. Scand., 8, 1120 (1954).(20) R. J. Bearman, J. Chem. Phys,, 32, 1308 (1960).
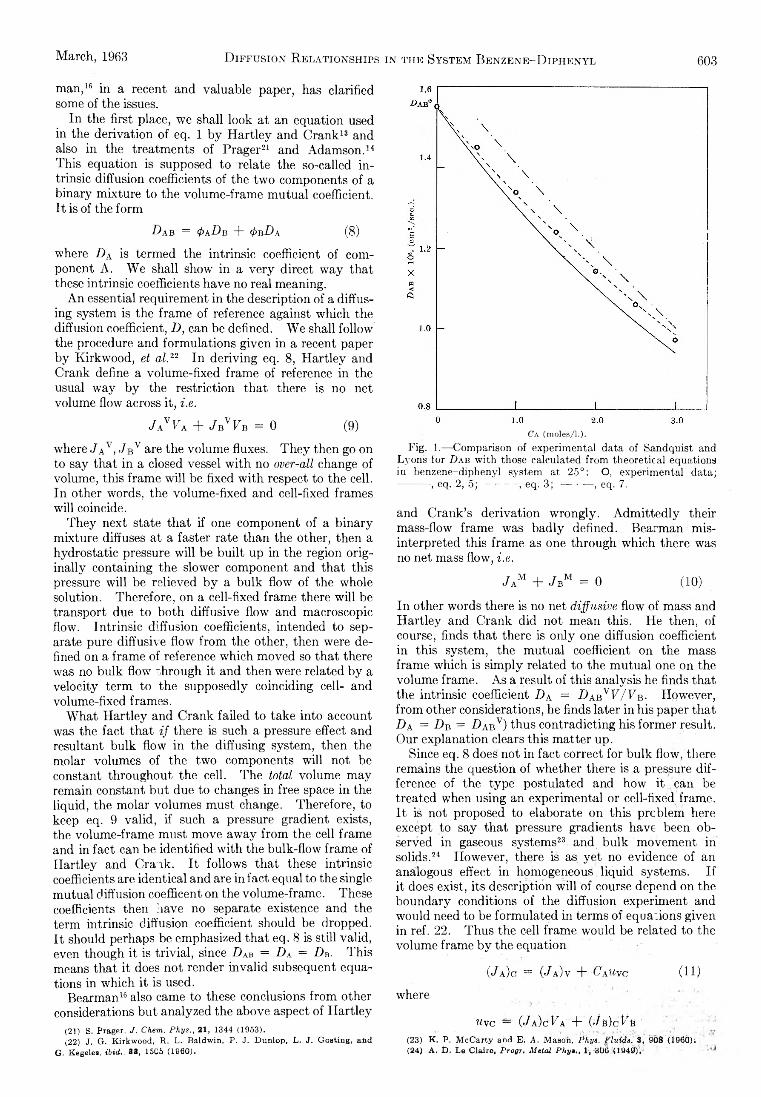
March, 1963 D iffusion R elationships in the System Benzene-D iphenyl 603
man , 16 in a recent and valuable paper, has clarified some of the issues.
In the first place, we shall look a t an equation used in the derivation of eq. 1 b y H a rtle y and C rank 13 and also in the treatm ents of P rager2 1 and Adam son . 14
T h is equation is supposed to relate the so-called in trinsic diffusion coefficients of the tw o components of a b inary m ixture to the volum e-fram e m utual coefficient. I t is of the form
D a b = 4>a D b + 4>b D a (8 )
where DA is term ed the in trins ic coefficient of component A . W e shall show in a v e ry d irect w a y that these in trins ic coefficients have no real meaning.
A n essential requirem ent in the description of a diffusing system is the fram e of reference against w hich the diffusion coefficient, D , can be defined. W e shall fo llow the procedure and form ulations given in a recent paper b y K irkw ood, et al, 22 In deriving eq. 8 , H a rtle y and Crank define a volum e-fixed fram e of reference in the usual w ay b y the restriction th a t there is no net volum e flow across it , i.e.
J a Y V a + J b V F b = 0 (9 )
where Ja v , Jb v are the volum e fluxes. T h e y then go on to say th at in a closed vessel w ith no over-all change of volum e, th is fram e w ill be fixed w ith respect to the cell. In other words, the volum e-fixed and cell-fixed frames w ill coincide.
T h e y next state th a t if one component of a b in a ry m ixture diffuses at a faster rate than the other, then a hydrostatic pressure w ill be b u ilt up in the region o rig in a lly containing the slower component and th a t th is pressure w ill be relieved b y a bu lk flow of the whole solution. Therefore, on a ce ll-fixed fram e there w ill be transport due to both d iffusive flow and macroscopic flow . In trin s ic diffusion coefficients, intended to separate pure diffusive flow from the other, then were defined on a fram e of reference w hich m oved so th a t there was no b u lk flow' through it and then were related b y a ve lo c ity term to the supposedly coinciding ce ll- and volum e-fixed frames.
W hat H a rtle y and C rank failed to take in to account was the fact th a t i f there is such a pressure effect and resultant bu lk flow in the d iffusing system, then the m olar volum es of the tw o components w ill not be constant throughout the cell. Th e total volum e m ay rem ain constant b u t due to changes in free space in the liqu id , the m olar volum es m ust change. Therefore, to keep eq. 9 va lid , if such a pressure gradient exists, the volum e-fram e m ust m ove aw ay from the cell fram e and in fact can be identified w ith the b u lk -flow fram e of H a rtle y and C rank. I t follow s th at these in trinsic coefficients are identical and are in fact equal to the single m utual d iffusion coefficent on the volum e-fram e. These coefficients then have no separate existence and the term in trinsic diffusion coefficient should be dropped. I t should perhaps be emphasized th a t eq. 8 is s till va lid , even though it is tr iv ia l, since D ab = D a = D B. Th is means th at it does not render in va lid subsequent equations in w hich it is used.
Bearm an 16 also came to these conclusions from other considerations but analyzed the above aspect of H a rtle y
(21) S. Prager, J. Chem. Phya., 21, 1344 (1953).(22) J. G. Kirkwood, R. L. Baldwin, P. J. Dunlop, L. J. Gosting, and
G. Kegeles, ibid., 33, 15C5 (1960).
Ca (moles/1.).Fig. 1.— Comparison of experimental data of Sandquist and
Lyons for Dab with those calculated from theoretical equations in benzene-diphenyl system at 25°: O, experimental data;---------- , eq. 2, 5 ; ---------- , eq. 3 ; ---------- , eq. 7.
and C rank’s derivation w ron g ly. A d m itte d ly the ir m ass-flow fram e was b a d ly defined. Bearm an m isinterpreted th is fram e as one through w hich there was no net mass flow , i.e.
JaM + JbM = 0 ( 1 0 )
In other words there is no net diffusive flow of mass and H a rtle y and C rank did not mean th is. H e then, of course, finds th a t there is o n ly one diffusion coefficient in th is system, the m utual coefficient on the mass fram e w hich is sim ply related to the m utual one on the volum e fram e. A s a result of th is analysis he finds th at the in trins ic coefficient D a = D a b v K / T b - How ever, from other considerations, he finds la te r in his paper th at D a = D b = D a b v ) thus contrad icting his form er result. O ur explanation clears th is m atter up.
Since eq. 8 does not in fact correct fo r bu lk flow , there remains the question of whether there is a pressure d ifference of the type postulated and how it can be treated when using an experim ental or cell-fixed frame. I t is not proposed to elaborate on th is problem here except to say th a t pressure gradients have been observed in gaseous systems23 and b u lk m ovement in solids . 24 H ow ever, there is as ye t no evidence of an analogous effect in homogeneous liq u id systems. I f it does exist, its description w ill of course depend on the boundary conditions of the diffusion experim ent and w ould need to be form ulated in term s of equations given in ref. 22. Thus the cell fram e w ould be related to the volum e fram e b y the equation
(J a) a =5= (Ja) v + CaUvc (11)
where
Mvc — (J a)c T a + (•/b)c T b
(23) K. P. McCarty and E. A. Mason, Phya. Fluids, 3, 908 (i960).(24) A, t). Le Claire, Progr. Metal Phya., 1, 306 (1949).
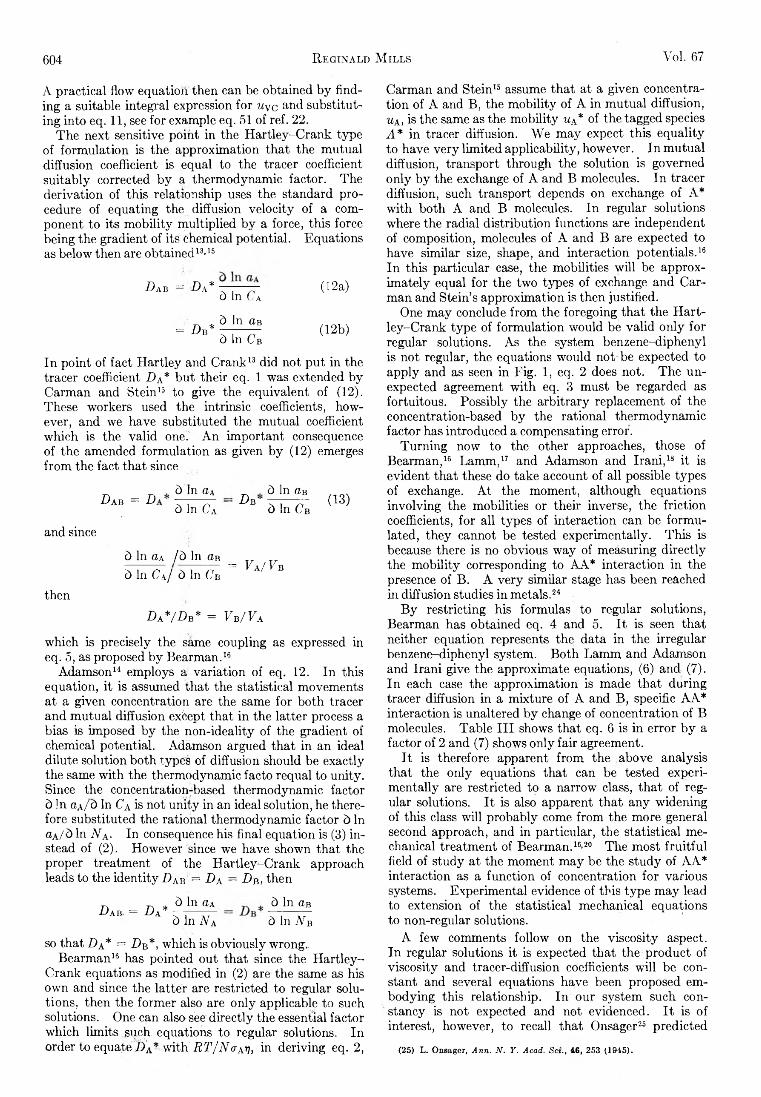
604 R eginald M ills Vol. 67
A practica l flow equation then can be obtained b y finding a suitable in tegra l expression fo r u^c and substitu tin g in to eq. 11, see fo r example eq. 51 of ref. 22.
Th e next sensitive po in t in the H a rtle y -C ra n k type of form ulation is the approxim ation th a t the m utual diffusion coefficient is equal to the tracer coefficient su ita b ly corrected b y a therm odynam ic factor. The d e riva tion of th is relationship uses the standard procedure of equating the diffusion ve lo c ity of a component to its m o b ility m ultip lied b y a force, th is force being the gradient of its chemical potentia l. Equations as below then are obtained 13 ’ 16
H ab = D a * ( 1 2 a)ò In C a
= D B *Ò In Ob ò In C b
( 1 2 b)
In po in t of fact H a rtle y and C ra n k 13 d id not pu t in the tracer coefficient D a* but th e ir eq. 1 was extended b y Carm an and Stein 15 to give the equivalent of (12). These workers used the in trins ic coefficients, however, and we have substituted the m utual coefficient w hich is the va lid one. A n im portant consequence of the amended form ulation as given b y ( 1 2 ) emerges from the fact th a t since
Dab = Dò In a a
and since
then
ò In Ca
ò In oa /à In Ob
D b'Ò In Ob Ò In Cb
(13)
= Va/Vbò In C'a / ò In C b
Da*/Db* = Vb/Va
w hich is precisely the same coupling as expressed in eq. 5, as proposed b y Bearm an . 16
Adam son 14 em ploys a va ria tion of eq. 12. In th is equation, it is assumed th a t the statistica l movements a t a given concentration are the same fo r both tracer and m utual d iffusion except th at in the la tte r process a bias is imposed b y the n o n -id e a lity of the gradient of chemical potentia l. Adamson argued th a t in an ideal d ilu te solution both types of d iffusion should be exactly the same w ith the therm odynam ic facto requal to u n ity . Since the concentration-based therm odynam ic factor d In cea/c) In C a is not u n ity in an ideal solution, he therefore substituted the ra tiona l therm odynam ic factor d In dA/d In N a - In consequence his final equation is (3) in stead of (2 ) . H ow ever since we have shown th a t the proper treatm ent of the H a rtle y -C ra n k approach leads to the id e n tity Dab = D a = D b, then
Dab = Da*ò In a a à In Na
ò In ab ò In N b
so th a t D a* = Db*, w hich is obviously w rong.Bearm an 16 has pointed out th a t since the H a rtle y -
C rank equations as m odified in (2) are the same as his own and since the la tte r are restricted to regular solution s, then the form er also are o n ly applicable to such solutions. One can also see d ire c tly the essential factor w hich lim its suph equations to regular solutions. In order to equateT>a * w ith RT/N<tav, in deriving eq. 2 ,
Carm an and Stein 16 assume th a t a t a given concentration of A and B , the m o b ility of A in m utual diffusion, ua, is the same as the m o b ility ua* of the tagged species A * in tracer diffusion. W e m ay expect th is equ a lity to have ve ry lim ited a p p lica b ility, however. In m utual diffusion, transport through the solution is governed o n ly b y the exchange of A and B molecules. In tracer diffusion, such transport depends on exchange of A* w ith both A and B molecules. In regular solutions where the rad ia l d istribu tion functions are independent of com position, molecules of A and B are expected to have sim ilar size, shape, and in teraction potentia ls . 16
In th is particu la r case, the m obilities w ill be approxim ate ly equal fo r the tw o types of exchange and C a rm an and Stein’s approxim ation is then justified .
One m ay conclude from the foregoing th a t the H a rtle y -C ra n k typ e of form ulation would be va lid o n ly fo r regular solutions. A s the system benzene-diphenyl is not regular, the equations w ould not be expected to a p p ly and as seen in F ig . 1, eq. 2 does not. Th e unexpected agreement w ith eq. 3 m ust be regarded as fortu itous. Possib ly the a rb itra ry replacem ent of the concentration-based b y the ra tiona l therm odynam ic factor has introduced a compensating error.
T u rn in g now to the other approaches, those of Bearm an , 16 Lam m , 17 and Adam son and Ira n i, 18 it is evident th a t these do take account of a ll possible types of exchange. A t the m oment, although equations in vo lv in g the m obilities or th e ir inverse, the fric tio n coefficients, fo r a ll types of in teraction can be form ulated, th ey cannot be tested experim entally. T h is is because there is no obvious w ay of m easuring d ire c tly the m o b ility corresponding to A A * in teraction in the presence of B . A v e ry sim ilar stage has been reached in diffusion studies in m etals . 24
B y restricting his form ulas to regular solutions, Bearm an has obtained eq. 4 and 5. I t is seen th a t neither equation represents the data in the irregu lar benzene-diphenyl system. B oth Lam m and Adam son and Ira n i give the approxim ate equations, (6 ) and (7). In each case the approxim ation is made th a t during tracer d iffusion in a m ixture of A and B , specific A A * in teraction is unaltered b y change of concentration of B molecules. Ta b le I I I shows th a t eq. 6 is in e rror b y a factor of 2 and (7) shows o n ly fa ir agreement.
I t is therefore apparent from the above analysis th a t the o n ly equations th a t can be tested experim enta lly are restricted to a narrow class, th a t of regu lar solutions. I t is also apparent th a t any w idening of th is class w ill p robab ly come from the m ore general second approach, and in particu la r, the sta tistica l mechanical treatm ent of Bearm an . 16’ 20 Th e m ost fru itfu l field of study a t the moment m ay be the stud y o f A A * interaction as a function of concentration fo r various systems. Experim ental evidence of th is typ e m ay lead to extension of the statistica l m echanical equations to non-regular solutions.
A few comments fo llow on the viscos ity aspect. In regular solutions it is expected th a t the product of viscosity and tracer-d iffusion coefficients w ill be constant and several equations have been proposed embodying th is relationship. In our system such constancy is not expected and not evidenced. I t is of interest, however, to recall th a t Onsager26 predicted
(25) L. Onsager, A n n . N . Y . Acad. Set., 46, 253 (1945).
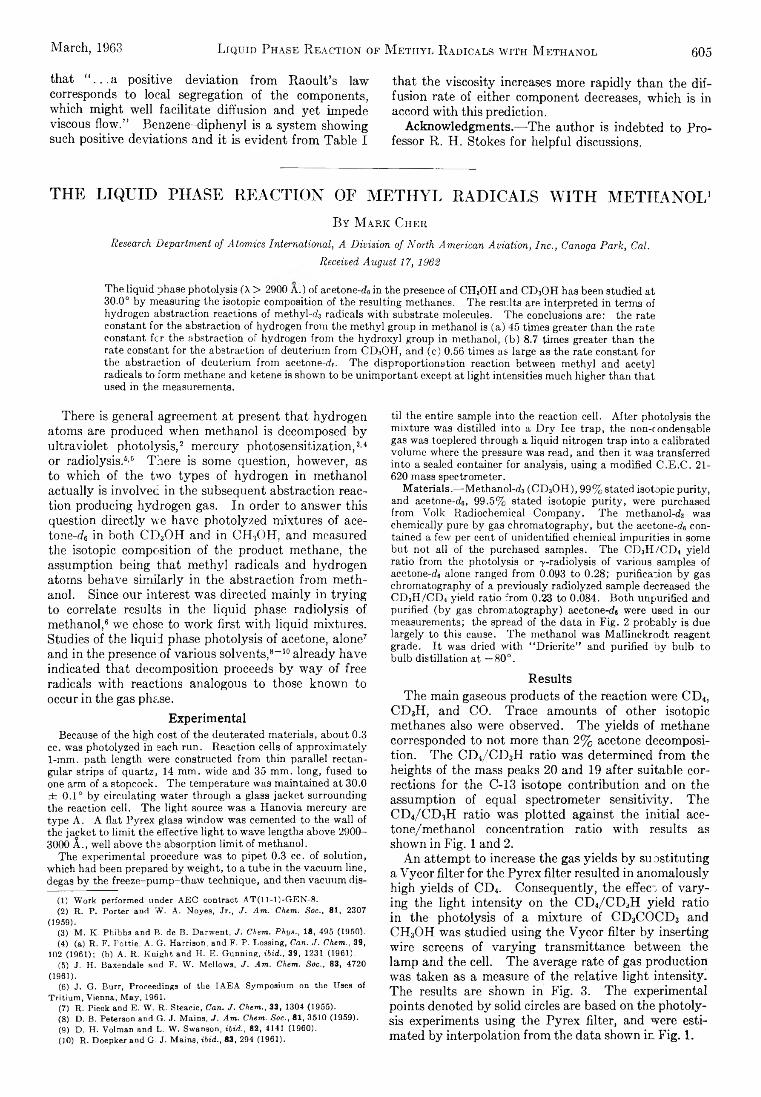
March, 1963 Liquid Phase R eaction of M ethyl R adicals with M ethanol 605
th at “ . . . a positive deviation from R a o u lt’s law corresponds to local segregation of the components, which m ight w ell facilita te diffusion and ye t impede viscous flow .” Benzene-diphenyl is a system showing such positive deviations and it is evident from Ta b le I
th a t the viscosity increases more ra p id ly than the d iffusion rate of either component decreases, w hich is in accord w ith th is prediction.
Acknowledgm ents.— Th e author is indebted to P ro fessor R . H . Stokes fo r helpfu l discussions.
THE LIQUID PHASE REACTION OF METHYL RADICALS WITH METHANOL1B y M a r k C h e r
Research Department of Atomics International, A Division of North American Aviation, Inc., Canoga Park, Cal.Received August 17, 1962
The liquid phase photolysis (X > 2900 A.) of acetone-d6 in the presence of CH3OH and CD3OH has been studied at 30.0° by measuring the isotopic composition of the resulting methanes. The results are interpreted in terms of hydrogen abstraction reactions of methyl-d3 radicals with substrate molecules. The conclusions are: the rate constant for the abstraction of hydrogen from the methyl group in methanol is (a) 45 times greater than the rate constant fcr the abstraction of hydrogen from the hydroxyl group in methanol, (b) 8.7 times greater than the rate constant for the abstraction of deuterium from CD3OH, and (c) 0.56 times as large as the rate constant for the abstraction of deuterium from acetone-de. The disproportionation reaction between methyl and acetyl radicals to form methane and ketene is shown to be unimportant except at light intensities much higher than that used in the measurements.
There is general agreement at present th at hydrogen atoms are produced when m ethanol is decomposed b y u ltra v io le t photolysis , 2 m ercury photosensitization , 3' 4 5
or radio lysis . 6-6 There is some question, however, as to w hich of the tw o types of hydrogen in m ethanol actua lly is involved in the subsequent abstraction reaction producing hydrogen gas. In order to answer th is question d ire c tly we have photolyzed m ixtures of ace- tone-r/ 6 in both C D 3O H and in C H 3O H , and measured the isotopic com position of the product methane, the assumption being th a t m ethyl radicals and hydrogen atoms behave s im ila rly in the abstraction from m ethanol. Since our interest was directed m ain ly in try in g to correlate results in the liq u id phase radio lysis of m ethanol, 6 we chose to w ork first w ith liq u id m ixtures. Studies of the liq u id phase photolysis of acetone, alone7 8 9 10
and in the presence of various solvents , 8 - 1 0 a lready have indicated th a t decom position proceeds b y w a y o f free radicals w ith reactions analogous to those known to occur in the gas phase.
Experim entalBecause of the high cost of the deuterated materials, about 0.3
cc. was photolyzed in each run. Reaction cells of approximately 1 -mm. path length were constructed from thin parallel rectangular strips of quartz, 14 mm. wide and 35 mm. long, fused to one arm of a stopcock. The temperature was maintained at 30.0 ± 0 . 1 ° by circulating water through a glass jacket surrounding the reaction cell. The light source was a Hanovia mercury arc type A. A flat Pyrex glass window was cemented to the wall of the jacket to limit the effective light to wave lengths above 2900- 3000 A ., well above the absorption limit of methanol.
The experimental procedure was to pipet 0.3 cc. of solution, which had been prepared by weight, to a tube in the vacuum line, degas by the freeze-pump-thaw technique, and then vacuum dis
(1) Work performed under AEC contract A T (ll-l)-G E N -8.(2) R. P. Porter and W. A. Noyes, Jr., J. Am. Chem. Soc., 81, 2307
(1959).(3) M. K. Phibbs and B. de B. Darwent, J. Chem. Phys., 18, 495 (1950).(4) (a) R. F. Pottie, A. G. Harrison, and F. P. Lossing, Can. J. Chem., 30,
102 (1961); (b) A. R. Knight and H. E. Gunning, ibid., 39, 1231 (1961).(5) J. H. Baxendale and F. W. Mellows, J. Am. Chem. Soc., 83, 4720
(1961).(6) J. G. Burr, Proceedings of the IAEA Symposium on the Uses of
Tritium, Vienna, May, 1961.(7) R. Pieck and E. W. R. Steacie, Can. J. Chem., 33, 1304 (1955).(8) D. B. Peterson and G. J. Mains, J. Am. Chem. Soc., 81, 3510 (1959).(9) D. H. Volman and L. W. Swanson, ibid., 82, 4141 (1960).(10) R. Doepkerand G. J. Mains, ibid., 83, 294 (1961).
til the entire sample into the reaction cell. After photolysis the mixture was distilled into a Dry Ice trap, the non-condensable gas was toeplered through a liquid nitrogen trap into a calibrated volume where the pressure was read, and then it was transferred into a sealed container for analysis, using a modified C.E.C. 21- 620 mass spectrometer.
Materials.— Methanol-ds (CD 3OH), 99% stated isotopic purity, and acetone-d6, 99.5% stated isotopic purity, were purchased from Volk Radiochemical Company. The methanol-da was chemically pure by gas chromatography, but the aeetone-d6 contained a few per cent of unidentified chemical impurities in some but not all of the purchased samples. The CD3H /C D 4 yield ratio from the photolysis or 7 -radiolysis of various samples of acetone-de alone ranged from 0.093 to 0.28; purification by gas chromatography of a previously radiolyzed sample decreased the CD 3H /C D 4 yield ratio from 0.23 to 0.084. Both unpurified and purified (by gas chromatography) acetone-d, were used in our measurements; the spread of the data in Fig. 2 probably is due largely to this cause. The methanol was Mallinckrodt reagent grade. It was dried with “ Drierite” and purified by bulb to bulb distillation at —80°.
ResultsTh e m ain gaseous products of the reaction were C D 4,
C D jH , and C O . Trace am ounts of other isotopic methanes also were observed. Th e yie lds of methane corresponded to not more than 2 % acetone decomposition . Th e C D 4/ C D 3H ra tio was determ ined from the heights of the mass peaks 20 and 19 after suitable corrections fo r the C-13 isotope contribution and on the assumption of equal spectrom eter se n sitiv ity. Th e C D 4/ C D 3H ra tio was p lotted against the in itia l ace- tone/m ethanol concentration ra tio w ith results as shown in F ig . 1 and 2.
A n attem pt to increase the gas yie lds b y substitu ting a V yc o r filte r fo r the P yre x filte r resulted in anom alously high yie lds of C D 4. Consequently, the effect of v a ry ing the lig h t in ten s ity on the C D 4/C D ,fH yie ld ra tio in the photolysis of a m ixture of C D 3C O C D 3 and C H 3O H was studied using the V yc o r filte r b y inserting w ire screens of va ryin g transm ittance between the lam p and the cell. Th e average rate of gas production was taken as a measure o f the re la tive lig h t in tensity. Th e results are shown in F ig . 3. The experim ental points denoted b y solid circles are based on the photo lysis experim ents using the P yre x filte r, and were estimated b y in terpolation from the data shown in F ig . 1.
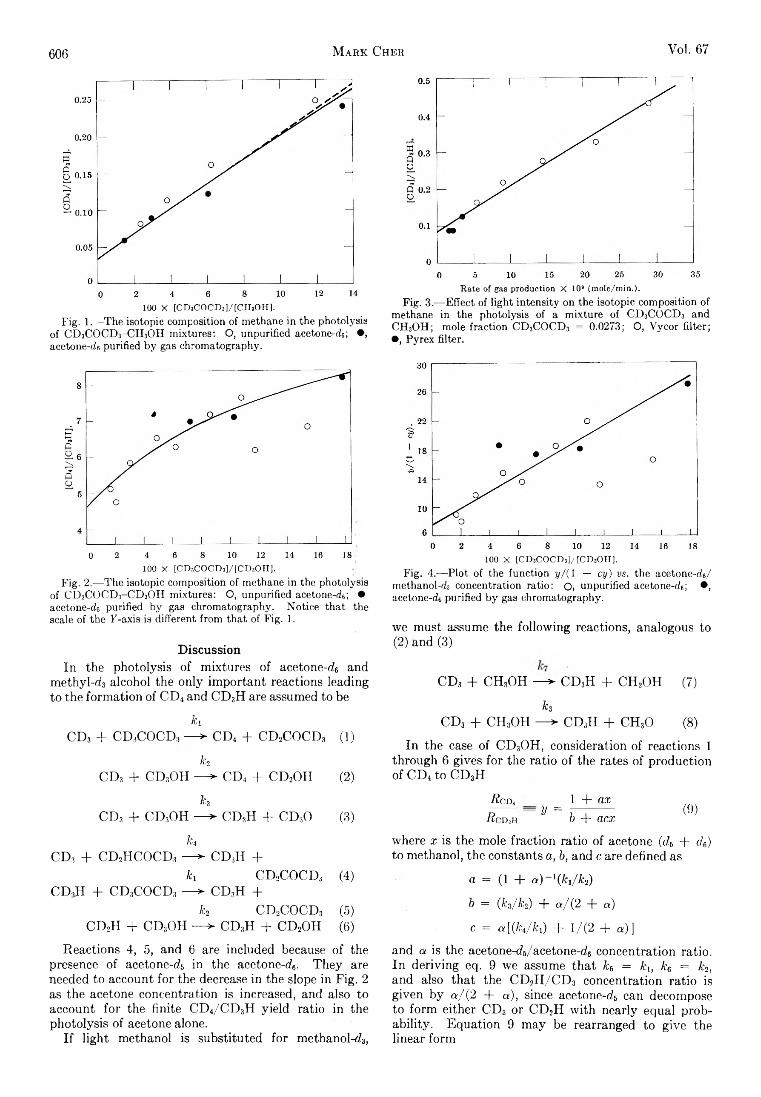
606 M ark Cher Vol. 67
100 X [C D ,C O C D 3]/[C H 3OH].Fig. 1. -T he isotopie composition of methane in the photolysis
of CD 3COCD3-C H 3OH mixtures: O, unpurified acetone-dc; •, acetone-ds purified by gas chromatography.
100 X [CDsC O C D j]/[C D »O H ].Fig. 2.— The isotopic composition of methane in the photolysis
of CD3COCD3-C D 3OH mixtures: O, unpurified acetone-d«; • acetone-d6 purified by gas chromatography. Notice that the scale of the F-axis is different from that of Fig. 1.
DiscussionIn the photolysis of m ixtures of acetone-d6 and
m ethyl-d 3 alcohol the on ly im portant reactions leading to the form ation of C D 4 and C D 3H are assumed to be
hC D 3 + C D jC O C D .! — ^ C D 4 + C D 2C O C D 3 ( 1 )
hC D 3 + C D sO H — ■> C D 4 + C D 2O H (2)
hC D 3 + C D 3O H — > C D 3H + C D 30 (3)
fc4
C D , + C D 2H C O C D , — > C D ,H +h C D 2C O C D , (4)
CD oH + C D ,C O C D 3 — ^ C D 3H +h C D 2C O C D 3 (5)
C D 2H + C D ,O H — > C D ,H + C D 2O H (6 )
Reactions 4, 5, and 6 are included because of the presence of acetone-dB in the acetone-d6. T h e y are needed to account fo r the decrease in the slope in F ig . 2 as the acetone concentration is increased, and also to account fo r the fin ite C D 4/ C D 3H yie ld ra tio in the photolysis of acetone alone.
I f lig h t m ethanol is substituted fo r m ethanol-d3,
Rate of gas production X 109 (mole/min.).Fig. 3.— Effect of light intensity on the isotopic composition of
methane in the photolysis of a mixture of CD3COCD3 and CH3OH; mole fraction CD3COCD3 = 0.0273; O, Vycor filter; •, Pyrex filter.
1 0 0 X [CD 3C OCD 3] / [CD 3OH].Fig. 4.— Plot of the function y/( 1 — cy) vs. the acetone-ds/
methanol-d3 concentration ratio: O, unpurified acetone-de; •, acetone-dc purified by gas chromatography.
we m ust assume the fo llow ing reactions, analogous to(2) and (3)
C D , + C H 3O H — ^ C D ,H + C H 2O H (7)
fc3
C D 3 + C H 3O H — > C D ,H + C H 30 (8 )
In the case of C D 3O H , consideration of reactions 1 through 6 gives fo r the ra tio of the rates of production of C D 4 to C D 3H
R cd, 1 T axp ------ = y = r y r -------- (6 )R cdjH 0 + acx
where x is the mole fraction ra tio of acetone (db + d6) to m ethanol, the constants a, b, and c are defined as
a = ( 1 + a ) - 1(/ci//c2)
b = (fc3/fc2) + a /( 2 + a)
C = a [(fc4//c4) + 1 /(2 + a)]
and a is the acetone-ds/acetone-dg concentration ra tio . In deriving eq. 9 we assume th a t kb = kh k6 = k2, and also th a t the C D 2H / C D 3 concentration ra tio is given b y a/ ( 2 + a), since acetone-d5 can decompose to form either C D 3 or C D 2H w ith nearly equal proba b ility . Equation 9 m ay be rearranged to give the linear form
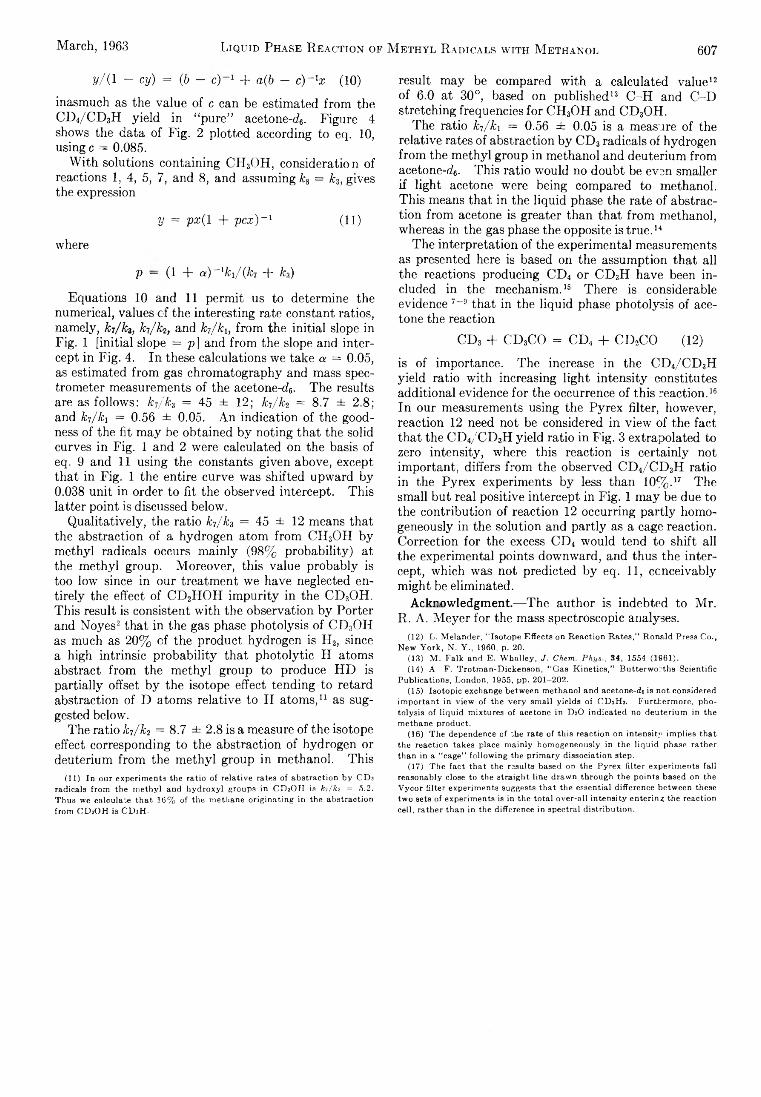
March, 1963 Liquid Phase R eaction op M ethyl R adicals with M ethanol 607
y / ( 1 — cy) = (b — c) 1 + a(b — c)~lx ( 1 0 )
inasmuch as the value of c can be estim ated from the C D 4/ C D 3H yie ld in “ pure” acetone-d6. F igu re 4 shows the data of F ig . 2 p lotted according to eq. 10, using c = 0.085.
W ith solutions containing C H 3O H , consideration of reactions 1, 4, 5, 7, and 8 , and assuming ks = k3j gives the expression
y = px(l + pcx ) _ 1 ( 1 1 )
where
V — ( 1 + oi)~% i/(fc 7 + h )
Equations 10 and 11 perm it us to determ ine the num erical, values of the interesting rate constant ratios, nam ely, k7/ks, k7/k2, and k7/kh from the in itia l slope in F ig . 1 [in itia l slope = p ] and from the slope and in te rcept in F ig . 4. In these calculations we take a = 0.05, as estimated from gas chrom atography and mass spectrom eter measurements of the acetone-d6- The results are as fo llow s: k7/k3 = 45 ± 12; k7/k2 = 8.7 ± 2.8; and k7/ki = 0.56 ± 0.05. A n ind ication of the goodness of the fit m ay be obtained b y noting th a t the solid curves in F ig . 1 and 2 were calculated on the basis of eq. 9 and 11 using the constants given above, except th a t in F ig . 1 the entire curve was shifted upward b y 0.038 u n it in order to f it the observed intercept. Th is la tte r po in t is discussed below.
Q u a lita tive ly , the ra tio k7/k3 = 45 ± 12 means that the abstraction of a hydrogen atom from C H 3O H b y m ethyl radicals occurs m a in ly (98% p ro b a b ility) at the m ethyl group. M oreover, th is value probab ly is too low since in our treatm ent we have neglected entire ly the effect of C D 2H O H im p u rity in the C D 3O H . T h is result is consistent w ith the observation b y P orte r and N oyes2 th a t in the gas phase photolysis of C D sO H as much as 2 0 % of the product hydrogen is H 2, since a high in trins ic p ro b a b ility th a t p h o to lytic H atoms abstract from the m ethyl group to produce H D is p a rtia lly offset b y the isotope effect tending to retard abstraction of D atoms re la tive to H atom s, 1 1 as suggested below.
The ra tio k7/k2 = 8.7 ± 2.8 is a measure of the isotope effect corresponding to the abstraction of hydrogen or deuterium from the m ethyl group in m ethanol. Th is
(11) In our experiments the ratio of relative rates of abstraction by C D 3
radicals from the methyl and hydroxyl groups in C D 3O H is ki/k% = 5.2. Thus we calculate that 16% of the methane originating in the abstraction from C D 3O H is C D sH .
result m ay be compared w ith a calculated value 12
of 6.0 at 30°, based on published 13 C -H and C -D stretching frequencies fo r C H 3O H and C D 3O H .
The ra tio k7/kx = 0.56 ± 0.05 is a measure of the re la tive rates of abstraction b y C D 3 radicals of hydrogen from the m ethyl group in m ethanol and deuterium from acetone-d6- Th is ra tio would no doubt be even sm aller if lig h t acetone were being compared to m ethanol. T h is means th at in the liq u id phase the rate of abstraction from acetone is greater than th a t from m ethanol, whereas in the gas phase the opposite is tru e . 14
Th e in terpretation of the experim ental measurements as presented here is based on the assumption th a t a ll the reactions producing C D 4 or C D 3H have been in cluded in the mechanism . 15 There is considerable evidence 7 - 9 th a t in the liq u id phase photolysis of acetone the reaction
C D 3 + CD sC O = C D 4 + C D 2C O ( 1 2 )
is of im portance. Th e increase in the C D 4/ C D 3H y ie ld ra tio w ith increasing lig h t in te n s ity constitutes additional evidence fo r the occurrence of th is reaction . 16
In our measurements using the P yre x filte r, however, reaction 1 2 need not be considered in view of the fact th a t the C D 4/ C D 3H yie ld ra tio in F ig . 3 extrapolated to zero in tensity, where th is reaction is certa in ly not im portant, differs from the observed C D 4/ C D 3H ra tio in the P yre x experim ents b y less than 10% . 17 The sm all but real positive in tercept in F ig . 1 m ay be due to the contribution of reaction 1 2 occurring p a rtly homogeneously in the solution and p a rtly as a cage reaction. Correction fo r the excess C D 4 w ould tend to sh ift a ll the experim ental points downward, and thus the in te rcept, w hich was not predicted b y eq. 1 1 , conceivably m ight be elim inated.
Acknowledgm ent.— T h e author is indebted to M r. R . A . M eyer fo r the mass spectroscopic analyses.
(12) L. Melander, “ Isotope Effects on Reaction Rates,” Ronald Press Co., New York, N. Y ., I960, p. 20.
(13) M . Falk and E. Whalley, J . Chem. Phys., 34, 1554 (1961).(14) A F. Trotman-Dickenson, “ Gas Kinetics,” Butterworths Scientific
Publications, London, 1955, pp. 201—202.(15) Isotopic exchange between methanol and acetone-de is not considered
important in view of the very small yields of C D 2H2. Furthermore, photolysis of liquid mixtures of acetone in D2O indicated no deuterium in the methane product.
(16) The dependence of nhe rate of this reaction on intensity implies that the reaction takes place mainly homogeneously in the liquid phase rather than in a “ cage” following the primary dissociation step.
(17) The fact that the results based on the Pyrex filter experiments fall reasonably close to the straight line drawn through the points based on the V ycor filter experiments suggests that the essential difference between these two sets of experiments is in the total over-all intensity entering the reaction cell, rather than in the difference in spectral distribution.
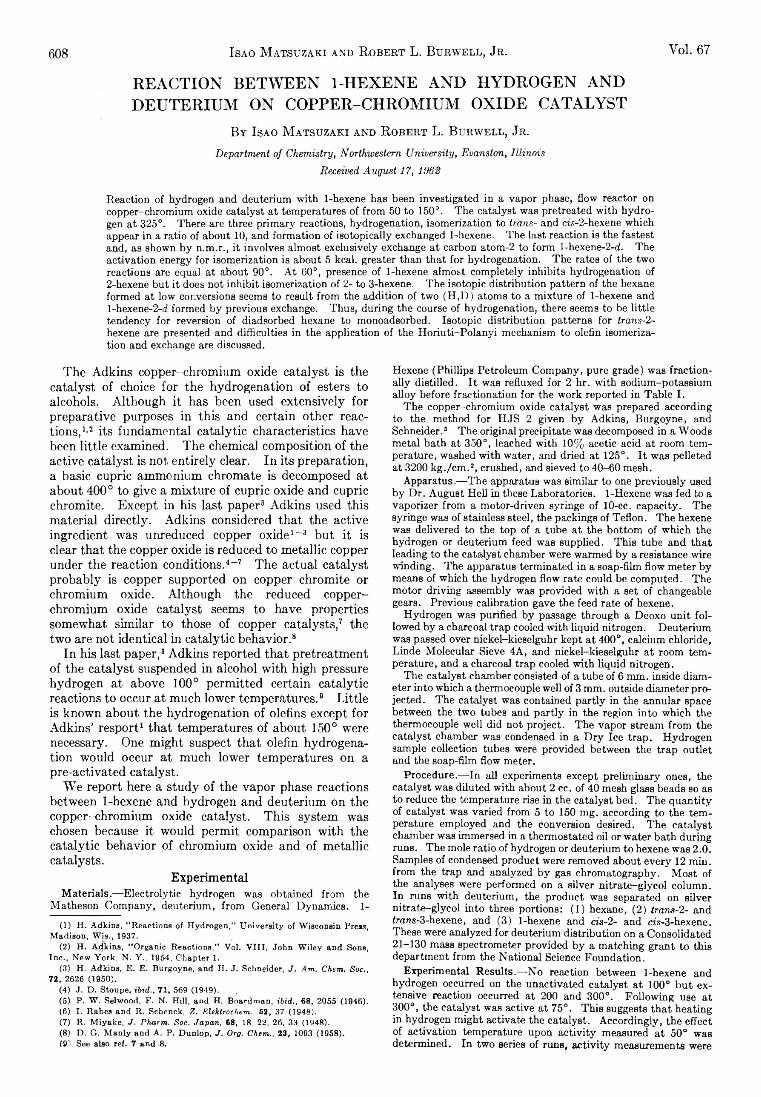
608 IsAO M atsuzaki and R obert L. Burwell, Jr . Yol. 67
REACTION BETWEEN 1-HEXENE AND HYDROGEN AND DEUTERIUM ON COPPER-CHROMIUM OXIDE CATALYST
B y I sa o M a t s u z a k i a n d R o b e r t L . B u r w e l l , Jr .
Department of Chemistry, Northwestern University, Evanston, Illinois Received August 17, 1962
Reaction of hydrogen and deuterium with 1-hexene has been investigated in a vapor phase, flow reactor on copper-chromium oxide catalyst at temperatures of from 50 to 150°. The catalyst was pretreated with hydrogen at 325°. There are three primary reactions, hydrogenation, isomerization to trans- and eis-2-hexene which appear in a ratio of about 10, and formation of isotopieally exchanged 1-hexene. The last reaction is the fastest and, as shown by n.m.r., it involves almost exclusively exchange at carbon atom-2 to form l-hexene-2-d. The activation energy for isomerization is about 5 kcal. greater than that for hydrogenation. The rates of the two reactions are equal at about 90°. At 60°, presence of 1-hexene almost completely inhibits hydrogenation of 2-hexene but it does not inhibit isomerization of 2- to 3-hexene. The isotopic distribution pattern of the hexane formed at low conversions seems to result from the addition of two (H ,D) atoms to a mixture of 1-hexene and l-hexene-2-d formed by previous exchange. Thus, during the course of hydrogenation, there seems to be little tendency for reversion of diadsorbed hexane to monoadsorbed. Isotopic distribution patterns for trans-2- hexene are presented and difficulties in the application of the Horiuti-Polanyi mechanism to olefin isomerization and exchange are discussed.
Th e Adk ins copper-chrom ium oxide cata lyst is the cata lyst of choice fo r the hydrogenation of esters to alcohols. A lthough it has been used extensively for preparative purposes in th is and certain other reactions , 1 ’ 2 its fundam ental ca ta lytic characteristics have been little examined. The chemical com position of the active cata lyst is not e n tire ly clear. In its preparation, a basic cupric am monium chromate is decomposed at about 400° to give a m ixtu re of cupric oxide and cupric chrom ite. Excep t in his last paper3 A dk ins used th is m aterial d ire ctly. Adk ins considered th a t the active ingredient was unreduced copper oxide 1 “ 3 6 but it is clear th a t the copper oxide is reduced to m etallic copper under the reaction conditions . 4 - 7 Th e actual cata lyst probab ly is copper supported on copper chrom ite or chrom ium oxide. A lthough the reduced copper- chrom ium oxide cata lyst seems to have properties somewhat sim ilar to those of copper cata lysts , 7 the tw o are not identical in ca ta lytic behavior. 8
In his last paper, 3 Adk ins reported th a t pretreatm ent of the cata lyst suspended in alcohol w ith high pressure hydrogen at above 1 0 0 ° perm itted certain ca ta lytic reactions to occur at m uch lower tem peratures . 9 L ittle is known about the hydrogenation of olefins except fo r A d k in s’ resport1 th at tem peratures of about 150° were necessary. One m ight suspect th a t olefin hydrogenation would occur a t m uch lower tem peratures on a pre-activated cata lyst.
W e report here a study of the vapor phase reactions between 1 -hexene and hydrogen and deuterium on the copper-chrom ium oxide cata lyst. T h is system was chosen because it would perm it com parison w ith the ca ta lytic behavior of chrom ium oxide and of m etallic catalysts.
Experim entalMaterials.—Electrolytic hydrogen was obtained from the
Matheson Company, deuterium, from General Dynamics. 1 -
(1) H. Adkina, “ Reactions of Hydrogen," University of Wisconsin Press, Madison, Wis., 1937.
(2) H. Adkins, “ Organic Reactions," Yol. VIII, John Wiley and Sons, Inc., New York, N. Y., 1954, Chapter 1.
(3) H. Adkins, E. E. Burgoyne, and H. J. Schneider, J. Am. Chem, Soc,, 72, 2626 (1950).
(4) J. D. Stoupe, ibid., 71, 569 (1949).(5) P. W. Selwood, F. N. Hill, and H. Boardman, ib id ., 68, 2055 (1946).(6) I. Rabes and R. Schenck, Z. Elektrochem.. 62, 37 (1948).(7) R. Miyake, J. Pharm. Soc. Japan, 68, 18, 22, 26, 33 (1948).(8) D. G. Manly and A. P. Dunlop, J. Org. Chem., 23, 1093 (1958).(9) See also ref. 7 and 8.
Hexene (Phillips Petroleum Company, pure grade) was fractionally distilled. It was refluxed for 2 hr. with sodium-potassium alloy before fractionation for the work reported in Table I.
The copper-chromium oxide catalyst was prepared according to the method for HJS 2 given by Adkins, Burgoyne, and Schneider.3 The original precipitate was decomposed in a Woods metal bath at 350°, leached with 10% acetic acid at room temperature, washed with water, and dried at 125°. It was pelleted at 3200 kg./cm .2, crushed, and sieved to 40-60 mesh.
Apparatus.— The apparatus was similar to one previously used by Dr. August Hell in these Laboratories. 1 -Hexene was fed to a vaporizer from a motor-driven syringe of 10-cc. capacity. The syringe was of stainless steel, the packings of Teflon. The hexene was delivered to the top of a tube at the bottom of which the hydrogen or deuterium feed was supplied. This tube and that leading to the catalyst chamber were warmed by a resistance wire winding. The apparatus terminated in a soap-film flow meter by means of which the hydrogen flow rate could be computed. The motor driving assembly was provided with a set of changeable gears. Previous calibration gave the feed rate of hexene.
Hydrogen was purified by passage through a Deoxo unit followed by a charcoal trap cooled with liquid nitrogen. Deuterium was passed over nickel-kieselguhr kept at 400°, calcium chloride, Linde Molecular Sieve 4A, and nickel-kieselguhr at room temperature, and a charcoal trap cooled with liquid nitrogen.
The catalyst chamber consisted of a tube of 6 mm. inside diameter into which a thermocouple well of 3 mm. outside diameter projected. The catalyst was contained partly in the annular space between the two tubes and partly in the region into which the thermocouple well did not project. The vapor stream from the catalyst chamber was condensed in a Dry Ice trap. Hydrogen sample collection tubes were provided between the trap outlet and the soap-film flow meter.
Procedure.— In all experiments except preliminary ones, the catalyst was diluted with about 2 cc. of 40 mesh glass beads so as to reduce the temperature rise in the catalyst bed. The quantity of catalyst was varied from 5 to 150 mg. according to the temperature employed and the conversion desired. The catalyst chamber was immersed in a thermostated oil or water bath during runs. The mole ratio of hydrogen or deuterium to hexene was 2.0. Samples of condensed product were removed about every 1 2 min. from the trap and analyzed by gas chromatography. Most of the analyses were performed on a silver nitrate-glycol column. In runs with deuterium, the product was separated on silver nitrate-glycol into three portions: ( 1 ) hexane, (2 ) trans-2 - and trans-3-hexene, and (3) 1-hexene and cis-2- and m-3-hexene. These were analyzed for deuterium distribution on a Consolidated 21-130 mass spectrometer provided by a matching grant to this department from the National Science Foundation.
Experimental Results.— No reaction between 1-hexene and hydrogen occurred on the unactivated catalyst at 1 0 0 ° but extensive reaction occurred at 200 and 300°. Following use at 300°, the catalyst was active at 75°. This suggests that heating in hydrogen might activate the catalyst. Accordingly, the effect of activation temperature upon activity measured at 50° was determined. In two series of runs, activity measurements were
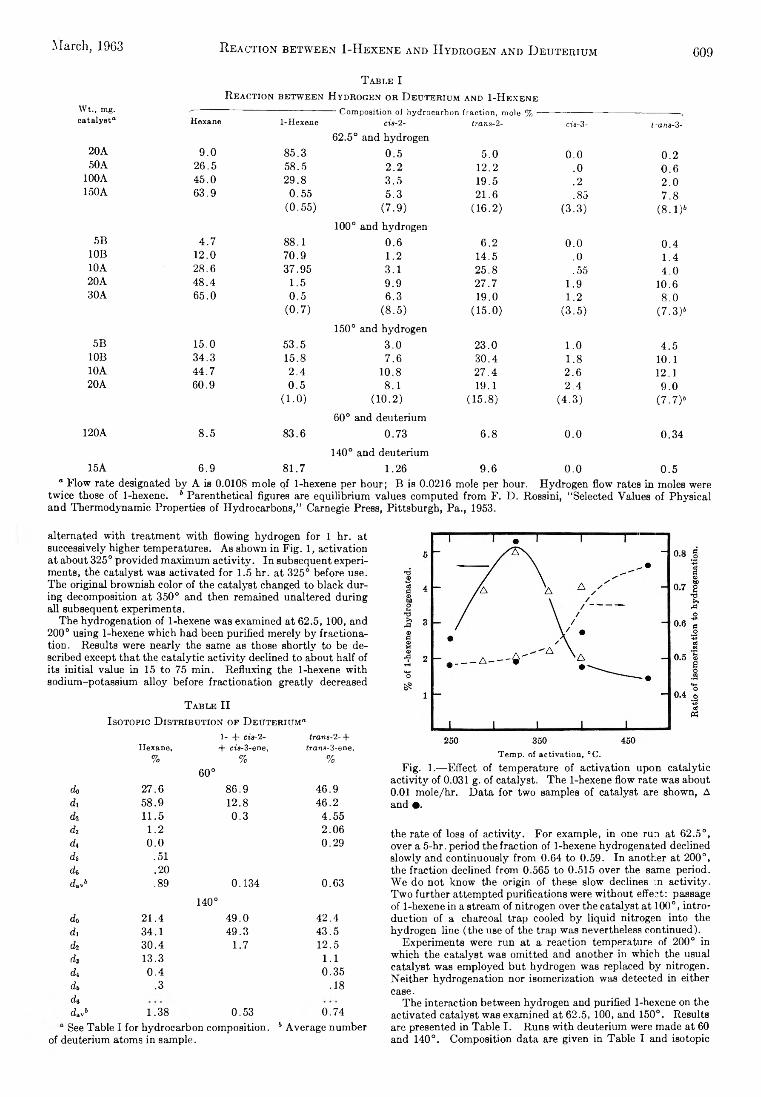
009March, 1963 R eaction between 1-Hexene and Hydrogen and D euterium
T a b l e IR e a c t io n b e t w e e n H yd ro g en o r D e u t e r iu m an d 1 -H e x e n e
Wt., mg. Composition of hydrocarbon fraction, mole % —catalyst® Hexane 1-Hexene cis- 2- trans-2- cis- 3- trans- 3-
62.5° and hydrogen20A 9.0 85.3 0.5 5.0 0 .0 0 . 250A 26.5 58.5 2 . 2 1 2 . 2 .0 0 . 6
100 A 45.0 29.8 3.5 19.5 . 2 2 . 0150 A 63.9 0.55 5.3 2 1 . 6 .85 7.8
(0.55) (7 .9) (16.2) (3 .3) (8 . 1)0
1 0 0 ° and hydrogen5B 4.7 8 8 . 1 0 .6 6 . 2 0 . 0 0.4
10B 1 2 . 0 70.9 1 . 2 14.5 .0 1.410A 28.6 37.95 3.1 25.8 .55 4.020A 48.4 1.5 9.9 27.7 1.9 1 0 . 630A 65.0 0.5 6.3 19.0 1 . 2 8 .0
(0 .7) (8 .5 ) (15.0) (3 .5) (7 .3F150° and hydrogen
5B 15.0 53.5 3.0 23.0 1 . 0 4.510B 34.3 15.8 7.6 30.4 1 . 8 1 0 . 110A 44.7 2.4 1 0 . 8 27.4 2 . 6 1 2 . 120A 60.9 0.5 8 . 1 19.1 2.4 9.0
( 1 .0 ) ( 1 0 .2 ) (15.8) (4 .3) (7.7)o60° and deuterium
120A 8.5 83.6 0.73 6 . 8 0 . 0 0.34140° and deuterium
15A 6.9 81.7 1.26 9.6 0 . 0 0.5“ Flow rate designated by A is 0.0108 mole qf 1-hexene per hour; B is 0.0216 mole per hour. Hydrogen flow rates in moles were
twice those of 1-hexene. b Parenthetical figures are equilibrium values computed from F. D. Rossini, “ Selected Values of Physical and Thermodynamic Properties of Hydrocarbons,” Carnegie Press, Pittsburgh, Pa., 1953.
alternated with treatment with flowing hydrogen for 1 hr. at successively higher temperatures. As shown in Fig. 1, activation at about 325° provided maximum activity. In subsequent experiments, the catalyst was activated for 1.5 hr. at 325° before use. The original brownish color of the catalyst changed to black during decomposition at 350° and then remained unaltered during all subsequent experiments.
The hydrogenation of 1-hexene was examined at 62.5, 100, and 2 0 0 ° using 1 -hexene which had been purified merely by fractionation. Results were nearly the same as those shortly to be described except that the catalytic activity declined to about half of its initial value in 15 to 75 min. Refluxing the 1-hexene with sodium-potassium alloy before fractionation greatly decreased
T a b l e III sotopic D is t r ib u t io n o f D e u t e r iu m “
1- + cis- 2- trans-2- +Hexane, 4- cis-3-ene, trans-S-ene,
% % %60°
d. 27.6 86.9 46.9di 58.9 1 2 . 8 46.2d% 11.5 0.3 4.55d, 1 . 2 2.06d4 0 . 0 0.29d5 .51do .2 0lì hu-av .89 0.134 0.63
140°do 21.4 49.0 42.4d, 34.1 49.3 43.5ck 30.4 1.7 12.5d, 13.3 1 . 1d4 0.4 0.35d4 .3 .18dodavO 1.38 0.53 0.74
See Table I for hydrocarbon composition. b Average numberof deuterium atoms in sample.
Temp, of activation, °C.Fig. 1.— Effect of temperature of activation upon catalytic
activity of 0.031 g. of catalyst. The 1-hexene flow rate was about 0.01 mole/hr. Data for two samples of catalyst are shown, A and •.
the rate of loss of activity. For example, in one run at 62.5°, over a 5-hr. period the fraction of 1-hexene hydrogenated declined slowly and continuously from 0.64 to 0.59. In another at 200°, the fraction declined from 0.565 to 0.515 over the same period. We do not know the origin of these slow declines m activity. Two further attempted purifications were without effect: passage of 1 -hexene in a stream of nitrogen over the catalyst at 10 0 °, introduction of a charcoal trap cooled by liquid nitrogen into the hydrogen line (the use of the trap was nevertheless continued).
Experiments were run at a reaction temperature of 200° in which the catalyst was omitted and another in which the usual catalyst was employed but hydrogen was replaced by nitrogen. Neither hydrogenation nor isomerization was detected in either case.
The interaction between hydrogen and purified 1-hexene on the activated catalyst was examined at 62.5, 100, and 150°. Results are presented in Table I. Runs with deuterium were made at 60 and 140°. Composition data are given in Table I and isotopic
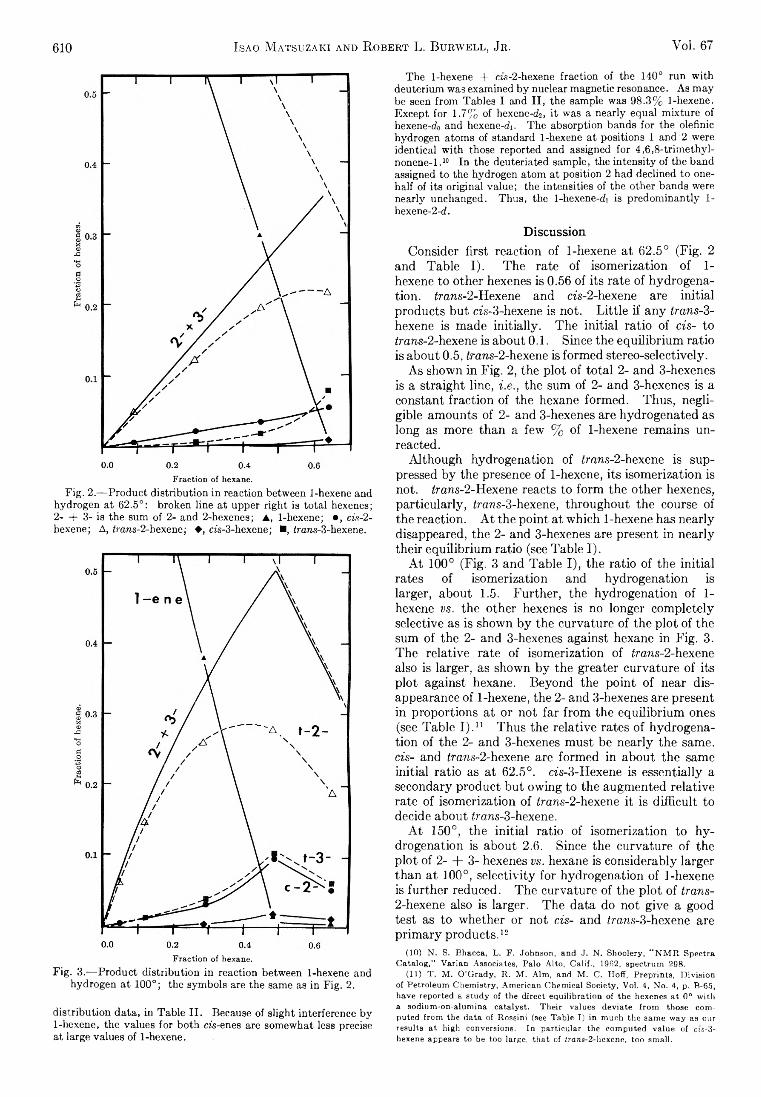
610 Isao M atsuzaki and R obert L. Burwell, Jr . Vol. 67
Fraction of hexane.Fig. 2.— Product distribution in reaction between 1-hexene and
hydrogen at 62.5°: broken line at upper right is total hexenes; 2- + 3- is the sum of 2- and 2-hexenes; ▲, 1-hexene; •, ci's-2- hexene; A, fowis-2-hexene; ♦, ez’.s-3-hexene; ■, Zraras-3-hexene.
Fraction of hexane.Fig. 3.— Product distribution in reaction between 1-hexene and
hydrogen at 100°; the symbols are the same as in Fig. 2.
distribution data, in Table II. Because of slight interference by 1 -hexene, the values for both cis-enes are somewhat less precise at large values of 1 -hexene.
The 1-hexene + eis-2-hexene fraction of the 140° run with deuterium was examined by nuclear magnetic resonance. As may be seen from Tables I and II, the sample was 98.3% 1 -hexene. Except for 1.7% of hexene-d2, it was a nearly equal mixture of hexene-do and hexene-di. The absorption bands for the olefinic hydrogen atoms of standard 1 -hexene at positions 1 and '2 were identical with those reported and assigned for 4,6,8-trimethyl- nonene-1. 10 In the deuteriated sample, the intensity of the band assigned to the hydrogen atom at position 2 had declined to one- half of its original value; the intensities of the other bands were nearly unchanged. Thus, the 1 -hexene-di is predominantly 1- hexene-2 -d.
DiscussionConsider firs t reaction of 1-hexene a t 62.5° (F ig . 2
and Table I ) . The rate of isom erization of 1- hexene to other hexenes is 0.56 of its rate of hydrogenation . trans-2-Hexene and cfs-2-hexene are in itia l products but cis-3-hexene is not. L ittle if any trans-3- hexene is made in itia lly . Th e in itia l ra tio of cis- to irans-2-hexene is about 0.1. Since the equ ilibrium ra tio is about 0.5, ¿mns-2-hexene is form ed stereo-selectively.
A s shown in F ig . 2, the p lo t of to ta l 2- and 3-hexenes is a stra ight line, i.e., the sum of 2- and 3-hexenes is a constant fraction of the hexane form ed. Thus, negligible amounts of 2- and 3-hexenes are hydrogenated as long as more than a few % of 1 -hexene rem ains unreacted.
A lthough hydrogenation of ¿rans-2-hexene is suppressed b y the presence of 1 -hexene, its isom erization is not. trans-2-Hexene reacts to form the other hexenes, p a rticu la rly, trans-3-hexene, throughout the course of the reaction. A t the po in t at w hich 1-hexene has nearly disappeared, the 2- and 3-hexenes are present in nearly th e ir equ ilibrium ra tio (see Table I ) .
A t 100° (F ig . 3 and Tab le I ) , the ra tio of the in itia l rates of isom erization and hydrogenation is larger, about 1.5. Fu rth er, the hydrogenation of 1- hexene vs. the other hexenes is no longer com pletely selective as is shown b y the curvature of the p lo t of the sum of the 2- and 3-hexenes against hexane in F ig . 3. The re la tive rate of isom erization of frans-2-hexene also is larger, as shown b y the greater curvature of its p lo t against hexane. Beyond the po in t of near disappearance of 1-hexene, the 2- and 3-hexenes are present in proportions at or not fa r from the equ ilibrium ones (see Table I ) . 1 1 Thus the re la tive rates of hydrogenation of the 2- and 3-hexenes m ust be nearly the same. cis- and trans-2 -hexene are form ed in about the same in itia l ra tio as at 62.5°. cfs-3-Hexene is essentially a secondary product but ow ing to the augmented re la tive rate of isom erization of trans-2 -hexene it is d ifficu lt to decide about ¿rans-3-hexene.
A t 150°, the in itia l ra tio of isom erization to h y drogenation is about 2.6. Since the curvature of the p lo t of 2- + 3- hexenes vs. hexane is considerably larger than a t 1 0 0 °, se lectiv ity for hydrogenation of 1 -hexene is fu rther reduced. Th e curvature of the p lo t of trans-2-hexene also is larger. The data do not give a good test as to whether or not cis- and ¿rans-3-hexene are p rim a ry products . 12
(10) N. S. Bhacca, L. F. Johnson, and J. N. Shoolery, “ NM E Spectra Catalog,” Yarian Associates, Palo Alto, Calif., 1962, spectrum 298.
(11) T. M. O’Grady, R. M. Aim, and M. C. Hoff, Preprints, Division of Petroleum Chemistry, American Chemical Society, Vol, 4, No. 4, p. B-65, have reported a study of the direct equilibration of the hexenes at 0° with a sodium-on-alumina catalyst. Their values deviate from those computed from the data of Rossini (see Table I) in much the same way as our results at high conversions. In particular the computed value of cis-3- hexene appears to be too large, that of trans-2-hcxene, too small.
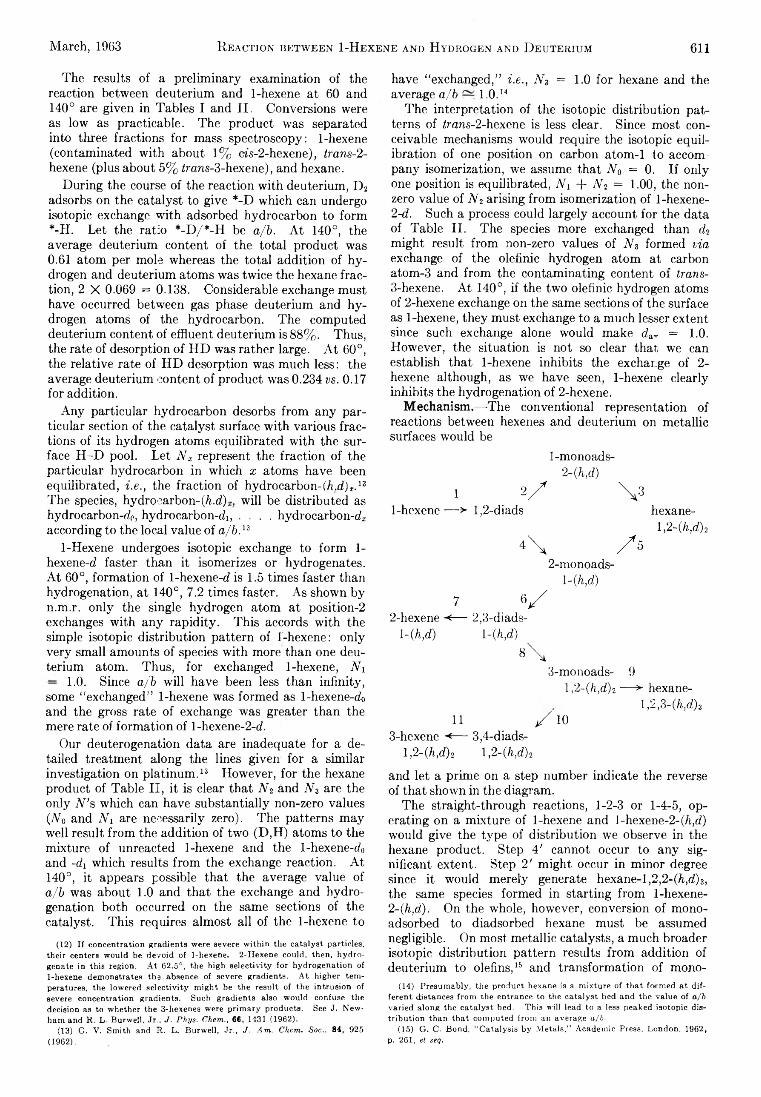
March, 1963 R eaction between 1-Hexene and Hydrogen and D euterium 611
The results of a p re lim inary exam ination of the reaction between deuterium and 1 -hexene a t 60 and 140° are given in Tables I and I I . Conversions were as low as practicable. The product was separated into three fractions fo r mass spectroscopy: 1 -hexene (contam inated w ith about 1 % ci.s-2 -hexene), trans-2 - hexene (plus about 5 % Zrans-3-hexene), and hexane.
D u rin g the course of the reaction w ith deuterium , D 2
adsorbs on the cata lyst to give * -D w hich can undergo isotopic exchange w ith adsorbed hydrocarbon to form * -H . Le t the ra tio * -D /* -H be a/b. A t 140°, the average deuterium content of the to ta l product was 0.61 atom per mole whereas the to ta l add ition of h y drogen and deuterium atoms was tw ice the hexane fraction , 2 X 0.069 = 0.138. Considerable exchange m ust have occurred between gas phase deuterium and h y drogen atoms of the hydrocarbon. The computed deuterium content of effluent deuterium is 8 8 % . Thus, the rate of desorption o f H D was rather large. A t 60°, the re lative rate of H D desorption was m uch less: the average deuterium content of product was 0.234 vs. 0.17 for addition.
A n y p articu la r hydrocarbon desorbs from an y particu la r section of the cata lyst surface w ith various fractions of its hydrogen atoms equilibrated w ith the surface H -D pool. Le t N x represent the fraction of the particu la r hydrocarbon in w hich x atoms have been equilibrated, i.e., the fraction of hydrocarbon- (h.d) z.13 The species, hyd rocarb on -(A d ) w ill be d istributed as hydrocarbon-do, hydrocarbon-d i, . . . . hydrocarbon-d* according to the local value o f a/b.13
1 -Hexene undergoes isotopic exchange to form 1 - hexene-d faster than it isomerizes or hydrogenates. A t 60°, form ation of 1 -hexene-d is 1.5 times faster than hydrogenation, a t 140°, 7.2 tim es faster. A s shown b yn .m .r. o n ly the single hydrogen atom at position - 2
exchanges w ith an y ra p id ity . T h is accords w ith the simple isotopic d istribu tion pattern of 1 -hexene: o n ly ve ry sm all am ounts of species w ith more than one deuterium atom . Thus, fo r exchanged 1-hexene, N\ — 1.0. Since a/b w ill have been less than in fin ity , some “ exchanged” 1 -hexene was form ed as l-hexene-d 0
and the gross rate of exchange was greater than the mere rate of form ation of l-h exene-2 -d .
O ur deuterogenation data are inadequate fo r a detailed treatm ent along the lines given fo r a sim ilar investigation on p la tinum . 13 How ever, fo r the hexane product of Tab le I I , it is clear th at iV 2 and N3 are the o n ly N ’s w hich can have substantia lly non-zero values (No and Ni are necessarily zero). The patterns m ay w ell result from the addition of tw o (D ,H ) atoms to the m ixture of unreacted 1 -hexene and the l-hexene-d 0
and -d i which results from the exchange reaction. A t 140°, it appears possible th at the average value of a/b was about 1 . 0 and th a t the exchange and hydro genation both occurred on the same sections of the cata lyst. T h is requires alm ost a ll of the 1-hexene to
(12) If concentration gradients were severe within the catalyst particles, their centers would be devoid of 1-hexene. 2-Hexene could, then, hydrogenate in this region. At 62.5°, the high selectivity for hydrogenation of 1-hexene demonstrates the absence of severe gradients. At higher temperatures, the lowered selectivity might be the result of the intrusion of severe concentration gradients. Such gradients also would confuse the decision as to whether the 3-hexenes were primary products. See J. Newham and R. L. Burwell, Jr., J. Phys. Chem., 66, 1431 (1962).
(13) G. V. Smith and R . L. Burwell, Jr., J . Am. Chem. S o c . , 84, 925 (1962).
have “ exchanged,” i.e., N3 = 1.0 fo r hexane and the average a/b 1 .0 . 14
The in terpretation of the isotopic d istribu tion patterns of trans-2-hexene is less clear. Since m ost conceivable mechanisms would require the isotopic equilib ra tion of one position on carbon atom - 1 to accompany isom erization, we assume th at N0 = 0. I f o n ly one position is equilibrated, Ni + M 2 = 1 .0 0 , the nonzero value of Ni arising from isom erization of 1 -hexene-2- d. Such a process could la rge ly account fo r the data of Table I I . The species more exchanged than d2
m ight result from non-zero values of N 3 form ed via exchange of the olefinic hydrogen atom at carbon atom -3 and from the contam inating content of trans-3- hexene. A t 140°, if the tw o olefinic hydrogen atoms of 2 -hexene exchange on the same sections of the surface as 1 -hexene, th ey m ust exchange to a m uch lesser extent since such exchange alone would make da~ = 1 .0 . H ow ever, the situation is not so clear th a t we can establish th a t 1 -hexene inh ib its the exchange of 2 - hexene although, as we have seen, 1 -hexene clearly inh ib its the hydrogenation of 2 -hexene.
M echanism .— Th e conventional representation of reactions between hexenes and deuterium on m etallic surfaces would be
1 - monoads-2 - ( M )
I 2/ V1 - hexene ■— -> 1 ,2 -diads hexane-
1 , 2 -(h,d)i
4\ A2 - monoads-
1 - ( M )
7 § /2 - hexene <— 2,3-diads-
l-(h,d) 1 -(h,d)
8\3- monoads- 9
1 ,2 ~(h,d)i — > hexane-1 , 2 , 3 - ( M ) 3
I I / 1 0
3- hexene <— ■ 3,4-diads-1 , 2 -(h,d)i l,2-(h,d)i
and le t a prim e on a step num ber indicate the reverse of th at shown in the diagram .
The stra ight-through reactions, 1-2-3 or 1-4-5, operating on a m ixture of 1 -hexene and 1 -hexene-2 -(A ,d ) w ould give the type of d istribu tion we observe in the hexane product. Step 4 ' cannot occur to any sign ificant extent. Step 2' m ight occur in m inor degree since it would m erely generate hexane-1 ,2 ,2-(h,d)3, the same species form ed in starting from 1 -hexene-2-(h,d). On the whole, however, conversion of m ono- adsorbed to diadsorbed hexane m ust be assumed negligible. On most m etallic catalysts, a m uch broader isotopic d istribu tion pattern results from addition of deuterium to olefins , 16 and transform ation of m ono-
(14) Presumably, the product hexane is a mixture of that formed at different distances from the entrance to the catalyst bed and the value of a/b varied along the catalyst bed. This will lead to a less peaked isotopic distribution than that computed from an average a/b.
(15) G. C. Bond, “ Catalysis by Metals,” Academic Press, London, 1962, p. 261, et seq.
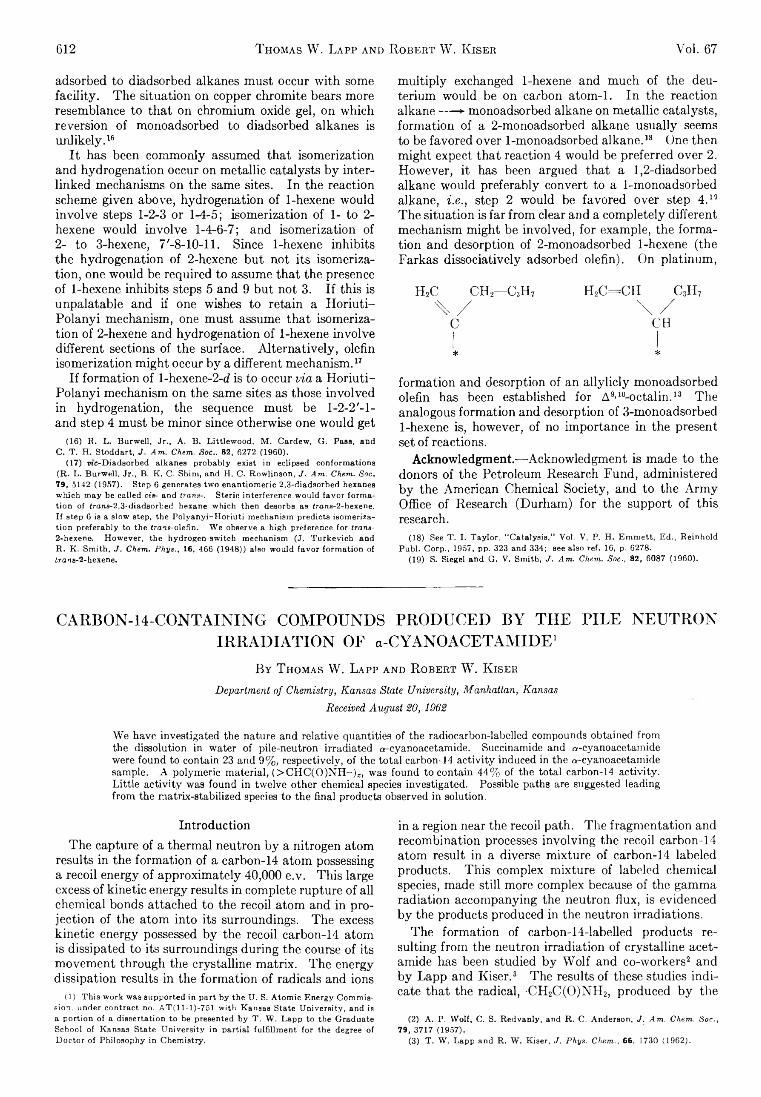
612 T homas W . Lapp and R obert W . Kiser Vol. 67
adsorbed to diadsorbed alkanes m ust occur w ith some fa c ility . Th e situation on copper chrom ite bears more resemblance to th a t on chrom ium oxide gel, on which reversion of monoadsorbed to diadsorbed alkanes is u n lik e ly . 16
I t has been com m only assumed th a t isom erization and hydrogenation occur on m etallic catalysts b y in te rlinked mechanisms on the same sites. In the reaction scheme given above, hydrogenation of 1 -hexene would in vo lve steps 1-2-3 or 1-4-5; isom erization of 1- to 2- hexene would invo lve 1-4-6-7; and isom erization of2 - to 3-hexene, 7 '-8 -1 0 -ll. Since 1 -hexene inh ib its the hydrogenation of 2 -hexene but not its isom erization , one would be required to assume th a t the presence of 1 -hexene in h ib its steps 5 and 9 but not 3. I f th is is unpalatable and if one wishes to re ta in a H o r iu t i- P o la n yi mechanism, one m ust assume th a t isom erization of 2 -hexene and hydrogenation of 1 -hexene invo lve different sections of the surface. A lte rn a tive ly , olefin isom erization m ight occur b y a different mechanism . 17
I f form ation of l-hexene-2 -d is to occur via a H o r iu t i- P o la n yi mechanism on the same sites as those involved in hydrogenation, the sequence m ust be l - 2 - 2 ' - l - and step 4 m ust be m inor since otherwise one w ould get
(16) R. L. Burwell, Jr., A. B. Littlewood, M. Cardew, G. Pass, and C. T. H. Stoddart, J. Am. Chem. Soc., 82, 6272 (1960).
(17) wc-Diadsorbed alkanes probably exist in eclipsed conformations (R. L. Burwell, Jr., B. K. C. Shim, and H. C. Rowlinson, J. Am. Chem. Soc. 79, 5142 (1957). Step 6 generates two enantiomeric 2,3-diadsorbed hexanes which may be called cis- and trans-. Steric interference would favor formation of £rons-2,3-diadsorbed hexane which then desorbs as trans-2-hexene. If step 6 is a slow step, the Polyanyi-Horiuti mechanism predicts isomerization preferably to the irons-olefin. We observe a high preference for trans- 2-hexene. However, the hydrogen-switch mechanism (J. Turkevich and R. K. Smith, J. Chem. Phys., 16, 466 (1948)) also would favor formation of ¿rans-2-hexene.
m u ltip ly exchanged 1 -hexene and m uch of the deuterium would be on carbon atom -1. In the reactionalkane------ *■ monoadsorbed alkane on m etallic catalysts,form ation of a 2 -monoadsorbed alkane usua lly seems to be favored over 1-monoadsorbed alkane . 18 One then m ight expect th a t reaction 4 would be preferred over 2. H ow ever, it has been argued th a t a 1,2-diadsorbed alkane w ould preferably convert to a 1 -m onoadsorbed alkane, i.e., step 2 would be favored over step 4. 19
Th e situation is fa r from clear and a com pletely d ifferent mechanism m ight be involved, fo r exam ple, the form ation and desorption of 2 -monoadsorbed 1 -hexene (the Parkas d issociatively adsorbed o lefin). On platinum ,
H 2C c h 2— c 3h 7 h *c = c h c 3h 7
\ / \ /C C H
form ation and desorption of an a lly lic ly monoadsorbed olefin has been established fo r A 9*10-o cta lin . 13 The analogous form ation and desorption of 3-monoadsorbed 1 -hexene is, however, of no im portance in the present set of reactions.
Acknowledgm ent.— Acknowledgm ent is made to the donors of the Petroleum Research Fund, adm inistered b y the Am erican Chem ical Society, and to the A rm y Office of Research (D urham ) fo r the support of th is research.
(18) See T. I. Taylor, “ Catalysis,” Vol. V, P. H. Emmett, Ed., Reinhold Publ. Corp., 1957, pp. 323 and 334; see also ref. 16, p. 6278.
(19) S. Siegel and G. V. Smith, J. Am. Chem. Soc., 82, 6087 (1960).
CARBON-14-CONTAINING COMPOUNDS PRODUCED BY THE PILE NEUTRONIRRADIATION OF a-CYANOACETAMIDE1
B y T h o m as W . L a p p a n d R o b e r t W . K ise r
Department of Chemistry, Kansas Stale University, Manhattan, Kansas Received August 20, 1962
We have investigated the nature and relative quantities of the radiocarbon-labelled compounds obtained from the dissolution in water of pile-neutron irradiated a-cyanoacetamide. Succinamide and a-cyanoacetamide were found to contain 23 and 9% , respectively, of the total carbon-14 activity induced in the a-cyanoacetamide sample. A polymeric material, (> C H C (0 )N H -)x, was found to contain 44% of the total carbon-14 activity.Little activity was found in twelve other chemical species investigated. Possible paths are suggested leading from the matrix-stabilized species to the final products observed in solution.
In troduction
Th e capture of a therm al neutron b y a nitrogen atom results in the form ation of a carbon-14 atom possessing a recoil energy o f approxim ate ly 40,000 e.v. T h is large excess of k inetic energy results in complete rupture of a ll chemical bonds attached to the recoil atom and in projection of the atom in to its surroundings. The excess k inetic energy possessed b y the recoil carbon-14 atom is dissipated to its surroundings during the course of its m ovem ent through the crysta lline m atrix. Th e energy dissipation results in the form ation of radicals and ions
(1) This work was supported in part by the U. S. Atomic Energy Commission, under contract no. AT(11-1)-751 with Kansas State University, and is a portion of a dissertation to be presented by T. W. Lapp to the Graduate School of Kansas State University in partial fulfillment for the degree of Doctor of Philosophy in Chemistry.
in a region near the recoil path. Th e fragm entation and recom bination processes in vo lv in g the recoil carbon-14 atom result in a diverse m ixture of carbon-14 labeled products. T h is com plex m ixture of labeled chemical species, made s till more com plex because of the gamma radiation accom panying the neutron flu x, is evidenced b y the products produced in the neutron irradiations.
Th e form ation of carbon-14-labelled products resu lting from the neutron irrad ia tion of crysta lline acetamide has been studied b y W o lf and co-w orkers2 and b y Lapp and K ise r . 3 The results of these studies in d icate th a t the radical, •CH2C (0 )N H 2, produced b y the
(2) A. P. Wolf, C. S. Redvanly, and R. C. Anderson, J. Am. Chem. Soc., 79, 3717 (1957).
(3) T. W. Lapp and R. W. Kiser, J. Phys. Chem., 66, 1730 (1962).
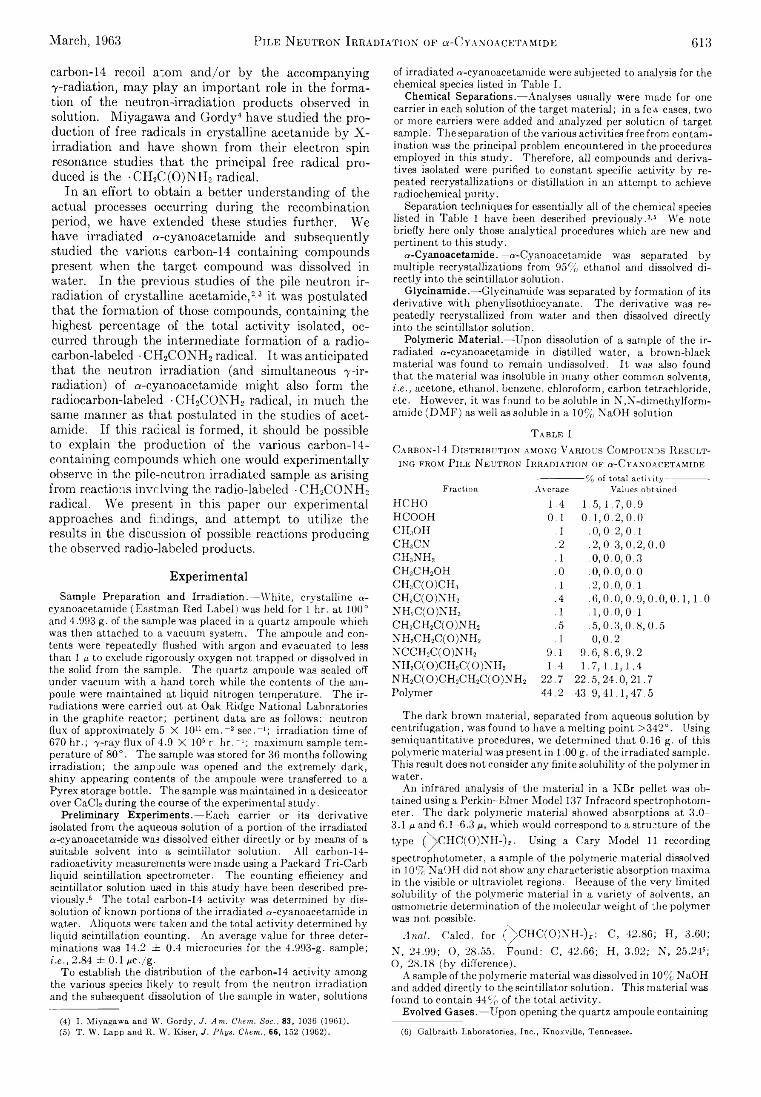
March, 1963 Pile Neutron Irradiation of «-C yano acetamide 613
carbon-14 recoil atom and/or b y the accom panying y-rad ia tion , m ay p la y an im portant role in the form ation of the neutron -irrad iation products observed in solution. M iyagaw a and G o rd y 4 have studied the production of free radicals in crysta lline acetamide b y X - irrad ia tion and have shown from th e ir electron spin resonance studies th a t the principa l free radical produced is the •CH2C (0 )N H 2 radical.
In an effort to obtain a better understanding of the actual processes occurring during the recom bination period, we have extended these studies further. W e have irradiated a-cyanoacetam ide and subsequently studied the various carbon-14 containing compounds present when the target compound was dissolved in water. In the previous studies of the pile neutron ir radiation of crysta lline acetamide , 2' 3 it was postulated that the form ation of those compounds, containing the highest percentage of the to ta l a c tiv ity isolated, occurred through the interm ediate form ation of a radiocarbon-labeled • C H 2C O N H 2 radical. I t was anticipated th at the neutron irrad ia tion (and simultaneous y - ir - radiation) of a-cyanoacetam ide m ight also form the radiocarbon-labeled • C H 2C O N H 2 radical, in much the same manner as th a t postulated in the studies of acetamide. I f th is radical is form ed, it should be possible to explain the production of the various carbon-14- containing compounds w hich one w ould experim entally observe in the p ile -neutron irradiated sample as arising from reactions in vo lv in g the radio-labeled • C H 2C O N H 2
radical. W e present in th is paper our experim ental approaches and findings, and attem pt to u tilize the results in the discussion of possible reactions producing the observed radio-labeled products.
Experim ental
Sample Preparation and Irradiation.—White, crystalline a- cyanoaeetamide (Eastman Red Label) was held for 1 hr. at 100° and 4.993 g. of the sample was placed in a quartz ampoule which was then attached to a vacuum system. The ampoule and contents were repeatedly flushed with argon and evacuated to less than 1 n to exclude rigorously oxygen not trapped or dissolved in the solid from the sample. The quartz ampoule was sealed off under vacuum with a hand torch while the contents of the ampoule were maintained at liquid nitrogen temperature. The irradiations were carried out at Oak Ridge National Laboratories in the graphite reactor; pertinent data are as follows: neutron flux of approximately 5 X 1011 cm . -2 sec.-1; irradiation time of 670 hr.; -y-ray flux of 4.9 X 10⁶ r. hr.-1; maximum sample temperature of 80°. The sample was stored for 36 months following irradiation; the ampoule was opened and the extremely dark, shiny appearing contents of the ampoule were transferred to a Pyrex storage bottle. The sample was maintained in a desiccator over CaCl2 during the course of the experimental study.
Preliminary Experiments.— Each carrier or its derivative isolated from the aqueous solution of a portion of the irradiated a-eyanoacetamide was dissolved either directly or by means of a suitable solvent into a scintillator solution. All carbon-14- radioactivity measurements were made using a Packard Tri-Carb liquid scintillation spectrometer. The counting efficiency and scintillator solution used in this study have been described previously.6 The total carbon-14 activity was determined by dissolution of known portions of the irradiated a-cyanoacetamide in water. Aliquots were taken and the total activity determined by liquid scintillation counting. An average value for three determinations was 14.2 ± 0.4 microcuries for the 4.993-g. sample; i.e., 2.84 ± 0.1 juc./g.
To establish the distribution of the carbon-14 activity among the various species likely to result from the neutron irradiation and the subsequent dissolution of the sample in water, solutions
(4) I. Miyagawa and W. Gordy, J. Am. Chem. >Soc., 83, 1036 (1961).(5) T. W. Lapp and R. W. Kiser, J. Phys. Chem., 66, 152 (1962).
of irradiated a-cyanoacetamide were subjected to analysis for the chemical species listed in Table I.
Chemical Separations.— Analyses usually were made for one carrier in each solution of the target material; in a few cases, two or more carriers were added and analyzed per solution of target sample. The separation of the various activities free from contamination was the principal problem encountered in the procedures employed in this study. Therefore, all compounds and derivatives isolated were purified to constant specific activity by repeated recrystallizations or distillation in an attempt to achieve radiochemical purity.
Separation techniques for essentially all of the chemical species listed in Table 1 have been described previously.3'5 We note briefly here only those analytical procedures which are new and pertinent to this study.
a-Cyanoacetamide.— a-Cyanoacetamide was separated by multiple recrystallizations from 95% ethanol and dissolved directly into the scintillator solution.
Glycinamide.— Glycinamide was separated by formation of its derivative with phenylisothiocyanate. The derivative was repeatedly recrystallized from water and then dissolved directly into the scintillator solution.
Polymeric Material.— Upon dissolution of a sample of the irradiated a-cyanoacetamide in distilled water, a brown-black material was found to remain undissolved. It was also found that the material was insoluble in many other common solvents, i.e., acetone, ethanol, benzene, chloroform, carbon tetrachloride, etc. However, it was found to be soluble in N,N-dimethylform- amide (D M F) as well as soluble in a 10% NaOH solution
T a b l e IC a r b o n -14 D is t r ib u t io n a m o n g V a r io u s C om pounds R e su l t
in g fro m P il e N e u tr o n I r r a d ia t io n o f a-CrANOACETAMiDE '----------------% of total activity----------------•
Fraction Average Values obtainedHCHO 1 . 4 1 .5 ,1 .7 ,0 .9HCOOH 0 . 1 0 .1 ,0 .2 ,0 .0CH3OH . 1 .0 ,0 .2 ,0 .1CHsCN .2 .2 ,0 .3 ,0 .2 ,0 .0CH3NH2 . 1 .0 ,0 .0 ,0 .3c h 3c h 2o h .0 .0 ,0 .0 ,0 .0CH3C (0)C H 3 . 1 .2 ,0 .0 ,0 .1CH3C (0)N H 2 .4 .6 ,0 .0 ,0 .9 ,0 .0 ,0 .1 ,1 .0NH2C(0)N H 2 . 1 .1 ,0 .0 ,0 .1CH3CH2C (0)N H 2 .5 .5 ,0 .3 ,0 .8 ,0 .5NH2CH2C (0)N H 2 . 1 .0 ,0 .2NCCH2C (0)N H 2 9 . 1 9 .6 ,8 .6 ,9 .2NH 2C(0)CH 2C (0)N H 2 1 . 4 1 .7 ,1 .1 ,1 .4NH 2C (0)C H 2CH2C (0)N H 2 2 2 . 7 22 .5 ,24.0 ,21.7Polymer 4 4 . 2 43 .9 ,41.1 ,47.5
The dark brown material, separated from aqueous solution by centrifugation, was found to have a melting point >342°. Using semiquantitative procedures, we determined that 0.16 g. of this polymeric material was present in 1 .0 0 g. of the irradiated sample. This result does not consider any finite solubility of the polymer in water.
An infrared analysis of the material in a KBr pellet was obtained using a Perkin-Elmer Model 137 Infracord spectrophotometer. The dark polymeric material showed absorptions at 3.0- 3.1 m and 6 .1-6.3 which would correspond to a structure of the type (^/CH C(0)N H -% . Using a Cary Model 11 recordingspectrophotometer, a sample of the polymeric material dissolved in 10% NaOH did not show any characteristic absorption maxima in the visible or ultraviolet regions. Because of the very limited solubility of the polymeric material in a variety of solvents, an osmometric determination of the molecular weight of the polymer was not possible.
Anal. Calcd. for (^>CHC(0)NH-)^: C, 42.86; H, 3.60;N, 24.99; O, 28.55. Found: C, 42.66; H, 3.92; N, 25.246;O, 28.18 (by difference).
A sample of the polymeric material was dissolved in 10% NaOH and added directly to the scintillator solution. This material was found to contain 44% of the total activity.
Evolved Gases.— Upon opening the quartz ampoule containing
(6) Galbraith Laboratories, Inc., Knoxville, Tennessee.
614 T h o m a s W . L a p p a n d R o b e k t W . K i s e r Vol. 67
the target m a t e r i a l , t h e gaseous products, produced by the pile- neutron irradiation, were collected and analyzed by mass spectrométrie techniques. The principal products were found to be hydrogen and methane. A quantitative determination of the relative amounts of the gases produced was not obtained, nor was the carbon-14 radioactivity present in these gases determined.
Results of Analyses.—The results obtained by the procedures described above are given in Table I. In all cases the data reported are based on specific activity measurements and the percentage activity is based on the total activity of aliquots of aqueous solutions of the original irradiated a-cyanoacetamide sample.
The total activity isolated in this study was 80.5% of the total carbon-14 activity induced in the a-cyanoacetamide sample by neutron irradiation. Nearly 95% of the total activity isolated in this study occurred in three compounds: a-cyanoacetamide, succinamide, and the polymeric material.
DiscussionThe results obtained from the investigation of the
system presented in this paper have afforded an interesting insight into possible solid matrix-stabilized species produced during the neutron irradiation of crystalline nitrogen-containing compounds.
By means of the procedures utilized in this investigation, we have considered only the final chemical form of the various species incorporating the recoil carbon-14 atom. It has been suggested previously7 that many chemical species containing the recoil carbon-14 atom are present within the solid matrix following irradiation. During the subsequent dissolution in water of the crystalline irradiated material, these matrix-stabilized species may undergo decomposition, rearrangement, or other types of reactions. Since only the final form assumed by the recoil carbon-14 atom is actually determined, the chemical species, stabilized within the crystalline matrix, can be estimated only by a critical analysis of the results obtained from a particular determination and the proposition of reasonable intermediates to yield the products experimentally observed.
An important result of this study is that the recoil carbon-14 atom in a-cyanoacetamide does not appear to be stabilized within the solid matrix in the form of a “ simple” chemical species or in a form that would undergo a chemical change, such as decomposition or rearrangement, in the presence of water to produce a “ simple” compound. This observation has been noted previously in the investigation of the chemical compounds containing the recoil carbon-14 atom which were produced by the neutron irradiation of solid acetamide.3 The small degree of carbon-14 labeling found in the “ simple” compounds suggests the radiocarbon labeling process occurs primarily as a result of reactions with other a-cyanoacetamide molecules within the solid matrix in which the C14 atom undergoes a replacement reaction with a carbon atom in the a-cyano- acetamide unlabeled molecule. As a result of this reaction, a fragmentation of the molecule occurs in which only one or two chemical bonds are broken and the multiple rupture of bonds to produce small fragments containing only one carbon atom does not occur to any significant extent. This suggestion is supported by the results observed in the neutron irradiation of crystalline acetamide and by the results reported in the present work. From the results of this study, it is concluded that the -CtLCTOjNIL radical plays an important role in the production of the final chemical
(7) P. E. Yankwieh and W. R. Cornman, Jr., J. Am. Chem. Soc., 77, 2096 (1955).
species incorporating the recoil carbon-14 atom. The production of this radical may occur by a replacement reaction with an a-cyanoacetamide molecule within the solid matrix, after the recoil atom has been slowed down to the point where it is stable toward recombination. This reaction results in the rupture of a carbon-hydrogen bond, in the case of acetamide, and a C-CN bond, in the case of a-cyanoacetamide. This leads to the formation of the radio-labeled -CFLC/CONFL radical, which may then undergo reactions with other molecules of the matrix to produce the final chemical compounds observed. If this process occurs, then the formation of “ simple” compounds, containing the recoil carbon-14 atom, would not be expected to take place to any large extent. This result has been verified by the studies performed on acetamide and the results obtained in this study.
An additional and very interesting result of this study is that nearly half of the total activity produced in the pile-neutron irradiation was found in the form of a polymer. The formation of this polymer may be postulated to occur by eq. 1, 2, and 3
(n,p)NCCH2C(0)N H 2--------->
recoil carbon-14 + molecular fragments (1)
recoil carbon-14 + NCCH2C(0)N H 2 — ►•C14H2C (0)N H 2 or -CH2C14(0)N H 2 + -CN (2)
and
7-ray■C14H2C (0)N H 2 or ■CH2C,4(0)N H 2--------- >
:C 14HC(0)NH- or :CHC14(0)NH- (3)
The carbon-14-containing radicals might further react with other similar inactive radicals, produced by the recoil carbon-14 atom passing through the matrix and/or by the action of the accompanying y-radiation.
If a -Cr(a-cyanoacetamide) of 5 is assumed for the y-damage of a-cyanoacetamide, the radiation damage of the sample is calculated to be about 15%. We have determined experimentally that the polymeric material comprises approximately 16% by weight of the sample. This would imply, however, that all of the a-cyano- acetamide decomposed by the y-radiation is utilized in the formation of the polymeric material. The formation of radiocarbon-labeled succinamide is also reported in this study, as discussed below. Although the specific quantity was not determined experimentally, we estimate that measurable quantities of succinamide were also formed as a result of the y-radiation accompanying the neutron flux. Therefore, we estimate a -G(a- cyanoacetamide) of >5 as a lower limit, for the y- damage of a-cyanoacetamide. Tolbert8 has stated that many compounds have decomposition coefficients ('6r-values) of 5-10 for irradiation of pure materials in vacuo, which is in agreement with our estimated values of > 5.
The results of this study have shown that, in addition to the polymeric material, significant levels of activity were found in only two other compounds, succinamide (23%) and a-cyanoacetamide (9%). The formation of succinamide may be suggested to occur in the same
(8) B. M. Tolbert, Nucleonics, 18, [8] 74 (1960).
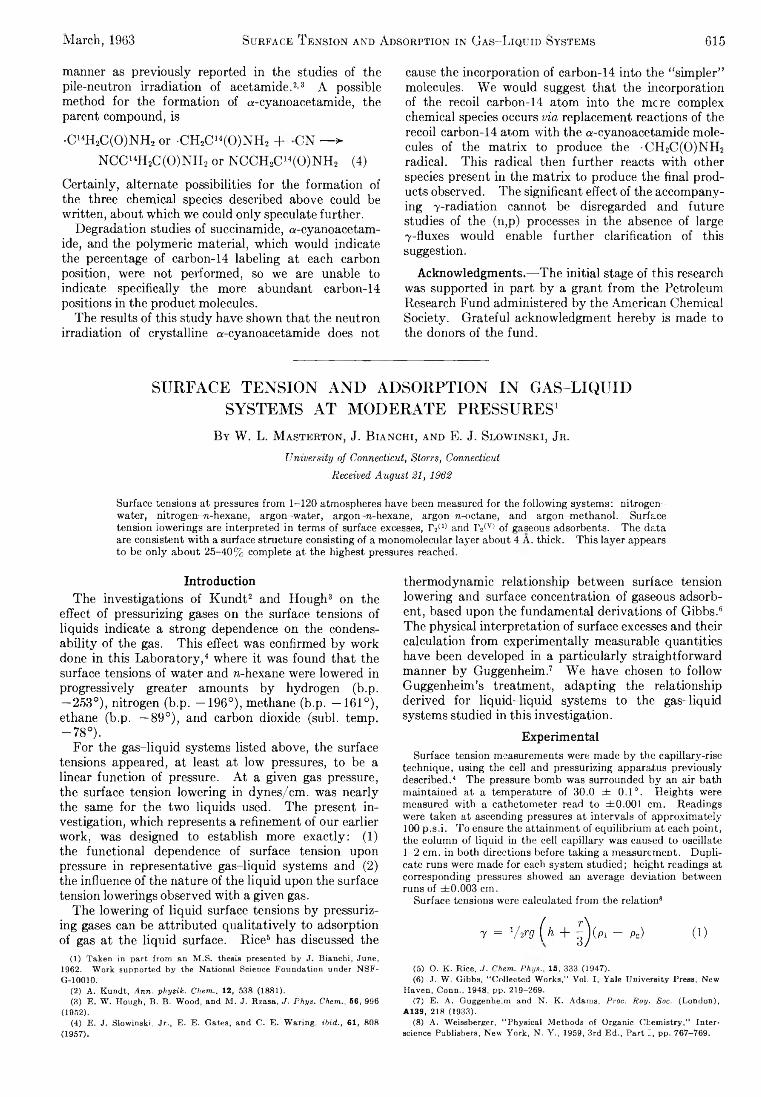
March, 1963 S u r f a c e T e n s i o n a n d A d s o r p t i o n i n G a s - L i q u i d S y s t e m s 615
manner as previously reported in the studies of the pile-neutron irradiation of acetamide.2'3 A possible method for the formation of a-cyanoacetamide, the parent compound, is
•C14H2C(0)N H 2 or -CH2C14(0)N H 2 + CN — ► NCC14H2C (0)N H 2 or NCCH2C14(0)N H 2 (4)
Certainly, alternate possibilities for the formation of the three chemical species described above could be written, about which we could only speculate further.
Degradation studies of succinamide, a-cyanoacetam- ide, and the polymeric material, which would indicate the percentage of carbon-14 labeling at each carbon position, were not performed, so we are unable to indicate specifically the more abundant carbon-14 positions in the product molecules.
The results of this study have shown that the neutron irradiation of crystalline a-cyanoacetamide does not
cause the incorporation of carbon-14 into the “ simpler” molecules. We would suggest that the incorporation of the recoil carbon-14 atom into the mere complex chemical species occurs via replacement reactions of the recoil carbon-14 atom with the a-cyanoacetamide molecules of the matrix to produce the -CH2C(0)N H 2 radical. This radical then further reacts with other species present in the matrix to produce the final products observed. The significant effect of the accompanying y-radiation cannot be disregarded and future studies of the (n,p) processes in the absence of large y-fluxes would enable further clarification of this suggestion.
Acknowledgments.—The initial stage of this research was supported in part by a grant from the Petroleum Research Fund administered by the American Chemical Society. Grateful acknowledgment hereby is made to the donors of the fund.
SURFACE TENSION AND ADSORPTION IN GAS-LIQUID SYSTEMS AT MODERATE PRESSURES1
B y W. L. M a ste r t o n , J . B ia n c h i, and E. J . Sl o w in s k i, J r .University of Connecticut, Storrs, Connecticut
Received August 21, 1962
Surface tensions at pressures from 1-120 atmospheres have been measured for the following systems: nitrogen- water, nitrogen-re-hexane, argon-water, argon-re-hexane, argon-re-octane, and argon-methanol. Surface tension lowerings are interpreted in terms of surface excesses, r 2(1) and I'2(V) of gaseous adsorbents. The data are consistent with a surface structure consisting of a monomolecular layer about 4 A. thick. This layer appears to be only about 25-40% complete at the highest pressures reached.
IntroductionThe investigations of Kundt2 and Hough3 on the
effect of pressurizing gases on the surface tensions of liquids indicate a strong dependence on the condensability of the gas. This effect was confirmed by work done in this Laboratory,4 where it was found that the surface tensions of water and n-hexane were lowered in progressively greater amounts by hydrogen (b.p. —253°), nitrogen (b.p. —196°), methane (b.p. —161°), ethane (b.p. —89°), and carbon dioxide (subl. temp. -7 8 ° ) .
For the gas-liquid systems listed above, the surface tensions appeared, at least at low pressures, to be a linear function of pressure. At a given gas pressure, the surface tension lowering in dynes/cm. was nearly the same for the two liquids used. The present investigation, which represents a refinement of our earlier work, was designed to establish more exactly: (1) the functional dependence of surface tension upon pressure in representative gas-liquid systems and (2) the influence of the nature of the liquid upon the surface tension lowerings observed with a given gas.
The lowering of liquid surface tensions by pressurizing gases can be attributed qualitatively to adsorption of gas at the liquid surface. Rice5 has discussed the
(1) Taken in part from an M.S. thesis presented by J. Bianchi, June, 1962. Work supported by the National Science Foundation under NSF- G-10010.
(2) A. Kundt, Ann. physik. Chem., 12, 538 (1881).(3) E. W. Hough, B. B. Wood, and M. J. Rzasa, J. Phys. Chem., 56, 996
(1952).(4) E. J. Slowinski.. Jr., E. E. Gates, and C. E. Waring, ibid., 61, 808
(1957).
thermodynamic relationship between surface tension lowering and surface concentration of gaseous adsorbent, based upon the fundamental derivations of Gibbs.6 The physical interpretation of surface excesses and their calculation from experimentally measurable quantities have been developed in a particularly straightforward manner by Guggenheim.7 We have chosen to follow Guggenheim’s treatment, adapting the relationship derived for liquid-liquid systems to the gas-liquid systems studied in this investigation.
ExperimentalSurface tension measurements were made by the capillary-rise
technique, using the cell and pressurizing apparatus previously described.4 The pressure bomb was surrounded by an air bath maintained at a temperature of 30.0 ± 0.1°. Heights were measured with a cathetometer read to ±0.001 cm. Readings were taken at ascending pressures a t intervals of approximately 100 p.s.i. To ensure the attainment of equilibrium a t each point, the column of liquid in the cell capillary was caused to oscillate 1-2 cm. in both directions before taking a measurement. Duplicate runs were made for each system studied; height readings at corresponding pressures showed an average deviation between runs of ±0.003 cm.
Surface tensions were calculated from the relation8
7 = V ¿ v g ( h + 0 ( p i - pg) (1)
(5) O. K. Rice, J. Chem. Phys., 15, 333 (1947).(6) J. W. Gibbs, “ Collected Works,” Vol. I, Yale University Press, New
Haven, Conn., 1948, pp. 219-269.(7) E. A. Guggenheim and N. K. Adams, Proc. Roy. Soc. (London),
A139, 218 (1933).(8) A. Weissberger, “ Physical Methods of Organic Chemistry,” Inter
science Publishers, New York, N. Y., 1959, 3rd Ed., Part I, pp. 767-769.
616 W . L. M a s t e r t o n , J . B i a n c h i , a n d E. J . S l o w i n s k i , J r . Vol. 67
Pressure (atm.). Figure 1.
Actual system.
1
Figure 2.where y is the surface tension, r the capillary radius, g the acceleration of gravity, h the capillary rise, pi the density of the liquid phase, and pg the density of the gas phase. The radius (average value = 0.02410 cm.) was determined to ±0.1% at 0.2- cm. intervals along the capillary from capillary rise measurements carried out at atmospheric pressure using water and benzene as calibrating liquids. Liquid densities for the systems involving organic solvents were determined by a closed float method.9 For the nitrogen-water and argon-water systems, the density of the liquid phase was taken to be that of pure water at the same pressure. Gas densities were calculated from the Beattie-Bridg- man equation, making a small correction for the effect of solvent vapor.
The nitrogen and argon used as pressurizing gases were of 99.9 mole % purity. The organic solvents were of 99.6 mole % purity or better. Laboratory distilled water was used without further purification. All solvents were degassed before use by refluxing. Measured surface tensions at 30.0° and atmospheric pressure (71.18, 17.45, 20.72, and 21.81 dynes/cm. for water, ra-hexane, w-octane, and methanol, respectively) agreed with literature values within at least 0.2 dyne/cm.
ResultsThe surface tension data obtained at 30.0° for
the six systems studied may be represented by the quadratic equations
N2-water: 7 = 70 — 0.0732(p — p0) +1.42 X 10⁻⁴(p - p0)2 (2)
N2-n-hexane: y = y? — 0.0813(p — p0) +1.42 X 10-‘ (p - p0) 2 (3)
Ar-watcr: y — y 0 — 0.0733 (p — p0) +1.27 X 10~4(p - p0) 2 (4)
(9) W. L. Masterton, D. A. Robins, and E. J. Slowinski, Jr., J . Chem . Eng. D a ta , 6, 531 (1961).
Ar-n-hexane: y = yo — 0.0840(p — p0) +1 . 2 0 X 1 0 - 4 ( p - p o ) 2 ( 5 )
Ar-n-octane: y = y 0 — 0 . 0 8 6 0 ( p — p 0) +
1 . 3 2 X 1 0 “ 4( p - p o ) 2 ( 6 )
Ar-methanol: y = y0 — 0 . 0 7 7 2 (p — p0) +1 . 4 9 X 1 0 - 4( p - p o ) 2 ( 7 )
where y is in dynes/cm., p in atm., 70 = surface tension at atmospheric pressure p0.
The average deviation of an experimentally determined surface tension from the value predicted by the above equations is ±0.04 dyne/cm. The precision of the measurements is indicated by the reproducibility of the data obtained from duplicate runs on the same system (Fig. 1).
It may be noted that in each case (eq. 2-7), the slope of the plot of y vs. p decreases with increasing pressure; the deviation from a linear relationship is particularly noticeable at high pressures. Surface tension lowerings at a given gas pressure are somewhat greater for the hydrocarbon solvents than for water. The curve for the argon-methanol system lies between that for argon-water and argon-n-hexane, closely approaching the former at high pressures. It appears that for these systems there is a qualitative relationship between surface tension lowering and gas solubility in the liquid phase. Nitrogen and argon are nearly 100 times as soluble in solvents such as n-hexane and n-octane as in water; the solubility of argon in methanol is intermediate between that in non-polar solvents and in water. The qualitative dependence of surface tension lowering on solubility is hardly surprising in view of the direct relation between surface tension lowering and adsorption; one might expect the extent of adsorption of a gas at a liquid surface to parallel to some extent its solubility in the liquid phase.
InterpretationSurface Excesses.—-For a two-component, two-phase
system, the relationship between surface tension (7) and the chemical potentials (m i, M2) of the components is given by the Gibbs adsorption isotherm which in its most general form may be written
dy = — FidMi — r 2dM2 (8)
The quantities I’i and r 2 are commonly referred to as “ surface excesses” of solvent and solute, respectively. They represent the difference, per cm.2 of surface, between the number of moles of a component in the actual system and in a hypothetical system in which the two phases are imagined to be homogeneous up to a mathematical plane drawn parallel to the physical surface.
The numerical magnitudes of Tj and r 2 depend upon the position at which one chooses to draw the dividing line in the hypothetical system. The most common choice, and the one which lends itself most readily to the direct calculation of surface excesses from surface tension data, is to draw the line at a position (x in Fig. 2) such that 1/ becomes zero. (For a gas-liquid system, this will ordinarily require that the line be drawn somewhat below the physical surface, within the liquid phase.) Adopting this convention, designated by the
March, 1963 S u r f a c e T e n s i o n a n d A d s o r p t i o n i n G a s - L i q u i d S y s t e m s 617
superscript (1) to conform to Guggenheim’s notation, eq. 8 simplifies to
d7 = - i y 1 (9)
For a gas-liquid system in which the pressure is changing, dp2 is given to an excellent degree of approximation by the expression F2°dp, where F2° is the molar volume of the pure gas. Therefore
d7 = - r 2(1)F2°dp or r 2(1) = ~ 7 -- (10)V-i dp
Equation 10 was used to calculate the values of r 2(1) reported in Table I; d7/dp, obtained in dynes cm. ' 1 atm.-1 from eq. 2-7 was converted to cm., while F2° in cm.3 mole-1 was calculated from the Beattie-Bridgman equation.
More meaningful expressions for T may be obtained by drawing the dividing line in the hypothetical system at a point x' such that the geometric surface S' coincides exactly with the limit of homogeneity of the gas phase, [5. The surface excess r 2(V) defined on the basis of this convention becomes the number of moles of solute per cm.2 in the surface region minus the number of moles of solute in an equal volume of the bulk liquid phase. The surface excess of solvent, IY V), may be given an analogous interpretation.
To relate r 2(V) and IYV) to r 2(1) for a gas-liquid system, it is convenient to start with Guggenheim’s general relation (eq. 6 in ref. 7)
IV = Ti + (*' - x )(C f - CO (1 1 )
This gives for the solute the relation
Pressure (atm.) Pressure (atm.)Nitrogen. Argon.
Fig. 3.—Fraction of surface covered by solute molecules.Partial molal volumes for the systems involving organic solvents were taken from density data previously reported.9 The partial molal volumes of nitrogen and argon in water were estimated to be about 40 and 35 cc., respectively.14
Structure of the Surface.— In order to calculate the number of moles, n,. of a component in unit area of the surface, it is necessary to add to the surface excess, i y V), an amount equal to the number of moles in an equal volume of the bulk liquid phase. That is
n2 = r 2(V) + C ft (17)
nx = Txm + Cxat (18)
where t is the thickness of the surface. To evaluate t, one must choose a suitable model for the surface region. The simplest choice, which will be shown to be consistent with the data, is to take the surface layer to be one molecule thick. On this basis
r 2(V) = r 2(1) + Or' - x){C/ - CV) (12)
and for the solvent, where C / is very small compared to Ci“ and i y *> is by definition zero
IYV) = -O r ' - x)CC (13)
Eliminating the quantity ( :r ' — x) between eq. 12 and 13 gives
r 2(V) = IV 11 - iV V) (14)Ci
It is readily shown that, provided the partial molal volumes of solute and solvent, F2 and V1} have the same values in the surface region as in the interior of the liquid, r 2(V) and i y V) are related by the simple expression
Fi(V) = - I 2 r 2<V) (15)Vi
Airh + A 2n2 = 1 (19)
where A t and A 2 are the areas per mole of the components in the unimolecular layer.
Solving eq. 17-16 simultaneously gives
1 - Atlh00 - A 2r 2(V) A A “ + A2C2“
(20)
To evaluate t and thereby nx and n2, areas estimated from adsorption measurements on solids15 were substituted in eq. 20. In view of the fact that these areas are subject to considerable uncertainty, particularly insofar as their variation with pressure is concerned, it is rather remarkable that the values of t calculated by eq. 20 agree so closely with those obtained from the relation16
Substituting (15) in (14) and rearranging, one obtains
r 2(V) IV»F2 (C / - C2a) Vx Cxa
(16)
Equation 16 was used to calculate the values of r 2(V) given in Table I from the corresponding values for IY F Concentrations of solute and solvent in the liquid phase at the various pressures were calculated from solubilities at 1 atm.10-13 using Henry’s law.
(10) F. L. Boyer and L. J. Bircher, J. Phys. Chem., 64, 1330 (1960).(11) H. L. Clever, R. Battino, J. H. Saylor, and P. M. Gross, ibid., 61,
1078 (1957).
for the thickness of an argon or nitrogen molecule. This agreement must to some extent be fortuitous; nevertheless it lends support to the concept of a mono- molecular surface layer. Only in the two systems involving water as a solvent are there serious discrepancies (Table II). Fortunately, in these systems the value of t is not critical for the calculation of n2, since
(12) J. C. Gjaldeback and J. H. Hildebrand, J. Am. Chem. Soc., 71, 3147 (1949).
(13) “ International Critical Tables,” Vol. Ill, McGraw-Hill Book Co., New York, N. Y., 1928, pp. 255-256.
(14) J. H. Hildebrand and R. L. Scott, “ The Solubility of Non-Electrolytes,” 3rd Ed., Reinhold Publ. Corp., NeW York, N. Y., 1950, p. 247.
(15) H. K. Livingston, J. Colloid Sci., 4, 447 (1949).(16) F. E. Bartell and F. C. Benner, J. Phys. Chem., 46, 847 (1942).
618 N. W . G r e g o r y Vol. 67
T a b l e IS u r f a c e E x c e s s e s i n M o l e s / c m .2 X 1 0 n
N 2 -w a te r N 2 -n -hexane A r --w aterp (a tm .) r»(1) r 2<v> r2(1) r 2<v> r,w r 2'V)
20 5.4 5.6 6.0 6.2 5.5 5.740 9.9 10.6 11.2 12.1 10.3 10.960 13.5 15.0 15.4 17.3 14.3 15.680 16.1 18.5 18.7 22.0 17.5 19.8
100 17.8 21.2 20.9 25.8 19.9 23.2120 18.5 22.8 22.3 28.9 21.5 26.0
T a b l e IIC a l c u l a t e d V a l u e s o f t h e S u r f a c e T h i c k n e s s , t, a t 100
A t m .“
E q u a tio n E q u a tio n20 21N2-water 3 . 1. Â. 4.0 A.N2-R-hexane 4 . 5 4.6Ar-water 3 . 0 3.9Ar-n-hexane 4 . 5 4.4Ar-n-octane 4 . 5 4.3Ar-methanol 3 . 8 4.2
“ Areas of molecules (A.)2 were taken as follows: H20 = 11, Ar = 15, N2 = 16, CH3OH = 20, n-CsHu = 55, n — CaHig = 65.the solubility of the gas, as reflected in C2“, is extremely small.
Plots (Fig. 3) of the fraction of the total surface area occupied by gas molecules
/ = TI2A 2 (22)as a function of pressure show several interesting features. At the highest pressures reached, only about 25-40% of the surface is occupied by nitrogen or argon molecules, indicating that the monomolecular layer is only partially filled in each of the gas-liquid systems studied.
A r-n -■hexane A r-n -o c ta n e A r-m eth a n o lr 20) r 2<v) r2<u r 2<v> r 2!l) r 2‘v>6.4 6.5 6.5 6.7 5.8 6.0
12.1 12.7 12.3 12.9 10.7 11.417.1 18.5 17.3 18.9 14.8 16.321.4 23.9 21.5 24.3 17.9 20.524.9 28.8 24.8 29.0 20.0 23.827.7 33.3 27.3 33.3 21.1 26.2
It is hardly surprising that at pressures up to 100 atm., / for the systems involving hydrocarbon solvents should be a nearly linear function of pressure. The displacement of a hydrocarbon molecule at the surface by a non-polar argon or nitrogen molecule should occur rather easily. One can speculate that at higher pressures where the monomolecular layer approaches completion the extent of adsorption in these systems would begin to level off.
In the two systems involving water as a solvent, deviations from the straight line relationship between / and p appear at pressures well below 100 atm. For example, in the argon-water system, the slope of the curve (Fig. 3) has decreased at 100 atm. to less than one-half of its initial value. Indeed, it would appear that the fraction of the surface occupied by argon molecules is approaching a limiting value corresponding roughly to 30% coverage. This could be interpreted to mean that at low pressures gas molecules enter the surface with relatively little distortion of the water structure, while further adsorption requires the rupture of hydrogen bonds holding water molecules together. A similar though less pronounced effect appears in the argon-methanol system.
THE CONDENSATION COEFFICIENT AND THE VAPORIZATION PROCESS
B y N. W. G regory
Department of Chemistry, University of Washington, Seattle, Washington Received August 23, 1962
Values for the entropies and enthalpies of activation for condensation and vaporization processes and theirrelation to the condensation coefficient are discussed.
Information on the kinetics of the vaporization of solids may be obtained from steady state (near equilibrium) effusion data as well as from direct measurement of rates of vaporization. Although determination of the actual area of the vaporizing surface is difficult, if not impossible, reasonable values of the condensation coefficient, ac, the fraction of molecules colliding with the surface which condense, appear to have been determined for a number of vaporization processes. a0 and its temperature dependence can be used to calculate activation enthalpies and entropies for the condensation process and, when used in conjunction with equilibrium vapor pressure data, similar activation values for the vaporization process. The significance of these values, based on a pseudo-equilibrium theory and suggestive of the molecular characteristics in the activated state, depends on the manner in which the
activated state is defined and the concomitant method of calculation.
Consider a region on the crystal surface, essentially a monolayer, X cm. thick. Molecules enter this region from the vapor at a frequency which may be calculated from kinetic gas theory; (the rate of striking is equal to
nsv* = P(2irMRT)~1/l moles cm.-2 sec.~l (1)
where ns is the number of moles cm.-3 of gas, corresponding to the pressure P at temperature T, and v*
= (7c21/ 2irm)1/,!, the average one-dimensional velocity in the direction of surface) or from the solid through vibration of particles at the surface. Only a certain fraction have the necessary characteristics to undergo condensation or vaporization, respectively. For condensation, this fraction is a0; hence the rate of condensation is equal to
C o n d e n s a t i o n C o e f f i c i e n t a n d V a p o r i z a t i o n P r o c e s s 619
acP(/2irWIRT)~ '1 = acnsv* moles cm.-2 sec.-1 (2)
The time of transit through distance X cm. is \/v* sec. Since the number of “ activated” molecules (n* = acng) entering (or which become activated) from the gas is n*v* moles cm.-2 sec.-1, n*X may be taken as the concentration of condensing molecules in the surface monolayer. Thus the activated state is visualized as a gas molecule, with certain special characteristics, found at a fixed “ equilibrium” concentration at the surface monolayer of the crystal. ac may be considered an “ activation equilibrium constant” and used to define and assign values to the enthalpy and entropy of activation for condensation.
«o = K * = e x p (-A F*/RT) = exp(AS*/R - AH*/RT)
(3)ASc* and AH,* are standard state values in the usual thermodynamic sense; since the process is unimolecular, however, they represent the difference in the corresponding properties of activated state and normal gas molecules if the two were at the same concentration (ideal gas basis). If ae is unity at all temperatures, both ASc* and AHc* are zero.
ac may be related to an Absolute Rate Theory type rate constant, fcc. Let rate of condensation = (frequency factor) (moles cm.-2 activated molecules in surface monolayer) =
(v*/\)(n*X) = v*n* moles cm.-2 sec.-1 (4)>fl*
- kQng\ = kc — X (5)
From (4) and (5)
ke = v*ac/\ = v*K*/\ =(v*/\)(Z*/Zg)exp (-A E */ R T ) sec.-1 (6)
where Z* and Ze represent the total partition functions for the activated state and normal gas molecules, respectively, and AEc* the zero-point energy of activation. Z* may be expected to correspond to a partition function for a loosely bound molecule on a surface with at least one of the free gas translational degrees of freedom changed to a contribution more nearly equivalent to a low frequency vibration. If a is unity at all temperatures, however, Z* must be the same as Zg.
In (6) we have
= (Z*/ZJ e x p (-A E*/RT) (7)
(7) reduces to the same expression given for the transmission coefficient by Mortensen and Eyring1 under special conditions. They begin with the usual ART form
kc = K(kT/h)(Z*/Zi) exp( —AE*/RT) (8)
where k is the transmission coefficient; Z *, the partition function for the activated state, is taken as that of a normal gas molecule but with only two translational degrees of freedom, and Z\, the partition function for the initial state, i.e., Z\ = Z% for the condensation case. Comparing (6) and (8) and recognizing that kT/h = Zpv*/\ (Zt1 is a one-dimensional translational partition function for distance X) one concludes that
(1 ) E . M . M ortensen a n d H . E y rin g , J . P h y s . C h em ., 64, 846 (1960).
March, 1963
ac = K(Zt'Z*/Zg) exp( — AE*/RT) (9)
In the special case where ZpZ * = Z& and the activation energy for condensation is zero, ac = k. ac, or k, as noted by Mortensen and Eyring and as seen from (7), then becomes equal to the true partition function of the activated state molecule over that of the normal gas molecule, which, they suggest, will be principally determined by the ratio of the rotational parts of the partition functions.
It should be emphasized that the frequently used alternate form of (8)
kc = K(kT/h) exp( — AF*/RT) (10)
or equivalent expressions in terms of AS,* and AIR*, will not give activation entropies and enthalpies equivalent to (3) because the transmission coefficient and kT/h contain some of the pertinent terms of the partition function for the activated state.
At the equilibrium vapor pressure the rate of condensation must equal the rate of vaporization. Equation 4 also may be written for the rate at which vaporizing molecules move through the surface monolayer to the gas phase (v* is the one-dimensional velocity in the direction away from the surface in this case). An activation “ equilibrium constant” for vaporization, A v*, which could be called the vaporization coefficient, may be defined as
K v* — n*\/ns\ = n*/ns (11)
where n*\ is again the concentration of molecules in the activated state in moles cm.-2 of monolayer, the same as the term considered in the condensation case (rate of vaporization = rate of condensation), and ns\ the corresponding concentration term for the normal solid; n3 may be evaluated from the density of the crystal. Sincen* = acng
K v* = Peae/nBRT (12)
Thus the rate of vaporization is equal to
(v*/\)(n*\) = v*Kv*ns moles cm.-2 sec.-1 (13)
or for the corresponding form of the rate constant
kv = rate vap./?isX = K v*v*/\ =(y*/X)(Z*/Zs) e x p (-A EW*/RT) sec.-1 (14)
The activation entropy A»SV* and enthalpy AHv* may be defined by and evaluated from K v* and its temperature dependence in the usual fashion. Again these are standard state quantities; for the unimolecular model they relate properties of the activated state and the normal solid at equal concentrations.
The actual fraction of the vibrating particles in the solid surface which have the necessary free energy of activation cannot be determined without knowledge of the actual vibration frequency at the surface. If the ratio v*/\ over the actual solid surface vibration frequency is x, the concentration of activated molecules in a solid surface monolayer then would be xn*\ moles cm.-2, i.e., just sufficient to maintain the concentration n*\ in the transition monolayer. K v*' then might be defined as xn*/ns, or xK v*.
For an oscillating molecule in the solid with classical energy kT per vibrational degree of freedom, the ve
620 N . W . G r e g o r y Vol. 67
locity (in the direction of the surface, one-half the time) ranges from zero to (2kT/m)1/2 with a mean roughly equivalent to v*. The distance to travel is X cm.; hence the frequency term for such a simple model is virtually the same as for the gas (of the order of 10u sec.-1). Alternatively, since the Einstein and Debye models give reasonably similar results at temperatures well above the Debye temperature of the crystal, the mean Debye frequency, 1012-1013 sec.“ 1, would seem a reasonable value for the solid surface frequency factor. However, MacRae and Germer2 have found evidence that the effective Debye temperature on the surface of nickel crystals is about 310 °K. as compared with the bulk crystal value 390 °K. Furthermore, probability factors also may reduce the effective value of the frequency factor, i.e., if the crystal is not molecular, cooperative movement of the components of the vaporizing molecule is required to separate a molecular unit from the crystal.
It seems reasonable to suggest that the value of x is somewhere between unity and 0.1. If this ratio is not significantly dependent on temperature, the corresponding effect on ASY* would be ca. 0-4.6 e.u. For convenience (11) has been used to define K v* and A/S’v* and AH v* without attempting to guess at the magnitude of x.
To relate activation entropies and enthalpies to the usual standard quantities for complete vaporization, it is convenient to choose a standard state for ns (and therefore n* in the condensation process) which corresponds to P = 1 atm. (as an ideal gas) and for ns (and therefore n* for the vaporization process), the normal concentration of molecules in the crystal under 1 atm. external pressure. The following three processes serve to clarify the relationship and significance of these standard state quantities.
(1) Solid (normal) —*■ activated state (an ideal gas surface state at the same concentration as the solid)
AFy*; AHv*; ASV*
(2) Activated state (at solid concentration) -> activated state (at an ideal gas pressure of 1 atm.)
AH = 0; —AF = T AS = RT In nJiT
(3) Activated state (1 atm.) -*• gas (normal, standard state, ideal gas, 1 atm.)
— AF * ; -A H c*; — ASC*
The sum of the changes (1), (2), and (3) gives the usual standard thermodynamic quantities for the sublimation process as calculated from equilibrium vapor pressure data.
Some results for vaporization of iodine and iron (III) chloride may be considered. For the vaporization of crystalline iodine at 0°, assume Pe = 4.35 X 10“ 6 atm., AHS° = 14,960 cal. mole“ 1, ASs° = 34.8 cal. deg.“ 1 mole“ 1, ac = 0.01, and d In ac/d(l/T) = 1460.s Hence for condensation
n* = 1.94 X I0“ u mole cm.” 3
AH * = -2900 cal. mole“ 1
ASc* = — 20 cal. deg.“ 1 mole“ 1(2) A. U. MacRae and L. H. Germer, Phys. Rev. Letters, 8, 489 (1962).(3) J. H. Stem and N. W. Gregory, J. Phys. Chem., 61, 1226 (1957).
AFc* = 2500 cal. mole“ 1
These numbers are for- the reverse of reaction 3 for iodine. For vaporization
K Y* = 1 X 10" 9 from ac and Pe and n3 = 0.0194 mole cm.” 8 (from the crystal density)
n*X = 7.8 X 10“ 19 mole cm.“ 2 monolayer (X taken as 4 X 10” 8 cm.)
v * = 10u sec.“ 1; average Debye frequency (do =X 106°) is 1.6 X 10¹²
AHv* = 12060 cal. mole“ 1
ASv* = 3 cal. deg.“ 1 mole" 1
AFv* — 11,250 cal. mole“ 1
The last three quantities correspond to reaction 1 for iodine. The changes in entropy and free energy for(2) are 12 e.u. and —3276 cal. mole“ 1, respectively. Relative to the activated state as an ideal gas at 1 atm. pressure, the activation entropy would be 15 e.u. (this value and AHv* are not quite the same as reported previously,2 where a slightly different definition of states was used).
Compared to the normal gas state at a comparable pressure, the activated state for iodine has lost nearly 60% of its condensation entropy and about 20% of the condensation enthalpy. If one thinks of a surface molecule with these properties, the energy term appears of the order of a van der Waals interaction; the entropy indicates considerable freedom on the surface but much less than in the gas. From the vaporization point of view, the activated molecules, at an equivalent concentration to the average for the crystal, gain only three entropy units but 80% of the necessary energy for vaporization. A larger increase in entropy is manifested by the change to the gas standard state, or, in the actual vaporization case, by the very low concentration of activated molecules on the surface.
The average Debye frequency, calculated from the ordinary Debye temperature without allowance for surface or for specific effects associated with vaporization from preferred faces or edges, is 16 times larger thanr*/X.
The simultaneous vaporization reactions
2FeCl3(s) — >■ Fe2Cl6(g)
2FeCl3(s) — > 2FeCl2(s) + Cl2(g)
recently have been studied by effusion.4 For the sublimation of Fe2Cl6 at 408°K., assume6 Pe = 5.5 X 10“ G atm., AH“ = 32,600 cal. mole“ 1, AS°v = 56 cal. deg.“ 1 mole“ 1, AF° = 9800 cal. mole“ 1; a = 7 X 10“ 3and d In a /d ( l /T ) = -3180. Hence
AH * = 6300 AH (2) = 0AiSe* = 5.6 AS (2) = 11 .2A Fc* =4010 AF(2) = -4600
AH v* = 38900 cal. mole“ 1 ASV* = 50.4 cal. mole deg.AFV* = 18,400 cal. mole
(4) R . R . H am m er and N . W . G regory , ibid., 66, 1705 (1962).(5) F or a sum m ary o f equilibrium data o f various w orkers, see L. E .
W ilson and N . W . G regory , ib id ., 62, 433 (1958).
(if na = 0.0086 mole cm.-3 for (FeCl3)2)
n*\ = 6 X 10-20 mole cm.-2 (if A = 5 X 10⁻⁶)
v*- = 0.8 X 10¹¹ sec. - 1A
(the estimated Debye temperature ~480°K . gives a mean frequency of 0.8 X 10¹³ sec.-1). Here AHc* and AS*C are both positive (rather than negative as found for iodine) and AH i and A S* are very large. The activated state for vaporization-condensation may be presumed to be FeCl3 molecules or perhaps pairs of FeCl3, i.e., incipient Fe2Cl6 molecules. The normally large condensation entropy loss as gas molecules move to the activated state may be offset by virtual dissociation of Fe2Cl6 into FeCl3 monomers. In the gas phase A»S0 for this dissociation is 29.3 e.u.6 An entropy change approaching this magnitude plus the loss on moving to the surface then could give a net small positive AiSc. A similar qualitative argument may be presented for a positive AFT*.
On vaporization, the six iron-chlorine bonds formed by each iron atom in the semi-ionic sandwich layer type solid are replaced by four interactions per iron atom in the gas dimer, or three if the activated state is a monomer; one would expect a large enthalpy and entropy increase in such a process.
The estimated Deoye frequency is about one hundred times larger than v*/X (using the molecular weight of Fe2Cl6). However, in addition to any surface reduction of the Debye temperature, one also would expect probability factors to lower the effective frequency. If the ions in the solid move more or less independently, a cooperative motion of the iron ion and its neighboring chloride ions is required for release of FeCl3(g). If the iron ion and three chloride ions must move together toward the surface while the other three neighboring chloride ions move away, a probability factor between
(6) W. Kangro and H. Bernstorff, Z. anorg. allgem. Chem., 263, 316 (1950); H. Schafer, ibid., 259, 53 (1949).
March, 1963
(1/ 2)7 20 = 1/6, if any three Cl- , and 1/128, if only specified ones, might be expected; direct release of Fc2Cl6 would be even less probable.
ae for the process 2FeCl3(s) -*■ 2 FeCl2(s) + Cl2(g) is very small and could only be roughly estimated as 10-6 with no temperature dependence apparent. With equilibrium data,7 AH° — 26,000 cal., AS0 = 39 e.u., and P e = 4 X 10⁻⁶ atm. at 408°K., one may tentatively suggest the following
621
AH * = 0 AH (2) = 0AS* = -27 .5 AS (2) = 1 1 .2A F * = 11,200 AF(2) = -4600
AH w* = 26,000 cal. mole-1 A.S'v* = 0.3 cal. deg.-1 mole AFv* = 26,000 cal. mole-1
n*\ = 3.2 X 10⁻²⁴ mole cm.-2( \ ~ 3 X 10⁻⁸ cm.)
v*/\ 9* 1.6 X 1011 sec.
v*/\ is somewhat closer to the Debye frequency than in the case of Fe2Cl6. The vibration probability factor should be larger here; only two chlorine atoms must move together, while the iron ion with which they are associated in the solid moves away.
AHv* appears to account for the full vaporization enthalpy and no appreciable change in standard entropy is associated with vaporization activation. The entire entropy of condensation is accounted for by A»SC* together with the standard state change term. The activated state would appear to correspond to an energetically unchanged chlorine gas molecule which finds an appropriate site on the FeCl2-FeCl3 surface; however, the sites are few and far between and virtually no translational motion is permitted once the molecule enters the condensation site.
Acknowledgment.—This work was supported by the National Science Foundation.
(7) H. Schafer and E. Oehler, ibid., 271, 205 (1953).
C o n d u c t a n c e o f S y m m e t r i c a l E l e c t r o l y t e s
THE CONDUCTANCE OF SYMMETRICAL ELECTROLYTES. II. THE RELAXATION FIELDBy R a y m o n d M. F u o s s a n d L a r s O n s a g e r
C o n t r i b u t i o n N o . 1 7 1 5 f r o m th e S t e r l i n g C h e m i s t r y L a b o r a t o r y , Y a l e U n i v e r s i t y , N e w H a v e n , C o n n e c t i c u t
R e c e i v e d A u g u s t 2 7 , 1 9 6 2
The Poisson equation for the asymmetry potentials of a symmetrical electrolyte in idle conductance process has been integrated by the use of the corresponding Green’s function in order to obtain the purely electrostatic terms of the relaxation field. The Boltzmann factor in the distribution function was retained explicitly as an exponential throughout the calculation, instead of approximating it as a truncated series as has been customary in previous derivations. The consequence of this refinement in mathematical methods is the appearance in the relaxation field of a term which will lead to a decrease in conductance with increasing concentration or decreasing dielectric constant. The decrease is proportional to the product of concentration and the square of the mean activity coefficient. I t depends on dielectric constant through a function which has as its asymptotic limit e b/ b 3 ( b = e " / a D k T ) , which is the form of the theoretical association constant for contact pairs. This result means that the a d h o c hypothesis of ion pairing controlled by a mass action equilibrium is no longer needed to obtain a satisfactory conductance function; the former mass action term is derivable from the Poisson equation.I t was missed in earlier theoretical work by too drastic approximation of the Boltzmann factor.
The relaxation field AX which retards the motion of gradient of the potential \p' which the asymmetry in the ions moving in an external electrical field is given by distribution of the other ions produces at the locationthe component in the field direction of the negative of a given ion
622 R a y m o n d M. F u o s s a n d L a r s O n s a g e r Vol. 67
AX = - V ^ '( a ) = -bip'/bx (1)
The potential is obtained by solving the corresponding Poisson equation
njA-p'j = — ( 4 x / D ) ' 2 i f ' j i (i (2 )
but in order to solve (2), the perturbation f ' }i in the distribution must, of course, first be known. It can be obtained by solving the equation of continuity, which relates the distribution functions f H and the velocities of the ions. Previous solutions of the problem have always started with an additive separation
M i) = Pair) + Pud) (3)which eventually required approximating the Boltzmann factor in the distribution function
Pit = UjUi exp( - etp j/ kT) (4)
by the first few terms of its series. For low concentrations in solvents of high dielectric constants, this approximation is valid (as confirmed by the excellent agreement in those cases between theory and experiments, but when the dielectric constant becomes small, the exponent
f = —ti'Pi/kT (5)
becomes significantly larger than unity, especially for ions in contact, and then the truncated series no longer leads to a conductance equation A = A (c) of the correct functional form. (Theory, concave-up; observation concave-down or inflection range, on a A — c h scale.)
An equation which accurately reproduces the observed conductance in these cases can be obtained by postulating first, that ion psirs contribute nothing to conductance, and second, that their concentration can be calculated by a classical mass action equilibrium between free ions and pairs. The earlier forms of this theory encountered difficulties in the definition of ion pairs; these finally were resolved by defining pairs to mean pairs in contact1 but even so, the ad hoc hypothesis of mass action equilibrium had to be retained. If the decrease of conductance ascribed to association were due solely to the effects of electrostatic forces between the ions, one should in principle be able to predict such a decrease from the solution of the Poisson equation, without recourse to an additional hypothesis. Since the theoretical association constant was found to be proportional to e", where
b = t2/aDkT (6)
and since eb is the value which e( approaches at low concentrations for ions in contact, we began to suspect the series approximation of the Boltzmann factor in the equation of continuity as the source of the failure of the 1957 equation2 for “ associated” electrolytes.
In the previous paper3 of this series, a new approach to the problem was made in which a multiplicative separation
M i ) = P ud ) [1 + xad) ] (7)of the distribution function permitted the explicit
(1) R. M. Fuoss, ./. Am. Chem. Soc.. 80, 5059 (1959).(2) R. M. Fuoss and L. Onsager, J . Phys. Chem., 61, 668 (1957).(3) R. M. Fuoss and L. Onsager, ibid., 66, 1722 (1962). Symbols defined
in part I will be used in part II without redefinition.
retention of the exponential function throughout the calculation. Introduction of a function 0(r,#) for the coordinate dependence of the asymmetry potentials for binary electrolytes
0(r,#) = iAi'(r)/ii = -W (r )/ t 2 (8)
simplified the Poisson equation to the form
eie2A0 = 72fcTerx2i (9)
where the coefficient
72 = q2K2 = (47T, DkT)(niti2ooi +ntez'Wd)/{coi + uji) (10)
reduces to *2/ 2 for this case, where m = n2, ei = — a- Then the total electrochemical potential u-£l for an ion of species 1 in the vicinity of a reference ion of species 2
M21 = — e iX x + k T x 21 + «20 (1 1 )
reduced the equation of continuity to the elegant form
V-(ef AM2i) = V(r) (12)
where F(r) depends on the local velocity field. The latter is known4 to give terms of order c log c and c in A(c). In order to focus attention on purely electrostatic terms (rather than hydrodynamic), m2i was separated into two terms
M21 = /Ai + P'n (13)where n'n was defined as the solution of the homogeneous equation
V-erVM,2i = 0 (14)
leaving /A i, the term of hydrodynamic origin, as the solution of
V-erV / '2i = V(r) (15)
Treatment of (15) will be given in a later paper. The solution of (14) was found to an approximation valid up to terms of order c3/2 in A(c)
ju'2i = — eiXR(r) cos# (16)
where R(r) is given explicitly by eq. (2.31) of part I- If 0(r,#) is separated in a fashion analogous to that
for the total potential
0 = 0' + 0" (17)
and likewise X21, the Poisson equation becomes
A0' — 72ef0' = (y2Xe(/ei)[R(r) — r\ cos# (18)
The purpose of the present paper is to present the solution of (18), which through (1) and (8) will give the electrostatic part AXe of the relaxation field.
Before beginning the mathematical development, it will be convenient to define several new functions. Since 0'(r,#) is proportional to the asymmetry potentials p j , it must satisfy the boundary condition
[r(dd'/dr) - 0']« = 0 (19)
and since it necessarily is of the form
0'(r,#) = II(r) cos# = xH/r(4) R. M. Fuoss, ibid., 73, G33 (1959).
(20)
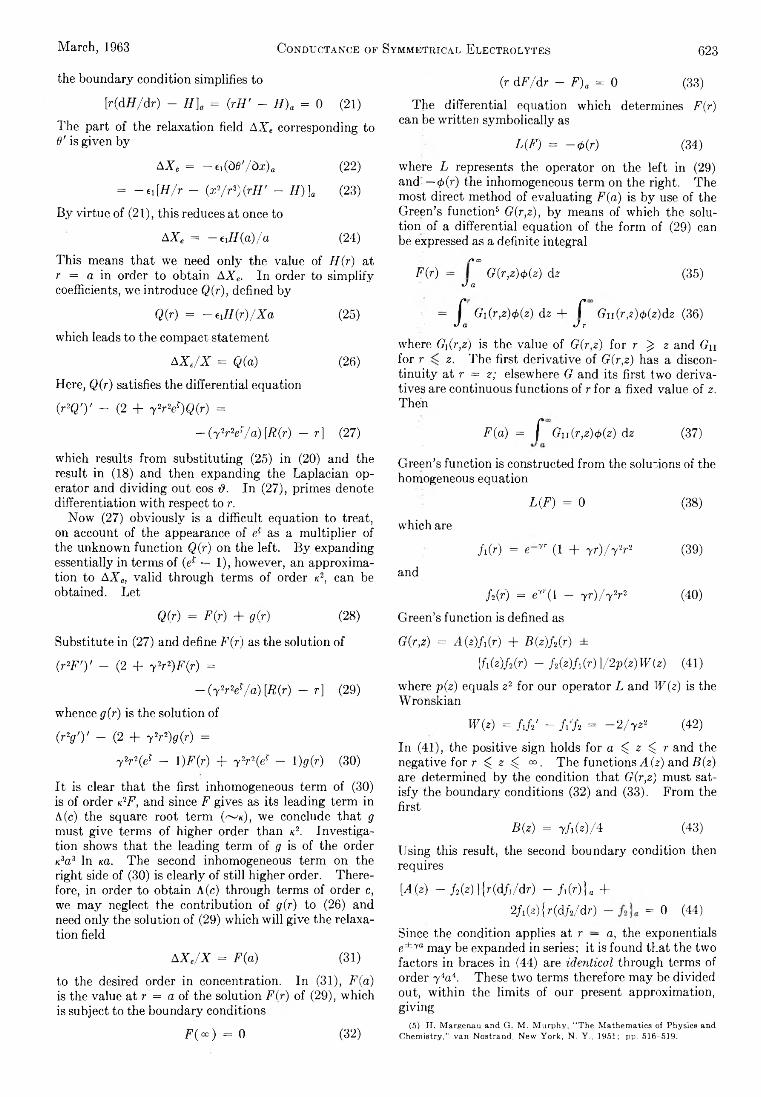
March, 1963 C o n d u c t a n c e o f S y m m e t r i c a l E l e c t r o l y t e s 623
the boundary condition simplifies to
[r(dH/dr) - H]a = (rH' - H )a = 0 (21)
The part of the relaxation field AXe corresponding to O' is given by
AXe = - e 1(de'/dx)a (22)
= —ei[H/r - (x2/r*)(rH' - H ))a (23)
By virtue of (21), this reduces at once to
AXe = — ei H(a)/a (24)
This means that we need only the value of H(r) at r = a in order to obtain AXe. In order to simplify coefficients, we introduce Q(r), defined by
Q(r) = - i i H(r)/Xa (25)which leads to the compact statement
AXe/X = Q(a) (26)
Here, Q(r) satisfies the differential equation
{r2Q')' - (2 + y 2rM)Q{r) =
- (y b ^ / a )[R (r ) - r] (27)
which results from substituting (25) in (20) and the result in (18) and then expanding the Laplacian operator and dividing out cos d. In (27), primes denote differentiation with respect to r.
Now (27) obviously is a difficult equation to treat, on account of the appearance of er as a multiplier of the unknown function Q(r) on the left. By expanding essentially in terms of (er — 1), however, an approximation to AXe, valid through terms of order k2, can be obtained. Let
Q(r) = Fir) + g(r) (28)
(r dF/dr - F)a = 0 (33)
TJie differential equation which determines F(r) can be written symbolically as
L(F) = - 0 (r) (34)
where L represents the operator on the left in (29) and- — <£(r) the inhomogeneous term on the right. The most direct method of evaluating F(a) is by use of the Green’s function5 G(r,z), by means of which the solution of a differential equation of the form of (29) can be expressed as a definite integral
/» ooH r) = G{r,z)4>iz) dz (35)J a■ = f Gi(r,z)(j)(z) dz + f Gn(r,z)<j)iz)dz (36)
•J a J r
where Gi(r,z) is the value of G(r,z) for r ^ z and (?n for r z. The first derivative of G(r,z) has a discontinuity at r = z; elsewhere G and its first two derivatives are continuous functions of r for a fixed value of 2. Then
F(a) = f Gn(r,z)<f>(z) dz (37)
Green’s function is constructed from the solutions of the homogeneous equation
L(F) = 0 (38)
which are
and
fi(r) = e yr (1 + yr)/y2r2
Mr) = e7’ (l — yr)/y2r2
Green’s function is defined as
(39)
(40)
Substitute in (27) and define F{r) as the solution of
(r2F ')' - (2 + y 2r2)F(r) =
— (y^rM/a) [ffi(r) — r] (29)
whence g(r) is the solution of
O V ) ' - (2 + y 2r2)g(r) =
7 2r2(ef — 1 )F(r) + 72r2(ef — l)^(r) (30)
It is clear that the first inhomogeneous term of (30) is of order k2F, and since F gives as its leading term in A (c) the square root term ( ~ k), we conclude that g must give terms of higher order than k2. Investigation shows that the leading term of g is of the order Ksa3 In na. The second inhomogeneous term on the right side of (30) is clearly of still higher order. Therefore, in order to obtain A(c) through terms of order c, we may neglect the contribution of g(r) to (26) and need only the solution of (29) which will give the relaxation field
AXe/X = F(a) (31)
to the desired order in concentration. In (31), F(a) is the value at r = a of the solution F(r) of (29), which is subject to the boundary conditions
F(cc) = 0 (32)
G(r,z) = A(z)Mr) + B(z)Mr) ±Ifi(z)Mr) - M z)M r))/2V(z)W(z) (41)
where p(z) equals z2 for our operator L and W(z) is the Wronskian
W{z) = f M - S\h = - 2 / V 2 (42)In (41), the positive sign holds for a ^ z ^ r and the negative for r ^ 2 ^ °o. The functions A (2) and B (2) are determined by the condition that G(r,z) must satisfy the boundary conditions (32) and (33). From the first
B(z) = 7/ 1G) / 4 (43)Using this result, the second boundary condition then requires
[A{z) - / 2(2)]{r(d/i/dr) - /i (r )}a +2/iOO{r(4A/dr) - = 0 (44)
Since the condition applies at r — a, the exponentials e±7° may be expanded in series; it is found that the two factors in braces in (44) are identical through terms of order 74a4. These two terms therefore may be divided out, within the limits of our present approximation, giving
(5) H. Margenau and G. M. Murphy, “ The Mathematics of Physics and Chemistry,” van Nostrand, New York, N. Y., 1951; pp. 516-519.
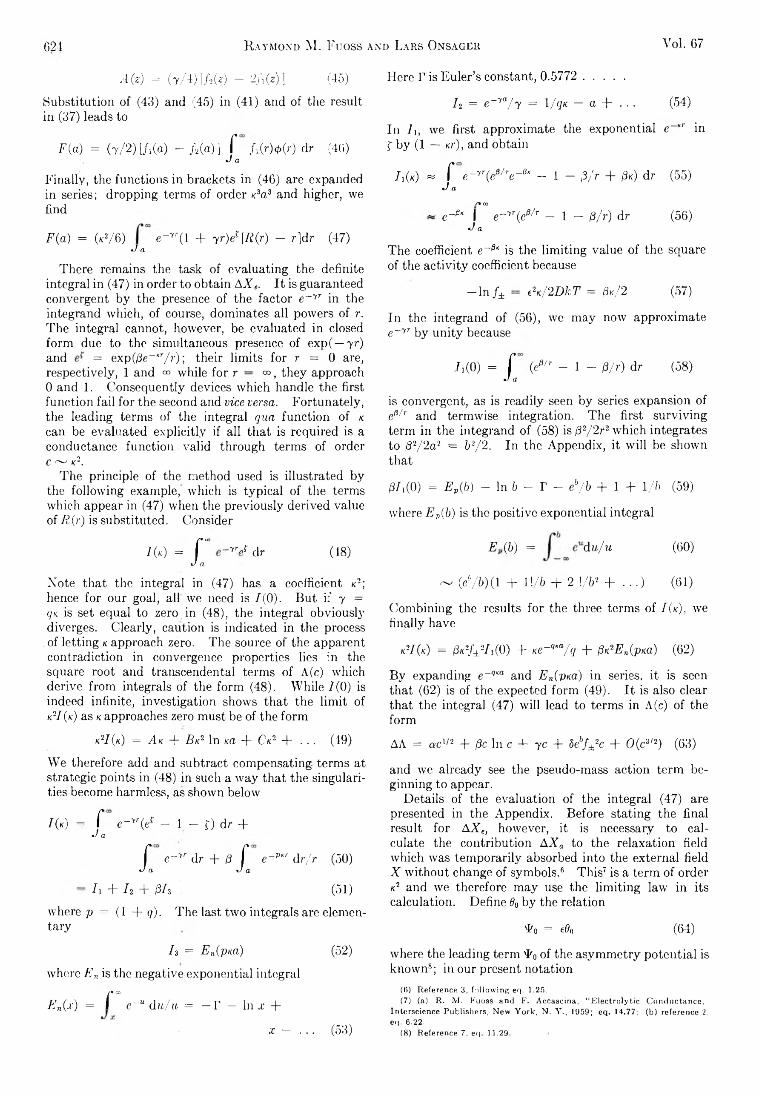
624 R a y m o n d M . F u o s s a n d L a r s O n s a g e r Vol. 67
A(z) = ( 7 / 4 ) 1/2(2) - 2 /1 (2 )] (45)
Substitution of (43) and (45) in (41) and of the result in (37) leads to
F(a) = (7/ 2) [/i(o) - / 2 ( a ) ] f Mr)<f>(r) dr (46)J aFinally, the functions in brackets in (46) are expanded in series; dropping terms of order x3a3 and higher, we find
F(a) = (k2/ 6) e -7r(l + 7r)er [«(r) - r]dr (47)J a
There remains the task of evaluating the definite integral in (47) in order to obtain AXe. It is guaranteed convergent by the presence of the factor e~yr in the integrand which, of course, dominates all powers of r. The integral cannot, however, be evaluated in closed form due to the simultaneous presence of exp( — yr) and = exp (/3e “ ”■/?•); their limits for r = 0 are, respectively, 1 and °° while for r — °°, they approach 0 and 1. Consequently devices which handle the first function fail for the second and vice versa. Fortunately, the leading terms of the integral qua function of k can be evaluated explicitly if all that is required is a conductance function valid through terms of orderC '— ' K2.
The principle of the method used is illustrated by the following example, which is typical of the terms which appear in (47) when the previously derived value of R(r) is substituted. Consider
I ( k) = /: - y r j dr (48)
Note that the integral in (47) has a coefficient k2; hence for our goal, all we need is 1(0). But if 7 = qa is set equal to zero in (48), the integral obviously diverges. Clearly, caution is indicated in the process of letting k approach zero. The source of the apparent contradiction in convergence properties lies in the square root and transcendental terms of A(c) which derive from integrals of the form (48). While 1 (0) is indeed infinite, investigation shows that the limit of k2I (k) as k approaches zero must be of the form
k2I (k) = A k + Bk2 In ka + Ck2 + . . . (49)
We therefore add and subtract compensating- terms at strategic points in (48) in such a way that the singularities become harmless, as shown below
I(k) = f e~yT(ex - 1 - f) dr +J af e~yr dr + 0 f e~VKr dr/r (50)
•J a */ a
— li + I2 + ßh (51)
where p = (1 + <7). The last two integrals are elementary
I 3 = En(pna) (52)
where En is the negative exponential integral/» co
En(x) = I e~“ du/u = — f — In x +
x — . . . (53)
Here F is Euler’s constant, 0.5772 ............
I 2 = e~ya/ 7 = 1 / qk - a + . . . (54)
In I], we first approximate the exponential e " in f by (1 — nr), and obtain
A M « f e~yr(e /re -^ - 1 - jS/r + /3k) dr (55)J a
S* CO
~ e~pK I e~yr(ee/r — 1 — /3/r) dr (56)•J a
The coefficient e~~ K is the limiting value of the square of the activity coefficient because
- l n /± t2K/2DkT = ßn/2 (57)
In the integrand of (56), we may now approximate e~yr by unity because
L(0) = f (eJ a „p/r _ 2 _ ß/r) dr (58)
is convergent, as is readily seen by series expansion of ee/r and termwise integration. The first surviving term in the integrand of (58) is /32/2 r2 which integrates to /32/2 a2 = b2/2. In the Appendix, it will be shown that
07,(0) = EP(b) - In b - T - eb/b + 1 + 1/5 (59)
where E„(b) is the positive exponential integral
E ,(b) = 'd u/u (60)
~ (eh/b)(l + 1 l/b + 2 \/b2 + . . . ) (61)
Combining the results for the three terms of I ( k), we finally have
k2I (k) = M ± 2E(0) + Ke-qm/q + dK2En(VKa) (62)
By expanding e~qm and En(pKa) in series, it is seen that (62) is of the expected form (49). It is also clear that the integral (47) will lead to terms in A(c) of the form
AA = acxn + 0c In c + 7c + 8ebf ±2c + 0(c3'2) (63)
and we already see the pseudo-mass action term beginning to appear.
Details of the evaluation of the integral (47) are presented in the Appendix. Before stating the final result for AXe, however, it is necessary to calculate the contribution AXa to the relaxation field which was temporarily absorbed into the external field X without change of symbols.6 This7 is a term of order k2 and we therefore may use the limiting law in its calculation. Define 60 by the relation
F0 = eft) (64)
where the leading term F0 of the asymmetry potential is known8; in our present notation
(6) Reference 3, following eq. 1.25.(7) (a) R. M. Fuoss and F. Accascina, “ Electrolytic Conductance,
Interscience Publishers, New York, N. Y., 1959; eq. 14.77; (b) reference 2, eq. 6.22.
(8) Reference 7, eq. 11.29.
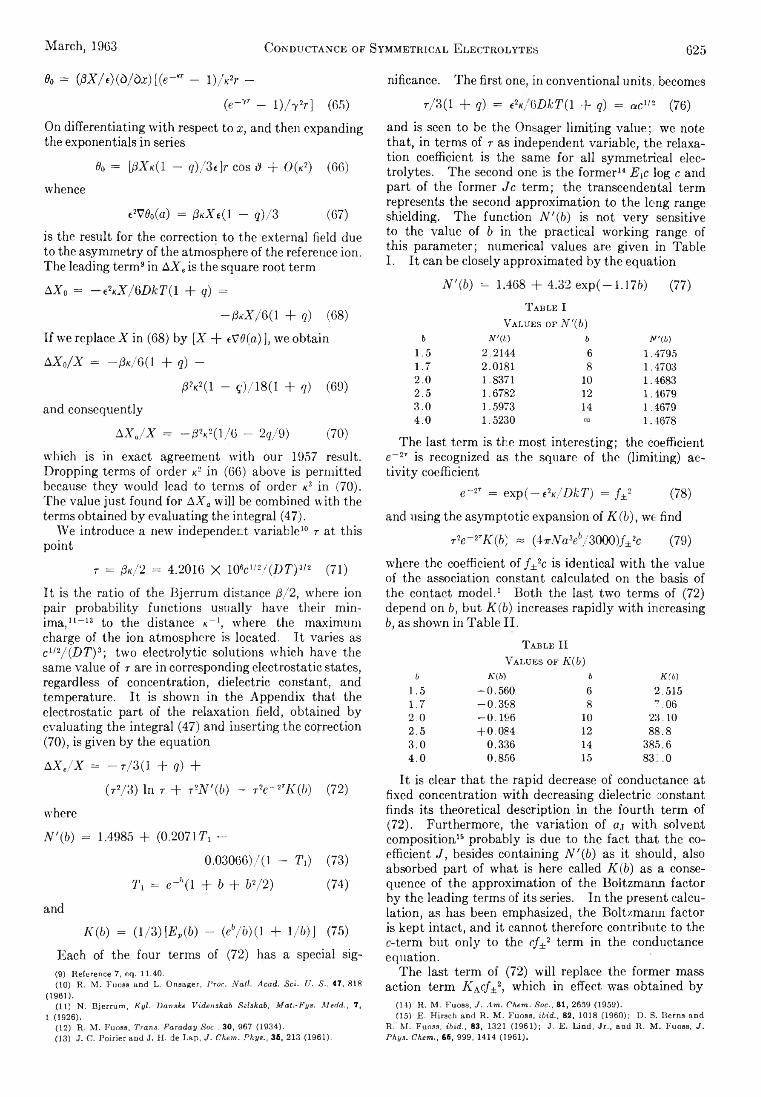
e0 = (/3X/e)(d /dx)[(e-'ir - 1) / k2t -
(e -7r - l ) / 72r] (65)
On differentiating with respect to x, and then expanding the exponentials in series
60 = [j3Xk(1 — q)/Si]r cos d + 0 (k2) (66)
whence
e2V0o(a) = PkX((1 - q) / 3 (67)is the result for the correction to the external field due to the asymmetry of the atmosphere of the reference ion. The leading term9 in AXe is the square root term
AX„ = -A X / 6 D k T (l +- q) =
-P «X / 6(1 + q) (68)If we replace X in (68) by [X + tVO(a) ], we obtain
AXo/X = —/3k/6(1 + q) —
|SV(1 - 5')/18(1 + q) (69)and consequently
AXo/X = - 0 V ( l / 6 - 2q/9) (70)
which is in exact agreement with our 1957 result. Dropping terms of order k2 in (66) above is permitted because they would lead to terms of order k3 in (70). The value just found for AXa will be combined with the terms obtained by evaluating the integral (47).
We introduce a new independent variable10 r at this point
t = Pk/2 = 4.2016 X 10⁶c1/2/(D T ) 3/2 (71)
It is the ratio of the Bjerrum distance /S/2, where ion pair probability functions usually have their minima,11-13 to the distance k- 1, where the maximum charge of the ion atmosphere is located. It varies as c1/2/(D T )3; two electrolytic solutions which have the same value of r are in corresponding electrostatic states, regardless of concentration, dielectric constant, and temperature. It is shown in the Appendix that the electrostatic part of the relaxation field, obtained by evaluating the integral (47) and inserting the correction (70), is given by the equation
AXe/X = — r /3 (l + q) +
(t2/3 ) In r + r2N'(b) - r%-*TK (6) (72)
where
N'(b) = 1.4985 + (0.20717\ -
0.03066)/(l - TO (73)
J\ = e-'Xl + b + 62/2 ) (74)
and
K(b) = (1/3)[E,{b) - (eb/b) (1 + 1/ 6)] (75)
Each of the four terms of (72) has a special sig-(9) Reference 7, eq. 11.40.(10) R. M. Fuoss and L. Onsager, Proc. Natl. Acad. Sci. U. S., 47, 818
(1961).(11) N. Bjerrum, Kgl. Danske Videnskab Selskab, Mat.-Fys. Medd., 7,
1 (1926).(12) R. M. Fuoss, Trans. Faraday Soc., 30, 967 (1934).(13) J. C. Poirier and J. H. de Lap, J. Chem. Phys., 36, 213 (1961).
March, 1963
nificance. The first one, in conventional units, becomes
r /3 (l + q) = t2K;{\DkT(\ + q) = ac1/2 (76)
and is seen to be the Onsager limiting value; we note that, in terms of r as independent variable, the relaxation coefficient is the same for all symmetrical electrolytes. The second one is the former14 Exc log c and part of the former Jc term; the transcendental term represents the second approximation to the long range shielding. The function N'(b) is not very sensitive to the value of b in the practical working range of this parameter; numerical values are given in Table I. It can be closely approximated by the equation
N'(b) = 1.468 + 4.32 e x p ( - 1.176) (77)
625
T able IV alues of V '(6 )
6 JV'(t) b N’(b)1.5 2.2144 6 1.47951.7 2.0181 8 1.47032.0 1.8371 10 1.46832.5 1.6782 12 1.46793.0 1.5973 14 1.46794.0 1.5230 CO 1.4678
The last term is the most interesting; the coefficient e~2T is recognized as the square of the (limiting) activity coefficient
e~2T = exp ( - tW D k T ) = /± 2 (78)
and using the asymptotic expansion of K (b) , we find
r2e -2TX (6) « (4tNa3eb/3000)/±2c (79)
where the coefficient of / ±2c is identical with the value of the association constant calculated on the basis of the contact model.1 Both the last two terms of (72) depend on b, but K(b) increases rapidly with increasing b, as shown in Table II.
T able II V alues of K(b)
b A'(5) b K(b)1.5 — 0.560 6 2.5151.7 — 0.398 8 7.062.0 -0 .1 9 6 10 23.102.5 +0.084 12 88.83.0 0.336 14 385.64.0 0.856 15 831.0
It is clear that the rapid decrease of conductance at fixed concentration with decreasing dielectric constant finds its theoretical description in the fourth term of (72). Furthermore, the variation of aj with solvent composition15 probably is due to the fact that the coefficient J, besides containing N'(b) as it should, also absorbed part of what is here called K(b) as a consequence of the approximation of the Boltzmann factor by the leading terms of its series. In the present calculation, as has been emphasized, the Boltzmann factor is kept intact, and it cannot therefore contribute to the c-term but only to the c/ ±2 term in the conductance equation.
The last term of (72) will replace the former mass action term X Ac/±2, which in effect was obtained by
(14) R. M. Fuoss, J. Am. Chem. Soc., 81, 2639 (1958).(15) E. Hirsch and R. M. Fuoss, ibid., 82, 1018 (1960); D. S. Berns and
R. M. Fuoss, ibid., 83, 1321 (1961); J. E. Lind, Jr., and R. M. Fuoss, J. Phys. Chem., 65, 999, 1414 (1961).
C o n d u c t a n c e o f S y m m e t r i c a l E l e c t r o l y t e s
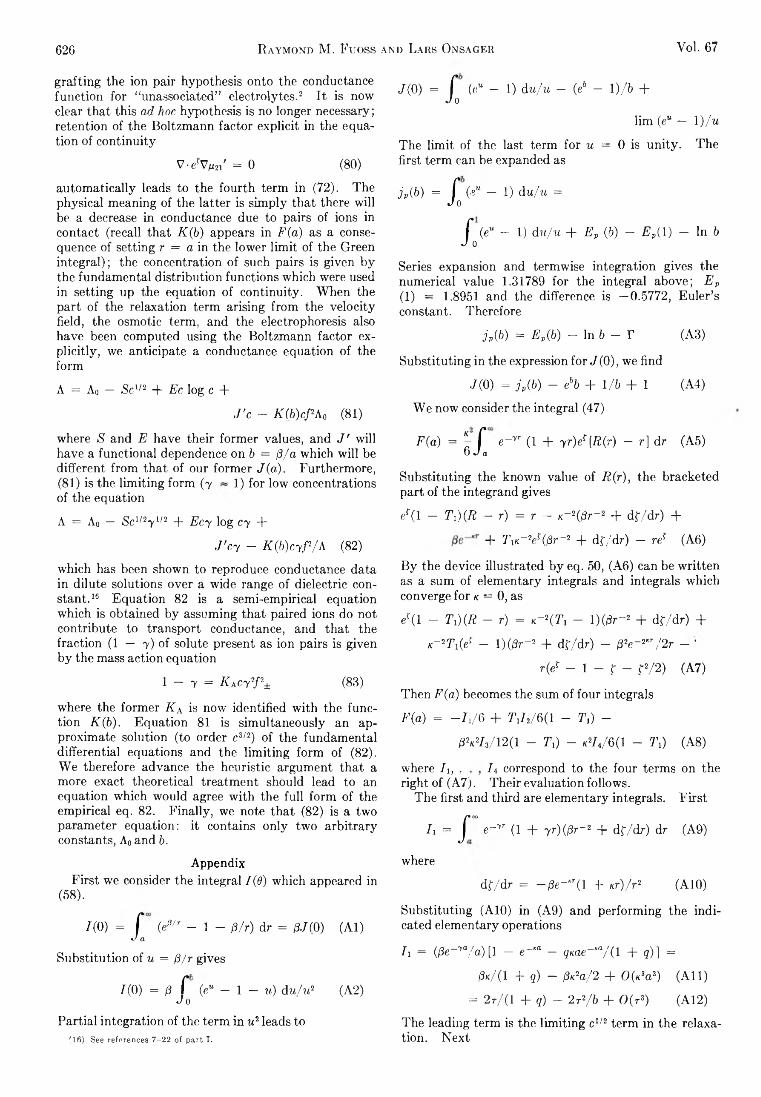
626 R a y m o n d M. F u o s s a n d L a r s O n s a g e r Voi. 67
grafting the ion pair hypothesis onto the conductance function for “ unassociated” electrolytes.2 It is now clear that this ad hoc hypothesis is no longer necessary; retention of the Boltzmann factor explicit in the equation of continuity
V-efVM21' = 0 (80)
automatically leads to the fourth term in (72). The physical meaning of the latter is simply that there will be a decrease in conductance due to pairs of ions in contact (recall that K(b) appears in F(a) as a consequence of setting r = a in the lower limit of the Green integral); the concentration of such pairs is given by the fundamental distribution functions which were used in setting up the equation of continuity. When the part of the relaxation term arising from the velocity field, the osmotic term, and the electrophoresis also have been computed using the Boltzmann factor explicitly, we anticipate a conductance equation of the form
A = A0 — Sc1/2 + Ec log c +
J'c - K(b)cf>A0 (81)
where S and E have their former values, and J' will have a functional dependence on h = p/a which will be different from that of our former J(a). Furthermore, (81) is the limiting form (7 ~ 1) for low concentrations of the equation
A = A0 — & + V ' 2 + Ecy log cy +
J'cy - K(b)cyp/P (82)
which has been shown to reproduce conductance data in dilute solutions over a wide range of dielectric constant.16 Equation 82 is a semi-empirical equation which is obtained by assuming that paired ions do not contribute to transport conductance, and that the fraction (1 — 7) of solute present as ion pairs is given by the mass action equation
1 - 7 = K AcyT ± (83)
where the former K A is now identified with the function K (6). Equation 81 is simultaneously an approximate solution (to order c3/2) of the fundamental differential equations and the limiting form of (82). We therefore advance the heuristic argument that a more exact theoretical treatment should lead to an equation which would agree with the full form of the empirical eq. 82. Finally, we note that (82) is a two parameter equation: it contains only two arbitrary constants, A0 and 6.
AppendixFirst we consider the integral 1(6) which appeared in
(58).
7(0) = f (efs,r - 1 - p/r) dr = ¡3.1(0) (Al)J a
Substitution of u = (3/r gives
7(0) = ¡3 i* (eu — 1 — u) dtt/tt* (A2) do
Partial integration of the term in w2 leads to(16) See references 7-22 of part I.
J(0) = f (eu - 1) du/u - (eb - 1 )/b + do
lim (e“ — 1 )/u
The limit of the last term for u = 0 is unity. The first term can be expanded as
jp(b) = f (eu ~ 1) du/u = do
f (eu — 1) du/u + Ev (b) — E„( 1) — In b J 0
Series expansion and termwise integration gives the numerical value 1.31789 for the integral above; E v (1) = 1.8951 and the difference is —0.5772, Euler’s constant. Therefore
j„(b) = Ev(b) - In b - T (A3)
Substituting in the expression for J (0), we find
d(0) = j p(b) - ebb + 1 / 6 + 1 (A4)
We now consider the integral (47)
F(a) = £ f e~yr (1 + 7r)ee (R(r) - r } dr (A5) 6 do
Substituting the known value of R(r), the bracketed part of the integrand gives
er(l — Ti)(R — r) = r — K ~ 2 ( P r ~2 + dt/dr) +
+ TiK_2er(|3r_2 + df/dr) — ref (A6)
By the device illustrated by eq. 50, (A6) can be written as a sum of elementary integrals and integrals which converge for k = 0, as
er(l - Ti)(R - r) = K- 2(7’1 - 1 )(0r~2 + df/dr) +
K_2Ti(er - l)(;8r~2 + df/dr) - p2e~2KT/2r - ‘
r(er - 1 - r ~ f 2/2 ) (A7)
Then F(a) becomes the sum of four integrals
F(a) = —7,/6 + Tif2/ 6(1 - Ti) -
P V 7,/12(l - TO - + /4/ 6O - 7\) (A8)
where h , . It correspond to the four terms on the right of (A7). Their evaluation follows.
The first and third are elementary integrals. First/■» oo
7j = J e~yr (1 + 7r)(/3r~2 + df/dr) dr (A9)
where
df/dr = — (¡e~Kr(l + xr)/r2 (A10)
Substituting (A10) in (A9) and performing the indicated elementary operations
h = (Pe-ya/a)[l - e - “ - g*ie— /(1 + q)] =
/3k/ (1 + q) - /3K2a/2 + 0 (K3a3) (A ll)
= 2 r /( l + q) - 2t2/6 + 0 (r 3) (A12)
The leading term is the limiting c1/2 term in the relaxation. Next
March, 1963 C o n d u c t a n c e o p S y m m e t r i c a l E l e c t r o l y t e s 627
h = I e~SKa(l + yr) dr/r (A13)J a
wheres = 2 - f g (A14)
I 3 — En(sna) + qe~SKa/(/2 + g) (A15)
The fourth integral has a coefficient k2, and is seen to be convergent for k = 0 ; hence we may set k = 0 in the integrand, after factoring out e~2r as was done in eq. 56. The result is
h = P2e~2r f * (e" - 1 - u - u2/2) du/u* (A16)
after substituting u = fi/r. By a procedure analogous to that used in evaluating 7 (0) at the beginning of this section, we find
h = (/32e_ 2T/2 ) [J(0) - 7 /6 2 + 1/6 + 1/ 62 + 1/21(A17)
Rearrangement of the last four terms in the brackets converts 74 to the convenient form
h = (/32e- 2V2) [J(0) - 7(1 - T/)/62] (A18) where
T! = e“ 6(l + 6 + 62/ 2) (A19)
The second integral in (A8) diverges for k = 0 but again the device of adding and subtracting compensating terms in the integrand leads to a result which is valid through terms of order k2. We proceed as
/* = P / o” e - * (1 + y r ){é — 1 — r )[l —
e~Kr (1 + «•)] dr/r2 + p2 J " e~VKT (1 + <yr)[l -
e ~ KT (i _|_ Kr)Jdr/r3 (A20)
= Phi + P2hï (A21)In In, the exponentials e~1T and e~KT are expanded in series, giving
In = 0 2e~272) (e3/r - 1 - p/r) dr + 0 (k3) (A22)
= (d«2e " 272 ) [j,(b) + 1 + 1/6 - 7 /6 ] (A23)
where j p(6) is defined by (A3). The second integral, / 22, can be evaluated explicitly.
1 22 = (e_î”i0/ 2a2)(l — K« + g/ca) —(e_SKa/ 2ffl2)( l + qKd) +
(k2/4) [#,(p«a) + S n(sKa)] (A24)
where s = (q + 2) and 7 7 7 ) is the negative exponential integral. Expansion of the exponentials in the first two terms on the right of (A24) then gives
I22 = (k2/2) (g — 1/2) + (k2/4 )[En(pKa) +EJsKa)} + 0 (k3) (A25)
Substitution of the values of I 21 and 122 in (A21) then evaluates 72
h = 7 V e - 27 2 ) [ jP(6) + 1 + 1/6 - 7 /6 ] +7 7 7 2 )0 7 - 1/2) + (pV/A) [En{VKa) + En{sKa)]
(A26)
Finally the values of the four integrals are substituted in (A8), giving after rearrangement
F(a) = — t/3(1 + q) - (r2/3 )En(sKa) -T2e~2rK(b) + (t2/3) (In 6 + r - 1) +
[r2/3 ( l - T1)][(2 ’1/2 ) { ^ ( p Ka) - £ re(SKa)} -
3/(2 + (?) + 7\(g - 1/2)] (A27)Further simplification is possible only by expansion of the exponential integrals, using (53). Noting that
ko = 2r/6 (A28)(A27) becomes
F(a) = — t/ 3(1 + g) + (r2/3) In r -T2e~2rK(b) + W "(6)(r2/3 ) (A29)
where
N"(b) = 2T - 1 + In 2 + In (2 + q) +(1 - T U - T O s - 1/ 2) — q/ (2 + g) +
(Ti/2) In (2 + g ) /( l + g)] (A30)
In order to obtain the final value of AXe, the correction AXa given by (70) is added to (A29); it is a constant times r2 and merely changes N"(b) above. On substituting numerical values of the constants, the coefficients shown in (73) result.
A general method for evaluating integrals of the type of 12 termwise also has been worked out. For further reference, it is described below. Consider
7(Ak) = 7 e ->“ r dr/r2 (A31)
where X is a numerical constant (g, 1 + g, etc.). Assume that I (Ak) may be expanded as
7(Xk) = A Bk -]- CnEn(/KKCL) -]-Dk2 + FK2En(\'Ka) + . . . (A32)
where X' = (X -j- 1) is an abbreviation which will keep the equations more compact. Assume that no higher teyms are needed than those given. (The number of terms retained in such expansions depends of course on the power of k in the coefficient of the integral being considered.) The integral (A32) converges for k = 0 and therefore A is obtained simply by setting K = 0 in the integrand
A = 7(0) = f ° ° eff/r dr/r2 = (7 - l)/p (A33)
Differentiating 7 (Ak) partially with respect to k gives
—¡3 ete~x’Kr dr/r2 — X ete~'x" dr/r =
B + CEn(\Ka) - Ce~Xm + 27)k +27777 (A 7a) - TVe“ ^ “ (A34)
Now compensating terms are inserted in the second integral on the left, giving
LHS = - p J*“ 7 e 'x'“r dr/r2 - X f ” e~x‘T (7 -
1) dr/r — X f e~x" dr/rJ a
The last integral is simply En(Xnr); therefore by setting
628 R a y m o n d M . F u o s s a n d L a r s O n s a g e r Vol. 67
C = - A (A35)
the logarithmic singularity is eliminated from both sides of (A34) and the constant C is determined. After cancelling these terms, k may be set equal to zero in the result
—¡3 f dr/r2 — A f (e&,r — 1) dr/r = B + X
whenceB = —X — j8A - \jp(b) (A36)
where j p(b) is the integral defined by (A3). Then a
second differentiation with respect to k and a repetition of the compensating process shows that
F = /3(A + 1)72 (A37)
Finally, letting k go to zero again, after cancelling exponential integrals on the two sides of the equation, D is evaluated
D = 014/2 + 0(1 + 2\)jp(b)/2 +(X*/2)J(0) + A2a/2 + 3/3(1 + X)*/4 (A38)
where J(Q) is the integral defined by (A4).
THE CONDUCTANCE OF SYMMETRICAL ELECTROLYTES.III. ELECTROPHORESIS
B y R aymond M . F uoss and L ars Onsager
C o n t r i b u t i o n N o . 1 7 2 0 f r o m t h e S t e r l i n g C h e m i s t r y L a b o r a t o r y , Y a l e U n i v e r s i t y , N e w H a v e n , C o n n e c t i c u t
R e c e i v e d O c t o b e r 1 8 , 1 9 6 2
The electrophoretic velocity in a dilute solution of a symmetrical electrolyte has been computed, with the following improvements over earlier treatments of the problem: (1) the volume force is calculated as the gradient of the potential of the total force acting on an ion instead of being approximated merely by the force due to the external field; (2) the Boltzmann factor is retained explicitly, instead of being approximated by a truncated series; and (3) the Oseen equations of motion (rather than the Stokes) are used. The result gives the Onsager 1926 limiting value ( — e jx X / G T r n ) as the leading term; to next approximation, this is opposed by a term proportional to concentration, which depends on b = e 2/ a D k T in a non-exponential fashion. For example, for 6 = 1.5( D as 100), F { b ) = 2.31 and for 6 = 15 ( D » 10), F ( b ) — —0.77. The coefficient goes through zero near 6 = 5.
Forces acting on ions in solution are transmitted to the solvent through which they move; the resulting local hydrodynamic currents in the latter are the source of the electrophoretic correction to the mobility. For a solution containing nt ions of species i per unit volume, the volume force acting on the ions is S4 ntk4, where kt is the force acting on one ¿-ion. In the steady state reached in the conductance process, the net force per unit volume of solution vanishes (there is no bulk flow); therefore
2< Wiki + tt0k0 = 0 (1)
where ko is the average force acting on one of the solvent molecules and n0 is the number of the latter per unit volume. In the vicinity of a specified reference ion of species j , however, the concentration of ¿-ions is riji and the net force acting on an element of volume dF becomes
dF = (2 j njikjt + nok0)d F (2)
where kJ( is the local force acting on an ¿-ion, given a j -ion at the origin of coordinates. Combining (1) and (2), the elementary volume force becomes
dF = 2 , (njikji — n<k()dF (3)
In previous calculations1--3 of the electrophoretic velocity from (3), the force kn was approximated by its leading term X e (i, that due to the external fieldX . This approximation is sufficient to give the limiting square root term, but neglects contributions to the total force produced by the atmospheric fields. As will
(1) L. Onsager, Physik. Z 27, 388 (1926).(2) L. Onsager and R. M. Fuoss, J. Phys. Chem., 36, 2689 (1932).(3) D. J. Karl and J. L. Dye, ibid., 66, 477 (1962).
be shown here, these lead to terms of order c in the conductance function A (c), and clearly should be considered in any attempt to deal consistently with terms of order c. Their previous neglect is undoubtedly part of the reason for the observed variation4 of the size parameter aj derived from J, the coefficient of the linear term in A(c). The purpose of this paper is to present a higher approximation obtained by using the gradient of the potential of the total force6 in the calculation of the velocity instead of merely the leading term Xai. The Boltzmann function will be kept explicit.
In our recent computations of the local fields and charge distributions in the ionic atmospheres, we found it convenient to consider for some purposes not just the electrical forces (due to the external field and to local charges) ~Ejiei but rather the total potential (Eye u — kT grad In fa). According to the equations of motion for an incompressible fluid, the formal forces representing the concentration gradients will not affect the resulting velocity field; it is exactly compensated by a redefinition of the pressure to include the osmotic pressure. We retained the hypothesis that the atmospheric charge densities of neighboring ions may be superimposed. To that approximation (at least), the local electric field will be a gradient field (derivable from a potential), and the virtual osmotic force field ( — kT grad In /) is inherently a gradient field.
In the first paper6 of this series, it was shown that the total potentials are
(4) J. E. Lind, Jr., and R. M. Fuoss, ibid., 65, 999, 1414 (1961); 66, 1727 (1962).
(5) R. M. Fuoss and L. Onsager, ibid., 66, 1722 (1962). Symbols defined in parts I and II will be used here without redefinition.
March, 1963 C o n d u c t a n c e o f S y m m e t r i c a l E l e c t r o l y t e s 629
Hu = — ttXR(r) cos # (4)
Hu = — etXP(r) cos # (5)
depending on whether the reference ion has a different charge or a like charge with respect to the ¿-ion located by coordinates r, d. The functions R(r) and P(r) are given by eq. 2.31 and 2.37 of ref. 5. Since the potential depends on both r and d (i.e., on x, y, and z), the simple Stokes equation
dv = dF/ 6 m/r (6)
which is valid when the force dF has only an z-compo- nent, may no longer be used to calculate the component of local velocity in the field direction. Instead, we must use the more general Oseen equation6
dv = [dF + (dF ■ r)r/r2] /87n?r (7)
which gives the velocity dv produced by a volume force dF, acting at the origin, at a point located by the vector r in a medium whose viscosity is -7. We are interested only in the component vjx of velocity in the field direction produced by the force; it is obtained by projecting Vj in the field direction, i.e., by forming the scalar product of Vj and i, the unit vector in the field direction
dvjx = [i-dFj + (rrdFj) cos d ] /8wyr (8)
the exponent t, we use the Debye-Hiickel first approximation for i/', giving
k = P e-xr/rDkT = p e -xr/r (16)
where ¡3 is a constant defined in (16).The partial integration leads to the result
Vjx = — (nejXp/Zn) f a e~KT (1 + xr)[e{R(r) +
e~rP(r) ] dr/r + (ne} Xa/Sy) [ebR(a) - G- bP(a) ] (17)
where
b = ey aDkT (18)
The result (17) follows from (15) by inspection: the limits of er and e_f for r = °= are unity and the limits of both P(r) and R(r) for large r are simply r; hence the integrated term vanishes at the upper limit. At the lower limit, where r = a, e±r becomes e±b plus terms of order xa; since the P-term has a coefficient ( — e“ f); differentiation gives it the same sign as the R- term. There now remains the explicit evaluation of the integral in (17) and the function in brackets.
The functions P(r) and R(r) are given explicitly by the equations6
P(r) = MPx{r) + NelP2(r) (19)
where rj is the unit vector in the radial direction. Let dF = 27rr2 sin d d# dr be an annular element of volume located by r, d. Then from (3)
dF ,/dF = —2 injiVHn (9)
where k^is replaced by Vhu and Sjnjkj in (3) vanishes by the condition of electroneutrality since k, = Aed. For a binary electrolyte, rii = n2 = n and
rin = ne_r, %2 = nef (10)
where
r = M /kT (ii)and ^ is of course the electrostatic potential. Substituting (10) in (9), and recalling that «i = — e2 = e, we obtain
dFi/dk — —TiuV hu — H12V/112 — (12)
neX[e~tV(P cos d) + esV(P cos $)] (13)
where
V(P cos d) = i (R/r) + ri(dP/dr — R/r)cos & (14)
and similarly for V (P cos d).In order to obtain the electrophoretic velocity, the
scalar products i-dFi and iydFi are formed, using(13) and (14), where i -r3 = cos x>. The results are substituted in (8) and the integrations over d (0 < $ < 77-) and r are performed. The result, after collecting terms and rearranging, is
v}x = —(ne}X/3ri) J a [e? d(rK)/dr —
e~f d(rP)/dr] dr (15)
The form of (15) suggests a partial integration. In(6) C. W . Oseen, “ Hydrodynamik,” Akademische Verlagsgesellschaft,
Leipzig, 1927.
PiW = r + (ß/x2r2)gi(r) (20)
P*(r) = r + (ß/x2r2)g2(r) (21)
M = T2/(T2 - 1) (22)
N = - 1/(P 2 - 1) (23)
Tt(jb) -= e6(l - b + Ò72) (24)
Qi(r) == 1 - e~xr (1 + xr) (25)
(r) = 1 — e~xr(l + xr + x2r2) (26)
R(r) = ARj(r) + P e -rP2(r) (27)
Pi(r) = r — (ß/x2r2)gi(r) (28)
Rz(r) = r — (ß/x2r2)g2(r) (29)
A - II i 1 (30)
B = 1/(1 - TO (31)
Ti(b) == e~6(l + b + b2/2) (32)
Since the operations at this stage of the derivation involve r as the independent variable, the functions P and R above are written as P(r) and R(r) for compactness. We must, however, bear in mind that both functions also depend on concentration via x2 and on the contact distance a = ¡3/b.
The integrated term of (17) is easily evaluated, because at r = a, the exponential functions in gi(a) and gz{a) may be expanded as series, giving
gi(a) = x2a2/2 + 0 (mW ) (33)
(72(a) = —x2a2/2 + 0 (x sa3) (34)
Higher terms than the one of order x2 a2 are not needed explicitly here, because the coefficient (ne-,Xa/3y) is already proportional to concentration and terms of order x3as in gi(a) and g2(a) would therefore give
630 R a y m o n d M . F u o s s a n d L a r s O n s a g e r Vol. 67
terms of order xa in R(a) and P(a), whence terms of order c ' 1 in A(c). To our present approximation, we may neglect them. The integrated term then becomes(e;Xr2/67njd)(&/4)[(l — TO“ 1 —
(T2 - l ) “ 1] = (e#Z r V 6mj/S)i,s(6) (35)
where we have substituted
n = x2/8irP (36)
in the coefficient of the integral of (17), and made use of the abbreviation5
t = px/2 (37)
Next we consider the integrals in (17). These are similar to the integrals which appeared in the calculation of the relaxation field7 and will be evaluated by the methods described in the Appendix of part II of this series. Let I\ represent one of the integrals in (17)
h = J'a‘°e~!‘P(r)e~*r(l + xr) dr/r (38)
It diverges for x = 0; as we shall see shortly, it is of the form
I\ — A/x T- Bi CEn(2,xa) T 0(x) (39)
Since 11 has a coefficient n ~ x2 in the electrophoretic velocity, it is clear that part of the square root term comes from A/x, while Bx contributes to linear terms in A(c). The transcendental term in (39) does not, however, lead to an additional c log c term in A(c), because it will be found that
72 = A/x T 7L — CEn(2xa) (40)
and the exponential integrals therefore cancel in the sum (7i + 72).
On substituting the explicit value of P(r), given by (19)-(26), the following integral appears as one of the terms of 7X
I(x) = J"a e~” (1 + xr) dr (41)
It clearly diverges for x = 0, but by adding and subtracting compensating terms in the integrand, we shall see that I(x) can be put into the form
I(x) = a j x + a2 + a3 In xa + <ux In xa (42)
When inserted in (17) to give the velocity, the coefficient n reduces the a\/x term above to the leading square root term in A(c); the a% In xa term is, as already mentioned, cancelled by an opposing term from h ; and the a4 term is of higher order than xl ~ c and is therefore dropped.
First, write 7 (x) asX co
(e“ r - 1 + r )e -xr (1 + xr) dr +
j"a e~xr (1 + xr) dr — 13 J a e~2xr (1 + xr) dr/r =
Ji(x) -f- J 2(x) — /3Jz(x) (43)
If the exponential e“ f in J x(x) is expanded, the leading term is seen to give
17) R . M . F u oss and L . Onsager, J . P h y s . C h e m 67, 621 (1963).
Ju(x) = (|82/2) J o” e -3” (1 + xr) d r/r2 (44)
which clearly converges to /n ( 0) = P2/2 a in the limit x = 0. The higher terms likewise are well behaved. Hence we need only ./j (0) in order to obtain the desired conductance function
<7i(0) = f aa (e -p/r - 1 + p/r) dr (45)
(A more rigorous argument which justifies replacing Ji(x) by ,7i(0) here is given in the Appendix.) By the methods used in part II, <7i(0) is found to have the value
<7i(0) = pJn(b) = P[jn(b) - 1 + (1 - e~b)/b] (46)
where
jn(b) = En{b) + In b + r (47)
En(b) is the negative exponential integral and r is Euler’s constant, 0.5772157 . . . .
The other two terms of 7 (x) are familiar integrals
Jt(x) = 2e~xa/x + pe~xa/b (48)
Jz(x) = En(2xa) + e“ 2*°/2 (49)
We now return to the calculation of h . After using the device of compensating terms just described, and using the condition that the sum of M and N must be unity, 11 can be put into the form
7: = h(x) - ph{x) + M p jn{b) +
{Np/x2)h(x) + (Mp/x2)h(x) (50)
The integral h(x), given by
I Ax) = e~xr (1 + xr) [1 - e -xr (1 + xr)]dr/r3
(51)
= fi(xr) (52)
is an elementary integral, and is found to have the explicit value
I Ax) = (e~xa/2a2)(l - e - xa) + (xe~xa / a) X
(V* - e~xa) + x2En(2xa) - (*2/2 )En(xa) (53)
On approximating the exponential e~xa by the first few terms of its series, we obtain
Ii(x) = 3x2/4 + x2En(2xa) —
(x2/2 )En(xa) + 0 (x za) (54)
The integral I Ax) is explicitly
I Ax) = J a c“ f fAxr) dr (55)
where fA xt) is the same screening function which appeared in I Ax). Using the methods described in the Appendix of part II, we find
h {x) = *2[3/ 4 - (V*)jn(b) - (1/t)En(xa) +
E n(2xa) ] (56)
Combining the five terms which make up 7j, we obtain the sum
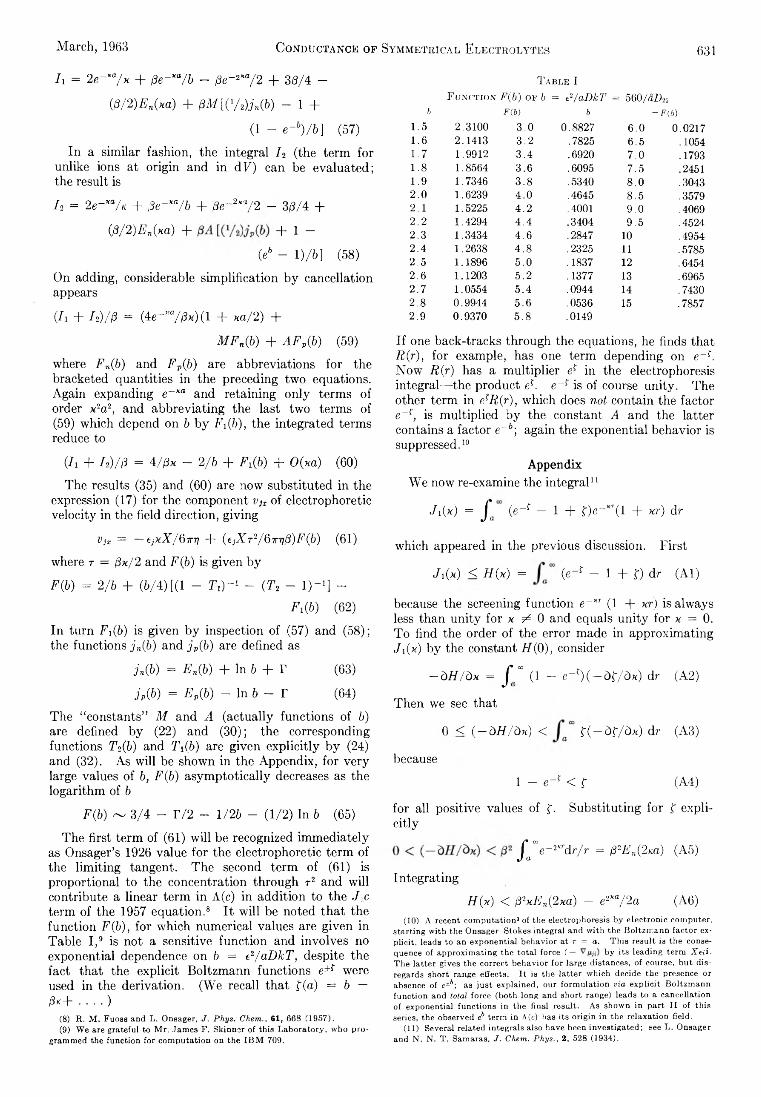
March, 1963 C o n d u c t a n c e o p S y m m e t r i c a l E l e c t r o l y t e s 631
h = 2 e -m/x + (je~*a/b - de~2*0/2 + 35/4 -
(P/2)En(xa) + 0M [(1/\)jn(b) - 1 +
(1 - e~b)/b] (57)
In a similar fashion, the integral h (the term for unlike ions at origin and in dF) can be evaluated; the result is
h = 2e-*°/K + /8e-*°/b + /3e~2xa/2 - 3/3/4 +
(l3/2)En(xa) + + 1 —
(eb - 1 )/b] (58)
On adding, considerable simplification by cancellation appears
(h + h)/p = (4e-J“,//5x)(l + xa/2) +
MFn(b) + AFv(b) (59)
where Fn(b) and Fp(b) are abbreviations for the bracketed quantities in the preceding two equations. Again expanding e~*a and retaining only terms of order x2a2, and abbreviating the last two terms of (59) which depend on b by /'/(?>), the integrated terms reduce to
(I i + 7*)//S = 4:/fix — 2/6 + Fi(b) + 0(xa) (60)
The results (35) and (60) are now substituted in the expression (17) for the component v]x of electrophoretic velocity in the field direction, giving
VjX = —ejxX/Qm) + (ejXT2/GT7]P)F(b) (61)
where r = l3x/2 and F(b) is given by
F(b) = 2/6 + (6/4) [(1 - Ti) “ 1 - (Tt - l ) “ 1] -F i(6) (62)
In turn Fi(6) is given by inspection of (57) and (58); the functions j n(b) and j p(b) are defined as
jn(b) = E n(b) + In 6 + T (63)
j p(b) = Ep(b) — In 6 — T (64)
The “ constants” M and A (actually functions of 6) are defined by (22) and (30); the corresponding functions T2(b) and rI\(b) are given explicitly by (24) and (32). As will be shown in the Appendix, for very large values of 6, F(b) asymptotically decreases as the logarithm of 6
F(b) — 3/4 - 172 - 1/26 - (1/2) In 6 (65)
The first term of (61) will be recognized immediately as Onsager’s 1926 value for the electrophoretic term of the limiting tangent. The second term of (61) is proportional to the concentration through r2 and will contribute a linear term in A(c) in addition to the . /|C term of the 1957 equation.8 It will be noted that the function F(b), for which numerical values are given in Table I ,9 is not a sensitive function and involves no exponential dependence on 6 = e2/aDkT, despite the fact that the explicit Boltzmann functions e±r were used in the derivation. (We recall that f(a) = 6 — /3k+ . . . . )
(8) R. M. Fuoss and L. Onsager, J. Phys.- C h em ., 61, 668 (1957).(9) We are grateful to Mr. James F. Skinner of this Laboratory, who pro
grammed the function for computation on the IBM 709.
T able IF unction F ( b ) of b = e 2/ a D k T = 560/(11)25
b F(b) b -F (6)1.5 2.3100 3.0 0.8827 6.0 0.02171.6 2.1413 3.2 .7825 6.5 .10541.7 1.9912 3.4 .6920 7.0 .17931.8 1.8564 3.6 .6095 7.5 .24511.9 1.7346 3.8 .5340 8.0 .30432.0 1.6239 4.0 .4645 8.5 .35792.1 1.5225 4.2 .4001 9.0 .40692.2 1.4294 4.4 .3404 9.5 .45242,3 1.3434 4.6 .2847 10 .49542.4 1.2638 4.8 .2325 11 .57852.5 1.1896 5.0 .1837 12 .64542.6 1.1203 5.2 .1377 13 .69652.7 1.0554 5.4 .0944 14 .74302.8 0.9944 5.6 .0536 15 .78572.9 0.9370 5.8 .0149
If one back-tracks through the equations, he finds that R(r), for example, has one term depending on e-r . Now R(r) has a multiplier ef in the electrophoresis integral—-the product er. e~f is of course unity. The other term in e{R(r), which does not contain the factor e- *', is multiplied by the constant A and the latter contains a factor e~b; again the exponential behavior is suppressed.10
AppendixWe now re-examine the integral11
Ji(x) = J a (e~{ — 1 + f)e ~ "(l + xr) dr
which appeared in the previous discussion. First
Jx(k) < H(x) = (e -r - 1 + f) dr (Al)
because the screening function e~XT (1 + xr) is always less than unity for x ^ 0 and equals unity for x = 0. To find the order of the error made in approximating J i(x) by the constant 17(0), consider
-dH /dx = J " (1 - e - f) ( - d f /d x ) dr (A2)
Then we see that
0 < (-dH /dx ) < f ( - d f /d x ) dr (A3)
because
1 - e~r < f (A4)
for all positive values of f. Substituting for f explicitly
X cot e -2“d r/r = ^ E n(2m) (A5)
Integrating
H(x) < PxE n(2xa) - e2*a/2a (A6)(10) A recent computation3 of the electrophoresis by electronic computer,
starting with the Onsager-Stokes integral and with the Boltzmann factor explicit, leads to an exponential behavior at r = a. This result is the consequence of approximating the total force ( — by its leading term Xeii. The latter gives the correct behavior for large distances, of course, but disregards short range effects. It is the latter which decide the presence or absence of e±b; as just explained, our formulation via explicit Boltzmann function and total force (both long and short range) leads to a cancellation of exponential functions in the final result. As shown in part II of this series, the observed eb term in A(c) has its origin in the relaxation field.
(11) Several related integrals also have been investigated; see L. Onsager and N. N. T. Samaras, J. C h em . P h y s . , 2, 528 (1934).
632 R i c h a r d K. W o l f o r d Vol. 67
and since E„(2xa) is of order In 2xa
H(x) = 0(x\Tixa) + const. (A7)
Since J\(x) has a coefficient of order x2, we see that the error in A(c) resulting from the replacement of Ji(x) by J i(0) is of order x3 In xa ~ c3/ 2 In c and hence permissible within our desired order of approximation.
Finally, we consider the asymptotic expansion of the function F (6) which appears in (61); it may be written
F(b) = 2lb + (6/4)F,(6) - M F „(b) - A Fv(b) (A8)
where F2(6) is the bracketed quantity in (62), F„(b) and Fpib) are the bracketed quantities in (57) and (58), and M and A are given by (22), (24), (30), and (32). Since Ti ~ b2e~b/2 and T2 b2eb/2, it is easy to see that F2(b) approaches unity for large values of b. The coefficient M also approaches unity. In F„(b), the function j„(b) asymptotically behaves like e~b/b and hence becomes negligible compared to In b; hence
F„(b) ~ 1/6 - 1 + r /2 + (In b)/2 (A9)
The last term of (A8) is most readily estimated by carrying the e~b of I\ inside; (1 — Tt) in the denominator can safely be approximated by unity for large b. Then
A Fv(b) ~ (1 + b + 62/2 ) [(1/26) (1 + 1/6 +
2 !/62 + . . . ) - (1 - e~b)/b + e - b]
~ - 6 /4 - 1/4 + 1/26 + 0(6~2) (A10)
Combining the asymptotic values of the three functions, the final result is
F(b) ~ 3/4 - T/2 - (In 6)/2 - 1/26 (A ll)
For very large values of 6
F (b ) -------(In 6)/2 (A 12)
as announced earlier.
KINETICS OF THE ACID-CATALYZED HYDROLYSIS OF ACETAL IN WATER-ACETONE SOLVENTS AT 15, 25, AND 35°
By R i c h a r d K. W o l f o r d
S o l u t i o n C h e m i s t r y S e c t i o n , N a t i o n a l B u r e a u o f S t a n d a r d s , W a s h i n g t o n 2 5 , D . C .
R e c e i v e d A u g u s t SO , 1 9 6 2
Rate constants for the acid-catalyzed hydrolysis of acetal in water-acetone mixtures have been obtained as a function of solvent composition and temperature. The reaction rate passes through a minimum at an approximately equimolar mixture of water and acetone. The activation energy determined for solutions of the same composition tends to increase as acetone content increases while the activation energy determined for solutions of the same dielectric constant increases as the dielectric constant of the solvent increases.
IntroductionThere are many examples in the literature of the
effect of solvent change on acid-catalyzed hydrolysis reactions of esters,1'2 but the number of such studies dealing with the effect of solvent on acid-catalyzed hydrolysis reactions of acetals has been small.3 The purpose of this investigation, therefore, was to study the effects of solvent change and temperature on the hydrolysis of acetal, CH3CH(OC2H5)2, in water-acetone mixtures and to compare these results with those obtained for ester hydrolyses by other workers. In addition, a correlation of the kinetic behavior with other measures of acidity in these mixed solvents has been attempted. The relation between the activation energy at constant composition and the activation energy at constant dielectric constant was examined to understand better specific solvation and electrostatic effects.
Acetal hydrolysis in aqueous solution is extremely sensitive to hydrogen ion and undergoes specific hydrogen ion catalysis.4 The reaction has been studied in amide-water mixtures as a function of temperature and solvent composition.5 An explanation of the rate be-
(1) E. Tommila and A. Hella, A n n . Acad. S c i. Fennicae, Ser. A , I I , No. 53, 3 (1954).
(2) H. S. Harned and A. M . Ross, J . A m . Chem. Soc., 63, 1993 (1941).(3 ; P. Salomaa, Acta Chem. Scand., 11, 461 (1957).(4) J. N. Bronsted and W . F. K. Wynne-Jones, Trans. Farad ay Soc., 25,
59 (1929).(5) R . K . W olford and R . G. Bates, J . P h ys. Chem .. 66, 1496 (1962).
havior in the amide-water system is difficult, due to the complex nature of the solvent. It is to be expected that a better understanding of the hydrolysis of acetal in mixed solvents can be attained by use of the water- acetone solvent system.
ExperimentalThe rate of reaction was followed by observing the change in
density of the reaction mixture using a dilatometric procedure. The apparatus and the method of purifying the acetal already have been described.6 The rate of the reaction
CH3CH(OC2H6)2 + H20 — *• CHsCHO + 2C2H6OHis given by v = k i C A = /c2Ca.Ch + where k , is the first-order rate constant in sec.-1 , C a the molar concentration of acetal, Ch + the stoichiometric molar concentration of hydrochloric acid, and fe the second-order rate constant in sec.-1 AT-1. The procedure used to obtain k1 from dilatometer readings taken at time t is similar to that used by Swinbourne.6
Spectral Grade acetone (Eastman White Label) was used without further purification.
A ll solutions were made up by weight with the appropriate vacuum correction applied. The concentration of each component was based on the total weight of all components. Density measurements at the temperature of the experiment permitted the calculation of molar concentrations.
The rate constants are considered to be accurate to within ± 2 % . The reproducibility of a given run is not good for solvent mixtures containing 89 mole % acetone. The reason is that as the acetone content increases, the water content decreases, and since one mole of water reacts per mole of acetal, the in itial acetal concentration had to be maintained at a value such that the
(6) E. S. Swinbourne, J . Ch en . Soc., 2371 (I960).
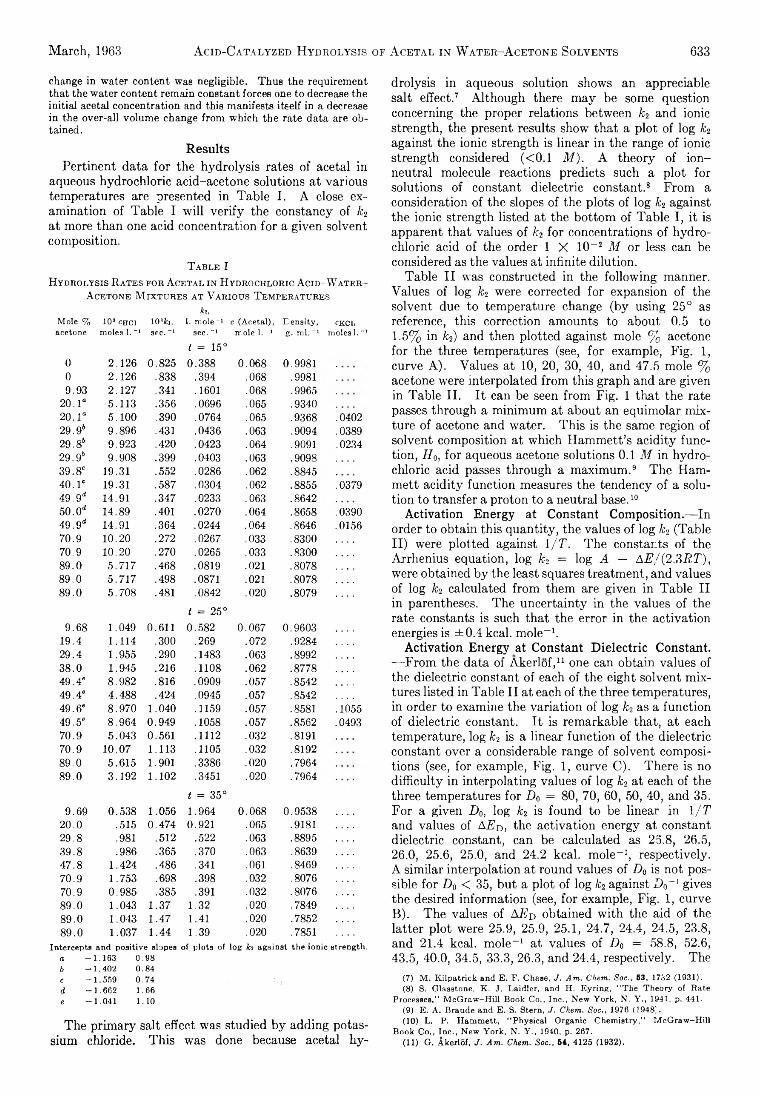
March, 1963 A c i d - C a t a l y z e d H y d r o l y s i s o f A c e t a l i n W a t e r - A c e t o n e S o l v e n t s 633
ch a n ge in w a te r c o n te n t w a s n e g lig ib le . T h u s th e re q u ire m e n t th a t th e w a te r c o n te n t re m a in c o n s ta n t fo rc e s o n e t o decrease th e in i t ia l a c e ta l c o n c e n tra t io n a n d th is m a n ife s ts it s e lf in a decrease in th e o v e r -a l l v o lu m e c h a n g e f ro m w h ic h th e ra te d a ta a re o b ta in e d .
ResultsPertinent data for the hydrolysis rates of acetal in
aqueous hydrochloric acid-acetone solutions at various temperatures are presented in Table I. A close examination of Table I will verify the constancy of k2 at more than one acid concentration for a given solvent composition.
T able IHydrolysis R ates for A cetal in H ydrochloric A cid-W ater-
A cetone M ixtu res a t V arious T emperatures to,
Mole % IO3 CHCl 103¿i, 1. mole-1 c (Acetal), Density, CKCl,acetone moles 1.-1 sec.-1 sec.-1 mole 1.-1 g. ml.-' moles 1._1
0 2 . 1 2 6 0 . 8 2 5
t = 1 5 °
0 . 3 8 8 0 . 0 6 8 0 . 9 9 8 1
0 2 . 1 2 6 . 8 3 8 . 3 9 4 . 0 6 8 . 9 9 8 1
9 . 9 3 2 . 1 2 7 . 3 4 1 . 1 6 0 1 . 0 6 8 . 9 9 6 5
2 0 . 1 ° 5 . 1 1 3 . 3 5 6 . 0 6 9 6 . 0 6 5 . 9 3 4 0
2 0 . 1 “ 5 . 1 0 0 . 3 9 0 . 0 7 6 4 . 0 6 5 . 9 3 6 8 . 0 4 0 2
2 9 . 9 s 9 . 8 9 6 . 4 3 1 . 0 4 3 6 . 0 6 3 . 9 0 9 4 . 0 3 8 9
2 9 . 8 s 9 . 9 2 3 . 4 2 0 . 0 4 2 3 . 0 6 4 . 9 0 9 1 . 0 2 3 4
2 9 . 9 s 9 . 9 0 8 . 3 9 9 . 0 4 0 3 . 0 6 3 . 9 0 9 8
3 9 . 8 ° 1 9 . 3 1 . 5 5 2 . 0 2 8 6 . 0 6 2 . 8 8 4 5
4 0 . 1 ' 1 9 . 3 1 . 5 8 7 . 0 3 0 4 . 0 6 2 . 8 8 5 5 . 0 3 7 9
4 9 . 9d 1 4 . 9 1 . 3 4 7 . 0 2 3 3 . 0 6 3 . 8 6 4 2
5 0 . O'* 1 4 . 8 9 . 4 0 1 . 0 2 7 0 . 0 6 4 . 8 6 5 8 . 0 3 9 0
4 9 . 9J 1 4 . 9 1 . 3 6 4 . 0 2 4 4 . 0 6 4 . 8 6 4 6 . 0 1 5 6
7 0 . 9 1 0 . 2 0 . 2 7 2 . 0 2 6 7 . 0 3 3 . 8 3 0 0
7 0 . 9 1 0 . 2 0 . 2 7 0 . 0 2 6 5 . 0 3 3 . 8 3 0 0
8 9 . 0 5 . 7 1 7 . 4 6 8 . 0 8 1 9 . 0 2 1 . 8 0 7 8
8 9 . 0 5 . 7 1 7 . 4 9 8 . 0 8 7 1 . 0 2 1 . 8 0 7 8
8 9 . 0 5 . 7 0 8 . 4 8 1 . 0 8 4 2 . 0 2 0 . 8 0 7 9
9 . 6 8 1 . 0 4 9 0 . 6 1 1
t = 2 5 °
0 . 5 8 2 0 . 0 6 7 0 . 9 6 0 3
1 9 . 4 1 . 1 1 4 . 3 0 0 . 2 6 9 . 0 7 2 . 9 2 8 4
2 9 . 4 1 . 9 5 5 . 2 9 0 . 1 4 8 3 . 0 6 3 . 8 9 9 2
3 8 . 0 1 . 9 4 5 . 2 1 6 . 1 1 0 8 . 0 6 2 . 8 7 7 8
4 9 . 4 ° 8 . 9 8 2 . 8 1 6 . 0 9 0 9 . 0 5 7 . 8 5 4 2
4 9 . 4 ° 4 . 4 8 8 . 4 2 4 . 0 9 4 5 . 0 5 7 . 8 5 4 2
4 9 . 6 ° 8 . 9 7 0 1 . 0 4 0 . 1 1 5 9 . 0 5 7 . 8 5 8 1 . 1 0 5 5
4 9 . 5 ' 8 . 9 6 4 0 . 9 4 9 . 1 0 5 8 . 0 5 7 . 8 5 6 2 . 0 4 9 3
7 0 . 9 5 . 0 4 3 0 . 5 6 1 . 1 1 1 2 . 0 3 2 . 8 1 9 1
7 0 . 9 1 0 . 0 7 1 . 1 1 3 . 1 1 0 5 . 0 3 2 . 8 1 9 2
8 9 . 0 5 . 6 1 5 1 . 9 0 1 . 3 3 8 6 . 0 2 0 . 7 9 6 4
8 9 . 0 3 . 1 9 2 1 . 1 0 2 . 3 4 5 1 .020 . 7 9 6 4
9 . 6 9 0 . 5 3 8 1 . 0 5 6
t = 3 5 °
1 . 9 6 4 0 . 0 6 8 0 . 9 5 3 8
2 0 . 0 . 5 1 5 0 . 4 7 4 0 . 9 2 1 . 0 6 5 . 9 1 8 1
2 9 . 8 . 9 8 1 . 5 1 2 . 5 2 2 . 0 6 3 . 8 8 9 5
3 9 . 8 . 9 8 6 . 3 6 5 . 3 7 0 . 0 6 3 . 8 6 3 9
4 7 . 8 1 . 4 2 4 . 4 8 6 . 3 4 1 . 0 6 1 . 8 4 6 9
7 0 . 9 1 . 7 5 3 . 6 9 8 . 3 9 8 . 0 3 2 . 8 0 7 6
7 0 . 9 0 . 9 8 5 . 3 8 5 . 3 9 1 . 0 3 2 . 8 0 7 6
8 9 . 0 1 . 0 4 3 1 . 3 7 1 . 3 2 . 0 2 0 . 7 8 4 9
8 9 . 0 1 . 0 4 3 1 . 4 7 1 . 4 1 . 0 2 0 . 7 8 5 2
8 9 . 0 1 . 0 3 7 1 . 4 4 1 . 3 9 .020 . 7 8 5 1
Intercepts and positive slopes of plots of log to against the ionic strength.a -1.163 0.98 b -1.402 0.84c -1.559 0.74 : I{- d -1.662 1.66 e -1.041 1.10
The primary salt effect was studied by adding potas-sium chloride. This was done because acetal hy-
drolysis in aqueous solution shows an appreciable salt effect.7 Although there may be some question concerning the proper relations between k2 and ionic strength, the present results show that a plot of log k2 against the ionic strength is linear in the range of ionic strength considered (<0.1 M ). A theory of ion- neutral molecule reactions predicts such a plot for solutions of constant dielectric constant.8 From a consideration of the slopes of the plots of log k2 against the ionic strength listed at the bottom of Table I, it is apparent that values of k2 for concentrations of hydrochloric acid of the order 1 X 10~2 M or less can be considered as the values at infinite dilution.
Table II was constructed in the following manner. Values of log k2 were corrected for expansion of the solvent due to temperature change (by using 25° as reference, this correction amounts to about 0.5 to 1.5% in k2) and then plotted against mole % acetone for the three temperatures (see, for example, Fig. 1, curve A). Values at 10, 20, 30, 40, and 47.5 mole % acetone were interpolated from this graph and are given in Table II. It can be seen from Fig. 1 that the rate passes through a minimum at about an equimolar mixture of acetone and water. This is the same region of solvent composition at which Hammett’s acidity function, H0, for aqueous acetone solutions 0.1 M in hydrochloric acid passes through a maximum.9 The Hammett acidity function measures the tendency of a solution to transfer a proton to a neutral base.10
Activation Energy at Constant Composition.—In order to obtain this quantity, the values of log k2 (TableII) were plotted against l/T. The constants of the Arrhenius equation, log k2 = log A — AE/(2.3RT), were obtained by the least squares treatment, and values of log k2 calculated from them are given in Table II in parentheses. The uncertainty in the values of the rate constants is such that the error in the activation energies is ±0.4 kcal. mole-1.
Activation Energy at Constant Dielectric Constant. — From the data of Akerlof,11 one can obtain values of the dielectric constant of each of the eight solvent mixtures listed in Table II at each of the three temperatures, in order to examine the variation of log k2 as a function of dielectric constant. It is remarkable that, at each temperature, log k2 is a linear function of the dielectric constant over a considerable range of solvent compositions (see, for example, Fig. 1, curve C). There is no difficulty in interpolating values of log k2 at each of the three temperatures for D0 = 80, 70, 60, 50, 40, and 35. For a given D0, log k2 is found to be linear in l/T and values of A1?d , the activation energy at constant dielectric constant, can be calculated as 26.8, 26.5,26.0, 25.6, 25.0, and 24.2 kcal. mole-1, respectively. A similar interpolation at round values of D0 is not possible for D0 < 35, but a plot of log lc2 against D ,r ] gives the desired information (see, for example, Fig. 1, curve B). The values of AZ?d obtained with the aid of the latter plot were 25.9, 25.9, 25.1, 24.7, 24.4, 24.5, 23.8, and 21.4 kcal. mole-1 at values of D0 = 58.8, 52.6,43.5, 40.0, 34.5, 33.3, 26.3, and 24.4, respectively. The
(7) M. Kilpatrick and E. F. Chase, J. Am. Chem. Soc., 53, 1732 (1931).(8) S. Glasstone, K. J. Laidler, and H. Eyring, “ The Theory of Rate
Processes,” McGraw-Hill Book Co., Inc., New York, N. Y., 1941, p. 441.(9) E. A. Braude and E. S. Stern, J. Chem. Soc., 1976 (1948).(10) L. P. Hammett, “ Physical Organic Chemistry,” McGraw-Hill
Book Co., Inc., New York, N. Y., 1940, p. 267.(11) G. Akerlof, J . Am . Chem. S o c ., 64, 4125 (1932).
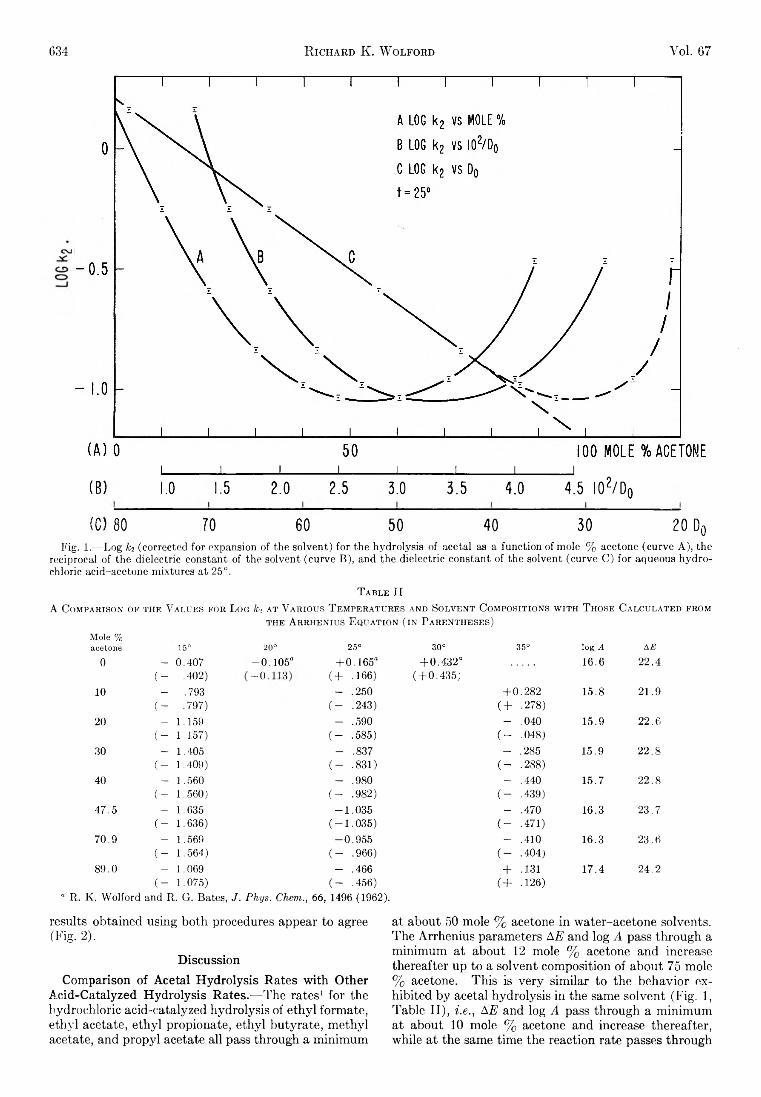
634 R i c h a r d R . W o l f o r d Vol. 67
I_________ I_________ I_________ I_________ I_________ I_________ I_________ I(B) 1.0 1.5 2.0 2.5 3.0 3.5 4.0 4.5 I02/D 0
( 0 80 70 60 50 40 30 20 D0Fig. 1.—Log fe (corrected for expansion of the solvent) for the hydrolysis of acetal as a function of mole % acetone (curve A), the
reciprocal of the dielectric constant of the solvent (curve B), and the dielectric constant of the solvent (curve C) for aqueous hydrochloric acid-acetone mixtures at 25°.
T able IIA C omparison of the V alues for Log k% at V arious T emperatures and Solvent C ompositions w ith T hose C alculated from
the A rrhenius E quation ( in Parentheses)Mole %acetone 15° 20° 25° 30° 35° log A AE
0 — 0.407 -0 .1 0 5 “ +0.165“ +0.432“ 16.6 22.4( - .402) CO©1 ( + .166) (+0.435)
10 — .793 - .250 +0.282 15.8 21.9( - .797) ( - .243) ( + .278)
20 - 1.159 - .590 - .040 15.9 22.6( - 1.157) ( - .585) ( - .048)
30 — 1.405 - .837 - .285 15.9 22.8( - 1.409) ( - .831) ( - .288)
40 — 1.560 - .980 — .440 15.7 22.8( - 1.560) ( - .982) ( - .439)
47.5 - 1.635 -1 .0 3 5 — .470 16.3 23.7( - 1.636) (-1 .0 3 5 ) ( - .471)
70.9 - 1.569 -0 .9 5 5 — .410 16.3 23.6( - 1.564) ( - .966) ( - .404)
89.0 - 1.069 - .466 + .131 17.4 24.2( - 1.075) ( - .456) ( + .126)
a R. K. Wolford and R. G. Bates, J . P h y s . C h e m . , 6 6 , 1496 (1962).results obtained using both procedures appear to agree (Fig. 2).
DiscussionComparison of Acetal Hydrolysis Rates with Other
Acid-Catalyzed Hydrolysis Rates.—The rates1 for the hydrochloric acid-catalyzed hydrolysis of ethyl formate, ethyl acetate, ethyl propionate, ethyl butyrate, methyl acetate, and propyl acetate all pass through a minimum
at about 50 mole % acetone in water-acetone solvents. The Arrhenius parameters AE and log A pass through a minimum at about 12 mole % acetone and increase thereafter up to a solvent composition of about 75 mole % acetone. This is very similar to the behavior exhibited by acetal hydrolysis in the same solvent (Fig. 1, Table II), i.e., AE and log A pass through a minimum at about 10 mole % acetone and increase thereafter, while at the same time the reaction rate passes through
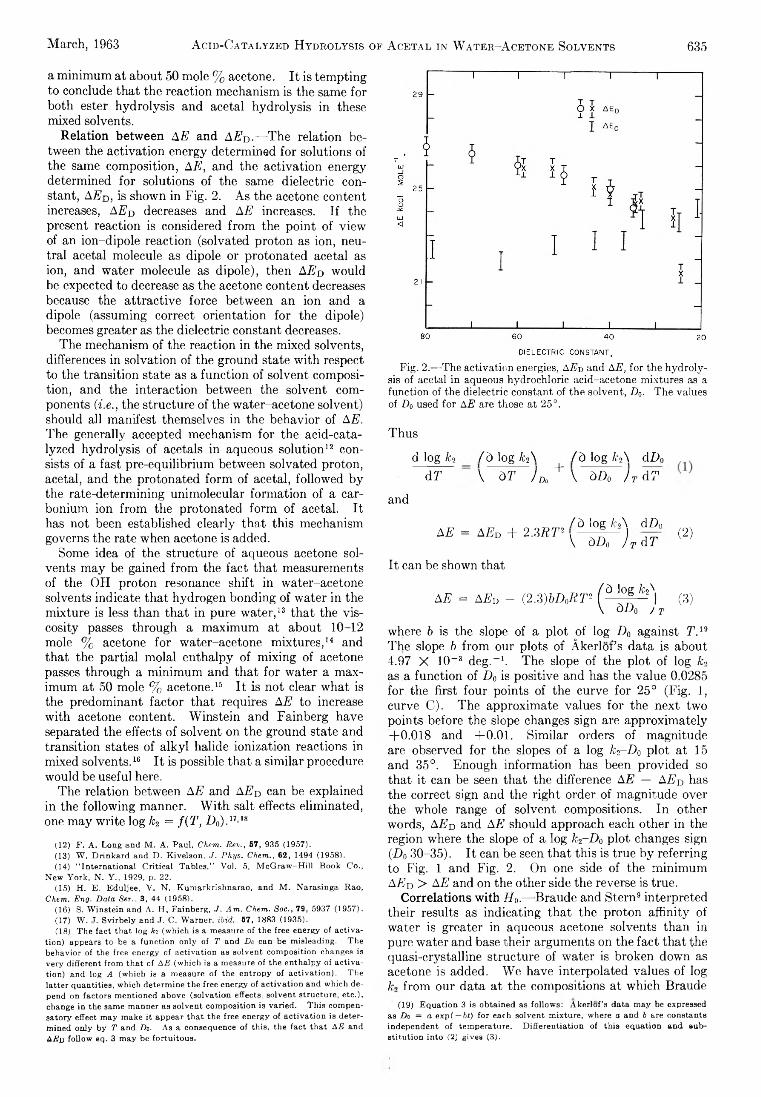
March, 1963 A c i d - C a t a l y z e d H y d r o l y s i s o f A c e t a l i n W a t e r - A c e t o n e S o l v e n t s 635
a minimum at about 50 mole % acetone. It is tempting to conclude that the reaction mechanism is the same for both ester hydrolysis and acetal hydrolysis in these mixed solvents.
Relation between AE and AEn.—The relation between the activation energy determined for solutions of the same composition, AE, and the activation energy determined for solutions of the same dielectric constant, AEd, is shown in Fig. 2. As the acetone content increases, AED decreases and AE increases. If the present reaction is considered from the point of view of an ion-dipole reaction (solvated proton as ion, neutral acetal molecule as dipole or protonated acetal as ion, and water molecule as dipole), then AE0 would be expected to decrease as the acetone content decreases because the attractive force between an ion and a dipole (assuming correct orientation for the dipole) becomes greater as the dielectric constant decreases.
The mechanism of the reaction in the mixed solvents, differences in solvation of the ground state with respect to the transition state as a function of solvent composition, and the interaction between the solvent components (i.e., the structure of the water-acetone solvent) should all manifest themselves in the behavior of AE. The generally accepted mechanism for the acid-catalyzed hydrolysis of acetals in aqueous solution12 consists of a fast pre-equilibrium between solvated proton, acetal, and the protonated form of acetal, followed by the rate-determining unimolecular formation of a car- bonium ion from the protonated form of acetal. It has not been established clearly that this mechanism governs the rate when acetone is added.
Some idea of the structure of aqueous acetone solvents may be gained from the fact that measurements of the OH proton resonance shift in water-acetone solvents indicate that hydrogen bonding of water in the mixture is less than that in pure water,13 that the viscosity passes through a maximum at about 10-12 mole % acetone for water-acetone mixtures,14 and that the partial molal enthalpy of mixing of acetone passes through a minimum and that for water a maximum at 50 mole % acetone.16 It is not clear what is the predominant factor that requires AE to increase with acetone content. Winstein and Fainberg have separated the effects of solvent on the ground state and transition states of alkyl halide ionization reactions in mixed solvents.16 It is possible that a similar procedure would be useful here.
The relation between AE and AEd can be explained in the following manner. With salt effects eliminated, one may write log fc2 = f(T , H0).17'18
(12) F. A. Long and M. A. Paul, Chem. Rev., 57, 935 (1957).(13) W. Drinkard and D. Kivelson, J. Phys. Chem., 62, 1494 (1958).(14) “ International Critical Tables,” Vol. 5, McGraw-Hill Book Co.,
New York, N. Y., 1929, p. 22.(15) H. E. Eduljee, Y. N. Kumarkrishnarao, and M. Narasinga Rao,
Chem. Eng. Data Ser., 3, 44 (1958).(16) S. Winstein and A. H, Fainberg, J. Am. Chem. Soc., 79, 5937 (1957).(17) W. J. Svirbely and J. C. Warner, ibid., 57, 1883 (1935).(18) The fact that log kv (which is a measure of the free energy of activa
tion) appears to be a function only of T and Do can be misleading. The behavior of the free energy of activation as solvent composition changes is very different from that of AE (which is a measure of the enthalpy of activation) and log A (which is a measure of the entropy of activation). The latter quantities, which determine the free energy of activation and which depend on factors mentioned above (solvation effects, solvent structure, etc.), change in the same manner as solvent composition is varied. This compensatory effect may make it appear that the free energy of activation is determined only by T and Do. As a consequence of this, the fact that AE and AEd follow eq. 3 may be fortuitous*
Pig. 2.—The activation energies, A E -d and A E , for the hydrolysis of acetal in aqueous hydrochloric acid-acetone mixtures as a function of the dielectric constant of the solvent, D 0. The values of D o used for A E are those at 25°.
Thus
d log h d T
and
/ ò log /c2\ / Ò log h \ dl)nV ÒT ) Da + V ÒDo Jt dT
AE = AEd + 2.3 RT2/ ò log k2\ dD0 \ àDo ) T dT
(2)
It can be shown that
AE = AEd - (2.3) W W 2 f 5 l0 fcgN) (3)\ d P 0 J t
where b is the slope of a plot of log D0 against 77.19 The slope b from our plots of Akerlof’s data is about 4.97 X 10⁻³ deg.“ 1. The slope of the plot of log k. as a function of Da is positive and has the value 0.0285 for the first four points of the curve for 25° (Fig. 1, curve C). The approximate values for the next two points before the slope changes sign are approximately +0.018 and +0.01. Similar orders of magnitude are observed for the slopes of a log k2-D 0 plot at 15 and 35°. Enough information has been provided so that it can be seen that the difference AE — AEd has the correct sign and the right order of magnitude over the whole range of solvent compositions. In other words, AEd and AE should approach each other in the region where the slope of a log k2-D 0 plot changes sign (Z)0 30-35). It can be seen that this is true by referring to Fig. 1 and Fig. 2. On one side of the minimum AEd > AE and on the other side the reverse is true.
Correlations with H0.—Braude and Stern9 interpreted their results as indicating that the proton affinity of water is greater in aqueous acetone solvents than in pure water and base their arguments on the fact that he quasi-crystalline structure of water is broken down as acetone is added. We have interpolated values of log k, from our data at the compositions at which Braude
(19) Equation 3 is obtained as follows: Akerlof’s data may be expressed as Do = a exp( — bt) for each solvent mixture, where a and b are constants independent of temperature. Differentiation of this equation and substitution into (2) gives (3).
636 W. K e i t h H a l l a n d J. A. H a s s e l l Vol. 67
and Stern determined H0 for aqueous acetone solutions that were 0.1 M in hydrochloric acid. A plot of log /c2 against H0 gives a good straight line of slope 0.83. A linear plot of the logarithm of the rate constant against Ii0 with unit slope has been used for many years as a criterion for an A-l mechanism in concentrated aqueous solutions of mineral acids.12-20 The usefulness of this criterion has been questioned for the past several years, and other proposals have been advanced to take its place.21-22 It has been pointed out that the H0 concept loses some of its generality as
(20) Reference 10, p. 273.(21) J. F. Bunnett, J. Am. Chem. Soc., 83, 4968 (1961).(22) E. Whalley, Trans. Faraday Soc., 55, 798 (1959).
one goes from aqueous solution to media of lower dielectric constant.23 This has been demonstrated many times. It appears then that one cannot assign a mechanism to a reaction occurring in mixed solvents on the basis of a rate-H 0 correlation.
Although the H0 scale has not been established on an absolute basis in aqueous binary solvents or non- aqueous solvents, there are many instances24 of good correlations of rates with indicator acidities to which the results of this work may be added.
(23) B. Gutbezahl and E. Grunwald, J. Am. Chem. Soc., 75, 559 (1953).(24) See, for example, ref. 3 and C. A. Bunton, J. B. Ley, A. J. Rhind-
Tutt, and C. A. Vernon, J. Chem. Soc., 2327 (1957); E. A. Braude and E. S. Stern, ibid., 1982 (1948).
MICROCATALYTIC STUDIES OF THE HYDROGENATION OF ETHYLENE. I. THE PROMOTING EFFECT OF ADSORBED HYDROGEN ON THE CATALYTIC
ACTIVITY OF METAL SURFACESBy W. K eith H all and J. A. H assell
M e l l o n I n s t i t u t e , P i t t s b u r g h , P a .
R e c e i v e d A u g u s t S O , 1 9 6 2
The enhanced activity of copper-nickel alloy catalysts, brought about by pretreatment with hydrogen, is shown to result from alteration of a surface property; it is not a bulk effect as previously supposed. The activity difference is maintained a t sub-zero reaction temperatures, even in a flowing stream of hydrogen. The metals of the first transition series have been surveyed, and it has been found that iron, cobalt, and nickel are poisoned by activated hydrogen chemisorption, while copper and copper-nickel alloys are promoted. Small amounts of oxygen left within the catalysts following reduction do not alter their activities substantially. When hydrogen was substituted for helium as carrying gas, the ortho-para hydrogen conversion could be measured concomitantly and was affected by pretreatment in the same way as the ethylene hydrogenation. The rates of these two reactions were generally correlative, but it was also observed tha t the o-p conversion was catalyzed, rather than poisoned, by the carbonaceous residues left from the hydrogenation. Similar behavior was observed for the H2-D 2 exchange. I t was concluded, therefore, that the activity variations result from alteration of the ability of the catalyst to activate hydrogen. Studies of the interaction of C2H4 with the surfaces did not show a correlation with pretreatment, as C2H6 was produced only on hydrogen treated surfaces, regardless of the catalyst composition. These results, nevertheless, provide some insight into the situation on the surface during hydrogenation.
IntroductionIn earlier work1 with a series of copper-nickel alloy
catalysts, it was observed that cooling from the reduction temperature (250 or 350°) to the reaction temperature ( ~ —80°) in the presence of hydrogen resulted in catalysts from two- to tenfold more active for the hydrogenation of ethylene than were produced when the alloys were outgassed at the reduction temperature and cooled in vacuo or in flowing helium. Further experiments2 showed that the amounts of hydrogen reversibly sorbed (corresponding to the difference in pretreatment) varied somewhat with pretreatment conditions but were many times their BET monolayer equivalents. This work also revealed that the hydrogen, in excess of that adsorbed on the catalyst surface, was in some way associated with small amounts of oxygen (less than 5 atom %) left trapped within the matrix of the metal following the reduction of the mixed oxides. This knowledge led to the supposition that the oxygen, and/or the hydrogen associated with it, had a controlling influence on the catalytic activity.
In discussing this paper2 at the Second International Congress on Catalysis, H. S. Taylor suggested that our observations offered an explanation for the well known
(1) W. K. Hall and P. EL Emmett, J. Phys. Chem., 63, 1102 (1959).(2) W. K. Hall, F. J. Cheselske, and F. E. Lutinski, “ Congres Inter
national de Catalyse,” 2ieme, Paris, 1960. Actes. Paris, Editions Technip, Vol. 2, 1961, p. 2199.
difference in the behavior of evaporated copper films and bulk copper catalysts. His idea was that the small amount of oxide dissolved in the metal provided the vacant d-orbitals required for the adsorption of hydrogen. The need for further work to ascertain the relationship of our observations to the basic theory of catalysis was pointed out.3 The present work was undertaken with this view and it has been found that the catalytic activity does not depend upon either the small amount of encapsulated oxide or on the rather large portion of hydrogen associated with it, but only upon that relatively small portion held on the catalyst surface or in solution in the metal. This finding is in accord with our earlier results1 for a pure nickel catalyst, which was poisoned by cooling in hydrogen but which had sufficient hydrogen associated with it to cover only about 80% of its surface. It is also in accord with the recent findings of Gharpurey and Emmett4 that the activity pattern obtained from evaporated copper-nickel alloy films, which were presumably free from oxygen, was substantially the same as that observed for our reduced oxide alloys.1
The phenomenon of chemical promotion has long been known, e.g., the effect of 0.5% K 20 added to iron catalysts used for the ammonia synthesis, but it still is
(3) P. H. Emmett, ref. 2, Vol. 2, p. 2218.(4) M. K. Gharpurey and P. H. Emmett, J. Phys. Chem., 65, 1182 (1961).
March, 1968 M i c r o c a t a l y t i c S t u d i e s o f H y d r o g e n a t i o n o f E t h y l e n e 637
little understood. The effects of a high temperature form of chemisorbed hydrogen on catalytic behavior have been known for many years1-6-10 but so far have not been studied systematically. The present paper is a step in this direction.
ExperimentalCatalysts.—The principal part of the present work was carried
out using fresh samples of the same unpromoted copper-nickel alloy catalysts reported previously.1 Notes on their preparation and purity are given elsewhere.11 I t will suffice to say here that the coprecipi bated oxides were reduced with hydrogen according to Best and Russell’s modification12 of the method of Long, Fraser, and O tt.13 A separate study14 showed that alloying was substantially complete; this was re-checked in the present work with the catalysts reduced by method B (see later). The designations and compositions of the reduced binary alloys in order of decreasing a t o m % nickel are11: VIII = 100%; V = 84.8%; VI = 72.4%; VII = 53.8%; IV = 20.6%; X I = 14.7%; I = II = 0%. Also, a catalyst having an over-all composition of 95.0% was made by grinding together aliquots of catalysts VIII and V. That complete alloying took place during reduction was checked by X-ray measurements.14
A number of other transition metals and several commercial catalysts were tested to ascertain the generality of the promoting effect of preadsorbed hydrogen. These materials, their sources, and information concerning their purity follow. Catalysts G- Fe-51 and G-Co-51 were spectroscopically pure iron and cobalt oxide catalysts purchased from the M. K. Research & Development Co., Pittsburgh, Pa. Spark spectra analysis indicated that their total metallic impurity contents were less than 50 p.p.m. and made up principally of Ca and Na. Catalysts P-2007 and 89EE were furnished by the Bureau of Mines. The former was a 3% A120 3 singly promoted iron-synthetic ammonia catalyst made from pure Allen Wood magnetite, while the latter was a cobalt- thoria-magnesia-kieselguhr catalyst having a composition ratio of 100:6:12:200. The method of its preparation16 and its physical properties16 are described elsewhere. Catalyst Ni (0104), a commercial nickel-kieselguhr catalyst, was a gift of the Harshaw Chemical Co.; it had a nominal composition of 59% Ni.
Gases Used.—The hydrogen and helium were obtained from the Air Reduction Sales Co. and had nominal purities of 99.8 and 99.95%, respectively. The ultimate practical limit of purification was used for all of the gases. The train for hydrogen consisted of a Deoxo purifier, anhydrous magnesium perchlorate, platinized asbestos at 375°, more anhydrous magnesium perchlorate, and a trap containing approximately 25 g. of high area charcoal thermostated a t —195°; this trap was evacuated at 375° at weekly intervals, i . e . , between every one or two experiments.
The helium carrying gas flowed continuously over the catalysts at a rate of 50 cc./min. for intervals of over 24 hr. In order to remove the last vestiges of poisoning of our most sensitive catalysts from this source, a series of traps was required. The system devised included a multistage Dry Ice trap followed by two liquid nitrogen traps, filled with high area charcoal. Water appeared to be the chief impurity removed in the first trap.
The ethylene used was C.p . grade obtained from the Matheson Co. I t had a nominal purity of 99.7%, the chief impurities being ethane, propane, and propylene to the extent of about 0.1% each. After drying by passing through a two-stage Dry Ice trap ( — 80 °), it was further purified by passing over a large amount (approximately 600 g.) of the commercial nickel-kieselguhr catalyst (Ni 0104). This was treated with pure hydrogen at 375° between
(5) P. H. Emmett and R. W. Harkness, J. Am. Chem. Soc., 57, 1628 (1935).
(6) J. T. Kummer and P. H. Emmett, J. Phys. Chem., 56, 258 (1952).(7) C. L. McCabe and G. D. Halsey, J. Am. Chem. Soc., 74, 2732 (1952).(8) A. Amano and G. Parravano, Advan. Catalysis, 9, 716 (1957).(9) R. E. Cunningham and A. T. Gwathmey, ibid., 9, 25 (1957).(10) P. B. Shalleross and W. W. Russell, J. Am. Chem. Soc., 81, 4132
(1959).(11) W. K. Hall and P. H. Emmett, J. Phys. Chem., 62, 816 (1958).(12) R. J. Best and W. W. Russell, J. Am. Chem. Soc., 76, 838 (1954).(13) J. H. Long, J. C. W. Fraser, and E. Ott, ibid., 56, 1101 (1934).(14) W. K. Hall and L. Alexander, J. Phys. Chem., 61, 242 (1957).(15) R. B. Anderson, A. Krieg, B. Seligman, and W. E. O’Neill, 2nd. Eng.
Chem., 39, 1548 (1947).(16) R. B. Anderson, W. K. Hall, H. Hewlett, and B. Seligman, J. Am.
Chem. Soc., 69, 3114 (1947).
runs and brought to the temperature of Dry Ice before diverting the ethylene stream over it. Since severe poisoning was observed in only a few cases, e . g . , with pure Ni and Co, and generally not at all, it could be attributed to carbonaceous residues resulting from the reaction.
For some experiments, blends of hydrogen and ethylene, separately purified as above, were made and stored at above atmospheric pressure in glass bulbs attached to an all-glass vacuum system. The use of blends freed the hydrogen train for use as carrying gas. The ortho-para ratio of this hydrogen corresponded to equilibrium at the temperature of liquid nitrogen.
Equipment and Procedure.—The equipment used in this work has been described in detail elsewhere.1'5 6 7 8 9 10 11 12 13 14 15 16 17’18 I t consisted of an all-glass vacuum system and auxiliary microcatalytic equipment. The catalyst was contained in the approximately 2 mm. annular space between the thermocouple well and the outside wall of the all-glass reactor. The catalyst volume was usually about 5 cc. The reactor was connected to the dosing device which could be filled with the blend of reactant gases (60% H2, 40% C2H4) either from the storage bulb or by flushing with a blend of the same composition prepared by mixing metered flows of the pure reactants. The flow meters used for this purpose were of an all-glass, vacuum tight design. This procedure was used for the evaluations of catalyst activity, as in the earlier work.1-17 Also, when the flow technique was used, the all-glass dosing device could be replaced by a gemi-automatic dosing system described previously.18 It was found tha t these techniques all yielded the same-results within the limits of reproducibility. The slug size was approximately 16 cc. (NTP) and the blends were carried over the catalyst by helium at a flow rate of 50 ± 1 cc./min.
The evacuated glass doser was filled from the storage bulb, v i a a BET system, in a number of special experiments. These included tests made with hydrogen carrying gas and studies of the self-hydrogenation of ethylene using blends of C2H4 and He.
The catalysts were heated by surrounding the all-glass reactor with a resistance-wound furnace controlled by a thyratron circuit. For studies carried out below room temperature, the furnace was replaced by the thyratron-controlled cryostat described earlier.1 The temperature of this could be set manually or programmed to change automatically in synchronism with the dosing device18; in the latter case, it was provided with a liquid nitrogen leveling device and could be operated continuously for several days without difficulty; the temperature could be controlled re- producibly to ±0.2°.
The catalysts were reduced by two methods. In m e t h o d A , the reduction was started in a high flow of H2 at 170°. The Onset of the reduction was indicated by the appearance of water vapor in the cool portion of the out-gas tube, and at this point it was customary to drop the furnace to slow down the reaction. Despite this precaution, the catalyst frequently was observed to glow briefly. This tendency was more pronounced the higher the copper content; with the pure nickel catalyst, the phenomenon was never observed. When the last vestiges of water had disappeared, the furnace was replaced and the temperature raised to, and maintained at, 350° overnight. All subsequent reductions were carried out at lower temperatures except where otherwise noted. At first it was thought that the “glow phenomenon” corresponded to a rapid loss in surface area as the physical structure of the high area oxide was broken down1'2 and it was supposed tha t the catalyst was still largely in the form of oxide until the furnace was replaced and the reduction continued at higher temperature. More recent measurements have shown tha t such is not the case; actually, it was found that over 95% of the reduction takes place during the first few minutes at 150°.
In reduction m e t h o d B , the reduction was started with a slow flow of a 50-50 blend of H2 and He. In this method, no glow was observed in any case. After 1 hr. at 150°, the temperature was raised to 350° and the reduction continued overnight in pure H2. Subsequent reductions were carried out at 250°.
Catalytic hydrogenation was tested after two different pretreatment procedures. In one of these, the hydrogen reduction stream was replaced with the purified helium carrying gas at 250°; the helium flow was maintained for 1 hr. at this temperature and then the catalyst was cooled rapidly to the sub-zero reaction temperature. Hereinafter, in this condition, catalysts are said to be in the h e l i u m - t r e a t e d s t a t e . The other method of pretreatment involved cooling the catalyst from 250 to 50° in H2
(17) W. K. Hall and P. H. Emmett, ibid., 79, 2091 (1957).(18) W. K. Hall, D. S. Maclver, and H. P, Weber, Ind. Eng. Chem., 52,
421 (1960).
638 W. K e i t h H a l l a n d J. A. H a s s e l l Yol. 67
at the normal cooling rate of the furnace. At this point, the furnace was removed and was replaced by a cryostat, which was cooled at the rate of about l°/m in . from room temperature to the sub-zero reaction temperature. Then, the helium carrying gas was turned over the catalyst. Hereinafter, the catalyst in this condition is said to be p r o m o t e d by hydrogen or to be in the h y
d r o g e n - t r e a t e d s t a t e . Differences in catalytic behavior obtained from catalysts following these two conditions of pretreatment provide the basis for the p r o m o t i n g e f f e c t discussed in the next section.
The capacity of a catalyst to sorb hydrogen was measured by attaching the tubes to a conventional BET system. The catalyst was then brought again to 250° in H2 and evacuated at this temperature for about 2 hr. The reversible hydrogen sorption was determined at 700 mm. pressure and 250°. Under these conditions, the sorption isotherm is at its maximum. For measurement of the total hydrogen held by the catalyst, the method of deuterium exchange used earlier2 was employed. The same samples of catalyst then were used for activity measurements.
ResultsStability of the Hydrogen Promoter.—Some explora
tory experiments, using hydrogen as a carrying gas, were made for several reasons. The first of these was to prove that different activity levels, corresponding to the hydrogen-treated and the helium-treated states, could be maintained for long periods of time, even in a flowing stream of hydrogen. It had been shown previously1 that when a catalyst was in the helium-treated state, its activity could be altered appreciably by treating it with hydrogen for 30 min. at —42°. However, the change was much smaller than that obtained when the catalyst was cooled in hydrogen from the reduction temperature. Moreover, it was observed that all of the alloy catalysts, when in the helium-treated state, increased in activity with slug number, whereas the same catalysts in the hydrogen-treated state did not. The use of hydrogen carrying gas afforded the opportunity to evaluate the degree of interconversion achievable at low temperature.
A second reason for the use of hydrogen carrying gas stemmed from the recent kinetic treatment of micro- catalytic reactors by Bassett and Habgood.19 These workers pointed out that the catalyst itself may act as a chromatographic column and actually cause separation of reactants. The obvious way to circumvent this difficulty was to use hydrogen as a carrying gas. Such data were needed to evaluate properly our earlier work.1
Table I provides a comparison of the results obtained from two catalysts. Two facts emerge from these experiments : (a) the effect of the pretreatment procedure persists even when hydrogen is used as the carrying gas, i.e., catalyst VIII is poisoned while catalyst VI is promoted by hydrogen treatment; and (b) higher conversions are obtained at the same temperature with hydrogen carrying gas regardless of the nature of the pretreatment, even with catalyst VIII, which is poisoned by hydrogen treatment at higher temperature. An auxiliary observation was that catalyst VIII did not poison noticeably with slug number when hydrogen was the carrying gas, in contrast to its behavior when helium was used.
The higher activities observed with hydrogen carrying gas are due, at least in part, to a clean-up of the surface during the 30-min. periods between test slugs. However, several other factors are also involved. The reaction is first order in hydrogen pressure and the average hydrogen pressure is higher with hydrogen carrying gas.
(19) D. W. Bassett and H. W. Habgood, J. Phya. Cham., 64, 769 (1960).
T able IE ffect of Carrying G as on Hydrogenation of E thylene in
M icrocatalytic R eactor
Catalyst® Carrying6 Conversion at T ° , %no. Temp., °C. gas He treated IL treated
VIII -9 4 He 88 18VIII -9 4 h 2 99 32VIII -9 5 .5 h 2 95VI -8 7 He 9 24VI -8 7 h 2 31 57
“ Catalyst VIII is pure nickel; catalyst VI is a copper-nickel alloy containing 72.4 % Ni. b Flow rate = 50 cc. (NTP)/m in.Moreover, the ethylene conversion is raised when the surface is saturated with preadsorbed hydrogen; when helium is used, the chromatographic effect, noted above, causes the more strongly adsorbed ethylene to trail the hydrogen as the slug leaves the bed. When these factors are taken into account, the several-fold higher conversions seem quite reasonable and it can be seen that the chromatographic separation of reactants could not have been sufficiently complete to vitiate any of our earlier conclusions.1 Finally, the fact that two different activity levels can be maintained even in the presence of hydrogen carrying gas demonstrates that the processes of sorption and desorption of the hydrogen promoter have activation energies associated with them.
T able IIE ffect of R eduction M ethod on Capacity of C u -N i Cata
lysts to H old H ydrogenReversiblehydrogen
Compn., Reduction Max. red. Total H2 content,6 sorption at 250°,6 Vm (Hs),'atom % Ni method® temp., °C. cc./g. cc./g. cc./g.72.4 A 350 8.0 7.8 0.6772.4 A 550 1.1 .2953.8 A 350 4.5 4.1 .7553.8 A 550 0.4 .4553.8 B 350 0.25 0.24 .8120.7 A 350 6.6 2.6 .2320.7 B 350 0.39 .4114.7 A 350 8.8 1.5 .1614.7 A 550 0.46 .1314.7 B 350 0.31 .2314.7 B 550 0.09 0.04 .14“ In method B, the reduction is started with a 50/50 mixture of
H2 and He; with method A, pure H2 is used; in the latter case, the catalysts glowed briefly during the initial stage of the reduction. 6 With nickel-rich alloys, the reversible hydrogen sorption is about equal to the total present; with copper-rich alloys, only a portion is reversible; see ref. 2. c BET V m corrected by multiplying by ratio of cross sectional areas, assuming 6.17 A.2/H site.
Catalyst Activity and Hydrogen Sorption Capacity.—-Earlier work2 revealed that an amount of hydrogen, equivalent to many monolayers, can be reversibly sorbed and desorbed by the alloys and that this gas is intimately associated with small amounts of oxygen left trapped within the matrix of the metal during the reduction process. The elimination of oxygen can be rendered more complete by increasing the reduction temperature to above 500°, thus affording a way of altering the ability of the alloy to hold hydrogen. When reduction method B was devised, it was found to be even more effective in this regard. The data collected in Table II show that the capacity to hold hydrogen is lower when the catalyst is reduced by method B at only
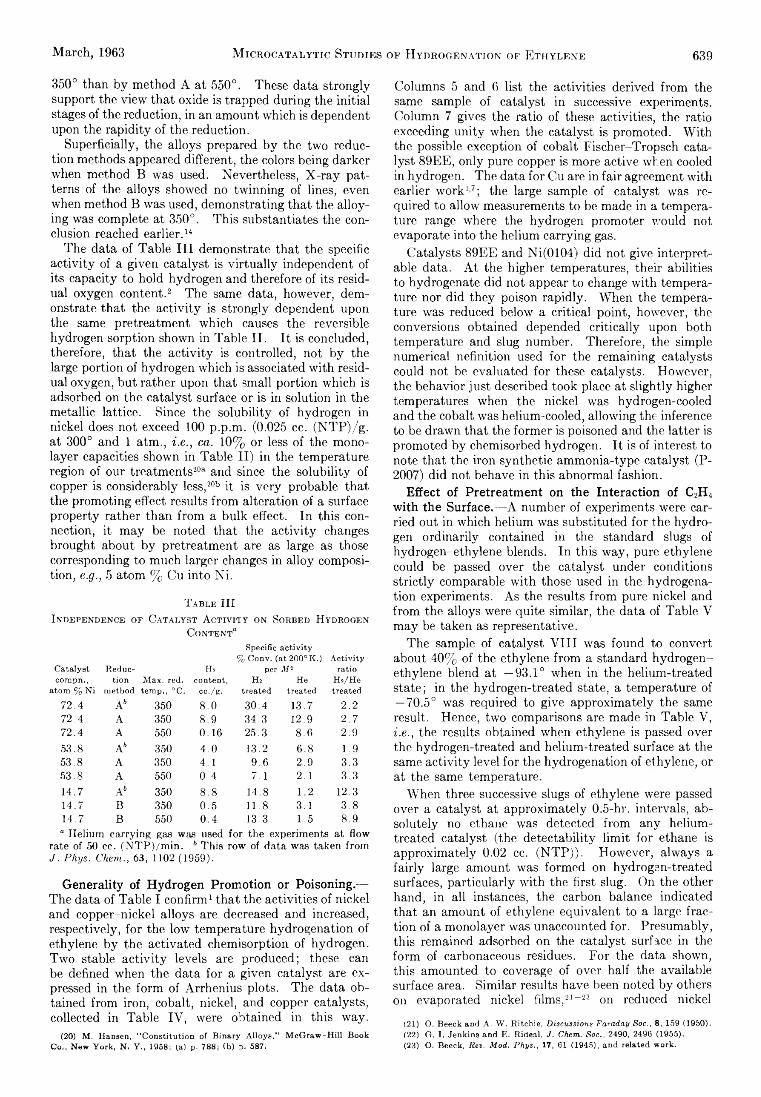
March, 1963 M i c r o c a t a l y t i c S t u d i e s o f H y d r o g e n a t i o n o f E t h y l e n e 639
350° than by method A at 550°. These data strongly support the view that oxide is trapped during the initial stages of the reduction, in an amount which is dependent upon the rapidity of the reduction.
Superficially, the alloys prepared by the two reduction methods appeared different, the colors being darker when method B was used. Nevertheless, X-ray patterns of the alloys showed no twinning of lines, even when method B was used, demonstrating that the alloying was complete at 350°. This substantiates the conclusion reached earlier.14
The data of Table III demonstrate that the specific activity of a given catalyst is virtually independent of its capacity to hold hydrogen and therefore of its residual oxygen content.2 The same data, however, demonstrate that the activity is strongly dependent upon the same pretreatment which causes the reversible hydrogen sorption shown in Table II. It is concluded, therefore, that the activity is controlled, not by the large portion of hydrogen which is associated with residual oxygen, but rather upon that small portion which is adsorbed on the catalyst surface or is in solution in the metallic lattice. Since the solubility of hydrogen in nickel does not exceed 100 p.p.m. (0.025 cc. (NTP)/g. at 300° and 1 atm., i.e., ca. 10% or less of the mono- layer capacities shown in Table II) in the temperature region of our treatments20a and since the solubility of copper is considerably less,20b it is very probable that the promoting effect results from alteration of a surface property rather than from a bulk effect. In this connection, it may be noted that the activity changes brought about by pretreatment are as large as those corresponding to much larger changes in alloy composition, e.g., 5 atom % Cu into Ni.
T able IIII ndependence of C atalyst A ctivity on Sobbed H ydrogen
C ontent“Specific activity
% Conv. (at 200°K.) ActivityCatalyst Reduc h2 per M 2 ratiocompn., tion Max. red. content, Hz He H2/He
atom % Ni method temp., °C. cc./g. treated treated treated72.4 A6 350 8.0 30.4 13.7 2.272.4 A 350 8.9 34.3 12.9 2.772.4 A 550 0.16 25.3 8.6 2.953.8 A5 350 4.0 13.2 6.8 1.953.8 A 350 4.1 9.6 2.9 3.353.8 A 550 0.4 7.1 2.1 3.314.7 A6 350 8.8 14.8 1.2 12.314.7 B 350 0.5 11.8 3.1 3.814.7 B 550 0.4 13.3 1.5 8.9“ Helium carrying gas was used for the experiments at flow
rate of 50 cc. (N TP)/m in. 6 This row of data was taken from J . P h y s . C h e m . , 63, 1102 (1959).
Generality of Hydrogen Promotion or Poisoning.—The data of Table I confirm1 that the activities of nickel and copper-nickel alloys are decreased and increased, respectively, for the low temperature hydrogenation of ethylene by the activated chemisorption of hydrogen. Two stable activity levels are produced; these can be defined when the data for a given catalyst are expressed in the form of Arrhenius plots. The data obtained from iron, cobalt, nickel, and copper catalysts, collected in Table IV, were obtained in this way.
(20) M. Hansen, “ Constitution of Binary Alloys,” McGraw-Hill Book Co., New York, N. Y., 1958; (a) p. 788; (b) p. 587.
Columns 5 and 6 list the activities derived from the same sample of catalyst in successive experiments. Column 7 gives the ratio of these activities, the ratio exceeding unity when the catalyst is promoted. With the possible exception of cobalt Fischer-Tropsch catalyst 89EE, only pure copper is more active when cooled in hydrogen. The data for Cu are in fair agreement with earlier work1'7; the large sample of catalyst was required to allow measurements to be made in a temperature range where the hydrogen promoter would not evaporate into the helium carrying gas.
Catalysts 89EE and Ni(0104) did not give interpretable data. At the higher temperatures, their abilities to hydrogenate did not appear to change with temperature nor did they poison rapidly. When the temperature was reduced below a critical point, however, the conversions obtained depended critically upon both temperature and slug number. Therefore, the simple numerical nefinition used for the remaining catalysts could not be evaluated for these catalysts. However, the behavior just described took place at slightly higher temperatures when the nickel was hydrogen-cooled and the cobalt was helium-cooled, allowing the inference to be drawn that the former is poisoned and the latter is promoted by chemisorbed hydrogen. It is of interest to note that the iron synthetic ammonia-type catalyst (P- 2007) did not behave in this abnormal fashion.
Effect of Pretreatment on the Interaction of C2H4 with the Surface.—A number of experiments were carried out in which helium was substituted for the hydrogen ordinarily contained in the standard slugs of hydrogen-ethylene blends. In this way, pure ethylene could be passed over the catalyst under conditions strictly comparable with those used in the hydrogenation experiments. As the results from pure nickel and from the alloys were quite similar, the data of Table V may be taken as representative.
The sample of catalyst VIII was found to convert about 40% of the ethylene from a standard hydrogen- ethylene blend at —93.1° when in the helium-treated state; in the hydrogen-treated state, a temperature of — 70.5° was required to give approximately the same result. Hence, two comparisons are made in Table V, i.e., the results obtained when ethylene is passed over the hydrogen-treated and helium-treated surface at the same activity level for the hydrogenation of ethylene, or at the same temperature.
When three successive slugs of ethylene were passed over a catalyst at approximately 0.5-hr. intervals, absolutely no ethane was detected from any helium- treated catalyst (the detectability limit for ethane is approximately 0.02 cc. (NTP)). However, always a fairly large amount was formed on hydrogen-treated surfaces, particularly with the first slug. On the other hand, in all instances, the carbon balance indicated that an amount of ethylene equivalent to a large fraction of a monolayer was unaccounted for. Presumably, this remained adsorbed on the catalyst surface in the form of carbonaceous residues. For the data shown, this amounted to coverage of over half the available surface area. Similar results have been noted by others on evaporated nickel films,21-23 on reduced nickel
(21) O. Beeck and A. W. Ritchie, Discussions Faraday Soc., 8, 159 (1950).(22) G. I. Jenkins and E. Rideal, J. Chem. Soc., 2490, 2496 (1955).(23) O. Beeck, Rev. Mod. Phys., 17, 61 (1945), and related work.
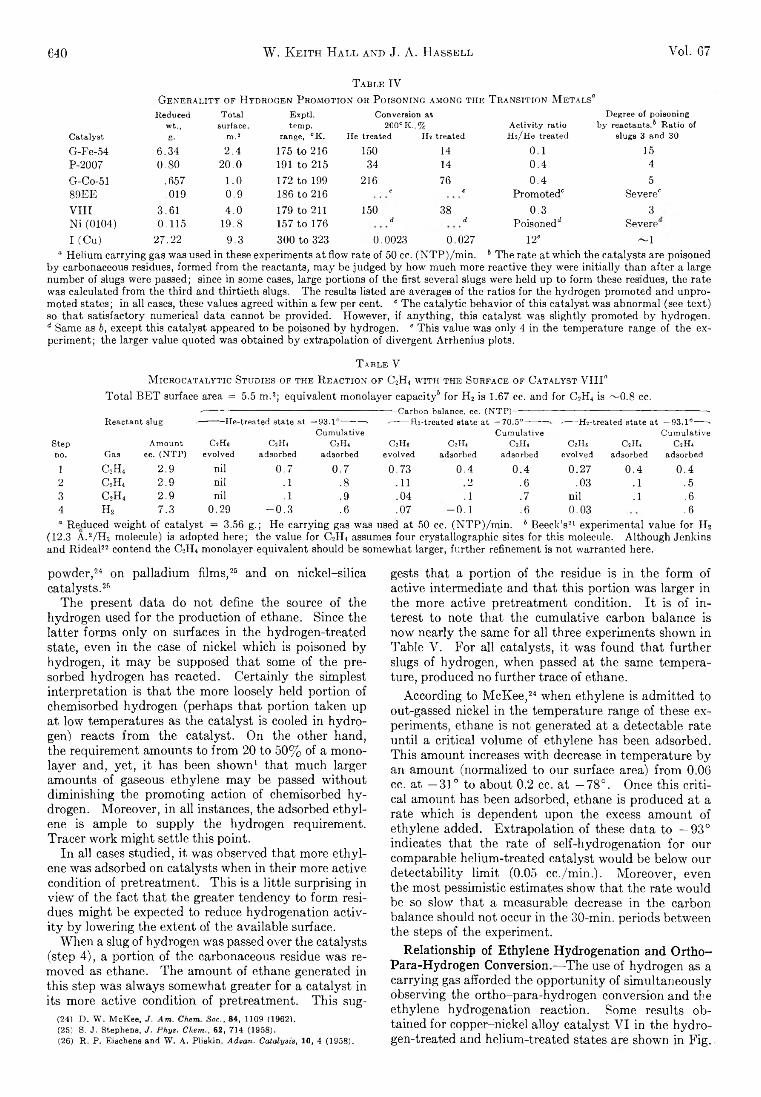
640 W. K eith Hall and J. A. Hassell Voi. 67
T able IVG enerality of H ydrogen P romotion or P oisoning among the T ransition M etals“
Catalyst
Deducedwt.,g.
Totalsurface,
m.2
Exptl. temp,
range, °K.
Conversion at 200°K.,%
He treated Hz treatedActivity ratio m /H e treated
Degree of poisoning by reactants.6 Ratio of
slugs 3 and 30G-Fe-54 6.34 2.4 175 to 216 150 14 0.1 15P-2007 0.80 20.0 191 to 215 34 14 0.4 4G-Co-51 .657 1.0 172 to 199 216 76 0.4 589EE .019 0.9 186 to 216 C C Promoted“ Severe'VIII 3.61 4.0 179 to 211 150 38 0.3 3Ni (0104) 0.115 19.8 157 to 176 d d Poisoned11 SevereI (Cu) 27.22 9.3 300 to 323 0.0023 0.027 12e ~ 1
“ Helium carrying gas was used in these experiments a t flow rate of 50 cc. (NTP)/min. 6 The rate at which the catalysts are poisoned by carbonaceous residues, formed from the reactants, may be judged by how much more reactive they were initially than after a large number of slugs were passed; since in some cases, large portions of the first several slugs were held up to form these residues, the rate was calculated from the third and thirtieth slugs. The results listed are averages of the ratios for the hydrogen promoted and unpromoted states; in all cases, these values agreed within a few per cent. ' The catalytic behavior of this catalyst was abnormal (see text) so tha t satisfactory numerical data cannot be provided. However, if anything, this catalyst was slightly promoted by hydrogen. d Same as b, except this catalyst appeared to be poisoned by hydrogen. e This value was only 4 in the temperature range of the experiment; the larger value quoted was obtained by extrapolation of divergent Arrhenius plots.
T able VM icrocatalytic Studies of the R eaction of C2H4 w ith the Surface of C atalyst V III“
Total BET surface area = 5.5 m.2; equivalent monolayer capacity* for H2 is 1.67 cc. and for C2H4 is ^ 0 .8 cc.'— ---------- ---------- -— ---------- -— ------------------- Carbon balance, cc. (NTP)--------------------------------------------------------- ------ -
Reactant slug <- ----He-treated state at —93.1°———» -—*— H2-treated state at — 70.5°—'—*— -——H2-treated state at —93.1°----- -Cumulative Cumulative CumulativeStep Amount CzH6 C2H4 CîH. cm . C2H4 C2H4 C2H6 C2H, C2H4no. Gas cc. (NTP) evolved adsorbed adsorbed evolved adsorbed adsorbed evolved adsorbed adsorbed
1 c 2h 4 2.9 nil 0.7 0.7 0.73 0.4 0.4 0.27 0.4 0.42 c 2h 4 2.9 nil .1 .8 .11 2 .6 .03 .1 .53 c 2h 4 2.9 nil .1 .9 .04 .1 .7 nil .1 .64 h 2 7.3 0.29 - 0 .3 .6 .07 - 0 .1 .6 0.03 .6° Reduced weight of catalyst = 3.56 g.; He carrying gas was used a t 50 cc. (NTP)/min. 6 Beeck’s21 experimental value for H2
(12.3 A.2/H 2 molecule) is adopted here; the value for C2H4 assumes four crystallographic sites for this molecule. Although Jenkins and Rideal22 contend the C2H4 monolayer equivalent should be somewhat larger, further refinement is not warranted here.powder,24 on palladium films,26 and on nickel-silica catalysts.26
The present data do not define the source of the hydrogen used for the production of ethane. Since the latter forms only on surfaces in the hydrogen-treated state, even in the case of nickel which is poisoned by hydrogen, it may be supposed that some of the presorbed hydrogen has reacted. Certainly the simplest interpretation is that the more loosely held portion of chemisorbed hydrogen (perhaps that portion taken up at low temperatures as the catalyst is cooled in hydrogen) reacts from the catalyst. On the other hand, the requirement amounts to from 20 to 50% of a mono- layer and, yet, it has been shown1 that much larger amounts of gaseous ethylene may be passed without diminishing the promoting action of chemisorbed hydrogen. Moreover, in all instances, the adsorbed ethylene is ample to supply the hydrogen requirement. Tracer work might settle this point.
In all cases studied, it was observed that more ethylene was adsorbed on catalysts when in their more active condition of pretreatment. This is a little surprising in view of the fact that the greater tendency to form residues might be expected to reduce hydrogenation activity by lowering the extent of the available surface.
When a slug of hydrogen was passed over the catalysts (step 4), a portion of the carbonaceous residue was removed as ethane. The amount of ethane generated in this step was always somewhat greater for a catalyst in its more active condition of pretreatment. This sug-
(24) D. W. McKee, J. Am. Chem. Soc., 84, 1109 (1962).(25) S. J. Stephens, J. Phys. Chem., 62, 714 (1958).(26) R. P. Eischens and W. A. Pliskin, Advan. Catalysis, 10, 4 (1958).
gests that a portion of the residue is in the form of active intermediate and that this portion was larger in the more active pretreatment condition. It is of interest to note that the cumulative carbon balance is now nearly the same for all three experiments shown in Table V. For all catalysts, it was found that further slugs of hydrogen, when passed at the same temperature, produced no further trace of ethane.
According to McKee,24 when ethylene is admitted to out-gassed nickel in the temperature range of these experiments, ethane is not generated at a detectable rate until a critical volume of ethylene has been adsorbed. This amount increases with decrease in temperature by an amount (normalized to our surface area) from 0.06 cc. at —31° to about 0.2 cc. at —78°. Once this critical amount has been adsorbed, ethane is produced at a rate which is dependent upon the excess amount of ethylene added. Extrapolation of these data to —93° indicates that the rate of self-hydrogenation for our comparable helium-treated catalyst would be below our detectability limit (0.05 cc./min.). Moreover, even the most pessimistic estimates show that the rate would be so slow that a measurable decrease in the carbon balance should not occur in the 30-min. periods between the steps of the experiment.
Relationship of Ethylene Hydrogenation and Ortho- Para-Hydrogen Conversion.—The use of hydrogen as a carrying gas afforded the opportunity of simultaneously observing the ortho-para-hydrogen conversion and the ethylene hydrogenation reaction. Some results obtained for copper-nickel alloy catalyst VI in the hydrogen-treated and helium-treated states are shown in Fig.
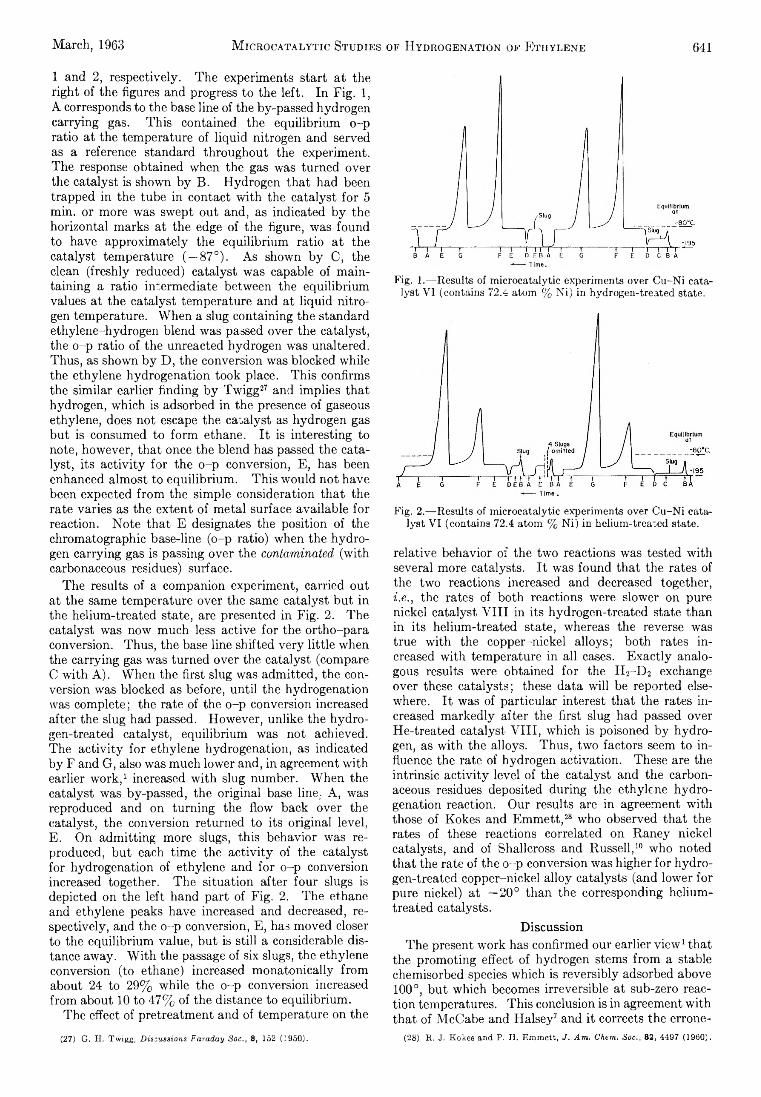
March, 1963 M icrocatalytic Studies of Hydrogenation of Ethylene 641
1 and 2, respectively. The experiments start at the right of the figures and progress to the left. In Fig. 1, A corresponds to the base line of the by-passed hydrogen carrying gas. This contained the equilibrium o-p ratio at the temperature of liquid nitrogen and served as a reference standard throughout the experiment. The response obtained when the gas was turned over the catalyst is shown by B. Hydrogen that had been trapped in the tube in contact with the catalyst for 5 min. or more was swept out and, as indicated by the horizontal marks at the edge of the figure, was found to have approximately the equilibrium ratio at the catalyst temperature ( — 87°). As shown by C, the clean (freshly reduced) catalyst was capable of maintaining a ratio intermediate between the equilibrium values at the catalyst temperature and at liquid nitrogen temperature. When a slug containing the standard ethylene-hydrogen blend was passed over the catalyst, the o-p ratio of the unreacted hydrogen was unaltered. Thus, as shown by D, the conversion was blocked while the ethylene hydrogenation took place. This confirms the similar earlier finding by Twigg27 and implies that hydrogen, which is adsorbed in the presence of gaseous ethylene, does not escape the catalyst as hydrogen gas but is consumed to form ethane. It is interesting to note, however, that once the blend has passed the catalyst, its activity for the o-p conversion, E, has been enhanced almost to equilibrium. This would not have been expected from the simple consideration that the rate varies as the extent of metal surface available for reaction. Note that E designates the position of the chromatographic base-line (o-p ratio) when the hydrogen carrying gas is passing over the contaminated (with carbonaceous residues) surface.
The results of a companion experiment, carried out at the same temperature over the same catalyst but in the helium-treated state, are presented in Fig. 2. The catalyst was now much less active for the ortho-para conversion. Thus, the base line shifted very little when the carrying gas was turned over the catalyst (compare C with A). When the first slug was admitted, the conversion was blocked as before, until the hydrogenation was complete; the rate of the o-p conversion increased after the slug had passed. However, unlike the hydro- gen-treated catalyst, equilibrium was not achieved. The activity for ethylene hydrogenation, as indicated by F and G, also was much lower and, in agreement with earlier work,1 increased with slug number. When the catalyst was by-passed, the original base line. A, was reproduced and on turning the flow back over the catalyst, the conversion returned to its original level,E. On admitting more slugs, this behavior was reproduced, but each time the activity of the catalyst for hydrogenation of ethylene and for o-p conversion increased together. The situation after four slugs is depicted on the left hand part of Fig. 2. The ethane and ethylene peaks have increased and decreased, respectively, and the o-p conversion, E, has moved closer to the equilibrium value, but is still a considerable distance away. With the passage of six slugs, the ethylene conversion (to ethane) increased monatonically from about 24 to 29% while the o-p conversion increased from about 10 to 47% of the distance to equilibrium.
The effect of pretreatment and of temperature on the
(27) G. H. Twigg, Discussions Faraday Soc., 8, 152 (1950).
Fig. 1.—Results of microcatalytie experiments over Cu-Ni catalyst VI (contains 72.4 atom % Ni) in hydrogen-treated state.
Fig. 2.—Results of microcatalytie experiments over Cu-Ni catalyst VI (contains 72.4 atom % Ni) in helium-treated state.
relative behavior of the two reactions was tested with several more catalysts. It was found that the rates of the two reactions increased and decreased together, i.e., the rates of both reactions were slower on pure nickel catalyst VIII in its hydrogen-treated state than in its helium-treated state, whereas the reverse was true with the copper-nickel alloys; both rates increased with temperature in all cases. Exactly analogous results were obtained for the H2-D 2 exchange over these catalysts; these data will be reported elsewhere. It was of particular interest that the rates increased markedly after the first slug had passed over He-treated catalyst VIII, which is poisoned by hydrogen, as with the alloys. Thus, two factors seem to influence the rate of hydrogen activation. These are the intrinsic activity level of the catalyst and the carbonaceous residues deposited during the ethylene hydrogenation reaction. Our results are in agreement with those of Kokes and Emmett,28 who observed that the rates of these reactions correlated on Raney nickel catalysts, and of Shallcross and Russell,10 who noted that the rate of the o-p conversion was higher for hydro- gen-treated copper-nickel alloy catalysts (and lower for pure nickel) at —20° than the corresponding helium- treated catalysts.
DiscussionThe present work has confirmed our earlier view1 that
the promoting effect of hydrogen stems from a stable chemisorbed species which is reversibly adsorbed above 100°, but which becomes irreversible at sub-zero reaction temperatures. This conclusion is in agreement with that of McCabe and Halsey7 and it corrects the errone-
(28) K. J. Kokes and P. H. Emmett, J. Am. Chem. Soc., 82, 4497 (1960).
642 W. K eith Hall and J. A. Hassell Vol. 67
Atom % Cu.Fig. 3.—Effect of composition and pretreatment on activity of
copper-nickel alloys at 200 °K.ous inference derived from the observation2 of a much larger amount of hydrogen which concomitantly sorbs or desorbs and which is associated with the oxygen impurity left when the catalyst was reduced. This is now understood as it has been shown recently29 that this hydrogen is held in the form of liquid water, in microvoids within the metal.
The data provide no insight into the mechanism of the promoting action, but they are sufficient to indicate certain generalities. The d-metals of the first transition series are poisoned by hydrogen for the ethylene hydrogenation, for the ortho-para conversion, and H2- D2 exchange. Copper and its alloys are promoted by the same treatment for these reactions at temperatures down to —100°. At liquid nitrogen temperature, it has been observed that nickel, copper-nickel alloys,10 and doubly promoted synthetic ammonia catalysts5’6 all are poisoned by hydrogen for the o-p conversion, but here the magnetic mechanism may be rate controlling. Kowaka30 found an analogous situation with Pd and Pd-Ag alloys, i.e., hydrogen poisoned pure Pd but acted as a promoter for ethylene hydrogenation over the alloys. Since Pd and its Ag alloys absorb hydrogen, these observations may correspond to a bulk effect. Nevertheless, the analogy with the closely related copper-nickel system suggests that a common surface effect cannot be excluded.
The hydrogenation proceeds on surfaces that are largely covered with carbonaceous residues. These residues have been studied on nickel by Beeck,23 McKee,24 Jenkins and Rideal,31 and Eischens26 and on Pd by Stephens,26 and it is known that hydrogen can be added to and abstracted from these residues. Eischens concluded that the adsorption of ethylene on nickel surfaces on which hydrogen has been preadsorbed is largely associative. When such a system was treated
(29) N. A. Scholtus and W. K. Hall, Trans. Faraday Soc., in press.(30) M. Kowaka, J. Japan Inst. Met., 23, 655 (1959).(31) G. J. Jenkins and E. Rideal, J. C h em . Soc., 2490 (1955).
with 4 mm. of hydrogen at 35°, adsorbed ethyl radicals were observed. When ethylene was admitted to an outgassed surface, it was chemisorbed dissociatively, but on addition of hydrogen to the system, ethyl radicals again appeared. It seemed likely, therefore, that the final distribution of surface species was different on outgassed surfaces than on those covered with preadsorbed hydrogen. This, in turn, could alter the overall mechanisms. Laidler and Townsend82 suggested that two mechanisms take place simultaneously on metal surfaces, i.e., a Langmuir-Hinshelwood reaction between adsorbed hydrogen and ethylene and a Rideal- type reaction between adsorbed hydrogen and gaseous ethylene, the latter being favored by admitting hydrogen first to the system. Evidence that the activity differences due to hydrogen promotion might result from such mechanistic changes was sought, but not obtained, in the experiments corresponding to the data of TableY. To the contrary, these results indicate that the activity differences correspond to changes in the intrinsic properties of the catalyst, i.e., larger quantities of ethylene are held less tenaciously by the more active surfaces. This view is confirmed by the fact that the rates of both the o-p hydrogen conversion and the H2— D2 exchange reaction vary in the same way with pre- treatment as the ethylene hydrogenation reaction. This correlation in rates implies that all these reactions have a common rate determining step, i.e., the activation of hydrogen.28 Finally, it should be noted that hydrogen activation is greatly accelerated on surfaces which are extensively covered with carbonaceous residues for reasons which are presently not understood.
The alteration of catalyst activity by chemisorbed hydrogen could be caused by either a geometric or an electronic factor. Infrared data suggest the latter. In the cases so far studied,26 the carbon-oxygen stretching frequency from CO adsorbed on metals is reduced by preadsorbed hydrogen, an effect associated with the transfer of electrons from the metal to the adsorbate.
Kokes and Emmett28 correlated the activities of a series of Raney nickel catalysts for the ethylene hydrogenation reaction with the electron concentration in the metal. The latter was varied by removing hydrogen from a parent catalyst by evacuating it to successively higher temperatures. The activity fell to a minimum as the electron concentration was lowered and then increased strongly again as the last of the hydrogen was removed. They were able to correlate the earlier data of Hall and Emmett1 on the same curve. Catalysts VIII, V, and VI were used for this purpose, as they spanned the range of electron concentration found for the Raney nickel. The point of interest is that catalyst V (the alloy containing the least copper), fell at the minimum of the curve. Thus, if it is assumed that hydrogen treatment increases the electron concentration, both of these alloys would be promoted by hydrogen treatment while nickel would be poisoned, as observed. To test this hypothesis, a new catalyst containing 95 atom % Ni was prepared and tested. Rather than being poisoned by hydrogen as required, it was promoted. Hence, the effect of chemisorbed hydrogen apparently cannot be correlated in this simple way.
Our new data, relating specific catalytic activity for
(32) K. J. Laidler and R. E. Townsend, Trans. Faraday Soc., 57, 1590 (1961).
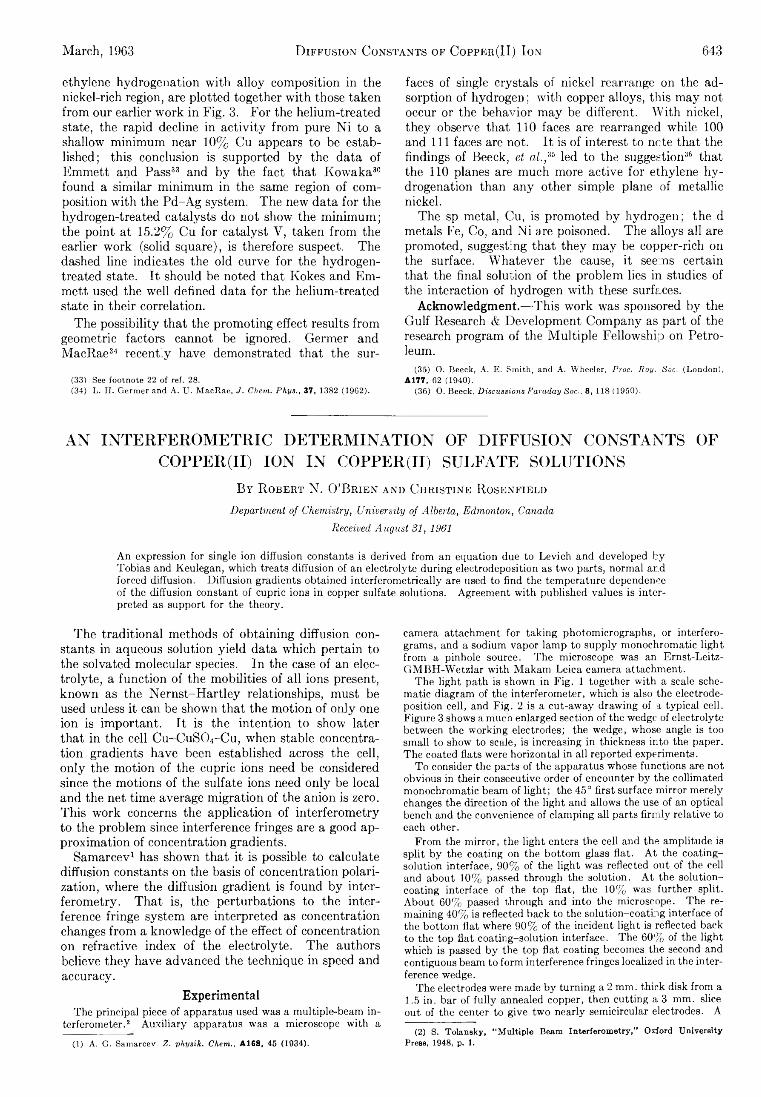
March, 1963 D iffusion Constants of Copper(II) Ion 643
ethylene hydrogenation with alloy composition in the nickel-rich region, are plotted together with those taken from our earlier work in Fig. 3. For the helium-treated state, the rapid decline in activity from pure Ni to a shallow minimum near 10% Cu appears to be established; this conclusion is supported by the data of Emmett and Pass33 and by the fact that Kowaka30 found a similar minimum in the same region of composition with the Pd-Ag system. The new data for the hydrogen-treated catalysts do not show the minimum; the point at 15.2% Cu for catalyst V, taken from the earlier work (solid square), is therefore suspect. The dashed line indicates the old curve for the hydrogen- treated state. It should be noted that Kokes and Emmett used the well defined data for the helium-treated state in their correlation.
The possibility that the promoting effect results from geometric factors cannot be ignored. Germer and MacRae34 recently have demonstrated that the sur-
(33) See footnote 22 of ref. 28.(34) L. H. Germer and A. U. MacRae, J. Chem. Phys., 37, 1382 (1962).
faces of single crystals of nickel rearrange on the adsorption of hydrogen; with copper alloys, this may not occur or the behavior may be different. With nickel, they observe that 110 faces are rearranged while 100 and 111 faces are not. It is of interest to ncte that the findings of Beeck, et al.,36 led to the suggestion36 that the 110 planes are much more active for ethylene hydrogenation than any other simple plane of metallic nickel.
The sp metal, Cu, is promoted by hydrogen; the d metals Fe, Co, and Ni are poisoned. The alloys all are promoted, suggesting that they may be copper-rich on the surface. Whatever the cause, it seems certain that the final solution of the problem lies in studies of the interaction of hydrogen with these surfaces.
Acknowledgment.—This work was sponsored by the Gulf Research & Development Company as part of the research program of the Multiple Fellowship on Petroleum.
(35) O. Reeck, A. E, Smith, and A. Wheeler, Proc. Roy. Soc. (London), A177, 62 (1940).
(36) O. Beeck, Discussions Faraday Soc., 8, 118 (1950).
AN INTERFEROMETRIC DETERMINATION OF DIFFUSION CONSTANTS OF COPPER (II) ION IN COPPER (II) SULFATE SOLUTIONS
B y R obert N. O’B rien and C hristin e R osenfield
D e p a r t m e n t o f C h e m i s t r y , U n i v e r s i t y o f A l b e r t a , E d m o n t o n , C a n a d a
R e c e i v e d A u g u s t 3 1 , 1 9 6 1
An expression for single ion diffusion constants is derived from an equation due to Levich and developed by- Tobias and Keulegan, which treats diffusion of an electrolyte during electrodeposition as two parts, normal ar.d forced diffusion. Diffusion gradients obtained interferometrically are used to find the temperature dependence of the diffusion constant of cupric ions in copper sulfate solutions. Agreement with published values is interpreted as support for the theory.
The traditional methods of obtaining diffusion constants in aqueous solution yield data which pertain to the solvated molecular species. In the case of an electrolyte, a function of the mobilities of all ions present, known as the Nernst-Hartley relationships, must be used unless it can be shown that the motion of only one ion is important. It is the intention to show later that in the cell Cu- CuS04-Cu, when stable concentration gradients have been established across the cell, only the motion of the cupric ions need be considered since the motions of the sulfate ions need only be local and the net time average migration of the anion is zero. This work concerns the application of interferometry to the problem since interference fringes are a good approximation of concentration gradients.
Samarcev1 has shown that it is possible to calculate diffusion constants on the basis of concentration polarization, where the diffusion gradient is found by interferometry. That is, the perturbations to the interference fringe system are interpreted as concentration changes from a knowledge of the effect of concentration on refractive index of the electrolyte. The authors believe they have advanced the technique in speed and accuracy.
ExperimentalThe principal piece of apparatus used was a multiple-beam in
terferometer.2 Auxiliary apparatus was a microscope with a(1) A. G. Samarcev Z. physik. Chem., A168, 45 (1934).
camera attachment for taking photomicrographs, or interfero- grams, and a sodium vapor lamp to supply monochromatic light from a pinhole source. The microscope was an Ernst-Leitz- GMBH-Wetzlar with Makam Leica camera attachment.
The light path is shown in Fig. 1 together with a scale schematic diagram of the interferometer, which is also the electrodeposition cell, and Fig. 2 is a cut-away drawing of a typical cell. Figure 3 shows a much enlarged section of the wedge of electrolyte between the working electrodes; the wedge, whose angle is too small to show to scale, is increasing in thickness into the paper. The coated flats were horizontal in all reported experiments.
To consider the parts of the apparatus whose functions are not obvious in their consecutive order of encounter by the collimated monochromatic beam of light; the 45° first surface mirror merely changes the direction of the light and allows the use of an optical bench and the convenience of clamping all parts firmly relative to each other.
From the mirror, the light enters the cell and the amplitude is split by the coating on the bottom glass flat. At the coating- solution interface, 90% of the light was reflected out of the cell and about 10% passed through the solution. At the solutioncoating interface of the top flat, the 10% was further split. About 60% passed through and into the microscope. The remaining 40% is reflected back to the solution-coating interface of the bottom flat where 90% of the incident light is reflected back to the top flat coating-solution interface. The 60% of the light which is passed by the top flat coating becomes the second and contiguous beam to form interference fringes localized in the interference wedge.
The electrodes were made by turning a 2 mm. thick disk from a1.5 in. bar of fully annealed copper, then cutting a 3 mm. slice out of the center to give two nearly semicircular electrodes. A
(2) S. TolanBky, "Multiple Beam Interferometry," Oxford University Press, 1948, p. 1.
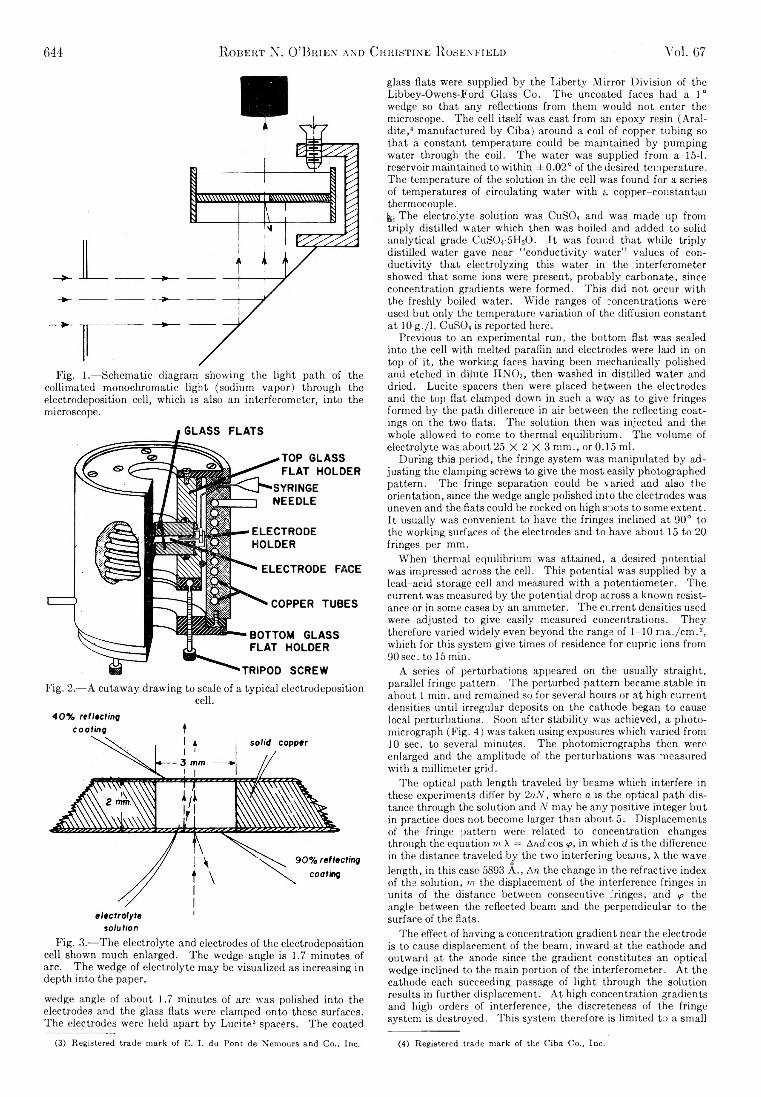
644 R obert N. O’Brien and Christine R osenfield Voi. 67
Fig. 1.—Schematic diagram showing the light path of the collimated monochromatic light (sodium vapor) through the electrodeposition cell, which is also an interferometer, into the microscope.
GLASS FLATS
TOP GLASS FLAT HOLDER
SYRINGE ] NEEDLE
ELECTRODEHOLDER
ELECTRODE FACE
COPPER TUBES
BOTTOM GLASS FLAT HOLDER
TRIPOD SCREW
Fig. 2.—A cutaway drawing to scale of a typical electrodepositioncell.
40% refltclingcoating t
so/u HonFig. 3.—The electrolyte and electrodes of the electrodeposition
cell shown much enlarged. The wedge angle is 1.7 minutes of arc. The wedge of electrolyte may be visualized as increasing in depth into the paper.wedge angle of about 1.7 minutes of arc was polished into the electrodes and the glass flats were clamped onto these surfaces. The electrodes were held apart by Lucite3 spacers. The coated
glass flats were supplied by the Liberty Mirror Division of the Libbey-Owens-Ford Glass Co. The uncoated faces had a 1° wedge so that any reflections from them would not enter the microscope. The cell itself was cast from an epoxy resin (Aral- dite,4 manufactured by Ciba) around a coil of copper tubing so that a constant temperature could be maintained by pumping water through the coil. The water was supplied from a 15-1. reservoir maintained to within ±0.02° of the desired temperature. The temperature of the solution in the cell was found for a series of temperatures of circulating water with a copper-constantan thermocouple.y. The electrolyte solution was CuS04 and was made up from triply distilled water which then was boiled and added to solid analytical grade CuSChAILO. I t was found that while triply distilled water gave near “conductivity water” values of conductivity that electrolyzing this water in the interferometer showed that some ions were present, probably carbonate, since concentration gradients were formed. This did not occur with the freshly boiled water. Wide ranges of concentrations were used but only the temperature variation of the diffusion constant at 10 g./l. CuS04 is reported here.
Previous to an experimental run, the bottom flat was sealed into the cell with melted paraffin and electrodes were laid in on top of it, the working faces having been mechanically polished and etched in dilute H N 03, then washed in distilled water and dried. Lucite spacers then were placed between the electrodes and the top flat clamped down in such a way as to give fringes formed by the path difference in air between the reflecting coatings on the two flats. The solution then was injected and the whole allowed to come to thermal equilibrium. The volume of electrolyte was about 25 X 2 X 3 mm., or 0.15 ml.
During this period, the fringe system was manipulated by adjusting the clamping screws to give the most easily photographed pattern. The fringe separation could be varied and also the orientation, since the wedge angle polished into the electrodes was uneven and the flats could be rocked on high spots to some extent. I t usually was convenient to have the fringes inclined a t 90° to the working surfaces of the electrodes and to have about 15 to 20 fringes per mm.
When thermal equilibrium was attained, a desired potential was impressed across the cell. This potential was supplied by a lead-acid storage cell and measured with a potentiometer. The current was measured by the potential drop across a known resistance or in some cases by an ammeter. The current densities used were adjusted to give easily measured concentrations. They therefore varied widely even beyond the range of 1-10 m a./cm .2, which for this system give times of residence for cupric ions from 90 sec. to 15 min.
A series of perturbations appeared on the usually straight, parallel fringe pattern. The perturbed pattern became stable in about 1 min. and remained so for several hours or at high current densities until irregular deposits on the cathode began to cause local perturbations. Soon after stability was achieved, a photomicrograph (Fig. 4) was taken using exposures which varied from 10 sec. to several minutes. The photomicrographs then were enlarged and the amplitude of the perturbations rvas measured with a millimeter grid.
The optical path length traveled by beams which interfere in these experiments differ by 2a N , where a is the optical path distance through the solution and N may be any positive integer but in practice does not become larger than about 5. Displacements of the fringe pattern were related to concentration changes through the equation m X = A n d cos <p, in which d is the difference in the distance traveled by the two interfering beams, X the wave length, in this case 5893 A., An the change in the refractive index of the solution, m the displacement of the interference fringes in units of the distance between consecutive fringes, and <p the angle between the reflected beam and the perpendicular to the surface of the flats.
The effect of having a concentration gradient near the electrode is to cause displacement of the beam, inward at the cathode and outward at the anode since the gradient constitutes an optical wedge inclined to the main portion of the interferometer. At the cathode each succeeding passage of light through the solution results in further displacement. At high concentration gradients and high orders of interference, the discreteness of the fringe system is destroyed. This system therefore is limited to a small
(3) Registered trade mark of E. I. du Pont de Nemours and Co., Ine. (4) Registered trade mark of the Ciba Co., Inc.
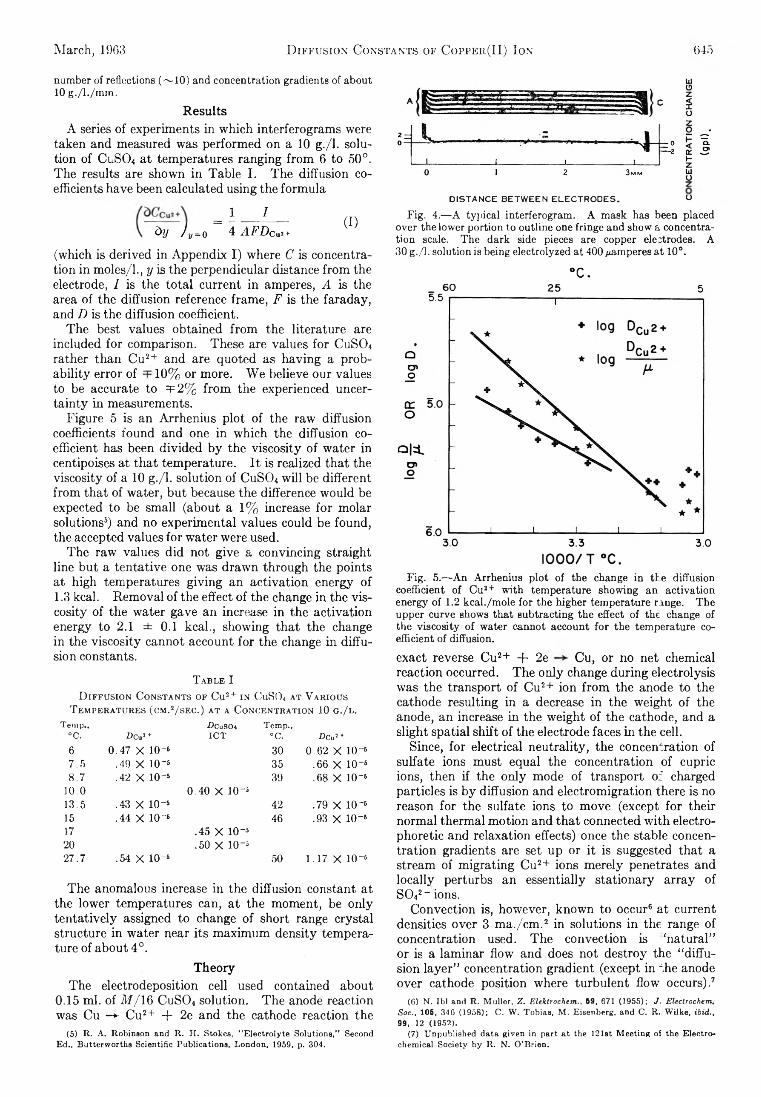
March, 19G3 D iffusion Constants of Coppeh(II) Ion 04.)
number of reflections (~10) and concentration gradients of about 10 g./l./m m .
ResultsA series of experiments in which interferograms were
taken and measured was performed on a 10 g./l. solution of CuS04 at temperatures ranging from 6 to 50°. The results are shown in Table I. The diffusion coefficients have been calculated using the formula
= 1 - J — (I)dy Jy=o 4 AFDcui+
(which is derived in Appendix I) where C is concentration in moles/1., y is the perpendicular distance from the electrode, I is the total current in amperes, A is the area of the diffusion reference frame, F is the faraday, and D is the diffusion coefficient.
The best values obtained from the literature are included for comparison. These are values for CuS04 rather than Cu2+ and are quoted as having a probability error of 10% or more. We believe our values to be accurate to =f 2% from the experienced uncertainty in measurements.
Figure 5 is an Arrhenius plot of the raw diffusion coefficients found and one in which the diffusion coefficient has been divided by the viscosity of water in centipoises at that temperature. It is realized that the viscosity of a 10 g./l. solution of CuS04 will be different from that of water, but because the difference would be expected to be small (about a 1% increase for molar solutions6) and no experimental values could be found, the accepted values for water were used.
The raw values did not give a convincing straight line but a tentative one was drawn through the points at high temperatures giving an activation energy of1.3 kcal. Removal of the effect of the change in the viscosity of the water gave an increase in the activation energy to 2.1 ± 0.1 kcal., showing that the change in the viscosity cannot account for the change in diffusion constants.
T able ID iffusion C onstants of C u2+ in CuS 0 4 at V arious
T emperatures ( cm.2/ sec.) at a C oncentration 10 g . / l .Temp., ■ Dcuso« Temp.,°C. nc«2 + ICT “C. z>cu! +
6 0.47 X 10⁻⁵ 30 0.62 X 10-57.5 .49 X IO“2 35 .66 X 10-58.7 .42 X IO“5 39 .68 X 10-5
10.0 0.40 X IO“313.5 .43 X IO-6 42 .79 X IO' 615 .44 X IO“6 46 .93 X IO"617 .45 X 10-520 .50 X 10-527.7 .54 X 10-5 50 1.17 X IO“6
The anomalous increase in the diffusion constant atthe lower temperatures can, at the moment, be only tentatively assigned to change of short range crystal structure in water near its maximum density temperature of about 4°.
TheoryThe electrodeposition cell used contained about
0.15 ml. of M [ 16 CuS04 solution. The anode reaction was Cu -*• Cu2+ + 2e and the cathode reaction the
(5) R. A. Robinson and R. H. Stokes, "Electrolyte Solutions," Second Ed.. Butterworths Scientific Publications, London, 1959, p. 304.
DISTANCE BETWEEN ELECTRODES. OFig. 4.—A typical interferogram. A mask has been placed
over the lower portion to outline one fringe and show a concentration scale. The dark side pieces are copper electrodes. A 30 g./l. solution is being electrolyzed at 400 ¿«amperes at 10°.
°c.
Fig. 5.-—An Arrhenius plot of the change in the diffusion coefficient of Cu2+ with temperature showing an activation energy of 1.2 kcal./mole for the higher temperature range. The upper curve shows that subtracting the effect of the change of the viscosity of water cannot account for the temperature coefficient of diffusion.exact reverse Cu2+ + 2e Cu, or no net chemical reaction occurred. The only change during electrolysis was the transport of Cu2+ ion from the anode to the cathode resulting in a decrease in the weight of the anode, an increase in the weight of the cathode, and a slight spatial shift of the electrode faces in the cell.
Since, for electrical neutrality, the concentration of sulfate ions must equal the concentration of cupric ions, then if the only mode of transport of charged particles is by diffusion and electromigration there is no reason for the sulfate ions to move (except for their normal thermal motion and that connected with electrophoretic and relaxation effects) once the stable concentration gradients are set up or it is suggested that a stream of migrating Cu2+ ions merely penetrates and locally perturbs an essentially stationary array of S042- ions.
Convection is, however, known to occur6 at current densities over 3 ma./cm.2 in solutions in the range of concentration used. The convection is ‘natural” or is a laminar flow and does not destroy the “ diffusion layer” concentration gradient (except in the anode over cathode position where turbulent flow occurs).7
(6) N. Ibl and R. Muller, Z. Elektrochem., 59, 671 (1955); J. Electrochem. Soc., 105, 346 (1958); C. W. Tobias, M. Eisenberg, and C. R. Wilke, ibid., 99, 12 (1952).
(7) Unpublished data given in part at the 121st Meeting of the Electrochemical Society by R. N. O'Brien.
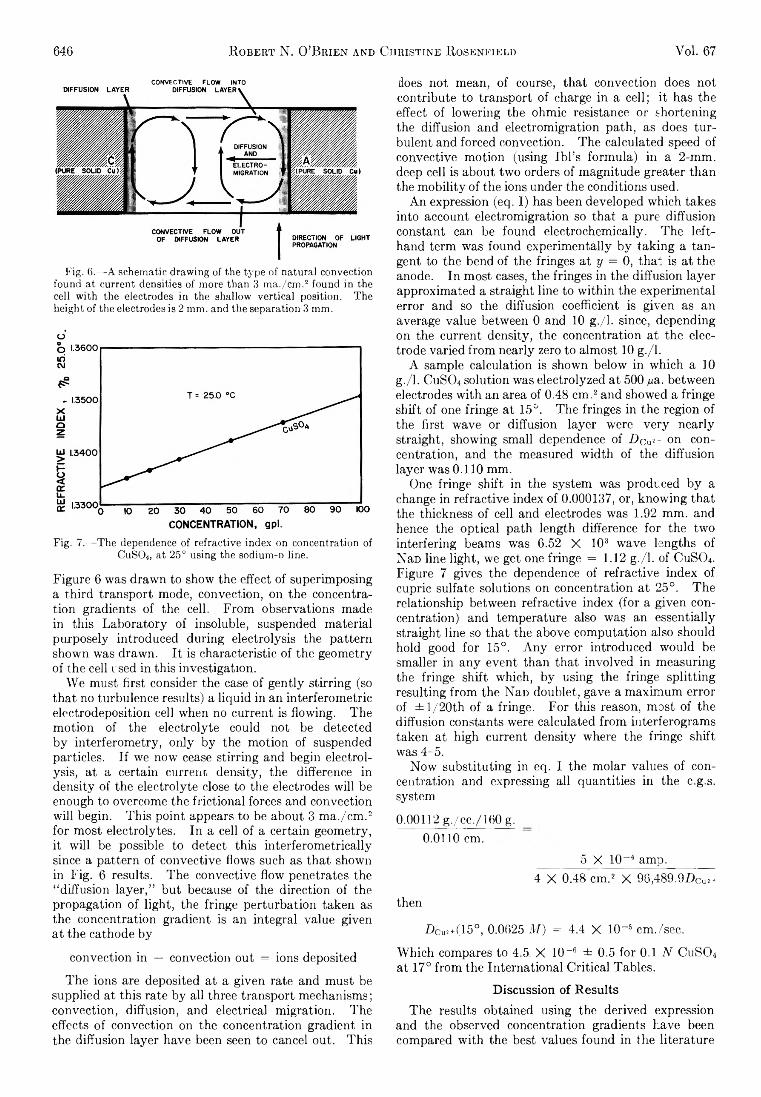
646 R obert N. O’Brien and Christine R osenfield Vol. 67
CONVECTIVE FLOW INTO
Fig. 6 .—A schematic drawing of the type of natural convection found at current densities of more than 3 ma./cm .2 found in the cell with the electrodes in the shallow vertical position. The height of the electrodes is 2 mm. and the separation 3 mm.o'
Fig. 7.—The dependence of refractive index on concentration of CuSCh, at 25° using the sodium-D line.
Figure 6 was drawn to show the effect of superimposing a third transport mode, convection, on the concentration gradients of the cell. From observations made in this Laboratory of insoluble, suspended material purposely introduced during electrolysis the pattern shown was drawn. It is characteristic of the geometry of the cell used in this investigation.
We must first consider the case of gently stirring (so that no turbulence results) a liquid in an interferometric electrodeposition cell when no current is flowing. The motion of the electrolyte could not be detected by interferometry, only by the motion of suspended particles. If we now cease stirring and begin electrolysis, at a certain current density, the difference in density of the electrolyte close to the electrodes will be enough to overcome the frictional forces and convection will begin. This point appears to be about 3 ma./cm .2 for most electrolytes. In a cell of a certain geometry, it will be possible to detect this interferometrically since a pattern of convective flows such as that shown in Fig. 6 results. The convective flow penetrates the “ diffusion layer,” but because of the direction of the propagation of light, the fringe perturbation taken as the concentration gradient is an integral value given at the cathode by
convection in — convection out = ions deposited
The ions are deposited at a given rate and must be supplied at this rate by all three transport mechanisms; convection, diffusion, and electrical migration. The effects of convection on the concentration gradient in the diffusion layer have been seen to cancel out. This
does not mean, of course, that convection does not contribute to transport of charge in a cell; it has the effect of lowering the ohmic resistance or shortening the diffusion and electromigration path, as does turbulent and forced convection. The calculated speed of convective motion (using Ibl’s formula) in a 2-mm. deep cell is about two orders of magnitude greater than the mobility of the ions under the conditions used.
An expression (eq. I) has been developed which takes into account electromigration so that a pure diffusion constant can be found electrochemically. The left- hand term was found experimentally by taking a tangent to the bend of the fringes at y = 0, that is at the anode. In most cases, the fringes in the diffusion layer approximated a straight line to within the experimental error and so the diffusion coefficient is given as an average value between 0 and 10 g./l. since, depending on the current density, the concentration at the electrode varied from nearly zero to almost 10 g./l.
A sample calculation is shown below in which a 10 g./l. CuSCh solution was electrolyzed at 500 ¿¿a. between electrodes with an area of 0.48 cm.2 and showed a fringe shift of one fringe at 15°. The fringes in the region of the first wave or diffusion layer were very nearly straight, showing small dependence of Z>cu*- on concentration, and the measured width of the diffusion layer was 0.110 mm.
One fringe shift in the system was produced by a change in refractive index of 0.000137, or, knowing that the thickness of cell and electrodes was 1.92 mm. and hence the optical path length difference for the two interfering beams was 6.52 X 10³ wave lengths of NaD line light, we get one fringe = 1.12 g./l. of CuS04. Figure 7 gives the dependence of refractive index of cupric sulfate solutions on concentration at 25°. The relationship between refractive index (for a given concentration) and temperature also was an essentially straight line so that the above computation also should hold good for 15°. Any error introduced would be smaller in any event than that involved in measuring the fringe shift which, by using the fringe splitting resulting from the NaD doublet, gave a maximum error of ± l/2 0 th of a fringe. For this reason, most of the diffusion constants were calculated from interferograms taken at high current density where the fringe shift was 4-5.
Now substituting in eq. I the molar values of concentration and expressing all quantities in the c.g.s. system
0.00112 g./cc./160 g.0.0110 cm.
5 X 10~4 amp.4 X 0.48 cm.2 X 96,489.9Z W
then
Z W (1 5 ° , 0.0625 M) = 4.4 X 10-s cm./sec.
Which compares to 4.5 X 10_6 ± 0.5 for 0.1 N CuSCh at 17° from the International Critical Tables.
Discussion of ResultsThe results obtained using the derived expression
and the observed concentration gradients have been compared with the best values found in the literature
March, 1963 D iffusion Constants of Copper(II) Ion 647
The literature values are of the diffusion constant for CuS04 and were found by various methods including conductivity. They are all rather old and the precision claimed is not high.
It is realized that direct comparison of single ion diffusion constants with that of the parent electrolyte is not valid. Consideration of the Nernst-Hartley relationships suggests that the Cu2+ diffusion constant should be about 85% of that for CuS04. Inspection of the data, remembering the precision claimed, shows that they are in the right range.
It also is realized that except at infinite dilution, the presence of oppositely charged ions will affect the diffusivity. Our values are integral values and hence apply to finite concentrations. They should, however, be independent of the specific anion present provided it has the same over-all charge and similar solubility characteristics.
Appendix IDerivation of Diffusion Equation.—According to
Levich8 and Keulegan,9 we may represent the total ion flux which is related to the concentration gradient developed in a solution in the presence of an applied potential by the expression
ÒW j
~dtADi + AU ¡C¡Zie
bybVòy (1)
in which ònj/òt represents the number of ions of the jth kind passing per unit time; A is the cross-sectional area; Dj is the Fick diffusion constant of the jth ion; IIi is the mobility of the jth ion; % is its valence; Cj is its concentration; e is the charge on an electron; V is the electrical applied potential; and y is the distance perpendicular to the electrode.
Since for an ideal solution Dj = UjkT, in which k is the Boltzmann constant and T is the absolute temperature10
_ , n . dCi ACjDjZje 5 7bt J by kT iny
If we let /j be the number of ions reacting per faraday of current passing, then at the electrode-electrolyte interface (y — 0)
_ dn> = h idf F
Thus
t t = A D (*Çi\ , ACiDiZjefòV \F ’ V ô y A - o k T \ ò y ) ym „
(3)
Multiplying (3) through by the factor Z j/D j, we obtain
(8) B. Levich, Acta Physicochim. URSS, 17, 257 (1942).(9) G. H. Keulegan, J. Res. Natl. Bur. Std., 47, 156 (1951).(10) H. S. Harned and B. B. Owen, “ The Physical Chemistry of Electro
lytic Solutions,” 3rd Ed., Eeinhold Publ. Corp., New York, N. Y., 1958,p. 118.
for the jth ions. If there are i ions in the solution, a similar equation may be written for each of them. Summing all such equations, we obtain
AekT E Z i2Ci (5)
Since there can be no macroscopic separation of charges in the solution, the sum for all ions, ZiCi = 0, and the first term on the right-hand side of (5) must vanish. Solving the remaining expression for (d V/ by)v=o the result is
IkT Y.Zifj/Di = fbV \ AFe E Z i2Ci \òy ) y=0
Substituting (6) into (3) gives
5 Ç A = ! _ [ I l _ v r ? by ) y=o AF U j ^ j 1 T,Zì2Cì J (7)
y — 0
Now let us consider a solution of CuS04. The only ions; present in appreciable quantities will be Cu2+ and S042-. In a solution of concentration a, these relations will hold
For Cu2+:
(bCcun \ by /y=0
2 a
AF1/2
Dcu! +
1/ 2'2/D cu2+ Q ( - 2)Dso,2-
4a + 4a
For SO,2- :
/bCs0i2~ \\ by ) y=o AF X
0Dsoy-
+2a ( 1/ 2-2D&1! Q ( - 2) \
Dso.2- /4a + 4a
1 I4 AFDcu* +
1 ___ I___4 AFDcui +
(8)Applying eq. 8 to the case of a solution of pure CuS04
in which the only two ions present in appreciable quantity are Cu2+ and S042-, and the reaction at either electrode is the dissolution or deposition of Cu, the experimental data may be used to calculate the diffusion coefficient for Cu2+. That is, the slope of the inter- ference fringe in the diffusion layer is used for dCcF'/ by in our final eq. 8 above.
ELECTRON IMPACT INVESTIGATIONS OF SULFUR COMPOUNDS. II.3-METHYL-2-THIABUTANE, 4-THIA-l-PENTENE, AND 3,4-DITHIAHEXANE1
B y B rice G. H obrock and R obert W. K iser
D e p a r t m e n t o f C h e m i s t r y , K a n s a s S t a t e U n i v e r s i t y , M a n h a t t a n , K a n s a s
R e c e i v e d A u g u s t 3 1 , 1 9 6 2
Appearance potentials and relative abundances of the principal positive ions from 3-methyl-2-thiabutane, 4-thia-l-pentene, and 3,4-dithiahexane are reported. Probable ionization and dissociation processes are postulated in agreement with the computed energetics. Heats of formation, consistent with the proposed processes, are given. From appearance potential data, the ionization potential of C2H 5SSH is derived to be 9.4 ± 0.3 e.v., in agreement with the group orbital calculations. More accurate values for the proton affinities of hydrogen sulfide and methanethiol are found to be —197 ± 7 and —199 ± 10 kcal./mole, respectively.
648 Brice G. Hobrock and R obert W . K iser Voi. 67
Introduction
In the first of a series of papers concerning the electron impact spectroscopy of sulfur compounds, we reported electron impact data for 2-thiabutane, 2- thiapentane, and 2,3-dithiabutane.2 In the course of our further investigation of sulfides and disulfides, we have completed studies of 3-methyl-2-thiabutane, 4- thia-l-pentene, and 3,4-dithiahexane and report the results in this article. Mass spectral cracking patterns as well as ionization and appearance potentials for the principal positive ions have been determined experimentally for these compounds. From the measured appearance potentials, probable processes for the formation of the various positive ions are postulated. Some of the interesting species (H3S+, CH6S+) observed in the mass spectra of the compounds in a previous paper2 also were studied from the mass spectra of the compounds reported in this investigation; therefore, slightly revised values for the proton affinities of hydrogen sulfide and methanethiol are reported based on our additional experimental results. As was reported recently,3 the very interesting species, H2S2+, is observed in the mass spectrum of 3,4-dithiahexane.
ExperimentalThe experimental data were obtained using a time-of-flight
mass spectrometer. A previous description of the instrumentation has been given.4 The mass spectra which we report were obtained at nominal electron energies of 70 e.v. Calibration of the voltage scale in the determination of ionization and appearance potentials was accomplished by intimately mixing xenon with the compound being investigated. Appearance potentials were determined primarily by the extrapolated voltage difference method.5 The technique of Lossing, Tickner, and Bryce6 and the energy compensation technique7 also was used and appeared to give somewhat better values for the ionization potentials of these sulfur compounds than did the extrapolated voltage difference method.
In early experiments we noted some difficulty in obtaining accurate values for the ionization potentials of the organic disulfides. Wefound that this problem could be resolved by removing any accumulated heavy deposits of electronic "dirt” from the
(1) This work was supported by the U. S. Atomic Energy Commission under contract no. AT(11-1)-751 with Kansas State University. This is a portion of a dissertation to be presented by B. G. Hobrock to the Graduate School of Kansas State University in partial fulfillment of the requirements for the degree of Doctor of Philosophy.
(2) B. G. Hobrock and R. W. Kiser, J . Phys. Chem., 66, 1648 (1D62); note that a minor change has been made in the title of this series of papers to avoid any confusion over the term electron impact spectroscopy. This change was made at the suggestion of S. Meyerson, and we wish to thank him for his comments.
(3) R. W. Kiser and B. G. Hobrock, ibid., 66, 1214 (1962).(4) E. J. Gallegos and R. W. Kiser, J . Am. Chem. Soc., 83, 773 (1961).(5) J. W. Warren, Nature, 165, 811 (1950).(6) F. P. Lossing, A. W. Tickner, and W. A. Bryce, ./. Chem. Phys., 19,
1254 (1951).(7) R. W. Kiser and E. J. Gallegos, J . Phys. Chem., 66, 947 (1962).
source components. This was accomplished by treating the ion source components with 12% HF in a Sonblaster ultrasonic sound generator8 for 2 min. or less. Longer treatment to the 12% HF in the ultrasonic cleaner was found to cause some coloration of the metallic components.
The samples of 3,4-dithiahexane, 3-methyl-2-thiabutane, and 4-thia-l-pentene were obtained from commercial sources. The purity of each of the compounds was checked by gas-liquid partition chromatography. The 3,4-dithiahexane showed no impurities. Both 4-thia-l-pentene and 3-methyl-2-thiabutane were found to contain small impurities of lower molecular weight, present in quantities less than 3 mole %. The mass spectrum of 3- methyl-2-thiabutane shows no significant differences with serial no. 589 and 912 in the API tables9 so no interference was expected. The impurity in 4-thia-l-pentene appeared to be methyl sulfide, since a peak of variable size appeared at m/e 62 in the mass spectrum. Appearance potential measurements on the ion at m / e 62 indicated that it was a parent molecule-ion and subsequently the impurity was identified as methyl sulfide by comparison with its reported mass spectrum.9
ResultsExperimentally determined mass spectra and ap
pearance potentials for the principal ions formed from the three compounds being investigated are given in columns two and three of Tables I—III. The probable processes for the formation of the various ions are given in column four and the heats of formation consistent with the proposed processes are presented in the last column.
The heat of formation of 4-thia-l-pentene was not available and we therefore estimated it to be 10 kcal./ mole, using the method of Franklin.10 The heats of formation for 3-methyl-2-thiabutane and 3,4-dithiahexane are —21.4311 and —17.42,12 respectively. Other heats of formation employed in our calculations were those tabulated by Gallegos.13
DiscussionIonization Potentials.—-Ionization potentials were
calculated for the complete series of disulfides, C2H 6S2 to CeH]4S2 (symmetrical and unsymmetrical) using a group orbital treatment14 and the ionization potential of H2S2 (10.2 e.v.)3 determined in this study. A C-SS interaction parameter of 2.06 is calculated using the ionization potential of 8.46 e.v. reported for 2,3-dithia-
(.8) “Sonblaster” Ultrasonic Generator, Series 600; The Narda Ultrasonics Corp., Westbury, L. I., New York.
(9) “Mass Spectral Data,” American Petroleum Institute Research Project 44, National Bureau of Standards, Washington, D. C.
(10) J. L. Franklin, Ind. Eng. Chem., 41, 1070 (1949).(11) W. N. Hubbard, W. D. Good, and G. Waddington, .7. Phys. Chem.,
62, 614 (1958).(12) W. N. Hubbard, D. R. Douslin, J. P. McCullough, D. W. Scott,
S. S. Todd, J. F, Messerly, I. A. Hossenlopp, and G. Waddington, J. Am. Chem. Soc., 80, 3547 (1958).
(13) E. J. Gallegos, “Mass Spectrometric Investigation of Saturated Hetero-cyclies,” Doctoral Dissertation, Kansas State University, Manhattan, Kansas, January, 1962.
(14) J. L. Franklin, J. Chem. Phys., 22, 1304 (1954).
March, 1963 Electron Impact Investigation of Sulfur Compounds 649
T a b l e I
A p p e a r a n c e P o t e n t i a l s a n d H e a t s o p F o r m a t i o n o p t h e
P r i n c i p a l I o n s f r o m 3 - M e t h y l - 2 - t i i i a b u t a n e
Relative Appearance A H f +,
a bu nd potentials, kcal./m /e ance e .v . Process mole
15 1 1.5 1 9 .4 zfc 0 .5 C U Lo S — C H a + + (?)27 5 2 .4 1 6 .5 =b FT — C a lia + + C H a + S + C H a (?) 29239 3 5 .8 2 1 . 0 zb .5 — CaHa + + C H a + S + 2 H + Ha 27441 8 9 .5 1 5.2 zb . 2 — CaHs + + C H a + S H + H 21442 2 2 . 8 1 3 .5 =b . 2 — C a H »+ + C H a + HaS 226
— Calie + + C H i + S H 22743 1 0 0 . 0 1 2.7 zfc .2 — C 3H 7 + + C H a + S 18645 2 1 . 2 1 6.4 zb .4 — C H S + + C a H , + H + H , 300
— C H S + + CaHs + C H a + Ha 26746 6 . 2 1 5.5 zb .4 — C H a S + + CaHa + C H a + I I 240
— C H a S + + Calie + 2 H 22747 28.1 1 5.3 zb ,.2 — C H a S + + CaHa + C H a 24248 6 2 .9 1 2 . 0 =fc ..2 — C H 4S + + CaHa + C H a 21949 3 4 .3 1 2 . 1 ± .2 — C H a S + + CaHa + C H a 17259 8 . 6 16.1 =b .3 — CaHaS + + 2 C H a + H 23461 6 . 2 1 3 .5 zb ,.3 — C 2H 5S + + CaHa + Ha 226
— CaHaS + + Calia + H 22575 8 3.1 1 1 .7 zb ,.2 — CaHaS + + C H a 21777 3 .990 5 8 .9 8 .7 zb .,2 — CaHmS + 17992 2 .5
T a b l e I I
A p p e a r a n c e P o t e n t i a l s a n d H e a t s o p F o r m a t i o n o f t h e
P r i n c i p a l I o n s f r o m 4 - T h i a - 1 - p e n t e n e
R ela tive Appearance A f f f +,
abund potential, kcal./m /e ance e.v. Process mole
15 1 5 .8 1 7 .7 zb 0 .5 CaHaS — C H a + + (?)27 2 6 .9 1 6 .5 zb .4 — CaH a+ + C H a S + C H a 285
— CaHa+ + C H a S + C H a 28335 18.1 1 4 .8 zb . 2 — HaS + + C H + CaHa 16337 6 .3 1 6 .6 ± .5 — C a H + + C H a + S + 2 Ha 30838 1 2.4 2 0 .3 zfc .5 — C aH a+ + C H a S + H + Ha 38839 7 3 .6 1 6 .5 zb .4 — C aH a+ + C H a + S H + H 275
— CaHa + + C H a + HaS + I i 27540 8 .441 8 2 .9 1 2 .7 zb .3 — CaH s+ + C H a + S 21842 6 .945 9 2.6 1 3 .8 zb .3 — C H S + + CaHe + Ha 296
— C H S + + C H a + CaHa 28446 4 4 .0 1 1.4 zb .3 — C H aS + + CaHa + Ha 22747 6 7.3 1 1 .9 zb . 2 — C H aS + + CaHa 25248 1 1 . 2 1 1 .5 zb . 2 — C H aS + + CaHa 22949 5 .1 1 1 .7 zb .4 -> - (C H a S « ) + + CaHs 24861 3 3 .8 1 2 . 0 zb . 2 — CaHaS + + CaHa 22373 7 2 .5 1 1 . 0 zfc . 2 — CaHaS + + C H a 23287 6 . 288 1 0 0 . 0 8 .7 0 zb 0 .2 — CaHaS + 21189 6 . 090 5 .2
butane.18 A value of 8.25 e.v. was calculated for 3,4- dithiahexane and is in very good agreement with our experimental value of 8.30 e.v., a previously calculated value of 8.36 e.v.,2 and a literature value of 8.27 e.v.16 The ionization potentials of the other disulfides were calculated to fall in the range of 8.2- 8.4 e.v.
Heats of Formation of Ions.— In general, the AH{+ of the various ions, as summarized in Tables I—III, are in agreement with literature values. A few specific cases are discussed in the following paragraphs.
m/e = 35.— The formation of H3S+ is noted in the study of two of these molecules. From 4-thia-l-pentene the formation of H3S+ appears to be accompanied by the neutral fragments CH + C3H4. A //f+(H3S) = 163kcal./mole is calculated, which agrees well with previously determined values.2
(15) K . W atanabe, T . N a k a ya m a , and J . M o tt l, " F in a l R ep o rt on Io niza tion Potentials of Molecules b y a Photoionization M e th o d ,” D ecem ber, 1959. D ep artm e nt of A r m y 5B99-01-004 O R D -T B 2 -0 0 1 -O O R -1 6 2 4 . C o n tract N o . D A -0 4 -2 0 0 O R D 480 and 737.
T a b l e I I I
A p p e a r a n c e P o t e n t i a l s and H e a t s op F o r m a t i o n op t h e
P r i n c i p a l I o n s f r o m 3 , 4 - D i t h i a h e x a n e
Relative Appearance AH[ +,
abund potential, kcal./m/e ance e.v. Process mole26 8.6 19.5 dz 0.5 CaHmS, — CaHa+ + (?)27 65.0 17.2 zb .4 — CaHs+ + CaHaS + S + Ha 28729 100.0 14.2 zb ,.2 — CaHa + + CaHaS + S 21835 7.4 15.3 zfc ,2 — Hs3+ + 2CaHa + SH 177
— HsS+, + CaHa + H + CaHaS 15445 13.5 17.8 zb . 5 — CHS+ + CHa + CaHaS + H 27046 4.558 5.4 18.6 ± .5 — CaHaS+ + CaHa + S + H +
Ha 28459 10.G 16.2 zb .3 — CaHaS + + CHa + CHaS + II 234
— CaHaS + + CHa + CHaS +Ha' 248
CO 10,6 12.3 zfc .3 — CaHaS + + CaHa + SH 21361 7.8 12.5 zfc .3 — CaHsS + + C2H5S 23264 7.3 14.9 zfc .4 — Sa+ + 2 CaHa 28266 66.7 12.2 =fc ,_ 2 — HaSa+ + 2 CaHa 23968 5.8 12.2 zfc ,,2 — (HaSS” ) + + 2CaHa 23970 0.279 5.5 14.6 zfc ,.2 — CHaSa+ + CHa + CaHa 229
— CH3S2+ + CHa + CaHa H; Ha 23394 50.2 10.8 zfc ,.3 — CaHeSa+ + CaHa 21995 4.396 4.8
122 51.9 8.30 zfc 0.15 — CaHxoSa + 174123 5.8124 5.4
Two processes are believed to contribute to the formation of H3S+ from 2,3-dithiahexane. These processes appear to involve the presence of C2H2 + H + C2H4S and 2C2H3 + SH as neutral fragments. A fff+(H3S) which results from this study and those values obtained in the previous investigation2 is 165 ± 6 kcal./mole. A proton affinity of —197 ± 7 kcal./mole is obtained, which is not greatly different from that reported previously.2
m/e = 49.—The interesting species at m/e = 49 appears in two of the compounds investigated here, 3- methyl-2-thiabutane and 4-thia-l-pentene. For 3- methyl-2-thiabutane, if the neutral fragments are assumed to be C2H2 + CH3, AHi+(CHS) = 172 kcal./ mole. It is believed that the major portion of the ion at m/e = 49 from 4-thia-l-pentene is due to the natural abundance of S34 and that the ion is (CH3S34) +. From the appearance potential, 11.7 e.v., which is nearly the same as 11.9 e.v. ior m/e = 47, A/71-‘h(C n 3S34) = 248 kcal./mole.
An average value for A //f+(CH6S) from previous study2 and the value of 172 kcal./mole obtained in this work is 163 ± 10 kcal./mole. From this value and using AiZf+(H) = 367 kcal./mole and A //f(CH,SH) = -5 .4 6 kcal./mole,16 the proton affinity of methanethiol is calculated to be —199 ± 10 kcal./mole.
m/e = 61.—The ion at m/e = 61 is C2H5S + and appears in significant quantities in each of the investigated compounds. From 3-methyl-2-thiabutane, two processes are thought to be of about equal probability and lead to AJ7f+(C2H6S) = 226 and 225 kcal./mole. (See Table I for the processes involved.) Good internal agreement is noted as A//f+(C2II5S) = 223 kcal./mole in the 4-thia-l-pentene study. The neutral fragment in this case is ethylene.
For the appearance potential of the m/e = 61 ion from 3,4-dithiahexane and for the subsequent heat of
(16) W . D . Good, J . L . Lacina, and J . P . M c C u llo u g h , J . P h y s . C h e m 65, 2229 (1961).
650 Brice G. Hobrock and R obert W. K iser Vol. 67
formation of C2H6S~ we obtain 12.5 ± 0.3 e.v. and 232 kcal./mole, respectively. Our appearance potential isI. 3 e.v. higher than that reported by Franklin and Lumpkin.17 It was feared that any possible dirty conditions in the source of the mass spectrometer (see Experimental) might prevent our obtaining accurate values as in the case of the ionization potentials of the disulfides. This was not the case, however; we found that an appearance potential of 11.2 e.v. could not be obtained under any experimental conditions in our instrument.
In addition, the value of A77£+(C2H5S) = 232 kcal./ mole, subject to some uncertainty in our use of A77f- (C2H5S) = 39 kcal./mole, agrees well with the values of 223 and 225 or 226 kcal./mole reported above and with values of 225, 213, and 233 kcal./mole reported in our earlier study.2 We conclude that A77f+(C2H6S) = 225 ± 5 kcal./mole, and by using our determined appearance potential of 12.5 e.v., that A77£(C2H5S) = 40 ± 4 kcal./mole. These values are somewhat different from those reported by Franklin and Lumpkin.17
m/e = 64.—The presence of S2+ is observed in the mass spectrum of 3,4-dithiahexane. From the measured appearance potential, A77£+(S2) = 282 kcal./mole, which is in excellent agreement with that calculated from the2.3- dithiabutane case.2 The derived ionization potential for S2 is unchanged from that obtained previously,I I . 0 ± 0.2 e.v.*
m/e = 66 and 68.—-The ion at m/e = 66 is quite intense in the mass spectrum of 3,4-dithiahexane and is the very interesting specie, H2S2+. The natural abundance of S34 and the abundances of ions at m/e = 68 to 70 indicate that the ion must contain two sulfur atoms. Measurements on both m/e = 66 and 68 give an appearance potential of 12.2 e.v. for H2S2+. The low value of the appearance potential indicates that the ionization and dissociation process leading to H2S2+ should be relatively simple. The formation of two molecules of ethylene as neutral fragments is such a process and leads to AFf+(H2S2) = 239 kcal./mole.16 Kiser and Hobrock3 have reported that from these data 7(H&) = 10.2 e.v. and have concluded that D(HS- SH) = 59 ± 3 kcal./mole.
m/e = 79.— CH382+ appears in the mass spectrum of3.4- dithiahexane, even as it did in the mass spectrum
(17) J. L. Franklin and H. C. Lumpkin, J. Am. Chem. Soc., 74, 102*5 (1952).
of 2,3-dithiabutane. The structure may be CH2SSH+, however, as we note the ease with which hydrogen and sulfur form bonds (H3S+, CH6S+, H2S2+). Either or both of two processes may be responsible for the formation of CH3S»+ and are shown in Table III. A77£+- (CH3S2) = 240 kcal./mole.2 An average value of 234 kcal./mole together with the estimated value of A //f+- (CH3S2) = 21 kcal./mole leads to 7(CH3S2) = 9.3 ± 0.3 e.v.
m/e = 88.—This is the parent molecule-ion from 4- thia-l-pentene. The measured ionization potential of 8.70 e.v. results in A77£+(C4H8S) = 211 kcal./mole, which is somewhat higher than A //f+(C4H83) = 190 kcal./ mole from tetrahydrothiophene.18 Assuming that the tetrahydrothiophene ion retains its cyclic structure, this difference is probably not too surprising.
m/e = 90.—This ion appears to a significant extent only in the mass spectrum of 3-methyl-2-thiabutane and is the parent molecule-ion of this compound. A/7£+- (C4H10S) = 179 kcal./mole.
m/e = 94.— Instead of simple cleavage of a C2H6 group to give an ion at m/e = 93, a hydrogen atom apparently rearranges to give the ion at m/e = 94, C2H6S2+. Assuming that the neutral fragment is C2H4, A //{+(C2II6S2) = 219 kcal./mole. Now, if we assume that the structure is C2H5SSH, and estimating A77f- (C2HBSSH) = 2 kcal./mole, we may calculate the ionization potential of C2H6SSH to be 9.4 ± 0.3 e.v. By use of the group orbital method14 and parameters by Gallegos and Kiser,19 the ionization potential of C2H6- SSH is calculated to be 8.95 e.v. Alternatively, using the parameters associated with the treatment of -S S - as a group, 7(C2H6SSH) is calculated to be 9.05 e.v. The agreement suggests that the structure of C2H6S2 + is C2H5SSH+, rather than the ion which might be formed by rearrangement, CH3SSCHs+.
m/e = 122.— The value determined for the ionization potential of 3,4-dithiahexane is 8.30 e.v. and agrees well with literature values.15 A77£+(C4Hi0S2) = 174 kcal./ mole, as calculated from the measured ionization potential and A77£(C4H ioS2).
Acknowledgments.—-We wish to express our indebtedness to Drs. H. C. Moser and A. A. Sandoval for their suggestion to use the 12% HF solution in the ultrasonic cleaner and for their aid in those operations.
(18) E. J. Gallegos and R. W. Kiser, J. Phys. Chem., 66, 136 (1962).(19) E. J. Gallegos and R. W. Kiser, ib id ., 65, 1177 (1961).
ON THERMODYNAMIC COUPLING OF CHEMICAL REACTIONS CLOSE TOEQUILIBRIUMB y M il t o n M a n e s
P i t t s b u r g h C h e m i c a l C o m p a n y , P i t t s b u r g h 2 5 , P a .
R e c e i v e d S e p t e m b e r 4 , 1 9 6 2
In a two-reaction system close to equilibrium wherein each rate is completely determined by the corresponding affinity { i . e . , where the rates are diagonal in the affinities), the contribution of each reaction to the entropy production must always be positive. However, if such a system is described in terms of equations that do not represent the individual reactions, the rates become non-diagonal in the affinities. In this new language one can confer or revoke thermodynamic coupling (the apparent existence of an entropy-reducing reaction) by appropriate modifications of the manner in which one chooses to perturb the system from equilibrium. Caution is therefore suggested in ascribing physical significance to thermodynamic coupling in the absence of a reaction mechanism.
March, 1963 T hermodynamic Coupling of Chemical R eactions Close to Equilibrium 651
Koenig, Horne, and Mohilner1 have recently cast doubt on the physical significance of “ thermodynamic coupling” (the existence of some entropy-reducing reactions in a multi-reaction system) by demonstrating that any set of net chemical reactions in which coupling does not occur can be transformed by linear combination into a set in which it does occur, and conversely, van Rysselberghe,2 however, has objected to the use by Koenig, et al.,1 of sets of equations that are not written in an “ intrinsic” manner, citing De Donder’s requirement that only such “ intrinsic” sets may be properly used in ascertaining the occurrence of thermodynamic coupling. Hooyman3 has shown how to write such a set (the criteria for which are stoichiometric in nature) and concludes that the division into reactions with positive or with negative entropy production is then uniquely determined.
This article is to draw attention to the fact that at least in systems close to equilibrium one can in general confer and revoke coupling by modifying the affinities (e.g., by perturbations of the composition), without making any changes in the equations. The only set of equations within which coupling cannot be conferred or revoked in this manner turns out to be the set of equations (if such exist) in which each rate depends only on the corresponding affinity. If such a set does exist, i.e., if the real reactions in the system are in fact uncoupled, we can always transform this set into one in which we can confer or revoke coupling. In such cases at least, the coupling cannot be more than an artifact of the mathematics. Although this does not prove that thermodynamic coupling cannot exist, it does suggest caution in ascribing physical significance to it in the absence of a reaction mechanism.
The point can be illustrated by an assumed two- reaction system, which can be readily generalized. Following Verschaffelt,4 we assume the existence of a pair of reactions in which the rates are diagonal in the affinities and transform it to a set in which the rates are not diagonal in the affinities. It is then a simple matter to show how the non-diagonal pair (or any nondiagonal pair) can be coupled or uncoupled.5
In the assumed two-reaction case close to equilibrium the observable rates, v, and v2, are related to the affinities, Ai and A 2, by the equations
(1) F. O. Koenig, F. H. Horne, and D. M. Mohilner, J . Am. Chem. Soc., 83, 1029 (1961). See this article for detailed references and definitions.
(2) P. van Rysselberghe, Bull. soc. chim. Belg., 70, 592 (1961). This article cites De Donder, Bull. Classe Sci. Acad. Roy. Belg., 23, 770 (1937).
(3) G. J. Hooyman, Proc. Natl. Acad. Sci. U. S., 47, 1169 (1961).(4) J. E. Verschaffelt, Bull. Classe Sci. Acad. Roy. Belg., 41, 316 (1955).(5) This was not considered in Verschaffelt’» article.
vi = n A,
v2 = r2A 2 (1)
where the proportionality constants r, and r2 are proportional to the equilibration velocities, or “ gross reaction rates.” 6 They are always positive and represent the assumed real rates in the system.
We now define a new set of affinities, A, and A i (by assuming a new set of equations), for example
A\ ~ A,
A i = Ai T A 2 (2)
in which case the new rates v i and v i become
V i = V i — v 2
v i = v2 (3)
Substitution of the v’s from equation 1 and the A ’s from equation 2 gives the new velocities in terms of the new affinities as
v i = (n + r2)Ai — r2A 2
v i = —r2A i + r2A i (4)
In the transformed set the velocities are no longer diagonal in the affinities and we can therefore couple or uncouple the equations by our choice of the A'. For example, v i is negative for positive A i when A i > Ai(rx + r2) /r2 (in which case v i must be positive for positive A i) and v i is negative for positive A i if Ai > A i (in which case v i must be positive for positive A i) . Since it is the non-diagonality of the rates in the affinities that makes this kind of manipulation possible, one cannot avoid it by choosing equations on the basis of any stoichiometric criteria, except in the trivial case where the assumed set of equations represents the actual uncoupled reactions in the system.
As an example, if we assume as our uncoupled reactions the pair
CO + H20 ^ C 02 + H2 (I)
CH4 + H20 CO + 3H2 (II)
the set resulting from the transformation of equation 2 can be written
CO = C 02 + H2 - H20 (I')(6) M. Manes, L. J. E. Hofer, and S. Weller, J. Chem. Phya., 18, 135b
(1950).
652 M . H. Lietzke and R. W . Stoughton Voi. 67
CH4 = C 02 + 4H2 - 2H20 (II')
This set conforms to Ilooyman’s3 criteria, since CO appears only in equation I ' and CH4 only in equation II '. As we have seen, however, the number of “ positive” and “ negative” equations is in fact not invariant,
except in the trivial case where we fix both the equations and the composition.
Although the foregoing discussion does not prove the non-existence of thermodynamic coupling, we see that it can appear as a consequence of ascribing physical significance to arbitrary equations.
THE SECOND DISSOCIATION CONSTANT OF DEUTERIOSULFURIC ACIDFROM 25 TO 225°
By M. H. L i e t z k e a n d R. W. S t o u g h t o n
C h e m i s t r y D i v i s i o n , O a k R i d g e N a t i o n a l L a b o r a t o r y , l O a k R i d g e , T e n n e s s e e
R e c e i v e d S e p t e m b e r 6 , 1 0 6 3
The second dissociation constant of deuteriosulfuric acid has been computed from 25 to 225° from data on the solubility of Ag2S04 in D2SOi solutions. In addition, the thermodynamic constants for the reaction D S04~ = D + + SO4“ 2 are presented. A comparison with the corresponding values for the H2SOi system is given.
In a previous paper2 the calculation of the bisulfate acid constant from 25 to 225° was reported. In the present work the second dissociation constant of deuteriosulfuric acid has been computed from data on the solubility of AgvSO.i in D2S04 solutions over the same temperature range. In addition the thermodynamic constants AF°, AH°. and AS0 for the reaction
DSO«- = D+ + S04“ 2 (1)
are presented.
Ag2S04 is lower than in H2S04, in 0.25 and 0.5 to D2S04 the solubility is about the same as in H2S04, while in 0.75 and 1.0 to D2S04 the solubility is higher than in the corresponding protonated systems. Thus the ionic strength effect is greater in the deuterated media.
Method of Calculation.—-In carrying out the calculations it was assumed that only the species Ag+, D +, S04~2, and D S04~ existed in a solution of Ag2S04 dissolved in D2S04. As in previous work6 it was also assumed that
ExperimentalThe D2SO4 solutions were prepared by diluting a i m stock
solution of D 2SO4 with D20 where m represents moles per 1000 g. of solvent. The D2304 stock solution was prepared according to the method given by Shudde, 3 which consists essentially of bubbling S03 vapor through D 20 . The SO3 vapor (obtained by heating Sulfan B (v-S03) from the Allied Chemical Co.) was conveyed with a stream of dry helium through the all-glass system. The D20 was prepared by twice distilling 99.7% D20 under an atmosphere of nitrogen tha t had been dried over Mg- (C104)2: the first distillation was made from a i m D2S04 and 0.5 m K2Cr2C>7 solution and the second from 2% KM n04 and 0.04 m NaOD. Extreme precautions were taken a t all times to exclude any contamination by H20 .
The Ag2Sv_4 was prepared according to the method described by Archibald.4 The solubility measurements were carried out using the synthetic method described previously.6
Results and Discussion
and
In Q2 — hi K 2 -f- 4St ~ V Î .1 + A V l -
(2)
In S = In 4 So3 + 6StV i
.1 + p V i
V 3so___1 T~ P \/3s<i
(3)where K2 is the D S04~ acid constant, St is the Debye- Hiickel limiting slope at temperature T for a singly charged ion, s0 is the solubility of Ag2S04 in D 20 at temperature T, P and A are adjustable parameters, and I is the ionic strength of the solution, given by
I = m + s + 2[S04- 2] (4)The solubility of Ag2S04 was measured in D20 and
in 0.1, 0.25, 0.5, 0.75, and 1.0 m D2S04 from 25 to at least 225°. The experimental solubility values in each solution then were fitted by the method of least squares to a cubic equation in the temperature.
In Table I is shown a comparison between the experimental solubility points and the values calculated using the equations whose coefficients are given in Table II. At any temperature the solubility of Ag2S04 is lower in D20 than in H20 (0.019 to in D20 at 25° compared to 0.027 to in H20). In 0.1 to D2S04 the solubility of 1 2 3 4 5
(1) Work performed for the U. S. Atomic Energy Commission and for the Office of Saline. Water, U. S. Department of the Interior, at the Oak Ridge National Laboratory, operated by Union Carbide Corporation for the U. S. Atomic Energy Commission.
(2) M. H. Lietzke and R. W. Stoughton, J. Phys. Chem., 65, 2247 (1961).(3) R. H. Shudde, North American Aviation Document NAA-SR-2158.(4) E. H. Archibald, “ The Preparation of Pure Inorganic Substances,”
John Wiley and Sons, Inc., New York, N. Y., 1932.(5) M. H. Lietzke and R. W. Stoughton, J. Am. Chem. Soc., 78, 3023
(1956).
where s is the molal solubility of Ag2S04 in D2S04 of molality to.
Hence the over-all problem involves the evaluation of In K t, A, and P by a non-linear least squares procedure subject to the restrictions represented by the equation for conservation of total sulfate, and those expressing the (molality) solubility product of Ag2S04 and the acid dissociation quotient in terms of the concentrations of the ionic species. Details of the calculation are very similar to those in the bisulfate acid constant , calculation2 and will not be repeated here. One difference, however, should be emphasized: measurement of Ag2S04 in five different concentrations of D2S04 permitted the direct evaluation of all three parameters. It was not necessary, as in the HS04~ calculation (where the solubility of Ag2S04 was studied in only three different concentrations of H2S04), to permute
(6) M, H. Lietzke and R. W. Stoughton, J. Phys. Chem., 63, 1183, 1186, 1188, 1190, 1984 (1959); 64, 816 (1960).
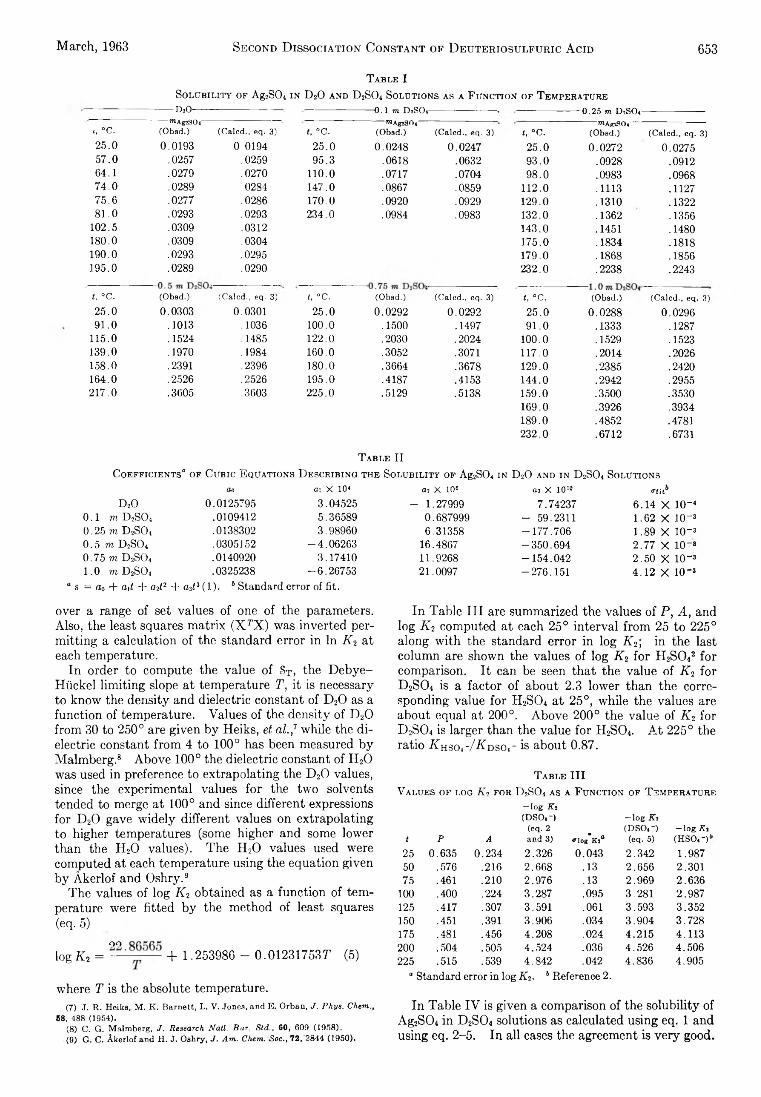
March, 1963 Second D issociation Constant of D euteriosulfuric A cid 653
T able ISolubility of Ag2S04 in D20 and D2SO4 Solutions as a F unction of T emperature
---------DzO------ 0.1m D2SO4 ---------------- , --- 0.25 m D2SO4-wAg2S04 WUg2S04 mAg2SOt(, °c. (Obsd.) (Caled., eq. 3) (, °C. (Obsd.) (Caled., eq. 3) i, °C. (Obsd.) (Caled., eq. 3)
25.0 0.0193 0.0194 25.0 0.0248 0.0247 25.0 0.0272 0.027557.0 .0257 .0259 95.3 .0618 .0632 93.0 .0928 .091264.1 .0279 .0270 1 1 0 . 0 .0717 .0704 98.0 .0983 .096874.0 .0289 ,0284 147.0 .0867 .0859 1 1 2 . 0 .1113 .112775.6 .0277 .0286 170.0 .0920 .0929 129.0 .1310 .132281.0 .0293 .0293 234.0 .0984 .0983 132.0 .1362 .1356102.5 .0309 .0312 143.0 .1451 .1480180.0 .0309 .0304 175.0 .1834 .1818190.0 .0293 .0295 179.0 .1868 .1856195.0 .0289 .0290 232.0 .2238 .2243t, °c. (Obsd.) (Caled., eq. 3) f, °c. (Obsd.) (Caled., eq. 3) t, °c. (Obsd.) (Caled., eq. 3)25.0 0.0303 0.0301 25.0 0.0292 0.0292 25.0 0.0288 0.029691.0 .1013 .1036 10 0 .0 .1500 .1497 91.0 .1333 .1287
115.0 .1524 .1485 1 2 2 .0 .2030 .2024 10 0 .0 .1529 .1523139.0 .1970 .1984 160.0 .3052 .3071 117.0 .2014 .2026158.0 .2391 2396 180.0 .3664 .3678 129.0 .2385 .2420164.0 .2526 .2526 195.0 .4187 .4153 144.0 .2942 .2955217.0 .3605 .3603 225.0 .5129 .5138 159.0 .3500 .3530
169.0 .3926 .3934189.0 .4852 .4781232.0 .6712 .6731
T able IIC oefficients“ of C ubic E quations D escribing the Solubility of Ag2S04 in D20 and in D2S04 Solutions
O0 ai X 10* at X 106 03 X 10'» <rtitbD20 0.0125795 3.04525 - 1.27999 7.74237 6.14 X IO“ 4
0.1 m D2SO< .0109412 5.36589 0.687999 - 59.2311 1.62 X IO-30.25 m D2SO4 .0138302 3.98960 6.31358 -177.706 1.89 X IO" 30.5 to D2S04 .0305152 -4.06263 16.4867 -350.694 2.77 X 10-«0.75 m D2SO4 .0140920 3.17410 11.9268 -154.042 2.50 X 10“ 31.0 m D2S04 .0325238 -6.26753 21.0097 -276.151 4.12 X IO“ 3
“ s = ao + a¡( + a2t2 + a3t3 (1). 6 Standard error of fit.over a range of set values of one of the parameters. Also, the least squares matrix (X TX ) was inverted permitting a calculation of the standard error in In K 2 at each temperature.
In order to compute the value of St , the Debye- Hiickel limiting slope at temperature T, it is necessary to know the density and dielectric constant of D20 as a function of temperature. Values of the density of D20 from 30 to 250° are given by Heiks, et al.,7 while the dielectric constant from 4 to 100° has been measured by Malmberg.8 Above 100° the dielectric constant of H20 was used in preference to extrapolating the D20 values, since the experimental Values for the two solvents tended to merge at 100° and since different expressions for D20 gave widely different values on extrapolating to higher temperatures (some higher and some lower than the H20 values). The H20 values used were computed at each temperature using the equation given by Akerlof and Oshry.9
The values of log K 2 obtained as a function of temperature were fitted by the method of least squares (eq. 5)
OOlo g K i = -------+ 1.253986 - 0 .0 12 3 17 5 3 7 7 (5)
where T is the absolute temperature.(7) J. R. Heiks, M. K. Barnett, L. V. Jones, and E. Orban, J. Phys. Chem.,
58, 488 (1954).(8) C. G. Malmberg, J. Research Natl. Bar. Std., 60, 609 (1958).(9) G. C. Akerlof and H. J. Oshry, J. Am. Chem. S o c ., 72, 2844 (1950).
In Table III are summarized the values of P, A, and log K 2 computed at each 25° interval from 25 to 225° along with the standard error in log K 2, in the last column are shown the values of log K 2 for H2S042 for comparison. It can be seen that the value of K 2 for D2S04 is a factor of about 2.3 lower than the corresponding value for H2S04 at 25°, while the values are about equal at 200°. Above 200° the value of K 2 for D2S04 is larger than the value for H2S04. At 225° the ratio X hso4- /X dso,- is about 0.87.
T able I IIV alues of log K 2 for D 2S 0 4 as a Function of T emperature
f P A
—log Kt (DSO.-)
(eq. 2 and 3) »1oü’k!°
—log Ki (DSO,-) (eq. 5)
—log Ki (HSO.-)1
25 0.635 0.234 2.326 0.043 2.342 1.98750 .576 .216 2 .66 8 .13 2.656 2.30175 .461 .210 2.976 .13 2.969 2.636
100 .400 .224 3.287 .095 3.281 2.987125 .417 .307 3.591 .061 3.593 3.352150 .451 .391 3.906 .034 3.904 3.728175 .481 .456 4.208 .024 4.215 4.113200 .504 .505 4.524 .036 4.526 4.506225 .515 .539 4.842 .042 4.836 4.905
“ Standard error in log K 2. 1 Reference 2.
In Table IV is given a comparison of the solubility of Ag2S04 in D2S04 solutions as calculated using eq. 1 and using eq. 2-5. In all cases the agreement is very good.
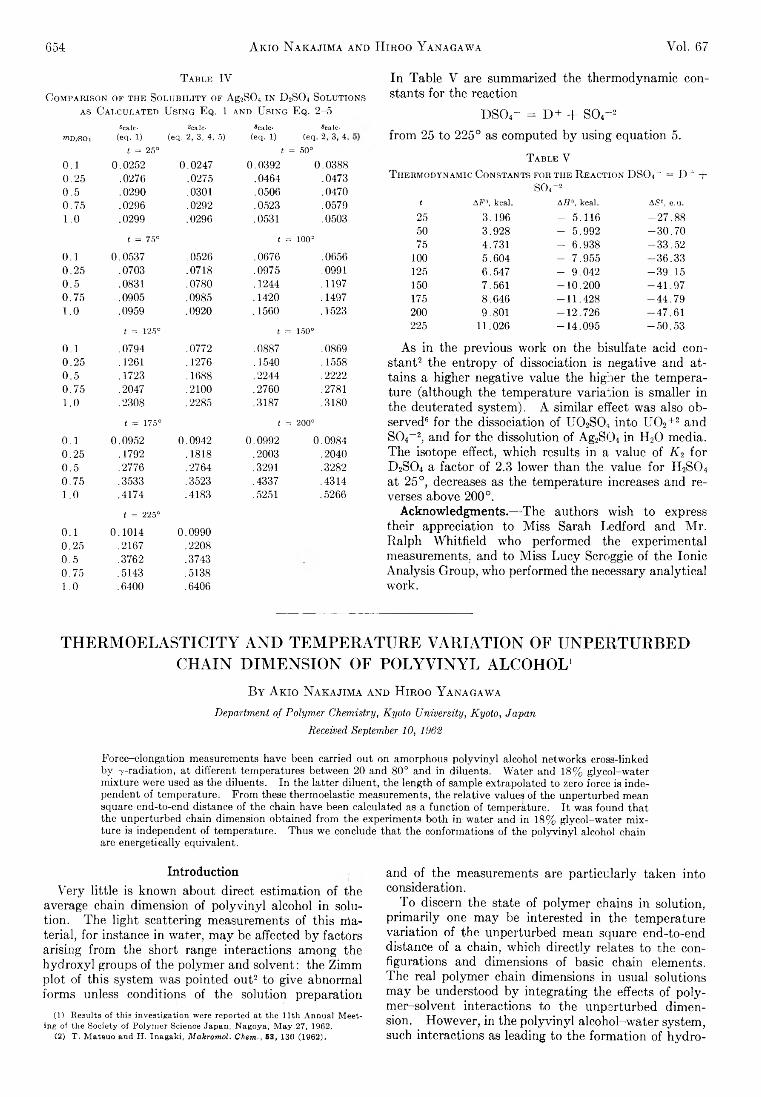
654 A kio Nakajima and Hiroo Y anagawa Voi. 67
Table IVComparison of the Solubility of Ag2S04 in D2S04 Solutions
as Calculated Using E q . 1 and Using E q . 2 -5
Scale- Scale- Scale- Scale-mD2S04 (eq. I) (eq. 2, 3, 4, 5) (eq. 1) (eq. 2, 3, 4,
t = 25° t = 50°0 .1 0 .0 25 2 0 .0247 0 .0392 0 .0 3 8 80 .2 5 .0276 .0275 .0464 .04730 .5 .0290 .0301 .0506 .04700 .7 5 .0296 .0292 .0523 .05791 .0 .0299 .0296 .0531 .0503
t = 75° t = 100°
0 .1 0 .0 53 7 .0526 .0676 .06560 .2 5 .0703 .0718 .0975 .09910 .5 .0831 .0780 .1244 .11970 .7 5 .0905 .0985 .1420 .14971 .0 .0959 .0920 .1560 .1523
t = 125° i = 150°
0 .1 .0794 .0772 .0887 .08690 .2 5 .1261 .1276 .1540 . 15580 .5 .1723 . 1688 .2244 .22220 .7 5 .2047 .2100 .2760 .27811 .0 .2308 .2285 .3187 .3180
t = 175° t = 200°
0 .1 0 .0952 0 .0942 0 .0 99 2 0 .0 9 8 40 .2 5 .1792 .1818 .2003 .20400 .5 .2776 .2764 .3291 .32820 .7 5 .3533 .3523 .4337 .43141.0 .4174 .4183 .5251 .5266
t = 225°
0 .1 0 .1 01 4 0 .09900 .2 5 .2167 .22080 .5 .3762 .37430 .7 5 .5143 . 51381 .0 .6400 .6406
In Table V are summarized the thermodynamic constants for the reaction
DS04- = D+ + S04- 2from 25 to 225° as computed by using equation 5.
Table VThermodynamic Constants for the Reaction DS04 = D + +
SCtr2i AF°, keal. AH0, kcal. AS0, e.u.
25 3 .1 9 6 - 5 .1 1 6 - 2 7 .8 850 3 .9 2 8 - 5 .992 - 3 0 . 7 075 4.731 - 6 .9 3 8 - 3 3 .5 2
100 5 .6 0 4 - 7 .9 5 5 - 3 6 . 3 3125 6 .5 4 7 - 9 .0 4 2 - 3 9 . 1 5150 7.561 -1 0 .2 0 0 - 4 1 . 9 7175 8 .6 4 6 -1 1 .4 2 8 - 4 4 . 7 9200 9.801 -1 2 .7 2 6 - 4 7 .6 1225 11.026 -1 4 .0 9 5 - 5 0 . 5 3
As in the previous work on the bisulfate acid constant2 the entropy of dissociation is negative and attains a higher negative value the higher the temperature (although the temperature variation is smaller in the deuterated system). A similar effect was also observed6 for the dissociation of U 02S04 into U 02+2 and S04~2, and for the dissolution of Ag2S04 in H20 media. The isotope effect, which results in a value of K 2 for D2S04 a factor of 2.3 lower than the value for H2S 04 at 25°, decreases as the temperature increases and reverses above 200°.
Acknowledgments.—-The authors wish to express their appreciation to Miss Sarah Ledford and Mr. Ralph Whitfield who performed the experimental measurements, and to Miss Lucy Scroggie of the Ionic Analysis Group, who performed the necessary analytical work.
THERMOELASTICITY AND TEMPERATURE VARIATION OF UNPERTURBED CHAIN DIMENSION OF POLYVINYL ALCOHOL1
B y A k i o N a k a j i m a a n d H i r o o Y a n a g a w a
Department of Polymer Chemistry, Kyoto University, Kyoto, Japan Received September 10, 1962
F o rc e -e lo n g a t io n m ea su rem e n ts h a v e been c a rr ie d o u t o n a m o rp h o u s p o ly v in y l a lc o h o l n e tw o rk s c ro s s -lin k e d b y Y - r a d ia t io n , a t d if fe re n t te m p e ra tu re s b e tw e e n 20 a n d 80° a n d in d ilu e n ts . W a te r a n d 1 8 % g ly c o l -w a t e r m ix tu r e w e re u sed as th e d ilu e n ts . I n th e la t te r d ilu e n t , th e le n g th o f sa m p le e x tra p o la te d to ze ro fo rc e is in d e p e n d e n t o f te m p e ra tu re . F r o m these th e rm o e la s tic m ea su rem e n ts , th e re la t iv e v a lu e s o f th e u n p e rtu rb e d m ea n sq u a re e n d -to -e n d d is ta n c e o f th e c h a in h a v e b een c a lc u la te d as a fu n c t io n o f te m p e ra tu re . I t w a s fo u n d t h a t th e u n p e r tu rb e d c h a in d im e n s io n o b ta in e d f ro m th e e x p e r im e n ts b o th in w a te r a n d in 1 8 % g ly c o l -w a t e r m ix tu re is in d e p e n d e n t o f te m p e ra tu re . T h u s w e c o n c lu d e th a t th e c o n fo rm a tio n s o f th e p o l y v in y l a lc o h o l c h a in a re e n e rg e t ic a lly e q u iv a le n t .
IntroductionVery little is known about direct estimation of the
average chain dimension of polyvinyl alcohol in solution. The light scattering measurements of this Material, for instance in water, may be affected by factors arising from the short range interactions among the hydroxyl groups of the polymer and solvent: the Zimm plot of this system was pointed out2 to give abnormal forms unless conditions of the solution preparation
(1) Results of this investigation were reported at the 11th Annual Meeting of the Society of Polymer Science Japan, Nagoya, May 27, 1962.
(2) T, Matsuo and H, Inagaki, Makromol, Chem*, 53, 130 (1962).
and of the measurements are particularly taken into consideration.
To discern the state of polymer chains in solution, primarily one may be interested in the temperature variation of the unperturbed mean square end-to-end distance of a chain, which directly relates to the configurations and dimensions of basic chain elements. The real polymer chain dimensions in usual solutions may be understood by integrating the effects of poly- mer-solvent interactions to the unperturbed dimension. However, in the polyvinyl alcohol-water system, such interactions as leading to the formation of hydro-
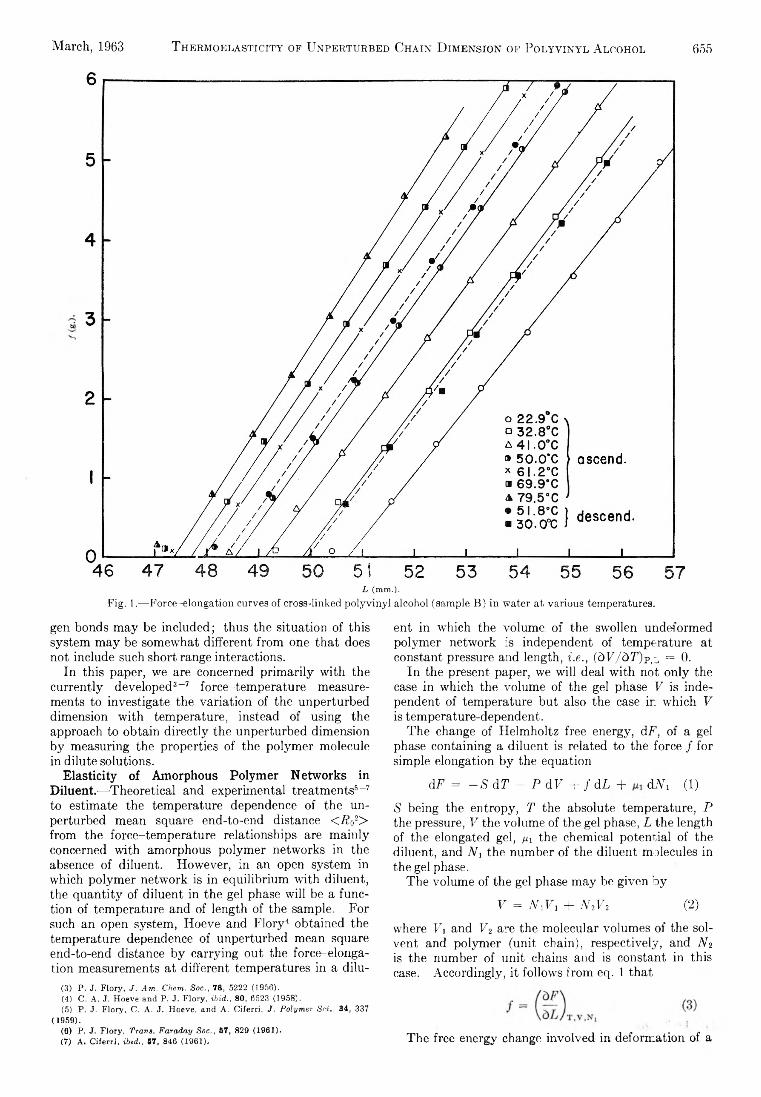
March, 1963 Thermoelasticity op Unperturbed Chain D imension of Polyvinyl Alcohol 655
L (mm.)-Fig. 1.—Force-elongation curves of cross-linked polyvinyl alcohol (sample B) in water at various temperatures.
gen bonds may be included; thus the situation of this system may be somewhat different from one that does not include such short range interactions.
In this paper, we are concerned primarily with the currently developed3-7 force-temperature measurements to investigate the variation of the unperturbed dimension with temperature, instead of using the approach to obtain directly the unperturbed dimension by measuring the properties of the polymer molecule in dilute solutions.
Elasticity of Amorphous Polymer Networks in Diluent.—Theoretical and experimental treatments6-7 to estimate the temperature dependence of the unperturbed mean square end-to-end distance <R 02> from the force-temperature relationships are mainly concerned with amorphous polymer networks in the absence of diluent. However, in an open system in which polymer network is in equilibrium with diluent, the quantity of diluent in the gel phase will be a function of temperature and of length of the sample. For such an open system, Hoeve and FJory4 obtained the temperature dependence of unperturbed mean square end-to-end distance by carrying out the force-elongation measurements at different temperatures in a dilu-
(3) P. J. Flory, / . Am Chem. Soc., 78, 5222 (1956).(4) C. A. J. Hoeve and P. J. Flory, ibid., 80, 6523 (1958).(5) P. J. Flory, C. A. J. Hoeve, and A. Ciferri, J. Polymer Sci., 34, 337
(1959).(6) P. J. Flory, Trans. Faraday Soc., 57, 829 (1961).(7) A. Ciferri, ibid., 57, 846 (1961).
ent in which the volume of the swollen undeformed polymer network is independent of temperature at constant pressure and length, i.e., (dV/dT)Pi = 0.
In the present paper, we will deal with not only the case in which the volume of the gel phase V is independent of temperature but also the case ir_ which V is temperature-dependent.
The change of Helmholtz free energy, dF, of a gel phase containing a diluent is related to the force / for simple elongation by the equation
dF = - S d T - P d V + / d L + dAb (1)
S being the entropy, T the absolute temperature, P the pressure, V the volume of the gel phase, L the length of the elongated gel, ¡j., the chemical potential of the diluent, and N 1 the number of the diluent molecules in the gel phase.
The volume of the gel phase may be given by
V = N iV1 + N2V2 (2)
where lb and V2 are the molecular volumes of the solvent and polymer (unit chain), respectively, and N2 is the number of unit chains and is constant in this case. Accordingly, it follows from eq. 1 that
The free energy change involved in deformation of a
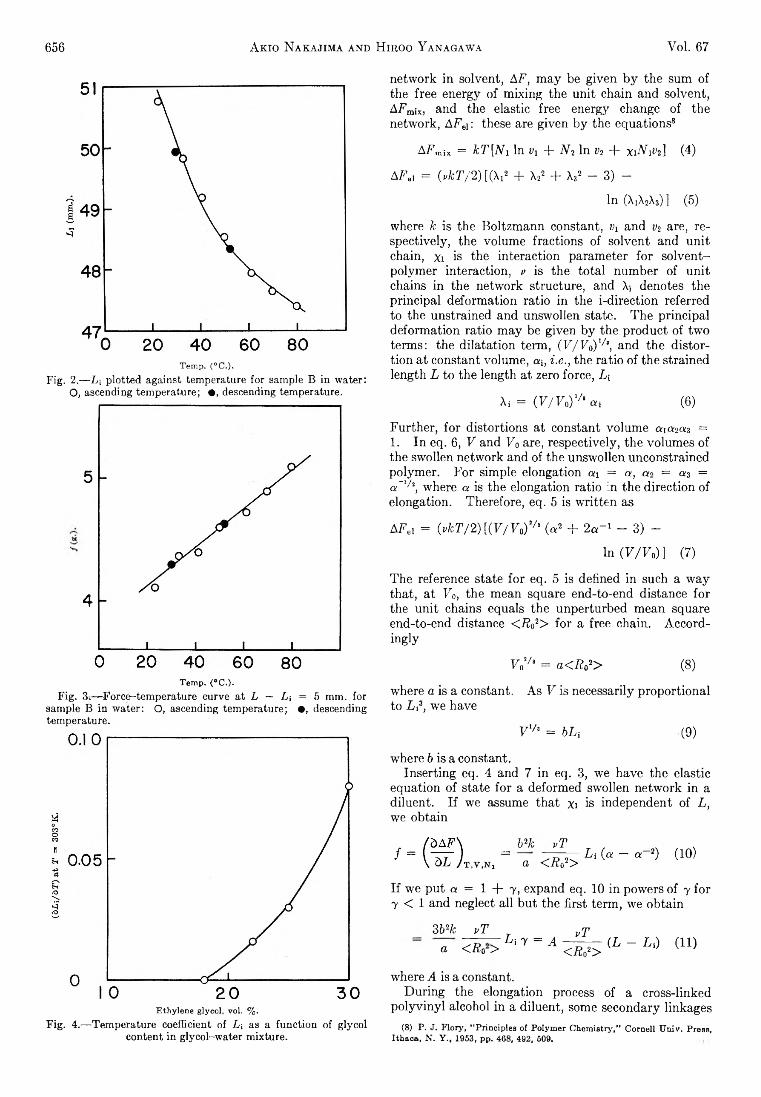
656 Akio Nakajima and Hiroo Y anagawa Vol. 67
Temp. (”C.).Fig. 2.—L \ plotted against temperature for sample B in water:
O, ascending temperature; • , descending temperature.
Temp. <°C.).Fig. 3.—Force-temperature curve a t L — L i = 5 mm. for
sample B in water: O, ascending temperature; • , descending temperature.
Ethylene glycol, vol. %.Fig. 4.—Temperature coefficient of L i as a function of glycol
content in glycol-water mixture.
network in solvent, AF, may be given by the sum of the free energy of mixing the unit chain and solvent, AFmix, and the elastic free energy change of the network, AFei : these are given by the equations8
AFmii = kT[N 1 In vx + N2 In v2 + xiN iV2] (4)
AFel = (vkT/2) [(Ar2 + X22 + X32 - 3) -
ln (X1X2X3) ] (5)
where k is the Boltzmann constant, vx and v2 are, respectively, the volume fractions of solvent and unit chain, xi is the interaction parameter for solvent- polymer interaction, v is the total number of unit chains in the network structure, and X, denotes the principal deformation ratio in the i-direction referred to the unstrained and unswollen state. The principal deformation ratio may be given by the product of two terms: the dilatation term, (V/Vo)1''3, and the distortion at constant volume, «¡, i.e., the ratio of the strained length L to the length at zero force, Li
X i = ( F / 7 0 ) 1/3ai (6)
Further, for distortions at constant volume axa2az = 1. In eq. 6, F and F0 are, respectively, the volumes of the swollen network and of the unswollen unconstrained polymer. For simple elongation ax = a, a2 = a3 = a~1/2, where a is the elongation ratio in the direction of elongation. Therefore, eq. 5 is written as
AFei = (vkT/2 )[(F /F 0) Vs (a2 + 2a“ 1 - 3) -
In (F /F 0)] (7)
The reference state for eq. 5 is defined in such a way that, at F0, the mean square end-to-end distance for the unit chains equals the unperturbed mean square end-to-end distance <R 02> for a free chain. Accordingly
F0Vs = a<Ro2> (8)
where a is a constant. As F is necessarily proportional to Li3, we have
F Va = bLi (9)
where b is a constant.Inserting eq. 4 and 7 in eq. 3, we have the elastic
equation of state for a deformed swollen network in a diluent. If we assume that %i is independent of L, we obtain
/ =b2k vT
a < £ o 2> L i ( “ ~ a 2) (10)
If we put a = 1 + 7, expand eq. 10 in powers of y for 7 < 1 and neglect all but the first term, we obtain
3 b2k a
v T T , vT— — — L ; 7 = a ----------------< Ro > <R 02>
(L - Ld (11)
where A is a constant.During the elongation process of a cross-linked
polyvinyl alcohol in a diluent, some secondary linkages(8) P. J. Flory, “ Principles of Polymer Chemistry,” Cornell Univ. Press,
Ithaca, N. Y., 1953, pp. 468, 492, 509.
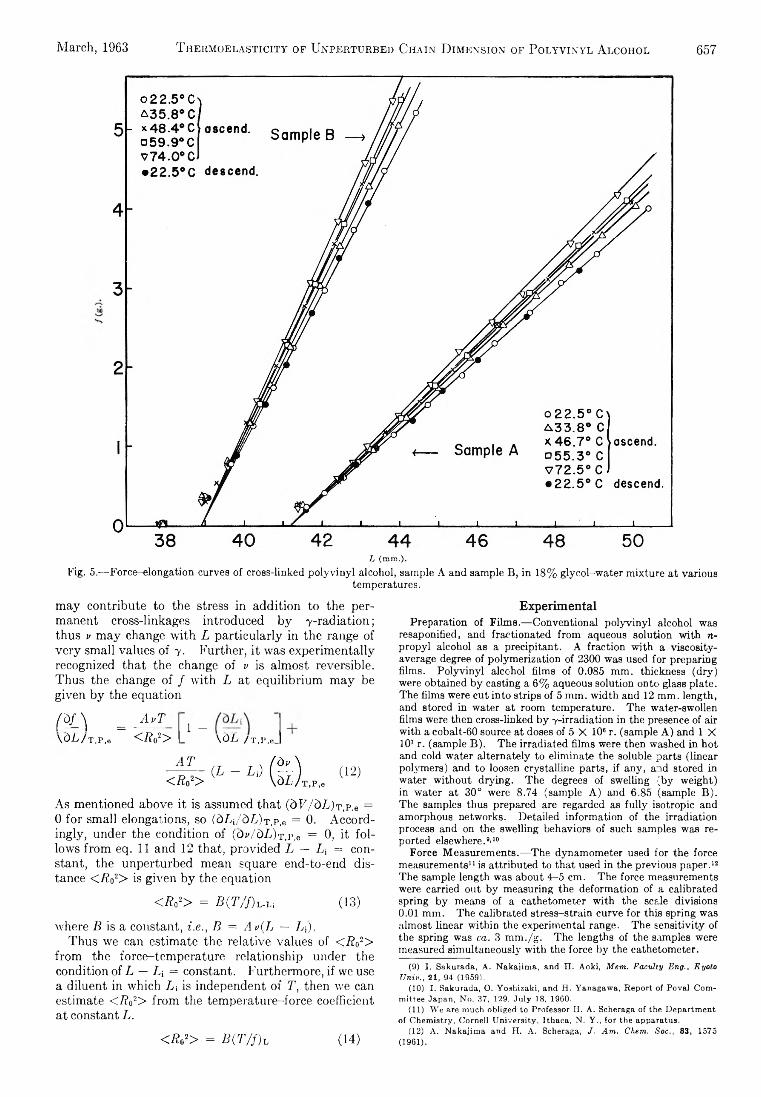
March, 1963 T hermoelasticity of Unperturbed Chain D imension of Polyvinyl Alcohol 657
L (mm.).Fig. 5.—Force-elongation curves of cross-linked polyvinyl alcohol, sample A and sample B, in 18% glycol-water mixture at various
temperatures.
may contribute to the stress in addition to the permanent cross-linkages introduced by y-radiation; thus v may change with L particularly in the range of very small values of y. Further, it was experimentally recognized that the change of v is almost reversible. Thus the change of / with L at equilibrium may be given by the equation
m =AvT
1 -\ 0 L / t ,p ,8 < L „ 2> \ Ò L /T ,I\ e_
AT<Ro2>
(L - Li) (12)
As mentioned above it is assumed that (dF/dLjT.p.e = 0 for small elongations, so (dLi/dL)T,p,e = 0. Accordingly, under the condition of ((W dL)T,p,e = 0, it follows from eq. 11 and 12 that, provided L — L\ = constant, the unperturbed mean square end-to-end distance <Ro2> is given by the equation
<R 0*> = B(T/J)l-u (13)
where B is a constant, i.e., B = A v(L — L\).Thus we can estimate the relative values of <R 02>
from the force-temperature relationship under the condition of L — L; = constant. Furthermore, if we use a diluent in which Li is independent of T, then we can estimate <7?02> from the temperature-force coefficient at constant L.
<Ro2> = B(T/f)L (14)
ExperimentalPreparation of Films.—Conventional polyvinyl alcohol was
resaponified, and fractionated from aqueous solution with n- propyl alcohol as a precipitant. A fraction with a viscosity- average degree of polymerization of 2300 was used for preparing films. Polyvinyl alcohol films of 0.085 mm. thickness (dry) were obtained by casting a 6% aqueous solution onto glass plate. The films were cut into strips of 5 mm. width and 12 mm. length, and stored in water at room temperature. The water-swollen films were then cross-linked by -y-irradiation in the presence of air with a cobalt-60 source at doses of 5 X 10⁶ r. (sample A) and 1 X 10⁷ r. (sample B). The irradiated films were then washed in hot and cold water alternately to eliminate the soluble parts (linear polymers) and to loosen crystalline parts, if any, and stored in water without drying. The degrees of swelling (by weight) in water at 30° were 8.74 (sample A) and 6.85 (sample B). The samples thus prepared are regarded as fully isotropic and amorphous networks. Detailed information of the irradiation process and on the swelling behaviors of such samples was reported elsewhere.9'10
Force Measurements.—The dynamometer used for the force measurements11 is attributed to that used in the previous paper.12 The sample length was about 4—5 cm. The force measurements were carried out by measuring the deformation of a calibrated spring by means of a cathetometer with the scale divisions 0.01 mm. The calibrated stress-strain curve for this spring was almost linear within the experimental range. The sensitivity of the spring was ca. 3 mm./g. The lengths of the samples were measured simultaneously with the force by the cathetometer.
(9) I. Sakurada, A. Nakajima, and H. Aoki, M e m . F a cu lty E n g ., K y o to U n iv ., 21, 94 (1959).
(10) I. Sakurada, O. Yoshizaki, and H. Yanagawa, Report of Poval Committee Japan, No. 37, 129, July 18, 1960.
(11) We are much obliged to Professor H. A. Scheraga of the Department of Chemistry, Cornell University, Ithaca, N. Y., for the apparatus.
(12) A. Nakajima and H. A. Scheraga, J . A m . C h em . S o c . , 83, 1575 (1961).
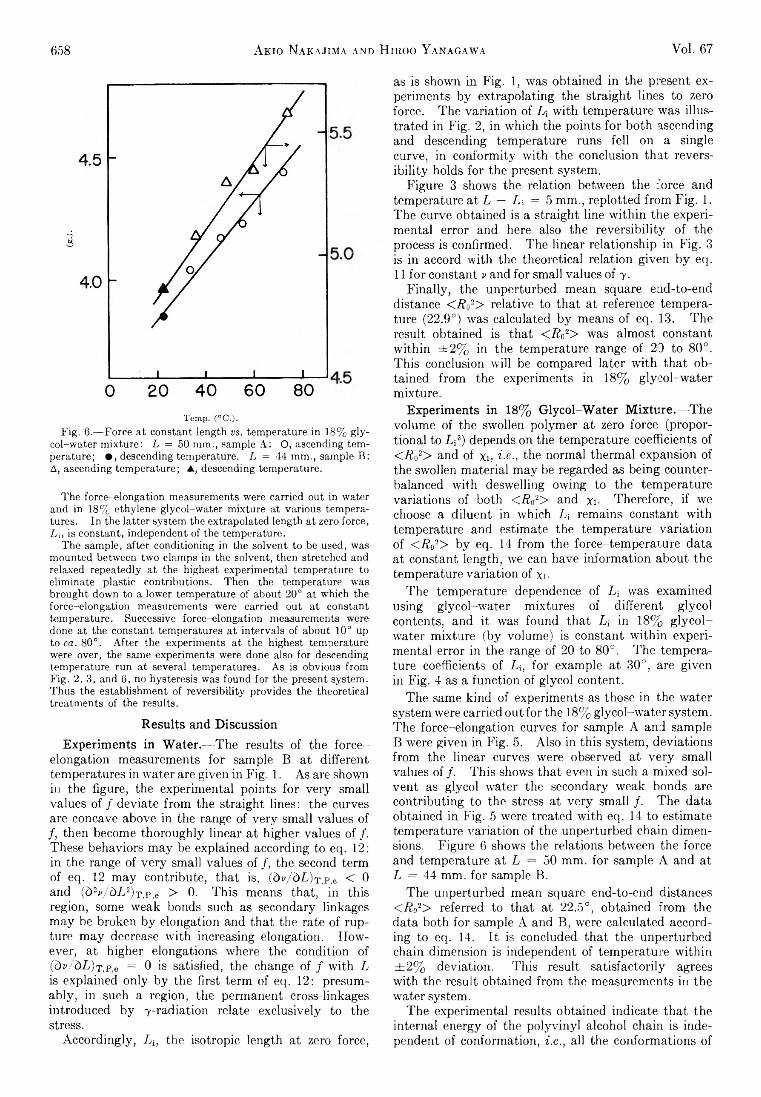
658 Am o Nakajima a n d H iroo Yanagawa Voi. 67
Temp. (°C.).Fig. 6 .—Force at constant length vs. temperature in 18% gly
col-water mixture: L = 50 mm., sample A: O, ascending temperature; • , descending temperature. L = 44 mm., sample B: A, ascending temperature; A , descending temperature.
The force-elongation measurements were carried out in water and in 18% ethylene glycol-water mixture at various temperatures. In the latter system the extrapolated length at zero force, L i , is constant, independent of the temperature.
The sample, after conditioning in the solvent to be used, was mounted between two clamps in the solvent, then stretched and relaxed repeatedly at the highest experimental temperature to eliminate plastic contributions. Then the temperature was brought down to a lower temperature of about 2 0° at wdiieh the force-elongation measurements were carried out at constant temperature. Successive force-elongation measurements were done at the constant temperatures at intervals of about 1 0 ° up to ca. 80°. After the experiments at the highest temperature were over, the same experiments were done also for descending temperature run at several temperatures. As is obvious from Fig. 2, 3, and 6 , no hysteresis was found for the present system. Thus the establishment of reversibility provides the theoretical treatments of the results.
Results and DiscussionExperiments in Water.—The results of the force-
elongation measurements for sample B at different temperatures in water are given in Fig. 1. As are shown in the figure, the experimental points for very small values of / deviate from the straight lines: the curves are concave above in the range of very small values of /, then become thoroughly linear at higher values of /. These behaviors may be explained according to eq. 12: in the range of very small values of / , the second term of eq. 12 may contribute, that is, (bv/bL)T,p,e < 0 and (b2v/bL2)T,p,e > 0. This means that, in this region, some weak bonds such as secondary linkages may be broken by elongation and that the rate of rupture may decrease with increasing elongation. However, at higher elongations where the condition of (dv/bL)T,p,e = 0 is satisfied, the change of / with L is explained only by the first term of eq. 12: presumably, in such a region, the permanent cross-linkages introduced by 7-radiation relate exclusively to the stress.
Accordingly, Lj, the isotropic length at zero force,
as is shown in Fig. 1, was obtained in the present experiments by extrapolating the straight lines to zero force. The variation of L, with temperature was illustrated in Fig. 2, in which the points for both ascending and descending temperature runs fell on a single curve, in conformity with the conclusion that reversibility holds for the present system.
Figure 3 shows the relation between the force and temperature at L — Li = 5 mm., replotted from Fig. 1. The curve obtained is a straight line within the experimental error and here also the reversibility of the process is confirmed. The linear relationship in Fig. 3 is in accord with the theoretical relation given by eq. 11 for constant v and for small values of 7 .
Finally, the unperturbed mean square, end-to-end distance <R 02> relative to that at reference temperature (22.9°) was calculated by means of eq. 13. The result obtained is that <Ro2> was almost constant within ± 2% in the temperature range of 20 to 80°. This conclusion will be compared later with that obtained from the experiments in 18% glycol-water mixture.
Experiments in 18% Glycol-Water Mixture.—Thevolume of the swollen polymer at zero force (proportional to L;3) depends on the temperature coefficients of <Ro2> and of xi, t'.e., the normal thermal expansion of the swollen material may be regarded as being counterbalanced with deswelling owing to the temperature variations of both <R 02> and xi- Therefore, if we choose a diluent in which L; remains constant with temperature and estimate the temperature variation of <R 02> by eq. 14 from the force-temperature data at constant length, we can have information about the temperature variation of xi-
The temperature dependence of Li was examined using glycol-water mixtures of different glycol contents, and it was found that Li in 18% glycol- water mixture (by volume) is constant within experimental error in the range of 20 to 80°. The temperature coefficients of A;, for example at 30°, are given in Fig. 4 as a function of glycol content.
The same kind of experiments as those in the water system were carried out for the 18% glycol-water system. The force-elongation curves for sample A and sample B were given in Fig. 5. Also in this system, deviations from the linear curves were observed at very small values of / . This shows that even in such a mixed solvent as glycol-water the secondary weak bonds are contributing to the stress at very small / . The data obtained in Fig. 5 were treated with eq. 14 to estimate temperature variation of the unperturbed chain dimensions. Figure 6 shows the relations between the force and temperature at L — 50 mm. for sample A and at L = 44 mm. for sample B.
The unperturbed mean square end-to-end distances <Ro2> referred to that at 22.5°, obtained from the data both for sample A and B, were calculated according to eq. 14. It is concluded that the unperturbed chain dimension is independent of temperature within ± 2% deviation. This result satisfactorily agrees with the result obtained from the measurements in the water system.
The experimental results obtained indicate that the internal energy of the polyvinyl alcohol chain is independent of conformation, i.e., all the conformations of
March, 1963 Thermodynamic Properties of Lanthanide Oxides 659
the chain are energetically equivalent under the condition whereby the short range interactions are suppressed. Presumably, for the conventional polyvinyl alcohol used here, the random occurrence of d- and l- configurations of the asymmetric carbon atoms along the chain together with the smallness in size of the side residue may contribute, on the average, to reduce the change of energy with chain conformation. Combining d<R02>/dT = 0 and OLJbT = 0, it follows that dxi/dT = 0 for polyvinyl alcohol in 18% glycol- water mixture: in other words, polyvinyl alcohol forms an athermal solution in 18% glycol-water mixture. A similar result that the unperturbed chain dimension is
independent of temperature was obtained by Hoeve and Flory3 on elastin from the force-temperature measurements in 30% glycol-water mixture. Further investigations with stereospecific polyvinyl alcohol are now under contemplation.
Acknowledgment.—The authors wish to thank Professor Ichiro Sakurada, Kyoto University, for his valuable suggestions. They also are grateful to Professor Leo Mandelkern, the Florida State University, for reading the manuscript and for his interest in this work. This work was partially supported by Scientific Research Funds provided by the Education Ministry of Japan.
THERMOPHYSICAL PROPERTIES OF THE LANTHANIDE OXIDES. III. HEAT CAPACITIES, THERMODYNAMIC PROPERTIES, AND SOME ENERGY LEVELS OF
DYSPROSIUM (III), HOLMIUM (III), AND ERBIUM (III) OXIDES1B y E d g a r F . W e s t r u m , J r ., a n d B r u c e H . J u s t ic e
D e p a r t m e n t o f C h e m i s t r y , U n i v e r s i t y o f M i c h i g a n , A n n A r b o r , M i c h i g a n
R e c e i v e d S e p t e m b e r 1 1 , 1 9 6 2
Heat capacities of three C-type lanthanide oxides have been resolved into lattice contributions and electronic Schottky-type anomalies; low-lying crystalline field levels have been delineated from these data. The lattice contributions were evaluated from the ytterbium !Ill) oxide and gadolinium(III) oxide heat capacities. Enthalpy increments (H ° — H ° io) at 298.15°K. have been evaluated from the measurements as 5025, 5009, and 4779 cal. (g.f.w. ) - 1 for D V 2 O 3 , H 0 2 O 3 , and E^Ch. By estimation of the remaining electronic entropy and the extrapolated lattice contribution below 10°K., practical entropies (S ° ) at 298.15°K. have been evaluated as 35.8,37.8, and 36.6 cal. (g.f.w. °K .)-1.
IntroductionThis paper describes the third of a series2'8 of en
deavors concerned with the evaluation of crystalline field states of the ground terms in the lanthanide(III) oxides from heat capacity measurements. The resolution of the electronic heat capacities of dysprosium, holmium, and erbium cubic (C-type) oxides4 into magnetic and lattice components was effected by using the previously-described3 lattice heat capacity for the C-type structure. Large degeneracies of the ground terms of D y +3 (4f9 — 6H16/2), H o+3 (4f10 — 6L), and Er+3 (4fn — 4L6/2) suggest that the electronic heat capacities might be very large over the temperature range of this study and thus provide unusually good data for the accurate evaluation of the crystal field levels. Spectrographic investigations6-9 on the lanthanide octahydrated sulfates suggested that erbium has an essentially cubic crystal field symmetry, whereas holmium and dysprosium ions have important non- cubic contributions to their fields. Theoretical calculations by Kynch10 served as a model for these studies. The essentially cubic oxygen ligand field surround-
(1) This investigation is a part of a doctoral thesis submitted by BHJ to the Horace H. Rackham School of Graduate Studies of the University of Michigan. This work was supported in part by the Division of Research of the United States Atomic Energy Commission and was presented at the Second Conference on Rare Earth Research at Glen wood Springs, Colorado, October, 1961.
(2) B. H. Justice and E. F. Westrum, Jr., J. Phys. Chem., 67, 339 (1963).(3) B. H. Justice and E. F. Westrum, Jr., ibid., 67, 345 (1963).(4) L. Pauling, Z. Rrist69, 415 (1929).(5) E. J. Meehan and G. C. Nutting, J. Chem. Phys., 7, 1002 (1939).(6) H. Severin, Ann. Physik, [6] 1, 41 (1947).(7) A. M. Rosa, ibid., f5] 43, 161 (1943).(8) S. Singh, Optik, 2, 133 (1947).(9) H. Severin, Z. Physik, 125, 455 (1949).(10) G. J. Kynch, Trans. Faraday Soc., 33, 1402 (1937).
mg these ions in the oxides makes it especially desirable to test the earlier hypotheses on these magnetically concentrated substances. Recent neutron scattering data11 giving independent estimates of energy levels in the holmium and erbium oxides provide further motivation for extending this study.
ExperimentalDysprosuim(III), Holmium(III), and Erbium(III) Oxide
Samples.—The 320 mesh oxide samples from Michigan Chemical Company were claimed to have a purity in excess of 99.9% with certified analyses for impurities summarized in Table I. All of the finely-divided samples were run as powders after muffle- furnace firing to constant weight at 1170°K. in the ambient atmosphere. Holmium and erbium oxides were fired in a platinum dish previously cleaned in nitric acid and heated to constant weight, while the dysprosium oxide heat treatment was done in a pre-ignited Alundum crucible. The cooling and loading of the samples were done in a nitrogen-filled drybox. The calorimeter subsequently was sealed off in a high vacuum line with a pressure of about 10 cm. of helium for thermal conduction. X- Ray powder diffraction patterns of the fired materials revealed a typical C-type oxide structure exclusively.
T able ID etails C oncerning the C alorimetric Samples
Mass of Gram DensiImpurities sample formula ties
Sample (p.p.m.) (g. vacuo) weight (g. cm.-3)DysO» Y-150, Si-100, Ca-100 146.8071 373.02 8.23Ho-jOs Er-100, Si-100, Ca-100 184.5233 377.88 8.40EroO, Tm-350, Ho-50, Dy-100, 151.8315 382.54 8.64
Si-100, Ca-100Cryostat and Calorimeter.—Measurements were made in the
Mark I calorimetric cryostat employing the adiabatic technique. Both cryostat and technique are similar in most respects to those previously described.12 A capsule-type, platinum resistance
(11) D. Cribier and B. Jacrot, Compt. rend., 250, 2871 (1960).
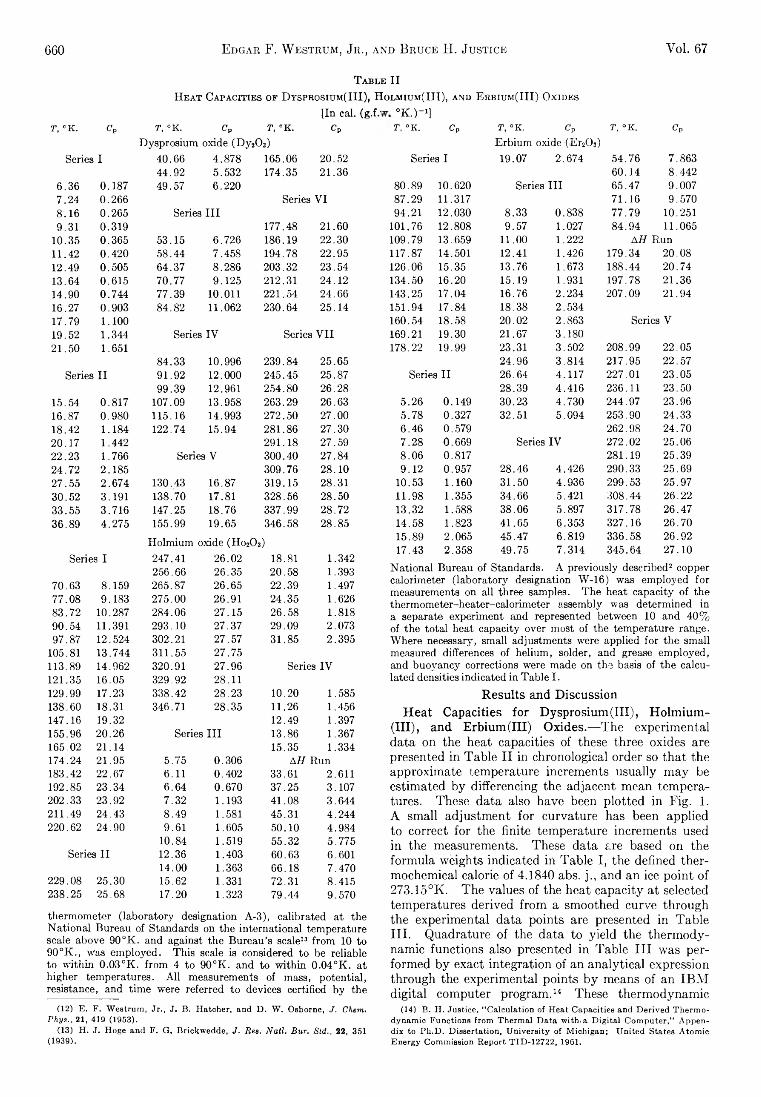
T a b l e I I
H e a t C a p a c it ie s o p D y s p r o s iu m ( I I I ) , H o l m iu m ( I I I ) , a n d E r b iu m ( I I I ) O x i d e s
660 Edgar F. W estrum, Jr ., and Bruce H. Justice Vol. 67
[In cal. (g.f.-T , eK. Cp T, °K. c p T , °K. cp
Dysprosium oxide (Dy30 3)Series I 40.66 4.878 165.06 20.52
44.92 5.532 174.35 21.366.36 0.187 49.57 6 .2 2 0
7.24 0.266 Series VI8.16 0.265 Series III9.31 0.319 177.48 21.60
10.35 0.365 53.15 6.726 186.19 22.3011.42 0.420 58.44 7.458 194.78 22.9512.49 0.505 64.37 8.286 203.32 23.5413.64 0.615 70.77 9.125 212.31 24.1214.90 0.744 77.39 1 0 . 0 1 1 221.54 24.6616.27 0.903 84.82 11.062 230.64 25.1417.79 1 . 1 0 019.52 1.344 Series IV Series VII21.50 1.651
84.33 10.996 239.84 25.65Series II 91.92 12.000 245.45 25.87
99.39 12.961 254.80 26.2815.54 0.817 107.09 13.958 263.29 26.6316,87 0.980 115.16 14.993 272.50 27.0018.42 1.184 122.74 15.94 281.86 27.3020.17 1.442 291.18 27.5922.23 1.766 Series V 300.40 27.8424.72 2.185 309.76 28.1027.55 2.674 130.43 16.87 319.15 28.3130.52 3.191 138.70 17.81 328.56 28.5033.55 3.716 147.25 18.76 337.99 28.7236.89 4.275 155.99 19.65 346.58 28.85
Holmium oxide (Ho20 3)Series I 247.41 26.02 18.81 1.342
256.66 26.35 20.58 1.39370.63 8.159 265.87 26.65 22.39 1.49777.08 9.183 275.00 26.91 24.35 1.62683.72 10.287 284.06 27.15 26.58 1.81890.54 11.391 293.10 27.37 29.09 2.07397.87 12.524 302.21 27.57 31.85 2.395
105.81 13.744 311.55 27.75113.89 14.962 320.91 27.96 Series IV121.35 16.05 329.92 28.11129.99 17.23 338.42 28.23 10 .2 0 1.585138.60 18.31 346.71 28.35 11.26 1.456147.16 19.32 12.49 1.397155.96 20.26 Series III 13.86 1.367165.02 21.14 15.35 1.334174.24 21.95 5.75 0.306 A H Run183.42 22.67 6 . 1 1 0.402 33.61 2.611192.85 23.34 6.64 0.670 37.25 3.107202.33 23.92 7.32 1.193 41.08 3.644211.49 24.43 8.49 1.581 45.31 4.244220.62 24.90 9.61 1.605 50.10 4.984
10.84 1.519 55.32 5.775Series II 12.36 1.403 60.63 6.601
14.00 1.363 66.18 7.470229.08 25.30 15.62 1.331 72.31 8.415238.25 25.68 17.20 1.323 79.44 9.570thermometer (laboratory designation A-3), calibrated at the National Bureau of Standards on the international temperature scale above 90 °K. and against the Bureau’s scale12 13 from 10 to 90°K., was employed. This scale is considered to be reliable to within 0.03°K. from 4 to 90°K. and to within 0.04°K. at higher temperatures. All measurements of mass, potential, resistance, and time were referred to devices certified by the
(12) E. F. Westrum, Jr., J. B. Hatcher, and D. W. Osborne, J. Chem. Phys., 21, 419 (1953).
(13) H. J. Hoge and F. G. Brickwedde, J. Rea. Natl. Bur. Std., 22, 351(1939).
0K.)->]T , °K. Cp T , °K. Up T , °K. Cp
Erbium oxide (Er20 3)Series I 19.07 2.674 54.76 7.863
60.14 8.44280.89 10.620 Series III 65.47 9.00787.29 11.317 71.16 9.57094.21 12.030 8.33 0.838 77.79 10.251
101.76 12.808 9.57 1.027 84.94 11.065109.79 13.659 1 1 . 0 0 1 . 2 2 2 A H Run117.87 14.501 12.41 1.426 179.34 20.08126.06 15.35 13.76 1.673 188.44 20.74134.50 16.20 15.19 1.931 197.78 21.36143.25 17.04 16.76 2.234 207.09 21.94151.94 17.84 18.38 2.534160.54 18.58 2 0.0 2 2.863 Series V169.21 19.30 21.67 3.180178.22 19.99 23.31 3.502 208.99 22.05
24.96 3.814 217.95 22.57Series II 26.64 4.117 227.01 23.05
28.39 4.416 236.11 23.505.26 0.149 30.23 4.730 244.97 23.965.78 0.327 32.51 5.094 253.90 24.336.46 0.579 262.98 24.707.28 0.669 Series IV 272.02 25.068.06 0.817 281.19 25.399.12 0.957 28.46 4.426 290.33 25.69
10.53 1.160 31.50 4.936 299.53 25.9711.98 1.355 34.66 5.421 308.44 26.2213.32 1.588 38.06 5.897 317.78 26.4714.58 1.823 41.65 6.353 327.16 26.7015.89 2.065 45.47 6.819 336.58 26.9217.43 2.358 49.75 7.314 345.64 27.10
National Bureau of Standards. A previously described2 copper calorimeter (laboratory designation W-16) was employed for measurements on all three samples. The heat capacity of the thermometer-heater-calorimeter assembly was determined in a separate experiment and represented between 10 and 40% of the total heat capacity over most of the temperature range. Where necessary, small adjustments were applied for the small measured differences of helium, solder, and grease employed, and buoyancy corrections were made on the basis of the calculated densities indicated in Table I.
Results and DiscussionHeat Capacities for Dysprosium (III), Holmium-
(IH), and Erbium(ni) Oxides.—The experimental data on the heat capacities of these three oxides are presented in Table II in chronological order so that the approximate temperature increments usually may be estimated by differencing the adjacent mean temperatures. These data also have been plotted in Fig. 1. A small adjustment for curvature has been applied to correct for the finite temperature increments used in the measurements. These data are based on the formula weights indicated in Table I, the defined thermochemical calorie of 4.1840 abs. j., and an ice point of 273.15°K. The values of the heat capacity at selected temperatures derived from a smoothed curve through the experimental data points are presented in TableIII. Quadrature of the data to yield the thermodynamic functions also presented in Table III was performed by exact integration of an analytical expression through the experimental points by means of an IBM digital computer program.14 These thermodynamic
(14) B. H. Justice, “ Calculation of Heat Capacities and Derived Thermodynamic Functions from Thermal Data with; a Digital Computer,” Appendix to Ph.D. Dissertation, University of Michigan; United States Atomic Energy Commission Report TID-12722, 1961.
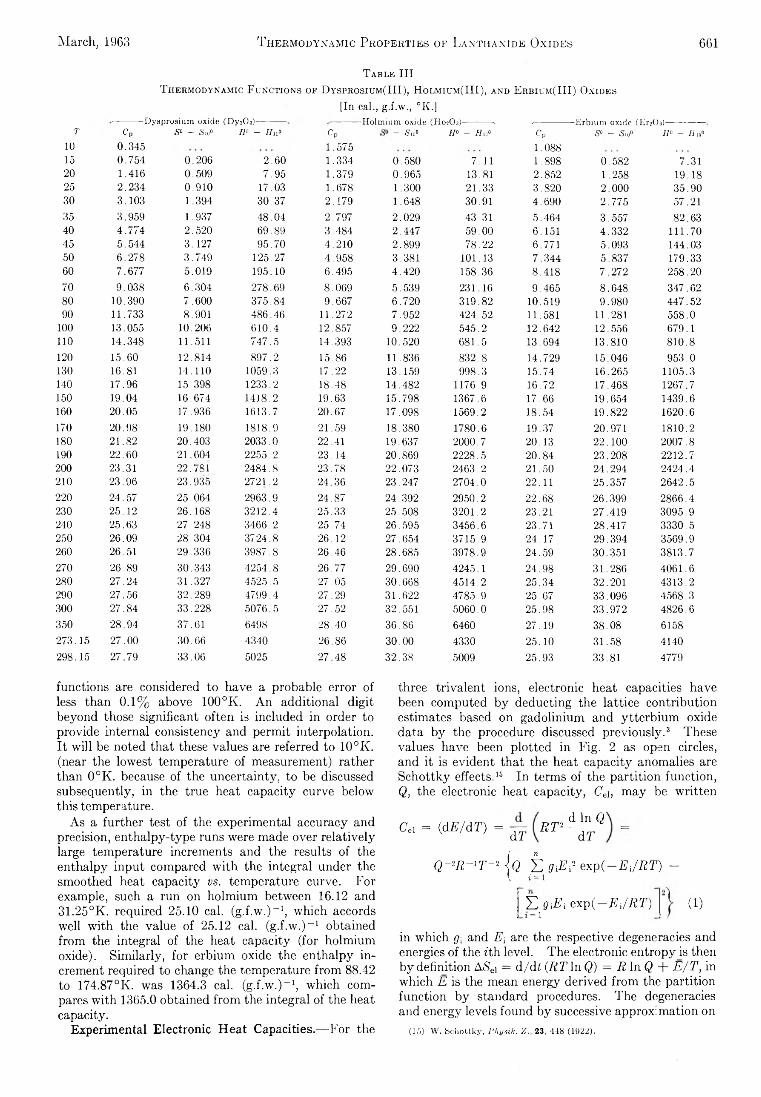
March, 1963 T h e r m o d y n a m i c P r o p e r t i e s o f L a n t h a n i d e O x i d e s 661
T able IIIT hermodynamic F unctions of D ysprosium(III ), H olmium(III ), and E rbium (I I I ) Oxides
[In cal., g.f.w., °K.jDysprosium oxide (Dy20s)-
T C p S» - Sui0 fit - Hu» C p
10 0.345 1.57515 0.754 0.206 2.60 1.33420 1.416 0.509 7.95 1.37925 2.234 0.910 17.03 1.67830 3.103 1.394 30.37 2.17935 3.959 1.937 48.04 2.79740 4.774 2.520 69.89 3.48445 5.544 3.127 95.70 4.21050 6.278 3.749 125.27 4.95860 7.677 5.019 195.10 6.49570 9.038 6.304 278.69 8.06980 10.390 7.600 375.84 9.66790 11.733 8.901 486.46 11.272
100 13.055 10.206 610.4 12.857110 14.348 11.511 747.5 14.393120 15.60 12.814 897.2 15.86130 16.81 14.110 1059.3 17.22140 17.96 15.398 1233.2 18.48150 19.04 16.674 1418.2 19.63160 20.05 17.936 1613.7 20.67170 20.98 19.180 1818.9 21.59180 21.82 20.403 2033.0 22.41190 22.60 21.604 2255.2 23.14200 23.31 22.781 2484.8 23.78210 23.96 23.935 2721.2 24.36220 24.57 25.064 2963.9 24.87230 25.12 26.168 3212.4 25.33240 25.63 27.248 3466.2 25.74250 26.09 28.304 3724.8 26.12260 26.51 29.336 3987.8 26.46270 26.89 30.343 4254.8 26.77280 27.24 31.327 4525.5 27.05290 27.56 32.289 4799.4 27.29300 27.84 33.228 5076.5 27.52350 28.94 37.61 649S 28.40273.15 27.00 30.66 4340 26.86298.15 27.79 33.06 5025 27.48
■Holmium oxide (H02O3)----------n ------------ —Erbium oxide (Er2Ü3)---------- -- S¡ 0° i/o - H i0o Cp
1 .0 88S° - £io° H0 - H io°
0 .5 8 0 7 . 1 1 1 .8 98 0 .5 8 2 7 .3 10 .9 6 5 13 .81 2 .8 5 2 1 .2 58 19 .181 .3 00 2 1 .33 3 .8 2 0 2 .0 0 0 3 5 .9 01 .6 48 30 .91 4 .6 9 0 2 .7 7 5 57 .212 .0 29 43 .31 5 .4 6 4 3 .5 57 8 2 .6 32 .4 4 7 5 9 .00 6 .1 51 4 .3 3 2 111 .702 .8 9 9 7 8 .2 2 6 .7 71 5 .0 93 144.033 .3 81 101.13 7 .3 4 4 5 .8 3 7 179.334 .4 2 0 158.36 8 .4 1 8 7 .2 7 2 2 5 8 .2 05 .5 39 231 .16 9 .4 6 5 8 .6 4 8 34 7 .6 26 .7 2 0 3 1 9 .82 10 .519 9 .9 8 0 4 4 7 .5 27 .9 5 2 4 2 4 .52 11.581 11.281 5 5 8 .09 .2 2 2 5 4 5 .2 12 .642 12 .556 67 9 .1
10 .520 6 8 1 .5 13 .694 13 .810 8 1 0 .811 .836 8 3 2 .8 14 .729 15 .046 9 5 3 .013 .159 9 9 8 .3 15 .74 16 .265 1105.314 .482 1176.9 16 .72 17 .468 1267 .715 .798 1367.6 17 .66 19 .654 1439 .617 .098 1569.2 1 8 .54 19 .822 1620 .618 .380 1780 .6 19.37 20 .971 1810.219 .637 2000 .7 20 .13 2 2 .1 0 0 2 0 07 .820 .869 2228 .5 2 0 .8 4 2 3 .208 2 2 12 .722 .073 2463 .2 2 1 .5 0 2 4 .294 2 4 24 .423 .247 2 7 04 .0 22 .11 25 .357 2 6 4 2 .524 .392 2950 .2 22.68 26 .399 2 8 6 6 .425 .508 3 2 01 .2 23 .21 27 .419 3 0 9 5 .92 6 .595 3 4 56 .6 2 3 .71 28 .417 3 3 30 .52 7 .654 3715 .9 24 .17 2 9 .3 9 4 3569 .928 .685 3978 .9 2 4 .5 9 30 .351 3813 .72 9 .690 4245 .1 2 4 .9 8 3 1 .286 4 0 6 1 .630 .6 6 8 4514 .2 2 5 .3 4 32 .201 4 3 13 .23 1 .6 2 2 4785 .9 2 5 .6 7 3 3 .096 4568 .332 .551 5060 .0 2 5 .9 8 3 3 .9 7 2 4 8 26 .63 6 .8 6 6460 2 7 .19 3 8 .0 8 61583 0 .0 0 4330 2 5 .1 0 3 1 .5 8 41403 2 .3 8 5009 2 5 .93 3 3 .81 4779
functions are considered to have a probable error of three trivalent ions, electronic heat capacities haveless than 0.1% above 100°K. An additional digit beyond those significant often is included in order to provide internal consistency and permit interpolation. It will be noted that these values are referred to 10°K. (near the lowest temperature of measurement) rather than 0°K. because of the uncertainty, to be discussed subsequently, in the true heat capacity curve below this temperature.
As a further test of the experimental accuracy and precision, enthalpy-type runs were made over relatively large temperature increments and the results of the enthalpy input compared with the integral under the smoothed heat capacity vs. temperature curve. For example, such a run on holmium between 16.12 and 31.25°K. required 25.10 cal. (g.f.w.)-1, which accords well with the value of 25.12 cal. (g.f.w.)-1 obtained from the integral of the heat capacity (for holmium oxide). Similarly, for erbium oxide the enthalpy increment required to change the temperature from 88.42 to 174.87°K. was 1364.3 cal. (g.f.w.)-1, which compares with 1365.0 obtained from the integral of the heat capacity.
Experimental Electronic Heat Capacities.—For the
been computed by deducting the lattice contribution estimates based on gadolinium and ytterbium oxide data by the procedure discussed previously.3 These values have been plotted in Fig. 2 as open circles, and it is evident that the heat capacity anomalies are Schottky effects.16 In terms of the partition function, Q, the electronic heat capacity, Cei, may be written
Cei = (cLE/dT) = d rRT2
d ln Q d T
Q -2R -'T ~ 2 { q È ÇiE ? exp(-E i/Æ T ) - { i = 1
E gtfi exp{ -E J R T )_ l = 1 (1)
in which gi and A) are the respective degeneracies and energies of the 7th level. The electronic entropy is then by definition ASei = d /d i (RT In © = R In Q + E/T, in which E is the mean energy derived from the partition function by standard procedures. The degeneracies and energy levels found by successive approximation on
(15) W. Schottky, Physik. Z . , 23, 448 (1922).
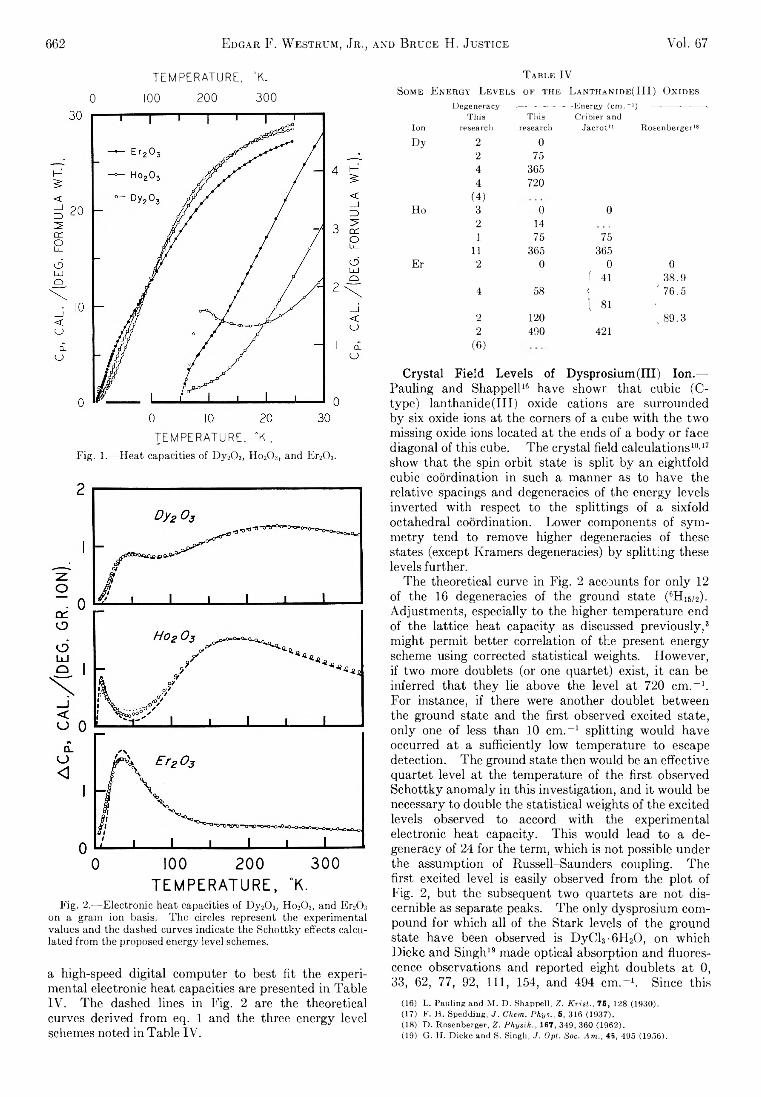
662 Edgar F. W estrum, Jr ., and Bruce H. Justice Vol. 67
TEMPERATURE, °K.0 100 200 300
TEMPERATURE, °K .Fig. 1.—Heat capacities of Dy20 3, Ho20 3, and Er20 3.
0 100 200 300T E M P E R A T U R E , *K.
Fig. 2.—Electronic heat capacities of Dy20 3, Ho20 3, and Er20 3 on a gram ion basis. The circles represent the experimental values and the dashed curves indicate the Schottky effects calculated from the proposed energy level schemes.
a high-speed digital computer to best fit the experimental electronic heat capacities are presented in TableIV. The dashed lines in Fig. 2 are the theoretical curves derived from eq. 1 and the three energy level schemes noted in Table IV.
T able IVSome E nergy Levels of the L anth an ide(I I I ) Oxid e s
Degeneracy -------——-------Energy (cm ."1) ------------------- -This This Cribier and
Ion research research Jacrot11 Rosenberger18
Dy 2 02 754 3654 720
(4 )Ho 3 0 0
2 141 75 75
11 365 365Er 2 0 0 0
Í 41 3 8 .94 58 j
l 81' 7 6 .5<
2 120 „ 8 9 .32 490 421
(6 )
Crystal Field Levels of Dysprosium (III) Ion.—Pauling and Shappell16 have shown that cubic (C- type) lanthanide(III) oxide cations are surrounded by six oxide ions at the corners of a cube with the two missing oxide ions located at the ends of a body or face diagonal of this cube. The crystal field calculations10’17 show that the spin orbit state is split by an eightfold cubic coordination in such a manner as to have the relative spacings and degeneracies of the energy levels inverted with respect to the splittings of a sixfold octahedral coordination. Lower components of symmetry tend to remove higher degeneracies of these states (except Kramers degeneracies) by splitting these levels further.
The theoretical curve in Fig. 2 accounts for only 12 of the 16 degeneracies of the ground state (6Hi6/2). Adjustments, especially to the higher temperature end of the lattice heat capacity as discussed previously,3 might permit better correlation of the present energy scheme using corrected statistical weights. However, if two more doublets (or one quartet) exist, it can be inferred that they lie above the level at 720 cm.-1. For instance, if there were another doublet between the ground state and the first observed excited state, only one of less than 10 cm.-1 splitting would have occurred at a sufficiently low temperature to escape detection. The ground state then would be an effective quartet level at the temperature of the first observed Schottky anomaly in this investigation, and it would be necessary to double the statistical weights of the excited levels observed to accord with the experimental electronic heat capacity. This would lead to a degeneracy of 24 for the term, which is not possible under the assumption of Russell-Saunders coupling. The first excited level is easily observed from the plot of Fig. 2, but the subsequent two quartets are not discernible as separate peaks. The only dysprosium compound for which all of the Stark levels of the ground state have been observed is DyCl3-6H20, on which Dieke and Singh19 made optical absorption and fluorescence observations and reported eight doublets at 0, 33, 62, 77, 92, 111, 154, and 494 cm.-1. Since this
(16) L. Pauling and M. D. Shappell, Z. Krist., 76, 128 (1930).(17) F. H. Spedding, J. Chem. Phys., 5, 316 (1937).(18) D. Rosenberger, Z. Physik., 167, 349, 360 (1962).(19) G. II. Dieke and S. Singh, J. Opt. Soc. Am., 43, 495 (1956).
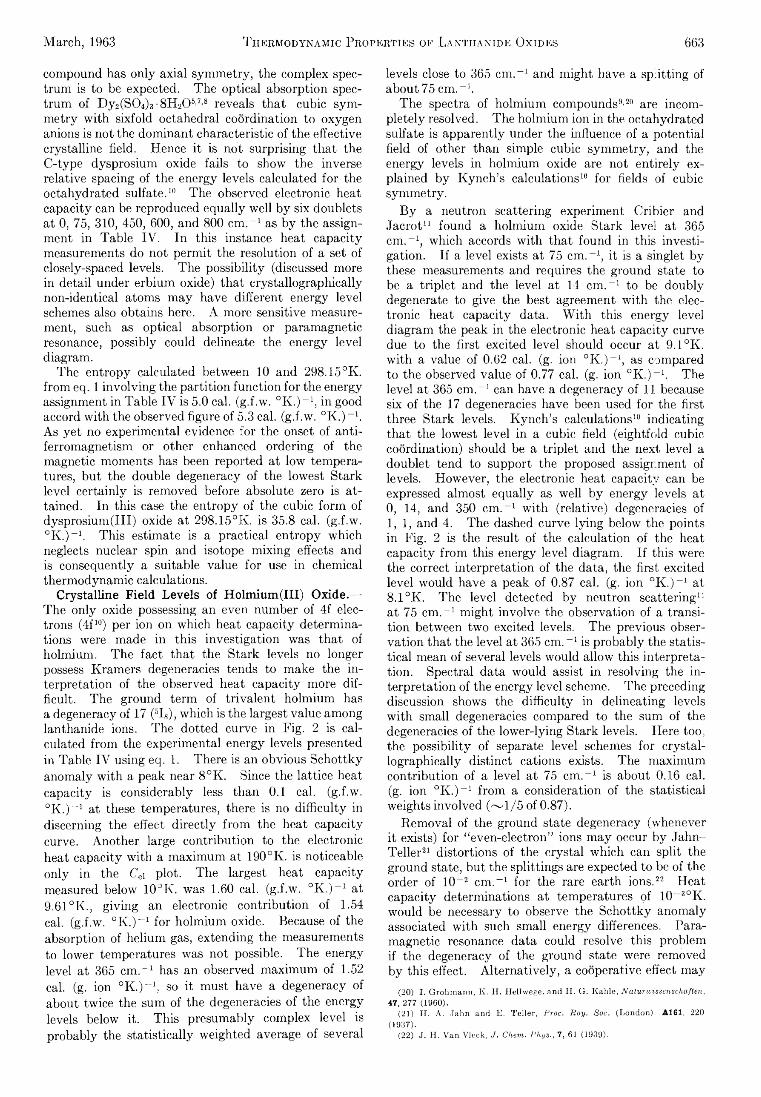
March, 1963 T hermodynamic Properties of Lanthanide Oxides 663
compound has only axial symmetry, the complex spectrum is to be expected. The optical absorption spectrum of Dy2(S04)3-8H20 5’7’8 reveals that cubic symmetry with sixfold octahedral coordination to oxygen anions is not the dominant characteristic of the effective crystalline field. Hence it is not surprising that the C-type dysprosium oxide fails to show the inverse relative spacing of the energy levels calculated for the octahydrated sulfate.10 The observed electronic heat capacity can be reproduced equally well by six doublets at 0, 75, 310, 450, 600, and 800 cm.-1 as by the assignment in Table IV. In this instance heat capacity measurements do not permit the resolution of a set of closely-spaced levels. The possibility (discussed more in detail under erbium oxide) that erystallographically non-identical atoms may have different energy level schemes also obtains here. A more sensitive measurement, such as optical absorption or paramagnetic resonance, possibly could delineate the energy level diagram.
The entropy calculated between 10 and 298.15°K. from eq. 1 involving the partition function for the energy assignment in Table IV is 5.0 cal. (g.f.w. °K .)-1, in good accord with the observed figure of 5.3 cal. (g.f.w. °K .)-1. As yet no experimental evidence for the onset of antiferromagnetism or other enhanced ordering of the magnetic moments has been reported at low temperatures, but the double degeneracy of the lowest Stark level certainly is removed before absolute zero is attained. In this case the entropy of the cubic form of dysprosium(III) oxide at 298.15°K. is 35.8 cal. (g.f.w. °K .)-1. This estimate is a practical entropy which neglects nuclear spin and isotope mixing effects and is consequently a suitable value for use in chemical thermodynamic calculations.
Crystalline Field Levels of Holmium(III) Oxide.— The only oxide possessing an even number of 4f electrons (4f10) per ion on which heat capacity determinations were made in this investigation was that of holmium. The fact that the Stark levels no longer possess Kramers degeneracies tends to make the interpretation of the observed heat capacity more difficult. The ground term of trivalent holmium has a degeneracy of 17 (5I8), which is the largest value among lanthanide ions. The dotted curve in Fig. 2 is calculated from the experimental energy levels presented in Table IV using eq. 1. There is an obvious Schottky anomaly with a peak near 8°K. Since the lattice heat capacity is considerably less than 0.1 cal. (g.f.w. °K .)-1 at these temperatures, there is no difficulty in discerning the effect directly from the heat capacity curve. Another large contribution to the electronic heat capacity with a maximum at 190°K. is noticeable only in the Cei plot. The largest heat capacity measured below 10°K. was 1.60 cal. (g.f.w. °K .)-1 at 9.61 °K., giving an electronic contribution of 1.54 cal. (g.f.w. “K )^1 for holmium oxide. Because of the absorption of helium gas, extending the measurements to lower temperatures was not possible. The energy level at 365 cm.-1 has an observed maximum of 1.52 cal. (g. ion °K .)_1, so it must have a degeneracy of about twice the sum of the degeneracies of the energy levels below it. This presumably complex level is probably the statistically weighted average of several
levels close to 365 cm.-1 and might have a splitting of about 75 cm.-1.
The spectra of holmium compounds9'20 are incompletely resolved. The holmium ion in the octahydrated sulfate is apparently under the influence of a potential field of other than simple cubic symmetry, and the energy levels in holmium oxide are not entirely explained by Kynch’s calculations10 for fields of cubic symmetry.
By a neutron scattering experiment Cribier and Jacrot11 found a holmium oxide Stark level at 365 cm.-1, which accords with that found in this investigation. If a level exists at 75 cm.-1, it is a singlet by these measurements and requires the ground state to be a triplet and the level at 14 cm.-1 to be doubly degenerate to give the best agreement with the electronic heat capacity data. With this energy level diagram the peak in the electronic heat capacity curve due to the first excited level should occur at 9.1°K. with a value of 0.62 cal. (g. ion °K .)-1, as compared to the observed value of 0.77 cal. (g. ion °K .)-1. The level at 365 cm.-1 can have a degeneracy of 11 because six of the 17 degeneracies have been used for the first three Stark levels. Kynch’s calculations10 indicating that the lowest level in a cubic field (eightfold cubic coordination) should be a triplet and the next level a doublet tend to support the proposed assignment of levels. However, the electronic heat capacity can be expressed almost equally as well by energy levels at 0, 14, and 350 cm.-1 with (relative) degeneracies of1,1, and 4. The dashed curve lying below the points in Fig. 2 is the result of the calculation of the heat capacity from this energy level diagram. If this were the correct interpretation of the data, the first excited level would have a peak of 0.87 cal. (g. ion °K .)-1 at8.1 °K. The level detected by neutron scattering11 at 75 cm.-1 might involve the observation of a transition between two excited levels. The previous observation that the level at 365 cm.-1 is probably the statistical mean of several levels would allow this interpretation. Spectral data would assist in resolving the interpretation of the energy level scheme. The preceding discussion shows the difficulty in delineating levels with small degeneracies compared to the sum of the degeneracies of the lower-lying Stark levels. Here too, the possibility of separate level schemes for crystal- lographieally distinct cations exists. The maximum contribution of a level at 75 cm.-1 is about 0.16 cal. (g. ion °K .)-1 from a consideration of the statistical weights involved ( ~ l /5 of 0.87).
Removal of the ground state degeneracy (whenever it exists) for “ even-electron” ions may occur by Jahn- Teller21 distortions of the crystal which can split the ground state, but the splittings are expected to be of the order of 10-2 cm.-1 for the rare earth ions.22 Heat capacity determinations at temperatures of 10- 3°K. would be necessary to observe the Schottky anomaly associated with such small energy differences. Paramagnetic resonance data could resolve this problem if the degeneracy of the ground state were removed by this effect. Alternatively, a cooperative effect may
(20) I. Grolimann, K. H. Hellwege. and H. G. Kahle, Naturwissenschaften, 47, 277 (1960).
(21) H. A. .Jahn and E. Teller, Proc. Roy. Soc. (London). A161, 220 (1937).
(22) J. H. Van Vleck, J. Cham. Phys., 7, 61 (1939).
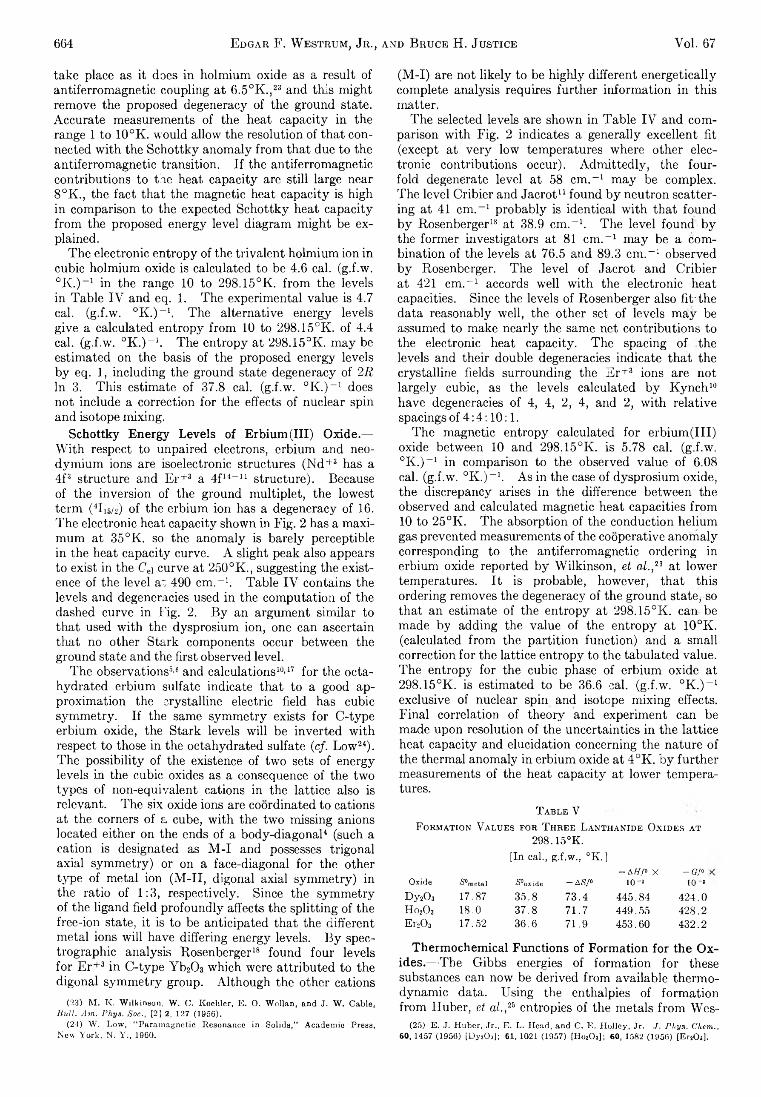
664 Edgar F. W estrum, Jr ., and Bruce H. Justice Voi. 67
take place as it does in holmium oxide as a result of antiferromagnetic coupling at 6.5°K .,23 and this might remove the proposed degeneracy of the ground state. Accurate measurements of the heat capacity in the range 1 to 10°K. would allow the resolution of that connected with the Schottky anomaly from that due to the antiferromagnetic transition. If the antiferromagnetic contributions to the heat capacity are still large near 8°K., the fact that the magnetic heat capacity is high in comparison to the expected Schottky heat capacity from the proposed energy level diagram might be explained.
The electronic entropy of the trivalent holmium ion in cubic holmium oxide is calculated to be 4.6 cal. (g.f.w. °K .)~1 in the range 10 to 298.15°K. from the levels in Table IV and eq. 1. The experimental value is 4.7 cal. (g.f.w. °K .)-1. The alternative energy levels give a calculated entropy from 10 to 298.15°K. of 4.4 cal. (g.f.w. °K .)-1. The entropy at 298.15°K. may be estimated on the basis of the proposed energy levels by eq. 1, including the ground state degeneracy of 2R In 3. This estimate of 37.8 cal. (g.f.w. °K .)-1 does not include a correction for the effects of nuclear spin and isotope mixing.
Schottky Energy Levels of Erbium(III) Oxide.—With respect to unpaired electrons, erbium and neodymium ions are isoelectronic structures (Nd+3 has a 4f8 structure and Er+3 a 4f14-11 structure). Because of the inversion of the ground multiplet, the lowest term (4L6/2) of the erbium ion has a degeneracy of 16. The electronic heat capacity shown in Fig. 2 has a maximum at 35 °K. so the anomaly is barely perceptible in the heat capacity curve. A slight peak also appears to exist in the Ce\ curve at 250 °K., suggesting the existence of the level at 490 cm.-1. Table IV contains the levels and degeneracies used in the computation of the dashed curve in Fig. 2. By an argument similar to that used with the dysprosium ion, one can ascertain that no other Stark components occur between the ground state and the first observed level.
The observations6'6 and calculations10’17 for the octa- hydrated erbium sulfate indicate that to a good approximation the crystalline electric field has cubic symmetry. If the same symmetry exists for C-type erbium oxide, the Stark levels will be inverted with respect to those in the octahydrated sulfate (cf. Low24). The possibility of the existence of two sets of energy levels in the cubic oxides as a consequence of the two types of non-equivalent cations in the lattice also is relevant. The six oxide ions are coordinated to cations at the corners of a cube, with the two missing anions located either on the ends of a body-diagonal4 (such a cation is designated as M -I and possesses trigonal axial symmetry) or on a face-diagonal for the other type of metal ion (M-II, digonal axial symmetry) in the ratio of 1:3, respectively. Since the symmetry of the ligand field profoundly affects the splitting of the free-ion state, it is to be anticipated that the different metal ions will have differing energy levels. By spec- trographic analysis Rosenberger18 found four levels for Er+3 in C-type Yb20 3 which were attributed to the digonal symmetry group. Although the other cations
(23) M. K. Wilkinson, W. C. Koehler, E. O. Wollan, and J. W. Cable, Bull. Am. Phys. Soc., [2] 2, 127 (1956).
(24) W. Low, “ Paramagnetic Resonance in Solids," Academic Press, New York, N. Y., 1960.
(M-I) are not likely to be highly different energetically complete analysis requires further information in this matter.
The selected levels are shown in Table IV and comparison with Fig. 2 indicates a generally excellent fit (except at very low temperatures where other electronic contributions occur). Admittedly, the fourfold degenerate level at 58 cm.-1 may be complex. The level Cribier and Jacrot11 found by neutron scattering at 41 cm.-1 probably is identical with that found by Rosenberger18 at 38.9 cm.-1. The level found by the former investigators at 81 cm.-1 may be a combination of the levels at 76.5 and 89.3 cm.-1 observed by Rosenberger. The level of Jacrot and Cribier at 421 cm.-1 accords well with the electronic heat capacities. Since the levels of Rosenberger also fit-the data reasonably well, the other set of levels may be assumed to make nearly the same net contributions to the electronic heat capacity. The spacing of the levels and their double degeneracies indicate that the crystalline fields surrounding the Er+3 ions are not largely cubic, as the levels calculated by Kynch10 have degeneracies of 4, 4, 2, 4, and 2, with relative spacings of 4 : 4 : 10: 1.
The magnetic entropy calculated for erbium(III) oxide between 10 and 298.15°K. is 5.78 cal. (g.f.w. °K .)-1 in comparison to the observed value of 6.08 cal. (g.f.w. °K .)-1. As in the case of dysprosium oxide, the discrepancy arises in the difference between the observed and calculated magnetic heat capacities from 10 to 25°K. The absorption of the conduction helium gas prevented measurements of the cooperative anomaly corresponding to the antiferromagnetic ordering in erbium oxide reported by Wilkinson, et al,,23 at lower temperatures. It is probable, however, that this ordering removes the degeneracy of the ground state, so that an estimate of the entropy at 298.15°K. can be made by adding the value of the entropy at 10°K. (calculated from the partition function) and a small correction for the lattice entropy to the tabulated value. The entropy for the cubic phase of erbium oxide at 298.15°K. is estimated to be 36.6 cal. (g.f.w. °K .)-1 exclusive of nuclear spin and isotope mixing effects. Final correlation of theory and experiment can be made upon resolution of the uncertainties in the lattice heat capacity and elucidation concerning the nature of the thermal anomaly in erbium oxide at 4°K. by further measurements of the heat capacity at lower temperatures.
T able VF ormation V alues por T hree L anthanide Oxid es at
298 . 15°K.[In cal., g.f.w., °K.]
- A H f« X - 0 /« :Oxide S°metal *S»oxide -A S /» 10 -s 10 -3Dy20 3 17.87 35.8 73.4 445.84 424..0H 02O3 18.0 37.8 71.7 449.55 428..2E 12O3 17.52 36.6 71.9 453.60 432..2
Thermochemical Functions of Formation for the Oxides.—The Gibbs energies of formation for these substances can now be derived from available thermodynamic data. "Using the enthalpies of formation from Huber, et ok,25 entropies of the metals from Wes-
(25) E. J. Huber, Jr., E. L. Head, and C. E. Holley, Jr. J. Phys. Chem., 60, 1457 (1956) [Dy20 3J; 61, 1021 (1957) [Ho2Oa]; 60, 1582 (1956) [Er20«].
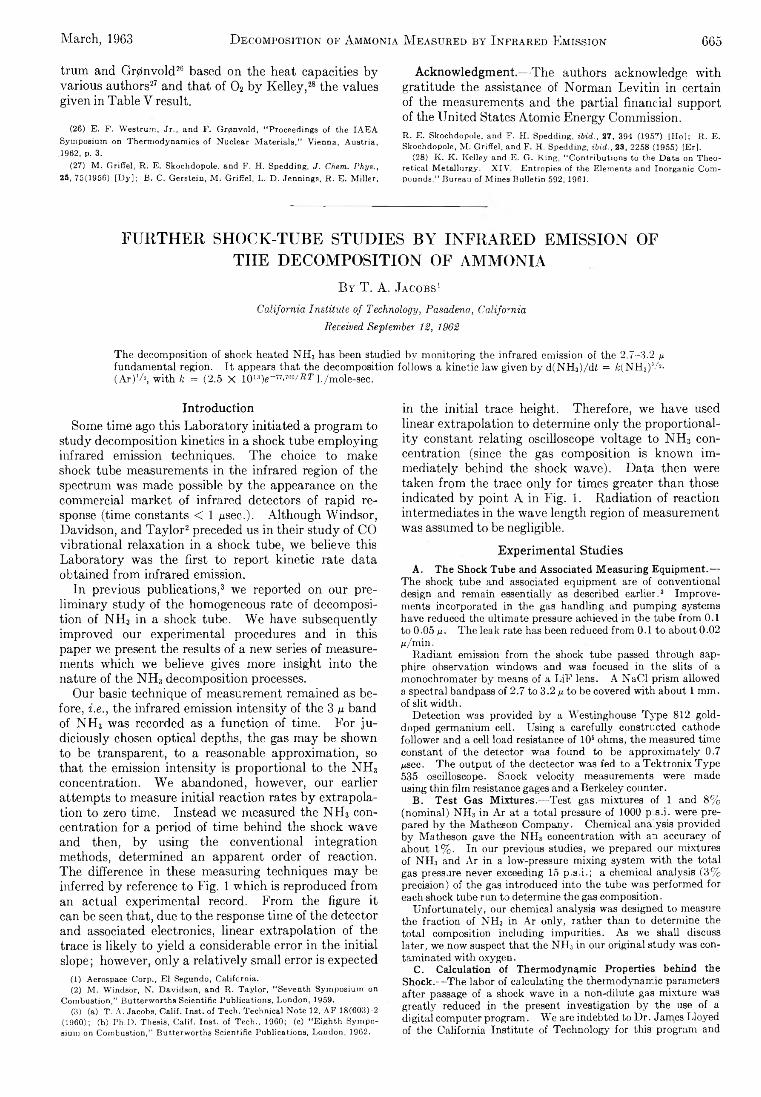
March, 1963 D ecomposition of Ammonia M easured by Infrared Emission 665
trum and Gr0nvold26 based on the heat capacities by various authors27 and that of 0 2 by Kelley,28 the values given in Table V result.
(26) E. F. Westrum, Jr., and F. Grjtfnvold, “ Proceedings of the IAEA $ympo8itim on Thermodynamics of Nuclear Materials,” Vienna, Austria, 1962, p. 3.
(27) M. Griffel, R. E. Skochdopole, and F. H. Spedding, J. Chern, Phys., 25, 75(1956) [Dy]; B. C. Gerstein, M. Griffel, L. D. Jennings, R. E. Miller,
Acknowledgment.—The authors acknowledge with gratitude the assistance of Norman Levitin in certain of the measurements and the partial financial support of the United States Atomic Energy Commission.R. E. Skochdopole. and F. H. Spedding, ibid., 27, 394 (1957) lHo]; R. E. Skochdopole, M. Griffel, and F. H. Spedding, ibid., 23, 2258 (1955) [Er],
(28) K. K. Kelley and E. G. King, “ Contributions to the Data on Theoretical Metallurgy. XIV. Entropies of the Elements and Inorganic Compounds,” Bureau of Mines Bulletin 592, 1961.
FURTHER SHOCK-TUBE STUDIES BY INFRARED EMISSION OF THE DECOMPOSITION OF AMMONIA
B y T. A. Jacobs1
C a l i f o r n i a I n s t i t u t e o f T e c h n o l o g y , P a s a d e n a , C a l i f o r n i a
R e c e i v e d S e p t e m b e r 1 2 , 1 9 6 2
The decomposition of shock heated NHS has been studied by monitoring the infrared emission of the 2.7-3.2 y fundamental region. I t appears tha t the decomposition follows a kinetic law given by d(NH3)/d£ = fc(NH,)Vi. (Ar)‘/ !, with!: = (2.5 X 10ls)e_7,,700/BJ' 1./mole-sec.
IntroductionSome time ago this Laboratory initiated a program to
study decomposition kinetics in a shock tube employing infrared emission techniques. The choice to make shock tube measurements in the infrared region of the spectrum was made possible by the appearance on the commercial market of infrared detectors of rapid response (time constants < 1 psec.). Although Windsor, Davidson, and Taylor2 preceded us in their study of CO vibrational relaxation in a shock tube, we believe this Laboratory was the first to report kinetic rate data obtained from infrared emission.
In previous publications,8 we reported on our preliminary study of the homogeneous rate of decomposition of NH3 in a shock tube. We have subsequently improved our experimental procedures and in this paper we present the results of a new series of measurements which we believe gives more insight into the nature of the NH3 decomposition processes.
Our basic technique of measurement remained as before, i.e., the infrared emission intensity of the 3 p band of NH3 was recorded as a function of time. For judiciously chosen optical depths, the gas may be shown to be transparent, to a reasonable approximation, so that the emission intensity is proportional to the NH3 concentration. We abandoned, however, our earlier attempts to measure initial reaction rates by extrapolation to zero time. Instead we measured the NHa concentration for a period of time behind the shock wave and then, by using the conventional integration methods, determined an apparent order of reaction. The difference in these measuring techniques may be inferred by reference to Fig. 1 which is reproduced from an actual experimental record. From the figure it can be seen that, due to the response time of the detector and associated electronics, linear extrapolation of the trace is likely to yield a considerable error in the initial slope; however, only a relatively small error is expected
(1) Aerospace Corp., El Segundo, California.(2) M. Windsor, N. Davidson, and R. Taylor, “ Seventh Symposium on
Combustion,” Butterworths Scientific Publications, London, 1959.(3) (a) T. A. Jacobs, Calif. Inst, of Tech. Technical Note 12, AF 18(603)~2
(1960); (b) Ph.D. Thesis, Calif. Inst, of Tech., 1960; (c) “ Eighth Symposium on Combustion,” Butterworths Scientific Publications, London, 1962.
in the initial trace height. Therefore, we have used linear extrapolation to determine only the proportionality constant relating oscilloscope voltage to NH3 concentration (since the gas composition is known immediately behind the shock wave). Data then were taken from the trace only for times greater than those indicated by point A in Fig. 1. Radiation of reaction intermediates in the wave length region of measurement was assumed to be negligible.
Experimental StudiesA. The Shock Tube and Associated Measuring Equipment.—
The shock tube and associated equipment are of conventional design and remain essentially as described earlier.3 Improvements incorporated in the gas handling and pumping systems have reduced the ultimate pressure achieved in the tube from 0.1 to 0.05 y . The leak rate has been reduced from 0.1 to about 0.02ii/rnin.
Radiant emission from the shock tube passed through sapphire observation windows and was focused in the slits of a monochromater by means of a LiF lens. A NaCl prism allowed a spectral bandpass of 2.7 to 3.2 y to be covered with about 1 mm. of slit width.
Detection was provided by a Westinghouse Type 812 gold- doped germanium cell. Using a carefully constructed cathode follower and a cell load resistance of 10s ohms, the measured time constant of the detector was found to be approximately 0.7 jiisec. The output of the dectector was fed to a Tektronix Type 535 oscilloscope. Shock velocity measurements were made using thin film resistance gages and a Berkeley counter.
B. Test Gas Mixtures.—Test gas mixtures of 1 and 8 % (nominal) NH3 in Ar at a total pressure of 1000 p s.i. were prepared by the Matheson Company. Chemical ana_ysis provided by Matheson gave the NH3 concentration with an accuracy of about 1%. In our previous studies, we prepared our mixtures of NH3 and Ar in a low-pressure mixing system with the total gas pressure never exceeding 15 p.s.i.; a chemical analysis (3% precision) of the gas introduced into the tube was performed for each shock tube run to determine the gas composition.
Unfortunately, our chemical analysis was designed to measure the fraction of NH3 in Ar only, rather than to determine the total composition including impurities. As we shall discuss later, we now suspect that the NH3 in our original study was contaminated with oxygen.C. Calculation of Thermodynamic Properties behind the Shock.—The labor of calculating the thermodynamic parameters after passage of a shock wave in a non-dilute gas mixture was greatly reduced in the present investigation by the use of a digital computer program. We are indebted to Dr. James Lloyed of the California Institute of Technology for this program and
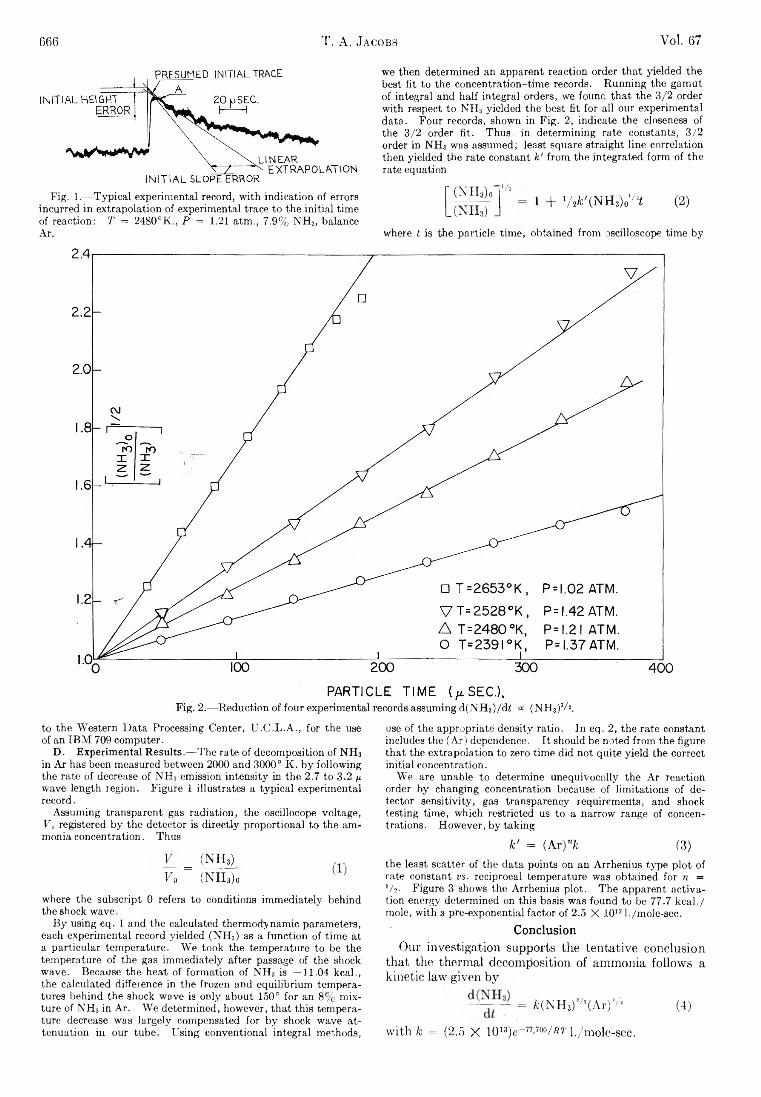
666 T. A. Jacobs Vol. 67
Fig. 1.—Typical experimental record, with indication of errors incurred in extrapolation of experimental trace to the initial time of reaction: T = 2480°K., P = 1.21 atm., 7.9% NH3, balanceAr.
we then determined an apparent reaction order tha t yielded thé best fit to the concentration-time records. Running the gamut of integral and half integral orders, we found that the 3/2 order with respect to NH3 yielded the best fit for all our experimental data. Four records, shown in Fig. 2, indicate the closeness of the 3/2 order fit. Thus, in determining rate constants, 3/2 order in NH3 was assumed; least square straight line correlation then yielded the rate constant fc' from the integrated form of the rate equation
~ (NH3)q 1A _(NH3) _ 1 + V2fc,(NH3)o,/2i (2)
where t is the particle time, obtained from oscilloscope time by
to the Western Data Processing Center, U.C.L.A., for the use of an IBM 709 computer.
D. Experimental Results.—The rate of decomposition of NH3 in Ar has been measured between 2000 and 3000° K. by following the rate of decrease of NH3 emission intensity in the 2.7 to 3.2 fi wave length region. Figure 1 illustrates a typical experimental record.
Assuming transparent gas radiation, the oscillocope voltage, V , registered by the detector is directly proportional to the ammonia concentration. Thus
V = (NH3)Fo (NH3)0 1 J
where the subscript 0 refers to conditions immediately behind the shock wave.
By using eq. 1 and the calculated thermodynamic parameters, each experimental record yielded (NH3) as a function of time at a particular temperature. We took the temperature to be the temperature of the gas immediately after passage of the shock wave. Because the heat of formation of NHS is —11.04 kcal., the calculated difference in the frozen and equilibrium temperatures behind the shock wave is only about 150° for an 8% mixture of NHj in Ar. We determined, however, tha t this temperature decrease was largely compensated for by shock wave attenuation in our tube. Using conventional integral methods,
use of the appropriate density ratio. In eq. 2, the rate constant includes the (Ar) dependence. I t should be noted from the figure that the extrapolation to zero time did not quite yield the correct initial concentration.
We are unable to determine unequivocally the Ar reaction order by changing concentration because of limitations of detector sensitivity, gas transparency requirements, and shock testing time, which restricted us to a narrow range of concentrations, However, by taking
¥ = (Ar)"fc (3)the least scatter of the data points on an Arrhenius type plot of rate constant v s . reciprocal temperature was obtained for n = l / z . Figure 3 shows the Arrhenius plot. The apparent activation energy determined on this basis was found to be 77.7 kcal./ mole, with a pre-exponential factor of 2.5 X 10131./mole-sec.
ConclusionOur investigation supports the tentative conclusion
that the thermal decomposition of ammonia follows a kinetic law given by
= fc(NH3)3/!(Ar)'^ (4)
with k = (2.5 X 10¹³)e” 77'700/ Kr l./mole-sec.
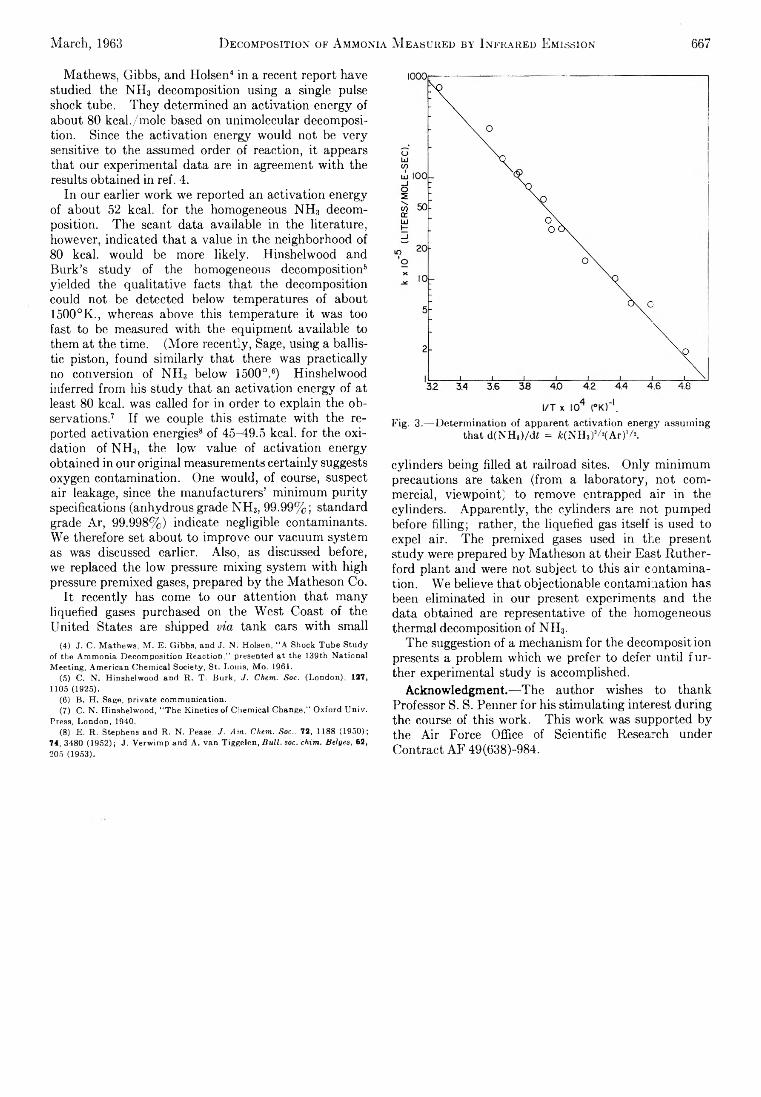
March, 1963 D ecomposition of A mmonia M easured by Infrared Emission 667
Mathews, Gibbs, and Holsen4 in a recent report have studied the NH3 decomposition using a single pulse shock tube. They determined an activation energy of about 80 kcal./mole based on unimolecular decomposition. Since the activation energy would not be very sensitive to the assumed order of reaction, it appears that our experimental data are in agreement with the results obtained in ref. 4.
In our earlier work we reported an activation energy of about 52 kcal. for the homogeneous NH3 decomposition. The scant data available in the literature, however, indicated that a value in the neighborhood of 80 kcal. would be more likely. Hinshelwood and Burk’s study of the homogeneous decomposition6 yielded the qualitative facts that the decomposition could not be detected below temperatures of about 1500°K., whereas above this temperature it was too fast to be measured with the equipment available to them at the time. (More recently, Sage, using a ballistic piston, found similarly that there was practically no conversion of NH3 below 15000.6) Hinshelwood inferred from his study that an activation energy of at least 80 kcal. was called for in order to explain the observations.7 If we couple this estimate with the reported activation energies8 of 4.5-49.5 kcal. for the oxidation of NH3, the low value of activation energy obtained in our original measurements certainly suggests oxygen contamination. One would, of course, suspect air leakage, since the manufacturers’ minimum purity specifications (anhydrous grade NH3, 99.99%; standard grade Ar, 99.998%) indicate negligible contaminants. We therefore set about to improve our vacuum system as was discussed earlier. Also, as discussed before, we replaced the low pressure mixing system with high pressure premixed gases, prepared by the Matheson Co.
It recently has come to our attention that many liquefied gases purchased on the West Coast of the United States are shipped via tank cars with small
(4) J. C. Mathews, M. E. Gibbs, and J. N. Holsen, “ A Shock Tube Study of the Ammonia Decomposition Reaction,” presented at the 139th National Meeting, American Chemical Society, St. Louis, Mo. 1961.
(5) C. N. Hinshelwood and R. T. Burk, J. Chem. Soc. (London), 127, 1105 (1925).
(6) B. H. Sage, private communication.(7) C. N. Hinshelwood, “ The Kinetics of Chemical Change,” Oxford Univ.
Press, London, 1940.(8) E. R. Stephens and R. N. Pease, J. A?n. Chem. Soc.. 72, 1188 (1950);
74, 3480 (1952); J. Verwimp and A. van Tiggelen, Bull. soc. chim. Beiges, 62, 205 (1953).
Fig. 3.—Determination of apparent activation energy assuming that d(NH3)/di = fc(NH3)5A(Ar)'A.
cylinders being filled at railroad sites. Only minimum precautions are taken (from a laboratory, not commercial, viewpoint) to remove entrapped air in the cylinders. Apparently, the cylinders are not pumped before filling; rather, the liquefied gas itself is used to expel air. The premixed gases used in the present study were prepared by Matheson at their East Rutherford plant and were not subject to this air contamination. We believe that objectionable contamination has been eliminated in our present experiments and the data obtained are representative of the homogeneous thermal decomposition of NH3.
The suggestion of a mechanism for the decomposition presents a problem which we prefer to defer until further experimental study is accomplished.
Acknowledgment.—The author wishes to thank Professor S. S. Penner for his stimulating interest during the course of this work. This work was supported by the Air Force Office of Scientific Research under Contract AF 49(638)-984.
668 0. J. K leppa and S. V. M eschel Vol. 67
THERMOCHEMISTRY OF ANION MIXTURES IN SIMPLE FUSED SALT SYSTEMS. I. SOLUTIONS OF MONOVALENT CHLORIDES AND BROMIDES IN THE
CORRESPONDING NITRATESB y 0 . J. K l e p p a a n d S. V. M e s c h e l
I n s t i t u t e f o r t h e S t u d y o f M e t a l s a n d D e p a r t m e n t o f C h e m i s t r y , U n i v e r s i t y o f C h i c a g o , C h i c a g o 3 7 , I l l i n o i s
R e c e i v e d S e p t e m b e r I S , 1 9 6 2
Calorimetric measurements have been performed on the heats of solution and of dilution for monovalent chlorides and bromides dissolved in the corresponding liquid nitrates. I t is found that all the studied alkali halide- alkali nitrate systems exhibit small positive enthalpies of mixing, with the largest effects observed for the sodium systems. I t is suggested that these results may be explained in terms of a packing effect which is due to the repulsion between the second nearest neighbor anion cores. Corresponding data for the silver and thallium salts are more complex. They cannot be explained in terms of the second nearest neighbor interactions.
IntroductionRecent unpublished equilibrium work by Toguri,
et al.,1 indicates that simple MCl-MBr melts tend to exhibit positive deviations from ideality, the deviation increasing in the sequence Li < Na < K. This suggests that the anion mixtures differ in a marked way from the analogous cation mixtures. Thus, one of the authors found in a recent calorimetric study that all the binary alkali nitrate systems exhibit negative enthalpies of mixing, the magnitude of the enthalpy increasing in a regular manner with increasing differences in size between the component cations.2
The present investigation was initiated in order to explore by calorimetry the general problem of anion mixtures in fused salt systems. When our work started, the only calorimetric equipment available was the previously described twin reaction calorimeter suitable for work up to 500°.3 This experimental restriction ruled out a study of the mentioned chloride-bromide systems, which melt at higher temperatures. These are now being investigated by means of a new calorimeter which can be operated at temperatures up to 800°, and will be the subject of later communications.
In the present work we discuss solutions of monovalent chlorides and bromides in the corresponding liquid nitrates. All experiments were carried out at or below about 450°. Due to the limitations imposed by temperature and by the thermal instability of the nitrates, our information covers only the nitrate-rich end of the considered binary systems.
Experimental and MaterialsIn the course of the present investigation the previously de
scribed calorimeter was modified slightly by inserting a close- fitting Pyrex liner (18-mm. diameter) in the stainless steel “protection” tube of the original calorimeter. This served to prevent attack on the stainless steel by the somewhat corrosive melts. The presence of this liner reduced the space available for experiments, but did not impair appreciably either the sensitivity or the accuracy of the apparatus.
The nitrates used in the present study were obtained from the same sources, and were treated in the same manner, as the nitrates used in our earlier work. 2 The lithium, potassium, and sodium halides were Mallinckrodt Analytical Reagents. The cesium, rubidium, and thallium halides were purchased from Millmaster Chemical Corporation and were stated by the manufacturer to be of 99.9% purity. This was checked by semi- quantitative spectrochemical analysis. The silver halides were of analytical grade, obtained from Goldsmith Bros. All halides were used without further purification. The data reported below
(1) J. Toguri, H. Flood, and T. Forland, unpublished results; quoted by II. Flood, Discussions Faraday Soc., 32, 168 (1961).
(2) O. J. Kleppa and L. S. Hersh, J. Chem. Phys., 34, 351 (1961).(3) O. J. Kleppa. J. Phys. Chem., 64, 1937 (I960).
are based on calibration by the “ gold drop method, ” 2 i.e., on the heat content equation for pure gold as calculated from the equation quoted by Kelley. 4
The present investigation was conducted in a manner entirely analogous to that adopted in our earlier study of the solutions of the alkaline earth nitrates in the alkali nitrates .6’6 Thus we carried out two different types of calorimetric experiments.
(а ) Solid-Liquid Mixing Experiments and (b) Dilution Experiments.—In the solid-liquid experiments, the solid halides were dissolved in the corresponding nitrate melts. These measurements involved quite large endothermic heat effects, and presented ho particular experimental problems. However, the heat effects associated with the dilution experiments were quite small, often of the order of 0.1 cal. or less. For these measurements, the uncertainties associated with heat generated in the breaking of the ampoule and in stirring became quite important. As a result, some of our dilution data are associated with quite large r e la t i v e errors.
ResultsAll experimental results obtained in the course of the
present work are shown in graphical form in Fig. 1. In the left-hand part of this figure we have plotted the mole fraction of halide along the abscissa, and the quantity AH M/X along the ordinate axis. AH M is the molar change in enthalpy associated with formation of a liquid solution of mole fraction X (of halide) from pure solid halide plus liquid nitrate. We have demonstrated elsewhere that the quantity AIIM/X, and its derivative, are particularly useful for calculating partial molal heat quantities.6 Direct experimental information on the derivative of AH M/X with respect to X [actually on A(AI7M/X )/A X ] is provided by the dilution experiments, the results of which are presented in the right-hand part of Fig. 1.
The limiting value of AHM/X at X = 0 is of special interest. This quantity represents the partial molal enthalpy associated with the transfer of one mole of halide from the pure crystalline state into “ pure” liquid nitrate at the considered temperature. Formally this number may be considered to represent a sum of two terms: (a) the enthalpy change, AH !(t), associatedwith the fusion of the pure halide at temperature t; (b) the enthalpy change associated with the solution of tins undercooled liquid halide into the pure nitrate.
Although our experiments cover a limited range of halide concentrations only, the data contained in Fig. 1 permit an approximate separation of these quantities. This separation is based on the assumption that the various halide-nitrate mixtures have enthalpies of mix-
(4) K. K. Kelley, “ Contributions to the Data on Theoretical Metallurgy,” Bureau of Mines Bulletin Number 584, 1960.
(5) O. J. Kleppa and L. S. Hersh, Discussions Faraday Soc., 32, 99 (1961).(б) O’ J. Kleppa, J. Phys. Chem., 66, 1G68 (1962).
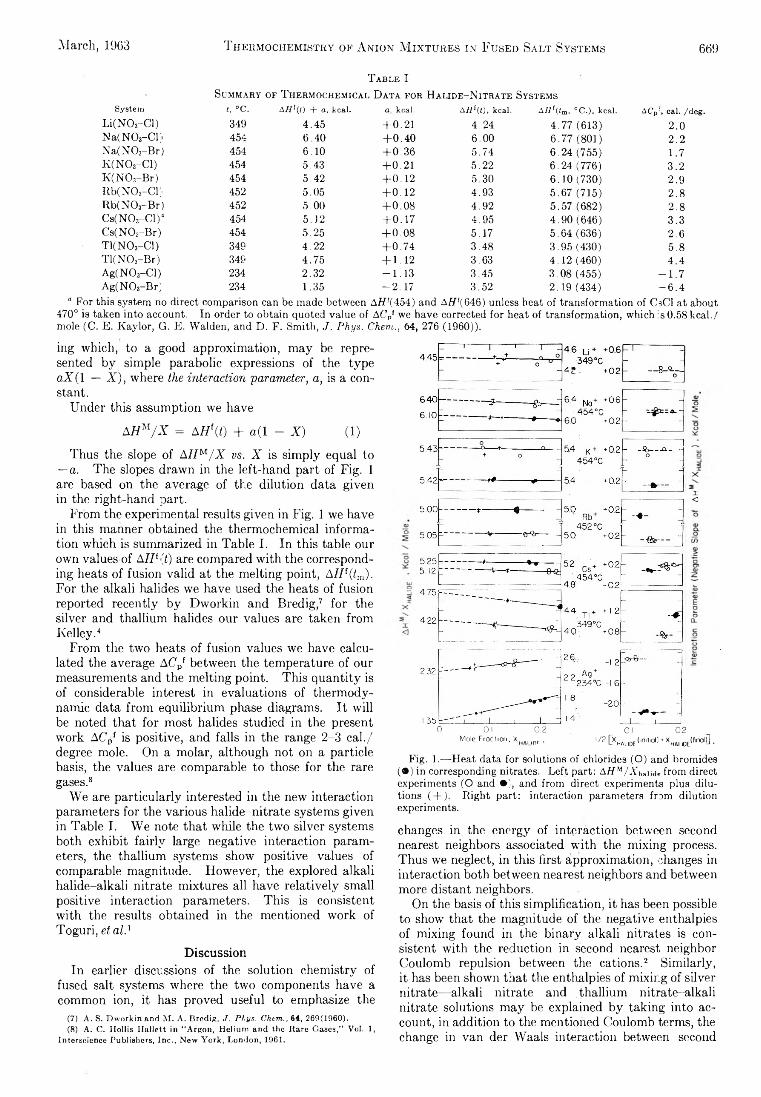
March, 1963 T hermochemistry of A nion M ixtures in Fused Salt Systems 669
T able ISummary of T hermochemical D ata for H alide- N itrate Systems
System t, "C. AHf(0 + a, kcal. a, kcal. AH s{ t ) , kcal. ARf(lm, °C.), kcal. ACp!, cal. /deg.Li(N03-Cl) 349 4.45 + 0 .2 1 4.24 4.77 (613) 2 .0Na(NOs-Cl) 454 6.40 + 0 .40 6 .0 0 6.77 (801) 2 . 2N a(N 03-Br) 454 6 . 1 0 + 0 .36 5.74 6.24.(755) 1.7K (N 03-C1) 454 5.43 + 0 . 2 1 5.22 6.24(776) 3.2K(NOs-Br) 454 5.42 + 0 . 1 2 5.30 6.10 (730) 2.9Rb(N 08-Cl) 452 5.05 + 0 . 1 2 4.93 5.67 (715) 2 .8Rb(NOs-Br) 452 5.00 +0.08 4.92 5.57 (682) 2 . 8Cs(N03-C l)'2 454 5.12 +0.17 4.95 4.90 (646) 3.3Cs(N03-Br) 454 5.25 + 0 .08 5.17 5.64 (636) 2 . 6T1(N03-C1) 346 4.22 +0.74 3.48 3.95 (430) 5.8T1(N03-Br) 349 4.75 + 1 . 1 2 3.63 4.12 (460) 4.4Ag(N03-Cl) 234 2.32 — 1.13 3.45 3.08 (455) - 1 .7Ag(N03-Br) 234 1.35 -2 .1 7 3.52 2.19 (434) - 6 .4
“ For this system no direct comparison can be made between Aff,(454) and Afff(646) unless heat of transformation of CsCl at about 470° is taken into account. In order to obtain quoted value of ACy we have corrected for heat of transformation, which is 0.58 kcal./ mole (C. E. Kaylor, G. E. Walden, and D. F. Smith, J . P h y s . C h e m . , 64, 276 (I960)).ing which, to a good approximation, may be represented by simple parabolic expressions of the type aX (l — X ), where the interaction parameter, a, is a constant.
Under this assumption we have
AH u/X = AH\t) + o (l - X ) (1)
Thus the slope of AHM/X vs. X is simply equal to — a. The slopes drawn in the left-hand part of Fig. 1 are based on the average of the dilution data given in the right-hand part.
From the experimental results given in Fig. 1 we have in this manner obtained the thermochemical information which is summarized in Table I. In this table our own values of AHf{t) are compared with the corresponding heats of fusion valid at the melting point, AHf((m). For the alkali halides we have used the heats of fusion reported recently by Dworkin and Bredig,7 for the silver and thallium halides our values are taken from Kelley.4
From the two heats of fusion values we have calculated the average AC,pf between the temperature of our measurements and the melting point. This quantity is of considerable interest in evaluations of thermodynamic data from equilibrium pirase diagrams. It will be noted that for most halides studied in the present work A6’pf is positive, and falls in the range 2-3 cal./ degree mole. On a molar, although not on a particle basis, the values are comparable to those for the rare gases.8
We are particularly interested in the new interaction parameters for the various halide-nitrate systems given in Table I. We note that while the two silver systems both exhibit fairly large negative interaction parameters, the thallium systems show positive values of comparable magnitude. However, the explored alkali halide-alkali nitrate mixtures all have relatively small positive interaction parameters. This is consistent with the results obtained in the mentioned work of Toguri, et al.1
DiscussionIn earlier discussions of the solution chemistry of
fused salt systems where the two components have a common ion, it has proved useful to emphasize the
(7) A. S. Dworkin and M. A. Bredig, J. Phys. Chem., 64, 269(1960).(8) A. C. Hollis Hallett in “ Argon, Helium and the Rare Gases,” Vol. 1,
Interscience Publishers, Inc., New York, London, 1961.
X<
0 0.1 0.2 Mole Fraction. XHW1DE.
0.1 0.2 l / 2 CX HAUDElin ' , I O i ; i X HALI0E(finO11
Fig. 1.—Heat data for solutions of chlorides (O) and bromides ( • ) in corresponding nitrates. Left part: AHM/A'haud. from direct experiments (O and • ) , and from direct experiments plus dilutions ( + ). Right part: interaction parameters from dilution experiments.changes in the energy of interaction between second nearest neighbors associated with the mixing process. Thus we neglect, in this first approximation, changes in interaction both between nearest neighbors and between more distant neighbors.
On the basis of this simplification, it has been possible to show that the magnitude of the negative enthalpies of mixing found in the binary alkali nitrates is consistent with the reduction in second nearest neighbor Coulomb repulsion between the cations.2 Similarly, it has been shown that the enthalpies of mixing of silver nitrate—alkali nitrate and thallium nitrate-alkali nitrate solutions may be explained by taking into account, in addition to the mentioned Coulomb terms, the change in van der Waals interaction between second
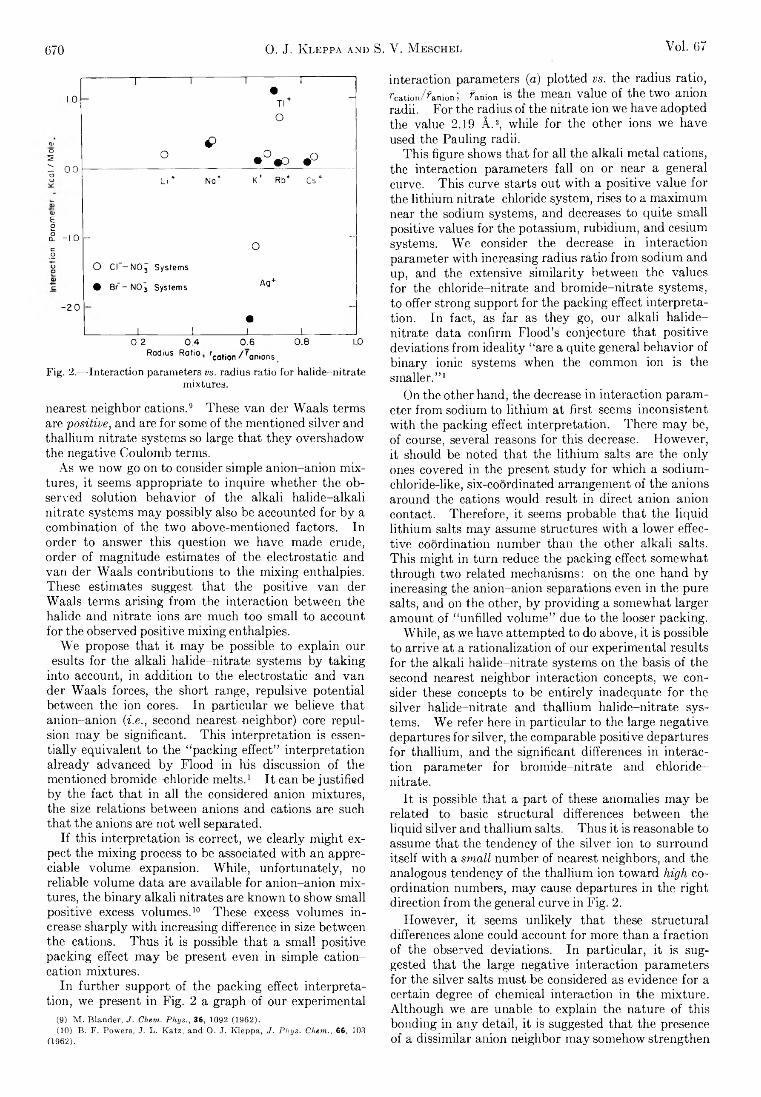
670 O. J. K leppa and S. Y. M eschel Yol. 67
10
_CD0 21 0.0oo0JaiE01 - 1.0coooaic
-2.0
0
Fig. 2.—Interaction parameters v s . radius ratio for halide-nitrate mixtures.
nearest neighbor cations.9 These van der Waals terms are positive, and are for some of the mentioned silver and thallium nitrate systems so large that they overshadow the negative Coulomb terms.
As we now go on to consider simple anion-anion mixtures, it seems appropriate to inquire whether the observed solution behavior of the alkali halide-alkali nitrate systems may possibly also be accounted for by a combination of the two above-mentioned factors. In order to answer this question we have made crude, order of magnitude estimates of the electrostatic and van der Waals contributions to the mixing enthalpies. These estimates suggest that the positive van der Waals terms arising from the interaction between the halide and nitrate ions are much too small to account for the observed positive mixing enthalpies.
We propose that it may be possible to explain our esults for the alkali halide-nitrate systems by taking
into account, in addition to the electrostatic and van der Waals forces, the short range, repulsive potential between the ion cores. In particular we believe that anion-anion (i.e., second nearest neighbor) core repulsion may be significant. This interpretation is essentially equivalent to the “ packing effect” interpretation already advanced by Flood in his discussion of the mentioned bromide-chloride melts.1 It can be justified by the fact that in all the considered anion mixtures, the size relations between anions and cations are such that the anions are not well separated.
If this interpretation is correct, we clearly might expect the mixing process to be associated with an appreciable volume expansion. While, unfortunately, no reliable volume data are available for anion-anion mixtures, the binary alkali nitrates are known to show small positive excess volumes.10 These excess volumes increase sharply with increasing difference in size between the cations. Thus it is possible that a small positive packing effect may be present even in simple cation- cation mixtures.
In further support of the packing effect interpretation, we present in Fig. 2 a graph of our experimental
(9) M. Blander, J. Chem. Phys., 36, 1092 (1962).(10) B. F. Powers, J. L. Katz, and O. J. Kleppa, J. Phys. Chem., 66, 103
(1962).
1 -------------r~ n•
Tl +
1
-
o
Oe
• ° ® o • °
Li" Na + K+ Rb+ Cs"
-o
-
o c r - no. Systems
• 8r~ - NO j Systems Ag"
__1__ 1•1 !
0.2 0.4 Radius Ratio rcation
0.6/ ranions
0.8 1
interaction parameters (a) plotted vs. the radius ratio, rcation/fanion; ranion is the mean value of the two anion radii. For the radius of the nitrate ion we have adopted the value 2.19 Á .2, while for the other ions we have used the Pauling radii.
This figure shows that for all the alkali metal cations, the interaction parameters fall on or near a general curve. This curve starts out with a positive value for the lithium nitrate-chloride system, rises to a maximum near the sodium systems, and decreases to quite small positive values for the potassium, rubidium, and cesium systems. We consider the decrease in interaction parameter with increasing radius ratio from sodium and up, and the extensive similarity between the values for the chloride-nitrate and bromide-nitrate systems, to offer strong support for the packing effect interpretation. In fact, as far as they go, our alkali halide- nitrate data confirm Flood’s conjecture that positive deviations from ideality “ are a quite general behavior of binary ionic systems when the common ion is the smaller.” 1
On the other hand, the decrease in interaction parameter from sodium to lithium at first seems inconsistent with the packing effect interpretation. There may be, of course, several reasons for this decrease. However, it should be noted that the lithium salts are the only ones covered in the present study for which a sodium- chloride-like, six-coordinated arrangement of the anions around the cations would result in direct anion-anion contact. Therefore, it seems probable that the liquid lithium salts may assume structures with a lower effective coordination number than the other alkali salts. This might in turn reduce the packing effect somewhat through two related mechanisms: on the one hand by increasing the anion-anion separations even in the pure salts, and on the other, by providing a somewhat larger amount of “ unfilled volume” due to the looser packing.
While, as we have attempted to do above, it is possible to arrive at a rationalization of our experimental results for the alkali halide-nitrate systems on the basis of the second nearest neighbor interaction concepts, we consider these concepts to be entirely inadequate for the silver halide-nitrate and thallium halide-nitrate systems. We refer here in particular to the large negative departures for silver, the comparable positive departures for thallium, and the significant differences in interaction parameter for bromide-nitrate and chloride- nitrate.
It is possible that a part of these anomalies may be related to basic structural differences between the liquid silver and thallium salts. Thus it is reasonable to assume that the tendency of the silver ion to surround itself with a small number of nearest neighbors, and the analogous tendency of the thallium ion toward high coordination numbers, may cause departures in the right direction from the general curve in Fig. 2.
However, it seems unlikely that these structural differences alone could account for more than a fraction of the observed deviations. In particular, it is suggested that the large negative interaction parameters for the silver salts must be considered as evidence for a certain degree of chemical interaction in the mixture. Although we are unable to explain the nature of this bonding in any detail, it is suggested that the presence of a dissimilar anion neighbor may somehow strengthen
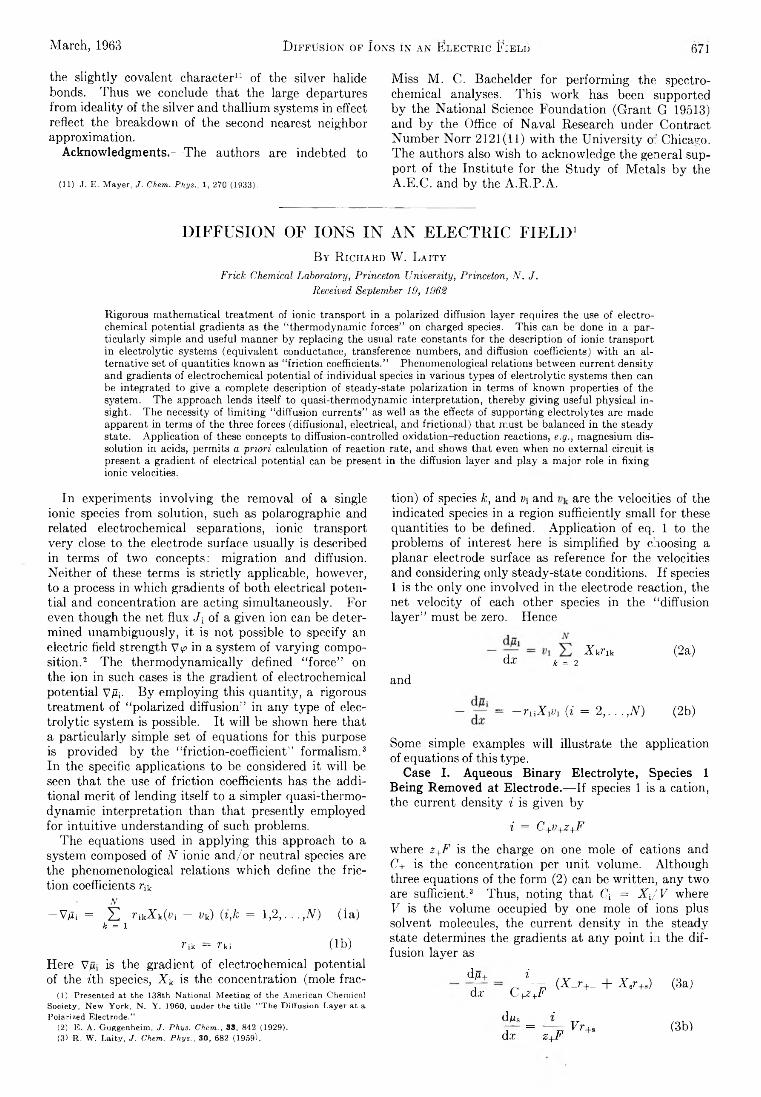
the slightly .covalent character11 of the silver halide bonds. Thus we conclude that the large departures from ideality of the silver and thallium systems in effect reflect the breakdown of the second nearest neighbor approximation.
Acknowledgments.—The authors are indebted to
(11) J. E. Mayer, J. Chem. Phys., 1, 270 (1933).
March, 1963
Miss M. C. Bachelder for performing the spectro- chemical analyses. This work has been supported by the National Science Foundation (Grant G 19513) and by the Office of Naval Research under Contract Number Norr 2121(11) with the University o" Chicago. The authors also wish to acknowledge the general support of the Institute for the Study of Metals by the A.E.C. and by the A.R.P.A.
671D iffusion of Ions in an Electric Field
DIFFUSION OF IONS IN AN ELECTRIC FIELD1B y R ic h a r d W . L a i t y
F r i c k C h e m i c a l L a b o r a t o r y , P r i n c e t o n U n i v e r s i t y , P r i n c e t o n , N . J .
R e c e i v e d S e p t e m b e r 1 9 , 1 9 6 2
Rigorous mathematical treatment of ionic transport in a polarized diffusion layer requires the use of electrochemical potential gradients as the “thermodynamic forces” on charged species. This can be done in a particularly simple and useful manner by replacing the usual rate constants for the description of ionic transport in electrolytic systems (equivalent conductance, transference numbers, and diffusion coefficients) with an alternative set of quantities known as “friction coefficients.” Phenomenological relations between current density and gradients of electrochemical potential of individual species in various types of electrolytic systems then can be integrated to give a complete description of steady-state polarization in terms of known properties of the system. The approach lends itself to quasi-thermodynamic interpretation, thereby giving useful physical insight. The necessity of limiting “diffusion currents” as well as the effects of supporting electrolytes are made apparent in terms of the three forces (diffusional, electrical, and frictional) that must be balanced in the steady state. Application of these concepts to diffusion-controlled oxidation-reduction reactions, e . g . , magnesium dissolution in acids, permits a p r i o r i calculation of reaction rate, and shows tha t even when no external circuit is present a gradient of electrical potential can be present in the diffusion layer and play a major role in fixing ionic velocities.
In experiments involving the removal of a single ionic species from solution, such as polarographic and related electrochemical separations, ionic transport very close to the electrode surface usually is described in terms of two concepts: migration and diffusion. Neither of these terms is strictly applicable, however, to a process in which gradients of both electrical potential and concentration are acting simultaneously. For even though the net flux J-, of a given ion can be determined unambiguously, it is not possible to specify an electric field strength Vv in a system of varying composition.2 The thermodynamically defined “ force” on the ion in such cases is the gradient of electrochemical potential V/Zi- By employing this quantity, a rigorous treatment of “ polarized diffusion” in any type of electrolytic system is possible. It will be shown here that a particularly simple set of equations for this purpose is provided by the “ friction-coefficient” formalism.3 In the specific applications to be considered it will be seen that the use of friction coefficients has the additional merit of lending itself to a simpler quasi-thermodynamic interpretation than that presently employed for intuitive understanding of such problems.
The equations used in applying this approach to a system composed of N ionic and/or neutral species are the phenomenological relations which define the friction coefficients r&
iv—V/Zi = X r ikIk(i'i — vk) (i,k = 1,2,. . ,,N) (ia)
k = 1Tik = fk i ( l b )
Here V£i is the gradient of electrochemical potential of the ith species, X k is the concentration (mole frac-
(1) Presented at the 138th National Meeting of the American Chemical Society, New York, N. Y. 1960, under the title “ The Diffusion Layer at a Polarized Electrode.”
(2) E. A. Guggenheim, J. Phys, Chem., 33, 842 (1929).(3) R. W. Laity, J. Chem. Phys., 30, 682 (1959).
tion) of species k, and v, and are the velocities of the indicated species in a region sufficiently small for these quantities to be defined. Application of eq. 1 to the problems of interest here is simplified by choosing a planar electrode surface as reference for the velocities and considering only steady-state conditions. If species 1 is the only one involved in the electrode reaction, the net velocity of each other species in the “ diffusion layer” must be zero. Hence
* k r lk (2 a )do; k = 2
and
- ~ = - r u X ^ Ç i = 2, . . . ,N) (2b)
Some simple examples will illustrate the application of equations of this type.
Case I. Aqueous Binary Electrolyte, Species 1 Being Removed at Electrode.— If species 1 is a cation, the current density i is given by
i = C+v+z+F
where z+F is the charge on one mole of cations and C+ is the concentration per unit volume. Although three equations of the form (2) can be written, any two are sufficient.3 Thus, noting that C-, = X-JV where V is the volume occupied by one mole of ions plus solvent molecules, the current density in the steady state determines the gradients at any point in the diffusion layer as
dg+da
iC ^ F
(X_r+_ + X sr+„) (3a)
djUsda
(3b)
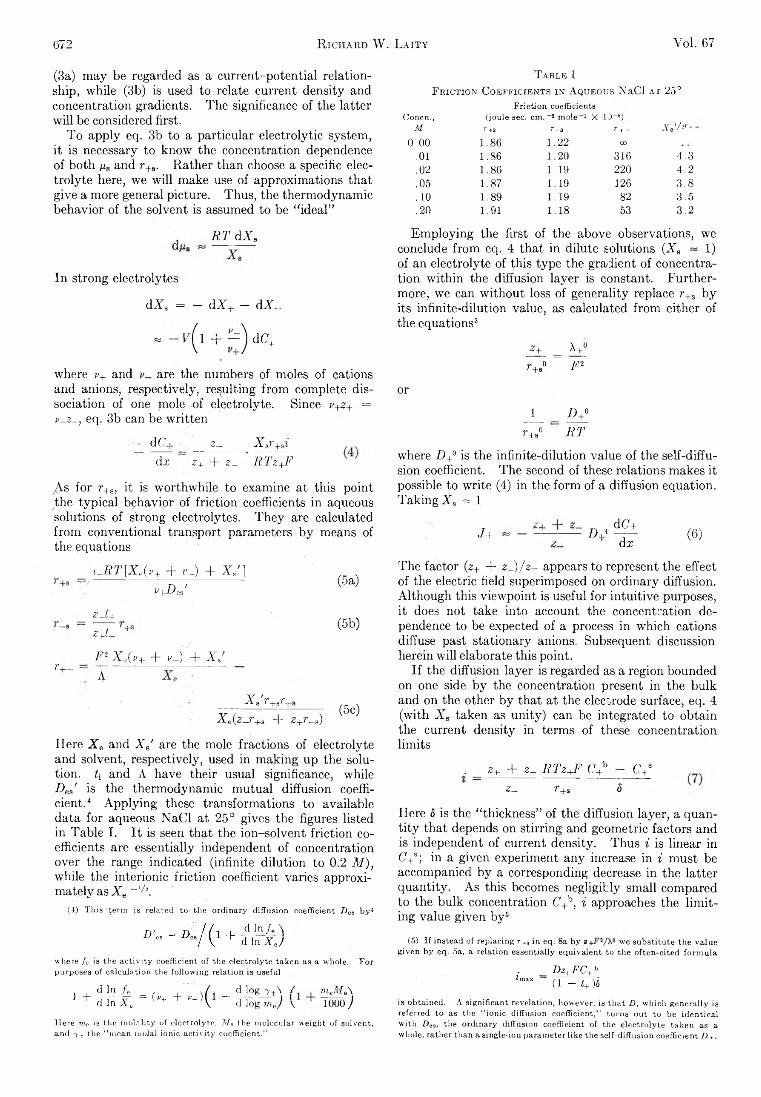
672 R ichard W. Laity Vol. 67
(3a) may be regarded as a current-potential relationship, while (3b) is used to relate current density and concentration gradients. The significance of the latter will be considered first.
To apply eq. 3b to a particular electrolytic system, it is necessary to know the concentration dependence of both ¡¿s and r+s. Rather than choose a specific electrolyte here, we will make use of approximations that give a more general picture. Thus, the thermodynamic behavior of the solvent is assumed to be “ ideal”
. RT dXs
In strong electrolytes
dX 8 = - dX+ - dX_
, _ F( 1 + A ) dCt
where v+ and are the numbers of moles of cations and anions, respectively, resulting from complete dissociation of one mole of electrolyte. Since v+z+ = v-Z-, eq. 3b can be written .
d r . __ 2___ X sr+dd;r :z+ + 2_ RTz+F
As for r4s, it is worthwhile to examine at this point the typical behavior of friction coefficients in aqueous solutions of strong electrolytes, They are calculated from conventional transport parameters by means of the equations
iJRT[X'(v+ + ti-) + X / ]V+De s'
(5a)
r+-
zJL+Z+t- +
F 2 X e( ,4 A
(5b)
+ vJ) + As
X g T _f_af .
X e{z-r+s + 2+r_s) (5c)
Here X e and X B' are the mole fractions of electrolyte and solvent, respectively, used in making up the solution. ti and A have their usual significance, while .Des' is the thermodynamic mutual diffusion coefficient.4 Applying these transformations to available data for aqueous NaCl at 25° gives the figures listed in Table I. It is seen that the ion-solvent friction coefficients are essentially independent of concentration over the range indicated (infinite dilution to 0.2 M), while the interionic friction coefficient varies approximately as X e - I/z.
(4) This erm is related to the ordinary diffusion coefficient Des by3
D 1es d In A \ d In X J
where / c is the activity coefficient of the electrolyte taken as a whole. For purposes of calculation the following relation is useful
i + d In /„ d In X\ = 0 + + V -
d log_7±\ / mel¥s\d log me) \ 1000 )
Here me is the molality of electrolyte, MR the molecular weight of solvent, and 7 -r the “ mean molal ionic activity coefficient.”
T a b l e IF ric tio n C o e f f ic ie n t s in A queous NaCl a t 25°
Friction coefficientsConcn., (joule sec. cm. 2 mole 1 X 10 a)
A V /2r+M r+s r-s r+ _0.00 1.86 1.22 CO
.01 1.86 1.20 316 4 .3
.02 1.86 1 .1 9 220 4 .2
.05 1 .8 7 1 .1 9 126 3 .8
.10 1 .8 9 1 .1 9 82 3 .5
.20 1 .91 1 .1 8 53 3 .2
Employing the first of the above observations, we conclude from eq. 4 that in dilute solutions (X a ~ 1) of an electrolyte of this type the gradient of concentration within the diffusion layer is constant. Furthermore, we can without loss of generality replace r+s by its infinite-dilution value, as calculated from either of the equations3
JA_ = k+_° r+B° F2
or
_1____i Vr+s0 RT
where Z)+° is the infinite-dilution value of the self-diffusion coefficient. The second of these relations makes it possible to write (4) in the form of a diffusion equation. Taking X s » 1
J+ D JdC+dx (6)
The factor (z+ + z_) / 2- appears to represent the effect of the electric field superimposed on ordinary diffusion. Although this viewpoint is useful for intuitive purposes, it does not take into account the concentration dependence to be expected of a process in which cations diffuse past stationary anions. Subsequent discussion herein will elaborate this point.
If the diffusion layer is regarded as a region bounded on one side by the concentration present in the bulk and on the other by that at the electrode surface, eq. 4 (with X s taken as unity) can be integrated to obtain the current density in terms of these concentration limits
. = 2+ + 2_ RTz+F C+h - C+s S- r+s S
Here 5 is the “ thickness” of the diffusion layer, a quantity that depends on stirring and geometric factors and is independent of current density. Thus i is linear in CV; in a given experiment any increase in i must be accompanied by a corresponding decrease in the latter quantity. As this becomes negligibly small compared to the bulk concentration C+h, i approaches the limiting value given by6
(5) If instead of replacing r +„ in eq. 8a by z we substitute the valuegiven by eq. 5a, a relation essentially equivalent to the often-cited formula
Dz+FC+h W " (1 - t + ) 5
is obtained. A significant revelation, however, is that D, which generally is referred to as the “ ionic diffusion coefficient,” turns out to be identical with Des. the ordinary diffusion coefficient of the electrolyte taken as a whole, rather than a single-ion parameter like the self-diffusion coefficient D + .
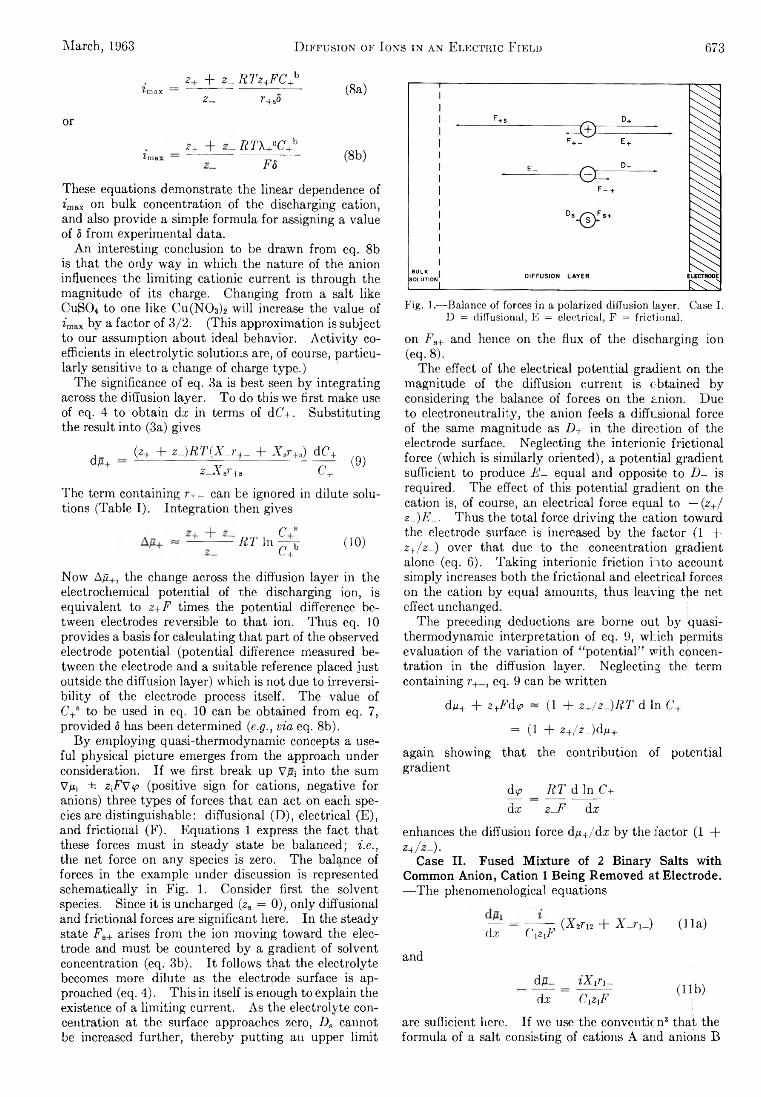
March, 1963 D iffusion of Ions in an Electric Field 673
or
2+ + z_ RTz+FC+hVax
z- r+a5(8a)
Vax2+ + RT\+°C+h
FS(8b)
These equations demonstrate the linear dependence of ¿max on bulk concentration of the discharging cation, and also provide a simple formula for assigning a value of 5 from experimental data.
An interesting conclusion to be drawn from eq. 8b is that the only way in which the nature of the anion influences the limiting cationic current is through the magnitude of its charge. Changing from a salt like CuS04 to one like Cu(N03)2 will increase the value of ¿max by a factor of 3/2. (This approximation is subject to our assumption about ideal behavior. Activity coefficients in electrolytic solutions are, of course, particularly sensitive to a change of charge type.)
The significance of eq. 3a is best seen by integrating across the diffusion layer. To do this we first make use of eq. 4 to obtain dx in terms of d(7+. Substituting the result into (3a) gives
d/x+ (z+ + z-)R T (X s+ _ + X ar+B) dC+ 2_X sr+s C+ (9)
The term containing r+— can be ignored in dilute solutions (Table I). Integration then gives
RT 1» Cc+b ( 10)
Now A/Z+, the change across the diffusion layer in the electrochemical potential of the discharging ion, is equivalent to z+F times the potential difference between electrodes reversible to that ion. Thus eq. 10 provides a basis for calculating that part of the observed electrode potential (potential difference measured between the electrode and a suitable reference placed just outside the diffusion layer) which is not due to irreversibility of the electrode process itself. The value of C+ to be used in eq. 10 can be obtained from eq. 7, provided 8 has been determined (e.g., via eq. 8b).
By employing quasi-thermodynamic concepts a useful physical picture emerges from the approach under consideration. If we first break up V « into the sum V i ± ZiFVy (positive sign for cations, negative for anions) three types of forces that can act on each species are distinguishable: diffusional (D), electrical (E), and frictional (F). Equations 1 express the fact that these forces must in steady state be balanced; i.e., the net force on any species is zero. The balance of forces in the example under discussion is represented schematically in Fig. 1. Consider first the solvent species. Since it is uncharged (zs = 0), only diffusional and frictional forces are significant here. In the steady state Fs+ arises from the ion moving toward the electrode and must be countered by a gradient of solvent concentration (eq. 3b). It follows that the electrolyte becomes more dilute as the electrode surface is approached (eq. 4). This in itself is enough to explain the existence of a limiting current. As the electrolyte concentration at the surface approaches zero, Ds cannot be increased further, thereby putting an upper limit
Fig. 1.—Balance of forces in a polarized diffusion layer. Case I.D = diffusional, E = electrical, F = frictional.
on Fa+ and hence on the flux of the discharging ion (eq. 8).
The effect of the electrical potential gradient on the magnitude of the diffusion current is obtained by considering the balance of forces on the anion. Due to electroneutrality, the anion feels a diffusional force of the same magnitude as D+ in the direction of the electrode surface. Neglecting the interionic frictional force (which is similarly oriented), a potential gradient sufficient to produce E - equal and opposite to D - is required. The effect of this potential gradient on the cation is, of course, an electrical force equal to — (z+/ z_)i?_. Thus the total force driving the cation toward the electrode surface is increased by the factor (1 + z+/z-) over that due to the concentration gradient alone (eq. 6). Taking interionic friction into account simply increases both the frictional and electrical forces on the cation by equal amounts, thus leaving the net effect unchanged.
The preceding deductions are borne out by quasi- thermodynamic interpretation of eq. 9, which permits evaluation of the variation of “ potential” with concentration in the diffusion layer. Neglecting the term containing r+_, eq. 9 can be written
d/i+ + z±Fd<p ~ (1 + z+/zJ)RT d In C+
= (1 + z+ / z-) dfx+
again showing that the contribution of potential gradient
dy> _ R/T d In C+ dx z-F da:
enhances the diffusion force d^/dx by the factor (1 +z + /z - ) .
Case II. Fused Mixture of 2 Binary Salts with Common Anion, Cation 1 Being Removed at Electrode.—-The phenomenological equations
~ = 77—7 ; (X 2r12 + X_r._) (11a)da: C izj1
and
dyÜ_ iX l?T_da; CiZ\F
( l ib)
are sufficient here. If we use the convention3 that the formula of a salt consisting of cations A and anions B
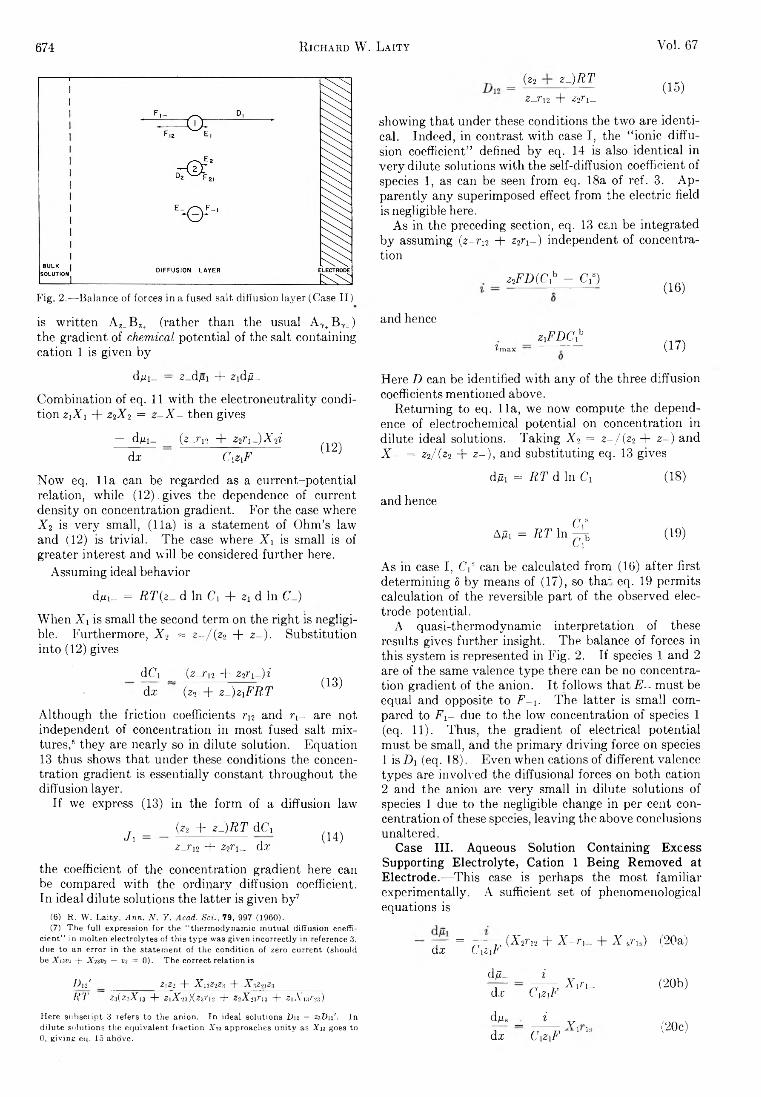
674 R ichard W. Laity Yol. 67
Fig. 2.—Balance of forces in a fused salt diffusion layer (Case II)
(z2 zJ)RT z~ri2 + z2n~
(15)
showing that under these conditions the two are identical. Indeed, in contrast with case I, the “ ionic diffusion coefficient” defined by eq. 14 is also identical in very dilute solutions with the self-diffusion coefficient of species 1, as can be seen from eq. 18a of ref. 3. Apparently any superimposed effect from the electric field is negligible here.
As in the preceding section, eq. 13 can be integrated by assuming (z-r12 + z2rx- ) independent of concentration
z2FD (C ? - C /)(16)
is written A Z_BZ+ (rather than the usual A7+BT_) and hence the gradient of chemical potential of the salt containing cation 1 is given by
z1FDClhmax * (17)
dm_ — z—dfii T id/T_
Combination of eq. 11 with the electroneutrality condition z\Xi + z2X 2 = z - X - then gives
— d,ui- (z^r12 + z2ri_)X2idx C&F
(12)
Now eq. 11a can be regarded as a current-potential relation, while (12). gives the dependence of current density on concentration gradient. For the case where X 2 is very small, (11a) is a statement of Ohm’s law and (12) is trivial. The case where X x is small is of greater interest and will be considered further here.
Assuming ideal behavior
d/m„ = RT(z^ d In Ci + Zi d In C'_)
When Xi is small the second term on the right is negligible. Furthermore, X 2 « z~ /{z2 + z~). Substitution into (12) gives
dCi _ (z_ri2 + z2riJ)i dx (z2 + zF)ziFRT (13)
Although the friction coefficients r12 and n~ are not independent of concentration in most fused salt mixtures,6 they are nearly so in dilute solution. Equation 13 thus shows that under these conditions the concentration gradient is essentially constant throughout the diffusion layer.
If we express (13) in the form of a diffusion law
J i = ( z 2 + Z -)R T d C i
zjt\2 + 22rj_ dx(14)
the coefficient of the concentration gradient here can be compared with the ordinary diffusion coefficient. In ideal dilute solutions the latter is given by7
(6) R. w. Laity, A n n . N . Y . A ca d . S c i ., 79, 997 (1960).(7) The full expression for the “ thermodynamic mutual diffusion coeffi
cient” in molten electrolytes of this type was given incorrectly in reference 3, due to an error in the statement of the condition of zero current (should be X izvi + X 23V2 — V3 = 0). The correct relation is
/ vHT
Z\Zi -{- X 13Z2Z3 -}- XZ./iZ:!23(23X13 -(- ZyX•ic)(Z:Z>'i2 + 22X23713 + 21X13723)
Here D can be identified with any of the three diffusion coefficients mentioned above.
Returning to eq. 11a, we now compute the dependence of electrochemical potential on concentration in dilute ideal solutions. Taking X 2 = z~/(z2 + z -) and X - = z2/(z2 + z- ), and substituting eq. 13 gives
dft = RT d In C2 (18)
and hence
Aft = RT In % (19)w
As in case I, GV can be calculated from (16) after first determining 8 by means of (17), so tha~ eq. 19 permits calculation of the reversible part of the observed electrode potential.
A quasi-thermodynamic interpretation of these results gives further insight. The balance of forces in this system is represented in Fig. 2. If species 1 and 2 are of the same valence type there can be no concentration gradient of the anion. It follows that E - must be equal and opposite to F -1. The latter is small compared to F i- due to the low concentration of species 1 (eq. 11). Thus, the gradient of electrical potential must be small, and the primary driving force on species1 is D\ (eq. 18). Even when cations of different valence types are involved the diffusional forces on both cation2 and the anion are very small in dilute solutions of species 1 due to the negligible change in per cent concentration of these species, leaving the above conclusions unaltered.
Case III. Aqueous Solution Containing Excess Supporting Electrolyte, Cation 1 Being Removed at Electrode.—This case is perhaps the most familiar experimentally. A sufficient set of phenomenological equations is
= n f7 (AVi2 + X - ri _ + X sris) (20a) dx CiZiT
dft.dx
iCiZiF
X in_ (20b)
Here subscript 3 refers to the anion. In ideal solutions Dn = Z3D 12' . In dilute solutions the equivalent fraction X 23 approaches unity as X 13 goes to 0, giving eq. 15 above.
d^s _ i v dx C1Z1F 1 L
(20c)
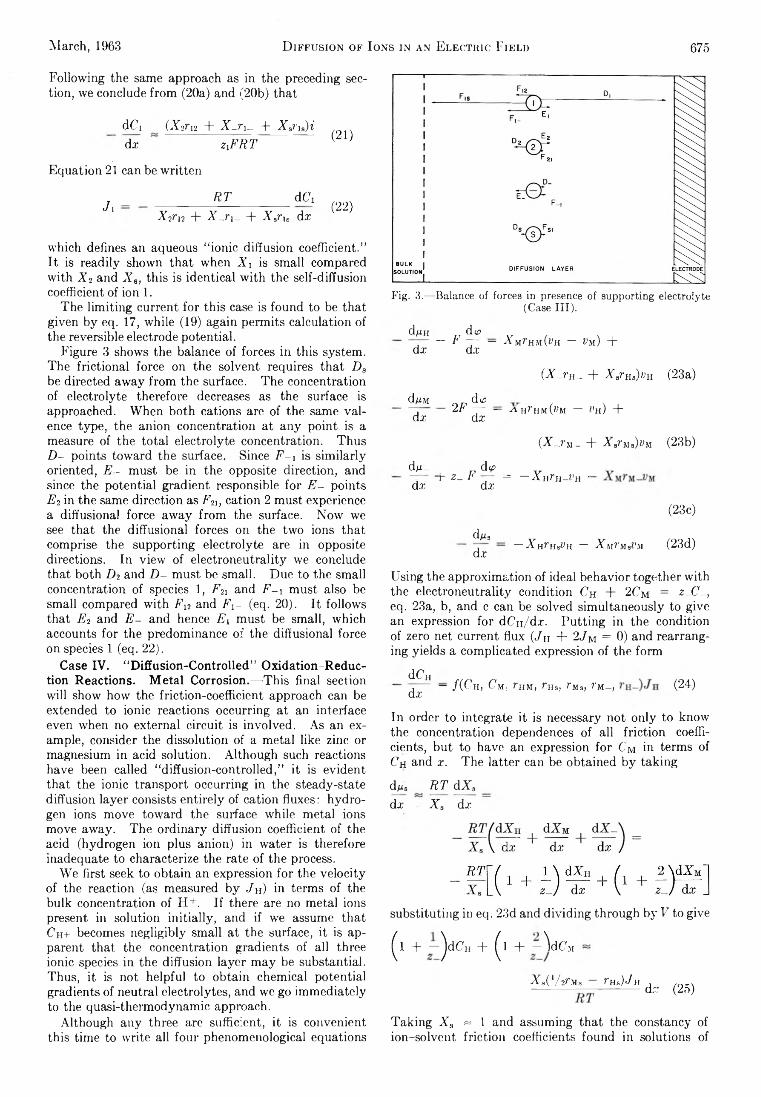
March, 1963 D iffusion of Ions in an Electric Field 675
Following the same approach as in the preceding section, we conclude from (20a) and (20b) that
dCidx
(X¿ri2 + X jti_ T X 3i'i3)i ZiFRT
(21)
Equation 21 can be written
Jx_________ RT__________ dCiX 2rn + X _n_ + X Bru dx
(22)
which defines an aqueous “ ionic diffusion coefficient.” It is readily shown that when X i is small compared with X 2 and X 8, this is identical with the self-diffusion coefficient of ion 1.
The limiting current for this case is found to be that given by eq. 17, while (19) again permits calculation of the reversible electrode potential.
Figure 3 shows the balance of forces in this system. The frictional force on the solvent requires that Ds be directed away from the surface. The concentration of electrolyte therefore decreases as the surface is approached. When both cations are of the same valence type, the anion concentration at any point is a measure of the total electrolyte concentration. Thus D - points toward the surface. Since F - 1 is similarly oriented, E- must be in the opposite direction, and since the potential gradient responsible for E - points Ei in the same direction as /'hi, cation 2 must experience a diffusional force away from the surface. Now we see that the diffusional forces on the two ions that comprise the supporting electrolyte are in opposite directions. In view of electroneutrality we conclude that both D<i and D - must be small. Due to the small concentration of species 1, Fn and F - 1 must also be small compared with Fu and F i- (eq. 20). It follows that Ei and E - and hence E\ must be small, which accounts for the predominance of the diffusional force on species 1 (eq. 22).
Case IV. “Diffusion-Controlled” Oxidation-Reduction Reactions. Metal Corrosion.—This final section will show how the friction-coefficient approach can be extended to ionic reactions occurring at an interface even when no external circuit is involved. As an example, consider the dissolution of a metal like zinc or magnesium in acid solution. Although such reactions have been called “ diffusion-controlled,” it is evident that the ionic transport occurring in the steady-state diffusion layer consists entirely of cation fluxes: hydrogen ions move toward the surface while metal ions move away. The ordinary diffusion coefficient of the acid (hydrogen ion plus anion) in water is therefore inadequate to characterize the rate of the process.
We first seek to obtain an expression for the velocity of the reaction (as measured by Jh) in terms of the bulk concentration of H+. If there are no metal ions present in solution initially, and if we assume that C h+ becomes negligibly small at the surface, it is apparent that the concentration gradients of all three ionic species in the diffusion layer may be substantial. Thus, it is not helpful to obtain chemical potential gradients of neutral electrolytes, and we go immediately to the quasi-thermodynamic approach.
Although any three are sufficient, it is convenient this time to write all four phenomenological equations
Fig. 3.—Balance of forces in presence of supporting electrolyte(CasellD-
dim do— F — — XuTau{vn — *>m ) + dx d.v
(X_r h_ + X aTiis)vu (23a)
dpM do~3 2 F — — a h ^h h ^ m — V h ) +dx dx
(X_r M - + X ariu)vn (23b)
dp_ d >~ b Z- F = —Wh h-^h ■d.r dx
d/isdx
(23c)
— X h hs h — X mí'msI’m (23d)
Using the approximation of ideal behavior together with the electroneutrality condition C h + 2 C m = Z-C -, eq. 23a, b, and c can be solved simultaneously to give an expression for dC'n/d.r. Putting in the condition of zero net current flux (JH + 2JM = 0) and rearranging yields a complicated expression of the form
dCndx — / ( U h , C m , ^h m , rns, ^ms, ?"m- , (24)
In order to integrate it is necessary not only to know the concentration dependences of all friction coefficients, but to have an expression for Cm in terms of Ch and x. The latter can be obtained by taking
d/is R T dX sdx X s dx
substituting in eq. 23d and dividing through by V to give
^1 + — dCH + 1 + — \lCji
X j/ W m s — T h s ) J h , / 0 _ .----------- — ----------- dx (2d)
Taking X s « 1 and assuming that the constancy of ion-solvent friction coefficients found in solutions of
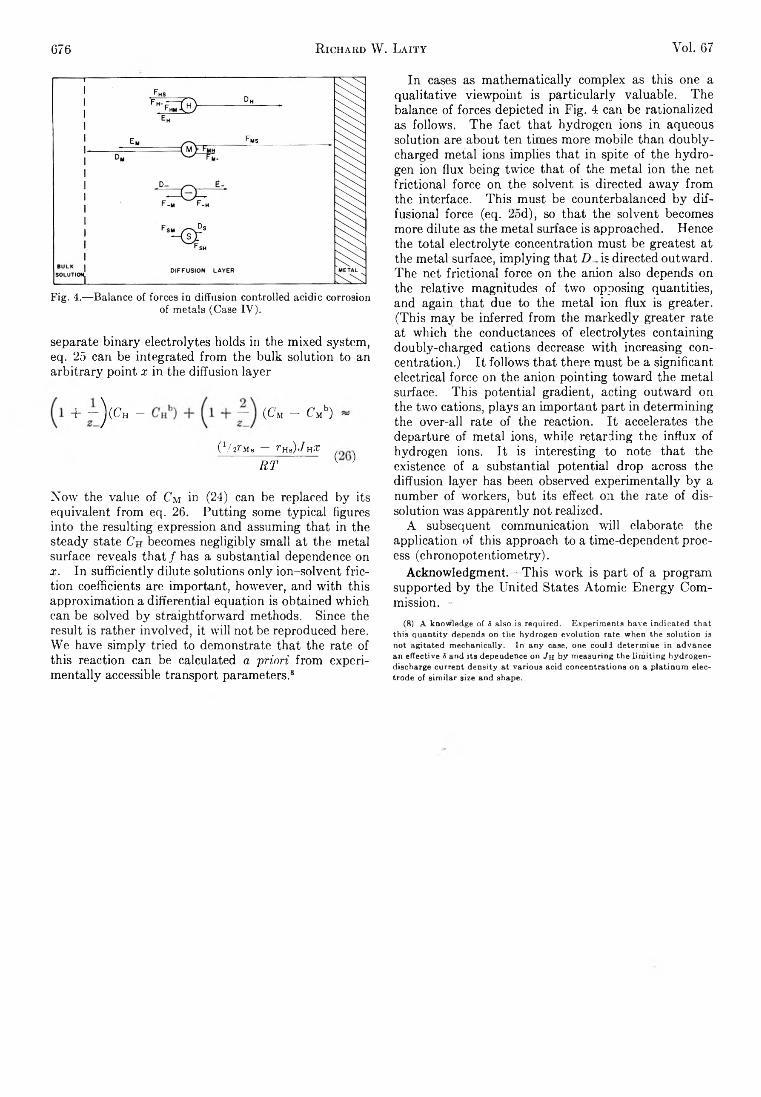
676 R ichaud W. Laity Vol. 67
Fig. 4.—Balance of forces in diffusion controlled acidic corrosion of metals (Case IV).
separate binary electrolytes holds in the mixed system, eq. 25 can be integrated from the bulk solution to an arbitrary point x in the diffusion layer
+ ~ ^ (C h — (Cm — Cm*5) ~
(VzrMs - rH*)Jnx . .RT { }
Now the value of Cm in (24) can be replaced by its equivalent from eq. 26. Putting some typical figures into the resulting expression and assuming that in the steady state Ch becomes negligibly small at the metal surface reveals that / has a substantial dependence onx. In sufficiently dilute solutions only ion-solvent friction coefficients are important, however, and with this approximation a differential equation is obtained which can be solved by straightforward methods. Since the result is rather involved, it will not be reproduced here. We have simply tried to demonstrate that the rate of this reaction can be calculated a priori from experimentally accessible transport parameters.8
In cases as mathematically complex as this one a qualitative viewpoint is particularly valuable. The balance of forces depicted in Fig. 4 can be rationalized as follows. The fact that hydrogen ions in aqueous solution are about ten times more mobile than doubly- charged metal ions implies that in spite of the hydrogen ion flux being twice that of the metal ion the net frictional force on the solvent is directed away from the interface. This must be counterbalanced by dif- fusional force (eq. 2od), so that the solvent becomes more dilute as the metal surface is approached. Hence the total electrolyte concentration must be greatest at the metal surface, implying that Z)_is directed outward. The net frictional force on the anion also depends on the relative magnitudes of two opposing quantities, and again that due to the metal ion flux is greater. (This may be inferred from the markedly greater rate at which the conductances of electrolytes containing doubly-charged cations decrease with increasing concentration.) It follows that there must be a significant electrical force on the anion pointing toward the metal surface. This potential gradient, acting outward on the two cations, plays an important part in determining the over-all rate of the reaction. It accelerates the departure of metal ions, while retarding the influx of hydrogen ions. It is interesting to note that the existence of a substantial potential drop across the diffusion layer has been observed experimentally by a number of workers, but its effect on the rate of dissolution was apparently not realized.
A subsequent communication will elaborate the application of this approach to a time-dependent process (chronopotentiometry).
Acknowledgment.—This work is part of a program supported by the United States Atomic Energy Commission.
(8) A knowledge of 8 also is required. Experiments have indicated that this quantity depends on the hydrogen evolution rate when the solution is not agitated mechanically. In any case, one could determine in advance an effective 8 and its dependence on Jh by measuring the limiting hydrogen- discharge current density at various acid concentrations on a platinum electrode of similar size and shape.
TRIMETHYLALUMINUM: THERMODYNAMIC FUNCTIONS IN THE SOLID AND LIQUID STATES, 0-380°K; VAPOR PRESSURE, HEAT OF VAPORIZATION, AND
ENTROPY IN THE IDEAL GAS STATE1B y J. P. M cC ullough , J. F. M esserly , R. T. M oore , and S. S. T odd
C o n t r i b u t i o n N o . 1 2 8 f r o m t h e T h e r m o d y n a m i c s L a b o r a t o r y o f t h e B a r t l e s v i l l e P e t r o l e u m R e s e a r c h C e n t e r , B u r e a u o f M i n e s ,
U . S . D e p a r t m e n t o f th e I n t e r i o r , B a r t l e s v i l l e , O h la .
R e c e i v e d S e p t e m b e r 1 9 , 1 9 6 2
This paper describes thermodynamic investigations of trimethylaluminum which were made by the Bureau of Mines as part of a program of studies of selected organic derivatives of elements in the second and third periods.From experimental measurements by low temperature calorimetry and comparative ebulliometry, the following properties of trimethylaluminum were determined: thermodynamic functions in the solid and liquid states (10-380°K.); vapor pressure (336-400°K.); heat of vaporization (298.15°K.); and entropy in the ideal gas state (298.15°K).
March, 1963 Thermodynamic Properties of T rimethylaluminum 677
The Bureau of Mines is studying the thermodynamic properties of selected organic derivatives of elements in the second and third periods. The experimental parts of these investigations include determination of accurate values of heat of formation, entropy, vapor pressure, vapor heat capacity, heat of vaporization, and related thermodynamic properties. If feasible, these results are used with spectroscopic and molecular- structure information in calculating chemical thermodynamic functions in the ideal gas state in the range RT500°K. and in evaluating thermochemical bond energies.
Studies of aluminum alkyls and their derivatives are in progress or planned. Results for trimethylaluminum reported in this paper include values of the thermodynamic functions in the solid and liquid states (0-380°K.), vapor pressure, heat of vaporization, and entropy in the ideal gas state at 298.15°K.
ExperimentalMaterial.—A sample of trimethylaluminum was obtained from
Ethyl Corporation, Baton Rouge, La., through the courtesy of J. R. Zietz, Jr. I t was distilled in an efficient column at 65 mm. pressure; a center cut of 150 ml. was taken for thermodynamic studies. A calorimetric study of the melting point as a function of fraction of sample melted showed that the purified sample contained 0.19 mole % impurity (based on trimethylaluminum as a monomer). After the sample had been in the calorimeter at or below room temperature for about 3 months, a second determination also showed 0.19 mole % impurity. However, after the sample had been heated once to 350°K. and once to 383°K. (in the course of heat capacity measurements in a 3-day period) the impurity increased significantly to 0.25 mole % . All of the measurements below room temperature were made before the sample was heated above that temperature.
Physical Constants.—The reported values are based on the 1951 International Atomic Weights, 2 1951 values of fundamental physical constants, 3 and the relations: 0°C. = 273.15°K. and 1 cal. = 4.184 joules (exactly). Temperature was measured with platinum resistance thermometers calibrated in terms of the International Temperature Scale4 between 90 and 500°K. and the provisional scale6 of the National Bureau of Standards between 11 and 90°K. All electrical and mass measurements
(1) The research reported in this article was supported by the United States Air Force and the Advanced Research Projects Agency of the U. S. Department of Defense through the Air Force Office of Scientific Research of tire Air Research and Development Command under Contract No. CSO- 59-9, ARPA Order No. 24-59, Task 3. Reproduction in whole or in part is permitted for any purpose of the United States Government.
(2) E. Wichers, J. Am. Chem. Soc., 74, 2447 (1952). Use of the unified atomic weight scale of 1962 [Chem. Eng. News, Nov. 20, 1961, p. 43] would increase all molal values reported herein by C.007%.
(3) F. D. Rossini, F. T. Gucker, Jr., H. L. Johnston, L. Pauling, and G. W. Vinal, J. Am. Chem. Soc., 74, 2699 (1952).
(4) H. F. Stimson, J. Res. Natl. Bur. Std., 42, 209 (1949).(o) H. J. Hoge and F. G. Brickwedde, ibid., 22, 351 (1939).
were referred to standard devices calibrated at the National Bureau of Standards.
The calorimetric data for the solid and liquid states are based on the trimethylaluminum m o n o m e r , although the compound actually is almost completely d i m e r i c below about 70° A7 Values of thermodynamic properties for the gas state at 29S.15°K. arc given for the d i m e r .
Procedures.—The apparatus and techniques used for low temperature calorimetry were as previously described,8 except that the temperature of the adiabatic shield was controlled automatically by an electronic device. A sample of 38.226 g. was sealed in a platinum calorimeter with helium (32 mm. pressure at room temperature) added to promote thermal equilibration. Measurements were made of heat capacity at saturation pressure, Cs, between 12 and 383°K., heat of fusion, AH m , and triple-point temperature, T t p .
The vapor pressure of trimethylaluminum was measured in an ebuDiometer system similar to that previously described,9 except that a second comparison ebulliometer containing benzene was added to extend the range of measurements down to 82 mm.
ResultsLow-Temperature Calorimetry.— The experimental
values of heat capacity are listed in Table I. Corrections for premelting caused by impurity in the sample have not been applied to the results for the solid, but corrections for vaporization have been applied to some of the results for the liquid. The temperature increments used in the measurements were small enough to obviate curvature corrections: 10% of the absolute temperature below 50°K., 5 to 8° for the solid above 53°K., and 10° for the liquid. Above 30°E., the accuracy uncertainty generally is less than 0.2% of C8,10 but the accuracy at the highest temperatures may have been affected slightly by decomposition of the sample. The heat capacity of the liquid between 290 and 380°K. is represented within 0.04% by the empirical equation
Cs(liq.) = 23.723 + 4.6369 X 10⁻²⁷’ - 4.0739 X 10⁻⁵T2 + 1.2346 X 10- 7213, cal. deg. - 1 mole- 1
(monomer) (1)
From four determinations, the heat of fusion was(6) A. W. Laubengayer and W. F. Gilliam, J. Am. Chem. Soc., 63, 477
(1941).(7) K. S. Pitzer and H. S. Gutowski, ibid., 68, 2204 (1946).(8) H. M. Huffman, Chem. Rev., 40, 1 (1947); H. M. Huffman, S. S.
Todd, and G. D. Oliver, J. Am. Chem. Soc., 71, 584 (1949); and D. W. Scott, D. R, Douslin, M. E. Gross, G. D. Oliver, and H. M. Huffman ibid., 74, 883 (1952).
(9) G. Waddington, J. W. Knowlton, D. W. Scott, G. D. Oliver, S. S. Todd, W. N. Hubbard, J. C. Smith, and H. M. Huffman, ibid., 71, 797 (1949).
(10) J. P. McCullough and J. F. Messerly, U. S. Bur. Mines Bull. 596 (1961).
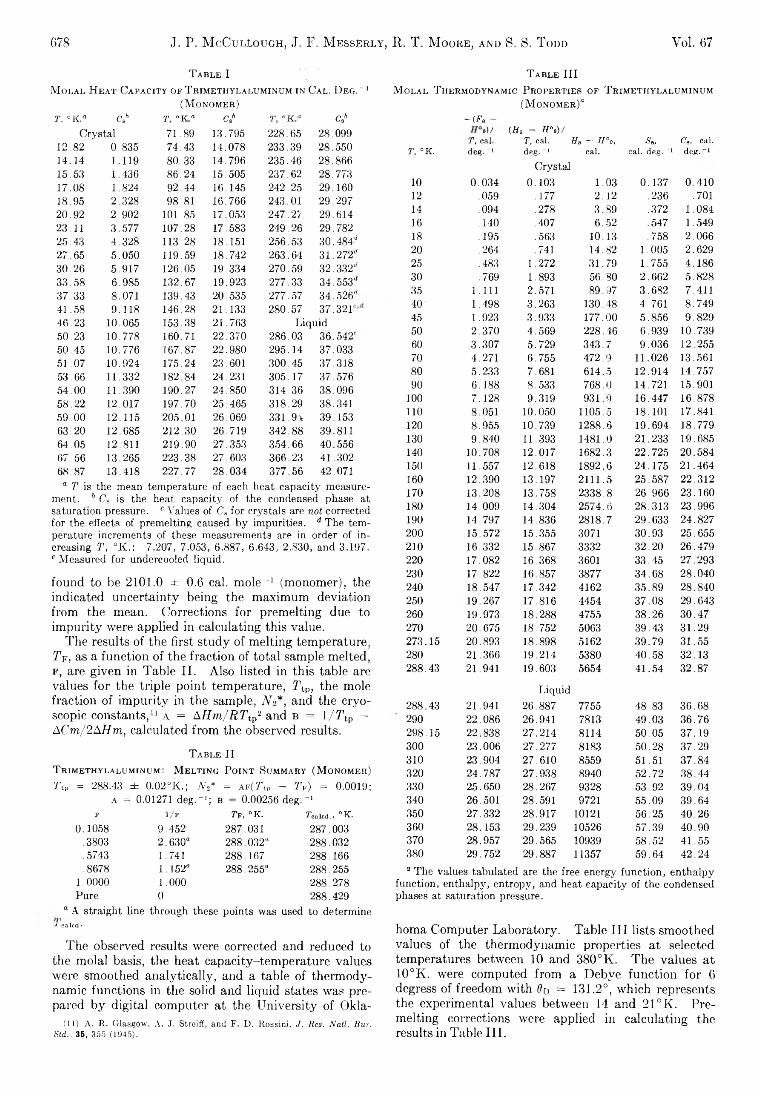
678 J. P. M cCullough, J. F. M esserly, R. T. M oore, and S. S. T odd Vol. 67
T a b l e IM o l a l H e a t C a p a c it y o f T r im e t h y l a l u m in u m in C a l . D e g . - 1
(M o n o m e r )T, ° K.° Csh T °K a c . ‘ T °K a c t
Crystal 7 1 .89 13 .795 22 8 .65 2 8 .09912. 82 0 .8 35 74 .43 14 .078 23 3 .39 2 8 .5 5 014. 14 1 .1 19 8 0 .33 14 .796 23 5 .4 6 2 8 .86615. 53 1 .4 36 8 6 .2 4 15 .505 23 7 .62 2 8 .77317. 08 1 .8 24 9 2 .4 4 16 .145 242 .25 29 16018. 95 2 .3 2 8 98 .81 16 .766 243.01 29 .2 9 720. 92 2 .9 0 2 101.85 17 .053 2 4 7 .2 ) 2 9 .61423. 11 3 .5 7 7 107 .28 17 .583 2 4 9 .2 6 2 9 .78225. 43 4 .3 2 8 113.28 18.151 256 .53 30.484**27. 65 5 .0 5 0 119.59 18 .742 2 6 3 .64 31.272**30. 26 5 .9 1 7 126 .05 19 .334 2 7 0 .59 32.332**33. 58 6 .9 85 132 .67 19 .923 277 .33 3 4 .553d37..33 8 .0 71 139.43 20 .535 2 7 7 .57 34.526**41..58 9 .1 1 8 146.28 21 .133 2 8 0 .5 7 3 7 .3 2 1 C|46 .23 10 ,065 153.38 21 .763 Liquid50 .23 10 .778 160.71 2 2 .370 286 .03 3 6 .5 4 2 '50 .45 10.776 167.87 22.980 295.14 37.03351 .07 10.924 175.24 23.601 300.45 37.31853 .66 11.332 182.84 24.231 305.17 37.57654 .00 11.390 190,27 24.850 314.36 38.09658 .2 2 12.017 197.70 25.465 318.29 38.34159 .00 12.115 205.01 26.069 331.94 39.15363 .20 12.685 212.30 26.719 342.88 39.81164 .05 12.811 219.90 27.353 354.66 40.55667 .56 13.265 223.38 27.603 366.23 41.30268 .87 13.418 227.77 28.034 377.56 42.071
a T is the mean temperature of each heat capacity measurement. 6 Cs is the heat capacity of the condensed phase at saturation pressure. c Values of C9 for crystals are not corrected for the effects of premelting caused by impurities. d The temperature increments of these measurements are in order of increasing T , °K.: 7.207, 7.053, 6.887, 6.643, 2.S30, and 3.197. e Measured for undercooled liquid.found to be 2101.0 ± 0.6 cal. mole^1 (monomer), the indicated uncertainty being the maximum deviation from the mean. Corrections for premelting due to impurity were applied in calculating this value.
The results of the first study of melting temperature, TV, as a function of the fraction of total sample melted, f , are given in Table II. Also listed in this table are values for the triple point temperature, 7\p, the mole fraction of impurity in the sample, AT*, and the cryo- scopic constants,11 a = AHm/RTtp2 and b = I / 7'tp — ACm/2AHm, calculated from the observed results.
T able IIT rimethylaluminum : M elting P oint Summary (M onomer) TtP = 288.43 ± 0.02°K.; N2* = AF(Ttp - TV) = 0.0019;
a = 0.01271 deg.-1; b = 0.00256 deg.^1F 1 / f Tf, °K. Ycalcd., °K.
0.1058 9.452 287.031 287.003.3803 2.630“ 288.032“ 288.032.5743 1.741 288.167 288.166.8678 1.152“ 288.255" 288.255
1 .0 0 0 0 1.0 0 0 288.278Pure 0 288.429
“ A straight line through these points was used to determine* calcd*
The observed results were corrected and reduced to the molal basis, the heat capacity-temperature values were smoothed analytically, and a table of thermodynamic functions in the solid and liquid states was prepared by digital computer at the University of Okla-
(11) A. R. Glasgow, A. J. Streiff, and F. D. Rossini, J. Res. Natl. Bur. Std.. 35, 355 (1945).
T a b l e IIIM o l a l T h e r m o d y n a m ic P r o p e r t ie s of T r im e t h y l a l u m in u m
( M o n o m e r )“-(Fs -
o)/ (Hs - H°»)/T, cal. 71, cal. Hs - H°o, S*, Cs, cal.
T, "K. d e g . '1 deg.-1 cal. cal. deg. _1 deg.Crystal
10 0 .0 3 4 0 .1 0 3 1 .0 3 0 .1 3 7 0 .4 1 012 .059 .177 2 .1 2 .236 .70114 .094 .278 3 .8 9 .372 1 .0 8 416 .140 .407 6 .5 2 .547 1 .5 4918 .195 .563 10 .13 .758 2 .0 6 620 .264 .741 14 .82 1 .0 05 2 .6 2 925 .483 1 .272 3 1 .7 9 1 .7 55 4 .1 8 630 .769 1 .893 5 6 .8 0 2 .6 6 2 5 .8 2 835 1.111 2 .571 8 9 .9 7 3 .6 8 2 7 .4 1140 1 .4 98 3 .2 63 130 .48 4 .7 61 8 .7 4 945 1.923 3 .9 33 17 7 .00 5 .8 5 6 9 .8 2 950 2 .3 7 0 4 .5 6 9 2 2 8 .46 6 .9 3 9 10 .73960 3 .3 0 7 5 .7 29 3 4 3 .7 9 .0 3 6 12 .25570 4 .271 6 .7 55 4 7 2 .9 11 .026 13 .56180 5 .2 33 7 .6 81 6 1 4 .5 1 2 .914 14 .75790 6 .1 88 8 .5 33 7 6 8 .0 14 .721 15 .901
100 7 .1 28 9 .3 19 9 3 1 ,9 16 .447 1 6 .878110 8 .0 51 10 .050 1105.5 18 .101 17 .841120 8 .9 5 5 10 .739 1288 .6 19 .6 9 4 18 .779130 9 .8 4 0 11.393 1481 .0 2 1 .233 19 .685140 10 .708 12 .017 1682.3 2 2 .725 2 0 .5 8 4150 11 .557 12 .618 1892 .6 2 4 .175 2 1 .4 6 4160 12 .390 13 .197 2 1 11 .5 2 5 .5 8 7 2 2 .3 1 2170 13 .208 13 .758 2 3 38 .8 2 6 .9 6 6 2 3 .1 6 0180 14 .009 14 .304 2 5 74 .6 2 8 .313 2 3 .996190 14 .797 14 .836 2 8 18 .7 2 9 .633 2 4 .8 2 7200 15 .572 15 .355 3071 3 0 .9 3 2 5 .6 5 5210 16 .332 15 .867 3332 3 2 .2 0 2 6 .4 7 9220 17 .082 16 .368 3601 3 3 .4 5 2 7 .2 9 3230 17 .822 16 .857 3877 3 4 .6 8 2 8 .0 4 0240 18 .547 17 .342 4162 3 5 .8 9 2 8 .8 4 0250 19 .267 17 .816 4454 3 7 .0 8 2 9 .643260 19 .973 18 .288 4755 3 8 .2 6 3 0 .4 7270 2 0 .675 18 .752 5063 3 9 .4 3 3 1 .2 92 7 3 .15 20 .893 18 .898 5162 3 9 .7 9 3 1 .5 5280 2 1 .3 6 6 19 .214 5380 4 0 .5 8 3 2 .1 3288 .43 21 .941 19.603 5654 4 1 .5 4 3 2 .8 7
Liquid288 .43 21 .941 2 6 .887 7755 4 8 .83 3 6 .6 8290 2 2 .0 8 6 26 .941 7813 4 9 .0 3 3 6 .7 6298 .15 2 2 .8 3 8 2 7 .214 8114 5 0 .0 5 3 7 .1 9300 2 3 .0 0 6 2 7 .277 8183 5 0 .2 8 3 7 .2 9310 2 3 .9 0 4 2 7 .610 8559 5 1 .51 3 7 .8 4320 2 4 .7 8 7 2 7 .938 8940 5 2 .7 2 3 8 .4 4330 2 5 .650 2 8 .267 9328 5 3 .9 2 3 9 .0 4340 26 .501 28 .591 9721 5 5 .0 9 3 9 .6 4350 2 7 .332 2 8 .917 10121 5 6 .2 5 4 0 .2 6360 28 .153 29 .239 10526 5 7 .3 9 4 0 .9 0370 2 8 .9 5 7 2 9 .565 10939 5 8 .5 2 4 1 .5 5380 2 9 .752 2 9 .887 11357 5 9 .6 4 4 2 .2 4
a The values tabulated are the free energy function, enthalpy function, enthalpy, entropy, and heat capacity of the condensed phases at saturation pressure.
homa Computer Laboratory. Table III lists smoothed values of the thermodynamic properties at selected temperatures between 10 and 380°K. The values at 10 °K. were computed from a Debye function for 6 degress of freedom with 0o = 131.2°, which represents the experimental values between 14 and 21 °K. Premelting corrections were applied in calculating the results in Table III.
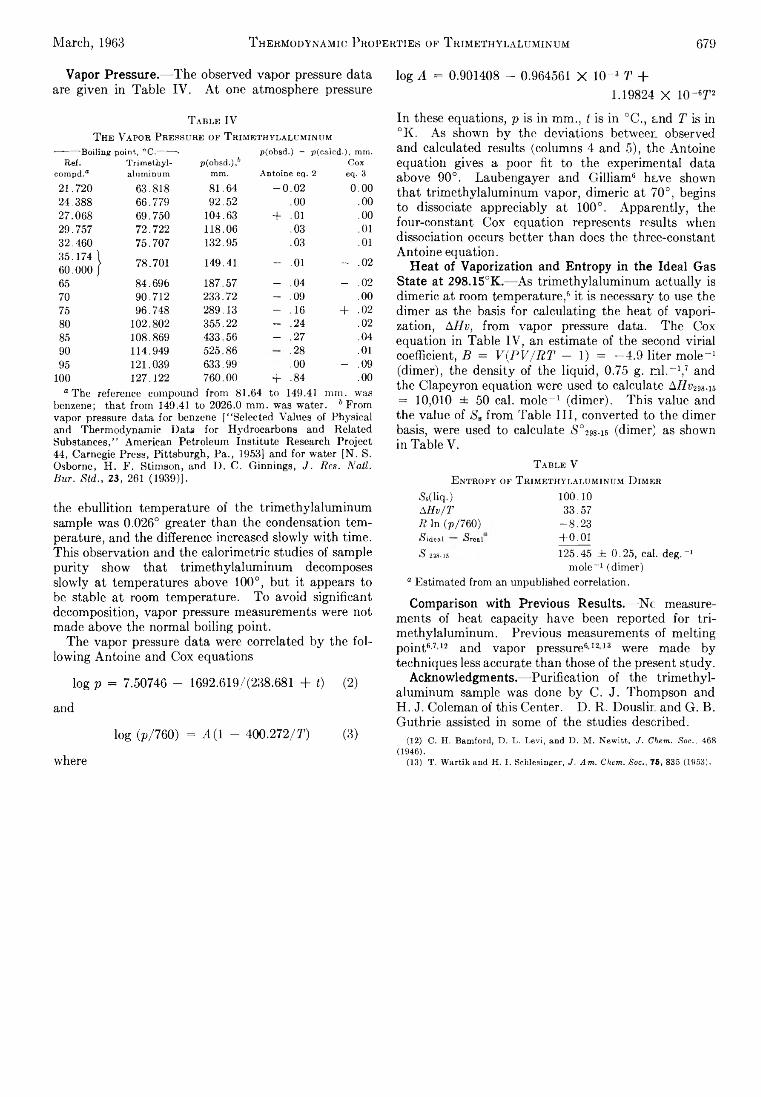
March, 1963 T hermodynamic Properties of Trimethylaluminum 679
Vapor Pressure.— The observed vapor pressure data are given in Table IV. At one atmosphere pressure
log A = 0.901408 - 0.964561 X 10⁻³ T +1.19824 X lO -T 2
T able IVT he V apor P ressure of T rimethylaluminum
'—* 'Boiling point, °C/—*—> p(obsd.) — p(calcd.). mm.Ref. Trimethyl #(obsd.),& Cox
compd.° aluminum mm. Antoine eq. 2 eq. 321.720 63.818 81.64 — 10 .0 2 0 .0 024.388 66.779 92.52 .00 .0027.068 69.750 104.63 + .0 1 .0029.757 72.722 118.06 .03 .0 132.460 75.707 132.95 .03 .0 135.17460.000 j 78.701 149.41 - .0 1 - .0 2
65 84.696 187.57 — .04 - .0 270 90.712 233.72 — .09 .00
75 96.748 289.13 - .16 + .0 2
80 102.802 355.22 — .24 .0 2
85 108.869 433.56 — .27 .0490 114.949 525.86 .28 .0 1
95 121.039 633.99 .00 - .09100 127.122 760.00 + .84 .00
“ The reference compound from 81.64 to 149.41 mm. wasbenzene; that from 149.41 to 2026.0 mm. was water . 6 Fromvapor pressure data for benzene [“ Selected Values of Physical and Thermodynamic Data for Hydrocarbons and Related Substances,” American Petroleum Institute Research Project 44, Carnegie Press, Pittsburgh, Pa., 1953] and for water [N. S. Osborne, H. F. Stimson, and I). C. Ginnings, J . R e s . N a t l .
B u r . S t d . , 23, 261 (1939)].
the ebullition temperature of the trimethylaluminum sample was 0.026° greater than the condensation temperature, and the difference increased slowly with time. This observation and the calorimetric studies of sample purity show that trimethylaluminum decomposes slowly at temperatures above 100°, but it appears to be stable at room temperature. To avoid significant decomposition, vapor pressure measurements were not made above the normal boiling point.
The vapor pressure data were correlated by the following Antoine and Cox equations
log p = 7.50746 - 1692.619/(238.681 + f) (2)
and
log (p /760) = A (1 - 400.272/T) (3)
where
In these equations, p is in mm., t is in °C., and T is in °K. As shown by the deviations between observed and calculated results (columns 4 and 5), the Antoine equation gives a poor fit to the experimental data above 90°. Laubengayer and Gilliam6 have shown that trimethylaluminum vapor, dimeric at 70°, begins to dissociate appreciably at 100°. Apparently, the four-constant Cox equation represents results when dissociation occurs better than does the three-constant Antoine equation.
Heat of Vaporization and Entropy in the Ideal Gas State at 298.15°K.—As trimethylaluminum actually is dimeric at room temperature,6 it is necessary to use the dimer as the basis for calculating the heat of vaporization, AHv, from vapor pressure data. The Cox equation in Table IV, an estimate of the second virial coefficient, B = V(PV/RT — 1) = —4.9 liter mole-1 (dimer), the density of the liquid, 0.75 g. ml.-1,7 and the Clapeyron equation were used to calculate AHvm-u = 10,010 ± 50 cal. mole-1 (dimer). This value and the value of *Ss from Table III, converted to the dimer basis, were used to calculate <S°298-i5 (dimer) as shown in Table V.
T able VE ntropy of T rimethylaluminum D imer
iS«(liq.)A H v / T
R In (p/760)$ideal iSreal S 238-15
100.1033.57
-8 .2 3+ 0.01125.45 ± 0 .2 5 , cal. deg.-1
mole-1 (dimer)° Estimated from an unpublished correlation.Comparison with Previous Results.—No measure
ments of heat capacity have been reported for tri- methylalummum. Previous measurements of melting point6'712 and vapor pressure61213 were made by techniques less accurate than those of the present study.
Acknowledgments.— Purification of the trimethylaluminum sample was done by C. J. Thompson and H. J. Coleman of this Center. D. R. Douslin and G. B. Guthrie assisted in some of the studies described.
(12) C. H. Bamforcl, D. L. Levi, and D. M. Newitt, J. Chem. Soc., 468 (1946).
(13) T. Wartik and H. 1. Schlesinger, J. Am. Chem. Soc., 75, 835 (1953).
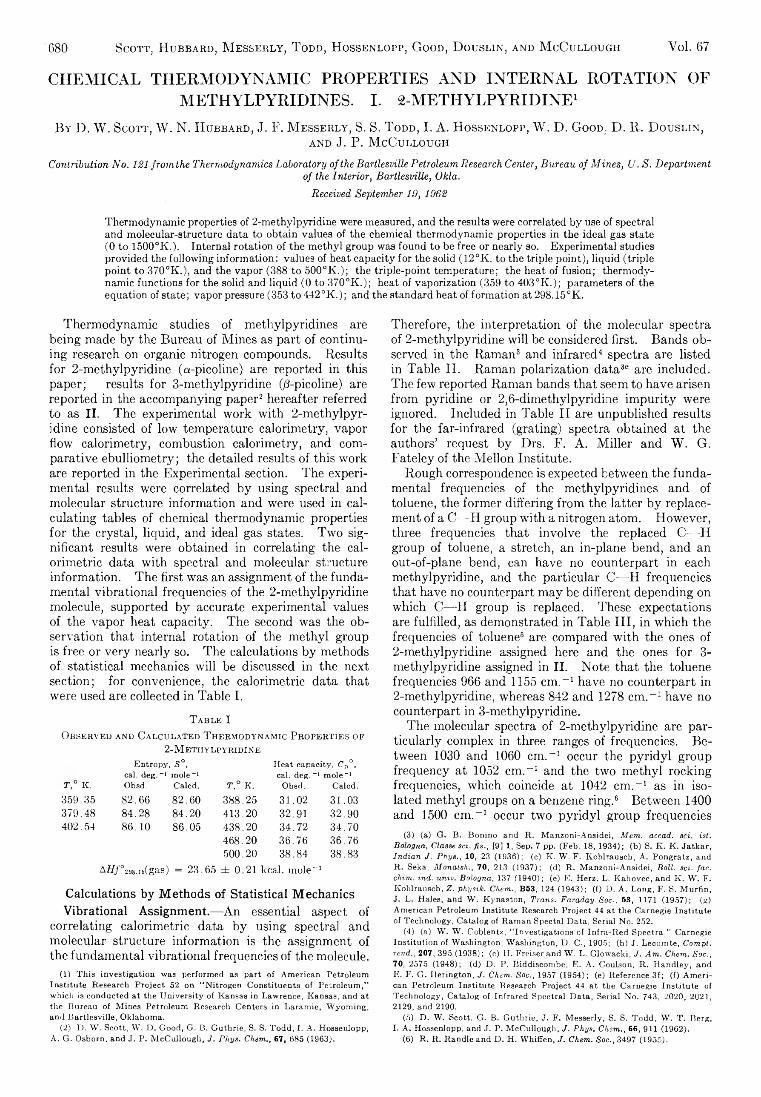
CHEMICAL THERMODYNAMIC PROPERTIES AND INTERNAL ROTATION OF METHYLPYRIDINES. I. 2-METHYLPYRIDINE1
680 Scott, Hubbard, M esserly, T odd, Hossenlopp, Good, D ouslin, and M cCullough Vol. 67
B y D. W. S c o t t , W. N. H u b b a r d , J. F. M e s s e r l y , S. S. T o d d , I . A. H o s s e n l o p p , W. D. G o o d . D. R. D o u s l i n ,a n d J. P. M c C u l l o u g h
Contribution No. 121 from the Thermodynamics Laboratory of the Bartlesville Petroleum Research Center, Bureau of Mines, U. S. Departmentof the Interior, Bartlesville, Okla.
Received September 19, 1962
Thermodynamic properties of 2-methylpyridine were measured, and the results were correlated by use of spectral and molecular-structure data to obtain values of the chemical thermodynamic properties in the ideal gas state (0 to 1500°K.). Internal rotation of the methyl group was found to be free or nearly so. Experimental studies provided the following information: values of heat capacity for the solid (L2°K. to the triple point), liquid (triple point to 370°K.), and the vapor (388 to 500°K.); the triple-point temperature; the heat of fusion; thermodynamic functions for the solid and liquid (0 to 370°K.); heat of vaporization (359 to 403°K.); parameters of the equation of state; vapor pressure (353 to 442°K.); and the standard heat of formation at 298.15°K.
Thermodynamic studies of methylpyridines are being made by the Bureau of Mines as part of continuing research on organic nitrogen compounds. Results for 2-methylpyridine (a-picoline) are reported in this paper; results for 3-methylpyridine (/3-picoline) are reported in the accompanying paper2 hereafter referred to as II. The experimental work with 2-methylpyridine consisted of low temperature calorimetry, vapor flow calorimetry, combustion calorimetry, and comparative ebulliometry; the detailed results of this work are reported in the Experimental section. The experimental results were correlated by using spectral and molecular structure information and were used in calculating tables of chemical thermodynamic properties for the crystal, liquid, and ideal gas states. Two significant results were obtained in correlating the calorimetric data with spectral and molecular structure information. The first was an assignment of the fundamental vibrational frequencies of the 2-methylpyridine molecule, supported by accurate experimental values of the vapor heat capacity. The second was the observation that internal rotation of the methyl group is free or very nearly so. The calculations by methods of statistical mechanics will be discussed in the next section; for convenience, the calorimetric data that were used are collected in Table I.
T a b l e IO b se r v e d an d C a lc u l a t e d T h e r m o d yn a m ic P r o p e r t ie s o f
2 -M e t h y l p y r id in e
T ° K.
Entropy, S ° ,
cal. deg.-1 mole-1 Obsd. Caled. T . ° K.
Heat capacity, C p ° ,
cal. deg.-1 mole-1 Obsd. Caled.
359 .35 82 .6 6 8 2 .6 0 388 .25 3 1 .0 2 3 1 .0 3379.4 8 84 .2 8 8 4 .2 0 413 .20 32.91 3 2 .9 0402 .54 8 6 .1 0 8 6 .0 5 438 .20 3 4 .7 2 3 4 .7 0
4 6 8 .20 3 6 .7 6 3 6 .7 6500.2 0 3 8 .8 4 3 8 .8 3
A f f / ° 29s.,5(g a s ) = 23. 65 ± 0 .2 1 k c a l , m u le ' -i
Calculations b y M ethods of S tatistica l M echanics V ib ra tion a l Assignm ent.— An essential aspect of
correlating calorimetric data by using spectral and molecular structure information is the assignment of the fundamental vibrational frequencies of the molecule.
(1) This investigation was performed as part of American Petroleum Institute Research Project 52 on “Nitrogen Constituents of Petroleum,” which is conducted at the University of Kansas in Lawrence, Kansas, and at the Bureau of Mines Petroleum Research Centers in Laramie, Wyoming, and Bartlesville, Oklahoma.
(2) D. W. Scott, W. D. Good, G. B. Guthrie, S. S. Todd, I. A. Hossenlopp, A. G. Osborn, and J. P. McCullough, J . P h y s . C h e m . , 67 s 685 (1963).
Therefore, the interpretation of the molecular spectra of 2-methylpyridine will be considered first. Bands observed in the Raman3 and infrared4 spectra are listed in Table II. Raman polarization data36 are included. The few reported Raman bands that seem to have arisen from pyridine or 2,6-dimethylpyridine impurity were ignored. Included in Table II are unpublished results for the far-infrared (grating) spectra obtained at the authors’ request by Drs. F. A. Miller and W. G. Fateley of the Mellon Institute.
Rough correspondence is expected between the fundamental frequencies of the methylpyridines and of toluene, the former differing from the latter by replacement of a C—H group with a nitrogen atom. However, three frequencies that involve the replaced C— H group of toluene, a stretch, an in-plane bend, and an out-of-plane bend, can have no counterpart in each methylpyridine, and the particular C— H frequencies that have no counterpart may be different depending on which C—H group is replaced. These expectations are fulfilled, as demonstrated in Table III, in which the frequencies of toluene6 are compared with the ones of2-methylpyridine assigned here and the ones for 3- methylpyridine assigned in II. Note that the toluene frequencies 966 and 1155 cm.-1 have no counterpart in2-methylpyridine, whereas 842 and 1278 cm.-1 have no counterpart in 3-methylpyridine.
The molecular spectra of 2-methylpyridine are particularly complex in three ranges of frequencies. Between 1030 and 1060 cm.-1 occur the pyridyl group frequency at 1052 cm.-1 and the two methyl rocking frequencies, which coincide at 1042 cm.-1 as in isolated methyl groups on a benzene ring.6 Between 1400 and 1500 cm.-1 occur two pyridyl group frequencies
(3) (a) G. B. Bonino and R. Manzoni-Ansidei, Mem. accad, sci. ist. Bologna, Classe sci. fis., [9] 1, Sep. 7 pp. (Feb. 18, 1934); (b) S. K. K. Jatkar, Indian J. Phys., 10, 23 (1936); (c) K. W. F. Kohlrausch, A. Pongratz, and R. Seka, Monatsh., 70, 213 (1937); (d) R. Manzoni-Ansidei, Boll. sci. fac. chim. ind. uniD. Bologna, 137 (1940); (e) E. Herz. L. Kahovec, and K. W. F. Kohlrausch, Z. physik. Chem., B53, 124 (1943); (f) D. A. Long, F. S. Murfin, J. L. Hales, and W. Kynaston, Trans. Faraday Soc., 53, 1171 (1957); (g) American Petroleum Institute Research Project 44 at the Carnegie Institute of Technology, Catalog of Raman Spectal Data, Serial No. 252.
(4) (a) W. W. Coblentz, “Investigations of Infra-Red Spectra,” Carnegie Institution of Washington, Washington, D. C., 1905; (b) J. Lecomte, Compt. rend., 207, 395 (1938); (c) H. Freiserand W. L. Glowacki, J. Am. Chem. Soc., 70, 2575 (1948); (d) D. P. Biddiscombe, E. A. Coulson, R. Handley, andE. F. G. Herington., J. Chem. Soc., 1957 (1954); (e) Reference 3f; (f) American Petroleum Institute Research Project 44 at the Carnegie Institute of Technology, Catalog of Infrared Spectral Data, Serial No. 743, 2020, 2021, 2129, and 2190.
(5) D. W. Scott, G. B. Guthrie, J. F. Messerly, S. S. Todd, W. T. Berg, I. A. Hossenlopp, and J. P. McCullough, J. Phys. Chem., 66, 911 (1962).
(6) R. R. Randle and D. H. Whiffen, J . Chem. Soc., 3497 (1955).
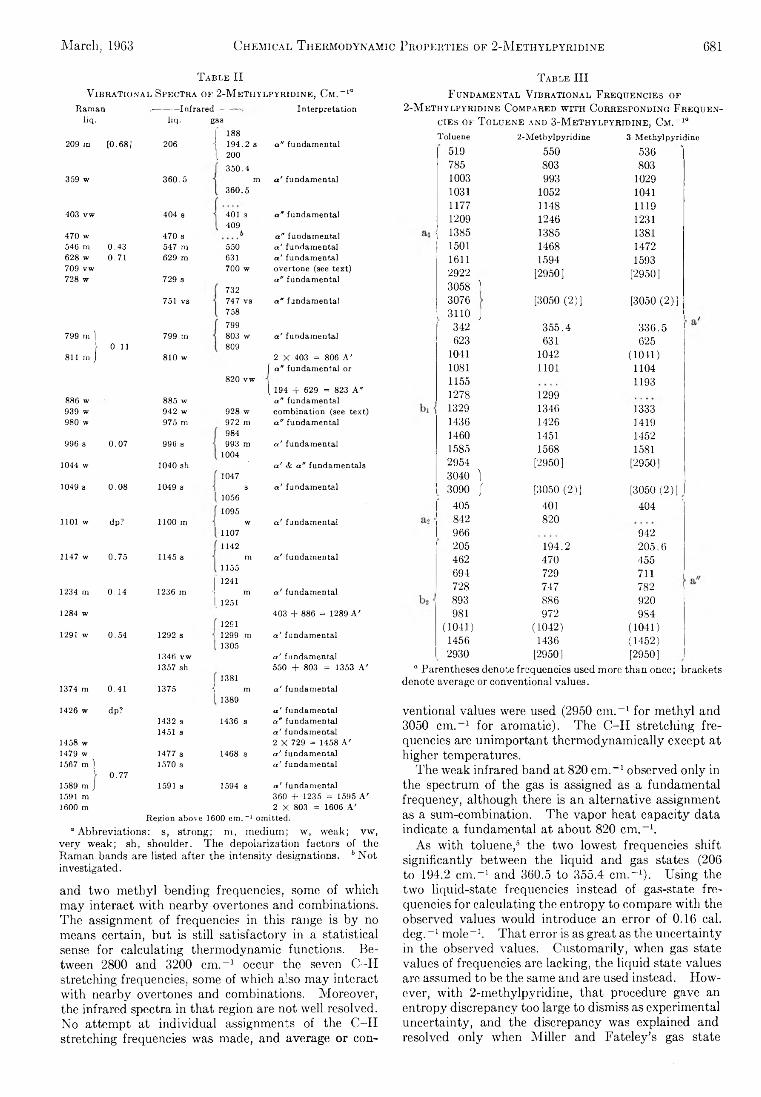
March, 1963 Chemical Thermodynamic Properties of 2-Methylpyridine 681
Table IIV ib r a t io n a l Sp e c t r a o f 2 -M e t h y l p y r id in e , Cm.- 1“
Raman ------ 1 nf rared Interpretationliq. liq. gas
188209 m [0.681 206 194.2 s
. 200 350.4
a " fundamental
359 w 360.5 m a ' fundamental360.5
403 vw 404 s 401 s 409
a n fundamental
470 w 470 s b a " fundamental546 m 0.43 547 m 550 a ' fundamental628 w 0.71 ,629 m 631 a.' fundamental709 vw 700 w overtone (see text)728 w 729 s
732a " fundamental
751 vs 747 vs758799
a * fundamental
799 m 1\ 0.11
799 m 803 w 809
a ' fundamental
811 in J 810 w 2 X 403 = 806 A ' j a " fundamental or
820 vw1 194 + 629 = 823 A"
886 w 885 w a n fundamental939 w 942 w 928 w combination (see text)980 w 975 m 972 m
984a " fundamental
996 s 0.07 996 s 993 m 1004
a ' fundamental
1044 w 1040 sh1047
a ' & a " fundamentals
1049 s 0.08 1049 s s a ' fundamental10561095
1101 w dp? 1100 m w a ' fundamental11071142
1147 w 0.75 1145 s m « ' fundamental11551241
1234 in 0.14 1236 in m a ' fundamental1251
1284 w1291
403 + 886 = 1289 A '
1291 w 0.54 1292 s 1299 m 1305
a.' fundamental
1346 vw a ' fundamental1357 sh
1381550 + 803 = 1353 A '
1374 m 0.41 1375 ( m a ' fundamental1389
1426 w dp?1432 s 1436 s
a ' fundamental a " fundamental
1451 s a ' fundamental1458 w 2 X 729 = 1458 A '1479 w 1477 s 1468 s a ' fundamental1567 m )
1589 m j"0.77
1570 s « ' fundamental
1591 s 1594 s a ' fundamental1591 m 360 -f 1235 = 1595 A '1600 m 2 X 803 = 1606 A '
Region above 1600 cm.“1 omitted.“ Abbreviations: s, strong; m, medium; w, weak; vw,
very weak; sh, shoulder. The depolarization factors of the Raman bands are listed after the intensity designations. 6 Not investigated.
and two methyl bending frequencies, some of which may interact with nearby overtones and combinations. The assignment of frequencies in this range is by no means certain, but is still satisfactory in a statistical sense for calculating thermodynamic functions. Between 2800 and 3200 cm.-1 occur the seven C-H stretching frequencies, some of which also may interact with nearby overtones and combinations. Moreover, the infrared spectra in that region are not well resolved. No attempt at individual assignments of the C-H stretching frequencies was made, and average or con-
T a b l e IIIF u n d a m e n t a l V ib r a t io n a l F r e q u e n c ie s o f
2 -M e t h y l p y r id in e C o m pa red w it h C o r r e spo n d in g F r e q u e n cie s o f T o l u e n e an d 3 -M e t h y l p y r id in e , Cm.- 1“Toluene 2-Methylpyridine 3-Methylpyridine
519 550 536785 803 8031003 993 10291031 1052 10411177 1148 11191209 1246 12311385 1385 13811501 1468 14721611 1594 15932922 [2950] [2950]3058 Ì3076 [3050 (2 )] [3050 (2 )]3110 J
342 3 5 5 .4 3 3 6 .5623 631 625
1041 1042 (1041)1081 1101 11041155 11931278 12991329 1346 13331436 1426 14191460 1451 14521585 1568 15812954 [2950] [2950]3040 )3090 J' [3050 (2 )] [3050 (2 )]
405 401 404842 820966 942205 19 4 .2 2 0 5 .6462 470 455694 729 711728 747 782893 886 920981 972 9S4
(1041) (1042) (1041)1456 1436 (1452)2930 [2950] [2950]
“ Parentheses denote frequencies used more than once; brackets denote average or conventional values.
ventional values were used (2950 cm.-1 for methyl and 3050 cm.-1 for aromatic). The C-H stretching frequencies are unimportant thermodynamically except at higher temperatures.
The weak infrared band at 820 cm.-1 observed only in the spectrum of the gas is assigned as a fundamental frequency, although there is an alternative assignment as a sum-combination. The vapor heat capacity data indicate a fundamental at about 820 cm.-1.
As with toluene,6 the two lowest frequencies shift significantly between the liquid and gas states (206 to 194.2 cm.-1 and 360.5 to 355.4 cm.-1). Using the two liquid-state frequencies instead of gas-state frequencies for calculating the entropy to compare with the observed values would introduce an error of 0.16 cal. deg.-1 mole-1. That error is as great as the uncertainty in the observed values. Customarily, when gas state values of frequencies are lacking, the liquid state values are assumed to be the same and are used instead. However, with 2-methylpyridine, that procedure gave an entropy discrepancy too large to dismiss as experimental uncertainty, and the discrepancy was explained and resolved only when Miller and Fateley’s gas state
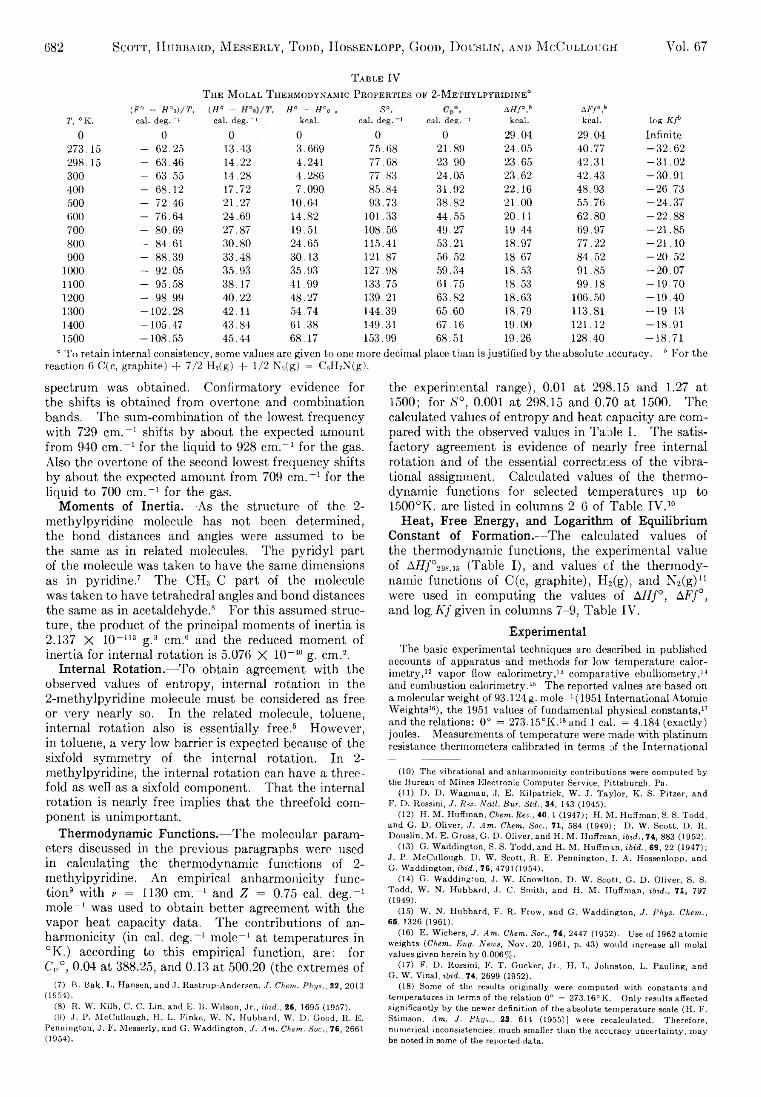
682 Scott, Hubbard, M esserly, T odd, Hossenlopp, Good, D ouslin, and M cCullough Vol. 67
T a b l e IVT h e M o la l T h er m o d yn a m ic P r o p e r t ie s of 2 -M e t h y l p y r id in e '*
(F° - H°o)/T, (»• - H° - H°o , S ° , A Hf°,b A Ff°,blog Kf1T, °K. cal. deg. ~l cal. deg.“ 1 kcal. cal. deg. 1 cal. deg. ~1 kcal. kcal.
0 0 0 0 0 0 2 9 .0 4 2 9 .0 4 Infinite2 7 3 .15 - 6 2 .2 5 13 .43 3 .6 6 9 7 5 .6 8 2 1 .89 2 4 .0 5 4 0 .7 7 - 3 2 . 6 22 9 8 .15 - 6 3 .4 6 14 .22 4 .2 41 7 7 .6 8 2 3 .9 0 2 3 .65 4 2 .3 1 - 3 1 . 0 2300 - 6 3 .5 5 14 .28 4 .2 8 6 7 7 .8 3 2 4 .05 2 3 .6 2 4 2 .4 3 - 3 0 . 9 1400 - 6 8 .1 2 17 .72 7 .0 9 0 8 5 .8 4 3 1 .9 2 2 2 .1 6 4 8 .9 3 - 2 6 . 7 3500 - 7 2 .4 6 2 1 .27 1 0 .64 9 3 .73 3 8 .8 2 2 1 .0 0 5 5 .7 6 - 2 4 . 3 7600 - 7 6 .6 4 2 4 .69 1 4 .82 101.33 4 4 .5 5 20 .11 6 2 .8 0 - 2 2 . 8 8700 - 8 0 .6 9 2 7 .87 19.51 108.56 4 9 .2 7 19 .44 6 9 .97 - 2 1 . 8 5800 - 84 .61 3 0 .8 0 2 4 .6 5 115.41 53 .21 18 .97 7 7 .2 2 - 2 1 . 1 0900 - 8 8 .3 9 3 3 .4 8 3 0 .1 3 121 .87 5 6 .5 2 18 .67 84.52 -2 0 .5 2
1000 - 92.05 35.93 35.93 127.98 59.34 18.53 91.85 -2 0 .0 7110 0 - 95.58 38.17 41.99 133.75 61.75 18.53 99.18 -1 9 .7 0120 0 - 98.99 40.22 48.27 139.21 63.82 18.63 106.50 -1 9 .4 01300 -1 0 2 .2 8 42.11 54.74 144.39 65.60 18.79 113.81 -1 9 .1 31400 -105 .47 43.84 61.38 149.31 67.16 19.00 1 2 1 . 1 2 -1 8 .9 11500 -1 0 8 .5 5 45.44 68.17 153.99 68.51 19.26 128.40 -1 8 .7 1
“ To retain internal consistency, some values are given to one more decimal place than is justified by the absolute accuracy. b For the reaction 6 C(c, graphite) + 7/2 H2(g) + 1/2 N2(g) = C6H7N(g).
spectrum was obtained. Confirmatory evidence for the shifts is obtained from overtone and combination bands. The sum-combination of the lowest frequency with 729 cm. " 1 shifts by about the expected amount from 940 cm.-1 for the liquid to 928 cm. " 1 for the gas. Also the overtone of the second lowest frequency shifts by about the expected amount from 709! c m . f o r the liquid to 700 cm. " 1 for the gas.
Moments of Inertia.— As the structure of the 2- methylpyridine molecule has not been determined, the bond distances and angles were assumed to be the same as in related molecules. The pyridyl part of the molecule was taken to have the same dimensions as in pyridine.7 The CH3-C part of the molecule was taken to have tetrahedral angles and bond distances the same as in acetaldehyde.8 For this assumed structure, the product of the principal moments of inertia is 2.137 X 10"us g.3 cm.6 and the reduced moment of inertia for internal rotation is 5.076 X 10" 40 g. cm.2.
Internal Rotation.—To obtain agreement with the observed values of entropy, internal rotation in the 2-methylpyridine molecule must be considered as free or very nearly so. In the related molecule, toluene, internal rotation also is essentially free.6 However, in toluene, a very low barrier is expected because of the sixfold symmetry of the internal rotation. In 2- methylpyridine, the internal rotation can have a threefold as well as a sixfold component. That the internal rotation is nearly free implies that the threefold component is unimportant.
Thermodynamic Functions.—The molecular parameters discussed in the previous paragraphs were used in calculating the thermodynamic functions of 2- methylpyridine. An empirical anharmonicity function9 with v = 1130 cm. " 1 and Z = 0.75 cal. deg. " 1 mole" 1 was used to obtain better agreement with the vapor heat capacity data. The contributions of anharmonicity (in cal. deg. " 1 mole-1 at temperatures in °K.) according to this empirical function, are: for CP°, 0.04 at 388.25, and 0.13 at 500.20 (the extremes of
(7) B. Bak, L. Hansen, and J, Rastrup-Andersen, .7. Chem. P h ys., 22, 2013(1954).
(8) R. W. Kilb, C. C. Lin, and E. B. Wilson, Jr., ibid., 26, 1695 (1957).(9) J. P. McCullough, H. L. Finke, W. N. Hubbard, W. D. Good, R. E.
Pennington, J. F. Messerly, and G. Waddington, J. A m . Chem. Soc., 76, 2661 (1954).
the experimental range), 0.01 at 298.15 and 1.27 at 1500; for S°, 0.001 at 298.15 and 0.70 at 1500. The calculated values of entropy and heat capacity are compared with the observed values in Table I. The satisfactory agreement is evidence of nearly free internal rotation and of the essential correctness of the vibrational assignment. Calculated values of the thermodynamic functions for selected temperatures up to 1500°K. are listed in columns 2-6 of Table IV .10 11
Heat, Free Energy, and Logarithm of Equilibrium Constant of Formation.—The calculated values of the thermodynamic functions, the experimental value of A ff/°29s.i6 (Table I), and values of the thermodynamic functions of C(c, graphite), H2(g), and N2(g)n were used in computing the values of AHf°, AFf°, and log K f given in columns 7-9, Table IV.
ExperimentalThe basic experimental techniques are described in published
accounts of apparatus and methods for low temperature calorimetry, 12 vapor flow calorimetry, 13 comparative ebulliometry, 14 15 and combustion calorimetry.16 The reported values are based on a molecular weight of 93.124 g. mole“ 1 (1951 International Atomic Weights16), the 1951 values of fundamental physical constants, 17 and the relations: 0° = 273.15°K.18 and 1 cal. = 4.184 (exactly) joules. Measurements of temperature were made with platinum resistance thermometers calibrated in terms of the International
(10) The vibrational and anharmonicity contributions were computed by the Bureau of Mines Electronic Computer Service, Pittsburgh, Pa.
(11) D. D. Wagman, J. E. Kilpatrick, W. J. Taylor, K. S. Pitzer, andF. D. Rossini, J. R es. N atl. Bur. Std., 34, 143 (1945).
(12) H. M. Huffman, Chem. Rev., 40, 1 (1947); H. M. Huffman, S. S. Todd, and G. D. Oliver, J . A m . Chem. S oc., 71, 584 (1949); D. W. Scott, D. R. Douslin, M. E. Gross, G. D. Oliver, and H. M. Huffman, ibid., 74, 883 (1952).
(13) G. Waddington, S. S. Todd, and H. M. Huffman, ibid., 69, 22 (1947); J. P. McCullough, D. W. Scott, R. E. Pennington, I. A. Hossenlopp, andG. Waddington, ibid., 76, 4791(1954).
(14) G. Waddington, J. W. Knowlton, D. W. Scott, G. D. Oliver, S. S. Todd, W. N. Hubbard, J. C. Smith, and H. M. Huffman, ibid., 71, 797 (1949).
(15) W. N. Hubbard, F. R. Frow, and G. Waddington, J . P h ys. Chem ., 65, 1326 (1961).
(16) E. Wichers, J . Am . Chem. Soc., 74, 2447 (1952). Use of 1962 atomic weights {Chem. Eng. N ews, Nov. 20, 1961, p. 43) would increase all molal values given herein by 0.006%.
(17) F. D. Rossini, F. T. Gucker, Jr., H. L. Johnston, L. Pauling, and G. W. Vinal, ibid., 74, 2699 (1952).
(18) Some of the results originally were computed with constants and temperatures in terms of the relation 0° = 273.16° K. Only results affected significantly by the newer definition of the absolute temperature scale (H. F. Stimson, A m . J. P h ys., 23, 614 (1955)] were recalculated. Therefore, numerical inconsistencies, much smaller than the accuracy uncertainty, may be noted in some of- the reported data.
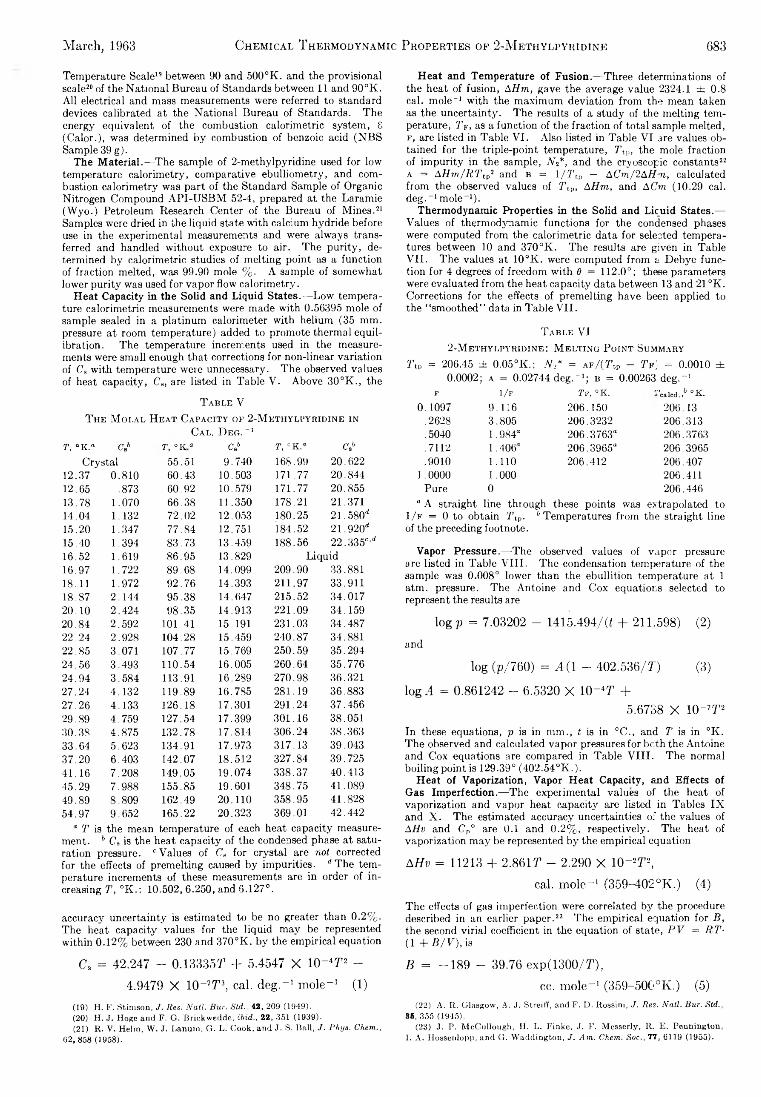
March, 1963 Chemical T hermodynamic Properties of 2-Methylpyridine 683
Temperature Seale19 between 90 and 500°K. and the provisional scale20 of the National Bureau of Standards between 1 1 and 90°K. All eleetrieal and mass measurements were referred to standard devices calibrated at the National Bureau of Standards. The energy equivalent of the combustion calorimetric system, S (Calor.), was determined by combustion of benzoic acid (NBS Sample 39 g).
The Material.—The sample of 2-methylpyridine used for low temperature calorimetry, comparative ebulliometry, and combustion calorimetry was part of the Standard Sample of Organic Nitrogen Compound API-USBM 52-4, prepared at the Laramie (W yo.) Petroleum Research Center of the Bureau of Mines.21 Samples were dried in the liquid state with calcium hydride before use in the experimental measurements and were always transferred and handled without exposure to air. The purity, determined by calorimetric studies of melting point as a function of fraction melted, was 99.90 mole % . A sample of somewhat lower purity was used for vapor flow calorimetry.
Heat Capacity in the Solid and Liquid States.—Low temperature calorimetric measurements were made with 0.56395 mole of sample sealed in a platinum calorimeter with helium (35 mm. pressure at room temperature) added to promote thermal equilibration. The temperature increments used in the measurements were small enough that corrections for non-linear variation of Cs with temperature were unnecessary. The observed values of heat capacity, Cs, are listed in Table V. Above 30°K ., the
T a b l e VT h e M o l a l H e a t C a p a c it y op 2 -M e t h y l p y b id in e in
C a l . D e g . -1T, °K.a Csb T °K ® Cs6 T, CK.“ c.h
Crystal 55.51 9.740 168.99 20.62212.37 0.810 60.43 10.503 171.77 20.84412.65 .873 60.92 10.579 171.77 20.85513.78 1.070 66.38 11.350 178.21 21.37114.04 1.132 72.02 12.053 180.25 21.580'*15.20 1.347 77.84 12.751 184.52 21.920'*15.40 1.394 83.73 13.459 188.56 22.3350'1*16.52 1.619 86.95 13.829 Liquid16.97 1.722 89.68 14.099 209.90 33.88118.11 1.972 92.76 14.393 211.97 33.91118.87 2.144 95.38 14.647 215.52 34.0172 0 .1 0 2.424 98.35 14.913 221.09 34.15920.84 2.592 101.41 15.191 231.03 34.48722.24 2.928 104.28 15.459 240.87 34.88122.85 3.071 107.77 15.769 250.59 35.29424.56 3.493 110.54 16.005 260.64 35.77624.94 3.584 113.91 16.289 270.98 36.32127.24 4.132 119.89 16.785 281.19 36.88327.26 4.133 126.18 17.301 291.24 37.45629.89 4.759 127.54 17.399 301.16 38.05130.38 4.875 132.78 17.814 306.24 38.36333.64 5.623 134.91 17.973 317.13 39.04337.20 6.403 142.07 18.512 327.84 39.72541.16 7.208 149.05 19.074 338.37 40.41345.29 7.988 155.85 19.601 348.75 41.08949.89 8.809 162.49 2 0 .1 1 0 358.95 41.82854.97 9.652 165.22 20.323 369.01 42.442
“ T is the mean temperature of each heat capacity measurement. b Ca is the heat capacity of the condensed phase at saturation pressure. c Values of CB for crystal are not corrected for the effects of premelting caused by impurities. dThe temperature increments of these measurements are in order of increasing T, °K .: 10.502, 6.250, and 6.127°.
accuracy uncertainty is estimated to be no greater than 0 .2 % . The heat capacity values for the liquid may be represented within 0.12% between 230 and 370°K. by the empirical equation
Cs = 42.247 - 0.13335T + 5.4547 X 10- 4T2 - 4.9479 X 10- 7T3, cal. deg.-1 mole-1 (1)
(19) H. F. Stimson, J. Res. Natl. Bur. Std.. 42, 209 (1949).(20) H. J. Hoge and F. G. Brickwcdde, ibid., 22, 351 (1939).(21) R. V. Helm, W. J. Lanum, G. L. Cook, and J. S. Ball, J. Phys. Chem.,
02, 858 (1958).
Heat and Temperature of Fusion.— Three determinations of the heat of fusion, AHm, gave the average value 2324.1 ± 0.8 cal. mole- 1 with the maximum deviation from the mean taken as the uncertainty. The results of a study of the melting temperature, Tf, as a function of the fraction of total sample melted, f, are listed in Table VI. Also listed in Table VI are values obtained for the triple-point temperature, Ttv, the mole fraction of impurity in the sample, V 2*, and the cryoscopic constants22 a = AHm/BTtp2 and b = 1 /7% — ACm/2AHm, calculated from the observed values of 7%, A Hm, and A Cm (10.29 cal. deg . - 1 mole-1).
Thermodynamic Properties in the Solid and Liquid States.—Values of thermodynamic functions for the condensed phases were computed from the calorimetric data for selected temperatures between 10 and 370°K. The results are given in TableVII. The values at 10°K. were computed from a Debye function for 4 degrees of freedom with d = 112.0°; these parameters were evaluated from the heat capacity data between 13 and 21 °K. Corrections for the effects of premelting have been applied to the “ smoothed” data in Table VII.
T a b l e VI2 -M e t h y l p y r id in e : M e l t in g P o in t S um m ary
7’tp = 206.45 ± 0.05°JK.; N , * = a f / (7 % - Tv] = 0.0010 ± 0.0002; a = 0.02744 deg .-1 ; b = 0.00263 deg.-1
F 1 / f Tf, "K. ” calcd./ °K.0 .1 097 9 .1 1 6 2 0 6 .15 0 206 .13
.2628 3 .8 0 5 20 6 .32 32 206 .313
.5040 1 .9 8 4 “ 2 0 6 .3 7 6 3 “ 206.3763
.7112 1 .4 0 6 “ 2 0 6 .3 9 6 5 “ 206 .3965
.9010 1 .1 10 20 6 .4 1 2 20 6 .40 71 .0000 1 .0 00 206.411
Pure 0 206 .446“ A straight line through these points was extrapolated to
1 / f = 0 to obtain 7%. b Temperatures from the straight line of the preceding footnote.
Vapor Pressure.— The observed values of vapor pressure are listed in Table VIII. The condensation temperature of the sample was 0.008° lower than the ebullition temperature at 1 atm. pressure. The Antoine and Cox equations selected to represent the results are
log j) = 7.03202 - 1415.494/(t + 211.598) (2)and
log (p/760) = A(1 - 402.536/T) (3)
log A = 0.861242 - 6.5320 X 10⁻⁴T +5.6738 X 10- , T2
In these equations, p is in mm., t is in °C., and T is in °K. The observed and calculated vapor pressures for both the Antoine and Cox equations are compared in Table VIII. The normal boiling point is 129.39° (402.54°K.).
Heat of Vaporization, Vapor Heat Capacity, and Effects of Gas Imperfection.— The experimental values of the heat of vaporization and vapor heat capacity are listed in Tables IN and X . The estimated accuracy uncertainties of the values of AHv and Cp° are 0.1 and 0.2% , respectively. The heat of vaporization may be represented by the empirical equation
AHv = 11213 + 2 .86 ir - 2.290 X 10- 2T2,cal. mole-1 (359-402°K.) (4)
The effects of gas imperfection were correlated by the procedure described in an earlier paper. 23 The empirical equation for B, the second virial coefficient in the equation of state, P V = RT- (1 + B / V ),is
B = -1 8 9 - 39.76 exp(1300/T),cc. mole-1 (359-50C,oK.) (5)
(22) A. R. Glasgow, A. J. Streiff, and F. D. Rossini, J. Res. Natl. Bur. Std., 35, 355 (1945).
(23) J. P. McCullough, H. L. Finke, J. F. Messerly, R. E. Pennington, I. A. Hossenlopp, and G. Waddington, J. Am. Chem. Soc., 77, 6119 (1955).
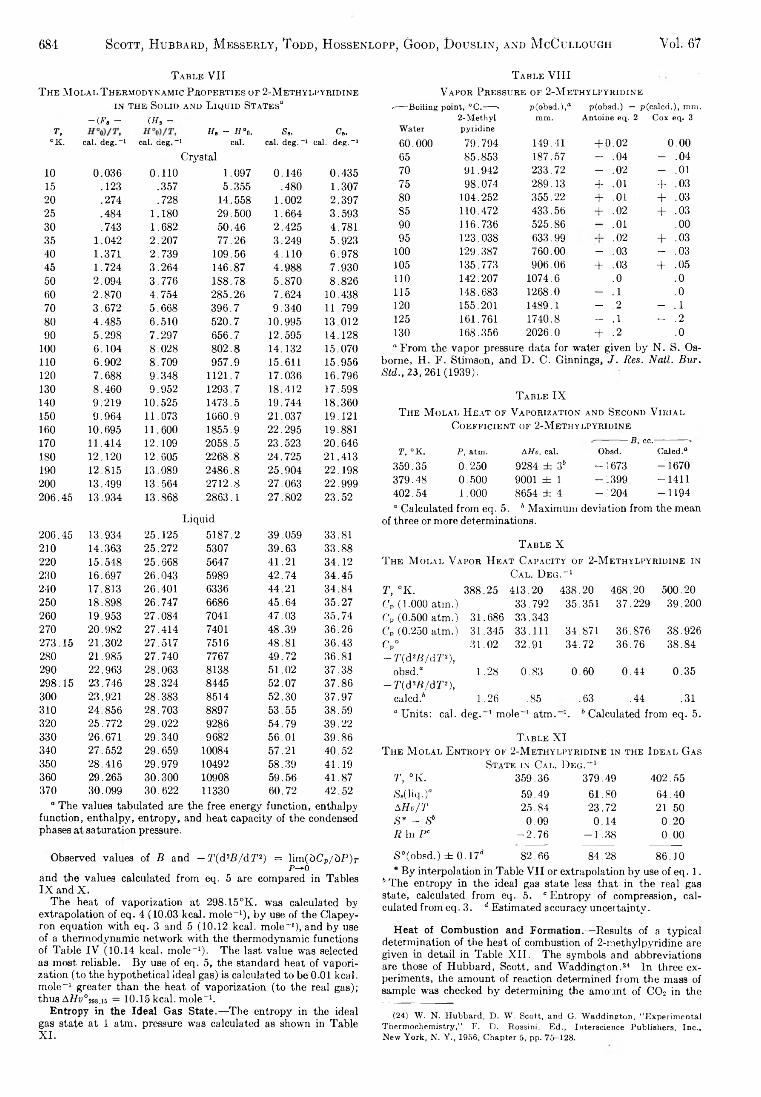
684 Scott, Hubbard, M esserly, T odd, H ossënlopp, Good, D oüslin, and M cCullough Vol. 67
T a b l e VIIT h e M o l a l T h e r m o d y n a m ic P r o p e r t ie s o f 2 -M e t h y l p y r id in e
in t h e S olid a n d L iq u id St a t e s “
T,-OF. - (.H, -
H, - H ° o, Ss, C„°K. cal. deg.-1 cal. deg.-1: cal. cal. deg.-1 cal. deg.“1
10 0 .03 6 0 .11 0
Crystal1 .097 0 .146 0 .43 5
15 .123 .357 5 .355 .480 1 .30720 .274 .728 14.558 1 .002 2 .39 725 .484 1 .180 29.500 1 .664 3 .59330 .743 1 .682 50 .4 6 2 .425 4 .78135 1 .042 2 .20 7 77 .2 6 3 .24 9 5 .92340 1 .371 2 .73 9 109.56 4 .11 0 6 .97 845 1 .724 3 .2 6 4 146.87 4 .98 8 7 .93 050 2 .09 4 3 .77 6 1S8.78 5 .87 0 8 .82 660 2 .87 0 4 .754 285 .26 7 .62 4 10.43870 3 .67 2 5 .668 3 9 6 .7 9 .34 0 11.79980 4 .485 6 .510 5 20 .7 10.995 13.01290 5 .298 7 .29 7 656 .7 12.595 14.128
100 6 .104 8 .02 8 8 0 2 .8 14.132 15.070110 6 .902 8 .70 9 9 57 .9 15.611 15.956120 7 .688 9 .34 8 1121.7 17.036 16.796130 8 .4 6 0 9 .952 1293.7 18.412 17.598140 9 .21 9 10.525 1473.5 19.744 18.360150 9 .9 6 4 11.073 1660.9 21 .037 19.121160 10.695 11.600 1855.9 22 .295 19.881170 11.414 12.109 2058 .5 23.523 20 .646ISO 12.120 12.605 2268 .8 24 .725 21.413190 12.815 13.089 2486 .8 25 .904 22.198200 13.499 13.564 2712 .8 27 .063 22.999206 .45 13.934 13.868 2863.1 27 .802 2 3 .5 2
206.45 13.934 25.125
Liquid5187.2 39 .059 33.81
210 14.363 25.272 5307 39 .6 3 33 .8 8220 15.548 25.668 5647 41 .21 34 .1 2230 16.697 26.043 5989 4 2 .7 4 34 .4 5240 17.813 26.401 6336 44 .21 3 4 .8 4250 18.898 26.747 6686 4 5 .6 4 3 5 .2 7260 19.953 27 .084 7041 47 .03 3 5 .7 4270 20.982 27.414 7401 48 .3 9 36 .2 6273 .15 21.302 27.517 7516 48 .81 36 .43280 21.985 27.740 7767 4 9 .7 2 36 .81290 22.963 28.063 8138 51 .02 3 7 .3 8298 .15 23.746 28 .324 8445 52 .0 7 3 7 .8 6300 23.921 28.383 8514 52 .3 0 3 7 .9 7310 24.856 28.703 8897 5 3 .5 5 38 .59320 25.772 29.022 9286 54 .79 39 .2 2330 26.671 29.340 9682 56.01 3 9 .8 6340 27.552 29.659 10084 57.21 40 .5 2350 28.416 29.979 10492 58 .39 41 .19360 29 :265 30.300 10908 59 .5 6 41 .8 7370 30.099 30.622 11330 60 .72 4 2 .52
° The values tabulated are the free energy function, enthalpyfunction, enthalpy, entropy, and heat capacity of the condensedphases at saturation pressure,
Observed values of B and — r (d 2jB /d r2) = lim(3C’y/5 P )rP—0
and the values calculated from eq. 5 are compared in Tables IX and X .
The heat of vaporization at 298.15°K. was calculated by extrapolation of eq. 4 (10.03 kcal. mole-1), by use of the Clapey- ron equation with eq. 3 and 5 (10.12 kcal. mole-1), and by use of a thermodynamic network with the thermodynamic functions of Table IV (10.14 kcal. mole-1). The last value was selected as most reliable. By use of eq. 5, the standard heat of vaporization (to the hypothetical ideal gas) is calculated to be 0 .0 1 kcal. mole- 1 greater than the heat of vaporization (to the real gas); thus AHv°m.u = 10.15 kcal. mole-1.Entropy in the Ideal Gas State.—The entropy in the ideal gas state at 1 atm. pressure was calculated as shown in Table XI.
T a b l e VIIIV a po r P r e ssu r e o f 2 -M e t h y l p y r id in e
.--- Boiling point, ”C.--- • p(obsd.),“ p(obsd.) — p(calcd.J, m m .2-Methyl mm. Antoine eq. 2 Cox eq. 3
Water pyridine60.000 79.794 149.41 + 0 .0 2 0 .0 065 85.853 187.57 — .04 - .0470 91.942 233.72 - .0 2 - .0 175 98.074 289.13 + .0 1 + .0380 104.252 355.22 + .0 1 + .0385 110.472 433.56 + .0 2 + .0390 116.736 525.86 .0 1 .0095 123.038 633.99 ■ .0 2 + .03
100 129.387 760.00 - .03 - .03105 135.773 906.06 + .03 + .051 1 0 142.207 1074.6 .0 .0115 148.683 1268.0 - . 1 .012 0 155.201 1489.1 - .2 - . 1125 161.761 1740.8 - . 1 — .2130 168.356 2026.0 + .2 .0
“ From the vapor pressure data for water given by N. S. Os-borne, H. F. Stimson, and D . C. Ginnings, J . Res,. Natl. Bur.S i d . , 2 3 , 261 (1939).
T a b l e I XT h e M o l a l H e a t of V a p o r iza t io n an d Secon d V ir ia l
C o e f f ic ie n t o f 2 -M e t h y l p y r id in e
B , cc.-T, °K. P , atm. AH v, cal. Obsd. Caled.“
359.35 0 .25 0 9284 ± 36 -1 6 7 3 -1 6 7 0379.48 0 .500 9001 ± 1 -1 3 9 9 -1 4 1 1402 .54 1 .000 8654 ± 4 - 1 2 0 4 - 1 1 9 4“ Calculated from eq. 5. 6 Maximum deviation from the mean
of three or more determinations.
T a b l e XT h e M o l a l V a p o r H e a t C a p a c it y o f 2 -M e t h y l p y r id in e i n
C a l . D e g . -1T, °K. 388.25 413.20 438.20 468.20 500.20(7P (1.000 atm.) Cp (0.500 atm.) 31.686
33.79233.343
35.351 37.229 39.200
Cp (0.250 atm.) 31.345 33.111 34.S71 36.876 38.926Cp°-n & B / d T * ),
31.02 32.91 34.72 36.76 38.84
obsd.“— T(d*B/dT'!),
1.28 0.83 0.60 0.44 0.35
caled.6 1.26 .85 .63 .44 .31“ Units: cal. deg. 1 mole 1 atm. 1. 6 Calculated from eq. 5.
T a b l e X IT h e M o l a l E n t r o p y o f 2 -M ethylpy ' r id in e in th e I d e a l G as
Sta t e in C a l . D e g . -1T, °K. 359.36 379.49 402.55Ss(liq.)“ 59.49 61.80 64.40Atfy/2’ 25.84 23.72 21.50S* - S” 0.09 0.14 0 .2 0R In Pc -2 .7 6 - 1 .38 0 .0 0
S°(obsd.) ± 0 .17d 82.66 84.28 8 6 .1 0
“ By interpolation in Table VII or extrapolation by use of eq . 1. '’ The entropy in the ideal gas state less that in the real gas state, calculated from eq. 5. “ Entropy of compression, calculated from eq. 3. d Estimated accuracy unceitainty.
Heat of Combustion and Formation.— Results of a typical determination of the heat of combustion of 2 -methylpyridine are given in detail in Table X II. The symbols and abbreviations are those of Hubbard, Scott, and Waddington. 24 In three experiments, the amount of reaction determined from the mass of sample was checked by determining the amount of C 0 2 in the
(24) W. N. Hubbard, D. W. Scott, and G. Waddington, “Experimental Thermochemistry,” F. D. Rossini, Ed., Interscience Publishers, Inc., New York, N. Y., 1958, Chapter 5, pp. 75-128.
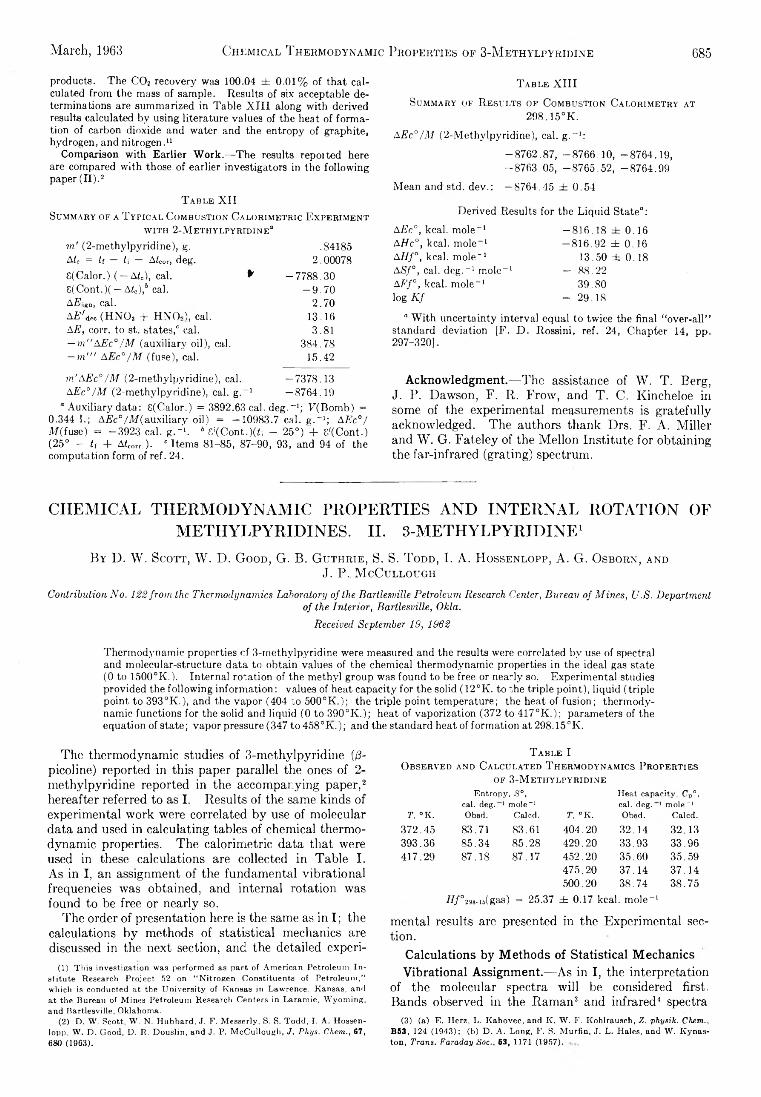
March, 1963 Chemical Thermodynamic Properties op 3-Methylpyridine 685
products. The C 02 recovery was 100.04 ± 0.01% of that calculated from the mass of sample. Results of six acceptable determinations are summarized in Table X III along with derived results calculated by using literature values of the heat of formation of carbon dioxide and water and the entropy of graphite, hydrogen, and nitrogen.11
Comparison with Earlier Work.—The results repotted here are compared with those of earlier investigators in the following paper (II).2
T able X IISu m m ary of a T y p ic a l C o m bu stio n C a l o r im e t r ic E x p e r im e n t
w it h 2 -M e t h y l p y r id in e “m ' (2-methylpyridine), g. .84185Atc = if - it - Afcor, deg. 2.00078S(Calor.) ( —Aio), cal. ► -7788.30S(Cont.)( — Aio),6 cal. —9.70AEign, cal. 2.70AE'dec (HNOo + HNOo), cal. 13.16AE , eorr. to st. states,“ cal. 3.81— m " A E c ° / M (auxiliary oil), cal. 384.78— to'" A E c ° / M (fuse), cal. 15.42m ' A E c ° / M (2-methylpyridine), cal. —7378.13A E c ° / M (2-methylpyridine), cal. g.-1 —8764.19
“ Auxiliary data: 6(Calor.) = 3892.63 eal. deg.-1; F(Bomb) = 0.344 1.; A E c ° / M (auxiliary oil) = —10983.7 cal. g .-1; AE c ° / M ( fuse) = -3923 cal. g .-1. 6 6‘(Cont.)(ii - 25°) + S'(Cont.) (25° — it + A t corr, ) . 'I tem s 81-85, 87-90, 93, and 94 of the computation form of ref. 24.
T a b l e X IIISu m m a r y o f R e su l ts o f C o m bu stio n C a l o r im e t r y a t
298.15°K.A E c ° / M (2-Methylpyridine), cal. g .-1:
-8762.87, -8766.10, -8764.19, -8763.05, -8765.52, -8764.99
Mean and std. dev.: —8764.45 ± 0 .5 4Derived Results for the Liquid State“:
A E c ° , kcal, mole-1 AH c ° , kcal, mole-1 AH f ° , kcal, mole-1 AiS/°, cal. deg.-1 mole-1 AF f ° , kcal, mole-1 log K J
- 8 1 6 .1 8 ± 0 .1 6 - 8 1 6 .9 2 ± 0 .1 6
1 3 .5 0 ± 0 .1 8 - 88.22
. 3 9 .8 0 - 2 9 .1 8
“ With uncertainty interval equal to twice the final “over-all” standard deviation [F. D. Rossini, ref. 24, Chapter 14, pp. 297-320].
Acknowledgment.—The assistance of W. T. Berg,J. P. Dawson, F. R. Frow, and T. C. Kincheloe in some of the experimental measurements is gratefully acknowledged. The authors thank Drs. F. A. Miller and W. G. Fat.eley of the Mellon Institute for obtaining the far-infrared (grating) spectrum.
CHEMICAL THERMODYNAMIC PROPERTIES AND INTERNAL ROTATION OF METHYLPYRIDINES. II. 3-METHYLPYRIDINE1
B y D. W. Scott, W. D. G ood, G . B . G u th r ie , S. S. T odd , I. A. H ossenlopp, A. G . O sbo rn , andJ. P. M cC ullough
C o n t r i b u t i o n N o . 1 2 2 f r o m t h e T h e r m o d y n a m i c s L a b o r a t o r y o f t h e B a r t l e s v i l l e P e t r o l e u m R e s e a r c h C e n t e r , B u r e a u o f M i n e s , U . S . D e p a r t m e n t
o f t h e I n t e r i o r , B a r t l e s v i l l e , O k la .
R e c e i v e d S e p t e m b e r 1 9 , 1 9 6 2
Thermodynamic properties of 3-inethylpyridine were measured and the results were correlated by use of spectral and molecular-structure data to obtain values of the chemical thermodynamic properties in the ideal gas state (0 to 1500°K.). Internal rotation of the methyl group was found to be free or nearly so. Experimental studies provided the following information: values of heat capacity for the solid (12°K. to the triple point), liquid (triple point to 393°K.), and the vapor (404 to 500°K.); the triple point temperature; the heat of fusion; thermodynamic functions for the solid and liquid (0 to 390°K.); heat of vaporization (372 to 417°K.); parameters of the equation of state; vapor pressure (347 to458°Iv.); and the standard heat of formation at 298.15°K.
The thermodynamic studies of 3-methylpyridine (/?- picol ine) reported in this paper parallel the ones of 2- methylpyridine reported in the accompanying paper,2 hereafter referred to as I. Results of the same kinds of experimental work were correlated by use of molecular data and used in calculating tables of chemical thermodynamic properties. The calorimetric data that were used in these calculations are collected in Table I. As in I, an assignment of the fundamental vibrational frequencies was obtained, and internal rotation was found to be free or nearly so.
The order of presentation here is the same as in I; the calculations by methods of statistical mechanics are discussed in the next section, and the detailed experi-
(1) This investigation was performed as part of American Petroleum Institute Research Project 52 on “ Nitrogen Constituents of Petroleum,” which is conducted at the University of Kansas in Lawrence, Kansas, and at the Bureau of Mines Petroleum Research Centers in Laramie, Wyoming, and Bartlesville, Oklahoma.
(2) D. W. Scott, W. N. Hubbard, J. F. Messerly, S. S. Todd, I. A. Hossenlopp, W. D. Good, D. R. Douslin, and J. P. McCullough, J. Phys. Chem., 67, 680 (1963).
T a b l e IO b se r v e d and C a lc u l a t e d T h e r m o d y n a m ic s P r o p e r t ie s
of 3 -M e t h y l p y r id in e
Entropy, S°, Heat capacity, Cp°,cal. deg. 1; mole-1 cal. deg. 11 mole-1
T, °K. Obsd. Caled. r, ° k . Obsd. Caled.3 7 2 .4 5 8 3 .71 83 .61 4 0 4 .2 0 3 2 .1 4 3 2 .1 33 9 3 .3 6 8 5 .3 4 8 5 .2 8 4 2 9 .2 0 3 3 .9 3 3 3 .9 64 1 7 .29 8 7 .1 8 8 7 .1 7 4 5 2 .2 0 3 5 .6 0 3 5 .5 9
4 7 5 .2 0 3 7 .1 4 3 7 .1 45 0 0 .2 0 3 8 .7 4 3 8 .7 5
H f ° 298-i6(gas) = 25.37 ± 0.17 keal. mole-1mental results are presented in the Experimental section.
Calculations by Methods of Statistical Mechanics Vibrational Assignment.— As in I, the interpretation
of the molecular spectra will be considered first. Bands observed in the Raman3 and infrared4 spectra
(3) (a) E. Herz, L. Kahovec, and K. W. F. Kohlrauseh, Z. physik. Chem., B53, 124 (1943); (b) D. A. Long, F, S. Murfin, J. L. Hales, and W. KynaS’* ton, Trans. Faraday Soc., 63, 1171 (1957).
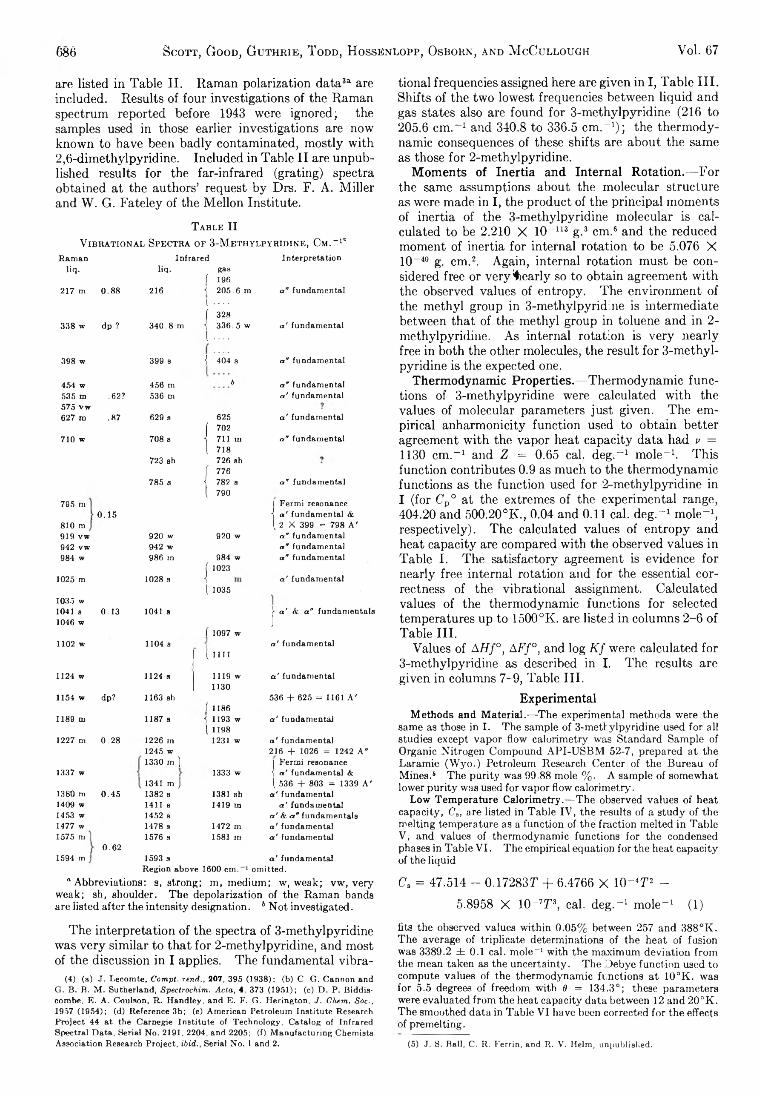
686 Scott, Good, Guthrie, T odd, HossEnlopp, Osborn, and M cCullough Vol. 67
are listed in Table II. Raman polarization data3a are included. Results of four investigations of the Raman spectrum reported before 1943 were ignored; the samples used in those earlier investigations are now known to have been badly contaminated, mostly with2,6-dimethylpyridine. Included in Table II are unpublished results for the far-infrared (grating) spectra obtained at the authors’ request by Drs. F. A. Miller and W. G. Fateley of the Mellon Institute.
T a b l e IIV ib r a t io n a l Sp e c t r a of 3 -M e t h y l p y r id in e , C m . -1“
Raman Infrared Interpretationliq. liq. gas
Í 196217 m 0.88 216 < 205.6 m a" fundamental
l • • • •f 328
338 w dp ? 340.8 m \ 336.5 w ( . . . .
a' fundamental
398 w 399 s. . . .
•{ 404 s a" fundamental
454 w 456 m 6 a" fundamental535 m .62? 536 m a' fundamental575 vw627 m .87 629 s 625 a' fundamental
( 702710 w 708 s \ 711 m
1 718a" fundamental
723 sh 726 sh Í 776
785 s \ 782 s { 790
a" fundamental
795 m0.15
j Fermi resonance j af fundamental &
810 m [ 2 X 399 = 798 A'919 vw 920 w 920 w a" fundamental942 vw 942 w an fundamental984 w 986 m 984 w
Í 1023a" fundamental
1025 m 1028 s \ a’ fundamental( 1035
1035 w 1041 s 1046 w
0.13 1041 s
Í 1097 w
j a' & a" fundamentals
1102 w 1104 s[ l l l l
a' fundamental
1124 w 1124 s 1119 w 1130
a' fundamental
1154 w dp? 1163 shÍ 1186
536 + 625 = 1161 A'
1189 m 1187 s i 1193 w 1 1198
a.’ fundamental
1227 m 0.28 1226 m 1231 w a.' fundamental1245 w 216 + 1026 = 1242 A "1330 m ) j Fermi resonance
1337 w1341 m J 1333 w a' fundamental &
l 536 + 803 = 1339 A'1380 m 0.45 1382 s 1381 sh a ' fundamental1409 w 1411 8 1419 m a' fundamental1453 w 1452 s a' & <x” fundamentals1477 w 1478 s 1472 m a' fundamental1575 m
0.621576 s 1581 m a' fundamental
1594 m 1593 s a' fundamentalRegion above 1600 cm. 1 omitted.
“ Abbreviations: s, strong; m, medium; w, weak; vw, very weak; sh, shoulder. The depolarization of the Raman bands are listed after the intensity designation. 6 Not investigated.
tional frequencies assigned here are given in I, Table III. Shifts of the two lowest frequencies between liquid and gas states also are found for 3-methylpyridine (216 to 205.6 cm.“ 1 and 340.8 to 336.5 cm.-1); the thermodynamic consequences of these shifts are about the same as those for 2-methylpyridine.
Moments of Inertia and Internal Rotation.—For the same assumptions about the molecular structure as were made in I, the product of the principal moments of inertia of the 3-methylpyridine molecular is calculated to be 2.210 X 10-113 g.3 cm.6 and the reduced moment of inertia for internal rotation to be 5.076 X 10-40 g. cm.2. Again, internal rotation must be considered free or very Nearly so to obtain agreement with the observed values of entropy. The environment of the methyl group in 3-methylpyridine is intermediate between that of the methyl group in toluene and in 2- methylpyridine. As internal rotation is very nearly free in both the other molecules, the result for 3-methylpyridine is the expected one.
Thermodynamic Properties.—Thermodynamic functions of 3-methylpyridine were calculated with the values of molecular parameters just given. The empirical anharmonicity function used to obtain better agreement with the vapor heat capacity data had v = 1130 cm.-1 and Z = 0.65 cal. deg.-1 mole-1. This function contributes 0.9 as much to the thermodynamic functions as the function used for 2-methylpyridine in I (for Cp° at the extremes of the experimental range, 404.20 and 500.20°K., 0.04 and 0.11 cal. deg.-1 mole-1, respectively). The calculated values of entropy and heat capacity are compared with the observed values in Table I. The satisfactory agreement is evidence for nearly free internal rotation and for the essential correctness of the vibrational assignment. Calculated values of the thermodynamic functions for selected temperatures up to 1500°K. are listed in columns 2-6 of Table III.
Values of AH f°, AFf°, and log K f were calculated for3-methylpyridine as described in I. The results are given in columns 7-9, Table III.
ExperimentalMethods and Material.—The experimental methods were the
same as those in I. The sample of 3-methylpyridine used for all studies except vapor flow calorimetry was Standard Sample of Organic Nitrogen Compound API-USBM 52-7, prepared at the Laramie (Wyo.) Petroleum Research Center of the Bureau of Mines.6 The purity was 99.88 mole %. A sample of somewhat lower purity was used for vapor flow calorimetry.
Low Temperature Calorimetry.—The observed values of heat capacity, C s , are listed in Table IV, the results of a study of the melting temperature as a function of the fraction melted in Table V, and values of thermodynamic functions for the condensed phases in Table VI. The empirical equation for the heat capacity of the liquidCs = 47.514 - 0.17283T + 6.4766 X 10- 4T2 -
5.8958 X 10- 7T3, cal. deg.-1 mole-1 (1)
The interpretation of the spectra of 3-methylpyridine was very similar to that for 2-methylpyridine, and most of the discussion in I applies. The fundamental vibra-
(4) (a) J. Lecomte, Compt. rend., 207, 395 (1938); (b) C. G. Cannon and G. B. B. M. Sutherland, Spectrochim. Acta, 4, 373 (1951); (c) D. P. Biddis- combe, E. A. Coulson, R. Handley, and E. F. G. Herington, J. Chem. Soc., 1957 (1954); (d) Reference 3b; (e) American Petroleum Institute Research Project 44 at the Carnegie Institute of Technology, Catalog of Infrared Spectral Data, Serial No. 2191, 2204, and 2205; (f) Manufacturing Chemists Association Research Project, ibid., Serial No. 1 and 2,
fits the observed values within 0.05% between 257 and 388°K. The average of triplicate determinations of the heat of fusion was 3389.2 ± 0.1 cal. mole-1 with the maximum deviation from the mean taken as the uncertainty. The Debye function used to compute values of the thermodynamic functions a t 10°K. was for 5.5 degrees of freedom with 6 = 134.3°; these parameters were evaluated from the heat capacity data between 12 and 20°K. The smoothed data in Table VI have been corrected for the effects of premelting.
(5) J. S. Ball, C. R. Ferrin, and R. V. Helm, unpublished.
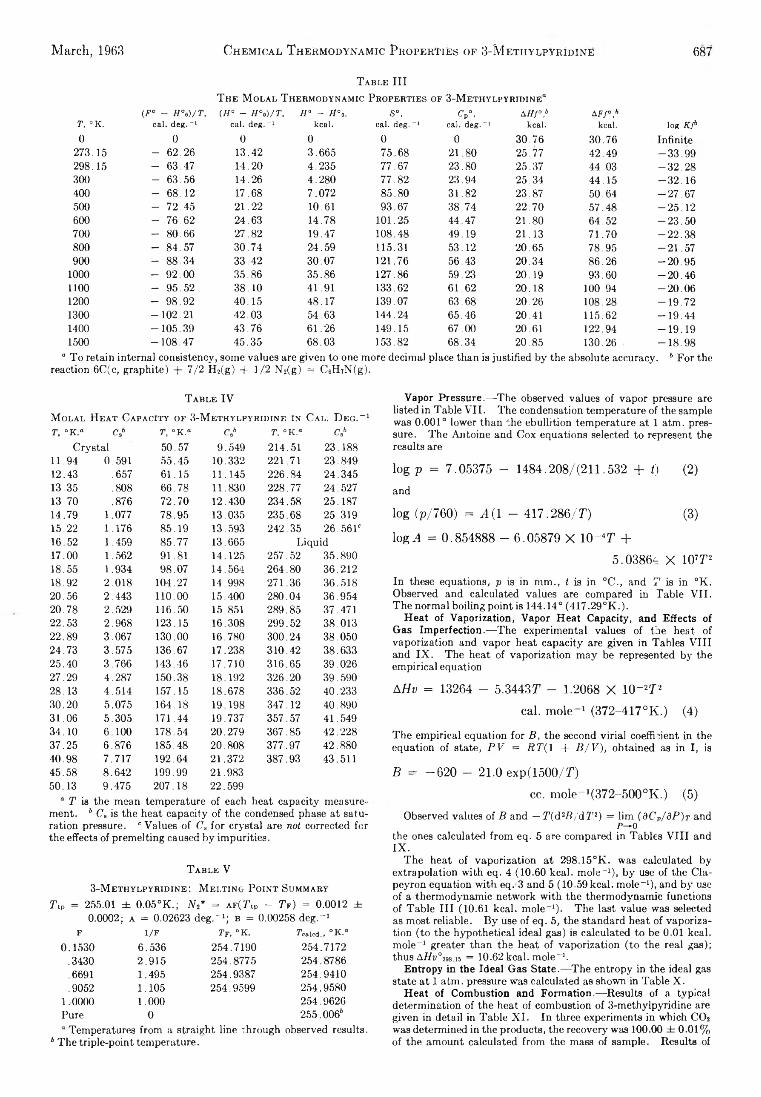
T a b l e IIIT h e M o la l T h e r m o d y n a m ic P r o p e r t ie s of 3 -M e t h y l p y r id in e “
March, 1963 Chemical T hermodynamic Properties of 3-MethylpyrIdIne 687
(F° - H°t)/T, (#° - H°a)/T, H° - H°o, s°, <V, AHP,b A F f ° ,bT, "K. cal. deg.-1 cal. deg.-1 kcal. cal. deg. -1 cal. deg.-1 kcal. kcal. log K fi
0 0 0 0 0 0 30.76 30.76 Infinite273.15 - 62.26 13.42 3.665 75.68 21.80 25.77 42.49 -33 .99298.15 - 63.47 14.20 4.235 77.67 23.80 25.37 44.03 -32 .28300 - 63.56 14.26 4.280 77.82 23.94 25.34 44.15 -32 .16400 - 68.12 17.68 7.072 85.80 31.82 23.87 50.64 -27 .67500 - 72.45 21.22 10.61 93.67 38.74 22.70 57.48 -25 .12600 - 76.62 24.63 14.78 101.25 44.47 21.80 64.52 -2 3 .5 0700 - 80.66 27.82 19.47 108.48 49.19 21.13 71.70 -22 .38800 - 84.57 30.74 24.59 115.31 53.12 20.65 78.95 -21.57900 - 88.34 33.42 30.07 121.76 56.43 20.34 86.26 -20 .95
1000 - 92.00 35.86 35.86 127.86 59.23 20.19 93.60 -20 .461100 - 95.52 38.10 41.91 133.62 61.62 20.18 100.94 -20 .061200 - 98.92 40.15 48.17 139.07 63.68 20.26 108.28 -19 .721300 -102 .21 42.03 54.63 144.24 65.46 20.41 115.62 -19 .441400 -105.39 43.76 61.26 149.15 67.00 20.61 122.94 -19 .191500 -108.47 45.35 68.03 153.82 68.34 20.85 130.26 -18 .98
“ To retain internal consistency, some values are given to one more decimal place than is justified by the absolute accuracy. b For the reaction 6C(c, graphite) + 7/2 H2(g) + 1/2 N2(g) = C6H7N(g).
T a b le IVM o la l H e a t C a p a c it y of 3 -M e t h y l p y r id in e in C a l . D e g . -1T , °K.fl c ab T , °K.“ C ,b T, °K.a C „b
Crystal 50.57 9.549 214.51 23.18811.94 0.591 55.45 10.332 221.71 23.84912.43 .657 61.15 11.145 226.84 24.34513.35 .808 66.78 11.830 228.77 24.52713 70 .876 72.70 12.430 234.58 25.18714.79 1.077 78.95 13.035 235.68 25.31915.22 1.176 85.19 13.593 242.35 26.561°16.52 1.459 85.77 13.665 Liquid17.00 1.562 91.81 14.125 257.52 35.89018.55 1.934 98.07 14.564 264.80 36.21218.92 2.018 104.27 14.998 271.36 36.51820.56 2.443 110.00 15.400 280.04 36.95420.78 2.529 116.50 15.851 289.85 37.47122.53 2.968 123.15 16.308 299.52 38.01322.89 3.067 130.00 16.780 300.24 38.05024.73 3.575 136.67 17.238 310.42 38.63325.40 3.766 143.46 17.710 316.65 39.02627.29 4.287 150.38 18.192 326.20 39.59028.13 4.514 157.15 18.678 336.52 40.23330.20 5.075 164.18 19.198 347.12 40.89031.06 5.305 171.44 19.737 357.57 41.54934.10 6.100 178.54 20.279 367.85 42.22837.25 6.876 185.48 20.808 377.97 42.88040.98 7.717 192.64 21.372 387.93 43.51145.58 8.642 199.99 21.98350.13 9.475 207.18 22.599
° T is the mean temperature of each heat capacity measure-ment. b C s is the heat capacity of the condensed phase at saturation pressure. c Values of C 3 for crystal are n o t corrected for the effects of premelting caused by impurities.
T a b le V3 -M e t h y l p y r id in e : M e l t in g P o in t S um m ary
T t P = 255.01 ± 0.05°K.; N \ * = a f( T tP - T y ) = 0.0012 ± 0.0002; a = 0.02623 deg.“ 1; b = 0.00258 deg.“1
F l/F T y . °K. Yea led., °K .°0 .1 5 3 0 6 .5 3 6 25 4 .71 90 254 .7172
.3430 2 .9 1 5 25 4 .87 75 25 4 .87 86.6691 1 .4 95 25 4 .93 87 25 4 .94 10.9052 1 .1 05 25 4 .95 99 25 4 .95 80
1 .0000 1 .0 00 25 4 .96 26Pure 0 2 5 5 .0066° Temperatures from a straight line through observed results.
4 The triple-point temperature.
Vapor Pressure.—The observed values of vapor pressure are listed in Table VII. The condensation temperature of the sample was 0.001° lower than the ebullition temperature at 1 atm. pressure. The Antoine and Cox equations selected to represent the results arelog p = 7.05375 - 1484.208/(211.532 + t) (2)
andlog (p/760) = A(1 - 417.286/71) (3)
log-4 = 0.854888 - 6.05879 X 10~4T +5.03864: X 107T2
In these equations, p is in mm., I is in °C., and T is in °K. Observed and calculated values are compared in Table VII. The normal boiling point is 144.14° (417.29°K.).
Heat of Vaporization, Vapor Heat Capacity, and Effects of Gas Imperfection.-—The experimental values of the heat of vaporization and vapor heat capacity are given in Tables VIII and IX. The heat of vaporization may be represented by the empirical equationAHv = 13264 - 5.3443T - 1.2068 X 10- 2T2
cal. mole- 1 (372-417°K.) (4)
The empirical equation for B , the second virial coefficient in the equation of state, P V = R T ( 1 + B / V ) , obtained as in I, isB = -6 2 0 - 21.0 exp (1500/T)
cc. mole - 1 (372-500°K .) (5)Observed values of B and — T ( d 2B / d 7 12) = lim (d C p/ d P ) T andp—othe ones calculated from eq. 5 are compared in Tables VIII and
IX.The heat of vaporization a t 298.15°K. was calculated by
extrapolation with eq. 4 (10.60 kcal. mole-1), by use of the Cla- peyron equation with eq. 3 and 5 (10.59 kcal. mole-1)» and by use of a thermodynamic network with the thermodynamic functions of Table III (10.61 kcal. mole-1). The last value was selected as most reliable. By use of eq. 5, the standard heat of vaporization (to the hypothetical ideal gas) is calculated to be 0.01 kcal. mole-1 greater than the heat of vaporization (to the real gas); thus Aifa°298.i5 = 10.62 kcal. mole-1.
Entropy in the Ideal Gas State.—The entropy in the ideal gas state a t 1 atm. pressure was calculated as shown in Table X.
Heat of Combustion and Formation.—Results of a typical determination of the heat of combustion of 3-methylpyridine are given in detail in Table XI. In three experiments in which C02 was determined in the products, the recovery was 100.00 ± 0.01% of the amount calculated from the mass of sample. Results of
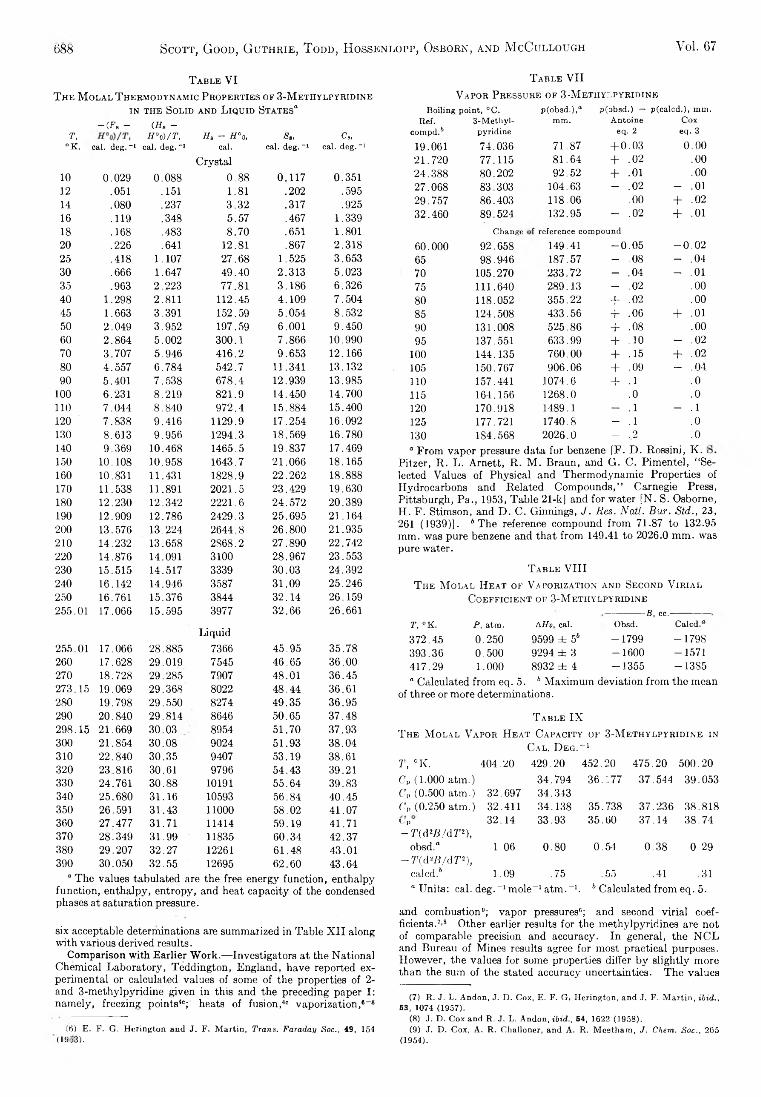
Scott, Good, Guthrie, T odd, Hossenlopp, Osborn, and M cCullough Yol. 67688
T a b l e V IT h e M o l a l T h e r m o d yn a m ic P r o p e r t ie s o f 3 -M e t h y l p y r id in e
i n th e Solid a n d L iq u id St a t e s '*— ( E s — ( ffs -
T, H°o)/T, Hs - H°0, s „ C»,°K. cal. deg.-1 cal. deg.-1 cal.
Crystalcal. deg. -1 cal. deg.-1
10 0.029 0.088 0 .8 8 0.117 0.3511 2 .051 .151 1.81 .2 0 2 .59514 .080 .237 3.32 .317 .92516 .119 .348 5.57 .467 1.33918 .168 .483 8.70 .651 1.80120 .226 .641 12.81 .867 2.31825 .418 1.107 27.68 1.525 3.65330 .666 1.647 49.40 2.313 5.02335 .963 2.223 77.81 3.186 6.32640 1.298 2.811 112.45 4.109 7.50445 1.663 3.391 152.59 5.054 8.53250 2.049 3.952 197.59 6 .0 0 1 9.45060 2.864 5.002 300.1 7.866 10.99070 3.707 5.946 416.2 9.653 12.16680 4.557 6.784 542.7 11.341 13.13290 5.401 7.538 678.4 12.939 13.985
100 6.231 8.219 821.9 14.450 14.700n o 7.044 8.840 972.4 15.884 15.40012 0 7.838 9.416 1129.9 17.254 16.092130 8.613 9.956 1294.3 18.569 16.780140 9.369 10.468 1465.5 19.837 17.469150 10.108 10.958 1643.7 21.066 18.165160 10.831 11.431 1828.9 22.262 18.888170 11.538 11.891 2021.5 23.429 19.630180 12.230 12.342 2 2 2 1 .6 24.572 20.389190 12.909 12.786 2429.3 25.695 21.164200 13.576 13.224 2644.8 26.800 21.9352 10 14.232 13.658 2868.2 27.890 22.742220 14.876 14.091 3100 28.967 23.553230 15.515 14.517 3339 30.03 24.392240 16.142 14.946 3587 31.09 25.246250 16.761 15.376 3844 32.14 26.159255.01 17.066 15.595 3977
Liquid
32.66 26.661
255.01 17.066 28.885 7366 45.95 35.78260 17.628 29.019 7545 46.65 36.00270 18.728 29.285 7907 48.01 36.45273.15 19.069 29.368 8022 48.44 36.61280 19.798 29.550 8274 49.35 36.95290 20.840 29.814 8646 50.65 37.48298.15 21.669 30.03 8954 51.70 37.93300 21.854 30.08 9024 51.93 38.04310 22.840 30.35 9407 53.19 38.61320 23,816 30.61 9796 54.43 39.21330 24.761 30.88 10191 55.64 39.83340 25.680 31.16 10593 56.84 40.45350 26.591 31.43 110 0 0 58.02 41.07360 27.477 31.71 11414 59.19 41.71370 28.349 31.99 11835 60.34 42.37380 29.207 32.27 12261 61.48 43.01390 30.050 32.55 12695 62.60 43.64
“ The values tabulated are the free energy function, enthalpy function, enthalpy, entropy, and heat capacity of the condensed phases at saturation pressure.
six acceptable determinations are summarized in Table X II along with various derived results.
Comparison with Earlier Work.— Investigators at the National Chemical Laboratory, Teddington, England, have reported experimental or calculated values of some of the properties of 2 - and 3-meihylpyridine given in this and the preceding paper I; namely, freezing points40; heats of fusion,40 vaporization,6-8
(6) E. F. G. Herington and J. F. Martin, Trans. Faraday Soc., 49, 154(19o3).
T a b l e V II
V a p o r P r e ssu r e o f 3 -M e t h y l p y r id in e
Boiling point, °C. p(obsd.),° p(obsd.) — pfcaled.), mm.Ref. 3-Methyl mm. Antoine Cox
compd.6 pyridine eq. 2 eq. 319.061 74.036 71.87 + 0 .03 0 .00
21.720 77.115 81.64 + .0 2 .00
24.388 80.202 92.52 + .0 1 .00
27.068 83.303 104.63 - .0 2 - .0 1
29.757 86.403 118.06 .00 + .0 2
32.460 89.524 132.95 - .0 2 + .0 1
Change < reference compound60.000 92.658 149.41 - 0 .05 - 0 .0 2
65 98.946 187.57 - .08 - .0470 105.270 233.72 - .04 - .0 1
75 111.640 289.13 - .0 2 .00
80 118.052 355.22 + .0 2 .0 0
85 124.508 433.56 + .06 + .0 1
90 131.008 525.86 + .08 .00
95 137.551 633.99 + . 1 0 - .0 2
100 144.135 760.00 + .15 + .0 2
105 150.767 906.06 + .09 - .041 1 0 157.441 1074.6 + . 1 .0115 164.156 1268.0 .0 .0
12 0 170.918 1489.1 - . 1 - .1125 177.721 1740.8 - . 1 .0
130 1S4.568 2026.0 - .2 .0
“ From vapor pressure data for benzene [F. D. Rossini, K . !Pitzer, R . L. Arnett, R . M . Braun, and G. C. Pimentel, “ Selected Values of Physical and Thermodynamic Properties of Hydrocarbons and Related Compounds,” Carnegie Press, Pittsburgh, Pa., 1953, Table 21-k] and for water [N. S. Osborne, H. P. Stimson, and D . C. Ginnings, J. Res. Natl. Bur. Std., 23, 261 (1939)]. 6 The reference compound from 71.87 to 132.95 mm. was pure benzene and that from 149.41 to 2026.0 mm. was pure water.
T a b l e V III
T he M o l a l H e a t o f V a p o r iza t io n a n d Secon d V i r i a l
C o e f f ic ie n t o f 3 -M e t h y l p y r id in e
b , cc.T, °K. P, atm. AHv, cal. Obsd. Caled.»372.45 0.250 9599 ± 56 —1799 -179S393.36 0.500 9294 ± 3 —1600 -1571417.29 1 .0 0 0 8932 ± 4 -13 55 -13 85“ Calculated from eq. 5. 6 Maximum deviation from the mean
of three or more determinations.
T a b l e IXT h e M o l a l V a p o r H e a t C a p a c it y of 3 -M e t h y l p y r id in e i n
Ca l . D eg . - i
T, °K. 404.20 429.20 452.20 475.20 500.20Cp ( 1.000 atm.) 34.794 36.177 37.544 39.053Cp (0.500 atm.) 32.697 34,343Cp (0.250 atm.) 32.411 34.138 35.738 37.236 38.818Up- T(A2B/dT2),
32.14 33.93 35.60 37.14 38.74
obsd.“— T(d'iB/dT2},
1.06 0.80 0.54 0.38 0.29
caled.6 1.09 .75 .55 .41 .31° Units: cal. deg. - 1 mole- 1 atm.-1. 6 Calculated from eq. 5.
and combustion9; vapor pressures6; and second virial coefficients.7 7 8 9’3 Other earlier results for the methylpyridines are not of comparable precision and accuracy. In general, the NCL and Bureau of Mines results agree for most practical purposes. However, the values for some properties differ by slightly more than the sum of the stated accuracy uncertainties. The values
(7) R. J. L. Andón, J. D. Cox, E. F. Gi Herington, and J. F. Martin, ibid., 53, 1074 (1957).
(8) J. D. Cox and R. J. L. Andón, ibid., 54, 1622 (1958).(9) J. D. Cox, A. R. Challoner, and A. R. Meetham, J. Chem. Soc., 265
(1954).
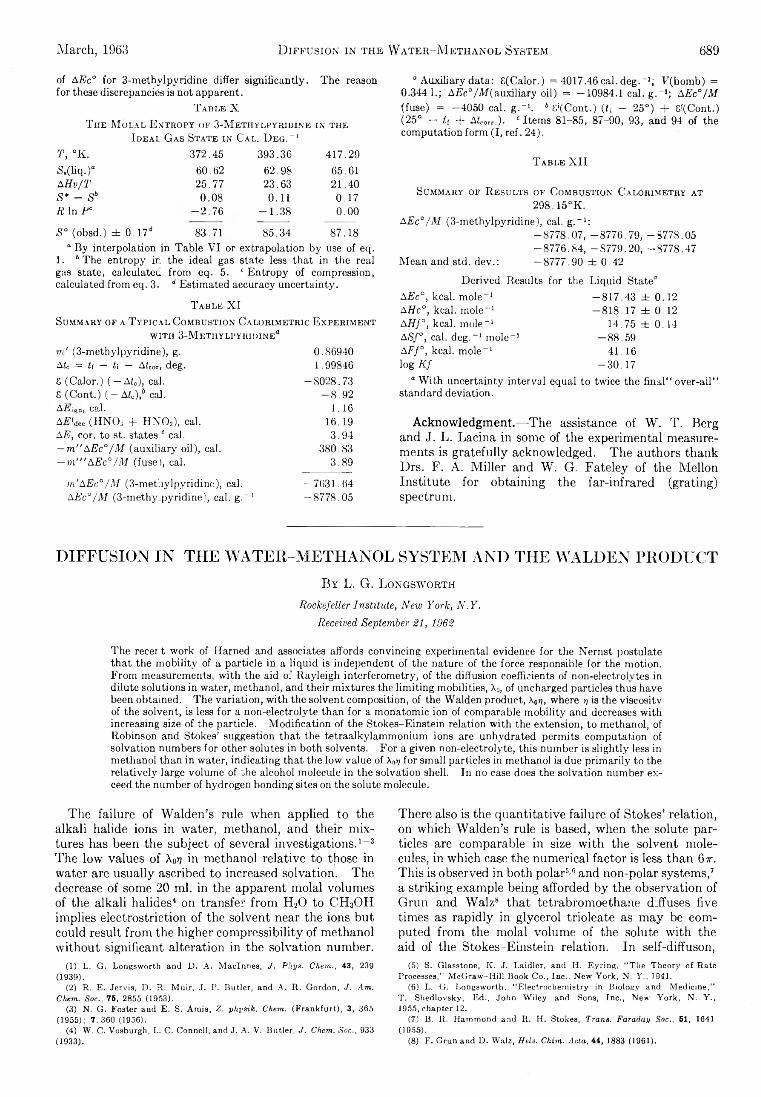
March, 1963 D iffusion in the Water-M ethanol System 689
of AEc° for 3-methylpyridine differ significantly. The reason for these discrepancies is not apparent.
Table XThe Molal Entropy of 3-Methylpyridi.ne in the
Ideal Gas State in Cal. Deg.*1T, °K. 372.45 393.36 417.29&(liq.)° 60.62 62.98 65.61A Hv/T 25.77 23.63 21.40S* - Sb 0.08 0.11 0.17R In P° -2 .76 -1 .3 8 0.00
S° (obsd.) ± 0.17* 83.71 85.34 87.18“ By interpolation in Table VI or extrapolation by use of eq.
1. 6 The entropy ir. the ideal gas state less that in the real gas state, calculated from eq. 5. c Entropy of compression, calculated from eq. 3. d Estimated accuracy uncertainty.
Table X I
Summary of a Typical Combustion Calorimetric Experiment WITH 3-METHYLPYRII)INEa
m' (3-methylpyridine), g. 0.86940AZc = tt — h — Afcor, deg. 1.99840S (Calor.) ( — Ai0), cal. -8028.73S (Cont.) ( — Aio),6 cal. -8.92A.2iTgnj C8/1. 1.16Ai?fdec (HNOs + HNO2), cal. 16.19AE, cor. to st. states,” cal. 3.94—m" AEc°/M (auxiliary' oil), cal. 380.83— m"'AEc°/M (fuse), cal. 3.89
m'AEc°/M (3-methylpyridine), cal. -7631.64AEc°/M (3-methylpyridine), cal. g.-1 -8778.05
“ Auxiliary data: S(Calor.) = 4017.46 cal. deg.-1; F(bomb) = 0.3441.; Al?c°/M(auxiliary oil) = —10984.1 cal. g.-1; AEc°/M (fuse) = -4050 cal. g.-1. 5 S'fCont.) {U - 25°) + S[(Cont.) (25° — U + Afcorr.)* 'Items 81-85, 87-90, 93, and 94 of the computation form (I, ref. 24).
Table XII
Summary of Results of Combustion Calorimetry at 298.15°K.
AEc°/M (3-methylpyridine), cal. g.- 1 :-8778.07, -8776.79, -8778.05 -8776.84, -S779.20, -8778.47
Mean and std. dev.: — 8777.90 ± 0.42Derived Results for the Liquid State"
AEc°, kcal, mole-1 AHc°, kcal, mole-1 AHf°, kcal, mole-1 A>S/°, cal. deg.-1 mole-1 AFf°, kcal, mole-1 log Kf
-817.43 ± 0.12 -818.17 ± 0.12
14.75 ± 0.14 -88.59
41.16 -30.17
“ With uncertainty interval equal to twice the final“ over-all” standard deviation.
Acknowledgment.—The assistance of W. T. Berg and J. L. Lacina in some of the experimental measurements is gratefully acknowledged. The authors thank Drs. F. A. Miller and W. G. Fateley of the Mellon Institute for obtaining the far-infrared (grating) spectrum.
DIFFUSION IN THE WATER-METHANOL SYSTEM AND THE WALDEN PRODUCTB y L. G. L ongsw orth
Rockefeller Institute, New York, N.Y.Received September 21, 1962
The recent work of Harned and associates affords convincing experimental evidence for the Nernst postulate that the mobility of a particle in a liquid is independent of the nature of the force responsible for the motion.From measurements, with the aid o: Rayleigh interferometry, of the diffusion coefficients of non-electrolvtes in dilute solutions in water, methanol, and their mixtures the limiting mobilities, X0, of uncharged particles thus have been obtained. The variation, with the solvent composition, of the Walden product, 'kw, where r¡ is the viscosity of the solvent, is less for a non-electrolyte than for a monatomic ion of comparable mobility and decreases with increasing size of the particle. Modification of the Stokes-Einstein relation with the extension, to methanol, of Robinson and Stokes’ suggestion that the tetraalkylammonium ions are unhydrated permits computation of solvation numbers for other solutes in both solvents. For a given non-electrolyte, this number is slightly less in methanol than in water, indicating that the low value of X0>; for small particles in methanol is due primarily to the relatively large volume of die alcohol molecule in the solvation shell. In no case does the solvation number exceed the number of hydrogen bonding sites on the solute molecule.
The failure of Walden’s rule when applied to the alkali halide ions in water, methanol, and their mixtures has been the subject of several investigations.1-3 The low values of \ov in methanol relative to those in water are usually ascribed to increased solvation. The decrease of some 20 ml. in the apparent molal volumes of the alkali halides4 on transfer from H20 to CH3OH implies électrostriction of the solvent near the ions but could result from the higher compressibility of methanol without significant alteration in the solvation number.
(1) L. G. Longsworth and D. A. Maclnnes, J. P h ys. Chem., 43, 239 (1939).
(2) R. E. Jervis, D. R. Muir, J. P. Butler, and A. R. Gordon, J. Am . Chem. Soc., 75, 2855 (1953).
(3) N. G. Foster and E. S. Amis, Z. physik. Chem. (Frankfurt), 3, 365(1955); 7.360 (1956).
(4) W. C. Vosburgh, L. C. Connell, and J. A. V. Butler, J. Chem. Soc., 933 (1933).
There also is the quantitative failure of Stokes’ relation, on which Walden’s rule is based, when the solute particles are comparable in size with the solvent molecules, in which case the numerical factor is less than 6ir. This is observed in both polar5’6 and non-polar systems,7 a striking example being afforded by the observation of Grun and Walz8 that tetrabromoethane diffuses five times as rapidly in glycerol trioleate as may be computed from the molal volume of the solute with the aid of the Stokes-Einstein relation. In self-diffuson,
(5) S. Glasstone, K. J. Laidler, and H. Eyring, “The Theory of Rate Processes,” McGraw-Hill Book Co., Inc.. New York, N. Y., 1941.
(6) L. G. Longsworth, “Electrochemistry in Biology and Medicine,” T. Shedlovsky, Ed., John Wiley and Sons, Inc., New' York, N. Y., 1955, chapter 12.
(7) B. R. Hammond and R. H. Stokes, Trans. Faraday Soc., 51, 1641 (1955).
(8) F. Grun and D. Walz, Helv. Chim. Acta, 44, 1883 (1961).
690 L. G. Longsworth Vol. 67
the particles are similar in size and Ottar9 used, in effect, a factor of 2.97t in his computation of the viscosities of several pure liquids from their self-diffusion coefficients and molal volumes. Assuming the tetra- alkylammonium ions to be unhydrated and of known size, Robinson and Stokes10 have suggested that these be used to evaluate the numerical factor in Stokes relation, and Nightingale11 adopted this procedure in a review of ion hydration.
Although primary solvation probably results from ion-dipole interaction, hydrogen bonding doubtless contributes to secondary solvation. It appeared of interest, therefore, to compare the mobilities of ions in the water-methanol system with this property of nonelectrolytes, where the solute-solvent friction is restricted to that resulting from dipole-dipole interaction in the form of hydrogen bonding. Diffusion measurements of non-electrolytes afford much the same information concerning solute mobility as do conductance and transference measurements on electrolytes. Moreover, the simple dependence of the diffusion coefficient of a non-electrolyte on concentration facilitates extrapolation to infinite dilution.
ExperimentalThe experimental procedure for the diffusion measurements was
the same as in the work with heavy water12 except tha t evaporation from the reservoirs during the diffusion period was minimized by displacing most of the air therein with loosely fitting tubes whose lower ends were closed. Densities were also measured as in that work. The methanol was the middle fraction of a synthetic material and was used without further treatment since its density at 25°, the temperature a t which all measurements were made, was that of the anhydrous alcohol, 0.78655. Although the solvent mixtures were prepared by direct weighing of both components into glass-stoppered flasks, the subsequent de-aeration in an oven at 45°, and occasional brief exposures to the atmosphere made it preferable to determine the composition of a solvent from a density measurement at the time the solutions were prepared. The density-composition data of Gibson13 were used for this purpose. With only a few exceptions, the solvent composition differed insignificantly from the round values given in Table II and where necessary the diffusion coefficients have been corrected to the tabulated mole fraction of methanol. Solute concentrations, m , are expressed as moles of solute per thousand grams of solvent.
The solutes were of reagent grade and, in the case of the solids, were used without further purification except for vacuum desiccation . The formamide and glycerin were distilled under reduced pressure and the fractions having densities of 1.12929 and 1.25787, respectively, were used. The ethylene glycol had a density of 1.10982, whereas that of the polyethylene glycol of average molecular weight 600 (PEG 600) was 1.12212. The polyethylene glycol of average weight 3350 (PEG 3350) was a solid. In all cases where comparison with diffusion data of modern precision is possible, i . e . , aqueous urea,14 formamide,15 acetamide,16 glycolamide,17 dextrose,18 and sucrose,19 the present results agree within 0.1% or better.
If the solutes were sufficiently soluble, diffusion measurements were made over three or more concentration intervals to permit linear extrapolation. A concentration difference was used that gave approximately 50 fringes in a 2.5 cm. channel. A solution
(9) B. Ottar, “ Self-diffusion and Fluidity in Liquids,” Oslo University Press, 1958; cf., Acta Chem. Scand., 9, 344 (1955).
(10) R. A. Robinson and R. H. Stokes, “ Electrolytic Solutions,” 2nd Edition, Butterworths Scientific Publications, London, 1959, p. 125.
(11) E. R. Nightingale, J. Phys. Chem., 63, 1381 (1959).(12) L. G. Longsworth, ibid., 64, 1914 (1960).(13) R. E. Gibson, J. Am. Chem. Soc., 57, 1551 (1935).(14) L. J*. Gosting and D. F. Akeley, ibid., 74, 2058 (1952).(15) J. G. Albright and L. J. Gosting, J. Phys. Chem., 64, 1537 (1960).(16) A. Biancheria and G. Kegeles, J. Am. Chem. Soc., 79, 5908 (1957).(17) P. J. Dunlop and L. J. Gosting, ibid., 75, 5073 (1953).(18) L. G. Longsworth, ibid., 75, 5705 (1953).(19) L. J. Gosting and M. S. Morris, ibid., 71, 1998 (1949).
of about the same concentration as that below the boundary in one experiment was the dilute solution above the boundary in the experiment at the next higher mean concentration. The small departures from ideal diffusion in the mixed solvents were not significantly different from those in the pure ones and no attempt has been made to correct for possible flow coupling in the three- component systems. Unless limited by the solubility, e.g., erythrbol and dextrose, the apparent molal volumes, <#>, were determined at a molality of 0.5.
ResultsThe experimental results in water and methanol are
summarized in Table I, whereas those in the mixed solvents are given in Table II, together with the pertinent values from Table I for completeness. In Table I the limiting value of the diffusion coefficient, D, is given together with the slope, A D /Am, of the line through the experimental points. The figure in parentheses to the right of each slope in Table I is 100 times the highest mean molality at which diffusion measurements were made. The slopes for aqueous urea,14 formamide,15 and glycolamide17 are taken from the more complete work of Gosting and associates, whereas the values for H20 in water are those of HDO,12 the isotope effect found by Wang, Robinson, and Edelman20 being neglected. The “ solvation” numbers, n, in the last two columns of Table I are considered in the discussion. There the Stokes radius, rs, which is inversely proportional to the Walden product, frequently will be used for convenience in comparison with other estimates of particle size. The relations10 are
rs = kT/&Trr]D = zF2/QttNt]X(i
where z is the valence of the ion whose limiting equivalent conductance is Ao, F is the Faraday equivalent and the other quantities have their usual significance. For interconversion of a volume and a radius the relation V = 47tÍWv8/3 has been used, V being the molal volume of the pure component.
DiscussionIn Fig. 1 the logarithm of the Stokes radius in
methanol is plotted as ordinate against the same function of this radius in water as abscissa. The values for non-electrolytes were computed from the data of Table I, whereas those for ions were taken from the compilations of Robinson and Stokes10 and Evers and Knox.21 On this plot any solute on the left of the diagonal line through the origin has a larger Stokes radius, i.e., a smaller Walden product, in methanol than in water. It will be noted that the alkali halide ions are farther to the left of this line than the non-electrolytes, only the higher tetraalkylammonium ions having larger Stokes radii in water than in methanol. The electrical screening effect of the large alkyl groups and their inability to form hydrogen bonds justifies the assumption that these ions are unhydrated.
From estimates of the radii, rh, of the tetraalkylammonium ions, and a plot of r¡, against their Stokes radii, rs, in water, Robinson, and Stokes10 have computed hydration numbers, n, for the monatomic cations having comparable ra values with the aid of the relation
n = (V„ - F ) /F 0
Here V\, = 4LwNrhs/S, V is the molar volume of the solute and F0 that of the solvent, 18 cc./mole for water
(20) J. H. Wang, C. V. Robinson, and I. S. Edelman, ibid., 75, 466 (1953).(21) E. C. Evers and A. G. Knox, ibid., 73, 1739 (1951).
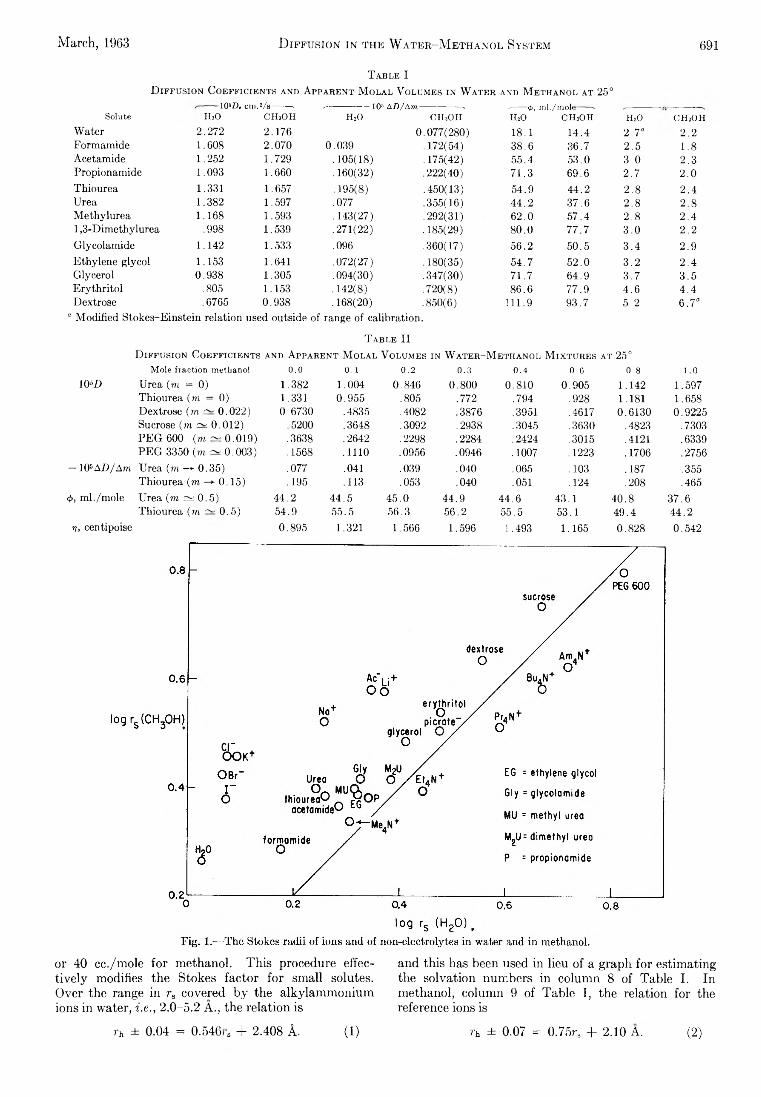
March, 1963 D iffusion in the W ater-M ethanol System 691
T able ID iffusion C oefficients and Apparent M olal V olumes in W ater and M ethanol at 25°
-1052), cm.2/s —' /------------ — 10s AD/Ara-------------- s ----- 0, ml./mol<Solute m o CHsOH H20 CEUOH H2O CHsOH H20 CH3OH
Water 2.272 2.176 0.077(280) 18.1 14.4 2.7° 2 .2Formamide 1.608 2.070 0.039 .172(54) 38.6 36.7 2.5 1 .8Acetamide 1.252 1.729 .105(18) .175(42) 55.4 53.0 3.0 2.3Propionamide 1.093 1.660 .160(32) .222(40) 71.3 69.6 2.7 2 .0
Thiourea 1.331 1.657 .195(8) .450(13) 54.9 44.2 2 .8 2.4Urea 1.382 1.597 .077 .355(16) 44.2 37.6 2 .8 2 .8Methylurea 1.168 1.593 .143(27) .292(31) 62.0 57.4 2 .8 2.41,3-Dimethylurea .998 1.539 .271(22) .185(29) 80.0 77.7 3.0 2 .2Glycolamide 1.142 1.533 .096 .360(17) 56.2 50.5 3.4 2.9Ethylene glycol 1.153 1.641 .072(27) .180(35) 54.7 52.0 3.2 2.4Glycerol 0.938 1.305 .094(30) .347(30) 71.7 64.9 3.7 3.5Erythritol .805 1.153 .142(8) .720(8) 86.6 77.9 4.6 4 .4Dextrose .6765 0.938 .168(20) .850(6) 111.9 93.7 5.2 6 .7 “
“ Modified Stokes-Einstein relation used outside of range of calibration.
T able IID iffusion C oefficients and A pparent M olal V olumes in W ater- M ethanol M ixtures
Mole fraction methanol 0.0 0.1 0.2 0.3 0.4 0.6AT 25°
0.8 1.010 5D Urea (m = 0) 1.382 1.004 0.846 0.800 0.810 0.905 1.142 1.597
Thiourea (m — 0) 1.331 0.955 .805 .772 .794 .928 1.181 1.658Dextrose (m ~ 0.022) 0.6730 .4835 .4082 .3876 .3951 .4617 0.6130 0.9225Sucrose (to ~ 0.012) .5200 .3648 .3092 .2938 .3045 .3630 .4823 .7303PEG 600 ( m ~ 0.019) .3638 .2642 .2298 .2284 .2424 .3015 .4121 .6339PEG 3350 (to ~ 0.003) .1568 . 1 1 1 0 .0956 .0946 .1007 . 1223 .1706 .2756
— 105AD/Ato Urea (to —► 0.35) .077 .041 .039 .040 .065 .103 .187 .355Thiourea (to —► 0,15) .195 .113 .053 .040 .051 .124 .208 .465
<j>, ml./mole Urea (to ^ 0.5) 44.2 44.5 45.0 44.9 44.6 43.1 40.8 37.6Thiourea (m ~ 0.5) 54.9 55.5 56.3 56.2 55.5 53.1 49.4 44.2
v, centipoise 0.895 1.321 1.566 1.596 1.493 1.165 0.828 0.542
or 40 cc./mole for methanol. This procedure effectively modifies the Stokes factor for small solutes. Over the range in rs covered by the alkylammonium ions in water, i.e ., 2.0-5.2 A., the relation is
rh ± 0.04 = 0.546/ s - 2.408 L
and this has been used in lieu of a graph for estimating the solvation numbers in column 8 of Table I. In methanol, column 9 of Table I, the relation for the reference ions is
rh ± 0.07 = 0.75r. + 2.10 A.(1) (2)
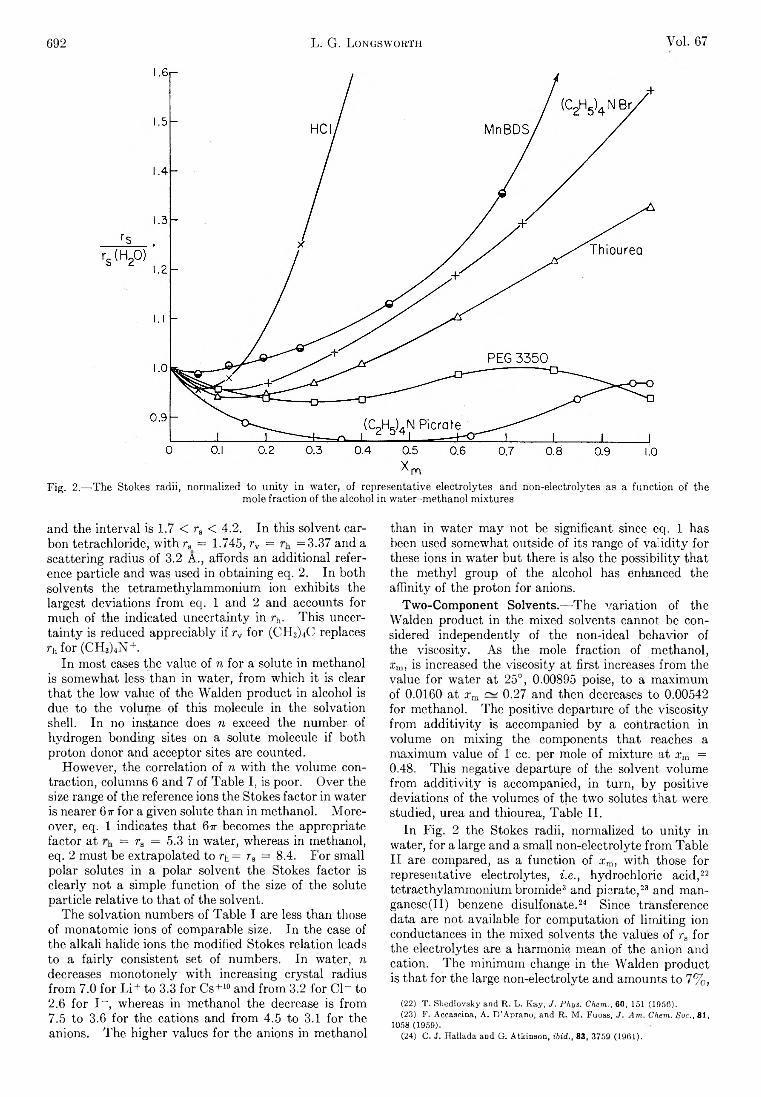
692 L. G. Longsworth Vol. 67
Fig. 2.—The Stokes radii, normalized to unity in water, of representative electrolytes and non-electrolytes as a function of themole fraction of the alcohol in water-methanol mixtures
and the interval is 1.7 < rs < 4.2. In this solvent carbon tetrachloride, withrs = 1.745, rv = =3.37 and ascattering radius of 3.2 A., affords an additional reference particle and was used in obtaining eq. 2. In both solvents the tetramethylammonium ion exhibits the largest deviations from eq. 1 and 2 and accounts for much of the indicated uncertainty in rh. This uncertainty is reduced appreciably if rv for (CH ^C replaces rhfor(CH 3)4N+.
In most cases the value of n for a solute in methanol is somewhat less than in water, from which it is clear that the low value of the Walden product in alcohol is due to the volume of this molecule in the solvation shell. In no instance does n exceed the number of hydrogen bonding sites on a solute molecule if both proton donor and acceptor sites are counted.
However, the correlation of n with the volume contraction, columns 6 and 7 of Table I, is poor. Over the size range of the reference ions the Stokes factor in water is nearer fiv for a given solute than in methanol. Moreover, eq. 1 indicates that 61 becomes the appropriate factor at = rs = 5.3 in water, whereas in methanol, eq. 2 must be extrapolated to rh= rs = 8.4. For small polar solutes in a polar solvent the Stokes factor is clearly not a simple function of the size of the solute particle relative to that of the solvent.
The solvation numbers of Table I are less than those of monatomic ions of comparable size. In the case of the alkali halide ions the modified Stokes relation leads to a fairly consistent set of numbers. In water, n decreases monotonely with increasing crystal radius from 7.0 for Li+ to 3.3 for Cs+10 and from 3.2 for Cl- to 2.6 for I - , whereas in methanol the decrease is from7.5 to 3.6 for the cations and from 4.5 to 3.1 for the anions. The higher values for the anions hi methanol
than in water may not be significant since eq. 1 has been used somewhat outside of its range of validity for these ions in water but there is also the possibility that the methyl group of the alcohol has enhanced the affinity of the proton for anions.
Two-Component Solvents.—The variation of the Walden product in the mixed solvents cannot be considered independently of the non-ideal behavior of the viscosity. As the mole fraction of methanol, xm, is increased the viscosity at first increases from the value for water at 25°, 0.00895 poise, to a maximum of 0.0160 at xm ~ 0.27 and then decreases to 0.00542 for methanol. The positive departure of the viscosity from additivity is accompanied by a contraction in volume on mixing the components that reaches a maximum value of 1 cc. per mole of mixture at xm = 0.48. This negative departure of the solvent volume from additivity is accompanied, in turn, by positive deviations of the volumes of the two solutes that were studied, urea and thiourea, Table II.
In Fig. 2 the Stokes radii, normalized to unity in water, for a large and a small non-electrolyte from Table II are compared, as a function of xm, with those for representative electrolytes, i.e., hydrochloric acid,22 tetraethylammonium bromide3 and picrate,23 and manganese (II) benzene disulfonate.24 Since transference data are not available for computation of limiting ion conductances in the mixed solvents the values of ra for the electrolytes are a harmonic mean of the anion and cation. The minimum change in the Walden product is that for the large non-electrolyte and amounts to 7%,
(22) T. Shedlovsky and R. L. Kay, J . Phys. Chem., 60, 151 (1956).(23) F. Accascina, A. D’Aprano, and R. M. Fuoss, J . Am. Chem. Soc., 81,
1058 (1959).(24) C. J. Hallada and G. Atkinson, ibid., 83, 3759 (1961).
March, 1963 D iffusion in the W ater-M ethanol System 693
whereas the variation in solvent viscosity is nearly 300%.
No exceptions have been noted to the observation, illustrated in Fig. 2, that on the addition of methanol to water the initial effect is a decrease in the Stokes radius. This is in accord with the results of Stokes25 on the limiting mobilities of ions in aqueous solutions whose viscosity has been raised by the addition of non-electrolytes of relatively large molal volume. Invariably, the depression of the ion mobility is less than the increase in the bulk viscosity but exceeds that to be expected if the added molecule is considered as an obstruction that increases the length of the path taken by the solute particle but not the viscosity of the medium in which this particle moves. This model is a stage in the transition from a fluid continuum to a porous medium and thus makes available the literature on tortuosity for the interpretation of experimental results. The model is applicable to ions and nonelectrolytes and provides, as Stokes has noted, an explanation for the modified Walden relation, \0va = constant, where a is less than unity. In the water-methanol system, however, the Stokes radius of small particles also decreases when water is added to methanol. Here the decrease could be attributed to replacement of methanol in the solvation shell by the smaller water molecules.
Fuoss26 has interpreted the variation of the Walden product for an ion in a two-component solvent, only one of which is polar, as a braking effect resulting from the orientation of the solvent dipoles ahead of, and their subsequent relaxation behind, the advancing ion. The effect increases with decreasing dielectric constant. If this braking effect also operates in the case of a moving dipole it would contribute to the observed change in the Stokes radius for the methanol-rich mixtures, since the dielectric constant in this system decreases monotonely with xw. In this system, however, both solvent components are polar and the non-ideality of their mixtures implies that other effects also are operating.
The cathodic transfer of water by hydrochloric acid and the alkali chlorides in the presence of a reference substance implies not only that the cation solvation exceeds that of the anion but that the solvation shell is rich in water. The assumption is tacit here that the anion is not preferentially solvated by the reference material. With the aid of an e.m.f. method, Feakins27 has obtained Washburn numbers for these electrolytes, with methanol at xm = 0.06 as the reference, that are comparable with the values derived from electrophoretic
(25) R. H. Stokes, in “ The Structure of Electrolytic Solutions," W. J. Hamer, Ed., John Wiley and Sons, Inc., New York, N. Y., Chapter 20, pp. 298-307.
(26) R. M. Fuoss, Proc. Nat. Acad. Sci. U.S., 45, 807 (1959).(27) D. Feakins, J. Chem. Soc., 5308 (1961).
methods using other reference materials. As xm -*■ 1 at what solvent composition, then, is the water in the solvation shell replaced by methanol? The curves of Fig. 2 suggest that the water content of this shell exceeds xw over the entire range of composition. In the case of the hydronium ion of HC1, the water shell essential for its abnormal conductance remains intact up to xm 0.15, whereas only a trace of water destroys the methanol shell that is required for the Grotthus mechanism at xm = 1. From a comparison of MnBDS and (Et)4NPic in Fig. 2, it is clear that the monatomic ions are chiefly responsible for the variation in the Walden product. In pure methanol rs/r s(H20) = 3.04 for MnBDS and 90% of the increase in the ratio occurs above xm = 0.7, these high concentrations being required to replace the tightly bound water around the compact divalent manganese ion with the larger methanol molecules. Although the Walden product for a small non-electrolyte varies less with :rm than that for a monatomic ion of the same mobility, the parallel behavior of the curves in Fig. 2 implies that the water content of the non-electrolyte solvation also exceeds xw. Insofar as the solvation numbers represent a preferential interaction of the solute with one component of a mixed solvent, it should be possible to relate them eventually to the cross-term diffusion coefficients in these three- component systems.
There remains the possibility that the solvation numbers afford a measure of hydrogen bonding. The clearest evidence for such bonding is afforded, however, by work in progress on N,N-dimethylacetamide and the parent amide in methanol. Although the volume of the dimethyl compound is 82% greater than that of acetamide it diffuses 10% faster. In methanol the solvation numbers are 0.8 and 2.3, respectively. Elimination, by N-methylation, of the only two proton donor sites on acetamide has thus reduced the solvaAon number by 1.5 and methanol is too weakly acidic to take advantage of the proton acceptor sites on the amide oxygen. In water the effect is somewhat less, di- methylation reducing the numbers from 3.0 to 1.9. The weakly acidic character of methanol is also apparent in the case of a related solute, acetone, that is not a proton donor. The solvation numbers for this solute are 1.6 and 0.0 in water and methanol, respectively. Other factors that contribute to the strength of the hydrogen bonds in these systems have been reviewed recently by Huggins.23
Acknowledgment.—The author is indebted to D. A. Maclnnes for a review of this manuscript and to Emilia Jurevicius for the analysis of the Rayleigh fringe patterns.
(28) M. L. Huggins, American Scientist, 50, 485 (1962).
694 Peter E. Y ankwich and Red y H. Haschemeyer Vol. 67
TEMPERATURE DEPENDENCE OF THE CARBON ISOTOPE EFFECT IN THE DECARBONYLATION OF LIQUID FORMIC ACID
B y P eter E. Y an kw ich and R udy H . H aschem eyer
Noyes Laboratory of Chemistry, University of Illinois, Urbana, III.Received September 22, 1962
The C 13 kinetic isotope fractionation in the decarbonylation of liquid formic acid was studied over the range 59.8-100.0°; (k12/fo3) lay in the range 1.05-1.04. The observed temperature dependence was examined by the “ gamma-bar” method of Bigeleisen and Wolfsberg, the “ semi-empirical” method of Yankwich, Weber, and Ikeda, and several “ two-center” approaches. Of the approximately 4.5% isotope effect, only a few tenths of a per cent is temperature independent; the calculated sums of the differences upon activation of the diagonal cartesian force constants correspond especially well with the value expected for C -0 bond rupture, and indicate strongly that this rupture is a major component of the reaction coordinate motion.
IntroductionA reinvestigation1 2 of the influence of temperature
on the kinetic carbon isotope effect in the dehydration of formic acid by concentrated sulfuric acid2 has shown that the temperature independent factor in the ratio of the isotope specific rate constants is very close to unity, and that the temperature dependence of the isotope effect, though large, is compatible with C -0 bond rupture being the major component of the reaction coordinate motion. The latter finding is consistent with the evidence recorded by Gel’bshtein, Shcheglova, and Temkin3 4 5 6 * 7 8 9 10 11 12 13 14 15 in support of the acid- catalyzed carbonium ion mechanism for the decarbonylation of formic acid in concentrated sulfuric and phosphoric acids. The research reported in this paper was undertaken in an effort to expose possible similarities in the mechanisms of decarbonylation of formic acid in concentrated sulfuric acid and in the pure liquid state. The formic acid employed in the study contained C 13 at the natural abundance level.
ExperimentalFormic Acid.—Reagent grade formic acid (Mallinckrodt,
“ 98-100% ” ) was dried for storage by distillation in vac'w at 25°, first from anhydrous copper sulfate, then from anhydrous magnesium perchlorate; before each distillation the acid stood in contact with the drying agent for two or three days. The dried formic acid was stored in vacuo over anhydrous magnesium perchlorate.
Samples of the formic acid used in the experiments were 99.9% pure, or better, as indicated by titration with standard base, and by close agreement between specific rate constants for the decomposition at several temperatures and those found with formic acid of this purity by Barham and C lark/ who investigated the negative catalytic effect of water on the rate of decarbonylation.
Apparatus and Procedure.— The reaction vessel consisted of a 30-ml. Pyrex bulb fitted with a breakoff tube and side arm, both terminating in standard taper joints to permit connection to the vacuum system. After the bulb was weighed and evacuated, 2 -6 ml. of formic acid was distilled into it through the side arm, which was then sealed5; the bulb and contents rvere weighed.
Reaction was initiated by placing the vessel in a constant (± 0 .0 5 °) temperature oil bath. After 1-3% decarbonylation had occurred,6 the bulb was removed from the oil bath and cooled in ice-water.
(1) J. Bigeleisen, R. H. Haschemeyer, M. Wolfsberg, and P. E. Yankwich, J. Am. Chem. Soc., 84, 1S13 (1962).
(2) G. A. Ropp, A. J. Weinbergber, and O. K. Neville, ibid., 73, 5573 (1951).
(3) A. I. Gel’bshtein, G. G. Shcheglova, and M. I. Temkin, Zh. Fiz. Khim., 30, 2267 (1956).
(4) H. N. Barham arid L. W. Clark, J. Am. Chem. Soc., 73, 4638 (1951).(5) It was established that inappreciable isotope fractionation occurred
under the conditions of this distillation transfer of part of the stock formic acid.
(6) Times for 1% decarbonylation ranged from about 5 hr. at 100° to13 days at 60°.
After being cooled, the reaction vessel was connected to a vacuum combustion system consisting of the following, in sequence: stopcock A; a trap, filled with glass wool and glass beads and cooled in liquid nitrogen7; stopcock B ; a tubular combustion furnace packed with copper oxide wire; a collection trap cooled in liquid nitrogen; stopcock C; the vacuum manifold. First, the reaction vessel was cooled in liquid nitrogen and the combustion system evacuated; with all stopcocks closed, the breakoff seal was shattered. By manipulation of stopcocks A and B, carbon monoxide was “ dosed” into the first trap, then through the furnace, and the product carbon dioxide collected in the second trap. The progress of the combustion of each “ dose” was followed by means of a thermocouple gage; the next manipulative cycle wTas started when the pressure in the system bad fallen to a low value, and the cycling of operations repeated until no significant pressure increase was noted upon opening stopcock A. With stopcock A closed, the contents of the reaction vessel were warmed to room temperature for a few moments, then re-frozen. Two or three freeze-thaw cycles were sufficient to liberate all the carbon monoxide product from the reaction solution.
The carbon dioxide was distilled to the vacuum manifold through stopcock C (stopcock B closed) for manometric quantity determination8 and final transfer to a mass spectrometer sample tube.
Isotope Analyses.— The procedures employed have been described in detail in earlier publications from this Laboratory.8 -11
Notation and Calculations.— The isotopic rate constant ratio sought was (ku/ku) in the notation
knHC12OOH — > C 120 + H20 (1)
knHC13OOH C130 + H20 (2)
Since the reaction was stopped at 3% decomposition or less, the following expression was employed in the calculation of results12-14
(kn/k13)obsd — (R f/Rc) (3)
w'here R f is the ratio (H C 18O OH /H C 12OOH) derived from measurements on carbon dioxide obtained by combustion (in a standard Pregl apparatus) of samples of the original dried formic acid, 15 and Rc is the ratio (C 130 /C 120 ) from measurements on carbon dioxide obtained from combustion of the samples of prod
(7) This trap prevented combustion of a small amount of formic acid “ fog” which apparently formed during the freeze-thaw cycles (vide infra).
(8) Carbon dioxide determinations by manometric measurement and estimates calculated from rate constants obtained from experiments with freshly dried formic acid were compared at intervals during the use of a given sample of formic acid. The agreement was always within the estimated manometric errors, which is indicative of the constancy of composition of the stock formic acid over a period of several weeks.
(9) P. E. Yankwich and R. L. Belford, J. Am. Chem. Soc., 75, 4178 (1953).
(10) P. E. Yankwich and R. L. Belford, ibid., 76, 3067 (1954).(11) P. E. Yankwich and J. L. Copeland, ibid., 79, 2081 (1957).(12) J. Bigeleisen, Science, 110, 14 (1949).(13) J. Bigeleisen, J. Chem. Phys., 17, 425 (1949).(14) J. Y.-P. Tong and P. E. Yankwich, J. Phys. Chem., 61, 540 (1957).(15) These samples of carbon dioxide were purified by several distillations
between traps at —150 and —196°.
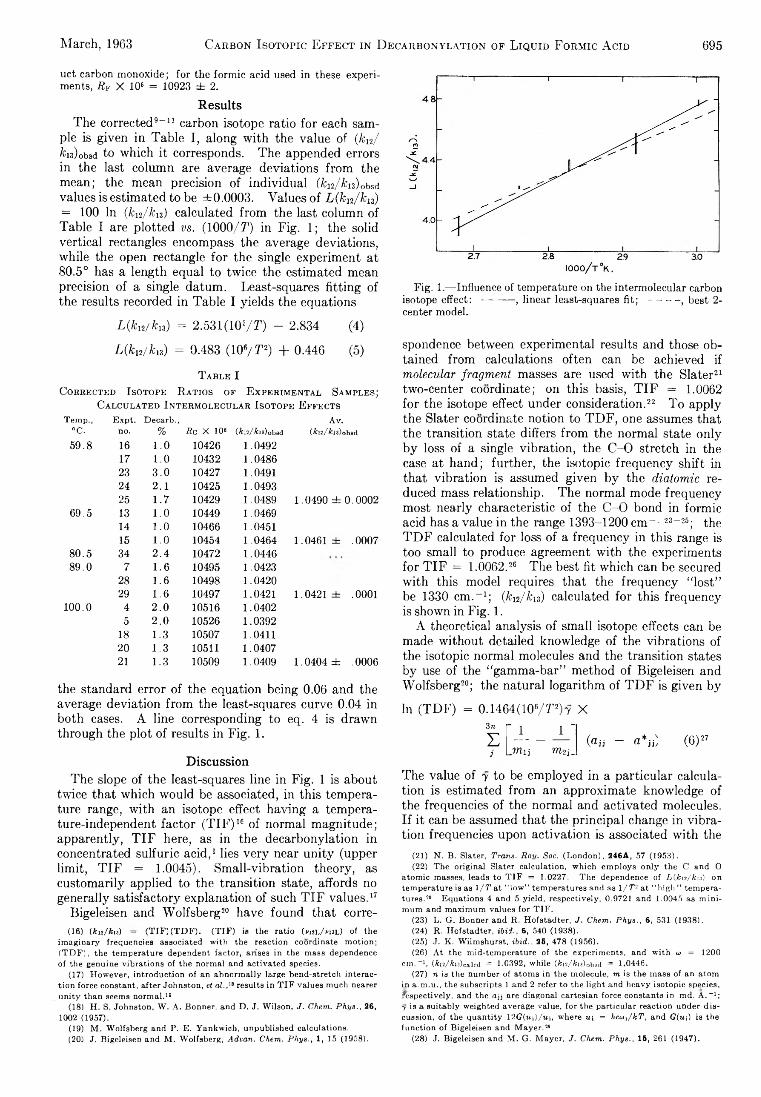
March, 1963 Carbon Isotopic Effect in D ecarbonylation of Liquid Formic A cid 695
uct carbon monoxide; for the formic acid used in these experiments, Rw X 106 = 10923 ± 2.
ResultsThe corrected9-11 carbon isotope ratio for each sam
ple is given in Table I, along with the value of (ku/ fci3)obsd to which it corresponds. The appended errors in the last column are average deviations from the mean; the mean precision of individual (kn/kn) obnd values is estimated to be ±0.0003. Values of L(k12/ku) = 100 In {kn/kn) calculated from the last column of Table I are plotted vs. (1000/ T) in Fig. 1; the solid vertical rectangles encompass the average deviations, while the open rectangle for the single experiment at 80.5° has a length equal to twice the estimated mean precision of a single datum. Least-squares fitting of the results recorded in Table I yields the equations
L(k12/k13) = 2.531 (10VT) - 2.834 (4)
L(/ci2/ /c13) = 0.483 (106/T 2) + 0.446 (5)
T able ICorrected I sotope R atios op E xperim ental Sam ples;
Calculated I ntermolecular I sotope E ffectsTemp., Expt. Decarb., Av.
°C. no. % Be X 10= (&_2/ii3)obsd (&l!/fa3)obsd59.8 16 1.0 10426 1.0492
17 1.0 10432 1.048623 3.0 10427 1.049124 2 . 1 10425 1.049325 1.7 10429 1.0489 1.0490 ± 0.0002
69.5 13 1.0 10449 1.046914 1.0 10466 1.045115 1 . 0 10454 1.0464 1.0461 ± .0007
80.5 34 2.4 10472 1.044689.0 7 1 . 6 10495 1.0423
28 1 . 6 10498 1.042029 1 . 6 10497 1.0421 1.0421 ± .0001
10 0 .0 4 2 .0 10516 1.04025 2 .0 10526 1.0392
18 1.3 10507 1.041120 1.3 10511 1.04072 1 1.3 10509 1.0409 1.0404 ± .0006
the standard error of the equation being 0.06 and the average deviation from the least-squares curve 0.04 in both cases. A line corresponding to eq. 4 is drawn through the plot of results in Fig. 1.
DiscussionThe slope of the least-squares line in Fig. 1 is about
twice that which would be associated, in this temperature range, with an isotope effect having a temperature-independent factor (TIF) 16 of normal magnitude; apparently, TIF here, as in the decarbonylation in concentrated sulfuric acid,1 lies very near unity (upper limit, TIF = 1.0045). Small-vibration theory, as customarily applied to the transition state, affords no generally satisfactory explanation of such TIF values.17
Bigeleisen and Wolfsberg20 have found that corre-(16) (ku/kiz) — (TIF)(TDF). (TIF) is the ratio (vnL/niL) of the
imaginary frequencies associated with the reaction coordinate motion; (TDF), the temperature dependent factor, arises in the mass dependence of the genuine vibrations of the normal and activated species.
(17) However, introduction of an abnormally large bend-stretch interaction force constant, after Johnston, et al.,18 results in TIF values much nearer unity than seems normal.19
(18) H. S. Johnston, W. A. Bonner, and D. J. Wilson, J. Chem. Phys., 26, 1002 (1957).
(19) M. Wolfsberg and P. E. Yankwich, unpublished calculations.(20) J. Bigeleisen and M. Wolfsberg, Advan. Chem. Phys., 1, 15 (1958).
Fig. 1.— Influence of temperature on the intermolecular carbonisotope effect: ------ — , linear least-squares f i t ; ----------, best 2 -center model.
spondence between experimental results and those obtained from calculations often can be achieved if molecular fragment masses are used with the Slater21 two-center coordinate; on this basis, TIF = 1.0062 for the isotope effect under consideration.22 To apply the Slater coordinate notion to TDF, one assumes that the transition state differs from the normal state only by loss of a single vibration, the C -0 stretch in the case at hand; further, the isotopic frequency shift in that vibration is assumed given by the diatomic reduced mass relationship. The normal mode frequency most nearly characteristic of the C -0 bond in formic acid has a value in the range 1393-1200 cm- : 23-26; the TDF calculated for loss of a frequency in this range is too small to produce agreement with the experiments for TIF = 1.0062.26 The best fit which can be secured with this model requires that the frequency “ lost” be 1330 cm.-1; (k12/ku) calculated for this frequency is shown in Fig. 1.
A theoretical analysis of small isotope effects can be made without detailed knowledge of the vibrations of the isotopic normal molecules and the transition states by use of the “ gamma-bar” method of Bigeleisen and Wolfsberg20; the natural logarithm of TDF is given by
In (TDF) = 0.1464(106/T 2)y X3 nE p - -
1 '(Ojj - o * i i ) ( 6 ) 27
Ò Lmu m 2j .
The value of y to be employed in a particular calculation is estimated from an approximate knowledge of the frequencies of the normal and activated molecules. If it can be assumed that the principal change in vibration frequencies upon activation is associated with the
(21) N. B. Slater, Trans. Roy. Soc. (London), 246A, 57 (1953).(22) The original Slater calculation, which employs only the C and O
atomic masses, leads to TIF = 1.0227. The dependence of L{kn/kn) on temperature is as 1 /Tat “ low” temperatures and as 1/T2 at “ high” temperatures.20 Equations 4 and 5 yield, respectively, 0.9721 and 1.0045 as minimum and maximum values for TIF.
(23) L. G. Bonner and R. Hofstadter, J. Chem. Phys., 6, 531 (1938).(24) R. Hofstadter, ibid., 6, 540 (1938).(25) J. K. Wilmshurst, ibid., 25, 478 (1956).(26) At the mid-temperature of the experiments, and with w = 1200
cm.-1, (&i2/&i3)calcd = 1.0392, while (fci2/&i3)obsd = 1.0446.(27) n is the number of atoms in the molecule, m is the mass of an atom
in a.m.u., the subscripts 1 and 2 refer to the light and heavy isotopic species, ^spectively, and the ay are diagonal cartesian force constants in md. A.” 1; 7 is a suitably weighted average value, for the particular reaction under discussion, of the quantity \2G{u\)/u\, where u\ = hc<aifkT, and G(u\) is the function of Bigeleisen and Mayer.28
(28) J. Bigeleisen and M. G. Mayer, J. Chem. Phys., 15, 261 (1947).
696 Peter E. Y ankwich and R udy H. Haschemeyer Vol. 67
normal mode which becomes the reaction coordinate, the most important component of y arises in that single frequency.
In their original application of this method,20 Bigelei- sen and Wolfsberg calculated TIF using molecular fragment masses; TDF was then computed using an estimated single critical frequency and sum of force constant differences by means of eq. 6. The resulting k/k' was then compared with experiment. We shall employ a somewhat different approach. First, let TIF be calculated using molecular fragment masses, and TDF then computed from the experimental values of k/k'. Second, let there be assumed a range of values for a single critical frequency and, therefrom, appropriate ranges of y29 over the span of temperatures covered by the experiments. Third, let the experimental TDF be matched at the mid-temperature, this resulting, for each assumed frequency, in an estimate of
Z («jj - an*) = Ac (7)j
Finally, one can test the applicability of the method thus employed by comparison of the values of A0 with force constants typical of the C 0 bond stretch and related bending vibrations, and by comparison of the slope of a plot of L(fci2/fci3)cai0d vs. 1000/T with that of the experimental plot.
The plots of such calculated L/kn/ki/) differ insignificantly from that for the “ best” 2-center model, shown in Fig. 1; for assumed frequencies in the 1100 to 1200 cm.-1 range, the values of Ac are 5.1-5.3 md. A .-1, whereas values of 6-7 md. A .-1 seem more reasonable. Improvement of the calculated A0 would require the assumption of frequencies much higher than those characteristic of the C -0 stretching vibration, TIF being taken as 1.0062; to secure better slope agreement, one would have to use a different (and smaller) TIF.
An experimental estimate of TIF can be obtained by employing the semi-empirical method described in earlier publications30'31 from this Laboratory. If formic acid is treated as a three particle system, the experimental temperature dependence corresponds to TIF = 1.0014 ± 0.002. Repetition using this TIF of the “ gamma-bar” method calculations described above does not improve significantly the agreement between calculated and observed slopes of the plot of L(kl2/kn) vs. (1000/T); but, the A0 values, again for frequencies in the 1100-1200 cm.-1 range, are 5.9-6.1 md. A.-1, a definite improvement.
Another experimental estimate of TIF can be obtained by eliminating Ac between a pair of expressions
(29) In the computations, the following weighting was employedX ^stretch . v, 2&5en(i
n i "T Tbend X , q„stretch i "t*bend ¿¿stretch I -"¿¿bendwith stretch. ” 3 bend*
(30) P. E. Yankwich and H. S. Weber, J. Am. Chem. Soc., 78, 564 (1956).(31) P. E. Yankwich and R. M. Ikeda, ibid., 81, 1532 (1959).
(kn/ku) = (TIF)(TDF), where TDF at two different temperatures is computed from eq. 6 ; similarly, TIF can be eliminated to yield values for Ac. To illustrate this procedure, calculations were carried out for average stretching frequencies (corrected for loss of bending vibrations)29 of 800, 1000, 1200 cm.-1 ; in the same order, the values of A0 (in md. A.-1) and TIF are: 6.4, 1.0021; 7.1, 1.0001; 7.8, 0.9982. The values of these parameters are in reasonable agreement with expectation except at the highest frequency.
This application of the “ gamma-bar” method seems to require a low C -0 frequency to explain the observed isotope effect, while the “ best” 2-center model involves a high C -0 frequency estimate. The former situation is due undoubtedly to the fact that values for y must be assumed for two temperatures according to some simple idea; in the discussion above, y was evaluated on the asumption that the C -0 stretching vibration was the major component of the reaction coordinate motion, due regard being had for the fact that bending motions are “ lost” when C -0 bond rupture occurs. A more sophisticated estimate of the values of y involves the same additional complications as are associated with solution of the small vibration problem for multiple-particle representations of the normal molecules and activated complexes, or the Monte Carlo approach which is the basis of the “ semi- empirical” method. In its higher approximations, the “ gamma-bar” method is equivalent to the “ semi- empirical” method; unlike other “ single frequency” approaches to the explanation of small isotope effects, the simplest “ gamma-bar” method application yields for many systems results in agreement with experiment which do not require an arbitrary estimate of TIF.
The several calculations described above have involved very similar models for the reaction coordinate motion; in one extreme it was assumed that the motion consisted entirely of the C -0 bond stretch (which disappears upon activation); in the other, that bond- stretch was assumed to be “ the most important component” of the motion. A more detailed specification of the reaction coordinate would require additional assumptions. The utility of the “ gamma-bar” and “ semi-empirical” methods lies in the fact that TIF need not be known or assumed in order to win useful information from the temperature dependence of experimental kinetic isotope effects.
Comparison of the results reported here with those obtained for the decarbonylation in concentrated sulfuric acid1 shows only that in both situations the major component of the reaction coordinate motion is as indicated above. In neither case do the calculations provide an explanation for the fact that TIF differs so little from unity.
Acknowledgments.—This research was carried out under the auspices of the U. S. Atomic Energy Commission. Mrs. Beverly Thomas and Mrs. Eulah Ihnen performed the mass spectrometric analyses.
e
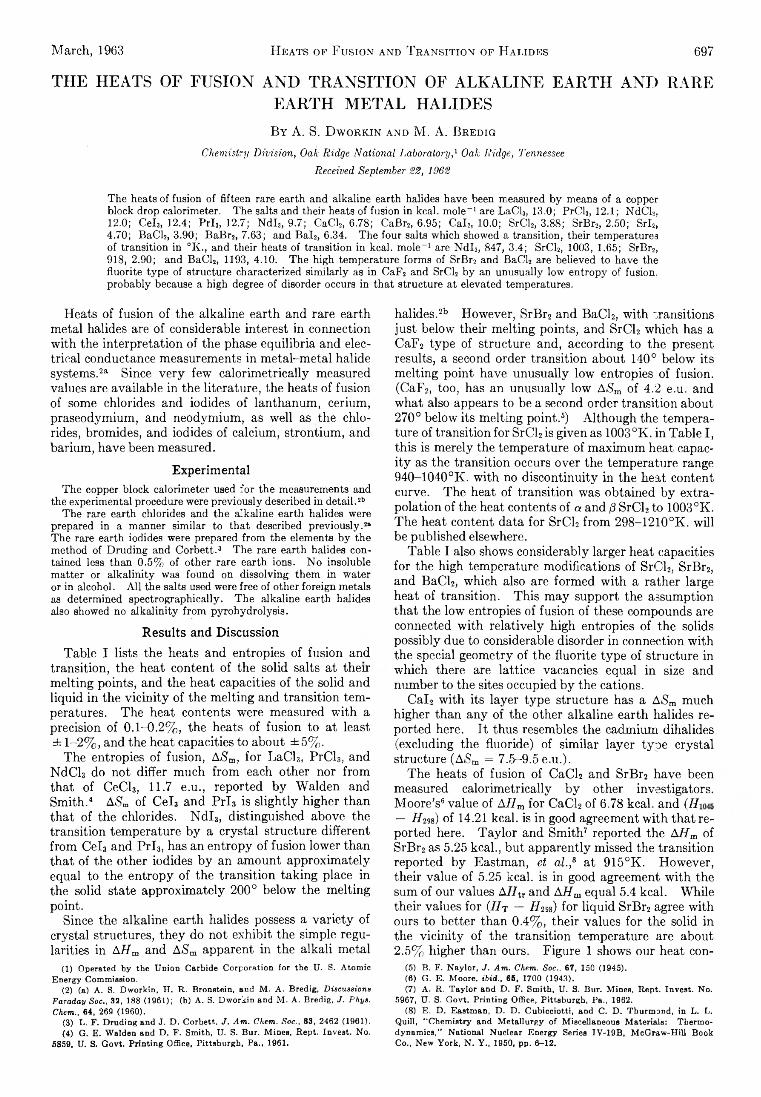
THE HEATS OF FUSION AND TRANSITION OF ALKALINE EARTH AND RAREEARTH METAL HALIDESBy A. S. D w or k in and M. A. B redig
Chemistry Division, Oak Ridge National Laboratory,1 Oak Ridge, Tennessee Received September 22, 1962
March, 1963 Heats op Fusion and Transition of Halides 697
The heats of fusion of fifteen rare earth and alkaline earth halides have been measured by means of a copper block drop calorimeter. The salts and their heats of fusion in kcal. mole- 1 are LaCl3, 13.0; PrCl3, 12.1; NdCl3, 12.0; Cel3, 12.4; Prl3, 12.7; N dls, 9.7; CaCl2, 6.78; CaBr2, 6.95; Cal2, 10.0; SrCl2, 3.88; SrBr2, 2.50; Srl2, 4.70; BaCl2, 3.90; BaBr2, 7.63; and Bal2, 6.34. The four salts which showed a transition, their temperatures of transition in °K., and their heats of transition in kcal. mole- 1 are N dl3, 847, 3.4; SrCl2, 1003, 1.65; SrBr2, 918, 2.90; and BaCl2, 1193, 4.10. The high temperature forms of SrBr2 and BaCl2 are believed to have the fluorite type of structure characterized similarly as in CaF2 and SrCl2 by an unusually low entropy of fusion, probably because a high degree of disorder occurs in that structure at elevated temperatures.
Heats of fusion of the alkaline earth and rare earth metal halides are of considerable interest in connection with the interpretation of the phase equilibria and electrical conductance measurements in metal-metal halide systems.211 Since very few calorimetrically measured values are available in the literature, the heats of fusion of some chlorides and iodides of lanthanum, cerium, praseodymium, and neodymium, as well as the chlorides, bromides, and iodides of calcium, strontium, and barium, have been measured.
ExperimentalThe copper block calorimeter used for the measurements and
the experimental procedure were previously described in detail.2bThe rare earth chlorides and the alkaline earth halides were
prepared in a manner similar to that described previously.2* The rare earth iodides were prepared from the elements by the method of Druding and Corbett.3 The rare earth halides contained less than 0.5% of other rare earth ions. No insoluble matter or alkalinity was found on dissolving them in water or in alcohol. All the salts used were free of other foreign metals as determined spectrographically. The alkaline earth halides also showed no alkalinity from pyrohydrolysis.
Results and DiscussionTable I lists the heats and entropies of fusion and
transition, the heat content of the solid salts at then- melting points, and the heat capacities of the solid and liquid in the vicinity of the melting and transition temperatures. The heat contents were measured with a precision of 0.1- 0 .2% , the heats of fusion to at least ± 1-2%, and the heat capacities to about ±5% .
The entropies of fusion, A$m, for LaCU, PrCl3, and NdCl3 do not differ much from each other nor from that of CeCU, 11.7 e.u., reported by Walden and Smith.4 A$m of Cels and Prig is slightly higher than that of the chlorides. N dl3, distinguished above the transition temperature by a crystal structure different from Cel3 and Prl3, has an entropy of fusion lower than that of the other iodides by an amount approximately equal to the entropy of the transition taking place in the solid state approximately 200° below the melting point.
Since the alkaline earth halides possess a variety of crystal structures, they do not exhibit the simple regularities in A //m and ASm apparent in the alkali metal
(1) Operated by the Union Carbide Corporation for the U. S. Atomic Energy Commission.
(2) (a) A. S. Dworkin, H. R. Bronstein, and M. A. Bredig, Discussions Faraday Soc., 32, 188 (1961); (b) A. S. Dworkin and M. A. Bredig, J. Phys. Chem., 64, 269 (1960).
(3) L. F. Druding and J. D. Corbett, J. Am. Chem. Soc., 83, 2462 (1961).(4) G. E. Walden and D. F. Smith, U. S. Bur. Mines, Rept. Invest. No.
5859, U. S. Govt. Printing Office, Pittsburgh, Pa., 1961.
halides.2b However, SrBr2 and BaCl2, with Transitions just below their melting points, and SrCl2 which has a CaF2 type of structure and, according to the present results, a second order transition about 140° below its melting point have unusually low entropies of fusion. (CaF2, too, has an unusually low A£m of 4.2 e.u. and what also appears to be a second order transition about 270° below its melting point.6) Although the temperature of transition for SrCl2 is given as 1003°K. in Table I, this is merely the temperature of maximum heat capacity as the transition occurs over the temperature range 940-1040°K. with no discontinuity in the heat content curve. The heat of transition was obtained by extrapolation of the heat contents of a. and /3 SrCl2 to 1003 °K. The heat content data for SrCl2 from 298-1210°K. will be published elsewhere.
Table I also shows considerably larger heat capacities for the high temperature modifications of SrCl2, SrBr2, and BaCl2, which also are formed with a rather large heat of transition. This may support the assumption that the low entropies of fusion of these compounds are connected with relatively high entropies of the solids possibly due to considerable disorder in connection with the special geometry of the fluorite type of structure in which there are lattice vacancies equal in size and number to the sites occupied by the cations.
Cal2 with its layer type structure has a ASm much higher than any of the other alkaline earth halides reported here. It thus resembles the cadmium dihalides (excluding the fluoride) of similar layer type crystal structure (A»Sm = 7.5-9.5 e.u.).
The heats of fusion of CaCl2 and SrBr2 have been measured calorimetrically by other investigators. Moore’s6 value of AHm for CaCl2 of 6.78 kcal. and (II — H2as) of 14.21 kcal. is in good agreement with that reported here. Taylor and Smith7 reported the AHm of SrBr2 as 5.25 kcal., but apparently missed the transition reported by Eastman, et al.,s at 915°K. However, their value of 5.25 kcal. is in good agreement with the sum of our values AHtr and AHm equal 5.4 kcal. While their values for (Ht — Hm) for liquid SrBr2 agree with ours to better than 0.4%, their values for the solid in the vicinity of the transition temperature are about 2.5% higher than ours. Figure 1 shows our heat con-
(5) B. F. Naylor, J. Am. Chem. Soc., 67, 150 (1945).(6) G. E. Moore, ibid., 66, 1700 (1943).(7) A. R. Taylor and D. F. Smith, U. S. Bur. Mines, Rept. Invest. No.
5967, U. S. Govt. Printing Office, Pittsburgh, Pa., 1962.(8) E. D. Eastman, D. D. Cubicciotti, and C. D. Thurmond, in L. L.
Quill, “ Chemistry and Metallurgy of Miscellaneous Materials: Thermodynamics,” National Nuclear Energy Series IV-19B, McGraw-Hill Book Co., New York, N. Y., 1950, pp. 6-12.
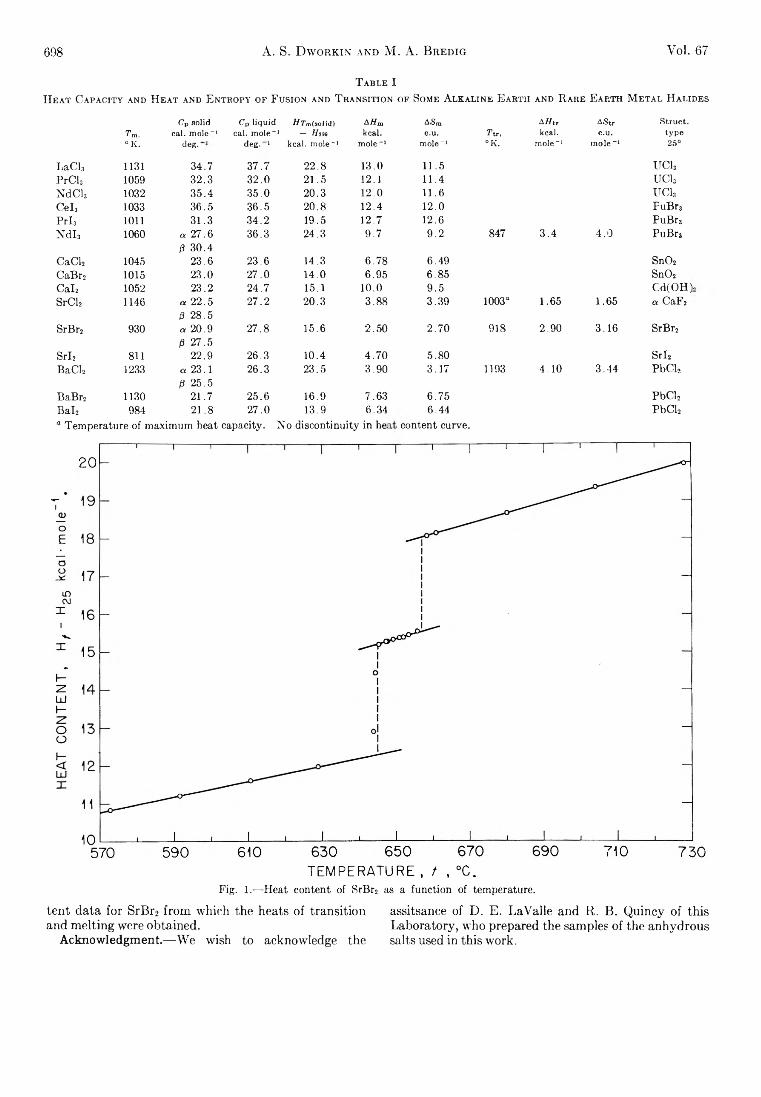
698 A. S. D workin and M. A. Bredig Vol. 67
T able IH e a t C apacity and H eat and E ntropy of F usion and T ransition of Some A lkaline E arth and R are E arth M etal H alides
Tm,Cp solid
cal. mole-1Cp liquid
cal. mole-Rrm(solid)
1 — HinAHpxkcal.
° K. deg. deg. 1 kcal. mole-1 mole -1
LaCb 1131 34.7 3 7 .7 2 2 .8 13 .0PrCl3 1059 3 2 .3 3 2 .0 2 1 .5 12.1NdClj 1032 3 5 .4 3 5 .0 2 0 .3 1 2 .0Celo 1033 3 6 .5 3 6 .5 2 0 .8 12 .4P rl3 1011 3 1 .3 3 4 .2 19 .5 12.7N d l3 1060 a 2 7 .6 3 6 .3 2 4 .3 9 .7
CaCb 1045p 3 0 .4
2 3 .6 2 3 .6 14.3 6 .7 8CaBr2 1015 2 3 .0 2 7 .0 1 4 .0 6 .9 5Cal2 1052 2 3 .2 2 4 .7 15.1 10 .0SrCl2 1146 CL 2 2 .5 2 7 .2 2 0 .3 3 .8 8
SrBr2 930Pa
2 8 .52 0 .9 2 7 .8 15 .6 2 .5 0
Srl2 811P 2 7 .5
2 2 .9 2 6 .3 1 0 .4 4 .7 0BaCl2 1233 CL 23.1 2 6 .3 2 3 .5 3 .9 0
BaBr2 1130P 2 5 .5
21 .7 2 5 .6 16 .9 7 .63Bal2 984 2 1 .8 2 7 .0 13.9 6 .34a Temperature of maximum heat capacity. No discontinuity in he;
AiSm Atftr AStr Struct.e.u. f t r, kcal. e.u. type
mole -I •K. mole-1 mole-1 25°
11 .5 UC131 1 .4 UC1311.6 u c u1 2 .0 FuBr312.6 FuBr3
9 .2 847 3 .4 4 .0 FuBr3
6 .49 Sn026 .8 5 Sn029 .5 Cd(OH).3 .3 9 1003“ 1 .65 1 .65 a CaF2
2 .7 0 918 2 .90 3 .1 6 SrBr2
5 .8 0 Srl23 .17 1193 4 .1 0 3 .4 4 PbCl2
6 .7 5 PbCl26 .4 4 PbCl2
content curve.
TEMPERATURE , / , °C.Fig. 1.-—Heat content of SrBr2 as a function of temperature.
tent data for SrBr2 from which the heats of transition assitsance of D. E. LaValle and R. B. Quincy of this and melting were obtained. Laboratory, who prepared the samples of the anhydrous
Acknowledgment.—We wish to acknowledge the salts used in this work.
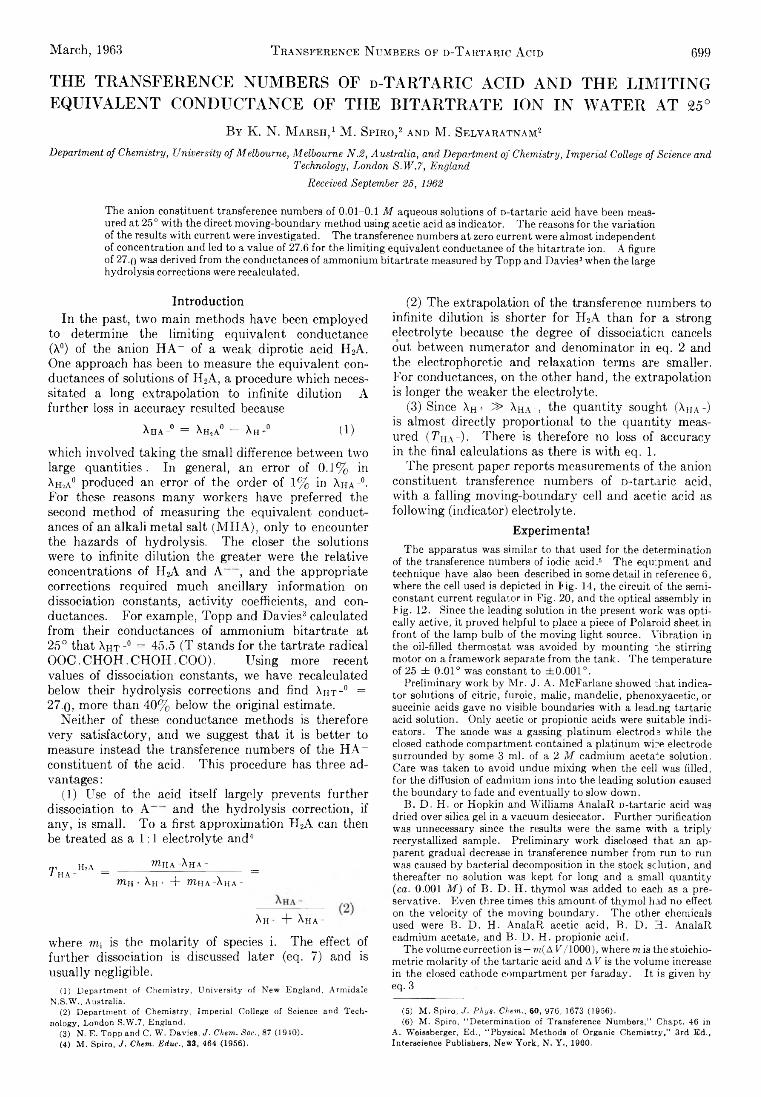
March, 1963 T ransference Numbers of d-Tartaric A cid 699
THE TRANSFERENCE NUMBERS OF d-TARTARIC ACID AND THE LIMITING EQUIVALENT CONDUCTANCE OF THE BITARTRATE ION IN WATER AT 25°
B y K. N. M a r s h , 1 M. S p i r o , 2 a n d M. S e l v a r a t n a m 2
Department of Chemistry, University of Melbourne, Melbourne N.2, Australia, and Department of Chemistry, Imperial College of Science andTechnology, London S.W.7, England
Received September 25, 1962
The anion constituent transference numbers of 0.01-0.1 M aqueous solutions of D-tartaric acid have been measured at 25° with the direct moving-boundary method using acetic acid as indicator. The reasons for the variation of the results with current were investigated. The transference numbers at zero current were almost independent of concentration and led to a value of 27.6 for the limiting equivalent conductance of the bitartrate ion. A figure of 27-o was derived from the conductances of ammonium bitartrate measured by Topp and Davies3 when the large hydrolysis corrections were recalculated.
IntroductionIn the past, two main methods have been employed
to determine the limiting equivalent conductance (X°) of the anion H A- of a weak diprotic acid H2A. One approach has been to measure the equivalent conductances of solutions of H2A, a procedure which necessitated a long extrapolation to infinite dilution A further loss in accuracy resulted because
Xha-° = XhjA0 — Xh+° (1)which involved taking the small difference between two large quantities. In general, an error of 0.1% in Xhsa° produced an error of the order of 1% in Xha-°- For these reasons many workers have preferred the second method of measuring the equivalent conductances of an alkali metal salt (MHA), only to encounter the hazards of hydrolysis. The closer the solutions were to infinite dilution the greater were the relative concentrations of H2A and A , and the appropriate corrections required much ancillary information on dissociation constants, activity coefficients, and conductances. For example, Topp and Davies3 calculated from their conductances of ammonium bitartrate at 25° that Xh t-° = 45.5 (T stands for the tartrate radical OOC. CHOH. CHOH. COO). Using more recent values of dissociation constants, we have recalculated below their hydrolysis corrections and find Xr t -0 = 27-0, more than 40% below the original estimate.
Neither of these conductance methods is therefore very satisfactory, and we suggest that it is better to measure instead the transference numbers of the HA- constituent of the acid. This procedure has three advantages :
(1) Use of the acid itself largely prevents further dissociation to A and the hydrolysis correction, if any, is small. To a first approximation H2A can then be treated as a 1:1 electrolyte and4
T h ,a __________ w ih a -Xh a -__________1 h a - — . . , —WIh + Xh+ + WIha-Xha-
Xh + + Xh a -
where m; is the molarity of species i. The effect of further dissociation is discussed later (eq. 7) and is usually negligible.
(1) Department of Chemistry, University of New England, ArmidaleN.S.W., Australia.
(2) Department of Chemistry, Imperial College of Science and Technology, London S.W.7, England.
(3) N. E. Topp and C. W. Davies, J. Chem. Soc., 87 (1940).(4) M. Spiro, J. Chem. Educ., 33, 464 (1956).
(2) The extrapolation of the transference numbers to infinite dilution is shorter for H2A than for a strong electrolyte because the degree of dissociation cancels out between numerator and denominator in eq. 2 and the electrophoretic and relaxation terms are smaller. For conductances, on the other hand, the extrapolation is longer the weaker the electrolyte.
(3) Since XH+ 3> Xr a -, the quantity sought (XHa -) is almost directly proportional to the quantity measured (Tha-)- There is therefore no loss of accuracy in the final calculations as there is with eq. 1.
The present paper reports measurements of the anion constituent transference numbers of D-tartaric acid, with a falling moving-boundary cell and acetic acid as following (indicator) electrolyte.
ExperimentalThe apparatus was similar to that used for the determination
of the transference numbers of iodic acid.5 6 The equipment and technique have also been described in some detail in reference 6 , where the cell used is depicted in f ig . 14, the circuit of the semiconstant current regulator in Fig. 20, and the optical assembly in l ig . 12. Since the leading solution in the present work was optically active, it proved helpful to place a piece of Polaroid sheet in front of the lamp bulb of the moving light source. Vibration in the oil-filled thermostat was avoided by mounting the stirring motor on a framework separate from the tank. The temperature of 25 ± 0.01° was constant to ±0 .001°.
Preliminary work by Mr. J. A. McFarlane showed that indicator solutions of citric, furoic, malic, mandelic, phenoxyacetic, or succinic acids gave no visible boundaries with a leading tartaric acid solution. Only acetic or propionic acids were suitable indicators. The anode was a gassing platinum electrode while the closed cathode compartment contained a platinum wire electrode surrounded by some 3 ml. of a 2 M cadmium acetate solution. Care was taken to avoid undue mixing when the cell was filled, for the diffusion of cadmium ions into the leading solution caused the boundary to fade and eventually to slow down.
B. D . H. or Hopkin and Williams AnalaR D-tartaric acid was dried over silica gel in a vacuum desiccator. Further purification was unnecessary since the results were the same with a triply recrystallized sample. Preliminary work disclosed that an apparent gradual decrease in transference number from run to run was caused by bacterial decomposition in the stock sclution, and thereafter no solution was kept for long and a small quantity (ca. 0.001 M ) of B. D . H. thymol was added to each as a preservative. Even three times this amount of thymol had no effect on the velocity of the moving boundary. The other chemicals used were B. D . H. AnalaR acetic acid, B. D . 3 . AnalaR cadmium acetate, and B. D . H. propionic acid.
The volume correction is —m(AF/1000), where mis the stoichiometric molarity of the tartaric acid and A V is the volume increase in the closed cathode compartment per faraday. It is given by eq. 3
(5) M. Spiro, J. Phys. Chem., 60, 976, 1673 (1956).(6) M. Spiro, “ Determination of Transference Numbers," Chapt. 46 in
A. Weissberger, Ed., “ Physical Methods of Organic Chemistry," 3rd Ed., Interscience Publishers, New York, N. Y., 1960.
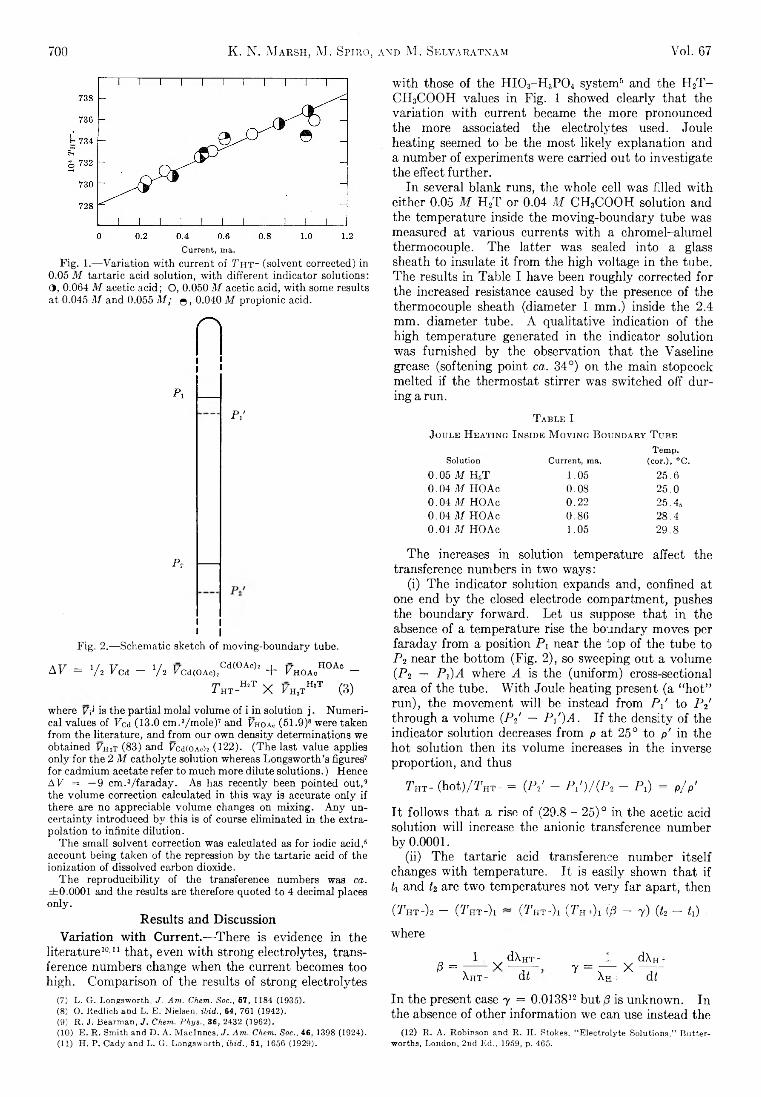
700 K. N. Marsh, M. Spiro, and M. Selvaratnam Vol. 67
Current, ma.Fig. 1.— Variation with current of T h t - (solvent corrected) in
0.05 M tartaric acid solution, with different indicator solutions: O, 0.064 M acetic acid; O, 0.050 M acetic acid, with some results at 0.045 M and 0.055 M ; © , 0.040 M propionic acid.
Pi'
P:
■ I I I
Fig. 2.— Schematic sketch of moving-boundary tube.
A F = Va Fed — V 2 Fcd(OAo)2CdiOAc^ + F hoaoHOA° —
. P h t - h *t X Fh2tHiT (3)where F j is the partial molal volume of i_in solution j . Numerical values of Fed (13.0 cm .3/m ole)7 and Fhoa» (51.9)8 were taken from the literature, and from our own density determinations we obtained Fh2t (83) and FcdtoAch (122). (The last value applies only for the 2 M catholyte solution whereas Longsworth’s figures7 for cadmium acetate refer to much more dilute solutions.) Hence A F = —9 cm.3/faraday. As has recently been pointed out, 9 the volume correction calculated in this way is accurate only if there are no appreciable volume changes on mixing. Any uncertainty introduced by this is of course eliminated in the extrapolation to infinite dilution.
The small solvent correction was calculated as for iodic acid,5 account being taken of the repression by the tartaric acid of the ionization of dissolved carbon dioxide.
The reproducibility of the transference numbers was ca. ±0.0001 and the results are therefore quoted to 4 decimal places only.
Results and DiscussionVariation with Current.—There is evidence in the
literature10'11 that, even with strong electrolytes, transference numbers change when the current becomes too high. Comparison of the results of strong electrolytes
(7) L. G. Longsworth, J. Am. Chem. Soc., 57, 1184 (1935),(8) O. Redlich and L. E. Nielsen, ibid., 64, 761 (1942).(9) R. J. Bearman, J. Chem. Phys., 36, 2432 (1962).(10) E. R. Smith and D. A. Maelnnes, J. Am. Chem. Soc., 46, 1398 (1924).(11) H. P. Cady and L. G. Longsworth, ibid., 51, 1656 (1929).
with those of the HIO3-H 3PO4 system5 and the H2T - CH3COOH values in Fig. 1 showed clearly that the variation with current became the more pronounced the more associated the electrolytes used. Joule heating seemed to be the most likely explanation and a number of experiments were carried out to investigate the effect further.
In several blank runs, the whole cell was filled with either 0.05 M H2T or 0.04 M CH3COOH solution and the temperature inside the moving-boundary tube was measured at various currents with a chromel-alumel thermocouple. The latter was sealed into a glass sheath to insulate it from the high voltage in the tube. The results in Table I have been roughly corrected for the increased resistance caused by the presence of the thermocouple sheath (diameter 1 mm.) inside the 2.4 mm. diameter tube. A qualitative indication of the high temperature generated in the indicator solution was furnished by the observation that the Vaseline grease (softening point ca. 34°) on the main stopcock melted if the thermostat stirrer was switched off during a run.
T able IJoule H eating I nside M oving B oundary T ube
Solution Current, ma.Temp,
(cor.), °C.0.05 M H»T 1.05 25.60.04 Af HOAc 0.08 25.00.04 M HOAc 0 .2 2 25 .450.04 M HOAc 0 .8 6 28.40.01 M HOAc 1.05 29.8
The increases in solution temperature affect the transference numbers in two ways:
(i) The indicator solution expands and, confined at one end by the closed electrode compartment, pushes the boundary forward. Let us suppose that in the absence of a temperature rise the boundary moves per faraday from a position Pi near the top of the tube to P 2 near the bottom (Fig. 2), so sweeping out a volume (P2 — Pi)A where A is the (uniform) cross-sectional area of the tube. With Joule heating present (a “ hot” run), the movement will be instead from Pfi to P 2' through a volume (P2' — Pi')A. If the density of the indicator solution decreases from p at 25° to p' in the hot solution then its volume increases in the inverse proportion, and thus
P h t - (hot)/PHT- = (P7 - P 1W 2 - Pi) = p/p '
It follows that a rise of (29.8 - 25)° in the acetic acid solution will increase the anionic transference number by 0.0001.
(ii) The tartaric acid transference number itself changes with temperature. It is easily shown that if ti and ¿2 are two temperatures not very far apart, then
( P h t - ) 2 — ( P h t - ) i ~ ( P h t - ) i ( P h +)i ( f t — 7 ) (¿2 — <l)
where
0 =1 d\HT-___ _ y 11
Xht- d£ XdXH -
di
In the present case 7 = 0.013812 but ¡3 is unknown. In the absence of other information we can use instead the
(12) R. A. Robinson and R. H. Btokes, “ Electrolyte Solutions," Butter- worths, London, 2nd Ed., 1959, p. 465.
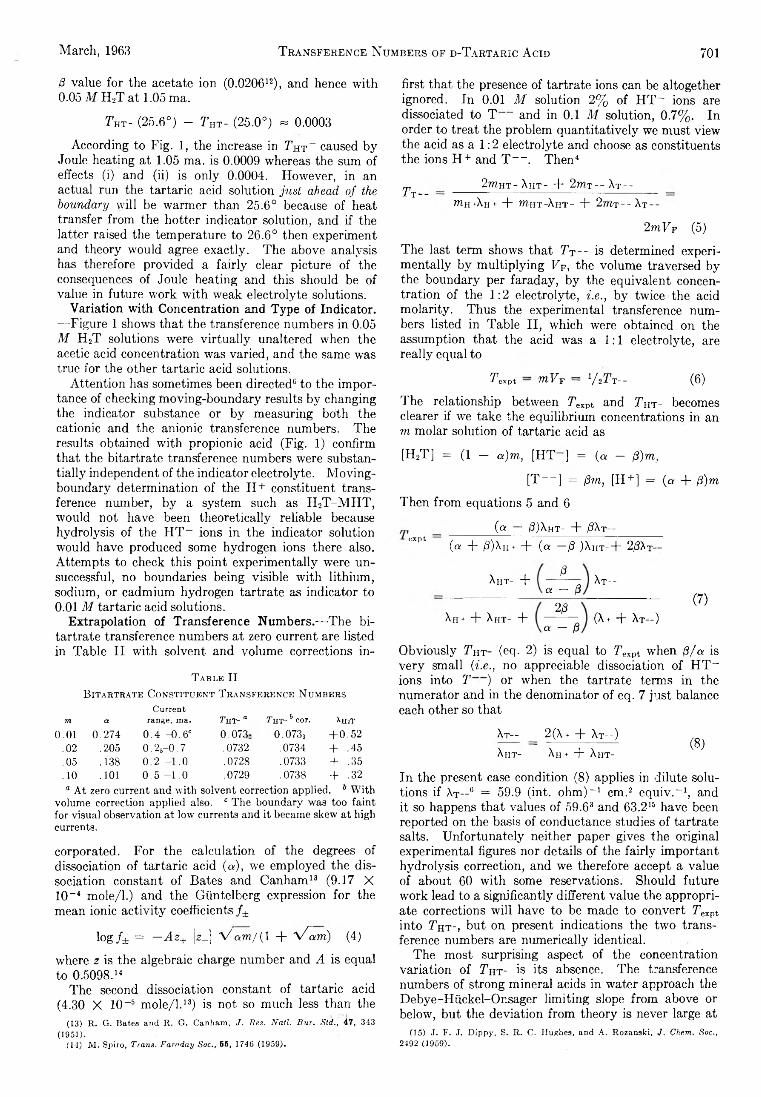
March, 1963 Transference Numbers op d-Tartaric A cid 701
fi value for the acetate ion (0.020612), and hence with 0.05 M H2T at 1.05 ma.
T ht- (25.6°) - THt- (25.0°) « 0.0003
According to Fig. 1, the increase in Tht~ caused by Joule heating at 1.05 ma. is 0.0009 whereas the sum of effects (i) and (ii) is only 0.0004. However, in an actual run the tartaric acid solution just ahead of the boundary will be warmer than 25.6° because of heat transfer from the hotter indicator solution, and if the latter raised the temperature to 26.6° then experiment and theory would agree exactly. The above analysis has therefore provided a fairly clear picture of the consequences of Joule heating and this should be of value in future work with weak electrolyte solutions.
Variation with Concentration and Type of Indicator. —Figure 1 shows that the transference numbers in 0.05 M H2T solutions were virtually unaltered when the acetic acid concentration was varied, and the same was true for the other tartaric acid solutions.
Attention has sometimes been directed6 to the importance of checking moving-boundary results by changing the indicator substance or by measuring both the cationic and the anionic transference numbers. The results obtained with propionic acid (Fig. 1) confirm that the bitartrate transference numbers were substantially independent of the indicator electrolyte. Movingboundary determination of the H + constituent transference number, by a system such as H2T-M H T, would not have been theoretically reliable because hydrolysis of the H T_ ions in the indicator solution would have produced some hydrogen ions there also. Attempts to check this point experimentally were unsuccessful, no boundaries being visible with lithium, sodium, or cadmium hydrogen tartrate as indicator to 0.01 M tartaric acid solutions.
Extrapolation of Transference Numbers.—The bitartrate transference numbers at zero current are listed in Table II with solvent and volume corrections in-
T able IIB itartrate C onstituent T ransference N umbers
Currentm a range, ma. Tht- “ Tht- 3 cor. XHsT
0 .0 1 0 .2 7 4 0 .4 - 0 . 6 ' 0 .073» 0 .0 7 3 3 + 0 .5 2.02 .205 0 . 25- 0 .7 .0732 .0734 + .45.05 .138 0 to 1 b .0728 .0733 + .35.10 .101 0 .5 - 1 . 0 .0729 .0738 + .32° At zero current and with solvent correction applied. t With
volume correction applied also. c The boundary was too faint for visual observation at low currents and it became skew at high currents.
corporated. For the calculation of the degrees of dissociation of tartaric acid (a), we employed the dissociation constant of Bates and Canham13 (9.17 X 10~4 mole/1.) and the Giintelberg expression for the mean ionic activity coefficients f ±
lo g /± = — Az+ ¡2_| V a m /(1 + \^am) (4)
where z is the algebraic charge number and A is equal to 0.5098.14
The second dissociation constant of tartaric acid (4.30 X 10~5 mole/1.13) is not so much less than the
(13) R. G. Bates and R. G. Canham, J. Res. Nall. Bur. Std., 47, 343 (1951).
(14) M. Spiro, Trans. Fawday S o c . , 55, 1746 (1959).
first that the presence of tartrate ions can be altogether ignored. In 0.01 M solution 2% of HT~ ions are dissociated to T and in 0.1 M solution, 0.7%. In order to treat the problem quantitatively we must view the acid as a 1:2 electrolyte and choose as constituents the ions H+ and T — . Then4
Tt -2mHT- Xht- + 2tot— At--
mh+Ah+ d~ ?u,ht-Xht- ~f~ 2wit--A t--
2mVF (5)The last term shows that Tt -~ is determined experimentally by multiplying Ff, the volume traversed by the boundary per faraday, by the equivalent concentration of the 1:2 electrolyte, i.e., by twice the acid molarity. Thus the experimental transference numbers listed in Table II, which were obtained on the assumption that the acid was a 1:1 electrolyte, are really equal to
Tex pt — mVf — V 2Tt— (6)
The relationship between Texpt and Tht- becomes clearer if we take the equilibrium concentrations in an m molar solution of tartaric acid as
[H2T] = (1 — a)m, [HT ] = (a — fi)m.
[T— ] = fim, [H+] = (« + fi)m
Then from equations 5 and 6
{ a — /3)Ah t - + |6At —■ expt (a + /3)Ah+ + (a —fi )Aht-+ 2/3At-
PXht- +a — fi At—
Ah+ + Xht- +2p
a — fi
(7)(X + + At—)
Obviously T h t - (eq. 2) is equal to Texpt when fi/a is very small (i.e., no appreciable dissociation of HT~ ions into T ) or when the tartrate terms in the numerator and in the denominator of eq. 7 just balance each other so that
At— 2(X+ -|- At—)Xht- Xh+ + Aht- (8)
In the present case condition (8) applies in dilute solutions if At —0 = 59.9 (int. ohm) ' 1 cm.2 equ iv .'1, and it so happens that values of 59.63 and 63.215 have been reported on the basis of conductance studies of tartrate salts. Unfortunately neither paper gives the original experimental figures nor details of the fairly important hydrolysis correction, and we therefore accept a value of about 60 with some reservations. Should future work lead to a significantly different value the appropriate corrections will have to be made to convert Texpt into T h t - , but on present indications the two transference numbers are numerically identical.
The most surprising aspect of the concentration variation of T h t - is its absence. The transference numbers of strong mineral acids in water approach the Debye-Hiickel-Onsager limiting slope from above or below, but the deviation from theory is never large at
(15) J. F. J. Dippy, S. R. C. Hughes, and A. Rozanski, J, Chem, Soc., 2492 (1959).
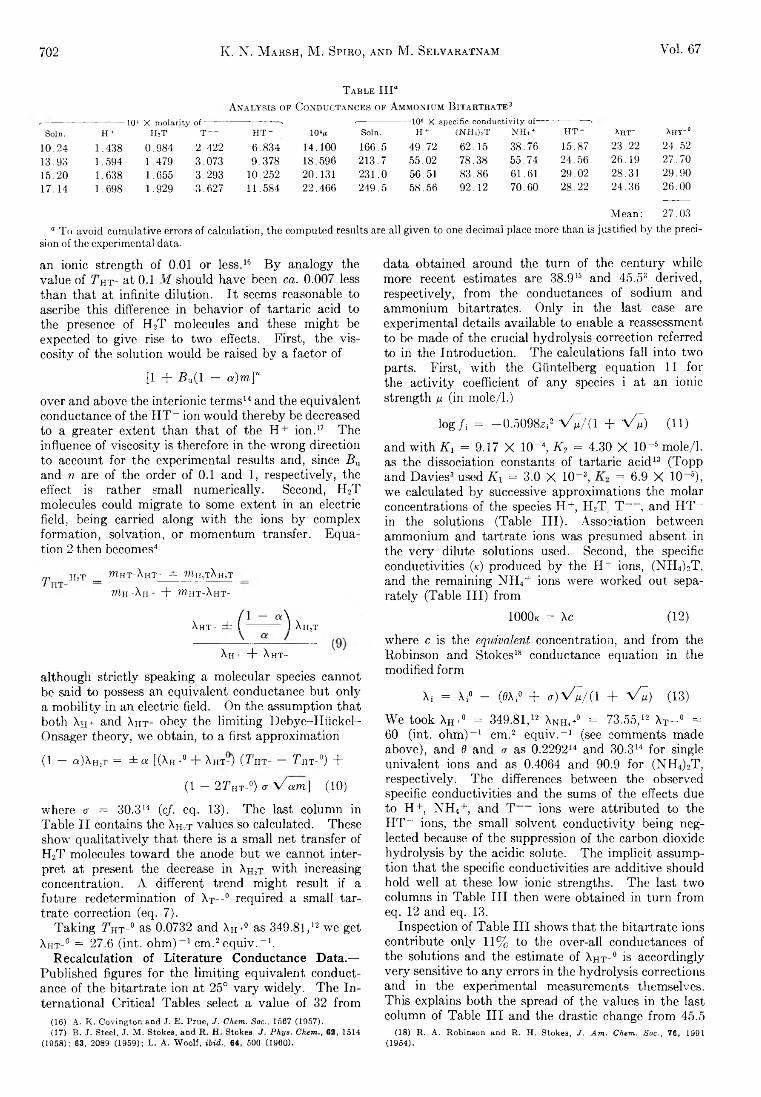
702 K. N. M arsh, M. Spiro, and M. Selvaratnam Vol. 67
T able III“A nalysis op Conductances of A mmonium B itartrate3
— I04 X molarity o f------------------------- - -—-------------- 10» X specific conductivity of-Soin. H + H2t T H T- 10V Soin. H + (NEUUT NHi + H T- XhT- \ht-°
10.24 1.438 0.984 2.422 6.834 14.100 166.5 49.72 62.15 38.76 15.87 23.22 24.5213.93 1.594 1.479 3.073 9.378 18.596 213.7 55.02 78.38 55.74 24.56 26.19 27.7015.20 1.638 1.655 3.293 10.252 20.131 231.0 56.51 83.86 61.61 29.02 28.31 29.9017.14 1.698 1.929 3.627 11.584 22.466 249.5 58.56 92.12 70.60 28.22 24.36 26.00
Mean: 27.03a To avoid cumulative errors of calculation, the computed results are all given to one decimal place more than is justified by the preci
sion of the experimental data.
an ionic strength of 0.01 or less.16 By analogy the value of 7 ht- at 0.1 M should have been ca. 0.007 less than that at infinite dilution. It seems reasonable to ascribe this difference in behavior of tartaric acid to the presence of H2T molecules and these might be expected to give rise to two effects. First, the viscosity of the solution would be raised by a factor of
[1 + Bu( 1 - a)m]n
over and above the interionic terms14 and the equivalent conductance of the H T- ion would thereby be decreased to a greater extent than that of the H+ ion.17 The influence of viscosity is therefore in the wrong direction to account for the experimental results and, since Bu and n are of the order of 0.1 and 1, respectively, the effect is rather small numerically. Second, H2T molecules could migrate to some extent in an electric field, being carried along with the ions by complex formation, solvation, or momentum transfer. Equation 2 then becomes4
j , HsT _ wiht-Xht- ± wih,tXhzt _
wih+Xh+ + w-ht-Xht-(1 - a\
Xht- ± I -------- 1 Xh2t
Xh+ + Xht-
although strictly speaking a molecular species cannot be said to possess an equivalent conductance but only a mobility in an electric field. On the assumption that both Xh+ and Xht- obey the limiting Debye-Hiickel- Onsager theory, we obtain, to a first approximation
(1 — a ) X n 2T = ± a [ ( X h +° + X h t - ) ( T h t - — T h t - 0) +
(1 — 2 7 ^ -°) o’ y/am] (10)
where cr = 30.314 (c/. eq. 13). The last column in Table II contains the Xh2t values so calculated. These show qualitatively that there is a small net transfer of H2T molecules toward the anode but we cannot interpret at present the decrease in Xh2t with increasing concentration. A different trend might result if a future redetermination of Xt—0 required a small tartrate correction (eq. 7).
Taking 7 ht-° as 0.0732 and Xh+° as 349.81,12 we get Xht-° = 27.6 (int. ohm) -1 cm.2equiv.-1.
Recalculation of Literature Conductance Data.— Published figures for the limiting equivalent conductance of the bitartrate ion at 25° vary widely. The International Critical Tables select a value of 32 from
(16) A. K. Covington and J. E. Prue, J. Chem. Soc., 1567 (1957).(17) B. J. Steel, J. M. Stokes, and R. H. Stokes, J. Phys. Chem., 62, 1514
(1958); 63, 2089 (1959); L. A. Woolf, ibid., 64, 500 (1960).
data obtained around the turn of the century while more recent estimates are 38.915 and 45.53 derived, respectively, from the conductances of sodium and ammonium bitartrates. Only in the last case are experimental details available to enable a reassessment to be made of the crucial hydrolysis correction referred to in the Introduction. The calculations fall into two parts. First, with the Guntelberg equation 11 for the activity coefficient of any species i at an ionic strength fj, (in mole/1.)
log /i = - 0.50982i2 V m/(1 + V m) (11)
and with Ki = 9.17 X 10⁻⁴, K 2 = 4.30 X 10⁻⁶ mole/1. as the dissociation constants of tartaric acid13 (Topp and Davies3 used K\ = 3.0 X 10⁻⁸, = 6.9 X 10⁻⁵),we calculated by successive approximations the molar concentrations of the species H+, H2T. T , and HT~ in the solutions (Table III). Association between ammonium and tartrate ions was presumed absent in the very dilute solutions used. Second, the specific conductivities (k) produced by the H + ions, (NH4)2T, and the remaining NH4+ ions were worked out separately (Table III) from
1000k = Xc (12)
where c is the equivalent concentration, and from the Robinson and Stokes18 conductance equation in the modified form
X; = X i° - (0Xi° + <rW u/(l + V~u) (13)
We took XH+° = 349.81,12 XNh4h-° = 73.55,12 XT- ° = 60 (int. ohm) -1 cm.2 equiv.-1 (see comments made above), and 9 and a as 0.229214 and 30.314 for single univalent ions and as 0.4064 and 90.9 for (NH4)2T, respectively. The differences between the observed specific conductivities and the sums of the effects due to H+, NH4+, and T ions were attributed to the H T- ions, the small solvent conductivity being neglected because of the suppression of the carbon dioxide hydrolysis by the acidic solute. The implicit assumption that the specific conductivities are additive should hold well at these low ionic strengths. The last two columns in Table III then were obtained in turn from eq. 12 and eq. 13.
Inspection of Table III shows that the bitartrate ions contribute only 11% to the over-all conductances of the solutions and the estimate of XHt-° is accordingly very sensitive to any errors in the hydrolysis corrections and in the experimental measurements themselves. This explains both the spread of the values in the last column of Table III and the drastic change from 45.5
(18) R. A. Robinson and R. H. Stokes, J. Am. Chem. Soc., 76, 1991 (1954).
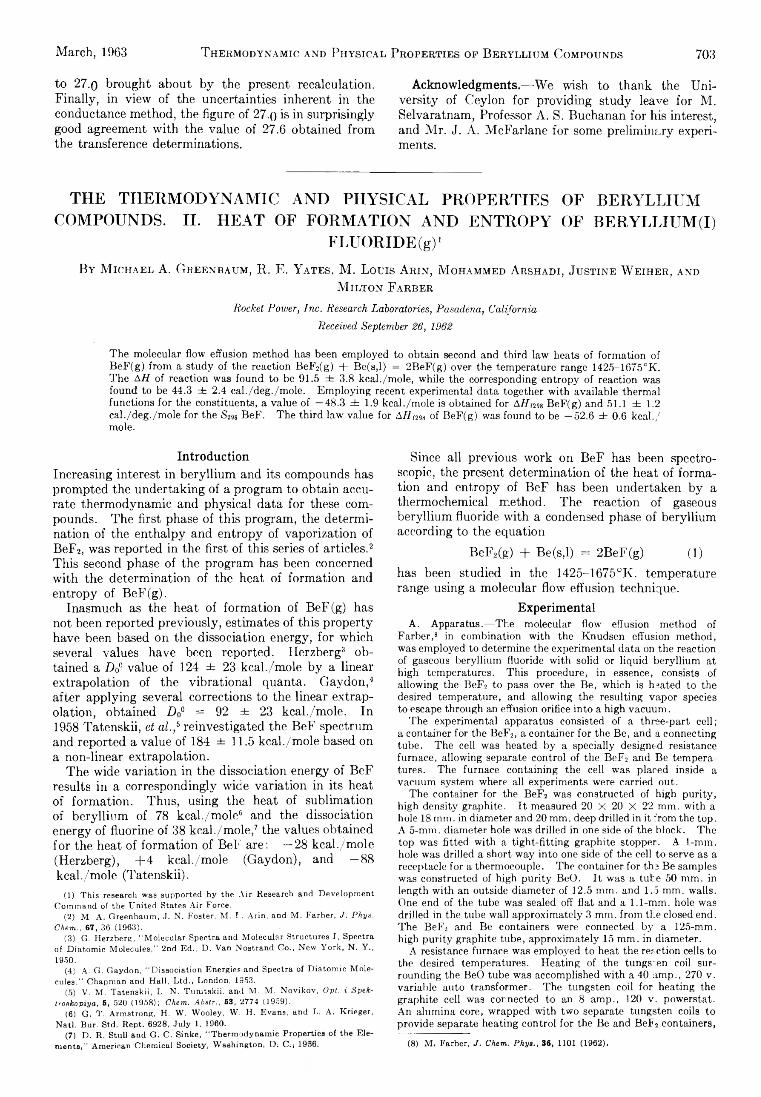
March, 1963 T hermodynamic and Physical Properties op Beryllium Compounds 703
to 27.0 brought about by the present recalculation. Finally, in view of the uncertainties inherent in the conductance method, the figure of 27.(j is in surprisingly good agreement with the value of 27.6 obtained from the transference determinations.
Acknowledgments.— We wish to thank the University of Ceylon for providing study leave for M. Selvaratnam, Professor A. S. Buchanan for his interest, and Mr. J. A. McFarlane for some preliminary experiments.
THE THERMODYNAMIC AND PHYSICAL PROPERTIES OF BERYLLIUM COMPOUNDS. II. HEAT OF FORMATION AND ENTROPY OF BERYLLIUM (I)
FLUORIDE (g)1B y M ichael A . G re en ba u m , R. E. Y a t e s , M . L ouis A r in , M ohammed A rsh ad i, Justine W e ih e r , and
M ilton Fär be r
Rocket Power, Inc. Research Laboratories, Pasadena, California Received September 26, 1962
The molecular flow effusion method has been employed to obtain second and third law heats of formation of BeF(g) from a study of the reaction BeF2(g) + Be(s,l) = 2BeF(g) over the temperature range 1425-1675°K. The AH of reaction was found to be 91.5 ± 3.8 kcal./mole, while the corresponding entropy of reaction was found to be 44.3 ± 2.4 cal./deg./mole. Employing recent experimental data together with available thermal functions for the constituents, a value of —48.3 ± 1.9 kcal./mole is obtained for AHmi BeF(g) and 51.1 ± 1.2 cal./deg./mole for the Sm BeF. The third law value for AH^sa of BeF(g) was found to be —52.6 ± 0.6 kcal./ mole.
IntroductionIncreasing interest in beryllium and its compounds has prompted the undertaking of a program to obtain accurate thermodynamic and physical data for these compounds. The first phase of this program, the determination of the enthalpy and entropy of vaporization of BeF2, was reported in the first of this series of articles.2 This second phase of the program has been concerned with the determination of the heat of formation and entropy of BeF(g).
Inasmuch as the heat of formation of BeF(g) has not been reported previously, estimates of this property have been based on the dissociation energy, for which several values have been reported. Herzberg3 obtained a Do0 value of 124 ± 23 kcal./mole by a linear extrapolation of the vibrational quanta. Gay don,4 after applying several corrections to the linear extrapolation, obtained Da° = 92 ± 23 kcal./mole. In 1958 Tatenskii, et al.,s reinvestigated the BeF spectrum and reported a value of 184 ± 11.5 kcal./mole based on a non-linear extrapolation.
The wide variation in the dissociation energy of BeF results in a correspondingly wide variation in its heat of formation. Thus, using the heat of sublimation of beryllium of 78 kcal./mole6 and the dissociation energy of fluorine of 38 kcal./mole,7 the values obtained for the heat of formation of BeF are: —28 kcal./mole(Herzberg), + 4 kcal./mole (Gaydon), and —88 kcal./mole (Tatenskii).
(1) This research was supported by the Air Research and Development Command of the United States Air Force.
(2) M. A. Greenbaum, J. N. Foster, M. L. Arin, and M. Farber, J. Phys. Chem., 67, 36 (1963).
(3) G. Herzberg, “ Molecular Spectra and Molecular Structures I, Spectra of Diatomic Molecules,” 2nd Ed., D. Van Nostrand Co., New York, N. Y., 1950.
(4) A. G. Gaydon, “ Dissociation Energies and Spectra of Diatomic Molecules,” Chapman and Hall, Ltd., London, 1953.
(5) V. M. Tatenskii, L. N. Tunitskii. and M. M. Novikov, Opt. i Spek- troskopiya, 5, 520 (1958); Chem. Ahstr., 53, 2774 (1959).
(6) G. T. Armstrong, H. W. Wooley, W. H. Evans, and L. A. Krieger, Natl. Bur. Std. Rept. 6928, July 1, 1960.
(7) D. R. Stull and G. C. Sinke, “ Thermodynamic Properties of the Elements,” American Chemical Society, Washington! D; C;$ 19o6;
Since all previous work on BeF has been spectroscopic, the present determination of the heat of formation and entropy of BeF has been undertaken by a thermochemical method. The reaction of gaseous beryllium fluoride with a condensed phase of beryllium according to the equation
BeF2(g) + Be(s,l) = 2BeF(g) (1)has been studied in the 1425-1675°K. temperature range using a molecular flow effusion technique.
ExperimentalA. Apparatus.— The molecular flow effusion method of
Farber,8 in combination with the Knudsen effusion method, was employed to determine the experimental data on the reaction of gaseous beryllium fluoride with solid or liquid beryllium at high temperatures. This procedure, in essence, consists of allowing the BeF2 to pass over the Be, which is heated to the desired temperature, and allowing the resulting vapor species to escape through an effusion orifice into a high vacuum.
The experimental apparatus consisted of a three-part cell; a container for the BeF2, a container for the Be, and a connecting tube. The cell was heated by a specially designed resistance furnace, allowing separate control of the BeF2 and Be tempera tures. The furnace containing the cell was placed inside a vacuum system where all experiments were carried out.
The container for the BeF2 was constructed of high purity, high density graphite. It measured 20 X 20 X 22 mm. with a hole 18 mm. in diameter and 20 mm. deep drilled in it from the top. A 5-mm. diameter hole was drilled in one side of the block. The top was fitted with a tight-fitting graphite stopper. A 1-mm. hole was drilled a short way into one side of the cell to serve as a receptacle for a thermocouple. The container for the Be samples was constructed of high purity BeO. It was a tube 50 mm. in length with an outside diameter of 12.5 mm. and 1.5 mm. walls. One end of the tube was sealed off flat and a 1 .1 -mm. hole was drilled in the tube wall approximately 3 mm. from the closed end. The BeF2 and Be containers were connected by a 125-mm. high purity graphite tube, approximately 15 mm. in diameter.
A resistance furnace was employed to heat the reaction cells to the desired temperatures. Heating of the tungsten coil surrounding the BeO tube was accomplished with a 40 amp., 270 v. variable auto transformer. The tungsten coil for heating the graphite cell was connected to an 8 amp., 12 0 v. powerstat. An alumina core, wrapped with two separate tungsten coils to provide separate heating control for the Be and BeF2 containers,
(8) M, Farber, J. Chem. Phys., S6, 1101 (1962).
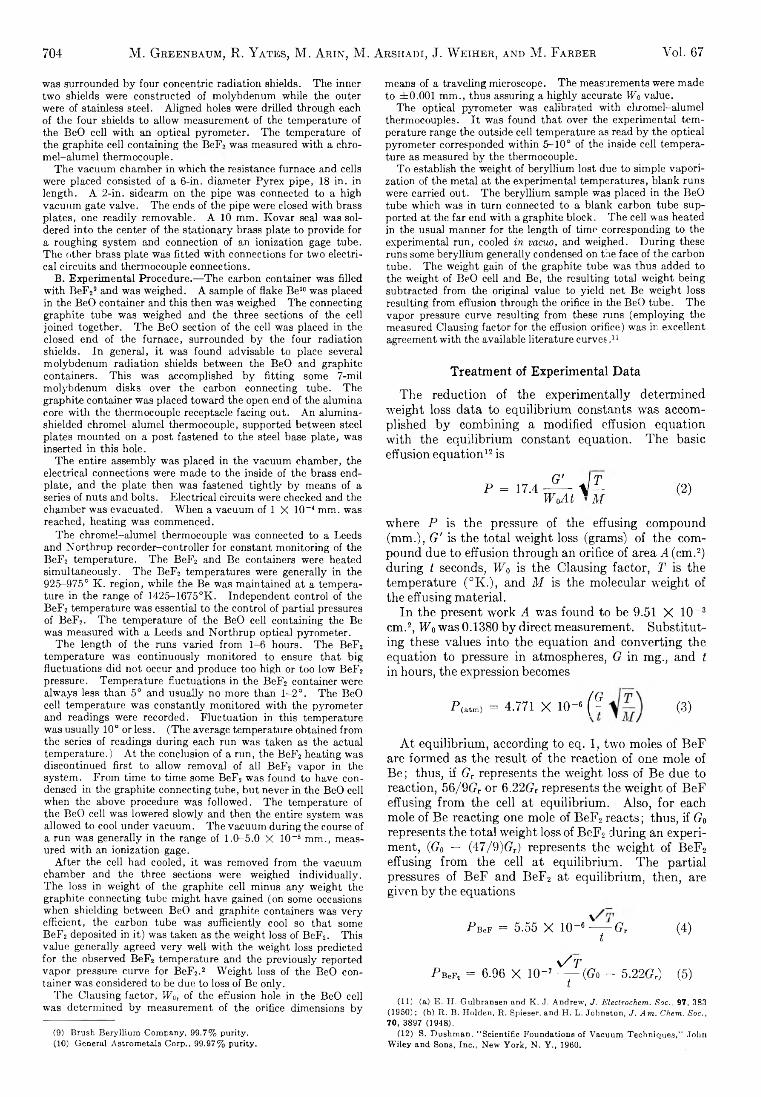
704 M. Greenbaum, R. Y ates, M. A rin, M. Arshadi, J. W eiher, and M. Farber Vol. 67
was surrounded by four concentric radiation shields. The inner two shields were constructed of molybdenum while the outer were of stainless steel. Aligned holes were drilled through each of the four shields to allow measurement of the temperature of the BeO cell with an optical pyrometer. The temperature of the graphite cell containing the BeF» was measured with a chro- mel-alumel thermocouple.
The vacuum chamber in which the resistance furnace and cells were placed consisted of a 6-in. diameter Pyrex pipe, 18 in. in length. A 2-in. sidearm on the pipe was connected to a high vacuum gate valve. The ends of the pipe were closed with brass plates, one readily removable. A 10 mm. Kovar seal was soldered into the center of the stationary brass plate to provide for a roughing system and connection of an ionization gage tube. The other brass plate was fitted with connections for two electrical circuits and thermocouple connections.
B. Experimental Procedure.— The carbon container was filled with BeF29 and was weighed. A sample of flake Be10 was placed in the BeO container and this then was weighed The connecting graphite tube was weighed and the three sections of the cell joined together. The BeO section of the cell was placed in the closed end of the furnace, surrounded by the four radiation shields. In general, it was found advisable to place several molybdenum radiation shields between the BeO and graphite containers. This was accomplished by fitting some 7-mil molybdenum disks over the carbon connecting tube. The graphite container was placed toward the open end of the alumina core with the thermocouple receptacle facing out. An alumina- shielded chromel-alumel thermocouple, supported between steel plates mounted on a post fastened to the steel base plate, was inserted in this hole.
The entire assembly was placed in the vacuum chamber, the electrical connections were made to the inside of the brass end- plate, and the plate then was fastened tightly by means of a series of nuts and bolts. Electrical circuits were checked and the chamber was evacuated. When a vacuum of 1 X 10~ 4 mm. was reached, heating was commenced.
The chromel-alumel thermocouple was connected to a Leeds and Northrup recorder-controller for constant monitoring of the BeF2 temperature. The BeF2 and Be containers were heated simultaneously. The BeF2 temperatures were generally in the 925-075° K . region, while the Be was maintained at a temperature in the range of 1425-1675°K. Independent control of the BeF2 temperature was essential to the control of partial pressures of BeF2. The temperature of the BeO cell containing the Be was measured with a Leeds and Northrup optical pyrometer.
The length of the runs varied from 1-6 hours. The BeF2 temperature was continuously monitored to ensure that big fluctuations did not occur and produce too high or too low BeF2 pressure. Temperature fluctuations in the BeF2 container were always less than 5° and usually no more than 1-2°. The BeO cell temperature was constantly monitored with the pjTometer and readings were recorded. Fluctuation in this temperature was usually 10° or less. (The average temperature obtained from the series of readings during each run was taken as the actual temperature.) At the conclusion of a run, the BeF2 heating was discontinued first to allow removal of all BeF2 vapor in the system. From time to time some BeF2 was found to have condensed in the graphite connecting tube, but never in the BeO cell when the above procedure was followed. The temperature of the BeO cell was lowered slowly and then the entire system was allowed to cool under vacuum. The vacuum during the course of a run was generally in the range of 1.0-5.0 X 10⁻⁵ mm., measured with an ionization gage.
After the cell had cooled, it was removed from the vacuum chamber and the three sections were weighed individually. The loss in weight of the graphite cell minus any weight the graphite connecting tube might have gained (on some occasions when shielding between BeO and graphite containers was very efficient, the carbon tube was sufficiently cool so that some BeF2 deposited in it) was taken as the weight loss of BeF2. This value generally agreed very well with the weight loss predicted for the observed BeF2 temperature and the previously reported vapor pressure curve for BeF2.2 Weight loss of the BeO container was considered to be due to loss of Be only.
The Clausing factor, IFo, of the effusion hole in the BeO cell was determined by measurement of the orifice dimensions by
(9) Brush Beryllium Company, 99.7% purity.(10) General Astrometals Corp., 99.97% purity.
means of a traveling microscope. The measurements were made to ± 0 .0 0 1 mm., thus assuring a highly accurate Wo value.
The optical pyrometer was calibrated with chromel-alumel thermocouples. It was found that over the experimental temperature range the outside cell temperature as read by the optical pyrometer corresponded within 5-10° of the inside cell temperature as measured by the thermocouple.
To establish the weight of beryllium lost due to simple vaporization of the metal at the experimental temperatures, blank runs were carried out. The beryllium sample was placed in the BeO tube which was in turn connected to a blank carbon tube supported at the far end with a graphite block. The cell was heated in the usual manner for the length of time corresponding to the experimental run, cooled in vacuo, and weighed. During these runs some beryllium generally condensed on the face of the carbon tube. The weight gain of the graphite tube was thus added to the weight of BeO cell and Be, the resulting total weight being subtracted from the original value to yield net Be weight loss resulting from effusion through the orifice in the BeO tube. The vapor pressure curve resulting from these runs (employing the measured Clausing factor for the effusion orifice) was in excellent agreement with the available literature curves ,u
Treatment of Experimental Data
The reduction of the experimentally determined weight loss data to equilibrium constants was accomplished by combining a modified effusion equation with the equilibrium constant equation. The basic effusion equation12 is
G' ITP = 17.4 — — V — (2)
WaAt *A f
■where P is the pressure of the effusing compound (mm.), G' is the total weight loss (grams) of the compound due to effusion through an orifice of area A (cm.2) during t seconds, W0 is the Clausing factor, T is the temperature (°K.), and M is the molecular weight of the effusing material.
In the present work A was found to be 9.51 X 10⁻³ cm.2, W0 was 0.1380 by direct measurement. Substituting these values into the equation and converting the equation to pressure in atmospheres, G in mg., and t in hours, the expression becomes
P(atm) = 4.771 X 10⁻⁶ ( ? (3)
At equilibrium, according to eq. 1, two moles of BeF are formed as the result of the reaction of one mole of B e; thus, if Gr represents the weight loss of Be due to reaction, 56/9Gr or 6.22(7r represents the weight of BeF effusing from the cell at equilibrium. Also, for each mole of Be reacting one mole of BeF2 reacts; thus, if G0 represents the total weight loss of BoF2 during an experiment, (G0 — (47/9)Gr) represents the weight of BeF2 effusing from the cell at equilibrium. The partial pressures of BeF and BeF2 at equilibrium, then, are given by the equations
PseF = 5.55 X 10⁻⁶^ y -(? r (4)
y/ TP BeF2 = 6.96 X 10~7 —j~ (Go - 5.22(?r) (5)
(11) (a) E. H. Gulbransen and K. J. Andrew, J. Electrochem. Soc., 97, 383 (1950); (b) R. B. Holden, R. Spieser, and H. L. Johnston, J. Am. Chem. Soc., 70, 3897 (1948).
(12) S. Dushman, “ Scientific Foundations of Vacuum Techniques,” John Wiley and Sons, Inc*, New York, N. Y., 1960.
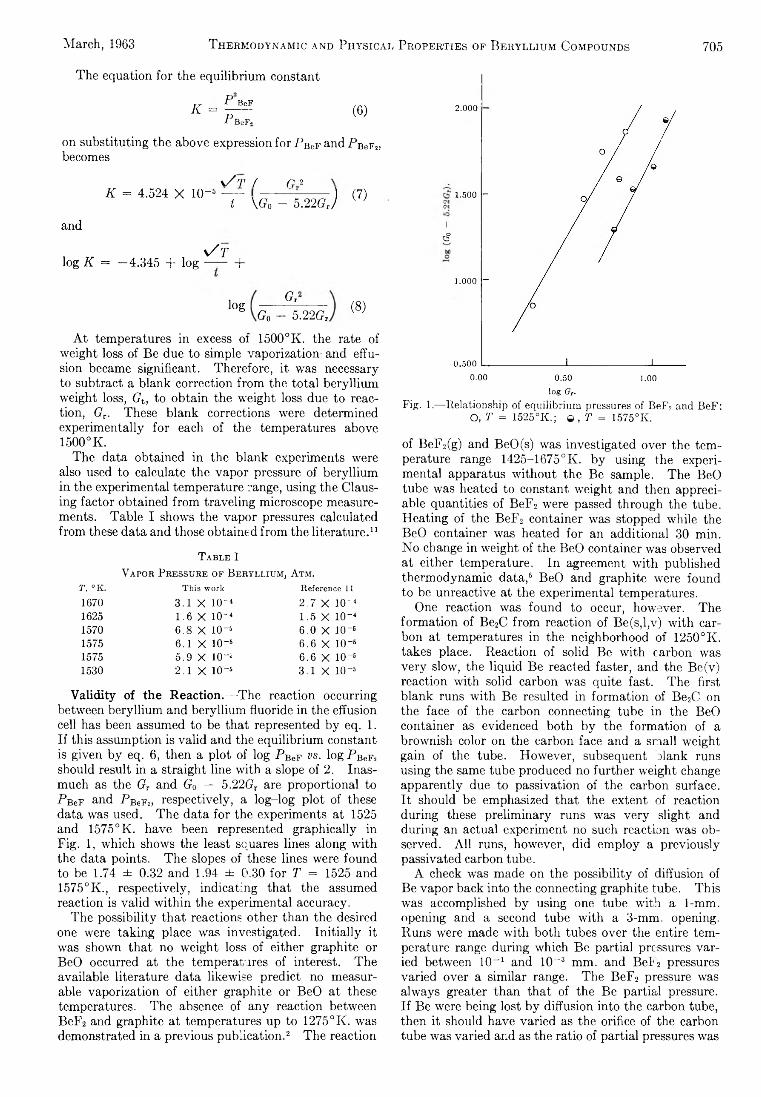
March, 1963 Thermodynamic and Physical Properties of Beryllium Compounds 705
The equation for the equilibrium constant
K = P BeF
P BeF.(6)
on substituting the above expression for PBef and PBef2, becomes
\/t / Q 2K = 4.524 X KR6 ------ ------ —------- ) (7)
i \G0 - 5.22G J K ’
and
s/ tlog K = —4.345 + log —------1-
log GrGo - 5.22Gr (8)
At temperatures in excess of 1500°K. the rate of weight loss of Be due to simple vaporization and effusion became significant. Therefore, it was necessary to subtract a blank correction from the total beryllium weight loss, Gt, to obtain the weight loss due to reaction, GT. These blank corrections were determined experimentally for each of the temperatures above 1500°K.
The data obtained in the blank experiments were also used to calculate the vapor pressure of beryllium in the experimental temperature range, using the Clausing factor obtained from traveling microscope measurements. Table I shows the vapor pressures calculated from these data and those obtained from the literature.11
T able IV apor P ressure of B eryllium , A tm .
T, °K. This work Reference 111670 3.1 X IO' 4 2.7 X IO-41625 1.6 X IO' 4 1.5 X 10~ 41570 6 .8 X IO“ 5 6.0 X IO-51575 6.1 X IO“ 6 6 .6 X IO- 51575 5.9 X IO“ 5 6 .6 X 10-®1530 2.1 X IO- 5 3.1 X IO- 5
Validity of the Reaction.— The reaction occurring between beryllium and beryllium fluoride in the effusion cell has been assumed to be that represented by eq. 1. If this assumption is valid and the equilibrium constant is given by eq. 6, then a plot of log PBeF vs. log PBeFz should result in a straight line with a slope of 2. Inasmuch as the GT and G0 — 5.22(7r are proportional to P BeF and PBeFi) respectively, a log-log plot of these data was used. The data for the experiments at 1525 and 1575°K. have been represented graphically in Fig. 1, which shows the least squares lines along with the data points. The slopes of these lines were found to be 1.74 ± 0.32 and 1.94 ± 0.30 for T = 1525 and 1575°K., respectively, indicating that the assumed reaction is valid within the experimental accuracy.
The possibility that reactions other than the desired one were taking place was investigated. Initially it was shown that no weight loss of either graphite or BeO occurred at the temperatures of interest. The available literature data likewise predict no measurable vaporization of either graphite or BeO at these temperatures. The absence of any reaction between BeF2 and graphite at temperatures up to 1275°K. was demonstrated in a previous publication.2 The reaction
2.000
1.500 -
I<5
1.000 -
0.500 _______________1--------------------J --------0.00 0.50 1.00
log Gt.Fig. 1.— Relationship of equilibrium pressures of BeF2 and BeF:
O, T = 1525°K .; © , T = 1575°K.
of BeF2(g) and BeO(s) was investigated over the temperature range 1425-1675°K. by using the experimental apparatus without the Be sample. The BeO tube was heated to constant weight and then appreciable quantities of BeF2 were passed through the tube. Heating of the BeF2 container was stopped while the BeO container was heated for an additional 30 min. No change in weight of the BeO container was observed at either temperature. In agreement with published thermodynamic data,6 BeO and graphite were found to be unreactive at the experimental temperatures.
One reaction was found to occur, however. The formation of Be2C from reaction of Be(s,l,v) with carbon at temperatures in the neighborhood of 1250°K. takes place. Reaction of solid Be with carbon was very slow, the liquid Be reacted faster, and the Be(v) reaction with solid carbon was quite fast. The first blank runs with Be resulted in formation of Be2C on the face of the carbon connecting tube in the BeO container as evidenced both by the formation of a brownish color on the carbon face and a small weight gain of the tube. However, subsequent blank runs using the same tube produced no further weight change apparently due to passivation of the carbon surface. It should be emphasized that the extent of reaction during these preliminary runs was very slight and during an actual experiment no such reaction was observed. All runs, however, did employ a previously passivated carbon tube.
A check was made on the possibility of diffusion of Be vapor back into the connecting graphite tube. This was accomplished by using one tube with a 1-mrn. opening and a second tube with a 3-mm. opening. Runs were made with both tubes over the entire temperature range during which Be partial pressures varied between !0 -1 and 10~3 mm. and BeF2 pressures varied over a similar range. The BeF2 pressure was always greater than that of the Be partial pressure. If Be were being lost by diffusion into the carbon tube, then it should have varied as the orifice of the carbon tube was varied and as the ratio of partial pressures was
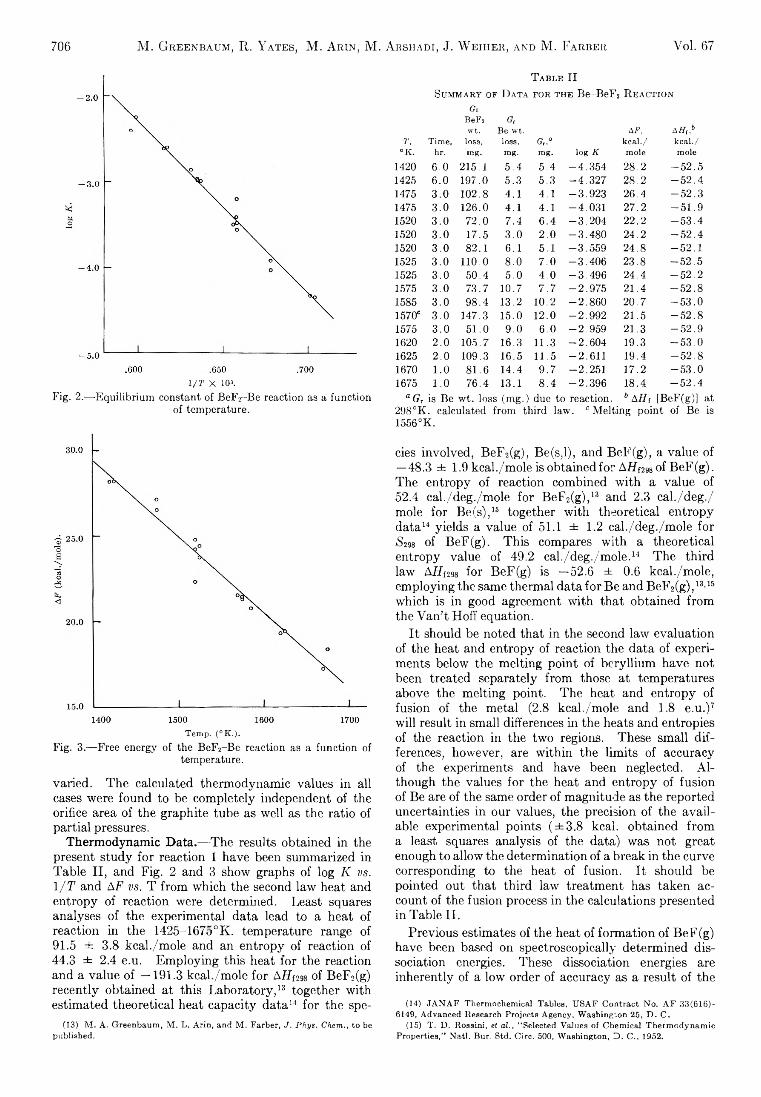
706 M . Greenbaum, R. Yates, M . A rin, M . Arshadi, J. W eiher, and M . Färber Voi. 67
1 / T X HRFig. 2.— Equilibrium constant of BeFa-Be reaction as a function
of temperature.
Temp. (°K.).Fig. 3.— Free energy of the BeF2-B e reaction as a function of
temperature.
varied. The calculated thermodynamic values in all cases were found to be completely independent of the orifice area of the graphite tube as well as the ratio of partial pressures.
Thermodynamic Data.—The results obtained in the present study for reaction 1 have been summarized in Table II, and Fig. 2 and 3 show graphs of log K vs. 1 /T and AF vs. T from which the second law heat and entropy of reaction were determined. Least squares analyses of the experimental data lead to a heat of reaction in the 1425-167o°K. temperature range of91.5 ± 3.8 kcal./mole and an entropy of reaction of44.3 ± 2.4 e.u. Employing this heat for the reaction and a value of —191.3 kcal./mole for AHms of BeF2(g) recently obtained at this Laboratory,13 together with estimated theoretical heat capacity data14 for the spe-
(13) M. A. Greenbaum, M. L. Arin, and M. Farber, J. Phys. Chem., to be published.
T able IISummary of D ata for the Be-BeFa R eaction
GoBeF2 a,-wt. Be wt. AF, A H,.b
T. Time, loss, loss. Gr,° kcal./ kcal./°K. hr. mg. mg. mg. log K mole mole
1420 6.0 215 .1 5 .4 5 .4 - 4 . 3 5 4 2 8 .2 - 5 2 . 51425 6.0 1 9 7 .0 5 .3 5 .3 - 4 . 3 2 7 2 8 .2 - 5 2 . 41475 3 .0 102.8 4 .1 4 .1 - 3 .9 2 3 2 6 .4 - 5 2 . 31475 3 .0 1 2 6 .0 4 .1 4 .1 - 4 .0 3 1 2 7 .2 - 5 1 . 91520 3 .0 7 2 .0 7 .4 6 .4 - 3 . 2 0 4 22.2 - 5 3 . 41520 3 .0 1 7 .5 3 .0 2.0 - 3 . 4 8 0 2 4 .2 - 5 2 . 41520 3 .0 8 2 .1 6.1 5 .1 - 3 . 5 5 9 2 4 .8 - 5 2 . 11525 3 .0 110.0 8.0 7 .0 - 3 . 4 0 6 2 3 .8 - 5 2 . 51525 3 .0 5 0 .4 5 .0 4 .0 - 3 . 4 9 6 2 4 .4 - 5 2 . 21575 3 .0 7 3 .7 1 0 .7 7 .7 - 2 . 9 7 5 2 1 .4 - 5 2 . 81585 3 .0 9 8 .4 1 3 .2 10.2 - 2 . 8 6 0 2 0 .7 - 5 3 . 01570' 3 .0 14 7 .3 1 5 .0 12.0 - 2 . 9 9 2 2 1 .5 - 5 2 . 81575 3 .0 5 1 .0 9 .0 6.0 - 2 .9 5 9 2 1 .3 - 5 2 . 91620 2.0 1 0 5 .7 1 6 .3 11 .3 - 2 . 6 0 4 1 9 .3 - 5 3 . 01625 2.0 10 9 .3 1 6 .5 1 1 .5 - 2 .6 1 1 1 9 .4 - 5 2 . 81670 1 .0 8 1 .6 1 4 .4 9 .7 - 2 .2 5 1 1 7 .2 - 5 3 . 01675 1 .0 7 6 .4 13 .1 8 .4 - 2 . 3 9 6 1 8 .4 - 5 2 . 4
“ G, is Be wt. loss (mg.) due to reaction. b AH, [BeF(g)] at 298°K. calculated from third law. c Melting point of Be is 1556 °K .
cies involved, BeF2(g), Be(s,l), and BeF(g), a value of — 48.3 ± 1.9 kcal./mole is obtained for AH'f298 of BeF(g). The entropy of reaction combined with a value of52.4 cal./deg./mole for BeF2(g),18 and 2.3 cal./deg./ mole for Be(s),15 together with theoretical entropy data14 yields a value of 51.1 ± 1.2 cal./deg./mole for $298 of BeF(g). This compares with a theoretical entropy value of 49.2 cal./deg./mole.14 The third law ARf298 for BeF(g) is —52.6 ± 0.6 kcal./mole, employing the same thermal data for Be and BeF2(g),13'15 which is in good agreement with that obtained from the Van’ t Hoff equation.
It should be noted that in the second law evaluation of the heat and entropy of reaction the data of experiments below the melting point of beryllium have not been treated separately from those at temperatures above the melting point. The heat and entropy of fusion of the metal (2.8 kcal./mole and 1.8 e.u.)7 will result in small differences in the heats and entropies of the reaction in the two regions. These small differences, however, are within the limits of accuracy of the experiments and have been neglected. Although the values for the heat and entropy of fusion of Be are of the same order of magnitude as the reported uncertainties in our values, the precision of the available experimental points (±3 .8 kcal. obtained from a least squares analysis of the data) was not great enough to allow the determination of a break in the curve corresponding to the heat of fusion. It should be pointed out that third law treatment has taken account of the fusion process in the calculations presented in Table II.
Previous estimates of the heat of formation of BeF(g) have been based on spectroscopically determined dissociation energies. These dissociation energies are inherently of a low order of accuracy as a result of the
(14) JANAF Thermochemical Tables, USAF Contract No. AF 33(616)- 6149, Advanced Research Projects Agency, Washington 25, D. C.
(15) T. D. Rossini, et al., “ Selected Values of Chemical Thermodynamic Properties,” Natl. Bur. Std. Circ. 500, Washington, D. C., 1952.
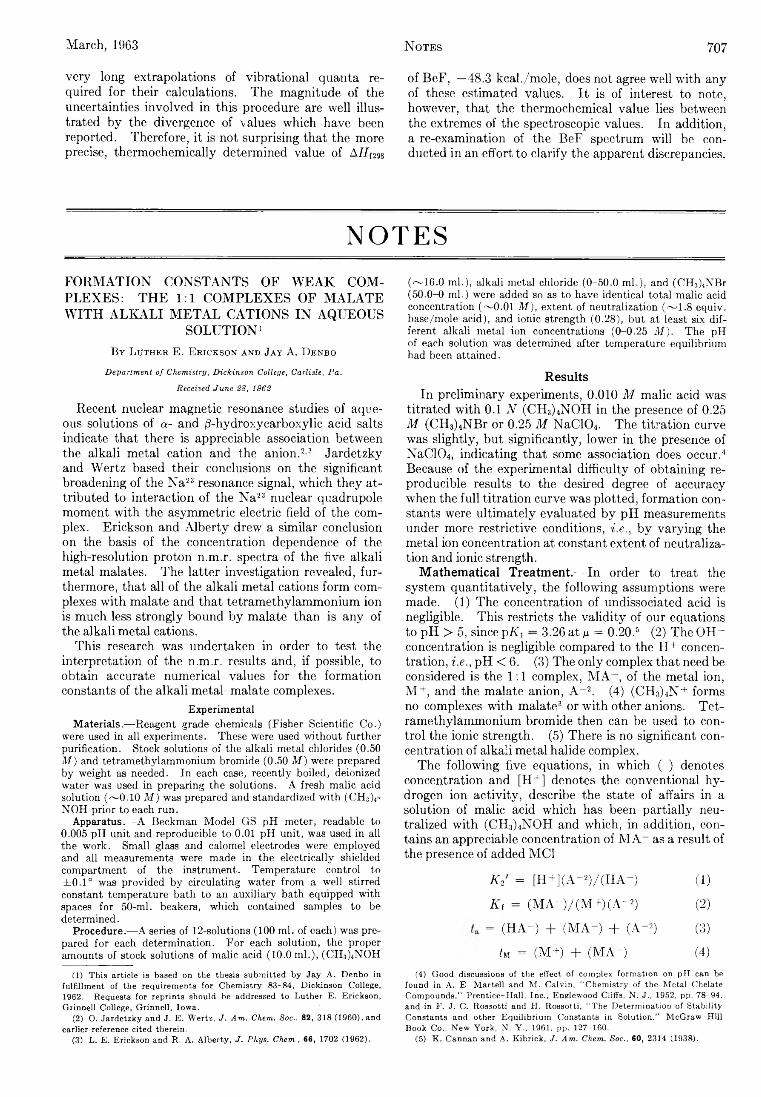
March, 1963 Notes 707
very long extrapolations of vibrational quanta required for their calculations. The magnitude of the uncertainties involved in this procedure are well illustrated by the divergence of values which have been reported. Therefore, it is not surprising that the more precise, thermochemically determined value of A //f29s
of BeF, —48.3 kcal./mole, does not agree well with any of these estimated values. It is of interest to note, however, that the thermochemical value lies between the extremes of the spectroscopic values. In addition, a re-examination of the BeF spectrum will be conducted in an effort to clarify the apparent discrepancies.
NOTESFORMATION CONSTANTS OF W EAK COMPLEXES: THE 1:1 COMPLEXES OF MALATE W ITH ALKALI METAL CATIONS IN AQUEOUS
SOLUTION1B y L u t h e h E. E e i c k s o n a n d J a y A. D e n b o
Department of Chemistry, Dickinson College, Carlisle, Pa.
Received June 28, 1962
Recent nuclear magnetic resonance studies of aqueous solutions of a- and /3-hydroxycarboxylic acid salts indicate that there is appreciable association between the alkali metal cation and the anion.2 3 Jardetzky and Wertz based their conclusions on the significant broadening of the Na23 resonance signal, which they attributed to interaction of the Na23 nuclear quadrupole moment with the asymmetric electric field of the complex. Erickson and Alberty drew a similar conclusion on the basis of the concentration dependence of the high-resolution proton n.m.r. spectra of the five alkali metal malates. The latter investigation revealed, furthermore, that all of the alkali metal cations form complexes with malate and that tétraméthylammonium ion is much less strongly bound by malate than is any of the alkali metal cations.
This research was undertaken in order to test the interpretation of the n.m.r. results and, if possible, to obtain accurate numerical values for the formation constants of the alkali metal-malate complexes.
ExperimentalMaterials.—Reagent grade chemicals (Fisher Scientific Co.)
were used in all experiments. These were used without further purification. Stock solutions of the alkali metal chlorides (0.50 M ) and tétraméthylammonium bromide (0.50 M ) were prepared by weight as needed. In each case, recently boiled, deionized water was used in preparing the solutions. A fresh malic acid solution (~0.10 M ) was prepared and standardized with (CH3)4- NOH prior to each run.
Apparatus.—A Beckman Model GS pH meter, readable to 0.005 pH unit and reproducible to 0.01 pH unit, was used in all the work. Small glass and calomel electrodes were employed and all measurements were made in the electrically shielded compartment of the instrument. Temperature control to ±0.1° was provided by circulating water from a well stirred constant temperature bath to an auxiliary bath equipped with spaces for 50-ml. beakers, which contained samples to be determined.
Procedure.—A series of 12-solutions (100 ml. of each) was prepared for each determination. For each solution, the proper amounts of stock solutions of malic acid (10.0 ml.), (CH3)4NOH
(1) This article is based on the thesis submitted by Jay A. Denbo in fulfillment of the requirements for Chemistry 83-84, Dickinson College, 1962. Requests for reprints should be addressed to Luther E. Erickson, Grinnell College, Grinnell, Iowa.
(2) O. Jardetzky and J. E. Wertz, J. Am. Chem. Soc., 82, 318 (1960), and earlier reference cited therein.
(3) L. E. Erickson and R. A. Alberty, J. Phys. Chem., 66, 1702 (1962).
(~16.0 ml.), alkali metal chloride (0-50.0 ml.), and (CH3)4NBr (50.0-0 ml.) were added so as to have identical total malic acid concentration (~0.01 M ) , extent of neutralization (~ 1 .8 equiv. base/mole acid), and ionic strength (0.28), but at least six different alkali metal ion concentrations (0-0.25 M ) . The pH of each solution was determined after temperature equilibrium had been attained.
ResultsIn preliminary experiments, 0.010 M malic acid was
titrated with 0.1 N (CH3)4NOH in the presence of 0.25 M (CH3)4NBr or 0.25 M NaClO.j. The titration curve was slightly, but significantly, lower in the presence of NaC104, indicating that some association does occur.4 Because of the experimental difficulty of obtaining reproducible results to the desired degree of accuracy when the full titration curve was plotted, formation constants were ultimately evaluated by pH measurements under more restrictive conditions, i.e., by varying the metal ion concentration at constant extent of neutralization and ionic strength.
Mathematical Treatment.— In order to treat the system quantitatively, the following assumptions were made. (1) The concentration of undissociated acid is negligible. This restricts the validity of our equations to pH > 5, since pKi — 3.26 at ju = 0.20.6 (2) The OH~ concentration is negligible compared to the H+ concentration, i.e., pH < 6. (3) The only complex that need beconsidered is the 1:1 complex, MA , of the metal ion, M+, and the malate anion, A -2. (4) (CH3)4N + formsno complexes with malate3 or with other anions. Tétraméthylammonium bromide then can be used to control the ionic strength. (5) There is no significant concentration of alkali metal halide complex.
The following five equations, in which ( ) denotes concentration and [H+] denotes the conventional hydrogen ion activity, describe the state of affairs in a solution of malic acid which has been partially neutralized with (CH3)4NOH and which, in addition, contains an appreciable concentration of M A _ as a result of the presence of added MCI
Ki = [H +](A -2)/(H A -) (1)Ki = (M A -) /(M + )(A -2) (2)
= (H A-) + (M A -) + (A -2) (3)
tu = (M+) + (M A -) (4)(4) Good discussions of the effect of complex formation on pH can be
found in A. E. Martell and M. Calvin, “Chemistry of the Metal Chelate Compounds,” Prentice-Hall, Inc., Englewood Cliffs, N. J., 1952, pp. 78-94, and in F. J. C. Rossotti and H. Rossotti, “The Determination of Stability Constants and other Equilibrium Constants in Solution,” McGraw-Hill Book Co., New York, N. Y., 1961, pp. 127-160.
(5) K. Cannan and A. Kibrick, J. Am. Chem. Soc., 60, 2314 (1938).
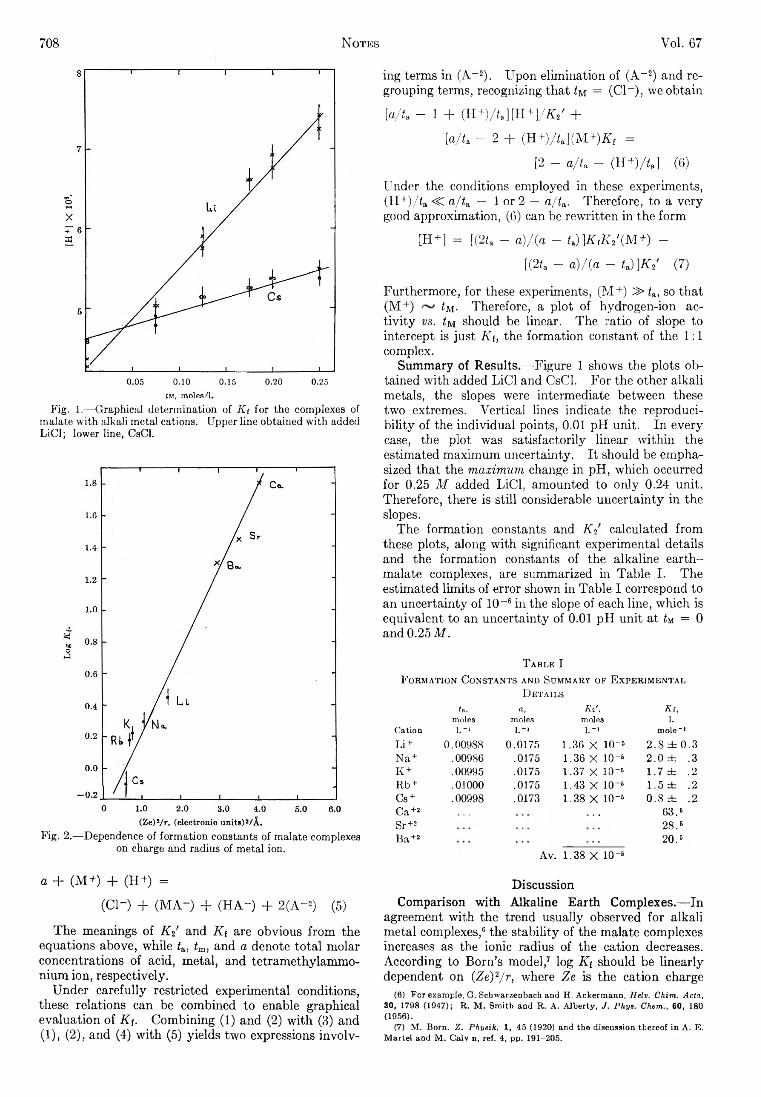
708 Notes Vol. 67
0.05 0.10 0.15 0.20 0.25îm, moles /l.
Fig. 1.—Graphical determination of K t for the complexes of malate with alkali metal cations. Upper line obtained with added LiCl; lower line, CsCl.
Fig. 2.—Dependence of formation constants of malate complexes on charge and radius of metal ion.
a + (M+) + (H+) =
(C l") + (M A -) + (H A -) + 2 (A-2) (5)
The meanings of K 2' and Ki are obvious from the equations above, while ia, tm, and a denote total molar concentrations of acid, metal, and tétraméthylammonium ion, respectively.
Under carefully restricted experimental conditions, these relations can be combined to enable graphical evaluation of Kf. Combining (1) and (2) with (3) and (1), (2), and (4) with (5) yields two expressions involv
ing terms in (A-2) . Upon elimination of (A-2) and regrouping terms, recognizing that <m = (Cl- ), we obtain
[a/t. - 1 + (H+)/ta][H +)/Ki' +
[a/L - 2 + (H +)AJ(M +)K f =
[2 - a/U - (H +)/*.] (6)
Under the conditions employed in these experiments, (H +)/fa « o/fa - 1 or 2 — a/t&. Therefore, to a very good approximation, (6) can be rewritten in the form
[H+] = [(2i. - a)/{a - Q ]K {K 2\M+) -
[(2fa — a) /(a — fa) }K2 (7)
Furthermore, for these experiments, (M+) » ia, so that (M+) ¿m . Therefore, a plot of hydrogen-ion activity vs. ¿m should be linear. The ratio of slope to intercept is just K f, the formation constant of the 1:1 complex.
Summary of Results.—-Figure 1 shows the plots obtained with added LiCl and CsCl. For the other alkali metals, the slopes were intermediate between these two extremes. Vertical lines indicate the reproducibility of the individual points, 0.01 pH unit. In every case, the plot was satisfactorily linear within the estimated maximum uncertainty. It should be emphasized that the maximum change in pH, which occurred for 0.25 M added LiCl, amounted to only 0.24 unit. Therefore, there is still considerable uncertainty in the slopes.
The formation constants and K 2 calculated from these plots, along with significant experimental details and the formation constants of the alkaline earth- malate complexes, are summarized in Table I. The estimated limits of error shown in Table I correspond to an uncertainty of 10-6 in the slope of each line, which is equivalent to an uncertainty of 0.01 pH unit at tu = 0 and 0.25 M.
T a b l e IF o r m a t i o n C o n s t a n t s a n d S u m m a r y o f E x p e r i m e n t a l
D e t a i l s
la, a, Kt’ . Ki,moles moles moles 1.
Cation l.-i l.-> l.-> mole-1Li + 0 .00988 0 .0175 1 .3 6 X 10⁻⁵ 2 .8 ± 0 .3N a+ .00986 .0175 1 .36 X IO“ ® 2 .0 ± .3K + .00995 .0175 1 .3 7 X IO "5 1 .7 ± .2Rb + .01000 .0175 1 .43 X IO "6 1 .5 ± .2Cs + .00998 .0173 1 .3 8 X IO "6 0 .8 ± .2Ca+2 . . . . . . 63.5Sr+2 28.5B a +2 20.5
A v. 1 .38 X 10 " 6
DiscussionComparison with Alkaline Earth Complexes.— In
agreement with the trend usually observed for alkali metal complexes,6 the stability of the malate complexes increases as the ionic radius of the cation decreases. According to Born’s model,7 log Ki should be linearly dependent on (Ze)2/r, where Ze is the cation charge
(6) For example, G. Schwarzenbach and H. Ackerraann, Helv. Chim. Acta, 30, 1798 (1947); R. M. Smith and R. A. Alberty, J. Phys. Chem., 60, 180(1956).
(7) M. Born, Z. Physik, 1, 45 (1920) and the discussion thereof in A. E. Martel and M. Calv n, ref. 4, pp. 191-205.
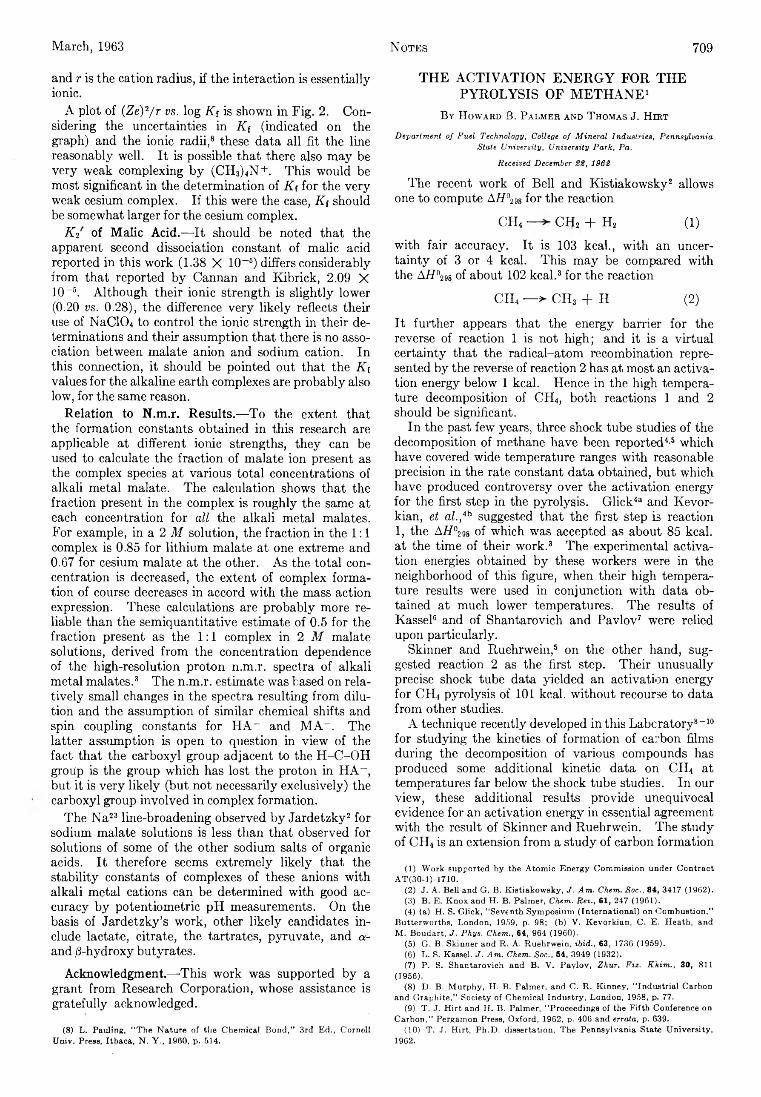
March, 1963 Notes 709
and r is the cation radius, if the interaction is essentially ionic.
A plot of (Ze)2/r vs. log Kf is shown in Fig. 2. Considering the uncertainties in Kf (indicated on the graph) and the ionic radii,8 these data all fit the line reasonably well. It is possible that there also may be very weak complexing by (CH3)4N+. This would be most significant in the determination of Kf for the very weak cesium complex. If this were the case, Kf should be somewhat larger for the cesium complex.
K2 of Malic Acid.—-It should be noted that the apparent second dissociation constant of malic acid reported in this work (1.38 X 10⁻⁶) differs considerably from that reported by Cannan and Kibrick, 2.09 X 10⁻⁵. Although their ionic strength is slightly lower (0.20 vs. 0.28), the difference very likely reflects their use of NaC104 to control the ionic strength in their determinations and their assumption that there is no association between malate anion and sodium cation. In this connection, it should be pointed out that the Kf values for the alkaline earth complexes are probably also low, for the same reason.
Relation to N.m.r. Results.—To the extent that the formation constants obtained in this research are applicable at different ionic strengths, they can be used to calculate the fraction of malate ion present as the complex species at various total concentrations of alkali metal malate. The calculation shows that the fraction present in the complex is roughly the same at each concentration for all the alkali metal malates. For example, in a 2 M solution, the fraction in the 1:1 complex is 0.85 for lithium malate at one extreme and 0.67 for cesium malate at the other. As the total concentration is decreased, the extent of complex formation of course decreases in accord with the mass action expression. These calculations are probably more reliable than the semiquantitative estimate of 0.5 for the fraction present as the 1 :1 complex in 2 M malate solutions, derived from the concentration dependence of the high-resolution proton n.m.r. spectra of alkali metal malates.3 The n.m.r. estimate was based on relatively small changes in the spectra resulting from dilution and the assumption of similar chemical shifts and spin coupling constants for HA- and M A - . The latter assumption is open to question in view of the fact that the carboxyl group adjacent to the H -C-OH group is the group which has lost the proton in HA- , but it is very likely (but not necessarily exclusively) the carboxyl group involved in complex formation.
The Na23 line-broadening observed by Jardetzky2 for sodium malate solutions is less than that observed for solutions of some of the other sodium salts of organic acids. It therefore seems extremely likely that the stability constants of complexes of these anions with alkali metal cations can be determined with good accuracy by potentiometric pH measurements. On the basis of Jardetzky’s work, other likely candidates include lactate, citrate, the tartrates, pyruvate, and a- and /3-hydroxy butyrates.
Acknowledgment.—-This work was supported by a grant from Research Corporation, whose assistance is gratefully acknowledged.
(8) L. Pauling, "The Nature of the Chemical Bond," 3rd Ed., Cornell Univ. Press, Ithaca, N. Y., I960, p. 514.
THE ACTIVATION ENERGY FOR THE PYROLYSIS OF METHANE1
B y H o w a r d B . P a l m e r a n d T h o m a s J. H i r t
D e p a rtm e n t o f F u e l Te c h n o lo g y , College o f M in e r a l In d u s tr ie s , P e n n s y lv a n ia
State U n iv e r s ity , U n iv e r s ity P a r k , P a .
Received D ecem ber 2 2 , 1962
The recent work of Bell and Kistiakowsky2 allows one to compute AH°MS for the reaction
CH4 — CH2 + H2 (1)
with fair accuracy. It is 103 kcal., with an uncertainty of 3 or 4 kcal. This may be compared with the A/7°298 of about 102 kcal.3 for the reaction
CH4 — ► CH3 + H (2)
It further appears that the energy bander for the reverse of reaction 1 is not high; and it is a virtual certainty that the radical-atom recombination represented by the reverse of reaction 2 has at most an activation energy below 1 kcal. Hence in the high temperature decomposition of CH4, both reactions 1 and 2 should be significant.
In the past few years, three shock tube studies of the decomposition of methane have been reported4-5 which have covered wide temperature ranges with reasonable precision in the rate constant data obtained, but which have produced controversy over the activation energy for the first step in the pyrolysis. Glick4a and Kevorkian, et al.,ib suggested that the first step is reaction 1, the AH°298 of which was accepted as about 85 kcal. at the time of their work.3 The experimental activation energies obtained by these workers were in the neighborhood of this figure, when their high temperature results were used in conjunction with data obtained at much lower temperatures. The results of Kassel6 and of Shantarovich and Pavlov7 were relied upon particularly.
Skinner and Ruehrwein,5 on the other hand, suggested reaction 2 as the first step. Their unusually precise shock tube data yielded an activation energy for CH4 pyrolysis of 101 kcal. without recourse to data from other studies.
A technique recently developed in this Laboratory8-10 for studying the kinetics of formation of carbon films during the decomposition of various compounds has produced some additional kinetic data on CH4 at temperatures far below the shock tube studies. In our view, these additional results provide unequivocal evidence for an activation energy in essential agreement with the result of Skinner and Ruehrwein. The study of CH4 is an extension from a study of carbon formation
(1 ) W o rk supported b y the A to m ic E n e rg y C om m ission un d er C o n tra c t A T (3 0 -1 )-1 7 1 0 .
(2 ) J . A . B ell and G . B . K istia k o w sk y, J . A m . C h e m . S o c ., 84, 3417 (1962).(3 ) B . E . K n o x and H . B . P alm er, C h e m . R e v ., 61, 247 (1961).(4 ) (a ) H . S. G lic k , "S e ve n th S ym p osiu m (In te rn a tio n a l) on C o m b u s tio n ,'’
B u tte rw o rth s, Lo n d o n , 1959, p. 98; (b ) V . K e vo rk ia n , C . E . H e a th , and M . B o u d a rt, J . P h y s . C h e m ., 64, 964 (1960).
(5 ) G . B . S kinner and R . A . R u e h rw e in , ib id . , 63, 1736 (1959).(6 ) L . S. Kassel. J. A m . C h e m . S o c ., 54, 3949 (1932).(7 ) P . S. Shan taro vich and B . V . P a v lo v , Z h u r . F i z . K h i m . , 30, 811
(1956).(8 ) D . B . M u rp h y , H . B . P alm er, and C . R . K in n e y , " In d u s tria l C a rbo n
and G ra p h ite ,” Society of C h e m ical In d u s try , Lo n d o n , 1958, p. 77.(9 ) T . J . H i r t and H . B . P alm er, “ Proceedings of the F ifth Conference on
C a rb o n ,” Pergam on Press, O xford , 1962, p. 406 and e rrata, p. 639.(1 0) T . J . H ir t , P h .D . dissertation, T h è P en nsylva nia State U n iv e rs ity ,
1962.
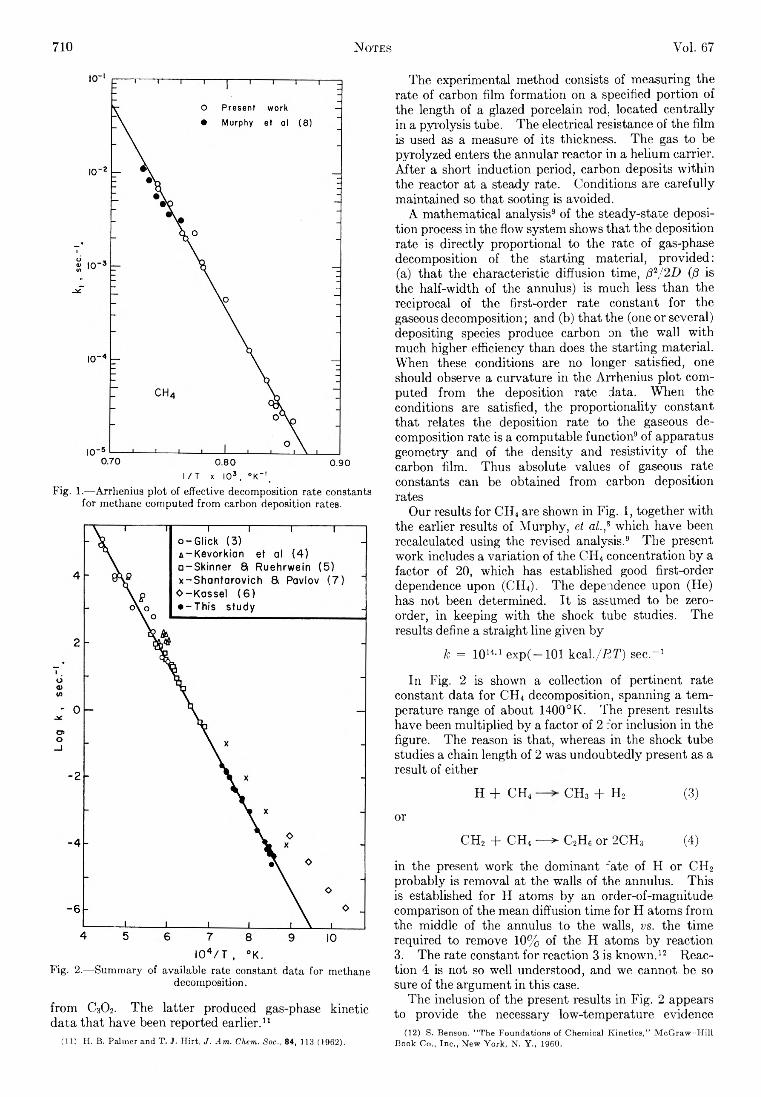
7 1 0 Notes V o l . 67
I / T x I03 , °K_I_Fig. 1.—Arrhenius plot of effective decomposition rate constants
for methane computed from carbon deposition rates.
I 0 4 / T , °K .Fig. 2.—Summary of available rate constant data for methane
decomposition.from C30 2. The latter produced gas-phase kinetic data that have been reported earlier.11
(11) H. B. Palmer and T. J. Hirt, J. Am. Chem. Soc., 84, 113 (1962).
The experimental method consists of measuring the rate of carbon film formation on a specified portion of the length of a glazed porcelain rod, located centrally in a pyrolysis tube. The electrical resistance of the film is used as a measure of its thickness. The gas to be pyrolyzed enters the annular reactor in a helium carrier. After a short induction period, carbon deposits within the reactor at a steady rate. Conditions are carefully maintained so that sooting is avoided.
A mathematical analysis9 of the steady-state deposition process in the flow system shows that the deposition rate is directly proportional to the rate of gas-phase decomposition of the starting material, provided: (a) that the characteristic diffusion time, /32j2D (fi is the half-width of the annulus) is much less than the reciprocal of the first-order rate constant for the gaseous decomposition; and (b) that the (one or several) depositing species produce carbon on the wall with much higher efficiency than does the starting material. When these conditions are no longer satisfied, one should observe a curvature in the Arrhenius plot computed from the deposition rate data. When the conditions are satisfied, the proportionality constant that relates the deposition rate to the gaseous decomposition rate is a computable function9 of apparatus geometry and of the density and resistivity of the carbon film. Thus absolute values of gaseous rate constants can be obtained from carbon deposition rates
Our results for CII4 are shown in Fig. 1, together with the earlier results of Murphy, et al.,s which have been recalculated using the revised analysis.9 The present work includes a variation of the CH4 concentration by a factor of 20, which has established good first-order dependence upon (CH4). The dependence upon (He) has not been determined. It is assumed to be zero- order, in keeping with the shock tube studies. The results define a straight line given by
k = 1014a exp(—101 kcal./ET) sec.-1
In Fig. 2 is shown a collection of pertinent rate constant data for CH4 decomposition, spanning a temperature range of about 1400°K. The present results have been multiplied by a factor of 2 for inclusion in the figure. The reason is that, whereas in the shock tube studies a chain length of 2 was undoubtedly present as a result of either
H + CH4 CH3 + H2 (3)
or
CH2 + CH4 — ^ C2H6 or 2CH3 (4)
in the present work the dominant fate of H or CIi2 probably is removal at the walls of the annulus. This is established for H atoms by an order-of-magnitude comparison of the mean diffusion time for H atoms from the middle of the annulus to the walls, vs. the time required to remove 10% of the H atoms by reaction3. The rate constant for reaction 3 is known.12 Reaction 4 is not so well understood, and we cannot be so sure of the argument in this case.
The inclusion of the present results in Fig. 2 appears to provide the necessary low-temperature evidence
(12) S. Benson. “ The Foundations of Chemical Kinetics,” McGraw-Hill Book Co., Inc., New York, N. Y., 1960.
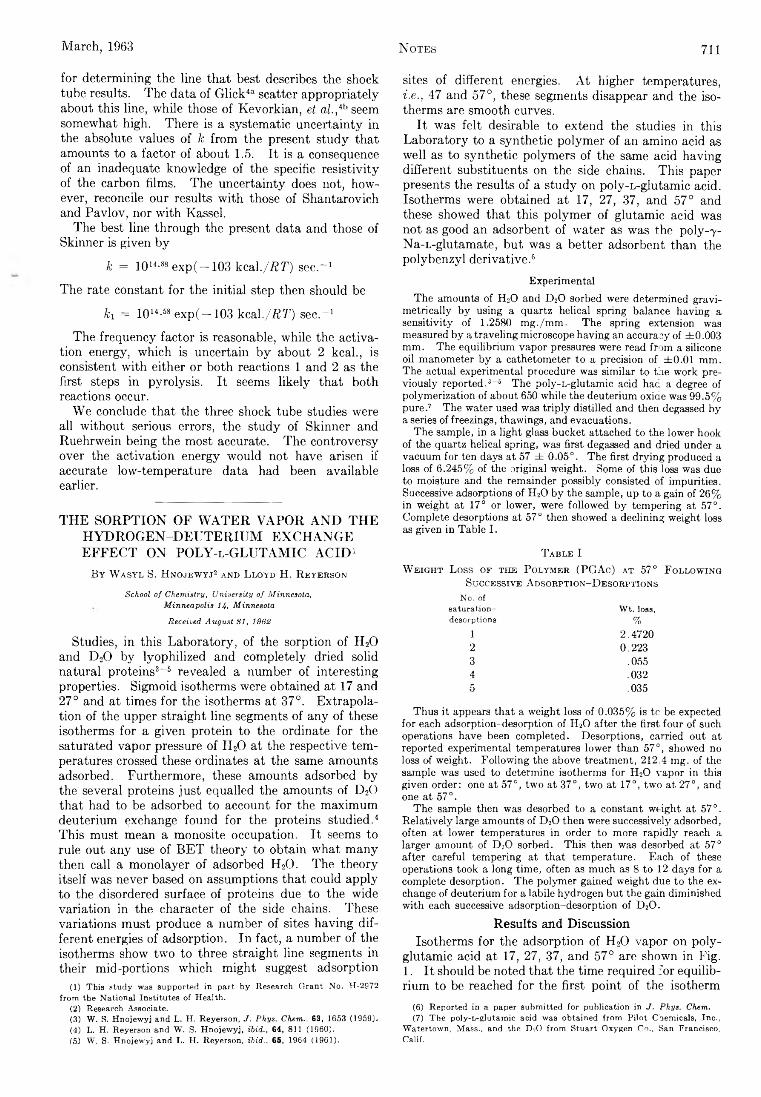
March, 1963 Notes 711
for determining the line that best describes the shock tube results. The data of Glick4a scatter appropriately about this line, while those of Kevorkian, et al.,ih seem somewhat high. There is a systematic uncertainty in the absolute values of k from the present study that amounts to a factor of about 1.5. It is a consequence of an inadequate knowledge of the specific resistivity of the carbon films. The uncertainty does not, however, reconcile our results with those of Shantarovich and Pavlov, nor with Kassel.
The best line through the present data and those of Skinner is given by
k = 1014-88 exp(—103 kcal./RT) sec.“ 1
The rate constant for the initial step then should be
fci = 1014-68 exp(—103 kcal ./RT) sec.“ 1
The frequency factor is reasonable, while the activation energy, which is uncertain by about 2 kcal., is consistent with either or both reactions 1 and 2 as the first steps in pyrolysis. It seems likely that both reactions occur.
We conclude that the three shock tube studies were all without serious errors, the study of Skinner and Ruehrwein being the most accurate. The controversy over the activation energy would not have arisen if accurate low-temperature data had been available earlier.
THE SORPTION OF W ATER VAPOR AND THE HYDROGEN-DEUTERIUM EXCHANGE EFFECT ON POLY-l-GLUTAMIC ACID 1
B y W asyl S. H nojewyj2 and L loyd H. R eyerson
School of Chemistry, University of Minnesota,Minneapolis 14> MinnesotaReceived August 81, 1962
Studies, in this Laboratory, of the sorption of H20 and D20 by lyophilized and completely dried solid natural proteins3“ 5 revealed a number of interesting properties. Sigmoid isotherms were obtained at 17 and 27° and at times for the isotherms at 37°. Extrapolation of the upper straight line segments of any of these isotherms for a given protein to the ordinate for the saturated vapor pressure of H20 at the respective temperatures crossed these ordinates at the same amounts adsorbed. Furthermore, these amounts adsorbed by the several proteins just equalled the amounts of D20 that had to be adsorbed to account for the maximum deuterium exchange found for the proteins studied.4 This must mean a monosite occupation. It seems to rule out any use of BET theory to obtain what many then call a monolayer of adsorbed H20. The theory itself was never based on assumptions that could apply to the disordered surface of proteins due to the wide variation in the character of the side chains. These variations must produce a number of sites having different energies of adsorption. In fact, a number of the isotherms show two to three straight line segments in their mid-portions which might suggest adsorption
(1) This study was supported in part by Research Grant No. H-2972 from the National Institutes of Health.
(2) Research Associate.(3) W. S. Hnojewyj and L. H. Reyerson, J. Phys. Chem., 63, 1653 (1959).(4) L. H. Reyerson and W. S. Hnojewyj, ibid., 64, 811 (1960).(5) W. S. Hnojewyj and L. H. Reyerson, ibid., 65, 1964 (1961).
sites of different energies. At higher temperatures,be., 47 and 57°, these segments disappear and the isotherms are smooth curves.
It was felt desirable to extend the studies in this Laboratory to a synthetic polymer of an amino acid as well as to synthetic polymers of the same acid having different substituents on the side chains. This paper presents the results of a study on poly-L-glutamic acid. Isotherms were obtained at 17, 27, 37, and 57° and these showed that this polymer of glutamic acid was not as good an adsorbent of water as was the poly-7- Na-L-glutamate, but was a better adsorbent than the polybenzyl derivative.6
ExperimentalThe amounts of H20 and D20 sorbed were determined gravi-
metrically by using a quartz helical spring balance having a sensitivity of 1.2580 mg./mm. The spring extension was measured by a traveling microscope having an accuracy of ±0.003 mm. The equilibrium vapor pressures were read from a silicone oil manometer by a cathetometer to a precision of ± 0.01 mm. The actual experimental procedure was similar to the work previously reported.3“ 6 The poly-L-glutamic acid had a degree of polymerization of about 650 while the deuterium oxide was 99.5% pure .7 The water used was triply distilled and then degassed by a series of freezings, thawings, and evacuations.
The sample, in a light glass bucket attached to the lower hook of the quartz helical spring, was first degassed and dried under a vacuum for ten days at 57 ± 0.05°. The first drying produced a loss of 6.245% of the original weight. Some of this loss was due to moisture and the remainder possibly consisted of impurities. Successive adsorptions of H20 by the sample, up to a gain of 26% in weight at 17° or lower, were followed by tempering at 57°. Complete desorptions at 57° then showed a declining weight loss as given in Table I.
T able IW eight L oss of the P olymer (P G A c ) at 57° F ollowing
Successive A dsorption- D esorptionsNo. of
saturation- Wt. loss,desorptions %
1 2.47202 0.2233 .0554 .0325 .035
Thus it appears that a weight loss of 0.035% is tc be expected for each adsorption-desorption of H20 after the first four of such operations have been completed. Desorptions, carried out at reported experimental temperatures lower than 57°, showed no loss of weight. Following the above treatment, 212,4 mg. of the sample was used to determine isotherms for H20 vapor in this given order: one at 57°, two at 37°, two at 17°, two at 27°, and one at 57°.
The sample then was desorbed to a constant weight at 57°. Relatively large amounts of D20 then were successively adsorbed, often at lower temperatures in order to more rapidly reach a larger amount of D20 sorbed. This then was desorbed at 57° after careful tempering at that temperature. Each of these operations took a long time, often as much as 8 to 12 days for a complete desorption. The polymer gained weight due to the exchange of deuterium for a labile hydrogen but the gain diminished with each successive adsorption-desorption of D 20 .
Results and DiscussionIsotherms for the adsorption of H20 vapor on poly-
glutamic acid at 17, 27, 37, and 57° are shown in Fig. 1. It should be noted that the time required for equilibrium to be reached for the first point of the isotherm
(6) Reported in a paper submitted for publication in J. Phys. Chem.(7) The poly-L-glutamic acid was obtained from Pilot Chemicals, Inc.,
Watertown, Mass., and the D2O from Stuart Oxygen Co., San Francisco, Calif.
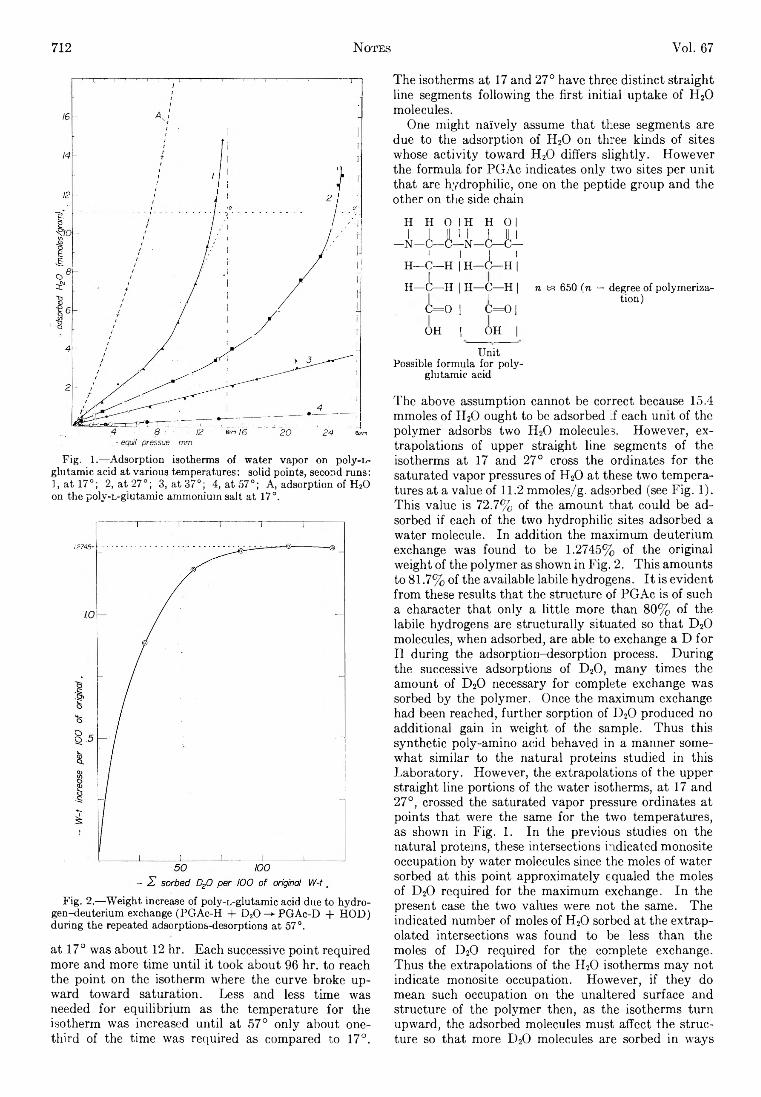
712 Notes V o l . 67
Fig. 1.—Adsorption isotherms of water vapor on poly-Lr- glutamic acid at various temperatures: solid points, second runs: 1, a t 17°; 2, a t 27°; 3, a t 37°; 4, a t 57°; A, adsorption of H20 on the poly-L-giutamic ammonium salt at 17°.
Fig. 2.—Weight increase of poly-L-glutamic acid due to hydrogen-deuterium exchange (PGAc-H + D20 —*■ PGAc-D + HOD) during the repeated adsorptions-desorptions a t 57°.at 17° was about 12 hr. Each successive point required more and more time until it took about 96 hr. to reach the point on the isotherm where the curve broke upward toward saturation. Less and less time was needed for equilibrium as the temperature for the isotherm was increased until at 57° only about one- third of the time was required as compared to 17°.
The isotherms at 17 and 27° have three distinct straight line segments following the first initial uptake of H20 molecules.
One might naively assume that these segments are due to the adsorption of H20 on three kinds of sites whose activity toward H20 differs slightly. However the formula for PGAc indicates only two sites per unit that are hydrophilic, one on the peptide group and the other on tl le side chain
H H 0 IH H 01A - U - l i - U i
! 1 I 1H—C—H | H—C—H |H—i —H | H—C—H | n ta 650 ( n = degree of polymeriza-! tion)C = 0 I C = 0 I
OH | OH |UnitPossible formula for poly- glutamic acid
The above assumption cannot be correct because 15.4 mmoles of H20 ought to be adsorbed if each unit of the polymer adsorbs two H20 molecules. However, extrapolations of upper straight line segments of the isotherms at 17 and 27° cross the ordinates for the saturated vapor pressures of H20 at these two temperatures at a value of 11.2 mmoles/g. adsorbed (see Fig. 1). This value is 72.7% of the amount that could be adsorbed if each of the two hydrophilic sites adsorbed a water molecule. In addition the maximum deuterium exchange was found to be 1.2745% of the original weight of the polymer as shown in Fig. 2. This amounts to 81.7% of the available labile hydrogens. It is evident from these results that the structure of PGAc is of such a character that only a little more than 80% of the labile hydrogens are structurally situated so that D 20 molecules, when adsorbed, are able to exchange a D for H during the adsorption-desorption process. During the successive adsorptions of D 20, many times the amount of D 20 necessary for complete exchange was sorbed by the polymer. Once the maximum exchange had been reached, further sorption of D 20 produced no additional gain in weight of the sample. Thus this synthetic poly-amino acid behaved in a manner somewhat similar to the natural proteins studied in this Laboratory. However, the extrapolations of the upper straight line portions of the water isotherms, at 17 and 27°, crossed the saturated vapor pressure ordinates at points that were the same for the two temperatures, as shown in Fig. 1. In the previous studies on the natural proteins, these intersections indicated monosite occupation by water molecules since the moles of water sorbed at this point approximately equaled the moles of D20 required for the maximum exchange. In the present case the two values were not the same. The indicated number of moles of H20 sorbed at the extrapolated intersections was found to be less than the moles of D 20 required for the complete exchange. Thus the extrapolations of the H20 isotherms may not indicate monosite occupation. However, if they do mean such occupation on the unaltered surface and structure of the polymer then, as the isotherms turn upward, the adsorbed molecules must affect the structure so that more D20 molecules are sorbed in ways
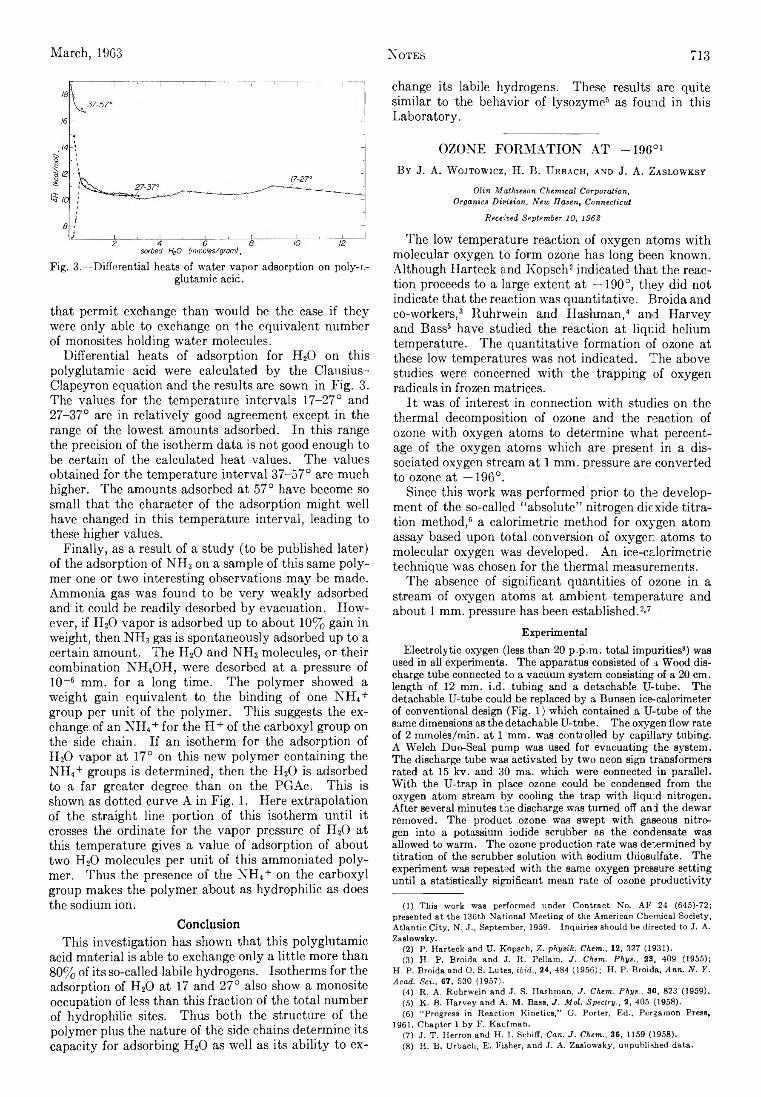
March, 1963 Notes 713
Fig. 3.—Differential heats of water vapor adsorption on poly-L- glutamic acid.
that permit exchange than would be the case if they were only able to exchange on the equivalent number of monosites holding water molecules.
Differential heats of adsorption for H20 on this polyglutamic acid were calculated by the Clausius- Clapeyron equation and the results are sown in Fig. 3. The values for the temperature intervals 17-27° and 27-37° are in relatively good agreement except in the range of the lowest amounts adsorbed. In this range the precision of the isotherm data is not good enough to be certain of the calculated heat values. The values obtained for the temperature interval 37-57° are much higher. The amounts adsorbed at 57° have become so small that the character of the adsorption might well have changed in this temperature interval, leading to these higher values.
Finally, as a result of a study (to be published later) of the adsorption of NH3 on a sample of this same polymer one or two interesting observations may be made. Ammonia gas was found to be very weakly adsorbed and it could be readily desorbed by evacuation. However, if H20 vapor is adsorbed up to about 10% gain in weight, then NH3 gas is spontaneously adsorbed up to a certain amount. The H20 and NH3 molecules, or their combination NH4OH, were desorbed at a pressure of 10-6 mm. for a long time. The polymer showed a weight gain equivalent to the binding of one NH4+ group per unit of the polymer. This suggests the exchange of an NH4+ for the H+ of the carboxyl group on the side chain. If an isotherm for the adsorption of H20 vapor at 17° on this new polymer containing the NH4+ groups is determined, then the H20 is adsorbed to a far greater degree than on the PGAc. This is shown as dotted curve A in Fig. 1. Here extrapolation of the straight line portion of this isotherm until it crosses the ordinate for the vapor pressure of H20 at this temperature gives a value of adsorption of about two H20 molecules per unit of this ammoniated polymer. Thus the presence of the NH4+ on the carboxyl group makes the polymer about as hydrophilic as does the sodium ion.
ConclusionThis investigation has shown that this polyglutamic
acid material is able to exchange only a little more than 80% of its so-called labile hydrogens. Isotherms for the adsorption of H20 at 17 and 27° also show a monosite occupation of less than this fraction of the total number of hydrophilic sites. Thus both the structure of the polymer plus the nature of the side chains determine its capacity for adsorbing H20 as well as its ability to ex
change its labile hydrogens. These results are quite similar to the behavior of lysozyme6 as found in this Laboratory.
OZONE FORMATION AT -1 9 6 01By J. A. W ojtowicz, H. B. Uebach , and J. A. Zaslowksy
Olin Mathieson Chemical Corporation,Organics Division, New Havent Connecticut
Received September 10, 1962
The low temperature reaction of oxygen atoms with molecular oxygen to form ozone has long been known. Although Harteck and Kopsch2 indicated that the reaction proceeds to a large extent at —190°, they did not indicate that the reaction was quantitative. Broida and co-workers,3 Ruhrwein and Hashman,4 and Harvey and Bass5 have studied the reaction at liquid helium temperature. The quantitative formation of ozone at these low temperatures was not indicated. The above studies were concerned with the trapping of oxygen radicals in frozen matrices.
It was of interest in connection with studies on the thermal decomposition of ozone and the reaction of ozone with oxygen atoms to determine what percentage of the oxygen atoms which are present in a dissociated oxygen stream at 1 mm. pressure are converted to ozone at —196°.
Since this work was performed prior to the development of the so-called “ absolute” nitrogen dioxide titration method,6 a calorimetric method for oxygen atom assay based upon total conversion of oxygen atoms to molecular oxygen was developed. An ice-calorimetric technique was chosen for the thermal measurements.
The absence of significant quahtities of ozone in a stream of oxygen atoms at ambient temperature and about 1 mm. pressure has been established.2-7
ExperimentalElectrolytic oxygen (less than 20 p.p.m. total impurities8) was
used in all experiments. The apparatus consisted of a Wood discharge tube connected to a vacuum system consisting of a 20 cm. length of 12 mm. i.d. tubing and a detachable U-tiibe. The detachable U-tube could be replaced by a Bunsen ice-calorimeter of conventional design (Fig. 1) which contained a U-tube of the same dimensions as the detachable U-tube. The oxygen flow rate of 2 mmoles/min. a t 1 mm. was controlled by capillary tubing. A Welch Duo-Seal pump was used for evacuating the system. The discharge tube was activated by two neon sign transformers rated a t 15 kv. and 30 ma. which were connected in parallel. With the U-trap in place ozone could be condensed from the oxygen atom stream by cooling the trap with liqu:d nitrogen. After several minutes the discharge was turned off and the dewar removed. The product ozone was swept with gaseous nitrogen into a potassium iodide scrubber as the condensate was allowed to warm. The ozone production rate was de^rmined by titration of the scrubber solution with sodium thiosulfate. The experiment was repeated with the same oxygen pressure setting until a statistically significant mean rate of ozone productivity
(1) This work was performed under Contract No. AF 24 (645)-72; presented at the 136th National Meeting of the American Chemical Society, Atlantic City, N. J., September, 1959. Inquiries should be directed to J. A. Zaslowsky.
(2) P. Harteck and U. Kopsch, Z. physik. Chem., 12, 327 (1931).(3) H. P. Broida and J. R. Pellam, J. Chém. Phys., 23, 409 (1955);
H. P. Broida and O. S. Lutes, ibid., 24, 484 (1956); H. P. Broida, Ann. N. Y. Acad. Sci., 67, 530 (1957).
(4) R. A. Ruhrwein and J. S. Hashman, J. Chem. Phys., 30, 823 (1959).(5) K. B. Harvey and A. M. Bass, J. Mol. Spectry., 2, 405 (1958).(6) “ Progress in Reaction Kinetics,” G. Porter, Ed., Pergamon Press,
1961, Chapter 1 by F. Kaufman.(7) J. T. Herron and H. I. Schiff, Can. J. Chem., 36, 1159 (1958).(8) H. B. Urbach, E. Fisher, and J. A. Zaslowsky, unpublished data.
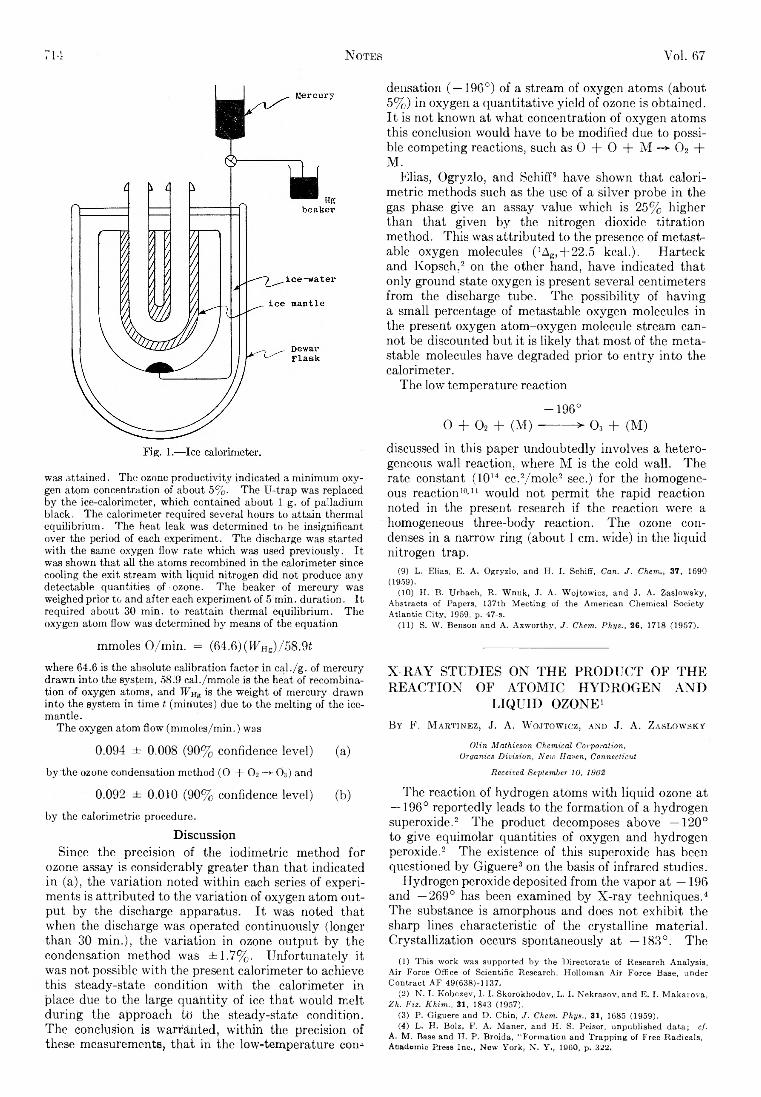
Notes V o l . 67714
was attained. The ozone productivity indicated a minimum oxygen atom concentration of about 5%. The U-trap was replaced by the ice-calorimeter, which contained about 1 g. of palladium black. The calorimeter required several hours to attain thermal equilibrium. The heat leak was determined to be insignificant over the period of each experiment. The discharge was started with the same oxygen flow rate which was used previously. I t was shown that all the atoms recombined in the calorimeter since cooling the exit stream with liquid nitrogen did not produce any detectable quantities of ozone. The beaker of mercury was weighed prior to and after each experiment of 5 min. duration. I t required about 30 min. to reattain thermal equilibrium. The oxygen atom flow was determined by means of the equation
mmoles O/min. = (64.6)(TFHg)/58.9iwhere 64.6 is the absolute calibration factor in cal./g. of mercury drawn into the system, 58.9 cal./mmole is the heat of recombination of oxygen atoms, and W S e is the weight of mercury drawn into the system in time t (minutes) due to the melting of the ice- mantle.
The oxygen atom flow (mmoles/min.) was0.094 ± 0.008 (90% confidence level) (a)
by the ozone condensation method (O + 0 2 -*• O3 ) and0.092 ± 0.010 (90% confidence level) (b)
by the calorimetric procedure.Discussion
Since the precision of the iodimetric method for ozone assay is considerably greater than that indicated in (a), the variation noted within each series of experiments is attributed to the variation of oxygen atom output by the discharge apparatus. It was noted that when the discharge was operated continuously (longer than 30 min.), the variation in ozone output by the condensation method was ±1.7% . Unfortunately it was not possible with the present calorimeter to achieve this steady-state condition with the calorimeter in place due to the large quantity of ice that would melt during the approach id the steady-state condition. The conclusion is warranted, within the precision of these measurements, that in the low-temperature com
densation ( —196°) of a stream of oxygen atoms (about 5%) in oxygen a quantitative yield of ozone is obtained. It is not known at what concentration of oxygen atoms this conclusion would have to be modified due to possible competing reactions, such a s 0 + 0 + M -»-02 +M.
Elias, Ogryzlo, and Schiff9 have shown that calorimetric methods such as the use of a silver probe in the gas phase give an assay value which is 25% higher than that given by the nitrogen dioxide titration method. This was attributed to the presence of metastable oxygen molecules (1Ag,+22.5 keal.). Harteck and Kopsch,2 on the other hand, have indicated that only ground state oxygen is present several centimeters from the discharge tube. The possibility of having a small percentage of metastable oxygen molecules in the present oxygen atom-oxygen molecule stream cannot be discounted but it is likely that most of the metastable molecules have degraded prior to entry into the calorimeter.
The low temperature reaction
-1 9 6 °O + 0 2 + (M) ---------> 0 3 + (M)
discussed in this paper undoubtedly involves a heterogeneous wall reaction, where M is the cold wall. The rate constant (1014 cc.2/ mole2 sec.) for the homogeneous reaction10’11 would not permit the rapid reaction noted in the present research if the reaction were a homogeneous three-body reaction. The ozone condenses in a narrow ring (about 1 cm. wide) in the liquid nitrogen trap.
(9) L. Elias, E. A. Ogryzlo, and H. I. Schiff, Can. J. Chem37, 1690 (1959).
(10) H. B. Urbach, R. Wnuk, J. A. Wojtowiez, and J. A. Zaslowsky, Abstracts of Papers, 137th Meeting of the American Chemical Society Atlantic City, 1959, p. 47-s.
(11) S. W. Benson and A. Axworthy, J. Chem. Phys., 26, 1718 (1957).
X -R A Y STUDIES ON THE PRODUCT OF THE REACTION OF ATOMIC HYDROGEN AND
LIQUID OZONE1B y F. M artinez, J. A. W ojtowicz, and J. A. Z aslow sky
Olin Mathieson Chemical Corporation,Organics Division, New Haven, Connecticut
Received September 10, 1962
The reaction of hydrogen atoms with liquid ozone at — 196° reportedly leads to the formation of a hydrogen superoxide.2 The product decomposes above —120° to give equimolar quantities of oxygen and hydrogen peroxide.2 The existence of this superoxide has been questioned by Giguere3 on the basis of infrared studies.
Hydrogen peroxide deposited from the vapor at —196 and —269° has been examined by X-ray techniques.4 The substance is amorphous and does not exhibit the sharp lines characteristic of the crystalline material. Crystallization occurs spontaneously at —183°. The
(1) This work was supported by the Directorate of Research Analysis, Air Force Office of Scientific Research, Holloman Air Force Base, under Contract AF 49 (638)-1137.
(2) N. I. Kobozev, I. I. Skorokhodov, L. I. Nekrasov, and E. I. Makarova, Zh. Fiz. Khim., 31, 1843 (1957).
(3) P. Giguere and D. Chin, J. Chem. Phys., 31, 1685 (1959).(4) L. H. Bolz, F. A. Maner, and H. S. Peiser, unpublished data; cf.
A. M. Bass and H. P. Broida, “ Formation and Trapping of Free Radicals, Academic Pfess Inc», New York, N. Y., 1960, p. 322.
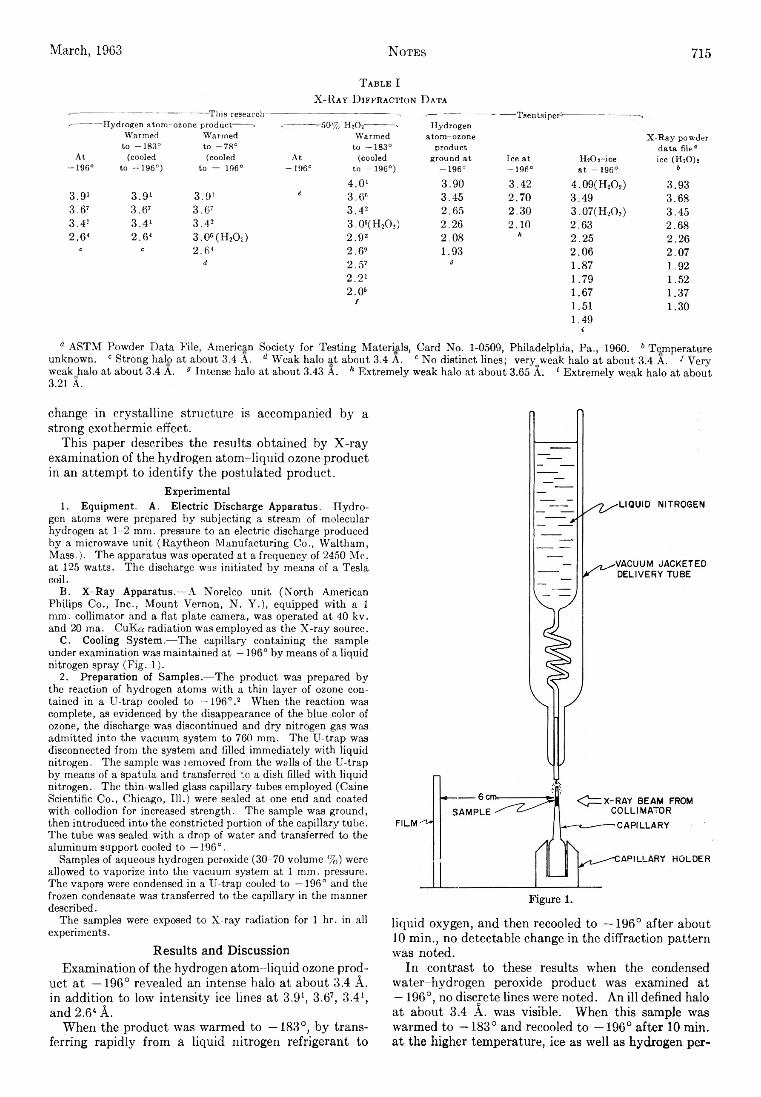
March, 1963 Notes 715
T able IX -R ay D iffraction D ata
' ■ • This research —■« Tsentsiper5--——— Hydrogen atom--ozone product------ n -50% mo;- - ■ - Hydrogen
Warmed Warmed Warmed atom-ozone X-Ray powderto -183° to -78 ° to -183° product data file“
At (cooled (cooled At (cooled ground at Ice at H2O 2-ice ice (H2Ü)2-196° to -196°) to — 196° -196° to -196°) -196° -196° at -196° b
4 .0 1 3.90 3.42 4.09(H2O2) 3.933 .91 3 .9 1 3.9' e 3.66 3.45 2.70 3.49 3.683.67 3.67 3.67 3 ,42 2.65 2.30 3.07(H2O2) 3.453.4= 3 .4 1 3 .42 3.06(H2O2) 2.26 2.10 2.63 2.682 .64 2 .64 3.06 (H20 2) 2 .9 3 2.08 A 2.25 2.26C C 2.64 2.6» 1.93 2.06 2.07
d 2.57 a 1.87 1.922 .2 1 1.79 1.522.05 1.67 1.37/ 1.51 1.30
1.49ia ASTM Powder D ata File, American Society for Testing Materials, Card No. 1-0509, Philadelphia, Pa., 1960. 6 Temperature
unknown. c Strong halo a t about 3.4 A. d Weak halo at about 3.4 A . e No distinct lines; veryoweak halo a t about 3.4 A. 1 Very weak halo at about 3.4 A. a Intense halo a t about 3.43 A. h Extremely weak halo at about 3.65 A. 4 Extremely weak halo at about 3.21 A.
change in crystalline structure is accompanied by a strong exothermic effect.
This paper describes the results obtained by X-ray examination of the hydrogen atom-liquid ozone product in an attempt to identify the postulated product.
Experimental1. Equipment. A. Electric Discharge Apparatus.—Hydro
gen atoms were prepared by subjecting a stream of molecular hydrogen at 1 - 2 mm. pressure to an electric discharge produced by a microwave unit (Raytheon Manufacturing Co., Waltham, Mass.). The apparatus was operated at a frequency of 2450 Mo. at 125 watts. The discharge was initiated by means of a Tesla coil.
B. X-Ray Apparatus.—A Norelco unit (North American Philips Co., Inc., Mount Vernon, N. Y.), equipped with a 1 mm. collimator and a flat plate camera, was operated at 40 kv. and 20 ma. CuKa radiation was employed as the X-ray source.
C. Cooling System.—The capillary containing the sample under examination was maintained at —196° by means of a liquid nitrogen spray (Fig. 1 ).
2. Preparation of Samples.—The product was prepared by the reaction of hydrogen atoms with a thin layer of ozone contained in a U-trap cooled to —196°.2 When the reaction was complete, as evidenced by the disappearance of the blue color of ozone, the discharge was discontinued and dry nitrogen gas was admitted into the vacuum system to 760 mm. The U-trap was disconnected from the system and filled immediately with liquid nitrogen. The sample was lemoved from the walls of the U-trap by means of a spatula and transferred to a dish filled with liquid nitrogen. The thin-walled glass capillary tubes employed (Caine Scientific Co., Chicago, 111.) were sealed at one end and coated with collodion for increased strength. The sample was ground, then introduced into the constricted portion of the capillary tube. The tube was sealed with a drop of water and transferred to the aluminum support cooled to —196°.
Samples of aqueous hydrogen peroxide (30-70 volume %) were allowed to vaporize into the vacuum system at 1 mm. pressure. The vapors were condensed in a U-trap cooled to —196° and the frozen condensate was transferred to the capillary in the manner described.The samples were exposed to X-ray radiation for 1 hr. in all experiments.
Results and DiscussionExamination of the hydrogen atom-liquid ozone prod
uct at —196° revealed an intense halo at about 3.4 A. in addition to low intensity ice lines at 3.91, 3.67, 3.41, and 2.64 A.
When the product was warmed to —183°, by transferring rapidly from a liquid nitrogen refrigerant to
liquid oxygen, and then recooled to —196° after about 10 min., no detectable change in the diffraction pattern was noted.
In contrast to these results when the condensed water-hydrogen peroxide product was examined at —196°, no discrete lines were noted. An ill defined halo' o ^
at about 3.4 A. was visible. When this sample was warmed to —183° and recooled to —196° after 10 min. at the higher temperature, ice as well as hydrogen per
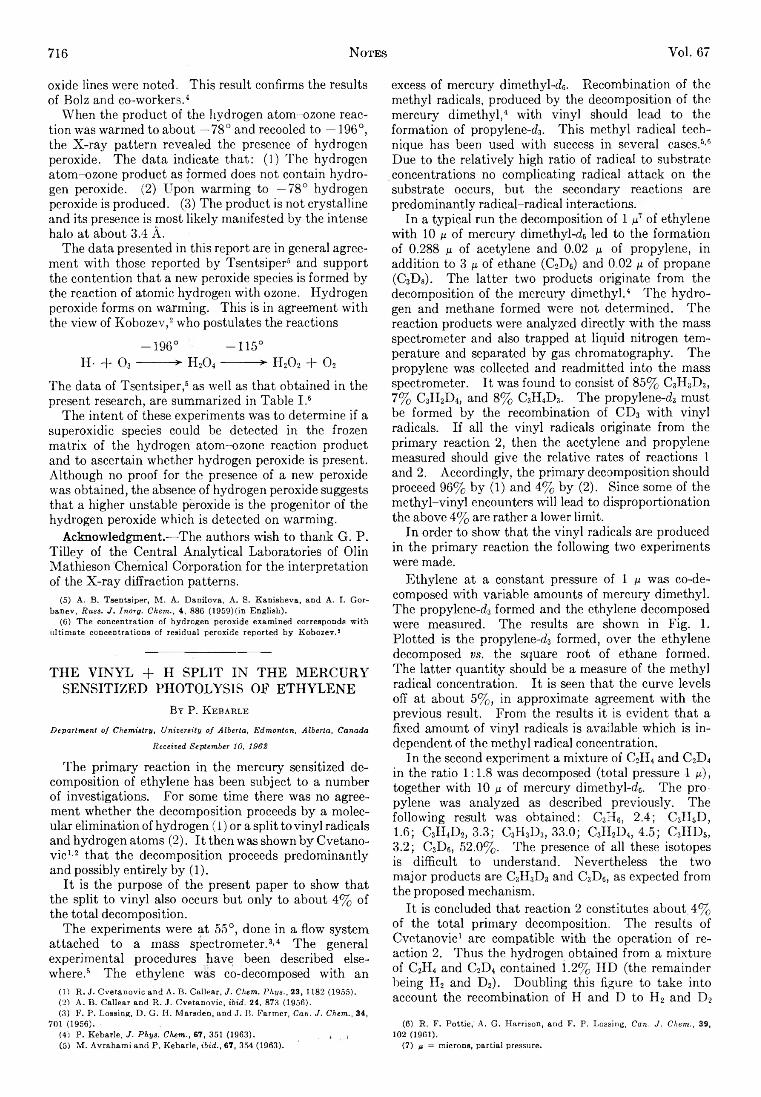
716 Notes Vol. 67
oxide lines were noted. This result confirms the results of Bolz and co-workers.4
When the product of the hydrogen atom-ozone reaction was warmed to about —78° and recooled to —196°, the X-ray pattern revealed the presence of hydrogen peroxide. The data indicate that: (1) The hydrogen atom-ozone product as formed does not contain hydrogen peroxide. (2) Upon warming to —78° hydrogen peroxide is produced. (3) The product is not crystalline and its presence is most likely manifested by the intense halo at about 3.4 Á.
The data presented in this report are in general agreement with those reported by Tsentsiper6 and support the contention that a new peroxide species is formed by the reaction of atomic hydrogen with ozone. Hydrogen peroxide forms on warming. This is in agreement with the view of Kobozev,2 who postulates the reactions
-1 9 6 ° -1 1 5 °H- + 0 3 ----------> H20 4 --------- > H20 2 + 0 2
The data of Tsentsiper,6 as well as that obtained in the present research, are summarized in Table I .6
The intent of these experiments was to determine if a superoxidic species could be detected in the frozen matrix of the hydrogen atom-ozone reaction product and to ascertain whether hydrogen peroxide is present. Although no proof for the presence of a new peroxide was obtained, the absence of hydrogen peroxide suggests that a higher unstable peroxide is the progenitor of the hydrogen peroxide which is detected on warming.
Acknowledgment.—-The authors wish to thank G. P. Tilley of the Central Analytical Laboratories of Olin Mathieson Chemical Corporation for the interpretation of the X-ray diffraction patterns.
(5) A. B. Tsentsiper, M. A. Danilova, A. S. Kanisheva, and A. I. Gor- banev, Russ. J. Inorg. Chem., 4, 886 (1959)(in English).
(6) The concentration of hydrogen peroxide examined corresponds with ultimate concentrations of residual peroxide reported by Kobozev.2
THE VINYL + H SPLIT IN THE MERCURYSENSITIZED PHOTOLYSIS OF ETHYLENE
B y P. K e b a r l e
Department, of Chemistry, University of Alberta, Edmonton, Alberta, Canada Received September 10, 1962
The primary reaction in the mercury sensitized decomposition of ethylene has been subject to a number of investigations. For some time there was no agreement whether the decomposition proceeds by a molecular elimination of hydrogen (1) or a split to vinyl radicals and hydrogen atoms (2). It then was shown by Cvetanovic1'2 that the decomposition proceeds predominantly and possibly entirely by (1).
It is the purpose of the present paper to show that the split to vinyl also occurs but only to about 4% of the total decomposition.
The experiments were at 55°, done in a flow system attached to a mass spectrometer.3'4 The general experimental procedures have been described elsewhere.5 The ethylene was co-decomposed with an
(1) R . J. Cvetanovic and A. B. Callear, J. Chem. Phys., 23, 1182 (1955).(2) A. B. Callear and R. J. Cvetanovic, ibid. 24, 873 (1956).(3) F. P. Lossing, D . G . H. Marsden, and J. B. Farmer, Can. J. Chem., 34,
701 (1956).(4) P. Kebarle, J. Phys. Chem., 67, 351 (1963). .. k f(5) M. Avrahami and P. Kebarle, ibid., 67, 354 (1963).
excess of mercury dimethyl-do. Recombination of the methyl radicals, produced by the decomposition of the mercury dimethyl,4 with vinyl should lead to the formation of propylene-d3. This methyl radical technique has been used with success in several cases.5'6 Due to the relatively high ratio of radical to substrate concentrations no complicating radical attack on the substrate occurs, but the secondary reactions are predominantly radical-radical interactions.
In a typical run the decomposition of 1 A of ethylene with 10 fj. of mercury dimethyl-cfe led to the formation of 0.288 ¡x of acetylene and 0.02 ¡x of propylene, in addition to 3 n of ethane (C2D6) and 0.02 ¡x of propane (C3D8). The latter two products originate from the decomposition of the mercury dimethyl.4 The hydrogen and methane formed were not determined. The reaction products were analyzed directly with the mass spectrometer and also trapped at liquid nitrogen temperature and separated by gas chromatography. The propylene was collected and readmitted into the mass spectrometer. It was found to consist of 85% C3H3D3, 7% C3H2D4, and 8% C3H4D3. The propylene-d3 must be formed by the recombination of CD3 with vinyl radicals. If all the vinyl radicals originate from the primary reaction 2, then the acetylene and propylene measured should give the relative rates of reactions 1 and 2. Accordingly, the primary decomposition should proceed 96% by (1) and 4% by (2). Since some of the methyl-vinyl encounters will lead to disproportionation the above 4% are rather a lower limit.
In order to show that the vinyl radicals are produced in the primary reaction the following two experiments were made.
Ethylene at a constant pressure of 1 v was co-decomposed with variable amounts of mercury dimethyl. The propylene-d;] formed and the ethylene decomposed were measured. The results are shown in Fig. 1. Plotted is the propylene-d3 formed, over the ethylene decomposed vs. the square root of ethane formed. The latter quantity should be a measure of the methyl radical concentration. It is seen that the curve levels off at about 5%, in approximate agreement with the previous result. From the results it is evident that a fixed amount of vinyl radicals is available which is independent of the methyl radical concentration.
In the second experiment a mixture of C2H4 and C2D4 in the ratio 1 : 1.8 was decomposed (total pressure 1 ¡ x ) ,
together with 10 ¡x of mercury dimetbyl-d6. The propylene was analyzed as described previously. The following result was obtained: C3H6, 2.4; C3H6D, 1.6; C3H4D2, 3.3; C3H3D3, 33.0; C3H2D4, 4.5; C3HD3, 3.2; C3D6, 52.0%. The presence of all these isotopes is difficult to understand. Nevertheless the two major products are C3H3D3 and C3D6, as expected from the proposed mechanism.
It is concluded that reaction 2 constitutes about 4% of the total primary decomposition. The results of Cvetanovic1 are compatible with the operation of reaction 2. Thus the hydrogen obtained from a mixture of C2H4 and C2D4 contained 1.2% HD (the remainder being H2 and D2). Doubling this figure to take into account the recombination of H and D to H2 and D2
(6) R. F. Pottie, A. G. Harrison, and F. P. Lossing, Can. J. Chem., 39, 102 (1961).
(7) p = microns, partial pressure.
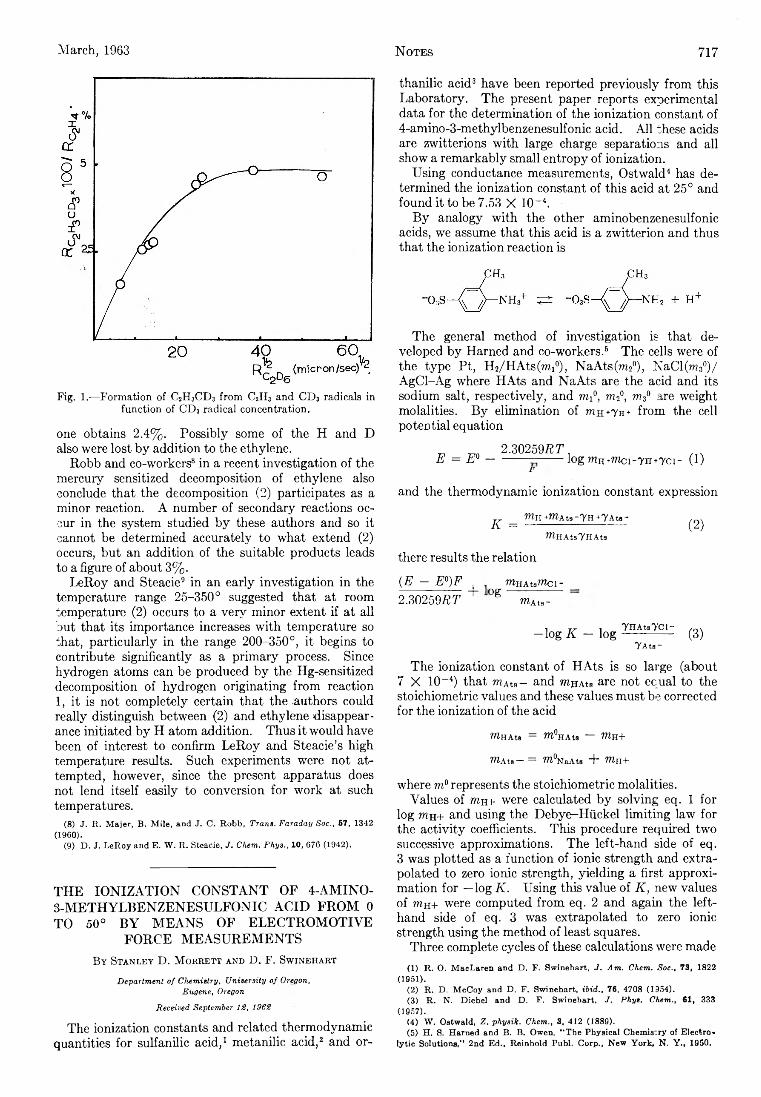
March, 1963
Fig. 1.— Formation of C2H3CD3 from C2II3 and C D 3 radicals in function of C D 3 radical concentration.
one obtains 2.4%. Possibly some of the H and D also were lost by addition to the ethylene.
Robb and co-workers8 in a recent investigation of the mercury sensitized decomposition of ethylene also conclude that the decomposition (2) participates as a minor reaction. A number of secondary reactions occur in the system studied by these authors and so it cannot be determined accurately to what extend (2) occurs, but an addition of the suitable products leads to a figure of about 3%.
LeRoy and Steacie9 in an early investigation in the temperature range 25-350° suggested that at room temperature (2) occurs to a very minor extent if at all but that its importance increases with temperature so that, particularly in the range 200-350°, it begins to contribute significantly as a primary process. Since hydrogen atoms can be produced by the Hg-sensitized decomposition of hydrogen originating from reaction 1, it is not completely certain that the .authors could really distinguish between (2) and ethylene disappearance initiated by H atom addition. Thus it would have been of interest to confirm LeRoy and Steacie’s high temperature results. Such experiments were not attempted, however, since the present apparatus does not lend itself easily to conversion for work at such temperatures.
( 8 ) J . R . M a j e r , B . M i l e , a n d J . C . R o b b , Trans. Faraday Soc., 6 7 , 1 3 4 2
( 1 9 6 0 ) .( 9 ) D . J . L e R o y a n d E . W . R . S t e a c i e , J. Chem. Phys., 1 0 , 6 7 6 ( 1 9 4 2 ) .
THE IONIZATION CONSTANT OF 4-AMINO-3-METHYLBENZENESULFONIC ACID FROM 0 TO 50° BY MEANS OF ELECTROMOTIVE
FORCE MEASUREMENTSB y S t a n l e y D . M o r r e t t a n d D . F. S w i n e h a r t
Department of Chemistry, University of Oregon,Eugene, Oregon
Received September 12, 1962 ■
The ionization constants and related thermodynamic quantities for sulfanilic acid,1 metanilic acid,2 and or-
thanilic acid3 have been reported previously from this Laboratory. The present paper reports experimental data for the determination of the ionization constant of4-amino-3-methylbenzenesulfonic acid. All these acids are zwitterions with large charge separations and all show a remarkably small entropy of ionization.
Using conductance measurements, Ostwald4 has determined the ionization constant of this acid at 25° and found it to be 7.53 X 10~4.
By analogy with the other aminobenzenesulfonic acids, we assume that this acid is a zwitterion and thus that the ionization reaction is
Notes 717
The general method of investigation is that developed by Harned and co-workers.6 The cells were of the type Pt, H2/HAts(rai°), NaAts(m2°), NaCl(wi30) / AgCl-Ag where HAts and NaAts are the acid and its sodium salt, respectively, and mi°, m2°, m3° are weight molalities. By elimination of mH*7H* from the cell potential equation
„ 2.30259R T ,E = E ° ----------- —------ logmH+mci-TH+yci- (1)F
and the thermodynamic ionization constant expression
K = W lH + Î W A t s - Y H + Y A t s -
W - H A t s Y H A t s
there results the relation
(E — E°)F mHAtsraci- 2.30259ET + °g mAt .-
(2)
, „ , YHAtsYCl-—log K — lo g -------------- (3)Y A t s ~
The ionization constant of HAts is so large (about 7 X 10~4) that mAts- and mjiAts are not equal to the stoichiometric values and these values must be corrected for the ionization of the acid
TOHAts = m°HAts - mu+
WlAts— = Wi°NaAts + % +
where m° represents the stoichiometric molalities.Values of mn+ were calculated by solving eq. 1 for
log t o h + and using the Debye-Hiickel limiting law for the activity coefficients. This procedure required two successive approximations. The left-hand side of eq. 3 was plotted as a function of ionic strength and extrapolated to zero ionic strength, yielding a first approximation for —log K. Using this value of K, new values of mH+ were computed from eq. 2 and again the left- hand side of eq. 3 was extrapolated to zero ionic strength using the method of least squares.
Three complete cycles of these calculations were made( 1 ) R . O . M a c L a r e n a n d D . F . S w in e h a r t , J. Am. Chem. Soc., 7 3 , 1 8 2 2
( 1 9 5 1 ) .( 2 ) R . D . M c C o y a n d D . F . S w in e h a r t , ibid., 7 6 , 4 7 0 8 ( 1 9 5 4 ) .( 3 ) R . N . D i e b e l a n d D . F . S w i n e h a r t , J. Phys. Chem., 6 1 , 3 3 3
( 1 9 5 7 ) .( 4 ) W . O s t w a ld , Z. physik. Chem., 3 , 4 1 2 ( 1 8 8 9 ) .( 5 ) H . S . H a r n e d a n d B . B . O w e n , “ T h e P h y s i c a l C h e m i s t r y o f E l e c t r o
l y t i c S o l u t i o n s , ’ * 2 n d E d . , R e i n h o l d P u b l . C o r p . , N e w Y o r k , N . Y . , 1 9 5 0 .
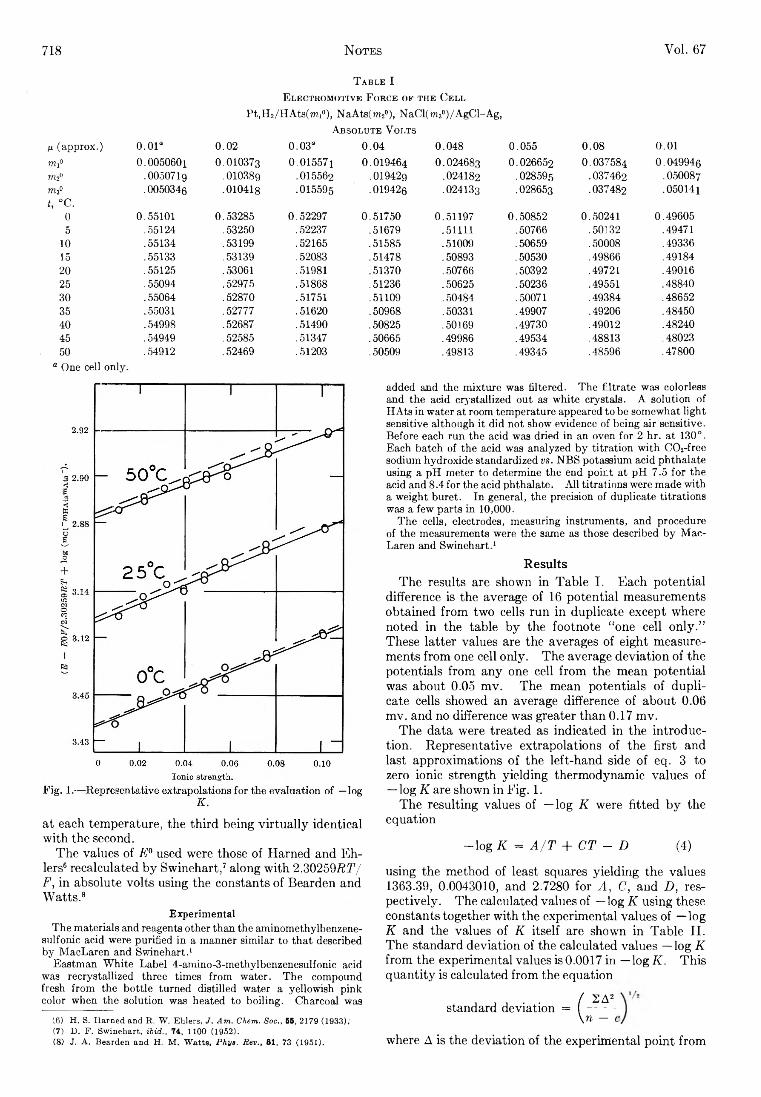
718 Notes Vol. 67
T a b l e I
E l e c t r o m o t i v e F o r c e o f t h e C e l l
P t,H 2/HAtB(m1°), NaAts(m 20), NaCl(m 3°)/A gC l-A g,
A b s o l u t e V o l t s
ß (approx.) 0 .0 1 “ 0 .0 2 0.03“ 0.04 0.048 0.055 0.08 0 .0 1
TOl° 0.0050601 0.010373 0.015571 0.019464 0.024683 0.026652 0.037584 0.049946m2° .0050719 .010389 .015562 ,01942g .024182 .028595 .037462 .050087
TOS°t, °C .
0
.0050346 .01041g .015595 .019426 .024133 .028653 .037482 .050141
0.55101 0.53285 0.52297 0.51750 0 .51197 0.50852 0.50241 0.49605
■5 .55124 .53250 .52237 .51679 .5 1111 .50766 .50132 .49471
10 .55134 .53199 .52165 .51585 .51009 .50659 .50008 .49336
15 .55133 .53139 .52083 .51478 .50893 .50530 .49866 .49184
20 .55125 .53061 .51981 .51370 .50766 .50392 .49721 .49016
25 .55094 .52975 .51868 .51236 .50625 .50236 .49551 .48840
30 .55064 .52870 .51751 .51109 .50484 .50071 .49384 .48652
35 .55031 .52777 .51620 .50968 .50331 .49907 .49206 .48450
40 .54998 .52687 .51490 .50825 .50169 .49730 .49012 .48240
45 .54949 .52585 .51347 .50665 .49986 .49534 .48813 .48023
50 .54912 .52469 .51203 .50509 .49813 .49345 .48596 .47800
a One cell only.
at each temperature, the third being virtually identical with the second.
The values of E° used were those of Harned and Eh- lers6 recalculated by Swinehart,7 along with 2.30259RT/ F, in absolute volts using the constants of Bearden and Watts.8
ExperimentalThe materials and reagents other than the aminomethylbenzene-
sulfonic acid were purified in a manner similar to that described b y MacLaren and Swinehart.1
Eastm an W hite Label 4-amino-3-methylbenzenesulfonic acid was recrystallized three times from water. The compound fresh from the bottle turned distilled water a yellowish pink color when the solution was heated to boiling. Charcoal was
( 6 ) H . S . H a r n e d a n d I t . W . E h le r s , J. Am. Chem. Soc., 55, 2 1 7 9 ( 1 9 3 3 ) .( 7 ) D . F . S w in e h a r t , ibid., 74, 1 1 0 0 ( 1 9 5 2 ) .( 8 ) J . A . B e a r d e n a n d H . M . W a t t s , Phye. Rev., 81, 7 3 ( 1 9 5 1 ) .
added and the mixture was filtered. The filtrate was colorless and the acid crystallized out as white crystals. A solution of H Ats in water at room temperature appeared to be somewhat light sensitive although it did not show evidence of being air sensitive. Before each run the acid was dried in an oven for 2 hr. at 130°. Each batch of the acid was analyzed b y titration with C 0 2-free sodium hydroxide standardized vs. N B S potassium acid phthalate using a pH meter to determine the end point at pH 7.5 for the acid and 8.4 for the acid phthalate. All titrations were made with a weight buret. In general, the precision of duplicate titrations was a few parts in 1 0 ,0 0 0 .
T he cells, electrodes, measuring instruments, and procedure of the measurements were the same as those described b y M acLaren and Swinehart.1
ResultsThe results are shown in Table I. Each potential
difference is the average of 16 potential measurements obtained from two cells run in duplicate except where noted in the table by the footnote “ one cell only.” These latter values are the averages of eight measurements from one cell only. The average deviation of the potentials from any one cell from the mean potential was about 0.05 mv. The mean potentials of duplicate cells showed an average difference of about 0.06 mv. and no difference was greater than 0.17 mv.
The data were treated as indicated in the introduction. Representative extrapolations of the first and last approximations of the left-hand side of eq. 3 to zero ionic strength yielding thermodynamic values of —log K are shown in Fig. 1.
The resulting values of —log K were fitted by the equation
- lo g K = A/T + CT - D (4)
using the method of least squares yielding the values 1363.39, 0.0043010, and 2.7280 for A, C, and D, respectively. The calculated values of —log K using these constants together with the experimental values of —log K and the values of K itself are shown in Table II. The standard deviation of the calculated values —log K from the experimental values is 0.0017 in —log K. This quantity is calculated from the equation
l 2A2standard deviation = I -------
\n — c
where A is the deviation of the experimental pohit from
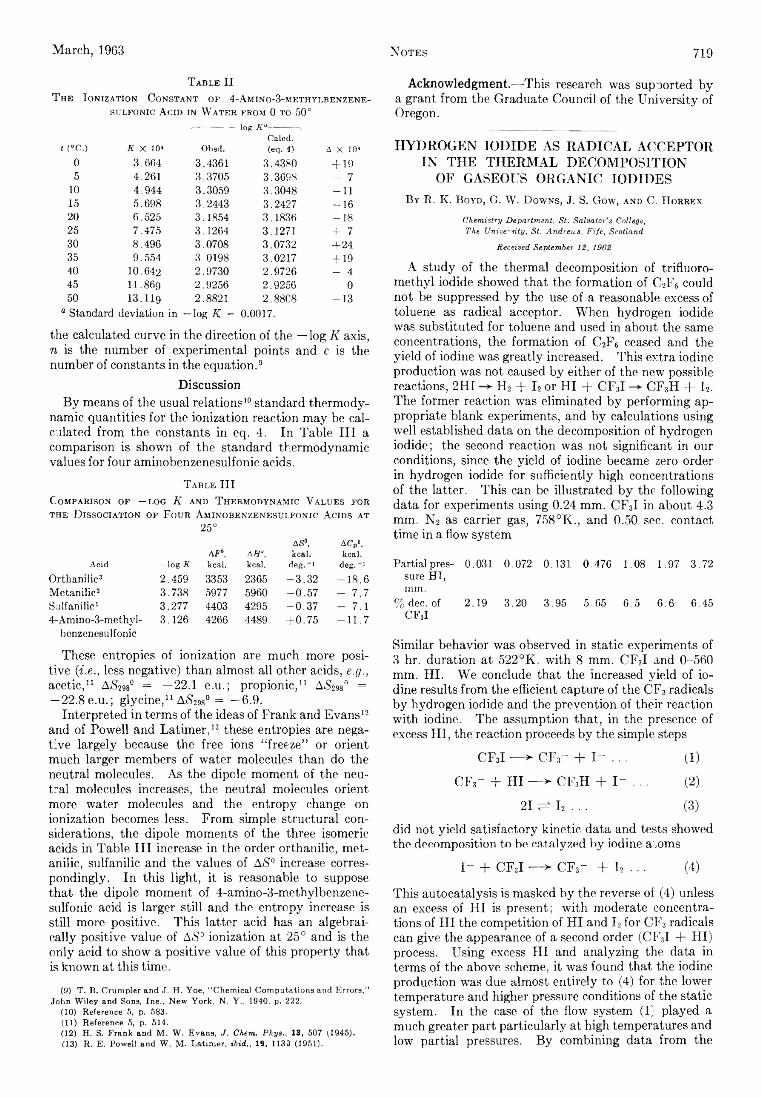
March, 1963 Notes 719
T able II
T he I o n iza tio n C o n st a n t of 4 -A m in o -3 -m e t h y l b e n ze n e - stjlfonic A cid in W a t e r from 0 to 50°
'----------------------l o g Ka-------------------.C a l c d .
1 ( ° o . ) K X 10* O b s d . (eq. 4) A X 10*
0 3.664 3.4361 3.4380 + 195 4.261 3.3705 3.3698 - 7
10 4.944 3.3059 3.3048 - 1 1
15 5.698 3.2443 3.2427 - 1 620 6.525 3.1854 3.1836 - 1 825 7.475 3.1264 3 .12 71 + 730 8.496 3.0708 3.0732 + 2 435 9.554 3.0198 3.0217 + 1940 10.642 2.9730 2.9726 - 445 I I .8 6 9 2.9256 2.9256 0
50 13 .119 2.8821 2.8808 - 1 3
a Standard deviation in - l o g K = 0.0017.
the calculated curve in the direction of the — log K axis, n is the number of experimental points and c is the number of constants in the equation.9
DiscussionBy means of the usual relations10 standard thermody
namic quantities for the ionization reaction may be calculated from the constants in eq. 4. In Table III a comparison is shown of the standard thermodynamic values for four aminobenzenesulfonic acids.
T a b l e III
C omparison of —log K and T hermodynamic V alues for the D issociation of F our A minobenzenesulfonic A cids at
25°
AS”, ACp»,AF°, AH\ k c a l . k c a l .
A c i d - l o g R k c a l . k c a l . d e g . - > d e g . - *
Orthanilic3 2.459 3353 2365 - 3 . 3 2 - 1 8 . 6M etanilic2 3.738 5977 5960 - 0 . 5 7 - 7 .7Sulfanilic1 3.277 4403 4295 - 0 . 3 7 - 7 .14-Amino-3-methyl- 3.126 4266 4489 + 0.75 - 1 1 . 7
benzenesulfonic
These entropies of ionization are much more positive (i.e., less negative) than almost all other acids, e.g., acetic,11 AiS29s° = —22.1 e.u.; propionic,11 A&ss0 = — 22.8e.u.; glycine,11 AjS2980 = —6.9.
Interpreted in terms of the ideas of Frank and Evans12 and of Powell and Latimer,13 these entropies are negative largely because the free ions “ freeze” or orient much larger members of water molecules than do the neutral molecules. As the dipole moment of the neutral molecules increases, the neutral molecules orient more water molecules and the entropy change on ionization becomes less. From simple structural considerations, the dipole moments of the three isomeric acids in Table III increase in the order orthanilic, met- anilic, sulfanilic and the values of A<S0 increase correspondingly. In this light, it is reasonable to suppose that the dipole moment of 4-amino-3-methylbenzene- sulfonic acid is larger still and the entropy increase is still more positive. This latter acid has an algebraically positive value of AS0 ionization at 25° and is the only acid to show a positive value of this property that is known at this time.
( 9 ) T . B . C r u m p l e r a n d J . H . Y o e , “ C h e m i c a l C o m p u t a t i o n s a n d E r r o r s , ” J o h n W i l e y a n d S o n s , I n e . , N e w Y o r k , N . Y . , 1 9 4 0 , p . 2 2 2 .
( 1 0 ) R e f e r e n c e 5 , p . 5 8 3 .( 1 1 ) R e f e r e n c e 5, p . 5 1 4 .( 1 2 ) H . S . F r a n k a n d M . W . E v a n s , J. Chem. Phys., 1 3 , 5 0 7 ( 1 9 4 5 ) .(1 3 ) R . E . P o w e l l a n d W . M . L a t i m e r , ibid., 1 9 , 1 1 3 9 ( 1 9 5 1 ) .
Acknowledgment.—This research was supported by a grant from the Graduate Council of the University of Oregon.
HYDROGEN IODIDE AS RADICAL ACCEPTOR IN THE THERMAL DECOMPOSITION
OF GASEOUS ORGANIC IODIDESB y R. K . B oyd, G. W. D owns, J. S. Gow, and C. H orrex
Chemistry Department, St. Salvator’s College,The University, St. Andrews, Fife, Scotland
Received September 12, 1962
A study of the thermal decomposition of trifluoro- methyl iodide showed that the formation of C2F6 could not be suppressed by the use of a reasonable excess of toluene as radical acceptor. When hydrogen iodide was substituted for toluene and used in about the same concentrations, the formation of C2F6 ceased and the yield of iodine was greatly increased. This extra iodine production was not caused by either of the new possible reactions, 2FH H2 + I2 or HI -+ CF3I CF3H +- I2. The former reaction was eliminated by performing appropriate blank experiments, and by calculations using well established data on the decomposition of hydrogen iodide; the second reaction was not significant in our conditions, since the yield of iodine became zero order in hydrogen iodide for sufficiently high concentrations of the latter. This can be illustrated by the following data for experiments using 0.24 mm. CF3I in about 4.3 mm. N2 as carrier gas, 758°K., and 0.50 sec. contact time in a flow system
Partial pres 0.031 0.072 0.131 0.476 1.08 1.9 7 3.72sure HI,mm.
% dec. of 2 .19 3.20 3.95 5.65 6 .5 6 . 6 6.45C F 3I
Similar behavior was observed in static experiments of 3 hr. duration at 522°K. with 8 mm. CF3I and 0-560 mm. HI. We conclude that the increased yield of iodine results from the efficient capture of the CF3 radicals by hydrogen iodide and the prevention of their reaction with iodine. The assumption that, in the presence of excess HI, the reaction proceeds by the simple steps
CFSI — ► CF3- + I~ - •. (1)
CF3- + HI — ► CF3H + I - .. . (2)
21 v i I2 . . . (3)
did not yield satisfactory kinetic data and tests showed the decomposition to be catalyzed by iodine acoms
W + CF3I — -> CF3- + I2 . .. (4)
This autocatalysis is masked by the reverse of (4) unless an excess of HI is present; with moderate concentrations of HI the competition of HI and I2 for CF3 radicals can give the appearance of a second order (CF3I + HI) process. Using excess HI and analyzing the data in terms of the above scheme, it was found that the iodine production was due almost entirely to (4) for the lower temperature and higher pressure conditions of the static system. In the case of the flow system (1) played a much greater part particularly at high temperatures and low partial pressures. By combining data from the
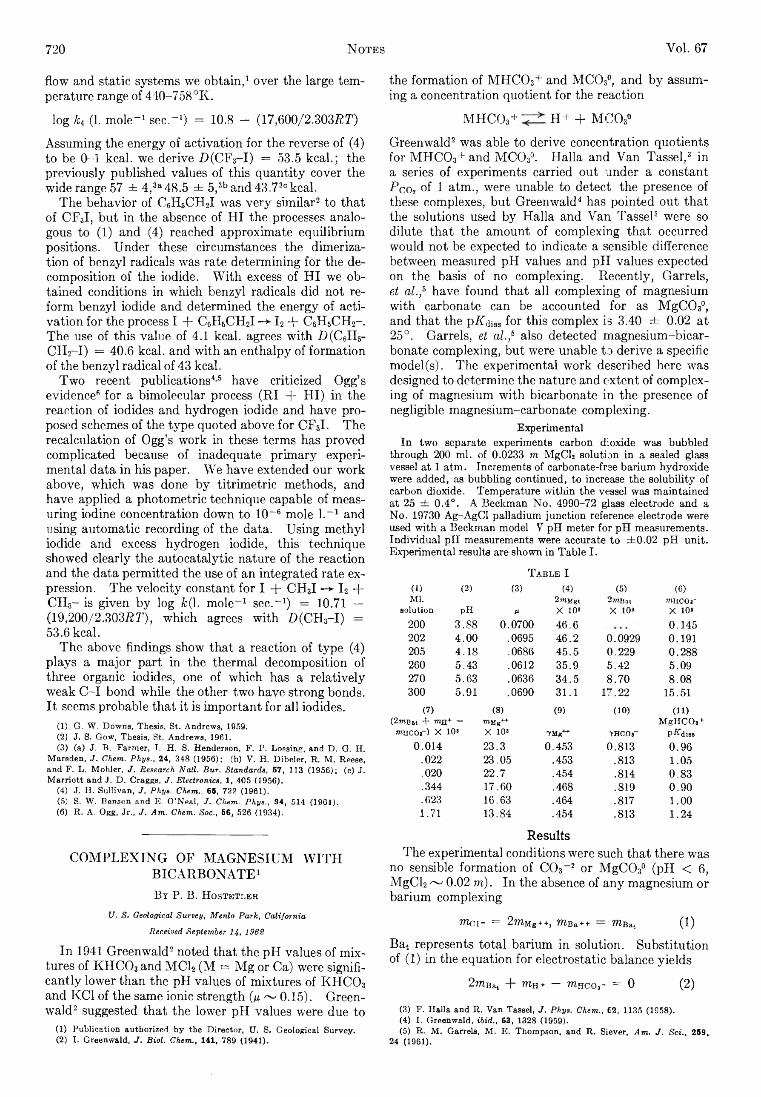
720 N otes Yol. 67
flow and static systems we obtain,1 over the large temperature range of 440-758°K.
log h (1. mole“ 1 sec.“ 1) = 10.8 - (17,600/2.303fi77)
Assuming the energy of activation for the reverse of (4) to be 0-1 kcal. we derive D(CF3-I ) = 53.5 kcal.; the previously published values of this quantity cover the wide range 57 ± 4,3a48.5 ± 5,3band43.73okcal.
The behavior of C6H6CH2I was very similar2 to that of CF3I, but in the absence of HI the processes analogous to (1) and (4) reached approximate equilibrium positions. Under these circumstances the dimerization of benzyl radicals was rate determining for the decomposition of the iodide. With excess of HI we obtained conditions in which benzyl radicals did not reform benzyl iodide and determined the energy of activation for the process I + C6H6CH2I -*■ I2 + C6H5CH2-. The use of this value of 4.1 kcal. agrees with -D(C6H8- CH2-I ) = 40.6 kcal. and with an enthalpy of formation of the benzyl radical of 43 kcal.
Two recent publications46 have criticized Ogg’s evidence6 for a bimolecular process (RI + HI) in the reaction of iodides and hydrogen iodide and have proposed schemes of the type quoted above for CF3I. The recalculation of Ogg’s work in these terms has proved complicated because of inadequate primary experimental data in his paper. We have extended our work above, which was done by titrimetric methods, and have applied a photometric technique capable of measuring iodine concentration down to HU6 mole l._1 and using automatic recording of the data. Using methyl iodide and excess hydrogen iodide, this technique showed clearly the autocatalytic nature of the reaction and the data permitted the use of an integrated rate expression. The velocity constant for I + CH3I -*■12 + CKU- is given by log 4(1. mole-1 sec.-1) = 10.71 — (19,200/2.303/47'); which agrees with Z>(CH3-I ) =53.6 kcal.
The above findings show that a reaction of type (4) plays a major part in the thermal decomposition of three organic iodides, one of which has a relatively weak C -I bond while the other two have strong bonds. It seems probable that it is important for all iodides.
( 1 ) G . W . D o w n s , T h e s i s , S t . A n d r e w s , 1 9 5 9 .( 2 ) J . S . G o w , T h e s i s , S t . A n d r e w s , 1 9 6 1 .( 3 ) ( a ) J . B . F a r m e r , I . H . S . H e n d e r s o n , F . P . L o s s i n g , a n d D . G . H .
M a r s d e n , J. Chem. Phys., 24, 3 4 8 ( 1 9 5 6 ) ; ( b ) V . H . D i b e l e r , R . M . R e e s e , a n d F . L . M o h l e r , J. Research Natl. Bur. Standards, 57, 1 1 3 ( 1 9 5 6 ) ; ( c ) J . M a r r i o t t a n d J . D . C r a g g s , J. Electronics, 1 , 4 0 5 ( 1 9 5 6 ) .
( 4 ) J . H . S u l l i v a n , J. Phys. Chem., 65, 7 2 2 ( 1 9 6 1 ) .( 5 ) S . W . B e n s o n a n d E. O 'N e a l , J. Chem. Phys., 3 4 , 5 1 4 ( 1 9 6 1 ) .( 6 ) R . A . O g g , J r . , J. Am. Chem. Soc., 6 6 , 5 2 6 ( 1 9 3 4 ) .
COMPLEXING OF MAGNESIUM WITH BICARBONATE1B y P. B . H ostetler
U. S. Geological Survey, Menlo Park, California Received September 14, 1968
In 1941 Greenwald2 noted that the pH values of mixtures of KHCO3 and MCU (M = Mg or Ca) were significantly lower than the pH values of mixtures of KH C03 and KC1 of the same ionic strength (n ~ 0.15). Greenwald2 suggested that the lower pH values were due to
(1) Publication authorized by the Director, U. S. Geological Survey.(2) I. Greenwald, J. Biol. Chem., 141, 789 (1941).
the formation of M H C03+ and MCOs°, and by assuming a concentration quotient for the reaction
M H C03+ H+ + M C 03°
Greenwald2 was able to derive concentration quotients for M H C03+ and M C 03°. Halla and Van Tassel,3 in a series of experiments carried out under a constant Pco, of 1 atm., were unable to detect the presence of these complexes, but Greenwald4 has pointed out that the solutions used by Halla and Van Tassel3 were so dilute that the amount of complexing that occurred would not be expected to indicate a sensible difference between measured pH values and pH values expected on the basis of no complexing. Recently, Garrels, et al,,6 have found that all complexing of magnesium with carbonate can be accounted for as M gC 03°, and that the p/Rjiss for this complex is 3.40 ± 0.02 at 25°. Garrels, et al.,6 also detected magnesium-bicarbonate complexing, but were unable to derive a specific model(s). The experimental work described here was designed to determine the nature and extent of complexing of magnesium with bicarbonate in the presence of negligible magnesium-carbonate complexing.
Experimental
In two separate experiments carbon dioxide was bubbled through 200 ml. of 0.0233 m M gC k solution in a sealed glass vessel at 1 atm. Increments of carbonate-free barium hydroxide were added, as bubbling continued, to increase the solubility of carbon dioxide. Temperature within the vessel was maintained at 25 ± 0.4°. A Beckman N o. 4990-72 glass electrode and a No. 19730 A g -A g C l palladium junction reference electrode were used with a Beckman model V pH meter for pH measurements. Individual pH measurements were accurate to ± 0 .0 2 pH unit. Experimental results are shown in Table I.
T able I
(1) (2) (3) (4) (5) (6)Ml. 2mMgt 2mBat mHCOr
solution pH a X 10' X 10' X 108200 3.88 0.0700 46.6 0.145202 4.00 .0695 46.2 0.0929 0 .19 1205 4.18 .0686 45.5 0.229 0.288260 5.43 .0612 35.9 5.42 5.09270 5.63 .0636 34.5 8.70 8.08300 5.91 .0690 3 1 .1 17.2 2 15 .5 1
(7) (8) (9) (10) (11)(2 mßat + WH+ ~ mMg++ MgHCOa +mHcor) X 10' X 10' 7Mg'H‘ 7HC0r plTdiss
0.014 23.3 0.453 0.813 0.96.0 2 2 23.05 .453 .813 1.0 5.020 22.7 .454 .814 0.83.344 17.60 .468 .819 0.90.623 16.63 .464 .817 1 .0 0
1 .7 1 13.84 .454 .813 1.2 4
ResultsThe experimental conditions were such that there was
no sensible formation of C 03- 2 or M gC03° (pH < 6, MgCh ~ 0.02 m). In the absence of any magnesium or barium complexing
mei- = 2mMg++, niBa+t = mBat (1)Bat represents total barium in solution. Substitution of (1) in the equation for electrostatic balance yields
2mBat + wih+ — tohcoj- = 0 (2)
(3) F. Halla and R. Van Tassel, J. Phys. Chem., 62, 1135 (1958).(4) I. Greenwald, ibid., 63, 1328 (1959).(5) R. M. Garrels, M. E. Thompson, and R. Siever, Am. J. Sci., 259,
24 (1961).
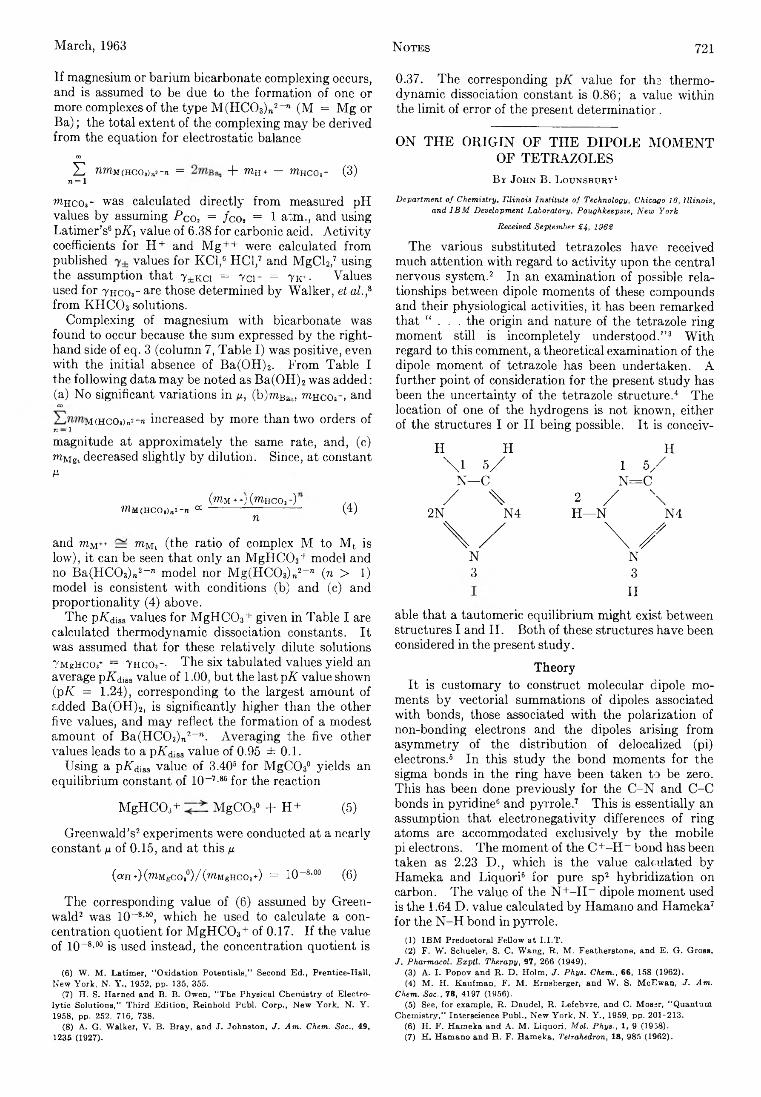
M a r c h , 1 9 6 3 721
If magnesium or barium bicarbonate complexing occurs, and is assumed to be due to the formation of one or more complexes of the type M (H C03)ri2_’1 (M = Mg or Ba); the total extent of the complexing may be derived from the equation for electrostatic balance
coX) titixm(hco,)„2 ~n = + niH+ — m n co , - (3)
n = l
Whcos- was calculated directly from measured pH values by assuming Pc o, = /co , = 1 atm., and using Latimer’s6 p A value of 6.38 for carbonic acid. Activity coefficients for H + and M g++ were calculated from published values for KC1,6 HC1,7 and MgCl2,7 using the assumption that t±kci = 7ci- = 7k+- Values used for 7hcos- are those determined by Walker, et al.,s from KHCO3 solutions.
Complexing of magnesium with bicarbonate was found to occur because the sum expressed by the right- hand side of eq. 3 (column 7, Table I) was positive, even with the initial absence of Ba(OH)2. From Table I the following data may be noted as Ba(OH)2 was added: (a) No significant variations in n, (b)mBa„ » ihco,-, andco
M(HCOa)n>-» increased by more than two orders ofn— 1magnitude at approximately the same rate, and, (c) niMgt decreased slightly by dilution. Since, at constant M
(tom++/' ( wihcos-) , . ,iUM(HCO,)„!-n “ ----------------------- - (4)n
and mM++ = mM, (the ratio of complex M to M t is low), it can be seen that only an M gH C03+ model and no Ba(HC03)n2_n model nor M g(H C03)„2-n (n > 1) model is consistent with conditions (b) and (c) and proportionality (4) above.
The pifdisa values for M gHC03+ given in Table I are calculated thermodynamic dissociation constants. It was assumed that for these relatively dilute solutions 7MgHco3+ = 7hco3-- The six tabulated values yield an average pRdiss value of 1.00, but the last pK value shown (pK = 1.24), corresponding to the largest amount of added Ba(OH)2, is significantly higher than the other five values, and may reflect the formation of a modest amount of Ba(HC03)n2_". Averaging the five other values leads to a pRdiss value of 0.95 ± 0.1.
Using a pAdjas value of 3.406 for M gC03° yields an equilibrium constant of 10 ~7-86 for the reaction
M gHC03+ M gC03° + H+ (5)
Greenwald’s2 experiments were conducted at a nearly constant ¡x of 0.15, and at this ¡x
( a H + ) ( m M g C O , ° ) / ( l T O M g H C O , + ) = 1 0 ~ 8 - 0 0 ( 6 )
The corresponding value of (6) assumed by Green- wald2 was 10“ 8-60, which he used to calculate a concentration quotient for M gH C03+ of 0.17. If the value of 10-8-00 is used instead, the concentration quotient is
(6) W. M. Latimer, “ Oxidation Potentials,” Second Ed., Prentice-Hall, New York, N. Y., 1952, pp. 135, 355.
(7) H. S. Harned and B. B. Owen, “ The Physical Chemistry of Electrolytic Solutions,” Third Edition, Reinhold Publ. Corp., New York, N. Y. 1958, pp. 252, 716, 738.
(8) A. G. Walker, V. B. Bray, and J. Johnston, J. Am. Chem. Soc., 49, 1235 (1927).
Notes
0.37. The corresponding pK value for the thermodynamic dissociation constant is 0.86; a value within the limit of error of the present determination.
ON THE ORIGIN OF THE DIPOLE MOMENT OF TETRAZOLES
B y John B . L ounsbury1
Department of Chemistry, Illinois Institute of Technology, Chicago 16, Illinois, and IBM Development Laboratory, Poughkeepsie, New York
Received September 24, 1962
The various substituted tetrazoles have received much attention with regard to activity upon the central nervous system.2 In an examination of possible relationships between dipole moments of these compounds and their physiological activities, it has been remarked that “ . . . the origin and nature of the tetrazole ring moment still is incompletely understood.” 3 With regard to this comment, a theoretical examination of the dipole moment of tetrazole has been undertaken. A further point of consideration for the present study has been the uncertainty of the tetrazole structure.4 The location of one of the hydrogens is not known, either of the structures I or II being possible. It is conceiv-
H H\ 1 5 /
N— C/ \
2N N4
\ /N3
H1 5 /N = C
2 / \H— N N4
\ /N3
II
able that a tautomeric equilibrium might exist between structures I and II. Both of these structures have been considered in the present study.
TheoryIt is customary to construct molecular dipole mo
ments by vectorial summations of dipoles associated with bonds, those associated with the polarization of non-bonding electrons and the dipoles arising from asymmetry of the distribution of delocalized (pi) electrons.6 In this study the bond moments for the sigma bonds in the ring have been taken to be zero. This has been done previously for the C -N and C-C bonds in pyridine6 and pyrrole.7 This is essentially an assumption that electronegativity differences of ring atoms are accommodated exclusively by the mobile pi electrons. The moment of the C +-II~ bond has been taken as 2.23 D., which is the value calculated by Hameka and Liquori6 for pure sp2 hybridization on carbon. The value of the N + -H " dipole moment used is the 1.64 D. value calculated by Hamano and Hameka7 for the N -H bond in pyrrole.
(1) IBM Predoctoral Fellow at I.I.T.(2) F. W. Schueler, S. C. Wang, R. M. Featherstone, and E. G. Gross,
J, Pharmacol. Exptl. Therapy, 97, 266 (1949).(3) A. I. Popov and R. D. Holm, J. Phys. Chem., 66, 158 (1962).(4) M. H. Kaufman, F. M. Ernsberger, and W. S. McEwan, J. Am.
Chem. Soc., 78, 4197 (1956).(5) See, for example, R. Daudel, R. Lefebvre, and C. Moser, “ Quantum
Chemistry,” Interseience Publ., New York, N. Y., 1959, pp. 201-213.(6) H. F. Hameka and A. M. Liquori, Mol. Phys., 1, 9 (1958).(7) H. Hamano and H. F. Hameka, Tetrahedron, 18, 985 (1962).
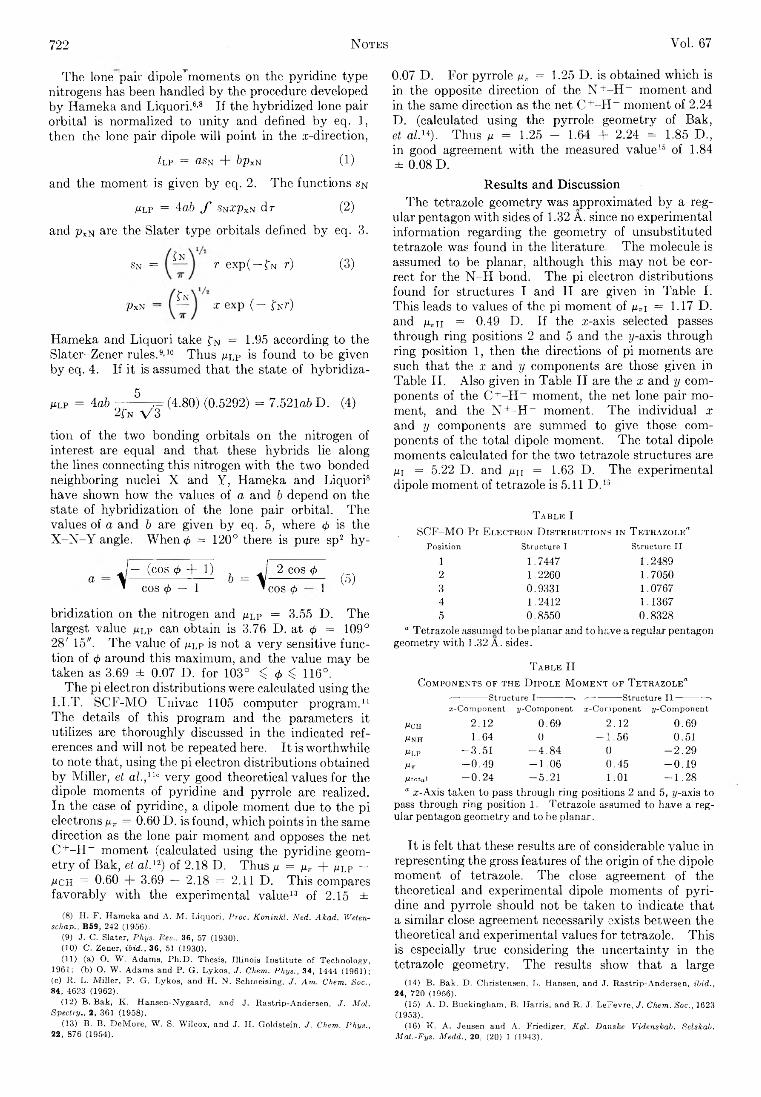
722 Notes Voi. 67
The lone pair dipoleFnoments on the pyridine type nitrogens has been handled by the procedure developed by Hameka and Liquori.6’8 If the hybridized lone pair orbital is normalized to unity and defined by eq. 1, then che lone pair dipole will point in the .^-direction,
¿lp = usn + bpx n (1)and the moment is given by eq. 2. The functions sn
mlp = 4ab f snzPxn dr (2)and pxN are the Slater type orbitals defined by eq. 3.
S n =
Px N —
¿N
Tn
r exp( — f N r)
x exp ( — f Nr)
(3 )
Hameka and Liquori take f N = 1.95 according to the Slater-Zener rules.9’10 Thus mlp is found to be given by eq. 4. If it is assumed that the state of hybridiza-
julf = 4a6 5 , - (4.80) (0.5292) = 7.521a6 D. (4)2fN v 3
tion of the two bonding orbitals on the nitrogen of interest are equal and that these hybrids lie along the lines connecting this nitrogen with the two bonded neighboring nuclei X and Y, Hameka and Liquori8 have shown how the values of a and b depend on the state of hybridization of the lone pair orbital. The values of a and b are given by eq. 5, where 4> is the X -N -Y angle. When<£ = 120° there is pure sp2 hy-
a V - (COS (j) + 1)
COS (f> — 1b = V;2 cos <f>
cos (¡> 1 (5 )
bridization on the nitrogen and mlp = 3.55 D. The largest value mlp can obtain is 3.76 D. at 0 = 109° 28' 15". The value of m lp is not a very sensitive function of 4> around this maximum, and the value may be taken as 3.69 ± 0.07 D. for 103° ^ <f> ^ 116°.
The pi electron distributions were calculated using the I.I.T. SCF-MO Univac 1105 computer program.11 The details of this program and the parameters it utilizes are thoroughly discussed in the indicated references and will not be repeated here. It is worthwhile to note that, using the pi electron distributions obtained by Miller, et al.,llc very good theoretical values for the dipole moments of pyridine and pyrrole are realized. In the case of pyridine, a dipole moment due to the pi electrons pw = 0.60 D. is found, which points in the same direction as the lone pair moment and opposes the net C +-H - moment (calculated using the pyridine geometry of Bak, et al.n) of 2.18 D. Thus p = pT + ^LP — m c h = 0.60 + 3.69 — 2.18 = 2.11 D. This compares favorably with the experimental value13 of 2.15 ±
(8) H. F. Hameka and A. M. Liquori, Proc. Koninkl. Ned. AJcad. Weten- schap., B59, 242 (1956).
(9) J. C. Slater, Phys. Rev., 36, 57 (1930).(10) C. Zener, ibid., 36, 51 (1930).(11) (a) O. W. Adams, Ph.D. Thesis, Illinois Institute of Technology,
1961; (b) O. W. Adams and P. G. Lykos, J. Chem. Phys., 34, 1444 (1961); (c) R. L. Miller, P. G. Lykos, and H. N. Schmeising, J. Am. Chem. Soc., 84, 4623 (1962).
(12) B. Bak, K. Hansen-Nygaard, and J. Rastrip-Andersen, J. Mol. Spectry., 2, 361 (1958).
(13) B. B. DeMore, W. S. Wilcox, and J. H. Goldstein, J. Chem. Phys., 22, 876 (1954).
0.07 D. For pyrrole pr = 1.25 D. is obtained which is in the opposite direction of the N +-H ~ moment and in the same direction as the net C+-H - moment of 2.24 D. (calculated using the pyrrole geometry of Bak, et al.u). Thus p = 1.25 - 1.64 + 2.24 = 1.85 D., in good agreement with the measured value15 of 1.84 ± 0.08 D.
Results and DiscussionThe tetrazole geometry was approximated by a reg
ular pentagon with sides of 1.32 A. since no experimental information regarding the geometry of unsubstituted tetrazole was found in the literature The molecule is assumed to be planar, although this may not be correct for the N -H bond. The pi electron distributions found for structures I and II are given in Table I. This leads to values of the pi moment of pri = 1.17 D. and pru = 0.49 D. If the x-axis selected passes through ring positions 2 and 5 and the ¡/-axis through ring position 1, then the directions of pi moments are such that the x and y components are those given in Table II. Also given in Table II are the x and y components of the C +-H ” moment, the net lone pair moment, and the N+-FI- moment. The individual x and y components are summed to give those components of the total dipole moment. The total dipole moments calculated for the two tetrazole structures are pi = 5.22 D. and pn = 1.63 D. The experimental dipole moment of tetrazole is 5.11 D .13
T a b l e ISCF-MO Pi E l e c t r o n D i s t r i b u t i o n s i n T e t r a z o l e "
Position Structure I Structure I I
1 1.7447 1.24892 1.2260 1.70503 0.9331 1.07674 1.2412 1.13675 0.8550 0.8328
“ Tetrazole assumed to be planar and to have a regular pentagon geometry with 1.32 A. sides.
T a b l e IIC o m p o n e n t s o f t h e D i p o l e M o m e n t o f T e t r a z o l e “
'—•--------Structure I ------- ---- * '—*-------Structure I I ----------- >rr-Component /-Component ^-Component ^-Component
Mch 2.12 0.69 2.12 0.69Mnh 1.64 0 -1 .5 6 0.51Mlp -3 .5 1 -4 .8 4 0 -2 .2 9ßir -0 .4 9 -1 .0 6 0.45 -0 .1 9ß total -0 .2 4 -5 .2 1 1.01 -1 .2 8“ z-Axis taken to pass through ring positions 2 and 5, y-axis to
pass through ring position 1. Tetrazole assumed to have a regular pentagon geometry and to be planar.
It is felt that these results are of considerable value in representing the gross features of the origin of the dipole moment of tetrazole. The close agreement of the theoretical and experimental dipole moments of pyridine and pyrrole should not be taken to indicate that a similar close agreement necessarily exists between the theoretical and experimental values for tetrazole. This is especially true considering the uncertainty in the tetrazole geometry. The results show that a large
(14) B. Bak, D. Christensen, L. Hansen, and J. Rastrip-Andersen, ibid., 24, 720 (1956).
(15) A. D. Buckingham, B. Harris, and R. J. LeFevre, J. Chem. Soc., 1623 (1953).
(16) K. A. Jensen and A. Friediger, Kgl. Danske Videnskab. Selskab. Mat.-Fys. Medd., 20, (20) 1 (1943).
M a r c h , 1963 Communication to the Editor 7 2 3
part of the difference in the dipole moments of 1- and 2-substituted tetrazoles lies in the difference in the vectorial sums of the lone pair moments and the sigma bond moments, these moments more nearly canceling each other in the case of 2-substitution. A much smaller part of the difference is due to the reduced pi moment of the 2-substituted compounds. Although the accuracy of the calculated dipole moments does not warrant it, and although the existence of a tautomeric equilibrium between structures I and II has never been demonstrated, it is of interest to calculate an equilibrium constant between structures I and II, if for no other reason than it is not known that this has ever been done before for tetrazole. It is found that, for a mixture of I and II to produce an apparent dipole moment of 5.11 D., K (lll = [I]/[II] = 31.3, which corresponds to tetrazole existing as 97% in form I. Considering the probable numerical accuracy, this calculation may be considered consistent with tetrazole existing exclusively
in the 1-protonated tautomer. This predominance of structure I is in agreement with the results of a recentn.m.r. study17 of the chemical shifts of the carbon bound proton on the tetrazole ring in tetrazole and N-alkylated tetrazoles. It is also consistent with the observation4 that 1-ethyltetrazole has a dipole moment o; 5.64 while2-ethyltetrazole has a moment of 2.64 D.
Acknowledgment.—The author is indebted to Dr.P. G. Lykos of this Laboratory for suggesting this problem and for encouragement and advice during the study. The author wishes to thank Drs. R. L. Flurry and R. L. Miller of this Laboratory for many stimulating discussions. This work was carried out with a generous grant of computer time by the Illinois Institute of Technology. The author is especially indebted to the International Business Machines Corporation for a fellowship from the IBM Special Education Program.
(17) D. W. Moore and A. G. Whittaker, J. Am. Chem. Soc., 82, 5007 (1960).
COMMUNICATION TO THE EDITOR
RELATIVE MOBILITIES OF LIKE-CHARGED IONS IN FUSED SALTS1-1
Sir:We wish to call attention to an observation, based on
results of other workers as well as our own experimental data, that appears sufficiently general to warrant consideration in any attempt to understand the mechanism of ionic transport in fused salts.
Our experiments were initiated in an effort to throw light on the reasons for the characteristic behavior of conductivity isotherms in fused salt mixtures. The equivalent conductance generally is found to deviate negatively from additivity of the pure salt values.lb Because this behavior is particularly striking in the case of LiCl-KCl mixtures, we have been running Hittorf-type transference experiments to determine the relative mobilities of the two cations at various concentrations. Electrolysis between chlorine electrodes is carried out in accordance with experimental procedures analogous to those described elsewhere for this type of experiment.2 By choosing the common ion (in this case chloride) as reference, we can use the results of such experiments to compare the two cation mobilities.3 A useful quantity for this purpose is the per cent mobility difference 100 (gi3 — which isequal to [100(<fo — and thus independent ofthe conductivity of the mixture. Here K\ is the equivalent fraction of the faster-moving ion and <f>-> (= 1 — fa) is the quantity designated <t> by Aziz and Wetmore.2b The latter quantity has been represented by P elsewhere.3
(1) (a) This work is supported by a contract with the U. S. Atomic Energy Commission. Financial assistance from a National Science Foundation pre-doctoral fellowship is also gratefully acknowledged, (b) See, for example, R. W. Laity, J. Chem. Educ., 39, 67 (1962), and references cited therein.
(2) (a) A. Klemm, H. Hintenberger, and P. Hoernes, Z. Naturforsch., 2a, 245 (1947); (b) P. M. Aziz and F. E. W. Wetmore, Can. J. Chem., 30, 779 (1952).
(3) R. W. Laity, J. Chem. Phys., 30, 682 (1959); Ann. N. Y. Acad. Sci., 79, 997 (I960).
Our preliminary results (described below) immediately recalled the corresponding observations of Duke and Victor4 on the system LiN03-K N 0 3, and prompted a search of the literature for all data indicative of relative mobilities of like-charged ions in binary fused salt mixtures. What follows is summary of our findings.
Hittorf-type experiments have yielded the following results.
LiCl-KCl.—At 2.2 mole per cent KC1 Fllemm and co-workers2a found the lithium ion more mobile than potassium by about 15%. Our results are in good agreement here, but are also consistent with the rather surprising observation of Chemla and coworkers5 on relative cation mobilities in the LiBr-KBr and NaBr- KBr systems. These workers reported that in spite of the substantially higher conductances of the pure salts LiBr and NaBr, K+ is the more mobile cation at concentrations greater than about 30 mole % KBr. Similarly we find that Li+ moves faster than K+ up to about the same concentration, after which the potassium ion becomes more mobile. Since our work permits quantitative evaluation of relative ionic mobilities, however, an even more striking observation has emerged from our results. We find that over the entire range of our measurements to date (3 to 50 mole % KC1) the relative mobility difference is never greater than about 13%. Thus, it is the similarity rather than the difference of cation mobilities that seems most noteworthy; the total conductivity of the mixture changes by more than 50% in the same region.6
LiN03 K N 03.— Duke and Victor4 reported the two cation mobilities equal within experimental error (presumably about 10% ) over the entire range of composition.
AgN03 NaNOs.—Although data of Aziz and Wet-(4) F. R. Duke and G. Victor, ./. Am. Chem. Soc., 83, 3337 (1961).(5) J. Perie, M. Chemla, and N. Gignoux, Bull. Soc. Chim. France, 1249
(1961).(6) E. R. Van Artsdalen, and I. S. Yaffe, J. Phys. Chem., 59, 118 (1955).
7 2 4 Communication to the Editor V o l . 67
more2b give silver ion mobilities up to 18 times greater than sodium, more recent Work by Duke, Laity, and Owens7 concludes that the cation mobilities are identical within experimental error over the entire range of composition. Employing improved experimental techniques, subsequent determinations carried out in this Laboratory8 appear to confirm the latter, the greatest mobility difference observed in the range covered by Aziz and Wetmore being 7%.
AgNCVAgCl .—The results of Hill and Wetmore9 for solutions rich in AgNO;, indicated a much greater mobility (relative to Ag+) for nitrate than for chloride ion, the difference being about 80% at 77 and at 88 mole % AgN 03. This is not consistent, however, with the more recent result of Monse,10 who reported a chloride ion mobility only 8% higher than that of nitrate at 66 mole % AgN 03.
PbCl2-KCl.— Lorenz and co-workers twice11 reported figures for equimolar mixtures from which a value of <f> can be calculated. Both results are in good agreement, and imply a potassium mobility more than three times greater than that of lead. From the data of Duke and Fleming,12 however, K+ moves only about 50% faster at this composition, the greatest mobility difference in the system being 77% at 63 mole % KC1. Nevertheless, compared with the other systems above these are still large differences. Although this completes the summary of Hittorf measurements, other experimental results on PbCL KCl are discussed below.
E.m.f. measurements on concentration cells with transference are another source of relevant information.13 When like-charged ions have equal mobilities, the “ junction potentials” in such cells are equal to zero,7b so that e.m.f. values can be predicted from those found in cells without transference (or from suitable thermodynamic data). The following systems have been studied in this way.
AgCl-KCl, AgBr-KBr, AgBr-NaBr, AgBr-LiBr, AgBr-PbBr2.—Junction potentials in every one of
( 7 ) ( a ) F . R . D u k e , R . W . L a i t y , a n d B . O w e n s , J. Electrochem. Soc., 1 0 4 , 2 9 9 ( 1 9 5 7 ) ; ( b ) R . W . L a i t y , J . Am. Chem. Soc., 7 9 , 1 8 4 9 ( 1 9 5 7 ) .
( 8 ) R . W . L a i t y , u n p u b l i s h e d r e s u lt s .( 9 ) S . H i l l A n d F . E . W . W e t m o r e , Can. J . Chem., 32, 8 6 4 ( 1 9 5 4 ) .( 1 0 ) E . M o n s e , Z . Naturforsch., 1 2 a , 5 2 6 ( 1 9 5 7 ) .( 1 1 ) ( a ) R . L o r e n z a n d G . F a u s t i , Z . Elektrochem., 1 0 , 6 3 0 ( 1 9 0 4 ) ; ( b )
R . L o r e n z a n d W . R u c k s t u h l , Z . anorg. allgem. Chem., 5 2 , 5 1 ( 1 9 0 7 ) .( 1 2 ) F . R . D u k e a n d R . A . F l e m i n g , J . Electrochem. Soc., 106, 1 3 0 ( 1 9 5 9 ) .( 1 3 ) R . W . L a i t y , i n “ R e f e r e n c e E l e c t r o d e s : T h e o r y a n d P r a c t i c e , ”
E d . b y D . J . G . I v e s a n d G . J . J a n z , A c a d e m i c P r e s s , N e w Y o r k , N . Y . , 1 9 6 1 .
these systems were found to be less than 1 mv. by Murgelescu and co-workers.14 The results indicate in each case that cation mobilities are equal within a few per cent over the entire range of composition studied (50 mole % or more). These workers deserve credit for pointing out the apparent generality of this pL nomenon in the systems they studied.14'15
PbCl2-KCl.—The junction potentials in cells con- taming 20 and 60 mole % KC1 (measured vs. pure PbCl2) also were found by Murgelescu and Marchidan to be zero within 1 mv.16 This appears to contradict the results of Duke and Fleming12 whose data predict a junction potential of about 11 mv. for the latter cell.
AgCl-NaCl, NaCl-KCl, and AgCl-KCl.—On thebasis of his e.m.f. measurements Stern17 concluded that cation mobilities are probably equal over the entire composition range in each of these systems. Unfortunately, however, the results may be invalidated by the use of a porous graphite separator that “ shorts out” any potential drop across the liquid-liquid junction.13
The moving boundary method is known to have been attempted once in a fused-salt system, with the following results.
PbCl2-LiCl.—-Klemm and Mouse18 reported that Li+ is the more mobile cation at all concentrations, the disparity reaching 140% at 95 mole % PbCl2.
In summary, data reported for at least 10 different systems are consistent with the hypothesis that the mobilities of like-charged ions in fused-salt mixtures are equal within about 10 to 15% at all concentrations. If the moving-boundary results for PbCl2-LiCl are valid, the latter system constitutes the only clearcut counter-example to this generalization we have found in the literature.
( 1 4 ) I . G . M u r g e l e s c u a n d D . I . M a r c h i d a n , R u ss. J . Phys. Chem., 34, 1 1 9 6 ( 1 9 6 0 ) .
( 1 5 ) I . G . M u r g e l e s c u a n d S . S t e r n b e r g , Discussions Faraday Soc., 32, 1 0 7 ( 1 9 6 1 ) .
( 1 6 ) I . G . M u r g e l e s c u a n d D . I . M a r c h i d a n , Acad. rep. populare Romine, studii cercetari chim., 8 , 3 8 3 ( 1 9 6 0 ) .
( 1 7 ) K . H . S t e r n , J . Phys. Chem., 63, 7 4 1 ( 1 9 5 9 ) .( 1 8 ) A. K l e m m a n d E . M o n s e , Z. Naturforsch., 12a, 3 1 9 ( 1 9 5 7 ) .
F r i c k C h e m i c a l L a b o r a t o r y R i c h a r d W . L a i t y
P r i n c e t o n U n i v e r s i t y C o r n e l i u s T . M o y n i i i a n
P r i n c e t o n , N. J .
R e c e i v e d D e c e m b e r 27, 1902