Structuring dynamic models of exploited ecosystems from trophic mass-balance assessments
Upload
independentCategory
view
1download
0
Misiko et al.
Int. J. Biol. Sci.
International Journal of Biological Sciences (IJBS)
RESEARCH PAPER
Trophic State Indices And Phytoplankton Quotients For
The Kisumu Bay
Monicah Florence Misiko1*, Lewis Morara Sitoki
1 Zoology Department, Maseno University, Maseno Kenya.2.Kenya Marine and Fisheries Research Institute, Kisumu, Kenya.3Environmental Protection Department
Rancheria Road, Lake Port California 954534Jaramogi Oginga Odinga University of Science and Technology,School of Agricultural and Food
Sciences,P.O. Box 210-40601,Bondo,Kenya.5School of Environment and Earth Science, Maseno University, Maseno, Kenya.
Corresponding Author: Misiko :
ABSTRACT
This study aimed at estimating the Phytoplankton Quotients;
Bay, and to determine eutrophic levels of the bay. The study was conducted from April 2009 to April 2010.
Nutrients and phytoplankton analyses were determined by spectrophotometric and microscopic techniques,
respectively. Significantly higher (p<0.05) chlorophyll a concentrations were recorded during the dry season
compared to the rainy season. At 57%, Cyanophyceae was the most abundant phyt
by Chlorophyceae (28%), Desmidaceae (11%), Bacillariophyceae (4%) and Euglenophyta (1%). Among the
Cyanophyceae, the most dominant species were Microcystis sp., Chroococcus sp., Anabaena sp and
Cylindrospermopsis sp. Different phy
Maboko station and the inshore stations. The mean phytoplankton quotient for Kisumu Bay was estimated to
be 4.1, indicating high eutrophic status.
from anthropogenic activities, industrial and municipal wastes, and stricter enforcement of the established
policies on the quality of discharges is recommended. There is also a need for environmental education and
public awareness targeting the lake basin inhabitants to abate pollution in the lake.
Keywords: Anthropogenic activities, Eutrophication, Nutrients, Nyanza gulf,
Dynamic Network for Research
DNetRW © 2014 http://www.dnetrw.com
International Journal of Biological Sciences (IJBS)
ISSN: 2313
http://www.dnetrw.com
Vol. 01, No. 03, p.
OPEN ACCESS
State Indices And Phytoplankton Quotients For
Kisumu Bay, Lake Victoria
*, Lewis Morara Sitoki2, John Gichuki3, Darius Otiato Andika
Anyona5, and John Radull1
Zoology Department, Maseno University, Maseno Kenya.
.Kenya Marine and Fisheries Research Institute, Kisumu, Kenya.
Environmental Protection Department Big Valley Rancheria Band of Pomo Indians, 2726 Mission
rt California 95453-9637, USA
Jaramogi Oginga Odinga University of Science and Technology,School of Agricultural and Food
40601,Bondo,Kenya.
School of Environment and Earth Science, Maseno University, Maseno, Kenya.
Address; P. O. Box, 150, Kaimosi, Kenya;
Email, [email protected] / [email protected]
Phone number, +254 734 575860/+254 718 566 527.
This study aimed at estimating the Phytoplankton Quotients; the key indicators of eutrophication,
Bay, and to determine eutrophic levels of the bay. The study was conducted from April 2009 to April 2010.
ses were determined by spectrophotometric and microscopic techniques,
respectively. Significantly higher (p<0.05) chlorophyll a concentrations were recorded during the dry season
compared to the rainy season. At 57%, Cyanophyceae was the most abundant phytoplankton group, followed
by Chlorophyceae (28%), Desmidaceae (11%), Bacillariophyceae (4%) and Euglenophyta (1%). Among the
Cyanophyceae, the most dominant species were Microcystis sp., Chroococcus sp., Anabaena sp and
Cylindrospermopsis sp. Different phytoplankton distribution patterns were observed between the offshore
Maboko station and the inshore stations. The mean phytoplankton quotient for Kisumu Bay was estimated to
be 4.1, indicating high eutrophic status. The elevated eutrophic state could be attributed to high nutrient loads
from anthropogenic activities, industrial and municipal wastes, and stricter enforcement of the established
policies on the quality of discharges is recommended. There is also a need for environmental education and
areness targeting the lake basin inhabitants to abate pollution in the lake.
Anthropogenic activities, Eutrophication, Nutrients, Nyanza gulf, Trophic.
P a g e | 53
2014
International Journal of Biological Sciences (IJBS)
ISSN: 2313-3740 (Online)
http://www.dnetrw.com
Vol. 01, No. 03, p. 53-67, 2014
OPEN ACCESS
State Indices And Phytoplankton Quotients For
, Darius Otiato Andika 4 , Nyambane
Big Valley Rancheria Band of Pomo Indians, 2726 Mission
Jaramogi Oginga Odinga University of Science and Technology,School of Agricultural and Food
Phone number, +254 734 575860/+254 718 566 527.
the key indicators of eutrophication, of Kisumu
Bay, and to determine eutrophic levels of the bay. The study was conducted from April 2009 to April 2010.
ses were determined by spectrophotometric and microscopic techniques,
respectively. Significantly higher (p<0.05) chlorophyll a concentrations were recorded during the dry season
oplankton group, followed
by Chlorophyceae (28%), Desmidaceae (11%), Bacillariophyceae (4%) and Euglenophyta (1%). Among the
Cyanophyceae, the most dominant species were Microcystis sp., Chroococcus sp., Anabaena sp and
toplankton distribution patterns were observed between the offshore
Maboko station and the inshore stations. The mean phytoplankton quotient for Kisumu Bay was estimated to
ributed to high nutrient loads
from anthropogenic activities, industrial and municipal wastes, and stricter enforcement of the established
policies on the quality of discharges is recommended. There is also a need for environmental education and
Trophic.

Misiko et al. P a g e | 54
Int. J. Biol. Sci.
DNetRW © 2014 http://www.dnetrw.com
2014
1.INTRODUCTION
Many of the world’s freshwater lakes suffer
from nutrient loading (Hecky, 1993).
Eutrophication is thought to be the primary
cause of freshwater impairment (Selman and
Greenhalgh, 2009). Like many freshwater bodies
in the world, Lake Victoria has experienced
deterioration in water quality and high levels of
ecological stress in recent years, a situation that
has largely been attributed to escalation of
anthropogenic activities within the riparian
areas. This has contributed to eutrophication
and contamination of the lake waters, with
grave implications on the fisheries economy of
the region (Hecky, 1993; Kaufman, 1992; Hecky,
et al., 1994). Scientific evidence of nutrient
enrichment in Nyanza Gulf has been reported
by (Lung’ayia et al. 2001; Gikuma-Njuru and
Hecky 2005). Consequently, limnological work
on Nyanza Gulf has been studied since 1960s,
and has shown increased hypolimnetic anoxia,
increased nitrogen and phosphorus inputs and
persistent high water levels accompanied by
decline of available silicon (Gophen et al., 1995).
In addition, phytoplankton productivity and
shifts from diatom to blue-green algae
dominance has occurred. Consequently,
enhanced chlorophyll a levels were reported in
the late 1980s and early 1990s (Hecky, 1993).
Nitrogen and phosphorus are particularly cited
as critical to biological processes in aquatic
ecosystems, results in increased biomass
production, upsetting the natural balance of
these ecosystems (Selman and Greenhalgh,
2009).
Nyanza Gulf is currently exhibiting
characteristic symptoms of eutrophication, as
evidenced by mats of floating macrophytes, high
turbidity, oxygen depletion, and changing
phytoplankton community structure. Despite all
these changes, no trophic state indices have been
calculated for Nyanza or Kisumu Bay. Effective
management of water quality and lake pollution
is only possible with improved scientific
understanding of the limnological and
hydrological aspects of the lake and
anthropogenic effects on the lake environment
(Hecky, 1993; Kaufman, 1992; Hecky, et al.,
1994). The aim of this paper was to address the
trophic status of Nyanza gulf waters and offer a
scientific understanding of the water quality and
pollution level through trophic state indices and
phytoplankton quotients for the gulf.
2. MATERIALS AND METHODS
Study area and Sampling
The study of Phytoplankton Quotients (P.Q.)
and Trophic State Indices (TSI) was conducted
between April 2009 and April 2010 in Kisumu
Bay taking into consideration the dry season
(August-September) and the wet season (March
-May). Three sampling stations were set at the
discharge points of rivers Kisian (S1) and Kisat
(S3), and the Yacht club (S5) to capture the
effects of stream inputs. Two other stations were
located at the Kisumu railways pier (S4) and
Maboko (S2), in the inner Winam Gulf, to
capture the effects of runoff and the ensuing
dilution, Figure 1. The sampling stations were
positioned using a Magellan Global Positioning
System (GPS) 315 meridian. Sampling was done
on a monthly basis for a year. All samples were
taken at a depth of 1 m. In situ parameters were
measured before sampling. Secchi depth
transparency was measured using a standard 20
cm diameter Secchi disk, water turbidity and pH
were measured using a Hatch Turbidimeter
2100 P, while pH was measured using a digital
Mini pH meter Model 49. Water depth,
temperature, conductivity and chlorophyll a
were measured using a submersible
Conductivity-Temperature-Depth, CTD (Sea-
bird Electronics) profiling system. Water
samples were collected using a 2.5 litre Van
Dorn water sampler, and placed in sterile plastic
sample bottles. Total alkalinity and total

Misiko et al. P a g e | 55
Int. J. Biol. Sci.
DNetRW © 2014 http://www.dnetrw.com
2014
hardness were determined using the methods of
(APHA ,1995) by titration of 50 ml of water
sample with 0.02 N HCI to a pH of 4.5, using
methyl orange indicator and 0.02 N EDTA
respectively. Samples for nutrient analysis were
stored in an ice box and transported to the
laboratory for analysis within 24-48 hours.
Phytoplankton samples were collected using a
Van Dorn water sampler (quantitative analysis)
and a 10 µm phytoplankton net (qualitative
analysis), fixed using acidic Lugol’s solution and
stored in plastic vials for laboratory analysis.
Total suspended solids and total dissolved
solids were determined by filtering 50mls of
water through a pre-weighed standard glass-
fiber filter into a dry and pre-weighed
evaporating dish. The residue retained on the
filter paper was dried to a
constant weight in an oven at 103 to 105°C for at
least 1 hour, while the filtrate in the evaporating
dish was evaporated in an oven, at 103 to 105°C
for at least 1 hour. These were then cooled in a
desiccator and weighed. The cycle of drying,
cooling in a desiccator, and weighing was
repeated until a constant weight was obtained.
The increase in weight of the filter represented
the total suspended solids (TSS) and was
calculated by multiplying the difference in
weight of filter + dried residue from weight of
filter alone by 1000, then divided by sample
volume (50ml). The increase in weight of the
evaporating dish represented the total dissolved
solids (TDS), calculated as by multiplying the
difference in weight of evaporating dish +
weight of dried residue from weight of
evaporating dish alone by 1000, then divided by
sample volume (50ml).
Figure 1: Map of Winam Gulf showing Kisumu Bay, its drainage system, and the sampling stations (S1-
R. Kisian, S2 – Maboko, S3 - R. Kisat, S4 - Railway Pier and S5 - Kisumu Yacht Club).

Misiko et al. P a g e | 56
Int. J. Biol. Sci.
DNetRW © 2014 http://www.dnetrw.com
2014
Nutrient Analyses
Ammonia content was analyzed using phenol
hypochlorite method while nitrates and nitrites
were analyzed using the Cadmium – reduction
method (USEPA, 1979). Total nitrogen and total
phosphorous were determined on unfiltered
water samples. Digestion of TN with potassium
per sulfate and autoclaving process was carried
out to convert organic nitrogen to nitrate
nitrogen while TP was oxidized using hot 5%
potassium per sulfate in distilled water,
autoclaved then further cooled at room
temperature to liberate organic phosphorus as
inorganic phosphate. Soluble reactive
phosphorous (PO4 – P) was analyzed using the
Ascorbic acid method. Silicates were analyzed
using the heteropoli blue technique according to
(APHA ,1995).
Phytoplankton analyses
Phytoplankton cells were identified, and
counted using an inverted microscope at 400x
magnification. Counts were made of all
individual cells, colonies and filaments.
Phytoplankton identification was done using the
methods of (Huber–Pestalozzi , 1938;Cocquyt et
al. 1993). Algal biomass determination was done
by counting and measuring algal cells and the
total cell count converted to cell biovolume
using appropriate geometric formulae as
outlined in (Wetzel and Likens ,2000).
RESULTS
Physico-Chemical Parameters
The physical and chemical characteristics of
Kisumu bay for the period 2009/2010 are shown
in Tables 1 and 2. Ambient water temperatures
for Kisumu bay ranged between 26.3oC and
28.5oC, with significantly lower temperatures
(ANOVA, p<0.05) experienced during the wet
season. Dissolved oxygen levels varied
significantly among sampling stations (ANOVA,
p<0.05), with the lowest (4.6 ± 0.4 mg/l) levels
recorded at the inlet of River Kisat and the
highest (8.0 ± 0.2 mg/l) at the offshore Maboko
station.
The concentrations of dissolved and suspended
solids in the water also varied among sampling
stations, with highest TDS (746.4 ± 48.1 mg/l)
level recorded at the mouth of River Kisian, and
the lowest (292.2 ± 26.9 mg/l) at Auji
drainage/River Nyamasaria inlet. Similarly,
highest (1597.7 ± 57.9 mg/l) and lowest (621.7 ±
7.4 mg/l) TSS levels were recorded at the inlets
of rivers Kisat and Auji, respectively. An
average pH of 7.7 ± 0.1 was recorded for the bay
during this period. Kisumu Bay waters recorded
low conductivity levels (Av. 178.7 ± 12.1 µS/cm)
and even lower Secchi depth measurements (<
0.3 m) during the same period. There were
variations in turbidity among sampling stations
(Table 1) and between the wet and dry seasons
(Table 3), with the highest (358.2 ± 7.2 NTU) and
lowest (197.4 ± 17.3 NTU) turbidity levels
recorded at the Railways pier and Auji
drainage/River Nyamasaria inlet stations,
respectively.
Kisumu bay recorded relatively high TP (289.6 ±
8.9µg/l) and TN (1518.5 ± 7.0µg/l) levels during
the study period, table 2. Significant spatial
variations (ANOVA, p<0.05) in total phosphorus
(TP) and total nitrogen (TN) levels were
observed within Kisumu Bay, with River Kisat
and River Kisian inlet stations recording higher
levels of both nutrients compared to other
stations. The relative levels of total nitrogen and
phosphorus and the TN/TP ratio in the bay,
however, remained constant throughout the
year. Silica levels in the bay also varied with
location and season.
Spatial and seasonal variations in chlorophyll a
levels were also observed in Kisumu Bay. While
the highest concentrations of chlorophyll a (32.6
± 5.7 µg/l) were recorded at the R. Kisat inlet, the
offshore station (Maboko), recorded
significantly lower mean chlorophyll a levels
(18.4 ± 1.1µg/l) during the wet season, Table 3.
Regression analyses revealed significant
negative relationship between chlorophyll a
Misiko et al. P a g e | 57
Int. J. Biol. Sci.
DNetRW © 2014 http://www.dnetrw.com
2014
levels and total suspended solids, water
turbidity, total nitrogen and total phosphorus
levels in the water (p<0.01), Figure 2. Secchi
transparency measurements were also
significantly negatively related to the
chlorophyll a levels, while TDS showed a
significant positive relationship with
chlorophyll a levels in the lake waters.
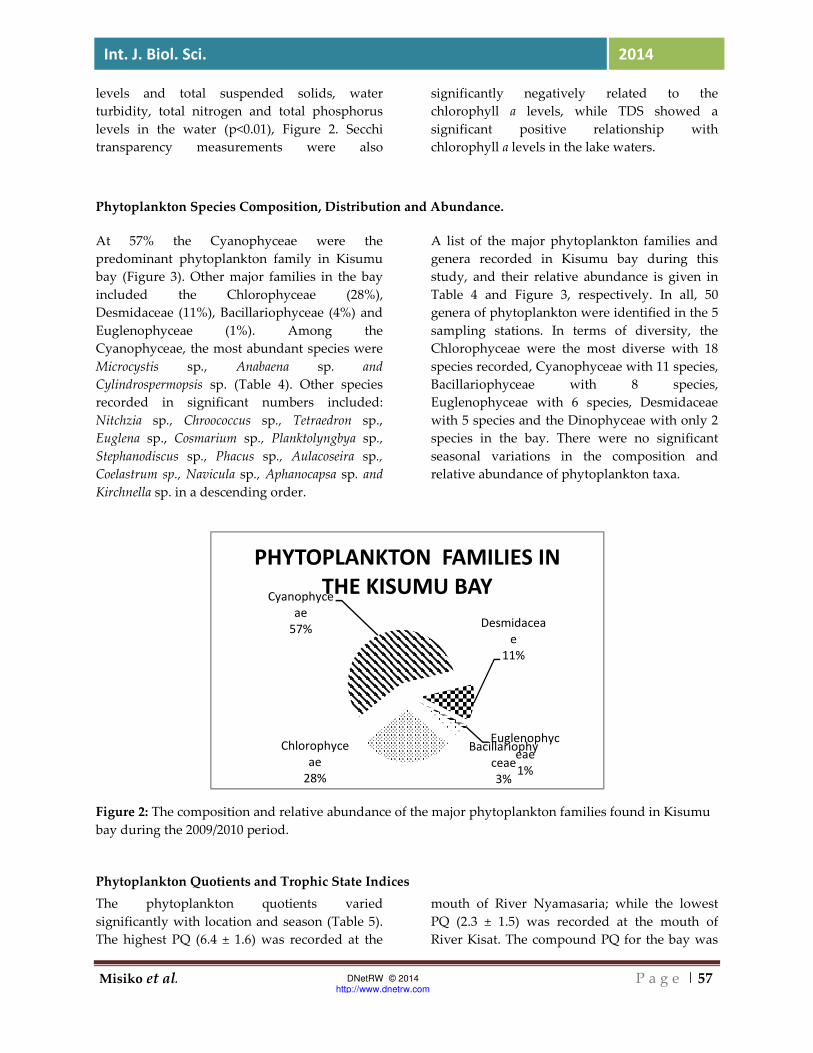
Phytoplankton Species Composition, Distribution and Abundance.
At 57% the Cyanophyceae were the
predominant phytoplankton family in Kisumu
bay (Figure 3). Other major families in the bay
included the Chlorophyceae (28%),
Desmidaceae (11%), Bacillariophyceae (4%) and
Euglenophyceae (1%). Among the
Cyanophyceae, the most abundant species were
Microcystis sp., Anabaena sp. and
Cylindrospermopsis sp. (Table 4). Other species
recorded in significant numbers included:
Nitchzia sp., Chroococcus sp., Tetraedron sp.,
Euglena sp., Cosmarium sp., Planktolyngbya sp.,
Stephanodiscus sp., Phacus sp., Aulacoseira sp.,
Coelastrum sp., Navicula sp., Aphanocapsa sp. and
Kirchnella sp. in a descending order.
A list of the major phytoplankton families and
genera recorded in Kisumu bay during this
study, and their relative abundance is given in
Table 4 and Figure 3, respectively. In all, 50
genera of phytoplankton were identified in the 5
sampling stations. In terms of diversity, the
Chlorophyceae were the most diverse with 18
species recorded, Cyanophyceae with 11 species,
Bacillariophyceae with 8 species,
Euglenophyceae with 6 species, Desmidaceae
with 5 species and the Dinophyceae with only 2
species in the bay. There were no significant
seasonal variations in the composition and
relative abundance of phytoplankton taxa.
Figure 2: The composition and relative abundance of the major phytoplankton families found in Kisumu
bay during the 2009/2010 period.
Phytoplankton Quotients and Trophic State Indices
The phytoplankton quotients varied
significantly with location and season (Table 5).
The highest PQ (6.4 ± 1.6) was recorded at the
mouth of River Nyamasaria; while the lowest
PQ (2.3 ± 1.5) was recorded at the mouth of
River Kisat. The compound PQ for the bay was
Chlorophyce
ae
28%
Cyanophyce
ae
57%Desmidacea
e
11%
Euglenophyc
eae
1%
Bacillariophy
ceae
3%
PHYTOPLANKTON FAMILIES IN
THE KISUMU BAY

Misiko et al. P a g e | 58
Int. J. Biol. Sci.
DNetRW © 2014 http://www.dnetrw.com
2014
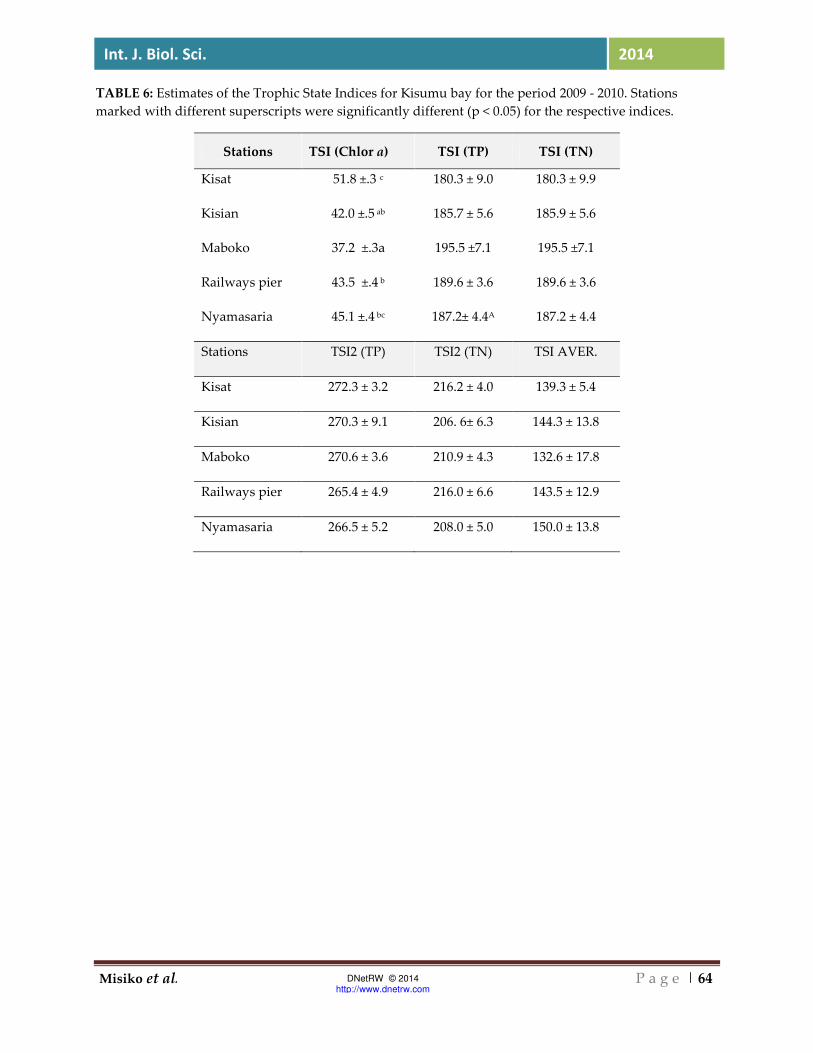
estimated to be 4.09. The Trophic State Indices
(TSI) for Kisumu bay is given in (Table 6). While
there were no spatial differences in TSI values
for TP and TN, the TSIs for chlorophyll a
differed markedly between stations, with the
highest TSI (51.8 ± 0.4) being recorded at Kisat
station while the lowest TSI (37.2 ± 0.3) was
recorded at the offshore Maboko station. The
combined TSI for the bay was estimated to be
145.263 ± 4.1, a value that was much higher than
the universally acceptable values for quality
waters (< 70).
DISCUSSION
Physico-chemical Parameters
Results showed that ambient water
temperatures for Kisumu Bay ranged between
26.3oC and 28.5oC; with significantly lower
temperatures during the wet season. The
temperature measurements recorded in Kisumu
Bay reflected the general diurnal temperatures
reported for L. Victoria waters (LVEMP, 2000).
The results also indicated that dissolved oxygen
levels in the bay varied significantly among
sampling stations, but were within the
internationally acceptable levels (APHA, 1995;
OECD, 1982) (Table 3). Low DO levels recorded
at Kisat Station, coincided with high levels of
TSS reflecting the effect of point source
discharges from the river Kisat, consistent with
the often-reported inverse correlation between
DO and TSS levels (USEPA, 2000; Gichuki et al,
2006) that is usually associated with high
nutrient inputs. Even though DO levels as low
as 1 mg/l have been recorded in the wider L.
Victoria waters (Verschuren et al., 2002; Odada et
al., 2004), the levels reported here indicate that
Kisumu Bay has enough dissolved oxygen to
sustain a healthy ecological diversity. The
highest levels of TDS (746.4 ± 48.1 mg/l) were
recorded at the mouth of R. Kisian, a river
surrounded by a continuously weathering rocky
catchment, which contributes to the relatively
high suspended solids load into the bay, while
the lowest (292.2 ± 26.9 mg/l) was recorded at
the Auji drainage/R. Nyamasaria inlet that flows
gently into Kisumu Bay, allowing for
sedimentation of solids before reaching the
mouth of the inlet. The Secchi depth
measurements recorded during this study were
even lower (< 0.3m), than those reported
successively by (Lehman and Brandstrator ,1994
; Sitoki et al., 2010), indicating a state of
continual degradation of the bay. The Kisumu
Bay waters, however, recorded low conductivity
levels (Av. 178.7 µS/cm) similar to those
reported by (Sitoki et al., 2010). The low
conductivity levels were probably expected
considering the low TDS levels recorded in the
bay during this study. High turbidity levels (>
197 NTU’s) were recorded in the bay indicating
that the waters of the bay were murky and of
poor quality. The variability of environmental
parameters among sampling stations indicate
presence of significant environmental impacts
exerted on the quality of the bay’s waters by the
inflows from the riparian areas around Kisumu
Bay, and that seasonality has a significant
influence on these impacts.
Nutrients levels and chlorophyll a concentrations of Kisumu Bay
The concentration of phosphorus in most
freshwaters range between 2 and 20 µg/l,
whereas that of nitrogen seldom exceeds
100µg/l. The nutrient (TN and TP) levels(Table
3) recorded in Kisumu Bay during this study
were not only much higher than the normal
freshwater levels, but also higher than those
previously recorded within the Nyanza gulf by
(Hecky ,1993; Hecky et al. 1996; Lung’ayia et al.,
,2000; Gikuma-Njuru and Hecky ,2005 ;Gichuki
et al. 2006). These high TP and TN levels may be
a reflection of high nutrient inputs resulting

Misiko et al. P a g e | 59
Int. J. Biol. Sci.
DNetRW © 2014 http://www.dnetrw.com
2014
from anthropogenic activities around the bay
area and from Kisumu City. Indeed, the
elevated TP and TN levels, which were more
pronounced at the Kisat and Kisian sampling
stations, and at the Auji-Nyamasaria inlet,
especially during the rainy season, may be a
confirmation of the influence of Kisumu City
and the riparian areas on Kisumu Bay that is
being exerted through the Kisat-Auji-
Nyamasaria drainage systems. Spatial and
seasonal variations in the levels of chlorophyll a
were also observed in Kisumu Bay. Variations in
levels of chlorophyll a coincided with spatial
distribution of nutrients, and seasonal variation
in the volume of discharge due to runoff. For
example, while the highest concentrations of
chlorophyll a were measured at R. Kisat inlet,
that is associated with sewage discharge, and
high nutrients levels, which lead to high algal
production rates, the offshore Maboko station
recorded significantly lower mean chlorophyll a
levels during the wet season, probably as a
result of a combination of dilution effects and
increased turbidity due to sediment inputs from
river Kisian, a fact that is amply supported by
the significant negative correlation observed
between chlorophyll a levels in the water and
total suspended solids, water turbidity and
Secchi transparency measurements in this study.
Phytoplankton population structure, PQ and TSI
Determination of the trophic state of a water
body is based upon the levels of phosphorus
and nitrogen, and the phytoplankton biomass in
the water, with high nutrient concentrations
being associated with eutrophication and algal
blooms, whereas high silica content leads to
high diatom populations. The nitrogen
phosphorus ratio (N:P ratio), on the other hand,
determines the phytoplankton community
structure, which in turn forms the basis for the
determination of the phytoplankton quotient of
a water body. The low TN:TP ratio (< 10) for
Kisumu Bay indicates that the bay is nitrogen
limited (Carlson, 1977), and increase in nitrogen
concentration results in increased
phytoplankton production, a fact that is
supported by the higher chlorophyll a levels
recorded at the Kisat and Auji-Nyamasaria
inlets, and during the high runoff wet season.
The high phosphorus loading and nitrogen
limitation favoured the proliferation of the
Cyanobacteria, which currently dominate the
algal population in the bay. The Cyanobacteria
pose a threat to aquatic life since they produce
algal toxins that are harmful to aquatic
organisms (Kilham, 1990; Hecky, 1993 and
Gichuki et al, 2006). The low SiO2 levels in the
bay were mirrored in the low Bacillariophyceae
populations recorded. This research confirms
the increasing level of the
Myxophyceae/Cyanophyceae families and
decreasing levels of the Chlorophytes in Nyanza
gulf that was previously reported by (Muggide
,1993 Lung’ayia et al., 2000).
Prevailing Trophic State of Kisumu Bay
In standing waters, water quality may be
determined by an array of physical and
biological factors. Quality determination for
Kisumu Bay waters was based upon the levels
of TP, chlorophyll a concentration, TSS and TDS
levels as well as the TSI and PQ prevailing in the
waters at the time of the study (Table 3, 5, and
6). Kisumu bay had a compound PQ ranging
between 2.3 and 6.4, placing it within the
eutrophic class of the (Nyaggard ,1949)
classification, which also classifies a eutrophic
water body as that having Chlorophycea,
Myxophycea and Bacillariophyceae quotients
ranging between 0.7 - 3.5, 0.8 - 3.0 and 0.2 – 3,
respectively, ranges that were surpassed in
Kisumu Bay. This may imply that the bay is in
worse state of eutrophication than previously
thought (Gichuki, 2000; Gichuki et al., 2006). The
higher than normal Carlson’s TSI values placing
the bay within the hypereutrophic category
attests to this observation. Results from this
study indicate that TN (r2 = 0.8888, p < 0.01) and
Turbidity (r2 = 0.8451, p < 0.01) were the best
indicators of the trophic state of Kisumu bay.

Misiko et al. P a g e | 60
Int. J. Biol. Sci.
DNetRW © 2014 http://www.dnetrw.com
2014
Other good indicators included TP (r2 = 0.8309) and Secchi depth (r2 = 0.733).
ACKNOWLEDGEMENTS
We wish to express our sincere gratitude to the
National Council of Science and Technology
(NCST), Kenya for providing the funds used to
conduct this study. We highly acknowledge the
zoology department of Maseno University, and
the Kenya Marine and Fisheries Research
Institute (KMFRI) for providing the required
infrastructure, materials and technical support
and for allowing us the use of their laboratories
during the study period. We also thank to the
technicians from KMFRI and Maseno University
who helped in the sampling process and sample
analysis. Many thanks go to Mr. Erick Jondiko
who greatly assisted in data analysis. Finally, we
wish to sincerely thank all those people who
may have participated in one way or another to
the success of this study.
TABLES
TABLE 1: Mean (± S.E.) values for physico-chemical parameters and chlorophyll a for Kisumu bay during
the study period, April 2009 – March 2010. Significant spatial differences (p < 0.05) are depicted by
different superscripts.
Parameter Kisian Maboko Kisat Railways pier Nyamasaria
Temperature
(o C)
28.5 ± 0.4b 26.3 ± 0.5a 28.5 ± 0.5b 27.5 ± 0.4b 27.0 ± 0.4b
Conductivity
(µS/cm)
184.3 ± 2.4 165.4 ± 4.5 195.2 ± 2.6 184.6 ± 2.8 163.8 ± 8.1
Secchi depth
(m)
0.2 ± 0.01 0.3 ± 0.03 0.1 ± 0.01 0.2 ± 0.01 0.2 ± 0.01
DO (mg/l) 5.6 ± 0.4b 8.0 ± 0.2c 4.6 ± 0.4a 5.6 ± 0.4b 5.7 ± 0.3b
pH 7.8 ± 0.1 7.87 ± 0.08 7.9 ± 0.07 7.5 ± 0.08 7.7 ± 0.06
TDS (mg/l) 746.4 ± 48.1c 392.2 ± 36.5b 687.1 ± 38.6c 620.2 ± 14.6c 292.2 ± 26.9a
TSS (mg/l) 1597.7 ± 57.9c 795.0 ± 26.8a 1147.3 ± 28.8b 1171.7 ± 16.3b 621.7 ± 7.4a
Turbidity
(NTU)
296.7 ± 13.3b 243.5 ± 10.6b 261.6 ± 11.5b 358.2 ± 7.2c 197.4 ± 17.3a
Chlorophyll
a (mg/l)
30.5 ± 3.5b 13.2 ± 1.9a 32.6 ± 5.7b 30.3 ± 3.3b 31.9 ± 3b
Misiko et al. P a g e | 61
Int. J. Biol. Sci.
DNetRW © 2014 http://www.dnetrw.com
2014
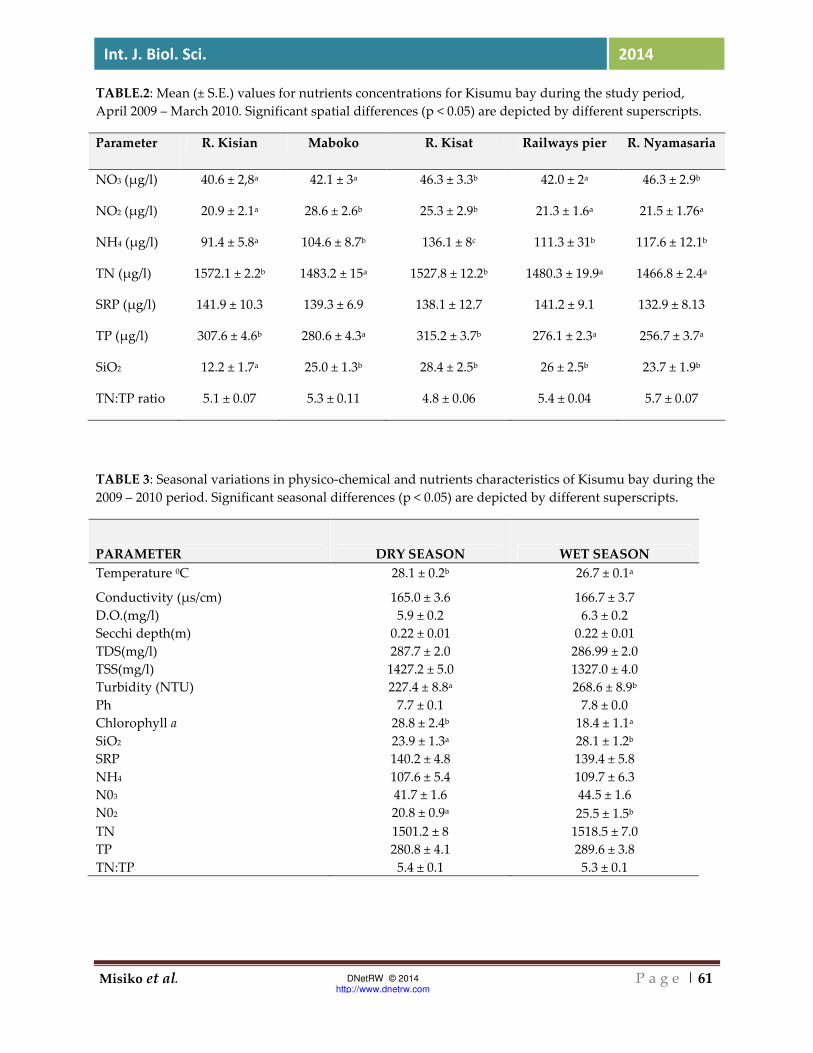
TABLE.2: Mean (± S.E.) values for nutrients concentrations for Kisumu bay during the study period,
April 2009 – March 2010. Significant spatial differences (p < 0.05) are depicted by different superscripts.
Parameter R. Kisian Maboko R. Kisat Railways pier R. Nyamasaria
NO3 (µg/l) 40.6 ± 2,8a 42.1 ± 3a 46.3 ± 3.3b 42.0 ± 2a 46.3 ± 2.9b
NO2 (µg/l) 20.9 ± 2.1a 28.6 ± 2.6b 25.3 ± 2.9b 21.3 ± 1.6a 21.5 ± 1.76a
NH4 (µg/l) 91.4 ± 5.8a 104.6 ± 8.7b 136.1 ± 8c 111.3 ± 31b 117.6 ± 12.1b
TN (µg/l) 1572.1 ± 2.2b 1483.2 ± 15a 1527.8 ± 12.2b 1480.3 ± 19.9a 1466.8 ± 2.4a
SRP (µg/l) 141.9 ± 10.3 139.3 ± 6.9 138.1 ± 12.7 141.2 ± 9.1 132.9 ± 8.13
TP (µg/l) 307.6 ± 4.6b 280.6 ± 4.3a 315.2 ± 3.7b 276.1 ± 2.3a 256.7 ± 3.7a
SiO2 12.2 ± 1.7a 25.0 ± 1.3b 28.4 ± 2.5b 26 ± 2.5b 23.7 ± 1.9b
TN:TP ratio 5.1 ± 0.07 5.3 ± 0.11 4.8 ± 0.06 5.4 ± 0.04 5.7 ± 0.07
TABLE 3: Seasonal variations in physico-chemical and nutrients characteristics of Kisumu bay during the
2009 – 2010 period. Significant seasonal differences (p < 0.05) are depicted by different superscripts.
PARAMETER DRY SEASON WET SEASON
Temperature 0C 28.1 ± 0.2b 26.7 ± 0.1a
Conductivity (µs/cm) 165.0 ± 3.6 166.7 ± 3.7
D.O.(mg/l) 5.9 ± 0.2 6.3 ± 0.2
Secchi depth(m) 0.22 ± 0.01 0.22 ± 0.01
TDS(mg/l) 287.7 ± 2.0 286.99 ± 2.0
TSS(mg/l) 1427.2 ± 5.0 1327.0 ± 4.0
Turbidity (NTU) 227.4 ± 8.8a 268.6 ± 8.9b
Ph 7.7 ± 0.1 7.8 ± 0.0
Chlorophyll a 28.8 ± 2.4b 18.4 ± 1.1a
SiO2 23.9 ± 1.3a 28.1 ± 1.2b
SRP 140.2 ± 4.8 139.4 ± 5.8
NH4 107.6 ± 5.4 109.7 ± 6.3
N03 41.7 ± 1.6 44.5 ± 1.6
N02 20.8 ± 0.9a 25.5 ± 1.5b
TN 1501.2 ± 8 1518.5 ± 7.0
TP 280.8 ± 4.1 289.6 ± 3.8
TN:TP 5.4 ± 0.1 5.3 ± 0.1

Misiko et al. P a g e | 62
Int. J. Biol. Sci.
DNetRW © 2014 http://www.dnetrw.com
2014
TABLE 4: List of the major phytoplankton families and genera recorded in Kisumu bay during the
2009/2010 study.
FAMILY GENUS
BACILLARIOPHYCEAE Amphora
Aulacoseira
Cyclotella
Cymbella
Diatoma
Navicula
Nitchzia
Stephanodiscus
CHLOROPHYCEAE Tetraedron
Ankistrodesmus
Botryococccus
Chodatella
Coelastrum
Dictyosphaerium
Gonatodesmidson
Kirchnella
Monoraphidium
Oocystis
Pediastrum
Scenedesmus
Schroidera
Schroederiella
Ceolastrum
Coenocystis
Rhapidium
Surillella
DESMIDACEAE Closterium
Crucigenia
Cosmarium
Straurastrum
Cosmarium
DINOPHYCEAE Synedra
Glenodinium
EUGLENOPHYCEAE Euglena
Phacus
Stromonas
Trachelemonous
Spurrillina
Fragillaria
CYANOPHYCEAE Coelomoron

Misiko et al. P a g e | 63
Int. J. Biol. Sci.
DNetRW © 2014 http://www.dnetrw.com
2014
FAMILY GENUS
Anabaena
Aphanocapsa
Chroococcus
Cylindrospermopsis
Microcycstis
Planktolyngbya
Pseudoanabaena
Romeria
Anabaenopsis
Merismopedia
Aphanothece
TABLE 5: Estimates of the phytoplankton quotients for the different sampling stations and the compound
quotient for Kisumu bay for the period 2009 - 2010. Stations marked with different superscripts were
significantly different (p < 0.05) for the respective quotients.
Station Bacillar Q Chloro Q Eugl Q Myxo Q CQ
Kisat 2.2 ± 0.5 a 3.1 ± 1.0 b 2.4 ± 0.9 c 0.3 ± 0.2 a 2.3 ± 1.5 a
Kisian 2.2 ± 1.1 a 1.4 ± 0.5 a 0.2 ± 0.1 a 2.7 ± 1.7c 2.9 ± 1.3 a
Maboko 0.7 ± 0.3 b 2.0 ± 1.5 ab 0.2 ± 0.4 a 3.3 ± 1.3 c 2.7 ± 1.6 a
Railway pier 2.2 ± 1.0 a 1.5 ± 0.8 a 1.1 ± 0.5 b 4.6 ± 1.8 C 4.9 ± 1.9 b
Nyamasaria 2.5 ± 1.3 a 0.7 ± 0.3 c 1.9 ± 0.9 c 1.7 ± 0.7 b 6.4 ± 1.6 c
Average 2.0 ± 0.3 2.1 ± 0.5 1.1 ± 0.4 2.9 ± 0.7 4.1 ± 0.7
Misiko et al. P a g e | 64
Int. J. Biol. Sci.
DNetRW © 2014 http://www.dnetrw.com
2014
TABLE 6: Estimates of the Trophic State Indices for Kisumu bay for the period 2009 - 2010. Stations
marked with different superscripts were significantly different (p < 0.05) for the respective indices.
Stations TSI (Chlor a) TSI (TP) TSI (TN)
Kisat 51.8 ±.3 c 180.3 ± 9.0 180.3 ± 9.9
Kisian 42.0 ±.5 ab 185.7 ± 5.6 185.9 ± 5.6
Maboko 37.2 ±.3a 195.5 ±7.1 195.5 ±7.1
Railways pier 43.5 ±.4 b 189.6 ± 3.6 189.6 ± 3.6
Nyamasaria 45.1 ±.4 bc 187.2± 4.4A 187.2 ± 4.4
Stations TSI2 (TP) TSI2 (TN) TSI AVER.
Kisat 272.3 ± 3.2 216.2 ± 4.0 139.3 ± 5.4
Kisian 270.3 ± 9.1 206. 6± 6.3 144.3 ± 13.8
Maboko 270.6 ± 3.6 210.9 ± 4.3 132.6 ± 17.8
Railways pier 265.4 ± 4.9 216.0 ± 6.6 143.5 ± 12.9
Nyamasaria 266.5 ± 5.2 208.0 ± 5.0 150.0 ± 13.8

Misiko et al. P a g e | 65
Int. J. Biol. Sci.
DNetRW © 2014 http://www.dnetrw.com
2014
TABLE 7: A comparison of the physico-chemical parameters measured in Kisumu bay during the 2009 –
2010 period and the internationally (WHO) accepted levels.
Parameter Levels in Kisumu bay WHO Standards
Dry Season Wet Season
Temperature 28.1 ± 0.2b 26.7 ± 0.1a -
Conductivity 165.0 ± 3.6 166.7 ± 3.7 10 – 1000 µS/cm
DO 5.9 ± 0.2 6.3 ± 0.2 8 – 15 mg/l @ 25oC
Secchi depth 0.22 ± 0.01 0.22 ± 0.01 -
TDS 287.7 ± 2.0 286.99 ± 2.0 < 1200 mg/l
TSS 1427.2 ± 5.0 1327.0 ± 4.0 25 – 80 mg/l
Turbidity 227.4 ± 8.8a 268.6 ± 8.9b < 1000 NTUs
pH 7.7 ± 0.1 7.8 ± 0.0 6.5 – 9.0
Chlorophyll a 28.8 ± 2.4b 18.4 ± 1.1a -
SiO2 23.9 ± 1.3a 28.1 ± 1.2b -
SRP 140.2 ± 4.8 139.4 ± 5.8 -
NH4 107.6 ± 5.4 109.7 ± 6.3 < 3 mg/l
NO3 41.7 ± 1.6 44.5 ± 1.6 < 5 mg/l
NO2 20.8 ± 0.9a 25.5 ± 1.5b < 1 mg/l
TN 1501.2 ± 8 1518.5 ± 7.0 < 6 mg/l
TP 280.8 ± 4.1 289.6 ± 3.8 < 1 mg/l

Misiko et al. P a g e | 66
Int. J. Biol. Sci.
DNetRW © 2014 http://www.dnetrw.com
2014
REFERENCES
APHA, 1995.Standard methods for analyses of
water and wastewater,(18th Ed). Port City Press,
Baitimore, MD.
Carlson, RE.1977.A Trophic State Index for
lakes. Limnology and Oceanography. 22:2 361-
369.
Cocquyt, C., Vyverman, W., Compère, P.1993.
A checklist of the algal flora of the East African
Great Lakes: Lake Malawi, Lake Tanganyika
and Lake Victoria. Scripta Botanica Belgica 8: 1-
56.
Gichuki, J. 2000. The chemical environment of
Lake Victoria (Kenya) with special reference to
nutrient dynamics. In: L. Victoria Fisheries Org.
2005, proceeding of L.V. 2000, a New Beginning
Conference 15– 19 May 2000, Jinja, Uganda.
Gichuki, J, Mugidde, R, Lung’aiya, HBO, Muli,
JR, Osumo, W., Kulekana, Y., Kishe, M.,
Katunzi, EFB, Mwamburi, J., Werimo, K. 2006.
Diversity of Aquatic Ecosystems. In aquatic
Biodiversity of Lake Victoria Basin: Its
conservation and sustainable use. Edited by P.
Kansoma. Lake Victoria management Project. Pp
9-30. Book Chapter (in Press).
Gikuma-Njuru ,P, Hecky ,RE. 2005. Nutrient
concentrations in Nyanza Gulf, Lake Victoria,
Kenya: light limits algal demand abundance.
Hydrobiologia.534:131-140.
Gophen, M, Ochumba, PBO, Kaufman, L.1995.
Some aspects of perturbation in the structure
and biodiversity of the ecosystem of Lake
Victoria (East Africa). Aquatic Living Resources,
8:27-41.
Hecky ,RE, Bugenyi, FW, Ochumba, R, Talling,
JF, Mugidde, R, Gophen, M, Kaufman, L. 1994.
The deoxygenation of Lake Victoria. Limnol.
Oceanogr. 39: 1476–1481.Hecky, RE. 1993. The
Eutrophication of L. Victoria. Proc. Int. Ass.
Theory. Appl. Limnol, 25: 39 – 48.
Hecky, RE, Bootsma, HA, Mugidde, R,
Bugenyi, FWB.1996. Phosphorus pumps,
nitrogen sinks and silicon drains: Plumbing
nutrients in the African Great Lakes. In:
Johnson, T.C. and Odada, E. (Eds) The
limnology, Climatology and paleoclimatology of
the East African Great Lakes. Gordon and
Breach. Toronto. Pp. 205-224.
Huber-Pestalozzi, G.1938. Allgemeiner
Tei.Blaualgen.Bacterien.Pilze.Das
Phytoplankton des suss-swassers, 1. Teil
(ed.G.Huber-Pestallozi), pp.1-6+1-342.
Schweizerbat’sche-Verlagsbuchhandslung,
Stuttgart.
Kaufman, L.1992. Catastrophic change in
species-rich freshwater ecosystems: the lessons
of Lake Victoria. BioScience 42, 846–858.
Kilham, S, Kilham, P.1990. Endless summer:
internal loading processes dominate nutrient
cycling in tropical lakes. Freshwater Biology, 23,
379-389.
Lehman ,JT, Brandstrator, DK.1994. Nutrient
dynamics and turnover rates of phosphate and
sulfate in Lake Victoria.
Lung’aiya, HBO, M’Harzi, A, Tackx, M.,
Gichuki, J., Symeons, JJ.2000. Phytoplankton
community structure and Environment in the
Kenyan waters of Lake Victoria. Freshwater
Biology 43 (4): 529-543.
LVEMP. 2002. Integrated water
quality/limnology study of Lake Victoria. Final
technical report. COWI/DHI, Denmark.
Maitland, P.S.1990, Biology of freshwaters, (2nd
ed). Blackie and Sons Limited, USA.
Selman, M, Greenhalgh, S. 2009.
Eutrophication: Sources and Drivers of Nutrient
Pollution, Accessed 14 April 2012
www.wri.org/.webloc

Misiko et al. P a g e | 67
Int. J. Biol. Sci.
DNetRW © 2014 http://www.dnetrw.com
2014
Mugidde, R.1993. The increase in
phytoplankton productivity and biomass in
Lake Victoria (Uganda). International
Association of Theoretical & Applied
Limnology, proceedings, 25: 846-849.
Nygaard, G.1949. Hydrobiological studies in
some ponds and lakes. Part II: The quotient
hypothesis and some new or little known
phytoplankton organisms. Kgl. Danske.
Vidensk. Selsk. Biol. Skrifter 7(1): 1-293.
Odada, E, Olango, D, Kulindwa, K, Ntiba, M,
Wangida, E.2004. Mitigation of environmental
problems in L. Victoria, East Africa: Causal
chain and policy options analyzes. Royal
Swedish Academy of Science. 33, 13 – 17.
Organization for Economic Cooperation and
Development (OECD), 1982. Eutrophication of
waters. Monitoring, assessment and control.
Final report, OECD cooperative programme on
monitoring of inland waters (eutrophication
control), Environment Directorate, OECD, Paris.
154 p.
Sitoki, L, Gichuki, J, Ezekiel, C,Wanda, F,
Mkumbo, C.O, Marshall, EB. 2010.The
Environment of Lake Victoria (East Africa):
Current Status and Historical Changes
International Review of Hydrobiology,95(3):
209–223.
USEPA.1979. Methods for Chemical Analysis of
Water and Wastes, EPA-600/4-79-020, Method
353.2.
Verschuren,
D,Thomas,CJ,Kling,HJ,Edgington,DN,Leavit,P
R,Brown,TE,Michael,RT,Hecky,RE. 2002.
History and timing of human impact on Lake
Victoria, East Africa. Proc. R. Soc. Lond. B Biol.
Sci. 269: 289–294.
Wetzel, RG, Likens, GE.2000. Limnological
analyses (3rd Ed). Springer-verlag New York,
Inc. 73.
Copyright © 2022 FDOKUMEN