International Conferences on Education, Informatics, and Cybernetics (ICEIC 2011); and Integrating...
332
Transcript of International Conferences on Education, Informatics, and Cybernetics (ICEIC 2011); and Integrating...


COPYRIGHT
Copyright and Reprint Permission: Abstracting is permitted with credit to
the source. Libraries are permitted to photocopy for private use.
Instructors are permitted to photocopy, for private use, isolated articles
for non-commercial classroom use without fee. For other copies, reprint,
or republication permission, write to IIIS Copyright Manager, 13750
West Colonial Dr Suite 350 – 408, Winter Garden, Florida 34787, U.S.A.
All rights reserved. Copyright 2011. © by the International Institute of
Informatics and Systemics.
The papers of this book comprise the proceedings of the conference
mentioned on the title and the cover page. They reflect the authors’
opinions and, with the purpose of timely disseminations, are published as
presented and without change. Their inclusion in these proceedings does
no necessarily constitute endorsement by the editors.
ISBN- 978-1-936338-50-4

International Conference on Education, Informatics, and Cybernetics: ICEIC 2011
Aguirre-Muñoz, Zenaida Texas Tech University USA Alvarado Moore, Karla University of Central Florida USA Ambriz-Galaviz, Norma Mission College Santa Clara USA Bangert, Patrick Algorithmica Technologies GmbH USA Belcher, E. Christina Trinity Western University Canada Bennett, Leslie University of Louisville USA Bidarra, José Open University Portugal Burke, David Robert Morris University USA Burnett, Andrea University of the West Indies Barbados Chang, Maiga Athabasca University Canada Chiou, Yin-Wah Nan Hua University Taiwan Desa, Shakinaz Sultan Idris University of Education Malaysia DeVore, Douglas University of La Verne USA Dierneder, Stefan Linz Center of Mechatronics GmbH Austria Doran, Chad Johns Hopkins University Applied Physics Laboratory USA Dosi, Vasiliki University of Ioannina Greece Dunning, Jeremy Indiana University USA Edwards, Stephen H. Virginia Tech USA Fisher, Wendy Open University UK Florescu, Gabriela C. National Institute for R&D in Informatics Romania Fox, Kelly Texas Tech University USA Ganchev, Ivan University of Limerick Ireland Goulding, Tom Daniel Webster College USA Grincewicz, Amy University of Cincinnati USA Hendel, Russell Jay Towson University USA Henninger, Michael University of Education Germany Herget, Josef University of Applied Sciences of Eastern Switzerland Switzerland Hodge, Diane M. Radford University USA Holifield, David University of Wales Institute Cardiff UK Horne, Jeremy Maricopa Community College USA Jones, Paul University of Cincinnati USA Karamat, Parwaiz Open Polytechnic of New Zealand New Zealand Kaufmann, Christian University of Applied Sciences Technikum Wien Austria Krakowska, Monika Jagiellonian University Poland Kutter, Anna K. University of Education Weingarten Germany Litvin, Vladimir California Institute of Technology USA Livne, Nava L. University of Utah USA
PROGRAM COMMITTEE
Chairs: Friedrich Welsch (Venezuela) Jorge Baralt (Venezuela)

Livne, Oren E. University of Utah USA López-Zafra, Juan M. Complutense University of Madrid Spain Lowe, John University of Bath UK Lowry, Pam Lawrence Technological University USA Machotka, Jan University of South Australia Australia Mackrill, Duncan University of Sussex UK Marino, Mark Erie Community College USA Martin, Paul University of Wisconsin-Marathon County USA Mascari, Jean-François National Research Council Italy Matsuno, Akira Teikyo University Japan Mazur, Amy The George Washington University USA Mehrabian, Ali University of Central Florida USA Mense, Alexander University of Applied Sciences Technikum Wien Austria Mostafaeipour, Ali Yazd University Iran Mussoi, Eunice Maria Federal University of Rio Grande do Sul Brazil Nahmens, Isabelina University of Central Florida USA Nave, Felecia M. Prairie View A&M University USA Nedic, Zorica University of South Australia Australia Olagunju, Amos Cloud State University USA Olla, Phillip Madonna University USA Ozdemir, Ahmet S. Marmara University Turkey Paré, Dwayne E. University of Toronto Scarborough Canada Pfeifer, Michael Technical University of Dortmund Germany Phillips, C. Dianne NorthWest Arkansas Community College USA Pozzatti Flores, Maria L. Lutheran University of Brazil Brazil Premadasa, Kirthi University of Wisconsin-Marathon County USA Pucher, Robert University of Applied Sciences Technikum Wien Austria Rosell, Bernard AT & T Laboratories USA Salazar, Dora Texas Tech University USA Schrader, P. G. University of Nevada USA Sert, Yasemin University of South Florida USA Shaw, Jill The Open University UK Sleit, Azzam Talal University of Jordan USA Soeiro, Alfredo University of Porto Portugal Štogr, Jakub Charles University in Prague Czech Republic Sturgill, Ronda The University of Tampa USA Sulema, Yevgeniya National Technical University of Ukraine Ukraine Swart, William East Carolina University USA Taylor, Stephen Sussex University UK Teng, Chia-Chi Brigham Young University USA Traum, Maria Johannes Kepler University Austria VanVooren, Carol California State University San Marcos USA Voss, Andreas Dortmund University of Technology Germany Wahl, Harald University of Applied Sciences Technikum Wien Austria Wells, Harvey King's College London UK Woodthorpe, John The Open University UK Yasser, Muhammad Chiba University Japan Yu, Xin University of Bath UK Zaretsky, Esther Academic College for Education Givat Washington Israel Zolotová, Iveta Technical University of Kosice Slovakia Zongo, Romaric Cloud State University USA

International Conference on Education, Informatics, and Cybernetics: ICEIC 2011
ADDITIONAL REVIEWERS
Albers, Albert University Karlsruhe Germany Aldana Segura, Waleska Galileo University Guatemala Alshanableh, Tayseer Near East University Turkey Andreopoulou, Zacharoula Aristotle University of Thessaloniki Greece Ariton, Viorel Danubius University Romania Auer, Michael E. Carinthia University for Applied Sciences Austria Baker, John Johns Hopkins University USA Batovski, Dobri Atanassov Assumption University of Thailand Thailand Baumeister, Alexander Saarland University Germany Baysal, Ugur Hacettepe University Turkey Beierschmitt, Penny Lockheed Martin Corporation USA Brodnik, Andrej Andy University of Primorska Slovenia Bruciati, Antoinette Sacred Heart University USA Burita, Ladislav University of Defence Czech Republic Byrne, Roxanne University of Colorado at Denver USA Cabrera Jiménez, Juan A. Centre for Energy, Environment and Technology Spain Caner, Mustafa Akdeniz University Turkey Chau, K. W. Hong Kong Polytechnic University Hong Kong Cheng, Tsung-Chi National Chengchi University Taiwan Chopra, Nidhi Indira Gandhi National Open University India Cubukcu, Feryal Dokuz Eylul University Turkey Dionisio, Angela Federal University of Pernambuco Brazil El Kashlan, Ahmed Academy for Science and Technology Egypt Encabo, Eduardo University of Murcia Spain Erbacher, Robert Utah State University USA Escudeiro, Paula Porto Superior Institute of Engineering Portugal Esperancini, Maura Estadual Paulista University Brazil Ezekiel, Soundararajan Indiana University of Pennsylvania USA Fernandes, Márcia Federal University of Uberlândia Brazil Finch, Aikyna Delores Strayer University USA Finkbine, Ronald Indiana University South East USA Flores, Juan University of Michoacan Mexico Florescu, Gabriela National Institute for R&D in Informatics Romania Fougeres, Alain-Jerome University of Technology of Belfort-Montbéliard France Frosch-Wilke, Dirk University of Applied Sciences Kiel Germany Gacnik, Bonita Mount Marty College USA Garcia-Otero, Singli Virginia State University USA Gavrilova, Tatiana Saint Petersburg State University Russian Federation Gedviliene, Genute Vytautas Magnus University Lithuania

Gendron, Dennis Tennessee State University USA Ghaddar, Nesreen American University of Beirut Lebanon Giurgiu, Mircea Technical University of Cluj-Napoca Romania Goldberg, Robert The City University of New York USA González, Fermín Public University of Navarra Spain Goodwin, Dave National Energy Research Scientific Computing USA Gras-Martí, Albert University of Alicante Spain Gravvanis, George Democritus University of Thrace Greece Gueron, Shay University of Haifa Israel Guijarro-Fuentes, Pedro University of Plymouth UK Güler, Ýnan Gazi University Turkey Hadjerrouit, Said University of Agder Norway Hadrich Belguith, Lamia University of Sfax Tunisia Hammam, Mahmoud Helwan University Egypt Hart, Alexis Virginia Military Institute USA Hartley, Roger Leeds University UK Hasim, Zuwati University of Malaya Malaysia Hassini, Abdelatif Laboratory of Application and Analysis of Radiations Algeria Hellstern, Gerd-Michael University of Kassel Germany Herrera, Oriel Temuco Catholic University Chile Hiraga, Rumi Tsukuba University of Technology Japan Holifield, David University of Wales Institute Cardiff UK Hoter, Elaine Talpiot Teachers College Israel Hou, Jianjun Peking University China Hovakimyan, Anna Yerevan State University Armenia Hsu, Li-Ling NTUNHS Taiwan Hu, Wanting Drexel University USA Huang, Hsiu-Mei Amy National Taichung Institute of Technology Taiwan Hudson, Clemente Valdosta State University USA Ibrahim, Hamidah Putra Malaysia University Malaysia Idowu, Adebayo Peter Obafemi Awolowo University Nigeria Ionita, Angela Romanian Academy Institute for Artificial Intelligence Romania Iung, Benoit University Henri Poincaré France Izydorczyk, Jacek Silesian University of Technology Poland Kalaian, Sema Eastern Michigan University USA Kargidis, Theodoros Technological Educational Institute of Thessaloniki Greece Kaur, Kiran University of Malaya Malaysia Khan, Rana University of Maryland USA Khatri, Anil Johns Hopkins University USA Kikkas, Kaido Tallinn University Estonia Kim, E-Jae LG Electronics Institute of Technology South Korea King, Franklin Jacksonville State University USA Koshy, Swapna University of Wollongong in Dubai UAE Koul, Saroj Jindal Global Business School India Kouroupetroglou, Georgios University of Athens Greece Koutselini, Mary University of Cyprus Cyprus Kropid, Wendy University of Wisconsin Superior USA Kroumov, Valeri Okayama University of Science Japan Krpalek, Pavel University of Economics Prague Czech Republic Krupar, Karen Metropolitan State College of Denver USA Kumar, Krishan Lall University of Botswana Botswana

Kundu, Anirban West Bengal University of Technology India Lertchalolarn, Chawalert Thailand Cyber Univerity Project Thailand Li, Jingyi University of Maryland USA Macianskiene, Nemira Vytautas Magnus University Lithuania Mahanti, Prabhat University of New Brunswick Canada Maharaj, Manoj University of KwaZulu-Natal South Africa Marchisio, Susana National University of Rosario Argentina Marshall, Susanne Nova Southeastern University USA Masrek, Mohamad N. Mara University of Technology Malaysia Mathew, Mary Indian Institute of Science India McWright, Mac Nova Southeastern University USA Mihir, Fnu Norwalk Community College USA Miller, Tracy Illinois Mathematics and Science Academy USA Neaga, Elena Irina Loughborough University UK Nongmeikapam, Kishorjit Manipur University India Rabaea, Adrian Ovidius University of Constantza Romania Romero, Margarida Universitat Autònoma de Barcelona Spain Sathyamoorthy, Dinesh Science & Technology Research Institute for Defense Malaysia Snow, Mary Embry-Riddle Aeronautical University USA Thirunarayanan, M. O. Florida International University USA Torrisi-Steele, Geraldine Griffith University Australia Tse, Ka Ho The Hong Kong Institute of Education Hong Kong Turnage, Doris U.S. Army Research Laboratory USA Vallejo Gutiérrez, José R. University of Guanajuato Mexico Vicente, Luís M. Polytechnic University of Puerto Rico Puerto Rico Wang, Feng-Hsu Ming Chuan University Taiwan


International Conference on Education, Informatics, and Cybernetics: ICEIC 2011
Abraham, Ajith Machine Intelligence Research Labs USA Ajami, Sima Isfahan University of Medical Sciences Iran Akram, Muhammad Agricultural University Peshawar Pakistan Arenaza, Iñaki Mondragon University Spain Ariton, Viorel Danubius University Romania Auer, Michael International Society for Engineering Education Germany Bateni, Mohammadreza Isfahan University of Medical Sciences Iran Biller, Peter Zurich University of Applied Sciences Switzerland Bjoerke, Sven University of Agder Norway Bowe, Rob National-Louis University USA Braimoh, Dele University of South Africa South Africa Camargo, Luz Francisco Jose of Caldas District University Colombia Cendegui, Iñigo Mondragon University Spain Coffland, David Idaho State University USA Cruz, Carlos University of Istmo Mexico Culbreth, Donnamaria Culbreth Educational Associates USA Datta, Ajoy University of Nevada, Las Vegas USA De la Rosa A., Oscar A. University of Istmo Mexico Demetrovics, János Hungarian Academy of Sciences Hungary Dwivedi, Anurag Johns Hopkins University Applied Physics Laboratory USA Faertes, Denise Energy Research Company Brazil Florescu, Gabriela National Institute for R&D in Informatics Romania García, Iván Technological University of the Mixteca Mexico Garzón, Enrique Francisco Jose of Caldas District University Colombia Gomes, José Federal University of Maranhão Brazil Horváth, Zoltán Eötvös Loránd University Hungary Hosny, Khalid Zagazig University Egypt Hoter, Elaine Talpiot Teachers College Israel Hsu, Donald Dominican College USA James, Kathryn University of Wales Trinity Saint David UK Kammer, Dietrich Dresden University of Technology Germany Kumbhar, Mallinath University of Mysore India Laiseca, Xabier University of Deusto Spain Lam, Antony National Institute of Informatics USA Larrañaga, Janire University of Deusto Spain Loskyll, Matthias German Research Center for Artificial Intelligence Germany Martín, Lepoldo University of the Basque Country Spain Marttinen, Kitte Haaga-Helia University of Applied Sciences Finland Novitskaya, Yelena The City University of New York USA Quadrado, José Carlos Lisbon Superior Engineering Institute Portugal
ADDITIONAL REVIEWERS FOR THE
NON-BLIND REVIEWING

Ramírez, Leila Free University of Colombia Colombia Ray, Kaushik University of Windsor Canada Rilett, David Wentworth Institute of Technology USA Ringger, Sven e-Teach Switzerland Ritalahti, Jarmo Haaga-Helia University of Applied Sciences Finland Rubio, Héctor National University of Rosario Argentina Russo, John Wentworth Institute of Technology USA Sánchez, Isahi University of Istmo Mexico Sanford, Kathy University of Victoria Canada Sathyamoorthy, Dinesh Science & Technology Research Institute for Defence Malaysia Schoenfeld, Alan University of California at Berkeley USA Shanklin, Trevor San Diego State University USA Shukla, Ranjana Unitec Institute of Technology New Zealand Silva, Mauro State University of Maranhão Brazil Siringoringo, Hotniar Gunadarma University Indonesia Spinolo, Nicoletta University of Bologna Italy Staupe, Arvid Norwegian University of Technology and Natural Science Norway Stout, William Salve Regina University USA Tang, Kok National University of Singapore Singapore Teissier, Honorato Autonomous University of Coahuila Mexico Telli, Gonca Okan University Turkey Thomson, Simon Leeds Metropolitan University UK Traum, Maria Johannes Kepler University Austria Trifas, Monica Jacksonville State University USA Turnage, Doris U.S. Army Research Laboratory USA Ullah, Farman Agricultural University Peshawar Pakistan Vaitis, Michail University of the Aegean Greece Vicente, Luís M. Polytechnic University of Puerto Rico Puerto Rico Von Krogh, Georg Swiss Federal Institute of Technology Zurich Switzerland Wallin, Mitchell Veterans Affairs Health Administration USA Wilkinson, Steve Leeds Metropolitan University UK Zhao, Hong University of Alberta Canada Zurutuza, Urko Mondragon University Spain

International Conference on Education, Informatics, and Cybernetics: ICEIC 2011
PROGRAM COMMITTEE CHAIRS
Jorge Baralt Friedrich Welsch
ORGANIZING COMMITTEE CHAIRS
Ángel Oropeza Belkis Sánchez
HARDCOPY PROCEEDINGS PRODUCTION CHAIR
María Sánchez
CD PROCEEDINGS PRODUCTION CHAIR Juan Manuel Pineda
SYSTEMS DEVELOPMENT, MAINTENANCE AND DEPLOYMENT
Dalia Sánchez Keyla Guédez Nidimar Díaz Jesús Malavé
OPERATIONAL ASSISTANTS
Marcela Briceño Cindi Padilla
GENERAL CHAIRS
Nagib Callaos Andrés Tremante
HELP DESK Louis Barnes Sean Barnes
CONFERENCES PROGRAM MANAGER
Leonisol Callaos
TECHNICAL CONSULTANT ON COMPUTING SYSTEMS Juan Manuel Pineda
META-REVIEWERS SUPPORT
Dalia Sánchez
PROCEEDINGS PRODUCTION SUPPORT Dalia Sánchez Keyla Guédez
Marcela Briceño Cindi Padilla

PROMOTIONAL SUPPORT Keyla Guédez Nidimar Díaz
Freddy Callaos

International Symposium on Integrating Research, Education, and Problem Solving: IREPS 2011
In the Context of
International Conference on Design and Modeling in Science, Education, and Technology: DeMset 2011
Acharya, Sushil Robert Morris University USA Afandizadeh Z., Shahriar Iran University of Science and Technology Iran Akashi, Takuya Yamaguchi University Japan Alam, Hassan BCL Technologies Inc. USA Alameh, Kamal Edith Cowan University Australia Alhayyan, Khalid N. University of South Florida USA Anwar, Faisal Columbia University USA Arikan, Emin Montclair State University USA Balasubramanian, K. Lefke Avrupa Üniversitesi Turkey Berndt, Donald J. University of South Florida USA Boccaletti, C. Sapienza University of Rome Italy Bradbury, Kyle J. Tufts University USA Castaño, Bonifacio University of Alcala Spain Chae, Hui Soo Columbia University USA Chang, Wen-Kui Tunghai University Taiwan Chopra, Deepak Netaji Subhas Institute of Technology India Chung, Jen-Yao IBM Research USA Das, Asesh Pennsylvania College of Technology USA Debnath, Rameswar The University of Electro-Communications Japan Doran, Michael V. University of South Alabama USA Edrington, Chris Florida State University USA El-Mezyani, Touria Florida State University USA Eshragh, Sepideh University of Delaware USA Eunni, Madhuri University of Kansas USA Fabbri, G. Sapienza University of Rome Portugal Faghri, Ardeshir University of Delaware USA Fan, Joshua Poh-Onn University of Wollongong Australia Fang, Chun-Hsiung National Kaohsiung University of Applied Sciences Taiwan Flores, Juan Universidad Michoacana Mexico Fukumi, Minoru University of Tokushima Japan Gebre, Biruk A. Stevens Institute of Technology USA Geyer-Schulz, Andreas Universität Karlsruhe Germany Goel, Gaurav Netaji Subhas Institute of Technology India
GENERAL CHAIR Nagib Callaos
ORGANIZING COMMITTEE CHAIR
Belkis Sánchez
PROGRAM COMMITTEE Chairs: C. Dale Zinn (USA) José Ferrer (Venezuela)

Guo, Liwen Stevens Institute of Technology USA Gupta, Neha Maharaja Agrasen Institute of Technology India Hartono, Rachmat BCL Technologies Inc. USA Hasnaoui, Salem National Engineering School of Tunis Tunisia Hoh, Carl University California San Diego USA Hu, Kai-Wei Tunghai University Taiwan Iyyunni, Chakradhar University of Houston USA Jenq, John Monclair State University USA Katsuyama, Tomoo Numazu National College of Technology Japan Kim, Seong-Gon University of Florida USA Kim, Yong-Gi Gyeongsang National University South Korea Kitagawa, Kazuhiro World Wide Web Consortium Keio Japan Kulkarni, Arun University of Texas USA Kumar, Aman BCL Technologies Inc. USA
Kurita, Takio National Institute of Advanced Industrial Science and Technology
Japan
Kwok, Kenneth National University of Singapore Singapore Lalooses, Francine The Mitre Corporation USA Leu, Fang-Yie Tunghai University Taiwan Li, Xiaoping National University of Singapore Singapore Lin, Hong University of Houston-Downtown USA Liu, Jun University of Ulster UK López Zafra, Juan Manuel Complutense University of Madrid Spain Low, Kin Huat Nanyang Technological University Singapore Lyuu, Yuh-Dauh National Taiwan University Taiwan Maggiore, Giulio Telecom Italia Italy Makaruk, Aleksander Vienna University of Technology Austria Marques Cardoso, A. J. University of Coimbra Portugal McDowell, William Carnegie Mellon University USA Mitrovic, Frane University of Split Croatia Moosavian, Ali A. K. N. Toosi University of Technology Iran Munitic, Ante University of Split Croatia Muñoz, Humberto Southern University and A&M College USA Mura, Gianluca Polytechnic University of Milan Italy Nagaoka, Tomoyuki Hoshino Resort Ltd. Japan Natriello, Gary Columbia University USA Oya, Hidetoshi Shonan Institute of Technology Japan Passos, Nelson Midwestern State University USA Patel, Nishit Stevens Institute of Technology USA Pochiraju, Kishore Stevens Institute of Technology USA Podaru, Vasile Military Technical Academy Romania Potente, Till RWTH Aachen University Germany Praus, Petr Charles University Czech Republic Rahman, Fuad BCL Technologies Inc. USA Repa, Václav University of Economics in Prague Czech Republic Reyes-González, Leonardo Carnegie Mellon University USA Savva, Andreas University of Nicosia Cyprus Schlette, Christian RWTH Aachen University Germany Seyed-Abbassi, Behrooz University of North Florida USA Shao, Shiyun National University of Singapore Singapore Singh, Madhusudan Netaji Subhas Institute of Technology India

Smith III, Charles V. University of South Alabama USA Srivastava, Sanjeev Florida State University USA Srivastava, Smriti Netaji Subhas Institute of Technology India Sulc, Bohumil Czech Technical University in Prague Czech Republic Suomi, Reima Turku School of Economics and Business Administration Finland Tanaka, Kanya Yamaguchi University Japan Tarnikova, Yuliya BCL Technologies Inc. USA Thede, Anke Universitat Karlsruhe Germany Treven, Sonja University of Maribor Slovenia Ucan, Osman N. Istanbul University Turkey Visram, Zabin University of Warwick UK Vrána, Stanislav Czech Technical University in Prague Czech Republic Wang, Chuan-Ju National Taiwan University Taiwan Wilson, Ralph Florida State University USA Wu, Sheng-You National Changhua University of Education Taiwan Yao, Wenbing Brunel University UK Yazawa, Toru Tokyo Metropolitan University Japan Young, Jieh-Shian National Changhua University of Education Taiwan Yu, Ke National University of Singapore Singapore Zheng, Huiyong University of Michigan USA Zolotová, Iveta University of Technology in Kosice Slovakia
ADDITIONAL REVIEWERS
Abdullah, Lazim University of Malaysia Terengganu Malaysia Alhayyan, Khalid N. University of South Florida USA Allali, Mohamed Chapman University USA Amos, David University of Nancy II France Arato, Peter Technical University of Budapest Hungary Arteaga B., José Ricardo University of the Andes Colombia Aruga, Masahiro Tokai University Japan Bruzzone, Agostino University of Genoa Italy Carnes, Patrick US Air Force Academy USA Cislaghi, Mauro Project Automation S. P. A. Italy Coffman, Michael G. Souther Illinois University Carbondale USA Corcuera, Pedro University of Cantabria Spain Cotsaftis, Michel Central School of Electronics France Dai, Weizhong Louisiana Tech University USA DeVore, Douglas University of La Verne USA Dobritoiu, Maria University of Petrosani Romania Dobritoiu, Nicolae University of Petrosani Romania Liang, Chih-Chin National Formosa University Taiwan Lin, Hong University of Houston-Downtown USA Lin, Jiann-Horng I-Shou University Taiwan Lipikorn, Rajalida Chulalongkorn University Thailand Lipinski, Piotr Technical University of Lodz Poland Liu, HsinChih, Frank Shih-Chien University Taiwan

Liu, Jun University of Ulster UK Liu, Ruey-Tarng National Chung-Hsing University Taiwan López Zafra, Juan Manuel Complutense University of Madrid Spain Lorenz, Pascal University of Haute Alsace France Mahdoum, Ali Microelectronics Laboratory Algeria Maluckov, Aleksandra University of Nis Russian Federation Mansour, Ali Tabuk University France Masotti, Andrea Bambino Gesù Children's Hospital Italy Matsuda, Michiko Kanagawa Institute of Technology Japan Matsumoto, Kazunori KDDI R&D Laboratories Inc. Japan Mayer, Daniel University of West Bohemia in Pilsen Czech Republic McConnell, George SELEX Communications UK Mekras, Nikolaos Technology Development and Research Company Greece Memon, Qurban United Arab Emirates University UAE Meyer, Heiko University of Applied Sciences Munich Germany Mihaita, Niculae University of Economics Romania Milani, Mattia Spas, Electronics Italy Minoro Abe, Jair Paulista University Brazil Mohamed, Azah University Kebangsaan Malaysia Malaysia Mohamed S., Khairul Salleh University Tenaga National Malaysia Moody, Scott The Boeing Company USA Moreira Vidal, Raul University of Porto Portugal Mozar, Stefan Central Queensland University Australia Nagar, Atulya Liverpool Hope University UK Nagy, Endre SICE Japan Nahm, In Hyun Sunmoon University South Korea Narasimhan, Lakshmi East Carolina University Australia
Natalia, Vaganova Institute of Computational Mathematics and Mathematical Geophysic
USA
Newsome, Mark Hewlett-Packard Company USA Odetayo, Michael Coventry University UK Omar, Farag United Arab Emirates University UAE Ortiz Sosa, Lourdes Maritza Andres Bello Catholic University Venezuela O'Shaughnessy, Douglas Institut National de la Recherche Scientifique Canada Ostrowski, David Ford Motor Research USA Paganoni, Anna Maria Polytechnic University of Milan Italy Pal, Bijay Baran University of Kalyani India Palencia, Javier Simon Bolivar University Venezuela Pantelelis, Nikos National Technical University of Athens Greece Passos, Nelson Midwestern State University USA Patel, Kuntalkumar Nirma University India Pirotti, Francesco University of Padova Italy Pisarchik, Alexander Center for Research in Optics Mexico Podaru, Vasile Military Technical Academy Romania Poltronieri, Palmiro National Research Council Italy Poobrasert, Onintra National Electronics and Computer Technology Center Thailand Prakah-Asante, Kwaku Ford Motor Company USA Prykarpatsky, Anatoliy University of Science and Technology Ukraine Rabaea, Adrian North University of Baia Mare Romania Rizwan, Muhammad University of Management and Technology Pakistan Romanov, Sergey Pavlov Institute of Physiology of Russian Academy of Sciences Russian Federation

Rot, Artur Wroclaw University of Economics Poland Semboloni, Ferdinando University of Florence Italy Shen, Zhiqi Nanyang Technological University of Singapore Singapore Silva, Paulo Military Institute of Engineering Brazil Simeonov, Stanislav Burgas Free Univertsity Bulgaria Singh, Harwinder Guru Nanak Dev Engineering College India Snorek, Miroslav Czech Technical University Czech Republic Sobh, Tarek University of Bridgeport USA Sokolov, Sergey Institute for Applied Mathematics Russian Federation Soundararajan, Ezekiel Indiana University of Pennsylvania USA Srivastava, Sanjeev Florida State University USA Stanchev, Peter Kettering University USA Stoleru, Neculai-Daniel Commerzbank AG Germany Stork, Milan University of West Bohemia Czech Republic Stranieri, Andrew University of Ballarat Australia Strefezza, Miguel Simon Bolivar University Venezuela Su, Hui Fang Nova Southeastern University USA Suárez Sarmiento, Álvaro University of Las Palmas de Gran Canaria Spain Suárez-Garaboa, Sonia M. University of A Coruña Spain Sugiyama, Shigeki Gifu University Japan Swierzowicz, Janusz Technical University of Rzeszow Poland Szygenda, Stephen A. Southern Methodist University USA Trofimov, Vyacheslav Lomonosov Moscow State University Russian Federation Tsaur, Woei Jiunn Da Yeh University Taiwan Tsiligaridis, John The State University of New York at Buffalo USA Tsubaki, Michiko The University of Electro-Communications Japan Tümay, Ahmet The Scientific & Technological Research Council of Turkey Turkey Umeo, Hiroshi Osaka Electro-Communication University Japan Vasilache, Simona University of Tsukuba Japan Vázquez, Ernesto Autonomous University of Nuevo Leon Mexico Verber, Domen University of Maribor Solomon Islands Winckler, Michael Heidelberg University Germany Xochicale Rojas, Hugo A. Technology University of Izúcar de Matamoros Mexico
ADDITIONAL REVIEWERS FOR THE NON-BLIND REVIEWING Acharya, Sushil Robert Morris University USA Adamopoulou, Evgenia National Technical University of Athens Greece Animalu, Alexander University of Nigeria Nigeria Atici, Tahir Gazi University Turkey Barham, Peter University of Bristol UK Boeller, Nadja University of Applied Sciences of Eastern Switzerland Switzerland Brame, Roderic University of South Florida USA Bulegon, Ana Marli Federal University of Rio Grande do Sul Brazil Burke, Kathleen State University of New York College at Cortland USA Chang, Hsin-Yi National Kaohsiung Normal University Taiwan Chong, Beng Keok KDU College Penang Campus Malaysia Clinton, John New School for Public Engagement USA

Coxon, Evelyn University of Auckland New Zealand Eijkel, Jan University of Twente Netherlands Frank, Rodolfo University of Buenos Aires Argentina García, Ninoska National University Experimental of Tachira Venezuela González, Guillermo Center for Research in Advanced Materials Mexico Guevara-Jordán, Juan Central University of Venezuela Venezuela Huang, Chieh-Sen National Sun Yet-Sen University Taiwan Iliev, Dean University St. Kliment Ohridski Macedonia Jahangard, Ali Sharif University of Technology Iran Janson, Robert Stockholm University Sweden Juárez, David Autonomous University of the State of Morelos Mexico Kaivo-Oja, Jari Turku School of Economics Finland Kamal, Mehruz State University of New York at Brockport USA Kantola, Tarja Laurea University of Applied Sciences Finland Kaufmann, Christian University of Applied Sciences Technikum Wien Austria King, Adrienne Emory University USA Kor, Ah-Lian Leeds Metropolitan University UK Krattiger, Anatole World Intellectual Property Organization Switzerland Kubiak, Chris The Open University UK Lawless, Deirdre Dublin Institute of Technology Ireland Leiman, Tony University of Cape Town South Africa Leow, Pei Ling Technological University of Malaysia Malaysia Mara, Diane University of Auckland New Zealand Martina, Esteban Metropolitan Autonomous University Mexico Miecinskiene, Algita Vilnius Gediminas Technical University Lithuania Miranda, Guilhermina University of Lisbon Portugal Mohd, Ahmad University Technology of Malaysia Malaysia Monostori, László Hungarian Academy of Sciences Hungary Monroy, Freddy National University of Colombia Colombia Morgan, James Texas A&M University USA Neelands, Jonothan University of Warwick UK Noe, Steffen M. Estonian University of Life Sciences Estonia O'Hara, Kelly de Lemos Serrano
University of Beira Interior Portugal
Ramírez, Leila Free University of Colombia Colombia Romero, Rosenberg Autonomous University of the State of Morelos Mexico Romkema, Hans University of Twente Netherlands Sathyamoorthy, Dinesh Science & Technology Research Institute for Defence Malaysia Serna, Sergio Autonomous University of the State of Morelos Mexico Sikalieh, Damary United States International University Kenya Strydom, Esmarie North-West University South Africa Tzeng, Shyuh-Yaur National Changhua University of Education Taiwan Venkataraman, Bhawani NewSchool USA Vicién, Carmen University of Buenos Aires Argentina Vrána, Stanislav Czech Technical University in Prague Czech Republic Wahl, Harald University of Applied Sciences Technicum Wien Austria Yeary, Amber Wright State University USA Yngström, Louise Stockholm University Sweden Yokota, Sho Setsunan University Japan

International Symposium on Integrating Research, Education, and Problem Solving: IREPS 2011
In the Context of
International Conference on Design and Modeling in Science, Education, and Technology: DeMset 2011
ORGANIZING COMMITTEE CHAIR
Belkis Sánchez
HARDCOPY PROCEEDINGS PRODUCTION CHAIR María Sánchez
CD PROCEEDINGS PRODUCTION CHAIR
Juan Manuel Pineda
SYSTEMS DEVELOPMENT, MAINTENANCE AND DEPLOYMENT Dalia Sánchez Keyla Guédez Nidimar Díaz Jesús Malavé
OPERATIONAL ASSISTANTS
Marcela Briceño Cindi Padilla
GENERAL CHAIRS
Nagib Callaos Jorge Baralt
Hsing-Wei Chu Michael J. Savoie
HONORARY PRESIDENT
William Lesso
HELP DESK Louis Barnes Sean Barnes
CONFERENCES PROGRAM MANAGER
Leonisol Callaos
TECHNICAL CONSULTANT ON COMPUTING SYSTEMS Juan Manuel Pineda
SUBMISSIONS QUALITY CONTROL SUPPORT
Leonardo Contreras
META-REVIEWERS SUPPORT Dalia Sánchez


Number of Papers Included in these Proceedings per Country (The country of the first author was the one taken into account for these statistics)
Country # Papers %
TOTAL 112 100%
United States 34 30,36%
Japan 9 8,04%
Finland 6 5,36%
Mexico 5 4,46%
Brazil 4 3,57%
Germany 4 3,57%
South Korea 4 3,57%
Taiwan 4 3,57%
New Zealand 3 2,68%
Spain 3 2,68%
Canada 2 1,79%
France 2 1,79%
Hungary 2 1,79%
India 2 1,79%
Iran 2 1,79%
Italy 2 1,79%
Malaysia 2 1,79%
Norway 2 1,79%
South Africa 2 1,79%
Sweden 2 1,79%
Switzerland 2 1,79%
United Kingdom 2 1,79%
Argentina 1 0,89%
Australia 1 0,89%
Austria 1 0,89%
Barbados 1 0,89%
Botswana 1 0,89%
China 1 0,89%
Lithuania 1 0,89%
Netherlands 1 0,89%
Poland 1 0,89%
Portugal 1 0,89%
Russian Federation 1 0,89%
Turkey 1 0,89%


Foreword
Information and Communication Technologies (ICT) are having an increasing impact in almost
every scientific discipline and are facilitating the creation of integrative systems and processes,
which are in turn supporting the creation of effective relationships among different academic
activities and potentiating effective collaboration in research, design, and education. On the other
hand the conceptual infrastructures of Systemics, Informatics, and Cybernetics (Communication
and control) are increasingly being related to each other and are providing an effective
intellectual platform for inter-disciplinary communication. Accordingly, the main purpose of the
organizing committees of the collocated events organized by the International Institute of
Informatics and Systemics (IIIS) on 11/29-12/2, 2011, in Orlando Florida is to bring together
researchers, developers, practitioners, consultants and users of Information and Communication
Technologies, for intra- and inter-disciplinary communication,
Consequently, three kinds of activities have been planned:
1. Regular traditional presentations in breakout sessions to support intra-disciplinary
communication,
2. Plenary sessions where Keynote Speakers will address the multi-disciplinary audience,
mostly with inter- or trans-disciplinary topics, and
3. Conversational sessions on inter- or trans-disciplinary topics in order to support inter-
disciplinary communications and to foster the analogical thinking that might emerge in a
multi-disciplinary forum based on trans-disciplinary concepts and/or multi-disciplinary
tools, technologies, and methodologies. Ideas generated by analogical thinking might be
a) applied to a diversity of areas and practical domains, and b) support a synergic
combination of analytical and synthetic thinking.
The disciplinary variety, required for inter-disciplinary communications, analogical learning, and
synergic analytical/synthetic thinking, is one of the motivation for organizing the following
related events:
• International Conference on Information and Communication Technologies and
Applications ICTA 2011
• Design and Modeling in Science, Education, and Technology: DeMset 2011
• International Symposium on Integrating Research, Education, and Problem Solving:
IREPS 2011
• International Conference on Education, Informatics, and Cybernetics: icEIC 2011
The articles accepted for presentation that also have an author registered in the conference for the
respective presentation, have been grouped in two volumes for their publications in the hard
copy proceedings of the collocated events. Their grouping is based on the similarities of the
respective topics. Consequently, papers of ICTA 2011 and DeMset 2011 have been grouped in
one volume, and papers of IREPS 2011 and ICEIC 2011 have been grouped in another volume.

All papers to be presented at the collocated events were included in the electronic version of the
proceedings as well.
Since different kinds of reviewing methodologies are applied in different disciplines we
integrated the most used reviewing methods into a systemic reviewing methodology for the
reviewing process of the papers submitted to the collocated events.
This methodology is based on three-tier reviews: open (or non-blind), double-blind, and
participative reviews. Final acceptance depends on the three kinds of reviews. However, a paper
should be recommended by non-blind reviewers AND blind reviewers in order to be accepted for
presentation at any event and to be included in the respective proceedings. A recommendation to
accept made by non-blind reviewers is a necessary condition, but it is not a sufficient one. A
submission, to be accepted, should also have a majority of its double-blind reviewers
recommending its acceptance. This double necessary conditions generate a more reliable and
rigorous reviewing than those reviewing methods based on just one of the indicated methods, or
just on the traditional double-blind reviewing.
Double-blind reviewing has been done by a random selection of 3-5 reviewers from about
20,000 IIIS reviewers who classified their research or expertise field in the same theme, area, or
subarea where the author classified his/her submission. The random selection (made by a
computer program) has been conceived in order to avoid any conscious, or un-conscious, bias
that might be done by a human-being selection of the respective reviewers.
IIIS’ non-blind reviewing is based on the essence of what Kaplan (2005, "How to Fix Peer
Review", The Scientist, Volume 19, Issue 1, Page 10, Jun. 6) proposed in order to fix peer
reviewing problems. Kaplan affirms that “Peer review subsumes two functions. First, peer
reviewers attempt to improve manuscripts by offering constructive criticisms about concrete
elements … The second function of peer review is to render a decision about the … significance
of the findings so that the manuscript can be prioritized for publication. I propose reforming peer
review so that the two functions are independent.” With regards to the first function of peer
reviewing, Kaplan proposes that “Review of a manuscript would be solicited from colleagues
by the authors. The first task of these reviewers would be to identify revisions that could be
made to improve the manuscript. Second, the reviewers would be responsible for writing an
evaluation of the revised work. This assessment would be mostly concerned with the significance
of the findings, and the reviewers would sign it” (emphasis added).
We try to achieve the first function via Kaplan’s non-blind peer reviewing and the second
function by the traditional means of double-blind review. This is why acceptance of submissions
by the non-blind reviewers is a necessary condition but not a sufficient one. The submission
should also have favorable recommendations by the majority of the double-blind reviewers in
order to be accepted by IIIS for its presentation and inclusion in the respective conference
proceedings.
A third reviewing tier is the participative peer reviewing, which complements the two tiers
described above but is not a necessary condition for accepting a submission. An article submitted
to a conference being organized by IIIS is immediately displayed for review to those authors

who submitted articles in the same theme, area, or sub-area. Accordingly, each submitting author
has access to all submissions sent to the same area where he/she submitted his/her article and can
comment and evaluate them. This is what we call at IIIS “Participative Peer-to-Peer Reviewing”
or PPPR. This kind of reviewing provides additional input to the selection process and assists all
participants in placing their presentations in context. It is not a necessary condition but it has a
complementary function, especially in those cases where the non-blind reviewers have a strong
disagreement or there is no majority of recommendations accepting, or not accepting, the article.
On behalf of the Organizing Committees, I extend our heartfelt thanks to the members of the
four Program Committees (from 74 countries), and to the additional 847 reviewers, from 85
countries, each one of whom reviewed at least one of the submitted articles. 327 reviewers, from
65 countries, were suggested by the respective authors for the non-blind peer reviews. Each
registered author could get information about: 1) the average of the reviewers’ evaluations
according to 8 criteria, and the average of a global evaluation of his/her submission; and 2) the
comments and constructive feedback made by the reviewers, who recommended the acceptance
of his/her submission, so the author would be able to improve the final version of the paper.
A total of 1792 reviews were made to the 303 submissions that were received, which means that
an average of 5.91 reviews were made to each received submission, and an average of 2.12
reviews were made by each reviewer. The 112 papers included in these proceedings, from 33
countries, are 36.96% of the 303 submissions that were initially received. Details for each of the
four events are summarized in the following table.
Conference # of submissions received
# of reviewers that made at least one review
# of reviews made
Average of reviews per reviewer
Average of reviews per submission
# of papers included in the proceedings
% of submissions included in the proceedings
icEIC 2011 58 210 400 1.90 6.90 22 37.93%
ICTA 2011 115 323 758 2.35 6.59 41 35.65%
DeMSET 2011 56 142 326 2.30 5.82 22 39.29%
IREPS 2011 74 172 308 1.79 4.16 27 36.49%
TOTAL 303 847 1792 2.12 5.91 112 36.96%
We are also grateful to the co-editors of these proceedings for the hard work, energy, and
eagerness they displayed in preparing them. We express our intense gratitude to Professor
William Lesso for his wise and opportune tutoring, for his eternal energy, integrity, and
continuous support and advice as Honorary President of IIIS’ conferences, as well as for being a
very caring old friend and intellectual father to many of us. We also extend our gratitude to
Professor Belkis Sanchez, who brilliantly managed the organizing process. Special thanks to
doctors C. Dale Zinn and Jeremy Horne, and to professors Hsing-Wei Chu, Friedrich Welsch,
Michael Savoie, Andrés Tremante, Jorge Baralt, Mohammad Siddique, and José Ferrer for
chairing, or co-chairing the respective program committees.

We also extend our gratitude to doctors Robert Baker, Joseph Finkelstein, Jeremy Horne, Daniel
Katz, Lisbeth Amhag, Merja Bauters and to professors Juha Kettunen, T. Grandon Gill, Bodil
Ask, Harald Haugen, Mohamed El-Sayed, and Donald Poochigian, for accepting to address the
audience of the General Joint Plenary Sessions with keynote addresses.
We also wish to thank all the authors for the quality of their papers.
We extend our gratitude as well to Juan Manuel Pineda, Leonisol Callaos, Dalia Sánchez, Keyla
Guedez, Nidimar Díaz, Marcela Briceño, Cindi Padilla, Louis Barnes, Sean Barnes, Abrahan
Marin, and Freddy Callaos for their knowledgeable effort in supporting the organizational
process producing the hard copy and CD versions of the proceedings, developing and
maintaining the software supporting the interactions of the authors with the reviewing process
and the Organizing Committee, as well as for their support in the help desk and in the
promotional process.
Professor Nagib C. Callaos,
General Chair

i
International Conference on Education, Informatics, and Cybernetics: icEIC 2011
International Symposium on Integrating Research, Education, and Problem Solving: IREPS 2011
CONTENTS
(Post-Conference Edition)
Contents Adult Literacy and Adult Education Finkelstein, Joseph; Cha, Eunme (USA): ''Learning about Atrial Fibrillation Using Social Media: A Qualitative Inquiry'' 1
Romero, Margarida (Spain): ''Online Lifelong Learners and the Work Life Learning Balance'' 5
Applications of Education Technologies Lago Vilariño, Ana Belén; Pretel García, Iván; Zabaleta Fernández, Koldo (Spain): ''Integration of Traditional and Emerging Technologies in the Education Sector'' 8
Yildirim, Fazli (Turkey): ''Transformation of e-Learning to Mobile Learning for the Academic Work Force in Turkey with Encountered Barriers and Tradeoffs'' 14
Applications of Information and Communication Technologies in Education and
Training: E-learning Berena, Arjulie John; Ueno, Haruki; He, Zheng; Sriprasertsuk, Pao; Chunwijitra, Sila (Japan): ''e-Meeting Solution for Higher Education on the WebELS Platform'' 19
Dipinto, Vito M.; Dipinto, Kaki; Rios, Jennifer (USA): ''Digital Storytelling: The Arts and Preservice Teachers'' 25
Hammett, Roberta F. (Canada): ''Digital Technologies, New Literacies and 21st Century Skills'' 28
Haugen, Harald; Ask, Bodil (Norway): ''Technology Evolves but Basic Ideas Survive. Enabling Institutional Collaboration through ICT'' 34
Education, Informatics, and Cybernetics Bao, Yufang (USA): ''Localized Image Segmentation and Enhancement for Meteorite Images'' 40
Hardy, Jim; Lambert, Clayn (USA): ''Technology in the Technical Mathematics Classroom'' 46
Li, Xiaosong *; Ganeshan, Kathiravelu *; Hu, Jie (Jack) ** (* New Zealand, ** China): ''Investigating the Need and Content for e-Security Training in New Zealand SMEs'' 51

ii
Education/Training Systems, Methodologies and Technologies Gifford, Timothy; Srinivasan, Sudha; Kaur, Maninderjit; Dotov, Dobri; Wanamaker, Christian; Dressler, Gregory; Marsh, Kerry; Bhat, Anjana (USA): ''Using Robots to Teach Musical Rhythms to Typically Developing Children and Children with Autism''
57
Goulding, Tom; MacLean, Lisa; Elysee, P. A.; Ellabidy, Magdy (USA): ''The International Digital Divide: Education and Wireless Technology in Developing Countries'' 63
Svetský, Štefan; Moravčík, Oliver; Štefánková, Jana; Schreiber, Peter (Slovakia): ''The Solving of Knowledge Processing for the Automation of Teaching and Learning Activities'' 69
Zamberlan, M.; Santos, V.; Streit, P.; Oliveira, J.; Cury, R.; Negri, T.; Pastura, F.; Guimarães, C.; Cid, G. (Brazil): ''DHM Simulation in Virtual Environments as a Training Tool: A Case-Study on Control Room Design''
75
Educational Research, Theories, Practice and Methodologies Orbán, György; Kozma, László (Hungary): ''Using Contracts for Developing and Testing Software Systems'' 79
Oulanov, Alexei; Madden, Karl (USA): ''Application of Psychometrics Methods to Library and Information Science Research Methodology'' 85
E-Learning Glavitsch, Ulrike *; Simon, Klaus *; Szakos, Jozsef ** (* Switzerland, ** Hong Kong): ''SpeechIndexer: A Flexible Software for Audio-Visual Language Learning'' 91
Hottenstein, Alex (USA): ''Empowering Instructors to Become Effective Content Curators. Using the Building Blocks of Today to Manage Dynamic Curriculums for the Education Space'' 95
Salamin, Anne-Dominique (Switzerland): ''Use of Micro Multimedia Learning Objects (MMOi) in Distant Learning Environment (First Phase)'' 101
Higher Education Harris, Trevor (UK): ''Individualising Media Practice Education Using a Feedback Loop and Instructional Videos within an eLearning Environment'' 107
Räihä, Kalle (Finland): ''What is Campus Markets and How is it Going to Help in Implementing the New Curriculum at Haaga-Helia Porvoo Campus?'' 113
Knowledge Management Schrobsdorff, Hecke *; Bücheler, Thierry **; Kaufmann, Pascal ** (* Germany, ** Switzerland): ''Knowledge Trading in Practice: Installing a Virtually Real Know-How Company''
118

iii
Werner, Horst; Latzina, Markus; Brade, Marius (Germany): ''Symbik - A New Medium for Collaborative Knowledge-Intensive Work'' 124
Educational Systems Engineering Dahi, Farid; Vannier, Michael W.; Obajuluwa, Ademola M.; Dachman, Abraham H. (USA): ''Development of Computer Software Simulation for Training CT Technologists in the Performance of CT Colonography (CTC)''
130
Yeong, Che Fai; Abdul Rahman, Hisyam Bin; Su, Eileen Lee Ming (Malaysia): ''A Hands-On Approach to Teaching Microcontroller'' 136
Informing via Teaching (Pedagogical Methods and Processes) and/or Getting
Informed Form Students, as Feedback for a more Effective Teaching Lester, Virda K. (USA): ''Relationships between Teaching and Practice How Can Teachers be Effective without the Knowledge and Application of Teaching Models?'' 142
Lunsford, Suzanne (USA): ''Interdisciplinary Professional Development Program for Teachers'' 147
Integrating Research, Education, and Problem Solving Cisneros-Molina, Myriam; Rodríguez-Montaño, Flora; Bernabé-Rocha, Araceli; Gómez-Reyes, Gabriel (Mexico): ''An Application of Nonlinear Regression Analysis to Residential Construction Loans Default and Recovery Risk in Mexico''
153
Monfelt, Yngve (Sweden): ''Cognition of Information System Control as Metalanguage (COINS)'' 159
Ohyama, Yasuhiro; Makino, Koji; Kobayashi, Hiroyuki; She, Jin-Hua (Japan): ''A Case Study of Off the Job Training Course for Control Engineering'' 165
Olthuis, Wouter; van den Berg, Albert (Netherlands): ''Designing a Technical System – Deliverables of a Process'' 171
Integrating Research, Teaching and Consulting or Practice Caron-Pargue, Josiane (France): ''Micro-Cognitive-Processes at the Interface Research-Education-Problem Solving'' 176
El-Sayed, Mohamed; El-Sayed, Jacqueline (USA): ''Integrating Field Research, Problem Solving, and Design with Education for Enhanced Realization'' 182
Redden, R. J.; Wolcott, Peter (USA): ''Agile Training: An Innovative Educational Process for Information Technology Educators'' 188
Rutkauskas, Aleksandras Vytautas; Stasytyte, Viktorija; Lapinskaite, Indre (Lithuania): ''Basement on Value Creation of Study Programs as Highway to Integrate Academic, Business and Public Interest as Well as to Shape Research Directions''
194

iv
Wambalaba, Francis; Muniafu, Maina; Nduati, Gidraph; Wanyama, Walter; Ndirangu, Dalton; Wambalaba, Akosa (Kenya): ''Developing an Agribusiness Management Module for Farmer Organizations. Integrating Research, Learning and Consulting/Teaching in Agribusiness for a Lifelong Learning Process''
200
Qualitative and Hybrid Research applied to Academic Informing Goede, Roelien; Taylor, Estelle (South Africa): ''Using Different Research Paradigms to Test Self-Directed Learning Readiness in 4th Year Information Systems Students'' 206
Haugen, Harald; Ask, Bodil (Norway): ''Experiences from Implementation of National and International, Collaborative, Virtual Universities (Invited Paper)'' 211
Relationships between Research and Teaching. Teaching via Collaborative
Research. Alemi, Minoo; Pashmforoosh, Roya (Iran): ''EFL Learners’ Willingness to Communicate: The Interplay between Language Learning Anxiety and Language Proficiency'' 218
Anderson, Phyllis R.; Reid, Joanne R. (USA): ''Collaboration of Research and Teaching Produces a New Course of Study in Critical Thinking'' 224
Cavus, Seda; Dogan, Nihal; Gungoren, Savas (Turkey): ''What Do Pre-Service Science and Mathematics Teachers’ Views about Scientific Theories and Laws?'' 230
Cheng, Sheila; Siow, Heng-Loke (Malaysia): ''Cognitive Processes in Problem Solving: Bridging the Intersection of Cognition and Management Science'' 233
Fink, Alexander; Werner, Linnette R. (USA): ''Curricular and Programmatic Structures to Support Sustained Community Research and Action in a Large Undergraduate Curricular Student Leadership Program''
239
Kettunen, Juha (Finland): ''Integrating Research and Education to Promote Innovations'' 245
Lai, Peng-Jen (Taiwan): ''Teaching Geometry and Research on Fractal Tilings'' 251
McGowan, Alan H. (USA): ''Renewable Energy: An Interdisciplinary Problem Solving Course'' 257
Ornelas Marques, Fernando; Marques, Maria Teresa (Portugal): ''No Problem? No Research, Little Learning ... Big Problem!'' 261
Paramonov, Mikhail; Lauri, Antti; Sylvius, Veera; Kulmala, Markku (Finland): ''Approaches for Multidisciplinary Research-Oriented Studies by Means of Joint Programmes: Cases, Experiences and Successes''
265
Yamaguchi, Precious Vida; Legaspi, Enrique (USA): ''Interregional and Intergenerational Virtual Collaborative Teaching Using the Apple FaceTime App: The East L.A. to PA Project'' 270

v
Relationships between Teaching and Practice or Consulting Erdélyi, Ferenc; Tóth, Tibor (Hungary): ''Research, Teaching and Industrial Problem Solving Activities in the Field of Production Information Engineering at the University of Miskolc, Hungary''
274
Mäntylä, Heljä; Pietilä, Kai; Jokinen, Tiina; Olkanen, Johanna; Vennonen, Helena (Finland): ''Learning together with Entrepreneurs - Description of a Project-Based Learning Process'' 280
Modai, Enrique; Jiménez Placer, Gustavo; Vitali, Amado (Argentina): ''Collaboration between Industrial Computing and the Final Integration Project Courses of a Degree in Electromechanical Engineer with Specialty in Industrial Automation, to Gain Competences in HMI/SCADA Systems''
285
Research Programs and Projects Engineering Domínguez Patiño, Martha Lilia; Rosas Trejo, Gerardo; Rodríguez Martínez, Alma Delia (Mexico): ''Engineering Proyect (Case Study) to Obtain Polymer Concrete through Recycled PET''
291
Domínguez-Patiño, Martha L.; Rodríguez-Martínez, Antonio; Jasso-Castillo, Luís A. (Mexico): ''Design and Implement a System of Wastewater Treatment Based on Wetlands'' 295
Authors Index 299


Learning about Atrial Fibrillation using Social Media: A Qualitative Inquiry
Joseph Finkelstein, Eunme Cha
Chronic Disease Informatics Program, Johns Hopkins University, Baltimore, MD
AbstractHealth information is one of the major topics searched on-line.Social media is increasingly used by patients for health education, empowerment and support. There is a lack of systematic data on what kind of information is being sought by patients via social medial channels. By analyzing information exchange in an on-line support group we can better understand what information is not provided reliably to patients in a clinical setting. The aim of this study was to analyze a content of messages exchanged between participants in an online support group for people with atrial fibrillation. Using Grounded Theory, we conducted a content analysis of 626 messages, which were grouped into seven categories. We described each category and provided examples of users�¶ citations belonging to each category. In addition, proportion of initial posts and responses to them was analyzed depending on message category. Socialmedia facilitated health education on major topics related to atrial fibrillation. Practical implications of qualitative analysis of messages posted on an online support group are discussed.
Keywords:
Atrial fibrillation, online support group, qualitative analysis,
knowledge gaps, social support
Introduction
Atrial fibrillation (AF) is the most common cardiac dysrhythmia
which affects over 6 million patients in Europe and
approximately 2.3 million in the United States. The number of
patients with AF continues to grow rapidly due to an expanding elderly population. AF increases the risk of embolic stroke by
about 4-5 times [1]. Furthermore, AF is responsible for one-third
of all hospitalizations for cardiac dysrhythmia, and the number of
hospital admissions for AF increased two- to three times from
1985 to 1999 [1].
Despite high hospital admission rates and high prevalence of the
disease, even after emergency room and hospital admission,
patients with recently detected AF have limited knowledge about
AF symptoms, purpose of medication, stroke prevention, and
side effects of warfarin [2]. Gaps in knowledge about the diseaseand its treatment, detection of symptoms and how and when to
seek treatment were found in another study in patients visiting
emergency room for AF symptoms and 3 months after discharge
[3].
AF significantly affects patients�¶ everyday quality of life [4]. Itmay sometimes limit their everyday and extracurricular
activities, such as physical exercise, travel and others. Treatment
for AF symptoms has been shown to improve the quality of life
[4]. Among treatment options available are prescription of
medication, electrical cardioversion, radiofrequency ablation,
implantation of atrial pacemakers, surgery and others.
With wide Internet expansion, individuals affected by AF turn to
Internet in search of informational and emotional support from
other people who are also affected by the disease by joining
disease-specific online support groups. Online support groups
help individuals to cope with their disease-related issues by overcoming distance, access, or communication-related
challenges [5]. Members can share their experiences
anonymously and ask questions that they may be uncomfortable
to ask in person when interacting with their peers or a medical
professional. Moreover, patients get access to more diverse
points of view and information as compared to what they can get
through established close relationships [6,7]. Therefore, online
group members may obtain diverse information about their
condition, treatment and related issues from other members. Such
information is based on members�¶ own experience and
information from other sources like Internet web sites, books, patients�¶ doctors and others. Thus, active participation in an
online support group may help educate patients about their
condition by addressing their knowledge gaps.
In addition to sharing information, patients share their emotions
and feelings related to their disease. Participation in online
groups promotes trust, empathy and emotional integration into a
�‡virtual community�· [8]. Higher levels of social support are
related to lower psychological distress and better mental health in
the sense of coping resources [9]. Social support buffers effect of
stressors, like chronic health conditions, negative life events and
other long-term conditions. In this case, social support may help
a patient to cope better with the disease. Perceived availability of
social support serves as a protective factor against psychological
distress, depression, and anxiety [10,11].
Qualitative research methods are widely used to gain in-depth
understanding of human behavior and the reasons that govern such behavior. The content of messages posted in online support
group web sites may be a valuable resource for understanding
experiences of group members and the utility of online
interactions for the group participants [12]. Content analysis of
the messages posted online has been previously successfully
applied to investigate moderated and non-moderated online
1
Proceedings of International Conference on Education, Informatics, and Cybernetics (icEIC 2011),
and the International Symposium on Integrating Research, Education, and Problem Solving (IREPS 2011)

disease-specific support groups [13-14]. However, analysis based
on Grounded Theory (GT) has not been applied systematically to
the content of online support groups, particularly in individuals
with AF [15].
The goal of the present study was to analyze information contentof messages exchanged between participants in an online AF
support group using qualitative methodology in order to identify
and classify major topics which are being discussed by the group
participants. Understanding the everyday concerns and worries
in the lives of patients with AF can help health care professionals
to better meet their patients�¶expectations, and address patient-
centered values, preferences and needs.
Methods
A grounded theory approach was followed in the analysis of
online posts [16]. Research based on GT employs inductive
thinking, aiming to understand a situation from 'inside' rather
than stating a hypothesis first. Therefore, no categories were
specified in advance of data collection. We analyzed archived
messages posted on one of the AF support group web site. The
content of 626 messages posted during the period of 1/1 to 1/31
2008 by 144 anonymous users was analyzed using the NVivo 8 software. Messages were analyzed in terms of similarities or
differences, which was followed by finding common themes and
developing categories. These categories then were used as a basis
for the creation of a hypothesis.
Results
All messages have been grouped into seven major categories (see
Table 1 for details). The most discussed category of messages
was related to medications. Within this category, group members
discussed medications prescribed to alleviate AF symptoms,
which medications helped and which did not, and medication
side effects. The most frequently mentioned medications were
amiodarone and coumodin, e.g. �‡It (amiodarone) got me very
very sick and I did not know it until I had to be hospitalized. �‡
The procedures category included postings about effectiveness
of such procedures as ablation, cardioversion, and half/full maze procedure, e.g. �‡My ablation healing seems to be progressing
very well. My EKG is fine. I have been AF free except for three
post ablation episodes (of decreasing duration) the first week. I
understand that is part of the healing process.�·
The experiences with AF category contained messages describing
personal experience with AF symptoms, asking how common the
symptoms are and how other members cope with them, e.g.
�‡Sometimes I will feel dizzy beforehand, but very often it will
come out of the blue (�« ) My heart does palpitate very strongly
several times a day, but this seems to happen independently of
other symptoms.�·
The category named quality of life included messages about the
impact of AF on quality of life. The members discussed
limitations in physical exercise and travel: �‡AF was basically
ruining my life. I could no longer travel, I could no longer feel
free to do simple things like paint a wall, or work in the garden
on a hot day.�· Also, members shared how the disease affects their everyday life activities such as shopping, work, leisure time.
The diet category reflected the properties of various foods and
drinks, such as green vs. black tea, fruits and vegetables, and
how they affect the disease and blood coagulation: �‡A month ago
after reading that green tea can cause palpitations I stopped
taking the tea - and my AF has been behaving itself!�·
In helpful links and articles helpful web sites, links and other
sources of information were posted, e.g. �‡See Medscape,
guidelines for the management of AF. Dr. Calkins has some very
useful comments on Amiodarone in his interview with editor.�‡
In the last category, devices, two devices helping to monitor and
regulate the heart rhythm were actively discussed - atrial
pacemakers and holter monitors, e.g. �‡I had a holter a few years
ago, but unfortunately wasn�¶t able to catch any of the episodes on
it.�·
Figure 1- Number of initial messages and their discussions in each message category
As seen in Figure 1, messages posted in some categories initiated
active discussion of a topic, whereas in other categories number
of responses was relatively low. For instance, the two most
discussed categories were medications and procedures. At the
same time, posts related to helpful links and articles were not
discussed as actively as other messages.
0 50 100 150 200 250
Procedures
Medications
Quality of life
Helpful links
Experiences with AF
Diet
Devices
Message
category
Number of messages in each category
DiscussionsInitial messages
2
Proceedings of International Conference on Education, Informatics, and Cybernetics (icEIC 2011),
and the International Symposium on Integrating Research, Education, and Problem Solving (IREPS 2011)

Table 1- Number of messages in each category and subcategory and their percentage values
Message category Total number of messages in each
category and subcategory and their
percentage
Total number %
Medications 252
Antiarrhythmicdrugs
79 31.35
Anticoagulants 59 23.41
Beta-blokers 27 10.71
Calcium channel
blockers
9 3.57
Calcium and
potassium
40 15.87
Side effects 33 13.01
Others 5 1.98
Procedures 239
Ablation 151 63.18
Cardioversion 26 10.88
Maze 19 7.95
Location 19 7.95
Other 24 10.04
Life with AF 59
Symptoms 17 28.80
Sleep 7 11.85
Dealing with AF 4 6.77
AF during
pregnancy
3 5.05
Other 28 47.44
Quality of life 44
Exercise 33 75.00
Travel 6 13.64
Influence of AF 2 4.55
Other 3 6.82
Diet 39
Green tea 15 38.46
Red tea 3 7.69
Other 21 53.84
Helpful links 28
Devices 18
Holter 7 38.88
Pacemaker 4 22.22
AfibAlert 2 11.11
Other 5 27.77
Discussion
We identified seven major categories of messages posted in the
AF online support group: medications, procedures, life with AF,
quality of life, diet, helpful links, and devices. With exception of
helpful links and devices categories, in all other categories the
proportion of messages offering support was much bigger than
initial messages. This finding supports previous research
describing major discussion topics in a disease-specific online
support group [18].
We analyzed messages posted on the AF online support group
during one month. Messages were content analyzed and grouped
into seven major categories. We found that in five out of seven
categories AF patients were more inclined to offer support than
ask for it. This pattern was especially evident in topics related to
AF medications and treatment procedures. At the same time,
much less interest was expressed toward objective information
related to atrial fibrillation available online, such as articles, web
sites and useful links.
Messages posted in AF online support group provided insight into the disease- related topics that are the most important for AF
patients and which were not addressed otherwise. The most
common topics in group members�¶ messages were related to AF
medications and treatment procedures. This finding supports
previous research demonstrating gaps in AF patients�¶ knowledge
about the disease and its treatment [2,3]. It also emphasizes
patients�¶ need in opinion from others who have similar condition,
not just a medical professional. The number of responses to posts
related to medications and treatment procedures was four times
greater than the number of initial posts. Therefore, group
members sought other members�¶ opinion and advice in addition
to their doctor�¶s suggestions, e.g., �‡I have been advised to increase that (medication dosage) to 400 mg of paceron once a
day, 200 in the AM and 200 at night. Anyone else take that large
a dose with no side effect?�·, �‡I think I am ready to say goodbye
to the meds, talk to my Doctor and go for rate control. Anyone
have any thoughts or advice?�·
Furthermore, AF patients paid much less attention to the
discussion of validated sources of factual information related to
atrial fibrillation available via online educational resources, such
as articles, web sites and useful links, as compared to exchange
of personal experiences and opinions. This demonstrates that theprimary impetus for joining the online group for the AF patients
was the desire to learn more about the disease from other people
with the same disease, to understand how other people deal with
this condition, and to validate their personal opinions by the
group experience. Similar findings were reported in a case study
of another online support group [8]. Our findings also
correspond to results of a recent survey which demonstrated that
patients preferred to discuss medical information online before
talking with medical professionals [17].
3
Proceedings of International Conference on Education, Informatics, and Cybernetics (icEIC 2011),
and the International Symposium on Integrating Research, Education, and Problem Solving (IREPS 2011)

Analysis of the content topics supported the notion that
participation in the AF online group helped patients to cope with
life challenges posed by their condition. Sharing emotions related
to life with AF and getting understanding from others reduced
psychological distress in patients, e.g. �‡Thanks for the additional information re: other rhythms. It has given me some stress relief
from the concerns I had.�· Moreover, in response to sharing
personal experiences, the patients received information about a
wide range of disease coping strategies that may be potentially
effective in patient�¶s situation. The fact that the group
participants were more inclined to provide support rather than
request it from others underscored previously described
phenomena according to which providing social support to others
may result in health benefits comparable to�† or even greater�†
than receiving support [19].
Previous studies demonstrated the efficacy of computer-assistededucation in delivering knowledge and empowerment for disease
prevention and management [20-21]. Social media can be used in
conjunction with other tools available on the internet to improve
continuous personalized patient education and support [22].
Conclusion
Our study provides evidence that an online support group for AF
patients can help them to address knowledge gaps about their
condition based on others�¶ personal experience. In addition, by
joining such groups, patients can find emotional and
informational support and resources that can help them to deal
with disease-related stress. Understanding information needs of
people with AF can help medical professionals to provide better
medical care and improve patient-provider communication.
References
1. Kannel WB, Benjamin EJ. Status of the Epidemiology of
Atrial Fibrillation. Med Clin North Am. 2008 January;
92(1): 17�–ix.
2. McCabe PJ, Schad S, Hampton A, Holland DE. Knowledge
and self-management behaviors of patients with recently
detected atrial fibrillation. Heart Lung. 2008 Mar-
Apr;37(2):79-90.
3. Koponen L, Rekola L, Ruotsalainen T, Lehto M, Leino-
Kilpi H, Voipio-Pulkki LM. Patient knowledge of atrial
fibrillation: 3-month follow-up after an emergency room
visit. J Adv Nurs. 2008 Jan;61(1):51-61.4. Thrall G, Lane D, Carroll D, Lip GY. Quality of life in
patients with atrial fibrillation: a systematic review. Am J
Med. 2006 May;119(5):448.e1-19. Review.
5. Braithwaite DO, Waldron VR, Finn J. Communication of
social support in computer-mediated groups for people with
disabilities. Health Commun. 1999;11(2):123-51.
6. Wright KB. Computer-mediated support groups: An
examination of relationships among social support,
perceived stress, and coping strategies. Communication
Quarterly 1999; 47: 402�–14.
7. Wright KB. The communication of social support within an
on-line community for older adults: A qualitative analysis of
the SeniorNet community. Qualitative Research Reports in
Communication 2000;1:33�–43.8. Preece J. Empathic communities: balancing emotional and
factual communication. Interacting with computers 1999
Sept;12(1):63-77.
9. Lehtinen V, Sohlman B, Kovess-Mastefy V. Level of
positive mental health in the European Union. Results from
Eurobarometer 2002 survey. Clin Pract Epidemol Ment
Health. 2005 Jul 21;1:9.
10. Cohen S, Syme SL, editors. Social Support and Health.
Orlando: Academic Press; 1985.
11. Cohen S. Social relationships and health. Am Psychol. 2004
Nov;59(8):676-84.
12. Christian A. Contesting the myth of the �µwickedstepmother�¶: Narrative analysis of an online stepfamily
support group. Western Journal of Communication. 2005;
69:27-47.
13. Donelle L, Hoffman-Goetz L. Functional health literacy and
cancer care conversations in online forums for retired
persons. Inform Health Soc Care. 2009 Jan;34(1):59-72.
14. Lasker JN, Sogolow ED, Sharim RR. The role of an online
community for people with a rare disease: content analysis
of messages posted on a primary biliary cirrhosis mailinglist.
J Med Internet Res. 2005 Mar 31;7(1):e10.
15. Huws JC, Jones RCP, Ingledew DK. Parents of Children with Autism using an Email Group: A Grounded Theory
Study, J Health Psychol 2001;6:569-84.
16. Glaser BG, Strauss AL. The discovery of grounded theory.Chicago: Aldine; 1967.
17. Hesse BW, Nelson DE, Kreps GL, Croyle RT, Arora NK,
Rimer BK, Viswanath K. Trust and sources of health
information: the impact of the Internet and its implications
for health care providers: findings from the first Health
Information National Trends Survey. Arch Intern Med. 2005
Dec 12-26;165(22):2618-24.
18. Meier A, Lyons EJ, Frydman G, Forlenza M, Rimer BK.
How cancer survivors provide support on cancer-relatedInternet mailing lists. J Med Internet Res. 2007 May
14;9(2):e12.
19. Musick MA, Wilson J. Volunteering and depression: the role
of psychological and social resources in different age
groups. Soc Sci Med 2003;56:259�–269.
20. Finkelstein J, Lapshin O, Wasserman E. Randomized study
of different anti-stigma media. Patient Educ Couns. 2008
May;71(2):204-14.
21. Finkelstein J, Lapshin O. Reducing depression stigma using
a web-based program. Int J Med Inform. 2007
Oct;76(10):726-3422. Escoffery C, Diiorio C, Yeager KA, McCarty F, Robinson
E, Reisinger E, Henry T, Koganti A. Use of computers and
the Internet for health information by patients with epilepsy.
Epilepsy Behav. 2008 Jan;12(1):109-14.
4
Proceedings of International Conference on Education, Informatics, and Cybernetics (icEIC 2011),
and the International Symposium on Integrating Research, Education, and Problem Solving (IREPS 2011)

Online Lifelong Learners and the
Work Life Learning Balance
Margarida ROMERO ESADE Law & Business School
Av. Pedralbes, 60, CP 08034, Barcelona, Spain
ABSTRACT We analyze the Work Life Learning Balance (WLLB) of life long learners’ time use, considering the time management strategies these adults consider to maintain equilibrium between their professional engagements, their family life and their academic times. Keywords: Work Life Balance (WLB); Work Life Learning Balance (WLLB); Time flexibility; Time quantity; Time quality; E-learning; Academic performance.
1. INTRODUCTION Over the last few years, the issue of work - life balance (WLB) has been receiving increasing attention in the society. Much is being considered about the strategies to adapt the professional timetable and temporal requirements to help encourage work/life balance within the employees. Companies are beginning to recognize signs of stress, or even worst, burnout among the employees that who invest themselves mainly in their professional activity, without considering their private and social life. In Europe Work-Life Balance (WLB) paints a mixed picture. It shows growing awareness of work-life issues, quite widespread flexible working practices, but also a dominant long-hours culture. The current financial crisis has stifled many of the Work Life Balance (WLB) initiatives promoted in the last years,
despite of the social interest of making professional life and family life more compatible. In addition to the balance of work and private and social time, there is a need to invest time in the personal learning and the development of competences (Beckett & Hager, 2002).
2. ENHANCING EUROPE COMPETITIVENESS THROUGH LIFE LONG
LEARNING The need for continuous life long learning actions has increased, especially in knowledge based sectors. The (life long) learning times (i.e., quantity, quality and pattern of usable time) must be combined with the professional and family times to ensure a balance of the adults’ academic, professional, and family responsibilities and the overall well-being and their personal development. However, finding an appropriate balance between different life domains is neither easy nor instantaneous (Metzger & Cléach, 2004).
3. ONLINE EDUCATION FOR TIME POOR ADULT LIFELONG LEARNERS
One of the main reasons to enrol in an online campus, is a lack of time availability to attend the traditional face to face university. The reasons for this lack of time availability is often related to the adult lifelong learners professional and family responsibilities. Online education offers them the temporal flexibility required to adjust their academic
5
Proceedings of International Conference on Education, Informatics, and Cybernetics (icEIC 2011),
and the International Symposium on Integrating Research, Education, and Problem Solving (IREPS 2011)

time-on-task to their professional and family temporal requirements. Temporal flexibility is one of the main expectations of online learners' enrolling in the virtual campus. Nevertheless, adult lifelong learners could fall in the error to confound time flexibility and academic time-on-task reduction. Learning times in the virtual campus are similar from the point of view of the student; despite the temporal flexibility the students' have for allocating the academic time-on-task in the flexible institutional time of the virtual campus.
4. ONLINE LEARNERS’ QUALITY TIME Time quality in online learning depends on a combination of time availability and willingness to devote quality cognitive time to learning activities (Romero & Barberà, 2011). However, the quantity and quality of the time spent by adult e-learners on learning activities can be reduced by professional, family and social commitments. Considering that the main time pattern of most adult e-learners is their professional time-pattern, online education could offer a certain degree of flexibility in instructional time to allow life long learners to adjust learning times to professional constraints. However, using the time left over once professional and family requirements have been fulfilled could lead to a reduction in quality time for learning. Romero and Barberà suggest analysing the distance life long learners’ performance according to their temporal attributes (working hours, time-on-task engagement, time flexibility, time of day, day of week) and also observe and capture attributes that influence the quality of the time invest in learning related with the level of performance (i.e., motivation, attention).
4. RESEARCH OBJECTIVES In this study, we propose the term Work Life Learning Balance (WLLB) to refer to the adjustments of the life long learners’ temporal patterns that are done to maintain equilibrium between their professional engagements, their family life and their academic times. Despite a possible WLLB in a quantitative perspective, we should consider the quality of the time devoted to each of the time uses (professional time use, family time, academic time) to analyse the impact that the quality of the time could have in their performance. In this study we focus on characterising the life long learners’ academic times
and their impact in their individual and collaborative learning activities’ performance in their distance learning course.
5. METHODOLOGY For this reason, we analyse the time-related attributes of the life long learners (working hours, time-on-task engagement, time flexibility, time of day, day of week) according to their individual and collaborative grades during an online master course. The context of the study is the Universitat Oberta de Catalunya virtual campus. The students are postgraduate students of the master of e-learning.
6. RESULTS Students’ time flexibility (r=.98) and especially their availability for time in the morning are related to better grades in individual (r=.93) and collaborative activities (r=.46).
7. DISCUSSION The results of our study allow us to consider better results in the morning time use for the academic activities in the virtual campus. In this study, better results are observed both in individual and collaborative activities. Previous research studies had considered the increase of the peak of performance during the early morning hours, especially for the morningness-types (McElroy & Mosteller, 2006). We should consider in further studies within the Time Factor research project, the analysis of the quality of the academic lifelong learners’ time to advance in the understanding between the students’ temporal flexibility, the moment of day and the learning activities typologies.
8. REFERENCES
[1] Beckett, D. & Hager, P, Life, Work and Learning: Practice in Postmodernity, 1, Routledge, London, 2002.
[2] Metzger, L. y Cleach, O, White-collar
telework: Between an overload and learning a new organization of time, Sociologie du Travail, 2004, Vol. 46 No. 4, pp. 433-450.
6
Proceedings of International Conference on Education, Informatics, and Cybernetics (icEIC 2011),
and the International Symposium on Integrating Research, Education, and Problem Solving (IREPS 2011)

[3] McElroy, T., & Mosteller, L. (2006). The influence of circadian type, time of day and class difficulty on students' grades. Electronic Journal of Research in Educational Psychology, 2006, 4(3), 611–622.
[4] Romero, M., & Barberà, E. (2011). Quality
of e-learners’ time and learning performance beyond quantitative time-on-task. The International Review Of Research In Open And Distance Learning, 12(5), 122-135.
7
Proceedings of International Conference on Education, Informatics, and Cybernetics (icEIC 2011),
and the International Symposium on Integrating Research, Education, and Problem Solving (IREPS 2011)

Integration of Traditional and Emerging Technologies
in the Education Sector
Ana Belén LAGO VILARIÑO
Internet, DeustoTech - Deusto Institute of Technology Bilbao, Bizkaia 48007, Spain
Iván PRETEL GARCÍA
Internet, DeustoTech - Deusto Institute of Technology Bilbao, Bizkaia 48007, Spain
and
Koldo ZABALETA FERNÁNDEZ
Internet, DeustoTech - Deusto Institute of Technology Bilbao, Bizkaia 48007, Spain
ABSTRACT
The constant evolution that the Internet and Communication Technologies (ICTs) have suffered in recent years, has allowed the creation and improvement of more productive sectors. Education sector has been one of the sectors which most increase has had due to ICTs. Unfortunately, ICTs have been designed and deployed to change drastically the learning methodologies. One of the reasons for this reality is the several technology plans promoted by the governments. The main objectives of this kind of plans are to provide ICT resources to students and schools, ensuring Internet connectivity within the classroom and to promote the access to digital educational materials. Moreover, the technological gap is the main problem to solve in this area. Lecturers, teachers and students have to learn a lot of tools to have better experience inside the educational environments. We show by this work a platform based on digital pens integrated with one Learning Management System to minimize the technological gap by using devices that are everyday used.
Keywords: learning management system; digital pen; technological gap, user experience
1. INTRODUCTION
The constant evolution that the Internet and Communication Technologies (ICTs) have suffered in recent years has allowed the creation and improvement of more productive sectors. Education sector has been one of the sectors which has had most increase due to ICTs.
One of the reasons for this reality is the technology plans promoted by public institutions and governments of the different countries. The most important plan in Spain, which promotes the use of ICTs in education, is called Escuela 2.0[1]. The main objectives of this plan are to provide ICT resources to students and schools, ensuring Internet connectivity and
interconnectivity within the classroom for all teams; to promote the training of teachers in the technological aspects, generating and facilitating access to digital educational materials; and to involve students and families in the acquisition, custody and use of these resources. One of the aims of these plans, which governments are trying to achieve, is the decrease of the technological gap.
Nowadays, we can find several number of education centres (from schools to universities) where a Learning Management System (LMS) is implanted. By those platforms resources like courses, subjects, teachers, students, or grades related to teaching are managed.
By this we show a platform based on digital pens integrated with one Learning Management System that can minimize the technological gap by using devices that are everyday used; in this case the subsequently exposed digital pen.
Firstly, existing LMSs are shown in Chapter II. In Chapter III we explain what a digital pen is. Chapter IV presents the Virtual Learning Environment (VLE) we have designed. In Chapter V we explain in great detail the system architecture of the VLE. Chapter VI presents the preliminary evaluation of the implemented system. Finally, the research is concluded and further work discussed in Chapter VII.
2. EXISTING LEARNING MANAGEMENT
SYSTEMS
Moodle [2] is one of the LMS companies that has the highest market share. Moodle was one of the firsts LMS platforms. This fact, combined with the open source philosophy, is the principal reason why it has a great commercial success. The groups, courses, documents and questionnaires (inside a specific course) management are the most important functionalities that this LMS platform offers.
8
Proceedings of International Conference on Education, Informatics, and Cybernetics (icEIC 2011),
and the International Symposium on Integrating Research, Education, and Problem Solving (IREPS 2011)

Due to the open source politic aforementioned, functionalities of Moodle grow steadily because of the facilities to create new components that developers have.
The other most used LMS in education centres is the BlackBoard Learning [3]. The biggest difference between this platform and Moodle is that BlackBoard Learning has a commercial use and so that, a license for its use has to be paid. Apart from this characteristic, the functionalities of both platforms are basically the same.
Sakai CLE [4] is a relatively new LMS that has deeply entered into the market. The main difference between this platform and the other two is that Sakai, apart from offering functionalities to manage different courses, adds more complete resources to manage different tests in order to evaluate the knowledge of the students.
These three platforms are the most commonly used in education but they are not the only ones. There are other fairly used platforms like In-houseDevelopment [5] and TotalLMS [6].
Moreover, there are many education centres where instead of using a system designed specifically for teaching, make use of generics ones. The most used platform in those centres is GoogleDocs [7]. Usually, schools that use this system have agreements with Google. This company offers the ability to access to various Google applications through an email from a domain which is different to the one Google offers (Gmail.com). GoogleDocs is typically used by companies for the sharing and collaborative editing of documents. The problem with this is that GoogleDocs, basically, focuses on records management across the board. At no time can be created courses, groups and so on, clearly representing concepts related to education.
Figure 1. LMS comparison
Although the productivity of those 3 platforms is high, all of them have the same problem. When a student wants to share the notes that he takes in class with his classmates, he has to transform them to a digital document or take them directly by digital way.
In the first case, the action of sharing notes has a low rate, because many people would not be willing to pass notes to digital format to share them later. The problem of the second case is that a low number of people would be able to take notes using a word processor as efficient as if they take them in a traditional way.
Another action that few LMS contemplate is the better and complete tests management. Even the tests are one of the most
common forms of assessment; none of the above described platforms enables the creation and automatically correction of tests.
3. THE DIGITAL PEN
A digital pen [8] looks and feels like a normal ballpoint pen. The person who uses this element does not realize that he is using a digital pen while he is writing; he does not sense the different between a digital and a traditional pen. Although the digital pen user does not realize of the difference, the digital pen contains an integrated digital camera, an advanced image microprocessor and a mobile communication device for wireless connection.
Thanks to the digital pen you can capture the handwriting, store it and finally send it in a safe way. By this manner you easily can convert the inked handwriting to digital data.
When a digital pen is used with a surface that has the Anoto dot pattern [9] printed on it, in the moment when the pen is put on the surface it starts to digitize handwritten text. Thanks to the Anoto dot pattern is easy to know in which place of the surface the digital pen is writing. The pen reads and records pen strokes in relation to the barely visible pattern. This digitizing content is sent to a server that saves all this data.
4. THE VIRTUAL LEARNING ENVIROMENT
Once we have analyzed the advantages and disadvantages of the existing LMS platforms, we have designed a new platform that takes into account the features that are already covered by existing platforms and adds very powerful new ones.
The new platform that has been designed and implemented along with the use of digital pen makes up what is called Virtual Learning Environment (VLE).
The main goal of this environment is to reduce the digital gap in the academic scope. To achieve it, the designed platform offers different functionality necessary to meet the 3 basic scenarios that have been established. The scenarios are attending classes, reviewing documents and conducting exercises.
Regarding the attendance to class, we have detected that the functionalities that has to satisfy the platform are the digitalization of the notes and the creation or edition of documents with the digitalized content. The system in order to meet these two features, allows students to take notes by traditional way (using a pen) and have them automatically available in digital format on the platform, with the advantages that entails.
Furthermore, the scenario in which students review the scanned
documents has been contemplated. Once the student notes have been scanned and digitalized, the student not only can use this content to create new documents but also can merge the content with other documents stored in the platform. In order to make the documents more accessible to the VLE users, the platform is integrated with GoogleDocs, where all the documents are stored. Users can share all the documents they have created with several platform users. Through this sharing any student with
9
Proceedings of International Conference on Education, Informatics, and Cybernetics (icEIC 2011),
and the International Symposium on Integrating Research, Education, and Problem Solving (IREPS 2011)

access to the document may take action on them such as correcting any information that is wrong or adding comments.
The functionalities that the platform develops to cover the scenario of creation of exercises are the creation of new tests and automatic correction of the digitized responses to them. The platform offers the possibility to create different tests, based on the questions, possible answers and the correct choice. When students complete the test in an answer sheet that has the Anoto pattern printed, automatically the items marked by the students are digitalized and the platform correct the test using the correct answers given by the teacher when the test was created.
Apart of the functionalities we can take out from the scenarios we have previously described (document digitalization, digitalized content management, test management, document sharing, etc.); there are another GoogleDocs functionalities that are offered by the VLE. The most interesting extra functionality is the collaborative online edition. Thanks to this functionality, more than one student can add information to a document or correct it at the same time.
5. SYSTEM ARCHITECTURE
The Virtual Learning Environment (VLE) is divided into the following 3 layers: Presentation, Logic and Integration. Each of these layers has its own distinct features. The Presentation layer is the responsible for exposing to the user all the functionality of the platform. The logic layer manages the system behaviour. Finally, the Integration layer is responsible for the communication with external services in order to obtain digital notes (Astutia) and management of documents (GoogleDocs).
Figure 2. VLE Architecture
Within the Presentation layer of VLE two modules can be distinguished: Web Presentation and Access Control modules.
Web Presentation module enables users to access to all the services the VLE offers, such as to authenticate into the platform, manage their documents, manage the tests performed and so on. The access to this module by the user can only be made by using a web browser.
VLE platform provides the Access Control module in order to obtain a safe access to the contents of the platform through the Web Presentation module. This module controls that only authenticated users can enter to the private areas of the platform and they can only perform actions for which they have been authorized. For an efficient control an input filter has been implemented. This filter is consulted whenever a user makes a HTTP request on any resource located in the private area of the VLE platform
The Logic layer in turn, is divided into the following modules: Profile Information, Course Management and Self-Learning.
Effective management of information associated with a student profile is critical in any system and the mismanagement of it can cause a lot of security problems. For this reason the VLE platform provides the Profile Information module. This module provides functionality for user authentication, authorization and the registration of new user.
With authentication, the system always knows that the connected user to the platform is the user who claims be. As the VLE platform is all time in communication with Google and this company provides its own authentication systems [10], the Profile Information module will use the AuthSub authentication protocol that Google offers to authenticate to the platform. With this feature the user should not learn a new user name and password to access to VLE.
The authorization functionality that the platform offers effectively controls the access to all resources it manages. Like all documents that use VLE platform are hosted in GoogleDocs and it has its own policy on roles and permissions, VLE uses these access rules defined by Google. [11]
The last of the features provided by this module is the possibility of registration on the VLE platform. As discussed in the section of authentication, the credentials that are used in the platform are obtained from Google. Therefore, the first time a user accesses to the platform, this module checks that the credentials are correct and the only thing that all the users have to do is to provide the identifier of his digital pen in order to finish his registration.
Figure 3. AuthSub protocol
One of the most important requirements of a virtual learning environment is the document management. To do this management VLE platform provides the Course Management
10
Proceedings of International Conference on Education, Informatics, and Cybernetics (icEIC 2011),
and the International Symposium on Integrating Research, Education, and Problem Solving (IREPS 2011)

module. For the proper management of these documents, the module makes use of the integration layer described later. The most important features that this module offers are the following ones: Obtaining the courses in which the student is enrolled, obtaining documents to which a student can access within a course, uploading a new document to a course, deleting a document from a course, downloading a document of a course and creating a new document from a scanned document.
The last module in the logic layer is the Self-Learning module. This module is intended to facilitate the process of implementation and test evaluation. In this context the system offers two functions: Firstly, the creation of a new test and secondly, the completion and immediate correction of tests. In the first case, creation of a new test, this functionality is oriented to teachers who wish to assess their students through this system. The second feature in turn is directed to the student. The student, once performed the tests will know the results, because this module is responsible for obtaining the answers the student has written in the sheet and comparing them with the correct answers that the teacher has introduced when he/she created the test.
As for the system Integration layer, thanks to it, the VLE platform communicates with services offered by Google for document management and scanning services created within the project scope. This layer is of great importance because it is responsible for the platform to have all the information necessary to satisfy user needs.
The Google integration module communicates with the services offered by this company using REST (Representational State Transfer) calls [12]. The first call made from this module by each user is the authentication on the Google system. This call returns a token which is used by the following queries. These consultations will be made against the Google Documents List API [13]. Without the token the calls to this API will fail.
On the other hand, the management of the communication with the services of digitization is performed by SOAP calls (Simple Object Access Protocol) [14]. These services have been implemented within the project scope.
We have used the Java Enterprise Edition (JEE) for the implementation of the VLE platform. To implement the layers of Logic and Integration, Enterprise JavaBeans (EJB) API has been used. On the other hand, in the case of the presentation layer, we used the JavaServer Faces (JSF) and RichFaces frameworks. Finally, the Web Services for the digitalization have been implemented using the Windows Comunication Foundation (WCF) tool of Microsoft .NET framework.
As for the servers where applications are deployed, we decided to use JBOSS as application server for the VLE platform deployment and Internet Information Services (IIS) for the deployment of the digitalization management Web Services.
6. PRELIMINARY EVALUATION
Finally, we decide to carry out the evaluation in a learning environment where the sharing of notes is a typical action on the students lifes. For this reason, we have considered the university as the most suitable place for conducting the tests. The selected users are students of the Network Design and
Evaluation subject that is taught in the fifth year of the degree of Computer Engineering at the Faculty of Engineering at University of Deusto. Students who have done the tests have had at their disposal all the necessary equipment: a digital pen, a notebook with the Anoto pattern printed on its pages, an answer sheet and a computer to access to the platform.
In order to validate the implemented platform we have studied the ISO/IEC 9126 [15] standard. ISO 9126 defines a quality framework by three aspects: Internal Quality, External Quality and Quality in Use. Internal Quality is the totality of characteristics of the software product from an internal view (i.e. cyclomatic complexity, code maintainability). This kind of quality can be improved during code implementation, reviewing and testing. External Quality is the quality when software is executed, which is measured and evaluated focusing on the software application behavior (i.e. number of wrong expected reactions of software). Finally, Quality in Use is defined within ISO/IEC 9126-4. It is the quality of the software system that the user can perceive when it is used in an explicit context of use.
It measures the extent to which users can complete their tasks in a particular environment. It is measured by four main capabilities of the software product in a specified context of use:
1) Effectiveness: The capability to enable users to achieve specified goals with accuracy and completeness.
2) Productivity: The capability to enable users to expend appropriate amounts of resources in relation to the effectiveness achieved.
3) Safety: The capability to achieve acceptable levels of risk
of harm to people, business, software, property or the surrounding environment.
4) Satisfaction: The capability to satisfy users.
These capabilities have to be measured in order to calculate how the quality in use of evaluated software is. Focusing on this kind of platforms, we have measured the satisfaction and the effectiveness of the platform.
The formulas used to calculate the shown characteristics are based on the adaptation of the formulas set of ISO 9126-4 standard for the system evaluated.
To make the experiment we lent five pens to a group of university students, these students could share notes by the exposed platform. Moreover, other five students collaborated in the experiment sharing between them the notes, but using traditional techniques. In these tests, several concepts have been explained and the students have had to aim by their respective methods of capturing notes. They have assisted three classes of 50 minutes in which students generated notes. These notes have been studied and several metrics have been captured for the subsequent calculation of results. At the end of the course, a test of satisfaction has also carried out to measure the satisfaction level.
In order to capture the metrics that make up the features to be measured, all the generated drafts have been read and several data have been completed. These data were the concepts explained at class, the concepts captured by the students, the number of sheets used and the number of discarded sheets. As
11
Proceedings of International Conference on Education, Informatics, and Cybernetics (icEIC 2011),
and the International Symposium on Integrating Research, Education, and Problem Solving (IREPS 2011)

we have already mentioned, the effectiveness measures the proportion of the goals achieved with completeness. In this case, the goals have been to capture the largest number of concepts presented and to minimize the number of sheets needed for the preparation of the final notes. Thanks to this, we had noticed the differences between taking notes by an ordinary way (Pen and paper) and taking notes by the described platform (VLE).
Another feature to be measured is the level of student satisfaction using the Digital Pen in class. A satisfaction form created by Google Docs has been sent and answered by mail using the accounts created by the studied students.
Figure 4. User satisfaction form
This form could capture the metrics used to the calculation of the satisfaction feature. In other words, by this form the students
could give us their feedback about their satisfaction and the discretionary use of the platform. In the following image we can see the asked questions and the answers given by students.
Figure 5. Graphs of retrieved results
7. CONCLUSIONS
As we can see in the previous graph that shows the averages of effectiveness of the platform, there is no improvement in the effectiveness of note taking because it shows a little reduce of the use of real paper sheets. However, an improvement is seen in the completeness of the note-taking because it increases by 8%. It surprisingly means users will not be affected by the new device use.
12
Proceedings of International Conference on Education, Informatics, and Cybernetics (icEIC 2011),
and the International Symposium on Integrating Research, Education, and Problem Solving (IREPS 2011)

Focusing on the results corresponding to the satisfaction of students using the system we can see not only the digital pen does not affect the use, but also the printed pattern has a good acceptance. In an overall view we can say students were satisfied sharing and using the system, in fact, the discretional use calculated is very good (more than 60% would pay more than 50€ for the digital pen).
Summing up, we have implemented a system to share notes by a digital platform with digital pens. By this way, we can improve competencies and we can provide a better method to digitize the notes without new devices. As we have shown, this system can help to write more complete notes with the same efficiency and completeness and also satisfying the students.
8. REFERENCES
[1] “Programa Escuela 2.0”. http://www.ite.educacion.es/es/escuela-20 (retrieved on June 13, 2011)
[2] “Moodle Platform” http://moodle.org/about/ (retrieved on June 20, 2011)
[3] “BlackBoard Platform” http://www.blackboard.com/ (retrieved on June 21, 2011)
[4] “Sakai CLE” http://sakaiproject.org/node/2260 (retrieved on June 20, 2011)
[5] “InhouseDevelopment” Platform URL (retrieved on June 21, 2011)
[6] “TotalLMS”. URL (retrieved on June 20, 2011) [7] “Google Docs basics”
https://docs.google.com/support/bin/answer.py?hl=en&answer=49008 (retrieved on June 27, 2011)
[8] “Digital Pen” http://www.anoto.com/?id=19146 (retrieved on June 13, 2011)
[9] “Anoto Pattern” http://www.anoto.com/?id=19147 (retrieved on June 13, 2011)
[10] “Authsub Protocol.” http://code.google.com/intl/es-ES/apis/accounts/docs/GettingStarted.html (retrieved on May 27, 2011)
[11] “Google Docs access rules” https://docs.google.com/support/bin/topic.py?hl=en&topic=15129 (retrieved on May 27, 2011)
[12] “Representational State Transfer protocol” http://www.ics.uci.edu/~fielding/pubs/dissertation/rest_arch_style.htm (retrieved on June 23, 2011)
[13] “Google Apps API” http://code.google.com/intl/es/googleapps/docs/ (retrieved on June 23, 2011)
[14] “Simple Object Access Protocol” http://www.w3.org/TR/soap/ (retrieved on June 23, 2011)
[15] ISO/IEC 9126:2001. “Information Technology - Software Product Evaluation Quality Characteristics and Guidelines for their use”, 2001.
13
Proceedings of International Conference on Education, Informatics, and Cybernetics (icEIC 2011),
and the International Symposium on Integrating Research, Education, and Problem Solving (IREPS 2011)

Transformation of E-Learning to Mobile Learning for the Academic Work Force in Turkey with Encountered Barriers and Tradeoffs
Fazli YildirimInformation Systems and Technologies, Okan University
Istanbul, Turkey
ABSTRACT
Most of the universities are executing distance learning or e-learning programs in Turkey as the reason of benefits such as low costs, reduced learning times, quick reference variables on the system, reduced grade evaluation time for academic staff, time and location advantages. With the advance of technological development, students have started to reach information everywhere and every time. These features attract students in order to use e-learning education instead of teacher centered education and we can examine the increase in numbers of e-learning based lectures in the universities. Throughout the integration period of e-learning, universities frequently suffer with various problems such as framework, lack of qualified academic staff for content creation step, low levels for interactive education systems and etc. At the same time, advanced mobile communication tools are spreading rapidly with the high technology in today’s world and Turkey has the youngest generations with highly capable of technological improvements and high ratio mobile phone usages. This research covers the transformation period for the academic institutions throughout the mobile learning integration with examining the barriers and tradeoffs in Turkey. Our aim is to look at the factors which affect the integration period of e-learning programs and measure the drivers. After framing the situation, research will provide suggestions to increase the level of mobile learning integration success.
Keywords: Mobile learning, E-learning, Distance Learning, Mobile Applications.
1. INTRODUCTION
At this point in time; companies, governments and individuals are trying to adapt the technological developments for harvesting the digital world benefits. Contemporaneously, education side is trying to adapt this transformation with distance or electronic learning and mobile learning concepts. Nowadays, universities are perceived as leaders of these change and companies are the followers.
Most of the universities throughout worldwide are executing e-learning programs as the reasons of new systems’ benefits will be examined in the following section and also new distance learning systems in Turkey will be discussed. For instance, low costs, reduced learning times, quick reference variables on the system, reduced grade evaluation time for academic staff, time, location advantage, the rich learning contents, new featured tools that increase the learning performance and socialization tools such as forums, chat rooms are the basic benefits of distance learning. These features attract students in order to use e-learning education instead of teacher centered education and we can examine the increase in numbers of e-learning based lectures in the universities.
Besides the benefits, throughout the integration period of e-learning, universities frequently suffer with various problems. Most encountered problems are framework, lack of qualified academic staff for content creation step and perceptions against the distance learning system. The second part of the content will cover the main barriers of the distance learning systems.
While examining the transformation period we should underline the distinction part of e-learning and mobile learning concepts. Because, main differences between e-learning and mobile learning
14
Proceedings of International Conference on Education, Informatics, and Cybernetics (icEIC 2011),
and the International Symposium on Integrating Research, Education, and Problem Solving (IREPS 2011)

can affect the transformation period of mobile learning. The third sections will underline the differences between e-learning and mobile learning with covering the main factors that affects the system.
With the advance of technological development and developed frameworks especially with the 3G frameworks in Turkey creates learning environments for students to reach information everywhere and every time. These features attract students in order to use distance learning education instead of teacher centered education and we can examine the increase in numbers of distance based lectures in the universities. Besides, mobile learning systems with supported applications and devices are rapidly spreading towards the universities and companies in Turkey. The fourth sections will cover the integration process with academic work force side and also will cover the main factors such as framework, students’ perceptions and service providers in Turkey.
2. BENEFITS
While examining distance or e-learning and mobile learning systems we can examine that there are four role players which are; distance learning provider institutions (companies, universities and etc.), students, teachers and distance learning system integration companies. We are going to focus the students, teachers and distance learning provider institutions' benefits through this section.
There are different types of distance education systems in Turkey. Generally, most of the institutions in Turkey prefer blended learning throughout the e-learning and mobile learning. Blended learning is a solution that covers different delivery methods such as web based courses, software and knowledge management practices [1]. The main reason of using blended learning is compensating interactivity and infrastructure problems. Providers can support e-learning and mobile learning courses, but students and teachers need more interactivity. Chat rooms, face to face video conferences can be supported by the providers. Throughout the integration period of e-learning and mobile learning systems, teachers and students should be oriented by deploying the blended learning systems. Most of the institutions in Turkey prefer blended learning as providing web and mobile application based courses with
supporting the course with classic system based courses with bringing students and teachers at the defined hours in the classes or conference rooms.
In the basis, distance learning provider institutions can use their sources such as teachers, physical locations, students’ affairs more effectively that can reduce their costs. There is no need to use physical rooms and instructors can consume less time relative to classic education systems. For instance, if a company wants to train their employees a word spreading software, company should send their employees to a education institution in their working hours and pay more related to mobile or e-learning learning system. Time and place dependency will be solved with the new education system.
Students can provide courses with low charges and use their time more effectively without place constraints. Also, new education system acts the courses as a one to one teaching, more customized. Rich visual contents help to learn more effectively and enjoying related to classical method. Furthermore, students can reach course announcements such as; course notes, documents and syllabus. This is important in terms of users, because they can know what instructor expects from them [2]. In addition, we should admit that there are no limits in mobile education systems and applications. For instance, while you are traveling you can learn the historical information of the building close to you with new generation mobile devices with GPS support.
Teachers or alias “content creators” are the key players of new education system. They can have more spare time, share course materials that are more richer visualized content more easily, track and evaluate their students more effectively. Besides, they can reach more students in a specified time and course without place constraints. Besides, slow learners and quick learners’ conflict can be solved with e-learning and mobile education systems.
3. BARRIERS
While examining the barriers of e-learning and mobile learning systems we can face different approaches, but generally the barriers usually covers the four role players that mentioned in the benefits section or classifies the barriers related to these
15
Proceedings of International Conference on Education, Informatics, and Cybernetics (icEIC 2011),
and the International Symposium on Integrating Research, Education, and Problem Solving (IREPS 2011)

players such as Yamamato that the barriers related to e-learning are macro barriers, personal barriers, organizational barriers and technological barriers [3].
But, in today's world, the technological or infrastructural barriers are just related to distance learning provider institutions and distance learning system integration companies’ strategic based decisions which covers cost concerns. Because, with cloud computing facilities, enhanced mobile application developer software, 3G and 4G based mobile networks, and sophisticated mobile devices such as pads, net books, Android operating system based devices we can announce that there are not technological based barriers; there are just cost concerns of institutions and integrator companies.
Besides the cost concerns, teacher and student based barriers are mainly perceptive [4]. Teachers are mainly scared of adapting themselves to new education system as a content creator as the reason of their low technological capabilities, we can face this result in many cases in Turkey such as primary school research in Turkey [5]. Another perceptive barrier for the teachers is the interactivity concerns, but most of the teachers are still hesitating to open online courses with more developed systems that support virtual face to face classes or a blended learning choice that meets students and teachers in physical classroom in a specified time periods.
Students based barriers are also based on perceptions. E-learning systems force the learners to be self managed and learners demand to be interactive with their teachers. Besides, enhanced visual contents and accessibility advantages the course dropout rates are high and the demand for classical system is still high [6]. At the same time, they want more interactive education system and rich lecture content and most of them are happy to be organized and planned with the help of the e-learning system [7].
Moreover, learners do not want to change their learning habits and also they have concerns on being social, because some students believe that virtual courses will prevent them to be socialized with other students. Mobile application based learning tools are more popular in these days, but the main problem is that students can really sustain the education and organized to finish their mobile application based learning. Besides, these barriers online book sales
are accelerating, so we have to think about the e-learning and mobile learning system based education models as a next education model.
4. DIFFERENCES BETWEEN E-LEARNING AND MOBILE LEARNING
E-learning can be summarized as web based learning and have blended learning or hybrid forms while mobile learning is perceived as the supplementary method of e-learning. After all, mobile learning is the second generation of e-learning with covering lots of technological advantages and can be act as a new learning method with mobile applications. This section covers the examination of the technological and connection based differences.
With the improved mobile devices m-learning supports more custom, flexible, rapid feed backs, mobilized learning systems and applications. Students and teachers can be more flexible throughout their lectures. For instance, they will carry lightweight devices with longer battery durations and with the support of 3G or 4G network they can access internet without any boundaries. Additionally, students can access and respond their assignments and tests more effectively, individualized, flexible and secured. In e-learning system, students should be connected in dedicated time and there is a chance to get response with delayed feed backs and they are evaluated in the dedicated times and locations frequently [8].
Formerly, e-learning lecture contents are richer than the mobile learning lectures because of the mobile devices. But, now improved mobile devices (pads and light net books with mobile network support such as 3G) students can access rich visual lecture contents. While mobile applications cope with resolution and different monitor sizes, pads and big monitor sized mobile devices are spreading throughout the worldwide by certain companies such as Apple, Samsung which are becoming as a monopoly. This situation helps developers to produce faster throughout the mobile application software production which increases the number of mobile applications.
16
Proceedings of International Conference on Education, Informatics, and Cybernetics (icEIC 2011),
and the International Symposium on Integrating Research, Education, and Problem Solving (IREPS 2011)

5. MOBILE LEARNING INTEGRATION PERIOD IN TURKEY
In Turkey, e-learning based education programs are increasing in last decade and now there are approximately one million e-learning system users in Turkey. Especially, finance, insurance, telecommunication, medicine and retail sectors are mainly using the e-learning applications in Turkey and listed in Table 1 [9]. Table 1: E-learning Users Numbers in Turkey
Year
Number of Company
Number of University
Number of Institutions
TotalNumber
1997 5 3 0 100002002 20 5 2 1200002008 150 20 10 8000002010 200 30 15 1000000
Because of the high service costs, there are not sufficient number of mobile application based learning education programs in Turkey. Mobile learning applications in the academic environment in Turkey are in the test mood while there are few commercial applications such as “Turkcell Mobil Egitim”, “Mobil Ogren” and “Avea Mobil Akademi” for educating companies’ employees in the business environment in Turkey [10].
As we mentioned, distance learning system integration companies are playing an important role through the transformation period. Enocta and Skillsoft named companies are important distance learning system providers in Turkey. According to report by general manager of Enocta, Turkish companies’ executives demand book summaries, papers, researches, online books or e-books, online contents for applicable in mobile devices, voice and video contents for their mobile devices [11].
Generally, the researches related to mobile learning applications in Turkey are based on students’ perceptions and the mobile learning environments’ success and most of them fasten on positive perception on mobile learning. For instance, according to a research by Cakir, students want to use mobile learning and students believe that mobile learning is effective [12]. There is a similar research by Demirbilek on mobile application and learning which supports that people have positive thoughts on mobile learning and they prefer synchronized
and interactive applications in Turkey [13]. Also, there are pre-test and post test based researches related to topic and underlines that mobile devices and applications support learning and more effective than classical learning tools especially in language learning [14].
The researches that reflect the teachers’ perceptions on mobile learning applications are inadequate in Turkey. In spite of high ratio of mobile devices users in Turkey the mobile learning based application numbers are still few. For evaluating the academic staffs’ attitudes toward the mobile learning application, we can use the data related to electronic learning based researches in Turkey. There is an effective research on e-learning in Turkey which covers 18 researches on academic staff and students aspects with comprising related researches in 2010 and 2009 by Yildirim underlines that technological capabilities of academic staff are correlated with attitudes towards distance learning [15]. The most important integrating barrier of distance learning is the content creation step for teacher. In addition, unsafe environments with low motivation decrease the success of teachers.
While focusing the teachers’ role in distance learning systems, we can conclude that teachers should focus on creating the content rather than delivering the old ways (lectures or books, test etc.). Also, they should create and support social networking and establish first hand learning environments [16].
Consequently, benefits, barriers, distance learning systems are forcing teachers to be more technologically skilled, creative, supporter of social network environments. So, education institutions should create environment by providing technological educations to their teachers with supporting online interactive distance learning systems and should motivate their academic staff for shortening the integration period in Turkey.
6. CONCLUSION
Mobile learning applications are becoming the new form of education. We examined that main factors are teachers, students and e-learning provider institutions. And, teachers are playing a crucial role in this trilogy. Institutions’ administrators and
17
Proceedings of International Conference on Education, Informatics, and Cybernetics (icEIC 2011),
and the International Symposium on Integrating Research, Education, and Problem Solving (IREPS 2011)

students indirectly are demanding teachers or academic staff to be more creative and technologically capable. But, at the same time institutions’ cost fears can prevent to create that environment for their academic staff and can prevent from fast transformation.
We can assume that the future of learning is distance learning covering mobile learning, so administrators should focus on academic staff and create needed environment and motivate them for change.
7. REFERENCES
[1] P. Valiathan, Blended Learning Models, Learning Circuits, Retrieved October 17, 2009 from http://www.learningcircuits.org/2002/aug2002/valiathan.html, 2002.
[2] S. Waterhouse & R. O. Rogers, The Importance of Policies in E-Learning Instruction, Number 3, 2004.
[3] G. Telli Yamamoto, E-Learning Developments in Turkiye, ICEGEG 2010 International Conference eGovernment and eGovernance, 2010. [4] F. Yildirim, O. Korucu, C. Aktaş, G. Kule, E-Learning Education System in Universities With Instructors’ Perspectives and A Survey In Turkey, International Journal Of Social Sciences And Humanity Studies vol 2, No 1, Issn: 1309-8063 (Online), 2010.
[5] E. Tezci, Teachers ’ Effect on ICT Use in Education: the Turkey Sample, Procedia Social and Behavioral Sciences 1, 2009, 1285-1294, Retrieved from ScienceDirect search engine in 2011.
[6] Z.L. Berge, & H. Yi-Ping, A Model For Sustainable Students Retention: A Holistic Perspective On The Student Dropout Problem With Special Attention To E-Learning, 2004, Deosnews, 13, Retrieved October 10, 2009 from http://www.ed.psu.edu/acsde/deos/deosnews/deosnews13_5.pdf.
[7] F. Yildirim, Integration Period of E-Learning in Universities: A Survey in Turkey, Jul. 2010, Volume 7, No.7 (Serial No.57), Journal of US-China Public Administration, ISSN 1548-6591, USA, 2010.
[8] Y. Laouris and N. Eteokleous, 2005, We Need an Educational Relevant Definition of Mobile Learning, Retreived from http://www.mlearn.org.za/CD/papers/Laouris%20&%20Eteokleous.pdf, 20.08.2010.
[9] A. Hancer, Turkiye'de E-Ogrenmenin Bugunu ve Gelecegi, Turkiye'de E-Ogrenme Gelismeler ve Uygulamalar, Efil publication, page 429, 2011.
[10] U. Demiray, G. T. Yamamato, O. Ozan, Mobil Ogrenme Teknolojileri ve Egitim Uygulamalari, Turkiye'de E-Ogrenme Gelismeler ve Uygulamalar, Efil publication, page 361-384, 2011.
[11] A. Hancer, Turkiye'de E-Ogrenmenin Bugunu ve Gelecegi, Turkiye'de E-Ogrenme Gelismeler ve Uygulamalar, Efil publication, page 421-425, 2011.
[12] H. Cakir, C.U., Mobil Ogrenmeye Iliskin Bir Yazilim Gelistirme Ve Degerlendirme, Egitim Fakultesi Dergisi: 40 (2011), 01-09. Retrieved from September 1, 2011 from http://egitim.cu.edu.tr/efdergi.
[13] M. Demirbilek, Investigating Attitudes of Adult Educators towards Educational Mobile Media and Games in Eight European Countries, Journal of Information Technology Education, Volume 9, 2010.
[14] E. B. Basoglu, O. Akdemir, A Comparison of Undergraduate students’ English Vocabulary Learning: Using Mobile Phones and Flashcards, TOJET: The Turkish Online Journal of Educational Technology, July 2010, volume 9 issue 3, 2010.
[15] F. Yildirim, Uzaktan Egitim Sistemine Gecisin Esas Ogeleri Olan: Ogretim Elemanlari ve Ogrencilerin Bakıs Acilari, Turkiye'de E-Ogrenme Gelismeler ve Uygulamalar, Efil publication, page 20-38, 2011.
[16] I. Yengin, D. Karahoca, A. Karahoca, Z. Ozcinar, Being Ready For The Paradigm Shifts in E-Learning:Where is the Change Happening and How to Catch the Change?, Procedia Social and Behavioral Sciences 2, 2010, 5762-5768, Retrieved from ScienceDirect search engine in 2011.
18
Proceedings of International Conference on Education, Informatics, and Cybernetics (icEIC 2011),
and the International Symposium on Integrating Research, Education, and Problem Solving (IREPS 2011)

e-Meeting Solution for Higher Education on the WebELS Platform
Arjulie John BERENA, Haruki UENO, Zheng HE, Pao SRIPRASERTSUK National Institute of Informatics
2-1-2 Hitotsubashi, Chiyoda-ku, 101-8430 Tokyo, Japan
and
Sila CHUNWIJITRA The Graduate University for Advanced Studies
2-1-2 Hitotsubashi, Chiyoda-ku, 101-8430 Tokyo, Japan
ABSTRACT
With the advancements of information technology and the
informatization of society, there is a paradigm shift of teaching
methodologies in higher education, where a virtual
collaborative learning system is being sought for not just as an
extension of traditional classroom-based methodology, but also
to meet the social demands for a flexible and internationalized
educational system. To achieve an effective virtual
collaborative learning system, features like online presentation,
online annotation, chat messaging and video conference system
are required, and the system must support the concept of
“anytime and anywhere” system. This paper introduces the e-
Meeting system built on the Web-based e-Learning System
(WebELS) platform designed for higher education in science
and engineering. The system supports easy content authoring,
online slide presentation, online annotation, chat messaging and
video conferencing. These features effectively demonstrate the
usefulness with higher performance of the system in supporting
collaborative learning for higher education in domestic and
international organizations and universities.
Keywords: e-Learning, e-Meeting, online presentation, video
conference, virtual collaborative learning
1. INTRODUCTION
Advancements of technology and the informatization of society
are factors that paved the way for shifting the teaching
methodologies in higher educational system from the traditional
classroom-based method to the use of information and
communications technology. In recent years, Internet-based
teaching and learning technologies have been widely available
enabling e-learning to become a major form of educational
methodology addressing time-limitation and location-limitation
between teacher and students [1]. e-Learning infrastructure can
be easily carried out because of the advancement in
internetworking technologies, multimedia information
processing technologies, and software technologies at lower
cost and higher quality in a global scale [2].
Unlike e-Learning in the middle school and undergraduate
programs where course management and automated student
assessment are typical features, the activities in the higher
education, particularly in the graduate school are characterized
as self-learning, group meetings, and research presentations. In
most cases, there is a need to collaborate with the experts of the
particular research field in the academe and industry. These
characteristics of higher education based on the information
technology perspective have been analyzed in previous studies
[3-6].
In carring out the demands of higher education in view of
information technology, an e-Meeting system is strongly
requested rather than a typical learning management system
(LMS) [7,8]. An effective e-Meeting system requires primary
features like online slide presentation, online annotation, chat
messaging and video conferencing. Although there are a lot of
similar systems, but it is very rare to find an all-in-one system
that really answer the need to support e-Meeting for higher
education.
In this paper, we discuss the design and implementation of the
e-Meeting system built on the Web-based e-Learning System
(WebELS) platform [9]. The system features online slide
presentation, online annotation, video conferencing, and chat
messaging system, which are required features for a virtual
collaborative learning system. Online presentation is based on
slide synchronization between the presenter and the listeners. It
is implemented by utilizing a shared virtual presentation board
(VPB) stored on the server, which is updated by the presenter
for every slide events, and polled by the listeners periodically
for synchronization [10]. Synchronization in our context refers
to real-time mirroring of slide presentation events that include
controls for changing the slides back and forth, vertical and
horizontal scrolling, panning, zooming, cursor positioning,
annotation, and even controlling the playback of video
embedded on the slide between the presenter and listeners. e-
Meeting is made possible then by combining the online slide
presentation and video conferencing system to create a virtual
classroom, where meeting participants convene via the Internet.
Video conferencing system is based on server-client
architecture, which is in contrast with the peer-to-peer
architecture utilized by a number of similar systems. Finally, we
present the practical application and evaluation of e-Meeting in
its successful performance in domestic and international
collaboration between academic institutes and organizations.
2. REVIEW OF RELATED TECHNOLOGIES
With the fast-paced development of Internet application
technologies, various web-based conferencing tools become
19
Proceedings of International Conference on Education, Informatics, and Cybernetics (icEIC 2011),
and the International Symposium on Integrating Research, Education, and Problem Solving (IREPS 2011)

widely available. We describe some popular related technology
on online presentation, video conference, and web-based
conference systems. We also discuss the advantages and
drawbacks for each in view of e-Meeting application for higher
education.
Online presentations systems widely available nowadays come
from a variety of underlying technologies, such as screen
sharing and document sharing. Screen sharing allows one to
transmit the contents of his computer desktop to one or more
remotely connected network users. Some screen sharing
systems allow remote control which shares the ability to control
the keyboard and mouse to other users. Some systems that use
screen sharing are GoToMeeting [11], Real VNC [12], Skype
[13], WebEx [14], to name a few. The advantage of screen-
sharing technique is that presenter can show various
applications on his desktop and be seen by other participants. In
view of e-Meeting however, presenter have to be careful that
sensitive information is not displayed as it can be visible to
other meeting participants. Another drawback of screen-sharing
technology is the reduced graphic quality that small text or
objects cannot be clearly seen. Screen sharing technique works
well in broadband, but may not operate well in narrowband as it
utilizes greater bandwidth for streaming of encoded pixel data
of screen image. Bandwidth demand gets very high if there is a
lot of pixel change at the same time, such as when scrolling a
window or viewing full-screen video. Another major drawback
of screen sharing is that it requires advanced network address
translation (NAT), firewall and router configuration such as port
forwarding in order for the connection to go through [15].
Document sharing tools are sometimes referred to as online
presentation tool because it is possible to share presentation
files online. Some document sharing tools allow one to create a
PowerPoint presentation online or upload an existing
PowerPoint file onto the server. Other users can then view and
edit the shared presentation [16,17], while others allow anyone
to view only but does not allow editing [18]. Some systems
support various file formats such as the Google Docs [16], but
others only support PowerPoint [17-19].
To realize an e-Meeting, some screen sharing and document
sharing systems have an integrated support for video conference
or Voice over Internet Protocol (VoIP) system. But others do
not have and users have to use another platform for video
conferencing or teleconferencing.
3. WebELS MEETING SYSTEM
The overview of the WebELS Meeting system is shown in Fig.
1. There are three servers in the server side, i.e., database server,
content server and streaming server. Database and content
server are used for content and user data management, while
streaming server is used for real-time audio-video
communication.
There are two major operations available for the user of the
system, i.e., content authoring and joining a meeting. Content
authoring is usually done by meeting presenter or lecturer.
Content authoring tool downloaded from the server is an easy-
to-use Java-based content authoring tool. Content authoring
using this tool can achieve three operations – (1) creating new
content, (2) editing content, and (3) importing content from
other servers. Files in the form of slide presentations, word
processor documents, portable document format (PDF) and
images can be used as raw material for the WebELS-based
content. Files are automatically converted to a series of slides
locally and compressed prior to uploading to the server.
However, if file conversion is not available locally, files are
converted at the server. Video files can also be embedded onto a
slide which is possible to playback in synchronous manner
when viewing the content.
Joining a meeting is another major user operation but it follows
only after creating content [5]. Assuming that content has
already been made and stored in the server, joining a meeting
requires the user to download the presentation panel and the
compressed content. The client user stores the downloaded
content onto the temporary folder, unzip the content package,
and then load the slide images onto the presentation panel. The
system prompts the user for username input, and when done,
displays the first slide image on the presentation panel. Online
presentation has two user modes, i.e., the presenter mode and
the listener mode. In presenter mode, the user has over-all
control of the slide, such as slide changing, cursor positioning,
panning, zooming and annotation functions. Users in listener
mode can only monitor who have joined the presentation, but
does not have the right to control the slides. The listener’s
presentation panel serves as a passive listener where it displays
what is on the presenter’s presentation panel. This slide
presentation synchronization is implemented using a virtual
presentation board (VPB) concept. VPB data that is stored on
the server is updated by the presenter every slide events, and
polled by the listener periodically to achieve synchronization.
Synchronization in our context refers to real-time mirroring of
slide presentation. Switching of presenter’s right among
meeting participants is permitted in order to attain a
collaborative approach.
The video conference system is based on client-server
architecture, in contrast with the peer-to-peer architecture
utilized by a number of similar systems. With client-server
architecture, more than two users can join the video meeting at
the same time. The video meeting panel is designed to be
independent from the presentation panel, thereby participants
logged-in on the video meeting can still open a different
presentation content, while keeping the video meeting
connection. There can be only one meeting administrator at one
time. Administrator can assign presenter, mute all listeners, kick
out a user, and manage the viewing focus to the presenter.
Figure 1: WebELS Meeting System Diagram
��������������� ��
���������� ��
�������� �� � �������� ��
� ����� ���������� �������
�� �������������
�����������
�� !��������� ��������"
#�������$� ��!�������
Authoring Tool
Download
Content
Upload
Video Conference Control
& VPB Data
Presentation Panel
& Content Download
��������������� ��
���������� ��
�������� �� � �������� ��
� ����� ���������� �������
�� �������������
�����������
�� !��������� ��������"
#�������$� ��!�������
Authoring Tool
Download
Content
Upload
Video Conference Control
& VPB Data
Presentation Panel
& Content Download
20
Proceedings of International Conference on Education, Informatics, and Cybernetics (icEIC 2011),
and the International Symposium on Integrating Research, Education, and Problem Solving (IREPS 2011)

Figure 2 depicts WebELS Meeting as a virtual collaborative
learning system. The fundamental requirements for e-Meeting
include online presentation, online annotation, video conference
and chat messaging, which are all available in the system. With
these features, users in remote location, i.e., presenter and
meeting participants, share the same virtual room over the
Internet anytime and anywhere. Moreover, WebELS Meeting
system is a web-based application, thus there is no need to
download software for installation. The user computer however
must have Java Runtime Environment (JRE) and Flash Player
installed as an Internet browser plug-in. A web-camera is also
required as well as the headset.
Figure 2: WebELS Meeting as a Virtual Collaborative Learning System
4. SYSTEM FEATURES
The following sub-sections describe the major features of
WebELS Meeting as a virtual collaborative learning system for
higher education.
Figure 3: Content Authoring Tool Interface
Content Authoring
WebELS content authoring tool is an easy-to-use Java-based
content editor shown in Fig. 3. Novice and non-IT users can
create their own presentation content very easily as a series of
slide images converted from various documents, such as
Microsoft Office (*.doc, *.docx. *.ppt, *.pptx, *.rtf),
OpenOffice (*.odt, *.odp, *.ods), PDF, and images (*.jpg, *.png,
*.tif). Video (*.mpg, *.mov, *.avi) can also be embedded on the
content with various template designs. Content presentation title,
content view and edit passwords, and title of each slide can be
inputted in the editor.
To create a WebELS-based content, all necessary documents
will be compressed first as a package, and then the package will
be uploaded to the server system through the Internet. In the
server, the package will be decompressed, and the server-side
program will choose the proper conversion tools (e.g.,
Ghostscript, OpenOffice) for file document to PDF to image
conversion. All different types of documents are converted into
images, except for the embedded video. All newly created
images will be compressed again to a package and sent back to
client. After receiving the package, the client uncompress the
package and display the first image on the presentation panel. A
copy of the content is stored in the server.
Online Presentation
The online presentation panel shown in Fig. 4 is divided into
four sub-panels, namely (1) Content Information and Slide List,
(2) Presentation Display, (3) Viewing Controls, and (4)
Collapsible Annotation Toolbar. Content information and slide
list shows the content title and the slide navigator for quick
slide browsing. Presentation display panel serves as the
graphical screen of the online slide presentation. Viewing
controls contain control buttons for slide changing, scrolling,
panning, zooming, and presentation mode selection buttons.
Annotation Toolbar is hidden by default, but is displayed when
annotation function is activated.
Online presentation features synchronized slide control, i.e.,
every event on presenter’s display panel is replicated on the
listeners’ display panel in almost real-time. These events
include the following:
• shifting slides back and forth using buttons for next,
back, move to first slide, and move to last slide,
• cursor display function as a pointer for helping an easy
presentation (Fig. 5a),
• zooming function, such as zoom-in, zoom-out and fit
window (Fig. 5c),
• scrolling function, such as vertical and horizontal
scrolling,
• slide panning function which is done by mouse clicking
any point on the slide, hold, and dragging the mouse.
Figure 4: Online Presentation Panel
�
�
�
�
�
�
�
�
�
�
�
�
����������
�� �����
��������������������
������������ �������
!����
��������������� ��
�� ���� � �����
��������"����������
����������������
���������#�"�� �
�$��������%��%
��������
����&���������&�����
�"���������������� �"����������������
�����������'�
�$��������%��%
�(����������'
�$��������%��%
�����"�)��"�� ������������%� �����"�)��"�* ������������%�
21
Proceedings of International Conference on Education, Informatics, and Cybernetics (icEIC 2011),
and the International Symposium on Integrating Research, Education, and Problem Solving (IREPS 2011)
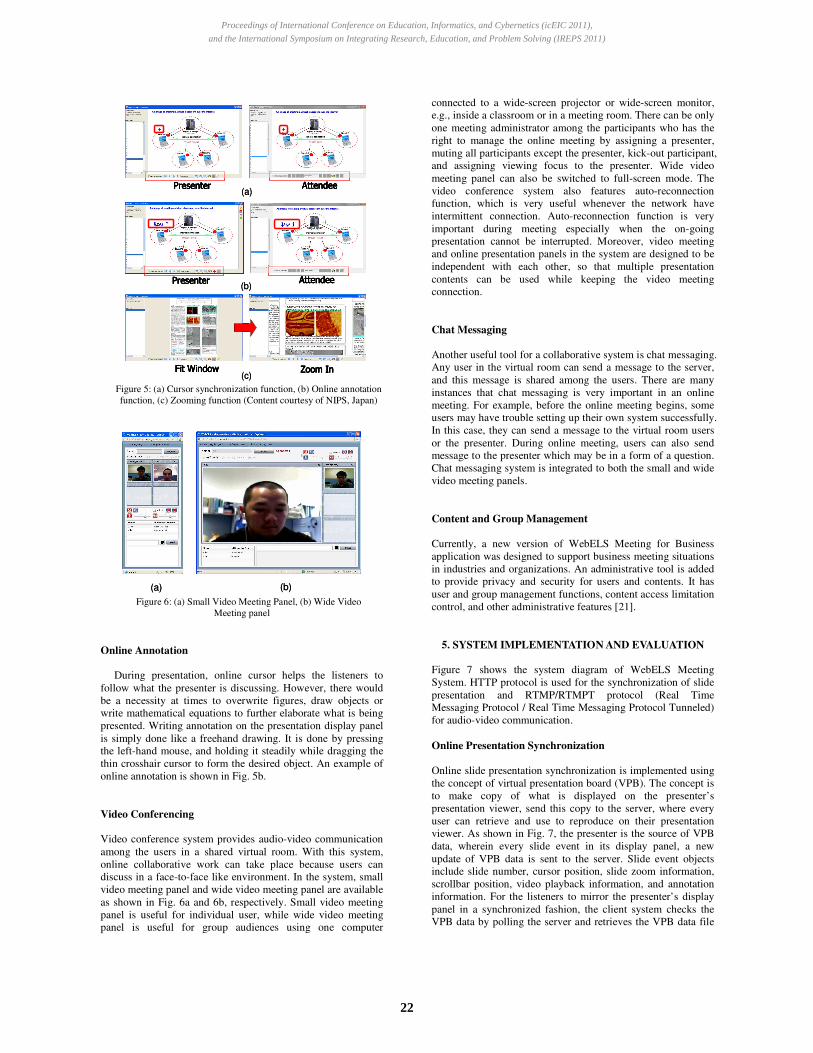
Figure 5: (a) Cursor synchronization function, (b) Online annotation
function, (c) Zooming function (Content courtesy of NIPS, Japan)
Figure 6: (a) Small Video Meeting Panel, (b) Wide Video
Meeting panel
Online Annotation
During presentation, online cursor helps the listeners to
follow what the presenter is discussing. However, there would
be a necessity at times to overwrite figures, draw objects or
write mathematical equations to further elaborate what is being
presented. Writing annotation on the presentation display panel
is simply done like a freehand drawing. It is done by pressing
the left-hand mouse, and holding it steadily while dragging the
thin crosshair cursor to form the desired object. An example of
online annotation is shown in Fig. 5b.
Video Conferencing
Video conference system provides audio-video communication
among the users in a shared virtual room. With this system,
online collaborative work can take place because users can
discuss in a face-to-face like environment. In the system, small
video meeting panel and wide video meeting panel are available
as shown in Fig. 6a and 6b, respectively. Small video meeting
panel is useful for individual user, while wide video meeting
panel is useful for group audiences using one computer
connected to a wide-screen projector or wide-screen monitor,
e.g., inside a classroom or in a meeting room. There can be only
one meeting administrator among the participants who has the
right to manage the online meeting by assigning a presenter,
muting all participants except the presenter, kick-out participant,
and assigning viewing focus to the presenter. Wide video
meeting panel can also be switched to full-screen mode. The
video conference system also features auto-reconnection
function, which is very useful whenever the network have
intermittent connection. Auto-reconnection function is very
important during meeting especially when the on-going
presentation cannot be interrupted. Moreover, video meeting
and online presentation panels in the system are designed to be
independent with each other, so that multiple presentation
contents can be used while keeping the video meeting
connection.
Chat Messaging
Another useful tool for a collaborative system is chat messaging.
Any user in the virtual room can send a message to the server,
and this message is shared among the users. There are many
instances that chat messaging is very important in an online
meeting. For example, before the online meeting begins, some
users may have trouble setting up their own system successfully.
In this case, they can send a message to the virtual room users
or the presenter. During online meeting, users can also send
message to the presenter which may be in a form of a question.
Chat messaging system is integrated to both the small and wide
video meeting panels.
Content and Group Management
Currently, a new version of WebELS Meeting for Business
application was designed to support business meeting situations
in industries and organizations. An administrative tool is added
to provide privacy and security for users and contents. It has
user and group management functions, content access limitation
control, and other administrative features [21].
5. SYSTEM IMPLEMENTATION AND EVALUATION
Figure 7 shows the system diagram of WebELS Meeting
System. HTTP protocol is used for the synchronization of slide
presentation and RTMP/RTMPT protocol (Real Time
Messaging Protocol / Real Time Messaging Protocol Tunneled)
for audio-video communication.
Online Presentation Synchronization
Online slide presentation synchronization is implemented using
the concept of virtual presentation board (VPB). The concept is
to make copy of what is displayed on the presenter’s
presentation viewer, send this copy to the server, where every
user can retrieve and use to reproduce on their presentation
viewer. As shown in Fig. 7, the presenter is the source of VPB
data, wherein every slide event in its display panel, a new
update of VPB data is sent to the server. Slide event objects
include slide number, cursor position, slide zoom information,
scrollbar position, video playback information, and annotation
information. For the listeners to mirror the presenter’s display
panel in a synchronized fashion, the client system checks the
VPB data by polling the server and retrieves the VPB data file
���������������
�������� �������
���������������
(a)
(b)
(c)
���������������
�������� �������
���������������
���������������
�������� �������
���������������
��������������� ���������������
�������� ��������������� �������
��������������� ���������������
(a)
(b)
(c)
(a) (b)(a) (b)
22
Proceedings of International Conference on Education, Informatics, and Cybernetics (icEIC 2011),
and the International Symposium on Integrating Research, Education, and Problem Solving (IREPS 2011)

every one second. It should be noted that the server stores the
presentation panel applet, the presentation content, and the VPB
data. When a client joins a meeting, it starts by automatically
downloading the presentation panel and the content in
compressed format. At the client computer, it is uncompressed
at the temporary folder, and the viewer retrieves the VPB data
from the server, and loads the slide image accordingly. VPB
data structure consists of static and dynamic data structures.
Static data structure is for slide and cursor representation object,
while dynamic data structure is for annotation data.
Figure 7: WebELS Meeting System Diagram
Video conference system
Also shown in Fig. 7, the video conference system uses
RTMP/RTMPT protocol for audio-video communication. In the
system, it uses RTMP as the default protocol. RTMP is a
protocol used for streaming audio, video and data over the
Internet, between a Flash player and a streaming server.
However, the system will switch automatically to RTMP
Tunneled (RTMPT) or HTTP tunneling when the video
communication cannot transverse through firewall due to
security issues of certain network location. RTMPT helps
facilitate the use of RTMP in scenarios where RTMP is not
possible to use, such as when the user is behind a firewall that
blocks non-HTTP outbound traffic. The reason that we don’t
use RTMPT from the beginning of the network connection is
because the speed of communication via RTMPT is slower than
RTMP. Hence, we want to keep the quality of real-time
communication as high as possible.
The communication control between the server and the client is
also managed by the communication manager that implements
the shared object. Shared object in video conference helps
facilitate the basic operations, such as turning on and off of the
camera, microphone, and admin functions, like assigning a
presenter and muting all listeners. Chat messages are also
distributed to meeting participants by means of shared object.
System Evaluation
It should be noted that in cursor-based presentation mode, only
the slide presentation data field of the VPB data structure
contain values, while the annotation data field is empty. When
the presenter uses the pen-based presentation mode, and writes
on the presentation display panel, the annotation data field
increases in size. Nevertheless, this size does not consume much
of the network bandwidth. Table 1 shows the online
presentation data type sizes and image quality. The data shows
that using VPB, the amount of data transmitted between the
server and the client is much smaller than the encoded computer
screen image used in screen sharing. With the slide presentation
data, the VPB data contains a minimum of 34 bytes to a
maximum or 54 bytes. With few annotation data, it may ranges
from 100 bytes to 1000 bytes. With annotations all over the
slide, it may amount to less than 10 Kbytes. In a narrowband
Internet environment, slide synchronization based on VPB can
work well in almost real-time.
With screen sharing technique, suppose an 800×600 true color
screen image has a size of 1.44 Mbytes and 85 fps will produce
more than 100 Mbytes data. Data compression is required in
order to transmit this image in real-time. Sophisticated data
compression algorithms may be able to produce encoded file
size less than 100 Kbytes [22]. With this data size, it is still
required to use broadband Internet for better quality.
Furthermore, the image quality for slide-based synchronization
technology is better than the screen sharing technology for
reasons that the images are located in client’s local computer.
Table 1. Online Presentation Data Sizes and Image Quality
Data Type Size (bytes) Image
Quality
VPB Slide Presentation
Data
34 ~ 54 Clear
VPB Slide Presentation
Data with Few Annotation
100 ~ 1000 Clear
VPB Slide Presentation
Data with Many Annotation
1,000 ~ 10,000 Clear
Encoded Computer Screen
Image for Screen Sharing
< 100,000 Blurry
6. PRACTICAL USAGE AND PERFORMANCE
WebELS Meeting has been used by a number of domestic and
international organizations and universities for distance
exchange lectures and meetings for e-Meeting purposes. Recent
distance lecture was conducted between the National Institute
and Informatics (Japan) and the Tsinghua University (China).
The exchange lecture was successful using the online slide
presentation and the video meeting functions.
Moreover, WebELS Meeting has been used to distribute the
presentation and live video for the 1st Asia-Arab Sustainable
Energy Forum held in Nagoya, Japan [23]. Fig. 8 shows the
system interconnection setup where there were individual and
group remote viewers of the on-going conference.
Because of the multi-location access and no firewall and proxy
setting requirements, WebELS is considered to be an effective
collaboration tool for higher education in international
cooperation between academic institutions and industries.
FLASH STREAMING SERVER
Java ClassesCommunication Manager• Shared Objects
WEB APPLICATION SERVER
Java Classes
WebELS Client (Presenter)
Slide
Online Presentation• Viewer Applet
• Presentation Content• Source VPB Data
Video Conference• Source Shared
Objects
Database
HTTP RTMP, RTMPT
WebELS Meeting System
File & Content Manager• Viewer Applet• Presentation Content• VPB Data
SlideOnline Presentation• Viewer Applet• Presentation Content• Local VPB Data
Video Conference• Local Shared
Objects
Slide
Online Presentation• Viewer Applet
• Presentation Content• Local VPB Data
Video Conference• Local Shared
Objects
RTMP, RTMPTHTTP
WebELS Client WebELS Client
FLASH STREAMING SERVER
Java ClassesCommunication Manager• Shared Objects
WEB APPLICATION SERVER
Java Classes
WebELS Client (Presenter)
Slide
Online Presentation• Viewer Applet
• Presentation Content• Source VPB Data
Video Conference• Source Shared
Objects
Slide
Online Presentation• Viewer Applet
• Presentation Content• Source VPB Data
Video Conference• Source Shared
Objects
Database
HTTPHTTP RTMP, RTMPTRTMP, RTMPT
WebELS Meeting System
File & Content Manager• Viewer Applet• Presentation Content• VPB Data
SlideOnline Presentation• Viewer Applet• Presentation Content• Local VPB Data
Video Conference• Local Shared
Objects
SlideOnline Presentation• Viewer Applet• Presentation Content• Local VPB Data
Video Conference• Local Shared
Objects
Slide
Online Presentation• Viewer Applet
• Presentation Content• Local VPB Data
Video Conference• Local Shared
Objects
Slide
Online Presentation• Viewer Applet
• Presentation Content• Local VPB Data
Video Conference• Local Shared
Objects
RTMP, RTMPTRTMP, RTMPTHTTPHTTP
WebELS Client WebELS Client
23
Proceedings of International Conference on Education, Informatics, and Cybernetics (icEIC 2011),
and the International Symposium on Integrating Research, Education, and Problem Solving (IREPS 2011)

Figure 8. e-Meeting System Interconnection Diagram
7. CONCLUSION
This paper presented the overview of WebELS Meeting System
as an e-Meeting solution for higher education in science and
engineering. The system combines the online slide presentation
and the video conferencing function that creates a so-called
virtual room, where meeting participants convene via the
Internet. The online slide presentation implements the VPB
concept wherein synchronization of slide presentation is
achieved. Synchronization in our context refers to real-time
mirroring of slide presentation between the presenter and
listeners. With VPB concept, online presentation can work well
with clear image display in narrowband Internet environment as
compared to screen sharing technique because VPB data is
considerably minimal. Moreover, the video conferencing
system provides face-to-face environment between the presenter
and listeners. Since the video meeting system is available in
small and wide panel, various e-Meeting setup can be made,
e.g., individual or group meeting. Finally, the usefulness and
performance of the system have been proven by practical usage
in various domestic and international organizations and
universities.
8. ACKNOWLEDGMENT
The authors would like to express sincere thanks to all persons
who supported the WebELS project of NII Japan, especially to
Dr. Vuthichai Ampornarambeth for contributions in designing
and implementing the WebELS system in the initial stage. The
project is funded by Science Research Foundation of Japan, The
Telecommunications Advancement Foundation, Amada
Foundation for Metal Work Technology, Japan Science and
Technology (JST) and The Graduate University of Advanced
Study (SOKENDAI). We express sincere thanks to Ohmsha for
a collaborative development, and to the e-Learning Project of
UNESCO Jakarta Office and the Sahara Solar Breeder (SSB)
Project for collaborations using WebELS.
9. REFERENCES
[1] H. Ueno, “Internet-Based Distance Learning for Lifelong
Engineering Education - A Personal View and Issues”,
Journal of Information and Systems in Education,
Vol.1, No.1, 2002, pp. 45-52.
[2] K. Blinco, J. Mason, N. McLean, and S. Wilson, “Trends
and Issues in E-Learning Infrastructure Development”,
DEST (Australia) and JISC-CETIS (UK), 2004.
[3] V. Ampornarambeth, T. Zhang, A. Hadiana, N.
Shimamoto, and H. Ueno, “A Web-Based e-Learning
Platform for Postgraduate Education”, Proceedings of the
Fifth IASTED International Conference on Web-Based
Education, 2006, pp.388-393.
[4] H. Ueno, “Role of e-Learning in Engineering Education -
Background and Outline of WebELS”, Proceedings of the
International Workshop on Engineering Education,
2008.
[5] H. Ueno, Z. He, and J. Yue, “WebELS: A Content-
Centered E-Learning Platform for Postgraduate Education
in Engineering”, Human-Computer Interaction, Part
IV, Lecture Notes in Computer Science, Volume 5613,
2009, pp. 246-255.
[6] A.J. Berena, P. Sriprasertsuk, Z. He, and H. Ueno, “An
Open Source Integrated e-Learning/e-Communication
Platform for Postgraduate Education and Corporate Cyber
Meeting”, IEICE Technical Report, ET 109(193), 2009,
pp.33-37.
[7] Moodle, http://moodle.org. (last retrieved September
2011)
[8] Joomla LMS, http://www.joomlalms.com (last retrieved
September 2011)
[9] WebELS Main Server, http://webels.ex.nii.ac.jp/
[10] A.J. Berena, Z. He, P. Sriprasertsuk, S. Chunwijitra, E.
Okano, and H. Ueno, “Shared Virtual Presentation Board
for e-Communication on the WebELS Platform”,
Proceedings of the APSCE 18th International
Conference on Computers in Education, Putrajaya,
Malaysia, 2010, pp. 280-284.
[11] GoToMeeting, http://www.gotomeeting.com (last
retrieved September 2011)
[12] RealVNC, http://www.realvnc.com (last retrieved
September 2011)
[13] Skype, http://skype.org (last retrieved September 2011)
[14] WebEx, http://webex.com (last retrieved September 2011)
[15] Virtual Network Computing (VNC),
http://en.wikipedia.org/wiki/Virtual_Network_Computing
(last retrieved September 2011)
[16] Google Docs, http://docs.google.com (last retrieved
September 2011)
[17] Sliderocket, http://sliderocket.com (last retrieved
September 2011)
[18] AuthorStream, http://www.authorstream.com (last
retrieved September 2011)
[19] 280Slides, http://280slides.com (last retrieved September
2011)
[20] He, Z., Yue, J., Ueno, H., “WebELS: A Multimedia E-
Learning Platform for Non-broadband Users”, Proceedings
of the International Conference on Computer
Engineering and Technology 2009, Vol. 1, pp.177-181.
[21] S. Chunwijitra, A.J. Berena, H. Okada, H. Ueno, “Design
of Suitable Meeting Management Model for WebELS
Meeting to Meet the Business Situations”, The First
International Conference on Advanced Collaborative Networks, Systems and Applications, Luxembourg, June
2011, pp. 62-67.
[22] Lin, T., Hao, P., “Compound Image Compression for Real-
Time Computer Screen Image Transmission”, IEEE
Transactions on Image Processing, Vol. 14, No. 8,
August 2005, pp. 993-1005.
[23] Sahara Solar Breeder Foundation, http://www.ssb-
foundation.com (last retrieved September 2011)
%�����#�&� �
��������������� ��
� �������
������������� �����
��������������������������
������������' ���������
%�����#�&� �
��������������� ��
� �������
������������� �����
��������������������������
������������' ���������
24
Proceedings of International Conference on Education, Informatics, and Cybernetics (icEIC 2011),
and the International Symposium on Integrating Research, Education, and Problem Solving (IREPS 2011)

Digital Storytelling: The Arts and Preservice Teachers
Vito M. Dipinto Associate Professor, Curriculum and Instruction/Science Education, National Louis University
1000 Capitol Drive, Wheeling, IL 60090 USA
and
Kaki Dipinto Adjunct Faculty, National Louis University
1000 Capitol Drive, Wheeling, IL 60090 USA
and
Jennifer Rios MAT student, National Louis University
1743 W. Addison St., Chicago, IL 60613 USA
ABSTRACT
In this presentation, the authors describe a journey of teachers in a graduate Fine Arts Methods course. The journey began with conversations about what art is and the nature of collections in exploring this question. Elements of visual liter-acy, storytelling and music were investigated. The final product was a Digital Story incorporating all of these elements into a teaching artifact that integrated the Arts into other content areas for K-8 students.
Keywords: visual literacy; digital storytelling; fine arts.
INTRODUCTION
Digital storytelling is not new [1] but how does a preservice teacher educator introduce this 21st century skill along with some kind of content to graduate students in an MAT program? We will describe the journey of students taking a Fine Arts Methods Course.
LITERATURE REVIEW
Joe Lambert [2], the executive director of the Center for Digital Storytelling, counters arguments that visual media have been a factor in the decline of written literacy and comprehension. One of the goals of the Center is to bring people back into the language of the written word. Digital storytelling has been criticized because traditional stories of indigenous peoples may become lost in translation by the use of graphic effects and outside perspectives [3]. Kunuk, an Inuit filmmaker, declares that, rather than threatening storytelling traditions, digital storytelling enriches the oral tradition of indigenous people since they are doing what they have always done: making things their own. Experience design focuses on creating memorable experiences as a foundation of any educational endeavor. McLellan [4] uses the experience design model to integrate technology into the classroom. Inherent in her model is the need for educators to
shift their thinking from notions of delivering instruction to one of staging an educational experience. Dramatic storytelling itself is designed to induce naturally specific actions essential to the experience design process. Storytelling is interactive, including and entertaining a specific audience, and providing closure both emotionally and cognitively. In conjunction with technology, storytelling is not an end unto itself; it is an all-encompassing approach to deliberate design through expe-rience. Chung [5] explores the impact on teachers of designing digital stories for teaching art. Chung’s students use a traditional approach to design electronic stories. Students examine and critique intact stories, develop a story that focused on art, research information, write a script, storyboard the digital story, and produce it. In this model, students perform multiple tasks as researchers, playwrights, designers, media producers, and educators; this enables them to implement the methodology in their own classrooms. However, this is a linear product-based approach. In contrast, the work described herein takes a nonlinear, aesthetically more abstract approach that engages the imagination. The final digital story, although important, is not the goal of the project. Nor is the essential objective doing digital storytelling with K-8 students. Maxine Greene [6] declares that if we can enable more young persons to make sense of what they see and hear and to attend to works [of art] in their particularity, they may begin to experience art as a way of understanding a way of knowing. She observes that the experience and knowledge gained by this way of knowing opens new modalities for us in the lived world; it brings us in touch with our primordial landscape, our original act of perceiving. Greene challenges us to enable young people to realize that they have the right to find works of art meaningful against their own lived lives. To do this teachers must experience this first themselves. Digital Storytelling: The Arts and Preservice Teachers is a beginning.
25
Proceedings of International Conference on Education, Informatics, and Cybernetics (icEIC 2011),
and the International Symposium on Integrating Research, Education, and Problem Solving (IREPS 2011)

INTER-DISCIPLINARY ANALOGY
This required course attempts, in five sessions, to provide both content and pedagogy for preservice teachers to learn how to integrate the arts into other content areas. This would be a daunting task over a semester or even a year; however, we believe we have established a good foundation from which these future teachers can grow. The presentation will include examples of students’ digital stories along with excerpts from their reflections upon this experience. The question becomes: how to begin?
I have always found monochromatic art interesting and I wanted to focus my project on telling a story-one color at a time. I think that students typically see art that is full of color. I thought focusing in on each color would help students see a new perspective and art that they may have never seen before. I would start with a picture that has multiple colors (maybe even a rain-bow) and then go through red, yellow, blue, etc. I wanted to use a combination of professional pho-tography and well-known paintings. Is this a good beginning? Jennifer
EXPRESSIONAL METAPHOR
A Collection The first element in good digital storytelling is developing the concept of a collection. All artists are collectors. Keri Smith [7] gives us a practical way to become artistic collectors and the methods to do it. The students began their collections that then became the themes for their digital stories.
I had been intrigued by his artwork. Besides his char-acteristic large-scale heavy pieces of sculptures that grace the open public spaces in many cities around the world, Alexander Calder also is renowned for the magical moving sculptures hanging in delicate balance in many art museums and buildings. Carol
Vito Dipinto is an artist: actually a performance artist. His long-est running performance piece is something he calls teaching. He is also a collector. The students explored how they could use his collections to help their future students to answer the questions:
What is art? What should students know about the arts? And why should they care?
This is the type of assignment that taught me a lot about art and how it is used in every aspect of life. From the perspective of a teacher, it would help me to learn what is important to my students and where their creative minds lead them. Franny
ANALOGICAL INFERENCE
Visual Literacy Knowledge of visual literacy is the second element in good digital storytelling. Just as we need to teach our students how to read and understand what they are reading, we need to teach them to how to read, understand, and use visual images. The Black Square Problem [8] introduced students to concepts in visual literacy and design. The Magic Square Activity [9]
provided a practical template for designing a story in discrete pieces.
I used a lot of Dali and Munch, some Matisse and Cezanne. The two hardest stanzas were “Shape without form, shade without colour/Paralysed force, gesture without motion.” Shape without form and shade without color? No picture is going to capture that. That is almost the antithesis of a visual image. I knew I needed abstract art for that one. The final stanza was tricky, because that’s the big punch of the poem. While I used very powerful images throughout, I knew that to stay with the meaning of the poem, I needed something simple, almost elegant. Rose
COMMUNICATIONAL ANALOGIES
The Story Of course, the story itself is critical in digital storytelling. Vito Dipinto is a professional storyteller among other things. Story-tellers collect stories. He has a collection of objects that are story starters. These form a cognitive template for storytelling.
For the digital story, I thought about what I think what makes a good story and I came up with a beginning, middle and an end. But then I thought, well, what about the seasons and nature? They have beginnings, middles, and ends, but then they repeat! And I liked the repetition because Mother Nature never truly repeats, each season our weather is different. Martina
Music Students also need to understand the importance of a musical background for good storytelling. Vito and Kaki Dipinto have used music in variety ways in teaching students. Each student selected one piece of music that their students might not have on their iPods. They presented the history of this musical piece, some interesting information about the artist, and some personal account of the impact of this music on their lives.
I let the music tell a story to me, the music sounded to me like the ocean. That got me thinking about all the various paintings of ocean scenes and I wondered if I could find a painting of all five oceans, it became a little challenge I gave myself. Justin
DESIGN PROPOSAL
Each student was required to visit the Center for Digital Story-telling [10]. Then they designed and produced a digital story in class. What they produce is not a virtual field trip. Students are telling stories with a collection of still images.
As a learner this assignment taught me to think outside of the box--to explore my creative side and interests in art. I wanted to find and use artwork that meant some-thing to me, that was more than just a painting on the wall. Krista
The students could choose to introduce some of world’s famous art museums, or choose an artist and provide a collection of his/her work displayed around the world, or look at indigenous peoples’ art, or some other creative theme. However, they needed to select at least 15 images and note the URL for each
26
Proceedings of International Conference on Education, Informatics, and Cybernetics (icEIC 2011),
and the International Symposium on Integrating Research, Education, and Problem Solving (IREPS 2011)

image. In addition, they needed a piece of music 2.5-3.5 minutes long. Using iMovie, each student produced a final product in less than two hours [11].
This assignment has impacted me as a learner because it helped to awaken my creative side and allowed me to view and use things in a way that I would have not normally been able to. While doing the assignment, I started thinking of other ways that I can use such an idea in the classroom to help students like myself begin to think more creatively. The thinking process of new ideas has allowed me to grow as a teacher. I now will feel more comfortable trying new things in the classroom. Narissa
CONCLUSION Most of the students had no previous experience in visual liter-acy or in using any kind of software to produce a digital story. The students incorporated the ideas of visual literacy and story-telling from the course to design a learning tool for K-8 students.
While doing this assignment I thought a lot about all the different forms of art there are, and how art is con-stantly changing and evolving to match the times. But while it evolves and changes, the things that came before are still done. The assignment helped cement the idea that there isn’t a wrong way to do something, only a different way. I have tried to live by that motto for a long time but it’s refreshing to have it enforced like this. But it also reminded me that even though I consider myself an artist I only use a few mediums and there are many more out there for me to explore. J.J.
REFERENCES [1] M. Rossier. & P. Garcia,” Digital Storytelling: A New
Player on the Narrative Field.” New Directions in Adult and Continuing Education, No. 126, Summer, 2010, 37-48.
[2] J. Lambert, “Digital Storytelling.” The Futurist, Vol.2,
2007, 25. [3] C. Hopkins, “Making Things Our Own: The Indigenous
Aesthetic in Digital Storytelling” Leonardo, Vol. 39, No. 4, 2006, 341-344.
[4] H. McLellan, “Experience Design.” Cyber Psychology &
Behavior, Vol. 3, No. 1, 2000, 59-69. [5] S. Chung, “Art Education Technology: Digital Storytelling.”
Art Education, 2007, 17-22. [6] M. Greene, Releasing the Imagination, NY: Jossey-Bass,
2000. [7] K. Smith, How to Be an Explorer of the World, NY:
Penguin Books, 2008. [8] J. Wilde & R. Wilde, Visual Literacy: A Conceptual
Approach to Graphic Problem Solving, NY: Watson-Guptill Publications, 1991.
[9] B. Edward, The New Drawing From the Right Side of the
Brain, NY: Penguin Books, 1999. [10] Center for Digital Storytelling. www.storycenter.org!
[11] V. Dipinto, K. Dipinto, & J. Rios, “Digital Fine Arts
Stories”, 2011 http://web.me.com/kaki.dipinto/Digital_Stories/
!
27
Proceedings of International Conference on Education, Informatics, and Cybernetics (icEIC 2011),
and the International Symposium on Integrating Research, Education, and Problem Solving (IREPS 2011)

Digital Technologies, New Literacies and 21st Century Skills
Roberta F. HAMMETT Faculty of Education, Memorial University of Newfoundland St. John’s, Newfoundland and Labrador, A1A0K9, Canada
ABSTRACT
The research described in this paper was conducted in action research collaboration between a university and local school district. The questions explored by teachers and university researcher (the author) include: What is the impact of the information and communication technologies on teaching and learning in classrooms? Do the educational trends and pedagogical mandates of new literacies and 21st century skills complement one another or do they increase teacher stress by pulling pedagogy in different directions? Data demonstrate the productive relationship among information and communication technologies (ICTs), new literacies, and 21st century skills.
Keywords: 21st century learning, ICT, technology infusion, new literacies, K-12 education, teacher research, classroom inquiry
INTRODUCTION
In K-to-12 schools, teachers are being challenged to change their pedagogical practice to accommodate three trends: the increasing availability and popularity of information and communication technologies (ICTs), expanded and changing notions of literacy, and the advocacy of 21st century skills and learning. These changing pedagogical practices raise research questions: What is the impact of the information and communication technologies on teaching and learning in their classrooms? Do these various education trends and pedagogical mandates complement one another or do they increase teacher stress by pulling pedagogy in different directions? I intend to draw on my recent research with teachers to explore these questions.
THE PEDAGOGICAL CONTEXT: NEW LITERACIES New literacies are conceptualized within a sociocultural perspective which accentuates literacies as contextualized practices [1]. Official curriculum has increasingly emphasized authentic literacy practices within real world contexts and experiences [See, for example, 2]. Current literacy curriculum in Newfoundland and Labrador has expanded to include viewing, representing, speaking and listening with traditionally emphasized literacies of reading and writing. These strands of literacy are intertwined, so that students interact with and produce texts that are often multimodal. As well, a critical lens is highlighted in current curriculum.
Lankshear and Knobel [3] describe literacies as “socially recognized ways of generating, communicating and negotiating meaningful content through the medium of encoded texts within contexts of participation in discourse” (p. 64). They add that new literacies are characterized by new technologies and new ethos – participatory, collaborative, and distributed. This latter concept – new ethos – is particularly important in Web 2.0, where communities of users contribute to and create texts and sites, and where mash-ups, remix, re-creation and collaborative writing are facilitated by available onsite technologies. Lankshear and Knobel [4] also emphasize that new literacies involve “using language (reading, writing, speaking, listening),
gestures and other semiotics (images, sounds, graphics, signs, codes) to communicate” (p. 3). Thus multimodality is another aspect of new literacies. Composing with sound, image, text and gesture is facilitated in Web 2.0 though application programming interfaces (APIs) and multimedia production tools.
Teachers who often worked within an autonomous model of literacy, whereby literacy was viewed as individual, de-contextualized skills [1], have found that digital technologies and Web 2.0 resources have facilitated a change to a sociocultural model in which social, cultural and historical contexts of literacy are acknowledged.
Leu et. al. [5] offer the following description of new literacies:
“The new literacies of the Internet and other ICTs include the skills, strategies, and dispositions necessary to successfully use and adapt to the rapidly changing information and communication technologies and contexts that continuously emerge in our world and influence all areas of our personal and professional lives. These new literacies allow us to use the Internet and other ICTs to identify important questions, locate information, critically evaluate the usefulness of that information, synthesize information to answer those questions, and then communicate the answers to others.” (¶8)
In the view of Leu et al., new literacies are digital literacies, dependent on Internet and other ICTs, but their use is contextualized within social practices and personal, professional and political contexts. Teachers go beyond information literacy (locating and evaluating information) to participation in communities, both local and global, and working toward, according to Evans [6] “[u]nderstanding ... technology as something that embodies a complex set of actions, behaviors, discourses, assumptions and ideologies....” (p. 5)
Web 2.0 provides a wealth of digital tools and resources that can either be downloaded or used online. Many of the available resources are ideal for student and school use, and are, in fact, set up with classrooms in mind. Three such Web 2.0 resources used by teachers in this are Kidblog, Ning, and Glogster. Kidblog offers K-12 teachers class sets of blogs so that students may blog and respond to one another within a collaborative space that may or may not be open to a wider audience. Ning, once free but now available for a small yearly fee, allows teachers to set up a social network for class interaction. Each student has a member page, a blog, and potential for threaded asynchronous discussion and synchronous chat, as well as possibilities for sharing images and other texts. Glogster, also once free, offers classroom accounts to teachers so that students may create and display electronic posters. The posters, which are displayed on the Glogster site, may include images, linguistic text, audio and video files, and decorative art. Teachers can determine the level of privacy for the site. These are three of a myriad of sites where users can create and display comics, animations, podcasts, presentations (e.g., Prezi), stories, and photo essays. In addition, teachers may download digital
28
Proceedings of International Conference on Education, Informatics, and Cybernetics (icEIC 2011),
and the International Symposium on Integrating Research, Education, and Problem Solving (IREPS 2011)

tools to record and edit audio, create digital movies (digital storytelling), screen capture, and create and edit images and photos. Teachers in the study are exploring the potential of these tools, as well as some of the collaborative sites that encourage communication with schools globally.
21st CENTURY SKILLS
Beginning with Metiri Group and Partnership for 21st Century Skills and spreading to and through many other educational organizations, 21st century skills emphasize the knowledge, attitudes and abilities students need for current and future success in globalized landscapes and economies. These skills include digital-age literacies, effective communication, inventive thinking, and high productivity [7]. Similarly, Partnership for 21st Century Skills [8] envision a comprehensive program of [traditional] core subjects; 21st century content, like global awareness, entrepreneurial literacy, civic knowledge, and health and wellness awareness; and learning and thinking skills that include critical-thinking and problem-solving skills, communication skills, creativity and innovation skills, collaboration skills, contextual learning skills, and information and media literacy skills; ICT literacy; life skills such as personal productivity and social responsibility, and 21st century assessments. These concepts of 21st century learning have been included in all recent professional development sessions in local schools and districts in Newfoundland and Labrador.
Much of the current published literature on 21st century skills falls into the advocacy realm [9]; descriptions of programs [10]; discussion of assessment challenges [11]; implications for teacher education [12]; links with gaming [13]; critiques of the concept and programs [14]; and exploration of applications to a variety of fields, like nursing [15] and higher education [16]. There is a dearth of concrete evidence of successful learning related to 21st century skills and new literacies (as opposed to advocacy literature). This research attempts to provide research-based evidence of enhanced learning.
RESEARCH CONTEXT
This action research partnership is being carried out within a school-university collaboration in which teachers receive technological (limited) and research support as they investigate their practice and explore ways to enhance their pedagogy with digital technologies and implement new literacies.1
Such classroom inquiry or teacher-as-researcher practice is well supported in research literature [See, for example, 18, 19, and 20]. Stenhouse [21] claimed: “the refinement of professional skills is generally achieved by the gradual elimination of failings through systematic study of one's own teaching” (p. 39). At the
As a professor of education and a researcher, the author offers professional development to teachers in the form of workshops and one-on-one support to facilitate integration of new technologies. Teachers, as pedagogical and curriculum experts, plan activities and learning opportunities to engage all students in inclusive classrooms. As reflective practitioners, they employ classroom inquiry to construct their “knowledge of practice” [17] as they integrate ICTs to accomplish their classroom learning outcomes along with their own professional development goals. They pose their own research questions and collect data to explore them in on-going iterative cycles.
1 This study is supported by the Social Sciences and Humanities Research Council of Canada, in the form of an Image, Text, Sound and Technology Program Grant (849-2009-0031). The author gratefully acknowledges this support.
core of practitioner research is an action-knowledge interaction – a reflective, cyclical process that enhances understanding of the teaching-learning process and other educational activities, by acting, observing, and constructing knowledge in situ. Classroom inquiry is systematic research, with data gathering, analysis and interpretation as part of the process [20].
In the study described here, both teachers and university researcher are collecting data, with teachers in ten K-12 classrooms writing reports of their research and sharing knowledge with one another and colleagues in general. The author’s data collection is primarily in the form interviews with teachers, the teacher-as-researcher reports, and archived student texts, such as blogs, social networking site postings and digital movies. These data, compiled with and from teachers, were analyzed for common themes and insights [20]. At this point, analysis has been preliminary and exploratory. Additional data analysis by multiple researchers is contemplated to establish inter-rater reliability. Often this is accomplished through research meetings with groups of teachers who share their own data for peer input as well as develop common themes between data sets.
FINDINGS The research question explored in the research related to the impact of digital technologies on teaching and learning. As data analysis progresses, it became apparent to teachers and researchers that data categories related to new literacies and 21st century skills. This paper contends that these work together in productive synergy, as do collaborations between universities and schools and between teacher-researchers and university-based researchers in supportive roles. Using the frame of 21st century skills this paper will describe and quote illustrative details of these themes from students’ multimodal texts, posted on blogs, nings, and other Web 2.0 sites, and from teachers’ reflective reports and interviews. The model of 21st century skills released by NCREL/Metiri Group [22] will serve as the organizing structure; its major categories are Digital-Age Literacy, Inventive Thinking, Effective Communication, and High Productivity. This model, like others, ties these skill categories to content area learning. Digital-Age Literacy
For teachers and their students, technological or digital literacy is an important outcome. Teacher researchers in this project began with some trepidation about their technological abilities. Vera described it this way: “One of the challenges I faced with the blogging was the time I had to invest in learning how to actually set up the blog as well as figuring out how to make postings and embed pictures and videos.”
Edna also commented that she was unsure about her technological skills, but she was ready to learn from and with her students: “I didn’t know what I had in store, [but] I was ready to jump into the deep end thinking they’ll help me along with whatever.” However, she learned that the students were not experts in all aspects of computer use, so her classes became sites of reciprocal learning:
“And I did learn a lot from them, but what I also learned in my surprise was that when it came to using Word, the very simplest of things, they didn’t understand what the squiggly lines were about, they didn’t know how to check for a spelling mistake or fix a grammatical error, they didn’t know how to find the thesaurus online to look up words, right in the Word document. They didn’t know how to do referencing or footnoting, so this was all stuff that came out
29
Proceedings of International Conference on Education, Informatics, and Cybernetics (icEIC 2011),
and the International Symposium on Integrating Research, Education, and Problem Solving (IREPS 2011)

as I was doing projects with them through the year, and they showed me some other things like how to work the WordArt and inserting different things that I wasn’t clear on.”
Students (9th graders, in this case) also commented on their technological experiences. Students, who were required to make a digital movie, selected the software that best fit their purposes. In most cases, they were unfamiliar with the programs and learned how to use them as they created their projects. Often, persistence and troubleshooting were required, but these led to learning and sense of accomplishment. Sample comments are:
“We found photostory easy to use after we learned how to work it.”
“We have experimented with all the programs and we have made a decision that windows movie maker is the easier, faster and more efficient format.”
Digital-age literacies also include visual and media literacies. In commenting about her grade one students experience making a video about patterning, Vera explains:
“Being able to construct new media teaches literacy and job skills that are highly valued in a digital society. Constructing media also plays an important role in the development of media literacy. If students are able to construct their own media, then they will be able to recognize and evaluate more effectively the techniques that the media uses to persuade them into buying things and know how they can take control of this in their own lives.”
Laura, in her interview, catalogued many of the skills her students had acquired: “how to copy and paste, how to save in different programs, how to upload and download, change font, how to add dialogue to pictures – how movies are actually made.” She added, “It was a brand new experience – really exciting to them.”
The author acknowledges that there are additional competencies under the rubric of Digital-Age Literacy. Although there is no data to support their inclusion here, teachers in the local school district are turning their attention to such learnings as multicultural literacy, global awareness, and scientific literacy. A science teacher has just joined the team of teacher-researchers.
Inventive Thinking
The enGauge model of 21st century thinking skills includes such skills as: Adaptability, Managing Complexity, and Self-Direction; Curiosity, Creativity and Risk taking; and Higher-Order Thinking and Sound Reasoning. A priority in our school district is critical thinking, both in the sense of higher order thinking and sound reasoning and critical literacy, whereby issues of power, equity and social justice are recognized and critiqued in texts. All of these skills were considered by teachers and researcher to be evident in the research data analyzed in this project.
Connections among creativity, collaboration, and learning have been argued within a variety of contexts. Both Web 2.0 and 21st century classrooms provide spaces for social discourse, collaboration, interactivity and intertextuality – and for creativity in the context of new literacies. The 9th graders the author observed made these connections themselves; they recognized that their collaborative digital compositions - mashups and remixes of others’ creative works from a wide
variety of contexts – are creative in that they generated new knowledge about the play in the social milieux of Web 2.0 resources and the classroom. For example, the group Jangly Janitors created a Photo Story comprised of black and white photos found on various Internet sites, a song soundtrack, and screens displaying quotations form Romeo and Juliet. Their classmates commented:
“This is great, the black and white show more emotion i think, like between good and dark, my personal take but great project, …very emotional and music’s just epic.”
“Wow, this is a great project. The black and white makes it so intense and epic. I love how deep all your pictures are, you definitely read into Romeo and Juliet in ways I never would've thought of!”
“I'm really impressed by the black and white photography project, it’s really intelligent the way they thought about the tones of the play and other expressions of the play (i.e. movies, old and new). I really like this project because i get to see how other people think and learn more about my thinking. Representing Romeo and Juliet in other forms is hard, but creative and fun. Even though reading the play was fun in itself, being able to play and manipulate it using technology that we know best really helped me understand the play more.”
The comments of the fellow students indicate their recognition that the digital movie conveyed the emotion of the play in unexpected and innovative ways and that Jangly Janitors “read into” the play through different perspectives and with divergent thinking.
Grade 7 students using Kidblog to post their original poems received peer feedback on their poems. For example, one student wrote to her classmate: “This poem is very heart felt it talks about life and death and it’s very truthful it makes me think about how we should cherish the people in our lives and enjoy every second together. I really liked this poem!” Such feedback shows not only interpersonal skills, but also demonstrates peer assessment. Teachers are keen to encourage peer and self assessment, to help students develop their own criteria for evaluating multimodal texts and acquire a language of critique that is supportive and effective.
Edna commented on the process of developing these skills with grade 9 students constructing digital movies in groups of two or three about a novel they had studied as a class:
“Also for the most part we learned, and I learned at that point, that if they watched the videos as a class while they were in the process of finishing them, before they did the end product, then they could get some really useful critiques of each others’ work: ‘that was too dark;’ ‘I don’t think that music matches;’ ‘I don’t think it shows what you’re trying to portray; why don’t you put this in a paint program and put the words there for that and make that a slide so that the picture is separate.’”
In her digital movie account of her research, Lenora described how her 5th-grade students composed digital multimodal responses to the novels they studied in literature circles. They used pictures and narratives to create a movie about the novel – a task that Lenora describes as risk-taking for both herself and her students. She concludes, “Sometimes taking a risk can be very rewarding for both me and my students.”
30
Proceedings of International Conference on Education, Informatics, and Cybernetics (icEIC 2011),
and the International Symposium on Integrating Research, Education, and Problem Solving (IREPS 2011)

Teachers are becoming more mindful of thinking skills and the various forms that may take in the classroom as they observe students and read students blogs and other posts about their composing processes and responses to classmates’ compositions. Students, too, can be encouraged to be metacognitive - to think about their own thinking processes.
Effective Communication
Teachers in the study, mostly English Language Arts teachers, noted that ICTs increased the quantity and quality of their students’ writing, and the enthusiasm with which they approached it.
Vera studied blogging in two studies: in her grade one classroom and while home-schooling her son during a temporary family resettlement to Singapore. In observing her son’s progress, she noted:
“My son was always a reluctant writer, but because he had the freedom to write what he wanted on his blog coupled with the fact that his work was more made public and accessible through the blog, he became much more motivated to write. Through blogging the quality of his writing also improved. He knew from the comments that he received that others were reading it and because of this the pressure to produce high quality work increased. Contrary to what many people think, students need to be able to write more effectively than ever in today’s digital age. They need to think and write clearly and precisely if they are to be effective contributors of the web. Blog writing helps with prioritization, conciseness and clarity.”
Vera also notes,
“Last fall in my grade one class, we decided to create our own blog page. Having explored several grade one blogs on the internet, the students were very excited about starting their own. The students began blogging by making a comment on their own photograph, as well as a classmate’s photo. Because I set up the blog to allow for ‘real-time’ participation and feedback, students were motivated to make additional responses as their ideas were still fresh in their heads.”
One of the sub-skills noted in Effective Communication is interactive communication and another is interpersonal skills. Most teachers in the study noted that ‘conversations’ among classmates increased greatly, with collaboration turning to other school tasks as well. Jane explained about the rules for the Ning she created:
“I told them what is was about and described it in relation to Facebook, except I told them that it would be academically related only. They did socialize about their academics, which was very refreshing and they took it upon themselves not just during computer lab time here at school but at home on their own time as well. Many times at night I would go in and see that if there were things that I needed to give approval for, and I could see that they are [writing] back and forth even for other courses, or they had a test or something about notes. It was strictly academically related, socially and academically.”
Vera also says,
“It is interesting to note, that the students were conversing with each other outside of school time. Blogging is a wonderful way to help bridge the gap between home and
school experiences. Blogging can also be very beneficial for those students whom are very shy or intimidated to speak in a classroom setting. This is a space where students can freely express themselves and get feedback from their peers.”
Vera adds,
“Blogging is also an excellent tool to help parents become involved in their children’s schooling. Parents can participate in the blogs by making comments to postings or simply being the viewer of a blog. In either case, the information on the blog brings with it an awareness of the learning that is occurring in the classroom and through students’ responses, parents can see the various levels of progress.”
Laura noted that her grade 5 students continued writing blogs after the year ended and told their next grade teacher about their blogs, encouraging her to continue blogging in her class.
As MOO, a 9th grader, concluded,
“Blogging lets you get your ideas out there, and lets you share what you know. Blogging also helps you make new connections with other bloggers, and through comments and new posts, you can create a virtual world of innovative thinking.”
High Productivity
Working individually and in groups on digital projects demands a commitment on the part of student composers to prioritize, plan and manage for results, to make effective use of real-world tools, and to produce relevant high-quality products [20]. Teachers all commented on the engagement of their students in the task. Edna noted:
“I had a group of grade eight and most of the class has difficulty in English, and even engaging them is difficult. So I asked them to do a PhotoStory for me on a novel that we had done together and they were to work in pairs or groups of three, and what I enjoyed watching was the engagement. They were automatically into the task, now admittedly the first thing they wanted to do was pick out the music. But at least it got them talking, and they were searching together, and they were sort of constructing ideas through their conversations so it was really good social process. Then as they watched each other, the people next to them working and they’d hear me going on and then it sort of made them want to do better than the other group.”
Grade 9 students using a Ning to plan, comment on, and display multimodal projects on Romeo and Juliet commented:
“After our experience with the project, we are finally accustomed with the ning and have truly realized how useful it really was. It was a great idea to use a specific website for this project. The ning was a fantastic way to organize your ideas and learn from fellow students, either from their comments, opinions, questions or ideas.”
Emma shared these observations about her use of a Ning for novel study (Lois Lowry’s The Giver):
“On average grades improved 14-16% over other novel assignments submitted throughout the year; students demonstrated a greater understanding of the novel that they had demonstrated with any other work this year.
31
Proceedings of International Conference on Education, Informatics, and Cybernetics (icEIC 2011),
and the International Symposium on Integrating Research, Education, and Problem Solving (IREPS 2011)

Assignment motivation among Ning participants was awesome, and class and hallway discussion of Ning experiences was prolific.”
As the teachers observed, using digital technologies engages students and motivates them to complete projects, produce their best work, and strive to interest and provide pleasure for their classmates.
Content Area Learning
Models of 21st century skills like Partnership for 21st Century Skills [8] and Metiri Group [20] emphasize that the skills are employed in learning the authorized curriculum and promoting academic achievement. Infusion of ICTs and digital technologies has that same goal. In their research, teachers observed not just the acquisition of technological literacies and demonstration of skills, but also learning of content.
Vera’s grade one class also the students created a video about patterning, which they posted on the blog. The students were very excited to show their video to other classes as well as friends and relatives at home. Vera argues, “Through the making of the video and the repeated viewings of the final production, the students gained a much stronger understanding of the concept of patterning and it became more meaningful to them.”
Edna explained than her students, through their ning activities of blogging and threaded discussions were preparing for the criterion reference tests (CRTs) administered by the Province at the end of grade 9:
“So they were constantly practicing for this demand aspect of the CRT, so when they wrote the other day their writing had been elevated to such a point where I was amazed at what they did. And I totally give credit to the use of the Ning because they had so much practice writing, and developing a voice, and knowing they had an audience meant that they were going to make that voice much more interesting and appealing.”
Laura, teaching her grade 5 students about setting in novels, decided to have them construct models of the novel’s settings in art class. Working in small groups, they created the settings important in 2 or 3 assigned chapters. Laura then used a digital camera to photograph the models and asked the groups to write summaries of the events in their chapters. Combining the pictures with audio-recordings of the summaries, they created digital movie clips that could then be combined into a digital movie of the entire movie. Laura described this as an excellent learning experience for students about setting and characters. She concluded that they learned much more about setting than ever before, and became more critical of their efforts making the models. If they could do it over, she said, they would be more careful of the details.
These, and the examples in other 21st century skill categories, are just a few of the illustrations selected from the collective data to demonstrate the importance of technology infusion in literacy teaching and learning. As the research continues, the team hopes to build resources for other teachers in the district, sharing their “knowledge of practice” [17] widely.
CONCLUSION
While not finely analyzed and interpreted at this stage, the data produced in these studies indicate that there is a productive relationship among information and communication technologies (ICTs), new literacies, and 21st century skills.
Teachers taking up technologies and infusing them in their literacy teaching and learning are excited about the engagement of their students, the possibilities for connecting with all learners and implementing differentiated instruction, and their own learning of multimodality. As we continue our collaboration, we will continue to gather data on these themes and 21st century skills, as well as sharing ideas about assessing multimodal projects. Interviews with teachers also illustrate that well-functioning computers, computer room availability, IT support and trouble shooting, and their own technological professional development are issues that still exist and problems that need solution. However, this research also indicates that the efforts to solve them are well worthwhile.
REFERENCES [1] B. Street, Literacy in Theory and Practice, Cambridge:
Cambridge University Press, 1984. [2] Department of Education Newfoundland and Labrador,
English Language Arts Grade 7 (Interim Edition), 2010, pp. 6, 17, 66. Available: http://www.ed.gov.nl.ca/edu/k12/ curriculum/guides/english/grade7_9/grade7_9_full_document_ie.pdf
[3] C. Lankshear and M. Knobel. New Literacies: Everyday Practices and Classroom Learning, 2nd ed., New York: McGraw Hill, 2006.
[4] C. Lankshear and M. Knobel. A New Literacies Sampler. New York: Peter Lang Publishing, 2007.
[5] D. Leu, Jr., C. Kinzer, J. Coiro and D. Cammack, Toward a Theory of New Literacies Emerging from the Internet and Other Information and Communication Technologies, 2004. Available: www.readingonline.org/ newliteracies/leu/
[6] E. Evans, “Autonomous Literacy or Social Practice? Students’ Constructions of Literacy, Journal of Literacy and Technology, Vol. 5, No. 1, 2005, pp. 1-40.
[7] C. Lemke, for NCREL/Metiri Group, enGuage 21st Century Skills for 21st Century Learners, 2003. Available: www.metiri.com
[8] Partnership for 21st Century Skills, A Framework for 21st Century Learning. Available: http://www.p21.org/
[9] S. R. Wynn and K. “Next Generation Education: Narratives for the 21st Century,” Journal of Education, Informatics and Cybernetics, Vol. 2, No.4, 2010.
[10] J. Black, “Case Study Research: Three Model Visual Arts New Media Programs in Canadian Secondary Schools,” Journal of Education, Informatics and Cybernetics, Vol. 1, No. 3, 2010. Available: http://www.journaleic.com/article/ view/3436/2599
[11] E. Silva, “Measuring Skills for 21st-Century Learning, The Phi Delta Kappan, Vol. 90, No. 9, 2009, pp. 630-634.
[12] C. Greenhow, C. (2007). “What Teacher Education Needs to Know About Web 2.0: Preparing New Teachers in the 21st Century,” in R. Carlsen et al. (Eds.), Proceedings of Society for Information Technology & Teacher Education International Conference 2007, pp. 1989-1992). Chesapeake, VA: AACE, 2007.
[13] K. Schrier, “Using Augmented reality Games to Teach 21st Century Skills,” (No. 15), ACM SIGGRAPH 2006 Educators Program, Special Interest Group on Computer graphics and Interactive Technologies Conference, Boston, MA, July 30 – August 03, 2006. Available: http://dl.acm.org/citation.cfm?id=1179311&CFID=64286196&CFTOKEN=91875844
32
Proceedings of International Conference on Education, Informatics, and Cybernetics (icEIC 2011),
and the International Symposium on Integrating Research, Education, and Problem Solving (IREPS 2011)

[14] A. J. Rotherham and D. Willingham, “21st Century Skills:
The Challenges Ahead,” Educational Leadership, Vol. 67, No. 1, 2009, pp. 16-21.
[15] J. Mahoney, “Leadership Skills for the 21st Century,” Journal of Nursing Management, Vol. 9, No. 5, 2001, pp. 269-271.
[16] J. S. Brown, “New Learning Environments for the 21st Century: Exploring the Edge,” Change: The Magazine of Higher Learning, Vol. 38, No. 5, 2006, pp. 8-24.
[17] M. Cochran-Smith and S. Lytle, “Relationships of Knowledge and Practice: Teacher Learning in Communities,” Review of Research in Education, Vol. 24, 1999, pp. 249-305.
[18] For example, S, Kemmis and R. McTaggert, The Action Research Planner, Geelong, AU: Deakin University Press, 1988.
[19] E. Stringer, Action Research: A Handbook for Practitioners, Thousand Oaks, CA: Sage, 1996.
[20] G. E. Mills, (2003). Action Research: A Guide for the Teacher Researcher, Upper Saddle River, NJ: Merrill/Prentice Hall, 2003.
[21] L. Stenhouse, An Introduction to Curriculum Research and Development. London, Heinemann, 1975.
[22] Metiri Group, “enGauge 21st Century Skills,” What’s So Different About the Twenty-First Century? Available: http://www.metiri.com/features.html
33
Proceedings of International Conference on Education, Informatics, and Cybernetics (icEIC 2011),
and the International Symposium on Integrating Research, Education, and Problem Solving (IREPS 2011)

Technology Evolves but Basic Ideas Survive. Enabling Institutional Collaboration through ICT
Harald HAUGEN
Stord/Haugesund University College Stord, N-5416, Norway
and
Bodil ASK University of Agder
Grimstad, N-4876, Norway
ABSTRACT In 1994 four colleagues from different HE institutions in Norway started a collaborative R & D project for net based, open and flexible higher education. The project was named Norway-net with IT for Open Learning (NITOL), with focus on professional and institutional collaboration. Exchange and distribution of learning material through electronic networks were hard to implement in the pre-WWW days, and much attention was given to technical solutions at the early stages. Students’ interest in the project was overwhelming. From 30 students registered in spring 1994, enrolments exceeded 2500 students in fall 1998. NITOL had outgrown the project stage, and the group asked their institutions to take over administration of course activities. Other institutions joined in and the management of a new, national, networked university, NVU, was given to administrative representatives from 9 partner institutions. After a couple of years, however, they decided to close down the joint course activities, and NVU became a forum for exchange of ideas and organisation of annual conferences. The basic principles from NITOL, however, were carried on through international projects on virtual universities, and now - nearly 20 years later - still seem to be relevant for fruitful collaboration across institutional borders.
Keywords: Higher Education, Net Based Learning, Institutional Collaboration, International Projects, Virtual Universities
ESTABLISHING THE NITOL MODEL OF COLLABORATION
It is not always obvious to administrators and professional staff at HE institutions that collaboration is superior to competition when it comes to attracting students. Four Norwegian higher educational institutions, the three University Colleges of Agder, Stord/Haugesund and Sør-Trøndelag, and the University of Trondheim (NTNU), have all been active in a European collaborative project on open learning, i.e. JITOL - Just In Time
Open Learning, 1992-94 [1] (Lewis et al, 1992) under the European Delta programme [2]. Building on experiences from this and other related projects, representatives from the four institutions decided to propose a national experiment along the same principles. Support was granted from a governmental agency, and NITOL - Norway-net with IT for Open Learning [3] was established in April 1994. NITOL was initially a joint open learning project for students, teachers, IT professionals and others. Research questions particularly focused on collaborative development and distribu-tion of course material. A group of around 30 students participated as “guinea pigs” in the experiment. Interest in the courses showed that there was possibly a large potential for business, expanding the experimental group and perhaps demanding student fees for participation and examination. At the pre-www time learning material had to be distributed through different electronic network systems, e.g. the nationally developed WINIX [4], a system that included many of the present World Wide Web features. The institutions collaborated on technical solutions and in the development of goals and objectives, strategies, courses, course material and evaluation tools for the project as well as in the on-line contact with students. Hypertext and hypermedia were at the time under development, parallel to the project. Experiences from the initial part of the project, i.e. pre-www existence, covered areas related to the learning process, such as − the establishment of an open network making higher
education available to students, groups and individual participants from business, schools, administration, SMEs, etc.
− production of joint learning/training materials − distribution of educational materials through electronic
networks − development of an extensive, dynamic and creative
electronic learning environment based on local and wide area electronic networks
− development and application of assessment tools − evaluation of open and distance learning/training In to-days world of e-learning, with Internet, World Wide Web (WWW), broad band connections, social media and lots of
34
Proceedings of International Conference on Education, Informatics, and Cybernetics (icEIC 2011),
and the International Symposium on Integrating Research, Education, and Problem Solving (IREPS 2011)

research and experiences from ICT-based open and distance learning, it is hard to imagine how much trouble the items listed above could cause. On the other hand, it made the project group appreciate the facilities eventually becoming available and simplifying practice of the basic thoughts that were once the foundation of NITOL [5].
Student Attraction The initial R & D group of students obviously told their friends about the net based possibilities for higher education where they could cross borders and distances between institutions virtually, having access to a wider selection of courses. Similarly the initial teachers and developers convinced some of their colleagues to join an interesting field of development. This changed the scope of the project. In addition to being an R & D project on collaboration and distribution for facilitation of learning, focusing on pedagogy and learning principles, the project group also had to look into the area of administration and organisation for larger groups of ODL-students. The resulting development of student enrolment is shown in Figure 1:
Figure 1. Development of NITOL, 1994-98 [6]
Parallel to the increase in student interest there was a growing political interest in ODL and the applications of Internet. The European year of lifelong learning in 1996 stressed the work for making education at all levels available to the public, and lots of attention was drawn towards the use of new technology. Funding of international projects helped the development both at national and international levels.
Technical and Software Development During the first couple of years technical hurdles had to be overcome almost daily. As Internet and PCs stabilised and became more user-friendly, pedagogy and subject content came more to the foreground of the work. The sudden introduction and rapid development of WWW indicated a major breakthrough for ICT-based ODL. NITOL happened to be there “just-in-time” to meet the requirements. The project group had a feeling of body-surfing at the front of a huge wave, only hoping
that the ride would end on a soft beach, not in rough waters and rocks.
Organising the Project The increase in student numbers required serious thinking about daily routines of the project running. In 1996 some systematic work was done to develop “The Administrative Concept of NITOL” [7], covering the central issues of the project organization. An important part of the concept was the free flow of material between the four NITOL partners. Of course, copy rights and the academic property rules applied equally well to electronic products as to printed material. At the start of the project, however, an agreement was signed, stating that partners were free to “borrow” material from their colleagues, use it in their own courses, develop it further and offer it back to the original author as well as to the other partners. The condition was that the name/institution of the author was visible to everyone who was exposed to the material. During the project period this free exchange of competence and material was one of the major assets of the project. All partners had great advantages from it. The NITOL project was based on inter-institutional collabo-ration on the organisational level, and also encouraged collabo-ration between professionals on content and pedagogical issues.
Examples of Professional Collaboration Sharing and exchange of learning material could be as simple as just putting courses together in an open course pool, making a joint catalogue of courses etc. In NITOL this was called the Open Access Model (Fig 2). Teaching staff having access to other colleagues’ materials could study their way of dealing with pedagogical problems, as a well of experience and inspiration. But it might be tough for the author to be scrutinized by several colleagues and their students. Once they got used to it, however, it was a win-win situation [8].
Figure 2. The Open Access Model
Another way of dealing with learning material was to join forces in development of course material, the Joint Venture Model (Fig 3). An example here can be when professionals from two or more institutions - even across national borders - join forces in developing a course. Networked institutions can really profit from this way of sharing workloads [9].
35
Proceedings of International Conference on Education, Informatics, and Cybernetics (icEIC 2011),
and the International Symposium on Integrating Research, Education, and Problem Solving (IREPS 2011)

A third option, the Composite Model (Fig. 4), was to develop independent modules - or learning units - that could be components in different courses or studies within the collabo-ration. This kind of arrangements requires particularly strong co-operation for recognition of credits and academic level. The model may have its special strength when colleges/institutions are small or medium sized, where resources and the staffs' expertise and capacity are limited.
Organising Networked Learning Environments For inter-institutional collaboration it seemed to be an advantage to agree on a common technical platform or learning environment. During the first years of NITOL this kind of environment had to be developed through special software techniques, e.g. the aforementioned WINIX system [4], and later on the basis of web pages. Today several Learning Management Systems (LMS) offer this kind of platforms. The weaknesses of many LMS’es are that they often focus more on management than on pedagogical approaches and facilities for developers. This is particularly supporting electronification of the traditional correspondence school where learning material and exercises are distributed to students, answers are returned and grades are awarded on the basis of work during the course and/or traditional exams. The initial courses in NITOL were often organised this way. As new tools became available more advanced pedagogical approaches were introduced, e.g. the popular socioconstructivist models, where students and tutors jointly exchanged ideas and
developed new knowledge through discussion forums and social media on the net. NITOL exchanged ideas and evolved in close relations with projects funded by the European Commission under different framework programmes and specific initiatives. Joint experien-ces through these projects have supported and inspired new developments, both on the R&D side and more practically for courses and study programmes that were offered. But establish-ments of collaborative virtual universities constituted great challenges for existing higher education institutions [5].
FURTHER APPLICATIONS OF THE NITOL MODEL
Figure 3. Joint Venture Model A rather modest national project showed a way that many other collaborative projects and net based education providers could follow for establishing and further develop towards virtual universities [10]. The model could be applied both nationally and across national borders.
Establishing a national networked university The NITOL project group realised that course activities soon grew too large for ad hoc administration. Leaders of the four partner institutions were invited for an institutionalisation and a more official status of the project. In early 1998 the agreement for establishment of a national networked university, NettVerksUniversitetet (NVU), was worked out. In December 1998 the partnership agreement was officially signed by the four NITOL institutions - plus five other Norwegian partners. A board and a steering committee for NVU were appointed at the institutional administrative level. The Networked University (NVU) was meant to be open to all HE institutions in Norway, not a new, independent Norwegian university, but a partnership between existing institutions, taking over the course activities from NITOL and develop it further. After a few years, however, the NVU board decided to skip most of their joint course activities, like course catalogue, enrolment of students, marketing etc.
Fig 4. The Composite Model Development of NVU did not meet the expectations of the NITOL group. The actual NVU joint activities ended up being the establishment of special interest groups (SIG) and the arrangement of a conference of e-learning once a year. Joint activities for marketing of courses etc. were abolished, the total course enrolments went down and there were only minor exchanges between the partner institutions. The major mistake is suspected to be that the new NVU administration distanced themselves from the professionals, the founders and enthusiast that created and developed the NITOL principles. The initial NITOL group remained active through 2008, since 1999 mainly with R & D work, engagement in national and international projects, and less with daily services to students and practical administration. There were lots of challenges that had been waiting for the group to find time for. Collaboration, openness and joint developments remained the major “glue” in the group. A final project report was printed, handed over to the four institutions and made available for interested parties [3].
International offsprings As already mentioned in the introduction, NITOL got its first inspiration from participation in the European JITOL project (1992-94) [1], where 11 HE institutions from 9 countries
36
Proceedings of International Conference on Education, Informatics, and Cybernetics (icEIC 2011),
and the International Symposium on Integrating Research, Education, and Problem Solving (IREPS 2011)

worked together for Development of European Learning through Technological Advance, DELTA [2]. The NITOL group further developed the principles of open collaboration, and “paid back” to the European Community through active engagement in several other EU projects, where the NITOL model was a central core of activities. Internationally the NITOL group kept up the activity within joint networks and e-learning projects also after the NVU was established. During the total of 15 years (1994 - 2008) the gospel of collaboration was promoted through several projects. A short-list of such projects with references follows below:
European projects. During 1995 – 2009 one of the NITOL institutions were leading and coordination 5 different European projects: • MECPOL - Models for European Collaboration and
Pedagogy in Open Learning (1995-98) [11] • Do ODL Dissemination of Open and Distributed Learning
(1996-97) [12] • EuroCompetence (1998-2000) [13] • MENU – Models for a European Networked University for
e-learning (2001-03), with a clear intention to create a European NITOL, or a European Virtual University EVU [14]
• QUIS – Quality, Interoperability and Standards in e-learning (2005-06) [15]
In several other projects NITOL was invited as a partner, either as a joint group, as four separate partners or through one of the institutions as partner representing the whole group. This was the case for e.g. • EONT - (1995-96), coordinated from Greece [16] • SHARP SHAreable Representation of Practice (1998-99),
coordinated from UK [17] • E-LEN (2003 - 05), coordinated from Cyprus [18] • B-learn – Blended Learning (2005-07), coordinated from
Estonia [19] • e-JUMP 2.0 – (2008 – 09), coordinated from Estonia [20] In particular the idea of developing a Model for a European Networked University (2004) was closely related to an initiative taken by the European Commission in 2001 [21], aiming at mobilising existing resources for designing tomorrow’s education. The partners of MENU defined strategy and models for collaboration - partnership agreement, for joint study plans, organization and economic strategy, which were tested and evaluated through user trials. Based on these building blocks, the model for establishing a sustainable ENU - a European Networked University for e-learning was presented in the reports from the project. Internationally MENU contributed to the direction of development for an offspring from the United Nations University, the Global Virtual University.
Global Virtual University, UNU-GVU [22] was established as an online network of universities for sustainable development, and had a particular objective to meet the educational needs of the third world. GVU was officially launched in September 2002 at the World Summit on Sustainable Development in Johannesburg, SA, where the Norwegian Government, the United Nations University, UNU,
[23] and the United Nations Environment Programme, UNEP, [24] pledged their support and partnership. The United Nations University - Global Virtual University, UNU-GVU, [25] offered courses from different universities, e.g. a course on global environment issues based on the UNEP report “Global Environment Outlook”, GEO [26], as part of a master degree programme, Global Environment and Develop-ment Studies, GEDS [27]. This was part of the MENU demonstrator, involving students and tutors from around the World, actually following the NITOL principles of joint development and collaboration for net based learning. One of the most popular courses offered through the GVU network, was e-Teaching, actually a sequence of two courses, E-teaching I [28] and e-Teaching II [29], both based on structure and content ideas from the NITOL course on Pedagogy in Open Learning, PiOL [30]. The main idea behind these courses was to qualify professors and teachers to develop and tutor e-learning - or net based - courses within their own subject areas. This was particularly important for the partners of GVU that should provide higher education for students in developing countries, in remote areas and at universities lacking capacity and competence in certain disciplines. The concept and principles of open collaboration, mutual trust and joint efforts are fragile, but still a key issues for success at local, national and international levels. They turn out to be hard to carry over from the initial NITOL partnership to other HE institutions. Even at the founding institutions, most of the basic principles in NITOL have suffered shifting support.
PRESENT STATUS NITOL is history with its final report in 2009 [3]. The four member institutions continued on separate basis with different net based activities that could be linked to the NITOL experiences. The courses that survived were mainly within ICT related topics at bachelor and masters level. The focus on inter-institutional collaboration, however, seemed to be dormant - at least for a while. At national level the NVU still exists. It has now 5 member institutions [31] with a revised partnership agreement signed in 2009. The intention is to create a meeting place and a network for professional collaboration on matters related to net based learning, with the main event being the annual NVU confe-rence. There are no joint courses, marketing or catalogues. At the European level, there is still no real joint virtual univer-sity according the MENU prescriptions. In discussions between e-learning professionals, the idea is generally supported. But the implementation of such an organisation, with devoted commit-ment from the participating institutions, still seems to be out of reach. This agrees well with experiences from the MENU trials, where institutional regulations, traditions and national laws were in conflict with the principles of open collaboration required by the suggested model. These hurdles are still hard to overcome. Paper presentations and discussions at international conferences on e-learning, reveal that in 2010 - 11 new projects and R&D groups are still working on similar challenges for net based collaboration.
37
Proceedings of International Conference on Education, Informatics, and Cybernetics (icEIC 2011),
and the International Symposium on Integrating Research, Education, and Problem Solving (IREPS 2011)

On the global level, UNU-GVU lost its governmental funding from 2008, and therefore had to wind up its portfolio. The e-teaching courses continued for 2-3 years under the umbrella of University of Agder, UiA [32]. The same university also coordinates a revised version of GEDS now named a master programme in development management [33], offered as blended learning in cooperation with African and Asian universities. The net based parts are designed and run in accordance with parts of the MENU model and the principles taught through the e-teaching courses.
Returning to the roots Stord/Haugesund University College, SHUC [34], was the coordinating institution for NITOL as well as for MECPOL and MENU, for longer periods also for NVU. Net based learning has been offered by the Department for Educational Information Science ever since the days of JITOL and the birth of NITOL. Attempts to involve other departments at the college have been met with scepticism, particularly when it comes to exchange and close collaboration over institutional borders. When the master’s programme for ICT in learning [35] was established in 2003, new approaches were made to other faculties again. And with the revision of study plans in 2006 several other subject specialists were involved as tutors and advisers for master students - but only for students registered at SHUC. When new national regulations for teacher education in Norway were introduced in 2009, the division into separate lines of study, more specialisation and requirements for larger variety of electives at each site, made the resource situation particularly difficult for smaller institutions. At a meeting in UH-nett Vest [36], i.e. a network of 5 higher educational institutions in Western Norway, different ways of exchanging competence and expertise were discussed. After the meeting the old proposal for the NITOL project - written in 1993 - was brought forward by SHUC. It seemed to fit right into the concept at hand, and a “new” pilot project was composed, revitalizing the original NITOL idea of joint development and expert collaboration between colleagues from different institutions. The new project was named Campus based e-learning at topic level [37]. It started in May 2011 and the partners will have its report and first products ready by June 2012. Technology has developed much sine NITOL started in 1994. Broadband connections, fast and high capacity PCs, video cameras, social media etc. were only dream-ware in the mid 1990ies. Now they are natural parts of the tools being applied. Educational methods for net based learning have also evolved over the past 17 years. The principles of work, however, are not so very different. A major goal is to promote campus based e-learning at the partner institutions. A central part along that road is to develop a particular 10 credit (ECTS) course on E-learning at HE level, and make it compulsory for all new teaching staff members at the institutions. The course will be net based, developed jointly by experts in the field from all partners, and at a next stage also made available for teachers outside of UH-nett Vest. Now in 2011 subject specialist groups are composed within a few limited topics early in the pilot period. In according with plans these are in the areas of Mathematics, Norwegian, English and Arts & Crafts. Each group has at least two subject specialists, coming from different institutions, who are now jointly developing their course, sharing responsibility and
tutoring of 10-15 “students” within the network. Each topic has a content value of 5 - 30 ECTS credits. The groups are already established, the development work is on its way, and the first trials will be performed during spring 2012. Partner and group meetings are performed through multi point Internet based video conferences, on low or no-cost platforms like Adobe Connect [38] or LiveRoom/Fronter [39], saving time and money previously needed for physical meetings. Otherwise, much of the methods and principles here are very close to the initial NITOL ideas, but at this stage only planning for services to campus students, i.e. net based support as part of blended learning, so far not inviting individuals outside the participating institutions. May be next year there will be an expanding round of the same ideas, from a small pilot through greater visions?
REFERENCES
[1] Lewis, R., Goodyear, P., and Boder, A. (1992): Just –in-Time Open Learning – A DELTA Project Outline; Occasional Paper: NL-1-92; Neurop Lab, International Business Park, Le Forum 74166, Archamps, France
[2] DELTA - Development of European Learning through Technological Advance (1988-94), http://www.eric.ed.gov/ERICWebPortal/custom/portlets/recordDetails/detailmini.jsp?_nfpb=true&_&ERICExtSearch_SearchValue_0=EJ405586&ERICExtSearch_SearchType_0=no&accno=EJ405586
[3] NITOL (2009): Haugen, H.; Ask, B.; Hjeltnes, T.; Staupe, A.: 15 years as pioneers within net based learning, TISIP 2009.
[4] Comdex Daily 1991, „Winix links PCs to Unix via
Windows“
[5] Ask, B. (2004) Collaborative Virtual Universities - a Challenge for Higher Education Institutions. (Not published).
[6] Maribu, G. (1999). Utvikling av NITOL 1994-98, Årsmelding for TISIP 1999, Norway
[7] NITOL (1996). The Administrative Concept of NITOL, 1996, Internal Document
[8] Ask, B., & Haugen, H. (1998). Learning by doing - an Internet course on methods for ICT based ODL. BITE - Bringing Information Technology to Education: Integrating Information & Communication Technology in Higher Education, ICTE (209-222)
[9] Retalis, Haugen, Ask & Skordalakis, (1997). A Sage on the Stage or a Guide on the Side? Teacher’s Role in the University of 2000. Changing Practices and Technologies: Decisions Now for the Future, ICTE, 2 (455-457)
[10] Haugen, H., & Ask, B (2005). From R&D Project to Virtual Universities. In Howard, C., Boettcher, J.V., Justice, L., Schenk, K., Rogers, P.L., & Berg, G.A. (Eds.),
38
Proceedings of International Conference on Education, Informatics, and Cybernetics (icEIC 2011),
and the International Symposium on Integrating Research, Education, and Problem Solving (IREPS 2011)

Encyclopedia of Distance Learning: Idea Group Reference. Hershey, PA.
[11] MECPOL - Models for European Collaboration and Pedagogy in Open Learning: http://www.aitel.hist.no/prosjekter/ekstern/mecpol/
[12] Do-ODL - .Dissemination of Open and Distance Learning: http://www.aitel.hist.no/prosjekter/ekstern/doodl
[13] EC - EuroCompetence: http://www2.tisip.no/engelsk/ec/
[14] MENU - Model for a European Networked University for e-learning, http://www.hsh.no/menu
[15] QUIS - Quality, Interoperablitily and Standards in e-learning: http://tisip.no/faces/public/forskning/index.jsp?ex=1&ink=prosjektkatalog#QUIS
[16] EONT - An Experiment in Open and distance learning using New information Technology. www.softlab.ece.ntua.gr/research/research_projects/EONT
[17] SHARP - Sharable Representation of Practice.
http://www.softlab.ntua.gr/sharp/events/events.html [18] E-LEN. (2002). E-LEN: a network for e-learning centres,
http://www.tisip.no/E-LEN [19] B-learn: http://www.ut.ee/blearn/index.aw/set_lang_id=2 [20] e-JUMP: http://portaal.e-uni.ee/ejump [21] EU Commission (2001), eLearning - Designing tomorrow's
education: http://europa.eu/legislation_summaries/education_training_youth/lifelong_learning/c11046_en.htm
[22] GVU: Global Virtual University:.
http://www.virtualcampuses.eu/index.php/Global_Virtual_University
[23] UNU: United Nations University, http://www.unu.edu/
[24] United Nations Environment Programme, UNEP: http://www.unep.org/
[25] UNU-GVU: United Nations University – Global Virtual University: http://dev.grida.no/gvu/pdf/brochure.pdf (viewed Oct. 2011)
[26] GEO: Global Environment Outlook (2003). http://www.grida.no/publications/other/geo3/?src=/geo/geo3/
[27] Global Environment and Development Studies, GEDS http://www.globdev.org/files/U%20of%20Agder%201%20IS415%20Study%20Guide.doc
[28] E-teaching 1, http://www.uia.no/no/portaler/studietilbud/etter-_og_videreutdanning/e-teaching_1
[29] E-teaching 2: http://www.uia.no/en/content/download/84272/1400923/file/E-teaching+2+course+description.pdf
[30] Pedagogy in Open Learning, PiOL http://www.aitel.hist.no/prosjekter/ekstern/mecpol/catalogue/pedopenlearning.htm
[31]The Norwegian Network University, NVU:
http://www.nvu.no/ (in Norwegian) [32] UiA: University of Agder. http://www.uia.no/en [33] MASTDEVM: Masters programme in Development
Management, http://www.uia.no/en/portals/study/student_info/ects/11-12/master_s_programme_in_development_management
[34] Stord/Haugesund University College, Norway; SHUC:
http://www.hsh.no/english.htm
[35] Master ICT in Learning, HSH: http://www.hsh.no/studentportal/studiekvardagen/studiehandbok/program.htm?db=Studiebok08&lang=ENGELSK&year=2008&termin=HØST&code=master
[36] UH-nett Vest, i.e. a network of HE institutions in Western Norway; http://www.uhnettvest.no/
[37] Starting networked collaboration: http://www.hsh.no/nyheter/index.php?arkiv=2011050000002059
[38] Adobe Connect Conference System, http://www.adobe.com/no/products/adobeconnect.html
[39] Fronter Elluminate, http://fronter.info/downloads/Meeting_Liveroom.pdf
39
Proceedings of International Conference on Education, Informatics, and Cybernetics (icEIC 2011),
and the International Symposium on Integrating Research, Education, and Problem Solving (IREPS 2011)

Localized Image Segmentation and Enhancement for Meteorite Images
Yufang Bao, PhD Math and Computer Science Department
Fayetteville State University, Fayetteville, NC 28301 [email protected]
ABSTRACT
This paper proposed an image enhancement and
segmentation algorithm to localize the segment of interest in a
series of images obtained from the Electron Microprobe. There
are totally four different images that are corresponding to the
spatial density distributions of four major chemical elements
inside a meteorite rock surface. The density distribution of
each chemical element is shown in a gray valued image with a
resolution in the micrometer range. Our algorithm applied a
statistical image enhancement technique to improve the
visualization of features about the same segment of interest in
three images using one image as a reference. The three
chemical elements distributions of a localized cluster were
enhanced, and eventually integrated together into a synthetic
color image to reflect various chemical compound distributions
insider this cluster.
Keywords
Image enhancement, segmentation, meteorite images.
1. INTRODUCTION The methods for analyzing images often
varied according to the different features in images
acquired from various imaging instruments. In the
case of studying the chemical compound in the
ureilites, the typical small size (about 1x1 in2) of
ureilites used for analysis has made measurement
extremely difficult for scientists. The measurement is
powered by using a new generation imaging system
called Electron Microprobe. The Electron
Microprobe allows scientists to acquire a set of high
spatial resolution gray images. Each shows the
concentration of one chemical element. In this paper,
four images of chemical distributions of a ureilite
rock are acquired from the Electron Microprobe. The
images represent the spatial density distributions of
four chemical elements, Magnesium (Mg), Iron (Fe),
Aluminum (Al), and Calcium (Ca). The Field of
view (FOV) of each image covers the polished
surface of ureilite with a resolution in a micrometer
(mm) range [1]. The high intensity pixel value in an
image shows high chemical concentration, while a
low intensity value shows a low chemical
concentration in a pixel. The four chemical element
images of the ureilite have the following features.
The intensity values of the Mg image are grouped by
clusters; hence, the overall image is of bright and
high contrast as shown (Fig. 1). This is consistent
with the existing knowledge of the rich Mg
concentrations inside a ureilite in general. The Iron
(Fe), Aluminum (Al), and Calcium (Ca) images
usually were very dark inside each cluster due to
their lower concentrations in general, and the low
intensity values shadowed the boundaries between
adjacent clusters as shown in Fig. 2.
It is not practical to study directly the whole
spatial content of the images while, often, only a
small cluster was of interest. The images acquired
from an Electron Microprobe usually are of large
size with around 1,000 x 1,500 pixels in total for a
ureilite roack of size 1x1 in2. Not only is the
computational burden a concern, but also the rich
intensity scales inside a large size image will degrade
the view of the cluster of interest if the whole image
is directly studied. Due to its simultaneous
acquisition feature, a pixel in the same location in
each image usually accounts for the same position in
the rock surface. It is useful to use one chemical
element image, such as the Mg image, as a reference,
to identify the segments of interest in the rest images
to reveal the material composition in the rock
surface. This is useful for analyzing all chemical
element distribution images simultaneously in order
to study the highly correlated features inside the
images. Another reason for narrowing into a small
segment of the images for study is that the rich
intensities coexisted in the image makes it difficult to
enhance the features using the existing algorithms. It
is rational to search for a small cluster of interest for
enhancement to avoid the complexity with
enhancement of the entire dark image (see fig. 2)
40
Proceedings of International Conference on Education, Informatics, and Cybernetics (icEIC 2011),
and the International Symposium on Integrating Research, Education, and Problem Solving (IREPS 2011)

In this paper, we first described an
interactive method to select a cluster of interest in the
rock surface by using the bright and high contrast
Mg image as a reference image. The location of the
selected cluster was then mapped into the distribution
images of the other chemical elements. The low
intensity contrast inside the cluster will be selected
for further processing. Secondly, we describe a
method to correct the gray values of the low intensity
images by constraining to this small cluster. The
interior pixels inside this cluster only count for a
fraction of the original image size. An improved
contrast within this cluster will be locally maximized.
Finally, we proposed to synthesize all the enhanced
segments of three major chemical elements into a
color image to characterize the chemical compounds
to show the microscopic view of a cluster inside the
rock surface.
2. CLUSTER SEGMENTATION
Image segmentation is often associated with
edge detection. Often, a closed edge formed with
connected curves is of interest, which typically
defines the boundary of a segmented object.
However, most of edge detection methods are simply
based on either the gradient or the zero crossing
information and therefore are not geometrically
oriented. The gradient information is used for edge
detection by defining edges as the local directional
maxima of the absolute gradient magnitude
computed. and is represented by the Sobel edge
detector [2] and Canny Edge Detector [3]. The zero-
crossing information is used for edge detection by
computing a second-order derivative of the image
values [9].
The tradition edge detection methods are
capable of detecting the potential edges faithfully
showing all the high constrast locations in the image
[2-3, 7]; however, it is not suitable when our goal is
to identify a cluster in the meteorite image. Our
interest is to label only the cluster of image for
analyzing the chemical compounds inside the cluster,
while neglecting some small segments inside this
cluster.
Meteorite images are featured by their
massive size (Fig. 1) with different clusters
integrated together. Each cluster was grouped by
pixels with similar intensity values while the
boundaries are marked with relatively different
intensity values. As we mentioned earlier, the Mg
image is the best candidate for edge detection. This
image is used to identify a cluster of interest to allow
enhancement [4] to be applied efficiently to this
cluster in the other images.
Our proposed edge detection technique is
based on the Sobel detector and modified
morphology methods [8]. To begin, we select a
rectangle segment on the reference, Mg, image.
Inside the rectangle region, the histogram of the
image is generated. The mean of the histogram is
used as an automatic threshold level for generating a
binary image where the pixels of the potential
boundaries of a cluster object are marked as 1, and
others are marked as 0. The initial operation of this
thresholding using the Sobel detector finds all the
potential boundaries blindly, which includes
boundaries of very small segments. Based on this
potential boundary image, B, the shortest Euclidean
distance of each pixel to the potential boundary in
Figure 1: The Mg image to be used as a reference.
Figure 2: The Fe image to be enhanced.
41
Proceedings of International Conference on Education, Informatics, and Cybernetics (icEIC 2011),
and the International Symposium on Integrating Research, Education, and Problem Solving (IREPS 2011)

image B is calculated, i.e. for each pixel represented
as (i, j), d(i, j) is defined as
)),(),((inf),(2),(
lkjijidBlk
−=∈
The boundary image, B, is updated to unify
the multiple broken boundaries that belong to the
same edge:
( )
( )
≥
<=
thresholdlkd
thresholdlkdlkB
, if ,0
, if ,1),(
where the threshold is set for number 3. Note this
threshold is different from the threshold used for
edge detection. The binary value of 1 in the image, B,
indicates the improved boundaries. This updated
boundary allows multiple boundaries for the same
segment to be unified together to show the
geometrical features.
Finally, the largest connected component is
identified; To do so, we identified all the connected
components in the edge images, and then defined the
size of each connected component, kO , as
∑∈
=
kOyx
kyxIoM
),(
),()(
The largest component to be preserved is defined as
)(maxarg kO
oMOk
=
This method discarded all the isolated small
segments initially being treated as boundaries. In
addition, the morphologically operations, namely, a
dilation followed by an erosion, are performed to
close the potential gaps inside the boundaries, while
to ensure the boundaries for a cluster are properly
connected. In so doing, the major boundaries are
identified. It separates the Mg image into several
clusters that we are interested in. Only the inside of
the cluster of interest was selected and preserved.
The major steps for finding a cluster of interest for
the Mg image is shown in Fig. 3.
3. ENHANCEMENT Enhancement of a low contrast chemical
element image allows us to visualize the spatial
density distribution of the compounds made from this
element, and provides a base for counting the
concentrations. When an image is in low contrast, the
image enhancement sometimes involves deblurring
and noise removal procedures [5]. The histogram of
an image statistically demonstrates the the image
intensity distribution and is typically the base for
contrast correction. Direct contrast adjustment
methods [2] and histogram equalization methods [6-
7] are two methods generally used for gray image
enhancement. To better preserve the chemical
element concentrations, histogram equalization
methods is used in our study. The histogram
equalization methods map the input gray levels to the
output gray levels which are evenly dispersed based
on statistical knowledge. The existing image
enhancement algorithm is improved to enhance the
distribution of each chemical element image.
Figure 3. Our proposed cluster segmentation
The traditional histogram equalization
methods adjust the image intensity globally. It treats
the entire image equivalent and usually yields poor
local performance; therefore, in a localized region,
the intensity may not be appropriately separated even
after enhancement. Several improvement algorithms
to enhance the intensity in a localized region have
since proposed [6, 8].
An image enhancement algorithm is ideal
only when it matches the unique image features;
hence, when referring to a chemical element
distribution image of the ureilite acquired from the
Microprobe, the special features of these images
needed to be considered. After the cluster of
interested was segmented, image content inside the
cluster was kept. Inside this cluster, Our
a) Select a rectangle
area from the original
Image.
b) A binary image was
generated by applying Sobel
detection with an automatic
threshold.
c) The largest connected
component with new
boundaries defined and
morphological operation.
d) An interactive
selection of the cluster
with closed contour.
42
Proceedings of International Conference on Education, Informatics, and Cybernetics (icEIC 2011),
and the International Symposium on Integrating Research, Education, and Problem Solving (IREPS 2011)

enhancement technique combines the Gaussian
smooth filter together with a modified histogram
equalization method to map the majority of the image
intensities into the maximum dynamic display range
available.
We proposed to partially equalize the gray
values Histogram equalization (HE) method. HE
method is a statistical analysis of image intensities.
The histogram of a digital image counts the number
of pixels whose values are inside a set of ranges
called bins. If we use ( )yxI , to represent an image,
a histogram is defined as a discrete function
( ) n,=highyxIlowpixelsiHii
,1i,),(#)( L≤<=
The (i
low , i
high ) is the range of the i-th bin, and n
is the total number of bins used. The relative
frequency histogram approximately defines the
probability of occurrence at the i bin, as
n,=iPN
iH,1i,)(
)(L=
where N is the total number of pixels in an image
taking into considerations.
A good enhancement result will have the histogram
stretched to the highest dynamic display range. The
histogram of pixels inside the selected cluster tends
to gravitate to the lower intensity within a narrow
range with outliers in both the high and low end in
the low contrast chemical element images that we
aim to enhance. The outliers are classified
dynamically as
( ) ( ) } )(ifor ,)( if , ,{
Outliers
nlowest
1
εε <<∈
=
∑∑== highestii
iPiPiBinyxI
with the lowest and highest represent the landmark
values used to define the outliers, which can be set to
about three times the inter quartile range (3IQR)
away from the median. In our case, we use the 0.1%
data as outliers. After the outliers are classified, we
set the
( ) ( )
( ) ( )iBinyxIiPhighestyxI
iBinyxIiPlowestyxI
highesti
i
∈<+=
∈<−=
∑
∑
=
=
, and , )(if ,1),(
, and ,)( if ,1),(
n
lowest
1
ε
ε
In addition a Gaussian smooth filter is applied for
preprocessing to make sure the outliers are properly
classified and a histogram of best fit can be resulted.
Our new histogram image enhancement steps are:
1. Determine the lowest 0.1% outliers in the
histogram.
2. Determine the highest 0.1% outlier in the
histogram.
3. Generate new histogram using the intensity
constrained between the lowest and highest
outliers defined.
4. Apply histogram equalization.
(a)
(b)
(c)
Figure 4: The Fe image segment (a) and the
cluster identified (b), followed by the enhanced
clusters (c) .
43
Proceedings of International Conference on Education, Informatics, and Cybernetics (icEIC 2011),
and the International Symposium on Integrating Research, Education, and Problem Solving (IREPS 2011)

In Fig. 4(a) is shown the cluster of Fe image.
In Fig. 4(b) is shown the cluster of Fe image after the
HE is directly applied; the cluster is marked in green
color. In Fig. 4(c), our partial HE enhancement
technique is applied; the cluster is marked red color.
The resulting image in Fig. 4(c) has higher contrast
than the image in Fig. 4(b). This is further shown in
the histogram in Fig. 5, where the histogram of the
Fig. 4(b) is shown in the Fig. 5 (b). The histogram of
Fig. 4(c) is shown in Fig. 5 (c) with Gaussian filter
applied. Fig. 5 (c) that is corresponded to the partial
HE method has shown improved histogram with our
partial HE method.
Figure 6. The diagram for generating the color synthesized
cluster image.
5. SYNTHESIZED COLOR IMAGE
Human eyes perceive color from three types
of cones in their retina-Red ( R), Green (G) and Blue
(B), corresponding to the three basic colors RGB. A
color image is represented in (R, G, B) vectors. We
can differentiate just noticeable difference in terms of
little changes in color distance, which makes the
color image rich to interpret.
Here, we have composed a color image using
the three chemical element image clusters. The color
images are generated after the segmentation and
enhancement are obtained. A color image is the
composed of vector (R, G, B) for each image pixel.
Here we designed the color vector (R, G, B)=(Fe,
(a)
(b)
(c)
Figure 5: The histogram of the original Fe
image cluster (a); the histogram of the cluster
that histeq was directly applied (b); the
histogram of our enhanced cluster (c).
Mg Image
cluster
identified
Fe Image Al Image Cluster
segmentation
algorithm
Identify the same cluster in
the Fe and Al images
Localized enhancement
applied to both clusters
Synthesized Color image output
Enhanced Fe
cluster image
Enhanced Al
cluster image
44
Proceedings of International Conference on Education, Informatics, and Cybernetics (icEIC 2011),
and the International Symposium on Integrating Research, Education, and Problem Solving (IREPS 2011)

Mg, Al). The whole processing is shown is the
diagram in Fig. 6.
The synthesized color image is shown in Fig.
7 (a), in comparison to the Mg gray intensity image.
The yellow color shown in the image likely indicated
rich iron content region. This distribution color
allows us to further study the compound distribution
and display the distribution of different chemical
compounds simultaneously in a color image.
6. CONCLUSIONS In this paper, we have proposed to localize
the cluster of interest in the meteorite images using
the Mg image as the reference. We further applied an
image enhancement to improve the visualization of
the low contrast images, and eventually synthesized
the three images of higher contrast into a color image
after the segmentation and enhancement.
7. ACKNOWLEDGMENTS Our thanks to Dr. Steven Singletary for his
help with the images provided. We also thank Miss
Cassandra Hall and Miss Siera Gonzales. Both are
students participated in the CPSER program in
Fayetteville State University, and have contributed to
this research when they are participated in the
mentored summer research project sponsored by the
Center for Promoting STEM Education and
Research.
8. REFERENCE
[1] S. J. Singletary and T. L. Grove, "Early
petrologic processes on the ureilite parent body,"
Meteoritics & Planetary Science, vol. 38, pp.
95-108, Jan 2003.
[2] R. C. Gonzalez and R. E. Woods, Digital image
processing, 2nd ed. Upper Saddle River, N.J.:
Prentice Hall, 2002.
[3] J. Canny, "A Computational Approach to Edge-
Detection," Ieee Transactions on Pattern
Analysis and Machine Intelligence, vol. 8, pp.
679-698, Nov 1986.
[4] Y. F. Bao and H. Krim, "Smart nonlinear
diffusion: A probabilistic approach," Ieee
Transactions on Pattern Analysis and Machine
Intelligence, vol. 26, pp. 63-72, Jan 2004.
[5] J. L. Lehr and P. Capek, "Histogram
equalization of CT images," Radiology, vol.
154, pp. 163-9, Jan 1985.
[6] J. S. Tang, et al., "Image enhancement using a
contrast measure in the compressed domain,"
Ieee Signal Processing Letters, vol. 10, pp. 289-
292, Oct 2003.
[7] J. A. Jiang, C. L Chuang, Y.L. Lu and C.S.
Fahn, "Mathematical-morphology-based edge
detectors for detection of thin edges in low-
contrast regions", IET Image Processing, Vol 1
(3) pp. 269-277, 2007
[8] C. Leung, K. Chan, H. Chan, W. Tsui, "A new
approach for image enhancement applied to
low-contrast–low-illumination IC and document
images", Pattern Recognition Letters, Vol. 26
pp. 769-778, 2005. [9] A. Yuille, T.A. Poggio, "Scaling theorems for zero
crossings." IEEE Trans. Pattern Analysis & Machine
Intelligence, Vol. PAMI-8, no. 1, pp. 15–25, Jan.
1986.
(a)
(b)
Figure 7. (a) The color synthesized cluster image. (b) the
gray intensity Mg image.
45
Proceedings of International Conference on Education, Informatics, and Cybernetics (icEIC 2011),
and the International Symposium on Integrating Research, Education, and Problem Solving (IREPS 2011)

Technology in the Technical Mathematics Classroom
Jim HARDY
Department of Technical General Education
Idaho State University
Pocatello, ID 83209, USA
Clayn LAMBERT
Department of Technical General Education
Idaho State University
Pocatello, ID 83209, USA
Introduction
It’s no secret that the use of technology in the
classroom is increasing. However, it is less clear
what effect that use of technology has on student
success and instructor workloads. While there is
some consensus in the research that the inclusion of
technology in the classroom is typically neutral or
positive, there is also consensus that more research
is needed in this area [5, 6]. This is particularly true
as the post-secondary student body expands to
include more non-traditional, disadvantaged, and
underprepared students. Aud et al, [1] report, for
example, that more than 20% of post secondary
students took a remedial course in the 2007-08
academic year. Of particular interest are case
studies which address the implementation of
technological interventions in specific contexts.
Spence & Usher and Walker & Singer [4, 7] provide
examples of this type of study. While lacking the
generalizability of more broad ranging studies, case
studies provide a level of detail that is useful for
programs in making decisions about whether, and to
what extent, to implement technology in the
classroom. This paper reports a case study of initial
results in the incorporation of instructional
technology into traditional (face-to-face)
mathematics courses within a professional-technical
curriculum.
The Technical General Education program (TGE) at
Idaho State University (ISU) is a part of the General
Education department of the College of Technology.
The College of Technology is a professional-
technical education (PTE) institution which operates
as a full college within ISU, a Carnegie Research
High institution in Southeastern Idaho. According
to the College of Technology website, the TGE
program is formally charged with providing courses
that assist in “technical training by providing
general educational courses such as
business/technical writing, math, oral
communication, building job search skills, and
understanding human relations issues pertinent to
the workplace.” (2009) One of the primary
emphases of TGE is pre-enrollment courses used to
orient and bolster student performance in math and
writing prior to their entry into degree or
certification programs.
TGE works as an independent general education
program focused on the needs of PTE students.
While courses offered through TGE are cross-listed
with corresponding courses in academic
departments throughout the University, courses are
developed independently. TGE faculty are not
considered members of these departments, though
they do hold equivalent degrees and participate in
similar levels of professional development as
instructors of comparable courses.
According to a 2011 internal review, more than 75%
of the students enrolled in TGE programs fit into at
least one demographic group considered as
academically at-risk, including groups such as
learners who are economically disadvantaged, non-
traditional, diagnosed with a learning disability, and
those who are either displaced homemakers or
single parents. Upon entry into TGE courses,
students are assessed using the Test for Adult Basic
Education (TABE). These TABE scores are used to
place students in the most appropriate course level
for their math and writing abilities. TGE math
courses begin at the level of place value and
continue to elementary statistics and other selected
topics. Satisfactory completion of courses is
46
Proceedings of International Conference on Education, Informatics, and Cybernetics (icEIC 2011),
and the International Symposium on Integrating Research, Education, and Problem Solving (IREPS 2011)

determined by a grade of at least a 2.0 on a 4.0 GPA
scale.
This study focus on two TGE courses, 100M and
100A, and the corresponding courses offered
through the Mathematics department at ISU, 015
and 025. 100M/015 is a course in arithmetic and
pre-algebra. It begins with place value and basic
arithmetical operations and continues through an
introduction to linear equations. 100A/025 is a
course in elementary algebra. It begins where
100A/015 leaves off and continues through all
subjects prerequisite for understanding a typical
college algebra course.
Justification
In an effort to further improve student outcomes,
TGE has begun implementation of a series of
technological improvements to its classrooms and
courses. For the last 5 years, TGE faculty have been
provided training and materials to integrate
instructional technology into their classrooms.
However, the impetus for these efforts has been
based primarily on anecdotal and circumstantial
evidence and a desire to be seen as progressive in
their teaching methodologies rather than on
validated research to justify this work.
Before more effort, time, and resources are allocated
to this effort, and before more emphasis is placed on
this trend in the college as a whole, it is worthwhile
to examine the results of previous efforts and to
determine what impact these technologies actually
have on student performance and retention.
It is also critical to examine these efforts in the light
of budgetary restrictions that have increased as a
result of recent economic downturns in the state of
Idaho. Considering the outlay requirements in
capital, resources, training, and support when
implementing extensive integrations of instructional
technology into classroom practice, hard and
verifiable research is clearly warranted in order to
progress further down this path.
The overall goal of the study is to offer a view as to
the advisability of continuing to invest in
technology upgrades to the professional technical
classroom. Student success is the primary
determinant of such advisability, but teacher
experience offers a secondary determinant.
Negative effects in student outcomes would
constitute a strong argument against further
inclusion, while positive effects would offer a
similarly strong argument for it. In the absence of
student effects, positive or negative effects on
teacher experience may be sufficient to decide the
issue. Although this study has a clear importance to
policy construction within TGE, we believe it offers
a further touchstone to similar efforts to introduce
classroom technology in other departments and
settings.
Methods
This initial study is a retrospective examination of
the impact of instructional technology on student
performance in Basic Math and Basic Algebra
courses in the TGE program from 2004 - 2009. The
study examines, specifically, the impact of two
classroom technologies, Interactive White Boards
(IWB) and lecture capture through Elluminate Live!
recordings, on student performance and retention in
TGE math courses when compared to performance
and retention trends in similar math courses offered
through traditional academic programs over the
same time period, based on Information provided by
the Idaho State University Office for Institutional
Research.
This study used a mixed methodology to examine
the impact of the implementation of technological
aids in mathematics courses within the professional
technical curriculum of a state university. First, a
retrospective quantitative analysis of 6 years of
student outcomes provides a baseline result
demonstrating that the inclusion of such technology
maintains the success and retention rates of students
as compared to the rates prior to its introduction.
Success rates in TGE courses were also compared
to rates in similar courses offered by the Math
department which did not undergo a systematic
enhancement of technology in the classroom during
this period. Second, structured interviews with the
instructors who implemented the technological aids
were conducted to determine factors that escape
quantitative representation and indicate ways to
improve the success of future implementations.
While student outcomes are the most critical
potential effect of technology in the classroom, there
are other effects that may argue for or against its
47
Proceedings of International Conference on Education, Informatics, and Cybernetics (icEIC 2011),
and the International Symposium on Integrating Research, Education, and Problem Solving (IREPS 2011)

inclusion. If technology improves teacher
efficiency, student comfort, or other such factors, its
use may be warranted even if it has no effect on
pass/fail/withdrawal rates.
The primary data set for the quantitative analyses
consists of pass, fail, and withdrawal rates for two
remedial mathematics courses offered through both
the TGE and Mathematics departments. The
primary statistical test was a series of two factor
analyses of variance (ANOVAs) comparing pass,
fail, or withdrawal rates for 3 year periods both
before and after the introduction of technology. For
all ANOVAs one independent variables was the
technology. The second independent variable was
either the particular course (100M, 100A, 015, 025),
the department (TGE or Mathematics), or the course
level (Arithmetic or Algebra). For each choice of
second independent variable a two factor ANOVA
was calculated with each of pass, fail, and
withdrawal rates as independent variable for a total
of 9 two factor ANOVAs.
Two instructors were primarily responsible for the
implementation of technology in the TGE courses
over the study period. Questionnaires were
completed by each of the two instructors involved in
the transition and followup interviews were
conducted to further clarify and elaborate their
responses. Structured interviews were conducted
with these instructors to determine the impact of the
technology on factors other than passing and
withdrawal rates. Specifically, these interviews
queried whether the technology has provided a
substantial change in the effort required to teach the
class, whether the technology has made the students
more or less comfortable in the classroom, and
whether instructors see the inclusion of technology
in the classroom as a net positive or net negative.
Interviews and questionnaires also included open
ended questions to allow instructors to offer points
of view on effects that the researchers may not have
considered prior to the interview.
Results
Enrollment, pass, fail, and withdrawal data were
collected for all sections of 4 courses from a 9 year
period (2000-2009). To facilitate comparison, data
was converted to percentage rates for pass, fail, and
withdrawal data and enrollment figures were
converted to standardized T-scores based on data
from 2000 to 2009 for each course. The following
figures the mea contains descriptive statistics for the
courses. Dark lines represent TGE courses, light
lines represent Math courses. Diamond marked
lines are Arithmetic, square marked lines are
Algebra.
Figure 1: Enrollment by Year
Figure 2: Pass Rate by Year
Figure 3: Withdrawal Rate by Year
Two-factor ANOVAs were calclulated to compare
pass, fail, and withdrawal rates from both before and
after the introduction of technology. No significant
difference was found between the means of the pre
and post technology groups. Nor were there any
30 35 40 45 50 55 60 65 70
1998 2000 2002 2004 2006 2008 2010
35% 40% 45% 50% 55% 60% 65% 70% 75% 80%
1998 2000 2002 2004 2006 2008 2010
0%
5%
10%
15%
20%
25%
1998 2000 2002 2004 2006 2008 2010
48
Proceedings of International Conference on Education, Informatics, and Cybernetics (icEIC 2011),
and the International Symposium on Integrating Research, Education, and Problem Solving (IREPS 2011)

significant interaction effects noted between
technology level and course, department, or course
level (arithmetic vs. algebra.)
The instructors involved in the implementation of
the technology presented a generally positive
characterization of its impact, though they also
noted some downsides and technical problems. On
the positive side, they noted that the technology
increased student access to material. Both
technologies allow lecture material to be accessed
by students online. Students were able to focus
more on the presentation of material during class
rather than on taking extensive notes. This material
also provided a study resource for students who
were unable to attend class. However, one
instructor mentioned that some students seemed to
place less importance on classroom attendance as a
result. These students were often those who she felt
would have benefitted most from that attendance.
In general, motivated students were able to use the
extra resources to their advantage while some less
motivated students used the presence of the
resources as an excuse to work even less. This was
particularly true regarding the ability to “attend”
lectures remotely via Elluminate. Because remote
students only see what is projected on the
whiteboard, and the instructor cannot see the remote
students at all, it was felt that the lack of full
interactivity and accountability made such
attendance of less value. Indeed, the instructors are
currently discussing not allowing such attendance in
the future except by prior arrangement.
The instructors also reported feeling that some of
the technology was not sufficiently reliable,
especially the live recording capability of
Elluminate Live! While it worked well most of the
time there were problems when students came to
rely on it and then, for whatever reason, it became
unusable for a period. Factors contributing to these
problems seem to be changes in the computer being
used for recording, variations in browsers and
computers used for viewing recordings, and
difficulty keeping all software versions and drivers
up to date.
The instructors were more positive about the effect
of the IWB technology. This technology allows the
instructor to keep multiple boards in computer
memory and switch between them quickly. The
instructors felt that this ability was helpful in
lectures.
Discussion
Based on the results of this study, we cannot
determine that the inclusion of IWB or Elluminate
Live! technology has had a significant effect, either
positive or negative, on student success or retention.
However, this must be taken in the context of
several limitations to this study.
From a quantitative perspective, there are features of
the data that might obscure such effects even if they
were present. As it happens, the time period of this
study (2004-2009) was a time of substantial
variability in enrollments generally. All four
courses experience an enrollment peak of T≥65
between 2002 and 2004 and experience declining
enrollments thereafter for a period of three to five
years. Both TGE courses peaked in 2002 and
bottomed out in 2005 or 2006 and then rose again to
T≥60 by 2009. The Math department courses show
a similar pattern in enrollment, but delayed by one
or two years. Thus it is unlikely that the rise in
enrollment from 2007 to 2009 in the TGE courses
was due to the inclusion of technology. Instead this
change in enrollment is likely due to unknown
external factors. Importantly, a similar dip occurs in
pass rates for three of the four courses, with the
lowest pass rates occurring in 2006. Retention rates
do not show this pattern. Based on the similarity
between the pattern in enrollment and pass rates
across courses in both departments, it seems most
plausible that there were substantial external factors
affecting the number, and likely the quality of
students in the courses during that period. If the
effect of technology use is substantially smaller than
the overall pattern present in the data, an ANOVA
would be unlikely to detect the effect. A more
powerful statistical analysis might be able to detect
such an effect, but it would also be helpful to use a
larger data set as one becomes available.
The quantitative portion of this study examines a
limited range of possible effects, primarily pass and
withdrawal rates. Even if there is no effect on these
measures, there may be significant effects on
measures that we haven’ examined. For example, it
is at least plausible that having access to recordings
of lectures might improve student satisfaction even
if it didn’t improve passing rates. Or it might be
49
Proceedings of International Conference on Education, Informatics, and Cybernetics (icEIC 2011),
and the International Symposium on Integrating Research, Education, and Problem Solving (IREPS 2011)

that even if the pass rate didn’t change, students
who did pass might have done so with higher
grades, especially given the bimodal grade
distributions that often occur in mathematics
courses. Of course neither of these scenarios can be
supported by the results of this study. Rather,
caution is urged against concluding that because
positive effects were not readily visible in the
quantitative portion of this study that they do not
exist.
Another important limitation of this study is that it
does not include qualitative information from the
viewpoint of the students. This should be addressed
in future studies.
Conclusions
This study shows no change in student success rates
after inclusion of IWB and lecture recording
technology in the classroom. Teacher reactions to
such technology are generally positive, though they
also include some concern about possible negative
effects on the lowest performing students and some
frustration with technical problems in
implementation.
However, the study has important limitations that
should be kept clearly in mind before using it as the
basis for policy decisions. The data examined seem
to have been heavily affected by factors external to
the study, possibly obscuring the effect of the
technology change. The study does not take into
account student viewpoints in qualitatively
evaluating the impact of technology on student
learning. These limitation should be addressed in
further studies.
References
[1] Aud, S., Hussar, W., Kena, G., Bianco, K.,
Frohlich, L., Kemp, J., Tahan, K. (2011). The
Condition of Education 2011 (NCES 2011-
033). U.S. Department of Education, National
Center for Education Statistics. Washington, DC:
U.S. Government Printing Office.
[2] Bowman, J., Newman, D. L., Masterson, J.
(2001). “Adopting educational technology:
Implications for designing interventions”,
Journal of Educational Computing Research,
25(1), 81-94.
[3] Connell, M. L. (1998). “Technology in
constructivist mathematics classrooms”, Journal
of Computers in Mathematics and Science
Teaching, 17, 311-338.
[4] Spence, D., & Usher, E. (2007). “Engagement
with mathematics courseware in traditional and
online remedial learning environments:
Relationship to self-efficacy and achievement”,
Journal of Educational Computing Research,
37(3), 267-288.
[5] Parsad, B., & Lewis, L. (2008). Distance
Education at Degree-Granting Postsecondary
Institutions: 2006–07 (NCES 2009–044). U.S.
Department of Education, National Center for
Education Statistics, Institute of Education
Sciences. Washington, DC: U.S. Government
Printing Office.
[6] Tallent-Runnels, M., Thomas, J., Lan, W.,
Cooper, S., & Ahern, T. (2006). “Teaching
courses online: a review of the research”,
Review of Educational Research, 76(1), 93-
135.
[7] Walker, S., & Singer, E. (2007). “Using
technology to teach developmental African-
American algebra students”, Journal of
Computers in Mathematics and Science
Teaching, 26(3), 217-231.
50
Proceedings of International Conference on Education, Informatics, and Cybernetics (icEIC 2011),
and the International Symposium on Integrating Research, Education, and Problem Solving (IREPS 2011)

Investigating the Need and Content for E-Security Training in New Zealand SMEs
Xiaosong LI
Department of Computing, Unitec Institute of Technology
Auckland, New Zealand
Kathiravelu GANESHAN
Department of Computing, Unitec Institute of Technology
Auckland, New Zealand
and
Jie (Jack) HU
HP Work Place Service APJ
Shanghai, P.R.China
�
ABSTRACT
Studies indicate that small and medium sized enterprises
(SMEs) face greater risk from e-security threats, compared to
larger organizations. This is particularly important in New
Zealand, where 90% of business organizations are SMEs. This
study investigates the need and content for e-security training in
New Zealand SMEs and is carried out in two stages: the status
of e-security training among the employees in New Zealand
SMEs is investigated first and then the status is analyzed to
identify possible training courses and course contents and to
make other related recommendations.
This study found that although the SME staff have reasonable
understanding of basic e-security issues, SMEs need to improve
and complete their e-security policies and the corresponding
implementation procedures and employ more effective and
appropriate e-security implementation tools. Only 40% of the
SMEs that participated in this study have policies for password
and internet usage and 33% stated that they have no IT security
policies. Most SMEs don’t have e-security training courses and
procedures. E-security training is highly recommended for these
SMEs. An e-security training system including course outlines
for both, the IT staff and non IT staff is recommended. Other
possible strategies and solutions for e-security are also
recommended.
Keywords: E-security, Training, SME, New Zealand, and
Knowledge.
1. INTRODUCTION
A transaction cost analysis study highlights the important
benefit that internet use can provide in reducing an SME’s
transaction costs [1]. The results of studies on e-security in small
and medium sized enterprises (SMEs) in USA, U.K., Germany
and Japan indicate that SMEs face greater risk from e-security
threats, compared to larger organizations. This is particularly
important in New Zealand, as 90% of business organizations in New Zealand are SMEs [2, 3] and these SMEs make a
significant contribution to New Zealand’s economy [2].
Therefore, it is important for these businesses to have
appropriate e-security management strategies to secure their
business. E-security training and the attitudes of the employees
toward it are very important to information security in New
Zealand SMEs [4].
Over 87% of organizations experienced some form of security
incident; the most common in New Zealand being virus
infection, laptop/cell phone theft and insider abuse of net
access/email [5]. It has been suggested [6] that more than 60,000
known virus threats exist in the current environment world-
wide. The most important element in e-security systems is
people, so it is important to keep employees updated [7]. Technology and training are important to protect customer data.
A lack of awareness exists among office systems users about
information vulnerabilities resulting from the use of personal
workstation automation systems [8]. In 2004, the importance of
information security training, awareness and education was
considered, more than ever, a priority for all education providers
[9].
The objectives of this study are to make owners of New Zealand
SMEs more aware of the importance of e-security for the e-
business environment in the digital economy; to analyze e-
security training in New Zealand SMEs and recommend
appropriate e-security training; to establish a baseline course in
order to educate and train IT users in New Zealand SMEs.
This study is carried out in two stages: the status of e-security
training among employees in New Zealand SMEs is investigated first and then the status is analyzed to identify possible training
courses and required contents as well as to make other, related
recommendations. This study is conducted from a number of
aspects, including if New Zealand SMEs conduct e-security
training for their employees; if employees attend/complete e-
security training before they join and commence using IT
facilities; where e-security training exists, what courses and
contents are covered; where e-security training does not exist,
what should be covered in an e-security training course for New
Zealand SMEs.
The data was gathered using online surveys and individual
interviews. In this study, SMEs are defined as businesses
employing between one and nineteen full time equivalent
people. The participants are from a sample of 15 SMEs out of
100 targeted candidates in the Auckland region who responded
to the invitation letter. The questions were designed to find out the attitudes and knowledge of the participants and their
organizations towards e-security. Two versions of the survey
were conducted, one for IT staff, another for non IT staff. The
selected IT staff had been interviewed to provide the necessary
information. The results are discussed to identify the current
status as well as existing issues and provide information for
New Zealand SMEs to complete and improve their e-security
51
Proceedings of International Conference on Education, Informatics, and Cybernetics (icEIC 2011),
and the International Symposium on Integrating Research, Education, and Problem Solving (IREPS 2011)

training. Six training areas for non IT staff and eleven
for IT staff are identified. Other possible technique solutions to
facilitate e-security training are also recommended.
In the following sections, the data is described first and then the
survey data and interview data are analyzed separately, and that
is followed by discussion and suggestions for future work.
2. THE DATA
The online survey was conducted in two parts; a survey for IT
staff and a survey for non IT/general staff. The survey for IT
staff consists of 17 questions (ITQs) and the survey for non IT
staff 20 questions (GQs). Most of the survey questions are
multiple choice questions. The questions are mainly about
attitude, behavior, background and knowledge of the
participants towards e-security. The main purpose of these
questions is to help us identify the need and the contents of e-
security training New Zealand SMEs. Complete lists of the
questions can be found in Appendices B and C of [4].
The interviews were only for IT managers or staff responsible
for IT in SMEs to get a better understanding of the
organization’s/owner’s views towards e-security. All
participants who supplied their contact details to the survey
from the sample SMEs were invited as participants for the
interviews. Five staffs had been interviewed. The participants
were asked 37questions about e-security covering the following
10 different e-security areas:
1) Securing New Systems
2) Password Management
3) Anti-Virus Measures
4) Software Maintenance
5) Backups
6) Physical Security
7) Network Security
8) Wireless Security
9) Intrusion Detection and Recovery
10) Disaster Recovery Planning
Each interview question (INQ) was provided with a few
possible answers. However, the purpose of these answers was to
stimulate the interviewees’ thinking, not to limit their answers.
All the interviews were semi structured, which provided
sufficient flexibility for those issues not covered by the
predefined questions to emerge during the interviews.
3. SURVEY DATA ANALYSIS
Fifteen valid and complete responses to the survey for IT staff
and thirty valid and complete responses to the survey for non
IT/general staff from the 15 sample SMEs were received. The
data analysis started with non IT/general staff. For each
question, the percentage of each selected option against the
total responses to that question was calculated and the results
were compared with the data from important e-security related
reports to get an idea of how serious the issue is or how much
content is needed. For example, the following is question
GQ3:
Do you have Anti-Spyware software on your working
computer?
• yes
• no
• don’t know
The responses to this question reflect the attitude of the SME
towards e-security and the knowledge of e-security of the
participant. 60% respondents answered “yes”, 20%
respondents answered “no” and another 20% respondents
answered “don’t know”. This indicates that only 60% of the
surveyed SMEs installed Anti-Spyware on their PCs, 40% of
the participated SMEs are not aware of the threats from
spyware. 60% is low compared with similar data from the
other reports, 65% from [10] and 69% from [11]. It shows that
the participants’ knowledge and the SMEs’ attitude regarding
to Spyware are not satisfactory, and the related knowledge
should be included in the training process.
Another example is question GQ5:
Do you frequently change your passwords for your working
computer?
• daily
• weekly
• monthly
• don’t know
The answers to this question reflect the e-security policy of the
SME and the e-security knowledge of the participant. 0%
respondents answered “daily”, 0% respondents answered
“weekly”, 13% respondents answered “monthly” and 87%
respondents answered “don’t know”. This indicates that 87%
people don’t know that it is best practice to frequently change
their password, which is not satisfactory when compared with
only a quarter of organisations had the same issue reported in
[5]. It is also much worse than 60% from [10] and 40% from
[11]. It shows that the surveyed SMEs don’t have an adequate
e-security policy about password change, obviously those
companies did not provide good e-security training for all
employees, and it also shows those employees did not get the
knowledge about password changing from the current and
previous employers. This issue is very serious therefore
training is certainly needed and it is critical to include
password regulations in a training process. Similar data
analysis has been done for IT staff.
Four examples are presented next. The first example is
question ITQ5, where the square list indicates that multiple
answers were allowed:
Does your company have a web usage policy?
• yes
• no
• don’t know
The responses to this question reflect the e-security attitudes of
the participating SMEs. 27% respondents answered “yes”,
60% respondents answered “no” and 13% respondents
answered “don’t know”. This shows that most of the
participating SMEs don’t have existing web usage policy, The
internet has brought a greatly increased information security
risk while providing many opportunities for organisations and
information risk management is in the two top five in the lists
of [10] (TABLE 4 and TABLE 5). These suggest that the
participating SMEs should significantly improve their
awareness of the internet risk. Therefore it should be included
in all the training processes. The second example is question
ITQ9:
Do you have additional measures (Software security lock?,
physical lock?) to protect laptop computers that staff carry
52
Proceedings of International Conference on Education, Informatics, and Cybernetics (icEIC 2011),
and the International Symposium on Integrating Research, Education, and Problem Solving (IREPS 2011)

around with them when they travel?
• yes
• no
• don’t know
The answers to this question reflect the e-security policy of the
SME and the e-security behaviour of the participant. 27%
respondents answered “yes”, 60% respondents answered “no”
and 13% respondents answered “don’t know”. This shows that
most of the participating SMEs don’t have additional lock to
protect laptops when these devices are away from office. It is
interesting to see that the distribution of the answers to this
question is same as that for question ITQ5. It is obvious that
most of the participating SMEs don’t have an e-security policy
in regards to physical protection of mobile devices that carry
sensitive and confidential business information. Improvement
of e-security strategy is needs to be addressed urgently by
these SMEs [12]. This confirms that risks associated with the
internet should be included in all training programmes.
The third example is question ITQ11:
What is your perception of e-security training?
• not important
• important
• very important
The answers to this question reflect the e-security attitudes of
the participants. 13% respondents answered “not important”,
53% respondents answered “important”. This suggests that
most of the participants consider e-security training important
or very important to them. This strongly suggests that there is
a need for e-security training. This positive attitude paves the
way for introducing e-security training courses in the
participating SMEs.
The fourth example is question ITQ12:
Does your company provide e-security training for all
employees?
• yes
• no
This question can reflect the e-security policy of the SMEs and
the e-security attitude of the participants. 7% respondents
answered “yes”, 93% respondents answered “no”. Comparing
the results of ITQ11 and ITQ12, it is interesting that although
the participating SMEs require e-security training, most of
them don’t provide e-security training for all the employees.
The cost of e-security training may be one factor that hinders
the employers’ decision [4, p44]. The answers to ITQ13 show
that at least 60% of the participating SMEs have budgets of
less than 5000 dollars for e-security every year. The answers to
ITQ14 show that 80% of the participating SMEs have budgets
fewer than 1000 dollars for e-security training. This suggests
that most of the participating SMEs only spend 20% of their e-
security budget on training, which is much lower that 40%
reported in [10]. This means that these SMEs require that the
e-security training course should not be too expensive and
cover all areas of e-security knowledge. On the other hand,
they do need to look at what benefit a well-established e-
security system and business training can bring to them.
Table I describes the satisfaction of the survey results. A
satisfactory result means that the results returned by the
participating companies are acceptable in comparison to the
similar results in the literature, on the other hand the not
satisfactory means that is not acceptable compared to similar
survey or study results as demonstrated in the above examples.
The “Should be covered in courses” column indicates that the
relevant knowledge should be included in e-security training
courses.
TABLE I. SURVEY RESULTS SUMMARY
Question
Type Satisfactory
Not
satisfactory
Should be
covered
in courses
GQs
1-2,4,7-9,12-
13,18,20
3,5,6,10-
11,14-17, 19 2-18
ITQs 10-11,13-17 1-9, 12 3-4, 8-10
From the survey summery of survey satisfaction, Table I
presents that among 20 general staff questions, answers to 10 of
them are satisfactory and another 10 are not satisfactory, and
almost all the questions should be covered in training courses;
among 17 IT staff questions, 7 of them are satisfactory and 10
are not satisfactory, 5 questions should be covered in training
courses. These suggest that both of the SMEs and their staff
have some understanding about basic e-security issues,
however, they are far from satisfactory. Training is definitely
needed. It is clear that those SMEs being surveyed need to
improve their e-security policies, and an e-security training
course covering the listed areas should be conducted.
4. INTERVIEW DATA ANALYSIS
The interviewees answered their questions based on their
situation of e-security training in SMEs and supplied their own
views from professional perspective. The targeted SMEs are
members of New Zealand SMEs and are from various business
organizations; they may present different views and answers
regarding the particular interview questions, so it will be
interesting to find out whether different business organizations
have dissimilar opinions in this particular area. Five IT staff
(one IT Consulter, three IT managers and one system
engineer) from five different SMEs were interviewed
individually. The results of these interviews are consistent with
the results of the survey. In addition to that, the interviews
provided more information about the actual implementation of
their e-security system which can help us have a deeper
understanding about the e-security status.
TABLE II. PASSWORD MANAGEMENT
INQ3: How often do
you require end
users to change their
password?
every 4 weeks 40%
every 12 weeks
20%
never change
20%
don’t require to change
20%
For example, TABLE II presents interview data for question
INQ3. 40% of the participated SMEs never or don’t require
end users to change passwords. This is not acceptable
according to IDC’s survey results [10]. These companies need
a tool or policy to force the end user to change their password
periodically [4, p50].
Each interviewee answered 37 questions. The interview results
are summarized according to these ten e-security areas. Most
of the participants believe that e-security training is definitely
the way to keep all employees updated with the necessary
53
Proceedings of International Conference on Education, Informatics, and Cybernetics (icEIC 2011),
and the International Symposium on Integrating Research, Education, and Problem Solving (IREPS 2011)

knowledge on e-security issues and skills so that SME’s
information assets can be kept secure. The training is just like
any other basic PC skills training, however, it can be a long
process for SMEs to implement the training such that all
employees stay updated on a regular basis [4, p59].
A. Securing New Systems Most of the participants stated that SMEs expect a defined set
of procedures to set up a new server or new client machine,
and only 40% participants have checklists of how to secure
new servers and applications. Furthermore, 60% participants
installed firewalls and turned off unnecessary services, and
fortunately all the SMEs rename administrator user names as
appropriate and change default passwords. However, less than
half of the participating SMEs don’t have much knowledge
about how to secure a new system.
B. Password Management It’s a good sign to see that most of the SMEs required end
users to change their passwords frequently. Also 80%
participants educate end users about good password choices,
remove privileged access for an inactive ID and periodically
review the administrative privileges on systems. But still 60%
of participants don’t provide tools to verify strong passwords
and don’t lock out the user's account after a pre-determined
number of failed login attempts and 40% of the participating
SMEs never or don’t require end users to change passwords.
C. Anti-Virus Measures
Anti-Virus is a very familiar topic for most SMEs, and all the
participants have anti-virus software installed on their devices.
This demonstrates that New Zealand SMEs have a good
understanding of using anti-virus tools to keep them safe from
viruses. However, only 40% of participants have spyware
detection software on server and client machines. Based on the
data collected during the interviews, most of the New Zealand
SMEs don’t know the significance of using spyware detection
tools, so there remains the need to improve the training in the
use of spyware detection tools in SMEs.
D. Software Maintenance Software maintenance is not an unfamiliar topic for most
SMEs. This study found that all the participants frequently
update security patches, hot fixes for the operating system,
office productivity applications and other applications. About
40% of the SMEs have centralized management tools to
update their devices. However, most of the SMEs don’t patch
laptop and mobile devices when users are off-site.
E. Backups
Around 80% of the participants backup their servers and 40%
backup their desktops, and 60% employees consider it their
responsibility to back up their data. But 60% participants don’t
know the last tested backup procedures to ensure the data can
be restored. From the interview results, it can be concluded
that most SMEs backup their data, but not often verify and test
the backup system.
F. Physical Security Physical security issues are easily ignored in SMEs, because
most of them don’t have the same amount of money to build
physical security systems, and most SMEs depend on the
property owner’s physical security measures. SMEs that do not
own their buildings are limited in what they can do to
implement an adequate physical security plan. In 80% SMEs,
only the business owner and IT managers have the keys and
keypad passwords for secure areas. Around 80% of the SMEs
keep their servers and critical desktops in secure areas.
However, 40% of the servers, critical desktop computers, and
critical systems areas are not protected by alarms or video
security systems.
G. Network Security
In general, network security is the primary security issue for
SMEs. 80% of participants don’t have network auditing tools
to monitor and analyze the unusual patterns of network traffic.
Moreover 60% of participants don’t examine the network
event logs to check if their systems are under attack. Most
SMEs think that if they have installed a firewall and have
security on networking system, that is enough; unfortunately,
network security not only refers to only the firewall, but also
needs the right policies in place to secure SMEs networks from
the most common threats, which require SMEs to take control
of their networks and create a more secure environment.
H. Wireless Security
Wireless security represents one of the highest risk categories
in SME security systems, however, most of the participants
answered that they have encryption keys over the active Wi-Fi
access points in their networks. Furthermore, most SMEs
educate users about the risks of using wireless (Wi-Fi)
networks, especially on unsecured open networks like hotels,
airport and coffee shops.
I. Intrusion Detection and Recovery Intrusion Detection and Recovery are not familiar words for
most SMEs. Most of the SMEs have installed firewall systems
on their networks, but 60% of participants don’t examine or
monitor their firewall logs to look for patterns of attack, also
60% of participants recover systems via formatting hard drive
and reinstalling operating system and applications. This
indicates that the SMEs don’t have adequate procedures on
Intrusion Detection and Recovery; SME’s need to train their
IT employees in Intrusion Detection and Recovery.
J. Disaster Recovery Planning
Disaster Recovery Planning is something not really considered
as important in New Zealand SMEs. Although it was discovered
through the interviews that most of the SMEs have disaster
recovery plans in writing, most of them never update the
disaster recovery plan. This area requires some more attention.
5. DISCUSION AND FUTURE WORK
A. The status of e-security in New Zealand SMEs
New Zealand SMEs and their staff have reasonable understanding about basic e-security issues. More than half the
participants consider e-security training as important and the
majority of SME employees’ would like to receive e-security
training. However, the SMEs and their IT staff need better
understanding about e-security strategies, policies and
implementation procedures. They need better understanding on
how e-security can impact their businesses and how they can
benefit from reasonable human resource and financial resource
investment on e-security. These can be achieved via e-security
training. E-security training is not a mandatory task for most
SMEs in New Zealand, and only 7% of SMEs provide e-
security training for all employees.
New Zealand SMEs should improve and complete their e-
security policies and the corresponding implementation
procedures. They should employ more effective and
appropriate tools in their e-security implementation. Most
SMEs do not conduct e-security training for employees and
many also do not possess any e-security training before they
join the company and commence using IT facilities. Only 40%
of the participating SMEs have policies for password and
54
Proceedings of International Conference on Education, Informatics, and Cybernetics (icEIC 2011),
and the International Symposium on Integrating Research, Education, and Problem Solving (IREPS 2011)

internet usage and 33% of the participating SMEs stated that there are no IT security policies existing in their organizations.
Furthermore, most SMEs don’t have e-security training
courses and procedures and there are no specific devices or
places to store or contain the training contents. E-security
training is expected and needed.
This study concludes that owners/IT staff/ non IT staff use
non-formal, but well-founded practices, which are different but
not necessarily inferior to large firm practices.
B. Recommended e-security training course for New
Zealand SMEs
This study found that IT and non-IT staff in most New Zealand
SMEs would benefit from additional training. An e-security
training course outline covering ten areas is recommended. On
the other hand, creating an intranet knowledge share point for
e-learning packages to train and educate users is an effective
way for SMEs to implement the e-security training. Furthermore, an initial induction program that involves face-
to-face training will make it work well if SMEs prepare and
invest in such training.
There is an increasing focus on e-security training of SMEs’
staff in the work with information security today. There are
some information security companies working with SMEs to
raise the e-security training in urgent situations, and several
publications indicate the best practices in this area. But many
SMEs need to focus on the e-security training to correct their
staffs’ attitudes and behavior at work.
A good training program should include participation and
active learning using interactive courseware [13]. E-security
education and its associated training courses are different from
the abstract academic discipline programs; they should help
employees of SMEs to be better prepared to deal with actual
tasks when they enter the work place [14]. In order to
complete a successful e-security training program in SMEs,
everyone has a role to play in the training process. Users are
the majority audience in this training process and they are the
most important people to help reduce unintentional errors and
e-security threats. Users may include employees, contractors,
guests and visitors. They must understand and comply with SMEs’ e-security policies and procedures.
An appropriate e-security training system for SMEs has to
include two parts:
• E-Security Training for SME Non IT Staff
• E-Security Training for SME IT Staff
Based on the previous analysis and discussion, an example of
e-security training course for SME non IT staff should address
in detail the fundamentals of e-security such as key principles,
concepts, vulnerabilities, threats and how to counter them.
Thus, the course outline for non IT staff is presented as
following:
1) The Internet Risk
2) Password Management
3) Anti-Virus Measures
4) Acceptable Use Policies
5) Physical Security
6) Incident Response
To ensure SME e-security, it is important to establish a
baseline training of e-security knowledge that every single IT employee in an SME must have. The e-security training course
for SME IT staff should cover the following 11 areas:
1) The Internet Risk 2) Securing New Systems
3) Password Management
4) Anti-Virus Measures
5) Software Maintenance
6) Backups
7) Physical Security
8) Network Security
9) Wireless Security
10) Intrusion Detection and Recovery
11) Disaster Recovery Planning
C. Other Recommendations for New Zealand SMEs
It is difficult to recommend and endeavor to change certain
areas directly applicable to New Zealand SMEs without any
external impetus which stimulates their motivation for change.
The recommendations are summarized as following:
Complete e-security policies and the
corresponding implementation procedures must be in
place: Effective e-security policies must be completely
developed. To develop the security policies, a noncompliance
policy for e-security and e-security training should be
considered as an important part of e-security policies. The
implementation procedures should clearly identify the
available e-security tools and how to use them.
Make e-security training as important as other
skills training: This study shows that the amount of e-security
training in New Zealand SMES is still very low and providing
proper e-security training is becoming more and more
important for most SMEs. Therefore, the first set of
recommendations aims to raise the e-security training as an
important skills training for SMEs:
• SME owners should consider e-security training as
important as any other skills training
• SME owners should initiate a noncompliance policy
for e-security and e-security training.
• SME owners should develop a recognized training
framework to encourage lifelong learning
The communication of the survey and interviews indicates that
SMEs should avoid abstract and tedious indoctrinations about
the importance of e-security. Instead, it would be better to
develop a well structured training framework with a fresh and
emotional introduction that captures the attention of the
audience such as real-life experiences in e-security skills and
knowledge training at their organizations.
Reward employees upon completion of e-security
training: When SME employees have succeeded in
completing an adequate level of e-security training, it is time
to reward those who carry out the organization policy and act
accordingly. This could be achieved by certain measures:
• Issuing a formal e-security training certificate
printed with employee’s name and completion date
• Investing in their career -- offering employees more
opportunities to learn new technologies and skills to
motivate the IT professionals and non IT staff
• Integrating the training as a part of the annual review
program
D. Research implications and limitation
The limitation is that this study does not aim at providing representative data and results as it is only studied the targeted
and selected SMEs in Auckland. However, based on the pool
of valid responses received, it is legitimate to make
55
Proceedings of International Conference on Education, Informatics, and Cybernetics (icEIC 2011),
and the International Symposium on Integrating Research, Education, and Problem Solving (IREPS 2011)

assumptions and “educated guesses” in regards to the e-security in the Auckland region. It was assumed that the
participants would represent different opinions. However,
most of the participants offered similar views in answering the
questions. Most of the analysis was based upon the calculation
of frequencies, because the limited pool of data it is
impractical to conduct any more advanced statistical analysis
such as correlations or regression [4].
E. Future work
The recommendations and baseline course are supposed to be
used in practical work with e-security training. To see if this is
possible and expedient, the baseline course must be developed
and tested in some SMEs. Such testing has not been done
currently, but it is considered a natural follow-up to this report.
It is expected that some or all of the recommendations and
baseline course are used to bring effective impact on attitudes
and behavior of New Zealand SMEs and their staff. From this
it would of course also be expected to find out if the baseline course could be used or not. Another output could be the
identification and definition of many new e-security training
baseline courses [4].
Also the recommended course has to provide a place for
employees to find security information, letting them know that
breaches in security could cost the company severely, and the
e-security training is necessary for everybody. On the other
hand, creating an intranet knowledge share point for e-learning
packages to train and educate users is an effective way for
SMEs to implement the e-security training. Furthermore, an
initial induction program that involves face-to-face training
will work well if SMEs prepare and invest in them properly.
6. REFERENCES
[1] F. T. Lohrke, G. Mcclure Franklin and C. Frownfelter-Lohrke, “The Internet as an Information Conduit: A Transaction Cost Analysis Model of US SME Internet Use”, International Small Business Journal, Vol 24(2), 2006, pp. 159–178.
[2] New Zealand Ministry of Economic Development, SMEs in New Zealand: Structure and Dynamics, Retrieved January 23, 2011, from http://www.med.govt.nz/templates/ContentTopicSummary____39289.aspx.
[3] Ministry of Economic Development, SMEs in New Zealand:Structure and Dynamics 2010, Retrieved Febuary 9, 2011, from http://www.med.govt.nz/upload/74417/SMEs%20in%20New%20Zealand%20Structure%20and%20Dynamics%202010.pdf.
[4] J. Hu, E-Security Training in New Zealand SMEs, Master Thesis, Unitec New Zealand, 2009.
[5] S. Quinn, 2005 New Zealand computer crime & security survey. Published by the Alpha-Omega Group, 2006. ISSN 1177-4207.
[6] McAfee Corporation, Security version from McAfee Avert Labs. Sage 2(1), 2008. Retrieved March 8, 2008, from http://www.mcafee.com/us/local_content/reports/sage_2008.pdf
[7] B. Blackley, E. McDermott & D. Geer, “Information security is information risk management”. Paper presented at the ACE 2001 Workshop on New Security Paradigms, Cloudcroft, New Mexico. Retrieved October 24, 2006, from the Unitec Library resource.
[8] J. Schweitzer, (1984). Information security and office automation: Challenge and opportunity. Proceedings of the ACM SIGSAC Conference, 1984, pp. 24-28.
[9] S. Narayan, & S. Narayan, “Information security qualifications in New Zealand” Bulletin of Applied
Computing and Information Technology 2 (3). November, 2004.
[10] A. Carey, 2005 G loba l Informa t ion Secur i t y Workforce S tudy by IDC. White Paper. January 23, 2011, from http://www.securitymanagement.com/archive/library/globalinformation_itsecurity0206.pdf.
[11] Ernst & Young, Global Information Security Survey 2004, Retrieved January 23, 2011, from http://www.issa-motorcity.org/files/GlobalInformationSecuritySurvey2004.pdf
[12] Symantec Corporation, New Survey From Symantec Shows Cracks in Small Business Security, 2008. Retrieved January 30, 2011, from http://www.symantec.com/en/uk/about/news/release/article.jsp?prid=20080807_02
[13] A.Wang, “Web-based interactive courseware for information security”, Proceedings of the 6th Conference on Information Technology Education, Newark, NJ, USA, SIGITE '05, 2005, pp. 199-204.
[14] S.F. Barnett, Computer security training and education: A needs analysis. Digital Object, Identifier 10.1109/SECPRI.1996.502666. Retrieved October 16, 2006, from the IEEE Database website, 1996.
56
Proceedings of International Conference on Education, Informatics, and Cybernetics (icEIC 2011),
and the International Symposium on Integrating Research, Education, and Problem Solving (IREPS 2011)

Using Robots to Teach Musical Rhythms to Typically Developing Children and Children
with Autism
Timothy GIFFORD
Center for the Ecological Study of Perception and Action, Department of Psychology,
Advanced Interactive Technology Center
Center for Health Intervention and Prevention, College of Liberal Arts and Sciences, University of Connecticut
Storrs, CT 06269
Movia Robotics LLC. Hartford, CT 06114
Sudha SRINIVASAN
Physical Therapy program, Department of Kinesiology,
Center for the Ecological Study of Perception and Action, Department of Psychology,
Center for Health Intervention and Prevention, College of Liberal Arts and Sciences, University of Connecticut
Storrs, CT 06269
Maninderjit KAUR
Physical Therapy program, Department of Kinesiology, University of Connecticut
Storrs, CT 06269
Dobri DOTOV
Center for the Ecological Study of Perception and Action, Department of Psychology, University of Connecticut
Storrs, CT 06269
Christian WANAMAKER
Center for Health Intervention and Prevention, College of Liberal Arts and Sciences, University of Connecticut
Storrs, CT 06269
Gregory DRESSLER
Center for Health Intervention and Prevention, College of Liberal Arts and Sciences, University of Connecticut
Storrs, CT 06269
Kerry MARSH
Center for the Ecological Study of Perception and Action, Department of Psychology,
Center for Health Intervention and Prevention, College of Liberal Arts and Sciences, University of Connecticut
Storrs, CT 06269
Anjana BHAT
Physical Therapy program, Department of Kinesiology,
Center for the Ecological Study of Perception and Action, Department of Psychology,
Center for Health Intervention and Prevention, College of Liberal Arts and Sciences, University of Connecticut
Storrs, CT 06269
ABSTRACT
Robot assisted therapies offer promise as training and
educational tools for facilitating learning in children. Music
training or therapy is often provided to school-age children.
We are using commercially available humanoid robots to
systematize music training sessions by providing consistent
repetitive training that is also spontaneous and interactive.
We use an embodied approach to musical training wherein
the robot progresses from whole body rhythmic actions to
finer drumming actions. In order to minimize the amount of
control and energy needed to create rich sounds we took
advantage of the forces in the system. In this way the robot
was able to produce complex dynamics with minimal control.
We were able to create multiple themes as basic behaviors.
10 typically developing children interacted with Nao across
12 rhythm training sessions within a robot-child-child
context. Pre-, mid- and posttest data have been collected to
examine the child’s motor patterns during whole body action
and drumming. Preliminary analyses are currently ongoing.
We hypothesize that the children will improve their intralimb
57
Proceedings of International Conference on Education, Informatics, and Cybernetics (icEIC 2011),
and the International Symposium on Integrating Research, Education, and Problem Solving (IREPS 2011)

and interlimb coordination during rhythmic actions such as
marching, clapping, and drumming following training. We
also hypothesize that social interactions such as conversation
bouts and rates of joint attention bids will increase across
training sessions. Overall, we believe that the rhythm
intervention context developed with a 23-inch tall humanoid
robot called Nao (Aldebaran Robotics, Inc.) is a highly
engaging context for children to facilitate social
communication and motor skills. Robot child interaction
based training shows promise as a modality for skills training
and education.
Keywords: humanoid robotics, rhythm therapy, education,
autism, music
1. INTRODUCTION
This work is based on a collaboration between several
departments at the University of Connecticut and members of
the community. We are looking at issues of human robotic
interface and how it relates to real world applications in
education and therapy. Our fundamental perspective is that
communication and social interaction are embodied
dynamical processes. [10,16,17] Aspects of perceptuo motor
control are fundamental to attunement and interaction.
Training that promotes motor control and awareness of the
movements of others can improve basic social skills,
communication, and quality of life. [5,11,12,13,14,17]
2. BACKGROUND
Robot assisted training offers promise as an educational and
therapeutic tool to facilitate learning in children.
[7,8,18,19,20,25] In robot assisted training the trainer works
with a child using the robot as a tool to lead and motivate the
child. The training contexts may involve one robot and one to
two children. In all cases we have an adult mediate the
interactions between the robot and the children. The trainer
sets the mode of operation of the robot, the child and robot go
through an activity. The activities address specific skill sets
within motor, social, and communication domains. Kids are
motivated to interact with robots. [20] Children in general
find robots interesting and enjoyable to work with. This
offers the opportunity to use robot interactions as a
motivating context for repetitive activities. This is helpful in
training regimens where part of the effort by the trainer is
generally engaging the child to participate and then
maintaining their engagement throughout the training
session. Some time is often spent in re-engaging the child
after they have been distracted from the task at hand. Robots
are dynamically interactive and can participate in re-engaging
the child and primary activity.
3. CAPABILTIES OF ROBOTS
In our research we are working to develop deployable
systems that can be used in real-world clinical and
educational environments. Commercial robotics has reached
a level of maturity that has made available robust humanoid
and mobile robots that could be used as training tools by
clinicians and educators in the field. These robots have
several capabilities that can be applied to robot assisted
training. Robots have the ability to provide social interactions
through the use of language and gestures [19,20]. The robot
can be programmed to speak predetermined sentences. The
phrases and sentences can be triggered as a response to
speech recognition or initiated by the trainer. Various
gestures can be programmed by these robots as part of their
motor repertoire. Each of these actions can be modified in a
systematic way so that the complexity of the interaction can
be varied based on the level of training that is appropriate.
Currently available robots such as the Nao (Aldebaran
Robotics, Inc.) can provide lifelike (real world?) interactions.
The Nao has 25 degrees of freedom giving it a morphology
that is very similar to that of a human. This provides the
opportunity for the robot to engage in simple to complex
motor activities with the children, for example, imitation
games. The similarity in morphology also provides the
opportunity for the robot to operate devices that can be used
by people. These can be toys or musical instruments.
Several robots have the ability to move through an
environment at various speeds. This locomotive ability
provides the opportunity for interactions with the child such
as chasing games or walking in step. [17] In some cases it is
necessary to use a wheeled robot to maneuver with the
children because of the greater robustness of the wheeled
modality as compared to current legged walking robots.
INTERPERSONAL SYNCHRONNY
Moving in synchrony with another, entails entrainment to the
other person. [12,21] This may be a form of mimicry which is
an important social skill. [12] This entrainment is the bases
for increasing interpersonal synchrony. This interpersonal
synchrony is a dynamic process that emerges from the
interplay between the members of the group. As they move
together they mutually influence each other creating an
emergent synchronous system that is self organizing. This
system is an emergent social unit. [16,17]
Acting in a coordinated fashion with others promotes feelings
of connectedness. [12] The activity of drumming with the
robot and another child may promote social bonds.
Wiltermuth and Heath found that synchronous activities can
lead people to cooperate with others and further that this
activity could lead to future cooperation. [26] This
synchronous activity equips the actor with abilities that
enable them to cooperate in the future.[9,26] Kirschner &
Tomasello found that typically developing (TD) children can
synchronize their drumming to a machine, but young TD
children benefited from a social context where they were
drumming with another child, enabling them to perform
better in difficult tasks such as adjusting to a different tempo.
58
Proceedings of International Conference on Education, Informatics, and Cybernetics (icEIC 2011),
and the International Symposium on Integrating Research, Education, and Problem Solving (IREPS 2011)

This is evidence for including a child-child-robot context[13].
The joint action task of drumming motivates the children to
act in a cooperative way[13].
Musical synchrony interacts with the social synchrony
during group music making .[5,17] Demos et al., 2011 found
the synchronous activity acted as a social attractor that lead
people to feel like they were synchronizing with other
people. Interestingly the degree to which people felt they
were in sync with others wasn’t correlated with how much
they were in sync to the other people, but rather to how much
they were in sync with the music. The music acted as a social
intermediary forming a bridge between the participants. [5] In
this way the rhythm imparted into the group by the robot
could act as a bridge between the two children. Other pro-
social effects were observed by Hove and Rosen 2009, who
found that interpersonal synchrony lead to feelings of
affiliation. [11]
4. RHYTHM THERAPY
Therefore one of our training contexts capitalizes on
interpersonal synchrony and is modeled on the principles of
rhythm therapy. This application takes advantage of many of
the features provided by the humanoid robots and provides
many benefits sought through robot assisted training
including cooperation and joint attention. [13,14] We have
developed drumming activities where children could play
drums along with the robot. This could be done in a dyadic
context where a single child plays with the robot and in a
triadic context where two children will play with a single
robot. [14] Drumming is fairly complex yet achievable
activity for the robot. With the appropriate programming, it is
possible to achieve reliable drum hits that have a good sound
using appropriate humanoid robots. Currently, we are
developing clear drumming motions of the robot so that they
are easily perceived and understood by the children[18].
5. ROBOT CONTOL
To support these activities the main capability necessary for
the robot is the ability to successfully and repeatedly play a
drum. The robot needs to be able to produce clear loud
sounds in simple and complex patterns at a measured tempo.
This seemingly simple set of requirements produces some
interesting technical issues that need to be solved.
In order to produce a clear and loud report from the drum
surface it is necessary to impact it with a quick forceful
stroke. If we impact the drum with the robot’s end effector
(hands or fingers in the case of Nao) it will cause great stress
and wear leading to failure of the mechanical structure. To
overcome this we have the robot playing the drum with
mallets or drumsticks. In this way the impact stress is taken
by the mallet and is reduced by the time it reaches the robot’s
joints. Since the children are of varying motor ability we ask
them to play the drum with their hands. The sounds generated
by these two activities are similar and we have not seen any
disconnect between the children and the robot based on the
different drumming tools used i.e., sticks versus hands.
Figure 1. The Aldebaran Nao robot shown in position at the
drum holding the drum mallets.
While drumming it is possible to over control the movements
of the robot in an effort to be precise. The system has its own
natural dynamics and cannot be completely constrained to a
particular motion path rather it needs to move within its
natural periodicity to produce the desired results[15]. If the
system is over constrained to achieve an ideal movement it
will entail additional mechanical stress and additional power
to maintain the exact motion path needed to produce the
desired result. Our solution to this problem is to use the
forces in the joint system of the robot, mallet, and drum to
our advantage. We are able to use simple control parameters
to produce complex dynamics that emerge naturally from the
system. These complex emergent dynamics are needed to
produce the rich sound desired [6,15].
Another problem facing mechanisms that need to produce
repetitive motion in synchrony with external events is
accumulating error. As the drumming robot produces each
stroke it is acting in a natural system where some of the
forces are not under its control. These forces can cause one
stroke to take a different amount of time than another stroke.
If the system is running in a linear fashion with each stroke
starting after the previous one is finished then the tempo of
the strokes will vary randomly based on these effects. These
errors will accumulate over time causing the system to move
further and further from the original timing. Our solution is to
enable the system to move dynamically from one action to
the next without regard for its current or previous position.
The system is able to interpolate from any given initial
position to the desired position at the required time to support
the tempo. This prospective behavior works toward a desired
future state rather than working off of a previously achieved
state. [22]
59
Proceedings of International Conference on Education, Informatics, and Cybernetics (icEIC 2011),
and the International Symposium on Integrating Research, Education, and Problem Solving (IREPS 2011)

6. DYNAMICS IN THE SYSTEM
In order to achieve the desired dynamics we use a
biologically inspired model where we use the morphology of
the robot in different ways depending on where we are in the
task. In nature muscles can play different roles with little
change in activation depending on the context. Muscles can
act as motors, struts, and springs depending on their
activation and the physical orientation of the entire system.
We also use the forces in the system to drive the performance
of the system as a whole [4]
Grasping: One way that biological systems detect
objects within the environment is through haptic feedback.
[3] Contact with an object is indicated through deformations
of the entire system. We use this same technique to detect
that the end effector is grasping the mallet by comparing the
actual or measured joint angles of the fingers to the joint
angles that being triggered by the control software. If the
joint angles are less than the requested angles then there is
something there that is restricting the movement of the
fingers.
Figure 2. Here we see the end effector grasping the drumstick. The dotted line indicates the requested finger
position. The solid line shows the actual resultant position.
The difference indicates the presence of an object.
Arm Dynamics: The stiffness of the actuators is
kept low throughout the cycle which enables them to be used
as motors and dampers depending on where in the cycle at
any given point. The elastic surface of the drum acts as a
spring. The mallet is grasped loosely and can swing freely
with momentum. The arm moves through an arc that is close
enough for the mallet to swing to reach the drum head. The
arm is beginning to return to the upswing while the mallet is
impacting the surface of the drum. The mallet is being carried
away from the drum head before it is able to bounce back
into the drumhead eliminating any repercussive effects of
multiple hits. The dynamics of the arm-end effector-mallet-
drum run on a much faster scale than our program and we do
not have to control it. We only have a projected joint angle
trajectory as a sinusoid. Functionality emerges as a product of
small parameter changes and context.[4,6,15,22]
Figure 3. Arm Joint Angles over time. The top graph shows
a continuous beat. The middle graph shows a tempo where
the length of a cycle is longer than the time it takes to complete a down swing and an upswing. The bottom graph
shows a rhythm where the time to complete the upswing is
greater than the time before the next downswing. The arm only travels part of the way to the upper position before being
triggered to go to the down stroke.
Arm Stroke Cycle: The arm is controlled by
triggering the arm to move to a desired angle in a precise
time t. At time t the arm is then triggered to move to the
upper joint angle by time 2t. The speed at which the joint
angles are altered follows a spline curve computed by a
movement interpolator imbedded in the Nao’s control
software. Although the joint angles are being controlled the
stiffness is low allowing the arm to naturally overshoot its
target angle. The momentum of the mallet carries the head of
the mallet into the drumhead. Due to the loose stiffness
setting of the grasp of the end effector the mallet bounces
freely off of the drum head without precise control. The time
triggered for travel to up position is longer than down
position time producing less force and stress on the system.
By using these principals we were able to take advantage of
the forces in the task to and use minimal control whole
producing complex dynamics. The end result is clear
drumming that can be easily controlled to produce multiple
rhythms.
7. EXPERIMENTAL DESIGN
Subjects: 14 typically developing children between 4 to 8
years of age have been observed over a 12 session training
protocol delivered over six weeks (2 sessions per week). Two
children with an age difference of approximately two years
interacted with Nao and a mobile robot Rovio (Wowwee,
Inc.) during each 45-minute training session. Pretest and
posttest assessments were conducted before and after
training.
Testing protocol: Pretests and posttests involved tasks-
specific actions (rhythmic gross motor and drumming
60
Proceedings of International Conference on Education, Informatics, and Cybernetics (icEIC 2011),
and the International Symposium on Integrating Research, Education, and Problem Solving (IREPS 2011)
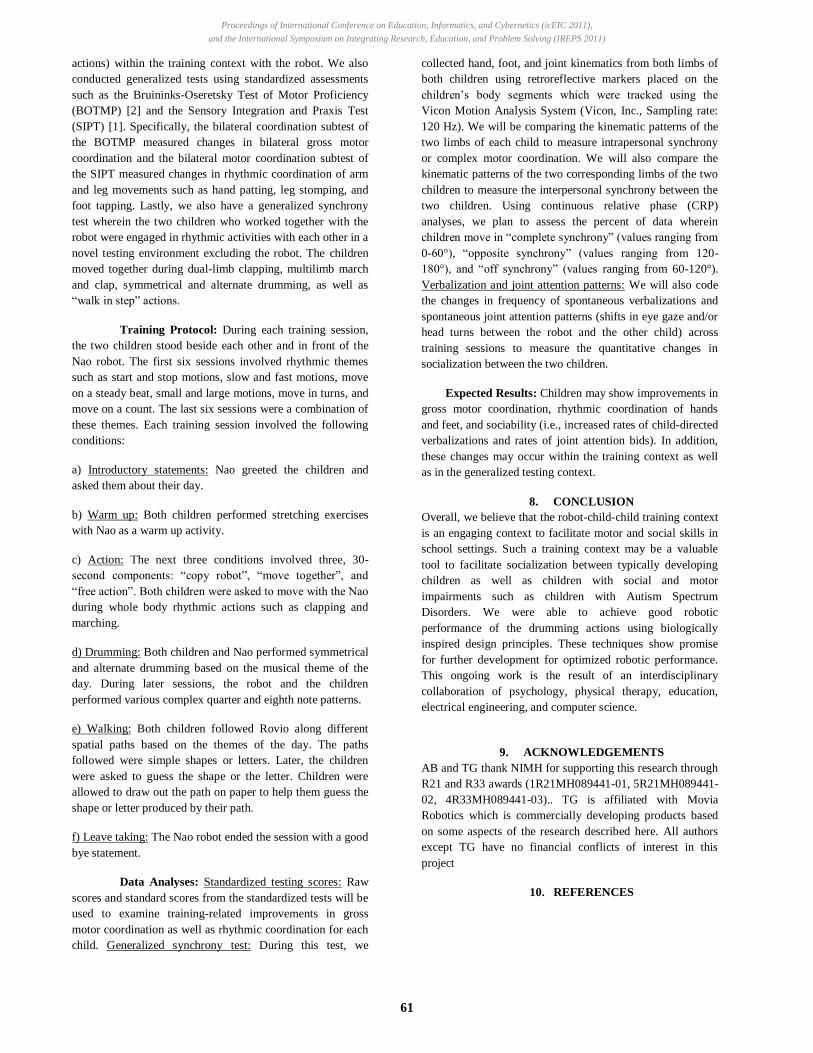
actions) within the training context with the robot. We also
conducted generalized tests using standardized assessments
such as the Bruininks-Oseretsky Test of Motor Proficiency
(BOTMP) [2] and the Sensory Integration and Praxis Test
(SIPT) [1]. Specifically, the bilateral coordination subtest of
the BOTMP measured changes in bilateral gross motor
coordination and the bilateral motor coordination subtest of
the SIPT measured changes in rhythmic coordination of arm
and leg movements such as hand patting, leg stomping, and
foot tapping. Lastly, we also have a generalized synchrony
test wherein the two children who worked together with the
robot were engaged in rhythmic activities with each other in a
novel testing environment excluding the robot. The children
moved together during dual-limb clapping, multilimb march
and clap, symmetrical and alternate drumming, as well as
“walk in step” actions.
Training Protocol: During each training session,
the two children stood beside each other and in front of the
Nao robot. The first six sessions involved rhythmic themes
such as start and stop motions, slow and fast motions, move
on a steady beat, small and large motions, move in turns, and
move on a count. The last six sessions were a combination of
these themes. Each training session involved the following
conditions:
a) Introductory statements: Nao greeted the children and
asked them about their day.
b) Warm up: Both children performed stretching exercises
with Nao as a warm up activity.
c) Action: The next three conditions involved three, 30-
second components: “copy robot”, “move together”, and
“free action”. Both children were asked to move with the Nao
during whole body rhythmic actions such as clapping and
marching.
d) Drumming: Both children and Nao performed symmetrical
and alternate drumming based on the musical theme of the
day. During later sessions, the robot and the children
performed various complex quarter and eighth note patterns.
e) Walking: Both children followed Rovio along different
spatial paths based on the themes of the day. The paths
followed were simple shapes or letters. Later, the children
were asked to guess the shape or the letter. Children were
allowed to draw out the path on paper to help them guess the
shape or letter produced by their path.
f) Leave taking: The Nao robot ended the session with a good
bye statement.
Data Analyses: Standardized testing scores: Raw
scores and standard scores from the standardized tests will be
used to examine training-related improvements in gross
motor coordination as well as rhythmic coordination for each
child. Generalized synchrony test: During this test, we
collected hand, foot, and joint kinematics from both limbs of
both children using retroreflective markers placed on the
children’s body segments which were tracked using the
Vicon Motion Analysis System (Vicon, Inc., Sampling rate:
120 Hz). We will be comparing the kinematic patterns of the
two limbs of each child to measure intrapersonal synchrony
or complex motor coordination. We will also compare the
kinematic patterns of the two corresponding limbs of the two
children to measure the interpersonal synchrony between the
two children. Using continuous relative phase (CRP)
analyses, we plan to assess the percent of data wherein
children move in “complete synchrony” (values ranging from
0-60°), “opposite synchrony” (values ranging from 120-
180°), and “off synchrony” (values ranging from 60-120°).
Verbalization and joint attention patterns: We will also code
the changes in frequency of spontaneous verbalizations and
spontaneous joint attention patterns (shifts in eye gaze and/or
head turns between the robot and the other child) across
training sessions to measure the quantitative changes in
socialization between the two children.
Expected Results: Children may show improvements in
gross motor coordination, rhythmic coordination of hands
and feet, and sociability (i.e., increased rates of child-directed
verbalizations and rates of joint attention bids). In addition,
these changes may occur within the training context as well
as in the generalized testing context.
8. CONCLUSION
Overall, we believe that the robot-child-child training context
is an engaging context to facilitate motor and social skills in
school settings. Such a training context may be a valuable
tool to facilitate socialization between typically developing
children as well as children with social and motor
impairments such as children with Autism Spectrum
Disorders. We were able to achieve good robotic
performance of the drumming actions using biologically
inspired design principles. These techniques show promise
for further development for optimized robotic performance.
This ongoing work is the result of an interdisciplinary
collaboration of psychology, physical therapy, education,
electrical engineering, and computer science.
9. ACKNOWLEDGEMENTS
AB and TG thank NIMH for supporting this research through
R21 and R33 awards (1R21MH089441-01, 5R21MH089441-
02, 4R33MH089441-03).. TG is affiliated with Movia
Robotics which is commercially developing products based
on some aspects of the research described here. All authors
except TG have no financial conflicts of interest in this
project
10. REFERENCES
61
Proceedings of International Conference on Education, Informatics, and Cybernetics (icEIC 2011),
and the International Symposium on Integrating Research, Education, and Problem Solving (IREPS 2011)

[ 1] Ayres, A. J. (2007). Sensory Integration and Praxis
Tests. Western Psychological Services Clinic. Los
Angeles, CA.
[ 2] Bruininks, R., (1978)The Bruininks-Oseretsky Test of
Motor Proficiency., Circle Pines, MN: American
Guidance Service.
[ 3] Carello, C., Turvey, M. (2004) Physics and Psychology of the Muscle Sense. Current Directions in Psychological Science February 2004 vol. 13 no. 125-28
[ 4] Collins,S., Ruina,A., Tedrake,R., Wisse, M. (2005)
Efficient Bipedal Robots Based on Passive-Dynamic
Walkers. Science 307, 1082
[ 5] Demos, A. P., Chaffin, R., Begosh, K. T., Daniels, J. R.,
& Marsh, K. L. (2011). Rocking to the Beat: Effects of
Music and Partner's Movements on Spontaneous
Interpersonal Coordination. Journal of Experimental
Psychology: General. Advance online publication, June
13, 2011.
[ 6] Dickinson, M.H., Farley,C.T.,Full, R.J., Koehl,M.,A.,
Kram,R., Lehman, S., (2000) How Animals Move: An
Integrative View, 7 APRIL 2000 VOL 288 SCIENCE
[ 7] Duquette, A., Michaud,F., Mercier,H.(2008)Exploring
the use of a mobile robot as an imitation agent with
children with low-functioning autism. Auton. Robots
24(2): 147-157
[ 8] Feil-Seifer, D., Matarić, M. J.(2009) Toward Socially
Assistive Robotics for Augmenting Interventions for
Children with Autism Spectrum Disorders. Springer
Tracts in Advanced Robotics, 2009, Volume 54/2009,
201-210
[ 9] Gernsbacher, M. A., Stevenson, J. L.,Khandakar, S.,
Hill-Goldsmith, H. (2008a). Why does joint attention
look atypical in autism? . Child Development
Perspectives , 2 (1), 38-45.
[ 10] Gibson, J. J. (1979) The ecological approach to visual
perception. Boston, Houghton Mifflin.
[ 11] Hove M. J. and Risen J. L. ( 2009 ) It’s all in the
timing: Interpersonal synchrony increases affiliation
. Social Cognition 27 , 949 – 960 .
[ 12] Kinsbourne, M., & Helt, M. (2011). Entrainment,
mimicry, and interpersonal synchrony. In D. A. Fein
(Ed.), The neuropsychology of autism (pp. 339-365).
New York: Oxford University press.
[ 13] Kirschner, S.,Tomasello,M.,Joint drumming: Social
context facilitates synchronization in preschool
children. Journal of Experimental Psychology 102. 299-
314.
[ 14] Kose-Bagci,H., Dautenhahn,K., Nehaniv, C.L. (2008)
Emergent Dynamics of Turn-Taking Interaction in
Drumming Games with a Humanoid Robot. Proc.
IEEE RO-MAN 2008, 1-3 August 2008, Technische
Universitat Munchen, Munich, Germany.
[ 15] Latash, A. L., Turvey, I. T., & Bernshteĭn, N. A.
(1996).Dexterity and its development. Lawrence
Erlbaum.
[ 16] Marsh, K. L., Richardson, M. J. Baron, R. M., &
Schmidt, R. C. (2006). Contrasting approaches to
perceiving and acting with others. Ecological
Psychology, 18, 1-37.
[ 17] Marsh, K. L., Richardson, M. J., & Schmidt, R. C.
(2009). Social connection through joint action and
interpersonal coordination. Topics in Cognitive
Science, 1(2), 320-339.
[ 18] Pierno, A. C., Mari, M., Lusher, D., & Castiello, U.
(2008). Robotic movement elicits visuomotor priming
in children with autism. Neuropsycholgia , 46, 448-
454.
[ 19] Robins,B., Dickerson,P., Stribling, P., Dautenhahn,K.,
(2004), Robot-mediated joint attention in children
with autism: A case study in robot-human
interaction. Interaction Studies 5:2 2004, 161–198.
[ 20] Robins, B., Dautenhahn, K., te Boekhorst, R., &
Billard,A., (2005), Robotic assistants in therapy and
education of children with autism: Can a small
humanoid robot help encourage social interaction
skills? Universal Access in the Information Society
(UAIS), Vol 4(2) special edition, Springer- Verlag.
[ 21] Scholz, J.P. and Kelso, S.(1989) A quantitative
approach to understanding the formation and
change of coordinated movement patterns., 21, Circle
Pines, MN: American Guidance Service, p. 122-144.
[ 22] Turvey, M.T.,(1992) Affordance and Prospective
Control: An Outline of the Ontology. Ecological
Psychology, 4(3), 173-187
[ 23] Valdesolo, P., Ouyang, J. & DeSteno, D.A. (2010). The
rhythm of joint action: Synchrony promotes
cooperative ability. Journal of Experimental Social
Psychology, 46, 693-695.
[ 24] Warren, W. H. (2006) The dynamics of perception
and action. Psychological Review, 113, 358-389.
[ 25] Werry,I., Dautenhahn, K., (1999): Applying robot
technology to the rehabilitation of autistic children.
In: Proceedings SIRS99, 7th International Symposium
on Intelligent Robotic Systems '99.
[ 26] Wiltermuth, S. S. & Heath, C. (2009). Synchrony and
cooperation. Psychological Science, 20, 1-5.
62
Proceedings of International Conference on Education, Informatics, and Cybernetics (icEIC 2011),
and the International Symposium on Integrating Research, Education, and Problem Solving (IREPS 2011)

The International Digital Divide: Education and Wireless Technology in Developing Countries
Tom Goulding, PhD., [email protected], Lisa MacLean, [email protected], P.A. Elysee, [email protected],
Magdy Ellabidy, [email protected]
Wentworth Institute of Technology
Boston, Massachusetts, USA
Abstract. The impact of wireless technology on
society is indelible, and its implementation is vital
for the advancement of developing countries. In
addition to having access to localized wireless
networks, the ability to take advantage of the
Internet and its worldwide possibilities can provide
a new medium for education, both on a local and a
global scale. The social impact wireless technology
can have are almost beyond imagination once the
world is opened up to isolated populations. The
goal of this paper is to define important wireless
technologies and demonstrate and analyze the
importance of wireless technology for education in
a developing country such as Haiti.
Keywords: Digital Divide, d
economy, Haiti Internet Initiative.
1. INTRODUCTION
Identifying the needs of the country and people
is the first process to complete the concept of appropriate technology. Appropriate technology is designed to take under consideration the whole environmental, ethical, cultural, social, political, and economic aspects facing a specific country. Using appropriate technology methods for countries with very low resources is the best way to educational opportunities. Appropriate technology is very easily maintained and requires few resources. The appropriate technology is harmless to the environment and works within its confinement, i.e., unusual weather, topology or geography [1]. Appropriate technology was created under the idea that certain types of technology are often inappropriate for certain countries. Haiti, for example falls under the category of a developing country; that is, a mainstream and costly technology would be inappropriate for their current economic climate and dissembled state at this time.
The island nation of Haiti will be used in this paper as an example of a developing country with a unique situation but needs for technology and education which are universal in nature.
1.1 The Tragedy of the Earthquake in Haiti
The country of Haiti is a republic in the West Indies on the western part of the island of Hispaniola. Although a country rich in language, culture and music, it is the poorest and most illiterate nation in the western hemisphere [2].
A devastating 7.3 magnitude earthquake struck Haiti on January 12, 2010. It left approximately 230,000 people dead and more than 1.2 million people homeless [3]. It came to light that their communication system was inadequate as areas affected by the earthquake could not communicate with each other. This highlighted the differences in availability throughout the population: the communication system in Haiti was not only weak, but not available to most. The rebuilding of the country telecom infrastructure and the increase access to fixed, mobile, and Internet access have been in the forefront of the reconstruction efforts.
1.2 The Communication System in Haiti
Haiti is among the developing countries that have strived to provide the benefits of the Internet to most. The need for reliable telecommunications system in Haiti is growing due to a large expatriate community living in the United States, Canada, France, and elsewhere [4]. However, the current telecommunications system is unable to support the high demand. There are a few working telephone lines; most of the telephone services are provided by three wireless companies: Voilà, Digicel, and Haitel [5]. The Internet services are limited and available to a low percentage of users due to their expensive monthly costs. Some Non-Governmental Organizations (NGOs) provide free wireless access to their network. The rest of the
Internet or make telephone calls using Voice Over IP (VoIP). It is very difficult for public school students to have access to a computer system, let alone the Internet.
1.3 The Educational System in Haiti
Education in Haiti is provided according to the
French educational system. Most of the schools in the country are privately run; countries like Canada, France, and The United States run some of
63
Proceedings of International Conference on Education, Informatics, and Cybernetics (icEIC 2011),
and the International Symposium on Integrating Research, Education, and Problem Solving (IREPS 2011)

the private schools as well. That is, over 90% of the schools are managed by the communities, religious organization or NGOs [6]. Enrollment at the universities represents a bare 2% of the youth population between the ages of 18 through 24 [7]. However, most of the schools were destroyed by the recent earth quake; Higher education was the hardest hit with 28 out of 32 universities destroyed and the remaining 4 were severely damaged [8]. In addition, the education system is anemic of qualified teachers and professors. There is a limited pool of qualified professionals living in the country since more than 84% of Haitians with a university degree live outside of the country [9]. Again, the recent earthquake has worsened this situation with the loss of many teachers and professors.
1.4 Do Haitian students have access to
computers and the Internet?
In Haiti, only the elite schools which represent a
very small percentage provide computers and internet access to their students. There is about one computer for every 1,111 people and outside of the capital it is one for every 5,000 people [10]. Students from non- -cafés for access to a computer for their homework or access to the Internet to do their research. The cost of five minutes usage of a computer is about 25 cents while the average Haitian family earns $2.00 a day. Several organizations are trying to provide computer labs and Internet access to the Haitian youths. That is the case of Educah via the Wentworth Internet Initiative and Hope Haiti Learning Center that provides free computer access and practical skills training [11].
2. FEASIBILITY OF WIRELESS
TECHNOLOGY IN HAITI
The telephony system, longed dominated by the
state-run Teleco, was opened up to private companies in 2000. Today, two main companies, Digicel and Voilà, capture more than 95% of the overall market. The state is fighting back by allowing a joint public-private partnership (PPP) to make Teleco more competitive. Such a strategy aims at modernizing Teleprovides more services to its customers. It will enable the new venture to provide telephony and Internet access to remote areas and to low income citizens [12]. John Stanton, who owns the second wireless company in the country, Voilà, would like to see Haiti become [13]. That is, the first-all wireless country in the world. Those remarks were echoed by former President Bill Clinton. Stanton first class telecom infrastructure without landline service-based completely on wireless technology [14].
2.1 The Technological Climate
The World Wide Web (internet usage have increased dramatically in recent years. World internet usage increased by an annual average of 14.1% between 2004 and 2009, reaching above 1.8 billion users worldwide [15]. High speed
coming the dominant technology for internet distribution in developing countries [16]. With internet usage being in such high demand, it is hoped that the educational systems in developing countries will advance. It is vital that the proper products and services be available and at hand. Internet access in third world countries will likely be driven by wireless technologies due to geographic distances and differing topologies. Wireless technology is less costly than wired connections and fits the model of economic need. As a result predictions have it that near universal mobile telephone access is likely to be achieved by 2015-2020 in third world countries [17].
In many different rural environments around the world satellites are being implemented to provide access to remote parts of countries. The speed with which an online or hybrid educational-delivery solution can be deployed means that more villages and schools can be brought into the system. Many of the rural environments in developing countries have created affordable broadband and wireless technologies which allow new and improved ways of teaching and learning [18]. Wireless technology has been proven to work fairly well in the rural environment of the developing countries. It is often used to connect rural schools and colleges to many different urban institutes. This will facilitate the spread of education in a persistent manner.
Today, information can be transmitted from remote areas to anywhere in the world. For example, wireless internet technology has brought together communities in Costa Rica, Rwanda, and India. By using scooters, bicycle messengers or buses, wireless internet is brought to people in remote places. In each village there is a terminal that stores a web browser and e-mail information on a local server. When a vehicle moves into town, it gathers all of the information wirelessly. When the vehicle gets to a town with a nearby connection to the Internet, it sends out the data to the internet. This means that all the information stored in each
h time the vehicle comes around [19].
3. CURRENT WIRELESS
TECHNOLOGY
Advances in Wireless technology make it appealing to provide Internet access to places where there is limited infrastructure. There are
64
Proceedings of International Conference on Education, Informatics, and Cybernetics (icEIC 2011),
and the International Symposium on Integrating Research, Education, and Problem Solving (IREPS 2011)

many different types of technologies available today:
3.1 Fixed Wireless Fixed wireless refers to the process of
connecting fixed locations most of the time antennas mounted on top of buildings using radio or Laser Bridge [20]. It uses transmission towers that communicate with each other via directional antennas to send and receive data signals. They send their signals through the air using the microwave spectrum. However, line-of-sight is needed to communicate with each other. That is, antennas cannot be installed anywhere; hills and trees must be avoided [21].
Fixed wireless can be used for broadband access to the Internet in areas where there is a lack of wired- infrastructure such as fiber-optic cable, Digital Services Lines (DSL), or cable television. It does not require the presence of satellite or telephone service to be operational. It brings broadband bandwidth to remote areas where there is little to no infrastructure. Due to the quick deployment and affordable cost, this technology is in high demand especially in developing countries [22].
3.2 Wi-Fi
Known as Wireless Fidelity, Wi-Fi is mostly used by end system devices like personal computers (PCs) or smart phones to connect to the Internet while within range of a wireless access point (WAP); the signal is diffused around the access point. Wi-fi is used to create a wireless local area network (WLAN) by covering a large area and creating overlapping regions between the access points known as hotspots. They are often used by organizations and businesses to provide free-of-charge public access in order to attract customers. Wi-Fi is convenient to provide wireless access in spaces where cables cannot be run like historical buildings [23].
Wi-Fi-enabled devices can create their own network when connecting to each other, known as an ad-hoc wireless network. It creates a peer-to-peer (P2P) communication network where each client or node can forward data to the next.
3.3 WiMax
WiMax stands for Worldwide Interoperability for Microwave Access. It is the telecommunications protocol that allows access to fixed and mobile wireless; its standards are set by the IEEE 802.16. [24] Existing WiMax technologies can provide between 30 to 40 Megabits/sec. WiMax devices are used to
implement wireless networks. WiMax differs from Wi-Fi in that:
1. It is similar to Wi-Fi but can go over longer
distances. It provides wireless connectivity
access across cities and countries.
2. The access of WiMax network is based upon a
scheduling algorithm while Wi-Fi users
compete for access.
3. WiMax uses a connection-oriented MAC
(Machine Access Code, the unique address of
the network interface card) protocol while Wi-
Fi uses a connectionless CSMA/CA protocol.
Because of its low cost, long distance range, and
ease of deployment WiMax is widely used to establish WLAN. It is a more cost-effective last mile broadband access than cable and DSL [25]. As of last October, the WiMax consortium claims that over 592 WiMax networks are deployed in over 148 countries [26].
3.4 Wireless Mesh Networks
A wireless mesh network is based on a mesh topology where each device represents a node in the network. Mesh devices use a small radio to connect to each other via their wireless access point. Each node receives data from adjacent nodes to forward to the next nodes sometimes far away which result in a larger network. Instead of having a centralized system that is responsible of forwarding data, each node routes the information along. Unlike a centralized system, if one node fails, adjacent nodes will forward the data [27]. Because of its non-centralized and redundant nature, wireless mesh topology is quite reliable. Fixed Wireless, WiMax, and Wi-Fi technologies can be used in tandem to create a mesh topology. Due to its low cost, ease of implementation, and adaptation to geography, wireless mesh is appropriate for a developing country like Haiti to provide Internet access to urban, remote places at an affordable price.
4. OUR CONTRIBUTION WITH THE
HAITI INTERNET INITIATIVE
The Haiti Internet Initiative recycles used
servers and network devices into networks created by Wentworth students in the Computer Networking Systems major. These networks will be deployed in Haiti to support educational goals and job creation. It will also address the issue of the
the limited access to technology based on poverty. The network will be extended to more schools until a mesh WAN is able to be created. Through the annual networking seminar course, students will continue to be
65
Proceedings of International Conference on Education, Informatics, and Cybernetics (icEIC 2011),
and the International Symposium on Integrating Research, Education, and Problem Solving (IREPS 2011)

engaged to contribute to its evolution as well as encouraging donations of obsolete networking equipment. Having a network system in Haiti will enable collaborative work with Wentworth and provide a medium for distance learning.
A typical wireless mesh network is made up of a set of 802.11 compliant wireless routers running one of the link state wireless mesh routing protocols. All nodes are connected with each other and arranged in full or partial mesh topology. Wireless Mesh Network (WMN) is very scalable and it can handle hundreds of nodes. This network is connected through a set of border routers to wired or satellite connections that will facilitate connection to the internet. To reduce cost and bandwidth usage our students decided to implement proxy servers throughout the network to allow for content caching.
Fig. 1. Here is a diagram of a typical WMN.
Internet Initiative is a significant, vital and multifaceted project that will be an ongoing feature of the curriculum. This provides benefits to everyone involved. Faculty is able to maintain up-to-date skills by working on a functioning telecommunications system. The students are able to participate in a meaningful experience and sharpen their skills just before graduation. Educational goals effectively supported and new skills can be introduced to them. Job creation will occur as the different locations are brought into the WAN.
Fig. 2. A WAN topology for the Haiti Internet
Initiative Three Pilot Sites
4.1 How can access to a wireless LAN network
impact The Digital Divide in Haiti?
Being online will empower Haitian students. With online libraries and online resources students will be able to complete their assignments, conduct research, and take online courses. A non-profit organization like the University of the People has been providing access to tuition-free online post-secondary education. This initiative is aimed at qualified students that are impeded access to higher education due to geography and financial hardship [28]. They have recently launched a program with the Clinton foundation to offer online associate degree in Business Administration land Computer Science to 250 qualified Haitian students.
4.2 Collaborative Initiatives between
Wentworth and Universities in Haiti
A year after the devastating earth quake not much has been done. Students are being taught under tents. Yet, they are motivated to learn, knowing through education they can reach the sky of opportunities. The Wentworth Institute of Technology has a longstanding tradition of hands-on education. It also maintains a strong commitment to community service and service-learning. The Institute is assisting the Haitian students in making their aspiration a reality through the Microsoft Imagine Cup Competition.
Microsoft organizes a yearly international competition for students to present software solutions to existing problems. The competition gathers the best designs for the final at the end of each year. A national competition will be held for Haitian students to come up with new concepts. They will work in teams of five to come up with solutions of existing problems that they are facing,
66
Proceedings of International Conference on Education, Informatics, and Cybernetics (icEIC 2011),
and the International Symposium on Integrating Research, Education, and Problem Solving (IREPS 2011)

work on proposed problems, or present their own innovations. The different categories will be: web applications, desktop applications, game applications, and phone applications.
Graduating computer science students from different universities will be working on the winning projects. Out of this group, we will select the best two prototypes. Students will be provided with appropriate tools like: Microsoft.net, SQL Server 2000, and Windows phone 7 toolkits to complete their projects. The two teams selected will be working directly with students at the Wentworth Institute of Technology. Given available technology, our students will be able to collaborate over the Internet with those in Haiti mostly through an established wireless LAN.
4.3 Collaborative projects
This network system can be used to teach our students taking Network Administration how to manage a network remotely; it can be used by our students in the network security courses to learn how to compromise and secure a network remotely. Finally, as Wentworth is contemplating providing remote classes to the citizens of the world, doing collaborative work with schools and universities in Haiti via our network, will be a good model to test the effectiveness of the content delivery.
5. CONCLUSION
Wireless technologies are expanding and becoming increasingly better: higher speeds, lower costs, greater accessibility. Wireless access devices are no longer limited to PCs but include devices such as highly functional mobile telephones. The proliferation of new wireless technologies, smart phones and PDAs can be used to create new learning communities and provide for more opportunities for the underprivileged in developing countries. This also provides opportunities for those who wish to make a significant impact in their lives and the lives of others: teachers and students at home and abroad collaborating together to create synergy and build active learning communities. Using wireless technology will allow
the developmental stages of technological advances. Countries such as Haiti can reap the benefits of a reliable, available and extensive communications network without heavily investing in the costs of fixed-line telephone infrastructure or other guided media technology. These cutting-edge devices such as iPads and Internet-ready cell phones not only allow connection to the Internet but can become nodes for propagating the network themselves. Efforts such as Wentworth Institute of
Haiti Internet Initiative will provide educational and economical benefits quickly and
efficiently, bringing underdeveloped and struggling nations into the next century.
References
Appropriate http://www.dcat.net/
2. Haiti country profile. Library of Congress Federal Research Division (May 2006). This article
incorporates text from this source, which is in the
public domain. 3. Leinwand, Donnamillion in Haiti. USA Today, February 17, 2010, http://www.usatoday.com/news/world/2010-02-16-haiti-homeless-tent-city_N.htm 4
Register, January 7, 2011, http://www.catholicregister.org/features/haitians-must-look-to-themselves-to-rebuild-their-nation 5. Kang, Cecilia, Telecom companies seek to make Haiti a mobile nation, Washington Post, March 25, 2010. 6. "Education: Overview". United States Agency for International Development. Archived from the original on 2007-10-17. http://web.archive.org/web/20071017050613/http://www.usaid.gov/ht/education.htm. 7
2010, http://children.foreignpolicyblogs.com/2010/02/28/the-future-of-education-in-haiti-continued/ 8. -Free Online Unihttp://www.huliq.com/10178/haiti-gets-tuition-free-online-university 9. Higher Education and Leadership Program (HELP), Project: Increase Access to Higher Education in Haiti, (n.d.), http://www.universalgiving.org/donate/educate_a_student_for_1_year_/id5729.do 10. Kang, Cecilia, Telecom companies seek to make Haiti a mobile nation, Washington Post, March 25, 2010. 11. Educah.org, www.educah.org 12. The Haitian Internet Newsletter, May 31, 2010, http://www.haitianinternet.com/articles.php/628 13
http://www.techflash.com/seattle/2010/03/wireless_pioneer_john_stanton_wants_haiti_to_be_copper_free.html 14. http://www.haitian-truth.org/haiti-state-run-telecoms-distant-savior-vietnam-added-commentary-by-haitian-truth/ 15. Igbokwe, Obi. Biohealthmatics.com - The
Biotechnology and Healthcare IT Career
Networking Site. Web. 09 Aug. 2010.
67
Proceedings of International Conference on Education, Informatics, and Cybernetics (icEIC 2011),
and the International Symposium on Integrating Research, Education, and Problem Solving (IREPS 2011)

16. "Wireless - Social Effects - M/Cyclopedia of New Media." Main Page - M/Cyclopedia of New
Media. Web. 09 Aug. 2010. http://wiki.media-culture.org.au/index.php/Wireless_-_Social_Effects_of_Wireless_Technology. 17. Banjanovic, Adisa, Special Report: Towards universal global mobile Euromonitor International 2011, December 8, 2009, http://www.euromonitor.com/Articles.aspx?folder=Special_Report_Towards_universal_global_mobile_phone_coverage&print=true 18. Gunasekran, Vinoth. "Emerging Wireless Technologies for Developing Countries." Emerald. Web. 09 Aug. 2010. http://www.emeraldinsight.com/journals.html 19. Derene, Glenn. "'Drive-by Wi-Fi' Takes Third-World Web Access to the Road - Popular Mechanics." Automotive Care, Home Improvement,
Tools, DIY Tips - Popular Mechanics. Web. 10 Aug. 2010. http://www.popularmechanics.com/technology/engineering/infrastructure/4268156. 20. "Wireless Broadband and Other Fixed-Wireless Systems". networkcomputing.com. http://www.networkcomputing.com/netdesign/bb1.html. Retrieved 2008-02-20. 21. About.com Wireless Internet Access -
http://compnetworking.about.com/od/wirelessinternet/Wireless_Internet_Access_Providers_and_Wireless_Services.htm 222010, http://en.wikipedia.org/wiki/Fixed_wireless 23. -http://en.wikipedia.org/wiki/Wi-Fi 24. http://en.wikipedia.org/wiki/WiMAX 25April 16, 2010, http://www.itbusinessedge.com/cm/community/features/interviews/blog/speeding-up-wimax/?cs=40726 26.. WiMAX Forum. http://www.wimaxforum.org/ 27. http://searchnetworking.techtarget.com/definition/wireless-mesh-network 28University For Students In Haiti, Thank You Bill
http://www.haitianinternet.com/articles.php/708
68
Proceedings of International Conference on Education, Informatics, and Cybernetics (icEIC 2011),
and the International Symposium on Integrating Research, Education, and Problem Solving (IREPS 2011)

The Solving of Knowledge Processing for the Automation of Teaching and Learning Activities
Štefan Svetský Faculty of Materials Science and Technology, Slovak Univeristy of Technology
Trnava, Slovak Republic
Oliver Moravčík Faculty of Materials Science and Technology, Slovak Univeristy of Technology
Trnava, Slovak Republic
Jana Štefánková Faculty of Materials Science and Technology, Slovak Univeristy of Technology
Trnava, Slovak Republic
Peter Schreiber Faculty of Materials Science and Technology, Slovak Univeristy of Technology
Trnava, Slovak Republic
ABSTRACT
Knowledge is an important resource in engineering education. Despite the high level of ICT, a software is not yet available for their processing, especially at the level of an individual. The article describes a long-term solution of information and knowledge processing at this level, i.e. for a client-personal computer. This began in industrial research. In a university environment, it was continuously programmed for the needs of Technology Enhanced Learning in engineering education. The result of a long-term development is a personalized environment with the working title BIKE (Batch Information and Knowledge Editor). This allows individuals to work with the huge amount of knowledge. The teacher has at one’s disposal a set of the multi-purpose informatics tools which can be applied in teaching undergraduate students. The importance of a balanced pedagogical – informatics approach is emphasized for solving Technology Enhanced Learning, unlike the prevailing technology - driven approach in the current state-of-the-art. This technological support is to be understood as a “solution of automation” of the entire teacher’s activity. Such an approach can-result into an entirely new form of pedagogical – informatics’ outcomes in teaching. In this paper, several examples are presented in relation to the solving of knowledge processing.
Keywords: technology enhanced learning, knowledge processing, engineering education, database applications, personalised learning environment
1. INTRODUCTION
Information and knowledge play a key role in the research and educational activities. Despite the huge progress of Internet and Communication Technologies, the appropriate software and informatics tools on the market lack processing tailored to the individual user (researcher, teacher, and student). In the period 2000 – 2005, the database application Zápisník (WritingPad) was developed within an industrial research environment; it was built on the FoxPro for Windows database. This served for computer support of a research - development laboratory of surface treatments and some research projects (for example, the laboratory’s information system was developed). After the modification of the WritingPad at the University, the processing of information was extended to the processing of knowledge. In this case, the power and advantages of conventional database technology of the nineties was used and was tailored for the processing of the huge amounts of data. During that time this advanced technology, could not be fully used by individuals due to the lower level of ICT. However, the introduction of an entirely new paradigm of batch processing of information and knowledge was needed, because in a conventional DBMS (Database Management System) the data are processed in another way based on a relational model. This gradually resulted in the development of the pre-programmed environment BIKE that was used for support of engineering education of bachelors. The existence of such an informatics tool allowed for teachers to solve the first stage of processing the knowledge flow between information sources and the 'knowledge' database tables. User outputs led both to the
69
Proceedings of International Conference on Education, Informatics, and Cybernetics (icEIC 2011),
and the International Symposium on Integrating Research, Education, and Problem Solving (IREPS 2011)

BIKE environment and HTML - format, which is readable by the common Internet browsers (browsable outputs). In this case, the default is set to Internet Explorer and Opera, and in some cases the browser Google Chrome is used. At this stage, a knowledge base and library with educational materials was created on an open web-domain and on the faculty server. This engineering content was processed using the BIKE or its selected standalone Zápisník / Writing Pad (file GeniusV.exe). The outputs supported a variety of educational activities (support for teacher’s personal activities; for blended, informal, distance, active learning). After analyzing the state-of-the-art, the issue of the more or less empirical research was categorized into the field of Technology Enhanced Learning (originally the issue seemed to be eLearning) [1]. In the continuously published results the BIKE was presented as the informatics tool (an in-house software) which was designed in the Technology Enhanced Learning for processing of content [e.g. 2, 3, 4, 5].
2. KNOWLEDGE PROCESSING WITHIN AN ENLARGED APPROACH FOR
TECHNOLOGY ENHANCED LEARNING
The processing of knowledge (engineering content) needs to address the flow of knowledge between the produced learning materials and the libraries (tailored for courses of study) and between individual educational activities. This represents the second phase of the solution for the flow of knowledge within which it was also automatically created a personalized virtual learning environment (VLE). Computer support of educational activities at this stage was more technology - driven than educational (pedagogical) - driven. Fig. 1 shows both stages of knowledge flow between information sources - knowledge tables (DBMS) and the teacher's activities.
Figure 1. Knowledge flow (information sources – the BIKE – teacher’s activities)
The empirical research has showed that the work of university teachers in engineering knowledge is highly sophisticated. From an informatics perspective, this means that support of mental, learning activities and teaching is characterized by the use of unstructured information and knowledge. Moreover, the actual learning activities are unstructured and are not defined by their exact procedures. Teachers usually do this quite unconsciously. Thus, each type of learning activity should be studied, analysed, (repeatability, elements, action sequences), this is the basis of the program codes. This creates a way to gradually set a menu as optional and also as specific tools. Each menu item can be tested directly in teaching and if it is successful it can lead as an introduction to the default menu BIKE environment. Two new elements come into play in practice. One is that the teacher selects different pedagogical approaches and teaching methods according to his needs to address communication with students (feedback). The second element is that it has to address the need to automate all kinds of normal teaching activities. This also applies to students, researchers and R&D staff in general. Therefore, the mechanical application of some existing general software (e.g. Learning Management System, Virtual Learning Environment, Educational Technology, Web 2.0) is not possible. It should also be taken into consideration, as already mentioned, for the need to promote the "automation" of mental activities. One can imagine this as an external chip, "Mind-ware", this is to say that technology is a partner of a person and creates a "social memory of individuals" linked to "global social memory" [see Saljö in 6]. As the teacher plays a key role technology must adapt. This is the principle of any automation solution. Computer aided education should be focused on those two elements on the level of educational quality and automation activities of the teacher and students. If we hold to Technology Enhanced Learning, the priority must be given to a pedagogically (Education) - driven. This principle expresses the scheme presented in Figure 2.
Figure 2. Schema of Technology Enhanced Learning enlarged with educational aspects
70
Proceedings of International Conference on Education, Informatics, and Cybernetics (icEIC 2011),
and the International Symposium on Integrating Research, Education, and Problem Solving (IREPS 2011)

From an informatics point of view it can be noted that the need for the above-mentioned processing of unstructured information, knowledge and activities, in this case, it is appropriate to use procedural programming (object-oriented and visual programming at this stage seems to be inappropriate). Conventional database environment FPW 2.6a running under all Windows operating systems makes it possible. Moreover, from the perspective of an individual it is very user friendly because it has its own text editor and allows one to create an exe - application. In addition, currently available databases that are commercial or free programs or office suites (MS Office, Open Office) are normally not suitable for the processing of unstructured knowledge. In the next stage of empirical research in engineering education, therefore, blocks of activities began to program which took into account both the pedagogical quality of teaching (pedagogical approach, didactic methods, communication) and pedagogically - driven automation. The programming codes gradually expand the menu of BIKE. It should be mentioned in particular that the solution to personal communications was in by adding the programming of the application PHP/MySQL. The application is launched and edited in the BIKE environment. It is installed on the computer of the teacher as well as on the faculty server. The combination of PHP with the MySQL database is used for activities in the on-line mode, i.e. mainly on personal social network programming between teacher and students. A particularity of the integration of computer-aid into the engineering education is demonstrated by the fact that on one hand the teacher has the BIKE environment with optional information tools (menu items), and on the other hand, their use can not make students or does not enable the education itself or technical equipment of computer classes. For example, a teacher wants to improve the quality of teaching by introducing elements of support in technical English. However, the subject is only taught in their mother tongue. Thus, the application of programming itself is not sufficient. The difficult part is in how to figure out away to incorporate the teaching of (time, content, methodology). This experience was gained when dealing with the support for teaching technical English (a teacher has mastered the application WritingPad - Text To Speech Technology, but students did not use it). A need to harmonize informatics and pedagogical approaches is therefore needed. Another specific example from the practice may be the implementation of batch internet retrieving. Here we have experienced such a paradox that a group of students to whom have been described and explained in great detail, a demonstration of how to work with the WritingPad on batch retrieving in collaboration with the Opera browser did not manage this activity. Conversely, it was managed by a group of students, even without the presence of a
teacher. It was enough just to tell them: "Go to class on your computer, click the icon Genius in the top menu, click SvDopl2 and type the keywords into the box then see what is displayed on your interactive screen, be sure to first open Opera". Here was important also the fact that one or two students understood and explained to others.
3. SOLUTION OF APPLICATIONS IN EDUCATION ON THE BASE OF
AUTOMATION
Practical solution of harmonisation of pedagogical - driven and technology-driven approach in Technology Enhanced Learning (as illustrated in Fig. 2) is shown in detail in Fig. 3.
Figure 3. Pedagogical – informatics background forsolving the automation of teacher’s / student activities
Below are descriptions that illustrate a solution of the informatics tools in common teaching activities undertaken and progress of activities which one may contemplate on how they can be integrated into the
71
Proceedings of International Conference on Education, Informatics, and Cybernetics (icEIC 2011),
and the International Symposium on Integrating Research, Education, and Problem Solving (IREPS 2011)

education of bachelor students. The following pictures display some of the processing solutions of knowledge and automation representing pedagogical – informatics approach according to the scheme in Fig. 3.
Figure 4. Sample output from the batch internet retrieving of students that was conducted within the course of study
"Background of Environmental Protection"
Figure 5. Screenshot of the BIKE environment from the solving of the by voice controlled batch internet
retrieving (using also the external speech recognition software Nuance Dragon-naturally speaking)
Figure 6. Example of batch internet retrieving by teachers in the survey of literature (scientific support for
writing the article)
Figure 7. Demonstration of tutorial of batch processed chemical calculations (Application of BIKE - PHP -
MySQL from the server of the faculty)
Figure 8. Demonstration of solutions from diploma thesis - Secondary school study material for production of
threads (R. Gross)
Figure 9. Demonstration of solutions from diploma thesis - Secondary school study material for lapping (Z. Kyselicová)
72
Proceedings of International Conference on Education, Informatics, and Cybernetics (icEIC 2011),
and the International Symposium on Integrating Research, Education, and Problem Solving (IREPS 2011)

Figure 10. Preview of personal social networks between teacher and students (shared area with instructions and
forum for retrieving information sources)
Figure 11. Example of modelling a written examination on a personal social network between teacher and
students of chemistry basics (students had to receive a paper and pencil to write chemical formulas, because it can not be done on the current software)
4. CHALLENGES FOR KNOWLEDGE PROCESSING AND AUTOMATION
OF TEACHER'S ACTIVITIES
The introduction of the pre-programmed BIKE environment to support engineering education created a basis for common personal support for activities of teachers, and students of bachelor studies. The teacher has a knowledge library (engineering content) and portfolio of informatics tools in the environment of BIKE. Based on the previous one it has a choice of how to support their daily activities (teaching, learning, publishing, other personal activities). Furthermore, when the real learning in the classroom takes place the previous
can be combined where appropriate (e.g., learning material with self-evaluated tests and calculation exercises, etc.). The Standalone application WritingPad created from BIKE was introduced for use on computers in the classroom and was also used in some diploma theses. The theses showed that the future teachers of technical subjects can create e-learning materials using the WritingPad, to solve technological transfers from old books (based on digitization) or to support learning styles. Two students similarly designed small information systems within their technological focused theses. It has been shown that the BIKE environment can produce user-friendly applications, i.e. the common informatics skills, software and hardware are sufficient. Moreover, ICT specialists can create sophisticated applications with this. It should also be noted that if one does not start from the bottom-up concept of automation of the teacher’s activities, the programmer using the technology - driven approach (top-down: technology to teachers) would often not even think that certain procedures must be programmed. This concept leads to the fact that in practice there can be completely new and unknown programming, because from an informatics point of view variants of support of mental activities should synergistic pedagogical - informatics outputs created. There does not exist a common system of be solved, and a set of informatics’ tools, communication and educational activities proposed. Practically, this means that if we want to automatize even the simplest learning activities this will cause the creation of hundreds, thousands to an infinite number of solutions. Here it is also important for the harmonization with the Windows operating system, programming of which is often very onerous (BIKE is solved in such way so that it can use the maximum number of functions for which users are accustomed to, e.g., Explorer for off-line work).
5. CONCLUSION
The paper presented the solving of knowledge processing for the automation of teaching and learning activities in teaching undergraduate studies at the Faculty of Material Sciences and Technology of Slovak University of Technology in Trnava. The key to the solving was the development of the pre-programmed BIKE multifunctional environment (in-house software), which uses the power and advantages of database technology. This works as an informatics tool for Technology Enhanced Learning, which allows individuals to work with a huge amount of knowledge (it enables batch knowledge processing). It helped to solve the processing of engineering content in two phases. In the first phase as the processing of the knowledge flow between information resources and the environment of BIKE, and the second phase, as the processing of knowledge flow
73
Proceedings of International Conference on Education, Informatics, and Cybernetics (icEIC 2011),
and the International Symposium on Integrating Research, Education, and Problem Solving (IREPS 2011)

between the environment BIKE (knowledge tables) and individual teaching, learning and personal activities (see Fig. 1). However, the creation of tools and solutions only for processing the content was not sufficient for the needs of teaching, because this technology - driven approach did not take the pedagogical aspects of education and the key role of the teacher into account. Therefore, the further programming of BIKE within the Technology Enhanced Learning was extended to computer support of pedagogical approaches, teaching methods and the establishment of communication between teachers and students (see Fig. 2 and 3). Practically, this meant that other items were programmed to extend the user menu of BIKE, as well as a personnel social network enabling on-line feedback communication between the teacher and bachelor students of various courses of study and the teacher and students – undergraduates (working on their diploma thesis). Practical experience has shown that not all informatics support is automatically suitable for teaching because it failed for students, or it was not allowed by the extent of teaching or the technical equipment in the classroom with computers. It is addressed so that part of the programmed application is therefore incorporated in the user’s menu BIKE, and part is being developed. The BIKE environment works on a teacher’s computer (author of the software). For students and other teachers it is available as a standalone Zápisník / WritingPad (as geniusv.exe), which is installed on twenty computers in a classroom. They also used it in five diploma thesis for the creation of personal technical information systems, eLearning materials and as a solution for the transfer of cultural heritage from in the form of technical content of books before the period of the internet.
From an informatics point of view, the next solving also showed a need to understand the information processing to support teaching and learning activities such as "automation." When programming is focused in this direction, it became clear that when dealing with the simplest of activities a large amount of alternatives are available. Moreover, it is always strictly necessary to establish default and optional menu items; one should start thinking about programming a comprehensive user menu. Here you have to be aware that such a user menu essentially represents a separate software development. This is already a challenge for the following programming the BIKE environment. Its further development will probably relate to the creation of intelligent software, which processes knowledge in a similar way that living systems do, just as cells do in cooperation with the brain.
6. REFERENCES
[1] TeLearn - European research on technology- enhanced learning [online], ICT Research in FP7 - Challenge 8: ICT for Learning and Access to Cultural Resources. [cit. 2011-02-15] Available at <http://cordis.europa.eu/fp7/ict/telearn-digicult/telearn_en.html>.
[2] Svetsky, Štefan et al., Five years of research of technology enhanced learning implementation in teaching at the Faculty of Materials Science and Technology, Journal Research papers MTF STU. Trnava: AlumniPress, 2011.
[3] Svetský, Š. et al., The Implementation of the Personalised Approach for Technology Enhanced Learning. In: WCECS 2010 : Proceedings of the World Congress on Engineering and Computer Science 2010. Volume I. San Francisco, USA - ISBN 978-988-17012-0-6. - S. 321-323.
[4] Moravčík, Oliver et al., Experiences with the Personalised Technology Support for Engineering Education. In: 21st Annual Conference of the Australasian Association for Engineering Education. Sydney: Australia, 2010. ISBN 978-0-646-54610-0, s. 532-538.
[5] Svetský, Štefan - Moravčík, Oliver - Tanuška, Pavol, Some aspects of the technology enhanced learning in engineering education. In: Proceedings of the Joint International IGIP-SEFI : Annual Conference 2010. Diversity unifies - Diversity in Engineering Education Trnava: Slovakia. - Brussel : SEFI, 2010. - ISBN 978-2-87352-003-8.
[6] Saljö, R., Digital tools and challenges to institutional traditions of learning: technologies, social memory and the performative nature of learning. Journal of Computer Assisted Learning. Special Issue: ‘CAL’– Past, Present and Beyond. Volume 26, Issue 1, pages 53–64, February 2010. DOI: 10.1111/j.1365-2729.2009.00341.x.
74
Proceedings of International Conference on Education, Informatics, and Cybernetics (icEIC 2011),
and the International Symposium on Integrating Research, Education, and Problem Solving (IREPS 2011)

DHM simulation in virtual environments as a training tool: a case-study on control room design
Zamberlan, Ma,*, Santos, Vb, Streit, Pa, Oliveira, Ja, Cury, Ra, Negri, Ta, Pastura, Fa, Guimarães, Ca and Cid, Ga
a Instituto Nacional de Tecnologia, INT. Avenida Venezuela, 82, Rio de Janeiro, RJ. Brasil - 20081-312
b Pontifícia Universidade Católica do Rio de Janeiro - PUC-Rio. Rua Marquês de São Vicente, 225, Gávea, Rio de Janeiro,
RJ - Brasil - 22451-900
* Venétia Santos. E-mail: [email protected]
Abstract.
This paper will present the workflow we have developed for the application of serious games as a training tool for the design of complex cooperative work settings. This project was based on ergonomic studies and on the development of a control room work environment considering participative design process. The main concerns were 3D human digital representation, human interaction simulation, workspace layout and equipment designed considering ergonomics standards. Unity3D platform was used to design virtual environments and to control digital human models on the virtual dynamic scenario, in order to evaluate new work settings and simulate work activities. The results obtained showed that this method can drastically change the design process by improving the level of interaction between final users, managers and human factors team.
Keywords: digital human model, simulation, virtual environment, motion capture, training
1. Introduction
The research in serious games has been a focus issue for Government and corporate organizations, applied on training, simulation and education. There is a clear need for considering new frameworks, theories, methods and design strategies for making serious games applications and virtual world technologies more effective and useful as part of education, health and training. Virtual simulation has been used in Ergonomics for the design of control centers, transport design and product evaluation. (SANTOS, V., et al. 2009, SANTOS,V. et al. 2008, GUIMARÃES, C. P. et al. 2010).
The aim of this paper is to discuss the use of serious games applied in a control room design and how virtual reality and game engines may improve the workflow for the design of complex cooperative situations.
The context of this project has been to develop a method to improve and "accelerate" the process of a participative design for a new control room work environment by using serious games as a simulation, training and design platform.
Due to a low level of availability and dispersion of stakeholders, it was decided to explore how serious games may improve the participative design. From a human factors point of view, there are strong constraints because: (1) future users must not only “see” their future work-settings in a virtual space but also be able to project their future actions in order to anticipate the pros and cons of the new situation, (2) the workflow must be very dynamic in order to maintain a momentum for the participative process. The different versions of serious games must be synchronized with the organizational process. With modern game engines, this constraint may be easily satisfied; and (3) reusability of virtual material (both objects and movements) is also an important issue.
Another important aspect regarding this specific project is to reproduce cognitive features. In other words, one should be able to visualize the others' intentions, processes and actions trajectories in order to make decisions, such as where someone is looking at, their reactions to adversities, "volume" of communication, dispersion and others.
In this context, one of the main concerns was the 3D human virtual representation. Other important issues studied were human interaction, workspace layout and equipment including their GUI (Graphic User Interface).
2. Materials and Methods
The project's stages consisted in (1) gathering information of existing control rooms and of operational personnel in different shifts by a multidisciplinary team that evaluated ergonomics and architectural aspects, personnel data (interviews, filming and analyzing activities, motion capture, 3D human scanning), internal communication, displacement and quantification of work volume, in order to design alternatives, (2) developing these alternatives in walk-around 3D virtual scenarios, so their evaluation is more effective, (3) developing a simulator from the chosen alternative.
The development of the simulator were segmented in a couple of stages: (1) building the 3D environment based on 2D CAD representation of the chosen proposal, (2) implementing furniture
75
Proceedings of International Conference on Education, Informatics, and Cybernetics (icEIC 2011),
and the International Symposium on Integrating Research, Education, and Problem Solving (IREPS 2011)

and workstations from an existing database with ergonomic recommendations and the application of Brazilian and International standards, (3) development of equipment and instruments' 3D models, (4) development of the DHMs based on 3D scanning and motion capture technologies and (5)implementation in the game engine with scripts and other setups.
Each 2D CAD proposal (Figure 1) was transformed into 3D virtual models, where later in Unity3D were applied interactive elements such as doors and windows, external scenarios, materials and textures, so that the environment is as realistic as possible, providing the user a more lifelike experience (Figure 2).
Fig 1 – 2D CAD floorplan
Furniture and workstations present in the virtual laboratory are reproduced based on ergonomics recommendations and standards, modeled in SketchUp software and implemented in a database including 3D equipment and other instruments (Figure 3). The 3D database allows direct exporting to the game platform in *.FBX format. The software allows the segmentation of interactive components in groups, which in Unity3D can be easily set up by its hierarchy characteristic. It also exports their textures in *.JPEG, which are reproduced using their own pictures as
textures (Figure 4), providing clearer understanding and faster recognition of each equipment by their respective users.
DHM used in the simulation have been obtained starting from high resolution DHM (more than one million vertex) obtained by 3D scanning of employees using “Cyberware Whole Body Color 3D Scanner” and “Cyberware Head and Face Color 3D Scanner”. To import the avatars into the virtual work environment in Unity3D, their meshes must be seriously reduced. The high poly scan is imported into a 3D software to make a manual re-topology - doing this process manually allows us to control edge-flow of each model, therefore, keep expression details enhanced by subdividing the T-zone - eyes, nose and mouth. For the body, it's important to maintain articulations also with higher poly count to avoid deformations in the low poly mesh and keep the movements fluid.
To generate a planar texture which can be edited in graphic software, the process of retopology must consider the following step of marking the loops for UV mapping, so it can be opened properly (Figure 5).
To apply the texture in the low poly model, there are two approaches: (1) capturing photographs during the scanning process in order to have several pictures in different angles, which provides better resolution (Figure 6) and (2) rendering the high poly model, which enables sectioning the model in order to have hidden surface images, such as armpits, inner legs, top and bottom views.
Fig. 4. Equipment 3D database.
Fig. 1. 2D CAD floorplan
Fig. 2. 3D environment in Unity3D
Fig. 3. Furniture recommendations
76
Proceedings of International Conference on Education, Informatics, and Cybernetics (icEIC 2011),
and the International Symposium on Integrating Research, Education, and Problem Solving (IREPS 2011)

The result of such a process is a virtual representation of the user (low poly and detailed mesh of the user) that respects with high fidelity the morphology of the person that was scanned (Figure 7). Most of the animation were acquired using "Moven" Motion capture suite. The motion capture sessions took place in the laboratory with personnel performing daily activities. The motion capture files were exported to an animation format recognized by 3D Max (*.bvh format), then were edited and imported into the digital human models.
In this process, the low poly model (*.obj format) is imported into 3D Max, where the biped structure is placed, correctly skinned to respond to each bone movement and exported to MotionBuilder.
Inside MotionBuilder, the biped structure is characterized to follow the bones naming conventions and the motion capture files are imported, animations are then divided into full animation and cycle animations, as walk and idle, animations that play on loop, avoiding that the animation loading takes too much time.
After all animations are correctly set to its character, the animation is plotted to the skeleton and the DHM is sent back to 3D Max were the empty skeleton animation will be updated for
those sent by MotionBuilder. At this time the file is already set to be exported to Unity3D with its correct media and animation.
3. Results
One of the simulator's goal is to allow multiple users to interact with each other using their own avatars. It will provide the team the ability to train activities, learn more about how their colleagues proceed and train new personnel (Figure 8).
In the final steps of the development of the project, the network function is set among all the 3D models. This setup involves: (1) scripting the objects (most of them are in java language - e.g. interactive doors, drawers, equipments, picking up and dropping objects), (2) scripting the scene (menus, cameras, interactive cameras, networking, illumination, layout, possibility to enable or disable a trail renderer in order to map users paths across the laboratory). All these components are brought to the users through a friendly GUI (Graphic User Interface), which makes the simulator as intuitive as possible, so the users can focus on the activities and not on how to work with the engine.
4. Conclusion
Nowadays, industrial projects are developed with the use of 3D software engines instead of 2D tools, allowing the main focus to be human labor and not only the project itself. Allying it to the study of social interactions at work helps to project better environments and also better training methodologies. The use of virtual environments gives the possibility to discuss, change, create and deliver a better result as it is more graphic and
Fig. 5. Planar texture and UV map.
Fig. 6. Example of captured pictures during the scanning process.
Fig. 7. Retopology and painting process/result.
Fig. 8. Control room simulator running.
77
Proceedings of International Conference on Education, Informatics, and Cybernetics (icEIC 2011),
and the International Symposium on Integrating Research, Education, and Problem Solving (IREPS 2011)

visual for non architects and designers professionals, to understand and discuss the new layout of the work space where can be chosen a better design alternative, optimize the interfaces, integrate countless projects and a great number of professionals involved. Transparency of the future project allows adjustments and error recovery throughout the design process. Projects become more robust, since the scenarios and future activities may be simulated and also the risks involved studied. These simulations may be used to evaluate technology, industrial safety and/or human performance. One may map process risks, ergonomic and architectural problems, escape routes, displacement of people in crisis situations, assembly and maintenance problems. Therefore the conclusion is that virtual simulators of social interactions contribute towards: the activity of designers in the occupation of three-dimensional space; evaluation of possible alternatives; detailing the environment; validation of the future project by users, managers, and others; safety, health and environment evaluation; training of human resources. Even if character interaction cannot always be done in the virtual space, stakeholders can easily project their knowledge of the working situation in order to assess part of the new working space characteristics improving the participative dimension of the project. Organizational decisions were taken around these tools; they help people to project themselves in their future working spaces and furthermore it was a great tool to improve the feeling of participation.
5. References
[1] V. Santos; M.C.P.L. Zamberlan; P.; B. Pavard; P. Streit; J.L. Oliveira; C.P. Guimarães; F.C.H. Pastura, Social Interaction Simulators: Serious games for the design of complex socio-technical systems. DHM 2011 - First International Symposium on Digital Human Modeling, UCBL - Université Claude-Bernard Lyon, 2011
[2] V. Santos; M.C.P.L. Zamberlan; P.; B. Pavard, Confiabilidade Humana e Projeto Ergonômico de Centros de Controle de Processos de Alto Risco, ed., Synergia, Rio de Janeiro, 2009.
[3] V. Santos; C. Guimarães; G. Cid, Simulação Virtual e Ergonomia, XV Congresso Brasileiro de Ergonomia, VI Fórum Brasileiro de Ergonomia, Porto Seguro, 2008.
[4] C. Guimarães; F.C.H. Pastura; B. Pavard; N. Pallamin; G. Cid; V. Santos; M.C.P.L. Zamberlan, Ergonomics Design Tools Based on Human Work Activities, 3D Human Models and Social Interaction Simulation IHX Congress, Miami, 2010.
78
Proceedings of International Conference on Education, Informatics, and Cybernetics (icEIC 2011),
and the International Symposium on Integrating Research, Education, and Problem Solving (IREPS 2011)

USING CONTRACTS FOR DEVELOPING AND TESTING SOFTWARE SYSTEMS
György ORBÁN Faculty of Informatics, Eötvös Loránd University
Budapest, Hungary
and
László KOZMA
Faculty of Informatics, Eötvös Loránd University
Budapest, Hungary
ABSTRACT
Software development techniques need to be equipped
with quality views too. Quality factors like reusability,
extendibility, compatibility are important factors in
component based development. To support component
based development and to build more reliable software
systems new techniques, methods and tools are needed.
In our paper we discuss recent research areas, available
tools which support the “design by contract”
methodology. The reliability of the components can be
increased using the contracts introduced by Bertrand
Meyer. The number of tools supporting contract based
development is increasing. From the available tools which
support contract based development we choose two one in
Java (Contracts for Java) and one in .Net (Code
Contracts) environment. We also compare these tools and
for this we choose some main point of views like do they
support static code analysis, dynamic checking or can
they help the testing processes. The educational aspects of
contracts are discussed as well.
Keywords: Components; Component Based Design;
Software Testing; Contracts; Design by Contract
1. COMPONENT BASED DESIGN
If we talk about component based development we can
talk about the development of each component and about
the development of the system from components. We will
use the definition of H-G Gross about the component:
“A component is a reusable unit of composition with
explicitly specified provided and required interfaces and
quality attributes that denotes a single abstraction and can
be composed without modification.” [13]
As we can see based on Gross‟s component definition one
of the important attributes of a component is its
reusability. Using components can make the development
process faster. If there are prebuilt components, the
system can be built from them, maybe some glue code, or
a middleware is necessary, so the components can
communicate with each other. For the communication
between the components and between the components
and the environment well defined interfaces are
necessary.
In the paper we will see, how the first level contracts can
help to define the interfaces, but the main parts in the
paper are related to the behavior level (second level)
contracts.
The interfaces which belong to a component are
categorized into two types. The first type is the necessary
interface, which is needed by the component to work
properly. The second type is the provided interface where
the component provides its services.
The KobrA approach addresses the problem that the
Component Based Software Engineering (CBSE) is
typically focused on the component implementation. The
focus in the KobrA method is on the entire software
development process, not just the implementation and
deployment, by adopting product-line strategy, the
creation, maintenance and deployment of components [1].
It is very important to use modeling languages like UML.
Creating the UML model of the component can make the
analysis and design processes component oriented. After
the model based design the components can be
implemented using any of the available component
models CORBA [19], DCOM [25], EJB [26, 27] etc.
The KobrA approach can be used for educational
purposes to because it tries to merge the benefits from
more software development methods OMT [23], Fusion
[5], ROOM [24].
There are three main dimensions in the KobrA
development process. From these three dimensions there
are six basic orientations for the development. These are
composition/ decomposition, abstraction/concretization,
generality/specialization.
When designing a system it will be decomposed into
smaller parts, and when each of the parts are implemented
the whole system can be composed from the components.
Using abstraction and concretization can help to
understand and develop the software system starting from
an abstract model and converging to a concrete
79
Proceedings of International Conference on Education, Informatics, and Cybernetics (icEIC 2011),
and the International Symposium on Integrating Research, Education, and Problem Solving (IREPS 2011)

implementation. First a component can be developed in a
generic way and whet it is needed a more target specific
version can be created from it.
Component models
Software systems can be built from different functional
and logical components. Using component models the
components can be implemented separately in different
developer teams. To build the system software support is
needed. This support can be a middleware which runs on
top of the Operating System and provides some
functionality for the components (maybe written in
different programming languages), so they can be
connected together and they can communicate with each
other.
There are many well known component models like
Common Request Broker Architecture (CORBA [19]),
Distributed Component Object Model (DCOM [25]),
Enterprise JavaBeans (EJB [26, 27]), but there are newer
architectures too like ICE from Zeroc [15].
2. DESIGN BY CONTRACT
Design by contract is an approach to design more reliable
software. Reliability is defined here as the “combination
of correctness and robustness” [17] as Bertrand Meyer
suggests it. Reliability is even more important in object
oriented programming and in component based software
development where there are many reusable parts in the
system.
In the development processes classes are defined as
“implementations of abstract data types” [18], but these
definitions are only attributes and routines. With the
usage of contracts the semantic properties can be added to
the definitions. With these axioms the properties written
down in the specification can appear in the software
systems. These can help de developer in the design,
development, debugging and testing processes.
Contracts
The theoretical background of the contracts is the
correctness proof methods of programs, software. A
software system is correct with respect to its specification,
so the software correctness is a relative notion. A
specification can be expressed by assertions [12, 14, 18].
Let P and Q assertions about program variables and S a
statement or a program, then the notation {P}S{Q}
denotes a correctness formula informally meaning that if
P is true before the execution of S, then Q is true after
execution of S. You can find a very good introduction in
Bertrand Meyer‟s book [18] to create and introduce
assertions into software texts. Several proving methods
for sequential and parallel programs have been developed
by this time [12, 14, 16, 20]. At our university there are
lectures related to these methods. These lectures give a
good basic understanding of the contracts and the usage
of the contracts in practice. Practicing these methods the
students will be well-skilled for creating contracts during
developing reliable software from verified components.
One of the main aim of introducing contracts to decrease
complexity [18] because the more complex is a system
the more errors can be in the design or implementation.
Contracts can help because all the necessary checks
related to correctness can be put in the contracts so there
is no need to check these properties in other places in the
implementation.
When defining the behavior of the system with contracts
there are three main variants of them which are
preconditions, post conditions and class invariants. These
variants define obligations and benefits related to the
participants in the system. If there is a provider and a
client in our system the benefit for the provider is an
obligation for the client and vice versa. At the provider
side in the preconditions there are the obligations for the
client. If the client wants some services it needs to satisfy
the preconditions, but if the preconditions are satisfied the
post conditions assure that the provider makes its task
correct which is a benefit for the client, but an obligation
for the provider. With the third kind of contracts
(invariants) we can describe such axioms which must hold
through the execution of the routine, or method.
These main three contracts can be used to define the
behavior of an object when preconditions, post conditions
and invariants are used in the routine implementations.
But when bigger and more complex systems need to be
built, there is a need for more levels of contracts [3].
These contracts can be used to define not only behaviors
in the system, but connection and synchronization related
aspects or quality properties too, between software
components.
Using contracts in the development process can help to
make more correct software but it has documentations
values too. The specifications which are identified at the
analysis phase of the software development process can
be written down by contracts. So it will be easier to check
the working system against the specification. The other
value it adds to the development and debug processes is
that the developer or maintainer can see the specification
in the source code when developing or searching for
errors or bugs [18].
Four levels of contracts: As in real life contracts
can be found in different levels, so the contracts used in
software systems can be available in different levels too
[3]. The main four levels are syntactic level, behavioral
level, synchronization level and quality of service level.
On each level there are different techniques for contracts.
On the first syntactic level IDL can be used to define the
“connectors” between the components. There are many
IDLs that can be used, which one to choose depends on
the system environment and the communication methods
between the parts.
80
Proceedings of International Conference on Education, Informatics, and Cybernetics (icEIC 2011),
and the International Symposium on Integrating Research, Education, and Problem Solving (IREPS 2011)

On the second behavioral level using preconditions, post
conditions and invariants the behavior can be defined.
The third synchronization level is needed, because the
first two levels do not recognize for example parallel
executions. The third level contracts specify the
synchronizations between method calls.
The fourth level is for quality of service. This is necessary
to write down contracts related to latency or the precision
of the result. These attributes can be negotiated between
the client and the provider.
Handling the contract violations can be different related to
the level. On different levels if a contract is violated the
program can behave differently it can ignore the violation,
reject it, wait or on the third level negotiation is available
too.
In this paper the focus is on the first two levels, the IDLs
and mostly contracts related to behavior on the second
level. In our tools the contract violation handling is in
most cases exception handling.
Contracts in middleware
To connect different components in a system well defined
interfaces are needed. In a system where the different
components are written in different languages, the
necessary interfaces have to be available on all
programming languages. For this there are many IDLs
(CORBA IDL, Java IDL (Figure 1), Slice [15], etc.).
From these IDLs interfaces can be generated for the
different components. These interfaces will connect
together the software system built from different
components.
interface MultiplyNumbers{ void multiply( in int a, in int b, out double result);
}; Figure 1: Java IDL
The simple IDL (Figure 1) is an interface description
where the multiply method has two input parameters „a‟
and „b‟ and an output parameter the result.
There are different kinds of middleware‟s like Babel [2,
8]. Babel was developed to be a common middleware for
components implemented in different programming
languages. For the supported programming languages an
interface could be generated from a SIDL (Scientific
Interface Definition Language) so they could
communicate with each other through the middleware.
SIDL is extended for scientific applications with the
support of dynamic multi-dimensional arrays, complex
numbers, In-process optimizations, etc. These extensions
were necessary for the scientific community to develop
applications.
There is also an opportunity to use contracts in the SIDL
specifications so the generated interfaces for the different
languages will contain the contracts. The usage of
contracts in interfaces makes available to check whether
the connected components can interact, communicate
with each other.
Support for contracts in different programming
languages
There are many programming languages (Eiffel, D,
Lisaac, Spec#) which support design by contract in a
native way. These languages were designed to support
contracts. These contracts are on the second level, so they
define the behavior of the component.
Recently there are many third-party tools that can add the
opportunity to use contracts in the software
implementation phase for programming languages which
does not support the contracts in a native way. There are
tools for C/C++, C#, Java, Python. In the next chapter
there is an introduction of two tools which support
contracts in Java and .NET programming languages.
The common part in almost all of these extensions of
languages, that they use the keywords require, ensure and
invariant for the contracts. The require keyword means
the precondition, the ensure means the post condition and
the invariant means the class invariants. There are some
other special keywords, but these may differ in different
programming languages, these are the old and the return
keywords. The old keyword refers to the value of a
variable when the method execution starts, and the return
keyword refers to the return value of the method. With
these keywords more meaningful post conditions can be
written related to the methods behavior.
Contracts and security
If a software system is built from components it is very
important to know how these components will work
individually or together in a common environment.
Contracts can be used for checking the components
behaviors. Security properties can be structured in
different ways. Like properties relate to security
functionality, software quality, monitoring, certification.
Based on security properties four different kinds of
security related contracts can be identified. These are
functional interaction, interaction protocol, security-
specific interaction and infrastructure [28]. Using single
level contracts to create secure systems is not enough
when creating big or complex systems different levels of
contracts are necessary.
3. CONTRACTS IN DEVELOPMENT,
DEBUGGING AND TESTING
As we see many programming languages support
contracts in the development processes. The usage of
contracts in software development spreads slowly, but
there are many research projects related to develop and
create tools which support very well the contract based
development.
From the development view contracts can be useful in the
source code. There is a connection between Test Driven
Development and Contract Based Development. In both
81
Proceedings of International Conference on Education, Informatics, and Cybernetics (icEIC 2011),
and the International Symposium on Integrating Research, Education, and Problem Solving (IREPS 2011)

cases the tests and contracts can be written before the
actual implementation. The contracts and the tests are
created based on the specification. Using contracts the
source code contains the specification. Changes in the
specification and so in the contracts have immediate
impact on the source code.
When contracts document the specification in the source
code, it will be available for the later code maintainer, and
also if the component with contracts will be reused in
another system, makes the search for errors or bugs
easier, and helps the component integration into new
systems.
In this paper we focus mainly on two (Contracts for Java
[4], .NET Code Contracts [6]) tools which support the
contract based development. Both tools are under
continuous development. There is a short introduction of
the tools followed by a comparison.
Java environment
Contracts are supported in Java too. There are many
projects (Modern Jass, Contracts4J, jContractor) related to
develop contract support for java. These projects were
started formerly but there are some projects where the
further development stopped for some reasons. There is a
project under continuous development the Contracts for
Java. Contracts for Java [4] is based on Modern Jass with
an enhanced version of compilation model. Their goal is
to develop a robust standalone framework dedicated to
contract programming in Java. Contracts for Java consists
of three parts an annotation processor, an instrumentation
agent and an offline byte code rewriter. Contracts can be
written into the java source code (Figure 2).
interface MultipleNumbers{ @Ensures({“a>=0”, “b>=0”}) void multiple(int a, int b); }
Figure 2: Contracts for Java
There is a precondition in the example, that the multiplied
numbers „a‟ and „b‟ must be larger or equal to zero.
.NET environment
Microsoft Research develops an extension for the
Microsoft Visual Studio which supports contract based
development for .NET programs. There is a simple
example for the usage of Code Contracts [6]. public void AddToList(int num) { Contract.Requires((num > 5) && (num < 10)); Contract.Ensures(list.Count == (Contract.OldValue(list.Count)+1)); list.Add(num); }
Figure 3: Simple .Net 4.0 source code with method
precondition and postcondition
This simple method (Figure 3) adds a number to a list, but
with the precondition and post condition checking the
behavior of the method is available. With the precondition
(requires) the value of the input number is checked and
with the post condition the method behavior is ensured. In
this case the method can add the number only once to the
list, so in the post condition the count of the list is
checked that it was increased by one.
4. COMPARISON OF CONTRACT BASED
DESIGN TOOLS FROM DIFFERENT
ASPECTS
The tools we compare in this paper is the Microsoft Code
Contracts integrated into Microsoft Visual Studio 2010
and the Contracts for Java extension. The main aspects of
comparing are how the extensions support static analysis,
dynamic checking, the testing processes and
documentation, document generation.
Static analysis
Static analysis is performed without executing the
software. The analysis can be made by an automated tool,
or manually by another developer. Right now we focus on
automated tools. Static analysis may include finding
coding errors or formal methods to prove properties based
on the specification.
Contracts for Java does not support static analysis only
dynamic contract checking is available.
Using the Microsoft Visual Studio and the Code
Contracts extension it is available to make static analysis
during the development process. With static analysis the
source code is analyzed at compile time, so finding errors
is available before the software execution. Fixing the
errors can be made earlier and faster especially if the run
environment is big and complex. The static checker can
decide if there are any contract violations without running
the program. It can check implicit and explicit contracts.
Implicit checking contains null dereferences or array
bounds checking.
Dynamic checking
Dynamic checking is a runtime activity. The analysis is
performed when the program is executing.
Contracts for Java supports only dynamic checking. When
a contract is broken a java exception is thrown. There are
two techniques for contract checking.
Using the first technique a separate file is generated at
compile time for the contracts. The checking of contracts
is made with the usage of java agents at runtime. This has
some advantages, because the contracts can be handled
separate from the source code, which makes easier the
later reuse of the contracts. Also the application source
code can be built separately.
The other technique is an offline byte code weaving.
Where the generated separate contract file is weaved into
82
Proceedings of International Conference on Education, Informatics, and Cybernetics (icEIC 2011),
and the International Symposium on Integrating Research, Education, and Problem Solving (IREPS 2011)

the programs byte code before execution, and the
contracts are checked runtime, there is no need for java
agents, and so there are no Contracts for Java
dependencies.
With the Microsoft Code Contracts a binary rewriter
modifies the software injecting the contracts so they are
checked at runtime.
Documentation (document generation)
The usage of contracts in the source code is already some
type of documentation. The contracts contain the
specification of the software system, so it can help the
developers, and the maintainers to understand the
semantics of the software system.
Contracts for Java supports the extension of classes and
interfaces with contracts, so it is available to create
documentation in the source code with contracts.
Microsoft Code Contracts also supports the
documentation in the source code but it is available to
generate external documentation from the contracts in the
source code. With the document generation it is easier to
maintain the documentation related to the software. The
modifications in the specification, in the contracts can be
updated faster in the additional documentations.
Testing
To support software testing is very important. Contracts
can help in the development processes, but they can be
used in testing too. Contracts can help in white-box
testing. With the usage of contracts more meaningful tests
can be created.
The exceptions can help to find errors, because if there is
an exception related to the precondition, the client who
tries to access a given service made an error, because the
input is not appropriate. If there is an exception related to
the post condition there is some error in the service
provider, so the error investigation should be there. The
usage of contracts can help to find the errors easier.
In java environment jUnit can be used to create unit test.
If there is a contract violation a java exception is thrown.
Code Contracts can be connected to support the test phase
of a software system with another extension for the IDE,
the Pex tool [21]. Pex is an automated parameterized unit
test generator for .NET programs. With Pex automatic test
generation is available with high code coverage. It is also
a research project. These two tools can work together so
when Pex is analyzing the source code to generate tests it
considers the contracts so there can be more meaningful
test cases generated.
Like in Figure 3., there is a precondition which says that
the input parameters can be integers between five and ten.
With this contract information Pex can generate
automatically parameterized unit tests related to the input
values.
Figure 4: Automatically generated test cases by Pex
Pex generates automatically test cases with input values 0
and 6 (Figure 4). If the input value is 0 a
ContractException is thrown, if the input value is 6 there
is no exception, the method can be executed properly
based on the given precondition. With these values Pex
tries to cover every available execution paths.
5. USAGE IN EDUCATION
There are some courses at our university where the
students can learn about the correctness proof methods of
sequential and parallel programs, or how to build
component based software systems and verify them.
During their studies they develop skills for applying
development methods and tools for building software
systems from verified components. In the lectures the
students learn about partial and total correctness of
structured programs by Hoare methods,
To create verified software systems formal methods can
be used. These methods, like those based on temporal
logic or Floyd‟s and Hoare‟s methods for proving
correctness need the necessary mathematical background
and the tools which support formal specification and
verification at model or implementation level. Extending
these more abstract methods to create correct, verified
software systems contract based design tools can add a
more practical approach. These are needed to turn an
abstract representation of the system into a more concrete
representation, for example an executable, deployable
component.
To figure out which tools support the best these
approaches the comparison of the available tools is
needed.
Contracts for is available for free, but it has not so many
features like Microsoft Code Contracts and it is a newer
project. It is quite easy to setup the development
environment and it can be integrated into the Eclipse IDE
[9]. With the usage of annotation processing in the
Eclipse IDE it is much easier to write contracts, because if
there is some missing variable in the contract IDE will
indicate it.
In contrast to Contracts for Java, Code Contracts is not
free but it supports more techniques static analysis,
document generation and more meaningful test cases with
Pex.
These tools can help the developers to write more formal
specifications with contracts, based on the requirements.
They can help to create software systems with better
quality. The process of the contract based development
could be similar to test driven development, when the
development of test cases precedes the implementation.
83
Proceedings of International Conference on Education, Informatics, and Cybernetics (icEIC 2011),
and the International Symposium on Integrating Research, Education, and Problem Solving (IREPS 2011)

Contract based development could be made as test driven
development, where the developer starts the development
with the test cases and after the tests comes only the
actual implementation of the methods. Using contract
based design the contracts could be created first. After
validating these contracts they can be used in the
developed system.
Contract based development could be part of software
quality lectures or lectures related to software testing also.
6. CONCLUSIONS
There are many continuously developed tools
(EiffelStudio [11]) and programming languages (Eiffel
[10], D [7], Python [22], etc.) which support the contract
based development. Further research is necessary to
compare more available tools and functionalities they
support. These tools can help during software
development, testing including debugging and
maintenancing. The contracts could be used in the debug
code to help find errors.
Building the different components with contracts a built
in checking is available for the components. This type of
checks can be very useful during integration tests when
the components are composed into a software system, in
such cases when a component is changed in the system, or
if the component has to work in a new environment.
Contract based development should be used to create
more reliable and better quality software.
7. ACKNOWLEDGEMENTS
The Project is supported by the European Union and co-
financed by the European Social Fund (grant agreement
no. TAMOP 4.2.1./B-09/1/KMR-2010-0003).
8. REFERENCES
[1] Atkinson, C., Bayer, J. and Muthig, D. 2000. Component-
Based Product Line Development: The KobrA
Approach. SOFTWARE PRODUCT LINE CONFERENCE,
289--309. 2000.
[2] Babel Homepage: 2010.
https://computation.llnl.gov/casc/components/index.html.
Accessed: 2011-06-19.
[3] Beugnard, A., Jézéquel, J.-M., Plouzeau, N. and Watkins, D.
1999. Making Components Contract Aware. Computer.
32, 7 (júl. 1999), 38–45.
[4] cofoja - Contracts for Java:
http://code.google.com/p/cofoja/. Accessed: 2011-08-31.
[5] Coleman, D. Object-Oriented Development. The Fusion
Method. Prentice Hall., 1994.
[6] Contracts - Microsoft Research: 2011.
http://research.microsoft.com/en-us/projects/contracts/.
Accessed: 2011-06-18.
[7] D Programming Language: http://www.d-programming-
language.org/index.html. Accessed: 2011-09-14.
[8] Dahlgren, T., Epperly, T., Kumfert, G. and Leek, J. Babel
Users’ Guide., 2009.
[9] Eclipse: http://eclipse.org/. Accessed: 2011-08-14.
[10] Eiffel Software: http://www.eiffel.com/products/.
Accessed: 2011-09-14.
[11] EiffelStudio: http://www.eiffel.com/products/studio/.
Accessed: 2011-09-14.
[12] Floyd, R.W. Assigning Meanings to Programs.
Proceedings of Symposium on Applied Mathematics. 19,
(1967), 19-32., 1967.
[13] Gross, H.-G. Component-based Software Testing with
UML. Springer-Verlag., 2005.
[14] Hoare, C.A.R. 1969. An axiomatic basis for computer
programming. Communications of the ACM. 12, (oct.
1969), 576-580.
[15] Ice, Zeroc: http://www.zeroc.com/. Accessed: 2011-08-31.
[16] Manna, Z. Mathematical Theory of Computation.
Mcgraw-Hill College., 1974.
[17] Meyer, B. Applying „design by contract”. Computer. 25,
10 (oct. 1992), 40-51., 1992.
[18] Meyer, B. Object-Oriented Software Construction,
Second edition. Prentice Hall., 1997.
[19] Object Management Group History of CORBA,
Technical Report., 1997.
[20] Owicki, S. and Gries, D. An axiomatic proof technique
for parallel programs I. Acta Informatica. 6, (1976), 319-
340., 1976.
[21] Pex, Automated White box Testing for .NET -
Microsoft Research: 2011.
http://research.microsoft.com/en-us/projects/pex/.
Accessed: 2011-06-18.
[22] Python zope.interface:
http://pypi.python.org/pypi/zope.interface/. Accessed:
2011-09-14.
[23] Rumbaugh, J. Object-Oriented Modeling and Design.
Prentice Hall., 1991.
[24] Selic, B. Real-Time Object-Oriented Modeling. Wiley.,
1994.
[25] Sessions, R. COM and DCOM : Microsoft’s vision for
distributed objects. Wiley., 1998.
[26] Sun Microsystems Enterprise JavaBeans technology
specification, version 2.1 – final release. Technical
Report., 1995.
[27] Sun Microsystems JavaBeans component architecture
documnetation, Technical Report., 1995.
[28] De Win, B., Piessens, F., Smans, J. and Joosen, W. 2005.
Towards a unifying view on security contracts.
Proceedings of the 2005 workshop on Software
engineering for secure systems---building trustworthy
applications - SESS ’05 (St. Louis, Missouri, 2005), 1-7.
84
Proceedings of International Conference on Education, Informatics, and Cybernetics (icEIC 2011),
and the International Symposium on Integrating Research, Education, and Problem Solving (IREPS 2011)

Application of psychometrics methods to Library and Information Science
research methodology
Dr. Alexei Oulanov, Karl Madden Department of the Library, Medgar Evers College, City University of New York
1650 Bedford Avenue, Brooklyn New York, 11225
ABSTRACT
Common patterns and interrelationships in Psychometrics and research methods in Library and Information Science suggest a need for systematized methodologies for research and assessment of information processing and human perception and use. This exploratory study shows where psychometrics may be practically applied to usability assessment of library online databases, bibliographic management software, and digital/virtual learning tools.
Usability, user perception, competencies, assessment are placed within various contexts of psychometric concepts, such as validity and reliability, and applied to an Information Search Process (ISP) model. Triangulation, integration, and broadening of commonalities are analyzed in contexts of usability of library online resources.
The wide variety of theories related to research methods in psychometrics, combined with the changing technological landscape of LIS brings expanding subjectivity to both quantitative and qualitative inquiry; review of literature shows a need to reconcile the qualitative/quantitative dichotomy for development of practical applications.
This research provides background for development of assessment tools, such as instruments and rubrics related to human-computer-interaction (HCI) and usability studies. Such tools facilitate design and re-design of software packages used in LIS and interdisciplinary social sciences and related cost-benefit analyses.
Keywords: Library and Information Science, Human-Computer, Psychometrics, Research Methodology
INTRODUCTION
Library and Information Science (LIS), a social science metadiscipline, occupies a practical/theoretical mid-ground where social sciences and Information Technology (IT) meet. Research in IT draws from the social sciences for the development of research databases, and the social sciences draws from IT for analyses of HCI, sociometrics, and related areas of psychometrics. LIS draws from both. This paper seeks to identify and flesh out areas in which psychometric measurement testing is well-suited to the research methods of LIS. IT, the tools of which increasingly use common language search terms, is a participant in the growing practical demand for assessment that can combine empirical, quantitative analyses with meaningful and useful qualitative interpretations. Budd (2010), verifying need in the literature for postpositivist social science (including LIS) methods, offers a syntheses of critical realism and phenomenology by providing theoretical base for the ontological reality of aspects of perception. The need for psychometric quantification of information-seeking behavior research is particularly applicable to modern LIS and HCI, with wide-ranging implications. Groenen (2006), in his general discourse on the current state of psychometrics, notes the expanding and ever-broadening nature of psychometrics, and focuses on the dual interest—by academics, researchers in statistical software packages, and educational and social psychologists. That several disciplines are concerned with modeling of choice behavior—utilizing research areas of as test theory, item response theory, factor analysis, structural equation modeling, and multidimensional scaling—is of great interest to educational software marketing, which is itself contributes to sociotheoretical contexts. Systematized bridging of psychometrics and LIS will bring clarity to the decades-old qualitative and quantitative debate. Practical problems associated with the debate are described in Hanson (2008), who asserts that the basis of separation is not supported by
85
Proceedings of International Conference on Education, Informatics, and Cybernetics (icEIC 2011),
and the International Symposium on Integrating Research, Education, and Problem Solving (IREPS 2011)

theoretical examination of the concepts of subjectivity/objectivity; that systematization and quantification adapt to generalization, and that sociopolitical traditions may lurk behind the split. Hanson suggests that the advancement of inquiry and method involves transcending the qualitative/quantitative issue, to move towards more pertinent issues of validity and causality. Movement toward such transcendence is shown in studies such as White (2007), which developed the pennant diagram—a visual ‘cloud’ display of word clusters that combines bibliometrics and psychometrics—
using Sperber and Wilson’s (2001) relevance theory
(RT)—in attempts to facilitate problems of perception and intent in information-seeking behavior. Such research will be enhanced by systematized, qualitative methodology, and is further supported by Madill (2008), who adds that qualitification will lend to coherence and further interactions across different methodologies. This exploratory paper presents an exploratory model graphic (Fig.1) showing where need in LIS research to extrapolate both the qualitative and quantitative methodological rigor from psychology research is applicable to modern LIS and HCI. Important implications for technological advances, for example in research database design studies using predictive information-seeking behavior psychometrics, provide supportive justification.
PRACTICAL/THEORETICAL RELEVANCE
Psychometrics is rigorously applicable to assessment of library services. LIBQual (Heath, 2002) is a measurement tool of library services which can be administered in-tandem with assessment of user perceptions, satisfaction, and other patron-centered measurements. Multidimensional scaling is noted by McGrath (1984) as applicable to assessment of library circulation, collection management, funding, and online retrieval. Information Literacy assessment is of great relevance. Classical test theory can be applied to LIS, and is itself in need of regular assessment and updating. Mery & Newby (2011) found that test questions tailored for localized institutions were successful according to application of both classical test theory and item response theory to evaluate the validity and reliability of the Standardized Assessment of Information Literacy (SAILS). SAILS utilizes the Association of College Research Libraries (ACRL) Information Competency
Standards for Higher Education, which is comprised of the following eight skills areas: developing a research strategy; selecting finding tools; searching;
Fig.1: Psychometrics and LIS applicability
86
Proceedings of International Conference on Education, Informatics, and Cybernetics (icEIC 2011),
and the International Symposium on Integrating Research, Education, and Problem Solving (IREPS 2011)

using finding tool features; retrieving sources; evaluating sources; documenting sources; understanding economic, legal, and social issues. Competencies, usability, and user perception—in application to information-seeking behavior—are foundations of LIS and information literacy, and are highly relevant areas for psychometric measurement. For example, Information literacy involves multi-dimensional information-seeking behaviors. For measuring multi-dimensional concepts such as practical knowledge, Meijer (2002), in attempting to increase testing instrument validity, applied the technique of multi-method triangulation. O’Brien
(2010), in developing and evaluating a survey to measure user engagement, says that user experience is a vital factor in interactive system design. Reliability analysis and exploratory factor analysis may identify attributes of engagement, such as perceived usability, aesthetics, focused attention, felt involvement, novelty, and endurability. It was found that these attributes have complex interrelationships across user and systems. Rigorous usability and user perception cohort testing projects are in planning stages; the authors of this paper will use regression analysis and analysis of variance in the development of a research question leading to a hypothesis-formulation testing stages. This research will result in a contribution to the systematization integration of psychometrics with LIS.
INFORMATION-SEEKING BEHAVIOR AND
PSYCHOMETRICS
Information-seeking behavior is a fertile and widely-applicable ground for research and psychometric quantification in LIS. Kuhlthau (2004) created a six-stage theory—the Information Search Process (ISP)—which isolates stages an information seeker experiences, and notes accompanying feelings (apprehension, uncertainty, optimism, relief). Information professionals such as librarians formulate appropriate response strategies and also anticipate subsequent behaviors. These factors may be used in experimental psychological research measurement, particularly involving predictive behavior. These measurements will be of great interest to the designers of keyword-based research databases, where the fluid, multidimensional mental processes of an information search, if quantitatively measured, can be of great use in HCI experimentation. Of note is that nearly twenty years after the six-stage ISP model became disseminated into the literature, in the context of modern keyword-search based research databases, Kulthau’s stages
have been tested and empirically shown to be still useful for LIS research. (Kuhlthau, 2008).
In the initial stages of a search, where awareness of a need for information to accomplish a task or goal may be accompanied by apprehension, perception surveys indicating dissatisfaction about source knowledge and search techniques will be lent perspective from systematized psychometric application. When assessing, for example, the effectiveness of a particular database, dissatisfaction may bear unique implications if seen as a stage in a process. User engagement, as asserted by O’Brien
(2010), plays a major role in the exploration stage. User engagement is related to perception and user appraisal of information sources; all involve skill sets involving conscious and unconscious mental processes. Perceived usefulness—before, during, and after an information search—an important area for psychometric measurement, LIS, and assessment in every stage of an information search—is relevant to psychological experimentation in predictive behavior, and its measurement. The exploration stage of information-seeking behavior is most readily associated with keyword searching in research databases. Tann & Sanderson (2009) find that search engine queries fall within categories including navigational, informational, and transactional. Their findings suggest that whereas in the past some queries would have been classified as informational, web searching has evolved to where they are now classified as navigational. It is surmised that modern large websites specializing in a particular type of information, such as Wikipedia and
Facebook, contribute to such changes in searching characteristics. This attention to public websites and the development of skill sets outside of formalized learning environments—involving tracking data—is of great use to psychometricians; the use of information-seeking behavioral statistics—of primary interest to marketing research for decades, will benefit from the development of a systematized integration with LIS research. Relevance Theory (RT) may be applied to the study of human-computer dialogues to account for, for example, the human tendency to apply the least possible amount of effort in order to obtain a result. This is important for the designers and re-designers of software, if they are to be cognizant of human information-seeking processes. In keyword searches, randomness—
mismatch irrelevancy and hit-and-miss—are cited as contributing factors to less-than-satisfactory HCI (White, 2007). These factors are in need of further research into evolving software, psychology, and HCI.
87
Proceedings of International Conference on Education, Informatics, and Cybernetics (icEIC 2011),
and the International Symposium on Integrating Research, Education, and Problem Solving (IREPS 2011)

TEST VALIDITY, RELIABILITY AND LIS
As Mery & Newby (2011) found with the SAILS testing, validity and reliability are central concerns for LIS. There is a need for continual revisiting of the concept of validation, as technology evolves, and conditions change. Validity clarification—the establishment that a test measures what it is intended to measure—is a topic for continual revisiting. Kim (2009) in a study on psychometric research instrument validation finds a need for standards on validation processes and reporting, which will provide structural ballast for a noted increase in attentions to specific validation issues. Kim’s article
offers ways for researchers to implement improved validity reporting. Tojib & Sugianto (2011) assert that research literature in information science suffers from a lack of agreement about definition of terms—
in the case of their article, the terms are convergent and discriminant validity. This lack of agreement evidences the need for a broad-based, systematized integrated foundation of research methodology bridging psychometrics and LIS; whereas LIS is at the forefront of the human-computer interface and of information-seeking behavior, and whereas the measurement of skill sets for the use of technological tools for information searches inevitably bleed into each other. Among the many aspects of validity, instrument construct validity—the primary form of validation underlying the trait-related approach to psychometrics—wherein the entity the test is measuring is normally not measurable directly, but is evaluated by examining the relationship between the test and the various phenomena that a theory predicts—is of great complexity in LIS and HCI, owing to the multidimensional nature of human neuroprocessing and computer processing of digital information. All aspects of validity are readily applicable and useful for psychometric considerations of LIS, HCI, and information-seeking behavior. For example, face validity—the assumption of the validity of a test according to its appearance, content, or context—addresses the complicated assessment of internet and database keyword searching, whereby there are so many approaches to an information search. There are no defined right or wrong approaches, and if a test-taker has searched a certain way for certain kinds of information, if presented with choices outside of their experience, may assume a test is invalid. This can affect the outcome of a test, and is particularly problematic for HCI and psychometrics. Content validity is of relevance whereas the relationship
between the content and the purpose of a test may be unclear regarding search techniques. A searcher naturally has more aptitude for familiar topics, and the level of information-seeking engagement changes during the process, depending on topic familiarity. Furthermore, there may be completely fluid and changing goals and tasks from one minute to the next. Criterion-related validity establishes the relationship between scores on a questionnaire and a criterion measure which should be indicative of something. For example, in an information search for a biology reference table, if a user is unable to identify source material, the test ought to show whether it was because of subject ignorance or database ignorance. Predictive validity and its measurement bear particularly important implications for database design. Database searching is a skill that develops according to different personal mental processes, and therefore the scores of a given assessment should accurately predict, for example, the potential for a patron to use a given database that is designed in a similar way to the one the patron was tested on. This should take into account how knowledge cross-pollinates over time and experience.
An estimate of the accuracy of a test, the concept of reliability is important to library and information science and, in-particular, the assessment of article database and bibliographic management software. For example, if users get similar or very different results from taking tests in different circumstances needs to be noted. Several ways of measuring reliability—test-retest, parallel forms, and split half—are pertinent to library and information science, and are shown to involve aspects the measurement of which beg for systematized integration into the research methodology. Test-retest, whereby respondents are given the same test, may be problematic for psychometrics in that not only the respondents of a given test may remember their responses on the second occasion (the common solution being have a long interval between the two administrations of the test). In the case of LIS, and, for example, internet or database searching, such searching skills are developed in a variety of ways in everyday internet use, as well as use of a variety of databases. There would appear to be a continuum of skill-set development that transcends the concept of reliability in any traditional sense, in terms of Library and information science. This special consideration could be taken into consideration in a systematization of psychometrics applications to research methodology. Parallel forms, whereby two different tests are created with questions that are meant to be equivalent—for correlation—involve problems
88
Proceedings of International Conference on Education, Informatics, and Cybernetics (icEIC 2011),
and the International Symposium on Integrating Research, Education, and Problem Solving (IREPS 2011)

whereby equivalencies in database keyword searching are difficult in that search processes are nonlinear and related to prior subject knowledge. Parallel form reliability applied to multidisciplinary keyword-search based databases seems naturally adaptable to LIS. Research methodologies in both psychology and LIS therefore would stand to benefit from an integrated, systematized supportive framework when conducting interdisciplinary information-seeking behavioral research. Mery (2010), noted that SAILS testing involved the need to establish complicated criteria framework design/redesign, including external validation related to other similar tests, item reliability related to level of difficulty, individual and cohort-score correlation, and other editing of the instrument. This was achieved over a three-year period, following which the final skill sets (Developing a research strategy; selecting finding tools; searching; using finding tool features; retrieving sources; evaluating sources; documenting sources; understanding economic, legal, and social issues) were configured successfully to ensure that what was being was measured conformed to the construct of information literacy. This complex design/redesign is further indicative of the need for a systematized integration of psychometric and LIS/HCI research methodology.
SUMMARY, CONCLUSIONS, FUTURE
RESEARCH
The literature review suggests a strong need for a systematized integration of psychometrics into the research methods of the field of Library and Information Science. Demonstrated affinities are evidence that they can be efficiently and effectively applied and integrated. Applied to usability studies in conjunction with fundamentals of information-seeking behavior and human-computer-interaction—
both components of the field of library and information science, psychometrics applications will broaden, triangulate, and further highlight commonalities, and facilitate their integration.
The expansive volume of theoretical literature related to research methods in psychology—and the various ways in which psychometrics may be applied to them, combined with the changing landscape of LIS, bring broadening subjectivity—and a need for flexibility—to this inquiry. Whereas theoretical literature may tend to complicate and frustrate goals for objectivity and practical implications and
applications, this is evidence of the need to anchor such related theoretical fields with practical controls.
The development of assessment instruments and tools—such as rubrics related to human-computer-interaction and usability studies—relies on practical systematization; to integrate psychometrics with LIS and HCI will contribute to the kinds of cost-benefit analyses research institutions and institutions of higher education are increasingly in need of in times of economic uncertainty. To plan for the future design and redesign of software packages and electronic research databases utilized in the field of Library and Information Science—in-tandem with psychometrics and other tools of the social sciences—is the driving force behind this project. The authors are developing a theoretical research question leading to a hypothesis that will be rigorously tested with regression analysis and analysis of variance, using cohorts of primarily undergraduate students in an urban college environment. The results will be submitted for publication, with the goal of wide use of the hypothesis in the development of systematized psychometric application tool for LIS. The results will benefit the broadening interdisciplinary fields involving digital information and its processing, usability and competencies involved in its use and assessment— in theoretical, practical, technological, and psychological contexts. What is happening inside the human mind during information-seeking behavior? Are there correlations to what is happening inside a computer? Can any such correlations be measured, analyzed, and put to practical use through the development of tools? Can those practical tools and their uses be assessed? Changing perceptions of Library and Information Science, human-computer interaction, and social sciences in general call for new applications of psychometrics that can facilitate integration across such related fields. This calls for new rigorous structural methodologies in research, which will result in practical development of widely-applicable assessment tools, and suggestions for the building of navigational tools for the information highways and byways ahead.
89
Proceedings of International Conference on Education, Informatics, and Cybernetics (icEIC 2011),
and the International Symposium on Integrating Research, Education, and Problem Solving (IREPS 2011)

References
Budd, J. M., Hill, H., & Shannon, B. (2010). Inquiring into the real: A realist phenomenological approach. Library
Quarterly, 80(3), 267-284. Groenen, P. J. F., & Andries van, d. A. (2006).
Visions of 70 years of psychometrics: The past, present, and future. Statistica
Neerlandica, 60(2), 135-144. Hanson, B. (2008). Wither Qualitative/Quantitative?:
Grounds for methodological convergence. Quality & Quantity, 42(1), 97-111.
Heath, F., Cook, C., Kyrillidou, M., & Thompson, B.
(2002). ARL index and other validity correlates of LibQUAL+[sup TM] scores. Portal: Libraries & the Academy, 2(1), 27.
Kim, Y. (2009). Validation of psychometric research
instruments: The case of information science. Journal of the American Society for
Information Science & Technology, 60(6), 1178-1191.
Kuhlthau, C. C. (2004). Seeking meaning : A process
approach to library and information services (2nd ed.). Westport, Conn: Libraries Unlimited.
Kuhlthau, C.C., HeinstrÖm, J. & Todd, R.J. (2008). "The 'information search process' revisited: is the model still useful?" Information Research, 13(4) paper 355. [Available at http://InformationR.net/ir/13-4/paper355.html] Madill, A., & Gough, B. (2008). Qualitative research
and its place in psychological science. Psychological Methods, 13(3), 254-271.
McGrath, W. E. (1984). Applications of
multidimensional scaling: Comment on "A method for studying intercorrelated circulation patterns in library systems". Journal of the
American Society for Information Science,
35(2), 122-123. Meijer, P. C., Verloop, N., & Beijaard, D. (2002).
Multi-method triangulation in a qualitative study on teachers' practical knowledge: An attempt to increase internal validity. Quality &
Quantity, 36(2), 145-167.
Mery, Y., Newby, J., & Ke, P. (2011). Assessing the reliability and validity of locally developed information literacy test items. Reference
Services Review, 39(1), 98-122. O'Brien, H. L., & Toms, E. G. (2010). The
development and evaluation of a survey to measure user engagement. Journal of the
American Society for Information Science &
Technology, 61(1), 50-69. Sperber, D., & Wilson, D. (2001). Relevance:
Communication and cognition. Oxford: Blackwell Publishers.
Tann, C., & Sanderson, M. (2009). Are web-based
informational queries changing? Journal of
the American Society for Information Science
& Technology, 60(6), 1290-1293. Tojib, D., & Ly-Fie, S. (2011). Construct Validity
Assessment in IS Research: Methods and Case Example of User Satisfaction Scale. Journal
of Organizational & End User Computing, 23(1), 38-63.
White, H. D. (2007). Combining bibliometrics,
information retrieval, and relevance theory, part 1: First examples of a synthesis. Journal
of the American Society for Information
Science & Technology, 58(4), 536-559. White, H. D. (2007). Combining bibliometrics,
information retrieval, and relevance theory, part 2: Some implications for information science. Journal of the American Society for
Information Science & Technology, 58(4), 583-605.
90
Proceedings of International Conference on Education, Informatics, and Cybernetics (icEIC 2011),
and the International Symposium on Integrating Research, Education, and Problem Solving (IREPS 2011)

SpeechIndexer: A Flexible Software for Audio-Visual Language Learning
Ulrike Glavitsch, Klaus Simon EMPA, Swiss Federal Laboratories for Materials Science and Technology
Media Technology Laboratory Überlandstrasse 129, 8600 Dübendorf, Switzerland
[ulrike.glavitsch, klaus.simon]@empa.ch
and
Jozsef Szakos Department of Chinese and Bilingual Studies
The Hong Kong Polytechnic University Hung Hom, Kowloon, Hong Kong [email protected]
ABSTRACT
This paper presents SpeechIndexer as a software tool to create teaching and learning material for language courses and as an e-learning program to train the oral comprehen-sion and speech production. We introduce the player func-tion where students can follow speech and text closely and the role play function that allows the learner to get in-volved in a dialog. Teachers can create material from the vast amount of speech recordings available (audio books, radio and TV podcasts, language learning CDs, etc.) that specifically match the knowledge level and interest of in-dividual students or the whole class. The software may complement regular language courses or may serve to teach languages where teaching and learning material scarcely exist, e.g. endangered languages that have a pure oral tradition.
Keywords: e-learning, language learning, teaching and learning material creation, oral comprehension and speech production training
1. INTRODUCTION
Current language learning software contains a variety of different functional blocks such as read speech, grammar modules and vocabulary exercises [1, 2]. These programs
are highly interactive, the learning progress is constantly evaluated and the student can advance at her own pace. Some of the programs even provide a pronunciation train-ing where the user speaks words into the microphone and a built-in automatic speech recognition component checks the utterance for correctness. However, state-of-the-art language learning programs have a very static design. They contain a control logic that presents the functional blocks in some order, accept inputs from the user and check it with fixed stored values and they contain jumps into predefined subroutines, e.g. in the case of automatic checks of pronunciation correctness. There is no way to adapt or extend the data content of this e-learning soft-ware, i.e. it is not possible to add material to it, namely, additional speech files or new vocabulary. Yet, a teacher in face-to-face instruction observes the level of knowl-edge in his class and provides additional training when needed.
In this paper, we consider the SpeechIndexer software as a platform to flexibly create both teaching and learning ma-terial and to serve as a language learning program. We present two functions of the software that specifically support the audio-visual learning of a language. These functions are described here for the first time in detail.
The SpeechIndexer software has been developed at ETH Zurich and EMPA in Switzerland by two of the authors. The original goal was the documentation of endangered
91
Proceedings of International Conference on Education, Informatics, and Cybernetics (icEIC 2011),
and the International Symposium on Integrating Research, Education, and Problem Solving (IREPS 2011)

aboriginal Formosan languages that have a pure oral tradi-tion and where large archives of recorded speech exist [3]. The language teaching aspect, however, has always been kept in mind during the development since endangered languages need also be taught to keep them alive [4].
The structure of the paper is as follows. We give an over-view of the SpeechIndexer software in Section 2. Then, we describe how a learner trains his listening comprehen-sion and speech production using SpeechIndexer’s player and role play function in Section 3 and 4. We present the flexible creation of teaching and language material in Sec-tion 5. Finally, we draw conclusions and give an outlook to future work in Section 6.
2. SPEECH INDEXER OVERVIEW
SpeechIndexer has been developed for the indexing and retrieval of speech files. The core component of SpeechIndexer is its semi-automatic indexing where seg-ments of speech are correlated with their corresponding text segments. The textual transcription for a given speech file is entered via the program or is loaded from outside. A built-in pause finder automatically divides the speech file into pause and speech segments. A speech segment denotes a flow of speech uttered without breathing and contains a few words, a phrase, a sentence or even more than that. The user manually combines corresponding speech and text segments to form the correlations called indices [5]. Text belonging to an index (indexed text) is marked and appears red, bold and underlined. The speech segment behind an indexed text can be played directly. Fig. 1 shows the SpeechIndexer main window that con-tains the audio window with the speech signal and the text window. The text window shows some unindexed text (black) and indexed sections (red, bold and underlined). The audio file is a section of Churchill’s famous speech “A United States of Europe” [6]. Furthermore, the user can mark speech segments of individual speakers with dif-ferent colors to see at first glance which parts of speech belong to the same speaker. Fig. 2 shows an indexed speech file with two speakers (Brian and Jane) that are marked differently – each of which with a different color. The speech file in this example is from the audio CD of an English language course [7]. The user can define marking colors of speakers individually. The speaker profiles are saved under a so called extras file. All loaded and created
files (audio, segmentation, text, indices and extras file) are captured under a project name. It is possible to load all files of a project at once and to save a set of files as a pro-ject. In addition, SpeechIndexer provides two search functions: (1) searching within the same file and (2) searching across collections of speech recordings. In both cases, the search results are listed and each result can be played immediately.
A number of helpful visualizations have been imple-mented. First, the speech signal is always visible, i.e. the user sees where the signal has low- or high-energy and where there are pauses in the signal. Secondly, a cursor in the speech signal follows the waveform when the signal is played, and more importantly, the indexed text currently played is highlighted. Finally, the aforementioned speaker coloring scheme provides a better overview in an indexed speech file with multiple speakers.
Fig. 1: SpeechIndexer main window with signal and text window. Indexed text appears red, bold and underlined.
3. LISTENING COMPREHENSION TRAINING
Given a fully indexed speech file students train their lis-tening comprehension in the following way. They play the speech file and follow the played text. The currently played text is highlighted for clarification, i.e. it appears in a different color that the user may specify. (Behind the scenes, the program checks for each play position whether there is an index that contains this audio position and it highlights the corresponding text segment. The played text is set to its original state as soon as playing the corre-sponding speech segment has finished.) Students can al-ways stop the recording and repeat playing a previous
92
Proceedings of International Conference on Education, Informatics, and Cybernetics (icEIC 2011),
and the International Symposium on Integrating Research, Education, and Problem Solving (IREPS 2011)

segment if they did not understand it. They can look up unknown words offline. After doing this listening exercise again and again, the learner understands the speech re-cording without looking at the text. In fact, this is the final goal of listening comprehension training, namely, being able to fully understand a piece of authentic speech.
Fig. 2: SpeechIndexer main window with speakers
marked individually.
4. SPEECH PRODUCTION TRAINING
Speech production is trained with SpeechIndexer’s role play function. The role play function operates on indexed dialogs as they often occur on CDs that are delivered with language learning books. The readings of language books are typically dialogs in everyday situations (in the super-market, at the bus station, in the restaurant, etc.). Those speech recordings are indexed by the teacher and the speakers are marked individually. The role play function lets SpeechIndexer take over the role of one dialog partner while the learner speaks the role of the other part. For this purpose, the program plays the speech of one dialog part-ner and mutes the speech of the other. The student can al-ways compare his given utterance by listening to the speech part he is supposed to take over in a second round. This way, the student learns to speak whole sentences in typical life contexts.
The role play function is activated by declaring one of the speakers as muted speaker. As a consequence, all text of this speaker is made invisible. When playing the file, the speech of the muted speaker is played soundless. Fig. 3 shows SpeechIndexer with the role play function acti-vated. The text of speaker Jane that is visible in Fig. 2 is
cleared in Fig. 3 and Jane’s speech is muted. The learner is supposed to speak Jane’s role.
Fig. 3: SpeechIndexer with role play function activated.
In fact, we believe that the role play function of SpeechIndexer is a better way to train the speech produc-tion of a learner than an automatic speech recognition component that lets a student speak single words only. First, state-of-the-art automatic speech recognition com-ponent often make errors and will recognize utterances as correctly pronounced if there are not and vice versa. But more importantly, the proposed role play function lets a learner to become involved in a dialog and trains a natural way of speaking.
5. LEARNING FROM AUTHENTIC DATA
With SpeechIndexer the teacher flexibly creates teaching and learning material suited for the needs of the class or for individual students. Speech recordings nowadays can be gained from various sources, e.g. from CDs associated with language books, from audio books and radio or TV podcasts. The audio tracks of these media files are con-verted into the WAVE file format by freely available pro-grams and loaded into SpeechIndexer. Some radio stations provide transcripts of their broadcasts and also audio books often come with the texts. Given transcripts can be converted into UTF8 files and loaded into SpeechIndexer. The teacher enters the text of an audio section within the program if no electronic transcript is available. The final step is the synchronization of the audio file with the texts by creating the indices and the marking of the speakers if
93
Proceedings of International Conference on Education, Informatics, and Cybernetics (icEIC 2011),
and the International Symposium on Integrating Research, Education, and Problem Solving (IREPS 2011)

needed. The set of files can be given to students for listen-ing comprehension and speech production training.
It is a particular advantage of SpeechIndexer that it allows the creation of teaching and learning material from cur-rent, authentic recordings, e.g. from news broadcasts of yesterday. Thus, teaching and learning material for the present-day use of the language is created. This is specifi-cally helpful in cases where the teaching and learning ma-terial is outdated or when it hardly exists. For instance, there is only very little language teaching and learning material available for endangered languages that mostly have a pure oral tradition.
6. CONCLUSIONS AND OUTLOOK
We have considered SpeechIndexer as a flexible tool to create language teaching and learning material from au-thentic speech recordings. From its original design goal it lets the learners train their oral fluency, namely, their listening comprehension and speech production.
SpeechIndexer gives the language learner a new view on the spoken language and makes it more transparent. It shows aspects of the spoken language that cannot be seen otherwise. It shows the speech signal and the position played, it highlights the text currently played and lets the text segments of different speakers appear in different marking colors. This way, the learner perceives spoken language as concrete. We believe that it is also a well-suited e-learning tool for primary and secondary school children since it has an uncomplicated user-interface and is easily learned.
Currently, SpeechIndexer is intended to complement ex-isting language learning material to specifically train the oral fluency and comprehension. However, we plan to evaluate SpeechIndexer in language classes in order to get feedback on its usability and effectiveness. Key questions are whether teachers create teaching and learning material in a user-friendly and effective way and how well learners improve their oral fluency when using SpeechIndexer. A corresponding project with the Swiss National Science Foundation and various partners, e.g. with the University of Teacher Education Central Switzerland, is in discus-sion.
7. REFERENCES
[1] Tell Me More® V10 English, www.tellmemore.com [2] Babbel, www.babbel.com [3] J. Szakos, U. Glavitsch. Seamless Speech Indexing and Retrieval: Developing a New Technology for the Documentation and Teaching of Endangered Formosan Aboriginal Languages. Proc. Intl. Conference on Educa-tion and Information Systems: Technologies and Applica-tions (EISTA’ 04), Orlando, Florida, July 21 – 25, 2004. [4] J. Szakos, U. Glavitsch, O. Hess. From Speech Cor-pora to Textbook Generation - Extending software tech-nology to non-European languages, 7th Teaching and Language Corpora Conference (TaLC7), Paris, France, July 2 - 4, 2006. [5] J. Szakos and U. Glavitsch. SpeechIndexer in Action: Managing Endangered Formosan Languages. In Proceed-ings of Interspeech, 2007. [6] Never give in! No. 1: Winston Churchill’s Greatest Speeches. [7] PONS Power-Sprachkurs Englisch in 4 Wochen, Re-becca Davies, PONS Stuttgart.
94
Proceedings of International Conference on Education, Informatics, and Cybernetics (icEIC 2011),
and the International Symposium on Integrating Research, Education, and Problem Solving (IREPS 2011)

Empowering Instructors to Become Effective Content Curators Using the Building Blocks of Today to Manage Dynamic Curriculums for the Education Space
Alex HOTTENSTEIN
NorthPoint Solutions, LLC, 130 W. 42nd
St, 5th
Floor
New York, NY 10003 USA
ABSTRACT
This paper will examine key technologies that exist in the
market today which can be used to enable instructor
content curation and idea growth through direct student
collaboration. Existing tools can be used to not only
recreate the in-class collaborative experience in a
distance-learning environment, but can also be used to
support growing collections of knowledge on
topics/subjects than just what can be gained from a single
class or semester.
This paper envisions a method for both instructors and
students to help them effectively curate content and helps
empower them to communicate through references to a
combination of text and digital media. These references
originate from multiple platforms across the Web, but
relate to a single topic or idea. This “compilation” of
material can then be treated as its own form of content
and can be assignable, consumable, and gradable in the
well-established pedagogy of standard learning
management systems.
This form of content would allow instructors or students
to present ideas that are greater than the sum of their
individual parts and provide a platform for further
discussion and learning, ultimately, growing the value of
the content itself.
KEYWORDS
Content curation, learning management, content
management, social media, content compilation,
collaborative learning, multi-dimensional content growth
1. INTRODUCTION
Don’t reinvent the wheel. The key systems that can be
used as the building blocks for effective content curation
have existed in multiple forms for many years. The key
systems are the Content Management (CMS), Learning
Management (LMS), and Social Media platforms.
In standard implementations, each one of these solutions
caters to the specific needs of the corporate, educational,
and consumer communities. They can be implemented
by themselves, or in combination to support the various
needs of enterprise organizations. Together, these
systems can provide the specific features for the creation,
management and distribution of content, as well as an
increased depth of conversation and detail through social
collaboration. Through proper configuration, these
systems can be focused to support educational needs by
providing instructors with an easily accessible library
with which they can identify areas of interest and build
“compilations” of content for their students to consume
and collaborate on.
In a web-based world content can be identified as any
digital resource, including text, video, audio, visual
activities, quizzes, assignments, and assessments. As a
content curator, the instructor’s responsibility would be to
identify the selections that they wished to combine and
build them into a new type of content, a Compilation.
Like all educational content, Compilations would be
distributable, consumable, gradable and a starting point
for collaboration, but each Compilation would hold a
depth of information greater than any one item,
representing an idea, greater than the sum of its parts.
This paper includes a breakdown of the technologies
involved, their capabilities, and the opportunities for
integration with each other. While the goal is to introduce
the concept of the Compilation content type, the
principles of content curation, and user-driven content
growth, it is not the aim of this paper to suggest a single
software product or even a collection of tools that easily
integrate. Instead, the goal is to highlight the
opportunities that are available using existing software
solutions to enhance the instructor’s and the student’s
educational experiences.
2. CONTENT MANAGEMENT SYSTEMS
The Content Management Systems (CMS) that exist
today are descendants of Document Management
Systems (DMS) that were introduced to the market in the
late 1980s and early 1990s. These systems were typically
standalone solutions that were created and used mainly to
manage imaging, storage, and workflow of corporate
document assets.
95
Proceedings of International Conference on Education, Informatics, and Cybernetics (icEIC 2011),
and the International Symposium on Integrating Research, Education, and Problem Solving (IREPS 2011)

With the introduction and rapid growth of the Internet in
the mid- to late-1990s, these document management
systems were pushed to become more web-centric, which
allowed for wider access to what were still primarily
internal corporate assets. With this growth, the need for
external user and client access to corporate information
increased, and web-accessibility and an increasingly
granular structure for content became a necessity. Over
time, key features of collaboration and categorization
were introduced to support an even broader, web-centric
environment. Using these building blocks, content
management systems were then capable of supporting
both the business and marketing needs of individuals and
corporations, and had effectively established a standard
set of methodologies and terminologies used to establish
business practices and solve problems.
Currently, Real Story Group (formally CMS Watch)
tracks and evaluates forty two unique, enterprise-level
Web CMS solutions. These products range across
technology platforms and each solution either attempts to
present a single generic approach to all CMS needs or to
provide specialized support for individual business types
(including education-focused models). While these
products vary in both cost and effectiveness, ranging
from free open-source solutions to those that cost
millions of dollars in licensing, at the core, they all
support the following four key elements:
1. Structured Content that allows for the version-
based storage of a list of well-defined content
types – each with their own set of fields
enabling differentiation between various “types”
of information that may be managed within the
organization
2. Hierarchal Categorization (Taxonomy)
structures which support the definition of multi-
level topics and ideas, across which content can
be linked and interrelated
3. Users who can be defined as not only those that
create and manage content, but also those that
consume content
4. User Groups who represent the different ways
that different types of users will interact with the
content or sub-sets of users that need to
collaborate on a smaller set of content
The above elements of a CMS allow this type of product
to be configured to support an organization’s educational
needs effectively. Using structured content, educational
material can be broken down to its most granular level.
Granularity is of upmost importance to effective content
use. The more individual parts a content item can be
broken into, the more effectively it can be linked to all
the unique ideas it may present. The better the breakdown
of content, the better the system will be able to
understand its value.
With hierarchical categorization (taxonomy), content can
be interrelated not only in common ways like a book’s
table of contents, topics, or state standards but also in less
obvious ways like difficulty and learning objectives.
Since any content item can be linked to any number of
taxonomies, this information can be presented to
consumers, searched, or browsed against in any number
of ways at the same time. The better the content structure
and the better the categorization, the more effective the
user experience will be.
In advanced CMS solutions, the definition of these
structures can be made not only at the original content
publisher level, but also at the consumer level. This
allows the individual users (be it the instructor or student
in an educational environment) to not only consume the
structures provided to them, but to also introduce new
content and taxonomy structures as they see fit. This
allows the user to enhance their own experience, albeit
not always the experiences of others. It is this feature of
CMS that most specifically supports the concept of a
Compilation content type, and its creation through user
content curation.
CMSs provide content producers with an easily
repeatable and maintainable process for creating, relating,
and distributing the content, and if properly configured,
allowing users to consume and enhance that content in
the way that works best for them.
While CMSs do support the sharing of user-generated
content and configuration, they typically view all users as
equals. This makes Content Management Systems by
themselves not particularly well-suited for the
educational environment, where a well-controlled, well-
structured instructor-to-student relationship is necessary
to support educational progress.
3. LEARNING MANAGEMENT SYSTEMS
Learning Management Systems (LMS) and Learning
Content Management Systems (LCMS) support the core
instructor-to-student workflow elements that are not
found in a CMS. The primary focus of these solutions is
to provide the functionality for the assignment,
consumption, grading and tracking of Learning Objects
(LO).
Learning Management Solutions have also evolved
significantly from their early forms in the 1980s.
However, unlike CMSs, LMSs’ core tenants have
96
Proceedings of International Conference on Education, Informatics, and Cybernetics (icEIC 2011),
and the International Symposium on Integrating Research, Education, and Problem Solving (IREPS 2011)

remained consistent since the time of their inception, as
they were based on the real-world classroom experience.
Currently, similar to the CMSs, there are approximately
forty significant LMS platforms supported at the
enterprise-level. These solutions typically have been
developed to support content consumption and work-flow
through key standards of structure and e-learning
methodologies like SCORM. While several such products
support generic LMS implementations, many focus their
toolsets on key areas of education, such as K-12, higher-
ed, or corporate models.
While individual toolsets may vary, current LMS
functionality standards have expanded beyond its core
tenants in several ways in order to support its wider use.
Thanks to an increased reliance on automation, LMS has
become far more effective in distributing dynamic sets of
requirements, randomized tests, auto-generated
algorithmic questions, etc. This functionality has vastly
expanded the instructor’s ability to not only distribute
unique assessments, but also continue to track a student’s
progress against learning objectives in a standardized,
non-subjective manner.
Learning Content Management Systems (LCMS) have
taken the Learning Management workflow and added
elements of Content Management, enabling not only the
distribution of learning objects to students, but also their
authoring within the same system.
While many LCMS solutions available represent a good
integration of these two technologies, they typically do so
in a way tailored to current educational needs and
limitations. Instructors, for example, may be the only
ones who can create content, or users may be limited to
the creation of only very specific content types. For that
reason, such systems may not allow for the broader
requirements of Complication creation available using the
capabilities of free standing, best of breed, CMS, LMS,
and Social Media solutions.
The key functionality that LMS brings to the table is its
dynamic representation of the core interaction of
education: the distribution of information from an
instructor to a student and the student’s subsequent
interaction with that information. Both LMS and LCMS
solutions may be capable of supporting this requirement
for any given implementation’s needs. While these
solutions provide effective mechanisms for the
interaction between instructors and students, they do not
typically support broad levels of student communication
or collaboration. This functionality is best supported
using existing Social Media platforms.
4. SOCIAL MEDIA PLATFORMS
Social Media platforms are ubiquitous in today’s society,
both online and off. Like CMSs and LMSs, they got their
start in the early 1980s with the creation of Usenets and
Bulletin Boards as areas for discussion of specific topics.
Those technologies, like the Facebooks of today,
interconnect people with like-minded ideas. Social Media
platforms like Learning Management Systems were born
from real-world scenarios of social interaction taken
digital. Unlike LMS however, where the relationships
supported are directed and small (between an instructor
and his/her student), Social Media platforms focus on the
support of the larger community, believing that ideas,
updates, images, etc. should be shared widely, and not
require one-on-one interaction. To complete the
functional picture the Compilation content type, this
tenant of social media is required.
Social Media platforms are primarily solutions developed
to support two key types of user interaction:
1. Direct communication between individual
users or specifically managed groups of users
2. Broadcast communication from an individual
user to whomever might be listening
These types of interaction take the forms of direct
asynchronous messing (email), direct synchronous
messaging (chat), broadcasting of individual ideas (feed
updates or tweets), or broadcasting of larger ideas
(blogging).
While today much of the popularity of these tools relates
to the recording and tracking of an individual’s everyday
life, the key strength in their ability to support extensive
discussion and debate over specific individual topics
remains the same as that contained in the original Usenets
and Bulletin Boards.
The mechanisms for discussion in standard Social Media
platforms are the foundation for our online
communications, and while useful to Education in a
communicative sense, are not particularly
“revolutionary.” However, recent advancements in key
Social Media platforms can be viewed as being
significant specifically in the capacity for discussions to
grow multi-dimensionally (See Figure 1).
Discussions are no longer limited to a stream of
comments going back and forth between a group of users,
and no longer need to be comments at all. Current Social
Media platforms support the integration of additional
content into conversations and the spawning of additional
layers of discussion from that content. By understanding
97
Proceedings of International Conference on Education, Informatics, and Cybernetics (icEIC 2011),
and the International Symposium on Integrating Research, Education, and Problem Solving (IREPS 2011)

this point, instructors/students can enable the growth of
conversation around any specific topic to go well beyond
a simple class discussion. Social Media platforms
encourage the start of a class conversation, allow the
students to break off into groups to discuss sub-topics,
and then provide them with the ability to rejoin the class
to present (and further discuss) the multiple outcomes.
Figure 1 – Multi-Dimensional Conversation
The educational challenge with existing generic Social
Media platforms is that without specific guidance, they
are incapable of identifying the important elements of
that conversation. Existing platforms typically base a
discussion or a comment’s relevance on how old it is or
how popular it is to the entire group – an understandable
method of automated management considering that not
all information could or should be shown.
For its proper use in education, however, the rules of
social media management must be different and they
must be configured to support the possibility that an idea
achieved many months ago may still be more valid than
any idea recently identified. In order to support this idea,
educated management must become the user’s
responsibility to identify the most relevant discussions
and highlight them for future use.
5. INSTRUCTORS AS CONTENT CURATORS
Now that one has a sense of the different functionalities
available through existing CMS, LMS, and Social Media
platforms, it is important to realize that any system
populated with information cannot by itself identify the
correct subset of information that should be used to
educate a class of students on any given topic.
The Internet, for example, with all its wealth of
information and search algorithms, cannot manage
exactly how a specific topic or idea should be presented.
The instructors therefore are responsible for identifying
the appropriate information, ordering the content, and
providing the context for the information that they
highlight and choose to present.
By effectively implementing the structured content and
categorization model of a CMS, instructors can use this
platform to identify and combine the content that they
deem relevant to the topic.
With the appropriate solution and adequate resources, an
instructor can identify key elements of content across the
breadth of the Web and use these elements to create a
Compilation for future consumption (See Figure 2).
Figure 2 – Creating a Content Compilation
The system supporting such an action would enable
instructors to select pieces of content they desire and let
them perform various actions to it like highlight a
particular paragraph in a page of information or identify a
30-second segment of a 15-minute video. The system
enabling content curation would keep track of these
selections and present these related pieces together as the
primary information source. Students would always have
the ability to view the content items referenced in
entirety. But the content curated by the instructor would
continue to act as the key information vehicle. In this
manner, the Compilation becomes an entirely new
content artifact, helping explain a topic or an idea with
further information that makes it greater than the sum of
its parts.
98
Proceedings of International Conference on Education, Informatics, and Cybernetics (icEIC 2011),
and the International Symposium on Integrating Research, Education, and Problem Solving (IREPS 2011)

6. DISTRIBUTING AND GRADING CONTENT
COMPILATIONS
Considering the educational goal of this solution, the
content Compilation created by the instructor can be
distributed within the instructor-student workflow
supported by the integrated LMS. As LMS solutions
typically depend on grading methods being implemented
for student response, assessments could be included as
part of the compilation and a student’s combined grades
on those assessments could be used as the overall grade
for the student on that assignment. Alternatively, a
student’s success on the assigned Compilation could be
entirely dependent on their social interaction with the
content itself and their collaboration with other students
in the class about the curated content.
Ultimately, the LMS would be responsible for tracking a
student’s progress on the Compilation and providing the
student with the ability to submit their progress for
review by the instructor. Depending on the design of the
application and the contents of the Compilation, grading
methods would need to vary and in many cases would
need to be subjective instead of automated. Using core
LMS functionalities, rubrics could be introduced to the
assignment of these content Compilations so that
subjective grading could be standardized as much as
possible across an instructor’s course.
7. ENHANCING COMPILATIONS WITH
SOCIAL MEDIA SOLUTIONS
As suggested above, the core features of a social media
platform can be used to provide students and instructors
with the ability to expand upon any content item in a
multi-dimensional way. This feature can provide
instructors with an effective method for tracking and
grading student interaction on assigned Compilations. If
alternative grading methods are not defined, an instructor
could view this collaboration as being similar to class
participation on a given topic. Students not only would
have the ability to simply comment on any given idea,
but also to contribute new content to the discussion,
which could in turn kick off further discussion.
In addition to grading methods and unlike the standard
LMS approach of a single request and response, the
breadth of student contribution on specific Compilations
could actually become part of the Compilation itself –
enabling further learning. A Compilation of content
curated by an instructor would no longer be limited to
only what the instructor found and selected, but could be
expanded to include the entire depth of student discussion
held on the subject. This deeper Compilation of content
could then be used as the original/base assignment for
instructor’s courses going forward.
8. TOOLS FOR CONTENT CURATION
CMS, LMS, and Social Media platforms provide the
infrastructure, workflow, processing, and storage
necessary to support content curation, but they do not
provide the web-centric tools needed to properly select
the desired content.
Bookmarking, highlighting, video cropping, audio
cropping, and image tagging are all techniques that are
becoming widely available against standard web content.
These techniques provide the user with the ability to
single-out specific pages, paragraphs, video/audio
segments, or even elements of images for specific review
further enhancing the user’s experience with the content.
The suggested content curation platform would provide
users with the ability to perform all these actions through
a centralized interface and use them to specifically
identify parts of existing content that they wanted to
curate into a Compilation.
The end goal is for the user to be able to access and
integrate content from any source on the Web. Certain
sources (especially multimedia sources) may be more
highly favored than others as they would provide the
necessary video, audio, or image formats that would be
required to properly crop and tag information.
Once selected for use in a Compilation, the content itself
would remain served from that original source. The CMS
solution would simply be responsible for managing the
structure and details of the content Compilation itself.
The LMS would enable the assignment, consumption,
submission, and grading of the content Compilation. The
Social Media platform would manage all communication,
comments, and collaboration that may occur on any
Compilation or element of the content that it is made of.
In this manner, each platform and tool implemented to
support the individual action that it is known for, would
when implemented together, supply an integrated
experience which would allow instructors to build out
significant foundations of knowledge and learning on the
topics that are pertinent to them and their classes.
9. ADDITIONAL USES FOR THE CONTENT
CURATION PROCESS
As an alternative, instead of distributing content
Compilations to students for collaborative review,
instructors could simply assign a topic to which each
student would be responsible for developing their own
content Compilation. This methodology would provide
99
Proceedings of International Conference on Education, Informatics, and Cybernetics (icEIC 2011),
and the International Symposium on Integrating Research, Education, and Problem Solving (IREPS 2011)

instructors with the capacity to assess a student’s abilities
to not only consume and contribute information on a
specific topic, but also to use standard technological tools
to find and highlight pertinent information across the
Web.
10. EDUCATIONAL PUBLISHER CASE STUDY
In 2010, NorthPoint Solutions, LLC (NorthPoint) was
engaged by a leading educational publisher to develop a
system to deliver and enhance the usability of its “For
Print” educational content. This content was already
available in electronic form, but this feature did nothing
to provide the reader with any additional functional
capabilities. While additional media assets were offered
as part of the existing solution, this material was not well
integrated into the overall presentation of the publisher’s
material, and was not widely used by the instructors or
students.
Through a collaborative effort, NorthPoint and the
publisher developed a content distribution platform that
supports not only the effective display of their published
media, but the creation of new content by site users, the
curation and assignment of site’s content by instructors to
students, and the full assessment of student activity based
both on standard testing practices and subjective grading
of the student collaboration.
The platform’s original goal was to increase the level of
standard online communication and interactivity between
students and their instructors surrounding the publisher’s
editorial content, but eventually, reviews and class testing
lead to the implementation of more advanced features
that became part of the core system.
The platform supports both the creation and management
of well-defined educational content types such as quizzes,
homework, writing assignments, peer reviews, etc. and
also more dynamically-defined content that enables the
introduction of specific tools and functionality to the
platform to meet individual educational discipline needs.
A key element of the platform is the ability for an
individual instructor or student to add content to the
system from any desired external source and use that
information as part of a lesson plan, topic discussion, or
assignment. The content added can be then shared during
and after the course, commented on, and consumed by
both the instructor and other students.
This new platform will be launched along with a specific
set of the educational publisher’s content in 2012 and will
be the platform for the delivery of all their educational
content going forward.
11. CONCLUSION
As instructors or students try to get their heads around the
massive amount of digital information they are
confronted with, they will look to a framework that
provides them with the tools to easily curate that content
into a more consumable idea or message. The act of
curation around a specific topic or idea represents a
valuable step in education, and can, in fact, be perceived
as “content creation”.
To this purpose, the building blocks from content
management, learning management, and social media
systems can be used to provide instructors with an
educational “toolset” that enable this curation into
content Compilations. Interaction on Compilations by
both instructors and students can support greater learning
and expansion of ideas – a process which has not yet
been fully taken advantage of in today’s marketplace.
The technology frameworks, used in conjunction with
web-based tools, provide the ability for today’s
instructors to demonstrate expertise, gain visibility, and
build thought leadership. The single content
Compilation can provide instructors with new techniques
for the collection and creation of information on
educational topics – thereby making the aggregated
content’s overall value greater than its individual parts.
12. REFERENCES
"What is Enterprise Content Management
(ECM)?". AIIM. Association for Information and Image
Management. Retrieved September 20, 2010.
Evolving Electronic Document Management Solutions:
The Doculabs Report, Third Edition. Chicago: Doculabs,
2002.
Technology Reviews | CMS WCM ECM DAM Portals
Search | Real Story Group. Web. 17 Oct. 2011.
<http://www.realstorygroup.com/>.
Bersin, Josh; Howard, Chris; O’Leonard, Karen; Mallon,
David (2009), Learning Management Systems 2009,
Bersin & Associates
100
Proceedings of International Conference on Education, Informatics, and Cybernetics (icEIC 2011),
and the International Symposium on Integrating Research, Education, and Problem Solving (IREPS 2011)
Use of Micro Multimedia learning Objects (MMOi)
in distant learning environment
(First phase)
Author :
Anne-Dominique Salamin
University of Applied Sciences, Western Switzerland (HES-SO)
Sierre, 3960, Switzerland
ABSTRACTii
The new, modern student is no longer content with passively
listening to lectures. His ability to concentrate has decreased,
while the use of communication devices, such as mobiles,
tablets or laptops, has increased. Besides, this new student
wants to participate and be active, in the same way he is
accustomed to interact using social media.
He is eager to experience different forms of interactivity.
Quizzes, forums, group projects. Offering him micro multi-
media objects related to well-delimited knowledge elements,
increases his commitment, his level of interest and, above all,
his capacity to make connections with the practical world, as
well as to transfer knowledge in the real work environment.
This paper presents a micro multimedia objects experiment
and offers a grid to help with their implementation.
This paper presents an overview of HES-SO e-learning center
Cyberlearn expertise on design, implementation and use of
micro multimedia objects.
Keywords: Distant learning, Interactivity, Grid, Multimedia,
Micro Knowledge Objects
MULTIMEDIA AS INTERACTING OBJECT
Pressing buttons to animate a virtual technical drawing,
choosing objects and interacting with associated sequences,
playing a video resource and understanding how a theoretical
notion is used in the field: all these actions are based on the
use of multimedia in learning and distance learning.
Because the technical aspect is fully grown, together with the
advent of multimedia resources, simple to produce and to
carry out, distance learning more frequently includes (espe-
cially in a blended learning model) small multimedia ele-
ments, such as videos, podcasts or interactive flash type
animations. These resources, far from being mere playful
toys, can illustrate a technical point, materialize abstract
knowledge or allow students to integrate theoretical notions,
applying them to situations close to reality. They are usually
produced as a contribution to solving or illustrating a micro
specific learning issue; they are simple to manipulate and
allow interactions between student and resource.
We call these resources: Micro Multimedia learning Objects
(MMO). This notion covers all types of multimedia content
associated to knowledge which needs to be acquired.
The concept of multimedia was defined by various authors in
the learning field. We selected Depover [3] proposition:
communication options (text, sound, still images, moving
images, videos), closely integrated and whose overall consis-
tency is provided by the computer system that manages these
options. 1 This definition clearly highlights the complexity of
multimedia, as well as its heterogeneity and proves that the
object constitutes a computing system in itself.
However, the nature of multimedia has evolved since the
decades between 1980 and 2000. The world of interactivity
has significantly changed from a once comprehensive system
(MOO2, platforms, micro-worlds), heavy to implement, quite
costly and complex to use.
Quick design, quick implementation, cost-effective, techni-
multimedia (since 2005) is charac-
terized by its power, its effectiveness and the increasing
number of devices on which it is able to run (computer,
1 Free translation 2 A MOO (MUD, object oriented) is a text-based online
virtual reality system to which multiple users (players)
are connected at the same time (source : http://en.wikipedia.org/wiki/MOO)
101
Proceedings of International Conference on Education, Informatics, and Cybernetics (icEIC 2011),
and the International Symposium on Integrating Research, Education, and Problem Solving (IREPS 2011)

smartphones, mobile tablets etc.). All these features promote
multimedia as a mass consumption pedagogical object.
As far as we know, one of the most interesting modern
multimedia characteristics consists in being able to quickly
and easily illustrate abstract or professional micro learning
issues, using simple means but with a real high impact on
knowledge acquisition.
We argue that by articulating an element of knowledge to-
gether with one or more MMO, this will contribute to im-
proving the learning process and make it more efficient,
rather than just using the MMO itself, as it is designed in
MOO or Virtual Environments.
This will be verified in phase 2 of our study. We intend to
lead a project which will investigate a large panel of learners
to measure how they improve their skills when regularly
using MMO, or not at all.
In phase 1, reported in this paper, we aimed at providing our
professors with an operational grid to help them with the
design of an efficient MMO and with implementing the best
object for a specific issue they intend to address and solve.
Since 2005, as part of our activities in the e-learning center of
our university, we have developed 473 small to medium sized
MMOs. So far, we have worked empirically and intuitively,
through a both technical and didactic approach.
Never have we assessed whether learners progressed more
easily, better and more in-depth using this kind of MMO.
Most of our MMOs were designed by professors, with our
didactic and technical support. In this survey, we intended to
validate our approach, and help professors with designing
better objects faster. We organized our survey in a cascade
sequence: from researcher to teacher to student.
We performed as follows:
We carried out a comprehensive review of theoreti-
cal contributions about multimedia and learning;
We designed a theoretical grid with guidelines to
design and implement a MMO;
We elaborated a questionnaire on MMO and sent it
to two classes of students who had recently used a
MMO;
We improved our grid by integrating their com-
ments and poll results;
We operationalized our grid to make it concrete,
practical and useful.
3 Some available here : http://cyberlearn.hes-so.ch/ecreation
We have theoretically described conditions of an effective
design and have worked on multimodal aspects and the con-
struction of knowledge. We have worked on a model of
interactive environment integrating Carter [10], [9], Kozma
[4], Chomienne [2], Marton [9], Benazet and Réseau [12]
contributions.
The results of the survey show that a majority of students are
receptive to the playful interaction offered by the use of
MMO; they like to interact with other students when using
their MMO and are motivated by elements, such as playing
against time, receiving funny feedbacks, challenging other
students or comparing each other.
They also appreciate personalization and contextualization of
knowledge and, as our university is an applied university,
training professional, MMO should be concrete, realistic and
practical.
Designing an effective grid
The grid is devised
contributions, technical and pedagogical aspects (i.e. learning
evaluation). Every theoretical concept has been translated to
concrete questions, so as to help professors with the applica-
tion of this grid. We tested our grid by evaluating an existing
MMO and by designing a new one.
At each iteration step, we integrated our three sources
(theory, tech ) in order to
improve our grid.
THEORETICAL FRAMEWORK
Chomienne [2] covers different approaches to enable under-
standing of the true nature of multimedia. The author com-
plements his works by mentioning which criteria can be used
to judge the quality of a multimedia resource.
He points out that multimedia consists of three systems: text,
icon and sound. When all three elements are well designed
technically and pedagogically, they help with achieving a
pertinent and efficient approach, as the three systems blend
with each other.
He relies on the double encoding theory (Paivio [11]) which
claims that memory storage capacities become more efficient
when two encoding systems are called upon.
He also reports that collision between the multimedia systems
and the representation systems used by the learner, positively
contribute towards the process of knowledge anchoring.
He reminds us of the importance of the metaphor when de-
veloping a multimedia environment, which should guide the
interactivity principles, the objects on which the learner will
act upon.
102
Proceedings of International Conference on Education, Informatics, and Cybernetics (icEIC 2011),
and the International Symposium on Integrating Research, Education, and Problem Solving (IREPS 2011)

Very often, interactivity is given limited scope when applied
to multimedia objects. There are five intervention levels:
The perceptive level activates the learner s senses.
It deals with choice, number and organization of
the physical aspects of messages (sound, image and
text);
The transactional level is concerned with examin-
ing how the system and the participant interact;
The cognitive level concerns tools made available
to the learner in order to facilitate his intellectual
effort;
The pedagogical level consists in choosing the na-
ture of the object to be learned and how the learn-
ing process can take place;
The evaluative level refers to the elements in the
system which produce the model on which to base
, and then to propose appropriate
activities.
Quality criteria are applied to each of these levels:
Clarity enables the learner to immediately under-
stand the messages he receives, whether they be in
an audio, visual or written form; it also makes it
turn to react; the user is informed of which items
are being assessed and is given feedback;
Coherency concerns the standardization the de-
signer will apply to environmental elements at
every intervention level;
Pertinence ensures that targeted objectives are met.
Analogies must make sure that the similarity be-
tween two different objects is well understood;
Redundancy implies that data is repeated in vari-
ous forms to take into account differences between
learners;
Supervision refers to the possibilities the user is
offered to act upon the environment;
Marton [7] states that the use of multimedia systems in the
educational field is very promising. Learners show interest
and a high level of satisfaction in the use of such systems.
The learning process is effective, time-saving (50 to 60%)
and economical, according to Marton, Giardina and Duchas-
tel (1987) [8]. However, the author points out that several
drawbacks hamper these systems, namely because of the
rapid change in technology, the few modules available,
resistance to change from the people in charge of the educa-
tional system.
He believes it is necessary to study in more detail the rela-
tionship between the sophistication of the implementation
and the planned pedagogical approach, the possible profit and
also the development costs.
These writings and researches raise some questioning:
Why was multimedia investigated when it appeared
between 1995 and 2000, and no longer since? Is the
subject exhausted? Did the undertaken research
definitely close this topic?
Why did the recent multimedia features (ease of
design, widespread )
not spur res ?
Could focusing on smaller learning multimedia ob-
jects be a starting point for operating a pushing ef-
fect on the learning process of abstract or concrete
notions?
In this research paper, we aimed at replying to the last ques-
tion and restricted our pondering to the use of multimedia in
total or partial distance learning situations.
GRID AND SURVEY
We relied on the works by Rézeau [12] and Chomienne [2] to
build a grid for guidelines on how to operationalize our hypo-
thesis, which could also be used as a working tool by the
people concerned. We proceeded in two steps. Firstly, we led
a quantitative survey among a sample of students having used
an MMO. Secondly, we polished the grid by integrating the
remarks made by the students, as users of the systems. The
objective was to make the grid for guidelines effective, in
order for a professor to efficiently lead and follow up on a
MMO production task.
1. Quantitative survey
For this reasearch, on which a larger scale survey will be led
as of 2012, we investigated a sample of the global population.
Features :
Schools :
Ingineering Chemistry /Life science (Oenology)
Nursing
Number of students:
26 (Oenology)
31 (Nursing)
MMO type:
Interactive
- y MMO : Assembling/Dismantling wine cellar
elements
103
Proceedings of International Conference on Education, Informatics, and Cybernetics (icEIC 2011),
and the International Symposium on Integrating Research, Education, and Problem Solving (IREPS 2011)

The student drags and drops the items on the right hand side
to assemble the device. A photo of each item was taken to
correspond to a real world item. If the item is placed correct-
ly, it will become stationary. If it is misplaced, the student
can move it. The assembly task runs against the clock.
The pedagogical aim of this MMO consists in familiarizing
the student with the machine and increasing his speed. Few
such machines are available to students, so the MMO enables
practicing the skills at home.
-Nursing MMO: Virtual medicine cabinet
Nursing students must calculate doses. These calculations,
based on the rule of three, are simple to carry out. However,
the students pout at them and when performed manually, they
tend to make many errors, which can be potentially lethal for
the patients. These errors are explained by the fact that, until
today, these calculations were disconnected from real life and
pole
enables them to accept or refuse a prescription, to choose the
medicine, the injection method, to calculate the dose, to
The survey comprised twelve questions aiming at obtaining
the following information :
The MMO usefulness;
Use habits (home/class);
Aims for its use (on a regular basis/before exams) ;
MMO assessment (features pinpointed by the stu-
dent);
Favorite learning aids (paper, professor, exchanges
among students etc.);
Expected result of the transfer from the learning to
the professional situation.
According to the majority of students, the tested MMO is;
- Useful
- Convenient
- A valuable course supplement
- Easy to use
- Enabling progress
We therefore deduced that the MMO reached its goal (sup-
porting progress during the learning process), that it can truly
be considered as a supplement to teaching material and me-
thods (hybrid teaching).
A large number of students having replied to this survey,
wish to use MMO more frequently, as they believe it can
contribute in reinforcing their motivation and can help them
be more efficient in their future professional practical tasks.
2. Grid
These small learning objects, easy to design, flexible, with a
positive cognitive result and the outstanding acceptance by
students, encouraged us in further developing such objects on
an empirical basis.
However, we have noticed that if professors master the
teaching material they decide to supplement with a multime-
dia item, and if they have a clear vision of the learning out-
come they wish to reach, they rarely know how to transform
knowledge into multimedia objects. They tend to focus on the
technical aspects, dazzled by or reluctant to the possibilities
offered, and often wish to design objects which are tremend-
ously costly, lacking recognized pedagogical contribution; or
on the contrary, they will get stuck when designing the scena-
rio. Due to lack of technical knowhow or didactic imagina-
tion, they may experience difficulties at concretely adjusting
the orientation of their projects.
Therefore, we decided to develop an operational grid aimed
at helping them with asking the right questions for setting up
the project, as well as to communicate with the technical
team in charge of developing their creation.
104
Proceedings of International Conference on Education, Informatics, and Cybernetics (icEIC 2011),
and the International Symposium on Integrating Research, Education, and Problem Solving (IREPS 2011)

This grid was designed based on empirically acquired expe-
rience. Its theoretical fundaments are as follows:
Authors Theoretical con-
cept Items
Paivio Double encoding sound, image, animated image Collision enco-ding representa-tions/MMO
- Sound - Image - Animated image
Chomienne [2]
Intervention levels Levels : - perceptive - transactional - cognitive - pedagogical - evaluative
Marton [9] Semiotic commu-nication
- Feedback Interface-Learner - Audio (sound, mu-sic) - Visual (images, still or animated) - Linguistic (oral or written words)
Rézeau[11] Nodes - Link with prior knowledge
Trocmé-Fabre [12]
Triple anchorage - In the present - During the experi-ment - During a project
The grid is based around these notions and is completed by more and broader technical or pedagogical elements, namely when follow up and learning assessment are concerned. Every theoretical notion was transformed into question items in order to enable assessment.
First iteration
The grid integrates the retained theoretical elements and transforms them into question items to make them operation-al. We tested the theoretical grid for guidelines by assessing one of the MMOs : AD-MED the medicine cabinet described above. (cf Annexe III). We noticed that this grid is relatively operational to assess an existing MMO. However, it is not practical or concrete enough for non-specialists to design their MMO, let alone appraise their ideas when developing an MMO. Moreover, some aspects necessary for preparing the MMO (narrative aspects, for instance) are not well integrated in this version of the grid for guidelines.
Second iteration
We adjusted the grid in the second iteration, based on the design of an interactive MMO. We imagined a new MMO about body language in communication. This MMO will have to deal with both knowledge acquisition and practical exer-cises. It will be completed by an entrance quiz and a final quiz.
We polished the grid for guidelines in order to make this tool more accessible. Indeed, we feel that the first version of the grid better suits specialists in the educational field, and is difficult to implement for technical staff as well as for profes-sors specialized in other fields, who might wish to design MMOs, via the e-creation call channel, for instance.
Adjustments
Based on the body language MMO example, we felt that the grid should be remodeled by integrated the following points:
a) Intentions
This section It will enable him to outline his project.
b) Didactic aspects
This section covers the relation between knowledge and MMO.
c) Pedagogical aspects
This section deals with how knowledge progress is conducted and measured.
d) Technical aspects
This section is concerned with technical and ergonomic aspects. Students are accustomed (daily exposure to video games, web interface, mobiles, television, cinema, etc.) to using high quality graphic and ergonomic multimedia objects. Therefore, the MMOs, although of smaller technical scale, must nevertheless be designed very carefully graphical-ly and ergonomically.
Third iteration
replies to the questionnaire and some items were integrated.
Two important items, highlighted by students, were inte-
grated into the grid for guidelines.
- The playful aspect : students wish to be motivated by the
proposed MMO. Their motivation depends on various factors
(interest, ease of use, knowledge achievement, reward
(grades), etc.). The playful aspect contributes in maintaining
motivation. Several items are combined to provide the
amusement and gaming approach: playing against the clock,
scoring points, including funny and amusing feedback, chal-
lenging other users or comparing scores;
- The link with professional practice : students clearly hig-
hlighted the importance of personalization and contextualiza-
tion of knowledge. HES studies aim at training students to
become active professionals, it is, therefore, legitimate and
useful to present the students with knowledge in a form
which they know is useful in practice, by ensuring delivery of
concrete, realistic and practical MMOs.
105
Proceedings of International Conference on Education, Informatics, and Cybernetics (icEIC 2011),
and the International Symposium on Integrating Research, Education, and Problem Solving (IREPS 2011)

Ajustements
We have created a new category for the
and added two questions to cover the fun, playful feature.
With the help the questionnaire, we also verified whether the
link with professional practice was outstanding enough.
Access to the grid : http://blog.cyberlearn.ch/
CONCLUSION
We now have an operational grid for guidelines. This grid,
where a number of theoretical notions related to the educa-
tional multimedia issue are intertwined, offers a validated aid,
which is not only based on theory, but is very operational, as
we tested it on an existing MMO, as well as on a future
MMO.
The effort put together so far unfolds in the form of a cascade
sequence: from researcher to teacher to student.
However, the current grid version will have to be used by
professors developing their own MMO, in order to check its
usability. Indeed, we could not detach ourselves completely
from actual years of experience in e-learning and multimedia.
Neither were we able to neutralize our theoretical knowledge
in educational sciences, nor our practical teaching experience
on the field.
We, therefore, wish to have the grid tested by professors
beginning in the creation of MMO, to verify if our position
and realizations are coherent, not only from an intellectual
point of view, but also to ensure that they are a truly useful
aid.
At a time when new mobile devices are appearing on the
educational market (Kindle, iPAD, etc.), allowing storage of
thousands of books, articles, interconnected via the Web,
playing animations, videos and easily and quickly sharing
them, these become part of a societal movement that slowly
affects the world of education.
We hope these observations will motivate education special-
ists and epistemologists to return to the work initiated in the
90s and think, analyze and verify the characteristics of new
multimedia objects resulting from the emergence of new
educational modalities.
This virtuous circle will generate new teaching and learning
learning habits and sustain their appetence for interaction
with knowledge.
BIBLIOGRAPHY
[1] Carter V. Do media influence learning? Revisiting the
debate in the context of distance education. In: Open Learning, February 1996 (pp 31 - 40)
[2] Chomienne, M. http://clic.ntic.org/cgi-bin/aff.pl?page=article&id=83 (2000) [3] Depover, C., Quintin, J.J. & Lièvre, B. de. Éléments pour
n-nement hypermédia. In G.-L. Baron, J. Baudé & B. de La Passardière (Éds.), Hypermédias et apprentissages, 2 (pp. 49-62). Paris : INRP. (1993) [4] Kosma http://www.ala.org/ala/mgrps/divs/aasl/aaslpubsandjournals/slmrb/editorschoiceb/infopower/selctkozmahtml.cfm [5] Giardina, M. L'interactivité, le multimédia et l'appren-
tissage. Série Références. Ed. l'Harmattan. (1999) [6] Paivo. http://tip.psychology.org/paivio.html [7] Marton. http://www.sites.fse.ulaval.ca/reveduc/html/vol1/no3/concept.html [8] Marton, Giardina et Duchastel.Environnements d'ap-
prentissage multimedia analyse et concept (1986) [9] C. Depover, M. Giardina, Marton.
. Revue des sciences de l'éducation. Volume 18, Number 1, p. 43-66(1992) [10] Moore, T. Active use of hypertext to aid learning and
classroom instruction. SIGCSE Bulletin, 27, 297-301.(1995) [11] Clark, J. M. & Paivio, A. (1991). Dual coding theory
and education. Educational Psychology Review, 3(3), 149-170 [12] Rézeau, J. professionnel
en EAO des langues. Nouvelles technologies et apprentis-sage des langues. Le Français dans le Monde, Recherches et applications, 44-58.(1988) [13] Trocmé-Fabre, H. . Paris :
i Referred to in this document asMMO ii In this text the masculine is used as a generic term
106
Proceedings of International Conference on Education, Informatics, and Cybernetics (icEIC 2011),
and the International Symposium on Integrating Research, Education, and Problem Solving (IREPS 2011)

Individualising Media Practice Education Using a Feedback Loop and Instructional Videos Within an eLearning Environment.
Trevor HARRISDepartment of Film and Media,
School of Creative Arts, University of Wales Trinity Saint DavidLampeter, Ceredigion, SA48 7ED, Wales, United Kingdom
ABSTRACT
This paper explores the development and impact of the author’s TELE (Technology Enhanced Learning Environment) action research project for individualising media practice education. The latest iteration of different classroom methodologies being employed to develop high-level skills in media production, the author has combined an interactive eLearning approach with instructional videos and, crucially, an individual feedback loop in order to widen access to the curriculum and create a more efficient teaching and learning environment. The focus therefore is on student engagement and organisational efficiencies as a result of the research.
It should be noted that there has been no funding attached to this work, nor are there any institutional imperatives or other stakeholder involvement in this research. This project has been undertaken by the author as an evolutionary development of the various methodologies, cognisant of the increased technology literacy of the student cohort. The educational benefit of bringing video instruction into the curriculum as part of the project is examined as a creative pedagogy of direct benefit to students rather than as a subliminal marketing tool that other systems are often used for.
The over 16K words of written data collected during the project is analysed both quantitatively and qualitatively with reference to the initial objectives of the research
Keywords: action research, feedback, eLearning, instructional video, creative pedagogy, technology enhanced learning, and student-centred teaching and learning
1. INTRODUCTION
Using material gathered from student feedback comments as well as empirical evidence from classroom support teachers and support tutors, the paper explore two aspects of the TELE concept. The primary focus is on the innovative use of feedback to individualise teaching and learning; the second aspect is to reinforce the use of video as an inclusive experience for a wide range of students and assess how it contributed to the individualisation of classroom teaching. Finally, the paper looks at how these innovations might have empowered students to become self-sufficient and reflective learners.
During the course of this research a range of manual and, more recently, digital technologies have been used in an attempt to generate interaction, deeper engagement and feedback from students. This paper concentrates primarily on the latest work using an eLearning system.
It is the use of the Moodle eLearning environment that has enabled the innovative use of an individual and inclusive feedback loop, which has in turn enabled evaluation of the impact of the technology implemented in workshops to be assessed and refined for the cohort of students engaged in the course. Instead of an end of course questionnaire evaluation, which has little if any relevance for students that have completed the course in question, the submission of feedback for every learning opportunity makes the process meaningful and relevant for the student actively participating in that learning. The standard summative questionnaire involves tick boxes and perhaps one sentence of comment, whereas the TELE methodology has elicited up to 1.5K of free text narrative per student,
107
Proceedings of International Conference on Education, Informatics, and Cybernetics (icEIC 2011),
and the International Symposium on Integrating Research, Education, and Problem Solving (IREPS 2011)

collected over 11 weeks, establishing a student-tutor discussion that can direct that student’s learning, whilst the tutor has in depth comments that can be used for evaluating the effectiveness of the teaching and perhaps for wider quality assurance purposes.
2. OBjECTIVES
The research was motivated by a number of factors and objectives set by the author, influenced by and having reflected on the unsatisfactory nature of the standard end of module questionnaire. Without any detailed comments the plethora of tick boxes were of limited or no help in assessing the ‘performance’ of the teacher, the usefulness of the teaching materials, and the development of the student as a critically reflective learner. How could the gap between the teacher as a lecturer and the class as passive recipients of teaching be bridged? A number of observations defined the approach taken.
Within traditional curriculum design there is acknowledgement of the power of assessment in defining the outcomes of a learning opportunity. This constructive alignment [2] is effective as far as it goes. It does not, however, realistically allow full and inclusive assessment of all aspects of a course or module to be assessed, due to the range, number and amount of assessments having to be limited due to obvious logistical considerations.
There is no measure or recognition of prior or experiential learning by the student. How do we know how much our teaching has actively contributed to the learning outcome?
How also can we gain an understanding of what the student is seeking to learn from a course. It may simply be “enough to be able to pass” but there may be a less jaundiced view. How can we find out if students have more altruistic motivations?
Finally how can we as teachers engage students in deeper learning, encouraging them in critically reflecting on their learning? Is it possible to give them individual attention, to individualise their education.
Initially, therefore, the research sought to address the following broad objectives1. How effective was the author as a teacher?2. How effective were the materials that were being
used?3. How did the students respond and reflect on their
learning?These were tested using a number of interventions.
3. INTERVENTIONS
Intervention 1: Manual use of post-it notes. The initial method for an intervention used anonymous post-it notes. These were used in order to gain an understanding of a student’s existing knowledge and their expectation of a course. These were colour coded; RED to indicate existing knowledge of, for example, their use of Photoshop for image manipulation; and GREEN for what the student expected to learn from the course. YELLOW was also used at times during the course to get feedback on a process such as handing in work on a disc (at the time a surprisingly fraught issue for first year students in an unfamiliar IT setup) or to ask what the most difficult aspect of a class had been. The post-it notes were handed out in class, filled in at the appropriate time and then collected up in a ballot box as students left the class. The author could then read and reflect on the contents and report back to the class any points of interest or changes made as a result of those comments.
The author found this to be a successful and personally empowering process. It was extremely gratifying to know that the students did not know very much about the subject, were wanting to learn what you are planning to teach them, and that unbeknowns to you, they were not all struggling with difficult concepts.
This manual process was used effectively in gaining insight and feedback from students up until the university made the Moodle VLE available in October 2008. The introduction of this service opened up the possibility of a new digital approach, albeit without the anonymity offered by post-it notes.
108
Proceedings of International Conference on Education, Informatics, and Cybernetics (icEIC 2011),
and the International Symposium on Integrating Research, Education, and Problem Solving (IREPS 2011)

Intervention 2: Introduction of the Moodle VLE.The advent of an eLearning system was immediately recognised as having the potential to be a powerful alternative to post-it notes. The Moodle system offered an enticing range of features for engaging students in dialogue, such as Blogs, Forums, and Assignments.
The author’s previous experience trialling a course message-board had not been successful, with little or no unprompted input from students. Thus an alternative approach was needed. The author found that Moodle’s online assignment tool had the most potential due to its free-text format option. Therefore, within the course structure in Moodle, each week’s workshop activities were uploaded, followed by a short ‘assignment’ soliciting feedback to the questions shown in figure 1 below.
Please comment briefly on the following:1. What did you learn from this workshop?2. What was the trickiest aspect of the workshop?3. How could the workshop be improved?
Figure 1 Stage one feedback questions
This relatively simple and unsophisticated method of gaining feedback was then ‘marked’ by suitable comments from the author; it was not formally included as part of the assessment for the course. It did, however, serve the purpose of prompting the student to reflect on the workshops as a learning experience, establishing whether the materials and arrangements for the workshops were satisfactory, and allowing students to make suggestions for improving a course whilst it was being taught to them. There were, however, no significant changes suggested and so consequently none were made as a direct result of this feedback.
The author reflected on the first year course in particular and wanted to find a more effective way to empower students and make more efficient use of resources. Having gone digital in terms of the mode of delivering content, the approach to teaching and learning had to be also be moved out of an analogue mode of thinking.
Intervention 3: All change in 2010-11. Having successfully introduced the Moodle VLE into teaching and learning in 2008-09 and bedded it down in 2009-10, the author decided to take it a step further in 2010-11. The first year class were chosen to be the guinea pigs for a deeper digital approach, reducing the amount of paper distributed and making greater use of online technologies.
For example, paper copies of workshop notes were to be reduced to one per workshop seat and therefore shared (workshops were repeated four or more times a week), whilst, controversially in the mind of the author, lecture notes and other handouts were to only be available online.
After the first week it was immediately made known that the new cohort of students had different expectations to their predecessors, particularly in terms of the type of materials used in workshops. Communicated using question 3 of the feedback mechanism, the message came through that learning from paper copies was not a suitable method for digital natives weaned on YouTube and online tutorials. The movement of materials onto Moodle had not gone far enough!
The most anguished comment, which was not expressed either in class or in any other environment, was that “Some people learn differently, when I was given the book to look through and follow, I wanted to cry. If I was given the option of watching a online tutorial (YouTube), this would be much better”.
Another student commented “I think that if there was a demonstration it would have helped me learn this a lot faster”, whilst a third observed that “I think the workshop could be improved by not only just giving us a handbook to work through but a practical demonstration at the beginning of the session”.
Taking these and many other comments on board, the author set about creating weekly videos as support material for the weekly workshops. After implementing the video channel in week four, the feedback was questions were subsequently expanded from three to five as shown in figure 2, adding in an opportunity to comment on the lecture as well as
109
Proceedings of International Conference on Education, Informatics, and Cybernetics (icEIC 2011),
and the International Symposium on Integrating Research, Education, and Problem Solving (IREPS 2011)

that relating to the additional weekly video material.
Please comment briefly on the following:1. How useful was this week’s lecture?2. Did you find the video helpful?3. What did you learn from this workshop?4. What was the trickiest aspect of the workshop?5. How could the workshop be improved?
Figure 2 Stage two feedback questions
There was immediate and positive comment from individual students, such as “I was told there was a online tutorial, which helped a lot.” Another commented, “It was easily understood thanks to the video“, whilst a third remarked on their use of both the printed and video material, “I’m using the video as well as the booklet now, because I find it easier to understand”. The empowering aspect of having a video to help reflect on the success of the workshop was another important factor, as noted in this feedback comment, “The video was useful, and gave a clearer outline of the end result instead of potentially making our way through the workshop, making a big mistake on it and being none the wiser”.
The university’s Student Support Service also found that the implementation of the video lessons was impacting positively on their students. A deaf student reported that, “The video is very, very helpful. It has a voice-over, which is not much use for me, but I can use the handbook with it as subtitles. The handbook on its own is very difficult to learn from, it is not clear enough”, whilst the impact on a Dyslexic student was noted, “Working from the handbook was overwhelming her and sapping her confidence as there were ‘too many words and it does it in a complicated way’. With the video she has regained her confidence finding ‘learning the software this way is much easier’.” The member of staff concerned also made the following unsolicited remark in an email “From the point of view of a support tutor I wish more lecturers would present information in such an inclusive and creative way.”
4. DATA ANALySIS
With the availability of the detailed and extensive
comments form the Moodle feedback the original objectives can be revisited and the data analysed using both quantitative and qualitative methods
Quantitative analysis. We can extract some raw statistics from the feedback data in terms of the amount written by the students, and how many sessions were commented upon, as shown in figure 3.
Moodle Feedback# of students in project = 34Number of words in feedback comments12% 0 words = 4 students26% 0-249 words = 9 students20% 250 - 499 words = 7 students15% 500 - 749 words = 5 students12% 750 - 999 words = 4 students15% Over 1K words = 5 studentsTOTAL number of words = 16,040TOTAL number of students making comments = 30TOTAL number of sessions commented on = 204
Figure 3 Moodle feedback data analysis
This can be compared to the standard end of course questionnaire feedback for the same course, as shown in figure 4.
End of course questionnaire feedback# forms distributed = 34# completed forms = 22 TOTAL number of words written = 108TOTAL number of students making comments = 8
Figure 4 Questionnaire feedback data analysis
From the data analysis shown in figure 3 and figure 4 it is clear that the continuous feedback loop set up in Moodle has very successfully engaged students in written feedback comments, despite that effort not being formally assessed or subject to any formal reward or, conversely, subject to sanction if not completed. To make the point even more starkly, the most words on the questionnaire was 25 words compared to a 1,564 words by one student submitted on Moodle.
It is not all about quantity, as any teacher will testify. Although 30 out of 34 students completed some
110
Proceedings of International Conference on Education, Informatics, and Cybernetics (icEIC 2011),
and the International Symposium on Integrating Research, Education, and Problem Solving (IREPS 2011)
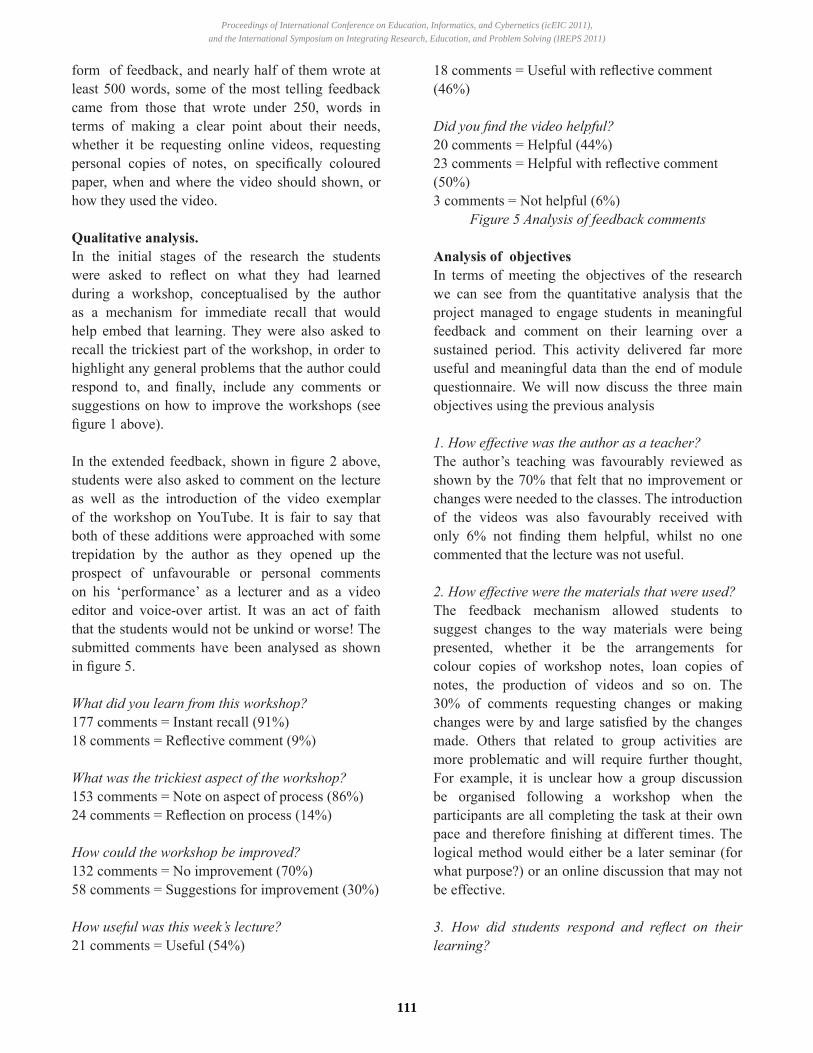
form of feedback, and nearly half of them wrote at least 500 words, some of the most telling feedback came from those that wrote under 250, words in terms of making a clear point about their needs, whether it be requesting online videos, requesting personal copies of notes, on specifically coloured paper, when and where the video should shown, or how they used the video.
Qualitative analysis.In the initial stages of the research the students were asked to reflect on what they had learned during a workshop, conceptualised by the author as a mechanism for immediate recall that would help embed that learning. They were also asked to recall the trickiest part of the workshop, in order to highlight any general problems that the author could respond to, and finally, include any comments or suggestions on how to improve the workshops (see figure 1 above).
In the extended feedback, shown in figure 2 above, students were also asked to comment on the lecture as well as the introduction of the video exemplar of the workshop on YouTube. It is fair to say that both of these additions were approached with some trepidation by the author as they opened up the prospect of unfavourable or personal comments on his ‘performance’ as a lecturer and as a video editor and voice-over artist. It was an act of faith that the students would not be unkind or worse! The submitted comments have been analysed as shown in figure 5.
What did you learn from this workshop?177 comments = Instant recall (91%)18 comments = Reflective comment (9%)
What was the trickiest aspect of the workshop?153 comments = Note on aspect of process (86%)24 comments = Reflection on process (14%)
How could the workshop be improved?132 comments = No improvement (70%)58 comments = Suggestions for improvement (30%)
How useful was this week’s lecture?21 comments = Useful (54%)
18 comments = Useful with reflective comment (46%)
Did you find the video helpful?20 comments = Helpful (44%)23 comments = Helpful with reflective comment (50%)3 comments = Not helpful (6%)
Figure 5 Analysis of feedback comments
Analysis of objectivesIn terms of meeting the objectives of the research we can see from the quantitative analysis that the project managed to engage students in meaningful feedback and comment on their learning over a sustained period. This activity delivered far more useful and meaningful data than the end of module questionnaire. We will now discuss the three main objectives using the previous analysis
1. How effective was the author as a teacher?The author’s teaching was favourably reviewed as shown by the 70% that felt that no improvement or changes were needed to the classes. The introduction of the videos was also favourably received with only 6% not finding them helpful, whilst no one commented that the lecture was not useful.
2. How effective were the materials that were used?The feedback mechanism allowed students to suggest changes to the way materials were being presented, whether it be the arrangements for colour copies of workshop notes, loan copies of notes, the production of videos and so on. The 30% of comments requesting changes or making changes were by and large satisfied by the changes made. Others that related to group activities are more problematic and will require further thought, For example, it is unclear how a group discussion be organised following a workshop when the participants are all completing the task at their own pace and therefore finishing at different times. The logical method would either be a later seminar (for what purpose?) or an online discussion that may not be effective.
3. How did students respond and reflect on their learning?
111
Proceedings of International Conference on Education, Informatics, and Cybernetics (icEIC 2011),
and the International Symposium on Integrating Research, Education, and Problem Solving (IREPS 2011)

The qualitative analysis shows that when asked to comment on what they had learned that 9% of the students offered a reflective comment that went beyond a simple listing of the content of the class. That figure rose to 14% when they were asked to comment on what had been the trickiest aspect of the class (aka ‘the muddiest point’[1]), rising again to 30% when asked how the workshop could be improved. An additional two questions were added in towards the end of the project and therefore had fewer responses. Nevertheless, when asked about usefulness of the weekly lecture almost half of the students reflected on why the lecture was useful, almost all of these exercising their critical faculties to contextualise the content into the broader course or their own learning objectives. Finally, the videos that had been introduced as part of the action research as a direct result of student demand, not surprisingly elicited the highest percentage of positive reflective comments at 50% of those submitted.
5. CONCLUSIONS
The TELE action research project has proven invaluable for the author in establishing a closer rapport with the student cohort. It has empowered the author in his teaching and confirmed his confidence with the materials being used. It has also empowered the students by introducing them to reflective practice early on in their higher education course. It has kick started the author into producing videos for use in the classroom having been prompted to work through the qualitative issues involved in instructional video production as well as overcoming the fear of being actively part of a video production.
It is suggested that there are the following lessons to be learned from the Technology Enhanced Learning Environment used in this research:1. Feedback should be a continuous process, acting
as a kind of ‘pedagogic glue’ that binds a course together
2. Formative feedback can enable students to direct their teaching and reflect on their learning
3. Video is a transformational and inclusive tool in education, freeing the classroom for
individualised teaching. Students can use the video to troubleshoot problems for themselves, freeing the teacher to answer deeper questions in one to one encounters. This can also create organisational efficiencies, as less support time is needed in the classroom to respond to technology related issues.
4. Technology can enable education practice to be ‘flipped’ [3]. Instead of classroom time being used in a “one size fits all” lecture, the lecture videos can be watched at any time allowing classroom time to be used in a far more effective and efficient way.
5. The focused and appropriate use of technology empowers students by allowing them to experience learning at their own pace and in their own time.
6. FURTHER RESEARCH
This research could be taken further to establish whether the methodology used is scalable, taking into account that the time taken to answer individual online feedback comments is not inconsiderable, let alone the time taken in any response or an initiative taken. A second question is what would be the impact of the student input being marked. Would it still be as extensive or would it conform to marking guidelines. Thirdly, could there be any scope for online peer group activities in this model? Finally, the profiles of the students could analysed and be correlated with the feedback data, as could the attainment of the students, to see if there were any insights to be gained from that analysis.
7. REFERENCES
[1] T Angelo & K Cross, Classroom assessment techniques: A handbook for college teachers. (2nd Ed.). San Francisco, CA: Jossey-Bass, 1993
[2] J Biggs, Teaching for Quality Learning at University, Buckingham: Open University Press, 1999
[3] S.Khan, ‘Let’s use video to reinvent education’, at http://www.ted.com/talks/salman_khan_let_s_use_video_to_reinvent_education.html (accessed on 20 April 2011)
112
Proceedings of International Conference on Education, Informatics, and Cybernetics (icEIC 2011),
and the International Symposium on Integrating Research, Education, and Problem Solving (IREPS 2011)

WHAT IS CAMPUS MARKETS AND HOW IS IT GOING TO HELP IN IMPLEMENTING THE NEW
CURRICULUM AT HAAGA-HELIA PORVOO CAMPUS?
Kalle RÄIHÄ
HAAGA-HELIA Univesity of Applied Sciences
Porvoo, Finland
Figure 1: The Porvoo Campus logo, which also functions as the entrance to the Campus Markets system.
The purpose of this paper is to present the main
idea of Campus Markets (working title), a system
which at this point is under construction. The aim
of the presentation is to create discussion and to
generate new ideas, points of view and
suggestions on how to further develop the
system and its implementation.
1. What is Haaga-Helia Porvoo Campus?
Until January 2011 Haaga-Helia University of
Applied Sciences Porvoo unit had operated its six
BBA degree programmes in three different
locations in the city of Porvoo, some 50 km east
of Helsinki, Finland. The students in Porvoo study
either business or tourism in three languages:
Finnish, Swedish and English. There are
approximately 1000 students and slightly less
than 100 staff members in the HH Porvoo unit.
Another UAS, Laurea, has a medical nursing
faculty with some 300 students in Porvoo. All of
these programmes and faculties moved under
the same roof in the beginning of 2011, when the
brand new Porvoo Campus opened for business.
Not only is the building new, it is also a rather
different one in design for a university of this
scale. In comparison with the old premises, the
number of traditional classrooms for lecturing
purposes has been reduced significantly (I must
mention that apart from the library there were
any other types of rooms in the old premises).
New types of rooms were adopted: conference
rooms, small rooms for team working, a lot more
new technology and even a room with only a
screen and a floor full of fatboy bean bags. One
major improvement upon moving to the new
Campus was that all students received a personal
laptop computer, which they get to keep after
they graduate.
2. What is the New Curriculum?
As soon as there were plans of building the new
Porvoo Campus, the plans for the new curriculum
were also launched. The main idea was that it
for us to move to a
113
Proceedings of International Conference on Education, Informatics, and Cybernetics (icEIC 2011),
and the International Symposium on Integrating Research, Education, and Problem Solving (IREPS 2011)

new location in order to do things in the way we
always had done. The working practices also had
to change. Many a teacher and student had
felt for a long time that the traditional way of
studying through series of courses comprised of
series of lectures, in which the students are to
absorb the knowledge presented by The Oracle in
front of the class, had come to an end.
The new curriculum emphasizes learning instead
of teaching. The focus is on the competences of
the individual student, rather than subjects. All
studies are in conjunction in projects which are
run with internal or, preferably, external
partners. The students learn real things by
working with real companies, dealing with real
money, people, tasks and challenges. The job of
the teacher is to guide the stu
the process and to help them put their
experiences in a larger context. Most of the work
is done in relatively small teams. The credits are
earned in modules, under the five main
competence areas: communication, production
of sales and services, social and collaboration,
business and entrepreneurial skills, as well as
operational environment. In addition, the
ssional growth within meta-
competences (project management, R&D,
coaching, creative problem solving and
innovation) is also evaluated. The
implementation of the meta-competences is
assessed under all the main competence areas.
Unsurprisingly, the new curriculum very much
dictated the design of the Porvoo Campus
interior, since a house full of classrooms just
The new curriculum has run for one academic
year now. Although most degree programmes
embraced it eventually, individual teachers and
students have not been able to fully live up to the
spirit of the curriculum. Among the issues causing
trouble apart from working in the new way in
the old buildings for the first semester - were
finding sufficiently large and suitably demanding
projects for rather a large groups of first-year
students. In many cases, probably out of fear of
Figure 2: Study Modules in Degree Programme in International Business. (Blue stands for free-choice study modules)
114
Proceedings of International Conference on Education, Informatics, and Cybernetics (icEIC 2011),
and the International Symposium on Integrating Research, Education, and Problem Solving (IREPS 2011)

point of view, a group of some 30 students were
given one often internal event organizing
project to work on. This led to a lot of people not
having much to do, which caused problems with
student motivation. There were those who did a
g, but all
might have received good grades because of the
good performance of the group as a whole.
It has been rather difficult for the students to
create their own path and to really design their
own competence portfolio, in which the
development of the individual student is
recorded by varied means. In the beginning
everyone in a team may have received the same
credits in the same modules, even if their tasks
and actual development in the five competences
were very different.
Students have often felt they were ordered to a
project by the teachers, rather than actually
applying for the ones they were most interested
in even if they were allowed the chance to give
their opinion on occasions where emerging
projects were presented.
Teachers have experienced difficulties in
adjusting their work (lectures, reading circles,
workshops, clinics, you name it) to the current
needs of the students. It has also been hard, even
impossible for many teachers to stand back from
the project management role. Many have felt
that in the end the external commissioners are
holding the teachers responsible for the outcome
of the project, which may have played a part in
teachers taking a more active role in running the
project. This is very much against the spirit of the
curriculum, as we are supposed to guide the
learning, not the work behind it. Also, if the
teachers are the True Project Managers, it
students nominally in charge of the case.
We also suffered many practical problems. How
could the partners, students and teachers easily
follow the progress of their project(s)? How could
a student follow their development and visualize
the competence portfolio, so that it all would
actually make some sense? One of the biggest
questions is where to announce new projects,
how to inform about them to the students, and
how to get a good team to work on the project?
How could a student actually be able to choose or
at least apply for a position in a project of their
choice, instead of being placed into one by a
teacher? Where to store all the data regarding
the work in the projects, the learning outcomes,
individual development, relationships with the
external partners, etc., etc.? How to let the world
and ourselves know, what kind of interesting
projects we are engaged in with a wide variety of
partners? How to best share and utilize the
currently scattered knowledge, networks and
information within the organization?
The answer is: Campus Markets.
3. What is Campus Markets?
Campus Markets is the working title of a web-
based system, which is the place where partners
can offer projects for the students to work with
and allow everyone involved to follow the
progress of their projects and their own profiles.
Campus Markets is co-ordinated by Ms. Anu
Sipilä and it is a part of VIDICO (Visible Digital
Competence) Digital Campus project, which is an
EU funded co-operation between a number of
educational institutes and development
companies. The project manager of VIDICO in
Haaga-Helia is Ms. Kitte Marttinen.
Technically, Campus Markets is a database
including information about available, running
and completed projects, the students and their
competence portfolios, the partner organizations,
the Porvoo Campus staff and all the
documentation regarding the projects. There will
also be different communication tools, such as
messages, e-mail and chat.
From a user perspective Campus Markets offers
different doors for the students, staff,
researchers, business partners to enter the
database from a desired point of view. The doors
are named Works (a list of projects), People
(student and staff profiles), Partners (partner
profiles), Stories (documentation) and possibly
Communications.
115
Proceedings of International Conference on Education, Informatics, and Cybernetics (icEIC 2011),
and the International Symposium on Integrating Research, Education, and Problem Solving (IREPS 2011)

Figure
At the time of writing this paper the system is on
planning stage. The actual programming started
in September 2011 and the pilot testing of the
system will start in January 2012. A number of
demos have been constructed so far, in order to
give some idea, what Campus Markets is about.
One main feature -y
links, which means that if, for instance, a student
or a partner is mentioned on the front page of a
project, there is also a link to their profiles. And
profile
front page from there.
3.1 What does Campus Markets mean to a student?
The students will be able to enter the Works
module and apply for relevant positions in
projects, which they find interesting. Once they
are working on a project, they can access the
project(s) in the same module, see whether there
has happened anything new on it (such as new
reports or other documents, new recruits, alarms
for missing deadlines, etc.) and add new
documents on it. The students can access their
projects even after completion in the Works
module. The opening list of projects is very
simple, but it can be customized through filters
and advanced functions. This principle applies to
most parts of the system.
The students can follow their professional growth
in their own profiles. The first view is the
competence portfolio, which shows how much of
each of the modules within the five competences
competences have been acquired can be seen by
clicking the modules. This should help the
student to quickly see, what she needs to work
on, where her main emphasis is and what kind of
concrete actions lie behind her credits.
The communication tools give the opportunity to
send messages to all parts involved in a project.
The possibility to upload documents into the
projects helps with sending reports, as a student
only needs to put a file in one place, where all
stakeholders can easily find it. No more e-mailing
to a wide range of recipients with varied level of
interest in the case.
3.2 What does Campus Markets mean to the staff?
The people working at Haaga-Helia should also
have their own profiles. We teachers should also
document our development. However, at this
point the staff profile has not been given much
attention, even if a well-tailored profile would 116
Proceedings of International Conference on Education, Informatics, and Cybernetics (icEIC 2011),
and the International Symposium on Integrating Research, Education, and Problem Solving (IREPS 2011)

help us a lot in organizing our work and keeping
track of our haves and have-nots, let alone
provide improved ways of keeping contact with
the students and each other. Our current habit of
running almost all (including group) discussions
by e-mail has become outdated and unbearable.
Be there useful staff profiles or not, Campus
Markets should help the staff to keep track of the
projects, in which their students are involved.
This is important because the number of projects
will increase substantially. The system will make
coaching and development discussions with the
students easier, as teachers can view the profiles
of their students.
Since teachers will very likely be heavily involved
in finding new projects even in the future, the
system will aid in finding out, which companies
we have been dealing with before, what they and
we have thought about the collaboration and
whether we are currently working on something
with them and whom we s
like to propose some sort of co-operation. This
means that even Campus Markets will function as
a type of CRM system for Porvoo Campus.
3.3 What does Campus Markets mean to partners?
Through their own profiles and access to their
own projects the partner organizations can easily
check the status of their projects by logging into
the system. This should help with building trust
between the companies and the school, as well
as minimizing the amount of fruitless e-mailing
and calling. The system will also provide a
have to feel all the work and results vanish
somewhere, without leading into any tangible
results or analyses for long-term use.
Figure 4: a project home page, this is where everything happens and where people can follow the development of the project.
As Campus Markets is designed to be a highly
visual, easily accessed tool for implementing the
Porvoo Campus curriculum, a written description
of it can only go so far. I will prepare a demo
version and/or a presentation, which will show in
a very concrete manner, how the system is
planned to work. If anyone attending the
presentation has an idea for a better name for
the system, I would be very pleased to hear it. As
long as it is not some old Google-derivative.
September 23rd
, 2011
Kalle Räihä
117
Proceedings of International Conference on Education, Informatics, and Cybernetics (icEIC 2011),
and the International Symposium on Integrating Research, Education, and Problem Solving (IREPS 2011)

Knowledge Trading in Practice:
Installing a Virtually Real Know-How Company
Hecke SCHROBSDORFFMPI for Dynamics and Self-Organization, Gottingen, Germany
Institute for Nonlinear Dynamics, University of Gottingen, Germany
and
Thierry BUCHELERArtificial Intelligence Laboratory, University of Zurich, Switzerland
and
Pascal KAUFMANNArtificial Intelligence Laboratory, University of Zurich, Switzerland
Starmind International AG, Brandschenkestrasse 33, Zurich, Switzerland
ABSTRACT
Every person and almost every organization faces prob-lems that cannot be solved by the know-how at hand.The traditional way of outsourcing these problems to aselected service provider risks a biased or just no solution,and comes with dependence on that particular provider.Hence, it is desirable to have a designated expert tacklingthe problem most effectively. We review the theoreticalbackground of know-how trading via an online commu-nity. We present the implementation of such a platformbased on the theoretical insights and show the impact onthe performance of the platform of applying the varioustheoretical concepts. The reported implementationpresents as a virtual company which aims at blurringthe boundary between online and offline worlds bydirect online user participation in the management of thecorresponding offline company actually running the portal.
Keywords: Knowledge Application, Knowledge Man-agement, Know-How Trading, Crowdsourcing, KnowledgeClassification
1. INTRODUCTION
Outsourcing of problem solving is desirable in cases wherethe available expertise or resources are not sufficient totackle the problem without help. With the global integra-tion of more than one billion users by means of the inter-net, global aggregation of know-how becomes tractable sothat expertise from every field can be made accessible toanyone through know-how trading portals. Since there arean overwhelming number of Internet forums where peopleoffer their know-how voluntarily, and for free, gatheringuseful information for a specified problem is a tedious pro-cess and often requires understanding the respective lan-guage and methods in order to rate the available flood ofinformation. From the viewpoint of a question poser, itis highly desirable to have some filtering mechanism thatquickly creates a single, accurate and comprehensible an-swer [21]. Currently, such a filter can only be achieved by
human resources, ideally orchestrated by a single point ofcontact. A global know-how trading portal not only offersa much wider search area for optimization, it also leadsto much more satisfying solutions to choose from, com-pared to the problem-solving capability of a small group.Further, it can also provide interaction between differentsolvers to create solutions to much more complex problemsthan a single solver could answer [21].The current contribution will consider the theoreticalbackground and the implementation of a know-how trad-ing platform. After a detailed presentation of the imple-mentation, the efficiency of the core of the platform, theincentive mechanism, is investigated.
2. BASICS OF KNOW-HOW TRADING
The idea of designing a portal for know-how tradingseems appealing and straightforward. People with a burn-ing question but either limited time or limited expertisepresent their problem and several portal members offertheir know-how to solve it. Interestingly, this simple sit-uation brings about high complexity not apparent at firstsight. Similar situations have been investigated in variousfields such as sociology, business and technology under therubrics crowdsourcing, user participation, open innovationand user-generated content.
Assessing Private Information
Besides the obvious benefits to pose problems to someoneelse with more time and/or a higher expertise, there is ad-ditional value in reaching out to a large group of humansto answer open questions: according to Von Hayek, everyperson possesses, due to his unique situation, particularknowledge, called private information, which might addvalue to the solution of a certain problem [24]. A know-how trading platform should make the relevant private in-formation accessible to solution seekers. This implies ei-ther identifying the individual who has the appropriateprivate information, or gathering solutions from severalsolvers, offering private information. In the first case thesearch for the person might not be successful, leaving the
118
Proceedings of International Conference on Education, Informatics, and Cybernetics (icEIC 2011),
and the International Symposium on Integrating Research, Education, and Problem Solving (IREPS 2011)

seeker with no solution, or a sub-optimal solution, if thesearch for the person with relevant private information isnot confined enough. In the latter case, either a fitering isnecessary to review the different contributions to identifythe relevant private information, or the seeker is presentedwith multiple solutions, perhaps too many to be useful,especially if he is under time pressure. The diversity of so-lutions is problematic for a seeker with low expertise whomay not be able to differentiate between correct and falsesolutions. This issue can be solved by publishing all so-lution submissions to the entire solver group to enable adiscussion among solvers combined with a ranking of so-lutions.
Prerequisites of Mass Innovation
The possibility that a large group of non-professionals cangive better answers than a single expert or small groupthereof is assumed to be dependent on several conditions.According to Howe, problems should be interesting andhard enough and solvers have to have some qualifications,including an understanding of the sometimes technical lan-guage used [8]. There must also be some method andhabit of aggregating the diverse contributions, which mayalready be built into the process of problem solving, pre-serving the important parts of useful private information.Participants must be drawn from a pool large enough toguarantee a variety of approaches. In the best case, di-versity and creativity are supported by the seeker or theenvironment. The community members must clearly un-derstand the rules, including intellectual property consid-erations, when asking or answering questions. And theremust be mechanisms in place to protect against gamingor sabotaging the system [18]. Strong feedback by othergroup members supports several of these prerequisites: itstrengthens intrinsic motivations for content and contribu-tions in general, lets members educate each other on rulesand the culture of the platform, and controls the quality ofcontributions, similar to traditional peer review processes.Usually, only the quality of the contributed know-how is,and can be, judged. In general, both experimental and the-oretical evidence indicates that mass innovation performswell on the basis of diversity of opinion, independence ofopinion, an incentive for truthful reporting, and estimatesof individuals being hampered only by imprecision and notby a systematic bias [10, 11, 15, 25].
Motivations and Incentives
Since users cannot be forced to contribute to a solution, asmight be the case in a hierarchically structured organiza-tion, the operability and efficiency of a know-how tradingplatform is directly related to the motivation of its mem-bers to provide their know-how and time to solve problems.Thus a thorough consideration of possible incentives pro-vides a view into the fundamental constituents of a portal.In the case of an internet portal, motivations to contributeto a larger project can be access to visibility, efficiency inuse of time, efficiency of use of labor, to gain experience,to increase productivity, to multiply proficiencies, to over-come intellectual isolation, need for additional confirma-tion of evaluation of a problem or the need for stimulationor crossfertilization [16]. In a study of motives underlyingcontributions to Wikipedia, certain values were found toform the basis of the online encyclopedia: altruism, reci-procity, community, reputation and autonomy [12]. Eachof those values is taken care of by the design of the Wikisystem. Investigating a more related portal, the know-howtrading platform Innocentive, the additional motivations
to win money, and spare time were identified as having apositive effect on the quality of a solution in addition tointrinsic motivations [13].
Self-Organization of Communities
The often surprising emergent phenomena shown by self-organizing systems are subject to a large variety of fre-quently interdisciplinary scientific projects, ranging frompattern-forming chemical reactions to the collective be-havior of life forms of all complexities. Interacting au-tonomous agents may add up to complex dynamics thatare entirely unexpected. Owing to the fast development ofcommunication technology, the Internet has introduced aradically broadened interaction network between humansas compared to the pre-Internet era, where interaction wasmostly restricted to people knowing each other or beingin geographical proximity. Peer-to-peer services like filesharing tools impressively demonstrate the impact the de-centralized Internet has on private and public life as wellas economy [23].The form of collective action, and hence often the function,is usually encoded in generative behavioral rules. Suchrules, being subject to natural selection, allow the genera-tion of self-organized adaptive patterns at group level. Asthe costs and benefits to individuals may change dynam-ically, even as a function of the position of an individualrelative to other group members, changes in single rulesare likely to occur as group members attempt to maximizetheir individual fitness. This can result in groups adoptingdifferent shapes, or motions, as well as being a potentialdriving force for internal structuring within both humanand animal groups according to studies from behavioralbiology [3].The goal in a distributed know-how trading platform isto maximize collective intelligence producing smart anduseful answers to hard questions. Group intelligence char-acterizes the ability of a team to solve problems. Inter-estingly, investigations demonstrated recently, the abilityof a group to solve a problem is not correlated with theindividual IQs of the team members but mainly dependson average social sensitivity of group members, the equal-ity in distribution of conversational turn-taking, and theproportion of females in the group [26].
Weaknesses of Large Groups
Care has to be taken that group discussions are nottrapped in dead-ends such as ignoring new informationfor the sake of the established group opinion [9, 22], infor-mation cascades where group members perceive the groupopinion as most rational [1], which are influenced by so-cial considerations and not rational decisions [6]. Addi-tionally, strategies of individuals differ dramatically fromwhat would seem rational from the external view whengroup interactions are present to find a collective solutionto a problem, which again will affect the individuals, e.g.,by rewards [23]. As long as there is no trust in the en-tire community, each individual will only try to maximizehis own benefit without aiming at a globally optimal so-lution, which is the goal of the solution seeker. But ifthe discussion members act in unbiased and cooperativeways, groups have shown to produce better solutions thanindividuals [2, 17].In order to prevent these dead-ends, it is important toavoid group cohesion and group insulation or isolation, di-rective leadership, homogeneity of the social backgroundand ideology of the members, high pressure, failures, com-munication difficulties and moral dilemmas. On the other
119
Proceedings of International Conference on Education, Informatics, and Cybernetics (icEIC 2011),
and the International Symposium on Integrating Research, Education, and Problem Solving (IREPS 2011)

hand, it is recommended to install norms requiring cer-tain methodologies, have separate teams working on thesame task, a culture to consider all available alternatives,a devil’s advocate in every team, and active exchange withexternal experts. Additionally, each member should be en-couraged to comment critically [9, 19].
Appraisal of the Community
As the members of a know-how trading portal are by nomeans legally bound to produce solutions, but often actpurely voluntarily, great care has to be applied when de-signing such a community in order to provide a usefultool, especially for organizations outsourcing tasks. In par-ticular, such tasks usually require a high level of qualityand meeting a hard deadline. Therefore, organizations ad-dressing such a portal have to change their way of thinkingabout service provision in contrast to traditional assign-ments. Members of successful crowds are deeply commit-ted to their community, and will defend any attempt atexploitation [8]. The right social climate within the com-munity is, therefore, an essential feature if a portal is to beproductive and successful. Such a climate is very sensitiveto many factors and thus difficult to achieve and maintain[20].
Intellectual Property
As the main purpose of a know-how trading platform isto transfer knowledge in the form of elaborate solutionsto specific problems, a clear handling of intellectual prop-erty aspects of solutions is essential. Also, offering severaldegrees of disclosure best addresses the different types ofproblems that might reach the community. Issues couldarise either directly between question poser and solver if,e.g., some solution is resold to a competitor of the seeker,or between the community members and the portal itselfwhen it comes to the publication of contributions on thewebsite. For the latter, a clear relationship of member tothe portal is important.In contrast to freely available know-how, scientific andtechnological knowledge is more and more restrictedthrough the use of patents, copyrights, and other, morenovel forms of intellectual property protection [4]. In thesituation where an organization outsources problem solv-ing to a know-how trading portal, the organization facesthe risks that their knowledge will be published.
Sabotage
An interactive online portal always is at risk of sabotage bydisappointed or snoopy users, e.g., Digg has been plaguedby users trading their votes for money [8]. Malicious usersmay have a personal motivation, but also coordinated sab-otaging in order to destroy the trust into the platform orthe community, which may be driven by a competing busi-ness, is a severe danger for a know-how trading platform.In order to minimize the risk of sabotage, the communitymust not be able to act entirely freely, but, e.g., to beunder the guidance of the portal owners [14].
3. KNOW-HOW TRADING PLATFORMS
There are a number of Internet portals that are dedicatedto questions and solving them by its users. Some of themore important examples are listed in Fig. 1 classified ac-cording to the estimated financial outcome for questionsolvers and the amount of money a question poser has tooffer.
Figure 1: Comparison of different know-how exchange portalsaccording to the amount of possible outcome for solvers in de-pendence of the necessary monetary input by question posers.Note the issue of high entry barriers and reward sums that ques-tion solvers could potentially earn. The lower the average re-ward is, the higher is the number of posted questions and hencesolvers can also earn more money by answering more questions.
a Yahoo answers: is different from common know-how platforms. It is mainly a chat forum where questionsare used as a starting point for discussion and socializing.
b Starmind: is currently working near the free andopen model of Yahoo Answers, with the striking differencesof a closed community with an influx of new members con-trolled by targeted invitation by members and the ratherstrict etiquette for answering questions mainly enforced bythe solution mask. In the future, Starmind is not intendedto rest at the level of low entrance barriers and low out-come. Rather, it is positioned in a region of low barriersaccording to free questions but high outcomes due to thepossibility to add paid features to a question and to assigna certain reward for question solvers.
c ExpertsExchange: is a technology help website.Users are experienced technology experts from around theglobe. It is mainly restricted to information technologyquestions. Members have to pay fees.
d Crowdspring: is one of the largest marketplacesin the world for crowdsourced creative services. Smallbusinesses, start-ups or agencies can have their logo, web-site or graphics designed with Crowdspring. Revenues aregenerated by taking a 10-20% share, where minimum re-wards start at US$ 200 per project.
e Hypios: is a French website operating since2009. Revenue-sharing schemes as well as reward alloca-tion schemes seem to be tested currently.
f Innocentive: is a pioneer in the field of know-how on demand and operating since 2001. Innocentivepublishes problems associated with rewards from severalthousands of dollars with a strong focus on research. En-try barriers for question posers are thus high, whereas thesolution probability is about 50%, which might be good forhard scientific problems, but bad for quick everyday ques-tions. Together with the complexity of their IP sharing
120
Proceedings of International Conference on Education, Informatics, and Cybernetics (icEIC 2011),
and the International Symposium on Integrating Research, Education, and Problem Solving (IREPS 2011)

schemes, taking part in the solver crowd requires exper-tise and time.
4. THE EXAMPLE OF STARMIND
We will now consider Starmind as an example of a know-how trading portal which implements many aspects re-viewed in the theory section of our contribution. Starmindis constituted as an online platform and social web for trad-ing know-how between individuals while actively locatingtalents around the globe to join the Starmind community.Starmind matches questions to qualified question solvers.Questions are posted combined with rewards. The Star-mind Community transfers solutions and intellectual prop-erty to question posers. Question posers have several op-tions to tune the appearance and visibility of their ques-tions. In general, solutions are created for free, based onintrinsic motivation of community members. Often talentstackle posted problems since they are either highly familiarwith the subject, have solved a similar question already orwant to use Starmind as a platform to successfully presenttheir individual know-how and therefore themselves. Bothquestion posers and question solvers benefit while new so-lutions are created ceaselessly.Starmind allows to outsource both challenging and alsotrivial problems to a community of question solvers lo-cated around the globe. The Starmind online portal unitesgraduates from the world’s top universities, business pro-fessionals, talents and creative minds who are willing toshare their know-how.In order to become a member of the Starmind commu-nity, individuals have to receive an invitation key from amember, or be affiliated with one of the partners of Star-mind, e.g., certain universities. The quality of solutionsgenerated by Starmind is achieved by both selection andsocial control. Questions as well as solutions can only beposted by community members. There is no distinctionbetween question posers and solvers, even though user ac-tivity shows that members usually show a tendency to ei-ther post questions or to solve questions of others.To present the mechanisms incorporated in the design ofStarmind, the following section will describe the part-icularities of question posing and solving, introduce thevoting mechanism as well as the so called career modelwhich defines the incentive system of Starmind that formsthe basis for non-monetary reward within Starmind.
Posing a Question
For question posing, a user has to define a short title,which has to be a question and is displayed in the list viewwhen browsing questions. The question body can be editedquite extensively. Finally, keywords have to be assigned tothe question, which will ensure that the right experts willreceive notification of the published question via email.Optionally, clear expectations for possible solutions can begiven. The latter usually helps a lot to answer questionsappropriately and eliminates misunderstandings and longclarifications in comments.Generally, questions on Starmind can be classified asproper questions and task assignments. Starmind focuseson the former, which can easily be solved by an experton that subject, while a small fraction of questions onStarmind are tasks. These tasks will require a significantamount of work even for experts, and are mostly postedas paid questions and in that context perceived as appro-priate.
When the portal launched a new release in June 2010, eachuser was allowed to post three so-called pioneer questionsfor free. All other questions had to be assigned a certainfinancial reward the question poser will transfer to the au-thors of satisfying solutions. With the growth of Star-mind which required a self-controlling mechanism withinthe Starmind community, the question mechanism was re-designed such that questions are free by default and solvers(as well as question posers) were rewarded with points fortheir internal career (see the section Career Mode) therebyproviding several of the prerequisites of mass innovation asintroduced above: a community culture based on certaincommon rules and the enforcement of quality by reciprocalrating.
Peer review
Questions of users below a defined experience level are firstheld in an unverified section and are only released intothe expert pool of Starmind questions when three positivevotes for that question have accumulated. In general, allquestions and solutions are subject to an open peer reviewby other users. They have the opportunity to commentand/or to vote. This peer review helps to solve the infor-mation overload problem a question poser is faced whenprovided with multiple and differing solutions [21].
Solving a Question
Currently, each experienced user is able to post a solutionto any question posed. Solutions can range from simpledescriptions to illustrated and structured submissions withattachments. Some solutions are private, other solutionsare publically visible and can be commented and votedupon by the community, thereby supporting the emergenceof collective intelligence by self-organization. All solutionsfor one question are presented below the question body inthe order of upvotes they received, except the particularsolution that has been accepted as the final solution to thequestion by the solution seeker, which is always displayedimmediately below the question body.
Voting Mechanism
Each user is able to express his favor or disfavor of a cer-tain question or solution by assigning his up- or downvotefor that particular item. Downvotes have proven to sig-nificantly improve quality [5, 7] and counteract sabotage.This process is essential for the evolution of the Starminduser base towards a crowd of very intelligent, versatile, pre-cise people, who can express themselves clearly, which isessential for the success of such a know-how trading portal.The voting process is made as simple as possible. It is donevia one mouse click. But not only the recipient gains (orloses) from being upvoted or downvoted; the person doingthe peer review is affected as well. If he gives an upvote, healso gains career points. If he votes down, he loses careerpoints. This mechanism is able to prevent abuse of thedownvote functionality, e.g., for surpassing a competitoron the internal ranking or systematic maligning of anotheruser. The sparse usage of downvotes proves the suitabilityof this method. Clearly, an important aspect when dealingwith negative feedback is that even though it is a way toassure a high quality of contributions, it negatively affectsintrinsic motivation. If the negative feedback becomes toofrequent, users may be repelled.
Career System
Since the beginning of April 2011, Starmind has imple-mented a novel user classification system by assigning job
121
Proceedings of International Conference on Education, Informatics, and Cybernetics (icEIC 2011),
and the International Symposium on Integrating Research, Education, and Problem Solving (IREPS 2011)

statuses to the users that resemble jobs in a real-life com-pany. With this approach, the Starmind portal, includingall users, became a know-how company. The so called ca-reer system is based on the voting mechanisms above andthe earning of career points by various activities, whereasupvotes, i.e., the positive reception to questions and solu-tions by the Starmind community have the greatest impacton the career of a user. By incorporating users directlyinto the physical company and thereby strengthening theircommitment to the community, Starmind ranges betweenthe online and offline world as a company offering bothvirtual and real-life affiliation for users.Career points are assigned (in decreasing order) dependingon received upvotes, acceptance of a solution, comments,upvoting of a solution, upvoting of questions. Points aresubtracted for downvoting either a question or a solutionand receiving a downvote, the latter being equivalent toloosing one upvote. This incentive model is able to in-troduce a very efficient self-organization process in theStarmind community, such that question posers as well assolvers are prudent and present original work of high qual-ity and well written up, such that the community will likeit. Additionally, the amount of work a user has to investin his career ensures that every user who reaches higherlevels has a good understanding of the functionality andthe aims of Starmind and is able to produce high-qualitysolutions and questions. The latter makes these users eligi-ble for very hard problems or challenging question posers.If a question is assigned a monetary reward, only users ofhigh experience are allowed to post answers. Virtual jobson Starmind range from a start as a Trainee via Man-agers who are involved in strategic decisions, to Partnerswho participate biannually in the revenues generated bya 10%-fee deduced from solved questions. Currently, asignificant crowd of users is actively building their careertowards higher managerial positions.
5. EFFICIENCY OF THE INCENTIVEMECHANISMS
The introduction of the career system into the Starmindcommunity in April 2011 allows to assess its impact bydirect comparison of global measures before and after thechange in the incentive mechanism. Before April 2011, al-most all questions on Starmind were paid questions. Allquestions were freely assigned a reward beginning fromone, and later ten euros. The reward, together with the es-timated effort influenced how many solutions were handedin, and how long their accomplishment took, with higherrewards producing more and faster responses. Only verylarge rewards in the range of several hundred euros re-ceived rather little and late responses, presumably becauseof the difficulty of the problem or the anticipated qualityrequirements of a solution.In order to assure high-quality solutions, solvers were re-quired to post a solution abstract based on which the ques-tion poser decides whether to open (and rate and pay) thesolution or decline it immediately. In the event of a suc-cessful solution, the poser rated the solution in percent ofsatisfaction, which is directly used as the percentage of theassigned reward to be transferred to the solver.Clearly, there was little interaction within the community,due to high degree of competition to post the best abstractand solution in order to be chosen versus other members.Such a lack of communication often led to poor qualityresponses, also because the question itself was not peer re-viewed. Often misunderstandings became apparent only
after a solution was posted. No self-organization amongthe community members took place, and therefore no mu-tual enhancement, in the sense of collective intelligencewas possible to emerge.After the introduction of the career mode, the number of(free) solutions shows the success of the new system. Notonly is a poorly posed question rather quickly identifiedand edited by the question poser. The different solutionscan be related to each other, potentially adding up to abetter solution for the question poser compared to the for-mer mechanism.
0 5 10 15 20 25 30 355
5.5
6
6.5
7
7.5
8
8.5
9
9.5
Week 2011
Act
ivity
[Log
ins/
(Use
r*D
ay)]
Figure 2: User activity, related to distinct logins per user perday before (white region) and after (shaded region) the intro-duction of the career system.
How the switch to the career system affects user activity isshown in Fig. 2. Since the introduction of job statuses andvotes, activity is rising steadily. Several factors have con-tributed to the increased activation: the possibility to par-ticipate by voting, as well as curiosity about votes receivedbut also the publication of solutions has made Starminda portal to browse for interesting questions and relatedanswers. In addition, the number of qualified commentsto questions and solutions shows great interest in assuringquality within Starmind.
5 10 15 20 25 30 3515
20
25
30
35
40
45
Week 2011
Key
Con
vers
ion
Rat
e [%
]
Figure 3: Conversion rate of invitation keys before (white re-gion) and after (shaded region) the introduction of the careersystem in a sliding average of 5 weeks. Invitation keys can begenerated by high-ranking users only while the conversion rate(=used keys) is an indicator of the perceived attractiveness ofStarmind.
Another indication of the changes introduced by the careermodel, the conversion rate of invitation keys generated byStarmind users, over the critical period of introduction ofthe career system is shown in Fig. 3. The process of invita-tion and registration was left unchanged by the transitionto career mode, thus the effect can be related directly tothe impact of the new community mechanisms. Clearly,
122
Proceedings of International Conference on Education, Informatics, and Cybernetics (icEIC 2011),
and the International Symposium on Integrating Research, Education, and Problem Solving (IREPS 2011)

the career system, especially the start as Trainee is notperceived negatively, but rather a plus, as more peopleactively invited to Starmind register.Considering the qualitative change within Starmind, dis-cussions have grown and span from comments to multi-ple solutions, each adding value to the solution a questionposer receives. The number of votes reflects active partici-pation in quality control and community building by users,showing the positive impact of the incentive implementa-tion chosen. The quantitative comparison of solution qual-ity would be the ultimate measure to prove success, butdesigning such a measure is a very complex task and isbeyond the scope of the present paper.
6. CONCLUSION
We have shown how to design a successful know-how trad-ing platform taking into account a multitude of aspectsthat arise in a community aimed at producing value in theform of solutions to problems. We have reviewed findingsfrom sociology, business and physics, i.e. self-organization,dynamics of groups and individual motivations to con-tribute to a community. We also pointed out commonpitfalls of know-how trading communities. We then pre-sented the approach used by Starmind as an example ofa recent implementation of a virtual know-how companywhere all members are assigned job statuses together withconcomitant privileges, in order to provide an ecosystemin which an agile and functional apparatus emerges. Weshowed the suitability of the career system reflected in theincrease in user activity and attractiveness of joining thecommunity.Starmind is about to evolve into a community of expertswith classification of their very diverse backgrounds andskills, so the right experts can be assigned to any problemposed to the portal. The high rewards, solvers can possiblygain, and the low barriers to question posing will attractmore and more users to Starmind, differentiating Starmindfrom comparable platforms.
7. REFERENCES
[1] S. Bikhchandani, D. Hirshleifer, and I. Welch. A the-ory of fads, fashion, custom, and cultural change asinformational cascades. Journal of political Econ-omy, pages 992–1026, 1992.
[2] A.S. Blinder and J. Morgan. Are two heads betterthan one? monetary policy by committee. Journalof Money, Credit and Banking, pages 789–811,2005.
[3] I.D. Couzin and J. Krause. Self-organization and col-lective behavior in vertebrates. Advances in theStudy of Behavior, 32:1–75, 2003.
[4] P.A. David. The economic logic of ’open science’ andthe balance between private property rights and thepublic domain in scientific data and information: aprimer. In National Research Council Sympo-sium on The Role of the Public Domain inScientific and Technical Data and Information(Washington, DC: National Academy of Sci-ences), 2002.
[5] E. Fehr and S. Gachter. Altruistic punishment in hu-mans. Nature, 415(6868):137–140, 2002.
[6] M. Gladwell. The tipping point: How littlethings can make a big difference. Little, Brownand Company, 2000.
[7] B. Herrmann, C. Thoni, and S. Gachter. An-tisocial punishment across societies. Science,319(5868):1362, 2008.
[8] J. Howe. Crowdsourcing: How the power of thecrowd is driving the future of business. Century,2008.
[9] I.L. Janis. Victims of groupthink. Houghton Mif-flin, 1972.
[10] N.L. Kerr and R.S. Tindale. Group performance anddecision making. Annu. Rev. Psychol., 55:623–655,2004.
[11] J. Krause, G.D. Ruxton, and S. Krause. Swarm intel-ligence in animals and humans. Trends in ecology& evolution, 25(1):28–34, 2010.
[12] S. Kuznetsov. Motivations of contributors towikipedia. ACM SIGCAS Computers and Soci-ety, 36(2):1–es, 2006.
[13] K.R. Lakhani, L.B. Jeppesen, P.A. Lohse, J.A.Panetta, and Harvard Business School. Divisionof Research. The Value of Openess in ScientificProblem Solving. Citeseer, 2007.
[14] S. Lane. Collective Intelligence for CompetitiveAdvantage: Crowdsourcing and Open Innova-tion. PhD thesis, University of Oregon, 2010.
[15] P.R. Laughlin, B.L. Bonner, and A.G. Miner. Groupsperform better than the best individuals on letters-to-numbers problems. Organizational Behavior andHuman Decision Processes, 88(2):605–620, 2002.
[16] S. Lee and B. Bozeman. The impact of research col-laboration on scientific productivity. Social Studiesof Science, 35(5):673, 2005.
[17] C. Lombardelli, J. Talbot, and J. Proudman. Com-mittees versus individuals: an experimental analysisof monetary policy decision-making. Bank of Eng-land Quarterly Bulletin, 42(3):262–73, 2002.
[18] T.W. Malone, R. Laubacher, and C. Dellarocas. Har-nessing crowds: Mapping the genome of collectiveintelligence. MIT Center for Collective Intel-ligence, 2009.
[19] Clark McCauley. Group dynamics in Janis’s theory ofgroupthink: Backward and forward. OrganizationalBehavior and Human Decision Processes, 73(2-3):142–162, 1998.
[20] V. Miemis. 6 tips for open collaboration.http://emergentbydesign.com/2010/06/01/6-tips-for-open-collaboration/, 2010.
[21] H.A. Simon. The sciences of the artificial. TheMIT Press, 1996.
[22] G. Stasser. The uncertain role of unshared informa-tion in collective choice. Shared cognition in or-ganizations: The management of knowledge,pages 49–69, 1999.
[23] J. Surowiecki. The Wisdom of Crowds: Whythe Many Are Smarter than the Few and How.Doubleday, 2004.
[24] F.A. Von Hayek. The use of knowledge in society.The American Economic Review, 35(4):519–530,1945.
[25] J. Wolfers and E. Zitzewitz. Prediction markets. TheJournal of Economic Perspectives, 18(2):107–126, 2004.
[26] A.W.Woolley, C.F. Chabris, A. Pentland, N. Hashmi,and T.W. Malone. Evidence for a collective intel-ligence factor in the performance of human groups.Science, 330(6004):686, 2010.
123
Proceedings of International Conference on Education, Informatics, and Cybernetics (icEIC 2011),
and the International Symposium on Integrating Research, Education, and Problem Solving (IREPS 2011)

Symbik - A New Medium for Collaborative
Knowledge-Intensive Work
Horst Werner
Markus Latzina
SAP AG
69190 Walldorf, Germany
and
Marius Brade
TU Dresden, Chair of Media Design
01062 Dresden, Germany
ABSTRACT
Knowledge-intensive work in business practice is usually
supported by rather static media where expressiveness
and ease of content consumption are paid for by a high
effort for content creation. In the area of highly
interactive collaboration, however, physical media like
whiteboards dominate because of the speed and ease of
content creation. Regrettably, physical media come with
a number of shortcomings, e.g., in terms of accommo-
dating increases in complexity and scope.
Computer support can help to create a new medium that
combines the directness and ease of use of physical media
with the power of mass data processing. However, the
current limitations of human computer interaction must
be overcome in order to make such a medium viable.
The paper outlines a new interaction metaphor and its
embodiment in a prototype, called Symbik, which
represents a significant step towards a powerful medium
for knowledge representation and creation.
INTRODUCTION
Knowledge creation and communication are vital for
creative business work, like decision making, problem
solving or planning. These activities often involve an
interdependent process of switching between problem
analysis (defining which items should be created or
gathered from other sources) and solution synthesis (how
these items ought to be linked, combined and prioritized).
This process has been coined reflection-in-action [1].
External representations are crucial components for many
of this kind of tasks – they are more than just memory
aids or permanent archives [2].
The media that are used for these external representations
highly depend on the granularity of information to be
represented and the interactivity of communication. In
highly interactive settings designers mentioned to
struggle with current collaborative tools such as wikis or
video conferencing [3].
Figure 1 gives an overview over the established media –
and corresponding tools as they have been reflected in
creative business work over the last fifteen years or so.
Elaborated content for remote consumption is usually
stored in documents, wiki pages, spreadsheets.
Illustrations are often created with high effort, using
dedicated tools, and then embedded into the documents.
In presentations, such visual representations play an over-
whelmingly important role in the form of slides. They
allow us to grasp complex content quickly because our
brains are able to translate spatial arrangements into
meaning in a particularly efficient way. Hasher and Zacks
demonstrated that spatial locations of objects are
processed automatically [4]. Further experimental results
demonstrate that a great deal of spatial information is
available for retrieval without attention having been
directed to it [5].
Still, the place of slide presentations in our media
ecosystem is mostly unidirectional communication,
where the time invested in the preparation of a visual
presentation is a multiple of the audience´s consumption
time. In Nonaka’s SECI model [6], this is the
Externalization interaction.
The most frequent and important interaction in
knowledge-intensive work, however, is the direct
discussion among people, contributing with their specific
knowledge towards a combined view (the Combination
interaction in the SECI model).
A typical example is collaborative problem solving,
where physical presence and direct interaction are vital.
Herring et al. observed that designers struggled to
communicate design ideas when working together with
team members in different locations. Collaborative tools
such as wikis and video conferencing were immediately
dismissed because designers’ needs were ignored [3].
For this kind of communication, the usage of presentation
software is much too cumbersome. The use of technology
in group sessions is often considered harmful since using
124
Proceedings of International Conference on Education, Informatics, and Cybernetics (icEIC 2011),
and the International Symposium on Integrating Research, Education, and Problem Solving (IREPS 2011)

Figure 1: Commonly used media and associated tools by granularity of content and degree of interactivity of the communication
desktop-based digital tools tends to isolate participants,
leading to a breakdown of communication that is vital for
a shared understanding of discussed work in the group
[7].
In rare cases, mind mapping software is used, but this
niche is almost exclusively occupied by physical tools
like whiteboards or flipcharts and sticky notes. Due to
limitations of time and drawing space, the content
produced in these media is rather qualitative and
simplified.
ASSESSMENT OF THE STATUS QUO
A glance at Figure 1 should make us aware of the
following:
1. The domain of knowledge representations used in
practice is rather strictly segmented into different
media and corresponding tools. Although some of the
media can be embedded into others, the media breaks
are a major source of concern in collaborative
knowledge-intensive work. Bergman et al. studied the
problem that users lost track of their project documents
and relations across the various tools and called this
“project fragmentation” [8].
2. For the whole area of highly interactive collaboration,
no suitable digital media exist for business practice.
3. The triangular structure of this chart hints at a trade-off
situation between the level of detail that can be
handled and the interactivity of the communication.
These points partly result from hardware limitations of
the past – with keyboard and mouse as the predominant
input devices – and partly from the mental concept of
unidirectional communication that shaped the design of
tools, with a clear separation between content creation
and consumption.
But in the highly interactive scenarios of discussion and
problem solving, every participant is a prosumer, i.e., at
the same time a producer and a consumer. Content is
created, discussed, modified, and erased within minutes
or even seconds.
The white space in the lower right corner of Figure 1
indicates the lack of a suitable medium for the immediate
and natural interaction with large amounts of fine-grained
information that supports the prosumer role. Since
visualization space and time are scarce in these highly
interactive situations, such a medium cannot statically
expose the full complexity to the humans. The most
efficient way of conveying complex information is to use
tangible models and real-time simulations: Instead of just
pushing information to the consumer, they rather answer
questions by their dynamic behavior.
Thus the missing medium needs to be interactive like a
tangible model and at the same time moldable like clay. If
the user is able to create interactive models with the
speed and ease of drawing sketches on a whiteboard, the
separation between creation and consumption can be left
behind. Thus the medium rather augments the human
capability to directly communicate instead of being just a
static means for information representation.
Only computer support can enable us to interact with
large amounts of fine-grained information in real-time.
While the creation of such a medium has become possible
with today’s hardware, the big obstacle here is the lack of
suitable human-computer-interaction.
Presentation
Summarized, Qualitative Detailed, Quantitative
Text Processing
Image Processing,
Diagramming,
Mindmapping Tools
Static
Documentation
Asynchronous
Communication
Granularity of content
Discussion
Inte
ract
ivit
yo
fco
mm
un
icatio
n
Spreadsheet Tools
Social Media
Slide Presentation Tools
Whiteboards,
Sticky Notes
Illustrations Text Tables
Slides
Sketches
Oral Communication
digital tool physical tool
125
Proceedings of International Conference on Education, Informatics, and Cybernetics (icEIC 2011),
and the International Symposium on Integrating Research, Education, and Problem Solving (IREPS 2011)

QUALITIES OF THE SYMBIOSIS
INTERACTION METAPHOR
The ideal situation for working on creative tasks would
be a symbiosis between computer and human, where the
specific strengths of both perfectly blend together. The
fundamental difference between computers and humans
was pointed out by Frieder Naake: “Humans Create,
Occasionally. Computers Operate, Always.” [9]. In
industrial practice, human-computer interaction is still
dominated by the machine’s limitations.
Several issues in user experience can be solved by
adhering to the large number of different design prin-
ciples and usability heuristics from the HCI literature
[10], [11], [12], [13]: Affordance, reducing cognitive
overload, low physical effort, learnability, user satis-
faction, flexibility in use, responsiveness and feedback,
and error tolerance.
However, creating an entirely new medium with the
characteristics outlined above requires a distinctly
different user experience: If the tool itself is disembodied
as much as possible, the user only perceives, and interacts
with, the content. We found that this kind of experience
can be achieved with the following qualities:
Immediateness of Interaction
Using a combination of touch screens with gesture
recognition and handwriting and/or voice recognition
instead of keyboard and mouse, a much more natural
interaction style can be achieved. Compared to clicking
through menus with tiny control areas, gesture input is
much faster and requires less precision. Some approaches
are using data mining to distinguish between text and
shapes in hand-drawn diagrams [14] as well as for
recognizing strokes [15]. An immediate and fluid
response of the system to any input creates a closed
“tangible” feedback loop that allows users to interact as
naturally as with physical objects.
Freedom and Open-endedness
A characteristic of human thinking is that it can start out
in a rather hazy way and crystallize into a more structured
form later. The structure of the result or solution, and
often even the structure of the problem itself emerge only
in the course of detailing, structuring and evaluating the
initially vague concepts.
Therefore, the medium should allow the user to capture,
visualize and manipulate content without restrictions in
layout, format or data model. Insights regarding how the
spatial layout of information supports visual information
gathering tasks were gained testing the prototype
BrainDump. The results show that users especially like
the fast way to visually change relations and associations
between information [16].
Continuity
The medium allows a smooth flow of creation, arrange-
ment, navigation, and exploration, without technically
imposed media breaks and interruptions.
This implies a seamless integration and transition of
information at various levels of structure, including
heterogeneous information types, such as free text and
sketches or web and database contents. Also, the user can
deliberately combine contents of different types. A stable
work environment across multiple sessions facilitates the
re-immersion into the work context.
Immersive Work Environment
The boundary between user and system should be as
seamless as possible to give users the feeling of being the
active part in a powerful environment that is tailored to
their needs. Such a work environment needs to have an
intuitive visual appeal and make all needed functionality
available in a natural and consistent way.
Support for Multiple Angles of View
Allowing subjectivity and considering the same content
from a multitude of different viewpoints is an essential
part of creative work. Involved people need to be enabled
to concurrently inspect the current state of their work
from individual perspectives. This includes the ability to
create multiple context-specific variations of the
visualization and data representation of a common
concept and to keep track of these contextual changes.
SYMBIK – A PROTOTYPE OF A NEW
INTERACTION MEDIUM
The key principles listed above were implemented in a
prototype code-named “Mother of All Whiteboards” [17].
The refined prototype is now called Symbik as a reference
to the symbiosis metaphor according to the qualities and
requirements as described above; it will be formatively
evaluated during a consulting project. Symbik is meant to
be used for creating and maintaining highly expressive
models of project-relevant knowledge, both during
customer workshops and in the subsequent project
execution phase.
Although technically a tool, the Symbik is rather an
interactive medium since it has no permanent controls or
menus. It presents itself as a plain interactive surface,
realizing the symbiotic qualities by means of the
following concrete capabilities:
Immediate Feedback
The Symbik has been designed for extreme performance,
so that any user interaction results in immediate and
smooth reaction. This allows all transitions to be
performed in a continuous, animated manner, even if it is
the zooming into, or the rearrangement of, sets of several
thousand objects. For example, the following frame rates
for zooming have been measured on a business notebook:
20 FPS with 8800 objects on the screen, 13 FPS with
17600 objects and 9 FPS with 26400 objects. This
smoothness is an essential factor for achieving the
quality of continuity as mentioned above.
126
Proceedings of International Conference on Education, Informatics, and Cybernetics (icEIC 2011),
and the International Symposium on Integrating Research, Education, and Problem Solving (IREPS 2011)

Gesture Control
Gestures can be executed very fast and at the same time
have a high expressiveness. This makes them ideal for
performing frequent tasks in a way that is natural to a
human. In the Symbik , lines and shapes are drawn
directly on the screen and then interpreted as new objects,
associations or commands depending on their geometry.
Deep Zooming and Free Spatial Positioning
Two-dimensional positioning of objects is an effective
approach for reflection in the early phases of a design
task. It helps the user to keep track of the task status
without detracting from the task itself [18].
Creative freedom and continuity are provided by the
ability to use an infinite layout area combined with a
zoomable user interface (ZUI) technique. ZUIs aim at
solving the problem of more information existing in a
system than fits on the screen by enabling panning and
zooming operations. Pad was the first system to explore
this idea [19].
Bederson defines ZUIs as "systems that support the
spatial organization of and navigation among multiple
documents or visual objects [20]." The abundance of
space allows the human to jot down thoughts as they
come: preliminary, unfinished, from multiple angles of
view. Not only can the user use this unlimited work area
as a canvas to lay out content, he or she can even mix
content and tools deliberately in an arrangement that
perfectly matches the needs of his or her current activity
and work style.
Semi-structured Information Representation and
Processing
A key requirement as mentioned above is the transition
from a hazy collection of thoughts to structured
information that is used as input for subsequent tangible
actions. Therefore, the Symbik maintains both a visual
and a semantic model of the content and ensures that both
are consistent. Every closed shape that is generated
corresponds to a meaningful object that can have
associations and attributes. The spatial arrangement of
objects is automatically translated into meaning in the
data model. New types of objects, associations and
attributes can be created on the fly by just defining them
ad hoc. What feels like tagging to the user in fact
generates a data structure that can be leveraged for
powerful mass operations on objects such as grouping
and filtering.
Lightweight Semantics
When subsequently making concepts more concrete,
human and computer “speak the same language”, i.e., the
computer is able to adopt the human’s terminology
instead of imposing a predefined set of terms and
concepts on the user. The use of taxonomies gives the
software a grasp of the meaning of content, thus enabling
powerful processing mechanisms. E.g., a box drawn on
the screen represents a generic topic at the beginning.
Later, the meaning of the box can be concretized by
tagging it with a more specific type, e.g., decision or
issue. Technically, this content is represented in the
Active Information Store data model which is similar to
RDF [17].
Content Integration
In order to connect user-created content with existing
content from arbitrary sources, the impact of system
boundaries is removed by a content integration layer so
that all content may be exposed if needed and can be
processed in a uniform way. This refers both to the
technical integration which enables the access to content
across system boundaries and to the semantic integration
which allows to use a unified set of terms to describe
similar content and attribute types.
Particle Dynamics
An efficient way to visualize the properties of large
amounts of concepts or entities is by spatially arranging
them in a meaningful way, e.g., on a geographic map, on
charts or even in a tag cloud. Thousands of entities can be
visualized at once if they are scaled down to the size of
particles. So a set of entities becomes a particle cloud that
can be reshaped according to user-defined structuring
criteria in fractions of seconds. By zooming in, the
individual properties of the objects can be inspected at
any time. This functionality is key to enabling the real-
time communication of very detailed and complex data.
Figure 2: Drawing shapes with the Symbik (left), results in visual representation of the drawn outline connected to a respective
data model (right).
127
Proceedings of International Conference on Education, Informatics, and Cybernetics (icEIC 2011),
and the International Symposium on Integrating Research, Education, and Problem Solving (IREPS 2011)

WORKING WITH THE SYMBIK
In a hypothetical example, a company producing high-
end kitchen equipment, which has invested massively in
the development of nanoparticle-based coatings for their
products, becomes aware of government plans to regulate
the usage of nanoparticles.
In a small group brainstorming session the impact and
possible reactions are discussed. At first, points of
concern are collected and drawn on the Symbik as
freehand rectangles (Figure 2). Each rectangle gets a
heading, e.g., Impact on Products, Impact on Production,
Task Force, PR Campaign, or Alternative Materials.
In the following discussion it becomes clear that most of
the topics obtain the character of a task. So an ellipse is
drawn and annotated with “Type: Task”. The topics that
are consequently dragged into the ellipse are changed into
tasks and immediately change shape and color
accordingly. Task Force is changed from topic to team by
editing the type annotation in its property sheet.
To carry out these tasks, different subject matter experts
should get involved. By annotating a circle with “Type:
Employee” and performing a query gesture, icons for all
employees are rendered in the circle. A context menu
allows dynamically arranging these five hundred icons in
subsets according to different criteria, like location or
department in a pie chart layout (Figure 3).
Figure 3: Arrangement in Subsets Mimicking a Pie Chart
Employees who qualify as task force members are picked
from these subsets and are either dragged into the Task
Force rectangle or associated with it by drawing a
freehand line. In either case, the association of the person
with the team is also maintained correspondingly in the
underlying data model.
In the same way, the tasks are assigned to employees.
Associating multiple tasks to the same person is
facilitated by drawing first an ellipse around them and
then a line between the ellipse and the employee (Figure
4). Annotations of ellipses are also used to maintain
attributes like priority or effort for multiple tasks.
In the course of the discussion, the content on the Symbik
is further structured: An action plan with several steps is
drawn and copies of the different tasks are dragged into
the corresponding steps. Cloning visual objects in order
to create different views on the same content is a
particularly important feature.
Figure 4: Set of items associated to a person and reflection
of the associations in the person’s property sheet.
The infinite zooming and automatic downscaling of
objects when dragged into each other allows creating
very detailed hierarchical views. The gesture-controlled
mass operations for creating, copying and rearranging
visual content make it viable that every participant can
create his/her own view on the topics in the course of the
meeting, e.g., organizational, technical, or financial.
Figure 5: A large-screen capture of the content of a Symbik
after several weeks of work.
All these views share one consistent data model. So it is
possible to look from the different participants’
perspectives at a specific object by having the camera
travel along the corresponding visual occurrences.
At the end of the meeting, specific views can be exported
as an HTML document or spreadsheet table and attached
to the meeting minutes. It is also possible to continue
maintaining the content throughout the whole project or
activity in order to keep track of the many different
aspects. As an example, Figure 5 depicts a high-level
view of a project documentation after several weeks.
128
Proceedings of International Conference on Education, Informatics, and Cybernetics (icEIC 2011),
and the International Symposium on Integrating Research, Education, and Problem Solving (IREPS 2011)

USER FEEDBACK AND OUTLOOK
Informal feedback sessions revealed that users
immediately liked the interactivity and versatility of the
Symbik. Still, the strong focus on gesture control initially
imposed some hurdles: People needed to learn how to
interact with this genuinely novel kind of an interactive
medium. Therefore it is planned to offer more common
interaction techniques and controls, e.g., the embedding
of widgets like tables or specific forms, which underscore
the aspired symbiotic interaction qualities.
Another consideration relates to accommodating the
diverse constellations in which users find themselves,
with respect to situational task characteristics and
equipment, e.g., the use of tablets or large touchscreens.
Therefore, dedicated versions of Symbik which entail
suitable HCI techniques may be needed.
ACKNOWLEDGMENTS
The authors would like to thank Joerg Beringer for his
ingenious inspiration and support in many respects, as
well as Rainer Groh and Angelika Salmen for their
invaluable support. Thanks to the funding of Marius
Brade's research project (contract no. 080951799) by the
European Social Fond and the Free State of Saxony, as
well as by SAP Research, he is able to collaborate with
the other authors. Furthermore the authors would like to
thank the reviewers for their invaluable feedback.
REFERENCES
1. The reflective practitioner: How professionals think in
action. Schön, Donald A. New York: Basic Books, 1983.
2. The nature of external representations in problem
solving. Zhang, Jiajie. 2, April-June 1997, Cognitive
Science, 21, 179-217.
3. Idea generation techniques among creative
professionals. Herring, Scarlett R.; Jones, Brett R. and
Bailey, Brian P. IEEE, 2009. Proceedings of the 42nd
Hawaii International Conference on System Sciences. 1-
10.
4. Automatic and effortful processes in memory. Hasher,
Lynn und Zacks, Rose T. 3, September 1979, Journal of
Experimental Psychology: General, vol. 108.
5. On the coding of spatial information. Mandler, Jean
M.; Seegmiller, Dale und Day, Jeanne. 1977, Memory
& Cognition, vol. 5, 10-16.
6. The knowledge-creating company. Nonaka, Ikujiro
and Takeuchi, Hirotaka. New York, Oxford: Oxford
University Press, 1995.
7. Recognizing creative needs in user interface design.
Terry, Michael and Mynatt, Elizabeth D. ACM Press,
2002. Proceedings of C&C’02. 38-44.
8. The project fragmentation problem in personal
information management. Bergman, Ofer; Beyth-
Marom, Ruth and Nachmias, Rafi. ACM Press, 2006.
Proceedings of the SIGCHI conference on Human
Factors in computing systems.
9. Humans create, occasionally. computers operate,
always. Nake, Frieder. Dagstuhl, Germany: Schloss
Dagstuhl - Leibniz-Zentrum fuer Informatik, Germany,
2009. Computational Creativity: An Interdisciplinary
Approach.
10. Designing from both sides of the screen: How
designers and engineers can collaborate to build
cooperative technology. Isaacs, Ellen and
Walendowski, Alan. Indianapolis: New Riders, 2002.
11. Heuristic evaluation of user interfaces. Nielsen,
Jakob and Molich, Rolf. 1990. In Conference on Human
Factors in Computing Systems.
12. The five dimensions of usability. Quesenbery, Whit-
ney. In content and complexity: Information design in
technical communication. M. Albers and B. Mazur, 2003.
13. Designing the user interface 5th revised edition.
Shneiderman, Ben and Plaisant, Catherine. Addison
Wesley, 2009.
14. Recognizing sketches of euler diagrams drawn with
ellipses. Wang, Mengdi; Plimmer, Beryl; Schmieder,
Paul; Stapleton, Gem; Rodgers, Peter; Delaney,
Aidan. 2011. IEEE Symposium on Visual Languages and
Human-Centric Computing.
15. Rata.SSR: data mining for pertinent stroke
recognizers. Chang, Samuel Hsiao-Heng; Plimmer,
Beryl and Blagojevic, Rachel. 2010. SBIM '10
Proceedings of the Seventh Sketch-Based Interfaces and
Modeling Symposium.
16. BrainDump: An interface for visual information-
gathering during web browsing sessions. Brade, Marius;
Heseler, Jörg and Groh, Rainer. Graz, Austria: ACM,
2011.Proceedings of the 11th International Conference on
Knowledge Management and Knowledge Technologies.
17. MOAW: An agile visual modeling and exploration
tool for irregularly structured data. Werner, Horst;
Bornhoevd, Christof; Kubis, Robert; Voigt, Hannes. Kaiserslautern: Gesellschaft für Informatik, 2011. 14th
Conference on Database Systems in Business,
Technology and Web (BTW).
18. Two dimensional spatial positioning as a means of
reflection in design. Nakakoji, Kumiyo; Yamamoto,
Yasuhiro; Takada, Shingo and Reeves, Brent N. New
York City, United States: ACM, 2000. Proceedings of the
3rd conference on Designing interactive systems:
processes, practices, methods, and techniques. 145-154.
19. Pad: an alternative approach to the computer
interface. Perlin, Ken and Fox, David. Anaheim, CA:
ACM, 1993. Proceedings of the 20th annual conference
on Computer graphics and interactive techniques. 57-64.
20. The Promise of Zoomable User Interfaces. Bederson,
Ben. B. Beijing, China: ACM, 2009. Proceedings of the
3rd International Symposium on Visual Information
Communication.
129
Proceedings of International Conference on Education, Informatics, and Cybernetics (icEIC 2011),
and the International Symposium on Integrating Research, Education, and Problem Solving (IREPS 2011)

Development of computer software simulation for training CT technologists in the performance of
CT Colonography (CTC)
Farid Dahi, Michael W. Vannier, Ademola M. Obajuluwa, Abraham H. Dachman
Department of Radiology-University of Chicago
Chicago, Illinois, USA
Abstract
A software tool was developed to train technologists on how to perform CT colonography (CTC) procedures. A prototype was developed
and tested to obtain feedback via a formative evaluation process. Initial assessment and required data for designing the software were
gathered through multiple sources (questionnaire, literature, interviews and observation). A simulator that emulates the CT scanner control
console, table and CO2 insufflator was developed using Adobe Captivate©. The simulator was evaluated by 2 technologists experienced in
the performance of CTC who completed all scenarios of the simulation via navigating through the software and provided detailed direct
verbal feedback and then completed feedback questionnaire asking about the “ease of use” of the software as well as the “content”. The
results of formative evaluation showed that the simulator software was promising and efficient as a training tool. Based on this experience,
a more detailed interactive CT console and CO2 insufflator user interface was developed using National Instruments LAbVIEW®
programming language. Conclusion: Training of CT technologists in the performance of CTC currently done by cumbersome and time-
consuming radiologist-technologist interaction with a large number of patients over a prolonged period of time can be supplanted by a
computer software simulation training program.
Keywords: Colorectal cancer (CRC), CT Colonography (CTC), Virtual colonoscopy, Technologists, Simulation, Training
Introduction
Colorectal cancer (CRC) is the third most commonly diagnosed
cancer in males and the second in females. Over 1.2 million new
cancer cases and 608,700 deaths are estimated to have occurred
in 2008[1]. In terms of geographic distribution, Australia and
New Zealand, Europe, and North America have the highest
incidence, whereas the lowest rates are reported in Africa and
south-Central Asia [1]. If CRC is diagnosed at early stage
(confined to the wall of the bowel) five-year survival is 90%.
The survival decreases to 68% for regional disease (lymph node
involvement) and reaches to 10% if distant metastases are
present[2] There are several screening test including: 1-stool
blood tests,2-sDNA, 3-Flexible Sigmoidoscopy 4- Colonoscopy
5- Double contrast barium enema (DCBE) and 6- Computed
tomographic colonography (CTC). The recommended repetition
intervals for average risk individuals aged between 50 and 80
years are: 10 years for colonoscopy, 5 years for sigmoidoscopy,
CTC and DCBE, and 1 year for stool blood tests.
Computed tomographic colonography (known also as virtual
colonoscopy), has been rapidly developed since its introduction
in mid-1990s as a minimally invasive imaging modality for
evaluation of entire colon and rectum. Helical CT images are
used to create standard axial and reformatted 2-dimensional
(2D) and 3-dimensional (3D) images of the colon. It provides
visualization of 3D endoscopic flight paths through the inside of
the colon accompanied with simultaneous interactive 2D images
which allows polyp detection and characterization of lesion
density and location. Bowel preparation and gaseous distention
of the colon through a CO2 insufflator is required for a
successful examination. The residual stool and fluid are tagged
with barium and/or iodine oral contrast agents. The advantages
of CTC are to be time efficient, minimally invasive, and no
sedation is utilized, so the patient can return to work on the same
day(Figure1) [2].
Figure1. Images of CT scanner (a), CO2 insufflator(b), CT
console (c), and different 2D and 3D views of exams(d).
Colonic insufflation and scanning are performed by trained
technologists working under the supervision of radiologists. To
be cost-effective and adapted to general practice, a technologist
must be sufficiently trained to function independently. Two of
the most important elements for successful CTC performance
130
Proceedings of International Conference on Education, Informatics, and Cybernetics (icEIC 2011),
and the International Symposium on Integrating Research, Education, and Problem Solving (IREPS 2011)

are: 1- optimal colonic insufflation/distension, and 2- the use of
proper scanning parameters [3, 4].
Technologists must learn unique skills that are not normally part
of their training. Currently, there are courses that equip
radiologists with the necessary skills and knowledge required to
interpret and read CTC cases. However, there are no training
programs specifically designed for technologists. There are few
expensive 1-3 day training programs designed for radiologists
that focus on exam interpretation. They may incorporate a
lecture on exam performance, but the details relevant to
optimizing colon insufflation and other details normally in the
domain of technologists are left out. These programs do not
offer the option of continuous practice which is time consuming,
and requires several months for a technologist to acquire and
retain the complex information.
Simulation can provide an interactive training environment that
replicates real experiences in an efficient and engaging manner.
In medical field it is defined as “a person, device, or set of
conditions which attempts to present [education and] evaluation
problems authentically”[5, 6]. Simulators have been mostly used
for training in aviation and medicine, but for limited particular
skills [7]. The first medical simulator was introduced by peter
Safar in late 1950s who was an anesthesiologist working on
cardiopulmonary resuscitation [8]. Since then, simulation-based
healthcare education has a considerable growth with creation of
society for simulation and related journal [9]. Surgery and
anesthesiology are two fields which have used simulators most
extensively compared to other specialties. Simulator base
training has been developed for ophthalmology and
gastroenterology [7]. Nowadays simulation has to be noticed as
an effective method and efforts are needed to facilitate practical
use of this powerful education tool.
In this paper, we present a software simulation training tool
developed by using Adobe Captivate to simulate the decision
points encountered by the technologist when performing CTC.
We also performed a formative evaluation of the tool through
getting feedback from two radiology technicians who navigated
through the software. Also, separately, we experienced creating
the user interface of CT console and CO2 insufflator using
industrial programming software (LabVIEW) to demonstrate the
feasibility of creating real environments for the purpose of
training.
Methods and Materials
Resources and software development: Initial assessments to
determine data required for simulation software were performed
through 4 sources including:
1. Questionnaire: questionnaire included a mixture of
qualitative open-ended questions and quantitative
(ordinal) Likert scale questions. Twelve radiology
technologists in the radiology department of the
University of Chicago Medical Center (UCMC)
participated to share their self-experience, familiarity,
training, expertise, and difficulties they encountered in
various aspects of CTC performance.
2. In-depth interviews of a knowledgeable informant and
two key informants. The knowledgeable informant
was one of the most experienced technologists in the
performance of CTC at UCMC while the key
informants were two experienced radiologists.
3. Literature review: Several articles[3,10,11] and books
[12,13] were reviewed in order to gather and analyze
existing validated protocols on the process of
performing CTC.
4. Naturalistic observation (observation in the real-world
setting) of several CTC procedures with construction
of extensive field notes
Data types included documents, questionnaires, graphic images,
step-by-step professional videos (scripted, recorded and edited
specifically for this project) of various tasks involved in the
performance of CTC (technologist interactions with both the
patient and the equipment), algorithms representing the
flowchart of decisions, and CT scan images.
An extensive, detailed algorithm was developed using
Inspiration© software, to capture the decision points and
possible scenarios involved in the performance of virtual
colonoscopy (Figure 2). A list of the steps involved in the
performance of CTC was made and each step was professionally
videotaped (employing the audiovisual department of the
University of Chicago Medical Center). The video clips
included patients (with informed consent), mock patients, a
technologist and usage of the equipment. Screen capture images
of the steps involved in positioning and scanning patients were
made at the computer console using SnagIt© screen capture
software. All videos were then edited using Apple Final Cut Pro
6© video editing software. Table1 summarizes tasks and tools
for developing the simulation software. Using the algorithm,
images, videos and text information the software simulation tool
was created using Adobe Captivate© software, which is a
software basically used for creating software demonstrations,
simulations, branched scenarios, and randomized quizzes in
flash(SWF) format. Adobe Captivate has a safe and simplified
environment for learning where corrective feedback is provided.
It is possible to add interactivity with branching to create
realistic practice scenarios. It supports many different interaction
types with no coding or scripting skills required [14].
Table 1 Summary of Software Simulation Tasks
Process/Task Tools and Methods
Creation of video library (50 video clips)
Video clips recorded with the help of the
AV department of University of Chicago Medical Center. Videos edited by author
using Apple Final Cut Pro 6© software
Creation of image library
(35 images) Digital camera
Creation of Virtual Colonoscopy algorithm
(25 pages)
Inspiration Software©
Screen captures of
scanning process (78 images)
SnagIt© software
CT scout scan image library (179 images)
Created by a radiologist/research assistant, includes teaching points
Creation of Software
Simulation (185 slides) Adobe Captivate©
131
Proceedings of International Conference on Education, Informatics, and Cybernetics (icEIC 2011),
and the International Symposium on Integrating Research, Education, and Problem Solving (IREPS 2011)

Software formative evaluation: Simulator software
performance was assessed through direct verbal and
questionnaire feedback. Two radiology technologists who had
more than 3 years’ work experience and more than 3 years of
work experience in CT gave their feedback after 3.5 hours
navigating through the software (Table2). In addition to verbal
feedback, a questionnaire was used to obtain feedback about the
“ease of use” of the software simulation as well as the “content”.
The “content” section of the questionnaire focused on evaluating
the effectiveness of the simulation in teaching specific skills and
decision points identified in the algorithm
User interface development: Other than development and
formative evaluation of a training tool for CTC, we decided to
try creating CT console and CO2 user interfaces looking more
real and interactive by using National Instruments’ LAbVIEW®
(Laboratory Virtual Instrument Engineering Workbench) which
is a graphical user interface (GUI) and visual programming
language (VPL). Labview is a general-purpose programming
tool which was introduced in 1986 and provided a powerful
object-oriented programming environment with a wide variety
of applications including simulation, instrumentation, process
control, automation and etc. The software is basically an
industry-standard programming language. LabVIEW is ideal for
developing software-based versions of real-world instruments.
Programming is done through block diagrams that consist of
icons and wires which can be directly compiled into executable
codes. It provides graphical user interface (GUI) in which the
program environment can be designed. LabVIEW programs are
called "virtual instruments" (VIs). Each VI consist of three
parts: 1) the front panel, in which the real environment is
designed and simulated by using a variety of controls (specifies
inputs) and indicators (specifies outputs), such as buttons,
switches, knobs, graphs and etc. ; 2) the block diagram, where
the icon-shaped codes ( rather than text-based codes) are placed,
and 3) the icon~connector, which are “wires” connecting code
icons together. Each front panel has a corresponding block
diagram, which defines the actual data flow between the inputs
and outputs. The code icons then are wired together by using
programming concepts like other programming languages[15–
17].We used Labview version 10.0 (2010) for creating CT console and CO2 insufflator user interface.
To create a user interface that accurately resembled the Philips
software and instrument, The Philips CT console software was
divided (and screen captured) into different user interfaces
which the trainees have to go through step by step from the
beginning (entering patient information) to the end of process.
The active fields of each interface that the trainee has to follow
were created by using LabVIEW elements in the front panel,
and relations among controls, indicators and VIs were
programmed by using graphical codes and wires in the block
diagram. To create the user interface of the CO2 insufflator, a
captured image of the instrument was imported into the front
panel. Then buttons, switches, indicators, LEDs and etc. were
designed in the imported image exactly at the same place with
the same shape. Some elements’ functionality on the instrument
were given through codes written in the block diagram.
Table2 Technologists’ experience backgrounds
Self-reported level of expertise in the performance of virtual colonoscopy
(1= Beginner, 5 = Expert)
Both technologists = 4
Number of virtual colonoscopy procedures performed in the last 12 months
Technologist A= 4 Technologist B = 10
Familiarity with the front panel and controls of the mechanical CO2 insufflator
(1 = Unfamiliar, 5 = Very familiar)
Technologist A = 5
Technologist B = 3
Familiarity with scanning parameters
(1 = Unfamiliar, 5 = Very familiar) Both technologists = 5
Self-reported level of expertise in the use of the mechanical CO2 insufflator
(1=Beginner, 5=Expert)
Technologist A = 5
Technologist B = 3
Self-reported level of expertise in the use
of manual room air insufflation (1=Beginner, 5=Expert)
Technologist A = 4
Technologist B = 1
Results
Using Adobe captivate, we developed the CTC training tool by
using prepared materials including detailed 25 pages algorithms,
Figure2). Sample flowchart page for the training tool. (There
are 25 pages of flowcharts in all).
132
Proceedings of International Conference on Education, Informatics, and Cybernetics (icEIC 2011),
and the International Symposium on Integrating Research, Education, and Problem Solving (IREPS 2011)

videos, images, transcripts, and screen captured of scanning
process. The total numbers of slides created were 185. Figure3
shows screenshots of the designed tool. After 3.5 hours
navigating through each slide of the training tool by two
technologists, they provided direct verbal feedback to the
author/interviewer. Their feedback was categorized and the
following general themes were deduced:
Design and “Ease of Use” issues: e.g. the position of
some buttons, navigational challenges, and the need
for better display techniques such as videos and
interactive animations instead of static images on
some screens.
Sequence of tasks: The order of some tasks in the
simulation needs revising.
Practice pattern issues: Some of the items reflect ideal
situations not actual practice patterns.
Omissions and additions: e.g. the need for visual aids
for some processes. No glaring omissions.
Both technologists also completed the feedback questionnaire
which is summarized in table3.
A primitive program was separately developed for making user
interfaces of CT console look like real and to be interactive. It
was designed by using LabView programming elements and
codes to create subVIs of working and pop-up windows and
their connections. The user interface for CO2 insufflator was
also designed using buttons and knobs and other LabView
controls. Figure4 demonstrates screenshots of the front panels
and block diagrams of designed CT console and also CO2
Insufflator.
Table3 Pilot Feedback Questionnaire
Ease of understanding the
instructions and navigation
Technologist A = "Easy"
Technologist B= "Very Easy"
Color scheme Technologist A = "Very good"
Technologist B = "Good"
Proportion of headings and buttons clearly labeled
Technologist A="Most" Technologist B = "All"
Effectiveness in teaching the
skills required for a “routine” or “difficult” virtual
colonoscopy procedure
Both technologists = “Effective”
Effectiveness in teaching 13
specific CTC skills
Both technologists rated all items as
either “Effective” or “Very Effective”
Discussion
The diagnostic accuracy of virtual colonoscopy is highly
dependent on factors such as good colonic distension and the use
of optimal scanning parameters. These factors are in turn largely
dependent on the training, experience and skill level of the
technologist performing the procedure. At the writing of this
paper, to the best of our knowledge, there are no training tools
specifically designed for training technologists to perform
virtual colonoscopy procedures although there are a few studies
offering suggested protocols in text format [3,11]
Figure 3. Screenshots from modules in the software simulation.
a) Screenshot of Simulator Menu. b) Screenshot of an interactive
screen from the "Assessing colonic Distension" practice
module.c) Screenshot of sample video screen.
a
b
c
133
Proceedings of International Conference on Education, Informatics, and Cybernetics (icEIC 2011),
and the International Symposium on Integrating Research, Education, and Problem Solving (IREPS 2011)

There are reports of the application of simulators to improve
techniques in performing ultrasound and vascular interventions
[19–21]. The Radiological Society of North America (RSNA),
the Cardiovascular and Interventional Radiological Society of
Europe, and the Society of Interventional Radiology have
emphasized the need for many factors to be taken into account
for simulation to form a part of training and assessment. They
established individual medical simulation task forces and have
set out joined strategies and proposed recommendations [22].
Our challenge was to create a simulation software that would
capture the knowledge, information, decision points and
branching logic that goes into the performance of virtual
colonoscopy resulting in good image sets for 3D
reconstruction/flythrough and problem solving. The needs
assessment for our software was performed thorough a
questionnaire and information which were gathered from
viewpoints of technologists who were from both ends of
expertise (60% rated themselves as average or experts in CTC
versus 40% rated themselves as beginners).
To create an effective simulation-based training program, we
had to consider some main characteristics. The Best Evidence
Medical Education (BEME) collaboration suggested 10 features
leading to effective learning, among which “Feedback” was
described as the most important feature to promote efficient
learning. The rest of the nine features include: Repetitive
practice, Range of difficulty level, Multiple learning strategies,
Clinical variation, Controlled environment, Individualized
learning, Defined outcomes/benchmarks, Simulator
validity/realism and Curricular integration [23]. In terms of
feedback, the formative evaluations of our simulator software
demonstrated very satisfactory results. However, we are aware
of the limitations of our training tool evaluation. Compared to
the respondents, non-respondents to our needs assessment
questionnaire may have had different opinions and contributions
that we were not able to capture. Secondly, since the
questionnaires were based on self-reported practice and
respondents’ recollections, the responses are subject to recall
bias. Thirdly, since our study focused mostly on virtual
colonoscopy performance at UCMC and our respondents are all
technologists at UCMC, our sample size was small and we could
not ensure the generalizability and external validity of our tool.
However, we reduced this limitation by ensuring that our data
collection towards building the simulation included several
studies done outside UCMC. Lastly, in designing our
questionnaires, we were not able to use objective metrics of
technologist expertise, since there are currently none, so we used
self-reported metrics.
Moreover, we were able to create some primitive, interactive,
real looking user interfaces for the CT console and the CO2
insufflator using an industrial programming language
(LabVIEW). Although they were created separate from the
training tool, the user interfaces can be used as a template for
professional Labview programmers to implement our training
materials into this framework and develop the program to a
more interactive environment by making the interfaces look like
the real CT console and insufflator. Besides the industrial use of
Labview in the field of engineering and medicine, this potent
software has been implemented in education for more than a
decade in the engineering field. Many lecture –based
engineering courses and conventional experiments which were
dependent on specialized instruments have been delivered in the
shape of computer-based applications [24]. However, medicine
has been far behind in using labview as an educational tool. In a
recent project, Altrabsheh developed an application using
labview software which automatically classifies normal and
abnormal heart sounds, murmurs and lung sounds recorded
directly through a microphone. This program has been proposed
as a detection aid tool as well as a potential tool for educational
purposes at medical and nursing schools[25]. This powerful
program should be encouraged to be used in radiology education
by creating real-time interactive tools.
In conclusion, this training tool has implications for the way in
which technologists are trained to perform CTC. If CTC is to
fulfill its promise of becoming a primary screening tool for
CRC, one piece of the puzzle that must fall into place is the
Figure4. a) Screenshots of the CT scanner user interface in the background and a component of the virtual instrument programming codes
shown in the circle. b.) Screenshots of the Co2 insufflator user interface in the background and programing codes shown in the circle.
a
b
134
Proceedings of International Conference on Education, Informatics, and Cybernetics (icEIC 2011),
and the International Symposium on Integrating Research, Education, and Problem Solving (IREPS 2011)

establishment of standardized training of technologists.
Compared to the current methods, our software simulation offers
a method of training technologists that is more efficient, saves
time and involves less practice on patients. A refined and
validated version of this simulation can also be used to
certify/recertify technologists thus providing a mechanism for
quality assurance in CTC performance. It would also be easy for
manufacturers of different CT equipment to make limited
substitutions of components of the simulator such that all
vendors would be able to make use of the training tool.
Acknowledgments: We thank Leroy Robinson, R.T and
Cynthia Keast, R.T, for helping us performing a formative
evaluation of the training tool. This project was supported in
part by an Educational Seed Grant of the Radiological Society of
North America, R & E Foundation, #ESD0901
References
1. Jemal A, Bray F, Center MM, Ferlay J, Ward E, Forman
D. Global cancer statistics. CA: A Cancer Journal for
Clinicians. 2011 Mar 1;61(2):69–90.
2. Levin B, Lieberman DA, McFarland B, Andrews KS,
Brooks D, Bond J, et al. Screening and Surveillance for
the Early Detection of Colorectal Cancer and
Adenomatous Polyps, 2008: A Joint Guideline From the
American Cancer Society, the US Multi-Society Task
Force on Colorectal Cancer, and the American College of
Radiology. Gastroenterology. 2008;134(5):1570–95.
3. Park SH, Yee J, Kim SH, Kim YH. Fundamental
Elements for Successful Performance of CT
Colonography (Virtual Colonoscopy). Korean J Radiol.
2007;8(4):264–75.
4. Macari M, Bini EJ. CT Colonography: Where Have We
Been and Where Are We Going?1. Radiology. 2005
Dec;237(3):819–33.
5. Bismuth J, Donovan MA, O’Malley MK, El Sayed HF,
Naoum JJ, Peden EK, et al. Incorporating simulation in
vascular surgery education. Journal of Vascular Surgery.
2010;52(4):1072–80.
6. Gaba D. The future vision of simulation in health care.
Qual Saf Health Care. 2004 Oct;13(Suppl 1):i2–10.
7. Towbin AJ, Paterson B, Chang PJ. A Computer-Based
Radiology Simulator as a Learning Tool to Help Prepare
First-Year Residents for Being On Call. Academic
Radiology. 2007 Oct;14(10):1271–83.
8. Desser TS. Simulation-based training: the next revolution
in radiology education? J Am Coll Radiol. 2007
Nov;4(11):816–24.
9. Issenberg SB. The Scope of Simulation-based Healthcare
Education. Simulation In Healthcare: The Journal of the
Society for Simulation in Healthcare. 2006;1:203–8.
10. Dachman AH. Advice for optimizing colonic distention
and minimizing risk of perforation during CT
colonography. Radiology. 2006;239(2):317–21.
11. Tolan DJM, Armstrong EM, Burling D, Taylor SA.
Optimization of CT colonography technique: a practical
guide. Clin Radiol. 2007 Sep;62(9):819–27.
12. Dachman A. Atlas of virtual colonoscopy comprehensive
atlas and fundamentals. New York : Springer,; 2011.
13. Lefere P. Virtual colonoscopy a practical guide.
Berlin ;;London :: Springer,; 2006.
14. Huettner B. Adobe Captivate 3: The Definitive Guide.
Jones & Bartlett Learning; 2008.
15. Jamal R. Graphical object-oriented programming with
LabVIEW. Nuclear Instruments and Methods in Physics
Research Section A: Accelerators, Spectrometers,
Detectors and Associated Equipment. 1994;352(1-
2):438–41.
16. Moriarty PJ, Gallagher BL, Mellor CJ, Baines RR.
Graphical computing in the undergraduate laboratory:
Teaching and interfacing with LabVIEW. Am. J. Phys.
2003;71(10):1062.
17. Johnson GW. LabVIEW Graphical Programming:
Practical Applications in Instrumentation and Control.
2nd ed. McGraw-Hill School Education Group; 1997.
18. Scarsbrook AF, Graham RNJ, Perriss RW. Radiology
education: a glimpse into the future. Clinical Radiology.
2006 Aug;61(8):640–8.
19. Berry M, Lystig T, Reznick R, Lönn L. Assessment of a
Virtual Interventional Simulator Trainer. Journal of
Endovascular Therapy. 2006;13(2):237–43.
20. Monsky WL, Levine D, Mehta TS, Kane RA, Ziv A,
Kennedy B, et al. Using a Sonographic Simulator to
Assess Residents Before Overnight Call. Am. J.
Roentgenol. 2002;178(1):35–9.
21. Chaer RA, DeRubertis BG, Lin SC, Bush HL,
Karwowski JK, Birk D, et al. Simulation Improves
Resident Performance in Catheter-Based Intervention.
Ann Surg. 2006;244(3):343–52.
22. Patel AA, Gould DA. Simulators in interventional
radiology training and evaluation: a paradigm shift is on
the horizon. J Vasc Interv Radiol. 2006;17(11 Pt
2):S163–73.
23. Issenberg SB, McGaghie WC, Petrusa ER, Lee Gordon
D, Scalese RJ. Features and uses of high-fidelity medical
simulations that lead to effective learning: a BEME
systematic review. Med Teach. 2005;27(1):10–28.
24. Ertugrul N. Towards virtual laboratories: a survey of
labVIEW-based teaching/learning tools and future trends.
International Journal of Engineering Education.
2000;16:171–80.
25. Altrabsheh B. Measurement and classification of heart
and lung sounds by using LabView for educational use. J
Med Eng Technol. 2010 Aug;35(5-6):340–9.
135
Proceedings of International Conference on Education, Informatics, and Cybernetics (icEIC 2011),
and the International Symposium on Integrating Research, Education, and Problem Solving (IREPS 2011)

A HANDS-ON APPROACH TO TEACHING MICROCONTROLLER
Che Fai YEONG , Hisyam bin ABDUL RAHMAN and Eileen SU Lee Ming
Faculty of Electrical Engineering,
Universiti Teknologi Malaysia
81310 Skudai, Johor, MALAYSIA
Abstract –Practice and application-oriented
approach in education is important, and some
research on active learning and cooperative
problem-solving have shown that a student will
learn faster and develop communication skill,
leadership and team work through these
methods. This paper presents a study of student
preference and performance while learning the
microcontroller subject with a 2-day
curriculum that emphasized on hands-on
approach. The curriculum uses the
PIC16F877A microcontroller and participants
learned to develop basic circuits and several
other applications. Programming was
completed on the MPLAB platform. Results
show that participants had better
understanding in this subject after attending
the hands-on course.
1. INTRODUCTION
Microcontroller subject is one of the
compulsory subjects for Electronic
Engineering undergraduate program [1].
Traditionally, this course was taught focusing
primary on computer software and hardware
architecture [2]. However, the advancement in
semiconductor electronics nowadays changed
the way industry solves manufacturing and
process control problems. Many control
problems can now be solved more effectively
and reliably using microcontroller rather than
using mechanical or electrical switching
systems. The increased used of microcontroller
in industries led to new trends in
microcontroller education [2].
There are two teaching methods in
teaching this subject which are traditional
approach and alternative approach [3]. The
traditional teaching method emphasizes direct
instruction and lecture, seatwork and the
student learn through listening and
observation. In the Faculty of Electrical
Engineering in Universiti Teknologi Malaysia,
microcontroller subject is taught as a lecture in
a classroom or lecture hall, for a period of
three to four months. During the semester,
students were taught theories about the internal
architecture of microcontroller and how to use
the microcontroller through programming with
a simulator. At the end of the course, students
may be given assignments to design or develop
an embedded system using the knowledge they
have acquired throughout the semester.
However, due to time constraint and the lack
of hands-on practice in class, students had
difficulty in completing their tasks.
Fig. 1: The 2-Day PIC Microcontroller:
Hands-on course
The alternative teaching methods
emphasize on group activities, students-led
discovery and hands-on activities. Learning
microcontroller courses with real-world
applications provides the opportunity of
tackling problems which would not be
normally encountered in traditional learning
[2]. The hands-on approach of teaching in
engineering curriculum must be exposed to
undergraduate students since first year for
them to retain in the coming year [4]. Several
academicians also have proposed new method
to teach microcontroller subject [5,2].
In Universiti Teknologi Malaysia, a 2-
day “PIC Microcontroller: Hands-On” course
was designed to complement the classic form
of lecturing. Fig. 1 shows the facilitator
136
Proceedings of International Conference on Education, Informatics, and Cybernetics (icEIC 2011),
and the International Symposium on Integrating Research, Education, and Problem Solving (IREPS 2011)

discussing with two participants. Students have
the option to attend this course if they needed
to. During this course, the students have to
construct and program a microcontroller based
on tasks given. The level of difficulty ranges
from elementary to intermediate tasks such as
LED blinking to motor control.
The course had been conducted many
times and had been improved over the time,
but only recently a formal survey in the form
of questionnaire was conducted to gauge the
response of participants and investigate the
effectiveness of the course. This paper
describes and discusses the results of this
survey.
II. METHOD
A total of 18 participants were
involved in this case study. The participants
attended a 2-day short course on
microcontroller, where 15 hands-on kit were
handed to the students. Twelve participants
were given individual kit to work on, while the
remaining six shared the kit in pairs. All
participants, either individuals or in pairs, were
given the same tasks and each task had to be
completed within 10-30 minutes.
All participants were between 18-32
years’ old, with 12 male and 6 female
participants. Their background included
Medical Electronics, Mechatronics,
Mechanical, Electrical and Computer Science.
At the point of data collection, most of the
participants had recently completed their
undergraduate programs and currently working
as research assistants in the university.
The course lasted 9 hours, starting
from 8 am till 5 pm each day, with half hour
break for tea in the morning and evening, and
an hour break for lunch. During this
microcontroller short course, the participant
learned by actively completing allocated tasks
rather than by passively absorbing information.
Explanation of technical concepts preceded
each task. Tasks were designed such that the
students progressively applied what they had
just learnt, and increased in difficulty from
easy, medium to hard.
Delivering the microcontroller subject
through a 2-day short course, with practical
sessions, have its challenges:
1. The participants come from various
backgrounds.
2. Most of the participant does not have
much experience working with a
microcontroller and had varying levels
of competency in programming.
3. Time is too limited to cover an entire
one semester subject syllabus.
Taking into consideration the factors
above, we selected several major concepts to
be discussed, that will help the participants to
grasp smaller technical details while working
on a solution to their tasks. The focus was on
learning through practice.
Course outline
Day 1
Introduction to microcontroller
Assemble microcontroller basic circuit and use
starter kit SK40C
Programming in assembly and C-language
Basic I/O: output (LEDs, 7segments, LCD)
Day 2
Basic I/O: input (switch)
Advance I/O: controlling motor (servo motor,
DC motor and Stepper motor)
Demonstration
On day 1, we started the course by
providing the student with MPLAB software
from Microchip Technology Inc [6]. This was
the platform on which source code for the tasks
would be written. During the installation
process, we showed some video clips of
robotic competitions where participating robots
were controlled using the microcontroller. The
objective of showing the videos was to expose
the participants to the variety of designs and
applications that can be achieved with a
microcontroller, e.g. how the robot can move
with intelligence. Following the clips,
participants were given short lectures on the
basics of microcontroller and the supporting
elements required to construct a basic working
circuit. The supporting elements such as
voltage regulator, oscillator and capacitors
were provided for the participants to start
building their own circuitry.
Simple programming using the
assembly language was also taught.
Participants were then given simple task such
as making an LED (light emitting diode) blink
at specified intervals, and progresses to
multiple LEDs blinking with several blinking
137
Proceedings of International Conference on Education, Informatics, and Cybernetics (icEIC 2011),
and the International Symposium on Integrating Research, Education, and Problem Solving (IREPS 2011)

patterns. In the afternoon, participants were
taught basic C language to replace the
assembly language that was used in the
morning session. SK40C PIC starter kit from
Cytron Technologies [7] was introduced to the
participants. This SK40C starter kit has built-in
microcontroller, voltage regulator, oscillator
and input-output connectors. This starter kit
reduces the hardware configuration time for
participants when trying to complete a task.
We started the 2nd day with short video
clips of robots and automatic systems, ranging
from straight-forward designs to sophisticated
devices. From the earlier task of LED
blinking, the participants progressed to more
challenging tasks such as detecting inputs,
directions of a servo motor, DC motor and
stepper motor.
At the end of the course, all
participants completed a set of questionnaire to
state their level of expertise in microcontroller
upon entry to the course, preferences and
feedbacks. Participants were not required to
state their names and details on the form.
Responses from the participants were then
analysed and presented in the results section.
IV. RESULT
Participants were categorized into four
skill levels:
(1) no experience,
(2) novice, who has learnt simple theory
in class and has previously completed
LED blinking projects using
microcontroller,
(3) intermediate, who has experience in
developing simple embedded system,
and
(4) advanced, who has experience in
developing complicated embedded
system.
From the 18 participants, 9 had no
experience, 7 were novice and the remaining
was intermediate. There was no advanced
participant in the course.
i. Teaching platform
Participants were asked to state if they prefer
to be taught using (a) Only basic circuit, which
they assembled on their own; (b) the SK40C
starter kit or (c) combination of both platforms.
As shown in Fig. 2a, 78% of participants
preferred to be taught on both platforms, where
(a) (b)
Fig. 2: (a) Percentage of participants with their preferred type of teaching platform
(b) Percentage of participants with their preferred programming language
(a) (b)
Fig. 3: (a) Percentage of participants with their preferred number of members in a group
(b) Percentage of participants with their preferred total number of tasks
138
Proceedings of International Conference on Education, Informatics, and Cybernetics (icEIC 2011),
and the International Symposium on Integrating Research, Education, and Problem Solving (IREPS 2011)
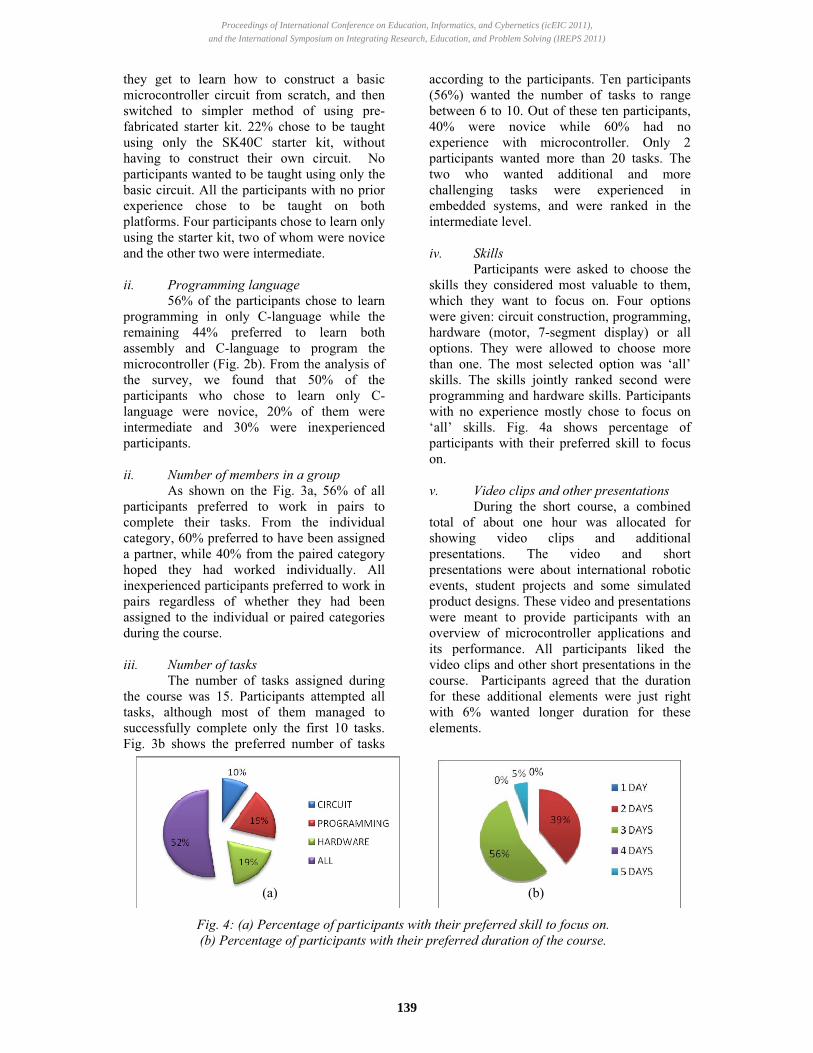
they get to learn how to construct a basic
microcontroller circuit from scratch, and then
switched to simpler method of using pre-
fabricated starter kit. 22% chose to be taught
using only the SK40C starter kit, without
having to construct their own circuit. No
participants wanted to be taught using only the
basic circuit. All the participants with no prior
experience chose to be taught on both
platforms. Four participants chose to learn only
using the starter kit, two of whom were novice
and the other two were intermediate.
ii. Programming language
56% of the participants chose to learn
programming in only C-language while the
remaining 44% preferred to learn both
assembly and C-language to program the
microcontroller (Fig. 2b). From the analysis of
the survey, we found that 50% of the
participants who chose to learn only C-
language were novice, 20% of them were
intermediate and 30% were inexperienced
participants.
ii. Number of members in a group
As shown on the Fig. 3a, 56% of all
participants preferred to work in pairs to
complete their tasks. From the individual
category, 60% preferred to have been assigned
a partner, while 40% from the paired category
hoped they had worked individually. All
inexperienced participants preferred to work in
pairs regardless of whether they had been
assigned to the individual or paired categories
during the course.
iii. Number of tasks
The number of tasks assigned during
the course was 15. Participants attempted all
tasks, although most of them managed to
successfully complete only the first 10 tasks.
Fig. 3b shows the preferred number of tasks
according to the participants. Ten participants
(56%) wanted the number of tasks to range
between 6 to 10. Out of these ten participants,
40% were novice while 60% had no
experience with microcontroller. Only 2
participants wanted more than 20 tasks. The
two who wanted additional and more
challenging tasks were experienced in
embedded systems, and were ranked in the
intermediate level.
iv. Skills
Participants were asked to choose the
skills they considered most valuable to them,
which they want to focus on. Four options
were given: circuit construction, programming,
hardware (motor, 7-segment display) or all
options. They were allowed to choose more
than one. The most selected option was ‘all’
skills. The skills jointly ranked second were
programming and hardware skills. Participants
with no experience mostly chose to focus on
‘all’ skills. Fig. 4a shows percentage of
participants with their preferred skill to focus
on.
v. Video clips and other presentations
During the short course, a combined
total of about one hour was allocated for
showing video clips and additional
presentations. The video and short
presentations were about international robotic
events, student projects and some simulated
product designs. These video and presentations
were meant to provide participants with an
overview of microcontroller applications and
its performance. All participants liked the
video clips and other short presentations in the
course. Participants agreed that the duration
for these additional elements were just right
with 6% wanted longer duration for these
elements.
(a) (b)
Fig. 4: (a) Percentage of participants with their preferred skill to focus on.
(b) Percentage of participants with their preferred duration of the course.
139
Proceedings of International Conference on Education, Informatics, and Cybernetics (icEIC 2011),
and the International Symposium on Integrating Research, Education, and Problem Solving (IREPS 2011)

vi. Duration of course
As shown in Fig. 4b, 56% preferred
that the course to be held for 3 days while 39%
agree with the current duration of 2 days. 5%
wanted the course to be 5 days’ long.
V. DISCUSSION
The feedbacks obtained from
participants of the short course have been
favorable and encouraging. Many claimed that
they have better understanding of the
microcontroller after the two days hands-on
course.
From the survey, it was found that
pairing the students had a positive impact in
the learning. Most participants preferred to
work in pairs and from observation during the
course, participants who were allocated
individual kits also chose to discuss with
friends and work together to complete their
tasks. This scenario applied mostly to
participants who had no experience and
novice. For expert participants, they enjoyed
working individually as they were able to work
faster, and could attempt more complicated
tasks based on their interest, with help from the
instructor. To make the course effective for all
participants, the instructor has to be aware of
participants’ skills and prepare additional tasks
with a higher difficulty level for skilled
participants who completed their tasks early.
From earlier experience in separate
courses, three or more participants per group
were found to be unsuitable as discussion
would be longer, and often, one or two
participants would be left out during the hands-
on. Two participants in a group was ideal for
this type of short course as both could work
together to complement each other in
understanding and applying theoretical
knowledge to applications. They also managed
to complete the tasks faster.
Constructing a basic circuit from
scratch helped the participants to understand
the fundamental requirements of a
microcontroller circuitry. While using the
starter kit eased their work, it was still
important for students to know how the starter
kit was constructed, which was achieved by
having students construct their own basic
circuit using proto-board and wires. With this
lesson, the participant then moved on to use
starter kit that allowed them to focus on
programming their applications rather than
being hindered by errors in wiring or hardware
faults.
While the knowledge imparted by
hands on approach should be comparable to
that of the conventional lecture-based
curriculum, the hands-on approach differed
from the latter in two important ways:
1. Students must actively participate in
their own education, with the emphasis
being on learning.
2. Participant’s immediate hands-on
practice that follows a theoretical
lecture will provide realistic
representation to that new knowledge
and encourage them to become self-
directed learners.
One improvement as suggested by the
participants was the extension of the course
duration from two to three days. This was to
give time for participants to digest their
knowledge and to ensure participants would be
able to complete all the tasks assigned. A
thorough review of the course with the
extended duration needs to be done to ensure
optimal delivery of this microcontroller
subject.
VI. CONCLUSION
From the survey, the hands-on
microcontroller short course was found to help
in better understanding of the microcontroller.
The practical sessions were fun for the students
as they could explore their ideas through
programming, and each participant came up
with variety of solutions for the same task.
Students learnt from each other and improved
their performance. A 2-day hands-on would
not be able to replace theoretical lectures, but
will serve as a helpful addition to enhance
student’s learning.
ACKNOWLEDGMENT
This project is funded by Malaysian
Ministry of Higher Education (MOHE) and
Universiti Teknologi Malaysia (UTM) research
grant no 08231.
140
Proceedings of International Conference on Education, Informatics, and Cybernetics (icEIC 2011),
and the International Symposium on Integrating Research, Education, and Problem Solving (IREPS 2011)

REFERENCES
[1]C. E. Nunnally , "Teaching microcontrollers
", Proc. of Frontiers in Education
Conference, 1996. FIE '96. 26th Annual
Conference, vol.1, 6-9 Nov 1996, pp.434-
436.
[2] T. K. Hamrita and R. W. Mcclendon “A
New Approach for Teaching
Microcontroller Courses*”, International
Journal of Engineering Education. vol. 13,
no. 4, July 1997, pp. 269-274.
[3]“Traditional Education”
http://en.wikipedia.org/wiki/Traditional
education, September 22, 2011.
[4] W.K. Daniel, E. C. Lawrence and F. S.
Jacquelyn.; “Improving Engineering
Student Retention through Hands-On,
Team Based, First-Year Design Projects”,
Inaugural International Conference on
Research in Engineering Education,
ICREE, Honolulu, HI., June 22-24, 2007
[5] S.M Miri and R.J. Fu, "A hands-on
practical approach to teaching engineering
design", IEEE Transactions on Education,
vol.36, no.1, Feb 1993, pp.131-136.
[6] www.micrcochip.com, September 22, 2011.
[7] www.cytron.com.my, September 22, 2011.
141
Proceedings of International Conference on Education, Informatics, and Cybernetics (icEIC 2011),
and the International Symposium on Integrating Research, Education, and Problem Solving (IREPS 2011)

Relationships Between Teaching and Practice
How Can Teachers be Effective Without the Knowledge and Application of Teaching Models?
Virda K. LESTER
Curriculum and Instruction
Tuskegee University
Tuskegee, Alabama 36088 USA
ABSTRACT
You have heard your colleagues say many times, “my
students have no idea what I presented in class today” or
“they did not understand the concepts that I
demonstrated”, and/or “they just can’t read”. These
comments are heard over and over nation-wide, causing
concern for educators at all levels and in many
disciplines. Additionally, you have heard your students
comment, “I can’t understand what Dr. X is saying”, or
“she may know what she is presenting, but I don’t
understand a thing she is saying”, and/or “she just
doesn’t know how to get the material across to us so that
we somewhat understand”. Is education in many schools
failing? Is there cause for alarm in the statements, “If the
child hasn’t learned, the teacher hasn’t taught?” All of the
aforementioned comments have some legitimacy.
However, with effective teaching models, methods,
strategies, and tactics through collaboration with
disciplines across the curriculum, the statements can be
“stamped” out.
Keywords: Teaching Models, Teacher-Centered,
Student-Centered and Lesson Plans.
1. INTRODUCTION
What factors affect the way teachers teach? How can
models of teaching be utilized to effect positive changes
in the classroom? These are just a few of the questions
that are concerns from outside entities, about student
performances in the classroom. Studies have shown that
attitudes and beliefs about teaching have been a long
driving force behind the success and/or failure of student
learning. Therefore, the focus of teaching should entail
one or a combination of the six models of teaching,
which include (1) Presenting and Explaining, (2) Direct
Instruction, (3) Concept and Inquiry-Based Teaching, (4)
Cooperative Learning, (5) Problem-Based Learning, and
(6) Classroom Discussion. Additionally, application of
teaching models is essential and what better way to
demonstrate these teaching models, than through best
practice lesson plans that illustrate students’
understanding of the models of teaching with public
school students in K-6 grades and with their peers in a
university class setting.
The object of this paper is to present models of teaching
that are used to impact a positive change in the learning
experience for students. The paper begins providing a
theoretical framework on which the work is based. The
next section introduces the teaching methods used in the
course. The paper concludes with summary points.
2. THEORETICAL FRAMEWORK
In an effort to prepare future teachers, during the fall
2010 and 2011 semesters, 13 and 6 students respectively,
enrolled in a curriculum and teaching Methods of
Teaching course. Generally, the course content focuses
on (1) developing a repertoire of teaching models and
strategies, (2) understanding the theoretical foundations
behind teaching and learning, (3) understanding the
dynamics, both inside and outside of the classroom, (4)
developing an awareness of current teaching practices,
(5) appreciating the challenges of teaching in diverse
classroom settings, (6) developing the skills for assessing
and evaluating student learning, and (7) becoming
knowledgeable on how to adapt instruction to meet the
needs of all learners.
Regardless of the discipline or profession, everyone
needs a “good” teacher, that is both “good and effective”
and everyone should aspire to be a “good” and
“effective” teacher to help all students’ survive in this
competitive world. Therefore, it is essential to be
knowledgeable about models of teaching as depicted in
figure 1. Research shows that there are six models of
teaching, characterized as either teacher-centered or
student-centered: (1) Presenting and Explaining, (2)
Direct Instruction, (3) Concept and Inquiry-Based
Teaching, (4) Cooperative Learning, (5) Problem-Based
Learning, and (6) Classroom Discussion.
142
Proceedings of International Conference on Education, Informatics, and Cybernetics (icEIC 2011),
and the International Symposium on Integrating Research, Education, and Problem Solving (IREPS 2011)

A teaching model is a broad, overall approach to
instruction with a coherent theoretical perceptive about
what students should learn and how they learn; albeit
through behaviorism (Skinner), Social Cognitive
(Bandura), Cognitive and Information Processing
(Bruner, Gagne, Anderson), and Social cultural and
constructivist (Dewey, Piaget, Vygotsky). [1].
Teaching models prescribe tested steps and procedures to
effectively generate desired outcomes [8]. The
presentation model is a teacher-directed and
systematically way of delivering information, Figure 2.
Figure 2. Presentation Model
The students are to acquire, assimilate, and retain
information, expand their conceptual structures, and
develop habits of thinking and learning [1]. The term
direct instruction, which is teacher-centered [3] refers to
a highly structured and fast-paced teaching method with
constant interaction between the teacher and the student,
accomplishing knowledge and skill mastery. Figure 3
provides an example of direct instruction.
Figure 3. Direct Instruction
A concept model of teaching can be described as teacher-
centered and moderately structured to effect students’
higher-level thinking. Figure 4 provides a graphical
representation of the concept model of teaching.
Figure 4. Concept Model
The aforementioned modalities of teaching stemmed
from the areas of behavioral, cognitive and information
processing theories of learning; and were all teacher-
centered. The teaching models of cooperative, problem-
based, and classroom discussion are all student-centered.
“Helping each other” describes the cooperative teaching
model. Figure 5 shows the cooperative teaching model.
Figure 5. Cooperative Teaching Model
Classroom
Discussion
Problem
Based
Cooperative
Learning
Concept and
Inquiry-
Based
Direct
Instruction
Presentation
and Explaining
Models of
Teaching
Teacher-Centered
Student-Centered
Figure 1. Models of Teaching
143
Proceedings of International Conference on Education, Informatics, and Cybernetics (icEIC 2011),
and the International Symposium on Integrating Research, Education, and Problem Solving (IREPS 2011)
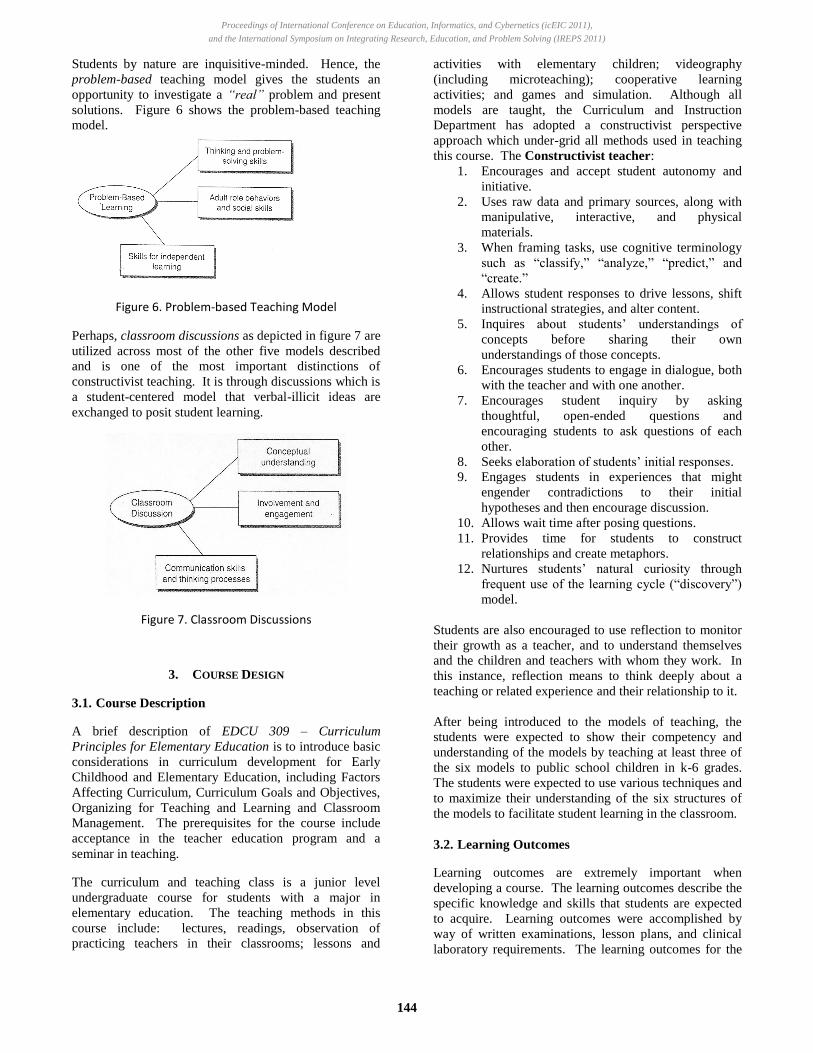
Students by nature are inquisitive-minded. Hence, the
problem-based teaching model gives the students an
opportunity to investigate a “real” problem and present
solutions. Figure 6 shows the problem-based teaching
model.
Figure 6. Problem-based Teaching Model
Perhaps, classroom discussions as depicted in figure 7 are
utilized across most of the other five models described
and is one of the most important distinctions of
constructivist teaching. It is through discussions which is
a student-centered model that verbal-illicit ideas are
exchanged to posit student learning.
Figure 7. Classroom Discussions
3. COURSE DESIGN
3.1. Course Description
A brief description of EDCU 309 – Curriculum
Principles for Elementary Education is to introduce basic
considerations in curriculum development for Early
Childhood and Elementary Education, including Factors
Affecting Curriculum, Curriculum Goals and Objectives,
Organizing for Teaching and Learning and Classroom
Management. The prerequisites for the course include
acceptance in the teacher education program and a
seminar in teaching.
The curriculum and teaching class is a junior level
undergraduate course for students with a major in
elementary education. The teaching methods in this
course include: lectures, readings, observation of
practicing teachers in their classrooms; lessons and
activities with elementary children; videography
(including microteaching); cooperative learning
activities; and games and simulation. Although all
models are taught, the Curriculum and Instruction
Department has adopted a constructivist perspective
approach which under-grid all methods used in teaching
this course. The Constructivist teacher:
1. Encourages and accept student autonomy and
initiative.
2. Uses raw data and primary sources, along with
manipulative, interactive, and physical
materials.
3. When framing tasks, use cognitive terminology
such as “classify,” “analyze,” “predict,” and
“create.”
4. Allows student responses to drive lessons, shift
instructional strategies, and alter content.
5. Inquires about students’ understandings of
concepts before sharing their own
understandings of those concepts.
6. Encourages students to engage in dialogue, both
with the teacher and with one another.
7. Encourages student inquiry by asking
thoughtful, open-ended questions and
encouraging students to ask questions of each
other.
8. Seeks elaboration of students’ initial responses.
9. Engages students in experiences that might
engender contradictions to their initial
hypotheses and then encourage discussion.
10. Allows wait time after posing questions.
11. Provides time for students to construct
relationships and create metaphors.
12. Nurtures students’ natural curiosity through
frequent use of the learning cycle (“discovery”)
model.
Students are also encouraged to use reflection to monitor
their growth as a teacher, and to understand themselves
and the children and teachers with whom they work. In
this instance, reflection means to think deeply about a
teaching or related experience and their relationship to it.
After being introduced to the models of teaching, the
students were expected to show their competency and
understanding of the models by teaching at least three of
the six models to public school children in k-6 grades.
The students were expected to use various techniques and
to maximize their understanding of the six structures of
the models to facilitate student learning in the classroom.
3.2. Learning Outcomes
Learning outcomes are extremely important when
developing a course. The learning outcomes describe the
specific knowledge and skills that students are expected
to acquire. Learning outcomes were accomplished by
way of written examinations, lesson plans, and clinical
laboratory requirements. The learning outcomes for the
144
Proceedings of International Conference on Education, Informatics, and Cybernetics (icEIC 2011),
and the International Symposium on Integrating Research, Education, and Problem Solving (IREPS 2011)

EDCU 309 course include the following: at the end of the
course, a student should be able to apply:
1. Knowledge of the importance of developing
learning objectives based on the Alabama course
of study and the needs, interests, and abilities of
students.
2. Knowledge of a wide range of research-based
instructional strategies and the advantages and
disadvantages associated with each.
3. Knowledge of the relationship between
assessment and learning and of how to integrate
appropriate assessments into all stages of the
learning process.
4. Knowledge of current Alabama assessment
requirements and procedures.
5. Knowledge of current trends, issues, and
problems related to elementary education;
knowledge of typical and alternative patterns of
elementary school organization.
6. Knowledge of how to plan instruction based on
curriculum goals/objectives and students’
experiences, and how and when to adjust plans
based on student responses and other
contingencies.
7. Knowledge of various techniques, strategies,
curriculum and literacy models, and programs
for promoting maximum development of
children, including interdisciplinary instruction,
flexible grouping patterns, and strategies for
facilitating cooperative and independent learning
and decision-making skills. Advantages and
limitations association with various instructional
strategies
8. Knowledge of the state course(s) of study
applicable to elementary education and how
elementary education relates to other teaching
fields.
9. Knowledge of approaches to knowledge
construction and application in all disciplines.
10. Knowledge of techniques for using manipulative
materials and play as instruments for enhancing
development and learning.
11. Knowledge of criteria to be used in selecting,
organizing, and evaluating available space
resources, experiences, and equipment
appropriate to the divergent components of the
elementary education curriculum.
12. Knowledge of effective classroom and behavior
management techniques and how to discipline
students.
13. Knowledge of a variety of strategies for
evaluating and reflecting on one’s own
performance as a teacher.
14. Knowledge of techniques for adapting the
school program for children from diverse
cultural backgrounds and exceptionalities.
15. Knowledge of appropriate strategies for working
with parents and other guardians.
16. Knowledge of community agency materials
and/or personnel which impact on the
elementary school program.
17. Knowledge of collaborating with other
professionals.
Hence, learning outcomes create a positive attitude
towards learning and an increased commitment and
responsibility for teaching and learning utilizing a plan of
action and lesson plans.
For many in the classroom, teaching poses a challenge for
lack of methodology and well-thought-out lesson plans.
This was not the case for the students enrolled in a
Curriculum and Teaching methods class in 2010 and
2011 fall semesters! They were required to develop,
demonstrate their skills and understanding, and teach at
least three of the six models of teaching in a public
elementary school and a four-year university. Specific
guidelines regarding the lesson plans and the teaching
models were utilized and hence, are the focus of the
student presentation through the actual lesson plans
developed and taught. Table 1 is an example of the
lesson plan presented in class.
Table 1. Lesson Plan
Lesson Plan Format – Internship
Curriculum & Instruction
Tuskegee University
Name _____________
Date of Observation _______
Primary Teaching/
Learning Strategies
A. Title/Content of Lesson
1. You may give your lesson any title you
choose. Be Creative!
2. Provide an overview of the content and
concepts included in this lesson.
B. Purpose/Learning Outcomes
1. Write objectives with active verbs
describing what you expect students to do
or accomplish during the lesson.
2. Write objectives concerning the type of
thinking you hope to promote the concepts
students are developing..…
3. Write any other important objectives you
have that may not be directly each other in
positive ways during their small group
discussions”.
C. Before the Lesson Assessment of Students’
Learning Needs
1. Describe students’ prior experiences with
the skill(s), knowledge and concepts
involved in this lesson.
2. Describe how your lesson addresses
students’ learning needs.
145
Proceedings of International Conference on Education, Informatics, and Cybernetics (icEIC 2011),
and the International Symposium on Integrating Research, Education, and Problem Solving (IREPS 2011)

3. Describe how you will provide for students’
individual differences.
D. Procedures
1. Describe what the students will be doing
during the lesson.
2. Include directions you will give the
students.
3. Include questions you want to ask during
the lesson.
4. Include questions that go beyond factual
recall of information.
5. Describe resources/materials you plan to
use.
6. Include the use of technology for planning,
implementation and assessment.
E. Plan for Assessment
1. Explain the method(s) you will use for
determining if all students have made
progress towards the learning outcomes.
As a result of the learning experiences of creating lesson
plans and utilizing methods of teaching, the students are
better equipped to manage the classroom setting.
4. CONCLUSION/STATEMENT OF THE PROBLEM
Learning to teach is a complex journey. It cannot be
learned over night. It continues for a lifetime, if teachers
are serious about being effective in the classroom.
Consequently, if we as teachers are to chart the way for a
new direction and to assure more meaningful learning in
the classroom, it is imperative for us to teach our students
through models of teaching that are problem-based. We
must instill in them the ability to think and read:
Critically
Creatively
Environmentally
Historically
Psychologically
Multi-culturally
Technologically
Sociologically
Philosophically
Economically
Geographically
Mathematically
Morally
Scientifically
Aesthetically
Politically
Legally
And to use other modalities that affect this
global society
There are several goals of the paper. One specific goal
was to study and learn how to use models of teaching to
effect positive change in the classroom. Another goal
was to have university students demonstrate their
understanding of the teaching models by teaching a
lesson utilizing several of the models with k-6 grade
students and their peers as well. Through these efforts, it
was our aim to further the understanding of models of
teaching and application of skills through lesson plans to
answer the initial questions, what factors affect the way
teachers teach? How can models of teaching be utilized
to effect positive changes in the classroom?
5. REFERENCES
[1] R.I. Arends, Learning to Teach, New York:
Mcgraw Hill Pub., 2012.
[2] J. Henning, The Art of Discussion-based
Teaching: Opening up Conversation in the
Classroom, New York: Routledge, 2008
[3] M. Savin-Baden, Problem-based Online
Learning, New York: Routledge, 2008.
[4] Direct Instruction: proven Success in Teaching.
http://www.jefflindsay.com/EducData.shtml.
(Accessed on October 5, 2011).
[5] The Presentation Model of Teaching.
http://richarddsolomonsblog.blogspot.com/2009/
09/presentation-model-of-teaching_30.html
(Accessed on October 5, 2011).
[6] Models on Teaching. http://www.slideshare.net/
competents2011/models-of-teaching-ppt
(Accessed on September 21, 2011).
[7] Conceptual Teaching. public.doe.k12.ga.us/.../
Conceptual-Teaching-PowerPoint.ppt?p...D
(Accessed on September 21, 2011).
[8] Constructivist Teaching Model. http://en.
wikipedia.org/wiki/Constructivist_teaching_met
hods (Accessed on October 3, 2011)
[9] Teaching Models. www.edtech.vt.edu/edtech
/id/models/index.html (Accessed on October 3,
2011).
146
Proceedings of International Conference on Education, Informatics, and Cybernetics (icEIC 2011),
and the International Symposium on Integrating Research, Education, and Problem Solving (IREPS 2011)

Interdisciplinary Professional Development Program for Teachers
Suzanne Lunsford, Ph.D. Wright State University
Dept. of Chemistry Dayton, Ohio 45435, USA
ABSTRACT
This professional development program has been designed to increase the integrated science content, pedagogical, and technological knowledge of teams of middle and high school teachers in Ohio. The selected schools are high need areas with an overall average from these school districts serving a population of 63% students who are economically disadvantaged. The 24 teachers participating in this program each year serve as catalysts and mentors to other teachers, and has driven curriculum change in these districts. This professional development program has effected these changes by using a three-phase research based approach to classroom educator training with hands-on experiences. Phase I is composed of a one week field experience followed by a week long laboratory experience. The field trip involves participants to the Atlantic Ocean to study the physical and biological processes that interact to form the modern ocean environment compared to the ancient ocean sediments preserved in the Atlantic Coastal Plain around the Duke University Marine Laboratory and research institute. The field experiences are founded in guided and constructivist based questioning content and pedagogical understandings. Following the inquiry based field trip, participants gathered for a week of
laboratory work, participating in inquiry based learning with samples collected from the field, and developing ideas to integrate inquiry with science activities into their own classrooms. Phase II involves a four-week long internet course designed to assist participants in developing classroom applications. The teams of classroom educators have developed, implemented and assessed inquiry based integrated science activities in their own classrooms. Phase III has an on-line course that incorporates Earth System Science with real world topics and scenarios. Support and contact with participants and project personnel is maintained during phase III of the project through frequent interactive web-conferences during the K-12 school year. Teachers participating in this program have been agents of change and have been assisting their districts with leading students to be more versed in the skills that are stressed by the National Science Education Standards and current efforts to improve STEM education.
Keywords: Hands-‐on /Inquiry-‐
based learning, Professional development, Science education, Interdisciplinary program.
147
Proceedings of International Conference on Education, Informatics, and Cybernetics (icEIC 2011),
and the International Symposium on Integrating Research, Education, and Problem Solving (IREPS 2011)
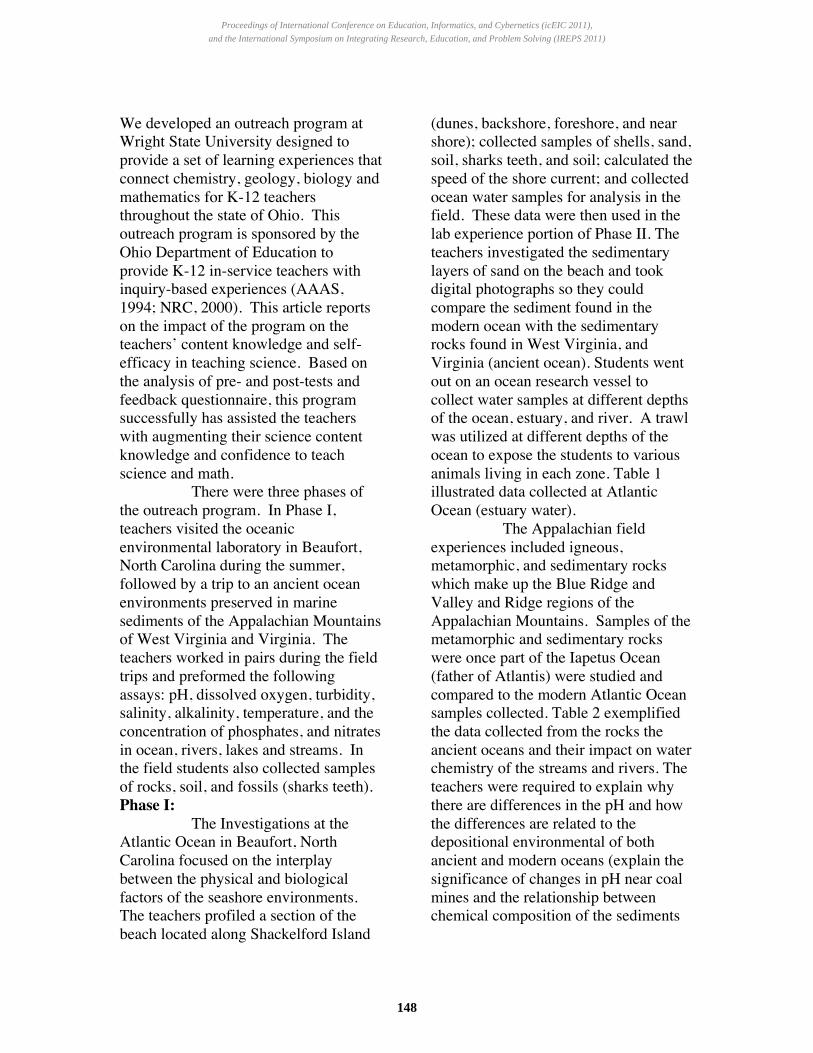
We developed an outreach program at Wright State University designed to provide a set of learning experiences that connect chemistry, geology, biology and mathematics for K-12 teachers throughout the state of Ohio. This outreach program is sponsored by the Ohio Department of Education to provide K-12 in-service teachers with inquiry-based experiences (AAAS, 1994; NRC, 2000). This article reports on the impact of the program on the teachers’ content knowledge and self-efficacy in teaching science. Based on the analysis of pre- and post-tests and feedback questionnaire, this program successfully has assisted the teachers with augmenting their science content knowledge and confidence to teach science and math. There were three phases of the outreach program. In Phase I, teachers visited the oceanic environmental laboratory in Beaufort, North Carolina during the summer, followed by a trip to an ancient ocean environments preserved in marine sediments of the Appalachian Mountains of West Virginia and Virginia. The teachers worked in pairs during the field trips and preformed the following assays: pH, dissolved oxygen, turbidity, salinity, alkalinity, temperature, and the concentration of phosphates, and nitrates in ocean, rivers, lakes and streams. In the field students also collected samples of rocks, soil, and fossils (sharks teeth). Phase I: The Investigations at the Atlantic Ocean in Beaufort, North Carolina focused on the interplay between the physical and biological factors of the seashore environments. The teachers profiled a section of the beach located along Shackelford Island
(dunes, backshore, foreshore, and near shore); collected samples of shells, sand, soil, sharks teeth, and soil; calculated the speed of the shore current; and collected ocean water samples for analysis in the field. These data were then used in the lab experience portion of Phase II. The teachers investigated the sedimentary layers of sand on the beach and took digital photographs so they could compare the sediment found in the modern ocean with the sedimentary rocks found in West Virginia, and Virginia (ancient ocean). Students went out on an ocean research vessel to collect water samples at different depths of the ocean, estuary, and river. A trawl was utilized at different depths of the ocean to expose the students to various animals living in each zone. Table 1 illustrated data collected at Atlantic Ocean (estuary water).
The Appalachian field experiences included igneous, metamorphic, and sedimentary rocks which make up the Blue Ridge and Valley and Ridge regions of the Appalachian Mountains. Samples of the metamorphic and sedimentary rocks were once part of the Iapetus Ocean (father of Atlantis) were studied and compared to the modern Atlantic Ocean samples collected. Table 2 exemplified the data collected from the rocks the ancient oceans and their impact on water chemistry of the streams and rivers. The teachers were required to explain why there are differences in the pH and how the differences are related to the depositional environmental of both ancient and modern oceans (explain the significance of changes in pH near coal mines and the relationship between chemical composition of the sediments
148
Proceedings of International Conference on Education, Informatics, and Cybernetics (icEIC 2011),
and the International Symposium on Integrating Research, Education, and Problem Solving (IREPS 2011)

and water near the coal mines in Virginia and West Virginia.) Phase II: A five-day lab exercise compared the modern ocean to the ancient ocean during the summer. These inquiry-based experiences during the field trips and lab allowed the teachers to discover the nature of science and how scientific evidence is based observations. Students were engaged in experimentation and Inquiry-based investigations with all of the data and scientific observations that were collected in the field experiences. The lab experiences integrated the different sciences to analyze the various samples collected. The teachers were required to investigate the similarities and the differences among the water, sediment, rock and fossil samples collected. For example one group of teachers did an analysis of phosphate (modern versus ancient) and asked the questions: “Is phosphate present in the ancient and the modern ocean? “ Fossils such as shark’s teeth were analyzed at the modern ocean versus the ancient ocean to compare the phosphate concentration present. Table 3 illustrates the data that was collected and analyzed to study phosphate concentrations at different sites visited.
In addition, analysis of anion and cation concentrations in water samples led to discussions regarding changes in dissolved oxygen and other parameters in collected water samples through time, chemical weathering, the water cycle, and ocean salinity. Students compared the composition of sands versus the composition of the source rocks and predator-prey relationships among modern and ancient mollusks.
PHASE III: (FOLLOW-UP) The Phase III is an asynchronous experience for the teachers during the fall had weekly assignments/ deadlines for interaction. Phase III, enhanced the teachers understanding of content and pedagogy by providing them with an online cooperative learning experience. This experience was inserted to assist with the development of classroom applications through utilizing peer interactions to enhance the hands-on activities in their own classrooms. Inquiry-based labs were developed such as: “What is the ideal pH for your garden soil?” “What is beach profiling- how to make a Pie chart to analyze grain size of sand?” These lessons incorporated math, graphing, geology, beach profiling, biology (plant life, turtles, clams, snails), and chemistry of water and soil.
Pre-test and Post-test were given to assess the content knowledge gained by the participating teachers. The average pre-test score was 51.3% and the average post-test score was 85.7%, resulting in a normalized gain of 0.71 for 141 teachers served with this hands-on experience course over a seven-year period of implementation. In addition participating teachers were served a questionnaire about their own science instruction as shown below, Table 4.
This professional development program has been found to be effective in developing appreciation for science process skills and inquiry-based learning. These three phases of the course build content knowledge in the various sciences and address the pedagogical understanding needed to meet the National Science Education Standards and current efforts to improve STEM education.
149
Proceedings of International Conference on Education, Informatics, and Cybernetics (icEIC 2011),
and the International Symposium on Integrating Research, Education, and Problem Solving (IREPS 2011)

Table 1. Data for Estuary Water at Shackelford Island (Atlantic Ocean)
Depth/meters 0.70 4.0 7.0 10.0 13.0 19.0
Temperature/0C 23.0 22.6 22.4 22.2 22.0 21.0
pH 7.8 7.6 7.6 7.6 7.6 7.6
Dissolved
Oxygen (mg/L)
7.13 5.93 4.12 4.07 4.12 4.57
Salinity (ppt) 26.4 26.7 26.9 22.0 22.0 27.1
Turbidity
(nephelometric
turbidity units,
NTU)
63 64 68 69 69 69
Nitrates (ppm) 1 1 1 1 1 1
Phosphates
(ppm)
2 2 2 2 1 1
Alkalinity
(ppm)
80 85 90 90 100 120
Hardness (ppm) 425 425 425 425 425 425
Table 2. River Water in West Virginia
Depth /m 0.2
Temperature /0C 25
pH 2.3
Dissolved Oxygen (mg/L) 4.0
Salinity (ppt) 6.0
Turbidity (NTU) 16.0
Nitrates (ppm) 0
Phosphates (ppm) 1
Alkalinity (ppm) 40
Hardness (ppm) 200
150
Proceedings of International Conference on Education, Informatics, and Cybernetics (icEIC 2011),
and the International Symposium on Integrating Research, Education, and Problem Solving (IREPS 2011)

Table 3. Phosphate Data of Field Sites Visited
151
Proceedings of International Conference on Education, Informatics, and Cybernetics (icEIC 2011),
and the International Symposium on Integrating Research, Education, and Problem Solving (IREPS 2011)

Table 4. Questionnaire About Teaching Science
1. Students learn science best in classes with students of similar abilities.
Agree No Opinion Disagree Pre-‐survey 29% 13% 58% Post-‐survey 20% 0% 80%
2. I enjoy teaching science.
Agree No Opinion Disagree
Pre-‐survey 60% 0% 40%
Post-‐survey 100% 0% 0%
3. I organize the curriculum around the textbook.
Agree No Opinion Disagree Pre-‐survey 20% 20% 60% Post-‐survey 28% 0% 72%
4. The teacher should consistently use activities that require students to do original thinking.
Agree No Opinion Disagree Pre-‐survey 93% 0% 7% Post-‐survey 100% 0% 0%
References:
1. American Association for the Advancement of Science. Benchmark for Science Literacy;
Oxford University Press: New York, 1994.
2. National Research Council. Inquiry and the National Science Education Standards, A Guide for Teaching and Learning; National Academy Press: Washington, DC, 2000.
Acknowledgment:
Dr. Roderic Brame for all his assistance with the success of Interdisciplinary Professional Development
Program for Teachers, Partners in Integrated Earth Systems Science, Paleontologist on this program.
152
Proceedings of International Conference on Education, Informatics, and Cybernetics (icEIC 2011),
and the International Symposium on Integrating Research, Education, and Problem Solving (IREPS 2011)

An Application of Nonlinear Regression Analysis toResidential Construction Loans Default and Recovery
Risk in MexicoMyriam Cisneros-Molina, Flora Rodrıguez-Montano, Araceli Bernabe-Rocha, y Gabriel Gomez-Reyes
Sociedad Hipotecaria Federal S. N. C.Ejercito Nacional 180 PB Col. Anzures C.P. 11590, Mexico City, Mexico
Abstract—Residential construction loans are short term innature and can involve large amounts of capital. Default riskcould be very costly and also hazardous to the overall marketstability, especially in emerging markets. This study analyzes theoverall behavior from 2005 to 2011 of residential constructionprojects and loans funded by Sociedad Hipotecaria Federal S. N.C. (Mexican Development Bank), and develop models for defaultand recovery risk by means of nonlinear regression analysis.These models are the two key cornerstones for reserves calcu-lations. The aim is to identify key factors that influence defaultand recovery rates. We found that a small set of behavioralcharacteristics can satisfactory describe the prospective behaviorof a construction loan, making the proposed models easy tointerpret and implement.
Index Terms—Housing market, default, loss given default,residential construction loan, Mexico, nonlinear regression.
I. INTRODUCTION
ATypical residential mortgage agreement require the bor-rower (mortgagors) to repay loan principal and interest
on a monthly basis, and when the borrower misses a estab-lished number of consecutive payments, she is considered tohave defaulted on the mortgage.1 Once a loan is declaredin default, the lender (mortgagee) could claim ownership ofthe property (repossession) and sell it in the open market(foreclosure) to compensate for financial losses. When as-sessing the severity of the loss given default from the lenderperspective, not only financial losses from foreclosure mustbe considered, but also that the disposition of the propertyis difficult at its full market value under such circumstances;apart from the extra costs incurred such as legal expenses,property agent’s commissions, property management feesand maintainance costs before disposal.
Commercial mortgage markets differ from their residentialcounterparts in several significant respects. Commercial loansfinance investment opportunities and are typically used bysophisticated investors and real estate developers. The latterkind specialized in developing for residential purposes iswhat we call Residential Construction Loans (RCL).
Residential Construction Loans may be fixed or floatingrate, interest-only, legally binding of a short-term bulletpayment at the end of the amortization term, but with theoptionality of amortizing at any time, in contrast to other
The views expressed in this article are those of the authors and donot necessarily represent the views of, and should not be attributedto Sociedad Hipotecaria Federal S. N. C. This is a short versionpaper for presentation in IREPS2011.
1It is very common to take three to six payment overdue as thethreshold to define default.
commercial loans that are usually with balloon payments.Explicitly in the agreement or by operative practice, thedistribution of the amortization payments corresponds to theselling of property, usually through a new typical residentialloan (this is why this type of loans are also called bridgingloans in Mexico).
In times of increased focus on risk management, riskcontrol mechanisms that enable to make quick a clear judg-ment has become an attractive and necessary line of appliedresearch. In particular, under Basel II and III, the properquantification of risk tends to help the release of own capital,and precisely mortgage portfolios are those where the relativebenefits of internal ratings-based approaches compared withthe standardized approach are greatest.
A Credit Score is a number summarizing an individual’scredit profile that indicates the likelihood that a borrower willrepay future obligations. Credit scoring models are developedby analyzing statistics and picking out characteristics that arebelieved to relate to creditworthiness. These models havebeen used for decades and usually by potential lenders torank consumers and determine whether a consumer qualifiesfor a loan, how much the consumer will be loaned and atwhat rate (i.e., at origination). Despite the fact that creditscore-type models have been widely criticized [1] [11], theirusage and range of applications has increased dramaticallyin the recent years. In 2001, The AARP Public PolicyInstitute estimated in one of its reports [10] that more than10 billion credit scores (using credit-scoring model) havebeen sold, representing around 90 percent of all consumercredit decisions in the United States. In particular, in thehome mortgage sector, it is estimated that 75 percent of loandecisions have been taken directly or indirectly using creditscores.
This paper intents to identify the dominant factors inResidential Construction Loans (RCL) default and severityof Loss Given Default (LGD) in Mexico using credit-scoretype models, specifically using Nonlinear Multivariable Re-gression. The remainder of the article is segmented into threeadditional sections. In the next section we discuss about thedata available and the construction of the sample database forestimating the models. In the section that follows we detailon the two models: for probability of defauls and severityof loss given default. We describe the research methodologyused and the estimation of parameters in the models. Weclose the article with conclusions.
153
Proceedings of International Conference on Education, Informatics, and Cybernetics (icEIC 2011),
and the International Symposium on Integrating Research, Education, and Problem Solving (IREPS 2011)

II. DATA COLLECTION
Sociedad Hipotecaria Federal S.N.C. (SHF) as a secondfloor bank monitors its granting Residential ConstructionLoans and their collateral . The database available for thisstudy consists of six and a half years of loan behavioral datafrom beginning of 2005 to may of 2011 of 2778 projects,corresponding to 86, 042 registries from six different prod-ucts,2 from which the 93.82% are either current or overdueaccounts, and 80.60% correspond to construction projects.The intersection of the two previous criteria form our popula-tion for study. The variety of loans and construction projectswill assure the broad application we were looking for in themodels.
In order to guarantee robustness in the estimation ofthe model parameters, invalid information and outliers werefiltered from the population. Thus, obtaining a sample with44,503 registries from 1475 projects. In terms of loan andproject behavioral characteristics, the sample database con-sists of 159 variables from which the 34.36% are attributesat origination, 30.06% of behavioural characteristics and35.58% corresponding to other variables not relevant to ourpurposes. Due to the broad range of construction projecttypes and loan characteristics at origination, it was necessaryto create 39 new composite variables to make the informationcomparable.
III. RESEARCH METHODOLOGY AND DATA ANALYSIS
While lenders usually assess borrower credit history andasset quality (in the RCL case, of the construction project anddeveloper), the riskiness of general commercial mortgagesis primarily based on the ability of the asset to generatesufficient cash flow to make periodic mortgage payments(return on investment) and the expected asset value at loanmaturity to repay principal (return of investment). Being theintention of our research to identify the dominant factors inResidential Construction Loans (RCL) default and severityof Loss Given Default (LGD) in Mexico, in the next twosections we detail on the methodology used and explain theselection of Nonlinear Multivariable Regression models.
A. A model for the probability of default
Usual residential loans amortize and pay interest in amonthly basis, and default is characterized by setting athreshold in the number of missed payments (delinquency).As discussed in the introduction, a Residential ConstructionLoan (RCL) is characterized by its monthly interest pay-ments, the need of fully amortization at maturity and cash-flows coming from the the selling of the residences. By thestructure of RCL, the definition of delinquency (resp. default)is more complex and need to involve not only the numberof months of missed interest payments, but also a measureof the ability of fully amortize the loan at maturity or nearit, and the departure of loan amortization from the incomecash-flows from liberalization of residences,3 as we discussas follows.
2By different products we mean granting credit lines with differentfunding objectives and requirements for the collateral involved.
3In general terms, liberalization of residences include cash pay-ment or the selling through a usual residential loan.
Interest arrears in RCL are similar to treat as in usualresidential loans. Although they have very different behav-ioral aspects, RCL by their shorter term and more moneyintensive nature, usually few interest payments overdue arealready a sign of financial difficulties leading to default. Fromall registries in our sample database, the 51.47% correspondto project-registries with no missing interest payments, the17.57% for one payment overdue, 7.57% correspond totwo interest arrears, 5.09% to three and 18.26% to morethan three payments overdue. This is, less than a quarterof the sample database have missed three or more interestpayments.
In regard to return on investment prior to maturity, an easymeasure of funds deviation can be constructed subtractingthe monetary amount of residences sold corresponding to theloan, from the total amortization amount.4 On one hand, funddeviation are more than a behavioral attribute. Similar to in-terest arrears and mainly because of the short term maturitiesof RCL contracts, it can serve as an early sign of financialdistress, either because funds might have been used for otherpurposes (working capital, wages, etc.) or as evidence ofpoor planning or administrative procedures. In our sampledatabase, the 4.5% of entries correspond to deviation ofless than −20%. This represents the loans with undesirablebehavior. Deviation in the range between −20% and −10%represents a 5.49% of the sample. A separating thresholdin this interval might be a good alternative considering thatsome natural operative deviation may occur, e.g. transferringof funds might take time. The 89.98% of the remaining datarepresent loans with deviations of more than −10%. This arethe loans with good behavior. A deviation on the positive sidemeans that a prepayment have occurred.
On the other hand, fund deviation is a key component tocomputing the severity of loss given default, as we discussin next section.
In a different context buy related, a recent study [2]recognizes that commercial mortgage default is not a one-step process and examines a previously under explored aspectin the whole default process, that is the stage betweenthe initial delinquency and default, distinguishing servicers’behavior from the borrowers’ behavior. They find that cash-flows condition is the most significant factor in the servicers’decision making process. They also find that borrowers makedefault decisions based upon both the equity position in theloan and the cash flow condition in the space market, whichis related to our usage of funds deviation.
In regard to the condition of fully amortize at maturity,usual studies focus on the risk that the borrower may defaultbefore the loan matures but generally pay little attention tothe possibility that a borrower may have difficulty payingoff the loan at maturity (some sort of basis risk) even thoughthe loan is not in default [7]. There are several recent studieson commercial mortgages that describe this situations. In Tuet al. [7] analyze commercial mortgages that are not fullyamortizing, thus requiring a baloon payment that arises fromthe borrower’s inability to refinance at mortgage maturity.Borrowers with a mortgage at maturity that is not in default
4This measure of deviation in monetary terms need to be scaledto make it more comparable among loans. A natural way is to divideby the loan principal.
154
Proceedings of International Conference on Education, Informatics, and Cybernetics (icEIC 2011),
and the International Symposium on Integrating Research, Education, and Problem Solving (IREPS 2011)

but does not meet contemporaneous underwriting standardswill often request to extend the loan with the lender. Theinability of a borrower to refinance a mortgage can leadto extension and ultimately default. This situation usuallyoccurs during periods of increasing interest rates and/or slowproperty appreciation rates, when weaker projects may notqualify for a new loan at maturity.
In the day to day operation of RCL in Mexico, it is verycommon for a loan to go through a restructure in maturity.It is even sometimes part of the original agreement and usedas a measure of control. If the construction project advancesas expected, a loan term extension is almost automaticallyapproved. In our sample, more than 50% of the database areloans with terms between 1 and 1.5 times the original ma-turity, and as the proportion of original loan term increases,the percentage of registries decreaces rapidly.
After numerous discussions with a group of experts onRCL in SHF, several analysis,5 taking into account previousdiscussion on commercial loan default factors, and an inorder to incorporate as much describing features as possiblein our model for the probability of default for RCLs, weconsider that at each observing time a “good” loan-project isdescribed by satisfying jointly the following three aspects:
1) The number of interest payments overdue are less orequal two,
2) Dev ≥ −20%, defining Dev as the percentage funddeviation as follows,
Dev =
accumulatedamortization
amount
−
accumulated amountby selling
of residences
× (LTV)
(loan principal).
(1)
3) Current age of loan is less or equal to 1.5 times theoriginal term.
And by simplicity, a “bad” loan-project is one that satisfythe complementary conditions.
As usual in multivariate regression models for probabilityof default, we choose a time horizon H . The random variableYH representing the state of a loan in the future time H ,follows a binomial distribution on the total number of entriesin the sample database with the success probability (the eventthat the loan becomes bad), the probability of default (PD)for the loan. Thus, one estimates statistically on the sampledatabase, the parameters (coefficients) in the logistic functionfor PD in Eqn. () and on a combinations of predefinedfunctional forms of the potential explicative variables. Weelaborate further on this in the coming sections.
For determining the functional relationships of the domi-nant factors in RCL default, we used a combination of oper-ational knowledge, data exploration and fitting procedures.We found that for some variables, a non linear functionfitted better than a linear relationship traditionally used inmultivariable regression models. We applied a backwardelimination procedure in the regression analysis via the max-imum likelihood method.6 And in order to assure robustnessin the selection of the describing variables, we choose themonly if their Chi-square probability were small (usually less
5Decision tree, clustering analysis and transitions matrices weresome of the analysis performed and used to set thresholds to definewhat a good RCL is.
6For the regression analysis, we used the statistical software SASand the GENMODE procedure.
or equal to five percent) for all analysis horizons H (from 1to 12 months). Table I presents the Chi-square probability foreach of the five variables selected and three of the horizonsH .7
1) Independent variables and regression coefficients: Thefour variables (five with the intercept) that describe theprobability of default are:
1) DevE. This variable is the deviation of funds (Dev inEqn. (1)) times the scaled age, computed as the currentage of the loan divided by the original maturity. By itscomposition, it is a nonlinear variable that differenti-ates the effect of funds deviation in relation with thecloseness to maturity (or origination, respectively). It issomehow natural to be one of the describing variablesas the definition of a good loan depended on it.
2) MinProjE Measures the difference between the per-centage disposed and construction progress, escaledby the age of the loan and maturity. The nonlinearityguarantees that a project with much progress in relationwith the amount disposed in early months will haveless probability of default than one closer to maturity.
3) Mora. This is the number of interest delinquencies atthe observing time. This is the usual way probabilityof default is defined in mortgages.
4) Mora6. In order to incorporate the most recent historyin terms of interest delinquency, the variable Mora6is computed as the number of months among the lastseven of behavior that the loan worsened from oneperiod to the next one, i.e., if the loan incrementedtwice its delinquency in the last seven months, thenMora6=2.
As we worked with twelve horizons (H), we really es-timated coefficients for the twelve models. The models forPDH therefore have the following form:
ln
(PDH
1 − PDH
)= β0 +
4∑i=1
βifi(xi) = f(x), (2)
where the values of the coefficients βi and the functionsfi(xi), for i = 1, ..., 4 are the pre established relations andthose in Table II.
The discriminatory power of a scoring model denotesits ability to discriminate ex ante between defaulting andnon-defaulting loans. The validation process assesses thediscriminatory power of scoring model, and it is usuallyvia the ROC curve.8 A score-type model performance is thebetter the stepper the ROC curve is at the left end and thecloser the ROC curve’ position is to the point (0,1). Similarly,for the model, the better the larger the area under the ROCcurve is. Fig. 2(a) shows the ROC curve for H = 12 monthsprobability of default model tested with our populationdatabase. For comparison purposes, we also have plotted aROC corresponding to the estimation of parameters underthe assumption that all variables follow linear relationships.
7The Chi-square statistic and probability is used to statisticallytest whether including a variable reduces badness-of-fit measure ina model. This is analogous to producing an increment in R-squarein hierarchical regression. If Chi-square is significant, the variableis considered to be a significant predictor in model.
8Fore more on ROC curves and its usage in validating score-typemodels see [14], [13], [12], [11].
155
Proceedings of International Conference on Education, Informatics, and Cybernetics (icEIC 2011),
and the International Symposium on Integrating Research, Education, and Problem Solving (IREPS 2011)

One can notice that the nonlinear model fits much betterthan a pure linear. The slope -1 curve included in Fig. 2(a)will represent a model with no discrimination power at all(random model).9
B. A model for the severity of the loss given default
Understanding the tradeoff between receiving incomestreams from postponing foreclosure and acting it, is animportant precursor to assessing the potential severity of loandefaults.
In a RCL, the severity of the loss given default is theunitary complement of the recovery rate. Once the loan is indefault, the only means for recovering any cash-flows is bycontinuing with the development of the construction project,if necessary, and foreclosure of all remaining residences inthe open market. Thus, severity of loss in a RCL is moreassociated to the project than the loan.
In Sociedad Hipotecaria Federal or anywhere else in Mex-ico, there is no large and robust database with informationabout foreclosure of construction loans. In order to come upwith a model, we created a synthetic database by fictitiouscalculation of recovery given default (the present value offuture cash-flows after default and foreclosure and includingall costs involved), and comparing it with the outstandingamount (including interests) at default time. This was per-formed for each of the construction projects in our sampledatabase. Once with the severity of loss given default figuresfor each project and each of the twelve analysis horizons, weconstructed a score-type model to identify the key project andloan characteristics that describes it. It is worth noting thatalthough we used a multivariate regression model, it is notbased on a Binomial distribution or any other distribution. Weestimate coefficient in the model directly from the syntheticestimates.
1) Severity of LGD synthetic database construction: Foreach of the RCL in the sample database, and assumingdefault has been declared, cash-flows were estimated basedon ten pairs of theoretical curves (construction progressand residence selling) shown in Fig. 2. These theoreticalcurves represents the full range of possible combinations ofconstruction progress and residential sale schedules (in termsof age of the loan).10 Every curve reaches 100%, meaningthat cash-flow recovery last until the last residence is sold.
2) Curve occurrence probability: In order to assign aprobability (likelihood) of occurrence to each of the pair oftheoretical curves and to each of the RCL in the sampledatabase, we used the following methodology.
1) Each RCL in the sample has monthly informationabout construction and selling progress since its orig-ination, denoted by Month = 0. We denote by
9Another measure of goodness-to-fit is the Kolmogorov-Smirnov(KS) test. For our nonlinar model KS=82.49% and for thelinear KS=69.82%. There are opposite opponions about how goodmodels are given by their KS statistics, but in general terms, a modelwith a KS larger than 60% has a good fitting. Both of our choices(linear and nonlinear) pass this criterion.
10These theoretical curves are the result of several historical anal-ysis of residential construction loans behavior and the constructionsector in Mexico, together with a series of meetings with experts inthese topics.
(a) C-1. (b) C-2. (c) C-3.
(d) C-4. (e) C-5. (f) C-6.
(g) C-7. (h) C-8. (i) C-9.
(j) C-10.
Fig. 1. Theoretical curves for cash-flow calculations. The x-axisrepresents the loan ages in months and the y-axis the progress inpercentage (construction and selling of property). In each figure,every top curve corresponds to construction and the down one to theselling of property. This is because construction precedes to retail.The vertical line appearing in the plots is set at 48 months for visualcomparison among curves.
Month = K the month of the more recent obser-vation.
2) Compute the distance between real data and theoreticalcurve points (measured as the absolute value of thedifference) as follows:11
dConst(Real curve,Theoretical curvei)
=1
K
j=Month=K∑j=Month=0
∣∣∣CConstreal (j) − CConst
i (j)∣∣∣ ,
dSell(Real curve,Theoretical curvei)
=1
K
j=Month=K∑j=Month=0
∣∣∣CSellreal(j) − CSell
i (j)∣∣∣ ,
11By our definition of distanced(Real curve,Theoretical curvei), it represents the meandistance among the months of history for the loan. Note that0 ≤ d(Real curve,Theoretical curvei) ≤ 1. The lesser the meandistance, the closer the real data to the theoretical curve.
156
Proceedings of International Conference on Education, Informatics, and Cybernetics (icEIC 2011),
and the International Symposium on Integrating Research, Education, and Problem Solving (IREPS 2011)

and then
d(Real curve,Theoretical curvei) = (3) dConst(Real curve,Theoretical curvei)+
dSell(Real curve,Theoretical curvei)
2
. (4)
3) Define occurrence probability as the inverse of the totaldistance, i.e.,
a) For each curve i, compute
ai =1
d(Real curve,Theoretical curvei).
b) Assign a probability of occurrence as
pioccurrence =ai∑i=10
i=1 ai.
Once probability of occurrence for each curve and eachRCL in the sample are assigned, cash-flows are computedunder the following assumptions: (1) History is reconstructedbased on the theoretical curves and projected a further Hmonths to cover the analysis period, (2) Cash-flows startafter twenty four months from default time, (3) Foreclosurecosts are considered (legal expenses, building costs, propertyagent’s commissions, property management fees and main-tenance costs before disposal, etc.), and (4) Cash-flows areprojected until last residence is sold.
Having all projected cash-flows, a Net Present Valueis computed at default time. Recovery percentage is thencomputed as
%rec(proj)
=
i=10∑i=1
V PNproj(age +H) × occ. prob.proj(curve i)
Outst. amountloan(age +H, curve i).
and finally, the severity of loss given default is calculatedwith %LGD(project) = 1 − %rec(project).
Similar as in the model for probability of default, firstlywe found the functional relationship of the dominant factorsin the severity of LGD as a combination of operationalknowledge and statistical analysis. We found several nonlinearities, as described in Table I. Using again a backwardelimination procedure in the regression analysis via themaximum likelihood method, we ended up with a set of fivedescribing variables satisfy too the robustness criteria overthe twelve horizon of analysis H (see Table I for details onthe Chi-square probabilities).
3) Independent variables and regression coefficients: Theseven variables (six with the intercept) that describe theseverity of loss given default are:
1) AvMin. This variable measures, as percentage, howmuch the developer has disposed of the original prin-cipal. It is very intuitive to be part of the set of variablesdescribing the loss given default.
2) AvAmort. Similar to previous variable, it measures thetotal amount amortized as percentage of the principal.The larger the amortization the lesser the probabilityof default.
3) DifMinAmort. Disposition and amortization sepa-rately play an important role in determining default, butthe model also incorporates too the relevance of the dif-ferential among them in a given valuation period. This
Horizon H
variablefunctional
form3 6 12
Probability of default model
Intercept none 0% 0% 0%
DevE [composite] 0% 0% 0%
MinProyE [composite] 0% 0% 0%
Mora L 0% 0% 0%
Mora6 L 0% 0% 0%
Loss given default model
Intercept none 0% 0% 0%
AvMin L 0.03% 0% 0%
AvProj [cubic] 3.47% 5.22% 1.26%
DifMinAmort [ln(ln(x+1.5))] 0% 0% 0%
AvAmort L 0% 0% 0%
MAmort [cuadratic] 0% 0.5% 2.09%
ResLib L 29.49% 0.09% 0%
L: Linear, and [composite]: linear in the composite variable, but nonlinear in the input.
TABLE IDESCRIPTIVE VARIABLES, FUNCTIONAL FORM AND CHI-SQUAREPROBABILITIES OF PROBABILITY OF DEFAULT AND LOSS GIVEN
DEFAULT MODELS.
spread is represented by the variable DifMinAmort.The shorter the spread, the healthier the behavior ofthe loan.
4) AvProj. One of the more natural variables to appearin the loss given default model is the project progress.It includes the progress on the part of the projectcurrently under construction, but also the proportionthat has been completed and even sold.
5) MAmort. This variable is computed as the number ofmonths since origination, that the loan has amortizingany amount, scaled by the loan age. It can be inter-preted as how often there has been financial activity interms of amortization in the loan. A loan that has notbeen forgotten, has less probability of default.
6) ResLib. It is the percentage of the total residences sold.It is a very natural variable for describing loss givendefault of a construction project.
The models for the severity of LGDH has the followingform:
ln
(LGDH
1 − LGDH
)= γ0 +
6∑i=1
γigi(xi) = g(x), (5)
where the values of the coefficients γi and the functionsgi(xi), for i = 1, ..., 6 are in Table II.
In this case, the parameter estimation did not involvedthe assumption of an underlying probability distribution, asour synthetic values of severity of LGD were already figuresbetween zero and one. Fig. 2(b) shows the distribution of thedifferences between the synthetic values and those estimatedby the model. We appreciate how the 77.8% of the samplehas differences in absolute values of less than 10%, and95.6% of the data an absolute difference of 20%.
For validation purposes, we adapted the concept of ROCcurves to test the closeness in estimation (instead of mea-suring its separating power as in usual ROC curves), bycomputing cumulative frequencies for each fix value ofabsolute differences. Fig. 2(c) shows the goodness of fit inthe severity of LGD model. Interpretation of the adjustedROC curve is similar as in PD. The closer to the left upcorner, the better the fit.
157
Proceedings of International Conference on Education, Informatics, and Cybernetics (icEIC 2011),
and the International Symposium on Integrating Research, Education, and Problem Solving (IREPS 2011)

(a) ROC for the PD model with thesample database.
(b) Distribution of thedifferences between syn-thetic severity and with themodel.
(c) Goodness-to-fit curvefor the loss given de-fault model and the sampledatabase.
Fig. 2. Validation for the loss given default model.
Probability of default model parametersH=3 mes H=6 mes H=12 mes
β0 -2.0449 -1.7471 -1.4717β1 -2.2745 -1.3604 -1.0788β2 0.7619 0.8388 0.6091β3 0.4198 0.2559 0.1367β4 0.3164 0.2569 0.1985
Loss given default model parametersγ0 -0.6434 -0.454 -0.2651γ1 -0.1232 -0.2146 -0.3089γ2 0.7215 0.4286 0.1688γ3 -0.4334 -0.0583 0.2909γ4 -0.1472 -0.2522 -0.3702γ5 0.5964 0.5538 0.5413γ6 0.6128 0.5513 0.5012γ7 0.1396 0.0591 0.0132γ8 -0.6869 -0.523 -0.4089γ9 0.0001 -0.0522 -0.1052
TABLE IIPARAMETERS IN THE PROBABILITY OF DEFAULT AND LOSS
GIVEN DEFAULT MODELS.
IV. CONCLUSIONS
The objectives of this research were to look for behavioralcharacteristics that determine the probability of default andseverity of loss given default in Residential ConstructionLoans in Mexico, and to examine their significance usinga mathematical and statistical approach.
This study contributes to the understanding of constructionloans behavior in Mexico and its credit risk in general.
On one hand, we find a model for the probability of
default of RCLs in Mexico that can be described by fivevariables, which happen to be very intuitive and with a directfinancial interpretation. On the other hand, although there isno in Mexico a database for severity of loss given default ofconstruction loans, we were able to built a synthetic sampleand find seven behavioral characteristics that describe it.These two models are the key cornerstones for computingcapital reserves for RCLs. These two models might serveas a first step toward analyzing systemic credit risk in themortgage sector.
Future studies of credit risk for RCLs might include theanalysis of macroeconomic factors.
ACKNOWLEDGMENT
We are most grateful to the following people from So-ciedad Hipotecaria Federal S. N. C. for providing data, ad-vise and knowledge: Javier Gavito, Daniella Gurrea, MiguelAngel Espinoza, Luis Mecinas, Hector Montiel, MariemHernandez and Miguel Angel Arellano.
REFERENCES
[1] Robert B. Avery, Raphael W. Bostic, Paul S. Calem and GelnnB. Canner, Credit Scoring: Statistical Issues and Evidence fromCredit-Bureau Files Real State Economics 2000 volume 28 Issue3 pp 523 – 547.
[2] Jun Chen, and Yongheng Deng, Commercial Mortgage WorkoutStrategy and Conditional Default Probability: Evidence fromSpecial Serviced CMBS Loans, Real Estate Research Institute(RERI), Working papers series, 2010.
[3] L. Goldberg, and C.A. Capone. A Dynamic Double-TriggerModel of Multifamily Mortgage Default. Real Estate Economics,forthcoming. 2002.
[4] J.P. Harding and C.F. Sirmans. Renegotiation of Trouble Debt:The Choice between Discounted Payoff and Maturity Extension.Working paper. University of Connecticut. 2001.
[5] Elizabeth Mays (Eds.), Handbook of Credit Scoring, GlenlakePublishing Company, Chicago. 2001.
[6] T.J. Riddiough and S.B. Wyatt. Strategic Default, Workout, andCommercial Mortgage Valuation. Journal of Real Estate Financeand Economics 9: 5-22. 1994.
[7] Charles C. Tu and Mark Eppli, Extension Risk in CommercialMortgages Real Estate Finance, Volume 18, No. 4 (Winter2002).
[8] K.D. Vandell How Ruthless Is Mortgage Default? A Review andSynthesis of the Evidence. Journal of Housing Research 6(2):245-264. 1995.
[9] Hendrik Wagner, The use of credit scoring in the mortgageindustry. Journal of Financial Services Marketing, Volume 9,Number 2, December 2004 , pp. 179-183(5).
[10] Neal Walters, and Sharon Hermanson, Credit Scores and Mort-gage Lending. Issue Brief No. 52, AARP Public policy Institute,August 2001. http://research.aarp.org
[11] Anthony M. Yezer, A Review of Statistical Problems in theMeasurement of Mortgage Market Discrimination and CreditRisk Research Institute for Housing America. Mortgage BankersAssociation. September 2010.
[12] Bernd Engelman, Evelyn Hayden and Dirk Tasche Measuringthe Discriminative Power of Rating Systems. Discussion paperSeries 2: Banking and Financial Supervision. No 01/2003.Deutsche Bundesbank.
[13] Stephen Satchell and Wei Xia Analytic Models of the ROCCurve: Applications to Credit Rating Model Validation. Uni-versity of Technology Sydney. Quantitative Finance researchCenter. Research paper 181, August 2006.
[14] Xuezhen Wu Credit Scoring Model Validation. Master Thesis.Faculty of Science Korteweg-de Vries Institute for Mathematic-sUniversitaiet van Amsterdam .June 2008.
158
Proceedings of International Conference on Education, Informatics, and Cybernetics (icEIC 2011),
and the International Symposium on Integrating Research, Education, and Problem Solving (IREPS 2011)

ABSTRACT
Information systems are treated as socio-technical systems for achieving some context relevant and consensual impact or effect through exchange of messages in the global marketplace. Hence, the systems have to be developed and implemented with respect to the spiritual system parts’, perception of cultural disparate or contextual content realities. The complex meta-system; i.e., the Internet providers have to know and cognize how to transparently satisfy cultural disparities for what realities are requested by the parts in the virtual market. Internet, as enabling system dependability, is supposed to be the driving factor for global prosperity development. So, the prosperity sustainability complexity language can relay on the language for management of a complex, but not necessarily complicated system; e.g., Internet control as meta-language. Keywords: Cognition, Information, System, Control, Language, Dependability.
PRESUPPOSITIONS
The Figure 1 socio-technological (SOT) system model is aimed to message an experienced general view on a system of entropy reducing [1]: (Miller, 1978; p. 16) processes being impacted of its environmental events. In particular, the model can represent realizations of “Technology and Industrial Innovation Management” [2]: (TIIM, 2011) proceedings as textbook objectives for sustainability efforts’ dependability with respect to [3]: (UN, 1948) Human Rights declaration meaning. The abbreviations —listed in the final paragraph— are for exemplifying how introduction of a meta-language and generic use of it for strategic ‘can be’, tactic ‘shall be’ and operation ‘is’ challenges questions of real effect of message exchange. The requisite variety width (RQW) idea is based on the meaning of requisite variety in [4]: (Ashby, 1999). The RQW cognition is achieved per entity (ETY) identity (IDY) function through Bloom's taxonomy application [5]: (IEEE, 2004), [6]:
(IOWA, 2009). Realizations depend on an enterprise (EPR) executive entity’s contextual perception of realities according to Figure 2 [7]: (Kjellman, 2003; pp. 117-124, adapted). Each spiritual, as well as technological (TEL), authentic ETY_IDY has to be authorized with respect to cognized RQW concerning the real world [8]: (IEA, 2007) events and access to dependent abilities as assets. The authorization process is de facto accreditation relatively to a, in policy, stated evaluation level. For feedback, each ETY_IDY behavior has to be monitored (MTR) and taken in account (ACT) when auditing (AUD) of the environmental events: “If a system’s negative feed-back discontinues and it is not restored by that system or by another on which it becomes parasitic or symbiotic, it decomposes into multiple components and its supra-system assumes control of them.” [1]: (Miller, 1978; p. 110, hypothesis 5.6-1) Trust as a dependability feature Dependability (DPY) is a basic for sustainability. It is about reliability in trust as a confidence asset: “Mutual understanding as ‘Trust’ between the Agents of Change [communicating parts]: 1. The two parties have faith in each other’s recommendations. 2. Each party is sensitive to the motivation, aspirations, and values of the other party. 3. Each party understands its own decision-making process as well as of the opposite side. 4. The “implementer” [imperative implementer as provider, P] is involved in the formulation of [policy, PCY] goals in order that his recommendations and programs bear relationships to the [quality of service, QOS] needs of the recipients [customer as questioner, Q]. 5. The recipients [Q] are involved in the preparation of plans and programs so that they bear relation to their own perception
Cognition of Information System Control as Metalanguage (COINS)
Yngve MONFELT Department of Computer and Systems Sciences, Stockholm University
Kista, SE-164 40 Sweden
Fig. 2. Cognition (COG) filters [7, pp. 117-124, adapted]
Figure 1. The contextual (CXT) system model concept
159
Proceedings of International Conference on Education, Informatics, and Cybernetics (icEIC 2011),
and the International Symposium on Integrating Research, Education, and Problem Solving (IREPS 2011)

of [RQW cognition] needs and [evaluation level] scale of values. 6. The agent promoting [P] change is capable of placing himself in the position of the recipients [Q] and of “thinking” like them.” [9]: (Van Gigch, 1978; p. 401) Security through certified dependability A de facto expression for information security is: ISC {confidentiality, integrity and availability}. For the conceptual Figure 1 context, that expression is not enough because any operator entity as authorized dependability has to be protected against not authorized impact and is, according to the strategic policy, certified and accredited with respect to class of: ISC {confidence or secrecy, integrity, dependability including availability, and feedback: (monitored performance, accounted behavior, and audits of environmental effects)}
ARISTOCRACY In the current context, an Aristocratic [10]: (Adizes, 2006) decision state associates with imperative [11] laissez-faire behavior; i.e., escape from difficulties motivating that some other executive entity than I will do what ought to be done. Perhaps it is because of RQW or access right is not in parity with the actual ETY_IDY’s authority: “The effects of steady decline in flexibility, which began in Prime [state], start to become more obvious in Aristocracy. Because it has neglected to pursue long-term opportunities, the company's [enterprise, entity's] focus becomes increasingly short-term. For the most part, its goals are financially oriented and low-risk. With less of the long-term view, the [cultural, ergonomic] climate in an Aristocratic organization is relatively stale.” [10]: (Adizes, 2006), [11] Not authorized (¬ATH), certified and 'robot' or 'chat-bot' like imperative mechanistic meta-language behavior need to be avoided. In general, any application implementation shall be SWOT {Strength, Weakness, Opportunity, and Threat} analyzed in an appropriate evaluation process for authorized adaptation of it with respect to a strategic risk policy.
SWOT RISK A risk reason may be routines, leading to antibiosis characteristic like behavior, if not reasonably programmed algorithms or rules as mandatory operational action duties. A ‘not adapted SWOT analyzed routines’ attitude can be interpreted as Adizes’ [10] “aristocracy” through delegating technical or bureaucratic functions the role attitude that associates with some of the characteristics: “As organizations enter Aristocracy they characteristically: - Are cash rich and have very strong financial statements. - Have reduced expectations for growth. - Demonstrate little interest in conquering new markets, technologies, and frontiers. - Focus on past achievements rather than future visions. - Are suspicious of change. - Reward those who do what they are told to do and punish those who do not. - Are interested in reducing their risks. - Invest much more on control systems, benefits, and facilities than they do on R & D. - Form dominates function in the organizational [cultural, CLT] climate.
- More emphasis is placed on how things are done, than what was done. - Value uniformity, consistency and formality in dress, decorum, and behavior. - Employ individuals who are concerned about the company's vitality, but are willing to abide by a "don't make waves" operating motto. - Engender only negligible innovation with internal efforts. - Acquire other products or companies for new products, markets, and entrepreneurship to feed into their distribution channels and operating systems. - May be takeover targets themselves.” [10]: (Adizes, 2006)
LIVING SYSTEMS
The Figure 1 system model is supposed to inhere with living systems characteristics. Structure “H1-1: In general, the more components a system has, the more echelons it has. [1]: (Miller, 1978; p. 92) H1-2: In general, the more structurally different types of members or components a system has, the more segregation of functions there is.” [1]: (Miller, 1978; p. 92), Process “H2-1: System components incapable of associating, or lacking experience, which has formed such associations, must function according to rigid programming or highly standardised operating rules. It follows that as turnover of components rises above the rate at which the components develop the associations necessary for operation, rigidity of programming increases. [1]: (Miller, 1978; p. 92) H2-2: The more rapid reassignment of function from one component to another a long-surviving system has, the more likely are the components to be totipotential [isolated cells', like space stations' maintainability to survive through spare part replacement; rapid turnover of personnel] rather than partipotential [specialized, key function organs]. [1]: (Miller, 1978; p. 92) H2-3: The more isolated a system is, the more totipotential it must be. [1]: (Miller, 1978; p. 92) H2-4: A system’s processes are affected more by its suprasystem than by its supra-suprasystem or above, and by its subsystems than by its sub-subsystems or below.” [1]: (Miller, 1978; p. 92) Frictions “Among the limited number of adjustment processes which channels in living systems employ as information input rates increase are: omission, error, queuing, filtering, abstracting, multiple channels, escape, and chunking. Each of these processes applies to random and non-random information inputs except chunking, which applies only to non-random inputs with repetitious patterning to a system that can associate (or learn). Each of these processes occurs at multiple levels of living systems. Each of these processes has a cost in some sort of decreased efficiency of information processing.” [1]: (Miller, 1978; pp. 103, 124, Hypothesis 5.1-3) Below Figure 3: “Theoretical curve on logarithmic coordinates based on average performance data of five living systems (cell, organ, organism, group, and organisation) under various rates of pulse-interval coded information [bits/s].” [1] (Miller, 1978; Fig. 5-54. p. 192) is based on Table 1 data (ibid) where a
160
Proceedings of International Conference on Education, Informatics, and Cybernetics (icEIC 2011),
and the International Symposium on Integrating Research, Education, and Problem Solving (IREPS 2011)

spiritual ETY’s number of organisms in the organization are four, in the group are two, and while the cell is part of an organism.
Table 1 experiment data for the Figure 3 theory, are expressed as base 2 logarithms in Figure 4.
Conclusive audit A conclusion of the above living systems characteristics may be that an entity with high general knowledge is more replaceable than a context cognized team participating specialist. That ability can, through deeper requisite variety width, participate to the higher organizational Table 1 Q-value.
For Figure 1, the MSGout/MSGin quotient (Q) value in Table 1 may indicate higher efficiency in organizations because of the fact that products; i.e., effects are absorbed uncertainties or entropy; i.e., information as gained knowledge. Waste is redundancy or distorting overload; e.g., contextual inadequacy.
COMPLEXITY METALANGUAGE
A basic method for analyzing complexities in systems is in [12]: (Miles, 1989). Computerization of the efforts gives opportunity to manage analyze of larger systems. To make such analyze understandable there are need of analyzing the output message: “How complexity leads to simplicity.” [13]: (Berlow, 2010) Such analyze is actual in: “Systems Engineering [SE] complexity. In real terms, applying SE is often seen as a project risk because of its reputation to be complex. Statement: 'Complexity can be managed [MGT] if the information [INF, gained knowledge] is managed [for being contextually (CXT) cognized (COG) requisite variety width (RQW)]'. Information management [i.e., ISC] in the context of SE requires a methodology. For that, [14]: ISO 15926 offers a framework (explicit [ITY], unambiguous [COF], traceable [AUD]) [14]: ISO 15288/ISO 15926” [15]: (V. Ruijven, 2007, p. 5) Products; i.e., Figure 1 outputs from one EPR_A can be data communications technology (DCT; i.e. TEL) components as material to be adapted (APT) as assets (AST) in another EPR_B’s information system (ISY). It is the meaning in Figure 5 [15]: (Ruijven, 2007; p. 12, adapted). The EPR_B has to communicate (COM) its system specifications ([16]: W3C; [17]: V. Renssen, 2005, 2008); [18]: Lawson, 2010) to EPR_A of which is a process from high uncertainty to lower ditto; i.e. from Table 1 right most column to the left most one. Furthermore, the EPR_B has for internal COM, to begin with; - EXE-0 strategic (STY) ‘can be/have’ auditable (AUD) policy (PCY), - EXE-1 tactical (TAC) ‘shall be’ accountable (ACT) ADP or MDP role (ROL) routines or rules (RUL) for - EXE-2 operative (OPE) ‘is/has’ monitored (MTR) COM of the EPR QOS mission actions (Act).
Figure 3. Theoretical curve based on experiments.
0 2 4 6 8 10 12 14 16
0
2
4
6
8
10
12
14
x =log (In [bits/s]); y =log (Out [bits/s])
log (In [bits/s]): 1.81; 2.46; 3.25; 7.23; 13.87log (O
ut [b
its/s]): 1.38; 1
.85; 2
.54; 5
.78; 12.30
Figure 4. Base 2 logarithms of Table 1 data.
Figure 5. Organization of EPR ECA is entropy reducing
Table 1. Bit rate max points. [Miller, 1978, p. 192; adapted] Max point bits/s
Organi- zation 4 pers.
Group 2 pers.
Organism 1 pers.
Organ [part of organism]
Cell [part of organ]
Out 2.6 3.6 5.8 55 5050 In 3.5 5.5 9.5 150 15000 [Q] 0.74 0.65 0.61 0.37 0.33
161
Proceedings of International Conference on Education, Informatics, and Cybernetics (icEIC 2011),
and the International Symposium on Integrating Research, Education, and Problem Solving (IREPS 2011)

METALANGUAGE REALITY Abbreviations One-line meaning (MNG) in below syntaxes, as a contextual [2, G1.3] information system security machine (ISM) draft example, does not, if hit, supersede, but emphasize the MNG in ITU-T recommendations E.800, X.200 or X.800 [20]. ABY Availability (to asset entities) ACR Accreditation (certified authorization) ACS Access (to assets in parity with role authority) ACT Account (of access) Act Action (use of access) ADM Administration (behavioural routines and rules) ADP Automated (algorithmic) data processing API Application; OSI layer #7 or equivalent APT Adaptation; SOL (ACR of COG API/ECA REL) ARC Archetype (is caricature of a phenomenon) ASP Aspect (message meaning) AST Asset (accessible ability) ATH Authority (RQW and ACT dependent right to ACS) AUD Audit (of behaviour with respect to EVT, PCY, ACT) AUT Authentic (not corrupted integrity) BEH Behaviour (possible authorized state variance) CLS Class (set of comparable features) CLT Culture; SOL (context dependent) COD Coding; OSI layer #6 or equivalent COF Confidentiality (confidence or secrecy) COG Cognition of contextual knowledge effect COM Communication (peer to peer interaction effect) CQE Consequence (effect of meaning in message) CTR Control (of STY, TAC, OPE) CXT Context (in STY, TAC, OPE) DAT Data (facts to be processed, stored and messaged) DCT Data communication technology DPY Dependability (ITU E.800; trusted and reliable ABY) DSC Data communication security (ITU X.800) EAL Evaluation level ECA Enterprise Communication Architecture; SOL ECT Effect (of EVT or OCU consequent MSG) EFY Efficiency (economy of effect in a LCP time slot) EPR Enterprise (QOS mission performance) ERR Error (is a consequence of reliability fault) ETH Ethic; SOL ETY Enabling unit with identity to be authorised for a role EVT Environmental event or occurrence EXE Enterprise executive entity EXE-0 Enterprise executive entity - strategic EXE-1 Enterprise executive entity - tactic EXE-2 Enterprise executive entity - operation FAL Failure (is a consequence of escalating error) FCN Function (strict relation aspect) FEB Feedback FLT Fault (causes reliability breach indicated as error) HW Physical framework (architecture) ICI Incident (fault caused error) IDY Identity (to be authenticated) Im Imaginary (may be an Re-accompanying attribute) INF Information (gained knowledge caused by MSG) ISC Information Security (state of INF certainty) ISM Information System Security Machine concept ITU International Telecommunication Union ITY Integrity (consistent and not corrupted, authentic) KNW Knowledge (of contextual events or occurrences) LAW Law or other mandatory rule; SOL LCP Life cycle period of an entity or process
LNK Link; OSI layer #2 MBY Maintainability (of fault caused erroneous ICI) MCE Maintenance (of ERR caused QOS or LAW FAL) MDP Manual data processing; ADM MEA Measure (is evaluation) MGT Management; SOL (of STY, TAC, OPE) MNG Meaning (is message aspect) MSG Message (is structured transport of data syntaxes) MTR Monitoring (of performances) NET Network; OSI layer #3 OCU Occurrence; EVT OPE Operation; EXE-2 ‘is/has’ relation aspect OPU Opportunity; SWT ORG Organization; SOL (of ECA) OSI Open System Interconnection (ITU-T X.200) PCS Process (of data or material) PCY Policy; SOL (strategic EVT and RSK concept) PEF Performance (of operative mission actions) PHY Physical medium; OSI layer #1 PRT Protection (of dependability; e.g., a SEC state) QOS Quality of Service in mission performance RBY Reliability (fault frequency dependent) Re Real, tangible effect REL Relation (may be a function) ROL Role (an authorized behaviour variance) RQW Requisite variety width in cognition RSK Risk (cost of consequences) RUL Rule (mandatory; e.g., LAW or ADM) SAF Safety (the condition of being protected) SEC Security (a state of protected safety; e.g., DPY) SES Session; OSI layer #5 SGN Signal (perceived meaning in message) SOE Social engineering (unauthorized BEH in ACR CXT) SOL Social layer (s) SOT Socio – technologic layer(s) (SOL, TEL) STR Strength (low vulnerability) STX Syntax (message structure) STY Strategy; EXE-0 ‘can be/have’ relation aspect. SW Software (definition of API algorithms or rules) SWT SWOT; strength, weakness, opportunity, threat TAC Tactic; EXE-1 ‘shall be/have’ relation aspect TEL Technologic layers; OSI layer (s) #1 to #7 TRP Transport (of MSG); OSI layer #4 TRT Threat (ITU-T X.800) UN United Nations VUE Value (of effect or consequence) WEK Weakness (vulnerable) The broadband vision as example Below, abbreviations within square brackets, included as comments to the extract from, [19]: (ITU/UNESCO, 2010; pp., 5f) Broadband Commission — contextual environment event (EVT) — for Digital Development Declaration [DCT; i.e., TTL] vision concerning the 2010 Millennium Development Goals (MDG), are ‘information security machine (ISM)’ aspects (ASP) with respect to [2]: (TIIM, 2011) as text book for open dictionary [11] phenomena to be structured according to system engineering [14, 15] principles. The square bracket comments are aimed as a memento of ‘information security (ISC) management (MGT) system (ISMS)’ general usability and may exemplify a step toward conceptual realization of the vision.
162
Proceedings of International Conference on Education, Informatics, and Cybernetics (icEIC 2011),
and the International Symposium on Integrating Research, Education, and Problem Solving (IREPS 2011)

Forging (Informing) seven forces For each of the “convergent and interdependent forces [ASP] of policy [PCY], infrastructure, technology [DCT; i.e., TEL], innovation, content [COG MNG] and applications [API], people [spiritual ETY] and government [EXE-0 relatively to MDG as EVT]: • Fundamentally, this will require government-wide leadership from the very top [CXT, EXE-0], at the level of Prime Minister or Head of State, with a supporting governance mechanism [EXE-0 communication architecture, ECA-0, SOL, QOS]; • A broad-based ‘bottom-up’ approach is also required [DPY] to build commitment to the concept of broadband [TEL_NET] inclusion for all; • Raising awareness [KNW] of the economic and social [SoL] benefits of broadband [TEL_NET] should be publicized among policy [PCY]- and decision-makers [EXE-0, PCY, providers, P], as well as the general public [DCT, QOS questioners, Q]; • Most of the investments for broadband [DCT] will come from the private sector [P], so policy-makers [EXE-0, STY] need to engage with industry and investors [EXE-1, TAC] to promote policy [OPE, PCY] objectives [OBJ] more broadly; • Providing [P] policy [PCY] development skills [COG, AST] to public authorities [EXE-1, agency, AGY] could help abolish some of the existing [BEH, SWT] barriers and [FLT] factors that hinder widespread uptake of broadband [TEL_NET] use in the population [Q]; • For areas where private investments are not feasible, public authorities [EXE-1 agency, AGY] and private entities [EXE-2, EPR, ETY] should find innovative ways of [ECA-2] cooperating to achieve widespread access [DPY ACS] to and use of broadband [TEL_NET]; • Content [MSG, RQW, MNG] and applications [ACR API] development is undergoing profound change. As the creation, funding [AST], sharing and distribution of content [MSG, RQW, MNG] in the digital [SOT] world increases in complexity, a fundamental concern of business [EPR], government and civil society [SOL, EPR] should be the stimulus of local and diversified development-centric applications [ACR, API], in local languages [COG]; • Security [SEC of DPY], authenticity [AUT], and integrity [ITY] issues will become ever more important, particularly with regard to privacy [AST], protection [PRT] and confidentiality [COF], and must be addressed [AUD], otherwise large-scale investment in broadband [DCT] infrastructure is unlikely to fulfil its potential [DPY fail, FAL].” ([19], p. 19) Content “As has been witnessed across the ICT [DCT for conveying MSG] world, connectivity [DPY] without content [MSG, RQW, MNG] can make even the most sophisticated technologies [TeL, ACR, API, APT] irrelevant or of limited value [VUE]. In today’s virtual world, it is vital that governments [EXE-0] do not neglect [FAL] the importance of content [MSG, RQW, MNG]. Policy-makers [EXE-0] have to emphasize the development of rich and diverse online content [MSG, RQW, MNG] and applications [ACR, API, APT] alongside infrastructure [DCT, EVT] and propose concrete policies [PCY] and practices [COG] for inclusion of new languages [ECA] and tools [API] for the measurement [MEA] of linguistic diversity [COG]. Some of the main issues with regard to content [COG] include making more online [OSI] material accessible [ACS, DPY] in local languages or accessible [ACS] to people with limited functional literacy skills [COG]. The digital divide is a result not only of a lack [FAL] of access [ACS] to connectivity [API, DPY] and infrastructure [DCT], but also of a lack [FAL]
of relevant and locally-developed content [COG] which can make a big difference to the [QOS] lives of ordinary people. It is important to recognize that broadcasting also plays an important role [ROL] in the developing world in the creation and dissemination of rich media content [COG].” … ([19], p. 31) Sustainability “The MDG on ensuring environmental sustainability [EVT] spans a wide range of targets [OBJ], from the provision of safe [SAF] drinking water and basic sanitation [PHY] facilities to reducing biodiversity loss [FAL] and improving the [QoS] lives of slum-dwellers. In virtually all these areas, broadband [DCT] networks can make an important contribution. They can swiftly transmit information [MSG] from ground sensors or satellites to monitor [MTR] the effects [ECT] of climate change [EVT] or impending natural disasters [FAL], such as drought or floods. They can provide early [ERR of FLT ICI] warning systems that reduce vulnerability [VUL, WEK] to disasters [FAL]. … GPS-based applications [API] can also help monitor [MTR] environmental abuses [EVT] (eg, illegal logging or pollution levels) and transmit that information [MSG] to authorities [AGY, ATH]. … Sharing experiences of what works [COG], learning from others and changing people’s expectations of their living [QoS] conditions and livelihoods are all part of the complex challenge of empowering [COG] people to improve their own lives [QOS].” ([19], p. 45f) Society “Building global commitment to broadband [TEL_NET, EVT] inclusion for all by connecting broadband with the MDGs and knowledge [RQW, KNW] society [SoL] priorities. a) At the global level [EVT] world leaders at the 2010 MDG Summit must galvanize the international community [EVT] to act [Act] on a common vision of the power [ATH] of technology [TeL] and innovation, built on broadband [TEL_NET], to accelerate the achievement of the MDGs and other internationally-agreed development goals [OBJ] and key knowledge [KNW, RQW] society [SoL] priorities such as those of the WSIS by 2015, in the context [CXT] of the new digital [DCT] realities and [SWT] opportunities [OPU] of the networked society [SoL, ECA] and economy. b) At the national level [EXE-0] governments should adopt national broadband [TEL_NET] strategies [STY], recognizing that, in the information [STX, MSG, RQW, MNG, COG, ECT] age, broadband [TEL_NET] – like water, electricity, and roads in the industrial age – is not just a tool [API] for communication [COM], but a social asset [SoL, AST] that provides one of the most cost-effective [ECT] and efficient [EFY] means [AST] for delivering services [QoS] to citizens and comprises a nation’s core functions [relations], provides a variety [RQW] of services [QoS], and should be made available [ABY] to all members of society [SOL, RQW], in their own languages. c) National [CXT, EXE-1] ICT Policies [DCT PCY] should be encouraged to build inclusive knowledge [KNW, RQW] societies [SOL] where all citizens [Qs] have the skills [COG] and confidence [COF] to create, share, and preserve information [MSG] and knowledge [KNW, RQW] to improve their [QOS] lives. Governments [EXE-0] need to promote policies [PCY] in universal access [ACS] and these policies [PCY] should include [DPY] broadband [TEL_NET] access [ACS] as an essential element of universal access [ACS, DPY] and services [QOS]. d) Special consideration should be given to the direct application [ACR, API] of broadband [TEL_NET] solutions to
163
Proceedings of International Conference on Education, Informatics, and Cybernetics (icEIC 2011),
and the International Symposium on Integrating Research, Education, and Problem Solving (IREPS 2011)

address the cross-cutting and cross-sectoral aspects [ASP] of the MDG agenda. Specifically, evidence pertaining to impact [IMP], new business and social [Provider/Questioner, P/A] models, and sustainability [DPY] is essential in demonstrating the benefits of broadband [TEL_NET] diffusion for scale-up and replication across all eight MDGs. e) A mid- and long-term perspective, taking into account [ACT] the requirements [REQ] of diverse communities [SOL, EVT] and stakeholders, is essential in forming a [ECA] consensus for broadband [DCT] investment and uptake. Governments [EXE-0] should play a pivotal role [ROL] in exploring innovative financing mechanisms [ADP, MDP, RUL] and incentive strategies [STY]. f) Advocacy efforts should be prioritized for a global market in broadband devices [TEL_NET, DCT], networks, software [SOW] and solutions that will harness the power [ATH] of network effects [ECT], as well as spill-over effects [ECT] of broadband [TEL_NET] across multiple sectors, while improving framework conditions for interoperability [OSI] between broadband [DCT] products and services [QoS, API]. g) Ultimately, new national [EXE-0] development models based on universal access [ACS] to broadband [DCT, APT] connectivity and multilingual content [COG, MNG] can aspire to the goal of ‘digital [DCT] opportunity [OPU]’ – that is social [SoL] and economic development made possible via access [ACS] to knowledge [KNW] that can narrow [COG P/A] gaps between rich and poor and among classes and regions. h) We urge all relevant stakeholders to continue to pose the key questions [Q] of what incentives can be created [COG] by governments [EXE-0] to encourage and enable the private sector to invest.” ([19], p. 55f)
REFERENCES
[1] Miller, J. G. (1978), Living Systems. McGraw-Hill, Inc. 1978. ISBN 0-07-042015-7. [2] TIIM 2011: Technology and industrial management innovation conference 28. – 30.6.2011 in Oulu, Finland; e.g., sessions E4.1, E4.2, E4.3, G1.3, G1.4. http://tuta.oulu.fi/Proceedings%20of%20TIIM2011%20Conference%20vol2.pdf/view ACS: Aug./31/11 [3] United Nation, UN (1948). United Nation, UN (1948), Universal Declaration of Human Rights. URL: http://www.un.org/events/humanrights/udhr60/hrphotos/declaration%20_eng.pdf ACS: Sep./18/11 [4] Ashby, Ross, W., 1953. An Introduction to Cybernetics. Chapman & Hall Ltd, London 1956. Internet 1999. http://pcspmcl.vub.ac.be/ books/IntroCyb.pdf ACS: Sep./11/18 [5] IEEE Computer Society. Guide to the Software Engineering Body of Knowledge (SWEBOK), 2004. http://www.computer.org/portal/web/swebok/html/appendixd ACS: Sep./16/11 [6] IOWA: Iowa State University. Center for excellence in learning and teaching. A Taxonomy for Learning, Teaching, and Assessing: A Revision of Bloom's Taxonomy of Educational Objectives, 2009. http://www.celt.iastate.edu/teaching/RevisedBlooms1.html [7] Kjellman, Arne: Constructive Systems Science – The Only Remaining Alternative. SU & KTH DSV No. 03-014; 2003. ISSN 1101-8526. ISRN SU-KTH/DSV/R—03/14—SE. Doctoral Thesis ISBN 91-7283-531-1. http://www.diva-portal.org/smash/searchlist.jsf?searchId=2 ACS: Sep./16/11 [8] IEA (2007). Mind the Gap, Quantifying Principal – Agent Problems in Energy Efficiency, International Energy Agency
(IEA). Head of Communication and Information Office, 9 rue de la Fédération, 75739 Paris Cedex 15, France. © OECD/IEA, 2007 (Theory, Ch. 1--3). http://www.iea.org/textbase/nppdf/free/2007/mind_the_gap.pdf ACS: Apr/8/11 [9] Van Gigch, John P. (1978). Applied systems theory. Harper & Row Publishers, 1978 (1974). ISBN 0-06-046776-2. [10] Adizes, I, 2006 /1973/. Understanding the corporate life cycle. http://www.adizes.com/corporate_lifecycle.html ACS: Sep./11/18 [11] Open dictionary. http://dictionary.reference.com/browse/open ACS: Sep./19/11 [12] Miles, L. D, (1989), Techniques of Value Analysis and Engineering, 3rd ed., Published by Eleanor Miles Walker Executive Director Lawrence D. Miles Value Foundation 1993. http://wendt.library.wisc.edu/miles/milesbook.html ACS: Sep./17/11 [13] Eric Berlow: How complexity leads to simplicity http://www.ted.com/ ACS: Sep./18/11 [14] System Engineering (Life cycle standard ISO/IEC 15288): http://www.ap233.org/ ACS:Sep./19/11 Doing business with the ISO 15926 standard: www.15926.org ACS:Sep./19/11 Dependability: http://www.dependability.org/ ACS:Sep./19/11 Gapfinder for a fact-based world view. http://www.gapminder.org/ ACS: Sep/19/11 [15] Van Ruijven, Leo. Practical use of a Reference Data Library (RDL) like ISO 15926-4 combined with the Gellish language, European plant engineering & design conference, EPEDC 2007. http://www.european-pedc.eu/program.html ACS: Sep./16/11 http://15926.org ACS: Oct. 18, 11. [16] W3G: Booth, D., Haas, H., McCabe, F., Newcomer, E., Champion, I.M., Ferris, Ch., and Orchard, D. W3Org, (2004). Web Services Architecture. http://www.w3.org/TR/ws-arch/ ACS: Sep./18/11 [17] Van Renssen, A.S.H.P. (2008). Gellish Modeling Method, Part 6, Knowledge and Product Modeling, Edition 5, May 2008. http://sourceforge.net/projects/gellish/files/Gellish%20Documentation/Gellish%20User%20Guides%20-%20Oct2008/Gellish_Modeling_Method_part_6_Creation_of_Facility_and_Product_Models_Jul2008.zip/download ACS: Sep./18/11 Van Renssen, A.S.H.P. (2005). Gellish: A Generic Extensible Ontological Language -- Design and Application of a Universal Data Structure. http://repository.tudelft.nl/view/ir/uuid%3Ade26132b-6f03-41b9-b882-c74b7e34a07d/ ACS: Sep./18/11 [18] Lawson, H.'B.' (2010). A Journey Through the Systems Landscape, College Publications, London, UK, 2010, ISBN 978-1-84890-010-3 [19] ITU/UNESCO, Members of the Broadband Commission for Digital Development. A 2010 Imperative: The future built on broadband. http://www.broadbandcommission.org/report1/report1.pdf ACS: Sep./18/11 [20] ITU-T. International telecommunication union, Geneva, Switzerland. http://www.itu.int/pub/T-REC ACS: Oct./21/11
164
Proceedings of International Conference on Education, Informatics, and Cybernetics (icEIC 2011),
and the International Symposium on Integrating Research, Education, and Problem Solving (IREPS 2011)

A Case Study of Off the Job Training Course for Control Engineering
Yasuhiro OHYAMA
School of Computer Science, Tokyo University of Technology,
Hachioji, Tokyo, Japan
Koji MAKINO
School of Computer Science, Tokyo University of Technology,
Hachioji, Tokyo, Japan
Hiroyuki KOBAYASHI
Department of Robotics, Osaka Institute of Technology,
Asahi-ku, Osaka, Japan
Jin-Hua SHE
School of Computer Science, Tokyo University of Technology,
Hachioji, Tokyo, Japan
ABSTRACT
In this paper, a case study of Off the Job Training course for
control engineering designed based on the collaboration with
authors and an industry is presented. This course is six weeks
long and is a blended learning one composed of a face-to-face
classroom, e-learning class and experiment based learning using
a simple hardware. A case study suggested experiment based
learning is effective, however the class schedule should be
designed in a careful way.
Keywords: Off the Job Training, Collaboration with Academy
and Industry, Experiment Based Learning, Blended Learning
1. INTRODUCTION
In industry, On the Job Training (OJT) is very common for fresh
engineers or mid-career engineers to develop their job skill or to
get wider engineering and management skill. On the other
hand, Off the Job Training (Off-JT) is also enforced mainly for
mid-career engineers to enhance their capabilities in the
different field or to collaborate with engineers in another section
of the company by studying together. In this paper, a case
study of Off the Job Training course for control engineering
designed based on the collaboration with authors and an industry
is presented.
A company, which produces information devices and
information systems with more than 1000 employees, planed an
Off-JT course for mid-career engineers with authors. The
objective of the Off-JT are 1) to study the advanced control
technology, 2) to improve problem solving skill in the field of
mechatoronics by considering the difference between the
theoretical response and the real response, 3) to improve
collaborate skill with engineers in other section of the company.
Most of the professional territory of participants is not control
engineering but other field such as mechanics, electronics,
chemistry and so on.
Basic control engineering is very essential knowledge for every
engineers and covers wide area such as mathematics, physics,
chemistry, mechanics, electronics and so on. Figure 1 shows
standard learning process of control engineering. Firstly,
students learn control theory by instructors in a class using
mainly textbook. Secondly, they verify the studied theory by
digital simulation using CAD tools and so on. Finally, they
verify the actual motion by experiment. Each process and
combinational study of these three process are very important.
In particular, essential practical details can be lost if learning is
reduced only to lectures and digital simulations bypassing
physical experiments because of their relatively high costs or
time-consuming [1]. Experiment-based teaching or learning is
absolutely necessary.
So far, authors have developed several Off-JT control
engineering course in collaboration with industries as follows.
1) One Month Intensive Course:
Study topics are learning theory, designing controller,
verifying by simulation, implementing digital controller and
analyzing the actual motion using a simple robot with
group-wise work.
2) One Week Intensive Course:
Study topics are learning theory, designing controller,
verifying by simulation and analyzing the actual motion using
given controller of a simple robot with group-wise work.
3) Three Days Intensive Course:
Study topics are learning theory, designing controller,
verifying by simulation and analyzing the actual motion using
given controller of a simple robot without group-wise work.
Class room Lecture(Theoretical Study)
Simulation(Virtual Verification)
Experiment(Real Verification)
Fig. 1 Learning process of Control Engineering
165
Proceedings of International Conference on Education, Informatics, and Cybernetics (icEIC 2011),
and the International Symposium on Integrating Research, Education, and Problem Solving (IREPS 2011)

One Month Intensive Course was the most effective one for
engineers, however it had time-problems for both engineers and
industry. One month Off-JT course is too long to be difficult
to enroll for mid-career engineers because they have daily
routine work. Three Days Intensive Course is good for their
time-schedule, however they have no time in the course to try
their own control idea or to follow through the theory by
simulation and experiment. They only studied lecture’s
explanations or follow prepared experimental results. One
Week Intensive Course is better than three days one, however
they don not have enough time to consider, for example a couple
of days, or to try their own control idea and to implement own
digital controller.
According to these experience, experiment-based learning is
found very effective as shown in [1]. However, for both
engineers and company, an intensive course is very difficult due
to their daily routine work. A virtual lab system or a remote
experience lab system will be one of the learning style instead of
real experiment-based learning [2],[3]. On the other hand,
e-learning using Internet is getting popular from viewpoint of
learning at anytime and anywhere [4],[5].
Authors designed a new course, which includes face to face
class lecture, e-learning and experience-based learning
according to a company’s request. In this paper, the course
design and some results are described.
2. COURSE DESIGN
Most of companies have planed and organized many kinds of
On the Job or Off the Job training course for fresh engineers or
mid-career engineers to develop their job skill or to get wider
engineering and management skill.
This time, the company’s request to Off-JT course for authors is
as follows.
1) students:
About 10 mid-career engineers who belong to different
section and have different specialized field each other.
2) class room:
They can attend a class opened in industry full or half day
(four to eight hours) once a week. The course should be one
to two months.
3) objective 1:
They want to learn the principal of a control system from
viewpoint of “Monozukuri” (Manufacturing), especially the
design approach based on control theory.
4) objective 2:
They want to study in cooperation with other section’s
engineer due to carry out a complicated and big project in
industry.
Authors have several classes for control engineering, electric
engineering and mechatronics laboratory in each university and
have knowledge that a hands-on mechanical system with a
microprocessor called Arm-Robot, control design CAD
(Scilab@), web-based discussion forum and group-wise work
using Arm-Robot are very effective educational materials
[6],[7].
The structure of the Arm-Robot is shown in Fig. 2. A small
motor (1 Watt) with gears drives a small bar called the arm. The
angle of the arm is determined with a hand-made encoder.
Fig. 2 A single axis Arm-Robot
9V
microprocessor
USB
PC
motor Switch
Drive voltage
u [Volt]
Rotating angle y [rad]encoder
gears
Robot Arm
Arm angel
y [rad]
motor
Power Amp.
Fig. 3 Controller Board with a microcontroller
Photo 1 Course materials
(Control program (see Fig.6), scilab and Arduino IDE is
installed in PC. Control Board is connected to PC by USB.)
166
Proceedings of International Conference on Education, Informatics, and Cybernetics (icEIC 2011),
and the International Symposium on Integrating Research, Education, and Problem Solving (IREPS 2011)

The control board with a microcontroller shown in Fig. 3 is a
digital controller of the robot and has an interface with a PC.
The control program (based on C) of the microcontroller can be
easily changed by the PC. Photograph 1 shows the arm robot
and the amplifier.
Authors designed a following new course as a result of
consulting the company’s supervisors.
1) Course Materials:
Hardware: Arm-Robot, controller board and PC
Software: Scilab@ , Arduino@ IDE and control programs
2) Course Style:
The course is totally six weeks combined with face to face
classroom (once a week) and e-learning class. Each student
has one set course materials (an Arm-Robot, controller board
and PC).
3) Course Contents:
Web-based lecture note, web-based simulation tools and
Remote-lab system are set up.
4) Course Topics :
Basic control theory such as transfer function, stability, PID
controller design, digital controller implementation,
Group-wise Project (system design with three robots)
3 COURSE MATERIALS
3.1 Arm- Robot System
It is a big problem which kind of experiment system is better for
students [6]. In this course, we focus on a simple and low-cost
hands-on system [7],[8]. This system is basically composed of
following three parts as shown in Fig.1 and Photo.1.
1) An Arm-Robot
2) A Control Board with a microcontroller
3) A control program for the Control Board, Scilab and
Arduino IDE on Windows system
The Arm-Robot system is so simple that its linear dynamic
equation is derived as
tkutydt
dcty
dt
dJ
2
2
(1)
where, J: moment of inertia, c: coefficient of viscous friction,
k : coefficient of motor torque.
A real step response of PID controlled system is usually
different from a theoretical one because of its non-linearity as
shown in Fig. 4. Recognizing and analyzing this difference is
the most important practice for control engineers. The
simulation considering its non-linearity is one of good practice
for students. This means that Eq.(1) will be modified as
)())((2
2
tutytydt
dcty
dt
dJ
dtd (2)
and students are going to find out more precise mathematical
model of the target system. On the other hand, as the
objective of the control is tracking the reference, tuning PID
parameters is the another good practice to achieve the objective
as shown in Fig. 5. This shows the advantageous effect of
feedback control system that a small model error is reduced by
high gain feedback technique.
[2] shows emulation-based virtual laboratories. The above
experience can be possible by simulation, however a
complicated nonlinear model as Eq.(2) is necessary and its
realistic derivation is sometimes very difficult.
Fig. 4 Step Response Comparison
(Linear model is based on Eq.(1) and Nonlinear mode is Eq.(2).)
Fig. 5 Tracking Response
( C(s) is transfer function of PID controller.)
Fig. 6 Control Program on PC
(It is only necessary to change controller’s parameters.)
167
Proceedings of International Conference on Education, Informatics, and Cybernetics (icEIC 2011),
and the International Symposium on Integrating Research, Education, and Problem Solving (IREPS 2011)

The control board uses a microcontroller called Arduino, which
shall be easily programmed by C language using Arduino IDE,
so students can learn digital control algorithm and will try their
own idea. A couple of programs, a control program on PC
and a digital control program on Arduino, is prepared for
beginners to study and analyze the standard PID feedback
control system for the Arm-Robot. Figure 6 shows the
snapshot of the control program on PC. At the first
experiment, students only need to change controller’s
parameters.
Authors have set up and used five kinds of course contents.
First one is animated simulation of Arm-Robot motion on the
web, which is used as first experience for students. Second one
is simulation on the web based on Java script. Students who
can not use CAD tool, can easily get step response by setting
parameters. Third one is CAD tool “Scilab”, which is
installed each student’s PC. After mastering usage of Scilab,
they do not have to use the second one. They can make up
more complicated control system configuration. Forth one is
Arm-Robot experiment system. All students are given their
own experiment system with their own PC (Photo. 1). Last
one is Remote-lab system for Arm-Robot (see Photo.2, Fig.7 and
Fig.8). When students can not use their Arm-Robot system,
they can access this Remote-lab system via the Internet and get
the real response.
3.2 Blended Learning
Figure 8 shows the educational setting of this course. Each
student has their own PC and hands-on Arm-Robot system,
which can be used in a classroom and at their office. We
developed 1) Lecture note, 2) Discussion forum, and 3)
Remote-lab system on a web serve in our university [7]. Off
the Job training consists of a face-to-face classroom during
working hours and self-study (e-learning class) after office hours,
Arm robotCameraLight
Photo.2 Inside of Remote-lab system
(The controller is behind this box.)
Fig. 7 A snap shot of Web page in Remote-lab operation
Fig. 8 Blended Learning and Course materials
(Each student has one set of course materials. They can use them in the class room, in their office and at home.)
168
Proceedings of International Conference on Education, Informatics, and Cybernetics (icEIC 2011),
and the International Symposium on Integrating Research, Education, and Problem Solving (IREPS 2011)

both of which are included in their working hours in this training
term. The classroom is opened once a week and students can
discuss with instructors or other students. At any other time,
students can discuss with each other or instructors by using web
discussion forum system. It is important that students have
come from different section of the company and they seldom
have the opportunity to meet during working hours. In this
point of view, blended learning as Fig. 8 is necessary and
considered effective.
Collaborative learning using web system is very popular these
days [3],[5]. There are many type of web system, on which
students can discuss each other or lecture can timely advise each
student. Authors use a hands-on simple web forum system
shown in Fig. 9.
3.3 Group-wise Project
The Arm-Robot system uses a microcontroller board, which can
be easily programmed by PC and has several unused I/O ports
(Fig. 3). After designing an optimum control system, students
can connect each robot by using these ports and can make robot
system with collaborative motion. Final group-wise project
assignment for student, where one group consists of three
members, is such that “Design and make sure a tracking PID
control system for the Arm-Robot and build up a cooperative
robot system using three Arm-Robot”. This type of group
work is intended to summarize or review the course. Authors
have fond this work was very effective for university students.
4. A CASE STUDY
4.1 Schedule
Nine engineers who belong different section joined this class in
2009 and 2010 respectively. The class schedule is shown
below.
Table.1 Class Schedule WEEK TIME TOPICS ASSIGNMENT
Pre-week Individual
Preparation
Self-introduction
1st week
(Mon.)
9:00
- 17:00
Course Navigation PD control system
2nd week
(Thu.)
13:00
- 17:00
Analysis of Control
system
Stability and Step
Response
3rd week
(Thu.)
13:00
- 17:00
Design of PID
control system
Simulation and
Experiment
4th week
(Thu.)
13:00
- 17:00
Implementation of
digital controller
Group-wise Project
5th week
(Thu.)
13:00
- 17:00
Evaluation method
of control system
Group-wise Project
6th week
(Fri.)
13:00
- 17:00
Presentation of
project theme
Group-wise Project
4.2 Discussion
The topics and assignments in each week is as follows.
Pre-week: The discussion forum is opened 2 weeks
before the class to introduce each other, because students belong
to different section and they do not know each other until staring
of this course. On the web, students have to pre-study
contents such as fundamental mathematical knowledge, basic
idea of feedback control system and control trial using virtual
animation tool or remote laboratory. As a result, all students
posted their self-introduction and instructors answered their
submission and both students and instructors could understand
each background.
1st week: 1st lecture is called “Course Navigation”,
which shows students the outline of the course and how to use
software and hardware. It took full day and trial and error
controller design was the most important study for students.
2nd week: The main topic is fundamental control theory
such as modeling, Laplace transform and stability. Students
measure real physical parameters of their robot and verify their
validity by simulation and experiment. The assignment is
the review of the lecture, however some of students could not
keep the due date because of their daily routine work.
3rd week: The main topic is PID controller design.
The integrator of PID controller usually works well, however
sometimes does not work well because of mechanical static
friction. The experiment using Arm-robot explicitly show this
phenomenon, which is very difficult to understand by simulation.
Through these experiment, students can acquire optimal
parameter tuning technique.
4th week: The explanation of group-wise project theme
and programming technique of controller are topics. Some
students are inexperienced in programming, however they
solved assignment in a group setting.
Fig. 9 A snap shot of Discussion Forum
(Ex. [5],[6],[7] and [13] are posted ones by a student and [17] is
a comment by another student. [22] and [33] are comments by
an instructor.)
169
Proceedings of International Conference on Education, Informatics, and Cybernetics (icEIC 2011),
and the International Symposium on Integrating Research, Education, and Problem Solving (IREPS 2011)

5th week: After showing the final assignment and
frequency analysis technique shortly, students got to work on
group project. It was very difficult for students to take time to
work together due to their daily work. This was unexpected
when authors designed this course.
6th week: Last class is each groups presentation and
demonstration of the final assignment (design a controller
according to the given specification) and group project. The
group project theme is “build up a cooperative robot system
using three Arm-Robot ”. Supervisors of students took part in
the presentation.
4.3 Questionnaire
Students’ questionnaire results are follows.
1) Experiment based learning is very easy to understand. (61%)
2) I understand the difference between the real response and
the simulation response. (44%)
3) Discussion on the web is good because we can read other’s
answers or comments. (44%)
4) Programming in the project is rather hard work. (11%)
5) We need more time to review topics and to discuss with
other members. (56%)
6) It is very difficult to collaborate with other members for the
final project. (22%)
7) I want to use Arm-Robot system in pre-week.
8) I think group presentation every two week is better.
9) Mathematics is very difficult.
10) I do not use Remote-lab system, because I could use my
own experiment system. (80%)
These show that Experiment based learning using a simple
structured robot is effective, however learning contents are too
much or too wider. At the same time, it was difficult for
students to arrange study time under their daily routine work.
5. CONCLUSION
In this paper, a case study of Off the Job Training course for
control engineering is presented. Six weeks blended learning
course which includes once a week face to face class, e-learning
class with discussion forum and Remote-lab system and
experimental based learning, is designed based on the
collaboration with authors and a company. Experiment based
learning using a simple structured robot is found effective for
mid-career engineers whose professional filed are not control
engineering. The blended class is also effective for such a
vocational education, however we have to consider the class
schedule in a careful way. Authors will try to change study
items or use longer class period while discussing with the
company’s supervisors.
5. REFERENCES
[1] R.R.Precup,et.al. “Experiment-Based Teaching in Advanced
Control Engineering”, IEEE Trans. on Education,Vol.54,No.3,
2011, pp.345-354
[2] Graham C. Goodwin, et al, “Emulation-Based Virtual
Laboratories: A Low-Cost Alternative to Physical
Experiments in Control engineering Education”, IEEE Trans.
on Education, Vol.54,No.1, 2011, pp.48-55
[3] Wei-Tek Tsai, et al, “Collaborative Learning Using Wiki
Sites for Computer Science Undergraduate Education: A Case
Study”, IEEE Trans. on Education, Vol.54,No.1, 2011,
pp.114-124
[4] B.Barraos, et.al.”Virtual Collaborative Experimentation: An
Approach Combining Remote and Local Labs”, IEEE Trans.
on Education,Vol.51,No.2, 2008, pp.242-250
[5] N. Hoic-Bozic, et.al. “A Blended Learning Approach to
Course Design and Implementation”, IEEE Trans. on
Education, Vol.52,No.1, 2009, pp.19-30
[6] A. Rojko, et.al. “PROFESSIONAL E-TRAINING IN
MECHATRONICS BASED ON REMOTE EXPERIMENTS”
10th International Workshop on Research and Education in
Mechatronics, 2009, Glasgow, CD-ROM
[7] Y. Ohyama, et.al., “A Web Based Lecture Note on Feedback
Control with Remote Lab”, Proc. of the 6th IFAC Symposium
on Advances in Control Education, Oulu, 2003 CD-ROM
[8] R. Puerto, et.al. , “REMOTE CONTROL LABORATORY
USING MATLAB AND SIMULINK:APPLICATION TO A
DC MOTOR MODEL”, Proc. of the Second IFAC Workshop
on Internet Based Control Education, Grenoble, 2004,
CD-ROM
[9] Scilab@, http://www.scilab.org/
[10] Arduino@,http://www.arduino.cc/
170
Proceedings of International Conference on Education, Informatics, and Cybernetics (icEIC 2011),
and the International Symposium on Integrating Research, Education, and Problem Solving (IREPS 2011)

Designing a Technical System – Deliverables of a Process
Wouter Olthuis and Albert van den Berg
Electrical Engineering, University of Twente
P.O. Box 217, 7500 AE Enschede, The Netherlands
ABSTRACT
Many students of the science and engineering faculties of the University of Twente finish their bachelor’s programme with an individual research assignment of typically 1 to 3 months. These assignments are often evaluated on skills that are
implicitly taught during the assignment itself. In order to improve this improper situation, it was decided to explicitly include the topic ‘designing a technical system’ in one of the courses preceding the research assignment. The complexity of the many steps the student has to take hold of during the assignment should not be underestimated. Therefore a step-by-step approach is presented in this paper for any typical process of designing a technical system. The different processes to
come to the final design are discussed and the deliverable per process is mentioned. The design process is based on partitioning the main function of the system to be designed in smaller functions that can be implemented by subsystems. The whole design process is guided by clearly stated deliverables, being the hold on for the students to finalize successfully their research assignment. The design process proposed in this paper is illustrated with the design of a sensor system for water quality monitoring.
Keywords: system design, process deliverables, sensor system.
1. INTRODUCTION
In many engineering programs, courses are about the detailed analysis of components or subsystems to come to a mathematical model description. However, understanding the operational principle of a certain component or subsystem and being able to derive a model is only one of the required steps to
get from a pursued goal to a realized technical system. This paper is about all those other steps required for the synthesis of such a system. The necessary processes are described as well as the deliverable of each of these processes. This paper is targeted at sensor design as will become clear from the example given at the end. Nevertheless, the system design process described here is not only valid for sensor design but it is applicable to the design of any engineered system.
Several terms will be used often and may lead to confusion if not properly defined. The terms: process, deliverable, function and system will therefore be defined first [1].
Process Sequence of interdependent and linked procedures which consume resources (employee time, energy, machines, money) to convert inputs (data, material, parts, etc.) into outputs. These outputs then serve as inputs for the next stage until a known goal or end result is reached.
Deliverable Something that has been created by someone or some process.
Function The normal or characteristic action of a system; the purpose for which a system is designed; its role. (A function, being an action, cannot be put into a box.)
System An organized, purposeful structure regarded as a whole and consisting of interrelated and interdependent elements (components). These elements influence one another to maintain their activity and the existence of the system, in order to achieve the goal of the system (= to perform a certain
function). (A system, being a set of components, can be put into a box.)
2. THE PROCESS OF DESIGNING
Designing a sensor system is a process, consisting of a series of smaller processes [2]. Each of these processes may have a particular deliverable. The processes and their deliverables are discussed below.
The input of the first process is a question or a problem. That process is carefully listening to this question and discussing the problem. This process has as output or deliverable the goal and main function of the sensor. It is therefore very important as its main function should address the original question as closely as possible and its goal should be to solve the problem.
The next process is that of functional analysis. Now, the main function of the system-to-be-designed must be described as complete and as exhaustively as possible. All facets of that main
function should be treated. Apart from those facets, other boundary conditions that are not directly related to the main function are equally important to take into account for arriving at the deliverable of this process: the specifications.
The following process is partitioning. This process is necessary because the main function of a complete system is often described at such an abstract level that even beginning to think of implementing the main function into a system is yet
impossible. Therefore, a set of functions should be found, all together fulfilling the main function, when acting in the right order. Each of these functions should have such a low level of abstraction that a possible implementation into the form of some system dawns. The deliverable of this process is a functional diagram.
Now, the process of systematic analysis and modeling starts. The operational principles of the subsystems and their possible
alternatives, accomplishing the required action of one of the functions are investigated and models are derived. The deliverable is a set of general models, each describing one of the subsystems. This process is repeated for all subsystems that form the possible implementation of a function.
Next is the process of choosing between a subsystem and its alternatives, being different implementations for one function. In this process the specifications play an important role. So, in
this process the number of subsystems per function is brought back from several alternatives to only one: one subsystem performing one function. The deliverable is a system diagram: blocks of all the subsystems with their relations or connections which in in total forms the complete system.
171
Proceedings of International Conference on Education, Informatics, and Cybernetics (icEIC 2011),
and the International Symposium on Integrating Research, Education, and Problem Solving (IREPS 2011)

The following process is the actual design of each subsystem. Using the models per subsystem and the specifications, the parameters in the general model get their appropriate values in order to meet the required function per subsystem. This design process must be repeated for each subsystem. The fact that subsystems are connected might pose additional conditions for the final design. The deliverable is a blueprint of the complete system, in which all the subsystems and their relation and
connections are described in detail.
Subsequently, the process of the actual realization and integration can start. From the blueprint, all the required components of each subsystem are obtained and every subsystem is realized. Then, the realized subsystems are connected according to the blueprint. The obvious deliverable of this process is the realized complete system.
Then, the process of testing will begin. A set of inputs can be given to the realized complete system. These inputs should
cover the full range as given in the specifications. The deliverable is a set of outputs or results of the system.
The final process is that of evaluation. The results of the complete system should be compared to the defined main function of the system taking the specifications into account. The deliverable could be a ‘go’ (with many additional consequences) or a ‘no-go’ probably requiring the iteration of one or more of the described processes. The possible iterations
are not discussed here.
Each process has an output, a deliverable that is the input for the next process. This means that the complete designing process can effortlessly be summarized in one flow chart, as shown in figure 1. In figure 1 the deliverables, being real things that can be held, are separated from the processes, being mental exercises.
Figure 1 Flow chart of the process of designing, clearly separating the processes (left) from the deliverables (right).
172
Proceedings of International Conference on Education, Informatics, and Cybernetics (icEIC 2011),
and the International Symposium on Integrating Research, Education, and Problem Solving (IREPS 2011)

So far, the designing process has been described on an abstract level. Now before giving a real practical example, an
intermediate stage of the process of designing is treated, fully in accordance with that of figure 1, but more clearly illustrating the parallelism in some of the processes and hence in some of
the deliverables. Thus, it becomes clear where alternatives should be developed and where choices have to be made. This
extensive flow chart of the process of designing is shown in figure 2. The processes and deliverables as discussed before are also included in figure 2.
Figure 2 The design process showing the parallel steps indicating alternatives and the need for making choices.
Note that processes in parallel as indicated in figure 2 can excellently be carried out by a team, working on the designing of a system. Different members of a team can work at the same time on processes in parallel, thus speeding up the complete design.
3. EXAMPLE
The process of designing a sensor system is now illustrated by providing an example. In this example, many things are
simplified, but it serves to explain all concepts: showing the deliverables of processes and giving examples of systems and functions.
The problem to be solved is to reverse the disappearance of biological life in a local river. The general question asked to a team of engineers is how to bring back biological life in the river?
Problem: disappearance of biological life in a local river
This question is the input for the process of listening and discussion about the most probable cause of the disappearing biological life. In the end it is hypothesized that silver ions in the waste of some industry, located upstream is the reason for the decaying bio-life. To test this hypothesis, it is decided to design a sensor system with one main function: the determination of the silver ion concentration.
173
Proceedings of International Conference on Education, Informatics, and Cybernetics (icEIC 2011),
and the International Symposium on Integrating Research, Education, and Problem Solving (IREPS 2011)

Main function: the determination of the silver ion concentration
Functional analysis is now needed to determine how this main function specifically should be accomplished; what is the maximum allowable silver ion concentration before endangering bio-life, what maximum concentration can be expected from the waste water, how long should a typical
measurement take, how accurate should this concentration be determined, how often should the system be calibrated, should the determination be carried in a laboratory or on-site, how trained is the person actually doing the measurement? The answers to all these questions, including boundary conditions like cost and size, really specify how the main function is to be fulfilled in detail, obviously resulting in specifications.
Specifications: Low limit of detection: 0.1 mM
Response time: 10 seconds Drift: less than 3% per day Portable system Range: 0.1 to 10 mM Accuracy: 10% off from true value Operation by trained people Production price: less than €200
Now the main function should be partitioned in smaller functions with a low level of abstraction that can somehow be fulfilled by an available subsystem. Functions that are definitely required to fulfill the main function are: river water sampling, silver ion concentration sensing, signal processing, displaying the result and supplying power to the system. These functions
and their order can be illustrated in a functional diagram.
Functional diagram:
sampling sensing signal processing displaying
supplying power
Systematic analysis and modelling is next. For each function a subsystem and possible alternatives should be proposed and its
theory should be investigated, resulting in a model description per subsystem for each function. In this example only the functions ‘sensing’ and ‘signal processing’ are elaborated. Sensing can be performed by amperometric or by potentiometric sensors [3]. Amperometry is based on the theory of mass transport resulting in the Cottrell equation as its model. For an amperometric sensor, a working- and counter electrode are required. Potentiometry is based on the theory of statistical
distribution of electrons by their energy and results in the Nernst equation as model. A working- and reference electrode are needed. Signal processing comes down in this example to using filters, which can be analog or digital. Analog filtering is based on classical network theory and can be modelled as a transfer function for a first-order RC-filter, requiring some resistors and capacitors. Digital filtering is described by digital signal processing theories and can be modelled by the expression for a digital moving averaging filter. Such a filter
could be implemented by a microcontroller and some software. So in the end each proposed subsystem is described by a model.
Models per subsystem and its alternatives for each function:
Function: sensing Amperometric sensor model: Cottrell equation Potentiometric sensor model: Nernst equation (alternative)
Function: signal processing Analog filter model: transfer function of a 1st-order RC-filter Digital filter model: expression of a moving averaging filter (alternative)
The steps taken so far with the parallel branches per process are shown in figure 3.
Figure 3 Interim overview of the process of designing a sensor system, showing the several options per branch in some of the process steps for this example.
174
Proceedings of International Conference on Education, Informatics, and Cybernetics (icEIC 2011),
and the International Symposium on Integrating Research, Education, and Problem Solving (IREPS 2011)

Now, choosing between the alternative subsystems has to be done, based on the specifications. The result is one subsystem
per function. After the choice has been made, a system diagram can be sketched. Here, the chosen subsystems for only two functions are shown.
System diagram:
Potentiometric sensor:
WE and RE
RC-filter:
some R’s and C’s
Each subsystem can now be designed. From the Nernst law and
the specifications, the actual size, shape and type of material, etc., of the working electrode must be determined. The same for the reference electrode: the preparation and the final thickness of the Ag/AgCl layer, etc., must be put on record. From the desired cut-off frequency of the RC-filter, the real values for the resistor and capacitor should be calculated and the final circuitry should be determined. The fact that the RC-filter is connected to the potentiometric sensor poses extra constraints
on its design: the signal from the potentiometric sensor should not be attenuated by the filter, possibly requiring an active filter equipped with an operational amplifier. The result is a detailed building plan, a blueprint of the complete system, part of it shown here.
(partial) Blueprint:
5 mm
7 cm
LM 318
C = 4.7 nF
R1 = 10 kΩ
R2 = 10 kΩ
Ag wire, Ø = 1 mm
in epoxy resin, Ø = 1 cm
3x5 mm2 Ag electrode
for 1 min. in 0.1 M
FeCl3 to form Ag/AgCl
From this blueprint, the actual system can be realized. Electrodes have to be ordered, shaped, packaged and modified. The components of the electronic circuit must be obtained and soldered. The electrodes of the sensor system must be connected to the realized filter. If this is done for all subsystems, the complete system is ready.
(partial) Realized system:
This system is now ready for testing. Several silver ion
concentrations within the specified range to be measured form the input of a series of tests. Subsequently, all the criteria form the specifications should be tested and the results must be compared to the specified values.
Results:
Calibration curve of the Ag/AgCl electrode
Finally, in the process of evaluation the agreement and
discrepancies between the results and the specifications should be discussed; is the target of the main function reached or not? The result might be a simple ‘go’ or ‘no-go’.
Evaluation result:
In reality, the result will often lead to partial redesign and improvements of some of the subsystems. This is not treated here. Neither are the next steps of patenting, mass-producing, advertising and selling, etc., elaborated here, in case of a ‘go’
situation.
4. CONCLUSIONS
In this paper a design process for technical systems is proposed based on partitioning the main function of that system into smaller functions that can be implemented by subsystems. This design process consists of a series of processes with each its particular deliverable. These deliverables form on the one hand a clear set of targets for the students during the design process
for, e.g., their individual research assignment, and on the other hand help the supervisor to more objectively evaluate the skills of the student, based on those deliverables.
5. REFERENCES
[1] http://www.businessdictionary.com/ [2] J. Jenney, Introduction to Systems Engineering, 2011,
https://sites.google.com/site/themanagersguide/system-engineering
[3] Allen J. Bard and Larry R. Faulkner, Electrochemical methods - Fundamentals and Applications, John Wiley & Sons, 2001.
175
Proceedings of International Conference on Education, Informatics, and Cybernetics (icEIC 2011),
and the International Symposium on Integrating Research, Education, and Problem Solving (IREPS 2011)

Micro-Cognitive-Processes at the Interface Research-Education-Problem Solving
Josiane CARON-PARGUE
Department of Psychology, University of Poitiers
F-86022 POITIERS CEDEX, France
ABSTRACT
A first part gives a rough picture of some difficulties
encountered in research, in education, and in problem
solving, for integrating them to one another. One can
notice a much too global characterization of cognitive
processes and a lack in the characterization of semiotic
aspects. A second part analyses some theoretical limits to
this integration. They are mainly due to the current
conception of memories unable to take into consideration
the micro-cognitive-processes at work under the
reorganizations of knowledge when actualized within the
situation. A third part presents a way toward the
integration research-education-problem solving, relying
on ciative theory of
language, and presents some micro-
cognitive-processes are depicted in terms of the
construction of aggregates (declarative versus procedural
ones, standing at different levels of internalization and
externalization), and of different processes of detachment
from the situation. Then several kinds of interactions
allow an on-line identification of the constraints of the
task. The characterization of these constraints seems
basic for each of the considered areas, research,
education, and problem solving.
Keywords: micro-cognitive-processes, functional
meaning, reorganization of knowledge, cognitive
linguistics, cognitive units, declarative versus procedural
units.
1. INTRODUCTION
Our suggestions for integrating research, education,
and problem solving are both theoretical and
methodological. Our intent is to provide some hints
about micro-cognitive-processes underlying
information processing and decision making. For
that, we will depict a rough picture of some
difficulties and limits encountered in each of these
areas. Then, we emphasize some theoretical dead
ends, underlying those limits. Finally we review
some of our data showing how we try to open a way
possibly integrating the three areas research,
education, and problem solving.
2. PROBLEMS FOR INTEGRATION
A multiplicity of ingenious and various simulations
have been proposed in the problem solving area,
especially at the interface between education and
informatics. But the help they provide
learning remains very limited, and can hardly be
generalized to other situational contexts. Indeed,
most of them suffer from an inadequacy in the
theoretical and methodological analysis of the
cognitive aspects which are simulated. The
challenge is to understand how learning proceeds.
An important step was made in CLARION model [16]
which constructs an interaction between implicit and
explicit knowledge, close ].
The interesting point stands in a process of re-
inscription of implicit knowledge in explicit form.
That allows the construction of new rules and of a
functional planning. Nevertheless, the usual
identification remains between declarative and
explicit levels and between implicit and procedural
levels, and the distinction between internal and
external knowledge remains confused.
Another difficulty concerns the identification of
semiotic aspects. Most researches rely on a
conceptual approach which directly refers to events
or objects or knowledge stored in memory. The
notion of functional meanings in Piagetian theory
[11], [12], allows to describe the way in which
children attribute meanings to the situation. For
example, experiment with a train1 shows
some early difficulties for young children, linked to
external meanings attributed to the situation [11]: to
partition the train into procedural units; to attribute
the meaning of a parking track to the goal track; to
understand that for turning the train right, the
turning slab has to turn left. Following Cellerier [6],
this example shows that the procedural units have to
1 At a triple intersection of tracks forming a T, a train has to
pass over a round turning slab on which only the engine and a
truck can take place. The children have to make the train turn
along one side of the two opposite tracks of the T.
176
Proceedings of International Conference on Education, Informatics, and Cybernetics (icEIC 2011),
and the International Symposium on Integrating Research, Education, and Problem Solving (IREPS 2011)

be coordinated with the representative declarative
units and re-inscribed at a more abstract level.
Furthermore, the structured procedural units may
become representative units. This interesting
approach is generally ignored by most researchers.
And the understanding of functional meanings
attributed by children to objects and actions remains
poor most of the time in many researches. In fact, a
well-known limitation to the Piagetian approach is
that the formal cues of functional meanings are
generally not clearly defined.
Moreover, the usual distinction between verbal
modality and imagery remains too rough. Opposite
systems may appear within an analogical level, as
shown by Caron- of
two cubes with two labels stuck respectively on the
middle of two adjacent versus opposite faces [5].
Fig. 1 shows that the correct 3-D Necker graphical
representation of a cube becomes a 2-D perceptive
representation. The faces of the cube are partitioned
by graphical lines into several parts on which the
stickers are drawn. The functional meaning of this
drawing is given by the difference between the
graphical positions of the stickers beyond the
analogical common graphical representation of the
cube itself.
Fig. 1. Ten-year-old drawing of two cubes with labels
stuck respectively on adjacent and opposite faces.
Finally, most cognitive researches rely on the
without considering the
different cognitive processes which can underlie the
same performance. Furthermore, these performances
are mainly evaluated in the case of well-defined
strategies, for example when the strategy is optimal
with the Tower of Hanoi puzzle. The strategy of
novices is rarely considered in spite of Newell and
approach [14]. The usual
characterization of cognitive processes remains
much too global, in terms of goal-stacks and
recursive strategies, or of priming, strengthening,
inhibitions, and interferences. However, we must
mention the interesting distinction made by some
authors (e.g. Clancey [7], VanLehn [17]) between
two kinds of generalization, one, linked to
abstraction, which requires attention and time, the
other, automatic, leading to a improvment in
performance. Likewise, the notion of external
memories must be mentioned, even if their
construction and the processes of their interactions
with internal representations must be specified (cf.
Clancey [8], Zhang [18]).
3. THEORETICAL LIMITS
The above difficulties and limits are linked to the
current cognitive conceptions of memory and of
language, for which the micro-cognitive-processes
at work have still to be defined. The possibility of
this definition depends on several theoretical points.
A first point is that the reorganizations occurring
between knowledge stored in memory and
knowledge contextualized in the current situation
must be taken into account, and formalized. In fact,
the retrieval of knowledge stored in memory is
generally conceived as a process of activation by
external cues of a subset of this memory composed
of more or less associated elements. But no
reorganization of the previous structure of
knowledge is conceived within the retrieval. In fact,
if reorganizations are considered, they are conceived
through generation processes. And only the result of
these reorganizations is considered as stored in
memory. The micro-cognitive-processes at work
throughout the process of generation remain
unknown. The knowledge is generally considered
as being automatically activated by external
information. That is the case only when the context
remains rigorously the same or when knowledge
becomes completely decontextualized. But the
different steps of decontextualization remain
unconsidered in such theoretical approaches.
A second theoretical limit concerns the way in
which semiotic aspects are considered. Most of
current models of memory characterize cognitive
meaning as conceptual. Indeed, it is necessary to
start with something. But the inadequacy stands in
the way in which flexibility is added to this
conceptualization. It does not take into account the
micro-cognitive-processes at work in the semiotic
modifications of concepts. Some progress was made
toward taking into account functional or contextual
meanings with the notion of affordances. But here
177
Proceedings of International Conference on Education, Informatics, and Cybernetics (icEIC 2011),
and the International Symposium on Integrating Research, Education, and Problem Solving (IREPS 2011)

again the inadequacy stands in the automatic
activation of every properties of the concept. In fact,
affordances are generally conceived as giving access
to abstraction, i.e. to all connections given by the
concept, themselves considered as always operating
in the current situation. However, as it is well
known in education, these processes cannot be
automatically at work [11], [15]. They must be
constructed but the challenge is to know how this is
done. The theoretical inadequacy concerns the way
in which the micro-cognitive-processes allow to
identify the constraints of the task. In other words,
how can the contextual meaning be generalized?
More generally, the interactions between internal
and external memories cannot be viewed as simple
exchanges of information, without any
reorganization. It is the support of information, its
medium, which plays a role in the transformation of
information, and refined semiotic aspects have to be
taken into account at this level.
Finally, similar limits due to semiotic aspects occur
with language, notably for its psychological
approaches, which rely generally on a litteral
conception of meaning mistaken for reference. That
entails misunderstandings in the use of verbal
reports [2], [3]. Therefore such a view is unable to
account for cognitive strategies, and many
researchers do not want to consider verbal reports.
Another consequence is a disconnection between
studies bearing on the cognitive representations, and
those bearing on communication. However,
language plays an important role, notably in
education where communicative and
representational purposes should always be
integrated together. In fact, language should be
considered as a behavioral observable cue as
worthwhile as every other else. The key point is not
the information itself but the way in which
information is given. For example, different lexical
choices referring to the same event or object have to
be differentiated in order to grasp the functional
meaning attributed to this event or object. Our view
relies on cognitive linguistics [9], [13], for which
syntax is meaningful, and constitutes formal cues
open to a cognitive interpretation.
4. TOWARD INTEGRATION
In this part, we will refer to our data in order to
show how we began to solve these difficulties. We
referred to the cognitive interpretation of two kinds
of enunciative operations, the basic operation of
location, and the processes of detachments from the
situation. That led us to a functional distinction
between declarative and procedural levels.
Fig. 2. Tower of Hanoi puzzle: configuration of the
initial state. Goal: move all disks to peg C with the
same configuration.
All our examples will refer to verbal reports
obtained simultaneously to the solving of the 4-
disks-Tower of Hanoi puzzle (cf. Fig. 1). The
subjects have to move all disks to peg C, one disk at
a time without placing a big disk on a smaller one.
To grasp micro-cognitive-processes To grasp micro-cognitive processes is a complex
challenge. In fact, it involves the articulation of
many theoretical fields, on specific points which are
not always completely constructed. For that, we
think that the formal linguistic model of Antoine
Culioli [9], [10], constitutes an interesting approach.
Indeed, this model relies on an original articulation
among philosophical, semiotic, and linguistic
approaches. Language is viewed as basically
intersubjective and is formalized by means of
enunciative operations at different steps of
reorganizations between notions (stored in memory)
and the discursive contextualized situation. Our
claim is that a cognitive interpretation of enunciative
operations must lead to a grasp of some micro-
cognitive-processes at work throughout the
reorganizations of propositional contents stored in
memory. Indeed, it is a fact that not every cognitive
activity leads to a linguistic expression. But
elementary micro-cognitive-processes could not be
so numerous. So, when they begin to be identified,
they can be considered as underlying as well
linguistic levels as non-linguistic ones.
Aggregates toward chunks
The cognitive interpretation of the basic enunciative
operation of location (in
to the notion of Langacker
178
Proceedings of International Conference on Education, Informatics, and Cybernetics (icEIC 2011),
and the International Symposium on Integrating Research, Education, and Problem Solving (IREPS 2011)

cognitive linguistics [13]. Then, in terms,
b located relatively to
a in the oriented predicative relation <
a R b > can be interpreted as a and b coming
together, with an attentional focus bearing on a.
The interesting point, notably for education, stands
in the possible identification of elementary cognitive
units, which we called
operation of location is applied to two consecutive
events or actions. For example, in the case of the
solving of a puzzle like the Tower of Hanoi, the
operation of location is marked by the repetition of
lexical choices the green disk in I put the green disk on peg C I put the pink disk on the green disk and
the repetition of peg C in I put the green disk on peg C I put the pink disk on peg C. That shows that the
subject is thinking of one mental action instead of
two. Then, it is possible to follow the progressive
construction of bigger cognitive units.
Aggregates constitute elementary cognitive units,
which contribute to the construction of chunks [2],
[3], [4]. In fact, a chunk may be considered as
resulting from two reverse aggregates, bearing on
the same elements but with a reverse attentional
focus between them. Nevertheless our analyses
showed that subjects used to construct aggregates
most of the time but rarely true chunks.
Detachments from the situation
But the most interesting aspects concern the
identification of two kinds of detachments from the
situation, one marked by starting terms, the other by
modal terms [3], [4].
Starting terms: One of the two arguments
of an oriented predicative relation takes the status of
starting term if it is extracted from the predicative
relation and replaced by an anaphora. For example,
the green disk takes the status of being a starting
term first argument, marked by anaphora it in the
green disk I put it on peg C. Likewise the green disk takes the status of a starting term second argument
marked by anaphora it in I take the green disk I put it on peg C.
The status of starting term defines a first level of
contextualization of the predicative relation which
can be located either relative to the starting term or
to the situation. Then in our data we interpreted the
starting term as the marker of the distinction
between an internal representational space and an
external one [2]: the internal space is marked by the
presence of a starting term; the external space is
marked by the absence of a starting term. Then,
different kinds of aggregates were defined [3], [4]:
external aggregates, when there is no starting term;
internal aggregates when there is an aggregate
between two starting terms, due mainly to an
anticipation (e.g. the green disk I put it on peg C in
order to move the pink disk the pink disk I put it on peg C), or to a return to the previous action (e.g.
the green disk I put it on peg C the green disk is on C I take the pink disk I put it on peg C).
Another basic enunciative function of a starting
term is to give access to abstraction and to
reconstruct the notions within its previous place in
the predicative relation. We proposed an articulation
internalization and externalization ([2], [6], [15]).
That led us to consider the cognitive function of the
starting term as marking the reconstruction of the
external aggregates at the internal level, that is
internalization, and as the reconstruction of the
internal aggregates at the external level, that is
externalization. Then an intermediary aggregate,
marker of interaction between internal and external
spaces. In the example the green disk I put it on peg C I put the pink disk on peg C, the external
aggregate marked by the repetition on peg C is
categorized by the starting term the green disk, itself
marked by anaphora it, and reconstructed at the
internal level. Its reconstruction appears as detached
from the current situation and can be re-used in
another situation. This decontextualization may be
completed when it will be articulated with another
categorized aggregate giving rise to its
externalization (see [3] and [4]. Then, the starting
term appears as the marker of a process of
decontextualization by means of an articulation
between internalization and externalization, in
contrast to the classical process of
decontextualization by repetition of similar events
or actions. Categorized aggregates are the necessary
condition of an elementary step of generalization to
another situation.
Modal terms: At the enunciative level,
modal terms involve a detachment from the current
situation, with the purpose of reorganizing the
situation. In our data, we interpreted the presence of
a modal term in terms of a differentiation between a
strategic access to memory and an automatic one
179
Proceedings of International Conference on Education, Informatics, and Cybernetics (icEIC 2011),
and the International Symposium on Integrating Research, Education, and Problem Solving (IREPS 2011)

[3], [4]. This differentiation concerns as well the
planning (with modal verbs such as can, want, have to), the initialization of a sequence (with
interjections such as well), the storage in memory
(with interjections in the context of action oh, oh
yes, no), and the retrieval (with modal evaluations
such as oh it is fine, I believe that I am blocked).
These strategic activities mark uncertainty and
difficulties because the subject does not understand
well all the internal constraints of the situation. At
the opposite, when there is no modal term, the
subject remains within the situation, without major
subjective difficulties, structuring the external space.
Finally, the basic property of modal markers is to
consider information at different levels of
processing in order to reorganize the current
situation.
Identification of constraints: The enuncia-
tive theory of Culioli considers various kinds of
detachments which can be added to one another so
as to turn back to the situation. It is the case with the
strange loop (cf. fig. 2). In fig. 2, p is the situation,
and anything else other than p; is a
detachment from both p and , and a
detachment from ; the arrows mark the allowed
paths from a level to another one. Each of these
arrows is matched to a detachment process. We can
see that we can be detached from the current
situation p, and that, adding several kinds of
detachments, following the arrows, we can return to
p. The loop becomes strange when the path passes
across p!.
Fig. 3. Culioli s diagram
every consecutive occurrence of one or other of our
two kinds of detachments, marked by modal terms
or by starting terms, during a complete solving of
the Tower of Hanoi puzzle. The successive steps of
this path were cognitively interpreted according to
tate of the
problem.
In fact, each current state of the problem can be
situated on the diagram in two ways: first, referring
to the position implied by starting terms and
aggregates; second, taking into account the
modifications of this first position due to modal
terms and to the history of previous states. Then we
cognitively interpreted the enunciative operations
underlying these modifications. For example, it was
possible to characterize:
1) The states where the subject anticipates that
everything goes well or goes wrong, marked by
the modification p-p! and positive versus
negative interjections.
2) The states where an internalization is broken
from material context, or where the
externalization leads to a reunification or a
sticking marked by the material context, with
the modification -p!. 3) The states where the subject identifies a
constraint or only its existence without
understanding its nature, marked by the
modification - and positive or negative
evaluations.
Finally, it is only when the path reached again the
situation p after a loop, that the modifications
disappeared, giving rise to stabilizations and to the
understanding of the constraints of the task.
Declarative-procedural interactions
Our approach takes semiotic aspects into account at
the level of lexical choices, establishing functional
meanings from their differentiations and giving
them the status of linguistic markers. For example,
choice, already mentioned above, contrasts with any
change in this lexical choice referring to the same
object. That led us to a functional semiotic
distinction between declarative and procedural
aspects, as classically defined [1]. Therefore
procedural aspects may appear at the declarative
level, and declarative aspects at the procedural level.
Then dynamical interactions between declarative
and procedural levels may be conceived in the line
of Cellerier [6].
The criterion we chose in our data was to consider
the operations of location between moved objects as
180
Proceedings of International Conference on Education, Informatics, and Cybernetics (icEIC 2011),
and the International Symposium on Integrating Research, Education, and Problem Solving (IREPS 2011)

being at the declarative level, and the operations of
location between the places where the objects have
to be moved at the procedural level. Then, in our
above examples, the repetition the green disk
between the naming of disks defines a declarative
aggregate, and the repetition on peg C between the
naming of pegs to which disks have to be moved
defines a procedural aggregate [2], [3], [4].
Then different kinds of aggregates can be defined at
declarative and procedural levels [3]. That allows an
on-line identification of the specific construction of
chunks, and aggregates, at both declarative and
procedural levels. They can be generalized by
internalization and externalization at both level, but
they do not develop at the same time [2], [3], [4].
6. CONCLUSION
In this paper, we use our data and the theoretical
background underlying them suggests a possible
way integrating several areas, namely research,
education, and problem solving.
In fact, these data have to be considered as
belonging to an exploratory research. Many other
results have to be discovered in this line. The
theoretical background must be developed. Other
criteria in order to grasp micro-cognitive-processes
must be developed. Furthermore, our approach was
mainly directed toward an integration of language.
But many issues beyond language must be
developed.
REFERENCES
[1] J.R. Anderson, C. Lebière, (Eds). The atomic
components of thought, Mahwah, NJ: Erlbaum,
1998.
[2] S. Bégoin-Augereau, J. Caron-Pargue, Linguistic
Markers of Decision Processes in a Problem Solving
Task Cognitive Systems Research, Vol. 10, 2009,
pp. 102-123.
[3] S. Bégoin-Augereau, J. Caron-Pargue, Modified
decision processes marked by linguistic forms in a
problem solving task Cognitive Systems Research,
Vol. 11, 2010, pp. 260-286.
[4] S. Bégoin-Augereau, J. Caron-Pargue, A dynamic
approach of information in a learning task Journal
of Systemics, Cybernetics and Informatics, Vol. 8,
No. 2, 2010, pp. 52-57.
[5] J. Caron-Pargue, Is pictorial space "perceived" as
real space ? Commentary of J.B.Deregowski : Real
space and represented space, cross-cultural
perspectives. Behavioural and Brain Sciences, Vol.
12, 1989, pp. 75-77.
[6] G. Cellerier, Structures and functions. In D. de
Caprona, B. Inhelder, A. Cornu-Wells, (Eds.), Piaget
today, London: Lawrence Erlbaum, 1987, pp. 15-36.
[7] -
psychological interpretation, response to Vera and
Cognitive Science, Vol. 17, 1993, pp. 87-
116. [8
Lewis, P. Mendelssohn, Lessons from learning, Amsterdam: North Holland, 1994, pp. 231-242.
[9] A. Culioli, Cognition and representation in
linguistic theory, Amsterdam: J. Benjamins, 1995.
[10]
Pour
: 2.
Formalisations et opérations de repérage, Paris :
Ophrys, 1999, pp. 95-114.
[11] B. Inhelder, G. Cellerier (Eds.), Le cheminement
: recherche sur les
microgenèses cognitives, Neuchâtel: Delachaux et
Niestlé, 1992.
[12
D.R. Olson, (Ed.), The social foundation of
language and thought. New York: Norton [First
French ed., 1979].
[13] R. -
Cognitive Linguistics, Vol. 4, 1993, pp. 1-38.
[14] A. Newell, H.A. Simon, Human problem solving,
Englewood Cliffs, NJ: Prentice Hall, 1972.
[15] J. Piaget, The grasp of consciousness: Action and
concept in the young child, Cambridge, M.A.:
Harvard University Press, 1976. (Translation of : J.
Piaget, La prise de conscience, Paris: PUF, 1974.)
[16
to explicit knowledge: A bottom-up model of skill
Cognitive Science, 25, 2001, pp. 203-244
[17 Annual
Review of psychology, Vol. 17, 1995, pp. 497-539. [18
Williams (Eds), Encyclopedia of Microcomputers, New York: Marcel Dekker, Inc., 2001.
181
Proceedings of International Conference on Education, Informatics, and Cybernetics (icEIC 2011),
and the International Symposium on Integrating Research, Education, and Problem Solving (IREPS 2011)
Integrating Field Research, Problem Solving, and Design with
Education for Enhanced Realization
Mohamed El-Sayed
Kettering University
Mechanical Engineering
Flint, MI, 48504 USA
and
Jacqueline El-Sayed
Kettering University
Mechanical Engineering
Flint, MI, 48504 USA
ABSTRACT
Developing the right set of educational objectives and
activities are some the key factors for a successful
education program. Since almost all educational processes
intend to improve quality of life or realty it is important to
consider the human interaction with reality and its
objectives before designing the educational experience. In
this paper the concept of realization or dealing with
reality is revisited in an attempt to address why the field
activities of research, problem solving and design should
be integrated with the educational programs.
The expanded realization concept includes the virtual and
perceptual realities as valid domains of realization. These
domains of realization and their interactions with the
physical reality are studied along with the relationships
between research, problem solving, and design. Bloom’s
cognitive domain educational objectives are also aligned
with the expanded realization concept. Finally, to provide
a model for how the field activities of research, problem
solving and design could be integrated with an education
program, and to assess the role of different learning
experiences in achieving enhanced realization, an
engineering case study utilizing alumni survey data is
presented.
Keywords: Realization, Education, Research, Problem
Solving, Design, Perceptual, Virtual.
1. INTRODUCTION
There have been a growing number of national reports
and articles that document the need for incorporating
innovative forms of teaching [1, 2]. To design, reform, or
continuously improve an educational program, a set of
clear educational objectives must be defined. In addition,
all learning experiences, courses, and activities, must be
streamlined and aligned to deliver the desired learning
outcomes and ultimately achieve the objectives. The
program outcomes should always be derived from the
program educational objectives and not the reverse.
Therefore, developing a meaningful and effective set of
educational objectives will always be the cornerstone for
success in education. In the following a study for
integrating field activities of research, problem solving
and design with the objectives and activities of
educational programs is conducted. In addition, to
demonstrate and assess the results of such integration an
engineering case study is discussed.
2. REALIZATION AND REALITY DOMAINS
For understanding the role of research, problem solving,
design, and education in enhancing realization it is
important to specify what the term realization actually
means. A definition, that reflects the current use of word
realization, considers realization as [3]:
1. An act of figuring out or becoming aware.
2. The act of making real.
3. The result of an artistic effort.
182
Proceedings of International Conference on Education, Informatics, and Cybernetics (icEIC 2011),
and the International Symposium on Integrating Research, Education, and Problem Solving (IREPS 2011)

Building on this definition it can be stated that the act of
realizing is the interaction with a reality to figure it out,
utilize it to achieve desired results, and alter it by
eliminating or bringing new objects to it. Therefore,
realization is the interaction with a reality to:
1. Understand it
2. Utilize it
3. Alter it
It is also clear from the current definition that reality
could be expanded to include other dimensions or
domains that go beyond what is physical. Among these
dimensions the following three forms or domains of
reality are considered [4]:
1. Physical reality: represented by the physical universe
we live in and can be realized with our senses such as
seeing, hearing, touching, smelling, and tasting.
2. Perceptual reality: represented by our individual
paradigms or the internal image of other realities.
3. Virtual reality: represented by the virtual modeling and
simulation of physical, perceptual, and other realities.
By examining all three realities, it could be observed that
the perceptual is the domain where the individual
realization is being formulated (developed and validated).
While perceptual reality is unique and may be subjective,
for each individual perception is reality. For example, the
act of having a new perception or paradigm shift is an act
of realization. An individual will usually use the phrase “I
realized” when a new perception or a perceptual paradigm
shift happens.
The virtual domain is the domain where collective and
shared perceptions are being formulated (developed and
validated). For example, when some information or
knowledge is shared a new shared perception or a virtual
realization is created.
The physical domain is the domain where physical reality
is being actualized (developed and validated). For
example, when perceptual realizations of a design team
are shared in the virtual domain and manufactured an
altered reality is achieved in the physical domain.
In all three domains of reality there are interacting
elements or objects specified by:
Forms (shapes and substances)
Functions (purpose and performance)
Interactions (actions and reaction) with other object
through fields of activities (interaction fields).
The transfer between the three reality domains is through
mapping. The main two elements for mapping are
modeling and simulation [4].
A model: is a representation of an object. Depending on
the reality domain a model is:
A physical representation of an object (physical)
A cognitive representation of an object (perceptual)
An abstraction using mathematical language or
computer programming to represent an object (virtual)
A simulation: is the act of an object or its model
performing in an actual or simulated environment.
Simulation is used to show the actual or eventual
performance of an object in the actual or intended
environment. Simulations are used in all three reality
domains:
Physical simulation or actual utilization of an object
actual or physical model (physical domain)
Mental simulation of an object’s perceptual model
(perceptual domain)
Virtual simulation of an object virtual model (virtual
domain)
Key issues to consider in mapping through modeling and
simulation between domains are:
Acquisition of valid information about the object for
accurate representation of the object and its environment.
Selection of key characteristics and behaviors to
establish meaningful correlations.
Use of simplifying approximations and assumptions
Fidelity and validity of the modeling and simulation.
To map objects and their environment between different
realities using modeling and simulation requires
deconstructing and reconstructing using analysis (for
deconstructing) and Integration (for reconstructing).
To illustrate the realization concept discussed so far
consider the following example [4]: An object represented
by a football in the physical domain, made of a specific
form and materials, interacted upon by a quarterback who
is throwing it to a receiver in a football field during a
game. At the time of the throw the wind in specific
direction is 15 mile per hour. The quarterback perceives
the whole physical domain of the field in his perceptual
domain through the perceptual modeling ability
(interaction between physical and perceptual domains).
Before throwing the ball he performs a perceptual
simulation of the location of the receiver, the speed, and
direction required to place the ball at the hand of the
183
Proceedings of International Conference on Education, Informatics, and Cybernetics (icEIC 2011),
and the International Symposium on Integrating Research, Education, and Problem Solving (IREPS 2011)

receiver away from the defenders. The receiver models
and simulates the physical reality in his perceptual
domain and translates it into a physical movement to be at
the right place and right time for making the catch
(interaction between physical to perceptual and perceptual
to physical). For the viewers watching the game being
broadcast on T.V. the physical reality on the field is
communicated (mapped) through the virtual reality to the
perceptual reality of the viewers (interaction from
physical to virtual and from virtual to perceptual). It can
be noticed that for the viewers each perceptual realization
to the physical reality on the field may be slightly
different from the others due to the emotional, cognitive,
objectivity, and experience level with the game.
Moreover, while reading this virtual example written in
the physical domain, the reader has formulated a
perceptual domain image of the situation (interaction
between perceptual and virtual domains).
Both analysis and integration use modeling and
simulation at different degrees [4]. As shown in Fig. 1,
analysis is performed with mostly simulation and some
modeling while integration is performed with mostly
modeling and some simulation. It is also obvious that both
analysis and simulation are logical and analytical in
nature while modeling and integration are more holistic
and creative in nature.
Figure 1 – Different realization processes
3. REALIZATION ACTIVITIES
The main objectives for interacting with any reality are:
1. To understand it (know it)
2. To utilize it (use it)
3. To improve it (alter it)
These three objectives are interconnected and overlapping
because utilizing or altering a reality requires an
understanding of it. Also utilizing or altering a reality
brings a better understanding of it. In addition, these three
objectives create the following three distinct but
interconnected human and reality interaction activities:
1. Research: aiming at understand reality
2. Problem solving; aiming at utilize reality
3. Design: aiming at improving or altering reality
These activities can happen in any reality or across all
three realities. Also, the aim of each activity does not
exclude the activity from achieving other objectives. In
other words, to understand a specific reality may require
the utilization of another reality and improve a third
reality. For example, performing research to understand a
specific phenomenon in the physical domain may require
the use of the virtual domain to improve the unacceptable
state of lack of understanding in the perceptual domain.
Each of the three activities is started due to one of the
following states and ends after reaching another state of
the three, as shown in Fig. 2. These states are [4]:
1. Unacceptable Reality
2. Acceptable Reality
3. Improved or altered Reality
Figure 2 – Beginning and end states for different activities
As shown in Fig. 2, research starts due to unsatisfying
state of understanding in the perceptual and virtual
domains and ends by reaching a state of improved
understanding at the perceptual and virtual domains.
Problem solving starts due to unacceptable state (things
are not the way they should be) at any of the three
domains and ends by reaching the desired state (things are
the way they should be) at same domain. Design starts
from a state of acceptable reality due to the desire for
improved reality in the physical or virtual domains and
184
Proceedings of International Conference on Education, Informatics, and Cybernetics (icEIC 2011),
and the International Symposium on Integrating Research, Education, and Problem Solving (IREPS 2011)

ends by reaching a state of improved or altered reality at
the physical or virtual domains. It is important to
recognize that while the starting domain can be different,
for each activity, all three activities are initiated by the
perceptual domain. Each of three activities can be further
explained as:
Research
Research is an activity initiated and conducted by the
perceptual domain aiming at understanding all three
reality domains. While a research activity may utilize the
virtual or physical domains the goal state is always an
improved state at the perceptual domain.
The processes to perform research are mainly analysis and
integration. Analysis is mostly conducted utilizing the
perceptual domain and performed in the physical domain
with the help of the virtual domain as needed. The gained
insights are usually integrated utilizing the perceptual
domain and communicated through the virtual domain.
Both analysis and integration use modeling and
simulation across the three domains as sub-processes at
different degrees. For example, to improve the efficiency
of a specific product the need for conducting research was
created. This research would start due to unacceptable
state of understanding for the product performance and
the parameters affecting it. The research would be
conducted until a desired improved state of understanding
is reached, before attempting to change the current design.
Utilizing the perceptual domain of the researcher(s) and
conducting the research in the physical and /or virtual
domains, through testing physically simulated models and
/or virtually simulated models of the product, could
produce an improved state of realization in the
researcher(s) perceptual domain. If the research results are
documented and communicated or published an improved
state of realization in virtual domain would result as well.
Problem solving
Problem solving is an activity initiated and conducted by
the perceptual domain aiming at transforming
unacceptable state of reality to acceptable state of reality
in all three domains. Problem solving activity may take
place in the perceptual, virtual, or physical domain the
goal state is always an acceptable state at the domain of
the starting state.
Similar to research, the processes to perform problem
solving are mainly analysis and integration. Analysis is
mostly conducted utilizing the perceptual domain and
executed in the physical or virtual domains depending on
the problem context. In educational settings solutions are
usually performed in the virtual domains. The gained
insights are usually integrated utilizing the perceptual
domain and used to solve the problem in the execution
domain. Both analysis and integration use modeling and
simulation across the three domains as sub-processes at
different degrees until the acceptable state of the problem
solution is reached. For example, if during a research
activity an object is not working as expected in any of the
three domains a problem is identified by the perceptual
domain. To develop a solution may require the utilization
of the virtual or physical domains in addition to the
perceptual domain until a solution is reached in the same
domain where it was identified.
Design
Design is an activity initiated and conducted by the
perceptual domain aiming at altering reality from an
acceptable state of reality to improved state of reality in
the physical and/or the virtual domain. While design
activity may take place in the perceptual, virtual, and
physical domains the goal state is always an improved
state at the domain of the starting state.
The processes to perform design are mainly integration
and analysis. Integration is mostly conducted utilizing the
perceptual domain and executed in the physical or virtual
domains depending on the desired end product context. In
educational settings designs are usually performed in the
virtual domains. The problems or lack of understanding
faced during integration are addressed through problem
solving and research performed using analysis and
integration. Perceptual domain creativity is usually
utilized to solve the design integration issues in the
execution domain. Both integration and supporting
analysis use modeling and simulation across the three
domains as sub-processes at different degrees until an
improved state of reality with a new product design is
reached. For example, utilizing the improved perception
during a research activity to design a new product can
produce an improved performance in the physical domain.
It must be noted that while the initial state trigger a
specific activity the other two activities may be involved
to achieve the end state. For example it may take some
research and design activities to solve a specific problem.
In fact some design engineers and researchers due to their
analytically dominated thinking and training in problem
solving like to start their design (a creative activity) by
defining what they call the design problem [4].
4. REALIZATION AND EDUCATION
Understanding the reality domains and realization
activities is important for the design and development of a
highly effective education programs. In addition, since all
realizations are propelled and conducted by the perceptual
185
Proceedings of International Conference on Education, Informatics, and Cybernetics (icEIC 2011),
and the International Symposium on Integrating Research, Education, and Problem Solving (IREPS 2011)

domain it is important to focus on how perceptions are
formulated (physical and virtual realities mapped or
modeled and simulated). Both teaching and learning are
perceptual domain exchanges between the teachers and
the learners. These exchanges are usually shaped by the
educational objectives in addition to the teachers and the
learners thinking preferences. Bloom’s classified
educational objectives into the following three domains
with different levels of objectives in each [5]:
Cognitive (thinking skills)
Affective (values and emotions)
Psychomotor (movement skills)
Focusing on the objectives related to the perceptual
domain activities of problem solving, design and research
the following are Bloom’s cognitive domain objectives:
1. Knowledge – information gathering without
necessarily understanding, using, or altering it.
2. Comprehension - understanding the gathered
information without necessarily relating it to
anything else.
3. Application - using general concept gained through
comprehension to solve a problem.
4. Analysis – disassembling something down into its
fundamental elements.
5. Synthesis - creating something new by integrating
different elements.
6. Evaluation - differentiating the subtle differences in
objects or methods.
Aligning these cognitive domain educational objectives
with the three main realization objectives discussed
previously it is clear that:
1. Knowledge and Comprehension can be aligned with
understanding realty 2. Application and Analysis can be aligned with
utilizing realty 3. Synthesis and Evaluation can be aligned with
altering realty
In other words, Bloom’s cognitive domain educational
objectives are aimed at developing the knowledge and
skills of dealing with a specific reality of a certain field.
These objectives are also aligned naturally with the
progression to a higher or enhanced level of realization
starting with understanding and ending with altering of
reality as shown in Fig. 3. In fact Bloom’s highest
objective of evaluation can only be reached with refined
realization at the perceptual domain. Therefore for
achieving enhanced levels of realization, educational
programs should include conducting research, problem
solving, and synthesis activity in the field of the intended
reality.
Figure 3 – Progression of Realization Objectives
5. ENGINEERING EDUCATION CASE STUDY
To identify the practices in the field of the intended reality
for engineers, the Transferable Integrated Design
Engineering Education (TIDEE) consortium of colleges in
the Pacific Northwest developed an engineer profile by
compiling accreditation criteria, codes of ethics, attributes
valued by employers, and core competencies valued by
professional societies. Synthesis of these traits produced
a set of ten holistic behaviors of an engineer. These ten
roles include those of analyst, problem solver, designer,
researcher, communicator, collaborator, leader, self-
grower, achiever, and practitioner. The Holistic Behaviors
associated with the roles and observable actions of an
expert engineer are listed in [6]. In this engineering case
study the intended field of practice learning experiences,
including the TIDEE ten roles, were considered as
program educational objectives. In addition to providing
the fundamental knowledge and skills needed for
professional practices in classroom activities, the program
includes a cooperative education experience for each
undergraduate student to achieve a targeted level of
performance before graduation. In the cooperative
education program, the undergraduate alternates between
working in an industrial setting and classroom instruction
at the university. Through cooperative education,
students are exposed to the field reality that they will face
as engineers. Students begin their cooperative education
rotation normally in their freshman year and must
successfully complete multiple cooperative education
Altering Realty
[Synthesis and Evaluation]
Utilizing Realty
[Application and Analysis]
Understanding Realty
[Knowledge and Comprehension]
186
Proceedings of International Conference on Education, Informatics, and Cybernetics (icEIC 2011),
and the International Symposium on Integrating Research, Education, and Problem Solving (IREPS 2011)

terms as a graduation requirement. For continuous
improvement purposes, the alumni of the program are
periodically surveyed about both their classroom and the
cooperative education worksite learning experiences. The
alumni surveys are usually conducted by the Office of
Institutional Effectiveness and adhere to the standard
practice in higher education. Surveys are conducted for
alumni three years after graduation. The typical number
of graduates surveyed is approximately 400 per class with
a return rate of approximately 16% [6].
In this case study, the 2008 alumni survey data [6], is
used for assessing the role of both classroom and
cooperative education learning experiences, in achieving
large increase in ability, focusing on the roles of problem
solver, designer, and researcher. In addition three other
roles of an analyst, practitioner and achiever were added
for their significance to this case study. The results are
shown in Fig 4.
Figure 4 – Setting accounted for a large increase in ability
As shown from Figure 4 the cooperative education real
life experience provided higher increase in ability than
classroom experience for both problem solving, and
design with equal ability in research. Similar increase in
ability is shown in analysis which a common sub-process
in all other three activities. As it would be expected the
largest increases are achieved in the abilities of being a
practitioner and achiever.
6. CONCLUSIONS
Since the start of human life on earth two realities have
emerged, the physical reality and the human perception of
it. To deal with the physical reality and share the
formulated perceptions humans introduced the third
domain known as the virtual reality. Considering these
added realities, the concept of realization could be
expanded to include all three reality domains. Therefore,
the three types of realization are the perceptual realization
which is unique for each individual, the virtual realization
which is shared with different individuals and the physical
realization which is universal.
Research, problem solving, and design are realization
activities performed in different domains. All three
activities utilize analysis and integration through
modeling and simulation as basic elements of mapping
between realities. Therefore, integrating these activities in
real life settings is necessary for achieving enhanced
realization in any education program. This integration
should be started with the educational objectives and
implemented with all program and classroom activities.
The presented engineering program case study
demonstrates that real life experience has equal or
superior effect on enhancing the abilities for conducting
all realization activities. However the largest increases in
abilities are in the perceptual domains of the learners
when dealing with professional realities with the
confidence of being achievers.
7. REFERENCES
[1] Baer, J., Cook, A., and Baldi, S., 2006, The Literacy
of America’s College Students (Washington, D.C.:
The National Survey of America’s College Students,
American Institutes for Research.
[2] U.S. Department of Education, 2006, A Test of
Leadership: Charting the Future of U.S. Higher
Education, Washington, D.C. [3] Wiktionary, 2011. The lexical companion to the
open-content encyclopedia, Wikipedia.
[4] M. El-Sayed, and J. El-Sayed, 2011, “A Product
Realization Approach to Creativity in Engineering
Education”, ASME Paper No., IMECE2011- 64501,
Proceedings of the ASME 2011 International
Mechanical Engineering Congress, Denver, Co.
[5] Bloom, B. S., Engelhart, M. D., Furst, E. J., Hill, W.
H., and Krathwohl, D. R., 1956, Taxonomy of
educational objectives: the classification of
educational goals; Handbook I: Cognitive
Domain New York, Longmans, Green.
[6] J. El-Sayed, M. El-Sayed, S. Beyerlein¸ 2010,
“Validation of Hybrid Program Design through
Stakeholder Surveys” International journal of
Process Education, Vol. 2, pp 3-10.
0 10 20 30 40 50 60 70 80 90
CR 08
CO 08
187
Proceedings of International Conference on Education, Informatics, and Cybernetics (icEIC 2011),
and the International Symposium on Integrating Research, Education, and Problem Solving (IREPS 2011)

Agile Training: An Innovative Educational Process for Information
Technology Educators
RJ REDDEN
University of Nebraska at Omaha
Omaha, NE 68182, USA
and
Dr. Peter WOLCOTT
University of Nebraska at Omaha
Omaha, NE 68182, USA
ABSTRACT
Information technology (IT) plays an important role in the
growth of small businesses. Many businesses unfamiliar with
technology tools risk being left behind in the so-called digital
divide, rendering them unable to compete in today's business
environment. Efforts to train owners of microenterprises often
employ plan driven training, which emphasizes structure and
linear learning with pre-defined learning objectives. This has
been effective to a point, but it is sometimes insufficient to help
microenterprises to cross the digital divide. This study
proposes an alternative educational method, known as agile
training. Agile Training is adapted from the Agile method of
information systems development. Agile Training is an iterative
method, designed to produce a demonstrable set of valuable
technical skills on a short timetable. This innovative educational
method adds process and psychological factors to standard plan
driven training.
Keywords: Agile methodology, training, education,
microenterprise, digital divide
1. INTRODUCTION
Microenterprises are a significant part of the economy in the
United States. According to the Association for Enterprise
Opportunity, microenterprises are defined as businesses with
fewer than five employees [1]. These businesses constitute a
vital part of a region’s economy, providing not only jobs, but
the innovation and entrepreneurial dynamic that benefit
communities as a whole [2].
Businesses unfamiliar with technology tools risk being left
behind in the digital divide, rendering them unable to compete
in today's business environment. Discovering more efficient
processes for keeping microenterprises abreast of technology
skills and tools will help ensure that more businesses will be
able to compete in the marketplace, thus sustaining and growing
local economies.
Information technology (IT) plays a critical role in the
development of small businesses by increasing efficiencies,
providing access to new markets, and fostering the development
of new products and services. Microenterprises often face great
challenges in using IT effectively. They may suffer not only
from a lack of resources and skills, but also the awareness,
knowledge, and confidence needed to adopt technology
successfully [3].
In the field of technological instruction, plan driven training has
been effective to a point, but it is sometimes insufficient to help
microenterprises to cross the digital divide [4]. In this context,
plan driven training refers to instruction in technology skills,
with little attention paid to psychological factors [3]. Traditional
education uses a plan driven approach, documented through a
course syllabus and training material prepared ahead of time.
Technical training programs that are part of microenterprise
development programs typically involve courses or workshops
with well defined, but previously determined, learning
objectives and pedagogical methods [5]. Even in more
customized technical assistance, the training process typically
begins with an interview of the subject, in which the technical
needs of the subject are taken into account. Information from
the interview is used to devise a technical instructional plan for
the subject. Each instructional session is intended to move the
188
Proceedings of International Conference on Education, Informatics, and Cybernetics (icEIC 2011),
and the International Symposium on Integrating Research, Education, and Problem Solving (IREPS 2011)

subject closer to the overall goal of the plan. This is a linear
process with prescribed goals that is difficult to adapt to
changing circumstances. While such training often produces
positive results, in other cases the impact has been negligible.
The elements that separate a high impact interaction from a low
impact interaction are not well understood; however,
psychological factors may play a role in the impact of the
interaction [6] [3].
This paper reports on research in progress to make technical
training and assistance more effective in an unconventional
educational setting, such as that of the microenterprises.
Through the use of agile training methods, participants will
overcome the barriers to learning that arise from gaps between
learning objectives and the prior knowledge, skills, abilities,
and perceptions [7].
2. AGILE EDUCATION
Agile education extracts principles from the agile software
development method and adapts those principles for use in
traditional classroom learning situations.
The agile development method was devised as an alternative to
heavyweight, inflexible systems development methods. The
principles underlying agile development are expressed
succinctly in the Agile Manifesto [8]. The agile method is
characterized by adaptive planning, customer collaboration and
rapid response to changes in the environment. This method has
been successful in delivering high quality software products,
particularly in chaotic environments where requirements change
often. Agile principles have also been adapted for other fields,
such as project management and education [9].
The adaptation of agile principles for use in education led to the
development of the agile education method. It has been used as
an alternative to traditional educational methods. Agile
education has already demonstrated success inside the
classroom, and is amenable for use in various educational
situations [10] [11]. Computer Science faculty have used the
Agile Education principles in courses about the software
development process, with noted success [12] [10]. Agile
Education principles have also been used to teach writing and
communications skills in a University setting [13].
3. AGILE TRAINING
Agile training is a pedagogical method similar to agile
education. The principles were taken from the Agile Manifesto
and adapted for use outside the classroom.
Agile training addresses the shortcomings of plan driven
training. The chart below illustrates the adaptation of agile
principles for use in unconventional educational settings.
Further elaboration on the adaptation of the 12 underlying
principles of the Agile Manifesto may be found in the appendix.
Principles of the Agile
Manifesto
Principles Adapted for Use
in Unconventional
Educational Settings
Individuals and
interactions over processes
and tools
Individuals and interactions
over pre-determined methods
Working software over
comprehensive
documentation
Demonstrated learning of
useful IT skills/concepts
over tutorials
Customer collaboration
over contract negotiation
User collaboration over
“student teacher” relationship
Responding to change over
following a plan
Responding to user over
following a plan
4. MENTAL MODELS
Agile training addresses the process of the instructional
interaction. Particular attention is paid to the psychological
factors of training [6]. The psychological factor measured in
this paper is so-called “mental models”.
Peter Senge's work with the concept of mental models led to
many advances in the field of organizational theory. Mental
models are the “deeply held internal images of how the world
works, images that limit us to familiar ways of thinking and
acting” [14]. If a business owner has deeply ingrained beliefs
about both technology and the role the technology plays within
the business, he/she takes actions based on those beliefs. When
those beliefs are incorrect, the business owner is unlikely to
achieve the desired impact.
Making decisions based on ill-formed mental models about
technology leaves the typical small business owner mired in
inefficiency. Attempting to teach individuals with undiscovered
mental models leaves the teacher mired in inefficiency, as well.
Consequently, a tool for measuring mental models is used in
order to create a high impact interaction.
5. METHODOLOGY
Action research involves utilizing an iterative method of
planning, taking action, observing, evaluating (including self-
evaluation) and critical reflection prior to planning the next
iteration [15] [16]. Action research asks the researcher to
execute an observation, orientation, decision, and action loop
[17]. These four actions take place within each session,
changing the trajectory of the session/s when necessary. The
Action Research method is often used in both information
science research and service learning courses [3]. This method
is also similar to the agile method itself, as it is developed
through iterations, and focuses on flexibility over a fixed plan.
The setting for the application of agile training is a technical
project undertaken for and with a microenterprise by a “team” –
a pair of individuals who may be consultants, students in a
service-learning class, etc. [4]. Each microenterprise identifies
at least one technical project that needs attention within their
organization. The team acts both as consultants (using technical
expertise to guide the project) and educators (using expertise to
teach technical skills). The duration of a project depends on a
number of factors, but each project takes on average 6-8
consulting sessions to complete. A session is a single visit to a
microenterprise, typically lasting one to two hours. Each
189
Proceedings of International Conference on Education, Informatics, and Cybernetics (icEIC 2011),
and the International Symposium on Integrating Research, Education, and Problem Solving (IREPS 2011)
session with a microenterprise is counted as an iteration of the
agile training method. Each session incorporates the cycle of
observation, orientation, decision, action, and critical reflection.
Insight gained from each session is then used in subsequent
sessions.
Prior to the initial session, an interview is conducted to
determine the mental models of the participants concerning
their attitudes/perspectives of technology. Interview questions
also determine hardware/software availability, and nature of
technological need.
A second survey is administered to the participants to collect
additional data about participants’ mental models, specifically
around the four constructs of fear, frustration, confidence and
empowerment. These four constructs emerged out of multiple
years of experience with microenterprises. Statements cropped
up repeatedly, statements such as "I never get this right" or
"The system just won't let me do anything”. Researchers
noticed that microenterprises with positive impact results also
tended to make positive statements (reflecting confidence and
empowerment), and vice versa with negative statements
(reflecting fear and frustration). A clear understanding of
mental models is essential for effecting change [14]. Each
microenterprise is given a rating according to measured level of
each construct.
The ratings are used as an initial guide for the investigators, in
order to assess a formal “starting point” for each
microenterprise. The approach for each microenterprise differs
according to the ratings. The four constructs are measured
informally within each session throughout the training period.
During the course of each session with a microenterprise,
special attention is paid to the statements and body language of
the participants, in order to note changes in perceptions of
technology. Any general shift toward either positive or negative
constructs is recorded. Training for each session alters
according to the perceived levels of positive and negative
constructs. For example, if the participant is making frustration
based statements, the instruction pauses while the team attempts
to determine the reason behind the statements. If the reason
cannot be determined within the session, the team resumes the
session and determines post session if/how the course of the
project should change.
The first session is a planning session between the team and the
participants. Given the overview of the technical situation, the
team and participants identify and prioritize user stories that are
collated into technical projects which can be done within
time/availability constraints. This project is agreed upon by
everyone, and broken into smaller project goals/technical
lessons that are accomplished within each session.
This approach mirrors the agile development method, which
collects user stories and prioritizes them in order of project
importance. It also brings to the table everyone who is
concerned with the project (stakeholders). The method of
breaking large technical projects into smaller, more manageable
pieces serves as a bit of instruction in itself for the
microenterprise owners. In the future, they will be more
empowered if this skill is something that they can repeat for
themselves.
The remaining sessions focus on the smaller project
goals/technical lessons that were previously agreed upon.
Before each session, the team decides on specific technical
lessons for the session. As the session proceeds, the team
members use interactive methods to teach each lesson. The
participants work hands-on with the hardware/software
whenever possible.
Impact measurement takes place during each session. Near the
end of each session, the team determines if a skill has been
successfully taught by asking the microenterprise owner to
teach them the skill as if they were a new employee. As an
alternative, the participant will be given the opportunity to
perform the evaluation at the beginning of the next session,
rather than immediately, if that makes the participant more
comfortable. This evaluation accomplishes several goals. It
causes the microenterprise owner to assimilate the new
information before the session breaks. In having the participant
to try to explain the new information to another person, the
approach identifies holes in the participant's learning. These
skills/tools/techniques are measured on a pass/try again basis.
At the beginning of the next session, the participant is offered a
second chance at the skills that were not passed.
After each session has ended, the team meets at a separate
location to evaluate the impact of the session. A list of technical
lessons learned is recorded. In addition, critical reflection takes
place. Critical reflection consists of the team members
discussing the session, particularly where the participant’s
reactions seemed out of the ordinary. The participant’s
responses to the session are noted, and further alterations to the
trajectory of the project are proposed if needed. Patterns that
produce positive mental models in the participants are
determined and encouraged. Patterns that produce negative
mental models are also discovered and minimized. A plan is
outlined for the next session. The effect of the session is
determined by shifts in mental models on the part of the
participants. These are determined both directly and indirectly,
using participant behavior as the principal measure. The effect
of the session is also measured by skills demonstrably learned
on the part of the participants.
The final session takes the same format, except the team does
not teach the participant new skills. Rather, they review the
process for breaking large projects into smaller ones, and unveil
the result of the project/s. There is also some skill review as a
spot check.
Defining an effective method requires the measurement of
impact. This paper describes impact in terms of first order
effects, both in number/quality of skills learned, and shifts in
the mental models of participants.
First order effects are defined as effects on the individual. When
an interaction is complete, how many new skills has the
participant learned? What can s/he do with technology that they
could not do before? Has the participant gained any new tools,
software or otherwise? What is the level of mastery that the
190
Proceedings of International Conference on Education, Informatics, and Cybernetics (icEIC 2011),
and the International Symposium on Integrating Research, Education, and Problem Solving (IREPS 2011)
participant has been able to attain with the new tool? Was the
participant able to learn any new techniques during the process
of the interaction? Have these techniques influenced the
participant’s daily work? Finally, has the participant learned
new options for making progress with problems which had
previously seemed insurmountable? Are there any new
alternatives/workarounds available?
First order effects will be measured in terms of the
psychological factors/mental models under examination. Has
the individual’s attitude toward technology changed? Has the
individual’s attitude toward themselves using technology
changed? How have their statements about technology changed
during the project? Overall, how has their body language
changed?
Plan driven training focuses on the teaching and retention of
skills. In agile training, skill instruction, process, and
psychological factors play equally important roles. Adjustment
of the teaching process will enable the participant to retain more
information. Affecting psychological factors toward more
positive mental models will enable the participant to continue to
make progress on technical skills in the future.
6. AGILE TRAINING IN PRACTICE
The following is an illustration of the Agile Training process.
As previously mentioned, research on Agile Training is
currently underway at the University of Nebraska at Omaha. A
number of sessions have been conducted. These sessions are the
basis for this illustration.
The owner of a gym (“participant”) requested assistance with a
marketing campaign. The team decided to introduce the
participant to two software programs, Prezi and YouTube. Both
programs were entirely new to the participant. These programs
were chosen for their centrality to his new marketing campaign.
The skills and concepts for these new programs were taught to
him within three working sessions. The first session provided
an introduction to basic tasks in YouTube and Prezi. The
second session delved into more advanced skills of both
programs. Between sessions, the participant was asked to use
the skills to prepare a video and a presentation. During the third
session, the participant and the team reviewed both presentation
and video. At the end of each session, the participant was asked
to role play by teaching the skills back to the team members.
The participant scored highly on the confidence and
empowerment constructs in the mental model survey. These
qualities were observed by the team throughout all three
sessions. For example, the participant asked many questions
about video streaming, developed new ideas for using video in
his business, and expressed that he did not feel as inept with
technology as he had before. The participant exhibited no
hesitation in demonstrating knowledge of all of the skills and
concepts involved in the session. These observations of the
participant’s mental model confirmed the path taken during the
sessions. Had the participant experienced more fear or
frustration, the team would have needed to revise the training
strategy.
At times, the progression of a session changed based on the
interests of the participant. In one case, as a result of the
participant’s interest in producing comedic videos for his
YouTube channel, the next appointment agenda was changed to
include a review of a YouTube software product called
Xtranormal. This product takes text and transforms it into a
fully animated cartoon.
One indicator of the success of the sessions is what the
participant does with the skills after the training session has
finished. On his own one evening, this participant wished to
embed a video into a presentation. The video was on his hard
drive, but Prezi would not allow him to embed the video
directly into the presentation. He noticed that YouTube videos
could be inserted into presentations. He uploaded the
presentation to YouTube and added text, overlays and
transitions. Then he made the video public and embedded it into
his presentation. He also set the video to be the featured video,
ready to play automatically upon visitor arrival to his channel.
The notable item about the participant’s experience is that he
had no knowledge of either YouTube or Prezi before his
sessions began. Not only did he learn the skills required to work
with both programs, he demonstrated the ability to find
workarounds in order to overcome obstacles. The entire video
embedding experience occurred outside of a regular session,
with no assistance.
7. CONCLUSION
Technological tools are essential for success in today’s business
environment. Plan driven training has been moderately
successful, yet it yields variable results. Methods must be
devised to make technological training more effective in
unconventional educational environments, such as the
microenterprise. The Informing Science Framework suggests
that “[i]deally, the knowledge skills, and abilities that are being
learned must be packaged, sequenced, and delivered in response
to each learner’s unique needs” [6]. The agile training method
seeks to provide such learning through techniques that
emphasize highly dynamic and flexible interactions between
trainers and microenterprise participant; frequent iterations
involving planning, instruction, practice, evaluation, and critical
reflection; and close attention to mental models.
The approach described above is currently being employed in a
study involving twenty microenterprises in the Nebraska/Iowa
region.
191
Proceedings of International Conference on Education, Informatics, and Cybernetics (icEIC 2011),
and the International Symposium on Integrating Research, Education, and Problem Solving (IREPS 2011)

Appendix
I. 12 Underlying Manifesto principles.
Agile Manifesto
Principles
Agile Training Principles
Customer satisfaction by
rapid delivery of useful
software
User empowerment by rapid
learning of useful IT skills/concepts
Welcome changing
requirements, even late in
development
Welcome changing learning scope,
anytime in development
Working software is
delivered frequently
(weeks rather than
months)
Useful IT skills/concepts are learned
frequently (weeks rather than
months)
Working software is the
principal measure of
progress
Demonstrable IT skills/concepts are
the principle measure of progress
Sustainable development,
able to maintain a constant
pace
Sustainable learning, able to
maintain a constant pace
Close, daily co-operation
between business people
and developers
Close cooperation between user and
teacher
Face-to-face conversation
is the best form of
communication (co-
location)
No Change
Projects are built around
motivated individuals,
who should be trusted
No Change
Continuous attention to
technical excellence and
good design
Continuous attention to the learning
environment
Simplicity No Change
Self-organizing teams No Change
Regular adaptation to
changing circumstances
No Change
192
Proceedings of International Conference on Education, Informatics, and Cybernetics (icEIC 2011),
and the International Symposium on Integrating Research, Education, and Problem Solving (IREPS 2011)

References
[1] Association for Enterprise Opportunity. (n.d.). Retrieved
September 21, 2011, from
http://www.microenterpriseworks.org/ [2] Williams, A. “Small Things Really Matter: The Important Role
of Microenterprise in Job Creation”. Retrieved from
http://www.frbatlanta.org [3] Kamal, M. ”Effects of Information Technology Interventions in
Micro-Enterprises on Development”, Omaha, NE, USA:
University of Nebraska at Omaha, 2009.
[4] Wolcott, P., Kamal, M., & Qureshi, S. “Meeting the Challenges
of ICT Adoption by Micro-enterprises”, Journal of Enterprise
Information Management, Vol. 21, No. 6, 2008, pp. 616-632.
[5] Edgcomb, E. “What Makes for Effective Microenterprise
Training?” Journal of Microfinance, Vol. 4, No. 1, 2002, pp.
99-114.
[6] Cohen, E. B., & Nycz, M. “Learning Objects and E-Learning:
an Informing Science Perspective”, Interdisciplinary Journal
of Knowledge and Learning Objects, Vol. 2, 2006, pp. 23-34.
[7] Cohen, E. B. “A Philosophy of Informing Science”, Informing
Science: The International Journal of an Emerging
Transdiscipline, Vol. 12, 2009, pp. 1-15.
[8] Beck, Kent; et al. "Manifesto for Agile Software Development",
Agile Alliance, 2001. Retrieved 2010-06-14.
[9] Fernandez, Daniel J., & Fernandez, John D. “Agile Project
Management - Agilism Versus Traditional Approaches”, The
Journal of Computer Information Systems, Vol. 49, No. 2,
2008, pp. 10-17.
[10] Razmov, V. “Effective pedagogical principles and practices in
teaching software engineering through projects”, 2007 37th
annual frontiers in education conference, 2007, pp. S4E-21-
S4E-26. Presented at the 2007 37th annual frontiers in
education conference - global engineering: knowledge without
borders, opportunities without passports, Milwaukee, WI, USA.
[11] Hislop, G. W., Lutz, M. J., Naveda, J. F., McCracken, W. M.,
Mead, N. R., & Williams, L. A. “Integrating Agile Practices
into Software Engineering Courses”, Computer Science
Education, Vol. 12, No. 3, 2002, pp. 169-185.
[12] Hanks, B. “Becoming Agile using Service Learning in the
Software Engineering Course”, AGILE 2007, 2007, pp. 121-
127. Presented at the AGILE 2007 Conference, Washington,
DC, USA.
[13] Kussmaul, Clifton. “Using agile development methods to
improve student writing”, Journal of Computing Sciences in
Colleges, Vol. 20, No. 3, 2005. Retrieved from
http://dl.acm.org/citation.cfm [14] Senge, P. The fifth discipline : the art and practice of the
learning organization. New York: Currency Doubleday, 1990.
[15] O’Brien, R. “Overview of Action Research Methodology”,
2001. Retrieved September 9, 2011, from
http://www.web.ca/~robrien/papers/arfinal.html
[16] McNiff, J. “AR Booklet”, 2002. Retrieved September 9, 2011,
from http://www.jeanmcniff.com/ar-booklet.asp
[17] Adolph, S. “What Lessons Can the Agile Community Learn
from A Maverick Fighter Pilot?”, AGILE 2006, 2006, pp. 94-
99. Presented at the AGILE 2006 Conference, Minneapolis,
MN, USA.
193
Proceedings of International Conference on Education, Informatics, and Cybernetics (icEIC 2011),
and the International Symposium on Integrating Research, Education, and Problem Solving (IREPS 2011)

Basement on Value Creation of Study Programs as Highway to Integrate Academic,
Business and Public Interest as well as to Shape Research Directions
Aleksandras Vytautas RUTKAUSKAS, Viktorija STASYTYTE, Indre LAPINSKAITE
Faculty of Business Management, Vilnius Gediminas Technical University
Vilnius, Sauletekio ave. 11, LT-10223, Lithuania
ABSTRACT
The object of this article is the process of studies, seeking
the sources and factors of this process effectiveness in the
stage of study programs preparation and highlighting the
necessity of interests’ compatibility of process
participants – entrants (students), university (academia),
business and nation (public interest). Plus, already in the
program of study process should be estimated risks of
discrepancy between the purposes projected in the
program and process of the reality. The prevention of the
mentioned risks or the education of students’ abilities to
qualify the subsequences of possible risks is necessary
requirement for study process and its organizers. The
hope is flattering that commanding requirement to follow
the principles of interests’ compatibility, to do reasoned
estimations of mentioned values and to publish its results
openly will eliminate the base for unreasoned or even
demagogical discussions about the advantages,
disadvantages or necessity of the one or other program.
Moreover, objective information would be useful for
choice of entrants. They could see the receivable benefit
from program, possible risks and, finally, have the
guaranty that the liabilities established in the program
will be fulfilled.
Keywords: Value Creation, Study Programs, Academic,
Public Interest, Information Systems, Study Program
Management.
1. INTRODUCTION
Nowadays there are a lot of discussions about value
creation. What do we mean by value creation? For the
customer, it entails making products and providing
services that customers find consistently useful. In today's
economy, such value creation is based typically on
understanding unique customer needs with ever-
increasing speed and precision. Involving in the
discussion the value creation of study programs, first the
understanding that there is potent relationship between
the participants of study process - for the university –
values of the service supplier, for the student – values of
the consumption (knowledge eater), for the business –
surplus values, for the nation – public values, should be
taken into account. All these values should be defined as
symbiotic model. It is necessary to know where all the
integrate values come from to the process and understand
the strategic factors that build or erode the value. Every
strategic decision we make affects general value of the
whole process creation. To assess and manage these
strategic decisions we have to understand all the process,
its components and environmental factors.
2. GENERAL REMARKS ABOUT ASSESSMENT OF
STUDY PROGRAMS EFECTIVENESS TODAY
Study program is production of intellectual activity and
has long evolution period. For this reason study program
instead original musical composition often reminds folk
musical composition useful for conversation about music,
amateurish training and, finally, for professional concerts.
Truly, study program having the same modules set and
references could be found in the programs digest of both
most progressive world university and ordinary college.
On the other hand, in the face of studies and science
management monopolization, if it would happen in any
country, we should say that science and studies also study
programs is not just public resource or public good about
which should care just government of particular country.
In order to develop mentioned programs features
first of all the interests of all interested parties – future
specialists, business, universities and nation – should be
deeply realized and to know how to estimate receivable
value. Dirk C. Moosmayer (2010) identified the paradox
of value-free science and the need for value- oriented
management education. Freeman and Soete (1997)
explain that science has emerged as an alternative engine
of economic growth in addition to the classic triumvirate
of land, labor and capital. Under the influence of a
knowledge-based economy, academic research
institutions are no longer simply the location of
education, research and public services. Academic
research institutions play a vital role in regional economic
development and employment creation [6, 8]. The
description of ‘‘entrepreneurial universities’’ has
increasingly been used in relation to the partnership of
technology commercialization in academia [5, 9].
Talking about competitiveness of studies programs
as a single product of institution of studies services it
would mean the ability of that program to attract more
students going to get particular speciality in particular
institution and in this way giving bigger financial benefit.
Academic discussion has primarily focused on the
194
Proceedings of International Conference on Education, Informatics, and Cybernetics (icEIC 2011),
and the International Symposium on Integrating Research, Education, and Problem Solving (IREPS 2011)

changed environment, exemplified in an increased
internationalization process and changing styles of
management in academic institutions [14, 11, 3, 15]. In
order to implement program goals especially important
attribute is economy of program. Economy of program
should be a direct component of the competitiveness of
program, but regarding to nowadays reality demand – to
look for saving possibilities in any activity, we should to
assess whether knowledge and practical skills got from
program, i.e. value for specialist, business and nation is
got with the minimal inputs. Doubtless that estimation
and practice of value of the study programs as creation
giving intellectual product and service should become
imperative. Probably it will become impulse to unclose
the benefit which exploiting and projecting study
program should bring to every participant of the study
process [17, 7, 10, 4, 13, 16, 1].
.
3. ABOUT INFROMATION SYSTEMS AS INTEGRATE
COMPONENT OF STUDY PROGRAMS AND
NECESSITY TO INVOKE ADEQUATE INFORMATION
SYSTEMS
Taking into consideration that there is general need of
description of the study programs rendering knowledge
and practical skills, set of the program modules and
digest of the important literature, potential indicators of
the methodical and material equipment should be
complemented by generally known or by program
authors’ created knowledge entirety or information
system, which has expanded information about possible
challenges for particular speciality from both practical
skills allowing professionally deal with activities tasks,
inadequacy and know uncertain ledge of decision
methods viewpoints. These are most common species of
study program risk and the readiness of the students to
buffer the subsequences is an important attribute of study
program quality. Also it is a means for students who
independently seek to increase the benefits from study
program.
Naturally, that mentioned knowledge and its
conversion to the practical skills, as rule, cannot become
direct object of the academicals and practical lectures or
practical exercises because the credo of the studies is
preparation for particular speciality. Preparation for the
possible risk challenges is separate problem requiring
several decision approaches and methods. Thus, also
according to the constantly shortening duration of studies,
especially important is to create information system or to
use already existing one in order to see particular
speciality in the risk challenges context.
With regard to creation of programs from both
general value and separate value species, should take very
important place in specialists’ preparation for possible
risk challenges. Thus, programs organizers and
administrators also users and assessors should
understand, that student’s ability to work self-
dependently should be complemented by students’ ability
to overtake him as “programmed” professional answering
to risk challenges. Most effective this problem is tackling
involving students into science-research activity and
giving for them knowledge about riskiness of the future
possibilities and possibilities to manage this riskiness.
The force of the study program express not just
the abilities of students education to go deep into
processes they are interested in, but also by unclosing
new possibilities of the processes development and
giving abilities for future professionals to use those
possibilities. This is especially effective search way of the
studies and science research synergy.
The implementation of the last three paragraphs
of this section is not possible without functioning of
study programs infrastructure information system,
principles of which are discussed in the next section
(Fig. 1).
Fig. 1. The scheme of the general possibilities of
interactions between study programs and its information
system
4. VILNIUS GEDIMINAS TECHNICAL
UNIVERSITY’S BUSINESS MANAGEMENT
FACULTY’S OBJECTIVES AND POSSIBILITIES TO
HARMONIZE INTERESTS OF STUDENTS, SOCIAL
DEVELOPMENT AND BUSINESS
The definitions used in this text (SUDIS - Sustainable
development information system, SETDIS - Social,
economic and technological development information
system, BUDIS - Business development information
system, INNVIS - Investment information system,
REGCDIS - Regional competitiveness development
information system, REGDRIS - Regional development
STUDY PROGRAM
The digest of modules
Means for practical
skills education
External and foreign
relationships
Scientific, information
accumulation and
usage skills
I N FO R M AT I O N
S Y S T E M
Information about demand changes
in labor market and international
relationships development
Information about innovations and
science results possible influence to
activity, for which specialists are
prepared
Knowledge
about
possibilities,
tools and
methods to
manage risk
of study
programs
Information
about
knowledge
and
practical
skills
inadequacy
to possible
changes
195
Proceedings of International Conference on Education, Informatics, and Cybernetics (icEIC 2011),
and the International Symposium on Integrating Research, Education, and Problem Solving (IREPS 2011)
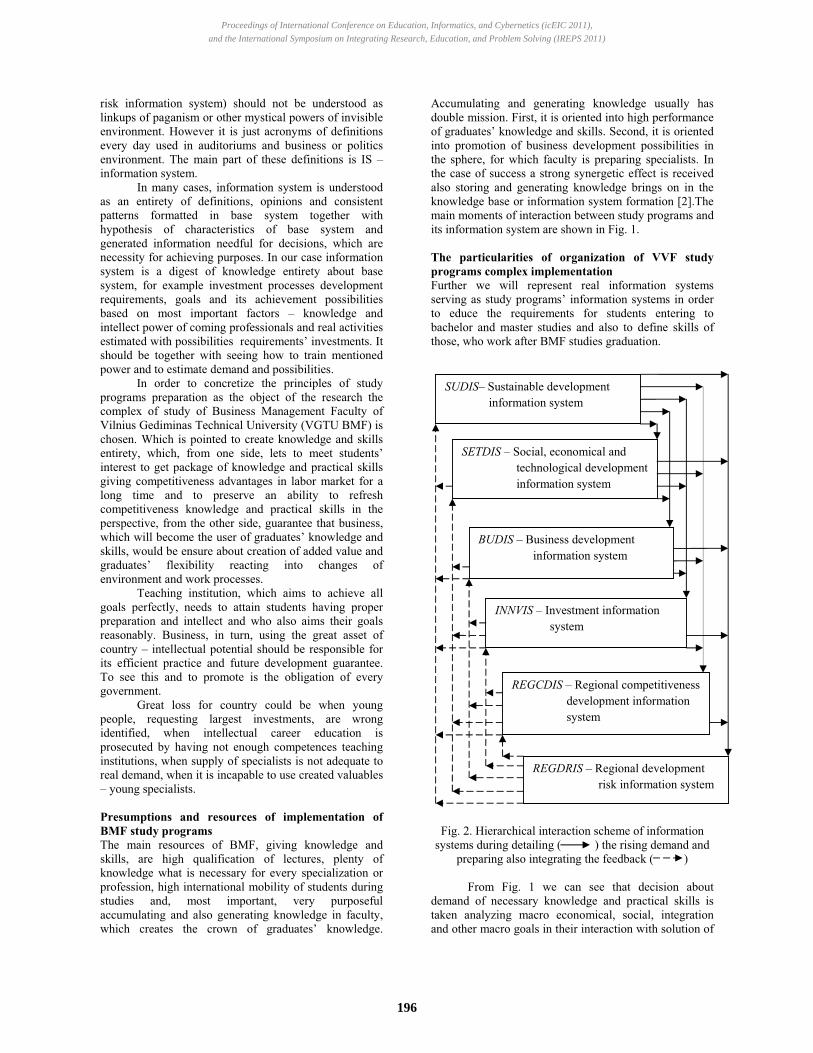
risk information system) should not be understood as
linkups of paganism or other mystical powers of invisible
environment. However it is just acronyms of definitions
every day used in auditoriums and business or politics
environment. The main part of these definitions is IS –
information system.
In many cases, information system is understood
as an entirety of definitions, opinions and consistent
patterns formatted in base system together with
hypothesis of characteristics of base system and
generated information needful for decisions, which are
necessity for achieving purposes. In our case information
system is a digest of knowledge entirety about base
system, for example investment processes development
requirements, goals and its achievement possibilities
based on most important factors – knowledge and
intellect power of coming professionals and real activities
estimated with possibilities requirements’ investments. It
should be together with seeing how to train mentioned
power and to estimate demand and possibilities.
In order to concretize the principles of study
programs preparation as the object of the research the
complex of study of Business Management Faculty of
Vilnius Gediminas Technical University (VGTU BMF) is
chosen. Which is pointed to create knowledge and skills
entirety, which, from one side, lets to meet students’
interest to get package of knowledge and practical skills
giving competitiveness advantages in labor market for a
long time and to preserve an ability to refresh
competitiveness knowledge and practical skills in the
perspective, from the other side, guarantee that business,
which will become the user of graduates’ knowledge and
skills, would be ensure about creation of added value and
graduates’ flexibility reacting into changes of
environment and work processes.
Teaching institution, which aims to achieve all
goals perfectly, needs to attain students having proper
preparation and intellect and who also aims their goals
reasonably. Business, in turn, using the great asset of
country – intellectual potential should be responsible for
its efficient practice and future development guarantee.
To see this and to promote is the obligation of every
government.
Great loss for country could be when young
people, requesting largest investments, are wrong
identified, when intellectual career education is
prosecuted by having not enough competences teaching
institutions, when supply of specialists is not adequate to
real demand, when it is incapable to use created valuables
– young specialists.
Presumptions and resources of implementation of
BMF study programs
The main resources of BMF, giving knowledge and
skills, are high qualification of lectures, plenty of
knowledge what is necessary for every specialization or
profession, high international mobility of students during
studies and, most important, very purposeful
accumulating and also generating knowledge in faculty,
which creates the crown of graduates’ knowledge.
Accumulating and generating knowledge usually has
double mission. First, it is oriented into high performance
of graduates’ knowledge and skills. Second, it is oriented
into promotion of business development possibilities in
the sphere, for which faculty is preparing specialists. In
the case of success a strong synergetic effect is received
also storing and generating knowledge brings on in the
knowledge base or information system formation [2].The
main moments of interaction between study programs and
its information system are shown in Fig. 1.
The particularities of organization of VVF study
programs complex implementation
Further we will represent real information systems
serving as study programs’ information systems in order
to educe the requirements for students entering to
bachelor and master studies and also to define skills of
those, who work after BMF studies graduation.
Fig. 2. Hierarchical interaction scheme of information
systems during detailing ( ) the rising demand and
preparing also integrating the feedback ( )
From Fig. 1 we can see that decision about
demand of necessary knowledge and practical skills is
taken analyzing macro economical, social, integration
and other macro goals in their interaction with solution of
REGDRIS – Regional development
risk information system
SETDIS – Social, economical and
technological development
information system
BUDIS – Business development
information system
INNVIS – Investment information
system
REGCDIS – Regional competitiveness
development information
system
SUDIS– Sustainable development
information system
196
Proceedings of International Conference on Education, Informatics, and Cybernetics (icEIC 2011),
and the International Symposium on Integrating Research, Education, and Problem Solving (IREPS 2011)

social problems, search and implementation of business
development strategies, investments as most active and
unique means in order to impact development of
Lithuania and, maybe, its’ survival, also to ensure
national, technological, intellectual, organizational
maturity and its’ dynamics.
Fig. 2 let us understand in which goals’ and
interests’ hierarchy level the necessary knowledge is
accumulated and guaranteed for concrete study program
or for specialization and also pursuing scientific
researches, which, from one side, are necessary for
modern and long-lasting knowledge formation for future
professionals and, from the other side, to stimulate of
business development in spheres where BMF graduates
should and could be in the lead.
The principles of individual program (specialization)
selection
BMF maintains limited number of programs at the same
time – two of bachelor and two of master studies. In order
to ensure the flexibility of these programs large number
of specializations, which are prepared on the base of
information system and gives particular knowledge, is
prepared.
Fig. 3. VGTU BMF forming specialization as a result for
future specialist, educating faculty, business, which use
the knowledge and skills of specialist and realization of
government’s interests
The selection of specializations in concrete period usually
proceeds following special procedure (Fig. 3):
according to forecast of specialities and professions
dynamics made in EU, Lithuania and other countries
with analogical or reachable social-economical
development, the list of most expected and popular
professions in Lithuania is formed;
according to current knowledge systems and it’s
refreshable possibilities, operated specializations are
selected;
the competitiveness of specialists prepared of BMF
operated specializations in labor market is estimated;
the levels of readiness, intellect and motivation of
entrants’ for selected specializations are forecasted;
the decision about concrete specialization operation
is made;
The team, which should implement programs and
specializations beforehand refreshing information
systems and other required means, is formed.
This procedure is prosecuting according to requirement,
that with the help of fostered speciality maximally meet
all in the process participating parties – future specialist,
business, university and government (Fig. 3).
5. PROGRAMS MANAGEMENT
In order to develop the quality of studies, to look for
economically optimal study process development ways,
to enshrine relationships of today’s market in science and
studies sphere the important attention should be given for
creation and management of the study programs for both
fundamentally of management and timeliness viewpoints.
Fig. 4. Aggregated management structure showing
necessary to implement decisions ( ) and
notifications ( ). Double cursor shows plurality of
requirements and information
Programs estimators
- Vice-rector for studies (the quality
of studies; value for programs
owner)
- MSM (public value)
Business (added value)
Programs
organizers
- Departments
of the
university;
- Scientific
laboratories;
- Social and
foreign
partners.
Programs council
PROGRAM’S LEADERS
The organization and
implementation of the program
Users of the programs services: 1.Preparing
specialists. 2. Others
School graduates, who intellectually and objectively are
ready for studies at university and reasonably
reaching for speciality, which has
competitiveness in market and
long lasting value, and readiness
to react into all profession
requirements’
changes
Government,
which is
responsible
for saving
and
education of
most
important
resource of
country –
„genetic
fund“
Business,
which is
interested on
specialist’s
capability to
create added
value,
readiness to
participate in
business
management
and
technological
development
and
flexibility VGTU VVF,
which reaches to dispose study’s
programs able to competitive in the
country and international level and
adequate scientific researches results
Speciality, which lets to
realize interests of
professional to-be,
business using his
capabilities, university
qualifying specialists and
fostering their activities
arsenal and government,
which is responsible for
country’s future.
197
Proceedings of International Conference on Education, Informatics, and Cybernetics (icEIC 2011),
and the International Symposium on Integrating Research, Education, and Problem Solving (IREPS 2011)

It is necessary to guarantee that the interests and
decisions of all interested parties would influence the
existence and development of the study program.
In the aggregated management structure of the
program (Fig. 4) the actions of the subjects of direct
programs process and its perspective development –
programs council and leader are unclosed together with
the interests and actions of programs organizers, users
and assessors.
According to Fig. 4 the main duties and rights of
the participants of study programs in the programs
management process could be formulated:
1) The main functions of the operative programs
management and monitoring of the implementation
quality and the strategic management belongs to the
leader of program, which:
- is responsible for the study process adequacy to the
declared programs goals and quality;
- is operatively balancing the interests of programs
users, assessors and organizers;
- is responsible for programs succession and
resumption. He is the main strategist of quality and
marketing;
- is responsible for programs council.
2) Programs council (scientific-methodical commission
in the case of department programs or directorate of
studies in the case of interdepartmental programs) is
responsible for the coordination of interprogramical
and interdepartmental interactions and accumulation
of the information got during particular programs
process supervision and its representation for the
leader.
3) Programs users are fully responsible for their
readiness and attempts to master knowledge and
practical skills giving to them in particular way. If
they unreservedly follow liabilities they have the right
to require a partial compensation for departed from
declared services and to make restitution of
subsequences during some time.
4) Programs assessors assessing and informing programs
council about programs adequacy to programs users
(in the broad sense) and about created value for the
owner (for the university), public value (for the
nation) and added value (for the business). It should
become as a base for assessment of programs
generated value as whole.
5) Theoretical basics and estimation practice of the
intellectual product or activities value estimation
already is in the mature state period but this practice
for the estimation of generating value of study
programs is not large. But it is doubtless that this
method based on science and progressive experience
should safe programs from incompetent “fighters” for
the saving of interests of nation, business and
university.
6) Programs organizers should be professionally and
financially free choosing services in one or other
program and to have the guaranty of activity’s
succession if the services meet the requirements of
quality and contract conditions.
Further we will discuss the selection one of the
programs and the preparation for its implementation.
6. BUSINESS MANAGEMENT study program
INVESTMENTS MANAGEMENT specialization
The necessity of the specialization.
The grounding of the specialization necessity could be
started saying that before becoming a person, human
being had to learn to invest. Actually investment is that
economical factor which is building the way to the future
by creating it. Investment is taking part in the all spheres
of society activities and person individual life and for this
socially and economically based decisions are needed.
These are the decisions which require knowing about
compatibility and mutual influence between social and
technological processes development and about the
importance and value dynamics in time perspective of
human, reproduce and not reproduce nature resources.
Doubtless, that the nation’s survival, as the base of
economically competitive region of the Europe, is the
ability of nation and all its citizens to invest. The vision
of the competitive state of nation and its single regions
should be based on the adequate investment strategy.
The goal of the specialization.
Is to prepare professionals highest qualification of the
able to understand integrally consistent patterns of the
development of social, technological, ecological and
valuable processes, knowing and generating investment
methods, principles and strategies, ready to divert the
investment forces of Lithuania’s citizens and business
subjects for nation welfare and competitiveness secure,
knowing how to prepare projects of competitive business,
enterprises reorganization, personal investments, able to
prepare real time investment strategies for currency and
capital markets.
In the case of the investment management
specialization clear unclosing the compatibility of
interests of all study process participants – entrants,
business, nation and university, the possibility to estimate
created total value and value for every participant and to
do estimations and optimization of the studies input as
value effect.
Methodical and material equipment of study
programs.
According to the assessment done by international
experts’ group methodical and material equipment of the
BMF study programs including investment management
specialization is good and should stay good in the future.
Together we should pay attention that traditional
attitude towards methodical equipment is not unclosing
liabilities implementation possibilities of study programs
to programs participants, and, first of all, to entrants when
it is not considered risk of knowledge and skills got from
studies inadequacy to real needs and not obtaining
standards of the practical skills needed for work in the
global market.
198
Proceedings of International Conference on Education, Informatics, and Cybernetics (icEIC 2011),
and the International Symposium on Integrating Research, Education, and Problem Solving (IREPS 2011)

Mentioned problems in the case of BMF
investment management specialization are solving using
data and knowledge basis of INNVIS (Investment
information system). The possibilities of the INNVIS are
complemented by possibilities of REGCDIS and
REGDRIS (Fig. 2). As exclusive possibility of INNVIS
we should to highlight historical data basis and data about
financial conditions of many global corporations, data
about these companies’ stocks prices dynamics and using
forecasting methods. This let to form information
necessary for decisions taking without wasting time and
abilities. In turn, INNVIS has information about
investment in global and local markets strategies created
during scientific experiments. The effect of those
strategies practice points about regularity of the giving
investment knowledge. This is especially important
material for high professional skills formation.
Information system of study program.
This is structural prognostic information about possible
activities or specializations requiring services of
specialists prepared by program and about those needs
possible changes challenged by globalization processes
innovations. Also this is information about alternative
activities treats to preparing specialists demand and rival
programs challenges.
This is information about amount and depth of the
fundamental knowledge and practical skills of speciality
and informatics needed for preparing specialist and about
possible scientific discoveries, challenges of the activities
inovatization to the competitiveness of this program
giving knowledge and practical skills.
The creation of the study program information
system is very susceptible to intellectual activity and
economically expensive creation. If there is possibility
general information systems should be used or cooperated
for information system of branch of studies preparation
(branch direction sphere).
7. CONCLUSIONS
1) Academic study program is the plan of knowledge
giving and practical skills formation. In the results of
this plan are interested not just university as the owner
of the intellectual capital – program and student as
recipient of programs direct result, but also particular
activities as users of programs prepared specialists,
services helping in added value creation and nation as
upholder of public value creation.
2) Success of the study program depends on both
compatibility of the mentioned above interested
parties and created spreads of owner, user, added and
public values. The base of programs utility and
acceptability should become integral, i.e. the value
inclusive all the mentioned values.
3) The factors related between each other by program
potential utility are not just program competitiveness,
economy, adaptively and flexibility but also growing
importance of program’s riskiness, the management of
its subsequences is constructive ability of the future
specialist.
4) The participants of the study program process –
university, student, business and nation have their
commitments and rights: for the university – to get
nation support, for the business – to get services of
specialist understanding local business peculiarities,
for the nation – to see the creation of the value for
users and investors and, finally, for the students – to
have rights for the compensation if the owner of the
program not guaranteed promised quality and amount
of the knowledge and skills.
5) One of the success preconditions of the study program
is its programmed management.
8. REFERENCES
[1] C. A. Bana e Costa, M. D. Oliveira, A Multicriteria Decision Analysis
Model for Faculty Evaluation, Omega., Vol. 40, 2012, pp. 424–436.
[2] R.Barkhi, P. Williams, The impact of electronic media on faculty
evaluation. Assessment & Evaluation in Higher Education, Vol. 35,
No. 2, 2010, pp. 241–262.
[3] M. Bartell, Internationalization of universities: A university culture-
based framework. Higher Education, Vol. 45, No. 1, 2003, pp. 43–70.
[4] R. J. Benton, Using Student Course Evaluations to Design Faculty
Development Workshops. Academy of Educational Leadership
Journal., Vol. 15, No. 2, 2011, pp. 41–53.
[5] L. M. Branscomb, F. Kodama , & R. Florida, Industrializing
knowledge: University–industry linkages in Japan and the United
States, 1999, London: MIT Press.
[6] J. J. Chrisman, T. Hynes, & S. Fraser, Faculty entrepreneurship and
economic development: The case of the University of Calgary. Journal
of Business Venturing, Vol. 10, 1995, pp. 267–281.
[7] D. G. Doherty, On quality in education. Quality Assurance In
Education., Vol. 16, No. 3, 2008, pp. 255–265.
[8] H. Etzkowitz, Research groups as ‘quasi-firms’? The invention of the
entrepreneurial university. Research Policy,Vol. 32, 2003, pp. 109–
121.
[9] H. Etzkowitz, The norms of entrepreneurial science: Cognitive effects
of the new university– industry linkage. Research Policy, Vol. 27,
1998, pp. 823–833.
[10] D. Grundey, TQM in university studies: Quality assessment and
quality assurance in a Lithuanian University. Transformations in
Business & Economics, Vol. 7, No. 2, 2008. pp. 216–235.
[11] S. Marginson, & G. Rhoades, Beyond national states, markets, and
systems of higher education: A glonacal agency heuristic. Higher
Education, Vol. 43 No. 3, 2002, pp. 281–309.
[12] D. C. Moosmayer, Professors as value agents: a typology of
management academics’ value structures. High Educ., Vol. 62, 2011,
pp. 49–67, DOI 10.1007/s10734-010-9364, DOI 10.1007/s10734-010-
9364-0
[13]E. Z. Rutschow, E. Schneider, Unlocking the Gate: What We Know
About Improving Developmental Education. MDRC, June 2011.
<http://www.eric.ed.gov/contentdelivery/servlet/ERICServlet?
accno=ED521471>.
[14] U. Teichler, The changing debate on internationalization of higher
education. Higher Education, Vol. 48, 2004, pp. 5–26.
[15] M. Vaira, Globalization and higher education organizational change:
A framework for analysis. Higher Education, Vol. 48, No. 4, 2004, pp.
483–510.
[16] G. Verdina, Risk Management as a Tool for Securing Internal Control
in the Process of Study Programme Implementation at Higher
Education Institutions. Economics & Management., Vol. 16, 2011, pp.
987–991.
[17] W. D. Wolansky, A multiple approach to faculty evaluation.
Education, Vol. 97, 2001. pp. 81–96.
[18] P. Y. Yang, Y.-C. Chang, Academic research commercialization and
knowledge production and diffusion: the moderating effects of
entrepreneurial commitment, Scientometrics , Vol. 83, 2010, pp. 403–
421, DOI 10.1007/s11192-009-0075-1
199
Proceedings of International Conference on Education, Informatics, and Cybernetics (icEIC 2011),
and the International Symposium on Integrating Research, Education, and Problem Solving (IREPS 2011)

Developing an Agribusiness
Management Module for
Farmer Organizations1
Integrating Research, Learning and
Consulting/Teaching in Agribusiness
for a Lifelong Learning Process.
The report of this study provides an overview
of the process for designing a course module
on Agribusiness Management for Farmer
Organizations (AMFOs).
The module development was based on several
interdisciplinary field case studies along with
provision of consultancy services to
participating farmers as part of the “AgShare”
Open Education Resource (OER) project. The
purpose of the study was to develop a
pedagogical model and a pilot module for
teaching farmer organizations such as
community based organizations to change their
attitude, gain new knowledge, and acquire
agri-business management skills (ASK) for
transforming farming from a livelihood
practice to a business enterprise. In other
words, transforming the farmer’s mindset from
perceiving a farm to a firm.
1 Francis Wambalaba, Maina Muniafu, Gidraph
Nduati, Walter Wanyama, Dalton Ndirangu and Akosa
Wambalaba are the module developers and case study
research faculty at the United States International
University (USIU). They were assisted by Mark
Odhiambo of Moi University, a team of student
interns, Sustainable Development Initiatives Center
(SUDIC) secretariat, Open Education Resources
(OER) Africa and farmers from, Emali, Kajiado,
Kapsabet, Kiambu, Nakuru.Tigania, and Sikulu. The
study was funded by Michigan State University‟s
AgSgare Project.
The foundation of this cyclical
process of research, learning and consulting is
based on two philosophical pedagogical
premises of learning at universities. First, is
about the role of universities in society which
highlights the significance of learning through
research. Second is the way of learning
which elicits the role of general education at
universities as a means of integrative learning.
Ultimately, the fundamental pedagogical role
of universities is to create opportunities that
nurture learning as a lifelong process
Learning by Research
The role of research at universities is very
critical for learning. Thus, the debate over the
role of research at universities has been with
us for over 200 years since Humboldts 1810
dichotomy between “university” and “school”
(Elton, 2008)2. According to Elton, in
Humboldt‟s view;
…..a university treats scholarship always “in terms of
not yet completely solved problems, whether in research
or teaching, while school is concerned essentially with
agreed and accepted knowledge.” The consequence, ….,
is that in universities “the teacher is then not there for
the sake of the student, but both have their justification
in the service of scholarship”.
2 Lewis Elton, Recognition and Acceptance
of the Scholarship of Teaching and Learning, International Journal for the Scholarship of Teaching and Learning Vol. 2, No. 1 (January 2008), http://www.georgiasouthern.edu/ijsotl
200
Proceedings of International Conference on Education, Informatics, and Cybernetics (icEIC 2011),
and the International Symposium on Integrating Research, Education, and Problem Solving (IREPS 2011)
In other words, the role of both
faculty and students is to enhance scholarship
which according to Elton has also been defined
by Ashby (1958, p. 22) as „the empirical
approach to knowledge‟. However, fear has
been expressed about positioning scholarship
on teaching and learning within the disciplines
(Weimer, 2008)3. This has been the most
common trend at universities as opposed to
Ashby‟s empirical approach to knowledge
which is interdisciplinary and integrative in
nature. For most universities in the American
system of university education, this process is
founded on the platform of General Education
(or other similar programs).
Role of General Education
In his discussion of “What is a Generally
Educated Person”, Jerry Gaff refers to the late
Joseph Katz who defined general education as
"the knowledge, skills, and attitudes that all of
us use and live by during most of our lives -
whether as parents, citizens, lovers, travelers,
participants in the arts, leaders, volunteers, or
Good Samaritans". (Gaff, 2004) He further
argues that general education is relevant today
“because the United States has moved from an
3 Maryellen Weimer, Positioning Scholarly
Work on Teaching and Learning International Journal for the Scholarship of Teaching and Learning Vol. 2, No. 1 (January 2008), http://www.georgiasouthern.edu/ijsotl
agrarian economy, through an industrial
economy, to a knowledge-based economy”.
He supports this contention by indicating that
labor economists have determined that, for a
knowledge-based economy where many
people work on solving unscripted problems, a
liberal education is excellent preparation for
the best careers (Carnevale and Strohl 2001).
And according to White (2004), one of the key
goals for general education is “to help students
develop the tools essential for constructive
participation in civic affairs - the social,
political, professional, and artistic
environments we inherit and then, leave for
others”.
One area of interest and debate
typically revolves around the approach to
teaching General Education. Indeed, Gaff
(2003), has equated the development of
general education to the “original sin” by
highlighting the demands on educators to
overcome their academic pride and sacrificing
the focus on their own discipline, research
interest and autonomy. Thus, in most cases,
educators at colleges and universities come
from specific disciplinary backgrounds.
However, general education requires an
interdisciplinary integrative approach to
teaching. A review of disciplinary perspectives
and approaches includes concepts such as
disciplinary, cross disciplinary,
201
Proceedings of International Conference on Education, Informatics, and Cybernetics (icEIC 2011),
and the International Symposium on Integrating Research, Education, and Problem Solving (IREPS 2011)

multidisciplinary, interdisciplinary, and
integrative approaches.
1. A disciplinary perspective involves teaching
a specific subject matter within a discipline by
an expert in the respective discipline using
specialized disciplinary theories and methods.
But while most college and university
programs have been designed around their
disciplines, all the models for teaching general
education need to go beyond a disciplinary
coverage.
2. On one hand, a cross disciplinary approach
tends to teach a subject matter in one
discipline by taking on ideas from another
discipline such as by borrowing of concepts,
models, theories etc in order to provide a rich
understanding or a comparative context of
ones own discipline. A multidisciplinary
approach on the other hand puts emphasis on
involvement of multiple disciplines, especially
in problem solving situations where input is
collected from a wide variety of view points.
In both cases, a teamwork approach to
teaching is not only encouraged but is
expected. While these two approaches enrich
student learning, they are still done along
disciplinary boundaries and therefore not fluid
enough.
3. An interdisciplinary approach tends to melt
these boundaries. According to Heidi Hayes
Jacobs (1989), interdisciplinary learning is a
“knowledge view and curriculum approach
that cautiously applies methodology and
language from more than one discipline to
examine a central theme, topic, issues,
problem or work”. According to Erickson
(1998), interdisciplinary learning is said to
have become active in the United States in the
1890s until the 20th
century when it gained
considerable attention from an education
theorist John Dewey and boosted during the
1960s “open classroom” concept and Hilda
Taba‟s research works when educators began
collaborative teaching units and creativity
became the most important element in
curriculum design. While the process
experienced some setbacks in the 1970s anti-
open classrooms, the education community
had started to shift so that by the 1980s,
emphasis was already being placed on the
teaching of higher order thinking skills.
Integrative Learning
However, this was not without concern from
those who viewed interdisciplinary approach
as a threat to the integrity of the disciplines
and thus “upsetting hundreds of years of
educational theory” (Jacobs, 1989). Jacobs‟
initial concern was about the earlier attempts
that resulted in the so called the "potpourri
effect," instead of true interdisciplinary design.
She therefore argued that it was the works of
202
Proceedings of International Conference on Education, Informatics, and Cybernetics (icEIC 2011),
and the International Symposium on Integrating Research, Education, and Problem Solving (IREPS 2011)

researchers such as Ackerman and Perkins
who helped expand horizons by suggesting
that “educators align the teaching of thinking
with the teaching of content, to ensure that
students developed higher-order thinking skills
and discipline-based knowledge in an
integrated way” (Jacobs, 1989).
While an interdisciplinary approach
has in many cases been treated as synonymous
with an integrative approach to learning, in
practice, the former tends to put emphasis on
the presentation from multiple perspectives
while the later tends to focus on the integration
of ideas covered previously and synthesizing
them from an interdisciplinary perspective.
For example, Schneider (2003) talks of
integrative learning in form of culmination of
learning. She points out that starting with:
“today’s students now have multiple, structured
opportunities to make connections across disciplines
and fields, to connect theories to practice, and even to
engage their own lived experiences in the context of
what they are learning in general education and in their
majors. This commitment to integrative learning helps
ensure that students will learn to take context and
complexity into account when they apply their analytical
skills to challenging problems”.
And according to Rothblatt (1993),
integrative learning focuses on educating the
"whole" person by encouraging "breadth of
outlook, a capacity to see connections and
hence an ability to make fundamental
decisions and judgments". It requires
deliberative and reflexive stance towards
knowledge acquisition and typically considers
differing dimensions or perspectives of the
problem and making links among the
perspectives or dimensions such as contextual
learning. According to the Center for
Excellence in Teaching (CET) at the
University of Southern California, “Contextual
learning occurs when teachers relate subject
matter to real world situations. Students are
motivated to make connections between
knowledge and its applications to their lives as
family members, citizens, and workers”.
According to Rothblatt (1993), the focus of
integrative learning is on: “discovery and
creativity, integrating and interpreting knowledge from
different disciplines, applying knowledge through real-
world engagements, or teaching students and
communicating with the public…..disciplines are now
less bounded, with new areas of scientific knowledge
emerging on the borders of old ones”.
Based on the context of the
disciplinary perspectives, and best practices, it
is therefore the interdisciplinary integrative
approaches that have been viewed as
representing the “whole” and therefore more
realistic for general education purposes. An
interdisciplinary integrative learning is thus the
foundation of an effective lifelong learning.
Project Design and Methodology
203
Proceedings of International Conference on Education, Informatics, and Cybernetics (icEIC 2011),
and the International Symposium on Integrating Research, Education, and Problem Solving (IREPS 2011)

The project involved research and consulting
activities to cultivate a process of learning
among all the three key stakeholders, i.e.,
faculty, students and farmers. The project
developed a pilot course module by combining
concepts with regard to the structure of the
agricultural sector and policies, context of the
economics of a firm, behaviors of an
entrepreneurial mind set, sustainable farming
and applications of information technology.
The framework was based on five key
outcome objectives as outlined below.
1.Form Community-wide Partnerships: The
goal here was to enable and facilitate
community-wide partnerships (CWP),
networking opportunities to support the
project‟s vision and exploration of policy and
strategy issues. This include partnerships with
both farmer organizations and other relevant
stakeholders, i.e., partnerships among USIU
faculty and at least one university in Kenya
with agriculture faculty, one producer
organization and one NGO involved in women
and agricultural / rural development and
arrangements for feedback loops among those
partners for information sharing for OER
development and use and reuse.
2. Build Capacity: The framework was
tailored towards facilitating advanced business
management and organizational skills
development of farmers and producer
organization to increase their overall ability to
transform their members‟ farming practice
from a livelihood to a business enterprise.
Similarly, in partnership with a local
agriculture university (AgShare Partner), the
module was to be used for training masters
level students as a field work seminar. This
included creating capacity for awareness of
OER platform and understanding of creating
information, using and reusing OER materials
among all USIU AgShare project partners.
3. Create Learning Materials (OER): The
team worked in partnerships with Moi
University to co-create an OER environment
and associated learning materials. USIU
faculty developed syllabus content, teaching
and class activity content, and case studies for
teaching. They also taught the course in
collaboration with each other from an
interdisciplinary perspective. USIU internship
students participated in the module
development and case study process. They
developed case study scenarios through
interview data collection, writing of farmer
stories, and captured farmer experiences
through films and pictures. The completed
draft was shared with the AgShare partner
universities for feedback, input and possible
adoption. All USIU AgShare project partners
agreed on Open Access Licencing of AgShare
project materials. This was a non credit
204
Proceedings of International Conference on Education, Informatics, and Cybernetics (icEIC 2011),
and the International Symposium on Integrating Research, Education, and Problem Solving (IREPS 2011)

module except that participants were to receive
a certificate of completion.
4. Create an AgShare Fellows Program : The
AgShare Fellows Program (AFP) constituted
both faculty, students and farmers who
championed the concept of OER within their
respective universities. USIU coordinated with
internship and community service programs to
recruit student Agshare fellows who would
capture local stories that could be used as
illustrations, examples and even case studies.
Four student‟s were recruited including three
USIU undergraduate students from journalism,
entrepreneurship, and IT and one agriculture
masters student from the AgShare partner
university.
5. Assess the Impact: During phase two of the
project, the team embarked on project
assessment with the dual quantitative and
qualitative goals of determining the level of
output as well the effects of the project. The
output levels included; assessing the level of
partnership and networking; development of
modules for Farmer Organizations; and
generating a variety of OER materials
produced (modules, cases and video.
Determination of impacts included; the impact
on farmers, impact on faculty and students;
and desirability of modules at universities.
Issues of sustainability and ethics
were embedded in the module. Agribusiness
issues to be covered included green business
development, sustainable supply chains and a
focus on development of socially responsible
ventures. The farmer organization issues also
included concepts of green farming practices,
carbon footprint minimization, economically
sustainable planting and harvests
methodologies, and sustainable and just labor
practices. This was accomplished through
participating faculty‟s selection of appropriate
books, articles, case studies, experiential
exercises, facilitated discussions and lectures
which make reference to sustainability and
ethics or provide a format for their use as one
of many analytical tools.
Concluding Observations
The process of course development is in itself
a research process that imparts learning for the
developer. The consultancy outcome solidifies
that learning process. This is further enriched
by not only a process of integrative learning,
but also when the teacher, student and
practitioner and all involved in the process of
creating knowledge, developing skills and
changing attitudes through research and
learning from each other. This project was a
demonstration of this integrative and
collaborative process of learning.
205
Proceedings of International Conference on Education, Informatics, and Cybernetics (icEIC 2011),
and the International Symposium on Integrating Research, Education, and Problem Solving (IREPS 2011)

Using different Research Paradigms to test Self-Directed Learning readiness in 4th
year Information Systems students
Roelien GOEDE
School of IT, North-West University,
Vanderbijlpark, 1935, South Africa
and
Estelle TAYLOR
School of Computer Science, Statistics and Mathematics, North-West University,
Potchefstroom, 2520, South Africa
ABSTRACT
Self-directed learning is a concept introduced by Malcolm
Knowles in 1975. Key to this concept is moving the
responsibility of learning away from the teacher to the learner.
The learner should take control of the learning experience and
the teacher should only facilitate this process. However, self-
directedness in a learner develops in stages. Learners need to be
guided to become more self-directed over time. In order to
guide learners the lecturer or facilitator should understand the
level of self-directedness also referred to as the readiness for
self-directed learning of the students. This paper reports on the
process of understanding the readiness for self-directed learning
of 4th year Information Systems students. Methods representing
the positivistic and interpretive research paradigms are applied
and compared to achieve this goal.
Keywords: Self-directed Learning, Self-directed Learning
Readiness, Mixed Methods Research, Research Paradigms.
1. INTRODUCTION
The aim of this paper is to report on the Self-directed Learning
(SDL) readiness of Information Systems (IS) students. In order
to prepare students as life-long learners, one needs to develop
their SDL skills. If the SDL skills of individual learners are
understood it is possible to develop study material suitable to
develop these skills. Blended learning where traditional face-
to-face teaching is enhanced by electronic material provides the
opportunity to provide different learning experiences for
learners on different levels of self-directedness. Methods from
two different research paradigms are used to gain a better
understanding of the SDL readiness of the students.
This paper contributes in the understanding of SDL readiness of
4th year IS students. It also contributes to the discussion on
using mixed methods in IS education research. The paper starts
with a motivation of the study followed by a brief literature
review of SDL. The empirical part of the study is introduced
with a short discussion of different research paradigms. This is
followed by reports on the positivistic and interpretive studies.
The results of the studies are compared from a paradigmatic
perspective. The paper concludes with reflections of the SDL
readiness of the students and the suitability of the research
methods used.
2. MOTIVATION FOR RESEARCH
Many IS lecturers complain that their 4th year students cannot
think for themselves and do not know how to solve problems.
As lecturers we are often amazed by our students‟ knowledge of
the latest electronic gadgets, but the same students do not know
where to start to investigate the problems we give them. This
problem may be related to the fact that we give our students
problems to solve for which they do not feel ownership. They
are only attempting to solve the problem because the lecturer is
telling them to solve it. Should we then rather give our students
more control of their learning environment? Should they gather
their own learning material? Should they decide how their
progress will be evaluated? Should they decide what to study
and how to study new IS technology? This might seem like
extremes but in the fast changing world of Information and
Communication Technology (ICT) we have an obligation to our
students to equip them with life-long learning skills. The
question investigated by this paper is: Are our students ready
for self-directed learning?
In South Africa the National Qualification Framework (NQF)
of the South African Qualification Authority (SAQA) puts 4th
year (honours) study on level 7. In their description of level 7
under problem solving the skills required by the learner includes
the ability to:
”[...] identify, analyse, critically reflect on and address
complex problems, applying evidence-based solutions
and theory driven arguments.” [11].
Further in terms of management of learning, the ability to:
”[...] identify, evaluate and address accurately his or her
learning needs in a self-directed manner and to facilitate
collaborative learning processes.” [11].
In order to demonstrate these skills our students should be
intrinsically motivated to learn and to solve problems to achieve
this learning process. In this respect it is the responsibility of
educators of this level to equip learners with SDL skills. This
can only be done effectively if educators understand their
learners‟ SDL readiness.
206
Proceedings of International Conference on Education, Informatics, and Cybernetics (icEIC 2011),
and the International Symposium on Integrating Research, Education, and Problem Solving (IREPS 2011)

3. RESEARCH METHODOLOGY
The term “research” as used in this paper corresponds to the
description given by Mingers [9] as:
“A construct that specifies a general set of philosophical
assumptions covering, for example, ontology (what is
assumed to exist), epistemology (the nature of valid
knowledge), ethics or axiology (what is valued or
considered right), and methodology.”
Three major research paradigms are discussed in IS literature:
Positivism, Interpretivism and Critical Social Theory (CST) [8].
The aim of methods used from a positivist paradigm is to
measure aspects of reality, often referred to as variables [1].
Positivistic questionnaires are developed to be reusable in
different environments to measure specific variables. Quite
often the same measurement tool (questionnaire) is used in very
diverse situations. Interpretive studies, on the other hand
focuses on specific situations. The researcher is transformed
from objective observer to subjective learner, who aims to
understand the situation from the point of view of the
participants in the study [3]. In CST studies the aim of the
researcher is to identify oppressing structures in the problem
environment and to facilitate change in order to emancipate the
oppressed.
Recently there is a trend in combining methods from different
paradigms in one project. The main advantage of such an
approach is that methods from different paradigms provide
different perspectives on the problem environment [9]. In other
words we use different methods from different paradigms to
better understand different aspects of the reality in our problem
situation. A mixed method approach was followed in
investigating the readiness for SDL of the 4th year IS students at
a university in South Africa.
As this paper focuses on the investigation of the readiness for
SDL of the students, a CST study is not applicable as it is not
the aim of the research team to influence the SDL readiness in
this phase of the project. When confronted with the choice
between using a positivistic SDL readiness tool and an
interpretive case study, this research team decided to perform
both types on a pilot group of 4th year IS students, in order to
get the best possible understanding of the SDL readiness of
these students.
The positivistic tool of Guglielmino was used [5]. This tool is
available at cost from the SDLR website. An interpretive
questionnaire was also developed from SDL readiness
literature, incorporating literature on positivistic readiness tests.
Students were asked open ended questions to explain their
perceptions, fears and aspirations on SDL. Before the detail of
the empirical work is discussed, a brief literature review of SDL
is provided to guide the reader.
4. SELF-DIRECTED LEARNING
Few people have ever defined self-directed learning with
precision [4]. Different terms are used interchangeable with
self-directed learning, for example individualized instruction,
prescriptive learning and contract learning [10]. One possible
definition is that self-directed learning takes place when the
learner takes control and accepts the freedom to learn what he
or she view as important [2]. Another definition is that self-
directed learning is a process in which learners take the
initiative for analysis and diagnosis of their learning needs,
formulation of personally relevant learning goals, identification
of how to achieve them, and reflection on their achievement [7].
For the purpose of this research self-directed learning will be
defined as learning where the learners control the process with
the guidance of a facilitator, including the analysis of learning
needs, formulation of goals, and decisions on how to achieve
these goals.
According to Grow the goal of the educational process is to
produce self-directed, lifelong learners [4]. Knowles believes
that self-directed learning is the best way to learn [7]. He states:
“[I] don‟t think it is healthy – or even humane – for a
person to be kept permanently dependent upon a system
or upon another person”.
Self-direction is partly a personality trait, and the degree of
control the learner is willing to accept depends on their attitude,
abilities, and personality characteristics [4]. Self-directed
learning is also unfamiliar to most students [10]. Many students
entering into a new situation feel the need for a structured plan
and teachers who are in charge, and they become anxious when
this is absent [7]. Teachers also find it difficult to change from
being a teacher to being a facilitator of learning [4,7].
Stages of self-directed learning
Grow developed the Staged Self-Directed Learning (SSDL)
model [4]. According to this model, there are 4 stages to self-
directed learning. During stage 1 the student is a dependent
learner who has to be taught by lectures, drilling, and coaching.
The stage 2 learner is interested and can be taught by inspired
lectures, guided discussion, and goal-setting. During stage 3 the
student is ready to explore, as long as he or she has a good
guide. The student can be taught by way of discussions,
seminars, and group projects. In the final stage, stage 4, the
student is self-directed, the teacher is a consultant, and the
teacher uses internships, dissertations, and study groups to
teach.
Preparing students to become more self-directed
The good news concerning self-directed learning is that it can
be learned [4]. It is very important that teaching is matched to
the self-directed learning readiness of the students. What is
„good teaching‟ for a student in one stage of development may
not be „good teaching‟ for another student in another stage of
development. Good teaching does two things: it matches the
student‟s stage of self-direction, and it empowers the student to
progress towards greater self-direction [4]. When the teaching
style is not matched to the student‟s degree of self-direction,
problems arise. The students can be prepared for the next
stages by gradually giving them more freedom and
responsibilities. During stage 2 it is important to begin training
students in basic skills such as goal setting, as part of preparing
the students to becoming more self-directed. Students need to,
at this stage, recognize their different personality types, life-
goals, and styles of learning [4]. The students have to be sold
on the advantages of self-directed learning [10].
Measuring the students’ readiness for self-directed learning
To be able to match the teaching to the students‟ self-
directedness, and guide the students through the relevant stages,
it is of course very important to measure the readiness of the
students for self-directed learning. The Self-Directed Learning
Readiness Scale (SDLRS) was developed in 1977 by Lucy
207
Proceedings of International Conference on Education, Informatics, and Cybernetics (icEIC 2011),
and the International Symposium on Integrating Research, Education, and Problem Solving (IREPS 2011)

Guglielmino, and has since been tested and revised. The self-
scoring form, called the Learning Preference Assessment (LPA)
was developed in 1991. Based on numerous literature reviews
the SDLRS / LPA has for some time been the most valid and
widely used quantitative instrument in the study of self-directed
learning. Although there has been some criticism of the
SDLRS / LPA [2], the vast majority of studies have supported
the reliability and validity of the instrument [2]. As the SDLRS
is the most widely used instrument, it was decided to use it in
this study, in combination with an interpretive study.
The following section reports on the empirical part of the study.
A discussion of the positivistic study is followed by a
discussion of the interpretive study.
5. MEASURING SDL READINESS
POSITIVISTICLY
The discussion of the positivistic readiness test of the 4th year IS
student starts with a brief introduction on the background of the
students. This is followed by sections on data collection and
analysis, and findings.
Background information
In South Africa most Bachelor‟s degrees are completed in three
years. A follow-up fourth year degree, called an Honour‟s
degree, is done in preparation for Master‟s study. The students
investigated here are Honour‟s students and have therefore
completed a Bachelor‟s degree. Most of these students
completed their degrees at other universities from the one where
they are enrolled for their IS Honour‟s degree. The students‟
backgrounds are vastly diverse from an academic and social
perspective. Some students studied previously at traditional
academic state subsidised universities, while others are from
technical state subsidised universities and other still are from
privately managed universities who present courses accredit
with mainly British universities.
Their preparation to deal with module content, in this case Data
Mining, differ substantially. It is therefore required to present
module content to individual students differently.
Data mining is presented as a year module. For the first five
months students had to do assignments as preparation for
lecturers. This was done to ensure that students have a solid
foundation in basis data mining skills. After five months the
students had to propose topics in data mining they wanted to
study using SDL techniques. It was at this time that the students
completed two SDL readiness questionnaires, one positivistic
and one interpretive questionnaire.
Data gathering and analysis
The SDLRS of Guglielmino was used from the SDLRS website
[12]. The questionnaire was completed by 17 students. The
students completed the questionnaire on the Internet and their
answers were then downloaded together with the descriptive
statistical analysis and results.
Findings
The SDLRS measure the current level of readiness for self-
directed learning. According to Guglielmino the average score
for adults completing the questionnaire is 214, as can be seen in
figure 1 [6]. The standard deviation is 25.59.
Figure 1 SDLRS scores [12]
The group that participated in this research had an above
average mean (221 compared to the average of 214), as can be
seen in table 1. The standard deviation is 22.11. The maximum
is 266, which is high above average, and the minimum 189,
which is below average.
Mean 221.0588235
Standard deviation 22.10619423
Minimum 189
Maximum 266
Range 77
Table 1 Group statistics
In table 2 the different levels of self-directed learning [6] can be
seen in column 1. In columns 2 and 3 the results for this group
can be seen. There were no students with a low readiness for
self-directed learning. There were 3 students (17.65%) with a
below average readiness for self-directed learning, while 9
students (52.94%) had an average readiness. There were 3
students (17.65%) with above average readiness, and 2
(11.76%) with a high readiness. This means that 82.35% of the
students scored average and above average.
Score Level of
readiness
Number of
students
% of
students
58-176 Low 0 0
177-201 Below average 3 17.65
202-226 Average 9 52.94
227-251 Above average 3 17.65
252-290 High 2 11.76
Table 2 Statistical results
208
Proceedings of International Conference on Education, Informatics, and Cybernetics (icEIC 2011),
and the International Symposium on Integrating Research, Education, and Problem Solving (IREPS 2011)

People with high SDLRS scores usually prefer to determine
their learning needs and plan and implement their own learning.
People with below average scores prefer very structured
learning options. If the scores of students are known, the
lecturer can adapt teaching to the readiness of the students. In
the group that participated in this research, the lecturer will have
to allow for the fact that all the students are not on the same
level of readiness for self-directed learning, and the variance is
high (varies from below average to high). Steps will have to be
taken to guide the students with low scores, while not
frustrating those with high scores.
6. MEASURING SDL READINESS
INTERPRETIVLY
This section reports on the interpretive part of the empirical
work in terms of data collection and analysis, and findings.
Data collection and Analysis
The same group of students completed interpretive
questionnaires on SDL readiness, although 24 students
completed the questionnaire compared to the 17 in the previous
section. The questions were compiled from SDL literature
incorporating questions on aspects found in positivistic
questionnaires.
The results of only 5 of the questions are discussed here to
illustrate the understanding achieved from interpretive analysis.
Content analysis was used and codes were identified to describe
the answers of the students.
The first question presented in this paper was:
“What was your first reaction to the change of the module?
Positive / Negative and why?”
As described earlier the first part of the module was presented
using a lecturer centred model and it was changed to a SDL
model. Codes were developed for (number of responses):
Anxious mixed (2);
Mixed (gave positive and negative reasons) (3);
Negative (enjoyed previous methods) (2)
Negative (against teamwork) (2)
Negative (time management) (2)
Positive (13).
From these one may group codes together. All the negatives add
up to about 6 students, mixed 5, and positives 13. To illustrate
the riches of information gathered a few of the answers and
their codes are given here:
Anxious: “Never have I done this before! Scared and excited.
Scared because of this huge change. Excited
because of this huge change. This is a good
opportunity to see if I can learn independent of any
course material and study guide. I can choose these
myself.”
Negative (time management): “Negative, because it seemed like
a lot of work to be done in a short period of time.
And also the confusion of where to start, how to
start, and to look for”
Negative (enjoyed previous methods): “Negative. Is easy to just
settle at one‟s comfort zone, lecture coming
prepared, lecturing and I just sit there and do what
she told me.”
Positive: “Positive because we are now applying the concepts
more practical to the field in a real world than
having assignments from the textbook only which
are pre–prepared questions from a certain
environment and difficult to imagine”
From this it is clear that special guidance on time management
and teamwork should be provided to students. In a blended
learning environment students can choose how much guidance
they use in terms of how many optional resources on non-
content related topics they study.
Another question was: “Do you view yourself as a curious
person?” All the students except one answered positively. Only
one student answered negatively to a question on their ability to
evaluate their own examination performance. Only one student
indicated that he thinks that he will not pass the module stating
the following:
“No, to be honest the time I spend on my studies is too
minimal. My responsibilities at home where not permitting
me to concentrate on my school work. As a father I had to
give full support at home. This worked against me at all
costs.”
The final question reported on in this section was: “Do you do a
lot of research on your hobbies? Explain.” After coding, 9
students indicated that they often don‟t do research on hobbies
while 13 indicated that they do. Two explained that they would
rather form interest groups to investigate their interests.
Findings
Most of the students were positive towards the idea of SDL.
Those who were negative mainly expressed time management,
negative teamwork experiences, and resistance to change as
motivation. All of this can be addressed by providing reading
material to the students on the electronic learning management
system.
Students view themselves as curious but only 13 of the 24
would actively research a topic associated with their hobbies.
A very encouraging result is that almost all the students are able
to predict their mark or evaluate their success in examination
papers. This might be due to the fact that all of them completed
a Bachelor‟s degree successfully prior to enrolling for this
module.
7. COMPARISON IN FINDINGS FROM
DIFFERENT METHODS
The specific scores for the individual students are available for
each question in the positivistic questionnaire. However the
motivation for the selection of the option is unclear. It is the
motivation of the few negative or low SDL readiness students
that may assist the lecturer in providing solutions that may also
assist other students who might not have been able to articulate
their feelings.
For interest sake the answer on the question on the reaction of
the student to the change towards SDL of the module given by
the student with the lowest score on Guglielmino‟s SDLRC
was:
“My first reaction to the change of the module was
negative. For me, it was a challenge that I was not sure I
could be up to. Generally students are lazy. So self-
directed learning could be useless for some students
because of the time management and the commitment of
the students. Not seeing a lecturer or getting explanation
from him/her could affect the performance of the student
learning.”
209
Proceedings of International Conference on Education, Informatics, and Cybernetics (icEIC 2011),
and the International Symposium on Integrating Research, Education, and Problem Solving (IREPS 2011)

On the hobby research the answer was:
“It is very seldom. I must admit. I don‟t even remember if
I did it once.”
Both methods of investigation identified this student as
somebody with a low level of SDL readiness. The interpretive
answers might provide more insight on how to guide him/her to
improved SDL skills.
Further analysis will be done to compare the results of specific
students for related questions in the questionnaires.
8. CONCLUSION
The aim of this paper was to investigate the readiness for SDL
of 4th year IS students. It was decided to do two studies in
parallel. The students completed the SDLRS of Guglielmino,
which is a positivistic measurement tool. The average score of
the students is slightly above average which may be contributed
to the fact that all of them have completed a Bachelor‟s degree
successfully. The students also completed an interpretive
questionnaire. Only a small number of the questions were
reported on in this paper, but it demonstrated the richness of
information contained in these answers. Specific fears and
negative sentiments towards SDL could be expressed by
students and could be understood by the lecturer. These may
now be addressed by the development of a blended learning
environment accommodating different levels of SDL
capabilities of students.
Interpretive data analysis is time consuming and it is difficult to
get an instant overall view of the concept that was investigated
when compared to positivistic data analysis. It does however
provide a better understanding of specific participant‟s
motivation for their answers. The authors of this paper support
the view of Mingers [9] that when methods from more than one
paradigm are applied to the same problem a greater richness of
understanding can be achieved.
9. REFERENCES
[1] A.L Berh, Empirical research methods for the human
sciences: An introductory text for students of education,
psychology and the social sciences. Pretoria: Butterworths.
1983.
[2] M. Fisher, J. King & G. Tague, Development of a self-
directed learning readiness scale for nursing education.
Nurse Education Today, 21, 2001. pp516-525.
[3] B.G. Glaser & A.L. Strauss, The discovery of grounded
theory: Strategies for qualitative research. New York,
N.Y.: Aldine de Gruyter. 1967.
[4] G.O. Grow, Teaching learners to be self-directed. Adult
Education Quarterly, 41(3). 1991. pp125-149.
[5] L.M. Guglielmino, Development of the self-directed
learning readiness scale. Athens: University of Georgia.
(Dissertation -PhD). 1977. 135p.
[6] P. Guglielmino & L. Guglielmino. General information.
http://www.guglielmino734.com/newpage1.htm Date of
access: 15 Oct. 2011.
[7] M.S. Knowles, Self-directed learning: A guide for learners
and teachers. Englewood Cliffs: Prentice Hall/Cambridge.
1975. 135p.
[8] H.K. Klein & M.D. Myers. A set of principles for
conducting and evaluating interpretive field studies in
information systems. MIS Quarterly, Vol. 23, No1, 1999.
pp 67-94.
[9] J. Mingers, Combining IS research methods: Towards a
pluralist methodology. Information systems research Vol.
12, No.3, 2001. pp240-259.
[10] G.M. Piskurich, Self-directed learning: a practical guide to
design, development, and implementation. California:
Jossey-Bass. 1993. 359p.
[11] SAQA, South African Qualification Authority. Level
descriptors for the South African National Qualifications
Framework.
http://www.saqa.org.za/show.asp?include=focus/ld.htm
Date of access: 13 Sept. 2011.
[12] SDLRS website. http://www.lpasdlrs.com/main.php Date
of access: 15 Oct. 2011.
210
Proceedings of International Conference on Education, Informatics, and Cybernetics (icEIC 2011),
and the International Symposium on Integrating Research, Education, and Problem Solving (IREPS 2011)

Experiences from Implementation of National and International, Collaborative, Virtual Universities
Harald HAUGEN
Stord/Haugesund University College Stord, N-5416, Norway
and
Bodil ASK University of Agder
Grimstad, N-4876, Norway
ABSTRACT Pressure from society and a growing need for education and specialised knowledge require new ways of facilitating access to learning and documentation of qualifications. Traditional universities do not have capacity to meet these challenges at their own premises. The use of ICT and Internet seems to be a possible way to increase access and capacity. In order to keep costs and efforts at a reasonable level without lowering study quality or staff qualifications, collaboration and sharing of material and competence may be the best option. This has been tested over the past 20 years in different plans and projects. Experiences from three projects are presented in this paper: NITOL (Norway-net with IT for Open Learning) as a national project in Norway, MENU (Model for a European Networked University) at a European level, and UNU-GVU (Global Virtual University) with students and partners around the World. The analysis of positive and negative findings leads up to certain recommendations that may be of value for future attempts to exploit the full potential of collaboration between universities. Hopefully the establishment of collaborative virtual universities can meet some of the global needs for higher education.
Keywords: Higher Education, Collaboration, ICT, Virtual Universities, National and International Projects
CLARIFICATION OF CONCEPTS Universities have been operating more or less in the same way for centuries; with students staying at the university for a period of time, getting their degrees and diplomas and then leaving. This has been the typical pattern until the last couple of decades. Terms like networked university, e-learning institution or a virtual university, are new terms that indicate universities offering distance or flexible education. Previously it was difficult to find a definition of the term virtual university; now it is defined in a way that suits our purpose well. Wikipedia explains:
A virtual university provides higher education programs through electronic media, typically the Internet. Some are bricks-and-mortar institutions
that provide online learning as part of their extended university courses while others solely offer online courses. They are regarded as a form of distance education. The goal of virtual universities is to provide access to the part of the population who would not be able to attend a physical campus, for reasons such as distance - where students live too far from a physical campus to attend regular classes; and the need for flexibility – some students need the flexibility to study at home whenever it is convenient for them to do so.. - - - [1]
Some universities are dedicated to distance learning only, for instance Open University in England [2] and the Open University in the Netherlands [3]. Both OU-UK and OU-NL allow students to enrol regardless of formal qualifications and still offer bachelor and higher degree studies. Other universities are dual-mode institutions, offering education at distance as well as on campus; examples: the Finnish Virtual University [4], Canadian Virtual University [5], and the Open Universities in Australia [6]. All these virtual universities are networks of universities, e.g. the FVU is a partnership of 21 Finnish Universities. It is based on collaboration, division of labour, shared knowledge and the expertise of the member universities. “It is not a new university in itself and does not provide university education. For virtual studies you have to enrol in one of the member universities” [4]. In this paper the term virtual university is used for universities that offer online education on the Internet, accessible to students both on and off campus, but not necessarily their own courses. Terms like open universities, net-universities, networked universities, e-universities etc are in this respect treated as synonyms to virtual universities. However, a collaborative virtual university (CVU) is defined to be a network of universities which collaborate in developing and offering courses and educational programmes online. Some of the above mentioned examples are of this kind. In a CVU the institutions join forces to develop and offer online education to students, either at distance or as blended solutions. Three such models will be presented below.
211
Proceedings of International Conference on Education, Informatics, and Cybernetics (icEIC 2011),
and the International Symposium on Integrating Research, Education, and Problem Solving (IREPS 2011)

NORWAY-NET WITH IT FOR OPEN LEARNING, NITOL [7]
Representatives from the ICT departments at four Norwegian higher education (HE) institutions,
• Teacher Education, at Stord/Haugesund University College (SHUC) [8]
• Institute of ICT at University of Agder (UiA) [9] • Engineering, at Sør-Trøndelag University College
(STUC) [10] • Institute of Informatics at Norwegian University of
Science and Technology (NTNU) [11] - joined forces in a proposal for the NITOL project. The proposal was awarded with a governmental grant for 2 + 2 years, 1994 - 97. NITOL was initially an open learning R&D project offering ICT related courses for students, teachers, ICT professionals and others. Research questions particularly focus-ed on learning environments based on collaborative develop-ment and distribution of course material. During the first years large efforts had to be devoted to technical solutions. As Internet and PCs gradually stabilised and became more user-friendly, pedagogy and subject content came more to the foreground of the work. The timely introduction and rapid development of World Wide Web (www) meant a major breakthrough for ICT-based Open and Distance Learning (ODL). NITOL happened to be there “just-in-time” to exploit the technology and to meet demands from the public. An important principle was the free flow of material between the four NITOL partners. Of course, copy rights and the academic property rules applied equally well to electronic products as to printed material. At the start of the project, however, a partnership agreement was signed, stating that partners were free to “borrow” material from their colleagues, use it in their own courses, develop it further and offer it to the whole team of partners. The condition was that the name/institution of the author - and further developers - should be visible to everyone who was exposed to the material. During the project period this free exchange of competence and material was one of the major assets of the project. All partners had great advantages from it.
0
500
1000
1500
2000
2500
Students
S/94 F/94 S/95 F/95 S/96 F/96 S/97 F/97 S/98 F/98Semester
NITOL Development, 1994-98
Fig. 1 [12] The fast growth in student enrolment (Fig 1) required serious thinking about daily routines for running the project. In 1996 some systematic work was done to develop “The Administrative Concept of NITOL” [13], covering the central issues of the project organisation. To keep the administrative
work at a minimal level, and to reduce parallel work as much as possible, the daily chores from the individual institutions were transferred to a joint secretariat. This secretariat took care of e.g. student registration, collection of course fees, organising exams, editing and printing course catalogues, providing technical support for students, assistants and staff etc. Students then had the advantage of dealing with only one point in the network when registering, paying and asking for practical information. The four institutions benefited from receiving both preliminary and final student lists for each course they were responsible for, and by receiving their respective sums of money earned through course fees without having to track each individual student. NITOL exchanged ideas and evolved in close relations with projects funded by the European Commission under different framework programmes and specific initiatives. Joint experien-ces through these projects have supported and inspired new developments, both on the R&D side and more practically for courses and study programmes that were offered. Despite that NITOL already operated as a collaborative virtual university, it turned out to be great challenges for other higher education institutions, both in Norway and internationally [14].
Transition to a national networked university The course activities in NITOL grew too large for ad hoc administration. Leaders of the four partner institutions were approached for institutionalisation and a more official status of the activities. In early 1998 an agreement for establishment of a national networked university, NettVerksUniversitetet (NVU) [15], was worked out. In December 1998 the partnership agreement was officially signed by the four NITOL institutions - plus five other Norwegian partners. A board and a steering committee for NVU were appointed at the institutional administrative level. The Networked University (NVU) was meant to be a network of HE institutions in Norway, not a new, independent Norwegian university. For a start they should take over the course activities from NITOL and develop it further. After a few years, however, the NVU board decided to skip most of their joint course activities, like the common course catalogue, central enrolment of students, marketing etc. The development of NVU did not live up to expectations of the NITOL group. NVU joint activities ended up being only the establishment of special interest groups (SIG) and the arrangement of an annual conference on e-learning. Joint activities for marketing of courses etc were abolished, the total course enrolments went down and there were only minor exchanges between the partner institutions. The major mistake is suspected to be that the new NVU administration distanced themselves from the professionals, the founders and enthusiasts that created and developed the NITOL principles. The initial NITOL group remained active through 2008, after the establishment of NVU mainly with R & D work, engagement in national and international projects, and less with daily services to students and practical administration. A final project report was worked out, printed, handed over to the four institutions and made available other for interested parties [7].
Going International Internationally the NITOL group kept up the activity within joint networks and e-learning projects also after the NVU was
212
Proceedings of International Conference on Education, Informatics, and Cybernetics (icEIC 2011),
and the International Symposium on Integrating Research, Education, and Problem Solving (IREPS 2011)

established. During the total of 15 years (1994 - 2008) the idea of openness and collaboration was promoted through several projects, most of them at a European level [16]. Some of these projects may still be of interest for understanding of the different ideas behind the final model for an international collaborative, virtual university. In particular the following five projects were central for gaining experience and developing competence at the four NITOL institutions: • MECPOL - Models for European Collaboration and
Pedagogy in Open Learning (1995-98) [17] • Do ODL Dissemination of Open and Distributed Learning
(1996-97) [18] • EuroCompetence (1998-2000) [19] • MENU – Model for a European Networked University for
e-learning (2001-03), with a clear intention to create a European NITOL, or a European Virtual University EVU [20]
• QUIS – Quality, Interoperability and Standards in e-learning (2005-06) [21]
The MENU project was particularly interesting for continued work on international, collaborative virtual universities. It was responding to an initiative taken by the European Commission in 2001 [22], aiming at mobilising existing resources for designing tomorrow’s education. This project also constituted the basic idea behind a global virtual university. Both of these concepts will be explained and analysed in the following two sections of this paper.
A EUROPEAN, COLLABORATIVE VIRTUAL UNIVERSITY
Based on priorities from the European Commission the MENU project [20] set out to develop a model that could be implemented into a sustainable consortium. The project was running from December 2001 till December 2003, intending to establish the virtual ENU (European Networked University) - or EVU (European Virtual University) in 2004. The aim and objectives of the MENU project were stated in the proposal that was submitted (2001) to the e-Learning Initiative, a programme launched by the European Commission [23]. The aim was to develop a model that provided guidelines for developing collaborative virtual universities. More precisely the main objectives were to:
• Activate the political principles stated in the Bologna and Sorbonne declarations, in the e-learning action plan, by establishing the 'business plan' for an ENU, accepted and integrated into national educational programmes
• Demonstrate the possibility of developing joint study programmes across institutional and national borders
• Establish a model for management and services for a virtual university. Options for scalability (up/down) for ENU as an independent organisation or as a virtual network. [24, p. 20]
The objectives were demanding and a real challenge for a project period of only 2 years.
There were four main stages in the project • Establishing the partnership and agreeing on
principles, goals and methods • Creating the necessary documents/plans for the model • Testing the model by running real courses on the net;
quality assurance • Finalising the model, based on plans and experiences;
dissemination of results [25, p.6]. The first task was to formulate a partnership agreement which could be signed by the partners involved. Further activities should include the establishment of joint study programmes across institutional and national borders, exemplified by a masters programme. [26, p.4]. A European master degree programme must have academic as well as political acceptance. The MENU project, therefore, was to provide the structure for a generic study plan and for the quality assurance needed. The pilot test, however, was meant as a first step for a more sustainable networked university. Anticipated outcomes from the project were: • A sustainable European Networked (virtual) uni-
versity, with an array of study programmes, avail-able throughout Europe, in various languages
• A common quality assurance system for general acceptance of credits and degrees obtained through ICT-based studies
• An operational study plan for a European Master Degree programme, based on contributions from several countries and institutions, a model showing
o Subject content and method o Learning material and environment
• A net based support system • Management plan for scalable studies • Publication of experiences, results and guidelines
for the establishment of a permanent ENU. [25, p.4] This was an extensive list, but every item of it was fulfilled during the project period and all documents can be found at the project’s website: http://www.hsh.no/menu During the 2 year project period representatives of the 11 partners from 7 countries worked intensively together through discussions, draft documents and testing of ideas to come up with a complete description of a model that was likely to be implemented. In the final report lists the structure and visions:
Principal ENU goals The primary goals of an ENU may be expressed as follows: • To enrich the portfolio of the programmes offered by each
of the ENU institutions today. New programmes should be collaboratively designed, directed and delivered within ENU. All programmes should use human resources and learning content from ENU institutions
• To fulfil demands that exist in the market for programmes covering new topics due to technological and cultural
213
Proceedings of International Conference on Education, Informatics, and Cybernetics (icEIC 2011),
and the International Symposium on Integrating Research, Education, and Problem Solving (IREPS 2011)

evolution, or not available yet due to lack of human and other recourses at a single university
• To guarantee high quality of the ENU programmes through pooling of ENU resources, instructors, course material etc. and a strict control applied to each programme following a Quality Assurance System (QAS) [27, p. 4]
In order to obtain these goals several measures must be taken.
Organisation The organisation of the network to master the challenges of the strategy was proposed in the following manner.
Organisational Entities a) ENU should have a Board with members at institutional
level to ensure the anchoring of ENU in each partner institution, to have access to resources in the institution and to bring political power to ENU.
b) A Board Working Group should be appoint as a sub-group among the Board members, consisting of people who are specialists in one or more tasks related to the operation of a virtual university.
c) The ENU Secretariat could be hosted by one of the legal institutions, or the services could be bought externally, for the daily operation of ENU. The size of the secretariat would depend on the finances of ENU, but should be kept at a minimum.
d) An Administrative Group should work on overcoming differences between administrative systems and practices at the institutions. There could also be an Academic Group, taking care of quality assurance, and development of new curricula, a Research Team to work on questions related to the use of ICT in education. [27, p. 5]
Agreement and services An agreement between the institutions collaborating in ENU must be established and signed, stating the role of the ENU both as a virtual and as a physical organisation. An example of such an agreement is found attached to the organisational plan for ENU. [28, p. 23-25 ] Offering distance e-learning courses requires both a pedagogical and a technical platform. ENU should not enforce particular pedagogical approaches or a common learning management system (LMS). ENU consists of several institutions with different traditions in teaching and e-learning. There should be plans and provisions for services to the public, the users, internal services, technical services, and measures for security. Committees or task groups could be set up for particular purposes like pedagogical methods, marketing of ENU programmes, business strategies, and in particular a forum for information and discussions about e-learning standards (e-learning environments, LMS, learning units etc.)
Quality of studies Students and society demand educational systems of high quality - the students because they spend time and money for the education, and the society because educational quality is the best insurance for future welfare and development. Reasons for implementing a comprehensive quality assurance system (QAS) stems from the competition with a growing number of institutions offering courses through the Internet, and that
institutions all over Europe are urged to offer joint study programmes. A QAS that could be applied and accepted across all partner institutions would be of particular importance. This would have to define parameters and assessment methods for several factors, like administrative systems, study programmes, courses, staff qualifications, student assessment and qualifi-cations. [29]
Plans and development of study programmes and courses In order for collaboration between institutions to take place, it was necessary to develop a joint approach to the description of programmes and courses in order to have a common working vocabulary, before designing the template. An explanation of the key terms used, were as follows: - A study programme consists of a number of courses, and
awards a formal qualification or a degree - A course can be part of more than one programme, and is
awarding credits - A course is made up of a number of modules or study
blocks - A module or a study block can be part of more than one
course. - A module or a study block consists of a number of
learning objects - A learning object can be used within more than one
module or study block [24, p. 64]
The mENU project adapted the structure from the first two levels as a starting point for designing the demonstrator, testing some courses of two different study programmes.
Credit Transfer An already existing and specified European Credit Transfer System (ECTS) was appropriate for the creation of transparency of the study programmes, for “building bridges” between institutions and widening the choices available to students. The system made it easier for institutions to recognise learning achievements of students through the use of commonly understood measurements - credits and grades - and it also provided means to interpret national systems of higher education. But it needed adaptation in order to accommodate procedures related to the net based learning (NL) nature of study programmes. A modular approach to construction of courses, applying the ECTS-NL, would enhance flexibility, cooperation and sustain-ability of dynamic study programmes. Clear advantages here can be stated as follows [24, p. 70-73]:
• Standardisation: Those designing a course or a module know in advance the exact amount of workload the total course shall have, and are guided in implementing it with a set of learning objects
• Flexibility: It is rather easy to develop interchangeable courses and modules that can be assembled, disassembled and re-used easily
• Distributed development of courses and modules: More than one institution can collaborate for the design, development and delivery of a study programme, a course or even a module
• Adaptability: a course or a module can be localised to diverse student populations or special target groups
214
Proceedings of International Conference on Education, Informatics, and Cybernetics (icEIC 2011),
and the International Symposium on Integrating Research, Education, and Problem Solving (IREPS 2011)

Economy ENU was meant to be a consortium administrated at the location of one of the ENU partners. Even if the experiences of models with rotating administration have not usually been very encouraging, this seemed to be a realistic first step [24, p. 86-88].
Funding The financing for the ENU work would basically consist of the following sources: • Annual remunerations, i.e. annual fees paid for the
participation in the ENU network; may be paid as service fees between the HEIs etc.
• Membership fees on an annual basis • Public subsidies from governments, EU projects, national /
regional projects etc. • Revenues from brokerage and fees, generated income,
partially channelled back to the partners for their courses and services
• Other income, e.g. specific infrastructure project funds One of the motives for joining the ENU would be to offer courses for a larger market, and perhaps make more revenues.
Costs / expenditure This will consist of e.g. board costs, board working group costs, the ENU secretariat which includes • personnel costs; leader, study administrator, technical
support etc. • office costs • operational costs Further on there would be development costs, where each institution is responsible for its own courses. Each institution must therefore cover these costs. Costs for joint development should be agreed upon in advance.
Concluding remarks In the mENU project there was developed a lot of tools that would be helpful in constructing an ENU. To some extent the tools were used to create a demonstrator i.e. master programmes and courses. The programmes were still at the end of the project period running with students from around the World and with courses delivered by several institutions. The testing was then at an early stage, but has during the following years been further developed. One of the programmes, the ICT in Learning, is still running as a permanent, mainly net based, study at Stord/ Haugesund University College in Norway, now announcing its tenth intake of students in 2012. In the process of designing tomorrow’s education and to foster the European dimension, the MENU partners strongly believed that virtual European universities, based on partnership and cooperation with other universities, represented a possible way to move forward. The above description outlines some of the main principles for a network model to create an ENU. More details and background for the suggestions can be found in the full report. The hope was that the work of the mENU team would be of benefit to the community and to institutions that embark on the development of a collaborative, virtual university.
A GLOBAL VIRTUAL UNIVERSITY A Global Virtual University, UNU-GVU [30] was established as an online network of universities for sustainable development, and had a particular objective to meet the educational needs of the third world. GVU was officially launched in September 2002 at the World Summit on Sustainable Development in Johannesburg, SA, where the Norwegian Government, the United Nations University, UNU, [31] and the United Nations Environment Programme, UNEP, [32] pledged their support and partnership. The United Nations University - Global Virtual University, UNU-GVU, [33] offered courses from different universities, e.g. a course on global environment issues based on the UNEP report “Global Environment Outlook”, GEO [34], as part of a master degree programme, Global Environment and Develop-ment Studies, GEDS [35]. This was part of the MENU demonstrator, involving students and tutors from around the World, actually following the NITOL principles of joint development and collaboration for net based learning. One of the most popular courses offered through the GVU network, was e-Teaching, actually a sequence of two courses, E-teaching I [36] and E-teaching II [37], both based on structure and content ideas from the NITOL course on Pedagogy in Open Learning, PiOL [38]. The main idea behind these courses was to qualify professors and teachers to develop and tutor e-learning - or net based - courses within their own subject areas. This was particularly important for the partners of GVU that should provide higher education for students in developing countries, in remote areas and at universities lacking capacity and competence in certain disciplines. The concept and principles of open collaboration, mutual trust and joint efforts are fragile, but still a key issues for success at local, national and international levels. They turn out to be hard to carry over from the initial NITOL partnership to other HE institutions. Even at the founding institutions, most of the basic principles in NITOL have suffered shifting support.
SUMMARY AND RECOMMENDATIONS
Brief summary of experiences Experiences from the above described projects seem to indicate that the Millennium was too early for most academic environ-ments to accept all the new concepts that made up the foundation for a collaborative virtual university:
1. Net based higher education, students not necessarily on campus
2. Sharing of knowledge, material and students 3. Acceptance of competence, courses and credits from
partner institutions The maturity within the institutions, regarding the use of ICT in education, implementation of ECTS and the willingness to create courses to be used over the Internet, varied considerably. There was still a way to go. Now, nearly 10 years later, experiences show that this maturing and readiness improves. But still there are hurdles to overcome.
215
Proceedings of International Conference on Education, Informatics, and Cybernetics (icEIC 2011),
and the International Symposium on Integrating Research, Education, and Problem Solving (IREPS 2011)

Past experiences indicate that Collaborative Virtual Universities face serious challenges: e.g. in the following areas: • Establishing and implementing a detailed and
mutually acceptable partnership agreement • Setting up an organisational framework for
– recognition of competence, courses, credits etc.
– similar or compatible technology and learning environment,
– a common quality assurance system, a QAS – economy, including fees, common
expenditures • Resolving national and institutional differences
related to degrees, credits, grades etc. • Sharing and allocation of responsibilities
The demonstrator, or user trials, with joint master study programmes in MENU, revealed that local and national regula-tions prevented some of the partner institutions to participate. Even though the institutional leaders had signed partnership agreements that included this kind of joint practice, some institutions were bound by own or national regulations that did not e.g. allow participation in courses by students who were not present on campus, or they could not accept exams or credits obtained from other institutions. In a few cases the project was able to over-rule this kind of objections by referring to the signed partnership agreement. Based on the experiences from NITOL, MENU and GVU there seem to be some central items that should be adhered to. These are presented as point of advice below. We still believe that the idea of collaboration between institutions for better quality, more efficient and sustainable net based study programmes with simpler access, particularly for people who are not in a position to stay on campus to obtain higher education.
Recommendations For academics and leaders who may embark on new projects and attempts to implement a collaborative virtual university, CVU, a list of hints to avoid the most obvious stumble blocks, will hopefully be of some help. These are a few observed recommendations along the road. Setting up the framework: • Choose partners whom you already know as professionals,
preferably making up a team with complementary compe-tences
• Start with few partners and do not involve all faculties and departments from the very beginning. Let the network expand gradually within your own institution
• Make sure that every partner understands what you are planning to do together
• Define area(s) of content, professions, target groups etc that you are going to serve within your CVU
• Have important principles and regulations settled in a partnership agreement, signed at both administrative and project level
Running the CVU: • Keep focus on the learning environment, e.g.
- Allow for varying and different pedagogical approaches
- Facilitate for efficient & deep learning - Learning is an active, individual process – also in
groups and on the net - Blended learning may be a relevant alternative in
some cases, with physical seminars if possible • Training of personnel is important, both professors, tutors
and service personnel • There may be extra costs involved, particularly at early
stages. Try to allocate extra funding. Internally or externally, to help transition to new methods
• New technology appears all the time. So be careful not to commit yourself or your partners to only one set of technology or software, but have open discussions about changes.
Taking these - and other - pieces of advise into account, it should hopefully be possible to implement more CVUs for the benefit of future learners.
REFERENCES
[1] Wikipedia, the free encyclopaedia. Retrieved 14.12.2011, from http://en.wikipedia.org/wiki/
[2] OU-UK. Open University - UK. Retrieved 14.12.2011, from http://www3.open.ac.uk/about/
[3] OU-NL. Open Universiteit Nederland. Retrieved 14.12. 2011, from http://www.ou.nl
[4] FVU. The Finnish Virtual University. Retrieved 14.12.2011, from http://www.virtuaaliyliopisto.fi/en/index.html
[5] CVU. Canadian Virtual University. Retrieved 14.12.2011, from http://www.cvu-uvc.ca/english.html
[6] OU-Au. Open Universities Australia. Retrieved 14.12.2011, from http://www.open.edu.au/
[7] NITOL (2009): Haugen, H.; Ask, B.; Hjeltnes, T.; Staupe, A.: 15 years as pioneers within net based learning, TISIP 2009
[8] Stord/Haugesund University College, Norway; SHUC,. Retrieved 14.12.2011 at http://www.hsh.no/english.htm
[9] UiA: University of Agder retrieved 14.12.2011 at http://www.uia.no/en
[10] Engineering, at Sør-Trøndelag University College (STUC), retrieved 14.12.2011 at http://hist.no/english/
[11] Institute of Informatics at Norwegian University of Science and Technology (NTNU), retrieved 14.12.2011 at http://www.ntnu.edu/
[12] Maribu, G. (1999). Utvikling av NITOL 1994-98, Årsmelding for TISIP 1999, Norway
216
Proceedings of International Conference on Education, Informatics, and Cybernetics (icEIC 2011),
and the International Symposium on Integrating Research, Education, and Problem Solving (IREPS 2011)

[13] NITOL (1996). The Administrative Concept of NITOL, 1996, Internal Document
[14] Ask, B. (2004) Collaborative Virtual Universities - a Challenge for Higher Education Institutions. (Not published)
[15] Norwegian Network University, NVU, retrieved 14.12.2011 at http://www.nvu.no/nvu.php
[16] Haugen, H., & Ask, B (2005). From R&D Project to Virtual Universities. In Howard, C., Boettcher, J.V., Justice, L., Schenk, K., Rogers, P.L., & Berg, G.A. (Eds.), Encyclopedia of Distance Learning: Idea Group Reference. Hershey, PA
[17] MECPOL - Models for European Collaboration and Pedagogy in Open Learning: http://www.aitel.hist.no/prosjekter/ekstern/mecpol/
[18] Do-ODL - .Dissemination of Open and Distance Learning: http://www.aitel.hist.no/prosjekter/ekstern/doodl
[19] EC - EuroCompetence: http://www2.tisip.no/engelsk/ec/
[20] MENU - Model for a European Networked University for e-learning, http://www.hsh.no/menu
[21] QUIS - Quality, Interoperablitily and Standards in e-learning: http://tisip.no/faces/public/forskning/index.jsp?ex=1&ink=prosjektkatalog#QUIS
[22] EU Commission (2001), eLearning - Designing tomorrow's education: http://europa.eu/legislation_summaries/education_training_youth/lifelong_learning/c11046_en.htm
[23] The eLearning Action Plan: Designing tomorrow's education,. COM(2001) 172 final, Brussels, 283.2001. Retrieved 14.12.2011, from http://eur-lex.europa.eu/LexUriServ/LexUriServ.do?uri=COM:2001:0172:FIN:EN:PDF
[24] MENU-Team (Eds.). (2004), Report WP 4a:. Model for ENU retrieved 15.12.2011 from http://ans.hsh.no/lu/inf/menu/final/wp/model_menu_final.pdf
[25] Ask, B., Haugen, H., Hjeltnes, T.,& Staupe, A. (2001). MENU: Model for a European Networked University, Project proposal. HiA, HSH, HiST, NTNU. Retrieved 15.12.2011, from http://ans.hsh.no/lu/inf/menu/protected/Annex%203.doc
[26] Haugen, H., & Ask, B. (2003, 8-9 May 2003). The MENU Project : Model for a European Networked University for E-Learning. Paper presented at the International Conference on Network Universities and E-Learning. Valencia
[27] MENU-Team (Eds) (2004), Report WP4a: Model for ENU - executive summary, retrieved 15.12.2011 at http://ans.hsh.no/lu/inf/menu/final/wp/MENU_folder.pdf
[28] MENU-Team (Eds( (2002), Report WP 1c: Preliminary organisational plan of ENU, retrieved 15.12.2011 at http://ans.hsh.no/lu/inf/menu/final/wp/org_plan_ver2_1.doc
[29] MENU-Team (Eds.). (2004), Report WP2b: Quality Assurance, retrieved 15.12.2011 at http://ans.hsh.no/lu/inf/menu/final/wp/QAS0202c1_bodils_siste.doc
[30] UNU-GVU: United Nations University – Global Virtual University: http://dev.grida.no/gvu/pdf/brochure.pdf (viewed Oct. 2011 [31] UNU: United Nations University, retrieved 17.12.2011 ttp://www.unu.edu/h
[32] United Nations Environment Programme, UNEP, retrieved 17.12.2011: http://www.unep.org/
[33] GVU: Global Virtual Univeristy, retrieved 17.12.2011: http://www.virtualcampuses.eu/index.php/Global_Virtual_University
[34] GEO: Global Environment Outlook (2003). http://www.grida.no/publications/other/geo3/?src=/geo/geo3/
[35] Global Environment and Development Studies, GEDS http://www.globdev.org/files/U%20of%20Agder%201%20IS415%20Study%20Guide.doc
[36] E-teaching 1, http://www.uia.no/no/portaler/studietilbud/etter-_og_videreutdanning/e-teaching_1
[37] E-teaching 2: http://www.uia.no/en/content/download/84272/1400923/file/E-teaching+2+course+description.pdf
[38] Pedagogy in Open Learning, PiOL http://www.aitel.hist.no/prosjekter/ekstern/mecpol/catalogue/pedopenlearning.htm
217
Proceedings of International Conference on Education, Informatics, and Cybernetics (icEIC 2011),
and the International Symposium on Integrating Research, Education, and Problem Solving (IREPS 2011)

* Corresponding author.
Learning Anxiety and Language Proficiency
Minoo Alemi * Languages and Linguistics Department, Sharif University of Technology, Tehran, Iran
Roya Pashmforoosh Languages and Linguistics Department, Sharif University of Technology, Tehran, Iran
ABSTRACT
Since willingness to communicate (WTC) model integrates
psychological, linguistic, and communicative variables to
predict L2 communication, and a few number of studies have
tested the model with EFL students, the current study is an
attempt to shed light on the examination of Iranian EFL
and its interaction with their language
anxiety and language proficiency. By helping the students to
decrease language anxiety and increase a willingness to use the
L2 inside and outside the classroom, we direct the focus of
language teaching away from merely linguistic and structural
competence to authentic communication. The purpose of this
study is to understand whether WTC model could explain the
relationships between psychological and linguistic variables in
orty nine university
students participated in this study, they took TOEFL first and
then filled out two questionnaires of WTC. For data analysis,
Repeated Measures ANOVA and Spearman correlation were run
and the results have revealed that Iranian universit
WTC is directly related to their language proficiency but not
language anxiety. Therefore, linguistic variables appear to be
more predictive of WTC for Iranians, and language instructors
Keywords: Willingness to communicate, Language anxiety,
Language proficiency, EFL context, Iranian students
1. INTRODUCTION
Willingness to communicate (WTC) has been proposed as both
an individual difference variable affecting L2 acquisition and as
a goal of L2 instruction (MacIntyre, Clement, Dornyei, & Noels,
1998) [20]. To process WTC, the interface between two
disparate approaches, linguistic and psychological, in EFL
context has been overarching such a sustained commitment to
engage in communication. The tendency to communicate with a
specific person emanates primarily from affiliation and control
motives as potent forces to propel individuals to be involved in
interactive discourse. Unlike the previous studies in EFL context
(e.g., Kim, 2004 [11]; Clement, Baker, & MacIntyre, 2003 [5];
MacDonald, Clement, & MacIntyre, 2003 [13]; MacIntyre,
Baker, Clement, & Conrod, 2001 [16]; Peng, 2007 [27]; Peng &
Woodrow, 2010 [28]; Yashima, 2002 [30]), the behavioral
intention to use the language has been examined among Iranian
EFL university students to eliminate the demarcation between
language anxiety as a psychological structure and language
proficiency as a linguistic structure. Regarding the success of
using the second language, the dialectical relation between being
able and being willing to successfully communicate and use the
L2 requires further investigation. In situations where a proficient
learner is unwilling to communicate, high motivation for
learning and high anxiety about communicating may appear to
have a direct influence on L2 use (MacIntyre, 2007) [15].
1.1. Purpose of the Study
Those who are generally capable of communicating and get high
scores in the proficiency test are more willing than those who
are not capable communicator and get low scores. The
interaction between the influences of language proficiency and
language anxiety on WTC in an L2 learning context among
Iranian EFL learners has gone rather unnoticed. To this end, the
relation between language proficiency and WTC has been
subjected to investigation among Iranian EFL learners.
Furthermore, it seems to be found that no studies have as yet
dealt with the relationship between willingness to engage in
communication and language anxiety in the context of Iran. If
effective communication is an important skill for academic
success, studies have examined the factors affecting the
development of this skill among EFL learners are increasingly
become important for fostering the communicative ability of
language learners. Hence, communicative effectiveness may
communication and maintain social interactions.
The resulting affective state might be considered to address the
following research questions in the current investigation:
1. Does language proficiency influence Iranian university
2. Does language anxiety influence Iranian university
3. Is there any relationship between language proficiency
and language anxiety for Iranian university students?
218
Proceedings of International Conference on Education, Informatics, and Cybernetics (icEIC 2011),
and the International Symposium on Integrating Research, Education, and Problem Solving (IREPS 2011)

2. METHOD
This study examined [20] WTC model
and measured L2 WTC with the scale adapted from MacIntyre
et al. (2001) [16]. The participants were freshmen university
students in the EFL context at Sharif University of Technology
in Iran. This study tar
their foreign language.
2.1. Participants
The participants for this study were 49 engineering freshmen
who were taking a three credit General English course which
was compulsory at Sharif University of Technology. These
students had recently graduated from high school and were 18
years of age or older. There was no opportunity for the simple
random selection of the participants and they were in intact
classes, which were selected by the researchers, and filled out
the questionnaires. From among this number, six students who
did not participate in all stages of data collection were omitted
consequently.
2.2. Instruments
The data collected and used for the further analyses was
gathered via TOEFL (2003) with reliability index of .88 and two
questionnaires of language anxiety with reliability of .80 and
WTC with the total reliability of .85. The latter was a four-part
questionnaire which was in English. The different parts of this
questionnaire were as follows:
Willingness to Communicate in the Classroom: The first
two parts of the questionnaire were adapted from MacIntyre et
al. (2001) [16] to measure WTC in each of four skill areas. It
communicate in their EFL class while being assigned the
communicative tasks. A 5-point Likert scale was employed to
ask the learners to rate their willingness to communicate (with
1=almost never willing, 2=sometimes willing, 3=willing half of
the time, 4=usually willing, and 5=almost always willing). The
categorization of the items in each section was based on the type
of language skill (alpha levels were calculated for the reliability
L2 skill areas was to determine which of the skills are the more
active (like speaking) and which are the more receptive (like
reading) with respect to L2 use. The receptive usage is also
related to the concept of WTC because authentic usage of the L2
in form of the receptive skills and tasks may increase the
study was then an attempt to focus on the correlation between
the four skill areas.
Willingness to Communicate outside the Classroom: In
this section, a total of 27 items written by a graduate from the
immersion program in MacIntyre et al. (2001) [16] were used in
the present study; however, these items referred to the
willingness to communicate of the student out of the classroom
context. The respondents were to rate their WTC with the
application of the previously used subscales ranging from
1=almost never willing to 5=almost always willing. So, the
rating scale was the same used in the previous section, but with
different reliability estimates of four language skills: speaking (8
Orientations for Language Learning: The items employed
in this section were adopted from the ones used by Clement and
Kruidenier (1983) [7]. Students were to choose the extent to
which each of the reasons for learning English was true of them
using a 6-point Likert scale (where 1= strongly agree,
2=moderately agree, 3=mildly agree, 4=mildly disagree,
5=moderately disagree, and 6=strongly disagree). It enjoyed a
reliability of 0.91. There were also five proposed orientations,
each with four items: travel (
Social Support: There were 6 yes/no questions and students
were to answer these questions with regard to the source of
support for their L2 learning. This procedure was similar to
[2] method for testing subjective norms. The
whether these people provided them with support for learning
the L2: mother, father, teacher, favorite sibling, best friend, and
other friends. The items used in this section were not on a scale,
but individually given to respondents. Consequently, reliability
estimates cannot be estimated for the individual responses.
Language Anxiety: It was taken from Horwitz, Horwitz, and
Cope (1986) [9] and modified and decreased to 10 items. It
enjoyed a good reliability estimate of .80. A 5-point Likert scale
was used for this 10-item questionnaire, including 1= strongly
disagree, 2= disagree, 3= neutral, 4= agree, and 5= strongly
The items tackled general English language anxiety of the
learner in an English classroom.
2.3. Data Collection Procedure
To categorize learners in terms of language proficiency, reading
and structure section of TOEFL (2003) were given to the
learners. The test enjoyed an acceptable reliability index of 0.88
for 45 items (reading section Alpha = 0.85; structure section
responding the questions of the test. Then the students were
asked to complete two questionnaires during the time of their
regularly scheduled class. They were assured that any
information that they would provide would be used
anonymously and their names would remain confidential.
Answering the items took those who agreed to answer around 30
minutes. The questionnaire, also, enjoyed an acceptable
reliability index of 0.80. Table 1 shows the descriptive statistics
of the anxiety questionnaire. As is shown in this table, it seems
that the students in the present sample are not very anxious (M=
28.59, SD =7.21), they are less than half standard deviation
above mean of anxiety test (M=14). Finally, the data was given
to SPSS to calculate all reliability of and correlation among
different parts.
Table 1
Descriptive statistics of the anxiety questionnaire
Min
Max
M
SD
Anxiety 14.00 43.00 28.59 7.21
219
Proceedings of International Conference on Education, Informatics, and Cybernetics (icEIC 2011),
and the International Symposium on Integrating Research, Education, and Problem Solving (IREPS 2011)

3. DATA ANALYSIS AND RESULTS
To answer the questions addressed in this study, different
statistical procedures were employed.
3.1. Analysis One: Language Proficiency and WTC
proficiency
was subjected to Repeated Measures ANOVA. Language
proficiency was used as fixed factor in this analysis and WTC
inside and outside the classroom as two within-subject variables
and skills as four between-subject variables. Firstly, the total
score of TOFEL was changed into standardized Z score.
Secondly, learners were classified into two groups in terms of
language proficiency according to the Z score of their total score
in the TOFEL they took. Then those students with negative Z
score were considered as lower proficient and those with
positive Z score were considered as higher proficient learners.
The data, then, was subjected to Repeated Measures ANOVA
through SPSS. The result indicates that the interaction between
WTC and language proficiency was significant, F (1, 47) =
communicate outside and inside the classroom is different across
language proficiency.
Looking at marginal estimates of the measures, we found out
that there are mixed results concerning the location of WTC
across language proficiency. As is shown in Table 2, those with
lower language proficiency have higher willingness to
communicate outside the classroom, whereas those with higher
language proficiency have higher willingness to communicate in
the classroom. This might indicate that language proficiency
functions as barrier for Iranian students in this sample.
Interestingly, learners with higher language proficiency are more
communicative inside the classroom than those with lower
language proficiency, whereas they are less communicative than
those with lower language proficiency outside the classroom.
That is, those learners with lower language proficiency are
afraid to get evaluated. Or maybe, those with higher language
proficiency get more supports from the teacher inside the
classroom and that is why they are more communicative and
confident in communication. Pedagogically speaking, this
indicates that we need more supportive teachers who encourage
learners to be more communicative in class.
Table 2
WTC location across language proficiency
LG group WTC M SD
Low
Inside
79.68
2.75
Outside
86.16
3.34
high Inside 87.83 2.80
Outside
77.54
3.41
Willingness to communicate can function as both trait
(MacIntyre et al., 1998) [20] and state construct (Cao & Philip,
2006 [3]; Kang, 2005 [10]; MacIntyre, 2007 [15]; Peng, 2007
[27]). In the present sample, it seems that language proficiency
has manipulated
learners with different language proficiency showed different
amount of willingness (see Table 2 and Figure 1). According to
McCroskey and Baer (1985), we have extended the trait-like
conceptualization of WTC (cited in McCroskey, 1997) [12].
Following the two underlying constructs proposed by Clement
(1986) [4], perceived competence and lack of anxiety are two
comprising elements of self-confidence. In particular, it is also
probable to draw a distinction between the trait-like and
momentary feeling of confidence, which is known as state self-
confidence (MacIntyre et al., 1998) [20].
Figure 1: The interaction between language proficiency and
WTC
3.2. Analysis Two: Language Anxiety and WTC
Repeated Measures ANOVA was run. Language anxiety was
used as the main factor in this analysis and WTC location (inside
vs. outside) as two within-
score of anxiety was estimated, and then learners were classified
into two groups in terms of their levels of anxiety; those with
positive Z score were grouped as highly anxious and those with
negative Z score were grouped as lowly anxious. (Xz = 1.53, SD
= 0.50). The result is shown in Table 3.
Table 3
Frequency of learners' standard score on anxiety
Frequency
Percent
Valid
Percent
Cumulative
Percent
Low 23 46.9 46.9 46.9
High 26 53.1 53.1 100.0
Total 49 100.0 100.0
was subjected to Repeated Measures ANOVA. The result
indicates that there was no significant within-subject effect
(WTC F (1, 47) = 0.237, P = NS) nor any significant effect was
220
Proceedings of International Conference on Education, Informatics, and Cybernetics (icEIC 2011),
and the International Symposium on Integrating Research, Education, and Problem Solving (IREPS 2011)

seen for between-subject factors (anxiety F (1, 47) = 1.115, P =
NS). Moreover, the interaction between WTC and anxiety did
not turn out to be significant (F (1, 47) = 0.172, p= NS). This
shows that in the present sample anxiety would not affect the
way learners might decide to participate in communication
(WTC). This finding is interesting because in previous research,
MacIntyre, Baker, Clement, and Donovan (2003) [18], Yashima,
Zenuk-Nishide, & Shimizu (2004) [32] found that there are
correlational relationship between perceived competence,
language anxiety, and WTC. It should be noted that L2 anxiety
has been studied both as a distinct individual factor and as a
contributing variable (Papi, 2010) [26]. Considering its
interaction with willingness to communicate (e.g., MacIntyre,
1994 [14]; MacIntyre, Baker, Clement, & Donovan, 2002 [17];
MacIntyre & Charos, 1996 [19]; Papi, 2010 [26]), a negative
association between these two variables has been confirmed.
3.3. Analysis Three: Language Proficiency and Anxiety
relationship between language proficiency and language anxiety
run between TOEFL score (interval scale by nature) and Anxiety
score (ordinal scale by nature). As displayed in the Table 4,
anxiety and language proficiency have a negative relationship
which means that with higher language proficiency the amount
of anxiety decreases. This is not surprising and is fully supported
in the literature (MacIntyre & Gardner, 1991 [22], 1994 [23];
MacIntyre, Noels, & Clement, 1997 [24]; Steinberg & Horwitz,
1986 [29]). This is also true for TOEFL components. This
finding is revealing that anxious people are generally less
communicative in comparison to non-anxious ones. This might
be due to the fact that they are not able to communicate well in
terms of output quality. In this regard, anxiety affects both what
the students say and how they say it (MacIntyre & Gardner,
1994 [23]). The close connection between self-perception and
self-expression in authentic communication makes a significant
departure from the postulation of other academic anxieties
(MacIntyre & Gardner, 1989 [21]; Horwitz et al., 1986 [9]).
Table 4
The relationship between anxiety and language proficiency
TOEFL
Structure
Reading
Anxiety
TOEFL
1
Structure .88** 1
Reading .86** .57** 1
Anxiety
-.61**
-.66**
-.45**
1
**Correlation is significant at the 0.01 level (2-tailed)
4. CONCLUSION AND IMPLICATIONS
Willingness to communicate is offered to account for the
communication (Zakahi & McCroskey, 1989) [34]. It is believed
that WTC is an indicative factor of whether the individual will
turn into an L2 speaker. Then there are a number of factors
contributing to the quality and quantity of WTC in the EFL
context (Clement, Dornyei, & Noels, 1994 [6]; Peng, 2007 [27]),
naming communicative competence, language anxiety, risk-
taking, learn
teacher support, and classroom organization.
Research on WTC is not very old; it has originally developed
in first language acquisition (McCroskey & Baer, 1985;
McCroskey & Richmond, 1982; all cited in McCroskey, 1997)
[12]. The core issue of WTC is that there is a dialectical relation
between being able and being willing to communicate through
L1 and L2 language. The factor contributing to WTC is then
highlighted when other impeding factors such as anxiety and
language proficiency are taken into account. The purpose of this
study was to investigate the relation between language
proficiency, language anxiety, and WTC among Iranian EFL
learners. To this end, the following questions were posited:
1. Does language proficiency influence Iranian university
2. Does language anxiety influence Iranian university
3. Is there any relationship between language proficiency
and language anxiety for Iranian university students?
As displayed in the current study, there were mixed results
concerning the location of WTC across language proficiency.
Lower proficient learners indicated to have lower WTC inside
the classroom in comparison to those with higher language
proficiency who exhibited higher willingness to communicate in
the classroom context. Contrary to our expectation, the higher
proficient learners showed to be less communicative than those
with lower language proficiency outside the classroom. This
proves the state-like nature of WTC in the present sample. WTC
as one of the necessary components of becoming fluent in L2
which varies over time and across situations. In favor of the
proposed model by MacIntyre et al. (1998) [20] to account for
individual differences in the willingness to communicate, then,
WTC is closely tied to the situational factors that determine
study is supported by Matsuoka and Evans (2005) [25] who,
through structural equation modeling, found that language
proficiency, along with motivational constructs are indicative
factor of WTC. Also, it is supported by Yashima and Zenuk-
[31] research who found that the development
of proficiency and frequency of communication are fully
entangled with the active participation in the community of
practice through content-based approach. This implies that
having self-confidence in communication is crucial for affecting
how one is willing to be engaged in L2. Moreover, this suggests
that success will come to those who are more willing to initiate
in L2 communication, likewise, WTC may function as a situated
construct or situated model (MacIntyre et al., 1998) [20] where
contextual fluctuations and modifications like language
Cao and Philip (2006) [3] note, WTC varies in terms of factors
associated with the specific situation, topic, interlocutor, and the
confidence of learners to accomplish the task.
It was found to be that neither significant within-subject
effects nor significant between-subject factors contributed to L2
WTC. Moreover, the interaction between WTC and anxiety did
not turn out to be significant. This shows that in the present
sample anxiety, the psychological aspect of the original WTC
model, would not affect the way learners might decide to
221
Proceedings of International Conference on Education, Informatics, and Cybernetics (icEIC 2011),
and the International Symposium on Integrating Research, Education, and Problem Solving (IREPS 2011)

participate in communication. This has not gone along with
previous studies where the correlation between perceived
competence, language anxiety, and WTC was significantly high
(MacIntyre et al., 2003; Yashima et al., 2004 [32]). Then it can
be concluded that L2 anxiety has been studied both as a distinct
individual factor and as a contributing variable (Papi, 2010)
[26]. Considering its interaction with willingness to
communicate (e.g., MacIntyre, 1994 [14]; MacIntyre et al., 2002
[17]; MacIntyre & Charos, 1996 [19]; Papi, 2010 [26]), a
negative association between these two variables has been
confirmed. The non-significant interaction between anxiety and
WTC in this study might be due to some reasons. First, the
number of participants in this study was not large enough to
represent the magnitude of real difference among the variables
under the investigation. Second, another moderator variable
might be required for anxiety to affect WTC. Clement (1986) [4]
and Clement and Kruidenier (1985) [8] proposed self confidence
as intervening variable for both anxiety and perceived
competence. According to MacIntyre et al. (1998) [20], L2
anxiety as an enduring personal characteristics results variations
in L2 self-confidence; however, based on situations, the
fluctuation may still exist in terms of the degree of anxiety and
L2 use.
In the current study, the findings revealed that anxiety and
language proficiency are negatively correlated. This indicates
that, in the present sample, anxiety has a debilitative influence
on WTC. This is not surprising and is fully supported in the
literature (MacIntyre & Gardner, 1991 [22], 1994 [23];
MacIntyre et al., 1997; Steinberg & Horwitz, 1986 [29]). When
applied to L2 use, anxious students communicate less in
comparison to those who are non-anxious. In addition, anxious
students are not able to communicate well in terms of output
quality. In this regard, anxiety affects both what the students say
and how they say it (MacIntyre & Gardner, 1994) [23]. In the
specific anxiety-provoking contexts, there is a high degree of
negative correlation between L2 anxiety and L2 performance.
Typically, a lower level of anxiety and perception of L2
competence lead to a higher level of WTC (Yashima, 2002
[30]). The association between language learning experience and
L2 anxiety has been confirmed in the results of the study
conducted by Aida (1994) [1] and Young (1991) [33]. The
results indicated that negative language learning experience
leads to increase in L2 anxiety, while, positive language learning
experience contributes to decrease in L2 anxiety. Concerning the
location of WTC across language proficiency, the future
directions in L2 WTC study and attempts to extend the construct
of WTC inside the classroom to bring learners and outside the
classroom to bring nations into contact receive considerable
attention. Conceptually, according to MacIntyre et al. (1998)
[20], generating a WTC lends support to the ultimate goal of
language learning, that is, intercultural communication between
persons of different language and cultural backgrounds.
Moreover, the interactions between linguistic variables and
WTC are the concluding remarks of the study. This study
utilized language proficiency, the linguistic aspect and language
anxiety, the psychological aspect of the original WTC model.
contribute to their participation in communication. To explain
why some approach, whereas others avoid, communication then
the linguistic variables should be taken into consideration in the
EFL context. Therefore, language teachers should increase
as a predictive variable of WTC
and provide convenience for their learners
behavior.
5. REFERENCES
[1] Y. Aida,
Foreign Language Anxiety: The Case of Students of
Modern Language Journal, Vol. 78,
1994, pp. 155-168.
[2] I. Ajzen, Attitudes, Personality, and Behavior, Chicago:
The Dorsey Press, 1988.
[3] Y. Cao, & J. Philip, Interactional Context and Willingness
to Communicate: A Comparison of Behavior in Whole
Class, Group and Dyadic Intera System, Vol.
34, 2006, pp. 480-493.
[4] R. Clement, roficiency and
Acculturation: An Investigation of the Effects of
Language Status and Individual Characteristics
Journal of Language and social Psychology, Vol. 5,
No. 4, 1986, pp. 271-290.
[5] R. Clement, S. C. Baker, & P. D. MacIntyre, Willingness to
Communicate in a Second Language: The Effect of
Context, Norms, and V Journal of Language
and Social Psychology, Vol. 22, No. 2, 2003, pp. 190-
209.
[6] R. Clement, Z. Dornyei, & K. Noels, Motivation, Self-
Confidence, and Group Cohesion in Foreign Language
Classroom Language Learning, Vol. 44, No. 3,
1994, pp. 417-448.
[7] R. Clement, & B. G. Kruidenier, Orientations in Second
Language Acquisition: The Effects of Ethnicity Milieu
and Target Language on Their E
Language Learning, Vol. 33, 1983, pp. 273-291.
[8] R. Clement, & B. G. Kruidenier,
Motivation in Second Language Proficiency: A Test of
odel Journal of Language and Social
Psychology, Vol. 11, 1985, pp. 203-232.
[9] E. K. Horwitz, M. B. Horwitz, & J. Cope, Foreign
Language Classroom Anxiety The Modern
Language Journal, Vol. 70, No. 2, 1986, pp. 125-
132.
[10] S. J. Kang, Dynamic Emergence of Situational
Willingness to Communicate in a Second L
System, Vol. 33, 2005, pp. 277-292.
[11] S. J. Kim, Exploring Willingness to Communicate in
English among Korean EFL Students in Korea: WTC
as a Predictor of Success in Second Language ,
Unpublished doctoral dissertation, Columbus: Ohio
State University, 2004.
[12] J. C. McCroskey, Willingness to Communicate,
Communication Apprehension, and Self- perceived
Communication Competence: Conceptualization and
J. Daly, & J. C. McCroskey (Eds.),
Avoiding Communication: Shyness, Reticence, &
Communication Apprehension, Cresskill, NJ:
Hampton Press, 1997, pp. 75-108.
[13] J. R. MacDonald, R. Clement, & P. D. MacIntyre,
Willingness to Communicate in a L2 in a Bilingual
Context: A Qualitative Investigation of Anglophone
and Francophone Students , Unpublished manuscript,
Cape Breton University, Sydney, Nova Scotia,
Canada, 2003.
222
Proceedings of International Conference on Education, Informatics, and Cybernetics (icEIC 2011),
and the International Symposium on Integrating Research, Education, and Problem Solving (IREPS 2011)

[14] P. D. MacIntyre, Variables underlying Willingness to
Communicate: A Causal Analysis Communication
Research Reports, Vol. 11, 1994, pp. 135-142.
[15] P. D. MacIntyre, Willingness to Communicate in the
Second Language: Understanding the Decision to
Speak as a Volitional P The Modern
Language Journal, Vol. 91, 2007, pp. 564-576.
[16] P. D. MacIntyre, S. C. Baker, R. Clement, & S. Conrod,
Willingness to Communicate, Social Support, and
Language Learning Orientations of Immersion
Students , Studies in Second Language Acquisition,
Vol. 23, 2001, pp. 369-388.
[17] P. D. MacIntyre, S. C. Baker, R. Clement, & L. A.
Donovan, Sex and Age Effects on Willingness to
Communicate, Anxiety, Perceived Competence, and
L2 Motivation among Junior High School French
Immersion S Language Learning, Vol. 52,
No. 3, 2002, pp. 537-564.
[18] P. D. MacIntyre, S. C. Baker, R. Clement, & L. A.
Donovan, Talking in Order to Learn: Willingness to
Communicate and Intensive Language P
The Canadian Modern Language Review, Vol. 59,
No. 4, 2003, pp. 589-607.
[19] P. D. MacIntyre, & C. Charos, Personality, Attitudes, and
Affect as Predictors of Second Language
C Journal of Language and Social
Psychology, Vol. 15, 1996, pp. 3-26.
[20] P. D. MacIntyre, R. Clement, Z. Dornyei, & K. Noels,
Conceptualizing Willingness to Communicate in a
L2: A Situational Model of L2 Confidence and
Aff The Modern Language Journal, Vol.
82, 1998, pp. 545-562.
[21] P. D. MacIntyre, & Anxiety and Second-
Language Learning: Toward a Theoretical
Clarificatio , Language Learning, Vol. 39, 1989,
pp. 251-275.
[22] P. D. MacIntyre, & R. C. Gardner, Methods and Results in
the Study of Anxiety in Language Learning: A Review
of the L Language Learning, Vol. 41,
1991, pp. 85-117.
[23] P. D. MacIntyre, & R. C. Gardner, ubtle Effects of
Language Anxiety on Cognitive Processing in the
Second Language Language Learning, Vol. 44, No.
2, 1994, pp. 283-305.
[24] P. D. MacIntyre, K. Noels, & R. Clement, Biases in Self-
Ratings of Second Language Proficiency: The Role of
Language A Language Learning, Vol. 47,
1997, 265-287.
[25] R. Matsuoka, & D. Richard Evans, Willingness to
Communicate in the Second L J Nurs
Studies, Vol. 4, No. 1, 2005, pp. 3-12.
[26] M. Papi, The L2 Motivational Self-system, L2 Anxiety,
and Motivated Behavior: A Structural Equation
Modeling Ap System, Vol. 38, 2010, pp. 467-
479
[27] J. Peng,
Integrative Motivation among College Students in an
Intensive En
University of Sydney Papers in TESOL, Vol. 2,
2007, pp. 33-59.
[28] J. Peng, & L. Woodrow, Willingness to Communicate in
English: A Model in the Chinese EFL Classroom
C Language Learning, Vol. 60, No. 4, 2010,
pp. 834-876.
[29] F. S. Steinberg, & E. K. Horwitz, The Effect of Induced
Anxiety on the Denotative and Interpretive Content of
Second Language Speech TESOL Quarterly, Vol.
20, 1986, pp. 131-136.
[30] T. Yashima,
The Modern
Language Journal, Vol. 86, 2002, pp. 54-66.
[31] T. Yashima, & L. Zenuk-Nishide, The Impact of Learning
Contexts on Proficiency, Attitudes, and L2
Communication: Creating an Imagined International
Community System, Vol. 36, No. 4, 2008, pp. 566-
585.
[32] T. Yashima, L. Zenuk-Nishide, & K. Shimizu, The
Influence of Attitudes and Affect on Willingness to
Communicate and Second Language
Communication Language Learning, Vol. 54, No.
1, 2004, pp. 119-152.
[33] D. J. Young, Creating a Low Anxiety Classrooms
Environment: What Does the Anxiety Research
Suggest? Modern Language Journal, Vol. 75,
1991, pp. 426-39.
[34] W. R. Zakahi, & J. C. McCroskey, Willingness to
Communicate: A Potential Confounding Variable in
Communicating Research Communication
Reports, Vol. 2, No. 2, 1989, pp. 96-104.
223
Proceedings of International Conference on Education, Informatics, and Cybernetics (icEIC 2011),
and the International Symposium on Integrating Research, Education, and Problem Solving (IREPS 2011)
Collaboration of Research and Teaching Produces a New Course of Study in Critical Thinking
Dr. Phyllis R. Anderson
Governors State University University Park, IL 60466
and Dr. Joanne R. Reid
Corporate Development Associates, Inc. Lombard, IL 60148
ABSTRACT A lack of Critical Thinking [CT] skills in business school
graduates has been linked to poor business decisions, which often lead to business failures. A senior member of the faculty of a Midwestern college of business was troubled by the poor thinking skills exhibited by her business students. She collaborated with a doctoral candidate in education, whose research interest was within the domain of Critical Thinking. Together, they developed a course of study combining the researcher’s Critical Thinking pedagogy within the environment of a senior-level business administration course of study.
Quantitative analysis of chapter assessments and the results from a standardized assessment instrument demonstrated: 1. Student’s acquired Critical Thinking skills; 2. Students’ transferred these skills to the domain of the standardized CT assessment instrument’s environment. Qualitatively, the senior member of the faculty of the college of business administration observed: 1. Students’ transferred CT skills to business case studies, as demonstrated by their superior reasoning and analytical skills; 2. Students’ transferred CT skills to a computerized simulation, as demonstrated by their superior performances and the lack of total failures within the simulation.
INTRODUCTION In a series of proposals, the Secretary of Labor’s Commission
on Achieving Necessary Skills [SCANS] redefined the skills that would be needed by industry in the late twentieth and early twenty-first centuries, and the educational requirements needed for workers to achieve those skills [1, 2, 3] . Six Thinking Skills were identified, as follows [4]:
A. Creative Thinking — generates new ideas B. Decision Making — specifies goals and constraints, generates alternatives, considers risks, and evaluates and chooses best alternative C. Problem Solving — recognizes problems and devises and implements plan of action D. Seeing Things in the Mind’s Eye — organizes, and processes symbols, pictures, graphs, objects, and other information E. Knowing How to Learn — uses efficient learning techniques to acquire and apply new knowledge and skills F. Reasoning — discovers a rule or principle underlying the relationship between two or more objects and applies it when solving a problem
These thinking skills had been previously defined by psychologists and educators as Critical Thinking. Six years prior
to the SCANS report, the noted psychologist and educator, Diane Halpern, published Thought and Knowledge: An Introduction to Critical Thinking [5]. A definitive text on the subject of Critical Thinking, Halpern assembled the ten basic skills and capacities necessary to think critically.
She defined Critical Thinking as, “… the use of those cognitive skills or strategies that increase the probability of a desirable outcome” [6]. Reid defined it as, “The conjunction of knowledge, skills, and strategies that promotes improved problem solving, rational decision making, and enhanced creativity” [7]. Critical Thinking is recognized as an essential part of education and a valuable life skill [8, 9]. Yet, in spite of the recommendations of these significant reports, educators did not incorporate Critical Thinking into their curricula.
In 2007, the U. S. Department of Education published the Nation’s Report Card [10]. This landmark report testified to the facts that the reading and mathematics scores of high school seniors continued a decades-long decline. Reading scores for literary experience, for information, and to perform a task, declined in the period from 1992 through 2005 (p. 10). In mathematics, almost 37% of graduating seniors were unable to perform even the most basic mathematical procedures, while an additional 40% of graduating seniors were able to perform only basic mathematics. Only one student in four was rated as Proficient, while only 1 in 50 was rated as Advanced.
Similarly, the National Science Foundation equated American’s poor understanding of scientific principles with a lack of Critical Thinking skills. The NSF reported in Science and Engineering Indicators [11] that, although, “…Americans express strong support for science and technology, they are not very well informed about these subjects.”
These data were further interpreted in The Nation’s Report Card: High school seniors [12]. For instance, in the area of retrieving information, the authors related reading assessments to Critical Thinking and judgment as follows.
Retrieving information from a highly detailed document is an example of the knowledge and skills demonstrated by students performing at the Basic level. Making a critical judgment about a detailed document and explaining their reasoning is an example of the knowledge and skills associated with students’ performance at the Proficient level. (p. 1)
Based on these studies, the National Mathematics Advisory Panel declared,
224
Proceedings of International Conference on Education, Informatics, and Cybernetics (icEIC 2011),
and the International Symposium on Integrating Research, Education, and Problem Solving (IREPS 2011)

Instructional practice should be informed by high-quality research, when available, and by the best professional judgment and experience of accomplished classroom teachers. High-quality research does not support the contention that instruction should be either entirely “student centered” or “teacher directed.” Research indicates that some forms of particular instructional practices can have a positive impact under specified conditions. NAEP [National Assessment of Educational Progress] and state assessments should be improved in quality and should carry increased emphasis on the most critical knowledge and skills leading to Algebra. [13, p xiv]
Yet, in spite of this expert testimony as to the state of American education, curricula in America’s colleges of business administration were not modified to include Critical Thinking skills, as specified by the Department of Labor, the Department of Education, the National Science Foundation, or the National Assessment of Educational Progress. One major impediment to the incorporation of Critical Thinking into the curriculum was the lack of an established course of study leading to the acquisition, retention, recall, and utilization of Critical Thinking skills. Until such a course was developed, the lack of implementation could be readily explained as lack of a valid pedagogy for the teaching, learning, or use of Critical Thinking. Further, there was no evidence that the acquisition of Critical Thinking skills led to improved student outcomes or greater career success. In large part, this doubt was caused by uncertainty of the transfer of these skills between domains of knowledge or practice. Until this uncertainty of transfer was resolved, educators were hesitant to implement any form of Critical Thinking pedagogy.
In order to resolve this impasse, a pedagogical treatment in Critical Thinking was developed and implemented. This pedagogical treatment was implemented in two classes at a college of business administration. A third class in the same college served as the control. The purpose of the treatment was to assess the acquisition, retention, and transfer of Critical Thinking skills across domains.
THE CRITICAL THINKING TREATMENT The research problem was to determine whether Critical
Thinking could be taught, learned, or transferred between domains. This required the development and implementation of a course of study in Critical Thinking, since no such course was extant. Therefore, a sound theoretical foundation in Critical Thinking was the first requirement in the development of such a course of study. Secondly, an instructional design model was needed to provide the pedagogical content and structure needed to develop and implement such a course of study. Third, a validated and reliable assessment was needed to measure any acquisition of Critical Thinking skills that might occur. Fourth, a sufficiently large number of willing test subjects had to be located to participate in the course and research study. Finally, the results of this experimental course of study would have to be distinguished from the results one would expect from the extant course of study that did not include the Critical Thinking component.
Theoretical Foundation The need for a strong theoretical foundation was satisfied by
the extensive literature generated by Dr. Diane Halpern, Director of the Berger Institute for Work, Family, and Children at Claremont McKenna College, Past President of the American Psychological Society, and noted expert in the field of Critical Thinking. In 1989, she published Thought and Knowledge - An Introduction to Critical Thinking [5], describing in exquisite detail the technical parameters of Critical Thinking. However, this tome was not only large and intimidating, but was also ill suited for use as a textbook. Subsequently, Halpern published Critical Thinking across the Curriculum: A Brief Edition of Thought and Knowledge [14]. Her reasons for writing this condensed version were to have it serve as a “… companion text that can be used in virtually any course where Critical Thinking is valued. It can also stand alone for use by anyone who wants to know what cognitive psychologists and educators have found that ‘works’ to improve learning, remembering, thinking and knowing”[14, p. vii]. However, even a condensed version of Thought and Knowledge proved to be both dense and challenging. Further, she had provided no philosophical foundation or content structure for its use in a classroom. As such, even a college-level teacher might be challenged to master the intricacies of logic and pedagogy required to convert the text into a course of study.
In 1998, Halpern provided the theoretical content and structure of such a course of study, which she called “Teaching for Critical Thinking” [15]. Halpern defined the goal of “Teaching for Critical Thinking” [TCT] as “… to promote the learning of transcontextual thinking skills and the awareness of and ability to direct one's own thinking and learning” [15, p. 451]. Within this context, she proposed a “… model for teaching Critical Thinking skills so they will transfer across domains of knowledge …” consisting of four constituent elements. The first component of the TCT pedagogical strategy was the dispositional or attitudinal element. The second was instruction in and practice of Critical Thinking skills. The third component was structure training to facilitate transfer across contexts or domains. Finally, a metacognitive component was used to direct and assess thinking.
Instructional Design Model Although Halpern presented both a construct and structure, it
was essential to translate that into instructional content. Foshay, Silber, and Stelnicki [16] provided the needed instructional design methodology. Borrowing heavily from Merrill [17, 18] and from Clark [19, 20], Foshay, Silber, and Stelnicki wrote Writing Training Materials That Work: How to Train Anyone to Do Anything. In this book, they describe a five-step model of instructional design that provided a parallel construction to Halpern’s model.
Assessment Instruments The primary assessment instrument was the California
Critical Thinking Skills Test, as recommended by Diane Halpern [21, p. 249]. This test derives from a pioneering effort by Peter Facione [22] in which he convened a Delphi panel of 46 scholars and educators to develop the principles upon which Critical Thinking assessment instruments were developed and implemented. One of these, the California Critical Thinking Skills Test [CCTST] has undergone vigorous testing, evaluation, and validation {23, 24, 25, 26]. This assessment instrument uses five scales to measure Critical Thinking Skills: Inductive Reasoning, Deductive Reasoning, Analysis, Inference, and
225
Proceedings of International Conference on Education, Informatics, and Cybernetics (icEIC 2011),
and the International Symposium on Integrating Research, Education, and Problem Solving (IREPS 2011)

Evaluation. Individual and group results are reported both as numeric values and as histograms.
In this study, the CCTST was used in two different ways. In the first instance, the CCTST was used as a pre-test/post-test in both of the experimental classes to determine if Critical Thinking skills had been acquired. In the second instance, the CCTST was used to determine the difference between the acquisitions of Critical Thinking skills in the experimental classes relative to the CT skills possessed by the control class.
The secondary assessment instruments were 10-question, True/False, Chapter quizzes provided by Halpern and Riggio [27]. The tests were comprehensive for each chapter. They were intended to test the student’s knowledge. They were designed by and obtained from Halpern and Riggio’s text, which was intended to be used in conjunction with Critical Thinking Across the Curriculum [14], the main CT text for the author’s pedagogical treatment.
Experimental Venue The venue for the course of instruction was a senior capstone
class in business administration at a Midwestern university. However, the instructor required that the course be integrated into the established course of study and reflect business problems and solutions. The author and the instructor worked together to add Critical Thinking content to the business course case studies, which were within the business class textbook.
BUSINESS COURSE ASSESSMENTS The senior member of the business school faculty needed to
determine the validity of the Critical Thinking pedagogical treatment. If successful, this treatment could be developed into a program of instruction that would improve students’ outcomes. Yet, it was also important that the research program should not interfere with the students’ fulfillment of the educational requirements of the capstone course of study.
Students in their final class prior to graduation performed two different types of assignments upon which their grades were based. In the first type of assignment, students analyzed case studies taken from the assigned textbook. Many of these case studies were mini-studies, used to emphasize specific information within the text. One was a major case study, also found in the same text. Students analyzed these case studies, reporting their analyses both in the form of written reports and in presentations to the entire class.
The second type of assignment involved student’s participation in a business simulation as a part of a team. Students assigned to teams, became the operating officers of the simulated corporation. The teams competed against each other, developing, manufacturing, and marketing similar products.
This experienced senior faculty instructor had noted the capacities of the students to think, to analyze business situations, to develop rational approaches to business problems. Their decision-making skills were below her expectations for graduating seniors. Their poor thinking skills were reflected in their analyses of the case studies and in the computerized team simulations. It was this instructor’s intention to incorporate Critical Thinking skills within the business course of study to improve the students’ analyses of business case studies, and to improve their performance as teams within the computerized corporate simulation.
METHODOLOGY The convenience sample was of three sections of a senior
level, capstone course in business administration, two of which
were experimental and one was the control. A total of thirty-nine students took part in the two experimental classes. Sixteen individuals took part in one or more of the research phases in the first class. Twenty-three took part in one or more phases of the research in the second class. The final sample (n=34) contained only those students who completed both the pre-test and the post-test of the CCTST. Twenty-one (n=21) students participated in the control class.
This unit of instruction consisted of 11 modules of approximately 1-1/2 hours of class time. This corresponded to one introductory module, nine book chapters of the Halpern text, and one wrap-up session. Each module, corresponding to a chapter in the Halpern text [14], contained a True/False quiz; a computer-aided, multi-media assisted lecture; a discussion of the previous chapter assignment; a new chapter assignment; a business case study.
To determine if the Critical Thinking component was transferred to the business course, CT skills were incorporating into the weekly case study analyses. Business case studies were a regular part of the capstone course in business administration. Case studies from the regular text were examined by the regular course instructor and the author for business content, which emphasized CT skills. A grading rubric was prepared to assess the combination of business and CT skills employed by the students in their analyses.
The students were also assigned a major case study of a corporation. The students were required to use all the knowledge they had gained in their business curriculum to analyze the corporation. In addition, they were required to use their CT skills to assess their case study corporation’s tactics and strategies to determine whether they would have been different had CT skills been utilized.
Three separate assessments were performed in the Critical Thinking treatment. In the first set, the CCTST was administered prior to the implementing the course of study in the experimental classes. This test was also administered after the conclusion of the course of study in the experimental classes. Statistical analyses were performed to determine whether there was a statistically significant difference between the pre-test and the post-test scores of the seven CCTST parameters.
In the second set, the CCTST was administered to a similar capstone class, but one in which the CT pedagogical treatment had not been administered. Because of logistical considerations, only one test was administered at the end of the course of study. This test was considered equivalent to the CCTST post-test administered in the experimental classes. Analyses were performed to determine whether the seven CCTST parameters of the experimental classes were statistically different from those of the control class.
In the third set, chapter pre-test and post-test questionnaires were administered to the experimental classes. The individual student’s pre-test and post-test results were obtained. The students’ responses for each question were summed, providing a percentage of correct responses, as well as a total percentage for the sum of all students in the pre-test and post-test with percentages of correct answers. Statistical analyses were performed to determine whether a statistically significant difference between the pre-test and the post-test scores of the nine chapter quizzes existed.
226
Proceedings of International Conference on Education, Informatics, and Cybernetics (icEIC 2011),
and the International Symposium on Integrating Research, Education, and Problem Solving (IREPS 2011)

RESULTS
Critical Thinking Treatment Sample-Control Analyses: The results of the CCTST from the experimental classes were compared to those of the control class. As explained, only one CCTST was obtained from the control capstone class. This test was taken at the end of the capstone course of study, corresponding in time and business course content to the post-tests taken by the test subjects.
The values of the seven parameters of the CCTST were identical for the control class and the experimental pre-test classes, within the reporting error of the assessment instrument. That is, the results of the control class were within one-tenth of a unit to the corresponding experimental pre-test class for all seven variables. The researchers compared the results of the control test with the pre-tests of both the experimental groups, noting that the scores of the untrained students were all in the thirty-fifth percentile for graduating seniors. The researchers concluded that it highly improbable that environmental effects of the capstone course would have decreased the control students’ performance in all seven of these tests. However, it was possible that the control group’s performance could have either been unaffected or had increased. Yet, if their scores had increased, then they would have had pre-test scores below the thirty-fifth percentile, which is already low for groups of graduating seniors. Finally, the control group’s scores were sufficiently similar to the experimental groups’ pre-test results as to be deemed identical. The researchers concluded that these scores were typical of graduating seniors in this college who did not have the benefit of training in Critical Thinking skills. Therefore, for the purposes of this preliminary study, only the pre-test and post-test experimental values were used to derive the statistical significance of the experiment results. Experimental Classes CCTST t-Tests: To determine the effects of the author’s Critical Thinking pedagogical treatment, the students’ scores of the pre-test CCTST from the experimental classes were compared to their corresponding post-tests. The students’ scores in the pre-test and post-test CCTST were compared using a one tail, repeated measures, t-Test. In six of the seven parameters of the CCTST, the t-Scores were found to be significant. The Analysis parameter was shown to be statistically insignificant. The Evaluation parameter was found to be significant at the 99% confidence level (α<.01). The other five parameters, i.e. Total Score, Percentile Score, Inference, Inductive Reasoning and Deductive Reasoning, were significant at greater than the 99.5% level (α<.005). Based upon these results, the authors reasoned that the students had acquired the Critical Thinking skills, knowledge, and capacities taught within the pedagogical treatment. Chapter Pre-Tests/Post Tests
To determine whether the content of each chapter of the author’s Critical Thinking treatment had been acquired, retained, and recalled, the results of the pre-test chapter quizzes from the experimental classes were compared to their corresponding post-tests. The students’ scores in pre-test and post-test of the chapter-by-chapter modules quizzes were compared using a one tail, repeated measures t-Test. In each Module, the t-Scores were found to be significant. In Modules 2 and 9, the t-Scores were found to be significant at the 95% confidence level (α<.05). In the other seven Modules, the t-Scores were found to be significant at greater than the 99.5% confidence level (α<.005). The overall score for all the Module scores was found to be significant at greater than the 99.5% confidence level (α<.005).
Business Course Studies Case Studies: The Mini-Case Studies obtained from the textbook usually highlighted one or two specific business problems. Students submitted a one-page analysis of the business problem including a well-reasoned solution. As previously specified, the authors selected these short cases to correspond with the Critical Thinking topic being covered at the time. The instructor noted consistent attempts by the students to incorporate the CT topic into these case studies. Semester Case Studies: The Semester Case Studies obtained from the textbook were extensive historical reviews of specific corporations, including their business strategies and the specific tactics used to address their business problems. Students developed a 15 to 20 page case analysis of the corporation, which included materials from other sources. These analyses included well-reasoned analyses of the corporation’s strategies, tactics, and business solutions. The instructor observed that the results of the Semester Case Study analyses were more thoughtful and better reasoned compared with those of previous classes. Student grades in this area improved in comparison with previous courses in which Critical Thinking was not included. Computer Simulation: The CapSim® simulation from Capsim Management Simulations, Inc.® (Capsim®) is an extensive computer simulation of complex, competitive business operations. Ideally, the student management teams have eight weeks of practice simulation rounds, and eight weeks of competition rounds. This simulation requires that student teams make business decisions in most operational business areas, against up to five competitive businesses. This requires in-depth evaluation of competitor’s actions as well as decisions for their company concerning manufacturing, capacity and scheduling, product R&D, pricing, labor relations and contract decisions, product mix, accounting, and capital investments in a competitive environment. The simulation is intense, and tests the students’ accumulated knowledge and integration of business concepts. Commonly, some student teams perform well in the simulation, while many teams fail to consider all of the variables, and, as a result, are forced out of business, or into bankruptcy.
The instructor observed that the results of the CapSim® analyses were more thoughtful and more reasoned compared with those of previous classes. Teams that had undergone the Critical Thinking regimen had no business failures. There were varying levels of success, but all teams performed satisfactorily. Student grades in this area improved in comparison to those in previous courses. Summary: In the reasoned judgment of the senior member of the faculty, there is a strong indication that the Critical Thinking treatment significantly improved the students’ analytical skills and student outcomes in the capstone course. However, since the purpose of this study was to determine whether the pedagogical treatment was effective in imbuing Critical Thinking skills, it was not possible to determine simultaneously the effect of the treatment on the business course of study. Since the pedagogical treatment appeared to be effective, a more formal study could be undertaken to determine whether Critical Thinking skills improve student outcomes.
RESULTS The objectives of this collaborative study were to determine
whether Critical Thinking could be taught, whether it could be learned, and whether Critical Thinking skills could be transferred among domains. A treatment was developed that was congruent with Halpern’s Teaching for Critical Thinking model.
227
Proceedings of International Conference on Education, Informatics, and Cybernetics (icEIC 2011),
and the International Symposium on Integrating Research, Education, and Problem Solving (IREPS 2011)

The treatment was taught to two capstone classes in a college of business administration. Emphasis was placed on reconstructing the regular business-class case studies to incorporate a Critical Thinking component to assess transfer. An independent, reliable, and validated assessment instrument was used to determine the acquisition, retention, and recall of Critical Thinking skills. Quizzes, designed by the author of the textbook used in the treatment, were used to assess chapter-by-chapter learning.
Statistical analyses showed that six of the seven parameters of the CCTST were shown to be significantly higher in the experimental classes than in the control class. These results were interpreted as evidence that the authors’ treatment had been effective in increasing the CT skills of the students in comparison to the regular, business class program of study.
Statistical analyses of chapter-by-chapter quizzes showed that the student’s scores of the post-tests were significantly higher than their scores in the pre-test. These results support and provide a rationale for the scores observed in the CCTST. These results were interpreted as evidence of the student’s acquisition, retention, and recall of the information content within each chapter of the Critical Thinking textbook.
Statistical analyses of the CCTST showed that six of the seven parameters were significantly higher in the post-tests than in the pre-tests. These results were interpreted as evidence of the students’ acquisition, retention, and recall of the Critical Thinking skills acquired during the authors’ treatment. These results were also interpreted as utilizing the skills initially learned within the domain of the CT treatment and the transfer of those skills successfully to the domain of the CCTST.
The senior faculty member verified that the students had successfully used their CT skills in the analyses of their weekly business course case studies. The senior faculty member also verified that the students had used the CT skills they had acquired to assess the tactics and strategies employed in case studies of their assigned corporations. These results were interpreted as utilizing the skills initially learned within the domain of the CT treatment and transferred those skills successfully to the domain of business.
Therefore, the goals of this study were achieved. The results indicate that Critical Thinking can be taught. The results indicate that Critical Thinking can be learned. The results indicate that Critical Thinking skills can be transferred from one domain to another.
DISCUSSION AND FUTURE STUDIES The Federal government and vast numbers of academic and
business experts have recommended that Critical Thinking be incorporated into academic programs. A significant barrier to integrating Critical Thinking into the curriculum has been a lack of such a course of study. Research from a recent collaborative effort indicates that this obstacle may have been overcome. However, it is important to test this pedagogical treatment to ensure that the results observed in this research are valid and can be reproduced in other academic programs, colleges, and universities.
This collaborative research suggests that long-term studies are needed. In general, such research might address whether a graduate’s success is affected by the acquisition of Critical Thinking skills. Specifically, such research might determine whether the acquisition of Critical Thinking skills produces measurably superior student outcomes in the capstone courses investigated in this research. Other research might inquire as to the relationship between the acquisition of Critical Thinking
skills and improvement in a graduate’s business skills, performance, or motivation.
REFERENCES [1] Brock, W. (1991). What Work Requires of Schools. Washington, DC: Department of Labor. [2] Kane, M., Berryman, S., Goslin, D., & Meltzer, A. (1990). Identifying and Describing The Skills Required by Work: The Secretary's Commission on Achieving Necessary Skills. [3] Whetzel, D. (1992). The Secretary of Labor's Commission on Achieving Necessary Skills. Eric Digest. Washington DC. [4] Kane, M., Berryman, S., Goslin, D., & Meltzer, A. (1990). Identifying and Describing The Skills Required by Work: The Secretary's Commission on Achieving Necessary Skills. [5] Halpern, D. (1984). Thought and knowledge: An introduction to critical thinking. Hillsdale, NJ: Lawrence Erlbaum Associates, Inc. [6] Halpern, D. (1998). Teaching critical thinking for transfer across domains: Dispositions, skills, structure training, and metacognitive monitoring. American Psychologist, 53, 449-455. [7] Reid, J. (2009). Can critical thinking be learned? Paper presented at the Mid-West Regional Educational Research Association, St. Louis, MO. [8] Case, R. (2005). Bringing critical thinking to the main stage. Education Canada, 45(2), 45-46. [9] Giancarlo, C. A., Blohm, S. W., & Urdan, T. (2004). Assessing secondary students' disposition toward critical thinking: Development of the California Measure of Mental Motivation. Educational and Psychological Measurement, 64(2), 347-364. [10] Grigg, W., Donahue, P., & Dion, G. (2007). The nation's report card: 12th-grade reading and mathematics 2005. (National Center for Educational Statistics Document no. NCES 007-468). Washington, D.C.: US Government Printing Office. [11] Board, N. S. (2004). Science and Engineering Indicators 2004. (NSB Publication No. NSB 02-1). Washington, D.C.: National Science Foundation. [12] Shettle, C., Roey, S., Mordica, J., Perkins, R., Nord, C., Teodorovic, J., Brown, J., Lyons, M., Averett, C., & Kastberg, D. (2007). The nation's report card: America's high school graduates. (National Center for Education Statistics Document No. NCES 2007-467). Washington, D.C.: US Government Printing Office. [13] Flawn, T. (2008). Foundations for success: The final report of the National Mathematics Advisory Panel. Washington, D.C.: Department of Education. [14] Halpern, D. (1997). Critical thinking across the curriculum: A brief edition of thought and knowledge. New York, NY: Lawrence Erlbaum Associates. [15] Halpern, D. (1998). Teaching critical thinking for transfer across domains: Dispositions, skills, structure training, and metacognitive monitoring. American Psychologist, 53, 449-455. [16] Foshay, W., Silber, K., & Stelnicki, M. (2003). Writing training materials that work: How to train anyone to do anything. New York, NY: John Wiley. [17] Merrill, D. (2002). First principles of instruction. Educational Technology Research & Development, 50(3), 43-59. [18] Merrill, D. (2007). A task-centered instructional strategy. Journal of Research on Technology in Education, 40(1), 5-22.
228
Proceedings of International Conference on Education, Informatics, and Cybernetics (icEIC 2011),
and the International Symposium on Integrating Research, Education, and Problem Solving (IREPS 2011)

[19] Clark, R., Yates, K., Early, S., & Moulton, K. (2006). An analysis of the failure of electronic media and discovery-based learning: Evidence for the performance benefits of guided training methods. In K. Silber & A. W. Foshay (Eds.), Handbook of Training and Improving Workplace Performance (Vol. 1). Somerset, NJ: Wiley. [20] Kirshner, P., Sweller, J., & Clark, R. (2006). Why minimal guidance during instruction does not work: An analysis of the failure of constructivist, discovery, problem-based, experiential and inquiry-based teaching. Educational Psychologist, 41(2), 75-86. [21] Halpern, D. (1993). Assessing the effectiveness of critical thinking instruction. Journal of General Education, 42(4), 239-254. [22] Facione, P. (1990). Critical thinking: A statement of expert consensus for purposes of educational assessment and instruction. Research findings and recommendations. [23] Facione, N. C. (1997). Critical thinking assessment in nursing education programs: An aggregate data analysis Millbrae, CA: The California Academic Pres. [24] Facione, N. C., Facione, P., Blohm, S. W., & Gittens, C. (2008). California Critical Thinking Skills Test: Test manual. Millbrae, CA: Insight Assessement, Inc. [25] Facione, N. C., & Facione, P. A. (1997). Critical thinking assessment in nursing education programs: An aggregate aata analysis. [26] Phillips, C., Chestnut, R., & Rospond, R. (2004). The California Critical Thinking Instruments for benchmarking, program assessment, and directing curricular change. American Journal of Pharmaceutical Education, 68(4), 1-8. [27] Halpern, D., & Riggio, H. (2003). Thinking Critically About Critical Thinking (4th ed.). Mahwah, NJ: Lawrence Erlbaum Associates.
229
Proceedings of International Conference on Education, Informatics, and Cybernetics (icEIC 2011),
and the International Symposium on Integrating Research, Education, and Problem Solving (IREPS 2011)

What Do Pre- Views about
Scientific Theories and Laws?
Seda CAVUS
Elementary Science Education Department/Gazi University
Ankara, 06500 / TURKEY
Nihal DOGAN
Elementary Science Education Department/Abant Izzet Baysal University University
Bolu, 14280 / TURKEY
Savas GUNGOREN
Elementary Science Education Department/Middle East Technical University
Ankara, 06800 / TURKEY
ABSTRACT
This study aimed to investigate pre-service science and
views about theories and laws and
compare their beliefs about them. The participants were 75
pre-service teachers (32 science and 43 mathematics).
Participants were engaged in different NOS activities through
one semester that explicit reflective approach to improve their
views. For data collection, Views of Nature of Science
(VNOS-C) questionnaire [6] was used for pre and post tests
-structured
interview was undertaken with 8 participants as post tests in
order to he
tests responses were analyzed and
coded as
revealed that majority of both groups have naive view
according to pre-test results. Meanwhile, the post test results
indicated that were more informed
after explicit reflective
approach.
Keywords: Nature of science, Pre-service Science Teachers,
Pre-service Mathematics Teachers, Scientific theory and law.
1. THEORETICAL FRAMEWORK
Scientific theories and laws have distinct characteristic of
knowledge. Their roles in science are different and there is no
hierarchical relationship between them [1]. Theories never
become laws even with additional evidence. Laws are
principles, generalizations or patterns in nature and theories
are the statements of those generalizations [7] (e.g. The Law
of Gravity). Scientific theories are the products of scientific
logical processes like laws. They are inferences generated as
a result of the relationship between the structures of the
natural phenomena [5]. There is no possibility to test the
theories directly (e.g. Big Bang Theory). Theories are only
supported by the data and different evidences. Scientists
proposed new theories only checking out these theories
against the verified data. The reliability of the theories
increase when there is such agreements between predictions,
experimental evidences, and the data. Popper (1983) [8]
concluded that a hypothesis, or theory is "scientific" only if it
is, among other things, falsifiable. That is, falsifiability is a
necessary (but not sufficient) criterion for scientific ideas. He
also stated that unfalsifiable statements are non-scientific,
although not without relevance. Differences between
observations and inferences revealed the distinction between
scientific theories and laws.
The nature of science concept has been proposed as an
important learning outcome for science education; however,
research studies have consistently shown that both students
a the structure of
epistemological scientific knowledge [7], [5]. McComas
(1998) [7] has listed mutual misconceptions on NOS made by
both pre-service teachers and in-service teachers as
hierarchical order between hypothesis, theory and law,
certainty of scientific laws and ideas. The false statements
knowledge and insufficient opportunities to develop
themselves cause the formation of these misconceptions. Irez
(2009) [4] examined the conception of the nature of science
in five high school biology textbooks. He reported that the
books are generally inadequate in terms of their vision of
NOS. Furthermore, fundamental aspects of the nature of
science have been found to be deficient in textbooks.
The science and mathematics are two important courses in
teaching nature of science and when compared with other
disciplines, these two courses classified in the same class
generally. However, the close relationship between math and
science is a little bit ignored and when the subject is nature of
science, this issue is considered only in terms of science
lessons. Many detailed studies have done about the nature of
science opinions of science teachers however, only a small
number of
views on nature of science.
According to AAAS (2001) [2], science supports
mathematics to create interesting problems, mathematics also
supports science with its mathematical tools (numbers,
symbols, graphics..). Mathematics defined as the language of
science. Mathematics and science have many common
features, for this reason, we must understand mathematicians
NOS conceptions, beliefs and/or views of the relevant
domains and topics. For that reason; one goal of this study
has been to explore the views of pre-service science and
on the scientific theories and laws
aspect of NOS. A second goal was to better understand how
pre-
affect their own concept of the nature of science. A third goal
was to compare NOS views of pre-service science and math
230
Proceedings of International Conference on Education, Informatics, and Cybernetics (icEIC 2011),
and the International Symposium on Integrating Research, Education, and Problem Solving (IREPS 2011)

which have similar mental structures and thought
systems, constitutes the importance of this study.
2. METHOD
Sample and Data Resources
A total of seventy-five pre-service elementary teachers (32
science and 43 math) participated in this study. Data were
obtained from the Views of Nature of Science Questionnaire-
Form C (VNOS-C) developed by Lederman, Scharwartz,
Abd-El-Khalick, and Bell (2002) [6]. The VNOS-C consists
of ten open-ended questions which assessing NOS views of
the students. This study has only three relevant questions
about theories and laws within VNOS-C. Additionally, data
were supported with interviews at the end of the semester.
Eight participants were interviewed with questions derived
from the VNOS-C.
The Context of the Current Study
Participants from both two groups were engaged in different
NOS activities (e.g. black box, tricky tracks) that explicit
reflective approach to improve their views through one school
semester. According to this, VNOS-C was used as a pre-test
to determine pa ,
and it was also administered at the end of the semester as a
-
structured interview was undertaken with 8 participants as
This study was carried out with the analysis of three
questions which are related with theories and laws. In these
questions, the students are asked to define theory and law,
expected to give examples related with them, expected to
describe how theories and laws are constituted and asked
whether there is a relationship between them. Each of the
were analyzed by
a coding system which has three-category coding scheme
Chi-square statistic
indicated statistically significant differences from pre- to
post- . Also, the examples of
theories and laws were analyzed given at the pre-test and post
test.
3. RESULTS
Generally, analysis of responses from pre-test and post-test
indicated significant changes about theories and laws at the
end of the semester. According to results of the analyses, it is
established that 81.2% of pre-service science teachers (PST)
and 81.4% of pre-service mathematic teachers (PMT) have
view. (18.8% of PST and
18.6% of PMT)
important result of this analyses is from both of the groups
were not have responses about theories and laws coded as
. These results were constituted from the pre-
hierarchical construct between theory and law. According to
the responses of pre-test Chi-square analyses, statistically
meaningful results were not obtained
987.0,000,0)1(2 px . The pre-service teachers from both
groups gave theory and law examples generally about
physics, chemistry and biology. There are some examples
given below about s pre-test views.
S(5): Scientific theory, is the version of the result which is
not exactly turning into a law obtained from our
experiments. Atomic theory.
(M25): A scientific reality (hypothesis) becomes scientific
theory if it gains validity about 90 % from the
authorities. Relativity theory.
After the instruction the survey results were analyzed 3.1% of
PST, and 34.9% of PMT have naive views according to the
post-test results. Beside this, 15.6% of PST and 34.9% of
PMT r the instruction. Also, none
according to the pre-test results; however, 52% of the
after the instruction.
Meanwhile, results indicated that views (81.2%) were
more informed than views (30.2%) about theories and
laws. According to the responses of post-test Chi-square
analyses, statistically meaningful results were
obtained 000.0,409,20)2(2 px . There is some examples
given below about post-test views.
S(32): Laws are the descriptions of facts in nature and
observed or perceived relations in nature, Gravity
Law
(M5) Law Lined area represents
the difference between
them
Gauss Law
Surprisingly, interview results contradicted with VNOS
results that half of participants stated that laws were more
certain than theories and theories can be law if they prove.
After the instruction some participants gave example of
theories and laws relevant with math.
4. CONCLUSIONS AND IMPLICATIONS
Contrast to Bell, et.al. (2003) [3] this study emphasizes that
the explicit instructional approach is effective in promoting
improved student views about theories and laws.
[9] study, researchers
who manipulated certain aspects of the learning environment
in their attempts conceptions will
be success. One of the primary aims of science education is to
train scientifically literate individuals for a healthy and
developing society. To achieve this, science and math
teachers must become scientifically literate. Therefore,
educating science and math teachers with a contemporary
view of scientific knowledge should become an important
issue in teacher education.
5. REFERENCES
[1] Akerson, V. L., & Abd-El-Khalick, F. (2000). Improving
conception of the nature of science
using a conceptual change teaching approach. Paper
presented at the Association for Education of Teachers
of Science (AETS) International Conference, Akron,
Ohio, USA.
Theory
231
Proceedings of International Conference on Education, Informatics, and Cybernetics (icEIC 2011),
and the International Symposium on Integrating Research, Education, and Problem Solving (IREPS 2011)

[2] American Association for the Advancement of Science
[AAAS] (1991). Science for all Americans. Oxford
University Press, New York.
[3] Bell, R., Blair, L., Crawford, B., & Lederman, N. G.
(2003). Just do it? The impact of a science apprenticeship
understandings of the
nature of science and scientific inquiry. Journal of
Research in Science Teaching, 40(5), 487-509.
[4] Irez, S. (2009). Nature of Science as Depicted in Turkish
Biology Textbooks. Science Education, 93(3),422-447.
[5] Lederman, N. G. (2007).Nature of science: past, present,
and future. In Abell, S. K., & Lederman, N.
G.(Eds),Handbook of research on science
education(pp. 831-879).London, Lawrence Erlbaum
Associates.
[6] Lederman, N. G., Abd-El-Khalick, F., Bell, R. L., &
Schwartz, R. (2002). Views of nature of science
questionnaire: Toward valid and meaningful assessment
Journal of
Research in Science Teaching, 39(6), 497-521.
[7] McComas, W. (1998). The principle elements of the
nature of science: Dispelling the myths. In McComas, W.
(Eds.), The Nature of Science in Science Education
Rationales and Strategies, (pp. 53-70). Dordrecth, the
Netherlands: Kluwer academic publishers.
[8] Popper (1983). Realism and the aim of science: The
postcript to the locic of scienctific discovery. 1. (Der.).
W.W. Bartley IIITotowa, NJ: Rowman I Littlefield.
[9]Trembath, R. J.(1972).The structure of science. The
Australian Science Teachers Journal,18(2), 59-63.
232
Proceedings of International Conference on Education, Informatics, and Cybernetics (icEIC 2011),
and the International Symposium on Integrating Research, Education, and Problem Solving (IREPS 2011)

Cognitive Processes in Problem Solving: Bridging the
Intersection of Cognition and Management Science
Sheila Cheng
School of Foundation Studies, Asia e University
Kuala Lumpur, 50000, Malaysia
Heng-Loke Siow
School of Graduate Studies, Asia e University
Kuala Lumpur, 50000, Malaysia
Abstract
Decision making is vital to business and life. Management
Science (MS) seems to help people make better informed
decisions and thus could make a difference to the real world.
However, solving MS problems need inputs from cognitive
psychology and therefore require the bridging of both for a
mutual coexistence. Many researchers acknowledged that
decision makers are required to possess different problem solving
skills to approach different types of problems, such as the solving
of well-structured and ill-structured problems requires peculiar
cognitive processes. Insofar, there is a need for deeper insights
on how undergraduate business students, who will soon be the
decision makers and leaders to make „calculated risk‟ decisions,
which are critical in our future society. The first part of paper is
to present a review on the cognitive processes in problem solving
based on Polya‟s 4-phase framework of problem solving,
Schoenfeld‟s six problem solving strategies, the Constructivist
Theory and the Information Processing Model (IPM). Using
Malaysian undergraduate business students as a case study, the
second part of this paper is to propose a 7-step problem solving
algorithmic model in an attempt to improve the cognitive
processes of students in solving MS problems and the quality of
decision making.
Key words: cognitive processes, management science, problem
solving, decision making.
1.0 INTRODUCTION
Problem solving is an omnipresent human activity. Leaders at all
levels are constantly facing challenges of various types of
problems. The domain of the problems ranging from highly
structured to ill-structured in real life [1]. Effective problem
solving and decision making are what leaders have to confront
with almost everyday. However, making quality decision is
highly dependent on the individual‟s skills and experiences.
Many literatures documented that there is a distinguishing feature
between well-structured and ill-structured problems [2].
Generally, solving the well-structured and ill-structured problems
requires different cognitive processes [3] and learners were
required to possess different problem solving skills to approach
these two types of problems [2].
In the 21st century, problems are becoming more complex and
difficult to solve, and the timescales available to solve the
problem are getting shorter. Management Science (MS) is an
emerging discipline that provides structured and logical approach
to problem solving as well as to improve the quality of decision
making [4].
It was noted that Polya was among the first proponents of on
problem solving by adopting heuristics in mathematical problems
in schools, but was slow to impact undergraduate mathematics
teaching[5]. Furthermore, his work was criticized by Shoenfeld
and others in that it was too general and could not develop the
problem solving abilities. With his Six Problem Solving
Strategies, Shoenfeld was able to plot the strategies on a time-
line graph that could provide the concrete illustration of non-
linearity of the problem solving processes [6].
In the 1950s, the information process theory (IPT) developed by
George Miller in 1956 was then a dominant theory in cognitive
psychology on problem solving. It featured two sets of
processes: the understanding processes and the search
processes[7]. Being criticized on its conceptual base, most of the
cognitive psychologists, over the last two decades, have shied
away from IPT[8].
The constructivist theory on the other hand, suggests that the
ability for an individual to solve the problem is built upon the
problem solver‟s knowledge and experiences [9]. In this study, it
was found that the constructivist theory seems to be an
appropriate theoretical framework in answering the research
objectives and questions.
From the perspective of MS, problem solving is the cognitive
processes of identifying the differences between the actual and
the desired state of affairs and taking action to resolve the
differences [10]. This paper is intended to investigate the
cognitive processes of Malaysian undergraduate business (MUB)
students (who will be the future leaders), in solving MS
problems. As a result in the decision making, this study further
investigates whether any particular algorithmic strategies exist in
solving the well-structured and ill-structured MS problems.
The findings of this study is attempted to provide some insight to
the effectiveness of problem solving and quality decision
making. Hopefully, the implications drawn could also enhance
our understanding in better designing the pedagogical strategies
for MS and its related subjects.
2.0 RESEARCH METHODOLOGY
This study employed a qualitative approach by observing the
participants in solving two different types of MS problems
namely well-structured and ill-structured problems, and then
followed by a semi-structured face-to-face interview. Well-
structured MS problem is featured by as well-defined and give
clear goals for problem solvers to assess them in a logical
manner, while the ill-structured problem is referred to those
without any particular hints on the patterns of approach and
generate more than one solution[2]. Participants are encouraged
to adopt the “thinking aloud” method during the problem solving
session. The observations and face-to-face interviews were
conducted to ensure that the researchers could obtain in-depth
and comprehensive information, whilst at the same time
participants could have freedom to respond and illustrate the
cognitive processes involved in problem solving.
2.1 Design
The data sources included the observation, field notes, answer
scripts of six participants solving the well-structured and ill-
structured MS problems individually. These processes were
video-taped and interviews were immediately conducted based
on the „solved‟ problems and were also audio recorded.
Participants were encouraged to use the “thinking-aloud”
approach during the problem solving session.
233
Proceedings of International Conference on Education, Informatics, and Cybernetics (icEIC 2011),
and the International Symposium on Integrating Research, Education, and Problem Solving (IREPS 2011)

2.2 Participants of the Study
A purposive sample comprising six willing participants were
selected from the BSc degree programme in Accounting and
Finance cohort. The selection was based on their prior
knowledge in Management Science, which happened to be one of
their subjects in the degree programme, as well as their exposure
to the well-structured and ill-structured MS problems and
decision making models. The participants gave their consents to
participate in this study.
2.3 Instruments
To solve a well-structured MS problem, the participant has to
access his/her problem schema in order to obtain numeric
solution as an optimal answer. The well-structured was adopted
and adapted based on the course text, Beasley (2004) Students‟
Study Guide, as indicated below:
“A company is involved in the production of two items (X and Y).
The resources needed to produce X and Y are twofold: namely,
machine time for automatic processing and craftsman time for
hand finishing. The table below gives the number of minutes
required for each item:
Machine Time Craftsman Time
Item X 13 20
Y 19 29
The company has 40 hours of machine time available in the next
working week but only 35 hours of craftsman time. Machine time
is costed at RM10 per hours worked and craftsman time is costed
at RM2 per hour worked. Both machine and craftsman idle times
incur no costs. The revenue received for each item produced (all
production is sold) is RM20 for X and RM30 for Y. The company
has specific contract to produce 10 items of X per week for a
particular customer.
Formulate the problem of deciding how much to produce per
week as a linear program. Solve this linear program
graphically.”
For the ill-structured problem, the question was constructed
based on the guidelines of problem structuring methods (or Soft
OR) developed by Rosenhead (2001), which emphasizes on the
importance of each individual‟s perception of the situation.
“You are the production manager in the ABC Paper Mill. You
are responsible for the production output and quality of the
paper.
The production planning in the paper mill goes like this:
The input to a paper mill is wood fiber and pulp; the output is
finished rolls of paper. At the heart of the paper mill are its
paper machines, which are very large and represent a significant
capital investment (between 50 and 100 million dollars each).
Each machine produces various types of paper characterized by
their basis of weights, grades and colors.
Master production plans for these machines are typically drawn
up on an annual basis. The projected schedules are cyclic with
cycle times of two weeks or longer. A particular type of paper
may be produced either every cycle, every other cycle, or even
less often, depending upon the demand.
Every time the machine switches over from one grade of paper to
another, a setup cost is incurred. During the changeover the
machine keeps on producing paper. However, since the paper
produced during a changeover does not meet any of the set
standards, it is either sold at a steep discount or considered
waste and fed back into the production system.
Determine what should be done to improve the production
performance.”
In terms of content validation, both the well- and ill-structured
problems were validated by three experts who have been
involved in teaching or practicing problem solving in MS.
2.4 Data Gathering Procedures
The data was gathered individually in an air-conditioned
classroom setting where table, chair and stationery were
provided. In carrying out the investigation, participants went
through 4 steps: (a) understanding “thinking aloud” method; (b)
personal data collection through a simply interview; (c) working
on the 2 problems; and (iv) interview and provide feedback. The
participants were given free hand to solve both well- and ill-
structured questions with no hints or guidelines.
Step 1 : participants were requested to view the video on
“thinking aloud” method and were later explained on how it
worked in order to understand the reflection of cognitive
processes in the problem solving session.
Step 2 : a structured questionnaire was used to solicit
participants on their personal data as well as their background
related to the level of mathematical skills and management
knowledge in their undergraduate studies.
Step 3: observations were carried out while participants were
working on the two MS problems, the processes were video-
tapped and audio recorded.
Step 4: a semi-structured face-to-face interview was conducted
based on the participants written documents.
A video camera was set up to record the entire problem solving
session and an interview was also audio-recorded. Both
recordings were transcribed, triangulated, analysed and coded.
3.0 RESULTS AND DISCUSSIONS
3.1 Cognitive Processes in Solving Well-Structured MS
Problem
From the observations, it was found that all six participants (four
females and two males) knew that the question was about
optimization (either maximization of profit or minimization of
cost). Only one participant indicated that she was not familiar
with the well-structured MS question given. The other
participants were able to identify the problem as Linear
Programming which was part of their syllabus in the
Management Science Methods course.
234
Proceedings of International Conference on Education, Informatics, and Cybernetics (icEIC 2011),
and the International Symposium on Integrating Research, Education, and Problem Solving (IREPS 2011)

As participants proceeded to solve the problems, all of them
indicated that at the beginning, they were unsure whether they
should use maximization of profit or minimization of cost as the
problem objective. This was due to the fact that the figures of
cost and revenue were given in the question. All participants
indicated that after reading the question for second time, they
began to assume that the objective function was maximization of
profit.
All the six participants were able to solve the problem. However,
only four participants could successfully obtain the correct
answer while the other two participants could not arrive at the
correct answer. It was mainly attributed to making careless
mistakes in the calculation.
Out of the six participants, five participants presented their
answers with diagram, while one participant TZ did not. In fact,
TZ drew the diagram at the beginning, but after drawing the axis,
he crossed it out. The reason given was that he did not want to
follow the algorithm of Linear Programming (LP) method which
he had learnt before. Instead, he tried another way and could
solve the problem by mathematical reasoning approach.
Table 1 provides two samples of transcripts (partial) from a
successful solver and an unsuccessful solver which describe how
the both participants approach to solve the well-structured MS
problem.
Table 1: Samples of Transcripts (partial) for Well-Structured MS
problem
Part
icip
ants
Successf
ul
solver
Approach to solve the
well-structured MS
problem
Strategy
TZ Successf
ul
“At first, after I wrote
the question, is to ask
myself to determine
how much the
company should
produce. So have to
make sure to make an
assumption like the
company would like
to maximize profit as
it‟s a profit oriental
company. And then
accept the objective
in order to maximize
the profit. And then
I‟ll look for the
resources, the
constraints of the
resources that convert
into the minutes, and
then I‟ll look on the
maximum amount
that I would I can
produce by producing
X, and by producing
Y. By using all the
resources, and then I
found out that the
machine hours are
always sufficient and
what is constraining
Reading
Planning
Analyzing
Exploring
Implementing
Verifying
our production is the
labour, we have the
real binding
constraint is the
labour time. So that‟s
one binding
constraint that I
found, so I just need
to make sure which
item will bring me
more profit, then I
just allocate all my
resources to produce
the item. So I
calculated the profit
the unit for X and Y,
I found Y is more
profitable to produce.
And then but
according to contract,
we have to produce at
least 10 units of X, so
after deducting the
RM10 of X then
we‟ll have to produce
according to the
contracts. I‟ll use all
the remaining
resources to produce
Y. They‟re the way
find to maximize the
unit.”
CY Unsucce
ssful
“I used the Linear
programming
approach and firstly I
will define the factor
X and the alphabet X
and Y. X is stand for
the number of product
X, which is produced.
And Y is the number
of product Y, which is
produced. After that, I
set up the objective
function, the main
idea I used for the
objective function is
the total revenue
minus the total cost.
This is my idea, after
that I reset up the
constraint. Constraint
1 is the machine time,
constraint 2 is the
craftsman time, and
the constraint 3 is the
production constraint
which the data that
the company need to
produce at least 10
items of X per week.
Okay, after that I will
draw the graph that I
calculated, the
Reading
Analyzing
Planning
Exploring
Implementing
Verifying
235
Proceedings of International Conference on Education, Informatics, and Cybernetics (icEIC 2011),
and the International Symposium on Integrating Research, Education, and Problem Solving (IREPS 2011)

production function in
order to get the
optimum production
unit.”
From the verbatim transcription above, it was noted that TZ used
a slightly different approach. He did not follow exactly the
algorithm of Linear Programming (LP) to solve the problem, but
instead, he used his mathematical reasoning. He did it purposely
as he mentioned that he was trying to use another way to solve
this type of LP problem. CY followed the algorithm of LP and
drew a diagram to help him found the answer. Unfortunately, he
made calculation mistakes in the final step while substituting
variables into the objective function. Figure 1 shows the answers
from the two above-mentioned participants solving the well-
structured.
Fig. 1: Sample Answers from the Two Above-mentioned
Participants
3.2 Cognitive Processes in Solving Ill-Structured MS
Problem
All the participants except SJ had been exposed to the topic of
how to formulate complex problem. However, all participants
were able to attempt the problem and came out with the
suggested solution, based on their interpretation. All participants
indicated that they needed to read the question for the second
time, in order to fully understand and tried to summarize the
information. All participants commented that the objective of the
question was clear to them. However, one participant
commented that production plan was a bit confusing and
ambiguous; it was quite tricky and needed time to analyze. Two
participants indicated that they were not familiar with paper
production. The suggested solutions indicate several variations
in solving the problem. Table 2 provides the partial transcripts of
the participants solving ill-structured MS problem.
Table 2: Sample transcripts (partial) for Ill-structured MS
problem
Participants
Approach to solve the ill-
structured MS problem
Strategy
CY “After I read through the
question, I think that the question
is about how to minimize the
production cost. In order to
improve the production
performance. And given the
constraints, the purpose is to
improve the current constraint in
order to improve the production
performance. .. Forecasting is one
of the factors to improve the
performance… maybe we can
self-manufacturing the pulp and
the wood fiber… we also can buy
our land, then we can plant the
wood ourselves… this one is
about the long term investment…
master production maybe I will
suggest the company review
quarterly… reduce the
changeover period…,we can
forecast the demand and the
production more closely from the
history data and the demand can
supply… we can plan the
production more efficient in the
sense that we don‟t often switch
the production.”
Reading
Planning
Analyzing
Exploring
TZ “Firstly, I think of what the things
I can do to improve the
performance, then we can do
some cost control, and then you‟ll
need a clearer way in doing it and
what‟s the result it will lead to.
And then will lead the objective
that we need is to improve the
production performance…
Mmmm… because they say they
have industries to set up cost
whenever we switching from one
grades of paper to another. And
then so we knew it should be
reducing the switch to the
machine, number of machine
switches... Then will reduce the
set up cost so we do a better
planning… Maybe we have a
fixed production cycle for each
grate of paper, and then it will
link to a less machine switch, the
machine change over and then
same thing it to less the
wastage… production quality is
quite important… should spend
more time in the quality control…
then we‟ll receive less complain.”
Reading
Planning
Analyzing
Exploring
The results indicate that the cognitive processes involved in
solving well- and ill-structured MS/OR problems were to some
extent similar. As an example, when participants attempted to
solve both the well-structured and ill-structured MS problems,
236
Proceedings of International Conference on Education, Informatics, and Cybernetics (icEIC 2011),
and the International Symposium on Integrating Research, Education, and Problem Solving (IREPS 2011)

they had to first “read” the problems, “read” again for the second
time to understand the objective of the problem, followed by
recalling their prerequisite knowledge in planning stage. The
first 4 stages of the strategies adopted were the same. i.e.
Reading, Planning, Analyzing and Exploring. According to Polya
(1957), these were the natural steps involved in problem solving.
In this study, the results also found that participants would go
through the strategies of “implementing” and “verifying” when
they were attempting the well-structure MS problem, but
somehow this did not happen in the ill-structured MS problem. In
the case of EJ, when she was drawing the diagram, she suddenly
realised and said : “I did some mistakes here because I did not
convert to standardized unit used…I think I made some mistakes
in the calculation on that…” Then, she went back to cross the
existing working and re-formulated the equations for constraints.
This indicates that participants‟ cognitive processes were quite
guided and trying to fit into certain patterns and attempted to
figure out a “correct” answer.
On the other hand, regardless of whether the participants were
familiar with the paper production or otherwise, they did attempt
to solve the problem and came out with solutions. However, they
did not verify if their suggested solution was right or wrong. On
the contrary, they were confident that they had provided a
reasonable and logical solution to the problem. In the case of TZ,
when he was asked if he had come across this type (ill-structured
MS problem), he said, “Maybe in movie.. quite normal
question… I‟m not really familiar with the paper production…not
really sure what‟s the production performance what they are
looking for.” However, from the verbatim transcription
mentioned above, apparently he had used his prior knowledge to
assess the problem decomposition [11]. Figure 2 shows the
sketches from the above-mentioned participants solving the ill-
structured problem.
Fig. 2 : The sketches from the two above-mentioned participants
solving the ill-structured problem.
4. CONCLUSION
It was noted that when participants approached the well-
structured problems, their cognitive processes were found to be
following several discrete steps, although prior knowledge was
used. On the other hand, when they approached the ill-structured
problem, their cognitive processes did not follow any particular
patterns. They tended to draw upon their knowledge or
experiences and tried to justify the situation.
Although the findings of this study are limited to a small sample
size and might not be generalisable enough to a wider context,
the findings however, may be able to contribute to the further
understanding of cognitive processes in problem solving
particularly related to MS problems. Linking the management
science problems and using the constructivist view of problem
solving, the study managed to uncover seven generic algorithmic
steps participants used in solving both well- and ill-structured
problems as displayed in Figure 3 and Table 3. It could be
concluded that for both well- and ill-structured questions, the
participants followed four common generic algorithmic steps
namely, reading, understanding, planning, and doing. However,
for the well-structured, the participants used three additional
algorithmic steps such as analyzing, verifying, and improving. It
is to be noted that the progression of the steps were not that linear
as participants constantly flipped flop from one steps to another.
Nonetheless, regardless of the questions, participants tended to
read the questions several times to understand them better. With
this framework, instructors could use these seven algorithmic
steps as a guide to help their students construct their own ways in
solving MS problems and hence in making effective decisions.
Fig 3: Proposed Framework for Effective Decision Making in MS
Problems
Table 3 : Description of Steps for the Proposed Framework
Steps Description 1. Reading - Quick reading of the whole question
once
2. Understanding - Understand the problem by re-
reading the question again, highlight
any keywords or figures
3. Planning - Planning what to do and recall
relevant prior knowledge
4. Doing - Extract (or write down) the relevant
information; sketch or draw out the
relationship
5. Analyzing &
Measuring
- Identify necessary criteria
6. Verifying - Refer back to the information given
in the problem and do checking
7. Acting &
Improving
- Implementing decision, review and
refine the outcome
REFERENCES:
[1] Newell, A., & Simon, H.A. (1972). Human Problem Solving,
Englewood Cliffs, NJ: Prentice Hall.
237
Proceedings of International Conference on Education, Informatics, and Cybernetics (icEIC 2011),
and the International Symposium on Integrating Research, Education, and Problem Solving (IREPS 2011)

[2] Jonassen, D.H. (1997), Instructional Design Model for well-
structured and ill-structured problem solving learning
outcome , Educational Technology: Research &
Development, 45(1), 65-95
Chin C. And Chia L.G. (2005), Problem-Based Learning :
Using Ill-structured Problems in Biology Project Work,
Wiley InterScience
[3] Shraw G, Dunkle M.E., and Bendixen L. D. (1995),
Cognitive Processes in Well-defined and Ill-defined Problem
Solving, Applied Cognitive Psychology, Vol.9, 523-538
(1995)
[4] Beasley, J.E. (2004). Management Science Methods,
University of London International Programme. London :
University of London press.
[5] Polya, G. (1957), How to solve it. NJ: Princeton Unviersity
Press
[6] Sheonfeld, Alan (1987), Mathematics Magazine, Polya,
Problem Solving, Eduction, Vol. 60, No. 5, Dec., 1987,
Mathematical Association of America.
[7] Schoenfeld, A. H. (1992). Learning to think mathematically:
Problem solving, metacognition, and sense-making in
mathematics. In D. Grouws (Ed.), Handbook for Research on
Mathematics Teaching and Learning (pp. 334-370). New
York: MacMillan.
[8] Tim Passmore (2007), Polya‟s legacy: fully forgotten or
getting a new perspective in theory and practice, Department
of Mathematics and Computing, University of Southern
Queensland
[9] Dubinsky Ed and Mcdonald M.A (2002), APOS: A
Constructivist Theory of Learning in Undergraduate
Mathematics Education Research, The Teaching and
Learning of Mathematics at Unviersity Level An ICMI Study, 1, volumn 7.
[10] Rosenhead Jonathan and Mingers John (2001), Rational
Analysis for a Problematic World: Problem Structuring
Methods for Complexity, Uncertainty and Conflict, 2nd
Edition, John Wiley & Sons Ltd., England.
[11] Jonassen, D.H. (1997), Instructional Design Model for well-
structured and ill-structured problem solving learning
outcome , Educational Technology: Research &
Development, 45(1), 65-95
238
Proceedings of International Conference on Education, Informatics, and Cybernetics (icEIC 2011),
and the International Symposium on Integrating Research, Education, and Problem Solving (IREPS 2011)
Curricular and Programmatic Structures to Support Sustained Community Research and Action in a Large Undergraduate
Curricular Student Leadership Program
Alexander Fink Leadership Education and Development, University of Minnesota
Minneapolis, MN 55455, USA
and
Dr. Linnette R. Werner Leadership Education and Development, University of Minnesota
Minneapolis, MN 55455, USA
ABSTRACT
There are numerous models for turning research questions into action projects. Often, these models are implemented by professional researchers or practitioners in fields such as sociology, education, and social work. Among the terms for these are Action Research, Participatory Action Research, and Community-Based Participatory Research. There have been many attempts to integrate these models into service-learning and other forms of university-community engagement. This case study examines an undergraduate leadership minor program at a Midwestern, research one, university that has implemented such a model throughout its four-core-course sequence. Basic to most of these models, it trains college students to ask questions, conduct relevant and original research, and take action to create change on social issues. The program has been implemented on a large scale, serving over five hundred students each year with thirty adjunct, many community faculty, instructors. The primary focus of this paper is an analysis of the programmatic, curricular, and training structures that surround and enable work that moves theory into research, then into action, and finally, reflection, at this scale in this setting. It asks about what structures might be necessary for undergraduate university programs to support learning and education that encourages and teaches at the intersections of research and real-world social problem solving.
INTRODUCTION
The Leadership Minor at the University of Minnesota is an interdisciplinary, undergraduate, minor that focuses on the practice of global leadership. It developed in the late 1990's in response to student demand for curricular leadership education opportunities and was one of the first undergraduate minors in leadership in the US. Its theoretical foundation rests on Astin and Astin’s [1] Social Change Model and the four core-course sequence reflects the Social Change Model’s progression from self (the introduction to leadership course) to community (the second and third courses) to the larger world (the capstone course). In order to cultivate skillful leadership practitioners, the curriculum has developed over time to include numerous opportunities to practice leadership and reflect on successes and failures. Participatory forms of action research serve as a core element of the four courses and are integrated into each class in order to broaden and deepen students’ skills in turning purposeful research into powerful action.
This paper outlines the multiple, layered, structures that are key to supporting the action-research learning processes with over five hundred students and thirty adjunct faculty each year. It does so recognizing that, though every context brings new and different challenges, some elements of this program may
239
Proceedings of International Conference on Education, Informatics, and Cybernetics (icEIC 2011),
and the International Symposium on Integrating Research, Education, and Problem Solving (IREPS 2011)

provide insights into context-specific challenges to implementing similar programming. The paper will explore (1) partnership and faculty, (2) core curricular models, (3) the curricular structures that support research and action, (4) the models of instructor training and support that enable this research, and (5) the use of course evaluations as an iterative process for the entire program.
1. PARTNERSHIPS AND FACULTY
Developed in response to student demand, this program was created as a tri-partite partnership between the Office for Student Affairs and two separate colleges within the university (The College of Education and Human Development and the Humphrey School of Public Affairs). The Office for Student Affairs office serves as the fiscal/managerial host for the program and provided the majority of the funding required to initially support the program. The colleges serve as the curriculum development and oversight board, help recruit faculty, and schedule the courses within the departments of Organizational Leadership, Policy, and Development (OLPD) and Public Affairs (PA). When these specific departments (OLPD and PA) originally joined the partnership, neither department offered undergraduate courses and the partnership offered the opportunity for access to undergraduate students for those faculty who were passionate about undergraduate education.
In order to provide a deep integration of theory and practice, and to pilot the initial curriculum, faculty members were paired with student affairs professionals to co-teach each class. After the pilot phase, new adjunct instructors were recruited from the community in order to meet the rising demand for sections. These new instructors were brought through a rigorous observation and co-teaching process. Eventually, this developed as a full program model, with a faculty supervision board that approves curriculum changes from both host colleges, the student affairs office serving as fiscal and staff host, and community faculty instructing most course offerings.
Community faculty often bring real-world experience and a willingness to try new pedagogical methods. This enables the curriculum to remain flexible and adaptive, changing in response to different students and
instructors while holding steady to core readings and outcomes across all sections. It also means that instructors move in and out more frequently, allowing changes in the curriculum to propagate quickly, rather than encountering resistance to change.
2. CORE MODEL
The Leadership Minor curriculum is sequentially based on the Social Change Model of Leadership Development created by Astin and Astin [1]. At the core of this model are several key beliefs, including: leadership is concerned with social change, leadership is collaborative, leadership is a process rather than a position, and leadership should be based in values. Additionally, the model firmly asserts that anyone is a potential leader. In addition to encouraging students to create social change, the model puts great emphasis on students achieving a knowledge of self that includes an understanding of their values, strengths, and interests. The model asks students to consider leadership from the perspective of themselves (as individuals), then from the perspective of communities, and finally the broader global society [1].
3. CURRICULAR STRUCTURES FOR RESEARCH AND ACTION
In the Leadership Minor program, we differentiate between what Harvard leadership researcher and educator, Ronald Heifetz, calls technical and adaptive challenges [2]. Technical challenges involve solving problems for which a suitable formula or solution has already been developed. An example might be implementing an affirmative action program at an organization based on company policy and state and federal laws. Adaptive challenges involve changing the attitudes and behaviors of those involved. This might involve an organization-wide program to develop a more open, diverse and accepting workforce culture.
We use a Participatory Action Research (PAR) framework to offer students a real life laboratory to practice solving adaptive challenges [5]. PAR involves raising questions about problems and taking action on these problems in collaboration with stakeholders affected by the problem. It is different from standard research in two ways. First, it involves stakeholders as more than research subjects, but as a valuable part of
240
Proceedings of International Conference on Education, Informatics, and Cybernetics (icEIC 2011),
and the International Symposium on Integrating Research, Education, and Problem Solving (IREPS 2011)

the research. Second, it asks researchers and research participants to take action as a part of the research process. PAR comes in many forms, with various levels of collaboration between researchers and stakeholders. The particular model utilized in the Leadership Minor is the Civic Action Project model developed by VeLure Roholt [4]. This model involves the researchers (in this case, our students) in researching and acting on problems of compelling interest to them.
The four-course sequence of the Leadership Minor program develops students’ ability to solve adaptive challenges, broadens the range of tools and skills they are able to address adaptive problems, and simultaneously deepens their abilities to practice problem-solving skillfully in a variety of diverse contexts.
Course 1: Leadership, You, and the University With Astin and Astin’s Social Change Model at the core, instructors guide small groups of students through a Social Change Project, wherein students collaborate to choose an issue they are passionate about, develop a strategy for, conduct research, and take action on to create change. The instructor asks students to organize themselves thoughtfully into groups based on group and teams theory learned during the course. Instructors also help students throughout the projects to reflect on the dynamics of their group activities in light of these theories and to develop effective interventions to improve group collaboration. There are eight elements of the Social Change Project: (1) Students determine and agree upon an issue that is of significant importance to them; (2) The students research this issue, including developing a map of the different elements relating to their issue; (3) The students develop a “power map” that identifies key stakeholders that have power over or within this issue; (4) Each group member meets with one of the individuals identified in the power map; (5) The group develops an action plan that is reviewed by the instructor; (6) The group executes at least a part of their action plan before the completion of the semester; (7) The group develops a presentation explaining their work and reflecting upon their group experience that is given to classmates and stakeholders.; (8) Individual group members write reflections on their role in the group, group dynamics, and their group work as related to course readings and in-class experiences.
Course 2: Leadership, You, and the Community In the second course, students use research as a vehicle for understanding and applying the Adaptive Leadership model [2]. Students explore adaptive leadership in a community setting by conducting interviews with community leaders, mapping the complex community contexts in which leadership occurs, and use the Adaptive Leadership lens to analyze the data they collect. Students are not encouraged to identify solutions to adaptive issues at this point. Instead, they are encouraged to conduct thorough research, and to seek to understand the presenting problems in complex and rigorous ways.
Course 3: Leadership Minor Field Experience Building upon this authentic experience with real and lived community adaptive issues, the third course allows students to continue their research, but to move toward action on the issue. Similar to a service-learning course, but nuanced with the task of making systemic progress toward a larger community-driven goal, this Field Experience course involves students in community work near campus. There are several options that students can choose from including grassroots community-organizing, coaching youth action projects, and developing a social entrepreneurship project. They key distinction between the Field Experience course and the first (introductory course) is that this class is developed within the context of sustained partnerships with communities and non-profit organizations. Students participate in the field experience for one semester, but they carry on work that was started before them and will continue after them. Students begin the class by developing their knowledge of the community they will be working with during the semester. This is accomplished through the use of course texts, news articles, speakers, observations, and site visits. They further this understanding through participation in community projects with non-profit organizations. At the end of the semester, they develop a final project that requires they make lasting change in the community. The instructor, through reflective writing and in-class discussions of field experiences, supports this process. Unlike the first two courses (which have 30 students per section), there are typically only fifteen students per section in this course in order to allow the instructor adequate time for personalized support.
241
Proceedings of International Conference on Education, Informatics, and Cybernetics (icEIC 2011),
and the International Symposium on Integrating Research, Education, and Problem Solving (IREPS 2011)

Course 4: Leadership for Global Citizenship In the final course in the sequence, students use the fields/majors they will graduate into as the global context for action research. Within their fields, they identify five people who are non-US citizens with whom to conduct interviews about the global issues facing their fields. In order to accomplish this task, many students start with U.S. professionals or professors within their majors who are able to connect them with people representing more global perspectives. After these interviews, students analyze the data to identify global issues within their fields. For example, an Information Technologies student may speak with people from all over the world to identify such global issues as intercultural communication within corporations, sustainable technology infrastructures for countries that have not been able to keep up with infrastructure at the same rate technological advances have occurred, or e-waste issues as they affect communities around the world.
Once students have identified these issues, they conduct literature reviews and professional organization reviews within their fields to understand how global practitioners’ views connect to the professional literature and conference agendas worldwide. The data from interviews is overlaid with the data from their fields' literature to create a more complete picture of the global issues they will face upon graduation. The final step is to identify how, as a Leadership Minor student, they personally will contribute to the amelioration of these adaptive issues.
4. INSTRUCTOR TRAINING AND SUPPORT
The Leadership Minor trains and/or supports over thirty instructors per semester. There have been particular structures created to aid these instructors in navigating this non-traditional and demanding work. Unlike traditional teaching, which can operate more or less successfully with teachers offering engaging lectures and discussions, teaching that involves students in real-world problem solving requires a re-conceptualization of the roles of instructors and students in the classroom. The teaching pedagogy employed by the instructors within the Leadership Minor comes out of the adaptive Case in Point™ methodology used by Heifetz, et al [1]. However it has
been adapted significantly for the undergraduate context (instead of the Harvard graduate school context in which it originated). This new approach to teaching research-infused leadership, called Intentional Emergent Context, requires instructors to serve as facilitators, challenge students to think in new ways, and to use the immediate context of the students’ lived experience as the bridge between theory and practice. This kind of teaching requires a great deal of training and continued support over time. There are four phases each instructor goes through:
1. Instructor Observations New instructors observe at least ten classes in the course they intend on teaching;
2. Observation Meetings New instructors reflect on their observations in the context of other observers and with several seasoned instructors;
3. Mentored Teaching New instructors are paired with a seasoned instructor to co-instruct a course;
4. Individual Teaching New instructors teach the next semester on their own to develop a personal style of instruction; and
5. Mentoring Teaching Now seasoned instructors are asked to take on the additional challenge of mentoring new instructors.
If an instructor carried through this process from beginning to end in back-to-back semesters, they would be mentoring new instructors in their fourth semester of involvement in the program. By investing significant energy in developing new instructors, the Leadership Minor assists these instructors in doing the work of supporting students to take on real-world challenges in meaningful and exciting ways.
Throughout this process (and on-going as long as instructors are teaching), instructors also participate in continuously evolving program curriculum. Small groups of instructors evaluate and update pieces of curriculum on a regular basis. Instructors are supported trying new ideas, testing the efficacy of experimental new curriculum, and continuously looking for the leading edge of best practices. Once an experimental resource or concept is proven worthy, Leadership
242
Proceedings of International Conference on Education, Informatics, and Cybernetics (icEIC 2011),
and the International Symposium on Integrating Research, Education, and Problem Solving (IREPS 2011)

Minor staff propagate successful curriculum throughout other courses in the program.
5. COURSE EVALUATIONS AS ANOTHER LAYER OF PRAXIS
Praxis, the coming together of research, reflection, and action, is a critical foundational component for the functioning and makeup of the Leadership Minor [3]. Students move through the praxis process each semester within all four core courses. Instructors engage in praxis through training, teaching, and shared reflection processes. Additionally, the course evaluations provide a meta-process of praxis for the entire program.
Program course evaluations collect information not only about the content of each course, the quality of instruction and materials, but also about the degree to which each course helps students reach the larger university Student Learning Outcomes (SLOs) and Student Development Outcomes (SDOs). Student ratings are correlated with the SLOs and SDOs each course asserts it meets to be sure that assignments and course materials are supporting the achievement of listed outcomes.
The rigorous evaluation process deeply engrains the value of Participatory Action Research and praxis at an instructor level as well as a programmatic level and ensures that the program is surfacing its own adaptive issues in a timely manner. The results of the process are then used to update readings and assignments on an annual basis through a reflective whole-instructor team process.
CONCLUSIONS
Leadership is a curricular area that is being widely adopted within colleges and departments from Liberal Arts to Science and Engineering. Whether leadership curriculum is taught in the context of these collegial lenses or as its own discipline, the study of leadership affords ample opportunities for the integration of research, leadership theory, and practice.
The process of research itself (identifying a problem, analyzing existing data to inform a new data collection plan, collecting new data, and analyzing new data) is
an exemplary vehicle for teaching adaptive leadership theory because the issues that arise during the research process provide real-life practice in applying leadership theory to successfully carry out the research tasks.
In addition, using a robust framework, such as Astin and Astin's Social Change Model [1], allows a leadership curriculum to incorporate research into theory and practice in a stratified and developmental approach throughout the progression of the curriculum from one unit of study to another. Using such intentionally connected and layered approaches, gives undergraduate students the concrete application practice they need for their specific developmental stages of learning.
The structures used to create, support, and evaluate the Leadership Minor within this specific case study cannot be overlooked as to their importance in its success and replication within other contexts. The first key structure, the tri-partite collaboration among a student affairs unit and two separate collegiate departments, created a need for innovative navigation of complex systems. Within a research one, land grant, big ten university, it is rare for cross-departmental collaboration of this level of complexity to occur. As a result of this partnership, the oversight of and vision for the work within the Minor is held within the hands of many instead of few, which not only allows for, but requires conversations about the deep purpose of the Minor and its future. Within a context of such collaboration, decision-making often focuses on what would be best for the students, the program, and the larger community instead of other more financial or political considerations. This has led to the absolute financial stability and rapid expansion of the Minor and contributes to its political safety within such a large institution.
The second structure, the curriculum (its theoretical foundations and its continuous evaluation), is equally important to the specific context of this program and its success. Grounding the curriculum in the Social Change Model [1], not only supports the integration of research, education, and problem-solving in the classroom, but provides for a developmentally appropriate scaffolding of such skills within the four core-course sequence of the Minor. Selecting a
243
Proceedings of International Conference on Education, Informatics, and Cybernetics (icEIC 2011),
and the International Symposium on Integrating Research, Education, and Problem Solving (IREPS 2011)

civically engaged and scaffolding model for the foundation allows the integration of research in a seamless manner that bypasses faculty-resistance that sometimes occurs with time-intensive teaching methodologies.
The final structure, instructor training and support, is specific to this context in that by accommodating over 500 students annually, the process of instructor recruitment, training, and support has become central to the health of the program and the student experience. Although most contexts may not call for the rapid deployment of 30 or more trained and fully autonomous adjunct faculty within each year, for those contexts where expansion to more sections than fulltime faculty can accommodate, the use of adjunct faculty is imperative, and therefore so is their training and support. Integrating research, education, and problem-solving into any classroom (leadership or otherwise), calls for an instructor with diverse strengths and a great deal of programmatic support. Within the Leadership Minor, new instructors are recruited not only for their academic background in leadership or related field, but also for their ability to teach in and Intentional Emergent Context model.
No matter the scope of the programmatic context, the process used to create the Leadership Minor and support its expansion from one section of 20 students in its pilot year to its current student engagement level is replicable: 1) Collaborate across disciplines, 2) Select a solid theoretical foundation that supports the integration of research, education, and problem-solving, 3) Recruit and support talented/committed faculty, and 4) have a constant and iterative process of program evaluation in place.
REFERENCES
[1] Astin, H., & Astin, A. (1996). A Social Change Model of Leadership Development: Guidebook. Los Angeles: University of California Education Research Institute.
[2] Heifetz, R., Grashow, A., & Linsky, M. (2009). The Practice of Adaptive Leadership: Tools and Tactics for Changing Your Organization and the World. Boston: Harvard Business School Press.
[3] Freire, P. (1970). Pedagogy of the Oppressed. Continuum International Publishing Group.
[4] VeLure Roholt, R., Hildreth, R. W., & Baizerman, M. (Eds.). (2009). Becoming Citizens. New York: Routledge.
[5] Wadsworth, Y. (1998). What is Participatory Action Research? Action Research International. Retrieved from http://www.scu.edu.au/schools/gcm/ar/ari/p-ywadsworth98.html
ABOUT THE AUTHORS
Alexander Fink
Alex Fink is a Ph.D. Student in the School of Social Work at the University of Minnesota and a leadership development educator.
Linnette Werner
Dr. Werner has been an instructor in the Leadership Minor at the University of Minnesota since 2001 and has a research agenda on Intentional Emergent Context as an effective means of teaching leadership to undergraduates.
244
Proceedings of International Conference on Education, Informatics, and Cybernetics (icEIC 2011),
and the International Symposium on Integrating Research, Education, and Problem Solving (IREPS 2011)

Integrating Research and Education to Promote Innovations
Juha KETTUNEN
Turku University of Applied Sciences
Joukahaisenkatu 3 A
FIN-20520 Turku, Finland
tel: +358 2 2633 5612
fax: +358 2 2633 5791
e-mail: [email protected]
ABSTRACT
This study presents typologies of learning to
bridge the gap between learning inside and
outside higher education institutions. The
different types of learning can be found in higher
education institutions to promote the learning
outcomes. The study also presents the approach
of innovation pedagogy and an example of how it
has been applied to form a multi-disciplinary
structure of the faculty. The results of this study
are useful for those who want to improve the
quality of education and promote innovations.
Keywords: Higher education, Pedagogy, Learning,
Knowledge, University, Innovations
1. INTRODUCTION
Learning includes two integrated but very
different processes. The learning can be an
external interaction process between the learner
and his or her social, cultural or material
environment or an internal psychological process
of acquisition and elaboration where new
impulses are connected with the results of prior
learning (Illeris, 2009a). Learning is constructivist
in nature so that the learner actively builds up or
construes his or her learning as mental
structures, but the term of the socio-cultural
theory of learning is also commonly used (Peck et
al., 2009). Both of the processes mentioned
above must be actively involved if any learning is
to take place.
The purpose of this study is to present typologies
to bridge the gap between learning inside and
outside higher education institutions and find
ways to promote innovations. Innovations are
created in value chains or networks, which
combine business, technology and other subjects,
which combine different kind of knowledge
needed in working life. Empirical evidence is
presented from the Turku University of Applied
Sciences, which does not have any business or
technology faculties but the institution has
created multi-disciplinary faculties and used the
concept of innovation pedagogy to support the
innovations.
Each higher education institution has its profile
which differentiates it from other institutions.
The Finnish Ministry of Education and Culture
asked every higher education institution to define
its profile. Therefore there is a need for a
comprehensive and up-to-date understanding
about the concept of learning that correspond
the profile of the institution. The Turku University
of Applied Sciences defined innovation pedagogy
for its profile (Kettunen, 2011).
2. TYPES OF LEARNING AND KNOWLEDGE IN
DIFFERENT CONTEXTS
The transfer problem of education psychology is
concerned with the challenge of transfer the
learned in one context to apply in a different
context. The challenge is how the higher
education institution can be more applicable
outside the institution. Typically, education is too
much oriented towards the reproduction of the
subject matters of institutions. Illeris (2009b, 145)
argues that the learning theories have been too
narrow in their scope and at least in the English-
speaking countries the learning theories have
been dominated by the behaviourist approach up
to the 1980s.
Table 1 collects the four types of learning and
knowledge in the context of higher education.
The types of learning and knowledge are
extended and combined in this study with the
context of higher education. Illeris (2009b)
presents a typology of four basic learning types
245
Proceedings of International Conference on Education, Informatics, and Cybernetics (icEIC 2011),
and the International Symposium on Integrating Research, Education, and Problem Solving (IREPS 2011)

based on his earlier study (Illeris, 2007) and the
earlier work by Piaget (1952). The concept of
expansive learning can be found Engeström
(1987) and the concept of transformative
learning from Mezirow (1991). The different
types of learning and knowledge can be found in
higher education.
Originally the typologies of learning and
knowledge are based on the different theoretical
backgrounds and developed in different ways.
They have come close to the understanding
about education in higher education. In practice
the four levels of transfer are not sharply
separated as the typology may indicate. All of
these typologies can be found in higher education
and are necessary to build up the capacities and
competence of an individual. The challenge of a
higher education institution is to find variation
and balance in the use of these levels.
Table 1. Types of learning, knowledge and context in higher education
Type of learning Type of knowledge Context
Cumulative of mechanical
learning
Learning of concepts and facts
Learning is characterised by a
type of automation
Replication of knowledge
Repetition of knowledge
Lecture, literature and
memorization in examinations
No context of meaning or
personal importance
Assimilative learning or learning
by addition
New element is linked as an
addition to a scheme
Learning is easy to recall and
apply in the field in question
Application of knowledge
Use acquired knowledge under
new circumstances
Follow the rules and
procedures related to the
knowledge
Problem solving and development
Gradual development of
capacities
Incremental innovations
Accommodative or transcendent
learning
Situation that is difficult relate
to any existing scheme
One breaks down an existing
scheme and reconstructs it in
a new way
Interpretation of knowledge
Understanding involves
personal perspectives or ways
of seeing
Requires professional insight
and an intellectual effort
Research
New idea has to be discovered
and solved
Produces results which are
significantly new or different
Radical innovations
Expansive or transformative
learning
Personality changes or
changes in the organisation of
the self
Includes emotional and social
patterns
Association of knowledge
A sense of purpose,
appropriateness and feasibility
Personal growth and internships
Acquisition depends on a
wealth of professional
experience
Transformative learning can
often be experienced physically
in internships
3. COGNITIVE DEVELOPMENT
According to Mezirow (1991), development is at
the heart of transformational learning and the
link between development and learning is
explicit. Merriam (2004) and Mezirow (2004)
argue that one must be at a mature level of
cognitive functioning to engage in the
transformational learning process and be able to
critically reflect and engage in rational discourse.
Numerous studies (Taylor, 2000) offer support for
the notion that development is an outcome of
transformational learning. Fostering greater
autonomy in thinking is both a goal and method
for adult educators and achieving greater
autonomy in thinking is a product of
transformative learning (Mezirow, 2000, 29). A
rather high level of cognitive functioning is a
prerequisite for transformational learning
(Merriam, 2004, 61). Feinstein (2004) notes that
critical reflection and reflective discourse are
used to facilitate transformative learning.
246
Proceedings of International Conference on Education, Informatics, and Cybernetics (icEIC 2011),
and the International Symposium on Integrating Research, Education, and Problem Solving (IREPS 2011)

Criticos (1993) observed that valuable is not the
experience itself but the intellectual growth that
follows the process of reflecting on experience.
Effective learning does not follow from positive
experience but from effective reflection (Criticos,
1993, 162). Critical reflection, or premise
reflection on assumptions, involves examining
long-held, socially constructed assumptions,
beliefs, and values about the experience or
problem. Brookfield (2000, 139) concurred that
an act of learning can be called transformative
only if it involves a fundamental questioning and
reordering of how one thinks or acts.
Reflective discourse is specialized dialogue
devoted to searching for a common
understanding and the assessment of the
justification of an interpretation or belief
(Mezirow, 2000, 10-11). Critical reflection and
reflective discourse assume a certain level of
cognitive development, but studies find that
many adults do not operate at higher levels of
cognitive functioning (Merriam, 2004, 63).
Mezirow (2000, 21) has acknowledged the
possibility that critical reflection may not be
necessary for transformational learning to occur,
but the transformations through assimilative
beyond our scope of awareness, we make a tacit
judgment to move toward a way of thinking or
behaving that we deem more appropriate to our
new situation (Mezirow, 1998, 191). Mindless
assimilation seems quite a different process from
Mezirow (2004) and Merriam (2004) recognize
that the fully developed learner moves through a
series of development form to arrive at the
highest potential for understanding to engage in
transformative learning. They recognize that this
occurs only in adulthood but not in all or even
most adults. This view is rather a limited view of
higher education and development. Mezirow
(2004) concludes that there is a need for a theory
in the process of development.
Paloniemi et al. (2010) recognise individual,
collaborative group-based and networked
learning even though they do not emphasise the
role of transfer and the learning inside and
outside the higher education institution. They
emphasise the role of socio-cultural learning,
where the individual learning has been extended
to learning in different contexts, situations and
cultures. They present evidence that
collaborative learning is able to produces better
results than individual learning. It has been
stipulated that the applied research and
development of the universities of applied
sciences support the regional development.
Multidisciplinary activities are appealing to
increase the effectiveness of research and
development and economic growth. The
challenges of interdisciplinary include according
to Kirjonen and Satka (2010) the definition of the
research task, language and communication, the
various limitations of research, the difficulties of
research career and to become qualified, the
sufficiency of know-how and motivation. On the
other hand, they list the many benefits of
interdisciplinary activities such as the opening of
thinking, broader views, better effectiveness, the
effective use of data and the development of new
ideas. They do not emphasise the role of applied
research and development which is based on the
customer needs, which are responded with
multidisciplinary projects.
4. INNOVATION PEDAGOGY FOR THE
UNIVERSITIES OF APPLIED SCIENCES
Education at the Finnish universities of applied
sciences includes internships which are at least
half a year, applied research and development
which in integrated with education to create
capabilities for students participate in the
projects of working life. Education also includes
project work and the thesis planned to support
the companies and public sector in the region.
The integration of research and development
requires, however, the multidisciplinary
education of activities to understand the
customer needs and solve the problems in an
innovative way.
Education at the Finnish traditional research
universities includes lectures, literature and
examinations to create the strong intellectual and
informative basis of learning and knowledge.
Collaborative and networked learning is not
systematically used in every subject, which is
perhaps due to the fact that teacher training is
not required as at the traditional universities.
247
Proceedings of International Conference on Education, Informatics, and Cybernetics (icEIC 2011),
and the International Symposium on Integrating Research, Education, and Problem Solving (IREPS 2011)

Internships are included only in a few subjects
where it is necessary.
The typical procedure of project work is that a
group of students selects a relevant problem
counselled by a teacher, plan the project,
investigate the problem and write a report and
present the results of the project. The
presentation together with the report forms the
basis for a grade or approval. In this form, the
project work is group-based collaborative
learning inside the institution and it does not
outreach and engage with the external customers
and partners outside the institution.
The alternative form of project work is that the
teachers apply funding from the European union,
other funding bodies or directly from customer
organisations, look for partners to the projects
and integrates the project with education so that
students are able to find a useful role in the
project and achieve real work experience in
project work, study in networked collaboration
and create capabilities that can be used after
graduation in working life.
Innovative projects can be created at the third
level of learning and knowledge. There must be
some kind of innovative element in the project
application which is solved in the project using
the networked collaboration. A radical innovation
is a new product, service or re-engineered
process, but typically the innovations are
incremental in applied research and development
(Tidd et al., 2001). Radical innovations are close
to re-engineering of processes which produce
new products or services (Hammer & Champy,
1993). Incremental innovations are improved
products, services and processes and hence close
to the concept of continuous improvement in
quality assurance.
The universities of applied sciences aim to be
valuable institutions in regional development.
The customer needs do not typically follow the
subject, the degree programme or field of study.
Therefore the project teams have members from
many backgrounds. Multi-field faculties and
operations across the faculties support the
projects of applied research and development,
which have shown their ability to respond the
needs of working life. This is different from the
creation of new universal knowledge which is an
ideal of traditional research universities which
have discipline-oriented faculties and subjects.
Environment
- sustainable development
- fisheries and environmental
care
Design
- industrial design
Sales
- professional sales
Technology
- automotive and
transportation engineering
- mechanical engineering
- civil engineering
- industrial management
- construction management
- construction
- environmental management
Business and administration
- business logistics
Figure 1. Innovative faculty in higher education
248
Proceedings of International Conference on Education, Informatics, and Cybernetics (icEIC 2011),
and the International Symposium on Integrating Research, Education, and Problem Solving (IREPS 2011)

Figure 1 depicts the innovative faculty of higher
education. The Faculty of Technology,
Environment and Business of the Turku University
of Applied Sciences have been planned to
combine business, environment and technology.
The next steps in the innovation process are the
design and sales education. Many other faculties
of the institution have been planned in a similar
way to combine business, technology and some
other knowledge.
5. CONCLUSIONS
Learning is not mechanical or isolated formation
of knowledge that can be recalled and used in
situations mentally similar to the learning
context. Typically, this type of education learning
is based on lectures and literature and includes
concepts and facts which are memorized in
examinations with no context of meaning or
personal importance. A more advanced learning
includes gradual development of capacities and
problem solving, where the new element is linked
as an addition to a scheme or pattern. This type
of learning can produce incremental innovations.
A new step is taken in learning when the learner
breaks down an existing scheme and uses the
knowledge in a new situation. This kind of
learning may take place, when the learner
accepts something that is significantly new or
different. Learning may also produce outcomes
which change the personality or the identity of
the learner. That can be characterised as
professional growth.
When education is integrated with development
projects assimilative learning may take place. In
assimilative learning, problems are solved and
new elements are linked as an addition to a
theoretical model or the framework. Assimilative
learning takes place also when knowledge is
applied in practice so that it develops the
products, services and processes and hence
produces incremental innovations.
Accommodative or transcendent learning takes
place when education is integrated with projects
so that they produce new products, services or
processes. These can be called radical
innovations.
REFERENCES
Brookfield, S. 2000. Transformative learning as
ideology critique. In J. Mezirow & Associates
(Eds.), Learning as transformation (pp. 125-150).
San Francisco: Jossey-Bass.
Collin, K., Paloniemi, S., Rasku-Puttonen, H. &
Tynjälä, P. (toim). 2010. Luovuus, oppiminen ja
asiantuntijuus. Helsinki: WSOYpro Oy, 13-37.
Criticos, C. 1993. Experiential learning and social
transformation for a post-apartheid learning
future. In D. Boud, R. Cohen & D. Walker (Eds.),
Using experience for learning (pp. 159-165).
Buckingham, UK: Society for Research into Higher
Education and Open University Press.
Engeström, Y. 1987. Learning by expanding: An
activity-theoretical approach to developmental
research. Helsinki: Orienta-Konsultit.
Hammer, M. & Champy, J. (1993). Reengineering
the Corporation: A Manifesto for Business
Revolution, Harper Collins Publishers, New York,
USA.
Illeris, K. 2009a. A comprehensive understanding
of human learning. International Journal of
Continuing Education and Lifelong Learning 2 (1),
46-63.
Illeris, K. 2009b. Transfer of learning in the
learning society: How can the barriers between
different learning spaces be surmounted, and
how can the gap between learning inside and
outside schools be bridged? International Journal
of Lifelong Education 28 (2), 137 148.
Kirjonen, J., & Satka, M. 2010. Tieteidenvälisyys
tutkimusryhmässä vaativaa asiantuntijatyötä. In
Collin, K., Paloniemi, S., Rasku-Puttonen, H. &
Tynjälä, P. (toim). 2010. Luovuus, oppiminen ja
asiantuntijuus. Helsinki: WSOYpro Oy, 57-77.
Kettunen, J. (2010a). Cross-evaluation of Degree
Programmes in Higher Education, Quality
Assurance in Education, Vol.18, No.1, pp. 34 46,
ISSN 0968-4883.
Kettunen, J. (2010b). Strategy Process in Higher
Education. Journal of Institutional Research, Vol.
15, No.1, pp. 16 27, ISSN 1443 2110.
249
Proceedings of International Conference on Education, Informatics, and Cybernetics (icEIC 2011),
and the International Symposium on Integrating Research, Education, and Problem Solving (IREPS 2011)

Kettunen, J. (2011a). Evaluation of the Centres of
Excellence in Higher Education. Tertiary
Education and Management, Vol.17, No.2, pp.
151 161, ISSN 1358-3883.
Kettunen, J. (2011b). Innovation Pedagogy for
Universities of Applied Sciences. Creative
Education, 2(1), pp. 56 62, ISSN 2151-4755.
Kettunen, J. (2011c). Strategy and Quality Maps
in Higher Education. US-China Education Review,
Vol.8, No.2, pp. 149 156, ISSN 1548-6613.
Kettunen, J. (2011d). Intranet as a Quality Manual
in Higher Education, International Journal of E-
Adoption, 2011, 3(3), 33-43.
Merriam, S.B. 2004. The role of cognitive
development in Mezirow´s transformational
learning theory. Adult Education Quarterly 55 (1),
60-68.
Mezirow, J. 1991. Transformative dimensions of
adult learning. San Francisco: Jossey-Bass.
Mezirow, J. 1998. On critical reflection. Adult
Education Quarterl, 48(3), 185-191.
Mezirow. J. 2000. Learning to think like an adult:
Core concepts of transformation theory. In J.
Mezirow & Associates (Eds.). Learning as
transformation (pp. 3-34). San Francisco: Jossey-
Bass.
Mezirow, J. 2004. Forum Comment on Sharan
Adult Education Quarterly 55 (1), 69-70.
Paloniemi, S., Rausku-Puttonen, H., Tynjälä, P.
(2010). In Collin, K., Paloniemi, S., Rasku-
Puttonen, H. & Tynjälä, P. (toim). Luovuus,
oppiminen ja asiantuntijuus. Helsinki: WSOYpro
Oy.
Peck, C.A., Gallucci, C., Sloan, T. & Lippincott, A.
(2009). Organizational learning and program
renewal in teacher education: A socio-cultural
theory of learning, innovation and change,
Educational Research Review, 4(1), 16-25.
Piaget, J. 1952. The origin of intelligence in
children. New york: International University
Press.
Taylor, E.W. 2000. Analyzing research on
transformative learning theory. In J. Mezirow &
Associates (Eds.), Learning as transformation (pp.
285-328). San Francisco: Jossey-Bass.
Tidd, J., Bessant, J. & Pavitt, K. (2001). Managing
Innovation: Integrating Technological Market and
Organizational Change, Wiley, Chicester, UK.
250
Proceedings of International Conference on Education, Informatics, and Cybernetics (icEIC 2011),
and the International Symposium on Integrating Research, Education, and Problem Solving (IREPS 2011)

Teaching Geometry and Research on Fractal Tilings
Peng-Jen Lai Department of Mathematics, National Kaohsiung Normal University
Kaohsiung 824, Taiwan (R.O.C.)
Abstract
In this paper, we demonstrate how our research
findings regarding fractal tilings arose through the
teaching of a geometry course, and describe the
mathematical relationships between the content of the
geometry course and our research results. We share
this delightful experience and demonstrate how
research can be closely related to teaching activities in
university.
Keywords: Geometry Course, Linking Teaching and
Research, Fractals, Fractal Tilings, Maple, Reptile.
1. Introduction
The geometry course at the National Kaohsiung
Normal University covers Euclidean and fractal
geometry. Because these students will eventually
become teachers in high school, a number of
interesting subtopics of Euclidean and fractal
geometry are also taught, including tilings, polyhedra,
the Golden ratio, and fractals. Students are provided
the opportunity to explore the properties of geometry
using dynamic geometry software, such as GSP and
GeoGebra, as well as computer algebra systems,
including Maple. After teaching the above content for
two years, the author sought to expand the curricula
with new materials related to tilings using fractal
shapes. This opened a door to the newly develop field
of fractal tilings.
The internet provides many sources of information
related to the topic of fractal tilings; however, this new
field is scarcely touched upon in textbooks on
geometry or fractals. The research results of the author
include a rigorous definition of fractal tilings in [1]
and an algorithm with which to generate self-similar
forms in [2]. The exploration of research questions in
this geometry course has proven highly rewarding,
both for instructors and students, particularly with
regard to the invention of new fractal shapes using
Maple by students. In this paper, we share this
delightful experience and demonstrate how research
can be closely related to teaching activities in
university.
About the relationship between research and teaching,
in [3,4] McNay, Healy et al. indicated the trend of
separation of research and teaching in university
“Structural changes: research centres housed staff
freed from teaching responsibilities; graduate schools
became the arenas for research, leaving department to
organize undergraduate teaching. Each of these
[developments] was particular and peculiar, but the
trend was gradually of a separation, structurally of
research from teaching”.
More recently, one of the topics to study linking
teaching and research is called “The Research
informed Teaching (RiT)” introduced in the homepage
of Staffordshire University in United Kindom as
"...recognise the importance of the reciprocal
relationship between teaching and research in
enhancing the students’ learning experience In the
University Research and Enterprise Strategy, for
example, it is stated that applied research activity will
underpin the student experience through its support of
learning and teaching, and many staff already make
good use of their research in the teaching context ." It
shows that the trend of linking research and teaching
is obvious.
In [5,6,7] the typology of teaching-research links was
developed as 1.Teaching can be research-led 2.
Teaching can be research-oriented 3. Teaching can be
research-based 4. Teaching can be research-informed.
In the geometry course, we conducted students to
understand the processes by which fractal knowledge
is produced and learn how to simulate fractals by
Maple programming. So our course should fall on the
second category of this typology. It was the teaching
experience in this course that made the author invent
new results about the fusion topic of tilings and
fractals. The remainder of this paper is organized as
follows: Section2 describes the main ideas of tilings
and fractals, and the computer simulation of fractals
with Maple by students. Section 3 describes our
published research results about fractal tilings. And
the conclusion is given in Section 4.
2. Geometry Course Teaching
The geometry course is taught three hours per week
for two semesters. The first part of the second
semester is devoted to the geometry of tilings and
fractal geometry is covered in the second. The need to
make these topics comprehensible to students led the
author to develop a novel fusion of tilings and fractals.
In the following subsections, we outline the main
ideas of these two topics in detail.
251
Proceedings of International Conference on Education, Informatics, and Cybernetics (icEIC 2011),
and the International Symposium on Integrating Research, Education, and Problem Solving (IREPS 2011)
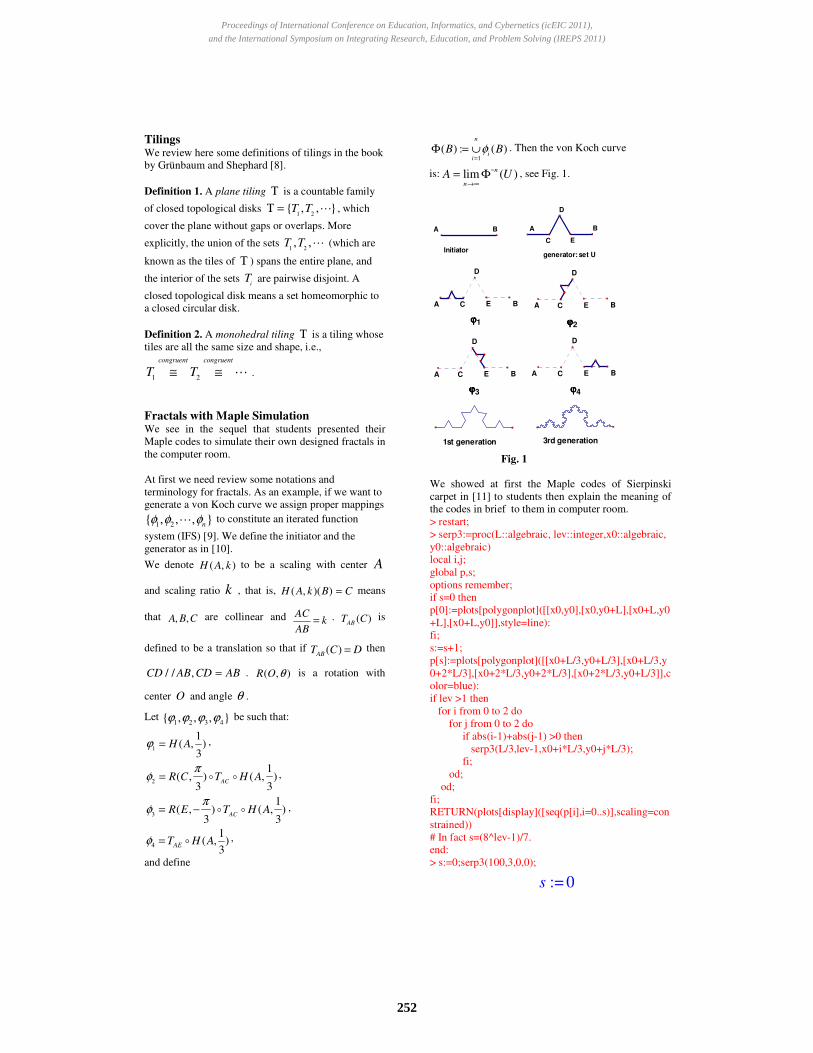
Tilings We review here some definitions of tilings in the book
by Grünbaum and Shephard [8].
Definition 1. A plane tiling Τ is a countable family
of closed topological disks 1 2
{ , , }T TΤ = ⋯ , which
cover the plane without gaps or overlaps. More
explicitly, the union of the sets 1 2, ,T T ⋯ (which are
known as the tiles of Τ ) spans the entire plane, and
the interior of the sets i
T are pairwise disjoint. A
closed topological disk means a set homeomorphic to
a closed circular disk.
Definition 2. A monohedral tiling Τ is a tiling whose
tiles are all the same size and shape, i.e.,
1 2
congruent congruent
T T≅ ≅ ⋯ .
Fractals with Maple Simulation We see in the sequel that students presented their
Maple codes to simulate their own designed fractals in
the computer room.
At first we need review some notations and
terminology for fractals. As an example, if we want to
generate a von Koch curve we assign proper mappings
1 2{ , , , }n
φ φ φ⋯ to constitute an iterated function
system (IFS) [9]. We define the initiator and the
generator as in [10].
We denote ( , )H A k to be a scaling with center A
and scaling ratio k , that is, ( , )( )H A k B C= means
that , ,A B C are collinear and ACk
AB= . ( )
ABT C is
defined to be a translation so that if ( )ABT C D= then
/ / ,CD AB CD AB= . ( , )R O θ is a rotation with
center O and angle θ .
Let 1 2 3 4
{ , , , }ϕ ϕ ϕ ϕ be such that:
1
1( , )
3H Aϕ = ,
2
1( , ) ( , )
3 3AC
R C T H Aπ
φ = � � ,
3
1( , ) ( , )
3 3AC
R E T H Aπ
φ = − � � ,
4
1( , )
3AET H Aφ = � ,
and define
1
( ) : ( )n
ii
B Bφ=
Φ = ∪ . Then the von Koch curve
is: lim ( )n
n
A U→∞
= Φ�
, see Fig. 1.
generator: set UInitiator
D
EC
A BA B
ϕϕϕϕ2ϕϕϕϕ1
D
EC
D
EC BA BA
ϕϕϕϕ4ϕϕϕϕ3
D
EC
D
ECA B A B
3rd generation1st generation
Fig. 1
We showed at first the Maple codes of Sierpinski
carpet in [11] to students then explain the meaning of
the codes in brief to them in computer room.
> restart;
> serp3:=proc(L::algebraic, lev::integer,x0::algebraic,
y0::algebraic)
local i,j;
global p,s;
options remember;
if s=0 then
p[0]:=plots[polygonplot]([[x0,y0],[x0,y0+L],[x0+L,y0
+L],[x0+L,y0]],style=line):
fi;
s:=s+1;
p[s]:=plots[polygonplot]([[x0+L/3,y0+L/3],[x0+L/3,y
0+2*L/3],[x0+2*L/3,y0+2*L/3],[x0+2*L/3,y0+L/3]],c
olor=blue):
if lev >1 then
for i from 0 to 2 do
for j from 0 to 2 do
if abs(i-1)+abs(j-1) >0 then
serp3(L/3,lev-1,x0+i*L/3,y0+j*L/3);
fi;
od;
od;
fi;
RETURN(plots[display]([seq(p[i],i=0..s)],scaling=con
strained))
# In fact s=(8^lev-1)/7.
end:
> s:=0;serp3(100,3,0,0);
s := 0
252
Proceedings of International Conference on Education, Informatics, and Cybernetics (icEIC 2011),
and the International Symposium on Integrating Research, Education, and Problem Solving (IREPS 2011)

Fig. 2
Fig.2 is the running result graph of the above maple
codes..
Then we showed the variant codes to get modified
Sierpinski carpet as in the fig. 3 to let the students
know more clearly how the codes work.
> serp2:=proc(L::algebraic, lev::integer,x0::algebraic,
y0::algebraic)
local i,j;
global p,s;
options remember;
if s=0 then
p[0]:=plots[polygonplot]([[x0,y0],[x0,y0+L],[x0+L,y0
+L],[x0+L,y0]],style=line):
fi;
s:=s+1;
p[s]:=plots[polygonplot]([[x0+L/3,y0+L/3],[x0+L/3,y
0+2*L/3],[x0+2*L/3,y0+2*L/3],[x0+2*L/3,y0+L/3]],c
olor=green):
if lev >1 then
for i from 1 to 2 do
for j from 1 to 2 do
if abs(i-1)+abs(j-1) >0 then
serp2(L/3,lev-1,x0+i*L/3,y0+j*L/3);
fi;
od;
od;
fi;
RETURN(plots[display]([seq(p[i],i=0..(3^lev-
1)/2)],scaling=constrained))
end:
> s:=0;serp2(100,4,0,0);
s := 0
Fig. 3
Then we assigned homework to all student teams to
design (invent) and simulate their fractals with Maple
programming. We found the students could design
their fractal shape by modifying the codes in [11] and
by repeating computer simulating. The following Fig.
4-Fig. 7 are part of photos of students while presenting
their homework in computer room.
Fig. 4 One team was presenting their Maple codes and
designed fractal in computer room.
Fig. 5 The detail of the designed fractal in the above
figure.
253
Proceedings of International Conference on Education, Informatics, and Cybernetics (icEIC 2011),
and the International Symposium on Integrating Research, Education, and Problem Solving (IREPS 2011)

Fig. 6 The Maple codes of a designed fractal by
another team.
Fig. 7 Another team was preparing the presentation.
3. Research Results
After teaching the above topics about fractals and
tilings in Geometry course, the author presented some
research results about fractal tilings in [1,2]. We state
the results in the following in brief.
In [12] they suggested a way of generating a fractal
tiling; they give the following intuitive definition for a
fractal tile.
Definition 3. A fractal tile is a tile whose boundary is
composed of fractal curves, or say, a topological
closed disk with fractal boundaries.
In [1] we give a rigorous definition of fractal tilings.
At first we review a prefractal [13].
Definition 4. A prefractal is the intermediate shape
for generating a fractal using the IFS method.
Then we give the definition of prefractal tilings.
Definition 5. Given a tile with fractal boundary , we
denote the tile by T and its fractal boundary by Γ . We
define the (kth) prefractal tile of T to be a set (tile)
with (kth) prefractal of Γ as boundary.
The following is a rigorous definition of fractal tiling
presented by the author in [1].
Definition 6. A tile with fractal boundary can tile the
plane if its every k th prefractal tile can tile the plane
for every k N∈ . If so, we call this tile with fractal
boundary a fractal tile.
Another research results in [1] included five methods,
including Escher’s tiling pictures methods and the
Conway criterion to create the fractal tilings. By the
results in [1] it is easy to check the well-known fractal
fudgeflake to be a fractal tilings see Fig 8. .
Fig. 8 The fudgeflake as a fractal tilings
Our another research result is an algorithm to generate
fractal reptiles [2].
Definition 7. A k-rep tile is defined as any set T that
can be dissected into k congruent parts 'T each of
which is similar to T . If the above T is disk-like,
then we say that T is a disk-like k-rep tile. A fractal
tile is called a fractal k-reptile if it is a k-reptile.
Sphinx is a famous example of a 4-rep tile. It is well
known that the Sierpinski gasket constitutes of 3n
copies of small congruent one for any n ∈ℕ . So the
Sierpinski gasket is a non-disk-like 3n
-rep tile for any
n ∈ℕ .
We investigate a well known process to generate
Gosper snowflake (Gosper island). With the aid of
Escher-style rules we can realize more deeply why this
process works. The investigation proceeds as follows.
The 0th step we begin with a hexagon 0
G (Fig. 9).
We can call it the initiator. Step 1. we use 7 congruent
hexagons scaled from 0
G to form the new polygon
called 1
G . For convenience we denote the scaled one
also by 0
G in the figure. We can see that because 1
G
is modified from a hexagon by the Escher parallel
translation rule, it follows that 1
G can tile the plane
well. We need the dashed hexagon attached to 1
G to
254
Proceedings of International Conference on Education, Informatics, and Cybernetics (icEIC 2011),
and the International Symposium on Integrating Research, Education, and Problem Solving (IREPS 2011)

indicate the relative position. We call it the referenced
hexagon of 1
G (Fig. 10). Step 2. shrink 1
G as small
as the scaled 0
G in 1
G and replace every small 0
G
by scaled 1
G by coinciding the referenced hexagon of
1G with small
0G to form
1G . Here we can see that
2G is modified from
1G by the Escher parallel
translation rule. So we know that 2
G can tile the
plane as well (Fig. 11). Step 3 Similarly, we replace
every small 1
G in 2
G by scaled 2
G to get 3
G .
Continue this process indefinitely to get the
convergent shape which is the Gosper snowflake.
0G
Fig. 9 Step 0: Choose a hexagon as the initiator
0G
0G
0G0G
0G
0G
0G
1G
Step1: Find a generator which is satisfied with Escher
rules.
Fig. 10 Find suitable initiator and generator of Gosper
snowflake.
1G
1G
1G
1G1G
1G
1G
2G
Fig. 11 Step 2: Replacing 0
G with 1
G to get 2
G .
With the aid of the above investigation, we can
provide an informal proof as follows. Let ,n k
G denote
the scaled previous generation shapes in 1n
G+
.
Because 1 ,
1, ,7n n k
k
G G+
=
= ∪⋯
for every n ∈ Ν , with
no overlap and no gap. Taking limit on both sides to
get
Gosper=1 ,
1, ,7
lim limn n k
n n k
G G+
→∞ →∞ =
= ∪⋯
,1, ,7 1, ,7
limn k
k n k
G= →∞ =
= ∪ = ∪⋯ ⋯
small Gosper
For the no overlap and no gap union we get that the
Gosper snowflake is a 7-reptile.
Base on the above investigation and Escher-style
rules we can now present an algorithm to generate
fractal reptiles. We find the key point is a criterion
with which the polygon initiator 0
P and the polygon
generator 1
P must satisfy.
Criterion 1. Several congruent scaled-down 0
P can
be joined together to form 1
P , i.e., 1 0
1
m
kk
P P=
= ∪ where
0kP is congruent to a scaled-down
0P , such that
1P
is modified from 0
P according to some Escher-style
rule or Conway criteria.
Algorithm for generating fractal reptiles:
Step 1. Choose a polygon 0
P (initiator) and a polygon
generator 1
P which satisfy criterion 1. Then we
should attach a referenced 0
P on 1
P ( as stated in the
above Gosper example) to proceed the next step.
Step 2. Replacing every 0k
P in 1
P by scaled-down
1P to form
2P . The Escher-style rule promises that
the union is no overlap and no gap. Also we need to
attach a referenced 0
P on 2
P for the successive
replacing process.
Step 3. Continue similar way in Step2 indefinitely to
get a limit set which is a fractal m-reptile.
4. Conclusion
In this paper, we demonstrate how our research
findings regarding fractal tilings arose through the
teaching of a geometry course, and describe the
mathematical relationships between the content of the
geometry course and our research results. This
experience is a poignant demonstration of the close
relationship between research and teaching.
5. Acknowledgement
We would like to express our warmest thanks to
Editor-in-Chief and the referees for their valuable
comments. This work was supported by the NSC of
Taiwan, ROC, under Grant No. NSC 100-2221-E-017-
015.
6. References
1. P.-J. Lai, Concise methods to generate fractal
tilings, International Journal of Nonlinear Sciences
and Numerical Simulation, vol. 10 (5), 585-594,
May 2009.
255
Proceedings of International Conference on Education, Informatics, and Cybernetics (icEIC 2011),
and the International Symposium on Integrating Research, Education, and Problem Solving (IREPS 2011)

2. P.-J. Lai, How to make fractal tilings and fractal
reptiles, Fractals, vol. 17 (4), 493–504 December
2009.
3. M. Healey, A. Jenkins, and R. Zetter, Linking
Teaching and Research in Disciplines and
Departments, York: HEAcademy, 2007.
4. I. McNay, The paradoxes of research assessment
and funding, in Henkel, M. and Little, B. (eds.)
Changing relationships betweenhigher and the state,
191-203. London: Jessica Kingsley Publishers,
1999.
5. R. Griffiths, Knowledge production and the
research-teaching nexus: the case of the built
environment disciplines, Studies in Higher
Education 29 (6) 709-726, 2004.
6. Jenkins, A, and Healey, M. Institutional strategies
to link teaching and research, the higher education
academy, 2005.
7. M. Healey, Linking research and teaching:
exploring disciplinary spaces and the role of
inquiry-based learning, in Barnett, R. (ed).
Reshaping the university: new relationships
between research, scholarship and teaching.
Maidenhead: McGraw-Hill/Open University Press,
pp.67-78, 2005.
8. B. Grünbaum, G C. Shephard, Tilings and Patterns.
W.H.Freeman and Company, 1987.
9. M. F. Barnsley, Fractals Everywhere, 2nd ed. AP
Professional, 1993.
10. M. Epstein, J. Śniatycki, The Koch curve as a
smooth manifold. Chaos Solitons and Fractals, 38,
334-338, 2008.
11. V. Rovenski, Geometry of Curves and Surfaces
with Maple, Birkhauser.
12. R. Darst, J. Palagallo, and T. Price, Fractal tilings
in the plane, Math. Magazine, 71(1), 12-23, 1998.
13. J. Feder, Fractal. Plenum Press, 1988.
256
Proceedings of International Conference on Education, Informatics, and Cybernetics (icEIC 2011),
and the International Symposium on Integrating Research, Education, and Problem Solving (IREPS 2011)

Renewable Energy: An Interdisciplinary Problem Solving Course
Alan H McGowan Department of Natural Sciences and Mathematics
Eugene Lang College The New School for Liberal Arts 65 West 11th Street, New York, NY 10025, USA
ABSTRACT
This paper describes a new intermediate course given in the Environmental Studies Program at The New School. It incorporates research activities by the class as a whole, in the process of which the class learns a great deal about the science and technology of non-fossil fuels, their promises and difficulties. Since ameliorating human influenced global climate change, educating and training students in the skills necessary to accomplish the necessary transition is essential. The course embodies a class project on which everyone works, entitled “Fueling America,” whose purpose is to determine what technologies deployed in what manner and in what quantities can eliminate the use of fossil fuels in the United States by a date certain. Knowing that it was impossible, we nevertheless chose an early date, 2030, so that it seemed reachable for the students. The project resulted in a technical paper, which included an economic analysis. In addition to alternative energy technologies, the technologies of energy efficiencies were also included. Keywords: fossil fuels, solar energy, energy efficiency, climate change, tidal energy, biomass, wind
INTRODUCTION The Renewable Energy course in Environmental Studies was comprised of students from Environmental Studies, Integrated Science, and Urban Studies programs. A prerequisite for the course was an introductory one, Energy and Sustainability, which I have taught for six years. [1] That course laid the basis of understanding energy from a physics and chemical point of view, considered the first two laws of thermodynamics, and assured the students had certain calculation skills necessary for the work in the course. The enthusiasm for the course was very high, due both to the commitment of the particular students in the course for building a more sustainable society, and because of the joint class project, in which every student participated. As one student said at the presentation of the final report to a group of students and teachers: “It was great because everyone worked together, and there was not the usual competition for grades that you find in many courses.” Of course grades were given, but based primarily on class discussions and individual presentations from the reading. Students met out of class, on their own, to discuss their work, and one student started a blog for the course, which I had nothing to do with. It was fundamentally a student centered course, and it showed the benefits of constructing a course in this manner.
Energy is fundamental to our lives, and students learn how difficult it is to wean ourselves off of the intensive use of energy which characterizes modern economies. Although the date we chose to be free of fossil fuels, was totally unrealistic, the date was chosen as a forcing mechanism, so that we could really face the problems of a fossil fuel free society. Students were eager to adopt an early date, because they were learning that global climate change was occurring more quickly than experts had originally predicted. The lack of political action on combatting climate change also fueled their eagerness.
THE COURSE The course started with consideration of basic concepts; we used a text for basic understanding of different energy concepts. The class was run as a true seminar; students made presentations from the text [2] as well as from supplemental reading posted on the on-line service we use, Blackboard. As well, students were required to search for their own supplemental material for the topic on which they were presenting. Although this meant a good deal more time preparing for each class hour than is usual, students ended up being very enthusiastic about this aspect. They felt as though they were being treated as serious researchers, which they were. Although this part of the course went on for some time, after a few weeks the students felt they were ready to tackle the main project, “Fueling America.” To be sure, in the beginning of this process they did not realize how hard a job it was going to be; one student said that one value of the class was to demonstrate how hard the job was, both of removing American dependence on fossil fuels and also finding adequate information about each technology. She said: “I used to say this is simple, just go to solar power. Now I think this is hard!” There followed intense discussion of the various technical possibilities, after which the class discussed how to proceed. They decided that one person - there were only six students in the class - would deal with one technology or technique, and that each student, in consultation with others, could choose what he or she wanted, making sure there were no duplications. With such a small number of students, that meant that some promising technologies would not be covered, and we would have to acknowledge that in our report. In the end, one of the most promising technologies, the many ways of using biomass, was not analyzed in the report. Although this is obviously a significant deficiency, the class decided, and I agreed, that it was more important in terms of student enthusiasm to let students work on a technology of their own choice. This would not have been an issue with a larger class, and there
257
Proceedings of International Conference on Education, Informatics, and Cybernetics (icEIC 2011),
and the International Symposium on Integrating Research, Education, and Problem Solving (IREPS 2011)

is, of course, another way to proceed, to insist that the most promising technologies be considered. This is a pedagogical issue, and I am sure there are many who would have chosen an alternative scenario. The six areas that were considered were: wind, tidal power, solar photovoltaics, nuclear, efficiency in buildings, and efficiencies in transportation. For both building and energy efficiencies, increasing the efficiency of buildings and automobiles, for example, were considered, as well as increasing the efficiency of the system, more mass transit, for example, and reorganizing where people live - more city and less suburban living, for one. The students working on efficiencies of the building and transportation sectors worked closely together, since housing patterns have much to do with automobile use and other transportation issues. To coordinate the effort, a Google Doc was created, so that each student could see each other’s work and comment on it. Each student had to report the basics about the technology, including its current state of development. Also necessary to include were cost - both current and projected future cost - land mass, and any environmental concerns about the manufacture or deployment of the technology. A portion of each class was devoted to a discussion of the data posted; as the end of the project neared, practically all class time was spent on this process. Each technology or technique posed its difficulties, which the students soon came to realize. Wind, for example, was a very attractive option, until the student involved had to calculate the land mass necessary. Although there are a number of sites in the United States which are capable of supplying electricity from wind, the land mass they must occupy is significant. A similar picture is found in solar photovoltaics; the density of the energy from the sun, though large in absolute terms, is simply not high enough to sustain, for example, a solar car, at least one that has normal dimensions and weight. Even a small car would need a huge collector on top to propel it at any speed. The basic problem, of course, is that with the exception of tidal power and geothermal, all non-fossil fuel energy comes from the sun. The power density of the sun is about 1 kW per square meter; the area of the United States is 9.8 x 10 to the twelfth power meters. On average, we can only obtain about 6 or 7 hours of sun per day; that gives us 7 kWh (kilowatt hours) per day per square meter. Assuming the 15% efficiency of current solar photovoltaic cells (redo calculations). [3] In 2009, the United States used 94.6 Quads, or quadrillion BTUs per year, which is what the class used as our benchmark, even though we knew that energy use would increase every year as it has for the last hundred, though energy use per capita in the United States has remained roughly the same or even declined in the last few years. [4] It gave us a target to shoot for. Nuclear power, to nobody’s surprise, was the most controversial. Despite many arguments in the class, it was determined - I must admit, with some urging from me - that
it had to be considered. After all the numbers came in, we and society could decide not to use it, but that it ought to be considered. It led to a very interesting discussion of the trade-offs that one inevitably faces in considering these issues. Although it is hard to find totally unbiased reports on the relative benefits of nuclear vs. coal, there is interesting information that can be found. [5] Almost everyone agrees that under regular running conditions, coal causes more deaths per unit of energy produced by orders of magnitude over nuclear. However, nuclear power makes many people nervous, partly because of its association with the atomic bomb, and partly because of the potential for very serious radioactive contamination. The poster child for this is Chernobyl, of course, Fukushima, both of which caused great damage and deaths; Three Mile Island while very serious, caused few if any deaths. Thus, the decision ultimately depends on how serious one takes global climate change and environmental pollution. Everyone in the class came into it with a strong feeling that these were very important issues, and that both global warming and environmental pollution were serious threats. Particularly when the students realized how difficult it was to completely eliminate fossil fuels from the energy picture, and that nuclear energy could be necessary to fill in where solar and other alternative energy forms might fall short, they started to face the tough issues. More about this later, but one of the real benefits of this course was showing them that tough choices had to be made. Tidal energy turned out to be an interesting choice. As I said, students could choose a source that was of interest to them. This continued to be true, even after the student who chose tidal quickly found out that tidal energy at most could supply one or two percent of our total energy supply. The class agreed that this should remain in the final report - even though if this were a realistic attempt to wean the nation off of fossil fuels, one would quickly abandon this and go on to something else - since there is a lot of talk in some circles about the benefits of tidal power and it was useful to make the point that some alternative energy sources are just not going to play a big role. The class also considered, because it discovered that it had to, some rather radical changes in societal organization. The urban studies student, who was studying building efficiencies, included a large section on the energy wasting facet of suburban living. Working very closely with the student studying transportation, he (there were five men in the class, one woman) pointed out that the very design of suburban homes and their layouts required a great deal of energy to heat and cool, since they were all separate units, and also required cars and much driving, since many suburban layouts foreclose any notion of an adequate public transportation system, although many suburban areas have some kind of bus system. The difficulties of changing the system were obviously seen as very difficult, pointing out yet again what an enormous task we face. The students finished with a report, detailing their research and their conclusions, and made the presentation previously referred to. The current plan is to use this report as the
258
Proceedings of International Conference on Education, Informatics, and Cybernetics (icEIC 2011),
and the International Symposium on Integrating Research, Education, and Problem Solving (IREPS 2011)

starting point for the next class - it is currently planned to offer this course every other year - and perhaps in three or four iterations have a complete report in publishable form.
BENEFITS
Although many of the claims I make about the benefits of this course are anecdotal, there is a good deal of research pointing to the value of this way of conducting a class. [6-15] We know that students learn best when they are engaged, and we know that creating a learning community in the classroom is important to retaining knowledge. All of these benefits have accrued to the students in this class. Student evaluations, both at mid-term and at the end of the class, were very high, with every student saying they would highly recommend the course to their friends. But, of course, student satisfaction is not the only measure of success, although I think it is a necessary condition for success. What we really want to know, we cannot measure at this time; that is, what the students will remember about and what they will remember from this course in ten or even twenty years after graduation. However, there is research, in the references above, that tells us students are much more likely to remember from this kind of course than a traditional lecture or even seminar course. Time will tell.
CONCLUSIONS In addition to the benefits, there are costs and risks to doing such a course. Its success depends greatly on the type of student who enrolls. One student who does not pull his or her own weight, or is difficult in class discussions, or who disrupts the class in one of any number of ways, will prevent the establishment of the good will that is necessary for the course to succeed. The students really have to be willing to help each other, and to contribute to the course in many ways. As noted above, one student started a blog, with which I had nothing to do; yet another posted results of the research on a web page she kept on sustainable development. The students also need to come to the course with a minimum of calculation and research skills. Students at the university in which I teach are traditionally math-phobic - mirroring the large number of students nation wide who suffer thus - and some time had to be spent in class going over basic computational and especially algebra skills. [13] I would expect in other, more technically oriented schools, this might not be such a problem, but students certainly need to know how to perform elementary mathematical operations, including conversions of one unit to another and other such calculations. Because a prerequisite was the Energy and Sustainability course - all truth be told not every student had actually taken the course, but were considered sufficiently skilled that they could take this course - they were well versed in the issue of global climate change, and so the motivation to switch to alternative fuels was strong. [16] This motivation
was key in impelling to do the rather large amount of work necessary. It was difficult to fit everything into the one hour forty minute class, twice a week for fifteen weeks. Time after time we would run out of time, and the students would be required to determine things on their own. Their work load was heavy; though remarkably nobody complained about it, they regularly said it was the hardest course they were taking that semester, and required the most work. The lack of time led to another problem. Although sustainability contains within it issues of social justice - some solutions for energy efficiency, rising prices dramatically, for example, affect poor people much more than the well-to-do - and there is a large literature that speaks to such issues, there was little time to consider such questions. [17-24] I would hope to be able to find time in future editions of the course to deal with such questions, for in my mind they are key. Finally, there is a good deal of research which is necessary to determine the effect of courses taught in this way. With such a small class, and with no control group, it was impossible to do a true assessment of the course, but such research is necessary. We think we know what effective teaching is, but in fact there are many surprises contained herein. It is my hope that by teaching such courses and by talking about them in conferences like this, we will be able to stimulate the necessary research. Bibliography 1. McGowan, A.H., Energy and Sustainability: An
Undergraduate Course. JOurnal of Environmental Studies and Sciences, 2011. 1(1).
2. Risinin, R.A. and J.P. Kraushaar, Energy and the Environment. 2nd ed2006, New Y ork: John Wiley & Sons.
3. Anonymous. Energy Independence. 2011 [cited 2011 October 15]; Web page with much data on solar energy]. Available from: http://www.americanenergyindependence.com/solarenergy.aspx.
4. Anonymous. Google Public Data. 2011 [cited 2011 October 15]; Available from: http://www.google.com/publicdata/explore?ds=d5bncppjof8f9_&met_y=eg_use_pcap_kg_oe&idim=country:USA&dl=en&hl=en&q=energy+use+in+the+us.
5. Hvistendahl, M., Coal Ash Is More Radioactive then Nuclear Waste, in Scientific American2007.
6. Alpay, E., Student-Inspired Activities for the Teaching and Learning of Engineering Ethics. Sci Eng Ethics, 2011. 17(2).
7. Anonymous, College Learning for the New Global Century, 2007, The National Leadership council for Liberal Education and America's Promise, Association of American Colleges and Universities: Washington, DC.
8. Bransford, J., National Research Council (U.S.). Committee on Developments in the Science of Learning., and National Research Council (U.S.).
259
Proceedings of International Conference on Education, Informatics, and Cybernetics (icEIC 2011),
and the International Symposium on Integrating Research, Education, and Problem Solving (IREPS 2011)

Committee on Learning Research and Educational Practice., How people learn : brain, mind, experience, and school. Expanded ed2000, Washington, D.C.: National Academy Press. x, 374 p.
9. DeBoer, G.E., Scientific Literacy: Another Look at Its Historical and Contemporary Meanings and Its Relationship to Science Educztion Reform. Journal of Research in Science Teaching, 2000. 37(6): p. 582-601.
10. Goodman, G.S., Educational psychology reader : the art and science of how people learn. Educational psychology,2010, New York: Peter Lang. xvii, 725 p.
11. Illeris, K., The fundamentals of workplace learning : understanding how people learn in working life. 1st ed2011, Abingdon, Oxon ; New York, NY: Routledge.
12. Meltzoff, A.N., et al., Foundations for a New Science of Learning. Science, 2009. 325(5938): p. 284-288.
13. National Research Council (U.S.). Committee on How People Learn A Targeted Report for Teachers., S. Donovan, and J. Bransford, How students learn : mathematics in the classroom2005, Washington, D.C.: National Academies Press. xiv, 615 p.
14. Mervis, J., Straight Talk About STEM Education. Science, 2007. 317(5834): p. 78-81.
15. Hemment, D., R. Ellis, and B. Wynne, Participatory Mass Observation and Citizen Science. Leonardo, 2011. 44(1).
16. Weart, S.R., The discovery of global warming. Rev. and expanded ed. New histories of science, technology, and medicine2008, Cambridge, Mass.: Harvard University Press. x, 230 p.
17. Adamson, J., American Indian literature, environmental justice, and ecocriticism : the middle place2001, Tucson: University of Arizona Press. xx, 213 p.
18. Adamson, J., M.M. Evans, and R. Stein, The environmental justice reader : politics, poetics, & pedagogy2002, Tucson, Arz.: University of Arizona Press. x, 395 p.
19. Agyeman, J., Sustainable communities and the challenge of environmental justice2005, New York: New York University Press.
20. Agyeman, J. and B. Evans, 'Just sustinability': the emerging discourse of environmental justice in Britain? The Geographical Journal, 2004. 170(2): p. 155-164.
21. Byrne, J., L. Glover, and C. Martinez, Environmental justice : discourses in international political economy. Energy and environmental policy series ; v. 82002, New Brunswick, N.J.: Transaction Pub. 303 p.
22. Cutter, S.L., Race, class and environmental justice. Progress in Human Geography, 1995. 19(111): p. 111-122.
23. Girdner, E.J. and J. Smith, Killing me softly : toxic waste, corporate profit, and the struggle for
environmental justice2002, New York: Monthly Review Press. ix, 165 p.
24. Goldman, B.A., Not just prosperity : achieving sustainability with environmental justice1993, [S.l.: s.n. ]. v, 49 p.
260
Proceedings of International Conference on Education, Informatics, and Cybernetics (icEIC 2011),
and the International Symposium on Integrating Research, Education, and Problem Solving (IREPS 2011)
No Problem? No Research, Little Learning ... Big Problem!
Fernando ORNELAS MARQUES Universidade de Lisboa and IDL, 1749-016 Lisboa, Portugal
and
Maria Teresa MARQUES
CCTIC, ESE/IP, 2914-504 Setúbal, Portugal
ABSTRACT The motivation to carry out this study
stemmed from the generalized perception that nowadays youth lacks the skills for the 21st century. Especially the high-level competences like critical thinking, problem solving and autonomy. Several tools can help to improve these competences (e.g. the SCRATCH pro-gramming language), but as researchers and educators we are mostly concerned with the skill to recognize problems. What if we do not find problems to solve? What if we do not even feel the need to find or solve problems? The problem is to recognize the problem; the next step is to equate the problem; finally we have to feel the need to solve it. No need? No invention. Recognizing a problem is probably the biggest problem of everyday life, because we are permanently faced with problems (many ill-defined problems), which we need to identify, equate and solve. Keywords: intuition; curiosity; problem recognition; creativity; problem solving; critical thinking; research and education
1. RATIONALE Youngsters seem to be more and more
passive consumers, little autonomous and less motivated intrinsically for learning at school. The innate curiosity, imagination, creativity and the need that is the mother of invention all vanish in most pupils along 11 to 12 years of
pre-university school. Therefore, youngsters do not develop high-level competences that can make them pro-active, autonomous, critical citizens, inventors and constructors in the future. In fact, most of our students even lack basic skills, which are needed to work, for instance, in a lab. They (male or female) do not know how to properly use a basic tool like a screwdriver. Even more worrying is the fact that most of the colleagues in the Geology department of a Faculty of Sciences have a very poor scientific production, and for one very simple reason: they cannot find problems to solve.
2. PREMISES As basis of argument, let us assume that
some very well-known sayings are true: (i) “He who can no longer pause to wonder and stand rapt in awe, is as good as dead: his eyes are closed” (A. Einstein); (ii) “The intuitive mind is a sacred gift and the rational mind is a faithful servant” (A. Einstein); (iii) “The need is the mother of invention” (old popular saying); (iv) “To raise new questions, new possibilities, to regard old problems from a new angle, requires creative imagination and marks real advance in science” (A. Einstein); (v) “The important thing is not to stop questioning” and “Imagination is more important than knowledge” (A. Einstein), who also recognized that “It is a miracle that curiosity survives formal education”, which seems to still hold.
261
Proceedings of International Conference on Education, Informatics, and Cybernetics (icEIC 2011),
and the International Symposium on Integrating Research, Education, and Problem Solving (IREPS 2011)

These famous sayings illustrate the problems we recognize in Natural Sciences students. The problems are related to observa-tion, intuition, need, (intrinsic) motivation, recognition of problems and problem solving. Because one of us travels regularly to many universities around the world, he has recognized these problems everywhere.
3. PROBLEMS 3.1. Observation
A basic and fundamental tool in sciences is observation. However, the present-day school does not teach the students to observe carefully and in detail, and to describe, in drawing and writing, with the rigor of science.
Our personal experience in the activities of teaching and scientific research has taught us that our eyes see what the brain is educated to see [e.g. 1-4]. This means that we first do a preliminary observation, then we use critical thinking to analyze the data, and finally usually come to the conclusion that the observation is insufficient or even irrelevant. Typically, we soon realize that we have problems to solve and so we need more observation and data. But now the brain is aware of what we need to look for (our eyes see what the brain is educated to see), which is the relevant data that will help to solve the problem. 3.2. Attitude
The need is the mother of invention. However, most kids nowadays have no needs, probably because parents in the so-called “first world countries” give them everything, espe-cially the superfluous, and not as a reward to anything.
The present-day helping culture is eroding autonomy and self-reliance [e.g. 5-8]. Nowa-days parents make life too easy to their kids, by removing every obstacle (however small). The result is that they are not being prepared for real life, which is full of obstacles at every step. Nowadays parents ignore a fundamental premi-se: “Adversity builds character” or “What does not kill you makes you stronger” (Nietzsche).
3.3. Where Is The Problem? High-level skills like critical thinking, pro-
blem solving and autonomy are all inherent in Problem-Based Learning (PBL) [e.g. 9, 10]. PBL can very successfully teach us how to solve problems; however, PBL by itself does not teach us how to find/recognize problems. What if we do not find problems to solve? What if we do not even feel the need to find or solve problems? The problem is to recognize the problem; the next step is to equate the problem; finally we have to feel the need to solve it. No need? No invention. Recognizing a problem is probably the biggest problem of everyday life, because we are permanently faced with pro-blems (many are ill-defined problems), which we need to identify, equate and solve (without recourse to a psychiatrist, who will try to help one recognize the problems).
Although experimentation and modelling are fundamental tools in basic Physics and pro-blem recognition, experimentation at pre-uni-versity level is absent in Portugal. The school textbooks for Natural Sciences are misleading and ineffective, because all the so-called “expe-rimental activities” (with no exception) are either physically wrong or no more than poor laboratory activities. 3.4. Intuition And Motivation
As recognized by A. Einstein, the intuitive mind is a sacred gift; it is indeed fundamental in science and in the recognition of problems. Children naturally and unconsciously develop intuition, which is our background knowledge of the way things work, gained from everyday experience [e.g. 11, 12]. When a child throws a ball vertically in the air, he intuitively (uncon-sciously) learns that the ball has some weight, that he has to spend some energy to throw it high (do some work), that the ball will slow down on the way up, come to a stop, and then accelerate downward back to his hand, where he will feel the impact. Without knowing a thing of Physics or Mathematics, he was intro-duced to many important concepts of Classical Mechanics. He does not know of them formally, but he knows how they work. So what should be a major objective of the School? Take this
262
Proceedings of International Conference on Education, Informatics, and Cybernetics (icEIC 2011),
and the International Symposium on Integrating Research, Education, and Problem Solving (IREPS 2011)

everyday life intuition of how things work and educate it [e.g. 13, 14]. However, it does exac-tly the opposite (“It is a miracle that curiosity survives formal education”, Einstein). Intuition may be wrong (e.g. it is not the sun that moves everyday from E to W, it is the Earth that rota-tes in the opposite sense) and must be corrected in a modern society. In a primitive society peo-ple did not care about correction or education of the intuition, because their main objective was the preservation of the species. Only later the human kind decided that this was not enough and started paying more attention to the intellect. We now live in an age of transition from primitive instinct/intuition/physical based society to a higher-level intellectual society. This time is dangerous because we are not as intellectually evolved as we often pretend to be. And this generates too many conflicts in the present human being, caught in a hybrid stage made of primitive instincts and higher intel-lectual development. But, paradoxically, the present-day school kills the most genuine high-level innate skills (curiosity, imagination and creativity) and does not promote the autonomy so necessary in the modern society and so basic in the primitive societies. An Einstein’s quote pops to my mind: “Only two things are infinite, the universe and human stupidity, and I am not sure about the former”.
Motivation is probably the biggest challen-ge: how can we trigger/develop intrinsic moti-vation, so critical to transform our pupils into students? 3.5. Critical Thinking
Most of our pre-university students, and none of our under or post-graduate students at the university question what we tell them, or what is written in textbooks or scientific papers. They do not even question the beautiful rocks we take them to observe in the field.
Many of our students, at any level, present, as the result of a problem, two values, one determined graphically and the other analytical-ly, for exactly the same angle, without recogni-zing that one value is obviously wrong.
4. POSSIBLE SOLUTIONS How can we improve students’ observation
skills? They should be taken more regularly outdoors to observe and describe large-scale and small-scale features. They should be taught how to collect relevant data according to different objectives.
How can we improve the students’ ability to recognize problems? Scientific drawing, writing and experimentation are excellent ways. When we draw, we become aware of geometrical problems and what is relevant according to the objectives; when we write, we usually find that the data is insufficient or even irrelevant for the proposed objectives; when we experiment and model, we realize that we have mechanical problems to solve. When the students use a programming language like SCRATCH, they soon find problems that they immediately have (feel the need) to solve in order to advance with the project.
The roles of Science and Mathematics are growing fast in our society. Mathematics teaches us how to solve problems in a logical and rational way. If it is important to know how to solve problems, it is not less important to know how to recognize and formulate them. However, Mathematics does not teach us how to find or recognize problems. This is a major role of Science that urgently needs to be taught to our youngsters (at least). With experimentation, students learn the most basic and fundamental practice in Science. Students even learn how to use basic tools (e.g. hammer, screwdriver, pliers, ...) when they are faced with the need to build new apparatuses to realize the experiments. Students even learn how to properly use a modern basic tool like the computer (usually used by youngsters for games) when they use programming languages like SCRATCH.
5. CONCLUSIONS Regarding observation, we should always
keep in mind that the eyes see what the brain is educated to see. Otherwise we are blind to many relevant details and many problems.
We need to improve the student’s innate
263
Proceedings of International Conference on Education, Informatics, and Cybernetics (icEIC 2011),
and the International Symposium on Integrating Research, Education, and Problem Solving (IREPS 2011)
intuition and educate it. This is likely the easiest way to motivate students.
Ultimately Science and Mathematics can help us with everyday life, because we are permanently faced with problems, which we need to identify, equate and solve rationally.
We try to teach our students, in 12 years of pre-university school, the science that took humanity thousands of years to develop. This is absolute nonsense! The solution could be to work only a few fundamental physical processes with students, and use the most basic and fundamental tools – observation, experimentation and analysis – to understand them. REFERENCES [1] R. L. Gregory, The intelligent eye, UK: Weidenfeld and Nicolson, 1970. [2] R. L. Gregory, Concepts and mechanisms of perception, London: Duckworth, 1974. [3] R. L. Gregory, Eye and the brain, 3rd ed., UK: Weidenfeld and Nicolson, 1977. [4] R. L. Gregory, Mind in science: A history of explanations in Psychology and Physics, UK: Weidenfeld and Nicolson, & Cambridge University Press, 1981. [5] T. W. Adorno, Educação e emancipação, 3rd ed.), Rio de Janeiro, Brasil: Paz e Terra, 2003. [6] P. Freire, Pedagogia da autonomia. Rio de Janeiro, Brasil: Paz e Terra, 1996. N.Y.: Basic books, 1991. [7] Kohlberg, Essays on moral development, S. Francisco: Harper & Row, 1981. [8] J. Piaget, Le jugement moral chez l’enfant, Paris: PUF, 1985. [9] J. Bruner, The process of education, Cambridge, Mass.: Harvard University Press, 1960. [10] J. Bruner, Toward a theory of instruction, Cambridge, Mass.: Belkapp Press, 1966. [11] J. Bruner, “The growth of the mind”, American Psychologist, Vol. 20, No. 12, 1965, pp. 1007-1017. [12] J. Piaget, Le jugement et le raisonnement chez l’enfant, 6th ed., Paris: Neuchâtel et
Niestlé, 1967. [13] H. Gardner, The unschooled mind: How children think and how schools should teach, New York: Basic books, 1991. [14] H. Gardner, The disciplined mind: What all Students should understand, New York: Simon and Schuster, 1999.
264
Proceedings of International Conference on Education, Informatics, and Cybernetics (icEIC 2011),
and the International Symposium on Integrating Research, Education, and Problem Solving (IREPS 2011)

Approaches for Multidisciplinary Research-Oriented Studies by Means of Joint Programmes: Cases, Experiences and Successes.
Mikhail PARAMONOV Department of Physics, University of Helsinki
Helsinki, FI-00014, Finland
Antti LAURI Department of Physics, University of Helsinki
Helsinki, FI-00014, Finland
Veera SYLVIUS Space Systems Finland, Kappelitie 6B,
Espoo, FI-02200, Finland
and
Markku KULMALA Department of Physics, University of Helsinki
Helsinki, FI-00014, Finland
ABSTRACT Research-oriented joint programmes in the Division of Atmospheric Sciences at the University of Helsinki have been conducted for almost ten years, and cover both Master’s and Doctoral degrees. These programmes are aimed at providing the students with multidisciplinary education, comprehensive curriculum, training in transferrable skills and networking opportunities. They cover a variety of subjects within the field of atmospheric and environmental sciences, and bring together both students and research/teaching staff from Nordic universities. The joint nature of the programmes is visible in two actions: e-learning courses and intensive field courses, both of which are attended by students from different universities. Courses given as part of these joint programmes are not only intended for pure scientific and learning purposes, but also for bringing students from different countries together and establishing international network connections. The chief goal is to educate a next generation of top-level scientists and experts with all necessary multidisciplinary skills to tackle the future challenges of climate change, air quality matters and environmental technologies. This is achieved by providing necessary facilities,
knowledge and environment, and by the collaboration of a large group of specialists. Keywords: joint programmes, multidisciplinarity, atmospheric research, master and doctoral studies, horizontal learning, participatory action research
INTRODUCTION The shift from discipline-tied fundamental education towards multidisciplinarity is imperative for a successful career in climate and global change science [1]. Therefore, we have adopted the education of the next generation of scientists in a truly multidisciplinary way of thinking as the chief educational and knowledge transfer goal. Participatory action research has been acknowledged as the main tool to achieve this goal. We also emphasize the recognition of the research career as a whole, ranging from master-level studies to postdoctoral researcher level. Following the CBACCI (Nordic-Baltic Graduate School on Biosphere-Carbon-Aerosol-Cloud-Climate Interactions) Education Structure [2], dedicated work on the national and regional scale (Nordic and Baltic countries) has been carried out to develop the multidisciplinary training on all levels (master
265
Proceedings of International Conference on Education, Informatics, and Cybernetics (icEIC 2011),
and the International Symposium on Integrating Research, Education, and Problem Solving (IREPS 2011)

students, doctoral students, postdoctoral scientists, professors and other senior researchers). Atmospheric research involves several fields of science, such as chemistry, physics, meteorology, mathematics, biology, agricultural and forest sciences, technology, and geosciences, combining observations, experimentation and modelling. In such a framework it is crucial that observations are based on unifying theoretical framework and are carried out with various measurement techniques supporting each other. Furthermore, observations should be tested against field and laboratory experiments, and process understanding should be tied to theoretical and modelling development work. Great importance is also given to the ability to up-scale the small scale processes to the regional and global level phenomena and dynamics. The research-oriented joint programmes described in this paper include all of these challenging components and bring them to the level of the student training.
MASTER LEVEL EDUCATION: JOINT PROGRAMME
ABS (Atmosphere-Biosphere Studies) is a Nordic Master's Degree Programme in Atmospheric Sciences and Biogeochemical Cycles. The aim of the programme is to educate environmental specialists, who are capable of independent and innovative work in the current and future challenges related to global climate change and environmental pollution. The approximate study period is two years. The ABS programme has been designed to be very multidisciplinary, involving a versatile education in atmospheric sciences, covering physical phenomena, atmospheric chemistry, meteorology, and ecosystem studies. The programme is a joint effort of ten Northern European universities, and serves as a forum for exchanging experiences and best practises concerning the European harmonization process and master level education in general. Each ABS programme student selects one major subject, and gets the main part of the two-year education in the selected university and department. The joint nature of the programme steps in after the introductory courses in the major subject are completed. Each year the partners jointly organize several intensive field courses as well as e-learning courses for the whole network. In particular, these courses address the multidisciplinary nature of the present-day environmental problems.
The programme started as an attempt to answer the global need for experts having multidisciplinary education in environmental issues. The governmental environmental agencies need people who are able to interpret the new scientific results as a base for future legislation. Close monitoring of scientific results, interpretation and action-taking is needed to combat the current and future global change effects on the environment. The industry, transport and commerce need to adapt to the new, stricter regulations. From the educational point of view, the idea of a common European educational area was introduced in the Bologna agreement [3]. Harmonisation of the degree structure of European universities, as well as a common credit transfer system (ECTS) improving the student mobility between European countries, are both included in the agreement. The programme has attracted students interested in environmental issues from all parts of the world. None of the units participating in the ABS programme could give such versatile education alone, but the ABS network enables the utilization of the highest environmental research in the region for master-level education. Luckily for the programme, the departments participating in the network have a great number of teachers who are highly motivated to collaborate internationally, to update their teaching skills, to create new courses, and to develop and implement new technologies in teaching. As a result of this, there has been a variety of teaching and learning methods available for the ABS programme students, e.g. e-learning, intensive courses, problem-based learning, new technology supporting learning, and training of a variety of transferable skills during the programme.
DOCTORAL LEVEL EDUCATION: JOINT PROGRAMME
At the University of Helsinki, the doctoral training is organized in the framework of a national doctoral programme “Atmospheric Composition and Climate Change: From Molecular Processes to Global Observations and Models (ACCC)”. As described in the previous section, multidisciplinary education is to a certain degree available already to undergraduate students. However, the undergraduate students are educated mainly within their specific disciplines, ensuring a strong scientific basis. The
266
Proceedings of International Conference on Education, Informatics, and Cybernetics (icEIC 2011),
and the International Symposium on Integrating Research, Education, and Problem Solving (IREPS 2011)

shift from still quite strongly discipline-tied fundamental education towards multidisciplinarity at the PhD and post-doctoral levels is needed. Therefore, the chief educational and knowledge transfer goal of the ACCC programme is to educate scientists in a truly multidisciplinary way of thinking. The direct involvement in industrial research and development is also addressed at this point. The offered graduate courses combine core and transferable skills, but always ensuring that these skills are learned actively and kept fully relevant to the students’ own research. The key transferable skills in the Doctoral Programme are (i) working in the field, (ii) instrument technology, (iii) data analysis, (iv) computer modelling, (v) writing articles, (vi) popular science writing, (vii) presentation skills including audiovisual skills, (viii) teaching skills, (ix) project management, (x) writing proposals, and (xi) commercialization of scientific ideas. The programme-wide training consists of scientific and technological knowledge, transferable skills and public outreach, and includes several annual activities: winter and summer schools, field courses, a researcher workshop, and a workshop for teachers and supervisors. The training is a combination of lectures, field measurements, computer modelling and transferable skills. The winter and summer schools combine several topics each, and always include training on transferable skills. A key part of the annual three-day researcher workshops is a two-day seminar where the Doctoral Programme students present their recent research results, and a networking day where distinguished researchers and industry representatives are invited. The researcher workshops provide an authentic experience, in which the research of the doctoral students is fused with their training and supervision by university, institute and industrial partners. In the annual teacher and supervisor workshops, lecturers and supervisors are trained on teaching, communication and supervising skills, including web-based teaching. The hosting of the annual events is circulated between programme partners, enabling all the students to get to know each of the Programme partners. In the organization of the joint activities, the good practices and experience from existing joint efforts, e.g. ABS Masters Degree Programme, are fully utilized.
CASE STUDY: NEW TECHNOLOGY TO SUPPORT TEACHING
An example of the new technology used in the research-oriented joint programmes at the University of Helsinki is Smart-SMEAR, a tool for structuring, visualising and analysing complex environmental field data [4]. Smart-SMEAR is a handy and inspiring tool to present complex environmental measurement data, and to see different causal connections in an understandable and simple way. The tool consists of two separate applications. The first is a visual implementation of the 15-year continuous dataset from the SMEAR II environmental and atmospheric measurement station in Hyytiälä, Finland [5], and the second one is used to download the desired data for further analysis. The central pedagogical principle is student’s inspiration through getting the idea. The Smart-SMEAR database contains several measured and modelled parameters, each of which requires special tools and knowledge to work with. The web-based tool collects and processes all the data so that the user does not have to know practically anything about how the data should be treated. This provides means for beginning scientists, students and researches from other fields to explore the data and see correlations and behaviour of different parameters without losing time in collecting data, pre-treatment and learning special plotting tools (e.g. plotting maps and surface plots). The pedagogical philosophy of the Smart-SMEAR is based on the idea of meaningful learning. Smart-SMEAR emphasises learning as the learner’s own process of constructing new information on top of the already achieved knowledge. This poses a few requirements to the learning environment. First, the already existing information structures and understanding of the student must be correct and well organised, so that the learning of the new information becomes meaningful. This can be achieved via various methods: discussions in small groups, questions, simple recapitulation and outliners. Second, the teaching becomes coaching, where the teacher allows the student to create understandable and meaningful information structures out of the material to be studied. This presumes that various pedagogical approaches are adopted, e.g. collaborative learning, reading and writing, discussions. The activity and motivation of the students play the key role. Third, the students need to have the time and space for reflection,
267
Proceedings of International Conference on Education, Informatics, and Cybernetics (icEIC 2011),
and the International Symposium on Integrating Research, Education, and Problem Solving (IREPS 2011)

which means that the students can evaluate their own learning and develop their metacognitive skills. This way they have the possibility to become experts of their own learning process. Fourth is the Smart-SMEAR emphasis on social interaction and shared cognition. It has been shown that working in small groups and talking about the cognitions enhances understanding [6]. Social interaction can consist of e.g. internet discussions and reading and commenting each other’s texts. The contextuality and constructiveness of Smart-SMEAR are based on the idea that by associating old and new knowledge in a meaningful way the student achieves true expert information, which is thoroughly understood and, thus, correct and reusable. The experiences have shown that students with very different backgrounds benefit from the usage of Smart-SMEAR. The tool was used as a part of teaching first time during an intensive field course given in spring 2007, and it was admitted an honourable mention in the University of Helsinki educational technology competition in 2007.
CASE: INTENSIVE FIELD COURSES Intensive field courses are given by the University of Helsinki several times a year, and have proven to be of great interest to both students and researchers. The forms of working during intensive courses include lectures, exercise sessions, seminars, discussion sessions, field work as well as social activities. Very often the emphasis is placed on intensive work in small student groups. From the pedagogical point of view, the intensive courses often represent a form of problem-based learning (PBL; see e.g. [7]). This instructional strategy was adopted in order to emphasize the students’ own responsibility of their learning process, with support from the instructor. The goals for the course are often set by the students in the beginning of the course, after a few introductory lectures. Teachers take the role of facilitators rather than lecturers. Collaborative learning is carried out throughout the courses. This allows for the social construction, sharing of information and cognition, and finally improves the metacognitive skills of the students, which, in turn, enhance self-directed learning skills. We have also noted that motivation and sociability is blossoming in these small groups, which allows the students to easily adopt the studied issues and open their minds for creative problem-solving.
Another pedagogically interesting fact has been the horizontal learning process during many of the courses and other training events. The participants of the events come from very different backgrounds and are specialized in very different topics. Thus, traditional “vertical” training courses have been out of question. Instead, horizontal learning has taken place, taking a broader approach, addressing a cross-section of knowledge from different fields and blending the information to reach new levels of understanding. As the goals of a course are typically commonly agreed in the beginning, the students working in small groups take the responsibility to find the best ways to reach these goals in a short time. Often the solution has been horizontal: students from different fields of study give small lectures to each other in the groups, and several times it has occurred that students wanted to present their ideas to the whole audience for a common discussion. This horizontal learning principle has been shown to be a good example of participatory action research. The experiences on the courses have been very encouraging, both from the teachers’ and students’ points of view. Generally, students have given very positive feedback of the training in ABS, and we expect that our experiences allow us to further enhance the quality and innovativeness of teaching.
CASE: E-LEARNING The internet provides an interesting, flexible and versatile learning environment that, at its best, motivates and inspires the students. E-learning frees the student from the requirements of time and space. In its own way it even enhances social interaction, although it is different from normal face-to-face interaction. The background for introducing e-learning courses was practical. Some teaching capacities could be released for additional courses, if the students could take certain courses remotely. Interaction in e-learning is three-fold: it is very much based on the student’s own activity, but is still based on the student-instructor-material triangle. An e-learning course demands thorough preparation in order to succeed. The planning consists of at least evaluating the needs for the course, the future students, the learning outcomes, the choice of contents and pedagogical approaches, provision of the needed material to the students, arrangement of a personal support for students if they face problems during the course, and last but not least, planning
268
Proceedings of International Conference on Education, Informatics, and Cybernetics (icEIC 2011),
and the International Symposium on Integrating Research, Education, and Problem Solving (IREPS 2011)

the evaluation of the students after the course. E-learning courses also form an integral part of the student’s curriculum, at both Master and Doctoral levels.
CONCLUSION The chief goal of the joint programmes at the University of Helsinki is to educate a next generation of top-level scientists and experts with all the necessary multidisciplinary skills to tackle the future challenges of climate change, air quality matters and environmental technologies. The supra-disciplinary education will enable those experts to serve in different challenging positions in society and industry. Besides classical curriculum skills and knowledge, the education on the state-of-art measurement technologies (laboratory, ground-based and remote sensing) are emphasized. The master and doctoral programmes are an effort at a national level in advanced and comprehensive climate change research education with main focus on training of students in the field of atmospheric and biogeochemical sciences, covering phenomena from the nanoscale to the global level and from nanoseconds to centuries. The success of this effort is showcased by the 100% employment rate of doctoral students immediately following their graduation, as well as by the overwhelming majority of students finishing their degrees. Special forms of teaching, namely intensive field courses and e-learning courses, can improve the learning compared to a traditional classroom course. Transferable skills can, and have also been successfully taught using these teaching forms. New technologies, such as Smart-SMEAR, can be used to support learning and students’ inspiration. The development of research-oriented joint programmes has not been without its challenges, and the improvement of these programmes is an utmost priority. In the past several years, the rapid internationalization of the research community has resulted in a few challenges both for students and the staff; however, the ABS Programme steadily continues to be dominated by foreign students, and the percentage of foreign doctoral students has also been increasing from 15% to 25% during the 2009-2010 period. Another challenge that remains to be solved is increasing the presence of industrial sector. Possible means for this include utilization of industry-related FiDiPro professors [8], and
boosting the employment of the doctoral graduates by the industry by providing direct contacts between the students and industry representatives, and deepening collaboration between the programmes and industry.
REFERENCES [1] Nordic Climate Change Research, 2009:
NordForsk Policy Briefs 2009-8. Mandag Morgen, 2009.
[2] CBACCI, 2003: CBACCI education structure.
Annex of the Steering Committee memorandum of the meeting 5.5.2003 in Oslo.
[3] The European Higher Education Area. Joint
Declaration of the European Ministers of Education. Convened in Bologna on the 19th of June 1999.
[4] Junninen, H., Lauri, A., Keronen, P., Aalto, P.,
Hiltunen, V., Hari, P. and Kulmala, M. 2009: Smart-SMEAR: on-line data exploration and visualization tool for SMEAR stations. Boreal Env. Res. 14, 447–457.
[5] Hari, P. and Kulmala, M., 2005. Station for
Measuring Ecosystem-Atmosphere Relations (SMEAR II). Boreal Env. Res. 10, 315-322.
[6] Hennessy, S. and Murphy, P. (1999). The
Potential for Collaborative Problem Solving in Design and Technology, International Journal of Technology and Design Education 9(1), 1–36.
[7] Duch, B. J., Groh, S. E. and Allen, D. E.
(2001). The Power of Problem-Based Learning. Stylus Publishing, Sterling, VA, U.S.A.
[8] Academy of Finland and TEKES, 2007:
Teaming up with the best. ISBN 978-951-715-653-7 (print), 978-951-715-654-5 (PDF).
269
Proceedings of International Conference on Education, Informatics, and Cybernetics (icEIC 2011),
and the International Symposium on Integrating Research, Education, and Problem Solving (IREPS 2011)

Interregional and Intergenerational Virtual Collaborative Teaching Using the Apple FaceTime App: The East L.A. to PA Project IREPS Conference 2011, Orlando, Florida
Precious Vida Yamaguchi, Ph.D.
Assistant Professor of Cedar Crest College Allentown, PA 18103 USA
and Mr. Enrique Legaspi
Teacher and Education Consultant of Hollenbeck Middle School Los Angeles, CA 90033 USA
ABSTRACT
This paper examines the utility of engaging middle school students living in the inner city of East Los Angeles with undergraduate college students at a women’s liberal arts college in Eastern Pennsylvania. This collaborative intergenerational and interregional research project involves social media and the use of the Apple app, FaceTime, as a method of experiential and virtual learning.
Keywords: Virtual Learning, Experiential Learning, Apps, Convergent Media, Intergenerational, Interregional, Virtual Classrooms
INTRODUCTION Building healthy and strong relationships is powerful for middle school and college students. This paper examines the utility of engaging middle school students living in the inner city of East Los Angeles with undergraduate college students at a women’s liberal arts college in Eastern Pennsylvania. This collaborative intergenerational and interregional research project involves social media and the use of the Apple app, FaceTime, as a method of experiential and virtual learning. The female undergraduate participants designed mentoring and communicative goals
specialized to engage in dialogue with the middle school students through the technology of video chatting twice a week throughout the school year and to take ethnographic notes of their experiences. Enrique Legaspi, the Hollenbeck Middle School history instructor and his students developed conversational and technological goals to discuss a variety of historical, regional, and cultural topics with the Cedar Crest College students. Hollenbeck Middle School is over a hundred years with old with decades of tradition and history. The population of its students is 98.4% Latino. The students at Hollenbeck reflect the generation of students who are digital natives and possess the need for classrooms to leverage technological access and resources to enhance media literacy and content expertise. The successes of the school are incredible as well as its failures, as it is a community that thrives on talented scholars who dream big and loud. It was important for the female college students to encourage the option of some day attending college as part of the middle school students’ dreams. Review of Literature
REVIEW OF LITERATURE Creating pedagogical environments and projects where experiential learning moves
270
Proceedings of International Conference on Education, Informatics, and Cybernetics (icEIC 2011),
and the International Symposium on Integrating Research, Education, and Problem Solving (IREPS 2011)

the focus away from the professor or instructor and to the experiences of the students provides the students with active and thoughtful leadership roles [1]. Social media gives us many opportunities to be mobile, interactive, and convergent in our activities. In this project, the female college students interacted, mentored, and engaged in a bi-coastal, multicultural, intergenerational, and interregional communication research project with the Hollenbeck Middle School classroom on the West Coast. Experiential learning has been an important characteristic in education throughout history [2] and in present day, social media increases the opportunities of teachers linking pedagogy and projects that contribute to diverse communities and to society.
For both the Hollenbeck Middle School students and the women at Cedar Crest College, the goal of this research was to provide interregional access and an experiential learning environment where two classrooms that were very different in age, location, ethnicity, size, and gender collaborated with one another. Online environments have the ability to create “fluid boundaries” [3], where the idea of a virtual field trip to opposite sides of the U.S. gave students the authentic experiences to communicate, inspire, and build their networks with each other.
METHODS OF COLLABORATIVE VIRTUAL LEARNING
Intergenerational and interregional communication is an important form of communication research in studying and learning more about the wants, needs, and communication norms and habits of future generations of people. In the Cedar Crest College women’s class the students watched a short CNN news clip about Hollenbeck Middle School’s use of social media. The college students engaged in conversations
with students of the ages 13-14 years old on a weekly basis. The women college’s students were encouraged to mentor the middle school students about topics such as higher education, U.S. history, geographic locations, and their daily diets. They also provided them with information about living in the eastern region of the U.S., the history of Pennsylvania, and their personal interests. Multicultural stories and leadership contribute to history and culture. Women and men play important roles as carriers and teachers of their cultures to the future generations. There is a focus on difference in history between genders and the women’s college students were enthusiastic to share their experiences with the middle school students. The ability to communicate life and cultural experiences on gender, ethnicity, and social class was empowering for both the women’s college students and the middle school students [4].
DISCUSSION
Both participants from the west coast and east coast reported personal benefits from engaging in the intergenerational and interregional pedagogical and virtual projects such as an increase in communication, technology, cultural knowledge, and social skills. The process and focus of students from the middle school and the college reflecting of their experiences was a significant benefit of the experiential and virtual learning. Through this project the students increased their knowledge and use of social media to understand the importance of their digital responsibilities to each other. The students also developed their inter-classroom experiences to learn and view the different lifestyles, diets, and cultures in the different regions of the U.S. Because of their interregional and intergenerational communication, their inquiries of U.S.
271
Proceedings of International Conference on Education, Informatics, and Cybernetics (icEIC 2011),
and the International Symposium on Integrating Research, Education, and Problem Solving (IREPS 2011)

history, geography, and technology has advanced and become more meaningful. Students from both the college and the middle school displayed an improvement in classroom attendance because they looked forward to the biweekly conversations with the students at each school. Last but not least, the students at the middle school’s coursework was connected to Pennsylvania, a state that is rich in history and making it applicable for the students to learn more about U.S. history and the events that shaped our nation. Online environments create many opportunities for its users [5] and media literacy and power influence one another [6] The process of reflection in experiential learning makes students accountable for the interactions and the decisions they made during the research process [7]. The students at the women’s college reflected on some of the challenges they faced, ranging from technical issues to age and cultural differences. The majority of the students at the college found the experience of talking to middle school students in Los Angeles to be very rewarding. As one of the female college students said:
“The FaceTime project is my favorite. It’s not only about mentoring but using the technology to reach people all across the country…It’s great to be able to give them information and I really enjoy it and think it’s a good experience.” This collaborative teaching and
research project aims to provide an example of applying the intersections of generation, region, and technology into a dual classroom where students of various backgrounds, ages, and locations can take place. The virtual collaboration LA2PA project gave students online experience in bi-coastal networking, helped them builds
skills using technology, and more importantly, it gave students an authentic experience to build their language and knowledge to with others outside of their local cities and age groups. The students were excited to learn about the world and adventures happening in the classrooms using technology. Going beyond the boundaries of classroom walls and using virtual technology enables students to gain more worldly experiences where they can interact with people outside of their location, city, state, and age group.
REFERENCES
[1] Kolb, D.A. (1984). Experiential learning: Experience as the source of learning and development. Englewood Cliffs, NJ: Prentice Hall. [2] Dewey, J. (1933). How we think: A restatement of the relation of reflective thinking to the educative process. New York: Heath. [3] Blair, K., Gajjala, R., & Tulley, C. (2009). Introduction: The webs we weave: Locating the feminism in cyberfeminism. In Blair, K., Gajjala, R., & Tulley, C. (Eds.), Webbing cyberfeminist practice. Cresshill, NJ: Hampton Press. [4] Ruiz, V.L., & DuBois, E.C. (Eds.). (2000). Unequal sisters: A multicultural readers in U.S. women’s history (3rd ed.). New York: Routeledge. [5] Baym, N. (2009). Response: Toward understanding the libratory potential of elective affinities online. In Blair, K., Gajjala, R., & Tulley, C. (Eds.), Webbing cyberfeminist practice. Cresshill, NJ: Hampton Press. [6] Herbst, C. (2009). Masters of the house: Literacy and the claiming of space on the internet. In Blair, K., Gajjala, R., & Tulley, C. (Eds.), Webbing cyberfeminist practice. Cresshill, NJ: Hampton Press. [7] Mitchell, J. (2003). Cooperative learning and service learning: Soul-mates for reflection in higher education. In J.L.
272
Proceedings of International Conference on Education, Informatics, and Cybernetics (icEIC 2011),
and the International Symposium on Integrating Research, Education, and Problem Solving (IREPS 2011)

Cooper, P. Robinson, & D. Ball (Eds.), Small group instruction in higher education (p.267-281). Stillwater, OK: New Forums Press.
273
Proceedings of International Conference on Education, Informatics, and Cybernetics (icEIC 2011),
and the International Symposium on Integrating Research, Education, and Problem Solving (IREPS 2011)

Research, Teaching and Industrial Problem Solving Activities in the Field of Production
Information Engineering at the University of Miskolc, Hungary
Ferenc ERDÉLYI
Department of Information Engineering
University of Miskolc
Miskolc, H-3515, Hungary
and
Tibor TÓTH
Department of Information Engineering
University of Miskolc
Miskolc, H-3515, Hungary
ABSTRACT
In the last 150 years a rapid progress and several big
paradigm-changes have happened in the field of technical
sciences. Information Science (IS) has a great impact on
today’s industrial practice. IS is not only a special branch
of sciences considering that the principles, means and
methods of information acquisition, processing and
transfer are indispensable for every engineer, moreover,
for our society as a whole. Today’s richness of IS has
derived from the enormous area of applications (applied
informatics, Information Technology (IT), Information
Engineering (IE)). In mechanical engineers’ training,
Production Information Engineering (IT for
Manufacturing) has a key role. These aspects justified the
foundation of the Department of Information Engineering
at the University of Miskolc. The subjects of IE have
already appeared in BSc, MSc and PhD education.
Applied informatics has facilitated the introduction and
education of engineering systems approach. In the new
approach IT has played the most important role because
complex, large systems can neither be planned nor be
controlled without IT. The demands of industrial
enterprises in this field have permitted a consortium-
based cooperation of universities, research institutes and
enterprises. The paper gives a summary on the results of
R&D works connected with an industrial project realized.
Keywords: Application Software, Information
Engineering, Production Information Engineering, IT for
Manufacturing, Systems Engineering, Digital Factory,
Cooperative Production.
INTRODUCTION
In the course of the last 150 years an extremely rapid
progress and several big paradigm-changes have
happened in the field of technical sciences [1]. In the
twenties of the last century the rapid advance of
processing industry was established by the activities of
Ford and Taylor, the creators of “mass production”
paradigm. The development of automotive industry has
been based on this paradigm up to now (The machine that
changed the world [2]). In the sixties, “automation”
paradigm resulted in an unprecedented increase of the
productivity of machine tools and manufacturing systems
(Programmable Automation [3]). The high production
performance of technological capacities operating in
global economy at present, can be considered as a
consequence of this paradigm.
The development of Information Science has the greatest
impact on today’s industrial practice, on technology in a
wider sense and on numerous other areas of society as
well. The “digital factory” paradigm, within the
framework of several consequent waves, has transformed
the entire internal structure of enterprises. It is interesting
to recognize that this process has been carried out in a
“bottom-up” way. It started with process control
digitization (NC, CNC, PLC), then it has continued with
digitizing engineering design and planning (CAD/CAM).
The top level is the digitization of several enterprise
management activities (MRP, ERP, SCM) [4].
In the seventies of the last century, it became clear at
technical universities that Information Science required
not only separate specialized engineer training (i.e. IT-
oriented engineer branch), considering that the principles,
means and methods of information acquisition,
processing and transfer were indispensable for all kinds
of engineers. This recognition resulted in the requirement
that it was expedient to establish departments of
Information Science, similarly to Mathematics, not only
in the faculties of Electrical and Electronic Engineering
but at all technical universities.
The two keystones of Information Science are
Information Theory and Computer Science, but its
richness originates in the wide range of applications built
on these bases (see: Fig.1.). These applications represent
interdisciplinary fields, where the laws of the systems and
processes specific to the given domain (Information
Technology, IT) exist together with the laws, methods
and tools of applied informatics (Information
Engineering, IE). This branch includes computer aided
design, planning, organizational, decision making and
274
Proceedings of International Conference on Education, Informatics, and Cybernetics (icEIC 2011),
and the International Symposium on Integrating Research, Education, and Problem Solving (IREPS 2011)

controlling methods and means using computer tools and
applications for defining and solving technical problems.
INFORMATION SCIENCE
INFORMATION
THEORY
COMPUTER
SCIENCE
APPLICATIONS
Fig. 1. The main fields of Information Science
The huge quantity of new information can only be used
for the members and organizations of the society by
means of computer applications. It is known for
everybody how and to what extent the role and
importance of computer applications, which were
implemented in many millions of copies and run every
day (e.g.: Explorer, Word, Excell, Power Point or
MatLab, AutoCAD, SAP R/3) have been increasing. The
development of applications has a special, unique
technology, in which platform definition, software
engineering and program coding appear only in the
second phase of creating the software-product. There is a
previous phase, in which
the conception of application,
the content and form of input and output,
the internal model of information processing,
the method, algorithm, accuracy and validity of
problem solution,
a user-friendly man-machine interface (HMI with
graphical display, visualization), and
the design of application level protocol for machine-
machine network communication (Application
Program Interface, API)
are the tasks to be elaborated.
It is obvious that the professional users of applications
have to know more than the source language of the
software and/or the features of the hardware platform.
Nowadays there is a special information technology for
hiding the latter from the users (“virtualization”, cloud
technology [5]).
APPLIED INFORMATICS, PRODUCTION
INFORMATION ENGINEERING
Faculties and branches of Information Science,
Engineering and Technology have special stories in the
life of universities. In Hungary, after a long development
process, Information Science became an independent
branch of science in the early seventies. It can be
originated in two main sources: Electrical and Electronic
Engineering and Computational Science as a branch of
Mathematics. In the process when Information Science
has become independent, Systems Theory also played an
important role. The third aspect of the development in
Information Science is related to application systems
where the specifications of the fields of application come
to the front line.
In engineers’ training and in engineering practice an
applied informatics branch has become of great
significance, which is named as Production Information
Engineering (or: IT for Manufacturing). This branch
includes computer aided planning, organizational,
decision making and controlling methods and means
using computer tools and applications for defining and
solving technical problems.
The multilevel (multilayer) and concurrent technical
systems of today’s modern enterprises (cooperating with
the financial, economic and business systems) can not
dispense with these tools any more if they want to be
competitive in global economy [6].
These considerations motivated the establishment and
development of the departments of applied informatics at
the Hungarian universities. In conformity with this
motivation, Department of Information Engineering was
established at the University of Miskolc in 1995.
Computer application programs stand in the centre of the
activity of the Department. Their development and
effective use are of primary importance for industrial
practice.
According to the conception suggested by the
Department, Production Information Engineering is the
field of science of the IT-based methods, procedures and
means suitable for planning (analysis and synthesis),
organizing and controlling industrial processes.
The scope of the branch is extremely complex and far-
reaching [7]. On the one hand, the specific properties of
production systems and processes require IT-tools
differing from one another to a certain extent (think of the
different properties of discrete and continuous technology
processes). On the other hand, different IT-applications
are required by the rich functional subsystem set of
production systems. At last, special application methods
have been elaborated for Production Information
Engineering using the most general IT-technologies
(shared systems, data base handling, artificial intelligence
methods, etc) (see: Fig.2.).
275
Proceedings of International Conference on Education, Informatics, and Cybernetics (icEIC 2011),
and the International Symposium on Integrating Research, Education, and Problem Solving (IREPS 2011)

ERP COMPONENTSCRM
Customer RelationManagement
Supply ChainManagement
SCMPPC
ProductionPlanning
Marketing,Demand
ForcastingFinancing
CAE COMPONENTS
CAD
CAPPProcessPlanning
PPCOrder
Management
PLMProduct Life CycleManagement
TQMTotal QualityManagement
MES COMPONENTS
APS
CC
Cell Control
DetailedScheduling
RecourceManagement
SFCDispatchingTracking
DNC,Data collection,
Evaluation
PRODUCTION PROCESSShop FloorLogistics,Inventory Cointrol
RFIDIdentificationSystem
FMS,
TMSManagement
Controllers
CNC, PLC, MMC
DCS
SCADA,
Process Control
ToolPPC
PPC
IT for Manufacturing Applications
Fig. 2. IT for manufacturing applications
In the focus of research, teaching and industrial (technical
problem solving) work are the following:
system and data models, their structures and
modeling methods;
ontological analyses, conceptual and object-oriented
approach;
application of standards in informatics;
connecting integrating and synchronizing systems;
practical application of the paradigms of “Digital
enterprise” and “Virtual enterprise”.
The most important academic subjects of IT for
manufacturing, which are present in the BSc, MSc and
PhD trainings at the University of Miskolc are as follows:
Production systems and processes,
Operations Research and Mathematical
Programming,
Modeling of production processes,
Elements of Artificial Intelligence,
Logistic systems and Supply Chain Management,
Production Planning and Control,
Computer Aided Manufacturing,
Computer Aided Quality Assurance,
Computer Integrated manufacturing (CIM),
Virtual Enterprise.
SYSTEMS ENGINEERING APPROACH
Applied informatics has enabled the introduction of a
more general and important discipline and approach in
engineers’ training. This branch is called Systems
Engineering (SE) in the literature. This includes all the
specific knowledge that characterize the whole complex
technical (engineering) system during its planning,
implementation and operation. Nowadays, being an
expert of technical systems means not only to be a
“system engineer” or “system administrator”, because
this latter refers mainly to a specialist of introducing
(installing) and servicing systems. In this new approach,
the professional knowledge of a “system engineer” is the
result of the technical scientific progress occurred in the
last 25 years with the establishment of large complex
technical systems. In this process IT has played the most
important role, because these systems can neither be
planned nor be controlled without IT. In today’s
industrial practice the expert support of controlling large
systems generally means IT management service.
The two basic fields of SE are:
structure and dynamics of technical or socio-
technical systems,
structure and operation of information systems.
The first branch deals with the theory, build-up,
processes, temporal behaviour and energy management of
the most fundamental general and specific technical
systems. The second branch is concerned with the theory,
means and methods of integrating systems, with special
regard to IT infrastructure.
Manufacturing Technology based on discrete parts and
assembly is one of the leading technologies in industrial
practice and its position seems to be immutable. In
mechanical engineering practice production systems,
logistic systems, energetic systems, transport systems are
good examples of systems approach for engineering
applications. At the University of Miskolc the
Information Engineering program had formed from a
Mechanical Engineering background in the nineties. It
was clear from the beginning that the students of
Information Engineering program should attain a special
IT knowledge in such a way that special application fields
suitable for testing their current expertise should be
available already in the course of their undergraduate
period (see: Fig.3.).
276
Proceedings of International Conference on Education, Informatics, and Cybernetics (icEIC 2011),
and the International Symposium on Integrating Research, Education, and Problem Solving (IREPS 2011)

ENGINEERING SCIENCES
INFORMATION SCIENCE MECHANICAL
PRODUCTPRODUCTION
SOFTWARE INFORMATION
THEORY & INFORMATION TECHNOLOGY ENGINEERING
ENGINEERING SYSTEMS
SYSTEMS
DATA BASES
COMPUTER
NETWORKS
APPLICATION
SYSTEMS
LOGISTIC
MANUFACTURING
SYSTEMS
MATERIALS
PROCESSES
MACHINES
DEVICES
SYSTEM
THEORY
SYSTEMS
PRODUCTION INFORMATION ENGINEERING
MANUFACTURING
TECHNOLOGY DESIGN
Fig. 3. System engineering approach for Production Information Engineering
At the Faculty of Mechanical Engineering there were
many departments which used and taught applications
connected with Information Sciences. This was the basis
of the complex planning work of Information
Engineering students. Joining to this process at the
Department of Information Engineering of the University
of Miskolc we have taught and studied Production
Information Engineering for several years, which field
fits into the line of Systems Engineering to a great extent
[8], [9].
R&D TASKS, THE PERFORMANCE OF
PRODUCTION SYSTEMS
In the last few years several industrial development tasks
have been presented for the Department of Information
Engineering which permitted the application of the
theoretical results and the improvement of the education
of students.
Production Information Engineering has obtained a key
role in an interesting and important application area, in
the field of performance evaluation of production
systems. In Hungary, the demand of the industrial
companies has made the consortium-based cooperation of
universities, research institutes and companies possible in
this area [10].
Production performance can fundamentally be measured
on the basis of the quantity and quality indices of the
products manufactured, but this should be complemented
by keeping the customers' terms of delivery, by
minimizing the stock levels, and by maximizing the
capacity of machine- and labor force. In addition to the
demand for measuring performance, there is a continuous
need for improving production scheduling which makes
the analysis and synthesis of dynamic production models
necessary. However, the models proposed in the literature
are not in all cases able to satisfy the ever-growing
requirements to the extent desired [11].
Last year, a large-scale industrial development project
series connected to an actual industrial demand and led
by the Production and Business Intelligence Research
Laboratory of the Computer and Automation Research
Institute of the Hungarian Academy of Sciences was
closed successfully. These projects are connected to
factories of Hungarian and multinational companies
which are operating according to the principles of
Customized Mass Production (CMP). Their production is
characterized by a wide variety of products, but the
demand for the products is highly fluctuating and is
therefore hard to predict. In order to keep their market
positions the customers' (great shopping centers') terms of
delivery (e.g. product parameters, ways of packaging,
deadlines for delivery) should strictly be fulfilled.
Accordingly, customer-centered production policy has
become vitally important at these companies, which
makes the measurement of production performance and
the integration of multilevel production planning and
control indispensable.
For handling the tasks appeared, new model classes have
been defined by the researchers which are appropriate for
the solution of extended flexible flow shop (EFFS)
problems, and their computer representations have been
developed as well [12]. The new model representations
enable the consideration of the parameters and
requirements of customized mass production even in the
case of higher technological and management demands.
The integrated method of this new approach supports the
decisions on combining and/or dividing the orders, on the
dynamic determination of production lot sizes, on
277
Proceedings of International Conference on Education, Informatics, and Cybernetics (icEIC 2011),
and the International Symposium on Integrating Research, Education, and Problem Solving (IREPS 2011)

handling technological alternatives, on positioning
machine resources, on specifying production tasks and on
scheduling their accomplishment. The solving algorithm
of the method, beside using initial heuristics and search
techniques, applies problem-space transformation based
on discrete event type simulation. A new mathematical
model and solution technique have been developed by the
researchers for the joint manipulation of objective
functions and for quantifying the quality of the solutions
allowed. The method can also be utilized in other multi-
objective combinatorial optimization tasks with different
structure, where the objective functions have dynamically
changing importance, differing dimensions and co-
domains.
Depending on the effects of unexpected events on the
production performance indices, various re-scheduling
procedures can also be used. There exist conservative,
time-shifted, partial, parametric and full re-scheduling.
Conservative re-scheduling aims at minimizing the
number of set-ups. In the case of time-shifted re-
scheduling only the time of completing certain tasks or
jobs are modified without changing the resources and lot
sizes assigned to them. In partial re-scheduling only the
jobs directly concerned are modified. In this case the
intervention has a smaller impact on the resources. By
parametric re-scheduling the rates and paths may be
changed. Full re-scheduling serves for creating a totally
new, realizable schedule.
ERP
ENTERPRISE
DATABASE
PRODUCTION
PROGRAM
CUSTOMERORDERS,
MASTER PLAN,
ROUTINGS,
JOBS
CURRENT
FINE
SCHEDULE
MANUFACTURING
MODEL
GENERATOR
SCHEDULER
SIMULATION
ENGINE
EVALUATION
ADVANCED PLANNING SYSTEMPLANT DATABASE
MES
SHOP FLOOR
CONTROL
TRACKING
SYSTEM
NEW GOALS,
CONSTRAINTS
JOB
STATUS EVALUATION
KPI, SITUATION BEHAVIOUR-BASED
CONTROL
COCKPIT TASK
MANAGEMENT
ORDERS
COMPLETED
KPI
Fig 4. Integrated scheduling and res-cheduling system
During the course of the research the optimization of the
component-based stock management policy of the
suppliers has also been investigated. The task has been
interpreted as a nonlinear optimization problem and the
analytic solution of a multi-period model has been
developed. By introducing the concept of specific
stocking cost, a new heuristic solution has been proposed
for determining the number of periods of parallel
production on a production time horizon with arbitrary
length. The bases for handling models with multiple
products and resource limitations have also been
developed. The results of the simulations show that the
computational time complexity of the method is low
enough to be applicable for decision support and for
testing different strategies and decision alternatives [13].
CONCLUSIONS
Nowadays Information Science has the greatest impact on
engineering, on industrial practice and on technology in a
wider sense, and also on several other fields of our
society. In the seventies of the last century, it became
clear at technical universities that Information Science
required not only separate specialized engineer training,
considering that the principles, tools and methods of
information acquisition, processing, visualizing and
sharing by network were indispensable for all kinds of
engineers.
The two fundamental fields of Information Science are
Information Theory and Computer Science, but its
richness originates in the wide range of applications built
on these bases. These applications represent
interdisciplinary fields, where the laws of the systems and
processes specific to the given domain (Information
Technology, IT) exist together with the laws, methods
and tools of applied informatics (Information
Engineering, IE).
278
Proceedings of International Conference on Education, Informatics, and Cybernetics (icEIC 2011),
and the International Symposium on Integrating Research, Education, and Problem Solving (IREPS 2011)

Application programs stand in the centre of the activity of
the Information Engineering Department at the
University of Miskolc, Hungary. Effective use of
application is of primary importance for Hungarian
industrial practice, too. In the focus of research, teaching
and industrial (technical problem solving) works are the
following:
system and data models, their structures and modelling
methods;
ontological analyses, conceptual and object-oriented
approach;
application of standards in application design;
connecting, integrating and synchronizing applications
to information systems;
practical application of management paradigms:
“Digital enterprise” “Cooperative production” and
“Virtual enterprise”.
The projects demonstrate the efforts that agile enterprises
in Hungary have to make in the competitive global
market in order to achieve the strategic goals in planning
and control of the production systems and processes.
These tasks, in the majority of the cases, can only be
solved by means of a new approach, new models and new
software applications of information engineering and
technology.
ACKNOWLEDGEMENTS
The described work was carried out as part of the
TÁMOP-4.2.2/B-10/1-2010-008 project in the framework
of the New Hungarian Development Plan. The realization
of this project is supported by the European Union, co-
financed by the European Social Fund.
REFERENCES
[1] Y. Koren, The Global Manufacturing Revolution:
Product-Process-Business Integration, John
Willey & Sons, New Jersey, 2010.
[2] J.P. Womack, D.T. Jones, and D. Ross, The
Machine That Changed the World, Perennial
Publisher, New York, 1991.
[3] R. Andelin (ed.), Computerized Manufacturing
Automation: Employment, Education, and the
Workplace, Washington DC, US Congress, OTA-
CIT-235, 1984.
[4] F.B. Vernadat, Enterprise Modeling and
Integration; Chapman & Hall, London, 1996.
[5] N. Wilde, T. Huber, Virtualization and Cloud
Computing, UWF Presentation.
http://www.docstoc.com/docs/44777232/Virtualizati
on-and-Cloud-Computing.
[6] V. D. Hunt, Computer Integrated Manufacturing,
Chapman & Hall, London, 1989.
[7] B. Scholten, A guide to applying the ISA-95
standard in manufacturing, ISA Instrumentation
System and Automation Society, 2007, ISBN 0-
9792646-8-7.
[8] F. Erdélyi and T. Tóth, “Virtual Enterprise – Vogue
Word or a New Integration Paradigm?”; GÉP, Vol.
LI, No. 3-4, 2000, pp. 3-8.
[9] T. Tóth, F. Erdélyi, ”Systems Engineering: A New
Approach to Complex IT-based Technological
Systems in Engineering Education.” Journal of
Universal Computer Science, V.12. Issue 9, 2006,
pp.1393-1404.
[10] L. Monostori, J. Váncza, T. Kis, B. Kádár, Zs.
Viharos, “Real-time Cooperative Enterprises”,
MITIP Conference, Budapest, 2006, pp. 1-8.
[11] T. Tóth, Gy. Kulcsár, F. Erdélyi, „Decision
Supporting of Production Planning and Control by
means of Key Production Performance Measuring
Indicators.” Seventh International Symposium on
Tools and Methods of Competitive Engineering,
TMCE 2008, April 21–25, Kusadasi, Turkey, pp.
1201-1215.
[12] Gy. Kulcsár, F. Erdélyi, „A New Approach to Solve
Multi-Objective Scheduling and Rescheduling
Tasks”, International Journal of Computational
Intelligence Research IJCIR, Vol. 3, No. 4, pp.
343-351, 2007.
[13] F. Erdélyi, T. Tóth, Gy. Kulcsár, P. Mileff, O.
Hornyák, K. Nehéz, A. Körei, „New Models and
Methods for Increasing the Efficiency of Customised
Mass Production.” Journal of Machine
Manufacturing, 2009, No. 1. pp. 1-7.
279
Proceedings of International Conference on Education, Informatics, and Cybernetics (icEIC 2011),
and the International Symposium on Integrating Research, Education, and Problem Solving (IREPS 2011)

Learning Together with Entrepreneurs - Description of a Project-Based Learning
Process
Heljä MÄNTYLÄ
HAAGA-HELIA University of Applied Sciences, Business Department
06100 Porvoo, Finland
and
Kai PIETILÄ
HAAGA-HELIA University of Applied Sciences, Business Department
06100 Porvoo, Finland
and
Tiina JOKINEN, Johanna OLKANEN, Helena VENNONEN
Abstract. This article describes a learning process between students, teachers, entrepreneurs and partners based on the output of the first year students in HAAGA-HELIA Universi-ty of Applied Sciences, Porvoo unit. The students carried out
a research project which gave students opportunities to learn
the business processes of the local small and medium sized
companies. The project provided extensive hands-on material
for further use for the students and the researchers and trained
the team working and project management skills of the stu-
dents. The research was the base for a further co-operation
with the companies in the field of business developing tasks.
This article consists of the following parts: the inquiry-based learning method, the progress of the project, the research questions, the main results of the interviews, the beneficiaries and the benefits of the project, and conclusions.
Keywords: Inquiry-based learning, life-cycle curve, SME , shared expertise, regional development
1 Introduction
This article describes a learning process between stu-
dents, teachers, entrepreneurs and partners based on the output of the first year students in HAAGA-HELIA Uni-versity of Applied Sciences, Porvoo unit. The main reason
to the research project was to implement the new curricu-
lum that is based on inquiry-based learning method. In
addition the research was designed so, that it can be re-
peated annually in order to collect material for an exten-
sive company life-cycle curve research. Added to this the
results of the survey can serve the local entrepreneurs in
their developing work as well as giving information to the
public sector organizations. The aims of the research
were:
to give opportunity for the first year students to
make aqcuaintance with the business process-
es of the local small and medium size compa-
nies,
to train students team working and project mana-
gerial skills,
to provide hands-
use,
to serve local partners in cooperation.
According to the Finnish Polytechnics Act (2003/351)
the mission of the polytechnics is to provide higher educa-tion based on the requirements of working life and its development, to support the professional growth of indi-viduals, and to carry out applied research and develop-ment that serves polytechnic education, to support the world of work and regional development taking the indus-trial structure of the region into account. In executing these tasks, polytechnics shall promote lifelong learning. In carrying out its mission, polytechnics shall cooperate with business and industry and other sectors of the labor market, in particular within its own region, and cooperate with Finnish and foreign higher education institutions and other educational establishments.
HAAGA-HELIA renewed the curricula during 2007-
2010 in order to meet the requirements of the new strate-gy. The main points of the new HAAGA-HELIA strategy are:
Pedagogic strategy - learning together with the
working life Research, development and innovation strategy
reformation of business operations Service, salesmanship and entrepreneurship
strategy reformer of service and sale Internationalization strategy - strengthening
competitiveness together with selected partners Know-how strategy proactive working life
skills
The new curriculum of HAAGA-HELIA Porvoo unit emphasizes inquiry - based learning method. Porvoo campus is considerably small having approximately 1000 students (HAAGA-HELIA in total 10000 students) and it is therefore agile and swift in adopting new methods.
280
Proceedings of International Conference on Education, Informatics, and Cybernetics (icEIC 2011),
and the International Symposium on Integrating Research, Education, and Problem Solving (IREPS 2011)

Fig 1 Strategy, Curriculum, Learning Objectives, Method, Tools and Results
Porvoo town is situated close to the Helsinki metropolitan area, in the middle of Eastern Uusimaa region with the biggest centre of oil refining and petro-chemical industries in the Nordic Countries and a nu-clear power plant. In spite of the small size of the re-gion (90000 inhabitants) and Porvoo town (50000 in-habitants) the business life is active and buoyant. The industrial giants attract subcontractors and increase the business possibilities. The limited size of the economic area enables easy networking between HAAGA-
HELIA Porvoo unit, entrepreneurs and public sector organizations.
2 The Inquiry-Based Learning Method
According to Hakkarainen, Lonka and Lipponen (2004) the inquiry learning process can be divided into different core components. The process is shared between various players, and after the process the players share the experiences and findings, they share the expertise.
Obtaining Deepening
Information
Interviews, lectures and literature, exercises, learning diary and presen-tations
Creating the New
Working Theory
The results of the projectand the new operation model
Setting of the Problem
Setting of problem andresearch questions
Problem
Analysis of the research results and the project
ontext
Orientation to project with meetings and discussion
Tool for Learning
Results of the Research Project
Inquiry-Based Learning MethodC
urric
ulu
m
Learning Objectives of the Academic Year
Command of Vocational Proficiency
Communication skills, command of operational environ-ment, service production and selling skills, community skills, operational business skills, entrepreneurial skills
Entrepreneurial Readiness
Expertise
Students, teachers,
entrepreneurs,
partners
W Theory
Basic theory and processesof business administration Workshops, lectures, exercises
Critical Evaluation
Meetings with the partnersSpecifying the aim of the projectWriting the project planSpecifying the research
projectWriting the project plan
281
Proceedings of International Conference on Education, Informatics, and Cybernetics (icEIC 2011),
and the International Symposium on Integrating Research, Education, and Problem Solving (IREPS 2011)

Fig 2 Inquiry-Based Learning Method
In order to apply the inquiry-based learning method in addition to the theoretical business studies, the teachers created a project for the first year students, during which the students interviewed local entrepreneurs, collected data and processed and analyzed it. The main aims of the project were to give students opportunities to learn the business processes of the local small and medium sized companies. The project also provided extensive hands-on material for further use and trained team working and project management skills. The project provided relevant information for two public sector partners in cooperation, municipal development company Posintra Oy, which was interested in how well the entrepreneurs knew about the supply of the public services and the sources of public funding. Employment and Economic Development Of-fice was mainly interested in knowing the need for re-cruitment as well as the need for further training of the staff in the companies.
3 The Progress of the Inquiry-Based Learning Pro-
ject
The autumn term 2010 started with traditional basic
courses in business administration, communication, eco-nomics, business law and ICT. The students participated in lectures, exercises and exams. At the same time the students, teachers and partners in cooperation orientated to the research project by defining its aims, tools and research questions.
The size of the group, 72 students, was challenging. The students were divided in teams of 3 - 4 persons, and each student was responsible for finding one company for the interview. The companies were mainly found in the list provided by Posintra Oy. The whole team discussed with each entrepreneur and the team members were acting by turns as chair person and as secretary, who filled in the questionnaire. The rest of the team filled in the observa-tion form.
The quantitative research method was chosen in order to secure the reliability of the result, and it also served the ICT learning best. The students pondered the research questions in details according to the theories they had just learned. The structure of multiple choice questions turned out to be very difficult, and finally the teacher team fin-ished the questionnaire, which was commented by the partners and tested by the students in interview exercises. In the end of October the questionnaire with 82 questions was printed out and the teams started working.
After some difficulties and with the help of the teach-ers each team succeeded in finding suitable companies and in the end of November the teams recorded infor-mation in Excel. After that students analyzed the data and started to write comparison reports of the companies. The reports adhered to the structure of the questionnaire and included both SWOT and PESTEL analyses. In December the teams were gathered in a seminar where they held
presentations and compared the findings. During the spring term 2011 students continued analyzing the data whilst their ICT skills improved. In May 2011 the final results such as frequencies and cross tabulations were presented to the entrepreneurs, partners and the media.
It is worth of mentioning that during the research pro-ject the students continued with their theoretical business studies as usual. In spring term the students carried on with their work with the entrepreneurs by preparing mar-keting plans for selected companies, and in autumn term 2011 they will write internationalization plans for some of the companies.
The teacher team continues the work on the data. The amount of the year 2010 observations is huge: 72 entre-preneurs answered 82 questions, of which 57 were multi-ple-choice questions and 25 open ones, in order to help students to create comfortable discussion.
There are plans for the future that during next 3 - 4 years the first year students will interview new entrepre-neurs in order to collect enough material for statistical conclusions of the life-cycle curve of the companies.
3.1 Research Problem and Research Questions
learning pro-
ject was formulated as follows: What kind of businesses
there are in Eastern Uusimaa region and what kind of
differences and/or similarities do the companies have
during different stages on the corporate life-cycle curve
and in different industries?
Research questions were phrased in following way:
How do the companies perceive their future, the
growth of demand and competition?
How does the development of national economy
affec
What is the impact of political, institutional and
social environments on the companies?
Do the companies need more work force?
What is the level of know-how in the company:
Does the entrepreneur or the staff need any addi-
tional training?
Do the entrepreneurs need coaching?
To what extent are public funding and public
services used?
How do the entrepreneurs perceive the status of
entrepreneurship in Finland?
The life-cycle research continues until year 2015. The
(annual) themes and questions for research are;
Growth of the company,
Labor => do the company need more labor and
how to find the requisite
labor?
282
Proceedings of International Conference on Education, Informatics, and Cybernetics (icEIC 2011),
and the International Symposium on Integrating Research, Education, and Problem Solving (IREPS 2011)

Learning => what are future skills needed for the
company?
Finance => how to finance companies invest-
ments?
Investments => what kind of investments are
needed?
The research problem in the long run is to find out what
kind of problems companies meet in different stages of
their life-cycle and how they see the next stage in the
companies life-cycle curve according to themes for the
research.
roject
Reliability and validity are the most important qualities
of the instrument. Reliability is the consistency and the
repeatability of the measurement, or the degree to which
an instrument measures the same way each time it is used
under the same condition with the same subjects. In this
research the questionnaire was detailed and well defined,
so that even the first year students were able to interview
the entrepreneurs and to make notes. The partners, as
experts, actively took part in the formulation of the ques-
tionnaire and it was tested several times by the students
and the teacher team. The big number of interviewers may
have affected the reliability, but the teacher team was
aware of this risk and controlled closely the process, and
even contacted some of the entrepreneurs afterwards.
Validity is the strength of the conclusions, inferences or
propositions. In our case, the questionnaire was strictly
based on the business processes and the questions of the
part
Most of the interviewees were the entrepreneurs them-selves. The majority of the companies had turnover less than one million Euros and less than ten employees. The
age distribution of companies was considerably even, 21
companies were under four-year-old, whereas 22 compa-
nies were more than 20 years old. The market area of the companies was mostly local. The two most common branches were trade and welfare sector.
Most of the entrepreneurs considered the demand of their services and products good and the majority believed that both the demand and the turnover will grow in next 2-3 years.
The competitive position was considered to be good, although it was expected that the competition stepped up. The worst competitors were the local companies in the same field. The strength of the company was generally the client service, good quality, good products and suitable business location.
In the opinion of most entrepreneurs, the local politics had effect mainly in form of the taxes and in town plan-ning. State politics and EU regulations had effect, too, e.g. alcohol locks in buses and in taxis.
More than half of the entrepreneurs answered that the lack of competent workforce has negative effect on the company's growth. New employees were mainly recruited on the basis of recommendations.
The employees needed training mostly in sales, mar-keting, customer service and information technology. Training was also needed in service production and ser-vice development. Entrepreneurs themselves needed coaching in sale and in marketing, ICT and in the use of the social media. Coaching was sought in most cases from the consultants, but one third of the entrepreneurs suffered from the lack of time. Most of the entrepreneurs were familiar with the public services and public funding, but they did not use them.
Most of the entrepreneurs felt that becoming an entre-preneur was easy and that the society offers enough of advice and service. Increasing the output and size of the company was considered difficult. Also the roles of the employer and the leader were seen as difficult and de-manding. Very positive signal was that only one of the 72 entrepreneurs contemplated closing down the business in nearest future.
There were significant differences between men and women when comparing the attitudes towards entrepre-neurship and the development plans as well as the growth of the companies. Men were willing to take more risks and to grow faster, while women were more careful in running the business.
4 Conclusions
The benefits of this research project can be divided in two parts: The benefits inside HAAGA-HELIA Porvoo unit and in Eastern Uusimaa region among the companies and partners in cooperation.
Inside HAAGA-HELIA the students were the major beneficiaries of the project. While visiting the companies the students observed the everyday life in the companies. In parallel with the interviews the students had great op-portunity to train their skills in project management, team working and in self management. They also could com-pare the theories of business administration, economics and business law to the practice in small and medium sized companies. The students used their fresh communi-cation knowledge when contacting the entrepreneurs and writing the comparison reports. They learned how to find information and how to master the MS-Office programs. The idea was not to train the students to become research-ers, but during the project they familiarized themselves with the structure and management of a survey and learned to interview and observe. Event management was practiced, when the students organized an informative meeting to the media, partners and entrepreneurs. Motiva-tion to business studies was high as the theory and prac-tice were combined in the process. The collected material is so extensive, that it can be collated in final theses by the third year students.
The teacher team met new challenges due to the size of the group and consequently more attention had to be paid to management and control, and the teach leadership skills were tested. The new teaching method was interest-ing and the teachers found rational reasons for deeper cooperation and team working. The project itself gives potential for a long-span and productive cooperation with the local entrepreneurs, too. Thirty eight of the seventy
283
Proceedings of International Conference on Education, Informatics, and Cybernetics (icEIC 2011),
and the International Symposium on Integrating Research, Education, and Problem Solving (IREPS 2011)

two interviewed companies wanted to continue coopera-tion with Haaga-Helia in the form of developing work and during the spring semester 2011 a marketing plan was made for six companies. In the autumn semester 2011 the cooperation continues with some of the companies and the students are making developing projects both in inter-nationalization and in financial accounting.
HAAGA-HELIA Porvoo unit could through the project fulfill the obligation given in the Polytechnics Act. At the same time the main issue in the HAAGA-HELIA strategy, learning together with the working world, was fulfilled. Also the demand of shared expertise was met and the aims of the first academic year were attained.
The partners in cooperation, Posintra Oy and Employ-ment and Economic Development Office, received up-to-date information from the topics that are important at the present moment. The occupying questions were an-swered, like how the entrepreneur feel about the use of social media, how much they use governmental and mu-nicipal consultation services and do the companies need financing for investments or for developing the opera-tions. The voice of the entrepreneurs was clearly heard in the results and thereby the partners can develop their services to meet the needs of the entrepreneurs in a better and more efficient way.
At the interviews the entrepreneurs in Eastern Uusimaa had the opportunity to contact students, future potential employees, directly. The entrepreneurs were content with the chance of sharing their experiences with keen young listeners and with the opportunity to tell their thoughts of the highlights and mishaps of the entrepreneurship. The majority of the respondents appreciated the contact from the school and would find it easier to turn to the teachers and students in their future projects. By means of the results the entrepreneurs can compare and contrast their own business situation with the others. Even 38 compa-nies answered, that they are willing to cooperate with HAAGA-HELIA in the future, too, and during the spring semester 2011 students prepared six marketing plans for the companies.
The officially approved strategy of HAAGA-HELIA defines the operational framework, but in practice the teacher team was obliged to plan and define the new pro-cess and the structure to implement the strategy. Also, a special attention has been paid to integrate the general learning goals of the BBA program, including both gener-ic competencies, professional skills and the project goal to meaningful entities. In addition teacher s work has been changed from the role of independent actor to the role of team worker. The project has been designed for serving the partners, and in the long run, also the local entrepre-neurs. However, the most important outcome of the pro-ject was the broadened experience of the students. References
1. Adizes, Ichak Ph.D.2004. Managing corporate Lifecy-cles. The Adizes Institute Publishing.
2. Yin R. (2003): Case Study Research. Design and Methods. Sage Publications
3. Barron, B.J.S., Schwartz, D.L., Vye, N.J. Moore, A., Petrosino, A., Zech, L., Bransford, J.D. & The Cog-
nition and Technology Group at Vanderbilt. (1998). Doing with understanding: Lessons from research on problem- and project-based learning. The Journal of the Learning Sciences, 7, 274.
4. Bereiter, C. & Scardamalia, M. (1999). Process and product in PBL research. Toronto: Ontario Institutes for Studies in Education/University of Toronto.
5. Blumenfield, P., Soloway, E., Marx, R., Krajcik, J., Guzdial, M. & Palincsar, A. (1991). Motivating pro-ject based learning: Sustaining the doing, supporting the learning. Educational Psychologist. 26(3&4), 369, 398.
6. Diehl, W., Grobe, T., Lopez, H. & Cabral, C. (1999). Project-based learning: A strategy for teaching and learning. Boston, MA: Center for Youth Development and Education, Corporation for Business, Work and Learning.
7. Gordon, R. (1998). Balancing real-world problems with real.world results. Phi Delta Kappan, 390-393.
8. Grant, M.M. (2002). Getting a grip on project based learning: Theory, cases and recommendations. Meridi-an: A Middle School Computer Technologies Journal, 5, 1. http://www.ncsu.edu/meridian/win2002/514/. (January 30th, 2008).
9. Hakkarainen, Lonka, Lipponen. 2004. Tutkiva oppi-minen. WS Bookwell Oy.
10. Harris, J.H. & Katz, L.G. (2001). Young investigators: The project approach in the early years. In Harel, I. & Papert, S. (Eds.). (1991). Constructionism. Norwood, NJ: Ablex.
11. Jones, B.F., Rasmussen, C.M. & Moffitt, M.C. (1997). Real-life problem solving: A collaborative approach to interdisciplinary learning. Washington, DC: American Psychological Association.
12. Marx, R.W., Blumenfield, P.C., Krajcik, J.S. & Solo-way, E. (1997). Enacting project-based science: Chal-lenges for practice and policy. Elementary School Journal, 97, 341-358.
13. PK-yritysbarometri. 2007. Pk-yritysbarometri. 2007. Suomen yrittäjät ry & Finnvera OyJ.
14. Richard Jones. 2007. Project Management survival. Kogan Page.
15. Stepien, W. & Gallagher, S. (1993). Problem-based learning: As authentic as it gets. Educational Leader-ship, 51, 25-28.
16. Thomas, J.W. (2000). A Review of Research on Pro-ject-based Learning. http://www.autodesk.com/foundation. (December 18th, 2007).
17. Thomas, J.W. & Mergendoller, J.R. (2000). Managing project-based learning: Principles from the field. Paper presented at the Annual Meeting of the American Ed-ucational Research Association, New Orleans.
284
Proceedings of International Conference on Education, Informatics, and Cybernetics (icEIC 2011),
and the International Symposium on Integrating Research, Education, and Problem Solving (IREPS 2011)

Figure 1. Process Model as it looks in a 3D picture
Collaboration between Industrial Computing and the Final Integration Project Courses of a Degree in Electromechanical Engineer with specialty in Industrial Automation, to gain competences in
HMI/SCADA Systems
Enrique Modai Instituto de Industria - Universidad Nacional de General Sarmiento
San Miguel, Buenos Aires, CP1613, Argentina
And
Gustavo Jimenez Placer Instituto de Industria - Universidad Nacional de General Sarmiento
San Miguel, Buenos Aires, CP1613, Argentina
And
Amado Vitali Instituto de Industria - Universidad Nacional de General Sarmiento
San Miguel, Buenos Aires, CP1613, Argentina
Abstract— This work is intended to show how the Industrial Computing Course, part of the second cycle of Electromechanical Engineering oriented in Automation curricula, can collaborate with the Final Integrator Project, in order to allow students to gain competences on the design, deployment and start up of automated electromechanical systems, including the development of a Human Machine Interface (HMI). This HMI not only acts as the project presentation, but also allows executing the trial showing how the batch evolution is being done, reporting any event or alarm that might be summarized, and saving historical records of any measurable magnitude for off line analysis. On that purpose a local application simulation of a generic standard batch process was developed, including Temperature Control, Flow Computing, Level Indication and Control, Valves, Pumps and other field devices,.
Index Terms—Programmable Logic Controller, Supervisory Control And Data Acquisition, Human Machine Interface, Remote Web Server,
I. INTRODUCTION Standard Industrial Automation and Process Control
teaching approaches are in general terms more oriented to theoretical concepts, and the gap between how things are being done in the real world and how students are learning those concepts to apply them later, is normally very wide.
On that purpose, to bridge the gap between those instances, we developed a program that consists in
building a Process Control Simulation Model that could be used to demonstrate general behavior of instruments, pumps, valves, sensors and actuators, involved in a classic thermal process (heating and cooling water that can be used in another reactive process).
285
Proceedings of International Conference on Education, Informatics, and Cybernetics (icEIC 2011),
and the International Symposium on Integrating Research, Education, and Problem Solving (IREPS 2011)

Figure 2
Pilot Plant – Rear View
In order to apply Factory Automation to a Standard Instrumented Process, all the necessary equipment was intentionally defined to support Input and Output Interaction with Programmable Logic Controllers (PLC), industrial communication protocols, Field Buses, local human Machine Interfaces (HMI), local and remote Supervisory Control And Data Acquisition Systems, and Intranet and Extranet Services, to provide full access from everywhere.
As the Industrial Computing Course takes place in a single semester, it cannot handle by itself developing a complete SCADA interface. On the other hand, the requirements and the necessary data to build this interface are often very specific to be treated as an in class experience. So, as most of the Final Integration Projects can handle a sort of Supervisory System, then it is mandatory for this project to include a standard HMI/SCADA interface, as a way to present all the related Project information in a condensed way, over a PC screen. Then, over this PC screen the students will have to demonstrate not only that the test is being done in a proper way, but also to get the right information and reports from the application, to strengthen its presentation..
II. CLASSIC APPROACH The standard way to develop PLC and SCADA
programs is to create algorithms, sequences and graphic interfaces, based on specific process documentation that try to explain how the process needs to behave, by the use of standard representations and symbology over drawings, tables and diagrams, supported by written documents that explain in words what is supposed to be done by a Factory Automation Engineering Team.
The way to try and demonstrate that sequences, loops, graphics and alarms are being programmed as expected, without needing to connect to thereal process, is by using
some standard programs called ¨simulators¨, that have the ability to interact directly with the PLC Programming software providing reactions¨ to the actions ordered by the Graphic or Manual Interface, replacing the information that would be provided by analog and digital process variables.
Simulation is very useful, but the main problem is to recreate all the conditions that the system would experiment, in order to have a real response, and a reliable model that helps to understand the process behavior.
On the other hand, simulations are only software pieces, portables, that allow students to analyze the process behavior without being connected to the real variables just beside the pumps, valves and instruments. This is a very flexible and costless way to study process models, but oftenly there is an undetermined extra modeling job, because you need to presuposse process behaviors and reactions, without having seen the real process running in the real world.
So, it is better to have a real model running and connected to Supervisory Control and Data Acquisition applications, in order to analyze the real process behavior, to understand how to apply control algorithms. On this
Figure 3 Pilot Plant: Side View
286
Proceedings of International Conference on Education, Informatics, and Cybernetics (icEIC 2011),
and the International Symposium on Integrating Research, Education, and Problem Solving (IREPS 2011)

way, students learn from the real processes how variables evolve when applying Control Algorithms. Only after this experience, with the addition of math modeling algortihms, the they can develop simulated process behaviors, to recreate normal process reactions.
But process evolution in some cases take long time to complete a batch, and statistics must be taken from a large series of samples, so student groups must spend many time beside the process in order to get the right information from it.
III. REMOTE SUPERVISORY SYSTEMS When processes are very long, or, for many reasons, it
is not possible to stop the process when it is unattended (continuous processes), Modern Process Control provides today a complete set of different options in order to remotely supervise and control batch and continuous processes, leaving only a few operators for emergency purposes and special issues. Here we show a few of these
options
Remote Alarm and Event System Remote Process Information System Remote Process Control System
In the first kind of systems, a selected group of Plant
people receives through special devices alarm and event data. Those devices includes beepers, mobile phones, PDAs, portable and home computers. If a crytical or important alarm and event occurs, a dedicated system generates a broadcast or single oriented message containing the information about the variable, the kind of alarm, and the corrective action to be taken (some of these systems allow also to interact with certain process variables, directly from the receiving device, by clicking a combination of keystrokes or functions, like a self banking system, for example).
The second Group allow the key people to receive complete Process Information in a text or tabular format at the client user request, or in ashift period basis. This kind of remote connection has the same functionality than a printed report, but in a remote way, because the report is ususally being sent to selected people e-mail addresses, with the formatted report printed over the mail body or as an attachment, or as a periodical advice with an hyperlink related to a web address in HTML or FTP formats, either for on line reporting, or a file server ready for downloading, indexed by specific date or kind of report.
This kind of connection can also be used as an ¨on demand information application that can be consulted on a regular basis, and allowing also viewing the last logged report or all the available list of generated reports, but also prepared to generate a new report at any time.
The third kind of remote client application is the real Time one, in where the remote user can interact with a remote application, that might be identical to the local one, but through the use of Internet thin clients, and publishing dynamic XML pages originated in each local
SCADA applicaton Screens. Some standard SCADA packages offers Web enabled software that can be purchased as an add-on that gives to the standard SCADA application the ability to be published on a web address, as a read only app. or a read-write one.
On the other hand, there are standard software packages, as the Microsoft ® Remote Desktop, or the VMC, among others, that allows to a remote user to do a take over action on the entire PC user interface. These kind of service is better used for a single user application, because implies only one connection at a time, and allows the remote user not only monitor the SCADA program, but also the PLC programming software, and any other diagnostics software resident on the local PC. That’s why this mostly used as a Teleservice option for a support provider, than a multi user application, that needs independent or related clients interacting at the same time on the same application, with different access levels, if necessary.
TABLE I. TYPE OF CONNECTION
Required ADD-on Remote System PLC level SCADA level DataBase level OS Level
Alarms and events dial-up MODEM GPRS modem
dial. up app Internet comm., provider
interface
dial.up app Internet comm, provider
interface no
Process Information Web Server - Internet connection
Web Server - Internet connection
Web Server - Internet connection
Remote desktop Internet connection
Process Control Web Server SCADA - Internet connection
Web Server - Internet connection no Remote desktop
Internet connection
Technical Support dial-up modem - Ethernet & VPN services Ethernet & VPN Services Ethernet & VPN Services Remote desktop
Internet connection
287
Proceedings of International Conference on Education, Informatics, and Cybernetics (icEIC 2011),
and the International Symposium on Integrating Research, Education, and Problem Solving (IREPS 2011)

Figure 4. Process and peripherals
IV. LABORATORY AT THE CLASSROOM LEVEL The idea of this model is to provide remote access to
the laboratory application, not only to receive real time data from the process at any time, but to prepare the students to be familiar with the different options available today for remote supervisory information systems. The Laboratory at the classroom is a small standard cooling and heating process where we can interact with valves, pumps, RTDs, flowmeters and other kind of devices, as level transmitters and indicators. Those devices should be equipped with some kind of communication ability, depending on the model complexity and costs. Digital devices, as switches, proximity sensors, etc. are standard digital Inputs, while electrovalves and contactors are standard digital outputs.
Analog variables are quite different to be treated. They depend on accuracy, but mostly on what kind electrical output signal can they provide to be connected to a Data Acquisition System. Those devices can provide one of these different kind of output signals
Pulse train Current loop (0-20 or 4-20 mA) Voltage (0-5v, 0-10v, -10+10v, etc.) Low voltage (thermocouple measuring) Resistor bridge (RTDs, Strain Gauges)
There are more sophisticated instruments that provide digital information through standard fieldbus protocols, as the following ones:
Modbus Hart Profibus Fieldbus Foundation Profinet Etc.
The extra benefit is to provide remote setup, configuration and diagnosis, while bringing a converted process value. Extra cost and complexity are their major disadvantages.
More sophysticated instruments require more powerful interfaces, and the PLC who will carry out this job must have more digital ports avaliable, more memory and capacity. On the other hand, the accuracy will be higher and the system more reliable.
The need is to have a system that could be interfaced by a PLC and SCADA, and after that, the best way to provide remote access to this plattform. The benefit of a modern and sophysticated PLC resides on special features like Ethernet connection, embedded web server and different expansion slots, that provide, as is, direct connection to an Internet Remote Client.
The following table shows different options that we need to consider for the local devices and applications, in order to provide remote access based on the kind of service needed.
The combination of two or three of the above hardware and software options, is the best approach to design a very powerful remote supervised and controlled model, to show how different key plant people should receive different process information packs.
Process Engineers should see how process normally evolves and the KPIs (Key Process Indicators). Maintenance engineers should receive downtime alarms and preventive alerts. Production Manager needs to receive a completion and deviations report. Students must adopt a role under this pilot plant and take care of his function in a local and remote way.
Process roles will need to log in the system and watch in real time what´s going on, from their remote places. Maintenances roles must receive every critical alarm in their mobile phones as an SMS or email message. Manager roles must require complete reports in their notebooks wherever they are (number of batches, global process information, totalyzers, etc.).
So, a complete remote supervised system, in our case, includes the following services:
a) Alarms and Events: send email messages and SMS messages to certain people
b) Process Information: complete reports in HTML format to be sent by email and published in a web page
c) Process Control: provides remote access through a web application that emules the same local SCADA Application.
d) Technical Support: provides remote access through a Remote Desktop application and brings remote access to the SCADA and the programming software
A. Alarms and Events These applications are normally available from the
SCADA side. Using a commercial package, there are two ways to get data from the Alarms and Events Table and send messages to another application:
Using and configuring the alarming module that normally comes as an add-on of the base software. There are certain packages that comes with partial functionality, such as emailing alarms.
Using the SDK (System Development Kit) that comes with programmed Dlls and routines to be applied in .Net, Java and other programming languages, to develop a short application that interfaces alarm tables on one side, and the telephone application on the other.
The student model is based on a standard SCADA
288
Proceedings of International Conference on Education, Informatics, and Cybernetics (icEIC 2011),
and the International Symposium on Integrating Research, Education, and Problem Solving (IREPS 2011)

System that handles alarm emailing. Once the local SCADA Station is connected to the
Internet, it will be necessary to configure an existing email account for the application, with smtp and pop servers, account name and all the data.
On the other side, each event and alarm that might be considered critic, will be configured to be sent to a group of email address list. The System requires return response, as a way to confirm that the alarm is already acknowledged. All these events (alarm, sent messages, every recipient acknowledge, are recorded on the History table, and gone away from the Summary table when normalized)
The remote alarm System is running at the same time of the local one, and permanently supervised by the same log application and the general event viewer.
B. Remote Process Information The process Information is coming both from the email
Server Application, and also from a Web based application that allows certain people to login and select or demand a sort of dynamic reports that represents periods of logged information condensed and rearranged, in order to provide a feasible way to analyze and measure how things are being done in the model/process/plant.
This is a web based reporting application in HTML/XML format, retrieving information from the Historical and realtime database, as a classic printed report, but now available from the Internet.
Then, a comparison between target and really done, is from the management point of view, a business process control loop
C. Remote Process Control For certain people, this kind of remote operator
interface is the model final purpose, as it looks like the local one. Teorethically, it would be highly recommended not to operate this kind of interfaces, but functionality is completelly available, and depends on the Internet provider bandwidth and connection speed. If the local application is developed in one of the last generation languages, as .Net VB or C Sharp, e.g., then the application is completely portable to a Web Server, in order to be published and viewed from any point of the Internet.
Most of the commercial SCADA packages are based on this language, and Windows ™ is a de facto standard for industrial communications, so it is relatively easy to migrate local to remote applications.
But, Universities and Companies are very committed to neworking security issues. And traditional OPC (Ole for Process Control), is normally captured by Firewalls and other security issues. So it is a must to get permissions and tunnels from IT (Information Technology) people, in order to assure reliable communications. OPC UA (Unified Architecture) is bridging this gap, because it is based on .Net Framework, instead of COM and DCOM (Comunications Object Model and Distributed Comunications Object Model)
The comparison in this case with the real industries is to provide the same functionality to a Proces Specialist,
Maintenance Manager or Production Manager, from a Remote Location (Another Plant, home, or mobile position), terieving the whole information needed, as being beside the process at the same location of the Local Scada System Application.
D. Teleservice This functionality is very easy to be provided over
Windows ™ XP Pro Operating System, by the use of Remote Desktop Application, that is available in standard WinXP Pro packages.
This software has the abilty to provide a PC Desktop sharing througout the Internet Network. On this purpose it is normally needed that anyone at the local PC is able to command the application while is being controlled or modified through a remote application anywhere in the Internet. In this case the remote application is using local resources and licenses.
Some PLC and/or SCADA manufacturers offers different kind of Remote Service applications, bur they normally require also a remote license and some extra conditions like a VPN (Virtual Private Network) or a dedicated phone line.
V. FINAL PROJECT INTEGRATION As the degree includes a specialization in Automation,
it is very desirable that most of the final projects that the students has to develop, also include an automation device and an HMI interface, not only to gain specific competences in automated interfaces, but also leveraging the opportunity to protocolize the experience through dedicated reports and data logging.
On this purpose, the Industrial Computing Course has established that all the HMI/SCADA practices are mostly oriented to planify and develop the Final Project Interface.
It is well known that the knowledge is more applicable when it is demanded to solve a real problem. So the real problem is the Final Project, normally designed to be approved in focus to obtain the degree.
The Course gives the students the opportunity to define and design the Project HMI while being trained in SCADA Systems and Communication Interfaces. This is a goal that empowers both Courses, and it is confirmed that produces sinergy between both practices, because some of the typical project inconveniences may be solved in the Industrial Computing Course time.
VI. CONCLUSION It is possible to recreate modern industries supervisory
Control, Alarm Management and Report capabilities from a remote site, in a University model application, without any important investment to be done, optimizing resources and equipment, and also without any important software development, as it is not the purpose for our students to be experimented programmers, allowing them to better concentrate in automation and control issues.
In addition, the collaboration between the Industrial Computing Course and the Final Project allows the student to develop the application while learning to design SCADA Systems and HMI interfaces.
289
Proceedings of International Conference on Education, Informatics, and Cybernetics (icEIC 2011),
and the International Symposium on Integrating Research, Education, and Problem Solving (IREPS 2011)

ACKNOWLEDGMENT To the students that helped to design the initial device
and to the lab people that help us everyday in having the material and tools just in time for the experience.
REFERENCES [1] Jiménez-Placer Gustavo, Amado Osvaldo Vitali, Alexander Edgar,
MálagaTorres, Fabiana Ferreira. (2008). Desarrollo de un experimento didáctico de bajo costo para la enseñanza de software de supervisión industrial. AADECA 2008 – Semana del Control Automático – XXIo Congreso Argentino de Control Automático del 1 al 3 de Septiembre de 2008 – Buenos Aires, Argentina.
[2] Mataix Claudio (2005). Mecánica de fluidos y maquinas hidráulicas. Editorial: Alfaomega. ISBN 970-15-1057-7.
[3] Rodriguez Penin Antonio (2007). Sistemas SCADA – 2º Edición. Editorial Marcombo Ediciones Técnicas S.A. Coedición Alfaomega Grupo Editor S.A.
[4] Boyer, Stuart A.R SCADA: Supervisory Control and Data Acquisition (4th Revised edition) (ISBN: 9781936007097).
[5] Bolton, W. Programmable Logic Controllers (ISBN 978-1-85617-751-1).
AUTHORS E. M. Modai is an Electrical Engineer with the
Universidad Nacional de General Sarmiento, Los Polvorines, Argentina, CP 1613 (e-mail: emodai@ ungs.com).
G. Jimenez Placer is an Electronical Engineer with the Universidad Nacional de General Sarmiento, Los Polvorines, Argentina, CP 1613 (e-mail: gplacer@ ungs.com).
A. O. Vitali is an Mechanical Engineer with the Universidad Nacional de General Sarmiento, Los Polvorines, Argentina, CP 1613 (e-mail: avitali@ ungs.com).
Published as submitted by the author(s).
290
Proceedings of International Conference on Education, Informatics, and Cybernetics (icEIC 2011),
and the International Symposium on Integrating Research, Education, and Problem Solving (IREPS 2011)

Engineering Proyect (Case Study) to Obtain Polymer Concrete through Recycled PET
Domínguez Patiño Martha Lilia
Facultad de Ciencias Químicas e Ingeniería, Universidad Autónoma del Estado de Morelos.
Av. Universidad 1001, Col. Chamilpa, C.P. 62209, Cuernavaca, Morelos, México.
Rosas Trejo Gerardo
Instituto de Investigaciones Metalúrgicas, Universidad Michoacana de San Nicolás de Hidalgo
Edificio U Ciudad universitaria, C.P. 58060, Morelia, Michoacán, México.
Rodríguez Martínez Alma Delia
Posgrado Centro de Investigación en Ingeniería y Ciencias Aplicadas,
Universidad Autónoma del Estado de Morelos.
Av. Universidad 1001, Col. Chamilpa, C.P. 62209, Cuernavaca, Morelos, México.
Keywords: Polyethylene terephthalate, polymer concrete,
thermoplastic, commercial thermoplastics, engineering
thermoplastics.
ABSTRACT We must continue to environmental awareness at all levels of
education and even more on graduate students, thus engaging
them in real trouble but looking for alternative solutions, this is a
case study of a graduate student in materials engineering, in
which the project was to develop a new composite material from
recycled PET. It is necessary to generate activities recyclable
solid waste processing, thereby decreasing the density of
garbage and recyclable materials are harvested. The
accumulation of solid waste is an environmental problem that,
without recycling, reusing or reducing its potential value is
wasted. The time taken for the decomposition of waste is
variable depending on the type of material to be extremely slow
in the case of plastics. Polyethylene terephthalate bottles (PET)
take longer than 50 years to decompose and last longer if they
are buried.
This research work aims to take advantage of recyclable solid
waste to generate new composite materials that help to minimize
environmental contamination and allowing for sustainable
development by giving economic value to waste. New materials
to consider in this paper as the main application area of
construction, is aimed at generating alternative construction
materials comprising a mixture of recyclable material such as
PET, to generate alternative building materials that improve the
properties mechanical properties of traditional building
materials. It also established a methodology feasible technique
for the development of a new composite material to called
"polymer concrete with recycled PET”.
INTRODUCTION
For convenience, most engineering materials are included in
three main groups: metallic materials, polymers and ceramics. In
this paper places emphasis on polymeric materials and
specifically to research on those who are otherwise recyclable
solid waste such as polyethylene terephthalate, to recycle, reuse
and give it value as a component of a new composite material
called "recycled PET polymer concrete."
Composite materials are classified primarily under the matrix,
and therefore will have metal matrix composites, polymer matrix
and ceramic matrix. [3] It is important to note that this research
was obtained a new composite material which was used as
polymer matrix polyester resin. Also composite materials are
classified according to type of reinforcement or filler. Therefore
there are particulate composites, short fibers, continuous fibers
and laminar or layered. [3] A particulate composite material is
one in which the reinforcement particle is approximately the
same dimensions in all directions. Therefore, the particles can be
rods, spheres, flakes and many other reasons which apparently
are about 10μ. The reason apparently is the length ratio between
the cross-sectional dimensions. In these composites, the size,
shape and distribution, the rate and the form of particles affect
the properties of the composite. Usually the particles of smaller
size and more rounded work best. It must ensure that the
distribution of the particles is uniform. [4]
Fiber composite materials are those in which the reinforcements
have reason to look much larger than 10μ (is in which the length
is much greater than the dimension of cross section). In the
composites with short fibers or staple the properties vary with
fiber length. [3]
The building today is demanding materials that exceed the usual
properties and constraints. In the domain of concrete has long
pursued, the resistance rapidly achieve high and very high,
especially for prefabricated to reduce sizes, thickness and weight
of their own, still very important to have a relationships tension /
compression higher than in normal concrete. Besides the
strength, durability is another property increasingly valued,
today we see an abundance of certain premature aging concrete
structures, built of course, with an emerging technology and
quality defects in many cases, but cannot forget some weakness
concrete against aggressive environments. Given the above, the
use of polymers in concrete, which began in 1950 as addenda to
improve the adhesion and wear resistance, has given way in the
last 25 years to a widespread recognition of the manufactured
concrete or modified polymers as building material. [5]
291
Proceedings of International Conference on Education, Informatics, and Cybernetics (icEIC 2011),
and the International Symposium on Integrating Research, Education, and Problem Solving (IREPS 2011)

Polymer Formulation. Very few polymers are used in its pure,
unadulterated, but mixed with other materials to enhance and
improve properties for use in various applications. Formulation
is the name of the process by which the components are mixed
intimately with each other in a molten state or at room
temperature until the dough is as homogeneous as possible. This
is the general term applied to: 1) the procedure of alloy or
polymer blend, 2) the use of additives and fillers such as
colorants, flame retardants, antistatic agents, plasticizers and
others and 3) the addition of braces or a combination of the three
treatments. Usually, the product of the third is known as
reinforced plastics or polymer matrix composite materials. [3]
It is noteworthy that for recycled PET polymer concrete, a
mixture is made with a polyester resin as a binder, are added
particles or short fibers mechanically recycled PET is used for
calcium carbonate in the structure volume.
Polymer Blends. The mixtures are combinations of polymers by
mechanical means, these combinations are not dependent on
chemical bonds, but typically require compatibilizers that
prevent segregation of the components. The mixtures are
normally kept the best features and in many cases the goal is to
find two or more components which, when mixed, produce
synergistic property improvements, beyond those that are purely
additive in their effect. The improvements sought are in the
areas of impact resistance, weather resistance, better behavior at
low temperatures and flame retardation of. [3]
Recycling of Polymers. The classifications of polymers are
determined by the type of recycled resin and symbols of
identification. The ID code is adopted in Mexico, November 25,
1999 in NMX-E-232-SCFI-1999 based on the identification of
Europe and American countries. [1]
According to the 2008 Statistical Yearbook of the Mexican
Association of Packaging (AMEE), for the production of
packaging consumed approximately 2.3 million tons of various
resins. According to the Mexican Institute of Industrial Plastic
(IMPI), the total production of plastic, 43% represents the
packaging market, being the most widely used plastics as
follows: 1) PET, 2) HDPE, 3) PVC, 4) LDPE and LLDPE, 5)
PP, 6) PS and 7) Other. Apparent Domestic Consumption of
plastics used for packaging development has shown a positive
trend in recent years. With respect to 2007, total consumption of
plastics increased by 4.5% compared to 2006 for each type of
plastic. Today, the plastic with the highest recycling rate in
Mexico is PET, however, the bulk corresponds to polyethylene.
Therefore the challenge for Mexico is that there are more than
one million outlets. The largest source comes from post-
consumer wastes which are more difficult to separate
contaminated and wash, they arise from scavenging garbage, or
specialized collection centers as in the case of containers PET.
Each plastic must be analyzed independently, as to choose the
most appropriate technology for recycling is important to know
the characteristics of the waste and the product sought, and
though the teams are often multi-recycling in the area of
specialization is worth.
PET is used to make bottles that are packaged in soft drinks and
purified water, mainly due to its transparency, gas barrier and
impact resistance, is also used for food packaging and products
household cleaners and some pharmaceuticals. The participation
of this resin in the total consumption is 33%. According to the
presentation; challenges and prospects for the plastics industry in
México. Conducted by the National Association of Plastic
Industries (ANIPAC) notes that the plastics industry in Mexico
has recorded in recent years a trade deficit in As resins (raw
materials), as its imports are more than exports. Hence the
urgent need for the government to speed up investment projects
in the petrochemical industry. Mexico imports more than 50% of
the resins they consume, in fact no one in the world plastics
industry strong and competitive in the short and long term which
in turn depends on both imported raw materials. So says the
ANIPAC not enough to invest in modernizing the plastics
industry in Mexico, because without sufficient local raw
material is vulnerable. In addition to the outlook in the medium
term indicate high commodity prices and limited supply of
polyethylene (2006-2010), among others. It also recommends
further develop petrochemical projects, pricing of basic
commodities, diversifying sources of supply, procurement
organization, negotiation and consolidated purchasing more
efficient and competitive logistics as well as the urgent need for
legislation for efficient recycling recyclable resins. [6]
Plastics are important engineering materials mainly for its wide
range of properties relating to the ease of molding into the
desired shape and relative low cost. PET is considered a
thermoplastic (TP) which have a glass transition temperature
above which these materials behave like elastic solids and
viscous or below it behave as brittle solids, glassy. Above the
glass transition temperature permanent deformation occurs
because the molecular chains slide with each other, breaking and
re-form the secondary links. [4]
Thermoplastics are classified as business or engineering. The
Commercial thermoplastics (TPC) is generally used in
applications without load or load very small, while engineering
thermoplastics (TPI) support loads for long periods and compete
with metals in certain structural applications. About 90% by
weight all plastics are TPC and only 10% are engineering resins. [3]
The TP (entangled polymers) in particular, are easy to recycle
using simple technologies, without a clutch because the melting
temperatures of the different plastics are different, sorted plastics
require a guy with similar melting properties for a cast
homogenous.
Types of Recycling. Recycling plastic is a very useful practice to
reduce solid waste, and that plastics represent about 8% of
municipal waste is expected that this year the percentage will
increase to 10% currently receiving increased attention recycling
and continue to develop techniques to improve it. Some
techniques were first developed in the 70's, when some countries
began to burn their plastic waste. Since then there have been
many advances in the way of recycling plastic, resulting in four
types of plastic recycling: primary, secondary, tertiary and
quaternary. [2]
EXPERIMENTAL METHODOLOGY
The experimental process for obtaining polyethylene
terephthalate polymer concrete recycling is divided into two
main stages: the first is in the process of obtaining mechanically
recycled PET flake-shaped and the second stage is the technique
to get the new material particulate reinforced composite fiber
and recycled PET.
292
Proceedings of International Conference on Education, Informatics, and Cybernetics (icEIC 2011),
and the International Symposium on Integrating Research, Education, and Problem Solving (IREPS 2011)

STEP 1. Obtaining process mechanically recycled PET.
As a first step applies primary recycling is the conservation of
plastic waste items with physical and chemical properties
identical to the original material. Usually this type of recycling
is done with thermoplastics such as PET (polyethylene
terephthalate).
• Collection. It is one of the initial activities for recyclable
plastics, which is important to identify and separate the solid
waste plastics by type of recycled resin that can be profitable. In
particular are selected those PET bottles that contained a
beverage as natural water, carbonated water or other beverage
ingested.
• Transport. After the harvest is carried out transport of PET
bottles, to a temporary storage warehouse, in which continuous
recycling process.
• Classification. On the site for the mechanical recycling of PET
bottles, is a classification of PET products by color, by hand.
Taparosca subsequently separates and falls off the label, which
are stored separately.
• Primary or mechanical recycling. PET bottles are washed with
pressurized water to remove accumulated debris inside the
bottle. The bottles were allowed to dry, preferably indoors in an
average of 2 to 6 hours. If the bottles are completely dry, go to a
conventional mill. It is noteworthy that the mill has built a mesh
that serves as a sieve which passes only a certain size from
ground PET flake, is particles are obtained from 0.1 to 1 cm.
Milled PET particles larger than 1 cm and are collected in the
mesh, to be ground again. The particle sizes between 0.1 - 1 cm,
packed in bags and stored as raw material for the production of
polyethylene terephthalate polymer concrete recycling.
STEP 2. Getting Technical with RPET CP mechanically.
As a second stage of the process to obtain the polymer concrete
is necessary to mix calcium carbonate and polyester resin, PET
chips were obtained as part of primary recycling waste bottles
that contained water or a carbonated drink.
Raw Materials.
• Polyester resin. As experimental design variable is chosen this
type of resin as binding agent characteristics (matrix) in the
mixture of the composite. In addition belongs to the group of
synthetic polyesters known, so this feature makes it compatible
with polyethylene terephthalate.
• Calcium carbonate. Chemical Formula: CaCO3. As raw
material is added to calcium carbonate as a filler that provides
volume to obtain a composite material.
• Flake RPET. The recycled PET flakes are mechanically
obtained from step number 1 and which are added as filler in the
binder to obtain reinforcement in the polymer matrix composite
material.
• Color. We used a commercial dye in liquid, brown for signs of
new polymeric materials.
Variables in the design of experiments.
Design Variable 1. Resin Type, as a base and binder in polymer
concrete composition as presented in Table 1.
Type of
Resin
Degree of
toxic
Cost Commercial
availability
Polyester Low Low High
Phenolic High High Low
Epoxy Means Means Means
Vinyl ester Means High Means
Table 1 Comparison of four types of resins used as a base
matrix and / or binding agent.
Based on comparative data are presented in Table 1 the polyester
resin has greater advantages drank to their low toxicity and does
not contain agents highly aggressive, low cost and greater
commercial availability, which is why using this type of resin as
binding agent in the polymer mixture to formulate the new
composite material (polymer concrete with recycled PET).
Design Variable 2. Type of recyclable plastic, according to their
classification by type of resin.
Based on the general characteristics of PET and be considered a
thermoplastic which belongs to the group of polyesters; this
material to be recycled mechanically and get chips as feedstock
is technically compatible with the polyester resin used as binder.
In addition, our country is the second most recyclable waste
generation and its consumption. Due to the above classification
of recyclable plastics PET is chosen for the development of new
composite material.
Design Variable 3. Mechanically recycled PET in the form of
flakes.
The process of obtaining mechanically recycled PET, the
material is RPET flakes with a size between 0.1 to 1 cm long
and 0.1 cm thick, which are added to the polymer mixture as a
filler and reinforcement. It is important to note that the materials
laboratory, samples were prepared by varying the amount by
weight and size of RPET flakes greater than 1 cm in size and
failed attempts the samples had an irregular appearance on the
surface because the saturated reinforcement the base (polyester
resin).
Design Variable 4. Equivalent portions of compounds (raw
materials) in the polymer blend, for the formulation of new
composite material.
In failed attempts of the polymer blend samples to be changing
the amount by weight of the load (RPET flake), it was
determined that the relationship to obtain a homogeneous
polymer blend is a function of the amount by weight of the load
added as reinforcement in polyester resin. That is why the
relationship with respect to the amount of polyester resin used is
1:2. taking as calcium carbonate fillers and RPET flakes as
reinforcement is for every 1 ml of binding agent is added to 1 g
and 1 g CaCO3 RPET flakes. In Figure 1 will represent the
amounts that were used to obtain a cube-shaped sample of the
composite.
Procedure for obtaining polymer blend.
1. Measure out 100 ml of polyester resin in a glass test tube.
2. Weigh 100 grams of calcium carbonate on a beam balance.
3. Weigh 100 grams of RPET flakes which have a particle size
between 0.1 and 1 cm.
293
Proceedings of International Conference on Education, Informatics, and Cybernetics (icEIC 2011),
and the International Symposium on Integrating Research, Education, and Problem Solving (IREPS 2011)

4. In a mixing bowl add the 100 ml plastic polyester resin,
gradually incorporate calcium carbonate alternating equal
portions of RPET flakes with a rubber spatula to mix the
components until a homogeneous mixture.
5. Add to the mix 5 grams of commercial dye.
6. Stirring the polymer blend, we proceed to pour it into molds
of high density polyethylene to obtain the desired shape.
7. Castings let stand for 24 hours at room temperature.
8. Remove from molds, parts of CP with RPET.
Figure 1 specifies the amounts used for polymer concrete sample
of 25 cm3.
Figure 1. Getting polymer concrete using recycled PET as raw
material.
CONCLUSIONS
The technology developed from recycled materials is a first step
in our country because the economic value of the components
that can be used in the application of new technology. In
addition research has made it possible to reduce waste, leading
to the development of new technologies, ensuring that the rate of
recovery and recycling of plastics and products will increase in
the future.
The emergence of recycling starts to try to preserve non-
renewable natural resources as a way of harnessing the waste
with economic and ecological value. It is also worth mentioning
that by recycling one ton of plastic saves 7 tonnes of crude oil
and pollutes 55% less.
The use of polyester resin as binding agent in the polymer blend
is feasible due to its low cost, commercial availability and
environmentally acceptable because of its low toxicity, in
comparison with other resins such as epoxy, phenolic or vinyl
ester.
The development of polymer concrete using recycled
polyethylene terephthalate is technically and economically
feasible, thereby contributing to minimize the negative
environmental impact generated by excessive consumption of
PET. In addition to this technological innovation would help
reduce environmental pollution, and recycle the plastic that is
discarded daily to apply it in developing a new composite
material that can be applied in the construction industry for its
high resistance. Moreover this research does not do justice
compared to traditional concrete hydraulic technologies and that
over time we are witnessing an effort in all respects to the
development of polymer concrete as a new environmentally
friendly alternative materials, together with a wealth of
theoretical research and experimental materials appearing on the
market with special properties, yet little used, but promising
future.
REFERENCES
[1] Blanco Rafael Ornelas. (2000). Plastics Encyclopedia 2000.
Mexican Institute of Industrial Plastic S.C. Third Edition.
[2] Daniel Bustos. (2009) History of environmental stories. PET
recycling. Center for Environmental Communication and
Information of North America, A.C. México, D.F.
[3] Mangonon Pat. L. (2001). Materials Science, Selection and
Design. Florida Institute of Technology. Prentice Hall, Pearson
Education. U. S.
[4] William F. Smith (2003). Fundamentals of Materials Science
and Engineering. Ed. Mc Graw Hill. Third Edition.
[5] Jose Luis Ramirez Ortiz. (1999) Mexican Institute of Cement
and Concrete, A.C. Construction and Technology Magazine.
Volume 49. Number 454.
[6] Sosa Alejandro Reyes. (2010) Focus Packaging Magazine,
Online. Number 10, Article 6. México.
294
Proceedings of International Conference on Education, Informatics, and Cybernetics (icEIC 2011),
and the International Symposium on Integrating Research, Education, and Problem Solving (IREPS 2011)

Design and Implement a System of Wastewater Treatment Based on Wetlands
Martha L. DOMÍNGUEZ-PATIÑOFacultad de Ciencias Químicas e Ingeniería, Universidad Autónoma del Estado de Morelos
Cuernavaca, Morelos, CP 62209, México
Antonio RODRÍGUEZ-MARTÍNEZCentro de Investigación en Ingeniería y Ciencias Aplicadas, Universidad Autónoma del Estado de Morelos
Cuernavaca, Morelos, CP 62209, México
and
Luis A. JASSO-CASTILLOEscuela Superior de Ingeniería Mecánica y Eléctrica. Instituto Politécnico Nacional
Distrito Federal, CP 07738, México
ABSTRACT
The wetlands are considered as a natural passive cleaning of waste water. Is a process characterizes by its simplicity of operation, low or zero-energy consumption and low waste production. These consist of shallow ponds planted with plants. The processes of decontamination are performed simultaneously by its physical, chemical and biological properties [1].
The objectives of this work are design and implement a system of artificial wetlands as an alternative method for treating waste water produced from the Faculty of Chemistry Science and Engineering that allow to reduce the costs of operation, knowing the degree of water pollution to determine how efficient the wetland and, finally improve the health and environmental conditions of the irrigation water.
So the first step was to know the degree of water pollution and quantity to determine the wetland process variables.
The second step was to determine the kind of plants that allow reducing the water contaminants. The Manning formula was applied to evaluate the free flow and Darcy’s equation for the surface flow by wetlands. A micro-scale prototype was design and built based on buckets.
The absorption capacity of several plants (Bacopa monnieri, Nephrolepis exaltata,Tradescantia zebrine) was determined. Also we use a natural filter consisting of Tezontle (first layer), sand (second layer), gravel (third layer), sand (fourth layer), Tezontle (fifth layer), gravel (sixth layer), sand (seventh layer) and, organic substrate (eighth layer).
A wetland decreases more than 60% the cost compared to a water purification plant as everything is based biodegradable materials and not using any energy or sophisticated equipment to water filtration.
Wetlands not only help to purify the water, but also help the conservation of flora and fauna that is dependent on wet conditions, as only biodegradable materials are used there is no pollution to the ground, helping the conservation of the environment. Today we are evaluating the wastewater flow because the prototype only allows treating from 0-1 L/min.
Key words: wetlands, phytodepuration, Bacopa monnieri, Nephrolepis exaltata,Tradescantia zebrine wastewater treatment plant.
1. INTRODUCTION
Because the treatment of wastewater through conventional treatment systems are expensive both in construction and in operation and taking into
295
Proceedings of International Conference on Education, Informatics, and Cybernetics (icEIC 2011),
and the International Symposium on Integrating Research, Education, and Problem Solving (IREPS 2011)

account that the pollutant removal rates are poor, alternative methods have been designed and constructed wetlands that are specifically designed and built systems for wastewater treatment in conjunction interacting plants, animals, microorganisms and abiotic environmental factors for treating waste water.
The artificial wetlands are artificial constructed wetland systems for wastewater (the term wetlands means Phytodepuration are wastewater systems designed to artificially recreate ecological conditions similar to those established in the areas of water).
The system consists of the development of a cultivation of certain plants rooted on a bed of volcanic rock gravel or sealed. The action makes it possible to plant a series of complex physical interactions, chemical and biological weapons through which the influent wastewater is cleaned and slowly progressive.
A wetland can have the following characteristics: treatments are based on physical, chemical and biological nature, requiring no extra supply of chemical reagents. In regard to its functioning as biological treatment, are operated under anaerobic conditions, facultative and/or aerobic in which oxygen is supplied spontaneously by transport from the atmosphere, which represents a significant saving of energy without mechanical aeration.
Wetlands remove pollutants through various processes including sedimentation, microbial degradation, plant action, absorption, chemical reactions and volatilization.
The operation of constructed wetlands is based on three basic principles: the biochemical activity of microorganisms, the oxygen through the plant during the day and the physical support of an inert bed serves as a support for rooting plants; and serve as filter material. Together, these elements dissolved and suspended materials removed in the wastewater and biodegrade organic matter to mineralization and form new organisms.
Wetlands have three basic functions that give them attractive potential for the treatment of wastewater: contaminant physically set on the surface of soil and organic matter, use and transform the elements by microorganisms and achieve levels of treatment
consistent with a low power consumption and low maintenance [2].
Constructed wetlands can be classified according to the type of macrophytes (plants) used in its operation: fixed to the substrate macrophytes (rooted) or free floating macrophytes.
Considering the way of life of these macrophytes, artificial wetlands can be classified as:
Treatment systems based on floating leaf macrophytes, mainly angiosperms on waterlogged soils [3]. The reproductive organs are floating or air. The water hyacinth (Eichhornia crassipes) and duckweed (Lemna sp.) are the species most used for this system.
Treatment systems based on submerged macrophytes: include ferns, mosses, and charophytes numerous and many angiosperms. They are found throughout the photic zone (at which sunlight reaches), although vascular angiosperms only live to about 10 m depth. The reproductive organs are aerial, floating or submerged.
Treatment systems based on rooted macrophytes emerging in waterlogged soil permanently or temporarily, in general are perennial plants with aerial reproductive organs.
Wetlands rooted macrophytes based on emerging can be of two types, depending on the movement of water used:
1) Surface flow wetland, if surface water circulates among the stems of the macrophytes and,
2) Wetlands subsurface flow, if the water flows below the surface layer of the wetland.
2. METHODOLOGY
We use the Manning formula applied to free flow wetlands and Darcy´s Law applied to surface flow wetlands.
The method used a free-flow wetland due to ground conditions.
296
Proceedings of International Conference on Education, Informatics, and Cybernetics (icEIC 2011),
and the International Symposium on Integrating Research, Education, and Problem Solving (IREPS 2011)

We performed a micro-scale prototype, based on buckets, to test the absorptive capacity of each plant to use.
The plants used were Bacopa monnieri, Nephrolepis exaltata and Tradescantia zebrina (See Fig. 1).
Fig. 1. Planst used in the prototype: (1) Bacopa monnieri, (2) Nephrolepis exaltata and (3)
Tradescantia zebrine.
3. RESULTS
A natural filter was added consisting of eight layers:
First layer (Tezontle)Second layer (Arena)Third layer (gravel)Fourth layer (Arena)Fifth layer (Tezontle)Sixth layer (gravel)Seventh layer (Arena)Eighth layer (organic substrate)
In Fig. 2 is shown the material used.
Fig. 2. Material used in the wetlands prototype.
In the Fig. 3 is presented the layers compositions of the support material.
Fig. 3. The final design of layers in the wetland prototype.
This alternative was implemented effluent treatment for reducing costs.
It was designed with the future implementation data shows a micro-scale design of a wastewater treatment plant based on wetlands, testing the ability of absorption of three different plants.
With the above conditions are improved and environmental health irrigation water.
In Fig. 4 is shown the final dimensions of the wetland prototype used.
297
Proceedings of International Conference on Education, Informatics, and Cybernetics (icEIC 2011),
and the International Symposium on Integrating Research, Education, and Problem Solving (IREPS 2011)

Fig. 4. Final dimensions of wetland prototype.
In the hydraulic design was observed that the flow through the wetland must overcome the frictional resistance of the same system. This resistance is imposed by vegetation and the sediment layer and the medium, the roots of plants and accumulated solids.
The best solution in terms of construction, the wetland is to provide a fund with an inclination sufficient to allow complete drainage and finally apply Darcy's law and the Manning equation applied to artificial flow wetlands.
4. CONCLUSIONS
A wetland decreases more than 60% the cost compared to a water purification plant as everything is based biodegradable materials and not using any energy or sophisticated equipment to water filtration.Wetlands not only help to purify the water, but also help the conservation of flora and fauna that is dependent on wet conditions, as only biodegradable materials are used there is no pollution to the ground, helping the conservation of the environment.Water is one of the most precious and if we do not LUID aware that both the hand of man does this precious liquid, finish with it.
5. REFERENCES
[1] Adriana Gutiérrez-Osorio, Ma. Laura Ortiz-Hernández, Enrique Sánchez-Salinas y Ma. Magdalena Ortega-Silva (2008). Tratamiento de aguas residuales por medio de la instalación secuencial de humedales artificiales. V congreso internacional y XI nacional de Ciencias Ambientales. ISBN 968-878-265-3. [2] Arias I., Hans Brix (2003). Humedales artificiales para el tratamiento de aguas residuales. Ciencia e Ingeniería Neogranadina. Bogota Colombia, pp. 17-24[3] Joan García Serrano, Angélica Corzo Hernández (2008). Guía Práctica de Diseño, Construcción y Explotación de Sistemas de Humedales de Flujo Subsuperficial. Universidad Politécnica de Catalunya.
298
Proceedings of International Conference on Education, Informatics, and Cybernetics (icEIC 2011),
and the International Symposium on Integrating Research, Education, and Problem Solving (IREPS 2011)

AUTHORS INDEX
(Post-Conference Edition)
Abdul Rahman, Hisyam Bin 136 Alemi, Minoo 218 Anderson, Phyllis R. 224 Ask, Bodil 34; 211 Bao, Yufang 40 Berena, Arjulie John 19 Bernabé-Rocha, Araceli 153 Bhat, Anjana 57 Brade, Marius 124 Bücheler, Thierry 118 Caron-Pargue, Josiane 176 Cavus, Seda 230 Cha, Eunme 1 Cheng, Sheila 233 Chunwijitra, Sila 19 Cid, G. 75 Cisneros-Molina, Myriam 153 Cury, R. 75 Dachman, Abraham H. 130 Dahi, Farid 130 Dipinto, Kaki 25 Dipinto, Vito M. 25 Dogan, Nihal 230 Domínguez Patiño, Martha Lilia 291 Domínguez-Patiño, Martha L. 295 Dotov, Dobri 57 Dressler, Gregory 57 Ellabidy, Magdy 63 El-Sayed, Jacqueline 182 El-Sayed, Mohamed 182 Elysee, P. A. 63 Erdélyi, Ferenc 274 Fink, Alexander 239 Finkelstein, Joseph 1 Ganeshan, Kathiravelu 51 Gifford, Timothy 57 Glavitsch, Ulrike 91 Goede, Roelien 206 Gómez-Reyes, Gabriel 153 Goulding, Tom 63
Guimarães, C. 75 Gungoren, Savas 230 Hammett, Roberta F. 28 Hardy, Jim 46 Harris, Trevor 107 Haugen, Harald 34; 211 He, Zheng 19 Hottenstein, Alex 95 Hu, Jie (Jack) 51 Jasso-Castillo, Luís A. 295 Jiménez Placer, Gustavo 285 Jokinen, Tiina 280 Kaufmann, Pascal 118 Kaur, Maninderjit 57 Kettunen, Juha 245 Kobayashi, Hiroyuki 165 Kozma, László 79 Kulmala, Markku 265 Lago Vilariño, Ana Belén 8 Lai, Peng-Jen 251 Lambert, Clayn 46 Lapinskaite, Indre 194 Latzina, Markus 124 Lauri, Antti 265 Legaspi, Enrique 270 Lester, Virda K. 142 Li, Xiaosong 51 Lunsford, Suzanne 147 MacLean, Lisa 63 Madden, Karl 85 Makino, Koji 165 Mäntylä, Heljä 280 Marques, Maria Teresa 261 Marsh, Kerry 57 McGowan, Alan H. 257 Modai, Enrique 285 Monfelt, Yngve 159 Moravčík, Oliver 69 Muniafu, Maina 200 Ndirangu, Dalton 200
299
Proceedings of International Conference on Education, Informatics, and Cybernetics (icEIC 2011),
and the International Symposium on Integrating Research, Education, and Problem Solving (IREPS 2011)

Nduati, Gidraph 200 Negri, T. 75 Obajuluwa, Ademola M. 130 Ohyama, Yasuhiro 165 Oliveira, J. 75 Olkanen, Johanna 280 Olthuis, Wouter 171 Orbán, György 79 Ornelas Marques, Fernando 261 Oulanov, Alexei 85 Paramonov, Mikhail 265 Pashmforoosh, Roya 218 Pastura, F. 75 Pietilä, Kai 280 Pretel García, Iván 8 Räihä, Kalle 113 Redden, R. J. 188 Reid, Joanne R. 224 Rios, Jennifer 25 Rodríguez Martínez, Alma Delia 291 Rodríguez-Martínez, Antonio 295 Rodríguez-Montaño, Flora 153 Romero, Margarida 5 Rosas Trejo, Gerardo 291 Rutkauskas, Aleksandras Vytautas 194 Salamin, Anne-Dominique 101 Santos, V. 75 Schreiber, Peter 69 Schrobsdorff, Hecke 118 She, Jin-Hua 165 Simon, Klaus 91
Siow, Heng-Loke 233 Srinivasan, Sudha 57 Sriprasertsuk, Pao 19 Stasytyte, Viktorija 194 Štefánková, Jana 69 Streit, P. 75 Su, Eileen Lee Ming 136 Svetský, Štefan 69 Sylvius, Veera 265 Szakos, Jozsef 91 Taylor, Estelle 206 Tóth, Tibor 274 Ueno, Haruki 19 van den Berg, Albert 171 Vannier, Michael W. 130 Vennonen, Helena 280 Vitali, Amado 285 Wambalaba, Akosa 200 Wambalaba, Francis 200 Wanamaker, Christian 57 Wanyama, Walter 200 Werner, Horst 124 Werner, Linnette R. 239 Wolcott, Peter 188 Yamaguchi, Precious Vida 270 Yeong, Che Fai 136 Yildirim, Fazli 14 Zabaleta Fernández, Koldo 8 Zamberlan, M. 75
300
Proceedings of International Conference on Education, Informatics, and Cybernetics (icEIC 2011),
and the International Symposium on Integrating Research, Education, and Problem Solving (IREPS 2011)